vernier acuity, crowding and cortical magnification
TRANSCRIPT
Vision Res. Vol. 25, No. 7, pp. 963-977, 1985Printed in Great Britain. All rights reserved Copyright i
0042-6989/85 $3.00 + 0.00) 1985 Pergamon Press Ltd
V
VERNIER ACUITY, CROWDING ANDCORTICAL MAGNIFICATION*
DENNIS M. LEVI, STANLEY A. KLEIN and A. P. AITSEBAOMOUniversity of Houston, University Park, College of Optometry, 4901 Calhoun Boulevard,
Houston, TX 77004, U.S.A.
(Received 4 September 1984; in revised form 14 November 1984)
Abstract—When a vernier target is flanked by optimally positioned lines, foveal vernier discriminationis strongly degraded (Westheimer and Hauske, 1975). We confirmed this observation (Experiment I) andhave mapped out a 2 dimensional "perceptive field" for crowding in the fovea using a 2 dot target(Experiment II). Crowding was also measured in peripheral vision, using either small flanking dots asmasks (Experiment III), or using repetitive vernier gratings (Experiment IV). The results showed that whenscaled in proportion to recent estimates of the cortical magnification factor, vernier acuity is as good inthe periphery as it is centrally. Both centrally and peripherally, there appears to be a psychophysicalprocessing module which we term a "perceptive hypercolumn". At all eccentricities vernier thresholds werefound to be approximately 1/40 of the size of a perceptive hypercolumn and were elevated if interferingcontours are present in the same (or adjacent) hypercolumns.
Vernier acuity Spatial interference Hyperacuity Periphery Cortical magnification
INTRODUCTION
When a vernier target is flanked by a pair of opti-mally positioned lines, foveal offset discrimination isstrongly degraded (Westheimer and Hauske, 1975).Such interference effects are ubiquitous in spatialvision, and have been demonstrated to occur forfoveal targets in tilt judgements (Westheimer et al.,1976; Andriessen and Bouma, 1976), stereopsis (But-ler and Westheimer, 1978) and letter acuity (Flom etal., 1963b). Because spatial interference occurs alsounder dichoptic conditions (Flom et al., 1963a; West-heimer and Hauske, 1975) it has been considered toreflect a central, neural inhibitory interaction. Spatialinterference in Hyperacuity tasks is especially inter-esting because it operates over distances which arevery large when compared to the accuracy of hyper-acuity thresholds (Westheimer, 1981). Spatial inter-ference is also evident in the finding that vernierdiscrimination is severely degraded at high spatialfrequencies (Levi and Klein, 1982 a,b; 1983). Thus,an understanding of the neural interactions involvedin spatial interference is important to any theory ofhyperacuity (Westheimer, 1981; Barlow, 1981; Wattand Morgan, 1983). In the first experiment to bereported here, we have confirmed the results ofWestheimer and Hauske (1975) in showing that thestrongest interference occurs when flanks are 2-4 minfrom the target with foveal viewing. Spatial inter-ference also occurs in 2 dot vernier discrimination.With these very localized stimuli, we have mapped
*Supported by research grants from the National EyeInstitute (R01 EY01728 and R01 EY04776).
out a "perceptive field" for spatial interference bothin the direction of the offset and in the orthogonaldirection (Experiment II).
Spatial interference in the periphery
It is generally thought that spatial interference withletter acuity is especially strong in the periphery(Korte, 1923; Bouma, 1970; Lettvin, 1976; Banks etal., 1979). For example, Bouma (1970) reported thatfor complete visual isolation of a letter presented atan eccentricity of E°, no other letter should bepresent within a distance of about 0.5 E°. Similarresults occur for tilt judgements in the periphery(Andriessen and Bouma, 1976). Because vernier acu-ity is especially degraded in the periphery (Bourdon,1902; Westheimer, 1982), it seemed likely that spatialinterference with vernier acuity might be particularlystrong in the periphery. Thus we explored spatialinterference with vernier acuity (using long abuttingtargets) in the periphery (Experiment I I I ) . We findthat vernier acuity for abutting targets is severelydegraded in the periphery, falling off more rapidlythan grating acuity. However, both foveally andperipherally, the functions relating vernier thresholdelevation to the distance of the flanks peaks ata distance approximately 30 times the unflankedvernier threshold. Complete isolation occurs onlywhen the flanks are about 60 times the unflankedthreshold value. Thus spatial interference with ver-nier acuity in the periphery "scales" to the unflankedvernier threshold. Comparable "crowding" occurswith repetitive vernier gratings (Levi and Klein,1982a, b; 1983) at high spatial frequencies (Experi-ment IV).
963
964 DENNIS M. LEVI et al.
Cortical magnification and hyperacuity
It is of special interest to attempt to relate thedecline in visual performance with eccentricity tochanges in the anatomy and physiology of the visualsystem (Weymouth, 1958; Cowey and Rolls, 1974;Rovamo et al., 1978; Koenderink et al. 1978; Drasdo,1977; Virsu and Rovamo, 1979; Schwartz 1980,1983). Our results, in agreement with Westheimer(1982) show that vernier acuity falls off faster witheccentricity than does grating acuity. The fall-off invernier acuity is compatible with recent estimates ofcortical magnification (Dow et al., 1981; Tootell etal., 1982; Van Essen et al., 1984) while the decline ingrating acuity is consistent with retinal factors. Thepresent results show that when scaled to corticalmagnification, vernier acuity over a wide range ofspatial frequencies is the same in the periphery as itis foveally.
EXPERIMENT I.VERNIER ACUITY WITH LONG LINES:
SPATIAL INTERFERENCE IN CENTRAL VISION
Methods and stimuli
An example of the stimulus is shown schematicallyin Fig. 1. The vernier stimulus consisted of two long(1.5°), thin (50"), bright (960cd/m2), high contrasthorizontal lines generated on the CRT of a computer(Commodore 2001 with green phosphor). The displaywas modified so that the vertical height could beshrunk, making it possible to precisely position thestimuli with high resolution in the vertical dimension(Klein and Levi, 1985). The left hand "reference" linewas presented continuously. The test line was flashedfor 250 msec in one of 5 positions. The observer's taskwas to judge whether the test line was above, belowor aligned with the abutting reference line, and to ratetheir confidence by giving numbers from — 2 to +2.Feedback as to the direction and magnitude of offsetwas given after each trial. Our psychophysical pro-cedures have been described in detail elsewhere (Leviand Klein, 1983; Levi, Klein and Aitsebaomo, 1984).Thresholds for discrimination of the position of thetest line were obtained by calculating a maximumlikelihood estimate of the d' values for each stimulusand interpolating to a d' = 0.675 equivalent to the75% correct level (e.g. Westheimer and Hauske,1975).
The flanking contours were symmetrically placedat various distances from the reference line. These
REFERENCE (CONTINUOUS)
_ TEST (FLASHED)
Fig. 1. Schematic of the stimulus. The lefthand (reference)line was presented continuously. The righthand (test) linewas flashed for 250 msec. The flanks, which were presentedat different distances from the target were also presented
continuously.
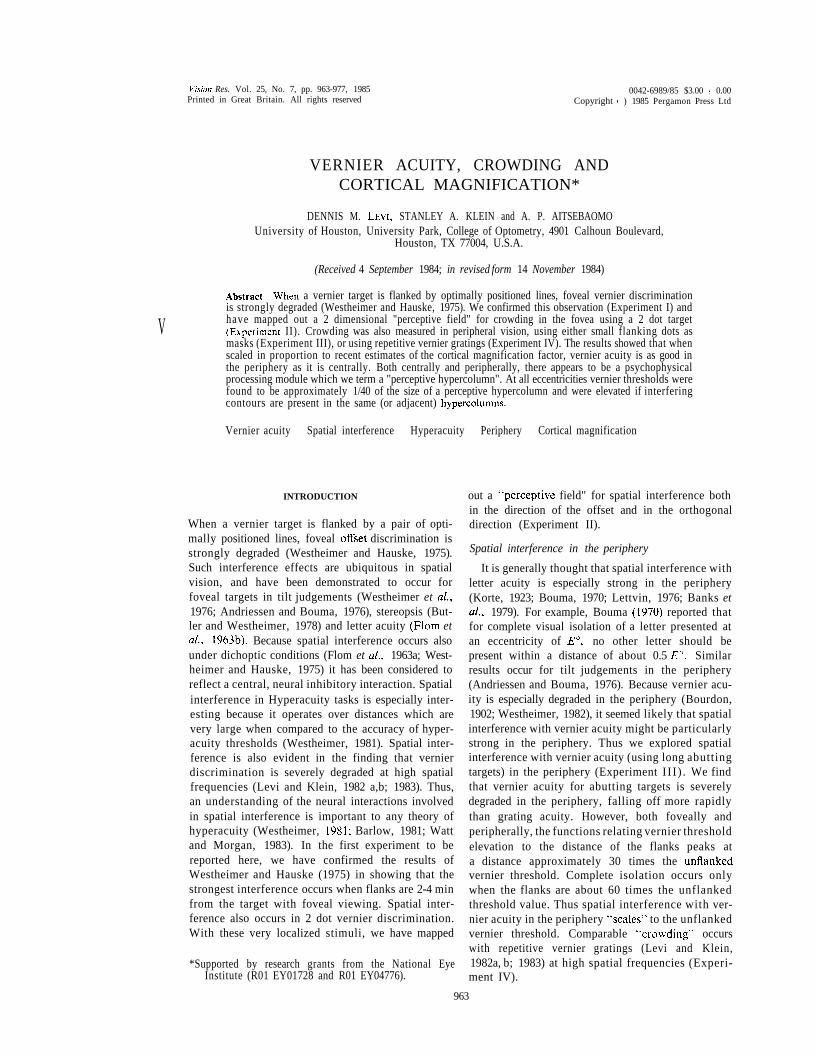
1 2 5 1 0
FLANK SEPARATION (MINUTES)
Fig. 2. Vernier threshold ( + 1 S E ) as a function of thedistance of the flanks from the target for four observers.
flanks were presented continuously with the referenceline. They were approximately 6% of the length of thereference and test lines. In order to minimize thepossibility of a bisection cue, the flanks were adjacentto the reference line and did not extend to the test lineas shown in Fig. I.The flanks were 5.8 min long by50" wide (the same width as the test and referencelines), and equal in brightness to the test and refer-ence lines.
Three of the observers were the authors who werehighly experienced and one observer was naive as tothe purpose of the experiment. All observers hadnormal visual acuity and normal binocular vision.Testing was monocular with the nondominant eyepatched via a black occluder. Data were collected inblocks of 125 trials, each preceded by 10-20 practicetrials, with the spacing of the flanking lines variedbetween blocks. Each condition was repeated (in adifferent order) and the thresholds shown are thegeometric mean of the threshold values determinedfrom several (2-5) blocks.
Results
Figure 2 shows the basic phenomenon for the foveaof the four observers with normal binocular vision.Vernier thresholds are plotted as a function of thedistance of the flanks (on log-log coordinates). Thesymbol closest to the ordinate shows the unflankedthreshold for each observer. The elTect of the flankswas to elevate thresholds in a nonmonotonic fashion.For each observer the strongest interference occurredwhen the flanks were about 2-3 minutes away fromthe reference line. At this point, the thresholds wereelevated approximately 3 fold. Moving the flankscloser or further from the reference line resulted in alowering of threshold, so that when the flanks were5-8 min away, thresholds returned to the unflankedbaseline value. This interference function is in directagreement with the results of Westheimer andHauske (1975).
Vernier acuity, crowding and cortical magnification 965
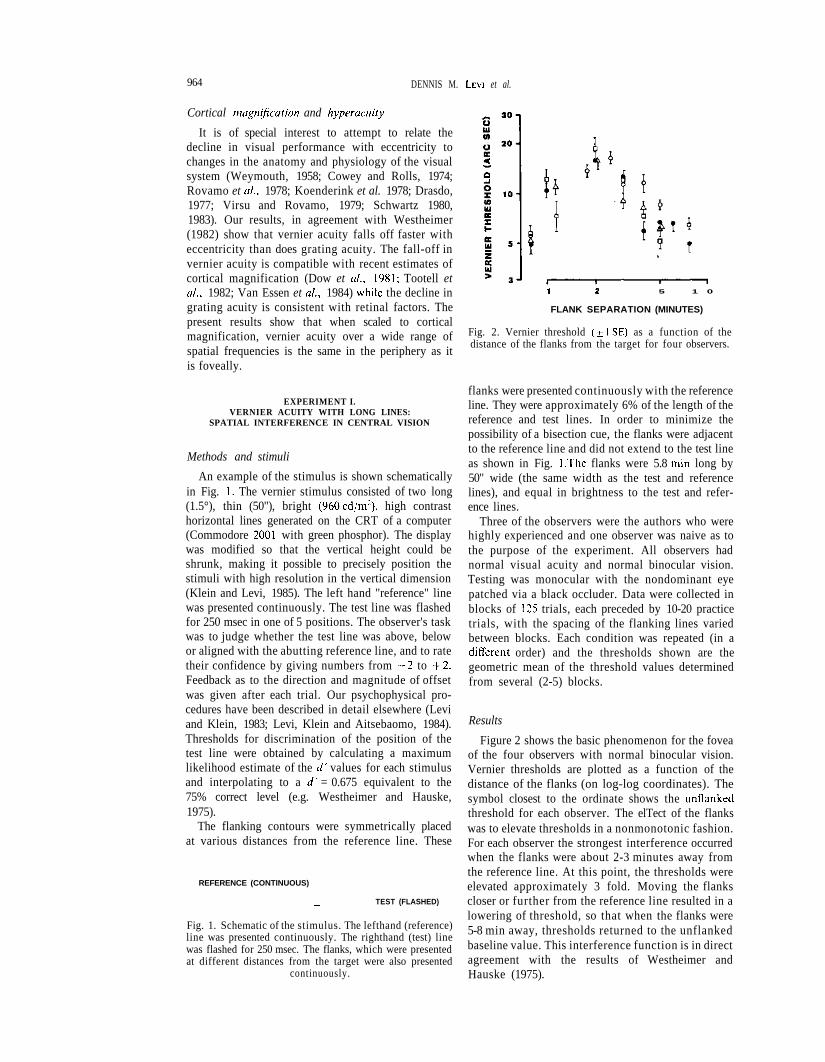
1 2.5 5 10 25 50 lio 250
FEATURE SEPARATION (MINUTES)
Fig. 3. Position thresholds are plotted as a function of feature separation for 2-dot vernier (2's), 3-dotvernier (3's) and 3-dot bisection (0's) for observer DL. For the 3-dot tasks, separation is specified betweenthe center dot and one of the outer dots. The error bars show ± 1 SE. The solid line has a slope of 1 and
is plotted for a Weber fraction = 1/60.
EXPERIMENT II.VERNIER ACUITY WITH DOTS: A "PERCEPTIVE
FIELD" FOR SPATIAL INTERFERENCE
Methods and stimuli
In order to explore interference effects with morelocalized stimuli, vernier acuity was measured using2 small bright rectangles (14" high by 1.21' long).These stimuli appeared as 2 small bright dots. As inExperiment I, one "dot" was presented continuously,and served as a reference. The "test" dot was flashedon for 1 sec in one of 5 positions. The observers' task,as in the previous experiment, was to judge whetherthe test dot was above, below or aligned with thereference dot, and to rate their confidence. The flankswere identical in size and brightness to the referencedot, and were presented continuously.
The first author served as the main observer forthis experiment, however all of the main results havebeen replicated in other observers and under differentluminance levels (Klein and Levi, 1984). Viewing wasbinocular.
Results
Figure 3 shows the dependence of vernier thresh-olds on the separation between the centers of the dots(with no flanks). The 2's are the data for the two dotstimulus. The 3's show that the addition of a secondreference equally spaced on the other side of the testdoes not significantly alter the vernier thresholds.Note that at separations of 2.5'-6' the thresholds arevery low. At both smaller and larger separations,thresholds increase. At small separations the increaseis caused by blurring. At larger separations thresh-olds increase, being approximately 1/70 of the featureseparation (i.e. equivalent to a constant orientationthreshold of about 0.8 deg). The effects of flanking
targets in the direction of the vernier offset wasexplored by placing the flanks symmetrically on eachside of the reference dot, at different distances.
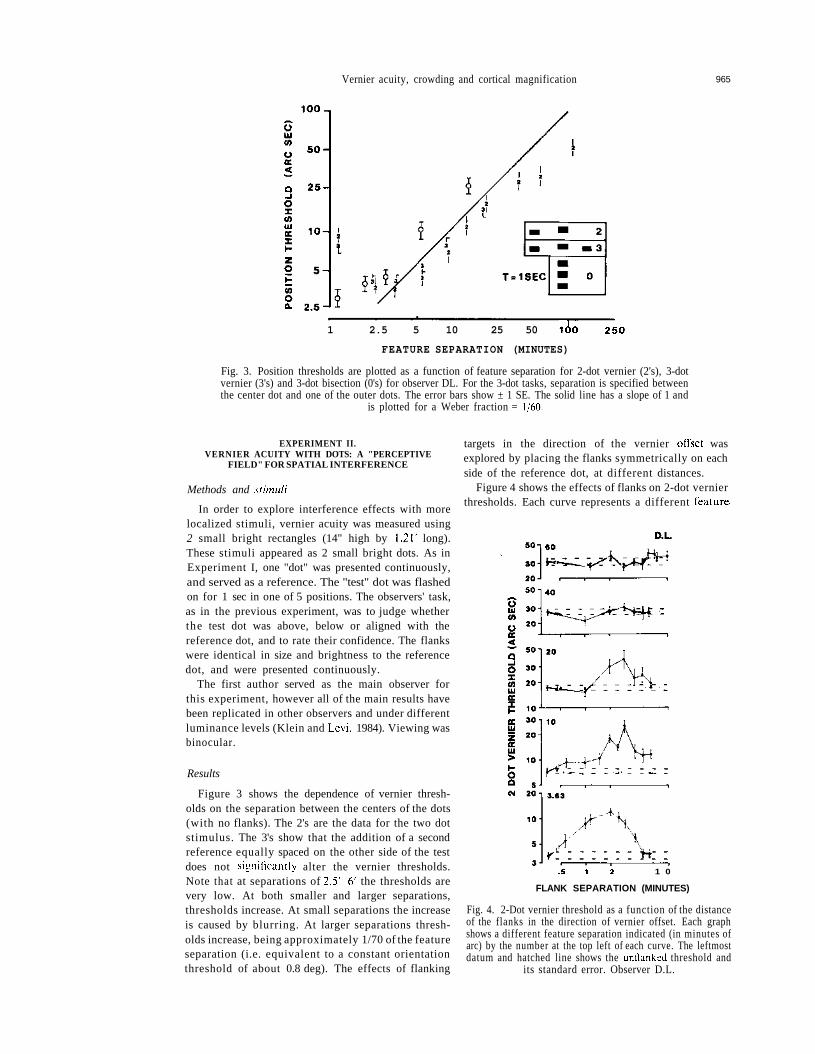
Figure 4 shows the effects of flanks on 2-dot vernierthresholds. Each curve represents a different feature-
. 5 1 2 1 0
FLANK SEPARATION (MINUTES)
Fig. 4. 2-Dot vernier threshold as a function of the distanceof the flanks in the direction of vernier offset. Each graphshows a different feature separation indicated (in minutes ofarc) by the number at the top left of each curve. The leftmostdatum and hatched line shows the unflanked threshold and
its standard error. Observer D.L.
966 DENNIS M. LEVI et al.
separation. For each curve the leftmost symbol andhatched line shows the unflanked threshold and itsstandard error. For widely separated targets, flanksdo not significantly elevate vernier thresholds; how-ever for separations of 20' or less, strong thresholdelevation is seen when the flanks are 2'-3' from thereference dot. The 3.63' curve resembles closely thedata of the previous experiment with abutting lines inshowing a 3-4 fold threshold elevation when theflanks are at 2' from the reference. Interestingly, withthe flanks at 2', eliminating the reference dot, givesapproximately the same threshold. Under these con-ditions the observer uses the strategy of bisecting theflanks to make the position judgements.
These results clearly demonstrate that flankingcontours in the direction of the vernier offset and at anoptimal distance, strongly mask vernier discrimi-nation. What are the properties of spatial interferencein the orthogonal direction?
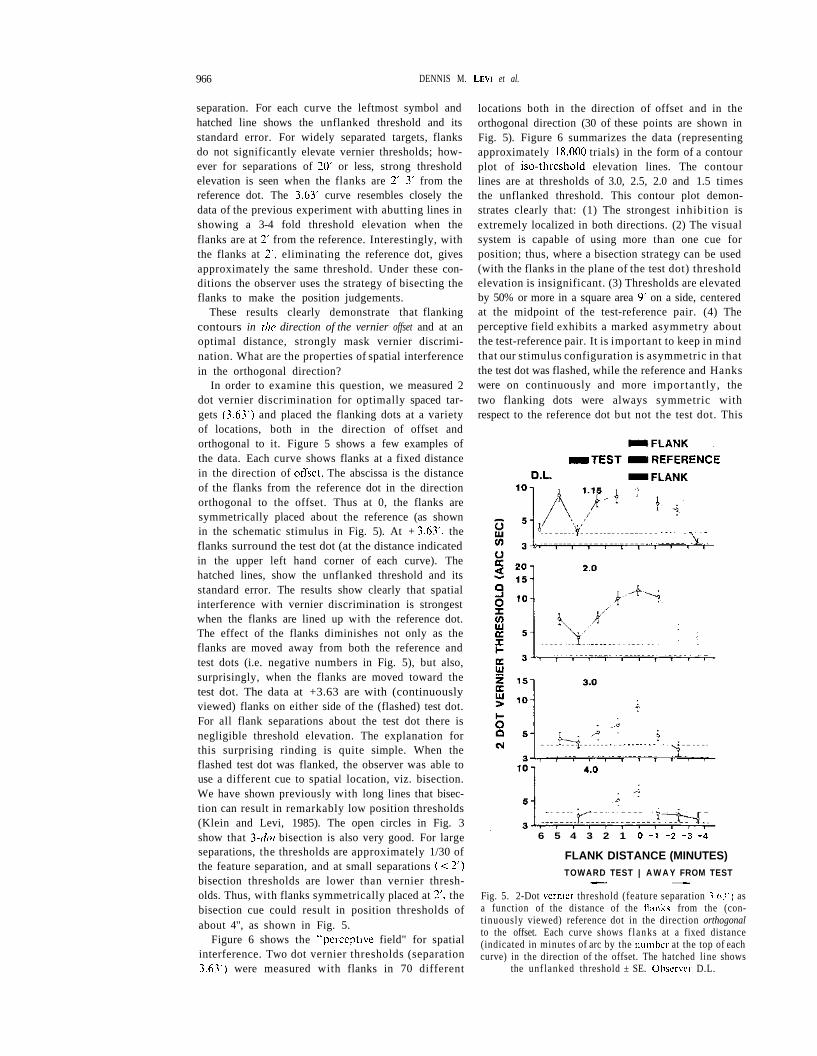
In order to examine this question, we measured 2dot vernier discrimination for optimally spaced tar-gets (3.63') and placed the flanking dots at a varietyof locations, both in the direction of offset andorthogonal to it. Figure 5 shows a few examples ofthe data. Each curve shows flanks at a fixed distancein the direction of offset. The abscissa is the distanceof the flanks from the reference dot in the directionorthogonal to the offset. Thus at 0, the flanks aresymmetrically placed about the reference (as shownin the schematic stimulus in Fig. 5). At + 3.63', theflanks surround the test dot (at the distance indicatedin the upper left hand corner of each curve). Thehatched lines, show the unflanked threshold and itsstandard error. The results show clearly that spatialinterference with vernier discrimination is strongestwhen the flanks are lined up with the reference dot.The effect of the flanks diminishes not only as theflanks are moved away from both the reference andtest dots (i.e. negative numbers in Fig. 5), but also,surprisingly, when the flanks are moved toward thetest dot. The data at +3.63 are with (continuouslyviewed) flanks on either side of the (flashed) test dot.For all flank separations about the test dot there isnegligible threshold elevation. The explanation forthis surprising rinding is quite simple. When theflashed test dot was flanked, the observer was able touse a different cue to spatial location, viz. bisection.We have shown previously with long lines that bisec-tion can result in remarkably low position thresholds(Klein and Levi, 1985). The open circles in Fig. 3show that 3-dot bisection is also very good. For largeseparations, the thresholds are approximately 1/30 ofthe feature separation, and at small separations (< 2')bisection thresholds are lower than vernier thresh-olds. Thus, with flanks symmetrically placed at 2', thebisection cue could result in position thresholds ofabout 4", as shown in Fig. 5.
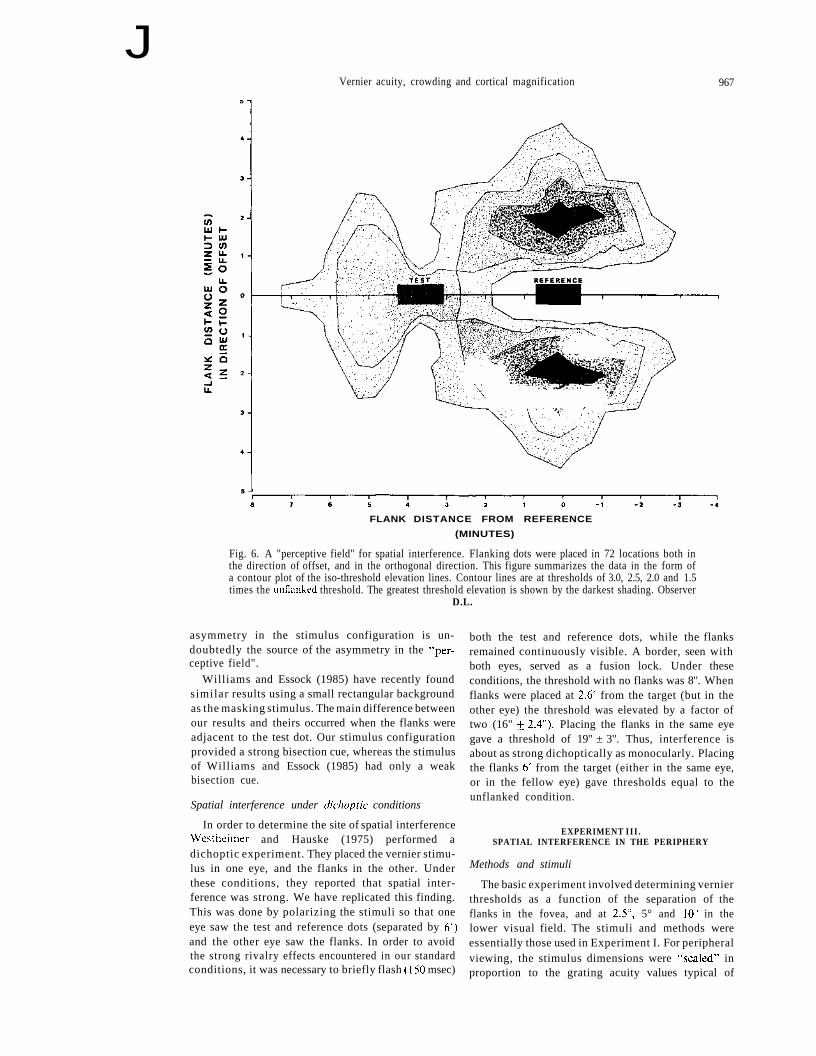
Figure 6 shows the "perceptive field" for spatialinterference. Two dot vernier thresholds (separation3.63') were measured with flanks in 70 different
locations both in the direction of offset and in theorthogonal direction (30 of these points are shown inFig. 5). Figure 6 summarizes the data (representingapproximately 18,000 trials) in the form of a contourplot of iso-threshold elevation lines. The contourlines are at thresholds of 3.0, 2.5, 2.0 and 1.5 timesthe unflanked threshold. This contour plot demon-strates clearly that: (1) The strongest inhibition isextremely localized in both directions. (2) The visualsystem is capable of using more than one cue forposition; thus, where a bisection strategy can be used(with the flanks in the plane of the test dot) thresholdelevation is insignificant. (3) Thresholds are elevatedby 50% or more in a square area 9' on a side, centeredat the midpoint of the test-reference pair. (4) Theperceptive field exhibits a marked asymmetry aboutthe test-reference pair. It is important to keep in mindthat our stimulus configuration is asymmetric in thatthe test dot was flashed, while the reference and Hankswere on continuously and more importantly, thetwo flanking dots were always symmetric withrespect to the reference dot but not the test dot. This
6 5 4 3 2 1 0 - 1 - 2 - 3 - 4
FLANK DISTANCE (MINUTES)TOWARD TEST | A W A Y FROM TEST
Fig. 5. 2-Dot vernier threshold (feature separation 3.63') asa function of the distance of the tlanks from the (con-tinuously viewed) reference dot in the direction orthogonalto the offset. Each curve shows f l anks at a fixed distance(indicated in minutes of arc by the number at the top of eachcurve) in the direction of the offset. The hatched line shows
the unflanked threshold ± SE. Observer D.L.
JVernier acuity, crowding and cortical magnification 967
5 4 3 2 1 0 - 1
FLANK DISTANCE FROM REFERENCE
(MINUTES)
Fig. 6. A "perceptive field" for spatial interference. Flanking dots were placed in 72 locations both inthe direction of offset, and in the orthogonal direction. This figure summarizes the data in the form ofa contour plot of the iso-threshold elevation lines. Contour lines are at thresholds of 3.0, 2.5, 2.0 and 1.5times the unflanked threshold. The greatest threshold elevation is shown by the darkest shading. Observer
D.L.
asymmetry in the stimulus configuration is un-doubtedly the source of the asymmetry in the "per-ceptive field".
Williams and Essock (1985) have recently foundsimilar results using a small rectangular backgroundas the masking stimulus. The main difference betweenour results and theirs occurred when the flanks wereadjacent to the test dot. Our stimulus configurationprovided a strong bisection cue, whereas the stimulusof Williams and Essock (1985) had only a weakbisection cue.
Spatial interference under dichoptic conditions
In order to determine the site of spatial interferenceWestheimer and Hauske (1975) performed adichoptic experiment. They placed the vernier stimu-lus in one eye, and the flanks in the other. Underthese conditions, they reported that spatial inter-ference was strong. We have replicated this finding.This was done by polarizing the stimuli so that oneeye saw the test and reference dots (separated by 6')and the other eye saw the flanks. In order to avoidthe strong rivalry effects encountered in our standardconditions, it was necessary to briefly flash (150 msec)
both the test and reference dots, while the flanksremained continuously visible. A border, seen withboth eyes, served as a fusion lock. Under theseconditions, the threshold with no flanks was 8". Whenflanks were placed at 2.6' from the target (but in theother eye) the threshold was elevated by a factor oftwo (16" ± 2.4"). Placing the flanks in the same eyegave a threshold of 19" ± 3". Thus, interference isabout as strong dichoptically as monocularly. Placingthe flanks 6' from the target (either in the same eye,or in the fellow eye) gave thresholds equal to theunflanked condition.
EXPERIMENT II I .SPATIAL INTERFERENCE IN THE PERIPHERY
Methods and stimuli
The basic experiment involved determining vernierthresholds as a function of the separation of theflanks in the fovea, and at 2.5", 5° and 10v1 in thelower visual field. The stimuli and methods wereessentially those used in Experiment I. For peripheralviewing, the stimulus dimensions were "scaled" inproportion to the grating acuity values typical of
968 DENNIS M. LEVI et al.
each retinal locus (Westheimer, 1979). This wasaccomplished by keeping the physical stimulus thesame at all eccentricities and varying the viewingdistance according to d = dff/(1 + E/2.5) where E isthe eccentricity in degrees and df is the distance usedfor foveal viewing. Thus for £" = 2.5° the height,width and length of the stimulus was doubled withrespect to the foveal values, by halving the viewingdistance (Levi el al., 1984).
Two highly practiced observers participated in theperiphery experiments. One observer was one of theauthors (P.A.) who had normal binocular vision andnormal visual acuity in each eye. The second observer(J.M.) was an anisometropic amblyope, with cor-rected to normal vision in his nonamblyopic eye. Forboth observers testing was monocular with the non-dominant eye patched via a black occluder. Since theperiphery is highly susceptible to the effects of prac-tice (Saugstad and Lie, 1964; Johnson and Leibowitz,1974; Fendick and Westheimer, 1983) the observerswere given extensive practice (> 6000 trials) distrib-uted across eccentricity, prior to the final datacollection.
Acuity was also measured for square wave gratingsat each eccentricity using the same CRT display andusing the method of adjustment.
Results
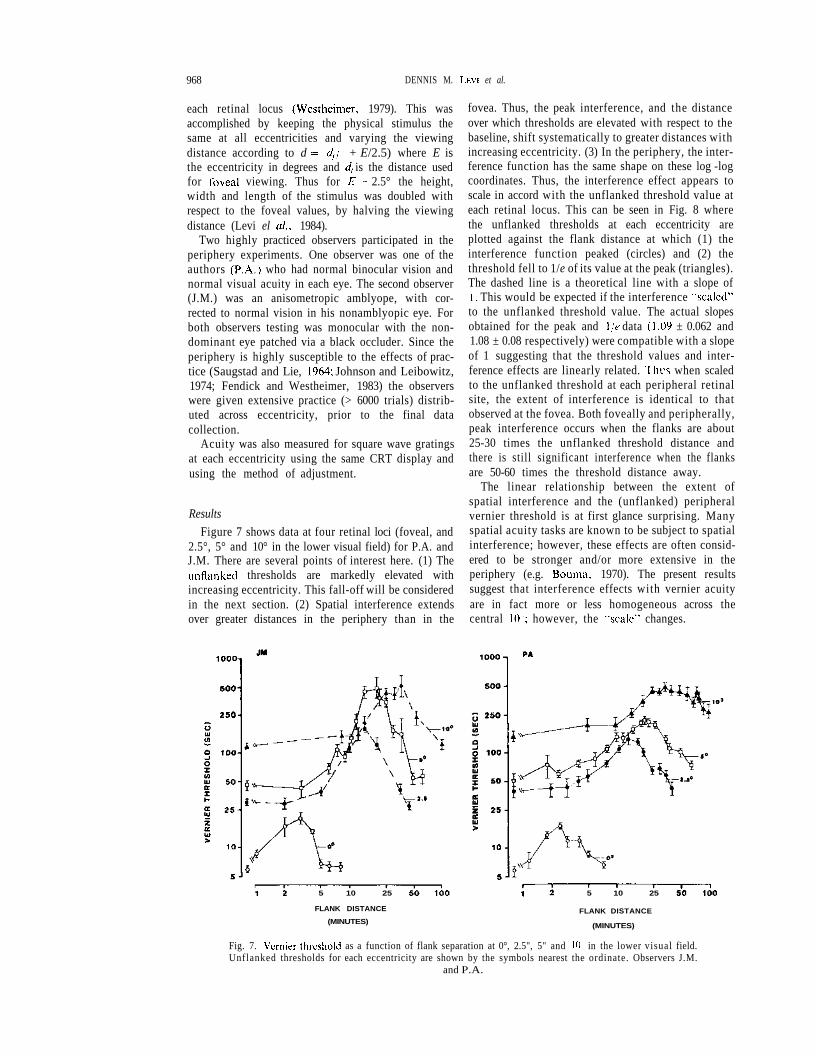
Figure 7 shows data at four retinal loci (foveal, and2.5°, 5° and 10° in the lower visual field) for P.A. andJ.M. There are several points of interest here. (1) Theunflanked thresholds are markedly elevated withincreasing eccentricity. This fall-off will be consideredin the next section. (2) Spatial interference extendsover greater distances in the periphery than in the
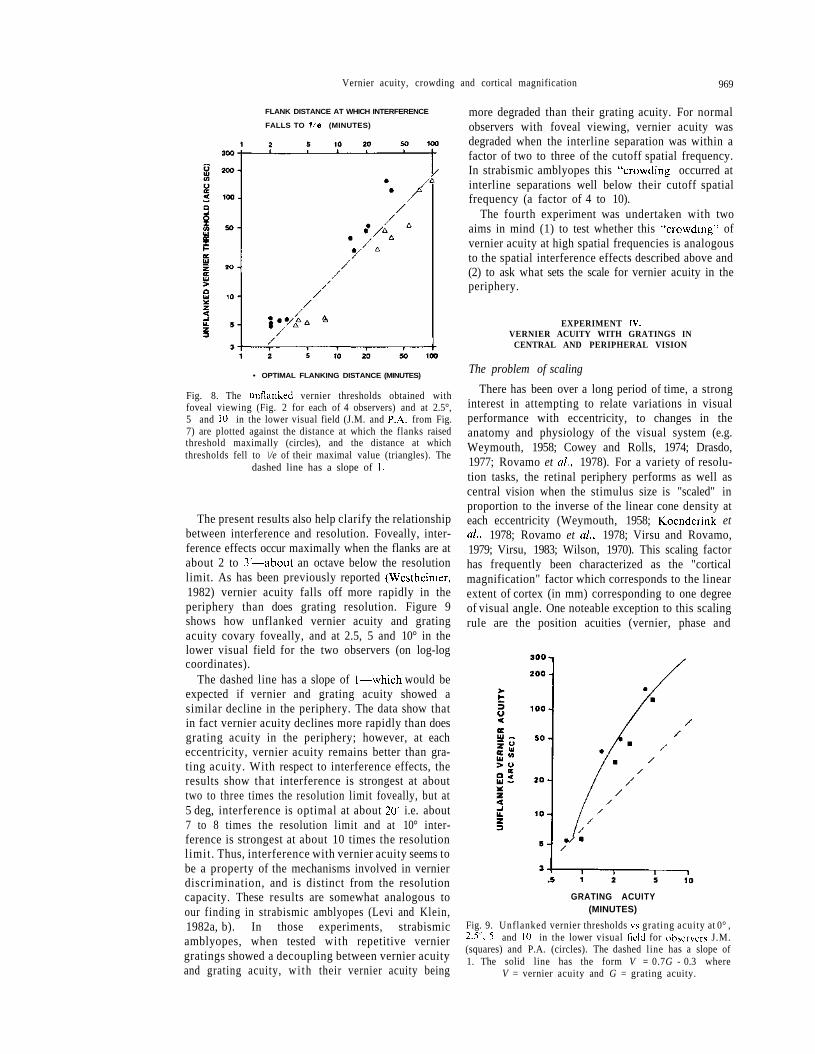
fovea. Thus, the peak interference, and the distanceover which thresholds are elevated with respect to thebaseline, shift systematically to greater distances withincreasing eccentricity. (3) In the periphery, the inter-ference function has the same shape on these log -logcoordinates. Thus, the interference effect appears toscale in accord with the unflanked threshold value ateach retinal locus. This can be seen in Fig. 8 wherethe unflanked thresholds at each eccentricity areplotted against the flank distance at which (1) theinterference function peaked (circles) and (2) thethreshold fell to 1/e of its value at the peak (triangles).The dashed line is a theoretical line with a slope of1. This would be expected if the interference kiscaled"to the unflanked threshold value. The actual slopesobtained for the peak and \/e data (1.09 ± 0.062 and1.08 ± 0.08 respectively) were compatible with a slopeof 1 suggesting that the threshold values and inter-ference effects are linearly related. Thi-s when scaledto the unflanked threshold at each peripheral retinalsite, the extent of interference is identical to thatobserved at the fovea. Both foveally and peripherally,peak interference occurs when the flanks are about25-30 times the unflanked threshold distance andthere is still significant interference when the flanksare 50-60 times the threshold distance away.
The linear relationship between the extent ofspatial interference and the (unflanked) peripheralvernier threshold is at first glance surprising. Manyspatial acuity tasks are known to be subject to spatialinterference; however, these effects are often consid-ered to be stronger and/or more extensive in theperiphery (e.g. Bouma, 1970). The present resultssuggest that interference effects with vernier acuityare in fact more or less homogeneous across thecentral 10°; however, the "scale" changes.
5 10 25
FLANK DISTANCE
(MINUTES)
5 10 25
FLANK DISTANCE
(MINUTES)
Fig. 7. Vernier threshold as a function of flank separation at 0°, 2.5", 5" and 10 in the lower visual field.Unflanked thresholds for each eccentricity are shown by the symbols nearest the ordinate. Observers J.M.
and P.A.
Vernier acuity, crowding and cortical magnification 969
FLANK DISTANCE AT WHICH INTERFERENCE
FALLS TO 1/e (MINUTES)
• OPTIMAL FLANKING DISTANCE (MINUTES)
Fig. 8. The unflanked vernier thresholds obtained withfoveal viewing (Fig. 2 for each of 4 observers) and at 2.5°,5 and 10° in the lower visual field (J.M. and P.A. from Fig.7) are plotted against the distance at which the flanks raisedthreshold maximally (circles), and the distance at whichthresholds fell to \/e of their maximal value (triangles). The
dashed line has a slope of 1.
The present results also help clarify the relationshipbetween interference and resolution. Foveally, inter-ference effects occur maximally when the flanks are atabout 2 to 3'—about an octave below the resolutionlimit. As has been previously reported (Westheimer,1982) vernier acuity falls off more rapidly in theperiphery than does grating resolution. Figure 9shows how unflanked vernier acuity and gratingacuity covary foveally, and at 2.5, 5 and 10° in thelower visual field for the two observers (on log-logcoordinates).
The dashed line has a slope of 1—which would beexpected if vernier and grating acuity showed asimilar decline in the periphery. The data show thatin fact vernier acuity declines more rapidly than doesgrating acuity in the periphery; however, at eacheccentricity, vernier acuity remains better than gra-ting acuity. With respect to interference effects, theresults show that interference is strongest at abouttwo to three times the resolution limit foveally, but at5 deg, interference is optimal at about 20' i.e. about7 to 8 times the resolution limit and at 10° inter-ference is strongest at about 10 times the resolutionlimit. Thus, interference with vernier acuity seems tobe a property of the mechanisms involved in vernierdiscrimination, and is distinct from the resolutioncapacity. These results are somewhat analogous toour finding in strabismic amblyopes (Levi and Klein,1982a, b). In those experiments, strabismicamblyopes, when tested with repetitive verniergratings showed a decoupling between vernier acuityand grating acuity, wi th their vernier acuity being
more degraded than their grating acuity. For normalobservers with foveal viewing, vernier acuity wasdegraded when the interline separation was within afactor of two to three of the cutoff spatial frequency.In strabismic amblyopes this "crowding" occurred atinterline separations well below their cutoff spatialfrequency (a factor of 4 to 10).
The fourth experiment was undertaken with twoaims in mind (1) to test whether this "crowding11 ofvernier acuity at high spatial frequencies is analogousto the spatial interference effects described above and(2) to ask what sets the scale for vernier acuity in theperiphery.
EXPERIMENT IV.VERNIER ACUITY WITH GRATINGS IN
CENTRAL AND PERIPHERAL VISION
The problem of scaling
There has been over a long period of time, a stronginterest in attempting to relate variations in visualperformance with eccentricity, to changes in theanatomy and physiology of the visual system (e.g.Weymouth, 1958; Cowey and Rolls, 1974; Drasdo,1977; Rovamo et al., 1978). For a variety of resolu-tion tasks, the retinal periphery performs as well ascentral vision when the stimulus size is "scaled" inproportion to the inverse of the linear cone density ateach eccentricity (Weymouth, 1958; Koenderink etal., 1978; Rovamo et al., 1978; Virsu and Rovamo,1979; Virsu, 1983; Wilson, 1970). This scaling factorhas frequently been characterized as the "corticalmagnification" factor which corresponds to the linearextent of cortex (in mm) corresponding to one degreeof visual angle. One noteable exception to this scalingrule are the position acuities (vernier, phase and
GRATING ACUITY(MINUTES)
Fig. 9. Unflanked vernier thresholds vs grating acuity at 0° ,2.5°, 5° and 10° in the lower visual field for observers J.M.(squares) and P.A. (circles). The dashed line has a slope of1. The solid line has the form V = 0.7G - 0.3 where
V = vernier acuity and G = grating acuity.
970 DENNIS M. LEVI et al
stereopsis) which decline more rapidly with eccen-tricity than contrast sensitivity or grating acuity(Westheimer, 1982; Klein and Tyler, 1981; Steph-enson and Braddick, 1983; Fendick and Westheimer,1983). There are several possible accounts for therelatively sharp decline of position acuity in theperiphery compared to grating acuity. One is thatdifferent psychophysical tasks may be processed indifferent cortical regions, each with its ownmagnification factor (Jamar et al., 1984). Or theperiphery may lack the specialized mechanism re-quired for position acuity. The explanation preferredby us is that retinal and cortical factors can imposedifferent limits on psychophysical performance. Sometasks (e.g. resolution) may be limited primarily byretinal factors (e.g. the blur-function of the eye; conedensity etc.), while other tasks (e.g. position acuities)may be primarily limited by cortical processing(Westheimer, 1982; Barlow, 1979, 1981).
It has been widely accepted that magnification ofthe foveal representations in the cortex and in theretina are approximately equal (Drasdo, 1977;Rovamo et al., 1978). However, recent physiologicaland anatomical evidence suggests that corticalmagnification of the foveola is considerably higherthan previously estimated, and that emphasis oncentral vision is far greater in the cortex than in theretina (Malpeli and Baker, 1975; Dow et al., 1981;Tootell et al, 1982; Van Essen et al., 1984) or in theLGN (Connolly and Van Essen, 1984).
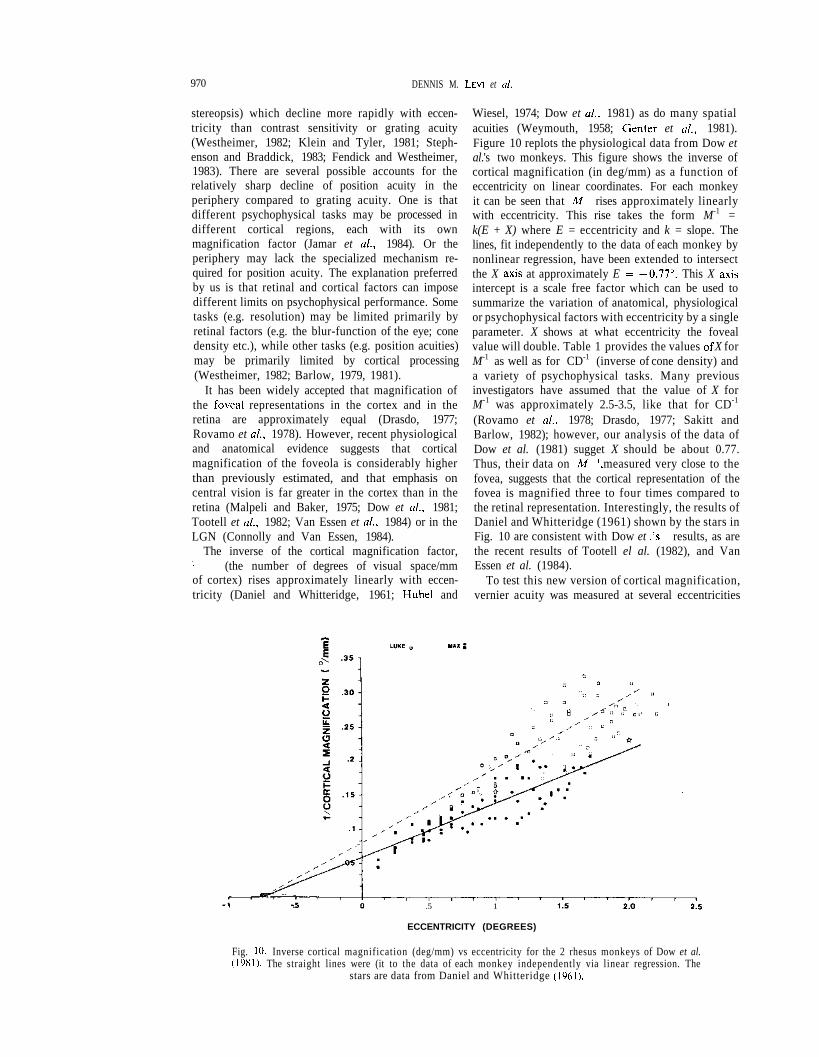
The inverse of the cortical magnification factor,M-1 (the number of degrees of visual space/mmof cortex) rises approximately linearly with eccen-tricity (Daniel and Whitteridge, 1961; Hubel and
Wiesel, 1974; Dow et al., 1981) as do many spatialacuities (Weymouth, 1958; Center et al., 1981).Figure 10 replots the physiological data from Dow etal.'s two monkeys. This figure shows the inverse ofcortical magnification (in deg/mm) as a function ofeccentricity on linear coordinates. For each monkeyit can be seen that M-1 rises approximately linearlywith eccentricity. This rise takes the form M-1 =k(E + X) where E = eccentricity and k = slope. Thelines, fit independently to the data of each monkey bynonlinear regression, have been extended to intersectthe X axis at approximately E = —0.77°. This X axisintercept is a scale free factor which can be used tosummarize the variation of anatomical, physiologicalor psychophysical factors with eccentricity by a singleparameter. X shows at what eccentricity the fovealvalue will double. Table 1 provides the values of X forM-1 as well as for CD-1 (inverse of cone density) anda variety of psychophysical tasks. Many previousinvestigators have assumed that the value of X forM-1 was approximately 2.5-3.5, like that for CD-1
(Rovamo et al., 1978; Drasdo, 1977; Sakitt andBarlow, 1982); however, our analysis of the data ofDow et al. (1981) sugget X should be about 0.77.Thus, their data on M-1, measured very close to thefovea, suggests that the cortical representation of thefovea is magnified three to four times compared tothe retinal representation. Interestingly, the results ofDaniel and Whitteridge (1961) shown by the stars inFig. 10 are consistent with Dow et al.'s results, as arethe recent results of Tootell el al. (1982), and VanEssen et al. (1984).
To test this new version of cortical magnification,vernier acuity was measured at several eccentricities
.5 1
ECCENTRICITY (DEGREES)
Fig. 10. Inverse cortical magnification (deg/mm) vs eccentricity for the 2 rhesus monkeys of Dow et al.(1981). The straight lines were (it to the data of each monkey independently via linear regression. The
stars are data from Daniel and Whitteridge (1961).
Vernier acuity, crowding and cortical magnification 971
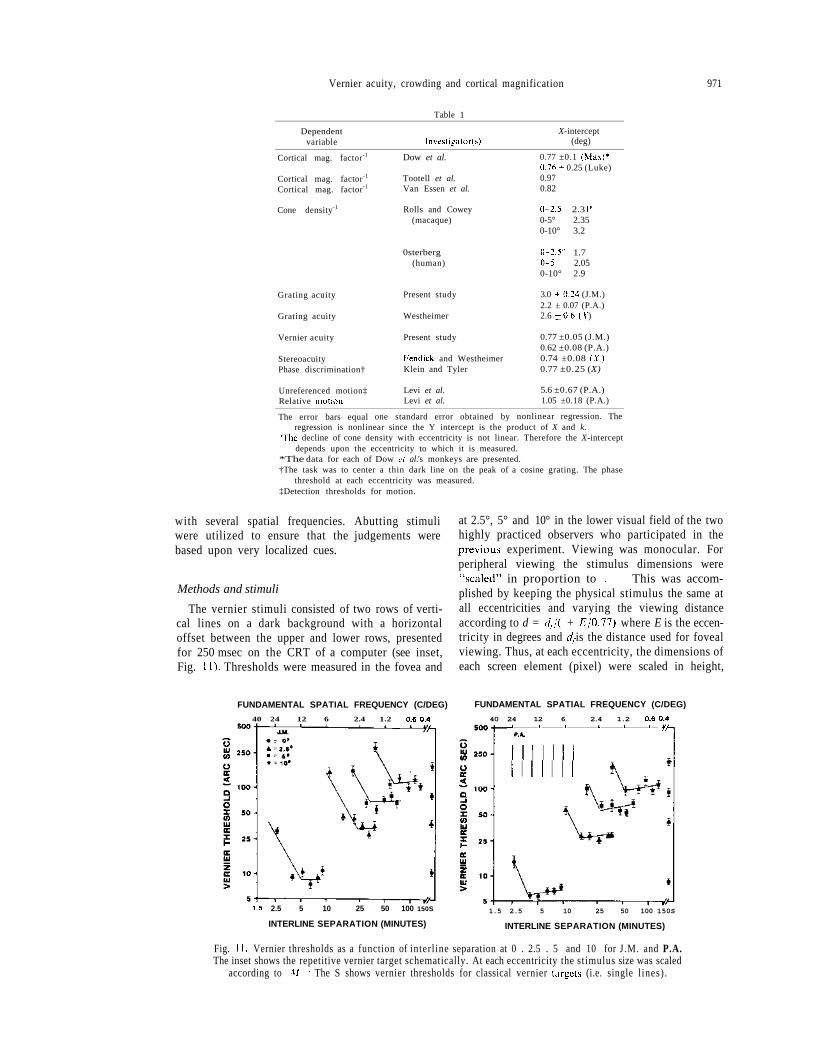
Table 1
Dependentvariable
Cortical mag. factor-1
Cortical mag. factor-1
Cortical mag. factor-1
Cone density-1
Grating acuity
Grating acuity
Vernier acuity
StereoacuityPhase discrimination†
Unreferenced motion‡Relative motion‡
The error bars equal
Investigator(s)
Dow et al.
Tootell et al.Van Essen et al.
Rolls and Cowey(macaque)
0sterberg(human)
Present study
Westheimer
Present study
Fendick and WestheimerKlein and Tyler
Levi et al.Levi et al.
one standard error obtained by
X-intercept(deg)
0.77 ±0.1 (Max)*0.76 + 0.25 (Luke)0.970.82
0-2.5° 2.3 la
0-5° 2.350-10° 3.2
0-2.5° 1.70-5° 2.050-10° 2.9
3.0 + 0.24 (J.M.)2.2 ± 0.07 (P.A.)2.6 ±0.6 (X )
0.77 ±0.05 (J.M.)0.62 ±0.08 (P.A.)0.74 ±0.08 (X)0.77 ±0.25 (X)
5.6 ±0.67 (P.A.)1.05 ±0.18 (P.A.)
nonlinear regression. Theregression is nonlinear since the Y intercept is the product of X and k.
aThe decline of cone density with eccentricity is not linear. Therefore the X-interceptdepends upon the eccentricity to which it is measured.
*The data for each of Dow et al.'s monkeys are presented.†The task was to center a thin dark line on the peak of a cosine grating. The phase
threshold at each eccentricity was measured.‡Detection thresholds for motion.
with several spatial frequencies. Abutting stimuliwere utilized to ensure that the judgements werebased upon very localized cues.
Methods and stimuli
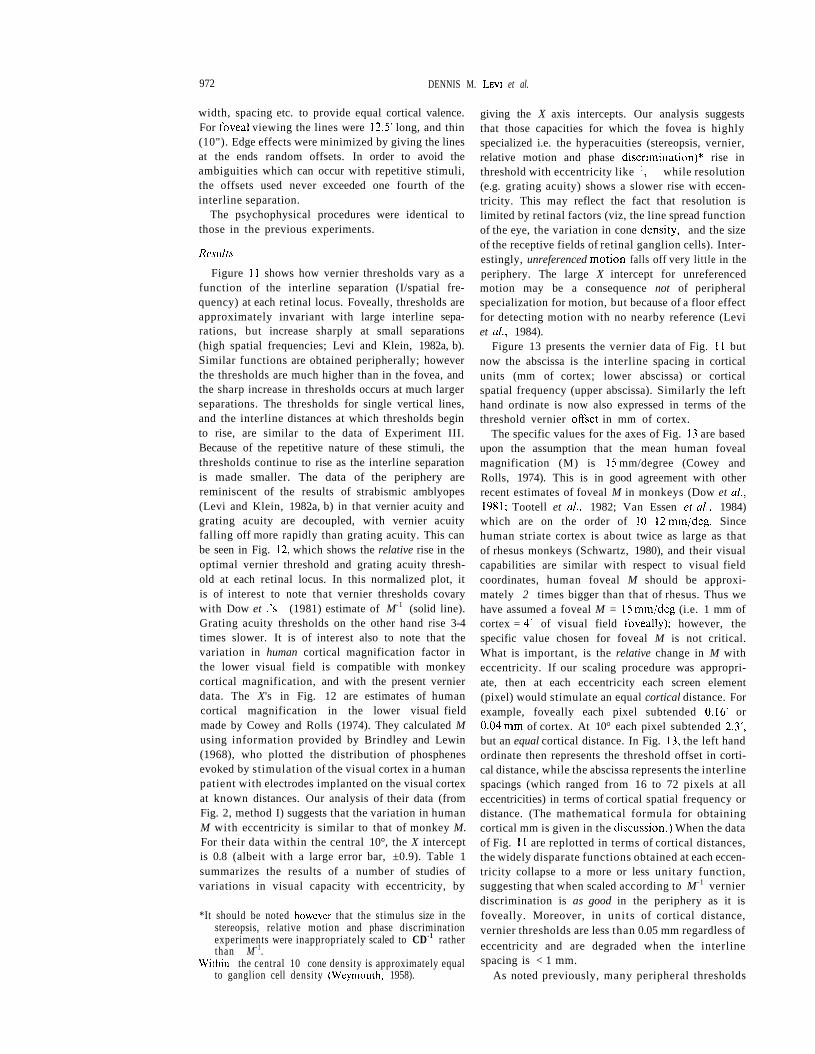
The vernier stimuli consisted of two rows of verti-cal lines on a dark background with a horizontaloffset between the upper and lower rows, presentedfor 250 msec on the CRT of a computer (see inset,Fig. 11). Thresholds were measured in the fovea and
at 2.5°, 5° and 10° in the lower visual field of the twohighly practiced observers who participated in theprevious experiment. Viewing was monocular. Forperipheral viewing the stimulus dimensions were"scaled" in proportion to M-1. This was accom-plished by keeping the physical stimulus the same atall eccentricities and varying the viewing distanceaccording to d = d f / ( 1 + E/0.77) where E is the eccen-tricity in degrees and df is the distance used for fovealviewing. Thus, at each eccentricity, the dimensions ofeach screen element (pixel) were scaled in height,
FUNDAMENTAL SPATIAL FREQUENCY (C/DEG)
40 24 12 6 2.4 1.2 0.60.4
1-5 2.5 5 10 25 50 100 150S
INTERLINE SEPARATION (MINUTES)
FUNDAMENTAL SPATIAL FREQUENCY (C/DEG)
40 24 12 6 2.4 1.2 0.60.4_i . . • 1 , ̂
1.5 2.5 5 10 25 50 100 150S
INTERLINE SEPARATION (MINUTES)
Fig. 11. Vernier thresholds as a function of interl ine separation at 0 . 2.5 . 5 and 10 for J.M. and P.A.The inset shows the repetitive vernier target schematically. At each eccentricity the stimulus size was scaled
according to M-1. The S shows vernier thresholds for classical vernier targets (i.e. single l ines) .
972 DENNIS M. LEVI et al.
width, spacing etc. to provide equal cortical valence.For foveal viewing the lines were 12.5' long, and thin(10"). Edge effects were minimized by giving the linesat the ends random offsets. In order to avoid theambiguities which can occur with repetitive stimuli,the offsets used never exceeded one fourth of theinterline separation.
The psychophysical procedures were identical tothose in the previous experiments.
Results
Figure 11 shows how vernier thresholds vary as afunction of the interline separation (I/spatial fre-quency) at each retinal locus. Foveally, thresholds areapproximately invariant with large interline sepa-rations, but increase sharply at small separations(high spatial frequencies; Levi and Klein, 1982a, b).Similar functions are obtained peripherally; howeverthe thresholds are much higher than in the fovea, andthe sharp increase in thresholds occurs at much largerseparations. The thresholds for single vertical lines,and the interline distances at which thresholds beginto rise, are similar to the data of Experiment III.Because of the repetitive nature of these stimuli, thethresholds continue to rise as the interline separationis made smaller. The data of the periphery arereminiscent of the results of strabismic amblyopes(Levi and Klein, 1982a, b) in that vernier acuity andgrating acuity are decoupled, with vernier acuityfalling off more rapidly than grating acuity. This canbe seen in Fig. 12, which shows the relative rise in theoptimal vernier threshold and grating acuity thresh-old at each retinal locus. In this normalized plot, itis of interest to note that vernier thresholds covarywith Dow et al.'s (1981) estimate of M-1 (solid line).Grating acuity thresholds on the other hand rise 3-4times slower. It is of interest also to note that thevariation in human cortical magnification factor inthe lower visual field is compatible with monkeycortical magnification, and with the present vernierdata. The X's in Fig. 12 are estimates of humancortical magnification in the lower visual fieldmade by Cowey and Rolls (1974). They calculated Musing information provided by Brindley and Lewin(1968), who plotted the distribution of phosphenesevoked by stimulation of the visual cortex in a humanpatient with electrodes implanted on the visual cortexat known distances. Our analysis of their data (fromFig. 2, method I) suggests that the variation in humanM with eccentricity is similar to that of monkey M.For their data within the central 10°, the X interceptis 0.8 (albeit with a large error bar, ±0.9). Table 1summarizes the results of a number of studies ofvariations in visual capacity with eccentricity, by
*It should be noted however that the stimulus size in thestereopsis, relative motion and phase discriminationexperiments were inappropriately scaled to CD-1 ratherthan M-1.
†Within the central 10 cone density is approximately equalto ganglion cell density (Weymouth, 1958).
giving the X axis intercepts. Our analysis suggeststhat those capacities for which the fovea is highlyspecialized i.e. the hyperacuities (stereopsis, vernier,relative motion and phase discrimination)* rise inthreshold with eccentricity like M-1, while resolution(e.g. grating acuity) shows a slower rise with eccen-tricity. This may reflect the fact that resolution islimited by retinal factors (viz, the line spread functionof the eye, the variation in cone density,† and the sizeof the receptive fields of retinal ganglion cells). Inter-estingly, unreferenced motion falls off very little in theperiphery. The large X intercept for unreferencedmotion may be a consequence not of peripheralspecialization for motion, but because of a floor effectfor detecting motion with no nearby reference (Leviet al., 1984).
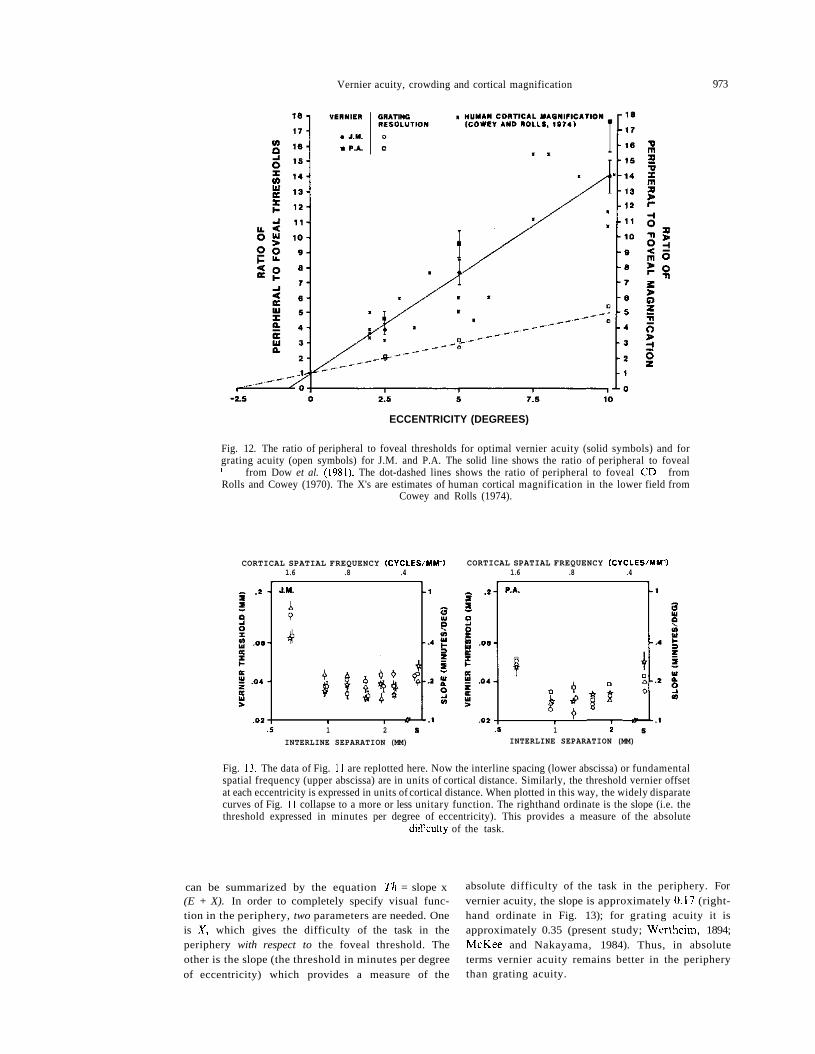
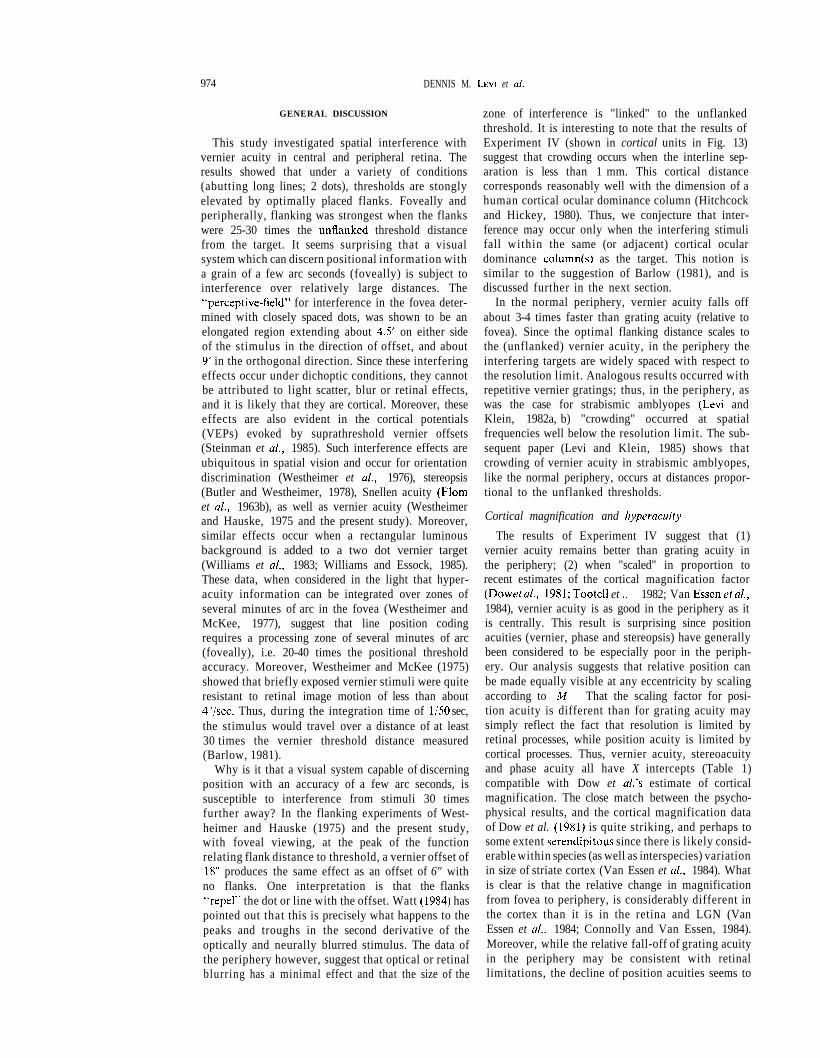
Figure 13 presents the vernier data of Fig. 11 butnow the abscissa is the interline spacing in corticalunits (mm of cortex; lower abscissa) or corticalspatial frequency (upper abscissa). Similarly the lefthand ordinate is now also expressed in terms of thethreshold vernier offset in mm of cortex.
The specific values for the axes of Fig. 13 are basedupon the assumption that the mean human fovealmagnification (M) is 15 mm/degree (Cowey andRolls, 1974). This is in good agreement with otherrecent estimates of foveal M in monkeys (Dow et al.,1981; Tootell et al., 1982; Van Essen 'et al., 1984)which are on the order of 10-12mm/deg. Sincehuman striate cortex is about twice as large as thatof rhesus monkeys (Schwartz, 1980), and their visualcapabilities are similar with respect to visual fieldcoordinates, human foveal M should be approxi-mately 2 times bigger than that of rhesus. Thus wehave assumed a foveal M = 15 mm/deg (i.e. 1 mm ofcortex = 4' of visual field foveally); however, thespecific value chosen for foveal M is not critical.What is important, is the relative change in M witheccentricity. If our scaling procedure was appropri-ate, then at each eccentricity each screen element(pixel) would stimulate an equal cortical distance. Forexample, foveally each pixel subtended 0.16' or0.04mm of cortex. At 10° each pixel subtended 2.3',but an equal cortical distance. In Fig. 13, the left handordinate then represents the threshold offset in corti-cal distance, while the abscissa represents the interlinespacings (which ranged from 16 to 72 pixels at alleccentricities) in terms of cortical spatial frequency ordistance. (The mathematical formula for obtainingcortical mm is given in the discussion.) When the dataof Fig. 11 are replotted in terms of cortical distances,the widely disparate functions obtained at each eccen-tricity collapse to a more or less unitary function,suggesting that when scaled according to M-1 vernierdiscrimination is as good in the periphery as it isfoveally. Moreover, in uni ts of cortical distance,vernier thresholds are less than 0.05 mm regardless ofeccentricity and are degraded when the interlinespacing is < 1 mm.
As noted previously, many peripheral thresholds
Vernier acuity, crowding and cortical magnification 973
ECCENTRICITY (DEGREES)
Fig. 12. The ratio of peripheral to foveal thresholds for optimal vernier acuity (solid symbols) and forgrating acuity (open symbols) for J.M. and P.A. The solid line shows the ratio of peripheral to fovealM-1 from Dow et al. (1981). The dot-dashed lines shows the ratio of peripheral to foveal CD-1 fromRolls and Cowey (1970). The X's are estimates of human cortical magnification in the lower field from
Cowey and Rolls (1974).
CORTICAL SPATIAL FREQUENCY (CYCLES/MAT)1.6 .8 .4
CORTICAL SPATIAL FREQUENCY (CYCLES/MIT)1.6 .8 .4
1 2
INTERLINE SEPARATION (MM)
1 2INTERLINE SEPARATION (MM)
Fig. 13. The data of Fig. 11 are replotted here. Now the interline spacing (lower abscissa) or fundamentalspatial frequency (upper abscissa) are in units of cortical distance. Similarly, the threshold vernier offsetat each eccentricity is expressed in units of cortical distance. When plotted in this way, the widely disparatecurves of Fig. 11 collapse to a more or less unitary function. The righthand ordinate is the slope (i.e. thethreshold expressed in minutes per degree of eccentricity). This provides a measure of the absolute
diffculty of the task.
can be summarized by the equation Th = slope x(E + X). In order to completely specify visual func-tion in the periphery, two parameters are needed. Oneis X, which gives the difficulty of the task in theperiphery with respect to the foveal threshold. Theother is the slope (the threshold in minutes per degreeof eccentricity) which provides a measure of the
absolute difficulty of the task in the periphery. Forvernier acuity, the slope is approximately 0.17 (right-hand ordinate in Fig. 13); for grating acuity it isapproximately 0.35 (present study; Wertheim, 1894;McKee and Nakayama, 1984). Thus, in absoluteterms vernier acuity remains better in the peripherythan grating acuity.
974 DENNIS M. LEVI et al.
GENERAL DISCUSSION
This study investigated spatial interference withvernier acuity in central and peripheral retina. Theresults showed that under a variety of conditions(abutting long lines; 2 dots), thresholds are stonglyelevated by optimally placed flanks. Foveally andperipherally, flanking was strongest when the flankswere 25-30 times the unflanked threshold distancefrom the target. It seems surprising that a visualsystem which can discern positional information witha grain of a few arc seconds (foveally) is subject tointerference over relatively large distances. The"perceptive-field" for interference in the fovea deter-mined with closely spaced dots, was shown to be anelongated region extending about 4.5' on either sideof the stimulus in the direction of offset, and about9' in the orthogonal direction. Since these interferingeffects occur under dichoptic conditions, they cannotbe attributed to light scatter, blur or retinal effects,and it is likely that they are cortical. Moreover, theseeffects are also evident in the cortical potentials(VEPs) evoked by suprathreshold vernier offsets(Steinman et al., 1985). Such interference effects areubiquitous in spatial vision and occur for orientationdiscrimination (Westheimer et al., 1976), stereopsis(Butler and Westheimer, 1978), Snellen acuity (Flomet al., 1963b), as well as vernier acuity (Westheimerand Hauske, 1975 and the present study). Moreover,similar effects occur when a rectangular luminousbackground is added to a two dot vernier target(Williams et al, 1983; Williams and Essock, 1985).These data, when considered in the light that hyper-acuity information can be integrated over zones ofseveral minutes of arc in the fovea (Westheimer andMcKee, 1977), suggest that line position codingrequires a processing zone of several minutes of arc(foveally), i.e. 20-40 times the positional thresholdaccuracy. Moreover, Westheimer and McKee (1975)showed that briefly exposed vernier stimuli were quiteresistant to retinal image motion of less than about4°/sec. Thus, during the integration time of 1/50 sec,the stimulus would travel over a distance of at least30 times the vernier threshold distance measured(Barlow, 1981).
Why is it that a visual system capable of discerningposition with an accuracy of a few arc seconds, issusceptible to interference from stimuli 30 timesfurther away? In the flanking experiments of West-heimer and Hauske (1975) and the present study,with foveal viewing, at the peak of the functionrelating flank distance to threshold, a vernier offset of18" produces the same effect as an offset of 6" withno flanks. One interpretation is that the flanks"repel" the dot or line with the offset. Watt (1984) haspointed out that this is precisely what happens to thepeaks and troughs in the second derivative of theoptically and neurally blurred stimulus. The data ofthe periphery however, suggest that optical or retinalblurring has a minimal effect and that the size of the
zone of interference is "linked" to the unflankedthreshold. It is interesting to note that the results ofExperiment IV (shown in cortical units in Fig. 13)suggest that crowding occurs when the interline sep-aration is less than 1 mm. This cortical distancecorresponds reasonably well with the dimension of ahuman cortical ocular dominance column (Hitchcockand Hickey, 1980). Thus, we conjecture that inter-ference may occur only when the interfering stimulifall within the same (or adjacent) cortical oculardominance column(s) as the target. This notion issimilar to the suggestion of Barlow (1981), and isdiscussed further in the next section.
In the normal periphery, vernier acuity falls offabout 3-4 times faster than grating acuity (relative tofovea). Since the optimal flanking distance scales tothe (unflanked) vernier acuity, in the periphery theinterfering targets are widely spaced with respect tothe resolution limit. Analogous results occurred withrepetitive vernier gratings; thus, in the periphery, aswas the case for strabismic amblyopes (Levi andKlein, 1982a, b) "crowding" occurred at spatialfrequencies well below the resolution limit. The sub-sequent paper (Levi and Klein, 1985) shows thatcrowding of vernier acuity in strabismic amblyopes,like the normal periphery, occurs at distances propor-tional to the unflanked thresholds.
Cortical magnification and hyperacuity
The results of Experiment IV suggest that (1)vernier acuity remains better than grating acuity inthe periphery; (2) when "scaled" in proportion torecent estimates of the cortical magnification factor(Dow et al., 1981; Tootell et al., 1982; Van Essen et al.,1984), vernier acuity is as good in the periphery as itis centrally. This result is surprising since positionacuities (vernier, phase and stereopsis) have generallybeen considered to be especially poor in the periph-ery. Our analysis suggests that relative position canbe made equally visible at any eccentricity by scalingaccording to M-1. That the scaling factor for posi-tion acuity is different than for grating acuity maysimply reflect the fact that resolution is limited byretinal processes, while position acuity is limited bycortical processes. Thus, vernier acuity, stereoacuityand phase acuity all have X intercepts (Table 1)compatible with Dow et al.'s estimate of corticalmagnification. The close match between the psycho-physical results, and the cortical magnification dataof Dow et al. (1981) is quite striking, and perhaps tosome extent serendipitous since there is likely consid-erable within species (as well as interspecies) variationin size of striate cortex (Van Essen et al., 1984). Whatis clear is that the relative change in magnificationfrom fovea to periphery, is considerably different inthe cortex than it is in the retina and LGN (VanEssen et al., 1984; Connolly and Van Essen, 1984).Moreover, while the relative fall-off of grating acuityin the periphery may be consistent with retinallimitations, the decline of position acuities seems to
975
.25 .5 1
FLANK DISTANCE (mm)
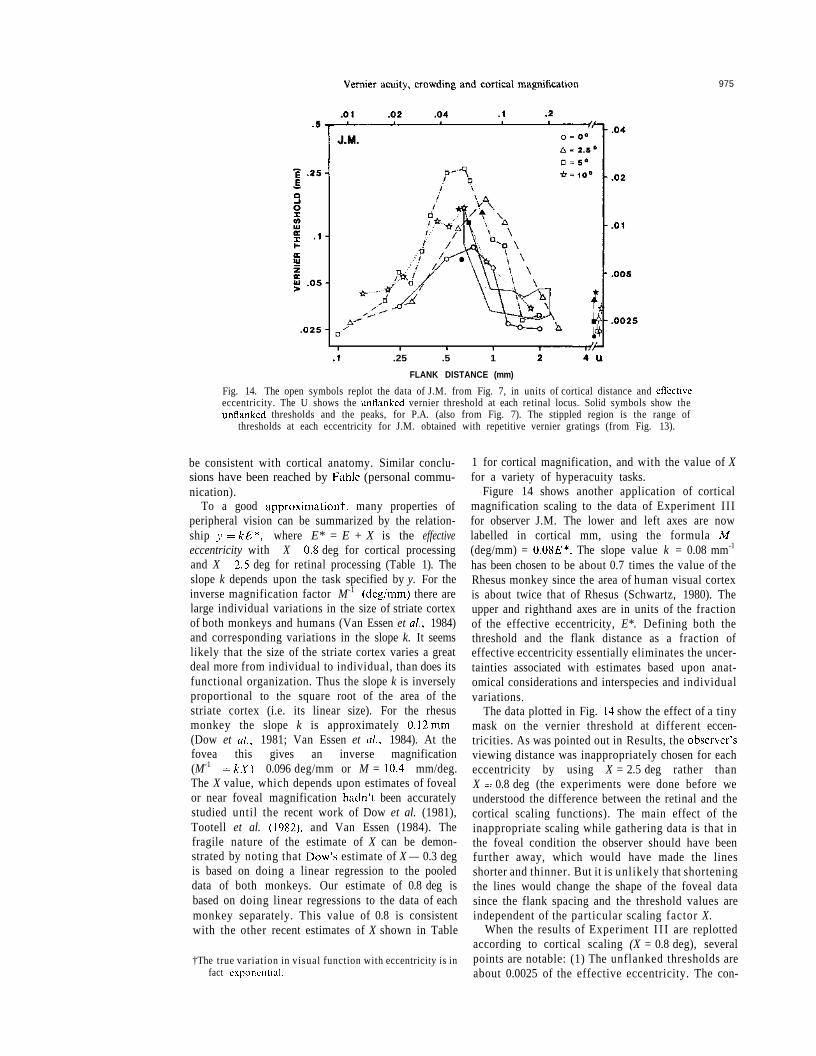
Fig. 14. The open symbols replot the data of J.M. from Fig. 7, in units of cortical distance and effectiveeccentricity. The U shows the unflanked vernier threshold at each retinal locus. Solid symbols show theunflanked thresholds and the peaks, for P.A. (also from Fig. 7). The stippled region is the range of
thresholds at each eccentricity for J.M. obtained with repetitive vernier gratings (from Fig. 13).
be consistent with cortical anatomy. Similar conclu-sions have been reached by Fahle (personal commu-nication).
To a good approximation†, many properties ofperipheral vision can be summarized by the relation-ship y=kE*, where E* = E + X is the effectiveeccentricity with X 0.8 deg for cortical processingand X 2.5 deg for retinal processing (Table 1). Theslope k depends upon the task specified by y. For theinverse magnification factor M-1 (deg/mm) there arelarge individual variations in the size of striate cortexof both monkeys and humans (Van Essen et al., 1984)and corresponding variations in the slope k. It seemslikely that the size of the striate cortex varies a greatdeal more from individual to individual, than does itsfunctional organization. Thus the slope k is inverselyproportional to the square root of the area of thestriate cortex (i.e. its linear size). For the rhesusmonkey the slope k is approximately 0.12mm -1
(Dow et al., 1981; Van Essen et al., 1984). At thefovea this gives an inverse magnification(M-1 =kX) = 0.096 deg/mm or M = 10.4 mm/deg.The X value, which depends upon estimates of fovealor near foveal magnification hadn't been accuratelystudied until the recent work of Dow et al. (1981),Tootell et al. (1982), and Van Essen (1984). Thefragile nature of the estimate of X can be demon-strated by noting that Dow's estimate of X — 0.3 degis based on doing a linear regression to the pooleddata of both monkeys. Our estimate of 0.8 deg isbased on doing linear regressions to the data of eachmonkey separately. This value of 0.8 is consistentwith the other recent estimates of X shown in Table
†The true variation in visual function with eccentricity is infact exponential .
1 for cortical magnification, and with the value of Xfor a variety of hyperacuity tasks.
Figure 14 shows another application of corticalmagnification scaling to the data of Experiment I I Ifor observer J.M. The lower and left axes are nowlabelled in cortical mm, using the formula M-1
(deg/mm) = 0.08E*. The slope value k = 0.08 mm-1
has been chosen to be about 0.7 times the value of theRhesus monkey since the area of human visual cortexis about twice that of Rhesus (Schwartz, 1980). Theupper and righthand axes are in units of the fractionof the effective eccentricity, E*. Defining both thethreshold and the flank distance as a fraction ofeffective eccentricity essentially eliminates the uncer-tainties associated with estimates based upon anat-omical considerations and interspecies and individualvariations.
The data plotted in Fig. 14 show the effect of a tinymask on the vernier threshold at different eccen-tricities. As was pointed out in Results, the observer'sviewing distance was inappropriately chosen for eacheccentricity by using X = 2.5 deg rather thanX = 0.8 deg (the experiments were done before weunderstood the difference between the retinal and thecortical scaling functions). The main effect of theinappropriate scaling while gathering data is that inthe foveal condition the observer should have beenfurther away, which would have made the linesshorter and thinner. But it is unlikely that shorteningthe lines would change the shape of the foveal datasince the flank spacing and the threshold values areindependent of the particular scaling factor X.
When the results of Experiment I I I are replottedaccording to cortical scaling (X = 0.8 deg), severalpoints are notable: (1) The unflanked thresholds areabout 0.0025 of the effective eccentricity. The con-
976 DENNIS M. LEVI et al.
stancy of the threshold in cortical units providesfurther evidence that thresholds are proportional toeffective eccentricity, E + 0.8. (2) Maximal maskingoccurs when the flanks are about 0.05E* away fromthe test line. It is worth stressing that the data in theperiphery makes it difficult to account for the effectof the mask in terms of optical or retinal factors sincein the periphery the blur size is small compared to theextent of masking. (3) Masking becomes negligiblewhen the flanks are more than 0.15E* away. Themasking locus is seen to be fairly independent ofeccentricity-further evidence supporting the role of acortical metric in controlling the effect of the masks.Bouma (1970) and Andriessen and Bouma (1976)found interference for letter identification and line tiltwith flanks as far away as about 0.4E*. It is unclearwhy they found such a large extent of interference. (4)The magnitude of the masking varies somewhat. It isseen that there is about a three to four fold thresholdelevation in the fovea, whereas the maximal thresholdelevation is somewhat higher at 5 deg, suggesting thatthere may be slight departures from simple scaling.The solid symbols in Fig. 14 are the locations of themaximal masking data points and the unflanked datapoints of observer P. A. replotted from Fig. 7 onto thenew axes. Both observers show similar results in thesecortical distance units. (5) Also shown in Fig. 14 is asummary of Experiment IV (vernier gratings) inwhich the full range of J.M.'s data from Fig. 13 forthe different eccentricities is replotted as the stippledregion. For low spatial frequencies (Experiment IV)or large flank distances (Experiment III) the data ofthe two experiments are in good agreement. This isquite surprising considering that the stimuli differedwith respect to: (i) their scaling (ii) orientation (verti-cal vs horizontal), (iii) temporal presentation (i.e. alllines flashed simultaneously in Experiment IV vs onlythe test line flashed in Experiment III, and (iv) thetype of masking (i.e. repetitive long line vs a pair oftiny flanks). The vernier threshold gratings becomesdegraded when the line separation is less than0.08E*. It is noteworthy that the crowding in Experi-ment I I I occurred at a slightly wider separation thanin Experiment IV.
Perceptive hypercolumns
We pointed out earlier (Experiment IV, Results)that spatial interference occurred when the interlinedistance was less than a cortical distance of about1 mm, approximately the size of a human corticalocular dominance column (Hitchcock and Hickey,1980). Because of the uncertainties associated withestimates based upon cortical anatomy and phys-iology (Van Essen el al., 1984) it is useful to definepsychophysical spatial processing modules as sug-gested by Westheimer (1981). These modules subtenda few minutes in the fovea. Our data suggests that inperipheral vision these psychophysical modules scaleto the eccentricity as do the anatomical modulestermed hypercolumns. Figure 14 showed that mask-
ing occurs at a distance of about 0.1E*. We shalldefine this distance as the size of a "perceptive"hypercolumn. Since this measure is in spatial units itshould be valid for both humans and monkeys (Sch-wartz, 1980) and should have less individual vari-ability than a metric based upon cortical millimeters.In terms of perceptive hypercolumns, the results ofExperiments III and IV can be summarized as: (a)The vernier threshold is approximately 1/40 of thesize of a perceptive hypercolumn. (b) The vernierthreshold will be elevated if interfering contours arepresent in the same or in adjacent hypercolumns.Since contrast sensitivity falls off more slowly in theperiphery than does vernier acuity or other spatialdiscrimination tasks (e.g. Jamar et al., 1984) theseresults present some difficulties for theories of hyper-acuity based upon the contrast sensitivity functionand its underlying filters unless additional assump-tions are made regarding the variation of spatialsampling with eccentricity.
In summary, our analysis suggests that hyper-acuity, when scaled to recent estimates of the corticalmagnification factor is the same in the periphery asin the fovea. This does not preclude the possibilitythat the fovea has. in addition, special mechanismsand/or functions, not found in the periphery. Thechallenge with regard to cortical magnification theoryis to find tasks which with appropriate scaling, theperiphery cannot perform as well as the fovea.
Acknowledgements—We thank Travett Robinson-Johnsonfor preparation of the manuscript, and Manfred Fahle andRoger Watt for helpful comments on an earlier version ofthe manuscript.
REFERENCES
Andriessen J. J. and Bouma H. (1976) Eccentric vision:adverse interactions between line segments. Vision Res.16, 71-78.
Banks W. P., Larsen D. W. and Prinzmetal W. (1979)Asymmetry of visual interference. Percept. Psychophys.25, 447-456.
Barlow H. B. (1979) Reconstructing the visual image inspace and time. Nature 279, 189-190.
Barlow H. B. (1981) Critical limiting factors in the designof the eye and visual cortex. Proc. R. Soc. Loud. B. 212,1-34.
Bouma H. (1970) Interaction effects in parafoveal letterrecognition. Nature 226, 177-178.
Bourdon B. (1902) La Perception Visuelle de l'Espace,p. 146. Scheicher. Paris.
Brindlcy G. S. and Lewin W. S. (1968) The sensationsproduced by electrical stimulation of the visual cortex. J.Physiol.. Lond. 196, 479-493.
Butler T. and Westheimer G. (1978) Interference withstereoscopic acuity: spatial temporal, and disparitytuning. Vision Res. 18, 1387-1392.
Connolly M. and Van Essen D. (1984) The representationof the visual field in parvicellular and magnocellularlayers of the lateral geniculate nucleus in the macaquemonkey. J. comp. Neurol. 226, 544-564.
Cowey A. and Rolls E. T. (1974) Human corticalmagnification factor and its relation to visual acuity. ExplBrain Res. 21, 447-454.
Daniel P. M. and Whitteridgc D. (1961) The representationof the visual field on the cerebral cortex in monkeys. J.Physiol. 159, 203-221.
Vernier acuity, crowding and cortical magnification 977
Dow B. M.. Snyder R. G., Vautin R. G. and Bauer R.(1981) Magnification factor and receptive field size infoveal striate cortex of the monkey. Expl Brain Res. 44,213-228.
Drasdo N. (1977) The neural representation of visual space.Nature 266, 554-556.
Fendick M. and Westheimer G. (1983) Effects of practiceand the separation of test targets on foveal and peripheralstereoacuity. Vision Res. 23, 145-150.
Flom M. C, Heath G. G. and Takahashi E. (1963a)Contour interaction and visual resolution: Contralateraleffects. Science 142, 979-980.
Flom M. C., Weymouth F. W. and Kahnemann D. (1963b)Visual resolution and contour interaction. J. opt. Soc.Am. 53, 1026-1032.
Center C. R., Kandell G. L. and Bedell H. E. (1981) Theminimum angle of resolution vs. angle of regard functionas measured with different targets. Ophthal. Phvsiol. Opt.1, 3-13.
Hitchcock B. and Hickey T. (1980) Ocular dominancecolumns: Evidence for their presence in humans. BrainRes. 182, 176-179.
Hubel D. H. and Wiesel T. N. (1974) Uniformity of monkeystriate cortex: A parallel relationship between field size,scatter, and magnification factor. /. comp. Neurol. 158,295-306.
Jamar J. H. T., Kwakman L. F. T. and Koenderink J. J.(1984) The sensitivity of the peripheral visual system toamplitude-modulation and frequency-modulation of sine-wave patterns. Vision Res. 24, 243-250.
Johnson C. A. and Leibowitz H. W. (1974) Practice, refrac-tive error and feedback as factors influencing peripheralmotion thresholds. Percept. Psyclwphys. 15, 276-280.
Klein S. A. and Levi D. M. (1984) Relatively few quantacount in hyperacuity. Invest. Ophthal. visual Sci., Suppl.25, 315.
Klein S. A. and Levi D. M. (1985) Hyperacuity thresholdsof 1 second: Quantitative predictions and empirical vali-dation. J. opt. Soc. Am. In press.
Klein S. A. and Tyler C. W. (1981) Phase discriminationusing single and compound gratings. Invest, ophthal.Visual Sci., Suppl. 20, 124.
Koenderink J. J., Bouman M. A., Bueno de Mesquita A. E.and Slappendel S. (1978) Perimetry of contrast detectionthresholds of moving sine wave patterns. J. opt. Soc. Am.68, 845-865.
Korte W. (1923) Uber Die Gestaltauffassung im IndirectenSehen. Z. Psychologic. 93, 17-82.
Lettvin J. Y. (1976) On seeing sidelong. N.Y. Acaci. Sci. 16,10-20.
Levi D. M. and Klein S. A. (1982a) Hyperacuity andamblyopia. Nature 298, 268-270.
Levi D. M. and Klein S. (1982b) Differences in vernierdiscrimination for gratings between strabismic and aniso-metropic amblyopes. Invest. Ophthal. visual. Sci. 23,398-407.
Levi D. M. and Klein S. (1983) Spatial localization innormal and amblyopic vision. Vision Res. 23, 1005-1017.
Levi D. M. and Klein S. A. (1985) Vernier acuity, crowdingand amblyopia. Vision Res. 25, 979-991.
Levi D. M., Klein S. A. and Aitsebaomo P. (1984) Detectionand discrimination of the direction of motion in centraland peripheral vision of normal and amblyopic observers.Vision Res. 24, 789-800.
Malpeli J. G. and Baker F. H. (1975) The representation ofthe visual field in the lateral geniculate nucleus of Macacamulatta. J. comp. Neurol. 161, 569-594.
McKee S. P. and Nakayama K. (19S4) The detection ofmotion in the peripheral visual field. Vision Res. 24,25-32.
0sterberg G. (1935) Topography of the layer of rods andcones in the human retina. Ada ophthal.. Khh. Suppl., 65,1-102.
Rolls E. T. and Cowey A. (1970) Topography of the retina
and striate cortex and its relationship to visual acuity inrhesus monkeys and squirrel monkeys. Expl Brain Res.10, 298-310.
Rovamo J., Virsu V. and Nasanen R. (1978) Corticalmagnification factor predicts the photopic contrast sensi-tivity of peripheral vision. Nature 271, 54-56.
Sakitt B. and Barlow H. B. (1982) A model for theeconomical encoding of the visual image in the cerebralcortex. BioL Cybernet. 43, 97-108.
Saugstad P. and Lie I. (1964) Training of Peripheral VisualAcuity. Scand. J. Psychol. 5, 218-224.
Schwartz E. L. (1980) A quantitative model of the func-tional architecture of human striate cortex with applica-tion to visual illusion and cortical texture analysis. Biol.Cybernet. 37, 63-76.
Schwartz E. L. (1983) Cortical mapping and perceptualinvariance: A reply to Cavanagh. Vision Res. 23, 831-835.
Steinman S. B., Levi D. M., Manny R. E. and Klein S. A.(1985) Specificity of the hyperacuity evoked potential forvernier offsets. Vision Res. 25, 951-961.
Stephenson C. and Braddick O. (1983) Discrimination ofrelative phase in fovea and periphery. Invest. Ophthal.visual Sci., Suppl. 24, 146.
Tootell R. B., Silverman M. S.. Switkes E. and De ValoisR. L. (1982) Deoxyglucose analysis of retinotopic or-ganization in primate striate cortex. Science 218, 902-904.
Van Essen D. C., Newsome W. T. and Maunsell J. H. R.(1984) The visual field representation in striate cortex ofthe macaque monkey: Asymmetries, anisotropies, andindividual variability. Vision Res. 24, 429-448.
Virsu J. (1983) Cortical magnification factor and contrastsensitivity to luminance—modulated chromatic gratings.Act a psych ol. scand. 119, 365-371.
Virsu V. and Rovamo J. (1979) Visual resolution, contrastsensitivity, and the cortical magnification factor. ExplBrain Res. 37, 475-494.
Watt R. J. (1984) Towards a general theory of the visualacuities for shape and spatial arrangement. Vision Res. 24,1377-1386.
Watt R. J. and Morgan M. J. (1983) The recognition andrepresentation of edge blur: Evidence for spatial prim-itives in human vision. Vision Res. 23, 1465-1478.
Wertheim T. (1894) Uber Die Indirekte Schescharefe. Z.Psychol. Physiol. Sinnesorg. 7, 172-189.
Westheimer G. (1979) Scaling of visual acuity mea-surements. Archs Ophthal. 97, 37-330.
Westheimer G. (1981) Visual hyperacuity. Prog. SensoryPhysiol. 1, 1-30.
Westheimer G. (1982) The spatial grain of the perifovealvisual field. Vision Res. 22, 157-162.
Westheimer G. and Hauske G. (1975) Temporal and spatialinterference with vernier acuity. Vision Res. 15,1137-1141.
Westheimer G. and McKee S. P. (1975) Visual acuity in thepresence of retinal image motion. J. opt. Soc. Am. 65,847-850.
Westheimer G. and McKee S. P. (1977) Integration regionsfor visual hyperacuity. Vision Res. 17, 89-93.
Westheimer G., Shimamura K. and McKee S. P. (1976)Interference with line-orientation sensitivity. J. opt. Soc.Am. 66, 332-338.
Weymouth F. W. (1958) Visual sensory units and theminimal angle of resolution. Am. J. Ophthal. 46, 102-113.
Williams R. A., Essock E. A. and Enoch J. M. (1983)Influence of variable-sized backgrounds on a hyperacuitythreshold. In Advances in Diagnostic Visual Optics (Editedby Bremen G. M. and Siegel L. M.), pp. 232-238.Springer, Berlin.
Williams R. A. and Essock E. A. (1985) Areas of spatialinteraction for a hyperacuity stimulus. To be published.
Wilson M. E. (1970) Invar iant features of spatial summationwith changing locus in the visual field. J. Physiol. 207,611-622.