regional input on eastward enlargement of the eurozone: labour markets
TRANSCRIPT

REGIONAL INPUT: LABOUR MARKETS
Achim Kemmerling
Tiiu Paas
Raul Eamets
Marit Rõõm
Rena Selliov
Anne Jürgenson
Jaan Masso
Ezoneplus Working Paper No. 6A
September 2002
FIFTH FRAMEWORK PROGRAMME
Ezoneplus
The Eastward Enlargement of the Eurozone Research Project HPSE-CT-2001-00084 Fifth Framework Programme 2001-2004
European Commission www.ezoneplus.org
Jean Monnet Centre of Excellence Freie Universität Berlin
Ihnestr. 22, 14195 Berlin, Germany Phone: +49 (30) 838 – 54966
Fax: +49 (30) 838 – 52357 Email: [email protected]
Ezoneplus Working Paper No. 6A September 2002
Regional Input: Labour Markets
Keywords : Statistics on Labour markets, Regional Input, Labour migration,
Wage flexibility
Corresponding authors: Prof. Ph.D. Tiiu Paas. & Ass. Prof. Ph.D. Raul EametsInstitute of Economics University of Tartu Narva mnt. 4-A208 EST-51009 Tartu [email protected]. [email protected]. Achim Kemmerling Jean Monnet Centre of Excellence Freie Universität Berlin Ihnestr. 22 14195 Berlin, Germany Email: [email protected]
This paper has been prepared as a part of a broader Ezoneplus project thatevaluates European Monetary Union (EMU) and its enlargement to prospectivemembers in central and eastern Europe. The project is financially supported byEuropean Commission (HPSE-CT-2001-00084).
Table of Contents
Regional Input: Labour Markets in Benelux, France and Germany
Achim Kemmerling
1. Overview 3
Part I: Western European Labour Markets – Structures and Trends 5
2 Migration, Mobility and the Composition of Labour Markets 5
3 Flexibility of Nominal and Real Wages 8
Part II: Western European Labour Markets – Policies and Institutions 12
4 Wage Bargaining Systems and Labour Market Regulation 12
5 The Social Security System, Taxes and Migration Policies 15
Conclusion 17
References 19
LABOUR MARKET FLEXIBILITY AND MIGRATION IN THE EU EASTWARD
ENLARGEMENT CONTEXT: THE CASE OF THE BALTIC STATES
Tiiu Paas, Raul Eamets, Marit Rõõm, Rena Selliov, Anne Jürgenson, Jaan Masso
1. Introduction 22
2. The main changes in the Baltic States’ labour markets 24
3. The concept of labour market flexibility 27
4. Institutional flexibility 30
4.1. Labour market regulation 30
4.2. The role of trade unions 33
4.3. Labour market policy 36
5. Wage flexibility 38
6. International labour migration 41
Conclusion 45
References 46
Regional Input: Labour Markets in Benelux, France and Germany
Achim Kemmerling
Ezoneplus Working Paper No. 6A
August 2002
FIFTH FRAMEWORK PROGRAMME
Ezoneplus
The Eastward Enlargement of the Eurozone Research Project HPSE-CT-2001-00084 Fifth Framework Programme 2001-2004
European Commission www.ezoneplus.org
Jean Monnet Centre of Excellence
Freie Universität Berlin Ihnestr. 22, 14195 Berlin, Germany
Phone: +49 (30) 838 – 54966 Fax: +49 (30) 838 – 52357
Email: [email protected]
3
Regional Input: Labour Markets in Benelux, France and Germany
Achim Kemmerling1
1 Overview
Western European labour markets show a considerable lack of flexibility in terms of
employment and wages (e.g. OECD 1994). In the beginning of the 21st century, two main
events are expected to increase pressure for a more flexible job market in Western Europe:
The European Monetary Union and the eastern enlargement of the European Union.
European Monetary Union enhances pressure on labour markets in three respects. First it
tightens fiscal policy in accordance with the so-called stability pact and thus forces
governments to cut spendings on social security systems. Labour market policies will have to
find better ways to get unemployed people back to work more quickly. Second, since there is
no room for devaluation of national currencies, opportunities for job creation by increasing
exports are forgone, too (Bolle/Neugart 2000). Third, the integration of product and capital
markets in a common currency area will lead to more transparency. This fosters competition
between firms and thus, again, market forces are going to cut bargaining power of trade
unions and put wages and employment protection under pressure (Burda 2001). If labour
markets and institutions do not become more flexible, higher unemployment rates will be the
consequence.
The same results become true for eastern enlargement of the European Union. Although
economic integration is expected to have positive overall welfare effects for all countries
involved (Baldwin 1994), gains may be strictly distributed between factors, sectors and
1 I thank Sandra Pogodda and Andreas Spannbauer for research assistance. All remaining errors are mine.
4
regions. Eastern enlargement will affect Western European labour markets through the
channels of (1) trade, (2) foreign direct investments and (3) migration and, in fact, increase
pressure on labour markets in western Europe in the following way (cf. Ezoneplus 2001):
First, trade between regions with different factor endowment might lead to factor price
convergence without factor mobility according to the Heckscher-Ohlin-Model. Thus, imports
form low-wage CEECs may force competition in product markets in western Europe and
thus lead to lower wages and higher unemployment in the sectors concerned. Second, the
same result might become true as a consequence of foreign direct investment: Firms may
have an incentive to move production to eastern Europe because of market access and/or
lower wages and taxes. This might reduce labour demand and, again, lower wages and higher
unemployment might be expected. Third, migration to western Europe due to freedom of
movement within the European Union might increase labour supply and thus competition in
Western European labour markets.
In sum, this development may pose severe political problems on the process of integration.
In order to avoid these problems, Western European labour markets will have to become
more flexible.
So far, labour markets in the incumbent countries do not seem to be prepared well to meet
the challenge. Rigidities of western European labour markets are considered high in terms of
factor prices (wages) and quantities. Other important features are labour market legislation
(payroll taxes, minimum wages), passive and active labour market policies (OECD 1994),
wage determination and union density and labour supply measures (reduced working time
and early retirement). Notably, not all of these factors are considered to cause high
unemployment (Nickell 1997).
The first round of enlargement will take place earliest in 2004. Theories about rational
expections, however, would predict that that markets might already have anticipated this
event since the early 1990s, at least since the application process formally started in 1998. This
assumption is moreover justified by empirical evidence about former enlargement rounds:
The strongest impact on labour markets in accession countries was noticed shortly after their
application, not after the date of membership (cf. Burda 1999: 94). So one might ask if the
prospect of eastward enlargement has already reshaped Western European labour markets.
This is what this paper indends to.
Section 2 starts with a glance on the current state of Western European labour markets. It
describes the development of quantitative adaption of labour markets to economic changes

5
and discusses east west migration in more detail. A next step contains the question whether
wages have already become more flexible in the wake of enlargement (Section 3). The second
main part probes into the issue of so-called real rigidities. Section 4 deals with the current
state of labour market policies and institutions. Section 5 discusses other relevant issues that
condition the performance of labour markets such as social security systems, taxes and
pensions.
Part I: Western European Labour Markets – Structures and Trends
2 Migration, Mobility and the Composition of Labour Markets
Are Western European labour markets prepared to absorb the shock of integrating Eastern
economies into the EU? A short glance on aggregate data shows that the state of labour
markets is everything but cosy at the moment (cf. Table 1). Unemployment, the politically
most important indicator of labour markets, continues to be high in Belgium, France and
Germany. Only the Netherlands have reduced (open) unemployment to levels even lower
than the US rate. Long-term unemployment indicates that differences are due to structural
problems as it is especially high in Belgium and Germany but has fallen significantly in the
Netherlands. Another way of accounting for structural unemployment, the NAIRU, shows
that in Western Europe equilibrium unemployment rose sharply in the 80s. Since then it
stagnates on a high level – except for the Netherlands (Chart 2.1) that have witnessed a
considerable down-turn of unemployment.
To round up the picture of aggregate levels, it is insightful to look at overall employment
levels. Interestingly, those countries with high unemployment rates also show the lowest
aggregate labour supply in terms of people employed. The contrast is particularly evident for
low female labour force participation in Germany and Belgium. However, there are also hugh
differences in the number and distribution of total hours worked in a national economy. Due
to a high percentage of part-time workers, the overall amount of working hours in the
Netherlands lacks significantly behind the number of employed people (Nickell/ Layard
1999: 3034). Another means of redistributing work is to reduce the average number of years
worked. The level of early retirement is high in all sample countries with Belgium ranking on
top position of core OECD countries. Germany is one of the countries with lowest
participation rates for young people up to 25 years old (Schömann et al. 1998: 37).
Changing from stock to flow analysis of Western European labour markets it becomes
evident that low employment, high unemployment and low levels of mobility and turnover go

6
hand in hand. Regional mobility, for instance, is low in the sample countries, ranging from 1
to 1.5 per cent of total labour force per annum (OECD 2000; EU 2001). The mirror image of
such low mobility rates is a high variation in regional unemployment rates in both big
economies, France and Germany. Similar arguments hold for occupational mobility. Though
it is difficult to compare changes of professions from one country to another, there is some
evidence that overall levels are low compared to OECD standards (Schömann et al. 1998: 92).
The general reaction of European labour markets to structural changes has been
unemployment and early retirement rather than switching occupations. In general, turnover
rates are low in Western Europe relative to other countries.
Table 1: Standard Labour Market Indikators
Time Unemployment Rate Employment/Pop ratio Labour Force Participation Rate Long-term Unemployment
BE FR GE NE US BE FR GE NE US BE FR GE NE US BE FR GE NE US
1990 7,2 9,2 4,7 7,4 5,6 54,7 60,4 64,8 61,8 74,3 59 66,5 70 60,5 78.7 68,7 38 46,8 49,3 5,5
1991 7 9,1 5,6 6,9 6,8 56,1 60,4 67,6 62,9 73 60,3 66,5 71,6 62 78,4 62,9 37,2 31,6 46,1 6,3
1992 6,7 10,1 6,6 5,5 7,5 56,8 60 66,7 63,8 72,9 60,9 66,8 71,5 63,3 78,8 59 36,1 33,5 43,9 11,1
1993 8,1 11,1 7,9 6,1 6,9 56,3 59,5 65,7 63,8 73,2 61,2 67 71,3 62,7 78,7 52,9 34,2 40,3 52,3 11,5
1994 9,6 12,4 8,4 6,8 6,1 56 58,7 65,1 63,9 74,2 62 67 71,1 62,7 79 58,3 38,3 44,3 49,4 12,2
1995 9,3 11,6 8,1 7 5,6 56,6 59,4 65,2 65,6 74,7 62,4 67,2 71 60,6 79,2 62,4 42,3 48,7 46,8 9,7
1996 9,5 12,1 8,9 6,5 5,4 56,6 59,6 64,9 66,7 75 62,5 67,8 71,2 61,5 79,3 61,3 39,5 47,8 50 9,5
1997 9 12,3 9,8 5,5 4,9 57,3 59,2 64,5 68,7 75,7 62,9 67,5 71,5 61,9 79,6 60,5 41,2 50,1 49,1 8,7
1998 9,3 11,8 9,2 4,3 4,5 57,5 59,7 65,4 70,4 76 63,5 67,8 72 62,3 79,6 61,7 44,1 52,6 47,9 8
1999 8,6 11,8 8,6 3,5 4,2 59,4 60,1 66 71,8 76,2 65 68,1 72,3 63,3 79,5 60,5 40,3 51,7 43,5 6,8
2000 6,6 10 8,1 3,3 4 61,3 61,5 67 72,7 76,4 65,6 68,3 72,9 53,4 79,6 56,3 42,5 51,5 32,7 6
Source OECD Labour Force Statistics 2002
Chart 1: Equilibrium Unemployment Rates 1980 – 1999
0
2
4
6
8
10
12
NAIRU
%
BE FR GE NE US
1980
1985
1990
1995
1999
Source: Van Poeck/ Borghijs 2001 based on OECD Ec. Outlook 2000
7
Besides regional and occupational mobility there is cross-boarder exchange between
European countries. Free movement of labour is one of the central features of the EU acquis.
Key empirical questions discussed in the literature so far are first, To what extent will an
increase of labour supply from Eastern Europe affect labour markets in the selected
countries? Second, Is there empirical evidence for increasing migration up to now? And,
finally, How is migration distributed across sectors and regions/ countries? (e.g. Kunze 2000;
Boeri/Brücker 2000; DIW 2000).
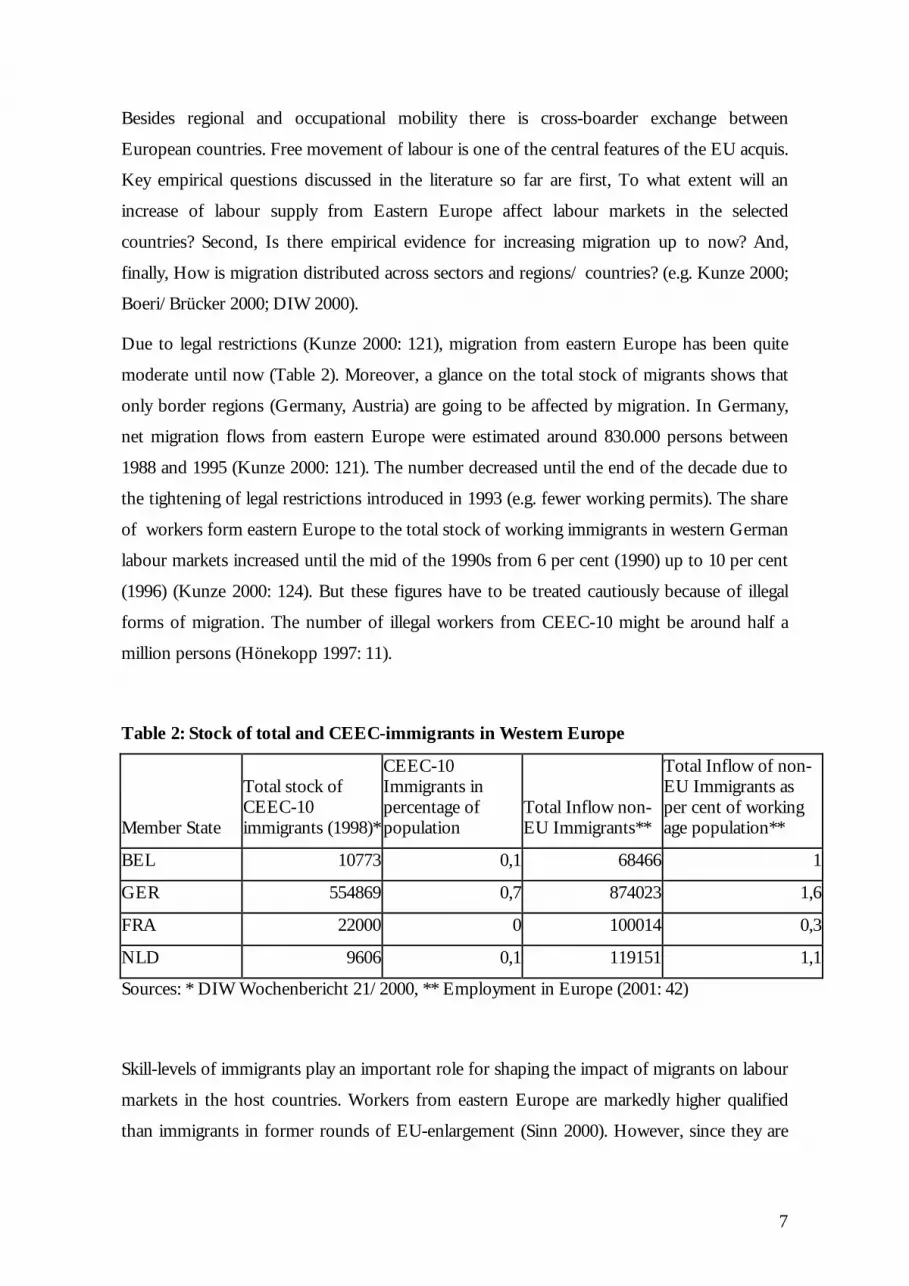
Due to legal restrictions (Kunze 2000: 121), migration from eastern Europe has been quite
moderate until now (Table 2). Moreover, a glance on the total stock of migrants shows that
only border regions (Germany, Austria) are going to be affected by migration. In Germany,
net migration flows from eastern Europe were estimated around 830.000 persons between
1988 and 1995 (Kunze 2000: 121). The number decreased until the end of the decade due to
the tightening of legal restrictions introduced in 1993 (e.g. fewer working permits). The share
of workers form eastern Europe to the total stock of working immigrants in western German
labour markets increased until the mid of the 1990s from 6 per cent (1990) up to 10 per cent
(1996) (Kunze 2000: 124). But these figures have to be treated cautiously because of illegal
forms of migration. The number of illegal workers from CEEC-10 might be around half a
million persons (Hönekopp 1997: 11).
Table 2: Stock of total and CEEC-immigrants in Western Europe
Member State
Total stock of CEEC-10 immigrants (1998)*
CEEC-10 Immigrants in percentage of population
Total Inflow non-EU Immigrants**
Total Inflow of non-EU Immigrants as per cent of working age population**
BEL 10773 0,1 68466 1
GER 554869 0,7 874023 1,6
FRA 22000 0 100014 0,3
NLD 9606 0,1 119151 1,1
Sources: * DIW Wochenbericht 21/2000, ** Employment in Europe (2001: 42)
Skill-levels of immigrants play an important role for shaping the impact of migrants on labour
markets in the host countries. Workers from eastern Europe are markedly higher qualified
than immigrants in former rounds of EU-enlargement (Sinn 2000). However, since they are

8
employed in jobs with low wages that afford low qualification (Kunze 2000), rentability on
human capital is not very high for most of them. In most cases, immigrants from CEEC-10
have been working in agriculture, construction and services in the past. Notably, employment
of foreigners didn’t have many negative effects on wages for German workers in total,
although subcontracting Eastern European construction workers was considered to have an
impact on unemployment of German construction workers (Kunze 2000: 125ff.) and their
wages. This has lead to political pressure from the sector specific trade unions and, finally, to
legal protection of German workers (Kunze 2000).
Enlargement of the EU including free movement of labour should boost migration to
Western Europe because of large income differentials. In the view of the Deutsche Institut
für Wirtschaftsforschung (DIW) the number of foreign residents from the CEEC-10 in the
EU-15 will increase by around 335.000 people p.a. immediately after the introduction of
freedom of movement without delay. Germany is expected to receive 220.000 people p.a. –
some 70 per cent of the total – immediately after full membership. Unskilled labour in the
host countries, in particular, is feared to loose from migration in terms of wages and
employment. The DIW concludes that an increase in the migrant share in a given branch by
one percentage point decreases average wages there by 0.6 per cent in Germany and increases
the individual risk of dismissal by 0.2 percentage points (Boeri/Brücker 2000). Sinn (2000)
cites estimates of 250.000 to 300.000 immigrants p.a. from CEEC-10.
So far, these figures are much lower since the EU and the CEEC-10 agreed on restricting free
movement of labour force for a limited period. To conclude, most observers (e.g. Puhani
1999) think that low cross-national mobility continues to be one of the main sources of real
rigidities even after the accession of new countries to the EU.
3 Flexibility of Nominal and Real Wages
Apart from increasing mobility of labour, wage flexibility is the second major process to be
induced by Eastward enlargement. Intensified competition – due to more transparency in
labour costs and prices in the wake of EMU – threatens labour-intensive firms, above all in
regions next to Eastern Europe. Especially those enterprises with low productivity but
without any possibility to source out parts of their business in countries with lower price
levels are particularly sensitive to the growth of labour costs relative to other countries
(Nicoletti 2001: 175).

9
According to Burda (2001) in an enlarged internal market the product market competition
among companies will increase dramatically. Hence there will be a rising elasticity of product
demand and of the demand for labour. Because of EWU, nominal price rigidity is expected to
increase in an enlarging internal market (ibid.: 8ff.). On the other hand, nominal wages are
likely to be less rigid than prices and should covary increasingly in accordance with
macroeconomic factors such as unemployment and productivity increases.
Empirically speaking, a first source of flexibility is between nominal wages and nominal
prices. Burda (2001: 12) reviewing some evidence finds that, indeed, nominal prices are
increasingly ‘more rigid’ than nominal wages. Moreover, the basic law of social enthropy
informs the hypothesis that the cross-country correlation in nominal wages should be
decreasing. Both Burda (2001) and Bolle/ Neugart (2000) found some empirical truth in these
claims.
Table 3: Nominal Manufacturing Wage Growth Correlations in National currency
Average Correlation Coefficient in Group
Nominal Wage Growth in Local Currency
Total Sample 1961-79 1980-96
Core Europe*
(BE, NE, GE, AT)
0.68 0.64 0.42
Core Europe+ FR, DK, IT* 0.66 0.59 0.22
Euro-11* 0.69 0.56 0.34
1986.1-1992.4 1993.1-1998.2
(BE, AT, GE, FR, NE)** - 0.34 0.00
(BE, NE, FR, GE)** - 0.42 0.04
EU-11 + SW, DK** - 0.20 0.07
Source: * Burda (2001); ** Bolle/ Neugart (2000)
Table 3 displays the advanced divergence in the past decade. The nominal wage behaviour in
EU member states has become increasingly uncorrelated over time - a tendency which will
certainly increase with the enlargement. This is not only valid for larger samples, but also for
those containing exclusively the countries analysed here.
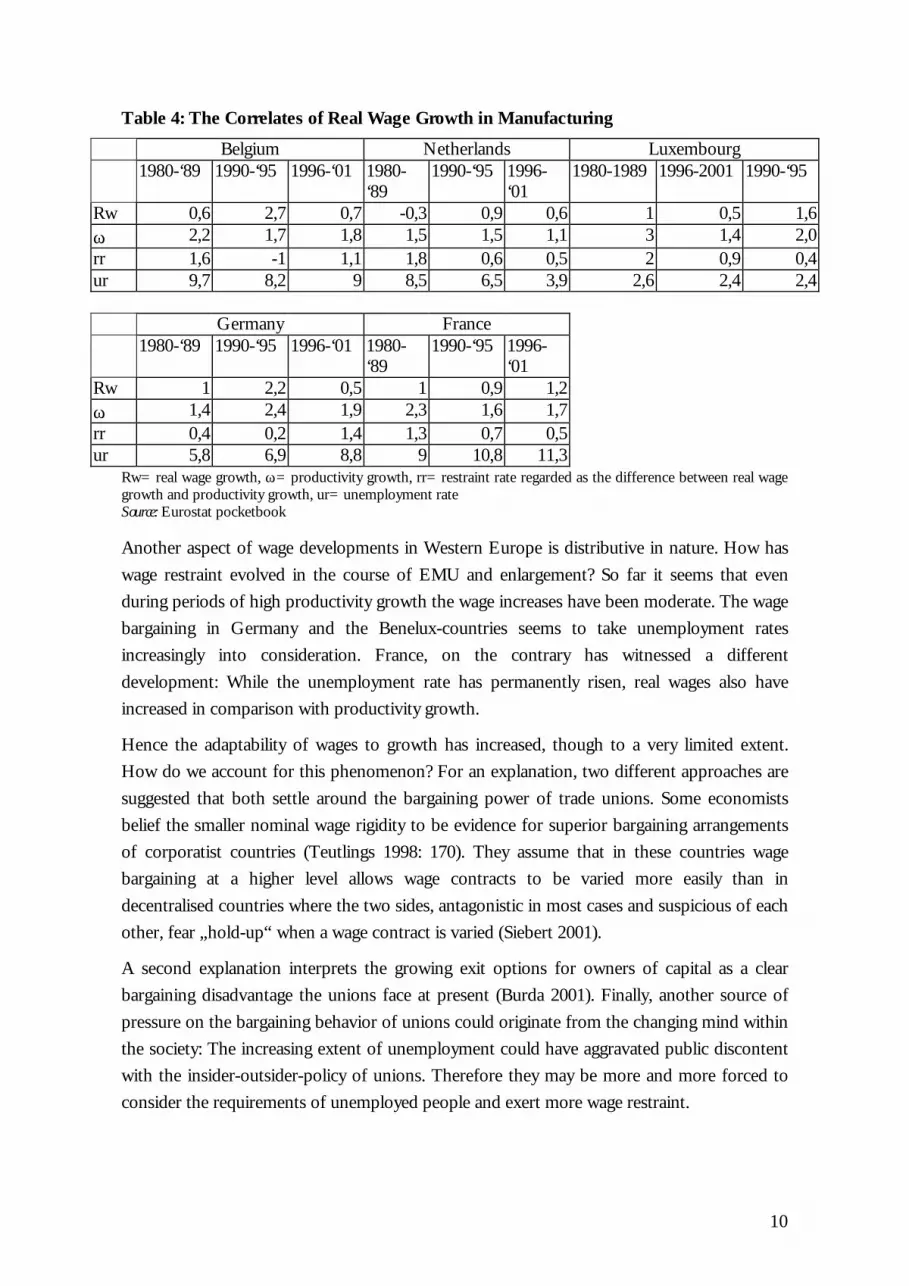
Less nominal wage flexibility together with more nominal price rigidity is likely to coincide
with increased real wage flexibility. Analyzing the development of real wages in France,
Germany and in the Benelux-countries, one can notice a tendency to more responsiveness of
wages with reference to the unemployment rate and productivity (Table 4).
10
Table 4: The Correlates of Real Wage Growth in Manufacturing
Belgium Netherlands Luxembourg 1980-‘89 1990-‘95 1996-‘01 1980-
‘89 1990-‘95 1996-
‘01 1980-1989 1996-2001 1990-‘95
Rw 0,6 2,7 0,7 -0,3 0,9 0,6 1 0,5 1,6 ϖ 2,2 1,7 1,8 1,5 1,5 1,1 3 1,4 2,0 rr 1,6 -1 1,1 1,8 0,6 0,5 2 0,9 0,4 ur 9,7 8,2 9 8,5 6,5 3,9 2,6 2,4 2,4 Germany France 1980-‘89 1990-‘95 1996-‘01 1980-
‘89 1990-‘95 1996-
‘01 Rw 1 2,2 0,5 1 0,9 1,2 ϖ 1,4 2,4 1,9 2,3 1,6 1,7 rr 0,4 0,2 1,4 1,3 0,7 0,5 ur 5,8 6,9 8,8 9 10,8 11,3
Rw= real wage growth, ϖ= productivity growth, rr= restraint rate regarded as the difference between real wage growth and productivity growth, ur= unemployment rate Source: Eurostat pocketbook Another aspect of wage developments in Western Europe is distributive in nature. How has
wage restraint evolved in the course of EMU and enlargement? So far it seems that even
during periods of high productivity growth the wage increases have been moderate. The wage
bargaining in Germany and the Benelux-countries seems to take unemployment rates
increasingly into consideration. France, on the contrary has witnessed a different
development: While the unemployment rate has permanently risen, real wages also have
increased in comparison with productivity growth.
Hence the adaptability of wages to growth has increased, though to a very limited extent.
How do we account for this phenomenon? For an explanation, two different approaches are
suggested that both settle around the bargaining power of trade unions. Some economists
belief the smaller nominal wage rigidity to be evidence for superior bargaining arrangements
of corporatist countries (Teutlings 1998: 170). They assume that in these countries wage
bargaining at a higher level allows wage contracts to be varied more easily than in
decentralised countries where the two sides, antagonistic in most cases and suspicious of each
other, fear „hold-up“ when a wage contract is varied (Siebert 2001).
A second explanation interprets the growing exit options for owners of capital as a clear
bargaining disadvantage the unions face at present (Burda 2001). Finally, another source of
pressure on the bargaining behavior of unions could originate from the changing mind within
the society: The increasing extent of unemployment could have aggravated public discontent
with the insider-outsider-policy of unions. Therefore they may be more and more forced to
consider the requirements of unemployed people and exert more wage restraint.
11
The increased necessity to reduce wage rigidities may also lead to shorter durations of wage
contracts (Bolle/ Neugart 2000). Long durations prevent wages from adjusting to shifts or
demand for labour. Proponents of such a policy in Western Europe claim that shorter
contracts will decrease inertia of wages relative to swings in productivity (Nicoletti et al. 2001;
for alternative views see discussion in Bolle/ Neugart 2000). Though there is some anectodal
evidence at least for the German case, at present it is very difficult to substantiate these claims
with empirical data.
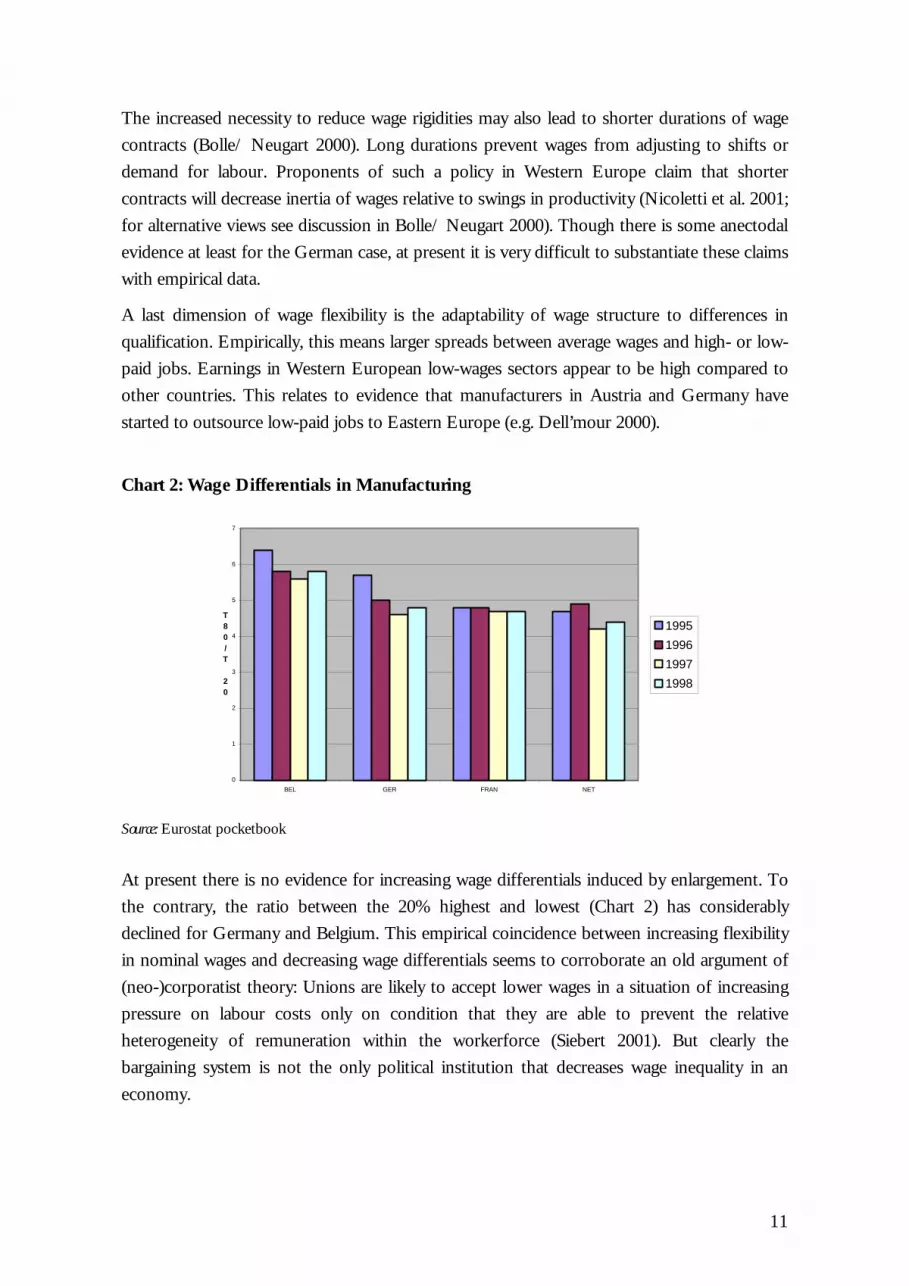
A last dimension of wage flexibility is the adaptability of wage structure to differences in
qualification. Empirically, this means larger spreads between average wages and high- or low-
paid jobs. Earnings in Western European low-wages sectors appear to be high compared to
other countries. This relates to evidence that manufacturers in Austria and Germany have
started to outsource low-paid jobs to Eastern Europe (e.g. Dell’mour 2000).
Chart 2: Wage Differentials in Manufacturing
0
1
2
3
4
5
6
7
BEL GER FRAN NET
T80/T 20
1995
1996
1997
1998
Source: Eurostat pocketbook
At present there is no evidence for increasing wage differentials induced by enlargement. To
the contrary, the ratio between the 20% highest and lowest (Chart 2) has considerably
declined for Germany and Belgium. This empirical coincidence between increasing flexibility
in nominal wages and decreasing wage differentials seems to corroborate an old argument of
(neo-)corporatist theory: Unions are likely to accept lower wages in a situation of increasing
pressure on labour costs only on condition that they are able to prevent the relative
heterogeneity of remuneration within the workerforce (Siebert 2001). But clearly the
bargaining system is not the only political institution that decreases wage inequality in an
economy.

12
Part II: Western European Labour Markets – Policies and Institutions
This part reviews some of the major issues and recent changes in institutions and policy areas
that are relevant for developments in the labour market. It starts with briefly sketching the
issues of wage bargaining systems and various forms of labour market policies and regulation.
Thereafter, the social security system, tax policies and some other policies are discussed.
4 Wage Bargaining Systems and Labour Market Regulation
How feasible is it to assume that the Eastward Enlargement of the Eurozone will dismantle
real rigidities in the labour market? There are good reasons to believe that traditional wage
bargaining systems are put under pressure. As the previous part has shown, there is some
evidence that labour markets have become slightly more flexible.
Though Western European bargaining institutions are similar in some respects, there are also
crucial differences between them. In general, the level of centralisation of wage bargaining is
assumed to be important for the macroeconomic performance (e.g. Calmfors/ Driffill 1988).
Germany is a prototypical case of a system centred around industry-level negotiations that
typically follow a sort of coordination practice dubbed as ‘patterned bargaining’: wage
bargaining in the most influential sectors (metal industries, public employees) are serving as
anchors for other industries. Bargaining is least coordinated in France (OECD 1997a; Kittel
2001a). Wage bargaining in Belgium and the Netherlands is also industry-specific, though the
temporal evolution shows that in the 70s and 80s there were also peak-level talks frequently
orchestrated by the government.2
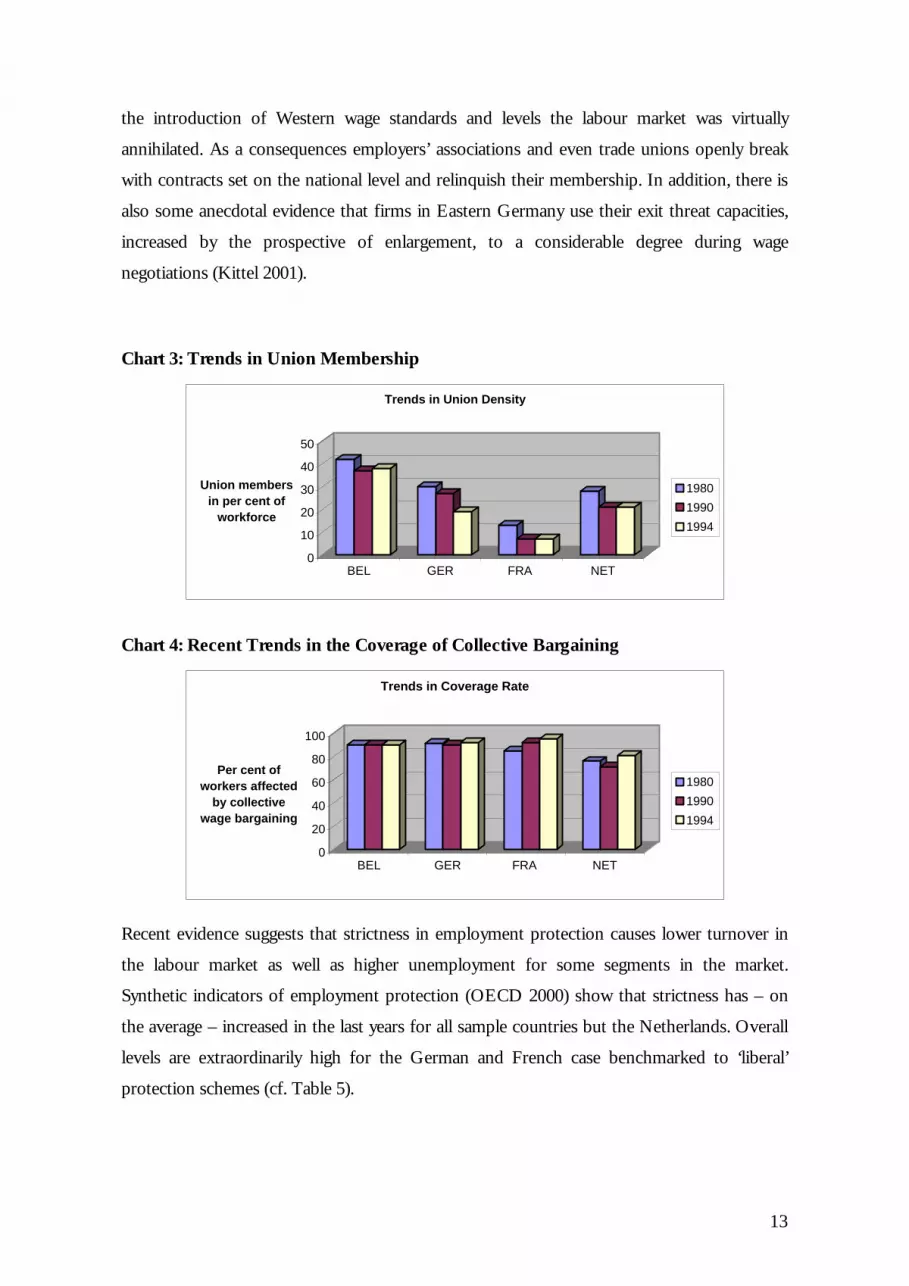
While the institutional features still show some inertia, changes in the organisation of unions
are plainly visible. Union density (Chart 3) shrunk in Germany and France by half, whereas
the decline was smoother in Belgium and the Netherlands. Some trade unions reacted to this
trend with increasing concentration. The recent merger of major German service unions into
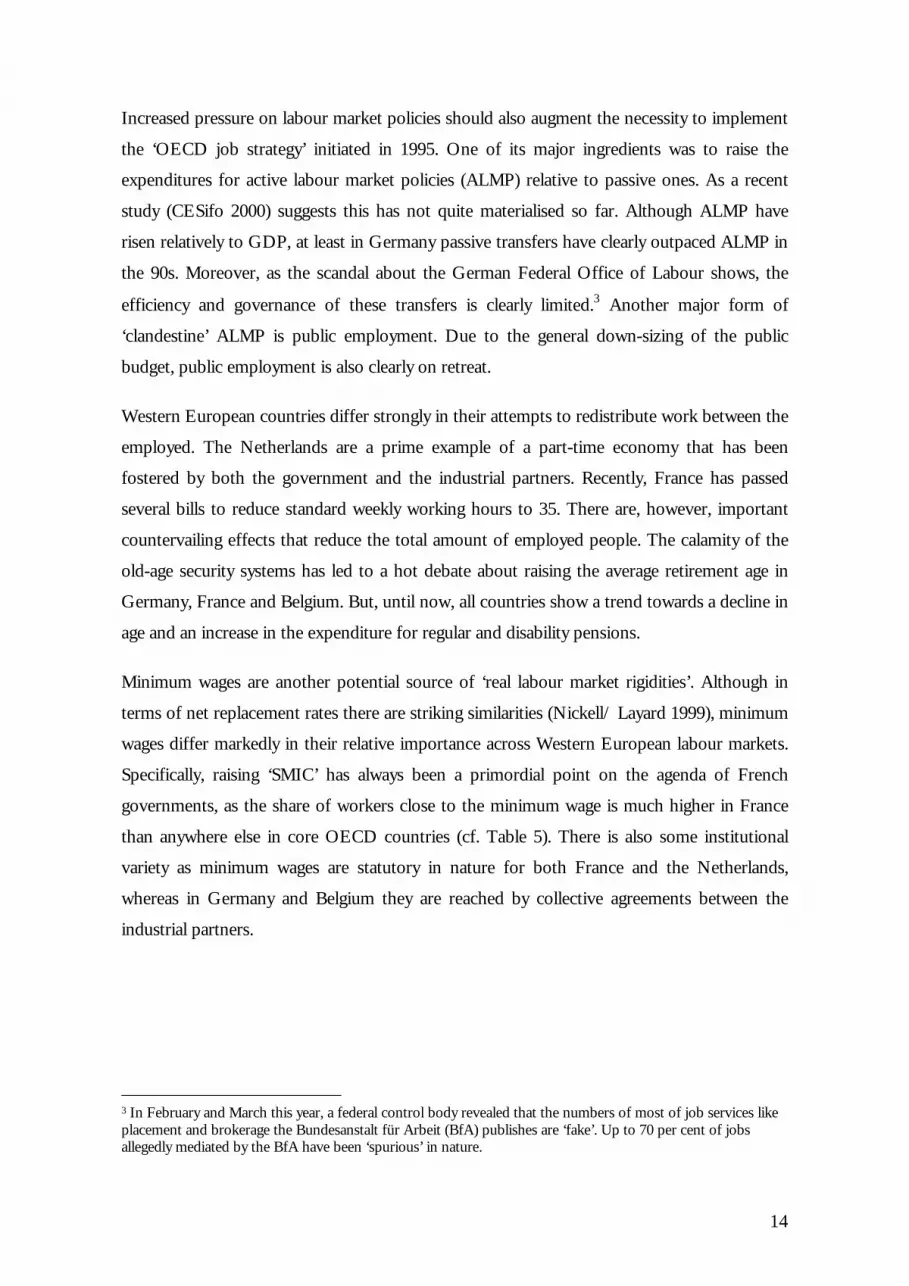
the world’s largest union, VERDI, is a case in point. Interestingly, the coverage rate of wage
contracts increased in all countries (Chart 4), implying that the number of employees affected
by wage negotiation has not diminished till the mid-90s. There is, however, increasing
regional and sectoral variety. The prime example is Eastern Germany (cf. Sinn 1999). After 2 Besides, this also implies that the idea of Calmfors and Driffils (1988) hardly fits the Western European case: although all countries show intermediate bargaining levels, the unemployment performance is very diverse.
13
the introduction of Western wage standards and levels the labour market was virtually
annihilated. As a consequences employers’ associations and even trade unions openly break
with contracts set on the national level and relinquish their membership. In addition, there is
also some anecdotal evidence that firms in Eastern Germany use their exit threat capacities,
increased by the prospective of enlargement, to a considerable degree during wage
negotiations (Kittel 2001).
Chart 3: Trends in Union Membership
0
10
20
30
40
50
Union members in per cent of
workforce
BEL GER FRA NET
Trends in Union Density
1980
1990
1994
Chart 4: Recent Trends in the Coverage of Collective Bargaining
0
20
40
60
80
100
Per cent of workers affected
by collective wage bargaining
BEL GER FRA NET
Trends in Coverage Rate
1980
1990
1994
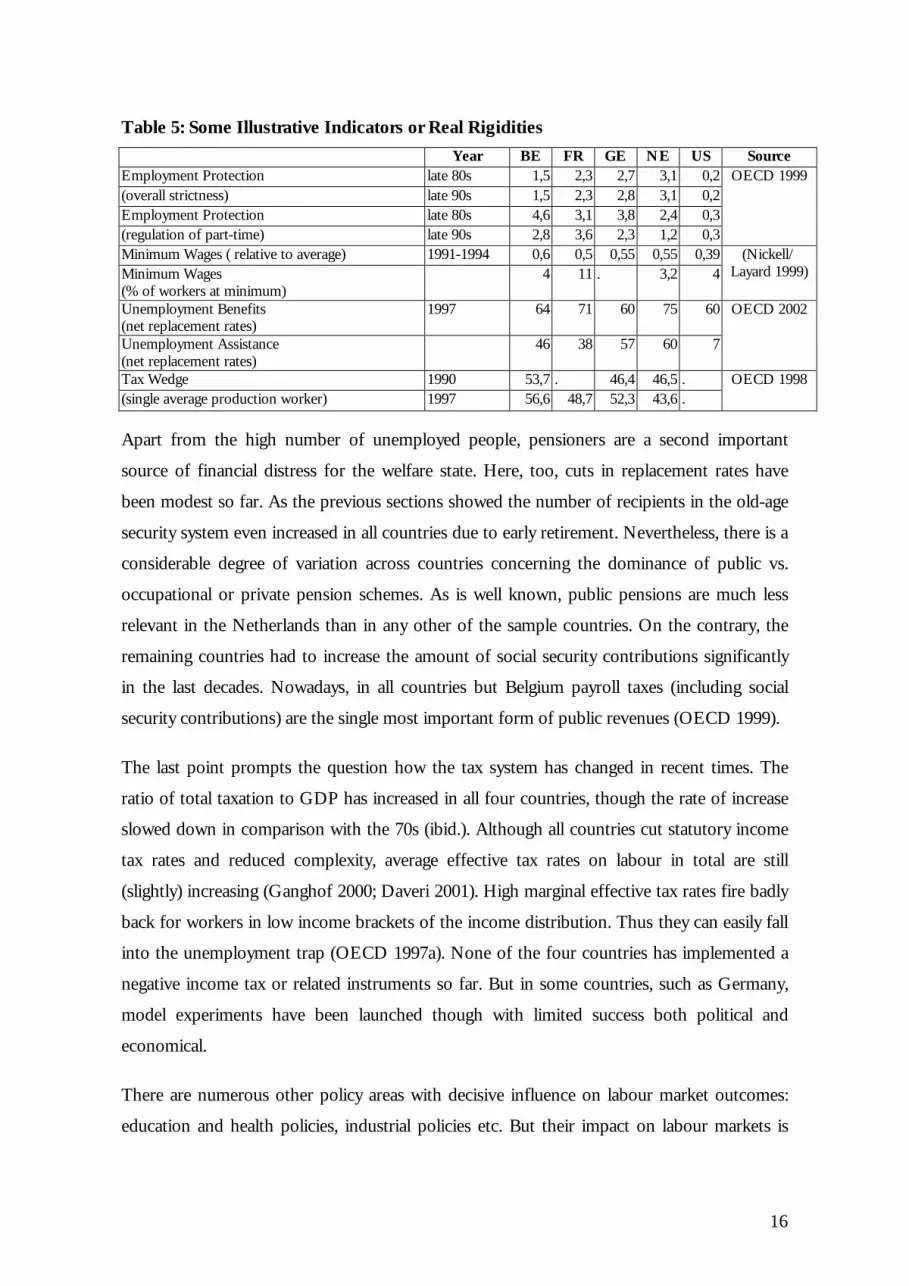
Recent evidence suggests that strictness in employment protection causes lower turnover in
the labour market as well as higher unemployment for some segments in the market.
Synthetic indicators of employment protection (OECD 2000) show that strictness has – on
the average – increased in the last years for all sample countries but the Netherlands. Overall
levels are extraordinarily high for the German and French case benchmarked to ‘liberal’
protection schemes (cf. Table 5).
14
Increased pressure on labour market policies should also augment the necessity to implement
the ‘OECD job strategy’ initiated in 1995. One of its major ingredients was to raise the
expenditures for active labour market policies (ALMP) relative to passive ones. As a recent
study (CESifo 2000) suggests this has not quite materialised so far. Although ALMP have
risen relatively to GDP, at least in Germany passive transfers have clearly outpaced ALMP in
the 90s. Moreover, as the scandal about the German Federal Office of Labour shows, the
efficiency and governance of these transfers is clearly limited.3 Another major form of
‘clandestine’ ALMP is public employment. Due to the general down-sizing of the public
budget, public employment is also clearly on retreat.
Western European countries differ strongly in their attempts to redistribute work between the
employed. The Netherlands are a prime example of a part-time economy that has been
fostered by both the government and the industrial partners. Recently, France has passed
several bills to reduce standard weekly working hours to 35. There are, however, important
countervailing effects that reduce the total amount of employed people. The calamity of the
old-age security systems has led to a hot debate about raising the average retirement age in
Germany, France and Belgium. But, until now, all countries show a trend towards a decline in
age and an increase in the expenditure for regular and disability pensions.
Minimum wages are another potential source of ‘real labour market rigidities’. Although in
terms of net replacement rates there are striking similarities (Nickell/ Layard 1999), minimum
wages differ markedly in their relative importance across Western European labour markets.
Specifically, raising ‘SMIC’ has always been a primordial point on the agenda of French
governments, as the share of workers close to the minimum wage is much higher in France
than anywhere else in core OECD countries (cf. Table 5). There is also some institutional
variety as minimum wages are statutory in nature for both France and the Netherlands,
whereas in Germany and Belgium they are reached by collective agreements between the
industrial partners.
3 In February and March this year, a federal control body revealed that the numbers of most of job services like placement and brokerage the Bundesanstalt für Arbeit (BfA) publishes are ‘fake’. Up to 70 per cent of jobs allegedly mediated by the BfA have been ‘spurious’ in nature.

15
5 The Social Security System, Taxes and Migration Policies
Eastward enlargement, so the argument goes, increases the pressure on ‘excessively’
benevolent welfare states by the mechanisms of ‘locational competition’ for physical capital
(‘Standortwettbewerb’), trade and migration, as well as the erosion of tax systems and
‘tourism’ for social transfers (e.g. Burda 2001; Sinn 2000). While this question is open for
speculation in future, it is interesting to scrutinize the recent past: Is there evidence for
significant changes in major components of the social transfer system?
One of the focus points in the debate about real rigidities is the lack incentives for labour
supply. In Western Europe social benefits are considered to be too high for many people to
take up work. Table 5 shows replacement rates for unemployment benefits (usually with
limited duration) and unemployment assistance (usually unlimited). Since some countries such
as the Netherlands tax these benefits only net-of-tax ratios are shown. In 1997 unemployment
assistance of the sample countries are significantly higher than in the US. This fact is closely
related to the duration of these transfers which is much longer than in the US and, so far,
there has been few changes. The picture for other forms of social transfers such as social
assistance is very similar (OECD 1997). Hence, there is some variation between countries in
terms of duration, whereas replacement levels were all in all in the same range and
significantly higher than in the UK or US. But there is no evidence that there have been
sizeable retrenchments so far. The OECD (1997), for example, shows that neither the benefit
levels nor the duration has declined. There are, however, some qualitative changes that have
arguably changed the responsiveness of labour supply predominantly in the Netherlands. The
Dutch system makes increasingly use of conditionalising social benefits to active job search
and take-up behaviour. In other words, social transfers are more and more granted on the
basis of a however precariously defined willingness to work.4
4 Two catch-words have been used in this context. The concomitance of high replacement levels with low levels of job protection has been dubbed ‘flexicurity’. The increasing activation of people receiving benefits is known as ‘workfare’.
16
Table 5: Some Illustrative Indicators or Real Rigidities
Year BE FR GE NE US Source Employment Protection late 80s 1,5 2,3 2,7 3,1 0,2 (overall strictness) late 90s 1,5 2,3 2,8 3,1 0,2 Employment Protection late 80s 4,6 3,1 3,8 2,4 0,3 (regulation of part-time) late 90s 2,8 3,6 2,3 1,2 0,3
OECD 1999
Minimum Wages ( relative to average) 1991-1994 0,6 0,5 0,55 0,55 0,39 Minimum Wages (% of workers at minimum)
4 11 . 3,2 4 (Nickell/
Layard 1999)
Unemployment Benefits (net replacement rates)
1997 64 71 60 75 60
Unemployment Assistance (net replacement rates)
46 38 57 60 7
OECD 2002
Tax Wedge 1990 53,7 . 46,4 46,5 . (single average production worker) 1997 56,6 48,7 52,3 43,6 .
OECD 1998
Apart from the high number of unemployed people, pensioners are a second important
source of financial distress for the welfare state. Here, too, cuts in replacement rates have
been modest so far. As the previous sections showed the number of recipients in the old-age
security system even increased in all countries due to early retirement. Nevertheless, there is a
considerable degree of variation across countries concerning the dominance of public vs.
occupational or private pension schemes. As is well known, public pensions are much less
relevant in the Netherlands than in any other of the sample countries. On the contrary, the
remaining countries had to increase the amount of social security contributions significantly
in the last decades. Nowadays, in all countries but Belgium payroll taxes (including social
security contributions) are the single most important form of public revenues (OECD 1999).
The last point prompts the question how the tax system has changed in recent times. The
ratio of total taxation to GDP has increased in all four countries, though the rate of increase
slowed down in comparison with the 70s (ibid.). Although all countries cut statutory income
tax rates and reduced complexity, average effective tax rates on labour in total are still
(slightly) increasing (Ganghof 2000; Daveri 2001). High marginal effective tax rates fire badly
back for workers in low income brackets of the income distribution. Thus they can easily fall
into the unemployment trap (OECD 1997a). None of the four countries has implemented a
negative income tax or related instruments so far. But in some countries, such as Germany,
model experiments have been launched though with limited success both political and
economical.
There are numerous other policy areas with decisive influence on labour market outcomes:
education and health policies, industrial policies etc. But their impact on labour markets is
17
commonly considered to be ambivalent in terms of efficiency. This has led us to exclude
these topics. Nevertheless, one issue merits a brief discussion as it is closely related to
geographical mobility: immigration law. In recent times, Germany has seen a couple of
controversial debates about which immigrants may come and how many of them will do so.
Last year, the government pushed through a German equivalent to the US Green Card. This
allows IT-experts to receive a work permit in Germany. The bill was passed only after a hefty
controversy about the allegedly harming effects for the labour market. A similar issue is in
vogue these days, as government and opposition are rowing about the question whether to
facilitate general immigration to Germany or not. It seems to be more a than a mere
coincidence that other countries share similar problems5 and that these issues have come to
the fore at a time when the EU negotiated the freedom of settlements between current and
future member countries.
Conclusion
The aim of this paper has been to speculate about the past and future impacts the
enlargement has on Western European labour markets. Whereas the adoption of EU
standards is sometimes believed to be a hazardous game for accession candidates (Burda
1999; Sinn 2000), many observers assert that the enlargement will be a ‘bargain’ for the West
(Baldwin et al. 1997). The overall impact on Western labour markets seems to be quite small
– apart from the regions close to Eastern Europe: Eastern Germany and Austria – and
increasing pressure on real rigidities may exert a ‘healthy’ influence on wage bargaining
mechanisms and social systems.
Indeed, there is some evidence that labour markets have become slightly more flexible in
Western Europe. Obviously, the enlargement has played a role in these trends, but it would
be a Sissiphussian task to determine the size of its impact. To a limited extent, regional
mobility will and has increased in Western Europe. Most of the migrants from the CEECs
could be absorbed without raising overall unemployment. Nominal wages have become more
flexible relative to prices, GDP growth and across countries.
It seems less clear, however, why this is the case. Most of the institutional features that are
commonly assumed to be sources of real rigidities have remained remarkably stable.
5 Immigration has become more severely restricted in all four countries.
18
Moreover, political attempts to reduce them have been moderate at best. This prompts the
question where the ‘institutional inertia’ comes from. If there is some revealed preference
logic at work in the political process of enlargement, the electorate does not tolerate massive
changes in these institutions so far. Hence governments seem to be cautious not to cut the
leash of the second ‘Trojan Horse’ after the Euro, enlargement that is, immediately. Most
likely they do so, because they fear a political backlash from precipitous reforms. In a
nutshell, it is the social dimension of the enlargement that seems to lack in a macroeconomic
account of Western European labour markets.
Finally, an important topic deals with further research of Ezoneplus. How could we go on
from here? A potential avenue for both academic and disseminative purposes would be to
think about synthetic measures operationalising the degree to which labour markets have
already been transformed. Of course, there are already related instruments available such as
those from the OECD jobs strategy or the reform monitor of the Bertelsmann Foundation.
But an indicator developed by Ezoneplus could and should be different in as much as it
focusses on the reshaping of labour markets in an enlarging Europe. Hence both accession
and member countries should be included. This could allow us to disentangle changes in
markets, institutions and policies and their potential impact on performance of Ezoneplus
labour markets.

19
References
Baldwin, R.E. 1994. Towards an Integrated Europe. London.
Baldwin, R.E.; J.F. Francois, and R. Portes. 1997 “The Costs and Benefits of Eastern Enlargement: The Impact on the EU and Central Europe” Economic Policy, 24April. pp. 125-176.
Boeri, T. and H. Brücker. 2000. “The impact of Eastern Enlargement on Employment And Labour Markets in the EU Member States”, European Integration Consortium: Berlin and Milano.
Bolle, M. and M. Neugart. 2000. “Will the Euro Shape European Economies?” Conference on the Effectiveness of the Economic Policy of the Republic of Estonia and the EU. University of Tartu.
Burda, M. 1999.“Mehr Arbeitslose - Der Preis für die Osterweiterung? Zur Auswirkung der EU-Erweiterung auf die europäischen Arbeitsmärkte im Osten und Westen“, in Schriftenreihe zur Jahrestagung des VfS, V.f. Socialpolitik, Editor. Duncker&Humblodt: Berlin. pp. 79-101.
Burda, M. 2001. “European Labour Markets and the Euro: How Much Flexibility Do We Really Need?” ENEPRI Working Paper, No. 3, March.
Calmfors, L. and J. Driffill. 1988. “Bargaining Structure, Corporatism and Macroeconomic Performance” Economic Policy, 6: pp. 13-61.
CESifo. 2000. “Active Labour Market Policies Running into Trouble”. CESifo Forum, 3/2000: pp. 33-32.
Daveri, F. 2001. “Labor Taxes and Unemployment: A Survey of the Aggregate Evidence”, 2nd Annual CERP Conference on Pension Policy Harmonization in an Integrating Europe. Moncalieri, Turin.
Dell'mour, R.e.a. 2000. “Outsourcing of Austrian Manufacturing to Eastern Countries” in Eastern Enlargement: The Sooner, the Better? S. Arndt, ed. Vienna. pp. 249-295.
DIW. 2000. DIW Wochenbericht 21/2000.
EU. “DG for Employment and Social Affairs, Employment in Europe 2001. Recent Trends and Prospects” Manuscript completed in July 2001.
Ganghof, S. 2000. “Adjusting National Tax Policy to Economic Internationalization. Strategies and Outcomes” in Welfare and Work in the Open Economy. F.W. Scharpf and V.A. Schmidt, eds. Oxford: Oxford University Press. pp. 597-645.
Hall, P.A. 2001. “Organized Market Economies and Unemployment in Europe: Is it finally Time to accept Liberal Orthodoxy?” in Unemployment in the New Europe. N. Bermeo, ed. Cambridge. pp. 52-86.
Hönekopp, E. 1997. “Labour Migration to Germany from Central and Eastern Europe - Old and New Trends” IAB Labour Market Research Topics, Nr. 23.

20
Kittel, B. 2001. “EU Enlargement and the European Social Model: Trends, Challenges, and Questions. Keynote Lecture 3” in The European Enlargement Process: Between 'Western Acculturation' and Regional Differences. Vienna.
Kittel, B. 2001a. “How Bargaining Mediates Wage Determination: An Exploration in a Pooled Time-Series Cross-Section Framework” MPIfGF Discussion Paper,. 01/3.
Krugman, P. and M. Obstfeld. 1988. International Economics. London.
Kunze, C. 2000. “Die Osterweiterung der Europäischen Union und ihre möglichen Folgen für den deutschen Arbeitsmarkt“ Transformation Nr. 9: pp. 115-135.
Nickell, S. 1997. “Unemployment and Labor Market Rigidities: Europe versus North America” Perspectives 11: pp. 55-74.
Nickell, S. and R. Layard. 1999. “Labor Market Institutions and Economic Performance”, in Handbook of Labor Economics O. Ashenfelter and D. Card, eds. ?: ? pp. 3029-3083.
Nicoletti, G.e.a. 2001. “European Integration, Liberalization and Labor-Market Performance” in Welfare and Employment in a United Europe. G.e.a. Bertola, ed. Cambridge.
OECD. 1994. “The OECD Jobs Study: Evidence And Explanations, Part II: The Adjustment Potential of the Labour Market” Paris.
OECD. 1997a. “Making Work Pay: Taxation, Benefits, Employment and Unemployment”, Paris: OECD Publications.
OECD. 1997. “Economic Performance and the Structure of Collective Bargaining. Employment Outlook 1997” pp. 63-92.
OECD. 1999. “Employment Protection and Labour Market Performance. OECD Employment Outlook, 1999.” pp. 50-59.
OECD. 1999a. “Tax Revenue Trends, 1965 - 1998. Revenue Statistics 1965 – 1998” pp. 17 -39.
OECD. 1999b. “OECD Employment Outlook” Paris.
OECD. 2000. “OECD Employment Outlook” Paris: OECD.
OECD 2002. “Database - Labour Market Statistics” OECD.
OECD. 2002. “About Benefit Systems and Work Incentives. A Selection of Net Replacement Rates” http://www.oecd.org/pdf/M00009000/M00009888.pdf Date of Access 29/03/02.
Puhani, Paul. March 1999. “Labour Mobility – an Adjustment Mechanism in Euroland? Empirical Evidence for Western Germany, France, and Italy” IZA Discussion Paper No. 34.
Schömann, K., T. Kruppe, and H. Oschmiansky. 1998. . “Beschäftigungsdynamik und Arbeitslosigkeit in der Europäischen Union“ WZB Discussion Papers, FS I 98-203.

21
Siebert, S.W. 2001. „Can Corporatism Partially Offset the Effects of Rigidities?” in Beschäftigungspolitik in Europa, D.F. Milleker, ed. Frankfurt. pp. 53-64.
Sinn, H.-W. 1999. „EU Enlargement, Migration, and Lessons from German Unification” CESifo Working Paper Series, No. 182.
Sinn, H.-W. 2000. “EU Enlargement and the Future of the Welfare State” CESifo Working Paper, 307.
Sinn, H.-W.e. 2000. “ifo Beiträge zur Wirtschaftsforschung: EU-Erweiterung und Arbeitskräftemigration“, Institut für Wirtschaftsforschung: Munich.
Teutling, C.a.J.H. 1998. Corporatism or Competition. Cambridge.
Van Poeck A., Borghijs A. 2001. “EMU and Labour Market Reform: Needs, Incentives and Realisations” Research paper / Faculty of Applied Economics UFSIA-RUCA ; 2001:22, Antwerpen.
Wallerstein, M., M. Golden, and P. Lange. 1997. “Unions, Employers' Associations, and Wage-Setting Institutions in Northern and Central Europe, 1950-1992.” Ind Labor Relat Rev, 50:3 pp. 379-401.
Faculty of Economics and Business Administration
University of Tartu
LABOUR MARKET FLEXIBILITY AND MIGRATION IN THE EU EASTWARD ENLARGEMENT CONTEXT: THE CASE OF THE BALTIC STATES
By
Tiiu Paas
Raul Eamets
Marit Rõõm
Rena Selliov
Anne Jürgenson
Jaan Masso
Tartu
2002

Table of Contents 1. Introduction ................................................................................................................ 22
2. The main changes in the Baltic States’ labour markets.............................................. 24
3. The concept of labour market flexibility .................................................................... 27
4. Institutional flexibility ................................................................................................ 30
4.1. Labour market regulation ................................................................................... 30 4.2. The role of trade unions...................................................................................... 33 4.3. Labour market policy ......................................................................................... 36
5. Wage flexibility .......................................................................................................... 38
6. International labour migration.................................................................................... 41
Conclusions ........................................................................................................................ 45
References .......................................................................................................................... 46
1. Introduction
The Eastern enlargement of the European Union and the requirements of the European
Monetary Union (EMU) increase pressure for a flexibility of labour markets in both the
current EU members (EU15) and candidate countries (CC)1. In order to follow the
requirements of optimal currency area (OCA) the growth of labour market flexibility is
unavoidable. If labour markets and institutions do not become more flexible, the growth of
market disequilibrium is highly probable in both groups of countries.
The EU candidate countries have to combine transition processes with the requirements of
the accession. Labour markets of the candidate countries deserve special attention because of
their flexibility may be needed to offset asymmetric shocks, especially when other means such
as monetary and fiscal policies are constrained. If labour markets of the accession countries
fail to adapt to the challenges of monetary union, the convergence process will be hindered.
This, in turn, may result in high unemployment and growth of labour migration. Social
conflicts are possible in the accession countries as well the EU current member states.
The first round of EU eastward enlargement will take place earliest in 2003 or 2004. Of the
former Soviet republics only the Baltic States are EU accession candidates. The Baltic States’
favourable location between East and West, historical and cultural traditions of cooperation
with the countries around the Baltic Sea, and market economy experience of the period
1 Candidate countries (CC10) are Hungary; the Czech Republic, Slovenia, Poland, Slovakia Estonia, Latvia, Lithuania, Romania and Bulgaria.
22
between the two world wars are important initial conditions for transition. After regaining
their independence in 1991, the Baltic States’ have followed almost similar principles of
economic policy that were directed to solving the following main tasks: 1) liberalization of
prices and gradual elimination of all state subsidies; 2) privatization of state owned
enterprises; 3) introducing a separate currency by means of a currency board system (Estonia
and Lithuania) or regular pegs (Latvia); 4) maintaining conservative fiscal policy; 5)
implementing a comparatively liberal foreign trade regime.
The Baltic States are providing an interesting case for generalizing transition and EU eastward
enlargement processes and developing a new field of economics – economics of transition
and integration. However the real influence of the Baltic economies on the EU eastward
enlargement processes can not be significant due to very small size of the Baltic markets
comparing to the markets of the EU current member states as well as the candidate countries.
The share of the Baltic States’ population is only 2% of the EU15 and 7.4% of CC10
population. The GDP of the Baltic States is forming about 0.3% of the EU15 and 6.3% of
the CC10 total GDP (Straubhaar, 2001, p. 170).
The aim of the paper is to give an overview of the main changes in the Baltic States’ labour
market over the period (1990 – 2001) giving emphasis on the problems of labour market
flexibility in the EU eastward enlargement context. The first section reviews the main changes
in the Baltic States’ labour markets. The next three sections analyse labour market flexibility
issues paying attention to the macro level of this concept. Flexibility of labour market on the
macro level can be divided into wage flexibility and institutional flexibility. Wage flexibility
denotes how responsive wages are to market fluctuations. The institutional flexibility
characterizes to what extent state institutions and trade unions are involved in the regulation
of the labour market. These different aspects of labour market flexibility are interrelated. If
institutional involvement is high, decrease of labour market flexibility could be the
consequence. In case of trade unions weakness, wage flexibility is usually high.
Labour migration problems are discussed in the section five giving emphasis on pull and push
factors of migration and on analysis of labour migration experience during the previous stages
of EU enlargement. In the case of the Baltic States labour movement is mostly expected
within the Baltic Sea region that has become one of the most competitive economic regions
in Europe due to its favourable location between East and West and the dynamic
23
interdependence between transition and integration. The possibilities for cross-border
movement of the Baltic States’ labour force are also discussed in this part of the paper.
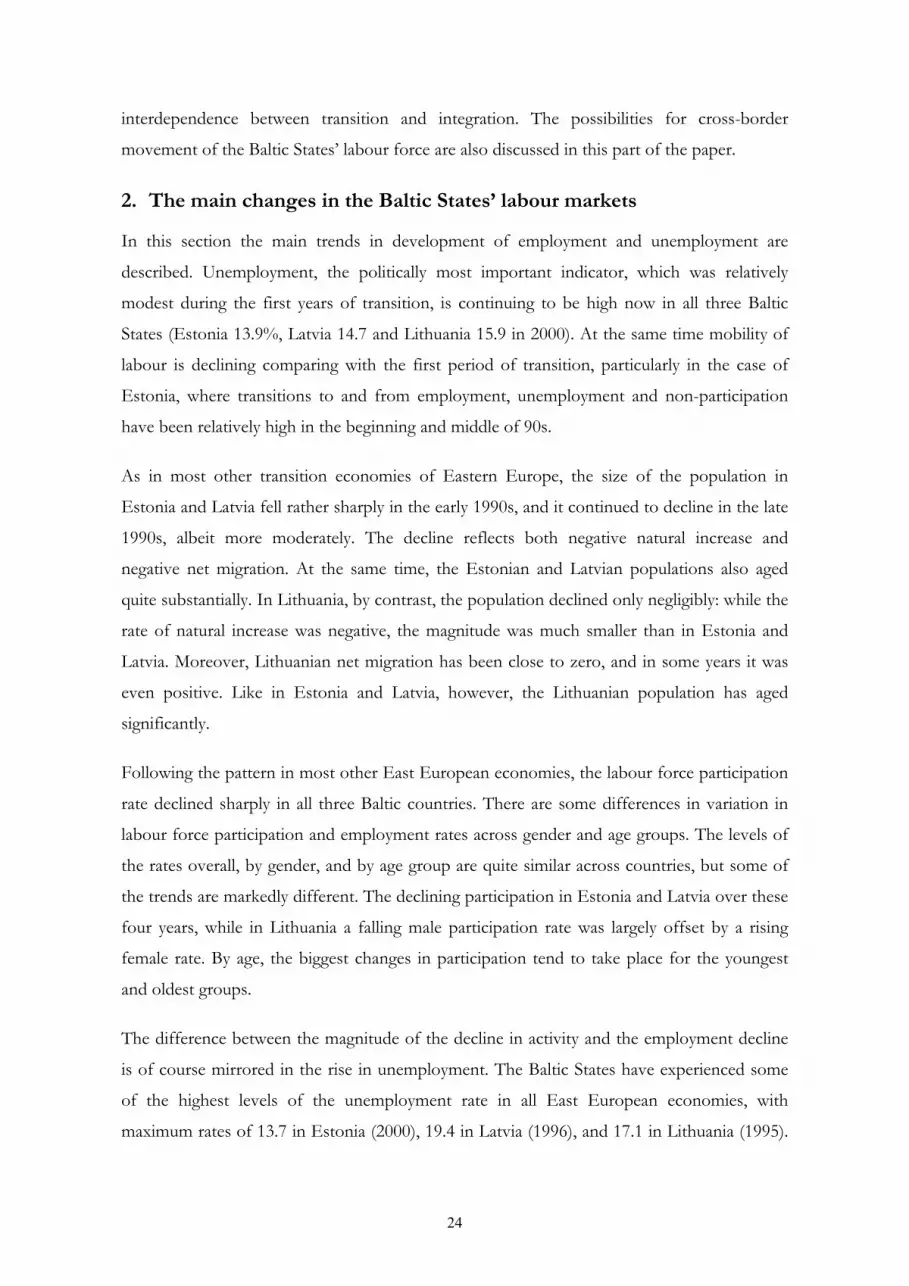
2. The main changes in the Baltic States’ labour markets
In this section the main trends in development of employment and unemployment are
described. Unemployment, the politically most important indicator, which was relatively
modest during the first years of transition, is continuing to be high now in all three Baltic
States (Estonia 13.9%, Latvia 14.7 and Lithuania 15.9 in 2000). At the same time mobility of
labour is declining comparing with the first period of transition, particularly in the case of
Estonia, where transitions to and from employment, unemployment and non-participation
have been relatively high in the beginning and middle of 90s.
As in most other transition economies of Eastern Europe, the size of the population in
Estonia and Latvia fell rather sharply in the early 1990s, and it continued to decline in the late
1990s, albeit more moderately. The decline reflects both negative natural increase and
negative net migration. At the same time, the Estonian and Latvian populations also aged
quite substantially. In Lithuania, by contrast, the population declined only negligibly: while the
rate of natural increase was negative, the magnitude was much smaller than in Estonia and
Latvia. Moreover, Lithuanian net migration has been close to zero, and in some years it was
even positive. Like in Estonia and Latvia, however, the Lithuanian population has aged
significantly.
Following the pattern in most other East European economies, the labour force participation
rate declined sharply in all three Baltic countries. There are some differences in variation in
labour force participation and employment rates across gender and age groups. The levels of
the rates overall, by gender, and by age group are quite similar across countries, but some of
the trends are markedly different. The declining participation in Estonia and Latvia over these
four years, while in Lithuania a falling male participation rate was largely offset by a rising
female rate. By age, the biggest changes in participation tend to take place for the youngest
and oldest groups.
The difference between the magnitude of the decline in activity and the employment decline
is of course mirrored in the rise in unemployment. The Baltic States have experienced some
of the highest levels of the unemployment rate in all East European economies, with
maximum rates of 13.7 in Estonia (2000), 19.4 in Latvia (1996), and 17.1 in Lithuania (1995).
24
After peaking in the mid-1990s, the unemployment rate fell back in all three countries, but
while the pattern in the late-1990s has been continually falling in Latvia, it has been U-shaped
in Estonia and Lithuania. The rise in the latter two countries was particularly steep in 1999
and 2000, perhaps due to side-effects of the Russian crisis. By 2000, the rates were roughly
equal in all three countries, in the 13-15 percent range.
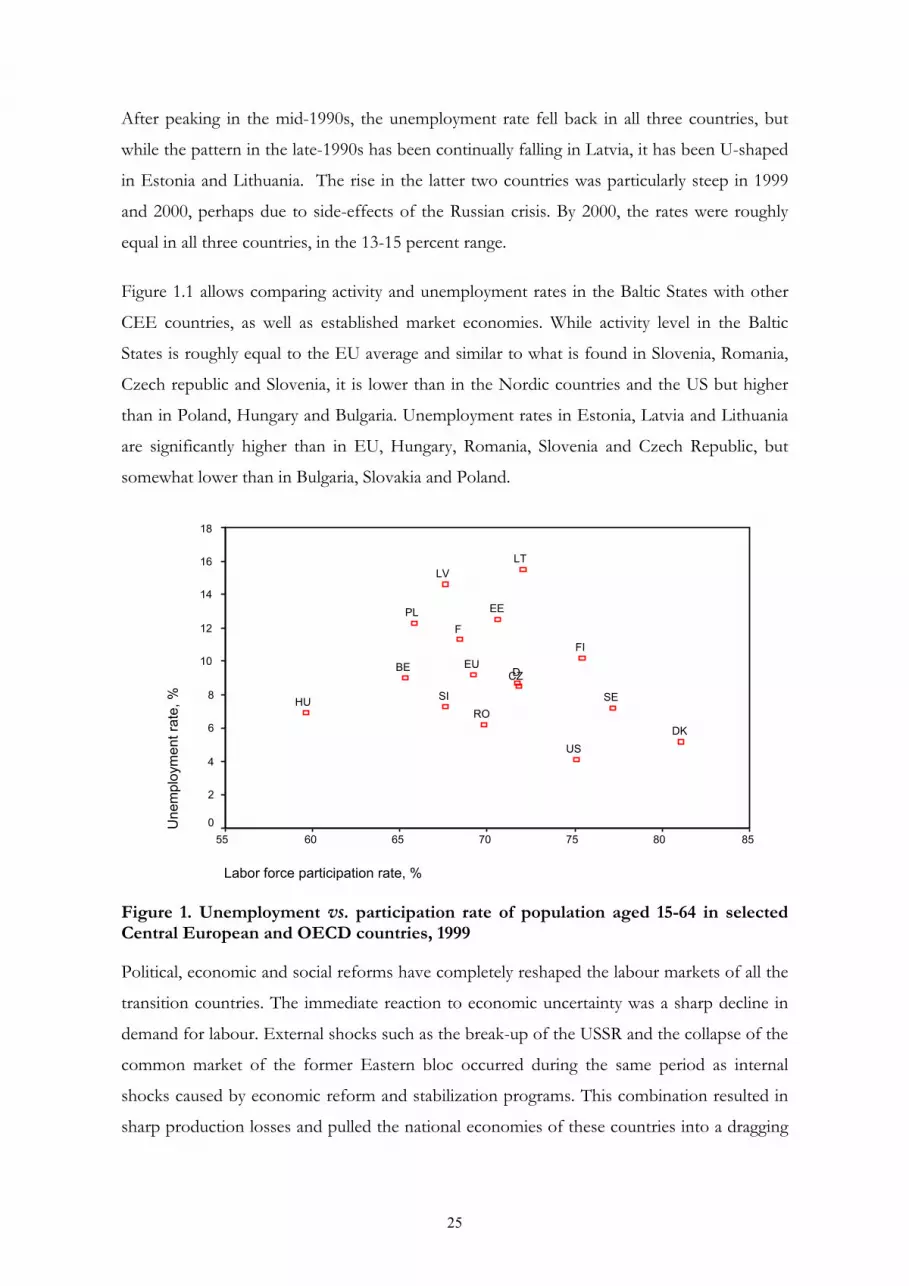
Figure 1.1 allows comparing activity and unemployment rates in the Baltic States with other
CEE countries, as well as established market economies. While activity level in the Baltic
States is roughly equal to the EU average and similar to what is found in Slovenia, Romania,
Czech republic and Slovenia, it is lower than in the Nordic countries and the US but higher
than in Poland, Hungary and Bulgaria. Unemployment rates in Estonia, Latvia and Lithuania
are significantly higher than in EU, Hungary, Romania, Slovenia and Czech Republic, but
somewhat lower than in Bulgaria, Slovakia and Poland.
Labor force participation rate, %
85807570656055
Une
mpl
oym
ent r
ate,
%
18
16
14
12
10
8
6
4
2
0
SIRO
HU
PL
CZBE
US
F
D
FI
SE
DK
EU
LTLV
EE
Figure 1. Unemployment vs. participation rate of population aged 15-64 in selected Central European and OECD countries, 1999
Political, economic and social reforms have completely reshaped the labour markets of all the
transition countries. The immediate reaction to economic uncertainty was a sharp decline in
demand for labour. External shocks such as the break-up of the USSR and the collapse of the
common market of the former Eastern bloc occurred during the same period as internal
shocks caused by economic reform and stabilization programs. This combination resulted in
sharp production losses and pulled the national economies of these countries into a dragging
25
transition crisis. There was a certain delay before the effects on employment were felt, as
enterprises were at first reluctant to dismiss redundant workers, assuming that the economic
recession would be a short-term crisis.
The transition process brought fundamental changes to the composition of employment by
sectors and by branches. If we analyze all CEE countries the serious employment losses were
experienced by the industrial sector (Latvia, Romania and Lithuania) and in most countries in
agriculture. Most dramatic decline of agricultural employment took place in Estonia where
total employment dropped from 140 thousand (1989) to nearly 30 thousand (2001).
Agricultural employment declined in other countries as well, except Romania and Lithuania.
This is rather interesting phenomenon, because both countries are characterized by
agriculture with small and medium-sized private farmers. One explanation for Lithuanian
increasing agriculture sector might be high state subsidies and high tariffs to food import.
Another reason for the increasing (or stable) employment in the agricultural sector in
Lithuania was the fact that during the privatization process the land was distributed free of
charge to those who were employed in the agriculture at that time, so that the people chose to
stay in land and work in agriculture rather than be unemployed.
The share of employment in service sector is largest in Hungary, next are Estonia and Latvia.
Also we see “industrialized” countries, like Czech Republic, Slovakia and Slovenia in our
sample, where around 40 % of people are employed in industry. Finally we have
“agricultural” countries like Romania, but also Bulgaria, Lithuania and Poland. If to look the
dynamics of shares of different sectors and analyse how this distribution was achieved, we see
that in agriculture we have clearly two groups of countries. One group represents countries
where employment share of those who work in agriculture is around 20 % or higher and
other group where the same share is 10 % or less. The low employment in agriculture in
developed countries is based on high effectiveness, while in most of CEE countries we are
simply dealing with decreases in production. We should also keep in mind that we are dealing
here the overall decollectivization of agriculture and the re-establishment of small and
medium-sized private farmers. The only exception was Poland where agriculture was based
on small farms also before economic reforms.
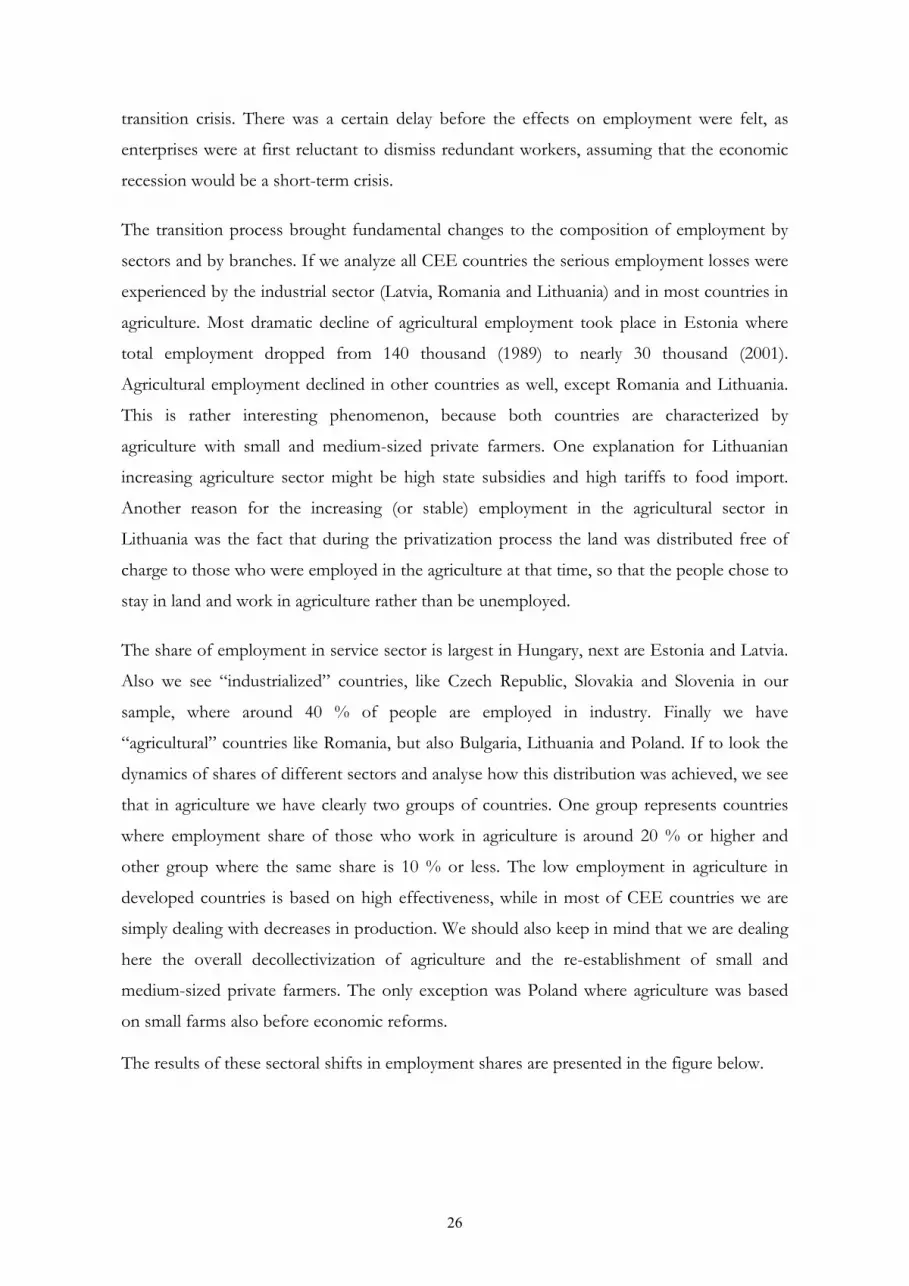
The results of these sectoral shifts in employment shares are presented in the figure below.
26
0
10
20
30
40
50
60
70R
oman
ia
Pola
nd
Slov
enia
Lith
uani
a
Cze
ch
Slov
akia
Bulg
aria
Latv
ia
Esto
nia
Hun
gary
AgricultureIndustryServices
Figure 2. Employment by three economic sectors in CEE countries, 2000
Notes: Agriculture (including Agriculture and hunting, Forestry, and Fishing), industry (Mining and quarrying, Manufacturing, Electricity, gas and water supply, Construction) and Services (all other activities). Employed aged 15-64 included.
The extent to which industry has been down-sized and services have grown is sometimes
taken as a measure of progress in transition towards a market economy, and the service sector
is well-developed in Latvia and Estonia, and slightly less so in Lithuania. Compared with
some other transition economies (e.g., Romania and Russia), industrial employment has
declined relatively little in the three Baltic States, especially in Estonia, where its share is still
above 30 percent. The service sector has grown most strongly in Estonia, where the share
increased from 43 to 59 percent.
3. The concept of labour market flexibility
The term labour market flexibility has been given many definitions. Wage and employment
flexibility are intuitive enough concepts. But there are also numerical versus functional
flexibility, internal versus external flexibility and, for the most exigent, the intensive and the
extensive margin of flexibility. Indeed, the term labour market flexibility has been given so
many definitions as to arouse the suspicion that one is grappling with a catchword devoid of
any theoretical rigor.
This is not entirely true. From the point of view of general equilibrium theory, perfect
flexibility may be thought of as a situation where all resources on a given market are allocated
in a Pareto efficient way (Hahn, 1998). But it could be also argued whether we treat this term
as characterizing state or process. It seems to be more appropriate to describe with the term
27

of flexibility the process. For instance, one market is more flexible if it moves towards Pareto
efficient resource allocation faster than the other. In principal it means that we use the
framework of neoclassical equilibrium model and any kind of intervention to labour market
will slow down adjustment speed. So, we can say that labour market flexibility shows
adjustment speed to the external shocks and changing macroeconomic conditions.
If we consider the tightness of the country’s employment protection legislation as a proxy for
labour market flexibility, we can see that Western European countries have relatively
inflexible labour markets (Bertola, 1990; Grubb, Wells, 1993). The group of experts with a
background in business, labour, and government formed by OECD identified six categories
of labour market flexibility and made recommendations for each (Flexibility in the labour…,
1996):
• labour costs: avoid mechanisms, whether institutional or automatic, that would lead to
wage increases greater than productivity increases;
• conditions of employment: strike a balance between workers' desire for job security
and the needs of economic efficiency;
• work practices and work patterns: modify the organization of work to enrich work
content and raise levels of skill and to provide increased flexibility in the arrangement
of working time;
• rules and regulations: apply rules and regulations in a reasonable manner and reassess
their direct and indirect impact at regular intervals;
• mobility: remove obstacles to mobility such as non-transferrable pension
arrangements and rigid housing markets;
• education and training: improve initial schooling, strengthen retraining programs, and
publicize the importance of lifetime learning for a flexible society.
28

WORKERS FLOWS Flows between labour
market states Occupational mobility Geographical mobility
JOB FLOWS
Job destruction Job creation
INSTITUTIONAL FLEXIBILITY
Labour legislation Labour policy Trade Unions
WAGE FLEXIBILITY
MICRO LEVEL MACRO LEVEL
LABOUR MARKET FLEXIBILITY
Figure 3 The concept of labour market flexibility.
We argue that labour market flexibility should be measured at two different levels: the macro
level and the micro level (see figure above). The former can be further divided into
institutional and wage flexibility. The institutional flexibility of labour market denotes to what
extent state institutions and trade unions are involved in the regulation of the labour market.
Wage flexibility denotes how responsive wages are to market fluctuations. Micro level
flexibility relates to labour market flow analyses. The labour market can be characterized by
various flows of transitions to and from employment, unemployment and non-participation,
as well as flows of job creation and job destruction. This paper concentrates on the macro
side of the labour market flexibility.
In practice different aspects of flexibility are interrelated, presumably in a hierarchical way. If
institutional involvement is very high, workers transition rates are likely to be low. If trade
unions are weak, then wages are more flexible. Thus, macro level flexibility can partly be
measured via indicators of micro level flexibility. While it is generally difficult to measure
quantitatively institutional involvement (although there are some indexes), it is much easier to
measure workers flows, job creation and job destruction.
Next we try to present an idea how these different flexibility interpretations are interrelated
and connected with general labour market behaviour. We do some simplifications. First, we
will concentrate on transition economies labour market; secondly, we assume that
restructuring and labour reallocation is dependent on labour market flexibility. More flexibility
29

means faster restructuring and reallocation2 Thirdly, we will draw our theoretical framework
from OST (Optimal speed of transformation) literature, first introduced by Aghion and
Blanchard (1994).
Aghion and Blanchard found that countries, which had a large initial shock and thus a large
increase in unemployment, are likely to restructure more slowly. From their model we can
conclude that gradualism in implementing reforms is the better policy choice. According to
them the transition was shaped by two main mechanisms: reallocation and restructuring.
Reallocation means the changes in employment structure, how labour is allocated between
sectors. Restructuring here means not only changes in the structure of ownership, but also
changes in the structure and the organization of their production. Firms must redefine their
product line, close some plants that are no longer needed and lay off workers in those plants.
Also they must replace most of their equipment and train/replace the managers.
Both reallocation and restructuring are dependent on labour market flexibility. Via labour
reallocation and restructuring economy reaches Pareto optimum resource allocation and this
enables efficient use of resources and higher productivity. Comparing two economies,
transition to higher productivity is faster in the economy with less rigid labour market. As far
as most of transition economies are concerned on the convergence and catch up strategies,
the issue of labour market flexibility becomes crucial for them. Secondly we believe, that
higher flexibility means lower unemployment, because matching process is more successful
and as result we have less long term unemployment than in rigid labour markets.
4. Institutional flexibility
4.1. Labour market regulation
This part of the paper reviews labour market legislation in Estonia, Latvia and Lithuania by its
effect on labour market flexibility, discussing issues like the regulation of dismissals,
regulation of work time and wages, the social protection of the unemployed. In general there
are five sources of legal regulation of labour relations in the jurisdictional systems of Baltic
States: 1) International conventions, 2) Constitution, 3) Laws 4) Decrees and regulations of
administrative authorities, 5) collective agreements. 2 This phenomenon characterises labour markets in transition economies. The dependence has also opposite direction, if market situation has stabilised, also institutional stability is achieved, then reallocation and restructuring will slow down and finally we can see fewer flows in labour market and less flexibility. In a way we can say that less flexibility shows that restructuring and reallocation (needed for transformation) will soon be over.
30

The regulation of employment relations mainly corresponds to international standards: the
most important ILO conventions are ratified and the legislation assures the protection of
employees’ rights in terms of work time, work remuneration, holidays, and termination of
contracts. There are several measures to protect employees in less favourable conditions like
old-aged employees, pregnant women and women with children, disabled persons etc.
The work relations are governed in all countries by employment contract (except people
working in civil service)3. On the one hand there are several similarities across Baltic States:
laws prohibit differential treatment, there exist upper limits for regular work time, overtime
and work during night-time, workers are granted regular vacations and other holidays,
termination of employment contracts is subject to restrictions like the obligation to give
advance notice, pay compensation etc. On the other hand, there are some differences in
regulation measures between the Baltic States. For instance, in Lithuania the legal regulation
has more adverse impact on labour market flexibility than in Latvia: higher minimum wage,
longer advance notice period and bigger compensations when employment contract is
terminated on the initiative of the employer.
The notification period varies in Latvia from 10 days (misconducts of employee) up to 1
month (lay-offs). In Lithuania the period is 2 month (4 month for minors, parents of children
etc.). In Estonia the notification period varies from 2 weeks (long-term incapacity for work)
to 4 month (lay-off of workers who have continuously worked for the employer more than
10 years). The compensation for the termination varies in Latvia from 1 to 4 month average
wage depending on the employee’s work experience with the present employer (according to
the Labour Code valid till 1 June 2002 the compensations was no less than 1 month average
pay and the notification period was 1 month4). In Lithuania the compensation varies from 1
to 12 average monthly wages depending on the reason of termination and the length of work
experience with the present employer. In Estonia the compensation for the termination varies
form 1 to 4-month average wage.
3 3 The Republic of Latvia Labour Law (comes into force 01.06.2002). Translation and Terminology Centre [http://www.ttc.lv/en/default-translations-lr.htm] Republic of Lithuania Law on the Employment Contract (12.06.2001). Seimas of the Republic of Lithuania. [http://www3.lrs.lt/c-bin/eng/preps2?Condition1=151151&Condition2=] Eesti Vabariigi Töölepingu seadus. (01.07.1992) [http://lex.andmevara.ee/estlex/kehtivad/AktDisplay.jsp?id=6668&akt_id=6668] 4 Republic of Latvia Labour Code (with amendments to 25 October 1994). Latvian National Labour legislation. International Labour Organization Central and Eastern European Team. [http://natlex.ilo.org/txt/E94LVA01.htm]
31

In order to generalize the information concerning legal regulation of employment relations
and to compare how strict is the regulation of labour relations across Baltic States and
European countries summary indicators were calculated according to the methodology of
Nicoletti et al. (2000). The value of index depends on the procedural inconveniences, notice
period and severance pay, penalties on unfair dismissals, regulation of the usage of probation
period. The index measuring the legal restrictions for individual dismissals shows that in
Latvia the dismissals are less regulated than in Estonia and Lithuania. The value of index for
the Baltic States is higher than the average of the European Union. On the other hand the
usage of fixed term contracts is less restricted in the Baltic States and in Lithuania their usage
is less restricted than in Latvia and Estonia.
Table 1 The index measuring the restrictions of dismissals for regular contracts and the usage of fixed term contracts
Country
Index
Latvia Lithuania Estonia
Average of the Baltic’s
Average of EU (1998)c
Germany United Kingdom
France Italy
Regular contracts 2.76 3.21 3.31 3.09 2.4 3.0 0.1 2.5 3.0 Fixed term contracts 2.29 1.85 2.13 2.09 2.3 2.5 0.3 3.7 3.6 Averageb 2.52 2.53 2.72 2.59 2.4 2.8 0.2 3.1 3.3
In the Baltic countries the status of civil servants is regulated by separate laws and
employment contracts shall not be concluded with civil servants5. So civil servants have some
advantages, but are also subject to additional duties. The positions of the civil servants are
grouped into categories and civil servants are given grades (Lithuania, Estonia) or
qualification categories (Latvia). There are several restrictions for who can be on the civil
service position. These restrictions are similar across the countries and concern citizenship,
possession of the official language, education and age.
Civil servants are paid wages for the grade of the servant and for the qualification category
and level of position. They are granted annual leave and other vacations and leaves. Civil
servants receive special benefits in case of death and work accident; have rights on training c See Nicoletti 2000 (pp. 87). The average of the European Union is the simple average of 14 member countries. b The average is here a simple average of the indexes for regular contracts and fixed term contracts. 5 5 The Republic of Latvia State Civil Service Law (01.01.2001) Translation and Terminology Centre [http://www.ttc.lv/en/default-translations-lr.htm] The Republic of Lithuania Law on Public Service (08.06. 1999). [http://www3.lrs.lt/c-bin/eng/preps2?Condition1=94580&Condition2=] Avaliku teenistuse seadus (01.01.1996).[ http://lex.andmevara.ee/estlex/kehtivad/AktDisplay.jsp?id=13738&akt_id=13738]
32

and improvement of professional qualification financed from the state, municipal etc.
budgets. For public servants there are special restrictions and duties, that limit the possibilities
to work elsewhere, membership in political parties (Estonia), responsibility for lawfulness of
ones’ actions or failure to act (Latvia) etc.
As the last issue the legal regulation of the unemployed needs to be discussed. In all three
Baltic Sates the status of the unemployed people is legally regulated and they are subject to
several rights6. But there are certain conditions that need to be fulfilled before acquiring the
status of the unemployed (registration at the state employment agency, presence of
employment record in Estonia etc.). After acquiring the status they are entitled to the receipt
of unemployment benefits, the vocational training (in Lithuania and Estonia with training
allowance), right to participate in paid public works, free labour exchange services in looking
for job. In Lithuania the unemployed people enjoy higher unemployment benefits and the
conditions for getting these are less stringent than in Latvia and Estonia. In Latvia these are
determined according to the length of service and of unemployment. In Lithuania
unemployment benefit is calculated from formula that considers along with state supported
income and minimum livings standard also the length of the individuals insurance. In Estonia
state unemployment benefit is fixed – 400 EEK per month but in addition the
unemployment insurance was introduced in 2001. According to that both employer and
employee make contributions to the fund; the payment period of benefit depends on
insurance tenure and the size of insurance payment depends on previous average salary. For
instance, if national average before tax salary is 5500 EEK, then maximum unemployment
benefit will be 50%⋅(3⋅5500)=8250 EEK. So the replacement rates are expected to increase.
4.2. The role of trade unions The role of trade unions in Central and East European countries (CEE) is discussed in this
part. The aim is to give the overview of trade unions in CEE countries concentrating
especially on trade union developments in the Baltic States. The union membership, collective
bargaining levels and coverage of collective agreements is discussed.
6 6 Republic of Lithuania Law on Support of the Unemployed (15.01.1998) Seimas of the Republic of Lithuania. [http://www3.lrs.lt/c-bin/eng/preps2?Condition1=56458&Condition2=] Republic of Lithuania Law on Vocational Education and Training (07.07.1999). Seimas of the Republic of Lithuania. [http://www3.lrs.lt/c-bin/eng/preps2?Condition1=123796&Condition2=] Töötu sotsiaalse kaitse seadus (01.01.1995 ). [http://lex.andmevara.ee/estlex/kehtivad/AktDisplay.jsp?id=36821&akt_id=36821]
33
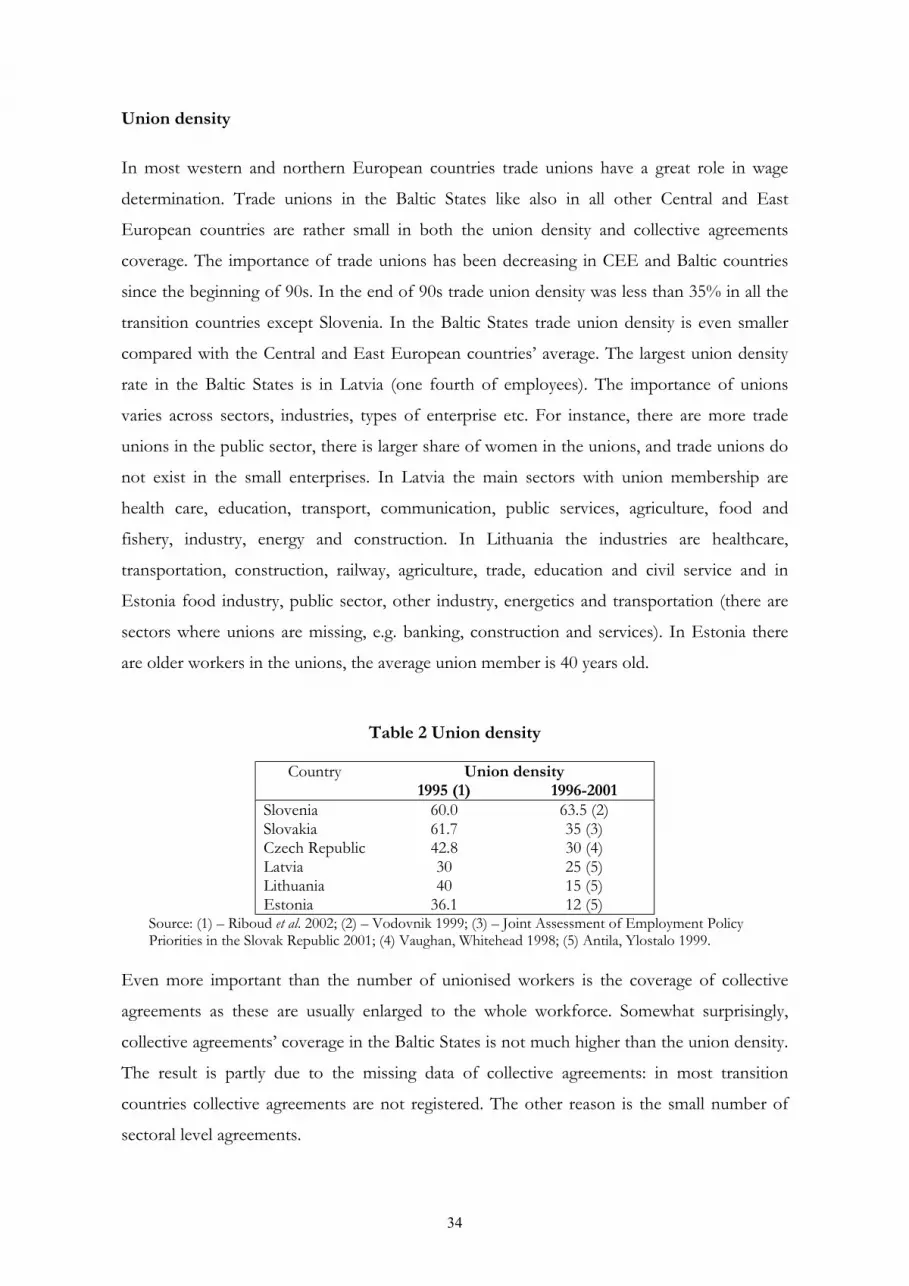
Union density
In most western and northern European countries trade unions have a great role in wage
determination. Trade unions in the Baltic States like also in all other Central and East
European countries are rather small in both the union density and collective agreements
coverage. The importance of trade unions has been decreasing in CEE and Baltic countries
since the beginning of 90s. In the end of 90s trade union density was less than 35% in all the
transition countries except Slovenia. In the Baltic States trade union density is even smaller
compared with the Central and East European countries’ average. The largest union density
rate in the Baltic States is in Latvia (one fourth of employees). The importance of unions
varies across sectors, industries, types of enterprise etc. For instance, there are more trade
unions in the public sector, there is larger share of women in the unions, and trade unions do
not exist in the small enterprises. In Latvia the main sectors with union membership are
health care, education, transport, communication, public services, agriculture, food and
fishery, industry, energy and construction. In Lithuania the industries are healthcare,
transportation, construction, railway, agriculture, trade, education and civil service and in
Estonia food industry, public sector, other industry, energetics and transportation (there are
sectors where unions are missing, e.g. banking, construction and services). In Estonia there
are older workers in the unions, the average union member is 40 years old.
Table 2 Union density
Country Union density 1995 (1) 1996-2001 Slovenia 60.0 63.5 (2) Slovakia 61.7 35 (3) Czech Republic 42.8 30 (4) Latvia 30 25 (5) Lithuania 40 15 (5) Estonia 36.1 12 (5)
Source: (1) – Riboud et al. 2002; (2) – Vodovnik 1999; (3) – Joint Assessment of Employment Policy Priorities in the Slovak Republic 2001; (4) Vaughan, Whitehead 1998; (5) Antila, Ylostalo 1999.
Even more important than the number of unionised workers is the coverage of collective
agreements as these are usually enlarged to the whole workforce. Somewhat surprisingly,
collective agreements’ coverage in the Baltic States is not much higher than the union density.
The result is partly due to the missing data of collective agreements: in most transition
countries collective agreements are not registered. The other reason is the small number of
sectoral level agreements.
34

Collective wage bargaining in the Baltic States (as well as in CEE general) takes place mainly
at the enterprise level or national level. At sectoral or regional level the bargaining process is
less developed (Casale 1997). Due to the low coverage of collective agreements, it can be
concluded that more employees in the Baltic States rely on individual employment contracts.
The popularity of the national level wage bargaining is probably caused by the traditional
coordinative role of government. The larger scale of enterprise level bargaining compared to
sectoral level is due to the less organised employers.
The state or national level bargaining Transition countries introduced the national level bargaining already in the beginning of
transition process and it takes place in tripartite bodies (members from government,
employers and unions). One of the main tasks of national level bargaining is to decide the
level of minimum wage; other questions in the bargaining have been reforms of labour
market legislation, social reforms and pensions. Still the importance of unions even in
national level bargaining is rather low and the main function of tripartite bodies is
consultative.
The regional level bargaining Regional level bargaining is not developed in most of the transition economies including the
Baltic States (one exceptions is Poland). Social partners in the Baltic States have weak regional
structure. One of the main reasons for the lack of regional level bargaining in the Baltic States
is the small geographical unit (much smaller than e.g. Poland).
The sectoral or branch level bargaining
Sectoral level bargaining is rather rare in transition economies, it is estimated to cover about
10-17% of the workers in the Baltic States (from 6 to 30 percent in all the CEE countries).
The idea of the sectoral level agreements is usually to provide minimum standards. In some
cases they are only agreements about fixing the minimum wage in the sector. The main
problem is the weak employer associations. It has been noted that trade unions have been
helping to establish employer federations in branch level to have the social partner in the
negotiations. It is expected that sectoral level bargaining will develop more when the
employers will organise themselves. Most of the sectoral level bargaining takes place in the
public sector. In Lithuania the sectoral level agreements are least developed in the Baltic
States with only a few examples of sectoral agreements in Lithuania (compared to 26
agreements in Latvia and 13 in Estonia in 2000) for example the agreement in
telecommunication industry (Due, Mailand 2001).
35

The enterprise level bargaining Besides the national level agreements, enterprise level agreements are the most common in
CEE countries. In all the CEE countries employers are not interested in concluding the
collective agreements. The initiative to bargain is usually taken by the trade unions.
Employers are under legal obligation to conclude the agreement if the employees wish to do
so, but in practice employers attempt to avoid signing agreements. Enterprise level bargaining
is more developed in the public sector and in privatised enterprises, and remarkably less
developed in foreign companies (Due, Mailand 2001). The estimates of enterprise level
agreements’ coverage in the Baltic States vary: according to Due and Mailand (2001) 6-14 %
in Estonia, 10-30 % in Latvia and in Lithuania. Antila and Ylöstalo (1999) report that in
Latvia is the rate of unionisation 25 % and in Lithuania 15 %.
It can be concluded that most employees in CEE countries rely on individual employment
contracts. The reasons for the small importance of unions in the transition economies have
usually been found in the following.
• Trade unions are not well organised, which could lead to a situation where several
unions with different aims enter the bargaining process.
• Weak position of unions.
• Weak employer associations.
• Large share of small enterprises.
• Employers’ preference to bargain only at the company level.
• No enforcement of sectoral level agreements.
4.3. Labour market policy Public spending on labour market programmes absorbs significant shares of national
resources in most EU member and candidate countries. For analytical purposes, the spending
is split into active measures (policies aimed at improving the access of the unemployed to the
labour market and jobs, job-related skills and the functioning of the labour market) and
passive measures (spending on income transfers).
Labour policies are rather insufficiently funded in the Baltic States compared to the EU. The
expenditures on labour market measure policies account for 0,22 % of GDP in Estonia, 0,64
% in Latvia and 0,27% in Lithuania in 20017. This is a very small fraction compared to the
respective average rate of 3, 4% in the EU. In Latvia, the expenditures on labour market 7 Source: Estonian Labour Market Board; Republic of Lithuania Ministry of Social Security and Labour
36
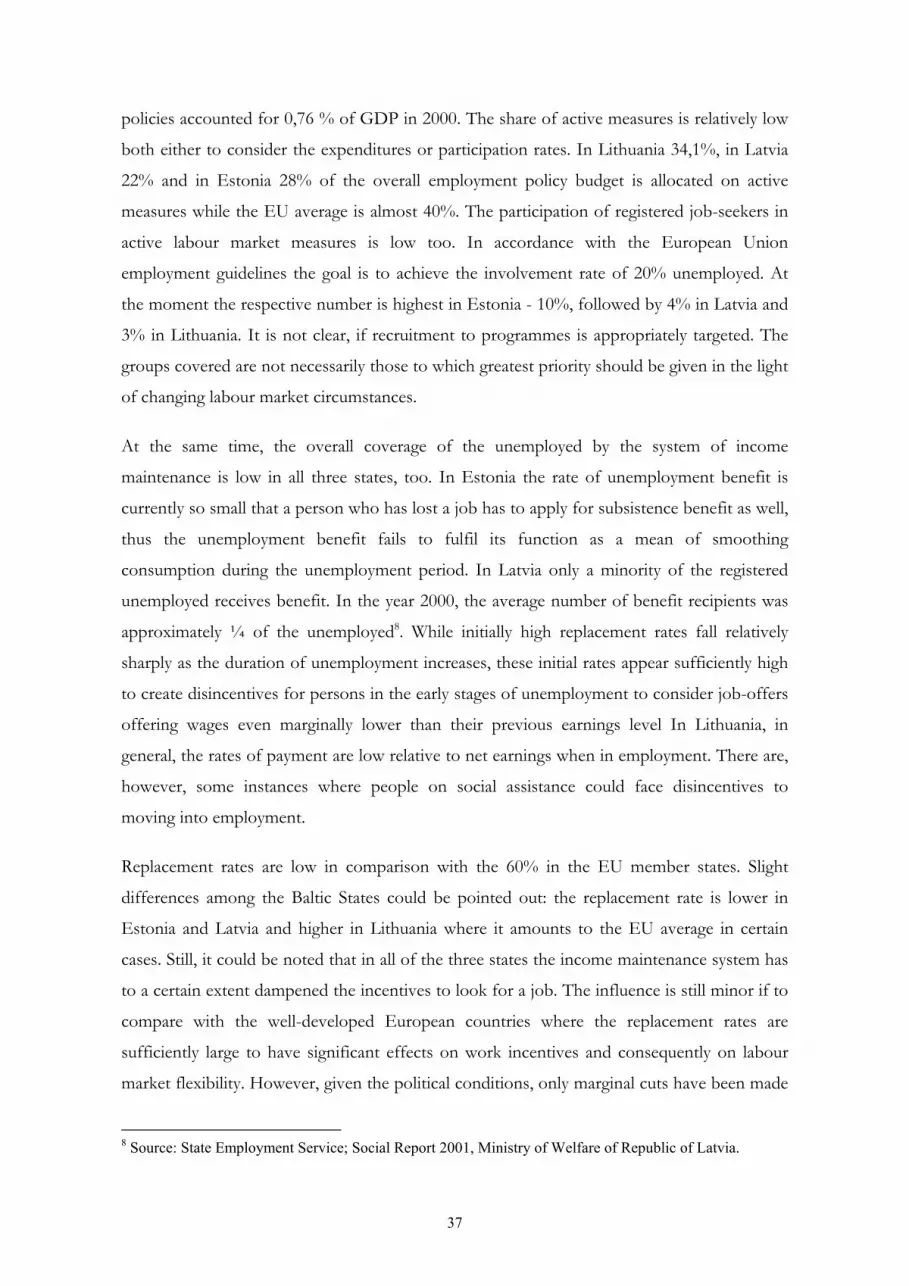
policies accounted for 0,76 % of GDP in 2000. The share of active measures is relatively low
both either to consider the expenditures or participation rates. In Lithuania 34,1%, in Latvia
22% and in Estonia 28% of the overall employment policy budget is allocated on active
measures while the EU average is almost 40%. The participation of registered job-seekers in
active labour market measures is low too. In accordance with the European Union
employment guidelines the goal is to achieve the involvement rate of 20% unemployed. At
the moment the respective number is highest in Estonia - 10%, followed by 4% in Latvia and
3% in Lithuania. It is not clear, if recruitment to programmes is appropriately targeted. The
groups covered are not necessarily those to which greatest priority should be given in the light
of changing labour market circumstances.
At the same time, the overall coverage of the unemployed by the system of income
maintenance is low in all three states, too. In Estonia the rate of unemployment benefit is
currently so small that a person who has lost a job has to apply for subsistence benefit as well,
thus the unemployment benefit fails to fulfil its function as a mean of smoothing
consumption during the unemployment period. In Latvia only a minority of the registered
unemployed receives benefit. In the year 2000, the average number of benefit recipients was
approximately ¼ of the unemployed8. While initially high replacement rates fall relatively
sharply as the duration of unemployment increases, these initial rates appear sufficiently high
to create disincentives for persons in the early stages of unemployment to consider job-offers
offering wages even marginally lower than their previous earnings level In Lithuania, in
general, the rates of payment are low relative to net earnings when in employment. There are,
however, some instances where people on social assistance could face disincentives to
moving into employment.
Replacement rates are low in comparison with the 60% in the EU member states. Slight
differences among the Baltic States could be pointed out: the replacement rate is lower in
Estonia and Latvia and higher in Lithuania where it amounts to the EU average in certain
cases. Still, it could be noted that in all of the three states the income maintenance system has
to a certain extent dampened the incentives to look for a job. The influence is still minor if to
compare with the well-developed European countries where the replacement rates are
sufficiently large to have significant effects on work incentives and consequently on labour
market flexibility. However, given the political conditions, only marginal cuts have been made
8 Source: State Employment Service; Social Report 2001, Ministry of Welfare of Republic of Latvia.
37

in the generosity of benefit entitlements. Rather the eligibility conditions for receipt of
benefits are tightening up and activation strategies for the unemployed are developed. The
Baltic States have the same path ahead of them.
Table 3. Spending on labour market programmes in the EU and selected candidate countries
Total spending (as % GDP)
Active spending (as % of GDP)
Active spending (as % of total spending)
Estonia 0,22 0,06 28,0 Latvia 0,76 0,15 22,0 Lithuania 0,27 0,12 34,1 Czech Republic 0,52 0,22 42,9 Hungary 0,87 0,39 45,3 Poland 2,25 0,54 24,0 EU 2,48 1,12 39,8
Sources: Martin et al. (2001); Estonian Labour Market Board; Ministry of Social Security and Labour of the Republic of Lithuania; Joint Assessment of Employment Priorities in Latvia (2002).
It could be concluded that because of the undercapitalization of the labour market policy, the
unemployment benefits are low and in this way do not decrease remarkably the labour market
flexibility. On the other hand, through placing stronger emphasis on active labour market
programmes, the positive impact of labour policy on labour market flexibility could be
increased. In this context, more attention should be paid on education and training, including
development of lifelong learning which is now an established priority throughout the EU. At
the moment, for example in Lithuania the balance within active programmes is over-
concentrated on the provision of temporary jobs but short periods of temporary employment
are unlikely to contribute to the longer-term employability of participants.
5. Wage flexibility Wage flexibility shows how the wages react to the recessions and growth in economy. It
shows if wages are rigid only downwards or if the long-term wage agreements also slow down
the wage rise. The more quickly the wages react to the changes in economy, the more flexible
the labour market is. Here we try to measure the flexibility of nominal wages. Usually the
flexibility of real wages is treated in literature. In our opinion the fluctuation of nominal
wages during business cycle is even better evidence of wage flexibility then the changes in real
wage.
We analysed the wage flexibility in Baltic States by investigating how wages behaved during
the recession caused by the Russian crises. In 1999 a remarkable fall in GDP growth has
taken place in the case of all three countries because of the crisis in Russia at the end of 1998.
38
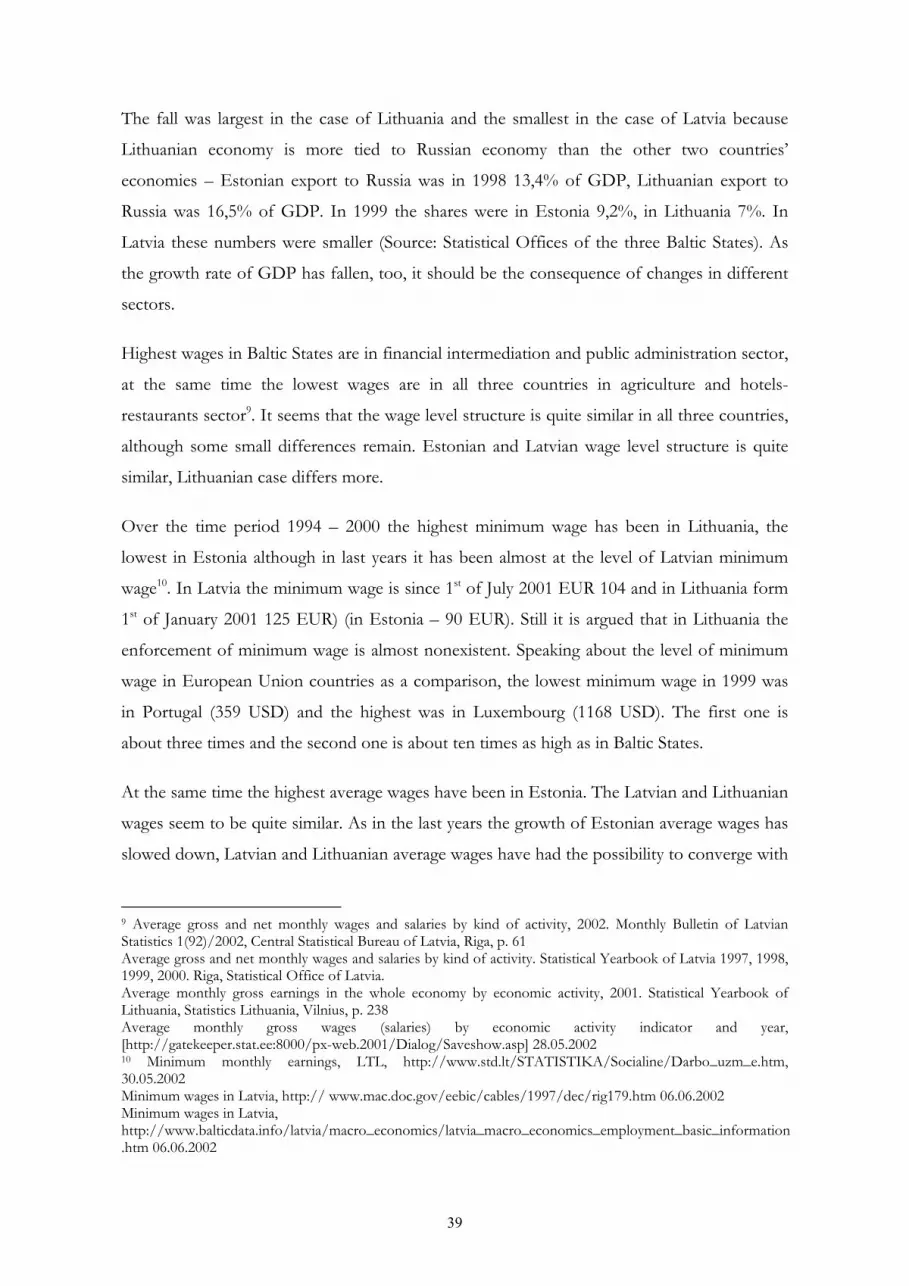
The fall was largest in the case of Lithuania and the smallest in the case of Latvia because
Lithuanian economy is more tied to Russian economy than the other two countries’
economies – Estonian export to Russia was in 1998 13,4% of GDP, Lithuanian export to
Russia was 16,5% of GDP. In 1999 the shares were in Estonia 9,2%, in Lithuania 7%. In
Latvia these numbers were smaller (Source: Statistical Offices of the three Baltic States). As
the growth rate of GDP has fallen, too, it should be the consequence of changes in different
sectors.
Highest wages in Baltic States are in financial intermediation and public administration sector,
at the same time the lowest wages are in all three countries in agriculture and hotels-
restaurants sector9. It seems that the wage level structure is quite similar in all three countries,
although some small differences remain. Estonian and Latvian wage level structure is quite
similar, Lithuanian case differs more.
Over the time period 1994 – 2000 the highest minimum wage has been in Lithuania, the
lowest in Estonia although in last years it has been almost at the level of Latvian minimum
wage10. In Latvia the minimum wage is since 1st of July 2001 EUR 104 and in Lithuania form
1st of January 2001 125 EUR) (in Estonia – 90 EUR). Still it is argued that in Lithuania the
enforcement of minimum wage is almost nonexistent. Speaking about the level of minimum
wage in European Union countries as a comparison, the lowest minimum wage in 1999 was
in Portugal (359 USD) and the highest was in Luxembourg (1168 USD). The first one is
about three times and the second one is about ten times as high as in Baltic States.
At the same time the highest average wages have been in Estonia. The Latvian and Lithuanian
wages seem to be quite similar. As in the last years the growth of Estonian average wages has
slowed down, Latvian and Lithuanian average wages have had the possibility to converge with
9 Average gross and net monthly wages and salaries by kind of activity, 2002. Monthly Bulletin of Latvian Statistics 1(92)/2002, Central Statistical Bureau of Latvia, Riga, p. 61 Average gross and net monthly wages and salaries by kind of activity. Statistical Yearbook of Latvia 1997, 1998, 1999, 2000. Riga, Statistical Office of Latvia. Average monthly gross earnings in the whole economy by economic activity, 2001. Statistical Yearbook of Lithuania, Statistics Lithuania, Vilnius, p. 238 Average monthly gross wages (salaries) by economic activity indicator and year, [http://gatekeeper.stat.ee:8000/px-web.2001/Dialog/Saveshow.asp] 28.05.2002 10 Minimum monthly earnings, LTL, http://www.std.lt/STATISTIKA/Socialine/Darbo_uzm_e.htm, 30.05.2002 Minimum wages in Latvia, http:// www.mac.doc.gov/eebic/cables/1997/dec/rig179.htm 06.06.2002 Minimum wages in Latvia, http://www.balticdata.info/latvia/macro_economics/latvia_macro_economics_employment_basic_information.htm 06.06.2002
39

Estonian wage level. But the difference between average wages in Baltic States and in
European Union is still very large – in 1999 the lowest average wage was in Portugal (653
USD) that is more than two times as high as in Estonia and the highest was in Luxembourg
(2866 USD). This is about ten times as high as in Estonia. Such huge differences between
wages (especially between minimum wages) in Baltic States and in European Union may
indicate also that the wages in Baltic States are more flexible than in European Union.
The easiest way to say whether the wages in Baltic States are flexible or not is to find out if
there has a fall taken place in wages of those sectors that were tightly connected to Russian
market. It is possible to summarize that wages are rather flexible, but there are also
differences between countries and economic sectors. The nominal wages are most rigid in
Lithuania and most flexible in Estonia. The most flexible wages are in construction sector in
all three countries. In Estonia and Latvia the wages are also flexible in fishing, agriculture,
hotels and restaurants sectors. The wages in public sector and in financial sector are mostly
rigid. The data also show that if the wages are low they are more flexible.
Lithuanian nominal wage dynamics is different compared to the other Baltic States. While in
other countries the Russian shock has bigger influence on agricultural sector and smaller
influence on sectors of non-tradables like services and public goods, the opposite dynamics
can be seen from Lithuanian figures. The only sector which suffered similarly in all three
countries after Russian crisis is industry and even here we have to add smoother exception —
Latvia does not suffer that much. It can be guessed that the crucial point here is the share of
the particular sector’s export to Russia, but we can not dismiss the fact that in some countries
and some industries wages react in a more sensitive way than in others. In this respect
Lithuania seems to have more rigid wages than Estonia and Latvia and the rigidity seems to
be the highest especially in agricultural sector. This may be a reason why Lithuania suffered
longer after Russian crisis than other Baltic States.
In the context of EU enlargement it is possible that the wages in these sectors where they are
most flexible will converge faster with the EU wage level if EU labour market policies will be
liberalized. It may also happen that if the labour markets of the Baltic States will be regulated
as highly as in EU, the wage flexibility will decrease in all three countries, especially in
Estonia. The last option is more realistic one.
40
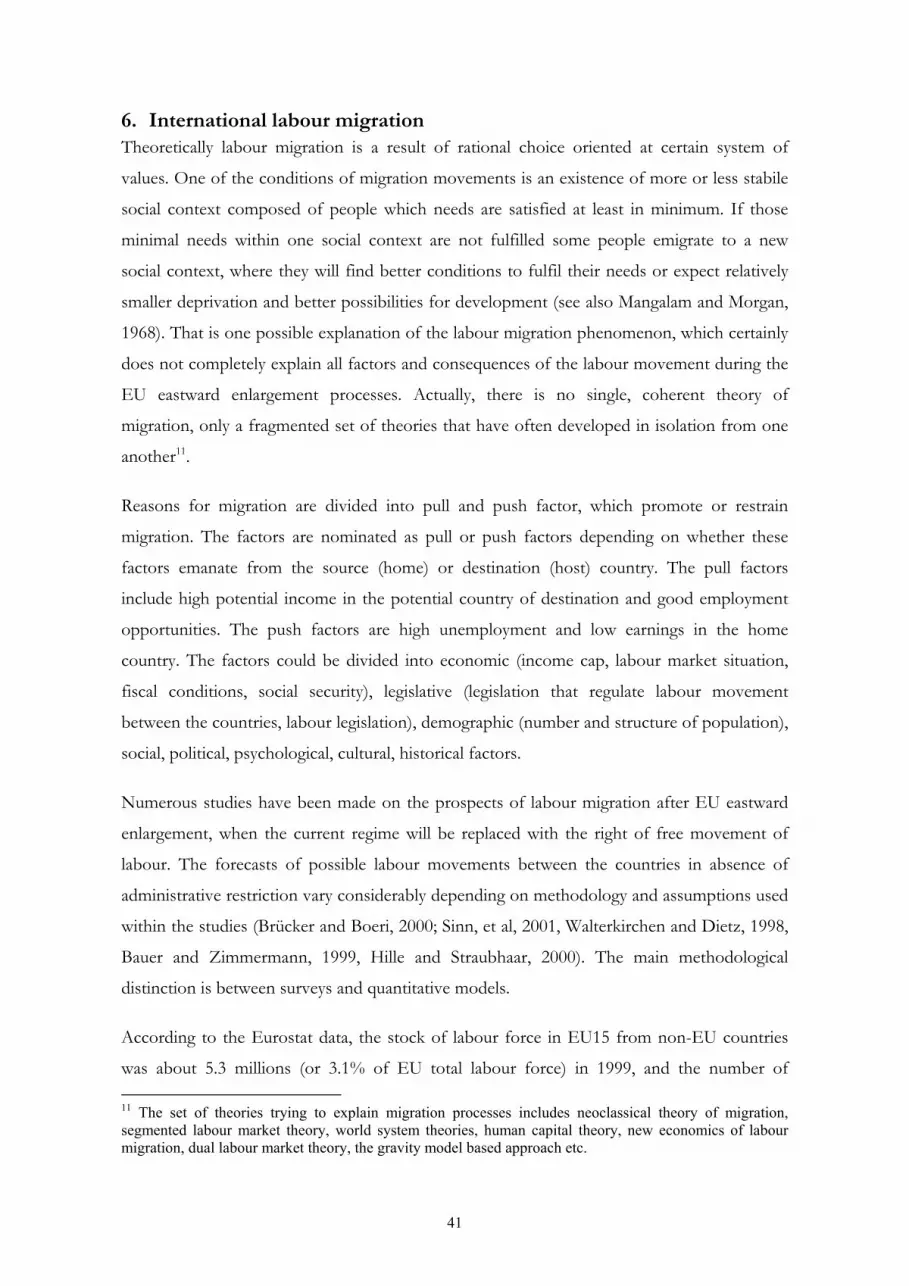
6. International labour migration Theoretically labour migration is a result of rational choice oriented at certain system of
values. One of the conditions of migration movements is an existence of more or less stabile
social context composed of people which needs are satisfied at least in minimum. If those
minimal needs within one social context are not fulfilled some people emigrate to a new
social context, where they will find better conditions to fulfil their needs or expect relatively
smaller deprivation and better possibilities for development (see also Mangalam and Morgan,
1968). That is one possible explanation of the labour migration phenomenon, which certainly
does not completely explain all factors and consequences of the labour movement during the
EU eastward enlargement processes. Actually, there is no single, coherent theory of
migration, only a fragmented set of theories that have often developed in isolation from one
another11.
Reasons for migration are divided into pull and push factor, which promote or restrain
migration. The factors are nominated as pull or push factors depending on whether these
factors emanate from the source (home) or destination (host) country. The pull factors
include high potential income in the potential country of destination and good employment
opportunities. The push factors are high unemployment and low earnings in the home
country. The factors could be divided into economic (income cap, labour market situation,
fiscal conditions, social security), legislative (legislation that regulate labour movement
between the countries, labour legislation), demographic (number and structure of population),
social, political, psychological, cultural, historical factors.
Numerous studies have been made on the prospects of labour migration after EU eastward
enlargement, when the current regime will be replaced with the right of free movement of
labour. The forecasts of possible labour movements between the countries in absence of
administrative restriction vary considerably depending on methodology and assumptions used
within the studies (Brücker and Boeri, 2000; Sinn, et al, 2001, Walterkirchen and Dietz, 1998,
Bauer and Zimmermann, 1999, Hille and Straubhaar, 2000). The main methodological
distinction is between surveys and quantitative models.
According to the Eurostat data, the stock of labour force in EU15 from non-EU countries
was about 5.3 millions (or 3.1% of EU total labour force) in 1999, and the number of 11 The set of theories trying to explain migration processes includes neoclassical theory of migration, segmented labour market theory, world system theories, human capital theory, new economics of labour migration, dual labour market theory, the gravity model based approach etc.
41

residents was about 12 millions (3,2% of total EU residents). The number of official labour
force from the candidate countries was only 290 000 (0.2%), but some estimates show that
there were also 600 000 “working tourists” from the candidate countries. The number of
residents from the Baltic States were respectively about 15 000 from Estonia, about 7500
from Latvia and about 8500 from Lithuania (Eurostat, 200o a and b).
Estimates that base on various research studies put the long-run migration potential from the
candidate countries roughly 1% of the EU15 population (hence, about 3.8 millions). Surveys
suggest a strong preference of candidate country nationals for temporary work, which implies
also important flows of return migration towards the candidate countries. Based on some
predictions in the absence of administrative restriction for labour movement, the initial
immigration from the CC8 countries (the European candidate countries excluding Bulgaria
and Romania) into EU15 would be around 70 000 workers annually (that means totally 200
000 people including also family members) or 0.05% of the EU15 population (The Free
Movement… 2001, pp.7-8).
According to the study of Brücker and Boeri (2000), labour migration would be concentrated
in only a few member states and enlargement will not significantly affect wages and
employment in the EU. It is expected that two-thirds of the labour migration flows from the
candidate countries will be absorbed by Germany (hence, around 45 000 – 50 000 workers
per year from the CC8 in the first few years). Austria will absorb about 20% of the labour
flows coming from the CC8. The forecasts show that the share of the CC10 people in the
population of the present EU member states would rise from 0.2% in 1998 to 1.1% in 2030
(Ibid. p.9). Hence, according to predictions, the movement of labour between the EU
countries after eastward enlargement will not be significant.
Analyzing labour migration problems of the Baltic States, the emphasis should be first of all
given to possible labour movement within the Baltic Sea region. The integration of border
regions appears to be relevant in the EU forthcoming enlargement. The countries, which
mainly attract the Baltic States’ labour force, are the current EU member states that belong to
the Baltic Sea region: Denmark, Finland, Sweden and Germany. According to the Eurostat
data (2000), 96% of the Baltic States citizens that were living in the EU15 countries lived in
the Baltic the Baltic Sea region countries, which are the current members of EU (98.2% of
Estonian citizens, 91.8% of Latvian and 92.6 of Lithuanian).
42
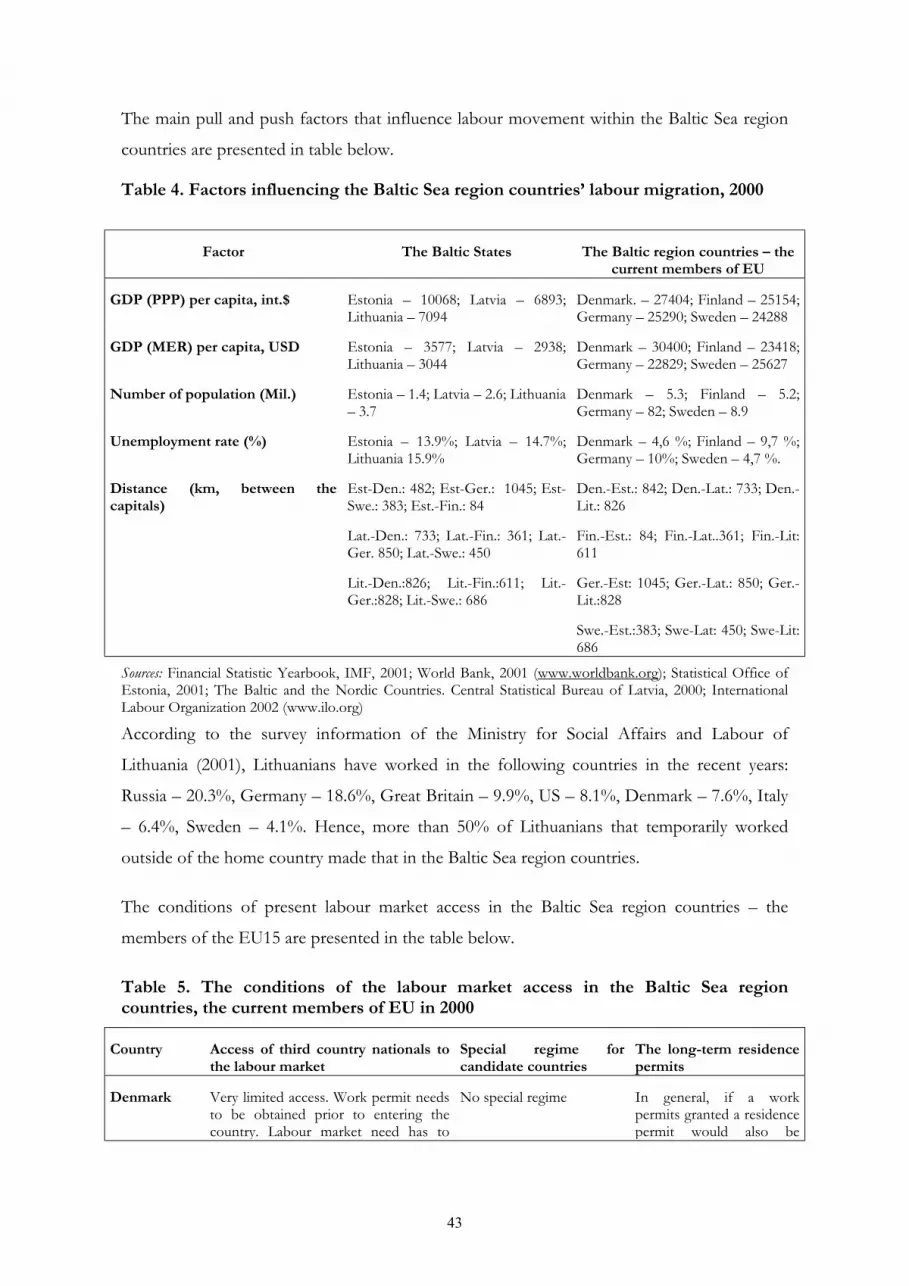
The main pull and push factors that influence labour movement within the Baltic Sea region
countries are presented in table below.
Table 4. Factors influencing the Baltic Sea region countries’ labour migration, 2000
Factor The Baltic States The Baltic region countries – the current members of EU
GDP (PPP) per capita, int.$ Estonia – 10068; Latvia – 6893; Lithuania – 7094
Denmark. – 27404; Finland – 25154; Germany – 25290; Sweden – 24288
GDP (MER) per capita, USD Estonia – 3577; Latvia – 2938; Lithuania – 3044
Denmark – 30400; Finland – 23418; Germany – 22829; Sweden – 25627
Number of population (Mil.) Estonia – 1.4; Latvia – 2.6; Lithuania – 3.7
Denmark – 5.3; Finland – 5.2; Germany – 82; Sweden – 8.9
Unemployment rate (%) Estonia – 13.9%; Latvia – 14.7%; Lithuania 15.9%
Denmark – 4,6 %; Finland – 9,7 %; Germany – 10%; Sweden – 4,7 %.
Distance (km, between the capitals)
Est-Den.: 482; Est-Ger.: 1045; Est-Swe.: 383; Est.-Fin.: 84
Lat.-Den.: 733; Lat.-Fin.: 361; Lat.-Ger. 850; Lat.-Swe.: 450
Lit.-Den.:826; Lit.-Fin.:611; Lit.-Ger.:828; Lit.-Swe.: 686
Den.-Est.: 842; Den.-Lat.: 733; Den.-Lit.: 826
Fin.-Est.: 84; Fin.-Lat..361; Fin.-Lit: 611
Ger.-Est: 1045; Ger.-Lat.: 850; Ger.-Lit.:828
Swe.-Est.:383; Swe-Lat: 450; Swe-Lit: 686
Sources: Financial Statistic Yearbook, IMF, 2001; World Bank, 2001 (www.worldbank.org); Statistical Office of Estonia, 2001; The Baltic and the Nordic Countries. Central Statistical Bureau of Latvia, 2000; International Labour Organization 2002 (www.ilo.org)
According to the survey information of the Ministry for Social Affairs and Labour of
Lithuania (2001), Lithuanians have worked in the following countries in the recent years:
Russia – 20.3%, Germany – 18.6%, Great Britain – 9.9%, US – 8.1%, Denmark – 7.6%, Italy
– 6.4%, Sweden – 4.1%. Hence, more than 50% of Lithuanians that temporarily worked
outside of the home country made that in the Baltic Sea region countries.
The conditions of present labour market access in the Baltic Sea region countries – the
members of the EU15 are presented in the table below.
Table 5. The conditions of the labour market access in the Baltic Sea region countries, the current members of EU in 2000
Country Access of third country nationals to the labour market
Special regime for candidate countries
The long-term residence permits
Denmark Very limited access. Work permit needs to be obtained prior to entering the country. Labour market need has to
No special regime In general, if a work permits granted a residence permit would also be
43
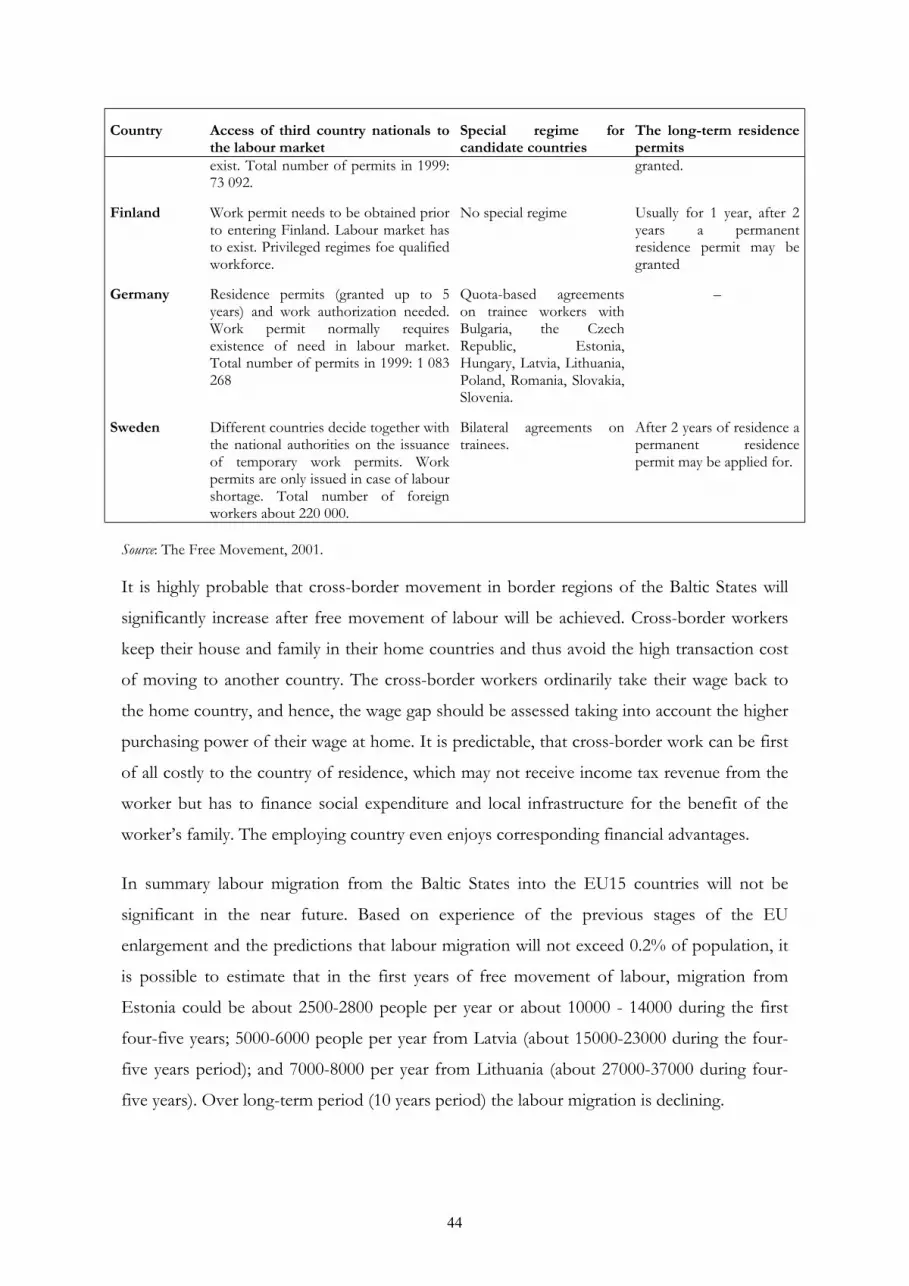
Country Access of third country nationals to the labour market
Special regime for candidate countries
The long-term residence permits
exist. Total number of permits in 1999: 73 092.
granted.
Finland Work permit needs to be obtained prior to entering Finland. Labour market has to exist. Privileged regimes foe qualified workforce.
No special regime Usually for 1 year, after 2 years a permanent residence permit may be granted
Germany Residence permits (granted up to 5 years) and work authorization needed. Work permit normally requires existence of need in labour market. Total number of permits in 1999: 1 083 268
Quota-based agreements on trainee workers with Bulgaria, the Czech Republic, Estonia, Hungary, Latvia, Lithuania, Poland, Romania, Slovakia, Slovenia.
–
Sweden Different countries decide together with the national authorities on the issuance of temporary work permits. Work permits are only issued in case of labour shortage. Total number of foreign workers about 220 000.
Bilateral agreements on trainees.
After 2 years of residence a permanent residence permit may be applied for.
Source: The Free Movement, 2001.
It is highly probable that cross-border movement in border regions of the Baltic States will
significantly increase after free movement of labour will be achieved. Cross-border workers
keep their house and family in their home countries and thus avoid the high transaction cost
of moving to another country. The cross-border workers ordinarily take their wage back to
the home country, and hence, the wage gap should be assessed taking into account the higher
purchasing power of their wage at home. It is predictable, that cross-border work can be first
of all costly to the country of residence, which may not receive income tax revenue from the
worker but has to finance social expenditure and local infrastructure for the benefit of the
worker’s family. The employing country even enjoys corresponding financial advantages.
In summary labour migration from the Baltic States into the EU15 countries will not be
significant in the near future. Based on experience of the previous stages of the EU
enlargement and the predictions that labour migration will not exceed 0.2% of population, it
is possible to estimate that in the first years of free movement of labour, migration from
Estonia could be about 2500-2800 people per year or about 10000 - 14000 during the first
four-five years; 5000-6000 people per year from Latvia (about 15000-23000 during the four-
five years period); and 7000-8000 per year from Lithuania (about 27000-37000 during four-
five years). Over long-term period (10 years period) the labour migration is declining.
44
Previous experience and research studies also show that labour migration processes have had
little effect on host country unemployment and wages (Sinn, 2001). Migration of labour from
a home country to a country of destination can even provide gain for the host country, since
migrants generally receive a wage below the gain in value added to the economy. Income
earned by immigrants does not usually create a burden for the domestic population. There are
also possibilities of additional investment income, rents and increased consumer spending. As
regards public finances, immigration impacts on government expenditure and revenues, but
the net impact at the national level is negligible. In a long-term perspective, immigration can
limit the adverse impact on living standards and government budgetary positions due to
declining and ageing of populations. Of course, labour migration cannot on its own solve the
ageing problem of the European population. In order to maintain a sufficient labour force,
additionally to import of labour through migration, the European countries have significantly
reduce unemployment rate and to increase the participation rate in their labour markets.
Free movement of labour will have rather serious pressure on the labour markets of the Baltic
States due to possible movement of better-qualified and flexible labour force. Movers will be
mainly people with good qualification, also young people with secondary school (gymnasium)
education, who do not find qualified job at home. They are ready to work abroad as blue
colour workers getting salaries which are relatively higher that their expected to get in their
home countries. Also possible cross-border movement of workers in the Baltic Sea region
will have a pressure on the Baltic States’ labour markets.
Conclusions The findings concerning the labour market flexibility can be summarized as follows:
Labour market flexibility is relatively high in all three Baltic States.
Wages have been flexible due to the low minimum wages and small importance of
trade unions.
Only the rather long advance notice periods and large compensations when employer
terminates employment contract decrease labour market flexibility.
The unemployment benefits are also low and do not decrease remarkably labour
market flexibility.
On the other hand, labour market flexibility could be increased through active labour
market programmes.
45
More attention should be paid especially on education and training. At the moment,
for example in Lithuania the balance within active programmes is over-concentrated
on the provision of temporary jobs.
Analysis of labour migration experience of the previous stages of EU enlargement allows us
to reach the following conclusions.
Free movement of labour will not have a significant pressure on the labour markets
(first of all on the level of unemployment and wages) of the EU current member
states. The main absorbers of the labour flows from CC10 will be Germany and
Austria.
Due to the very small size of the Baltic labour markets comparing to the rest of EU,
labour migration from the Baltic States into the EU15 countries will be insignificant
and will not have any remarkable pressure on the EU labour market
Due to historical and cultural conditions and close neighbourhood, the migration of
the Baltic States labour force will be mainly to the Baltic Sea region countries. The
growth of the cross-border movement is expected with significant cost to the country
of residence.
Free movement of labour will have a certain burden on the home countries’ economy.
It is predictable that movers are first of all qualified and flexible labour force.
The European countries have to reduce the unemployment rate and to increase the
participation rate in their labour markets in order to maintain a sufficient labour force
for sustainable development.
References Aghion, P., Blanchard, O. (1994). On the speed of transition in Central Europe. National
Bureau for Economic Research Macroeconomic Annual, pp. 283-320.
Antila, J. Ylöstalo, P, 1999. Working Life Parameter in the Baltic Countries 1999. Labour
Policy Studies No. 214, Ministry of Labour, Helsinki, pp. 50-188.
Arro, R., Eamets, R., Järve, J., Kallaste, E., Philips, K, 2001. Country Report on Labour
Market Flexibility and Employment and Social Security: Estonia. Tartu, 96 pp.
Bauer, T., Zimmermann, K.F., 1999 Assessment of Possible Migration pressure and Its
Labour Market Impact Following EU Enlargement to Central and Eastern Europe, IZA,
Bonn, CEPR, London.
Bertola, G., 1990. Job security, employment and wages. European Economic Review, Vol. 34,
46
pp. 851-879.
Brücker, H., Boeri, T., 2000. The Impact of Eastern Enlargement on Employment. Berlin,
Milano, European Integration Consortium.
Casale, G. 1997 Collective Bargaining and the Law in Central and Eastern Europe: Some
Comparative Issues. – ILO-CEET Working Paper, No 20, Hungary, 34 p.
Due, J., Mailand, M., 2001. Social Dialogue in the Baltic Sea region – the state of the art.
University of Copenhagen, 16 p.
Eamets, R., 2002. Eesti tööturu paindlikkus Euroopa Liiduga liitumise kontekstis – Effect of
Accession to the European Union on the Economic Policy of Estonia, Värska, pp. 54-64
Eamets, R.; Philips, K.; Annus, T., 1999. Background Study on Labour Market and
Employment in Estonia. ETF National Observatory.
Employment Action Plan 2002, 2001. Republic of Estonia. Tallinn.
Estonia Latvia Lithuania in Figures 2000/2001/2002. Statistical Office of Estonia,
2000/2001/2002.
Estonian Statistics Monthly, 2001. Statistical Office of Estonia, Tallinn
Europäische Sozialstatistik, 2000. EUROSTAT, Wanderung, Ausgabe, Brüssel.
Flexibility in the labour market: The current debate. A technical report, 1996. OECD, Paris
Grubb, D, Wells, W., 1993. Employment Regulation and Patterns of Work in EC Countries,
OECD Economic Studies, no. 21, pp. 7-58
Hahn, F., 1998. Labour market flexibility and welfare, Quaderni del Dipartimento di
Economia Politica, No. 223, Universita degli Studi di Siena.
Hille, H., Strabhaar, T. (2000) The Impact of the EU Enlargement on Migration Movements
and Economic Integration: Results of Recent Studies. OECD Discussion Paper
Joint Assessment of Employment Policy Priorities in the Slovak Republic, 2001. European
Commission for Employment and Social Affairs/Ministry for Labour, Social Affairs and
Family, 41p.
Joint Assessment of Employment Priorities in Estonia. 2001.
Joint Assessment of Employment Priorities in Latvia. Draft, 2002.
Joint Assessment of Employment Priorities in Lithuania. 2002.
Labor Market Flexibility, 1986. Report by a high-level group of experts to the Secretary-
General, OECD, Paris
Mangalam, J., Morgan C., 1968. A Guide to Migration. Lexington
47
Martin, J. P., Grubb, D., 2001. What works and for whom: a review of OECD countries’
experiences with active labour market policies. Office of Labour Market Policy Evaluation,
Working Paper 2001:14, 53 p.
Nicoletti, G., Scarpetta, S., Boylaud, O., 2000. Summary Indicators of Product Market
Regulation with an Extension to Employment Protection Legislation. OECD ECO/WKP
No. 220, 86 p.
Patterns and Trends in International Migration in Western Europe, 2000. Eurostat Studies
and Research, Luxembourg, 2000.
Riboud, M., Sanchez-Paramo, C., Silva-Jauregui, C., 2002. Does Eurosclerosis Matter?
Institutional Reform and Labour Market Performance in Central and Eastern European
Countries. – in eds. by Bernard Funck and Lodovico Pizzati, Labour, Employment and Social
Policies in the EU Enlargement Process. World Bank, Washington, pp 243–311.
Sinn, H.W., 2001. Social Dumping in the Transformation Process. NBER Working Paper,
No 8346
Sinn, H:W. et al., 2001. EU – Erweiterung und Arbeitskräftemigration. Wege zu einer
schrittweisen Annäherung der Arbeitsmarkets. IFO Beiträge zur Wirtschaftsforschung, 2,
München
Social Report 2001. Ministry of Welafrae of Republic of Latvia, Riga, 110 pp.
Straubhaar, T., 2001. East-West Migration: Will It Be a Problem? INTERECONOMICS;
July/August.
The Baltic and the Nordic Countries. A Collection of Statistical Data. Central Statistical
Bureau of Latvia, Riga, 2000
The Free Movement of Workers in the Context of Enlargement, 2001. Information Note,
European Commission.
Vaughan-Whitehead, D., 1998. Paying the price: the wage crisis in Central and Eastern
Europe. ILO, 418 p.
Vodovnik, Z., 1999. Tripartism and industrial relations in Slovenia. – in Ed by G. Casale,
Social Dialogue in Central and Eastern Europe. ILO, pp 305-318.
Walterkirchen, E., Dietz, R, 1998. Auswirkungen der EU-Ost-Erweiterung auf den
Österreichischen Arbeitsmarkt. Österreichisches Institut für Wirtschaftsforschung. Wien
48