garch modelling of banking integration in the eurozone
TRANSCRIPT

This article appeared in a journal published by Elsevier. The attachedcopy is furnished to the author for internal non-commercial researchand education use, including for instruction at the authors institution
and sharing with colleagues.
Other uses, including reproduction and distribution, or selling orlicensing copies, or posting to personal, institutional or third party
websites are prohibited.
In most cases authors are permitted to post their version of thearticle (e.g. in Word or Tex form) to their personal website orinstitutional repository. Authors requiring further information
regarding Elsevier’s archiving and manuscript policies areencouraged to visit:
http://www.elsevier.com/copyright
Author's personal copy
Research in International Business and Finance 25 (2011) 1–10
Contents lists available at ScienceDirect
Research in International Businessand Finance
journal homepage: www.elsevier.com/locate/r ibaf
GARCH modelling of banking integration in the Eurozone
George Alexandroua,1, Athanasios Koulakiotisb,2, Apostolos Dasilasc,∗
a Kingston Business School, School of Accounting and Finance, Kingston Hill KT2 7LB, UKb University of Macedonia, Department of International and European Studies, 156 Egnatia Str., 54006 Thessaloniki, Greecec International Hellenic University, School of Economics and Business Administration, 14th klm Thessaloniki-Moudania,57101 Thessaloniki, Greece
a r t i c l e i n f o
Article history:Received 10 November 2008Received in revised form 9 May 2010Accepted 13 May 2010Available online 24 May 2010
JEL classification:F33G15
Keywords:European bankingMarket integrationGARCH modelsEU enlargement
a b s t r a c t
We investigate the progress of integration in the European bankingindustry and its effects on the price of the common stock of bankslisted on European stock exchanges. We estimate the overall effectof progress by comparing the changes in the stock price volatility oflisted banks over the period from January 1990 to December 2005.Using univariate and bivariate GARCH models, we document thatthe introduction of the Euro and the enlargement of the EuropeanUnion in May 2004 have contributed to the integration process ofthe banking industry in Europe. We also find evidence of negativevolatility spillovers among bank stock returns for different groupsof countries that have been involved in various recent stages of theEuropean economic and political integration.
© 2010 Elsevier B.V. All rights reserved.
1. Introduction
We investigate the level of integration in the banking sector among the member states of theEuropean Union (EU). In particular, we examine the volatility spillovers of bank stock returns for thosecountries that adopted the Euro in 2002 and during the period prior to the formation of the Eurozone,in particular from 1990 to 1998. Moreover, we compare the volatility spillovers of bank stock returns
∗ Corresponding author. Tel.: +30 2310 807544.E-mail addresses: [email protected] (G. Alexandrou), [email protected] (A. Koulakiotis),
[email protected] (A. Dasilas).1 Tel.: +44 208 5478435.2 Tel.: +30 2310 891457.
0275-5319/$ – see front matter © 2010 Elsevier B.V. All rights reserved.doi:10.1016/j.ribaf.2010.05.001
Author's personal copy
2 G. Alexandrou et al. / Research in International Business and Finance 25 (2011) 1–10
for those countries that adopted the Euro in 2002 and those that they have not yet adopted the Eurosuch as the UK, Denmark and Sweden.
The integration of financial markets has significant implications for investors, practitioners andpolicy-makers and it has attracted significant attention in the academic literature. A large number ofstudies have explored the level of integrations between various markets. The interest is associated withthe identification of barriers and opportunities for international investment, asset pricing, portfoliodiversification and social welfare implications (Bartram and Dufey, 2001). Measures of financial inte-gration have typically employed price and return data (see Adam et al., 2002). The study of Kearneyand Lucey (2004) provides a comprehensive review of international equity market integration anddescribes the methodology and the empirical evidence of influential studies of equity market integra-tion among the developed economies. The Generalised Autoregressive Conditional Heteroscedasticity(GARCH) model has been employed to explore the interdependency among various stock markets interms of volatility slipovers.
This paper contributes to the field by shedding new light on the debate regarding European bank-ing integration. We examine the volatility and error spillovers among bank stock returns in thosecountries that have adopted the Euro (Euro-adopters), those that have not adopted the Euro (non-adopters), the new-members who joined the EU in 2004 (new-members) and countries outside theEU3 (non-members). Our findings are useful to investors and market participants and have signifi-cant implications for policy-makers and regulators both at the national and EU levels. Internationalagencies, like the European Central Bank (ECB) and International Monetary Fund (IMF) may also gainuseful insights on how their recommendations, incorporate in EU directives, can affect the Europeanbanking sector.
The European banking industry has recently experienced significant changes within the broaderframework of the EU determination to promote effective market integration. The Single European Act(1986) and the Second Banking Directive (1989) signalled the EU determination to achieve a singlemarket in the banking and financial services industry. However, significant progress occurred in 1990swith the adoption of the amended Basel Accord (1996) and the implementation of the Capital AdequacyDirective-II (CAD-II), which replaced CAD-I in 1998. Finally, the adoption of the Euro as the commonEuropean currency and the establishment of the European Central Bank (ECB) as the central bank ofall EU member states were decisive steps towards European economic and banking integration.
The rest of the paper is organized as follows: Section 2 provides a review of the GARCH modelingof market integration. Section 3 describes the data and sample characteristics. Section 4 outlines themethodology employed. Section 5 presents our empirical results and Section 6 presents the concludingremarks.
2. GARCH modeling of market integration
The pertinent literature has used variations of ARCH models to account for the existence of ARCHeffects observed in higher frequency data (see Fratzscher, 2002). Hamao et al. (1990) examine firstand second moment interdependencies among New York, Tokyo and London stock exchanges employ-ing GARCH models. They report that innovations in New York and London affect volatility in Tokyo.Koutmos and Booth (1995) also examine the dynamic interaction among the New York, Tokyo andLondon stock exchanges focusing on the price and volatility spillovers. They use an extended multi-variate EGARCH model and document significant volatility spillovers from New York to London andTokyo, from London to New York and Tokyo and from Tokyo to London and New York. They reportthat these stock exchanges have become more integrated after October 1987 and stocks in New Yorkand London have become more sensitive to innovations originating in Tokyo. Lin and Ito (1994) findsimilar volatility spillovers between the London, Tokyo and New York stock exchanges.
Koutmos (1996) provides evidence on the lead/lag relationships and volatility interactions of fourmajor European stock markets, i.e., the UK, France, Germany, Italy using a multivariate VAR-EGARCH
3 The Euro-Adopters are Austria, Belgium, Finland, France, Germany, Greece, Ireland, Italy, Luxemburg, Netherlands, Portugaland Spain. The non-adopters are the UK, Sweden and Denmark. The New-Members are Cyprus, Czech Republic, Estonia, Latvia,Slovenia, Malta, Poland, Lithuania, Slovakia and Hungary and the Non-Members are Croatia, Iceland, Norway, Russia and Turkey.

Author's personal copy
G. Alexandrou et al. / Research in International Business and Finance 25 (2011) 1–10 3
model and reports evidence of multidirectional lead/lag relationships and the presence of an asym-metric volatility transmission mechanism among these markets. Fratzscher (2002) examines theintegration process of European equity markets since the 1980s, focusing on the role of the Euro-pean Monetary Union (EMU) and the effects of changes in exchange rate volatility on the integrationprocess of European financial markets. He employs an uncovered interest rate parity condition tomeasure financial integration using a trivariate GARCH model. He finds evidence that the Europeanunification process raised the degree of integration, in particular among countries that have adoptedthe Euro (Euro-adopters). The conclusion is that the primary impetus behind European financial inte-gration is the reduction of uncertainty in exchange rates and the convergence of monetary policiesrelating to interest rates and inflation.
Bartram et al. (2005) investigate the impact of the introduction of Euro on the integration of equitymarkets in Europe during the period 1994–2003 using a GJR-GARCH-t model that allows captur-ing time-varying and non-linear relationships. They examine the time-varying dependencies amongEuropean markets within the Euro area as well as between the Euro and non-Euro areas. They findthat, within the Euro area, market dependence increases after the introduction of Euro but for largeequity markets only, such as France, Germany, Italy, the Netherlands and Spain. Those large marketsare characterized by larger equity market capitalization, comprehensive regulations, higher liquidityand lower transaction and information costs. On the other hand, transaction costs remained impor-tant barriers for investing in the smaller markets and thus their integration. Testing for alternativestructural breaks in market dependence, Bartram et al. (2005) find that the increase in dependencestarted in late 1997 or early 1998 when Euro membership was determined and announced. Most ofthe remaining European countries, however, continued to lack significant integration with the Euroarea. The UK and Sweden have not adopted the Euro, but their stock market dependence with the Euroarea markets had slightly increased since its introduction, indicating possible market anticipation ofeventual Euro adoption.
Using a bivariate GARCH-BEKK model, Caporale et al. (2006) examine the international volatilitytransmission effects following the South East Asia financial crisis in 1997. They investigate whetherthe crisis affected the volatility transmission mechanism and altered the integration of internationalfinancial markets. They find bidirectional volatility spillovers between the South East Asian, European,Japanese and US stock markets. In post-crises period the causality linkages become unidirectional,running only from the South East Asian to other markets.
Most recently, Singh et al. (2010) examine price and volatility spillovers in fifteen stock mar-kets across North America, Europe and Asia. The AR-GARCH model is employed to model volatilityspillovers. Their findings suggest that for both returns and volatility spillovers the index of a particularmarket is mostly affected by the indices of the markets that open or close just before it. They also finda greater regional influence among the Asian stock markets than the European and US markets.
We provide new evidence on the level of integration in the European banking sector. We focus onimportant developments like the passing of the Second Banking Directive and the introduction of theEuro. The EU is seeking an integrated banking industry, which would have become one primary driverfor a broader integration across the economies. In spite of a number of significant developments overthe past fifteen years (i.e. introduction of CAD-I, CAD-II and the Euro) and the accession of new-memberstates into the EU which have changed the economic environment and the operational framework ofEuropean banking, there is limited evidence on the effect of these changes on the degree of integrationin European banking sector. Thus, we provide new evidence on the level of integration for the Europeanbanking sector.
3. Data and sample characteristics
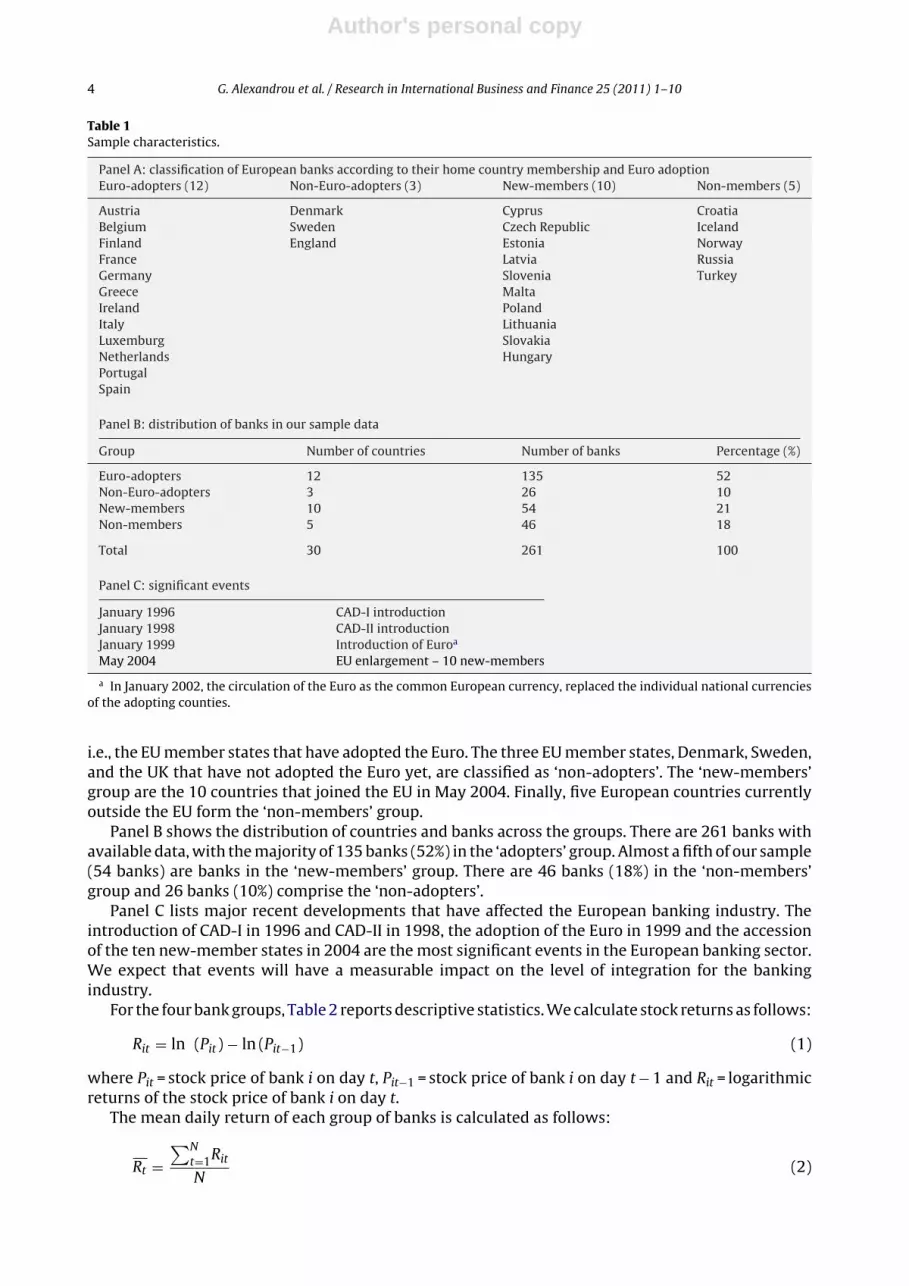
We use daily stock returns for 261 European banks listed on the stock exchanges of 30 Europeancountries. We extracted the data from Datastream International. The sample period is from January1990 to December 2005 and includes 4168 daily observations. Table 1 describes the sample and theadopted classification.
Table 1, Panel A shows the classification of the 30 European countries and the various groups whichthey belong to, in order to follow our analysis. The largest group, with 12 countries, is the ‘adopters’,
Author's personal copy
4 G. Alexandrou et al. / Research in International Business and Finance 25 (2011) 1–10
Table 1Sample characteristics.
Panel A: classification of European banks according to their home country membership and Euro adoptionEuro-adopters (12) Non-Euro-adopters (3) New-members (10) Non-members (5)
Austria Denmark Cyprus CroatiaBelgium Sweden Czech Republic IcelandFinland England Estonia NorwayFrance Latvia RussiaGermany Slovenia TurkeyGreece MaltaIreland PolandItaly LithuaniaLuxemburg SlovakiaNetherlands HungaryPortugalSpain
Panel B: distribution of banks in our sample data
Group Number of countries Number of banks Percentage (%)
Euro-adopters 12 135 52Non-Euro-adopters 3 26 10New-members 10 54 21Non-members 5 46 18
Total 30 261 100
Panel C: significant events
January 1996 CAD-I introductionJanuary 1998 CAD-II introductionJanuary 1999 Introduction of Euroa
May 2004 EU enlargement – 10 new-members
a In January 2002, the circulation of the Euro as the common European currency, replaced the individual national currenciesof the adopting counties.
i.e., the EU member states that have adopted the Euro. The three EU member states, Denmark, Sweden,and the UK that have not adopted the Euro yet, are classified as ‘non-adopters’. The ‘new-members’group are the 10 countries that joined the EU in May 2004. Finally, five European countries currentlyoutside the EU form the ‘non-members’ group.
Panel B shows the distribution of countries and banks across the groups. There are 261 banks withavailable data, with the majority of 135 banks (52%) in the ‘adopters’ group. Almost a fifth of our sample(54 banks) are banks in the ‘new-members’ group. There are 46 banks (18%) in the ‘non-members’group and 26 banks (10%) comprise the ‘non-adopters’.
Panel C lists major recent developments that have affected the European banking industry. Theintroduction of CAD-I in 1996 and CAD-II in 1998, the adoption of the Euro in 1999 and the accessionof the ten new-member states in 2004 are the most significant events in the European banking sector.We expect that events will have a measurable impact on the level of integration for the bankingindustry.
For the four bank groups, Table 2 reports descriptive statistics. We calculate stock returns as follows:
Rit = ln (Pit) − ln (Pit−1) (1)
where Pit = stock price of bank i on day t, Pit−1 = stock price of bank i on day t − 1 and Rit = logarithmicreturns of the stock price of bank i on day t.
The mean daily return of each group of banks is calculated as follows:
Rt =∑N
t=1Rit
N(2)

Author's personal copy
G. Alexandrou et al. / Research in International Business and Finance 25 (2011) 1–10 5
Table 2Descriptive statistics.
Mean Variance Skewness Kurtosis JB ARCH ADF
Euro-adopters 0.00032 0.0039 −0.5442 9.7081 8020.096a 151.72b −27.918c(3)Non-euro-adopters 0.00009 0.0004 0.0810 7.2471 3137.291a 4.21b −32.668c(3)New-members 0.00053 0.0123 2.1204 41.1523 255914.4a 147.45b −29.856c(3)Non-members 0.00061 0.0078 0.0048 8.3274 4927.792a 75.90b −29.290c(3)
Notes: Euro-adopters, non-Euro-adopters, new-members and non-members denote the stock returns of banks in the Euro-adopters group, the non-Euro adopters group, the new-members group and the group of countries outside Euro. JB denotes theJarque Bera normality test. ADF denotes the augmented Dickey Fuller unit root test. In parentheses next to the ADF test statisticis the number of lags in the ADF regression.
a Denotes rejection of the null hypothesis of normality, for the Jarque Bera test.b Denotes rejection of the null hypothesis of homoskedasticity at the 5% level.c Denotes rejection of the null of hypothesis of non-stationarity for the ADF test.
where R̄t = average (mean) bank returns on day t, Rit = return of bank i on day t, N = number of banksincluded in each group.
‘Non-members’ have the highest mean daily stock return (0.061%) and volatility (0.78%), withthe ‘non-adopters’ experiencing the lowest return (0.009%) and volatility (0.04%). All bank groups,however, show excess kurtosis implying fatter tails, so that extreme values are more likely than forhaving a normal distribution. The Jarque Bera statistic indicates that all bank stock returns series arenon-normal. Using the Augmented Dickey–Fuller test for unit roots, we find that all stock returns foreach group of banks are stationary.
4. Methodology
We employ univariate and bivariate GARCH models to examine the level of volatility and error ofbank returns for different periods of investigation. The univariate GARCH model for the return andvariance equation is2:
Rt = ˛0 +n∑
i=1
˛iRt−n + εt (3)
ht = Var(εt) = ˇ0 +n∑
p=1
ˇp(ST)ARCHt−p +n∑
q=1
ˇq(ST)GARCHt−q (4)
The parameter restrictions ˇ0(ST) > 0, ˇp(ST) ≥ 0, ˇq(ST) ≥ 0 and ˇp(ST) + ˇq(ST) < 1 ensure that thestochastic process {�t} is well-defined (i.e., ht > 0∀t) and the covariance is stationary with E(�t) = 0,Var(�t) = ht and Cov(�t,�s) = 0, t /= s.
Among GARCH models, the bivariate GARCH approach is the most widely used in time-varyingsecond moments studies. The GARCH-BEKK model successfully overcomes the problems associatedwith previous approaches, like the requirement of the definite matrix Ht to be positive, which does notalways hold. Similarly, previous approaches examining volatility spillovers also imposed the restric-tion for the estimated variance to be greater than zero. In contrast, the GARCH-BEKK parameterisationis specified so that no restrictions are required to ensure a positive definite Ht matrix.
The bivariate GARCH-BEKK model (Engle and Kroner, 1995) for the return and variance is:
Rt+1 = ˛0 +n∑
i=1
R(t+1)−n + εt+1 (5)
2 See Bollerslev (1986) and Bollerslev et al. (1992) for further details of the GARCH model. We use the BHHH method in Berndtet al. (1974) for model estimation.

Author's personal copy
6 G. Alexandrou et al. / Research in International Business and Finance 25 (2011) 1–10
E(εt) = E(Rt+1 − �(ST)) (6)
Ht+1 = CC ′ + B′HtB + A′εt × ε′tA (7)
where �(ST) is the long-term drift coefficient for the constant.Given a sample of T observations of the returns vector, Rt+1, the parameters of the bivariate systems
are estimated by computing the conditional log-likelihood function for each time period as:
Lt(�) = − log 2� − 12
log |Ht+1| − 12
E(εt)′(�)H−1
t (�)E(εt)(�)
and,
L(�) =T∑
t=1
Lt(�) (8)
where � is the vector of all parameters.Numerical maximization of the log-likelihood function following the algorithm of Berndt et al.
(1974), yields the maximum likelihood estimates and associated asymptotic standard errors.
5. Empirical results
We report the empirical findings on the process of banking sector integration as indicated by therelevant GARCH’s coefficients in relation to the adoption of CAD-I, CAD-II, the introduction of the Euroand the accession of new-members.
5.1. The effects of CAD-I, CAD-II and the introduction of the Euro
Table 3 reports the results from estimating the univariate R(k)-GARCH (p,q) model in Eqs. (3) and(4). We test the null hypothesis of no ARCH and GARCH differences (i.e. one ARCH and GARCH lag)against the alternative of an ARCH or GARCH difference (for example two ARCH or GARCH lags). Thenull hypothesis is equivalent to a low level of heteroscedasticity and thus, to the linear R(k)-GARCH(1,1). The standard Akaike and Schwartz Information Criteria are used to test the hypothesis.
In Panels A and B of Table 3, we report that the log-likelihood value is significantly higher forthe R(k)-GARCH (1,1) model (15270.11) than for either the R(k)-GARCH (1,2) models (10411.06 and8403.35) or the R(k)-GARCH (2,1) models (8507.60) in the period before the introduction of Euro.3 Forthe groups of adopters, new-members and non-members, the Akaike and Schwartz criteria4 suggestthat the null hypothesis of no ARCH and GARCH differences is rejected and higher level R(k)-GARCH(p,q) models are favoured over the R(k)-GARCH (1,1) model. In addition, the Akaike and Schwartzcriteria favours the R(k)-GARCH (3,2) model for the new-member group in the post-adoption period.The two periods of investigation, therefore, exhibit a volatility of variety patterns since there are ARCHand GARCH differences.
In particular, the ARCH effects (the sum of ˇp(ST) coefficients) for the group of adopters are higherin the first period (i.e. before the introduction of Euro) (0.221) than the second period (i.e. after theintroduction of Euro) (0.094). The same result holds for the group of non-adopters (0.082 versus0.049) and the group of new-members (0.672 versus 0.228 − 0.327 + 0.190 = 0.091). In contrast, forthe group of non-members, the ARCH effects in the first period are lower than in the second period(0.222 − 0.106 = 0.116 versus 0.134). The reverse applies for the GARCH effects (the sum of ˇq(ST) coeffi-cients), which are lower in the first period than the second period for the adopters (0.160 + 0.512 = 0.672versus 0.864), the non-adopters (0.902 versus 0.948) and the new-members (0.229 + 0.375 = 0.604versus 1.451 − 0.551 = 0.900), but higher in the first period than the second one for the non-members(0.878 versus 0.795).
3 The period before the introduction and adoption of Euro by 11 countries covers the years from 1990 to 1998 and includesthe introduction of CAD-I and CAD-II.
4 Akaike and Schwartz criteria are not reported, but are available upon request.

Author's personal copy
G. Alexandrou et al. / Research in International Business and Finance 25 (2011) 1–10 7
Table 3The Impact of CAD-I, CAD-II and the adoption of the Euro on volatility for bank equities over the periods of 1990–1998 and1999–2005.
Panel A: period: 1990–1998 Euro-adopters Non-euro-adopters New-members Non-members
Return equation R(1) R(1) R(1) R(1)
C 0.174E−3***(3.11) 0.190E−4***(2.73) −0.170E−4(−0.91) 0.021E−2**(2.26)R(1) 0.262***(11.44) 0.126***(6.06) 0.388***(106.21) −0.0650***(−2.80)GARCH equation GARCH (1,2) GARCH (1,1) GARCH (1,2) GARCH (2,1)C 1.14E−5***(11.53) 2.87E−8***(5.19) 1.29E−7***(8.0889) 0.10E-5***(13.468)ARCH (1) 0.221***(12.13) 0.082***(10.79) 0.672***(31.87) 0.222***(10.58)ARCH (2) −0.106***(−5.13)GARCH (1) 0.160***(4.06) 0.902***(99.60) 0.229***(6.87) 0.878***(131.71)GARCH (2) 0.512***(12.67) 0.375***(13.70)(ARCH + GARCH) <1 0.893 0.984 1.276 0.994Log-likelihood 10411.06 15270.11 8403.35 8507.60
Panel B: period: 1999–2005 Euro-adopters Non-Euro-adopters New-members Countries outside EU
Return equation R(1) R(1–2) R(1) R(1)
C 0.045E−2***(5.19) 0.0103E−3(1.38) 0.066E−2***(4.71) 0.102E2***(5.73)R(1) 0.110***(4.37) −0.038**(−2.06) 0.052***(1.81) 0.067***(2.80)R(2) −0.0392**(−2.0634)GARCH GARCH (1,1) GARCH (1,1) GARCH (3,2) GARCH (1,1)C 0.792E−6***(5.16) 0.538E−9***(3.08) 0.134E−5(6.07)*** 0.516E−5***(9.25)ARCH (1) 0.094***(9.39) 0.049***(9.24) 0.228(9.54)*** 0.134***(11.05)ARCH (2) −0.327(−10.62)***ARCH (3) 0.190(12.95)***GARCH (1) 0.864***(58.25) 0.948***(194.87) 1.451(28.86)*** 0.795***(55.26)GARCH (2) −0.551(−14.25)***(ARCH + GARCH) <1 0.958 0.997 0.991 0.929Log-likelihood 7487.762 11807.39 6444.580 6251.252
Notes: Numbers in parentheses are z-statistics. *, **, *** declare significance at the 10%, 5% and 1% significance level, respectively.The lag selection over the return and variance equation for the various GARCH models has been achieved using the Akaike andSchwartz criteria. The results are not reported due to limited space, but are available upon request.
The ARCH and GARCH effects (the sum of ˇp(ST) + ˇq(ST)) are lower in the first period than in thesecond period (0.893 versus 0.958) for the adopters and marginally lower for the non-adopters (0.984versus 0.997). In contrast, the ARCH and GARCH effects are higher in the first period than in thesecond period for the new-members (1.276 versus 0.991) and for the non-members (0.994 versus0.929).
Furthermore, we examine the significance of the difference of the average ARCH effects, GARCHeffects and the sum of the ARCH and the GARCH effects between the two periods. The first hypothesisof equality of the overall ARCH effects between the two periods is rejected at the 1% significancelevel (t = 5.49). Similarly, the second hypothesis of equality of the overall GARCH effects between thetwo periods is also rejected at the 5% significance level (t = 2.27). Finally, the third hypothesis, whichconsiders the equality of the sum of the ARCH and the GARCH effects between the two periods, isalso rejected at the 10% significance level (t = 1.66). Our results are in line with those of Bartram et al.(2005) for the univariate GARCH analysis.
5.2. The effect of Euro adoption and the expansion of the EU
We also investigate the differential impact of the adoption of the Euro on bank stock returnsbetween the adopters and the non-adopters. Specifically, we examine whether the decision of threeEU member states (i.e. Denmark, Sweden and the UK) not to adopt the Euro had an impact on thelevel of integration for the banking industry within the EU. Similarly, we also explore the differentialimpact of the EU’s 2004 enlargement on the banking industry outside the EU, that is, between thenew-members and non-members.

Author's personal copy
8 G. Alexandrou et al. / Research in International Business and Finance 25 (2011) 1–10
Table 4Bivariate transitions of news for the period after the circulation of Euro.
Panel A: circulation of Euro period: (January 2002–April 2004) – Euro-adopters (1), non-Euro-adopters (2)
Return equation of Euro-adopters Return equation of non-Euro-adopters
C 0.162E−3(1.28) C 0.437E−5(0.35)R1 (1) 0.148***(5.49) R2 (1) 0.779E−2(0.29)R1 (2) 0.025(0.93) R2 (2) −0.076***(−2.84)
Bivariate GARCH equation transmission of volatility and error between the Euro-adopters: GARCH (1,1) and thenon-Euro adopters: GARCH (1,1)
�1(ST) 0.372E−3***(3.46)�2(ST) 0.131E−4(1.13)c11(ST) 0.107E−2***(9.21)c12(ST) 0.192E−4**(2.218)c22(ST) 0.264E−7(0.25E−3)b11(ST) 0.904***(60.94)b12(ST) −0.003***(−3.90)b21(ST) 0.123(1.54)b22(ST) 0.990***(252.35)˛11(ST) 0.356***(12.61)˛12(ST) 0.012***(6.83)˛21(ST) −0.317(−1.22)˛22(ST) 0.143***(7.98)Log-likelihood 17161.73Null hypothesis: the volatility and error transmission between the Euro-adopters and non-Euro-adopters is zeroChi-squared (8) 1506307.95(0.000)Null hypothesis: the residuals of the Euro-adopters and non-Euro-adopters are equalLR 6410.58(0.000)
Panel B: expansion of EU period: May 2004–2005 – new-members (1), non-members (2)
Return equation of new-members Return equation of non-members
C 0.105E−2***(3.766) C 0.161E−2***(4.78)R1 (1) 0.129***(2.68) R2 (1) 0.100**(2.08)
Bivariate GARCH equation transmission of volatility and error between the new-members: GARCH (1,1) and thenon-members: GARCH (1,2)�1(ST) 0.887E−3***(3.242)�2(ST) 0.203E−2***(8.50)c11(ST) 0.433E−2***(9.76)c12(ST) 0.959E−4(0.22)c22(ST) 0.171E−4(0.56E−3)b11(ST) 0.477***(3.45)b12(ST) −0.076(−0.53)b21(ST) 0.102***(2.58)b22(ST) 0.866***(19.52)˛11(ST) 0.350***(8.12)˛12(ST) 0.041(0.55)˛21(ST) −0.035(−0.414)˛22(ST) 0.502***(7.62)Log-likelihood 4017.29Null hypothesis: the volatility and error transmission between the new-members and non-members is zeroChi-squared (8) 3817.05(0.000)Null hypothesis: the residuals of the new-members and non-members are equalLR 141.47(0.000)
Notes: Numbers in parentheses are t-statistics. *, **, *** declare significance at the 10%, 5% and 1% significance level, respectively.�2(ST) is the long- term coefficient which replaces the expected value of the return equation: ˛0 +
∑n
i=1R(t+1)−n , �2 is the long-
term coefficient which replaces the expected value of the return equation: ˛0 +∑n
i=1R(t+1)−n , c11(ST) is the constant coefficient
of the variance equation for the first series, c12(ST) is the joint constant coefficient of the two variables for the joint varianceequation, c22(ST) is the constant coefficient for the variance equation of the second variable, b11(ST) declares volatility persistencefor series 1, b12(ST) indicates volatility transmission from the second variable to the first variable, b21(ST) indicates volatilitytransmission from the first variable to the second variable, b22(ST) indicates volatility persistence for the second series, ˛11(ST)
indicates level of noise persistence for the first series, ˛12(ST) indicates transmission of noise from the second variable to thefirst variable, ˛21(ST) indicates transmission of noise from the first variable to the second variable and ˛22(ST) indicates level ofnoise persistence for the second variable.
Author's personal copy
G. Alexandrou et al. / Research in International Business and Finance 25 (2011) 1–10 9
We use a bivariate R(k)-GARCH-BEKK model to measure the level of integration of bank stockreturns in the group of adopters and non-adopters. We focus on the period following the adoptionof the Euro and that before the EU expansion (e.g. from May 2004 and subsequently to the end of2005). We test the difference on the measurement of integration between these events consideringthe volatility and noise transmission between the Euro-adopters and non-Euro-adopters and betweenthe new-members and non-members.
Panel A of Table 4 reports the results for the R(k)-GARCH-BEKK model during the period of theEuro for the adopters and non-adopters. it is rejected the null hypothesis of no volatility depen-dence. This happens due to the significantly unilateral transmission of volatility (b12(ST)) from thenon-adopters to the adopters (−0.003), implying that a 1% increase in volatility for the non-adoptersresults in a 0.3% decrease in volatility for the adopters. There is also a significantly unilateral trans-mission of noise (a12(ST)) from the non-adopters to the adopters (0.012), implying that a 1% increasein noise for the non-adopters results in a 1.2% increase in noise to the adopters. The likelihood ratiotest (LR = 6410.58) further supports this result. Thus, the period of the Euro is characterized by partialvolatility dependence (one-direction integration), as it has been identified by the R(k)-GARCH-BEKKtechnique.
The results for testing the volatility spillovers between the new-members and non-members arereported in Panel B. The null hypothesis of no volatility dependence is rejected. Specifically, wefind that the volatility is transmitted from the new-members to the non-members (b21(ST) = 0.102)in the period following the accession of the new-members to the EU, in May 2004. This meansthat a 1% increase in volatility from the new-members results in a 10.2% increase in volatilityto the non-members. Comparing this result with that of volatility spillovers following the intro-duction of the Euro, we observe that in the second, post-enlargement period, a different level ofdependence (different type of integration) is evident. This result suggests that there are no bilat-eral volatility spillover effects between the new-members and non-members, but only unilateralvolatility dependence between them. The likelihood ratio test (LR = 141.47) further supports thisfinding.
Overall, our results show that there is a different pattern of volatility and noise spillover effects forthe different periods under examination and as well for the different groups of countries. Fratzscher(2002) examined market integration between the adopters and non-adopters and reported that therewas high volatility, especially after the adoption of the Euro. We find that for the first period, followingthe introduction of the Euro, there are negative volatility spillover effects from the group of non-adopters to the group of adopters. In particular, there is a negative (b12(ST) = −0.003) and statisticallysignificant (t = −3.90) volatility spillover effect from the group of the non-adopters to the group ofthe adopters. In contrast, the larger positive volatility spillover (b21(ST) = 0.123) from the adoptersto the non-adopters is not statistically significant (t = 1.54). Over the second period, following theexpansion of the EU, we find that the volatility spillover from the new-members to the non-membersis positive (b21(ST) = 0.102) and statistically significant (t = 2.58). In contrast, the effect in the oppositedirection, that is, the volatility spillover from the non-members to the new-members is negative(b12(ST) = −0.076) and statistically insignificant (t = −0.53).
6. Conclusions
We examine the changes in the level of integration in the European banking industry followingthe Second Banking Directive (1989). We examine the impact of the introduction of the Euro on thevolatility of bank stock returns in various portfolios over the period from 1990 to 2005. In particular,at the first stage we compare the bank stock returns in the groups of adopters, non-adopters, new-members and non-members and investigate the impact of the introduction of CAD-I, CAD-II and theEuro and at the second stage the impact of the EU enlargement in May 2004.
The results reveal that the introduction of the Euro has changed the level of volatility and integrationin the banking industry not only for the adopters, but also for the non-adopters, new-members andnon-members. in particular, the level of volatility in all the above groups of countries has decreasedafter the impact of CAD-I, CAD-II and the adoption of the Euro, while the change in volatility and erroris larger for those countries that have not adopted the Euro (non-adopters). Our findings on the effect
Author's personal copy
10 G. Alexandrou et al. / Research in International Business and Finance 25 (2011) 1–10
of the EU enlargement in May 2004 indicate that volatility and error have increased more for the newentrants (new-members) compared to those that have not entered (non-members).
Our findings suggest that volatility and error transmission of the bank stock returns have increasedfor the adopters and non-adopters. There is an increase, therefore, in the level of European bankingintegration following the introduction of the Euro. However, we conclude that there are only unilateralspillover effects among the above groups of countries. We find that the degree of market integration isaffected not only by the adopters but also by the non-adopters. Overall, we conclude that the adoptionof the Euro has a positive effect on the integration of the European banking industry.
We believe that our findings have significant economic and political implications in respect tothe assessment of the efficacy of significant economic decisions of the EU on securities and financialinvestments. Moreover, international agencies, like the ECB and IMF, might also gain useful insightson how their recommendations, adopted into EU directives, might affect the European banking sector.
References
Adam, K., Jappelli, T., Menchini, A., Padula, M., Pagano, M., 2002. Analyse, Compare, and Apply Alternative Indicators and Mon-itoring Methodologies to Measure the Evolution of Capital Market Integration in the European Union. CESF, University ofSalerno.
Bartram, S., Taylor, S.T., Wang, Y.H., 2005. The Euro and European Market Integration. Unpublished Working Paper. EuropeanCentral Bank.
Bartram, S., Dufey, G., 2001. International portfolio investment: theory, evidence and institutional framework. financial markets.Inst. Instrum. 10, 85–155.
Berndt, E.K., Hall, H.B., Hall, R.E., Hausman, J.A., 1974. Estimation and Inference in nonlinear structural models. Ann. Econ. Soc.Meas. 4, 653–666.
Bollerslev, T., 1986. Generalized autoregressive conditional heteroscedasticity. J. Econ. 31, 307–327.Bollerslev, T., Chou, R.Y., Kroner, K.F., 1992. ARCH Modeling in finance: a review of the theory and empirical evidence. J. Economet.
52, 5–60.Caporale, G.M., Pittis, N., Spagnolo, N., 2006. Volatility transmission and financial crises. J. Econ. Finance 30 (3), 376–390.Engle, R.F., Kroner, K.F., 1995. Multivariate simultaneous generalized ARCH. Econ. Theory 11, 122–150.Fratzscher, M., 2002. Financial market integration in europe: on the effects of emu on stock markets. Int. J. Finance Econ. 7,
165–194.Hamao, R., Masulis, R., Ng, V., 1990. Correlation in price changes and volatility across international stock markets. Rev. Finan.
Stud. 3, 281–307.Kearney, C., Lucey, B., 2004. Equity market integration—an overview. Int. Rev. Finan. Anal. 13 (5), 571–583.Koutmos, G., 1996. Modelling the dynamic interdependence of major european stock markets. J. Business Finance Account. 23
(7), 975–989.Koutmos, G., Booth, G., 1995. Asymmetric volatility transmission in international stock markets. J. Int. Money Finance 14,
747–762.Lin, W.L., Ito, T., 1994. Price Volatility and Volume Spillovers between the Tokyo and New York Indexes in the Estimation of
Time-Varying Betas. Royal Melbourne Institute of Technology, Mimeo.Singh, P., Kumar, B., Pandey, A., 2010. Price and volatility spillovers across north american, european and asian stock markets.
Int. Rev. Finan. Anal. 19, 55–64.