developments in the economies of member states outside the eurozone
TRANSCRIPT
Developments in the Economies of MemberStates Outside the Eurozonejcms_2182 251..274
RICHARD CONNOLLYUniversity of Birmingham
Introduction
As 2009 ended, the global economy began to recover from the deepestrecession in the post-war period. This recovery continued into 2010, withstrong growth in many of the world’s major emerging economies – espe-cially China and India – along with a firm rebound in the two largestadvanced economies, the United States and Japan. This recovery was aidedby the continuation of a historically unique, accommodative monetarypolicy in all of the world’s important economies. Outside some Europeaneconomies afflicted by sovereign debt risks, most countries also continuedto pursue expansionary fiscal policies. These factors caused internationaltrade to grow at 12.3 per cent, wiping out the catastrophic fall of 11.3 percent in 2009 (OECD, 2010). Asset and commodity prices grew at a healthypace, with much of the losses of the Great Recession all but made up by theend of 2010. This generated higher levels of inflation, which in 2009 hadthreatened to turn negative, leading to a slight increase to 1.8 per cent,easing earlier concerns that the world might enter a deflationary spiral ofthe sort that characterized the Great Depression. Globally, unemploymentalso began to fall slightly, albeit at a much slower rate than in previousperiods of recovery from severe recession. Indeed, this reflected the generalpattern of the global recovery: slow, steady, but also uncertain. And theissue of most importance to the long-term prospects for the global economy– the persistent and large current account imbalances that were arguably
JCMS 2011 Volume 49 Annual Review pp. 251–273
© 2011 The Author(s)JCMS: Journal of Common Market Studies © 2011 Blackwell Publishing Ltd, 9600 Garsington Road, Oxford OX4 2DQ, UK and 350 MainStreet, Malden, MA 02148, USA
the ultimate cause of the Great Recession – remained unsolved (Wolf,2009).
Within Europe, the patterns of recovery reflected those at the global level.Following a savage 4.6 per cent contraction in output in 2010, gross domesticproduct (GDP) increased by 2.3 per cent across the European Union (EU) asa whole. This pace of recovery was slow compared to previous recoveries,and a number of significant risks remained, including: heightened fears of thesolvencies of a number of sovereigns across the region; concerns over thehealth of the European banking system which is extremely exposed to sov-ereign default risks; and evidence of persistently subdued domestic demand,especially in the private sector. The recovery – for those economies thatexperienced it – was largely based on either external demand – manifested inthe rapid rebound in international trade, and stimulated by strong domesticdemand in major emerging economies; or by the actions of public authorities,with the maintenance of large fiscal deficits, alongside loose monetary poli-cies, helping to compensate for anaemic private sector activity, illustrated bya slow rebound in the rate of investment. Output slowed in the second half of2010 as demand from emerging economies began to decelerate and domesticstocks were rebuilt. Furthermore, not only was the recovery sluggish, but theaverage growth rate of 2.3 per cent obscured considerable heterogeneity.While growth exceeded 3 per cent in Germany, Poland, Slovakia and Sweden,negative growth was observed in Greece, Ireland, Latvia, Romania and Spain.
This article assesses how the broader trends in the wider global andEuropean economies outlined above affected the performance of the ten EUeconomies outside the eurozone in 2010.1 In particular, it will examine thesources of recovery and attempts to explain the heterogeneous nature of therecovery. Overall, it will be argued that the strength of recovery was deter-mined by how much each of the economies was (a) able to benefit from theacceleration in international trade that boosted demand for European exports;and (b) constrained by balance sheet weaknesses – both public and private –that held back growth in domestic demand. Where an economy was posi-tioned with regard to these two variables explained the majority of variationin the rate of recovery. Section I gives an overview of key economic perfor-mance indicators. Section II explores the determinants of the heterogeneity ofthe recovery. Section III summarizes key developments in each of the tenEuropean economies outside the eurozone. The final section provides a briefsummary and suggests key issues for the year ahead.
1 Because the EU gave final approval for Estonia’s entry into the eurozone in July 2010, Estonia is notincluded in the review of 2010. It did not formally enter the eurozone until 1 January 2011. Estonia isincluded in Hodson’s contribution to this volume, which reviews developments in the eurozone.
252 RICHARD CONNOLLY
© 2011 The Author(s)JCMS: Journal of Common Market Studies © 2011 Blackwell Publishing Ltd
I. Economic Performance Outside the Eurozone:Main Economic Indicators
Economic Growth
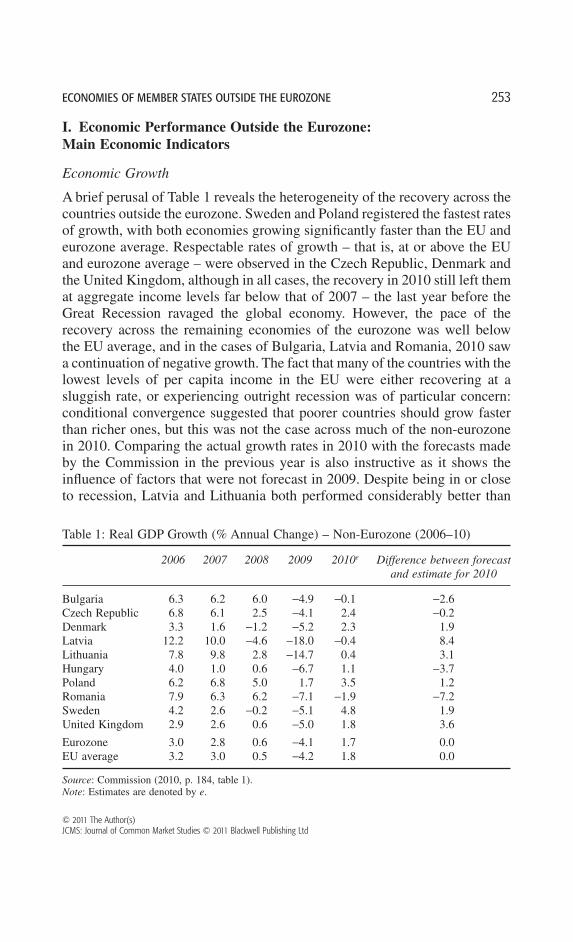
A brief perusal of Table 1 reveals the heterogeneity of the recovery across thecountries outside the eurozone. Sweden and Poland registered the fastest ratesof growth, with both economies growing significantly faster than the EU andeurozone average. Respectable rates of growth – that is, at or above the EUand eurozone average – were observed in the Czech Republic, Denmark andthe United Kingdom, although in all cases, the recovery in 2010 still left themat aggregate income levels far below that of 2007 – the last year before theGreat Recession ravaged the global economy. However, the pace of therecovery across the remaining economies of the eurozone was well belowthe EU average, and in the cases of Bulgaria, Latvia and Romania, 2010 sawa continuation of negative growth. The fact that many of the countries with thelowest levels of per capita income in the EU were either recovering at asluggish rate, or experiencing outright recession was of particular concern:conditional convergence suggested that poorer countries should grow fasterthan richer ones, but this was not the case across much of the non-eurozonein 2010. Comparing the actual growth rates in 2010 with the forecasts madeby the Commission in the previous year is also instructive as it shows theinfluence of factors that were not forecast in 2009. Despite being in or closeto recession, Latvia and Lithuania both performed considerably better than
Table 1: Real GDP Growth (% Annual Change) – Non-Eurozone (2006–10)
2006 2007 2008 2009 2010e Difference between forecastand estimate for 2010
Bulgaria 6.3 6.2 6.0 -4.9 -0.1 -2.6Czech Republic 6.8 6.1 2.5 -4.1 2.4 -0.2Denmark 3.3 1.6 -1.2 -5.2 2.3 1.9Latvia 12.2 10.0 -4.6 -18.0 -0.4 8.4Lithuania 7.8 9.8 2.8 -14.7 0.4 3.1Hungary 4.0 1.0 0.6 -6.7 1.1 -3.7Poland 6.2 6.8 5.0 1.7 3.5 1.2Romania 7.9 6.3 6.2 -7.1 -1.9 -7.2Sweden 4.2 2.6 -0.2 -5.1 4.8 1.9United Kingdom 2.9 2.6 0.6 -5.0 1.8 3.6
Eurozone 3.0 2.8 0.6 -4.1 1.7 0.0EU average 3.2 3.0 0.5 -4.2 1.8 0.0
Source: Commission (2010, p. 184, table 1).Note: Estimates are denoted by e.
ECONOMIES OF MEMBER STATES OUTSIDE THE EUROZONE 253
© 2011 The Author(s)JCMS: Journal of Common Market Studies © 2011 Blackwell Publishing Ltd
expected in the autumn of 2010, as did the United Kingdom. However,Bulgaria, Hungary and Romania all registered much slower growth thanforecast last year.
Employment
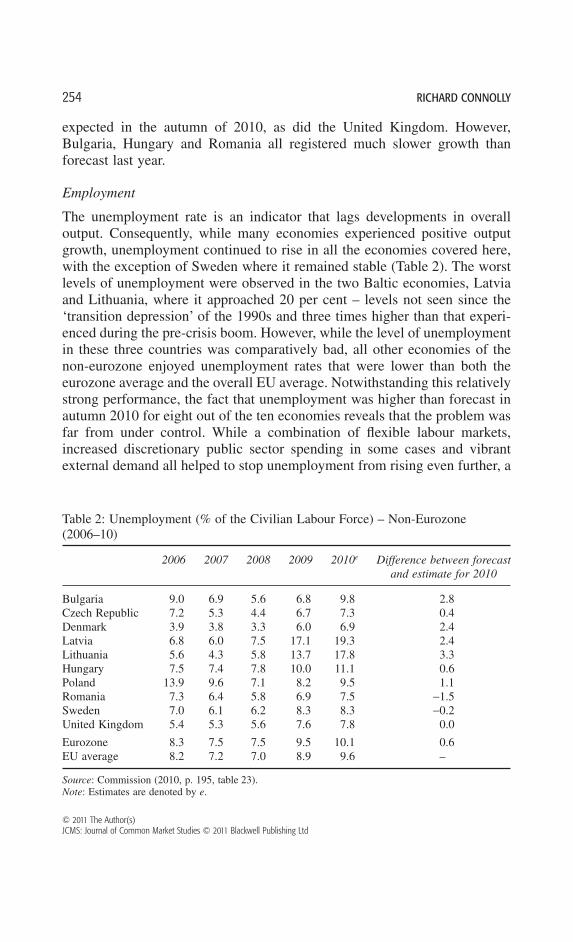
The unemployment rate is an indicator that lags developments in overalloutput. Consequently, while many economies experienced positive outputgrowth, unemployment continued to rise in all the economies covered here,with the exception of Sweden where it remained stable (Table 2). The worstlevels of unemployment were observed in the two Baltic economies, Latviaand Lithuania, where it approached 20 per cent – levels not seen since the‘transition depression’ of the 1990s and three times higher than that experi-enced during the pre-crisis boom. However, while the level of unemploymentin these three countries was comparatively bad, all other economies of thenon-eurozone enjoyed unemployment rates that were lower than both theeurozone average and the overall EU average. Notwithstanding this relativelystrong performance, the fact that unemployment was higher than forecast inautumn 2010 for eight out of the ten economies reveals that the problem wasfar from under control. While a combination of flexible labour markets,increased discretionary public sector spending in some cases and vibrantexternal demand all helped to stop unemployment from rising even further, a
Table 2: Unemployment (% of the Civilian Labour Force) – Non-Eurozone(2006–10)
2006 2007 2008 2009 2010e Difference between forecastand estimate for 2010
Bulgaria 9.0 6.9 5.6 6.8 9.8 2.8Czech Republic 7.2 5.3 4.4 6.7 7.3 0.4Denmark 3.9 3.8 3.3 6.0 6.9 2.4Latvia 6.8 6.0 7.5 17.1 19.3 2.4Lithuania 5.6 4.3 5.8 13.7 17.8 3.3Hungary 7.5 7.4 7.8 10.0 11.1 0.6Poland 13.9 9.6 7.1 8.2 9.5 1.1Romania 7.3 6.4 5.8 6.9 7.5 -1.5Sweden 7.0 6.1 6.2 8.3 8.3 -0.2United Kingdom 5.4 5.3 5.6 7.6 7.8 0.0
Eurozone 8.3 7.5 7.5 9.5 10.1 0.6EU average 8.2 7.2 7.0 8.9 9.6 –
Source: Commission (2010, p. 195, table 23).Note: Estimates are denoted by e.
254 RICHARD CONNOLLY
© 2011 The Author(s)JCMS: Journal of Common Market Studies © 2011 Blackwell Publishing Ltd
more vigorous and broad-based recovery was required if permanent losses topotential output were not to occur.
Inflation
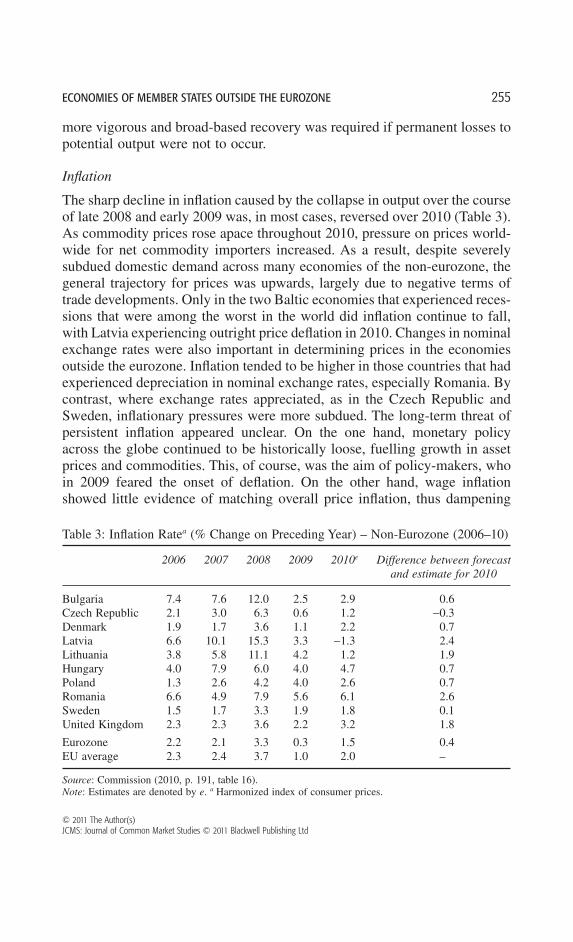
The sharp decline in inflation caused by the collapse in output over the courseof late 2008 and early 2009 was, in most cases, reversed over 2010 (Table 3).As commodity prices rose apace throughout 2010, pressure on prices world-wide for net commodity importers increased. As a result, despite severelysubdued domestic demand across many economies of the non-eurozone, thegeneral trajectory for prices was upwards, largely due to negative terms oftrade developments. Only in the two Baltic economies that experienced reces-sions that were among the worst in the world did inflation continue to fall,with Latvia experiencing outright price deflation in 2010. Changes in nominalexchange rates were also important in determining prices in the economiesoutside the eurozone. Inflation tended to be higher in those countries that hadexperienced depreciation in nominal exchange rates, especially Romania. Bycontrast, where exchange rates appreciated, as in the Czech Republic andSweden, inflationary pressures were more subdued. The long-term threat ofpersistent inflation appeared unclear. On the one hand, monetary policyacross the globe continued to be historically loose, fuelling growth in assetprices and commodities. This, of course, was the aim of policy-makers, whoin 2009 feared the onset of deflation. On the other hand, wage inflationshowed little evidence of matching overall price inflation, thus dampening
Table 3: Inflation Ratea (% Change on Preceding Year) – Non-Eurozone (2006–10)
2006 2007 2008 2009 2010e Difference between forecastand estimate for 2010
Bulgaria 7.4 7.6 12.0 2.5 2.9 0.6Czech Republic 2.1 3.0 6.3 0.6 1.2 -0.3Denmark 1.9 1.7 3.6 1.1 2.2 0.7Latvia 6.6 10.1 15.3 3.3 -1.3 2.4Lithuania 3.8 5.8 11.1 4.2 1.2 1.9Hungary 4.0 7.9 6.0 4.0 4.7 0.7Poland 1.3 2.6 4.2 4.0 2.6 0.7Romania 6.6 4.9 7.9 5.6 6.1 2.6Sweden 1.5 1.7 3.3 1.9 1.8 0.1United Kingdom 2.3 2.3 3.6 2.2 3.2 1.8
Eurozone 2.2 2.1 3.3 0.3 1.5 0.4EU average 2.3 2.4 3.7 1.0 2.0 –
Source: Commission (2010, p. 191, table 16).Note: Estimates are denoted by e. a Harmonized index of consumer prices.
ECONOMIES OF MEMBER STATES OUTSIDE THE EUROZONE 255
© 2011 The Author(s)JCMS: Journal of Common Market Studies © 2011 Blackwell Publishing Ltd
fears of a ‘cost-push’ inflationary spiral. Furthermore, the spike in commodityprices that followed political instability across the Middle East and NorthAfrica threatened to break the commodity bull cycle.
Private Sector Financial Balances
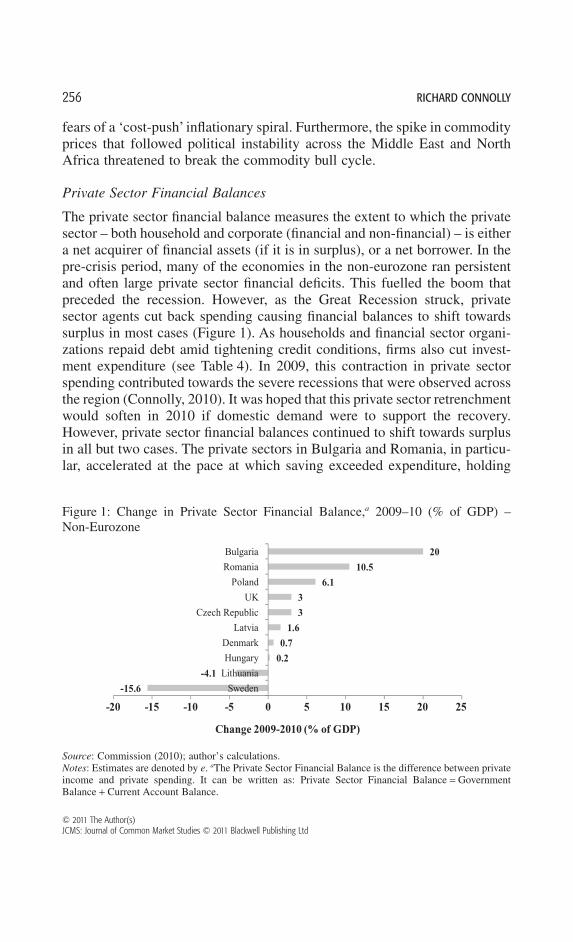
The private sector financial balance measures the extent to which the privatesector – both household and corporate (financial and non-financial) – is eithera net acquirer of financial assets (if it is in surplus), or a net borrower. In thepre-crisis period, many of the economies in the non-eurozone ran persistentand often large private sector financial deficits. This fuelled the boom thatpreceded the recession. However, as the Great Recession struck, privatesector agents cut back spending causing financial balances to shift towardssurplus in most cases (Figure 1). As households and financial sector organi-zations repaid debt amid tightening credit conditions, firms also cut invest-ment expenditure (see Table 4). In 2009, this contraction in private sectorspending contributed towards the severe recessions that were observed acrossthe region (Connolly, 2010). It was hoped that this private sector retrenchmentwould soften in 2010 if domestic demand were to support the recovery.However, private sector financial balances continued to shift towards surplusin all but two cases. The private sectors in Bulgaria and Romania, in particu-lar, accelerated at the pace at which saving exceeded expenditure, holding
Figure 1: Change in Private Sector Financial Balance,a 2009–10 (% of GDP) –Non-Eurozone
-15.6
-4.1
0.2
0.7
1.6
3
3
6.1
10.5
20
-20 -15 -10 -5 0 5 10 15 20 25
Sweden
Lithuania
Hungary
Denmark
Latvia
Czech Republic
UK
Poland
Romania
Bulgaria
Change 2009-2010 (% of GDP)
Source: Commission (2010); author’s calculations.Notes: Estimates are denoted by e. aThe Private Sector Financial Balance is the difference between privateincome and private spending. It can be written as: Private Sector Financial Balance = GovernmentBalance + Current Account Balance.
256 RICHARD CONNOLLY
© 2011 The Author(s)JCMS: Journal of Common Market Studies © 2011 Blackwell Publishing Ltd
back the prospects of a broad-based and robust recovery. This deficiency indomestic demand can be observed elsewhere; even in Poland – the onlycountry to avoid recession in 2009, and where 2010 output growth washealthy – growth was held back by the reluctance of the corporate sector toexpand investment projects. The most obvious exception is Sweden, wherevigorous private sector consumption drove its strong output performance in2010. In all cases where private sector retrenchment continued, growth wasgenerated by either net export growth or through public sector spending, withprivate sector demand muted.
Public Finances
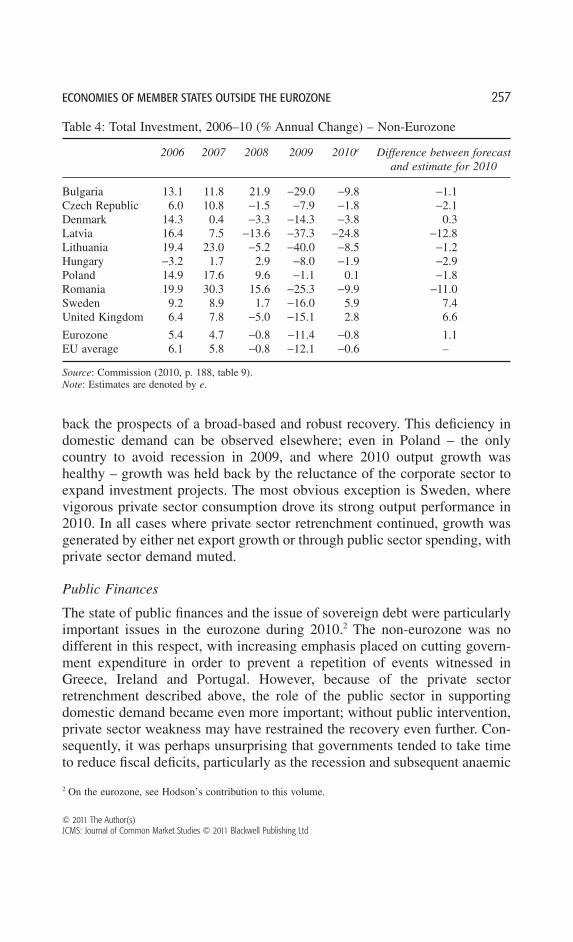
The state of public finances and the issue of sovereign debt were particularlyimportant issues in the eurozone during 2010.2 The non-eurozone was nodifferent in this respect, with increasing emphasis placed on cutting govern-ment expenditure in order to prevent a repetition of events witnessed inGreece, Ireland and Portugal. However, because of the private sectorretrenchment described above, the role of the public sector in supportingdomestic demand became even more important; without public intervention,private sector weakness may have restrained the recovery even further. Con-sequently, it was perhaps unsurprising that governments tended to take timeto reduce fiscal deficits, particularly as the recession and subsequent anaemic
2 On the eurozone, see Hodson’s contribution to this volume.
Table 4: Total Investment, 2006–10 (% Annual Change) – Non-Eurozone
2006 2007 2008 2009 2010e Difference between forecastand estimate for 2010
Bulgaria 13.1 11.8 21.9 -29.0 -9.8 -1.1Czech Republic 6.0 10.8 -1.5 -7.9 -1.8 -2.1Denmark 14.3 0.4 -3.3 -14.3 -3.8 0.3Latvia 16.4 7.5 -13.6 -37.3 -24.8 -12.8Lithuania 19.4 23.0 -5.2 -40.0 -8.5 -1.2Hungary -3.2 1.7 2.9 -8.0 -1.9 -2.9Poland 14.9 17.6 9.6 -1.1 0.1 -1.8Romania 19.9 30.3 15.6 -25.3 -9.9 -11.0Sweden 9.2 8.9 1.7 -16.0 5.9 7.4United Kingdom 6.4 7.8 -5.0 -15.1 2.8 6.6
Eurozone 5.4 4.7 -0.8 -11.4 -0.8 1.1EU average 6.1 5.8 -0.8 -12.1 -0.6 –
Source: Commission (2010, p. 188, table 9).Note: Estimates are denoted by e.
ECONOMIES OF MEMBER STATES OUTSIDE THE EUROZONE 257
© 2011 The Author(s)JCMS: Journal of Common Market Studies © 2011 Blackwell Publishing Ltd
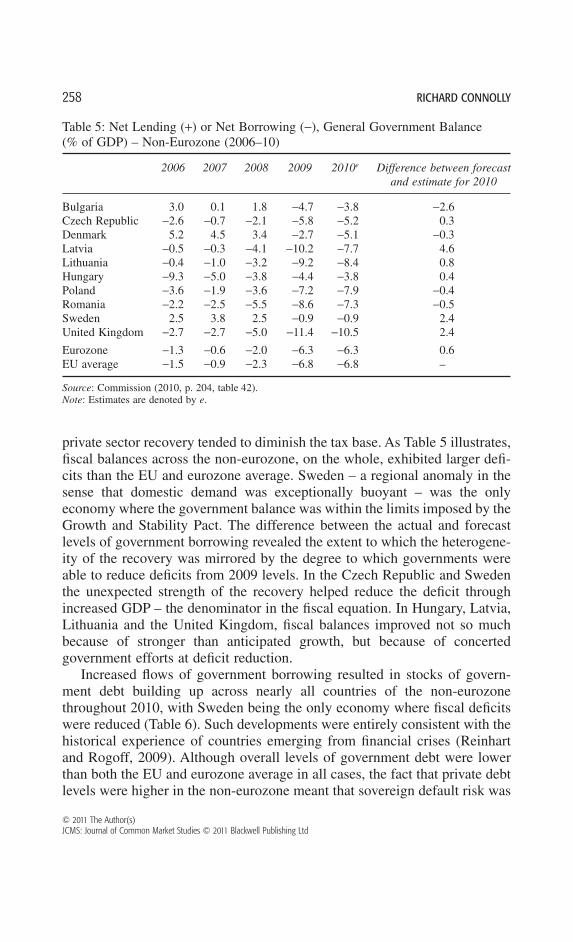
private sector recovery tended to diminish the tax base. As Table 5 illustrates,fiscal balances across the non-eurozone, on the whole, exhibited larger defi-cits than the EU and eurozone average. Sweden – a regional anomaly in thesense that domestic demand was exceptionally buoyant – was the onlyeconomy where the government balance was within the limits imposed by theGrowth and Stability Pact. The difference between the actual and forecastlevels of government borrowing revealed the extent to which the heterogene-ity of the recovery was mirrored by the degree to which governments wereable to reduce deficits from 2009 levels. In the Czech Republic and Swedenthe unexpected strength of the recovery helped reduce the deficit throughincreased GDP – the denominator in the fiscal equation. In Hungary, Latvia,Lithuania and the United Kingdom, fiscal balances improved not so muchbecause of stronger than anticipated growth, but because of concertedgovernment efforts at deficit reduction.
Increased flows of government borrowing resulted in stocks of govern-ment debt building up across nearly all countries of the non-eurozonethroughout 2010, with Sweden being the only economy where fiscal deficitswere reduced (Table 6). Such developments were entirely consistent with thehistorical experience of countries emerging from financial crises (Reinhartand Rogoff, 2009). Although overall levels of government debt were lowerthan both the EU and eurozone average in all cases, the fact that private debtlevels were higher in the non-eurozone meant that sovereign default risk was
Table 5: Net Lending (+) or Net Borrowing (-), General Government Balance(% of GDP) – Non-Eurozone (2006–10)
2006 2007 2008 2009 2010e Difference between forecastand estimate for 2010
Bulgaria 3.0 0.1 1.8 -4.7 -3.8 -2.6Czech Republic -2.6 -0.7 -2.1 -5.8 -5.2 0.3Denmark 5.2 4.5 3.4 -2.7 -5.1 -0.3Latvia -0.5 -0.3 -4.1 -10.2 -7.7 4.6Lithuania -0.4 -1.0 -3.2 -9.2 -8.4 0.8Hungary -9.3 -5.0 -3.8 -4.4 -3.8 0.4Poland -3.6 -1.9 -3.6 -7.2 -7.9 -0.4Romania -2.2 -2.5 -5.5 -8.6 -7.3 -0.5Sweden 2.5 3.8 2.5 -0.9 -0.9 2.4United Kingdom -2.7 -2.7 -5.0 -11.4 -10.5 2.4
Eurozone -1.3 -0.6 -2.0 -6.3 -6.3 0.6EU average -1.5 -0.9 -2.3 -6.8 -6.8 –
Source: Commission (2010, p. 204, table 42).Note: Estimates are denoted by e.
258 RICHARD CONNOLLY
© 2011 The Author(s)JCMS: Journal of Common Market Studies © 2011 Blackwell Publishing Ltd
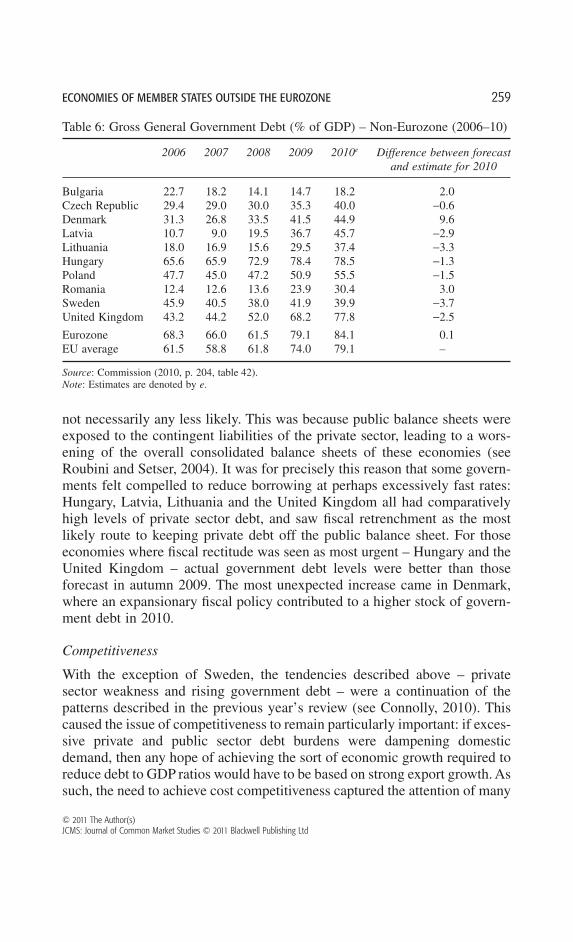
not necessarily any less likely. This was because public balance sheets wereexposed to the contingent liabilities of the private sector, leading to a wors-ening of the overall consolidated balance sheets of these economies (seeRoubini and Setser, 2004). It was for precisely this reason that some govern-ments felt compelled to reduce borrowing at perhaps excessively fast rates:Hungary, Latvia, Lithuania and the United Kingdom all had comparativelyhigh levels of private sector debt, and saw fiscal retrenchment as the mostlikely route to keeping private debt off the public balance sheet. For thoseeconomies where fiscal rectitude was seen as most urgent – Hungary and theUnited Kingdom – actual government debt levels were better than thoseforecast in autumn 2009. The most unexpected increase came in Denmark,where an expansionary fiscal policy contributed to a higher stock of govern-ment debt in 2010.
Competitiveness
With the exception of Sweden, the tendencies described above – privatesector weakness and rising government debt – were a continuation of thepatterns described in the previous year’s review (see Connolly, 2010). Thiscaused the issue of competitiveness to remain particularly important: if exces-sive private and public sector debt burdens were dampening domesticdemand, then any hope of achieving the sort of economic growth required toreduce debt to GDP ratios would have to be based on strong export growth. Assuch, the need to achieve cost competitiveness captured the attention of many
Table 6: Gross General Government Debt (% of GDP) – Non-Eurozone (2006–10)
2006 2007 2008 2009 2010e Difference between forecastand estimate for 2010
Bulgaria 22.7 18.2 14.1 14.7 18.2 2.0Czech Republic 29.4 29.0 30.0 35.3 40.0 -0.6Denmark 31.3 26.8 33.5 41.5 44.9 9.6Latvia 10.7 9.0 19.5 36.7 45.7 -2.9Lithuania 18.0 16.9 15.6 29.5 37.4 -3.3Hungary 65.6 65.9 72.9 78.4 78.5 -1.3Poland 47.7 45.0 47.2 50.9 55.5 -1.5Romania 12.4 12.6 13.6 23.9 30.4 3.0Sweden 45.9 40.5 38.0 41.9 39.9 -3.7United Kingdom 43.2 44.2 52.0 68.2 77.8 -2.5
Eurozone 68.3 66.0 61.5 79.1 84.1 0.1EU average 61.5 58.8 61.8 74.0 79.1 –
Source: Commission (2010, p. 204, table 42).Note: Estimates are denoted by e.
ECONOMIES OF MEMBER STATES OUTSIDE THE EUROZONE 259
© 2011 The Author(s)JCMS: Journal of Common Market Studies © 2011 Blackwell Publishing Ltd
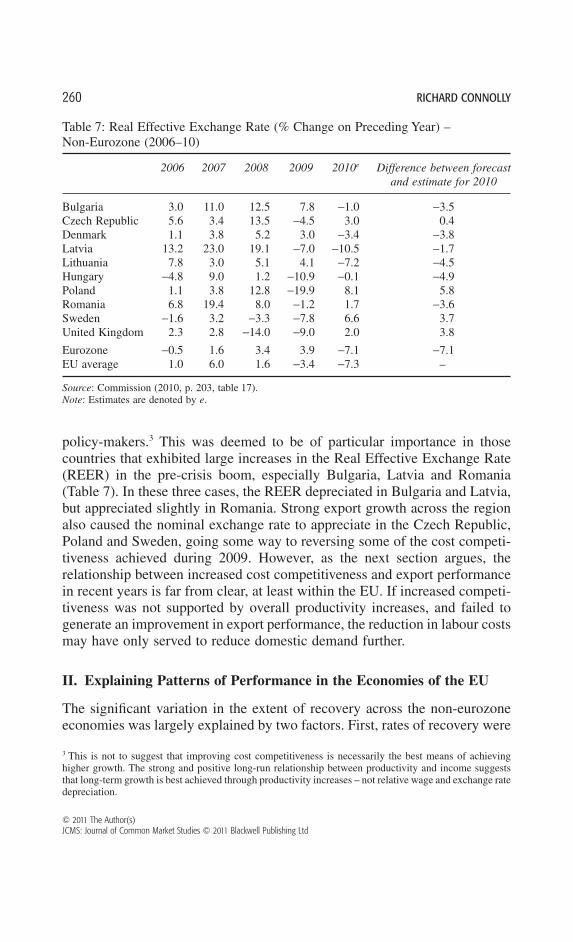
policy-makers.3 This was deemed to be of particular importance in thosecountries that exhibited large increases in the Real Effective Exchange Rate(REER) in the pre-crisis boom, especially Bulgaria, Latvia and Romania(Table 7). In these three cases, the REER depreciated in Bulgaria and Latvia,but appreciated slightly in Romania. Strong export growth across the regionalso caused the nominal exchange rate to appreciate in the Czech Republic,Poland and Sweden, going some way to reversing some of the cost competi-tiveness achieved during 2009. However, as the next section argues, therelationship between increased cost competitiveness and export performancein recent years is far from clear, at least within the EU. If increased competi-tiveness was not supported by overall productivity increases, and failed togenerate an improvement in export performance, the reduction in labour costsmay have only served to reduce domestic demand further.
II. Explaining Patterns of Performance in the Economies of the EU
The significant variation in the extent of recovery across the non-eurozoneeconomies was largely explained by two factors. First, rates of recovery were
3 This is not to suggest that improving cost competitiveness is necessarily the best means of achievinghigher growth. The strong and positive long-run relationship between productivity and income suggeststhat long-term growth is best achieved through productivity increases – not relative wage and exchange ratedepreciation.
Table 7: Real Effective Exchange Rate (% Change on Preceding Year) –Non-Eurozone (2006–10)
2006 2007 2008 2009 2010e Difference between forecastand estimate for 2010
Bulgaria 3.0 11.0 12.5 7.8 -1.0 -3.5Czech Republic 5.6 3.4 13.5 -4.5 3.0 0.4Denmark 1.1 3.8 5.2 3.0 -3.4 -3.8Latvia 13.2 23.0 19.1 -7.0 -10.5 -1.7Lithuania 7.8 3.0 5.1 4.1 -7.2 -4.5Hungary -4.8 9.0 1.2 -10.9 -0.1 -4.9Poland 1.1 3.8 12.8 -19.9 8.1 5.8Romania 6.8 19.4 8.0 -1.2 1.7 -3.6Sweden -1.6 3.2 -3.3 -7.8 6.6 3.7United Kingdom 2.3 2.8 -14.0 -9.0 2.0 3.8
Eurozone -0.5 1.6 3.4 3.9 -7.1 -7.1EU average 1.0 6.0 1.6 -3.4 -7.3 –
Source: Commission (2010, p. 203, table 17).Note: Estimates are denoted by e.
260 RICHARD CONNOLLY
© 2011 The Author(s)JCMS: Journal of Common Market Studies © 2011 Blackwell Publishing Ltd
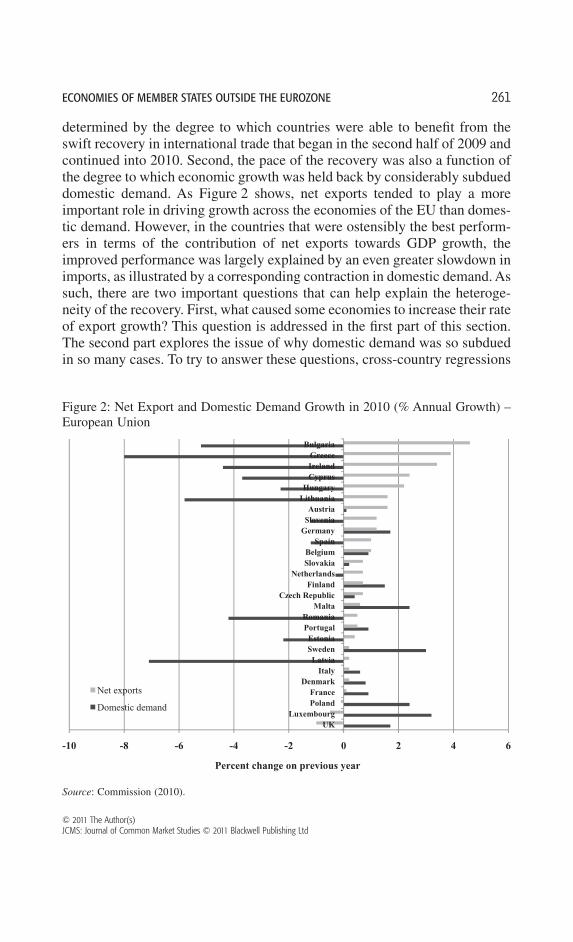
determined by the degree to which countries were able to benefit from theswift recovery in international trade that began in the second half of 2009 andcontinued into 2010. Second, the pace of the recovery was also a function ofthe degree to which economic growth was held back by considerably subdueddomestic demand. As Figure 2 shows, net exports tended to play a moreimportant role in driving growth across the economies of the EU than domes-tic demand. However, in the countries that were ostensibly the best perform-ers in terms of the contribution of net exports towards GDP growth, theimproved performance was largely explained by an even greater slowdown inimports, as illustrated by a corresponding contraction in domestic demand. Assuch, there are two important questions that can help explain the heteroge-neity of the recovery. First, what caused some economies to increase their rateof export growth? This question is addressed in the first part of this section.The second part explores the issue of why domestic demand was so subduedin so many cases. To try to answer these questions, cross-country regressions
Figure 2: Net Export and Domestic Demand Growth in 2010 (% Annual Growth) –European Union
-10 -8 -6 -4 -2 0 2 4 6
UKLuxembourg
PolandFrance
DenmarkItaly
LatviaSwedenEstonia
PortugalRomania
MaltaCzech Republic
FinlandNetherlands
SlovakiaBelgium
SpainGermanySloveniaAustria
LithuaniaHungary
CyprusIrelandGreece
Bulgaria
Percent change on previous year
Net exports
Domestic demand
Source: Commission (2010).
ECONOMIES OF MEMBER STATES OUTSIDE THE EUROZONE 261
© 2011 The Author(s)JCMS: Journal of Common Market Studies © 2011 Blackwell Publishing Ltd
using data from all 27 countries of the EU are used to identify those factorsthat can help explain the variation in export performance and levels of domes-tic demand observed across the non-eurozone.
Why were Some Economies Able to Benefit from the Recovery inInternational Trade?
The economies that experienced the most export growth in 2010 were able tobenefit from the recovery in international trade. But there was much variationin the extent to which individual countries were able to benefit from thisrebound. In order to identify the sources of this variation, on a sample thatincludes all the economies of the EU, real export growth in 2010 wasregressed on several hypothesized determinants. The first variable measuresthe sophistication of a country’s export basket.4 This is to test the hypothesisthat more sophisticated export structures were associated with a more rapidrecovery in export growth. A second variable measures a country’s opennessto trade to test the view that greater trade orientation might facilitate a quickerresponse to the recovery in external trading conditions. The third and fourthmeasures – REER change in 2009 and 2010 – are included to explore whetherchanges in a country’s cost competitiveness were associated with improvedexport performance. Two years are included because it is plausible that theremay be a lag of a year before the effects of changes in competitiveness arerevealed in export performance.
The results of the regression are contained in Table 8. A number of obser-vations can be made on the results from this simple exercise. First, thestructure of a country’s export basket appears to be unrelated to exportperformance in 2010, with ExpY exhibiting a negative association with exportgrowth that is statistically insignificant. Second, trade openness is positivelyrelated to export performance and highly significant. This suggests that it wasthose countries that were already open to trade that were most likely to benefitfrom the recovery in international trade in 2010. A corollary of this is thatcountries, such as Greece, that were not comparatively export-oriented, wereunable to switch quickly to an export-oriented growth model. Finally, changesin competitiveness do not appear to have exerted any influence on export
4 The ExpY measure of export sophistication is also used to measure the relative sophistication of acountry’s export basket. This index measures the productivity level associated with a country’s exportspecialization pattern. ExpY is calculated in two steps. First, using 4-digit SITC.4 product classification(which yields more than 1,000 different products), the weighted average of the incomes of the countriesexporting each traded product are calculated, where the weights are the RCA of each country in thatproduct (normalized so that the weights sum up to 1). This gives the income level of that product, whichis termed ‘ProdY’. Following this, ExpY is then calculated as the weighted average of the ProdY for eachcountry, where the weights are the share of each commodity in that country’s total exports. This methodis taken from Hausmann et al. (2006).
262 RICHARD CONNOLLY
© 2011 The Author(s)JCMS: Journal of Common Market Studies © 2011 Blackwell Publishing Ltd
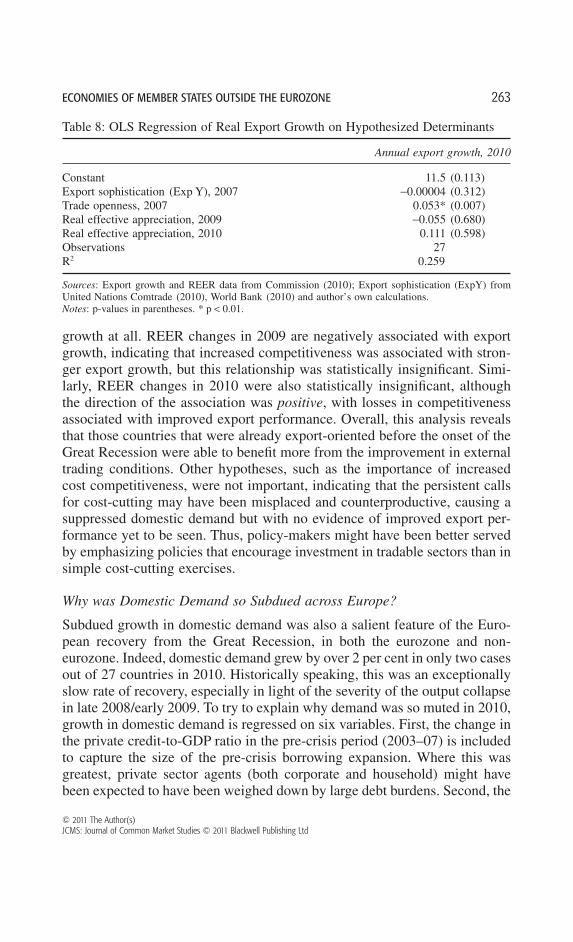
growth at all. REER changes in 2009 are negatively associated with exportgrowth, indicating that increased competitiveness was associated with stron-ger export growth, but this relationship was statistically insignificant. Simi-larly, REER changes in 2010 were also statistically insignificant, althoughthe direction of the association was positive, with losses in competitivenessassociated with improved export performance. Overall, this analysis revealsthat those countries that were already export-oriented before the onset of theGreat Recession were able to benefit more from the improvement in externaltrading conditions. Other hypotheses, such as the importance of increasedcost competitiveness, were not important, indicating that the persistent callsfor cost-cutting may have been misplaced and counterproductive, causing asuppressed domestic demand but with no evidence of improved export per-formance yet to be seen. Thus, policy-makers might have been better servedby emphasizing policies that encourage investment in tradable sectors than insimple cost-cutting exercises.
Why was Domestic Demand so Subdued across Europe?
Subdued growth in domestic demand was also a salient feature of the Euro-pean recovery from the Great Recession, in both the eurozone and non-eurozone. Indeed, domestic demand grew by over 2 per cent in only two casesout of 27 countries in 2010. Historically speaking, this was an exceptionallyslow rate of recovery, especially in light of the severity of the output collapsein late 2008/early 2009. To try to explain why demand was so muted in 2010,growth in domestic demand is regressed on six variables. First, the change inthe private credit-to-GDP ratio in the pre-crisis period (2003–07) is includedto capture the size of the pre-crisis borrowing expansion. Where this wasgreatest, private sector agents (both corporate and household) might havebeen expected to have been weighed down by large debt burdens. Second, the
Table 8: OLS Regression of Real Export Growth on Hypothesized Determinants
Annual export growth, 2010
Constant 11.5 (0.113)Export sophistication (Exp Y), 2007 -0.00004 (0.312)Trade openness, 2007 0.053* (0.007)Real effective appreciation, 2009 -0.055 (0.680)Real effective appreciation, 2010 0.111 (0.598)Observations 27R2 0.259
Sources: Export growth and REER data from Commission (2010); Export sophistication (ExpY) fromUnited Nations Comtrade (2010), World Bank (2010) and author’s own calculations.Notes: p-values in parentheses. * p < 0.01.
ECONOMIES OF MEMBER STATES OUTSIDE THE EUROZONE 263
© 2011 The Author(s)JCMS: Journal of Common Market Studies © 2011 Blackwell Publishing Ltd
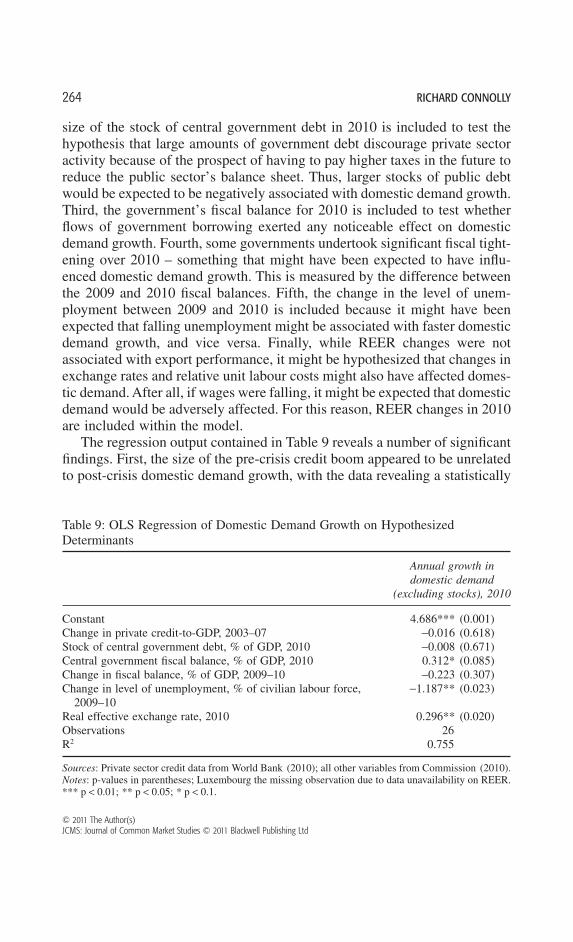
size of the stock of central government debt in 2010 is included to test thehypothesis that large amounts of government debt discourage private sectoractivity because of the prospect of having to pay higher taxes in the future toreduce the public sector’s balance sheet. Thus, larger stocks of public debtwould be expected to be negatively associated with domestic demand growth.Third, the government’s fiscal balance for 2010 is included to test whetherflows of government borrowing exerted any noticeable effect on domesticdemand growth. Fourth, some governments undertook significant fiscal tight-ening over 2010 – something that might have been expected to have influ-enced domestic demand growth. This is measured by the difference betweenthe 2009 and 2010 fiscal balances. Fifth, the change in the level of unem-ployment between 2009 and 2010 is included because it might have beenexpected that falling unemployment might be associated with faster domesticdemand growth, and vice versa. Finally, while REER changes were notassociated with export performance, it might be hypothesized that changes inexchange rates and relative unit labour costs might also have affected domes-tic demand. After all, if wages were falling, it might be expected that domesticdemand would be adversely affected. For this reason, REER changes in 2010are included within the model.
The regression output contained in Table 9 reveals a number of significantfindings. First, the size of the pre-crisis credit boom appeared to be unrelatedto post-crisis domestic demand growth, with the data revealing a statistically
Table 9: OLS Regression of Domestic Demand Growth on HypothesizedDeterminants
Annual growth indomestic demand
(excluding stocks), 2010
Constant 4.686*** (0.001)Change in private credit-to-GDP, 2003–07 -0.016 (0.618)Stock of central government debt, % of GDP, 2010 -0.008 (0.671)Central government fiscal balance, % of GDP, 2010 0.312* (0.085)Change in fiscal balance, % of GDP, 2009–10 -0.223 (0.307)Change in level of unemployment, % of civilian labour force,
2009–10-1.187** (0.023)
Real effective exchange rate, 2010 0.296** (0.020)Observations 26R2 0.755
Sources: Private sector credit data from World Bank (2010); all other variables from Commission (2010).Notes: p-values in parentheses; Luxembourg the missing observation due to data unavailability on REER.*** p < 0.01; ** p < 0.05; * p < 0.1.
264 RICHARD CONNOLLY
© 2011 The Author(s)JCMS: Journal of Common Market Studies © 2011 Blackwell Publishing Ltd
weak and insignificant association between the two variables. The size ofcentral government stocks also appeared to be of little importance in explain-ing changes in domestic demand; although the direction of the associationwas expected (that is, negatively associated with domestic demand growth), itwas statistically insignificant. Third, efforts at fiscal tightening did not appearto have any relationship with changes in domestic demand. While the sign ofthe coefficient indicates that fiscal tightening depressed domestic demand,this relationship was again statistically insignificant. The three other variableswere, however, significant. Of these, the significance was weakest for thecentral government balance in 2010, where smaller deficits were associatedwith higher rates of domestic demand growth. The two variables that exhib-ited the strongest levels of significance were the change in unemployment,and the change in the REER. In terms of changes in the level of unemploy-ment, there was an extremely strong and negative relationship between unem-ployment growth and domestic demand growth. This seems plausible enoughas higher unemployment would be expected to hold back domestic demandgrowth. Finally, changes in the REER were positively associated with growthin domestic demand, with greater appreciation – whether through the nominalexchange rate in countries with floating exchange rates, or through risinglabour costs – linked to higher demand growth. On its own, this suggests thatthe effect of cost-cutting on domestic growth was negative, particularly asdomestic demand typically constituted up to 60–85 per cent of GDP in thecountries under examination here. Taken together with the findings from theregression results in Table 8, these findings indicate that REER depreciationneither helped stimulate export growth, nor did it help stimulate domesticdemand; instead, REER depreciation appeared to serve only to suppresseconomic activity in 2010.
To sum up, it is evident from the first regression analysis carried out herethat export growth in 2010 was related to one factor: whether a country wasopen and trade-oriented prior to the onset of the Great Recession. If theywere, they tended to benefit more from the improvement in external tradingconditions. Other hypotheses, such as the importance of increased cost com-petitiveness, were not important. Explaining variation in domestic demandgrowth was more complicated. Changes in the REER and unemploymentwere the two most important factors in explaining why domestic demandgrowth varied across the region. If the REER depreciated, and if unemploy-ment rose, domestic demand growth tended to be much lower. Perhaps sur-prisingly, government efforts in undertaking fiscal tightening were notimportant; neither was the extent of the pre-crisis credit boom. In the follow-ing section, the importance of the variables that were identified as importantin the cross-country analysis is explored at the individual country level.
ECONOMIES OF MEMBER STATES OUTSIDE THE EUROZONE 265
© 2011 The Author(s)JCMS: Journal of Common Market Studies © 2011 Blackwell Publishing Ltd
III. Economic Developments in the Non-Eurozone
Bulgaria
Compared to many of its neighbours, the recession in Bulgaria began quitelate, with the contraction in output continuing into the first quarter of 2010.Estimates differ, but GDP was estimated to have been flat over 2010. Thisrelatively poor performance was driven by exceptionally depressed domesticdemand, with gross fixed capital formation falling by 11.8 per cent in 2010,private consumption declining by 3.6 per cent, and – due to efforts to reducepublic expenditure at a fast pace – public consumption contracting by 2.4 percent. Unemployment increased from 6.8 per cent in 2009 to 9.8 per cent in2010, with many labour intensive sectors, such as construction, particularlybadly affected. In line with the rise in unemployment, real labour costs fell by1 per cent over the year. Thus, according to the preceding analysis, Bulgariahad all the elements required for a slump in domestic demand. In addition,Bulgaria had experienced a higher than average pre-crisis expansion inprivate credit – an expansion that was in the process of unwinding over 2010.As a result, private sector balance sheet adjustments were also importantfactors in restraining domestic demand growth. Fortunately, strong exportgrowth – and imports that barely grew at all – helped net exports make thelargest contribution to GDP growth during the year, perhaps causing Bulgariato avoid another year of recession. At 135 per cent of GDP, the sum ofBulgaria’s imports and exports made it a small, export-oriented economy,enabling it to benefit from the upturn in international trade that began mid-way through 2009.
Czech Republic
The Czech Republic experienced growth in both domestic demand and netexports, although the latter was more important in contributing to a 2.4 percent rise in GDP over 2010. As an open economy (trade openness of 142 percent of GDP in 2007) that was tightly integrated into international productionnetworks (IPNs) that were focused on machinery exports, the Czech Republicwas boosted by robust growth in Germany and Slovakia. This strong exportperformance was achieved despite a 3 per cent appreciation in the REER,generated more by a rise in the nominal exchange rate than in unit labourcosts, which stayed roughly stable. This strong performance in exports wassupported by a relatively positive rebound in domestic demand, driven pri-marily by private consumption, which grew by 1.3 per cent after a -0.2 percent fall in 2009. Although gross fixed capital formation fell by -1.8 per cent,this decline was much shallower than in many other countries. This helped
266 RICHARD CONNOLLY
© 2011 The Author(s)JCMS: Journal of Common Market Studies © 2011 Blackwell Publishing Ltd
real unit labour costs grow at a modest rate (0.2 per cent), with unemploymentalso rising at only a gentle pace, from 6.7 to 7.3 per cent. This enabled thegovernment to reduce its deficit slowly and ahead of previous forecasts – from-5.8 per cent to -5.2 per cent of GDP – without too much fear of tipping theeconomy back into recession. Unlike many of its neighbours, the balancesheets of private sector agents in the Czech Republic were relatively strong,reducing the prospect of the sort of debt-induced collapse in consumption thatwas present in some other cases.
Denmark
As with the Czech Republic, both domestic demand and net exports madepositive contributions to GDP growth in 2010, with growth estimated to reacharound 2.3 per cent. While Denmark is a relatively small and open economy,and in the context of rising demand from its two main trading partners –Germany and Sweden – export growth of a comparatively modest 6.4 per centwas recorded. This is especially curious given that Denmark experienced thethird largest REER depreciation (-3.4 per cent) in the non-eurozone, althoughthis was not as fast a depreciation as the eurozone average. Moreover, thisfailure of REER depreciation to generate faster export growth is consistentwith the preceding regression analysis. As a result of this steady but unspec-tacular growth in exports, the main driver of growth in Denmark was domesticdemand, caused primarily by growth in both private and public consumption.Because Denmark entered the recession in strong fiscal shape, the governmentwas able to enact a number of expansionary policies over 2009 and 2010 thathelped prop up domestic demand. Thus, while gross fixed capital formationcontinued to decline (-3.8 per cent), consumer confidence rose as income taxeswere cut, resulting in an increase in household real disposable incomes.
Latvia
Latvia experienced one of the most severe recessions in the world during2009, and this recession continued into 2010, although the overall decline ofan estimated -0.4 per cent concealed three straight quarters of output expan-sion, technically ending the recession in Q3 of 2010. This performance, whilestill not the sharp rebound needed to help recover the severe output lossescaused by the recession, was much better than forecast in late 2009. While ithas been argued that this better than expected performance was caused by theconsiderable REER depreciation observed over 2010, the extent of exportgrowth was a relatively modest 8.6 per cent, with Latvia ranking 19th out ofthe 27 economies from the EU. Indeed, given Latvia’s small, open economy(trade openness of 105 per cent), Latvia would have been expected to have
ECONOMIES OF MEMBER STATES OUTSIDE THE EUROZONE 267
© 2011 The Author(s)JCMS: Journal of Common Market Studies © 2011 Blackwell Publishing Ltd
benefited from any improvement in external trading conditions. Conse-quently, net exports made only a meagre, if positive, contribution to growth.Of more importance to the performance of the Latvian economy was thecontinued weakness in domestic demand. Private and public consumptioncontinued to decline, with gross fixed capital formation falling by an enor-mous 24.8 per cent – even more impressive in the context of a 37.3 per centdrop in 2009. Only the strong and positive influence of inventory restockinghelped mitigate the collapse in domestic demand, perhaps because of theindirect spillover from the resumption of export growth. The overall picture ofdeflationary tendencies in Latvia that saw unemployment rise and wages fall,combined with the existence of still-high levels of private debt, pointed to theneed for a more impressive growth in exports in future if strong and sustainedoutput growth were to resume.
Lithuania
Like Latvia, Lithuania is only just beginning to suffer from an exceptionallydeep recession. After registering a collapse in output of 14.9 per cent in 2009,the Lithuanian economy grew by a modest 0.4 per cent in 2010. This was alsomuch better than forecast the previous year. As in Latvia, this relative changein fortunes has been attributed to the positive effects of REER depreciation,which registered as a fall of 7.2 per cent in 2010, following unit cost stagna-tion in 2009. This relationship appears stronger in the Lithuanian case; afterall, export growth was 11 per cent in 2010, placing Lithuania ninth out of 27EU economies. However, given its small size (trade openness of 118 percent), Lithuania would have also been expected to benefit from increasedinternational trade, especially in its main export markets – Germany andRussia. As such, it was unclear whether REER depreciation significantlyhelped Lithuania perform any better than would have been expected. Indeed,the positive effects of REER depreciation are even less evident when placedagainst domestic demand performance, which continued to decline at a rapidrate: private consumption fell by 5.9 per cent, and public consumption fell by1.3 per cent. Combined with a sharp increase in the level of unemployment,from 13.7 per cent in 2009 to 17.8 per cent in 2010, this compression ofdomestic consumption looked to be a permanent feature of the Lithuanianeconomy, especially as it also exhibited quite severe private sector balancesheet weaknesses.
Hungary
The Hungarian economy experienced a modest rebound from the severerecession of 2009, registering overall GDP growth of an estimated 1.1 per
268 RICHARD CONNOLLY
© 2011 The Author(s)JCMS: Journal of Common Market Studies © 2011 Blackwell Publishing Ltd
cent in 2010. Domestic consumption remained especially subdued, withprivate consumption falling by 3.2 per cent, and public consumption declin-ing by -0.9 per cent as the tough fiscal demands imposed by the jointEU–IMF financial support package continued to bite. Indeed, Hungary was arelative anomaly in the non-eurozone because of its large stock of governmentdebt (78.5 per cent of GDP in 2010). This debt – in part a legacy of thesocialist period, and in part a result of fiscal incontinence during the pre-crisisperiod – marked Hungary out as a potential victim whenever sovereign debtfears flared, as they did on several occasions during 2010. This was exacer-bated by a high and growing level of unemployment, as well as weak privatesector balance sheets. As another small, open economy (trade openness of141 per cent), exports grew by 13.5 per cent in 2010, helped by boomingdemand in Germany. It was this strong export performance that enabledHungary to avoid recession, with Hungary’s fortunes looking as though theywould be determined almost entirely by external events.
Poland
The Polish economy, which was the only EU economy to avoid recession in2009, continued to grow, with growth increasing in pace to 3.5 per cent in2010. This was driven by positive developments in both export growth (9.8per cent) and domestic demand (4.8 per cent). However, while exports grewat a healthy pace, imports also picked up on the back of nominal exchangerate appreciation and strong domestic demand. The contribution of netexports was, as a result, slightly negative. The strong growth in domesticdemand was based on consumption growth, both public (3.5 per cent) andprivate (2.8 per cent). However, signs of shaky corporate confidence in thePolish economy were evident in the failure of gross fixed capital formation togrow. While unemployment continued to rise, the overall picture of the labourmarket in Poland was relatively positive, with employment continuing togrow. The only real worry was how Poland would achieve fiscal consolidationafter using the strong public balance sheet to enact a significant stimuluspackage during 2009 and 2010. Despite the strong GDP growth registeredduring 2010, the deficit increased to -7.9 per cent of GDP. Thus, managingpublic finances appeared to represent the key challenge in the medium term.
Romania
The Romanian economy continued to suffer from a prolonged slump ineconomic activity throughout the year. After experiencing an unprecedentedboom during the years preceding the Great Recession, the Romanianeconomy contracted by 7.1 per cent in 2009, and a further 1.9 per cent in
ECONOMIES OF MEMBER STATES OUTSIDE THE EUROZONE 269
© 2011 The Author(s)JCMS: Journal of Common Market Studies © 2011 Blackwell Publishing Ltd
2010. This persistently poor performance could be explained by the severityof the collapse in domestic demand, caused in large part by the unwinding ofunsustainable balance sheet weaknesses built up during the pre-crisis periodin both the public and the private sector. The international community (theEU, IMF, World Bank and the European Bank for Reconstruction and Devel-opment) was heavily involved in helping Romania implement an adjustmentprogramme that would alleviate the pressure on the public finances. Whilethis helped Romania avoid a full-blown balance of payments crisis, andhelped reduce public expenditure from the unsustainable levels of the pre-crisis period, the effect on domestic demand was negative. Thus, publicconsumption fell by 3.9 per cent, and private consumption declined by 1.6 percent. Gross fixed capital formation fell by a considerable 9.9 per cent. Privatesector debt stocks, fuelled in the pre-crisis period by external capital flows,also constrained consumption. Fortunately, exports grew at 16.9 per cent – thesecond highest rate of growth in the EU. With imports growing much moreslowly due to depressed domestic demand, the current account deficit con-tinued to narrow from the pre-crisis levels of around nearly 14 per cent ofGDP to around 5.5 per cent.
Sweden
The Swedish economy experienced a brisk rebound in 2010, growing at 4.8 percent, following the decline of 5.1 per cent in 2009. This recovery was drivenprimarily by strong growth in private consumption (3.4 per cent). This increasein private sector sentiment was helped by the discretionary fiscal measuresenacted in 2009 and 2010 that saw the Swedish fiscal balance swing fromsurplus to deficit. Low levels of public debt facilitated such an expansion, andthe improved economic performance of 2010 caused the deficit to stay at arelatively modest 0.9 per cent of GDP. The importance of monetary policyshould also not be underestimated, with low interest rates helping reducepressure on indebted households and effecting an overall increase in householddisposable income over the year. Gross fixed capital formation, which hadeither contracted or grown at a slow rate in the rest of the non-eurozone, grewat a brisk 5.9 per cent, lending corporate support to household sector demand.Export performance was also strong, growing at nearly 11 per cent, and, despitefaster strong import growth generated by the expansion of domestic demand,net exports were able to make a positive contribution to GDP growth. While theoutlook was comparatively rosy, a number of potential weaknesses remainedthat were not addressed during the recession, not least the high level ofhousehold indebtedness (c.160 per cent of disposable income) that was inex-tricably linked to the Swedish housing market, which saw prices resume
270 RICHARD CONNOLLY
© 2011 The Author(s)JCMS: Journal of Common Market Studies © 2011 Blackwell Publishing Ltd
growth throughout 2010. While the debt dynamics appeared relatively benignin an environment of low interest rates and only mild levels of unemployment,the risks associated with any increase in interest rates was substantial.
United Kingdom
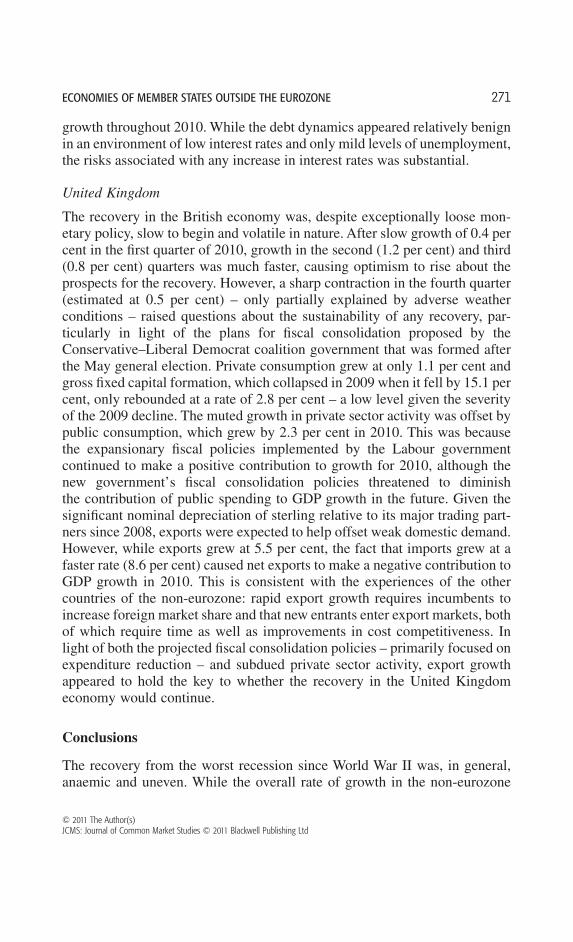
The recovery in the British economy was, despite exceptionally loose mon-etary policy, slow to begin and volatile in nature. After slow growth of 0.4 percent in the first quarter of 2010, growth in the second (1.2 per cent) and third(0.8 per cent) quarters was much faster, causing optimism to rise about theprospects for the recovery. However, a sharp contraction in the fourth quarter(estimated at 0.5 per cent) – only partially explained by adverse weatherconditions – raised questions about the sustainability of any recovery, par-ticularly in light of the plans for fiscal consolidation proposed by theConservative–Liberal Democrat coalition government that was formed afterthe May general election. Private consumption grew at only 1.1 per cent andgross fixed capital formation, which collapsed in 2009 when it fell by 15.1 percent, only rebounded at a rate of 2.8 per cent – a low level given the severityof the 2009 decline. The muted growth in private sector activity was offset bypublic consumption, which grew by 2.3 per cent in 2010. This was becausethe expansionary fiscal policies implemented by the Labour governmentcontinued to make a positive contribution to growth for 2010, although thenew government’s fiscal consolidation policies threatened to diminishthe contribution of public spending to GDP growth in the future. Given thesignificant nominal depreciation of sterling relative to its major trading part-ners since 2008, exports were expected to help offset weak domestic demand.However, while exports grew at 5.5 per cent, the fact that imports grew at afaster rate (8.6 per cent) caused net exports to make a negative contribution toGDP growth in 2010. This is consistent with the experiences of the othercountries of the non-eurozone: rapid export growth requires incumbents toincrease foreign market share and that new entrants enter export markets, bothof which require time as well as improvements in cost competitiveness. Inlight of both the projected fiscal consolidation policies – primarily focused onexpenditure reduction – and subdued private sector activity, export growthappeared to hold the key to whether the recovery in the United Kingdomeconomy would continue.
Conclusions
The recovery from the worst recession since World War II was, in general,anaemic and uneven. While the overall rate of growth in the non-eurozone
ECONOMIES OF MEMBER STATES OUTSIDE THE EUROZONE 271
© 2011 The Author(s)JCMS: Journal of Common Market Studies © 2011 Blackwell Publishing Ltd
was positive at 1.4 per cent for the unweighted average of the group as awhole, it was still lower than the overall rate of growth for the economies ofthe EU. This was especially worrying given that most economies of thenon-eurozone had per capita income levels that were substantially lower thanthe EU average. As such, they would have expected to be growing at a fasterrate than their richer neighbours. Instead, they were struggling to generatesufficient growth in domestic demand to help force a broad-based and per-sistent economic recovery. This looked unlikely to change soon, especiallygiven the weakness of many of the private sector balance sheets of thecountries covered here. In some countries, such as Hungary and the UnitedKingdom, the presence of both public and private sector balance sheet weak-nesses meant that any recovery would be dogged by significant risks. Indeed,given the tendency for many economies to be reliant on external demand togenerate growth, events in the wider economy looked to be of even moreimportance than usual. While some major developing economies, such asBrazil, China and India, continued to grow at healthy rates, doubts about thesolvency of many European sovereigns, and the continued rise in commodityprices to near record levels, threatened to snuff out any nascent recovery.
This article examined the nature of the recovery across the non-eurozonein three sections. The first section traced developments on a number ofimportant economic indicators, highlighting the heterogeneity of the recov-ery. After illustrating that variation in export growth and changes in domesticdemand were of greatest importance in explaining the patchiness of therecovery, the second section attempted to identify those factors that helpexplain why some countries differed in the extent to which they were able toexperience export growth and increased domestic demand. Here, it wasargued that variation in export growth was related to one important factor:whether a country was open and trade-oriented prior to the onset of the GreatRecession. If they were, they tended to benefit more from the growth ininternational trade. Other hypotheses, such as the importance of increasedcost competitiveness, were not considered important. This was significant,considering the degree to which official discourse in 2010 had presented theissue of competitiveness as the most important challenge facing the EU(Tilford, 2011; Llewellyn and Westaway, 2011). Indeed, this point is perhapseven more important considering the findings from the analysis of the deter-minants of variation in the growth of domestic demand growth. Here, it wasargued that changes in the REER and the level of unemployment were the twomost important factors in explaining why domestic demand growth variedacross the region. If the REER depreciated, and if unemployment rose,domestic demand growth tended to be much lower. Perhaps surprisingly,government efforts in undertaking fiscal tightening were not important;
272 RICHARD CONNOLLY
© 2011 The Author(s)JCMS: Journal of Common Market Studies © 2011 Blackwell Publishing Ltd
neither was the extent of the pre-crisis credit boom. Thus, the evidencesuggests that improvements in cost competitiveness over 2009 and 2010 notonly failed to cause significant export growth, but they also contributed to thepersistence of subdued domestic demand.
References
Commission of the European Communities (2010) European Economic Forecast:Autumn 2010 (Brussels: Ecofin).
Connolly, R. (2010) ‘The EU Economy: Member States Outside the Euro Area2009’. JCMS, Vol. 48, s1, pp. 243–66.
Hausmann, R., Hwang, J. and Rodrik, D. (2006) ‘What You Export Matters’. HarvardUniversity Working Paper. Available at: «http://ksghome.harvard.edu/~drodrik/hhr.pdf».
Llewellyn, J. and Westaway, P. (2011) ‘Europe’s Pact is the First Step to Recovery’.Financial Times, 10 March. Available at: «http://www.ft.com/cms/s/0/91e9ac24-4b54-11e0-b2c2-00144feab49a.html#axzz1KT2ls09g».
Organisation for Economic Co-operation and Development (OECD) (2010) WorldEconomic Outlook (Paris: OECD Press).
Reinhart, C. and Rogoff, K. (2009) This Time is Different: Eight Centuries ofFinancial Folly (Princeton, NJ: Princeton University Press).
Roubini, N. and Setser, B. (2004) Bail-Outs or Bail-Ins? Responding to FinancialCrises in Emerging Economies (Washington, DC: Institute for InternationalEconomics).
Tilford, S. (2011) ‘Europe’s Damaging Obsession with “Competitiveness” ’. Centrefor European Reform blog. Available at: «http://centreforeuropeanreform.blogspot.com/2011/03/europes-damaging-obsession-with.html».
United Nations Comtrade (2010) Commodity Trade Statistics Database (New York:United Nations Statistics Division). Available at: «http://unstats.un.org/unsd/comtrade».
Wolf, M. (2009) Fixing Global Finance: How to Curb Financial Crises in the 21stCentury (New Haven, CT: Yale University Press).
World Bank (2010) World Financial Development Database. Available at: «http://data.worldbank.org/».
ECONOMIES OF MEMBER STATES OUTSIDE THE EUROZONE 273
© 2011 The Author(s)JCMS: Journal of Common Market Studies © 2011 Blackwell Publishing Ltd