reevaluation of historic earthquakes in spain
TRANSCRIPT
Reevaluation of Historic Earthquakes in Spain Julio Mezcua 1,2 Juan Rueda and Rosa M Garcia Bianco 2
INTRODUCTION
In recent years considerable effort has been expended to find new accounts of earthquake effects in Spain. With this infor- mation a reevaluation of intensities has been performed. These new data have allowed us to recalculate the seismic haz- ard maps of Spain which are included in recent seismic codes (Mezcua and Martln, 1993; Rueda and Mezcua, 2001; NCSR, 2O02).
The limitation of single intensity values for unambigu- ous assignment of the strength of shocks is widely known (e.g., Reiter, 1990). In particular, the use of maximum inten- sity values may produce misleading results. This fact may eventually be overcome by the use of magnitude values deduced from the whole set of intensity values for all histori- cal events.
There are numerous studies on the conversion of single maximum intensity values or isoseismal areas to different magnitude scales, e.g., Nuttli (1973), Street and Turcotte (1977), and Johnston (1996a), including Mezcua (1982) for use in the Iberian Peninsula. The correlations obtained con- sider the magnitude scale that is in use in the area under study. In the case of Spain the rnbLg magnitude was used for the relationship. However, it is well known this magnitude definition saturates in the upper range (beyond magnitude 6). This saturation is due, as in other magnitude definitions, to the types and frequencies of the waves used in the magni- tude calculation. In recent years many earthquake hazard studies have been performed using moment magnitude, which does not suffer from saturation problems.
Another important problem in hazard studies is poor knowledge of the locations of historical events. This uncer- tainty is translated to the source model needed in any hazard calculation. For that reason, any effort in improving such parameters will improve the hazard values obtained in a spe- cific site.
To obtain a relationship between the moment magnitude and the intensity observations recorded, we followed the approach of Bakun and Wentworth (1997), obtaining a rela- tionship between the moment magnitude M and the mean or median distances between the epicenter and different locali- ties with different intensity values. Once we obtain such rela- tionships using events with both types of data, called training events, we can obtain the M value from the intensity values
1. Instituto Geogr~fico Nacional, Madrid, Spain. 2. Universidad Politdcnica de Madrid, Madrid, Spain.
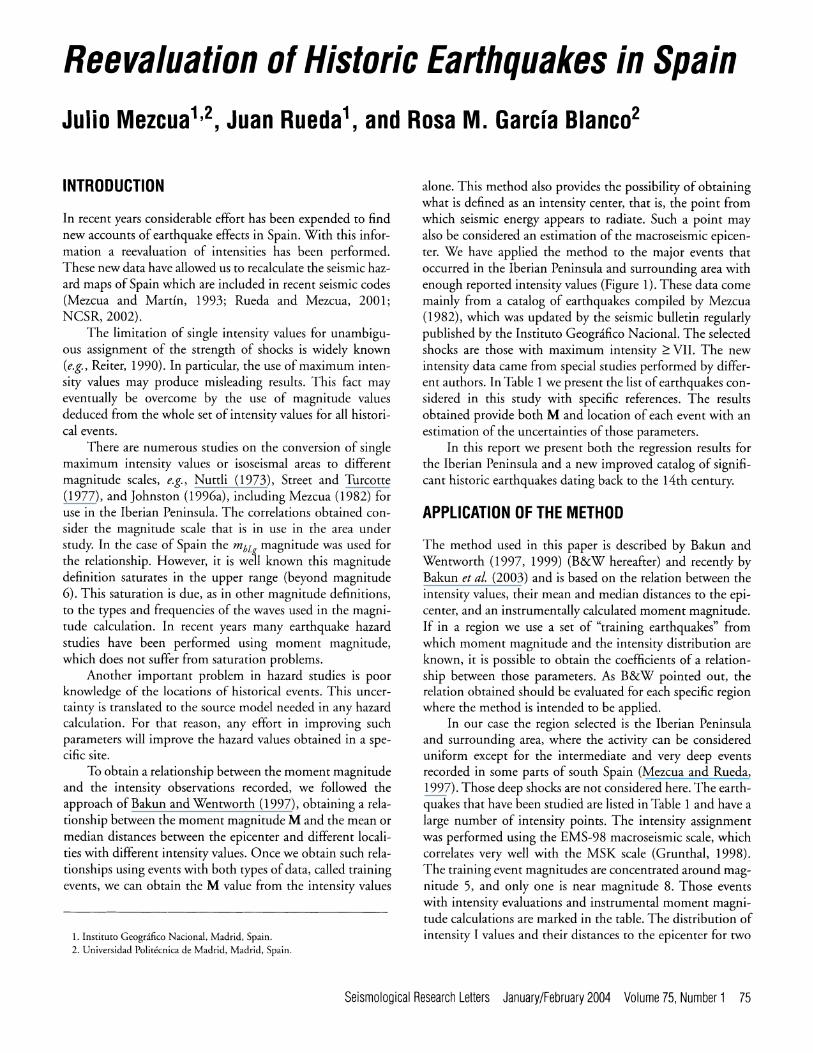
alone. This method also provides the possibility of obtaining what is defined as an intensity center, that is, the point from which seismic energy appears to radiate. Such a point may also be considered an estimation of the macroseismic epicen- ter. We have applied the method to the major events that occurred in the Iberian Peninsula and surrounding area with enough reported intensity values (Figure 1). These data come mainly from a catalog of earthquakes compiled by Mezcua (1982), which was updated by the seismic bulletin regularly published by the Instituto Geogr~ifico Nacional. The selected shocks are those with maximum intensity _> VII. The new intensity data came from special studies performed by differ- ent authors. In Table 1 we present the list of earthquakes con- sidered in this study with specific references. The results obtained provide both M and location of each event with an estimation of the uncertainties of those parameters.
In this report we present both the regression results for the Iberian Peninsula and a new improved catalog of signifi- cant historic earthquakes dating back to the 14th century.
APPLICATION OF THE METHOD
The method used in this paper is described by Bakun and Wentworth (1997, 1999) (B&W hereafter) and recently by Bakun et al. (2003) and is based on the relation between the intensity values, their mean and median distances to the epi- center, and an instrumentally calculated moment magnitude. If in a region we use a set of "training earthquakes" from which moment magnitude and the intensity distribution are known, it is possible to obtain the coefficients of a relation- ship between those parameters. As B&W pointed out, the relation obtained should be evaluated for each specific region where the method is intended to be applied.
In our case the region selected is the Iberian Peninsula and surrounding area, where the activity can be considered uniform except for the intermediate and very deep events recorded in some parts of south Spain (Mezcua and Rueda, 1997). Those deep shocks are not considered here. The earth- quakes that have been studied are listed in Table 1 and have a large number of intensity points. The intensity assignment was performed using the EMS-98 macroseismic scale, which correlates very well with the MSK scale (Grunthal, 1998). The training event magnitudes are concentrated around mag- nitude 5, and only one is near magnitude 8. Those events with intensity evaluations and instrumental moment magni- tude calculations are marked in the table. The distribution of intensity I values and their distances to the epicenter for two
Seismological Research Letters January/February2004 Volume 75, Number1 75
12~
42~
39~
36~
12~
9~ 6ow 3~ 0 o 3OE
. , , . . . . . . : ~ ooo [ ~ ,~ o o o Oo e o o ~ o . _ Oo :,~O;o OoO :?~i0
c o o o o , _ : o o ~ i ] ~ oo o o o
o - - ~ & ~ ~~176 o o ' ~o o o o o �9 ,, _ o~, <>$923o o ~ 1 7 6 ~ o ~ o o ~ o o ~ - - O ~ o o I oo o Oo ~oOoo o . . . . . . "oF:T ~ o - ' o ; o o i ,ooo Oo2~o ~ oo:O :OooO~:oo ~ o o o o ~ ;O~oo~oo , o o o ~ , ~ , . , o . k
oOOo ~ o~. o o~,o~..~ ti:oo 7: o O oi [io:: oii. :Oo,i :o o ;i ~176 oo oo,: ooo , - : ~ ; : - ; "~ o o o o o o o O Oo o i t
< , . " " - " . - ~ o%.~oo ~ o O o o o o o o oo o o
,_o ~ 1 7 6 o e o o O o ~ & . / ~
o / 0 % % o o o o o % 0 0 0
~ o o o O / ~ .
o ; o o o ] a s o ~ ~ t ,.,, / o o io L o ~ 1 7 6 1 7 6 1 7 6 ~ ~ ; k
�9 t o ~ oo oOj/ .
/:Ooo , Oooooo<J ~176 ooo o o[ i ; : , o io[ oo Ooooo:o:; o o , ,, o :o i , o o Ox �9
, o o : o o ~ o o o o I I , ~ - -
- ~ o <;[oOo o oo.~:,o, o o~ : ;ooOi~o:O oOOoo~i,;: o,~U I ~ - ~ I �9 I _~ . - ~ I -
o~ ,s20 I 0 i l lmll ' . ! - i I
100km ' '/'~''''i~'~'~i ~~176 ; ~ ~ ~ o I i 1722 oO ~ o ~ �9
, ~ i l l l i l B I (at 40o ) . . . . . ' ~ ~ ~ 8 0 ~ D 19t~" 1804 J ~ I
w ~ ' : ~ / ~ ~ ' -
, I ] , , I 1 I I I I . 9~ 6ow 3~ 0 o 3OE
42~
39~
36~
, i Fioure 1. Locations and dates of events in the Iberian Peninsula considered in this study.
out of the five training events are shown in Figure 2. The intensity values outside the +1 standard deviation around the median are considered outliers and are not used in the calcu- lations. To compare the results obtained for the slopes and intercepts of the fit to our training events and those obtained from B&W, we present both sets of data in Figure 3. For sim- plicity, the slope distribution with M may be considered to be constant mainly above magnitude values of 5.5. This cut-off value may be extended down, however, as Hinzen and Oemisch (2001) showed using local magnitude for shocks in the northern Rhine area, to values around 4.0 local magni- tude. We conclude that the behavior of the slope with M may be considered constant at least for events greater than around 5 moment magnitude.
Following B&W, the result obtained for those training events, indicated in Table 1, is expressed as:
I= 1.96 + 1.41 M - 2 . 9 3 log (1)
where I is the MSK intensity value selected, M is the moment magnitude of the event, and d is the median of the distances for each intensity value.
It is implicitly assumed that the earthquakes have the same depth (crustal activity) and that the intensity values are not systematically affected by local geology. The last assump- tion is valid only on average, as is discussed by Bakun e t a l .
(2003). Also, Hinzen and Oemisch (2001) do not use inten- sity corrections to the observed intensity values due to the geology because the results obtained for training events do not show any further improvement in location and magni- tude estimation from the corrected intensity values.
The above relation may be inverted to calculate mac- roseismic magnitude M i for each intensity level:
I i - 1.96 + 2.93 log di M i - (2)
1.41
where at i is the median of distance for each locality with intensity I i that lies inside the interval of _+ 1 standard devia- tion. For each event, the mean value of M i is the assigned macroseismic moment magnitude M s for the event.
To calculate the epicenter or the so-called intensity cen- ter the three-step strategy defined by B&W is used. First, val- ues of M s and rms[M s] over a grid of trial locations around the initial tentative epicenter are obtained, with
rms [MI] = rms[Mi - Mi] - rms0[M I - Mi]
where rms0[Mi-Mi] corresponds to the minimum rms value over the grid of trial epicenters considered. The grid used here is 100 km • 100 km with 10 km spacing. To account for the distance from the intensity observation and
76 Seismological Research Letters Volume75, Number1 January/February2004
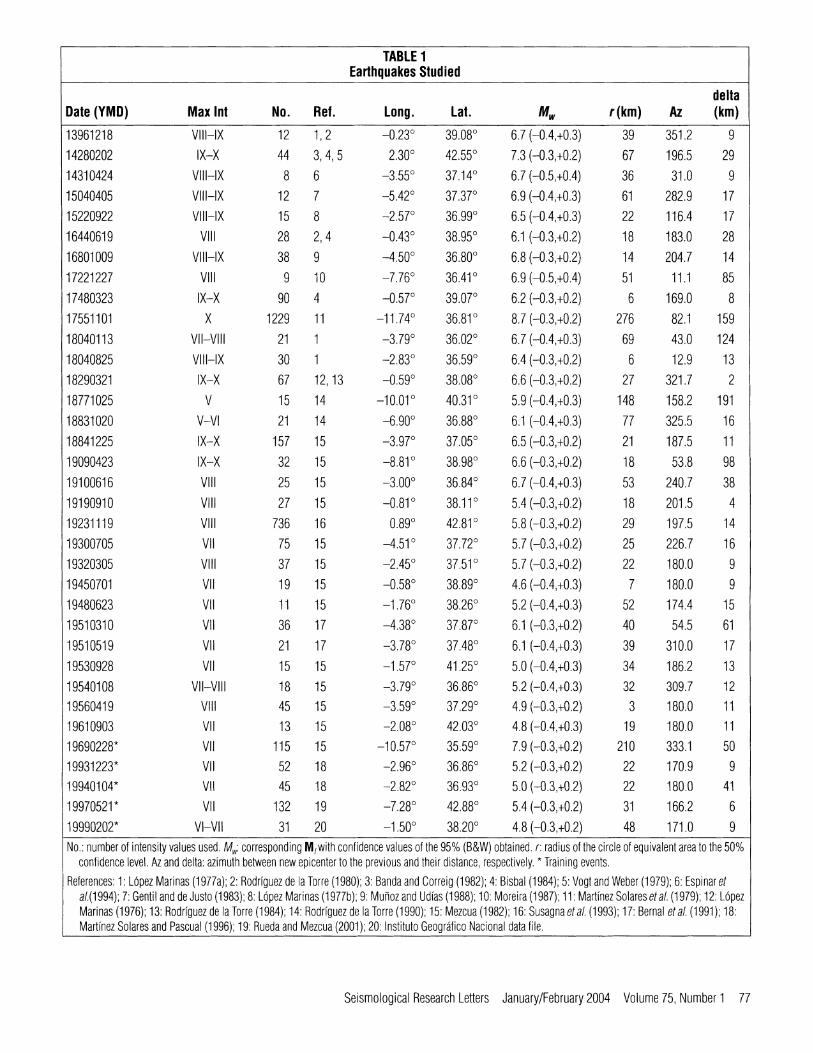
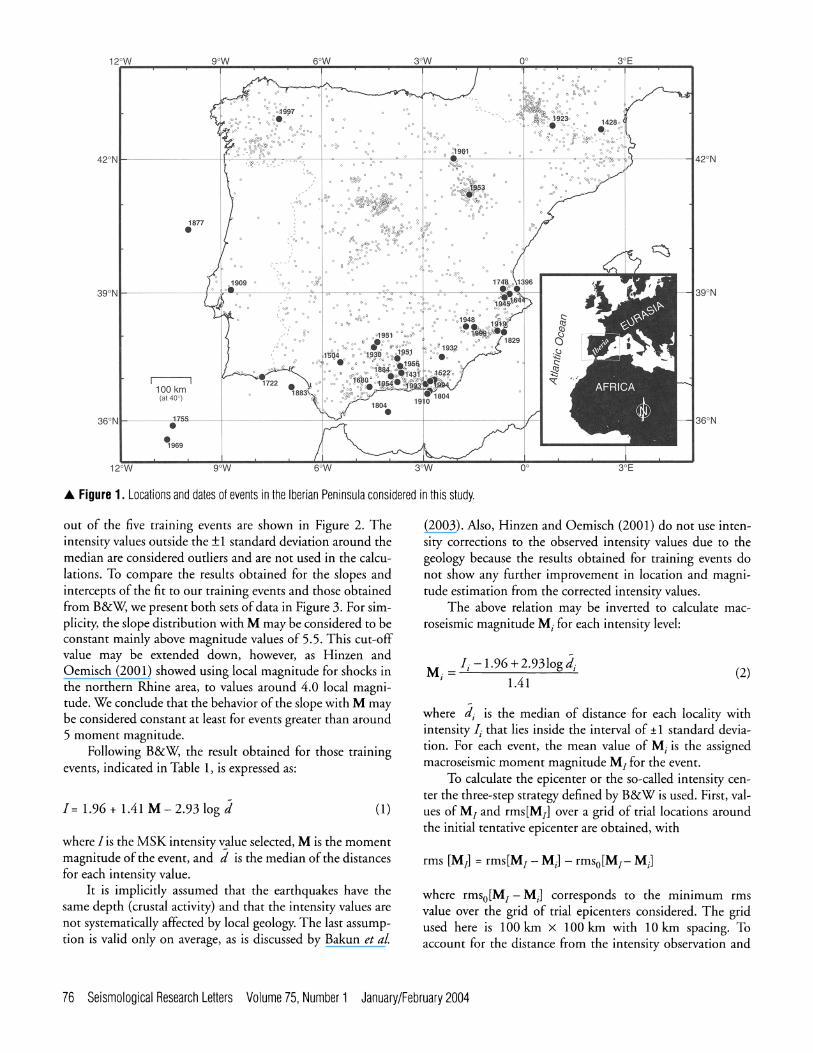
TABLE 1 Earthquakes Studied
delta Date (YMD) Max Int No. Ref. Long. Lat. M w r (km) Az (km)
13961218 VIII-IX 12 1,2 -0.23 ~ 39.08 ~ 6.7 (-0.4,+0.3) 39 351.2 9
14280202 IX-X 44 3, 4, 5 2.30 ~ 42.55 ~ 7.3 (-0.3,+0.2) 67 196.5 29
14310424 VIII-IX 8 6 -3.55 ~ 37.14 ~ 6.7 (-0.5,+0.4) 36 31.0 9
15040405 VIII-IX 12 7 -5.42 ~ 37.37 ~ 6.9 (-0.4,+0.3) 61 282.9 17
15220922 VIII-IX 15 8 -2.57 ~ 36.99 ~ 6.5 (-0.4,+0.3) 22 116.4 17
16440619 VIII 28 2, 4 -0.43 ~ 38.95 ~ 6.1 (-0.3,+0.2) 18 183.0 28
16801009 VIII-IX 38 9 -4.50 ~ 36.80 ~ 6.8 (-0.3,+0.2) 14 204.7 14
17221227 ViII 9 10 -7.76 ~ 36.41 ~ 6.9 (-0.5,+0.4) 51 11.1 85
17480323 IX-X 90 4 -0.57 ~ 39.07 ~ 6.2 (-0.3,+0.2) 6 169.0 8
17551101 X 1229 11 -11.74 ~ 36.81 ~ 8.7 (-0.3,+0.2) 276 82.1 159
18040113 VII-VIII 21 1 -3.79 ~ 36.02 ~ 6.7 (-0.4,+0.3) 69 43.0 124
18040825 VIII-IX 30 1 -2.83 ~ 36.59 ~ 6.4 (-0.3,+0.2) 6 12.9 13
18290321 IX-X 67 12, 13 -0.59 ~ 38.08 ~ 6.6 (-0.3,+0.2) 27 321.7 2
18771025 V 15 14 -10.01 ~ 40.31 ~ 5.9 (-0.4,+0.3) 148 158.2 191
18831020 V-V! 21 14 -6.90 ~ 36.88 ~ 6.1 (-0.4,+0.3) 77 325.5 16
18841225 IX-X 157 15 -3.97 ~ 37.05 ~ 6.5 (-0.3,+0.2) 21 187.5 11
19090423 IX-X 32 15 -8.81 ~ 38.98 ~ 6.6 (-0.3,+0.2) 18 53.8 98
19100616 VIII 25 15 -3.00 ~ 36.84 ~ 6.7 (-0.4,+0.3) 53 240.7 38
19190910 VIII 27 15 -0.81 ~ 38.11 ~ 5.4 (-0.3,+0.2) 18 201.5 4
19231119 VIII 736 16 0.89 ~ 42.81 ~ 5.8 (-0.3,+0.2) 29 197.5 14
19300705 VII 75 15 -4.51 ~ 37.72 ~ 5.7 (-0.3,+0.2) 25 226.7 16
19320305 VIII 37 15 -2.45 ~ 37.51 ~ 5.7 (-0.3,+0.2) 22 180.0 9
19450701 VII 19 15 -0.58 ~ 38.89 ~ 4.6 (-0.4,+0.3) 7 180.0 9
19480623 VII 11 15 -1.76 ~ 38.26 ~ 5.2 (-0.4,+0.3) 52 174.4 15
19510310 Vii 36 17 -4.38 ~ 37.87 ~ 6.1 (-0.3,+0.2) 40 54.5 61
19510519 VII 21 17 -3.78 ~ 37.48 ~ 6.1 (-0.4,+0.3) 39 310.0 17
19530928 VII 15 15 -1.57 ~ 41.25 ~ 5.0 (-0.4,+0.3) 34 186.2 13
19540108 VII-VIII 18 15 -3.79 ~ 36.86 ~ 5.2 (-0.4,+0.3) 32 309.7 12
19560419 VIII 45 15 -3.59 ~ 37.29 ~ 4.9 (-0.3,+0.2) 3 180.0 11
19610903 VII 13 15 -2.08 ~ 42.03 ~ 4.8 (-0.4,+0.3) 19 180.0 11
19690228* VII 115 15 -10.57 ~ 35.59 ~ 7.9 (-0.3,+0.2) 210 333.1 50
19931223* VII 52 18 -2.96 ~ 36.86 ~ 5.2 (-0.3,+0.2) 22 170.9 9
19940104* VII 45 18 -2.82 ~ 36.93 ~ 5.0 (-0.3,+0.2) 22 180.0 41
19970521* VII 132 19 -7.28 ~ 42.88 ~ 5.4 (-0.3,+0.2) 31 166.2 6
19990202* VI-VII 31 20 -1.50 ~ 38.20 ~ 4.8 (-0.3,+0.2) 48 171.0 9
No.: number of intensity values used. Mw: corresponding M/with confidence values of the 95% (B&W) obtained, r: radius of the circle of equivalent area to the 50% confidence level. Az and delta: azimuth between new epicenter to the previous and their distance, respectively. * Training events.
References: 1: L6pez Marinas (1977a); 2: Rodriguez de la Torre (1980); 3: Banda and Correig (1982); 4: Bisbal (1984); 5: Vogt and Weber (1979); 6: Espinar et a/.(1994); 7: Gentil and de Justo (1983); 8: L6pez Marinas (1977b); 9: Mu~oz and Udfas (1988); 10: Moreira (1987); 11: Martinez Solares et al. (1979); 12: L6pez Marinas (1976); 13: Rodriguez de la Torre (1984); 14: Rodriguez de la Torre (1990); 15: Mezcua (1982); 16: Susagna et al. (1993); 17: Bernal et al. (1991); 18: Martinez Solares and Pascual (1996); 19: Rueda and Mezcua (2001); 20: Instituto Geogr,~fico Nacional data file.
Seismological Research Letters January/February2004 Volume 75, Number 1 77
Dec 23, 1993
6 o > ,
, - 5
e-
- " 4 �9 oo D - - o ~ ~ o
r i , T i
0 20 40 60 80 100 120 140 160
Distance km
6
. i
c 5
e -
4
May 21, 1997
0 20 40 60 80 100 120 140 160
Distance km
A Figure 2. Seismic intensity versus epicentral distance for two training events. Circles represent the individual intensity values; closed squares are the cal- culated median distances for each intensity value obtained without outliers (those distances outside a ___1 standard deviation).
0
-0.01
-0.02
-0.03
o_ _go -0.04
-0.05
-0.06
-0.07
-0.08
n ~ 0
0
0- o
o o
o
[ ] 0
[ ]
9.0
8.0 Q.. O O
7.0 {E . _
6.0
A
Z~
A
4.5 5 ,0 w i
4.0 5.0 5.5
Z~A z~Z~
z~ Z~
Z~
6.0 , , i
6.5 7.0 7.5 8.0
Moment IVlagnitude
A Figure 3. Slopes and intercept values obtained for training events of the least squares fits of intensity versus median distances. Circles with error bars indicating +1 standard deviation correspond to our data. Open squares are B&W data for California events.
78 Seismological Research Letters Volume 75, Number1 January/February2004
411000~ I ,,- I ~-~ . -~-.
,o,ooo<> ~ ,). ,..,<>~
�9 x /
~.~" ,.' l / ///
403000 ,," /, , .-" 4280000
320000 360'000 400'000
436000~
4320000
'Y _."l Mar 2'3, 1748 I'""~. "'t
:' ~' "'.U, " ..... "'7", '" ",('/
, ',5</- 'v--~,, ', "- ,0:. ,," ,,' ;' ',, '._.Q, ~./ . _ .... �9 , ,
~.:.., ~,.,~-" "x/ ~ ~ .... \ " / x ~ . "',. ~
660000 700000
410000@
390000G
740000
," >~ .-.r ~.-\,~-- - ..~ ,, ',
',, ',, ".."'--LL-~.'.." ," , / !
,___ r~-. , ~ 350000 550000
, t ......... ~[..)..,,(~,l~~,,->', "" /'~ Ir4780001 425ooo Mar 21, 1829 ...... Dec 25, 1884 ~5, . \ ~ - - . -.., . . . . . . . . . e ~,~- "" "'. ..., ,, ~. . . . . . . . .. - . . . ..<>, ..- _;[~[; o . ~ .. ~ . , . < , , =0 ~ 00 : ~ o o-..
..ooo r t 7 ~ ~ ~ . 2 . . \ k /"~176176176 ,, ~ xL'"~x'-~-('~""~~[' )'~ '/5''71474000J0-5--~----~176 '~ ~''-'~''- )) '''~ i i I J r . . ...... .
i - ,~.'," ~ 4o~ooo ," ,o~ # # ,~ 4.,ooo~""[~~"k ~ t - ..... ' > / / ~ / , , L ( ~ : ~ 7 ~ [ ~ ~ : ~ ~ . , " 4 7 0 0 0 0 ~
660000 700000 740000 380000 420000 460000 770000 810000 850000
4190000.t IL ; ; '/ ' / ~, -412000 , = i ] ~" ~' ~.-o--.~Mar 5, 19321, 479000 .."')o IMay21,199_~'-. i
" i i i o o ,, o ~1,
I~ ' ~ i , ~ /
..~ooo " ~ " +~~ \ -408000 o o
I",, \ ' , t , , ' - - ,,' , ," ..-~~---. l ~ . , t ~ , \ ~ ..... ',,~" ."" <,."~ <>-"" /
411000M",, "'.'~,.~U~ \ --' ..'" <o" ,q>, ~ o ~ i~t~.." "" ..r162 ~ 4710000' ..._o . . . . . . .-- o, ,"" / , ,
500000 540000 580'000 460'000 500'000 540000 110'000 150000 190000
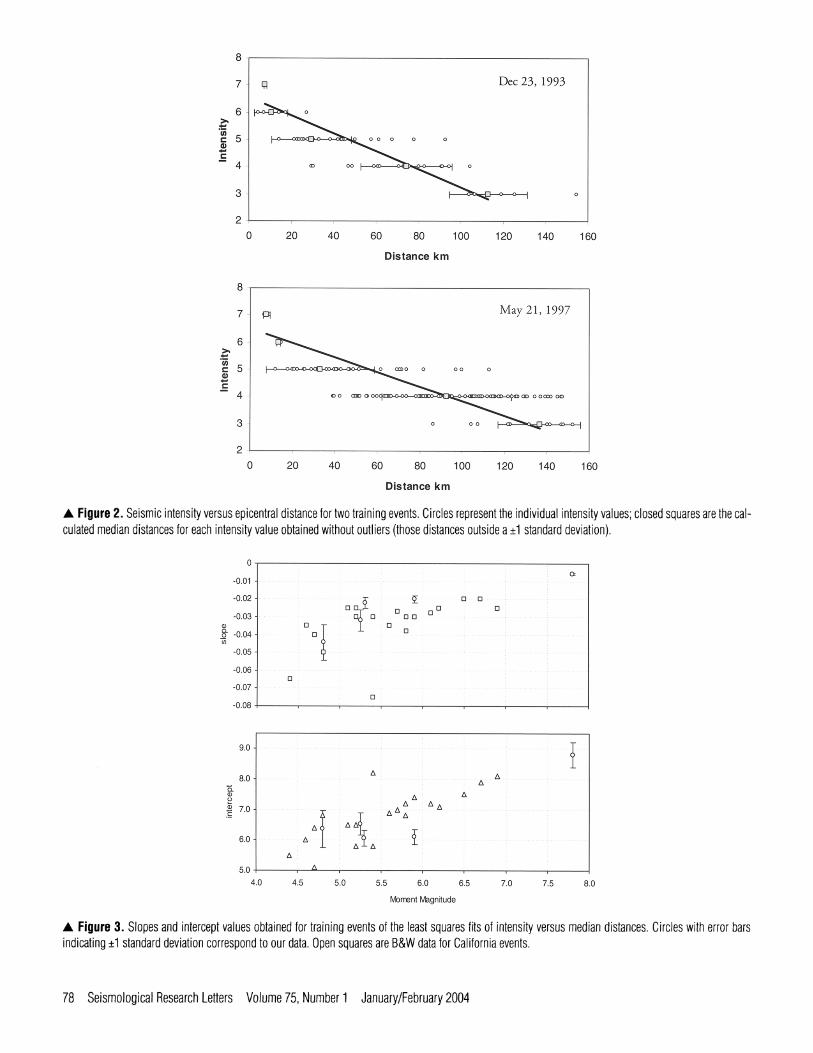
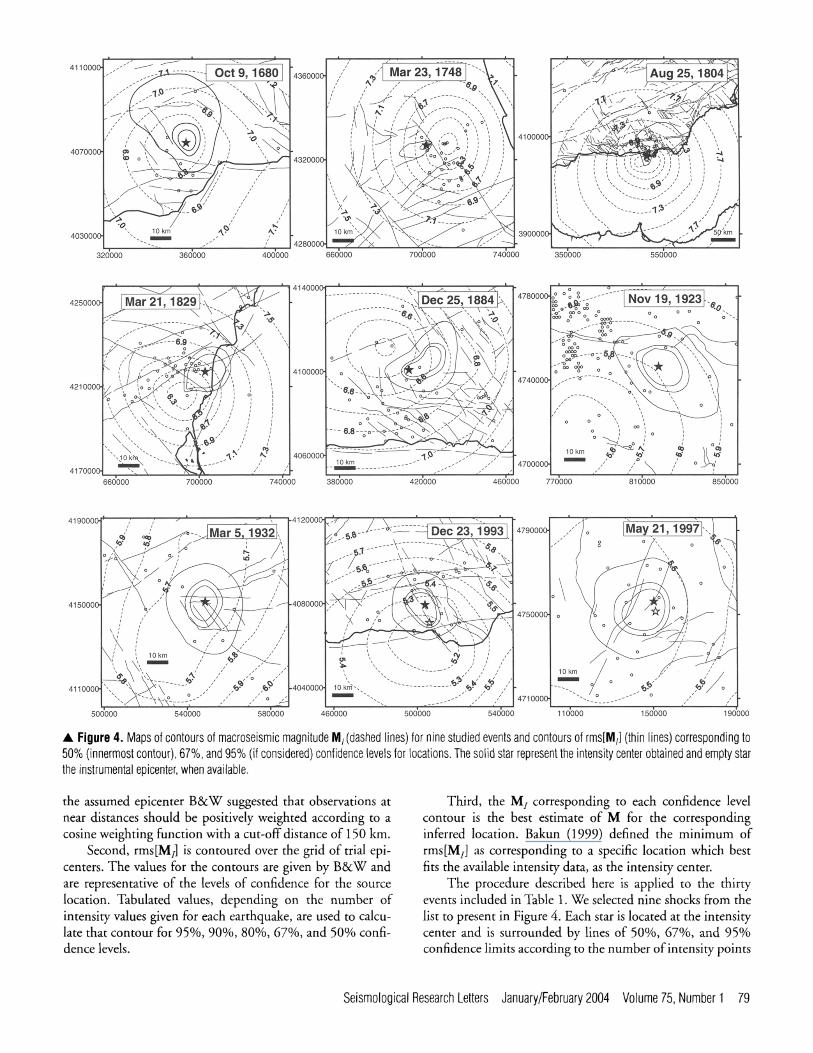
i , Figure 4. Maps of contours of macroseismic magnitude M/(dashed lines) for nine studied events and contours of rms[M/] (thin lines) corresponding to 50% (innermost contour), 67%, and 95% (if considered) confidence levels for locations. The solid star represent the intensity center obtained and empty star the instrumental epicenter, when available.
the assumed epicenter B&W suggested that observations at near distances should be positively weighted according to a cosine weighting function with a cut-off distance of 150 km.
Second, rms[M s] is contoured over the grid of trial epi- centers. The values for the contours are given by B&W and are representative of the levels of confidence for the source location. Tabulated values, depending on the number of intensity values given for each earthquake, are used to calcu- late that contour for 95%, 90%, 80%, 67%, and 50% confi- dence levels.
Third, the M s corresponding to each confidence level contour is the best estimate of M for the corresponding inferred location. Bakun (1999) defined the minimum of rms[M/] as corresponding to a specific location which best fits the available intensity data, as the intensity center.
The procedure described here is applied to the thirty events included in Table 1. We selected nine shocks from the list to present in Figure 4. Each star is located at the intensity center and is surrounded by lines of 50%, 67%, and 95% confidence limits according to the number of intensity points
Seismological Research Letters January/February2004 Volume 75, Number1 79
used in the calculation. To show the applicability of the method two training events are presented at the bottom of the figure with both the instrumental epicenter and the inten- sity center. The distances between both solutions are less than 10 km and the estimated magnitudes are close to the calcu- lated ones. However, Bakun (2000) found that source loca- tions using intensity data from shocks outside or at the edge of the intensity points are not reliably estimated. Locations obtained for shocks near the coast may thus be relatively unreliable. Figure 1 shows the final earthquake locations and localities.
RESULTS ABOUT HISTORICAL EARTHQUAKES IN SPAIN
To compare our results with previous studies (Mezcua, 1982; Mezcua and Martfnez Solares, 1983) we calculated the dis- tances and azimuth between the new and the old epicenters. We also have included an estimation of the uncertainty of the solution which corresponds to the radius r of the equivalent circle of the same area of 50% of the confidence limit. The M I corresponding to the intensity center is our best estimate of M, which is given with the confidence values for 95% accord- ing to the number of intensity data. All this information is presented in Table 1.
From Table 1 we observe that for the same maximum intensity value for several shocks, the deduced M is some- times quite different. For example, the 1428, 1748, 1829, 1884, and 1910 earthquakes all had a maximum intensity of IX-X, but the corresponding magnitudes range from 6.2 to 7.3. This result is not unexpected, as maximum intensity is known to be a very poor indicator of magnitude.
Our estimated M for the Lisbon Earthquake of 1755 is 8.7, consistent with the estimate of Johnston (1996b). Our magnitude values are higher than magnitude calculations obtained from old instrumental records in Spain by Badal et
al. (2000), however, except for the 1956 event in Granada, with a measured M of 4.6 close to the 4.9 obtained in this study. The general discrepancy can be related either to defi- cient knowledge of the instrument response and/or the use of stations with poor azimuthal coverage (if any), or to an insuf- ficient number of training earthquakes to characterize the region properly.
In the last column of Table 1 we include the distance in kilometers between the old epicenter and the value obtained here. Greater discrepancies are found for the shocks of 1722, 1755, 13 January 1804, 1877, and 1909. The distance ranges from 85 to 191 km. All of them except 1909 event are at sea with locations at a great distance from the maximum inten- sity values. This discrepancy is understandable considering the fact that the macroseismic epicenters given in Mezcua and Martinez Solares (1983) were obtained assuming that the epi- center was close to the maximum intensity values. The only inland earthquake with a large discrepancy is the 1909 Benavente earthquake in Portugal. It is possible that our solu- tion for this event is not accurate because it is based on inten-
sity data from Spain only. The uncertainty given as the equivalent radius is, as an average, greater for ancient events than modern shocks. Moreover, it is highly dependent on how the intensity values are distributed around the epicentral area. For example, the 1428 earthquake in the Pyrenees, 1755 Lisbon earthquake, 1877, and 1969 have most or all of the intensity evaluations to one side of the epicentral area. These epicenters are less reliable than those in which the intensity values are distributed around the epicenter, whatever the number of intensity points is.
The locations provided in Table 1 provide a different pic- ture of the historic seismic activity in Spain and nearby regions than that available previously. Due to the limited number of training events used the results should be treated with caution. Whereas new shocks could be added to the training events set, we note that the relationships obtained in this study are consistent with those obtained for California (Bakun and Wentworth, 1997). There is reason to believe that the two regions have similar attenuation characteristics: The attenuation curve used for hazard calculation in the area, Jimenez et al. (1999), is the one developed by Joyner and Boore (1981) from earthquakes in California, which repre- sents fairly well the data for the area.
These new results will be useful for seismotectonic inter- pretations and to redefine a new seismotectonic zoning of active structures in Spain. The results should also benefit future studies of seismic hazard in Spain. El
REFERENCES
Badal, J., E. Samardjieva, and G. Payo (2000). Moment magnitudes for early (1923-1961) instrumental Iberian earthquakes, Bulletin of the Seismological Society of America 90, 1,161-1,173.
Bakun, W. H. (1999). Seismic activity of the San Francisco Bay region, Bulletin of the Seismological Society of America 89, 764-784.
Bakun, W. (2000). Seismicity of California's north coast, Bulletin of the Seismological Society of America 90, 797-812.
Bakun, W. H., A. C. Johnston, and M. G. Hopper (2003). Estimating locations and magnitudes of earthquakes in eastern North America from Modified Mercalli intensities, Bulletin of the Seismological Society of America 93, 190-202.
Bakun, W. H. and C. M. Wentworth (1997). Estimating earthquake location and magnitude from seismic intensity data, Bulletin of the Seismological Society of America 87, 1,502-1,521.
Bakun, W. H. and C. M. Wentworth (1999). Erratum to "Estimating earthquake location and magnitude from seismic intensity data", Bulletin of the Seismological Society of America 89, 557.
Banda, E. and A. M. Correig (1982). The Catalan earthquake of Febru- ary 2, 1428, Engineering Geology 20, 89-97.
Bernal, A., T. Barrera, and J. L. Santiago (1991). The earthquakes of March 10th and May 19th, 1951 occurred in the province of Jaen, Spain, in j. Mezcua and A. Udlas (editors), Seismic#y, Seismotecton- ics and Seismic Risk of the Ibero-Maghrebian Region, Madrid: Insti- tuto Geogr~ifico Nacional, 149-161.
Bisbal, L. (1984). Estudio de la distribuci6n de intensidades slsmicas en el dmbito valenciano. Su incidencia en los obras p~blicas, Ph.D. thesis, Universidad Politdcnica de Valencia.
Espinar, M., J. J. Quesada, and J. D. Morcillo (1994). Terremotos de Granada (siglos XV-XVI) Edificaci6n y Sismicidad, Almerfa: Arraez Editores.
80 Seismological Research Letters Volume75, Number1 January/February2004
Gentil, P. and J. L. de Justo (1983). Terremoto de Carmona de 1504, in Sismicidad Hist&ica de la regidn de la Peninsula Ibdrica, Asociaci6n Espafiola de Ingenierfa Sfsmica, 9-16.
Grunthal, G. (1998). European Macroseismic Scale 1998, Cahiers du Centre Europden de Gdodynamique et de Sdismologie 15, 100 pp.
Hinzen, K. and M. Oemisch (2001). Location and magnitude from seismic intensity data of recent and historic earthquakes in the northern Rhine area, Central Europe, Bulletin of the Seismological Society of America 91, 40-56.
Jimdnez, M. J., M. Garcia, and the GSHAP Ibero-Maghreb Working Group (1999). Seismic hazard assessment in the Ibero-Maghreb region, in D. Giardini (editor), The Global Seismic Hazard Assess- ment Program (GSHAP) 1992-1999, Annali di Geofisica 42, 1,057-1,065.
Johnston, A. C. (1996a). Seismic moment assessment of earthquakes in stable continental regions--II. Historical seismicity, Geophysical Journal International 125, 639-678.
Johnston, A. C. (1996b). Seismic moment of earthquakes in stable con- tinental regions III. New Madrid 1811-12, Charleston 1886 and Lisbon 1755, Geophysical Journal International 126, 314-344.
Joyner, W. B. and D. M. Boore (1981). Peak horizontal acceleration and velocity from strong-motion records including records from the Imperial Valley, California earthquake, Bulletin of the Seismological Society of America 71, 2,011-2,038.
L6pez Marinas, J. M. (1976). Sismo de 21 de Marzo de 1829, Hidroeldctrica Espahola Int. Reporte, 201 pp.
L6pez Marinas, J. M. (1977a). Estudio de los sismos de 18 diciembre 1395 y 15 o 18 de diciembre de 1396, Hidroeldctrica Espahola Int. Reporte, 18 pp.
L6pez Marinas, J. M. (1977b). Estudio del periodo sismico de 1804 en Almerfa, Hidroeldctrica Espahola Int. Reporte, 30 pp.
Martfnez Solares, J. M., A. L6pez Arroyo, and J. Mezcua (1979). Isos- eismal map of the 1755 Lisbon earthquake obtained from Spanish data, Tectonophysics 53, 301-313.
Martfnez Solares, J. M. and G. Pascual (1996). Efectos de los terremotos de Almerfa de 1993-94, in J. Mezcua (editor),Avances de Geofisica y Geodesia, Madrid: Instituto Geogr~ifico Nacional, 85-90.
Mezcua, J. (1982). Catalogo General de Isosistas de la Peninsula Ibdrica, Instituto Geogr~ifico Nacional Pub. 202, 322 pp.
Mezcua, J. and A. J. Martfn (1993). Seismic hazard in Spain, in R. K. McGuire (editor), The Practice of Earthquake Hazard Assessment, International Association of Seismology and Physics of the Earth's Interior and European Seismological Commission, 223-226.
Mezcua, J. and J. M. Martlnez Solares (1983). Sismicidad dele4rea Iber- omogrebi, Instituto Geogr~ifico Nacional Pub. 203, 301 pp.
Mezcua, J. and J. Rueda (1997). Seismological evidence for a delamina- tion process in the lithosphere under the Alboran Sea, Geophysical Journal International 129, F 1-F8.
Moreira, V. S. (1987). Sismicidade historica de Portugal continental, in Jornadas de Estudios sobre metodologla para la investigacidn hist6rica de terremotas, Madrid: Instituto Geogr~ifico Nacional, 199-404.
Mufioz, D. and A. Ud~as (1988). Evaluation of damage and source parameters of the Malaga earthquake of 9 October 1680, in W. H. K. Lee, H. Meyers, and K. Shimazaki (editors), Historical Seismo- grams and Earthquakes af the World, San Diego: Academic Press, 208-221.
NCSR (2002). Norma de construcci6n sismorresistente: parte general y edificaci6n, Boletln Oficial del Estado 244, 35,898-35,967.
Nuttli, O. W. (1973). Seismic wave attenuation and magnitude rela- tions for eastern North America, Journal of Geophysical Research 78, 876-885.
Reiter, L. (1990). Earthquake Hazard Analysis: Issues and Insights, New York: Columbia University Press, 254 pp.
Rodrfguez de la Torre, E (1980). Catalogo sfsmico de la actual provincia de Alicante (hasta final del siglo XVIII), Rev. Inst. Estudios Alican- tinos 30, 107-133.
Rodrlguez de la Torre, E (1984). Los terremotos alicantinos de 1829, Ins. Estudios Alicantinos Serie I, n ~ 100.
Rodrfguez de la Torre, E (1990). Sismologia y s#micidad en la Peninsula Ibdrica durante el siglo XIX, Ph.D. thesis, Universidad de Barce- lona.
Rueda, J. and J. Mezcua (2001). Sismicidad, sismotect6nica y peligrosidad slsmica en Galicia, Madrid: Instituto Geogr~ifico Nacional, 64 pp.
Street, R. L. and E T. Turcotte (1977). A study of northeastern North America spectral moments, magnitudes and intensities, Bulletin of the Seismological Society of America 67, 599-614.
Susagna, T., A. Roca, X. Goula, and J. Batllo (1993). Analysis of mac- roseismic and instrumental data for the study of the November 19, 1923 earthquake in the Aran Valley (Central Pyrenees), Natural Hazards 10, 7-17.
Vogt, J. and C. Weber (1979). Les grands traits de la sismicitd de la France: Les tremblements de terre en France, Mdmoires du Bureau de recherches gdologique et mini2res 96, 205-217.
Instituto Geogrdfico Nacional General Ibd~ez de Ibero 3
28003 Madrid Spain
[email protected] (J.M., J.R.)
Universidad Politdcnica de Madrid Madrid, Spain
(J.M., R.M. G.B.)
Seismological Research Letters January/February2004 Volume 75, Number1 81