reconstructing uniformly attenuated rotating slant-hole spect projection data using the dbh method
TRANSCRIPT

This content has been downloaded from IOPscience. Please scroll down to see the full text.
Download details:
IP Address: 162.129.251.29
This content was downloaded on 19/03/2014 at 17:49
Please note that terms and conditions apply.
Reconstructing uniformly attenuated rotating slant-hole SPECT projection data using the DBH
method
View the table of contents for this issue, or go to the journal homepage for more
2009 Phys. Med. Biol. 54 4325
(http://iopscience.iop.org/0031-9155/54/13/024)
Home Search Collections Journals About Contact us My IOPscience

IOP PUBLISHING PHYSICS IN MEDICINE AND BIOLOGY
Phys. Med. Biol. 54 (2009) 4325–4339 doi:10.1088/0031-9155/54/13/024
Reconstructing uniformly attenuated rotatingslant-hole SPECT projection data using the DBHmethod
Qiu Huang1, Jingyan Xu2, Benjamin M W Tsui2 and Grant T Gullberg1
1 The E O Lawrence Berkeley National Laboratory, One Cyclotron Road, Mail Stop 55R0121,Berkeley, CA 94720, USA2 The Division of Medical Imaging Physics, Department of Radiology, Johns Hopkins University,Baltimore, MD 21287, USA
E-mail: [email protected], [email protected], [email protected] and [email protected]
Received 22 December 2008, in final form 3 April 2009Published 17 June 2009Online at stacks.iop.org/PMB/54/4325
AbstractThis work applies a previously developed analytical algorithm to thereconstruction problem in a rotating multi-segment slant-hole (RMSSH)SPECT system. The RMSSH collimator has greater detection efficiencythan the parallel-hole collimator with comparable spatial resolution at theexpense of limited common volume-of-view (CVOV) and is therefore suitablefor detecting low-contrast lesions in breast, cardiac and brain imaging. Theabsorption of gamma photons in both the human breast and brain can be assu-med to follow an exponential rule with a constant attenuation coefficient.In this work, the RMSSH SPECT data of a digital NCAT phantom withbreast attachment are modeled as the uniformly attenuated Radon transformof the activity distribution. These data are reconstructed using an analyticalalgorithm called the DBH method, which is an acronym for the procedureof differentiation backprojection followed by a finite weighted inverse Hilberttransform. The projection data are first differentiated along a specific directionin the projection space and then backprojected to the image space. Theresult from this first step is equal to a one-dimensional finite weighted Hilberttransform of the object; this transform is then numerically inverted to obtainthe reconstructed image. With the limited CVOV of the RMSSH collimator,the detector captures gamma photon emissions from the breast and from partsof the torso. The simulation results show that the DBH method is capableof exactly reconstructing the activity within a well-defined region-of-interest(ROI) within the breast if the activity is confined to the breast or if the activityoutside the CVOV is uniformly attenuated for each measured projection, whilea conventional filtered backprojection algorithm only reconstructs the highfrequency components of the activity function in the same geometry.
0031-9155/09/134325+15$30.00 © 2009 Institute of Physics and Engineering in Medicine Printed in the UK 4325

4326 Q Huang et al
1. Introduction
The rotating multi-segment slant-hole (RMSSH) SPECT system is known for its high detectionefficiency and a relatively small field-of-view (FOV). These two intrinsic properties make theRMSSH SPECT system applicable to breast, brain or cardiac imaging. In SPECT breastimaging, radioactive emissions from the breast are attenuated by the uniform breast tissue andcaptured by the gamma camera. The small FOV of an RMSSH SPECT system is large enoughto contain the breast region, however, activities originating from other organs may causeartifacts if appropriate methods are not used to correct for the effects of truncation. In thispaper, an RMSSH SPECT system for breast imaging was investigated through a simulationstudy. An analytically exact algorithm was utilized in reconstruction of simulated uniformlyand nonuniformly attenuated data with truncation.
The SPECT system with an RMSSH collimator has been studied for some time (Edholmet al 1980, Holman et al 1981, Dale et al 1985, Wessell 1999, Bal et al 2000, 2006, Wagneret al 2001, 2002, Baird et al 2003, Liu et al 2004, Xu et al 2006, Xu and Tsui 2006). Earlydevelopment and application of RMSSH SPECT is reviewed in the dissertation of Wessell(1999). Recent interest in RMSSH imaging has been shown in cardiac (Bal et al 2000,2006) and breast imaging (Baird et al 2003, Liu et al 2004). Reconstruction algorithms forRMSSH SPECT have also been developed (Wagner et al 2001, 2002, Xu et al 2004, Xu andTsui 2006) for the case in which a complete tomographic data set is acquired. A projectiondata set is complete if the projections are sampled such that Orlov’s condition is satisfied(Orlov 1975). Analytical algorithms for RMSSH SPECT with uniform attenuation correctionwere considered in the works of Wagner et al (2001, 2002) which assumed that the activitysources were fully contained within the FOV of the RMSSH SPECT system, i.e., there wasno truncation. The 3D data set was rebinned to the conventional circular SPECT parallelgeometry, so that a two-dimensional reconstruction algorithm could be used to compensatefor the uniform attenuation. Xu et al (2004) presented an iterative algorithm to correct thenon-uniform attenuation effect in breast imaging.
Recently, Xu and Tsui (2006) derived an analytical method for RMSSH SPECT breastimaging using a two-step procedure with differentiation backprojection (DBP) followed bya finite inverse Hilbert transform. The algorithm was an adaptation of the one developed byNoo et al (2004) in CT reconstruction to the RMSSH SPECT geometry. Although unable tocorrect for attenuation of gamma photon emissions, the algorithm was able to reconstruct aregion-of-interest (ROI) from truncated projections in RMSSH SPECT geometry. A similartwo-step algorithm on inverting the exponential Radon transform (Natterer 1986) was firstpresented by Rullgard (2004).
In this paper, a two-step algorithm which was developed in the works of Noo et al (2007)and Huang et al (2009) is applied to a complete RMSSH SPECT data set to reconstruct theactivity in the breast with uniform attenuation correction. The algorithm reconstructs thesame ROI as that developed by Xu and Tsui (2006) except the presented algorithm is moresensitive to numerical errors because of the modeling for attenuation and requires more carefulnumerical implementation to minimize reconstruction artifacts.
The analytical reconstruction algorithm developed in this paper for the correction ofuniform attenuation is computationally more efficient than an iterative algorithm and mayhave potential applications in clinical SPECT. Analytical methods treat the projection data asperfect line integrals and the reconstruction can be carried out efficiently using mathematicallyexplicit formulae. Analytical methods provide a quick reconstruction useful in quality control;for example, the evaluation of subject positioning and determination of whether an experimentneeds to be redone, or the evaluation of whether geometrical calibrations, such as the center of
Reconstructing RMSSH SPECT data with DBH method 4327
(a) RMSSH collimator. (b) Side view.
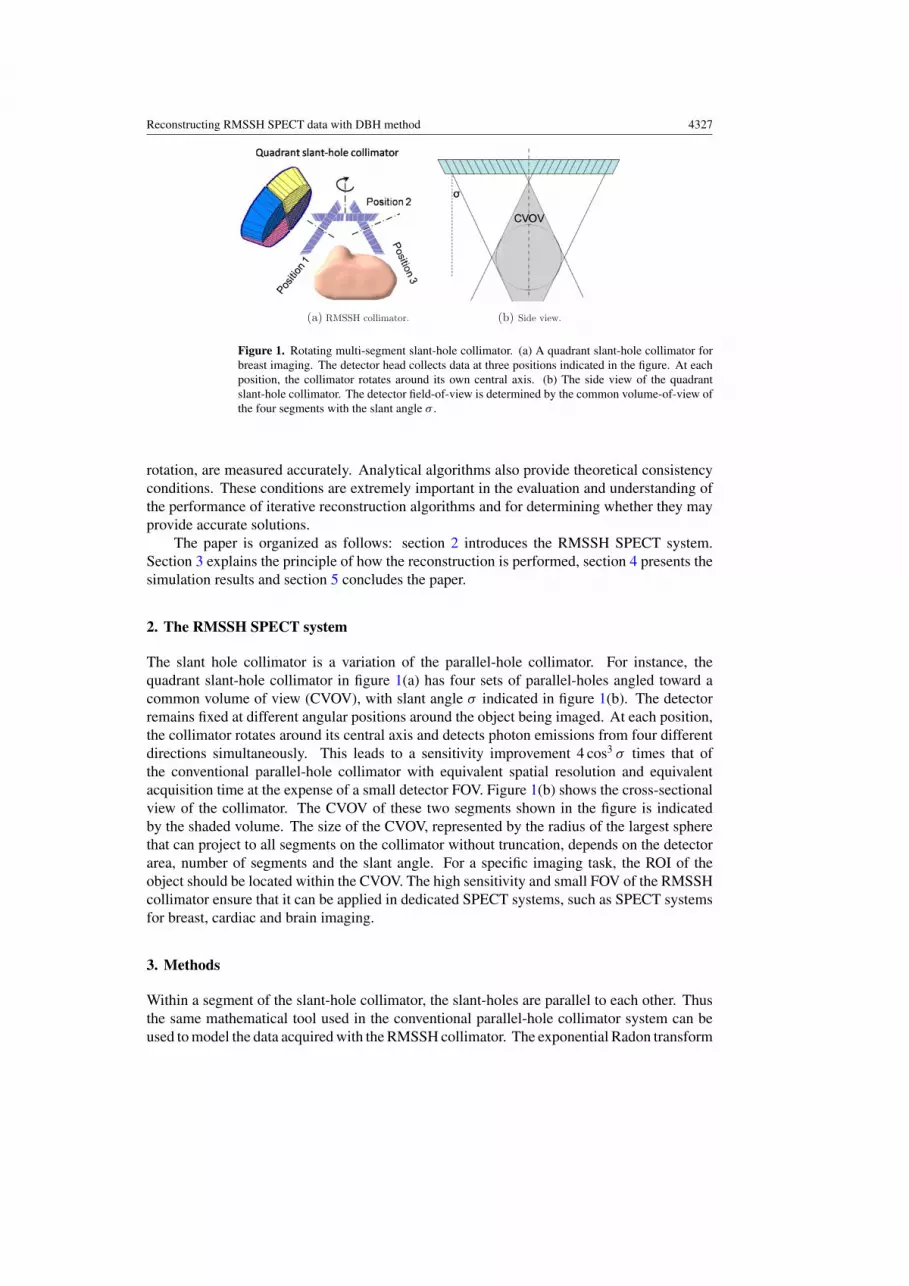
Figure 1. Rotating multi-segment slant-hole collimator. (a) A quadrant slant-hole collimator forbreast imaging. The detector head collects data at three positions indicated in the figure. At eachposition, the collimator rotates around its own central axis. (b) The side view of the quadrantslant-hole collimator. The detector field-of-view is determined by the common volume-of-view ofthe four segments with the slant angle σ .
rotation, are measured accurately. Analytical algorithms also provide theoretical consistencyconditions. These conditions are extremely important in the evaluation and understanding ofthe performance of iterative reconstruction algorithms and for determining whether they mayprovide accurate solutions.
The paper is organized as follows: section 2 introduces the RMSSH SPECT system.Section 3 explains the principle of how the reconstruction is performed, section 4 presents thesimulation results and section 5 concludes the paper.
2. The RMSSH SPECT system
The slant hole collimator is a variation of the parallel-hole collimator. For instance, thequadrant slant-hole collimator in figure 1(a) has four sets of parallel-holes angled toward acommon volume of view (CVOV), with slant angle σ indicated in figure 1(b). The detectorremains fixed at different angular positions around the object being imaged. At each position,the collimator rotates around its central axis and detects photon emissions from four differentdirections simultaneously. This leads to a sensitivity improvement 4 cos3 σ times that ofthe conventional parallel-hole collimator with equivalent spatial resolution and equivalentacquisition time at the expense of a small detector FOV. Figure 1(b) shows the cross-sectionalview of the collimator. The CVOV of these two segments shown in the figure is indicatedby the shaded volume. The size of the CVOV, represented by the radius of the largest spherethat can project to all segments on the collimator without truncation, depends on the detectorarea, number of segments and the slant angle. For a specific imaging task, the ROI of theobject should be located within the CVOV. The high sensitivity and small FOV of the RMSSHcollimator ensure that it can be applied in dedicated SPECT systems, such as SPECT systemsfor breast, cardiac and brain imaging.
3. Methods
Within a segment of the slant-hole collimator, the slant-holes are parallel to each other. Thusthe same mathematical tool used in the conventional parallel-hole collimator system can beused to model the data acquired with the RMSSH collimator. The exponential Radon transform

4328 Q Huang et al
(Natterer 1986) is used in this paper to describe the uniform attenuation of the gamma photonsin breast tissue. The task of reconstruction is to restore the activity from its exponential Radontransform.
3.1. Exponential Radon transform
Activity at a point in the three-dimensional (3D) space �x = (x, y, z)T is denoted by f (�x).The projection detected by each segment has an angle (π/2 − σ) to the detector plane, if theslant angle is σ . For simplicity, in this mathematical model the detector plane is assumed to beperpendicular to the projections and lie at the center of the field, as in figure 2. The emissionray is assumed to be along the direction �θ = �θ(ϕ, θ), which has the azimuth angle ϕ and thezenith angle θ . The projection g(u, v, �θ) is the exponential Radon transform of the activity f :
g(u, v, �θ) =∫ ∞
−∞f (u�α + v�β + t�θ)eμtdt, (1)
where μ is the linear attenuation coefficient assumed to be known a priori. We assume that thebreast tissue is adipose, which has an attenuation coefficient close to water. In the numericalstudy μ = 0.15 cm−1 is chosen at the photon energy of 140 keV. The unit directional vectorsin (1) are defined as
�α = (− sin ϕ, cos ϕ, 0)T ,
�β = (− cos θ cos ϕ,− cos θ sin ϕ, sin θ)T ,
�θ = (sin θ cos ϕ, sin θ sin ϕ, cos θ)T .
3.2. Data acquisition
The activity function f (�x) can be exactly reconstructed if a complete tomographic set ofprojection data g(u, v, �θ) is available. Using Orlov’s condition (Orlov 1975), to acquirea complete tomographic projection set, the RMSSH detector head should stop at π/(2σ)
positions equally spaced on an arc of π − 2σ . At each position, the collimator rotates andrecords emissions at sufficient views.
The RMSSH SPECT system for breast imaging is shown in figure 1(a) for slant angleσ = π/6. The detector stops at three positions to acquire data. At each position, the collimatorrotates such that the trace of projection directions draws half a circle on the unit sphere seenas solid arcs in figure 3 and denoted by �1,�2 and �3, respectively. The representation ofall the projection directions on the unit sphere is then a continuous curve consisting of thesethree half circles.
The measured data are assumed to have the form
p(u, v, �θ) =∫ ∞
−∞f (u�α + v�β + t�θ)e− ∫ ∞
tμdτ dt. (2)
where in practice, the detector plane is located at a finite distance outside the patient. As isimplied in (1), the data used in the new algorithm assume that the detector is placed at thecenter of rotation, which is the center of the ROI. Thus the acquired data is modified to form theexponential Radon transform in (1) by multiplying by a factor e
∫ ∞0 μdτ to obtain the modified
projections g(u, v, �θ) before the step of differentiation. With the attenuation map known, itis easy to calculate this factor. Along each projection ray, the factor is the integral of theattenuation map from the imaginary central detector plane to the edge of the attenuation map.This requires the boundary of the attenuation map to be known and a proper coordinate system

Reconstructing RMSSH SPECT data with DBH method 4329
Figure 2. Coordinate systems. The imaginary detector plane (shaded) is assumed to beperpendicular to the projection direction �θ and contains the origin O. The projection directionis indicated by a unit vector �θ with the azimuth angle ϕ and the zenith angle θ . Unit vectors �α and�β indicate the directions of the u-axis and the v-axis of the detector plane.
Figure 3. Projection directions on a unit sphere. Each point on the sphere indicates a unit vector.The RMSSH SPECT system in figure 1(a) has projection directions constituting three arcs �1, �2and �3 shown in solid lines for positions 1, 2 and 3, respectively.
to be set up. For instance, the Cartesian coordinates for �2 are shown in figure 3. Similarly,for �1 and �3, the y–z plane should be rotated around the x-axis by 2σ counterclockwise andclockwise.
3.3. Differentiation backprojection
To reconstruct the image, the two-step method first calculates the differentiation backprojection(DBP) of the modified projections g(u, v, �θ). Without loss of generality, the data g(u, v, �θ)
are assumed to be modified from the data measured at the second camera position. Thedifferentiation is carried out along the u-axis, which is the tangential direction of the

4330 Q Huang et al
self-rotating orbit of the collimator:
∂g
∂u(u, v, �θ) =
∫ ∞
−∞
∂
∂u[f (u�α + v�β + t�θ)eμt ]dt,
=∫ ∞
−∞[�α · ∇f (u�α + v�β + t�θ)]eμtdt, (3)
where ∇ is the gradient operator. For a ray passing through �x, the differentiation is
∂g
∂u(u, v, �θ)|u=�x·�α,v=�x·�β =
∫ ∞
−∞[�α · ∇f ((�x · �α)�α + (�x · �β)�β + t�θ)]eμtdt,
=∫ ∞
−∞[�α · ∇f (�x + (t − �x · �θ)�θ)]eμtdt,
=∫ ∞
−∞[�α · ∇f (�x + τ �θ)]eμ(τ+�x·�θ)dτ.
The relation �x = (�x · �α)�α + (�x · �β)�β + (�x · �θ)�θ was used in the second equality. The lastequality of (4) holds for τ = t − �x · �θ . Then the exponential backprojection is performed overthe entire �2 with d �ω = sin θdθdϕ:
b2(�x) =∫∫
�2
∂g
∂u(u, v, �θ)|u=�x·�α,v=�x·�βe−μ�x·�θd �ω,
=∫∫
�2
(∫ ∞
−∞[�α · ∇f (�x + t�θ)]eμ(t+�x·�θ)dt
)e−μ�x·�θd �ω,
=∫∫
�2
(∫ ∞
−∞[�α · ∇f (�x + t�θ)]eμtdt
)d �ω. (5)
The expression
[�α · ∇f (�x + t�θ)] =[
1
t sin θ
∂
∂ϕf (�x + t�θ)
]holds by the chain rule
∂
∂ϕf (�x + t�θ) = ∇f (�x + t�θ) · ∂
∂ϕ(�x + t�θ)
and
∂
∂ϕ(�x + t�θ) = (− sin θ sin ϕ, sin θ cos ϕ, 0) = (t sin θ)�α.
Thus after rearrangement, (5) can be expressed as
b2(�x) =∫ ∞
−∞
eμt
t
(∫∫�2
[1
sin θ
∂
∂ϕf (�x + t�θ)
]d �ω
)dt. (6)
Define two unit directions �θ1 = �θ1(ϕ1, σ ) and �θ2 = �θ2(ϕ2, σ ) illustrated in figure 3. Theintegral in the parenthesis in (6) is∫∫
�2
[1
sin θ
∂
∂ϕf (�x + t�θ)
]d �ω,
=∫ ϕ2
ϕ1
∫ π/2
0δ(θ − σ)
[1
sin θ
∂
∂ϕf (�x + t�θ)
]sin θdθdϕ,

Reconstructing RMSSH SPECT data with DBH method 4331
=∫ ϕ2
ϕ1
∂
∂ϕf (�x + t�θ)
∣∣∣∣θ=σ
dϕ,
= f (�x + t�θ2) − f (�x + t�θ1).
Accordingly, equation (5) (the DBP of data measured at the second camera position) can bewritten as ∫ ∞
−∞
eμt
t(f (�x + t�θ2) − f (�x + t�θ1))dt.
The equation shows that the DBP is the difference of the image blurred along two directions.These two directions are determined by the two ends of the trajectory (i.e., �2) of the projectiondirections. The DBP for the first camera position and the third camera position can be similarlyobtained, although the coordinate system should be rotated so that the z-axis aligns with the self-rotating axis of the detector. The three DBP’s add up to
∫ ∞−∞
eμt
t(f (�x + t�v2) − f (�x + t�v1)) dt .
Direction �v1 is the starting point of �1 in the unit sphere. Direction �v2 is the ending point of�3 in the unit sphere. With the system configuration in figure 1(a), the two directions �v1 and�v2 are opposite to each other along the y-axis, i.e., �v1 = −�v2 and �v2 = (0, 1, 0). The sum ofall three DBP’s is∫ ∞
−∞
eμt
t[f (�x + t�v2) − f (�x + t�v1)]dt,
=∫ ∞
−∞
eμt
t[f (�x + t�v2) − f (�x − t�v2)]dt,
=∫ ∞
−∞
eμt + e−μt
tf (�x + t�v2)dt,
=∫ ∞
−∞
eμt + e−μt
tf (x, y + t, z)dt,
= −2πcosh μy
πy∗ f (x, y, z) (7)
�= f (x, y, z). (8)
The DBP of the projection data is then a one-dimensional (1 D) convolution of the activityfunction with a hyperbolic-cosine-weighted Hilbert kernel along the y-axis. The image can bereconstructed by inverting this convolution.
3.4. Inversion of the finite weighted Hilbert transform
Care must be taken while numerically inverting the hyperbolic-cosine-weighted Hilberttransform. The kernel (cosh μy)/y has a singularity as in the conventional Hilbert transform.However, with constant attenuation coefficient μ, the difference is that the kernel is notbounded at infinity and truncation is also present in the data which makes the problem morecomplicated.
For f (x, y, z) in (8), the goal is to restore the function f (x, y, z) from f (x, y, z), whichis the finite weighted Hilbert transform of f (x, y, z). The function f (x, y, z) can be obtainedfrom the measured data via differentiation and backprojection. However, with truncation,only the part in some finite region (the FOV, for instance) is accurate. In our previous work(Huang et al 2009), we showed that f (x, y, z) could be exactly reconstructed from f (x, y, z)

4332 Q Huang et al
if f (x, y, z) was available in the same support region of f (x, y, z). Here we sketch how thisis performed.
Since f (x, y, z) and f (x, y, z) are related by a 1 D operator, we simplify notationsby h(y) = f (x, y, z) and Hμ(y) = f (x, y, z)/(−2π). Assume f (x, y, z) = 0 fory ∈ (−∞,−q) ∪ (q,∞). This is justifiable since radioactive activity is always restrictedin some organs or patient body. Then the finite weighted Hilbert transform is
Hμ(y) =∫ ∞
−∞
cosh(μ(y − y))
π(y − y)h(y)dy,
=∫ q
−q
cosh(μ(y − y))
π(y − y)h(y)dy. (9)
The inversion can be symbolically put in the following equation:
h(y) = M−1∫ q
−q
Hμ(y)
π(y − y)
√q2 − y2
q2 − y2dy, (10)
where M−1 is an operator performed on the entire integral, which can be implemented as amatrix multiplication if both h(y) and Hμ(y) are column vectors. The matrix M = M(y, y)
is obtained as follows:
M(y, y) = K(y, y) + δ(y − y),
K(y, y) =∫ q
−q
Aμ(s − y)
π2(s − y)
√q2 − y2
q2 − s2ds,
Aμ(y) = cosh(μy) − 1
y.
More details on implementation can be found in our previous work (Huang et al 2009).
4. Numerical study
Let us first outline the four simulations which were performed. In each simulation, the 3DNCAT phantom (Segars et al 1999, Segars 2001) with an attached breast and with a 1 cm breastlesion was used for the numerical study. The contrast of breast, lesion, heart, liver and lungs tothe body background was set to 2, 20, 75, 75 and 4 to 2. The voxel size was 1.56 mm. Figure 4shows one transaxial slice of the emission distribution, in the phantom. The first simulationgenerated attenuated projections without noise assuming a uniform attenuation coefficient of0.15 cm−1 throughout the thorax. This simulation was repeated with Poisson noise added tothe projections. A third simulation was performed using the same emission distribution infigure 4 but with a variable attenuation distribution provided by the NCAT phantom. This wasrepeated for noise by adding Poisson noise to the projections.
The simulated slant-hole collimator had a slant angle σ = 30◦ and a CVOV with adiameter of 12.5 cm. The detector plane was chosen to be a 256 × 256 array with a bin sizeof 1.56 mm. Projection data were simulated at three detector positions. The rotating axes ofthe collimator at these three positions were 60◦ apart in a transaxial plane. At each detectorposition projections were simulated at 90 angular steps. Thus, a set of projection data wereformed with view angle steps of 1◦. Examples can be seen in figure 5 where the detectoris located at the second position. The uniform attenuation coefficient was chosen to be 0.15cm−1, the breast tissue attenuation at 140 keV.

Reconstructing RMSSH SPECT data with DBH method 4333
Figure 4. Sample phantom slice of the emission distribution in a transaxial plane. The contrastof breast, lesion, heart, liver and lungs to the body background was set to 2, 20, 75, 75 and 4 to 2,respectively. Projections from this distribution are simulated both for uniform and for nonuniformattenuation.
Figure 5. The simulated projections on the detector at position 2 (in figure 3) from two viewangles. The arrows indicate the direction of differentiation on each of the four quadrants of theslant-hole collimator.
The direction of differentiation is along vector �α shown in figure 2, which is equivalent tothe tangential direction of the trajectory of the projection directions drawn on Orlov’s sphere.In the numerical implementation, the central difference operator for the first derivative basedon three points was performed on the projections along the directions indicated by the arrowsin figure 5. After backprojecting the differentiated data to a 3D mesh in the image space, the1D inversion of the finite weighted Hilbert transform was performed within the CVOV.
In the backprojection, the activity at each point in the image space was calculated byadding the differentiated data for all the views. For computational simplicity, differentiatedprojections at the nearest detector bins were used. Then, a 1D processing of the DBP datawas performed within the CVOV. This was to invert the finite-weighted Hilbert transform.High activity from outside of the breast, such as heart and liver, contributed to the projectiondata at some views but not all views. The algorithm presented in this work reconstructs theactivity in the ROI accurately even with this data inconsistency if the attenuation distribution isuniform.
Figure 6 displays the reconstructed image with attenuation correction. Three slices passingthrough the center of the lesion are shown. The same gray scale is used for both true imagesand reconstructed images. Figure 6(d) shows profiles along lines indicated in figure 6(a).The profiles of the reconstructed image using the presented algorithm match those of

4334 Q Huang et al
True
1
2 3
DBH BPF
(a) Transaxial slices.
(b) Coronal slices.
(c) Sagittal slices.
9.375 cm 18.75 0
5
10
15
20
0
Profile 1
True
DBH
BPF
0 9.375 cm 18.755
0
5
10
Profile 2
True
DBH
BPF
ROI
0 9.375 cm 18.755
0
5
10
15
20
Profile 3
True
DBH
BPF
ROI
(d) Profiles along lines 1, 2, and 3 indicated in (a).
Figure 6. Simulation results. (a)–(c) Slices passing through the center of the lesion. The leftcolumn is for the true images, the central column is for the reconstructed images with the algorithmpresented and the right column is for the reconstructed images using conventional BPF algorithm.All images are displayed in the same gray scale. (d) Profiles along lines shown in the phantomimage in (a). The part along the vertical profiles that can be reconstructed exactly with the DBHmethod is marked as ‘ROI’ in the figure. With the conventional BPF method, no region can bereconstructed accurately from truncated projections.
the phantom, except for the end portions of the vertical profiles where the truncation artifactsare severe.
The NCAT phantom with the right breast attached is used in figure 7(a) to illustratethe region of interest that can be reconstructed accurately. With the aforementioned dataacquisition system set up, the 1 D filtration on the DBP is performed along parallel lines.

Reconstructing RMSSH SPECT data with DBH method 4335
(a) (b)
Figure 7. The region of interest that can be reconstructed accurately. (a) A transaxial slice of theNCAT phantom with the right breast attached. With the RMSSH system in figure 1(a), the finiteHilbert transform should be inverted along lines parallel to the dashed line. Within the hexagonalCVOV the part above the dashed line can be reconstructed accurately. (b) A sagittal slice of thesame phantom in the CVOV. The part of the breast to the left of the dashed line can be reconstructedaccurately.
The finite Hilbert transform requires the original function to be defined in a finite region andvanishes outside the region. Hence, if the intersection of the filtration lines with the patientbody falls within the CVOV, the breast activity can be exactly reconstructed, even whenemissions from the heart and the liver also contribute to the measured data. The hexagon infigure 7(a) indicates the CVOV and the region within the hexagon and above the dashed linecan be exactly reconstructed with the current system configuration.
Simulation results show that with the presented algorithm, the breast activity in someregion can be restored accurately. It is not the case if a traditional backprojection filtering(BPF) algorithm is applied. We designed the filter according to Wessell’s dissertation (1999)and show the result in the last column of figures 6(a)–(c). Severe artifacts can be observedin these reconstructed images using the BPF algorithm. The profiles in figure 6(d) also showthat the reconstructed image using the BPF algorithm does not agree with the true imagequantitatively.
In SPECT imaging, acquired data are always contaminated by noise. Thus the algorithmwas evaluated with simulated noisy data. The data without noise were first used to generatedata with Poisson noise and then modified as described in section 3.2. To simulate the practicalcase, the average total count of events was chosen to be 45 000 for the four segments at oneview. A reconstructed image from these simulated noisy data is shown in figure 8. In orderto illustrate the effect of noise in this algorithm, no filter was used to suppress the noise. Theresult looks noisy since the differentiation magnifies noise. However, the lesion is evident inthe reconstructed image with the current noise level and activity contrast.
In this algorithm, the attenuation is assumed to be uniform everywhere there is activity.However, projections passing through the lungs and the bones are not attenuated in thesame way as those only passing through the breast tissues. The image in figure 9shows the reconstructed image from nonuniformly attenuated data while the reconstructionwas performed assuming a uniform attenuation map. The assumption causes quantitativeinaccuracy in the image. The activity outside the region of interest and the nonuniformity ofattenuation map outside the region of interest both contribute to the inaccuracy. Figure 10shows the reconstruction with noise at a clinical level. The image is as noisy as that in figure 8where uniformly attenuated data were reconstructed.

4336 Q Huang et al
Figure 8. The reconstructed images from noisy data displayed with the same gray scale as infigure 6. Only the region which can be reconstructed exactly is shown. No filter was used tosuppress the noise effect in the reconstruction and display.
0 9.375cm 18.75
0
10
20
30
40
50
60True
DBH
Figure 9. The reconstructed images from nonuniformly attenuated data. The reconstruction wasperformed assuming a uniform attenuation map, which results in quantitative inaccuracy in theimage.
5. Discussions and conclusion
The RMSSH SPECT system is applicable in breast, brain and heart imaging. The DBH methodapplied to uniformly attenuated SPECT projection data as previously presented (Huang et al2009) can be used in the reconstruction of RMSSH SPECT data with uniform attenuation. TheDBH method is a new direction in the development of analytical reconstruction algorithmsfor tomographic imaging. It provides important insight into understanding the limitations andpossibilities for reconstructing truncated projections with uniform attenuation correction. Fora well-defined region of the breast the method suppresses the effects of truncation due to thesmall CVOV of the RMSSH collimator. Results from using this method are superior to those

Reconstructing RMSSH SPECT data with DBH method 4337
Figure 10. The reconstructed images from nonuniformly attenuated data with noise. The averagenumber of total counts of the four segments at each view is around 45 000.
(a) (b)
Figure 11. (a) A different system orientation. The detectors are located such that the 1 D weightedHilbert transform is performed parallel to the solid line in the figure. (b) A different availableregion for exact reconstruction. Within the hexagonal CVOV the part above the dashed line canbe reconstructed exactly.
obtained with a conventional BPF algorithm, which is not capable of reconstructing the imagefrom truncated projections. Furthermore, the implementation of the conventional BPF methodrequires a three-dimensional filtration, while in the proposed method only a 1D derivative anda 1D de-convolution are required. Even though these results are very encouraging, methodsstill need to be developed to better quantify in the case of activity included in the projectionmeasurements that is attenuated by the variable attenuation in the thorax.
The region that has an exact and stable reconstruction is determined by the geometry.For instance, if the detectors are located as shown in figure 11(a) instead of as those shownin figure 1(a), then the 1 D weighted Hilbert transform would be performed parallel to theline indicated in figure 11(a). As a consequence, the region that can be reconstructed exactlyis different and larger as shown in figure 11(b). We would like to point out that for non-attenuated data, Defrise et al (2006) generalized the sufficiency condition for an exact andstable reconstruction so that an even larger region can be reconstructed accurately. Thequestion whether the same theory works for uniformly attenuated data or not remains forfuture work.
Furthermore, compared to the case without attenuation, the simulation and reconstructionwith uniform attenuation are more vulnerable to numerical errors. For instance, the

4338 Q Huang et al
non-attenuated projections with detector bins of 3.12×3.12 mm2 and angular steps of 3◦ couldbe sufficient for a good reconstruction; while with the attenuation, finer angular sampling andsmaller detector bin size are preferred. Also, for quantitative accuracy especially when thelesion is small, a dense grid is needed for backprojection. In our simulation for example,without attenuation, the voxel size could be 3.12 mm, while with attenuation, the voxel shouldbe as small as 1.56 mm for comparable resolutions.
This work extends our previous analytical work to an application in breast SPECTimaging and provides a fully three-dimensional reconstruction from truncated projections.The performance of the algorithm is compromised in the presence of noise. Data processingprocedures could be added to improve the signal-to-noise ratio. The nonuniformity of theattenuation map also results in quantitative inaccuracies. Further work will be focused onvariable attenuation correction in the same scenario presented in this paper.
Acknowledgments
This work was supported by grants R01 EB01983 and R21 EB00121 from the NationalInstitutes of Health, by grant bio02-10300 from the UC Discovery Grant Program withsponsorship from Philips Medical Systems, and in part by the Director, Office of Science,Office of Biological and Environmental Research, Medical Science Division of the USDepartment of Energy under contract no. DE-AC02-05CH11231.
References
Baird W H, Frey E C, Tsui B M W, Wang Y and Wessell D E 2003 Evaluation of rotating slant-hole SPECTmammography using Monte Carlo simulation methods IEEE Trans. Nucl. Sci. 50 105–9
Bal G, Clackdoyle R, Kadrmas D J, Zeng G L and Christian P E 2000 Evaluating rotating slant-hole SPECT withrespect to parallel hole SPECT IEEE Nucl. Sci. Symp. Conf. Record 3 22/67–71
Bal G, DiBella E V R, Gullberg G T and Zeng G L 2006 Cardiac imaging using a four-segment slant-hole collimatorIEEE Trans. Nucl. Sci. 53 2619–27
Dale S, Edholm P E, Hellstrom L G and Larsson S 1985 Ectomography—a tomographic method for gamma cameraimaging Phys. Med. Biol. 30 1237–49
Defrise M, Noo F, Clackdoyle R and Kudo H 2006 Truncated Hilbert transform and image reconstruction from limitedtomographic data Inverse Problems 22 1037–53
Edholm P, Granlund G, Knutsson H and Petersson C 1980 Ectomography—a new radiographic method for reproducinga selected slice of varying thickness Acta Radiol. Diagn. 21 433–42
Huang Q, You J, Zeng G L and Gullberg G T 2009 Reconstruction from uniformly attenuated SPECT projection datausing the DBH method IEEE Trans. Med. Imaging 28 17–29
Holman B L, Wynne J, Zielonka J S and Idoine J D 1981 A simplified technique for measuring right ventricularejection fraction using the equilibrium radionuclide angiocardiogram and the slant-hole collimator Radiology138 429–35
Liu C, Tsui B M W, Baird W H, Wang Y, Xu J and Frey E C 2004 Evaluation of rotating slant-hole SPECTmammography with respect to planar scintimammography using Monte Carlo simulation methods IEEE Nucl.Sci. Symp. Conf. Record 7 4063–7
Natterer F 1986 The Mathematics of Computerized Tomography (Philadelphia: SIAM)Noo F, Clackdoyle R and Pack J D 2004 A two-step Hilbert transform method for 2D image reconstruction Phys.
Med. Biol. 49 3903–23Noo F, Defrise M, Pack J and Clackdoyle R 2007 Image reconstruction from truncated data in SPECT with uniform
attenuation Inverse Problems 23 645–67Orlov S S 1975 Theory of three-dimensional reconstruction. 1. Conditions of a complete set of projections Sov. Phys.
Crystallogr. 20 312–4Rullgard H 2004 An explicit inversion formula for the exponential Radon transform using data from 180◦ Ark.
Math. 42 353–62Segars W P 2001 Development of a new dynamic NURBS-based cardiac-torso (NCAT) phantom PhD Dissertation
University of North Carolina at Chapel Hill

Reconstructing RMSSH SPECT data with DBH method 4339
Segars W P, Lalush D S and Tsui B M W 1999 A realistic spline-based dynamic heart phantom IEEE Trans. Nucl.Sci. 46 503–506
Wagner J-M, Noo F and Clackdoyle R 2002 Exact inversion of the exponential x-ray transform for rotating slant-hole(RSH) SPECT Phys. Med. Biol. 47 2713–26
Wagner J-M, Noo F, Clackdoyle R, Bal G and Christian P E 2001 Attenuation correction for rotating slant-hole (RSH)SPECT using exact rebinning IEEE Nucl. Sci. Symp. Conf. Record 3 1527–30
Wessell D E 1999 Rotating slant-hole single-photon emission computed tomography PhD Dissertation University ofNorth Carolina at Chapel Hill
Xu J, Liu C, Wang Y C, Frey E C and Tsui B M W 2006 Attenuation correction for rotating multi-segment slant-holeSPECT in breast imaging Phys. Med. 21 (Suppl.) 44–47
Xu J and Tsui B M W 2006 An accurate region-of-interest reconstruction method using a two-step Hilbert transformfor rotating slant hole SPECT J. Nucl. Med. 47 123P (abs)