comparison of slant and runway visual range relationships for
TRANSCRIPT
—
h~rt Us. FAA-RD-il-ill
COMPARISON OF SLANT AND RUNWAY VISUAL RANGERELATIONSHIPS FOR 100, 124, AND 155 FEET
WILLIAM LEWIS ~ ~ :~~~
‘ ‘ YC~\a,APRIL 1918
.-•.•‘•
FINAL REPORT
Document is avalithie to the U.S. public throughthe National Technical information Service,
Springfield, Vhglnla fl161.
Prupud for
U.S. DEPARTMENT OF TRANSPORTATIONFEDERAL AVIATiON ADMINISTRATION
SJ$teMS RI!kfdl & DSVS~p.SPt SSIVIcS
_ _ _ _
~~~~~~~~
- — •~
~~~~~~~~~
I
NOTICE
The United States Government does not endorse productsor manufacturers . Trade or manufacturer ’s names appearherein solely because they are considered essential tothe object of this report.
-. .
~~~~~~~~~ ~~ ~~
—.~~-
..
j ~~~~~~~~
•1— •~~~‘
1.• I ! iiUI! I~ ~~ ~ ~~I •
~• • §
— -E • ~~~~
.. • • — .2
j ~. ~~~
-
ZZ 16 61 II LI 91 51 Ii £1 61 II Dl 6 6 L 9 ç e g
~~ ~~~
j ~~~~~~~~~~~~~~~~~~~~~~~~~
H .~ •e .2hIH ~fl ~~~~~~
I g” ~~
~ ~;~‘i ~:::ii !~Jill L IU ~ Iii~ IlulihI ~J E~~~~~1 ~I1# ’~1
~1~)
~~~~~~~~
T.cluuico l k.poit Docuu...tstion Pag.
J~~~~~ aort ‘4~
2. Gov.rnm.nt *cc.ss ion No. 3. R.cipi .nt . Catalog No.
~~~~ -RDj~~~~l9~~~ _ _ _ _ _ _ _ _ _ _ _ _ _
~~~~~~~~~~~~~~~~~~~~~~~~~ l~ 24~~A~~~ l554~~ Ti~~j 6. P.donn,ng Orgamzotion Cod.
___________________________________________________________________________ 8. P.rfor.u,ing Organization R.port No.7. Author1
~)
~~~~~~~~~i iiam~~ewis J UFAA—NA—78—itJ9. P,rfo,n,, ng Organ ization Non,. and Add r.ss 10. Wo,k Unit No. (TRAIS)
Federal Aviation Administration ____________________________
National Aviation Facilities Experimental Center 11. Contract or 9za $ No .
Atlantic City, New Jersey 08405 l5~~*e2~O6013. yp. of Rapo,t and P.riod Cov.r .d
12. Sponsoring Ag.ncy Ham, and Addr.ss .4.U.S. Department of Transportation Final ~t ~Federal Aviation Administration Ma7 ~
— Ju 77Systems Research and Development Service 14. SpoWashing ton , D.C. 20590 I~ ~~~
— 115 . Suppl.m.ntary Not.. ______
This report is a continuation of report FAA—RD—77—34 .by Lewis, W., anSchiatter, E., “Slant and Runway Visual Relationships ,” sponsored and
~ managed by the Aviation Weather Systems Branch, ARD—450. \
~ _~~~~ tj ..
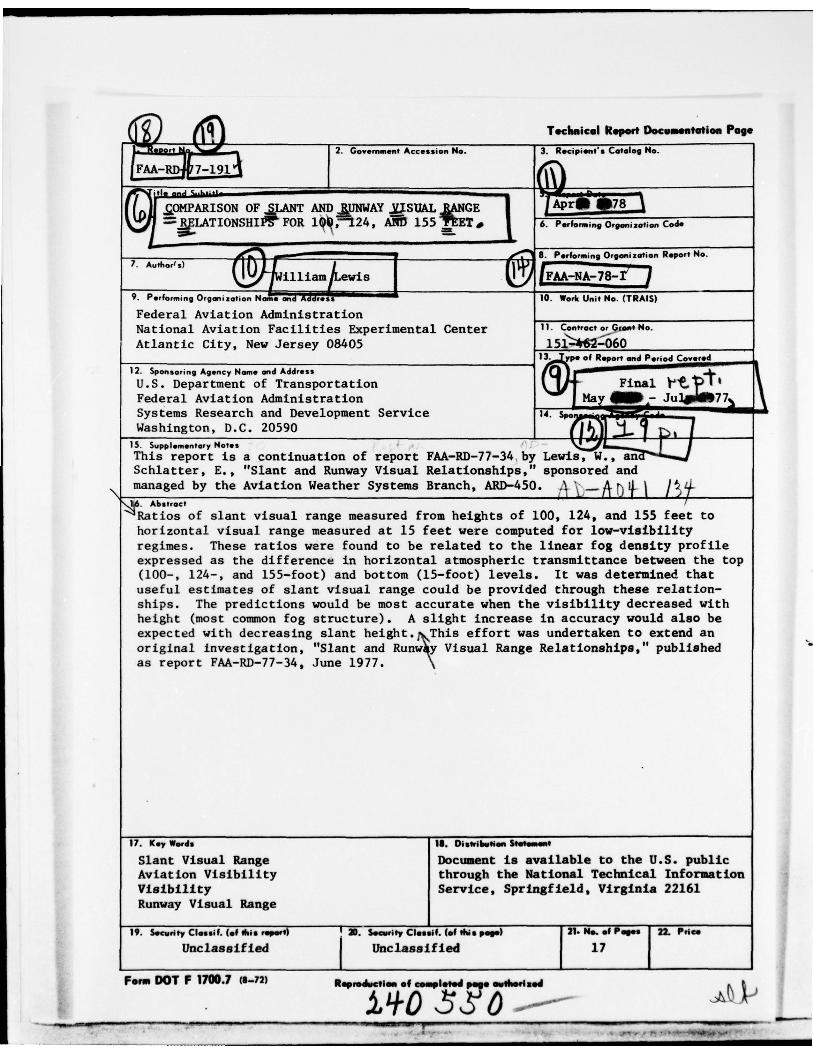
~.Jt6. Abstract‘~ Ratios of slant visual range measured from heights of 100, 124, and 155 feet tohorizontal visual range measured at 15 feet were computed for low—visibilityregimes. These ratios were found to be related to the linear fog density profileexpressed as the difference in horizontal atmospheric transmittance between the top(100—, 124— , and 155—foot) and bottom (15—foot) levels. It was determined thatuseful estimates of slant visual range could be provided through these relation-ships. The predictions would be most accurate when the visibility decreased withheight (most common fog structure). A slight increase in accuracy would also beexpected with decreasing slant height.~~ This effort was undertaken to extend anoriginal investigation, “Slant and Runw~y Visual Range Relationships,” publishedas report FAA—RD—77—34, June 1977.
17. K.y W.rds 1$. Disiributian S. ats ian$
Slant Visual Range Document is available to the U.S. publicAviation Visibility through the National Technical Infor mationVisibility Service , Spr ingfield , Virginia 22161Runway Visual Range
19. S.cv$iy Cl.s. if. (•f this rpoais ) I ~~~ • S.auift y Cl.ssll . (of ills p. .) 21. Ifs. •f P. .s 22. Pri cs
Unclassified Unclassified 17
Form DOT F 1700.7 (8 72) R.p,o~ .cUan .f c s pI..d uushanlg.d
PREFACE
The author wishes to acknowledge the assistance and advice of Ernest B. Schiatter,ANA—430, in the preparation of this report.
iii
.. ..,~. . .
~~~~ . . .t,. ~~~. .,r... ~ ~~~~~~~~ ‘~wpi~~~
TABLE OF CONTENTS
Page
INTRODUCTION 1
Objective 1• Background 1
DISCUSSION 2
Data Sample 2Data Analysis 2Fog Profile Classifications 5Profile 3 Visual Range Ratios 5Profile 1 and 2 Visual Range Ratios 7
CONCLUSION 10
RECOMMENDATION 10
REFERENCES 10
APPENDIX
____ B~~~~.IiGT TI
V
_ _
—
-..
.
~ 4~~
.,. .~~~~~~~~
. ~~~~~~~~~~~~~~~~~~~~~~~~~~~~~~~~~~~~~~~~~~~~~~~~~~~~~~~~~~~~~~~~~
LIST OF TABLES
Table Page
1 Fog Profile Classifications Based on the Difference 4Between the Horizontal Atmospheric PercentTransmittances at the Top (100—, 124—, and 155—Foot)and Bottom (15—Foot) Levels
2 Percentage Occurrences of Fog Profiles with Top Level 4at 100, 124, and 155 Feet
3 Linear Correlation/Regression Parameters for Profile 63 Observations, Night
4 Linear Correlation/Regression Parameters for Profile 63 Observations, Day
5 Profile 1 Average Slant/l5—Foot Visual Range Ratios 7and Standard Deviations
6 Profile 2 Average Slant/l5—Foot Visual Range Ratios 9and Percentages 21.0 and 1.5, Night
7 Profile 2 Average Slant/iS—Foot Visual Range Ratios 9and Percentages �l.O and 1.5, Day
vi
INTRODUCTION
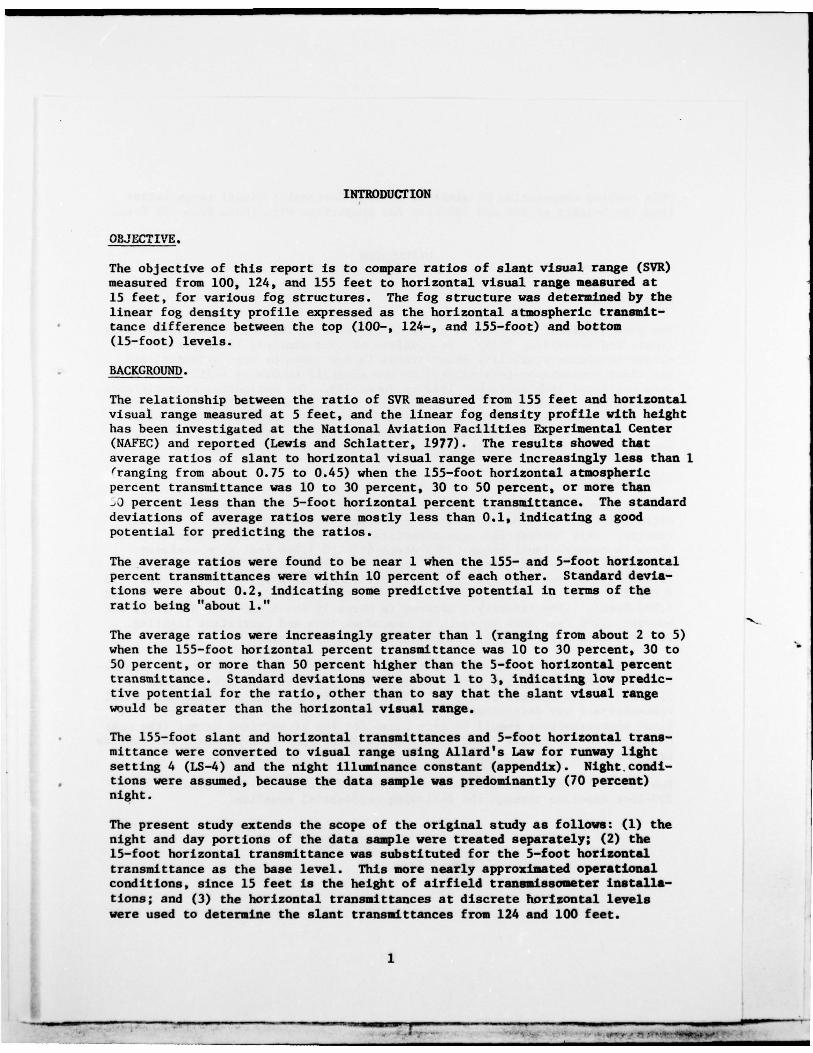
OBJECTIVE.
The objective of this report is to compare ratios of slant visual range (SVR)measured from 100, 124 , and 155 feet to horizontal visual range measured at15 feet, for various fog structures. The fog structure was determined by thelinear fog density profile expressed as the horizontal atmospheric transmit-tance difference between the top (100—, 124—, and 155—foot) and bottom(15—foot) levels.
BACKGROUND.
The relationship between the ratio of SVR measured from 155 feet and horizontalvisual range measured at 5 feet, and the linear fog density profile with heighthas been investigated at the National Aviation Facilities Experimental Center(NAFEC) and reported (Lewis and Schiatter, 1977). The results showed thataverage ratios of slant to horizontal visual range were increasingly less than I
~ranging from about 0.75 to 0.45) when the 155—foot horizontal atmosphericpercent transmittance was 10 to 30 percent, 30 to 50 percent, or more than
~J percent less than the 5—foot horizontal percent transmittance. The standarddeviations of average ratios were mostly less than 0.1, indicating a goodpotential for predicting the ratios.
The average ratios were found to be near 1 when the 155— and 5—foot horizontalpercent transmittances were within 10 percent of each other. Standard devia-tions were about 0.2, indicating some predictive potential in terms of theratio being “about 1.”
The average ratios were increasingly greater than 1 (ranging from about 2 to 5)when the 155—foot horizontal percent transmittance was 10 to 30 percent, 30 to50 percent, or more than 50 percent higher than the 5—foot horizontal percenttransmittance. Standard deviations were about 1 to 3, indicating low predic-tive potential for the ratio, other than to say that the slant visual rangewould be greater than the horizontal visual range.
The 155—foot slant and horizontal transmittances and 5—foot horizontal trans-mittance were converted to visual range using Allard’s Law for runway lightsetting 4 (LS—4 ) and the night illu.inance constant (appendix) . Night , condi-tions were assumed, because the data sample was predominantly (70 percent)night.
The present study extends the scope of the original study as follows: (1) thenight and day portions of the data sample were treated separately; (2) the15—foot horizontal transmittance was substituted for the 5—foot horizontaltransmittance as the base level. This more nearly approximated operationalconditions, since 15 feet is the height of airfield transaissometer installa-tions; and (3) the horizontal transaittances at discrete horizontal levelswere used to determine the slant transaittances from 124 and 100 feet.
1
~~~~~~~~~~~~~~~~~~~~~~
This enabled computation of slant to 15—foot horizontal visual range ratiosfrom the heights of 100 and 124 feet for comparison with those from 155 feet.
DISCUSS ION
DATA SAMPLE.
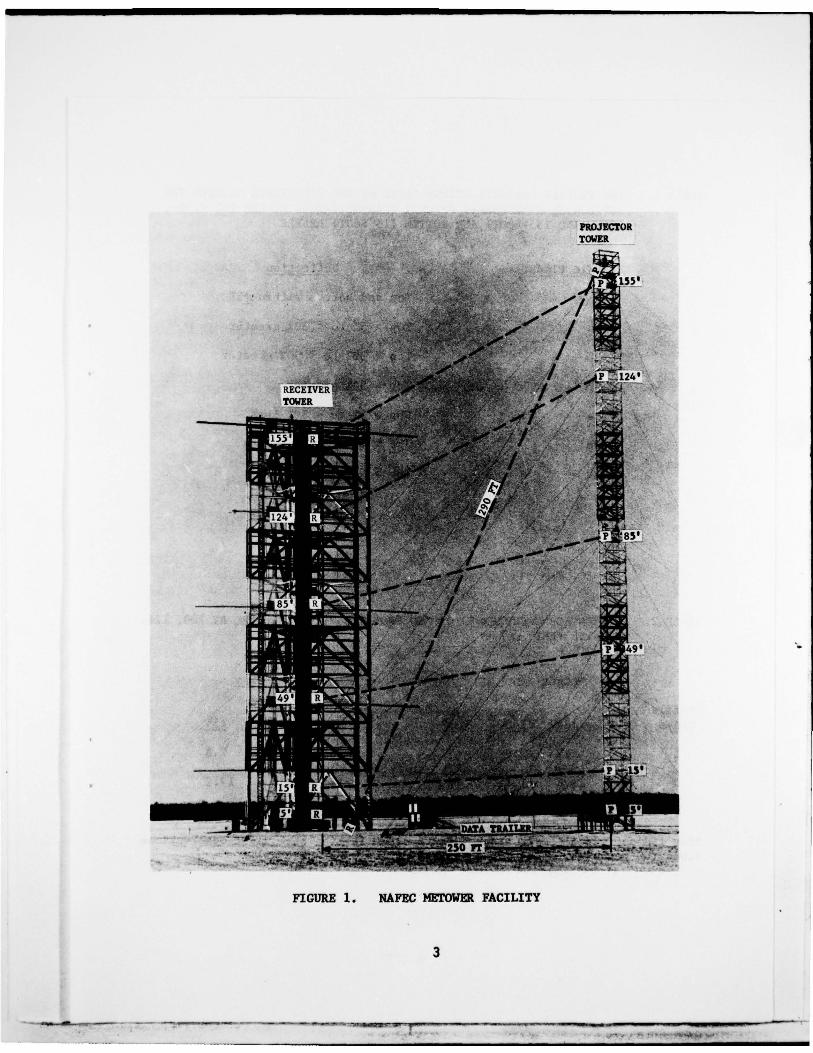
The data sample of the present study is the same as that of the previous study(Lewis and Schlatter, 1977). It consists of approximately 190 hours ofminute—to—minute visibility observations in fog taken by six horizontal andone slant transmissometers mounted on two airfield towers at NAFEC. The datawere collected from September 1972 to June 1973. The horizontal transmittancereadings were taken at 5, 15, 49, 85, 124, and 155 feet over a 250-foot base-line. The slant reading was taken from 155 to 5 feet over a 290—foot base-line. Figure 1 shows the towers and instrumental configuration. The datawere processed by electronic computer through a FORTRAN IV program.
DATA ANALYSIS.
The data were separated into day and night portions by assuming daytime con-ditions between sunrise and sunset, nighttime conditions between sunset andsunrise. Only observation sets associated with 15-foot visual range observa-tions in runway visual range (RVR) steps 600— to 3,000 feet were analyzed.This range covers RVR category III (600—, 600, 800, and 1,000 teet), category II(1,200, 1,400, and 1,600 feet), a low portion of category I (1,800, 2,000, and2,200 feet) and an intermediate portion of category I (2,400 2,600, 2,800, and3,000 feet). (The category I minimum is normally the 1,800—foot RVR step, butbecomes 2,400 feet when there is no touchdown zone and centerline lighting.See reference 2 for further information on RVR categories.)
The slant transmittances from 100 to 5 feet and from 124 to 5 feet were approx-imated by proportionately weighting and summing the average transmittance indiscrete layers between 5, 15, 49, 85, and 124 feet. (The 100-foot horizontaltransmittance was determined by interpolation between 85 and 124 feet.) Theslant approximations should be very close for fog of vertical extent (the mostcommon type——see tables 1 and 2, discussed later) and less accurate for shallowfog, depending on fog height with respect to a particular level.
The 155—foot slant transmittance was converted from a 290—foot baseline to a• 250—foot baseline through the following exponential equation:
(250/290)t250 — t290
2
n—. -- .—-. -— — -~~
PROJECTORTOWER
‘—7~~ I
•~~~~ \ ~_4•
_’
/I- / -~~~~
- • ~~f~~V%~ 1 1~~~~24’RECEIVER
_ _ _
_ _
/
124’ R - ,.~~
~~~~
85’
________________________ ~~~~~ _Iø ’
~~••
~~~~~ ~~~~~~~~~~~I
~~~~~~~~~~~~~~~~ :f . -
85 ’ R ‘ /.~.
.~~~~~~~~~~~
,
- 1~ ‘ “d-- ~~~~~ - ._— P
I ~~~~ R
_ _ _ _ _
- II — -
~~~~~~~ P
FIGURE 1. NAFEC METOWER FACILITY
3
__________ — — - — — - —
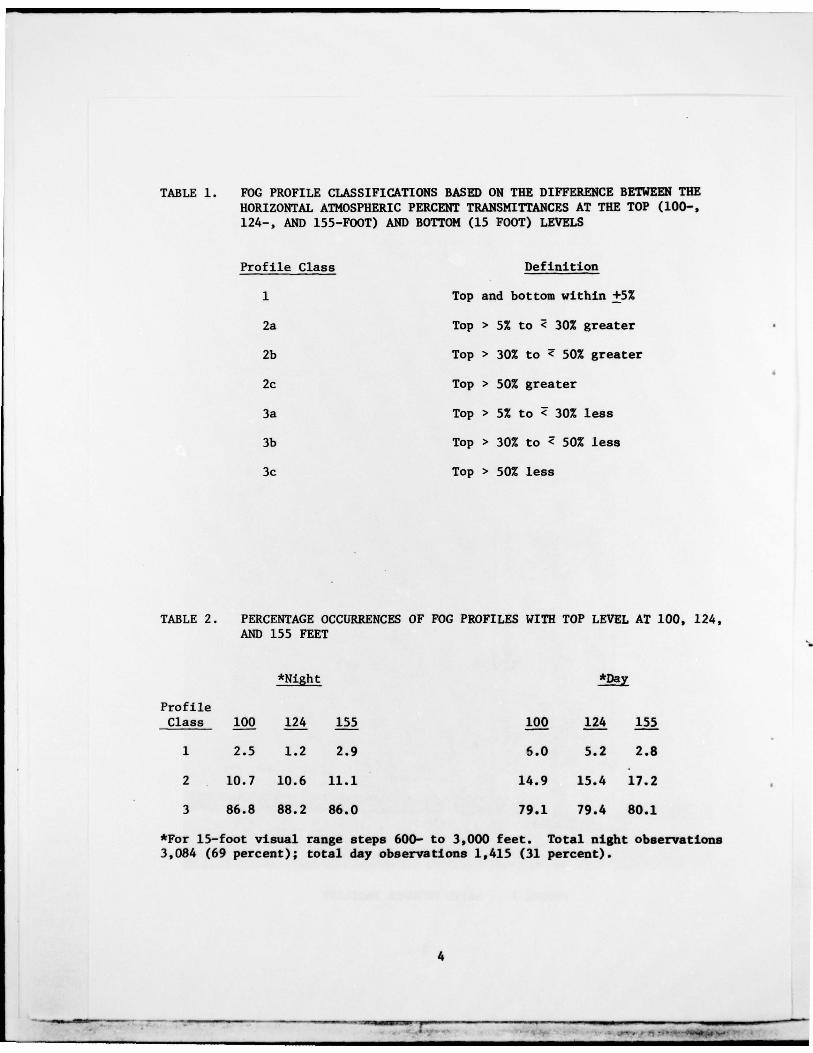
TABLE 1. FOG PROFILE CLASSIFICATIONS BASED ON TUE DIFFERENCE BETWEEN TIlEHORIZONTAL ATMOSPHERIC PERCENT TRANSMITTANCES AT THE TOP (100— ,124—, AND 155—FOOT) AND BOTTOM (15 FOOT) LEVELS
Profile Class Definition
1 Top and bottom within ~~
2a Top > 5% to ~ 30% greater
2b Top > 30% to ~ 50% greater
2c Top > 50% greater
3a Top > 5% to ~ 30% less
3b Top > 30% to ~ 50% less
3c Top > 50% less
TABLE 2. PERCENTAGE OCCURRENCES OF FOG PROFILES WITH TOP LEVEL AT 100 , 124 ,AND 155 FEET
*Night ____
Pro fileClass 100 124 155 100 124 155
1 2.5 1.2 2.9 6.0 5.2 2.8
2 10.7 10.6 11.1 14.9 15.4 17.2
3 86.8 88.2 86.0 79.1 79.4 80.1
*For 15—foot visual range steps 600— to 3,000 feet . Total night observations3,084 (69 percent); total day observations 1,415 (31 percent).
4
• ---~~- - •— - - ~~~~~~
__ _~
_ ___ -~~
__ _T- - - — — .
~~~~~~~~~~—- — — - —
0 - •‘ - - • • - •~~ — .; .
~~~~~~~~~~~ ~.. -
Where t is transmittance (expressed as a fraction) over the subscripted baseline.
The slant transmittances from 100, 124, aud 155 feet and the 15—foot trans-mittance were converted to visual range using light setting 4 (LS—4) and thenight illuminance constant for night observations, LS—5, and the day constantfor day observations (appendix). The night percent transmittance range forRVR steps 600— to 3,000 feet is 0 to 54.5 percent. The corresponding day rangeis 0 to 77.7 percent.
FOG PROFILE r~,~.SSIFICATIONS.
The data were organized according to linear fog profiles with height deter-mined by the difference between the top (100—, 124—, 155—foot) horizontal per-cent transmittance and the bottom (15—foot) horizontal percent transmittance.Table 1 shows the profile classifications and top minus bottom percent trans-mittance differences.
The profile classifications of table 1 are quite similar to those of the pre-vious study. The main difference is that profile 1 has been narrowed from±10 to ±5—percent transmittance difference. This gave a better separation ofslant to 15—foot horizontal visual range ratios near 1. Profiles 2a and 3awere enlarged accordingly. The percentage occurrences of profiles 1, 2, and3 for the three heights of 100, 124, and 155 feet are shown in table 2.
Table 2 shows the dominance of profile 3 situations (fog ‘me verticalextent) for all three heights, both night and day. Profi.., s have greaterpercentage occurrences for day versus night for all heights. This probablyreflects the relatively greater frequency of radiation fog during the day(mostly early morning occurrence). The greater occurrences of profile l’sfor 100 and 124 feet versus 155 feet for the day data probably reflect breakupof radiation fog where elements dissipate before reaching 155 feet.
PROFILE 3 VISUAL RANGE RATIOS.
Slant/15—foot horizontal visual range ratios were computed for heights of 100,124, and 155 feet for profile 3 situations in the four subclasses within the600— to 3,000 feet visual range step range (see DATA ANALYSIS section). Theaverage ratios ranged from about 0.80 to 0.50, decreasing with increasingskewness of the profile (3a to 3b to 3c). Standard deviations were generallyless than 0.1. This character indicated a potential for a linear correlation/regression analysis using ratio and transmittance difference between top andbottom levels as arguments. This analysis was made and shoved that one regres-sion. equation was sufficient to define the 600— to 3,000 feet range for eachheight. Table 3 shows the results for night data, table 4 for day data.
Tables 3 and 4 show that the slant/15—foot horizontal visual range ratio ishighly correlated with transmittance difference between top and bottom levels.The standard errors of estimate (SY’s) are low and show a trend toward moreaccuracy of prediction with lower slant height. Compared with the standarddeviation of ratios (SIGY ’s), the SY’s indicate that the regression relation-ships have decreased the scatter by roughly 50 percent.
5
1~ —~ - —--- - -~~ ~~~~~~~~~~ ~— -
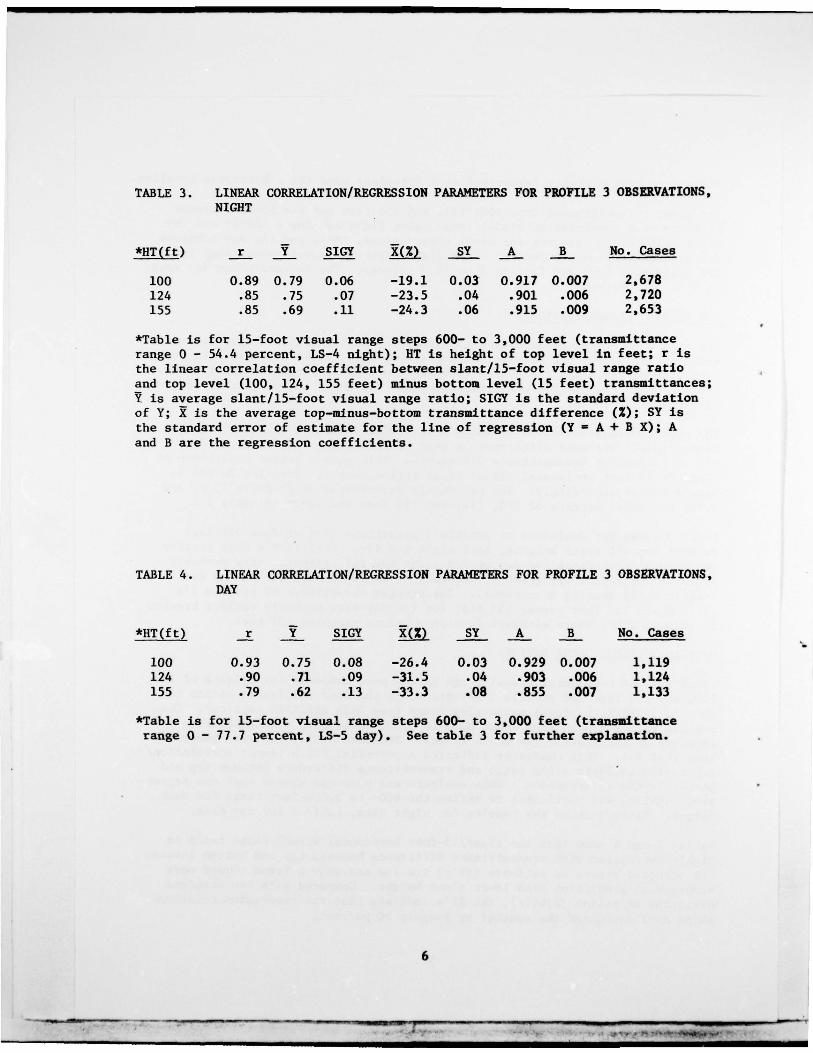
TABLE 3. LINEAR CORRELATION/REGRESSION PARAMETERS FOR PROFILE 3 OBSERVATIONS,NIGHT
*HT(ft) r V SIGY ~(%) SY A B No. Cases
100 0.89 0.79 0.06 —19.1 0.03 0.917 0.007 2,678124 .85 .75 .07 —23.5 .04 .901 .006 2,720155 .85 .69 .11 —24.3 .06 .915 .009 2,653
*Table is for 15—foot visual range steps 600— to 3,000 feet (transmittancerange 0 — 54.4 percent, LS—4 night); HT Is height of top level in feet; r isthe linear correlation coefficient between slant/15—foot visual range ratioand top level (100, 124, 155 feet) minus bottom level (15 feet) transmittances;I is average slant/iS—foot visual range ratio; SIGY is the standard deviationof Y; ~ is the average top—minus—bottom transmittance difference (Z); SY isthe standard error of estimate for the line of regression (Y — A + B X); Aand B are the regression coefficients.
TABLE 4. LINEAR CORRELATION/REGRESSION PARAMETERS FOR PROFILE 3 OBSERVATIONS,DAY
*HT(ft) V SIGY SY A B No. Cases
100 0.93 0.75 0.08 —26.4 0.03 0.929 0.007 1,119124 .90 .71 .09 —31.5 .04 .903 .006 1,124155 .79 .62 .13 —33.3 .08 .855 .007 1,133
*Table is for 15—foot visual range steps 600— to 3,000 feet (transmittancerange 0 — 71.1 percent, LS—5 day). See table 3 for further explanation.
6
- - • • - -- - —.--- —--- ~~~—--- ___ •~~~~
_ T— ~~~~~~~~
—- — —
The average slant/iS—foot horizontal visual range ratios (l’s) decrease withincreasing height, consistent with the profile 3 fog structure of decreasingtransmitttance with height. Thi8 is also shown by the increasing (negativesense) average transmittance difference between !oP and bottom levels (X ’s)with increasing height of top level. The lower Y’s and higher X’s (negativesense) for the day data, reflect the greater range for transmittance dropoffwith height. This is because the 15—foot day transmittance can go to 77.7 per-cent, versus 54.5 percent for night.
Predictions of SVR in terms of RVR and linear fog density measurement withheight should be reasonably accurate for profile 3 situations. The regressionequations of tables 3 and 4 indicate that this could be done to within one200—foot step of actual for the 155—foot slant, probably more accurately forthe lower levels.
PROFILE 1 AND 2 VISUAL RANGE RATIOS.
Slant/15—foot horizontal visual range ratios were computed for heights of 100,124, and 155 feet for profile 1, 2a, 2b , and 2c samples in the four subclasses
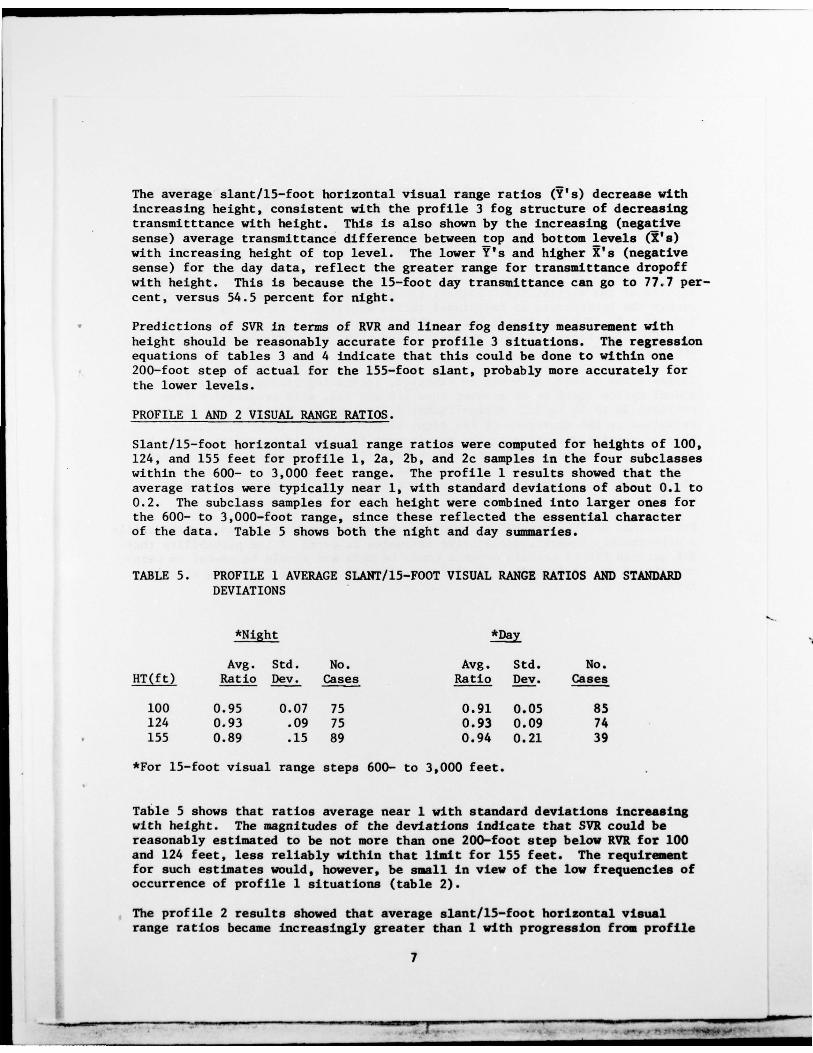
• within the 600— to 3,000 feet range. The profile 1 results showed that theaverage ratios were typically near 1, with standard deviations of about 0.1 to0.2. The subclass samples for each height were combined into larger ones forthe 600— to 3,000—foot range, since these reflected the essential characterof the data. Table 5 shows both the night and day summaries.
TABLE 5. PROFILE 1 AVERAGE SLANT/l5—FOOT VISUAL RANGE RATIOS AND STANDARDDEVIATIONS
*Night *Day
Avg. Std. No. Avg. Std. No.HT(ft) Ratio Dev. Cases Ratio Dev. Cases
100 0.95 0.07 75 0.91 0.05 85124 0.93 .09 75 0.93 0.09 74
• 155 0.89 .15 89 0.94 0.21 39
*For 15—foot visual range steps 600— to 3,000 feet.
Table 5 shows that ratios average near 1 with standard deviations increasingwith height. The magnitudes of the deviations indicate that SVR could bereasonably estimated to be not more than one 200-foot step below RVR for 100and 124 feet, less reliably within that limit for 155 feet. The requirementfor such estimates would, however, be small in view of the low frequencies ofoccurrence of profile 1 situations (table 2).
The profile 2 results shoved that average siant/l5—foot horizontal visualrange ratios became increasingly greater than 1 with progression fro. profile
7
~0— ___
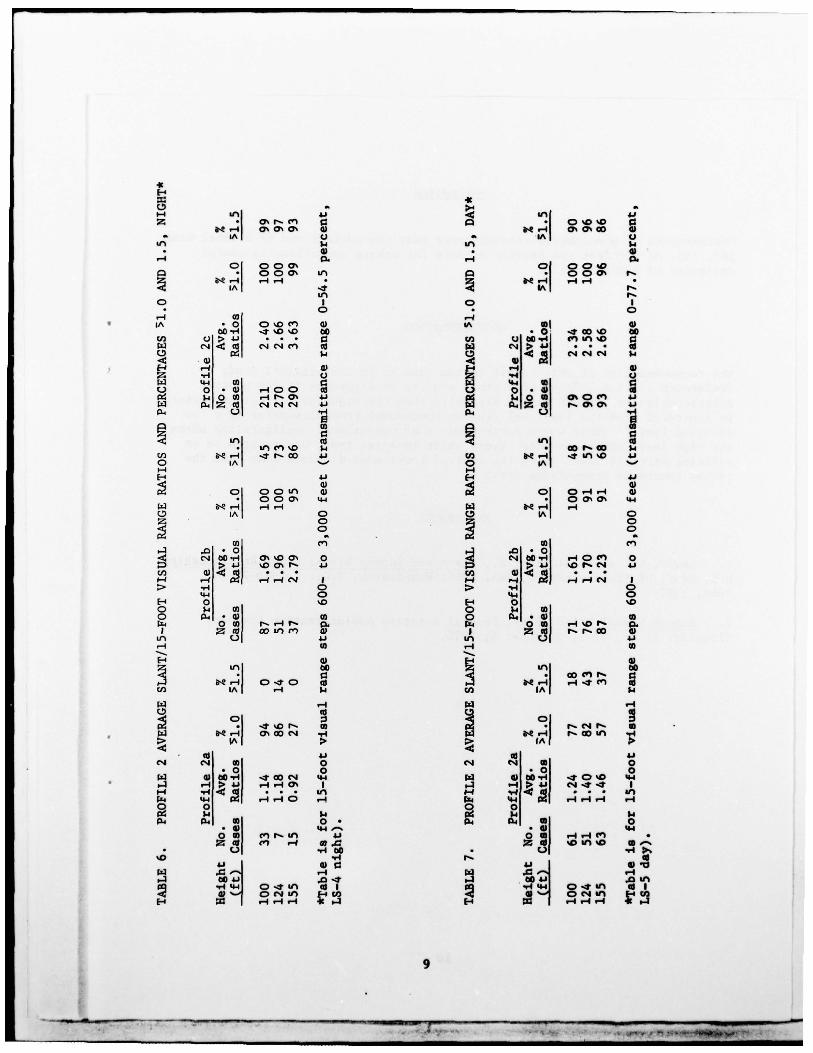
2a to 2b to 2c. The average ratios ranged from about 1 to 5, with standarddeviations ranging from 1/4 to 3. The variability reflects the essentiallyradiation fog character of profile 2 situations. The average ratios andstandard deviations of ratios mostly increased with height, consistent withthe increase in transmittance with height.
A linear correlation/regression analysis would not do for profile 2 situationsin view of the variability. Rather, the data have been organized to showsimply the percentages of individual ratios equaling or exceeding values of1.0 and 1.5. The subclasses were combined into one class covering the 600—to 3,000 feet range for this analysis. The night data are shown in table 6,the day data in table 7.
Tables 6 and 7 show, as would be expected, increasing percentages of indi-vidual ratios equal to or greater than 1.0 and 1.5, with progression fromprofiles 2a to 2b to 2c. A significant difference in the night and day dis-tribution is the dominance of the night samples by profile 2c situations.This Is related primarily to the requirement for the top transmittance to bemore than 50 percent higher than the bottom (15—foot) transmittance for pro-file 2c. Thus, the lower 15—foot transmittance range for the night data (0to 54.5 percent versus 0 to 77.7. percent, day) allows more situations toqualify.
Predictions of SVR from RVR and profile measurement cannot be exact with profile2 situations. However, qualitative estimates in terms of the probability thatSVR exceeds RVR by certain amounts could be made and should be useful in warn-ing pilots of the impending decrease in visibility to the RVR value at runwaylevel.
8
_________ - .- — .. - ~ -_--— —• . i ~-
.• • . - • - • • • • - • J-,••, ~~~~~~~~~~~~~~~~~~~~~~~~~~~~~~ -
.5(-4
.5
—z .1 0~ N. ~~ • 0 ~O ~O ~* IAI 0 — -IA 1 0
H .14 0% 0’ 0’ W H .14 0% 0% 00 4)In 14 In $4
- 4) • 4)‘-4 0. .14 0.
01 00 0~ Of O Oo O000’ In 0 00 % N.
H —~ ~ —4 • H ‘—I i—I . 4
IA I IAI N.It, I.-
0 I 0 I0 • 0
.14 5) .1401 0 ‘.0 C~ 4) IA 4)00 -.4’ -~ ‘.0 ‘.0 00 • 0 ~t 00 ‘.0 00
I ~ ~~ . . . 00.14 f’~ In ‘0 ~1i~ c’4 .4: (
~I e.i~~~~cn fz~ c..i1 .. IJI 4)
-~~ - WI .~~
c”~~~~~~ $4
~ —‘1 E- ‘-~I Uz •~i’ U ‘s_I l
~l~~ ~s_~I mlo ol . W I ,-~~~~0 4) 0 01 . 41. 4)1.1101 .-4N.O’. 1.104)11.1r~1 0 4 Z 4 ) c’ic1~~ 1 .‘.
~ ~~ 04lZ~~~1 r-. 0’. O’ 4-’
P.1 00 1
Sn In.1 inm ’ .o s_sH ~~ I -* N. 00 U 00 H In ‘.0 U
CD f- 00 II
0 IA I 0 IAII-I I-I
IJ El U4) 4)
0 00 In W 0 0 ‘-4 .14 4).1 000% (1-iH
~~
.4 H .14~ 0 0’. 0’. 94I-I
0 IA 0 IA 0
(01 m(~~ DI .0l
~~ .01 . 0..~~ c~1 l -0 ~ .,4I 0’. ‘.0 0’. 0 (“1100 ..-4 1 .14 0 (‘~ 0‘.o o’. N. U
1~~~.- 4J I n r ~ e’i U
W ’~~~
. . (0 • • •s-i .-( .-4 .-f C’J 1 I-f ‘-4.141 0
~~. 14~ 0
0 (1.4 1 00• ‘0 El 01 ‘00 ml 0 s_~I ~~l
0 04 4) 5 0 ~4 I~~~ I 4)0 4 ) ’ .-l i0N. Q.r~. O UiJ ~~~~~~~~ I Z 4 1 l N.N.00 4)I Z ~ ~ in 01 Uit, 0
.4 5 ,-I 4)
~~ . CO m N . ~
I-I U)
00 sAl .4 1.1 (0 IAJ I-IH - I ,-I .*m 41
I-I ni .4c i0~.1 ,~~ ‘.~~ r-. w N. C’•l N. 41
Iii H 1 I 0’. (0 ,..i ni H .14 F- 00 In -‘.1v~I ~. (A l
- 411 411 4.1c’i c.~i ~~l o c~1 “i. ml 0I .o l o 1 . 0 1 0lxi 4)1 04 -n I .*00 c”l 5M nil 411 44 ’ . l .. 1 O’ . O ‘I-I..i .4l
~~~1J1 r-I .-I 0% I p.l ‘~~~ 1 I C ’ l t* I
5_4 .14 .~~ I~ I—~ -f ~~ •
lxi SM ~ I ‘.10 .-4 lxi 94 ~~ I i-I .-4 ‘.4 .140 01 0 ol$41 I_I (~ i-lI 14~~ 04i ~~l
‘4.’ -.—. .41 1 (440 m r.. In 1.1 0 411 .—.I i—I (‘~‘.OIn’.D ø. .€~7 .-4 m.~~ Z 4 1j
0 4 -øO • 0‘.0 -.4 r-. 41
4 . 1 1 4 . 1 1lxi .c - .4 nz~ .~~ i-II-i
~O
~~-’I .0.* — bOU-‘.4(441 0-4 Ifl 41 I • .rI~~~
) o-* sn 41 I
d~ ‘-.1 0 (“1 In El (0 ~~
0 (“4 In El Cl)F-I
~~ I .-I .-4.-4 41~~.I El r4 ’.4r4 .I~~4
9
— r T ~~~~~
T 1~~~~ • • - -~ •~~~~~~~~~~~~~~ •‘.
. ~T. ~~~~~~~~~~~~~~~~~~~~~
CONCLUSION
Measurements of atmospheric transmittance near the surface and at a level near100, 125, or 150 feet can provide a basis for making operationally usefulestimates of SVR/RVR ratio.
RECOMMENDATION
The recommendation of this report is the same as in the original study(reference 1); i.e., “conduct further studies to determine if fog profilerelationships to SVR/RVR ratios are valid when the high—level transmissometeris separated from the low—level (runway touchdown) transmissometer by a fewthousand feet.” (This would correspond to an operational configuration wherethe high level transinissometer (very short baseline type) was mounted on anexisting airfield tower or on the control tower some distance away from therunway touchdown transmissometer.)
REFERENCES
1. Lewis, W., and Schlatter, E., Slant and Runway Visual Range Relationships,U.S. Dept. of Transportation, FAA, SRDS, Washington, D.C., FAA—RD—77—34,June, 1977.
2. Runway Visual Range (RVR), Federal Aviation Administration AdvisoryCircular, AC No. 97—1, November 4, 1976.
10
- --- I- —— •- -- - _ _ _ _ _ _ • _ _ _
~~~_ _ _ —_ _ _T- - —-------— — - -- ---
• - ,.• - , ~‘. ~~~~~~~~~~~~~~~
-
APPENDIX
DETERMINATION OF RUNWAY VISUAL RANGE
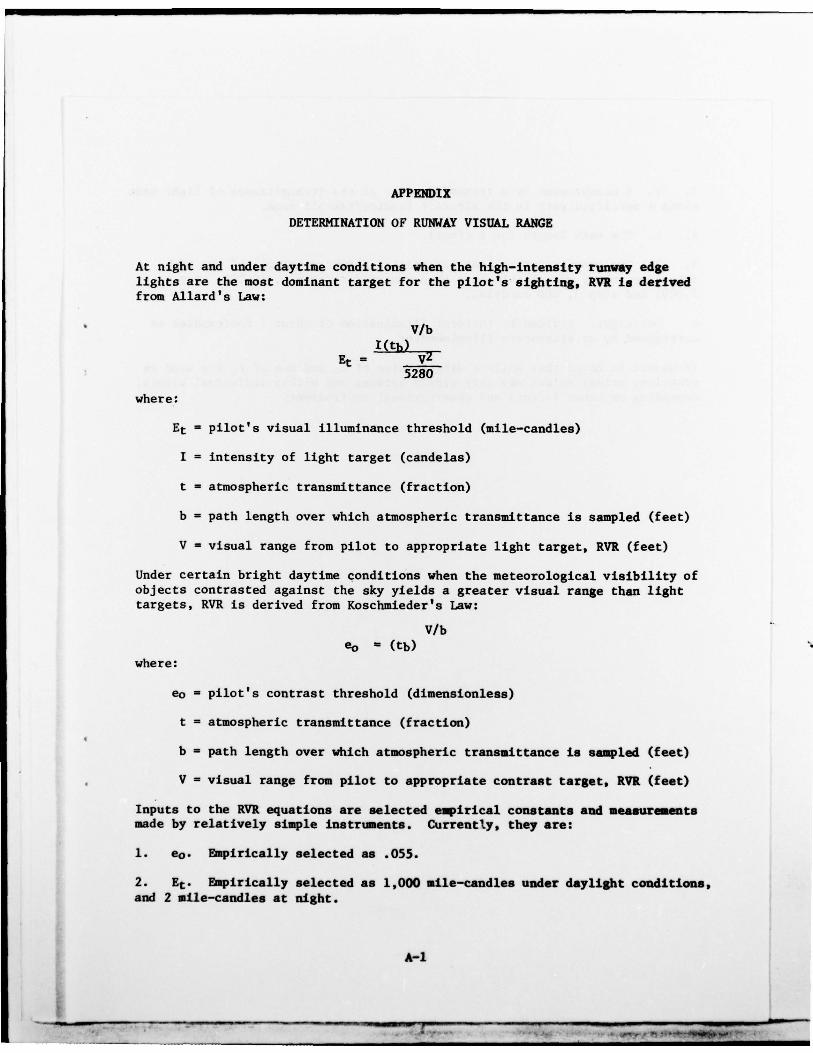
At night and under daytime conditions when the high—intensity runway edgelights are the most dominant target for the pilot’s sighting, RVR is derivedfrom Allard’s Law:
V/bI (tb)
V25280
where:
= pilot ’s visual illuminance threshold (mile—candles)
I = intensity of light target (candelas)
t = atmospheric transmittance (fraction)
b — path length over which atmospheric transmittance is sampled (feet)
V — visual range from pilot to appropriate light target, RVR (feet)
Under certain bright daytime conditions when the meteorological visibility ofobjects contrasted against the sky yields a greater visual range than lighttargets, RVR is derived from Koschmieder’s Law:
V/be0 = (tb)
where:
eo = pilot’s contrast threshold (dimensionless)
t atmospheric transmittance (fraction )
b = path length over which atmospheric transmittance is sampled (feet)
V = visual range from pilot to appropriate contrast target , RVR (feet)
Inputs to the RVR equations are selected empirical constants and aeaauramentsmade by relatively simple instruments . Currently, they are:
1. e0. Fmpirically selected as .055.
2. ~t.
Fmpirically selected as 1,000 mile—candles under daylight conditions,and 2 alie-candles at night.
A-i
- • -. - • • - •. ~~~~~~~~~ ~~~~~
3. t. A measurement by a trans.issometer of the transmittance of light madealong a specif ied path in the aircraft landing/ takeoff zone.
4. b. The path length for t (feet).
5. I. The representative step intensities (light settings) of the high—intensity runway edge lights have been accepted as step 5, 10,000; step 4,2,000; and step 3, 400 candelas.
6. Day/night. Divided by incident iflumination of about 2 footcandles asdetermined by an elementary illuininometer.
It should be noted that while a single value of e0 and two of Et are used inpractice , actual values may vary widely between and within individual pilots ,depending on human factors and observational environment.
A-2
--
- - . - -