rani anna government college for women
TRANSCRIPT
INTERNATIONAL JOURNAL OF ECONOMICS
(A Peer-Reviewed-Refereed/Scholarly Quarterly Journal Globally Indexed with Impact Factor)
Vol. 6 Special Issue 1 March, 2018 Impact Factor: 3.104
ISSN: 2319 - 961X UGC Approval No: 44192
National Seminar on
CONTEMPORARY MACRO ECONOMIC ENVIRONMENTAL ISSUES
28th March 2018
Edited by
Dr.V.Duraisingh
Dr.J.Ravithenraj
Dr.E.Thangadurai
Dr.G.Mahalakshmi
Organized by
PG Department of Economics
RANI ANNA GOVERNMENT COLLEGE FOR WOMEN
TIRUNELVELI – 627 008, TAMIL NADU, INDIA

PREFACE
Rani Anna Government College for Women was started in the year 1970 by the
Government of Tamilnadu. The college is affiliated to Manonmaniam Sundaranar University
which provides education to socially downtrodden and economically deprived section of the
society.
The college is situated at the outskirts of Tirunelveli on the Tenkasi road nearby
Manonmaniam Sundaranar University with 40 acres of land. The college has 14 UG
Departments, 12 P.G Departments with 4 M.Phil courses and 11 Research Departments. Seven
UG Departments impart higher education through Tamil medium too. The college works on
shift system.
The college is reaccredited with “A” grade by NAAC. The motto of our college is “Let the
darkness of our mind depart and the rays of wisdom linger”. The vision of our college is to
impart education to students of economically backward, rural areas and weaker section. The
college aims at improving the lives of rural girls and makes them women graduates as agents
for social change.
The Department of Economics was started during the academic year 2013-2014 with
under graduate courses both in Tamil and English medium. The P.G Department was started in
the year 2015. There are nine members in the faculty of Economics with Ph.D. degree. There
are 360 students at UG level and 50 students at PG level. We are imparting quality education to
students.
This national level seminar aims at congregating experts, scholars and students to discuss
about contemporary macroeconomic environmental issues. This seminar will give a lot of
insight for the attendees in terms of understanding macroeconomic environmental issues and
its application on Indian trade that are involved in Crypto Currency, Financial Resolution and
Deposit Insurance, Goods and Services Tax, Demonetization and other recent issues. .
This journal is a good collection of research articles from all over the country. So far 110
papers related to the theme of the seminar are received from experts, professors, scholars and
students of various colleges and universities.
We are much grateful to our respected Principal, HOD and beloved staff and students of
our department for encouraging us to organize a seminar in the National Level.
Editors

CONTENTS
S.
No. Title
Page
No.
1 Goods and Service Tax
Dr.E.Thangadurai
1
2 Digitalization in Commercial Banks is the Need of the Hour - A Study with
Special Reference to Tiruchendur Area
Dr.G.Kamalaselvi & M.Parvathi
6
3 Strategies for the Agents to Achieve Success in Selling Life Insurance Products
Dr.P.R.Jayaprabha
10
4 Macroeconomic Analysis of Consumer Expenditure Inequalities in India
V.Arockia Amuthan
13
5 Macroeconomic Analysis of Futures Market and Volatility in Commodity Spot
and Future Prices
Dr.T.Saravanan
18
6 Macroeconomic Analysis of the Food Inflation in India
Dr.D.Jones Rajan & V.Arockia Amuthan
23
7 Macroeconomic Analysis of Unit Root Test in Real Effective Exchange Rate in
India
Dr.S.Henry Pandian
30
8 Green Energy: A Study of Solar Energy in India
Dr.D.Swamikannan & N.Periyamayan
34
9 Climate Change and Migration in India: Issues and Challenges
P.Maneesh & Dr.C.Muniyandi
41
10 A Study on Currency Replacement with Digital Cash in Thoothkudi
Dr.R.Bhavani & R.Dibeya
51
11 A Study on Leadership Style and Its impact on Job Satisfaction and Performance
of Sterlite Private Ltd Employees in Thoothukudi City
S.Thirumathi & Dr.A.Asok
56
12 Positive Impact of GST on the Common Man in India
Dr.A.Jeyanthi
62
13 Cut – throat Competition and the Fear of Re-emergence of Monopoly in the
Telecom Sector
Dr.G.Mahalakshmi
65
14 A Study on Customer Satisfaction towards Electronic Payment System in
Tiruchendur Area
Dr.R.Bhavani & V.Suganthi
69
15 Demonetization - Narendra ModiThe Latest Version of Muhammad – Bin –
Tugluq
Dr.A.Theeba
74
16 A Study On Banking Credit And Deposit Ratio In Public Sector In India
Dr.P.Chennakrishnan
78
17 Cryptocurrency - The Werewolf
Dr.R.Sindhu
84
18 Demonetisation and Its Impact on Indian Economy
Dr.G.D.Reji
87
19 GST impact on Gross Domestic Product in India
M.Balageetha
91
20 GST and Port Sector
U.Ilayarasan & Dr.K.Jayaraman
95
21 Integrating the Nation through Infrastructure Development
Dr.T.Vijayanthi
100
22 Opinion of Business People on the Downside of GST in Tiruchendur
Dr.J.Jeya Sheela
103
23 Small Traders’ Perception towards GST Implementation
Dr.M.Mariammal & Mrs.T.Subasini
108
24 A Study on Impact of TASMAC in Rural Areas of Tirunelveli District
R.Iyappan & Dr.S.Sarasudevi
111
25 A Study on Perception towards Mutual Fund Investment among
Investors in Bangalore
Shama Stephen
115
26 Impact of Environmental Pollution on Human Health: An Economic Analysis
Dr.M.Saravanan & Dr.J.John Vellakkan
119
27 An Econometric Analysis of Structure and Performance of Indian Banking
Sector
Dr.V.Duraisingh
126
28 Goods and Service Tax in India : An Overview
M.Anto Soniya
131
29 Demonetization Impact on Various Sectors
S.Muthu Raj & K.Esakki Muthu
135
30 Demonetisation and Rural India
Dr.P.Chennakrishnan & S.Vijayalakshmi
139
31 Macroeconomic Impact of Demonetisation
K.Esakki Muthu & Dr.K.Rajamannar
143
32 Demonetization is a Revolutionary Strategy
Dr.T.C.Shanthi & Dr.S.Subramanian
147
33 Demonetization and its Impact on Indian Society
R.Krishna Lekha & Dr.Sham Shankar
151
34 Overview of GST in India
C.Mathimitha & Dr.V.Thiruselvan
154
35 GST : One Nation, One Tax, One Market
S.Paramasivan
158
36 Impact of Demonetization on Banking Sector
Dr.P.Chennakrishnan & R.Thirunukkarasu
161
37 Impact of Demonetarization in Unorganized Sectors in India
Mr.S.Kumar & Mr.N.Lakshmanan
165
38 Implications of Implementing GST in India
Dr.V.Rajarajeswari
169
39 Contemporary Macro Economic Environmental Issues
P.Ambika Bai
172
40 Impact of Demonetization on People - A Study with Reference to
Ambasamudram Town
M.Karthikeyan
176
41 An Empirical Study on Relationship between Health Care Expenditure and Per
capita income in India
T.H.Fahad
181
42 Wilful Defaulters and the Growth of Non Performing Assets in Indian Banking
Sector
Dr.C.Ramesh
185
Vol. 6 | Special Issue. 1 | March 2018 | ISSN: 2319-961X
1 Shanlax International Journal of Economics
GOODS AND SERVICE TAX
Dr.E.Thangadurai
Assistant Professor of Economics, Rani Anna Government College for Women, Tirunelveli
GST is a single tax on the supply of goods and services, right from the manufacturer to the
consumer. Credits of input taxes paid at each stage will be available in the subsequent stage of
value addition, which makes GST essentially a tax only on value addition at each stage. The
final consumer will thus bear only the GST charged by the last dealer in the supply chain, with
set-off benefits at all the previous stages.
GST in India
In India, the idea of adopting GST was first suggested by the AtalBihari Vajpayee
Government in 2000. The State finance ministers formed in Empowered Committee (EC) to
create a structure for GST, based on their experience in designing State VAT. Representatives
from the Centre and states were requested to examine various aspects of the GST proposal and
create reports on the thresholds, exemptions, taxation of inter –state supplies, and taxation of
services. The committee was headed by Asim Dasgupta, the finance minister of West Bengal.
Dasgupta chaired the committee till 2011.
A task force that was headed by Vijay L. Kelkar the advisor to the finance ministry,
indicated that the existing tax structure many issues that would be ministry, indicated that the
existing tax structure had many issues that would be mitigated by the GST system, in 2004.
The finance minister, P.Chidambaram, said that the medium to long term global of the
government was to implement a uniform GST structure across the country, covering the whole
production-distribution chain. This was discussed in the budget session for the financial year
2005-2006.
The finance minister set 1 April 2010 as the GST introduction date. Parthasarathy Shome,
the advisor to P.Chidambaram, mentioned the states will have to prepare and make reforms
for the upcoming GST regime. The 1 April 2010 deadline for GST implementation was
retained in the union budget for 2007-2008.
At the union budget session for 2008-09, the finance minister confirmed that considerable
progress was being made in the preparation of the roadmap for GST. The targeted timeline for
the implementation was confirmed to be 1 April 2010. Pranab Mukherjee, the new finance
minister of India, announced the basic skeleton of the GST system. The 1 April 2010 deadline
was being followed then as well.
The EC that was headed by Asim Dasgupta put forth the First Discussion Paper (FDP),
describing the proposed GST regime. The paper was expected to start a debate that would
generate further inputs from stakeholders.
National Seminar on CONTEMPORARY MACRO ECONOMIC ENVIRONMENTAL ISSUES
2 Rani Anna Government College for Women, Tirunelveli
The government introduced the mission –mode project that laid the foundation for GST.
This project, with a budgetary outlay of Rs.1,133crore, computerized commercial taxes in
states. Following this, the implementation of GST was pushed by one year.
The government led by the Congress party puts forth the constitution (115th Amendment)
Bill for the introduction of GST. Following protest by the opposition party, the Bill was sent to
standing committee for a detailed examination.
The standing committee starts discussion on the Bill. Opposition parties raise concerns over
the 279B clause that offers additional powers to the Centre over the GST dispute authority in
2012.
P. Chidambaram and the finance ministers of states hold meeting and set the deadline for
resolution of issues as 31 December 2012.
The finance minister during the budget session, announces that the government will
provide Rs.9,000crore as compensation to states. He also appeals to the state finance ministers
to work in association with the government for the implementation of the indirect tax reform in
2013.
India’s new finance minister, Arun Jaitley, submits the Constitution (122nd Amendment)
Bill, 2014 in the parliament. The opposition demanded that the Bill be sent for discussion to the
standing committee.
Jaitley, in his budget speech, indicated that the government is looking to implement the
GST system by 1 April 2016.
The Lok Sabha passes the Constitution Amendment Bill. Jaitley also announced that
petroleum would be kept out of the ambit of GST for the time being.
The Bill is not passed in the RajyoSabha. Jaitley mentions that the disruption had no
specific cause.
Jaitley says that he is in agreement with the Congress’s demand for the GST rate not to be
set above 18%. But he is not inclined to fix the rate at 18% In the future if the Government, in
an unforeseen emergency, is required to raise the tax rate, it would have to take the permission
of the parliament. So, a fixed rate of tax is ruled out.
The Ministry of Finance releases the draft model law on GST to the public, expecting
suggesting and views. The Congress-led opposition finally agrees to the Government’s proposal
on the four broad amendments to the Bill. The Bill was passed in the RajyaSabha. The
Honourable President of India gives his consent for the Constitution Amendment Bill to
become an Act.
Four Bills related to GST become Act, following approval in the parliament and the
President’s assent.
Central GST Bill
Integrated GST Bill
Union Territory GST Bill
GST (Compensation to States) Bill
The GST Council also finalized on the GST rates and GST rules. The Government
declares that the GST Bill will be applicable from 1 July 2017.
Vol. 6 | Special Issue. 1 | March 2018 | ISSN: 2319-961X
3 Shanlax International Journal of Economics
Tax Structure before GST
Before the implementation of GST, taxation laws between the Centre and states were
clearely demarcated. There were no overlaps between the fiscal powers, whatsoever. The
Centre would levy tax on goods manufacture, except alcohol for consumption, narcotics,
opium, etc.
The States had the power to charge tax on the sale of goods.
The Centre would levy the Central Sales Tax that was collected by the originating states.
The Centre was also levying service tax on all types of services.
Additionally, the Centre was charging and collecting additional duties of customs on goods
that were imported into or exported from India. This tax was levied in addition to the Basic
Customs Duty. This additional duty of customs is referred to as Countervailing Duty
(CVD) and Special Additional Duty (SAD) and it counter balances excise duties, state
VAT, sales tax, and other such taxes.
The introduction of the GST regime made amendments to the Constitution so that the
Centre and states are empowered at the same time to levy and collect GST. This concurrent
jurisdiction of the states and Centre also requires an institutional mechanism that ensures joint
decisions are taken about the structure and operation of GST.
Benefits of GST
For business and industry
A robust and comprehensive e IT system would be the foundation of the GST regime in
India. Therefore, all tax payer services such as registrations, returns, payments etc would be
available to the tax payers online, which would make compliance easy an transparent.
GST will ensure that indirect tax rates and structures are common across the country,
thereby increasing certainly and ease of doing business. In the words, GST would make doing
business in the country tax neutral, irrespective of the choice of place of doing business.
Reduction in transaction costs of doing business would eventually lead to an improved
competitiveness for the trade and industry.
The subsuming of major Central and State taxes in GST, complete and comprehensive set-
off of input goods and services and phasing out of Central Sales Tax (CST) would reduce the
cost of locally manufactured goods and services. This will increase the competitiveness of
Indian goods and services in the international market and give boost to Indian exports. The
uniformity in tax rates and producers across the country will also go a long way reducing the
compliance cost.
For Central and State Governments
Multiple indirect taxes at the Central and State levels are being replaced by GST. Backed
with a robust end-to-end IT system, GST would be simpler and easier to administer than all
other indirect taxes of the Centre and State levied so far.
GST will result in better tax compliance due to a roust IT infrastructure. Due to the
seamless transfer of input tax credit from one stage to another in the chain of value addition,
National Seminar on CONTEMPORARY MACRO ECONOMIC ENVIRONMENTAL ISSUES
4 Rani Anna Government College for Women, Tirunelveli
there is an in-built mechanism in the design of GST that would incentivize tax compliance by
traders.
GST is expected to decrease the cost of collection of tax revenues of the Government, and
will therefore, lead to higher revenue efficiency.
Due to multiple indirect taxes being levied by the Centre and State, with incomplete or no
input tax credits available at progressive stages of value addition, the cost of most goods and
services in the country today are laden with many hidden taxes. Under GST, there would be
only one tax from the manufacturer to the consumer, leading to transparency of taxes paid to
the final consumer.
Because of efficiency gains and prevention of leakages, the overall tax burden on most
commodities will come down, which will benefit consumers.
Tetley, the finance Minister introduced the GST taxes to the people on the rates of
proportional. But commodities prices raises, people totally against the GST. So the Govt.
immediately formed the GST. Council. The Council decided to reduce the GST taxes ie,
178 goods 28% to 18%
13 goods 18% 12%
8 goods 12% to 5%
6 goods 18% to 5%
and 6 goods 5% to 0%
Luxury goods rate now 28% GST.
Silent feature of proposed GST Model
Consistent with the federal structural of the country-CGST and SGST.
CGST and SGST would be applicable to all transactions of Goods and Services except the
exempted Goods and Services.
CGST and SGST are to be paid to the account of center as well as state government
separately.
CGST and SGST are to be treated separately, normally taxes paid against the CGST shall
allow to be taken as Input Tax Credit for CGST and same principal will be applicable for
SGST.
The administration of the CGST would be center and SGST with sate.
Assessment, enforcement, scrutiny and adult would be undertaken by the authority witch is
collecting and Tax.
The different rates of taxes on goods and services are tabulated below.
Rate of GST vs. other Taxes
Conclusion
GST and its future aspects in
Indian economy showing a signal
of rapid growth of Indian
economy. Goods and Service tax
is a key for our GDP, this should
S.No. Particulars Goods Service
1 Excise Duty 12.500% / 6%/12% -
2 VAT12.50%/
13.50%/14% -
3 CST (against Form C) 2% -
4 Local Body Tax 40.100% to 8%
5 Service Tax - 14%
Vol. 6 | Special Issue. 1 | March 2018 | ISSN: 2319-961X
5 Shanlax International Journal of Economics
be send a strong signal to the investors (Internal & External) that India’s economy can
overcome serous global issues and challenges. GST would help country to make ‘One India
rather than divide India’ India is proposing to implement “dual GST”. All transaction of goods
and service made for the consideration would attract two levies-CGST (Central Good and
Service Tax) and SGST (State goods and service Tax) Country’s economic growth forecast,
Indian economy is expected to register a growth of 7.5 percent to 8 percent in 2016-17 and nine
per cent in 2018-19 and it will be depend upon the all economy factors. In an overview help to
understand GST will or doing work in India and benefit for Indian economy as well as
consumers and how much relief to the customer on tax burden point of view.
References
1. RBI. Bulletin, New Delhi
2. Southern Economist- Journal
3. The Hindu – Newspaper
4. The Finance – Journal.
5. Indian Economy – Dutt & Sundaram
National Seminar on CONTEMPORARY MACRO ECONOMIC ENVIRONMENTAL ISSUES
6 Rani Anna Government College for Women, Tirunelveli
DIGITALIZATION IN COMMERCIAL BANKS IS THE NEED OF THE HOUR
- A STUDY WITH SPECIAL REFERENCE TO TIRUCHENDUR AREA
Dr.G.Kamalaselvi
Head and Assistant Professor, Department of Commerce
M.Parvathi
II M.Com., Govindammal Aditanar College for Women, Tiruchendur
Abstract
India is the fastest growing economy in the world. The Indian economy is the
Seventh largest economy in the world measured by GDP and third largest by Purchasing Power Parity (PPP) after
US and China. According to a Goldman Sachs report released in September 2015, India could grow at a potential 8
per cent on average during from fiscal 2016 to 2020 powered by greater access to banking, technology adoption,
urbanization and other structural reforms. Banking Industry is the most important contributor for the health of any
economy is also strives to create delight customers through differentiated services with the help of technologies.
Digitalization is the method of using technologies to transform the existing banking operations and helps new banks
through their innovative, creative work processes, procedures, practices to take advantages of the opportunities inherent
in the digital economy and in the digital era.
Digitalization is forcing banks to undergo the most extensive transformation in their history, says Holger
Spielberg. In banking industry, digital is the new way to delight customers and to create new customers. With the
help of digital banking, the banking industry can bring numerous innovations in their sector to retain their loyal
customers. Digitalization is not an option for banking industry. It is inevitable because every industry is being
digitized and banking sector is no exception. Hence an attempt is made to findout the role of digitalization in
Commercial Banks on the title “Digitalization in Commercial Banks is the Need of the Hour - A Study with Special
Reference to Tiruchendur Area is chosen.
Introduction
India is the fastest growing economy in the world. The Indian economy is the Seventh
largest economy in the world measured by GDP and third largest by Purchasing Power Parity
(PPP) after US and China. According to a Goldman Sachs Report released in September 2015,
India could grow at a potential 8 per cent on average during from fiscal 2016 to 2020 powered
by greater access to banking, technology adoption, urbanization and other structural reforms.
Banking Industry is the most important contributor for the health of any economy is also
strives to create delight customers through differentiated services with the help of technologies.
Digitalization is the method of using technologies to transform the existing banking operations
and helps new banks through their innovative and creative work processes, procedures,
practices to take advantages of the opportunities inherent in the digital economy and in the
digital era.
Statement of the Problem
Digitalization is forcing banks to undergo the most extensive transformation in their
history, says Holger Spielberg.In banking industry, digital is the new way to delight customers
and to create new customers. With the help of digital banking, the banking industry can bring
Vol. 6 | Special Issue. 1 | March 2018 | ISSN: 2319-961X
7 Shanlax International Journal of Economics
numerous innovations in their sector to retain their loyal customers. Digitalization is not an
option for banking industry. It is inevitable because every industry is being digitized and
banking sector is no exception. Hence an attempt is made to findout the role of digitalization in
Commercial Banks on the title “Digitalization in Commercial Banks is the Need of the Hour -
A Study with Special Reference to Tiruchendur Area is chosen.
Objectives of the Study
1. To know the demographic profile of sample respondents.
2. To know the reasons for digitalizing the banking transactions.
3. To examine the benefits of digitalizing the banking services.
4. To find out the obstaeles in the process of digitalization in the commercial banks
5. To offer suggestions based on the present study.
Methodology
Both Primary and Secondary data were used to collect the information regarding
digitalization in Commercial Banks. Primary data were collected through Questionnaire. In
Tiruchendur, four Public Sector Banks State Bank of India, Indian Overseas Bank, Indian Bank
and Canara Bank are providing services to people who are residing and two Private Sector
Banks - Tamilnad Mercantile Bank and Karur Vysha Bank are providing services to the people
who are residing. From each bank, 20 customers were selected at random by adopting
Convenient Sampling Method to collect the data to analyse the role of digitalization in
Commercial Banks. Hence the Sample Size is 120.
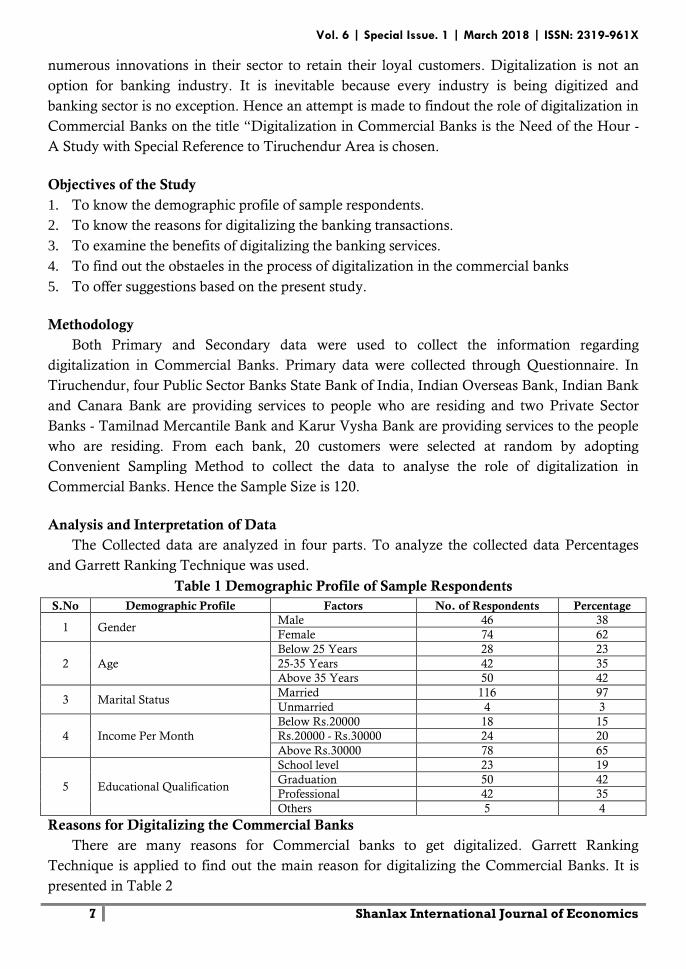
Analysis and Interpretation of Data
The Collected data are analyzed in four parts. To analyze the collected data Percentages
and Garrett Ranking Technique was used.
Table 1 Demographic Profile of Sample Respondents
S.No Demographic Profile Factors No. of Respondents Percentage
1 Gender Male 46 38
Female 74 62
2 Age
Below 25 Years 28 23
25-35 Years 42 35
Above 35 Years 50 42
3 Marital Status Married 116 97
Unmarried 4 3
4 Income Per Month
Below Rs.20000 18 15
Rs.20000 - Rs.30000 24 20
Above Rs.30000 78 65
5 Educational Qualification
School level 23 19
Graduation 50 42
Professional 42 35
Others 5 4
Reasons for Digitalizing the Commercial Banks
There are many reasons for Commercial banks to get digitalized. Garrett Ranking
Technique is applied to find out the main reason for digitalizing the Commercial Banks. It is
presented in Table 2
National Seminar on CONTEMPORARY MACRO ECONOMIC ENVIRONMENTAL ISSUES
8 Rani Anna Government College for Women, Tirunelveli
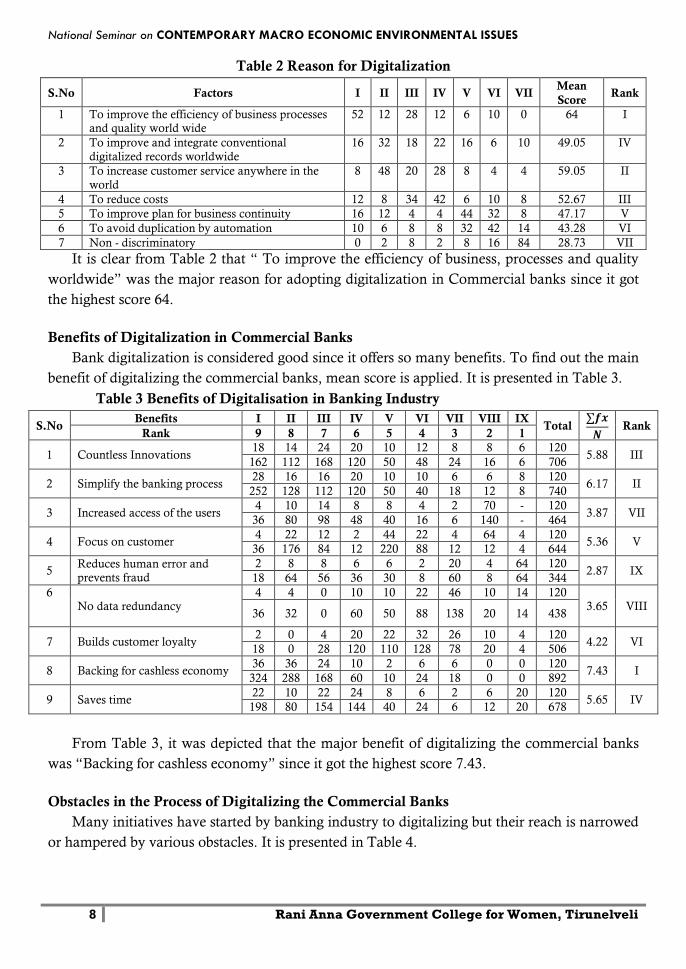
Table 2 Reason for Digitalization
S.No Factors I II III IV V VI VII Mean
Score Rank
1 To improve the efficiency of business processes and quality world wide
52 12 28 12 6 10 0 64 I
2 To improve and integrate conventional
digitalized records worldwide
16 32 18 22 16 6 10 49.05 IV
3 To increase customer service anywhere in the
world
8 48 20 28 8 4 4 59.05 II
4 To reduce costs 12 8 34 42 6 10 8 52.67 III
5 To improve plan for business continuity 16 12 4 4 44 32 8 47.17 V
6 To avoid duplication by automation 10 6 8 8 32 42 14 43.28 VI
7 Non - discriminatory 0 2 8 2 8 16 84 28.73 VII
It is clear from Table 2 that “ To improve the efficiency of business, processes and quality
worldwide” was the major reason for adopting digitalization in Commercial banks since it got
the highest score 64.
Benefits of Digitalization in Commercial Banks
Bank digitalization is considered good since it offers so many benefits. To find out the main
benefit of digitalizing the commercial banks, mean score is applied. It is presented in Table 3.
Table 3 Benefits of Digitalisation in Banking Industry
S.No Benefits I II III IV V VI VII VIII IX
Total
Rank
Rank 9 8 7 6 5 4 3 2 1
1 Countless Innovations 18 14 24 20 10 12 8 8 6 120
5.88 III 162 112 168 120 50 48 24 16 6 706
2 Simplify the banking process 28 16 16 20 10 10 6 6 8 120
6.17 II 252 128 112 120 50 40 18 12 8 740
3 Increased access of the users 4 10 14 8 8 4 2 70 - 120
3.87 VII 36 80 98 48 40 16 6 140 - 464
4 Focus on customer 4 22 12 2 44 22 4 64 4 120
5.36 V 36 176 84 12 220 88 12 12 4 644
5 Reduces human error and
prevents fraud
2 8 8 6 6 2 20 4 64 120 2.87 IX
18 64 56 36 30 8 60 8 64 344
6
No data redundancy 4 4 0 10 10 22 46 10 14 120
3.65 VIII 36 32 0 60 50 88 138 20 14 438
7 Builds customer loyalty 2 0 4 20 22 32 26 10 4 120
4.22 VI 18 0 28 120 110 128 78 20 4 506
8 Backing for cashless economy 36 36 24 10 2 6 6 0 0 120
7.43 I 324 288 168 60 10 24 18 0 0 892
9 Saves time 22 10 22 24 8 6 2 6 20 120
5.65 IV 198 80 154 144 40 24 6 12 20 678
From Table 3, it was depicted that the major benefit of digitalizing the commercial banks
was “Backing for cashless economy” since it got the highest score 7.43.
Obstacles in the Process of Digitalizing the Commercial Banks
Many initiatives have started by banking industry to digitalizing but their reach is narrowed
or hampered by various obstacles. It is presented in Table 4.
Vol. 6 | Special Issue. 1 | March 2018 | ISSN: 2319-961X
9 Shanlax International Journal of Economics
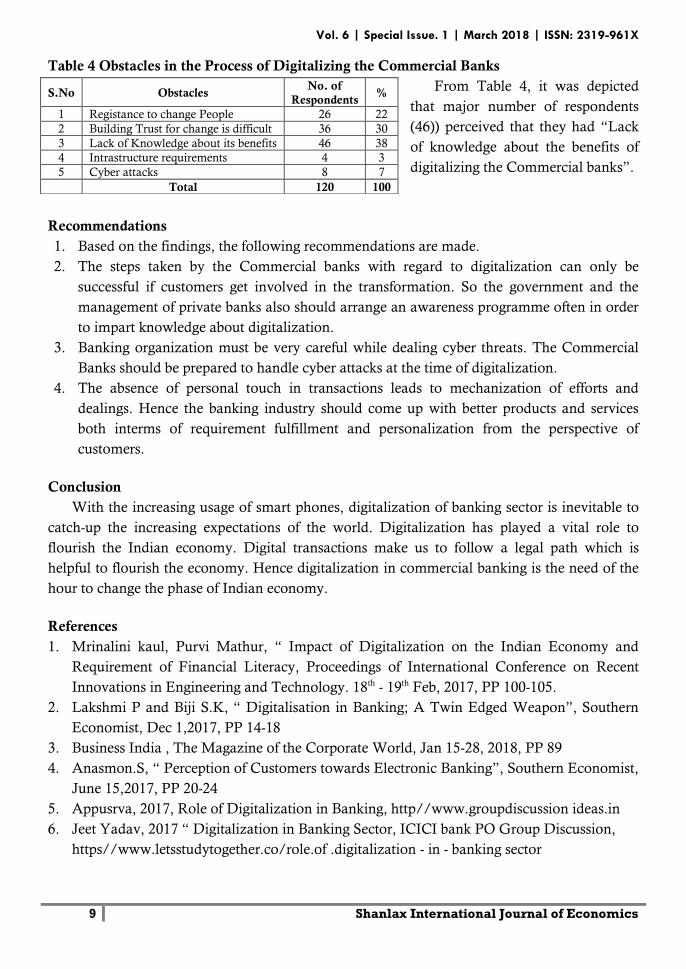
Table 4 Obstacles in the Process of Digitalizing the Commercial Banks
From Table 4, it was depicted
that major number of respondents
(46)) perceived that they had “Lack
of knowledge about the benefits of
digitalizing the Commercial banks”.
Recommendations
1. Based on the findings, the following recommendations are made.
2. The steps taken by the Commercial banks with regard to digitalization can only be
successful if customers get involved in the transformation. So the government and the
management of private banks also should arrange an awareness programme often in order
to impart knowledge about digitalization.
3. Banking organization must be very careful while dealing cyber threats. The Commercial
Banks should be prepared to handle cyber attacks at the time of digitalization.
4. The absence of personal touch in transactions leads to mechanization of efforts and
dealings. Hence the banking industry should come up with better products and services
both interms of requirement fulfillment and personalization from the perspective of
customers.
Conclusion
With the increasing usage of smart phones, digitalization of banking sector is inevitable to
catch-up the increasing expectations of the world. Digitalization has played a vital role to
flourish the Indian economy. Digital transactions make us to follow a legal path which is
helpful to flourish the economy. Hence digitalization in commercial banking is the need of the
hour to change the phase of Indian economy.
References
1. Mrinalini kaul, Purvi Mathur, “ Impact of Digitalization on the Indian Economy and
Requirement of Financial Literacy, Proceedings of International Conference on Recent
Innovations in Engineering and Technology. 18th - 19th Feb, 2017, PP 100-105.
2. Lakshmi P and Biji S.K, “ Digitalisation in Banking; A Twin Edged Weapon”, Southern
Economist, Dec 1,2017, PP 14-18
3. Business India , The Magazine of the Corporate World, Jan 15-28, 2018, PP 89
4. Anasmon.S, “ Perception of Customers towards Electronic Banking”, Southern Economist,
June 15,2017, PP 20-24
5. Appusrva, 2017, Role of Digitalization in Banking, http//www.groupdiscussion ideas.in
6. Jeet Yadav, 2017 “ Digitalization in Banking Sector, ICICI bank PO Group Discussion,
https//www.letsstudytogether.co/role.of .digitalization - in - banking sector
S.No Obstacles No. of
Respondents %
1 Registance to change People 26 22
2 Building Trust for change is difficult 36 30
3 Lack of Knowledge about its benefits 46 38
4 Intrastructure requirements 4 3
5 Cyber attacks 8 7
Total 120 100
National Seminar on CONTEMPORARY MACRO ECONOMIC ENVIRONMENTAL ISSUES
10 Rani Anna Government College for Women, Tirunelveli
STRATEGIES FOR THE AGENTS TO ACHIEVE SUCCESS IN
SELLING LIFE INSURANCE PRODUCTS
Dr.P.R.Jayaprabha
Associate Professor, Department of Commerce, Sree Ayyappa College for Women, Chunkankadai
Introduction
In the world of business today marketing engulfs a wide range of issues to identify and
satisfy the needs of the customer. The broader term of marketing is particularly applicable to a
service industry like insurance. Marketing is no longer regarded as one of the many activities of
a business organization like personnel, finance or production. Marketing is not merely a
function. It is the whole business. In insurance the prospective customer may not be able to
immediately and clearly perceive his problem (prospective hazards) and hence may be reluctant
to purchase the solution (insurance covers). Hence it may be said that the marketing of
insurance involves the creation of demand.
The need of the hour is to inject professionalization in the entire approach of life insurance
marketing. A modern professional approach demands not only up-to-date information about
life insurance, but also careful application of modern techniques of salesmanship. Insurance
agent is a facilitator in the whole process and has probably a more onerous marketing job than
their counterparts in many other trades and services. The quality and quantity of business
would always depend on the quality of the agents. The ‘quality’ aspect of a business is to signify
the particular aspect, which does not compromise with the number of policies, but put stress on
the underlying attributes of continuity, durability, cumulativeness and the success of
maintaining it in an unblemished fashion.
A successful insurance agent is one who can think from the perspective of the customer and
not for his own good. A life insurance agent is a businessman possessing the conviction of
clergyman, the stamina of an athlete, the perception of a doctor, the inquisitiveness of a
scientist, the mission of a teacher, the restlessness of a boy, the thirst for knowledge of a
scholar.
Insurance Salesmanship
It is difficult and frustrating. To succeed the salesman should have the,
To become more professional
To be more successful
To obtain more returns for resources invested
Their goal setting requires,
o Increase in business
o Increase in commission income
o Increase in area of coverage
Vol. 6 | Special Issue. 1 | March 2018 | ISSN: 2319-961X
11 Shanlax International Journal of Economics
o Increase in product variety sold
o Target prospect in professional manner
Their plan requires
o Setting clear time bound plan
o Plan of action should not include more than 5-6 issues
o Should be measurable
o Spell out specific terms
Specific Strategies Strategy is a term that comes from the Greek word strategic meaning generalship. Strategy
bridges the gap between policy and tactics. Together strategy and tactics bridge the gap between
ends and means. Such strategies are,
Agents should go again and again to their existing customers as the same customers can
give more business since it is five times costlier to get a new customer than it is to sell to an
existing one.
Agents should choose a limited geographical area to work in, which will help them to have
higher density of customers in a small geographical location that will enhance branding,
create more awareness among customers and thereby they can easily achieve the target.
The agents should re-skill themselves from time to time. The agents should acquire
knowledge through training session conducted by the respective branches and interacting
with seniors and top officials regularly will help enrich knowledge.
Agents should interact with their fellow agents to share their experiences, which will also
help them to solve their day to day difficulties in getting their business a success.
Huge market largely untapped in rural areas should be targeted by the agents to increase the
volume of business.
Agents should do business across many customer segments because if they focus on any
one particular segment, they face the same risk as faced by their customer segments.
Before meeting the clients, the agents should collect data pertaining to the concerned
clients’ background, health, financial position, size of the family, if any policy already held
with the clients, so that a suitable plan to suit their requirement and interest could be
suggested.
Speed and agility in meeting the customers’ needs have been the notable attributes for the
present sales force. Providing high quality information to the customers makes a vast
difference. High quality information means highly reliable, detailed, accurate and
supported by verifiable data. Agents should provide value added information service to the
clients at every stage.
Agents should prepare a sales presentation that educates or moves people around. They
should use visual aids to amplify the task and interaction. They should handle the question
and answer session with ease and confidence.
Agents should create some urge of policy purchasing in the minds of the customer. Then
the prospect will be ready to purchase the product at proper cost, even by taking loans or
selling his/her gold/other ornaments.
National Seminar on CONTEMPORARY MACRO ECONOMIC ENVIRONMENTAL ISSUES
12 Rani Anna Government College for Women, Tirunelveli
To increase the business, the agents should choose the right person keeping in mind the
favorable factors like seasons, festivals, atmosphere, profession, previous
interviews/conceptions and own experiences and exposures. Then they should meet the
prospective customer in the right place and at the right time.
To achieve the target, agents should give stress on making a list of prospects that can pay
high amount of premiums.
The agents should render proper guidance and help to the beneficiaries by making available
all the documents for registration as well as for the claim settlement.
Successful selling continues with good service. After the sale, they should see whether they
pay the subsequent premiums regularly. Agents should give after sales service which gives
birth to further sales and referrals from the prospect. This is an unending process, if
properly taken care of.
Agents should help the customers in prompt and speedy settlement of claims.
Agents should call the customers from time to time with updates on improvement to the
product and other services to make the product’s consumption more satisfying.
Agents should be encouraged to become members of the professional clubs like Lion,
Rotary, consumer and welfare groups which will facilitate them to contact people of higher
income groups, and it makes easy for them to catch up new policies.
Conclusion It is concluded that insurance is a multifaceted tool, which promotes stability, prosperity
and happiness to the individual and society. The challenge for the LIC agent is three-fold,
creating the need where it is not there, changing the need into their want and turning the want
into demand which they must be able to satisfy. Sales and Service are the two sides of the same
coin. This fact, agents should not forget and take these two aspects as challenging factors in day
to day activities so that LIC can emerge as a market leader in the industry.
References 1. Hoverstad et.al., (1990), The Use of Survival Analysis to Examine Sales Force of Part time
and Fulltime Sales Employees, International Journal of Research in Marketing, Vol.7.
2. Ingram et.al., (1992) Why Sales People Fail, Industrial Marketing Management, Vol.21.
3. Jegendra Kumar, (2005), Insurance Agent: The New Financial Advisor, Life Insurance
Today, Vol.1, No.4, July.
4. Jegendra Kumar, (2009), Lapsation of a Life Insurance Policy, Life Insurance Today,
Vol.1V, No.10, January.
5. Malliga R. and Punithavathy Pandian, (2007), Attitude of LIC Agents towards Job and the
Marketing Performance, Life Insurance Today, Vol.11, No.10, January.
6. Mundra S.L., (2004), Training: Why? Yogakshema, Vol.48, No.8, August.
7. Musafer Abdul Rahuman, (2001), In the Wonderland of Insurance Selling, Southern
Splendour, No.54, September.
8. Narayanaswamy, (1991), Profession of Selling, Southern Splendour, No. 26 September.
Vol. 6 | Special Issue. 1 | March 2018 | ISSN: 2319-961X
13 Shanlax International Journal of Economics
MACROECONOMIC ANALYSIS OF CONSUMER EXPENDITURE
INEQUALITIES IN INDIA
V.Arockia Amuthan
Assistant Professor, Post Graduate Department and Research Center in Economics Pope’s College (Autonomous), Sawyerpuram, Thoothukudi District
Abstract
This paper deals with the decomposition of consumer expenditure inequalities in India by lower and upper
expenditure groups. Relative contribution of within groups and between groups components are explicitly examined
for all food and non-food consumption items. Rural urban disparity is also examined. Decomposition of between and
within group inequality components is done on the basis of the Generalized Entropy Measure [E(α)] using India’s
National Sample Survey data for the years 1993-94 and 2015-16. Between groups component is more pronounced in
case of almost all the consumption items except some non-food items.
Keywords: Consumer Expenditure, Inequality, Decomposition JEL Classification: D63, I31
Introduction
Inequality in the distribution of income/expenditure undergoes variations over time across
different groups. Such variations are not uniform for different subgroups of individuals.
Researchers are likely to be interested in quantifying the relative contribution of each subgroup
to the overall inequality and their over time variations. Number of recent literature (Bourguignon
1979; Shorrocks, 1980, 1984) includes the issue of decomposition of total inequality into
subgroups. Many inequality indices are additively decomposable and give clear separation of
between and within group inequalities. Recent studies put emphasis on inequality in different
subgroups defined along religion, occupation, region or other lines. How sub-group inequalities
are related to overall inequality is the point of interest. In this paper we intend to decompose
the inequality in consumer expenditure in India in order to quantify the contribution of Lower
and Upper Expenditure Groups in case of each food and non-food consumption items.
During the period of on-going economic reforms in India, pattern of consumer expenditure
has undergone a divergent change irrespective of rural and urban areas. Studies are available on
structural changes in consumption expenditure after economic reforms (Bhattacharya 1998;
Maity, 1998; Sen et al, 2004; Sen, 2009). There are some studies where the sub-group
decompositions of inequality are done for several countries (Bhattacharya and Mahalanobis,
1979; Glewee, 1986; Das and Parikh, 1982; Mukherjee & Shorrocks, 1982). Consumer
expenditure inequalities and their sub-group decompositions for different consumption items
(food and non-food) are not hitherto examined in case of Indian economy.
We have used household consumer expenditure survey data (based on uniform reference
periods) compiled by National Sample Survey Organization (NSSO) of India. Two time points
are considered- 1993-94 and 2015-16 in order examine the changes during the period of on-
going economic reforms. Two sub groups (Upper and Lower expenditure groups) are identified
on the basis of median expenditure group. Consumption items are divided into two broad
National Seminar on CONTEMPORARY MACRO ECONOMIC ENVIRONMENTAL ISSUES
14 Rani Anna Government College for Women, Tirunelveli
categories – food items and non-food items. Food items consists of (i) Cereals (ii) Pulses and
Pulse Products (iii) Milk and Milk Products (iv) Edible oil (v) Meat Egg and Fish (vi)
Vegetables and (vii) Fruits. Non-food items are divided into (i) Fuel ad Light (ii) Clothing and
Footwear (iii) Miscellaneous Goods and Services and (iv) Durable goods. Inequality
decompositions (within and between groups) are done in case of each food and non-food items.
The Generalized Entropy Measure [E(α)] is used. Decomposition of between and within group
inequality components is done on the basis of E(1).
Methodology
Let ( be the consumption structure where ≥ 0. The class of inequality
indices based on the concept of entropy which is related to the measure of disorder. The
generalized entropy index is
E( ) assumes different forms depending upon the value of α. The parameter α may be
assigned to all possible real values however it is usually chosen to be non-negative. Common
values of α used are 0, 1 and 2. Two particular cases are the interest for inequality
measurement. When α = 0, we get
which is known as Theil’s second measure of inequality (L). When α = 1, the generalized
entropy index becomes
=
which is Theil’s inequality Index (T). Theil’s index is based on entropy which is associated
with
where c is equal to the total consumption expenditure.
Suppose there are m groups such that the first group consists of n1 persons, second group
with n2 persons and so on. So the structure becomes
So, T =
.
Now,
=
=
=
Similarly,
=
Therefore, T =
Aggregate inequality is thus decomposed into two components. The first part is the within
group component which is the weighted average of group inequality indices and weights being
Vol. 6 | Special Issue. 1 | March 2018 | ISSN: 2319-961X
15 Shanlax International Journal of Economics
the income shares
of each group. The second part is the between groups inequality
component which is derived if the within groups income differences are suppressed. It can be
defined as the value of the index if every person receives the mean income of that group. So it
quantifies inequality between the group means. Within group component can be defined as the
value of the inequality index when all between group inequalities are suppressed by a
hypothetical equalization of group means to the overall mean.
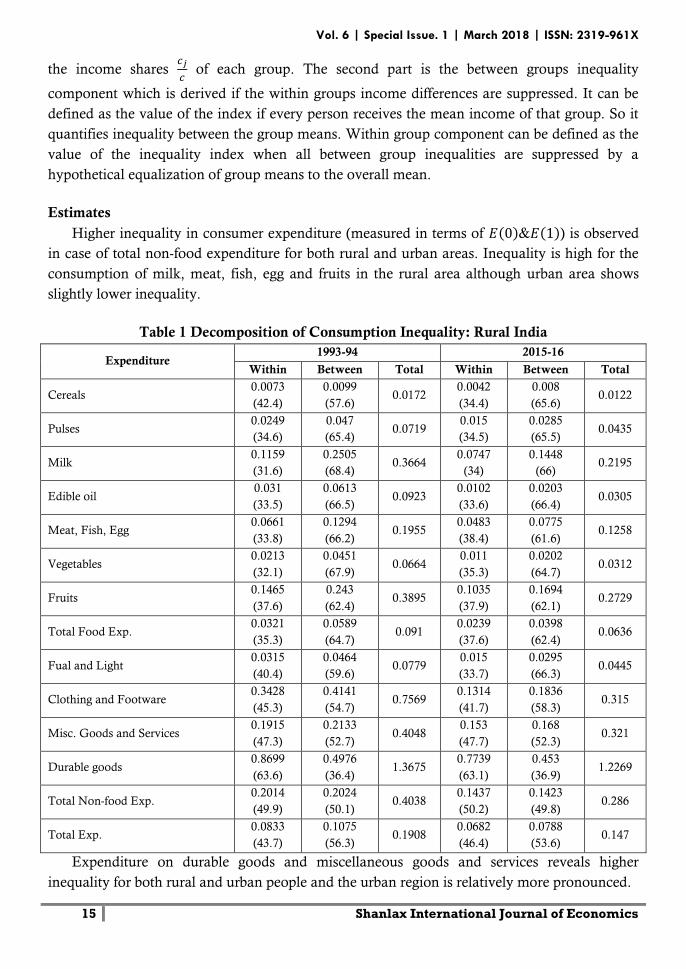
Estimates
Higher inequality in consumer expenditure (measured in terms of & ) is observed
in case of total non-food expenditure for both rural and urban areas. Inequality is high for the
consumption of milk, meat, fish, egg and fruits in the rural area although urban area shows
slightly lower inequality.
Table 1 Decomposition of Consumption Inequality: Rural India
Expenditure 1993-94 2015-16
Within Between Total Within Between Total
Cereals 0.0073
(42.4)
0.0099
(57.6) 0.0172
0.0042
(34.4)
0.008
(65.6) 0.0122
Pulses 0.0249
(34.6)
0.047
(65.4) 0.0719
0.015
(34.5)
0.0285
(65.5) 0.0435
Milk 0.1159
(31.6)
0.2505
(68.4) 0.3664
0.0747
(34)
0.1448
(66) 0.2195
Edible oil 0.031
(33.5)
0.0613
(66.5) 0.0923
0.0102
(33.6)
0.0203
(66.4) 0.0305
Meat, Fish, Egg 0.0661
(33.8)
0.1294
(66.2) 0.1955
0.0483
(38.4)
0.0775
(61.6) 0.1258
Vegetables 0.0213
(32.1)
0.0451
(67.9) 0.0664
0.011
(35.3)
0.0202
(64.7) 0.0312
Fruits 0.1465
(37.6)
0.243
(62.4) 0.3895
0.1035
(37.9)
0.1694
(62.1) 0.2729
Total Food Exp. 0.0321
(35.3)
0.0589
(64.7) 0.091
0.0239
(37.6)
0.0398
(62.4) 0.0636
Fual and Light 0.0315
(40.4)
0.0464
(59.6) 0.0779
0.015
(33.7)
0.0295
(66.3) 0.0445
Clothing and Footware 0.3428
(45.3)
0.4141
(54.7) 0.7569
0.1314
(41.7)
0.1836
(58.3) 0.315
Misc. Goods and Services 0.1915
(47.3)
0.2133
(52.7) 0.4048
0.153
(47.7)
0.168
(52.3) 0.321
Durable goods 0.8699
(63.6)
0.4976
(36.4) 1.3675
0.7739
(63.1)
0.453
(36.9) 1.2269
Total Non-food Exp. 0.2014
(49.9)
0.2024
(50.1) 0.4038
0.1437
(50.2)
0.1423
(49.8) 0.286
Total Exp. 0.0833
(43.7)
0.1075
(56.3) 0.1908
0.0682
(46.4)
0.0788
(53.6) 0.147
Expenditure on durable goods and miscellaneous goods and services reveals higher
inequality for both rural and urban people and the urban region is relatively more pronounced.
National Seminar on CONTEMPORARY MACRO ECONOMIC ENVIRONMENTAL ISSUES
16 Rani Anna Government College for Women, Tirunelveli
Between-group component of consumer expenditure inequality in rural India (Table 1) is
slightly more pronounced and it has declined from 56.3 per cent to 53.6 per cent during the
period. Percentage contribution of between group inequality is more than 60 per cent for all the
food items in 1993-94 and the picture remained the same in 2015-16. Contribution of within
group inequality has increased in case of milk, meat, egg, fish and vegetables whereas it has
declined in case of clothing, fuel, light and footwear. Only for the consumption of durable
goods, within group inequality contributes more than 60 per cent.
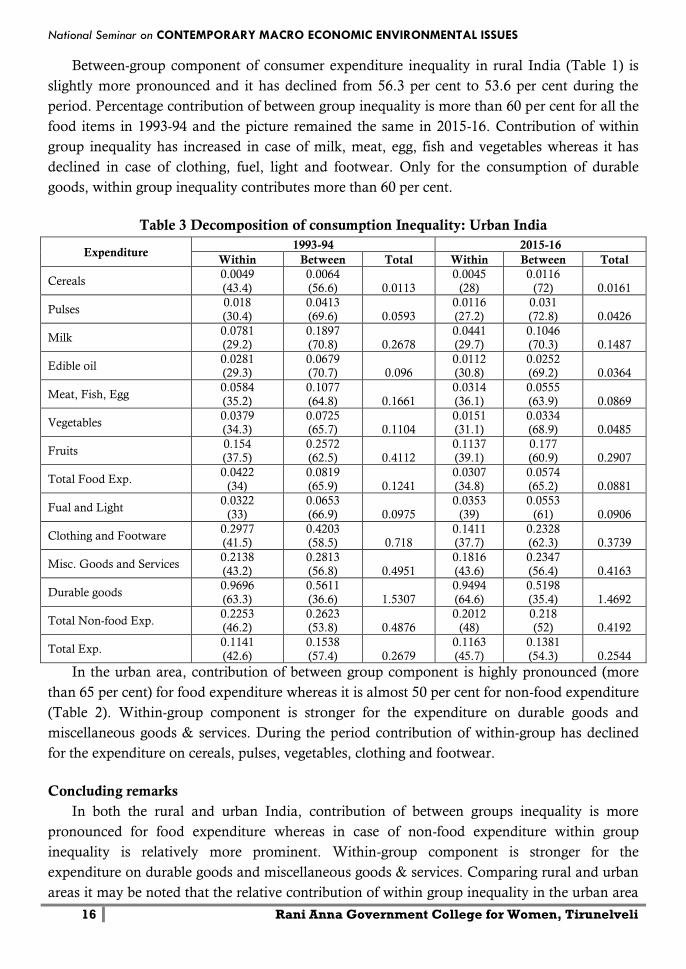
Table 3 Decomposition of consumption Inequality: Urban India
Expenditure 1993-94 2015-16
Within Between Total Within Between Total
Cereals 0.0049
(43.4)
0.0064
(56.6) 0.0113
0.0045
(28)
0.0116
(72) 0.0161
Pulses 0.018
(30.4)
0.0413
(69.6) 0.0593
0.0116
(27.2)
0.031
(72.8) 0.0426
Milk 0.0781 (29.2)
0.1897 (70.8) 0.2678
0.0441 (29.7)
0.1046 (70.3) 0.1487
Edible oil 0.0281 (29.3)
0.0679 (70.7) 0.096
0.0112 (30.8)
0.0252 (69.2) 0.0364
Meat, Fish, Egg 0.0584
(35.2)
0.1077
(64.8) 0.1661
0.0314
(36.1)
0.0555
(63.9) 0.0869
Vegetables 0.0379 (34.3)
0.0725 (65.7) 0.1104
0.0151 (31.1)
0.0334 (68.9) 0.0485
Fruits 0.154 (37.5)
0.2572 (62.5) 0.4112
0.1137 (39.1)
0.177 (60.9) 0.2907
Total Food Exp. 0.0422
(34)
0.0819
(65.9) 0.1241
0.0307
(34.8)
0.0574
(65.2) 0.0881
Fual and Light 0.0322
(33)
0.0653
(66.9) 0.0975
0.0353
(39)
0.0553
(61) 0.0906
Clothing and Footware 0.2977 (41.5)
0.4203 (58.5) 0.718
0.1411 (37.7)
0.2328 (62.3) 0.3739
Misc. Goods and Services 0.2138
(43.2)
0.2813
(56.8) 0.4951
0.1816
(43.6)
0.2347
(56.4) 0.4163
Durable goods 0.9696
(63.3)
0.5611
(36.6) 1.5307
0.9494
(64.6)
0.5198
(35.4) 1.4692
Total Non-food Exp. 0.2253 (46.2)
0.2623 (53.8) 0.4876
0.2012 (48)
0.218 (52) 0.4192
Total Exp. 0.1141
(42.6)
0.1538
(57.4) 0.2679
0.1163
(45.7)
0.1381
(54.3) 0.2544
In the urban area, contribution of between group component is highly pronounced (more
than 65 per cent) for food expenditure whereas it is almost 50 per cent for non-food expenditure
(Table 2). Within-group component is stronger for the expenditure on durable goods and
miscellaneous goods & services. During the period contribution of within-group has declined
for the expenditure on cereals, pulses, vegetables, clothing and footwear.
Concluding remarks
In both the rural and urban India, contribution of between groups inequality is more
pronounced for food expenditure whereas in case of non-food expenditure within group
inequality is relatively more prominent. Within-group component is stronger for the
expenditure on durable goods and miscellaneous goods & services. Comparing rural and urban
areas it may be noted that the relative contribution of within group inequality in the urban area
Vol. 6 | Special Issue. 1 | March 2018 | ISSN: 2319-961X
17 Shanlax International Journal of Economics
is smaller compared to the rural area in case of almost all consumption items except fruits, fuel
and light and durable goods. Govt. should take care of the of redistribution policies in order to
reduce consumption expenditure inequalities in India.
References
1. Bhattacharya, N. and Mahalanobis, B., 1963. Regional Disparities in Household
Consumption in India, Journal of American Statistical Association, 62, 143-161,.
2. Bourguignon, F., 1979.Decomposable Income Inequality Measures.Econometrica.47, pp
901-20.
3. Sen, J. (2009), ‘Changing Pattern of Consumption Expenditure in Rural India during the
Reform Period’ in Dr. P. K. Pal (Ed), Reforms and Structural Changes in India, Regal
Publications, New Delhi.
4. Shorrocks, A..F., 1980.The class of additively decomposable inequality measures.
Econometric a. 48, pp 613-625.
5. Theil, H. (1961): Economics and Information Theory, North Holland.
National Seminar on CONTEMPORARY MACRO ECONOMIC ENVIRONMENTAL ISSUES
18 Rani Anna Government College for Women, Tirunelveli
MACROECONOMIC ANALYSIS OF FUTURES MARKET AND
VOLATILITY IN COMMODITY SPOT AND FUTURE PRICES
Dr.T.Saravanan
Assistant Professor, Department of Economics AVVM Sri Pushpam College (Autonomous), Poondi, Thanjavur District
Abstract
Now-a-days volatility has become a fashionable slogan in financial literature in general and futures trading in
particular. Most of the studies have talked about volatility of futures prices as well as spot prices not only in India but
also in abroad. Some of them revealed that the futures prices are more volatile then spot (Shively, 1996; Park, 1993)
where as Jack (2005) and others have argued that spot prices are more volatile. At the same time Wahl (1996) and
others have suggested that in some cases futures prices are more volatile then spot and in other cases it becomes reverse.
Keeping the previous related literature aside, this paper explores a relationship not between the spot and futures
commodity prices but both spot and future agricultural index in Indian context coupled with the estimation of
volatility between the two indices. The whole analysis is based on the agricultural commodity index of both futures
and spot prices through GARCH model and co-integration test. Data has been collected from Multi commodity
exchange, Mumbai from 6th June 2005 to 31st December 2008 on daily basis. Briefly the result presented in this
paper suggested that over long run there exhibits a linear relationship and agricultural commodity futures prices are
more volatile than spot prices.
Keywords: futures commodity price; volatility; spot prices; GARCH model
Introduction
Now-a-days volatility has become a fashionable slogan in financial literature in general and
futures trading in particular. Most of the studies have talked about volatility of futures prices as
well as spot prices not only in India but also in abroad. Some of them revealed that the futures
prices are more volatile then spot (Shively, 1996; Park, 1993) where as Jack (2005) and others
have argued that spot prices are more volatile. At the same time Wahl (1996) and others have
suggested that in some cases futures prices are more volatile then spot and in other cases it
becomes reverse.
Forward Market/Contract
It is same as futures market but the former runs under unauthorised (OTC) where as the
later runs under organised/registered cases i.e. forward market commission (FMC).
Option Market
Options are one type of futures which is carried with legal obligation to both buyers and
sellers.
Emergence of Indian Futures Market
Indian farmers’ are risk averter than risk lover. Henceforth, in the late 1900s, India guesses
futures trading in commodity markets. However, the commodity futures have been in the State
of hibernation for the past few decades owing to a lot of government restrictions. Drastically
Vol. 6 | Special Issue. 1 | March 2018 | ISSN: 2319-961X
19 Shanlax International Journal of Economics
changes in commodity futures took place in 2003-2004. The government issued a notification
on 1st April 2003 withdrawing all previous notifications which prohibited futures trading in
large number of commodities in the country. This was followed by a notification in May 2003
revoking prohibition on non-transferable specific delivery forward contacts. The futures market
was open in anticipation of sound market institution and market design. In order to set up
proper markets, the government of India (GoI) on recommendation of forward market
commission (FMC) granted recognition to national multi-commodity exchange, Ahmadabad
(NMCE); Multi-commodity Exchange, Mumbai (MCX); National commodity and derivative
exchange, Mumbai (NCDEX) as nationwide multi-commodity exchanges. Trading
commenced as MCX and NCDEX in November 2003 and December 2003 respectively. Every
commodity had different set of Mandies to be pooled depending upon the proportion of spot
market trade. The total volume of trade in the commodity futures market rises from Rs. 34.84
lakh crores in 2006 to Rs. 36.54 crores in 2007. The volume of growth of trade is primarily
propelled by MCX and MCDEX. At present, we have three national level electronic exchange
and 21 regional exchanges for commodity trading which allowed 80 commodities for delivery
trading.
Estimations of Volatility
Volatility can be estimated by using several methods but largely two methods are largely
used in the various studies. One is unconditional method that includes that includes co-
variation, standard deviation and the other is conditional method which includes ARCH and
GARCH analysis .The present study has used ARCH/GARCH for modelling volatility.
Objectives
1. To examine the relationship between futures and spot commodity prices.
2. To estimate the volatility in both futures and spot prices of the agricultural commodities.
Methodology and Data Sources
In order to achieve the above objectives, the study has used Unit root test, co-integration
test (ADF) and ARCH /GARCH model. Brief about methodology has been discussed in
section three. Agricultural commodity index has collected from (MCX) which is daily basis
covering from 6th June 2005 to 31st Dec 2008. The whole sale commodity index is based on real
prices with major agricultural commodities.
Empirical Analysis and Result Interpretation
In order to support and to fulfil our above objectives this section deals with the empirical
analysis with appropriate data and methodology. Some sort of theoretical model for
methodology is also explained in this section in order to make the analysis more flavour and
vibrant. Interpretation of the result is made in this section also.
National Seminar on CONTEMPORARY MACRO ECONOMIC ENVIRONMENTAL ISSUES
20 Rani Anna Government College for Women, Tirunelveli
Econometric Tools
Though the study deals with time series analysis, few concepts relating to time series are
analysed below, and are worth mentioning.
Unit Root Stochastic Process: it is the nonstationary stochastic process and it is unit root
because of =1.
Y t =ρY 1t +u t -1 ≤ ρ ≤1 (3.1)
There are several tests available for testing the nonstationarity but the most celebrated and
widely used test is unit root in time series. It includes Dickey-Fuller, Augmented Dickey-fuller
and Philips- perron test to check the presence of unit root in the data. These tests are necessary
because the usual student-t test is inappropriate to the test the null hypothesis.
ARCH and GARCH Models
The ARCH and GARCH model has been used for measuring the volatility of the spot and
futures prices of agricultural index in this study. So it is obligatory to discuss the model of
ARCH and GARCH here.
Given the information set (Ω 1t ), a stochastic process, Y t , is called autoregressive
conditional heteroscedasticity process, if it’s time-varying conditional variance, h t , is
heteroscedastic with auto regression as given below:
Y t = t (3.6)
t / Ω 1t ~N (0, h t )
h t =E ( t2
) = α 0 +α 1 2
t 1 + ………. +α q 2
qt (3.7)
Equation (3.5) is the conditional mean where regressors can generally be added to the right
hand side along with the residuals ( t ) and equation (3.5) is the conditional variance, assumed
to be an AR (q) process. Equation (3.4) and (3.7) together are called an ARCH (q) model for
Y t .
Bollerslev (1986) has generalized the ARCH (q) process where the time- varying
conditional variance is heteroscedastic with both autoregressive and moving average structure.
The general GARCH model can be written as:
Y t = t (3.8)
t / Ω 1t ~N (0, h t )
h t = α 0 +α 1 2
t 1 + ………. +α q 2
qt + β 1 h t 1 +…. +β p h t p
= α 0 + α i 2
t 1 + β j h jt (3.9)
With α 0 >0, 0≤ α i ≤1 for I=1, 2……q and 0≤ β j ≤1 for j=1, 2…. …p.
The equation (3.8) and (3.9) represent a GARCH (p, q) process where the conditional
variance of t has an autoregressive and moving averages component of order q and p
Vol. 6 | Special Issue. 1 | March 2018 | ISSN: 2319-961X
21 Shanlax International Journal of Economics
respectively. In higher order processes, GARCH model may claim priority over an ARCH
model because the former will be more parsimonious than latter in view of the positive (and
<1) sign restriction on all the parameters. Bollerslev (1986) has shown that the GARCH process
will be stationary, i.e. all characteristics roots of equation (3.9) will lay within the unit circle,
provided the process satisfies the finite variance condition,
p
j
j
1
< 1 (3.10)
In empirical applications, if the above condition is not satisfied, in GARCH (or in ARCH)
model, restriction need to be imposed on the parameters to keep the conditional variance
positive and finite. This may not be an easy task. If >1, it implies that any shock will continue
to increase the conditional volatility forever. On the other hand, if =1, then the process is not
covariance stationary (Engel and Bollerslev, 1986) and it is known as integrated GARCH (I
GARCH) model. In this case, the conditional variance behaves like a random walk and may
persist over infinite time horizon. However, the standard asymptotically based inference has
been shown to be valid for I GARCH process, even though its covariance is non stationary
(Bougerol and Picard, 1992).
In addition to the above commonly used models, there is a few other variance of GARCH
process that is used in special cases. These include models, which incorporates asymmetry in
volatility in mean equation (ARCH-M or GARCH-M), power ARCH (PARCH) and
EGARCH some of these are specially proposed for modelling volatility of financial market
variables.
Cointegration Test
In regressing a time series variable or another time series variable, we may obtain a very
high R-square but there is no meaning full relation between two variables. So it is the problem
of spurious regression. That is they are not co-integrated but over long run their linear
combination may be linear i.e. they are co-integrated.
There are several methods to test conintegration but here the study has used simple ADF
test which is meant for a two variable analysis.
Test of volatility in spot and futures prices
Volatility of both commodity prices has been tested by employing GARCH model and the
results are as follows.
Volatility in futures prices (LFAGRIDEX)
The LFAGRIDEX also follows an asymmetric GARCH model (EGARCH) i.e. EGARCH
(1, 1) which is as follows
Yt= β 1 Y t 1 +β 2 1t + t , where Yt= 1st first difference of LFAGRIDEX (3.14)
σ t
2= µ+ ρ
2
t 1 + 11 td 2
t 1 + δ σ2
1t (3.15)
t /Ω 1t ~N (0, h t ) t=1, 2, 3………..
National Seminar on CONTEMPORARY MACRO ECONOMIC ENVIRONMENTAL ISSUES
22 Rani Anna Government College for Women, Tirunelveli
Table given below, β 1 , β 2 and are the slope coefficient of the AR (1),and MA (1),
respectively. µ is the intercept term of the GARCH model and it is statistically significant. The
ρ is the slope coefficient of ARCH which shows that, it is highly statistically significant and δ is
the slope coefficient of which shows that, it is statistically significant also. The Q refers to the
Ljung-Box statistics. The above table shows that, there is complete absence of serial correlation
in the mean equation at lag order Q (9), Q (14) and Q (16). There is also absence of serial
correlation in the variance equation in the same lag order. The conditional variance of
LFAGRIDEX which is capture from the estimated EGARCH (1, 1) model is given in the
following figure.
Major Findings, Limitations and Policy Suggestions
On the basis of the previous studies and the gap of the studies, the present study has
explored the thing in a slight different way which is new one. The study has taken agricultural
commodity index rather than by taking prices of the major crops. Suitable and sophisticated
econometric tools are also used to make the analysis more interesting and vibrant. Except the
numerical results the study has also presented a graphical interpretation in order to bring
attention to the analysis. The major findings of the study are futures commodity prices are
more volatile than spot commodity prices and they exhibit a long run linear relationship
between the two.
Policy Suggestions
In order to avoid the excess fluctuations that arise in both the markets which have a
negative impact on futures trading following policies should be undertaken by the concerning
authorities.
Forward market commission (FMC) should take necessary steps to control the bubbles that
makes unhealthy of the futures trading system which brings volatility in the spot prices and
more volatility in the futures prices.
Government intervention may also be fruitful to control these unhealthy risks that arise in
the system.
References
1. Ahuja L. Narender (2006) Commodity Derivatives Market in India: Development,
Regulation and Futures Prospects, International Research Journal of Finance and Economics,
Issue 2.
2. Antoniou A. and Holmes P. (1995) Futures trading information and spot price volatility:
evidence for the FTSE – 100 Stock Index Futures contract using GARCH, Journal of
Banking & Finance, Vol. 19, Pp. 117-129.
3. Dahl M. Christian and Iglesias M. Emma (2009) Volatility spill-overs in commodity spot
prices: New empirical results, Economics Modelling, Issue 26, Pp. 601-607.
4. Hennessy A. David and Wahl I. Thomas (1996) The Effects of Decision Making on
Futures Price Volatility, American Journal of Agricultural Economics, Vol. 78, No. 3, Pp. 591-
603.
5. Jacks S. David (2007) Populists versus theorists: Futures markets and the volatility of
prices, Explorations in Economics History, Issue 44, Pp. 342-362.
Vol. 6 | Special Issue. 1 | March 2018 | ISSN: 2319-961X
23 Shanlax International Journal of Economics
MACROECONOMIC ANALYSIS OF THE FOOD INFLATION
IN INDIA
Dr.D.Jones Rajan
Physical Director, Department of Physical Education
V.Arockia Amuthan
Assistant Professor, Post Graduate Department and Research Center in Economics
Pope’s College (Autonomous), Sawyerpuram, Thoothukudi District
Abstract
The study is an endeavour to evaluate the demand pull causes of inflation of food articles in India. Using the
cointegration analysis, it has been observed that inflation of primary articles in long-run is the outcome of i) rising
GDP per capita; ii) growth of the agriculture sector; and iii) increasing net-exports of the primary articles. The first
two factors support the hypothesis of demand pull inflation whereas, the third factor represents the inflation caused by
supply leakages in the domestic commodity market. Given the short-run VECM analysis, net-exports of primary
articles has been observed the most significant variable to control inflation of food articles instantaneously.
JEL Codes: C01, C22, E31
Keywords: Inflation, VAR/VECM, Cointegration.
Introduction
The study of Inflation in food prices is pertinent because of its linkages to both industrial
and general price level. An increase in industrial prices stems from rising inputs cost through an
increase in money wages. With rising money wages, public expenditure in money terms has to
increase so as to meet a given real expenditure targets and hence to finance this increased
money expenditure the government resorts among other things to higher indirect taxes, notably
excise duties, which also raise industrial costs. Thus, food inflation got translated into inflation
at wholesale price index of all commodities. Moreover, if industry generally follows a prime-
cost-plus policy, these increased costs are passed on in the form of higher industrial prices.
Besides, higher agricultural, especially food grain prices usually imply a cutback in the demand
for industrial goods, both because of a switch of expenditure from industrial mass consumption
goods to food, and also because of the relative restriction of public spending which ensues
during such periods .
Selection of Variables
The Wholesale Price Index (WPI) of primary articles has been used as the proxy of
inflation of food products in India given that the weight of food articles in explaining WPI of
primary articles is 92.65 percent at the base year of 1993/94 (Economic Survey of India,
2009/10, pp. A62). The variable GDP per capita has been used to explain the impact of the
economic growth of India on food prices. It has been hypothesised that the growth of the
economy is having a positive impact on the food prices.
National Seminar on CONTEMPORARY MACRO ECONOMIC ENVIRONMENTAL ISSUES
24 Rani Anna Government College for Women, Tirunelveli
The second variable Production represents agriculture output at constant prices. An increase
in the agriculture output may affect the food prices in two ways: i) it may reduce the food prices
given the general over production; or ii) may increase the price level because of he prosperity of
the farmer and consequent increase in the aggregate demand from rural masses.
The third variable Net Exports of primary articles may also have dual affect on food prices: i)
an increase in net exports is one of the indicator of economic prosperity and thus, may lead to
increase price level via increase in per capita income; or ii) increasing net exports may lead to the
leakage of domestic supply of primary articles and thereby, increase the prices given the
increasing demand and supply shortages in domestic market.
Further, all of these variables except WPI of primary articles have been deflated at 1993/94
prices to neutralise the impact of change in price level. The natural logs of all these variables
have been used for the analysis purpose because: i) the estimated coefficients of the log-linear
function are elasticities which are easy to interpret; and ii) a variable in logarithmic form
becomes stationary at lesser order of integration.
Methodology Used
Given a-priori expectations regarding the impact of the aforementioned variables on the
food prices, the present study endeavours to estimate the Cointegration relationship among
these variables. However, the estimation involves three steps procedure. The first step is to test
the stationarity of the time series variables with the help of unit-root tests. The presence of unit-
root may lead to estimate a spurious regression and thus, disturb the accuracy of the parameters
estimated (for a detailed discussion on ‘stationarity of time series’ see Asteriou and Hall, 2007,
p.288). Hence, to check whether the selected time series variables are stationary at their levels
or not, ADF and PP tests have been applied.
One way of resolving the problem of non-stationarity in time series data is to difference the
series successively until stationarity is achieved and then use stationarity series for regression
analysis. However, this solution is not ideal. There are two main problems using first
differences: i) if the model is correctly specified as a relationship between variables (say Y and
X) and we difference both variables then implicitly we are also differencing the error process in
the regression. This would then produce a non-invertible moving average error process and
would present serious estimation problems; and ii) if we difference the variables the model can
no longer give a unique long-run solution.
The desire to have models which combine both short-run and long-run properties, and
which at the same time maintain stationarity in all of the variables, has led to a reconsideration
of the problem of regression using variables that are measured at their levels. As we know that
when we have non-stationary variables in a regression model then we may get results that are
spurious. So if we have tY and tX that are both I(1), then if we regress:
1 2t t tY X u (1)
Vol. 6 | Special Issue. 1 | March 2018 | ISSN: 2319-961X
25 Shanlax International Journal of Economics
We will not generally obtain satisfactory estimates of 1 and 2 . One way of resolving this
is to difference the data in order to ensure stationarity of our variables. Therefore, after that we
will have (0)tY I and (0)tX I , and the regression model will be:
1 2t t tY a a X u (2)
In this case the regression model may give us correct estimates of the 1a and 2a parameters
and the spurious equation problem has been resolved. However, what we have from equation
(2) is only the short-run relationship between the two variables. Remember that in the long-run:
*
1 2t tY X (3)
So tY does not give information about the long-run behaviour of our model. Knowing
that economists are mainly interested in long-run relationship this constitutes a big problem,
and in order to resolve this, the concepts of cointegration and error correction mechanism
(ECM) are very useful. As per our supposition tY and tX both are integrated of order one i.e.,
(1)tY I and (1)tX I . In the special case that there is a linear combination of tY and tX ,
that is I(0), then tY and tX are cointegrated. Thus, if this is the case the regression of equation
(1) is no longer spurious, and it also provides us with the linear combination:
1 2ˆ ˆˆ
t t tu Y X (4)
that connects tY and tX in the long-run. Thus, the second step involves identification of a
cointegrating long-run relationship between the variables selected. If tY and tX are
cointegrated, then by definition ˆ (0)tu I . Thus, we can express the relationship between tY
and tX with an error correction specification (ECM) specification as:
0 1 1ˆ
t t t tY a b X u Y (5)
This will now have the advantage of including both long-run and short-run information. In
this method, 1b is the impact multiplier (the short-run effect) that measures the immediate
impact that a change in tX will have on a change in tY . On the other hand is the feedback
effect, or the adjustment effect, and shows how much of the disequilibrium is being corrected
i.e., the extent to which any disequilibrium in the previous period affects any adjustment in tY .
Of course 1 1 1 2 1ˆ ˆˆ
t t tu Y X , and therefore from this equation we also have 2 being the
long-run response (it is estimated by equation 1).
Equation (5) now emphasizes the basic approach of cointegration and error correction
models. The spurious regression problem arises because we are using non stationary data but in
equation (5) everything is stationary, the change in X and Y is stationary because they are
assumed to be I(1) variables and the residual from the levels regression (4) is also stationary by
the assumption of cointegration. So equation (5) fully conforms to our set of assumptions about
the classical linear regression model and OLS should perform well.
National Seminar on CONTEMPORARY MACRO ECONOMIC ENVIRONMENTAL ISSUES
26 Rani Anna Government College for Women, Tirunelveli
Estimating cointegrating relationship in multivariate model may cause the existence of
more than one cointegrating vectors. By this we mean that the variables in the model might
form several equilibrium relationships governing the joint evolution of all the variables. In
general for n number of variables we can have only up to n-1 cointegrating vectors. Therefore,
when n=2 which is the simplest case, we can understand that if cointegration exists then the
cointegrating vector is unique. Having n>2 and assuming that only one cointegrating
relationship exists, where there are actually more than one, is a very serious problem that
cannot be resolved by the traditional Engle Granger (EG) single equation approach (see Harris
and Sollis, 2006, p.109). Therefore, an alternative to the EG approach is needed and this is the
Johansen approach for multiple equations.
In order to present this approach, it is useful to extend the single equation error correction
model to a multivariate one. Let’s assume that we have three variables, tY , tX and tW which
can all be endogenous (i.e., we have matrix notation for [ , , ]t t t tZ Y X W ), then:
1 1 2 2t t t k t k tZ AZ A Z A Z u (6)
It can be reformulated in a vector error correction model (VECM) as follows:
1 1 2 2 1 1 1t t t k t k t tZ Z Z Z Z u (7)
Where, 1 2( ... )i kI A A A and 1 2( ... )kI A A A ; i=1,2…,k-1
Here we need to carefully examine the matrix of order3 3 . The matrix contains
information regarding the long-run relationships and the rank of can be determined using
Lambda-Max and Trace statistics (see, for detail Asteriou and Hall, 2007, p.324). We can
decompose where will include the speed of adjustment to equilibrium coefficients
while will be the long-run matrix of coefficients. Therefore the 1tZ term is equivalent to
the error correction term ( 1 0 1 1t tY X ) in the single equation case, except that now
1tZ contains up to n-1 vectors in a multivariate framework. In present analysis, models (6)
and (7) have been estimated with aforementioned set of variable.
Empirical Results
The analysis of Table 1 for the selected time series depicts that food prices in India (as
proxied by WPI) have increased at a significant rate of 7.47 percent per annum. The analysis of
the growth rates of the control variables depict that per-capita income in India has increased at
a statistically significant rate of 3.05 percent per annum during the study period. Thus, the
observed high rate of growth of the prices of food articles is a matter of serious concern from
welfare point of view and it becomes pertinent to analyse the factors responsible for food
inflation in India along with the determination of important control variables to cater
inflationary tendencies in India.
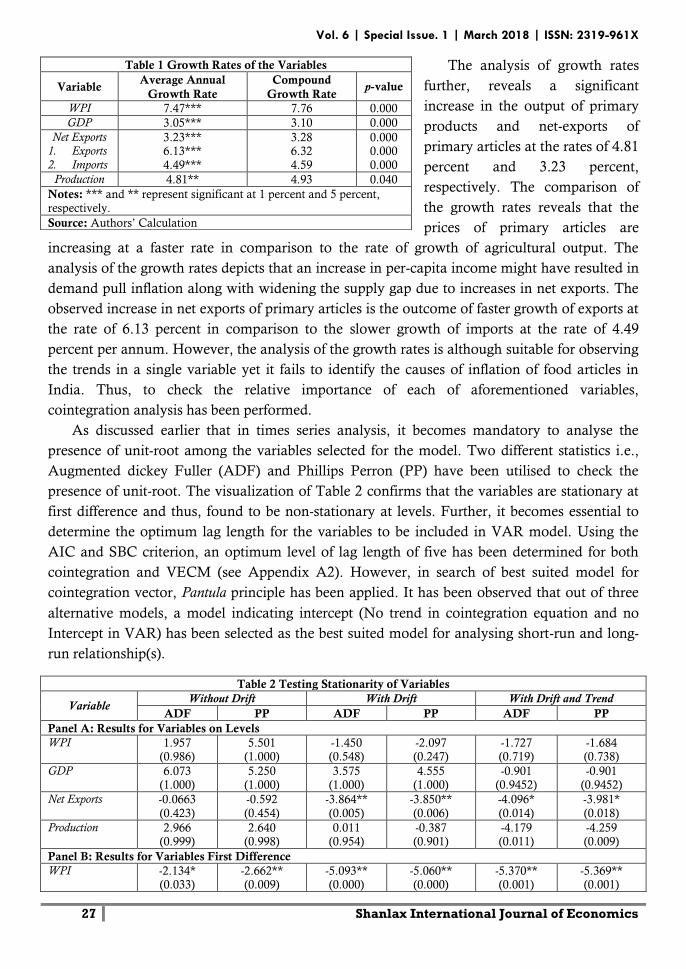
Vol. 6 | Special Issue. 1 | March 2018 | ISSN: 2319-961X
27 Shanlax International Journal of Economics
The analysis of growth rates
further, reveals a significant
increase in the output of primary
products and net-exports of
primary articles at the rates of 4.81
percent and 3.23 percent,
respectively. The comparison of
the growth rates reveals that the
prices of primary articles are
increasing at a faster rate in comparison to the rate of growth of agricultural output. The
analysis of the growth rates depicts that an increase in per-capita income might have resulted in
demand pull inflation along with widening the supply gap due to increases in net exports. The
observed increase in net exports of primary articles is the outcome of faster growth of exports at
the rate of 6.13 percent in comparison to the slower growth of imports at the rate of 4.49
percent per annum. However, the analysis of the growth rates is although suitable for observing
the trends in a single variable yet it fails to identify the causes of inflation of food articles in
India. Thus, to check the relative importance of each of aforementioned variables,
cointegration analysis has been performed.
As discussed earlier that in times series analysis, it becomes mandatory to analyse the
presence of unit-root among the variables selected for the model. Two different statistics i.e.,
Augmented dickey Fuller (ADF) and Phillips Perron (PP) have been utilised to check the
presence of unit-root. The visualization of Table 2 confirms that the variables are stationary at
first difference and thus, found to be non-stationary at levels. Further, it becomes essential to
determine the optimum lag length for the variables to be included in VAR model. Using the
AIC and SBC criterion, an optimum level of lag length of five has been determined for both
cointegration and VECM (see Appendix A2). However, in search of best suited model for
cointegration vector, Pantula principle has been applied. It has been observed that out of three
alternative models, a model indicating intercept (No trend in cointegration equation and no
Intercept in VAR) has been selected as the best suited model for analysing short-run and long-
run relationship(s).
Table 2 Testing Stationarity of Variables
Variable Without Drift With Drift With Drift and Trend
ADF PP ADF PP ADF PP
Panel A: Results for Variables on Levels
WPI 1.957 (0.986)
5.501 (1.000)
-1.450 (0.548)
-2.097 (0.247)
-1.727 (0.719)
-1.684 (0.738)
GDP 6.073 (1.000)
5.250 (1.000)
3.575 (1.000)
4.555 (1.000)
-0.901 (0.9452)
-0.901 (0.9452)
Net Exports -0.0663
(0.423)
-0.592
(0.454)
-3.864**
(0.005)
-3.850**
(0.006)
-4.096*
(0.014)
-3.981*
(0.018)
Production 2.966 (0.999)
2.640 (0.998)
0.011 (0.954)
-0.387 (0.901)
-4.179 (0.011)
-4.259 (0.009)
Panel B: Results for Variables First Difference
WPI -2.134* (0.033)
-2.662** (0.009)
-5.093** (0.000)
-5.060** (0.000)
-5.370** (0.001)
-5.369** (0.001)
Table 1 Growth Rates of the Variables
Variable Average Annual
Growth Rate
Compound
Growth Rate p-value
WPI 7.47*** 7.76 0.000
GDP 3.05*** 3.10 0.000
Net Exports 1. Exports
2. Imports
3.23*** 6.13***
4.49***
3.28 6.32
4.59
0.000 0.000
0.000
Production 4.81** 4.93 0.040
Notes: *** and ** represent significant at 1 percent and 5 percent,
respectively.
Source: Authors’ Calculation
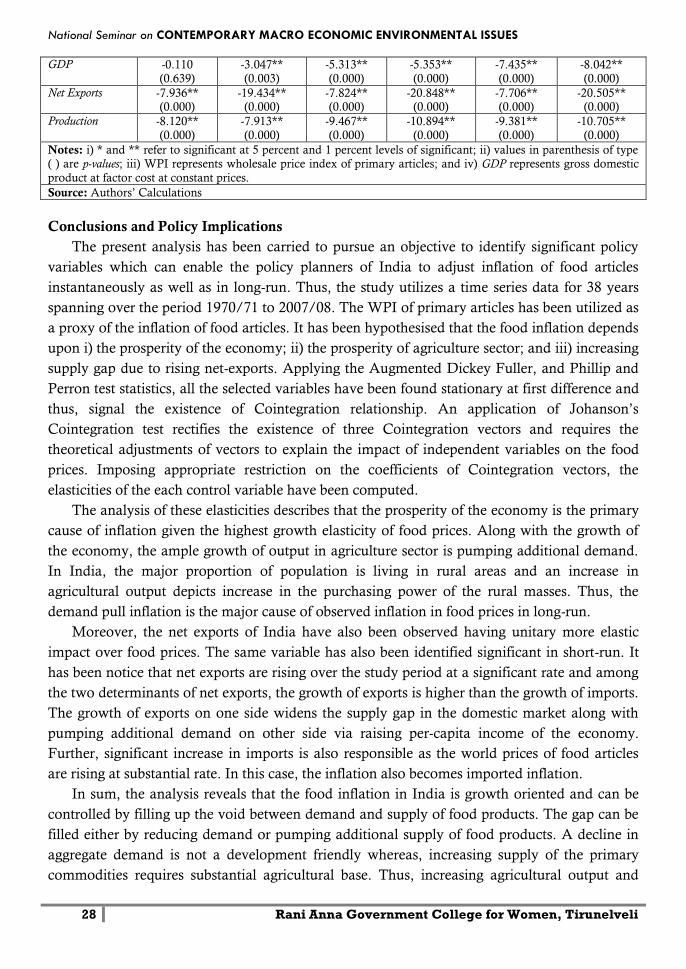
National Seminar on CONTEMPORARY MACRO ECONOMIC ENVIRONMENTAL ISSUES
28 Rani Anna Government College for Women, Tirunelveli
GDP -0.110
(0.639)
-3.047**
(0.003)
-5.313**
(0.000)
-5.353**
(0.000)
-7.435**
(0.000)
-8.042**
(0.000)
Net Exports -7.936** (0.000)
-19.434** (0.000)
-7.824** (0.000)
-20.848** (0.000)
-7.706** (0.000)
-20.505** (0.000)
Production -8.120**
(0.000)
-7.913**
(0.000)
-9.467**
(0.000)
-10.894**
(0.000)
-9.381**
(0.000)
-10.705**
(0.000)
Notes: i) * and ** refer to significant at 5 percent and 1 percent levels of significant; ii) values in parenthesis of type
( ) are p-values; iii) WPI represents wholesale price index of primary articles; and iv) GDP represents gross domestic
product at factor cost at constant prices.
Source: Authors’ Calculations
Conclusions and Policy Implications
The present analysis has been carried to pursue an objective to identify significant policy
variables which can enable the policy planners of India to adjust inflation of food articles
instantaneously as well as in long-run. Thus, the study utilizes a time series data for 38 years
spanning over the period 1970/71 to 2007/08. The WPI of primary articles has been utilized as
a proxy of the inflation of food articles. It has been hypothesised that the food inflation depends
upon i) the prosperity of the economy; ii) the prosperity of agriculture sector; and iii) increasing
supply gap due to rising net-exports. Applying the Augmented Dickey Fuller, and Phillip and
Perron test statistics, all the selected variables have been found stationary at first difference and
thus, signal the existence of Cointegration relationship. An application of Johanson’s
Cointegration test rectifies the existence of three Cointegration vectors and requires the
theoretical adjustments of vectors to explain the impact of independent variables on the food
prices. Imposing appropriate restriction on the coefficients of Cointegration vectors, the
elasticities of the each control variable have been computed.
The analysis of these elasticities describes that the prosperity of the economy is the primary
cause of inflation given the highest growth elasticity of food prices. Along with the growth of
the economy, the ample growth of output in agriculture sector is pumping additional demand.
In India, the major proportion of population is living in rural areas and an increase in
agricultural output depicts increase in the purchasing power of the rural masses. Thus, the
demand pull inflation is the major cause of observed inflation in food prices in long-run.
Moreover, the net exports of India have also been observed having unitary more elastic
impact over food prices. The same variable has also been identified significant in short-run. It
has been notice that net exports are rising over the study period at a significant rate and among
the two determinants of net exports, the growth of exports is higher than the growth of imports.
The growth of exports on one side widens the supply gap in the domestic market along with
pumping additional demand on other side via raising per-capita income of the economy.
Further, significant increase in imports is also responsible as the world prices of food articles
are rising at substantial rate. In this case, the inflation also becomes imported inflation.
In sum, the analysis reveals that the food inflation in India is growth oriented and can be
controlled by filling up the void between demand and supply of food products. The gap can be
filled either by reducing demand or pumping additional supply of food products. A decline in
aggregate demand is not a development friendly whereas, increasing supply of the primary
commodities requires substantial agricultural base. Thus, increasing agricultural output and
Vol. 6 | Special Issue. 1 | March 2018 | ISSN: 2319-961X
29 Shanlax International Journal of Economics
reducing net-exports via controlling exports of primary articles may be the suitable policy to
control inflation of food-articles in India.
References
1. Alam, S. (1999), “Foreign Direct Investment and Economic Growth of India and
Bangladesh:
2. Bhatti, U. (2006), Foreign Direct Investment: Contemporary Issues, Deep & Deep Publications
Pvt. Ltd., New Delhi.
3. Borensztein, E., J. DE Gregorio and J.W. Lee (1998), “How Does Foreign Direct
Investment Affect Economic Growth,” Journal of International Economics, Vol. 45.
4. Carkovic, M. and R. Levine (2000), “Does Foreign Direct Investment Accelerate
Economic Growth?,” University of Minnesota, Working Paper.
5. Child, J. (1973), “Parkinson’s Progress: Accounting for the Number of Specialists in
Organisations,” Administrative Science Quarterly, Vol. 18, No. 3, pp. 328-348.
6. DE Mello, L.R. (1999), “Foreign Direct Investment-led Growth: Evidence from Time
Series and Panel Data,” Oxford Economic Papers, Vol. 51.
7. Dickey, D.A. and W.A. Fuller (1979), “Distribution of the Estimators for Autoregressive
Time-Series with a Unit-root,” Journal of American Statistical Association, Vol. 74, pp. 427-
431.
National Seminar on CONTEMPORARY MACRO ECONOMIC ENVIRONMENTAL ISSUES
30 Rani Anna Government College for Women, Tirunelveli
MACROECONOMIC ANALYSIS OF UNIT ROOT TEST IN REAL
EFFECTIVE EXCHANGE RATE IN INDIA
Dr.S.Henry Pandian
Associate Professor, Department of Economics, Pope’s College (Autonomous) Sawyerpuram -628 25, Thoothukudi District, Tamil Nadu
Abstract
This study seeks to examine whether there is a unit root in the real effective exchange rate (REER) in India
during the post reform period by using more recent tests such as DF GLS, DF GLSu, Ng and Perron which are
known to be more powerful than the traditional tests of ADF, PP and KPSS. The tests by and large reject the null of
unit root in favor of mean reversion in both 6 currency and 36 currency REER in India.
Introduction
The issue whether real exchange rates contain a unit root (follow a random walk) or not has
been a subject of controversy since a long time. Though the earlier studies in various countries
supported the random walk, the recent studies refuted it. The studies concluding random walk
reject mean reversion and also refute long run Purchasing Power Parity in real exchange rate
series. A number of empirical studies on PPP of real exchange rate for diverse time periods,
using a variety of techniques are available in the literature for developed as well as developing
countries. The voluminous evidences however are mixed and remain inconclusive.
Real Exchange Rate of Rupee
The study of mean reverting tendency for REER becomes important in view of its
significance in determining the overall trade competitiveness of India in international market.
While the nominal effective exchange rate reflects movements in the external value of the
Rupee against a basket of currency of the country’s main trading partners, the real effective
exchange rate is the nominal effective exchange rate adjusted for the inflation differential
between India and its major trading-partner countries. In calculating these indices, each
currency in the basket are assigned an appropriate weight, based on trade with these countries.
Therefore, the real effective exchange rate of Rupee may be regarded as a barometer of external
competitiveness of trading goods. The weights assigned to the selected trading partners reflect
the price competition between Indian exports and locally produced goods in foreign markets,
between imports from the rest of the world and locally produced goods in India, and between
Indian exports and exports of other countries. REER appreciates if the nominal exchange rate
appreciates or domestic inflation is higher than foreign inflation. From a competitive point of
view and also in the medium term perspective, it is the REER, which should be monitored as it
reflects changes in the external value of a currency in relation to its trading partners in real
terms.
Vol. 6 | Special Issue. 1 | March 2018 | ISSN: 2319-961X
31 Shanlax International Journal of Economics
The Reserve Bank of India has been constructing five- country and thirty six country
REER/NEER till 2005. However, on account of introduction of Euro Zone in 2002 and
significant shift in India’s trade relation across countries/regions, mainly towards developing
and emerging economies, requiring change in currency basket and weight assigned to India’s
trading partners included in REER, the 5 country index was replaced by six country index of
REER and also there was revision in 36 country indices. Post 1992, a credible macroeconomic,
structural and stabilization programme encompassing trade, industry, foreign investment,
exchange rate, public finance and the financial sector was put in place in India to improve the
overall productivity, competitiveness and efficiency of the economic system in general, and the
external sector, in particular. In foreign exchange market, various reform measures aimed at
widening and deepening the foreign exchange market and liberalisation of exchange control
were initiated. In a move towards market-determined exchange rate system, Liberalised
Exchange Rate Management System (LERMS) initially involving a dual exchange rate system
was put in place in March 1992. Latter convergence of the dual rates was made effective from
March 1993, leading to the introduction of a market-determined exchange rate regime. The
dual exchange rate system was replaced by a unified exchange rate system in March 1993,
whereby all foreign exchange receipts could be converted at market determined exchange rates.
On unification of the exchange rates, the nominal exchange rate of the rupee against both the
US dollar as also against a basket of currency got adjusted lower, which almost nullified the
impact of the previous inflation differential. The restrictions on a number of other current
account transactions were relaxed. The unification of the exchange rate of the Indian rupee was
an important step towards current account convertibility, which was finally achieved in August
1994. In addition to the measures for development in forex market deregulation, economic
reforms on other fronts like abolishment of import licensing and quantitative restrictions,
encouragement of foreign investment through simplifying procedures, abolishment of industrial
licensing, allowing private sectors in areas earlier reserved for the public sector, decontrol of
interest rates, reduction in pre-emption of banking resources and enforcing capital adequacy
and prudential norms; government borrowing at market rates and the discontinuation of
automatic monetization of deficit, and the gradual liberalization of administrative price control
mechanism on a number of commodities were initiated. The various policy measures
introduced in all these years have yielded results in terms of surge in foreign funds inflow,
foreign exchange reserves, foreign investments etc. Have these structural changes resulted in
permanent disturbance in REER or the changes are only short lived shocks and the REER have
shown mean reverting behavior in long run? This present paper addresses this issue using unit
root tests for the period covering April 1993 to June 2010. A cursory inspection of 36 country
REER since 1993 indicates a cyclical trend, barring minor aberration, at regular intervals.
A similar trend is observed in 6 currency REER.
Empirical Results
The preliminary graphical representations of 36 currency REER and 6 currency REER (see
figure 1) suggest some sort of mean reverting tendency in both the series. Though there are
National Seminar on CONTEMPORARY MACRO ECONOMIC ENVIRONMENTAL ISSUES
32 Rani Anna Government College for Women, Tirunelveli
frequent diversions from the mean level because of external shocks, these shocks have
temporary effect and the series show the tendency of coming back to their mean level.
Next, traditional unit root tests namely ADF (1979), and Phillips and Perron (1988) are
employed on the model without deterministic time trend. The lag length for these tests are
based on AIC for ADF and Newey West Bandwidth for PP. Both the tests reject the null of
unit root for 36 currency REER at 5 percent significance but failed to reject unit root in 6
currency REER.
The most common stationarity test- KPSS test, tests the null that the series is stationary.
The results of ADF test and PP test is confirmed by KPSS test, which rejects stationarity in 6
currency REER but failed to reject stationarity in 36 currency REER.
Next, the same tests are employed for the model with deterministic time trend. The results
are mixed. The ADF and KPSS tests support stationarity only in 36 currency REER. However,
PP test failed to support stationarity in either of the series.
Also, ADF test is employed on detrended series using general to specific approach as lag
selection criteria, setting maximum number of lags equal to twelve (if the coefficient for the
highest lag is not statistically significant at the 10% level, the number of lags was reduced). If
the lag length determined is same as the maximum lag length, we start over with maximum lag
of 14. This criterion for lag length selection has given improved result over the AIC criteria.
The ADF test with general to specific lag length criteria rejects the null of nonstationarity for
both 36 currency REER and 6 currency REER at one percent and 5 percent significance,
respectively for the model without time trend. The efficient unit root tests, namely, DF GLS
and DF GLSu , employed on the detrended series reject the null of unit root for 36 currency
REER at 1 percent significance, and 6 currency REER at 5 percent significance level for the
model without deterministic time trend. For the model with deterministic time trend, when the
lag is selected through general to specific criteria, all ADF, DF GLS and DF GLSu tests reject
unit root in both 36 currency REER and 6 currency REER. Compared to the mixed evidences
thrown out by the three unit root tests namely ADF, PP and KPSS, this finding is consistent.
Before employing Ng and Perron(2001) test, ARMA(1,1) model is fitted to each series.
Both the seires show autoregressive root which is close to one (0.90 for REER 36 and 0.93 for
REER 6). Traditional unit root tests have low power when the root of the autoregressive
polynomial is close to but less than unity (e.g. Dejong et.al.(1992)). To overcome the problem,
Ng and Perron (2001) have proposed improved test in terms of power and size distortion. As
suggested by the authors, the lag length is selected based on MIC (Modified Information
Criteria). For the model without deterministic time trend, contrary to findings of the Phillips
and Perron test, MZα statistic, which is modified Zα of PP test, rejects the nonstationarity in 36
currency REER at 1 percent significance and 6 currency REER at 10 percent significance.
However, MZt,, improved version of Zt of PP test, rejects the nonstationarity only in 36 currency
REER at 1 percent significance level. Similarly, modified Bhargava (MSB) test rejects the non
stationarity in 36 currency REER and 6 currency REER series at 1 percent and 5 percent
significance, respectively. However, the results of modified ERS optimal point test denoted as
MPT rejects unit root in only 36 currency REER at 1 percent significance. For the model with
Vol. 6 | Special Issue. 1 | March 2018 | ISSN: 2319-961X
33 Shanlax International Journal of Economics
deterministic time trend, the Ng-Perron tests have consistently rejected unit root in both the
series.
The efficient unit root tests and Ng and Perron tests (2001) except for MZt and MPT reject
unit root in the two series. The MZt and MPT failed to reject unit root in 6 currency REER.
Concluding Remarks
For the model without deterministic time trend, though the ADF, PP and KPSS unit root
tests consistently failed to reject null of unit root in 6 currency REER, all the new tests, barring
MZt and MPT have rejected unit root in 6 currency REER in post reform period and hence
support PPP theory in Indian context. This is in contrast to the findings of Kohli (2002), which
failed to reject unit root in 36 currency REER.
For the model with time trend, ADF and KPSS tests support unit root in 6 currency REER and
rejects for 36 currency REER, PP test failed to reject unit root in both the series. However, unit
root in both the series is rejected by all the efficient tests and Ng and Perron tests. Consistent
rejection of unit root in 6 currency REER after including time trend suggests Balassa-
Samuelson effect, where the failure of PPP to hold can be due to differential rates of
productivity growth in tradable and non tradable sectors. Thus, as the tests suggest, PPP
hypothesis holds for India. The mean reverting behavior in REER indicates that the shocks in
the form of structural changes are short lived and do not have permanent effect on REER.
References
1. Amara, Jomana, Papell, David H. (2003) “Testing for purchasing power parity using
stationary covariates” working paper, Department of Economics, University of Houston.
2. Cheung, Yin-Wong, Lai, Kon S. (1998) “Parity reversion in real exchange rates during the
post-Bretton Woods period” Journal of International Money and Finance 17, 597-614.
3. Cushman, David O. (2001) “Bayesian and DF-GLS unit root tests of real exchange rates
over the current floating Period” Economics Bulletin 6, No. 1, 1-7.
4. Dejong, D.N., J.C. Nankervis, N.E. Savin and C.H.Whiteman(1992), “The Power
Problems of Unit Root Tests for Time Series with Autoregressive Errors”, Journal of
Econometrics, Vol. 53 ,Issue:1-3, 323-343.
5. Dickey, David A., Fuller, Wayne A. (1981) “Likelihood ratio statistics for autoregressive
time series with a unit root” Econometric a 49, 1057-1072.
National Seminar on CONTEMPORARY MACRO ECONOMIC ENVIRONMENTAL ISSUES
34 Rani Anna Government College for Women, Tirunelveli
GREEN ENERGY: A STUDY OF SOLAR ENERGY IN INDIA
Dr.D.Swamikannan
Professor & Head, Chairperson i/c, Department of Environmental Economics
School of Economics, Madurai Kamaraj University, Madurai
N.Periyamayan
Ph.D Research Scholar, Department of Environmental Economics
School of Economics, Madurai Kamaraj University, Madurai
Abstract
Energy is a most important key to the economic development of the country. The crisis of energy is hampering the
growth of, industrial growth, economic growth, and human development. The demand for energy is increasing day by
day in India due to population growth and growing activities of the country. However, the 87 per cent of energy
converted from conventional sources which lead to an impact on environmental problems and exhausted. Therefore
generating of electricity is a shift to the renewable energy sources. Among the renewable energy solar energy is a great
and best source in India. Because India is a tropical country, sunshine is available for longer hours per day and 300
days in per year is sunny days. Solar energy is enhancing the energy supply it will help to improve the future energy
security and declining the global warming. The objective of the study are 1) to analyze the state wise estimated solar
energy potential, 2) to examine the commissioning status of grid-connected capacity and 3) to know the installed
capacity of solar power in India. The entire study is based on secondary data. The finding of the study resulted that
the state wise potential source of solar power in India, in which Rajasthan, Jammu and Kashmir, Maharashtra,
Madhya Pradesh and Andhra Pradesh states are accounted higher potential source of solar power as compared to
other states in India and lowest potential source are accounted by UT, Goa, Tripura, Delhi, and Punjab. The states
of Rajasthan, TamilNadu, Gujarat, and Andhra Pradesh are the highest installed capacity and Arunachala Pradesh,
Himachala Pradesh, Mizoram, and Pondicherry are zero percent installed capacity of solar power in India. The
installed capacity of solar power in India is increasing the study period.
Keywords: Solar power, Potential, Environmental Pollution.
Introduction
Solar energy is the best alternative source for electricity generation of the world because has
a large potential of green energy. India has a huge potential for generating green electricity from
the renewable energy sources like solar, wind, small hydro, biomass etc. Whereas it promoting
the green energy sector like launching many schemes for the renewable energy resources.
Among the renewable energy sources, solar energy is a best alternative source for electricity
generation in India. It is a clean renewable resource with zero emission, has got the incredible
potential of energy which can be harnessed using a variety of devices. With recent
developments, solar energy systems are easily available for industrial, agriculture and domestic
use with the added advantage of minimum maintenance. Most of the developed countries are
switching over to solar energy as one of the major renewable energy sources. The solar power is
enhancing the energy supply it will help to improve the future energy security as well as
declining the global warming, climate change, environmental pollution, electricity
problem, and Green House Gases and CO2 emissions.
Vol. 6 | Special Issue. 1 | March 2018 | ISSN: 2319-961X
35 Shanlax International Journal of Economics
Solar Energy in India
India is an enriched with an abundant source of solar energy and majority of the parts in
India get 300 days of sunshine in a year and about 5,000 trillion kWh per year. Solar energy is
incident over Indian land area with most area receiving 4-7 kWh per sq. meter per day1. It is
harnessed efficiently which is easily reduced our energy deficit scenario and no carbon
emissions. Many states in India have identified solar energy potential for energy generations.
Solar energy is produced from solar thermal and solar photovoltaic’s system. The government
of India funded for installation of a solar system for about 25MW in 2010, 468.3.MW in 2011
and 1040.67 MW in 2012. India expects to install an additional 10,000MW by 2017 and a total
of 100GW by 20222.
Statement of the Problem
India is facing the critical problem of energy crisis it’s hampering to the growth of human
and economic development of the country. In India the 87 per cent of electricity is converted
from the conventional sources which impact an environmental problem such as pollution,
global warming, climate changes, health threats, etc. The solar energy generation is very high
cost as compared to conventional sources and more land is needed to install a solar panel. The
land is scarce resources in India and area for exclusive installation solar panel competitive it
requires to other necessity such as agriculture, industry, schools, hospital, houses etc, whereas
the per capita land availability of India is very low. The failure of installations in India is
primarily lack of money, materials, poor maintenance and skilled manpower and it’s demanded
by the mainly rich people because installation of solar panel is high cost as well as lack of
awareness of the people. Solar energy is still not a visible product for the consumer. India
imports solar cell system from developed countries and lack of technical knowledge, especially
in the solar system. The other problems of solar energy are lack of technical knowledge and
support for the remote locations, and availability of solar panel, battery replacements remain
the vital challenges for the long term of the solar photovoltaic system. Besides cloudy days is an
obstacle for solar energy generation.
Methodology
The study is exclusively based on secondary data. The data were collected from the
previous study, various journals, government reports, and website. In addition, the study makes
time series data from the Ministry of New and Renewable Energy Annual Report 2015-2016
and Ministry of New and Renewable Energy; Energy statistics 2013.The researcher has used
the simple percentage analysis.
The Objectives of the study
The objectives of the study are;
1. To analyzes the state wise estimated solar energy potential in India.
2. To examine the state wise commissioning status of grid-connected capacity of solar
power as on 31st July 2016 in India.
3. To know the year wise Installed capacity of solar power in India during the study period in
4. 2010 to 30.03.2016 (MW).
National Seminar on CONTEMPORARY MACRO ECONOMIC ENVIRONMENTAL ISSUES
36 Rani Anna Government College for Women, Tirunelveli
Review of literature
Srivastava and Prakash Srivastava (2012),3 expressed that the solar energy is a clean
renewable energy with the environment- friendly and is easily available for industrial and
domestic use with the added advantage of minimum maintenance. It made financially viable
with government tax incentives and rebates. The current architectural designs make provision
for photovoltaic cells and necessary circuitry while making building plans. The National Solar
Mission is a major initiative of the Government of India and State Governments to promote
ecologically sustainable growth while addressing India’s energy security challenge. It will also
constitute a major contribution by India to the global effort to meet the challenges of climate
change. The objective of the National Solar Mission is to establish India as a global leader in
solar energy, by creating the policy conditions for its diffusion across the country as quickly as
possible. The immediate aim of the Mission is to focus on setting up an enabling environment
for solar technology penetration in the country both at a centralized and decentralized level
thereby empowering people at the grassroots level.
Abhishek Srivastava et.al (2016), 4 highlighted that the solar energy is one of the cleanest
sources of energy with the minimum maintenance of this system as well as not polluted or
harmful emissions in the environment. In this potential to reduce the dependency of
conventional energy based sources like coal, oil, etc. Solar energy provides self-sufficiency of
the energy, remunerative growth, and sustainable development in the world. It is seen not only
as sources of energy and also a tool for some other important requirements, like improving
energy security access, minimizing the health, environmental impacts due to the emission of
harmful gases from fossil fuels. It observed that the dependency on imported fuels is increasing
and it may create serious problems for the energy security in the country. In addition to that
India’s around 65 per cent current power generation capacity is based on coal, which leads to
an impact on environmental contaminations.
Nath Basu et.al (2016), 5 has emphasized that the solar energy is unlimited energy resources
it will meet up long-term global energy crisis. The energy crisis and environmental burden are
increasing, urgent and drawing enormous attention to the solar-energy utilization. It shows that
capturing and using the sunlight which hits the earth in one day could provide enough energy
for the entire world all year. Solar power has the immense capacity to bring instability to the
fluctuating electricity tariffs in India as it is cheaper than thermal and domestic coal. It realized
that solar radiation in the worst part of India is better than the best part of Europe. In India, the
electricity demand is drastically increasing. Solar Thermal and Photovoltaic Electricity
technology are implemented in India as solar resources and large wasteland areas are widely
available in the country.
Harendra Kumar Yadav et.al (2015)6, the study analyzed that the availability, current
status, promotion policies and future potential of a different form of solar energy in India. It
observed that the solar power is very good option in India because it leads to increase power
production with environmental protection and economic development. It is an unlimited
source of energy and provides a suitable climate for this energy but need some better idea to
increase efficiency and decrease the production cost. The government launches some schemes
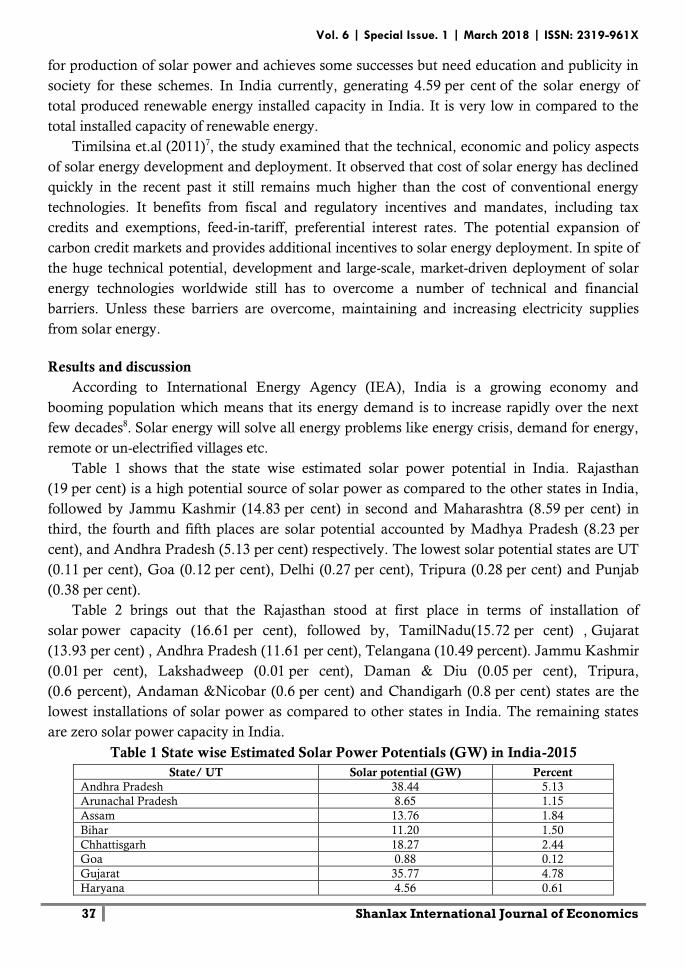
Vol. 6 | Special Issue. 1 | March 2018 | ISSN: 2319-961X
37 Shanlax International Journal of Economics
for production of solar power and achieves some successes but need education and publicity in
society for these schemes. In India currently, generating 4.59 per cent of the solar energy of
total produced renewable energy installed capacity in India. It is very low in compared to the
total installed capacity of renewable energy.
Timilsina et.al (2011)7, the study examined that the technical, economic and policy aspects
of solar energy development and deployment. It observed that cost of solar energy has declined
quickly in the recent past it still remains much higher than the cost of conventional energy
technologies. It benefits from fiscal and regulatory incentives and mandates, including tax
credits and exemptions, feed-in-tariff, preferential interest rates. The potential expansion of
carbon credit markets and provides additional incentives to solar energy deployment. In spite of
the huge technical potential, development and large-scale, market-driven deployment of solar
energy technologies worldwide still has to overcome a number of technical and financial
barriers. Unless these barriers are overcome, maintaining and increasing electricity supplies
from solar energy.
Results and discussion
According to International Energy Agency (IEA), India is a growing economy and
booming population which means that its energy demand is to increase rapidly over the next
few decades8. Solar energy will solve all energy problems like energy crisis, demand for energy,
remote or un-electrified villages etc.
Table 1 shows that the state wise estimated solar power potential in India. Rajasthan
(19 per cent) is a high potential source of solar power as compared to the other states in India,
followed by Jammu Kashmir (14.83 per cent) in second and Maharashtra (8.59 per cent) in
third, the fourth and fifth places are solar potential accounted by Madhya Pradesh (8.23 per
cent), and Andhra Pradesh (5.13 per cent) respectively. The lowest solar potential states are UT
(0.11 per cent), Goa (0.12 per cent), Delhi (0.27 per cent), Tripura (0.28 per cent) and Punjab
(0.38 per cent).
Table 2 brings out that the Rajasthan stood at first place in terms of installation of
solar power capacity (16.61 per cent), followed by, TamilNadu(15.72 per cent) , Gujarat
(13.93 per cent) , Andhra Pradesh (11.61 per cent), Telangana (10.49 percent). Jammu Kashmir
(0.01 per cent), Lakshadweep (0.01 per cent), Daman & Diu (0.05 per cent), Tripura,
(0.6 percent), Andaman &Nicobar (0.6 per cent) and Chandigarh (0.8 per cent) states are the
lowest installations of solar power as compared to other states in India. The remaining states
are zero solar power capacity in India.
Table 1 State wise Estimated Solar Power Potentials (GW) in India-2015
State/ UT Solar potential (GW) Percent
Andhra Pradesh 38.44 5.13
Arunachal Pradesh 8.65 1.15
Assam 13.76 1.84
Bihar 11.20 1.50
Chhattisgarh 18.27 2.44
Goa 0.88 0.12
Gujarat 35.77 4.78
Haryana 4.56 0.61
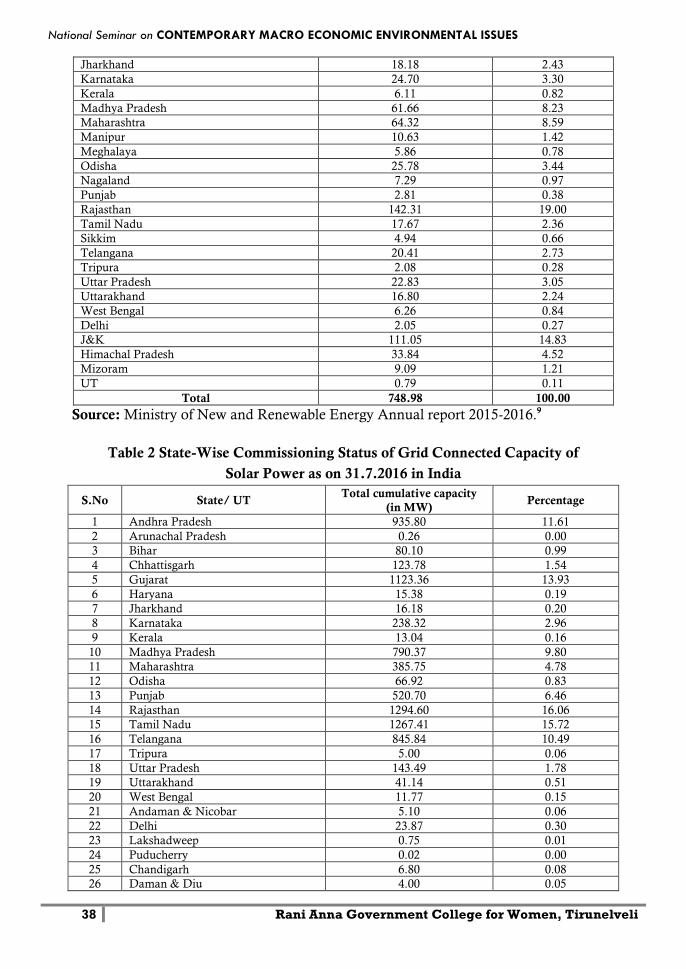
National Seminar on CONTEMPORARY MACRO ECONOMIC ENVIRONMENTAL ISSUES
38 Rani Anna Government College for Women, Tirunelveli
Jharkhand 18.18 2.43
Karnataka 24.70 3.30
Kerala 6.11 0.82
Madhya Pradesh 61.66 8.23
Maharashtra 64.32 8.59
Manipur 10.63 1.42
Meghalaya 5.86 0.78
Odisha 25.78 3.44
Nagaland 7.29 0.97
Punjab 2.81 0.38
Rajasthan 142.31 19.00
Tamil Nadu 17.67 2.36
Sikkim 4.94 0.66
Telangana 20.41 2.73
Tripura 2.08 0.28
Uttar Pradesh 22.83 3.05
Uttarakhand 16.80 2.24
West Bengal 6.26 0.84
Delhi 2.05 0.27
J&K 111.05 14.83
Himachal Pradesh 33.84 4.52
Mizoram 9.09 1.21
UT 0.79 0.11
Total 748.98 100.00
Source: Ministry of New and Renewable Energy Annual report 2015-2016.9
Table 2 State-Wise Commissioning Status of Grid Connected Capacity of
Solar Power as on 31.7.2016 in India
S.No State/ UT Total cumulative capacity
(in MW) Percentage
1 Andhra Pradesh 935.80 11.61
2 Arunachal Pradesh 0.26 0.00
3 Bihar 80.10 0.99
4 Chhattisgarh 123.78 1.54
5 Gujarat 1123.36 13.93
6 Haryana 15.38 0.19
7 Jharkhand 16.18 0.20
8 Karnataka 238.32 2.96
9 Kerala 13.04 0.16
10 Madhya Pradesh 790.37 9.80
11 Maharashtra 385.75 4.78
12 Odisha 66.92 0.83
13 Punjab 520.70 6.46
14 Rajasthan 1294.60 16.06
15 Tamil Nadu 1267.41 15.72
16 Telangana 845.84 10.49
17 Tripura 5.00 0.06
18 Uttar Pradesh 143.49 1.78
19 Uttarakhand 41.14 0.51
20 West Bengal 11.77 0.15
21 Andaman & Nicobar 5.10 0.06
22 Delhi 23.87 0.30
23 Lakshadweep 0.75 0.01
24 Puducherry 0.02 0.00
25 Chandigarh 6.80 0.08
26 Daman & Diu 4.00 0.05
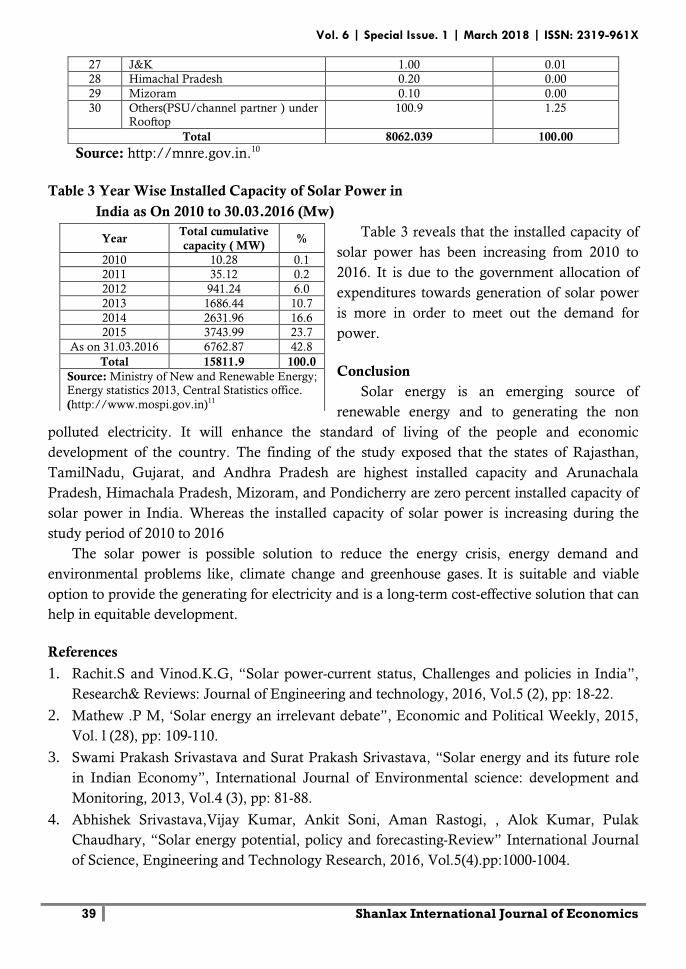
Vol. 6 | Special Issue. 1 | March 2018 | ISSN: 2319-961X
39 Shanlax International Journal of Economics
27 J&K 1.00 0.01
28 Himachal Pradesh 0.20 0.00
29 Mizoram 0.10 0.00
30 Others(PSU/channel partner ) under Rooftop
100.9 1.25
Total 8062.039 100.00
Source: http://mnre.gov.in.10
Table 3 Year Wise Installed Capacity of Solar Power in
India as On 2010 to 30.03.2016 (Mw)
Table 3 reveals that the installed capacity of
solar power has been increasing from 2010 to
2016. It is due to the government allocation of
expenditures towards generation of solar power
is more in order to meet out the demand for
power.
Conclusion
Solar energy is an emerging source of
renewable energy and to generating the non
polluted electricity. It will enhance the standard of living of the people and economic
development of the country. The finding of the study exposed that the states of Rajasthan,
TamilNadu, Gujarat, and Andhra Pradesh are highest installed capacity and Arunachala
Pradesh, Himachala Pradesh, Mizoram, and Pondicherry are zero percent installed capacity of
solar power in India. Whereas the installed capacity of solar power is increasing during the
study period of 2010 to 2016
The solar power is possible solution to reduce the energy crisis, energy demand and
environmental problems like, climate change and greenhouse gases. It is suitable and viable
option to provide the generating for electricity and is a long-term cost-effective solution that can
help in equitable development.
References
1. Rachit.S and Vinod.K.G, “Solar power-current status, Challenges and policies in India”,
Research& Reviews: Journal of Engineering and technology, 2016, Vol.5 (2), pp: 18-22.
2. Mathew .P M, ‘Solar energy an irrelevant debate”, Economic and Political Weekly, 2015,
Vol. l (28), pp: 109-110.
3. Swami Prakash Srivastava and Surat Prakash Srivastava, “Solar energy and its future role
in Indian Economy”, International Journal of Environmental science: development and
Monitoring, 2013, Vol.4 (3), pp: 81-88.
4. Abhishek Srivastava,Vijay Kumar, Ankit Soni, Aman Rastogi, , Alok Kumar, Pulak
Chaudhary, “Solar energy potential, policy and forecasting-Review” International Journal
of Science, Engineering and Technology Research, 2016, Vol.5(4).pp:1000-1004.
Year Total cumulative
capacity ( MW) %
2010 10.28 0.1
2011 35.12 0.2
2012 941.24 6.0
2013 1686.44 10.7
2014 2631.96 16.6
2015 3743.99 23.7
As on 31.03.2016 6762.87 42.8
Total 15811.9 100.0
Source: Ministry of New and Renewable Energy; Energy statistics 2013, Central Statistics office.
(http://www.mospi.gov.in)11
National Seminar on CONTEMPORARY MACRO ECONOMIC ENVIRONMENTAL ISSUES
40 Rani Anna Government College for Women, Tirunelveli
5. Soumendra Nath Basu, Avijit Karmakar, and Pushmataha Bhattacharya, “Growth of solar
energy in India-Present status and future possibilities”, International Journal of Electrical,
Electronics and Computer Systems, 2016, Vol. 3(5), pp: 27-32.
6. Harendra Kumar Yadav, Vijay Kumar and Vinay Kumar Yadav, “Potential of Solar
Energy in India: A Review”, International Advanced Research Journal in Science,
Engineering and Technology (IARJSET), May, 2015, Vol.2 (1), pp.63-66.
7. Govinda R. Timilsina Lado Kurdgelashvili Patrick A. Narbel, “A Review of Solar Energy
Markets, Economics and Policies”, Policy Research Working Paper 5845, The World Bank
Development Research Group Environment and Energy Team October 2011.
8. https://www.economist.com/news/economic-and-financial-indicators/21678211-energy-
demand-India (Date accessed 14-03-2018).
9. Ministry of New and Renewable Energy; Energy statistics 2013, Central statistics office.
(http://www.mospi.gov.in)
10. http://mnre.gov.in.
11. http://mnre.gov.in./ grid-connected-solar-power-project-installed-capacity.pdf.
Vol. 6 | Special Issue. 1 | March 2018 | ISSN: 2319-961X
41 Shanlax International Journal of Economics
CLIMATE CHANGE AND MIGRATION IN INDIA:
ISSUES AND CHALLENGES
P.Maneesh
Research Scholar, Department of Econometrics
Dr.C.Muniyandi
Assistant Professor, Department of Econometrics School of Economics Madurai Kamaraj University, Madurai
Abstract
Today, displacement and movement because of environmental change are regular everywhere throughout the
world. The expanded movement is likely inside India because of the impacts of environmental change, for example,
dry spell, surge, corrosive rain, desertification, ocean level ascent, water shortage and low nourishment efficiency, and
liquefying ice sheets. The quickened impacts of environmental change have brought about expanded stream of
vagrants to look for asylum. Environmental change is probably going to add to uprooting instead of regular movement
in India. The investigation plans to investigate the idea of environmental change actuated movement and its differing
issues in India. In addition, the investigation plans to build up a thought regarding environmental refugee in India.
The examination is spellbinding and explanatory in nature and altogether transfers on the optional wellspring of
data. The auxiliary information gathered from distributed sources like diaries, books, periodicals, reports and web
sources. The examination uncovers that at the worldwide level, 50 million individuals were accounted for to be earth
dislodged by 2010 while projections states around 200-250 million individuals will uproot and move by the year 2050.
As per the projection, before the finish of 2100, West Bengal, Maharashtra and Tamil Nadu will confront the most
noteworthy rates of atmosphere exiles with 10 million, 12 million and 10 million individuals moving out from these
states. An expected 3,00,000 workers relocate from dry season inclined Bolangir region in western Orissa consistently.
Expanded dry spell conditions because of environmental change may influence the jobs of individuals initiating them
to move. Environmental change is relied upon to expand the seriousness of dry spell particularly in western India.
Environmental change may actuate a significantly bigger movement from Bangladesh to India later on. It might put
extra weights on the asset base of zones they will move in India and debilitate the jobs of individuals who are by and
by living there. In this manner the Government and in addition the worldwide organizations should concentrate
speculations on diminishing the negative effects of environmental change and settling on some solid choices to help and
secure of vagrants and atmosphere displaced people.
Keywords: Climatic change, migration and refugee, challenges, security and human vulnerability, survival.
Introduction
Migration is a typical marvel in the time of globalization, with the headway of
transportation and correspondence innovations, individuals are moving over the fringes having
an expectation of better socio, monetary, political and social condition. Dissimilar to financial
transients, there are vagrants on the planet who are compelled to leave his place/nation
because of regular disasters, ethnic clash, and political savagery, etc. It isn't another marvel in
the mankind's history. In the early period likewise, individuals abandon one place a
consequence of normal catastrophes like surge, dry spell, seismic tremor, avalanches, war and
strife between groups. For time being, satisfactory changes have been received in the human
settlement and built up an environment for better living on the earth. The world is more
stressed over the progressions of atmosphere that are happening today have been speeded up on
National Seminar on CONTEMPORARY MACRO ECONOMIC ENVIRONMENTAL ISSUES
42 Rani Anna Government College for Women, Tirunelveli
account of man's exercises. The human has driven a consolidated existence with nature in the
prior periods and he/she gathered every one of the materials from his/her encompassing
condition which is accessible copiously.
As per the United Nations (UN), starting at 2015 roughly 244 million individuals were
living outside their nation of birth, and another 740 million were either inside uprooted or
included moved inside their nation (UNDESA, 2016a). Be that as it may, it is exceptionally
hard to unwind the amount of this development is exclusively or mostly as a result of
atmosphere related dangers, or what number of these perils were impacted by environmental
change. Tempests, surges and dry spells have happened for centuries, and keeping in mind that
environmental change is verifiably changing the idea of atmosphere related dangers what's
more, patterns, only one out of every odd danger is totally inferable from or on the other hand
impacted by environmental change.
While environmental change will influence the entire planet, a few territories of human
residence will be influenced more than others. The worldwide hazard administration firm
Maplecroft finished up in 2010 that developing economies in Asia and Africa are most helpless
against environmental change, particularly Bangladesh and India. The association's Climate
Change Vulnerability Index joins introduction to normal perils (dry spells, serious tempests,
avalanches, and so forth.) with destitution related defenselessness and strength (adjustment
limit) to figure a nation's hazard. Bangladesh is in the lead position as a result of its destitution
and thickly populated, low-lying waterfront delta. India is second, positioned very in view of
the strain its enormous, poor populace applies on regular assets. The rest of the nations in the
main ten for helplessness were Madagascar, Nepal, Mozambique, Philippines, Haiti,
Afghanistan, Zimbabwe, and Burma.
For last numerous decades,
individuals are moving from rural to
urban territories for work and higher
salaries. Notwithstanding,
environmental change is probably going
to add to dislodging as opposed to
occasional relocation in India. Removal
is the constrained or obliged
development, departure or movement of
people or gatherings of individuals from
their homes or submits of the ongoing
home in the request to maintain a
strategic distance from the danger or
effect of a calamity. Environmental change may bring about two sorts of removal and
movement in India. In the first place, the expanded movement is likely inside India because of
the impacts of environmental change, for example, dry season, desertification, ocean level
ascent, water shortage and low sustenance profitability, and dissolving ice sheets. Second,
environmental change may prompt expanded stream of migrants from neighbouring nations
Figure 1: Selected hotspots of climate change
Source: German Advisory Council on Global Change (WBGU)
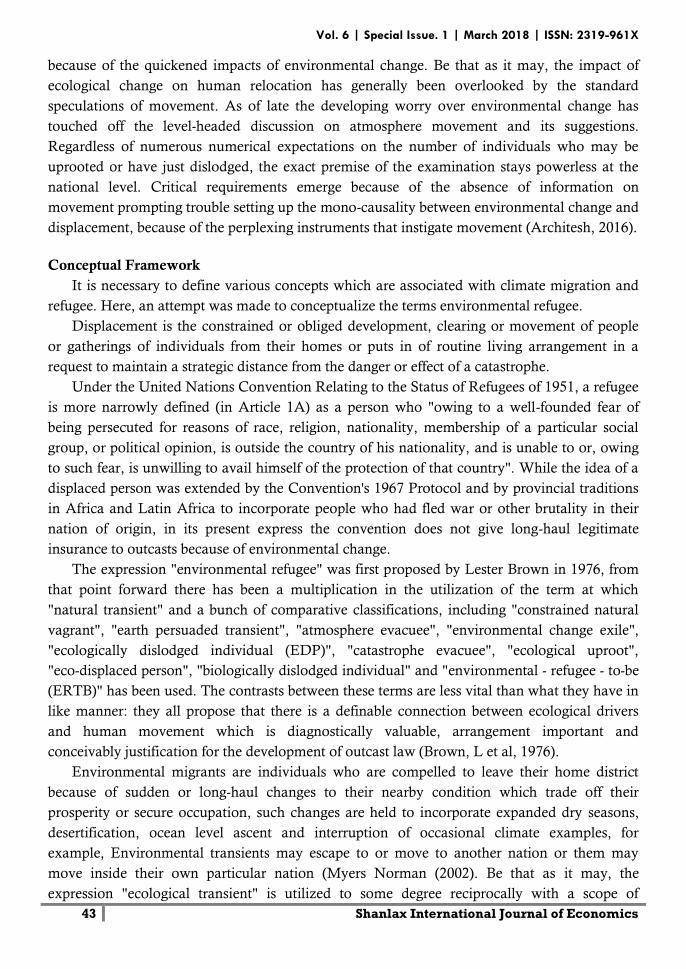
Vol. 6 | Special Issue. 1 | March 2018 | ISSN: 2319-961X
43 Shanlax International Journal of Economics
because of the quickened impacts of environmental change. Be that as it may, the impact of
ecological change on human relocation has generally been overlooked by the standard
speculations of movement. As of late the developing worry over environmental change has
touched off the level-headed discussion on atmosphere movement and its suggestions.
Regardless of numerous numerical expectations on the number of individuals who may be
uprooted or have just dislodged, the exact premise of the examination stays powerless at the
national level. Critical requirements emerge because of the absence of information on
movement prompting trouble setting up the mono-causality between environmental change and
displacement, because of the perplexing instruments that instigate movement (Architesh, 2016).
Conceptual Framework
It is necessary to define various concepts which are associated with climate migration and
refugee. Here, an attempt was made to conceptualize the terms environmental refugee.
Displacement is the constrained or obliged development, clearing or movement of people
or gatherings of individuals from their homes or puts in of routine living arrangement in a
request to maintain a strategic distance from the danger or effect of a catastrophe.
Under the United Nations Convention Relating to the Status of Refugees of 1951, a refugee
is more narrowly defined (in Article 1A) as a person who "owing to a well-founded fear of
being persecuted for reasons of race, religion, nationality, membership of a particular social
group, or political opinion, is outside the country of his nationality, and is unable to or, owing
to such fear, is unwilling to avail himself of the protection of that country". While the idea of a
displaced person was extended by the Convention's 1967 Protocol and by provincial traditions
in Africa and Latin Africa to incorporate people who had fled war or other brutality in their
nation of origin, in its present express the convention does not give long-haul legitimate
insurance to outcasts because of environmental change.
The expression "environmental refugee" was first proposed by Lester Brown in 1976, from
that point forward there has been a multiplication in the utilization of the term at which
"natural transient" and a bunch of comparative classifications, including "constrained natural
vagrant", "earth persuaded transient", "atmosphere evacuee", "environmental change exile",
"ecologically dislodged individual (EDP)", "catastrophe evacuee", "ecological uproot",
"eco-displaced person", "biologically dislodged individual" and "environmental - refugee - to-be
(ERTB)" has been used. The contrasts between these terms are less vital than what they have in
like manner: they all propose that there is a definable connection between ecological drivers
and human movement which is diagnostically valuable, arrangement important and
conceivably justification for the development of outcast law (Brown, L et al, 1976).
Environmental migrants are individuals who are compelled to leave their home district
because of sudden or long-haul changes to their nearby condition which trade off their
prosperity or secure occupation, such changes are held to incorporate expanded dry seasons,
desertification, ocean level ascent and interruption of occasional climate examples, for
example, Environmental transients may escape to or move to another nation or them may
move inside their own particular nation (Myers Norman (2002). Be that as it may, the
expression "ecological transient" is utilized to some degree reciprocally with a scope of
National Seminar on CONTEMPORARY MACRO ECONOMIC ENVIRONMENTAL ISSUES
44 Rani Anna Government College for Women, Tirunelveli
comparable terms, for example, natural evacuee or atmosphere exile in spite of the fact that the
qualification between these terms is challenged. The International Organization for Migration
proposes the definition for ecological transients as "Natural vagrants are people or gatherings of
people who, for convincing reasons of sudden or dynamic changes in the condition that
antagonistically influence their lives or living conditions, are obliged to leave their constant
homes, or do as such, either briefly or for all time, and who move either inside their nation or
abroad" (Forum on Climate Refugees, 2012). In spite of issues in detailing a uniform and
obvious meaning of 'ecological movement', such an idea has expanded as an issue of worry in
the 2000s as arrangement creators, natural and social researchers endeavour to conceptualize
the potential societal impacts of environmental change and general natural debasement.
The term ‘Ecological refugee’ first appeared in 1970s. Besides other terms also developed to
describe this population of people include ‘environmental migrants’, ‘environmentally
displaced persons’, ‘climate refugees’, ‘climate change refugees’, ‘environmental refugees’. The
term ‘environmental refugee’ was first coined by Essam El-Hinnawi in a 1985 United Nations
Environmental Programme report. He defined environmental refugees as: “…those people who
have been forced to leave their traditional habitat, temporarily or permanently, because of a
marked environmental disruption (natural and/or triggered by people) that jeopardized their
existence and/or seriously affected the quality of their life”. (Vikram Odedra Kolmannskog,
2008).
The term Climate refugee or Climate Migrants alludes to the subset of ecological vagrants
compelled to move "because of sudden or progressive adjustments in the common habitat
identified with no less than one of three effects of environmental change: ocean level ascent,
outrageous climate occasions, and dry spell and water shortage" (Global Governance Project
2012). The term Climate banishes has been utilized to allude to those atmosphere vagrants who
might be at risk of getting to be stateless. Atmosphere displaced people are essentially
defenseless individuals compelled to move from their homes due to climatic changes. Indeed,
even as movement stands to be the most time-tried way of dealing with the stress of the general
population, the vagrants—all the more exactly, the "dislodged"— are yet to be formally
perceived. The issue needs critical consideration as atmosphere initiated uprooting is expanding
by the day (Sujatha Byravan, et. al, 2007). Canals initially voiced his worries about
environmental change-related development in 2007, at UNHCR's Executive Committee
meeting. Nonetheless, he likewise expressed that UNHCR's legitimate order blocks its formal
inclusion in this new test.
In any case, a typical accord on the meaning of these refugees is yet to develop while
environmental migration isn't authoritatively perceived, the universal group is progressively
recognizing the way that ecological corruption and environmental change could conceivably
bring about populace removal on a scale the world is as of now poorly prepared to address in a
compelling way. Several evaluations have been proposed by a few researchers (Terra Green,
2011).
Vol. 6 | Special Issue. 1 | March 2018 | ISSN: 2319-961X
45 Shanlax International Journal of Economics
Climate Change Induced Migration in India
Indian economy is inseparably fixing to atmosphere touchy areas like agriculture, which are
as of now confronting various burdens, and worldwide ecological change could additionally
intensify these anxieties. Migration and particularly inside relocation, is as of now a testing
question. The Indian subcontinent is very powerless against the negative effects of
environmental change. This area likewise houses a huge number of poor and undernourished
individuals who for the most part rely on the farming segment for their sustenance. This poor
people comprises of ladies and children who are more defenseless against environmental
change-related relocation, and incidentally, are minimal supporters of environmental change.
Climate variability in the form of floods and cyclones has resulted in destruction of crops,
property and infrastructure, as well as in negative impacts on human health and well-being
Traditionally India is highly vulnerable to climate change impacts like drought, flood, sea
level rise and glacier melting. Jairam Ramesh, the former Indian minister of state for environment
and forests (MoEF), argued that “No country in the world is as vulnerable, on so many
dimensions, to climate change as India” (MoEF, 2010). In a current report, the International
Commission for Snow and Ice (ICSE) detailed that Himalayan glaciers – that are the key dry-
season water wellsprings of Asia's greatest streams - Ganges, Indus, Brahmaputra, Yangtze,
Mekong, Salween and Yellow – are contracting snappier than anyplace else and that if ebb and
flow patterns proceed with they could vanish by and large by 2035.27 If the forecasts are
genuine then the size of the effect can be checked from the sheer quantities of individuals it will
influence. Around 2.4 billion individuals live in the seepage bowl of the Himalayan Rivers. The
above expectations surely represent a genuine risk to horticulture which impacts human lives
from numerous points of view. One of the premier effects is sustenance security.
Because of increment in temperature noteworthy changes in precipitation design have been
seen amid the twentieth century in India. A genuine ecological issue has additionally been seen
in the Indo-Gangetic Plain Region (IGPR) in the past whereby distinctive streams (counting
Kosi, Ganga, Ghaghara, Son, Indus and its tributaries and Yamuna) changed their course
various circumstances. The current annihilating surge in Nepal and Bihar because of progress
obviously of River Kosi is a valid example. Accessible investigation recommends that
sustenance generation must be expanded to the tune of 300 mt by 2020 so as to bolster India's
regularly developing populace, which is probably going to achieve 1.30 billion by the year
2020. The aggregate sustenance grain creation must be expanded by 50 for each penny by 2020
to meet the prerequisite. It is expected that the quick expanding interest for sustenance in the
following a few decades could be very dreary especially in perspective of the major issue of soil
corruption and environmental change. The ascent in populace will expand the interest for water
prompting the quicker withdrawal of water and this thusly would diminish the energizing time
of the water tables. Therefore, accessibility of water will undoubtedly achieve basic levels at
some point or another.
As indicated by the Internal Displacement Monitoring Center around 3,655,000 were
displaced because of catastrophes in India in 2015. In 1998 depicted as super El Nino year,
because of flood eight million individuals were dislodged in India especially surges crosswise
National Seminar on CONTEMPORARY MACRO ECONOMIC ENVIRONMENTAL ISSUES
46 Rani Anna Government College for Women, Tirunelveli
over 12 northern states. Further, various and rehashed relocations in similar parts India point to
zones of especially high presentation and powerlessness. India encounters abnormal amounts
of uprooting along its east drift, where groups are presented to hurricanes from the Bay of
Bengal, and in the Ganges, Brahmaputra and Yamuna stream bowls in the north and north-
east of the nation. In September, the most exceedingly awful surges to hit Jammu and Kashmir
in 50 years uprooted around 812,000 individuals in urban zones of the state.
About 851,000 people were displaced by tropical cyclone Mora, with subsequent floods and
landslides in Bangladesh, Myanmar and India. More than 477,000 people were evacuated to
shelters in 15 coastal districts of Bangladesh, because of high winds, storm surges and heavy
rainfall associated with Mora, which made landfall in Cox’s Bazar district on 30 May, 2017.
The storm then tracked north-east over land, crossing Chittagong division, where it caused
floods and landslides, displacing more than 353,000 people, of whom 350,000 were evacuated
to shelters. In Myanmar more than 19,000 were displaced, and in India 235 people were
displaced (Internal Displacement Monitoring Center, 2017).
Displacement for populations due to erratic and extreme weather, a fallout of climate
change, has become a scary reality for millions of people across swathes of India. Flooding in
Jammu and Kashmir last year, in Uttarakhand in 2013 and in Assam in 2012 displaced 1.5
million people. Cyclone Phailin, which swamped the coastal Indian state of Orissa in October
2013, triggered large-scale migration of fishing communities.
Sea level rise is the major threat to the country due to global warming and melting of
glaciers. It is found that approximately 13 km2 of land area of Kanyakumari would be
permanently inundated due to sea level rise, resulting in loss of land, alteration of coastal zone
and destruction of coastal eco system (Natesan and Parthasarathy, 2010). A critical division of
ocean level ascent is because of warm extension of a warmed sea (as much as 0.3 to 0.8 m over the
previous century, as per the 2007 IPCC report). Geographic examples of ocean level ascent are
expected basically to changes in the appropriation of warmth and saltiness in the sea, bringing about
changes in sea flow. Exact satellite estimations since 1993 demonstrate that the biggest ocean level
ascent since 1992 has occurred in the western Pacific and eastern Indian Oceans, with the potential
for huge effects on the east shoreline of India. The 2004 Indian National Communication to the
UNFCCC states that ocean level ascent is most astounding in the Gulf of Kutch (Gujarat) and on
the shore of West Bengal. According to Asian Development Bank (ADB) roughly 37 million
people from India, 22 million from China and 21 million from Indonesia will be at risk from
sea levels rising by 2050. Research in Assam in India and in Bangladesh have assessed that
around a million people have been rendered destitute because of disintegration in the
Brahmaputra stream bowl in the course of the most recent three decades. Especially helpless to
environmental change are the Sundarbans, a low-lying delta district in the Bay of Bengal where
around 13 million ruined Indians and Bangladeshis live.
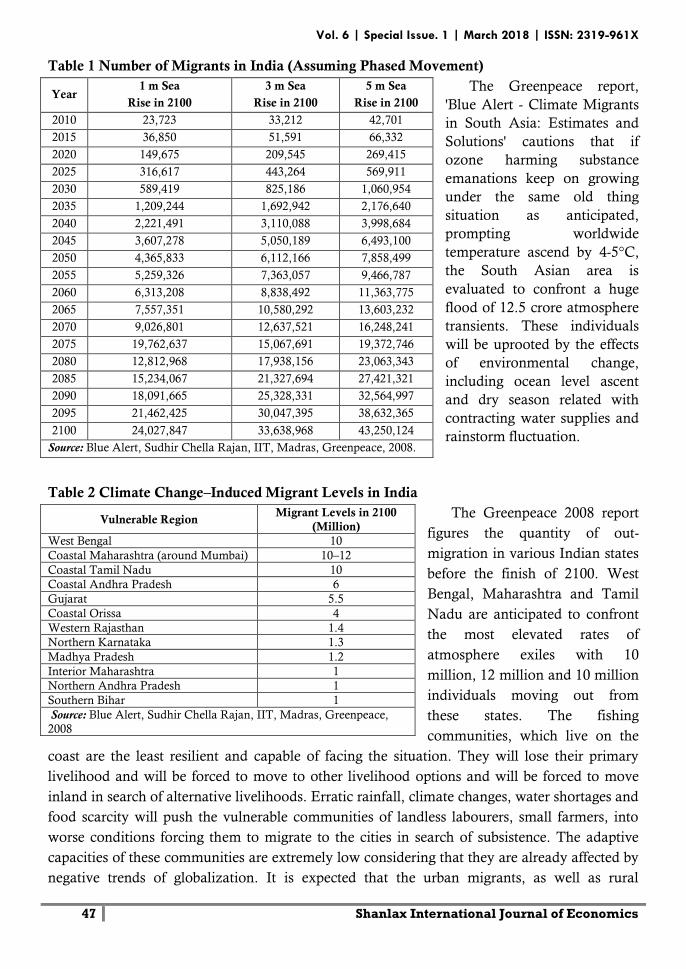
Vol. 6 | Special Issue. 1 | March 2018 | ISSN: 2319-961X
47 Shanlax International Journal of Economics
Table 1 Number of Migrants in India (Assuming Phased Movement)
The Greenpeace report,
'Blue Alert - Climate Migrants
in South Asia: Estimates and
Solutions' cautions that if
ozone harming substance
emanations keep on growing
under the same old thing
situation as anticipated,
prompting worldwide
temperature ascend by 4-5°C,
the South Asian area is
evaluated to confront a huge
flood of 12.5 crore atmosphere
transients. These individuals
will be uprooted by the effects
of environmental change,
including ocean level ascent
and dry season related with
contracting water supplies and
rainstorm fluctuation.
Table 2 Climate Change–Induced Migrant Levels in India
The Greenpeace 2008 report
figures the quantity of out-
migration in various Indian states
before the finish of 2100. West
Bengal, Maharashtra and Tamil
Nadu are anticipated to confront
the most elevated rates of
atmosphere exiles with 10
million, 12 million and 10 million
individuals moving out from
these states. The fishing
communities, which live on the
coast are the least resilient and capable of facing the situation. They will lose their primary
livelihood and will be forced to move to other livelihood options and will be forced to move
inland in search of alternative livelihoods. Erratic rainfall, climate changes, water shortages and
food scarcity will push the vulnerable communities of landless labourers, small farmers, into
worse conditions forcing them to migrate to the cities in search of subsistence. The adaptive
capacities of these communities are extremely low considering that they are already affected by
negative trends of globalization. It is expected that the urban migrants, as well as rural
Year 1 m Sea
Rise in 2100
3 m Sea
Rise in 2100
5 m Sea
Rise in 2100
2010 23,723 33,212 42,701
2015 36,850 51,591 66,332
2020 149,675 209,545 269,415
2025 316,617 443,264 569,911
2030 589,419 825,186 1,060,954
2035 1,209,244 1,692,942 2,176,640
2040 2,221,491 3,110,088 3,998,684
2045 3,607,278 5,050,189 6,493,100
2050 4,365,833 6,112,166 7,858,499
2055 5,259,326 7,363,057 9,466,787
2060 6,313,208 8,838,492 11,363,775
2065 7,557,351 10,580,292 13,603,232
2070 9,026,801 12,637,521 16,248,241
2075 19,762,637 15,067,691 19,372,746
2080 12,812,968 17,938,156 23,063,343
2085 15,234,067 21,327,694 27,421,321
2090 18,091,665 25,328,331 32,564,997
2095 21,462,425 30,047,395 38,632,365
2100 24,027,847 33,638,968 43,250,124
Source: Blue Alert, Sudhir Chella Rajan, IIT, Madras, Greenpeace, 2008.
Vulnerable Region Migrant Levels in 2100
(Million)
West Bengal 10
Coastal Maharashtra (around Mumbai) 10–12
Coastal Tamil Nadu 10
Coastal Andhra Pradesh 6
Gujarat 5.5
Coastal Orissa 4
Western Rajasthan 1.4
Northern Karnataka 1.3
Madhya Pradesh 1.2
Interior Maharashtra 1
Northern Andhra Pradesh 1
Southern Bihar 1
Source: Blue Alert, Sudhir Chella Rajan, IIT, Madras, Greenpeace,
2008
National Seminar on CONTEMPORARY MACRO ECONOMIC ENVIRONMENTAL ISSUES
48 Rani Anna Government College for Women, Tirunelveli
populations, are more likely to migrate to other urban regions. It is estimated that the big cities
of Delhi, Hyderabad, Mumbai, Kolkata, and Chennai are likely to face the most pressure from
migration. These measurements are unmistakably a clarion require the administration and the
global agencies to concentrate ventures on lessening the negative effects of environmental
change and settling on some solid choices to help and secure atmosphere outcasts (Blue Alert
Report, 2008).
Growing Concern
India gets migrants from various nations. Under environmental change conditions, it might
be overflowed with some more, especially from Bangladesh. Such relocation may intensify
pressure between the two nations and additionally putting a strain on Indian central and state
governments. To the extent the most extreme environmental change issue is concerned, rising
sea level may start things out. Different reports and studies are affirming that while more
beachfront individuals in India will tend to move into urban areas; an ever-increasing number
of Bangladeshis will tend to move to urban communities in that nation, as well as into India.
Both Sunderbans and Odisha drifts in India are ideal spots to affirm this situation. Here, not
exclusively is the ocean rise constraining individuals from the coasts to move urban areas and
making it troublesome for the administration to move them legitimately; the entrance of
Bangladeshi outcasts is likewise making various neighborhood financial and political issues.
The time has, in this way, come to perceive the situation of atmosphere displaced people and
act in a constructive way.
The flood in urban communities is a significant risks which demolishing all the formative
exercises. Also, dry season in rural regions has actuated the country masses to move urban
areas. The loss of agriculture because of atmosphere variety has brought about the movement
of farmers and manual works to search for work. This will brings about congestion in urban
regions. The farmer’s migration and fall in production of food crops have significant impact on
food security as the population in the country growing gradually. As indicated by the UN's
Global Environmental Outlook (GEO-6), Regional Assessments, in excess of 40 million
Indians will be in danger from rising ocean levels by 2050. This will add to the quantity of
transients and inside dislodged. Provincial populaces and fizzled agriculturists are as of now
rushing to the urban areas looking for better open doors adding to biological pressure and social
destabilization.
According to World Bank report (November 2015), by 2030, climate change’s effect on the
Indian economy could impoverish 45 million. Considering the link between revolts and climate
change-induced food insecurity, inflation and income inequality, ensuring social stability is
definitely at peril. In a more domestic consequence of climate-induced insecurity, domestic
violence against women left behind by migrant workers is on the rise. The absence of proper
data on climate change victims and migrants will hinders the formulation of policies.
Conclusion
Migration is an old social marvel in India. By and large, relocations happen because of social,
monetary and wellbeing reasons. Environmental change initiated movement or Climate Refugees
Vol. 6 | Special Issue. 1 | March 2018 | ISSN: 2319-961X
49 Shanlax International Journal of Economics
seemed just as of late in the social history of India. Extraordinary atmosphere occasions like surges,
typhoons and tidal surges, and also slow effects of environmental change like saltiness or waterway
disintegration, cause atmosphere actuated movement. By and large, the migrants are to a great
degree poor. Their neediness is additionally strengthened by effects of environmental change, which
stamp the purpose of their takeoff from the country where they abandon their relatives, their
associations and a past set apart by dissatisfactions and sufferings. Be that as it may, frequently, their
future is bleak, brimming with vulnerability and unconventionality. A summed up example of
atmosphere relocation is towards cities, bigger and quickly developing urban areas and towns, and
perhaps some to India. In the zone of source, absence of sustenance and water, absence of salary
openings, absence of framework and nonattendance of elective employment alternatives are the
underlying driver for movement caused by environmental change. Government may give
humanitarian help to those unfavorably influenced by environmental change, planning to hold them
over until the point when conditions enhance or resolutions other than global relocation rise. A more
forward-looking strategy reaction is bolster enthusiastically the endeavors of states gravely influenced
by environmental change to enable their kin to adjust to changed conditions through monetary,
logical, specialized, and different types of deliberate help.
References
1. Alam, S. (2003). Environmentally Induced Migration from Bangladesh to India. Retrieved
from http://www.idsa.in/publications/strategicanalysis/2003/jul/Sarfaraz.pdf.
2. Anthoff, D, R Nicholls, R Tol and Vafeidis, A. (2006). Global and Regional Exposure to
Large Rises in Sea-Level: A Sensitivity Analysis. Tyndall Centre Working Paper No 90.
Tyndall Centre for Climate Change Research, Norwich, London.
3. Barnett Jon, and Webber Michael, (2009). Accommodating Migration to Promote
Adaptation to Climate Change. The Commission on Climate Change and Development.
Retrieved from www.ccdcommission.org.
4. Biermann, F. and Ingrid Boss, (2007). Protecting Climate Refugees: The Case for a Global
Protocol. Retrieved from
http://www.environmentmagazine.org/Archives/Back%20Issues/November-
December%202008/Biermann-Boas-full.html
5. Black Richard, (2001).Environmental Refugees: Myth or Reality? Retrieved from
http://www.unhcr.org/research/working/3ae6a0d00/environmental-refugees-myth-
reality-richard-black.html.
6. Boano Zetter, C. R. and Morris, T. (2007). Environmentally Displaced People:
Understanding the Linkages between Environmental Change, Livelihoods and Forced
Migration. a policy briefing by the Refugee Studies Centre, University of Oxford. Brown,
O. (2007). Climate Change and Forced Migration: Observations, Projections and
Implications. Retrieved from http://www.iisd.org/library/climate-change-and-forced-
migration-observations-projections-and-implications.
7. Castles, S. (2002). Environmental Change and Forced Migration: Making Sense of the
Debate. Retrieved from
National Seminar on CONTEMPORARY MACRO ECONOMIC ENVIRONMENTAL ISSUES
50 Rani Anna Government College for Women, Tirunelveli
http://www.unhcr.org/research/working/3de344fd9/environmental-change-forced-
migration-making-sense-debate-stephen-castles.html.
8. Deshingkar, P. (2003). Improved Livelihoods in Improved Watersheds: Can Migration Be
Mitigated?” in Watershed Management Challenges: Improving Productivity, Resources
and Livelihoods, International Water Management Institute, Colombo.
9. Editorials, (2009). Climate Refugees. Economic & Political Weekly, 44(23), p.7.
10. El-Hinnawi, E. (1985). Environmental Refugees. United Nations Environment
Programme. Retrieved from
http://wedocs.unep.org/handle/20.500.11822/2651?show=full.
11. Gupta, K Anil, Anderson M David, Pandey N Deep and Singhvi K Ashok, (2006).
Adaptation and Human Migration, and Evidence of Agriculture Coincident with Indian
Summer Monsoon during the Holocene. Current Sceince, 90(8), 1082-1090.
12. Homer-Dixon Thomas, (1994). Environmental Scarcities and Violent Conflict: Evidence
from Cases. International Security, 19(1), 5-40.
13. Internal Displacement Monitoring Center, (2017). New displacements. Retrieved from
http://www.internal-displacement.org/assets/country-profiles/Mid-Year-update-
2017/IND-disaster.pdf.
14. Kibreab, G. (1997). Environmental Causes and Impact of Refugee Movements: A Critique
of the Current Debate. Disasters, 21(1), 20-38.
15. Kniveton, D, K Schmidt-Verkerk, C Smith and R Black, (2008). Climate Change and
Migration: Improving Methodologies to Estimate Flows. IOM Migration Research Series,
No 33, International Organisation for Migration, Sussex University, Brighton.
16. Lonergan, S. (1998). The Role of Environmental Degradation in Population Displacement.
Environmental Change and Security Project Report, 4: 5-15.
17. Maplecroft, (2010). Climate Change Risk Atlas 2011. Bath, UK: Maplecroft.
18. McGranahan, G. D. Balk and Anderson, B. (2007). The Rising Tide: Assessing the Risks of
Climate Change and Human Settlements in Low Elevation Coastal Zones. Environment and
Urbanisation, 19 (1), 17-37.
19. Mortreux, C. and Barnett, J. (2009). Climate Change, Migration and Adaptation in
Funafuti, Tuvalu. Global Environmental Change, 19, 105-12.
20. Myers, N. (1993). Environmental Refugees in a Globally Warmed World. Bioscience, 43,
752-61.
21. Natesan Usha, and Parthasarathy Anitha, (2010). The Potential Impacts of Sea Level Rise
along the Coastal Zone of Kanyakumari District in Tamil Nadu. India. Journal of Coastal
Conservation, 14 (3), 207-14.
22. Panda Architesh, (2010). Climate Refugees: Implications for India. Economic and Political
Weekly, 45(20), 76-79.
Vol. 6 | Special Issue. 1 | March 2018 | ISSN: 2319-961X
51 Shanlax International Journal of Economics
A STUDY ON CURRENCY REPLACEMENT WITH
DIGITAL CASH IN THOOTHKUDI
Dr.R.Bhavani
Assistant professor, Department of Commerce, Govindammal Aditanar College for Women, Tiruchendur
R.Dibeya
M.Phil. Research Scholar (Commerce), Govindammal Aditanar College for Women, Tiruchendur
Introduction
Digital cash acts like real cash except that it’s not on paper. Money is converted to digital
code and Used for several purposes immediately. The possibility that consumers could start
paying for all Retail purchases with digital money once it becomes established instead of with
paper money Paper Money was introduced and it was gradually replaced by central bank notes
and bank cheques and Later to electronic fund transfers and automated clearing houses, the
world is now readying itself for The next step in automation of money Payments made today in
nearly all of the deposit currencies. The world’s banking systems are handled electronically
through a series of interbank computer Networks. One of the largest of these networks in
CHIPS (Clearing House Interbank Payments System), which is owned and operated by the
New York clearing House. Importantly, payment risk is Inherent in all forms of currency
presently in use. Though much effort has been expended in recent Years to eliminate payment
risk, the complete elimination of this risk is not possible. At best, the Payment risk inherent in
present forms of currency can be mitigated, but it cannot be eliminated Because the essential
nature of currency now in use precludes the complete elimination of payment Risk cannot be
eliminated from currency today because all currency presently in use is a liability of Some
institution issuing that currency. Payment risk can be eliminated completely in only one way –
If he currency is used as an asset like Gold or silver.
Thus this study is an attempt made to analyse the nature of currency replacement with
digital cash, reasons for replacement, factors influencing the transfer of paper money into
digital cash, problems in replacement, the satisfaction level of traditional money replacement
with digital cash and offers suitable suggestions.
Statement of the Problem
The internet may be the natural environment in which digital cash will flourish. In fact, if
the internet is continue to grow, many experts argue that it must become commercial. But
credit card numbers and other personal information could be snatched away by a clever hacker
which make many users apprehensive about buying goods over the internet.
National Seminar on CONTEMPORARY MACRO ECONOMIC ENVIRONMENTAL ISSUES
52 Rani Anna Government College for Women, Tirunelveli
The unconditional anonymity that some of these systems provide is much greater that what
paper cash provides its users today. With electronic cash, criminals would be able to perform
illegal transactions anonymously and untraceably. Haring to perform transactions with paper
cash in person reduces the anonymity of a transaction. Power failures, loss of records and
undependable software often cause a major set beck in promoting the technology. The present
study which aims at understanding the transfer of currency replacement with digital cash.
Objectives of the Study
To study the personal profile of the respondents.
To study the usage of digital cash.
To offer suitable suggestions.
Scope of the Study
The study covers the nature of currency replacement with digital cash, reasons for
Replacements, factors influencing the transfer of paper money into digital cash, problems in
Replacement and identify the level of satisfaction about the currency replacement with digital
cash.
Research Methodology
Sources of data: The study is compiled with the help of both primary data and secondary
data. The primary data were collected from the sample respondents with the help of
questionnaire. Secondary data were collected from journals, websites and books.
Sample Technique: The researchers have used questionnaire for collecting data.
Care was taken to ensure completeness and accuracy in the questionnaire.
Sample Size: A sample is a small representation of lot of population selected at random.
The random of drawing a sample from a large population is called sampling. 50 respondents
were selected as samples by adopting convenient sampling method.
Statistical tools used: The data collected with the help of questionnaire is analysed with the
help of descriptive statistics like Percentages and chi-square test.
Limitations of the Study
The following are the limitations of the study,
The study is restricted with business and working people.
The time period for the project was limited.
The number of respondents were limited in this area.
Hypothesis
There exists no significant relationship between the gender and the usage of digital cash.
There exists no significant relationship between the age groups and the usage of digital
cash.
There exists no significant relationship between the marital status and the usage of digital
cash.
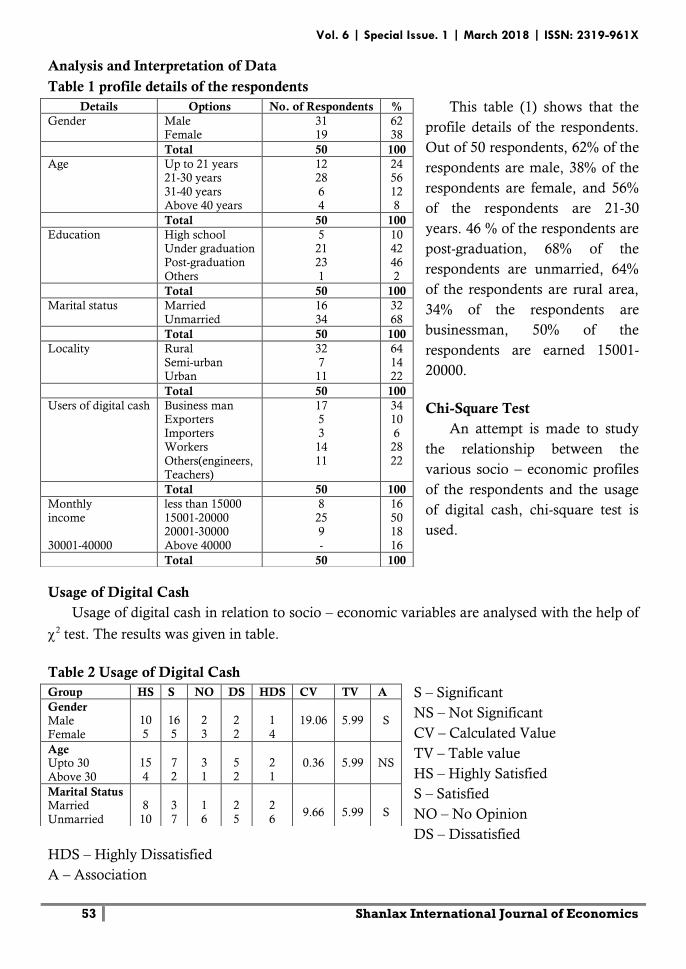
Vol. 6 | Special Issue. 1 | March 2018 | ISSN: 2319-961X
53 Shanlax International Journal of Economics
Analysis and Interpretation of Data
Table 1 profile details of the respondents
This table (1) shows that the
profile details of the respondents.
Out of 50 respondents, 62% of the
respondents are male, 38% of the
respondents are female, and 56%
of the respondents are 21-30
years. 46 % of the respondents are
post-graduation, 68% of the
respondents are unmarried, 64%
of the respondents are rural area,
34% of the respondents are
businessman, 50% of the
respondents are earned 15001-
20000.
Chi-Square Test
An attempt is made to study
the relationship between the
various socio – economic profiles
of the respondents and the usage
of digital cash, chi-square test is
used.
Usage of Digital Cash
Usage of digital cash in relation to socio – economic variables are analysed with the help of
2 test. The results was given in table.
Table 2 Usage of Digital Cash
S – Significant
NS – Not Significant
CV – Calculated Value
TV – Table value
HS – Highly Satisfied
S – Satisfied
NO – No Opinion
DS – Dissatisfied
HDS – Highly Dissatisfied
A – Association
Details Options No. of Respondents %
Gender Male Female
31 19
62 38
Total 50 100
Age Up to 21 years 21-30 years
31-40 years Above 40 years
12 28
6 4
24 56
12 8
Total 50 100
Education High school Under graduation
Post-graduation
Others
5 21
23
1
10 42
46
2
Total 50 100
Marital status Married
Unmarried
16
34
32
68
Total 50 100
Locality Rural
Semi-urban Urban
32
7 11
64
14 22
Total 50 100
Users of digital cash Business man Exporters
Importers Workers
Others(engineers,
Teachers)
17 5
3 14
11
34 10
6 28
22
Total 50 100
Monthly
income
30001-40000
less than 15000
15001-20000 20001-30000
Above 40000
8
25 9
-
16
50 18
16
Total 50 100
Group HS S NO DS HDS CV TV A
Gender Male Female
10
5
16
5
2
3
2
2
1
4 19.06 5.99 S
Age Upto 30
Above 30
15
4
7
2
3
1
5
2
2
1 0.36 5.99 NS
Marital Status Married
Unmarried
8
10
3
7
1
6
2
5
2
6
9.66
5.99
S
National Seminar on CONTEMPORARY MACRO ECONOMIC ENVIRONMENTAL ISSUES
54 Rani Anna Government College for Women, Tirunelveli
Gender
From Table 31, it is clear that the obtained calculated value (19.06) is more than the table
value (5.99) at 5% level of significance. Hence the null hypothesis is rejected and concluded
that “there is significant relationship between gender and usage of digital cash”.
Age: The obtained calculated value (0.36) is less than the table value (5.99) at 5% level of
significance. Hence the null hypothesis is accepted and concluded that “there is no significant
relationship between age group and usage of digital cash”.
Marital Status
The obtained calculated value (9.66) is more than the table value (5.99) at 5% level of
significance. Hence the null hypothesis is rejected and concluded that “there is significant
relationship between marital status and usage of digital cash
Summary of Findings
1. 62 per cent of the respondents were male.
2. 56 per cent of the respondents were in the age group of 21 – 30 years.
3. 46 per cent of the respondents have studied upto PG degree.
4. 68 per cent of the respondents were unmarried.
5. 64 per cent of the respondents were in rural area.
6. 34 per cent of the respondents were doing business.
7. 50 per cent of the respondents earned the income of `15,001-`20,000.
Suggestions
Government must take necessary steps for power failures and more technological
development to solve the problems of loss of records and undependable software.
Proper enactment of actions must be undertaken to acrid money laundering and frail
because of some hackers who steal the information and uses for their benefits.
The interface should be presented in a logical, clear and understandable way.
Features of automatization of payments should be provided.
Conclusion
The rapid development of communication and computer technology is fueling a revolution
in our business and personal lives. Within a decade from now, many of us will spend our
money differently from how we spend it today. Cash, Cheques and credit cards will spend our
money differently from how we spend it today. Cash, Cheques and credit cards will
undoubtedly still exist, but totally new payment mechanisms will evolve and slowly absorb
market share from the currencies and the methods of payment familiar to us today. Digital cash
promises to be a revolutionary method for conducting business. It will allow transactions to
occur between parties on opposite sides of the globe with the same ease as going to the corner
gas station to buy gas. Electronic cash also gives us the ability to trade in non-governmental
units of currency. Electronic cash transitions have the potential to become as popular as credit
card transactions. Banks or other financial institutions will then, essentially, be minting these
Vol. 6 | Special Issue. 1 | March 2018 | ISSN: 2319-961X
55 Shanlax International Journal of Economics
electronic coins which will be backed by the financial stability of a corporation rather than a
government. This will certainly have an impact on world economics. However, this new
technology will present us new challenges.
References
Books
1. Seth Godwin, “A Presenting Digital Cash”, Sams Publishing, 1st Edition, Nov.1995.
2. Peter Wayner, “Digital Cash Commerce on the Net”, AP Professional, 1996.
3. Macmillan “the Bank Credit Card Business”, Macmillan India Ltd, 2nd Edition.
Journals
1. The ICFAI Journal of Marketing Management, May 2006, Vol.14.
2. Indian Journal of Marketing, Vol.32, No.5-12, May 2002.
Websites
1. Digital cash and Net commerce http://www.2.pro-ns.net/crypto/toc12.html.
2. Electronic Money. http://en.wikipedia.org/wiki/electronic-money.
3. Ez-link.http://en.wikipedia.org/wiki/EZ-link
National Seminar on CONTEMPORARY MACRO ECONOMIC ENVIRONMENTAL ISSUES
56 Rani Anna Government College for Women, Tirunelveli
A STUDY ON LEADERSHIP STYLE AND ITS IMPACT ON JOB
SATISFACTION AND PERFORMANCE OF STERLITE PRIVATE LTD
EMPLOYEES IN THOOTHUKUDI CITY
S.Thirumathi, MA., M.Phil.,
Ph.D. Research Scholar, Research Centre in Economics Kamaraj College, Thoothukudi. Tamilnadu
Dr.A.Asok, MA., MBA., M.Phil., Ph.D.,
Head & Associate Professor of Economics, Research Centre in Economics Kamaraj College, Thoothukudi, Tamilnadu
Introduction
Today’s work places are more complex and sophisticated requiring erudite leadership due
to global Economic competitiveness, as leaders are confronted with unpredictable challenges,
which require different degree of leadership management. Effective management of employees
may be assumed to be achievable through leadership behavior, which promotes employee’s
commitment and productivity. Although, employee’ sperformance can be highly affected by
many factors arising from within and outside organizational context.
Job satisfaction refers to the extent that the working environment meets the needs and values
of employees and the individual’s response to that environment (Lambert, 2004; Tewksbury &
Higgins, 2006). It is the affective feelings that people have about their jobs. No wonder, Robins
(2005) study shows that employees with high job satisfaction behave differently from
employees with low job satisfaction. Similarly, job satisfaction is also related to many job out
comes (Spector, 2000) such as job performance (Gebauer &Lowman, 2009; Macey &
Schneider, 2008; Macey, Schneider, Barbera & young, 2009). The leadership style of managers
and the job satisfaction of subordinate’s have been found to have salient effects on subordinate
work outcomes (Spector, 2000). Therefore, adopting a leadership style that works best for an
organization and its employee’s remains one of the most effective and efficient means by which
organizations achieve their objectives and that of employee’s satisfaction.
Statement of the Problem
Leadership is one of the most import factors in our social lives to enhance the performance
(Ather and Sobhani, 2007; Hafeez et al., 2012). Hence scrutinizing the impact of the leadership
styles on the employees performance has a great significance to our today’s society. Few
leaders understand the full significance of how influential their leadership styles are on the
performance and satisfaction of their employees. Leadership is the main weapon of the
organization, through better leadership managers can achieve their organizational goals and
productivity as well as the workers productivity.
Vol. 6 | Special Issue. 1 | March 2018 | ISSN: 2319-961X
57 Shanlax International Journal of Economics
However, very few researches were done on leadership and employees in Tuticorin but the
case of not even single research has been investigated the impacts of the leadership styles on the
employees performance. Hence, our research will focus only the impact of leadership style in
Sterlite. The object on the inquiry is to ascertain the most favorable leadership style amongst
autocratic, democratic, bureaucratic, servant, transformational, transactional and laissez faire,
used in the case organization to determine its influence on employees performance through
satisfaction and motivation. According to Bidyut and Mukulesh (2014) the level of service
delivery in public institutions remains low. This is evident by many public complaints about its
effectiveness, corruption, Absenteeism, negligence among others. Despite all these effort the
employees are still not satisfied and are still demanding for better terms. This study will
therefore be undertaken to find out Factors Influencing Employee Job Satisfaction.
Objectives of the Study
To identify the socio-economic profile of the employees in Sterlite private limited.
To have the theoretical overview of various concept of job satisfaction and performance.
To assess the leadership style and the impact on job satisfaction and job performance of
Sterlite employees.
To find out relationship between leadership style with on job satisfaction employees.
To find the interrelationship between the factors of job satisfaction of employees towards
leadership style.
To find the interrelationship between the factors of job performance of employee towards
leadership style.
To decipher the relationship between the leadership style followed in an organisation and
its level of impacts on job satisfaction.
To provide the suitable suggestions for improving job performance of employees in Sterlite
private ltd.
Scope of the Study
This study is based on data collected from employees working in Sterlite private ltd. This is
concerned with ‘a study on leadership style and its impact on job satisfaction and job
performance of sterlite employees. Its aims to identify the socio-economic profile of the
employees in Sterlite private limited. It gives a theoretical overview various concepts of job
satisfaction and performance. Its assess the leadership style and the impact on job satisfaction
and job performance of Sterlite employees. This study focus on the leadership style and impact
of leadership style on job satisfaction and performance of Sterlite employees.
Hypotheses to be Tested
In order to study the relationship between leadership style respondents and the level of Job
satisfaction, the following hypotheses were formulated.
There exists no significant difference between the factors of leadership style and the factor
job satisfaction of the Sterlite employes.
National Seminar on CONTEMPORARY MACRO ECONOMIC ENVIRONMENTAL ISSUES
58 Rani Anna Government College for Women, Tirunelveli
Methodology
Collection of data
The researcher has collected data from both primary and secondary sources. The primary
data were collected from the Sterlite employee’s through a questionnaire. The secondary data
were collected from books, journals and websites.
Sampling Design
With a view to study the employees in Sterlite private ltd, 120 samples were selected. The
respondents were selected by adopting convenient sampling method.
Framework of Analysis
The information collected through the questionnaire was analyzed with the help of Likert’s
scaling technique. For positive statements, weight of 5 points was given for ‘strongly agree’, 4
for ‘agree’, 3 for for no opinion’, 2 for ‘disagree’ and 1 for ‘strongly disagree’. In case of
negative statements, the scores are reversed. To test the level of perception towards educational
and environmental factors and profile of the respondents, F – test is used. Besides, descriptive
statistics like mean, standard deviation were calculated to find out the level of perception of
students. Besides, karl Pearson’s correlation co-efficient is also used to find out the degree of
relationship between the leadership style and job satisfaction, performance factors in Sterlite
private limited.
Fieldwork
The researcher herself carried out the fieldwork for this study. It was conducted during the
period during the period from January 2017 to March 2017. The researcher has used
questionnaire for collection of data. The data was collected on Sundays and holidays. Care was
taken to ensure completeness and accuracy in the interviews.
Geographical Coverage
The present study has been conducted in Thoothukudi Area. The researcher has collected
data form employees working in Sterlite private limited in and around Thoothukudi.
Limitations of the Study
The following are the limitations of the study.
1. The results obtained cannot be generalized to the population as a whole.
2. As the study was conducted for a short duration of tree months, it is difficult to study in
depth about the various aspects.
3. Time, cost and other resources were constraints for a fully comprehensive study.
4. The number of sample respondents was restricted to 120 only.
Democratic Leadership
Democratic Leadership comes as the First Factor which is very essential for a good
employees and computes the basic Factor for the Leadership index.
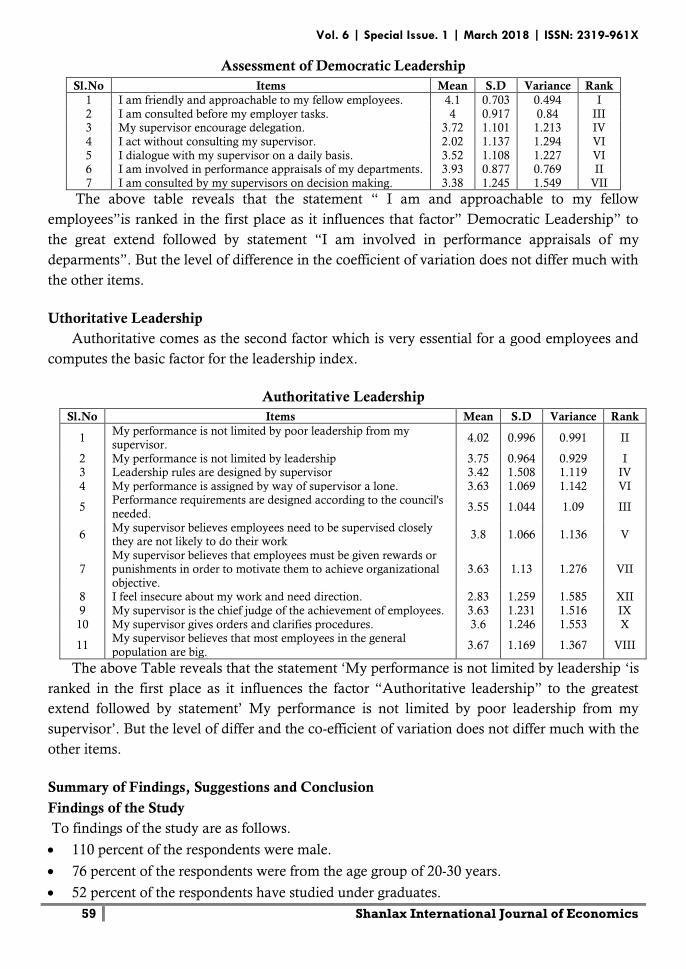
Vol. 6 | Special Issue. 1 | March 2018 | ISSN: 2319-961X
59 Shanlax International Journal of Economics
Assessment of Democratic Leadership
Sl.No Items Mean S.D Variance Rank
1 I am friendly and approachable to my fellow employees. 4.1 0.703 0.494 I
2 I am consulted before my employer tasks. 4 0.917 0.84 III 3 My supervisor encourage delegation. 3.72 1.101 1.213 IV
4 I act without consulting my supervisor. 2.02 1.137 1.294 VI
5 I dialogue with my supervisor on a daily basis. 3.52 1.108 1.227 VI 6 I am involved in performance appraisals of my departments. 3.93 0.877 0.769 II
7 I am consulted by my supervisors on decision making. 3.38 1.245 1.549 VII
The above table reveals that the statement “ I am and approachable to my fellow
employees”is ranked in the first place as it influences that factor” Democratic Leadership” to
the great extend followed by statement “I am involved in performance appraisals of my
deparments”. But the level of difference in the coefficient of variation does not differ much with
the other items.
Uthoritative Leadership
Authoritative comes as the second factor which is very essential for a good employees and
computes the basic factor for the leadership index.
Authoritative Leadership
Sl.No Items Mean S.D Variance Rank
1 My performance is not limited by poor leadership from my supervisor.
4.02 0.996 0.991 II
2 My performance is not limited by leadership 3.75 0.964 0.929 I 3 Leadership rules are designed by supervisor 3.42 1.508 1.119 IV
4 My performance is assigned by way of supervisor a lone. 3.63 1.069 1.142 VI
5 Performance requirements are designed according to the council's
needed. 3.55 1.044 1.09 III
6 My supervisor believes employees need to be supervised closely they are not likely to do their work
3.8 1.066 1.136 V
7 My supervisor believes that employees must be given rewards or punishments in order to motivate them to achieve organizational
objective.
3.63 1.13 1.276 VII
8 I feel insecure about my work and need direction. 2.83 1.259 1.585 XII
9 My supervisor is the chief judge of the achievement of employees. 3.63 1.231 1.516 IX
10 My supervisor gives orders and clarifies procedures. 3.6 1.246 1.553 X
11 My supervisor believes that most employees in the general
population are big. 3.67 1.169 1.367 VIII
The above Table reveals that the statement ‘My performance is not limited by leadership ‘is
ranked in the first place as it influences the factor “Authoritative leadership” to the greatest
extend followed by statement’ My performance is not limited by poor leadership from my
supervisor’. But the level of differ and the co-efficient of variation does not differ much with the
other items.
Summary of Findings, Suggestions and Conclusion
Findings of the Study
To findings of the study are as follows.
110 percent of the respondents were male.
76 percent of the respondents were from the age group of 20-30 years.
52 percent of the respondents have studied under graduates.
National Seminar on CONTEMPORARY MACRO ECONOMIC ENVIRONMENTAL ISSUES
60 Rani Anna Government College for Women, Tirunelveli
62 percent of the respondents reported that their family income per month was from Rs.
10000-Rs. 20000.
62 percent of the respondents were married.
70 percent of the respondents were in nuclear family.
78 percent of the respondent’s family size was between 3-5 years.
60 percent of the respondents are number of 2 children.
58 percent of the respondents shad experience of 3-5 years working.
78 percent of the respondents have worked 8 hours – 12 hours.
76 percent have Opportunity to make a difference in the leadership position.
62 percent of the respondents are working in maintenances departments.
80 percent of the respondents were selecting their job, at their own interest.
70 percent of the respondents set that are following participative style.
58 percent of the respondents have been middle level of management level.
28 percent of the respondents it should be paid by the pension.
62 percent of the respondents it is provided by incentives yes.
17 percent of the respondents have received incentives in the form of Money.
It is clear that in case of job satisfaction all the possible pairs relating to factors of role
efficiency of leadership style significantly related except the pair ‘democratic leadership’,
‘authoritative leadership’ and Laissez-faire’ which is not significantly related.
There is significant relationship between leadership style and job satisfaction of sample
respondents and the level of respondents.
There is significant relationship between leadership style and job performance of the sample
respondents and the level of respondents.
There is significant relationship between the factors of leadership style and the factor job
satisfaction of Sterlite respondents.
Suggestions
There should be a good relationship between supervisors and manages in order to increases
the production
Majority of the respondents faced the problem of unregulated working hours.
Therefore the working hours can be regulated by Sterlite organization.
Majority of the employees are satisfied with all the facilities and only a few are not satisfied.
Therefore suitable measures ensuring optimum level of satisfaction must be focused by the
organization.
Grievance redressal procedures in the organization may be made systematic with a
transparent procedure to improve the motivation of the employees.
Skills training among the administrative employees should be offered because some of them
feel inadequate as shown by their feelings.
Leadership that encourage quality principle should be put on place of authority.
Vol. 6 | Special Issue. 1 | March 2018 | ISSN: 2319-961X
61 Shanlax International Journal of Economics
Conclusion
The leadership style had a statistically significant effect on employee job satisfaction.
Leadership encompasses effective communication and participation of employees in decision
making. Study is an active attempt to investigate the effects of leadership style on job
satisfaction and loyalty, and how this might be applied among car manufacturing managers.
Although many of the findings in this study are left explained, it has suggested some interesting
topics for future cross cultural research. The study confirms that leadership styles are important
organizational antecedents of job satisfaction and loyalty in organization. Overall, the main
objective of this study was to find the extent of relationship between leadership styles, job
satisfaction and organizational commitment. The results showed that a positive and significant
relationship exists between leadership and job satisfaction.
References
1. Rita Devi, “A Study of Relationship between Leadership Styles, Job Satisfaction and
Organizational Commitment” Imperial Journal of Interdisciplinary Research (IJIR) Vol-2,
No-8, 2016, pp: 508-513.
2. Samson Girma, “The relationship between leadership styles, job Applied Research, IJAR;
2(4), 016, pp: 35-45.
3. Samson Babalola, “The effects of leadership style, job satisfaction and employees-
supervisor relationship on job performance and organizational commitment”. The journal
of applied business research, vol:32, no:3, May/June 2016, pp: 935-945.
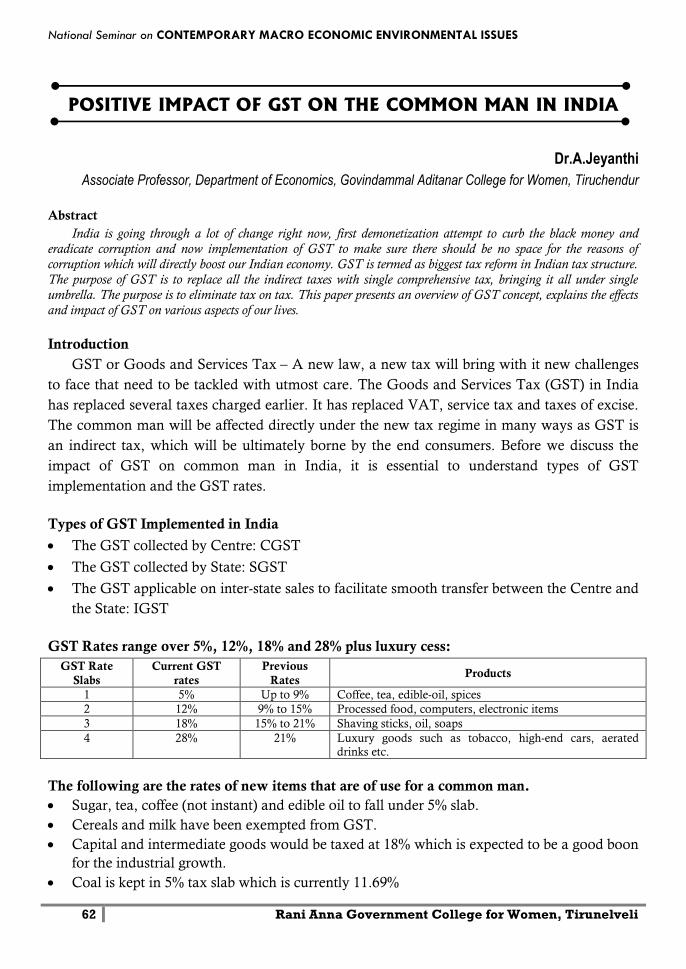
National Seminar on CONTEMPORARY MACRO ECONOMIC ENVIRONMENTAL ISSUES
62 Rani Anna Government College for Women, Tirunelveli
POSITIVE IMPACT OF GST ON THE COMMON MAN IN INDIA
Dr.A.Jeyanthi
Associate Professor, Department of Economics, Govindammal Aditanar College for Women, Tiruchendur
Abstract
India is going through a lot of change right now, first demonetization attempt to curb the black money and
eradicate corruption and now implementation of GST to make sure there should be no space for the reasons of
corruption which will directly boost our Indian economy. GST is termed as biggest tax reform in Indian tax structure.
The purpose of GST is to replace all the indirect taxes with single comprehensive tax, bringing it all under single
umbrella. The purpose is to eliminate tax on tax. This paper presents an overview of GST concept, explains the effects
and impact of GST on various aspects of our lives.
Introduction
GST or Goods and Services Tax – A new law, a new tax will bring with it new challenges
to face that need to be tackled with utmost care. The Goods and Services Tax (GST) in India
has replaced several taxes charged earlier. It has replaced VAT, service tax and taxes of excise.
The common man will be affected directly under the new tax regime in many ways as GST is
an indirect tax, which will be ultimately borne by the end consumers. Before we discuss the
impact of GST on common man in India, it is essential to understand types of GST
implementation and the GST rates.
Types of GST Implemented in India
The GST collected by Centre: CGST
The GST collected by State: SGST
The GST applicable on inter-state sales to facilitate smooth transfer between the Centre and
the State: IGST
GST Rates range over 5%, 12%, 18% and 28% plus luxury cess:
GST Rate
Slabs
Current GST
rates
Previous
Rates Products
1 5% Up to 9% Coffee, tea, edible-oil, spices
2 12% 9% to 15% Processed food, computers, electronic items
3 18% 15% to 21% Shaving sticks, oil, soaps
4 28% 21% Luxury goods such as tobacco, high-end cars, aerated drinks etc.
The following are the rates of new items that are of use for a common man.
Sugar, tea, coffee (not instant) and edible oil to fall under 5% slab.
Cereals and milk have been exempted from GST.
Capital and intermediate goods would be taxed at 18% which is expected to be a good boon
for the industrial growth.
Coal is kept in 5% tax slab which is currently 11.69%
Vol. 6 | Special Issue. 1 | March 2018 | ISSN: 2319-961X
63 Shanlax International Journal of Economics
Toothpaste, hair oil and soaps will be taxed at 18% instead of 28% current rate.
Common man items have been kept under 12% and 18% slab.
Indian sweets and mithai in 5% slab.
All raw food items including food grains are exempted from GST.
Processed food of daily needs to be in 5% slab.
How GST will impact a common man's budget
GST is stated to be one of the biggest tax reforms in India, which would not only impact
the businesses but also the common man.
Within the household budget, there are likely to be some obvious gainers and some obvious
losers but once the law and pricing of commodities reach steady state, all consumers should
gain.
Now, let us categorize all house expenses into 5 buckets i.e., Food, Entertainment,
Personal Care, Transportation and communication services.
Food items – Earlier tax 12.5% -New Tax under GST – 5% Positive news
Entertainment – Earlier tax 30% - New Tax under GST – 28% - Positive news
Transportation – Earlier tax 15% - New Tax under GST – 18% - Negative news
Personal Care – Earlier tax 28% - New Tax under GST -18% - Positive news
Communication (mobile and internet services) – Earlier taxes 15% - New Tax under GST –
18% - Negative news.
It is expected that the consumer would reap the benefits of the new tax regime, once the
corporates have transitioned completely to the new tax structure and start to pass on the
benefits to the end user.
Positive Impact of GST on the Common Man
A unified tax system removing a bundle of indirect taxes like VAT, CST, Service tax, CAD,
SAD, Excise etc.
A simplified tax policy as compared to earlier tax structure.
GST or Goods & Services tax removes cascading effect of taxes i.e. removes tax on tax.
Due to lower burden of taxes on the manufacturing sector, the manufacturing costs will be
reduced, hence prices of consumer goods likely to come down.
Due to reduced costs some products like cars, FMCG etc. will become cheaper.
This will help in lowering the burden on the common man i.e. you will have to shed less
money to buy the same products which were earlier costly.
The low prices will further lead to an increase in the demand/consumption of goods.
Increased demand will lead to increase supply. Hence, this will ultimately lead to rise in the
production of goods.
The increased production will lead to more job opportunities in the long run. But, this can
happen only if consumers actually get cheaper goods.
It will curb circulation of black money. This can happen only if the “kacha bill” system,
normally followed by traders and shopkeepers is put to check.
A unified tax regime will lead to less corruption which will indirectly affect the common
man.
National Seminar on CONTEMPORARY MACRO ECONOMIC ENVIRONMENTAL ISSUES
64 Rani Anna Government College for Women, Tirunelveli
Most importantly, experts hope to see a positive impact of GST on Indian economy in the
long run.
In the shorter term, consumers will pay less tax on goods and services and thereby have
more disposable income.
The centre and state will also earn more tax from the GST rollout, which will aid in GDP
growth (according to most research reports an estimate 1-2%) over the next 3 to 5 years.
This incremental income can be used in developing public infrastructure in the longer term.
Black money will get stifled and this may lead to more income for the government
exchequer. This will then percolate to public spending and better quality of life.
But, this is possible only if the actual benefit of GST is passed on to the final consumers.
GST has definitely changed the earlier tax regime taxation, which was production-based, to
now consumption-based system. The common man, in the long-run would be benefited from
GST in terms of infrastructure and economic growth of the country, and a lot more.
Conclusion
Goods and Services Tax (GST), hailed as one of the most powerful tax reforms which India
has ever seen, purports to do away with the multiple tax regulations on most of the goods and
services. GST affected the life of a common man as they were the ultimate consumers. Many
things become cheaper and many things become costly. The movement of goods will now
become much simpler across the country and cheaper as the new regime replaces the old
system, where a product was taxed multiple times and at different rates. Let us hope this “One
nation, one tax” proves to be a game changer in a positive way and proves to be beneficial not
only to the common man but to the country as a whole. A rising Indian economy will anyways
help in the financial growth of the common man. However, GST is a long term strategy and
the real impact can be seen in the long run only.
References
1. https://blog.loanbaba.com/7-impacts-of-gst-on-common-man-in-india/
2. https://economictimes.indiatimes.com/news/economy/policy/how-gst-will-impact-a-
common-mans-budget/articleshow/60011410.cms
3. https://fintrakk.com/gst-what-is-the-impact-of-gst-on-common-man/
4. https://blog.saginfotech.com/gst-impact-on-common-man
5. http://www.gstax.guru/impact-gst-common-man-india/972
6. https://www.quora.com/How-will-GST-affect-my-taxation-as-a-common-man
7. https://www.ndtv.com/india-news/gst-is-here-how-it-will-impact-you-in-10-points-
1719130
8. https://www.slideshare.net/SubhashGupta35/presentation3-71495822
9. https://www.slideshare.net/tridentbull/impact-of-goods-and-services-tax-gst-to-the-
common-man
10. http://www.ijemr.net/DOC/ImpactOfGSTOnCommonMan.pdf
11. Nath, B. (2017). Goods and services tax: A milestone in Indian economy. IJAR, 3(3), 699-
702.
12. International Research Journal of Management and Commerce ISSN: (2348-9766) Impact
Factor- 5.564, Volume 4, Issue 9, September 2017
Vol. 6 | Special Issue. 1 | March 2018 | ISSN: 2319-961X
65 Shanlax International Journal of Economics
CUT – THROAT COMPETITION AND THE FEAR OF RE-
EMERGENCE OF MONOPOLY IN THE TELECOM SECTOR
Dr.G.Mahalakshmi
Associate Professor of Economics, Rani Anna Government College (W), Tirunelveli
Abstract
In India Telecom industry was started as a monopoly and gradually transformed into an industry flooded by
private players. There are multiple operators offering similar products and targeting same segment of customers. The
only option for these companies to seize the market is to eliminate others. Therefore almost every company offer heavy
discounts and put up prices well below the production cost to attract customers and deprive other companies from
business. Albeit this is unsustainable in the long run, for the time being, cut-throat competition is going on in the
Telecom industry. The ultimate result is exit of losers, consolidation of some players which may lead to concentration
of power in the hands of a single private player, in other words, monopoly. If this happens, it will bring the evil effects
of monopoly like poor customer service, no consumer sovereignty, consumer exploitation, high prices and low quality
of goods and services and ultimately it will affect bankers, employees, vendors and the customers. The present article
explains how the telecom sector has transformed from monopoly to competitive market, resulting present scenario, and
the impact of cut-throat competition on the telecom sector as well as the economy.
Keywords: Cut-throat Competition, Monopoly, Telecom Sector
Introduction
The Indian Telecom sector has been under pressure for the last 8 years because of rising
unhealthy competition among the private players. Increased competition and price wars in the
sector have led to deterioration in the financials of telecom firms, which in turn could hurt
banks that have issued loans to them. All the Telecom companies have to invest continuously
to purchase spectrum, new equipments for up gradation of new technology and coverage.
Therefore they are not able to manage their cost of capital and the profit has consistently
declined. The interest coverage ratio is an indicator that measures the debt servicing ability a
firm. A ratio less than 1 suggests that a company does not earn enough to make good on
interest payments. RBI reported that the aggregate interest coverage ratio of the telecom sector
now has fallen below 1. The contribution of telecom services to GDP has also declined from 2
per cent of GDP in 2009 to 1.2 per cent % in 2017
Inception of Telecom Industry - Monopoly
In India, Telecom industry was started in 1851 when the first operational land lines were
laid by the government near Calcutta. In 1881, the Telephone services were introduced and in
1883 it was merged with the postal system. In 1923 the Indian Radio Telegraph Company was
formed. After independence, Telecom industry was formed as a monopoly by the
nationalization of private players.
In 1981, Liberalisation of Indian telecommunication was started and in 1985
the Department of Telecom was separated from Indian Post and Telecommunication
Department. Till 1986, DoT was responsible for telecom services in the entire country. After
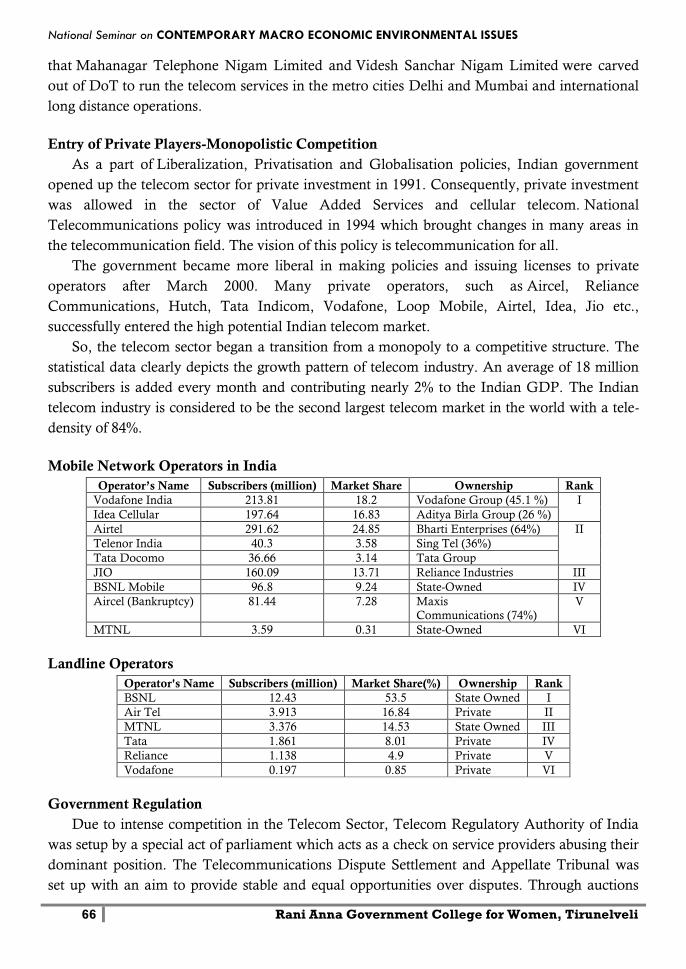
National Seminar on CONTEMPORARY MACRO ECONOMIC ENVIRONMENTAL ISSUES
66 Rani Anna Government College for Women, Tirunelveli
that Mahanagar Telephone Nigam Limited and Videsh Sanchar Nigam Limited were carved
out of DoT to run the telecom services in the metro cities Delhi and Mumbai and international
long distance operations.
Entry of Private Players-Monopolistic Competition
As a part of Liberalization, Privatisation and Globalisation policies, Indian government
opened up the telecom sector for private investment in 1991. Consequently, private investment
was allowed in the sector of Value Added Services and cellular telecom. National
Telecommunications policy was introduced in 1994 which brought changes in many areas in
the telecommunication field. The vision of this policy is telecommunication for all.
The government became more liberal in making policies and issuing licenses to private
operators after March 2000. Many private operators, such as Aircel, Reliance
Communications, Hutch, Tata Indicom, Vodafone, Loop Mobile, Airtel, Idea, Jio etc.,
successfully entered the high potential Indian telecom market.
So, the telecom sector began a transition from a monopoly to a competitive structure. The
statistical data clearly depicts the growth pattern of telecom industry. An average of 18 million
subscribers is added every month and contributing nearly 2% to the Indian GDP. The Indian
telecom industry is considered to be the second largest telecom market in the world with a tele-
density of 84%.
Mobile Network Operators in India
Operator’s Name Subscribers (million) Market Share Ownership Rank
Vodafone India 213.81 18.2 Vodafone Group (45.1 %) I
Idea Cellular 197.64 16.83 Aditya Birla Group (26 %)
Airtel 291.62 24.85 Bharti Enterprises (64%) II
Telenor India 40.3 3.58 Sing Tel (36%)
Tata Docomo 36.66 3.14 Tata Group
JIO 160.09 13.71 Reliance Industries III
BSNL Mobile 96.8 9.24 State-Owned IV
Aircel (Bankruptcy) 81.44 7.28 Maxis
Communications (74%)
V
MTNL 3.59 0.31 State-Owned VI
Landline Operators
Operator's Name Subscribers (million) Market Share(%) Ownership Rank
BSNL 12.43 53.5 State Owned I
Air Tel 3.913 16.84 Private II
MTNL 3.376 14.53 State Owned III
Tata 1.861 8.01 Private IV
Reliance 1.138 4.9 Private V
Vodafone 0.197 0.85 Private VI
Government Regulation
Due to intense competition in the Telecom Sector, Telecom Regulatory Authority of India
was setup by a special act of parliament which acts as a check on service providers abusing their
dominant position. The Telecommunications Dispute Settlement and Appellate Tribunal was
set up with an aim to provide stable and equal opportunities over disputes. Through auctions
Vol. 6 | Special Issue. 1 | March 2018 | ISSN: 2319-961X
67 Shanlax International Journal of Economics
and administrative allocations, certain portions of spectrum will be assigned to every telecom
operator. With penetration of mobile telephony in rural areas, the rural folk were the biggest
beneficiaries. Banking and other reforms like financial inclusion were also possible with the
Telecom revolution.
Cut-Throat Competition
After witnessing intense competition the Telecom industry is in a stage of consolidation
today. Since there are multiple operators offering similar products and targeting same segment
of customers their competition was more in terms of price and conditions of sale. That is they
follow cut throat competition strategy to attract the customers and force the rivals to exit from
the market. Cut throat competition is a situation where competitors use predatory pricing and
heavy promotion to eliminate their rivals. In economics, cut throat competition is also referred
to as ruinous competition. Generally, cut throat competition is also known as "destructive
competition" or “unhealthy competition”. Many countries have strict legislation against anti-
competitive practices in pricing an cut throat competition.
But this is unsustainable in the long run and cannot be achieved. The outcome is India’s top
seven telecommunications companies’ total debt burden has increased from Rs 3,02,321 crore
in 2015-16 to Rs 3,59,940 crore in 2016-17. The mounting debt burden has increased the
finance costs for the companies and also diminished their ability to re-pay debt. A report of
Brokerage house Credit Suisse revealed that 45 percent of the telecom sector debt is held by
companies with an interest coverage ratio less than one. Interest coverage ratio measures a
company’s financial ability to service debt. Their interest coverage ratios have worsened in the
recent year.
Re-emergence of Monopoly
The smaller and loss making entities are being taken over by bigger and established players.
Vodafone and Idea are in the process of merger, Airtel bought Tata Teleservices and RCOM
closed its voice services. The industry currently is at a very distressing stage and one has to see
whether this consolidation will again lead to concentration of the market by a select few. Earlier
there were 12 operators. Now they are already down to six-seven. The telecom operator is said
to be troubled since Reliance Jio’s extravagant entry into the Indian telecom market by their
offer. Aircel cites unsustainable debt, price wars, legal challenges and massive losses resulting
in bankruptcy. The company acknowledged that it had been facing troubles in a highly
competitive market and financially stressed industry. Aircel customers who enrolled their
Aircell number for Aadhaar Card, Gas, Banking and all other services are in distress.
Today many service providers are undergoing deep financial stress. There is a fear that
stress in the telecom sector could come to haunt Indian lenders. One side, the bankruptcy
would have unfavourable impact on the society and on the other side there is a possibility of
reappearance of monopoly. If it happens, the poor and middle class people have to meet the evil
effects of monopoly like poor level of service, no consumer sovereignty, consumer exploitation,
high prices and low quality of goods and services.
National Seminar on CONTEMPORARY MACRO ECONOMIC ENVIRONMENTAL ISSUES
68 Rani Anna Government College for Women, Tirunelveli
Conclusion
India’s telecom industry has been through a paradigm shift over the last three decades.
Department of Telecommunications was the sole service provider in the early 1990s. Gradually
it transformed into monopolistic market structure with the entry of private players. There are too
many sellers offering similar products and targeting same segment of customers. Therefore at
present cut-throat competition is going on in the Telecom industry. The ultimate result is exit of
losers, consolidation of some players which may lead to reappearance of monopoly. In the
earlier case the government was the monopoly in Telecom sector. But, at the present scenario, a
wealthy private player would be the monopoly. If this indeed happens, it will bring the evil
effects of monopoly like poor customer service, no consumer sovereignty, consumer
exploitation, high prices and low quality of goods and services and ultimately it will affect
bankers, employees, vendors and the customers. Therefore corrective steps should be taken by
the government for ensuring orderly growth in this sector in terms of services to the common
man.
References
1. http://www.businesstoday.in/sectors/telecom
2. https://telecom.economictimes.indiatimes.com/
3. https://www.ibef.org>industry
4. https://academic.oup.com/restud/article
5. https://www.nytimes.com/monooly
6. www.economist.com/node
7. https://en.wikipedia.org/wiki/Cut_throat_competition
Vol. 6 | Special Issue. 1 | March 2018 | ISSN: 2319-961X
69 Shanlax International Journal of Economics
A STUDY ON CUSTOMER SATISFACTION TOWARDS ELECTRONIC
PAYMENT SYSTEM IN TIRUCHENDUR AREA
Dr.R.Bhavani
Assistant Professor, Department of Commerce
Govindammal Aditanar College for Women, Tiruchendur, Tamilnadu
V.Suganthi
M.Phil Research Scholar (Commerce) Govindammal Aditanar College for Women, Tiruchendur, Tamilnadu
Introduction
The electronic payment issue is proving to be the one of the biggest stumbling blocks in the
popularization of commerce over the net. Perfect solution to questions regarding security,
integration ease of use and other issues are still not available. E payment is a subset of an e-
commerce transaction to include electronic payment for buyers selling goods or service offered
through the Internet. Generally we think of electronic payment referring to online transaction
on the internet, there are actually many forms of electronic payment. As technology
developing, the range of devices and processes to transact electronically cor increase while the
percentage of cash and check a transaction continues to decrease.
The term electronic payment is a collective phrase for the many different kinds of electronic
payment methods available and the processing of transactions and their application within
online merchants and e commerce websites.
Electronic payment systems can also increase your cash flow, reduce administrative costs
and labors provide yet another way for your customers to pay. Care must be taken when
choosing an electronic payment solution as it will need to fit within the constraints of your
particular inline business and integrate within your website.
Statement of Problem
E-banking was adopted by banks so as to improve their service delivery, decongest queues
in the banking hall, enable customers withdraw cash 24/7, aid international payment and
remittance, track personal banking transaction, request for online statement, or even transfer
deposit to a third party account. Despite the effort of banks to ensure that customers reap the
benefits of e-banking, the bank is met with complaints from customers as regards,
malfunctioning Automated Teller machines (ATM), network downtime, online theft and fraud,
non-availability of financial service, payment of hidden cost of electronic banking like short
massage services (SMS), for sending alert, mandatory acquisition of ATM cards, non
acceptability of Nigerian cards for international transaction amongst others. This study is
National Seminar on CONTEMPORARY MACRO ECONOMIC ENVIRONMENTAL ISSUES
70 Rani Anna Government College for Women, Tirunelveli
aimed at finding out the reason why these problems occur and in most cases persist, and then to
make recommendations based on the outcome of the study.
Objectives of the Study
To study the social-economic profile of the respondents.
To find out the level of perception towards electronic payment system.
To offer suitable suggestions to improve E-payment system.
Scope of the Study
A study covers use of E-payment system, problems faced by the respondents while making
E-payment system, and also the level of satisfaction towards the E-payment system.
Research Methodology
Sources of Data
The researcher has collected data both from primary and secondary sources. The primary
data were collected from respondents directly through a questionnaire. The secondary data
were collected from books, journals and website.
Sample Technique
This section describes the methodology which includes the collection of data, the
construction of questionnaire and sampling design and convenience sampling methods.
Sample Size
120 respondents using electronic payment system were selected as sample in Tiruchendur
area which covers Tiruchendur, Kurumbur, Arumuganeri and Udangudi for this study.
Statistical Tools Used
The data were analyzed by chi-square test.
Limitation of the Study
The following are the limitation of the study.
The study is based on the opinion and views of 120 respondents only. So the findings and
suggestions of this study may not be suitable to all the respondents.
This study was continued only to Tiruchendur area. Hence the conclusion derived from this
study may not be applicable to other place.
The period of the study is very much limited.
Time cost and other resources were constraints for a fully comprehensive study.
Hypotheses
There is no significant association between the level of perception towards the E-payment
system and the personal variable like gender, age, educational qualification
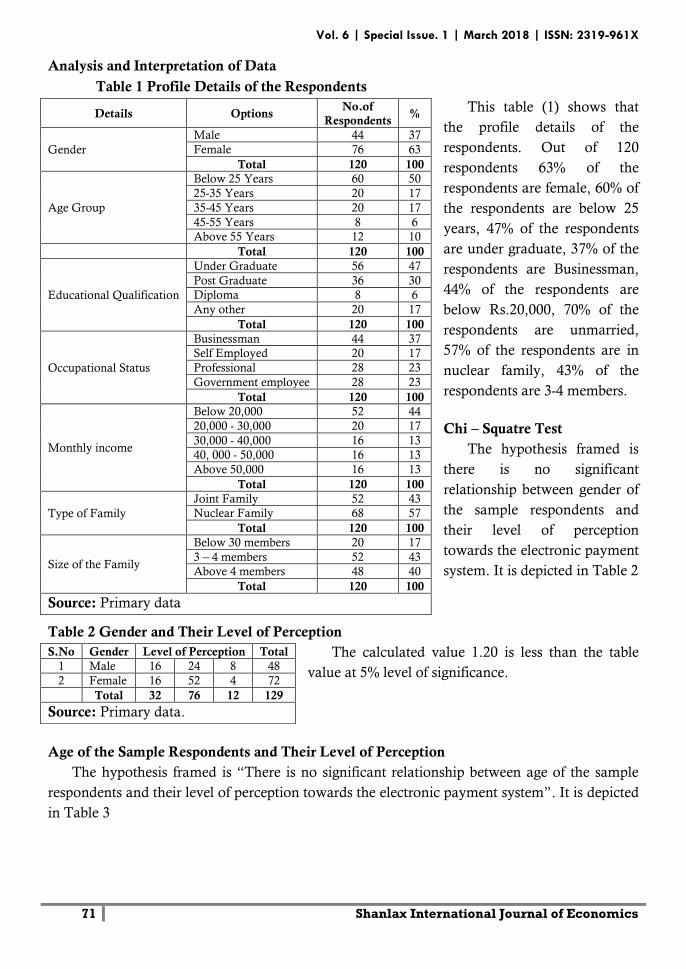
Vol. 6 | Special Issue. 1 | March 2018 | ISSN: 2319-961X
71 Shanlax International Journal of Economics
Analysis and Interpretation of Data
Table 1 Profile Details of the Respondents
This table (1) shows that
the profile details of the
respondents. Out of 120
respondents 63% of the
respondents are female, 60% of
the respondents are below 25
years, 47% of the respondents
are under graduate, 37% of the
respondents are Businessman,
44% of the respondents are
below Rs.20,000, 70% of the
respondents are unmarried,
57% of the respondents are in
nuclear family, 43% of the
respondents are 3-4 members.
Chi – Squatre Test
The hypothesis framed is
there is no significant
relationship between gender of
the sample respondents and
their level of perception
towards the electronic payment
system. It is depicted in Table 2
Table 2 Gender and Their Level of Perception
The calculated value 1.20 is less than the table
value at 5% level of significance.
Age of the Sample Respondents and Their Level of Perception
The hypothesis framed is “There is no significant relationship between age of the sample
respondents and their level of perception towards the electronic payment system”. It is depicted
in Table 3
Details Options No.of
Respondents %
Gender
Male 44 37
Female 76 63
Total 120 100
Age Group
Below 25 Years 60 50
25-35 Years 20 17
35-45 Years 20 17
45-55 Years 8 6
Above 55 Years 12 10
Total 120 100
Educational Qualification
Under Graduate 56 47
Post Graduate 36 30
Diploma 8 6
Any other 20 17
Total 120 100
Occupational Status
Businessman 44 37
Self Employed 20 17
Professional 28 23
Government employee 28 23
Total 120 100
Monthly income
Below 20,000 52 44
20,000 - 30,000 20 17
30,000 - 40,000 16 13
40, 000 - 50,000 16 13
Above 50,000 16 13
Total 120 100
Type of Family
Joint Family 52 43
Nuclear Family 68 57
Total 120 100
Size of the Family
Below 30 members 20 17
3 – 4 members 52 43
Above 4 members 48 40
Total 120 100
Source: Primary data
S.No Gender Level of Perception Total
1 Male 16 24 8 48
2 Female 16 52 4 72
Total 32 76 12 129
Source: Primary data.
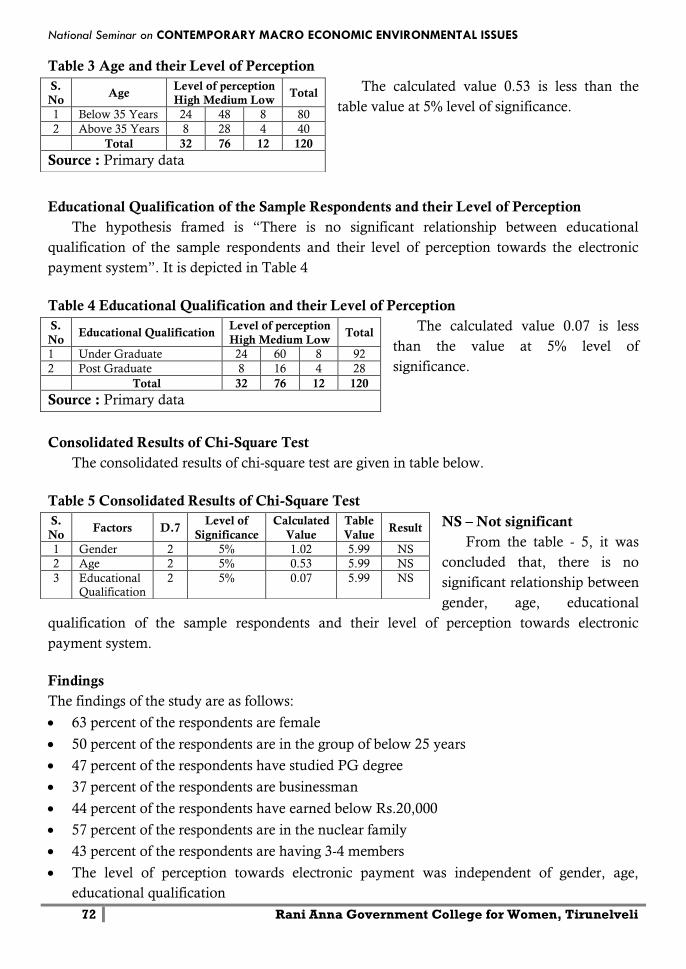
National Seminar on CONTEMPORARY MACRO ECONOMIC ENVIRONMENTAL ISSUES
72 Rani Anna Government College for Women, Tirunelveli
Table 3 Age and their Level of Perception
The calculated value 0.53 is less than the
table value at 5% level of significance.
Educational Qualification of the Sample Respondents and their Level of Perception
The hypothesis framed is “There is no significant relationship between educational
qualification of the sample respondents and their level of perception towards the electronic
payment system”. It is depicted in Table 4
Table 4 Educational Qualification and their Level of Perception
The calculated value 0.07 is less
than the value at 5% level of
significance.
Consolidated Results of Chi-Square Test
The consolidated results of chi-square test are given in table below.
Table 5 Consolidated Results of Chi-Square Test
NS – Not significant
From the table - 5, it was
concluded that, there is no
significant relationship between
gender, age, educational
qualification of the sample respondents and their level of perception towards electronic
payment system.
Findings
The findings of the study are as follows:
63 percent of the respondents are female
50 percent of the respondents are in the group of below 25 years
47 percent of the respondents have studied PG degree
37 percent of the respondents are businessman
44 percent of the respondents have earned below Rs.20,000
57 percent of the respondents are in the nuclear family
43 percent of the respondents are having 3-4 members
The level of perception towards electronic payment was independent of gender, age,
educational qualification
S.
No Age
Level of perception
High Medium Low Total
1 Below 35 Years 24 48 8 80
2 Above 35 Years 8 28 4 40
Total 32 76 12 120
Source : Primary data
S.
No Educational Qualification
Level of perception
High Medium Low Total
1 Under Graduate 24 60 8 92
2 Post Graduate 8 16 4 28
Total 32 76 12 120
Source : Primary data
S.
No Factors D.7
Level of
Significance
Calculated
Value
Table
Value Result
1 Gender 2 5% 1.02 5.99 NS
2 Age 2 5% 0.53 5.99 NS
3 Educational
Qualification
2 5% 0.07 5.99 NS
Vol. 6 | Special Issue. 1 | March 2018 | ISSN: 2319-961X
73 Shanlax International Journal of Economics
Suggestions
There should be arrangement of systematic educational campaign for the clients to educate
them.
Banks should do whatever they can to facilitate and encourage the current electronic
payment instruments and system that can correlate to the movement of financial services
and funds from one sector to another.
The banks in both sectors should increase the number of onsite and offsite ATMS.
Conclusion
An overview of the payment system Landscape in reveals that while the growth of
electronic payment have been impressive, the benefits of modern electronic payment systems
are yet to reach all sections of the society and be accepted across the length and breath of the
country. Current analysis also indicates that the penetration and success of modern electronic
payment methods are to be strengthened further so as to slim the cream of the benefits of
technologically innovative banking products.
References
Books
1. Prasad L.M. “Modern Banking”, Sultan chand Sons, New Delhi.
2. Machiraj Y.H.R,”E – commerce”, vikas publishing House, New Delhi, 2003.
Journals
1. Claude muller, “secure Electronic Transaction”, Journal of internet Banking and
commerce, vol.10, 2005.
2. Rajesh.I and srivalli. K.V “customer’s perception towards Technology based Banking –
A Review” IJEMR, Vol.3, Issue.3, March 2013.
Websites
1. www.indianrail.gov.in
2. www.erail.in
3. www.vikipedia .com
National Seminar on CONTEMPORARY MACRO ECONOMIC ENVIRONMENTAL ISSUES
74 Rani Anna Government College for Women, Tirunelveli
DEMONETIZATION - NARENDRA MODI
THE LATEST VERSION OF MUHAMMAD – BIN – TUGLUQ
Dr.A.Theeba
Associate Professor in History, Rani Anna Government College, Tirunelveli
Abstract
Demonetization has come to describe in India. One economic decision that shook a billion people from the very
moment it was announced by Prime Minister NarendraModi on 8th November 2016. From the manifestation
shrouded in the secrecy, the rationale aftermath, the short and long term economic impact, the social and political
impacts and much more endless animated discussions in virtually every kind of group of any kind of place, unending
serpentine ques of banks and ATMs. Continuous news headlines for days and weeks etc proved that the policy of
NarendraModi brought numerous problems to multitudes of people. Muhammad – Bin – tugluq, the wisest fool as
the historians refer was also interested in experiments. He did man many experiments for which innocent people lost
their lives. Though his intentions were indeed good, the people were not prepared for the new situation. Issue of token
currency was one of his novel experiment which at last ended in ultimate failure. Likewise NarendraModi announced
demonetization to confiscate black money, but at the end the problems of corruption or black money still remains the
same problem. The economic policies of India’s Prime Minister NarendraModi are calles ‘Modinomics’. His followers
or voters belive that Modinomics is a much needed panacea to Indias economy, the Indian economy led by Prime
Minister Modi and his ‘Expert’ team is consciously ignorant of economics. This paper focus on the adverse effects of
demonetization and a comparative study with sulan Muhammad – Bin – tugluq.
Introduction
Demonetization is a situation where the central bank of the country (RBI) withdraws the
old currency notes of certain domination as an official mode of payment on 8th November
2016, Prime Minister Narendra Modi in a surprise announcement said the existing higher
denomination currencies ( Rs.500 and Rs.1000 ) will cease to be legal tenders. Prime Minister
said this is governments biggest push to fight black money and end corruption. The opposition
however criticized the government for poor implementation of the scheme and said a lot of
people have died standing in queues trying to get their hands on the new currency. The
government also introduced new Rs 500 and Rs2000 notes and urged people to move towards
cash less economy. But the opposition has been protesting the government’s decision, even
stalling parliament. A ‘Jan Aakrosh Diwas’ was observed by the left and other major parties. The
economic policies of Indian Prime Minister Narendra Modi are called Modinomics. Their
‘intergral humanism’ application of economics stands intellectually dishonest, when the scope
of catallaxy is introduced in the said discourse. This paper compares demonetization with that
of the introduction of the ‘Copper Coins’ of the sultan Muhammad-Bin-Tugluq. Narendar
Modi is personified as the latest version of Muhammad-Bin-Tugluq.
The announcement about the demonetization of Rs500 and Rs1000 currency
denominations has caused ripples of excitement about its impact on black money as well as
anxiety about what’s in store for the common man. While the sudden decision has received as
many brickbats as bouquets, it has also reminded many of a medieval monarch who once tried
Vol. 6 | Special Issue. 1 | March 2018 | ISSN: 2319-961X
75 Shanlax International Journal of Economics
his hand at demonetizing in the 14th century India Muhammad – Bin – Tugluq. Tugluq ruled
over the northern part of Indian subcontinent and Deccan from 1324 to 1351. A learned man
with an open mind and a unique streak of intellectual creativity, Tugluq was well versed in
poetry, astronomy, religion and philosophy.
Muhammad – Bin – Tugluq tried to bring reforms in several areas of state administration
with the help of his wazir Khwaja Jahan one among which was the bullion currency. He
wanted to increase his resources for his grand scheme’s of conquest and administrative reforms,
but the revenue had fallen because of famine. As a genius who delighted in experiments he
introduced his famous token currency and struck vast quantity of copper coins known as
Dirhams. Tugluq got the idea of demoneization from Kublai Khan (1260-1294) of China and
Gaikhata (1293) of Persia. He introduced token currency system and minted vast quantities of
brass and copper coins that could be exchanged for fixed amounts of gold and silver. While this
decision helped the sultanates finances initially, it also proved to be lucrative to forgers who
began issuing a large number of fake coins. Loopholes like a simple design and no royal seals
made the task easier for the forgers. Every Hindu house became a mint for copper coin while
gold and silver coins were zealously hoarded, soon the market was awash with fake coins.
As good money was driven out of circulation, token coins became practically valueless
leading to hyperinflation. Foreign traders also refused to accept them, paralyzing trade.
Realizing that scheme failed Tugluq withdrew the currency in an attempt to strength the
economic chaos. However, the number of fakes was so large that for many years mounds of
worthless copper and brass coins rejected by the government remained piled outside the royal
fort. The economic chaos and public resentment were also one of the major reason why, by the
time Tugluq died, his kingdom had diminished to a small region around Delhi. Muhammad-
Bin-Tugluq had the best intentions and his moves were bold for his times but were poorly
implemented. Also. In his hurry to realize his dreams, he severely punished anyone who
opposed his hasty moves. This combined with his habit of acting without assessing risks and
without providing for unforeseen difficulties resulted in his administrative gambles ending in
disaster.
Likewise, Modi’s announcement of demonetization, right from day one, the more attracted
sharp criticism from many quarters. Most non credited money in the world today is what called
Fiat Money is to say it is not backed by any real commodities such as gold but it is only backed
by the government currency in the form of bank notes is through legal tender, whereby the
issuing authority promises to accept that note at its face value. Demoneization is the removal of
backing, it is the process by which particular currency notes are no longer legal tender. Deposits
of the demonetized notes into banks were allowed only until 30th December 2016. At first it was
stated that the RBI would continue to accept such notes until 31st March 2017. Subsequently an
ordinance was promulgated, this legally terminated RBIs liability on the banned currency note
and even prescribed a penalty for anyone found to be holding more than ten such notes or
dealing in these notes.
Cash withdrawls from bank account were restricted to Rs 10000 per day and Rs 20000
(later Rs 24000) per week. ATM withdrawls of cash were limited Rs 2000 per day and then to
National Seminar on CONTEMPORARY MACRO ECONOMIC ENVIRONMENTAL ISSUES
76 Rani Anna Government College for Women, Tirunelveli
Rs 2500 per day by end November 2016. Foreign tourists were only allowed to exchange
foreign currency upto Rs 5000 per person per week. Subsequently, as the amount of deposits of
cash into the banking system grew well beyond the governments own expectation, the failure of
this move to eliminate cash hoards stored by ‘black marketeer’ became clear
The black economy is once again in the news because of the announcement of
demonetization of a large denomination currency notes. The country witnessed the government
taking a decision against corruption, inflation, crime, counterfeiting and tax evasing to
discourage a cash dependent country. This decision is being made to curb financing of
terrorism through the proceedes of fake Indian currency notes and for eliminating black money.
The issue of black money brings to mind the garlands of rupee notes presented to Miss
Mayavati the former Chief Minister of Uttar Pradesh on her birthday. Untraceable black
money notoriously funds political campaign and facilitates tax evasion notably stamp duties in
real estate. Nobody really knows the amount of black money in India. In this effort for
development our motto has been ‘Sab Ka Saath Sab Ka Vikas’. Several economists also opined
that control economy is so fertile land for black money. Anna Hazare’s agitation against
corruption in 2011, better known as ‘Bharashtracharya Virodhi Andolan’ compelled the
government to announce in the parliament in November 2011, that it will prepare ‘white paper’
on black money. But the Modi government in the name of seizing black money squeezed
money from the poor and the needy. It has not confiscated hoards of black money
If the government had aligned demonetization with the In cone Declaration Scheme 2016,
it would have fetched a minimum of 2-3 lakhs crore as tax upfront. By unintelligently
separating them, it is now chasing demonetization depositors for tax. Demonetization as a
means of tackling the black money was destined to fail. It was carried out on the incorrect
premise that black money means cash. Black money is a result of black income generation. Any
black cash squeezed out by demonetization would then quickly get regenerated. So there is
little impact of demonetization on the black economy. News papers daily publishen articles
realted to the capture of new Rs 2000 in hoards in the homes of politicians and higher officials.
While most of the common people starved to death in the queues of the ATM’s the rich people
very coolly exchange their devalued currency sitting in the home with the help of bank officials.
The surgical strike of black money has told by Modi is a complete failure. More than 100
people have died as a result of demonetization plan. It is said that Prime Minister Modi is a
pragmatic modernizer of the government running the economy, but in reality the government
failed to minimize governments role. His favourite rhetoric ‘minimum government, maximum
governance’ convinced the ultra crepidrain class youngsters and global investors but the result
is ‘maximum government, minimum liberty’. Modinomics is still old wine in new bottle. He is
the latest version of Muhammad- Bin – Tugluq without any doubt.
Vol. 6 | Special Issue. 1 | March 2018 | ISSN: 2319-961X
77 Shanlax International Journal of Economics
References
1. Uma Kapila , ‘Demonetisation : The Economists Speak’ Vol 227 of Economic Developments in
India,2017
2. Rajat Yadav, ‘Dusk To Dawn-Demonetisation’, Chennai,2017
3. Kushboo Jain, ‘The War On Cash Demonetisation’, New Delhi,2017
4. Jayati Ghosh, C.P.Chandrasekhar &Prabhat Patnaik, ‘Demonetisation Decoded-A Critique of
India’s Currency Experiment’, New York , 2017
5. Ram Gopal Agarwala, ‘Demonetization : A Means to an End’, New Delhi,2017
6. Tamal Bandyopadhyay, ‘From Lehman To Demonetization’ A Decade of Disruption, Reforms and
Misadventures, 2017
7. Geetanjali Srivatsava, ‘Demonetization-Mirror or Mirage
8. Satish Chandra, ‘Medieval India : From Sultanate To Mughals (1206 – 1526), New Delhi, 2006
9. J.L.Mehta, ‘Indian Society And Culture’ Vol III, New Delhi,1983
10. Salma Ahmed Farooq, ‘A Comprehensive History of Medieval India-Twelfth To The Eighteenth
Century , New Delhi,2011
11. The Better India, 18th November 2016
12. The Hindu, 9th November 2017
13. Forbes, 8th December 2016
14. Economic Times, 9th November 2017
15. Dinakaran, 9th November 2017
National Seminar on CONTEMPORARY MACRO ECONOMIC ENVIRONMENTAL ISSUES
78 Rani Anna Government College for Women, Tirunelveli
A STUDY ON BANKING CREDIT AND DEPOSIT RATIO IN
PUBLIC SECTOR IN INDIA
Dr.P.Chennakrishnan
Assistant Professor, Department of Economics Thiruvalluvar University, Serkkadu, Vellore, Tamil Nadu
Abstract
This paper examines bank credit and Deposits ratio in public sector Banks are germane to economic development
through the financial services provided by them. The performance efficient and effective of the banking industry over
time is an index of financial stability. Banks has mobilization and allocation of resources play an important role in
the economy. The whole economy of the nation, the sound financial position of a bank is the guarantee not only to its
depositors but equally important it. Respectively, of funds of the bank’s Deposits and Credits are inflow and outflow.
In order to optimize credit flow and to ensure higher efficiency of credit creation, a monetary tool, called Credit-
Deposit (C-D) ratio was introduced by RBI. Credit-Deposit ratio is proportion of loan created by banks from deposits
it receives, in other words its capacity of banks to lend. High ratio indicates banks are generating more credit from its
deposits and vice-versa. The outcome of this ratio reflects the ability of the bank to make optimal use of the available
resources. The purpose of this study is to examine the impact of Credit-Deposit ratio on the profitability of public
sector banks for the period of 2009 to 2015.
Introduction
In Indian Banking Sector has a very play an important role in economic development of the
country. The people service in the banking system of India is featured by a large network of
bank branches and serving many kinds of financial services of the people. The State Bank of
India, popularly known as one of the leading bank of public sector in India. SBI has 14 Local
Head Offices and 57 Zonal Offices located at important cities throughout the country. HDFC
Bank Ltd is a major Indian financial services company based in Mumbai. The Bank is a
publicly held banking company engaged in providing a wide range of banking and financial
services including commercial banking and treasury operations. The Bank at present has an
enviable network of 2201 branches and 7110 ATMs spread in 996 cities across India. The
purpose of the study is to examine the financial performance of SBI and HDFC Bank, public
sector and private sector respectively. The research is descriptive and analytical in nature. The
data used for the study was entirely secondary in nature. The present study is conducted to
compare the financial performance of SBI and HDFC Bank on the basis of ratios such as credit
deposit, net profit margin etc. The period of study taken is from the year 2008-2009 to 2012-
2013. The HDFC Bank is performing well and financially sound than SBI but in context of
deposits and expenditure both is SBI and HDFC bank has better managing efficiency. In the
era of globalization the utilization of finance is considered as the most important function of an
organization. The firms are facing a stiff competition from the whole market, so the inflow and
outflow of funds will be managed well. Finance is one of the most important aspects of business
management. Without proper financial planning an enterprise is unlikely to be successful.
Vol. 6 | Special Issue. 1 | March 2018 | ISSN: 2319-961X
79 Shanlax International Journal of Economics
A competent banking system is acknowledged as fundamental requisite for the financial
progress of any country. The proficient banks can build a constructive role in lighting the
procedure of augmentation depends on the successful banking system. Public sector
commercial banks (PSCB’s) consist of State Bank of India, its seven subsidiaries and nineteen
other nationalized banks.( Das & Ghosh,2006) These PSCB’s in India persist to be the key
lenders in the economy due of their steep size and penetrative networks which promise them
elevated deposit mobilization and control of 80 percent of banking business in India. (Singh &
Tandon, 2012) In India, there is a bank-centered monetary structure where banks and financial
institutions are the financial intermediaries for commercial sector credit. (Kaur, 2012) Now a
days, the Banks are countenancing various challenges for instance, regular amends in know-
how, rigorous prudential capital norms, escalating competition, distressing intensity of NPA’s,
increasing customer hopes, rising strain on productivity, asset-liability management, liquidity
and credit risk management, increasing operating expenses and so on. (Oral & Yolalan, 1990)
With the transform in the societal and financial goals of Commercial banks, it becomes
enormously necessary to evaluate their financial performance. A study of Cash - Deposit Ratio
& Credit - Deposit Ratio would assist the policy makers to prepare policies for recovering
concert of these institutions. (Mittal & Dhade, 2007)
Objective of the study
The objective of this study is to analyze Cash Deposit Ratio & Credit - Deposit Ratio of
Indian Public Sector Banks in India.
1. To study the status of Non Performing Assets of Indian Scheduled Commercial Banks in
India
2. To study the impact of Credit and Deposit ratio in Banking Sector in India
Methodology
Mainly used on the secondary data for the study. The secondary data collected from Books,
journals, papers, Websites, performance of banking credit and deposit ratio in public sector in
India department in Government of India and other relevant data have been collect from
various government published data.
Sources of Data
The data collected is mainly secondary data. The sources of data for this thesis include the
literature published by Indian Bank and the Reserve Bank of India, various magazines,
Journals, Books dealing with the current banking scenario and research papers. The study is
based on secondary data. The paper discusses the conceptual framework of NPA and it also
highlights the trends, status and impact of NPA on scheduled commercial banks during the
period of i.e. from 2008-09 to 2014 -15. Several reputed research journal including research
paper and articles have been used by the researchers. Moreover, RBI Report on Trend and
Progress of Banking in India for various years, websites and a book on banking has been
referred during the study.
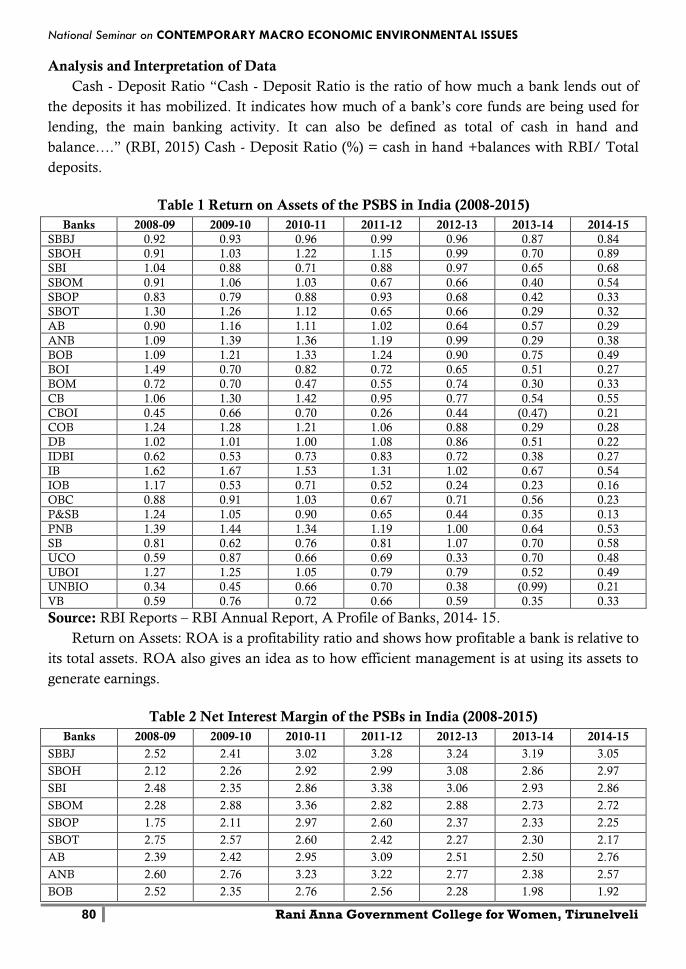
National Seminar on CONTEMPORARY MACRO ECONOMIC ENVIRONMENTAL ISSUES
80 Rani Anna Government College for Women, Tirunelveli
Analysis and Interpretation of Data
Cash - Deposit Ratio “Cash - Deposit Ratio is the ratio of how much a bank lends out of
the deposits it has mobilized. It indicates how much of a bank’s core funds are being used for
lending, the main banking activity. It can also be defined as total of cash in hand and
balance….” (RBI, 2015) Cash - Deposit Ratio (%) = cash in hand +balances with RBI/ Total
deposits.
Table 1 Return on Assets of the PSBS in India (2008-2015)
Banks 2008-09 2009-10 2010-11 2011-12 2012-13 2013-14 2014-15
SBBJ 0.92 0.93 0.96 0.99 0.96 0.87 0.84
SBOH 0.91 1.03 1.22 1.15 0.99 0.70 0.89
SBI 1.04 0.88 0.71 0.88 0.97 0.65 0.68
SBOM 0.91 1.06 1.03 0.67 0.66 0.40 0.54
SBOP 0.83 0.79 0.88 0.93 0.68 0.42 0.33
SBOT 1.30 1.26 1.12 0.65 0.66 0.29 0.32
AB 0.90 1.16 1.11 1.02 0.64 0.57 0.29
ANB 1.09 1.39 1.36 1.19 0.99 0.29 0.38
BOB 1.09 1.21 1.33 1.24 0.90 0.75 0.49
BOI 1.49 0.70 0.82 0.72 0.65 0.51 0.27
BOM 0.72 0.70 0.47 0.55 0.74 0.30 0.33
CB 1.06 1.30 1.42 0.95 0.77 0.54 0.55
CBOI 0.45 0.66 0.70 0.26 0.44 (0.47) 0.21
COB 1.24 1.28 1.21 1.06 0.88 0.29 0.28
DB 1.02 1.01 1.00 1.08 0.86 0.51 0.22
IDBI 0.62 0.53 0.73 0.83 0.72 0.38 0.27
IB 1.62 1.67 1.53 1.31 1.02 0.67 0.54
IOB 1.17 0.53 0.71 0.52 0.24 0.23 0.16
OBC 0.88 0.91 1.03 0.67 0.71 0.56 0.23
P&SB 1.24 1.05 0.90 0.65 0.44 0.35 0.13
PNB 1.39 1.44 1.34 1.19 1.00 0.64 0.53
SB 0.81 0.62 0.76 0.81 1.07 0.70 0.58
UCO 0.59 0.87 0.66 0.69 0.33 0.70 0.48
UBOI 1.27 1.25 1.05 0.79 0.79 0.52 0.49
UNBIO 0.34 0.45 0.66 0.70 0.38 (0.99) 0.21
VB 0.59 0.76 0.72 0.66 0.59 0.35 0.33
Source: RBI Reports – RBI Annual Report, A Profile of Banks, 2014- 15.
Return on Assets: ROA is a profitability ratio and shows how profitable a bank is relative to
its total assets. ROA also gives an idea as to how efficient management is at using its assets to
generate earnings.
Table 2 Net Interest Margin of the PSBs in India (2008-2015)
Banks 2008-09 2009-10 2010-11 2011-12 2012-13 2013-14 2014-15
SBBJ 2.52 2.41 3.02 3.28 3.24 3.19 3.05
SBOH 2.12 2.26 2.92 2.99 3.08 2.86 2.97
SBI 2.48 2.35 2.86 3.38 3.06 2.93 2.86
SBOM 2.28 2.88 3.36 2.82 2.88 2.73 2.72
SBOP 1.75 2.11 2.97 2.60 2.37 2.33 2.25
SBOT 2.75 2.57 2.60 2.42 2.27 2.30 2.17
AB 2.39 2.42 2.95 3.09 2.51 2.50 2.76
ANB 2.60 2.76 3.23 3.22 2.77 2.38 2.57
BOB 2.52 2.35 2.76 2.56 2.28 1.98 1.92
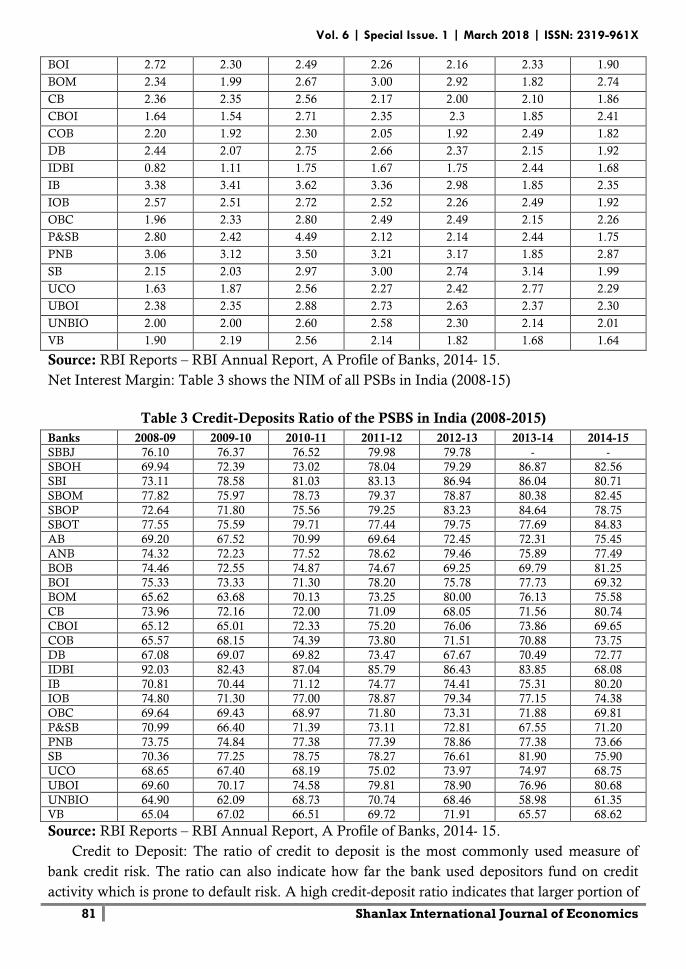
Vol. 6 | Special Issue. 1 | March 2018 | ISSN: 2319-961X
81 Shanlax International Journal of Economics
BOI 2.72 2.30 2.49 2.26 2.16 2.33 1.90
BOM 2.34 1.99 2.67 3.00 2.92 1.82 2.74
CB 2.36 2.35 2.56 2.17 2.00 2.10 1.86
CBOI 1.64 1.54 2.71 2.35 2.3 1.85 2.41
COB 2.20 1.92 2.30 2.05 1.92 2.49 1.82
DB 2.44 2.07 2.75 2.66 2.37 2.15 1.92
IDBI 0.82 1.11 1.75 1.67 1.75 2.44 1.68
IB 3.38 3.41 3.62 3.36 2.98 1.85 2.35
IOB 2.57 2.51 2.72 2.52 2.26 2.49 1.92
OBC 1.96 2.33 2.80 2.49 2.49 2.15 2.26
P&SB 2.80 2.42 4.49 2.12 2.14 2.44 1.75
PNB 3.06 3.12 3.50 3.21 3.17 1.85 2.87
SB 2.15 2.03 2.97 3.00 2.74 3.14 1.99
UCO 1.63 1.87 2.56 2.27 2.42 2.77 2.29
UBOI 2.38 2.35 2.88 2.73 2.63 2.37 2.30
UNBIO 2.00 2.00 2.60 2.58 2.30 2.14 2.01
VB 1.90 2.19 2.56 2.14 1.82 1.68 1.64
Source: RBI Reports – RBI Annual Report, A Profile of Banks, 2014- 15.
Net Interest Margin: Table 3 shows the NIM of all PSBs in India (2008-15)
Table 3 Credit-Deposits Ratio of the PSBS in India (2008-2015)
Banks 2008-09 2009-10 2010-11 2011-12 2012-13 2013-14 2014-15
SBBJ 76.10 76.37 76.52 79.98 79.78 - -
SBOH 69.94 72.39 73.02 78.04 79.29 86.87 82.56
SBI 73.11 78.58 81.03 83.13 86.94 86.04 80.71
SBOM 77.82 75.97 78.73 79.37 78.87 80.38 82.45
SBOP 72.64 71.80 75.56 79.25 83.23 84.64 78.75
SBOT 77.55 75.59 79.71 77.44 79.75 77.69 84.83
AB 69.20 67.52 70.99 69.64 72.45 72.31 75.45
ANB 74.32 72.23 77.52 78.62 79.46 75.89 77.49
BOB 74.46 72.55 74.87 74.67 69.25 69.79 81.25
BOI 75.33 73.33 71.30 78.20 75.78 77.73 69.32
BOM 65.62 63.68 70.13 73.25 80.00 76.13 75.58
CB 73.96 72.16 72.00 71.09 68.05 71.56 80.74
CBOI 65.12 65.01 72.33 75.20 76.06 73.86 69.65
COB 65.57 68.15 74.39 73.80 71.51 70.88 73.75
DB 67.08 69.07 69.82 73.47 67.67 70.49 72.77
IDBI 92.03 82.43 87.04 85.79 86.43 83.85 68.08
IB 70.81 70.44 71.12 74.77 74.41 75.31 80.20
IOB 74.80 71.30 77.00 78.87 79.34 77.15 74.38
OBC 69.64 69.43 68.97 71.80 73.31 71.88 69.81
P&SB 70.99 66.40 71.39 73.11 72.81 67.55 71.20
PNB 73.75 74.84 77.38 77.39 78.86 77.38 73.66
SB 70.36 77.25 78.75 78.27 76.61 81.90 75.90
UCO 68.65 67.40 68.19 75.02 73.97 74.97 68.75
UBOI 69.60 70.17 74.58 79.81 78.90 76.96 80.68
UNBIO 64.90 62.09 68.73 70.74 68.46 58.98 61.35
VB 65.04 67.02 66.51 69.72 71.91 65.57 68.62
Source: RBI Reports – RBI Annual Report, A Profile of Banks, 2014- 15.
Credit to Deposit: The ratio of credit to deposit is the most commonly used measure of
bank credit risk. The ratio can also indicate how far the bank used depositors fund on credit
activity which is prone to default risk. A high credit-deposit ratio indicates that larger portion of
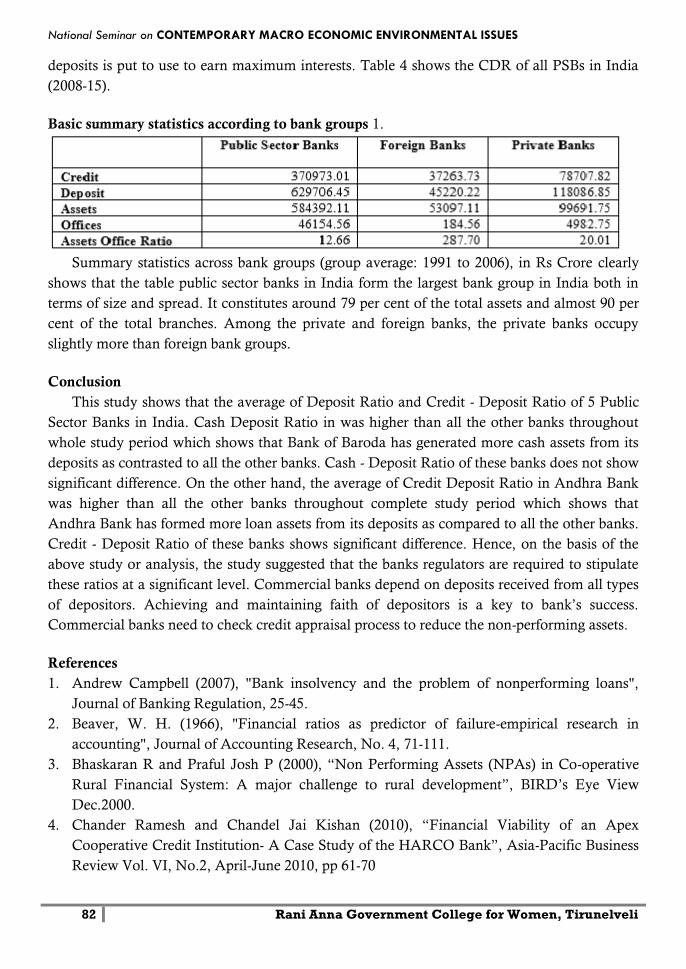
National Seminar on CONTEMPORARY MACRO ECONOMIC ENVIRONMENTAL ISSUES
82 Rani Anna Government College for Women, Tirunelveli
deposits is put to use to earn maximum interests. Table 4 shows the CDR of all PSBs in India
(2008-15).
Basic summary statistics according to bank groups 1.
Summary statistics across bank groups (group average: 1991 to 2006), in Rs Crore clearly
shows that the table public sector banks in India form the largest bank group in India both in
terms of size and spread. It constitutes around 79 per cent of the total assets and almost 90 per
cent of the total branches. Among the private and foreign banks, the private banks occupy
slightly more than foreign bank groups.
Conclusion
This study shows that the average of Deposit Ratio and Credit - Deposit Ratio of 5 Public
Sector Banks in India. Cash Deposit Ratio in was higher than all the other banks throughout
whole study period which shows that Bank of Baroda has generated more cash assets from its
deposits as contrasted to all the other banks. Cash - Deposit Ratio of these banks does not show
significant difference. On the other hand, the average of Credit Deposit Ratio in Andhra Bank
was higher than all the other banks throughout complete study period which shows that
Andhra Bank has formed more loan assets from its deposits as compared to all the other banks.
Credit - Deposit Ratio of these banks shows significant difference. Hence, on the basis of the
above study or analysis, the study suggested that the banks regulators are required to stipulate
these ratios at a significant level. Commercial banks depend on deposits received from all types
of depositors. Achieving and maintaining faith of depositors is a key to bank’s success.
Commercial banks need to check credit appraisal process to reduce the non-performing assets.
References
1. Andrew Campbell (2007), "Bank insolvency and the problem of nonperforming loans",
Journal of Banking Regulation, 25-45.
2. Beaver, W. H. (1966), "Financial ratios as predictor of failure-empirical research in
accounting", Journal of Accounting Research, No. 4, 71-111.
3. Bhaskaran R and Praful Josh P (2000), “Non Performing Assets (NPAs) in Co-operative
Rural Financial System: A major challenge to rural development”, BIRD’s Eye View
Dec.2000.
4. Chander Ramesh and Chandel Jai Kishan (2010), “Financial Viability of an Apex
Cooperative Credit Institution- A Case Study of the HARCO Bank”, Asia-Pacific Business
Review Vol. VI, No.2, April-June 2010, pp 61-70
Vol. 6 | Special Issue. 1 | March 2018 | ISSN: 2319-961X
83 Shanlax International Journal of Economics
5. Chandra, Buddhadeb (2006), “Performance of Burdwan Central Cooperative Bank in the
Development of the District (1988-89 to 1998-99)”, Finance India, September, 2006.
6. Dutta Uttam and Basak Amit (2008), “Appraisal of financial performance of urban
cooperative banks- a case study.” The Management Accountant, case study, March 2008,
170-174.
7. Fulbag Singh and Balwinder Singh (2006), "Funds management in the central cooperative
banks of Punjab- an analysis of financial margin", The ICFAI Journal of Management, Vol.
5, 74-80.
8. Geeta Sharma and Ganesh Kawadia (2006), "Efficiency of urban cooperative banks of
Maharashtra: A DEA Analysis", The ICFAI Journal of Management, Vol. 5, Issue 4.
9. Harish Kumar Singla (2008), "Financial performance of banks in India", The ICFAI
Journal of Management, Vol. 7, Issue 1.
10. Jain (2001),“Comparative study of performance of District Central Cooperative Banks
(DCCBs) of Western India i.e. Maharashtra, Gujarat & Rajasthan for the year 1999-2000
from the point of view of net profit/loss”, NAFSCOB Bulletin, April-June 2001.
National Seminar on CONTEMPORARY MACRO ECONOMIC ENVIRONMENTAL ISSUES
84 Rani Anna Government College for Women, Tirunelveli
CRYPTOCURRENCY - THE WEREWOLF
Dr.R.Sindhu
Assistant Professor of Economics Rani Anna Government College for Women,Tirunelveli
Abstract
Currencies are tangible until 1980’s and introduction of internet disrupt the entire currency economy by
introducing online services without need to go to banks in person to transfer money. But after the introduction of
decentralized currencies (cryptocurrencies) the trend is moving toward the building new type of economy.
Cryptocurrencies are fail-proof and easy to maintain than the traditional banking system. With cryptocurrency
exchanges where you can buy and sell cryptocurrencies, which offers the same traditional features as of stock exchange.
Keywords: Digital Currency, Cryptocurrency, Block Chain
Introduction
We are living in 21st century and WWW (World Wide Web - Internet) is ruling the whole
world, due to its technical advancement for past two decades it is capable of changing the
world's economy by its blink of an eye. The internet is the backbone of all the developed
nations, most of the countries are solely relying on the internet to advance its economic status.
When it come to individual share with internet on the economic activities were very low
initially, they used internet for mostly entertainment and information purposes until
cryptocurrencies emerged as strong competitor and change the entire horizon.
What is Crypto Currency
Cryptocurrencies are the virtual currencies that exists on the internet through a mechanism
call `blockchain`, and it is fail proof and distributed. Anyone can do transaction with minimum
to no commission on money transfer and maintenance. Due to its decentralized nature it
cannot be controlled by any government authorities.
Now there are large number of cryptocurrencies exists in the world, to name few bitcoin,
litecoin ethereum, etc.
Problems with real world currencies:
In comparison with the cryptocurrencies, the real world currencies is having a hard time to
put on maintenance and protection. As the currency exists in the real world as a entities they
should be protected by all means.
The movement of money, theft protection, black money, fake currencies, environmental
hazards such as fire, water, etc. are really painful in overhead. And as the reusability of money
is also less as the currencies are unusable at certain point of time, which increases the
maintenance cost of the currencies .Banks are the central bodies that maintain the currency and
unfortunately they are profit maximizing entities. So they basically charge for the service they
are providing us.
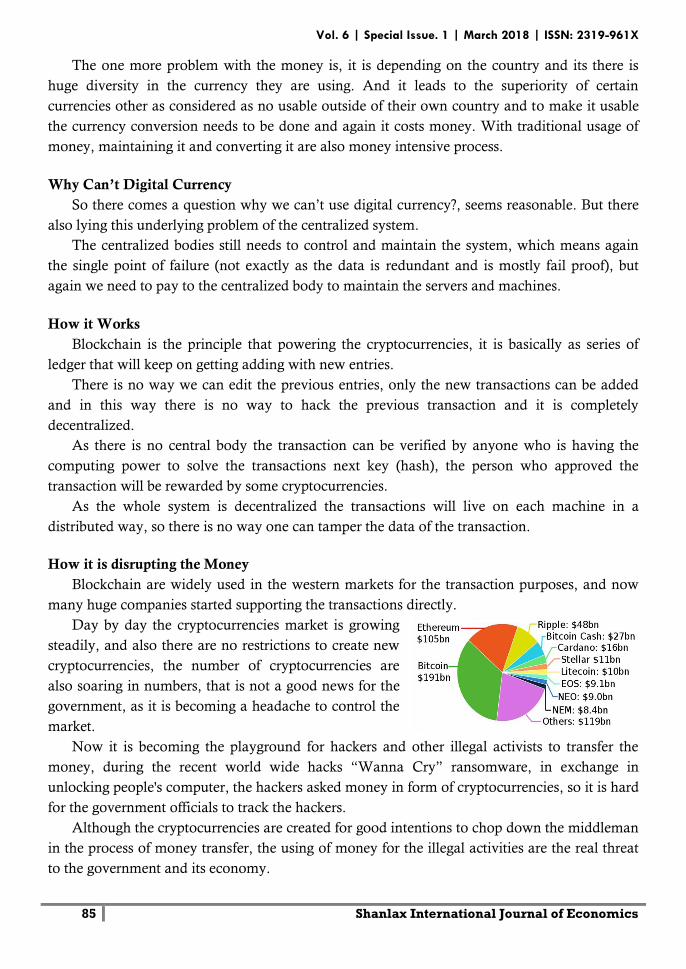
Vol. 6 | Special Issue. 1 | March 2018 | ISSN: 2319-961X
85 Shanlax International Journal of Economics
The one more problem with the money is, it is depending on the country and its there is
huge diversity in the currency they are using. And it leads to the superiority of certain
currencies other as considered as no usable outside of their own country and to make it usable
the currency conversion needs to be done and again it costs money. With traditional usage of
money, maintaining it and converting it are also money intensive process.
Why Can’t Digital Currency
So there comes a question why we can’t use digital currency?, seems reasonable. But there
also lying this underlying problem of the centralized system.
The centralized bodies still needs to control and maintain the system, which means again
the single point of failure (not exactly as the data is redundant and is mostly fail proof), but
again we need to pay to the centralized body to maintain the servers and machines.
How it Works
Blockchain is the principle that powering the cryptocurrencies, it is basically as series of
ledger that will keep on getting adding with new entries.
There is no way we can edit the previous entries, only the new transactions can be added
and in this way there is no way to hack the previous transaction and it is completely
decentralized.
As there is no central body the transaction can be verified by anyone who is having the
computing power to solve the transactions next key (hash), the person who approved the
transaction will be rewarded by some cryptocurrencies.
As the whole system is decentralized the transactions will live on each machine in a
distributed way, so there is no way one can tamper the data of the transaction.
How it is disrupting the Money
Blockchain are widely used in the western markets for the transaction purposes, and now
many huge companies started supporting the transactions directly.
Day by day the cryptocurrencies market is growing
steadily, and also there are no restrictions to create new
cryptocurrencies, the number of cryptocurrencies are
also soaring in numbers, that is not a good news for the
government, as it is becoming a headache to control the
market.
Now it is becoming the playground for hackers and other illegal activists to transfer the
money, during the recent world wide hacks “Wanna Cry” ransomware, in exchange in
unlocking people's computer, the hackers asked money in form of cryptocurrencies, so it is hard
for the government officials to track the hackers.
Although the cryptocurrencies are created for good intentions to chop down the middleman
in the process of money transfer, the using of money for the illegal activities are the real threat
to the government and its economy.
National Seminar on CONTEMPORARY MACRO ECONOMIC ENVIRONMENTAL ISSUES
86 Rani Anna Government College for Women, Tirunelveli
Advantages of Cryptocurrency There are some serious advantages of using the cryptocurrencies, first of all as mentioned
earlier it is decentralized, so it is having no maintenance cost for the user to use it, and the
transactions will happen fairly quick,
As cutting down the middleman such as banks, the transaction will generally happen at
very quickly, and with less or no transaction money required. Which is the huge selling point of
this cryptocurrencies.
There is no government regulations in the transactions, and it will help in reducing the
unwanted policies to be enforced on the transactions.
The currencies can transitioned in a globally without any restriction, which helps the user
to avoid the high transfer cost of the sending money to foreign countries.
Disadvantages of Cryptocurrency As digital currencies are based on central authority, there are some potential advantages. It
will have the power to cancel or freeze the transactions with the power of authorities during
suspicion.
In a Digital or Banking system, there is a set of people responsible for the operation of the
entire system. If there is a mistake in transaction, we can make a request and possibly revert
and correct the transaction. But with cryptocurrencies there is no way of reverting the
transactions, once the transaction is approved that is unalterable.
In traditional Banking system, all the transaction can be monitored by the government for
taxing and other government purposes, but with the cryptocurrency system all the transactions
happen with anonymously, so there is very hard to track back to the user, as the cryptocurrency
wallets are not tied to the people identity, even we track the senders address there is less chance
of tracking the user who did the malicious transaction.
The money value of the cryptocurrencies are very volatile and as it is not maintained by the
central body. Some huge internet marketing companies dropped support for the cryptocurrency
as they are highly volatile, it is very hard for them to get the appropriate money (sometimes low
and sometimes high).
Takeaways The whole discussion boiled down to two important aspects, the “speed and integrity” of
the cryptocurrencies to the “stable and controlled environments” on the traditional currencies
which make harder to avoid as well as embrace the cryptocurrencies.
As of now some government organizations are creating its own currencies to tackle the
currencies available in the market to overcome the uncontrolled and volatile market.
Some other government organizations are taking measure to ensure the existing transaction
wallets are attached to the particular people so that the transaction can be tracked back the user,
if there is a malicious activity
Even though the cryptocurrencies are fail proof, it will take time for people as well as
government to adapt these transformation.
References 1. https://masterthecrypto.com/evolution-cryptocurrency-problem-money-today/
2. https://en.wikipedia.org/wiki/Cryptocurrency
3. https://cointelegraph.com/explained/digital-currencies-vs-cryptocurrencies-explained
Vol. 6 | Special Issue. 1 | March 2018 | ISSN: 2319-961X
87 Shanlax International Journal of Economics
DEMONETISATION AND ITS IMPACT ON INDIAN ECONOMY
Dr.G.D.Reji
Assistant Professor of Economics CSI Institute of Legal Studies, Parassala, Trivandrum District
Introduction
Demonetisation is the process that involves a change of national currency, where the old
currency is replaced with a new currency. The act to cease a currency unit or put an official
stop on its status as a legal tender is known as demonetisation. The circulation of a specific
currency unit is stopped, followed by the withdrawal of old banknotes or coins. The process of
demonetisation is opposite to remonetisation, where the legal status is restored.
History of Demonetisation of Indian Currency
Demonetisation is going to be a landmark in the history of the Indian economy. It was an
experience which might create fear in the minds of the people who indulge in illegal activities
like tax evasion or money laundering of any kind.
In 1946, the currency note of Rs 1,000 and Rs 10,000 were removed from circulation. The
ban really did not have much impact, as the currency of such higher denomination was not
accessible to the common people. The highest denomination note ever printed by the Reserve
Bank of India was the Rs 10,000 note in 1938 and again in 1954. But these notes were
demonetised in January 1946 and again in January 1978, according to RBI data. Rs 1,000 and
Rs 10,000 banknotes were in circulation prior to January 1946. Higher denomination
banknotes of Rs 1,000, Rs 5,000 and Rs 10,000 were reintroduced in 1954 and all of them were
demonetised in January 1978. The Rs 1,000 note made a comeback in November 2000. Rs 500
note came into circulation in October 1987.
However, this is the first time that Rs 2,000 currency note is being introduced. Banknotes in
Ashoka Pillar watermark series in Rs 10 denomination were issued between 1967 and 1992, Rs
20 in 1972 and 1975, Rs 50 in 1975 and 1981 and Rs 100 between 1967-1979. The banknotes
issued during this period contained the symbols representing science and technology, progress
and orientation to Indian art forms.
In the year 1980, the legend Satyameva Jayate – ‘truth alone shall prevail’ - was
incorporated under the national emblem for the first time. In October 1987, Rs 500 banknote
was introduced with the portrait of Mahatma Gandhi and Ashoka Pillar watermark.
Mahatma Gandhi (MG) series banknotes - 1996 were issued in the denominations of Rs 5,
(introduced in November 2001), Rs 10 (June 1996), Rs 20 (August 2001), Rs 50 (March 1997),
Rs 100 (June 1996), Rs 500 (October 1997) and Rs 1,000 (November 2000). The Mahatma
Gandhi Series - 2005 banknotes were issued in the denomination of Rs 10, Rs 20, Rs 50, Rs
100, Rs 500 and Rs 1,000 and contained some additional/new security features as compared to
National Seminar on CONTEMPORARY MACRO ECONOMIC ENVIRONMENTAL ISSUES
88 Rani Anna Government College for Women, Tirunelveli
the 1996 MG series. The Rs 50 and Rs 100 banknotes were issued in August 2005, followed by
Rs 500 and Rs 1,000 denominations in October 2005 and Rs 10 and Rs 20 in April 2006 and
August 2006, respectively.
On November 8, 2016, Prime Minister Narendra Modi in a surprise announcement said the
existing higher denomination currency (Rs 500 and Rs 1000) will cease to be legal tenders.
Prime Minister said this is government’s biggest push to fight black money and end corruption.
The government also introduced new Rs 500 and Rs 2000 notes and urged people to move
towards the cash-less economy.
Objectives of the Study
1. To study the impact of demonetisation on the Indian Economy.
2. To understand the effects of positive and negative aspects of demonetisation on the Indian
Economy.
Methodology
The research paper is based on empirical study. It is a type of descriptive research paper.
The study is based upon secondary data collected through various sources like websites,
newspapers, articles and magazines. Here, we consider demonetisation as a factor introduced
into an economic system and its impact is being studied based on latest news and views.
This paper mainly discussed the impact on GDP, daily wage workers, small-scale
industries, digital economy, benefits and disadvantages of demonetization. It has had many
short-term effects which are visible. The long-term effects are yet to be experienced and felt.
Advantages of Demonetisation
With a perfect implementation, demonetisation policy can provide a great boost to any
country’s economy. They are: 1) Eradicate the use of fake currency, 2) Tackle with corruption
due to currency upholds, 3) Withdrawal of old currency and bring unaccounted money back
into the banking system by a considerable increase in bank deposits. With this the idle money
becomes productive, 4) Encourage digital payment modes to reach the target of a cashless
society, 5) Reduction of illegal activities and 6) Reduced tax avoidance by encouraging higher
tax payments.
Disadvantages of Demonetisation
Some of the disadvantages that may emerge could be:- 1) Inconvenience to the public, 2)
Huge economic cost to the nation, 3) Disruption of business activities, 4) Decrease in sales,
particularly cash-based sales, 5) Labour / Wage payment issues, 6) Additional printing and
distribution cost of new currency and 7) Problem situation for small-scale business operations
that deal in cash.
Impact on Gross Domestic Product (GDP)
The Indian economy is a cash-driven economy and demonetisation has largely affected its
growth. This was largely due to less availability of cash in cash-intensive industries like
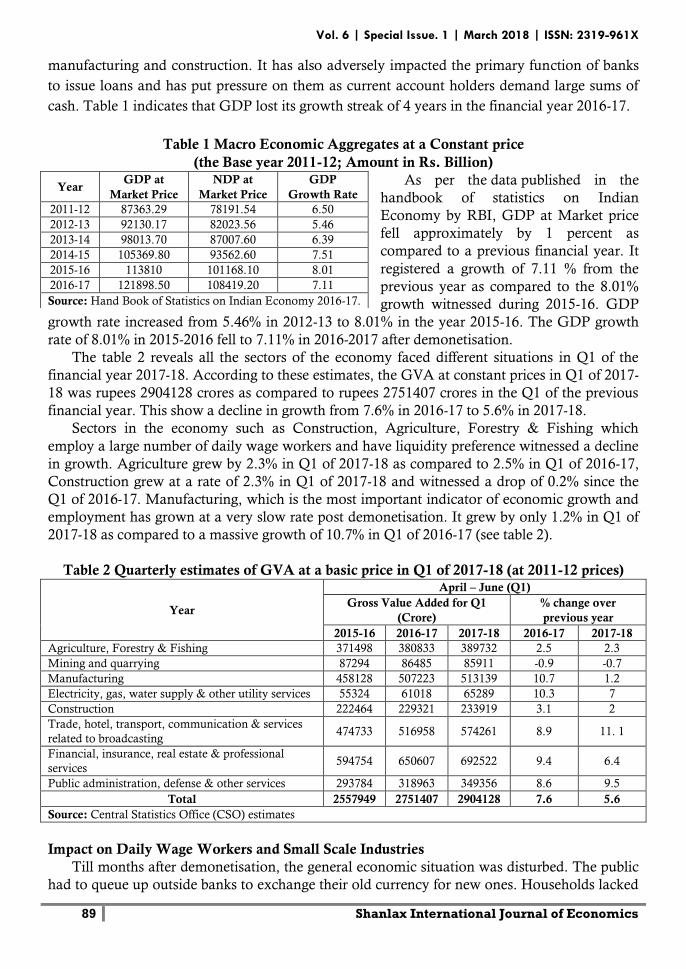
Vol. 6 | Special Issue. 1 | March 2018 | ISSN: 2319-961X
89 Shanlax International Journal of Economics
manufacturing and construction. It has also adversely impacted the primary function of banks
to issue loans and has put pressure on them as current account holders demand large sums of
cash. Table 1 indicates that GDP lost its growth streak of 4 years in the financial year 2016-17.
Table 1 Macro Economic Aggregates at a Constant price
(the Base year 2011-12; Amount in Rs. Billion)
As per the data published in the
handbook of statistics on Indian
Economy by RBI, GDP at Market price
fell approximately by 1 percent as
compared to a previous financial year. It
registered a growth of 7.11 % from the
previous year as compared to the 8.01%
growth witnessed during 2015-16. GDP
growth rate increased from 5.46% in 2012-13 to 8.01% in the year 2015-16. The GDP growth
rate of 8.01% in 2015-2016 fell to 7.11% in 2016-2017 after demonetisation.
The table 2 reveals all the sectors of the economy faced different situations in Q1 of the
financial year 2017-18. According to these estimates, the GVA at constant prices in Q1 of 2017-
18 was rupees 2904128 crores as compared to rupees 2751407 crores in the Q1 of the previous
financial year. This show a decline in growth from 7.6% in 2016-17 to 5.6% in 2017-18.
Sectors in the economy such as Construction, Agriculture, Forestry & Fishing which
employ a large number of daily wage workers and have liquidity preference witnessed a decline
in growth. Agriculture grew by 2.3% in Q1 of 2017-18 as compared to 2.5% in Q1 of 2016-17,
Construction grew at a rate of 2.3% in Q1 of 2017-18 and witnessed a drop of 0.2% since the
Q1 of 2016-17. Manufacturing, which is the most important indicator of economic growth and
employment has grown at a very slow rate post demonetisation. It grew by only 1.2% in Q1 of
2017-18 as compared to a massive growth of 10.7% in Q1 of 2016-17 (see table 2).
Table 2 Quarterly estimates of GVA at a basic price in Q1 of 2017-18 (at 2011-12 prices)
Year
April – June (Q1)
Gross Value Added for Q1
(Crore)
% change over
previous year
2015-16 2016-17 2017-18 2016-17 2017-18
Agriculture, Forestry & Fishing 371498 380833 389732 2.5 2.3
Mining and quarrying 87294 86485 85911 -0.9 -0.7
Manufacturing 458128 507223 513139 10.7 1.2
Electricity, gas, water supply & other utility services 55324 61018 65289 10.3 7
Construction 222464 229321 233919 3.1 2
Trade, hotel, transport, communication & services
related to broadcasting 474733 516958 574261 8.9 11. 1
Financial, insurance, real estate & professional
services 594754 650607 692522 9.4 6.4
Public administration, defense & other services 293784 318963 349356 8.6 9.5
Total 2557949 2751407 2904128 7.6 5.6
Source: Central Statistics Office (CSO) estimates
Impact on Daily Wage Workers and Small Scale Industries
Till months after demonetisation, the general economic situation was disturbed. The public
had to queue up outside banks to exchange their old currency for new ones. Households lacked
Year GDP at
Market Price
NDP at
Market Price
GDP
Growth Rate
2011-12 87363.29 78191.54 6.50
2012-13 92130.17 82023.56 5.46
2013-14 98013.70 87007.60 6.39
2014-15 105369.80 93562.60 7.51
2015-16 113810 101168.10 8.01
2016-17 121898.50 108419.20 7.11
Source: Hand Book of Statistics on Indian Economy 2016-17.
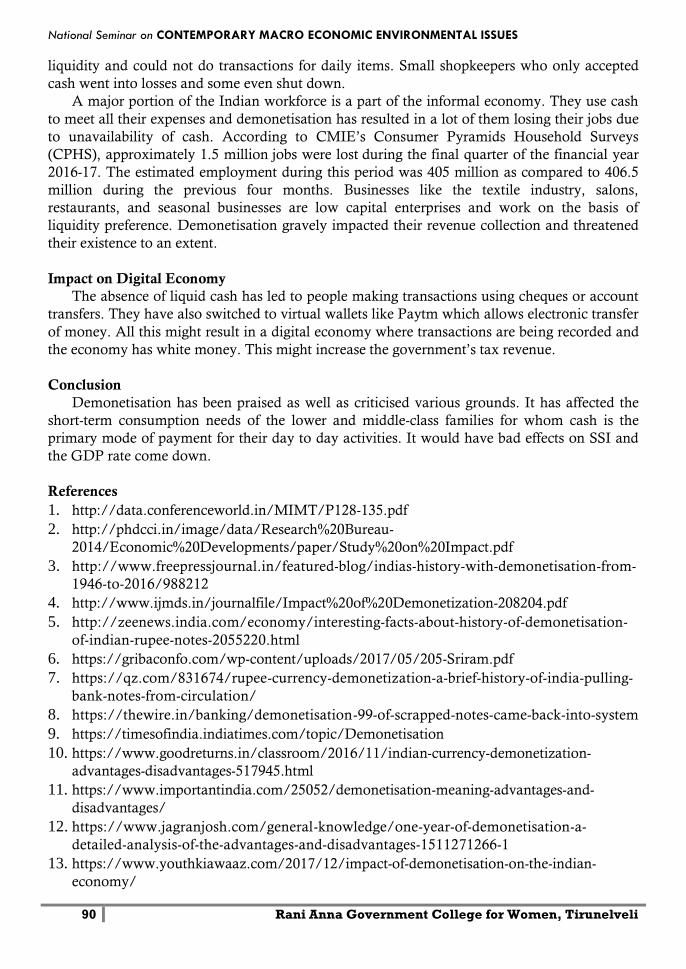
National Seminar on CONTEMPORARY MACRO ECONOMIC ENVIRONMENTAL ISSUES
90 Rani Anna Government College for Women, Tirunelveli
liquidity and could not do transactions for daily items. Small shopkeepers who only accepted
cash went into losses and some even shut down.
A major portion of the Indian workforce is a part of the informal economy. They use cash
to meet all their expenses and demonetisation has resulted in a lot of them losing their jobs due
to unavailability of cash. According to CMIE’s Consumer Pyramids Household Surveys
(CPHS), approximately 1.5 million jobs were lost during the final quarter of the financial year
2016-17. The estimated employment during this period was 405 million as compared to 406.5
million during the previous four months. Businesses like the textile industry, salons,
restaurants, and seasonal businesses are low capital enterprises and work on the basis of
liquidity preference. Demonetisation gravely impacted their revenue collection and threatened
their existence to an extent.
Impact on Digital Economy
The absence of liquid cash has led to people making transactions using cheques or account
transfers. They have also switched to virtual wallets like Paytm which allows electronic transfer
of money. All this might result in a digital economy where transactions are being recorded and
the economy has white money. This might increase the government’s tax revenue.
Conclusion
Demonetisation has been praised as well as criticised various grounds. It has affected the
short-term consumption needs of the lower and middle-class families for whom cash is the
primary mode of payment for their day to day activities. It would have bad effects on SSI and
the GDP rate come down.
References
1. http://data.conferenceworld.in/MIMT/P128-135.pdf
2. http://phdcci.in/image/data/Research%20Bureau-
2014/Economic%20Developments/paper/Study%20on%20Impact.pdf
3. http://www.freepressjournal.in/featured-blog/indias-history-with-demonetisation-from-
1946-to-2016/988212
4. http://www.ijmds.in/journalfile/Impact%20of%20Demonetization-208204.pdf
5. http://zeenews.india.com/economy/interesting-facts-about-history-of-demonetisation-
of-indian-rupee-notes-2055220.html
6. https://gribaconfo.com/wp-content/uploads/2017/05/205-Sriram.pdf
7. https://qz.com/831674/rupee-currency-demonetization-a-brief-history-of-india-pulling-
bank-notes-from-circulation/
8. https://thewire.in/banking/demonetisation-99-of-scrapped-notes-came-back-into-system
9. https://timesofindia.indiatimes.com/topic/Demonetisation
10. https://www.goodreturns.in/classroom/2016/11/indian-currency-demonetization-
advantages-disadvantages-517945.html
11. https://www.importantindia.com/25052/demonetisation-meaning-advantages-and-
disadvantages/
12. https://www.jagranjosh.com/general-knowledge/one-year-of-demonetisation-a-
detailed-analysis-of-the-advantages-and-disadvantages-1511271266-1
13. https://www.youthkiawaaz.com/2017/12/impact-of-demonetisation-on-the-indian-
economy/
Vol. 6 | Special Issue. 1 | March 2018 | ISSN: 2319-961X
91 Shanlax International Journal of Economics
GST IMPACT ON GROSS DOMESTIC PRODUCT IN INDIA
M.Balageetha, MA., M.Phil.,
Assistant Professor, Department of Economics, Thiagarajar College, Madurai
Abstract
At present Indian indirect taxation structure has different types of taxes including VAT in some states, Central
sales tax and multiplicity of taxes. There are problems of double taxation of commodities. For instance, before the
commodity is produces inputs are first taxed. Then after the commodity is produces, the output is taxed again. This
causes an unfair double taxation with cascading effect. There is multiplicity of taxes such as sales tax, turnover tax,
additional surcharge, cess, resale tax etc. there is a general tendency to avoid of tax this results in loss of revenue to the
state. The Goods and Service Tax or GST is a taxation system where there is a single tax in the economy for goods
and services. This taxation system is meant to create a single taxation system in the entire country for all goods and
services. GST is a tax on goods and services with value addition at each stage having comprehensive and continuous
chain of set-of benefits from the producer’s/ service provider’s point up to the retailer’s level where only the final
consumer should bear the tax. This paper analysis the impact of GST on gross Domestic Product in India.
Keywords: Gross Domestic Product, growth, Agriculture
Introduction
The biggest tax reform i.e. Goods and Services Tax is now a part of Indian Economy. A
new and unified tax structure is followed for indirect taxation on the place of various tax laws
like Excise duty, Service Tax, VAT, CST etc. and for sure the new tax regime is determined to
eliminate the cascading effect of tax on transaction of products and services, and it will result in
availability of product and services to consumers at lower price. It is expected that it will be
helpful in increasing production and the purchasing power of the buyer which may increase the
GDP by 1% to 3%. India accounted 7.1 percent growth for the financial year of 2016-17 while
for the March quarter. On the historic midnight of 30th June 2016, India’s PM Narendra Modi
ushered the country into the age of GST – ‘One Nation One Tax’. Being an impartial tax
framework, the effects of GST can be seen across all domains.
Objectives of Goods and Services Tax or GST
Due to the complex nature of the indirect tax structure in India, Goods and Services Tax or
GST was proposed to fulfill the following objectives:
To eliminate the cascading effects of production and distribution of goods and services;
To eliminate the indirect taxation system in India. This would be beneficial for the
manufacturer as well as for the consumer;
To overcome the shortcoming of the Value-Added System;
To optimize the efficiency and equity of system; and
To restrict the export of taxes across taxing jurisdiction.
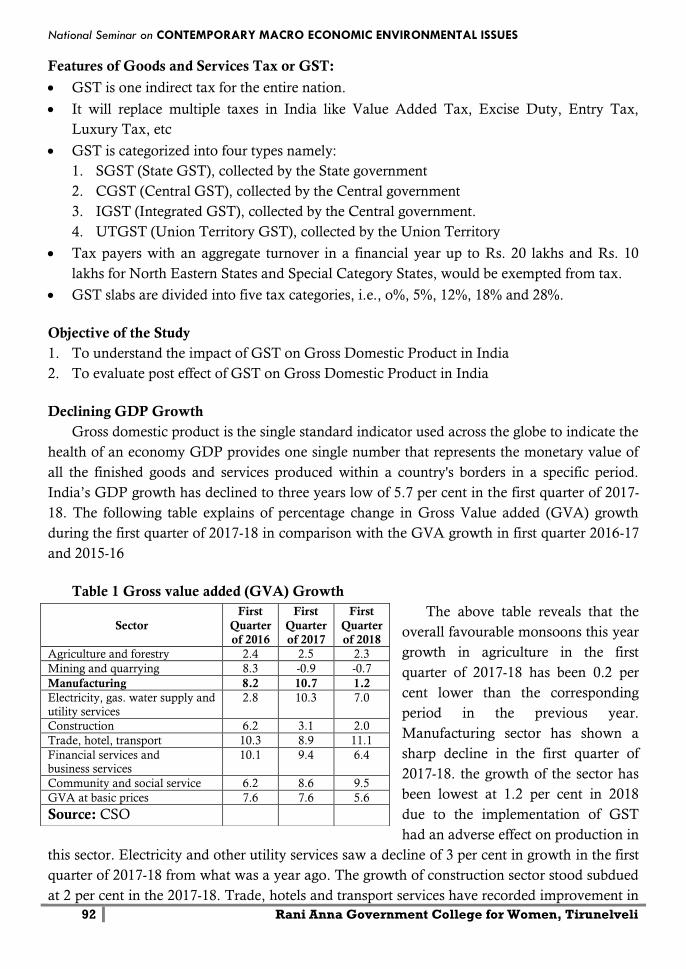
National Seminar on CONTEMPORARY MACRO ECONOMIC ENVIRONMENTAL ISSUES
92 Rani Anna Government College for Women, Tirunelveli
Features of Goods and Services Tax or GST:
GST is one indirect tax for the entire nation.
It will replace multiple taxes in India like Value Added Tax, Excise Duty, Entry Tax,
Luxury Tax, etc
GST is categorized into four types namely:
1. SGST (State GST), collected by the State government
2. CGST (Central GST), collected by the Central government
3. IGST (Integrated GST), collected by the Central government.
4. UTGST (Union Territory GST), collected by the Union Territory
Tax payers with an aggregate turnover in a financial year up to Rs. 20 lakhs and Rs. 10
lakhs for North Eastern States and Special Category States, would be exempted from tax.
GST slabs are divided into five tax categories, i.e., o%, 5%, 12%, 18% and 28%.
Objective of the Study
1. To understand the impact of GST on Gross Domestic Product in India
2. To evaluate post effect of GST on Gross Domestic Product in India
Declining GDP Growth
Gross domestic product is the single standard indicator used across the globe to indicate the
health of an economy GDP provides one single number that represents the monetary value of
all the finished goods and services produced within a country's borders in a specific period.
India’s GDP growth has declined to three years low of 5.7 per cent in the first quarter of 2017-
18. The following table explains of percentage change in Gross Value added (GVA) growth
during the first quarter of 2017-18 in comparison with the GVA growth in first quarter 2016-17
and 2015-16
Table 1 Gross value added (GVA) Growth
The above table reveals that the
overall favourable monsoons this year
growth in agriculture in the first
quarter of 2017-18 has been 0.2 per
cent lower than the corresponding
period in the previous year.
Manufacturing sector has shown a
sharp decline in the first quarter of
2017-18. the growth of the sector has
been lowest at 1.2 per cent in 2018
due to the implementation of GST
had an adverse effect on production in
this sector. Electricity and other utility services saw a decline of 3 per cent in growth in the first
quarter of 2017-18 from what was a year ago. The growth of construction sector stood subdued
at 2 per cent in the 2017-18. Trade, hotels and transport services have recorded improvement in
Sector
First
Quarter
of 2016
First
Quarter
of 2017
First
Quarter
of 2018
Agriculture and forestry 2.4 2.5 2.3
Mining and quarrying 8.3 -0.9 -0.7
Manufacturing 8.2 10.7 1.2
Electricity, gas. water supply and
utility services
2.8 10.3 7.0
Construction 6.2 3.1 2.0
Trade, hotel, transport 10.3 8.9 11.1
Financial services and business services
10.1 9.4 6.4
Community and social service 6.2 8.6 9.5
GVA at basic prices 7.6 7.6 5.6
Source: CSO
Vol. 6 | Special Issue. 1 | March 2018 | ISSN: 2319-961X
93 Shanlax International Journal of Economics
growth at above 10 per cent. Growth of financial services has also decline from 9.4 per cent to
6.4 per cent. However, community services have shown improvement in growth from 8.6 per
cent to 9.5 per cent
GST and its impact on national income:
Income received by the Government in the form of taxes (SGST, CGST, UTGST, IGST
and Cess) will be divided between the Centre and the States. SGST will go to the State
Governments, CGST will go to the Central Government and IGST would be apportioned
between the State and the Central Government.
GST will boost up the national income as it will widen the tax bracket. Following are the
reasons why GST will increase the national income from taxes
1. The definition of supply is very broad covering a large number of transactions under GST
taxability.
2. There is a strict cross check mechanism under matching of invoices and credit availability.
Hence people evading taxes earlier in the unorganized sector will now have to come under
the ambit of organized sector to stay in the market.
3. PAN India threshold limit for GST applicability is Rs. 20 lakhs as against individual limits
for VAT, Service Tax and Excise.
4. There is compulsory registration for inter-state supply, e-commerce operator, agent, input
service distributor (ISD), casual and non-resident taxable person.
5. Overall exemptions given under existing laws will not be available under GST.
In the long term, GST will be clearly positive as gains from a more efficient tax system,
greater price competitiveness (reduced costs), and the removal of interstate tax barriers should
boost growth via higher exports and investments, and higher government (Centre + State) tax
revenues, enabling greater general government fiscal consolidation.
GST Positive Impact of GDP
There will be one tax rate for all which will create a unified market in terms of tax
implementation and the transaction of goods and services will be seamless across the states.
The same will reduce the cost of the transaction. In a survey, it was found that 10-11 types
of taxes levied on the road transport businesses. So, the GST will be helpful to reduce
transportation cost by eliminating other taxes.
After GST implementation the export of goods and services will become competitive
because of nil effect of cascading effect of taxes on goods and products. It was suggested
that GST would be the key revolution in Indian Economy and it could increase the GDP
by 0.9 to 1.7 percent. As speculated earlier, the tax experts can now assume that the growth
will be around 1 to 2 percent after the implementation of the GST.
GST will be more transparent in comparison to the existing law provision so it will generate
more revenue to the Government and will be more effective in reducing corruption at the
same time. Overall GST will improve the tax Compliances.
In a report issued by the Finance Ministry, it was mentioned that Make in India
programme will be more benefited by the GST structure due to the availability of input tax
credit on capital goods.
National Seminar on CONTEMPORARY MACRO ECONOMIC ENVIRONMENTAL ISSUES
94 Rani Anna Government College for Women, Tirunelveli
As the GST will subsume all other taxes, the exemption available for manufacturers in
regards of excise duty will be taken off which will be an addition to Government revenue
and it could result in an increase in GDP.
The GST regime has although a very powerful impact on many things including the GDP
also. The Gross Domestic Product has the tendency to loom on the shoulders of revenue
generated by the economy in a year. Still, a worthwhile point includes that the GST has the
capability to extend the GDP by a total of 2 percent in order to complete the ultimate goal
of increasing the per-capita income of every individual.
The GST scheme will certainly improve the indirect revenues to the government as the tax
compliance will be further enhanced and rigid, extending the taxpaying base which will add
to the revenue. The increased income of the government will redirect towards the
developmental projects and urban financing creating an overall implied scenario.
GST Negative Impact on GDP
As the GST rates are 5%, 12%, 18% and 28% and if the GST rate on service will be
finalized at 5% or 12% then cost of services will get reduced while in else case if the rate will be
18% or 28% on services then services will become costlier and it will lead to inflation for a short
period.
GST will lead to the rise in inflation rate which will remain for a year but after that GST
will affect positively on the economy.
Real Estate also plays an important role in Indian economy but some expert thinks that
GST will impact the Real Estate business negatively as it will add up the additional 8 to 10
percent to the cost and reduce the demand about 12 percent.
GST will apply in the form of IGST, CGST and SGST on the Center and State
Government, but some economists say that there is nothing new in the form of GST
although these are the new names of Central Excise, VAT, CST and Service Tax etc
Conclusion
The Goods and Services Tax (GST) appears to have had an immediate and significant
impact on economic growth. As every coin has two faces in the same way the things related to
GST with both perspective i.e. positively and negatively. Despite having some factor which is
being expected to affect the Economy adversely there are so many other things which are
expected with a positive impact on GDP
References
1. Girish Garg, Basic Concepts and Features of Good and Service Tax in India International
Journal of scientific research and management (IJSRM)
2. RumaniSaikiaPhukan What is GST: How will it change India, January 28, 2015
3. GST for accelerated economic growth and competitiveness. Text of the Speech delivered by
Dr. Vijay Kelkar, Chairman Thirteenth Finance Commission on the occasion of
ASSOCHAM 3rd National Conference on “GST for Accelerated Economic Growth and
Competitiveness”
4. Vijay Kelkar, GST to push India’s economic growth rapidly
5. http://en.wikipedia.org/wiki/Goods_and_Services_Tax_(India)accessed on 15 Jan 2014
Vol. 6 | Special Issue. 1 | March 2018 | ISSN: 2319-961X
95 Shanlax International Journal of Economics
GST AND PORT SECTOR
U.Ilayarasan
Ph.D. Research Scholar, Department of Economics, Periyar University, Salem
Dr.K.Jayaraman
Associate Professor, Department of Economics, Periyar University, Salem
Abstract
GST (goods and services tax) is a new means to revitalize the tax system of an economy for the ease of doing
business. It reduces the work of paying multiple taxes leading to cascading effect nullifying the growth potential. The
GST aims at ease of business, transparency, curbing the menace of black money and online business. Article 269A
makes it mandatory for imports to be treated as inter-state supply of goods and services. As per the I GST Act, 2017,
the import of goods should be treated as bringing goods into India from a place astride India. The goods that are
imported are subjected to basic customs duty plus integrated tax at such rate leviable under I GST Act 2017.
Sections 3 and 21 provide chances for import of goods and determine the place of supply of goods. It includes
taxable person from a distinct person. It consists of transportation of goods, other that by way of mail or courier. It
includes the first scheduled point of departure of that conveyance for the journey. With the arrest of liberalization, the
national incomes have increased a lot. This has become an impetus for the import of foreign goods to our country. The
change in trend, population, tastes and preferences and the happenings in the present world had influenced India to
embark on the import of commodities. India imports ornaments, machinery, oil products, pharma products and
fertilizers.
This paper tries to analyze the impact of GST and perspectives of it.
Keywords: Import of GST performance, Impact, Inter-State supply GST
Introduction
The import of goods has been defined in the IGST Act, 2017 as bringing goods into India
from a place outside India. All imports have to be treated as inter-State supplies and
accordingly integrated tax shall be levied in addition to the applicable Custom duties. The
IGST Act, 2017 provides that the integrated tax on goods imported into India shall be levied
and collected in accordance with the provisions of the Customs Tariff Act, 1975 on the value as
determined under the said Act at the point when duties of customs are levied on the said goods
under the Customs Act, 1962. The integrated tax on goods shall be in addition to the applicable
Basic Customs Duty (BCD) which is levied as per the Customs Tariff Act. In addition, GST
compensation cess, may also be leviable on certain luxury and demerit goods under the Goods
and Services Tax (Compensation to States) Cess Act, 2017.
Below are some of the implications for imports and importers by virtue of GST
implementation in India:
Import as Inter-State Supply – Import into India will be considered as Inter-State supply
under Model GST Law and accordingly will attract Integrated Goods and Services Tax
(IGST) along with BCD and other surcharges.
Import of Services – Model GST law accord liability of payment of tax on the service
receiver, if such services are provided by a person residing outside India. This is similar to
National Seminar on CONTEMPORARY MACRO ECONOMIC ENVIRONMENTAL ISSUES
96 Rani Anna Government College for Women, Tirunelveli
the current provision of reverse charge, wherein service receiver is required to pay tax and
file return.
Transaction Value based Valuation Principal – Model GST law has borrowed the concept
of transaction value based valuation principal from current customs law for charging
GST. This will have implication at the time of tax liability determination as currently CVD
is charged on MRP valuation principle. Under the new regime IGST which subsumes CVD
will be charged on transaction value. This may also require working capital restructuring.
This may also reveal the margin of Service Provider which is currently not the case.
Refund of Duty – Under the new law, tax paid during import will be available as a credit
under “Import and Sale” model, whereas no such credit is available presently. Also refund
of SAD which is available now, after doing specific compliance, no such restrictions are
placed under GST.
Withdrawal of Current Exemptions – The current customs import tariff is loaded with
multiple exemption notifications which are likely to reviewed and possibly withdrawn or
converted into a refund mechanism. This could mean change in the structure of export-
linked duty exemption schemes under the FTP where the duty exemptions may get limited
to exemption from payment of BCD, while IGST may not be exempted. Withdrawal of
exemptions or changing them to refund mechanism could fundamentally change the
attractiveness and viability of some of the key schemes under the FTP like EOU, STP,
Advance authorization etc.
Review of Literature
Gupta (2015) has briefly explained the various provisions related to inter- state transactions
in Goods and Services Tax (GST) IGST Model. Various advantages of the implementation of
GST in India have been discussed. The relevant data is collected from the meetings held by the
GST council.
Kanojia (2014) made an attempt to study on Goods and Services Tax in India. This paper
result shows that reasons for moving GST i.e., current system of indirect taxes is not able to
increase the competitiveness of industry, exports and company. This paper also emphasized
that how a goods and service tax is an improvement over VAT and Service Tax.
Ahmad and Poddar (2009) informed of GST reforms and inter-governmental
Considerations in India, in their working paper have given a detailed explanation about the
shortcomings of the current tax regime and the objective of the tax reform. Besides these it also
gave options for Centre and State GST. It threw light on the tax base and tax rates for various
sectors. It concluded by giving means of harmonizing taxes and ways of administering them.
Keen and Lockwood (2007) studied value added tax. Many countries have started
adopting VAT in the economic armory.
Statement of the Problem
The GST is a new breed of taxation aiming at reducing the cascading effect of the earlier
sales taxation. The unwanted and many taxes have been subsumed into the single tax reflecting
in the One Nation One Market and One Tax. The simplification of tax procedures would
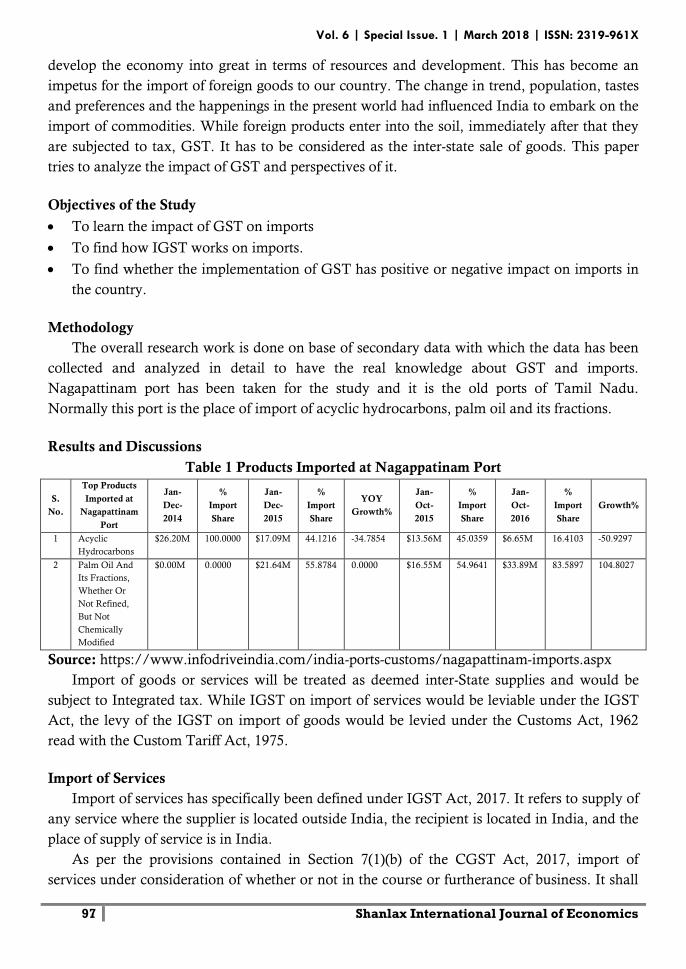
Vol. 6 | Special Issue. 1 | March 2018 | ISSN: 2319-961X
97 Shanlax International Journal of Economics
develop the economy into great in terms of resources and development. This has become an
impetus for the import of foreign goods to our country. The change in trend, population, tastes
and preferences and the happenings in the present world had influenced India to embark on the
import of commodities. While foreign products enter into the soil, immediately after that they
are subjected to tax, GST. It has to be considered as the inter-state sale of goods. This paper
tries to analyze the impact of GST and perspectives of it.
Objectives of the Study
To learn the impact of GST on imports
To find how IGST works on imports.
To find whether the implementation of GST has positive or negative impact on imports in
the country.
Methodology
The overall research work is done on base of secondary data with which the data has been
collected and analyzed in detail to have the real knowledge about GST and imports.
Nagapattinam port has been taken for the study and it is the old ports of Tamil Nadu.
Normally this port is the place of import of acyclic hydrocarbons, palm oil and its fractions.
Results and Discussions
Table 1 Products Imported at Nagappatinam Port
S.
No.
Top Products
Imported at
Nagapattinam
Port
Jan-
Dec-
2014
%
Import
Share
Jan-
Dec-
2015
%
Import
Share
YOY
Growth%
Jan-
Oct-
2015
%
Import
Share
Jan-
Oct-
2016
%
Import
Share
Growth%
1 Acyclic
Hydrocarbons
$26.20M 100.0000 $17.09M 44.1216 -34.7854 $13.56M 45.0359 $6.65M 16.4103 -50.9297
2 Palm Oil And
Its Fractions,
Whether Or
Not Refined,
But Not
Chemically
Modified
$0.00M 0.0000 $21.64M 55.8784 0.0000 $16.55M 54.9641 $33.89M 83.5897 104.8027
Source: https://www.infodriveindia.com/india-ports-customs/nagapattinam-imports.aspx
Import of goods or services will be treated as deemed inter-State supplies and would be
subject to Integrated tax. While IGST on import of services would be leviable under the IGST
Act, the levy of the IGST on import of goods would be levied under the Customs Act, 1962
read with the Custom Tariff Act, 1975.
Import of Services
Import of services has specifically been defined under IGST Act, 2017. It refers to supply of
any service where the supplier is located outside India, the recipient is located in India, and the
place of supply of service is in India.
As per the provisions contained in Section 7(1)(b) of the CGST Act, 2017, import of
services under consideration of whether or not in the course or furtherance of business. It shall
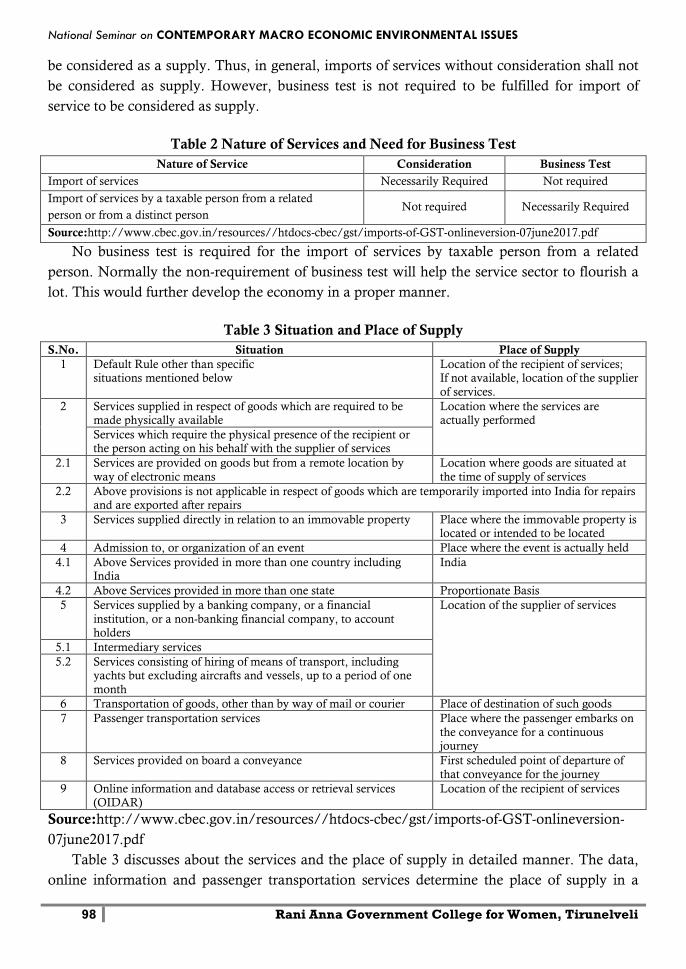
National Seminar on CONTEMPORARY MACRO ECONOMIC ENVIRONMENTAL ISSUES
98 Rani Anna Government College for Women, Tirunelveli
be considered as a supply. Thus, in general, imports of services without consideration shall not
be considered as supply. However, business test is not required to be fulfilled for import of
service to be considered as supply.
Table 2 Nature of Services and Need for Business Test
Nature of Service Consideration Business Test
Import of services Necessarily Required Not required
Import of services by a taxable person from a related
person or from a distinct person Not required Necessarily Required
Source:http://www.cbec.gov.in/resources//htdocs-cbec/gst/imports-of-GST-onlineversion-07june2017.pdf
No business test is required for the import of services by taxable person from a related
person. Normally the non-requirement of business test will help the service sector to flourish a
lot. This would further develop the economy in a proper manner.
Table 3 Situation and Place of Supply
S.No. Situation Place of Supply
1 Default Rule other than specific situations mentioned below
Location of the recipient of services; If not available, location of the supplier
of services.
2
Services supplied in respect of goods which are required to be made physically available
Location where the services are actually performed
Services which require the physical presence of the recipient or the person acting on his behalf with the supplier of services
2.1
Services are provided on goods but from a remote location by
way of electronic means
Location where goods are situated at
the time of supply of services
2.2
Above provisions is not applicable in respect of goods which are temporarily imported into India for repairs and are exported after repairs
3
Services supplied directly in relation to an immovable property Place where the immovable property is located or intended to be located
4 Admission to, or organization of an event Place where the event is actually held
4.1 Above Services provided in more than one country including India
India
4.2 Above Services provided in more than one state Proportionate Basis
5
Services supplied by a banking company, or a financial
institution, or a non-banking financial company, to account holders
Location of the supplier of services
5.1 Intermediary services
5.2
Services consisting of hiring of means of transport, including yachts but excluding aircrafts and vessels, up to a period of one
month
6 Transportation of goods, other than by way of mail or courier Place of destination of such goods
7
Passenger transportation services Place where the passenger embarks on
the conveyance for a continuous journey
8 Services provided on board a conveyance
First scheduled point of departure of
that conveyance for the journey
9 Online information and database access or retrieval services
(OIDAR)
Location of the recipient of services
Source:http://www.cbec.gov.in/resources//htdocs-cbec/gst/imports-of-GST-onlineversion-
07june2017.pdf
Table 3 discusses about the services and the place of supply in detailed manner. The data,
online information and passenger transportation services determine the place of supply in a
Vol. 6 | Special Issue. 1 | March 2018 | ISSN: 2319-961X
99 Shanlax International Journal of Economics
succinct way. The passenger transportation service requires the convenient journey also. The
location of the recipient of services paves the line for the online information and data base
access.
Suggestions
GST will integrate the Indian market and stimulate economic activities, potentially leading
to an increase in GDP growth.
The implementation of GST would lead to major structural changes in the economy. Hence
care has to be taken for the correct carry out of it. It is desired that GSTN must be catering
the need of
Eligible companies for registration purposes also. Development encompasses the growth of
networks and integrated tax which has been in the form of GST.
Conclusion
GST on import is treated as GST on inter-state supply of goods and services. Nagapattinam
port is basically public sector port. Mostly they cater to the immediate needs of the consumers
in the form of single price without variation in all states. It is expected that GST would provide
a lot of opportunities for prices to be aligned in line with international conditions. This is a right
step towards making a common market under one indirect taxation umbrella. Being a customer
oriented tax GST would remove cascading effect in the form of fair import prices. GST may
pave way for normal and fair prices, essential products, and infallible network involving GST
transactions. On the whole GST on importation of goods and services would have far reaching
positive effects on the Indian Economy. The success of GST depends on its proper
implementation. Nagapattinam port may utilize the opportunities thrown by economic reforms
and indirect taxation reforms unleashed in the economy. This will further develop India into a
good destination for the international trade.
References
1. Ahmad E. & Poddar, S. (2009). GST Reforms and Intergovernmental Considerations in
India. Retrieved 15 August 2015, from http://www.lse.ac.uk/ asia Research
Centre/_files/ARCWP26-AhmadPoddar.pdf
2. Keen, Michael and Ben Lockwood (2007): “The value-Added Tax: its Causes and
Consequences”, Michael Keen & Ben Lockwood, 2007.
3. Gupta, Upender (March, 2015), “GST in India: Challenges and prospects” Additional
Commissioner GST CELL CBEC, Reprieved from: http://puneicai.org/wp-content/
uploads/2015/03/Place-of-Supply-Rules-ICAI-22032015.pdf, India.
4. Neha Kanojia (2014), “A Study on Goods and Services Tax in India”, The International
Journal of Research Publication’s Research Journal of Social Science and Management.
Vol.3, No.10 (2014)
National Seminar on CONTEMPORARY MACRO ECONOMIC ENVIRONMENTAL ISSUES
100 Rani Anna Government College for Women, Tirunelveli
INTEGRATING THE NATION THROUGH INFRASTRUCTURE
DEVELOPMENT
Dr.T.Vijayanthi
Assistant Professor of Economics, Rani Anna Government College for Women, Tirunelveli
Abstract
India needed investments over Rs.50 trillion in infrastructure to “increase growth of GDP, connect and integrate
the nation with a network of roads, airports, railways, ports and inland waterways and to provide good quality
services”. Government was committed to this and would ensure the required investment. The challenge is not so much
in the allocation of funds as in strategizing appropriately and ensuring timely implementation. The 2018 - 2019 Union Budget recognizes a total allocation of Rs.5.97 trillion in
infrastructure. This compares with an expected expenditure of Rs. 4.94 trillion in 2017 - 18.
The infrastructure allocations have not only been increasing in absolute terms, but also as a
share of total budgetary allocation. The allocations have been going up in all the sub - sectors of
infrastructure including railways, roads, aviation, etc.
The single largest entity spend is for the Indian Railways. The thrust in the current budget
has been on capacity creation, including track doubling, third and fourth line works; 5,000 km
of gauge conversion; redeveloping 600 railway stations; and introduction of modern train - sets.
The proposed gauge conversion would make the country broad gauge based unigauge system.
The budget also has a special focus on suburban railways including Mumbai and Bengaluru.
The spend on Mumbai would be part of phase 3A of the Rs. 0.55 trillion Mumbai Urban
Transport Project (MUTP).
The Union Budget includes a total outlay of Rs. 1.21 trillion on road infrastructure. The
spend is part of the approved Rs. 5.35 trillion Bharatmala Project, which includes development
of economic corridors, efficiency improvements on key national corridors; and border, coastal
and port connectivity roads.
Both the Railways and the National Highways Authority of India (NHAI) are expected to
source funds beyond just internal surpluses and budgetary support. The Railways, apart from
the traditional sourcing through bonds, are expected to bring in funds through public - private
partnerships (PPPs), especially in railway station redevelopment and rolling stock
manufacturing. The NHAI would use schemes like toll, operate and transfer (TOT) and raising
equity from the market using road assets that have crossed the transfer phase of the earlier
build, operate and transfer (BOT).
In the maritime sector, the focus is on spends as part of the Sagamala Project. In aviation,
the focus is on improving airport capacity, developing new airports and increasing connectivity
to unserved airports and helipads.
Other domains of infrastructure spend include the 99 smart cities and rural infrastructure
through development of rural roads, houses, electricity, sanitation, irrigation and water supply.
Vol. 6 | Special Issue. 1 | March 2018 | ISSN: 2319-961X
101 Shanlax International Journal of Economics
Bandwidth for Spending
One of the important challenges with the increased allocations is our ability to spend it
effectively. For example, even though the allocation for railways from Gross Budgetary
Support (GBS) in 2017 - 2018 was Rs. 0.55 trillion, the expected actual spend has been revised
downward to Rs.0.42 trillion. Consequently, the GBS provision for 2018 - 19 has been kept at
Rs. 0.55 trillion, without any increase and almost identical to the previous year’s provision.
The inability to spend is a function of insufficient governmental bandwidth in putting out
well - written project documents and quick processing of permissions; lack of legal and judicial
bandwidth; and the significant non-performing infrastructure assets that put limits on debt
financing. Stalled permissions and /or legal issues have help up many projects mid way. A
concerted effort to protect and unlock such assets is important. The Ministry of Road Transport
and Highways (MORTH) must be commended for attempting to resolve legal issues in many
projects, though there are many others still stuck.
It is rather unfortunate that though the budget gets such heightened annual attention, there
is no mechanism of reviewing the budgetary performance, not just financially, but in actual
outcomes achieved with an analysis of the causes. The annual economic survey is at best a
document that looks at performance in an aggregate manner, albeit in different sub sectors.
Budgets tend to focus on political rhetoric, often repeating the same activities. For example, the
railway station development and the new airports development have been repeated in many
successive budgets. While earlier budgets had schemes like Setu Bharatam (to remove level
crossings on National Highways), Special Unit for Transportation Research and Analytics
(SUTRA) and Special Railway Establishment for Strategic Technology and Holistic
Advancement (SRESHTA), it is difficult to find the state of progress of these activities vis-a-vis
their original intent.
Projectising as a Means of Directing the Spend.
On the credit side though, the allocations in different sectors over the past few years have
tended to be guided by long-term multi-activity project conceptualization like the
PradhanMantri Gram SadakYojana (PMGSY), Sagarmala, High Speed Rail (HSR) and
Bharatmala Projects. The HSR and Bharatmala Projects were announced in September and
October 2017 respectively. (Of course, the Bharatmala is, in many ways, a modified version of
the earlier National Highways Development Project.) Such conceptualization provides more
stability and direction, rather than being buffeted by varying annual demands.
In spite of projectising, there are domains where we falter. For example, the BharatNet
project (the earlier National Optical Fibre Network), which is to provide broadband
connectivity to every Gram Panchayat, has had implementation issues, causing significant
delays in timelines. Part of the problem was due to the implementation being ‘handed over’ to
public sector undertakings, which did not have this as a priority.
In the context of rural infrastructure, the PMGSY has been one of the most successful
infrastructure projects. The second decadal phase of this project has been advanced to be
completed by 2019 (instead of 2021), so that the third phase can be put in place. Apart from
deeper penetration, the rural road network is focusing on improved maintenance and two -
National Seminar on CONTEMPORARY MACRO ECONOMIC ENVIRONMENTAL ISSUES
102 Rani Anna Government College for Women, Tirunelveli
sided connectivity to facilitate not just physical connectivity, but also services. In the context of
rural electricity, the focus is shifting from village- level connectivity. In terms of sanitation,
though the focus is on building toilets, full effectiveness can be achieved only by changing the
behavior to increase usage. This needs ‘marketing’ like efforts.
Inter-sectoral Issues
However, a related challenge is one of examining inter - sectoral implications. For example,
it is not clear whether building and connecting more airports is the way to go, given the
improving road connectivity. More airports will reduce the catchment per airport, reducing
frequency of service and thus putting the overall viability in question. For example, Hubbali
and Belagavi are less than 100 kilometers apart with excellent road connectivity, but still wish
to have modern airports with just a couple of flights a day each. It would take under two hours
to reach either airport from their catchment. As a comparison, there are many parts in
Bengaluru where reaching the airport would take more than two hours. An overall approach to
air connectivity by integrating roads, and keeping a focus on access time rather than distance
would be the way to go. For example, in hilly areas, airports closer to one another may still be
okay.
Another inter-sectoral domain is that of intermodal connectivity between the metro and the
railways. Bengaluru and Delhi are examples where such connectivity has as of now been
compromised, leading to poor service quality for customer transfer, and resulting in reduced
demand. It does make one reflect on the need for basic smartness, rather than what is implied
by ‘smart’ cities.
There are inter-sectoral issues between energy and transportation. This government has
demonstrated significant awareness of this matter. Electric traction in railways is being
promoted, with significant allocations. Similarly, the government has announced that the
policy would be to convert all road vehicles to electric vehicles by 2030. In the road instrance,
the industry is not fully in agreement with the government, both in terms of the announced
timeline and the focus on electric vehicles over hybrids.
Conclusion
The Finance Minister at the start of his budget speech indicated that India needed
investments over Rs. 50 trillion in infrastructure to “increase growth of GDP, connect and
integrate the nation with a network of roads, airports, railways, ports and inland waterways
and to provide good quality services”. He declared that the government was committed to this
and would ensure the required investment.
The challenge is not so much in the allocation of funds as in strategizing appropriately and
ensuring timely implementation.
Vol. 6 | Special Issue. 1 | March 2018 | ISSN: 2319-961X
103 Shanlax International Journal of Economics
OPINION OF BUSINESS PEOPLE ON THE DOWNSIDE OF
GST IN TIRUCHENDUR
Dr.J.Jeya Sheela
Assistant Professor, Department of Economics Rani Anna Government College for Women, Tirunelveli
Abstract
GST is one indirect tax for the whole nation, which will make India one unified common market. The tax
replaced existing multiple cascading taxes levied by the central and state governments. The tax rates, rules and
regulations are governed by the Goods and Services Tax Council. GST simplified a slew of indirect taxes with a
unified tax and is therefore expected to dramatically reshape the economy. GST is thought of as a superior tax regime
that could boost exports and trigger the overall economic development of India. Hyped as a highly advantageous and
meritful taxation system, experts have never really assessed how much pitfalls adopting this structure could pose to the
nation and her citizens. Hence the paper focuses on the downside of GST and how it is going to affect the business
people in Tiruchendur.
Introduction
Goods and Services Tax (GST) is an indirect tax levied in India on the sale of goods and
services. The tax came into effect from July 1, 2017 through the implementation of One
Hundred and First Amendment of the Constitution of India by the then President of
India, Pranab Mukherjee, and the Prime Minister of India Narendra Modi. The tax replaced
existing multiple cascading taxes levied by the central and state governments. The tax rates,
rules and regulations are governed by the Goods and Services Tax Council which comprises
finance ministers of centre and all the states. GST simplified a slew of indirect taxes with a
unified tax and is therefore expected to dramatically reshape the economy. In the study,
I would look into GST Taxation and its disadvantages and the opinion of business people on
the downside of GST in Tiruchendur.
Meaning
GST is one indirect tax for the whole nation, which will make India one unified common
market. GST is a single tax on the supply of goods and services, right from the manufacturer to
the consumer. Credits of input taxes paid at each stage will be available in the subsequent stage
of value addition, which makes GST essentially a tax only on value addition at each stage. The
final consumer will thus bear only the GST charged by the last dealer in the supply chain, with
set-off benefits at all the previous stages.
The single GST (goods and service taxes) replaced several former taxes and levies which
included: central excise duty, services tax, additional customs duty, surcharges, state-level value
added tax and Octroi. Other levies which were applicable on inter-state transportation of goods
have also been done away within GST regime. GST is levied on all transactions such as sale,
transfer, purchase, barter, lease, or import of goods and/or services. India adopted a dual GST
National Seminar on CONTEMPORARY MACRO ECONOMIC ENVIRONMENTAL ISSUES
104 Rani Anna Government College for Women, Tirunelveli
model, meaning that taxation is administered by both the Union and State Governments.
Transactions made within a single state are levied with Central GST (CGST) by the Central
Government and State GST (SGST) by the State governments. For inter-state transactions and
imported goods or services, an Integrated GST (IGST) is levied by the Central Government.
GST is a consumption-based tax/destination-based tax, therefore, taxes are paid to the state
where the goods or services are consumed not the state in which they were produced. Goods
and services are divided into five tax slabs for collection of tax - 0%, 5%, 12%, 18% and 28%.
IGST complicates tax collection for State Governments by disabling them from collecting the
tax owed to them directly from the Central Government.
Objectives
To examine the demographic profile of the business people
To identify the problems faced by the business people towards GST
To know the level of satisfaction of the business people by the launch of GST
Methodology
The study is based on both primary and secondary data. Primary data are collected directly
from the respondents through the interview schedule. The secondary data are collected from
the books, journals and websites. A total of 75 respondents are selected by adopting convenient
sampling method in Tiruchendur. The data are analyzed by applying simple percentage and
Garrett’s ranking.
Problems associated with GST
GST is thought of as a superior tax regime that could boost exports and trigger the overall
economic development of India. Hyped as a highly advantageous and meritful taxation system,
experts have never really assessed how much pitfalls adopting this structure could pose to the
nation and her citizens. Below, I have outlined the downside of GST and how it is going to
affect our society.
Increased costs due to software purchase
Businesses have to either update their existing accounting or ERP software to GST-
compliant one or buy a GST software so that they can keep their business going. But both the
options lead to increased cost of software purchase and training of employees for an efficient
utilization of the new billing software.
Being GST-compliant
Small and medium-sized enterprises (SME) who have not yet signed for GST have to
quickly grasp the nuances of the GST tax regime. They will have to issue GST-complaint
invoices, be compliant to digital record-keeping, and of course, file timely returns. This means
that the GST-complaint invoice issued must have mandatory details such as GSTIN, place of
supply, HSN codes, and others.
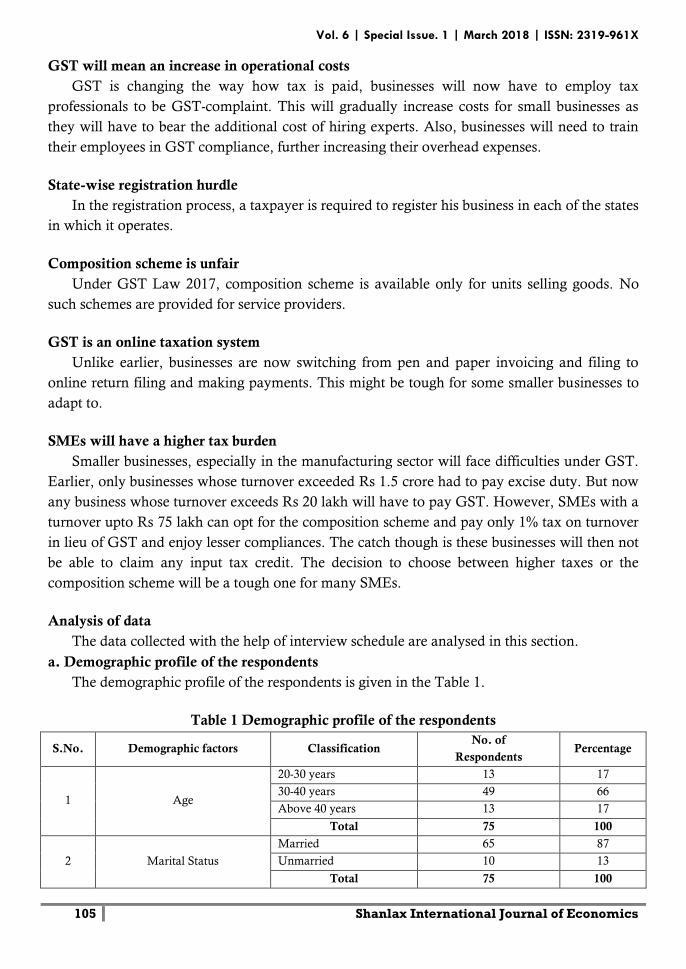
Vol. 6 | Special Issue. 1 | March 2018 | ISSN: 2319-961X
105 Shanlax International Journal of Economics
GST will mean an increase in operational costs
GST is changing the way how tax is paid, businesses will now have to employ tax
professionals to be GST-complaint. This will gradually increase costs for small businesses as
they will have to bear the additional cost of hiring experts. Also, businesses will need to train
their employees in GST compliance, further increasing their overhead expenses.
State-wise registration hurdle
In the registration process, a taxpayer is required to register his business in each of the states
in which it operates.
Composition scheme is unfair
Under GST Law 2017, composition scheme is available only for units selling goods. No
such schemes are provided for service providers.
GST is an online taxation system
Unlike earlier, businesses are now switching from pen and paper invoicing and filing to
online return filing and making payments. This might be tough for some smaller businesses to
adapt to.
SMEs will have a higher tax burden
Smaller businesses, especially in the manufacturing sector will face difficulties under GST.
Earlier, only businesses whose turnover exceeded Rs 1.5 crore had to pay excise duty. But now
any business whose turnover exceeds Rs 20 lakh will have to pay GST. However, SMEs with a
turnover upto Rs 75 lakh can opt for the composition scheme and pay only 1% tax on turnover
in lieu of GST and enjoy lesser compliances. The catch though is these businesses will then not
be able to claim any input tax credit. The decision to choose between higher taxes or the
composition scheme will be a tough one for many SMEs.
Analysis of data
The data collected with the help of interview schedule are analysed in this section.
a. Demographic profile of the respondents
The demographic profile of the respondents is given in the Table 1.
Table 1 Demographic profile of the respondents
S.No. Demographic factors Classification No. of
Respondents Percentage
1 Age
20-30 years 13 17
30-40 years 49 66
Above 40 years 13 17
Total 75 100
2 Marital Status
Married 65 87
Unmarried 10 13
Total 75 100
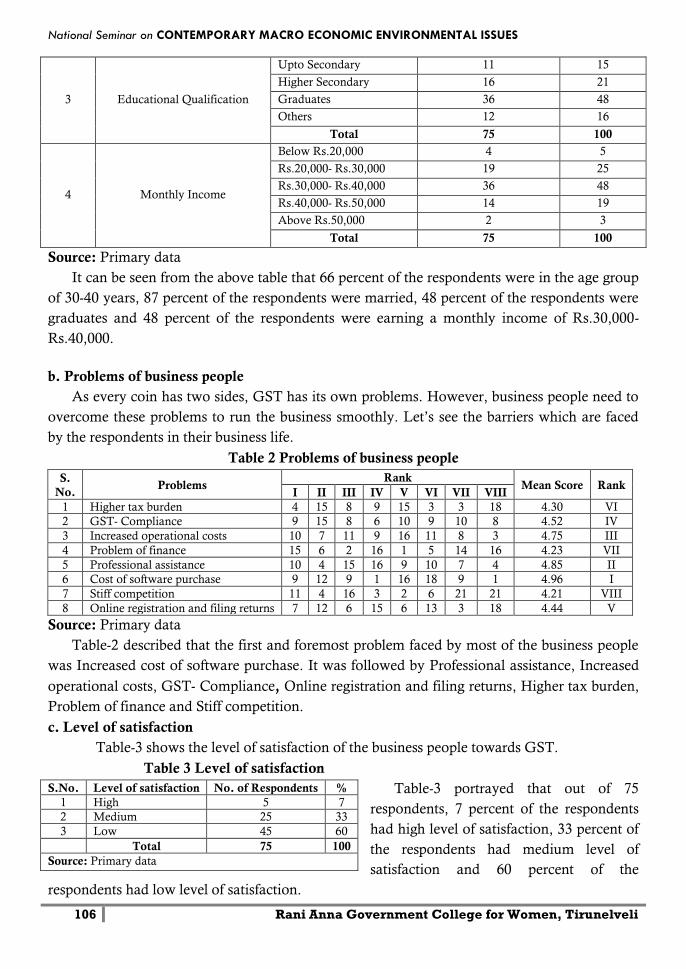
National Seminar on CONTEMPORARY MACRO ECONOMIC ENVIRONMENTAL ISSUES
106 Rani Anna Government College for Women, Tirunelveli
3 Educational Qualification
Upto Secondary 11 15
Higher Secondary 16 21
Graduates 36 48
Others 12 16
Total 75 100
4 Monthly Income
Below Rs.20,000 4 5
Rs.20,000- Rs.30,000 19 25
Rs.30,000- Rs.40,000 36 48
Rs.40,000- Rs.50,000 14 19
Above Rs.50,000 2 3
Total 75 100
Source: Primary data
It can be seen from the above table that 66 percent of the respondents were in the age group
of 30-40 years, 87 percent of the respondents were married, 48 percent of the respondents were
graduates and 48 percent of the respondents were earning a monthly income of Rs.30,000-
Rs.40,000.
b. Problems of business people
As every coin has two sides, GST has its own problems. However, business people need to
overcome these problems to run the business smoothly. Let’s see the barriers which are faced
by the respondents in their business life.
Table 2 Problems of business people
S.
No. Problems
Rank Mean Score Rank
I II III IV V VI VII VIII
1 Higher tax burden 4 15 8 9 15 3 3 18 4.30 VI
2 GST- Compliance 9 15 8 6 10 9 10 8 4.52 IV
3 Increased operational costs 10 7 11 9 16 11 8 3 4.75 III
4 Problem of finance 15 6 2 16 1 5 14 16 4.23 VII
5 Professional assistance 10 4 15 16 9 10 7 4 4.85 II
6 Cost of software purchase 9 12 9 1 16 18 9 1 4.96 I
7 Stiff competition 11 4 16 3 2 6 21 21 4.21 VIII
8 Online registration and filing returns 7 12 6 15 6 13 3 18 4.44 V
Source: Primary data
Table-2 described that the first and foremost problem faced by most of the business people
was Increased cost of software purchase. It was followed by Professional assistance, Increased
operational costs, GST- Compliance, Online registration and filing returns, Higher tax burden,
Problem of finance and Stiff competition.
c. Level of satisfaction
Table-3 shows the level of satisfaction of the business people towards GST.
Table 3 Level of satisfaction
Table-3 portrayed that out of 75
respondents, 7 percent of the respondents
had high level of satisfaction, 33 percent of
the respondents had medium level of
satisfaction and 60 percent of the
respondents had low level of satisfaction.
S.No. Level of satisfaction No. of Respondents %
1 High 5 7
2 Medium 25 33
3 Low 45 60
Total 75 100
Source: Primary data
Vol. 6 | Special Issue. 1 | March 2018 | ISSN: 2319-961X
107 Shanlax International Journal of Economics
Conclusion
Change is definitely never easy. The government is trying to smoothen the road to GST. It
is important to take a leaf from global economies that have implemented GST before us, and
who overcame the teething troubles to experience the advantages of having a unified tax system
and easy input credits. The key is to be GST-compliant at any time. We at Clear Tax have an
All-in-one GST kit specially designed for CAs. Though GST is considered to be a historical tax
reform in India, it also has some demerits. Ignoring negative aspects, positive aspects can be
taken into consideration, in order to improve the economy of the country.
References
1. "Looking back at GST's journey: How an idea is now near reality", Indian Express,
31 March 2017
2. "GST: A 17-year-old dream, 17 phases towards creating history", India Today, 29 June 2017
3. "Goods and Services Tax: History of India's biggest tax reform and people who made it
possible", India TV, 29 Jun 2017
4. "GST: Meet the men behind India's biggest tax reform that's been in making for 17
years", India Today, June 29, 2017
5. "GST rollout: All except J-K pass State GST legislation", The Indian Express, 22 June 2017
6. "GST draft makes it must for companies to pass tax benefit to consumers", The Times of
India, 27 November 2016
7. "GST Rollout Attendees", Financial Express, June 30, 2017
8. "GST launch: Times when the Parliament convened for a session at midnight",
The Hindustan Times, 30 June 2017
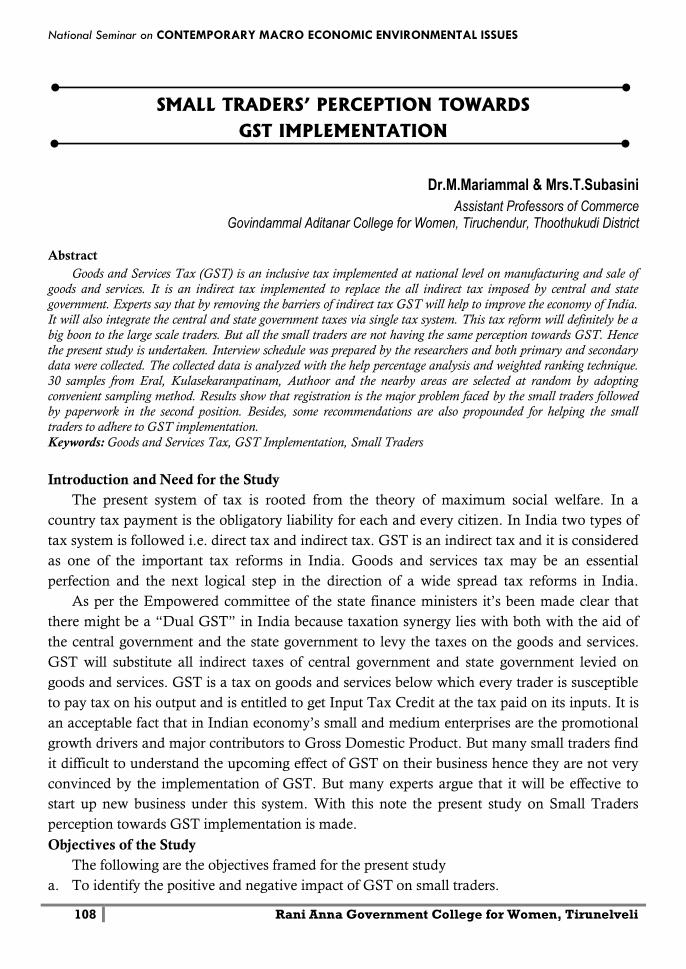
National Seminar on CONTEMPORARY MACRO ECONOMIC ENVIRONMENTAL ISSUES
108 Rani Anna Government College for Women, Tirunelveli
SMALL TRADERS’ PERCEPTION TOWARDS
GST IMPLEMENTATION
Dr.M.Mariammal & Mrs.T.Subasini
Assistant Professors of Commerce Govindammal Aditanar College for Women, Tiruchendur, Thoothukudi District
Abstract
Goods and Services Tax (GST) is an inclusive tax implemented at national level on manufacturing and sale of
goods and services. It is an indirect tax implemented to replace the all indirect tax imposed by central and state
government. Experts say that by removing the barriers of indirect tax GST will help to improve the economy of India.
It will also integrate the central and state government taxes via single tax system. This tax reform will definitely be a
big boon to the large scale traders. But all the small traders are not having the same perception towards GST. Hence
the present study is undertaken. Interview schedule was prepared by the researchers and both primary and secondary
data were collected. The collected data is analyzed with the help percentage analysis and weighted ranking technique.
30 samples from Eral, Kulasekaranpatinam, Authoor and the nearby areas are selected at random by adopting
convenient sampling method. Results show that registration is the major problem faced by the small traders followed
by paperwork in the second position. Besides, some recommendations are also propounded for helping the small
traders to adhere to GST implementation.
Keywords: Goods and Services Tax, GST Implementation, Small Traders
Introduction and Need for the Study
The present system of tax is rooted from the theory of maximum social welfare. In a
country tax payment is the obligatory liability for each and every citizen. In India two types of
tax system is followed i.e. direct tax and indirect tax. GST is an indirect tax and it is considered
as one of the important tax reforms in India. Goods and services tax may be an essential
perfection and the next logical step in the direction of a wide spread tax reforms in India.
As per the Empowered committee of the state finance ministers it’s been made clear that
there might be a “Dual GST” in India because taxation synergy lies with both with the aid of
the central government and the state government to levy the taxes on the goods and services.
GST will substitute all indirect taxes of central government and state government levied on
goods and services. GST is a tax on goods and services below which every trader is susceptible
to pay tax on his output and is entitled to get Input Tax Credit at the tax paid on its inputs. It is
an acceptable fact that in Indian economy’s small and medium enterprises are the promotional
growth drivers and major contributors to Gross Domestic Product. But many small traders find
it difficult to understand the upcoming effect of GST on their business hence they are not very
convinced by the implementation of GST. But many experts argue that it will be effective to
start up new business under this system. With this note the present study on Small Traders
perception towards GST implementation is made.
Objectives of the Study
The following are the objectives framed for the present study
a. To identify the positive and negative impact of GST on small traders.
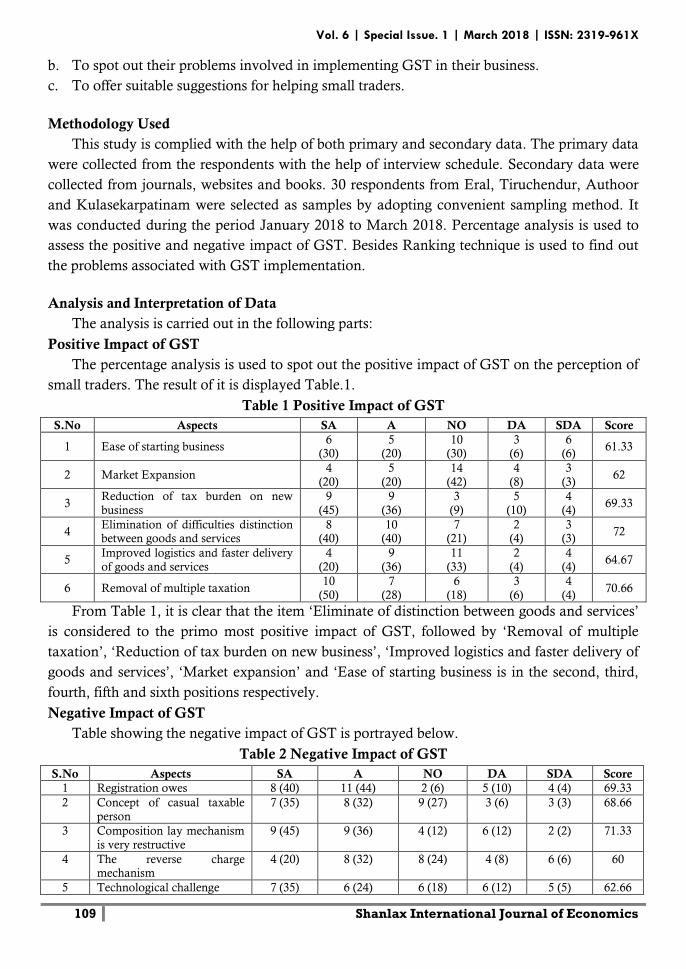
Vol. 6 | Special Issue. 1 | March 2018 | ISSN: 2319-961X
109 Shanlax International Journal of Economics
b. To spot out their problems involved in implementing GST in their business.
c. To offer suitable suggestions for helping small traders.
Methodology Used
This study is complied with the help of both primary and secondary data. The primary data
were collected from the respondents with the help of interview schedule. Secondary data were
collected from journals, websites and books. 30 respondents from Eral, Tiruchendur, Authoor
and Kulasekarpatinam were selected as samples by adopting convenient sampling method. It
was conducted during the period January 2018 to March 2018. Percentage analysis is used to
assess the positive and negative impact of GST. Besides Ranking technique is used to find out
the problems associated with GST implementation.
Analysis and Interpretation of Data
The analysis is carried out in the following parts:
Positive Impact of GST
The percentage analysis is used to spot out the positive impact of GST on the perception of
small traders. The result of it is displayed Table.1.
Table 1 Positive Impact of GST
S.No Aspects SA A NO DA SDA Score
1 Ease of starting business 6
(30) 5
(20) 10
(30) 3
(6) 6
(6) 61.33
2 Market Expansion 4
(20)
5
(20)
14
(42)
4
(8)
3
(3) 62
3 Reduction of tax burden on new
business
9
(45)
9
(36)
3
(9)
5
(10)
4
(4) 69.33
4 Elimination of difficulties distinction between goods and services
8 (40)
10 (40)
7 (21)
2 (4)
3 (3)
72
5 Improved logistics and faster delivery
of goods and services
4
(20)
9
(36)
11
(33)
2
(4)
4
(4) 64.67
6 Removal of multiple taxation 10
(50)
7
(28)
6
(18)
3
(6)
4
(4) 70.66
From Table 1, it is clear that the item ‘Eliminate of distinction between goods and services’
is considered to the primo most positive impact of GST, followed by ‘Removal of multiple
taxation’, ‘Reduction of tax burden on new business’, ‘Improved logistics and faster delivery of
goods and services’, ‘Market expansion’ and ‘Ease of starting business is in the second, third,
fourth, fifth and sixth positions respectively.
Negative Impact of GST
Table showing the negative impact of GST is portrayed below.
Table 2 Negative Impact of GST
S.No Aspects SA A NO DA SDA Score
1 Registration owes 8 (40) 11 (44) 2 (6) 5 (10) 4 (4) 69.33
2 Concept of casual taxable
person
7 (35) 8 (32) 9 (27) 3 (6) 3 (3) 68.66
3 Composition lay mechanism
is very restructive
9 (45) 9 (36) 4 (12) 6 (12) 2 (2) 71.33
4 The reverse charge mechanism
4 (20) 8 (32) 8 (24) 4 (8) 6 (6) 60
5 Technological challenge 7 (35) 6 (24) 6 (18) 6 (12) 5 (5) 62.66
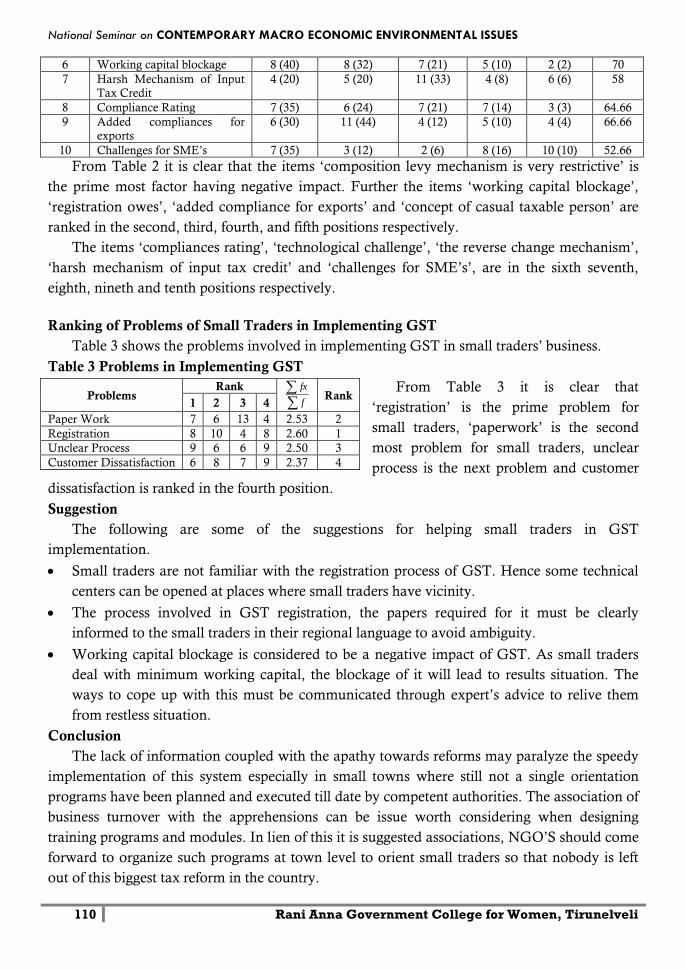
National Seminar on CONTEMPORARY MACRO ECONOMIC ENVIRONMENTAL ISSUES
110 Rani Anna Government College for Women, Tirunelveli
6 Working capital blockage 8 (40) 8 (32) 7 (21) 5 (10) 2 (2) 70
7 Harsh Mechanism of Input
Tax Credit
4 (20) 5 (20) 11 (33) 4 (8) 6 (6) 58
8 Compliance Rating 7 (35) 6 (24) 7 (21) 7 (14) 3 (3) 64.66
9 Added compliances for
exports
6 (30) 11 (44) 4 (12) 5 (10) 4 (4) 66.66
10 Challenges for SME’s 7 (35) 3 (12) 2 (6) 8 (16) 10 (10) 52.66
From Table 2 it is clear that the items ‘composition levy mechanism is very restrictive’ is
the prime most factor having negative impact. Further the items ‘working capital blockage’,
‘registration owes’, ‘added compliance for exports’ and ‘concept of casual taxable person’ are
ranked in the second, third, fourth, and fifth positions respectively.
The items ‘compliances rating’, ‘technological challenge’, ‘the reverse change mechanism’,
‘harsh mechanism of input tax credit’ and ‘challenges for SME’s’, are in the sixth seventh,
eighth, nineth and tenth positions respectively.
Ranking of Problems of Small Traders in Implementing GST
Table 3 shows the problems involved in implementing GST in small traders’ business.
Table 3 Problems in Implementing GST
From Table 3 it is clear that
‘registration’ is the prime problem for
small traders, ‘paperwork’ is the second
most problem for small traders, unclear
process is the next problem and customer
dissatisfaction is ranked in the fourth position.
Suggestion
The following are some of the suggestions for helping small traders in GST
implementation.
Small traders are not familiar with the registration process of GST. Hence some technical
centers can be opened at places where small traders have vicinity.
The process involved in GST registration, the papers required for it must be clearly
informed to the small traders in their regional language to avoid ambiguity.
Working capital blockage is considered to be a negative impact of GST. As small traders
deal with minimum working capital, the blockage of it will lead to results situation. The
ways to cope up with this must be communicated through expert’s advice to relive them
from restless situation.
Conclusion
The lack of information coupled with the apathy towards reforms may paralyze the speedy
implementation of this system especially in small towns where still not a single orientation
programs have been planned and executed till date by competent authorities. The association of
business turnover with the apprehensions can be issue worth considering when designing
training programs and modules. In lien of this it is suggested associations, NGO’S should come
forward to organize such programs at town level to orient small traders so that nobody is left
out of this biggest tax reform in the country.
Problems Rank
f
fx Rank
1 2 3 4
Paper Work 7 6 13 4 2.53 2
Registration 8 10 4 8 2.60 1
Unclear Process 9 6 6 9 2.50 3
Customer Dissatisfaction 6 8 7 9 2.37 4
Vol. 6 | Special Issue. 1 | March 2018 | ISSN: 2319-961X
111 Shanlax International Journal of Economics
A STUDY ON IMPACT OF TASMAC IN RURAL AREAS OF
TIRUNELVELI DISTRICT
R.Iyappan
Ph.D. Research Scholar, Kamaraj College, Thoothukudi
Dr.S.Sarasudevi
Assistant professor in Economics, Rani Anna Government College for Women, Tirunelveli
Abstract
This study embarks on the assessment of the effects of TASMAC (alcoholism) on rural areas in Tirunelveli
district of Tamil Nadu using sociological, economical and psychological perspective. The major objectives are to study
the impact of TASMAC shops in the study area. The study adopted survey method of research and surveillance
technique was used for sample size determination. Descriptive statistics was used for data analysis in the study area.
Alcohol consumption has created neglect, frustration and fear among the families of the drunkard as well as unrest
(lack of peace) within the society. and concluded that alcohol consumption has had profound negative effects on the
individual drunkards, the family (especially the children and women) and recommends that all other sources of law
should emulate the mahatma’s concept of total abstinence on alcoholic beverages.
Keywords: Alcohol, drunkards, perception, consumption
Introduction
Over half of Tamil Nadu total population lives below the poverty line and these people are
more depend on rain-fed agriculture. Noting that about half of the workforce relies on
agriculture for their livelihoods, the statement said the sector is now threatened by falling crop
yields caused by floods, droughts, erratic rainfall and other climate change impacts. Thus most
of the rural workers find alternate sources of employment in the non-farm sector in the state.
Besides the non-farm sector provides a regular employment throughout the year. Even today, a
section of the rural society is unable to fulfil even its basic necessities of life. When a substantial
segment of the society is developed the minimum level of living continues at a bare subsistence
level, the society is said to be plagued with mass poverty. Under this circumstance, most of the
rural workers spend half of their daily earnings in drinking alcohol particularly in TASMAC.
This leads to them below poverty line and social, economic and psychological distress.
In the recent years, there have been limited studies on the impact of TASMAC to the tune
of poverty, inflation and changing consumer preferences. Thus, this study going to fill the gap
and proposes and some policy recommendations. The TASMAC, this monopoly was
established by the year 2003. The company has about 30000 employees in 32 districts of Tamil
Nadu. It has 6800 retail outlets throughout the state. Employees of TASMAC are not
considered as government employees and are not entitled to the benefits and legal rights (like
statutory pay, paid holidays and an 8 hours working in a day) of other employees of the state.
They sell other kinds of liquor as well. Almost all the outlets have bars attached to them.
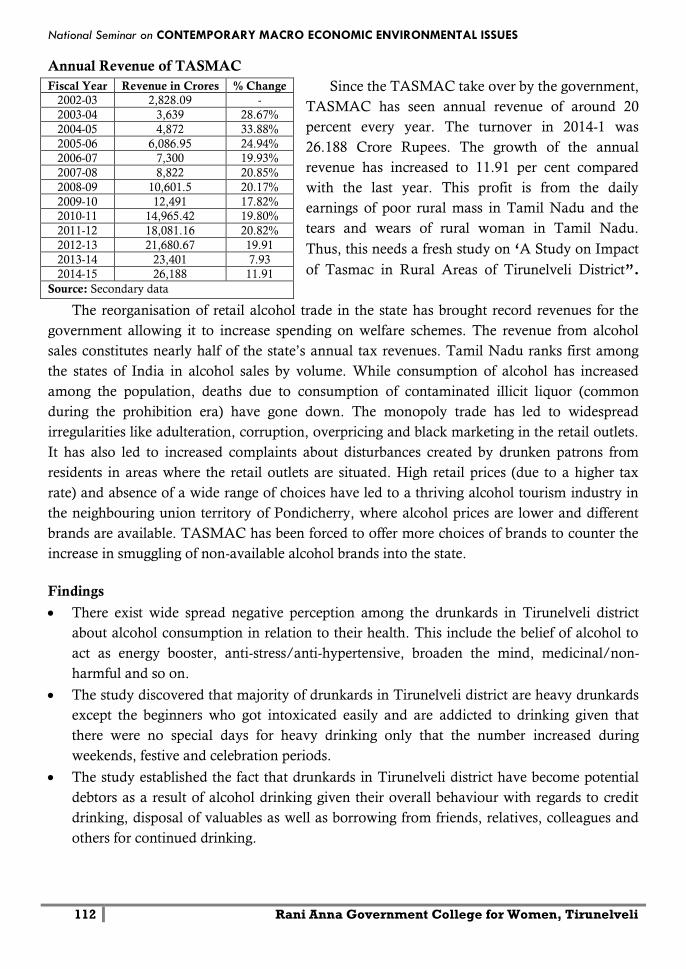
National Seminar on CONTEMPORARY MACRO ECONOMIC ENVIRONMENTAL ISSUES
112 Rani Anna Government College for Women, Tirunelveli
Annual Revenue of TASMAC
Since the TASMAC take over by the government,
TASMAC has seen annual revenue of around 20
percent every year. The turnover in 2014-1 was
26.188 Crore Rupees. The growth of the annual
revenue has increased to 11.91 per cent compared
with the last year. This profit is from the daily
earnings of poor rural mass in Tamil Nadu and the
tears and wears of rural woman in Tamil Nadu.
Thus, this needs a fresh study on ‘A Study on Impact
of Tasmac in Rural Areas of Tirunelveli District”.
The reorganisation of retail alcohol trade in the state has brought record revenues for the
government allowing it to increase spending on welfare schemes. The revenue from alcohol
sales constitutes nearly half of the state’s annual tax revenues. Tamil Nadu ranks first among
the states of India in alcohol sales by volume. While consumption of alcohol has increased
among the population, deaths due to consumption of contaminated illicit liquor (common
during the prohibition era) have gone down. The monopoly trade has led to widespread
irregularities like adulteration, corruption, overpricing and black marketing in the retail outlets.
It has also led to increased complaints about disturbances created by drunken patrons from
residents in areas where the retail outlets are situated. High retail prices (due to a higher tax
rate) and absence of a wide range of choices have led to a thriving alcohol tourism industry in
the neighbouring union territory of Pondicherry, where alcohol prices are lower and different
brands are available. TASMAC has been forced to offer more choices of brands to counter the
increase in smuggling of non-available alcohol brands into the state.
Findings
There exist wide spread negative perception among the drunkards in Tirunelveli district
about alcohol consumption in relation to their health. This include the belief of alcohol to
act as energy booster, anti-stress/anti-hypertensive, broaden the mind, medicinal/non-
harmful and so on.
The study discovered that majority of drunkards in Tirunelveli district are heavy drunkards
except the beginners who got intoxicated easily and are addicted to drinking given that
there were no special days for heavy drinking only that the number increased during
weekends, festive and celebration periods.
The study established the fact that drunkards in Tirunelveli district have become potential
debtors as a result of alcohol drinking given their overall behaviour with regards to credit
drinking, disposal of valuables as well as borrowing from friends, relatives, colleagues and
others for continued drinking.
Fiscal Year Revenue in Crores % Change
2002-03 2,828.09 -
2003-04 3,639 28.67%
2004-05 4,872 33.88%
2005-06 6,086.95 24.94%
2006-07 7,300 19.93%
2007-08 8,822 20.85%
2008-09 10,601.5 20.17%
2009-10 12,491 17.82%
2010-11 14,965.42 19.80%
2011-12 18,081.16 20.82%
2012-13 21,680.67 19.91
2013-14 23,401 7.93
2014-15 26,188 11.91
Source: Secondary data
Vol. 6 | Special Issue. 1 | March 2018 | ISSN: 2319-961X
113 Shanlax International Journal of Economics
The study also found strong effects of alcohol on both family and the society at large in
Tirunelveli district. Alcohol consumption has created neglect, frustration and fear among
the families of the drunkard as well as unrest (lack of peace) within the society.
Mostly the literates are the alcoholic consumers.
More than half of the earnings spend on the alcoholic consumption in the study area.
It is noticed that most of the TASMAC rules are only on paper.
Most of these shops and bars attached to them often find themselves in the midst of the
storm for violation of rules.
The Tamil Nadu Liquor Retail vending (in shops and bars) Rules , 2003, state that every
bar attached to a liquid shop must be housed in a ‘pacca’ building and the bar must be
sufficiently screened so that consumption of liquor is not visible for outside. But it is not so
in reality. Mostly the TASMAC bars have been functioning with tin sheets serving as roof
and walls.
It is heard from the respondents who complain that it is the women, young girls and
children who face a great deal of difficulty in passing through the street as the drunk spill
over into the street, especially during Sundays, and tease the passer by.
“They also sit on the stairways leading to the houses in the street, throw away liquor bottles
here and three and indulge in all sorts of indecent activities”, women respondents lament.
The rules state that no liquors shops should be set up near places of worship and
educational institutions but still the rule has been violated.
Liquor shops run by the state has ruined many happy families and made the youth addicted
to booze.
Rules 11-A of the TNLRV rules states that liquor should not be sold or served to any
person below the age of 21 years. Contrary to the rules, one can easily witness to
school/college students in uniform buying liquor bottles and stuffing them into their
pockets.
It is heart rending to see such scenes like even women buying liquor at TASMAC shops.
Even after a decade, the TASMAC employees continue to be working as contract
labourers. People are hired and fired at will. They are treated like slaves despite helping
TASMAC to augment its revenue from Rs. 3,639.93 crores in the financial year 2003-04 to
Rs. 21,680.67 crores in 2012-13, the employees add.
The contribution of the TASMAC income is 11% of the State income.
Recommendations
1. Government should institute public campaigns and awareness in order to create intensive
information bank for public on the dangers of alcohol consumption on human health,
family and society. This will help correct wide spread negative perception about alcohol
consumption.
2. There should be effective rules and regulations on registration, production, distribution,
place of sales including high tax rate to serve as discouragement to the seller and drunkards
in order to minimize the burden of indebtedness among drunkards.
National Seminar on CONTEMPORARY MACRO ECONOMIC ENVIRONMENTAL ISSUES
114 Rani Anna Government College for Women, Tirunelveli
3. There should be modalities of educating society members, especially the family to cope and
manage the drunkards such that family as well as societal impact can be greatly reduced.
4. Civil organizations as well as other sources of law should explicitly take a stand on the
ideal effect of alcohol consumption on human health.
5. The Government cannot be running liquor shops in the guise of preventing sale of illicit
arrack. Since it’s the solution to numerous ills plaguing TASMAC.
6. The Government should not earn the income by sucking the blood of the rural innocent
people.
Conclusion
The Government of Tamil Nadu must develop its states through full utilisation of all
available resources. Of them, Human resource is the most important one. In order to earn
income of the state, the state should not destruct the human resource through TASMAC.
A Man should not be happy by making others unhappy. The government ignores even this
simple philosophy. On the contrary the slogan, “Liquor ruins life, family, society and country”
The government itself ruins the ordinary man, his family, its society, its state, and its country.
It seems to the saying of “A GLUTTON DIGS HIS GRAVE WITH HIS TEETH”.
The Government cannot be running the TASMAC in the guise of preventing sales of illicit
arracks, the researcher points out.
“One wrong act cannot be used as a shield to perpetrate another wrong act”.
References
1. The Annual Revenue Of TASMAC for www.tasmac.tn.in (wiki & PDF)
2. The problem of TASMAC and rules for THE HINDU, oct, 07, page-2.
Vol. 6 | Special Issue. 1 | March 2018 | ISSN: 2319-961X
115 Shanlax International Journal of Economics
A STUDY ON PERCEPTION TOWARDS MUTUAL FUND
INVESTMENT AMONG INVESTORS IN BANGALORE
Shama Stephen
II MA., Economics, Kristu Jayanti College, Bangalore
Abstract
The evolution of mutual fund began in the 19th century by London merchant bankers they started taking
investment funds among the rich and then these funds floated among small investors they tried investing in small
shares which in turn took a wide turn of huge investments taking place in a wide variety of financial institutions.
India’s mutual fund assets are high but its penetration is skewed towards few states only few investors tend to invest in
mutual funds. The study is about creating awareness among general public that mutual funds are not very risky
instruments to invest as it is perceived by the public.
Introduction
The term ' mutual’ signifies a system where in the benefits of investment applies to all
investors in proportion to their investment. It’s a financial institution through which the pooled
devoted money is invested in a diversified portfolio. In India the interest of mutual funds all
started when Indian economy was adversely affected by war in 1962. In 1963 the setting up of
unit trust of India got established by Shri T.T. Krishnamachari where he introduced the unit
trust of India bill in the Indian parliament. The main objective of this trust was to recover
India's economy which suffered from scarce resources while allocation had to be increased for
defence. The main objective was to introduce small investors to financial markets. The RBI,
LIC, SBI and its subsidiaries and other banks and financial institutions contributed as initial
contributors to UTI.
The first open ended mutual fund scheme started in 1964 which mobilised a subscription of
Rs 17.5 crores from 125000 investors. Later mutual fund investments gained faster speed
amongst the country. Later government opened up the sector to other markets and players later
security exchange Board of India was introduced in 1992. according to security exchange board
of India ‘’A mutual fund means a fund established in the form of trust to raise money through
the sale of units to the public or sections of public under one or more schemes for investing in
securities including money market instruments.”
The mutual funds have their own advantages and disadvantages compared to the direct
investing in individual securities. But today mutual fund investment plays an important role in
household finance. So many factors influence the performance of the mutual fund industry in
India. The mutual fund industry faces a few problems which can be reduced through proper
measures. The increasing number of households and rise in the income levels etc. provides
wide scope to make investments in mutual funds.
National Seminar on CONTEMPORARY MACRO ECONOMIC ENVIRONMENTAL ISSUES
116 Rani Anna Government College for Women, Tirunelveli
Objectives
1. To study the current scenario of India’s mutual fund industry and to analyse its growth.
2. To study the perception of investors towards the investment in mutual funds among
investors in Bangalore.
Hypothesis
The tentative statements of the study are
H01: There is no significance difference between the percent of investment in mutual funds
with the individual person’s perception towards buying of mutual funds.
Data
The study conducted was on primary and secondary data basis
Primary data was conducted under simple random sampling method where information was
gathered from 100 samples.
Secondary data was collected from second hand related books, journals, annual reports,
and websites.
Sources
Money control.com, SEBI, IMF, AMFI were the main sources where information was
gathered.
Tools of analysis
Tools like simple factor analysis, where many variables were interrelated to each other were
taken into consideration for data reduction. Similarly multiple regressions were also done to
find out which factors cause significance with the dependent variable.
Review of literature
Mutual fund investments naturally depend on many variables that needs to be explored.
some of them were as follows Ferreira et al, (2011) studied the determinants of mutual fund
performance using a new data set of 16,316 open-end actively managed domestic and
international equity funds in 27 countries. They concluded that mutual funds underperform the
market overall, but performance persists on a short-term basis. Domestic funds outperform
international funds, and U.S.-domiciled funds outperform funds elsewhere in the world. Fund
age and fees are negatively related to performance, while funds that belong to large fund
families, solo-managed funds, and funds distributed in several countries perform better.
Country characteristics also help to explain fund performance. Domestic funds located in
developed countries, especially those with liquid stock markets and strong legal institutions,
display better performance.
Statistical analysis
The Indian mutual funds industry has been one such industry that has provided a platform
to all type of investors to participate in India’s growth story. Investors today can pick and
Vol. 6 | Special Issue. 1 | March 2018 | ISSN: 2319-961X
117 Shanlax International Journal of Economics
choose as many mutual funds easily at lower cost.As per sources by MD & CEO of CRISIL
Ltd quotes “How mutual funds have emerged as the new establishing force. As it has reflected
in the increasing share of equity mutual funds in the total equity market cap from 2.9% to 5.5%
in past 3 years ended March 31, 2017.”Keeping this reference in mind we decided to study the
current scenario of India’s mutual fund industry and to analyze its growth. Maharashtra ranks
at 43.4% growth of mutual fund investments, followed by New Delhi at 9.8%, karnatataka
having 7% followed by Gujarat and Haryana with 5.8% and 5.6% growth of mutual fund
investment activities taking place all over India.The results show us that customers outlook
towards investment is less and savings is more, perception towards mutual funds is tend to be
looked as risky investment and so trying to deposit in fixed and savings deposits more investors
in Bangalore towards the investment of their savings was the second objective.
Multiple regressions
Multiple regressions are a statistical tool used to derive the value of a criterion from several
other independent or predictor, variables. It is the simultaneous combination of multiple factors
to assess how and to what extent they affect a certain outcome. Here in our statistical analysis
from factor analysis we further tried doing multiple regressions among the four variables that
showed correlation for the investment of mutual funds.
Hypothesis
H01: There is no significance difference in the percentage of savings and past performance
H02: There is no significance difference in the percentage of savings and ratings by research
agency
H03: There is no significance difference in the percentage of savings and newspaper &
magazines
H04: There is no significance difference in the percentage of savings and reputations of the
fund companies.
The equation will be % of investment in mutual funds=1.278-0.179* past
performance+0.168*ratings by research Agency+0.280* newspapers & magazines +0.000*
reputation of the fund companies. The standard error of estimated of reputation of the fund
companies is 0.128 compared to estimates of others that means estimation regression of the
reputation of fund companies is more accurate as compared to other estimates.
Regression coefficient of past performance shows that an -0.179 implies decrease in the% of
investment in the mutual funds. Similarly with ratings in research agency shows decrease in the
% of investment in mutual funds, followed by an increase in the estimation regression
coefficient of magazines & newspapers of 0.280 shows an increase in the investment % of
mutual funds. Whereas reputation of mutual funds shows no accurate results with increase or
decrease in the % of investment in mutual funds.
Significance of the regression coefficients T test is carried out to find if regression coefficient
is significant HO: B1=0, i=1, 2, 3, and 4
For B1 Test statistic value T= -1.195 with P value 0.237 which is greater than 0.05.
National Seminar on CONTEMPORARY MACRO ECONOMIC ENVIRONMENTAL ISSUES
118 Rani Anna Government College for Women, Tirunelveli
Therefore we accept HO: The regression coefficient is not significant between % of savings
and past performance. Similarly the rating by research agency and reputation of fund
companies also shows the regression coefficient is not significant with P values more than the
level significance. But newspaper & magazines show the regression coefficient is significant
with Value being 0.059 which can be partially accepted. With low VIF measures showing there
is absence of multicollinearity in the model.
Conclusion
India ranks 8th all over the world for its mutual fund: GDP ratio, moreover Indians believe
in savings rather than investments because the precautionary motives are generally high. The
demand can only be reached through advertisements, technology diversification in the form of
e-wallet, online applications and mobile apps where documents can be submitted online.
Though the mutual fund industry’s assets are at a record high, its penetration is skewed
towards a few states and the larger cities. This is because in most parts of the country, the focus
is more on savings rather than investing. Lack of information about mutual funds and the
perception that it is a risky product have resulted in investors preferring banks’ fixed deposits
and physical assets such as gold and real estates. Amfi’s recent multimedia campaign allowing
celebrity endorsements are welcome moves to increase investor awareness. There is ample
scope to increase financial awareness, especially in the untapped rural areas.
References
1. Hortaçsu, A., & Syverson, C. (2004). Product differentiation, search costs, and competition
in the mutual fund industry: A case study of S&P 500 index funds. The Quarterly Journal of
Economics, 119(2), 403-456.
2. Ippolito, R. A. (1992). Consumer reaction to measures of poor quality: Evidence from the
mutual fund industry. The Journal of Law and Economics, 35(1), 45-70.
3. Nitzsche, D., Cuthbertson, K., & O'Sullivan, N. (2006). Mutual fund performance.
4. Sangeetha, R., & Sugirtha, C. M. R. performance evaluation of selected mutual fund
schemes of hdfc asset management company, TIRUNELVELI. Primax International Journal
of Finance (PIJF)
5. Tufano, P., & Sevick, M. (1997).Board structure and fee-setting in the US mutual fund
industry. Journal of Financial Economics, 46(3), 321-355
Vol. 6 | Special Issue. 1 | March 2018 | ISSN: 2319-961X
119 Shanlax International Journal of Economics
IMPACT OF ENVIRONMENTAL POLLUTION ON
HUMAN HEALTH: AN ECONOMIC ANALYSIS
Dr.M.Saravanan
Assistant Professor, PG & Research Department of Economic Vivekananda College, Agasteeswarm, Kanyakumari
Dr.J.John Vellakkan
Head of the Department of Economics (Rtd.), St. John’s College, Palayamkottai, Tirunelveli, Tamilnadu
Abstract
Environmental resources like air and water can be regarded as global public goods and they have to be preserved
for the well-being of the humanity. Economists consider environment as an asset and the services provided by the
environment have a direct relationship with the economy. Though environment has enormous capacities for recycling,
there are tolerance limits. When such limits are exceeded, a pollution crisis exists. Pollution is considered a harmful
return which affects the economic and social well-being. This study is concerned with economic analysis of
environmental pollution in general and drinking water pollution on human health in particular which refers to the
adverse effects on the quality of human life.
Research objective of the study is to evaluate the loss in employment, health and productivity of urban
community employed in various fields due to environmental pollution. In this study both primary and secondary data
are used. In this study Tirunelveli Corporation has been divided into fur zones. They are i) Tininelveli zone, ii)
Palayarnkottaizone. iii) Melapalavam zone and iv) Tachanallur zone. Apart from these zones, the entire area is
divided into 55 wards. Each ward is divided according to the size of' population not exceeding a maximum of 7.500
per ward. In the wards 12 twelve 35 (Thirty five), there are a minimum of nine streets and the 19th ward has a
maximum of 53 (fifty three) streets.
Introduction
Rapid urbanization in India and the growth of city contribute considerably to the
deterioration in the urban environment and quality of life. Urban environment is defined as
"including such physical elements as water and air quality, waste disposal, noise levels,
neighbourhood conditions and availability of open and green space. It also includes ecological
conditions, opportunities for recreational activities, aesthetic quality of architecture and
landscape and urban amenities (defined as characteristics and qualities which contribute to the
pleasantness, harmony and cultural quality of the surroundings)". (OECD 1990)
In developing countries about 17 million people die every year of infections and parasitic
diseases such as diarrhoea, malaria and tuberculosis (Human Development Report 1995) which
are essentially environmental oriented. As the Seventh Five Year Plan (1985-1990)reports
pointed out that high rate of incidence of death and disease in urban poor settlements can be
attributed largely to the poor quality of' water and sanitation facilities. (Planning Commission)
According to a study conducted in 1994 by a group of students of SMS Medical College, Jaipur
indicated that on an average, a person living in Jaipur inhaled25 bacteria every two minutes.
(The Hindu Survey of the Environment 1995)
National Seminar on CONTEMPORARY MACRO ECONOMIC ENVIRONMENTAL ISSUES
120 Rani Anna Government College for Women, Tirunelveli
The main water-borne diseases that break out frequently in Chennai (Madras)include
enteric fever, hepatitis-A, leptospirosis, acute diarrhoeal diseases and tuberculosis. The cholera
epidemic in 1987 claimed over 70 lives, while a more virulent and varied strain of bacteria
which struck in 1992 claimed 13 lives. Besides these epidemics, Chennai (Madras) has a high
incidence of Malaria and filariasis, both transmitted by mosquitoes.
According to Tirunelveli Municipal Corporation officials, in the first half of this century,
the outbreak of cholera was common as Tirunelveli City had no proper drainage system. In
1992, there was an outbreak of cholera in Tirunelveli town when the district was hit by floods.
About a dozen people lost their lives, according to government records.
Previous Studies on Impact of Environmental Pollution on Human Health
Beveridge has attempted to explain how animal health affects man in three important ways.
According to him some diseases of animals are transmissible to man. There are over a hundred
zoonoses as these diseases are called. The most widespread zoonosis is salmonella food
poisoning. This disease is due to international trade in human foods, importation of feed stuffs,
widespread use of house hold detergents and also industrial centralization of food processing.
According to Beveridge's findings the diseases are transmissible from animals to man.
(Beveridge 1967)
Dubos in his article on "Promises and Hazards of Man's Adaptability" has pointed out that
environmental pollution has become a universal problem. Economic wealth is produced by
people in contaminated atmospheres. Many environmental factors affect human life.
Adaptability is almost an asset for survival. At the same time it may lead to some stressful
effects on the human beings. The chemical pollution of water and food will have to be
sufficiently controlled to prevent the kind of toxic effects. The world is becoming more and
more urbanized and industrialized. Scientific progress is not the only factor of importance in
the control of disease. The cost of preventing and treating diseases has become higher. lie has
concluded that the public health programme should include the control of pollution of the
environment as one of the major objectives. (Dubos 1971)
A study by Desai was undertaken to deal with the health problem of people living in and
around the Sandhur mine area of Karnataka State of India, during1978-82. The census method
was used in order to cover the entire area mainly composed of Iron and Manganese. The
findings of this study confirm that the 'Slow Killer" diseases attacked the people of this area
which were mainly air and waterborne. (Desai R G 1985)
Research objective
To evaluate the loss in employment, health and productivity of urban community
employed in various fields due to environmental pollution.
Sampling frame work
In this study both primary and secondary data are used. The data published by the Central
and State Government in India and data published by international reputed institutions are
used. Further the data from the Department of Animal Husbandry, Public Health, Public
Vol. 6 | Special Issue. 1 | March 2018 | ISSN: 2319-961X
121 Shanlax International Journal of Economics
Works Department, the various zonal offices of Tirunelveli Corporation and all the
government departments including pollution control offices in Tirunelveli District are also used
for analysis.
Survey Method
The Researcher used two types of questionnaires and schedules for this study.
Questionnaire I is meant for the public households of Tirunelveli Corporation which is the
universe of this study and Questionnaire II is meant for the four zonal officers of the Tirunelveli
Corporation.
Location of Survey for the Questionnaire
Tirunelveli Corporation has been divided into fur zones. They are i) Tininelveli zone,
ii) Palayarnkottaizone. iii) Melapalavam zone and iv) Tachanallur zone. Apart from these
zones, the entire area is divided into 55 wards. Each ward is divided according to the size of'
population not exceeding a maximum of 7.500 per ward. In the wards 12 twelve 35 (Thirty
five), there are a minimum of nine streets and the 19th ward has a maximum of 53 (fifty three)
streets.
In order to give equal representation to every zone and to every ward of the Tirunelveli
Corporation, it was decided to take 300 sample households out of 81,400 households in
Tirunelveli Corporation.
The number of households selected from each zonal area is
Tirunelveli zone 111 Households
Palayamkottai zone 110 Households
Melapalayam zone 60 Households
Tachanallur zone 19 Households
Impact of environmental pollution on human health
Nearly one fifth of the people in the sample households were suffering from some diseases
or the other due to environmental pollution. Totally 8.73 per cent of people in the sample study
were affected by water borne and water related diseases alone and 20.46 per cent of affected
persons were due to environmental pollution.
These environmental diseases are Typhoid (enteric fever), Cholera, Leprosy, (Jastro
Enteritis, Cerebrospinal Meningitis, and Diphtheria. Wooping Cough, Tuberculosis, Fever,
Viral Encephalitis, Virus Fever, Common Cold, Hepatitis A(Jaundice), Mumps, Measles,
Chicken-pox, Diarrhoea, Dysentery, Stone-formation, Scabies, Malaria, Tetanus, Asthma,
Depression, Madness and Snake bites. Therefore this chapter is mainly devoted to study the
economic impact on human beings due to environmental pollution related diseases.
Illness and death due to environmental pollution based diseases account for loss of several
thousand man-days of labour and considerable morbidity and mortality. In terms of man-days
loss and the cost of treatment for curing the diseases, the consequent drain on individual’s
timely budget would work out to a few thousands of rupees per annum which pushes back the
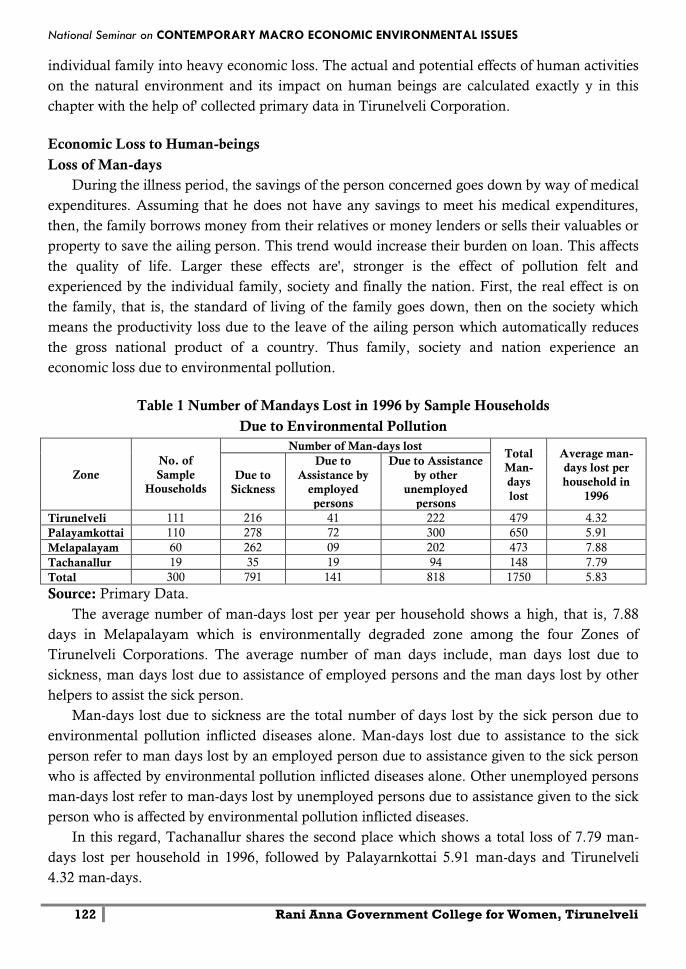
National Seminar on CONTEMPORARY MACRO ECONOMIC ENVIRONMENTAL ISSUES
122 Rani Anna Government College for Women, Tirunelveli
individual family into heavy economic loss. The actual and potential effects of human activities
on the natural environment and its impact on human beings are calculated exactly y in this
chapter with the help of' collected primary data in Tirunelveli Corporation.
Economic Loss to Human-beings
Loss of Man-days
During the illness period, the savings of the person concerned goes down by way of medical
expenditures. Assuming that he does not have any savings to meet his medical expenditures,
then, the family borrows money from their relatives or money lenders or sells their valuables or
property to save the ailing person. This trend would increase their burden on loan. This affects
the quality of life. Larger these effects are', stronger is the effect of pollution felt and
experienced by the individual family, society and finally the nation. First, the real effect is on
the family, that is, the standard of living of the family goes down, then on the society which
means the productivity loss due to the leave of the ailing person which automatically reduces
the gross national product of a country. Thus family, society and nation experience an
economic loss due to environmental pollution.
Table 1 Number of Mandays Lost in 1996 by Sample Households
Due to Environmental Pollution
Zone
No. of
Sample
Households
Number of Man-days lost Total
Man-
days
lost
Average man-
days lost per
household in
1996
Due to
Sickness
Due to
Assistance by
employed
persons
Due to Assistance
by other
unemployed
persons
Tirunelveli 111 216 41 222 479 4.32
Palayamkottai 110 278 72 300 650 5.91
Melapalayam 60 262 09 202 473 7.88
Tachanallur 19 35 19 94 148 7.79
Total 300 791 141 818 1750 5.83
Source: Primary Data.
The average number of man-days lost per year per household shows a high, that is, 7.88
days in Melapalayam which is environmentally degraded zone among the four Zones of
Tirunelveli Corporations. The average number of man days include, man days lost due to
sickness, man days lost due to assistance of employed persons and the man days lost by other
helpers to assist the sick person.
Man-days lost due to sickness are the total number of days lost by the sick person due to
environmental pollution inflicted diseases alone. Man-days lost due to assistance to the sick
person refer to man days lost by an employed person due to assistance given to the sick person
who is affected by environmental pollution inflicted diseases alone. Other unemployed persons
man-days lost refer to man-days lost by unemployed persons due to assistance given to the sick
person who is affected by environmental pollution inflicted diseases.
In this regard, Tachanallur shares the second place which shows a total loss of 7.79 man-
days lost per household in 1996, followed by Palayarnkottai 5.91 man-days and Tirunelveli
4.32 man-days.
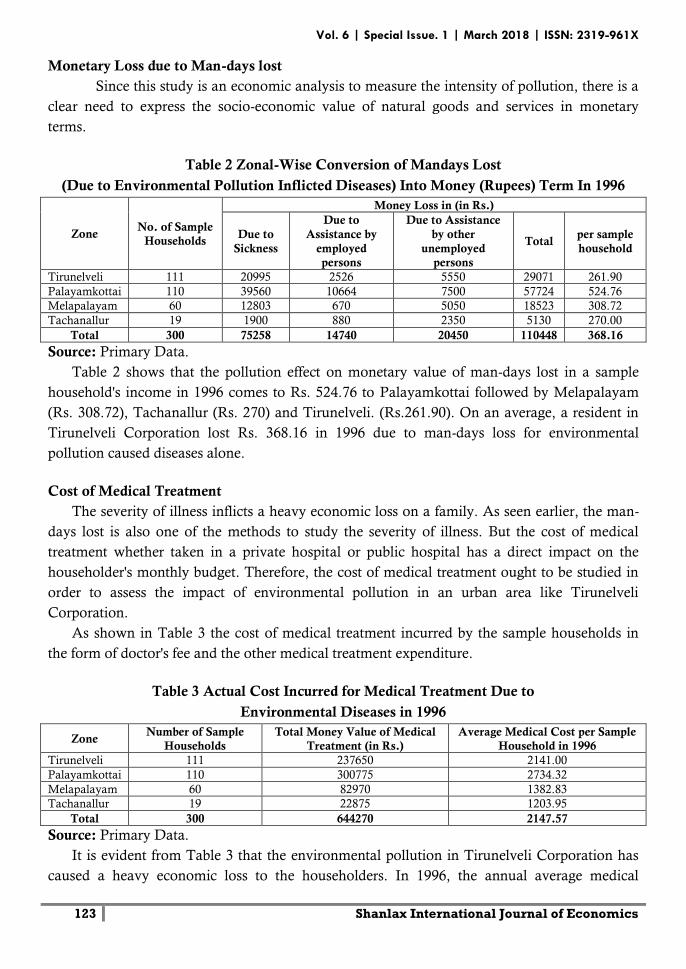
Vol. 6 | Special Issue. 1 | March 2018 | ISSN: 2319-961X
123 Shanlax International Journal of Economics
Monetary Loss due to Man-days lost
Since this study is an economic analysis to measure the intensity of pollution, there is a
clear need to express the socio-economic value of natural goods and services in monetary
terms.
Table 2 Zonal-Wise Conversion of Mandays Lost
(Due to Environmental Pollution Inflicted Diseases) Into Money (Rupees) Term In 1996
Zone No. of Sample
Households
Money Loss in (in Rs.)
Due to
Sickness
Due to
Assistance by
employed
persons
Due to Assistance
by other
unemployed
persons
Total per sample
household
Tirunelveli 111 20995 2526 5550 29071 261.90
Palayamkottai 110 39560 10664 7500 57724 524.76
Melapalayam 60 12803 670 5050 18523 308.72
Tachanallur 19 1900 880 2350 5130 270.00
Total 300 75258 14740 20450 110448 368.16
Source: Primary Data.
Table 2 shows that the pollution effect on monetary value of man-days lost in a sample
household's income in 1996 comes to Rs. 524.76 to Palayamkottai followed by Melapalayam
(Rs. 308.72), Tachanallur (Rs. 270) and Tirunelveli. (Rs.261.90). On an average, a resident in
Tirunelveli Corporation lost Rs. 368.16 in 1996 due to man-days loss for environmental
pollution caused diseases alone.
Cost of Medical Treatment
The severity of illness inflicts a heavy economic loss on a family. As seen earlier, the man-
days lost is also one of the methods to study the severity of illness. But the cost of medical
treatment whether taken in a private hospital or public hospital has a direct impact on the
householder's monthly budget. Therefore, the cost of medical treatment ought to be studied in
order to assess the impact of environmental pollution in an urban area like Tirunelveli
Corporation.
As shown in Table 3 the cost of medical treatment incurred by the sample households in
the form of doctor's fee and the other medical treatment expenditure.
Table 3 Actual Cost Incurred for Medical Treatment Due to
Environmental Diseases in 1996
Zone Number of Sample
Households
Total Money Value of Medical
Treatment (in Rs.)
Average Medical Cost per Sample
Household in 1996
Tirunelveli 111 237650 2141.00
Palayamkottai 110 300775 2734.32
Melapalayam 60 82970 1382.83
Tachanallur 19 22875 1203.95
Total 300 644270 2147.57
Source: Primary Data.
It is evident from Table 3 that the environmental pollution in Tirunelveli Corporation has
caused a heavy economic loss to the householders. In 1996, the annual average medical
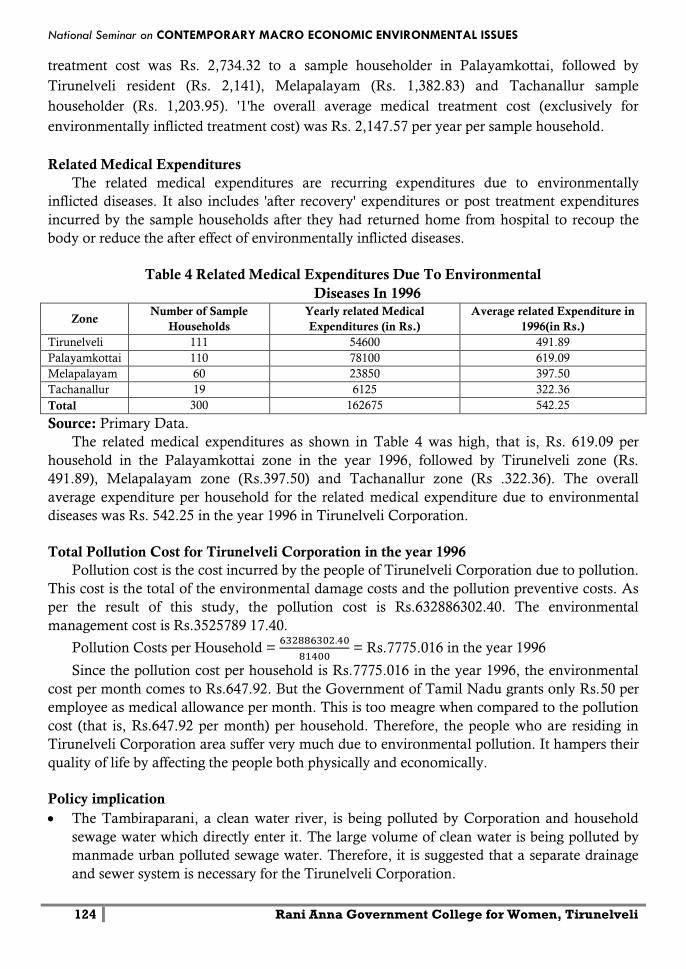
National Seminar on CONTEMPORARY MACRO ECONOMIC ENVIRONMENTAL ISSUES
124 Rani Anna Government College for Women, Tirunelveli
treatment cost was Rs. 2,734.32 to a sample householder in Palayamkottai, followed by
Tirunelveli resident (Rs. 2,141), Melapalayam (Rs. 1,382.83) and Tachanallur sample
householder (Rs. 1,203.95). '1'he overall average medical treatment cost (exclusively for
environmentally inflicted treatment cost) was Rs. 2,147.57 per year per sample household.
Related Medical Expenditures
The related medical expenditures are recurring expenditures due to environmentally
inflicted diseases. It also includes 'after recovery' expenditures or post treatment expenditures
incurred by the sample households after they had returned home from hospital to recoup the
body or reduce the after effect of environmentally inflicted diseases.
Table 4 Related Medical Expenditures Due To Environmental
Diseases In 1996
Zone Number of Sample
Households
Yearly related Medical
Expenditures (in Rs.)
Average related Expenditure in
1996(in Rs.)
Tirunelveli 111 54600 491.89
Palayamkottai 110 78100 619.09
Melapalayam 60 23850 397.50
Tachanallur 19 6125 322.36
Total 300 162675 542.25
Source: Primary Data.
The related medical expenditures as shown in Table 4 was high, that is, Rs. 619.09 per
household in the Palayamkottai zone in the year 1996, followed by Tirunelveli zone (Rs.
491.89), Melapalayam zone (Rs.397.50) and Tachanallur zone (Rs .322.36). The overall
average expenditure per household for the related medical expenditure due to environmental
diseases was Rs. 542.25 in the year 1996 in Tirunelveli Corporation.
Total Pollution Cost for Tirunelveli Corporation in the year 1996
Pollution cost is the cost incurred by the people of Tirunelveli Corporation due to pollution.
This cost is the total of the environmental damage costs and the pollution preventive costs. As
per the result of this study, the pollution cost is Rs.632886302.40. The environmental
management cost is Rs.3525789 17.40.
Pollution Costs per Household =
= Rs.7775.016 in the year 1996
Since the pollution cost per household is Rs.7775.016 in the year 1996, the environmental
cost per month comes to Rs.647.92. But the Government of Tamil Nadu grants only Rs.50 per
employee as medical allowance per month. This is too meagre when compared to the pollution
cost (that is, Rs.647.92 per month) per household. Therefore, the people who are residing in
Tirunelveli Corporation area suffer very much due to environmental pollution. It hampers their
quality of life by affecting the people both physically and economically.
Policy implication
The Tambiraparani, a clean water river, is being polluted by Corporation and household
sewage water which directly enter it. The large volume of clean water is being polluted by
manmade urban polluted sewage water. Therefore, it is suggested that a separate drainage
and sewer system is necessary for the Tirunelveli Corporation.
Vol. 6 | Special Issue. 1 | March 2018 | ISSN: 2319-961X
125 Shanlax International Journal of Economics
In each and every ward of Tirunelveli Corporation an 'environment supervisor' should be
appointed in order to cheek street squatting. If any person whether a child or an adult
willfully commits street squatting he/she should be fined ‘on the spot' itself. This fine
should be imposed by applying' polluters pay' principle.
Conclusion
Intensity of water contaminated diseases is fairly spread over all types of income and
occupational groups. Therefore, drinking water pollution in Tirunelveli Corporation has
affected all the sections of people irrespective of income and occupational hierarchy. Further,
as the water-borne diseases are fairly spread over all income and occupational groups, it is
proved that the drinking water supplied by Tirunelveli Corporation is not potable.
References
1. Organisation for Economic Co-operation and Development (OECD),"Environment
Policies for Cities in the 1990's", Federal Republic of Germany, 1990.pp. 20-21.
2. Madhura Swaminathan, "Slums in Bombay Deprivation and the Environment", in The
Hindu Survey of Environment, 1995, p.22.
3. W.I.B. Beveridge, "Animal Health and Its Implications for Man", Symposium of "Health of
Mankind" held on 8th-10th March 1967, Ciba Foundation,100th Symposium, Edited by
Wolstenholme, Gorden and O'Cornor, Maeve, J & A Churchill Ltd., London, W.I, 1967.
4. Rene Dubos, "Promises and Hazards of Man's Adaptability" in Environment Quality in a
Growing Economy, (Ed.) by Henry Jarrett, The John's Hopkins Press, Baltimore, 1971,
p.23-39.
5. R.G. Desai, Journal of Environmental Science, 1985, pp. 19-25.
6. D. Mink, "Agriculture Operations Division, World Bank Discussion, Papers No. 189,
Washington D.C., U.S.A., 1993.
7. De E Lange,, IWT Foundation, Amsterdam (Netherlands), 125 Pages, June 1994. Cited in
the "Abstracts on Tropical Agriculture", Vol. 20, No.7, July 1997.
8. V. Smil, "Environmental Problems in China: Estimates of Economic Costs", East-West
Center Special Report (USA), No. 5, April 1996, p. 62.
9. United Nations Environment Programme, Environmental Data Report 1994-95, GEMS
Monitoring and Assessment Research Centre, London, U.K., Black Well, Ox-ford (U.K.),
p. 415, 1993, cited in the 'Abstracts on Tropical Agriculture', Vol 20, No. 10, October 1995.
10. WHO, "The Urban Health Crisis: Strategies for Health for All in the Face of Rapid
Urbanisation", Geneva, Switzerland, 1993, p.96, cited in the Abstracts on Rural
Development in the Tropics, Vol.9, No.4, July-August, 1994. p. 81.
11. M. Munasinghe, "Environmental Economics and Sustainable Development-, Policy and
Research Division, World Bank Environment Paper No. 3, World Bank. Washington
D.C., I ..A., 1993. p.1 18.
12. Wilfrid I Card, "General Economics of Health", in Economies of the Environment -
Environment and Man 10, (Ed.) John Lenihan and William W Fletcher, Academic Press,
New York and San Francisco, 1979, pp. 1 -29.
13. DennananCodit and Udo E. Sirnoni, "Poverty and Sustainable Development", in
Economics, Vol. 48, Edited by the Institute for Scientific Cooperation, Tubingen, 1992,
pp.7-33.
National Seminar on CONTEMPORARY MACRO ECONOMIC ENVIRONMENTAL ISSUES
126 Rani Anna Government College for Women, Tirunelveli
AN ECONOMETRIC ANALYSIS OF STRUCTURE AND
PERFORMANCE OF INDIAN BANKING SECTOR
Dr.V.Duraisingh
Assistant Professor, Post Graduate Department of Economics
Rani Anna Government College for Women, Tirunelveli
Abstract In the context of the ongoing reforms process in Indian economy in general and banking sector in particular, the
present paper makes an attempt to examine structure, conduct and performance of Indian banking sector. The study is
carried out with necessary data collected from the Prowess Database of the Centre for Monitoring Indian Economy
(CMIE). It is observed that structure of the market, conducts of the banks and their performance have changed over the
years in the post-reform era, especially in the current decade. Using a panel data set of 59 banks operating in India
during 1999-2000 to 2015-2016and applying the two-stage least squares (2SLS) method of estimation, the paper finds
that there are strong inter-linkages between market structure, banks’ conducts and their financial performance. The
banks that have larger market or make greater selling efforts have larger share in the market. On the other hand, the
larger banks end up with lesser market share. Similarly, selling efforts of the banks vary directly with their market
share, market size and debt-equity ratio, whereas their financial performance vary directly with market size and
selling efforts, but inversely with banks’ size, market share and cost inefficiency. It is also found that the nature of
ownership has significant influence on its market share, selling efforts and financial performance of the banks. On the
basis of the above findings, the paper suggests for proactive regulatory role of the RBI to ensure effective competition
and greater efficiency in Indian banking sector.
Keywords: Banking, Structure, Conduct, Performance, Policy, India
Introduction
Indian economy has taken a new dimension, particularly after initiation of economic
reforms in 1991. The banking sector has also experienced a number of such reform initiatives.
The basic objectives of these measures are to make Indian banking system internationally
competitive, especially in respect of capital adequacy and other prudential norms. Hence,
improving productivity, efficiency, technology and profitability of the banks are a few
important aspects which have got adequate attention in recent years. As the Narasimham
Committee 1992 recommends integrity and autonomy of the public sector banks is the more
relevant issue in the present context and they can improve profitability and efficiency without
changing their ownership if competition is enhanced. Interestingly, instead of a drastic
privatization measure, Indian government chose a gradual approach toward restructuring these
banks to enhance their competitiveness through deregulatory measures and entry of foreign and
domestic banks.
However, introduction of the deregulatory policy measures is largely based on the
assumption that efficiency of banks increases in a liberalized framework. What is more
important, perhaps, is that with deregulation leading to competitive business environment, the
banks have started appropriate strategies to cope with the emerging situation. The major
strategies applied by the banks include creating product/service differentiation and strategic
Vol. 6 | Special Issue. 1 | March 2018 | ISSN: 2319-961X
127 Shanlax International Journal of Economics
entry barriers through advertising, widening customer base through promotional activities,
diversification of product/service portfolio to reduce risk of operation and grow, mergers and
acquisitions to consolidate business and enhance and floating joint ventures with foreign firms
to bring in better management and enhance capital base
SCP in Indian Banking Sector: An Overview
As mentioned above, the analytical approach of the present paper is based on the structure-
conduct-performance (SCP) framework. The traditional S-C-P paradigm, developed initially
and modified subsequently postulates a unidirectional relationship between market structure,
conduct and performance with structure of the market (concentration, conditions on entry, etc.)
influencing performance of the firms (profits, growth, etc.) via their conducts (price and non-
price behavior). However, the successive developments in the industrial organization literature
result in multidirectional structure-conduct-performance-policy relationships. In the revised
SCP framework the components are endogenous because of inter-dependencies between
market structure, conducts and performance (Scherer/Ross 1990 and Neuberger 1997).
Inclusion of public policy and allowing for feedback across various components make the
framework even more interlinked.
SCP Relationships in Indian Banking Sector: Model Specification
In the present paper, following Khambampati (1996), we apply simultaneous equation
approach This approach contains three different models assuming that structure (S), conduct
(C) and performance (P) is a function of the other two, i.e.,
),(),,(),,( 321 CSfPPSfCPCfS
Here, we take market share (SHARE) as a proxy for market structure, selling intensity
(SELL) for conduct and profitability (PROF) for performance. In addition to market share,
structural aspects of market include market size (MSZ) and size of the banks (BSZ). Similarly,
debt-equity ratio (DER) is an important conduct of the banks along with selling their efforts,
whereas, apart for profitability, total inefficiency (COST) and current ratio (CR) can be
considered as an important indicator of banks’ performance. Therefore, the above three
equation can be rewritten as:
Here, S’ stands for set of variables relating to market structure other than market share of
the banks, C’ conducts other than selling efforts, and P’ for performance other than profitability.
As the above functional relationships may not be necessarily instantaneous in nature, following
Kambhampati (1996) we incorporate appropriate lag structure in the envisaged models.
Determinants of Market Structure
We assume that SHAREi,t is a function of lagged profitability (PROFi,t-1), lagged selling
intensity (SELLi,t-1), lagged market size (MSZi,t-1), current bank size (BSZi,t) and nature of
ownership, i.e.,
)',,(),,',(),,,'(1 PCSPROFPCSSELLPCSSHARE
National Seminar on CONTEMPORARY MACRO ECONOMIC ENVIRONMENTAL ISSUES
128 Rani Anna Government College for Women, Tirunelveli
)1(),,,,,( 211,1,1, DDBSZMSZSELLPROFfSHARE ittititiit
Here, MSZi,t-1 and BSZit are other proxy for structural aspects other than market share,
SELLi,t-1 for strategy, PROFi,t-1 for performance and D1 and D2 are dummy variables that
capture the nature of ownership of the banks. We divide all the banks into three categories, viz.,
public sector banks, domestic private banks and foreign private banks. We take public sector
banks as the base category. As such, D1 = 1 for private domestic banks and D1 = 0 otherwise,
whereas D2 = 1 for private domestic banks and D2 = 0 otherwise.
Assuming the functional relationship to be linear, (1) can be rewritten as
)2(261541,31,21,1 DDBSZMSZSELLPROFSHARE ittititiit
Determinants of Conduct
We assume that SELLit is a function of lagged market share (SHAREit-1), lagged
profitability (PROFit-1), lagged market size (MSZit-1), current bank size (BSZit), current debt-
equity ratio (DERit) and nature of ownership, i.e,
)3(211,1,1, ),D,D,DER,BSZ,MSZ,PROFf(SHARESELL itittititiit
Here, SHAREi,t-1, MSZit-1 and BSZit control for structural aspects of the market, DERit is for
conduct other than selling efforts and PROFi,t-1 and DERi,t for performance.
Assuming the functional relationship is to be linear, (3) can be rewritten as
)4...(2716541,31,21,1 titittititiit DDDERBSZMSZPROFSHARESELL
Methodology and Data
If there is no simultaneity problem, the OLS estimators produce consistent and efficient
estimators. On the other hand, if there is simultaneity, OLS estimators are not even consistent.
The three equations specified above contain independent variables that are endogenous in
nature. Therefore, the system cannot be estimated consistently with ordinary least square
(OLS) method of estimation. This is so because one of the crucial assumptions of the OLS
method is that the explanatory variables are either non-stochastic or even if stochastic are
distributed independently of stochastic disturbance term. When neither of these conditions is
satisfied, the least-square estimators become biased and inconsistent. This means that even if
the sample size increases indefinitely, the estimates do not converge to their true values. Since
in simultaneous equation models the endogenous variable in one equation may appear as an
explanatory variable in another equation of the system, this endogenous explanatory variable
becomes stochastic and is usually correlated with the random disturbance term making the
OLS estimators inconsistent (Gujarati, 2007). So in the present paper, we use two-stage least
square method (2SLS) to deal with the simultaneity problem. In the presence of simultaneity,
the methods of two stage least squares (2SLS) and instrumental variables give estimators that
are consistent and efficient. This 2SLS method is used to estimate the three-equation model
with the included lag structure.
In the present paper, the endogenous variables include are current market share, current
selling efforts, current profitability, current market size, current bank size, debt-equity ratio,
current total cost inefficiency and current ratio. On the other hand, the lagged market size,
Vol. 6 | Special Issue. 1 | March 2018 | ISSN: 2319-961X
129 Shanlax International Journal of Economics
lagged market share, lagged selling intensity and lagged profitability, and nature of ownership
are treated as the exogenous variables. In the first stage, the endogenous explanatory variables
are regressed on all the exogenous variables included in the system. In the second stage, the
predicted values of the endogenous explanatory variables from the first stage regression are
used as their instruments for estimating the three structural equations. The lagged structure of
the equations is also expected to control endogeniety of the independent variables.
The present paper uses secondary data and the necessary data are collected from the
PROWESS database of the Centre for Monitoring Indian Economy (CMIE), Mumbai. The
sample includes 27 out of 28 public sector banks, 18 out of 22 foreign banks and 14 out of 16
private sector banks. Hence, a total of 59 banks are included in the sample. The above
equations are estimated with a pooled dataset of these 59 banks over the period from 2000-01 to
2008-09. Necessary adjustments to the data are made to overcome data inconsistencies and
other fundamental problems. The cooperative banks and a few other banks are excluded due to
availability of discontinuous data as well as their peculiar operating structure.
Results and Discussions The variables used in estimating the regression models. It is observed that the F-statistic is
statistically significant for all these three equations. This means that the estimated equations are
statistically significant. Value of adjusted R2 is reasonably high in the equation for market
structure and quite low for the other two equations. However, this does not necessarily indicate
that the estimated models are not acceptable. As pointed R2 has a very modest role in
regression analysis. Nothing in classical linear regression model (CLRM) requires that the
value of R2 should be high. Neither is a high value of R2 evidence in favour of a model nor is a
low value of R2 evidence against it. As regards individual coefficients, the t-statistics are
computed by using robust standard errors to control for heteroscedasticity.
Finally, as regards the determinants of performance, we find that the coefficients of all the
variables except CRit and D1 are statistically significant. While the coefficient of SELLit, MSZit
and D2 are positive that of SHAREit, BSZit, COSTit are negative. This means that the banks
with greater selling efforts and larger market demand record higher profitability. On the other
hand, the banks that have greater market share or are larger in size or suffer from higher cost
inefficiency suffer from lower profitability. Further, the private foreign banks experience higher
profitability vis-à-vis the public sector banks. However, current ratio does not have any
significant impact on banks profitability. More interestingly, the profitability of the private
domestic banks does not differ significantly from that of the public sector banks discarding the
proposition that the private banks are necessarily better performers as compared to the public
sector banks, i.e., nature of ownership does not necessarily influence banks’ performance.
Summary Findings and Conclusions
The findings discussed above have some important policy implications. First, as aggressive
selling efforts by the banks and hence their larger market penetration raises market share, the
RBI should play a proactive regulatory role particularly in respect of unfair and restrictive
business practices. However, as larger asset base has inverse relationship with market share,
National Seminar on CONTEMPORARY MACRO ECONOMIC ENVIRONMENTAL ISSUES
130 Rani Anna Government College for Women, Tirunelveli
growth of the banks in size should not be a serious concern. Second, entry of private domestic
banks fails to enhance market competition or improve cost efficiency in a significant way. This
means that better financial performance of the bank does not necessarily depend on the nature
ownership. This raises an important question, what should be the policy approach to the
private banks, especially the domestic ones? Are the customers and investors benefitted from
the changing dynamics of the sector? What are the macroeconomic impacts of these changes?
Addressing these issues, however, requires detailed further research in this line.
References
1. Bhattacharya, K. and Das, A., (2003), “Dynamics of Market Structure and
Competitiveness of the Banking Sector in India and its Impact on Output and Prices of
Banking Services”, Reserve Bank of India Occasional Papers, Vol. 24, pp.124-159.
2. BhanuMurthy, K.V, & Deb, A. T, (2008), "Theoretical Framework Of Competition As
Applied To Banking Industry," MPRA Paper 7465, University Library of Munich,
Germany.
3. Edward, F. R., (1964), “Concentration in Banking and Its Effect On Business Loan Rates”,
Review of Economic and Statistics, Vol. 46, pp. 294–300.
4. Khambampati, U.S., (1996), “Industrial concentration and performance: a study of the
structure, conduct, and performance of Indian industry”, Oxford University Press.
5. Rammohan, T.T., (2003), “Long run performance of public and private sector bank
stocks”, Economic and Political Weekly, Vol. 38, pp. 785-788.
Vol. 6 | Special Issue. 1 | March 2018 | ISSN: 2319-961X
131 Shanlax International Journal of Economics
GOODS AND SERVICE TAX IN INDIA: AN OVERVIEW
M.Anto Soniya
Ph.D. Full Time Research Scholar, Department of Economics
Manonmaniam Sundaranar University, Tirunelveli
Abstract Traditionally India's tax regime relied heavily on indirect taxes. Revenue from indirect taxes was the major
source of tax revenue till tax reforms were undertaken during nineties. The major argument put forth for heavy
reliance on indirect taxes was that the India's majority of population was poor and thus widening base of direct taxes
had inherent limitations. But the Indian system of indirect taxation is characterized by cascading, distorting tax on
production of goods and services which leads to hampering productivity and slower economic growth. There are
endless taxes in present system few levied by Centre and rest levied by state, to remove this multiplicity of taxes and
reducing the burden of the tax payer a simple tax is required and that is Goods and Service Tax (GST). This paper
throws an insight into the Goods and Service Tax concept, advantages and disadvantages of GST.
Keywords: GST in india, Goods and service tax, Indirect tax.
Introduction
Tax policies play an important role on the economy. The main source of revenue for
government of India is from tax. Direct and indirect taxes are the two main source of tax
revenue. When the impact and incidence falls on same person it is called direct tax. When the
impact and incidence falls on different person that is when burden can be shifted to other
person it is called indirect tax. The indirect tax system is currently mired in multi-layered taxes
levied by the Centre and state governments at different stages of the supply chain such as excise
duty, octroi, central sales tax (CST) and value-added tax (VAT), among others. . First Indirect
Tax Reform occurred in India when the Modified Value Added Tax (MODVAT) was
introduced for selected commodities in 1986 to replace the Central Excise Duty. The other
reforms are the introduction of service tax in 1994, decision to introduce VAT in 1999,
introduction of Constitution Amendment Bill on GST in 2011.
GST Model in India
In India, GST was first time introduced on 28 th February 2006 in the Budget speech of the
year 2006-07 by finance minister P. Chidambaram A message was left by the Finance Minister
in the Union Budget 2007-08 that GST will be introduced with effect from 1 st April 2010.
Central and State Governments will be work together to prepare a roadmap for the
introduction on of GST in India. They planned to introduce GST or “replacing the previous
VAT and Services Tax” on 1 st April 2010, but some of the states were not ready to implement
the GST. After that on April 2012, again Government was going to introduce GST, but due to
some management and infrastructure problems it was not introduced. Finance Minister Arun
Jaitley introduced the 122 nd Constitution Amendment Bill in Parliament and intends to
implement GST reform by 1st April 2016. The advantage of GST is that it will replace Indirect
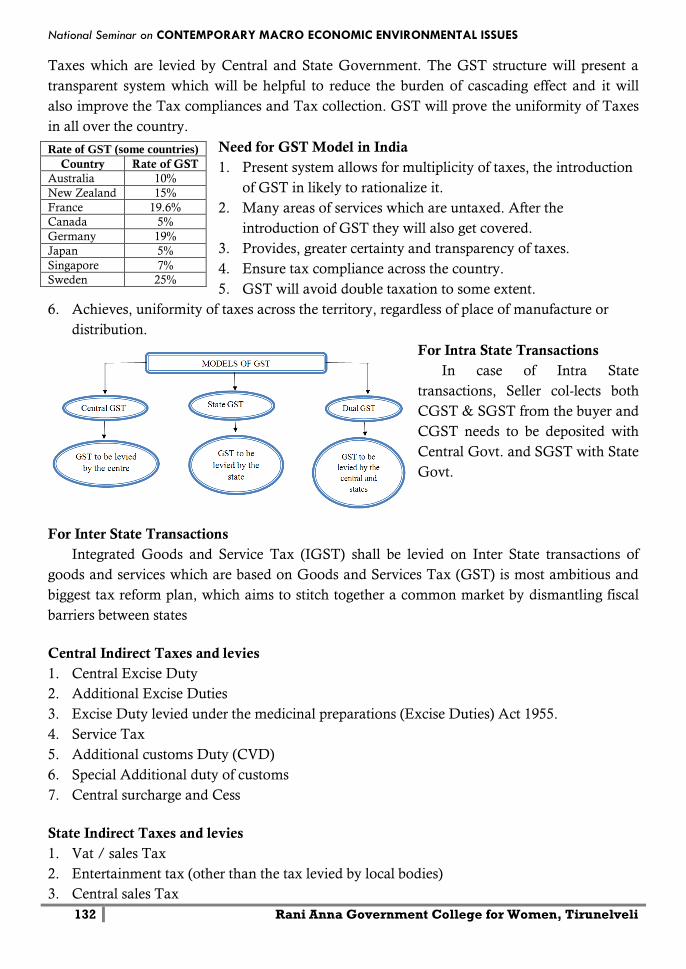
National Seminar on CONTEMPORARY MACRO ECONOMIC ENVIRONMENTAL ISSUES
132 Rani Anna Government College for Women, Tirunelveli
Taxes which are levied by Central and State Government. The GST structure will present a
transparent system which will be helpful to reduce the burden of cascading effect and it will
also improve the Tax compliances and Tax collection. GST will prove the uniformity of Taxes
in all over the country.
Need for GST Model in India
1. Present system allows for multiplicity of taxes, the introduction
of GST in likely to rationalize it.
2. Many areas of services which are untaxed. After the
introduction of GST they will also get covered.
3. Provides, greater certainty and transparency of taxes.
4. Ensure tax compliance across the country.
5. GST will avoid double taxation to some extent.
6. Achieves, uniformity of taxes across the territory, regardless of place of manufacture or
distribution.
For Intra State Transactions
In case of Intra State
transactions, Seller col-lects both
CGST & SGST from the buyer and
CGST needs to be deposited with
Central Govt. and SGST with State
Govt.
For Inter State Transactions
Integrated Goods and Service Tax (IGST) shall be levied on Inter State transactions of
goods and services which are based on Goods and Services Tax (GST) is most ambitious and
biggest tax reform plan, which aims to stitch together a common market by dismantling fiscal
barriers between states
Central Indirect Taxes and levies
1. Central Excise Duty
2. Additional Excise Duties
3. Excise Duty levied under the medicinal preparations (Excise Duties) Act 1955.
4. Service Tax
5. Additional customs Duty (CVD)
6. Special Additional duty of customs
7. Central surcharge and Cess
State Indirect Taxes and levies
1. Vat / sales Tax
2. Entertainment tax (other than the tax levied by local bodies)
3. Central sales Tax
Rate of GST (some countries)
Country Rate of GST
Australia 10%
New Zealand 15%
France 19.6%
Canada 5%
Germany 19%
Japan 5%
Singapore 7%
Sweden 25%
Vol. 6 | Special Issue. 1 | March 2018 | ISSN: 2319-961X
133 Shanlax International Journal of Economics
4. Octroi and Entry Tax
5. Purchase Tax
Advantages of GST
1. GST is structured to simplify the current indirect system by removing multi-ple taxes. It
creates India as a single market.
2. It taxes goods and services at the same rates so many disputes are eliminated on tax matter.
3. GST will be levied only at the final destination of consumption based on VAT principle and
not at various points (from manufacturing to retail out-lets). This will help in removing
economic distortions and bring about devel-opment of a common national market.
4. The procedural cost is reduced due to uniform accounting namely, CGST, SGST, IGST
have to be maintained for all types of taxes.
5. Tax burden on companies will reduce production cost making exporters more competitive at
national and international level.
6. More business entities including unorganized will come under the tax sys-tem thus widening
the tax base. This may lead to better and more tax revenue collections.
7. Many businesses create depots and go downs in different states simply because there is a
difference in tax rates. Now that GST will come, this dif-ference between states will vanish.
It would help to remove the tax differ-ence as a bias, thereby helping businesses.
Disadvantages of GST
1. There will be dual control on every business by Central and State Govern-ment. So
compliance cost will go up.
2. All credit will be available on from online connectivity with GST Network. Hence, small
businesses may find it difficult to use the system
3. VAT and service tax on some products may become higher than the current levels.
4. States may lose autonomy to change their tax rates.
5. Manufacturing states would lose big revenue
6. Service sector may oppose because they have to register in every state with central and state
government. So every business at all India level will have around 60 registrations while they
are having just one today. Moreover their rates will also go up.
7. Retail business may oppose because their taxes will go up and they will also have to deal
with Central Government now in addition to States.
8. GSTN may not work optimally for quite some time.
Conclusion
Due to dissilent environment of Indian economy, it is demand of time to implement GST.
Consumption and productions of goods and services is undoubtedly increasing and because of
multiplicity of taxes in current tax regime administration complexities and compliance cost is
also accelerating. Thus, a simplify, user-friendly and transparent tax system is required which
can be fulfilled by implementation of GST. Although implementation of GST requires
National Seminar on CONTEMPORARY MACRO ECONOMIC ENVIRONMENTAL ISSUES
134 Rani Anna Government College for Women, Tirunelveli
concentrated efforts of all stake holders namely, Central and State Government, trade and
industry. Thus, necessary steps should be taken.
References
1. Pankaj Kumar and Subhrangshu Sekhar Sankar, “Goods and service tax in India. Problems
and propects”, Asian Journal of management Research, Vol.6, Issue 3, 2016 P-507
2. Akanksha Khurana and Astha Sharma, “Goods and service Tax in India –A positive
Reform for Indirect Tax system”, International Journal of Advanced Research, Vol.4, Issue
3, 2016 P- 201
3. R.Rupa, GST in India International Education and Research Journal, , E-I SSN No : 2454-
9916, Vol :3 , Feb 2017 Isuue : 2, P-88.
Monika Sehrawal and Upasana Dhanda , “GST in India A key Tax Rform, International
Journal Research granthaalayah, Vol.3,2015, No.12, P-13
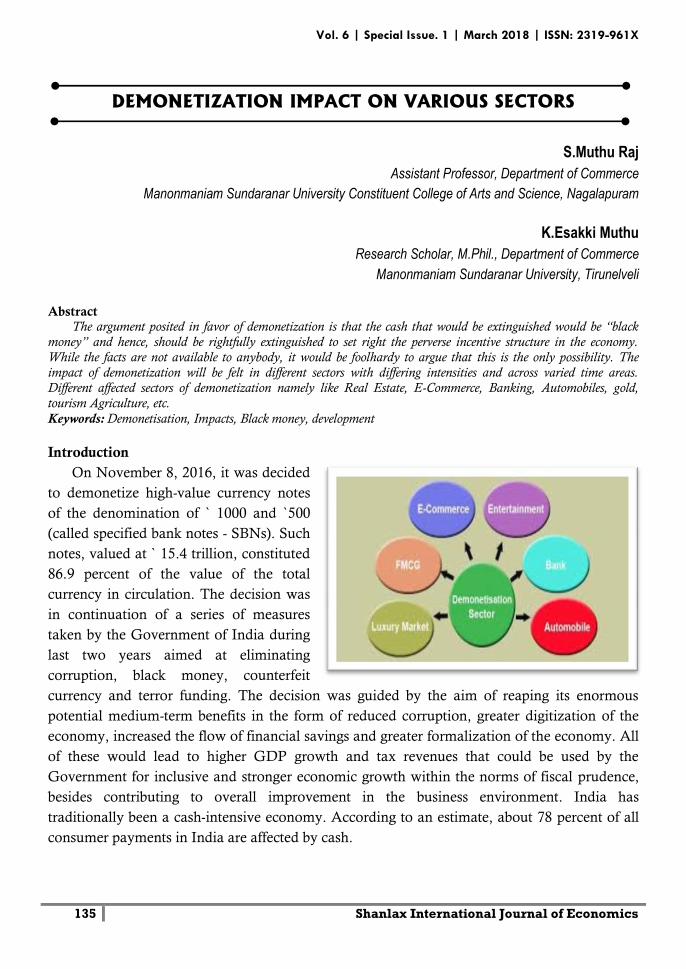
Vol. 6 | Special Issue. 1 | March 2018 | ISSN: 2319-961X
135 Shanlax International Journal of Economics
DEMONETIZATION IMPACT ON VARIOUS SECTORS
S.Muthu Raj
Assistant Professor, Department of Commerce
Manonmaniam Sundaranar University Constituent College of Arts and Science, Nagalapuram
K.Esakki Muthu
Research Scholar, M.Phil., Department of Commerce
Manonmaniam Sundaranar University, Tirunelveli
Abstract The argument posited in favor of demonetization is that the cash that would be extinguished would be “black
money” and hence, should be rightfully extinguished to set right the perverse incentive structure in the economy.
While the facts are not available to anybody, it would be foolhardy to argue that this is the only possibility. The
impact of demonetization will be felt in different sectors with differing intensities and across varied time areas.
Different affected sectors of demonetization namely like Real Estate, E-Commerce, Banking, Automobiles, gold,
tourism Agriculture, etc.
Keywords: Demonetisation, Impacts, Black money, development
Introduction
On November 8, 2016, it was decided
to demonetize high-value currency notes
of the denomination of ` 1000 and `500
(called specified bank notes - SBNs). Such
notes, valued at ` 15.4 trillion, constituted
86.9 percent of the value of the total
currency in circulation. The decision was
in continuation of a series of measures
taken by the Government of India during
last two years aimed at eliminating
corruption, black money, counterfeit
currency and terror funding. The decision was guided by the aim of reaping its enormous
potential medium-term benefits in the form of reduced corruption, greater digitization of the
economy, increased the flow of financial savings and greater formalization of the economy. All
of these would lead to higher GDP growth and tax revenues that could be used by the
Government for inclusive and stronger economic growth within the norms of fiscal prudence,
besides contributing to overall improvement in the business environment. India has
traditionally been a cash-intensive economy. According to an estimate, about 78 percent of all
consumer payments in India are affected by cash.
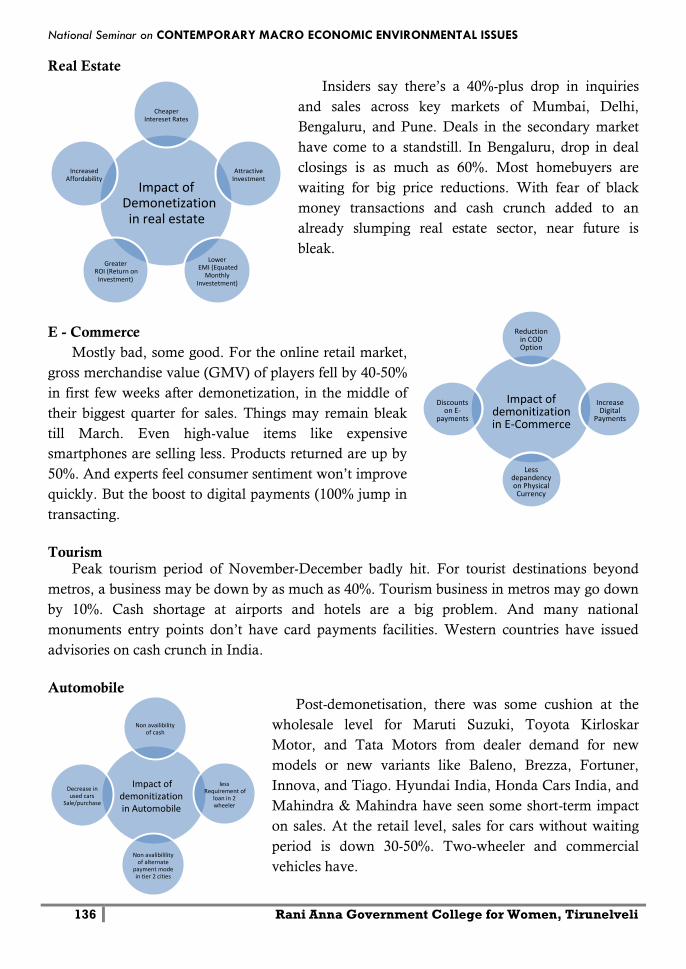
National Seminar on CONTEMPORARY MACRO ECONOMIC ENVIRONMENTAL ISSUES
136 Rani Anna Government College for Women, Tirunelveli
Real Estate
Insiders say there’s a 40%-plus drop in inquiries
and sales across key markets of Mumbai, Delhi,
Bengaluru, and Pune. Deals in the secondary market
have come to a standstill. In Bengaluru, drop in deal
closings is as much as 60%. Most homebuyers are
waiting for big price reductions. With fear of black
money transactions and cash crunch added to an
already slumping real estate sector, near future is
bleak.
E - Commerce
Mostly bad, some good. For the online retail market,
gross merchandise value (GMV) of players fell by 40-50%
in first few weeks after demonetization, in the middle of
their biggest quarter for sales. Things may remain bleak
till March. Even high-value items like expensive
smartphones are selling less. Products returned are up by
50%. And experts feel consumer sentiment won’t improve
quickly. But the boost to digital payments (100% jump in
transacting.
Tourism Peak tourism period of November-December badly hit. For tourist destinations beyond
metros, a business may be down by as much as 40%. Tourism business in metros may go down
by 10%. Cash shortage at airports and hotels are a big problem. And many national
monuments entry points don’t have card payments facilities. Western countries have issued
advisories on cash crunch in India.
Automobile Post-demonetisation, there was some cushion at the
wholesale level for Maruti Suzuki, Toyota Kirloskar
Motor, and Tata Motors from dealer demand for new
models or new variants like Baleno, Brezza, Fortuner,
Innova, and Tiago. Hyundai India, Honda Cars India, and
Mahindra & Mahindra have seen some short-term impact
on sales. At the retail level, sales for cars without waiting
period is down 30-50%. Two-wheeler and commercial
vehicles have.
Impact of Demonetization in real estate
Cheaper Intereset Rates
Attractive Investment
Lower EMI (Equated
Monthly Investetment)
Greater ROI (Return on
Investment)
Increased Affordability
Impact of demonitization in E - Commerce
Reduction in COD Option
Increase Digital
Payments
Less depandency on Physical Currency
Discounts on E -
payments
Impact of demonitization in Automobile
Non availibility of cash
less Requirement of
loan in 2 wheeler
Non avalibilility of alternate
payment mode in tier 2 cities
Decrease in used cars
Sale/purchase
Vol. 6 | Special Issue. 1 | March 2018 | ISSN: 2319-961X
137 Shanlax International Journal of Economics
Agriculture
Interestingly, villages have adapted in some ways better than cities. GoI allowing tax-free
deposits of any amounts for farmers have led to many of them getting 20% premium from
traders when transacting. Informal credit for daily purchases and use of old notes for key inputs
and selling produce have kept the rural economy going. Crop planting increased 20-35% every
week after demonetization and remained higher than last year in all weeks after November.
Metals
Real estate slowdown has hit steel and may hit further. Aluminum, copper, zinc also hit
since they are raw materials in building industry products. If auto sales are hit badly, metals
business will do worse.
Consumer Spend
Consumption, a big GDP contributor, will take a hit for at least two quarters, say
companies and analysts. Two main problems: Low circulation of lower denomination notes,
which may be temporary, and wealth erosion, that is impacting big-ticket purchases. FMCG
sales dropped 20-30% in November. At store levels, impulse buys like snacks, biscuits were
hard hit, as were personal care items, Nielsen data shows. December can be worse than
November,
Gold
Scared by government warnings, the sale of gold against old currency notes fell drastically.
NRI customers have fled. Sales are down sharply, and it was already a bad year for gold.
Telecom
Mobile phone shipments fell by 26% in November, compared to the previous month.
Smartphone shipments are down by 23%. Inventory pile up with retailers. Big sellers who do a
card and online transactions less badly hit. IDC analysts expect sales for feature phones to drop
by 25% in the quarter, and smartphones to fall by 17.5%.
Aviation
In world’s fastest growing aviation market, passenger traffic growth will fall below 20%
from an average 23-24% growth recorded in previous years. Flight bookings dropped drastically
in days after demonetization. Recovered somewhat later. Offline travel agents, who took cash,
badly hit. Flights to small towns, where cash payments are the norm, are also badly hit, may
post negative growth.
Economy
Demonetisation torpedoed India’s economy just when it was getting into a cruise mode,
fired by good monsoon-led rural demand and Seventh Pay Commission-enabled urban buying.
The 8% growth that looked within grasp in FY17 is beyond horizon now. Only about a quarter
National Seminar on CONTEMPORARY MACRO ECONOMIC ENVIRONMENTAL ISSUES
138 Rani Anna Government College for Women, Tirunelveli
of currency canceled is back in circulation, and that too is being stashed away for an
emergency. Lower denomination notes are not available to facilitate transactions.
References
1. https://rbidocs.rbi.org.in/rdocs/Publications/PDFs/MID10031760E85BDAFEFD497193
995BB1B6DBE602.PDF
2. http://www.nipfp.org.in/media/medialibrary/2016/11/WP_2016_182.pdf
3. https://www.researchgate.net/publication/319143752_Demonetization_and_Its_Impact_
on_IndiaI_Economy
4. http://www.thehindu.com/business/Economy/only-12-of-demonetised-1000-notes-did-
not-return-rbi/article19590311.ece
5. http://www.internationaljournalssrg.org/IJEMS/2017/Volume4-Issue2/IJEMS-
V4I2P103.pdf
6. https://marketrealist.com/2016/11/impact-demonetization-indias-financial-markets
7. https://economictimes.indiatimes.com/news/economy/indicators/demonetisation-
impact-on various-sectors-govt-needs-to-inject-positive-sentiment-led-by-taxb
8. cuts/articleshow/55843771.cms
Vol. 6 | Special Issue. 1 | March 2018 | ISSN: 2319-961X
139 Shanlax International Journal of Economics
DEMONETISATION AND RURAL INDIA
Dr.P.Chennakrishnan
Assistant Professor, Department of Economics, Thiruvalluvar University, Serkkadu, Vellore
S.Vijayalakshmi Ph.D, Research Scholar, Department of Economics, Thiruvalluvar University, Serkkadu, Vellore
Abstract The paper discusses the demonetization and rural Indian Demography has more than 70% of populace in
provincial region and horticulture/cultivate based activitivities play real salary source. Having tech arrangement as a
major aspect of their life is key for progress. The UPI based monetary exchanges have turned into the biggest received
model in most brief possible of time. The Indian players like Truepay are presently running head on with Visa and
Mastercard. The Government needs to discover new, extra approaches to infuse trade liquidity out the rustic economy,
as quickly setting up camps in towns for the best possible trade of old cash. The Government can utilize the foundation
of the agreeable banks.
Introduction
The current declaration of demonetization by the Modi Government has no uncertainty
began an unrest of tidy up in the nation. Be that as it may, since it has come at such a vital time
for the agriculturists, it is probably going to influence them more than any other individual.
Agriculturists in India for the most part bargain in real money, and this present period, which is
the beginning for the Rabi season, is making a great deal of frenzy among them since ranchers
normally get just 15-20 days to plant their products. Subsequently, the trade smash out rustic
India must be dealt with before long by the Government. The Government needs to ensure that
the money achieves the ranchers rapidly than to different areas of society. Any kind of
postponement in this planting season will undermine to scratch the nation's agrarian and
general monetary development to a vast degree.
The Modi Government, catching the circumstance, has in certainty taken two or three
choices to facilitate the cash stream to ranchers, such as enabling them to buy seeds with the
old money and furthermore giving them a chance to pull back upto Rs25,000 from their
ledgers. In any case, considering the colossal money lack with banks, particularly in rustic
India, most banks are not permitting such withdrawals for need of assets. This has additionally
exacerbated the emergency time frame for the agriculturists.
Demonetization is probably going to impact the rustic and cultivating economy since this is
thought to be the busiest time for agriculturists in connection to the money exchanges, as they
will critically expect money to furrow their fields, to buy compost, to enlist hardware and work,
and make courses of action for water, buy of diesel and so forth, aside from purchasing seeds
from the market. For instance, for sugarcane cultivators, the devastating season has quite
recently begun and the agriculturists don't have money to gather the sticks, pay for work and
transport the stick to the sugar factories.
National Seminar on CONTEMPORARY MACRO ECONOMIC ENVIRONMENTAL ISSUES
140 Rani Anna Government College for Women, Tirunelveli
In like manner, when ranchers go to the neighborhood mandis to offer their deliver, it will
be hard to discover a money purchaser; and by possibility in the event that they discover one, it
is far-fetched that they will get the suitable cost of their harvests. They will basically need to
offer using a loan. The agriculturists, who had officially done their furrowing and water system
before the demonetisation, are thinking that it’s hard to keep the dirt sodden since they don't
have sufficient money to move further. What's more, this deferral in sowing can incredibly
influence the yield and is likewise liable to open the harvests to number of helpless sicknesses,
which thusly will make it troublesome for ranchers to recoup their cost of development. For
instance, a deferral in sowing of wheat can radically diminish the wheat respect 1.5 quintals for
each section of land every week. This situation is presently critically requesting that the
Government find a way to help the agriculturists.
The saving money infiltration in rustic India is very low and the agriculturists are thinking
that it’s hard to handle this intense move by the Modi Government. Agriculturists live miles
from their closest bank office, and the quantity of ATMs in the provincial locales is likewise
insignificant, as the banks by and large spotlight on urban regions for their keeping money
business — which has made the circumstance somewhat more troublesome for ranchers in this
vital period. The Union Government has proposition to begin the Indian Post Payment Bank
(IPPB), which can turn into an intense and viable vehicle of genuine budgetary infiltration in
the nation. Be that as it may, that still is some time away to begin, and in this penniless period
it would have unquestionably came helpful with its 650 branches and 5,000 ATMs the nation
over, particularly in the country part. The Government needs to discover new, extra
approaches to infuse trade liquidity out the country economy, as promptly setting up camps in
towns for the best possible trade of old money. The Government can utilize the framework of
the helpful banks, which have been rejected in this demonetisation program, to open counters
of the Reserve Bank of India.
Since the general populations of the nation have indicated overpowering help to this choice
by the Prime Minister, it is additionally now the obligation of the Government to not simply
stop at this, but rather to take this battle to clean and enhance the framework advance by
thinking about other related measures. An all encompassing methodology is called for. Issues
like huge concealed endowments and assessment discounts and exceptions offered every year
to the corporate segment in India by the Union and State Governments ought to be reevaluated
in the light of an announcement by Prime Minister Modi early this year. He had said, "When
an advantage is given to ranchers or to poor people, specialists and Government officers
regularly call it an appropriation. In any case, I find that if an advantage is given to industry or
business, it is typically a motivator or a subvention." An investigation of National Tax Data
unmistakably demonstrates that, because of the Government motivations around 52,000
organizations made benefits in the year 2014-15, however shockingly had paid zero assessment.
The quantum of expense finding/exclusions given by the Government to these organizations
are to the degree that, amid the time of 2014-15, the general population organizations paid
higher powerful duty rates than privately owned businesses This measure of assessment
discounts to the corporate area in India, in the event that we ascertain, will roughly be no less
than twice that of the sum which the Government is probably going to get from the present
demonetisation program. The Government gives these assessment discounts to the corporate
Vol. 6 | Special Issue. 1 | March 2018 | ISSN: 2319-961X
141 Shanlax International Journal of Economics
area after affirmations from them that they will work towards the advancement of the nation
and will likewise help in work creation and deal with their corporate social duty. This has not
worked by any stretch of the imagination. Corporates have never conveyed on this
confirmation however have helpfully taken the refunds and exclusions from the Government.
Presently, with the huge drive of demonetisation, the Government should likewise put a top on
these gigantic duty discounts and endowments so the nation can really push ahead by taking
every one of the areas of the general public with it. Narandar Modi has provoked it will take 50
days for individuals to conform to the change. This declaration gives off an impression of being
the most critical change made by the Narandar Modi's administration to date, says Girish
Vanvari, accomplice and head KPMG in India. A choice like this can bring about the broad up
of a framework for which numerous assume that it wasn't possible, as prior endeavors did not
have rich effect. Be that as it may, the choice by Prime Minister Mr. Narandar Modi is one the
most recorded strides in India. A choice like this can help control expansion, recapitalise banks,
limiting the loan fees and making the economy lively, with capital inflows. India is the second
most populated nation on the planet with almost a fifth of the total populace. Out of the
aggregate 121 crore Indians of Indian populace, 83.3 crore of populace live in country zones
while 37.7 crore remain in urban regions, said the Census of India 2011. As a rustic populated
nation a large portion of the provincial populaces are occupied with horticultural exercises as
the majority of the number of inhabitants in country zones relies upon farming. Agribusiness
frames the foundation of the nation's economy. The horticultural area like ranger service,
logging and angling represented 17% of the GDP contributes most to the general monetary
improvement of India. it is the biggest business source and an imperative bit of the general
financial improvement of India The conditions of Uttar Pradesh, Punjab, Haryana, Madhya
Pradesh, Andhra Pradesh, Telangana, Bihar, West Bengal, Gujarat and Maharashtra are key
supporters of Indian farming.
Goals of Paper
To think about the effect of demonetization on normal individual of India
To contemplate the effect of demonetization on agrarian division and ranchers of country India.
To think about the effect of demonetization on economy of India.
Research Methodology The paper depends on optional information. The information has been gathered from web,
articles daily papers and so forth. Diagram and percentile technique has been utilized to dissect
the information.
Effect of demonetization on normal individual of India
Demonetization is an age's important affair and will be one the financial occasions of our
opportunity. Its effect is felt by each Indian subject. As the nation says farewell to the old Rs.
500 and Rs. 1,000 rupee notes and with limitations on trading cash and tax collection on high
measures of stores, Indian economy had looked through some genuine stirs. In any case, how is
this going to influence the normal individual of India in the short keep running and in addition
the long run? At first, there was an immense clamor about the thought; individuals needed to
National Seminar on CONTEMPORARY MACRO ECONOMIC ENVIRONMENTAL ISSUES
142 Rani Anna Government College for Women, Tirunelveli
hold up in extremely long lines just to pull back the fundamental cash they required. General
society questioned PM's arrangement and rebelled against the awful planning they looked in
such manner. The progressions invited a ton of inconvenience to the general population to start
with however everything appeared to be justified regardless of that, to the extent the long haul
impacts were concerned. There was a farthest point to the per-capita withdrawal and that was a
gigantic issue for some individuals, predominantly on account of their own prerequisites which
included marriage, wellbeing, property and so forth. During the time spent checking dark cash
the blameless average citizens and poor had appeared to be most endured like, those
individuals who don't approach post workplaces and banks had appeared freezing for trading
notes. Those families who had weddings and other uncommon events are discouraged because
of absence of cash a large number of weddings have been wiped out which affected the sellers
who supply for those weddings. Likewise, agriculturists have confronted part of issues since
they could never again stand to offer their reap from Kharif yield or sow Rabi crops.
Additionally Many road sellers have loosed their business in light of the fact that would prefer
not to part with money or can't roll out improvement. Individuals have reduced spending on
the grounds that the banks are proportioning money. Numerous Daily wage laborers can't look
for some kind of employment. Additionally Demonetization directly affects areas managing
money—merchants, auto rickshaw proprietors, cab drivers, day by day breadwinners and little
dealers. The Indian framework principally works on money, thus less trade implies disturbance
out the stream. In this way, the administration's progression to check dark cash and phony
money has hit hard to destitute individuals the most. Be that as it may, as the time passed the
things backed off a bit. The lines in the banks abbreviated, ATMs were loaded with cash, new
money circled and all these standardized the circumstance. By and by, this change will hugy
affect the economy. It will require some investment for things to wind up ordinary again and
for the time being, it is only a play of time till we become more acquainted with whether it was
an okay choice or a misrepresented ramification.
Conclusion Demonetization is a one stage of numerous means in battling defilement, dark promoting,
and financing insurrection. However readiness for demonetization was trim sided and its effects
were shocking on Indian open. On the off chance that 86% of money is taken out, with a small
sum accessible, all market exchanges have been murdered. The general population, who were
focused on, did not go ahead boulevards, but rather normal people are out from their work puts
and additionally homes., Somebody put an illustration on social net. For executing ten
crocodiles, government directed out all water from the lake comes about slaughtering ten
thousand fish in lake yet Crocodiles strolled off on dry sand. With an aim to free the nation of
dark cash and uncover impose defaulters and dark cash holders, government has made move to
demonetized Rs 500 and Rs 1000 notes. This move will have real effect on the parallel
economy yet sudden declaration and inability to get ready ahead of time has made
impermanent tumult and inconvenience among the overall population. Basic Men are thinking
that it’s hard to purchase with no cash in stash, squandering hours in lines which despite the
fact that could have been maintained a strategic distance from if arranged ahead of time.
Vol. 6 | Special Issue. 1 | March 2018 | ISSN: 2319-961X
143 Shanlax International Journal of Economics
MACROECONOMIC IMPACT OF DEMONETISATION
K.Esakki Muthu
Research Scholar, M.Phil., Department of Commerce
Manonmaniam Sundaranar University, Tirunelveli
Dr.K.Rajamannar
Assistant Professor, Department of Commerce
Manonmaniam Sundaranar University, Tirunelveli
Abstract Demonetisation announced on November 8, 2016, was aimed at addressing corruption, black money, counterfeit
currency and terror financing. Although demonetization holds huge potential benefits in the medium to long-term,
given the scale of operation, it was expected to cause transient disruption in economic activity. The analysis in this
paper suggests that demonetization has impacted various sectors of the economy in varying degrees; however, in the
affected sectors, the adverse impact was transient and felt mainly in November and December 2016. The impact
moderated significantly in January 2017 and dissipated by and large by mid-February, reflecting the fast pace of
remonetization. The latest CSO estimates suggest that the impact of demonetization on GVA growth was modest.
Currency squeeze due to demonetization along with seasonal factors pushed food inflation significantly down but has
not had much impact on inflation excluding food and fuel. A surge in deposits led to a sharp expansion in the
consolidated balance sheet of scheduled commercial banks and created large surplus liquidity conditions. These were
managed by the Reserve Bank of India through a mix of conventional and unconventional policy instruments. There
has not been any significant impact on the external sector. There has been a sharp increase in the number of accounts
under the Pradhan Mantri Jan Dhan Yojana and the deposits in such accounts have also surged. Financial re-
intermediation may have received a boost following demonetization. An important consequence of demonetization has
been the sharp increase in the use of digital transactions.
Keywords: Demonetisation, Development, India, Reserve Bank of India.
Introduction
On November 8, 2016, it was decided to demonetize high-value currency notes of the
denomination of ` 1000 and ` 500 (called specified bank notes - SBNs). Such notes, valued at `
15.4 trillion, constituted 86.9 percent of the value of the total currency in circulation. The
decision was in continuation of a series of measures taken by the Government of India during
last two years aimed at eliminating corruption, black money, counterfeit currency and terror
funding. The decision was guided by the aim of reaping its enormous potential medium-term
benefits in the form of reduced corruption, greater digitization of the economy, increased the
flow of financial savings and greater formalization of the economy. All of these would lead to
higher GDP growth and tax revenues that could be used by the Government for inclusive and
stronger economic growth within the norms of fiscal prudence, besides contributing to overall
improvement in the business environment. India has traditionally been a cash-intensive
economy. According to an estimate, about 78 percent of all consumer payments in India is
affected by cash. It was, therefore, obvious that currency squeeze during the demonetization
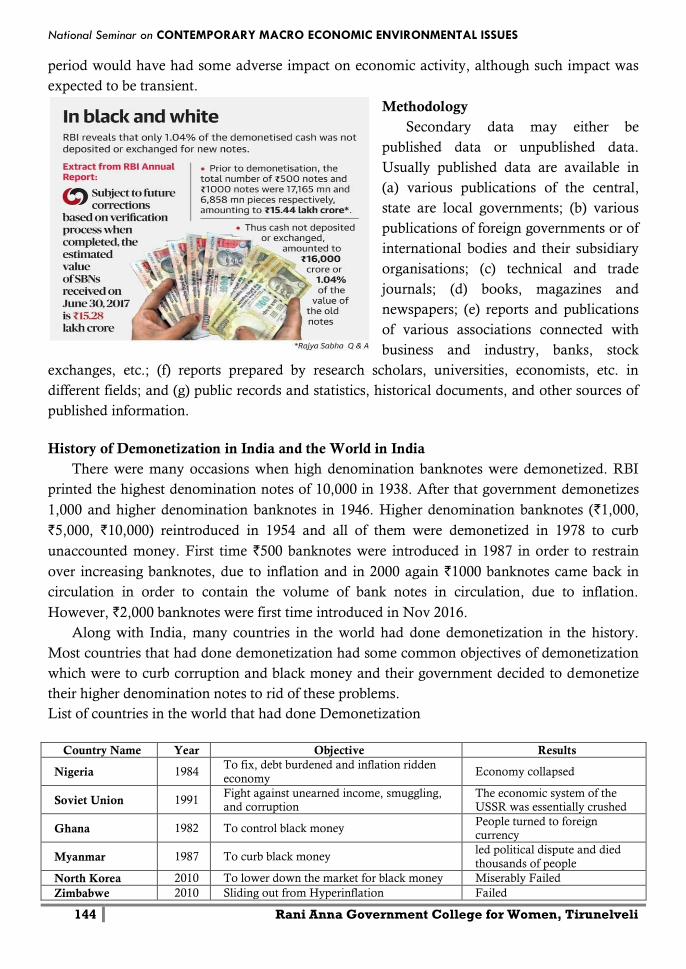
National Seminar on CONTEMPORARY MACRO ECONOMIC ENVIRONMENTAL ISSUES
144 Rani Anna Government College for Women, Tirunelveli
period would have had some adverse impact on economic activity, although such impact was
expected to be transient.
Methodology
Secondary data may either be
published data or unpublished data.
Usually published data are available in
(a) various publications of the central,
state are local governments; (b) various
publications of foreign governments or of
international bodies and their subsidiary
organisations; (c) technical and trade
journals; (d) books, magazines and
newspapers; (e) reports and publications
of various associations connected with
business and industry, banks, stock
exchanges, etc.; (f) reports prepared by research scholars, universities, economists, etc. in
different fields; and (g) public records and statistics, historical documents, and other sources of
published information.
History of Demonetization in India and the World in India
There were many occasions when high denomination banknotes were demonetized. RBI
printed the highest denomination notes of 10,000 in 1938. After that government demonetizes
1,000 and higher denomination banknotes in 1946. Higher denomination banknotes (`1,000,
`5,000, `10,000) reintroduced in 1954 and all of them were demonetized in 1978 to curb
unaccounted money. First time `500 banknotes were introduced in 1987 in order to restrain
over increasing banknotes, due to inflation and in 2000 again `1000 banknotes came back in
circulation in order to contain the volume of bank notes in circulation, due to inflation.
However, `2,000 banknotes were first time introduced in Nov 2016.
Along with India, many countries in the world had done demonetization in the history.
Most countries that had done demonetization had some common objectives of demonetization
which were to curb corruption and black money and their government decided to demonetize
their higher denomination notes to rid of these problems.
List of countries in the world that had done Demonetization
Country Name Year Objective Results
Nigeria 1984 To fix, debt burdened and inflation ridden
economy Economy collapsed
Soviet Union 1991 Fight against unearned income, smuggling, and corruption
The economic system of the USSR was essentially crushed
Ghana 1982 To control black money People turned to foreign currency
Myanmar 1987 To curb black money led political dispute and died
thousands of people
North Korea 2010 To lower down the market for black money Miserably Failed
Zimbabwe 2010 Sliding out from Hyperinflation Failed
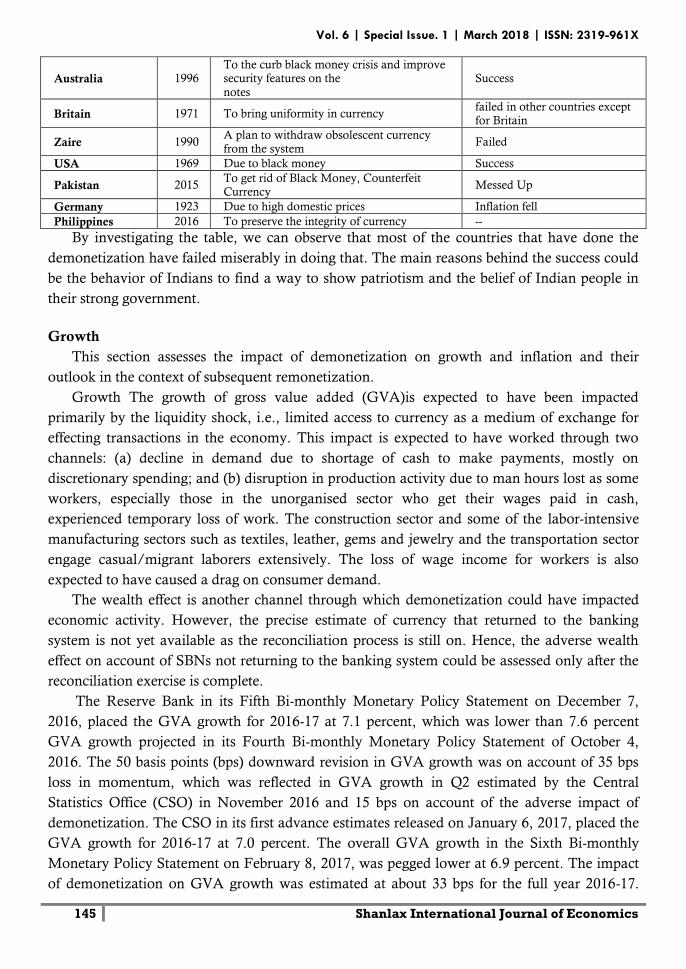
Vol. 6 | Special Issue. 1 | March 2018 | ISSN: 2319-961X
145 Shanlax International Journal of Economics
Australia 1996 To the curb black money crisis and improve security features on the
notes
Success
Britain 1971 To bring uniformity in currency failed in other countries except for Britain
Zaire 1990 A plan to withdraw obsolescent currency from the system
Failed
USA 1969 Due to black money Success
Pakistan 2015 To get rid of Black Money, Counterfeit Currency
Messed Up
Germany 1923 Due to high domestic prices Inflation fell
Philippines 2016 To preserve the integrity of currency --
By investigating the table, we can observe that most of the countries that have done the
demonetization have failed miserably in doing that. The main reasons behind the success could
be the behavior of Indians to find a way to show patriotism and the belief of Indian people in
their strong government.
Growth
This section assesses the impact of demonetization on growth and inflation and their
outlook in the context of subsequent remonetization.
Growth The growth of gross value added (GVA)is expected to have been impacted
primarily by the liquidity shock, i.e., limited access to currency as a medium of exchange for
effecting transactions in the economy. This impact is expected to have worked through two
channels: (a) decline in demand due to shortage of cash to make payments, mostly on
discretionary spending; and (b) disruption in production activity due to man hours lost as some
workers, especially those in the unorganised sector who get their wages paid in cash,
experienced temporary loss of work. The construction sector and some of the labor-intensive
manufacturing sectors such as textiles, leather, gems and jewelry and the transportation sector
engage casual/migrant laborers extensively. The loss of wage income for workers is also
expected to have caused a drag on consumer demand.
The wealth effect is another channel through which demonetization could have impacted
economic activity. However, the precise estimate of currency that returned to the banking
system is not yet available as the reconciliation process is still on. Hence, the adverse wealth
effect on account of SBNs not returning to the banking system could be assessed only after the
reconciliation exercise is complete.
The Reserve Bank in its Fifth Bi-monthly Monetary Policy Statement on December 7,
2016, placed the GVA growth for 2016-17 at 7.1 percent, which was lower than 7.6 percent
GVA growth projected in its Fourth Bi-monthly Monetary Policy Statement of October 4,
2016. The 50 basis points (bps) downward revision in GVA growth was on account of 35 bps
loss in momentum, which was reflected in GVA growth in Q2 estimated by the Central
Statistics Office (CSO) in November 2016 and 15 bps on account of the adverse impact of
demonetization. The CSO in its first advance estimates released on January 6, 2017, placed the
GVA growth for 2016-17 at 7.0 percent. The overall GVA growth in the Sixth Bi-monthly
Monetary Policy Statement on February 8, 2017, was pegged lower at 6.9 percent. The impact
of demonetization on GVA growth was estimated at about 33 bps for the full year 2016-17.
National Seminar on CONTEMPORARY MACRO ECONOMIC ENVIRONMENTAL ISSUES
146 Rani Anna Government College for Women, Tirunelveli
After the peak impact in Q3, GVA growth was estimated to strengthen with the progressive
remonetization in Q4. As per the second advance estimates of the CSO released on February
28, 2017, GVA growth for 2016-17 is pegged at 6.7 percent, which is about 30 bps lower than
what was estimated on January 6, 2017. Importantly, Q3 growth (at 6.6 percent) was only
marginally lower than that recorded in Q2 (6.7 percent), thereby suggesting that
demonetization had only a modest impact on growth in Q3 of 2016-17.
Conclusion
Initially Govt’s Objective was to curb black money but if we look at the figure, 97% of `500
and 1000 rupees’ banknotes were deposited in banks and only 3% (.43 trillion rupees) black
money scraped as undeclared income hence we can say a less part of Black Money is in cash so
this action isn’t effective to curb black money. However, Tax GDP ratio will increase in future.
Due to demonetization counterfeiting currency market offhand shut down for a while but they
have the capability to create new notes’ duplicate so we can say in short run their activity will
be slowdown but in long run they can rebuild their market and also it is easy to handle 2000
rupees notes instead of 1000 rupees notes in briefcase to giving bribe. In this study, we have
found some important points about the short-term effects of demonetization as well as about
the long-term effects by observing the previous cases of demonetization in other countries. We
have to be alert and thoughtful to sustain our growth because many countries which
demonetizations have done could not sustain the same. In short run, almost all the sector in the
Indian economy has been affected negatively due to shorting of cash.
References
1. https://rbidocs.rbi.org.in/rdocs/Publications/PDFs/MID10031760E85BDAFEFD497193
995BB1B6DBE602.PDF
2. http://www.thehindu.com/business/Economy/only-12-of-demonetised-1000-notes-did-
not-return-rbi/article19590311.ece
3. http://www.nipfp.org.in/media/medialibrary/2016/11/WP_2016_182.pdf
4. http://www.internationaljournalssrg.org/IJEMS/2017/Volume4-Issue2/IJEMS-
V4I2P103.pdf
5. file:///C:/Users/ELCOT/Downloads/Demonetization_14531.pdf
6. http://www.thehindu.com/business/Economy/only-12-of-demonetised-1000-notes-did-
not-return-rbi/article19590311.ece
7. https://www.researchgate.net/publication/319143752_Demonetization_and_Its_Impact_
on_Indian_Economy
Vol. 6 | Special Issue. 1 | March 2018 | ISSN: 2319-961X
147 Shanlax International Journal of Economics
DEMONETIZATION IS A REVOLUTIONARY STRATEGY
Dr.T.C.Shanthi
Assistant Professor of Economics, Department of Commerce
C.S.I. Jayaraj Annapackiam College, Nallur
Dr.S.Subramanian
Head and Assistant Professor, Department of Commerce
C.S.I. Jayaraj Annapackiam College, Nallur
Abstract On 8 November 2016, in a sudden Address to the nation, Prime Minister Narendra Modi announced that
banknotes of Rs.500 and Rs.1000 would cease to be legal tender from the midnight. He said that decision was taken to
crack down on black money and corruption which is destroying the country. He also said that the process of cash
circulation directly related to corruption is his country impacting the lower classes of society. The number of income
tax returns filed for 2016-17 grew by 25 percent to 2.82 crores and the advance tax the collections during that period in
India, black money is funds earned on the blackmarket, on which income and other taxes have not been paid. Also the
unaccounted money that is concealed from the tax administrator is called black money. The black money is
accumulated by the Criminals, Smugglars, hoarders, tax evaders and other anti-social elements of the society who are
not scared of the punishment given by the law for such crimes. Around 20,000 Crs of rupees are supposed to have been
accumulated by the criminals for vested interests. But we are unable to obtain corrupt-free economy due to lack of apt
policy. The need of the hour is suitable policy and make a country in a corrupt -free economy.
Keywords: Demonetization, objectives, demonetization process, effect on various terms and impact.
Introduction
India is having young population as compared to the most of developed nations. Around
65% of Indian population is under the age of 35 (www.census India.gov.in 2011). World has
criticize India for having high birth rate but at the same time, India has developed its
population into the trained professional including IT Engineers, Medical experts, scientists and
management professionals. Unlike professional of other competitive countries Indian
professional are fluent English Speakers. Indeed India is the second largest English speaking
country and it is second to United States (US) (www.times of India. India times.com 2005)
Moreover improved health care facilities resulted into the decline of mortality rate and various
birth control awareness programmes caused a declining fertility. But we are unable to obtain
corrupt free economy due to lack of apt strategy. In this article deals with objectives of
demonetization strategy, demonetization process, effects on GDP, effect on Agriculture, effect
on transportation and effect on Black money.
Background of Demonetization Policy
Sudden demonetization is not a new phenomenon to India. This is third demonetization
since 1946 and 1978. However the circulation of the higher denomination bank notes during
that period was very limited and the most of the higher denomination bank notes held with
banks only. According to Reserve Bank of India (RBI) records 2016, Indian Rupee bank notes
National Seminar on CONTEMPORARY MACRO ECONOMIC ENVIRONMENTAL ISSUES
148 Rani Anna Government College for Women, Tirunelveli
worth 16.664 billion are being circulated among the public of these 86% (14.180 billion) are in
Rs.500 and Rs 1000 bank notes. It is a general thought that the corrupt hold money in the form
of such ` 500 and ` 1000 notes will curb black money holdings. However relief was provided to
people as they could exchange their old banknotes with the banks from Nov. 10, 2016 to
31dec.2016 Further they could also deposit these old bank notes in their respective bank
accounts. Use of these bank notes for necessary services such as purchasing petrol, diesel, air
tickets and rail tickets was permitted by the government. Since the announcement was made,
people have had a mixed reaction to this policy. However mayhem occurred on Nov. 10, 2016
when huge crowds flooded every single bank in the country. The government started facing
major criticism because the banks did not have enough of the new bank notes to meet the daily
requirement of people still, the government insisted that these are just a few initial hiccups that
are being faced and ultimately this would defeat the black money monster that had cripple the
economy.
Objectives of Demonetization
The government has different objectives beyond this demonetization.
1. The first and foremost objective is to attempt to make an India corruption free country.
2. In his different, speech on demonetization, Indian prime minister Narendra Modi clearly
points out that this bold step has been taken to get a control over corruption in the country.
3. It is done to curb black money.
4. It is also a step to control escalating price rise.
5. To stop the fund flow to illegal activity. On the other hand demonetization in India is also a
very well planned step of government of India to earn enormous amount of tax from
citizen.
Demonetization Process
The plan to demonetize the Rs.500/- Rs.1000/- bank notes was initiated between six and
10 months before it was announced, and was kept confidential, with only 10 people being
completely aware of it. The preparations for printing new Rs.500 and Rs. 1000 bank notes
began in early May 2016. The Union Cabinet was informed about the plan on 8th Nov 2016 in a
meeting called by the Indian Prime Minister Narendramodi. The process involved five steps
Viz., Public announcement, Exchange of oldnotes, withdrawal limits, ordinance and
information leaks. The following are the various effects related to Demonetization Strategy.
Effect on Blackmoney
The government had estimated that three Trillion (or) approximately 20% of the
demonetised notes would be permanently removed from circulation. However by 30 dec 2016,
approximately 97% of the demonetized bank notes (or) 14.97 trillion ($ 220 billion) of the 15.4
trillion that had been demonetized, had been deposited with the banking system. A central
Bank Report released in Aug.2017 started that a total 99% of the Rs.500 and Rs.1000 notes that
were demonetized returned to the banking system. Prime Minister of India stated that due to
Vol. 6 | Special Issue. 1 | March 2018 | ISSN: 2319-961X
149 Shanlax International Journal of Economics
demonetization, corrupt officials, business men and criminals – popularly believed to hoard
large amount of illicit cash – would be worthless pieces of paper.
Effect on Death
Several people were reported to have died from standing in queues for hours to exchange
their old bank notes. Deaths were also attributed to lack of medical help due to refusal of old
bank notes by hospitals. As on 15 Nov. 2016, death rate was 25 and 33 death as on 18th Nov.
By the end of the year opposition leaders claimed that over 100 people had died due to
demonetization.
Effect on Transportation
After the demonetization was announced about 8,00,000 truck drivers were affected with
Scarcity of cash, with around 4,00,000 trucks standed at major high ways across India were
reported. While Major highway toll junctions on the Gujarat, and Delhi and Mumbai
highways also saw queues as toll plaza operators refused the old bank notes. Nitin Gadkari, the
Minister of Transport, Subsequently announced a Suspension of toll collections on all National
highways across India until Midnight of 11th Nov, Later extended till 2nd Dec 2016.
Effect on Agriculture
Transactions in the Indian agriculture sector are heavily dependent on cash and were
adversely affected by the demonetization of Rs.500 and Rs.1000 bank notes. Due to scarcity of
the new banknotes, many farmers have insufficient cash to purchase seeds, fertilizers and
pesticides needed for the plantation of rabi crops usually sown around mid November 2016.
Farmers and their unions conducted protest rallies in Gujarat, Amritsar and Muzaffar Nagar
against the demonetization as well as against restrictions imposed by the RBI on district Co-
operative central banks which were ordered not to accept (or) exchange the demonetized bank
notes. The demonetization led to unavailability of cash to pay for food products. The reduction
in demand that arose in turn to a rise in the prices of crops. Farmers were unable to recover
even the cost of transportation from their fields to the market from the low prices offered. The
prices dropped as low as 50 paise / Kg for tomatoes and and onions. This forced the farmers
across the country to dump their products in desperation. Some farmers resorted to buying
unsold vegetables. Agricultural produces vegetables, foodgrains, sugarcane milk nad eggs were
dumped on roads. Some farmers dumped their produce due to the protest against the
government.
Effect on GDP Growth Rate
Global analysers cut their forecasts of India’s GDP growth rate for the financial year 2016-
2017 by 0.5 to 3.0 percent with an increase of 2.5% due to demonetization . India’s GDP in
2016 is estimated to be US $ 2.25 trillion, hence each one percent reduction in growth rate
represents a shortfall of US $ (dollar) 22.5 billion ` (1.54 Lakh Crs) for the Indian economy.
According to Societe General, India’s quarterly GDP growth rates would drop below 7% for an
entire year at a stretch for the first time since June 2011. India’s GDP growth for the quarter
National Seminar on CONTEMPORARY MACRO ECONOMIC ENVIRONMENTAL ISSUES
150 Rani Anna Government College for Women, Tirunelveli
Jan- Mar’17 was 6.1% was predicted by economists. The GDP Growth for the entire financial
year 7.1% growth was attribute from the 8% of previous year. This drop in GDP was attributed
to demonization which was predicted by economists. The GDP growth rate for the quarter
APR – June 2017 dropped to 5.7% in comparison to 7.9% for the same quarter in the previous
year. This drop in GDP growth was attributed to demonetization.
Impact on Demonetization
1) All the currency in higher denomination either come out into banking circulation or
dumped in sewer. In case of former if this income comes from illegitimate sources, owner
might need to face scrutiny or he will have option to take advantage of recent IDS to help
them, If it latter, that would help in increase value of currency, as all currency notes in
circulation is liability on government. So overall advantage common man, as what ever
money he/she hold would see improvement in their values.
2) Since all the money is coming back to banking channel, will result in lowering of Interest
rates for loan, which would help infrastructure companies to invest more hence whole
economic cycle would start resulting in humongous number of jobs. The downside would
be elders or senior citizen who are dependent on interest income to run their houses, they
going to be impacted most.
3) Banks and their employees have done commendable job to help citizen in this
demonetization process, however due to some bankers, now all other getting bad name due
ongoing IT raids resulting in catching hugh deposits of money in old as well new currency.
However again this is good news is all confiscated money would again either taken by
government or returned to actual owner after deducting tax and penalty resulting in
increase in value of currency
4) Demonetization exercise all helped people to identify political class, what their stand on
corruption and black money. As per my belief no one oppose demonetization till he has
something to hide ( and their criticism towards scheme increase with amount they hide),
their is no question their are shortcoming in the implementation of scheme e.g. bank queues
even after the month, however kudos to Indian population they are resilient and accepting
scheme with open heart.
Conclusion
Indian Social activist, Anna Hazare stated that demonetization as a revolutionary step. The
former president of India pranab Muharjee welcomed the demonetization move by calling it
bold step. By and large International response was positive which saw the move as a bold crack
down on corruption. Also International Monetary Fund (IMF) issued a statement supporting
Modi’s efforts to fight corruption by the demonetization policy. Moreover, the common people
suffered a lot during the time of introduction of the demonetization strategy. First educate the
society is more important because large no.of traders are doing the retail business and basically
they are doing cash transactions only. Finally the need of the hour is change the attitude in the
minds of people is essential for the success of the demonetization strategy.
Vol. 6 | Special Issue. 1 | March 2018 | ISSN: 2319-961X
151 Shanlax International Journal of Economics
DEMONETIZATION AND ITS IMPACT ON INDIAN SOCIETY
R.Krishna Lekha
M.Phil. Scholar, Department of Economics, S.T. Hindu College, Nagercoil
Dr.Sham Shankar
Associate Professor, Department of Economics, S.T. Hindu College, Nagercoil
Abstract “Demonetization is one of the most trending topics which occupied the columns of Indian newspapers in 2016.
INDIAN PM Mr.Narendra Modi took a bold step against the black money holders by declaring demonetization in
November 2016. Initially, implementation of demonetization in a populous country like India was not a cakewalk for
the government. The sudden declaration of demonetization in the country has created lots of chaos and confusion
among the common people of the country, but gradually everything becomes normal.”
Keywords: Impact, Growth rate, Inflation, Gross Value Added,
Introduction
On November 8, 2016, it was decided to demonetize high value currency notes of
denomination of ‘1000’ and ‘500’ (called specified bank notes - SBNs). Such notes, valued at
15.4 trillion, constituted 86.9 per cent of the value of total currency in circulation. The decision
was in continuation of a series of measures taken by the Government of India during last two
years aimed at eliminating corruption, black money, counterfeit currency and terror funding.
The decision was guided by the aim of reaping its enormous potential medium-term benefits in
the form of reduced corruption, greater digitalization of the economy, increased flow of
financial savings and greater formalization of the economy. All of these would lead to higher
GDP growth and tax revenues that could be used by the Government for inclusive and stronger
economic growth within the norms of fiscal prudence, besides contributing to overall
improvement in business environment.
Objectives of Demonetisation
The foremost objective of demonetisation is to make India a corruption free country. In his
different speech on demonetization Indian prime minister Narendra Modi, points out that bold
steps has been taken to get a control over corruption in the country. Secondly, it is done to curb
black money, thirdly it is also a step to control escalating price rise, fourth to stop fund flow to
illegal activity.
Impact on Growth and Inflation
Growth
The growth of gross value added (GVA) is expected to have been impacted primarily by the
liquidity shock, i.e., limited access to currency as a medium of exchange for effecting
transactions in the economy. This impact is expected to have worked through two channels: (a)
National Seminar on CONTEMPORARY MACRO ECONOMIC ENVIRONMENTAL ISSUES
152 Rani Anna Government College for Women, Tirunelveli
decline in demand due to shortage of cash to make payments, mostly on discretionary
spending; and (b) disruption in production activity due to man hours lost as some workers,
especially those in the un organized sector who get their wages paid in cash.
Although the organised sector on the whole remained resilient, some manufacturing and
services segments were adversely affected. Within industry, electricity generation was expected
to have been impacted the least, with the share of the un organised sector being very low and
the share of informal employment close to zero. Weak demand for electricity was already a
challenge before demonetisation, with power generation in excess relative to demand. In
November and December, however, electricity generation increased by 8.9 per cent and 6.3 per
cent, respectively, which was higher than the average growth of 4.5 per cent recorded during
April-October, 2016 . In January 2017, however, it decelerated to 3.9 per cent. Coal production
also increased by 6.4 per cent in November, 4.4 per cent in December and 4.8 per cent in
January (as against contraction in the previous three months).
Table 2 Growth in Consumer Durable Segments (in per cent) Category
Volume Growth Value Growth
October 2016 November 2016 October 2016 November 2016
Microwave 90.6 -53.0 90.7 -51.5
Refrigerator 74.0 -41.2 73.4 -40.3
Air conditioner 1.8 -34.0 4.0 -33.8
Washing machine 116.7 -31.7 113.1 -34.4
Flat panel TV 94.7 -30.4 99.4 -26.6
Source: Retail sales data by GFK-Nielsen.
Inflation
The impact of demonetisation on inflation in the near-term stemmed mainly from
moderation in food inflation, especially perishables, as inflation excluding food and fuel
remained broadly unaffected. With demand expected to recover from the latter part of Q4 of
2016-17, inflation risks to CPI excluding food and fuel and headline inflation are, therefore,
tilted to the upside. I.2.1 Food Inflation Food inflation declined from 3.7 per cent (year-on-
year, y-o-y) in October 2016 to 2.6 per cent in November, to 2.0 per cent in December and
further to 1.3 per cent in January 2017. This was mainly on account of vegetables and pulses.
Vegetable prices declined by 6.2 per cent on a month-on-month (m-o-m) basis in November
2016 and further by 11.7 per cent in December 2016. The vegetable price decline continued in
January 2017 albeit at a lower rate of 4.7 per cent. Pulses prices declined by 7.4 per cent
between October 2016 and January 2017. The sharp decline in prices of pulses and vegetables
was due to a number of factors. In the case of pulses, there was a record production of kharif
pulses of 8.7 million tonnes due to good monsoon aided by favourable weather conditions.
Adequate provision of quality seeds, fertiliser and pesticides, and timely hike in minimum
support prices also provided suitable incentives.
Impact on Financial Sector
This section sets out the impact of demonetisation on banks; liquidity conditions and
transmission of monetary policy; non-banking financial intermediaries; and, Jan Dhan
Vol. 6 | Special Issue. 1 | March 2018 | ISSN: 2319-961X
153 Shanlax International Journal of Economics
accounts. Balance Sheet and Profitability of Banks Demonetisation has had a significant impact
on the balance sheet of scheduled commercial banks (SCBs), both in terms of size and
composition. Balance Sheet Effects Decline in currency in circulation on account of
demonetisation led to a surge in bank deposits. The demonetised notes were accepted at bank
counters till December 30, 2016. Between October 28, 2016 and January 6, 2017 (i.e., days
immediately prior to and after demonetisation for which fortnightly banking system data are
available), total currency in circulation declined by about ` 8,800 billion. This, in turn, was
largely reflected in sharp increase of about ` 6,720 billion in aggregate deposits of the banking
system even after outflows in NRI deposits during the period.
Impact on Non-Banking Financial Intermediaries
Demonetisation has impacted various financial intermediaries differently. As explained
earlier, consolidated balance sheet of SCBs has expanded by about ` 6.7 trillion in the post-
demonetisation period. Debt oriented mutual funds and insurance companies have also gained.
Non-banking financial companies (NBFCs) and micro finance institutions (MFIs) were
adversely affected, both in terms of disbursals and collection of dues. However, the situation
with regard to most NBFCs has started to improve from late December 2016. II.3.1 Mutual
Funds Reduction in deposit interest rates by banks after demonetisation enhanced the relative
attractiveness of debt oriented mutual funds (MFs). As a result, there were net inflows in
income/debt schemes during November 2016-January 2017 in contrast to net outflows during
November 2015-January 2016. This was reflected in a sharp increase in the overall resources
mobilised by mutual funds during November 2016-Janauary 2017 in contrast to outflows in the
same period.
Conclusion Demonetization act, to drive the economy towards digitization. The process of forging an
efficient path towards digitalization of the payments economy and prospects in financial
inclusion initiatives, have been the biggest agenda for the financial regulators and the
Government since 2014. There have been sizable improvements and progress between private
companies and the ‘organized sector’ and those in the population who have accepted
electronic/online methods of payment. Demonetisation has also improved transmission in the
banking system and led to the greater financialisation of savings.
References 1. Chandra shekhar Ghosh (2017) “ Demonetisation: A boon or bbane for the Indian
Economy?
2. Reserve Bank of India March 10, (2017) “ Macro economic Impact of Demonetisation – A
preliminary Assessment
3. Litrack.L., and Vigne.S,(2017) Demonetisation in India and Emerging challenges: A report
delivered to the department for the Economy, Northern Ireland and the Government of
India by Queen’s University Belfast.
4. https: www.businessinsider.in
National Seminar on CONTEMPORARY MACRO ECONOMIC ENVIRONMENTAL ISSUES
154 Rani Anna Government College for Women, Tirunelveli
OVERVIEW OF GST IN INDIA
C.Mathimitha
Ph.D. Scholar, Department of Economics, S.T. Hindu College, Nagercoil
Dr.V.Thiruselvan
Associate Professor and Head, Department of Economics, S.T. Hindu College, Nagercoil
Abstract The Goods and Service Tax (GST) is defined as a uniform indirect tax levied on goods and services across a
country. More than 160 countries have implemented GST. The GST rolled out from July 1, 2017. GST, as an
umbrella tax has replaced central taxes such as central Excise Duty, Service Tax, Additional Duties of Excise &
Customs, Special Additional Duty and Customs and cesses and surcharges on supply of goods and services. The
present paper it has been shown that which sectors are positively or negatively affected by GST.
Introduction
When the history of modern India is written, three events will stand out. The first of course,
is the 15th of August 1947; the day India’s awoke to life and freedom. The second happened in
1991 when India dusted the cobwebs of socialism to marry market economy. But the biggest
breaking news of the century, its most defining moment, is the GST, which when handled well,
can dramatically after the landscape of India’s taxation.
“The Goods and Services Tax (GST) is a Canadian Value Added Tax levied on most goods
and services sold for domestic consumption. The tax is levied to provide revenue for the federal
Government. The GST is paid by consumers, but it is levied and remitted to the Government
by businesses selling the goods and services”.
The Goods and Services Tax (GST) is a multi-level Value Added Tax introduced in
Canada on January 1, 1991, by then Prime Minister Brian Mulroney and his finance minister
Michael Wilson. The Goods and Services Tax was launched on the midnight of 30 June 2017
by the Prime Minister of India Narendra Modi. The launch was marked by a historic midnight
(June 30- July 1, 2017) session of both the houses of Parliament convened at the Central hall of
the Parliament.
Slays Taxes
The GST Act kills a number of other taxes at the least five at the Central Value Added Tax
(CENVAT or Excise duty), the Service Tax, the Central Sale Tax (CST), the Countervailing
Duties (CVD) and the Special Additional Duty of customs (SAD). The most significant taxes
include the State Value Added Tax (VAT), the Sales Tax (in some states), the Entry Tax, the
Luxury Tax and the Entertainment Tax.
But hold on. This does not mean that we are going to become a tax heaven. Taxes will not
disappear overnight. They will come with a different name; Goods and Services Tax (GST). On
a transaction, both the centre and the state will levy a tax. The centre’s levy is called Central
Vol. 6 | Special Issue. 1 | March 2018 | ISSN: 2319-961X
155 Shanlax International Journal of Economics
GST (CGST) and the State’s GST (SGST). In the case of interstate sale the tax is called
Integrated GST (IGST) and will be collected by the Centre.
GST Objectives
Ensuring availability of input credit across the value chain.
Minimizing cascading effects of taxation.
Simplification of tax administration and compliances
Harmonization of tax base, laws across the country
Prevention of unhealthy competition among state
Increasing the tax base and raising the compliances
Need of GST
There are three reasons to have GST.
It is psychologically far more appealing to pay one tax instead of ten taxes even if the rate
of the one tax is higher than the cumulative rate on the ten taxes. With many taxes, you get
the feeling of being taxed at infinite.
Today an identical product is taxed at different states. GST shifts this and ensures that the
tax on a single product is the same across all over India. This is the best way for making
states competitive, this gives the feeling of oneness in the country as an identical product
get taxes at an equal rate across India, leading to the chorus ‘One Nation, One Tax’.
Like, internationally, GST will shift the collection of tax from the producing state to the
consuming state. The view is that by shifting the collection points, these states will gain and
could use that money for development. All economists are not agreed on this point. There
argument is that the best countries of the world are producing countries and a shift to
rewarding consuming states with more cash, could make them consume rather than
produce.
Benefits of GST
1. No cascading effect of taxes
The term ‘cascading effect of taxes’ refers to a tax on tax. As if paying a tax is not bad
enough, under the present regime you pay tax on tax. Tax on tax is at best irrigation and worst
is a pain. With GST, as there will be only one tax, the tax on tax is eliminated.
2. GDP Growth
GST will not just increase indirect tax collection. It will also affect direct taxes by widening
the tax base. Money from parallel economy finds its way to the real economy and GDP will go
up in the short run not because production will get reportedly more correctly. Over the long
period, as inflation tumbles, prices fall and more purchasing power stays in the hands of the
customer GDP will go up.
3. Black money
Since GST will have a proper trail, which can be accessed by the income tax department, it
will discourage the generation of black money. PAN and Aadhar will be required to file GST
National Seminar on CONTEMPORARY MACRO ECONOMIC ENVIRONMENTAL ISSUES
156 Rani Anna Government College for Women, Tirunelveli
returns. This will help the income tax department track transactions, which it is unable to do
today. Moreover, the tax boards, Central Board of Direct Taxes and the Central Board of
Excise and customs have already started sharing the data with each other to better tracking of
black money.
4. Consumers
GST will not make commodity cheaper immediately. The uniform rate of GST will
increase the prices in the short term. However, in the long run, GST will reduce the prices of
goods and services due to no tax on tax and account of improvement in productivity. But while
some commodities will become cheaper, others could turn dearer. From the consumer point of
view, the biggest advantage would be a reduction in the overall tax burden on goods, free
movement of goods from one state to another without stopped at state borders for hours for
payment of entry tax and reduction in paperwork to a large extent.
5. Industry
Currently, the industry faces multiple taxes. Under the new regime, there will be only one
tax, albeit by two agencies, the Central and the state. If the compliance obligations, uniform tax
rates, better administration of taxes, are some of the pluses. The removal of barriers of state
boundaries for interstate trade would go a long way in the creation of a buoyant economy.
6. Government
GST will increase tax buoyancy. As we saw, the GDP will go up, which would mean more
incomes are reported, and hence more taxes are collected.
Revenue Surplus
A Surplus refers to the excess revenues a business or Government agency has after it has
completed its budget. The surplus funds can then be appropriated for other expenses that may.
GST and Revenue Surplus
Single biggest taxation reform since independence, GST will subsume 16 different levies
and transform India into a common market for seamless transfer of goods services. The Centre
and States have already fitted over 1200 goods and 500 services in tax slabs of 5, 12, 18 and 28
percent.
Besides, cues would be levied on certain demerit and luxury goods and the proceeds from it
will make good any shortfall in revenue to the States post GST. GST will mark a shift away
from production to consumption based tax. Overall, the States are likely to achieve higher
revenues in the GST phase, including compensation from the Centre. In the initial years, most
of the surplus is likely to be used to reduce fiscal deficits, as states will not know the actual
surplus that might accrue to them GST.
Impact of GST in India
GST is a destination based tax, levied on the consumption of goods and services.
Positive Impact of GST in India
1. GST will also help to build a transparent and corruption free tax administration.
Vol. 6 | Special Issue. 1 | March 2018 | ISSN: 2319-961X
157 Shanlax International Journal of Economics
2. Presently, a tax is levied on when a finished product moves out from a factory, which is
paid by the manufacturer, and it is again levied at the retail outlet when sold.
3. GST is backed by the GSTN, which is a fully integrated tax platform to deal with all aspect
of GST.
4. GST also has an optional scheme of lower taxes for small businesses with turnover between
INR20 to 50 lakhs. It is called the composition scheme. It has now been proposed to be
increased to 75 lakhs. This will bring respite from tax burdens to many small businesses.
5. Removing cascading tax effect, simpler online procedure under GST, defined treatment for
E-commerce and regulating the unorganized sector.
Negative Impact of GST In India
1. Some Economist says that GST in India would impact negatively on the real estate market.
It would add up 8 percent to the cost of new homes and reduce demand by about 12
percent.
2. Some experts says that CGST (Central GST), SGST (State GST) are nothing but new
names for Central Excise/Service tax, VAT and CST. Hence, there is no major reduction in
the number of tax layers.
3. Some retail products currently have only four percent tax on them. After GST, garments
and clothes could become more expensive.
Conclusion
Implementation of GST is one of the best decisions taken by the Indian Government. For
the same reason, July 1 was celebrated as Financial Independence Day in India when all the
members of Parliament attended the function in Parliament house. In fact, the introduction of
GST is only the next stage of reform. In that sense, the introduction of GST will not be a silver
bullet and we should keep expectations at a realistic level.
References
1. V. Pattabhi Ram, “India keeps its Duties with Destiny”, Industrial Economist, Vol.L, No.5,
July 2017, p.p.16-18.
2. www.livemint.com
3. www.quora.com
National Seminar on CONTEMPORARY MACRO ECONOMIC ENVIRONMENTAL ISSUES
158 Rani Anna Government College for Women, Tirunelveli
GST: ONE NATION, ONE TAX, ONE MARKET
S.Paramasivan
Ph.D. Full time Research Scholar, Department of Economics
ManonmaniamSundaranar University, Tirunelveli (Dist)
Abstract The Goods and Service Tax (GST) is the biggest and substantial indirect tax reform since 1947. The main idea
of GST is to replace existing taxes like value –added tax, excise duty, service tax and selas tax. It will be levied to
manufacture sale and consumption of goods and servic. GST is expected to address the cascading effect of the existing
of tax structure and result in uniting the country economically. The paper highlights the back ground and objectivies
of the proposed GST. Finally the paper examines and draws out a conculsion.
Introduction
The most revolutionary tax reform in the Indian taxation history; will streamline the system
through a single tax for supply of all goods and services across the country.
In India, the unified tax will take form of a “dual” GST, to be levied concurrently by the
both Centre and States. The unified tax will comprise of a GST and a State GST, which will be
legislated, levied and administrated by the respective levels of government. The same taxable
base will be subject to both GSTs.
The words “legislate, levy and administer” are key, since the Centre and State will legislate
the respective GST Acts and both will have power to administer the taxes.
The proposed system will subsume a variety of central and state levies such as Central
Excise Duty, Service tax and VAT, there by simplifying the complicated tax structure and
reducing compliance costs.
Key features of GST
Terrestrial Spread: Whole country including J&K
Applicable on “supply” of goods and services and not on the present concept of tax on
manufacture of goods/sale or on provision of services
Based on the principle of destination based consumption taxation as against the present
principle of origin based taxation
Introduction in India required amendment to the Constitution of India: Introduced as The
Constitution (One Hundred and First Amendment) Act 2017, following the passage of
Constitution 122nd Amendment Bill.
Amendment Why?
Centre: Had the power to levy tax on the manufacture of goods (expect alcoholic liquor for
human consumption, opium, narcotics, etc.)
States: Power to levy tax on the sale of goods
Vol. 6 | Special Issue. 1 | March 2018 | ISSN: 2319-961X
159 Shanlax International Journal of Economics
Inter – State sales: Centre had the power to levy a tax (the Centre and Sales tax) but the tax
was collected and retained entirely by the States.
Services: Only Centre was empowered to levy the Services Tax
GST Council – Constitution
Chairperson – Union FM
Vice Chairperson – to be chosen amongst the Ministers of State Government
Members – MOS (Finance) and all Ministers of Finance / Taxation each State
Quorum is 50 % of total members
States – 2/3 weightage and Center – 1/3 weightage
Decision by 75 % majority
Council to make recommendations on everything related to GST including laws, rules and rates ect.
GST Council – Decisions
Threshold limit for exemption to be Rs. 20 lac (Rs. 10 lac for special category States) Compounding threshold limit to be Rs. 50 lac with –
Government may convert existing Area based exemption schemes into reimbursement based sheme Four taxes rates namely 5%, 12%, 18% and 28% Some goods and services would be exempt
Separate tax rate for precious metals Cess over the peak rate of 28% on specified luxury and sin goods To ensure single interface – all administrative control over
(i). 90% taxpayers having turnover below Rs. 1.5 cr would vest with State tax administration (ii). 10 % tax payers having turnover below Rs. 1.5 cr would vest with Centaladministration (iii). Taxpayers having turnover above Rs. 1.5 cr would be divided equally between Centre and State tax administration
Categories Tax Rate
Traders 1 %
Manufactures 2 %
Restaurants 5 %
Objectives of the GST
1. Interest of poor and vulnerable sections of the society are protected and goods of mass
consumption and essential commodities remain at affordable level
2. The overall revenues of the States and the Centre are protected
3. The tax incidence on the goods and services does not increase or decrease substantially
from the present incidence of tax.
How GST came into being?
First recommended by: Kelkar Committee Task Force
2000 In 2000, the Vajpayee Government started discussion on GST by setting up an empowerment committee. The committee was headed by AsimDasgupta, (Finance Minister, Government of
West Bengal)
2002 – 2004 The Kelkar Task Force on the implementation of Fiscal Responsibility and Budget Management (FRBM) Act, 2003 and suggested that a comprehensive Goods and Service Tax (GST)
2006 A proposal to introduce a national level Goods and Services Tax (GST) by April 1, 2010 was first
mooted in the Budget Speech for the financial year 2006 - 07
2007 May 2007, Empowerment committee of State Finance Minister, on the request started, worked on
National Seminar on CONTEMPORARY MACRO ECONOMIC ENVIRONMENTAL ISSUES
160 Rani Anna Government College for Women, Tirunelveli
GST roadmap.
November 2007, The Join working group, submitted its report to the Empowerment Committee
on November 19, 2007
2008 April 2008 – Empowerment Committee finalized views over GST and submitted report titled “A
model roadmap for Goods and Services Tax (GST) in India”
2009 November 2009 – First Discussion paper on Released by Empowerment Committee
2010 Feb – 2010 – Mentioned in the speech of then FM – GST to be introduced in April 2011
2011 Mar – 2011 – The Constitution 115th amendment bill introduced in Loksabha for levy of GST all
goods and services except for the specified goods
2013 Aug 2013 – Standing Committee Submitted its report on GST
Nov 2013 – EC rejected Govt’s proposal to include petroleum products
2014 Dec 2014 – The Constitution 122th amendment bill passed in Lok Sabha for levy of GST which enables the introduction GST probably by April 2016 on 17th December, 2014.
Which taxes at the Centre and State level are being subsumed into GST?
Central Level
Central Excise Duty
Additional Excise Duty
Services Tax
Additional Customs Duty commonly known as Countervailing Duty
Special Additional Duty of Customs
State level
Subsuming of State Value Added Tax / Sales Tax
Entertainment Tax, Central Sales Tax
Octroi and Entry tax
Purchase Tax
Luxury tax
Taxes on lottery, betting and gambling
Conclusion In the light of the discussion, the authors have recommended that GST system is more
beneficial for the Government at well as stakeholders from the management and analysis point
of view. We believe that CGST must have the authority to collecting Tax and SCGST should
be given the power to take the decision regarding Tax rate. GST is also helpful in avoiding tax
evasion, improved tax collection and compliances. It can be looked as simplification of Taxes
in country and avoiding unnecessary complexities. Researcher’s observation is in support of
GST system, experience of other countries strengthen the belief that it will be a will be a
milestone in the development of Taxation in India. As for challenges are concern it is between
State and Central Government proportion in Taxes majorly, but directly or indirectly it is
adding wealth to nation only. It has great prospects in favor of the nation.
References
1. Goods and Service Tax in India, “Yojana and Kurukshetra – Aug 2017” p : 1 – 7
2. Economictimes.com / news / policy.
Vol. 6 | Special Issue. 1 | March 2018 | ISSN: 2319-961X
161 Shanlax International Journal of Economics
IMPACT OF DEMONETIZATION ON BANKING SECTOR
Dr.P.Chennakrishnan
Assistant Professor, Department of Economics, Thiruvalluvar University, Serkkadu, Vellore
R.Thirunukkarasu
Ph.D. Research Scholar, Department of Economics, Thiruvalluvar University, Serkkadu, Vellore
Abstract The paper examine the impact of demonstration its effect of banking sector has move by the administration to
demonetize Rs.500 and Rs.1000 notes by supplanting them with new Rs.500 and Rs.2000 notes has taken the nation
with astonish. The administration is to handle the danger of dark cash, defilement fear financing and phony money.
From a market point of view, we imagine this is an exceptionally welcome move by the legislature and which has
taken the dark cash hoarders with amaze. The aggregate estimation of old Rs.500 and Rs.1000 notes in the flow is to
the tune of Rs.14.2 trillion, which is around 85% of the aggregate estimation of cash available for use. This implies
the aggregate money needs to now pass however the formal managing an account channels to get authenticity. The
World Bank in July, 2010 evaluated the span of the shadow economy for India at 20.7% of the Gross Domestic
Product (GDP) in 1999 and ascending to 23.2% out of 2007. Accepting that this figure has not ascended from that
point forward and that the money segment of the shadow economy is additionally corresponding evaluated
unaccounted estimation of the cash could be to the tune of Rs.3.3 trillion.
Introduction
Demonetization is a procedure by which a progression of cash won't be lawful delicate. At
that point the arrangement of Currency won't satisfactory as substantial money. The
declaration done by our Prime Minister Sri Narendra Damodardas Modi on eighth November
2016 with respect to the demonetization of Rs. 500 and Rs. 1000 notes is a striking choice
identifying with financial arrangement of the country. The essential purpose for the choice is
controling all dark cash in India. Optional wellsprings of information have been utilized for
contemplate which is gathered from different diaries, news notices, periodicals, and online
sources. Consequently it can be reasoned that separated from upsetting day by day lives of
regular national, there are much greater ramifications for the economy in general. The rustic
zones specifically, which don't have formal wellsprings of saving money, additionally bargain
generally in real money from disorderly segment like land rulers, private cash moneylender and
Chites. The present paper is an endeavor to ponder the effect of demonetization on Indian
economy especially on business condition. It was discovered that as an effect of demonetization
the loan fee may go down, builds the employability opportunity, diminish the cost of the item
and other item.
Banks are center piece of any economy. They channelized the cash to the smooth working
of various areas. Activities of Green Banking, made the banks to change ordinary managing an
account administrations into current keeping money administrations. The items and
administrations are offered through electronic gadgets with the assistance of web. Presently a
day, bank administrations are provided food at the fingertip of clients. Surgical Strike on Black
National Seminar on CONTEMPORARY MACRO ECONOMIC ENVIRONMENTAL ISSUES
162 Rani Anna Government College for Women, Tirunelveli
Money called 'Demonetization' got tremendous changes every one of the divisions of the
nation. Banks are not excellent from the impact of Demonetization and it made vibrations in
the activities and additionally items and administrations of Banks. It made more noteworthy
request to computerized keeping money administrations where cashless exchanges are
organized. Everyday activities of Banks are influenced and discovered extreme in Management
of liquidity and Employees. It made more noteworthy effect on Management of liquidity and
its request brought by clients up in trading of their prohibited cash notes while limiting danger
and augmenting nature of administration. In the meantime meeting the direction of Reserve
Bank of India was testing. Demonetization has irritated the bank activities and made the
representatives to work under unequivocal worry in broadened working hours of a day. A large
portion of the banks were not ready to release other saving money administrations while
trading the prohibited cash notes. Subsequently, the present examination is made to make sense
of the impact of demonetization on managing an account part. It grandstands post
demonetization impact on banks and its tasks.
Define Demonetization
Demonetization - ending something, termination, conclusion as no longer the legal tender
of a country. The act of ending something; the termination of the agreement. There is a famous
saying in Telugu, the one who gets caught doing a mistake is a thief, and the one who doesn't
get caught, and doing the same mistake is a king".
1. The numbers and calculations for this are mind-boggling. According to the RBI press
conference, there are 16.5 billion ‘500-rupee’ notes and 6.7 billion ‘1000-rupee’ notes were
circulated.
2. Of this Rs 500 notes constituted almost 45% of the currency in circulation while 39% of the
notes were of the Rs 1,000 denomination. In value terms. However Rs 10 and Rs 100 notes
constituted 53% of the notes in circulation.
3. The Financial Action Task Force, a global body that looks at the criminal use of the
international financial system.
4. In two words: black money. Unaccounted money, often used in any form of corruption or
illicit deals, usually takes the form of high-value notes, which in this case are the Rs 500
and Rs 1,000 bills.
Impact of Demonetization
It is too soon to remark on the effect of demonetization or impact of demonetization. This
is still under usage process. There are both positive and negative effects of demonetization.
Overabundance store development in the keeping money framework amid the demonetisation
time frame (i.e., November 11, 2016 to December 30, 2016) works out to 4-4.7 rate focuses. On
the off chance that the period up to mid-February 2017 is considered to take into account some
surge to decrease, abundance store development is in the scope of 3.3-4.2 rate focuses. The
liquidity support coming about because of the demonetisation declaration on November 8,
2016 has remained with the managing an account segment a year after the occasion, helping
banks lessen their high-cost stores and boosting their present record and investment account
Vol. 6 | Special Issue. 1 | March 2018 | ISSN: 2319-961X
163 Shanlax International Journal of Economics
(CASA) proportion. CASA is condensing of current Account Savings Account. It is the
proportion which demonstrates the amount of the aggregate stores with bank in the present
record and investment account. In a basic dialect, the stores with the bank are in the present
record and investment account. Banks don't pay enthusiasm on the present record stores and
pays an exceptionally low% of enthusiasm on funds on account stores. Consequently, it is a
decent measures to get stores at no or minimal efforts.
Review of Literature
Nikita Gajjar (2016) examined demonetization and its effect on Indian Economy. They
opined that demonetization has here and now negative effect on various segments of the
economy and such effects are comprehended when the new money notes are broadly coursed
in the economy. They additionally contended that the legislature should clear every one of the
issues made because of demonetization and help the economy to work easily.
Nithin and Sharmila (2016) thought an investigation on Black Money in India: Present
Status and Future Challenges and Demonetization. She portrayed the structure, approach
choices and systems that Indian Government should adjust to handle with this issue and the
future difficulties to be looked by the Government.
Manpreet Kaur (2017) demonetization and its entire money related incorporation. They
felt that the prizes of demonetization are much reassuring and the demonetization is in the long
haul enthusiasm of the nation. They communicated that it had given brief agony yet it educated
money related lessons. It affected saving money enterprises to do extensively venture on
digitalization of saving money administrations.
Vijay and Shiva (2016) inspected led an examination on demonetization and effect on
Cashless Payment System. He said that the cashless framework in the economy has numerous
productive advantages less tedious, less cost; paper less exchange and so on and he expected
that the future exchange framework in every one of the divisions is cashless exchange
framework.
Objectives
1. Aimed at combating corruption. And Check black money and fake currency note.
2. 1000 and 500 were put out of circulation and Effect on parallel economy.
3. All the bank accounts are tied up to one PAN (Permanent Account Number).
4. This move shows strength of the Banking system, Retail boost, and increases deposit.
5. This move will also cause short-term pain for the working class, small businesses and nearly
anybody who deals with cash on a daily basis.
6. Remove black money from the economy as they will be blocked since the owners will not
be in a position to deposit the same in the banks.
Methodology of the Study
The study is based on Secondary Sources of data. It includes available published literatures
such as books, journals, newspapers and relevant government websites. The study tries to look
at the extent of demonetization influence on normal banking operations.
National Seminar on CONTEMPORARY MACRO ECONOMIC ENVIRONMENTAL ISSUES
164 Rani Anna Government College for Women, Tirunelveli
Conclusion
Demonetisation would be sure for divisions like saving money and framework in the
medium to long haul and could be negative for parts like shopper durables, extravagance
things, adornments, land and unified segments, in the close to medium term. It can likewise
prompt enhanced assessment consistence, financial adjust, bring down swelling, bring down
defilement, finish end of phony money, a stage for supported monetary development in the
more drawn out term. Banks have picked up stores generously after demonetisation which they
can contribute for enhancing their productivity. There non-performing propels have
additionally descended. Other than as banks will decrease their money possessions because of
more computerized interface it will add to their long haul productivity and money misfortune
for different reasons like burglary, dacoit and misappropriation will be avoided.
Vol. 6 | Special Issue. 1 | March 2018 | ISSN: 2319-961X
165 Shanlax International Journal of Economics
IMPACT OF DEMONETARIZATION IN UNORGANIZED
SECTORS IN INDIA
Mr.S.Kumar
Ph.D. Research Scholar in Economics
Centre for Study of Social Exclusion and Inclusive Policy (CSSE&IP)
Manonmaniam Sundaranar University, Tirunelveli
Mr.N.Lakshmanan
Ph.D. Research Scholar in Economics
Centre for Study of Social Exclusion and Inclusive Policy (CSSE&IP)
Manonmaniam Sundaranar University, Tirunelveli
Abstract On the 9th of November 2016, the Government of India, delivered a masterstroke, by declaring, as illegal tender,
the Rs. 500/-and Rs. 1000/-denominations in the currency system. National Restaurant Association of India had
reported downfall of averaging upto 40% revenue in the sector in their initial weeks. Demonetization is the current
biggest challenge in Unorganized sector in India have described in this paper. After a tumultuous fortnight for the
entire country ever since the government declare the partial demonetization of the higher value rupee notes. Objective:
To study the impact of demonetarization in Indian economy. To study the impact of demonetarization in
unorganized sectors. Methodology of the study- the study includes only secondary methods of data collection. The
paper includes impact of demonetarization in unorganized sectors in India, conclusion- The study conclude that
demonetization, unorganised sector is the worst hit. Most of the traders are not familiar with technology and do not
know about mobile banking, e-wallets and other cashless means. The people working in the unorganised sector have
traditionally functioned through cash and did have the habit of saving money in banknotes.
Keywords: Demonetarization, Unorganized Sectors, Currency, etc.
Introduction
Government of India announced demonetization of the high value currencies of Rs. 500
and 1000 with an objective to unearth the black money and to curb the corruption, counterfeit
currency as well as terror funding. This decision is considered as biggest cleanliness drive
against the black money in the history of Indian economy whose benefits will be reaped in the
long run. However, the impact of this sudden move is causing major cash crunch in the
economy affecting day to day requirements of the common man and businesses.
Black money is kept in the form of land, building, gold or kept abroad. Most of the
transactions in these sectors are held in cash. The demonetization reduced the transaction of
cash in real estate and the above sector. Many other countries have also followed the
demonetization in their country. Some countries achieved success and some countries got
failure in the policy. India will get success or will not get success it depends on how this move
affect the Unorganised sectors.
National Seminar on CONTEMPORARY MACRO ECONOMIC ENVIRONMENTAL ISSUES
166 Rani Anna Government College for Women, Tirunelveli
Various analysts, experts and scholars have expressed their views regarding impact of
demonetization on the economy and have estimated 0.5% - 3% impact on the Gross Domestic
Product (GDP) of the country in the current financial year 2016-17.
Definition of Demonetarization
Demonetization is the act of stripping a currency unit of its status as legal tender. It occurs
whenever there is a change of national currency: The current form or forms of money is pulled
from circulation and retired, often to be replaced with new notes or coins. Sometimes, a
country completely replaces the old currency with new currency. The opposite of
demonetization is demonetization, in which a form of payment is restored as legal tender.
Definition of Unorganized Sector
The term “Unorganised Sector” used by the Indian National Account Statistics is
equivalently known as informal sector internationally. Unorganised, unregulated, traditional,
household and informal are different terms used interchangeably in contrast with organised,
regulated, modem, corporate and formal sector.
Scope of the Study
The study on impact of demonetarization in unorganized sectors in India. The total
population of the India is 121cr in 2011. Formal jobs now comprise over a quarter of our
employment, higher than previous estimates, which pegged the informal sector employing over
90 per cent (including agriculture) of our 460 million-odd workforce. Government employment
policy has no better work in the India, labour of India are unorganized, no wage policy, most
farmer holding in less than one hectares so agricultural labour problems arises in the India.
Objective of the Study
The following objectives are in the study:
To study the impact of demonetarization in Indian economy.
To study the impact of demonetarization in unorganized sectors.
Methodology
The study of impact on demonetarization in unorganized sector in India is based on
secondary method of data collection from various books, Newspapers, government publication
report etc.
Impact on Demonetarization in Indian Economy
Small farmers, sellers, merchants, daily wage laborers and traders are suffering because of
lack of proper planning, intelligence and foresight such as recalibration of ATM machines. If
we look at the farm sector, this is the harvest time. Farmers generally deal in cash and India is
also largely a cash economy. If suddenly implementing demonetization this sector suffering lot.
People are facing problems because the limit of withdrawal has not been kept at a higher level.
If this would have been kept at a higher level, there were chances that the recycling of black
Vol. 6 | Special Issue. 1 | March 2018 | ISSN: 2319-961X
167 Shanlax International Journal of Economics
money might begin. In the tribal and farmers heartland of the country, the poor people through
middlemen are getting their currencies exchanged for Rs.300 or Rs.400 because of lack of
proper information which is hitting them. Temporarily unorganized sector buying capacity will
decrease for examples purchasing of raw material, fertilizers, and selling cost. Majority of
Indians unorganized sector have no knowledge about cashless transaction and resources also
limited. When a poor farmer is unable to repay his small loan Picking holes in the cashless
economy five-six percent of the amount deducted in every digital transaction as service charge.
Impact on Demonetarization in Unorganized Sectors
A January 2017 report by Crisil highlighted that as many as 41% of 1,100 of micro, small
and medium enterprises (MSMEs) surveyed said their clients had shifted to cheque or
electronic payments since demonetisation, yet the wage decline or job loss in the unorganized
sector was on an unprecedented scale. Like most of the unorganised sector, some industries in
the organised sector had also suffered due to the slowdown in consumer spending after
demonetisation. The impact of demonetisation was clearly visible from the 5% contraction in
production of consumer non-durables and 10.3% fall in production of durables until January
2017. The decline signaled that consumption demand in both rural and urban had been
impacted. Two-wheeler sales dropped to a 16-year low in December 2016 and a Nielsen survey
over 750 stores (November 2016) reported a 20-40% drop in sales of most of the fast-moving
consumer goods (FMCG) goods.
According to an India Spend analysis reported in January 2017, tomato farmers in
Karnataka and Tamil Nadu were affected the most as prices fell by 60-85%, while onion
farmers in Maharashtra and Gujarat were also badly hit. In an earlier study by Nidhi Agarwal
and Sudha Narayan in November 2016, the short-term decline in farm supply to the
agricultural produce markets was highlighted. The striking feature was the significant variation
across states. For example, aggregate soya bean and maize arrivals across mandis in Madhya
Pradesh fell by about 97%. In contrast, aggregate soya bean arrivals in Maharashtra fell by
68%. Their hypothesis was that more cash-intensive mandis with limited penetration of banks
or connection to urban areas were likely to be more affected.
The decline of employment in the unorganised sector (especially construction) possibly led
to some reverse migration. According to Bihar’s finance minister in December 2016, 95% of
migrant workers from Bihar had returned home because their employers had no money to pay
their salaries. Reverse migration in Bihar and other states may have put pressure both on
agricultural labour markets and MGNREGA. In key states such as Bihar, Rajasthan and
Maharashtra, the total number of people who demanded and got work under the MGNREGS
in November and December 2016 shows a jump over 2013-14, which was a normal monsoon
year.
Findings of the Study
Finding is that India increasing unorganized sectors labour problem due to high birth rate
and decreasing employment opportunities and capital formation. Government policy does not
work better in the India. While medium and large scale business is unaffected to such ban,
National Seminar on CONTEMPORARY MACRO ECONOMIC ENVIRONMENTAL ISSUES
168 Rani Anna Government College for Women, Tirunelveli
many small-size commercial establishments are deeply affected by such sudden move by the
government. The economy of the country may experience recession in the coming few weeks
but is expected to get back to its shape shortly after the influence of Modi government. Central
government’s recent decision to demonetize the high value currency is one of the major step
towards the eradication of black money in India. The demonetization drive will affect some
extent to the general public, but for larger interest of the country such decisions are inevitable.
Also it may not curb black money fully, but definitely it has major impact in curbing black
money to large extent.
Conclusion
From this study demonetisation, unorganised sector is the worst hit. Most of the traders are
not familiar with technology and do not know about mobile banking, e-wallets and other
cashless means. The people working in the unorganised sector have traditionally functioned
through cash and did have the habit of saving money in banknotes. According to a recent
report, the unorganised sector in India will be the worst hit by demonetisation and might lose a
major amount of its business. Organized players will be least affected but will have some
impact.
References
1. “How demonetization will impact top six sectors of economy” By Sanjeev Sinha.
2. “Demonetisation impact on various sectors: Government needs to inject positive sentiment,
led by tax cuts” By ET Bureau.
3. “How Demonitization can change your Home Buying Decision” By Sanjeev Sinha.
4. “Impact of demonetization on different sectors of Society” By Zia & filed under Social.
5. “Impact of demonetization of Rs 500 and Rs 1000 notes on the automotive industry” By
sukhpreet Singh.
6. http://www.newindianexpress.com/business/2018/jan/30/indias-unorganised-sector-is-
shrinking-1765363.html
7. https://www.researchgate.net/publication/318876493_IMPACT_OF_DEMONETIZATI
ON_IN_INDIAN_HOSPITALITY_AND_TOURISM_INDUSTRY
8. http://www.livemint.com/Politics/a0Fk7NwHWsKcxiu4A3i4tK/How-demonetisation-
has-impacted-key-sectors.html
Vol. 6 | Special Issue. 1 | March 2018 | ISSN: 2319-961X
169 Shanlax International Journal of Economics
IMPLICATIONS OF IMPLEMENTING GST IN INDIA
Dr.V.Rajarajeswari
Assistant Professor of Economics, Sri K.G.S. Arts College, Srivaikuntam
Abstract Goods and Services Tax is a Comprehensive, multistage, destination based tax that will be levied on every value
addition. Goods and Service Tax (GST) implemented in India to bring in the “one nation one tax” system, but its
effect on various industries will be slightly different. The first level of differentiation will come in depending on whether
the industry deals with manufacturing, distributing and retailing or is providing a Service. It is expected to remove the
cascading effect of taxation. At present the date of introduction of Good and Service Tax is like a “mirage”. It is
because of lack of support from opposition party and other political parties in the Parliament in amending the
Constitution improper support and autonomy of various State governments, creation of information Technology
Infrastructure for tax administration. In spite of all these challenges the government has taken lot of steps in
implementing GST, as if everything goes well as the union Finance minister says that GST would be come into force
from 1st April, 2016.
Keywords: Indirect tax reform, Goods and Service Tax(GST), cascading effect and Implementing tax system.
Introduction
In India, the idea of GST was contemplated in 2004 by the task Force on implementation
of the Fiscal Responsibility and Budget Management Act, 2003, named Kelkar Committee.
The Kelkar Committee was convinced that a dual GST system shall be able to tax almost all
the goods and services in the Indian economy shall be able to have wider market of tax base,
improve revenue collection through levying and collection of indirect tax and move Pragmatic
approach of efficient resource allocation under the Goods and Service Tax mechanism, every
person is be liable to pay tax on output and shall be entitled to enjoy credit on input tax paid
and tax shall be only on the amount of value added.
India has witnessed significant reforms in indirect taxes over the past two decades. The
Goods and Service Tax (GST) is one of the prime indirect tax reforms in India. The decision on
which is pending in parliament since March 2010. The fundamental idea behind this form of
taxation is to replace existing indirect Taxes like central excise duty, customs duty, service tax
and value-added tax (or) sales tax by levying a comprehensive tax on the manufacture, sale and
consumption of goods and services in the Country. i.e., GST.
GST is definitely a good move to reform indirect taxation in India and has positive effects
on GDP growth, Tax revenue, exports, employment and so many. But even after a decade
Government have failed to implement it, due to variety of reasons like, compensation
mechanism for the states, GST rates, and issues relating to food products, petrol and tobacco
and many political issues as well. With lots of flaws in the present tax structure which is
affecting the growth of economy, there is a need to implement GST and to streamline our
growth with global economy. The implementation of GST would pave way for a simple and
understandable tax structure, and also help in avoiding any evasion taking place at any level.
Thus, lot being said and done, an appropriate implementation would lead to actually
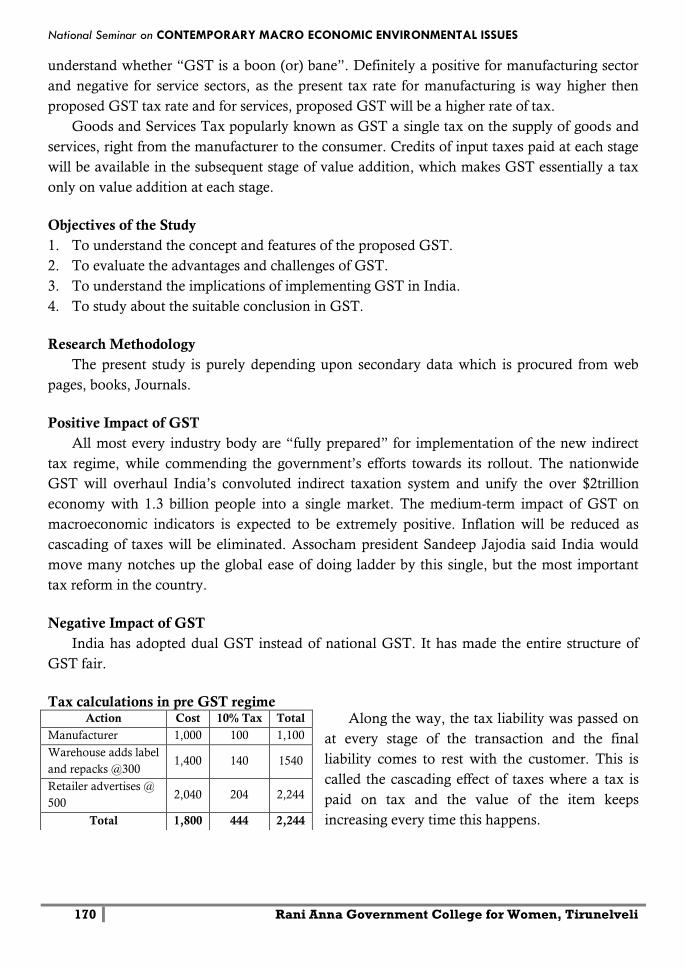
National Seminar on CONTEMPORARY MACRO ECONOMIC ENVIRONMENTAL ISSUES
170 Rani Anna Government College for Women, Tirunelveli
understand whether “GST is a boon (or) bane”. Definitely a positive for manufacturing sector
and negative for service sectors, as the present tax rate for manufacturing is way higher then
proposed GST tax rate and for services, proposed GST will be a higher rate of tax.
Goods and Services Tax popularly known as GST a single tax on the supply of goods and
services, right from the manufacturer to the consumer. Credits of input taxes paid at each stage
will be available in the subsequent stage of value addition, which makes GST essentially a tax
only on value addition at each stage.
Objectives of the Study
1. To understand the concept and features of the proposed GST.
2. To evaluate the advantages and challenges of GST.
3. To understand the implications of implementing GST in India.
4. To study about the suitable conclusion in GST.
Research Methodology
The present study is purely depending upon secondary data which is procured from web
pages, books, Journals.
Positive Impact of GST
All most every industry body are “fully prepared” for implementation of the new indirect
tax regime, while commending the government’s efforts towards its rollout. The nationwide
GST will overhaul India’s convoluted indirect taxation system and unify the over $2trillion
economy with 1.3 billion people into a single market. The medium-term impact of GST on
macroeconomic indicators is expected to be extremely positive. Inflation will be reduced as
cascading of taxes will be eliminated. Assocham president Sandeep Jajodia said India would
move many notches up the global ease of doing ladder by this single, but the most important
tax reform in the country.
Negative Impact of GST
India has adopted dual GST instead of national GST. It has made the entire structure of
GST fair.
Tax calculations in pre GST regime Along the way, the tax liability was passed on
at every stage of the transaction and the final
liability comes to rest with the customer. This is
called the cascading effect of taxes where a tax is
paid on tax and the value of the item keeps
increasing every time this happens.
Action Cost 10% Tax Total
Manufacturer 1,000 100 1,100
Warehouse adds label
and repacks @300 1,400 140 1540
Retailer advertises @
500 2,040 204 2,244
Total 1,800 444 2,244
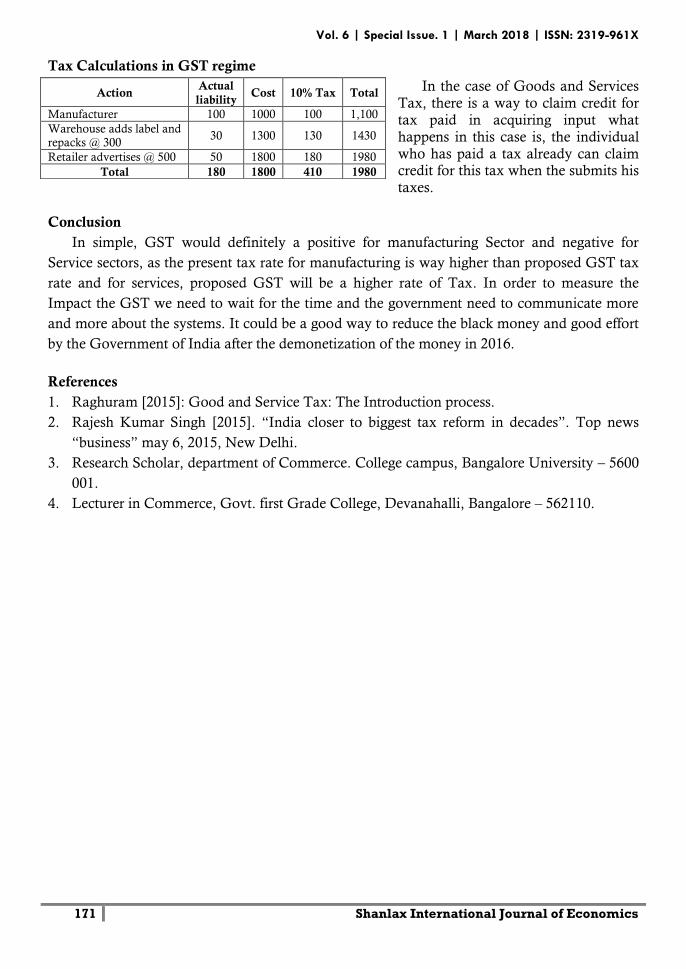
Vol. 6 | Special Issue. 1 | March 2018 | ISSN: 2319-961X
171 Shanlax International Journal of Economics
Tax Calculations in GST regime
In the case of Goods and Services
Tax, there is a way to claim credit for tax paid in acquiring input what happens in this case is, the individual who has paid a tax already can claim credit for this tax when the submits his taxes.
Conclusion
In simple, GST would definitely a positive for manufacturing Sector and negative for
Service sectors, as the present tax rate for manufacturing is way higher than proposed GST tax
rate and for services, proposed GST will be a higher rate of Tax. In order to measure the
Impact the GST we need to wait for the time and the government need to communicate more
and more about the systems. It could be a good way to reduce the black money and good effort
by the Government of India after the demonetization of the money in 2016.
References
1. Raghuram [2015]: Good and Service Tax: The Introduction process.
2. Rajesh Kumar Singh [2015]. “India closer to biggest tax reform in decades”. Top news
“business” may 6, 2015, New Delhi.
3. Research Scholar, department of Commerce. College campus, Bangalore University – 5600
001.
4. Lecturer in Commerce, Govt. first Grade College, Devanahalli, Bangalore – 562110.
Action Actual
liability Cost 10% Tax Total
Manufacturer 100 1000 100 1,100
Warehouse adds label and repacks @ 300
30 1300 130 1430
Retailer advertises @ 500 50 1800 180 1980
Total 180 1800 410 1980
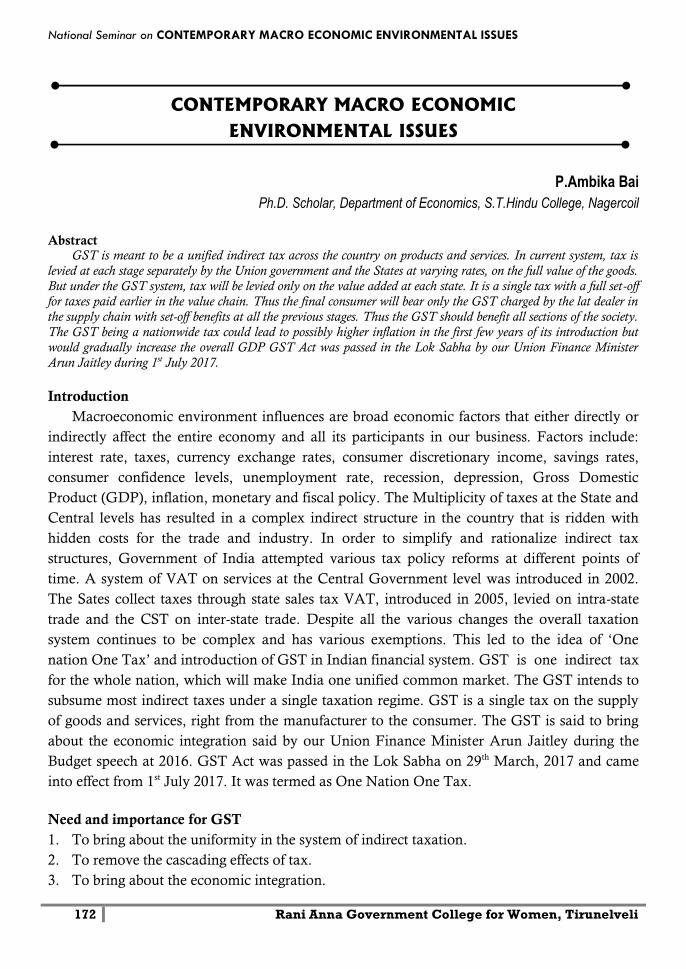
National Seminar on CONTEMPORARY MACRO ECONOMIC ENVIRONMENTAL ISSUES
172 Rani Anna Government College for Women, Tirunelveli
CONTEMPORARY MACRO ECONOMIC
ENVIRONMENTAL ISSUES
P.Ambika Bai
Ph.D. Scholar, Department of Economics, S.T.Hindu College, Nagercoil
Abstract GST is meant to be a unified indirect tax across the country on products and services. In current system, tax is
levied at each stage separately by the Union government and the States at varying rates, on the full value of the goods.
But under the GST system, tax will be levied only on the value added at each state. It is a single tax with a full set-off
for taxes paid earlier in the value chain. Thus the final consumer will bear only the GST charged by the lat dealer in
the supply chain with set-off benefits at all the previous stages. Thus the GST should benefit all sections of the society.
The GST being a nationwide tax could lead to possibly higher inflation in the first few years of its introduction but
would gradually increase the overall GDP GST Act was passed in the Lok Sabha by our Union Finance Minister
Arun Jaitley during 1st July 2017.
Introduction
Macroeconomic environment influences are broad economic factors that either directly or
indirectly affect the entire economy and all its participants in our business. Factors include:
interest rate, taxes, currency exchange rates, consumer discretionary income, savings rates,
consumer confidence levels, unemployment rate, recession, depression, Gross Domestic
Product (GDP), inflation, monetary and fiscal policy. The Multiplicity of taxes at the State and
Central levels has resulted in a complex indirect structure in the country that is ridden with
hidden costs for the trade and industry. In order to simplify and rationalize indirect tax
structures, Government of India attempted various tax policy reforms at different points of
time. A system of VAT on services at the Central Government level was introduced in 2002.
The Sates collect taxes through state sales tax VAT, introduced in 2005, levied on intra-state
trade and the CST on inter-state trade. Despite all the various changes the overall taxation
system continues to be complex and has various exemptions. This led to the idea of ‘One
nation One Tax’ and introduction of GST in Indian financial system. GST is one indirect tax
for the whole nation, which will make India one unified common market. The GST intends to
subsume most indirect taxes under a single taxation regime. GST is a single tax on the supply
of goods and services, right from the manufacturer to the consumer. The GST is said to bring
about the economic integration said by our Union Finance Minister Arun Jaitley during the
Budget speech at 2016. GST Act was passed in the Lok Sabha on 29th March, 2017 and came
into effect from 1st July 2017. It was termed as One Nation One Tax.
Need and importance for GST
1. To bring about the uniformity in the system of indirect taxation.
2. To remove the cascading effects of tax.
3. To bring about the economic integration.
Vol. 6 | Special Issue. 1 | March 2018 | ISSN: 2319-961X
173 Shanlax International Journal of Economics
4. The taxes are imposed at various rates among various states in India. So there is a huge loss
of revenue to the central and state government, though GST a uniform tax rate is followed
all over the country and so that there will no such loss of revenue.
5. Reduces complexities and increases more number of economic transactions.
6. The main aim of GST is to bring about the single tax system which will reduce the cost of
production for the manufacturers. So that it will be a big boost for those producers who
made their products at lower cost and involves in international trade that is exports.
7. It is the Single tax system; the tax burden for starting industrial units will be reduced.
8. Through GST the government receives more amount of Tax revenue which will be utilized
for the services to the public.
9. To avoid the tax burden of the common consumers and the public by making it into a
single tax system.
10. The GST brings about a competitive pricing. As all the products are taxed uniformly across
the country, the various forms of indirect taxes will remove and which in turn will reduce
the tax burden of the consumers. This will reduce the prices of the products and increases
the consumption which in turn will be more beneficial for the companies.
GST and Economic Growth
To make Indian as a financial super power, the introduction of GST is must. Taxation both
direct and indirect plays an important role in promoting economic growth as well as equitable
distribution. The structure of GST will be based on the destination principle. As a result, the tax
base will shift from production to consumption whereby imports will be liable to tax exports
will be relieved of the burden of the goods and service tax. Moreover GST will redistribute the
burden of taxation equitably between manufacturing and services bringing out a qualitative
change in the tax system. It will lower the tax rate by broadening the tax base and minimizing
exemptions.
The greatest impact of the implementation of the GST would create a common market
across the country and reduce compliance costs and thus, create an equitable distribution. In
the absence of significant fiscal options, incentivized policy to attract investors to states would
shift of greater emphasis on structural reforms. The over macroeconomic effect of reduction in
economic distortions due to GST would be to provide an impetus to economic growth. The
manufacturing sectors would benefit from economies of scale. The implementation of a
comprehensive GST will lead to efficient allocation of factors of production and will lead to
gain in GDP and exports. It would enhance economic welfare and returns to the factors of
production, i.e. land, labour and capital.
The manufacturing sectors would benefit from economies of scale. Output of sectors
including textiles and readymade garments; minerals other than coal, petroleum, gas and iron
ore; organic heavy chemicals; industrial machinery for food and textiles; beverages; and
miscellaneous manufacturing is expected to increase. The sectors in which output is expected to
decline include natural gas and crude petroleum; iron ore; coal tar products; and nonferrous
metal industries. The results also suggested of GST’s positive environmental impact on the
economy. A fall in tax incidence on goods and services offered would enable producers to sell
National Seminar on CONTEMPORARY MACRO ECONOMIC ENVIRONMENTAL ISSUES
174 Rani Anna Government College for Women, Tirunelveli
their focus at a lower price, leading to increased demand. Finally a more rational tax system
would lead to lesser disruption to the market economy and more efficient distribution of
resources within industry. To conclude, the implementation of GST will play an important role
in the growth of Indian Economy.
GST impact on Gross Domestic Product (GDP) and inflation in India
The biggest tax reform i.e. Goods and Services Tax is now a part of Indian Economy. A
new and unified tax structure is followed for indirect taxation on the place of various tax laws
like Excise duty, Service Tax, VAT, CST etc. and for sure the new tax regime is determined to
eliminate the cascading effect of tax on transaction of products and services and it will result in
availability of product and services to consumers at lower price. It is expected that it will be
helpful increasing production and the purchasing power of the buyer which may increase the
GDP by 1% to 3%. Due to the implementation of GST, the tax rates on goods and services will
decline. At present, service oriented components 25.30% of the CPI basket with a major share
belonging to housing, transport and communication. Services tax is net imposed on certain
services and these service are expectedly remain exempt under GST. A hike in tax rate on
services will not be having any material a direct impact on CPI. Hence, the overall transition to
get will not have a significant impact on inflation.
Sector Wise Impact on GST
The tax rate under GST are set at 0%, 5%, 12%, 18%, and 28% for various goods and
services and almost 50% of goods and services comes under 18% tax rate. The GST is said to
have a positive impact on the economy as a whole. Here are some sectors given below:
Agriculture: Agricultural sector is the largest contributing sector the overall Indian GDP. It
covers around 16% of Indian GDP. GST provide India with its first National Market for the
agricultural goods.
Textile: The Indian textile industry provides employment to a large number of skilled and
unskilled workers in the country. It contributes about 10% of the total annual export and this
value is likely to increase under GST.
Automobile Sector: Currently taxes paid by car manufacturers are 27.6% to max 45.1% and
the GST rates on automobile sector would be 28%. So rates seem to be revenue neutral though
gains would occur from easy compliance and less cascading effect.
Banking, Financial Services and Insurance (BFSI): Among the services provide by Banks and
NBFCs, financial series such as fund based, fee-based and insurance services will major shifts
from the current scenario.
Telecommunication: In the telecom sector, prices are expected to come down after GST.
Manufacturers will save on costs through efficient management of inventory and by
consolidating their warehouses. The will also save up on logistics costs.
Technology: The GST system of indirect taxation has made the duty on the manufacturing
goods. The prices of the software products will be at high which will give either a neutral or
slightly negative impact on the Technology Sector as a whole. But they will be benefited
through the reduction of tax and benefits of other industries and can somewhat mitigate it.
Vol. 6 | Special Issue. 1 | March 2018 | ISSN: 2319-961X
175 Shanlax International Journal of Economics
Hospitality: Goods and Services Tax (GST) role levy on the hospitality sector is within the
range of 2 to 28%. On the whole, GST is expected to benefit the pharma and healthcare
industries. The pharma sector is hoping for a tax respite as it will make affordable healthcare
easier to access by all.
Engineering, Capital goods and poor equipment: Introduction of GST is expected to improve
prospects engineering, capital goods and power equipment (ECPE) sector by simplifying the
structure.
Conclusion
GST aims to replace all indirect levied on goods and services by the Indian Central and
State governments. At the same time, the government should make an attempt to insulate the
vast poor population of India against the likely inflation due to implementation of GST.
However GST is a long term strategy planned by government and its positive impacts will be
seen in the long run only. Also this can happen if GST is introduced at nominal rate to reduce
overall tax burden.
References 1. Yogesh Kailashchandra Agarwal, “Goods and Services Tax and Its Impact on Indian
Economy”, IOSR Journal of Business and Management, Vol. 19, issue 10, PP 26-30,
Oct 2017.
2. Sankar, “GST: Impact and implications on various industries in Indian Economy”, Journal
of Internet banking and commerce, Vol.22, no.2Aug 2017.
National Seminar on CONTEMPORARY MACRO ECONOMIC ENVIRONMENTAL ISSUES
176 Rani Anna Government College for Women, Tirunelveli
IMPACT OF DEMONETIZATION ON PEOPLE - A STUDY WITH
REFERENCE TO AMBASAMUDRAM TOWN
M.Karthikeyan., M.Com (NET)., M.Phil., MBA (SET), M.Sc., (Psychology).,
Assistant Professor and Head, Department of Commerce (SF)
Sri Paramakalyani College, Alwarkurichi
Abstract Demonetisation is an arrangement where the Reserve Bank of India withdraw the old currency notes of certain
denomination as an official means of payment. On 9th of November, when the citizens of India- were told that the
500 and 1000 Indian Rupee currency notes in their hands will no longer continue to be lawful tender, the entire
country was in astonish. The next few days that followed were lengthy queue outside ATM’s. The prime minister
promise the citizens that the soreness would last a few days and this was a brave move to tackle black money,
corruption as well as counterfeit notes that terrorists use to cause havoc in our country. This paper helps to study the
impact of demonetization on public located at Ambasamudram town.
Keywords: Demonetization, Black money, Corruption, Terrorism, Success and failures.
Introduction
History of demonetisation in the world:
The French were the foremost to use the Demonetize in the years between 1850 to1855.
Many countries have introduced the demonetization policy which disrupts economics and
population at large.In 1982, Ghana revolve out the decision to demonetise their 50 cedi
currency notes in order to watch money laundering and corruption. The change was not
welcomed warmly, creating chaos across the country and finally resulted in a move back to
physical assets and foreign currency. Nigeria’s economy buckled after the 1984 demonetisation
move that did not go as designed. The military government of their President Muhammadu
Buhari introduced different coloured notes to quash their old currency in order to fight black
money. Around 80% of Myanmar’s currency was demonetised in 1987 by the military to curb
black money, but the move resulted in a lot of dispute and the country witnessed several
killings. Under the governance of Mikhail Gorbachev in 1991, the Soviet Union demonetised
the higher denominations of ruble bills, the 50s and 100s. The move did not go well and
resulted in takeover of Mikhail’s leadership within eight months of the plan. North Korea face
demonetisation of their currency in 2010, which led to major financial system breakdown with
people left to go hungry for basics. In India demonetization was first introduce on 12th January
1946, out of total issue of Rs.143.97 crores of the high denomination notes, notes of the value
of Rs.134.9 crores were exchanged. In the second time on 28th february 1978, demonetization
was aimed at controlling illegal transactions. It is a part of a series of measures which
government has taken and is determined to take against anti social elements. In the third time
On 28 October 2016 the total banknotes in circulation in India was Rs.17.77 trillion (US$260
billion). In terms of value, the annual report of Reserve Bank of India (RBI) of 31 March 2016
stated that total bank notes in circulation valued to Rs.16.42 trillion (US$240 billion) of which
Vol. 6 | Special Issue. 1 | March 2018 | ISSN: 2319-961X
177 Shanlax International Journal of Economics
nearly 86% (around Rs.14.18 trillion (US$210 billion)) were Rs.500 and Rs.1,000 banknotes.
They were taken out of circulation from 2016.
Definition of 'Demonetization: Demonetization is the act of strip a currency unit of its
position as legal tender. It occurs whenever there is a change of national currency: The current
form or forms of money is pull from flow and retired, often to be put back with new notes or
coins.
Black Money: Black money is money which is earned through any unlawful activity
controlled by country regulations. Black money earnings are usually received in cash from
underground economic activity and, as such, are not taxed. Recipients of black money must
hide it, spend it only in the alternative economy, or attempt to give it the appearance of
legitimacy through money laundering. Black money is money on which tax is not paid to the
government. A store that accepts cash for its products and does not issue receipts to its
customers will be transacting in black money since it would not pay tax on the unaccounted
sales.
Corruption: Corruption is a form of fraudulent done by a person entrusted with a position of
authority, often to acquire personal benefit. Corruption may include many activities
including bribery, embezzlement, though it may also involve practices that are legal in various
countries.
Terrorism: Terrorism is ''a violent act or an act hazardous to human life in violation of the
criminal laws of the United States or of any state to threaten or coerce a government, the
civilian population, or any segment thereof, in continuance of political or social objectives.''
Statement of the Problem
The purpose of this study is to investigate the Impact of Demonetization on people at
Ambasamudram Town, Tirunelveli District.
Objectives of the Study
To study the Demographic Profile of the Sample Respondents
To study the people’s impact on demonetization.
To check the awareness of Net banking transactions.
Methodology
This study is based on primary data collected from the people located at ambasamudram.
They are analysed and interpreted with the help of statistical device like percentage, Garrett
ranking etc among the collected data.
Data Collection and Sampling Method The primary data are obtained using a well-set questionnaire. The questionnaire contained
questions relating to Demonetization and given to the respondents. The questions included in
the questionnaire were open-ended and giving multiple choices. For this study, 50 respondents
irrespective of their occupation, age and educational level have been selected randomly as a
sample of the data analysis.
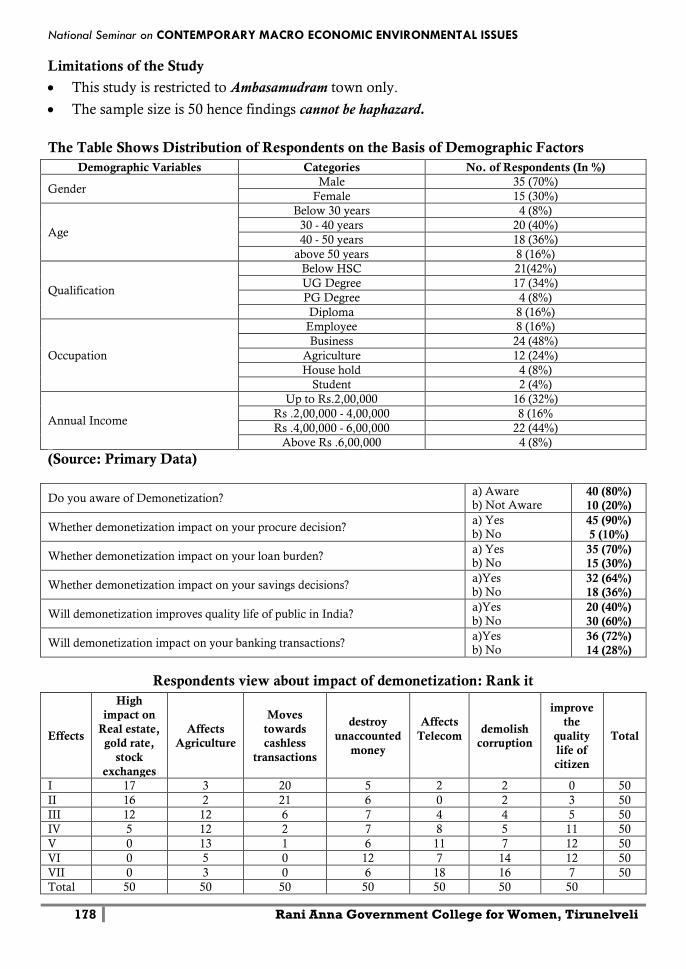
National Seminar on CONTEMPORARY MACRO ECONOMIC ENVIRONMENTAL ISSUES
178 Rani Anna Government College for Women, Tirunelveli
Limitations of the Study
This study is restricted to Ambasamudram town only.
The sample size is 50 hence findings cannot be haphazard.
The Table Shows Distribution of Respondents on the Basis of Demographic Factors
Demographic Variables Categories No. of Respondents (In %)
Gender Male 35 (70%)
Female 15 (30%)
Age
Below 30 years 4 (8%)
30 - 40 years 20 (40%)
40 - 50 years 18 (36%)
above 50 years 8 (16%)
Qualification
Below HSC 21(42%)
UG Degree 17 (34%)
PG Degree 4 (8%)
Diploma 8 (16%)
Occupation
Employee 8 (16%)
Business 24 (48%)
Agriculture 12 (24%)
House hold 4 (8%)
Student 2 (4%)
Annual Income
Up to Rs.2,00,000 16 (32%)
Rs .2,00,000 - 4,00,000 8 (16%
Rs .4,00,000 - 6,00,000 22 (44%)
Above Rs .6,00,000 4 (8%)
(Source: Primary Data)
Do you aware of Demonetization? a) Aware b) Not Aware
40 (80%)
10 (20%)
Whether demonetization impact on your procure decision? a) Yes
b) No 45 (90%)
5 (10%)
Whether demonetization impact on your loan burden? a) Yes b) No
35 (70%)
15 (30%)
Whether demonetization impact on your savings decisions? a)Yes b) No
32 (64%)
18 (36%)
Will demonetization improves quality life of public in India? a)Yes
b) No 20 (40%)
30 (60%)
Will demonetization impact on your banking transactions? a)Yes b) No
36 (72%)
14 (28%)
Respondents view about impact of demonetization: Rank it
Effects
High
impact on
Real estate,
gold rate,
stock
exchanges
Affects
Agriculture
Moves
towards
cashless
transactions
destroy
unaccounted
money
Affects
Telecom
demolish
corruption
improve
the
quality
life of
citizen
Total
I 17 3 20 5 2 2 0 50
II 16 2 21 6 0 2 3 50
III 12 12 6 7 4 4 5 50
IV 5 12 2 7 8 5 11 50
V 0 13 1 6 11 7 12 50
VI 0 5 0 12 7 14 12 50
VII 0 3 0 6 18 16 7 50
Total 50 50 50 50 50 50 50
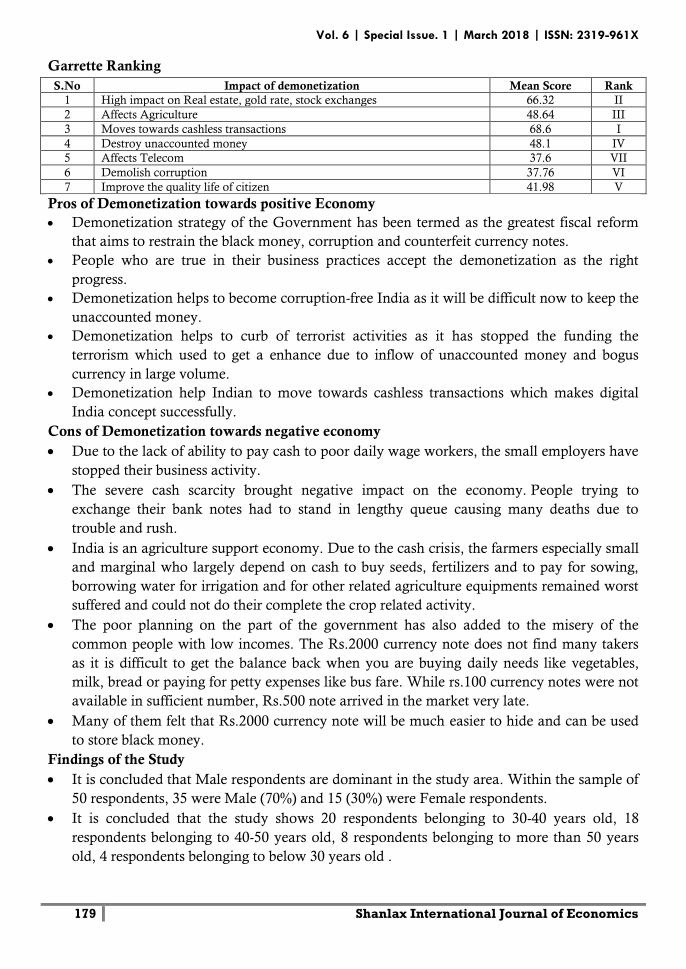
Vol. 6 | Special Issue. 1 | March 2018 | ISSN: 2319-961X
179 Shanlax International Journal of Economics
Garrette Ranking
S.No Impact of demonetization Mean Score Rank
1 High impact on Real estate, gold rate, stock exchanges 66.32 II
2 Affects Agriculture 48.64 III
3 Moves towards cashless transactions 68.6 I
4 Destroy unaccounted money 48.1 IV
5 Affects Telecom 37.6 VII
6 Demolish corruption 37.76 VI
7 Improve the quality life of citizen 41.98 V
Pros of Demonetization towards positive Economy
Demonetization strategy of the Government has been termed as the greatest fiscal reform
that aims to restrain the black money, corruption and counterfeit currency notes.
People who are true in their business practices accept the demonetization as the right
progress.
Demonetization helps to become corruption-free India as it will be difficult now to keep the
unaccounted money.
Demonetization helps to curb of terrorist activities as it has stopped the funding the
terrorism which used to get a enhance due to inflow of unaccounted money and bogus
currency in large volume.
Demonetization help Indian to move towards cashless transactions which makes digital
India concept successfully.
Cons of Demonetization towards negative economy
Due to the lack of ability to pay cash to poor daily wage workers, the small employers have
stopped their business activity.
The severe cash scarcity brought negative impact on the economy. People trying to
exchange their bank notes had to stand in lengthy queue causing many deaths due to
trouble and rush.
India is an agriculture support economy. Due to the cash crisis, the farmers especially small
and marginal who largely depend on cash to buy seeds, fertilizers and to pay for sowing,
borrowing water for irrigation and for other related agriculture equipments remained worst
suffered and could not do their complete the crop related activity.
The poor planning on the part of the government has also added to the misery of the
common people with low incomes. The Rs.2000 currency note does not find many takers
as it is difficult to get the balance back when you are buying daily needs like vegetables,
milk, bread or paying for petty expenses like bus fare. While rs.100 currency notes were not
available in sufficient number, Rs.500 note arrived in the market very late.
Many of them felt that Rs.2000 currency note will be much easier to hide and can be used
to store black money.
Findings of the Study
It is concluded that Male respondents are dominant in the study area. Within the sample of
50 respondents, 35 were Male (70%) and 15 (30%) were Female respondents.
It is concluded that the study shows 20 respondents belonging to 30-40 years old, 18
respondents belonging to 40-50 years old, 8 respondents belonging to more than 50 years
old, 4 respondents belonging to below 30 years old .
National Seminar on CONTEMPORARY MACRO ECONOMIC ENVIRONMENTAL ISSUES
180 Rani Anna Government College for Women, Tirunelveli
It is concluded that the study covers 42% of them have completed their school studies only,
34% of the sample respondents have completed their under graduation, 16% of them have
done diploma and 8% of them only completed their PG Degree.
It is concluded that the study covers 48% of the sample respondents are doing Business,
followed by 24% are Agriculturists, 16% are employees, 8% are household, and 4% of them
are students.
It is concluded that the study reveals 44% of the sample respondent earns annually
Rs4,00,000- Rs.6,00,000 income group, followed by 32% are from Below Rs2,00,000
annual income earning group, 16% are from Rs2,00,000 – Rs.4,00,000 annual income
earning group, and only 8% of them earns annually above Rs.6,00,000.
It is concluded that 80% of the respondents are aware about demonetization and only 17%
of them are not aware about demonetization.
It is concluded that 90% of the respondents revealed that demonetization definitely affect
their purchase decision and 10% of the respondents revealed that demonetization not affect
their purchase decision.
It is concluded that 70% of the respondents revealed that demonetization definitely increase
their loan burden and 30% of them revealed that demonetization not affect their loan
burden.
It is concluded that 64% of the respondents told that demonetization definitely affect their
savings decision and 36% of the respondents told that demonetization not affect their
savings decision.
It is concluded that 40% of the respondents told that demonetization definitely helps to
increase the quality life of the citizen of India and 60% of the respondents told that
demonetization does not help to increase the quality life of the citizen of India.
It is concluded that 72% of the respondents revealed that demonetization definitely impact
their banking transactions and 28% of the respondents revealed that it does not impact their
banking transactions.
It is concluded that demonetization led towards cash less transactions ranks first, heavily
impact on real estate, gold rate, stock exchange ranks second, affects agriculturists of our
country ranks third, destroy unaccounted money ranks fourth, it helps to increase the
quality life of the citizen ranks fifth, it demolish corruption ranks sixth and lastly it affects
telecom and insurance sector.
Conclusion
From the above study the demonetization of the highest denomination note undertaken by
the government is a bold move. The demonetization is taken for restricting tax evasion, bogus
currency and funding of terrorism. It curbs the black money and brings the black money into
account subject to higher tax and other penalties. It helps to improve the idea of digital India
that is E - Payment methods, such as e-wallets, online transactions using e-banking, debit and
credit card.
References
1. https://mumbaimirror.indiatimes.com
2. https://economictimes.indiatimes.com
3. www.investopedia.com
4. https://en.wikipedia.org
Vol. 6 | Special Issue. 1 | March 2018 | ISSN: 2319-961X
181 Shanlax International Journal of Economics
AN EMPIRICAL STUDY ON RELATIONSHIP BETWEEN HEALTH
CARE EXPENDITURE AND PER CAPITA INCOME IN INDIA
T.H.Fahad
Kristu Jayanti College, Bangalore
Abstract Health expenditure occurs when money is spent on health goods and services. This spending occurs at different
levels of government, as well as by non-government entities such as private health insurers and individuals. India’s
human development index (HDI) ranking for 2015 puts Asia’s third largest economy among a group of countries
classed as “medium” in the list, as opposed to “low” in the 1990s, thanks to factors such as an increase in life
expectancy and mean years of schooling in the past 25 years . As it stands, India is ranked 131 out of 188 countries in
a list that is topped by Norway. The purpose of this study is to analyze the trend in public and private expenditure on
health and its effect on per capita income.
Introduction
Health expenditure will improve human development through of a few channels: economic
growth, reduce mortality rates and improve the learning process. Economic growth is the
process of increases in capacity of economic generation over its time, which will raise income
level and production. Health directly and indirectly affects economic growth. Health promotion
makes human capital increase through capital health accumulation, and has direct effect on
growth. On the other hand, health promotion improves labor productivity through increased
longevity and reduced working days due to illness, and indirectly affects the production.
According to some economists, health expenditure will decrease the GDP since it diverts
resources from productive investment. The new concept of human capital by Becker (1964) has
opened another route to show health expenditure influence on GDP. In this new direction,
health expenditures by improving health indicators will increase human capital inventory and
GDP growth in countries.
Research Background and Empirical Studies (Review of Literature)
Clovis, Nobuko (2011), in an article states that there is a positive and significant effect of
government spending on health variables and the most important variable among them is the
per capita income and that three-quarter of the development goals with the private sector and
public health expenditure can be explained. Therefore it is proposed that developing countries
to achieve the Development Goals should increase consistently their health expenditure per
capita income and the proportion of the population.
Health can also affect growth indirectly when health status affects education performance.
Good health can be associated with increased levels of schooling and high education
performance. Barro (1996) finds that there is an incentive to invest in education given an
increase in health indicators. Thus, for children who are chronically ill, parents may not have
an incentive to invest in their education. This establishes a strong link between education and
National Seminar on CONTEMPORARY MACRO ECONOMIC ENVIRONMENTAL ISSUES
182 Rani Anna Government College for Women, Tirunelveli
health and more specifically goes to support the arguments projecting health as a human capital
component. Similarly, given the need to take care of sick relatives, labour productivity may be
reduced and more importantly, years of schooling may be reduced for children if parents are
chronically ill.
The work of studies the cyclical behaviour of public spending on health and education in
150 countries during 1987-2007, found that spending on education and health is pro-cyclical in
developing countries and a cyclical in developed countries; they are pro-cyclical during periods
of positive output gap and a cyclical during period of negative output gap. Furthermore, the
higher the degree of cyclicality, the lower the level of human development.
Health makes development more achievable. Sorkin (1977) suggests that in areas where
economic activity has been hindered owing to unfavourable health condition, an investment
into a robust major health programme could be a catalyst to promote development. This
argument is in line with assertions made by Bryant (1969) who indicates that economic
development as well as social changes within the developing world can be improved with an
enhancement in health and health services.
Methodology
The study uses the descriptive and analytical methods .The secondary data is used for the
present study for the period of 1994 to 2014. It was collected from the National Sample Survey,
Central Statistical Organization, Ministry of Statistics, Ministry of health, Human development
reports published by UNDP and Plan Implementation, Government of India.
Empirical Methodology
To understand the relationship Multivariate regression analysis is conducted. The essence
of regression analysis is to fit a model to our data and use it to predict values of the dependent
variable (DV) from one or more independent variables (IVs). To use multivariate regression, it
is important to check for the statistical assumption violation.
Objectives
To analyze the relationship between healthcare expenditure and per capita income in India.
Hypothesis
H3: There is a significant relation between public and private expenditure on per capita
income.
Empirical analysis
Per capita Income at factor cost
Per capita income depends on the total value of final goods and services produced in the
country and also the total number of population in the country. Population in a country
depends up on the quality of health care of the nation and also the private and public health
expenditure in that nation. So in the analysis below we look in to the effect and influence of
private and public health expenditure on the per capita income of India.
Vol. 6 | Special Issue. 1 | March 2018 | ISSN: 2319-961X
183 Shanlax International Journal of Economics
Normality Test
Test for normality of Per capita annual income at factor cost:
Jarque-Bera test 1.90549 with p-value 0.385682
H0= The values of literacy rate follows normal distribution.
The Jarque Bera test shows the vale 1.90549 and the p value 0.385682>0.05 so accept the
null hypothesis. The data follows a normal distribution.
Heteroskedasticity-corrected, using observations
Dependent variable: per capita income annual at factor cost
Coefficient Std. Error t-ratio p-value
Constant −95205.6 27688.8 −3.438 0.0031
Private expenditure on health 61585.7 12498.2 4.928 0.0001
Private expenditure on health 16521.8 9499.72 1.739 0.1001
Statistics based on the weighted data
Sum squared resid 90.97768 S.E. of regression 2.313359
R-squared 0.701106 Adjusted R-squared 0.665942
F(2, 17) 19.93816 P-value(F) 0.000035
Per capita Income at factor cost = 61585.7 * Government Health expenditure + 16521.8 *
Private health expenditure - 95205.6 Government health expenditure has more effect in increasing the per capita income of the
country as compared to the private expenditure on health as the correlation co-efficient of
government expenditure on health is 61585.7 which is more than the correlation co-efficient of
private health care expenditure which is 16521.8.
Standard error
Standard error of the estimated public expenditure on health is low 12498.2 compared to
the Private health expenditure of GDP 14.439.That means the estimated regression co efficient
of public expenditure on health of GDP is more accurate compared to the private health care
expenditure.
T-Test
T-test is carried out to find if the regression co-efficient is significant.
H0: Bi=0 (i=1,2)
For B1 (Public expenditure on health) test statistics value is t=4.928 and P=0.0001<0.05 so
the H0 get rejected and the regression coefficient is significant.
For B2 (private expenditure on health)test statistics value is t=1.739 and P=0.001<0.05 so
the H0 get rejected and the regression coefficient is significant.
R2 Test
The R2 value 0.701106 implies 70.11% variation in the per capita income is explained by
the model. The model is significant by 70.11% which show the model is fit for prediction
F Test
H0 =R2 is not significant
f value = 19.93816 and the p value= 0.000035 < 0.05 so the null hypothesis get rejected.
This means that the R2 is singinifcant.
National Seminar on CONTEMPORARY MACRO ECONOMIC ENVIRONMENTAL ISSUES
184 Rani Anna Government College for Women, Tirunelveli
Normality of the Residuals H0: Residuals follows normal distribution
Chi-square(2) = 0.726 with p-value 0.69546 which is more than 0.05, which accept the null
hypothesis of normality of residuals. So the residuals are normal. Which shows that the model
is best fit for the prediction.
Findings
Prediction model for Per capita Income at factor cost= 61585.7* Government Health
expenditure + 16521.8* Private health expenditure - 95205.6
The public expenditure on health has more effect in increasing the per capita income which
is 60185.7 per single percentage increase in the public expenditure on health of GDP.
Estimated regression co efficient of public expenditure on health of GDP is more accurate
in predicting infant mortality rate.
Regression coefficient of Private and Public expenditure is significant for predicting the per
capita income at factor cost. The model is significant by 70.11% which show the model is
fit for prediction.
Conclusion
Human capital is an important factor for the development of the country, the above study
has proven that the health expenditure can increase the human development of the people in
different ways. If the government is allocating adequate amount as health expenditure in sync
with the other human development expenses like expenditure on education and other schemes
for improving the employment and living condition there will be a combined effect that will
accelerate the growth of the economy and which will take the human development of the
nation to the next level. The forecasting results of the study shows that the government should
allocate more of the GDP for the improvement of health of the people and per capita income to
achieve better standard of living for achieving a better human development.
References
1. Barro, R. J. (1996). Determinants of Economic Growth: A Cross-Country Empirical Study.
NBER Working Paper No. 5698.
2. Clovis Freire, Nobuko Kajiura (2011), Impact of Health Expenditure on Achieving the
Health-Related MDGs, MPDD Working Papers, August 2011.
3. Gustav Ranis (2004), Human Development and Economic Growth, economic growth
center, Yale University.
4. Sorkin, A. (1977). Health Economics in Developing Countries Lexington, MA: Lexington
Books.
5. http://hdr.undp.org/en/69206
6. htt://uis.unesco.org/country/IN
7. http://www.cso.ie/en/index.html
Vol. 6 | Special Issue. 1 | March 2018 | ISSN: 2319-961X
185 Shanlax International Journal of Economics
WILFUL DEFAULTERS AND THE GROWTH OF NON
PERFORMING ASSETS IN INDIAN BANKING SECTOR
Dr.C.Ramesh
Associate Professor of Economics, Aditanar College of Arts and Science, Tiruchendur
Abstract India is one of the fastest growing countries and therefore credit flow to various sectors is inevitable. Banks in a
country are a source of financial reserves funding the capital intensive industries and a key to government’s various
initiatives to boost the economic growth. The assets of the banks which do not bring any return are called Non
Performing Assets or bad loans. In India, the credit growth reduced to 15.1 per cent while the NPAs increased to 40.2
per cent. Moreover, a large portion of the non-performing assets pertains to Public Sector Banks. It is disheartening to
know that the role of willful defaulters is more in NPAs. Given this background, the paper discusses the willful
defaults and the growth of non-performing assets in public and private sector banks.
Keywords: Wilful Defaulters, Non-Performing Assets, Public Sector Banks
Introduction
The growth of non-performing assets and the resulting insolvency is the burning issue
today. The assets of the banks which do not bring any return are called Non Performing Assets
or bad loans. If customers don’t pay either interest or part of principal or both, the loan turns
into bad loan. According to RBI, terms loans on which interest or installment of principal
remain overdue for a period of more than 90 days from the end of a particular quarter is called
a Non-performing Asset. India is one of the fastest growing countries and therefore credit flow
to various sectors is inevitable. Banks in a country are a source of financial reserves funding the
capital intensive industries and a key to government’s various initiatives to boost the economic
growth. In India, the credit growth reduced to 15.1 per cent while the NPAs increased to 40.2
per cent. Moreover, a large portion of the non-performing assets lies with the Public Sector
Banks.
Types of Non-Performing Assets
Substandard assets: An assets which has remained NPA for a period less than or equal to
18 months.
Doubtful assets: An asset would be classified as doubtful if it has remained in the
substandard category for a period exceeding 18 months.
Loss assets: A loss asset is one where loss has been identified by the bank or internal or
external auditors or the RBI inspection but the amount has not been written off wholly.
Impacts of Non-Performing Assets
Non-performing assets is one the indicator to assess the soundness of banking sector. If the
amount of NPA is high, it is not possible for the banks to lend to new borrowers. Bank will
reduce the interest rate on deposits which decelerate the saving and increase the interest rate on
National Seminar on CONTEMPORARY MACRO ECONOMIC ENVIRONMENTAL ISSUES
186 Rani Anna Government College for Women, Tirunelveli
loan which discourages the genuine borrowers, their investment and thereby affecting the
economic productivity. NPA will affect the revenue stream of the banks and hence it is tough
for the banks to survive in the market. This results in negative balance of trade and large
unemployment and social unrest.
NPA will bring scarcity of funds in the Indian markets. It will impact shareholders, retail
consumers and investors. All these factors affect the overall demand in the Indian economy.
Finally, it will lead to lower growth.
According to the Reserve Bank of India’s latest “Financial Stability Report”, Gross NPA
rose from 9.2 per cent in September 2016 to 9.6 per cent in March 2017. RBI reported that this
number could rise to 10.2% very soon. The net NPA ratio increased marginally from 5.4 per
cent in September 2016 to 5.5 per cent in March 2017.
The Internal advisory committee of the Reserve Bank of India had recently identified
12 accounts for insolvency proceedings. The disturbing fact is each of them having over Rs
5,000 crore of outstanding loans which accounts for 25 percent of total NPAs of banks.
Reasons for growth of NPA
The following are some of the reasons for the growth of NPA.
1. Companies divert funds for the purposes other than for which loans were taken.
2. Economic downturn of 2008 has been a reason for increasing bad loan
3. Exports in all sector has shown a declining trend for a long due to low global demand.
4. Economic Survey 2015 mentioned over leveraging by corporate as one of the reasons
behind rising bad loans
5. Lack of training in lending principles for the loan officers
6. Due to the rotation of duties among officers
7. Poor techniques to recover loans
8. Mismanagement in the loan distribution carried by the Public sector banks.
Wilful Defaulter
Default means non-repayment of a loan availed by a borrower. A willful defaulter is an
entity or a person that has not paid the loan back despite the ability to repay it. As per the RBI
regulations, willful default covers several areas like non -repayment despite adequate cash flow,
misuse of assets and proceeds, falsification of records, disposal of securities without bank’s
knowledge, fraudulent transactions etc. In India, the most important reason for non-payment of
loan is willful defaulters. Initially the measures against willful default were started in 1999 and
then several modifications were made on that. However, non-performing assets have increased
continuously in the banking sector, more specifically, public sector banks. According to Credit
Information Bureau of India Ltd, State-owned banks have reported wilful defaults of Rs 93,357
crore involving 7,564 borrowers as on September 2017. This is a 340 per cent surge in less than
five years as total wilful defaults were just Rs 25,410 crore in 2013.Therefore now-a-days willful
default is getting increased attention. The following table shows the growth pattern of non-
performing assets in India during the period September 2013 to September 2017.
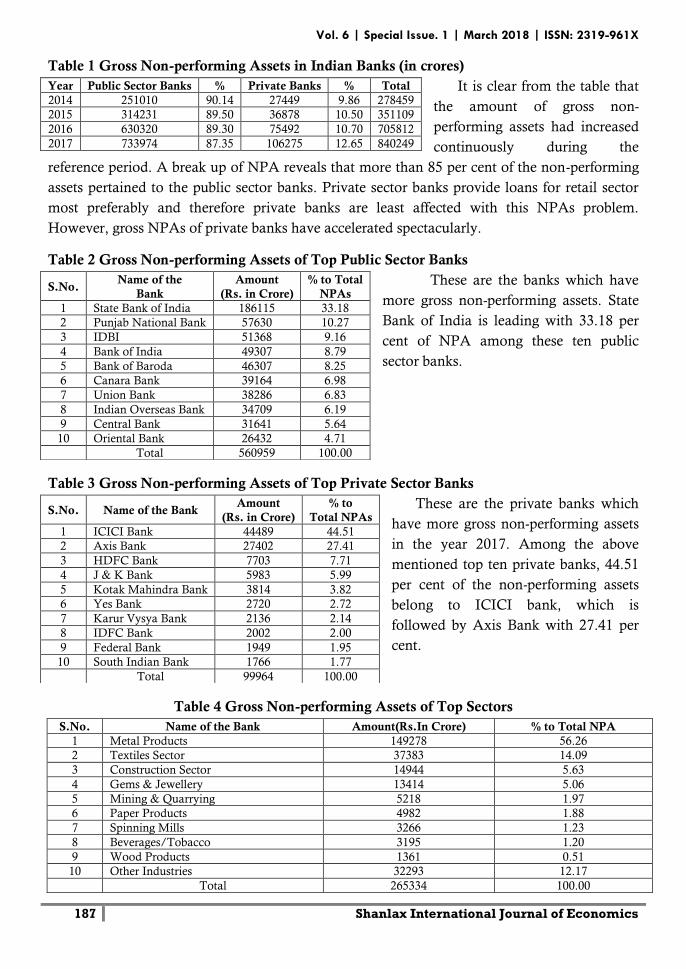
Vol. 6 | Special Issue. 1 | March 2018 | ISSN: 2319-961X
187 Shanlax International Journal of Economics
Table 1 Gross Non-performing Assets in Indian Banks (in crores)
It is clear from the table that
the amount of gross non-
performing assets had increased
continuously during the
reference period. A break up of NPA reveals that more than 85 per cent of the non-performing
assets pertained to the public sector banks. Private sector banks provide loans for retail sector
most preferably and therefore private banks are least affected with this NPAs problem.
However, gross NPAs of private banks have accelerated spectacularly.
Table 2 Gross Non-performing Assets of Top Public Sector Banks
These are the banks which have
more gross non-performing assets. State
Bank of India is leading with 33.18 per
cent of NPA among these ten public
sector banks.
Table 3 Gross Non-performing Assets of Top Private Sector Banks
These are the private banks which
have more gross non-performing assets
in the year 2017. Among the above
mentioned top ten private banks, 44.51
per cent of the non-performing assets
belong to ICICI bank, which is
followed by Axis Bank with 27.41 per
cent.
Table 4 Gross Non-performing Assets of Top Sectors
Year Public Sector Banks % Private Banks % Total
2014 251010 90.14 27449 9.86 278459
2015 314231 89.50 36878 10.50 351109
2016 630320 89.30 75492 10.70 705812
2017 733974 87.35 106275 12.65 840249
S.No. Name of the
Bank
Amount
(Rs. in Crore)
% to Total
NPAs
1 State Bank of India 186115 33.18
2 Punjab National Bank 57630 10.27
3 IDBI 51368 9.16
4 Bank of India 49307 8.79
5 Bank of Baroda 46307 8.25
6 Canara Bank 39164 6.98
7 Union Bank 38286 6.83
8 Indian Overseas Bank 34709 6.19
9 Central Bank 31641 5.64
10 Oriental Bank 26432 4.71
Total 560959 100.00
S.No. Name of the Bank Amount
(Rs. in Crore)
% to
Total NPAs
1 ICICI Bank 44489 44.51
2 Axis Bank 27402 27.41
3 HDFC Bank 7703 7.71
4 J & K Bank 5983 5.99
5 Kotak Mahindra Bank 3814 3.82
6 Yes Bank 2720 2.72
7 Karur Vysya Bank 2136 2.14
8 IDFC Bank 2002 2.00
9 Federal Bank 1949 1.95
10 South Indian Bank 1766 1.77
Total 99964 100.00
S.No. Name of the Bank Amount(Rs.In Crore) % to Total NPA
1 Metal Products 149278 56.26
2 Textiles Sector 37383 14.09
3 Construction Sector 14944 5.63
4 Gems & Jewellery 13414 5.06
5 Mining & Quarrying 5218 1.97
6 Paper Products 4982 1.88
7 Spinning Mills 3266 1.23
8 Beverages/Tobacco 3195 1.20
9 Wood Products 1361 0.51
10 Other Industries 32293 12.17
Total 265334 100.00
National Seminar on CONTEMPORARY MACRO ECONOMIC ENVIRONMENTAL ISSUES
188 Rani Anna Government College for Women, Tirunelveli
These are the top ten sectors which have more non-performing assets for recent years.
Among these top sectors, more than 50 per cent of the non-performing assets belong to Metal
Products sector. NPA are high in Textile sector also.
Conclusion
NPA is a big threat to the macro-economic stability of the Indian economy since it has
resulted in the deterioration of business, economic slowdown and distress of different sectors of
the economy. It is no doubt that the menace of NPAs needs to be curbed. Banking officials
should focus more in the selection of right borrowers, viable economic activity, assessment of
repaying capacity of the borrowers, timely disbursement of credit , use of loan amount, follow
up and timely recovery of loans. Willful defaulters should be identified and proper measures
should be taken to get back the money. RBI should also take necessary efforts to improve the
health of the banking system by preventing the incidence of fresh NPAs.
References
1. https://www.rbi.org.in
2. https://businesstoday.in/current/policy/npa
3. https://invetopedia.com
4. http://www.indusresearch.org/indian-economy-and-rising-level-of-non-performing-assets/
5. https://indianexpress.com/
6. www.thehindu.com/business/economy