anna maria skarke - iiasa pure
TRANSCRIPT
EXPLORATORY ANALYSES OF THE 1966-1971
AUSTRIAN MIGRATION TABLE
R o s s D . MacKinnon
Anna Maria S k a r k e
S e p t e m b e r 1975
R e s e a r c h R e p o r t s a r e p u b l i c a t i o n s r e p o r t i n g o n t h e work o f t h e a u t h o r s . Any v i e w s o r c o n c l u s i o n s a re t h o s e o f t h e a u t h o r s , a n d d o n o t n e c e s s a r i l y r e f l e c t t h o s e o f IIASA.

Abstract
Four different techniques of a rather simple
type are used to analyze recent interregional
migration flows in Austria. Purely descriptive
methods are used to reduce the large data set to
proportions which facilitate interpretation. Ptethods
of Markov and matrix growth operator type are used
to project future spatial redistribution of popula-
tion arising from both migration and differences
in the rates of natural increase. A least squares
approach is used to measure the attractiveness and
emissiveness of regions based on a revealed pref-
erence rationale. Finally, the biproportional
economic input-output and transportation origin-
destination tables are used to generate the most
plausible changes in migration propensities which
would give rise to a specified target population
distribution.
Acknowledsements
The Canada Council's financial support of MacKinnon
in the form of a leave fellowship is gratefully acknow-
ledged. Waldo Tobler made available his computer pro-
grams and made helpful comments on many aspects of the
study. Peter Skarke assisted us in some of the compu-
tations. William Berentsen, working on the related
problem of regional development policy in Austria, made
some useful suggestions. The migration data were made
available by Plr. ads tatter of the Statistische Zentral- amt. Thanks are due to Helmut Frey who prepared the
graphics. Ann Drew did the typing and good humouredly
made revisions to several versions of the "final" draft.

Exploratory Analyses of the 1966-1971
Austrian Migration Table
Ross D. MacKinnon*
Anna Maria Skarke**
1. Introduction
Clearly the government of any country would like to be
able to predict, understand and, in some cases, control the
differential rates of growth of cities and regions. The
provision of many public services, the distribution of sources
of revenues (and political support), economic inefficiencies
and environmental quality -- these and other concerns are frequently closely related to the magnitude, distribution,
and structural characteristics of the population within a
country. The two components of population change are net
natural increase and migration. In this study we focus on
the patterns of internal migration of Austria in recent years.
The modes of analysis are rather simple, aggregate and explor-
atory. In the first instance, the methods are inductive and
descriptive. What are the doninant spatial trends in Austrian
migration? What are the implications for future population
distributions if these trends continue? Inevitably an inter-
pretation of empirical patterns leads one to generate hypotheses
-- rationales for the observed patterns. More rigorous causal
analyses may be undertaken in subsequent studies.
In recent years, Interregional migraticn has been the
focus of an increasingly large number of research studies.
(See Cordey-Hayes (1975) for an extensive review.) Some
approaches attempt to describe migration patterns (e.g. Tobler,
1975). Others extend descriptive models into a predictive con-
text (e.g. Rogers, 1968). Some researchers attempt to specify
the causal structure in multivariate. systems of equations
-r
IIASA and The University of Toronto, Toronto, Canada. * * IIASA and Interdisziplinares Institut fur Raumordnung,
Wirtschaftsuniversitat, Vienna.
(e.g. econometric models such as in Alperovich, Bergsman and
Ehemann, 19751. Finally, a few models are of a normative or
goal-seeking type (e.g. Evtushenko and FlacKinnon, 1975).
All of these approaches to migration modelling have been
experimented with by people at IIASA in the past year.
It would seem appropriate at this time to apply some of these
methods to the local Austrian migration system. In view of
the limited previous analysis of interregional migration in
Austria, this report is highly exploratory -- an attempt to gain some experience with the various methods and some
preliminary insights into the Austrian migration system
itself. The approaches we have selected all have the char-
acteristic of simplicity. This is in part a pragmatic de-
cision -- reflecting very real time constraints which limit the scope of the research. But perhaps more importantly,
this selection arises from a predisposition to develop broad,
aggregate and rather rough models initially, and, subsequently,
to modify the models by incorporating our improved knowledge
of the system. This dynamic learning approach to urban
system modelling is elaborated in some detail in Cordey-Hayes
(1975).
2. Description of the Data
The Austrian migration table is of a rather conventional
type, generated by asking respondents in 1971 to indicate
their residential location in 1966. A typical element of this
matrix m (i # j) is the number of people who were located ij in region j in 1971 but were in region i in 1966. Intermediate
moves are not recorded, nor are emigrants to foreign locations.
Austrians returning from foreign countries and foreign workers
with families have been enumerated, but tnese data have only been
used to a limited extent in the analyses undertaken here.
Similarly the data disaggregated by sex and labour force
participation have not been analyzed.
In addition to the explicit shortcomings of the data,
there are of course errors which are difficult if not impossible
to take into account. It can only be hoped that these errors
a r e n o t o f a s y s t e m a t i c k i n d . There i s some r e a s o n t o b e l i e v e ,
however, t h a t something less t h a n a t o t a l enumera t ion of moves
h a s been made. T h a t i s , a s i g n i f i c a n t number o f changes of
a d d r e s s may have gone u n r e c o r d e d .
A u s t r i a h a s a f e d e r a l form o f government w i t h n i n e
" ~ a n d e r " ( p r o v i n c e s ) , 98 p o l i t i c a l d i s t r i c t s , and a b o u t 2 ,500
communi t ies . The r e g i o n a l a n a l y s i s r e p o r t e d h e r e u s e s t h e 98
p o l i t i c a l d i s t r i c t s . Thus t h e m i g r a t i o n t a b l e h a s on t h e
o r d e r o f l o 4 e l e m e n t s , a v e r y l a r g e number a b o u t which t o
make summary o b s e r v a t i o n s .
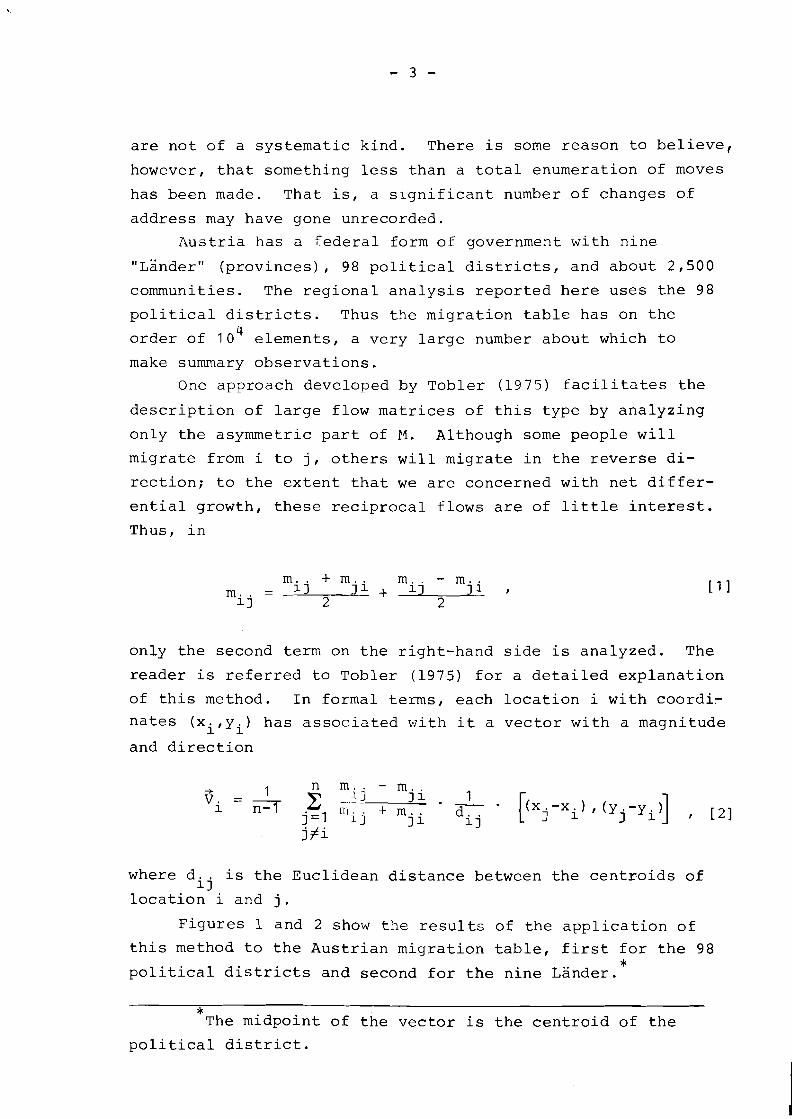
One approach deve loped by T o b l e r ( 1 9 7 5 ) f a c i l i t a t e s t h e
d e s c r i p t i o n o f l a r g e f l o w m a t r i c e s o f t h i s t y p e by a n a l y z i n g
o n l y t h e asymmetr ic p a r t of PI. ~ l t h o u g h some p e o p l e w i l l
m i g r a t e from i t o j , o t h e r s w i l l m i g r a t e i n t h e reverse d i -
r e c t i o n ; t o t h e e x t e n t t h a t w e a r e conce rned w i t h n e t d i f f e r -
e n t i a l g rowth , t h e s e r e c i p r o c a l f l o w s a r e of l i t t l e i n t e r e s t .
Thus, i n
o n l y t h e second t e r m on t h e r i g h t - h a n d s i d e i s a n a l y z e d . The
r e a d e r i s r e f e r r e d t o T o b l e r (1975) f o r a d e t a i l e d e x p l a n a t i o n
o f t h i s method. I n f o r m a l terms, each l o c a t i o n i w i t h c o o r d i -
n a t e s ( x i , y i ) h a s a s s o c i a t e d w i t h it a v e c t o r w i t h a magn i tude
and d i r e c t i o n
where d i s t h e E u c l i d e a n d i s t a n c e between t h e c e n t r o i d s o f i j l o c a t i o n i and j .
F i g u r e s 1 and 2 show t h e r e s u l t s o f t h e a p p l i c a t i o n o f
t h i s method t o t h e A u s t r i a n m i g r a t i o n t a b l e , f i r s t f o r t h e 98 *
p o l i t i c a l d i s t r i c t s and second f o r t h e n i n e Lander .
* The m i d p o i n t o f t h e v e c t o r i s t h e c e n t r o i d o f t h e
p o l i t i c a l d i s t r i c t .
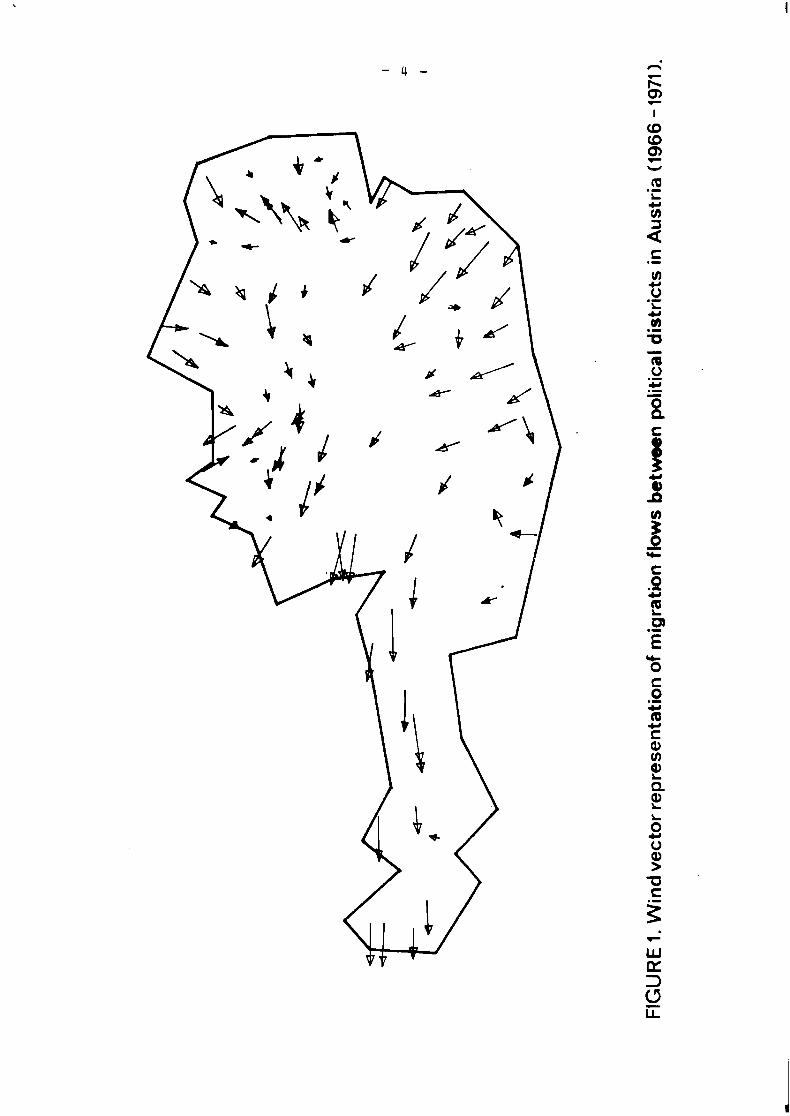
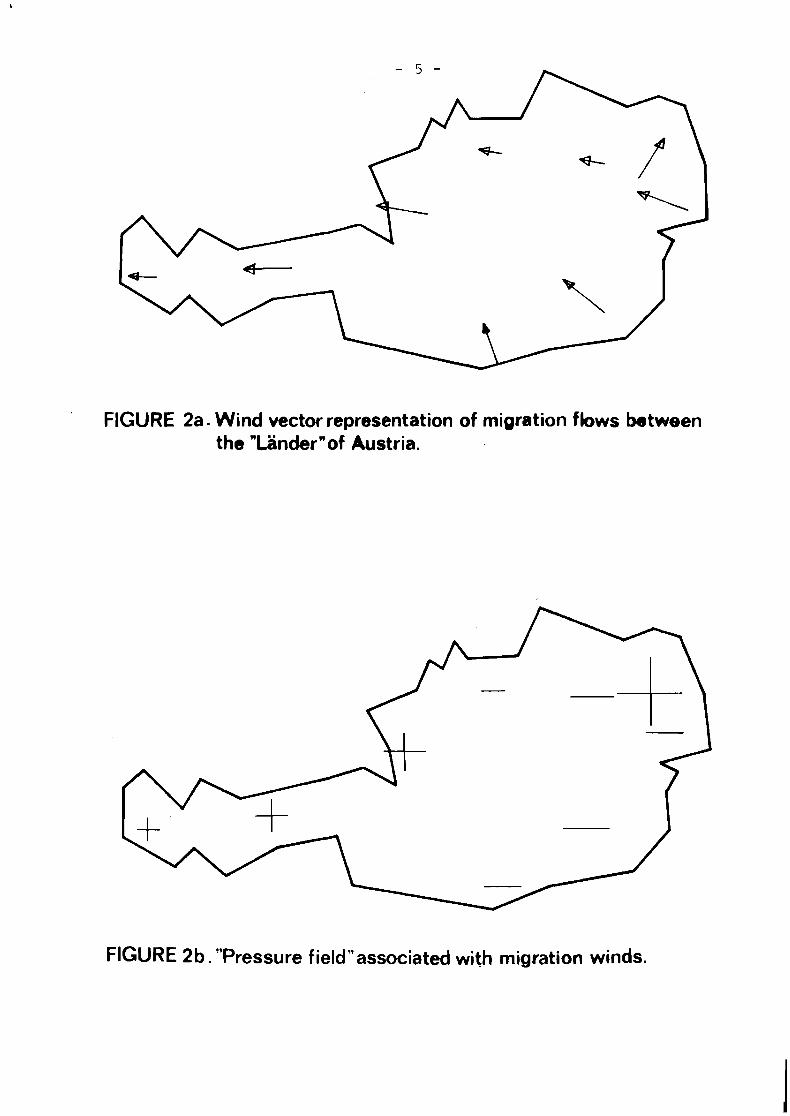
FIGURE 2a. Wind vector representation of migration fbws between the "La;inderUof Austria.
FIGURE 2 b . "Pressure field" associated with migration winds.
A r a t h e r s t r i k i n g p a t t e r n i s immediately a p p a r e n t . There i s
a v e r y s t r o n g t r e n d of movement towards t h e w e s t e r n r e g i o n s
a s w e l l a s i n t o t h e Vienna a r e a . The v e c t o r s from t h e s o u t h e r n
d i s t r i c t s a p p e a r t o be t h e r e s u l t s of movements t o Vienna and
t h e w e s t . With t h e e x c e p t i o n of t h e w e s t e r n r e g i o n s , most b o r d e r
d i s t r i c t s have v e c t o r s o r t h o g o n a l t o and away from t h e b o r d e r .
P a r t i c u l a r c a r e s h o u l d be t aken i n i n t e r p r e t i n g a l l v e c t o r s
c l o s e t o t h e b o r d e r s of t h e s t u d y a r e a . No f o r e i g n m i g r a t i o n
d a t a a r e i n c l u d e d ; t h u s v e c t o r s a p p a r e n t l y d i r e c t e d t o Swi tze r -
l a n d and t h e FRG s h o u l d n o t be i n t e r p r e t e d a s m i g r a n t f lows t o
t h e s e l o c a t i o n s . R a t h e r , t h e s e v e c t o r s a r e i n d i c a t o r s of a
s t r o n g d i r e c t i o n a l imbalance of m i g r a n t s i n t o t h e s e b o r d e r
r e g i o n s , t h e a v e r a g e s o u r c e of which i s i n t h e d i r e c t i o n
e x a c t l y o p p o s i t e t o t h e v e c t o r .
Although c e r t a i n l y much i n f o r m a t i o n i s l o s t i n a v e r a g i n g
t h e r e s u l t s , c e r t a i n unmis takab le b road s p a t i a l p a t t e r n s a r e
made v e r y c l e a r by t h i s r e p r e s e n t a t i o n . The p a t t e r n f o r t h e
"Lander , " w h i l e o b v i o u s l y less complex, i s c o m p l e t e l y c o n s i s -
t e n t w i t h t h e s p a t i a l l y d i s a g g r e g a t e d p a t t e r n . These naps
a r e r e v e a l i n g i n a q u a l i t a t i v e way, s u g g e s t i n g p e r h a p s t h a t
t h e r e a r e "pu l l1 ' f a c t o r s a t work i n Vienna and t h e w e s t and
"push" f a c t o r s a t work e l s e w h e r e . The " f o r c i n g f u n c t i o n ' '
c o u l d b e mapped a s a s p a t i a l l y c o n t i n u o u s s u r f a c e ( a " p r e s s u r e "
f i e l d a s s o c i a t e d w i t h t h e m i g r a t i o n " w i n d s " ) , and v a r i a b l e s
s o u g h t t h a t a c c o u n t f o r t h e s p a t i a l v a r i a t i o n i n t h i s s u r f a c e .
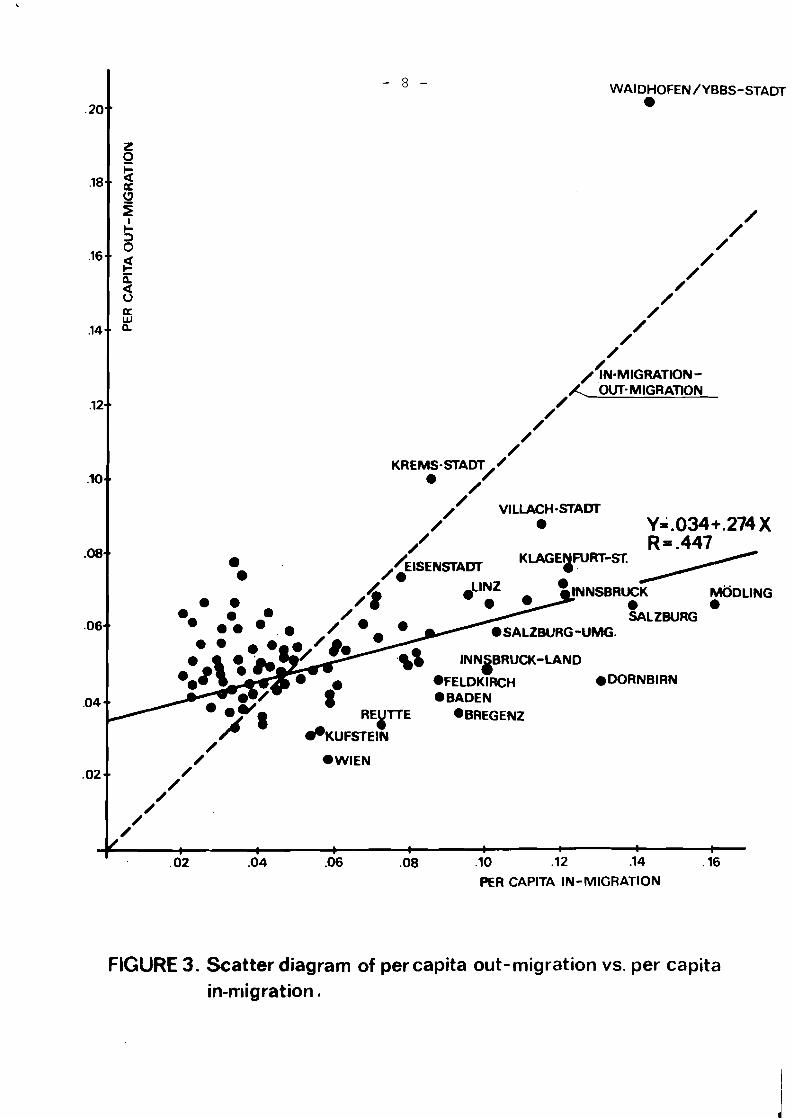
Another e s s e n t i a l l y d e s c r i p t i v e method which c o u l d be
s u g g e s t i v e o f i n t e r e s t i n g h y p o t h e s e s i s t h e p l o t t i n g o f p e r
c a p i t a o u t - m i g r a t i o n f l o w s a g a i n s t p e r c a p i t a i n - m i g r a t i o n
f lows . A s Cordey-Hayes (1975) p o i n t s o u t , t h e s i m p l e economic
t h e o r y o f m i g r a t i o n would s u g g e s t t h a t t h e r e s h o u l d b e a neg-
a t i v e r e l a t i o n s h i p between t h e s e two v a r i a t e s . On t h e o t h e r
hand, t h e r e a r e good r e a s o n s , r e l a t e d t o s o c i a l and occupa-
t i o n a l m o b i l i t y , a g e s t r u c t u r e and o t h e r f a c t o r s , t o s u g g e s t
t h a t i n - and o u t - m i g r a t i o n r a t e s w i l l b e p o s i t i v e l y c o r r e l a t e d .
The d i f f e r e n c e i n r a t e s o f c o u r s e i s due t o n e t i n c r e a s e i n
p o p u l a t i o n a r i s i n g from m i g r a t i o n . F i g u r e 3 shows t h e
p a t t e r n f o r A u s t r i a . W e see from t h i s t h a t t h e r e i s cer-
t a i n l y some r e s t r u c t u r i n g o f p o p u l a t i o n ( t h e t r e n d i s less
s t e e p t h a n t h e 45O l i n e * ) , b u t t h e r e i s a l s o some t e n d e n c y
f o r t h e r e g i o n s w i t h t h e h i g h e s t g rowth r a t e s t o have l a r g e r
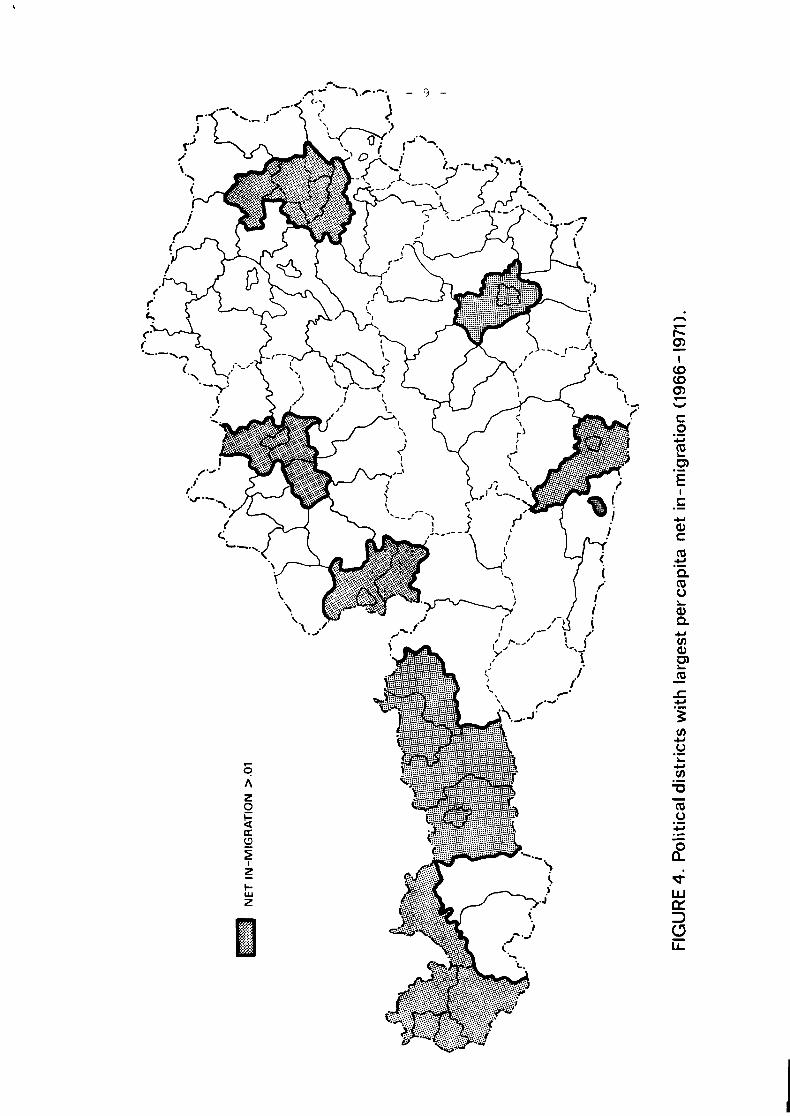
o u t - m i g r a t i o n r a t e s . F i g u r e 4 shows t h e p o l i t i c a l d i s t r i c t s
w i t h t h e l a r g e s t p e r c a p i t a i n - m i g r a t i o n i n r e l a t i o n t o p e r
c a p i t a o u t - m i g r a t i o n ( i . e . t h o s e f a r t h e s t t o t h e r i g h t a n d
be low t h e 45O l i n e ) . T h r e e s p a t i a l t e n d e n c i e s a r e a p p a r e n t :
f i r s t , r u r a l - u r b a n m i g r a t i o n ; s e c o n d , s u b u r b a n i z a t i o n ; and
t h i r d , a s t r o n g movement i n t o w e s t e r n r e g i o n s . F u r t h e r
e v i d e n c e o f t h e s e t h r e e t e n d e n c i e s w i l l b e g i v e n i n l a t e r
s e c t i o n s o f t h i s r e p o r t .
3. Markov and Quasi-blarkov P o p u l a t i o n D i s t r i b u t i o n P r o j e c t i o n Models
3 . 1 T e c h n i q u e s o f P o p u l a t i o n P r o j e c t i o n
The d e t e r m i n a n t s o f p o p u l a t i o n g rowth and d i s t r i b u t i o n
a r e u n d o u b t e d l y v a r i e d ; moreover t h e i n t e r r e l a t i o n s h i p s among
t h e s e d e t e r m i n a n t s may b e s u b t l e a n d complex. I t i s o f some
i n t e r e s t , however , t o a t t e m p t t o model s u c h s y s t e m s u s i n g
methods where t h e c a u s a l s t r u c t u r e i s n o t d e l i m i t e d e x p l i c i t l y .
F o r example , it may b e assumed t h a t p a s t b e h a v i o u r p r o v i d e s a
u s e f u l g u i d e t o f u t u r e s y s t e m b e h a v i o u r . Of t h i s c l a s s o f
model , e x t r a p o l a t i o n methods a r e c e r t a i n l y t h e c r u d e s t .
Time series a n a l y s i s ex t . ends t h i s a p p r o a c h , d i f f e r e n t i a l l y
w e i g h t i n g p a s t b e h a v i o u r u s i n g f o r g e t t i n g f u n c t i o n s , i . e . ,
d i s t r i b u t e d l a g ( a u t o r e g r e s s i v e ) mode l s . C u r r y and B a n n i s t e r
(1974) a n d o t h e r s h a v e f u r t h e r e n r i c h e d t h i s a p p r o a c h by
t a k i n g s p a t i a l a s w e l l a s t e m p o r a l l a g s i n t o a c c o u n t . A l l
t h e s e methods r e q u i r e l a r g e sets o f s p a t i a l and t e m p o r a l
d a t a on a few ( p e r h a p s o n e ) v a r i a b l e s , i n c o n t r a s t t o de-
t a i l e d c a u s a l mode l s w i t h d a t a on many v a r i a b l e s f o r a
* P o i n t s on t h e 45O l i n e h a v e a p e r f e c t b a l a n c e be tween
i n - and o u t - m i g r a t i o n ,
/.IN-MIGRATION - A OUT- MIGRATION
/
KREMS-STADT /- . / /
w - 1' D O R N B I R N
l BADEN RE TTE Y BREGENZ
HKUFSTEIN
.02 .04 .06 .08 .10 .12 .14 .16
PER CAPITA IN-MIGRATION
FIGURE 3. Scatter diagram of per capita out- migration vs. per capita in-rnigrat.ion .
few (perhaps one) time periods.
Because of a dearth of long time and space series data,
even these autoregressive approaches are frequently infeasible.
In this section, a Markov approach to population distribution
projection is employed. With these models, the current loca-
tion of a resident is the only factor which influences his
residential location in the next time period. Implicit in this
statement is that there is an interregional structure of migra-
tion which will tend to persist through time. The assumption is
that people will continue to migrate in the future as they have
in the recent past.
More formally, if x(t) is the expected regional population
distribution vector at time t, the simple Markov projection model
takes the following form:
where P is composed of elements P ij the conditional probability
that resident in i at time t will be residing in j at time t + I * .
* One common way of estimating migration transition
probabilities is
But in the Austrian case, the regional population data for 1966 are not available. In this study, we have used the following method. We first estimate the diagonal elements of the migration table:
n+ 1
where the (n + 1 ) St row includes foreign in-migrants. Our estimates of the 1966 populations are then
Finally, our transition probability estimates are
m.. (66-71) - B i j - 1 3 f (66)
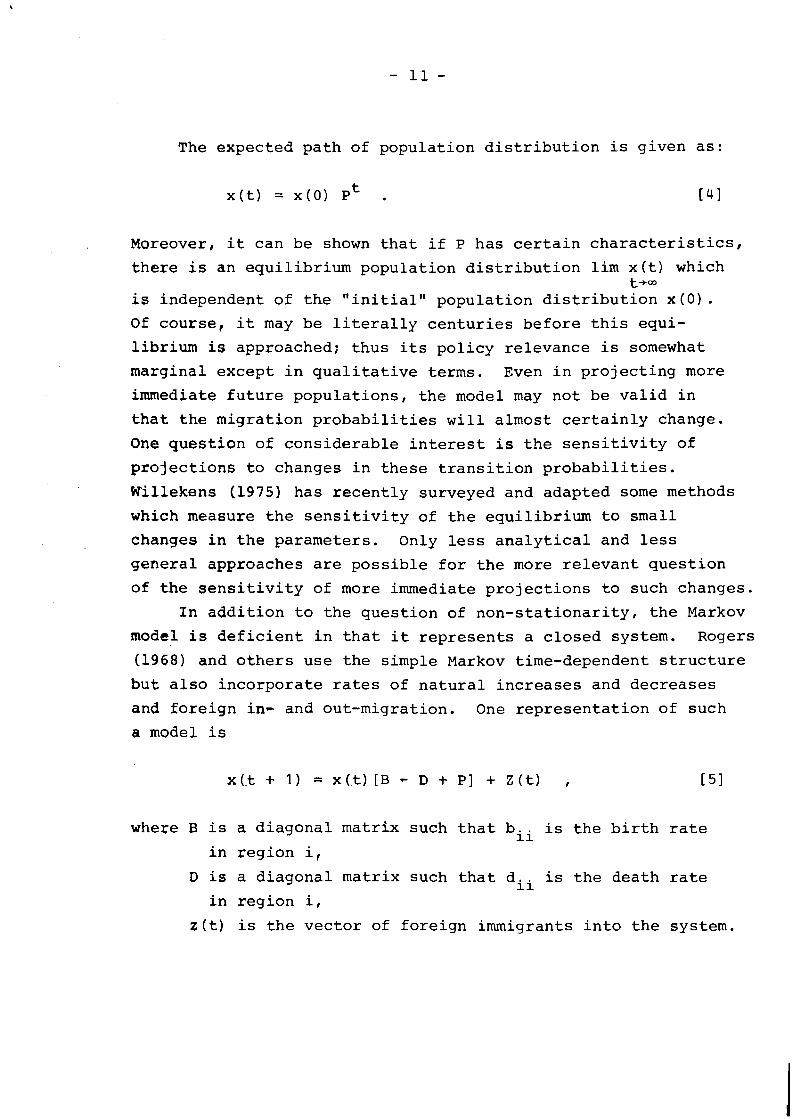
The expected path of population distribution is given as:
Moreover, it can be shown that if P has certain characteristics,
there is an equilibrium population distribution lim x(t) which t+w
is independent of the "initial" population distribution x (0) . Of course, it may be literally centuries before this equi-
librium is approached; thus its policy relevance is somewhat
marginal except in qualitative terms. Even in projecting more
immediate future populations, the model may not be valid in
that the migration probabilities will almost certainly change.
One question of considerable interest is the sensitivity of
projections to changes in these transition probabilities.
Willekens (1975) has recently surveyed and adapted some methods
which measure the sensitivity of the equilibrium to small
changes in the parameters. Only less analytical and less
general approaches are possible for the more relevant question
of the sensitivity of more immediate projections to such changes.
In addition to the question of non-stationarity, the Markov
model is deficient in that it represents a closed system. Rogers
(1968) and others use the simple Markov time-dependent structure
but also incorporate rates of natural increases and decreases
and foreign in- and out-migration. One representation of such
a model is
where B is a diagonal matrix such that bii is the birth rate
in region i,
D is a diagonal matrix such that dii is the death rate
in region it
z(t) is the vector of foreign immigrants into the system.
If we denote G = B - D + P, then: t- 1
x(t) = ~ ( 0 1 ~ ~ + z(k)G t-i k=O
The dimension of G, at least in principle, can be enlarged,
disaggregating by age and sex cohorts so that not only is the
age and sex composition of different regions taken into account
in fertility and mobility rates, but also the regional age
and sex structure of the population changes over time as a
result of aging and survival rates and of the migration
patterns themselves.* ~~e-specific migration data are not
available for Austria. Although estimates of age-specific
parameters could be made, a decision was made to use a more
aggregate approach on the basis of data which are readily
available. Thus, two sets of projections are made, the first
using the closed system Markov model, and the second an open
system quasi-Markov model incorporating rates of net natural
increase, but not foreign in- or out-migration. Thus in the
growth projection model [51 and E61 are simplified to
In the applications of both the Markov and growth projection
models, the "initial" state of the system x(0) is the popula-
tion distribution in 1971 by political district. The stages
of the process are five-year intervals. The discrete approx-
imation to a continuous time process results in an implicit
assumption that net additions to the population remain in the
region of birth until the beginning of the next stage, when
they begin to migrate with the rest of the population.
* Rogers (1975) outlines the theory and mathematics of
such systems.
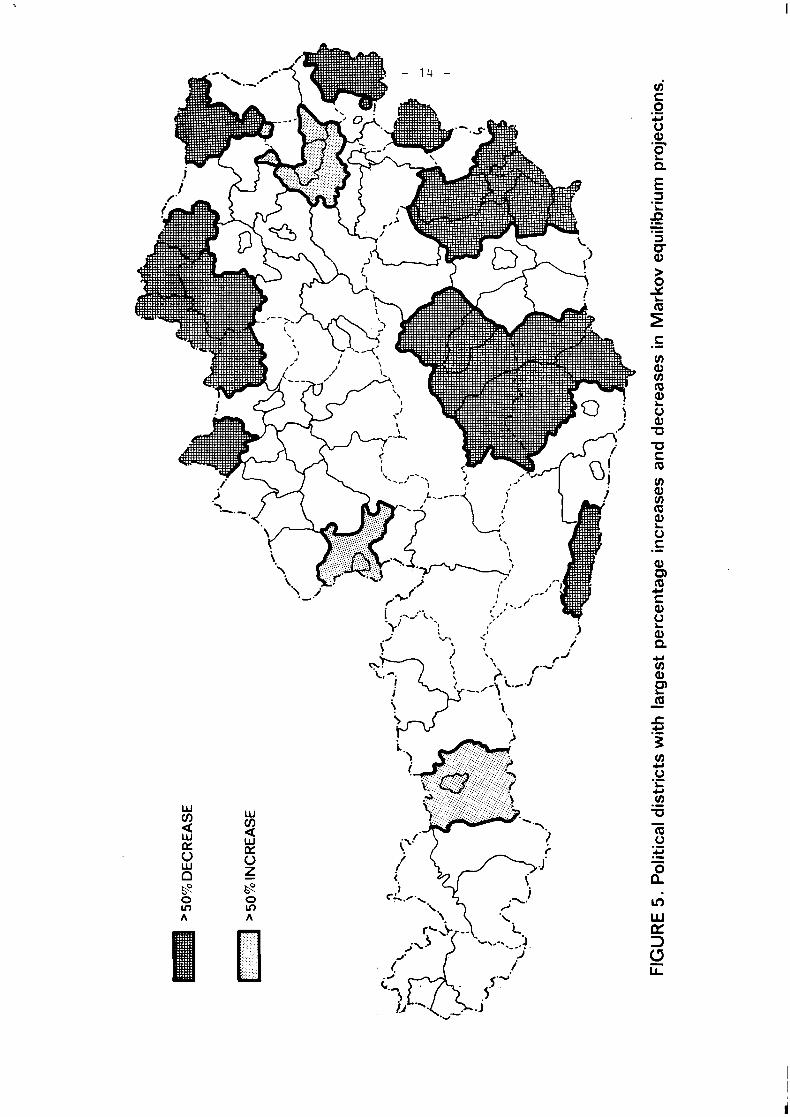
3.2 The Numerical Results*
How to present in an effective way the multitude of numbers
generated for large multiregional systems is a bothersome problem.
Figure 5 shows the pattern of long-run major losers and gainers
in population as the system approaches its equilibrium. We note
a very large variance in the projected population growth and decline. Major losing regions are in the southern, eastern, and
northern border areas, undoubtedly reflecting a decrease of
employment in agricultural activities and a truncation of
"natural" market areas close to the borders with Eastern Euro-
pean countries (see OECD, 1974) . Although the directions of these tendencies are unequivocal,
the absolute and even relative magnitude of changes is undoubt-
edly exaggerated. First, we note that to approximate this
equilibrium distribution, about 500 time periods (2,500 years)
need to elapse. Clearly even politicians are not concerned with
such long planning horizons. More importantly, long before such
an equilibrium is approximated, the parameters will change -- perhaps exogenously as a result of government or business policies,
tastes, technologies, etc. Alternatively the migration propen-
sities may adjust themselves endogenously with respect to changes
in the population distribution. (See for example Feeriey (1973)
and Gleave (1975) . )
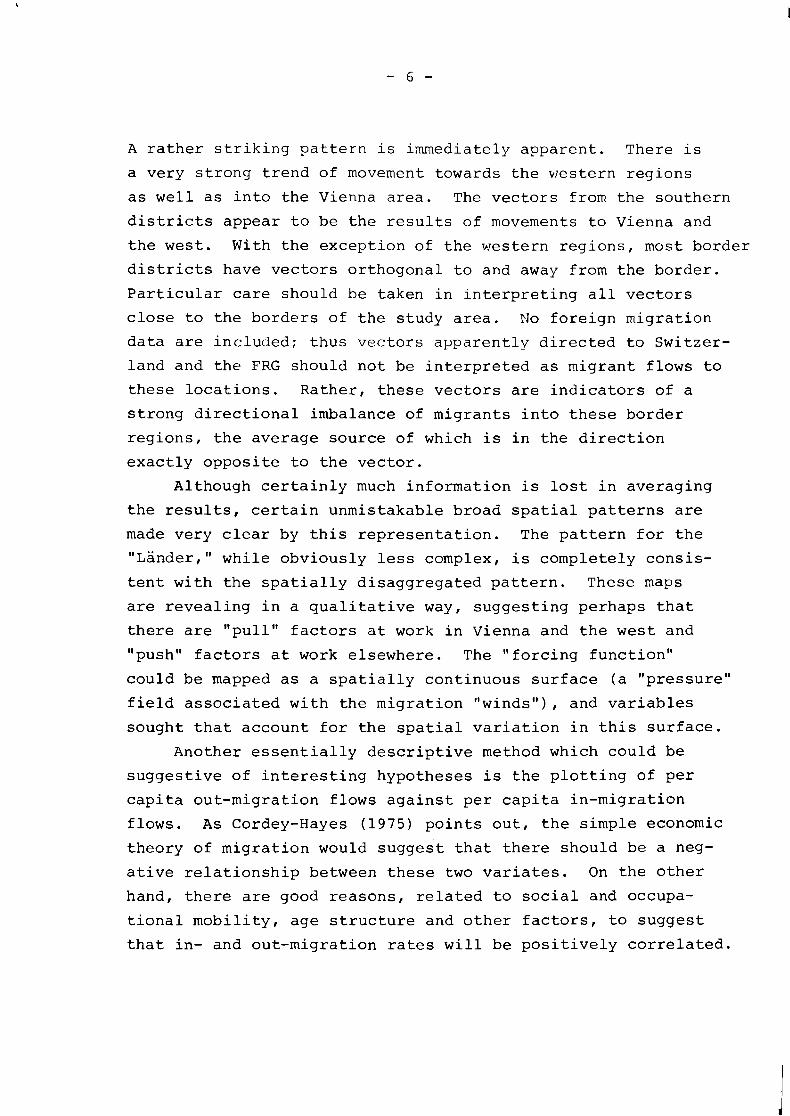
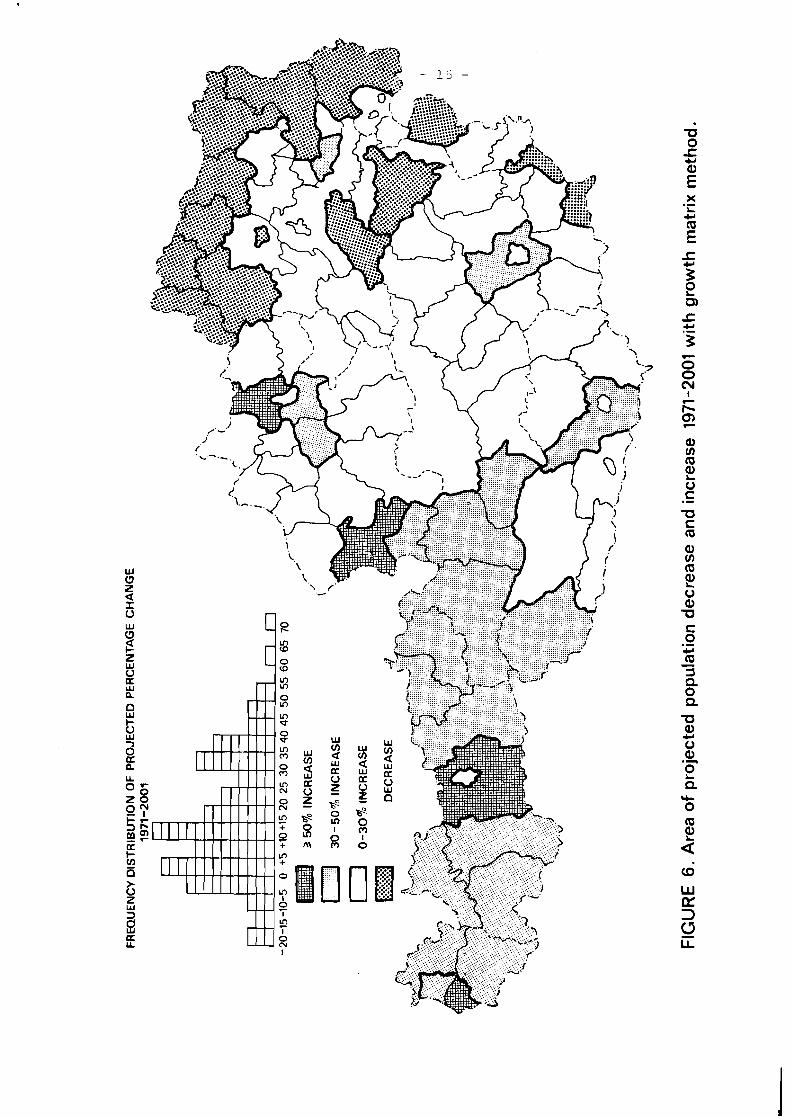
Thus, projected changes over the next thirty years are
more relevant at least in a quantitative sense. These are
displayed in Figure 6 and in more detail in Appendix A. Al-
though the patterns of redistribution are similar for the Markov.
and growth models, they are not identical.
For example, whereas Vienna is a rather important growth
centre in the Markov model, its age structure is suci, that it
becomes a declining centre when the birth and death rates are
introduced into the model. Of course, since in-migrants tend
to be younger, the age structure and fertility rates in Vienna
h he reader is refer-red to bsterreichisches Institut fur Raurnplanung (1975) for a complementary set of population pro- jections. The methods used there strongly emphasize age structure effects, using only net migration rates rather than the entire interregional table.
FRE
QU
EN
CY
DIS
TR
IBU
TIO
N O
F P
RO
JEC
TED
PE
RC
EN
TAG
E C
HA
NG
E
1971
-2001
FIG
UR
E 6
. A
rea
of
pro
ject
ed p
op
ula
tion
dec
reas
e an
d in
crea
se 1
971-
2001
wit
h g
row
th m
atri
x m
eth
od
.

may be expected t o change over t ime. Therefore , a good
popula t ion p r o j e c t i o n might l i e somewhere between t h o s e
r ep re sen ted by F igu res 5 and 6 .
I n c o n t r a s t , some southern a r e a s i n t h e S te ie rmark
( S t y r i a ) and ~ s r n t e n ( C a r i n t h i a ) a r e t ransformed i n t o growth
reg ions when c o r r e c t i o n s f o r r e g i o n a l r a t e s of n a t u r a l
i n c r e a s e a r e made. High b i r t h r a t e s more than compensate
f o r l a r g e n e t ou t -migra t ion r a t e s . But i f out-migrants
t end t o be younger and/or i f t h e r e i s a s e c u l a r d e c l i n e i n
f e r t i l i t y r a t e s , t h e s e a r e a s w i l l n o t be a b l e t o .cont inue
t o grow i f h igh out-migrat ion r a t e s p e r s i s t .
I n o t h e r i n s t a n c e s , f o r example i n t h e no r th -eas t (Wald-
and W e i n v i e r t e l ) , h igh n a t u r a l r a t e s of i n c r e a s e a r e n o t
s u f f i c i e n t t o o f f s e t h igh out-migrat ion r a t e s . Note t h a t
t h e frequency d i s t r i b u t i o n appears t o be bimodal, i n d i c a t i n g
t h a t some d i s t r i c t s t end t o be growing very r a p i d l y ; whi le
ano the r , l a r g e r , group of r eg ions i s d e c l i n i n g , o r growing, i f
a t a l l , on ly s lowly. The s p a t i a l p a t t e r n of f a s t growth i s
s t r o n g l y concen t r a t ed i n and around urban a r e a s , and i n addi-
t i o n i n some wes te rn r eg ions .
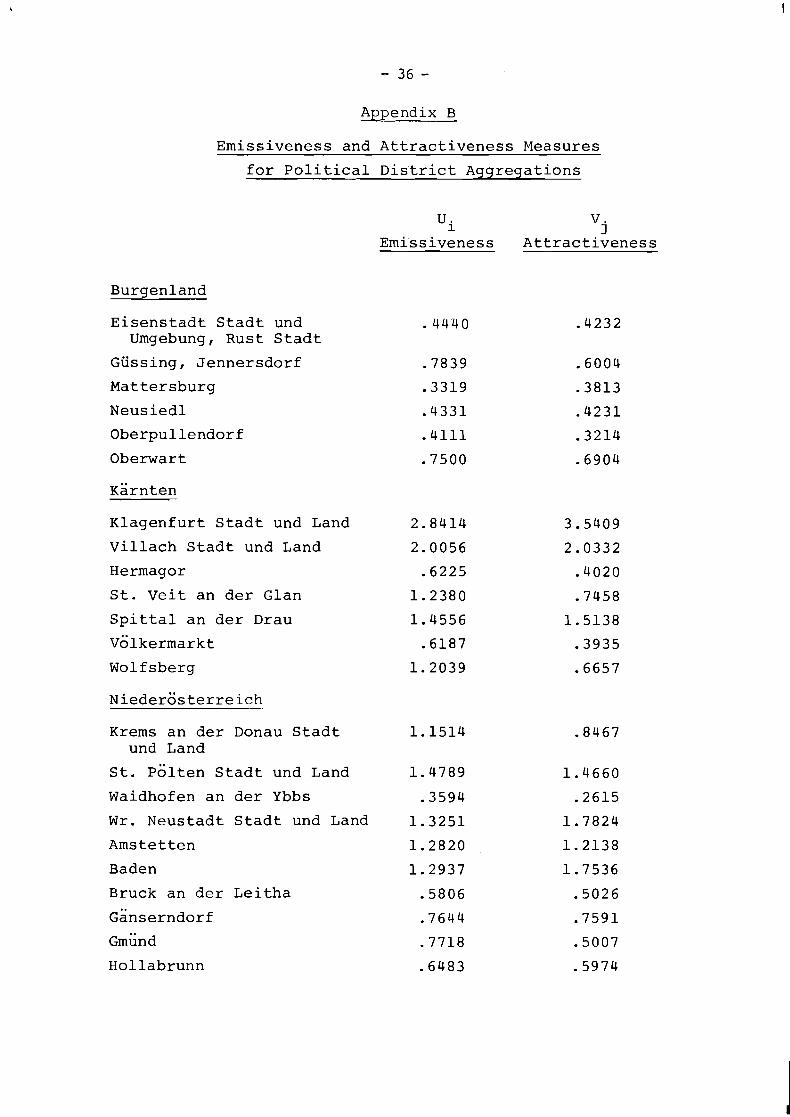
4 . A S t a t i s t i c a l Model t o Measure Emissiveness and A t t r a c t i v e n e s s
Cesa r io (1973) has developed a methodology which d i v i d e s
i n t e r a c t i o n f a c t o r s i n t o t h r e e c a t e g o r i e s -- o r i g i n e f f e c t s *
( emis s iveness ) ; d e s t i n a t i o n e f f e c t s ( a t t r a c t i v e n e s s ) ; and
impedance e f f e c t s ( t r a v e l t imes and/or c o s t s i n h i s o r i g i n a l
t r a n s p o r t a t i o n c o n t e x t ) . He a rgues t h a t emiss iveness and
a t t r a c t i v e n e s s a r e o f t e n n o t d i r e c t l y measurable, bu t must
be e s t ima ted from t h e d a t a . That i s , t h e o r i g i n and d e s t i n a -
t i o n t o t a l s ( o r popu la t ions ) a r e no t used d i r e c t l y a s i n d i -
c a t o r s i n t h a t they may be heav i ly condi t ioned by r e l a t i v e
* This framework i s c l o s e l y r e l a t e d t o Cordey-Hayes'
(1972) concepts of escape and c a p t u r e r a t i o s .
location within the system and purely locational effects are
to be incorporated into the impedance or distance term. The
emissiveness and attractiveness measures are to include only
the intrinsic characteristics of places, standardizing for
distance effects. These aggregate measures, estimated within
a revealed preference framework, may later be analyzed in-
dependently -- related for example to quality of life, age structure, and job opportunity variables in a migration
model.
More formally, the model proposed is
m = kU.V.f (d. . ) , ij 1 3 1 3
m i j is the interaction between two locations;
Ui,Vj are emissiveness and attractiveness parameters;
f (d . .) is the distance impedance function; 1 7
k is a scaling constant.
Using the familiar power function form of the interactance
modzl, [91 becomes
where B is a parameter to be estimated.
The similarity between [lo] and the traditional social
gravity model is obvious, but at the same time potentially
misleading. It must be emphasized that the Ui and V are j
estimated. This means that areas with large populations need
not have large numbers of in-migrants and/or out-migrants.
Moreover, the migration flows predicted by the model will not
in general be symmetric. That asymmetric flows are important
has already been demonstrated many times in this report;
otherwise, migration would not be a factor in restructuring
the Austrian population distribution.
Thus the problem is to find estimates for 2 ( N + 1)
parameters in [ l o ] . Taking logarithms of [lo] facilitates
the estimation process:*
En mij = knk + En Ui + En V j + '
Letting Yi = an mij , Dij = Ln dij, and m = En k re-expressing
the model in deviation units, normal equations become:
where k, Bi, 9 . and are the ordinary least-squares estimate I
of the model parameters.
For this analysis, the 98 political districts have been
reduced to eighty regions, incorporating the surrounding areas
of cities with the cities themselves. In addition, inter-
regional road distances are used instead of airline distances. * * Using the estimation procedures described above, the
* In a later paper, Cesario (1974) recognizes that the
parameter estimates using this transformation are biased and presents an alternative estimation method. A variant on only the simplest method has been used here. * *
This table was obtained from the ~AMTC (Austrian Auto- mobile Touring Club).
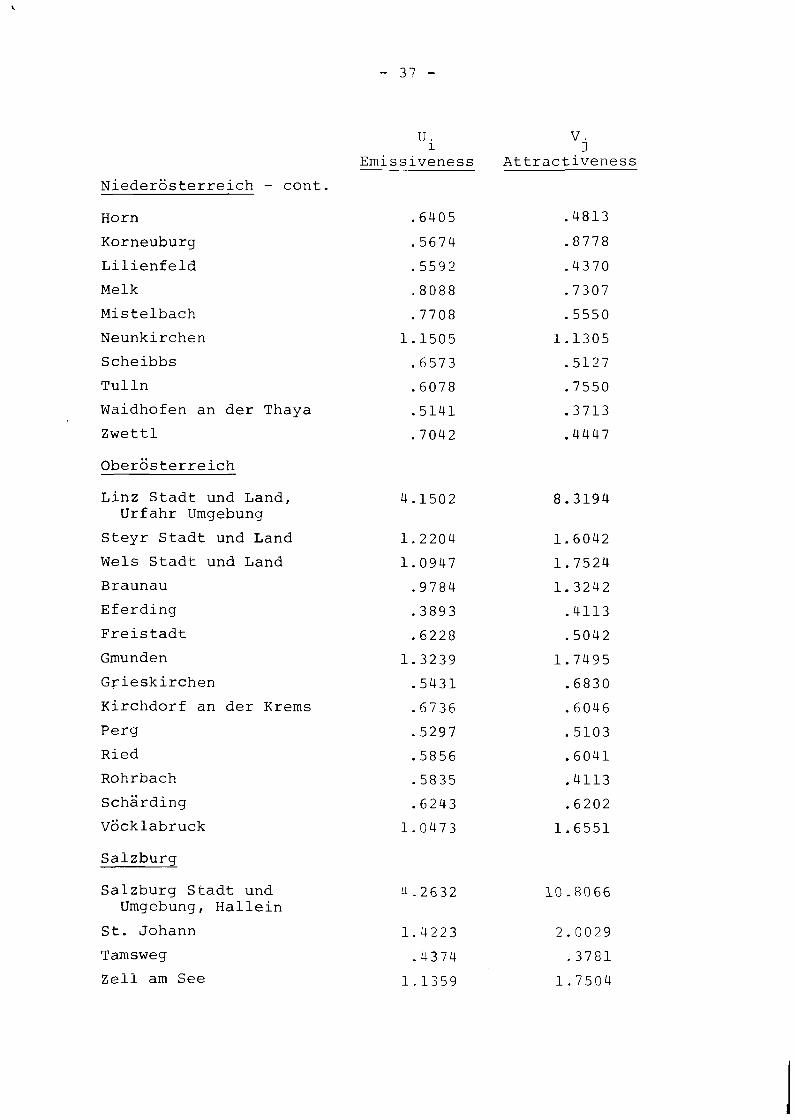
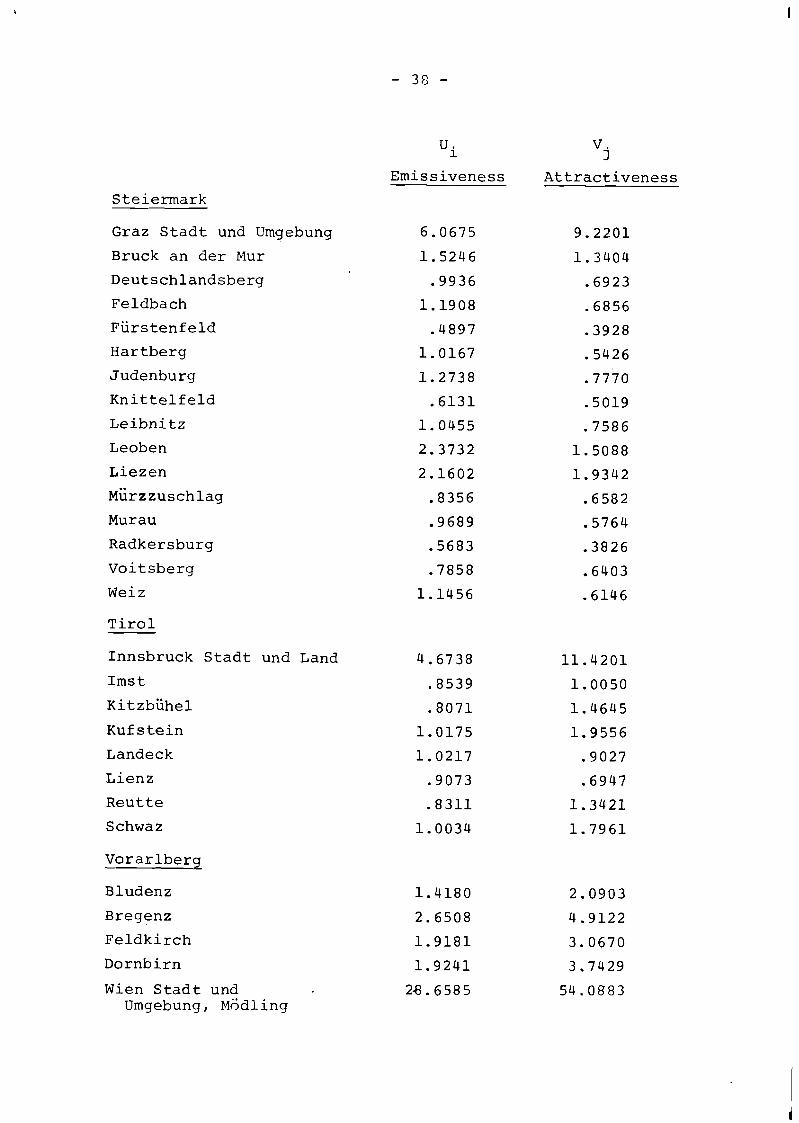
results are
The 160 values of Ui and V are presented in Appendix B I j
but it is useful to make some summary comments about the
qualitative nature of these numerical results. In spite of
the freedom of the model to incorporate asymmetry, there is 2
a strong correlation between these two variates (r = . 9 8 4 ) .
That is, areas with strong attractiveness to migrants are
also important sources of out-migration. The distribution
of these variates is highly skewed, with the cities accoui~cing
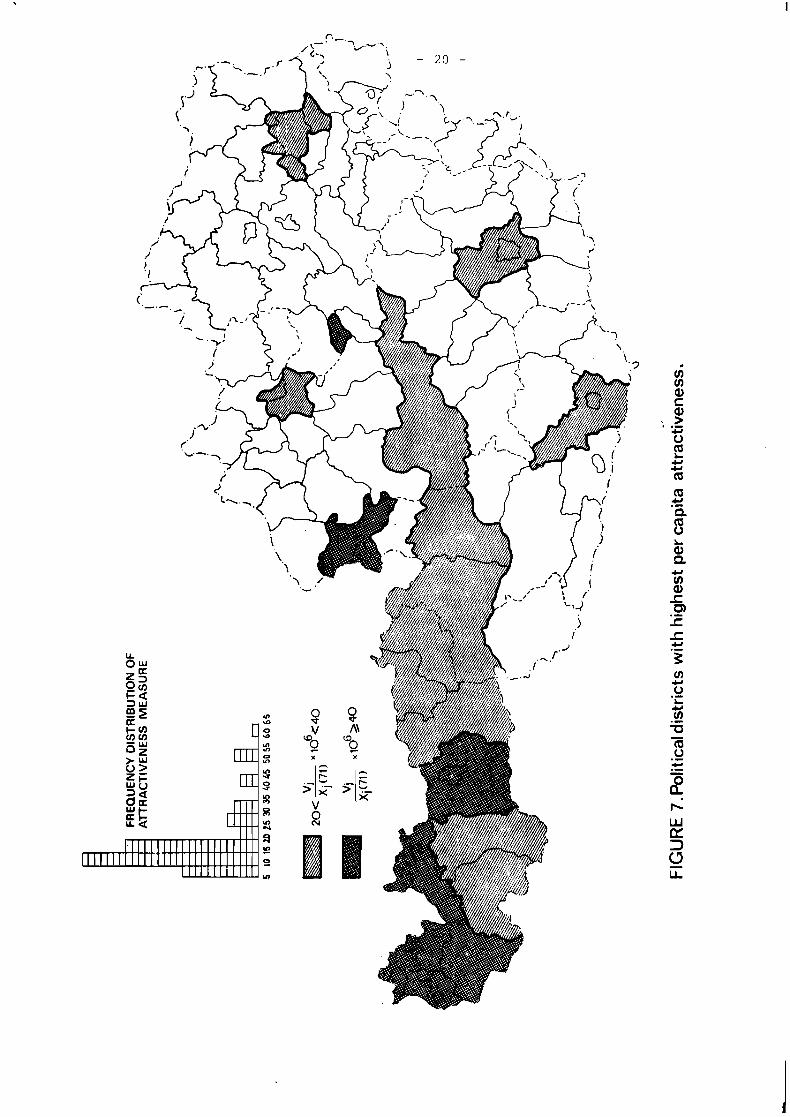
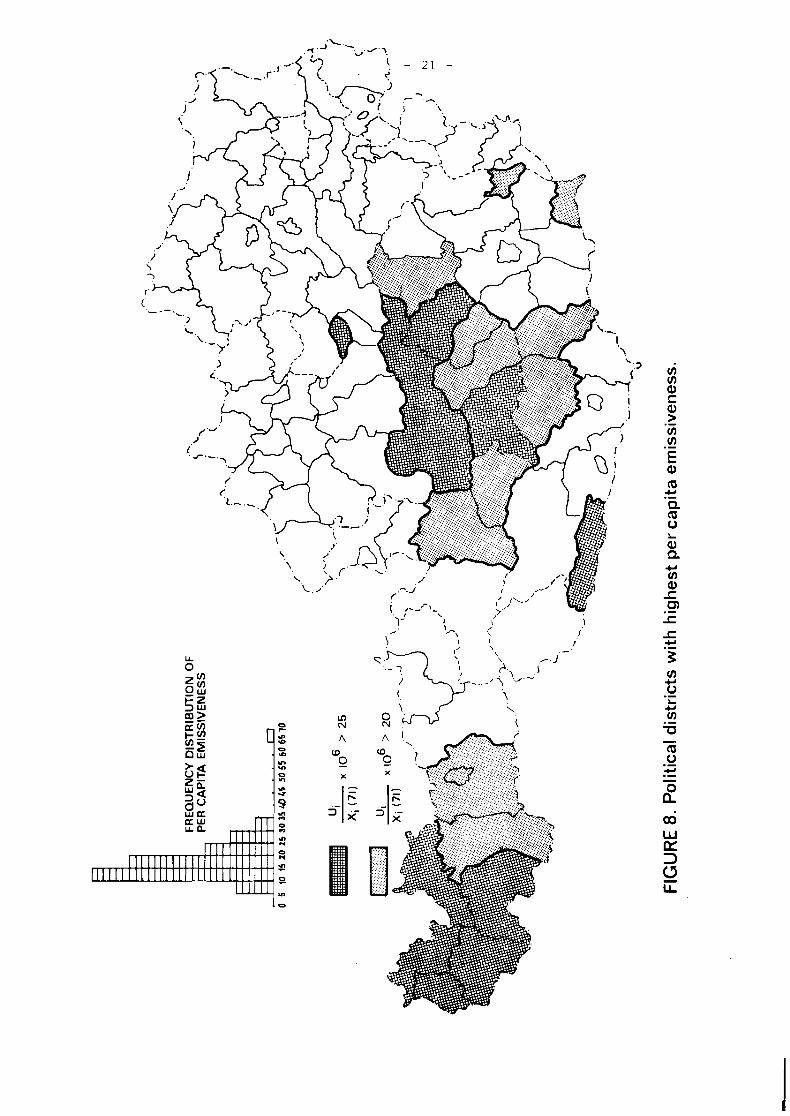
for most of the variance. Figures 7 and 8 show the areas of
highest per capita attractiveness and emissiveness. Again,
even when standardized for scale effects, the urbanization
and suburbanization processes and westerly movement of mi-
grants are strikingly apparent. All of the largest cities arid
their surrounding areas are very attractive to migrants even
in regions which, in an overall sense, are rather unattractive.
The pattern of high emissiveness rates (Figure 8) is somewhat
more complicated. Here we see both highly attractive and un-
attractive areas represented. The populations in western
regions tend to be highly mobile with large in- and out-migra-
tion rates. These areas have emissiveness rates comparable to
those in Steiermark and Ksrnten.
5. Normative Approaches
An institution exists for coordinating and formulating
regional projects according to a general Austrian concept of
regional planning: the Austrian Conference on Regional Plan-
ning (~ROK). On a voluntary basis, delegates of the Federal
government, and of ~ander, city- and community-governments,
attempt to agree to a plan for regional development, including
strategies for the Austrian settlement structure. There are
four categories of objectives to be- explored:
FRE
QU
EN
CY
DIS
TR
IBU
TIO
N O
F A
lTR
AC
TlV
EN
ES
S
ME
AS
UR
E
. - F
IGU
RE
7 .P
olit
ical
dis
tric
ts w
ith
hig
hes
t per
cap
ita
attr
acti
ven
ess.
FR
EQ
UE
NC
Y D
IST
RIB
UT
ION
OF
PE
R C
AP
ITA
EM
ISS
IVE
NE
SS
0 5
10 1
5 20
25
30 3
5 40
45
50 5
5 60
65
70
FIG
UR
E 8
. P
olit
ical
dis
tric
ts w
ith
hig
hes
t p
er c
apit
a em
issi
ven
ess,
1) National political goals;
2) General societal goals;
3) General economic goals; and
4) Spatial goals.
Since the foundation of the ~ R O K in 1971, an abstract
goal catalog has been generated, which is rather difficult
to translate into spatial terms. One of the reasons for this
is that there may exist strong conflicts between the Federal
government and the Lander; some of the Lander have developed
plans for their own regions. The resolution of these conflicts
at the OROK level has to be unanimous; thus far this institu-
tion has only been able to generate a catalog of goals which
must be described as rather optimistic and unspecific, setting
no priorities nor asking what instruments are involved and
from where the resources can be derived. One of the most-cited
goals is that of "equal regional living and working conditions"
-- the implications of which are somewhat ambiguous. Relating
this goal to migration processes, it can be argued that on the
one hand it can be achieved by increased labour mobility; and
on the other, that it may also be attained by reducing out-
migration from rural regions to avoid the danger of tax-base * erosion. There is no explicit or obvious link between this
goal and a specific population distribution. At this time,
it has not been possible to derive quantitative and defensible
population distribution objectives for the 98 political dis-
tricts used in this study.
Although well-defined and generally accepted goals for
future population distribution are rather difficult, perhaps
impossible, to generate, it may be of some interest to study
the feasibility and the most plausible paths to achieve cer-
tain hypothetical goals. Such exercises may be instructive
in gaining some insights into the magnitude of change and
control necessary to achieve certain system trajectories. A
variety of approaches are feasible in changing system tra-
jectories -- inputs may be manipulated and the forward and
* Organization for Economic Development and Cooperation (1974).
backward linkage multiplier effects traced through the system.
Alternatively, or in addition! the migration parameters them-
selves can be changed. The most direct and obvious technical
procedures to control such systems are those of mathematical
programming and control theory (see Evtushenko and MacKinnon
(1975) and Mehra (forthcoming) ) . Simpler methods are also available, however. For example,
if the input vector is to be constant over time, and only a
target population at time t is specified (t) , Rogers (1971) describes a method which requires only the solution of a
system of linear equations.
With regard to interregional migration parameter changes,
the methods used to update economic input-output tables and
origin-destination tables of transportation surveys may be
relevant.* The basic principle of these methods is simple -- systems are characterized by a high degree of inertia, and
the most plausible set of parameter changes consistent with a
new population distribution is the one which is in some sense
as small as possible. It can be argued that matrices which
are "close" to each other in this manner are perhaps the least
costly ways in which to achieve the stated goals. Most of the
methods minimize the squared deviations of new from old para-
meter values. ** The computer program**+ deals directly with
interregional flows rather than parameters. The row sum
x mij is the number of people in region i at time t (i.e. i J
m the people remaining in i and x mij the people leaving ii' j#i
i). The column sum mji is the number of people in region j
- * These methods with very minor differences are known as
the Fratar, Furness and biproportional methods. See Bacharach (1971) and Evans (1970) for descriptions of the methods and formal proofs of convergence. * *
The more complicated numberical method derived by Ickler and Flachs (1973) minimizes the sum of the squared rations of new to old values of the parameters. * * *
The program was written and made available to us by Waldo Tobler of IIASA.
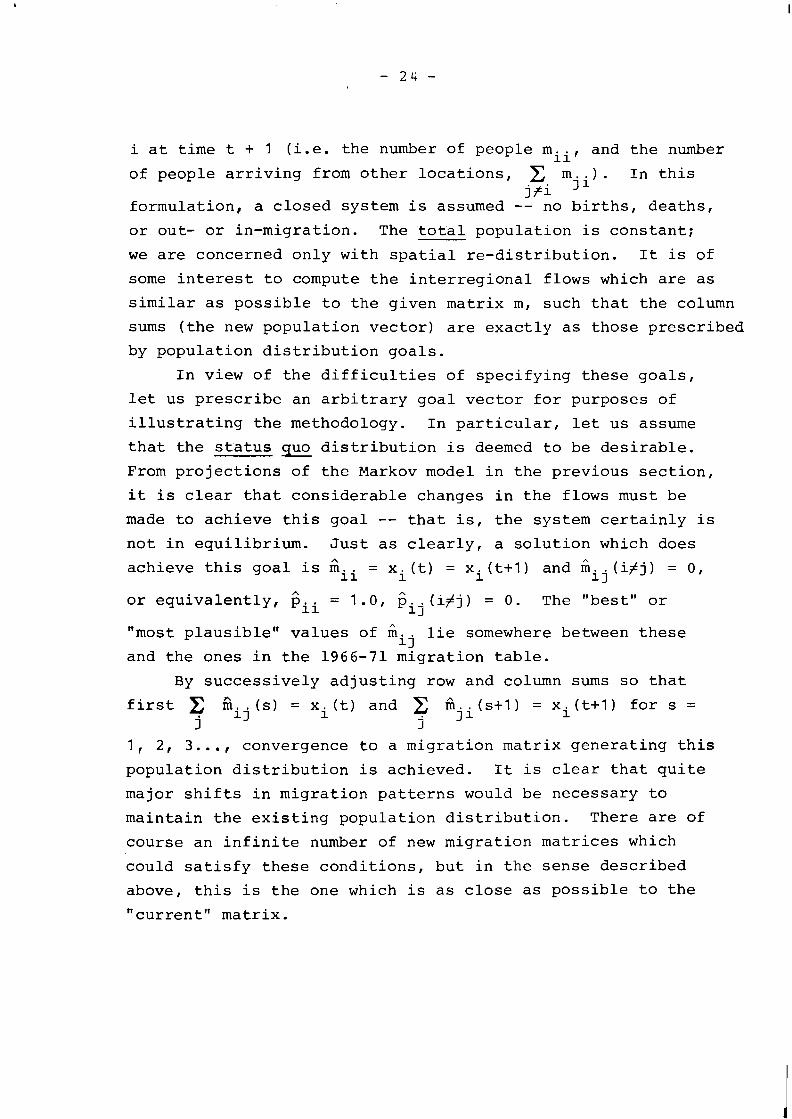
i at time t + 1 (ieee the number of people mii, and the number
of people arriving from other locations, m i . In this i f1 - -
formulation, a closed system is assumed -- no births, deaths, or out- or in-migration. The total population is constant;
we are concerned only with spatial re-distribution. It is of
some interest to compute the interregional flows which are as
similar as possible to the given matrix m, such that the column
sums (the new population vector) are exactly as those prescribed
by population distribution goals.
In view of the difficulties of specifying these goals,
let us prescribe an arbitrary goal vector for purposes of
illustrating the methodology. In particular, let us assume
that the status quo distribution is deemed to be desirable. From projections of the Markov model in the previous section,
it is clear that considerable changes in the flows must be
made to achieve this goal -- that is, the system certainly is not in equilibrium. Just as clearly, a solution which does
achieve this goal is $i = xi (t) = xi (t+l) and iij (i#j) = 0,
A
or equivalently, Cii = '.Of 'ij
(ifj) = 0. The "best" or
"most plausible' values of iij lie somewhere between these and the ones in the 1966-71 migration table.
By successively adjusting row and column sums so that
first fij (s) = xi(t) and i?tji(s+l) = xi(t+l) for s = j j
1 , 2, 3..,, convergence to a migration matrix generating this
population distribution is achieved. It is clear that quite
major shifts in migration patterns would be necessary to
maintain the existing population distribution. There are of
course an infinite number of new migration matrices which
could satisfy these conditions, but in the sense described
above, this is the one which is as close as possible to the
"current" matrix.
The f i n a l r e s u l t s o f t h i s i t e r a t i v e p r o c e d u r e a r e row
( o u t - m i g r a t i o n ) and column ( i n - m i g r a t i o n ) m u l t i p l i e r s . Thus ,
The A i l s a r e f a c t o r s by which e a c h e l e m e n t i n t h e ith row must
b e m u l t i p l i e d t o a c h i e v e t h e s p e c i f i e d g o a l . S i m i l a r l ? , t h e t h
B a t s are f a c t o r s by which e a c h e l e m e n t i n t h e j column must I
b e m u l t i p l i e d . Ai < 1 . 0 i m p l i e s t h a t o u t - m i g r a t i o n mus t he
r e d u c e d ; Ai > 1 . 0 , t h a t o u t - m i g r a t i o n mus t b e i n c r e a s e d .
S i m i l a r comments w i t h r e s p e c t t o i n - m i g r a t i o n h o l d f o r t h e
B j f a c t o r s . Both t h e s e f a c t o r s a r e r e l a t e d t o a t t r a c t i v e r i e s s
a n d e m i s s i v e n e s s m e a s u r e s g e n e r a t e d ea r l i e r e x c e p t t h a t t h e y
are h i g h l y c o n d i t i o n e d by t h e t a r g e t p o p u l a t i o n d is t r i . )nu t . i c jn .
Thus w i t h o n e d i s t r i b u t i o n , Ai may b e less t h a n 1 . 0 , b1.1t wikh
a n o t h e r g r e a t e r t h a n 1 . 0 . Thus t h e g e n e r a l i t y o f t h e s e i n d i c e s
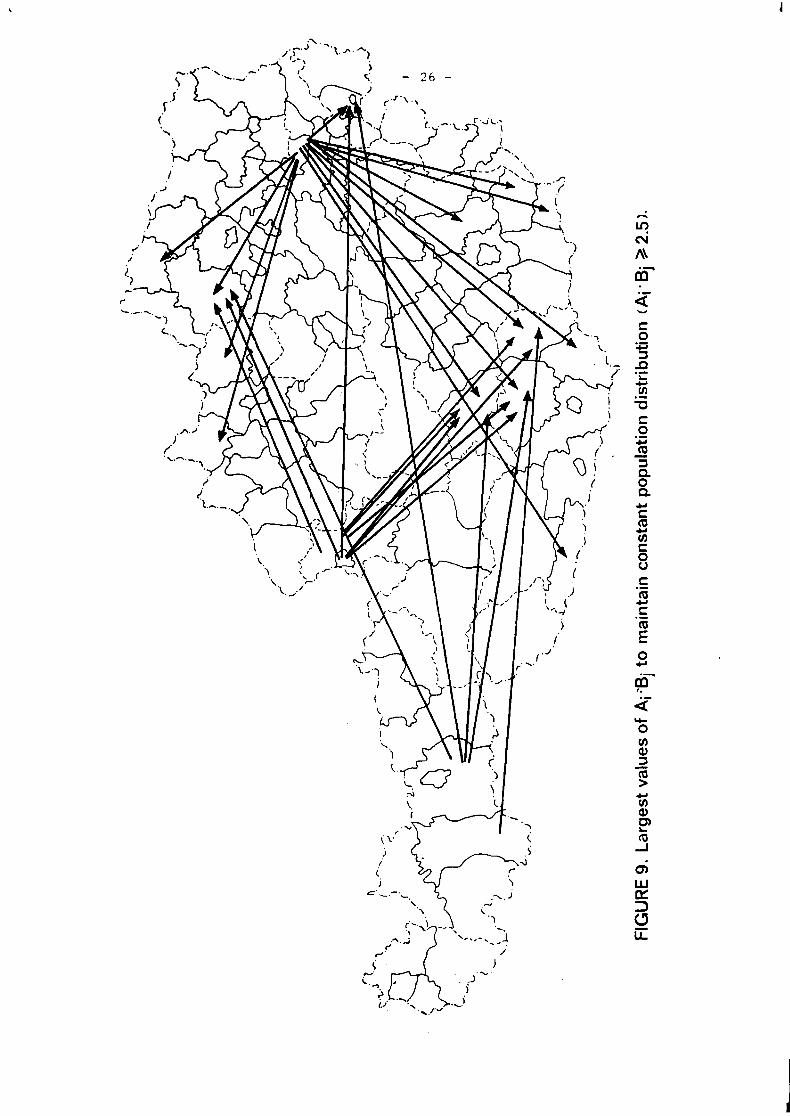
i s r a t h e r l i m i t e d . The i n t e r a c t i o n e f f e c t s be tween t h e row and A
m 3 ) a r e o f i n t e r e s t column f a c t o r s ( i . e . t h e p r o d u c t s A . B =
1 j i j i n t h a t t h e s e i d e n t i f y t h e dyads ( o r i g i n - d e s t i n a t i o n p a i r s )
which mus t b e a l t e r e d t h e mos t ( e i t h e r d e c r e a s e d o r i n c r e a s e s )
i n o r d e r t o r e a c h t h e t a r g e t p o p u l a t i o n d i s t r i b u t i o n i n a
s i n g l e f i v e - y e a r p e r i o d . Some o f t h e l a r g e s t o f t h e s e a r e
shown i n F i g u r e s 9 and 10 . Us ing t h i s r e p r e s e n t a t i o n , t h e
dominan t m i g r a t i o n " s i n k s " i n t h e s y s t e m a r e ~ G d l i n q , S a l z b u r g
( c i t y and v i c i n i t y ) and I n n s b r u c k ( c i t y and l a n d ) , and t h e s e
g rowth a r e a s t e n d t o b e s t r o n g l y c o n n e c t e d t o Z w e t t l anld
Rohrbach i n t h e n o r t h and Wol f sbe rg , S t . V e i t a . d . G lan , and
Radke r sbu rg i n t h e s o u t h o f A u s t r i a . Al tk ,ough t h e s e l a r c ~ e prc-
p o r t i o n a l changes i n rnic j ra t ion p r o p e n s i t i e s have some tenc1ei:c.l~
t o w a r d s a r e g i o n a l i z e d s t r u c t u r e , v e r y l o n q d i s t a n c e l i n k a g c s a r e
a l s o i n c l u d e d .
I t s h o u l d b e emphas ized t h a t t h e s e maps show o n l y t h e
l a r g e s t p r o p o r t i o n a t e c h a n g e s i n f l o w s i m p l i e d by t h e
s p e c i f i e d p o p u l a t i o n d i s t r i b u t i o n . I n t h i s c o n t e x t , i t i s
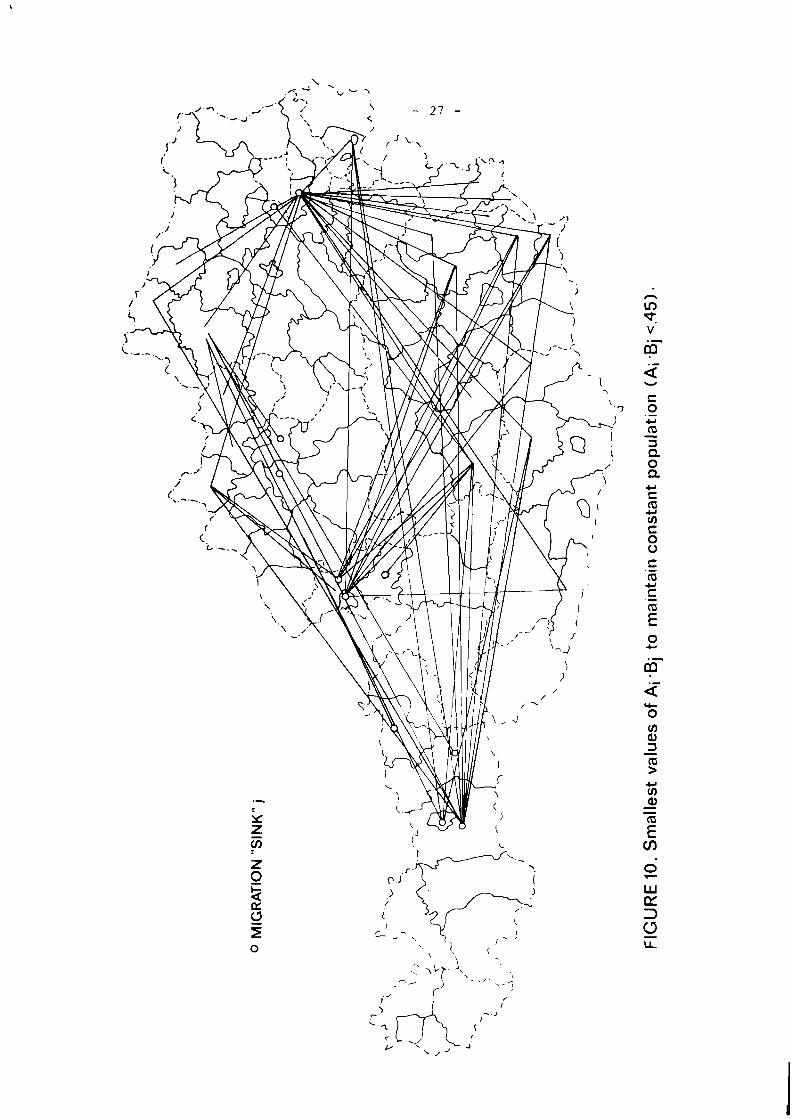
interesting to note that some very fast-growing areas are not
represented in these large changes. In the western region,
only the Innsbruck and Salzburg areas are strong end points
of "critical" origin-destination pairs. Thus, for example,
Bregenz, Reutte, Dornbirn, etc. are not included in these
extreme values, even though the long-term population pro-
jections for these districts are very high indeed. The ten-
tative interpretation of this type of result is that these
and other areas attract migrants from virtually all of the
political districts in Austria. Thus rather broad incentives
and disincentives would have to be imposed in order to retard
the growth of these areas, whereas some finer policy instru-
ments (of an origin-destination-specific type) would perhaps
be more effective with those regions with a more limited net-
work of connections.
In addition, since only proportionate changes have been
studied, the overall importance and difficulty of effecting
these changes has not been considered. Clearly large pro-
portionate changes may imply small absolute changes; and
of course, the reverse holds as well. The estimated absolute
migration table and its difference from the previous one have
been generated, but time has not permitted their interpretation;
the Tobler "winds" method could perhaps be employed, or some
data reduction technique such as principal components analysis. A
Another matrix fi has been computed which generates the equilibrium population distribution in a single five-year
time period. The sum of the deviations of old and new migra-
tion flows is, as expected, much larger with respect to
attaining the equilibrium state compared to maintaining the
existing population distribution. (Of course, the population
distribution in the second example is an equilibrium one only
with respect to the initial migration matrix. Thus would
not maintain that equilibrium in subsequent periods.)
We have then a method which can be used to determine the
most probable parameter changes implied by postulated future
population distribution. In addition, we have an index of the
plausibility of future population distribution changes, i.e.
5 5 4- . For the constant population distribu- i=1 j=1
n 2
tion, this index is 5.37 while for the Markov equilibrium
distribution it is 21.03.
The biproportional method, to our knowledge, has not been
employed in a normative context before, and it certainly has
some difficulties in this area of application. This technique,
as applied, requires the specification of target populations
which must be attained precisely. All linear methods where
the number of target variables is equal to the instrument
variables do not require the specification of an objective or
welfare function. Some would argue that this is preferable to
having to make such a specification with respect to broad
social systems (see for example Russell and Smith (1975) 1 .
However, there are clearly few instances where there exists
such a rigid goal structure. From an examination of the
generated table, it is clear that quite radical changes in
migration behaviour are necessary to achieve the goal of a
static population distribution. Since in this case the
number of target variables (98) is far less than the number
of instrument variables (98 x 98), an implicit criterion
function is imposed (that the new matrix be as close as
possible to the old one). Although it does satisfy this h
closeness criterion, M remains implausible in the sense
that (a) virtually all migration flows must undergo signif-
icant changes, and (b) there are no constraints on the
difficulty of essentially reversing the existing pattern of
migration. Ideally, there should be a trade-off between
goal attainment and the cost of imposing controls. Thus,
for example, Figure 10 shows that more than 2.5 times as
many people should move from Plodling to Hermagor or Inns-
bruck Land to Zwettl than in the 1966-71 period. Such be-
haviour is undoubtedly quite implausible, in spite of the
fact that we are dealing in these cases with rather small
movements in absolute terms. Even more implausible are
the specified declines in migration rates into the important
growth points in the system -- Innsbruck Land, Salzburg vicinity, Mzdling, etc. In these cases considerable magni-
tudes are involved and possibly irreversible forces are to
be altered (at the very least, to alter them would involve
considerable costs). Although the explicit specification
of goal and cost functions would be difficult, and in any
objective sense perhaps impossible, it is important that
the technique outlined here be regarded only as exploratory
-- used to gain only some order of magnitude approximation about the feasibility of alternative future population dis-
tributions. A cursory analysis of the results generated by
the biproportional method would seem to indicate, not surpris-
ingly, that a static population diskribution is infeasible in
that much too radical alterations in migration behaviour are
implied. Somewhat ironically, however, larger changes in
migration behaviour may be even more plausible from an ad-
ministrative point of view. That is, changing on the order
of l o 4 migration propensities would clearly he more difficult
than changing the 1 0 0 most critical ones by perhaps imposing
constraints on new housing or job opportunities. In addition,
account should be taken of any underlying statistical rule
(e.g. a decline of migration propensities with distance) which
we have reason to believe will persist over time. Finally,
the biproportional technique, as applied, is a single-stage
method which cannot incorporate many of the interesting
multistate dynamic aspects of regional settlement systems.
6. Closure
Some simple descriptive, predictive, statistical, and
normative approaches have been used in an attempt to gain
some preliminary insights into the tendencies and processes
in interregional migration in Austria and the implications
such tendencies and processes may have on the future spatial
pattern of human settlements in the country. The processes
of urbanization, suburbanization and "westernization" have
been well documented using almost all of the approaches.
Most of the methods, while simple, have generated large
arrays of secondary and tertiary data which have as yet not
been fully interpreted. The results as presented, however,
effectively delimit the nature of the Austrian migration
system, at least in broad outline. Moreover, some or all
of these methods are useful as ways of monitoring on-going
system behaviour. They have the merit that they are readily
applicable to virtually any interregional migration table in
different countries or in the same country at different times.
It is hoped that in the near future our numerical results
for Austria will be more intensively interpreted and the
methodologies adapted and applied to other countries; finally
an attempt will be made to introduce a stronger causal struc-
ture into our models which will further enrich the predict-
ability, our understanding and perhaps the controllability
of interregional migration behaviour and national urban
settlement systems.
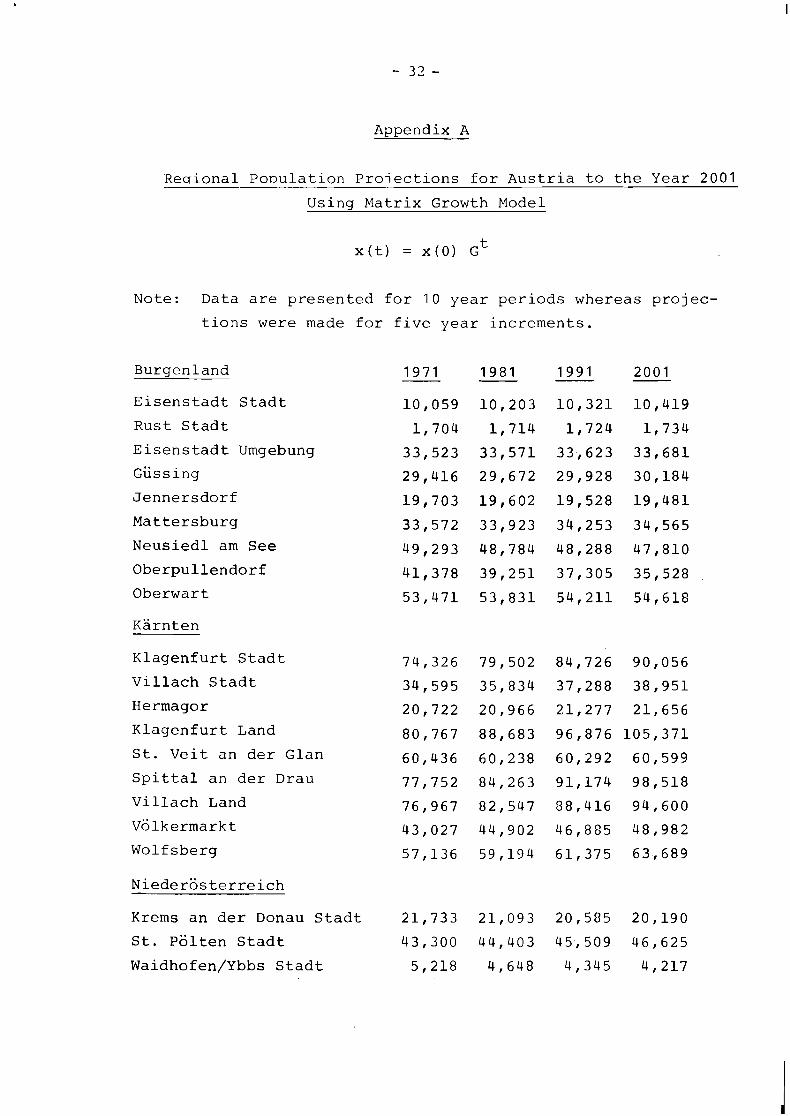
Appendix A
Reqional Ponulation Proiections for Austria to the Year 2001
Usina Matrix Growth Model
Note: Data are presented for 10 year periods whereas projec-
tions were made for five year increments.
Burgenland
Eisenstadt Stadt
Rust Stadt
Eisenstadt Umgebung
Giissing
Jennersdorf
Mattersburg
Neusiedl am See
Oberpullendorf
Oberwart
Karnten
Klagenfurt Stadt
Villach Stadt
Hermagor
Klagenfurt Land
St. Veit an der Glan
Spittal an der Drau
Villach Land
~olkermarkt
Wolfsberg
Krems an der Donau Stadt 21,733 21,093 20,585 20,190
St. Polten Stadt 43,300 44,403 45,509 46,625
Waidhofen/Ybbs Stadt 5,218 4,648 4,345 4,217
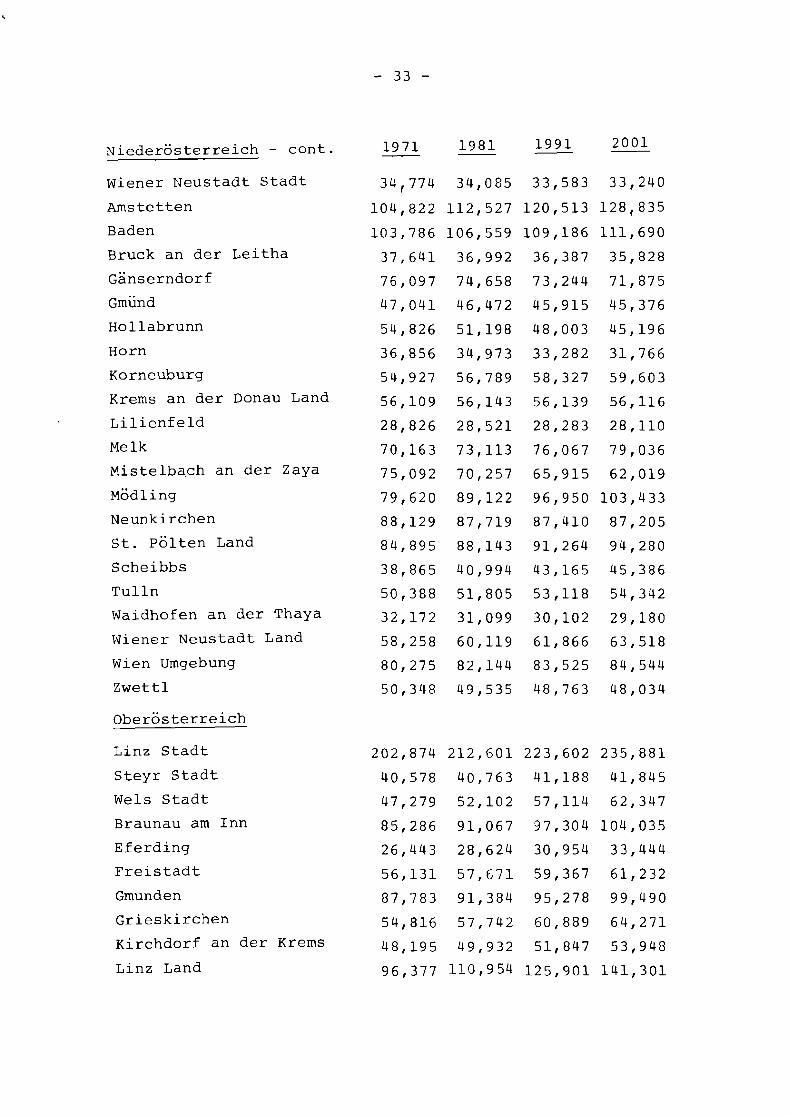
~ i e d e r o s t e r r e i c h - c o n t . - 1 9 7 1 1 9 8 1 1 9 9 1
w i e n e r N e u s t a d t S t a d t 3 4 , 7 7 4 3 4 , 0 8 5 3 3 , 5 8 3
A m s t e t t e n 1 0 4 , 8 2 2 1 1 2 , 5 2 7 1 2 0 , 5 1 3
Baden 1 0 3 , 7 8 6 1 0 6 , 5 5 9 1 0 9 , 1 8 6
B r u c k a n der L e i t h a 3 7 , 6 4 1 3 6 , 9 9 2 3 6 , 3 8 7
G a n s e r n d o r f 7 6 , 0 9 7 7 4 , 6 5 8 7 3 , 2 4 4
Gmiind 4 7 , 0 4 1 4 6 , 4 7 2 4 5 , 9 1 5
H o l l a b r u n n 5 4 , 8 2 6 5 1 , 1 9 8 4 8 , 0 0 3
Horn 3 6 , 8 5 6 3 4 , 9 7 3 3 3 , 2 8 2
K o r n e u b u r g 5 4 , 9 2 7 5 6 , 7 8 9 5 8 , 3 2 7
K r e m s a n d e r Donau L a n d 5 6 , 1 0 9 5 6 , 1 4 3 5 6 , 1 3 9
L i l i e n f e l d 2 8 , 8 2 6 2 8 , 5 2 1 2 8 , 2 8 3
Melk 7 0 , 1 6 3 7 3 , 1 1 3 7 6 , 0 6 7
M i s t e l b a . c h a n d e r Zaya 7 5 , 0 9 2 7 0 , 2 5 7 6 5 , 9 1 5
~ S d l i n g 7 9 , 6 2 0 8 9 , 1 2 2 9 6 , 9 5 0
N e u n k i r c h e n 8 8 , 1 2 9 8 7 , 7 1 9 8 7 , 4 1 0
s t . p o l t e n Land 8 4 , 8 9 5 8 8 , 1 4 3 9 1 , 2 6 4
S c h e i b b s 3 8 , 8 6 5 4 0 , 9 3 4 4 3 , 1 6 5
T u l l n 5 0 , 3 8 8 5 1 , 8 0 5 5 3 , 1 1 8
W a i d h o f e n a n d e r T h a y a 3 2 , 1 7 2 3 1 , 0 9 9 3 0 , 1 0 2
W i e n e r N e u s t a d t L a n d 5 8 , 2 5 8 6 0 , 1 1 9 6 1 , 8 6 6
Wien Umgebung 8 0 , 2 7 5 8 2 , 1 4 4 8 3 , 5 2 5
Z w e t t l 5 0 , 3 4 8 4 9 , 5 3 5 4 8 , 7 6 3
~ b e r o s t e r r e i c h
L i n z S t a d t
S t e y r S t a d t
Wels S t a d t
B r a u n a u a m I n n
Ef e r d i n g
F r e i s t a d t
Gmunden
G r i e s k i r c h e n
K i r c h d o r f a n d e r Krems
L i n z Land
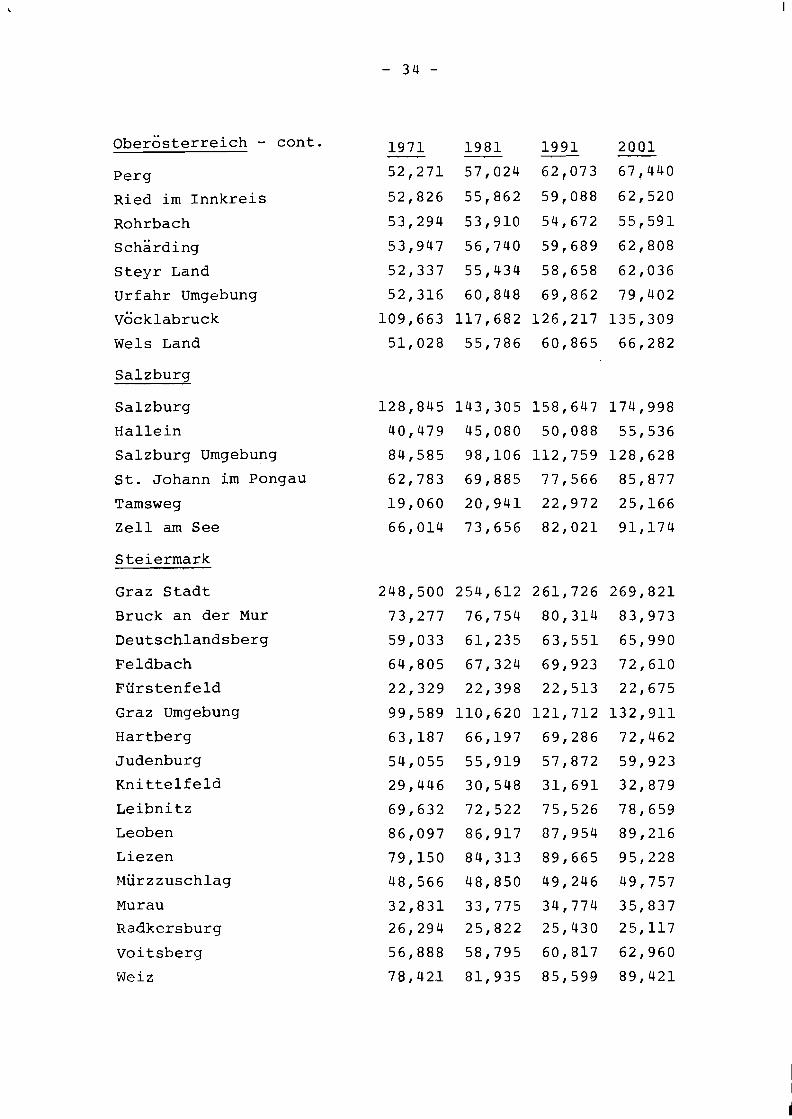
~berosterreich - cont. Perg
Ried im Innkreis
Rohrbach
char ding Steyr Land
Urfahr Umgebung
vgcklabruck
Wels Land
Salzburg
Salzburg 128,845 143,305 158,647 174,998
Hallein 40,479 45,080 50,088 55,536
Salzburg Umgebung 84,585 98,106 112,759 128,628
St. Johann im Pongau 62,783 69,885 77,566 85,877
Tamsweg 19,060 20,941 22,972 25,166
Zell am See 66,014 73,656 82,021 91,174
S teiermark
Graz Stadt
Bruck an der Mur
Deutschlandsberg
Feldbach
Furstenfeld
Graz Umgebung
Hartberg
Judenburg
Knittelfeld
Leibnitz
Leoben
Liezen
Murzzuschlag
Murau
Radkersburg
Voitsberg
Weiz
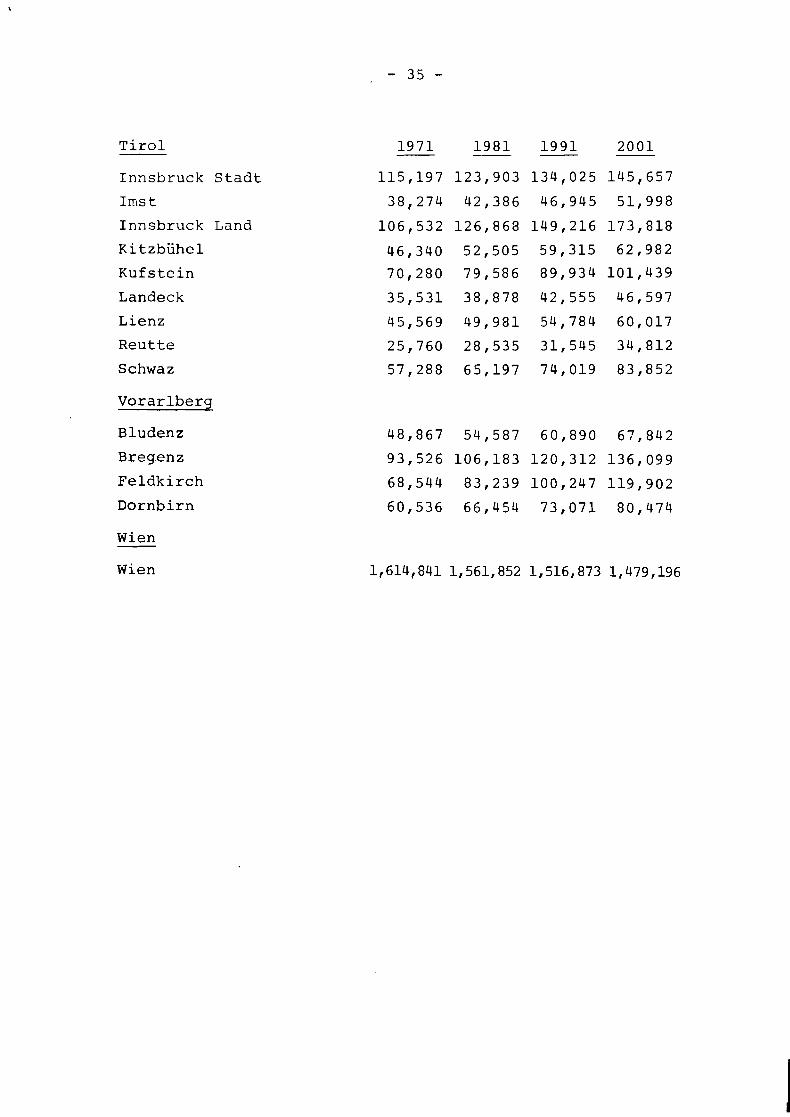
T i r o l
I n n s b r u c k S t a d t
I m s t
I n n s b r u c k Land
Ki t zb i ihe l
K u f s t e i n
Landeck
L ienz
R e u t t e
Schwaz
V o r a r l b e r g
Bludenz
Bregenz
F e l d k i r c h
D o r n b i r n
Wien
Wien
Appendix B
Emissiveness and Attractiveness Measures
for Political District Aggregations
I J Emissiveness Attractiveness
Burgenland
Eisenstadt Stadt und .4440 Umgebung, Rust Stadt
Gussing, Jennersdorf .7839
Mattersburg .3319
Neusiedl .4331
Oberpullendorf .4111
Oberwart .7500
Klagenfurt Stadt und Land 2.8414 3.5409
Villach Stadt und Land 2.0056 2.0332
Hermagor .6225 .4020
St. Veit an der Glan 1.2380 .7458
Spittal an der Drau 1.4556 1.5138
Volkermarkt .6187 .3935
Wolf sberg 1.2039 .6657
Krems an der Donau Stadt und Land
St. polten Stadt und Land
Waidhofen an der Ybbs
Wr. Neustadt Stadt und Land
Amstetten
Baden
Bruck an der Leitha
Ganserndorf
Gmund
Hollabrunn
Niederosterreich - cont.
Horn
Korneuburg
Lilienfeld
Melk
Mistelbach
Neunkirchen
Scheibbs
Tulln
Waidhofen an der Thaya
Zwettl
Linz Stadt und Land, Urfahr Umgebung
Steyr Stadt und Land
Wels Stadt und Land
Braunau
Ef erding
Freistadt
Gmunden
Grieskirchen
Kirchdorf an der Krems
Perg
Ried
Rohrbach
char ding
~Gcklabruck
Salzburg
Salzburg Stadt und Umgebung, Hallein
St. Johann
Tamsweg
Zell am See
'i Emissiveness
'i v j
Emissiveness Attractiveness
Steiermark
Graz Stadt und Umgebung
Bruck an der Mur
Deutschlandsberg
Feldbach
Furstenfeld
Hartberg
Judenburg
Knittelfeld
Leibni tz
Leoben
Liezen
~urzzuschla~
Murau
Radkersburg
Voitsberg
Weiz
Tirol
Innsbruck Stadt und Land
Ims t
~itzbiihel
Kufstein
Landeck
Lienz
Reutte
Schwaz
Vorarlberq
Bludenz
Bregenz
Feldkirch
Dornbirn
Wien Stadt und Umgebung, ~6dling
References
[l] Alperovich, G., J. Bergsman and C. Ehemann, 1975. "An Econometric Model of Migration Between U.S. Metro- politan Areas." Working Paper 0974-4. The Urban Institute, Washington, D.C.
[2] Bacharach, 11., 1970. Biproportional Matrices and Input- Output Change, Cambridge : University Press
[3] Cesario, F.G., 1973. "A Generalized Trip Distribution Model." Journal of Regional Science, 13:2; 233-247
[4] Cesario, F.G., 1974. "More on the Generalized Trip Distribution Model." Journal of Regional science, 14: 3; 389-398
[5] Cordey-Hayes, M., 1972. "Dynamic Frameworks for Spatial Models." Socio-Economic Planning Science, 6: 365-385
[61 Cordey-Hayes, M., 1975. "Migration and the Dynamics of Multi-Regional Population Systems." Environment and Planning, 7: 7 (in press)
[7] Curry, L. and G. Bannister, 1974. "Forecasting Township Populations of Ontario from Time-Space Covariances." Urban Futures for Central Canada: Perspectives on Forecastinq Urban Growth and Form,, L.S. Bourn et. al., eds. Toronto : University of Toronto Press, pp.34-59
[8] Evans, A.W., 1970. "Some Properties of Trip Distribution Methods." Transportation Research, 4: 19-36
[9] Evtushenko, Y. and R.D. MacKinnon, 1975. "Non-Linear Programming Approaches to National Settlement System Planning." IIASA Research Report RR-75-26, Laxenburg, Austria
[lo] Feeney, G., 1973. "Two Models for Multiregional Population Dynamics." Environment and Planning, 5: 31-43
[ll] Gleave, D., 1975. "The Utility and Compatibility of Simple Migration Models." IIASA Research Report RR-75-10, Laxenburg, Austria
[12] Ickler, S.R. and G.M. Flachs, 1972. "A Probabilistic Trip Distribution Model with Calibration Technique." Transportation Research, 6: 113-117
[13] Klaassen, L. and P. Drewe, 1973. Migration Policy in European Countries, Farnboroush : Saxon House
[14] Mehra, R.K., (forthcoming) . "An Optimal Control Approach to National Settlement System Planning." IIASA Research Memorandum, Laxenburg, Austria
[15] Osterreichisches Institut fur Raumplanung, 1975. Extrapolation der Bevolkerungsentwicklung bis 1991 in den Stadt- und Wohnungsmarktregionen, Wien
[16] Osterreichische Raumordnungskonferenz: Regional- Politik in Osterreich, Bericht des Bundes- kanzlerantes an die OECD, Arbeitsgruppe 6 des Industriekomitees
[17] Organisation for Economic Cooperation and Development, 1974. Salient Features of Austrian Regional Policy, Paris
[18] Rogers, A., 1968. Matrix Analysis of Interregional Po~ulation Growth and Distribution. Berkelev :
A.
University of California Press
1191 Rogers, A., 1971. Matrix Methods in Urban and Regional Analysis, San Francisco : Holden-Day
[20] Rogers, A., 1975. Introduction to Multiregional Math- ematical Demography, New York : Wiley
[21] Tobler, W.R., 1975. "Spatial Interaction Patterns," IIASA, Research Memorandum RM-75-26, Laxenburg, Austria
[22] Willekens, F., 1975. "Spatial Impacts of Changes in the Population Growth Matrix." IIASA Working Paper WP-75-70, Laxenburg, Austria