element of costing unit 4 and 5.pdf - rani channamma
TRANSCRIPT
RCUB, B.Com – 6th Semester Elements of Costing – II
Page | 1
RANI CHANNAMMA UNIVERSITY B.Com – 6th Semester Elements of Costing – II
UNIT – 4: MARGINAL COSTING
Marginal costing is the change in total cost on account of adding/ subtracting one additional unit. Definition:
The ICMA London has defined, “Marginal cost as the amount of any given volume of output by which aggregate costs are changed, if the volume of output is increased or decreases. In simple Marginal cost is the additional cost of producing additional units. For example: A company is producing 100 cell phones per month. The total fixed cost per month is Rs 10,000 and variable cost per phone is Rs. 500. The total cost per month is:
Marginal Cost (Variable) of 100 phones = 100 X 500 50,000 Fixed Cost 10,000 Total Cost 60,000
If the output is increased by one unit, the cost will be: Marginal Cost (Variable) of 100 phones = 101 X 500 50,500 Fixed Cost 10,000 Total Cost 60,500
Thus, the additional cost of producing one additional unit is Rs. 500. It is known as marginal cost. Characteristics of Marginal Costing:
1. It is a technique of analysis and presentation of cost rather than an independent method of costing
2. Total costs are classified into fixed costs and variable costs. 3. It considers only variable costs in analysis. 4. It guides pricing and other managerial decisions on the basis of ‘contribution’ which is the
difference between sales value and variable costs. 5. It valuates finished stock and work-in-progress at marginal cost only. 6. It charges the fixed costs against ‘contribution’ 7. It takes the difference between contribution and fixed cost as profit or loss.
Assumptions: The following are some of the assumptions of marginal costing.
1. All costs are divisible into fixed costs and variable costs. 2. Selling price and variable cost per unit will remain the same. 3. Total fixed costs will remain constant. 4. Volume is the only factor which influences the costs. 5. There is a linear relationship between variable costs and revenues.
RCUB, B.Com – 6th Semester Elements of Costing – II
Page | 2
Marginal Cost Equation: The following equation is known as basic marginal cost equation: If Profit : Sales – Variable Cost = Fixed Cost + Profit or Loss If Loss : Sales – Variable Cost = Fixed Cost – Loss Contribution: Contribution is the difference between sales and variable cost. In other words, contribution is the excess of sales over the variable cost. It is also known as gross margin or marginal income. It enables to meet fixed costs and contributes to profit. Contribution = Sales – Variable Cost Contribution = Fixed Cost + Profit Contribution = Fixed Cost – Loss
Contribution = Sales x P/V Ratio Profit Volume Ratio (P/V Ratio): P/V Ratio is a ratio of contribution to sales. It states the relationship between contribution and ales. Therefore it is also called as contribution/sales ratio, or contribution ratio or marginal ratio. It is calculated by using the following formula:
Pr //
Change in ofit Loss Contribution per unitS V F PP VRatio or or or
Change in Sales Sales Sales Selling price per unit
This ratio can also be calculated by comparing the change in contribution or profit to change in sales as follows:
Or /Change in Contribution
P VRatioChange in Sales
Or Pr /
/Change in ofit Loss
P VRatioChange in Sales
Break Even Point (BEP): Break-even point is a point at which the total costs are equal to sales. It is a volume of sales at which there is neither profit nor loss. Hence, it is also called as no profit no loss point. If the sale is increased beyond break-even-point level, profit will accrue and if sale is decreased below the BEP level, loss will occur.
Determination of Profit under Marginal Costing
Particulars Total (Rs.)
Per Unit (Rs.)
Sales xxx xxx Less: Variable costs
1. Direct Materials xxx 2. Direct Wages xxx 3. Direct Expenses xxx 4. Variable Overheads xxx xxx xxx
Contribution xxx xxx Less: Fixed Cost xxx xxx Profit/Loss xxx xxx
RCUB, B.Com – 6th Semester Elements of Costing – II
Page | 3
1. BEP (in units) =Fixed Cost
Contribution per unit
2. BEP (in Rs.) = BEP units × Selling price per unit
3. BEP (in Rs.) = /
Fixed Cost
P V Ratio
Margin of Safety: Margin of safety is the excess of actual sales over sales at break-even-point. In other words, sales over and above the break-even point are known as margin of safety. If the margin of safety is large, it is the sign of soundness of the business and if the margin of safety is small, it is a sign of weak position of business. The margin of safety can be expressed in absolute sales amount or in terms of percentage to sales.
1. Margin of Safety (Amount) = Actual sales – Sales at BEP 2. Margin of Safety (Units) = Actual Sales units – BEP Sales units
3. Margin of Safety (Amount) = Pr
/
ofit
P V Ratio
4. Margin of Safety (Units) = Pr ofit
Contribution per unit
Estimated Sales or Profit: In order to calculate the estimated sales at a given profit or estimated profit at given volume of sales the following formulae are used.
1. Estimated Sales (units) = PrFixed Cost Given ofit
Contribution per unit
2. Estimated Sales (amt) = Estimated Sales (units) × Selling price per unit
3. Estimated Sales (amt) = Pr
/
Fixed Cost Given ofit
P VRatio
Ascertainment of Variable Cost: 1. Variable Cost = Sales – Contribution 2. Variable Cost = Total Cost – Fixed Cost
3. Variable Cost ratio to sales = Change in total cost
Change in Sales
Therefore, Variable Cost = Sales × Variable cost ratio 4. Variable Cost = Sales (1- P/V Ratio)
5 Marks Illustrations: 1. Calculate P/V ratio, from the following:
Particulars Years 2010 2011
Sales (Rs.) 1,50,000 2,00,000 Profit (Rs.) 25,000 40,000
Solution: P/V Ratio = PrChange in ofit
Change in Sales
40,000 25,000 15,000
100 30%2,00,000 1,50,000 50,000
= P/V Ratio
2. From the following particulars, calculate P/V Ratio:
RCUB, B.Com – 6th Semester Elements of Costing – II
Page | 4
Year Sales(Rs.) Profit/Loss (Rs.) 2010 6,00,000 60,000 (loss) 2011 12,00,000 90,000 (Profit)
Solution: P/V Ratio = PrChange in ofit
Change in Sales
= 90,000 ( 60,000) 1,50,000
100 25%12,00,000 6,00,000 6,00,000
3. Calculate P/V Ratio from the following information: Year Sales(Rs.) Total Cost (Rs.) 2010 7,00,000 5,50,000 2011 10,00,000 8,00,000
Solution: Particulars 2011(Rs.) 2010 (Rs.) Sales 10,00,000 7,00,000 Less: Total Cost 8,00,000 5,50,000 Profit 2,00,000 1,50,000
P/V Ratio = PrChange in ofit
Change in Sales
= 2,00,000 1,50,000 50,000
100 16.67%10,00,000 7,00,000 3,00,000
= PV R
Break Even Point (BEP) 4. Diya Ltd. Gives the following information, calculate BEP in value and in units.
i. Sales – 40,000 units at Rs. 20 per unit. ii. Profit volume ratio = 50%
iii. Fixed Cost = Rs. 3,20,000 Solution:
BEP (Value) = 3,20,000
.6, 40,000/ 0.5
Fixed CostRs
P V Ratio
BEP (Units) = 6,40,000
32,000Pr 20
BEP in ValueUnits
Selling ice Per Unit
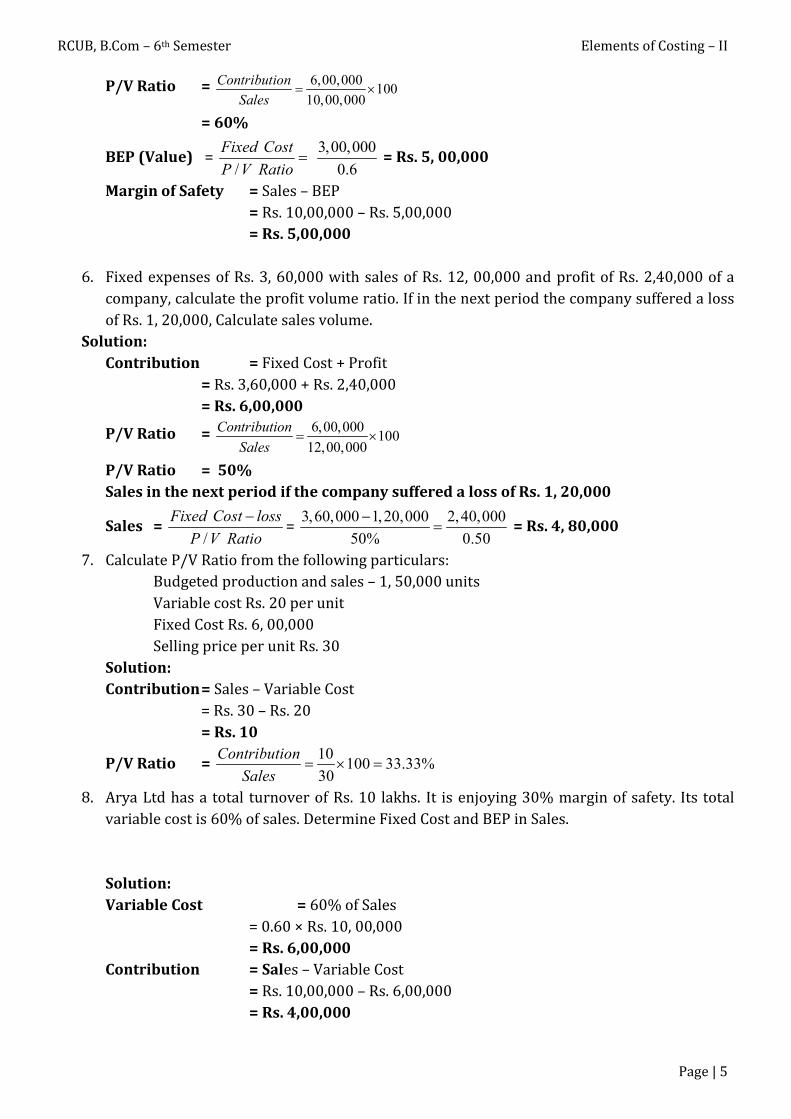
5. From the following information of Asha Co. Ltd. Calculate P/V Ratio and Margin of Safety.
i. Sales -- Rs. 10, 00,000 ii. Variable Cost -- Rs. 4, 00,000
iii. Profit -- Rs. 3, 00,000 Solution: Contribution = Sales – Variable Cost = Rs. 10,00,000 – Rs. 4,00,000 = Rs. 6,00,000 Fixed Cost = Sales – Variable Cost – Profit or Contribution - Profit = Rs. 10,00,000 – Rs. 4,00,000 – Rs. 3,00,000 = Rs. 10,00,000 – Rs. 7,00,000 = Rs. 3,00,000
RCUB, B.Com – 6th Semester Elements of Costing – II
Page | 5
P/V Ratio = 6,00,000100
10,00,000
Contribution
Sales
= 60%
BEP (Value) = 3,00,000
/ 0.6
Fixed Cost
P V Ratio = Rs. 5, 00,000
Margin of Safety = Sales – BEP = Rs. 10,00,000 – Rs. 5,00,000 = Rs. 5,00,000
6. Fixed expenses of Rs. 3, 60,000 with sales of Rs. 12, 00,000 and profit of Rs. 2,40,000 of a
company, calculate the profit volume ratio. If in the next period the company suffered a loss of Rs. 1, 20,000, Calculate sales volume.
Solution: Contribution = Fixed Cost + Profit = Rs. 3,60,000 + Rs. 2,40,000 = Rs. 6,00,000
P/V Ratio = 6,00,000100
12,00,000
Contribution
Sales
P/V Ratio = 50% Sales in the next period if the company suffered a loss of Rs. 1, 20,000
Sales = /
Fixed Cost loss
P V Ratio
=
3,60,000 1,20,000 2,40,000
50% 0.50
= Rs. 4, 80,000
7. Calculate P/V Ratio from the following particulars: Budgeted production and sales – 1, 50,000 units Variable cost Rs. 20 per unit Fixed Cost Rs. 6, 00,000 Selling price per unit Rs. 30
Solution: Contribution = Sales – Variable Cost = Rs. 30 – Rs. 20 = Rs. 10
P/V Ratio = 10
100 33.33%30
Contribution
Sales
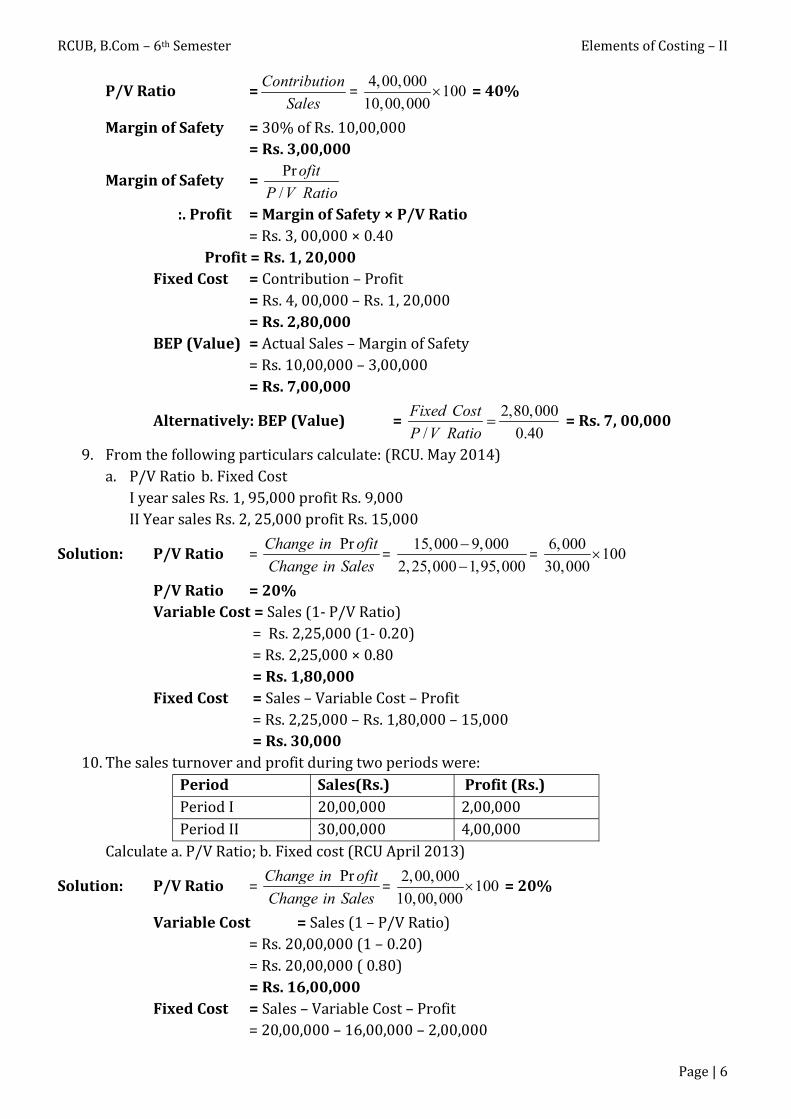
8. Arya Ltd has a total turnover of Rs. 10 lakhs. It is enjoying 30% margin of safety. Its total variable cost is 60% of sales. Determine Fixed Cost and BEP in Sales. Solution: Variable Cost = 60% of Sales = 0.60 × Rs. 10, 00,000 = Rs. 6,00,000 Contribution = Sales – Variable Cost = Rs. 10,00,000 – Rs. 6,00,000 = Rs. 4,00,000
RCUB, B.Com – 6th Semester Elements of Costing – II
Page | 6
P/V Ratio =Contribution
Sales=
4,00,000100
10,00,000 = 40%
Margin of Safety = 30% of Rs. 10,00,000 = Rs. 3,00,000
Margin of Safety = Pr
/
ofit
P V Ratio
:. Profit = Margin of Safety × P/V Ratio = Rs. 3, 00,000 × 0.40
Profit = Rs. 1, 20,000 Fixed Cost = Contribution – Profit = Rs. 4, 00,000 – Rs. 1, 20,000 = Rs. 2,80,000 BEP (Value) = Actual Sales – Margin of Safety = Rs. 10,00,000 – 3,00,000 = Rs. 7,00,000
Alternatively: BEP (Value) = 2,80,000
/ 0.40
Fixed Cost
P V Ratio = Rs. 7, 00,000
9. From the following particulars calculate: (RCU. May 2014) a. P/V Ratio b. Fixed Cost
I year sales Rs. 1, 95,000 profit Rs. 9,000 II Year sales Rs. 2, 25,000 profit Rs. 15,000
Solution: P/V Ratio = PrChange in ofit
Change in Sales=
15,000 9,000
2,25,000 1,95,000
= 6,000
10030,000
P/V Ratio = 20% Variable Cost = Sales (1- P/V Ratio) = Rs. 2,25,000 (1- 0.20) = Rs. 2,25,000 × 0.80 = Rs. 1,80,000 Fixed Cost = Sales – Variable Cost – Profit = Rs. 2,25,000 – Rs. 1,80,000 – 15,000 = Rs. 30,000
10. The sales turnover and profit during two periods were: Period Sales(Rs.) Profit (Rs.) Period I 20,00,000 2,00,000 Period II 30,00,000 4,00,000
Calculate a. P/V Ratio; b. Fixed cost (RCU April 2013)
Solution: P/V Ratio = PrChange in ofit
Change in Sales=
2,00,000100
10,00,000 = 20%
Variable Cost = Sales (1 – P/V Ratio) = Rs. 20,00,000 (1 – 0.20) = Rs. 20,00,000 ( 0.80) = Rs. 16,00,000 Fixed Cost = Sales – Variable Cost – Profit = 20,00,000 – 16,00,000 – 2,00,000
RCUB, B.Com – 6th Semester Elements of Costing – II
Page | 7
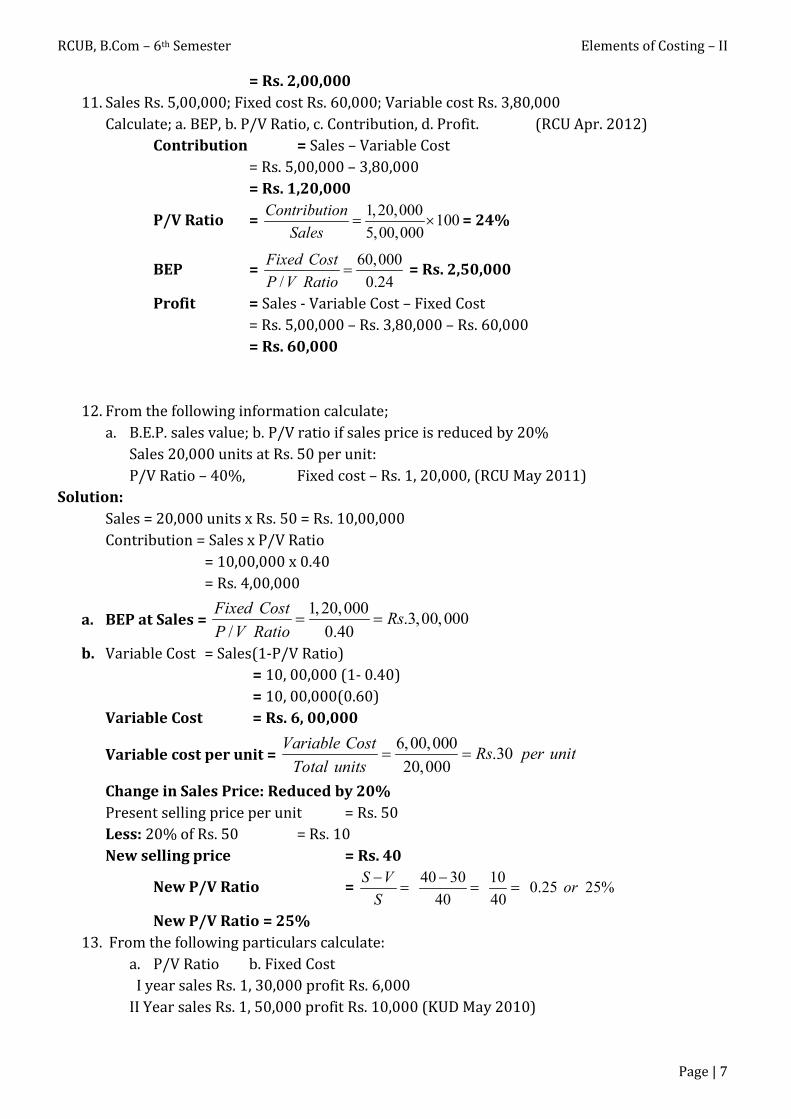
= Rs. 2,00,000 11. Sales Rs. 5,00,000; Fixed cost Rs. 60,000; Variable cost Rs. 3,80,000
Calculate; a. BEP, b. P/V Ratio, c. Contribution, d. Profit. (RCU Apr. 2012) Contribution = Sales – Variable Cost = Rs. 5,00,000 – 3,80,000 = Rs. 1,20,000
P/V Ratio = 1,20,000
1005,00,000
Contribution
Sales = 24%
BEP = 60,000
/ 0.24
Fixed Cost
P V Ratio = Rs. 2,50,000
Profit = Sales - Variable Cost – Fixed Cost = Rs. 5,00,000 – Rs. 3,80,000 – Rs. 60,000 = Rs. 60,000
12. From the following information calculate; a. B.E.P. sales value; b. P/V ratio if sales price is reduced by 20%
Sales 20,000 units at Rs. 50 per unit: P/V Ratio – 40%, Fixed cost – Rs. 1, 20,000, (RCU May 2011)
Solution: Sales = 20,000 units x Rs. 50 = Rs. 10,00,000 Contribution = Sales x P/V Ratio = 10,00,000 x 0.40 = Rs. 4,00,000
a. BEP at Sales = 1,20,000
.3,00,000/ 0.40
Fixed CostRs
P V Ratio
b. Variable Cost = Sales(1-P/V Ratio) = 10, 00,000 (1- 0.40) = 10, 00,000(0.60)
Variable Cost = Rs. 6, 00,000
Variable cost per unit = 6,00,000
.3020,000
Variable CostRs per unit
Total units
Change in Sales Price: Reduced by 20% Present selling price per unit = Rs. 50 Less: 20% of Rs. 50 = Rs. 10 New selling price = Rs. 40
New P/V Ratio = 40 30 10
0.25 25%40 40
S Vor
S
New P/V Ratio = 25% 13. From the following particulars calculate:
a. P/V Ratio b. Fixed Cost I year sales Rs. 1, 30,000 profit Rs. 6,000 II Year sales Rs. 1, 50,000 profit Rs. 10,000 (KUD May 2010)
RCUB, B.Com – 6th Semester Elements of Costing – II
Page | 8
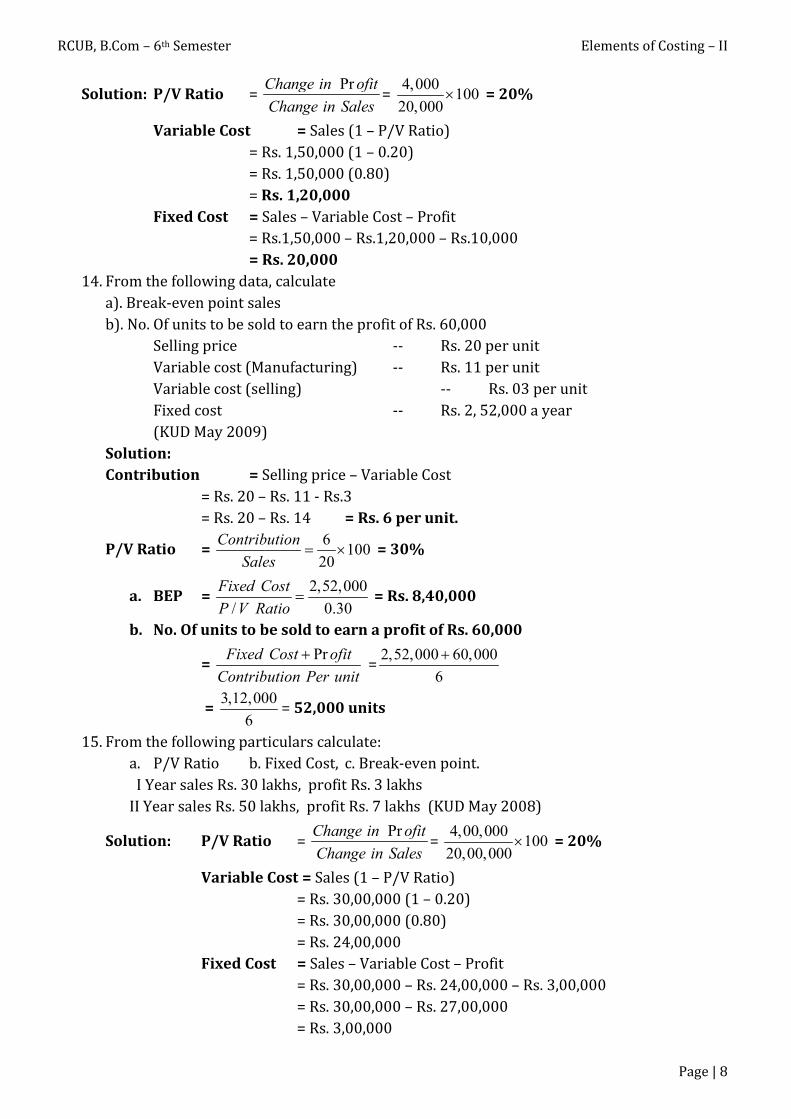
Solution: P/V Ratio = PrChange in ofit
Change in Sales=
4,000100
20,000 = 20%
Variable Cost = Sales (1 – P/V Ratio) = Rs. 1,50,000 (1 – 0.20) = Rs. 1,50,000 (0.80) = Rs. 1,20,000 Fixed Cost = Sales – Variable Cost – Profit = Rs.1,50,000 – Rs.1,20,000 – Rs.10,000 = Rs. 20,000 14. From the following data, calculate
a). Break-even point sales b). No. Of units to be sold to earn the profit of Rs. 60,000 Selling price -- Rs. 20 per unit Variable cost (Manufacturing) -- Rs. 11 per unit Variable cost (selling) -- Rs. 03 per unit Fixed cost -- Rs. 2, 52,000 a year (KUD May 2009) Solution: Contribution = Selling price – Variable Cost = Rs. 20 – Rs. 11 - Rs.3 = Rs. 20 – Rs. 14 = Rs. 6 per unit.
P/V Ratio = 6
10020
Contribution
Sales = 30%
a. BEP = 2,52,000
/ 0.30
Fixed Cost
P V Ratio = Rs. 8,40,000
b. No. Of units to be sold to earn a profit of Rs. 60,000
= PrFixed Cost ofit
Contribution Per unit
=
2,52,000 60,000
6
= 3,12,000
6= 52,000 units
15. From the following particulars calculate: a. P/V Ratio b. Fixed Cost, c. Break-even point. I Year sales Rs. 30 lakhs, profit Rs. 3 lakhs II Year sales Rs. 50 lakhs, profit Rs. 7 lakhs (KUD May 2008)
Solution: P/V Ratio = PrChange in ofit
Change in Sales=
4,00,000100
20,00,000 = 20%
Variable Cost = Sales (1 – P/V Ratio) = Rs. 30,00,000 (1 – 0.20) = Rs. 30,00,000 (0.80) = Rs. 24,00,000 Fixed Cost = Sales – Variable Cost – Profit = Rs. 30,00,000 – Rs. 24,00,000 – Rs. 3,00,000 = Rs. 30,00,000 – Rs. 27,00,000 = Rs. 3,00,000
RCUB, B.Com – 6th Semester Elements of Costing – II
Page | 9
BEP = /
Fixed Cost
P V Ratio=
3,00,000
0.20 = Rs. 15,00,000
Utility of Marginal Costing and Cost-Volume-Profit Analysis: Marginal Costing and CPV analysis assume a greater significance in guiding management in making various decisions with the help of its tools like contribution, Break-even point, P/V Ratio and Margin of Safety. Following are some of the important areas where marginal costing is effectively applied for decision making.
1. Pricing Decisions 2. Accepting Special Bulk Orders or Foreign Market Orders 3. Profit Planning 4. Make or Buy Decisions 5. Problem of Key or Limiting factor 6. Choice of Profitable Sales Mix 7. Decision Making 8. Evaluation of Performance 9. Determination of optimum Activity Level 10. Cost Control
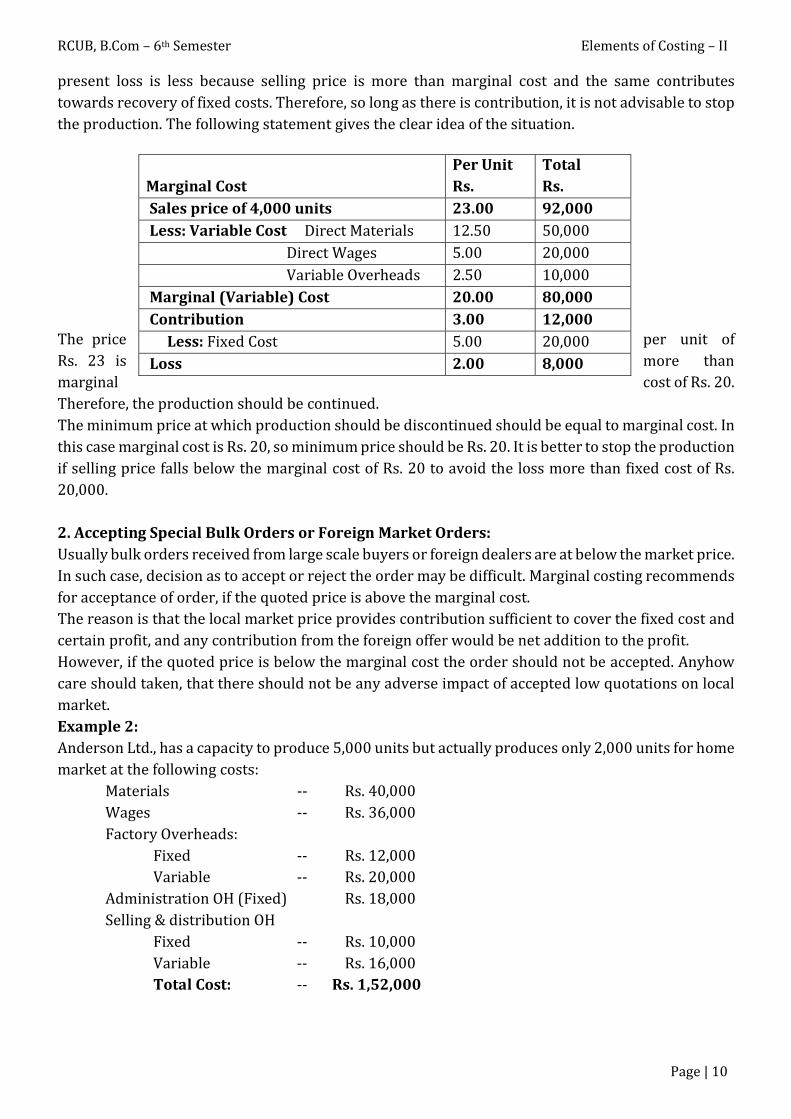
1. Pricing Decisions: In normal situations the prices of the products are usually fixed to cover variable cost, fixed cost and desired margin of profit. Under such situations, the marginal costing has no role to play. But during the period of depression and competition marginal costing guides the management in fixing selling price. According to marginal costing, the price of the product should be equal to marginal cost during depression and competition. If price falls below the marginal cost, it would be advisable to stop the production. In other words the production should be continued so long as the price equals the marginal cost. It is so because any excess of price over marginal cost contributes to the recovery of fixed cost and minimizes loss to such extent. Example 1: A cost sheet shows the following situations prevailing in Star Ltd., which is facing depression: Direct Materials -- Rs. 50,000 Direct Wages -- Rs. 20,000 Overheads: Variable -- Rs. 10,000 Fixed -- Rs. 20,000 -- Rs. 30,000 Total Cost -- Rs.1,00,000 Sales 4,000 units @ Rs. 23 per unit -- Rs. 92,000 Loss: -- Rs. 8,000 There is no sign of improvement in the situation. Therefore, the management wants to know whether it is desirable to stop the production. What should be the minimum price at which company should shut down its production? Solution: Even if there is a loss of Rs. 8,000, it is not desirable to stop the production. Because, fixed costs will be incurred even if production is stopped and loss would be equal to fixed cost of Rs. 20,000. The
RCUB, B.Com – 6th Semester Elements of Costing – II
Page | 10
present loss is less because selling price is more than marginal cost and the same contributes towards recovery of fixed costs. Therefore, so long as there is contribution, it is not advisable to stop the production. The following statement gives the clear idea of the situation.
The price per unit of Rs. 23 is more than marginal cost of Rs. 20. Therefore, the production should be continued. The minimum price at which production should be discontinued should be equal to marginal cost. In this case marginal cost is Rs. 20, so minimum price should be Rs. 20. It is better to stop the production if selling price falls below the marginal cost of Rs. 20 to avoid the loss more than fixed cost of Rs. 20,000. 2. Accepting Special Bulk Orders or Foreign Market Orders: Usually bulk orders received from large scale buyers or foreign dealers are at below the market price. In such case, decision as to accept or reject the order may be difficult. Marginal costing recommends for acceptance of order, if the quoted price is above the marginal cost. The reason is that the local market price provides contribution sufficient to cover the fixed cost and certain profit, and any contribution from the foreign offer would be net addition to the profit. However, if the quoted price is below the marginal cost the order should not be accepted. Anyhow care should taken, that there should not be any adverse impact of accepted low quotations on local market. Example 2: Anderson Ltd., has a capacity to produce 5,000 units but actually produces only 2,000 units for home market at the following costs: Materials -- Rs. 40,000 Wages -- Rs. 36,000 Factory Overheads: Fixed -- Rs. 12,000 Variable -- Rs. 20,000 Administration OH (Fixed) Rs. 18,000 Selling & distribution OH Fixed -- Rs. 10,000 Variable -- Rs. 16,000 Total Cost: -- Rs. 1,52,000
Marginal Cost Per Unit Rs.
Total Rs.
Sales price of 4,000 units 23.00 92,000 Less: Variable Cost Direct Materials 12.50 50,000 Direct Wages 5.00 20,000 Variable Overheads 2.50 10,000 Marginal (Variable) Cost 20.00 80,000 Contribution 3.00 12,000 Less: Fixed Cost 5.00 20,000 Loss 2.00 8,000
RCUB, B.Com – 6th Semester Elements of Costing – II
Page | 11
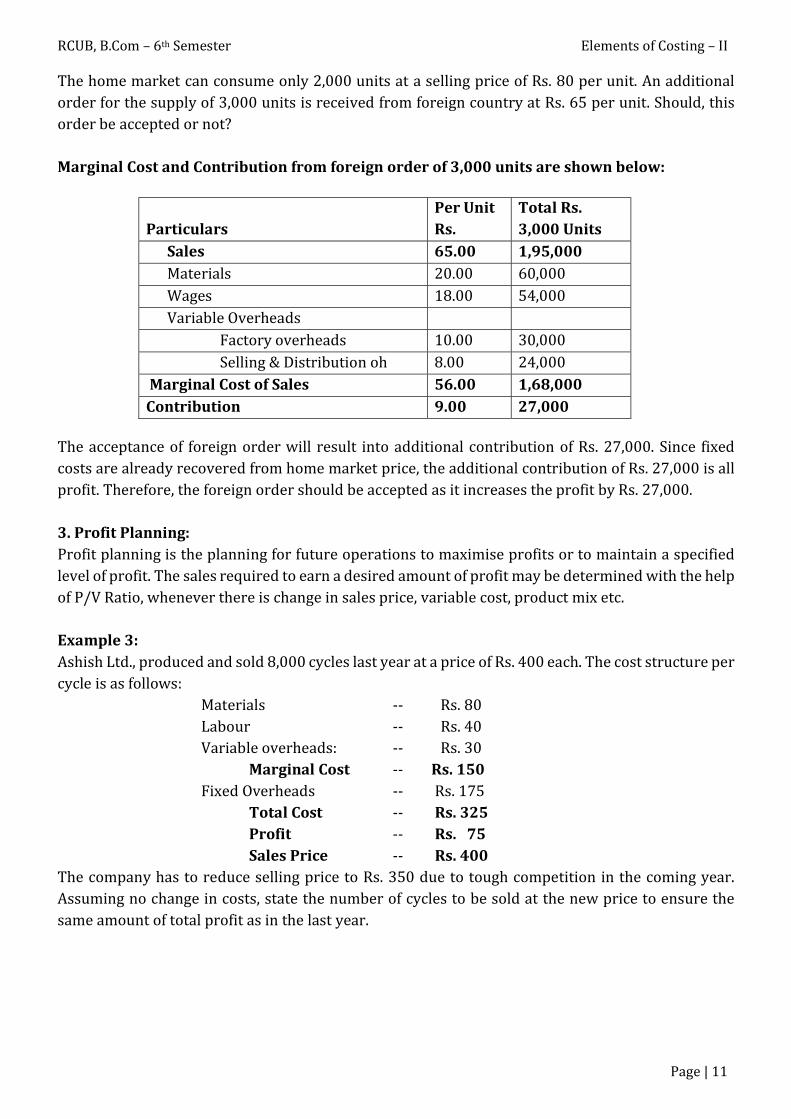
The home market can consume only 2,000 units at a selling price of Rs. 80 per unit. An additional order for the supply of 3,000 units is received from foreign country at Rs. 65 per unit. Should, this order be accepted or not? Marginal Cost and Contribution from foreign order of 3,000 units are shown below: The acceptance of foreign order will result into additional contribution of Rs. 27,000. Since fixed costs are already recovered from home market price, the additional contribution of Rs. 27,000 is all profit. Therefore, the foreign order should be accepted as it increases the profit by Rs. 27,000. 3. Profit Planning: Profit planning is the planning for future operations to maximise profits or to maintain a specified level of profit. The sales required to earn a desired amount of profit may be determined with the help of P/V Ratio, whenever there is change in sales price, variable cost, product mix etc. Example 3: Ashish Ltd., produced and sold 8,000 cycles last year at a price of Rs. 400 each. The cost structure per cycle is as follows: Materials -- Rs. 80 Labour -- Rs. 40 Variable overheads: -- Rs. 30 Marginal Cost -- Rs. 150 Fixed Overheads -- Rs. 175 Total Cost -- Rs. 325 Profit -- Rs. 75 Sales Price -- Rs. 400 The company has to reduce selling price to Rs. 350 due to tough competition in the coming year. Assuming no change in costs, state the number of cycles to be sold at the new price to ensure the same amount of total profit as in the last year.
Particulars Per Unit Rs.
Total Rs. 3,000 Units
Sales 65.00 1,95,000 Materials 20.00 60,000 Wages 18.00 54,000 Variable Overheads Factory overheads 10.00 30,000 Selling & Distribution oh 8.00 24,000 Marginal Cost of Sales 56.00 1,68,000 Contribution 9.00 27,000
RCUB, B.Com – 6th Semester Elements of Costing – II
Page | 12
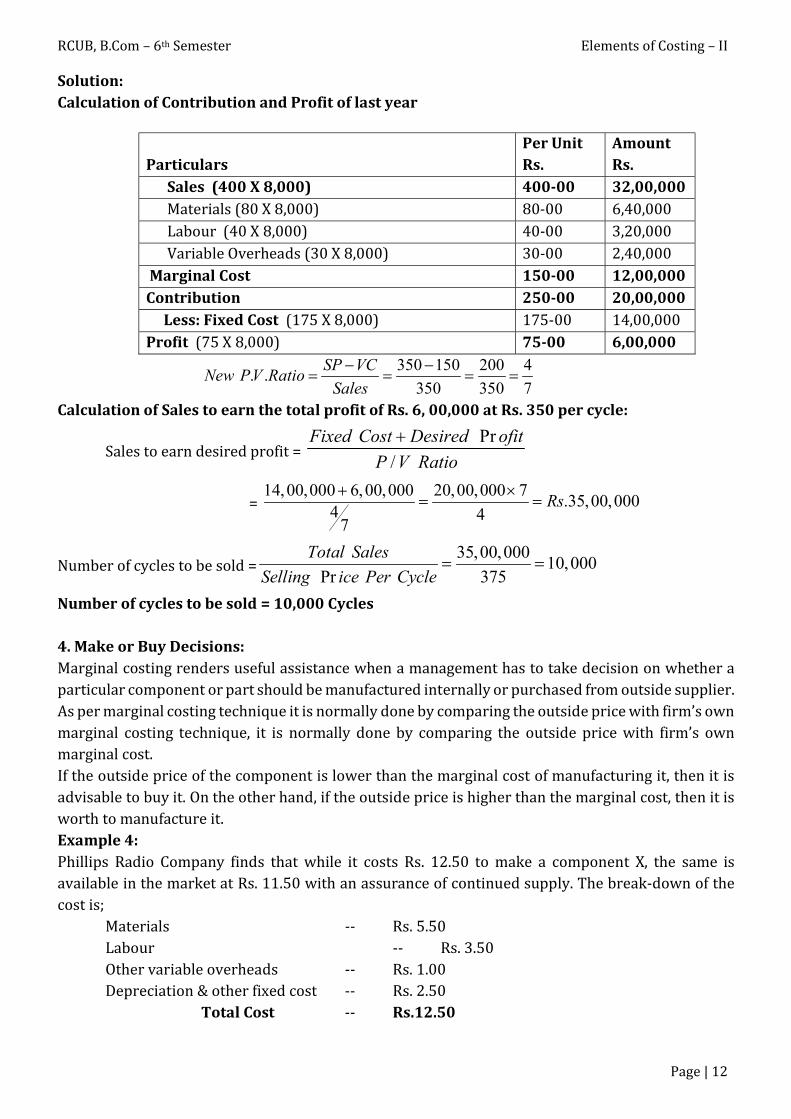
Solution: Calculation of Contribution and Profit of last year
350 150 200 4. .
350 350 7
SP VCNew PV Ratio
Sales
Calculation of Sales to earn the total profit of Rs. 6, 00,000 at Rs. 350 per cycle:
Sales to earn desired profit = Pr
/
Fixed Cost Desired ofit
P V Ratio
= 14,00,000 6,00,000 20,00,000 7
.35,00,0004 4
7
Rs
Number of cycles to be sold =35,00,000
10,000Pr 375
Total Sales
Selling ice Per Cycle
Number of cycles to be sold = 10,000 Cycles 4. Make or Buy Decisions: Marginal costing renders useful assistance when a management has to take decision on whether a particular component or part should be manufactured internally or purchased from outside supplier. As per marginal costing technique it is normally done by comparing the outside price with firm’s own marginal costing technique, it is normally done by comparing the outside price with firm’s own marginal cost. If the outside price of the component is lower than the marginal cost of manufacturing it, then it is advisable to buy it. On the other hand, if the outside price is higher than the marginal cost, then it is worth to manufacture it. Example 4: Phillips Radio Company finds that while it costs Rs. 12.50 to make a component X, the same is available in the market at Rs. 11.50 with an assurance of continued supply. The break-down of the cost is; Materials -- Rs. 5.50 Labour -- Rs. 3.50 Other variable overheads -- Rs. 1.00 Depreciation & other fixed cost -- Rs. 2.50 Total Cost -- Rs.12.50
Particulars Per Unit Rs.
Amount Rs.
Sales (400 X 8,000) 400-00 32,00,000 Materials (80 X 8,000) 80-00 6,40,000 Labour (40 X 8,000) 40-00 3,20,000 Variable Overheads (30 X 8,000) 30-00 2,40,000 Marginal Cost 150-00 12,00,000 Contribution 250-00 20,00,000 Less: Fixed Cost (175 X 8,000) 175-00 14,00,000 Profit (75 X 8,000) 75-00 6,00,000
RCUB, B.Com – 6th Semester Elements of Costing – II
Page | 13
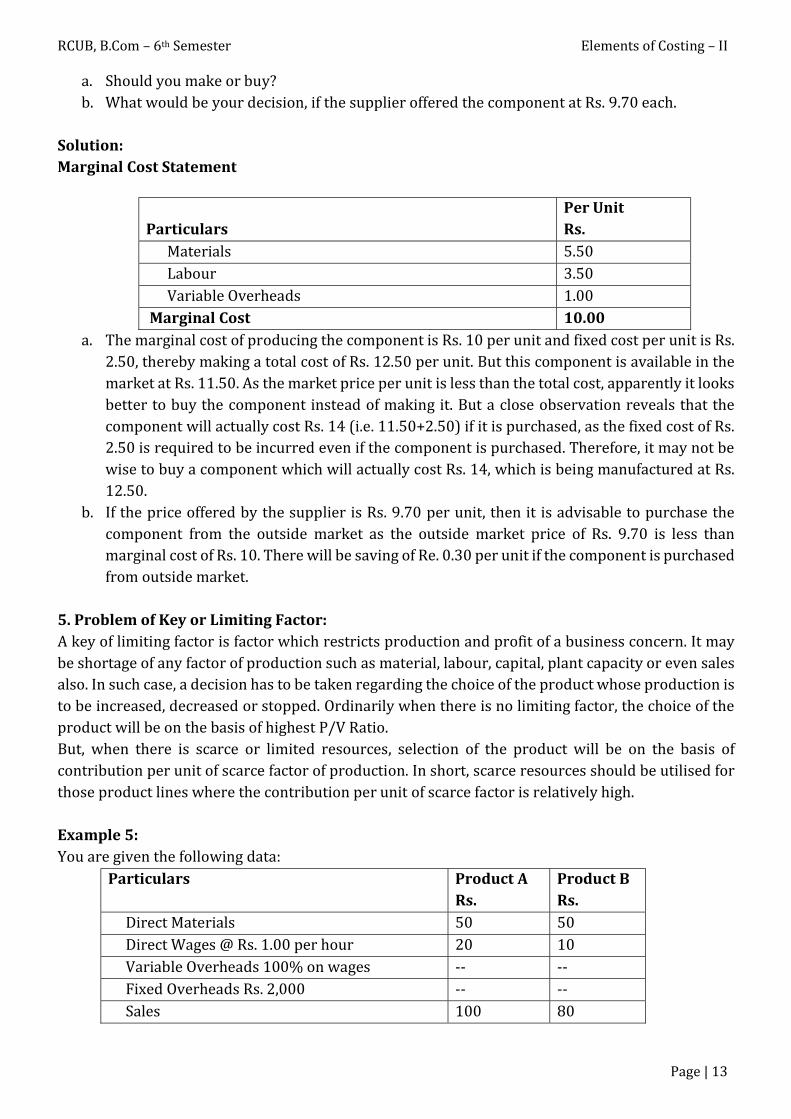
a. Should you make or buy? b. What would be your decision, if the supplier offered the component at Rs. 9.70 each.
Solution: Marginal Cost Statement
a. The marginal cost of producing the component is Rs. 10 per unit and fixed cost per unit is Rs. 2.50, thereby making a total cost of Rs. 12.50 per unit. But this component is available in the market at Rs. 11.50. As the market price per unit is less than the total cost, apparently it looks better to buy the component instead of making it. But a close observation reveals that the component will actually cost Rs. 14 (i.e. 11.50+2.50) if it is purchased, as the fixed cost of Rs. 2.50 is required to be incurred even if the component is purchased. Therefore, it may not be wise to buy a component which will actually cost Rs. 14, which is being manufactured at Rs. 12.50.
b. If the price offered by the supplier is Rs. 9.70 per unit, then it is advisable to purchase the component from the outside market as the outside market price of Rs. 9.70 is less than marginal cost of Rs. 10. There will be saving of Re. 0.30 per unit if the component is purchased from outside market.
5. Problem of Key or Limiting Factor: A key of limiting factor is factor which restricts production and profit of a business concern. It may be shortage of any factor of production such as material, labour, capital, plant capacity or even sales also. In such case, a decision has to be taken regarding the choice of the product whose production is to be increased, decreased or stopped. Ordinarily when there is no limiting factor, the choice of the product will be on the basis of highest P/V Ratio. But, when there is scarce or limited resources, selection of the product will be on the basis of contribution per unit of scarce factor of production. In short, scarce resources should be utilised for those product lines where the contribution per unit of scarce factor is relatively high. Example 5: You are given the following data:
Particulars Product A Rs.
Product B Rs.
Direct Materials 50 50 Direct Wages @ Rs. 1.00 per hour 20 10 Variable Overheads 100% on wages -- -- Fixed Overheads Rs. 2,000 -- -- Sales 100 80
Particulars Per Unit Rs.
Materials 5.50 Labour 3.50 Variable Overheads 1.00 Marginal Cost 10.00
RCUB, B.Com – 6th Semester Elements of Costing – II
Page | 14
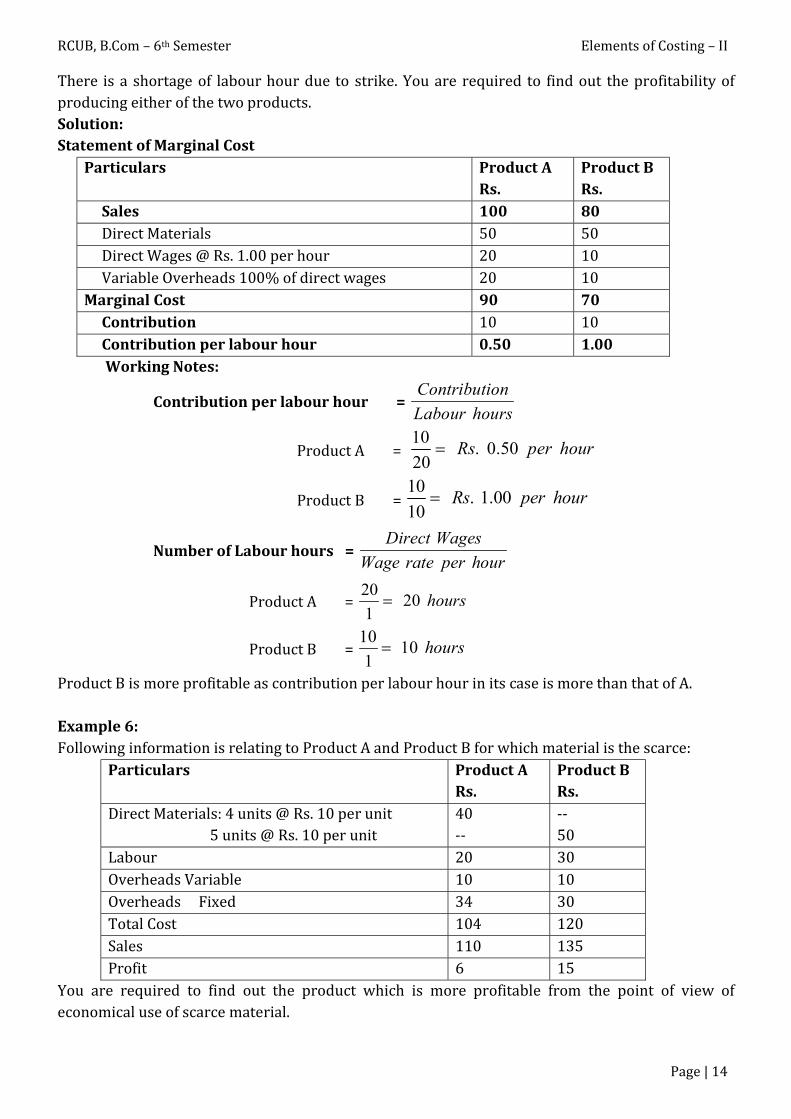
There is a shortage of labour hour due to strike. You are required to find out the profitability of producing either of the two products. Solution: Statement of Marginal Cost
Particulars Product A Rs.
Product B Rs.
Sales 100 80 Direct Materials 50 50 Direct Wages @ Rs. 1.00 per hour 20 10 Variable Overheads 100% of direct wages 20 10 Marginal Cost 90 70 Contribution 10 10 Contribution per labour hour 0.50 1.00
Working Notes:
Contribution per labour hour = Contribution
Labour hours
Product A = 10
. 0.5020
Rs per hour
Product B = 10
. 1.0010
Rs per hour
Number of Labour hours = Direct Wages
Wage rate per hour
Product A = 20
201
hours
Product B = 10
101
hours
Product B is more profitable as contribution per labour hour in its case is more than that of A. Example 6: Following information is relating to Product A and Product B for which material is the scarce:
Particulars Product A Rs.
Product B Rs.
Direct Materials: 4 units @ Rs. 10 per unit 5 units @ Rs. 10 per unit
40 --
-- 50
Labour 20 30 Overheads Variable 10 10 Overheads Fixed 34 30 Total Cost 104 120 Sales 110 135 Profit 6 15
You are required to find out the product which is more profitable from the point of view of economical use of scarce material.
RCUB, B.Com – 6th Semester Elements of Costing – II
Page | 15
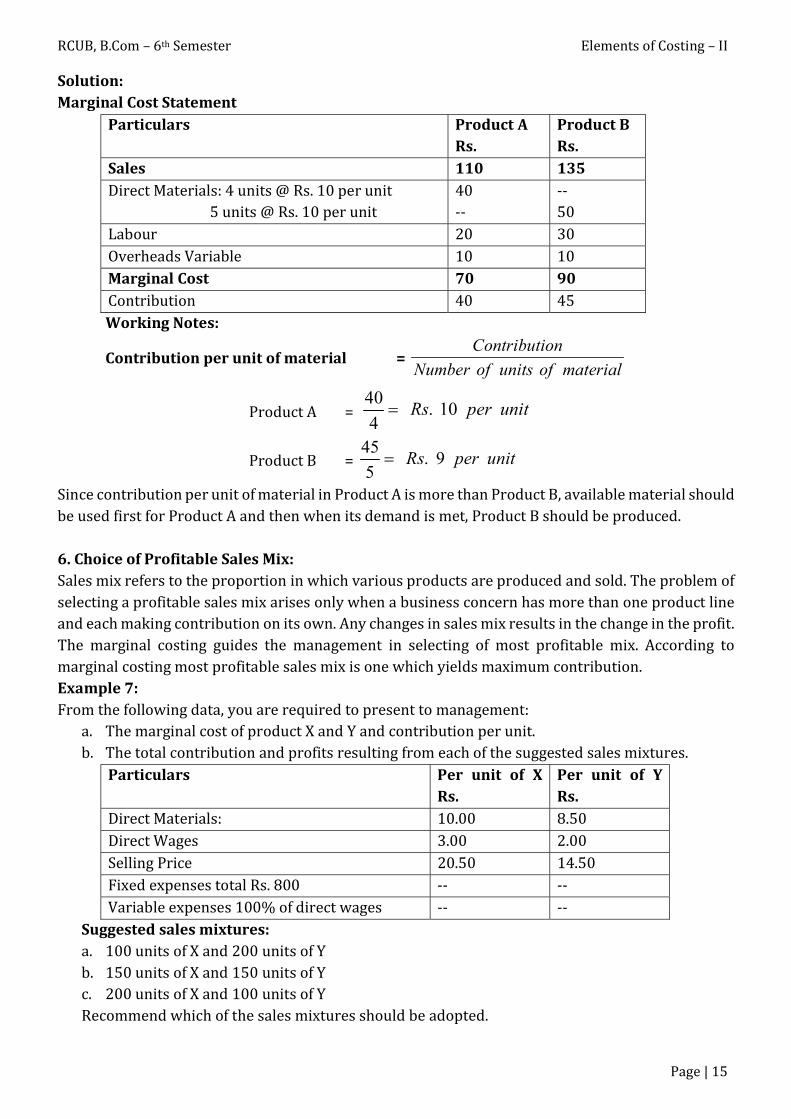
Solution: Marginal Cost Statement
Particulars Product A Rs.
Product B Rs.
Sales 110 135 Direct Materials: 4 units @ Rs. 10 per unit 5 units @ Rs. 10 per unit
40 --
-- 50
Labour 20 30 Overheads Variable 10 10 Marginal Cost 70 90 Contribution 40 45 Working Notes:
Contribution per unit of material = Contribution
Number of units of material
Product A = 40
. 104
Rs per unit
Product B = 45
. 95
Rs per unit
Since contribution per unit of material in Product A is more than Product B, available material should be used first for Product A and then when its demand is met, Product B should be produced. 6. Choice of Profitable Sales Mix: Sales mix refers to the proportion in which various products are produced and sold. The problem of selecting a profitable sales mix arises only when a business concern has more than one product line and each making contribution on its own. Any changes in sales mix results in the change in the profit. The marginal costing guides the management in selecting of most profitable mix. According to marginal costing most profitable sales mix is one which yields maximum contribution. Example 7: From the following data, you are required to present to management:
a. The marginal cost of product X and Y and contribution per unit. b. The total contribution and profits resulting from each of the suggested sales mixtures.
Particulars Per unit of X Rs.
Per unit of Y Rs.
Direct Materials: 10.00 8.50 Direct Wages 3.00 2.00 Selling Price 20.50 14.50 Fixed expenses total Rs. 800 -- -- Variable expenses 100% of direct wages -- --
Suggested sales mixtures: a. 100 units of X and 200 units of Y b. 150 units of X and 150 units of Y c. 200 units of X and 100 units of Y Recommend which of the sales mixtures should be adopted.
RCUB, B.Com – 6th Semester Elements of Costing – II
Page | 16
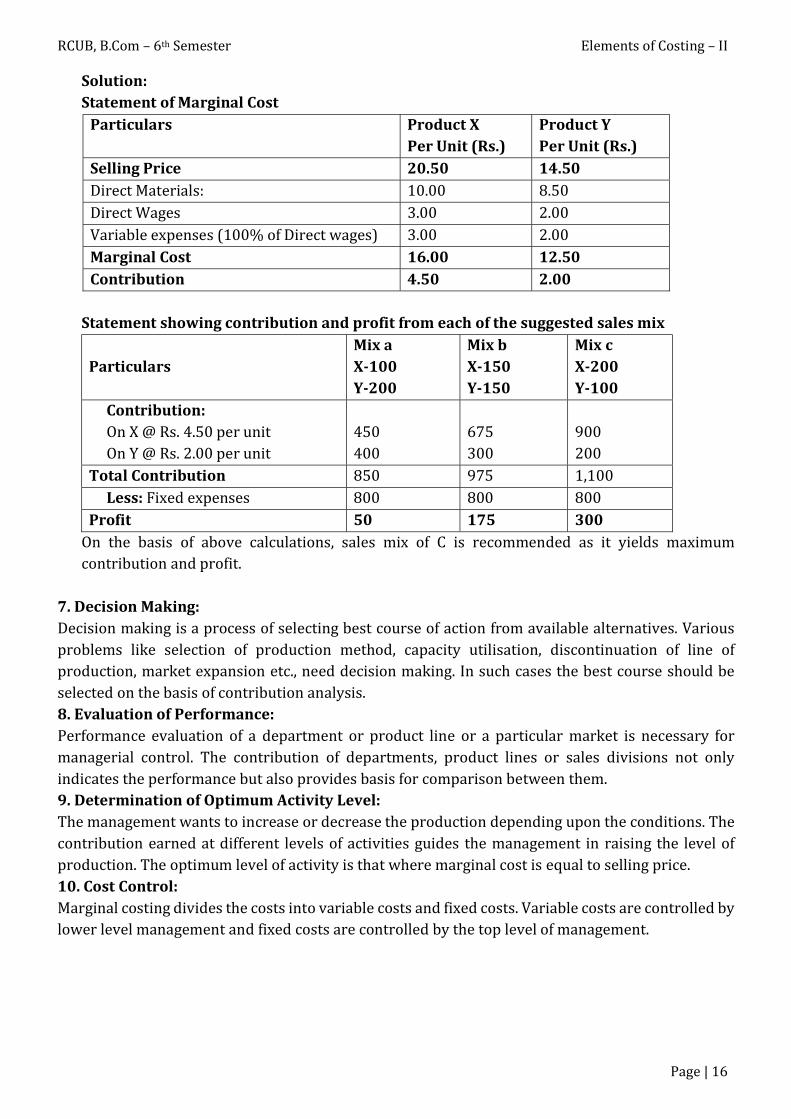
Solution: Statement of Marginal Cost
Particulars Product X Per Unit (Rs.)
Product Y Per Unit (Rs.)
Selling Price 20.50 14.50 Direct Materials: 10.00 8.50 Direct Wages 3.00 2.00 Variable expenses (100% of Direct wages) 3.00 2.00 Marginal Cost 16.00 12.50 Contribution 4.50 2.00
Statement showing contribution and profit from each of the suggested sales mix
Particulars
Mix a X-100 Y-200
Mix b X-150 Y-150
Mix c X-200 Y-100
Contribution: On X @ Rs. 4.50 per unit On Y @ Rs. 2.00 per unit
450 400
675 300
900 200
Total Contribution 850 975 1,100 Less: Fixed expenses 800 800 800 Profit 50 175 300
On the basis of above calculations, sales mix of C is recommended as it yields maximum contribution and profit.
7. Decision Making: Decision making is a process of selecting best course of action from available alternatives. Various problems like selection of production method, capacity utilisation, discontinuation of line of production, market expansion etc., need decision making. In such cases the best course should be selected on the basis of contribution analysis. 8. Evaluation of Performance: Performance evaluation of a department or product line or a particular market is necessary for managerial control. The contribution of departments, product lines or sales divisions not only indicates the performance but also provides basis for comparison between them. 9. Determination of Optimum Activity Level: The management wants to increase or decrease the production depending upon the conditions. The contribution earned at different levels of activities guides the management in raising the level of production. The optimum level of activity is that where marginal cost is equal to selling price. 10. Cost Control: Marginal costing divides the costs into variable costs and fixed costs. Variable costs are controlled by lower level management and fixed costs are controlled by the top level of management.
RCUB, B.Com – 6th Semester Elements of Costing – II
Page | 17
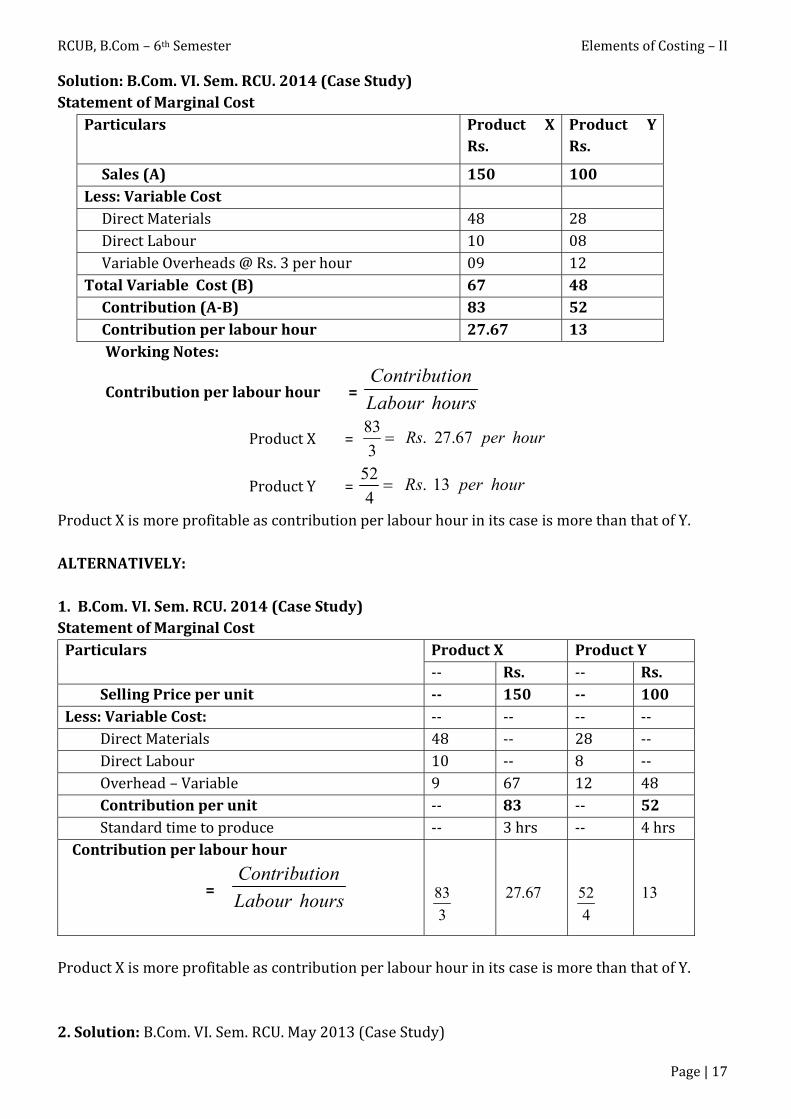
Solution: B.Com. VI. Sem. RCU. 2014 (Case Study) Statement of Marginal Cost
Particulars Product X Rs.
Product Y Rs.
Sales (A) 150 100 Less: Variable Cost Direct Materials 48 28 Direct Labour 10 08 Variable Overheads @ Rs. 3 per hour 09 12 Total Variable Cost (B) 67 48 Contribution (A-B) 83 52 Contribution per labour hour 27.67 13
Working Notes:
Contribution per labour hour = Contribution
Labour hours
Product X = 83
. 27.673
Rs per hour
Product Y = 52
. 134
Rs per hour
Product X is more profitable as contribution per labour hour in its case is more than that of Y. ALTERNATIVELY: 1. B.Com. VI. Sem. RCU. 2014 (Case Study) Statement of Marginal Cost
Particulars Product X Product Y -- Rs. -- Rs.
Selling Price per unit -- 150 -- 100 Less: Variable Cost: -- -- -- -- Direct Materials 48 -- 28 -- Direct Labour 10 -- 8 -- Overhead – Variable 9 67 12 48 Contribution per unit -- 83 -- 52 Standard time to produce -- 3 hrs -- 4 hrs Contribution per labour hour
= Contribution
Labour hours
83
3
27.67
52
4
13
Product X is more profitable as contribution per labour hour in its case is more than that of Y. 2. Solution: B.Com. VI. Sem. RCU. May 2013 (Case Study)
RCUB, B.Com – 6th Semester Elements of Costing – II
Page | 18
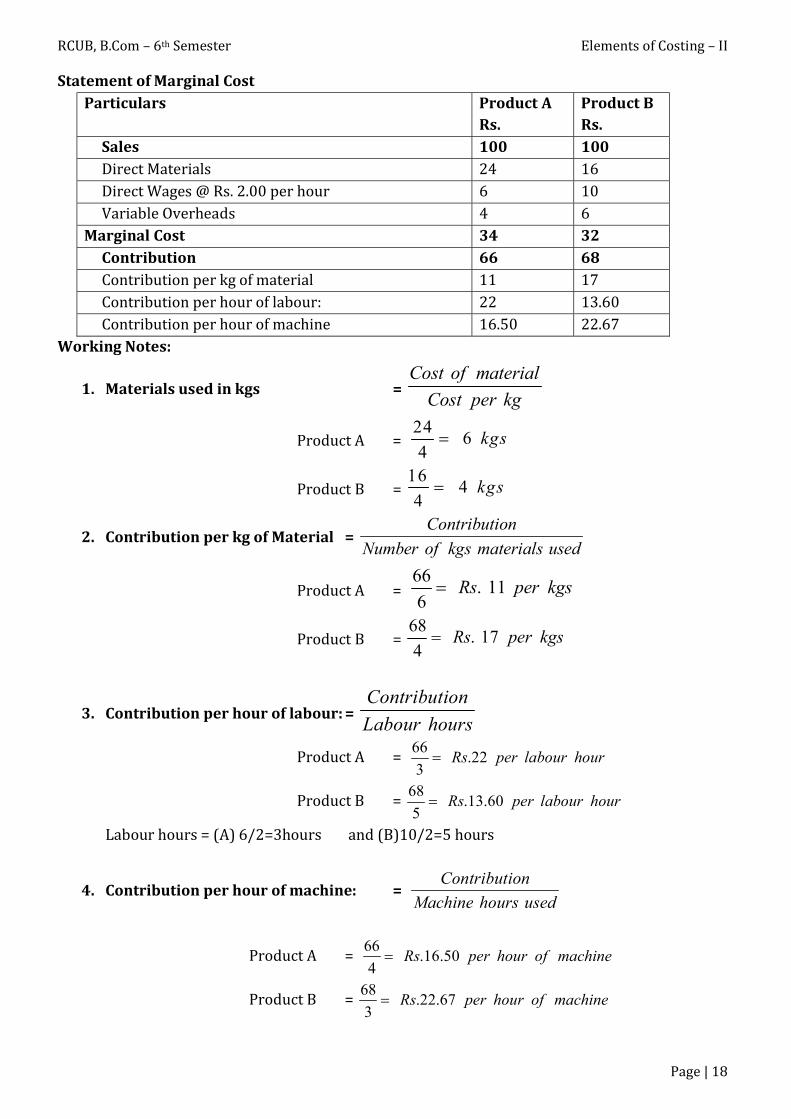
Statement of Marginal Cost Particulars Product A
Rs. Product B Rs.
Sales 100 100 Direct Materials 24 16 Direct Wages @ Rs. 2.00 per hour 6 10 Variable Overheads 4 6 Marginal Cost 34 32 Contribution 66 68 Contribution per kg of material 11 17 Contribution per hour of labour: 22 13.60 Contribution per hour of machine 16.50 22.67
Working Notes:
1. Materials used in kgs = Cost of material
Cost per kg
Product A = 24
64
kgs
Product B = 16
44
kgs
2. Contribution per kg of Material = Contribution
Number of kgs materials used
Product A = 66
. 116
Rs per kgs
Product B = 68
. 174
Rs per kgs
3. Contribution per hour of labour: = Contribution
Labour hours
Product A = 66
.223
Rs per labour hour
Product B = 68
.13.605
Rs per labour hour
Labour hours = (A) 6/2=3hours and (B)10/2=5 hours
4. Contribution per hour of machine: = Contribution
Machine hours used
Product A = 66
.16.504
Rs per hour of machine
Product B = 68
.22.673
Rs per hour of machine
RCUB, B.Com – 6th Semester Elements of Costing – II
Page | 19
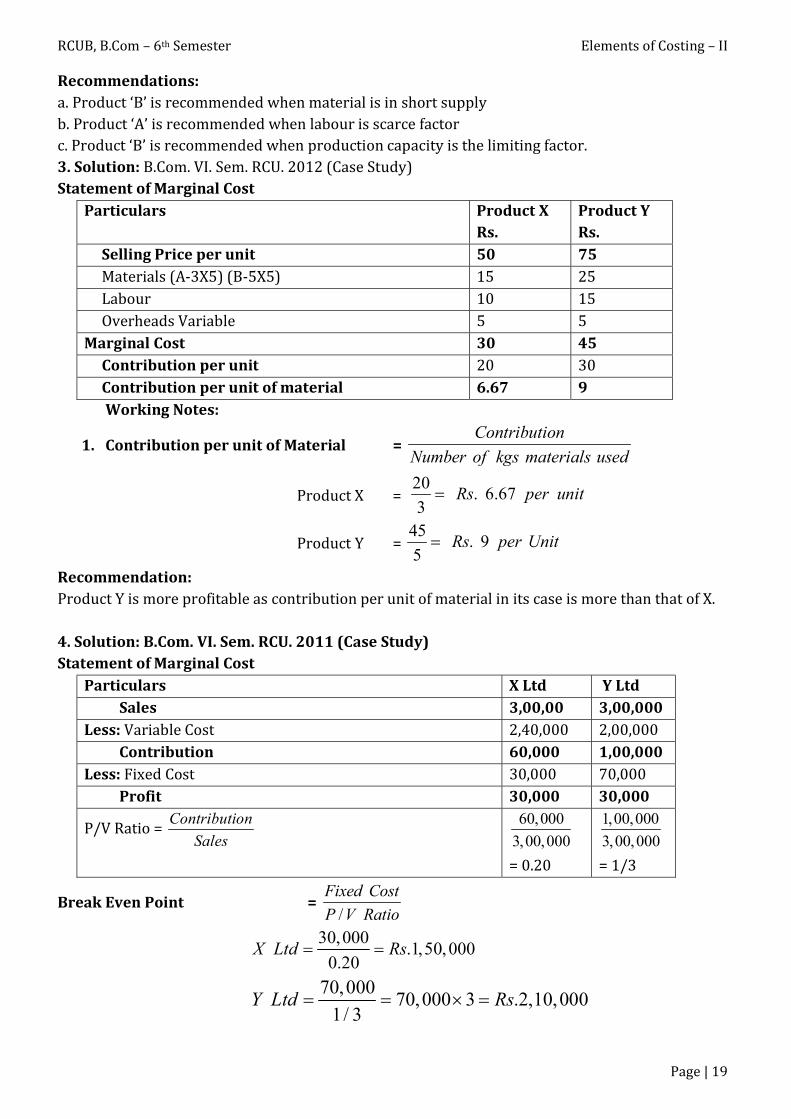
Recommendations: a. Product ‘B’ is recommended when material is in short supply b. Product ‘A’ is recommended when labour is scarce factor c. Product ‘B’ is recommended when production capacity is the limiting factor. 3. Solution: B.Com. VI. Sem. RCU. 2012 (Case Study) Statement of Marginal Cost
Particulars Product X Rs.
Product Y Rs.
Selling Price per unit 50 75 Materials (A-3X5) (B-5X5) 15 25 Labour 10 15 Overheads Variable 5 5 Marginal Cost 30 45 Contribution per unit 20 30 Contribution per unit of material 6.67 9
Working Notes:
1. Contribution per unit of Material = Contribution
Number of kgs materials used
Product X = 20
. 6.673
Rs per unit
Product Y = 45
. 95
Rs per Unit
Recommendation: Product Y is more profitable as contribution per unit of material in its case is more than that of X. 4. Solution: B.Com. VI. Sem. RCU. 2011 (Case Study) Statement of Marginal Cost
Particulars X Ltd Y Ltd Sales 3,00,00 3,00,000 Less: Variable Cost 2,40,000 2,00,000 Contribution 60,000 1,00,000 Less: Fixed Cost 30,000 70,000 Profit 30,000 30,000
P/V Ratio = Contribution
Sales
60,000
3,00,000
= 0.20
1,00,000
3,00,000
= 1/3
Break Even Point = /
Fixed Cost
P V Ratio
30,000
.1,50,0000.20
X Ltd Rs
70,000
70,000 3 .2,10,0001/ 3
Y Ltd Rs
RCUB, B.Com – 6th Semester Elements of Costing – II
Page | 20
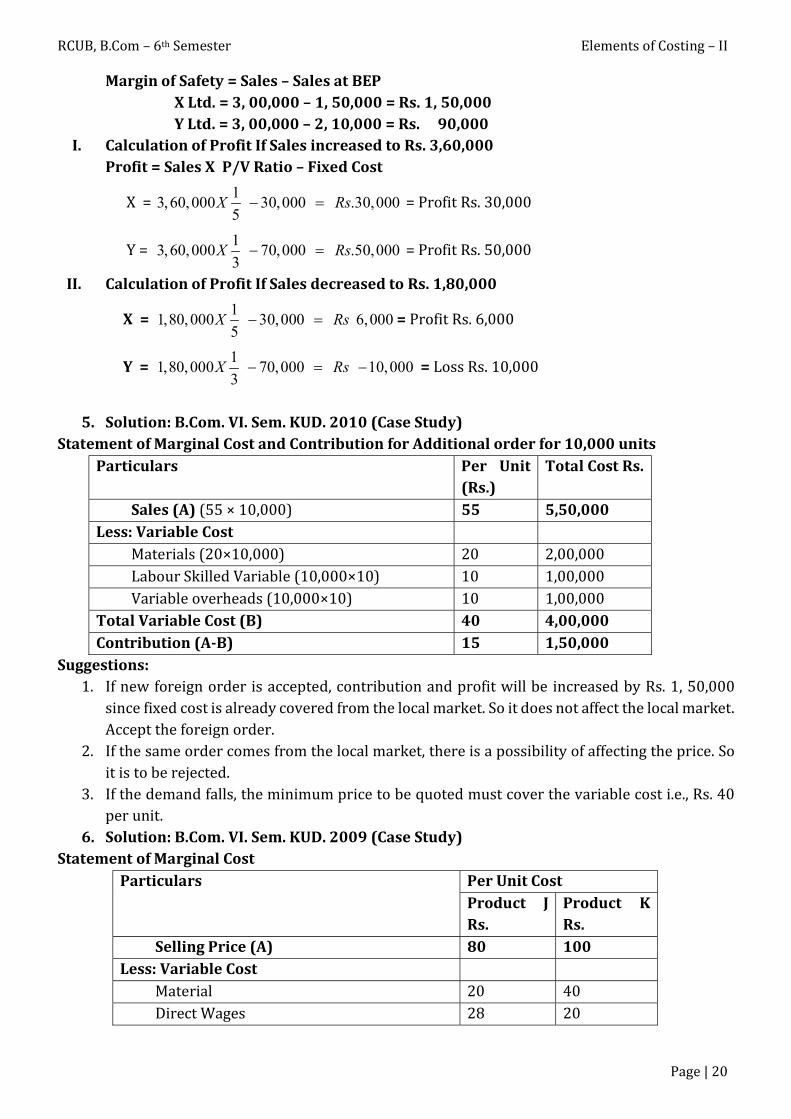
Margin of Safety = Sales – Sales at BEP X Ltd. = 3, 00,000 – 1, 50,000 = Rs. 1, 50,000 Y Ltd. = 3, 00,000 – 2, 10,000 = Rs. 90,000
I. Calculation of Profit If Sales increased to Rs. 3,60,000 Profit = Sales X P/V Ratio – Fixed Cost
X = 1
3,60,000 30,000 .30,0005
X Rs = Profit Rs. 30,000
Y = 1
3,60,000 70,000 .50,0003
X Rs = Profit Rs. 50,000
II. Calculation of Profit If Sales decreased to Rs. 1,80,000
X = 1
1,80,000 30,000 6,0005
X Rs = Profit Rs. 6,000
Y = 1
1,80,000 70,000 10,0003
X Rs = Loss Rs. 10,000
5. Solution: B.Com. VI. Sem. KUD. 2010 (Case Study)
Statement of Marginal Cost and Contribution for Additional order for 10,000 units Particulars Per Unit
(Rs.) Total Cost Rs.
Sales (A) (55 × 10,000) 55 5,50,000 Less: Variable Cost Materials (20×10,000) 20 2,00,000 Labour Skilled Variable (10,000×10) 10 1,00,000 Variable overheads (10,000×10) 10 1,00,000 Total Variable Cost (B) 40 4,00,000 Contribution (A-B) 15 1,50,000
Suggestions: 1. If new foreign order is accepted, contribution and profit will be increased by Rs. 1, 50,000
since fixed cost is already covered from the local market. So it does not affect the local market. Accept the foreign order.
2. If the same order comes from the local market, there is a possibility of affecting the price. So it is to be rejected.
3. If the demand falls, the minimum price to be quoted must cover the variable cost i.e., Rs. 40 per unit.
6. Solution: B.Com. VI. Sem. KUD. 2009 (Case Study) Statement of Marginal Cost
Particulars Per Unit Cost Product J Rs.
Product K Rs.
Selling Price (A) 80 100 Less: Variable Cost Material 20 40 Direct Wages 28 20
RCUB, B.Com – 6th Semester Elements of Costing – II
Page | 21
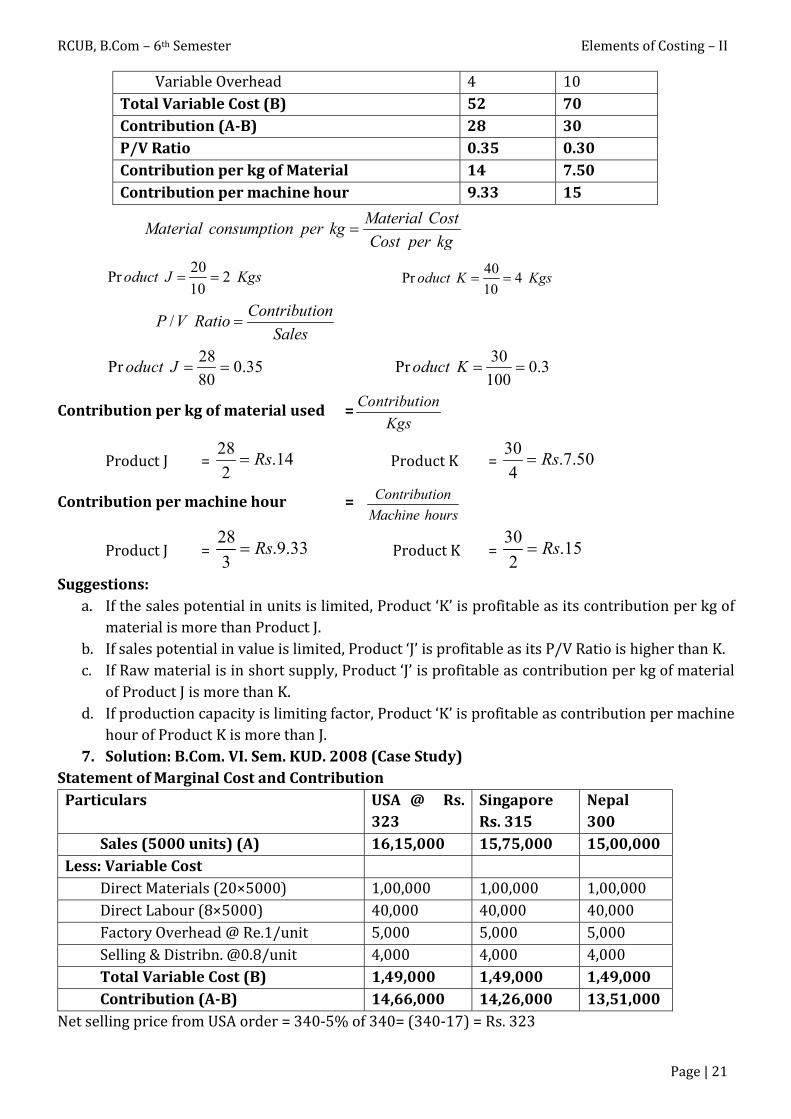
Variable Overhead 4 10 Total Variable Cost (B) 52 70 Contribution (A-B) 28 30 P/V Ratio 0.35 0.30 Contribution per kg of Material 14 7.50 Contribution per machine hour 9.33 15
Material Cost
Material consumption per kgCost per kg
20Pr 2
10oduct J Kgs 40
Pr 410
oduct K Kgs
/Contribution
P V RatioSales
28Pr 0.35
80oduct J
30Pr 0.3
100oduct K
Contribution per kg of material used =Contribution
Kgs
Product J = 28
.142
Rs Product K = 30
.7.504
Rs
Contribution per machine hour = Contribution
Machine hours
Product J = 28
.9.333
Rs Product K = 30
.152
Rs
Suggestions: a. If the sales potential in units is limited, Product ‘K’ is profitable as its contribution per kg of
material is more than Product J. b. If sales potential in value is limited, Product ‘J’ is profitable as its P/V Ratio is higher than K. c. If Raw material is in short supply, Product ‘J’ is profitable as contribution per kg of material
of Product J is more than K. d. If production capacity is limiting factor, Product ‘K’ is profitable as contribution per machine
hour of Product K is more than J. 7. Solution: B.Com. VI. Sem. KUD. 2008 (Case Study)
Statement of Marginal Cost and Contribution Particulars USA @ Rs.
323 Singapore Rs. 315
Nepal 300
Sales (5000 units) (A) 16,15,000 15,75,000 15,00,000 Less: Variable Cost Direct Materials (20×5000) 1,00,000 1,00,000 1,00,000 Direct Labour (8×5000) 40,000 40,000 40,000 Factory Overhead @ Re.1/unit 5,000 5,000 5,000 Selling & Distribn. @0.8/unit 4,000 4,000 4,000 Total Variable Cost (B) 1,49,000 1,49,000 1,49,000 Contribution (A-B) 14,66,000 14,26,000 13,51,000
Net selling price from USA order = 340-5% of 340= (340-17) = Rs. 323
RCUB, B.Com – 6th Semester Elements of Costing – II
Page | 22
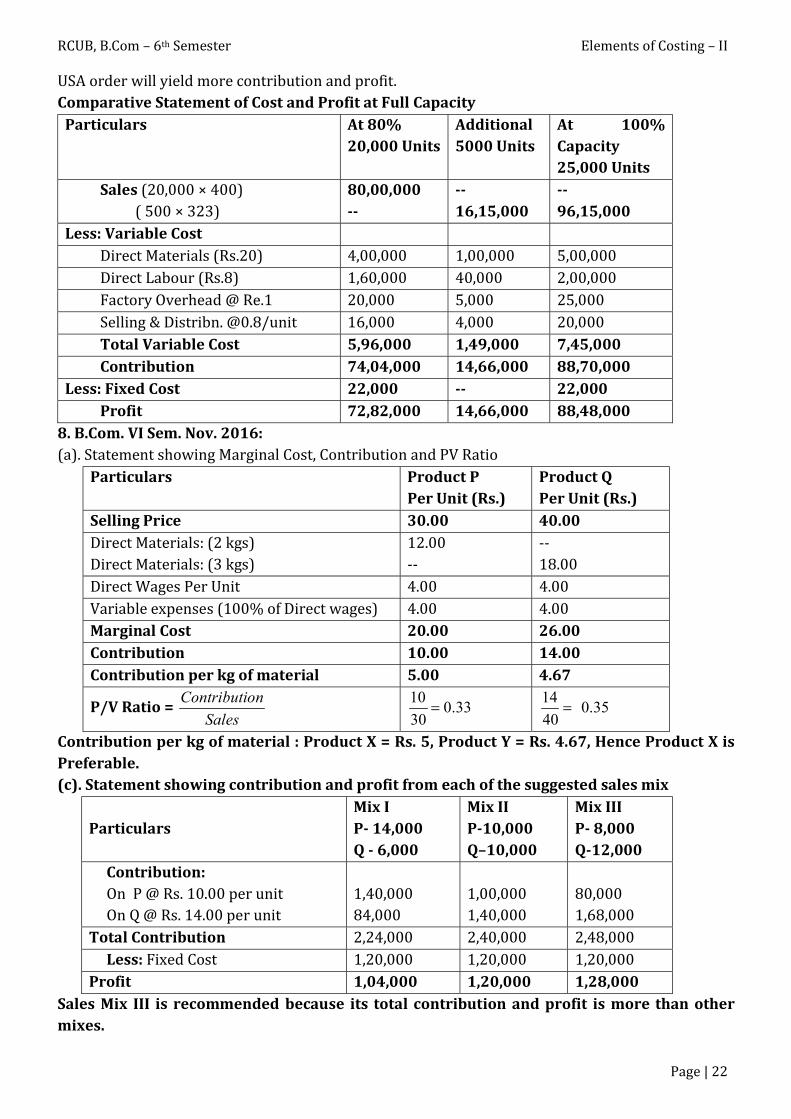
USA order will yield more contribution and profit. Comparative Statement of Cost and Profit at Full Capacity
Particulars At 80% 20,000 Units
Additional 5000 Units
At 100% Capacity 25,000 Units
Sales (20,000 × 400) ( 500 × 323)
80,00,000 --
-- 16,15,000
-- 96,15,000
Less: Variable Cost Direct Materials (Rs.20) 4,00,000 1,00,000 5,00,000 Direct Labour (Rs.8) 1,60,000 40,000 2,00,000 Factory Overhead @ Re.1 20,000 5,000 25,000 Selling & Distribn. @0.8/unit 16,000 4,000 20,000 Total Variable Cost 5,96,000 1,49,000 7,45,000 Contribution 74,04,000 14,66,000 88,70,000 Less: Fixed Cost 22,000 -- 22,000 Profit 72,82,000 14,66,000 88,48,000
8. B.Com. VI Sem. Nov. 2016: (a). Statement showing Marginal Cost, Contribution and PV Ratio
Particulars Product P Per Unit (Rs.)
Product Q Per Unit (Rs.)
Selling Price 30.00 40.00 Direct Materials: (2 kgs) Direct Materials: (3 kgs)
12.00 --
-- 18.00
Direct Wages Per Unit 4.00 4.00 Variable expenses (100% of Direct wages) 4.00 4.00 Marginal Cost 20.00 26.00 Contribution 10.00 14.00 Contribution per kg of material 5.00 4.67
P/V Ratio = Contribution
Sales
100.33
30
140.35
40
Contribution per kg of material : Product X = Rs. 5, Product Y = Rs. 4.67, Hence Product X is Preferable. (c). Statement showing contribution and profit from each of the suggested sales mix
Particulars
Mix I P- 14,000 Q - 6,000
Mix II P-10,000 Q–10,000
Mix III P- 8,000 Q-12,000
Contribution: On P @ Rs. 10.00 per unit On Q @ Rs. 14.00 per unit
1,40,000 84,000
1,00,000 1,40,000
80,000 1,68,000
Total Contribution 2,24,000 2,40,000 2,48,000 Less: Fixed Cost 1,20,000 1,20,000 1,20,000 Profit 1,04,000 1,20,000 1,28,000
Sales Mix III is recommended because its total contribution and profit is more than other mixes.
RCUB, B.Com – 6th Semester Elements of Costing – II
Page | 23
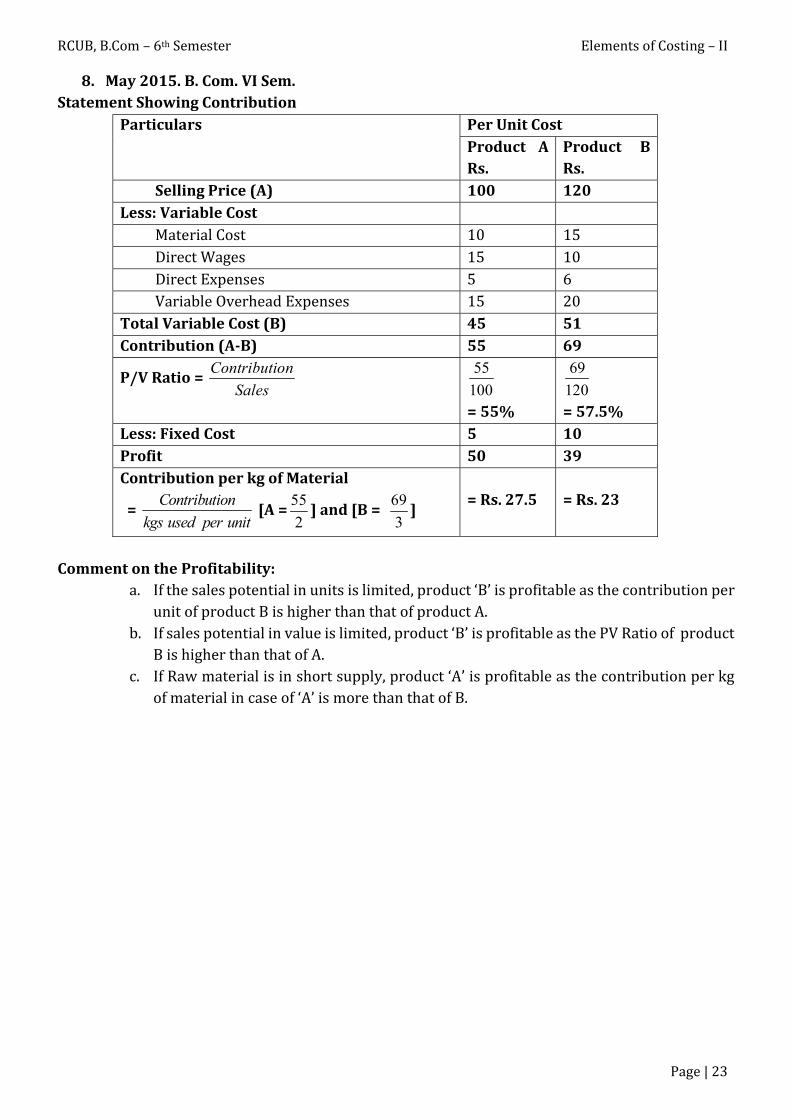
8. May 2015. B. Com. VI Sem. Statement Showing Contribution
Particulars Per Unit Cost Product A Rs.
Product B Rs.
Selling Price (A) 100 120 Less: Variable Cost Material Cost 10 15 Direct Wages 15 10 Direct Expenses 5 6 Variable Overhead Expenses 15 20 Total Variable Cost (B) 45 51 Contribution (A-B) 55 69
P/V Ratio = Contribution
Sales
55
100
= 55%
69
120
= 57.5% Less: Fixed Cost 5 10 Profit 50 39 Contribution per kg of Material
= Contribution
kgs used per unit [A =
55
2] and [B =
69
3]
= Rs. 27.5
= Rs. 23
Comment on the Profitability:
a. If the sales potential in units is limited, product ‘B’ is profitable as the contribution per unit of product B is higher than that of product A.
b. If sales potential in value is limited, product ‘B’ is profitable as the PV Ratio of product B is higher than that of A.
c. If Raw material is in short supply, product ‘A’ is profitable as the contribution per kg of material in case of ‘A’ is more than that of B.
RCUB, B.Com – 6th Semester Elements of Costing – II
Page | 24
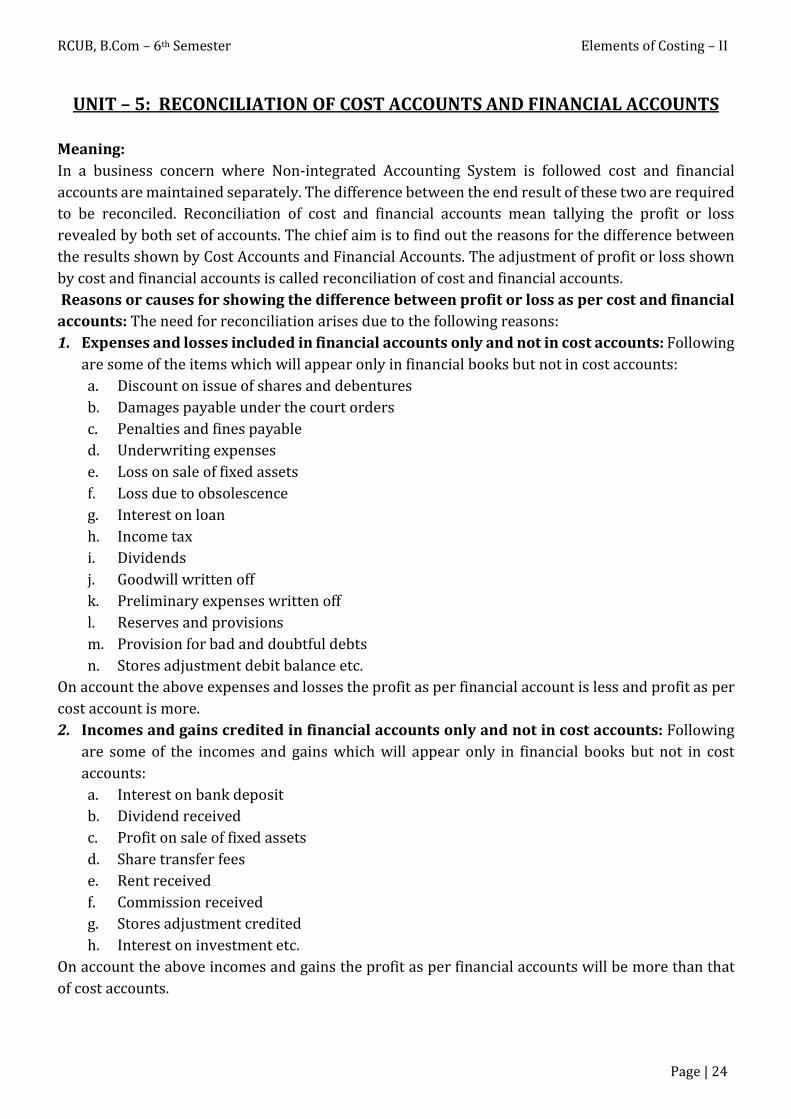
UNIT – 5: RECONCILIATION OF COST ACCOUNTS AND FINANCIAL ACCOUNTS Meaning: In a business concern where Non-integrated Accounting System is followed cost and financial accounts are maintained separately. The difference between the end result of these two are required to be reconciled. Reconciliation of cost and financial accounts mean tallying the profit or loss revealed by both set of accounts. The chief aim is to find out the reasons for the difference between the results shown by Cost Accounts and Financial Accounts. The adjustment of profit or loss shown by cost and financial accounts is called reconciliation of cost and financial accounts. Reasons or causes for showing the difference between profit or loss as per cost and financial accounts: The need for reconciliation arises due to the following reasons: 1. Expenses and losses included in financial accounts only and not in cost accounts: Following
are some of the items which will appear only in financial books but not in cost accounts: a. Discount on issue of shares and debentures b. Damages payable under the court orders c. Penalties and fines payable d. Underwriting expenses e. Loss on sale of fixed assets f. Loss due to obsolescence g. Interest on loan h. Income tax i. Dividends j. Goodwill written off k. Preliminary expenses written off l. Reserves and provisions m. Provision for bad and doubtful debts n. Stores adjustment debit balance etc.
On account the above expenses and losses the profit as per financial account is less and profit as per cost account is more. 2. Incomes and gains credited in financial accounts only and not in cost accounts: Following
are some of the incomes and gains which will appear only in financial books but not in cost accounts: a. Interest on bank deposit b. Dividend received c. Profit on sale of fixed assets d. Share transfer fees e. Rent received f. Commission received g. Stores adjustment credited h. Interest on investment etc.
On account the above incomes and gains the profit as per financial accounts will be more than that of cost accounts.
RCUB, B.Com – 6th Semester Elements of Costing – II
Page | 25
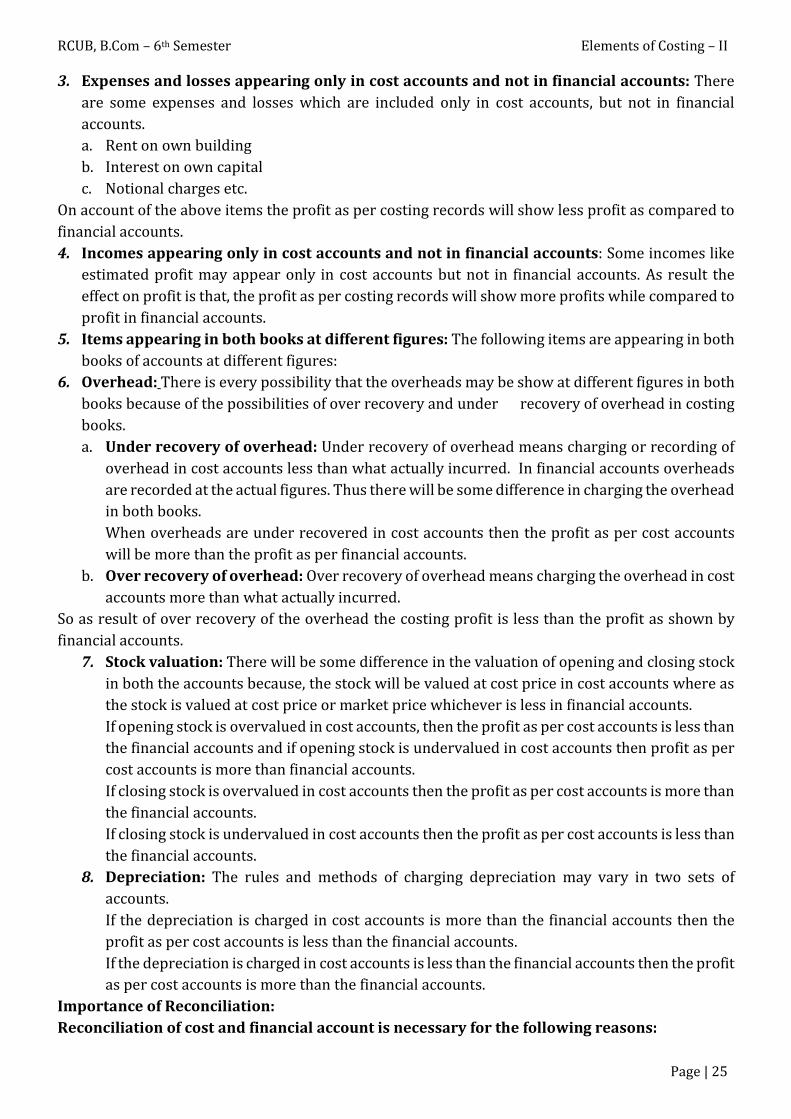
3. Expenses and losses appearing only in cost accounts and not in financial accounts: There are some expenses and losses which are included only in cost accounts, but not in financial accounts. a. Rent on own building b. Interest on own capital c. Notional charges etc.
On account of the above items the profit as per costing records will show less profit as compared to financial accounts. 4. Incomes appearing only in cost accounts and not in financial accounts: Some incomes like
estimated profit may appear only in cost accounts but not in financial accounts. As result the effect on profit is that, the profit as per costing records will show more profits while compared to profit in financial accounts.
5. Items appearing in both books at different figures: The following items are appearing in both books of accounts at different figures:
6. Overhead: There is every possibility that the overheads may be show at different figures in both books because of the possibilities of over recovery and under recovery of overhead in costing books. a. Under recovery of overhead: Under recovery of overhead means charging or recording of
overhead in cost accounts less than what actually incurred. In financial accounts overheads are recorded at the actual figures. Thus there will be some difference in charging the overhead in both books. When overheads are under recovered in cost accounts then the profit as per cost accounts will be more than the profit as per financial accounts.
b. Over recovery of overhead: Over recovery of overhead means charging the overhead in cost accounts more than what actually incurred.
So as result of over recovery of the overhead the costing profit is less than the profit as shown by financial accounts.
7. Stock valuation: There will be some difference in the valuation of opening and closing stock in both the accounts because, the stock will be valued at cost price in cost accounts where as the stock is valued at cost price or market price whichever is less in financial accounts. If opening stock is overvalued in cost accounts, then the profit as per cost accounts is less than the financial accounts and if opening stock is undervalued in cost accounts then profit as per cost accounts is more than financial accounts. If closing stock is overvalued in cost accounts then the profit as per cost accounts is more than the financial accounts. If closing stock is undervalued in cost accounts then the profit as per cost accounts is less than the financial accounts.
8. Depreciation: The rules and methods of charging depreciation may vary in two sets of accounts. If the depreciation is charged in cost accounts is more than the financial accounts then the profit as per cost accounts is less than the financial accounts. If the depreciation is charged in cost accounts is less than the financial accounts then the profit as per cost accounts is more than the financial accounts.
Importance of Reconciliation: Reconciliation of cost and financial account is necessary for the following reasons:
RCUB, B.Com – 6th Semester Elements of Costing – II
Page | 26
1. To ensure arithmetical accuracy of both set of accounts for effective cost ascertainment and cost control.
2. To identify the reasons for different results in two sets of accounts. 3. To evaluate the reasons for variations for effective internal control. 4. To enable the smooth co-operation and co-ordination between the activities of cost and
financial accounting departments. 5. To ensure the standardization of policies relating to stock valuation, depreciation and
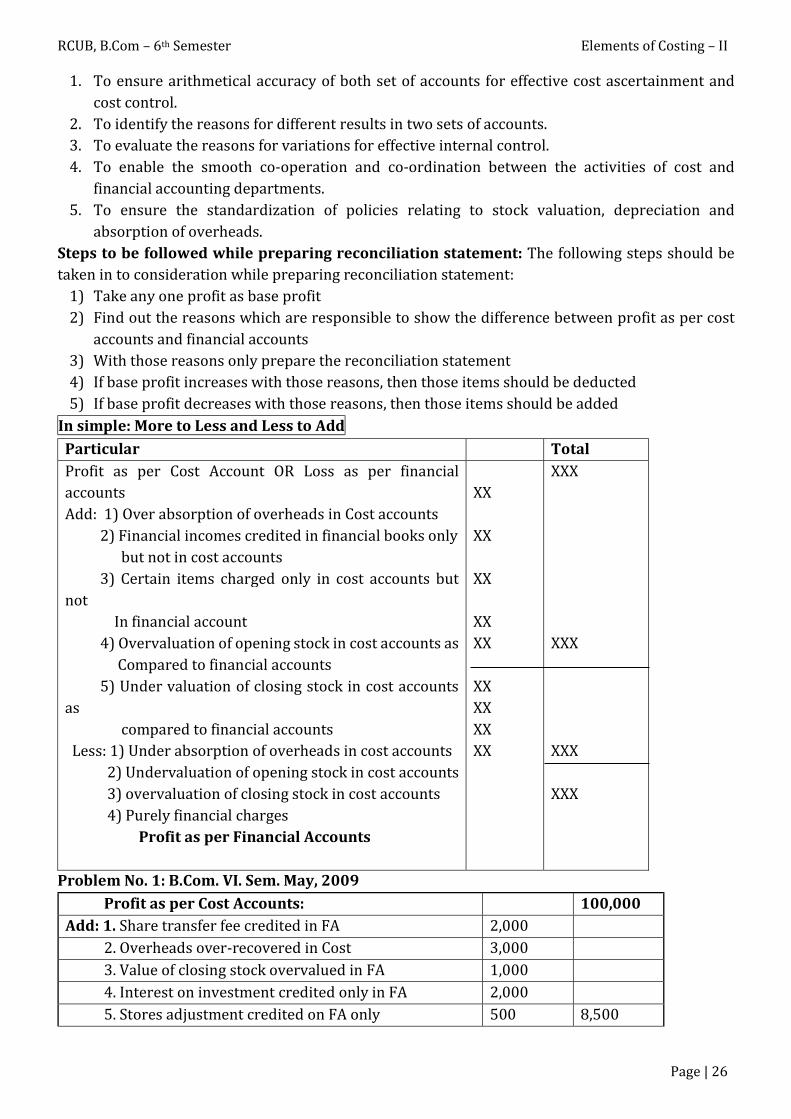
absorption of overheads. Steps to be followed while preparing reconciliation statement: The following steps should be taken in to consideration while preparing reconciliation statement:
1) Take any one profit as base profit 2) Find out the reasons which are responsible to show the difference between profit as per cost
accounts and financial accounts 3) With those reasons only prepare the reconciliation statement 4) If base profit increases with those reasons, then those items should be deducted 5) If base profit decreases with those reasons, then those items should be added
In simple: More to Less and Less to Add Particular Total Profit as per Cost Account OR Loss as per financial accounts Add: 1) Over absorption of overheads in Cost accounts 2) Financial incomes credited in financial books only but not in cost accounts 3) Certain items charged only in cost accounts but not In financial account 4) Overvaluation of opening stock in cost accounts as Compared to financial accounts 5) Under valuation of closing stock in cost accounts as compared to financial accounts Less: 1) Under absorption of overheads in cost accounts 2) Undervaluation of opening stock in cost accounts 3) overvaluation of closing stock in cost accounts 4) Purely financial charges Profit as per Financial Accounts
XX XX XX XX XX XX XX XX XX
XXX XXX XXX XXX
Problem No. 1: B.Com. VI. Sem. May, 2009 Profit as per Cost Accounts: 100,000 Add: 1. Share transfer fee credited in FA 2,000 2. Overheads over-recovered in Cost 3,000 3. Value of closing stock overvalued in FA 1,000 4. Interest on investment credited only in FA 2,000 5. Stores adjustment credited on FA only 500 8,500
RCUB, B.Com – 6th Semester Elements of Costing – II
Page | 27
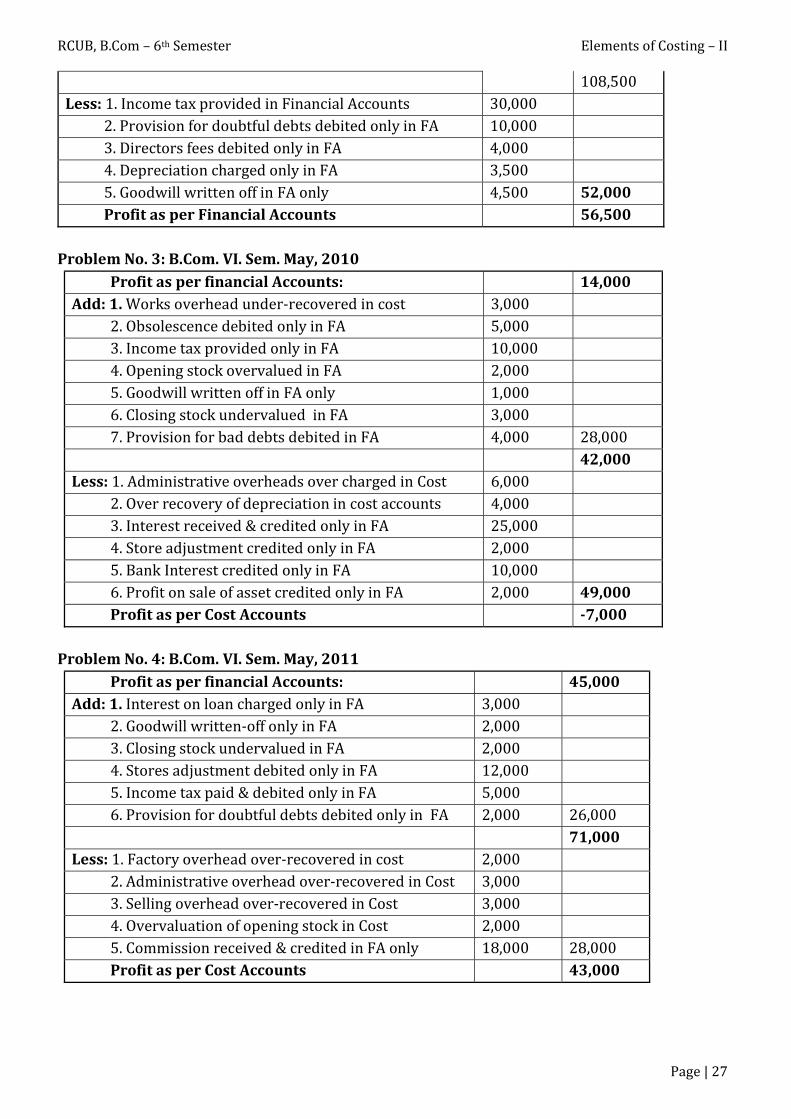
108,500 Less: 1. Income tax provided in Financial Accounts 30,000 2. Provision for doubtful debts debited only in FA 10,000 3. Directors fees debited only in FA 4,000 4. Depreciation charged only in FA 3,500 5. Goodwill written off in FA only 4,500 52,000 Profit as per Financial Accounts 56,500
Problem No. 3: B.Com. VI. Sem. May, 2010
Profit as per financial Accounts: 14,000 Add: 1. Works overhead under-recovered in cost 3,000 2. Obsolescence debited only in FA 5,000 3. Income tax provided only in FA 10,000 4. Opening stock overvalued in FA 2,000 5. Goodwill written off in FA only 1,000 6. Closing stock undervalued in FA 3,000 7. Provision for bad debts debited in FA 4,000 28,000 42,000 Less: 1. Administrative overheads over charged in Cost 6,000 2. Over recovery of depreciation in cost accounts 4,000 3. Interest received & credited only in FA 25,000 4. Store adjustment credited only in FA 2,000 5. Bank Interest credited only in FA 10,000 6. Profit on sale of asset credited only in FA 2,000 49,000 Profit as per Cost Accounts -7,000
Problem No. 4: B.Com. VI. Sem. May, 2011
Profit as per financial Accounts: 45,000 Add: 1. Interest on loan charged only in FA 3,000 2. Goodwill written-off only in FA 2,000 3. Closing stock undervalued in FA 2,000 4. Stores adjustment debited only in FA 12,000 5. Income tax paid & debited only in FA 5,000 6. Provision for doubtful debts debited only in FA 2,000 26,000 71,000 Less: 1. Factory overhead over-recovered in cost 2,000 2. Administrative overhead over-recovered in Cost 3,000 3. Selling overhead over-recovered in Cost 3,000 4. Overvaluation of opening stock in Cost 2,000 5. Commission received & credited in FA only 18,000 28,000 Profit as per Cost Accounts 43,000
RCUB, B.Com – 6th Semester Elements of Costing – II
Page | 28
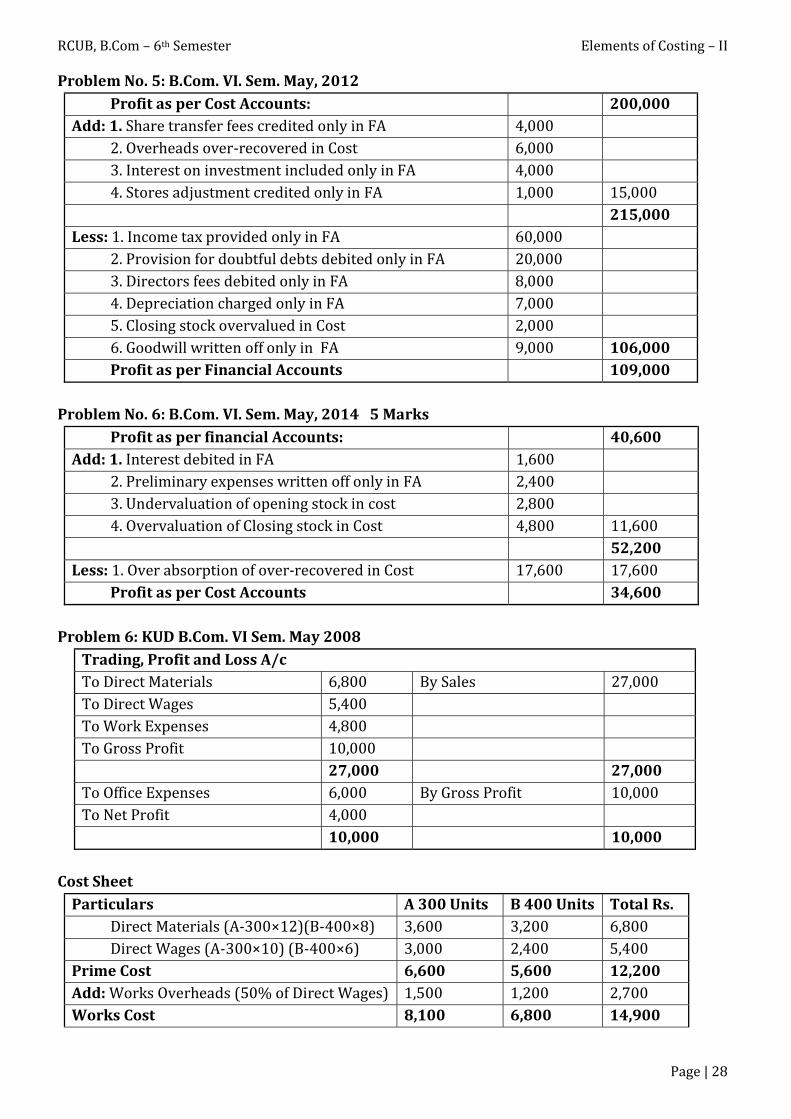
Problem No. 5: B.Com. VI. Sem. May, 2012 Profit as per Cost Accounts: 200,000 Add: 1. Share transfer fees credited only in FA 4,000 2. Overheads over-recovered in Cost 6,000 3. Interest on investment included only in FA 4,000 4. Stores adjustment credited only in FA 1,000 15,000 215,000 Less: 1. Income tax provided only in FA 60,000 2. Provision for doubtful debts debited only in FA 20,000 3. Directors fees debited only in FA 8,000 4. Depreciation charged only in FA 7,000 5. Closing stock overvalued in Cost 2,000 6. Goodwill written off only in FA 9,000 106,000 Profit as per Financial Accounts 109,000
Problem No. 6: B.Com. VI. Sem. May, 2014 5 Marks
Profit as per financial Accounts: 40,600 Add: 1. Interest debited in FA 1,600 2. Preliminary expenses written off only in FA 2,400 3. Undervaluation of opening stock in cost 2,800 4. Overvaluation of Closing stock in Cost 4,800 11,600 52,200 Less: 1. Over absorption of over-recovered in Cost 17,600 17,600 Profit as per Cost Accounts 34,600
Problem 6: KUD B.Com. VI Sem. May 2008
Trading, Profit and Loss A/c To Direct Materials 6,800 By Sales 27,000 To Direct Wages 5,400 To Work Expenses 4,800 To Gross Profit 10,000 27,000 27,000 To Office Expenses 6,000 By Gross Profit 10,000 To Net Profit 4,000 10,000 10,000
Cost Sheet
Particulars A 300 Units B 400 Units Total Rs. Direct Materials (A-300×12)(B-400×8) 3,600 3,200 6,800 Direct Wages (A-300×10) (B-400×6) 3,000 2,400 5,400 Prime Cost 6,600 5,600 12,200 Add: Works Overheads (50% of Direct Wages) 1,500 1,200 2,700 Works Cost 8,100 6,800 14,900
RCUB, B.Com – 6th Semester Elements of Costing – II
Page | 29
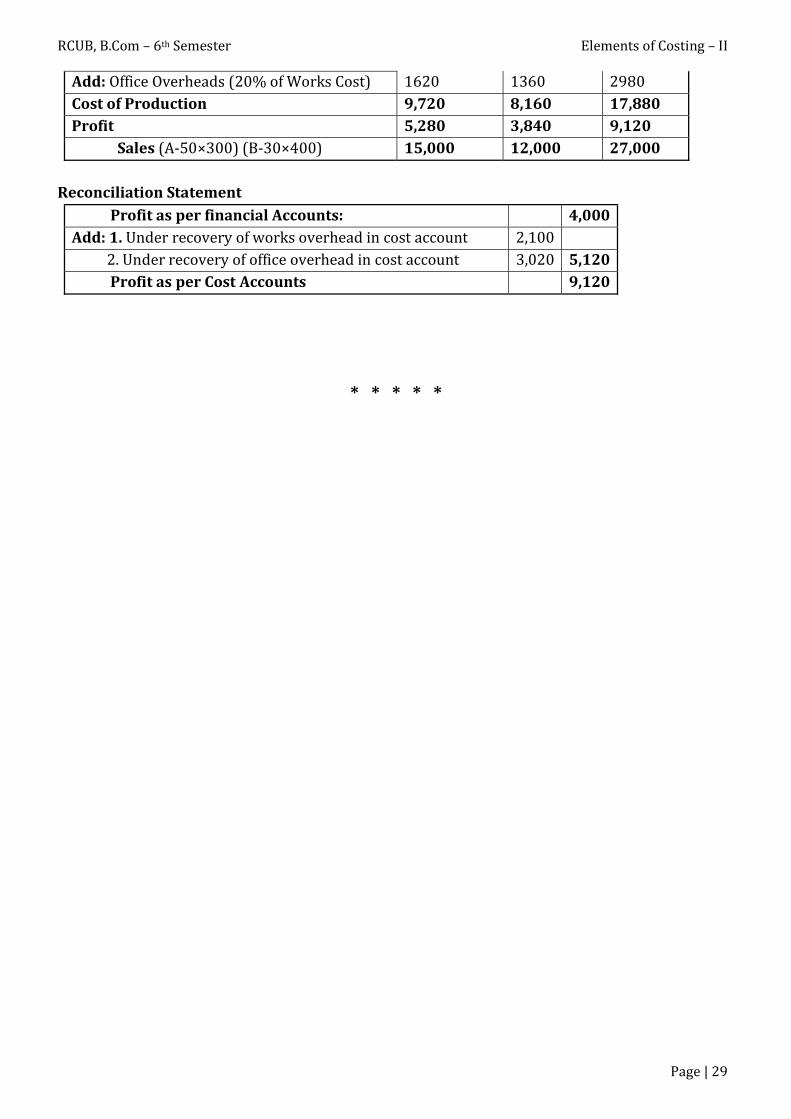
Add: Office Overheads (20% of Works Cost) 1620 1360 2980 Cost of Production 9,720 8,160 17,880 Profit 5,280 3,840 9,120 Sales (A-50×300) (B-30×400) 15,000 12,000 27,000
Reconciliation Statement
Profit as per financial Accounts: 4,000 Add: 1. Under recovery of works overhead in cost account 2,100 2. Under recovery of office overhead in cost account 3,020 5,120 Profit as per Cost Accounts 9,120
* * * * *
RCUB, B.Com – 6th Semester Elements of Costing – II
Page | 30
DISCLAIMER
All the information and contribution provided by commerce faculty as
a part of academic fulfillment during this COVID-19 lockdown period, is
solely responsible by the same faculty. In any way university is not
responsible for any of the information or facts or figures etc. provided in it.