radio resource allocation and hybrid multiplexing of voice
TRANSCRIPT
Radio Resource Allocation and
Hybrid Multiplexing of Voice
and Data over IP in a
GSM/GPRS Cellular Network
David Emmanuele Vannucci
A research report submitted to the Faculty of Engineering and the Built Environ-
ment, University of the Witwatersrand, Johannesburg, in partial fulfilment of the
requirements for the degree of Master of Science in Engineering.
Johannesburg, February 2004
brought to you by COREView metadata, citation and similar papers at core.ac.uk
provided by Wits Institutional Repository on DSPACE
Declaration
I declare that this research report is my own, unaided work, except where other-
wise acknowledged. It is being submitted for the degree of Master of Science in
Engineering to the University of the Witwatersrand, Johannesburg. It has not been
submitted before for any degree or examination in any other university.
Signed this day of 20
David Emmanuele Vannucci.
i
Abstract
In this study, a first order investigation of the issue of resource allocation between
circuit voice, packet data and packet voice was completed. The study was done with
reference to the GSM / GPRS air interface. To study the allocation of resources,
suitable traffic source models were developed to represent the nature of the traffic
offered to the base station subsystem. Circuit voice and packet data were represented
using Markovian arrivals and exponentially distributed holding times. Voice over IP
was modelled using a two-state Markov modulated Poisson process. The base station
subsystem was modelled as a continuous time controller with eight channels (one
GSM / GPRS TDMA frame). The radio propagation environment was considered
by means of a large-scale propagation model, which would merely alter the load
presented to the developed simulator package. From the results of the simulations,
it was found that insufficient data resources lead to similar packet delay regardless
of the packet size. It was found that if capacity on demand is used, then the data
resources could equal the load. In the case of sufficient data channels, with capacity
on demand, additional channels have a greater effect on average delay than the
probability of it occurring. Prioritisation of VoIP packets did not significantly alter
the probability of delay but affected the average packet delay. Packet size had a
greater effect on average delay than the probability of delay. In the case of all eight
channels being used for VoIP and data, the combined load should not exceed seven
erlang, indicating that a higher voice load could be supported with VoIP than with
circuit switched voice.
ii
Acknowledgements
I would like to thank my supervisor, Dr Peter J. Chitamu, for his assistance and
encouragement to submit papers to conferences, which allowed me to travel. I am
grateful for the financial assistance provided by Prof Hu Hanrahan, for conferences
and expenses. Thanks also go to Dr. Ian Kennedy for advice and proof reading.
This work was performed in the Centre for Telecommunications Access and Services
at the University of the Witwatersrand. The Centre is funded by Telkom SA Limited,
Siemens Telecommunications, Sun Microsystems and the Department of Trade and
Industry’s THRIP programme. Their financial support is much appreciated.
iii

Contents
Declaration i
Abstract ii
Acknowledgements iii
Contents iv
List of Figures viii
List of Tables xii
1 Background 1
1.1 Combining Voice and Data . . . . . . . . . . . . . . . . . . . . . . . 2
1.2 Wireless Voice and Data . . . . . . . . . . . . . . . . . . . . . . . . . 5
1.3 Global System for Mobile Communication (GSM), Research Objectives 7
1.4 Overview of Research Report . . . . . . . . . . . . . . . . . . . . . . 8
1.5 Key Achievements of the Study . . . . . . . . . . . . . . . . . . . . . 8
iv

2 GSM and GPRS Operation 9
2.1 A Brief Background on GSM . . . . . . . . . . . . . . . . . . . . . . 9
2.1.1 GPRS - General Packet Radio Service . . . . . . . . . . . . . 11
2.2 Introduction to GSM Architecture . . . . . . . . . . . . . . . . . . . 12
2.2.1 Mobile Station . . . . . . . . . . . . . . . . . . . . . . . . . . 12
2.2.2 Base Station Subsystem . . . . . . . . . . . . . . . . . . . . . 12
2.3 Towards an All IP Infrastructure . . . . . . . . . . . . . . . . . . . . 14
3 VoIP and its Application to GSM/GPRS 16
4 Theoretical Models for Traffic Simulation 20
4.1 Traffic Source Models . . . . . . . . . . . . . . . . . . . . . . . . . . 20
4.1.1 Circuit Switched Voice . . . . . . . . . . . . . . . . . . . . . . 20
4.1.2 Packet Switched Data . . . . . . . . . . . . . . . . . . . . . . 22
4.1.3 Packet Switched VoIP . . . . . . . . . . . . . . . . . . . . . . 22
4.2 BSS Resource Allocation Modelling . . . . . . . . . . . . . . . . . . . 23
4.3 The Effects of the Propagation Environment . . . . . . . . . . . . . . 25
4.4 Traffic Source Modelling and Queueing . . . . . . . . . . . . . . . . . 27
4.4.1 Circuit Switched Voice and Packet Switched Data . . . . . . 28
4.4.2 Packet Switched Voice and Packet Switched Data . . . . . . . 32
4.4.3 Determining the Grade of Service from the Queueing Models 33
v
5 Simulation Environment Specification, Validation and Verification 35
5.1 Simulator Specification . . . . . . . . . . . . . . . . . . . . . . . . . . 36
5.1.1 Simulator Functionality . . . . . . . . . . . . . . . . . . . . . 37
5.1.2 Simulator Output . . . . . . . . . . . . . . . . . . . . . . . . 37
5.1.3 Simulator Output Processing . . . . . . . . . . . . . . . . . . 37
5.1.4 Simulator Random Number Generator . . . . . . . . . . . . . 38
5.2 Simulation Validation and Verification . . . . . . . . . . . . . . . . . 38
5.2.1 Validation . . . . . . . . . . . . . . . . . . . . . . . . . . . . . 40
5.2.2 Verification . . . . . . . . . . . . . . . . . . . . . . . . . . . . 41
6 Object Orientated Simulator Structure 48
6.1 Generation of Events . . . . . . . . . . . . . . . . . . . . . . . . . . . 49
6.2 Processing the Event List . . . . . . . . . . . . . . . . . . . . . . . . 52
7 Simulation Results 54
7.1 Effect of Insufficient Capacity . . . . . . . . . . . . . . . . . . . . . . 54
7.2 Packet Delay: Capacity-on-Demand vs Fixed Channel Allocation . . 55
7.3 Packet Delay: Delay vs. Load . . . . . . . . . . . . . . . . . . . . . . 59
7.4 VoIP and Data: GoS . . . . . . . . . . . . . . . . . . . . . . . . . . . 63
7.5 VoIP Exponentially Distributed and Data: GoS . . . . . . . . . . . . 64
vi
8 Review and Conclusions 70
8.1 Review . . . . . . . . . . . . . . . . . . . . . . . . . . . . . . . . . . . 70
8.2 Conclusions . . . . . . . . . . . . . . . . . . . . . . . . . . . . . . . . 72
8.3 Recommendations and Future Improvements . . . . . . . . . . . . . 73
References 75
Appendix 81
8.4 Calculating the Erlang Formula in Microsoft Excel . . . . . . . . . . 81
8.5 Structure of the Compact Disc . . . . . . . . . . . . . . . . . . . . . 82
vii

List of Figures
1.1 The VoIP hype cycle (Winogradoff 2002) . . . . . . . . . . . . . . . 4
1.2 Fixed and mobile telephone subscribers in South Africa (1000s) (ITU
2001) . . . . . . . . . . . . . . . . . . . . . . . . . . . . . . . . . . . . 6
2.1 GSM/GPRS resource allocation . . . . . . . . . . . . . . . . . . . . . 11
2.2 Basic GSM/GPRS architecture . . . . . . . . . . . . . . . . . . . . . 12
2.3 Evolutionary path of GSM (Bates 2002) . . . . . . . . . . . . . . . . 15
3.1 The GPRS protocol stack (Bates 2002; Halonen et al. 2002) . . . . . 18
3.2 Mean opinion score versus packet loss (Watson and Sasse 1997) . . . 19
4.1 Exponential density function: equation 4.3 . . . . . . . . . . . . . . . 21
4.2 VoIP model . . . . . . . . . . . . . . . . . . . . . . . . . . . . . . . . 22
4.3 A generic TDM heterogeneous channel . . . . . . . . . . . . . . . . . 23
4.4 Continuous time model, with voice and data . . . . . . . . . . . . . . 24
4.5 GSM/GPRS model . . . . . . . . . . . . . . . . . . . . . . . . . . . . 28
4.6 Fixed resources state space . . . . . . . . . . . . . . . . . . . . . . . 30
4.7 Variable resources state space . . . . . . . . . . . . . . . . . . . . . . 31
viii
4.8 Illustration of talksputs and gaps during conversation . . . . . . . . 32
4.9 Two-state VoIP model . . . . . . . . . . . . . . . . . . . . . . . . . . 32
4.10 VoIP GPRS model . . . . . . . . . . . . . . . . . . . . . . . . . . . . 32
4.11 Theoretical Grade of Service for voice and data for varying loads and
resources . . . . . . . . . . . . . . . . . . . . . . . . . . . . . . . . . . 34
5.1 General model confidence (Sargent 1994) . . . . . . . . . . . . . . . . 39
5.2 Adapted version of the Modelling Process . . . . . . . . . . . . . . . 39
5.3 Voice blocking probability with seven voice channels . . . . . . . . . 43
5.4 Voice blocking probability with six voice channels . . . . . . . . . . . 44
5.5 Probability of data delay with seven data channels, no COD . . . . . 44
5.6 Percentage difference between Erlang C and simulated results for
seven effective channels . . . . . . . . . . . . . . . . . . . . . . . . . 45
5.7 Probability of data delay with seven PDCHs, one voice channel, COD 46
5.8 Percentage difference between Erlang C and simulated results for
eight effective channels . . . . . . . . . . . . . . . . . . . . . . . . . . 46
5.9 Simulation convergence to a mean value, seven data erlang . . . . . 47
5.10 Simulation convergence to a mean value, six data erlang . . . . . . . 47
6.1 Operational structure and flow of simulation package . . . . . . . . . 49
6.2 Logical flow chart of voice generation . . . . . . . . . . . . . . . . . . 50
6.3 VoIP packet generation . . . . . . . . . . . . . . . . . . . . . . . . . 51
6.4 Illustrative list of voice and data events . . . . . . . . . . . . . . . . 51
ix
6.5 Logical flow diagram of Simulation Engine logic . . . . . . . . . . . . 53
7.1 Average delay of various packet sizes with one data erlang load and
no fixed resources. . . . . . . . . . . . . . . . . . . . . . . . . . . . . 55
7.2 Average delay of various packet sizes with two data erlang load and
one PDCH. . . . . . . . . . . . . . . . . . . . . . . . . . . . . . . . . 56
7.3 The effect of COD,
Delay Probability, two data erlang, two PDCH . . . . . . . . . . . . 57
7.4 The effect of COD,
Average Delay, two data erlang, two PDCH . . . . . . . . . . . . . . 58
7.5 The effect of COD,
Delay Probability, two data erlang, three PDCH . . . . . . . . . . . 58
7.6 The effect of COD,
Average Delay, two data erlang, three PDCH . . . . . . . . . . . . . 59
7.7 The effect of COD,
Delay Probability, three data erlang, two PDCH . . . . . . . . . . . 60
7.8 The effect of COD,
Average Delay, three data erlang, two PDCH . . . . . . . . . . . . . 60
7.9 The effect of COD,
Delay Probability, three data erlang, three PDCH . . . . . . . . . . . 61
7.10 The effect of COD,
Average Delay, three data erlang, three PDCH . . . . . . . . . . . . 61
7.11 The effect of COD,
Delay Probability, three data erlang, four PDCH . . . . . . . . . . . 62
7.12 The effect of COD,
Average Delay, three data erlang, four PDCH . . . . . . . . . . . . . 62
7.13 Probability of delay for various voice loads, NV = 7 . . . . . . . . . . 63
x
7.14 Probability of delay for various voice loads, NV = 6 . . . . . . . . . . 64
7.15 Two-state VoIP and data, Probability of data delay . . . . . . . . . 65
7.16 Two-state VoIP and data, Probability of VoIP delay . . . . . . . . . 66
7.17 Probability of data delay for various exponential VoIP loads . . . . . 66
7.18 Average data delay for various VoIP loads . . . . . . . . . . . . . . . 67
7.19 Probability of data delay for various voice loads . . . . . . . . . . . . 67
7.20 Average data delay for various VoIP loads . . . . . . . . . . . . . . . 68
7.21 Probability of exponentially distributed VoIP delay for various data
loads . . . . . . . . . . . . . . . . . . . . . . . . . . . . . . . . . . . . 68
7.22 Average exponential VoIP packet delay for various data loads . . . . 69
8.1 Structure of the Compact Disc . . . . . . . . . . . . . . . . . . . . . 82
xi

List of Tables
2.1 Some milestones in GSM history . . . . . . . . . . . . . . . . . . . . 10
2.2 The four GSM coding schemes (Bates 2002) . . . . . . . . . . . . . . 14
3.1 VoIP codec properties (Blakely et al. 2000; Cisco Systems 2002) . . . 17
4.1 Path loss exponents for various environments (Rappaport 2002) . . . 26
xii

Chapter 1
Background
In the past, circuit switched voice and packet switched data have been operated
by a majority of service providers as two separate networks, having completely
different structures. Today’s networks are rapidly converging to become a single,
homogeneous next generation network capable of satisfying all user requirements
simultaneously. Whilst this network is slowly becoming a reality with entities such
as the soft switch, the concept of combining voice and data is not new. This topic has
been of considerable interest since the advent of packet switching and its multiplexing
gains.
The Integrated Services Digital Network (ISDN) is a prime example of a product
which has evolved from these ideas. ISDN supports voice communications whilst
transmitting and receiving data, provides the advantages of a single access, high
data rates and the flexibility to operate both services simultaneously (Jr. Andrews
1984). Although the manner in which this is done does not entirely create a con-
verged network, due to the fact that the only integrated feature ISDN possesses
is the physical path from the exchange to the customers’ premises (Turner 1986).
Nevertheless, a substantial amount of useful queueing theory was applied to un-
derstanding these networks and their properties, as discussed in (Schwartz 1987,
pg. 661–668) and (Higginbottom 1998, pg. 329–334). Gimpleson (1965) analyses the
mixture of wide and narrow band traffic as both a blocked calls lost network and a
blocked calls queued network, with the conclusion that the economy which results
from combining traffic types has to be greater than the cost of the queueing facility
and increased trunking capacity. With current processing power and rapid evolution
in high speed communication links, the processing complexity and required band-
width is becoming less of an issue. However, when the case of wireless systems is
considered, the radio resources are once again limited to the allocated frequency
1

bandwidth. Much deliberation on the distribution of resources has to be performed,
to reduce resource wastage and increase the usage efficiency of those frequencies
allocated to a particular station.
Services such as banking, trade, tourism, education and entertainment are increas-
ingly making use of Information and Communication Technologies (ICT) by means
of the Internet, mobile phone transactions, point to point connections and virtual
private networks. Cellular networks are rapidly adopting suitable network models
for supporting packet switched data services and as such, are expected to be able to
support a variety of packet switched data services such as Internet access and e-mail
(Koodli and Puuskari 2001). As users are becoming increasingly familiar with the
use of technology, they are demanding greater flexibility and mobility, performing
transactions out of the office and at any time of day. GSM phones offer the most
convenient medium of access, with the ability to provide transactions over a highly
secure interface, Internet access through WAP, or as a wireless modem for the user’s
notebook. With the introduction of GPRS to GSM, the support of packet based
billing allows the user to always be connected to the network with an always-on IP
connection. By combining voice and data onto a common IP platform, the user can
benefit from additional services such as push to talk, Voice over IP which allows
various bandwidths and thus options in call cost, click-to-talk services and voice
advertising during mobile transactions. In addition to the perceived user benefits,
the operator would also have a consolidated management platform, and also possi-
bly benefit from increased efficiencies due to the statistical multiplexing of packets,
especially if voice is transmitted as VoIP in the core of the network, where a large
degree of aggregation could occur.
1.1 Combining Voice and Data
The criteria for handling the transmission of voice and data are extremely different,
especially where tolerable data loss and delay are concerned. For example, data is
usually far more loss sensitive than voice, but relatively delay insensitive (although
according to Mitrou et al. (1993) voice should not have a bit error rate (BER)
exceeding 10−3), whereas voice requires delays of less than 300 ms (Mitrou et al.
1993). Voice is also extremely sensitive to out of sequence delivery, and fluctuation
in delay (known as jitter). Thus the understanding of bandwidth allocation issues is
extremely important in order to provide an acceptable Grade of Service with such
different services.
2

Bandwidth allocation usually falls into three categories (Mitrou et al. 1993):
1. Circuit switching - Resources are granted to a connection for the entire dura-
tion of the connection and may not be reassigned for other use. This dedicated
allocation of resources results in a predictable grade of service but is extremely
inefficient if data is not being continuously transmitted over the link.
2. Burst or Packet switching - Resources are allocated for the duration of a data
burst or talkspurt period. However the prediction of the duration of the burst
can be inaccurate and resources are not guaranteed for bursts which follow
the initial burst. Packet switching is a refinement of burst switching where
resources are allocated to serve the immediate requirement. This makes the
most efficient use of resources but requires very fast reallocation of resources,
as is the case with the General Packet Radio Service over GSM (Bettstetter
et al. 1999), when resources are allocated on a case by case basis.
3. Hybrid switching - Hybrid switching supports both circuit switching and burst
switching, combining the strategies in three different manners:
• Fixed Boundaries - In such a scheme, a dedicated portion of the avail-
able resources are allocated for a particular service, usually in a circuit
switched manner, whilst the remainder are freely allocated to other ser-
vices.
• Moving Boundaries - The allocation of resources can be freely altered
but one particular service is guaranteed a certain amount of resources
as in a fixed boundary, whilst other services can use those resources if
unallocated.
• No boundaries - This allocation allows all services of all available re-
sources, usually in a packet switched manner.
Intuitively, hybrid switching provides both the benefits of circuit switching and
packet switching, with moving boundaries making the best use of the available
resources whilst still being able to provide a guarantee of resources to a particu-
lar service. No boundaries is similar to a moving boundary except that no service
receives a greater degree of guaranteed resources than another. The access con-
trol or bandwidth allocation method is the fundamental constraint of the network
when considering factors such as quality of service and performance. Each access
control performs differently, depending on the environment, and is usually tailored
to a certain expected traffic behaviour. A hybrid switching protocol is discussed by
3
���������
�����
�� ����
���� ���
������ �����
��������
���������������
��������
�������������
�� �� ����
����������
��������� �
��� ��
!"�#�
���$
����� ������
�������%� ����
�����������
��������
&������'����
������ �����
���%�����
����()�����������
�� ���(��
��*�� +�����()
������������%������
���������'��������
"�#� " � ����'���
�������
'���
, ����� ��
�� ��������-�
�������� ��-� �
� �����.����-� �
"����� ��.����-� �
'���+����
" ����
������������
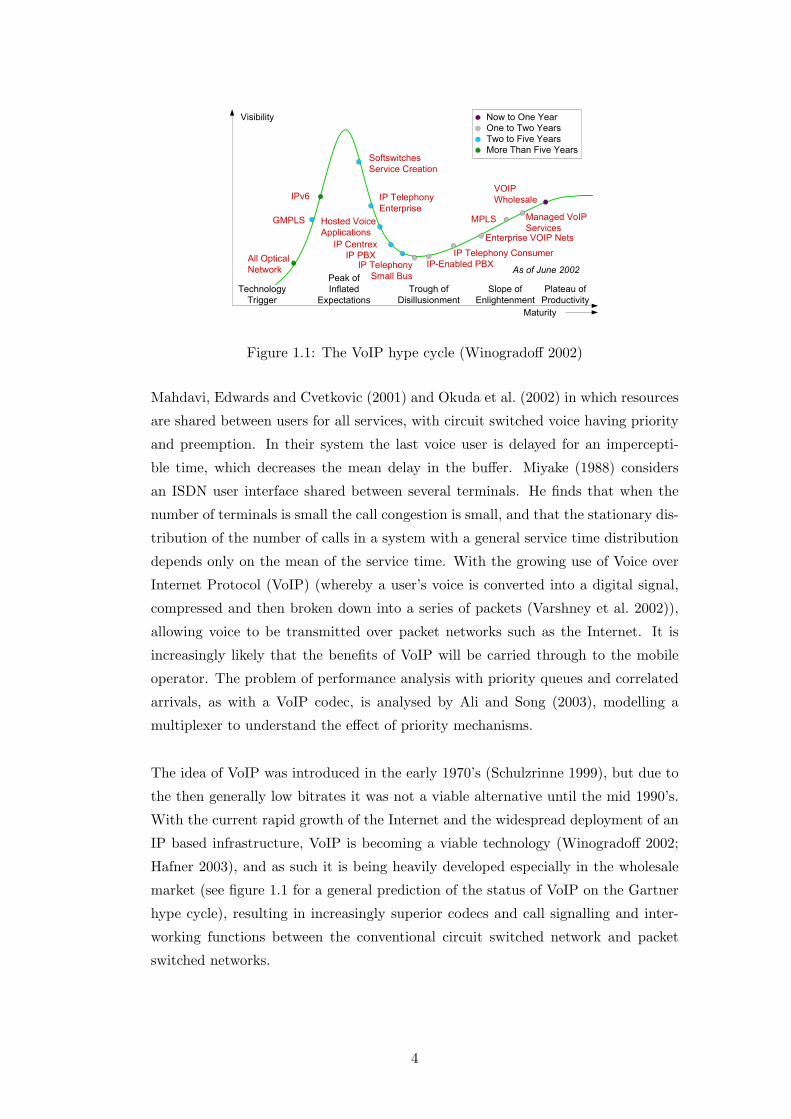
Figure 1.1: The VoIP hype cycle (Winogradoff 2002)
Mahdavi, Edwards and Cvetkovic (2001) and Okuda et al. (2002) in which resources
are shared between users for all services, with circuit switched voice having priority
and preemption. In their system the last voice user is delayed for an impercepti-
ble time, which decreases the mean delay in the buffer. Miyake (1988) considers
an ISDN user interface shared between several terminals. He finds that when the
number of terminals is small the call congestion is small, and that the stationary dis-
tribution of the number of calls in a system with a general service time distribution
depends only on the mean of the service time. With the growing use of Voice over
Internet Protocol (VoIP) (whereby a user’s voice is converted into a digital signal,
compressed and then broken down into a series of packets (Varshney et al. 2002)),
allowing voice to be transmitted over packet networks such as the Internet. It is
increasingly likely that the benefits of VoIP will be carried through to the mobile
operator. The problem of performance analysis with priority queues and correlated
arrivals, as with a VoIP codec, is analysed by Ali and Song (2003), modelling a
multiplexer to understand the effect of priority mechanisms.
The idea of VoIP was introduced in the early 1970’s (Schulzrinne 1999), but due to
the then generally low bitrates it was not a viable alternative until the mid 1990’s.
With the current rapid growth of the Internet and the widespread deployment of an
IP based infrastructure, VoIP is becoming a viable technology (Winogradoff 2002;
Hafner 2003), and as such it is being heavily developed especially in the wholesale
market (see figure 1.1 for a general prediction of the status of VoIP on the Gartner
hype cycle), resulting in increasingly superior codecs and call signalling and inter-
working functions between the conventional circuit switched network and packet
switched networks.
4

1.2 Wireless Voice and Data
Mobile telephony in African countries has proven to be far more effective than fixed-
line telephony for a number of reasons:
• Installation is faster - individual copper pairs do not have to be installed in
customer premises
• Prepaid contracts allow telecommunication services to be offered to those who
would not be able to qualify for post-paid services - and facilitate asymmetri-
cal access, allowing those who can afford the basic GSM handset a means of
receiving calls, and sending text messages.
• Coverage areas are greater using wireless - the size of the network can be
reconfigured as capacity or coverage limited, allowing a large amount of users
to be serviced with a single base station.
• Fraud and illegal use of telecommunication services is reduced. The possibility
of making fraudulent calls is reduced since the air interface is more secure than
that of a fixed line.
In addition, the management of accounts within a mobile network is easier due to
each subscriber having a unique identity number stored within both the phone and
the subscriber identity module. The suitability of mobile telephony is illustrated by
the fact that in a study done by the ITU (2001), it is predicted that by 2005 there
will be three times as many mobile subscribers as fixed-line subscribers. This trend
is believable, considering the growth of mobile subscribers in South Africa compared
to fixed-line subscribers, as shown in figure 1.2.
Wireless links introduce a number of problems which would be added to those of
a wireline environment. For example radio channels experience propagation distur-
bances such as frequency dependent fading (Mitrou et al. 1993), reflection (Neskovic
et al. 2000), diffraction (Rappaport 2002, pg. 126), delay spread due to multipath ef-
fects and signal decay as a function of separation distance (Rappaport 2002, pg. 138).
To minimise these errors, a number of techniques are implemented such as inter-
leaving to reduce burst errors, antenna diversity to minimise multipath interference,
frequency hopping to reduce frequency dependent fading, as well as encoding tech-
niques such as forward-error-correction and advanced encoding. There are also a
number of delays introduced into wireless environments (Balaji et al. 2000), for
example the processing delays, the channel allocation delays and propagation delay.
5

0
1000
2000
3000
4000
5000
6000
7000
8000
9000
Tele
phon
e su
bscr
iptio
ns (1
000s
)
0.0
2.0
4.0
6.0
8.0
10.0
12.0
14.0
16.0
18.0
20.0
Den
sity
Fixed 3926 4259 4645 5075 5493 4962
Mobile 535 953 1574 2600 5269 8308
Mobile per 100 inhabitants 1.4 2.3 3.8 6.2 12.2 19.0
Fixed per 100 inhabitants 9.9 10.5 11.3 12.1 12.8 11.4
1996 1997 1998 1999 2000 2001
Figure 1.2: Fixed and mobile telephone subscribers in South Africa (1000s) (ITU
2001)
Chaskar and Madhow (2001) analyse statistical multiplexing on wireless links with
interleaving. They consider two sources of delay, 1) the queueing delay at the base
station buffer and packet loss due to buffer overflow, and 2) link shaping and cod-
ing delay. From this study they develop a framework for quality of service (QoS)
provisioning over the wireless link. Various resource allocation schemes are also con-
sidered by Moorhead et al. (2000), and the authors find that the mechanism used
to reserve resources for the VoIP packets is central to the use of VoIP over GPRS.
Mitrou et al. (1993) investigate the integration of voice and data over an air inter-
face, in order to facilitate the efficient sharing of network resources among various
services, thereby reducing the overall cost and improving the flexibility of the net-
work management and configuration. A number of benefits from the integration of
voice and data over an air interface are enumerated below (Bi et al. 2001):
• Efficient usage of limited radio bandwidth due to statistical multiplexing.
• Contributing to the development of an understanding and implementation of
a converged network supporting a variety of different services.
• A simplified channel management due to homogeneous services.
• Flexible and faster service creation due to a common platform.
6

1.3 Global System for Mobile Communication (GSM),
Research Objectives
In this dissertation, hybrid multiplexing of voice and data is considered with respect
to the GSM network. GSM as a second generation technology provides circuit
switched capabilities for both voice and data. To support packet switching, the
GSM network can be upgraded to support General Packet Radio Service (GPRS),
which adds additional software and hardware to the network, as discussed further in
Chapter 2. The radio resources of the air interface between the mobile terminal and
base station are shared using hybrid allocation methods (Brasche and Walke 1997;
Bettstetter et al. 1999).
The standard used in GSM/GPRS is circuit switched voice and packet switched data,
supporting services such as multimedia messaging (MMS) and Internet browsing.
The use of Voice over IP has been a subject of intense interest as it offers the
possibility of furthering the benefits of statistical multiplexing and making better
use of the radio resources.
Whilst such a service is currently not implemented using GPRS, a future implemen-
tation is not inconceivable, especially as it would provide the last step towards a
completely unified voice and data network using the Internet Protocol, a step seen
as the inevitable future despite the challenges created by protocol overhead (Bi et al.
2001). Thus there is a requirement by operators to understand the needs of users,
and the behaviour of the network under varying resource allocations. This disserta-
tion provides an analysis of such a situation (hybrid multiplexing of voice and data),
using the GSM/GPRS operation as a case study.
This work has a number of objectives some of which are:
• To analyse the performance of a hybrid multiplexing scheme, with circuit
switched voice, packet switched data and packet switched voice, with vary-
ing allocated resources over a common air interface.
• To develop acceptable models for the operational environment for such a net-
work.
• To propose resource allocation bounds from the results of the studies.
7

1.4 Overview of Research Report
To achieve the goals outlined in the previous section, this report is structured as
follows: The GSM/GPRS network is discussed briefly in Chapter 2 within the scope
of the details that are required in order to model the operation of the GSM/GPRS
network. In Chapter 3, the requirements and considerations for VoIP operation are
discussed with respect to boundaries and performance in a limited resource data
switched environment. Chapter 4 introduces the models developed and the basic
queueing theory applied to the investigation, application of the queueing theory is
shown for the case of fixed boundary hybrid multiplexing. The verification and
validation of the developed simulator is discussed in Chapter 5, and the functioning
of the simulator is illustrated in Chapter 6. The results of the simulations are
presented in Chapter 7. An overview of the results and recommendations made
from the findings are reported in Chapter 8.
1.5 Key Achievements of the Study
The key achievements of this study are as follows:
• Traffic source models were developed to simulate the allocation of resources in
a hybrid resource allocation environment such as GSM/GPRS.
• A computer simulation was designed using these models to predict the perfor-
mance under varying loads. The source code for the simulator is contained in
the compact disc, in the Appendix.
• Using the developed simulator, recommendations and conclusions could be
made as to the behaviour of the modelled GSM/GPRS base station controller
under varying loads and resource allocations.
The following chapter describes the basics of the GSM/GPRS operation and the
components within the network.
8
Chapter 2
GSM and GPRS Operation
This chapter introduces the components, and operation of a GSM network necessary
for understanding the details of the study.
2.1 A Brief Background on GSM
In the mid 1980’s Wireless mobile communication was already well underway with
the Advanced Mobile Phone System (AMPS) widely deployed as a proven technol-
ogy. However, demand was increasing at a rate AMPS could not sustain, thus new
second generation systems were developed to address the increased capacity require-
ments. Three technologies were standardised and deployed in the USA (Halonen
et al. 2002): IS-95 (a 1.25 MHz CDMA carrier scheme), IS-136 (a TDMA technol-
ogy utilising the AMPS 30 kHz structure), and GSM (a European 200 kHz TDMA
standard at 900 MHz). GSM was defined by the standardisation body “Group Spe-
cial Mobile” within the Conference Europeenne des Postes et Telecommunications
(CEPT) (Halonen et al. 2002). The major GSM milestones are shown in table 2.1
(Bates 2002, pg. 4). From the 1990’s most GSM development was conducted by the
European Telecommunications Standards Institute (ETSI) Special Mobile Group.
GSM was rapidly proving to be the leader in these three standards, due to its roaming
and diverse implementation. As further countries adopted GSM, it benefitted from
large economies of scale for its equipment and software. With GSM currently used
in 197 countries and 863.6 million subscribers 1 it truly stands for the Global System
for Mobile Communications (GSM-Association 2003).1As of May 2003
9
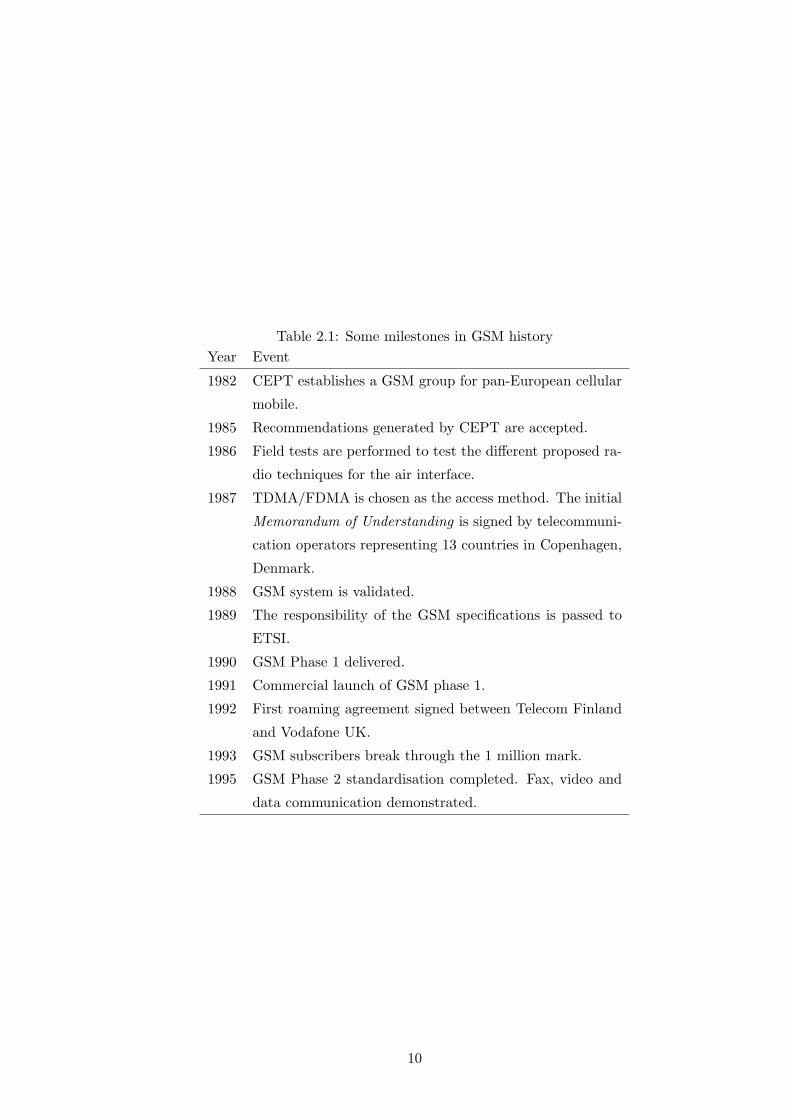
Table 2.1: Some milestones in GSM historyYear Event
1982 CEPT establishes a GSM group for pan-European cellular
mobile.
1985 Recommendations generated by CEPT are accepted.
1986 Field tests are performed to test the different proposed ra-
dio techniques for the air interface.
1987 TDMA/FDMA is chosen as the access method. The initial
Memorandum of Understanding is signed by telecommuni-
cation operators representing 13 countries in Copenhagen,
Denmark.
1988 GSM system is validated.
1989 The responsibility of the GSM specifications is passed to
ETSI.
1990 GSM Phase 1 delivered.
1991 Commercial launch of GSM phase 1.
1992 First roaming agreement signed between Telecom Finland
and Vodafone UK.
1993 GSM subscribers break through the 1 million mark.
1995 GSM Phase 2 standardisation completed. Fax, video and
data communication demonstrated.
10
����
���
���������
��� ����
����������
��� ����
���������������
������������������
�
�
�
�
�
�
!
Figure 2.1: GSM/GPRS resource allocation
2.1.1 GPRS - General Packet Radio Service
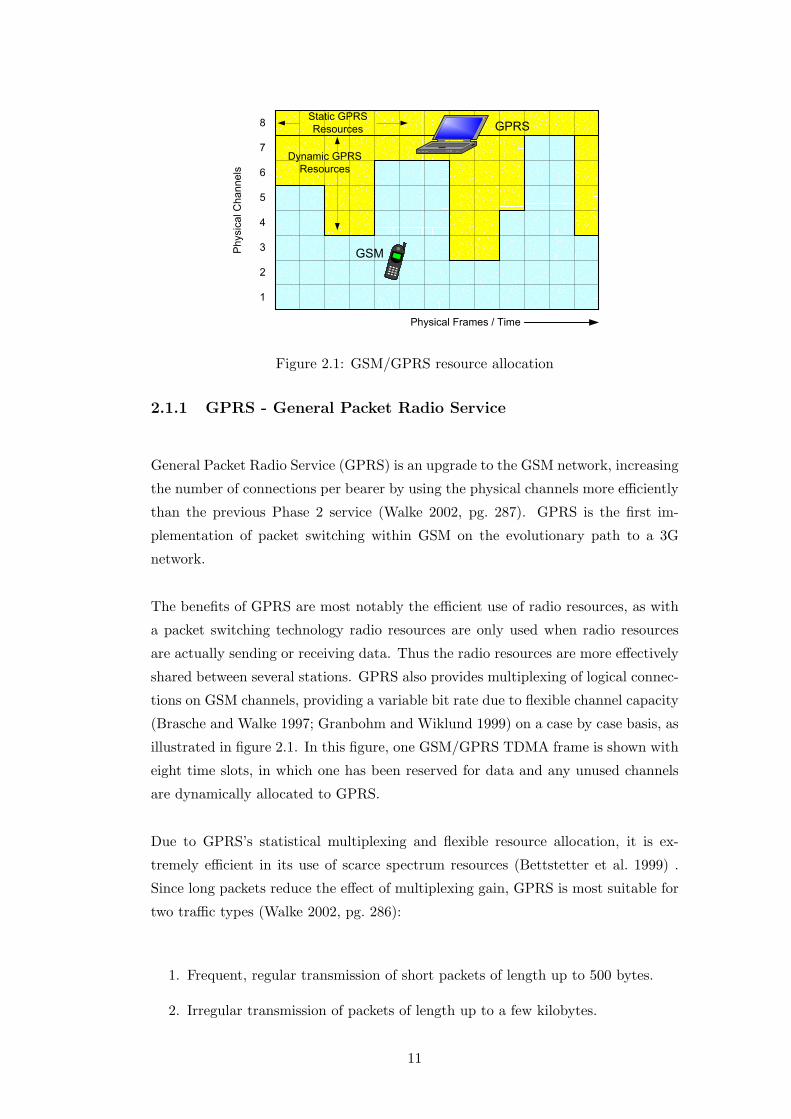
General Packet Radio Service (GPRS) is an upgrade to the GSM network, increasing
the number of connections per bearer by using the physical channels more efficiently
than the previous Phase 2 service (Walke 2002, pg. 287). GPRS is the first im-
plementation of packet switching within GSM on the evolutionary path to a 3G
network.
The benefits of GPRS are most notably the efficient use of radio resources, as with
a packet switching technology radio resources are only used when radio resources
are actually sending or receiving data. Thus the radio resources are more effectively
shared between several stations. GPRS also provides multiplexing of logical connec-
tions on GSM channels, providing a variable bit rate due to flexible channel capacity
(Brasche and Walke 1997; Granbohm and Wiklund 1999) on a case by case basis, as
illustrated in figure 2.1. In this figure, one GSM/GPRS TDMA frame is shown with
eight time slots, in which one has been reserved for data and any unused channels
are dynamically allocated to GPRS.
Due to GPRS’s statistical multiplexing and flexible resource allocation, it is ex-
tremely efficient in its use of scarce spectrum resources (Bettstetter et al. 1999) .
Since long packets reduce the effect of multiplexing gain, GPRS is most suitable for
two traffic types (Walke 2002, pg. 286):
1. Frequent, regular transmission of short packets of length up to 500 bytes.
2. Irregular transmission of packets of length up to a few kilobytes.
11
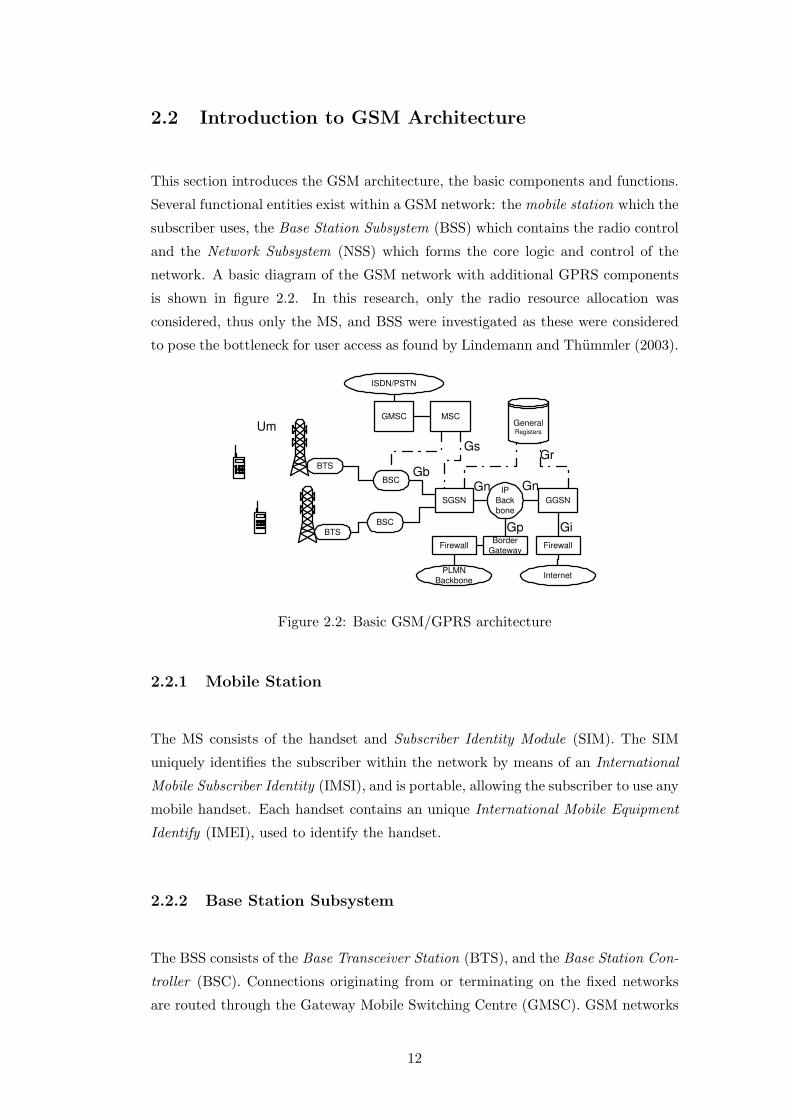
2.2 Introduction to GSM Architecture
This section introduces the GSM architecture, the basic components and functions.
Several functional entities exist within a GSM network: the mobile station which the
subscriber uses, the Base Station Subsystem (BSS) which contains the radio control
and the Network Subsystem (NSS) which forms the core logic and control of the
network. A basic diagram of the GSM network with additional GPRS components
is shown in figure 2.2. In this research, only the radio resource allocation was
considered, thus only the MS, and BSS were investigated as these were considered
to pose the bottleneck for user access as found by Lindemann and Thummler (2003).
BTS
BTS
BSC
BSC
SGSN
MSC General Registers
GGSN
GMSC
ISDN/PSTN
Firewall
IP Back bone
Border Gateway Firewall
Internet PLMN Backbone
Gr Gs
Gn Gn
Gp Gi
Gb
Um
Figure 2.2: Basic GSM/GPRS architecture
2.2.1 Mobile Station
The MS consists of the handset and Subscriber Identity Module (SIM). The SIM
uniquely identifies the subscriber within the network by means of an International
Mobile Subscriber Identity (IMSI), and is portable, allowing the subscriber to use any
mobile handset. Each handset contains an unique International Mobile Equipment
Identify (IMEI), used to identify the handset.
2.2.2 Base Station Subsystem
The BSS consists of the Base Transceiver Station (BTS), and the Base Station Con-
troller (BSC). Connections originating from or terminating on the fixed networks
are routed through the Gateway Mobile Switching Centre (GMSC). GSM networks
12
have a hierarchical structure, with at least one administrative region (comprising
multiple location areas) assigned to a particular Mobile Switching Centre (MSC)
(Bettstetter et al. 1999). Among the general registers used for call control are the:
Home Location Register (HLR), Visitor Location Register (VLR), the Authentica-
tion Centre (AUC) and Equipment Identity Register (EIR) (Brand and Aghvami
2002, pg. 100). Permanent and temporary data of registered users is stored in the
HLR. At all times the HLR knows the position of the subscriber, and is queried in
order to route calls to the correct base station controller. The VLR is responsible for
a number of location areas and the subscribers in these area, maintaining temporary
HLR information for faster access.
Base Transceiver Station
The BTS contains the radio modems, and radio link protocols. The BTS is visibly
identified as the mast, antennas and enclosure containing the equipment. Each
BTS serves a single cell and can also perform the following functions (Bates 2002,
pg. 19–20):
• Coding, multiplexing, modulating and encrypting the RF signals.
• Transcoding2 and rate adaption.
• Time and frequency synchronising
• Timing advances
• Channel measurements
Four Coding schemes are implemented in GPRS, Coding Scheme 1 (CS-1) to CS-4,
for the radio link control data blocks. As can be seen from table 2.2, CS-1 has a
high level of error correction, whilst CS-4 has no error correction but a higher data
rate. Each coding scheme is paid for by the operator individually, with CS-1 being
mandatory for GPRS operation, whilst CS-2 and CS-3 are most commonly imple-
mented. Since GPRS Phase II, the packet’s encoding is determined dynamically
based on factors such as the measured link quality, and as such an average bit rate
has to be assumed for the sake of simulation, as discussed in Chapter 7.2The direct digital-to-digital conversion from one encoding scheme to a different encoding scheme
without returning the signals to analogue form (American National Standard 1996)
13

Table 2.2: The four GSM coding schemes (Bates 2002)Coding Scheme Code Rate RLC/MAC RLC/MAC max
Block data size throughput
(bytes) (Kbps)
CS-1 1/2 20 8
CS-2 2/3 30 12
CS-3 3/4 36 14.4
CS-4 1 50 20
Base Station Controller
A single BSC controls a number of BTSs and manages the radio resources. The
BSC handles radio channel setup, frequency hopping, and handovers (Bates 2002).
The BSC translates 13 Kbps voice used over the radio link to the standard 64 Kbps
channel used over the PSTN and controls the power levels of attached BTS and
MS in the cells. The BSC assigns and controls the allocation of time slots and
frequencies. One BSC can serve up to nine fully loaded BTSs (Bates 2002), or more
if only partially loaded.
2.3 Towards an All IP Infrastructure
The use of an all IP network has a number of advantages: for example the use of
generic data networking equipment reduces the infrastructure cost, service creation
on a common platform is faster and a greater number of services can be offered to
users. In (Chitamu and Vannucci 2002) another two key reasons are given for imple-
menting a packet switched data-centric network: a packet switched network allows
an operator to provide a wide range of varying bandwidth services, such as e-mail,
voice, video and Internet browsing. Packet switching also facilitates effective use of
resources, especially necessary in lowering the average cost per user. The support of
multimedia services such as video and packet voice are two key applications in an
all IP network, as these are services that subscribers will use frequently. Fabri et al.
(2000) analysed the performance of MPEG-4 video using GPRS. They found that
with ten frames per second, at an average throughput of 32 kbit/s, the quality was
comparable to that of a wireline environment.
The transportation of voice over IP is considered as a possible method of increasing
14

Figure 2.3: Evolutionary path of GSM (Bates 2002)
the capacity of the GSM network. As such, methods to enable VoIP services have
received much attention. A mechanism to enable VoIP is discussed by Chang et al.
(2003) in which the costly MSC is replaced with a VoIP softswitch routing voice
through the GPRS network to a H.323 Gateway, as opposed to the public circuit
switched telephone network. Another scenario similar to Telecommunications and
Internet Protocol Harmonisation over Network (TIPHON) (ETSI 1998) and GSM
on the Net (Granberg 1998) is discussed by Rao et al. (2000), where VoIP is provided
as a service without any additional access equipment.
The use of the Internet Protocol is viewed as a fundamental component of any
third generation network, and the shift to an all IP network is seen as a part of
the natural evolution of the network. One evolutionary path proposed for GSM is
that of GPRS and later Enhanced GPRS (EGPRS), or alternatively from GPRS to
Enhanced Data rates for Global Evolution (EDGE), as shown in figure 2.3. EGPRS
can be implemented without modifying the logical link control layer for GSM/GPRS
but the radio link control/medium access control has to be modified to allow for the
more efficient multiplexing and link adaption (Bates 2002, pg. 339). Due to the cost
of upgrading GSM to support GPRS, it is understandable that the operator would
like to leverage most benefit from the existing resources, thus being able to transport
voice over IP using GPRS would allow the offering of some 3G-like services. Should
this be possible it could extend the lifespan of GSM/GPRS in the presence of 3G
technologies, perhaps even mitigating the need to implement an outright upgrade
to a 3G technology.
In the following chapter VoIP and its requirements are reviewed with respect to
some of the challenges facing its implementation in a GSM/GPRS network and
environment.
15

Chapter 3
VoIP and its Application to
GSM/GPRS
This section describes what Voice over Internet Protocol is, the fundamental traffic
theory, statistical models, applications and analysis of VoIP, as applied in a network.
This information is used for the simulation of the VoIP sources in Chapters 4 and
5 where the voice activity detection is taken into account as well as factors such as
header compression.
Benefits of VoIP VoIP has the potential to provide a unified IP network through
GPRS by combining voice and data over IP. Some of the benefits of using VoIP as
opposed to conventional circuit switched voice are:
• variable bandwidth allocation on a hop-by-hop basis assists the control of
congestion and caters for differing user requirements.
• reduces bandwidth with high compression codecs
• potential reduction in call costs due to common infrastructure
• silence suppression allows bandwidth to be used by other data during pauses
in conversation.
• allows a flexible network hierarchy due to the ability to route VoIP packets
independently through the network.
As listed by Blakely et al. (2000) there are a number of issues to consider when
integrating voice and data in a wireline network, such as the codec used, the silence
16

Table 3.1: VoIP codec properties (Blakely et al. 2000; Cisco Systems 2002)Voice Frame VoIP Packets RTP/UDP cRTP Layer 3
Algorithm BW size payload per /IP header header BW
(kbps) (bytes) (bytes) second (bytes) (bytes) (kbps)
G.711 64 80 160 50 40 - 80.0
G.711 64 80 160 50 - 2 64.8
G.729 8 10 20 50 40 - 24.0
G.729 8 10 20 50 - 2 8.8
G.723.1 6.3 30 30 26 40 - 14.56
G.723.1 6.3 30 30 26 - 2 6.656
suppression, VoIP packet compression and loss sensitivity. Likewise these issues
have to be considered in a wireless network.
VoIP Codecs Many VoIP codecs are available, requiring different bandwidth,
processing power and providing different voice quality. Some of the standard codecs
used are G.711, G.723.1, G.726, G.728, and G.729. Each of these codecs can also
have different implementations such as G.729a and G.729b. The codec used deter-
mines the ultimate bandwidth required, since the codec determines the size of the
packets used to encode the speech. Table 3.1 shows some codecs and their associ-
ated data characteristics (Blakely et al. 2000; Cisco Systems 2002). Wong and Mack
(1996) discusses some of the mean opinion scores associated with various codecs.
The rate of packet transmission and the payload size can also be altered so as to
vary the bandwidth and packet size. For example, by increasing the payload, the
number of packets sent is reduced and thus the bandwidth is reduced due to lower
protocol overhead. In this research, an average packet size of thirty bytes was used
for simulation purposes.
Voice Activity Detection Voice conversations can consist of as much as 60%
silence (Wang et al. 1998), with VoIP as with standard circuit switched traffic both
voice and silence is encoded. With the use of Voice Activity Detection (VAD), in
which only the conversation is encoded, the bandwidth required is approximately
reduced by the amount of silence removed. The G.729 Annex-B codec has a built-in
VAD, but in all other respects has identical performance to G.729 (Cisco Systems
2002). It was assumed for all simulation purposes that VAD is used for VoIP.
17
����������
�� ���
�����
���
���
���
������
���
���
������
�����
�������
��� ���!
�"�#�!
���
����$
�����
���
�����
�%�
&���
%��
�
����$
�������
��� ���!
�"�#�!
��
�"
�� ���
�%�
&���
%��
�
��
�"
&'�� ��� �# ���� � ���� ��
Figure 3.1: The GPRS protocol stack (Bates 2002; Halonen et al. 2002)
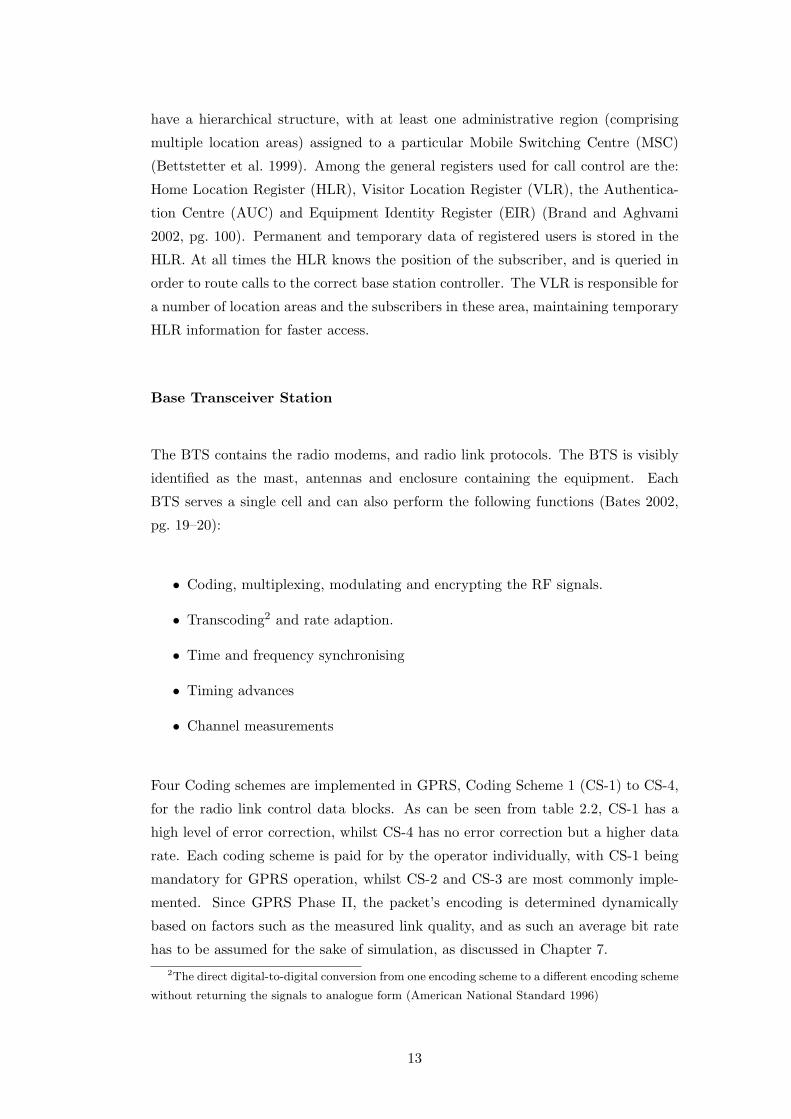
RTP Header Compression The Real-Time Protocol (RTP) provides applica-
tions with end-to-end network functionality for the transmission of real-time data,
such as voice (Network Sorcery 2003). All VoIP packets are encapsulated by a RTP
header, UDP and IP, which together form a forty byte header, the VoIP codec, RTP
and UDP would form part of the Application layer in the GPRS protocol stack as
shown in figure 3.1. When this header is compared to that of the default twenty
byte sample of a G.729 packet, these headers are extremely inefficient. RTP header
compression can compress the header size from 40 bytes to 2-4 bytes, resulting in a
further considerable saving in the required bandwidth and improved throughput. A
number of header compression schemes exist such as cRTP, ROHC, and ROCCO.
Robust header compression schemes can permit a Bit Error Rate (BER) of 10−4
(Eriksson et al. 2000).
VoIP and sensitivity to Packet Loss VoIP is generally loss insensitive to a
degree, as opposed to data which is loss sensitive. Random packet loss can be sub-
stituted with silence or for better performance white (background) noise, which can
then be interpolated by the human brain to maintain the conversation coherency
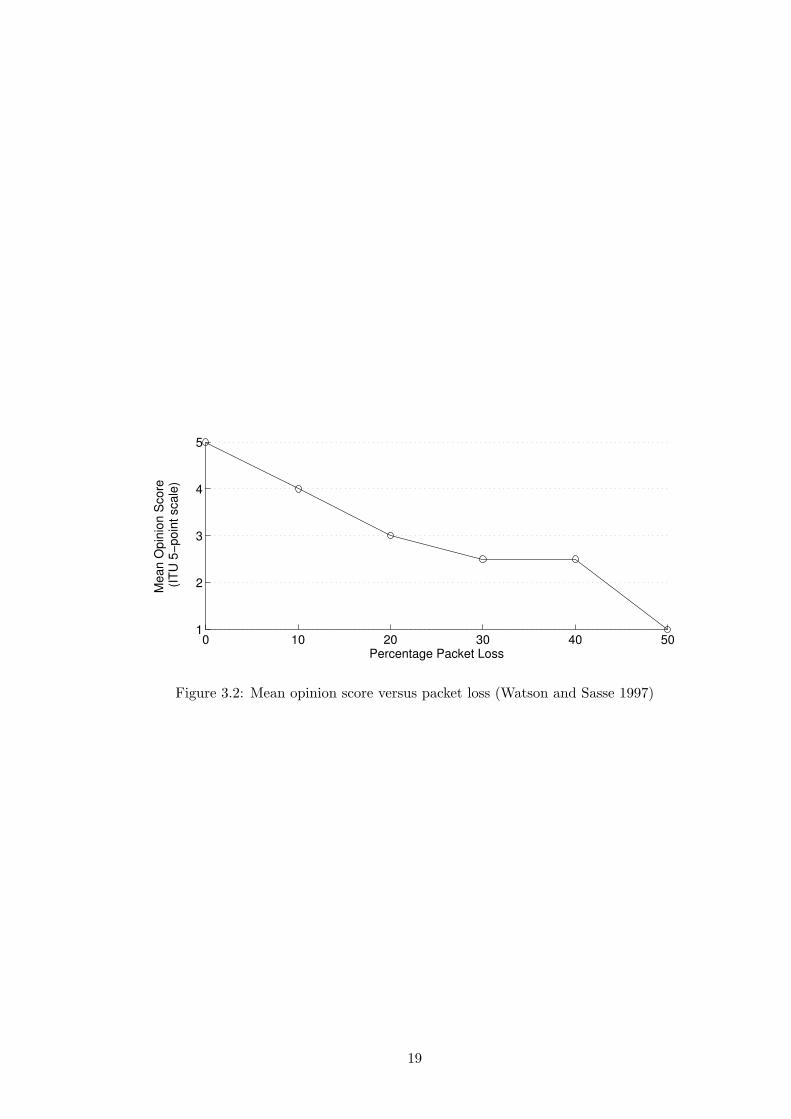
(Hassan et al. 2000). Figure 3.2 shows the user perceived quality for a 16bit linear,
8kHz DVI4 voice codec as a function of packet loss (Watson and Sasse 1997). In
the paper by Blakely et al. (2000) a burst packet loss of no more than 15% is rec-
ommended. Persistent packet loss would result in the VoIP conversation becoming
unintelligible. As with wireline VoIP persistent delays due to overload is aggravated
by the lack of flow control within the IP/UDP/RTP protocol stack (Blakely et al.
2000). Thus for an acceptable conversation, the packet loss for VoIP should
be kept below 20%.
18
0 10 20 30 40 501
2
3
4
5
Percentage Packet Loss
Mea
n O
pini
on S
core
(IT
U 5
−poi
nt s
cale
)
Figure 3.2: Mean opinion score versus packet loss (Watson and Sasse 1997)
19
Chapter 4
Theoretical Models for Traffic
Simulation
This section describes the various models used for the simulation study, and their
key parameters. The traffic source models are described with respect to a GSM
situation.
4.1 Traffic Source Models
There are three primary sources of traffic: voice, data and packetised voice. For each
source a suitable model was used to reflect its load on the GSM/GPRS network.
Each of these models is discussed in further detail with respect to the equations used
and the properties of the model.
4.1.1 Circuit Switched Voice
The model used for circuit switched voice was a Markovian arrival process with a
Markovian departure process. Thus the holding times are exponentially distributed
as well as the inter-arrival times as in (Lindemann and Thummler 2003). Exponen-
tially distributed processes indicate a seemingly random arrival pattern. A Poisson
process describes the nature of arrivals at a certain point in time. The n-th interar-
rival time An is described as exponentially distributed (Hlavacs et al. 1999)
20

0 1 2 3 4 5 6 70
0.2
0.4
0.6
0.8
1
x
f(x)
Figure 4.1: Exponential density function: equation 4.3
P{An ≤ τ} = 1− e−λτ (4.1)
An exponential distribution is continuous and its function is given by equation 4.2
(Higginbottom 1998, pg. 138), where λ is the average arrival rate.
F (x) =
1− e−x/β if x ≥ 0
0 otherwise.(4.2)
The density function of equation 4.2 as shown in figure 4.1, is given by equation 4.3,
where β is a scaling factor.
f(x) =
1β e−x/β if x ≥ 0
0 otherwise.(4.3)
This density function shows the probability of a call lasting for the duration shown
on the x axis, as in figure 4.1 in which a mean of one (i.e. a β of one) was used for
illustrative purposes. All voice calls were assumed to have a mean of two minutes, ie
a β of two, given higher cellular call costs compared to those of a wireline network.
21
γβλ te−−=−= 11
σαµ te−−=−= 11
γβ te−= σα te−=�������
����
������
����
Figure 4.2: VoIP model
4.1.2 Packet Switched Data
The data was modelled as an Poisson arrival process as in the case of the voice, but a
mean duration of 300 bytes was assumed. The duration of the packet was calculated
by determining the transmission time for a set baud rate. An average baud rate of
13.2 kbps was used for the simulations. Thus if a packet size of 450 bytes is assumed,
the packet duration is 450 × 8/(13.2 × 1024) = 266.3 ms. Given that one data
channel reserved for one hour could carry one hour of voice traffic, the
relationship between erlang and data can be established as the channel
occupancy time. Thus, if the data channel rate is assumed to be 13.2 kbps, a
transmission of approximately six mega bytes would be equivalent to one erlang of
data traffic which we here name as a data erlang.
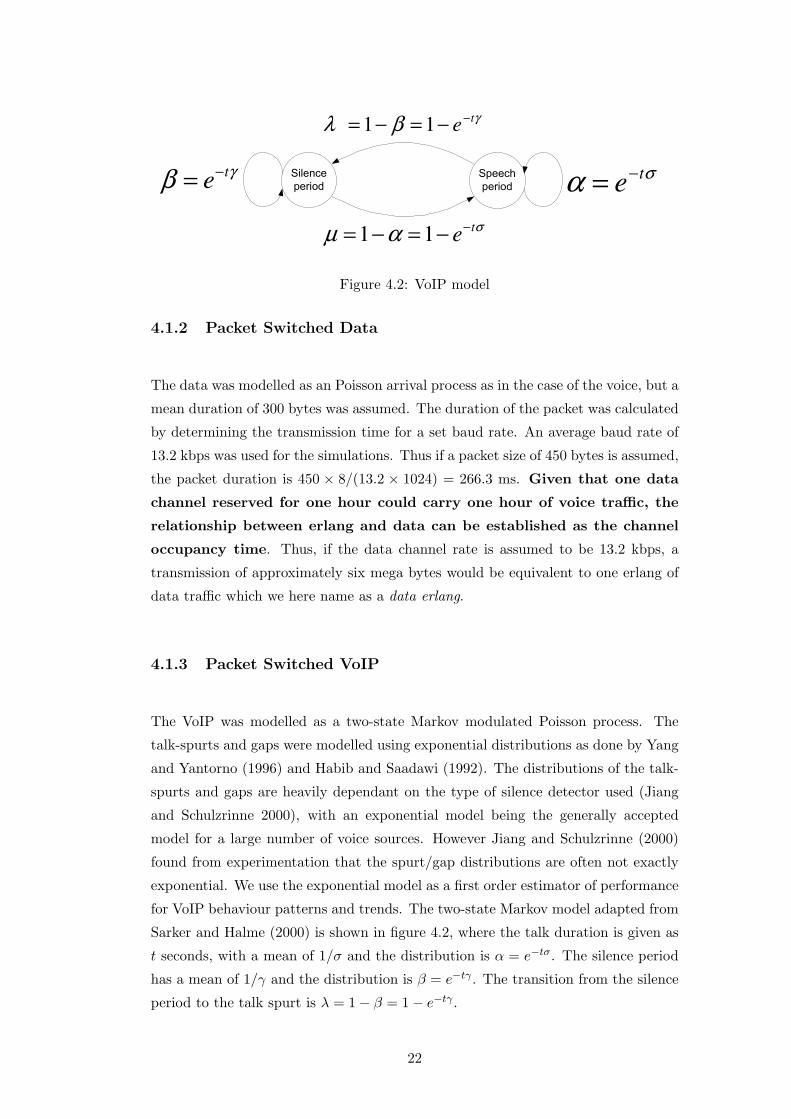
4.1.3 Packet Switched VoIP
The VoIP was modelled as a two-state Markov modulated Poisson process. The
talk-spurts and gaps were modelled using exponential distributions as done by Yang
and Yantorno (1996) and Habib and Saadawi (1992). The distributions of the talk-
spurts and gaps are heavily dependant on the type of silence detector used (Jiang
and Schulzrinne 2000), with an exponential model being the generally accepted
model for a large number of voice sources. However Jiang and Schulzrinne (2000)
found from experimentation that the spurt/gap distributions are often not exactly
exponential. We use the exponential model as a first order estimator of performance
for VoIP behaviour patterns and trends. The two-state Markov model adapted from
Sarker and Halme (2000) is shown in figure 4.2, where the talk duration is given as
t seconds, with a mean of 1/σ and the distribution is α = e−tσ. The silence period
has a mean of 1/γ and the distribution is β = e−tγ . The transition from the silence
period to the talk spurt is λ = 1− β = 1− e−tγ .
22

dC
C FFrames/Second
TransmissionLink
time
dλ 1−dµ
1vλ 1
1
−vµ
mvλ 1−mvµ
circuits
packets
123....N
Figure 4.3: A generic TDM heterogeneous channel
4.2 BSS Resource Allocation Modelling
The Base Station Subsystem resource allocation was modelled as a controller with
eight channels (one GSM/GPRS TDMA frame). A number of resource allocation
strategies were considered, the most feasible of which was the strategy in which
circuit switched Voice would receive a higher priority than data. VoIP packets
would receive a higher priority than standard data packets.
It was assumed that when a voice call arrives and no resources are available, the
call is discarded. For GPRS operation, if a data packet arrives and no resources are
available, it is queued in a buffer until it may be serviced.
Since there is a combination of both voice and data, a heterogeneous traffic case
had to be considered. As shown in figure 4.3 (Schwartz 1987, pg. 664), hybrid
multiplexing is used to combine different traffic types. In this case, circuit switched
voice and packet switched data is multiplexed onto a common transmission link.
Figure 4.3 shows circuit switched voice with arrival rate λv and holding time µ−1v
being combined with data packets onto a common time division multiplexing (TDM)
channel of total capacity C bits/second. The TDM channel has a total of C time
slots per frame (F), with Cd reserved for data and C − Cd for voice.
In our model of the BSS, all circuit switched users are considered to be one class
of traffic and packet switched data is assumed to be queued in a common queue.
23
vλ 1−vµ
voice
dλ 1−dµ
data
1
2
Nchannels
Controller
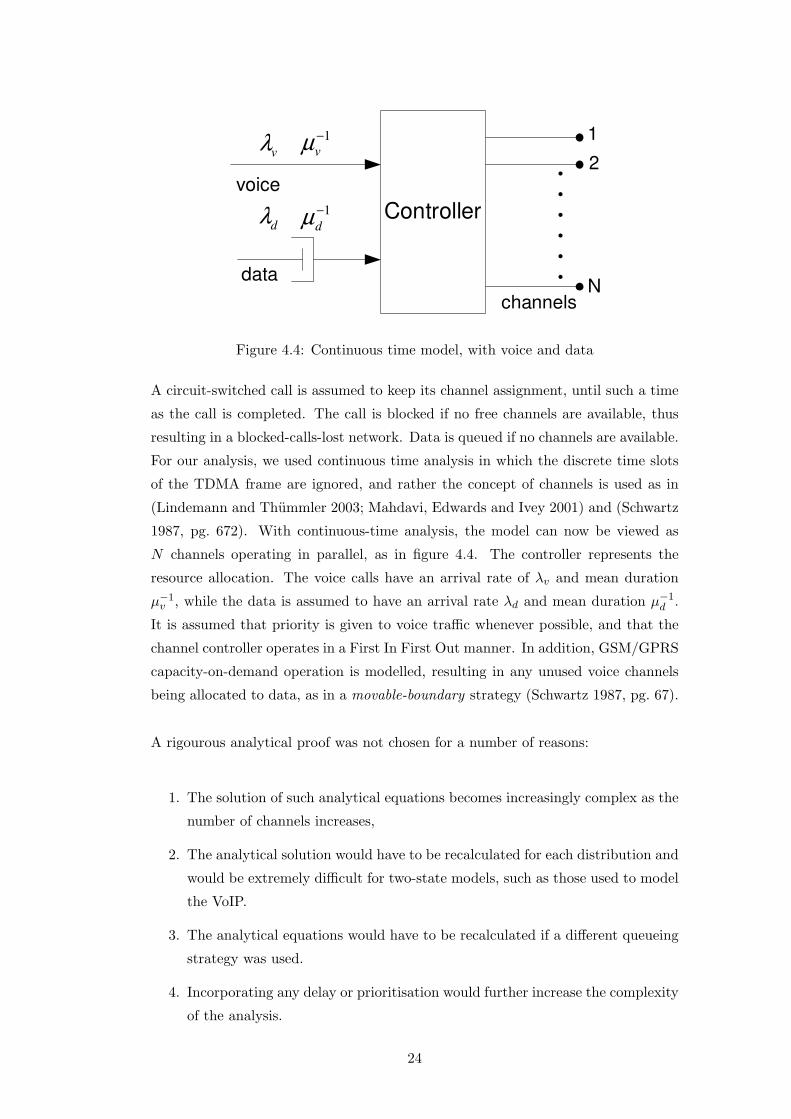
Figure 4.4: Continuous time model, with voice and data
A circuit-switched call is assumed to keep its channel assignment, until such a time
as the call is completed. The call is blocked if no free channels are available, thus
resulting in a blocked-calls-lost network. Data is queued if no channels are available.
For our analysis, we used continuous time analysis in which the discrete time slots
of the TDMA frame are ignored, and rather the concept of channels is used as in
(Lindemann and Thummler 2003; Mahdavi, Edwards and Ivey 2001) and (Schwartz
1987, pg. 672). With continuous-time analysis, the model can now be viewed as
N channels operating in parallel, as in figure 4.4. The controller represents the
resource allocation. The voice calls have an arrival rate of λv and mean duration
µ−1v , while the data is assumed to have an arrival rate λd and mean duration µ−1
d .
It is assumed that priority is given to voice traffic whenever possible, and that the
channel controller operates in a First In First Out manner. In addition, GSM/GPRS
capacity-on-demand operation is modelled, resulting in any unused voice channels
being allocated to data, as in a movable-boundary strategy (Schwartz 1987, pg. 67).
A rigourous analytical proof was not chosen for a number of reasons:
1. The solution of such analytical equations becomes increasingly complex as the
number of channels increases,
2. The analytical solution would have to be recalculated for each distribution and
would be extremely difficult for two-state models, such as those used to model
the VoIP.
3. The analytical equations would have to be recalculated if a different queueing
strategy was used.
4. Incorporating any delay or prioritisation would further increase the complexity
of the analysis.
24
4.3 The Effects of the Propagation Environment
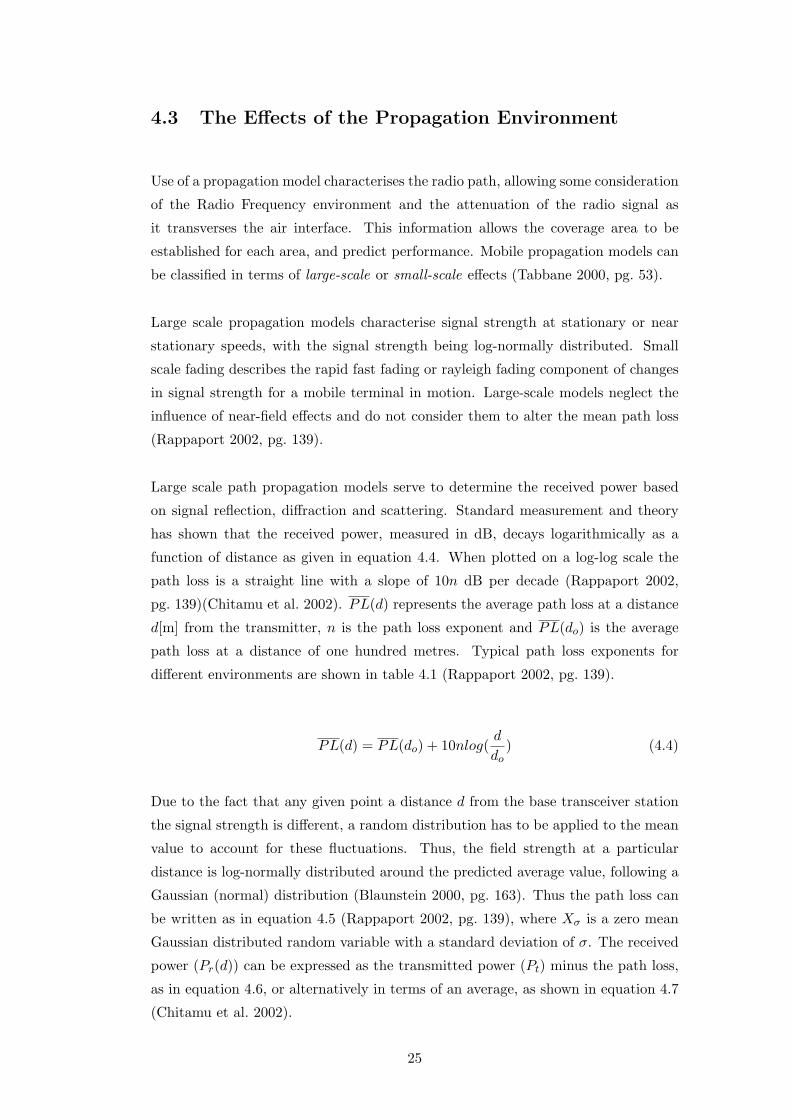
Use of a propagation model characterises the radio path, allowing some consideration
of the Radio Frequency environment and the attenuation of the radio signal as
it transverses the air interface. This information allows the coverage area to be
established for each area, and predict performance. Mobile propagation models can
be classified in terms of large-scale or small-scale effects (Tabbane 2000, pg. 53).
Large scale propagation models characterise signal strength at stationary or near
stationary speeds, with the signal strength being log-normally distributed. Small
scale fading describes the rapid fast fading or rayleigh fading component of changes
in signal strength for a mobile terminal in motion. Large-scale models neglect the
influence of near-field effects and do not consider them to alter the mean path loss
(Rappaport 2002, pg. 139).
Large scale path propagation models serve to determine the received power based
on signal reflection, diffraction and scattering. Standard measurement and theory
has shown that the received power, measured in dB, decays logarithmically as a
function of distance as given in equation 4.4. When plotted on a log-log scale the
path loss is a straight line with a slope of 10n dB per decade (Rappaport 2002,
pg. 139)(Chitamu et al. 2002). PL(d) represents the average path loss at a distance
d[m] from the transmitter, n is the path loss exponent and PL(do) is the average
path loss at a distance of one hundred metres. Typical path loss exponents for
different environments are shown in table 4.1 (Rappaport 2002, pg. 139).
PL(d) = PL(do) + 10nlog(d
do) (4.4)
Due to the fact that any given point a distance d from the base transceiver station
the signal strength is different, a random distribution has to be applied to the mean
value to account for these fluctuations. Thus, the field strength at a particular
distance is log-normally distributed around the predicted average value, following a
Gaussian (normal) distribution (Blaunstein 2000, pg. 163). Thus the path loss can
be written as in equation 4.5 (Rappaport 2002, pg. 139), where Xσ is a zero mean
Gaussian distributed random variable with a standard deviation of σ. The received
power (Pr(d)) can be expressed as the transmitted power (Pt) minus the path loss,
as in equation 4.6, or alternatively in terms of an average, as shown in equation 4.7
(Chitamu et al. 2002).
25
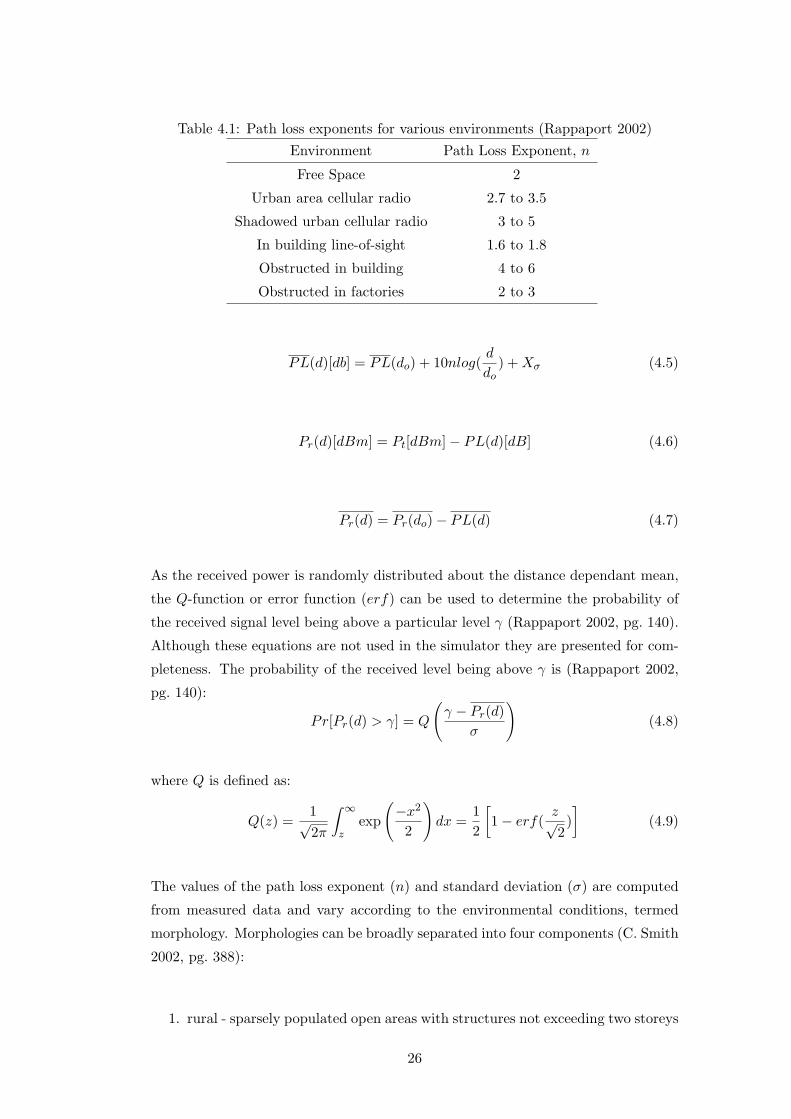
Table 4.1: Path loss exponents for various environments (Rappaport 2002)Environment Path Loss Exponent, n
Free Space 2
Urban area cellular radio 2.7 to 3.5
Shadowed urban cellular radio 3 to 5
In building line-of-sight 1.6 to 1.8
Obstructed in building 4 to 6
Obstructed in factories 2 to 3
PL(d)[db] = PL(do) + 10nlog(d
do) + Xσ (4.5)
Pr(d)[dBm] = Pt[dBm]− PL(d)[dB] (4.6)
Pr(d) = Pr(do)− PL(d) (4.7)
As the received power is randomly distributed about the distance dependant mean,
the Q-function or error function (erf) can be used to determine the probability of
the received signal level being above a particular level γ (Rappaport 2002, pg. 140).
Although these equations are not used in the simulator they are presented for com-
pleteness. The probability of the received level being above γ is (Rappaport 2002,
pg. 140):
Pr[Pr(d) > γ] = Q
(γ − Pr(d)
σ
)(4.8)
where Q is defined as:
Q(z) =1√2π
∫ ∞z
exp
(−x2
2
)dx =
12
[1− erf(
z√2)]
(4.9)
The values of the path loss exponent (n) and standard deviation (σ) are computed
from measured data and vary according to the environmental conditions, termed
morphology. Morphologies can be broadly separated into four components (C. Smith
2002, pg. 388):
1. rural - sparsely populated open areas with structures not exceeding two storeys
26
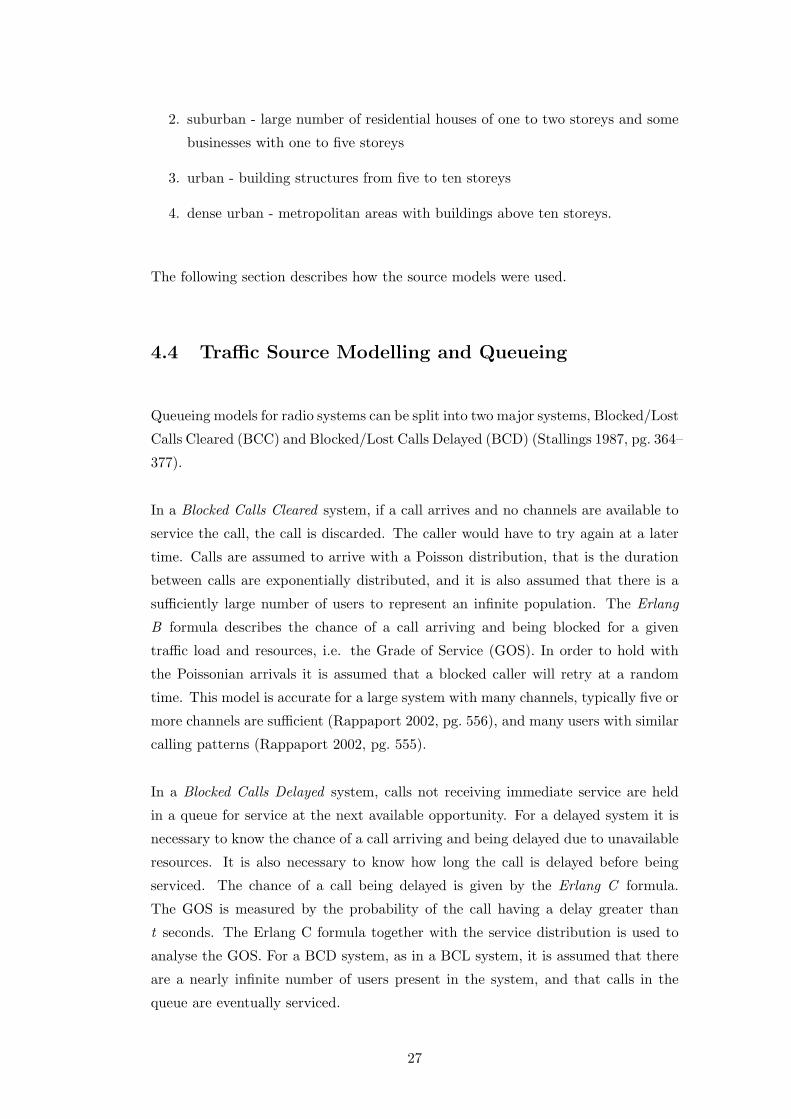
2. suburban - large number of residential houses of one to two storeys and some
businesses with one to five storeys
3. urban - building structures from five to ten storeys
4. dense urban - metropolitan areas with buildings above ten storeys.
The following section describes how the source models were used.
4.4 Traffic Source Modelling and Queueing
Queueing models for radio systems can be split into two major systems, Blocked/Lost
Calls Cleared (BCC) and Blocked/Lost Calls Delayed (BCD) (Stallings 1987, pg. 364–
377).
In a Blocked Calls Cleared system, if a call arrives and no channels are available to
service the call, the call is discarded. The caller would have to try again at a later
time. Calls are assumed to arrive with a Poisson distribution, that is the duration
between calls are exponentially distributed, and it is also assumed that there is a
sufficiently large number of users to represent an infinite population. The Erlang
B formula describes the chance of a call arriving and being blocked for a given
traffic load and resources, i.e. the Grade of Service (GOS). In order to hold with
the Poissonian arrivals it is assumed that a blocked caller will retry at a random
time. This model is accurate for a large system with many channels, typically five or
more channels are sufficient (Rappaport 2002, pg. 556), and many users with similar
calling patterns (Rappaport 2002, pg. 555).
In a Blocked Calls Delayed system, calls not receiving immediate service are held
in a queue for service at the next available opportunity. For a delayed system it is
necessary to know the chance of a call arriving and being delayed due to unavailable
resources. It is also necessary to know how long the call is delayed before being
serviced. The chance of a call being delayed is given by the Erlang C formula.
The GOS is measured by the probability of the call having a delay greater than
t seconds. The Erlang C formula together with the service distribution is used to
analyse the GOS. For a BCD system, as in a BCL system, it is assumed that there
are a nearly infinite number of users present in the system, and that calls in the
queue are eventually serviced.
27
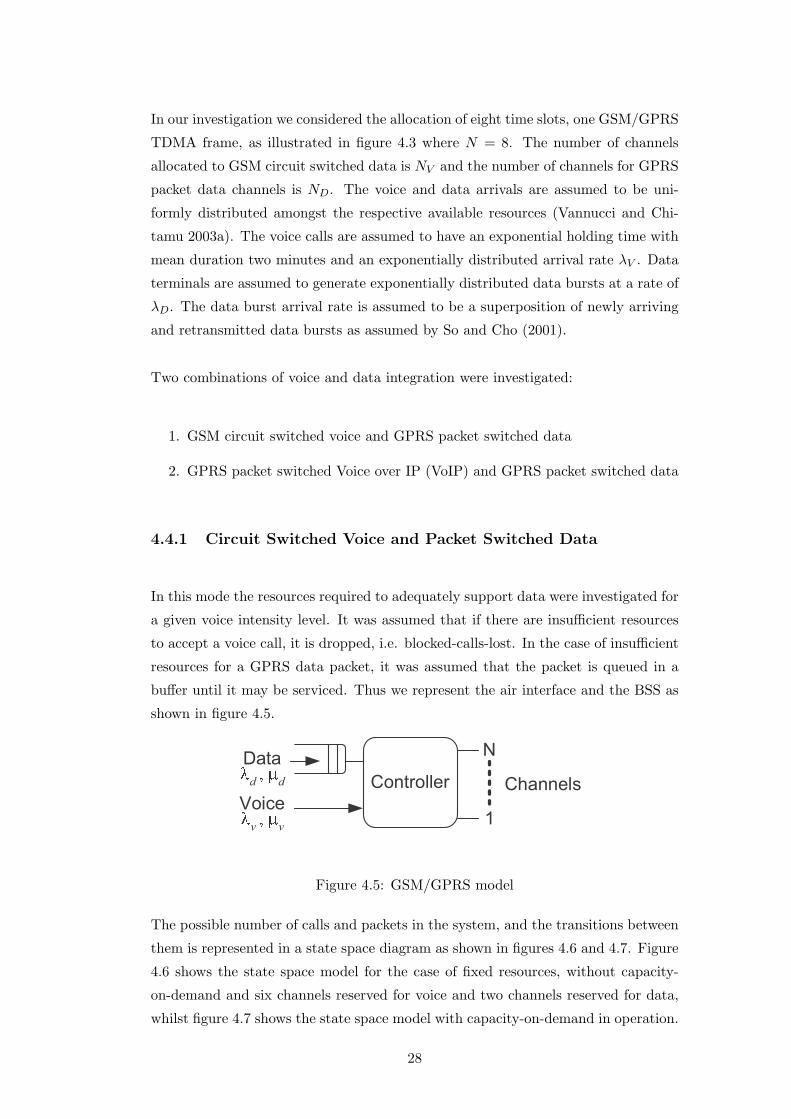
In our investigation we considered the allocation of eight time slots, one GSM/GPRS
TDMA frame, as illustrated in figure 4.3 where N = 8. The number of channels
allocated to GSM circuit switched data is NV and the number of channels for GPRS
packet data channels is ND. The voice and data arrivals are assumed to be uni-
formly distributed amongst the respective available resources (Vannucci and Chi-
tamu 2003a). The voice calls are assumed to have an exponential holding time with
mean duration two minutes and an exponentially distributed arrival rate λV . Data
terminals are assumed to generate exponentially distributed data bursts at a rate of
λD. The data burst arrival rate is assumed to be a superposition of newly arriving
and retransmitted data bursts as assumed by So and Cho (2001).
Two combinations of voice and data integration were investigated:
1. GSM circuit switched voice and GPRS packet switched data
2. GPRS packet switched Voice over IP (VoIP) and GPRS packet switched data
4.4.1 Circuit Switched Voice and Packet Switched Data
In this mode the resources required to adequately support data were investigated for
a given voice intensity level. It was assumed that if there are insufficient resources
to accept a voice call, it is dropped, i.e. blocked-calls-lost. In the case of insufficient
resources for a GPRS data packet, it was assumed that the packet is queued in a
buffer until it may be serviced. Thus we represent the air interface and the BSS as
shown in figure 4.5.
���������� ������
�
�
����
�� �
��
�� �
Figure 4.5: GSM/GPRS model
The possible number of calls and packets in the system, and the transitions between
them is represented in a state space diagram as shown in figures 4.6 and 4.7. Figure
4.6 shows the state space model for the case of fixed resources, without capacity-
on-demand and six channels reserved for voice and two channels reserved for data,
whilst figure 4.7 shows the state space model with capacity-on-demand in operation.
28
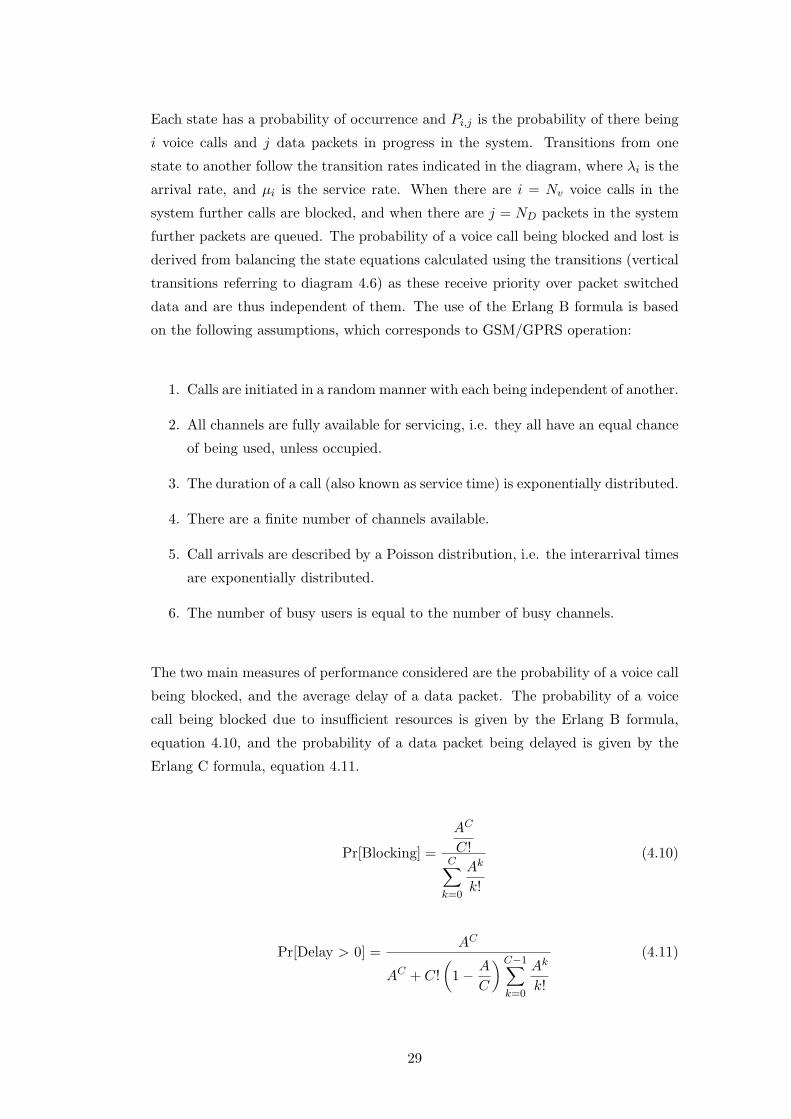
Each state has a probability of occurrence and Pi,j is the probability of there being
i voice calls and j data packets in progress in the system. Transitions from one
state to another follow the transition rates indicated in the diagram, where λi is the
arrival rate, and µi is the service rate. When there are i = Nv voice calls in the
system further calls are blocked, and when there are j = ND packets in the system
further packets are queued. The probability of a voice call being blocked and lost is
derived from balancing the state equations calculated using the transitions (vertical
transitions referring to diagram 4.6) as these receive priority over packet switched
data and are thus independent of them. The use of the Erlang B formula is based
on the following assumptions, which corresponds to GSM/GPRS operation:
1. Calls are initiated in a random manner with each being independent of another.
2. All channels are fully available for servicing, i.e. they all have an equal chance
of being used, unless occupied.
3. The duration of a call (also known as service time) is exponentially distributed.
4. There are a finite number of channels available.
5. Call arrivals are described by a Poisson distribution, i.e. the interarrival times
are exponentially distributed.
6. The number of busy users is equal to the number of busy channels.
The two main measures of performance considered are the probability of a voice call
being blocked, and the average delay of a data packet. The probability of a voice
call being blocked due to insufficient resources is given by the Erlang B formula,
equation 4.10, and the probability of a data packet being delayed is given by the
Erlang C formula, equation 4.11.
Pr[Blocking] =
AC
C!C∑
k=0
Ak
k!
(4.10)
Pr[Delay > 0] =AC
AC + C!(
1− A
C
) C−1∑k=0
Ak
k!
(4.11)
29

���
���
���
���
���
���
���
���
���
���
���
���
���
���
���
���
���
���
���
����� ������������������� � ������� ����
�������� �������������������
�����������
���
���
���
���
���
���
���
���
���
!"�#
���
Figure 4.6: Fixed resources state space
30

���
���
���
���
���
���
���
���
���
���
���
���
���
���
���
���
���
���
���
���� ������������������������������
�������������������������������������������
���
���
���
���
���
���
���
���
���
!"�
�����
���
���
���
���
���
���
���
���
���
���
���
���
���
���
���
���
���
���
���
���
���
��#
��#
��#
��#
��#
��#
��#
��$
��$
��$
��$
��$
��$
��$
Figure 4.7: Variable resources state space
31

������������
Figure 4.8: Illustration of talksputs and gaps during conversation
�
� �
� ���������� ��
���������� ��
���
����
Figure 4.9: Two-state VoIP
model
ControllerD a ta
Ch a nnels
1
N
� �
V oi c e� �
Figure 4.10: VoIP GPRS model
A is the offered traffic in erlang. An erlang is the call arrival rate (arrivals/s)
multiplied by the average call holding time. C is the number of channels available.
The average delay for a data packet is given by the probability of a packet being
delayed multiplied by the average holding time in the queue, as in equation 4.14. The
link shaping and coding delay is assumed to be a constant and thus was discounted
since the probability of the data packet being delayed is dependant on the resources
and load.
4.4.2 Packet Switched Voice and Packet Switched Data
Packetised voice is represented as an encoded variable data rate source made up of
talk-spurts and gaps, as shown in figure 4.8. A two-state ON-OFF Markov model
was used to generate voice segments which are then broken into VoIP packets, as in
figure 4.9. The On and Off states were exponentially distributed (using the natural
log of a random number between 0 and 1) with respective means of dON=352 ms
and dOFF=650 ms (Habib and Saadawi 1992).
VoIP packets are treated as normal data, except that the VoIP packets are priori-
tised, and will receive priority service whenever possible. Thus the VoIP and data
packets can be modelled as in figure 4.10.
32

The probability of a data packet being delayed can be calculated using the Erlang
C formula, if the amount of resources is known explicitly. The Erlang C formula is
derived from the assumption that a single queue is used to hold all requested calls
which cannot be immediately assigned a channel. That is, referring to figure 4.6,
the Erlang C formula is derived from balancing state equations calculated using the
horizontal transitions as these are independent of the voice calls in a fixed resource
situation. If no channels are available, the packet is delayed and held in a queue,
until it can be serviced. The chance that a queued packet is forced to wait more
than t seconds is given by equation 4.12.
Pr[Delay > t|delayed] = e−(C −A)
Ht
(4.12)
where C is the total number of channels, t is the delay time of interest, and H
is the average duration of a call or packet in seconds. Note that one assumes an
exponential distribution. If this is not the case, the probability of delay would
change. The chance of any call waiting for a duration greater than t is equation 4.12
multiplied by equation 4.11 as given in equation 4.13
Pr[Delay > t] = Pr[Delay > 0]× e−(C −A)
Ht
(4.13)
The average delay D for all packets in a BCD system is given by
D =∫ ∞0
Pr[Delay > 0]× e−(C −A)
Htdt = Pr[Delay > 0]× H
(C −A)(4.14)
4.4.3 Determining the Grade of Service from the Queueing Models
The Erlang B and Erlang C formula can be used collectively to estimate the Grade
of Service (GoS) for voice and data for a given load and resources. The number of
fixed allocated packet data channels (PDCH) for the data is used in the Erlang C
formula to predict the average delay and grade of service for data packets. While the
number of channels minus the fixed PDCH for GPRS would be used in the Erlang
B formula to determine the grade of service for the voice traffic. A Microsoft Excel
implementation of the Erlang formulas is shown in the appendix.
33

0%
10%
20%
30%
40%
50%
60%
70%
80%
90%
100%
0 0.5 1 1.5 2 2.5 3 3.5 4 4.5 5
Gra
de o
f Ser
vice
for V
oice
,G
rade
of S
ervi
ce fo
r dat
aND=1ND=2ND=3ND=4ND=5
ND=6
ND=7
Voice Load (Erlang)
Data Load (Erlang)
NV=7NV=6
NV=5
NV=4
NV=3
NV=2
NV=1
00.511.522.533.544.55
Figure 4.11: Theoretical Grade of Service for voice and data for varying loads and
resources
If the load is assumed to vary from zero to five erlang, then a graph can be plotted
of the GoS for both the voice and data, as shown in figure 4.11. Note that only
the GoS for a fixed resource can be predicted from the Erlang equations, and the
instantaneous GoS for a capacity-on-demand mode of operation has to be obtained
by changing the demand model in real time, and averaging the result to determine
the average grade of service over the busy hour.
Using figure 4.11, it is possible to predict the number of channels required for a
given load and GoS. For example, if seven channels are reserved for voice, and a
GoS of 5% is required, then from the graph one can determine that theoretically
a load of 3.5 erlang could be supported. With the remaining channel reserved for
data, at a 5% GoS, a load of approximately 0.2 erlang could be supported. From
figure 4.11 one can also observe the effects of packet multiplexing and the greater
efficiency of packet switching over circuit switching. For example, consider the case
of five channels, for a 5% GoS for packet switching the load would be approximately
3.5 erlang, as opposed to 2.25 erlang for circuit switching traffic operation.
The next chapter describes the verification of the computer simulation, and how
the simulator was validated before being used for the simulation of more complex
models, such as the two-state VoIP model and the capacity on demand functionality
of the controller.
34
Chapter 5
Simulation Environment Specification,
Validation and Verification
Modelling a communication network can take two forms: a mathematical analysis,
using mathematical methods such as the probability theory discussed in the previous
section, allowing exact answers to particular questions to be gained by way of an
analytic solution (Law and Kelton 1982), or computer simulation (Balaban 1984).
However, mathematical analysis can often become intractable if a large number of
initial parameters are considered, and thus often becomes exceedingly complex as
the number of variables and model complexity increases. Computer simulation, the
second accepted method used to analyse communication networks, uses the computer
to evaluate the model numerically over a period of time and provide an estimated
solution. Due to the use of high level languages, this approach is considered to be
far more flexible.
There are a number of advantages and some disadvantages to computer simulation,
some of which as reported by (Law and Kelton 1982, pg. 8–9):
+ Most real-world systems with stochastic elements cannot be accurately de-
scribed by an analytical model
+ Simulation allows the operating conditions to be varied and the performance
under the varying conditions to be altered. An analytical model often assumes
a fixed set of operating conditions.
− Simulation models are time consuming to develop and require multiple simu-
lations to provide an acceptable estimated answer, whilst an analytical model
produces one deterministic result.
35
The computerised model developed in this study uses a combination of discrete and
continuous time simulation, known as combined discrete-continuous simulation (Law
and Kelton 1982, pg. 47). In this section, the required simulation functionality is
discussed as well as the features of the developed simulator.
A simulation of the system incorporating the models developed during the problem
analysis phase was created to solve the problem recursively. The computerised model
was created in Java, using object orientated techniques. This section describes the
computerised model functionality, capabilities, components and verification.
5.1 Simulator Specification
The problem entity description is of great importance when evaluating the com-
putational model, since the conceptual model is based on the description of the
real world system, and likewise the computerised model is based on the conceptual
model, thus the description of the real system leads is fundamental to the modelling
and simulation1.
One of the first considerations undertaken in the development of the model of the
GSM/GPRS system was the validity of the model, the degree to which it corresponds
to the real world system. Validity can be portrayed symbolically as in equation 5.1
(Zeigler 76, pg. 5), where validity is expressed in degrees of strength.
real system data ?= model generated data (5.1)
The objective of this computerised model was to present a first order predictively
valid model, i.e. a model that could match the general operation of the real system
before data is acquired from the real system (Zeigler 76, pg. 5).
The reason for the modelling was to gain an understanding of the operation, ob-
serve its behaviour and suggest possible improvements which would warrant further
investigation.
After analysis of the real world system, it was decided to simplify the model to
retain only what was relevant to the study: the GSM/GPRS resource allocation
methodology and the traffic source models. The hybrid multiplexing methodology1“modelling deals primarily with the relationships between the real system and models; simula-
tion refers primarily to the relationship between computers and models.” (Zeigler 76, pg. 3)
36
was modelled together with the offered traffic nature. Due to the complexity of
GSM/GPRS operation, other features such as signalling, temporary block flow allo-
cation, coding scheme variations and other supervisory functions and protocols were
not simulated.
By simulating only the radio resources, the resulting patterns could be analysed so
as to make recommendations for further analysis of a more realistic system.
5.1.1 Simulator Functionality
As the simulator was created to implement the BSS model, all aspects of the initial
traffic could be varied to determine the impact of those variables under different
conditions. For all traffic types, the mean holding time and arrival rate could be
altered to vary the traffic intensity. For the VoIP traffic, the mean ON and OFF
durations could be altered.
5.1.2 Simulator Output
The output of the simulation is an entry into a comma separated text file, specifying
the results of the simulation in terms of the delay for the packets, the average call
blocking, the average probability of delay. In order for a statistically acceptable
averages, these parameters had to be combined by means of further processing in
Matlab as described in the following paragraph.
5.1.3 Simulator Output Processing
Due to the results of the simulation being stored in a text file, the output files
had to be further processed to collate similar simulations and produce
an average simulation result. The results were entered into a SQL database and
then collated and exported to a text delimitated file for processing within Matlab.
Within Matlab the results were averaged, and graphs of the results plotted. All of
the Matlab scripts are contained on the compact disc in the Appendix.
37
5.1.4 Simulator Random Number Generator
By their basic nature, simulations are models for stochastic processes, and hence
one of the key functions of a simulator is the ability to generate uncorrelated ran-
dom variables (Higginbottom 1998, pg. 96). A Mersenne twister Portable Random
Number Generator (PRNG) was used to produce repeatable random numbers of a
high quality as reported by Luke (2000); Matsumoto and Nishimura (1998). Such
a portable random number generator allows a set of random numbers to be repro-
duced given the same initial seed. This is very useful for testing to reduce the effects
of stochastic variation and observe if the simulation output is repeatable.
5.2 Simulation Validation and Verification
This section discusses the verification and validation (V&V) of the developed com-
puterised model. The recommended procedures for V&V are defined and their
application is discussed with respect to the resulting developed simulator. Model
validation is defined by Schlesinger et al. (1979) as “substantiation that a com-
puterised model within its domain of applicability possesses a satisfactory range of
accuracy consistent with the intended application of the model”. Likewise, model
verification is defined as “ensuring that a computerised model represents a con-
ceptual model within specified limits of accuracy” (Schlesinger et al. 1979). It is
generally accepted that a model is developed for a specific purpose and its validity
should be determined for that purpose (Sargent 1994). As part of development pro-
cess (Sargent 1994), several versions of the model were developed prior to obtaining
a satisfactorily valid model. Determining the validity of the model for the entire
stated domain was deemed too time consuming. Instead, tests and evaluations were
conducted until a sufficient body of evidence existed to develop an acceptable confi-
dence in the simulator, a standard practice considering the abstracted nature of the
model (Sargent 1994). The relationship between cost/time of the model validation
and the perceived value of the model to a user is shown in figure 5.1 (Sargent 1994).
From this graph we can see that even a moderately validated model has a value
to the user, and the rate of return on model value decreases as the validation cost
increases.
Sargent (1994) and (Schlesinger et al. 1979) illustrate a model validation and veri-
fication modelling process. This diagram, shown in figure 5.2, has been adapted to
further simplify the relationship between the problem entity and the computerised
38

�����
��
����
�����
����
��������
���
���������������� ����
�����
���
Figure 5.1: General model confidence (Sargent 1994)
model with only one way relationships, and to enhance the relationship between the
computerised model and conceptual model with a two-way relationship which better
illustrates the methodology used in the development of this computer simulation.
Figure 5.2 shows the development of the computer simulation, represented by the
computerised model, and the intermediate verification and validation that occurs
between iterations. The problem entity is the system being modelled, the concep-
tual model is the developed representation, the computerised model is the concep-
tual model implemented using a high level programming language (Sargent 1994;
Schlesinger et al. 1979), which in this case was Java. The dotted arrows indicate
the design phases. It was also found that there was an iterative process between
the conceptual model and the computerised model, with the introduction of more
complex traffic source models such as the VoIP codec described in Chapter 3.
����
��������
��� ��������
������ �� �
��� �
���� �����
��� �
��� �� �������
������ ��������������
�� �������
�
� �
��������
���� ��������� �
����������� �����
������������
���� � �������
������ �� ����� �
��������
Figure 5.2: Adapted version of the Modelling Process
39
5.2.1 Validation
There are three fundamental approaches to determining the validity of a comput-
erised model, as outlined in (Sargent 1994). Each validation process is part of the
V&V that takes place at each iterative stage of development. The first and most
common method to determine validity is based on the subjective decision of the de-
velopers themselves, and whilst this decision is based on the results of various tests
and evaluations during the development process, it can be biased. Thus a preferred
method is the process of independent verification and validation (IV&V) (Sargent
1994). IV&V requires the review of an independent third party, ranging in detail
from simple reviewing to a involved V&V effort. As part of the IV&V process, the
developed models for this simulation were discussed at multiple conferences in which
they were peer-reviewed (Vannucci and Chitamu 2003a;b;c). The third validation
approach is to use a scoring model. This method of validation was found by Sargent
(1994) to be impractical for a number of reasons as listed below, and thus was not
used in the validation of this simulation model:
1. Individual scores are determined subjectively by the developer of the model.
2. The final total score at which to accept a model is ambiguous and varies
between models.
3. A model might be defective and still have an acceptable score.
4. A high score might cause an overconfidence in the model and be used to
compare simulation models with different objectives.
(Law and Kelton 1982, pg. 338) cite the paper by Naylor and Finger (Naylor and
Finger 1967) as one of the fundamental papers in validation literature. In (Nay-
lor and Finger 1967), an alternative three-step process, as below, is described for
validating a simulation model. This is further discussed by Law and Kelton (1982).
The first step is developing a model with a high face validity, a form or rationalism
(Naylor and Finger 1967), i.e. a system that seems reasonable. This can be accom-
plished in a number of ways, conversations with experts (Chitamu 2003), existing
theory and practice (i.e. previous GSM/GPRS simulations) and general knowledge
(i.e. the application of queueing theory). The second step is empirical testing, de-
termining the validity of simulation results by comparing them to known real world
results. Due to the inability to experiment on a live system, empirical testing could
40

only be verified for some of the source models for which such testing had already been
performed by independent parties. The third step is to determine how representative
the simulation output is, by comparing the output to a more detailed simulation of
the system or doing a statistical comparison with the real system behaviour. This
was not done for this computer simulation due to the excessive validation cost that
this would incur (see figure 5.1) for a model which was only meant to evaluate one
aspect of a GSM/GPRS system.
5.2.2 Verification
In Simulation Modeling and Analysis, Law and Kelton (1982) identify five techniques
to assist in the verification of the simulation model. These techniques are (Law and
Kelton 1982, pg. 334–336):
1. Write and debug the computer program in modules. This technique was used
extensively due to the object orientated programming techniques used, allow-
ing the simulator objects to be tested and detail added as each function was
verified, gradually increasing the complexity of the model.
2. Have more than one person evaluate the computer program. This technique was
used during the initial design and construction of the simulation, by consulting
an experienced programmer (Hodgkinson 2002) who assisted in implementing
the core functionality and processes of the computational engine.
3. Use a trace whilst debugging the program. All major high level programming
languages allow the system variables to be inspected at any stage of the pro-
gram. This proved to be crucial in successfully debugging the program. The
use of fixed seeds and a portable random number generator allowed determin-
istic events to be inputted, providing a known event set for computation.
4. The model should be run under simplifying assumptions in which the charac-
teristics can be easily computed. The output of the simulator was tested under
constrained circumstances and the results were compared to those predicted
by theory, namely the Erlang B and Erlang C formulas. The simulator testing
is limited to the assumptions of the Erlang formulas, for which exponentially
distributed inter-arrivals are assumed. Thus confidence in the simulator oper-
ation was established before further more complex models were implemented
such as the two-state Markov modulated Poisson process. The simulator out-
put was verified under different simulation durations and traffic loads.
41
5. Graphically display the progress of the simulation. This feature was imple-
mented by setting the debug flag in the simulation engine, so that the progress
of the simulation and the event handling could be observed. This allowed
the cause of infrequent errors to be observed by simultaneously recording the
debug output in a text file.
In addition to the simulator verification, it is extremely important to validate the
simulations performed, since experimentation with a simulation is a proxy for ex-
perimenting with a existing or proposed system. Thus one of the primary goals in
simulation is the relevancy of the simulation, to ensure that the model developed
can be used to predict the performance of the real system, were such changes feasible
and possible. However, one should always keep in mind the constraints of a simu-
lation and the fact that it is merely an approximation, thus rather referring to the
degree to which the model agrees with the system (Law and Kelton 1982, pg. 337),
and likewise keeping in mind the overall objective of the simulation study.
Verification Results
The results of multiple computerised model verification tests under varying condi-
tions are shown in figures 5.3, 5.4, 5.5, 5.7. Verification of the computerised model is
of utmost importance in ensuring that the computer programming and implementa-
tion of the conceptual model are correct (Sargent 1994). Before the final simulation
was completed, basic testing was done on the simulation functions, such as the ran-
domness of the Mersenne Twister, the generation of events, the chronological sorting
of events, and other subsections of the program, as described in Chapter 6. By vary-
ing the initial conditions, the dynamic load testing of the computerised model could
be done, as shown in the following figures. In addition, some critical components
of the program, such as the sorting and queueing methods, were redone to im-
prove the speed of the computerised model, allowing internal consistency tests to be
performed.
In figure 5.3 the data load was varied from 0.9 to 1.5 erlang and the voice load from
1 to 4 erlang, capacity-on-demand was in operation. Similarly in figure 5.4 the data
load was varied from 1.5 erlang to 1.9 erlang.
It can be seen that the voice percentage blocking does not vary with different data
loads. This corresponds to the theoretical operation due to voice being prioritised.
42
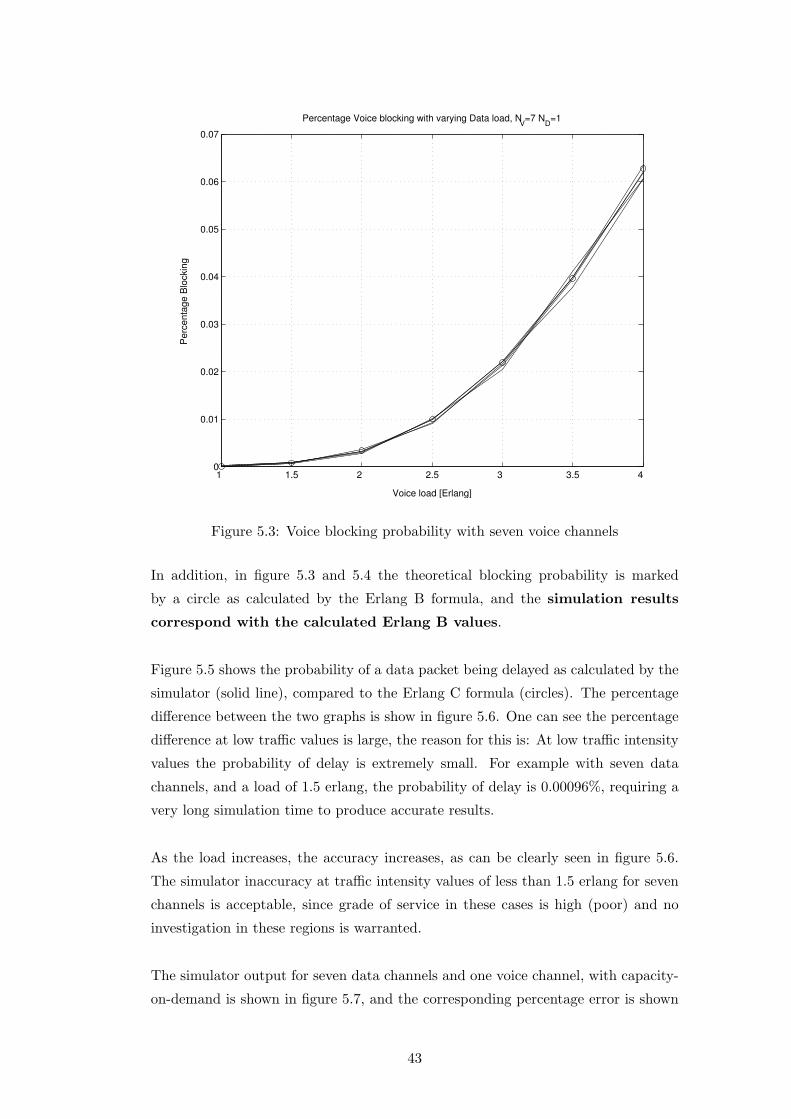
1 1.5 2 2.5 3 3.5 4 0
0.01
0.02
0.03
0.04
0.05
0.06
0.07
Percentage Voice blocking with varying Data load, NV=7 N
D=1
Voice load [Erlang]
Per
cent
age
Blo
ckin
g
Figure 5.3: Voice blocking probability with seven voice channels
In addition, in figure 5.3 and 5.4 the theoretical blocking probability is marked
by a circle as calculated by the Erlang B formula, and the simulation results
correspond with the calculated Erlang B values.
Figure 5.5 shows the probability of a data packet being delayed as calculated by the
simulator (solid line), compared to the Erlang C formula (circles). The percentage
difference between the two graphs is show in figure 5.6. One can see the percentage
difference at low traffic values is large, the reason for this is: At low traffic intensity
values the probability of delay is extremely small. For example with seven data
channels, and a load of 1.5 erlang, the probability of delay is 0.00096%, requiring a
very long simulation time to produce accurate results.
As the load increases, the accuracy increases, as can be clearly seen in figure 5.6.
The simulator inaccuracy at traffic intensity values of less than 1.5 erlang for seven
channels is acceptable, since grade of service in these cases is high (poor) and no
investigation in these regions is warranted.
The simulator output for seven data channels and one voice channel, with capacity-
on-demand is shown in figure 5.7, and the corresponding percentage error is shown
43
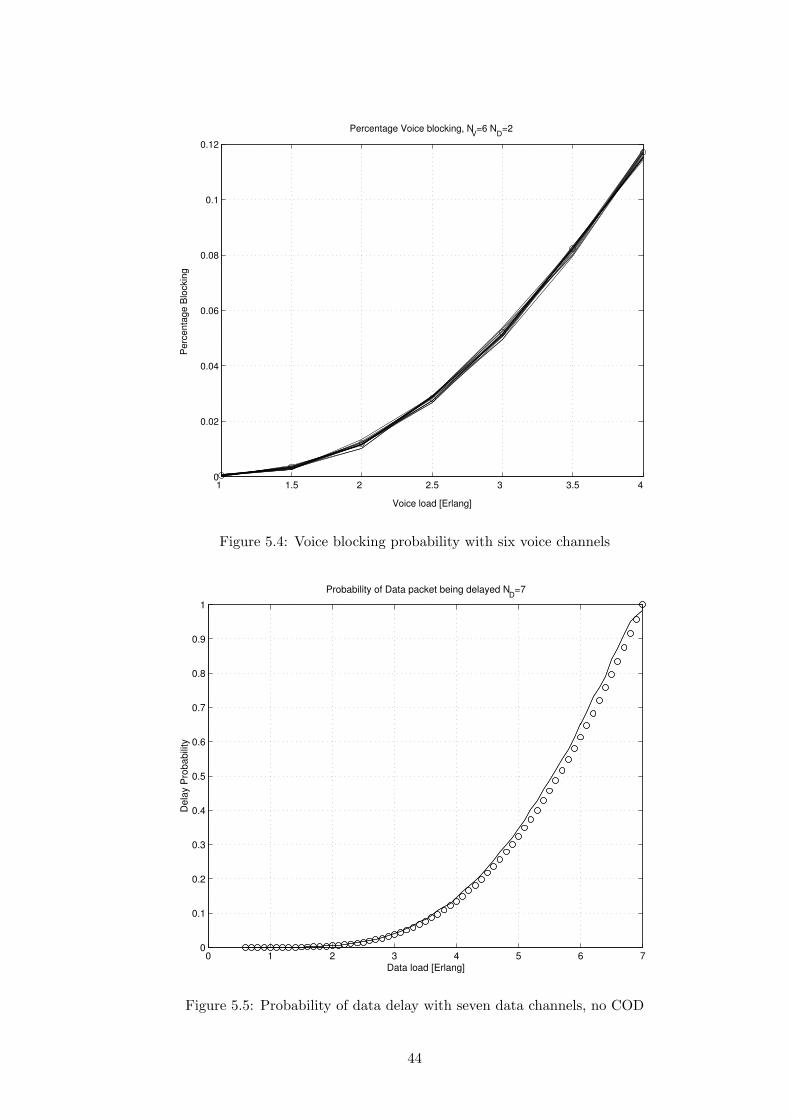
1 1.5 2 2.5 3 3.5 4 0
0.02
0.04
0.06
0.08
0.1
0.12
Percentage Voice blocking, NV=6 N
D=2
Voice load [Erlang]
Per
cent
age
Blo
ckin
g
Figure 5.4: Voice blocking probability with six voice channels
0 1 2 3 4 5 6 70
0.1
0.2
0.3
0.4
0.5
0.6
0.7
0.8
0.9
1
Probability of Data packet being delayed ND
=7
Data load [Erlang]
Del
ay P
roba
bilit
y
Figure 5.5: Probability of data delay with seven data channels, no COD
44
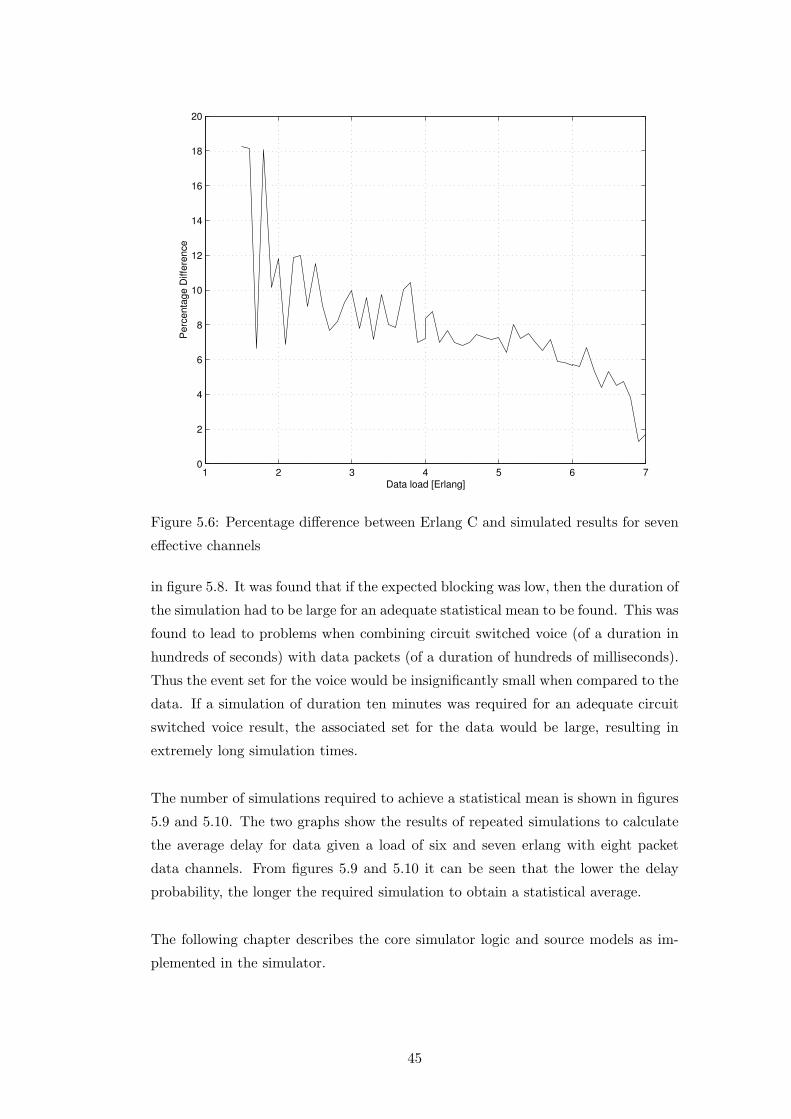
1 2 3 4 5 6 70
2
4
6
8
10
12
14
16
18
20
Data load [Erlang]
Per
cent
age
Diff
eren
ce
Figure 5.6: Percentage difference between Erlang C and simulated results for seven
effective channels
in figure 5.8. It was found that if the expected blocking was low, then the duration of
the simulation had to be large for an adequate statistical mean to be found. This was
found to lead to problems when combining circuit switched voice (of a duration in
hundreds of seconds) with data packets (of a duration of hundreds of milliseconds).
Thus the event set for the voice would be insignificantly small when compared to the
data. If a simulation of duration ten minutes was required for an adequate circuit
switched voice result, the associated set for the data would be large, resulting in
extremely long simulation times.
The number of simulations required to achieve a statistical mean is shown in figures
5.9 and 5.10. The two graphs show the results of repeated simulations to calculate
the average delay for data given a load of six and seven erlang with eight packet
data channels. From figures 5.9 and 5.10 it can be seen that the lower the delay
probability, the longer the required simulation to obtain a statistical average.
The following chapter describes the core simulator logic and source models as im-
plemented in the simulator.
45

0 1 2 3 4 5 6 7 80
0.1
0.2
0.3
0.4
0.5
0.6
0.7
0.8
0.9
1
Probability of Data packet being delayed, ND
=7, NV=1, COD
Data load [Erlang]
Del
ay P
roba
bilit
y
Figure 5.7: Probability of data delay with seven PDCHs, one voice channel, COD
2 3 4 5 6 7 80
2
4
6
8
10
12
14
Percentage Difference between Erlang C and Simulation Results, ND
=7, NV=1, COD
Data load [Erlang]
Per
cent
age
Diff
eren
ce
Figure 5.8: Percentage difference between Erlang C and simulated results for eight
effective channels
46
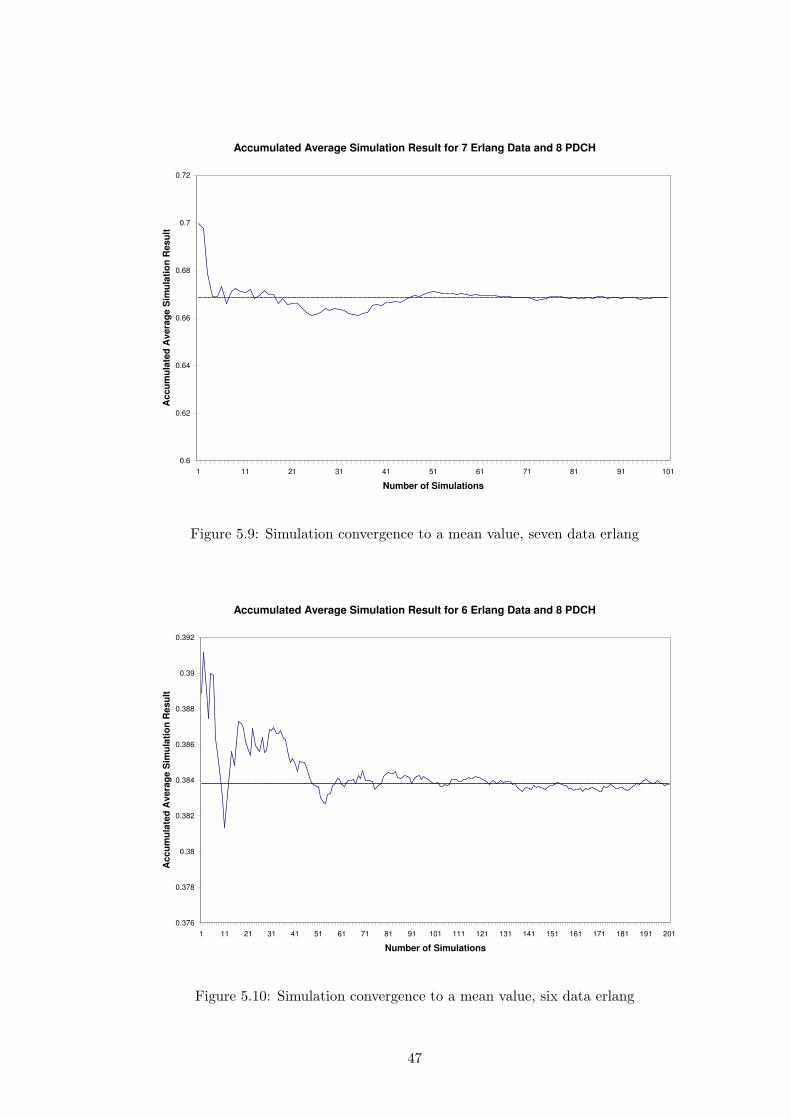
Accumulated Average Simulation Result for 7 Erlang Data and 8 PDCH
0.6
0.62
0.64
0.66
0.68
0.7
0.72
1 11 21 31 41 51 61 71 81 91 101
Number of Simulations
Acc
umul
ated
Ave
rage
Sim
ulat
ion
Res
ult
Figure 5.9: Simulation convergence to a mean value, seven data erlang
Accumulated Average Simulation Result for 6 Erlang Data and 8 PDCH
0.376
0.378
0.38
0.382
0.384
0.386
0.388
0.39
0.392
1 11 21 31 41 51 61 71 81 91 101 111 121 131 141 151 161 171 181 191 201
Number of Simulations
Acc
umul
ated
Ave
rage
Sim
ulat
ion
Res
ult
Figure 5.10: Simulation convergence to a mean value, six data erlang
47
Chapter 6
Object Orientated Simulator Structure
This chapter describes the construction of the simulator in order to simulate the
GSM/GPRS operation.
An Object Orientated Design (OOD) was used for the models and the programming
of the simulator.
The objects used in the simulator are as follows:
• ArrayEvent - A class used to label events and compare them
• Event - An event can be either voice, data, or VoIP.
• EventQueue - This represents the buffer, allowing events to be added to or
removed from the queue
• FileHandler - This records the results of the simulation to a file
• MersenneTwister - This class provides the random number generator devel-
oped by Sean Luke (Luke 2000).
• OnOffTrafficGenerator - Generates talk spurts and gaps from a given voice
call
• SimulationEngine - The core computational engine of the simulator
• Tester - The main class in which the simulation parameters are configured
• VoIPTrafficGenerator - This class breaks a talkspurt into VoIP packets
48

������
���� �����
��� �����
���������
����
���������
���
����������
���
��������
��������
���������
���������
��������
������
����������
�����������������
Figure 6.1: Operational structure and flow of simulation package
The computerised model structure was similar to that proposed by Balaban (1984),
where the modular structure and process flow is as in figure 6.1. The system config-
urator is responsible for initialising the correct parameters, the simulation exercisor
(SimulationEngine) is responsible for the actual simulation, and the output of the
post processor (FileHandler) is what is analysed. The results of each simulation
lead to further investigations and iterations of the topology and system parameters.
6.1 Generation of Events
The events generated for the simulation are of type voice, data or VoIP. The traffic
intensity for each traffic type is specified in the initial simulation setup, and the traffic
types are either generated natively in the Simulation engine or with assistance of
the OnOffTrafficGenerator and VoIPTrafficGenerator.
The parameters necessary for voice and data are:
• The traffic intensity of the voice or data measured in erlang
• The mean duration of the voice call or data packet
From these two values the arrival intensity is simply given as the traffic intensity
divided by the mean duration. The logical flow chart of the voice generation process
49
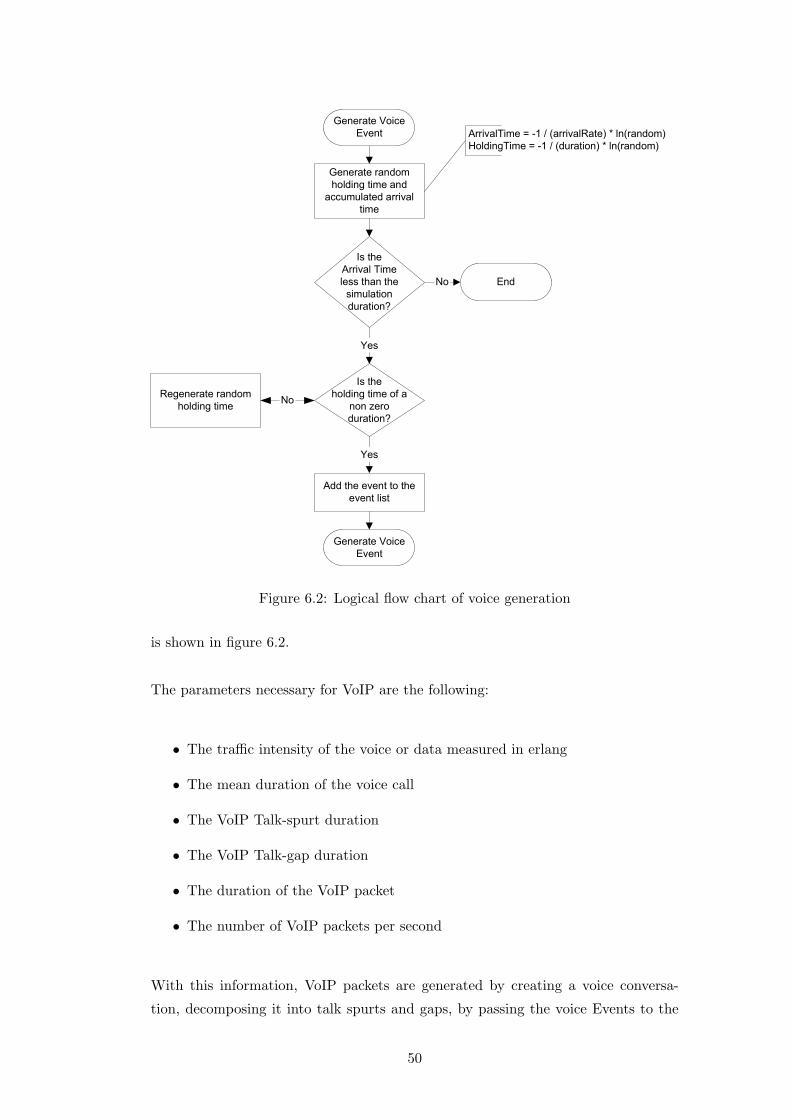
������������
� ��� ��� ����������������� �������������������
������������������������������������
��������������
�������������
��������������� ��
���
� ����
��� ������
�� ���������
������
������!
� ����
����������"��
���#��
������!
$�
��������� ���������
� ����� �
����������������
���������%
������������
� ���
$�
���%
Figure 6.2: Logical flow chart of voice generation
is shown in figure 6.2.
The parameters necessary for VoIP are the following:
• The traffic intensity of the voice or data measured in erlang
• The mean duration of the voice call
• The VoIP Talk-spurt duration
• The VoIP Talk-gap duration
• The duration of the VoIP packet
• The number of VoIP packets per second
With this information, VoIP packets are generated by creating a voice conversa-
tion, decomposing it into talk spurts and gaps, by passing the voice Events to the
50
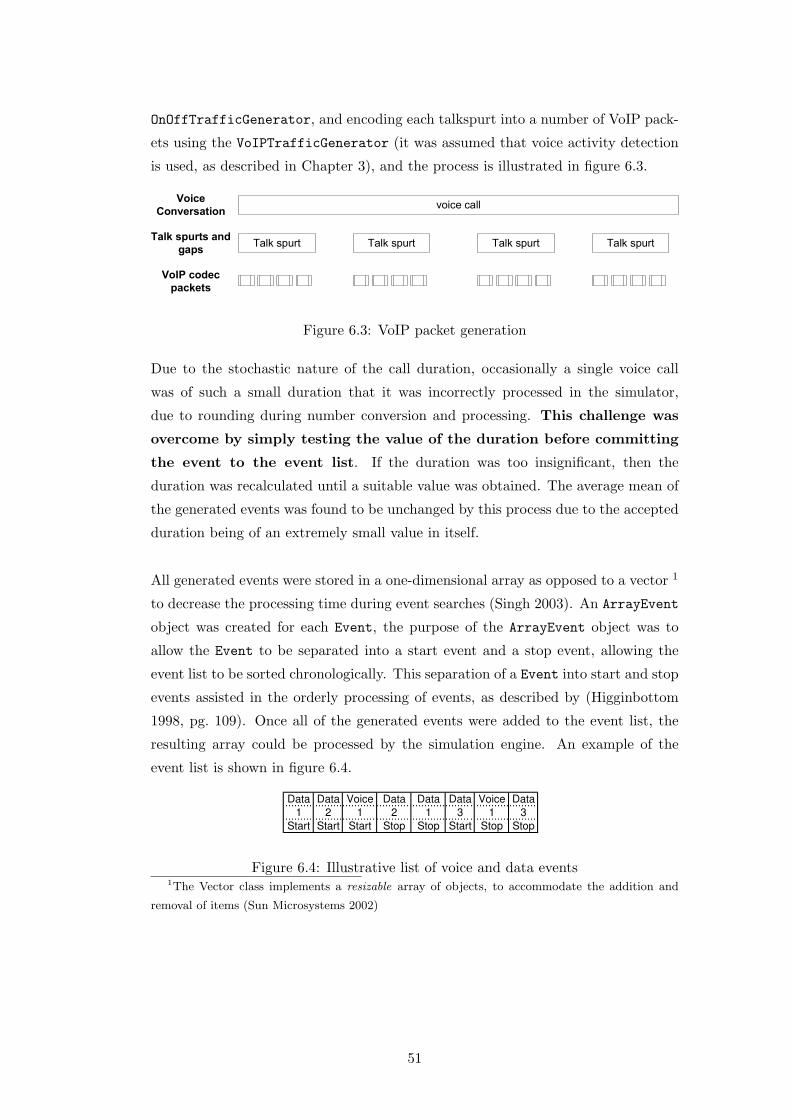
OnOffTrafficGenerator, and encoding each talkspurt into a number of VoIP pack-
ets using the VoIPTrafficGenerator (it was assumed that voice activity detection
is used, as described in Chapter 3), and the process is illustrated in figure 6.3.
����������
����� �� ����� �� ����� ������� ��
�����
����������
�����������
���
����������
������
Figure 6.3: VoIP packet generation
Due to the stochastic nature of the call duration, occasionally a single voice call
was of such a small duration that it was incorrectly processed in the simulator,
due to rounding during number conversion and processing. This challenge was
overcome by simply testing the value of the duration before committing
the event to the event list. If the duration was too insignificant, then the
duration was recalculated until a suitable value was obtained. The average mean of
the generated events was found to be unchanged by this process due to the accepted
duration being of an extremely small value in itself.
All generated events were stored in a one-dimensional array as opposed to a vector 1
to decrease the processing time during event searches (Singh 2003). An ArrayEvent
object was created for each Event, the purpose of the ArrayEvent object was to
allow the Event to be separated into a start event and a stop event, allowing the
event list to be sorted chronologically. This separation of a Event into start and stop
events assisted in the orderly processing of events, as described by (Higginbottom
1998, pg. 109). Once all of the generated events were added to the event list, the
resulting array could be processed by the simulation engine. An example of the
event list is shown in figure 6.4.
Data Data Voice Data Data Data Voice Data1 2 1 2 1 3 1 3
Start Start Start Stop Stop Start Stop Stop
Figure 6.4: Illustrative list of voice and data events1The Vector class implements a resizable array of objects, to accommodate the addition and
removal of items (Sun Microsystems 2002)
51

6.2 Processing the Event List
The SimulationEngine object was responsible for the processing of the Event List.
Once all the events are generated, the list is processed. There are six possible events:
• Voice Start • Voice Stop
• Data Start • Data Stop
• VoIP Start • VoIP Stop
The logical flow of the simulation engine is shown in diagram 6.5. To reduce the
simulation time an event was removed from the event list once it was completed,
thus reducing the length of the event list as the simulation progressed. This removal
of events consumed a finite amount of time and thus a tradeoff had to be made
between the time to process a list and the time to remove events that were no longer
required from the list. A suitable tradeoff point was found by processing the list
once a voice event had been completed, thus resulting in two voice events being
removed, but hundreds of frequently occurring data packet events being removed.
Once any event was removed from the queue, a new effective starting time had to be
reassigned to it so that the time continuum could be preserved. The new starting
time required the event list to be resorted, so a modified insertion sort was used for
this purpose, since the event to be sorted was known, and it allowed a faster sort
than a quick sort does.
The next chapter presents the results of the simulation.
52
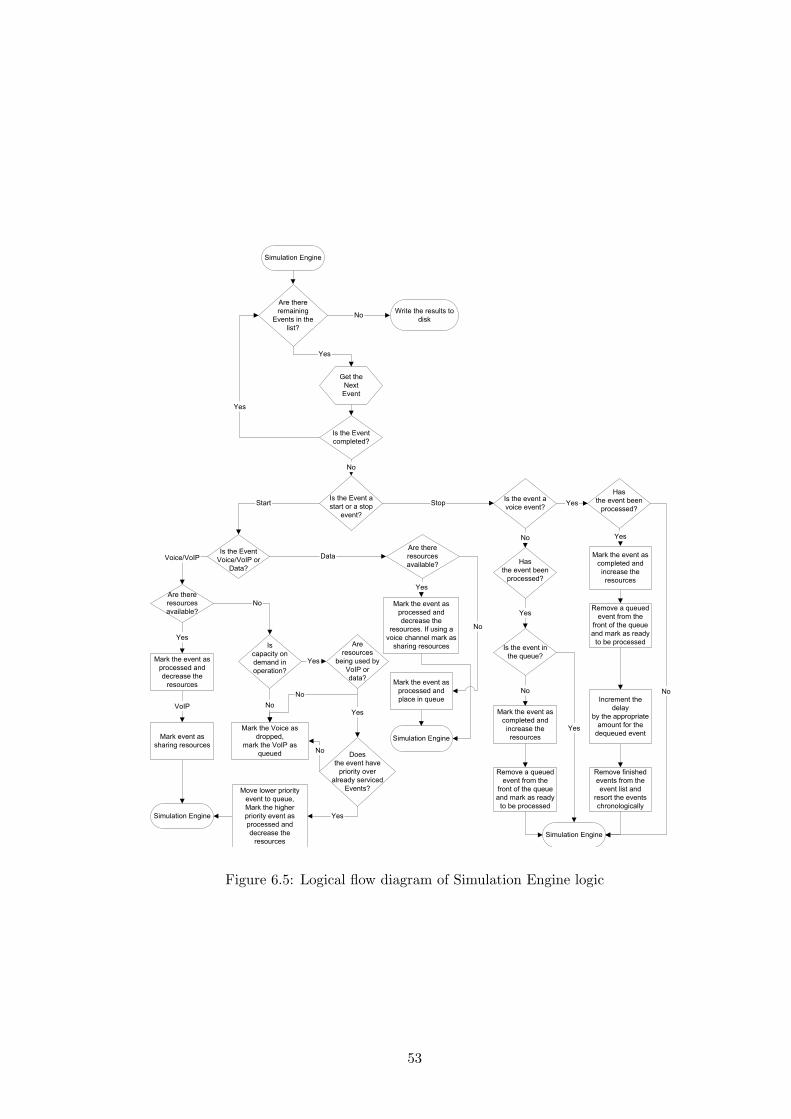
���������
�����
� ��������
����
�������
����
� ��
�������� ��
����������
���
���
�������� ����
���������������
� ���
��
�������� ��
������������
�����
�����
���������
���������
� ��� ���
���������
���
����
��
��
������!��
������
��������
��
���
���������
�������� !
�������
�����
���
��
���
����
����� ����� �
�����!�� ��
������!���� ���
� ����
��
���
���������
���������
� ��� ���
����
���
��
�������� ����
����� ������� ���
"��
����� ��� ��
����������
�����
���
�������� ���
����#�����
��
$ ������������������
��%��
�����������
"��
����� ��� ��
����������
�����������
�����������
���
�����������
��
&��%������������
�������'
���%������������
#�����
&� ����(��������!
� ������#����'
&��%����������
�����!�� �����
������������
������������
���������
&��%�� �����
���������������
&��%������ �����
������������
������������
���������
&��%������ �����
������������
������������
���������)��*������
�������������%���
���������������
&��%������ �����
������������
�������#����
&��%������ �����
������������
����������
���������
+��� ����#�����
� ���*�������
*�����*�����#����
������%��������!
��� �����������
+��� ��*����
� ����*�������
� ���������
������������ ���
������������!
�����������
����!
!���������������
������*������
��#������� ��
+��� ����#�����
� ���*�������
*�����*�����#����
������%��������!
��� �����������
&��%������ �����
������������
����������
���������
Figure 6.5: Logical flow diagram of Simulation Engine logic
53

Chapter 7
Simulation Results
This chapter deals with the results of simulations performed with the aid of the
developed computer simulation tool. Varying loads and resource allocations, as well
as different multiplexing configurations were considered to provide an insight into
the patterns and trends of such configurations.
7.1 Effect of Insufficient Capacity
In this test, the effect of insufficient capacity was investigated for varying packet
sizes. The purpose was to determine the theoretical delay and performance of various
packet sizes under varying load in a condition of insufficient capacity. Three packet
sizes for the data were considered in this experiment: 100 bytes, 200 bytes and
300 bytes. One erlang of data traffic was applied with no channels reserved for the
data, but capacity-on-demand was in operation. As can be seen from figure 7.1, the
average delay is similar for all three packet sizes. This is also the case for a load of two
data erlang as in figure 7.2. From these simulations we can conclude that in the case
of insufficient resources the delay is similar, regardless of packet size (Vannucci and
Chitamu 2003a;c). This result is intuitive since in the case of insufficient resources,
where the service rate is less than the arrival rate, the buffer would overflow and all
packets would receive the same service regardless of the packet size.
54

0 1 2 3 4 5 6 70
1
2
3
4
5
6
7
Average Delay for 1 Erlang Data, NV=8, N
D=0
Voice Load (Erlang)
Ave
rage
Del
ay (s
)
y = (0.29)*x2+ (−1.06)*x+ (0.93) →
Fitted Average100 Bytes200 Bytes300 Bytes
Figure 7.1: Average delay of various packet sizes with one data erlang load and no
fixed resources.
7.2 Packet Delay: Capacity-on-Demand vs Fixed Chan-
nel Allocation
In this test the effect of capacity-on-demand is investigated. The purpose of this test
was to determine the effect that Capacity-On-Demand (COD) has on the probability
of a data packet being delayed. Different PDCH allocations were considered with
COD in operation, and the delay probability was compared to that predicted in the
same situation with a fixed resource allocation by using theoretical calculations. Due
to capacity-on-demand, as the voice load increases the average resources available to
the data decrease. Since the available resources in a capacity-on-demand situation
is constantly fluctuating, it was taken that the average resources available to the
data would be the total resources less the average voice load, thus the theoretical
probability of delay is shown in the figures (by means of solid dots) for eight channels
minus the voice load. Note that the number of channels has to be an integer
value.
55
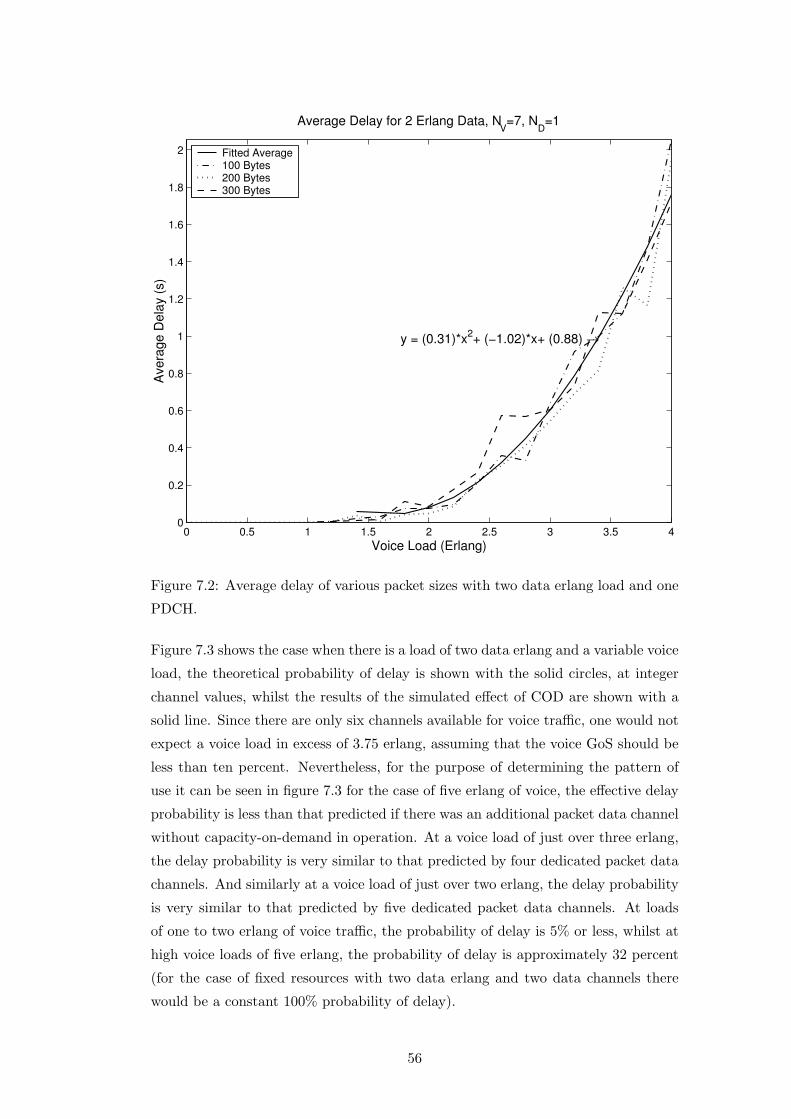
0 0.5 1 1.5 2 2.5 3 3.5 40
0.2
0.4
0.6
0.8
1
1.2
1.4
1.6
1.8
2
Average Delay for 2 Erlang Data, NV=7, N
D=1
Voice Load (Erlang)
Ave
rage
Del
ay (s
)
y = (0.31)*x2+ (−1.02)*x+ (0.88) →
Fitted Average100 Bytes200 Bytes300 Bytes
Figure 7.2: Average delay of various packet sizes with two data erlang load and one
PDCH.
Figure 7.3 shows the case when there is a load of two data erlang and a variable voice
load, the theoretical probability of delay is shown with the solid circles, at integer
channel values, whilst the results of the simulated effect of COD are shown with a
solid line. Since there are only six channels available for voice traffic, one would not
expect a voice load in excess of 3.75 erlang, assuming that the voice GoS should be
less than ten percent. Nevertheless, for the purpose of determining the pattern of
use it can be seen in figure 7.3 for the case of five erlang of voice, the effective delay
probability is less than that predicted if there was an additional packet data channel
without capacity-on-demand in operation. At a voice load of just over three erlang,
the delay probability is very similar to that predicted by four dedicated packet data
channels. And similarly at a voice load of just over two erlang, the delay probability
is very similar to that predicted by five dedicated packet data channels. At loads
of one to two erlang of voice traffic, the probability of delay is 5% or less, whilst at
high voice loads of five erlang, the probability of delay is approximately 32 percent
(for the case of fixed resources with two data erlang and two data channels there
would be a constant 100% probability of delay).
56
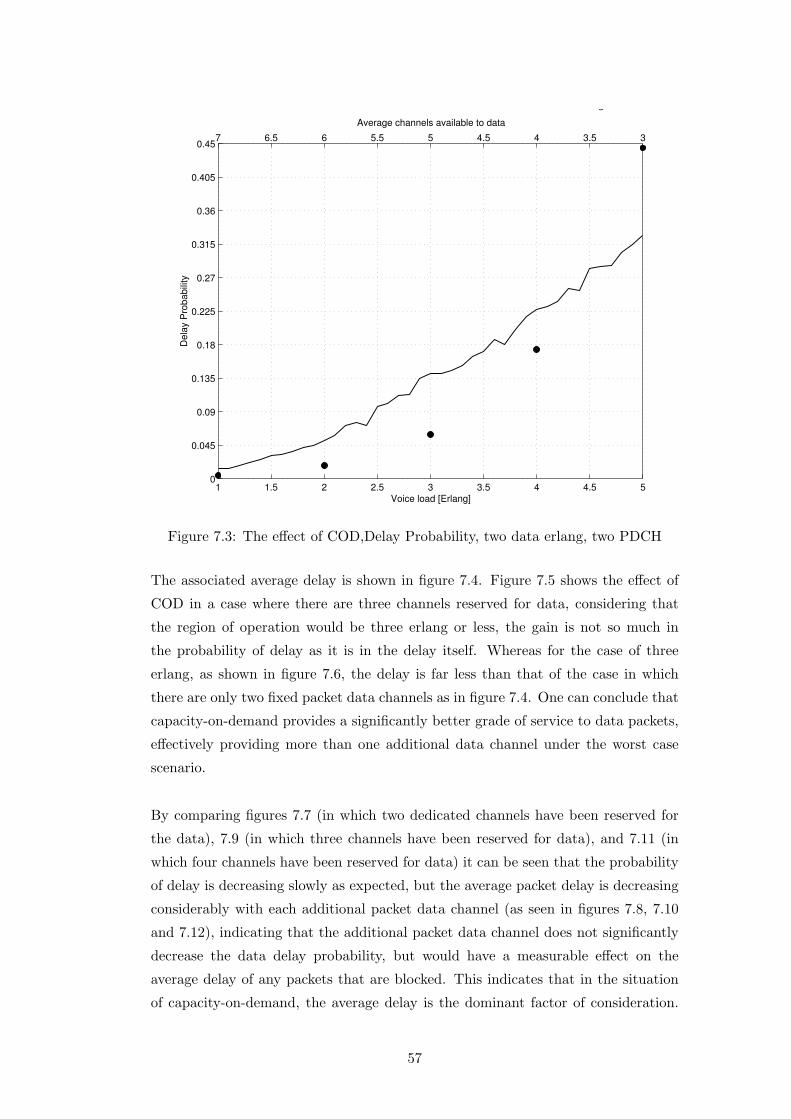
1 1.5 2 2.5 3 3.5 4 4.5 50
0.045
0.09
0.135
0.18
0.225
0.27
0.315
0.36
0.405
0.45
Voice load [Erlang]
Del
ay P
roba
bilit
y
7 6.5 6 5.5 5 4.5 4 3.5 3
Average channels available to data
Probability of Data packet being delayed with capacity on demand,2 Erlang Data, ND
=2
Figure 7.3: The effect of COD,Delay Probability, two data erlang, two PDCH
The associated average delay is shown in figure 7.4. Figure 7.5 shows the effect of
COD in a case where there are three channels reserved for data, considering that
the region of operation would be three erlang or less, the gain is not so much in
the probability of delay as it is in the delay itself. Whereas for the case of three
erlang, as shown in figure 7.6, the delay is far less than that of the case in which
there are only two fixed packet data channels as in figure 7.4. One can conclude that
capacity-on-demand provides a significantly better grade of service to data packets,
effectively providing more than one additional data channel under the worst case
scenario.
By comparing figures 7.7 (in which two dedicated channels have been reserved for
the data), 7.9 (in which three channels have been reserved for data), and 7.11 (in
which four channels have been reserved for data) it can be seen that the probability
of delay is decreasing slowly as expected, but the average packet delay is decreasing
considerably with each additional packet data channel (as seen in figures 7.8, 7.10
and 7.12), indicating that the additional packet data channel does not significantly
decrease the data delay probability, but would have a measurable effect on the
average delay of any packets that are blocked. This indicates that in the situation
of capacity-on-demand, the average delay is the dominant factor of consideration.
57
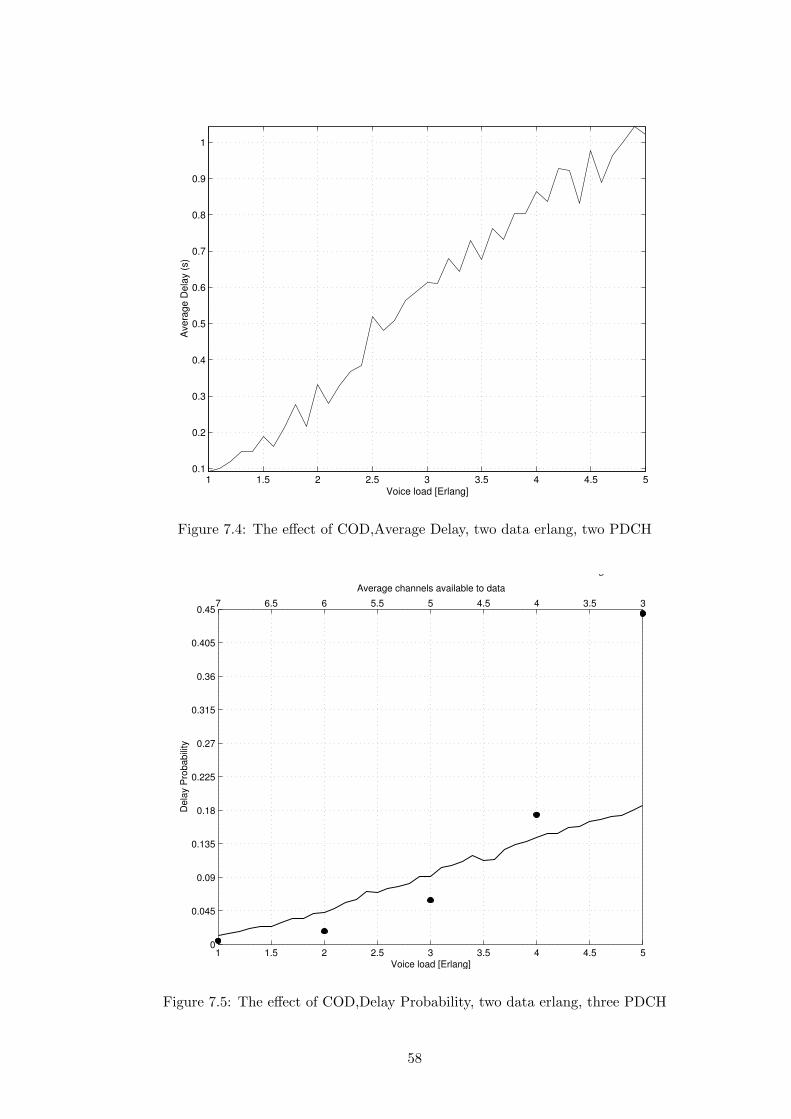
1 1.5 2 2.5 3 3.5 4 4.5 50.1
0.2
0.3
0.4
0.5
0.6
0.7
0.8
0.9
1
Voice load [Erlang]
Ave
rage
Del
ay (s
)
Figure 7.4: The effect of COD,Average Delay, two data erlang, two PDCH
1 1.5 2 2.5 3 3.5 4 4.5 50
0.045
0.09
0.135
0.18
0.225
0.27
0.315
0.36
0.405
0.45
Voice load [Erlang]
Del
ay P
roba
bilit
y
7 6.5 6 5.5 5 4.5 4 3.5 3
Average channels available to data
Probability of Data packet being delayed with capacity on demand,2 Erlang Data, ND
=3
Figure 7.5: The effect of COD,Delay Probability, two data erlang, three PDCH
58
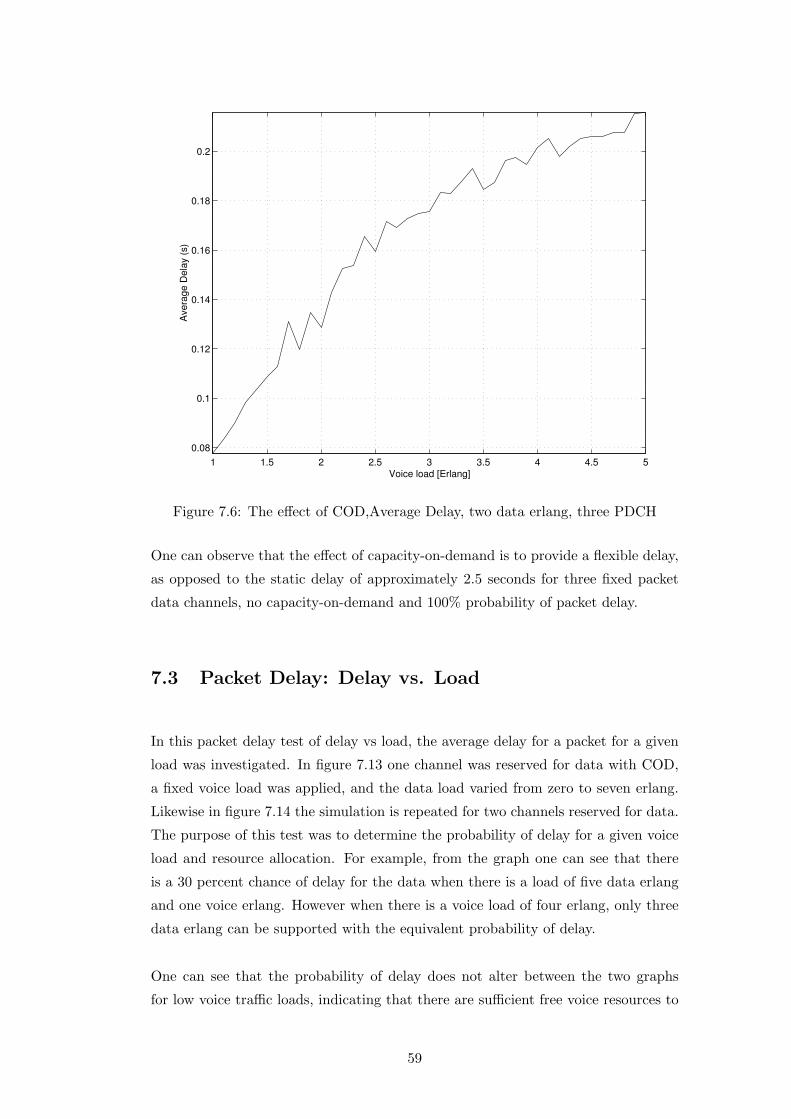
1 1.5 2 2.5 3 3.5 4 4.5 50.08
0.1
0.12
0.14
0.16
0.18
0.2
Voice load [Erlang]
Ave
rage
Del
ay (s
)
Figure 7.6: The effect of COD,Average Delay, two data erlang, three PDCH
One can observe that the effect of capacity-on-demand is to provide a flexible delay,
as opposed to the static delay of approximately 2.5 seconds for three fixed packet
data channels, no capacity-on-demand and 100% probability of packet delay.
7.3 Packet Delay: Delay vs. Load
In this packet delay test of delay vs load, the average delay for a packet for a given
load was investigated. In figure 7.13 one channel was reserved for data with COD,
a fixed voice load was applied, and the data load varied from zero to seven erlang.
Likewise in figure 7.14 the simulation is repeated for two channels reserved for data.
The purpose of this test was to determine the probability of delay for a given voice
load and resource allocation. For example, from the graph one can see that there
is a 30 percent chance of delay for the data when there is a load of five data erlang
and one voice erlang. However when there is a voice load of four erlang, only three
data erlang can be supported with the equivalent probability of delay.
One can see that the probability of delay does not alter between the two graphs
for low voice traffic loads, indicating that there are sufficient free voice resources to
59

1 1.5 2 2.5 3 3.5 4 4.5 50
0.1
0.2
0.3
0.4
0.5
0.6
0.7
0.8
0.9
1
Voice load [Erlang]
Del
ay P
roba
bilit
y
7 6.5 6 5.5 5 4.5 4 3.5 3
Average channels available to data
Probability of Data packet being delayed with capacity on demand,3 Erlang Data, ND
=2
Figure 7.7: The effect of COD,Delay Probability, three data erlang, two PDCH
1 1.5 2 2.5 3 3.5 4 4.5 5
1
2
3
4
5
6
7
Voice load [Erlang]
Figure 7.8: The effect of COD,Average Delay, three data erlang, two PDCH
60

1 1.5 2 2.5 3 3.5 4 4.5 50
0.1
0.2
0.3
0.4
0.5
0.6
0.7
0.8
0.9
1
Voice load [Erlang]
Del
ay P
roba
bilit
y
7 6.5 6 5.5 5 4.5 4 3.5 3
Average channels available to data
Probability of Data packet being delayed with capacity on demand,3 Erlang Data, ND
=3
Figure 7.9: The effect of COD,Delay Probability, three data erlang, three PDCH
1 1.5 2 2.5 3 3.5 4 4.5 5
0.2
0.3
0.4
0.5
0.6
0.7
0.8
0.9
1
Voice load [Erlang]
Ave
rage
Del
ay (s
)
Figure 7.10: The effect of COD,Average Delay, three data erlang, three PDCH
61
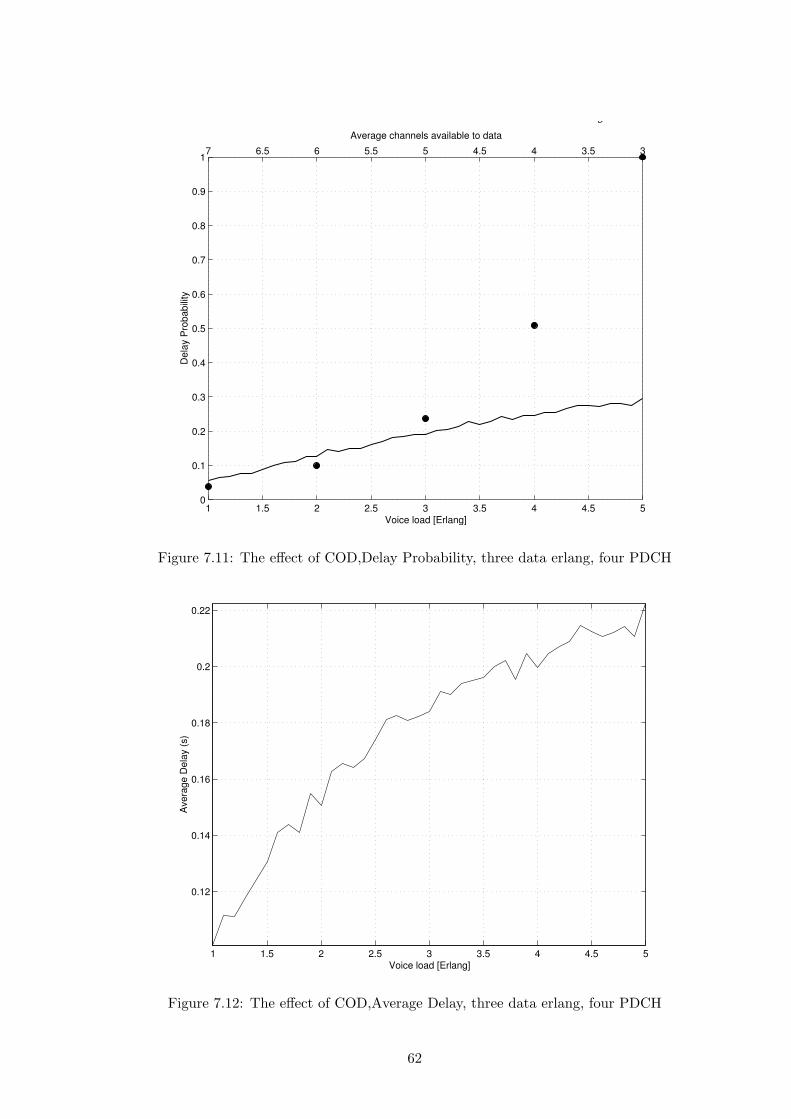
1 1.5 2 2.5 3 3.5 4 4.5 50
0.1
0.2
0.3
0.4
0.5
0.6
0.7
0.8
0.9
1
Voice load [Erlang]
Del
ay P
roba
bilit
y
7 6.5 6 5.5 5 4.5 4 3.5 3
Average channels available to data
Probability of Data packet being delayed with capacity on demand,3 Erlang Data, ND
=4
Figure 7.11: The effect of COD,Delay Probability, three data erlang, four PDCH
1 1.5 2 2.5 3 3.5 4 4.5 5
0.12
0.14
0.16
0.18
0.2
0.22
Voice load [Erlang]
Ave
rage
Del
ay (s
)
Figure 7.12: The effect of COD,Average Delay, three data erlang, four PDCH
62
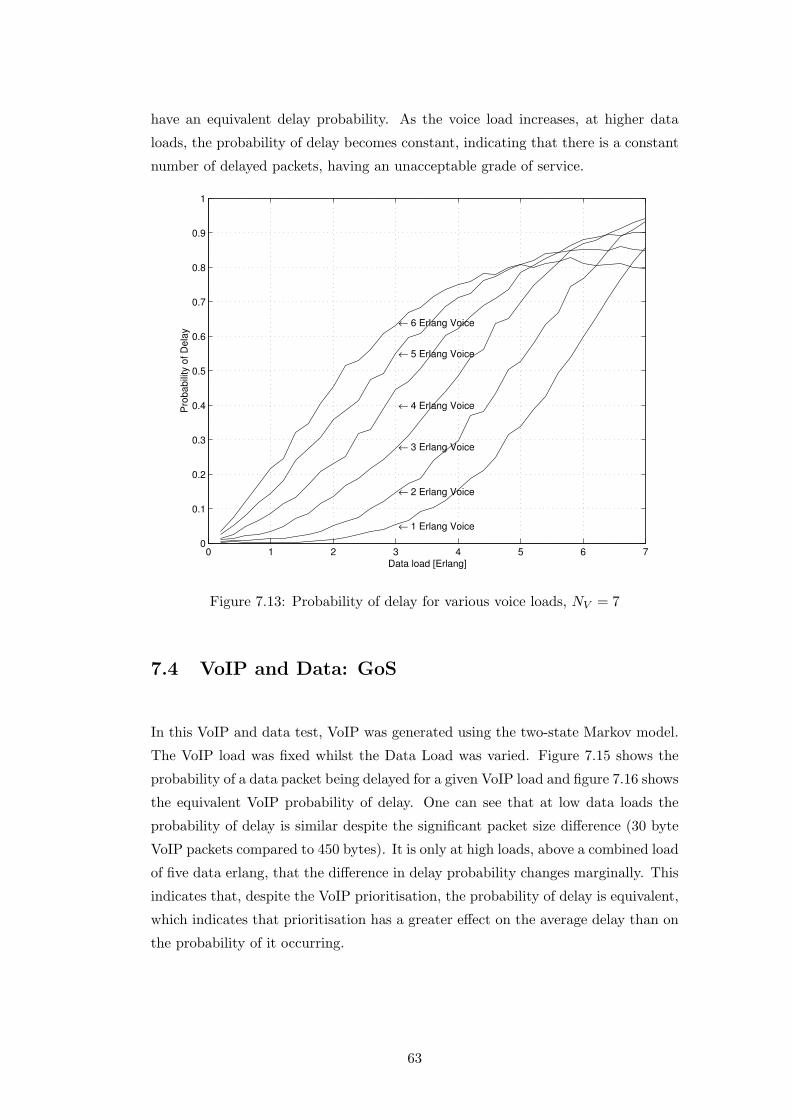
have an equivalent delay probability. As the voice load increases, at higher data
loads, the probability of delay becomes constant, indicating that there is a constant
number of delayed packets, having an unacceptable grade of service.
0 1 2 3 4 5 6 70
0.1
0.2
0.3
0.4
0.5
0.6
0.7
0.8
0.9
1
← 1 Erlang Voice
← 2 Erlang Voice
← 3 Erlang Voice
← 4 Erlang Voice
← 5 Erlang Voice
← 6 Erlang Voice
Data load [Erlang]
Pro
babi
lity
of D
elay
Figure 7.13: Probability of delay for various voice loads, NV = 7
7.4 VoIP and Data: GoS
In this VoIP and data test, VoIP was generated using the two-state Markov model.
The VoIP load was fixed whilst the Data Load was varied. Figure 7.15 shows the
probability of a data packet being delayed for a given VoIP load and figure 7.16 shows
the equivalent VoIP probability of delay. One can see that at low data loads the
probability of delay is similar despite the significant packet size difference (30 byte
VoIP packets compared to 450 bytes). It is only at high loads, above a combined load
of five data erlang, that the difference in delay probability changes marginally. This
indicates that, despite the VoIP prioritisation, the probability of delay is equivalent,
which indicates that prioritisation has a greater effect on the average delay than on
the probability of it occurring.
63

0 1 2 3 4 5 6 70
0.1
0.2
0.3
0.4
0.5
0.6
0.7
0.8
0.9
1
← 1 Erlang Voice
← 2 Erlang Voice
← 3 Erlang Voice
← 4 Erlang Voice
← 5 Erlang Voice
← 6 Erlang Voice
Data load [Erlang]
Pro
babi
lity
of D
elay
Figure 7.14: Probability of delay for various voice loads, NV = 6
7.5 VoIP Exponentially Distributed and Data: GoS
In this experiment VoIP packets were represented using a simple exponential model.
The VoIP packets were assumed to be 30 bytes, representing 20 ms of speech. It is
further assumed that approximately 65% of the conversation was silence, and thus
one VoIP packet occurs every 60 ms. In figures 7.17 and 7.18, the data was assumed
to consist of 450 byte packets. In figures 7.19 and 7.20 the data was assumed to
consist of 150 byte packets. It can be seen that figures 7.17 and 7.19 are similar,
thus indicating that the size of the data packets is not a large factor in the delay
probability, but rather affects the average delay. Figure 7.18 and 7.20 show the
corresponding average delay for the given VoIP load. From the simulation one can
see that at loads of four erlang and above, the average delay is similar in both
graphs, whilst at lower VoIP loads, the smaller 150 byte packets suffer less delay,
as expected. A conclusion which can be made from such behaviour is that smaller
packets whilst having a similar probability of delay as larger packets, do not have
as large a delay under lower loads and thus would provide a better grade of service
for an application.
In figure 7.22, the average delay for exponentially distributed VoIP packets is shown
64

1 2 3 4 5 6 70
0.1
0.2
0.3
0.4
0.5
0.6
0.7
0.8
0.9
1 Erlang VoIP
6 Erlang VoIP
Data load [Erlang]
Pro
babi
lity
of D
elay
Figure 7.15: Two-state VoIP and data, Probability of data delay
for loads of one to six data erlang. From this figure one can see that if a delay of less
than 150 ms is to be used, then with three data erlang, only four data erlang of VoIP
can be supported, assuming no further delays. One can observe that a combined
load of no more than seven erlang should be present for eight channels if the VoIP
delay is to be kept at 150 ms. In figure 7.21 one can see that the probability of a
VoIP packet being blocked is consistently increasing as the data load increases, thus
with three data erlang and five data erlang of VoIP the probability of a VoIP packet
being delayed is approximately 27%.
65
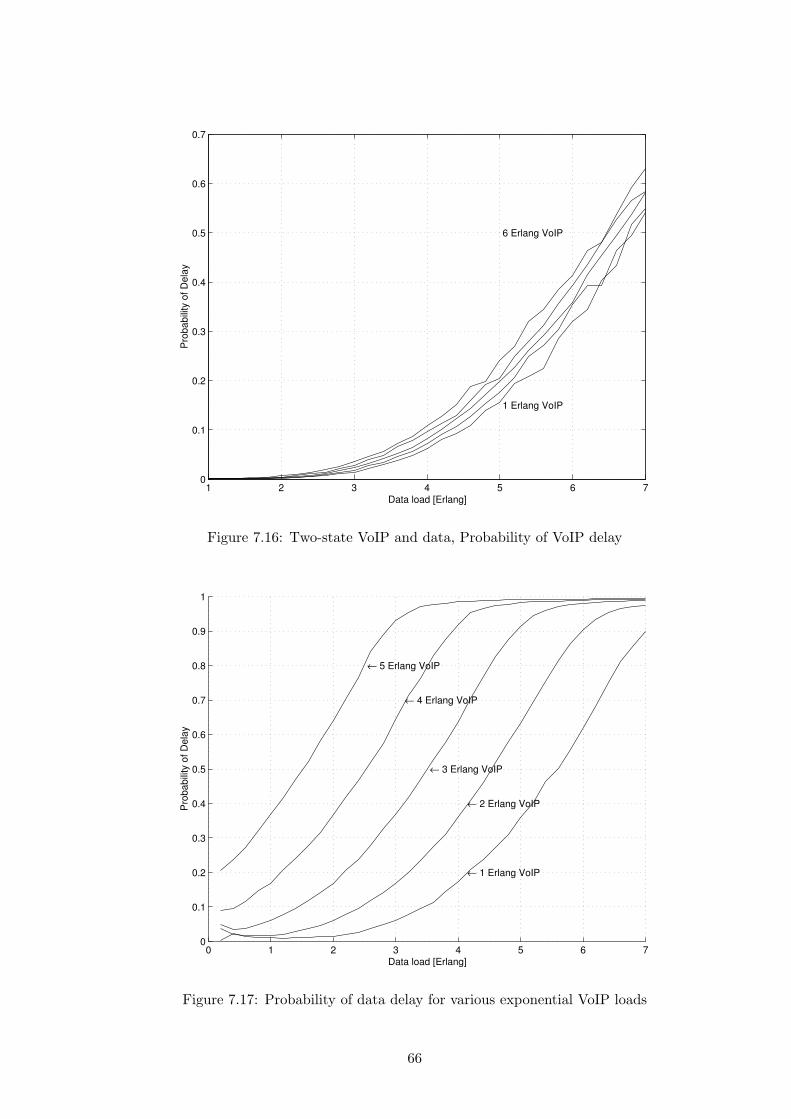
1 2 3 4 5 6 70
0.1
0.2
0.3
0.4
0.5
0.6
0.7
1 Erlang VoIP
6 Erlang VoIP
Data load [Erlang]
Pro
babi
lity
of D
elay
Figure 7.16: Two-state VoIP and data, Probability of VoIP delay
0 1 2 3 4 5 6 70
0.1
0.2
0.3
0.4
0.5
0.6
0.7
0.8
0.9
1
← 1 Erlang VoIP
← 2 Erlang VoIP
← 3 Erlang VoIP
← 4 Erlang VoIP
← 5 Erlang VoIP
Data load [Erlang]
Pro
babi
lity
of D
elay
Figure 7.17: Probability of data delay for various exponential VoIP loads
66
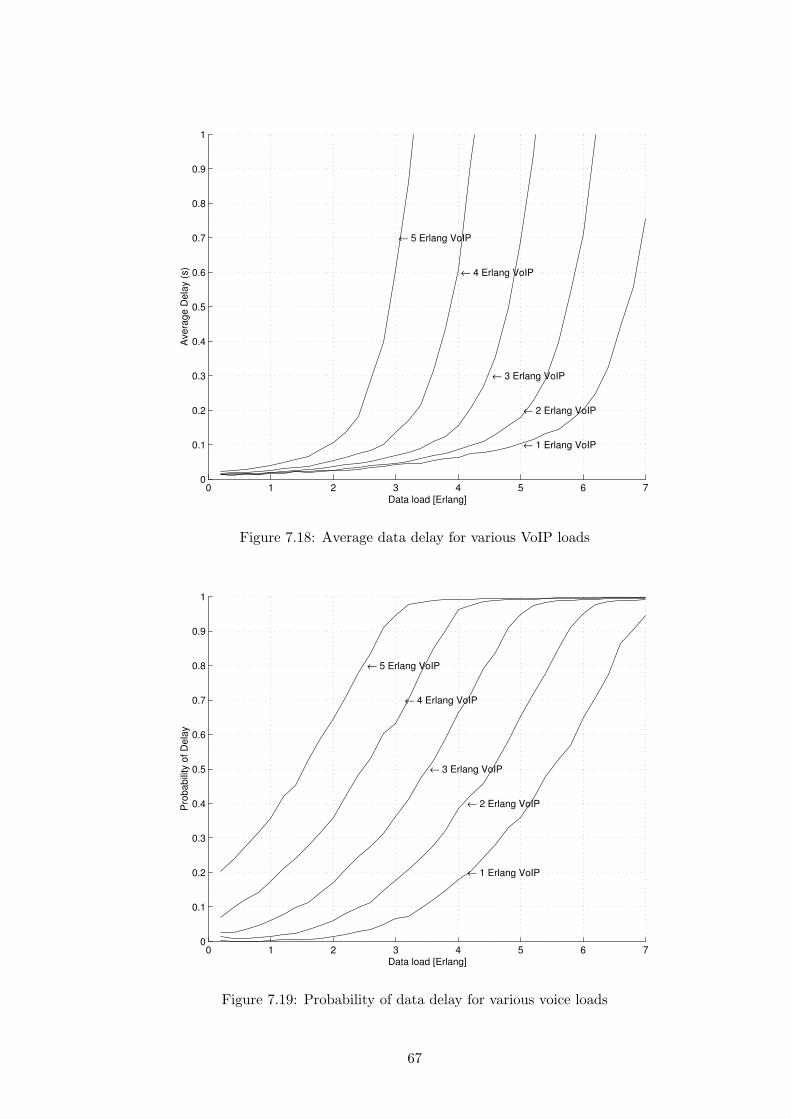
0 1 2 3 4 5 6 70
0.1
0.2
0.3
0.4
0.5
0.6
0.7
0.8
0.9
1
← 1 Erlang VoIP
← 2 Erlang VoIP
← 3 Erlang VoIP
← 4 Erlang VoIP
← 5 Erlang VoIP
Data load [Erlang]
Ave
rage
Del
ay (s
)
Figure 7.18: Average data delay for various VoIP loads
0 1 2 3 4 5 6 70
0.1
0.2
0.3
0.4
0.5
0.6
0.7
0.8
0.9
1
← 1 Erlang VoIP
← 2 Erlang VoIP
← 3 Erlang VoIP
← 4 Erlang VoIP
← 5 Erlang VoIP
Data load [Erlang]
Pro
babi
lity
of D
elay
Figure 7.19: Probability of data delay for various voice loads
67
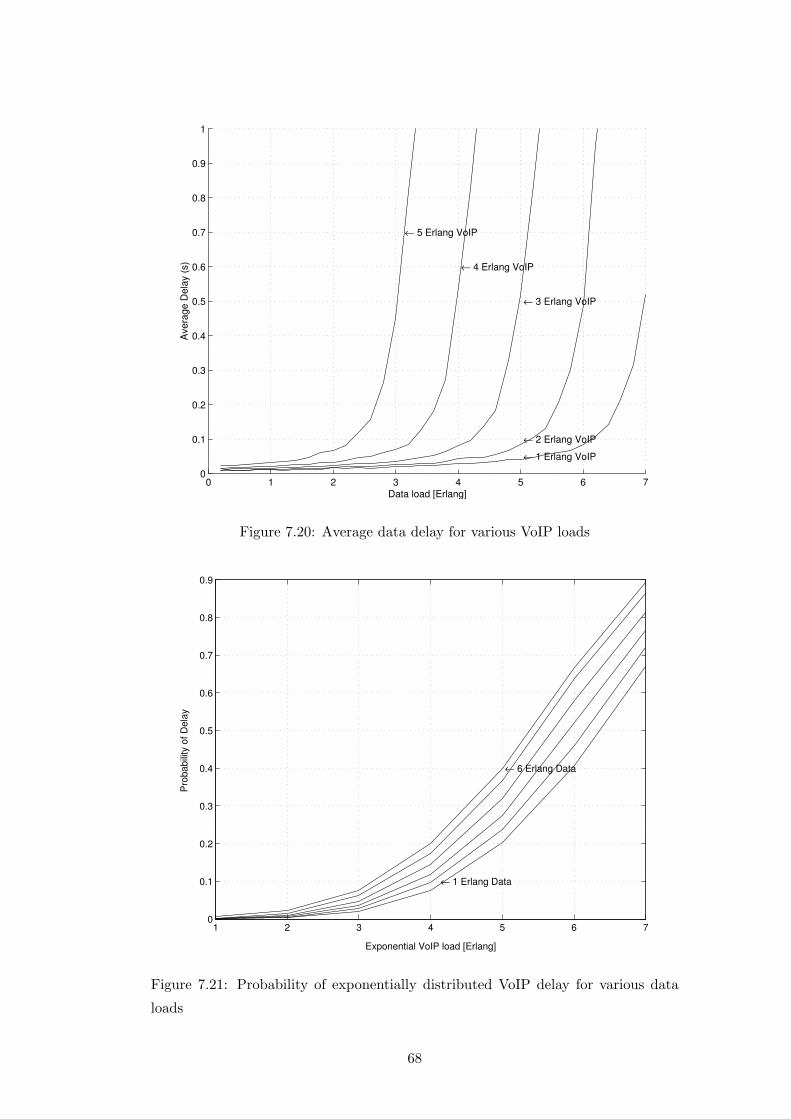
0 1 2 3 4 5 6 70
0.1
0.2
0.3
0.4
0.5
0.6
0.7
0.8
0.9
1
← 1 Erlang VoIP
← 2 Erlang VoIP
← 3 Erlang VoIP
← 4 Erlang VoIP
← 5 Erlang VoIP
Data load [Erlang]
Ave
rage
Del
ay (s
)
Figure 7.20: Average data delay for various VoIP loads
1 2 3 4 5 6 70
0.1
0.2
0.3
0.4
0.5
0.6
0.7
0.8
0.9
← 1 Erlang Data
← 6 Erlang Data
Exponential VoIP load [Erlang]
Pro
babi
lity
of D
elay
Figure 7.21: Probability of exponentially distributed VoIP delay for various data
loads
68

0 0.5 1 1.5 2 2.5 3 3.5 4 4.5 5 5.5 60
0.05
0.1
0.15
0.2
0.25
0.3
0.35
0.4
0.45
0.5
← 1 Erlang Data
← 2 Erlang Data
← 3 Erlang Data
← 4 Erlang Data
← 5 Erlang Data
← 6 Erlang Data
Exponential VoIP load [Erlang]
Ave
rage
Del
ay (s
)
Figure 7.22: Average exponential VoIP packet delay for various data loads
69

Chapter 8
Review and Conclusions
It is clear that the current communication networks are rapidly converging towards
one homogeneous network capable of fulfilling many different requirements. The
key factor in such a convergence is the ability to support both voice and data si-
multaneously, even though both services have very different requirements. Wireless
communications is seen as the most suitable medium for communication in Africa,
due to the large coverage areas and low average population densities. This is clearly
demonstrated by the growth of mobile telephone subscribers on the continent. How-
ever, with wireless communications the bandwidth is a limited resource and thus
has to be carefully conserved and managed to ensure the best possible allocation for
a particular service and area. Thus the resource allocation between voice and data
was examined in this study, with particular reference to the GSM/GPRS cellular
network.
8.1 Review
GSM, together with GPRS, offers the possibility of serving both circuit switched
voice and packet switched data over a common air interface. The multiplexing of
resources can take on two forms in a GSM/GPRS network, a static resource alloca-
tion for both circuit switched voice and packet switched data, or a superior flexible
moving boundary resource allocation. Both resource allocations were considered in
this study, as well as the possibility of using Voice over IP in place of circuit switched
voice.
The use of VoIP is seen as a key feature in the move towards an all IP based
70
packet network. Such a network would offer a number of benefits such as the use
of generic data networking equipment, common service creation and more flexible
network configurations. The possibility of transporting voice using VoIP would allow
GSM/GPRS networks to be able to support an all IP operation, thus allowing the
GSM/GPRS network’s life to be extended, since some 3G network services could be
offered immediately. In addition to this, is is possible that there could be a capacity
gain since the majority of a voice conversation is silence, and in GSM operation
even though the mobile station does not transmit, during silence the channel is still
reserved, whilst using GPRS those resources could be used for another purpose.
VoIP has a large number of requirements that have to be overcome before VoIP
could be implemented in a GPRS network. For example VoIP is more sensitive to
delay than standard data, but is less sensitive to loss. The VoIP header has a large
overhead due to the many protocols used, and there are a large amount of different
codecs. A number of these issues have been addressed in previous studies and
solutions exist to satisfy a number of the requirements such as header compression,
voice activity detection, and low variable-bit-rate codecs, allowing VoIP to be seen
as an accepted technology.
To study the allocation of radio resources at the GSM/GPRS air interface, traffic
source models had to be developed which would suitably represent the nature of
the offered traffic. For this purpose traffic models were created for circuit switched
voice, packet switched data and packet switched voice. Circuit switched voice and
packet switched data were represented using Markovian models, Markovian arrivals
and exponentially distributed holding times. VoIP was modelled using a two-state
Markov modulated Poisson process, which better models the talk-spurts and talk-
gaps in a conversation. The base station subsystem was modelled as a controller with
eight channels (one GSM/GPRS TDMA frame). For the voice operation, a blocked-
calls-lost approach was used, and for the data a blocked-calls-queued approach was
used. All the circuit switched users were assumed to be in one class of traffic whilst,
packet switched data was assumed to be queued in a common queue. Continuous
time analysis was used in which the channels can be seen as operating in parallel,
rather than discrete time slots. Capacity-on-demand was modelled as in a moveable
boundary resource allocation. The radio propagation environment was considered
by means of a large scale propagation power outage model, which would merely alter
the load presented to the simulator.
Using the Erlang formulae, the Grade of Service for a given voice and data load was
estimated and the results presented in a graph that allows for intuitive inspection.
71
However the Erlang formulae require a static number of channels to evaluate the
GoS. In order for the GoS to be evaluated for a capacity-on-demand situation an
average of the real-time instantaneous GoS would have to be obtained, over the
duration of the business day busy hour.
A complete validation and verification of the computer simulation was performed,
developing the simulation from the given problem entity to the conceptual model
and implementing that model using the Java high level programming language. The
models were independently verified and validated and found to be acceptable for the
given scenarios. The simulator underwent extensive verification whenever possible,
and the results were compared to those predicted by theory, thus allowing confidence
to be established in the simulator.
The models were implemented using logical flow charts to facilitate the programming
and description of the computer simulation. Specific parts of the simulator were
described to facilitate an understanding of the workings of the simulator and some
of the optimisations implemented were discussed to give insight into some of the
problems of constructing a computer simulation.
8.2 Conclusions
This study has presented the results of an investigation into, and simulation of the
air interface radio resource allocation of a GSM/GPRS network. Various different
resource allocations for voice, VoIP and data were investigated, under varying loads.
The results of the simulations lead to a number of conclusions:
1. In the case of insufficient resources allocated to data, the average packet delay
is similar regardless of the size of the data packet. It was found that if capacity-
on-demand is in operation, then the allocated data resources should be equal
to the expected load or more, to ensure delay is kept to a tolerable limit.
2. Investigations into fixed resource allocation have shown that in the case of suf-
ficient statically assigned data channels with capacity-on-demand being used,
additional packet data channels were found to have a greater effect on the av-
erage delay than on the probability of delay. Capacity-on-demand was found
to be equivalent to an additional channel under a high voice load scenario,
and provided an increasing benefit as the voice traffic decreased. In addition,
72
capacity-on-demand was found to provide an average delay probability well
below that predicted in a fixed resources scenario. Of greater importance, the
average delay is varying and less than that predicted with a static resource
allocation.
3. From the analysis of the case of VoIP and data, it could be seen that the
prioritisation of the voice packets did not significantly alter the probability
of delay but rather had a more pronounced effect on the average data packet
delay.
4. The size of the data packet was found to be a significant factor in the average
packet delay. However it does not significantly affect the delay probability.
Thus one can deduce from the analysis of the GSM/GPRS operation, smaller
packet sizes would provide a better grade of service than large packets.
5. Simulations of VoIP and data have shown that the combined load should not
exceed seven erlangs (for the case of eight channels), if the average delay is
to be kept below one hundred milliseconds. This leads to the conclusion that
when transporting voice over IP, a higher average load can be tolerated than
the case of circuit switched voice and packet switched data.
8.3 Recommendations and Future Improvements
From the results of the investigation, transporting voice over packet switched data
appears to offer greater traffic carrying capacities through the use of statistical
multiplexing. However as a study that was intended to investigate the trends in the
resource allocation, it is by no means a completed study. Improvements that could
be made are as follows:
• Internet traffic and packet switched data is often heavy-tailed and an exponen-
tially distributed Markovian model, whilst adequate for a first order approxi-
mation, does not suitably represent all data traffic types, especially given that
the multimedia messaging and services often have peculiar characteristics.
• A large scale propagation power outage model was considered which would
merely alter the load presented to the base station controller. However mobile
station movement and the effects of interference were not considered, so the
results of the simulations could be slightly optimistic due to the absence of
these factors.
73

• By modelling the base station subsystem as a continuous time controller with
eight channels, the essence of the radio resource allocation was captured. How-
ever such a model does not consider the intricate resource reservation and al-
location signalling of a GSM/GPRS network, a factor which would be critical
in any in-depth study on such a topic.
• The computer simulation was found to be slow when extremely large loads
were applied to the simulator. This is due in part to the Java virtual machine.
Whilst Java is a programming language that is extremely object orientated,
it is not able to compile natively into byte code, and as such is always slower
than executable languages. It is clear that Java is not the optimal language
to use when such computer intensive simulation packages are created, and
C++ would have provided additional speed. However Java offers all of the
functionality of other programming languages, so only this one factor was not
in its favour.
In conclusion, this study was intended as a first order investigation of the issues of
resource allocation between circuit switched voice, packet switched data and packet
switched voice. The developed simulator was found to produce results which com-
pared to those predicted by theory, and further used to produce results for more
complex cases of resource allocation. The methodology used in this investigation
will hold for cases of other networks where resources are similarly allocated.
74

References
Ali, M. M. and Song, X.: 2003, A Performance Analysis of a Multiplexer with
Priority Queues and Correlated Arrivals, Proceedings of the 18th International
Teletraffic Congress – ITC-18: Providing Quality of Service in Heterogeneous En-
vironments, Vol. 5a, International Teletraffic Congress, Berlin, Germany, pp. 481–
490.
American National Standard: 1996, Transcoding: Definition, Federal Stan-
dard 1037C: Glossary of Telecommunications Terms . http://glossary.its.
bldrdoc.gov/fs-1037/dir-037/_5538.htm.
Balaban, P.: 1984, Computer-Aided Modeling, Analysis, and Design of Communica-
tion Systems: Introduction and Issue Overview, IEEE Journal on Selected Areas
in Communications 2(1), 1–7.
Balaji, A., Gonsalves, T. A. and Kumar, R.: 2000, The Performance of corDECT
Voice/Data Wireless Local Loop, IEEE IETE Journal of Research 46(6), 489–504.
Bates, R. J.: 2002, GPRS (General Packet Radio Service), McGraw-Hill, New York,
USA.
Bettstetter, C., Vogel, H. J. and Eberspacher, J.: 1999, GSM Phase 2+ General
Packet Radio Service GPRS: Architecture, Protocols, and Air Interface, IEEE
Communications Surveys 2(3), 2–14.
Bi, Q., Zysman, G. I. and Menkes, H.: 2001, Wireless Mobile Communications at
the Start of the 21st Century, pp. 110–116.
Blakely, K., Gregson, S. and Mulvey, M.: 2000, Unified IP Networks, BT Technology
Journal 18(2), 44–56.
Blaunstein, N.: 2000, Radio Propagation in Cellular Networks, Artech House, Mas-
sachusetts, USA.
Brand, A. and Aghvami, H.: 2002, Multiple Access Protocols for Mobile Communi-
cations GPRS, UMTS and Beyond, John Wiley and Sons, New York, USA.
75
Brasche, G. and Walke, B. H.: 1997, Concepts, Services, and Protocols of the New
GSM Phase 2+ General Packet Radio Service, IEEE Communications Magazine
35(8), 94–104.
C. Smith, D. C.: 2002, 3G Wireless Networks, McGraw-Hill, New York, USA.
Chang, M. F., Lin, Y. B. and Pang, A. C.: 2003, vGPRS: A Mechanism for Voice
over GPRS, Wireless Networks 9(2), 157–164.
Chaskar, H. M. and Madhow, U.: 2001, Statistical Multiplexing and QoS Provisioing
for Real-Time Traffic on Wireless Downlinks, IEEE Journal on Selected Areas in
Communications 19(2), 347–354.
Chitamu, P. J.: 2003, private communication.
Chitamu, P. J., Kennedy, I. G. and van Olst, R.: 2002, Technology Options to sup-
port Telecommunications in Countries with Low Tele-densities, Proceedings of the
ISCIT 2002: The International Symposium on Communication and Information
Technology, Pattaya, Chonburi, Thailand, pp. 289–292.
Chitamu, P. J. and Vannucci, D. E.: 2002, Networking Africa: A Case for VoIP,
Proceedings of the IEEE Africon 2002 Conference, Vol. 1, George, South Africa,
pp. 361–361.
Cisco Systems: 2002, Traffic Analysis for Voice over IP, Cisco White Papers
. http://www.cisco.com/univercd/cc/td/doc/cisintwk/intsolns/voipsol/
ta_isd.pdf.
Eriksson, G. A. P., Olin, B., Svanbro, K. and Turina, D.: 2000, The challenges of
voice-over-IP-over-wireless, Ericsson Review (1), 20–31.
ETSI: 1998, Telecommunications and Internet Protocol Harmonization Over Net-
works (TIPHON); Description of technical issues, Technical Report TR 101 300
v1.1.5, European Telecommunications Standards Institute.
Fabri, S. N., Worrall, S. T. and Kondoz, A. M.: 2000, Video Communications over
Mobile Networks, Proceedings of Communicate 2000, Online conference, London,
United Kingdom.
Gimpleson, L. A.: 1965, Analysis of Mixtures of Wide- and Narrow-Band Traffic,
IEEE Transactions on Communication Technology 13(3), 258–266.
Granberg, O.: 1998, GSM on the Net, Ericsson Review (4).
Granbohm, H. and Wiklund, J.: 1999, GPRS–General packet radio service, Ericsson
Review (2), 82–88.
76
GSM-Association: 2003, Membership and Market Statistics as at end of May 2003.
http://www.gsmworld.com/news/statistics/stats_03.pdf.
Habib, I. W. and Saadawi, T. N.: 1992, Multimedia Traffic Characteristics in Broad-
band Networks, IEEE Communications Magazine 30(7), 48–54.
Hafner, B.: 2003, IP Telephony Can Revolutionise Business Communications, Re-
search Note SPA-20-1210, Gartner.
Halonen, T., Romero, J. and Melero, J. (eds): 2002, GSM, GPRS and EDGE Per-
formance: Evolution Towards 3G/UMTS, Wiley.
Hassan, M., Nayandoro, A. and Atiquzzaman, M.: 2000, Internet Telephony:
Services, Technical Challenges, and Products, IEEE Communications magazine
38(4), 96–103.
Higginbottom, G.: 1998, Performace Evaluation of Communication Networks,
Artech House, Massachusetts, USA.
Hlavacs, H., Kotis, G. and Steinkeller, C.: 1999, Traffic Source Modeling, Tech-
nical Report TR-99101, Institute of Applied Computer Science and Information
Systems, University of Vienna.
Hodgkinson, W. T.: 2002, private communication.
ITU: 2001, Africa Reaches Historic Telecom Milestone: The unwiring of a continent,
Indicators update, ITU Telecommunication Indicators Update. http://www.itu.
int/ITU-D/ict/update/pdf/Update_3_01.pdf.pdf.
Jiang, W. and Schulzrinne, H.: 2000, Analysis of On-Off Patterns in VOIP and Their
Effect on Voice Traffic Aggregation, Proceedings of The 9th IEEE International
Conference on Computer Communication Networks, Las Vegas, Nevada, USA.
Koodli, R. and Puuskari, M.: 2001, Supporting Packet-Data QoS in Next-Generation
Cellular Networks, IEEE Communications Magazine 39(2), 180–188.
Law, A. M. and Kelton, W. D.: 1982, Simulation Modeling and Analysis, first edn,
McGraw-Hill, New York, USA.
Lindemann, C. and Thummler, A.: 2003, Performance analysis of the general packet
radio service, Proceedings of Computer Networks, number 41, pp. 1–17.
Luke, S.: 2000, Mersenne Twister and MersenneTwisterFast. http://www.math.
keio.ac.jp/~matumoto/emt.html.
77

Mahdavi, M., Edwards, R. M. and Cvetkovic, S. R.: 2001, Policy for Enhancement
of Traffic in TDMA Hybrid Switched Integrated Voice/Data Cellular Mobile Com-
munications Systems, IEEE Communications Letters 5(6), 242–244.
Mahdavi, M., Edwards, R. M. and Ivey, P. A.: 2001, Performance Evaluation of a
Data Subsystem in GSM/GPRS Using Complete Sharing of Available Bandwidth,
Proceedings of London Communications Symposium.
Matsumoto, M. and Nishimura, T.: 1998, Mersenne Twister: A 623-dimensionally
equidistributed uniform pseudorandom number generator, ACM Trans. on Mod-
eling and Computer Simulation 8(1), 3–30.
Mitrou, N. M., Lyberopoulos, G. L. and Panagopoulou, A. D.: 1993, Voice and
Data Integration in the Air-Interface of a Microcellular Mobile Communications
System, IEEE Transactions on Vehicular Technology 42(1), 1–13.
Miyake, K.: 1988, Traffic Study on High Speed/Multiplexed ISDN User-Network
Interface, Proceedings of the Fifth ITC Seminar :Traffic Engineering for ISDN
Design and Planning, Vol. 9, Lake Como, Italy, pp. 487–490.
Moorhead, C., Hardman, V. J. and Lane, P. M.: 2000, Resource Allocation Schemes
to Provide QoS for VoIP over GPRS, Proceedings of the 1st IEE International
Conference on 3G Mobile Communication Technologies, London, United King-
dom, pp. 138–142.
Naylor, T. H. and Finger, J. M.: 1967, Verification of Computer Simulation Models,
Management Science 14(2), 92–101.
Neskovic, A., Neskovic, N. and Paunovic, G.: 2000, Modern Approaches in Mod-
elling of Mobile Radio Systems Propagation Environment, IEEE Communications
Surveys pp. 2–12.
Network Sorcery: 2003, RTP, Real-Time Protocol. http://www.networksorcery.
com/enp/protocol/rtp.htm.
Okuda, T., Ando, Y., Ideguchi, T. and Tian, X.: 2002, A Simplified Performance
Evaluation for Delay of Voice End-User in TDMA Integrated Voice/Data Cellular
Mobile Communications Systems, Proceedings of IEEE GLOBECOM 2002: The
World Converges, Taipei, Taiwan, R.O.C.
Rao, H. C. H., Lin, Y. B. and Cho, S. L.: 2000, iGSM: VoIP Service for Mobile
Networks, IEEE Communications Magazine 4(38), 62–69.
Rappaport, T. S.: 2002, Wireless Communications: Principles and Practice, second
edn, Prentice Hall, New Jersey, USA.
78
Sargent, R. G.: 1994, Verification and Validation of Simulation Models, Proceedings
of the 26th conference on Winter simulation, Orlando, Florida, United States,
pp. 77–87.
Sarker, J. H. and Halme, S. J.: 2000, An Analysis of Channel Efficiency With(out)
Voice and Data Traffic Activity Factors, Proceedings of The Twelfth Annual In-
ternational Conference on Wireless Communications, Wireless 2000, Calgary, Al-
barta, Canada, pp. 618–626.
Schlesinger, S., Crosbie, R. E., Gagne, R. E., Innis, G. S., Lalwani, C. S., Loch, J.,
Wright, R. D., Kheir, N. and Bartos, D.: 1979, Terminology for model credibility,
Simulation 32(3), 103–104.
Schulzrinne, H.: 1999, Service for telecom: Version II, IEEE Internet Computing
3(3), 40–43.
Schwartz, M.: 1987, Telecommunication Networks: Protocols, Modeling and Analy-
sis, Addison-Wesley, Massachusetts, USA.
Singh, T.: 2003, Things you can do to speed up things, Technical report. http:
//www10.brinkster.com/geniusportal/speedjava.html.
So, J. W. and Cho, D. H.: 2001, Access Scheme for Integrated Voice/Data Trans-
missions over Common Packet Channel in 3GPP, IEEE Communication Letters
5(2).
Stallings, W.: 1987, Local Networks, third edn, Macmillian Publishing Company,
New York, USA.
Sun Microsystems: 2002, Java 2 Platform Standard Edition JDK API Documenta-
tion, Technical Report v1.4.1, Sun Microsystems.
Tabbane, S.: 2000, Handbook of Mobile Radio Networks, Artech House, Mas-
sachusetts, USA.
Jr. Andrews, F. T.: 1984, ISDN ’83, IEEE Communications Magazine 22(1), 6–10.
Turner, J. S.: 1986, New Directions in Communications (or Which Way to the
Information Age?), Proceedings of Digital Communications: New Directions in
Switching and Networks, pp. 25–31.
Vannucci, D. E. and Chitamu, P. J.: 2003a, Efficient Radio Resource Allocation in a
GSM and GPRS Cellular Network, Proceedings of the 7th World Multiconference
on Systemics, Cybernetics and Informatics, Florida, USA.
79
Vannucci, D. E. and Chitamu, P. J.: 2003b, Investigation of Radio Resource Al-
location for GSM/GPRS, Proceedings of the 2003 International Conference on
Electrical Engineering and Technology, Dar es Salaam, Tanzania.
Vannucci, D. E. and Chitamu, P. J.: 2003c, Radio Resource Allocation and Multi-
plexing of Voice and Data over IP in a GSM/GPRS Cellular Network, Proceedings
of Southern African Telecommunication Networks and Applications Conference
(SATNAC): IP Generation leading the charge for convergence, George, South
Africa.
Varshney, U., Snow, A., McGivern, M. and Howard, C.: 2002, Voice over IP, Com-
munications of the ACM 45(1), 89–96.
Walke, B. H.: 2002, Mobile Radio Networks - Networking, Protocols and Traffic
Performance, second edn, John Wiley and Sons, New York, USA.
Wang, J., McCann, P. J., Gorrepati, P. B. and Liu, C. Z.: 1998, Wireless Voice-over-
IP and Implications for Third-Generation Network Design, Bell Labs Technical
Journal 3(3), 79–97.
Watson, A. and Sasse, M.: 1997, Multimedia Conferencing via Multicast: Determin-
ing the Quality of Service Required by the End User, Proceedings of International
Workshop on Audio-Visual Services over Packet Networks AVSPN ’97, Aberdeen,
Scotland, pp. 189–194.
Winogradoff, A.: 2002, VoIP in Public Services: Facts, Fiction and Myth, Article
Top View AV-18-6958, Gartner.
Wong, W. T. K. and Mack, R. M.: 1996, Low rate speech coding for telecommuni-
cations, BT Technology Journal 14(1), 28–44.
Yang, W. and Yantorno, R.: 1996, Development of a burst model for speech trans-
mission with cell losses in an ATM network, Proceedings of the 1996 1st Annual
Conference on Emerging Technologies and Applications in Communications, eta-
COM, pp. 20–23.
Zeigler, B. P.: 76, Theory of Modelling and Simulation, John Wiley & Sons, Mas-
sachusetts, USA.
80
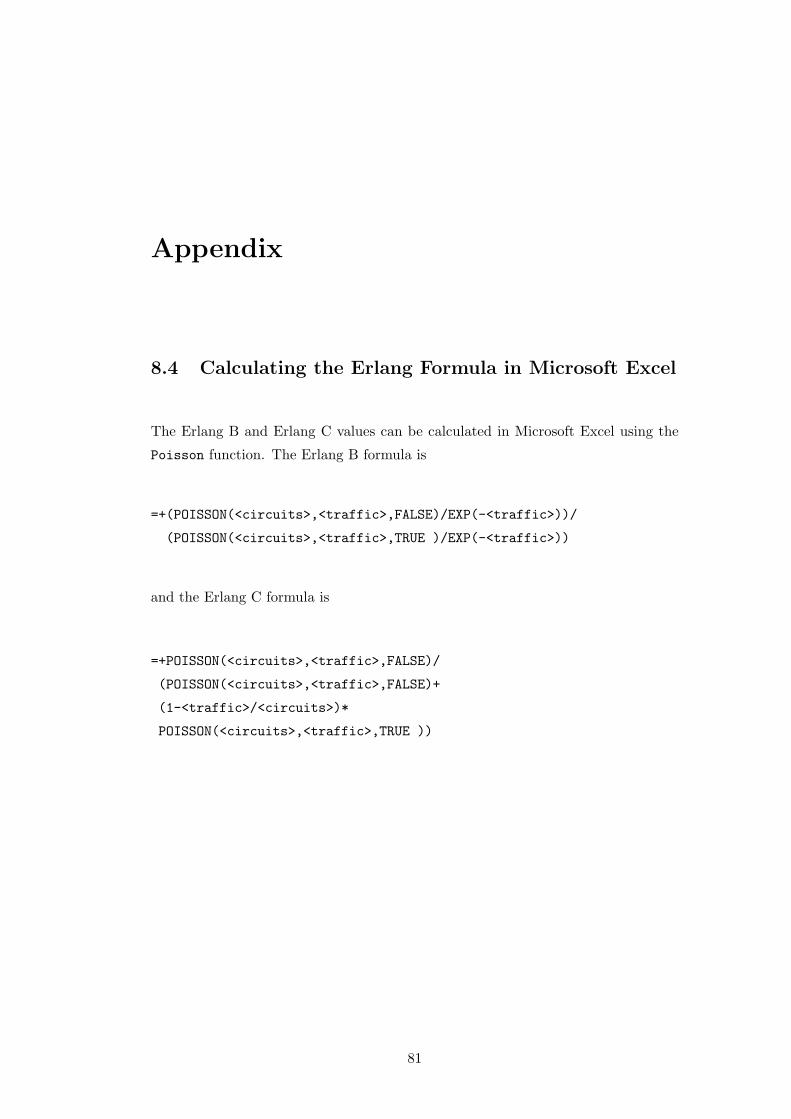
Appendix
8.4 Calculating the Erlang Formula in Microsoft Excel
The Erlang B and Erlang C values can be calculated in Microsoft Excel using the
Poisson function. The Erlang B formula is
=+(POISSON(<circuits>,<traffic>,FALSE)/EXP(-<traffic>))/
(POISSON(<circuits>,<traffic>,TRUE )/EXP(-<traffic>))
and the Erlang C formula is
=+POISSON(<circuits>,<traffic>,FALSE)/
(POISSON(<circuits>,<traffic>,FALSE)+
(1-<traffic>/<circuits>)*
POISSON(<circuits>,<traffic>,TRUE ))
81
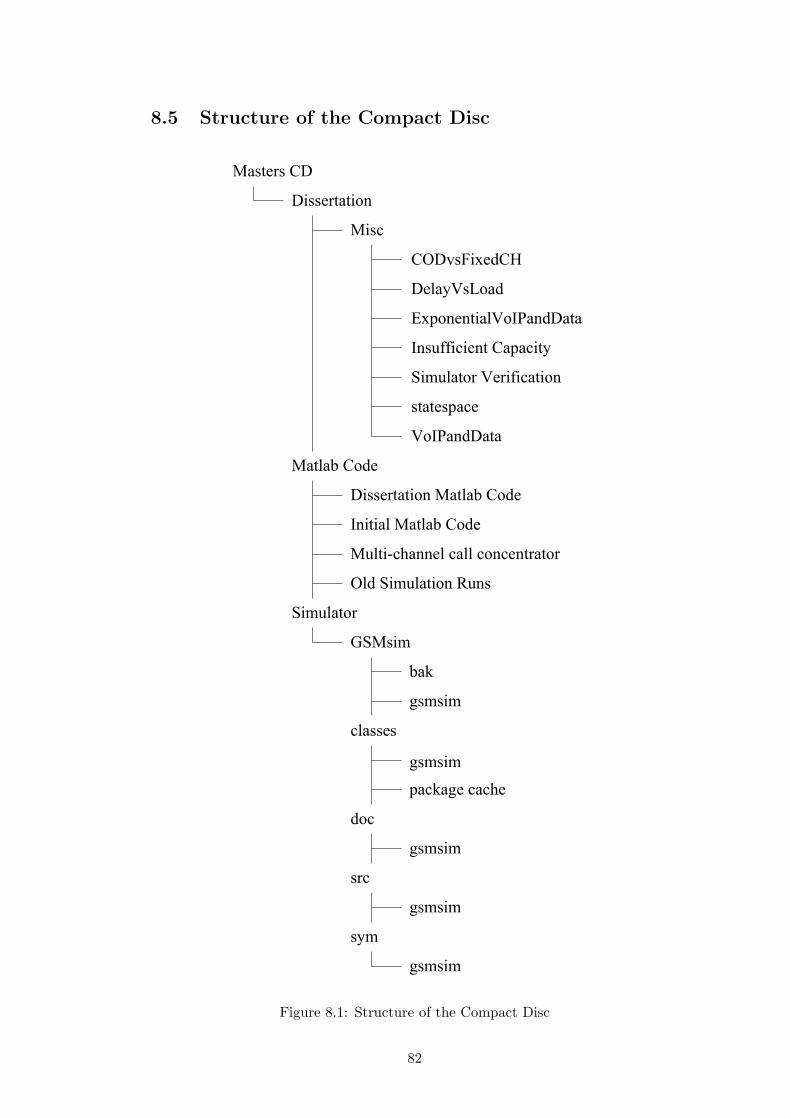
8.5 Structure of the Compact Disc
�����������
���
� ����������
�����������
�������������������
�������������������
���������������������
����������
����������
���� �����
���������������� �����
����������� �����
����!�"�������������������
�������������#��
���������
$����
�%
&�����
�������
&�����
���%�&�����"�
���
&�����
���
&�����
���
&�����
���������
Figure 8.1: Structure of the Compact Disc
82