quarterly service performance and activity report - tusla
TRANSCRIPT
Quarterly Service
Performance and
Activity Report
QUARTER 4 2019
Quality Assurance Directorate
CONTENTS
CONTENTS ............................................................................................................... 2
1.0 PERFORMANCE OVERVIEW ......................................................................... 3
2.0 CHILD PROTECTION AND WELFARE SERVICES...................................... 10
2.1 Referrals (Child Welfare and Child Abuse/Neglect) ................................................................. 10
2.2 Social Work Activity Data (Child Protection & Welfare) ........................................................... 21
2.3 Child Protection Notification System ........................................................................................ 27
2.4 National Out Of Hours Service ................................................................................................. 31
3.0 ALTERNATIVE CARE SERVICES ................................................................ 33
3.1 Children in Care (Foster care / Residential care) ..................................................................... 33
3.2 Aftercare ................................................................................................................................... 43
3.3 Adoption services ..................................................................................................................... 49
3.4 Foster carers ............................................................................................................................ 52
4.0 REGULATORY FUNCTIONS ........................................................................ 58
4.1 Early Years Inspectorate .......................................................................................................... 58
4.2 Alternative Education Regulation ............................................................................................. 62
4.3 Non Statutory Alternative Care Services .................................................................................. 66
5.0 TUSLA EDUCATION SUPPORT SERVICES ................................................ 67
6.0 FAMILY SUPPORT SERVICES ..................................................................... 70
6.1 Family Support Services .......................................................................................................... 70
6.2 Meitheal .................................................................................................................................... 77
7.0 HUMAN RESOURCES .................................................................................. 85
8.0 FINANCE ....................................................................................................... 92
APPENDIX I ............................................................................................................. 94
01 April 2020
3
1.0 PERFORMANCE OVERVIEW
This report provides an update on the performance and activity of Tusla services at the end of
Q4 2019. It is structured around key performance and activity measures included in the
Agency’s Business Plan. The data presented was provided by services and refers to the latest
performance and activity information available at this time. These data can change from
data previously published due to the ongoing validation of data.
The summary by service type set out below provides an overview of the Q4 2019 position
regarding activity and performance.
CHILD PROTECTION AND WELFARE SERVICES
Referrals
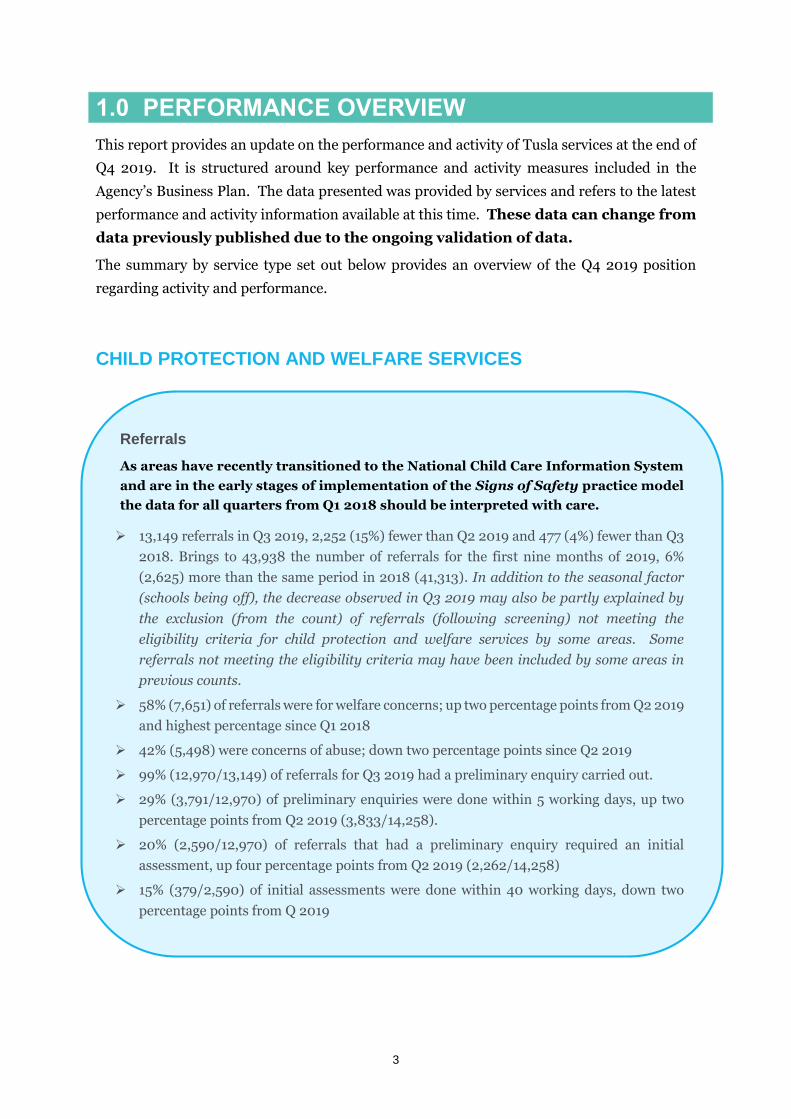
As areas have recently transitioned to the National Child Care Information System
and are in the early stages of implementation of the Signs of Safety practice model
the data for all quarters from Q1 2018 should be interpreted with care.
13,149 referrals in Q3 2019, 2,252 (15%) fewer than Q2 2019 and 477 (4%) fewer than Q3
2018. Brings to 43,938 the number of referrals for the first nine months of 2019, 6%
(2,625) more than the same period in 2018 (41,313). In addition to the seasonal factor
(schools being off), the decrease observed in Q3 2019 may also be partly explained by
the exclusion (from the count) of referrals (following screening) not meeting the
eligibility criteria for child protection and welfare services by some areas. Some
referrals not meeting the eligibility criteria may have been included by some areas in
previous counts.
58% (7,651) of referrals were for welfare concerns; up two percentage points from Q2 2019
and highest percentage since Q1 2018
42% (5,498) were concerns of abuse; down two percentage points since Q2 2019
99% (12,970/13,149) of referrals for Q3 2019 had a preliminary enquiry carried out.
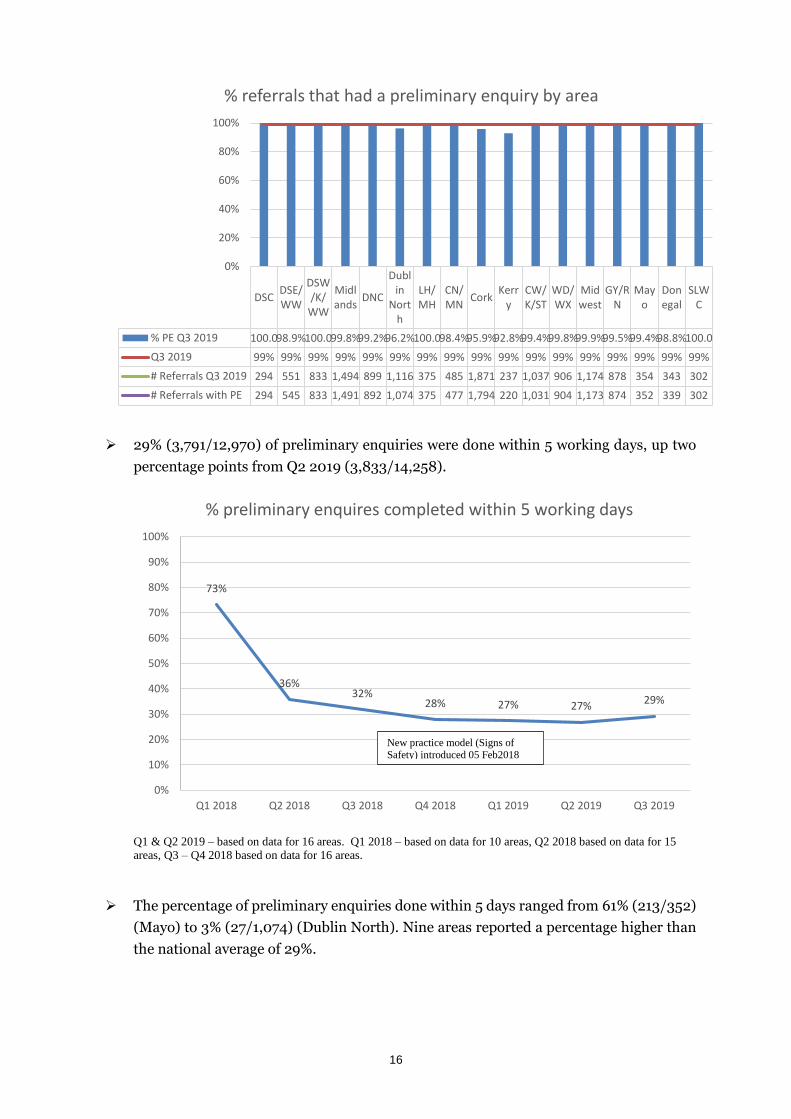
29% (3,791/12,970) of preliminary enquiries were done within 5 working days, up two
percentage points from Q2 2019 (3,833/14,258).
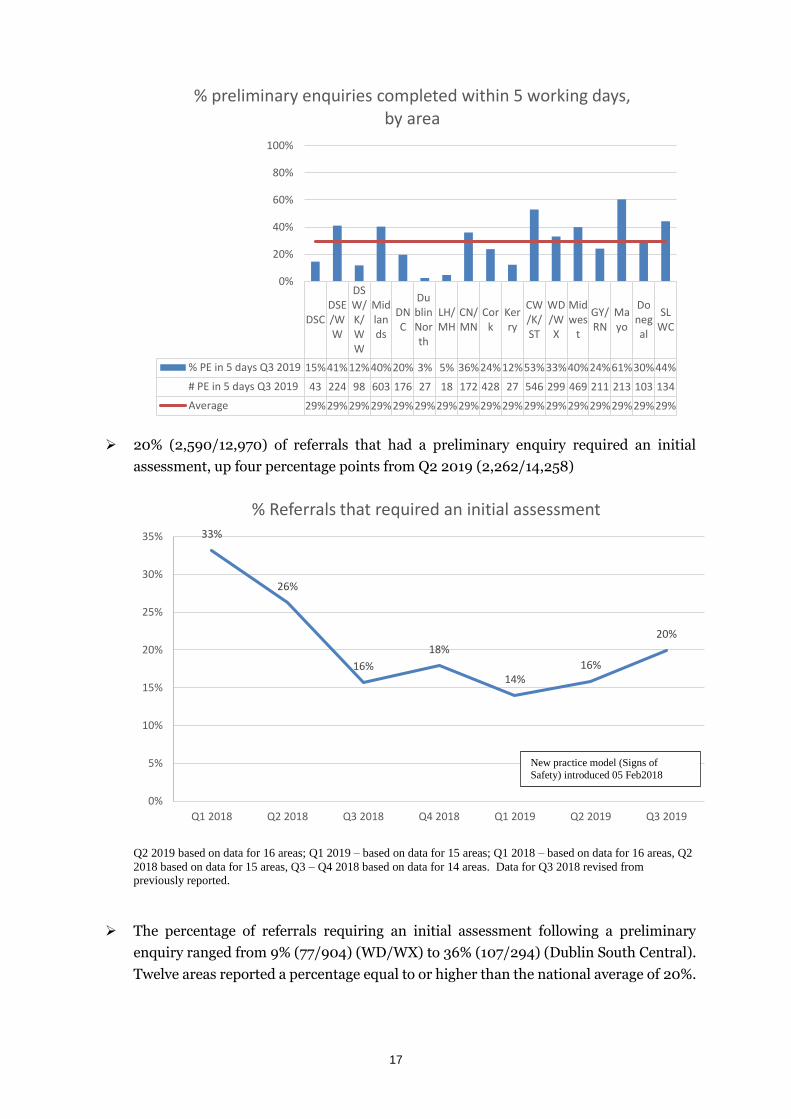
20% (2,590/12,970) of referrals that had a preliminary enquiry required an initial
assessment, up four percentage points from Q2 2019 (2,262/14,258)
15% (379/2,590) of initial assessments were done within 40 working days, down two
percentage points from Q 2019
4
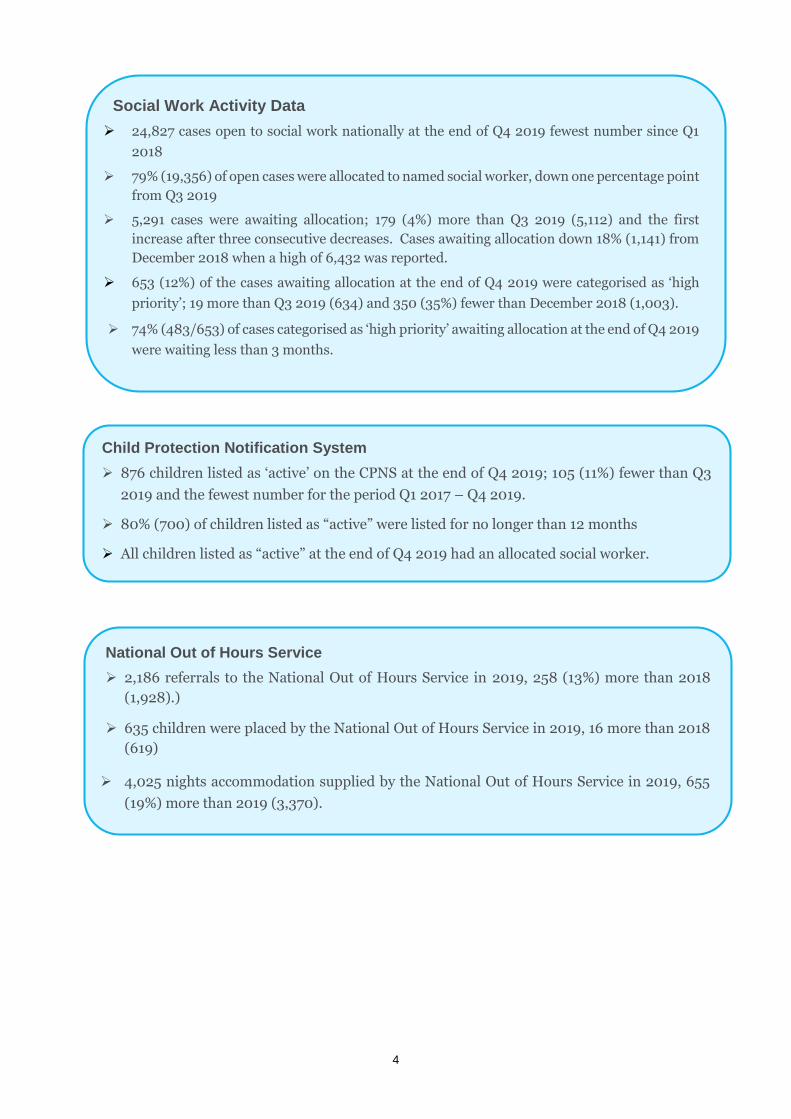
Social Work Activity Data
24,827 cases open to social work nationally at the end of Q4 2019 fewest number since Q1
2018
79% (19,356) of open cases were allocated to named social worker, down one percentage point
from Q3 2019
5,291 cases were awaiting allocation; 179 (4%) more than Q3 2019 (5,112) and the first
increase after three consecutive decreases. Cases awaiting allocation down 18% (1,141) from
December 2018 when a high of 6,432 was reported.
653 (12%) of the cases awaiting allocation at the end of Q4 2019 were categorised as ‘high
priority’; 19 more than Q3 2019 (634) and 350 (35%) fewer than December 2018 (1,003).
74% (483/653) of cases categorised as ‘high priority’ awaiting allocation at the end of Q4 2019
were waiting less than 3 months.
National Out of Hours Service
2,186 referrals to the National Out of Hours Service in 2019, 258 (13%) more than 2018
(1,928).)
635 children were placed by the National Out of Hours Service in 2019, 16 more than 2018
(619)
4,025 nights accommodation supplied by the National Out of Hours Service in 2019, 655
(19%) more than 2019 (3,370).
Child Protection Notification System
876 children listed as ‘active’ on the CPNS at the end of Q4 2019; 105 (11%) fewer than Q3
2019 and the fewest number for the period Q1 2017 – Q4 2019.
80% (700) of children listed as “active” were listed for no longer than 12 months
All children listed as “active” at the end of Q4 2019 had an allocated social worker.
5
ALTERNATIVE CARE SERVICES
Children in Care
5,985 children in care at the end of 2019; two more than Q3 2019, but 56 fewer than Q4 2018
(6,041) and 211 fewer than Q4 2017 (6,196).
695 children in private placements; 11 more than Q3 2019 (684) and 40 (6%) more than Q4
2018 (655); highest number for all quarters Q1 2018 – Q4 2019.
92% (5,486/5,985) of children in care had an allocated social worker at the end of 2019; no
change in percentage from Q3 2019
499 children were awaiting allocation of a social worker; 27 more than at the end of Q3 2019
(472)
Highest number awaiting in the Dublin North (79, up 8 from Q3) followed by Midwest (68,
down 6 from Q3), CW/K/ST (54, down 18 from Q3), DSW/K/WW (53, down 3 from Q3) and
Midlands (50, up 7 from Q3)
93% (5,570/5,985) of children in care had an up-to-date care plan against a target of 90%, up
one percentage points from Q3 2019 (92%).
415 children did not have an up-to-date care plan, 70 fewer than Q3 2019 (485). Highest
number in Cork (170, down 57 from Q3) followed by Midwest (62, down 8 from Q3).
Aftercare
2,774 young persons/adults in receipt of an aftercare service at the end of Q4 2019, 74 more
than Q3 2019 and 152 (6%) more than Q1 2019.
73% (1,533/2,108) of those 18-22 years inclusive in receipt of an aftercare service were in
education/accredited training.
82% (2,265) of young persons/adults in receipt of aftercare services at the end of 2019 had an
aftercare plan, no change from Q3 2019. A total of 509 were awaiting a plan, 14 more than Q3
2019 (495). Nine areas along with the SWTSCSA reported a percentage equal to or above the
national average of 82%.
90% (1,889/2,099) of those assessed as needing an aftercare worker had an aftercare worker at
the end of 2019, up one percentage point from Q3 2019. A total of 210 young people were
awaiting an aftercare worker at the end of 2019, down four from Q3 2019 (214 awaiting).
Thirteen areas along with the SWTSCSA reported a percentage equal to or higher than the
national average of 90% with nine of these areas reporting 100%.
6
Foster Carers
4,201 foster carers on the panel of approved foster carers at the end of 2019, two fewer than
Q3 2019 and the fewest number for the period Q1 2018 – Q4 2019
82% (1,095/1,335) of relative foster carers approved against a target of 80%
94% (2,428) of general foster carers had an allocated link worker (target 90%); 146 awaiting
a link work, 30 fewer than Q3 2019 (176). Rates reported by Dublin South East/Wicklow
(76%), DSW/K/WW (84%) and Midlands (84%) lower than all other areas.
91% (995) of relative foster carers approved and on the panel had an allocated link (social)
worker (target 85%); 100 were awaiting an allocated link worker, eight fewer than Q3 2019
(108). Rates reported by DSW/K/WW (64%), LH/MH (74%), WD/WX (76%) and Midlands
(79%) lower than all other areas.
240 unapproved relative foster carers; 16 fewer than Q3 2019
211 (88%) of the unapproved relative foster carers had a child placed with them for longer
than 12 weeks, 12 fewer than Q3 2019 (223).
94% (199) had an allocated link worker, down four percentage points from Q3 2019; 12
awaiting allocation across three areas (7 more than Q3)
Adoption
398 new enquiries regarding information and tracing received in Q4 2019, fewest number
for all quarters 2019. Brings to 2,332 the number of enquires for 2019, nearly double (90%;
1,107) the number for 2018 (1,225)
148 new applications to commence tracing of a searched person received in Q4 2019; fewest
number for all quarters 2019. Brings to 804 the number of applications for 2018; 42 (5%)
fewer than 2018 (846)
619 applicants awaiting an information and tracing service at the end of Q4 2019; 110 (15%)
fewer than Q3 2019 and the fewest number for the period Q1 2017 – Q4 2019.
39 receipted completed applications for adoption (all types) received during Q4 2019, fewest
number for all quarters 2019. Brings to 194 the number of applications received for 2019, 18
(8%) fewer than 2018 (212).
40 new children were referred for adoption in Q4 2019. Brings the total number for 2019 to
179; 18 fewer than 2018 (197).
37 completed assessments (all types) were presented to Local Adoption Committees during
Q4 2019. Brings the total number for 2019 to 152, one more than 2018 (151).
7
Early Years Inspectorate
4,310 EYS on the register nationally at the end of Q4 2019; fewest number for the period Q1 2018
– Q4 2019
514 inspections (all types) carried out in Q4 2019, bringing the total number for 2019 to 2,308.
A total of 2,513 inspections carried out in 2018.
102 incidents notified to the Inspectorate in Q4 2019. Brings to 403 the number for 2019, 149
(59%) more than 2018 (254).
157 unsolicited information submissions received by the Inspectorate during Q4 2019. Brings to
597 the number for 2019, 184 (45%) more than 2018 (413).
4 services removed from the national register in 2019.
Non-Statutory Alternative Care Services
130 non-statutory residential centres at the end of 2019; one more than Q3 2019 and 10 more
than at the end of 2018
29 inspections (all types and onsite) conducted in Q4 2019; three more than Q3 2019. Brings to
128 the number of inspections for 2019, six fewer than 2018 (134).
Alternative Education Regulation
Home Education
1,495 children on the register for home education at the end of 2019; 85 (6%) more than 2018.
160 applications received for home education during Q4 2019. Brings to 617 the number of
applications received for 2019, 12 more than 2018 (605).
98 assessments (all types) for home education carried out in Q4 2019, 48 (96%) more than Q3
2019 and the highest number since Q1 2018. Brings to 301 the number of assessments done for
2019, 61(17%) fewer than 2018 (362).
650 children awaiting a preliminary assessment for registration at the end of Q4 2019, eight more
than Q3 2019 and the highest number for the period Q1 2019 – Q4 2019.
429 registered children awaiting a review at the end of Q4 2019; fewest number for all quarters
Q1 2018 – Q4 2019.
Independent Schools
6,688 children attending 49 assessed schools at the end of 2019
3 schools awaiting a preliminary assessment at the end of 2019 and a further seven schools
allocated to an assessor for review.
8
Family Support Services (data reported bi-annually, Q2 and Q4)
Family Support Services includes those services funded through a Service Arrangement with the Agency and those funded internally and delivered through the Agency
At least 18,343 children in receipt of family support services at the end of 2019 (based on
88% response rate). At least 19,016 in receipt at the end of 2018 (response rate 89%).
At least 37,024 children referred to family support services in 2019. At least 33,270 children
referred in 2018.
67% (24,828) of children referred to family support services in 2019 received a service, down
six percentage points from 2018 (73%; 24,211).
Meitheal (data reported bi-annually, Q2 and Q4)
2,330 Meitheal processes requested in 2019; 596 (34%) more than 2018 (1,734)
72% (1,670) of requests requested through Direct Access, 18% (413) requested through Social
Work Diversion and 11% (247) Social Work Step Down
82% (1,921) of Meitheal requests received in 2019 proceeded to Stage 2 (Discussion Stage),
up from 67% (1,164/1,734) in 2018.
1,534 the number of Meitheal processes reached completion of Stage Two in 2019.
58% (889) of processes reaching completion of Stage Two, proceeded to delivery (Stage 3)
1,654 Meitheals closed in 2019, 597 (56%) more than 2018 (1,057). 35% (577) were closed
following submission of a Meitheal request form (Stage 1). 31% (520) were closed following
completion of the Strengths and Needs Form (Stage 2). 10% (169) were closed following
commencement of Meitheal Support Meetings (Stage 3) and 23% (388) were closed post-
delivery.
115 Child and Family Support Networks1 (CFSN) operating at the end of 2019; nine more
than 2018. A further 17 CFSNs are planned.
Tusla Education Support Services
1,419 referrals screened by senior educational welfare officers in Q4 2019, bringing the total
number for the period Sept 2019 – Dec 2019 to 1,668; 232 (16%) more than the same period in
2018 (1,436)
1,914 screened referrals on a waiting list at the end of 2019, 395 (26%) more than at the end of
December 2018 (1,519).
840 new individual children worked with in Q4 2019, bringing the total number for the period
Sept 2019 – Dec 2019 to 1,006; 223 fewer than the same period in 2018 (1,229)
157 School Attendance Notices (SANs) issued in Q4 2019, bringing the total number for the
period Sept 2019 – Dec 2019 to 204; 25 fewer than the same period in 2018 (229).
27 summonses issued in Q4 2019, bringing the total number for the period Sept 2019 – Dec
2019 to 34; seven fewer than the same period in 2018 (41).
72 Section 24 meetings convened by EWOs in Q4 2019, bringing the total number for the period
Sept 2019 – Dec 2019 to 89; 38 fewer than the same period in 2018 (127)
9
Finance
The financial outturn for the year to date (Dec 2019) is an under-spend of €1.024 million
Pay costs are under-spent against budget by €2.718 million
Non pay costs are over-spent against budget by €9.016 million
Key area of over-spend is private residential and foster care costs at €5.323 million over
budget
48% (€14.512 million) of legal expenditure (€30.286 million) was on guardians ad litem
(GALs), including GAL’s solicitors and counsel.
Human Resources
4,122 (WTE) employed by the Agency at the end of 2019; a 6% (229) increase on 2018.
522 new staff joined Tusla (came onto Tusla’s payroll) in 2019; four more than 2018 (518)
257 staff left Tusla (i.e., resigned, career breaks, excluding retirements) in 2019, 38 more than
2018 (219)
63 staff retired in in 2019; 25 fewer than 2018 (88)
153 staff were on maternity leave at the end of November 2019.
5.43% absence rate (November 2019)
227 class-room based courses run by Workforce Learning & Development during Q4 2019 at
which 3,069 persons attended. There were 1,636 completions of online training targeted at Tusla
staff
10
2.0 CHILD PROTECTION AND WELFARE SERVICES
KEY AREAS OF FOCUS
2.1 Referrals (child welfare and child abuse)
2.2 Social Work Activity Data
2.3 Child Protection Notification System (CPNS)
2.4 Crisis Intervention Service / Out of Hours Service
2.1 REFERRALS (CHILD WELFARE AND CHILD ABUSE/NEGLECT)
Number of Referrals Q3 2019
13,149 referrals to Child Protection and Welfare Service during Q3 20191; 2,252 (15%)
fewer than Q2 2019 and 477 (4%) fewer than Q3 2018. This brings to 43,938 the number
of referrals for the first nine months of 2019, 6% (2,625) more than the same period in
2018 (41,313). In addition to the seasonal factor (schools being off), the decrease
1 Data on referrals are reported quarterly in arrears.
Key Facts
As areas have recently transitioned to the National Child Care Information
System and are in the early stages of implementation of the Signs of Safety
practice model the data for all quarters from Q1 2018 should be interpreted with
care.
13,149 referrals in Q3 2019, 2,252 (15%) fewer than Q2 2019 and 477 (4%) fewer than Q3
2018. Brings to 43,938 the number of referrals for the first nine months of 2019, 6%
(2,625) more than the same period in 2018 (41,313). In addition to the seasonal factor
(schools being off), the decrease observed in Q3 2019 may also be partly explained by
the exclusion (from the count) of referrals (following screening) not meeting the
eligibility criteria for child protection and welfare services by some areas. Some
referrals not meeting the eligibility criteria may have been included by some areas in
previous counts.
58% (7,651) of referrals were for welfare concerns; up two percentage points from Q2
2019 and highest percentage since Q1 2018
42% (5,498) were concerns of abuse; down two percentage points since Q2 2019
99% (12,970/13,149) of referrals for Q3 2019 had a preliminary enquiry carried out.
29% (3,791/12,970) of preliminary enquiries were done within 5 working days, up two
percentage points from Q2 2019 (3,833/14,258).
20% (2,590/12,970) of referrals that had a preliminary enquiry required an initial
assessment, up four percentage points from Q2 2019 (2,262/14,258)
15% (379/2,590) of initial assessments were done within 40 working days, down two
percentage points from Q 2019
‘No further action’ was recorded in 42% (547) of cases where outcome was provided
(1,276).
11
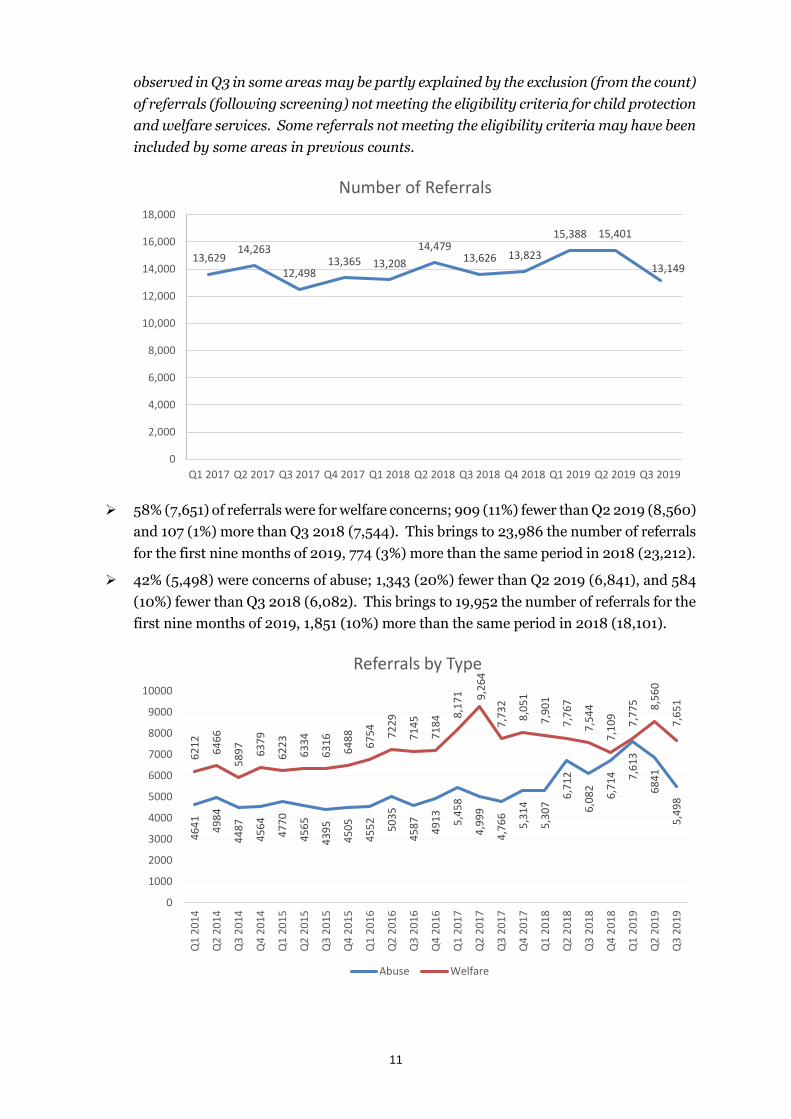
observed in Q3 in some areas may be partly explained by the exclusion (from the count)
of referrals (following screening) not meeting the eligibility criteria for child protection
and welfare services. Some referrals not meeting the eligibility criteria may have been
included by some areas in previous counts.
58% (7,651) of referrals were for welfare concerns; 909 (11%) fewer than Q2 2019 (8,560)
and 107 (1%) more than Q3 2018 (7,544). This brings to 23,986 the number of referrals
for the first nine months of 2019, 774 (3%) more than the same period in 2018 (23,212).
42% (5,498) were concerns of abuse; 1,343 (20%) fewer than Q2 2019 (6,841), and 584
(10%) fewer than Q3 2018 (6,082). This brings to 19,952 the number of referrals for the
first nine months of 2019, 1,851 (10%) more than the same period in 2018 (18,101).
13,62914,263
12,49813,365 13,208
14,47913,626 13,823
15,388 15,401
13,149
0
2,000
4,000
6,000
8,000
10,000
12,000
14,000
16,000
18,000
Q1 2017 Q2 2017 Q3 2017 Q4 2017 Q1 2018 Q2 2018 Q3 2018 Q4 2018 Q1 2019 Q2 2019 Q3 2019
Number of Referrals4
64
1
49
84
44
87
45
64
47
70
45
65
43
95
45
05
45
52
50
35
45
87
49
13
5,4
58
4,9
99
4,7
66
5,3
14
5,3
07
6,7
12
6,0
82
6,7
14 7,6
13
68
41
5,4
98
62
12
64
66
58
97
63
79
62
23
63
34
63
16
64
88
67
54
72
29
71
45
71
84 8
,17
1 9,2
64
7,7
32
8,0
51
7,9
01
7,7
67
7,5
44
7,1
09
7,7
75 8,5
60
7,6
51
0
1000
2000
3000
4000
5000
6000
7000
8000
9000
10000
Q1
20
14
Q2
20
14
Q3
20
14
Q4
20
14
Q1
20
15
Q2
20
15
Q3
20
15
Q4
20
15
Q1
20
16
Q2
20
16
Q3
20
16
Q4
20
16
Q1
20
17
Q2
20
17
Q3
20
17
Q4
20
17
Q1
20
18
Q2
20
18
Q3
20
18
Q4
20
18
Q1
20
19
Q2
20
19
Q3
20
19
Referrals by Type
Abuse Welfare
12
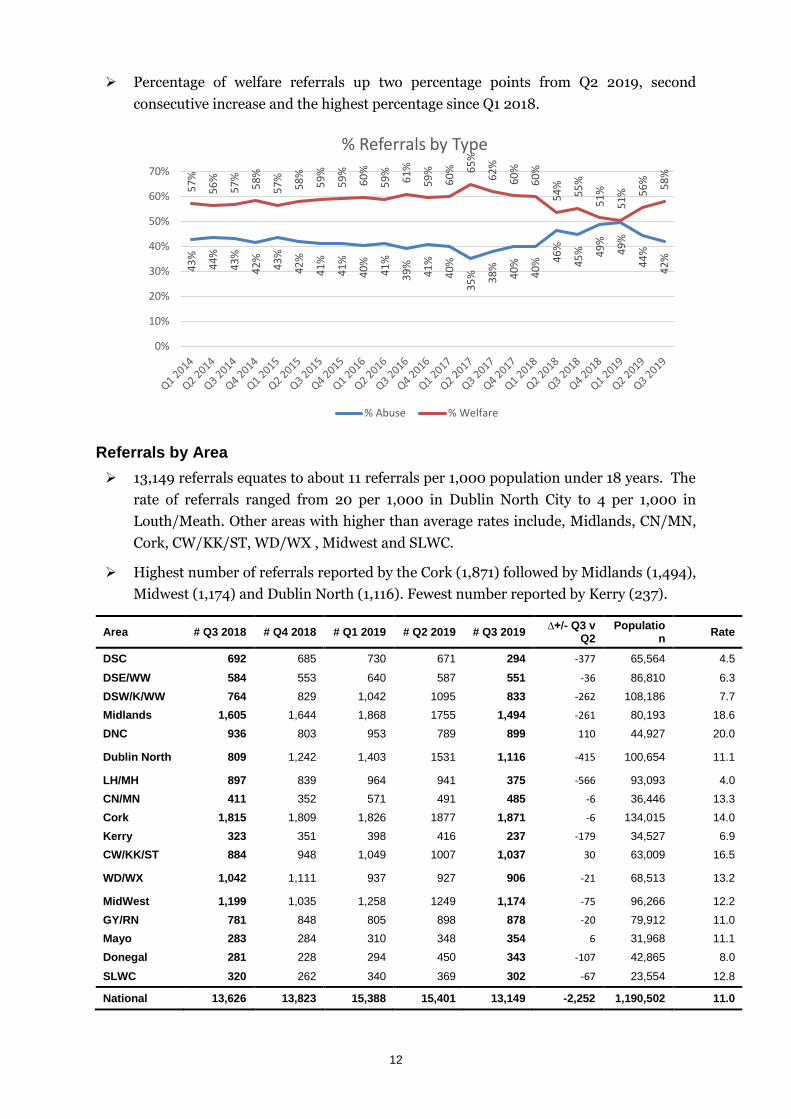
Percentage of welfare referrals up two percentage points from Q2 2019, second
consecutive increase and the highest percentage since Q1 2018.
Referrals by Area
13,149 referrals equates to about 11 referrals per 1,000 population under 18 years. The
rate of referrals ranged from 20 per 1,000 in Dublin North City to 4 per 1,000 in
Louth/Meath. Other areas with higher than average rates include, Midlands, CN/MN,
Cork, CW/KK/ST, WD/WX , Midwest and SLWC.
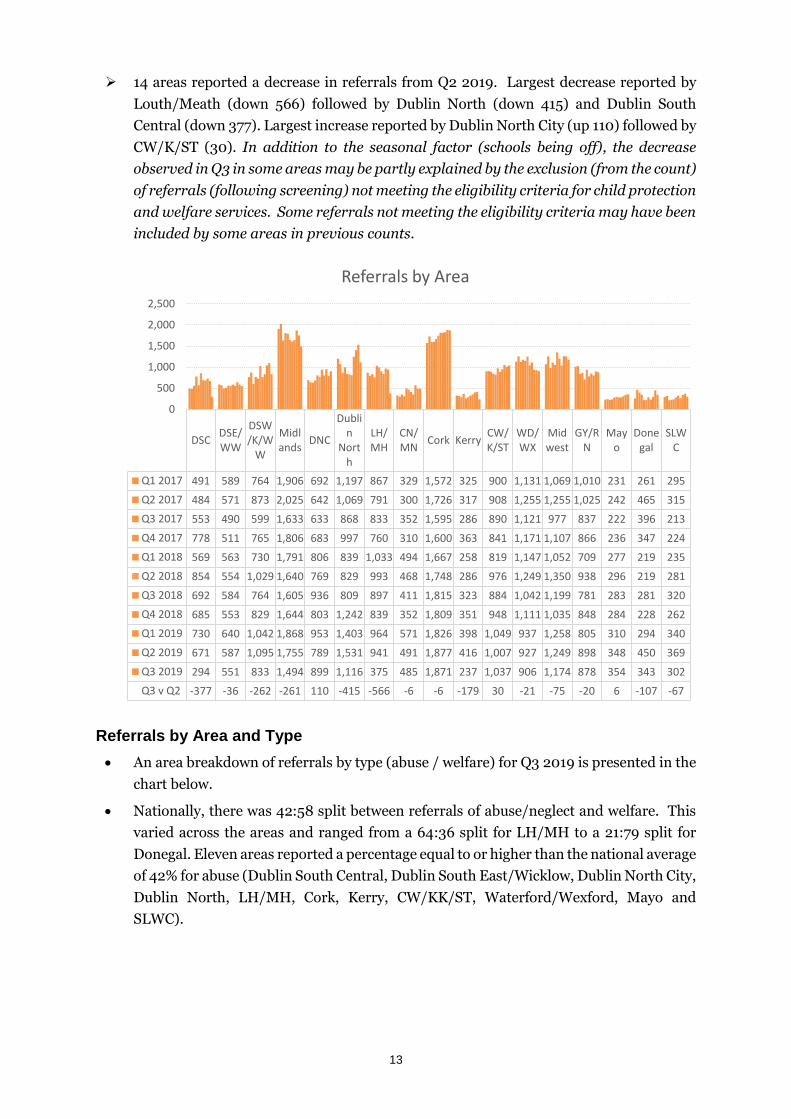
Highest number of referrals reported by the Cork (1,871) followed by Midlands (1,494),
Midwest (1,174) and Dublin North (1,116). Fewest number reported by Kerry (237).
Area # Q3 2018 # Q4 2018 # Q1 2019 # Q2 2019 # Q3 2019 ∆+/- Q3 v
Q2 Populatio
n Rate
DSC 692 685 730 671 294 -377 65,564 4.5
DSE/WW 584 553 640 587 551 -36 86,810 6.3
DSW/K/WW 764 829 1,042 1095 833 -262 108,186 7.7
Midlands 1,605 1,644 1,868 1755 1,494 -261 80,193 18.6
DNC 936 803 953 789 899 110 44,927 20.0
Dublin North 809 1,242 1,403 1531 1,116 -415 100,654 11.1
LH/MH 897 839 964 941 375 -566 93,093 4.0
CN/MN 411 352 571 491 485 -6 36,446 13.3
Cork 1,815 1,809 1,826 1877 1,871 -6 134,015 14.0
Kerry 323 351 398 416 237 -179 34,527 6.9
CW/KK/ST 884 948 1,049 1007 1,037 30 63,009 16.5
WD/WX 1,042 1,111 937 927 906 -21 68,513 13.2
MidWest 1,199 1,035 1,258 1249 1,174 -75 96,266 12.2
GY/RN 781 848 805 898 878 -20 79,912 11.0
Mayo 283 284 310 348 354 6 31,968 11.1
Donegal 281 228 294 450 343 -107 42,865 8.0
SLWC 320 262 340 369 302 -67 23,554 12.8
National 13,626 13,823 15,388 15,401 13,149 -2,252 1,190,502 11.0
43
%
44
%
43
%
42
%
43
%
42
%
41
%
41
%
40
%
41
%
39
%
41
%
40
%
35
% 38
%
40
%
40
% 46
%
45
% 49
%
49
%
44
%
42
%
57
%
56
%
57
%
58
%
57
%
58
%
59
%
59
%
60
%
59
%
61
%
59
%
60
% 65
%
62
%
60
%
60
%
54
%
55
%
51
%
51
% 56
% 58
%
0%
10%
20%
30%
40%
50%
60%
70%
% Referrals by Type
% Abuse % Welfare
13
14 areas reported a decrease in referrals from Q2 2019. Largest decrease reported by
Louth/Meath (down 566) followed by Dublin North (down 415) and Dublin South
Central (down 377). Largest increase reported by Dublin North City (up 110) followed by
CW/K/ST (30). In addition to the seasonal factor (schools being off), the decrease
observed in Q3 in some areas may be partly explained by the exclusion (from the count)
of referrals (following screening) not meeting the eligibility criteria for child protection
and welfare services. Some referrals not meeting the eligibility criteria may have been
included by some areas in previous counts.
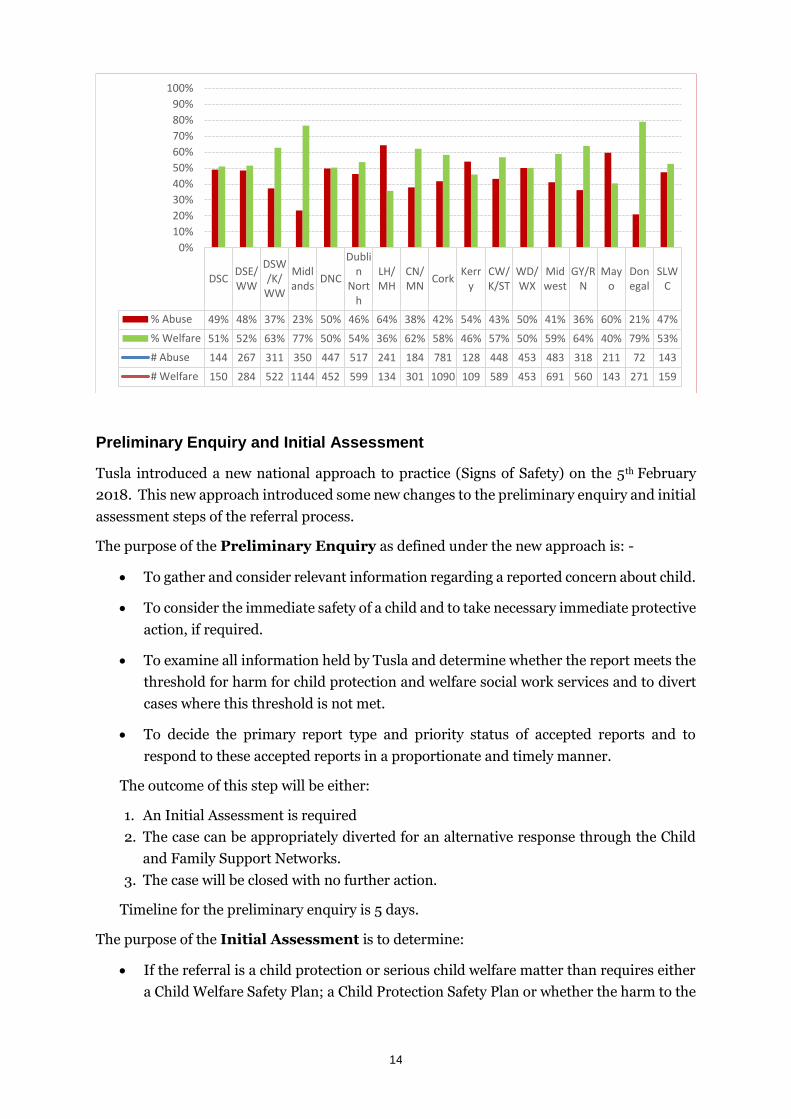
Referrals by Area and Type
An area breakdown of referrals by type (abuse / welfare) for Q3 2019 is presented in the
chart below.
Nationally, there was 42:58 split between referrals of abuse/neglect and welfare. This
varied across the areas and ranged from a 64:36 split for LH/MH to a 21:79 split for
Donegal. Eleven areas reported a percentage equal to or higher than the national average
of 42% for abuse (Dublin South Central, Dublin South East/Wicklow, Dublin North City,
Dublin North, LH/MH, Cork, Kerry, CW/KK/ST, Waterford/Wexford, Mayo and
SLWC).
DSCDSE/WW
DSW/K/W
W
Midlands
DNC
Dublin
North
LH/MH
CN/MN
Cork KerryCW/K/ST
WD/WX
Midwest
GY/RN
Mayo
Donegal
SLWC
Q1 2017 491 589 764 1,906 692 1,197 867 329 1,572 325 900 1,131 1,069 1,010 231 261 295
Q2 2017 484 571 873 2,025 642 1,069 791 300 1,726 317 908 1,255 1,255 1,025 242 465 315
Q3 2017 553 490 599 1,633 633 868 833 352 1,595 286 890 1,121 977 837 222 396 213
Q4 2017 778 511 765 1,806 683 997 760 310 1,600 363 841 1,171 1,107 866 236 347 224
Q1 2018 569 563 730 1,791 806 839 1,033 494 1,667 258 819 1,147 1,052 709 277 219 235
Q2 2018 854 554 1,029 1,640 769 829 993 468 1,748 286 976 1,249 1,350 938 296 219 281
Q3 2018 692 584 764 1,605 936 809 897 411 1,815 323 884 1,042 1,199 781 283 281 320
Q4 2018 685 553 829 1,644 803 1,242 839 352 1,809 351 948 1,111 1,035 848 284 228 262
Q1 2019 730 640 1,042 1,868 953 1,403 964 571 1,826 398 1,049 937 1,258 805 310 294 340
Q2 2019 671 587 1,095 1,755 789 1,531 941 491 1,877 416 1,007 927 1,249 898 348 450 369
Q3 2019 294 551 833 1,494 899 1,116 375 485 1,871 237 1,037 906 1,174 878 354 343 302
Q3 v Q2 -377 -36 -262 -261 110 -415 -566 -6 -6 -179 30 -21 -75 -20 6 -107 -67
0
500
1,000
1,500
2,000
2,500
Referrals by Area
14
Preliminary Enquiry and Initial Assessment
Tusla introduced a new national approach to practice (Signs of Safety) on the 5th February
2018. This new approach introduced some new changes to the preliminary enquiry and initial
assessment steps of the referral process.
The purpose of the Preliminary Enquiry as defined under the new approach is: -
To gather and consider relevant information regarding a reported concern about child.
To consider the immediate safety of a child and to take necessary immediate protective
action, if required.
To examine all information held by Tusla and determine whether the report meets the
threshold for harm for child protection and welfare social work services and to divert
cases where this threshold is not met.
To decide the primary report type and priority status of accepted reports and to
respond to these accepted reports in a proportionate and timely manner.
The outcome of this step will be either:
1. An Initial Assessment is required
2. The case can be appropriately diverted for an alternative response through the Child
and Family Support Networks.
3. The case will be closed with no further action.
Timeline for the preliminary enquiry is 5 days.
The purpose of the Initial Assessment is to determine:
If the referral is a child protection or serious child welfare matter than requires either
a Child Welfare Safety Plan; a Child Protection Safety Plan or whether the harm to the
DSCDSE/WW
DSW/K/
WW
Midlands
DNC
Dublin
North
LH/MH
CN/MN
CorkKerr
yCW/K/ST
WD/WX
Midwest
GY/RN
Mayo
Donegal
SLWC
% Abuse 49% 48% 37% 23% 50% 46% 64% 38% 42% 54% 43% 50% 41% 36% 60% 21% 47%
% Welfare 51% 52% 63% 77% 50% 54% 36% 62% 58% 46% 57% 50% 59% 64% 40% 79% 53%
# Abuse 144 267 311 350 447 517 241 184 781 128 448 453 483 318 211 72 143
# Welfare 150 284 522 1144 452 599 134 301 1090 109 589 453 691 560 143 271 159
0%
10%
20%
30%
40%
50%
60%
70%
80%
90%
100%

15
child is at a level where the children should be removed from the care of their parents
until such time as a safety plan can be established.
If the referral can be closed or diverted to an early intervention response that doesn’t
require Tusla Social Work intervention and can be diverted to a needs led approach
like Meitheal.
The timeline for the Initial Assessment is 40 days from receipt of the referral.
Due to these changes the data presented below are not directly comparable with data
reported prior to Q1 2018.
As areas have recently transitioned to the National Child Care Information System
and are in the early stages of implementation of the Signs of Safety practice model
the data for all quarters from Q1 2018 should be interpreted with care.
99% (12,970/13,149) of referrals for Q3 2019 had a preliminary enquiry carried out.
The percentage of referrals that had a preliminary enquiry ranged from 93% to 100%.
Four areas reported 100%.
96%
98%99%
97%98% 99% 98.6%
70%
75%
80%
85%
90%
95%
100%
Q1 2018 Q2 2018 Q3 2018 Q4 2018 Q1 2019 Q2 2019 Q3 2019
% Referrals that had a preliminary enquiry
New practice model (Signs of Safety)
introduced 05 Feb2018
16
29% (3,791/12,970) of preliminary enquiries were done within 5 working days, up two
percentage points from Q2 2019 (3,833/14,258).
Q1 & Q2 2019 – based on data for 16 areas. Q1 2018 – based on data for 10 areas, Q2 2018 based on data for 15 areas, Q3 – Q4 2018 based on data for 16 areas.
The percentage of preliminary enquiries done within 5 days ranged from 61% (213/352)
(Mayo) to 3% (27/1,074) (Dublin North). Nine areas reported a percentage higher than
the national average of 29%.
DSCDSE/WW
DSW/K/
WW
Midlands
DNC
Dublin
North
LH/MH
CN/MN
CorkKerr
yCW/K/ST
WD/WX
Midwest
GY/RN
Mayo
Donegal
SLWC
% PE Q3 2019 100.098.9%100.099.8%99.2%96.2%100.098.4%95.9%92.8%99.4%99.8%99.9%99.5%99.4%98.8%100.0
Q3 2019 99% 99% 99% 99% 99% 99% 99% 99% 99% 99% 99% 99% 99% 99% 99% 99% 99%
# Referrals Q3 2019 294 551 833 1,494 899 1,116 375 485 1,871 237 1,037 906 1,174 878 354 343 302
# Referrals with PE 294 545 833 1,491 892 1,074 375 477 1,794 220 1,031 904 1,173 874 352 339 302
0%
20%
40%
60%
80%
100%
% referrals that had a preliminary enquiry by area
73%
36%32%
28% 27% 27% 29%
0%
10%
20%
30%
40%
50%
60%
70%
80%
90%
100%
Q1 2018 Q2 2018 Q3 2018 Q4 2018 Q1 2019 Q2 2019 Q3 2019
% preliminary enquires completed within 5 working days
New practice model (Signs of Safety) introduced 05 Feb2018
17
20% (2,590/12,970) of referrals that had a preliminary enquiry required an initial
assessment, up four percentage points from Q2 2019 (2,262/14,258)
Q2 2019 based on data for 16 areas; Q1 2019 – based on data for 15 areas; Q1 2018 – based on data for 16 areas, Q2
2018 based on data for 15 areas, Q3 – Q4 2018 based on data for 14 areas. Data for Q3 2018 revised from previously reported.
The percentage of referrals requiring an initial assessment following a preliminary
enquiry ranged from 9% (77/904) (WD/WX) to 36% (107/294) (Dublin South Central).
Twelve areas reported a percentage equal to or higher than the national average of 20%.
DSCDSE/WW
DSW/K/WW
Midlands
DNC
DublinNorth
LH/MH
CN/MN
Cork
Kerry
CW/K/ST
WD/WX
Midwes
t
GY/RN
Mayo
Donegal
SLWC
% PE in 5 days Q3 2019 15%41%12%40%20% 3% 5% 36%24%12%53%33%40%24%61%30%44%
# PE in 5 days Q3 2019 43 224 98 603 176 27 18 172 428 27 546 299 469 211 213 103 134
Average 29%29%29%29%29%29%29%29%29%29%29%29%29%29%29%29%29%
0%
20%
40%
60%
80%
100%
% preliminary enquiries completed within 5 working days, by area
33%
26%
16%
18%
14%16%
20%
0%
5%
10%
15%
20%
25%
30%
35%
Q1 2018 Q2 2018 Q3 2018 Q4 2018 Q1 2019 Q2 2019 Q3 2019
% Referrals that required an initial assessment
New practice model (Signs of
Safety) introduced 05 Feb2018
18
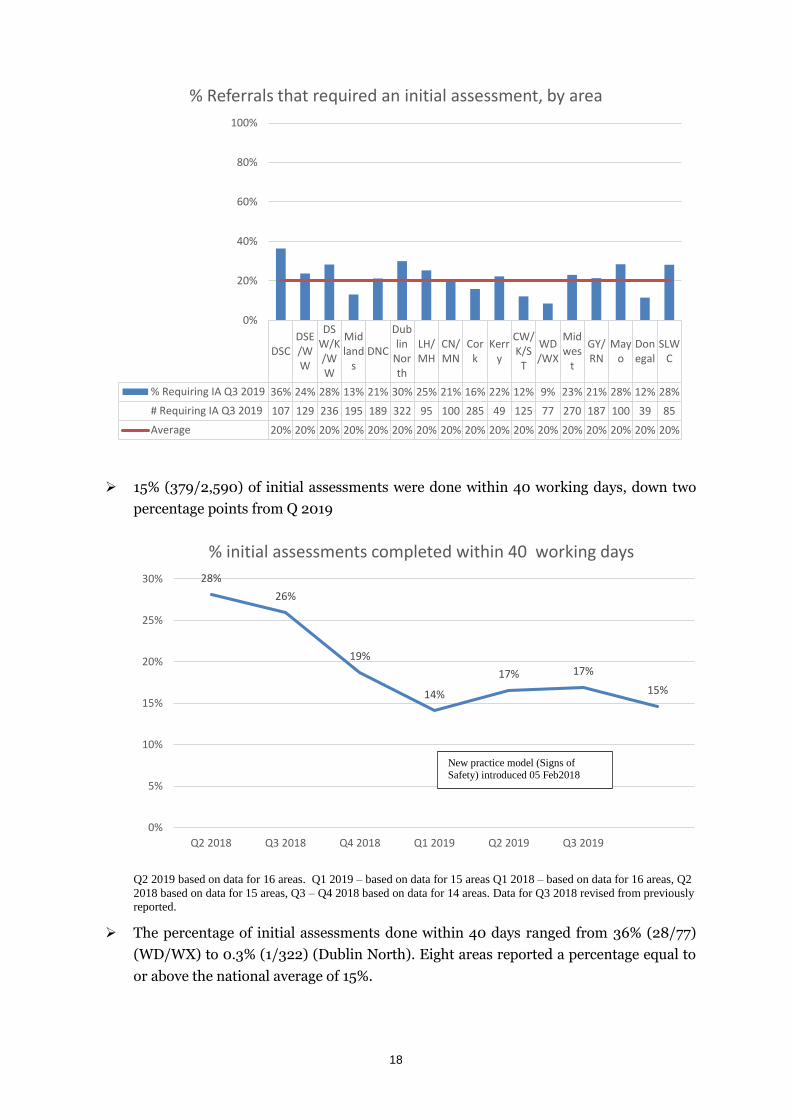
15% (379/2,590) of initial assessments were done within 40 working days, down two
percentage points from Q 2019
Q2 2019 based on data for 16 areas. Q1 2019 – based on data for 15 areas Q1 2018 – based on data for 16 areas, Q2
2018 based on data for 15 areas, Q3 – Q4 2018 based on data for 14 areas. Data for Q3 2018 revised from previously reported.
The percentage of initial assessments done within 40 days ranged from 36% (28/77)
(WD/WX) to 0.3% (1/322) (Dublin North). Eight areas reported a percentage equal to
or above the national average of 15%.
DSCDSE/WW
DSW/K/WW
Midland
sDNC
Dublin
North
LH/MH
CN/MN
Cork
Kerry
CW/K/ST
WD/WX
Midwes
t
GY/RN
Mayo
Donegal
SLWC
% Requiring IA Q3 2019 36% 24% 28% 13% 21% 30% 25% 21% 16% 22% 12% 9% 23% 21% 28% 12% 28%
# Requiring IA Q3 2019 107 129 236 195 189 322 95 100 285 49 125 77 270 187 100 39 85
Average 20% 20% 20% 20% 20% 20% 20% 20% 20% 20% 20% 20% 20% 20% 20% 20% 20%
0%
20%
40%
60%
80%
100%
% Referrals that required an initial assessment, by area
28%
26%
19%
14%
17% 17%
15%
0%
5%
10%
15%
20%
25%
30%
Q2 2018 Q3 2018 Q4 2018 Q1 2019 Q2 2019 Q3 2019
% initial assessments completed within 40 working days
New practice model (Signs of Safety) introduced 05 Feb2018
19
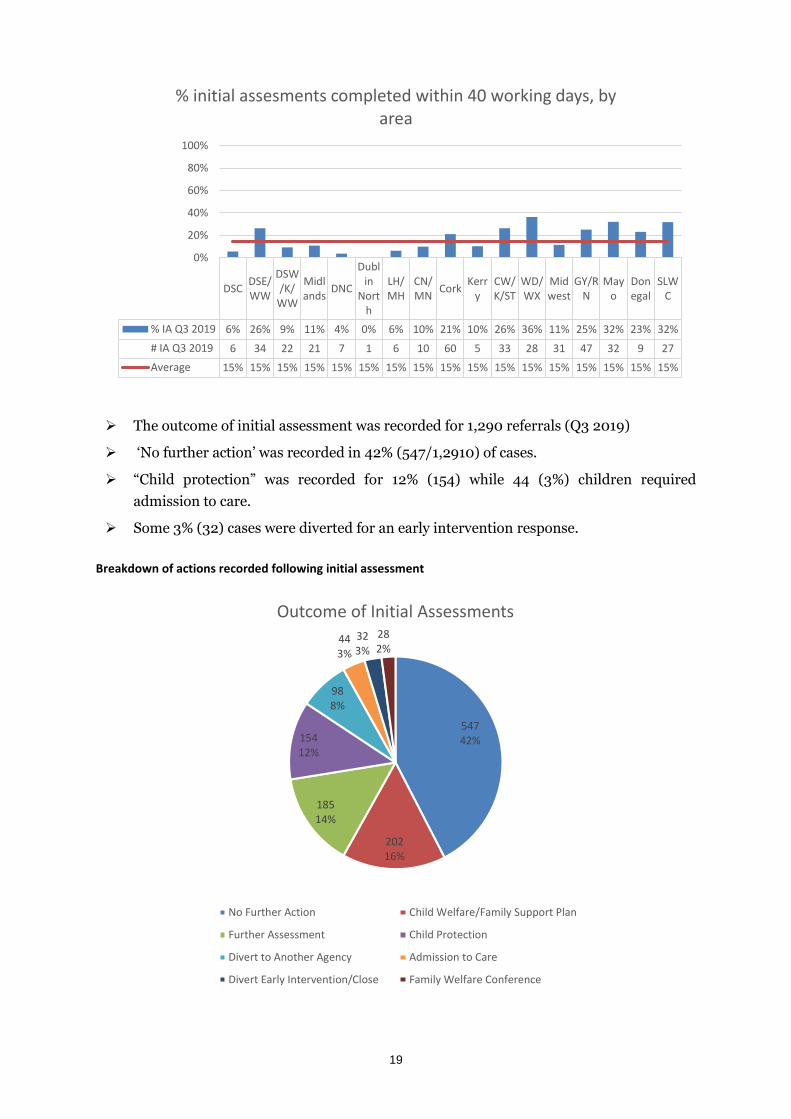
The outcome of initial assessment was recorded for 1,290 referrals (Q3 2019)
‘No further action’ was recorded in 42% (547/1,2910) of cases.
“Child protection” was recorded for 12% (154) while 44 (3%) children required
admission to care.
Some 3% (32) cases were diverted for an early intervention response.
Breakdown of actions recorded following initial assessment
DSCDSE/WW
DSW/K/
WW
Midlands
DNC
Dublin
North
LH/MH
CN/MN
CorkKerr
yCW/K/ST
WD/WX
Midwest
GY/RN
Mayo
Donegal
SLWC
% IA Q3 2019 6% 26% 9% 11% 4% 0% 6% 10% 21% 10% 26% 36% 11% 25% 32% 23% 32%
# IA Q3 2019 6 34 22 21 7 1 6 10 60 5 33 28 31 47 32 9 27
Average 15% 15% 15% 15% 15% 15% 15% 15% 15% 15% 15% 15% 15% 15% 15% 15% 15%
0%
20%
40%
60%
80%
100%
% initial assesments completed within 40 working days, by area
54742%
20216%
18514%
15412%
988%
443%
323%
282%
Outcome of Initial Assessments
No Further Action Child Welfare/Family Support Plan
Further Assessment Child Protection
Divert to Another Agency Admission to Care
Divert Early Intervention/Close Family Welfare Conference
20
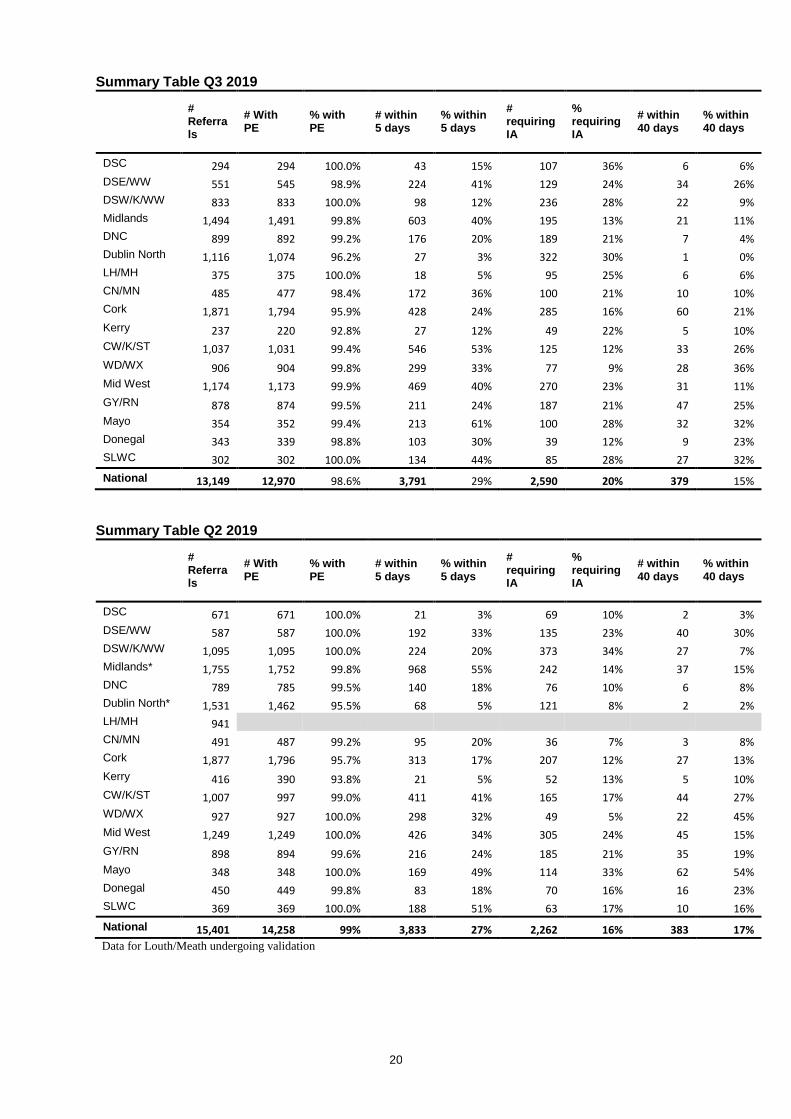
Summary Table Q3 2019
# Referrals
# With PE
% with PE
# within 5 days
% within 5 days
# requiring IA
% requiring IA
# within 40 days
% within 40 days
DSC 294 294 100.0% 43 15% 107 36% 6 6%
DSE/WW 551 545 98.9% 224 41% 129 24% 34 26%
DSW/K/WW 833 833 100.0% 98 12% 236 28% 22 9%
Midlands 1,494 1,491 99.8% 603 40% 195 13% 21 11%
DNC 899 892 99.2% 176 20% 189 21% 7 4%
Dublin North 1,116 1,074 96.2% 27 3% 322 30% 1 0%
LH/MH 375 375 100.0% 18 5% 95 25% 6 6%
CN/MN 485 477 98.4% 172 36% 100 21% 10 10%
Cork 1,871 1,794 95.9% 428 24% 285 16% 60 21%
Kerry 237 220 92.8% 27 12% 49 22% 5 10%
CW/K/ST 1,037 1,031 99.4% 546 53% 125 12% 33 26%
WD/WX 906 904 99.8% 299 33% 77 9% 28 36%
Mid West 1,174 1,173 99.9% 469 40% 270 23% 31 11%
GY/RN 878 874 99.5% 211 24% 187 21% 47 25%
Mayo 354 352 99.4% 213 61% 100 28% 32 32%
Donegal 343 339 98.8% 103 30% 39 12% 9 23%
SLWC 302 302 100.0% 134 44% 85 28% 27 32%
National 13,149 12,970 98.6% 3,791 29% 2,590 20% 379 15%
Summary Table Q2 2019
# Referrals
# With PE
% with PE
# within 5 days
% within 5 days
# requiring IA
% requiring IA
# within 40 days
% within 40 days
DSC 671 671 100.0% 21 3% 69 10% 2 3%
DSE/WW 587 587 100.0% 192 33% 135 23% 40 30%
DSW/K/WW 1,095 1,095 100.0% 224 20% 373 34% 27 7%
Midlands* 1,755 1,752 99.8% 968 55% 242 14% 37 15%
DNC 789 785 99.5% 140 18% 76 10% 6 8%
Dublin North* 1,531 1,462 95.5% 68 5% 121 8% 2 2%
LH/MH 941
CN/MN 491 487 99.2% 95 20% 36 7% 3 8%
Cork 1,877 1,796 95.7% 313 17% 207 12% 27 13%
Kerry 416 390 93.8% 21 5% 52 13% 5 10%
CW/K/ST 1,007 997 99.0% 411 41% 165 17% 44 27%
WD/WX 927 927 100.0% 298 32% 49 5% 22 45%
Mid West 1,249 1,249 100.0% 426 34% 305 24% 45 15%
GY/RN 898 894 99.6% 216 24% 185 21% 35 19%
Mayo 348 348 100.0% 169 49% 114 33% 62 54%
Donegal 450 449 99.8% 83 18% 70 16% 16 23%
SLWC 369 369 100.0% 188 51% 63 17% 10 16%
National 15,401 14,258 99% 3,833 27% 2,262 16% 383 17%
Data for Louth/Meath undergoing validation
21
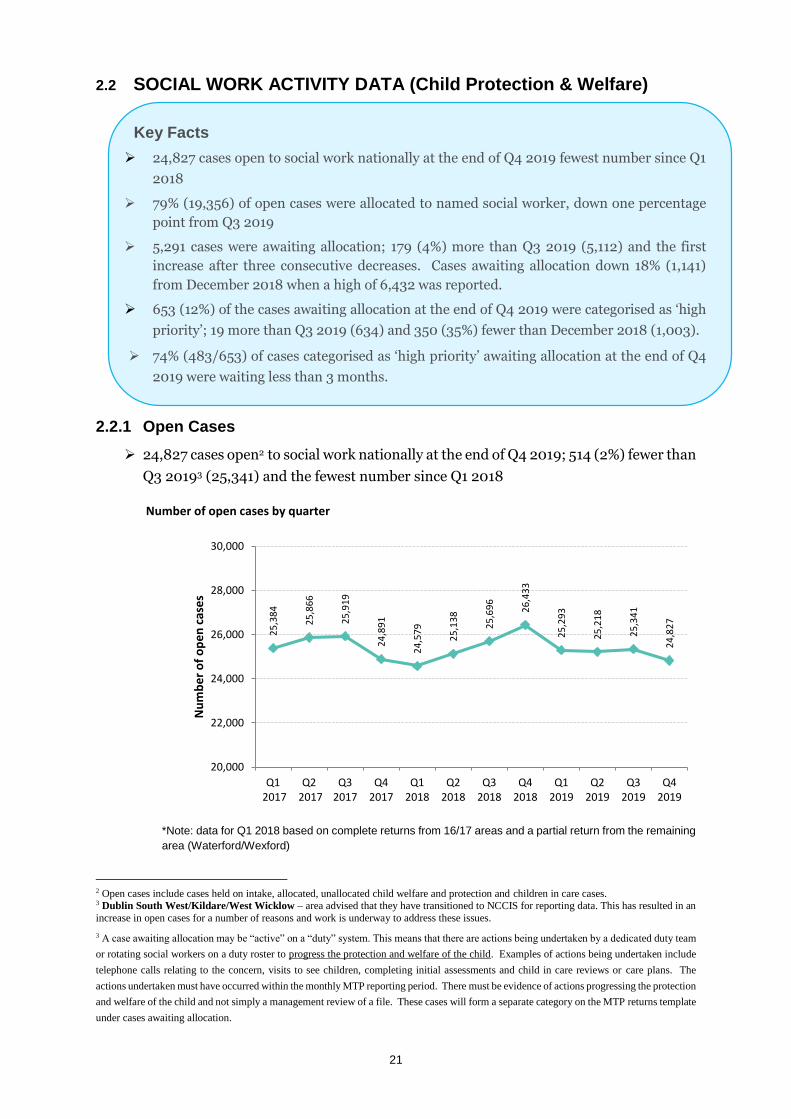
2.2 SOCIAL WORK ACTIVITY DATA (Child Protection & Welfare)
2.2.1 Open Cases
24,827 cases open2 to social work nationally at the end of Q4 2019; 514 (2%) fewer than
Q3 20193 (25,341) and the fewest number since Q1 2018
Number of open cases by quarter
*Note: data for Q1 2018 based on complete returns from 16/17 areas and a partial return from the remaining
area (Waterford/Wexford)
2 Open cases include cases held on intake, allocated, unallocated child welfare and protection and children in care cases. 3 Dublin South West/Kildare/West Wicklow – area advised that they have transitioned to NCCIS for reporting data. This has resulted in an
increase in open cases for a number of reasons and work is underway to address these issues.
3 A case awaiting allocation may be “active” on a “duty” system. This means that there are actions being undertaken by a dedicated duty team
or rotating social workers on a duty roster to progress the protection and welfare of the child. Examples of actions being undertaken include
telephone calls relating to the concern, visits to see children, completing initial assessments and child in care reviews or care plans. The
actions undertaken must have occurred within the monthly MTP reporting period. There must be evidence of actions progressing the protection
and welfare of the child and not simply a management review of a file. These cases will form a separate category on the MTP returns template
under cases awaiting allocation.
25
,38
4
25
,86
6
25
,91
9
24
,89
1
24
,57
9
25
,13
8
25
,69
6
26
,43
3
25
,29
3
25
,21
8
25
,34
1
24
,82
7
20,000
22,000
24,000
26,000
28,000
30,000
Q1 2017
Q2 2017
Q32017
Q42017
Q12018
Q22018
Q32018
Q42018
Q12019
Q22019
Q32019
Q42019
Nu
mb
er
of
op
en
cas
es
Key Facts
24,827 cases open to social work nationally at the end of Q4 2019 fewest number since Q1
2018
79% (19,356) of open cases were allocated to named social worker, down one percentage
point from Q3 2019
5,291 cases were awaiting allocation; 179 (4%) more than Q3 2019 (5,112) and the first
increase after three consecutive decreases. Cases awaiting allocation down 18% (1,141)
from December 2018 when a high of 6,432 was reported.
653 (12%) of the cases awaiting allocation at the end of Q4 2019 were categorised as ‘high
priority’; 19 more than Q3 2019 (634) and 350 (35%) fewer than December 2018 (1,003).
74% (483/653) of cases categorised as ‘high priority’ awaiting allocation at the end of Q4
2019 were waiting less than 3 months.
22
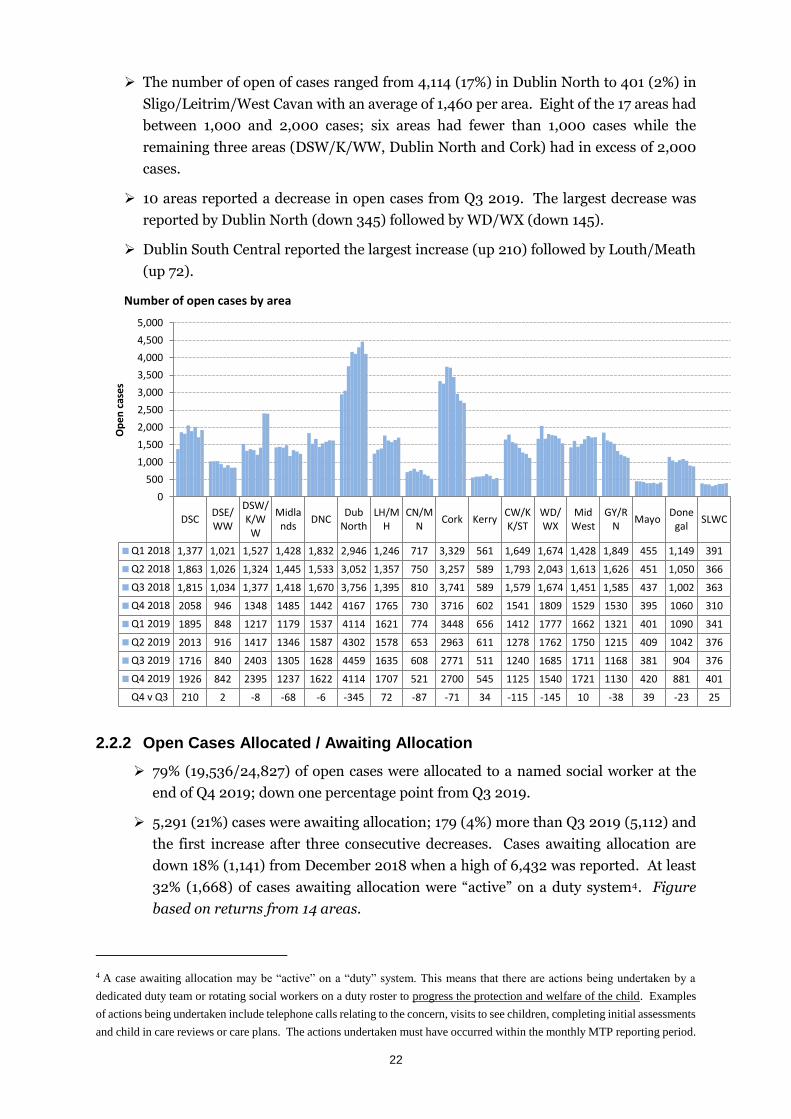
The number of open of cases ranged from 4,114 (17%) in Dublin North to 401 (2%) in
Sligo/Leitrim/West Cavan with an average of 1,460 per area. Eight of the 17 areas had
between 1,000 and 2,000 cases; six areas had fewer than 1,000 cases while the
remaining three areas (DSW/K/WW, Dublin North and Cork) had in excess of 2,000
cases.
10 areas reported a decrease in open cases from Q3 2019. The largest decrease was
reported by Dublin North (down 345) followed by WD/WX (down 145).
Dublin South Central reported the largest increase (up 210) followed by Louth/Meath
(up 72).
Number of open cases by area
2.2.2 Open Cases Allocated / Awaiting Allocation
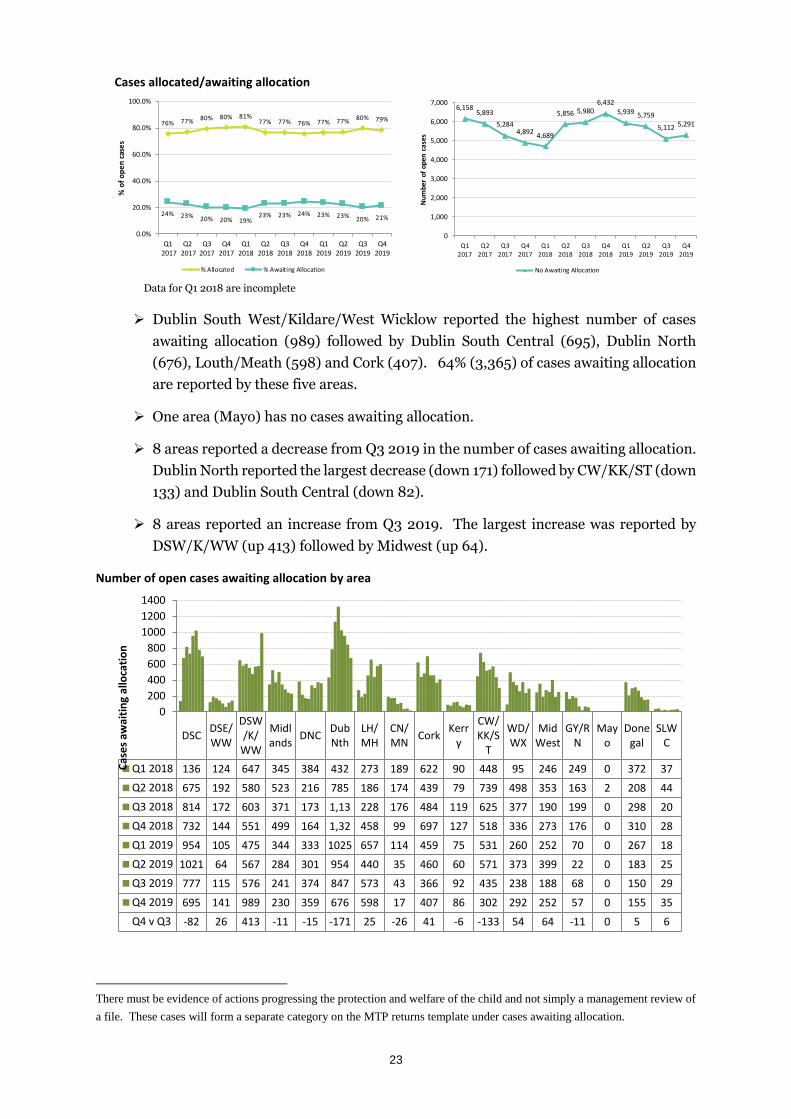
79% (19,536/24,827) of open cases were allocated to a named social worker at the
end of Q4 2019; down one percentage point from Q3 2019.
5,291 (21%) cases were awaiting allocation; 179 (4%) more than Q3 2019 (5,112) and
the first increase after three consecutive decreases. Cases awaiting allocation are
down 18% (1,141) from December 2018 when a high of 6,432 was reported. At least
32% (1,668) of cases awaiting allocation were “active” on a duty system4. Figure
based on returns from 14 areas.
4 A case awaiting allocation may be “active” on a “duty” system. This means that there are actions being undertaken by a
dedicated duty team or rotating social workers on a duty roster to progress the protection and welfare of the child. Examples
of actions being undertaken include telephone calls relating to the concern, visits to see children, completing initial assessments
and child in care reviews or care plans. The actions undertaken must have occurred within the monthly MTP reporting period.
DSCDSE/WW
DSW/K/W
W
Midlands
DNCDub
NorthLH/M
HCN/M
NCork Kerry
CW/KK/ST
WD/WX
MidWest
GY/RN
MayoDone
galSLWC
Q1 2018 1,377 1,021 1,527 1,428 1,832 2,946 1,246 717 3,329 561 1,649 1,674 1,428 1,849 455 1,149 391
Q2 2018 1,863 1,026 1,324 1,445 1,533 3,052 1,357 750 3,257 589 1,793 2,043 1,613 1,626 451 1,050 366
Q3 2018 1,815 1,034 1,377 1,418 1,670 3,756 1,395 810 3,741 589 1,579 1,674 1,451 1,585 437 1,002 363
Q4 2018 2058 946 1348 1485 1442 4167 1765 730 3716 602 1541 1809 1529 1530 395 1060 310
Q1 2019 1895 848 1217 1179 1537 4114 1621 774 3448 656 1412 1777 1662 1321 401 1090 341
Q2 2019 2013 916 1417 1346 1587 4302 1578 653 2963 611 1278 1762 1750 1215 409 1042 376
Q3 2019 1716 840 2403 1305 1628 4459 1635 608 2771 511 1240 1685 1711 1168 381 904 376
Q4 2019 1926 842 2395 1237 1622 4114 1707 521 2700 545 1125 1540 1721 1130 420 881 401
Q4 v Q3 210 2 -8 -68 -6 -345 72 -87 -71 34 -115 -145 10 -38 39 -23 25
0
500
1,000
1,500
2,000
2,500
3,000
3,500
4,000
4,500
5,000
Op
en
cas
es
23
Cases allocated/awaiting allocation
Data for Q1 2018 are incomplete
Dublin South West/Kildare/West Wicklow reported the highest number of cases
awaiting allocation (989) followed by Dublin South Central (695), Dublin North
(676), Louth/Meath (598) and Cork (407). 64% (3,365) of cases awaiting allocation
are reported by these five areas.
One area (Mayo) has no cases awaiting allocation.
8 areas reported a decrease from Q3 2019 in the number of cases awaiting allocation.
Dublin North reported the largest decrease (down 171) followed by CW/KK/ST (down
133) and Dublin South Central (down 82).
8 areas reported an increase from Q3 2019. The largest increase was reported by
DSW/K/WW (up 413) followed by Midwest (up 64).
Number of open cases awaiting allocation by area
There must be evidence of actions progressing the protection and welfare of the child and not simply a management review of
a file. These cases will form a separate category on the MTP returns template under cases awaiting allocation.
76% 77% 80% 80% 81%77% 77% 76% 77% 77%
80% 79%
24% 23% 20% 20% 19%23% 23% 24% 23% 23%
20% 21%
0.0%
20.0%
40.0%
60.0%
80.0%
100.0%
Q1 2017
Q2 2017
Q32017
Q42017
Q12018
Q22018
Q32018
Q42018
Q12019
Q22019
Q32019
Q42019
% o
f o
pe
n c
ase
s
% Allocated % Awaiting Allocation
6,1585,893
5,2844,892
4,689
5,856 5,9806,432
5,939 5,759
5,112 5,291
0
1,000
2,000
3,000
4,000
5,000
6,000
7,000
Q1
2017
Q2
2017
Q3
2017
Q4
2017
Q1
2018
Q2
2018
Q3
2018
Q4
2018
Q1
2019
Q2
2019
Q3
2019
Q4
2019
Nu
mb
er
of
op
en
ca
ses
No Awaiting Allocation
DSCDSE/WW
DSW/K/
WW
Midlands
DNCDubNth
LH/MH
CN/MN
CorkKerr
y
CW/KK/S
T
WD/WX
MidWest
GY/RN
Mayo
Donegal
SLWC
Q1 2018 136 124 647 345 384 432 273 189 622 90 448 95 246 249 0 372 37
Q2 2018 675 192 580 523 216 785 186 174 439 79 739 498 353 163 2 208 44
Q3 2018 814 172 603 371 173 1,13 228 176 484 119 625 377 190 199 0 298 20
Q4 2018 732 144 551 499 164 1,32 458 99 697 127 518 336 273 176 0 310 28
Q1 2019 954 105 475 344 333 1025 657 114 459 75 531 260 252 70 0 267 18
Q2 2019 1021 64 567 284 301 954 440 35 460 60 571 373 399 22 0 183 25
Q3 2019 777 115 576 241 374 847 573 43 366 92 435 238 188 68 0 150 29
Q4 2019 695 141 989 230 359 676 598 17 407 86 302 292 252 57 0 155 35
Q4 v Q3 -82 26 413 -11 -15 -171 25 -26 41 -6 -133 54 64 -11 0 5 6
0
200
400
600
800
1000
1200
1400
Cas
es
awai
tin
g al
loca
tio
n
2.2.3 Cases Awaiting Allocation by Priority Level5
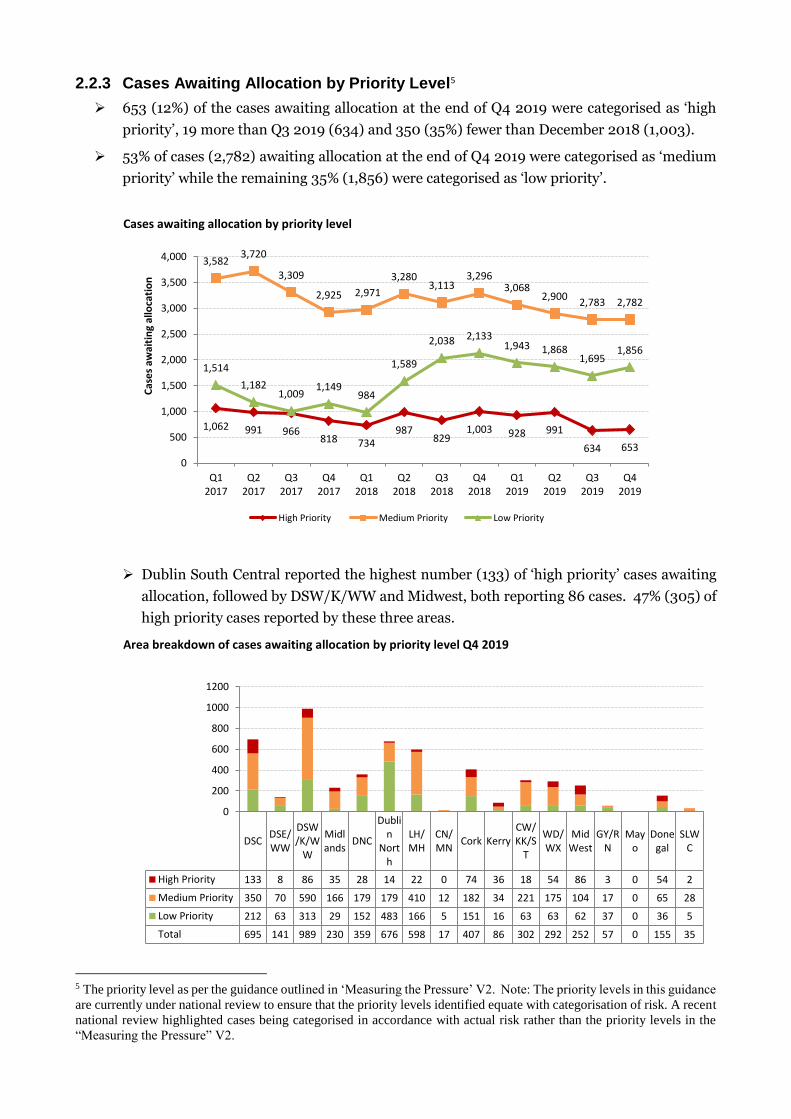
653 (12%) of the cases awaiting allocation at the end of Q4 2019 were categorised as ‘high
priority’, 19 more than Q3 2019 (634) and 350 (35%) fewer than December 2018 (1,003).
53% of cases (2,782) awaiting allocation at the end of Q4 2019 were categorised as ‘medium
priority’ while the remaining 35% (1,856) were categorised as ‘low priority’.
Cases awaiting allocation by priority level
Dublin South Central reported the highest number (133) of ‘high priority’ cases awaiting
allocation, followed by DSW/K/WW and Midwest, both reporting 86 cases. 47% (305) of
high priority cases reported by these three areas.
Area breakdown of cases awaiting allocation by priority level Q4 2019
5 The priority level as per the guidance outlined in ‘Measuring the Pressure’ V2. Note: The priority levels in this guidance
are currently under national review to ensure that the priority levels identified equate with categorisation of risk. A recent
national review highlighted cases being categorised in accordance with actual risk rather than the priority levels in the
“Measuring the Pressure” V2.
1,062 991 966818 734
987829
1,003 928 991
634 653
3,5823,720
3,309
2,925 2,971
3,2803,113
3,2963,068
2,9002,783 2,782
1,514
1,1821,009
1,149984
1,589
2,038 2,1331,943 1,868
1,6951,856
0
500
1,000
1,500
2,000
2,500
3,000
3,500
4,000
Q12017
Q22017
Q32017
Q42017
Q12018
Q22018
Q32018
Q42018
Q12019
Q22019
Q32019
Q42019
Cas
es
awai
tin
g al
loca
tio
n
High Priority Medium Priority Low Priority
DSCDSE/WW
DSW/K/W
W
Midlands
DNC
Dublin
North
LH/MH
CN/MN
Cork KerryCW/KK/S
T
WD/WX
MidWest
GY/RN
Mayo
Donegal
SLWC
High Priority 133 8 86 35 28 14 22 0 74 36 18 54 86 3 0 54 2
Medium Priority 350 70 590 166 179 179 410 12 182 34 221 175 104 17 0 65 28
Low Priority 212 63 313 29 152 483 166 5 151 16 63 63 62 37 0 36 5
Total 695 141 989 230 359 676 598 17 407 86 302 292 252 57 0 155 35
0
200
400
600
800
1000
1200
25
2.2.4 Cases Awaiting Allocation by Waiting Time
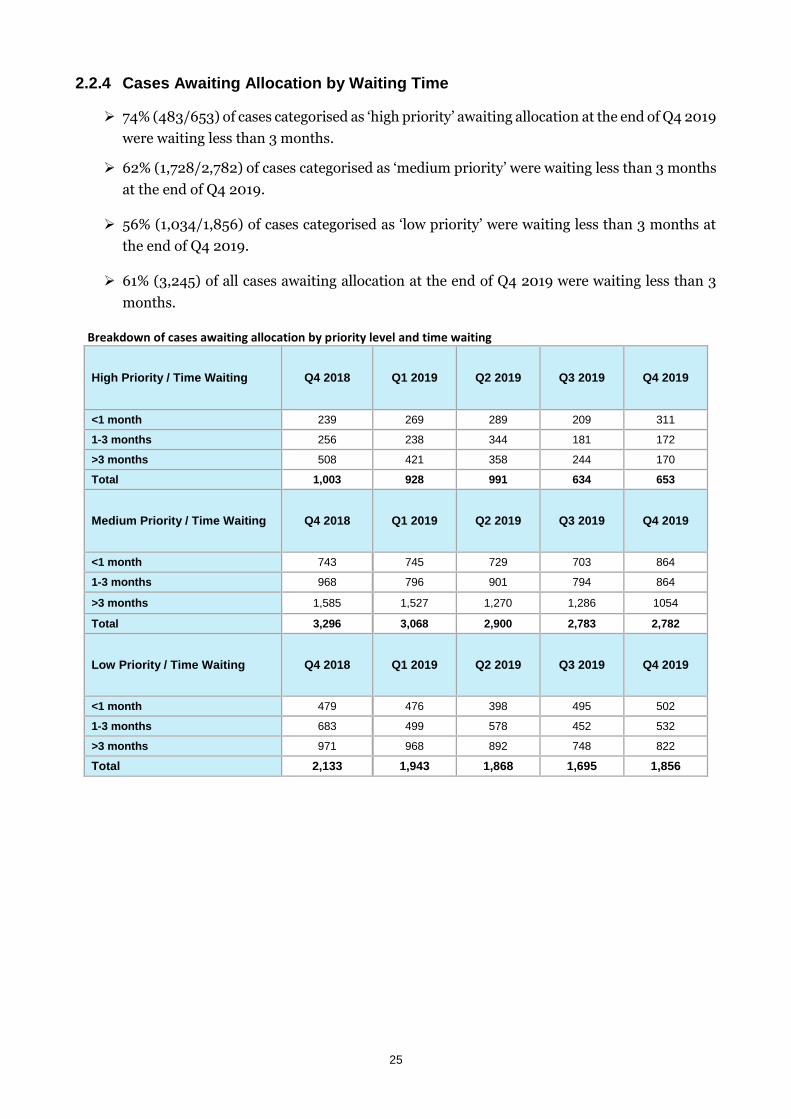
74% (483/653) of cases categorised as ‘high priority’ awaiting allocation at the end of Q4 2019
were waiting less than 3 months.
62% (1,728/2,782) of cases categorised as ‘medium priority’ were waiting less than 3 months
at the end of Q4 2019.
56% (1,034/1,856) of cases categorised as ‘low priority’ were waiting less than 3 months at
the end of Q4 2019.
61% (3,245) of all cases awaiting allocation at the end of Q4 2019 were waiting less than 3
months.
Breakdown of cases awaiting allocation by priority level and time waiting
High Priority / Time Waiting Q4 2018 Q1 2019 Q2 2019 Q3 2019 Q4 2019
<1 month 239 269 289 209 311
1-3 months 256 238 344 181 172
>3 months 508 421 358 244 170
Total 1,003 928 991 634 653
Medium Priority / Time Waiting Q4 2018 Q1 2019 Q2 2019 Q3 2019 Q4 2019
<1 month 743 745 729 703 864
1-3 months 968 796 901 794 864
>3 months 1,585 1,527 1,270 1,286 1054
Total 3,296 3,068 2,900 2,783 2,782
Low Priority / Time Waiting Q4 2018 Q1 2019 Q2 2019 Q3 2019 Q4 2019
<1 month 479 476 398 495 502
1-3 months 683 499 578 452 532
>3 months 971 968 892 748 822
Total 2,133 1,943 1,868 1,695 1,856
26
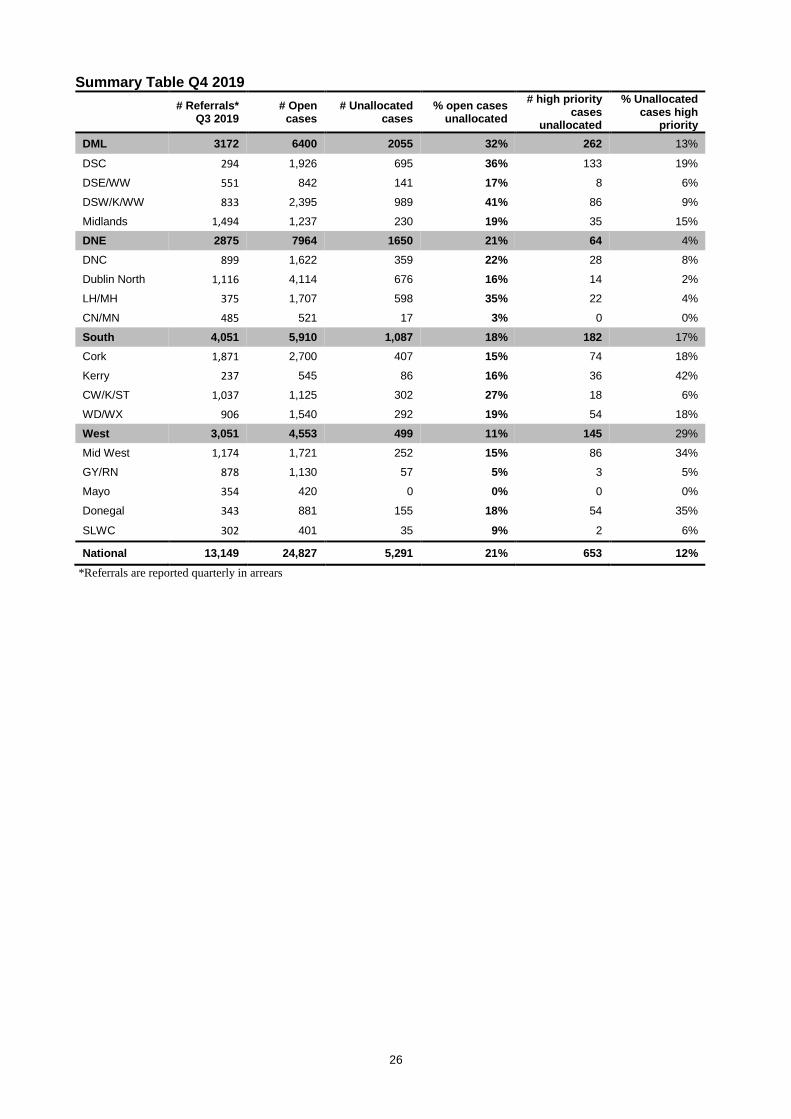
Summary Table Q4 2019
# Referrals*
Q3 2019 # Open
cases # Unallocated
cases % open cases
unallocated
# high priority cases
unallocated
% Unallocated cases high
priority
DML 3172 6400 2055 32% 262 13%
DSC 294 1,926 695 36% 133 19%
DSE/WW 551 842 141 17% 8 6%
DSW/K/WW 833 2,395 989 41% 86 9%
Midlands 1,494 1,237 230 19% 35 15%
DNE 2875 7964 1650 21% 64 4%
DNC 899 1,622 359 22% 28 8%
Dublin North 1,116 4,114 676 16% 14 2%
LH/MH 375 1,707 598 35% 22 4%
CN/MN 485 521 17 3% 0 0%
South 4,051 5,910 1,087 18% 182 17%
Cork 1,871 2,700 407 15% 74 18%
Kerry 237 545 86 16% 36 42%
CW/K/ST 1,037 1,125 302 27% 18 6%
WD/WX 906 1,540 292 19% 54 18%
West 3,051 4,553 499 11% 145 29%
Mid West 1,174 1,721 252 15% 86 34%
GY/RN 878 1,130 57 5% 3 5%
Mayo 354 420 0 0% 0 0%
Donegal 343 881 155 18% 54 35%
SLWC 302 401 35 9% 2 6%
National 13,149 24,827 5,291 21% 653 12%
*Referrals are reported quarterly in arrears
27
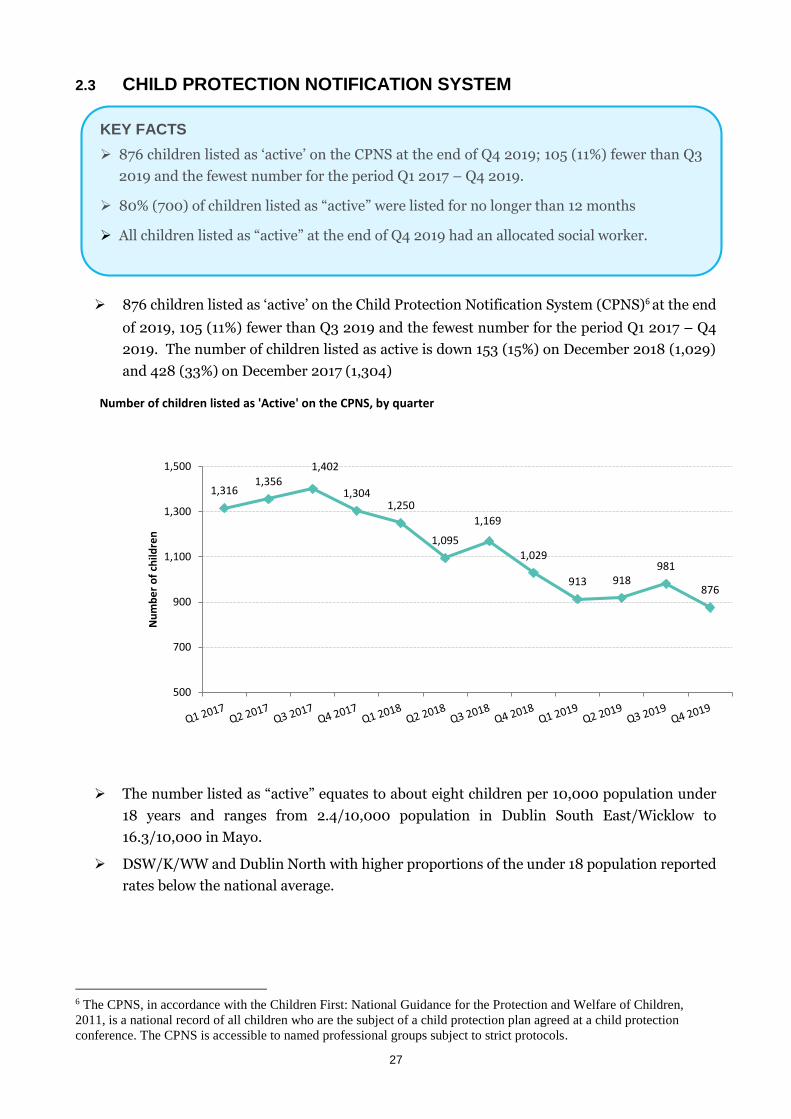
2.3 CHILD PROTECTION NOTIFICATION SYSTEM
876 children listed as ‘active’ on the Child Protection Notification System (CPNS)6 at the end
of 2019, 105 (11%) fewer than Q3 2019 and the fewest number for the period Q1 2017 – Q4
2019. The number of children listed as active is down 153 (15%) on December 2018 (1,029)
and 428 (33%) on December 2017 (1,304)
Number of children listed as 'Active' on the CPNS, by quarter
The number listed as “active” equates to about eight children per 10,000 population under
18 years and ranges from 2.4/10,000 population in Dublin South East/Wicklow to
16.3/10,000 in Mayo.
DSW/K/WW and Dublin North with higher proportions of the under 18 population reported
rates below the national average.
6 The CPNS, in accordance with the Children First: National Guidance for the Protection and Welfare of Children,
2011, is a national record of all children who are the subject of a child protection plan agreed at a child protection
conference. The CPNS is accessible to named professional groups subject to strict protocols.
1,3161,356
1,402
1,3041,250
1,095
1,169
1,029
913 918981
876
500
700
900
1,100
1,300
1,500
Nu
mb
er
of
child
ren
KEY FACTS
876 children listed as ‘active’ on the CPNS at the end of Q4 2019; 105 (11%) fewer than Q3
2019 and the fewest number for the period Q1 2017 – Q4 2019.
80% (700) of children listed as “active” were listed for no longer than 12 months
All children listed as “active” at the end of Q4 2019 had an allocated social worker.
28
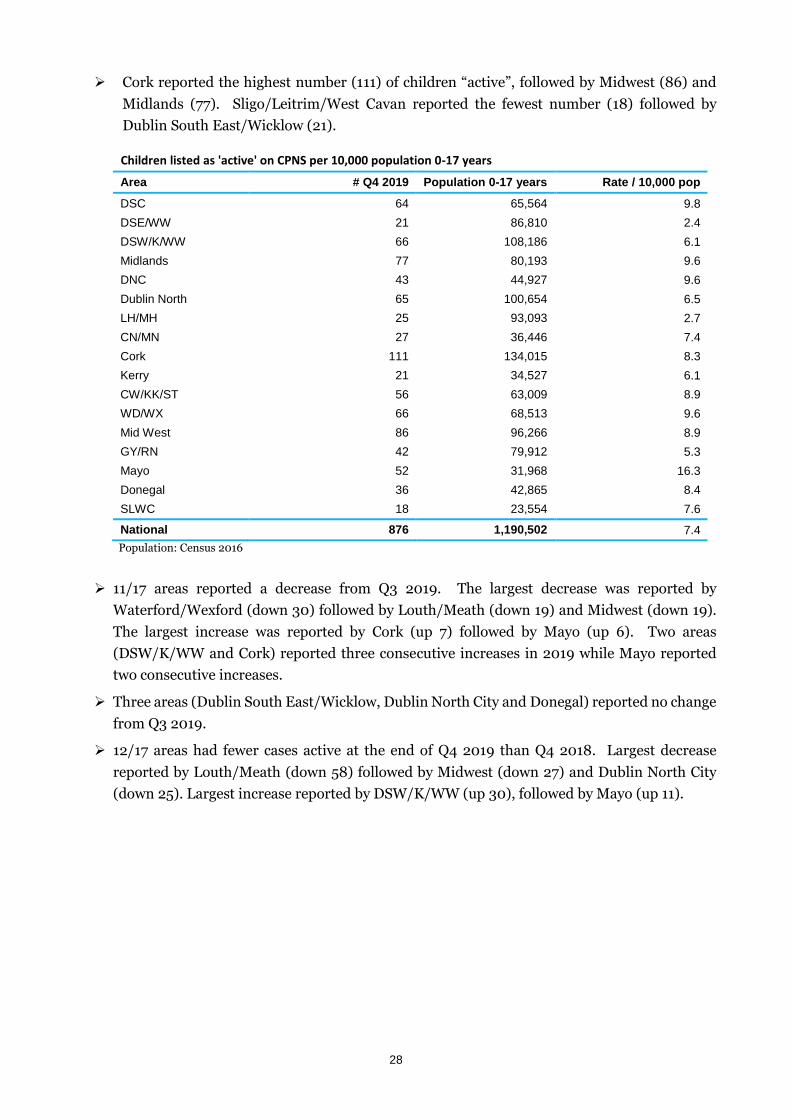
Cork reported the highest number (111) of children “active”, followed by Midwest (86) and
Midlands (77). Sligo/Leitrim/West Cavan reported the fewest number (18) followed by
Dublin South East/Wicklow (21).
Children listed as 'active' on CPNS per 10,000 population 0-17 years
Area # Q4 2019 Population 0-17 years Rate / 10,000 pop
DSC 64 65,564 9.8
DSE/WW 21 86,810 2.4
DSW/K/WW 66 108,186 6.1
Midlands 77 80,193 9.6
DNC 43 44,927 9.6
Dublin North 65 100,654 6.5
LH/MH 25 93,093 2.7
CN/MN 27 36,446 7.4
Cork 111 134,015 8.3
Kerry 21 34,527 6.1
CW/KK/ST 56 63,009 8.9
WD/WX 66 68,513 9.6
Mid West 86 96,266 8.9
GY/RN 42 79,912 5.3
Mayo 52 31,968 16.3
Donegal 36 42,865 8.4
SLWC 18 23,554 7.6
National 876 1,190,502 7.4
Population: Census 2016
11/17 areas reported a decrease from Q3 2019. The largest decrease was reported by
Waterford/Wexford (down 30) followed by Louth/Meath (down 19) and Midwest (down 19).
The largest increase was reported by Cork (up 7) followed by Mayo (up 6). Two areas
(DSW/K/WW and Cork) reported three consecutive increases in 2019 while Mayo reported
two consecutive increases.
Three areas (Dublin South East/Wicklow, Dublin North City and Donegal) reported no change
from Q3 2019.
12/17 areas had fewer cases active at the end of Q4 2019 than Q4 2018. Largest decrease
reported by Louth/Meath (down 58) followed by Midwest (down 27) and Dublin North City
(down 25). Largest increase reported by DSW/K/WW (up 30), followed by Mayo (up 11).
29
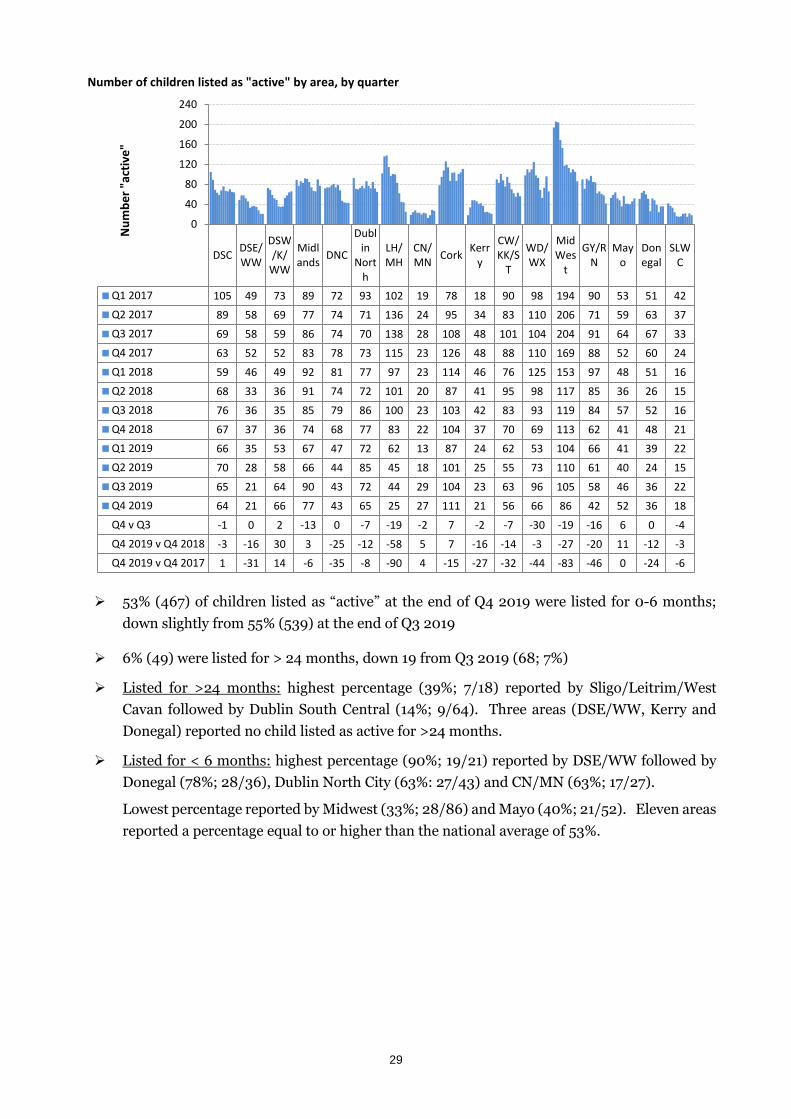
Number of children listed as "active" by area, by quarter
53% (467) of children listed as “active” at the end of Q4 2019 were listed for 0-6 months;
down slightly from 55% (539) at the end of Q3 2019
6% (49) were listed for > 24 months, down 19 from Q3 2019 (68; 7%)
Listed for >24 months: highest percentage (39%; 7/18) reported by Sligo/Leitrim/West
Cavan followed by Dublin South Central (14%; 9/64). Three areas (DSE/WW, Kerry and
Donegal) reported no child listed as active for >24 months.
Listed for < 6 months: highest percentage (90%; 19/21) reported by DSE/WW followed by
Donegal (78%; 28/36), Dublin North City (63%: 27/43) and CN/MN (63%; 17/27).
Lowest percentage reported by Midwest (33%; 28/86) and Mayo (40%; 21/52). Eleven areas
reported a percentage equal to or higher than the national average of 53%.
DSCDSE/WW
DSW/K/
WW
Midlands
DNC
Dublin
North
LH/MH
CN/MN
CorkKerr
y
CW/KK/S
T
WD/WX
MidWes
t
GY/RN
Mayo
Donegal
SLWC
Q1 2017 105 49 73 89 72 93 102 19 78 18 90 98 194 90 53 51 42
Q2 2017 89 58 69 77 74 71 136 24 95 34 83 110 206 71 59 63 37
Q3 2017 69 58 59 86 74 70 138 28 108 48 101 104 204 91 64 67 33
Q4 2017 63 52 52 83 78 73 115 23 126 48 88 110 169 88 52 60 24
Q1 2018 59 46 49 92 81 77 97 23 114 46 76 125 153 97 48 51 16
Q2 2018 68 33 36 91 74 72 101 20 87 41 95 98 117 85 36 26 15
Q3 2018 76 36 35 85 79 86 100 23 103 42 83 93 119 84 57 52 16
Q4 2018 67 37 36 74 68 77 83 22 104 37 70 69 113 62 41 48 21
Q1 2019 66 35 53 67 47 72 62 13 87 24 62 53 104 66 41 39 22
Q2 2019 70 28 58 66 44 85 45 18 101 25 55 73 110 61 40 24 15
Q3 2019 65 21 64 90 43 72 44 29 104 23 63 96 105 58 46 36 22
Q4 2019 64 21 66 77 43 65 25 27 111 21 56 66 86 42 52 36 18
Q4 v Q3 -1 0 2 -13 0 -7 -19 -2 7 -2 -7 -30 -19 -16 6 0 -4
Q4 2019 v Q4 2018 -3 -16 30 3 -25 -12 -58 5 7 -16 -14 -3 -27 -20 11 -12 -3
Q4 2019 v Q4 2017 1 -31 14 -6 -35 -8 -90 4 -15 -27 -32 -44 -83 -46 0 -24 -6
0
40
80
120
160
200
240
Nu
mb
er
"act
ive
"
30
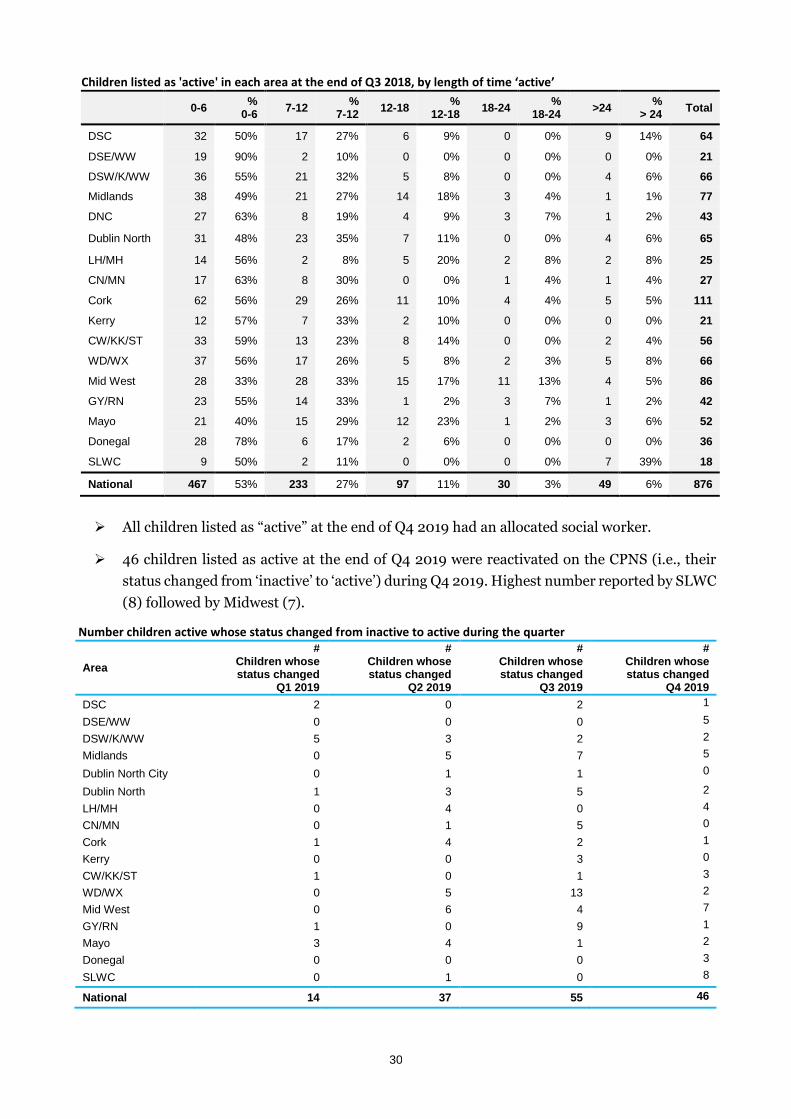
Children listed as 'active' in each area at the end of Q3 2018, by length of time ‘active’
0-6 %
0-6 7-12
% 7-12
12-18 %
12-18 18-24
% 18-24
>24 %
> 24 Total
DSC 32 50% 17 27% 6 9% 0 0% 9 14% 64
DSE/WW 19 90% 2 10% 0 0% 0 0% 0 0% 21
DSW/K/WW 36 55% 21 32% 5 8% 0 0% 4 6% 66
Midlands 38 49% 21 27% 14 18% 3 4% 1 1% 77
DNC 27 63% 8 19% 4 9% 3 7% 1 2% 43
Dublin North 31 48% 23 35% 7 11% 0 0% 4 6% 65
LH/MH 14 56% 2 8% 5 20% 2 8% 2 8% 25
CN/MN 17 63% 8 30% 0 0% 1 4% 1 4% 27
Cork 62 56% 29 26% 11 10% 4 4% 5 5% 111
Kerry 12 57% 7 33% 2 10% 0 0% 0 0% 21
CW/KK/ST 33 59% 13 23% 8 14% 0 0% 2 4% 56
WD/WX 37 56% 17 26% 5 8% 2 3% 5 8% 66
Mid West 28 33% 28 33% 15 17% 11 13% 4 5% 86
GY/RN 23 55% 14 33% 1 2% 3 7% 1 2% 42
Mayo 21 40% 15 29% 12 23% 1 2% 3 6% 52
Donegal 28 78% 6 17% 2 6% 0 0% 0 0% 36
SLWC 9 50% 2 11% 0 0% 0 0% 7 39% 18
National 467 53% 233 27% 97 11% 30 3% 49 6% 876
All children listed as “active” at the end of Q4 2019 had an allocated social worker.
46 children listed as active at the end of Q4 2019 were reactivated on the CPNS (i.e., their
status changed from ‘inactive’ to ‘active’) during Q4 2019. Highest number reported by SLWC
(8) followed by Midwest (7).
Number children active whose status changed from inactive to active during the quarter
Area
# Children whose status changed
Q1 2019
# Children whose status changed
Q2 2019
# Children whose status changed
Q3 2019
# Children whose status changed
Q4 2019
DSC 2 0 2 1
DSE/WW 0 0 0 5
DSW/K/WW 5 3 2 2
Midlands 0 5 7 5
Dublin North City 0 1 1 0
Dublin North 1 3 5 2
LH/MH 0 4 0 4
CN/MN 0 1 5 0
Cork 1 4 2 1
Kerry 0 0 3 0
CW/KK/ST 1 0 1 3
WD/WX 0 5 13 2
Mid West 0 6 4 7
GY/RN 1 0 9 1
Mayo 3 4 1 2
Donegal 0 0 0 3
SLWC 0 1 0 8
National 14 37 55 46
31
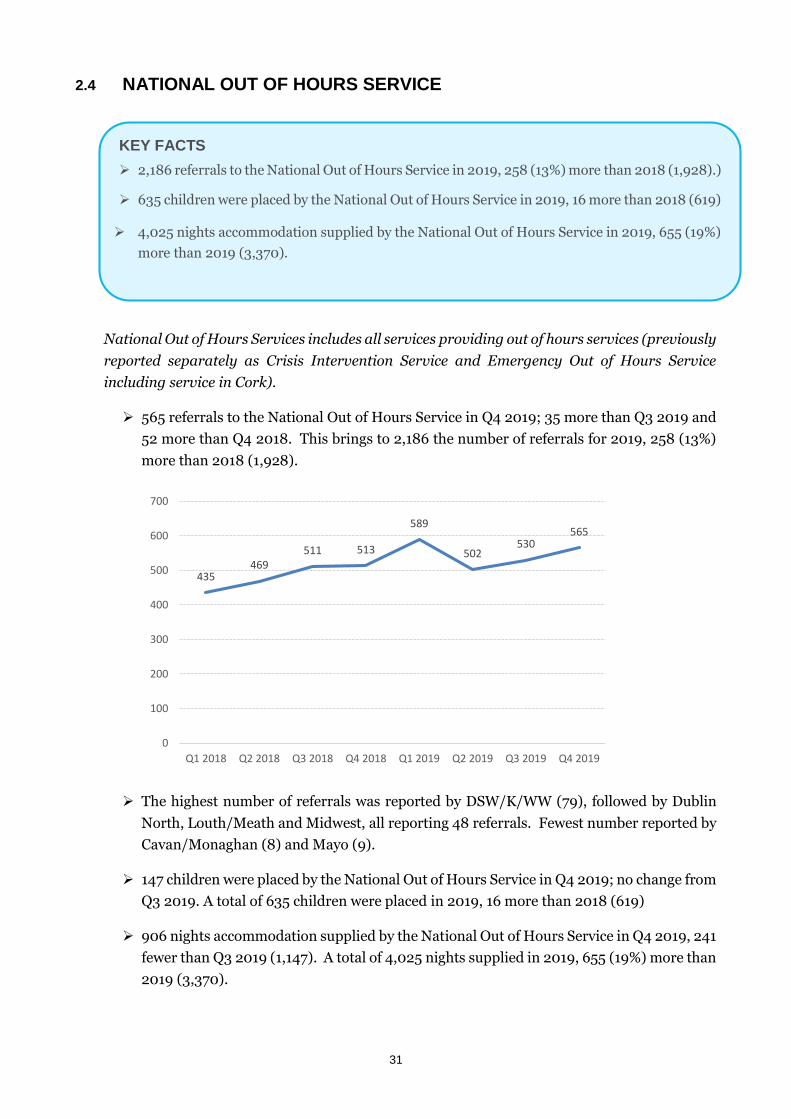
2.4 NATIONAL OUT OF HOURS SERVICE
National Out of Hours Services includes all services providing out of hours services (previously
reported separately as Crisis Intervention Service and Emergency Out of Hours Service
including service in Cork).
565 referrals to the National Out of Hours Service in Q4 2019; 35 more than Q3 2019 and
52 more than Q4 2018. This brings to 2,186 the number of referrals for 2019, 258 (13%)
more than 2018 (1,928).
The highest number of referrals was reported by DSW/K/WW (79), followed by Dublin
North, Louth/Meath and Midwest, all reporting 48 referrals. Fewest number reported by
Cavan/Monaghan (8) and Mayo (9).
147 children were placed by the National Out of Hours Service in Q4 2019; no change from
Q3 2019. A total of 635 children were placed in 2019, 16 more than 2018 (619)
906 nights accommodation supplied by the National Out of Hours Service in Q4 2019, 241
fewer than Q3 2019 (1,147). A total of 4,025 nights supplied in 2019, 655 (19%) more than
2019 (3,370).
435469
511 513
589
502530
565
0
100
200
300
400
500
600
700
Q1 2018 Q2 2018 Q3 2018 Q4 2018 Q1 2019 Q2 2019 Q3 2019 Q4 2019
KEY FACTS
2,186 referrals to the National Out of Hours Service in 2019, 258 (13%) more than 2018 (1,928).)
635 children were placed by the National Out of Hours Service in 2019, 16 more than 2018 (619)
4,025 nights accommodation supplied by the National Out of Hours Service in 2019, 655 (19%)
more than 2019 (3,370).
32
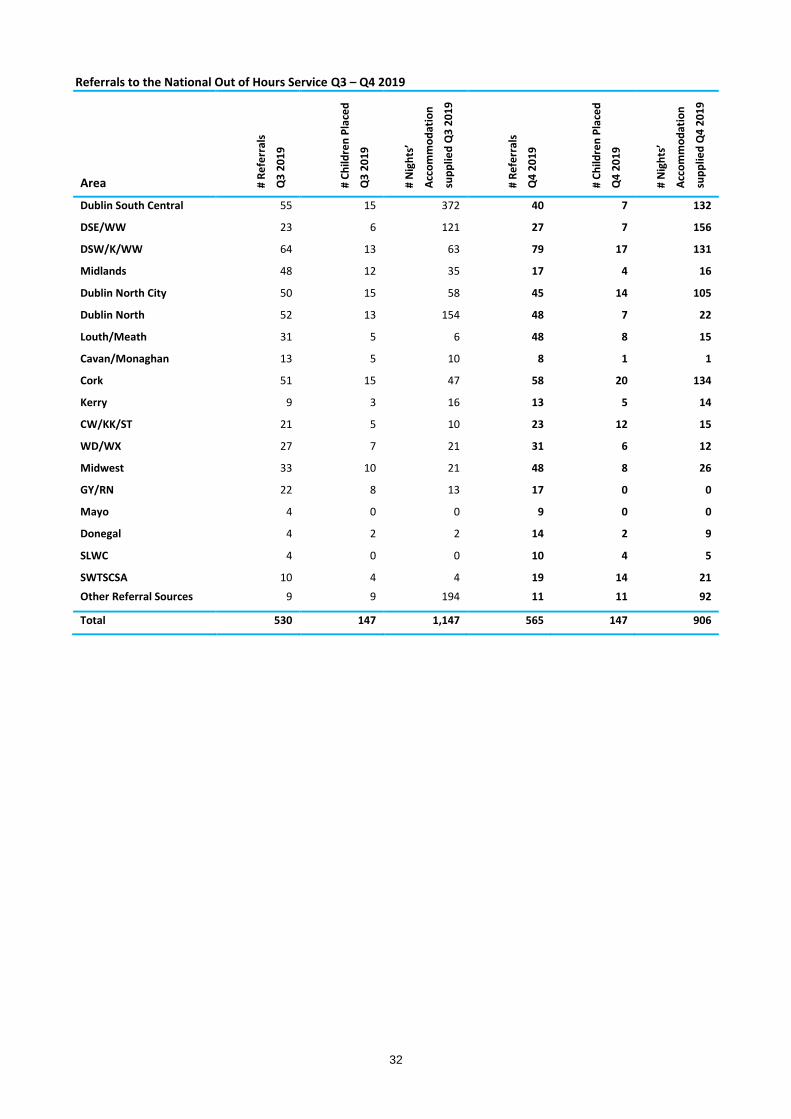
Referrals to the National Out of Hours Service Q3 – Q4 2019
Area # R
efe
rral
s
Q3
20
19
# C
hild
ren
Pla
ced
Q3
20
19
# N
igh
ts’
Acc
om
mo
dat
ion
sup
plie
d Q
3 2
01
9
# R
efe
rral
s
Q4
20
19
# C
hild
ren
Pla
ced
Q4
20
19
# N
igh
ts’
Acc
om
mo
dat
ion
sup
plie
d Q
4 2
01
9
Dublin South Central 55 15 372 40 7 132
DSE/WW 23 6 121 27 7 156
DSW/K/WW 64 13 63 79 17 131
Midlands 48 12 35 17 4 16
Dublin North City 50 15 58 45 14 105
Dublin North 52 13 154 48 7 22
Louth/Meath 31 5 6 48 8 15
Cavan/Monaghan 13 5 10 8 1 1
Cork 51 15 47 58 20 134
Kerry 9 3 16 13 5 14
CW/KK/ST 21 5 10 23 12 15
WD/WX 27 7 21 31 6 12
Midwest 33 10 21 48 8 26
GY/RN 22 8 13 17 0 0
Mayo 4 0 0 9 0 0
Donegal 4 2 2 14 2 9
SLWC 4 0 0 10 4 5
SWTSCSA 10 4 4 19 14 21
Other Referral Sources 9 9 194 11 11 92
Total 530 147 1,147 565 147 906
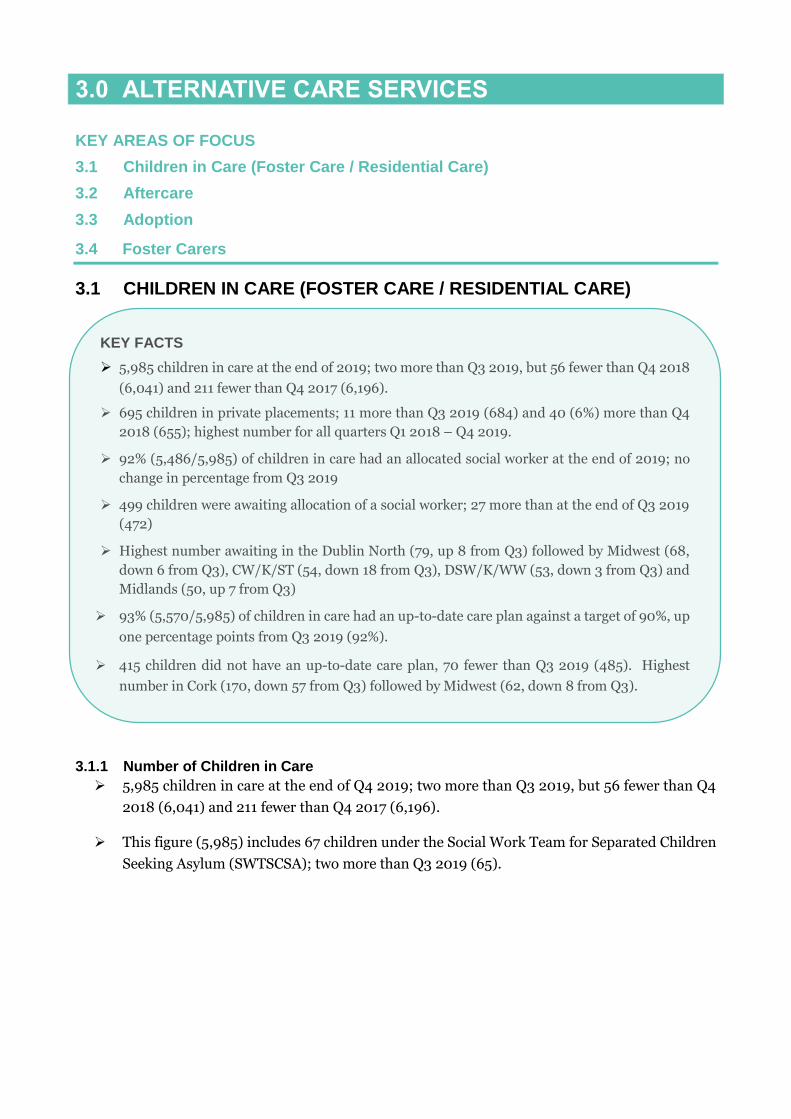
3.0 ALTERNATIVE CARE SERVICES
KEY AREAS OF FOCUS
3.1 Children in Care (Foster Care / Residential Care)
3.2 Aftercare
3.3 Adoption
3.4 Foster Carers
3.1 CHILDREN IN CARE (FOSTER CARE / RESIDENTIAL CARE)
3.1.1 Number of Children in Care
5,985 children in care at the end of Q4 2019; two more than Q3 2019, but 56 fewer than Q4
2018 (6,041) and 211 fewer than Q4 2017 (6,196).
This figure (5,985) includes 67 children under the Social Work Team for Separated Children
Seeking Asylum (SWTSCSA); two more than Q3 2019 (65).
KEY FACTS
5,985 children in care at the end of 2019; two more than Q3 2019, but 56 fewer than Q4 2018
(6,041) and 211 fewer than Q4 2017 (6,196).
695 children in private placements; 11 more than Q3 2019 (684) and 40 (6%) more than Q4
2018 (655); highest number for all quarters Q1 2018 – Q4 2019.
92% (5,486/5,985) of children in care had an allocated social worker at the end of 2019; no
change in percentage from Q3 2019
499 children were awaiting allocation of a social worker; 27 more than at the end of Q3 2019
(472)
Highest number awaiting in the Dublin North (79, up 8 from Q3) followed by Midwest (68,
down 6 from Q3), CW/K/ST (54, down 18 from Q3), DSW/K/WW (53, down 3 from Q3) and
Midlands (50, up 7 from Q3)
93% (5,570/5,985) of children in care had an up-to-date care plan against a target of 90%, up
one percentage points from Q3 2019 (92%).
415 children did not have an up-to-date care plan, 70 fewer than Q3 2019 (485). Highest
number in Cork (170, down 57 from Q3) followed by Midwest (62, down 8 from Q3).
34
Number of children in care by quarter
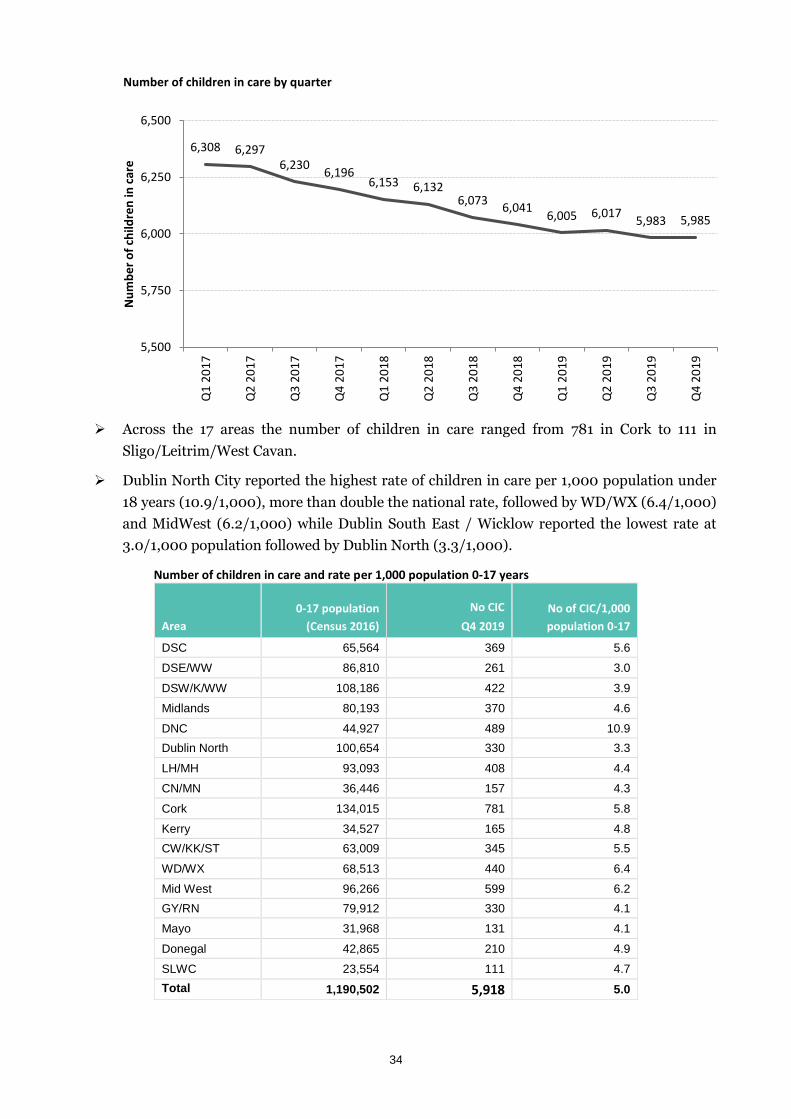
Across the 17 areas the number of children in care ranged from 781 in Cork to 111 in
Sligo/Leitrim/West Cavan.
Dublin North City reported the highest rate of children in care per 1,000 population under
18 years (10.9/1,000), more than double the national rate, followed by WD/WX (6.4/1,000)
and MidWest (6.2/1,000) while Dublin South East / Wicklow reported the lowest rate at
3.0/1,000 population followed by Dublin North (3.3/1,000).
Number of children in care and rate per 1,000 population 0-17 years
Area
0-17 population
(Census 2016)
No CIC
Q4 2019
No of CIC/1,000
population 0-17
DSC 65,564 369 5.6
DSE/WW 86,810 261 3.0
DSW/K/WW 108,186 422 3.9
Midlands 80,193 370 4.6
DNC 44,927 489 10.9
Dublin North 100,654 330 3.3
LH/MH 93,093 408 4.4
CN/MN 36,446 157 4.3
Cork 134,015 781 5.8
Kerry 34,527 165 4.8
CW/KK/ST 63,009 345 5.5
WD/WX 68,513 440 6.4
Mid West 96,266 599 6.2
GY/RN 79,912 330 4.1
Mayo 31,968 131 4.1
Donegal 42,865 210 4.9
SLWC 23,554 111 4.7
Total 1,190,502 5,918 5.0
6,308 6,2976,230
6,1966,153 6,132
6,0736,041
6,005 6,0175,983 5,985
5,500
5,750
6,000
6,250
6,500
Q1
20
17
Q2
20
17
Q3
20
17
Q4
20
17
Q1
20
18
Q2
20
18
Q3
20
18
Q4
20
18
Q1
20
19
Q2
20
19
Q3
20
19
Q4
20
19
Nu
mb
er
of
child
ren
in c
are
35
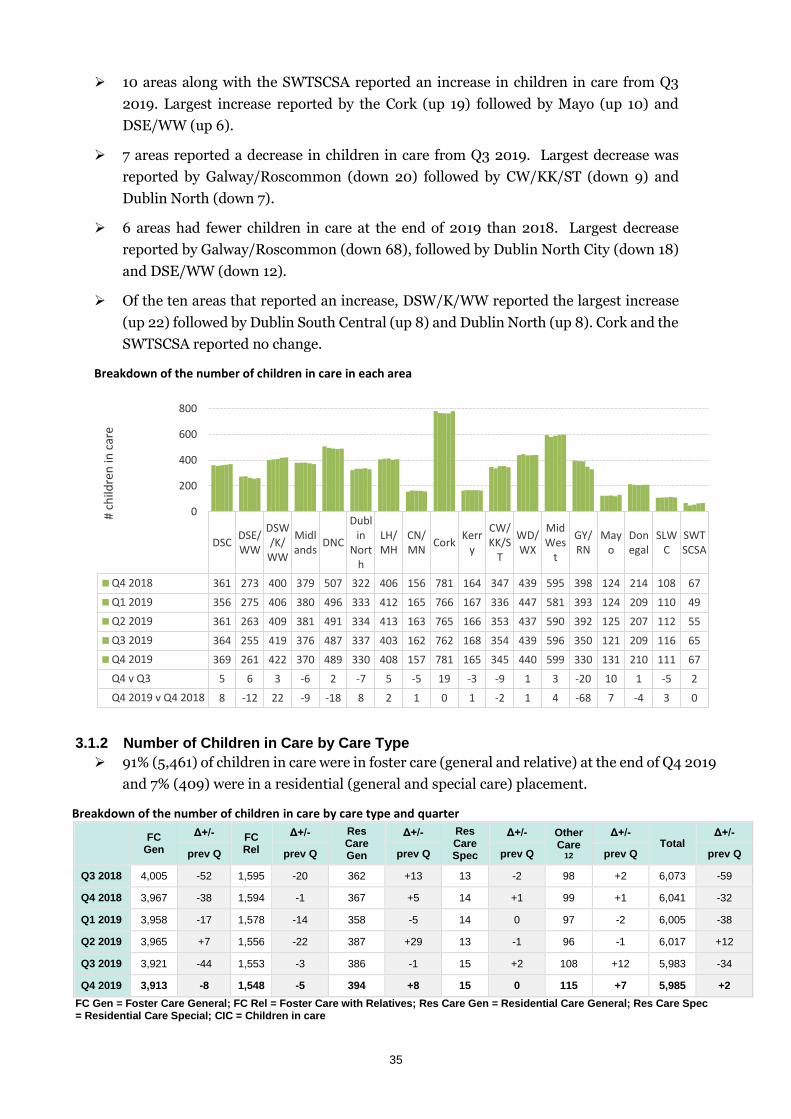
10 areas along with the SWTSCSA reported an increase in children in care from Q3
2019. Largest increase reported by the Cork (up 19) followed by Mayo (up 10) and
DSE/WW (up 6).
7 areas reported a decrease in children in care from Q3 2019. Largest decrease was
reported by Galway/Roscommon (down 20) followed by CW/KK/ST (down 9) and
Dublin North (down 7).
6 areas had fewer children in care at the end of 2019 than 2018. Largest decrease
reported by Galway/Roscommon (down 68), followed by Dublin North City (down 18)
and DSE/WW (down 12).
Of the ten areas that reported an increase, DSW/K/WW reported the largest increase
(up 22) followed by Dublin South Central (up 8) and Dublin North (up 8). Cork and the
SWTSCSA reported no change.
Breakdown of the number of children in care in each area
3.1.2 Number of Children in Care by Care Type
91% (5,461) of children in care were in foster care (general and relative) at the end of Q4 2019
and 7% (409) were in a residential (general and special care) placement.
Breakdown of the number of children in care by care type and quarter
FC
Gen
Δ+/- FC Rel
Δ+/- Res Care Gen
Δ+/- Res Care Spec
Δ+/- Other Care
12
Δ+/- Total
Δ+/-
prev Q prev Q prev Q prev Q prev Q prev Q
Q3 2018 4,005 -52 1,595 -20 362 +13 13 -2 98 +2 6,073 -59
Q4 2018 3,967 -38 1,594 -1 367 +5 14 +1 99 +1 6,041 -32
Q1 2019 3,958 -17 1,578 -14 358 -5 14 0 97 -2 6,005 -38
Q2 2019 3,965 +7 1,556 -22 387 +29 13 -1 96 -1 6,017 +12
Q3 2019 3,921 -44 1,553 -3 386 -1 15 +2 108 +12 5,983 -34
Q4 2019 3,913 -8 1,548 -5 394 +8 15 0 115 +7 5,985 +2
FC Gen = Foster Care General; FC Rel = Foster Care with Relatives; Res Care Gen = Residential Care General; Res Care Spec = Residential Care Special; CIC = Children in care
DSCDSE/WW
DSW/K/
WW
Midlands
DNC
Dublin
North
LH/MH
CN/MN
CorkKerr
y
CW/KK/S
T
WD/WX
MidWes
t
GY/RN
Mayo
Donegal
SLWC
SWTSCSA
Q4 2018 361 273 400 379 507 322 406 156 781 164 347 439 595 398 124 214 108 67
Q1 2019 356 275 406 380 496 333 412 165 766 167 336 447 581 393 124 209 110 49
Q2 2019 361 263 409 381 491 334 413 163 765 166 353 437 590 392 125 207 112 55
Q3 2019 364 255 419 376 487 337 403 162 762 168 354 439 596 350 121 209 116 65
Q4 2019 369 261 422 370 489 330 408 157 781 165 345 440 599 330 131 210 111 67
Q4 v Q3 5 6 3 -6 2 -7 5 -5 19 -3 -9 1 3 -20 10 1 -5 2
Q4 2019 v Q4 2018 8 -12 22 -9 -18 8 2 1 0 1 -2 1 4 -68 7 -4 3 0
0
200
400
600
800
# ch
ildre
n in
car
e
36
20 (0.33%) children were in out of State placements at the end of Q4 2019; three fewer than
Q3 2019. These children are included in the figures for the various care types set out in the
table above.
12 children in residential care were in a single care placement at the end of Q4 2019; six more
than Q3 2019.
82 children were in respite care (from home) at the end of Q4 2019, 79 in respite care (from
home) at the end of Q3 2019.
3.1.3 Children in Private Placements
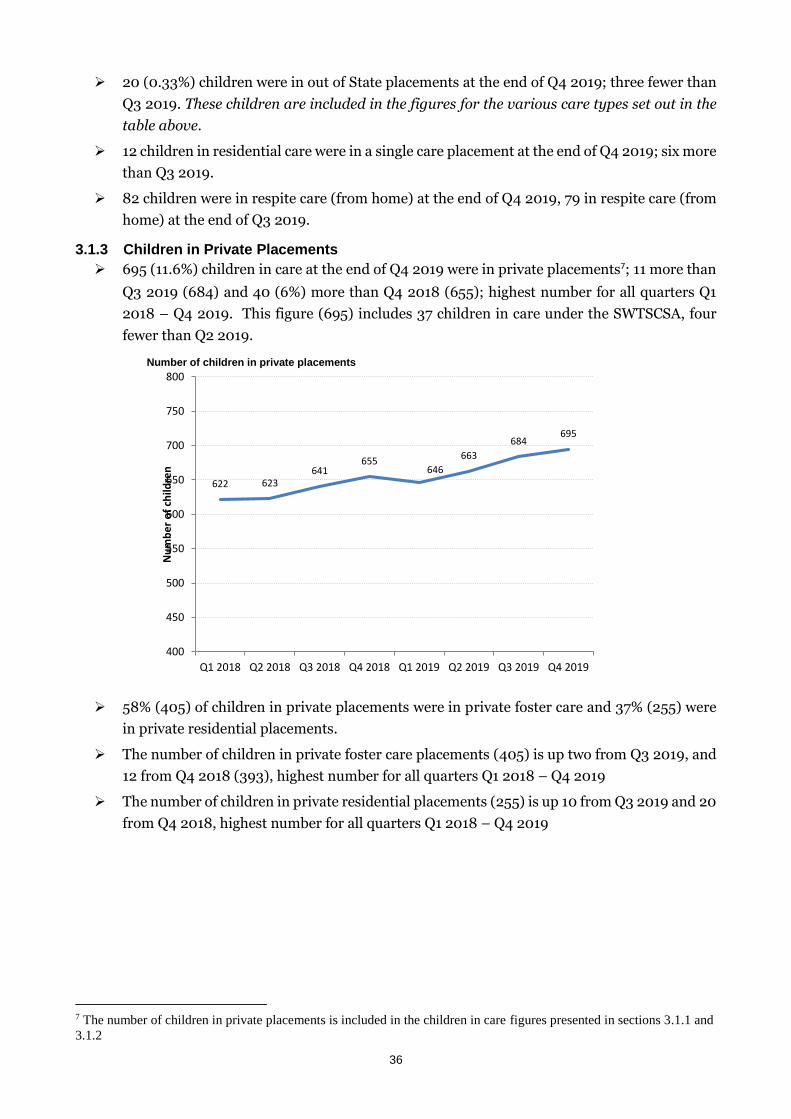
695 (11.6%) children in care at the end of Q4 2019 were in private placements7; 11 more than
Q3 2019 (684) and 40 (6%) more than Q4 2018 (655); highest number for all quarters Q1
2018 – Q4 2019. This figure (695) includes 37 children in care under the SWTSCSA, four
fewer than Q2 2019.
Number of children in private placements
58% (405) of children in private placements were in private foster care and 37% (255) were
in private residential placements.
The number of children in private foster care placements (405) is up two from Q3 2019, and
12 from Q4 2018 (393), highest number for all quarters Q1 2018 – Q4 2019
The number of children in private residential placements (255) is up 10 from Q3 2019 and 20
from Q4 2018, highest number for all quarters Q1 2018 – Q4 2019
7 The number of children in private placements is included in the children in care figures presented in sections 3.1.1 and
3.1.2
622 623641
655646
663
684695
400
450
500
550
600
650
700
750
800
Q1 2018 Q2 2018 Q3 2018 Q4 2018 Q1 2019 Q2 2019 Q3 2019 Q4 2019
Nu
mb
er
of
child
ren
37
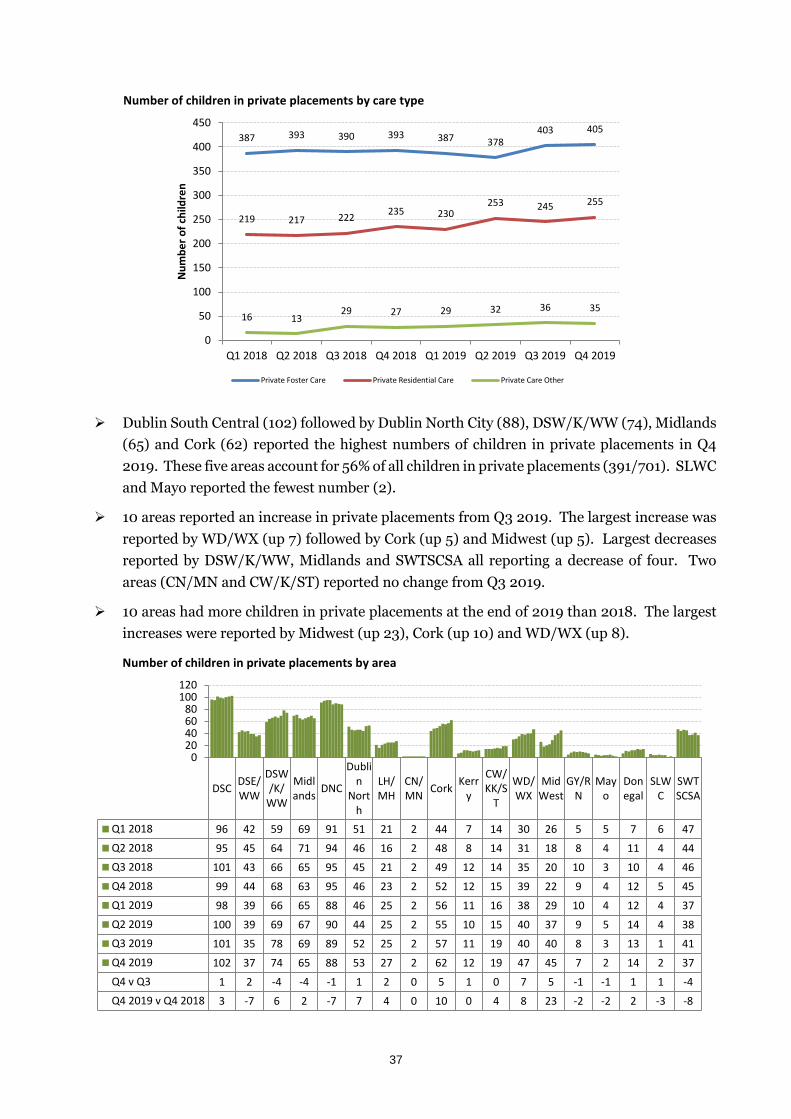
Number of children in private placements by care type
Dublin South Central (102) followed by Dublin North City (88), DSW/K/WW (74), Midlands
(65) and Cork (62) reported the highest numbers of children in private placements in Q4
2019. These five areas account for 56% of all children in private placements (391/701). SLWC
and Mayo reported the fewest number (2).
10 areas reported an increase in private placements from Q3 2019. The largest increase was
reported by WD/WX (up 7) followed by Cork (up 5) and Midwest (up 5). Largest decreases
reported by DSW/K/WW, Midlands and SWTSCSA all reporting a decrease of four. Two
areas (CN/MN and CW/K/ST) reported no change from Q3 2019.
10 areas had more children in private placements at the end of 2019 than 2018. The largest
increases were reported by Midwest (up 23), Cork (up 10) and WD/WX (up 8).
Number of children in private placements by area
387 393 390 393 387 378403 405
219 217 222235 230
253 245 255
16 1329 27 29 32 36 35
0
50
100
150
200
250
300
350
400
450
Q1 2018 Q2 2018 Q3 2018 Q4 2018 Q1 2019 Q2 2019 Q3 2019 Q4 2019
Nu
mb
er
of
child
ren
Private Foster Care Private Residential Care Private Care Other
DSCDSE/WW
DSW/K/
WW
Midlands
DNC
Dublin
North
LH/MH
CN/MN
CorkKerr
y
CW/KK/S
T
WD/WX
MidWest
GY/RN
Mayo
Donegal
SLWC
SWTSCSA
Q1 2018 96 42 59 69 91 51 21 2 44 7 14 30 26 5 5 7 6 47
Q2 2018 95 45 64 71 94 46 16 2 48 8 14 31 18 8 4 11 4 44
Q3 2018 101 43 66 65 95 45 21 2 49 12 14 35 20 10 3 10 4 46
Q4 2018 99 44 68 63 95 46 23 2 52 12 15 39 22 9 4 12 5 45
Q1 2019 98 39 66 65 88 46 25 2 56 11 16 38 29 10 4 12 4 37
Q2 2019 100 39 69 67 90 44 25 2 55 10 15 40 37 9 5 14 4 38
Q3 2019 101 35 78 69 89 52 25 2 57 11 19 40 40 8 3 13 1 41
Q4 2019 102 37 74 65 88 53 27 2 62 12 19 47 45 7 2 14 2 37
Q4 v Q3 1 2 -4 -4 -1 1 2 0 5 1 0 7 5 -1 -1 1 1 -4
Q4 2019 v Q4 2018 3 -7 6 2 -7 7 4 0 10 0 4 8 23 -2 -2 2 -3 -8
020406080
100120
38
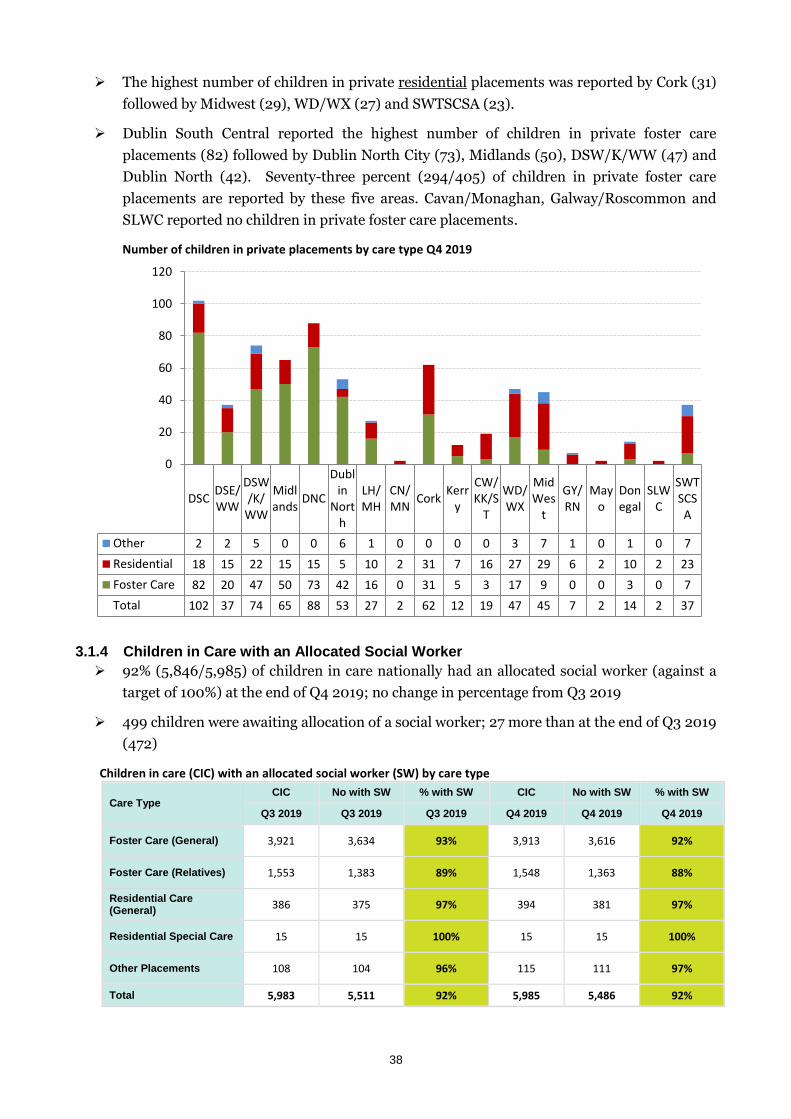
The highest number of children in private residential placements was reported by Cork (31)
followed by Midwest (29), WD/WX (27) and SWTSCSA (23).
Dublin South Central reported the highest number of children in private foster care
placements (82) followed by Dublin North City (73), Midlands (50), DSW/K/WW (47) and
Dublin North (42). Seventy-three percent (294/405) of children in private foster care
placements are reported by these five areas. Cavan/Monaghan, Galway/Roscommon and
SLWC reported no children in private foster care placements.
Number of children in private placements by care type Q4 2019
3.1.4 Children in Care with an Allocated Social Worker
92% (5,846/5,985) of children in care nationally had an allocated social worker (against a
target of 100%) at the end of Q4 2019; no change in percentage from Q3 2019
499 children were awaiting allocation of a social worker; 27 more than at the end of Q3 2019
(472)
Children in care (CIC) with an allocated social worker (SW) by care type
Care Type CIC No with SW % with SW CIC No with SW % with SW
Q3 2019 Q3 2019 Q3 2019 Q4 2019 Q4 2019 Q4 2019
Foster Care (General) 3,921 3,634 93% 3,913 3,616 92%
Foster Care (Relatives) 1,553 1,383 89% 1,548 1,363 88%
Residential Care (General)
386 375 97% 394 381 97%
Residential Special Care 15 15 100% 15 15 100%
Other Placements 108 104 96% 115 111 97%
Total 5,983 5,511 92% 5,985 5,486 92%
DSCDSE/WW
DSW/K/
WW
Midlands
DNC
Dublin
North
LH/MH
CN/MN
CorkKerr
y
CW/KK/S
T
WD/WX
MidWes
t
GY/RN
Mayo
Donegal
SLWC
SWTSCSA
Other 2 2 5 0 0 6 1 0 0 0 0 3 7 1 0 1 0 7
Residential 18 15 22 15 15 5 10 2 31 7 16 27 29 6 2 10 2 23
Foster Care 82 20 47 50 73 42 16 0 31 5 3 17 9 0 0 3 0 7
Total 102 37 74 65 88 53 27 2 62 12 19 47 45 7 2 14 2 37
0
20
40
60
80
100
120
39
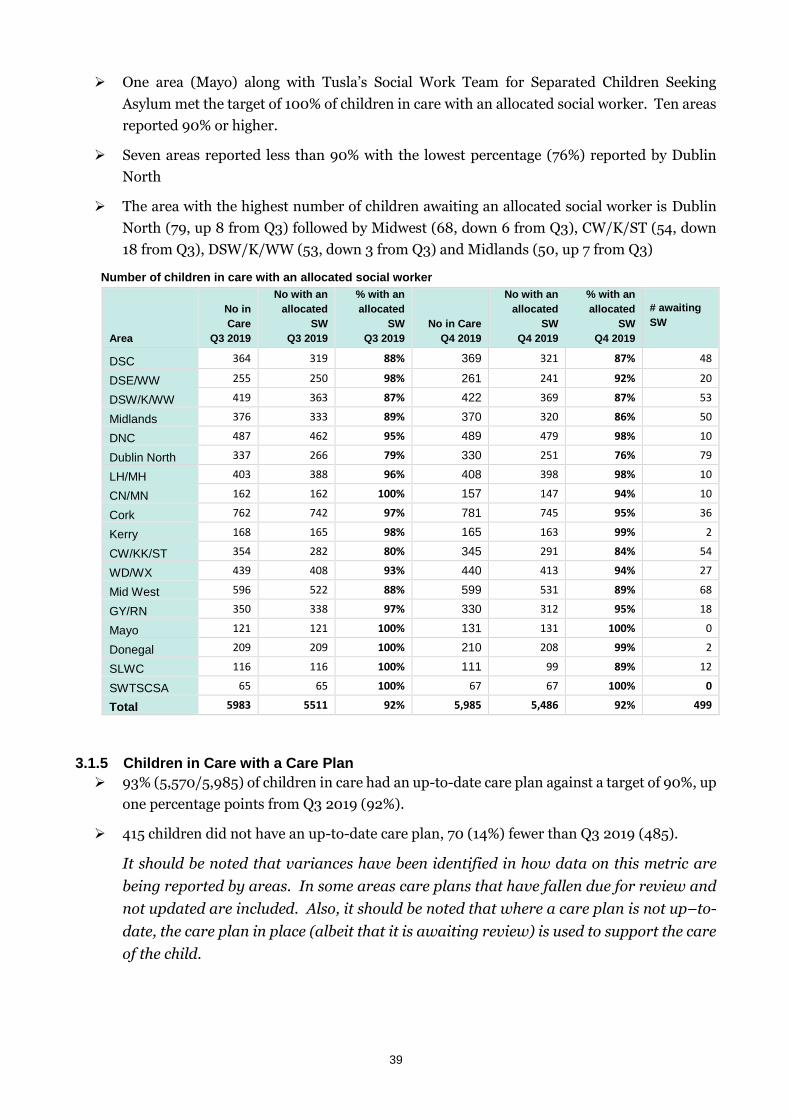
One area (Mayo) along with Tusla’s Social Work Team for Separated Children Seeking
Asylum met the target of 100% of children in care with an allocated social worker. Ten areas
reported 90% or higher.
Seven areas reported less than 90% with the lowest percentage (76%) reported by Dublin
North
The area with the highest number of children awaiting an allocated social worker is Dublin
North (79, up 8 from Q3) followed by Midwest (68, down 6 from Q3), CW/K/ST (54, down
18 from Q3), DSW/K/WW (53, down 3 from Q3) and Midlands (50, up 7 from Q3)
Number of children in care with an allocated social worker
Area
No in
Care
Q3 2019
No with an
allocated
SW
Q3 2019
% with an
allocated
SW
Q3 2019
No in Care
Q4 2019
No with an
allocated
SW
Q4 2019
% with an
allocated
SW
Q4 2019
# awaiting
SW
DSC 364 319 88% 369 321 87% 48
DSE/WW 255 250 98% 261 241 92% 20
DSW/K/WW 419 363 87% 422 369 87% 53
Midlands 376 333 89% 370 320 86% 50
DNC 487 462 95% 489 479 98% 10
Dublin North 337 266 79% 330 251 76% 79
LH/MH 403 388 96% 408 398 98% 10
CN/MN 162 162 100% 157 147 94% 10
Cork 762 742 97% 781 745 95% 36
Kerry 168 165 98% 165 163 99% 2
CW/KK/ST 354 282 80% 345 291 84% 54
WD/WX 439 408 93% 440 413 94% 27
Mid West 596 522 88% 599 531 89% 68
GY/RN 350 338 97% 330 312 95% 18
Mayo 121 121 100% 131 131 100% 0
Donegal 209 209 100% 210 208 99% 2
SLWC 116 116 100% 111 99 89% 12
SWTSCSA 65 65 100% 67 67 100% 0
Total 5983 5511 92% 5,985 5,486 92% 499
3.1.5 Children in Care with a Care Plan
93% (5,570/5,985) of children in care had an up-to-date care plan against a target of 90%, up
one percentage points from Q3 2019 (92%).
415 children did not have an up-to-date care plan, 70 (14%) fewer than Q3 2019 (485).
It should be noted that variances have been identified in how data on this metric are
being reported by areas. In some areas care plans that have fallen due for review and
not updated are included. Also, it should be noted that where a care plan is not up–to-
date, the care plan in place (albeit that it is awaiting review) is used to support the care
of the child.
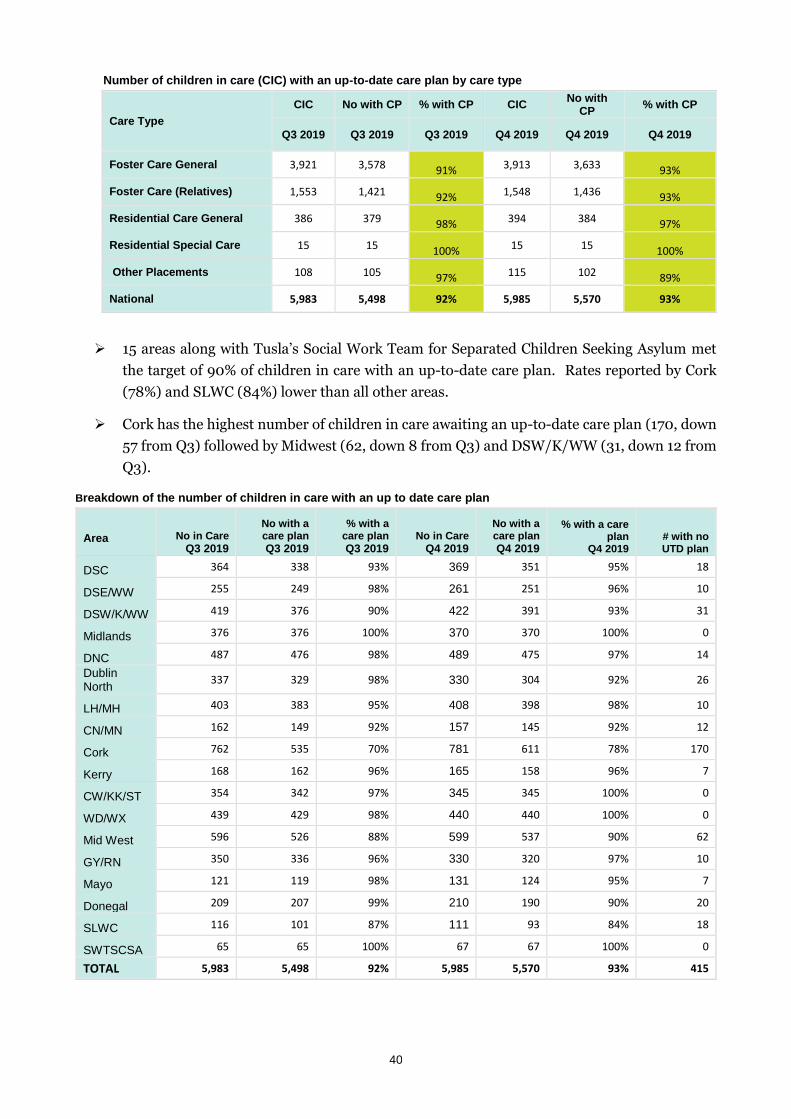
40
Number of children in care (CIC) with an up-to-date care plan by care type
Care Type
CIC No with CP % with CP CIC No with
CP % with CP
Q3 2019 Q3 2019 Q3 2019 Q4 2019 Q4 2019 Q4 2019
Foster Care General 3,921 3,578 91% 3,913 3,633 93%
Foster Care (Relatives) 1,553 1,421 92% 1,548 1,436 93%
Residential Care General 386 379 98% 394 384 97%
Residential Special Care 15 15 100% 15 15 100%
Other Placements 108 105 97% 115 102 89%
National 5,983 5,498 92% 5,985 5,570 93%
15 areas along with Tusla’s Social Work Team for Separated Children Seeking Asylum met
the target of 90% of children in care with an up-to-date care plan. Rates reported by Cork
(78%) and SLWC (84%) lower than all other areas.
Cork has the highest number of children in care awaiting an up-to-date care plan (170, down
57 from Q3) followed by Midwest (62, down 8 from Q3) and DSW/K/WW (31, down 12 from
Q3).
Breakdown of the number of children in care with an up to date care plan
Area No in Care
Q3 2019
No with a care plan
Q3 2019
% with a care plan
Q3 2019
No in Care
Q4 2019
No with a care plan
Q4 2019
% with a care plan
Q4 2019 # with no UTD plan
DSC 364 338 93% 369 351 95% 18
DSE/WW 255 249 98% 261 251 96% 10
DSW/K/WW 419 376 90% 422 391 93% 31
Midlands 376 376 100% 370 370 100% 0
DNC 487 476 98% 489 475 97% 14
Dublin North
337 329 98% 330 304 92% 26
LH/MH 403 383 95% 408 398 98% 10
CN/MN 162 149 92% 157 145 92% 12
Cork 762 535 70% 781 611 78% 170
Kerry 168 162 96% 165 158 96% 7
CW/KK/ST 354 342 97% 345 345 100% 0
WD/WX 439 429 98% 440 440 100% 0
Mid West 596 526 88% 599 537 90% 62
GY/RN 350 336 96% 330 320 97% 10
Mayo 121 119 98% 131 124 95% 7
Donegal 209 207 99% 210 190 90% 20
SLWC 116 101 87% 111 93 84% 18
SWTSCSA 65 65 100% 67 67 100% 0
TOTAL 5,983 5,498 92% 5,985 5,570 93% 415
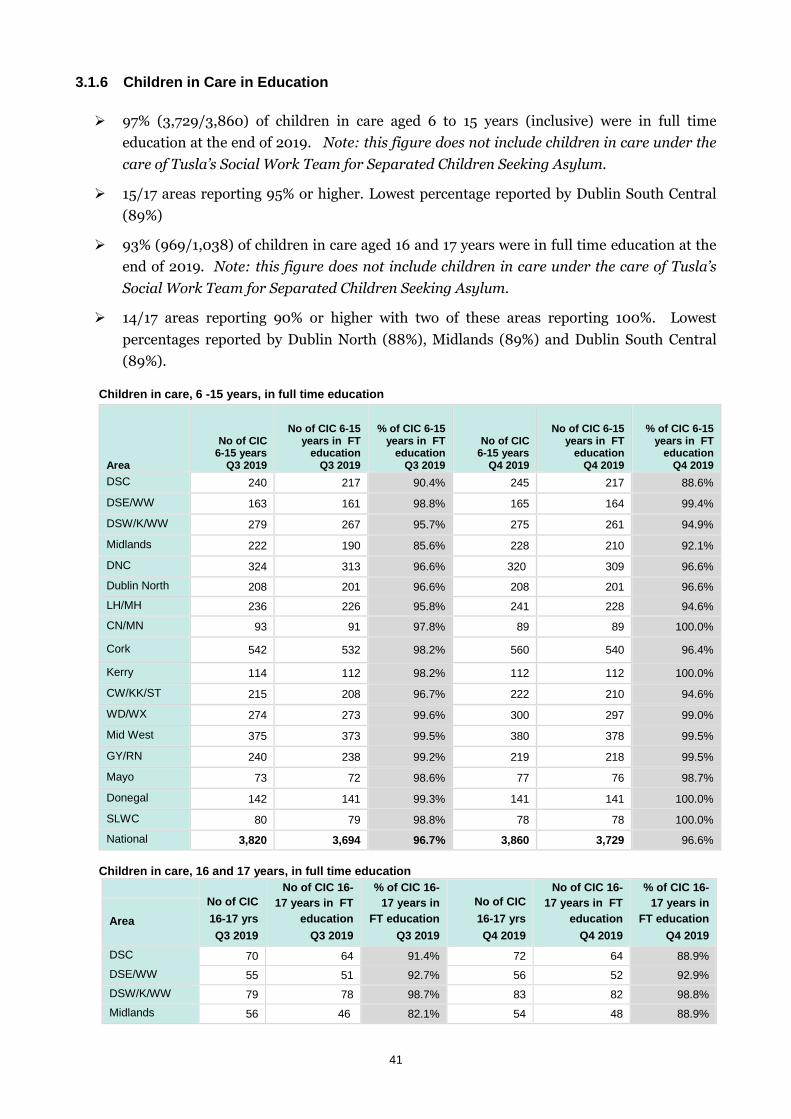
41
3.1.6 Children in Care in Education
97% (3,729/3,860) of children in care aged 6 to 15 years (inclusive) were in full time
education at the end of 2019. Note: this figure does not include children in care under the
care of Tusla’s Social Work Team for Separated Children Seeking Asylum.
15/17 areas reporting 95% or higher. Lowest percentage reported by Dublin South Central
(89%)
93% (969/1,038) of children in care aged 16 and 17 years were in full time education at the
end of 2019. Note: this figure does not include children in care under the care of Tusla’s
Social Work Team for Separated Children Seeking Asylum.
14/17 areas reporting 90% or higher with two of these areas reporting 100%. Lowest
percentages reported by Dublin North (88%), Midlands (89%) and Dublin South Central
(89%).
Children in care, 6 -15 years, in full time education
Area
No of CIC 6-15 years
Q3 2019
No of CIC 6-15 years in FT
education Q3 2019
% of CIC 6-15 years in FT
education Q3 2019
No of CIC 6-15 years
Q4 2019
No of CIC 6-15 years in FT
education Q4 2019
% of CIC 6-15 years in FT
education Q4 2019
DSC 240 217 90.4% 245 217 88.6%
DSE/WW 163 161 98.8% 165 164 99.4%
DSW/K/WW 279 267 95.7% 275 261 94.9%
Midlands 222 190 85.6% 228 210 92.1%
DNC 324 313 96.6% 320 309 96.6%
Dublin North 208 201 96.6% 208 201 96.6%
LH/MH 236 226 95.8% 241 228 94.6%
CN/MN 93 91 97.8% 89 89 100.0%
Cork 542 532 98.2% 560 540 96.4%
Kerry 114 112 98.2% 112 112 100.0%
CW/KK/ST 215 208 96.7% 222 210 94.6%
WD/WX 274 273 99.6% 300 297 99.0%
Mid West 375 373 99.5% 380 378 99.5%
GY/RN 240 238 99.2% 219 218 99.5%
Mayo 73 72 98.6% 77 76 98.7%
Donegal 142 141 99.3% 141 141 100.0%
SLWC 80 79 98.8% 78 78 100.0%
National 3,820 3,694 96.7% 3,860 3,729 96.6%
Children in care, 16 and 17 years, in full time education
No of CIC
16-17 yrs
Q3 2019
No of CIC 16-
17 years in FT
education
Q3 2019
% of CIC 16-
17 years in
FT education
Q3 2019
No of CIC
16-17 yrs
Q4 2019
No of CIC 16-
17 years in FT
education
Q4 2019
% of CIC 16-
17 years in
FT education
Q4 2019
Area
DSC 70 64 91.4% 72 64 88.9%
DSE/WW 55 51 92.7% 56 52 92.9%
DSW/K/WW 79 78 98.7% 83 82 98.8%
Midlands 56 46 82.1% 54 48 88.9%
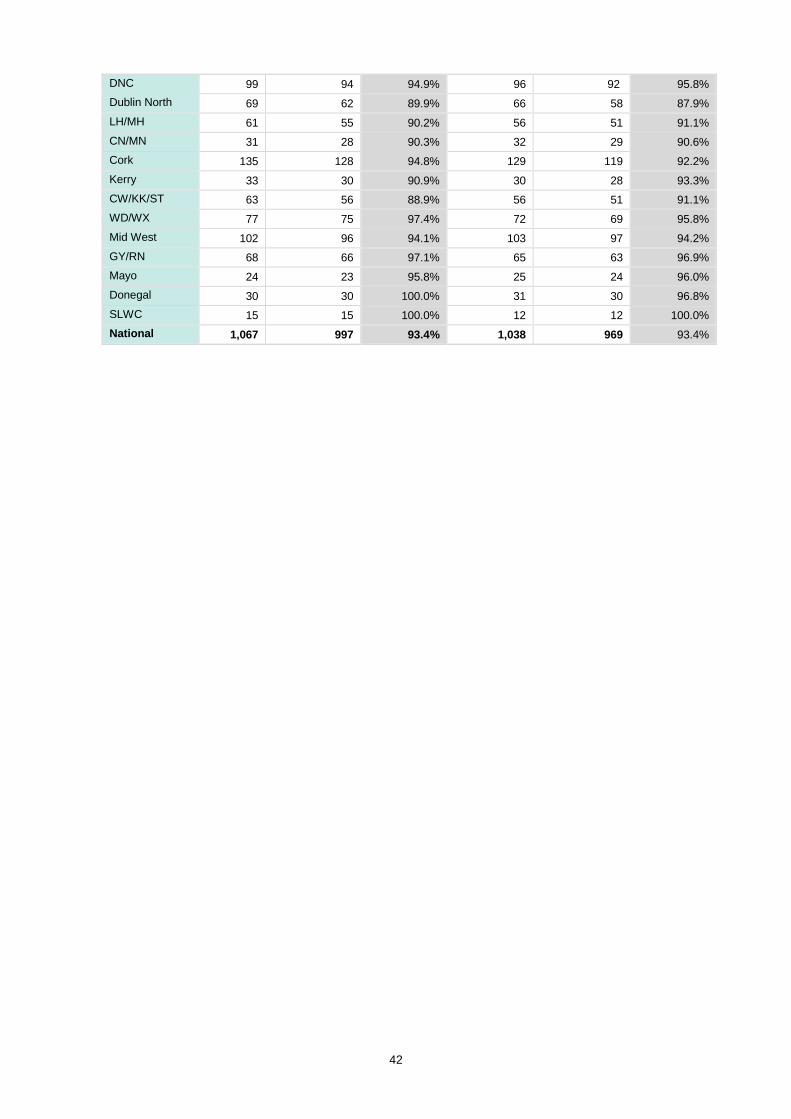
42
DNC 99 94 94.9% 96 92 95.8%
Dublin North 69 62 89.9% 66 58 87.9%
LH/MH 61 55 90.2% 56 51 91.1%
CN/MN 31 28 90.3% 32 29 90.6%
Cork 135 128 94.8% 129 119 92.2%
Kerry 33 30 90.9% 30 28 93.3%
CW/KK/ST 63 56 88.9% 56 51 91.1%
WD/WX 77 75 97.4% 72 69 95.8%
Mid West 102 96 94.1% 103 97 94.2%
GY/RN 68 66 97.1% 65 63 96.9%
Mayo 24 23 95.8% 25 24 96.0%
Donegal 30 30 100.0% 31 30 96.8%
SLWC 15 15 100.0% 12 12 100.0%
National 1,067 997 93.4% 1,038 969 93.4%
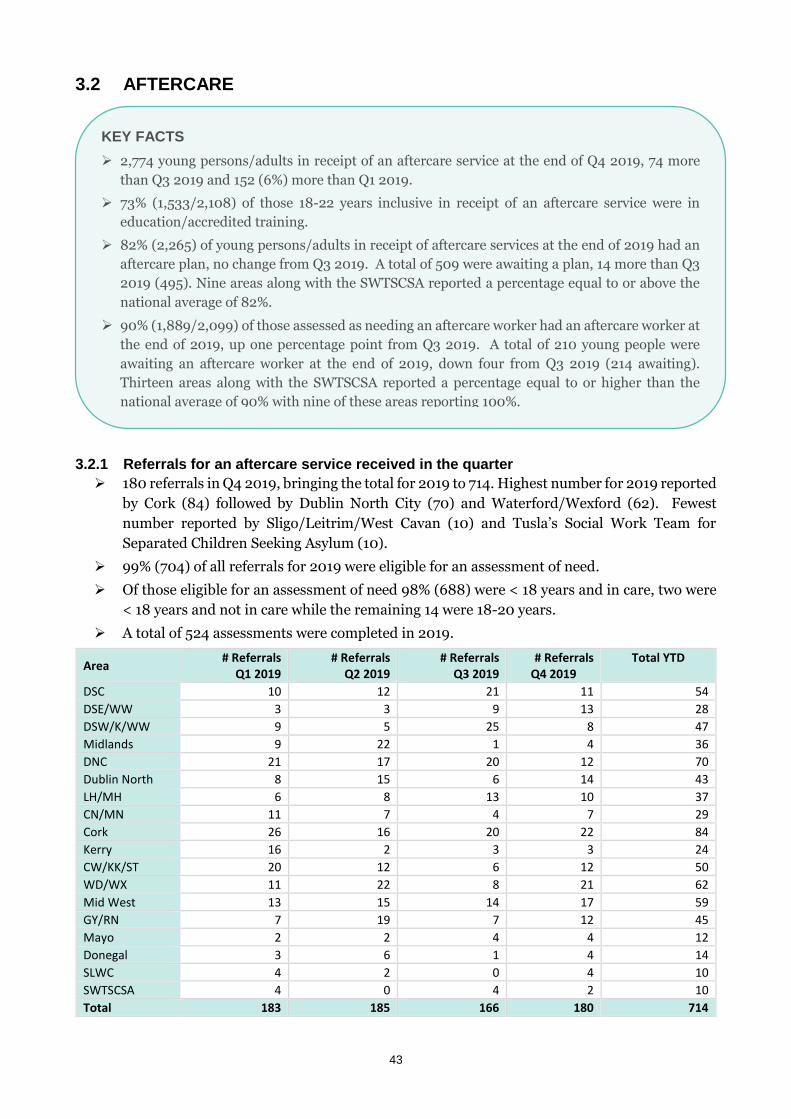
43
3.2 AFTERCARE
3.2.1 Referrals for an aftercare service received in the quarter
180 referrals in Q4 2019, bringing the total for 2019 to 714. Highest number for 2019 reported
by Cork (84) followed by Dublin North City (70) and Waterford/Wexford (62). Fewest
number reported by Sligo/Leitrim/West Cavan (10) and Tusla’s Social Work Team for
Separated Children Seeking Asylum (10).
99% (704) of all referrals for 2019 were eligible for an assessment of need.
Of those eligible for an assessment of need 98% (688) were < 18 years and in care, two were
< 18 years and not in care while the remaining 14 were 18-20 years.
A total of 524 assessments were completed in 2019.
Area # Referrals
Q1 2019 # Referrals
Q2 2019 # Referrals
Q3 2019 # Referrals
Q4 2019 Total YTD
DSC 10 12 21 11 54
DSE/WW 3 3 9 13 28
DSW/K/WW 9 5 25 8 47
Midlands 9 22 1 4 36
DNC 21 17 20 12 70
Dublin North 8 15 6 14 43
LH/MH 6 8 13 10 37
CN/MN 11 7 4 7 29
Cork 26 16 20 22 84
Kerry 16 2 3 3 24
CW/KK/ST 20 12 6 12 50
WD/WX 11 22 8 21 62
Mid West 13 15 14 17 59
GY/RN 7 19 7 12 45
Mayo 2 2 4 4 12
Donegal 3 6 1 4 14
SLWC 4 2 0 4 10
SWTSCSA 4 0 4 2 10
Total 183 185 166 180 714
KEY FACTS
2,774 young persons/adults in receipt of an aftercare service at the end of Q4 2019, 74 more
than Q3 2019 and 152 (6%) more than Q1 2019.
73% (1,533/2,108) of those 18-22 years inclusive in receipt of an aftercare service were in
education/accredited training.
82% (2,265) of young persons/adults in receipt of aftercare services at the end of 2019 had an
aftercare plan, no change from Q3 2019. A total of 509 were awaiting a plan, 14 more than Q3
2019 (495). Nine areas along with the SWTSCSA reported a percentage equal to or above the
national average of 82%.
90% (1,889/2,099) of those assessed as needing an aftercare worker had an aftercare worker at
the end of 2019, up one percentage point from Q3 2019. A total of 210 young people were
awaiting an aftercare worker at the end of 2019, down four from Q3 2019 (214 awaiting).
Thirteen areas along with the SWTSCSA reported a percentage equal to or higher than the
national average of 90% with nine of these areas reporting 100%.
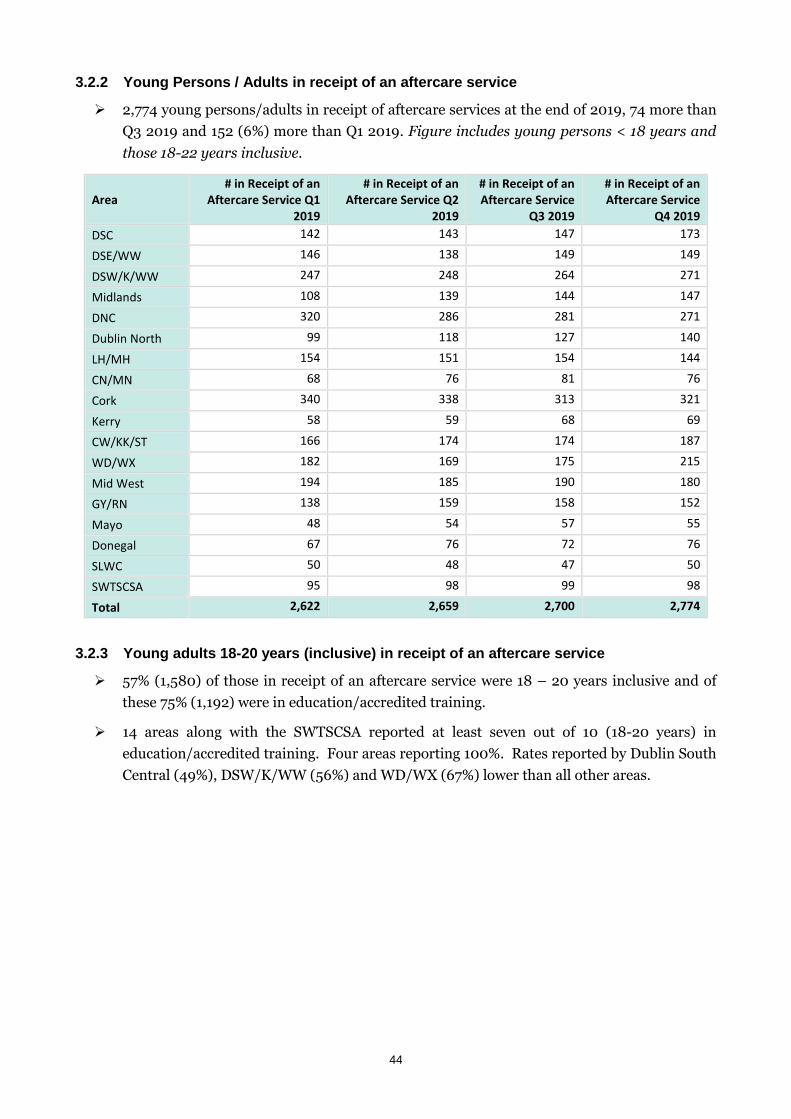
44
3.2.2 Young Persons / Adults in receipt of an aftercare service
2,774 young persons/adults in receipt of aftercare services at the end of 2019, 74 more than
Q3 2019 and 152 (6%) more than Q1 2019. Figure includes young persons < 18 years and
those 18-22 years inclusive.
Area # in Receipt of an
Aftercare Service Q1 2019
# in Receipt of an Aftercare Service Q2
2019
# in Receipt of an Aftercare Service
Q3 2019
# in Receipt of an Aftercare Service
Q4 2019
DSC 142 143 147 173
DSE/WW 146 138 149 149
DSW/K/WW 247 248 264 271
Midlands 108 139 144 147
DNC 320 286 281 271
Dublin North 99 118 127 140
LH/MH 154 151 154 144
CN/MN 68 76 81 76
Cork 340 338 313 321
Kerry 58 59 68 69
CW/KK/ST 166 174 174 187
WD/WX 182 169 175 215
Mid West 194 185 190 180
GY/RN 138 159 158 152
Mayo 48 54 57 55
Donegal 67 76 72 76
SLWC 50 48 47 50
SWTSCSA 95 98 99 98
Total 2,622 2,659 2,700 2,774
3.2.3 Young adults 18-20 years (inclusive) in receipt of an aftercare service
57% (1,580) of those in receipt of an aftercare service were 18 – 20 years inclusive and of
these 75% (1,192) were in education/accredited training.
14 areas along with the SWTSCSA reported at least seven out of 10 (18-20 years) in
education/accredited training. Four areas reporting 100%. Rates reported by Dublin South
Central (49%), DSW/K/WW (56%) and WD/WX (67%) lower than all other areas.
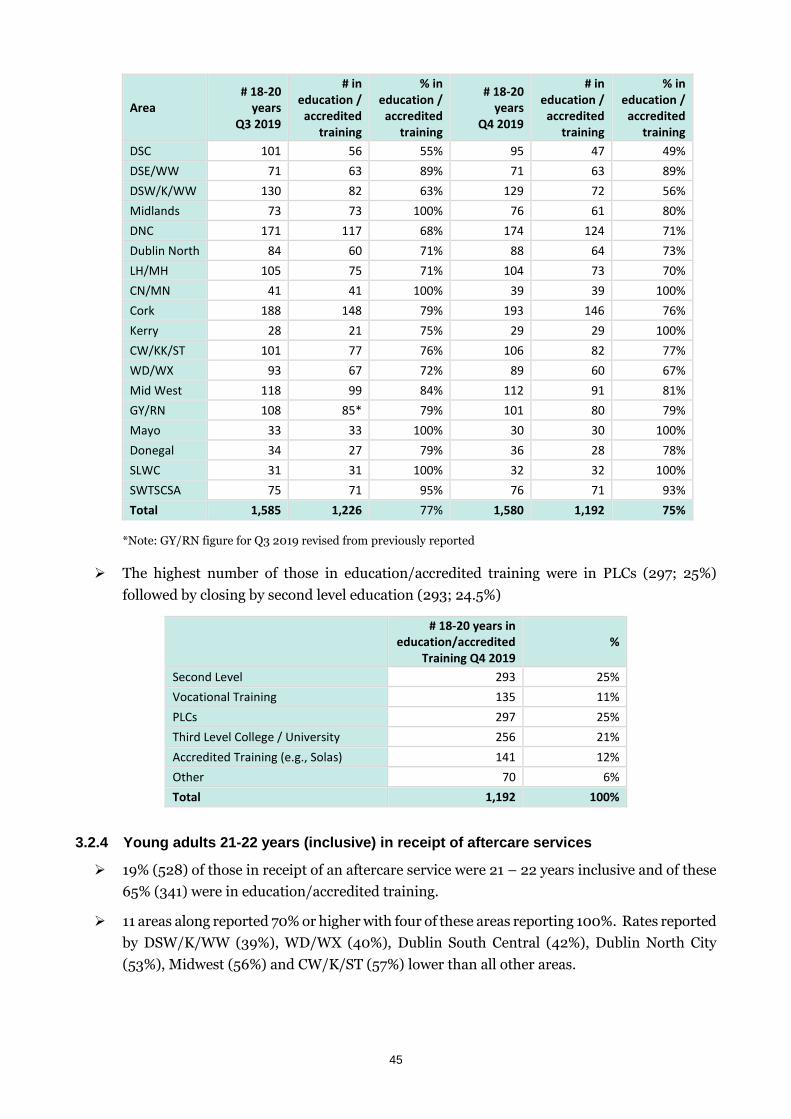
45
Area # 18-20
years Q3 2019
# in education /
accredited training
% in education /
accredited training
# 18-20 years
Q4 2019
# in education /
accredited training
% in education /
accredited training
DSC 101 56 55% 95 47 49%
DSE/WW 71 63 89% 71 63 89%
DSW/K/WW 130 82 63% 129 72 56%
Midlands 73 73 100% 76 61 80%
DNC 171 117 68% 174 124 71%
Dublin North 84 60 71% 88 64 73%
LH/MH 105 75 71% 104 73 70%
CN/MN 41 41 100% 39 39 100%
Cork 188 148 79% 193 146 76%
Kerry 28 21 75% 29 29 100%
CW/KK/ST 101 77 76% 106 82 77%
WD/WX 93 67 72% 89 60 67%
Mid West 118 99 84% 112 91 81%
GY/RN 108 85* 79% 101 80 79%
Mayo 33 33 100% 30 30 100%
Donegal 34 27 79% 36 28 78%
SLWC 31 31 100% 32 32 100%
SWTSCSA 75 71 95% 76 71 93%
Total 1,585 1,226 77% 1,580 1,192 75%
*Note: GY/RN figure for Q3 2019 revised from previously reported
The highest number of those in education/accredited training were in PLCs (297; 25%)
followed by closing by second level education (293; 24.5%)
# 18-20 years in
education/accredited Training Q4 2019
%
Second Level 293 25%
Vocational Training 135 11%
PLCs 297 25%
Third Level College / University 256 21%
Accredited Training (e.g., Solas) 141 12%
Other 70 6%
Total 1,192 100%
3.2.4 Young adults 21-22 years (inclusive) in receipt of aftercare services
19% (528) of those in receipt of an aftercare service were 21 – 22 years inclusive and of these
65% (341) were in education/accredited training.
11 areas along reported 70% or higher with four of these areas reporting 100%. Rates reported
by DSW/K/WW (39%), WD/WX (40%), Dublin South Central (42%), Dublin North City
(53%), Midwest (56%) and CW/K/ST (57%) lower than all other areas.
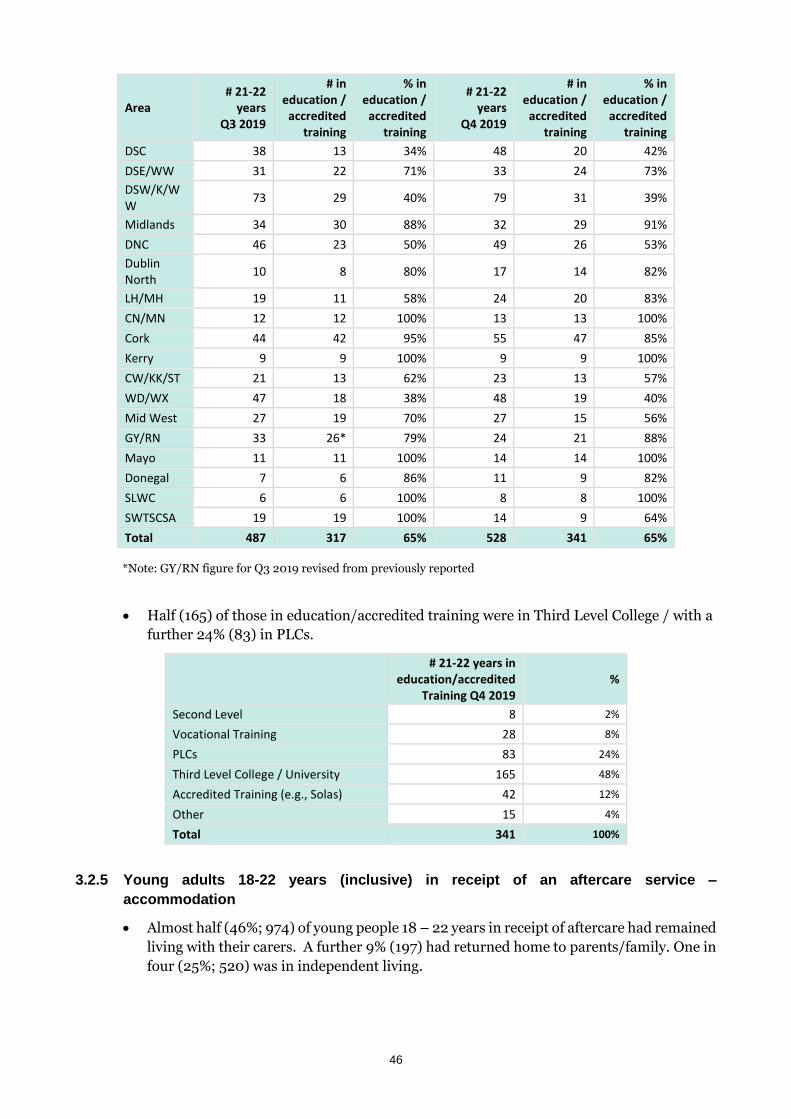
46
Area # 21-22
years Q3 2019
# in education /
accredited training
% in education /
accredited training
# 21-22 years
Q4 2019
# in education /
accredited training
% in education /
accredited training
DSC 38 13 34% 48 20 42%
DSE/WW 31 22 71% 33 24 73%
DSW/K/WW
73 29 40% 79 31 39%
Midlands 34 30 88% 32 29 91%
DNC 46 23 50% 49 26 53%
Dublin North
10 8 80% 17 14 82%
LH/MH 19 11 58% 24 20 83%
CN/MN 12 12 100% 13 13 100%
Cork 44 42 95% 55 47 85%
Kerry 9 9 100% 9 9 100%
CW/KK/ST 21 13 62% 23 13 57%
WD/WX 47 18 38% 48 19 40%
Mid West 27 19 70% 27 15 56%
GY/RN 33 26* 79% 24 21 88%
Mayo 11 11 100% 14 14 100%
Donegal 7 6 86% 11 9 82%
SLWC 6 6 100% 8 8 100%
SWTSCSA 19 19 100% 14 9 64%
Total 487 317 65% 528 341 65%
*Note: GY/RN figure for Q3 2019 revised from previously reported
Half (165) of those in education/accredited training were in Third Level College / with a
further 24% (83) in PLCs.
# 21-22 years in
education/accredited Training Q4 2019
%
Second Level 8 2%
Vocational Training 28 8%
PLCs 83 24%
Third Level College / University 165 48%
Accredited Training (e.g., Solas) 42 12%
Other 15 4%
Total 341 100%
3.2.5 Young adults 18-22 years (inclusive) in receipt of an aftercare service –
accommodation
Almost half (46%; 974) of young people 18 – 22 years in receipt of aftercare had remained
living with their carers. A further 9% (197) had returned home to parents/family. One in
four (25%; 520) was in independent living.
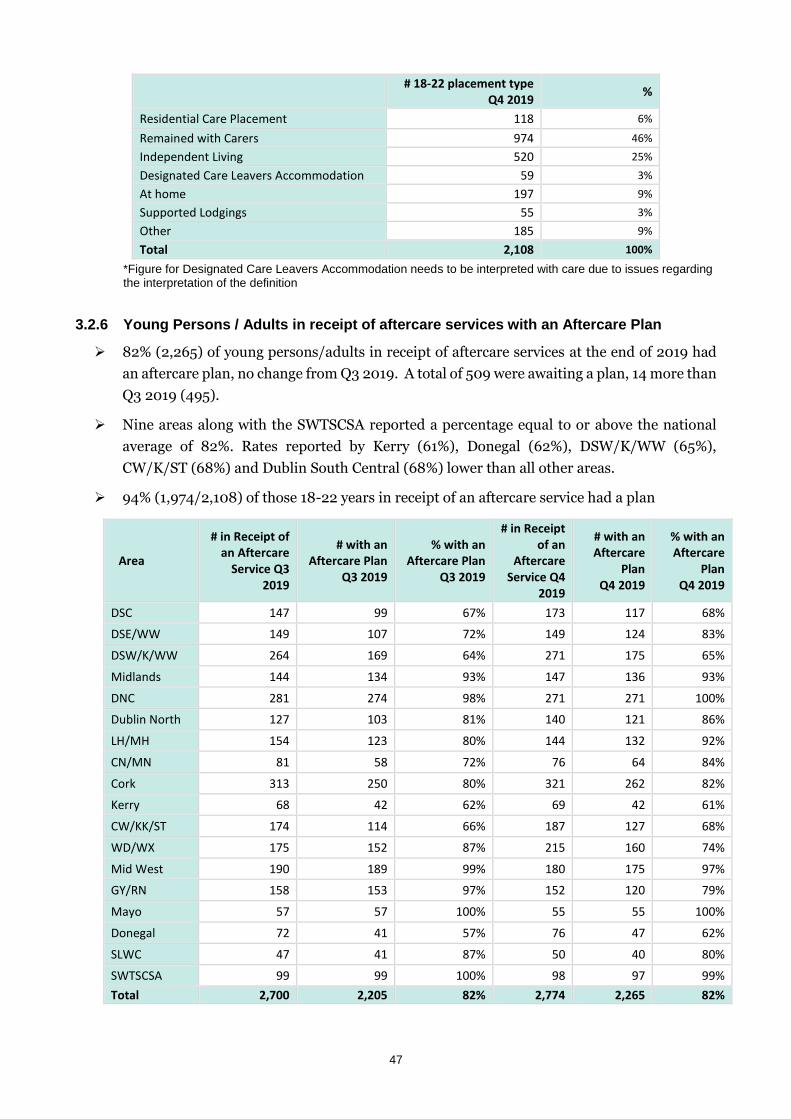
47
# 18-22 placement type
Q4 2019 %
Residential Care Placement 118 6%
Remained with Carers 974 46%
Independent Living 520 25%
Designated Care Leavers Accommodation 59 3%
At home 197 9%
Supported Lodgings 55 3%
Other 185 9%
Total 2,108 100%
*Figure for Designated Care Leavers Accommodation needs to be interpreted with care due to issues regarding the interpretation of the definition
3.2.6 Young Persons / Adults in receipt of aftercare services with an Aftercare Plan
82% (2,265) of young persons/adults in receipt of aftercare services at the end of 2019 had
an aftercare plan, no change from Q3 2019. A total of 509 were awaiting a plan, 14 more than
Q3 2019 (495).
Nine areas along with the SWTSCSA reported a percentage equal to or above the national
average of 82%. Rates reported by Kerry (61%), Donegal (62%), DSW/K/WW (65%),
CW/K/ST (68%) and Dublin South Central (68%) lower than all other areas.
94% (1,974/2,108) of those 18-22 years in receipt of an aftercare service had a plan
Area
# in Receipt of an Aftercare
Service Q3 2019
# with an Aftercare Plan
Q3 2019
% with an Aftercare Plan
Q3 2019
# in Receipt of an
Aftercare Service Q4
2019
# with an Aftercare
Plan Q4 2019
% with an Aftercare
Plan Q4 2019
DSC 147 99 67% 173 117 68%
DSE/WW 149 107 72% 149 124 83%
DSW/K/WW 264 169 64% 271 175 65%
Midlands 144 134 93% 147 136 93%
DNC 281 274 98% 271 271 100%
Dublin North 127 103 81% 140 121 86%
LH/MH 154 123 80% 144 132 92%
CN/MN 81 58 72% 76 64 84%
Cork 313 250 80% 321 262 82%
Kerry 68 42 62% 69 42 61%
CW/KK/ST 174 114 66% 187 127 68%
WD/WX 175 152 87% 215 160 74%
Mid West 190 189 99% 180 175 97%
GY/RN 158 153 97% 152 120 79%
Mayo 57 57 100% 55 55 100%
Donegal 72 41 57% 76 47 62%
SLWC 47 41 87% 50 40 80%
SWTSCSA 99 99 100% 98 97 99%
Total 2,700 2,205 82% 2,774 2,265 82%
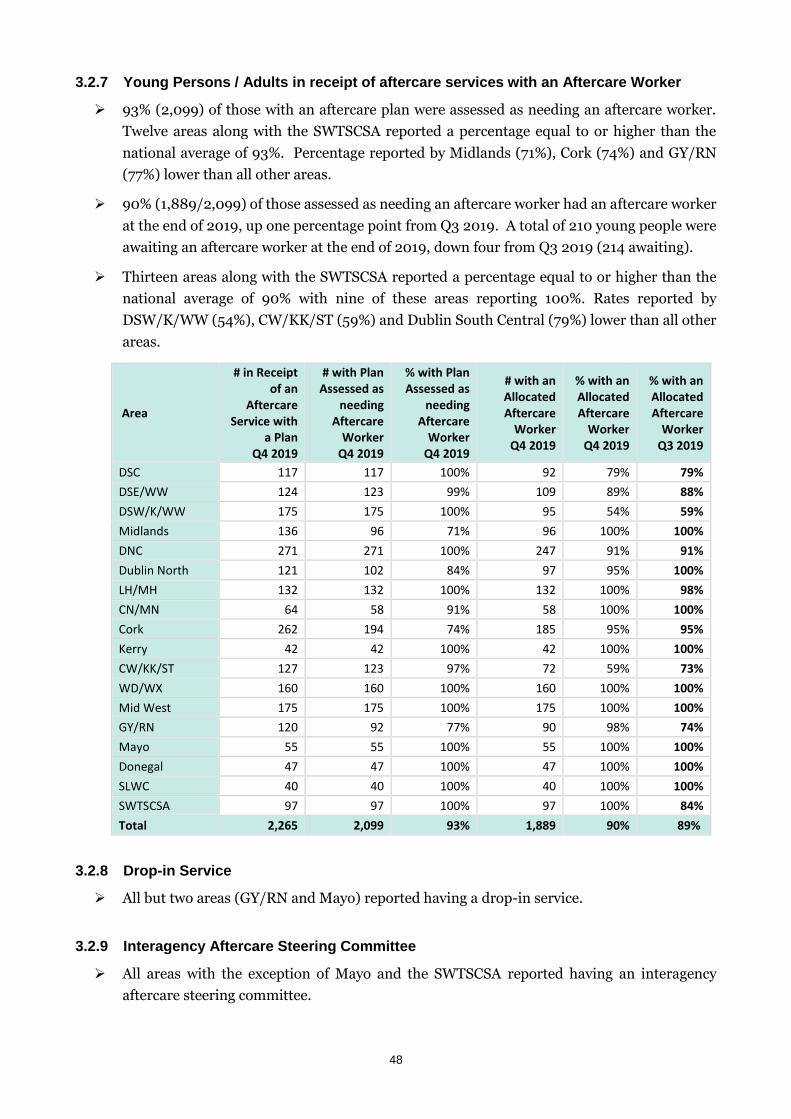
48
3.2.7 Young Persons / Adults in receipt of aftercare services with an Aftercare Worker
93% (2,099) of those with an aftercare plan were assessed as needing an aftercare worker.
Twelve areas along with the SWTSCSA reported a percentage equal to or higher than the
national average of 93%. Percentage reported by Midlands (71%), Cork (74%) and GY/RN
(77%) lower than all other areas.
90% (1,889/2,099) of those assessed as needing an aftercare worker had an aftercare worker
at the end of 2019, up one percentage point from Q3 2019. A total of 210 young people were
awaiting an aftercare worker at the end of 2019, down four from Q3 2019 (214 awaiting).
Thirteen areas along with the SWTSCSA reported a percentage equal to or higher than the
national average of 90% with nine of these areas reporting 100%. Rates reported by
DSW/K/WW (54%), CW/KK/ST (59%) and Dublin South Central (79%) lower than all other
areas.
Area
# in Receipt of an
Aftercare Service with
a Plan Q4 2019
# with Plan Assessed as
needing Aftercare
Worker Q4 2019
% with Plan Assessed as
needing Aftercare
Worker Q4 2019
# with an Allocated Aftercare
Worker Q4 2019
% with an Allocated Aftercare
Worker Q4 2019
% with an Allocated Aftercare
Worker Q3 2019
DSC 117 117 100% 92 79% 79%
DSE/WW 124 123 99% 109 89% 88%
DSW/K/WW 175 175 100% 95 54% 59%
Midlands 136 96 71% 96 100% 100%
DNC 271 271 100% 247 91% 91%
Dublin North 121 102 84% 97 95% 100%
LH/MH 132 132 100% 132 100% 98%
CN/MN 64 58 91% 58 100% 100%
Cork 262 194 74% 185 95% 95%
Kerry 42 42 100% 42 100% 100%
CW/KK/ST 127 123 97% 72 59% 73%
WD/WX 160 160 100% 160 100% 100%
Mid West 175 175 100% 175 100% 100%
GY/RN 120 92 77% 90 98% 74%
Mayo 55 55 100% 55 100% 100%
Donegal 47 47 100% 47 100% 100%
SLWC 40 40 100% 40 100% 100%
SWTSCSA 97 97 100% 97 100% 84%
Total 2,265 2,099 93% 1,889 90% 89%
3.2.8 Drop-in Service
All but two areas (GY/RN and Mayo) reported having a drop-in service.
3.2.9 Interagency Aftercare Steering Committee
All areas with the exception of Mayo and the SWTSCSA reported having an interagency
aftercare steering committee.
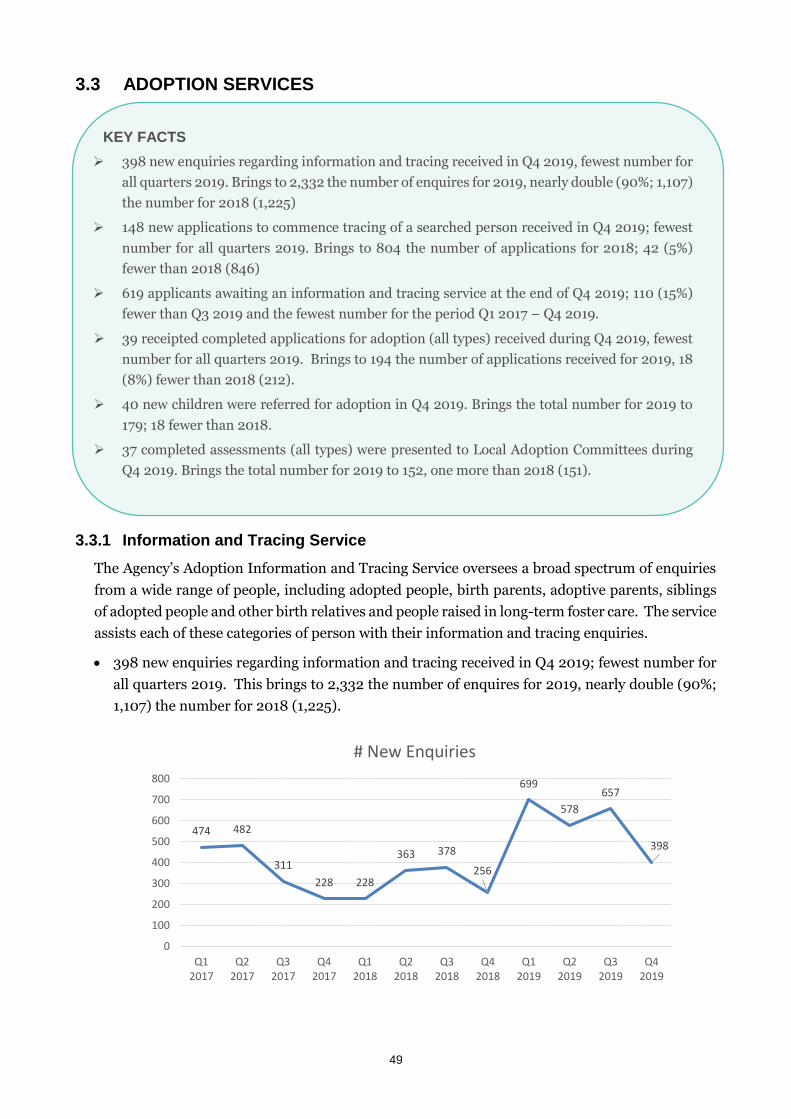
49
3.3 ADOPTION SERVICES
3.3.1 Information and Tracing Service
The Agency’s Adoption Information and Tracing Service oversees a broad spectrum of enquiries
from a wide range of people, including adopted people, birth parents, adoptive parents, siblings
of adopted people and other birth relatives and people raised in long-term foster care. The service
assists each of these categories of person with their information and tracing enquiries.
398 new enquiries regarding information and tracing received in Q4 2019; fewest number for
all quarters 2019. This brings to 2,332 the number of enquires for 2019, nearly double (90%;
1,107) the number for 2018 (1,225).
474 482
311
228 228
363 378
256
699
578
657
398
0
100
200
300
400
500
600
700
800
Q12017
Q22017
Q32017
Q42017
Q12018
Q22018
Q32018
Q42018
Q12019
Q22019
Q32019
Q42019
# New Enquiries
KEY FACTS
398 new enquiries regarding information and tracing received in Q4 2019, fewest number for
all quarters 2019. Brings to 2,332 the number of enquires for 2019, nearly double (90%; 1,107)
the number for 2018 (1,225)
148 new applications to commence tracing of a searched person received in Q4 2019; fewest
number for all quarters 2019. Brings to 804 the number of applications for 2018; 42 (5%)
fewer than 2018 (846)
619 applicants awaiting an information and tracing service at the end of Q4 2019; 110 (15%)
fewer than Q3 2019 and the fewest number for the period Q1 2017 – Q4 2019.
39 receipted completed applications for adoption (all types) received during Q4 2019, fewest
number for all quarters 2019. Brings to 194 the number of applications received for 2019, 18
(8%) fewer than 2018 (212).
40 new children were referred for adoption in Q4 2019. Brings the total number for 2019 to
179; 18 fewer than 2018.
37 completed assessments (all types) were presented to Local Adoption Committees during
Q4 2019. Brings the total number for 2019 to 152, one more than 2018 (151).
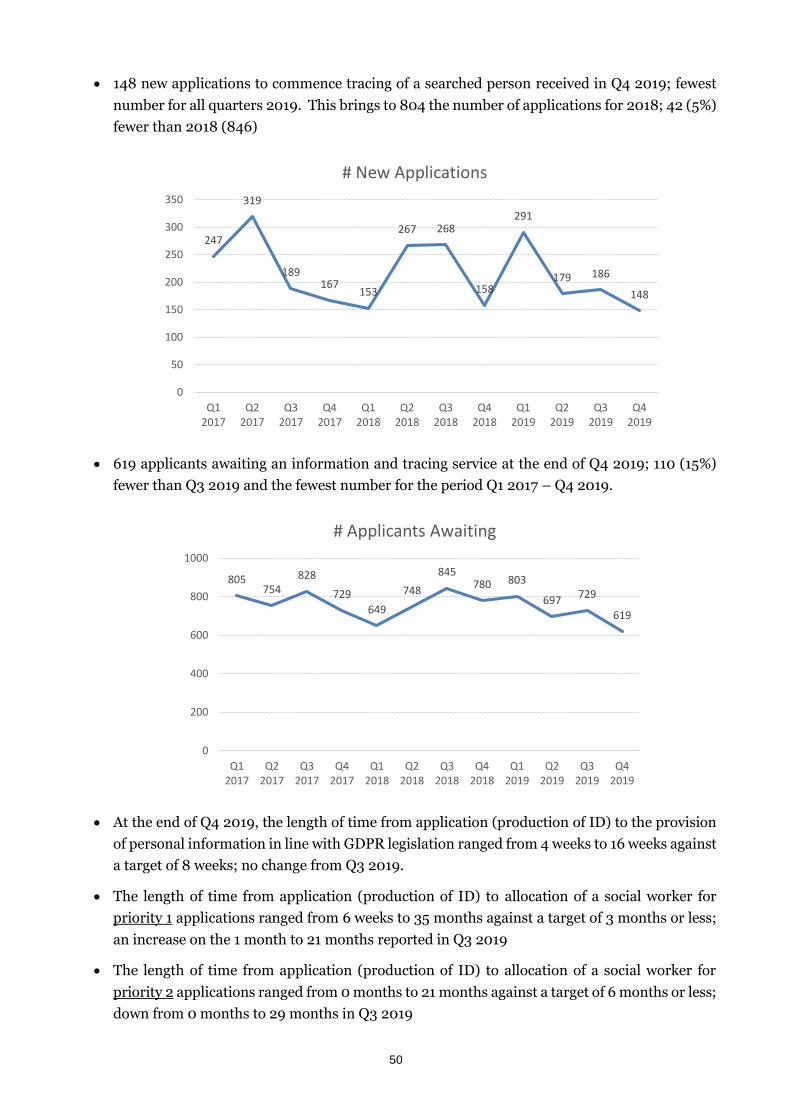
50
148 new applications to commence tracing of a searched person received in Q4 2019; fewest
number for all quarters 2019. This brings to 804 the number of applications for 2018; 42 (5%)
fewer than 2018 (846)
619 applicants awaiting an information and tracing service at the end of Q4 2019; 110 (15%)
fewer than Q3 2019 and the fewest number for the period Q1 2017 – Q4 2019.
At the end of Q4 2019, the length of time from application (production of ID) to the provision
of personal information in line with GDPR legislation ranged from 4 weeks to 16 weeks against
a target of 8 weeks; no change from Q3 2019.
The length of time from application (production of ID) to allocation of a social worker for
priority 1 applications ranged from 6 weeks to 35 months against a target of 3 months or less;
an increase on the 1 month to 21 months reported in Q3 2019
The length of time from application (production of ID) to allocation of a social worker for
priority 2 applications ranged from 0 months to 21 months against a target of 6 months or less;
down from 0 months to 29 months in Q3 2019
247
319
189167
153
267 268
158
291
179 186
148
0
50
100
150
200
250
300
350
Q12017
Q22017
Q32017
Q42017
Q12018
Q22018
Q32018
Q42018
Q12019
Q22019
Q32019
Q42019
# New Applications
805754
828
729
649
748
845780 803
697729
619
0
200
400
600
800
1000
Q12017
Q22017
Q32017
Q42017
Q12018
Q22018
Q32018
Q42018
Q12019
Q22019
Q32019
Q42019
# Applicants Awaiting
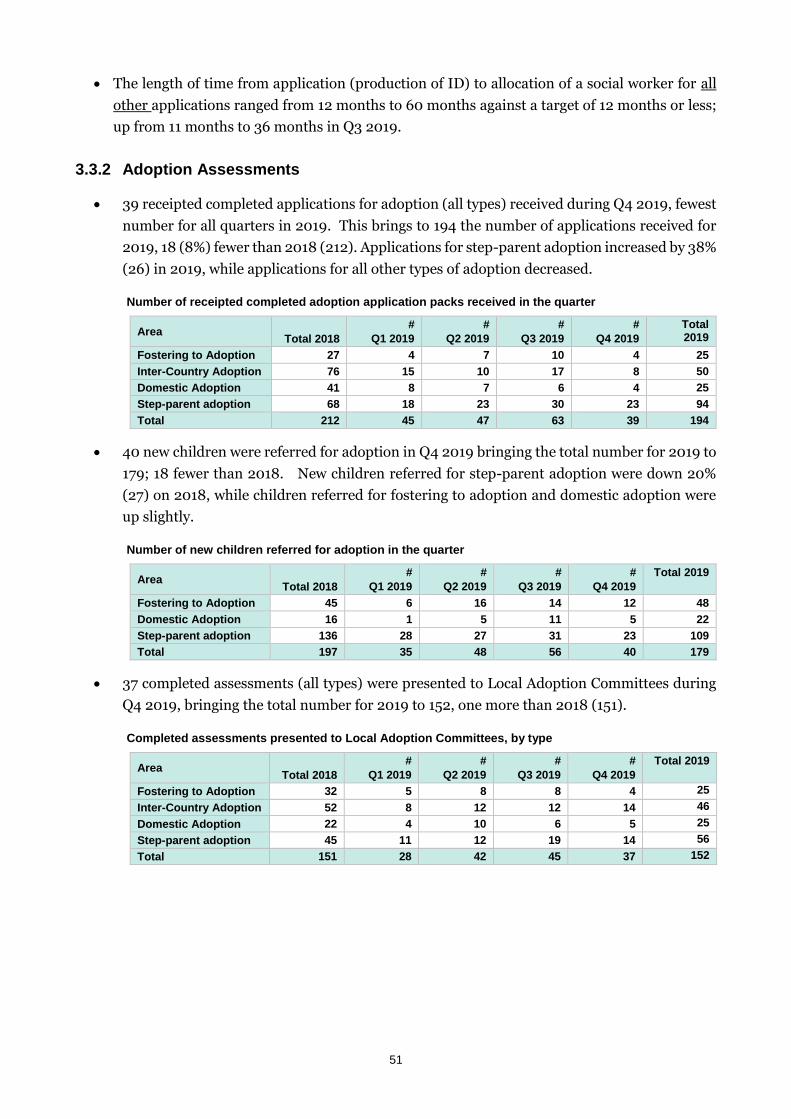
51
The length of time from application (production of ID) to allocation of a social worker for all
other applications ranged from 12 months to 60 months against a target of 12 months or less;
up from 11 months to 36 months in Q3 2019.
3.3.2 Adoption Assessments
39 receipted completed applications for adoption (all types) received during Q4 2019, fewest
number for all quarters in 2019. This brings to 194 the number of applications received for
2019, 18 (8%) fewer than 2018 (212). Applications for step-parent adoption increased by 38%
(26) in 2019, while applications for all other types of adoption decreased.
Number of receipted completed adoption application packs received in the quarter
Area Total 2018
#
Q1 2019
#
Q2 2019
#
Q3 2019
#
Q4 2019
Total 2019
Fostering to Adoption 27 4 7 10 4 25
Inter-Country Adoption 76 15 10 17 8 50
Domestic Adoption 41 8 7 6 4 25
Step-parent adoption 68 18 23 30 23 94
Total 212 45 47 63 39 194
40 new children were referred for adoption in Q4 2019 bringing the total number for 2019 to
179; 18 fewer than 2018. New children referred for step-parent adoption were down 20%
(27) on 2018, while children referred for fostering to adoption and domestic adoption were
up slightly.
Number of new children referred for adoption in the quarter
Area Total 2018
#
Q1 2019
#
Q2 2019
#
Q3 2019
#
Q4 2019
Total 2019
Fostering to Adoption 45 6 16 14 12 48
Domestic Adoption 16 1 5 11 5 22
Step-parent adoption 136 28 27 31 23 109
Total 197 35 48 56 40 179
37 completed assessments (all types) were presented to Local Adoption Committees during
Q4 2019, bringing the total number for 2019 to 152, one more than 2018 (151).
Completed assessments presented to Local Adoption Committees, by type
Area Total 2018
#
Q1 2019
#
Q2 2019
#
Q3 2019
#
Q4 2019
Total 2019
Fostering to Adoption 32 5 8 8 4 25
Inter-Country Adoption 52 8 12 12 14 46
Domestic Adoption 22 4 10 6 5 25
Step-parent adoption 45 11 12 19 14 56
Total 151 28 42 45 37 152
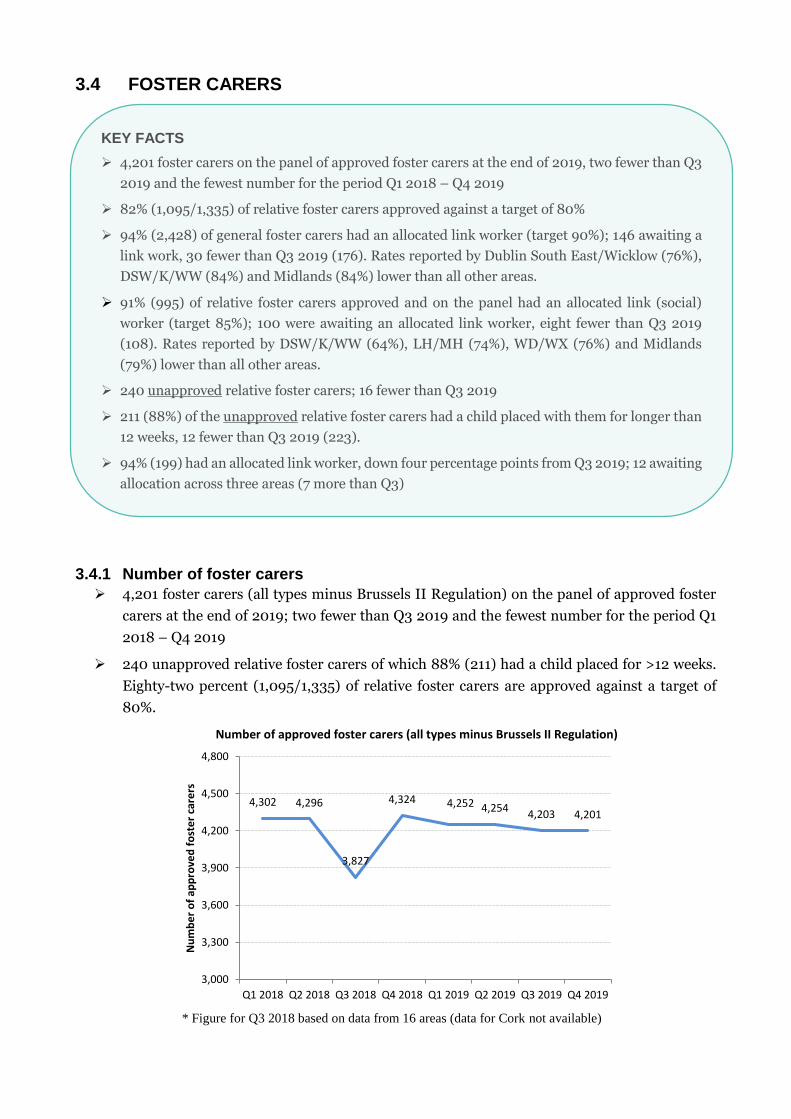
3.4 FOSTER CARERS
3.4.1 Number of foster carers
4,201 foster carers (all types minus Brussels II Regulation) on the panel of approved foster
carers at the end of 2019; two fewer than Q3 2019 and the fewest number for the period Q1
2018 – Q4 2019
240 unapproved relative foster carers of which 88% (211) had a child placed for >12 weeks.
Eighty-two percent (1,095/1,335) of relative foster carers are approved against a target of
80%.
Number of approved foster carers (all types minus Brussels II Regulation)
* Figure for Q3 2018 based on data from 16 areas (data for Cork not available)
4,302 4,296
3,827
4,324 4,252 4,2544,203 4,201
3,000
3,300
3,600
3,900
4,200
4,500
4,800
Q1 2018 Q2 2018 Q3 2018 Q4 2018 Q1 2019 Q2 2019 Q3 2019 Q4 2019
Nu
mb
er
of
app
rove
d f
ost
er
care
rs
KEY FACTS
4,201 foster carers on the panel of approved foster carers at the end of 2019, two fewer than Q3
2019 and the fewest number for the period Q1 2018 – Q4 2019
82% (1,095/1,335) of relative foster carers approved against a target of 80%
94% (2,428) of general foster carers had an allocated link worker (target 90%); 146 awaiting a
link work, 30 fewer than Q3 2019 (176). Rates reported by Dublin South East/Wicklow (76%),
DSW/K/WW (84%) and Midlands (84%) lower than all other areas.
91% (995) of relative foster carers approved and on the panel had an allocated link (social)
worker (target 85%); 100 were awaiting an allocated link worker, eight fewer than Q3 2019
(108). Rates reported by DSW/K/WW (64%), LH/MH (74%), WD/WX (76%) and Midlands
(79%) lower than all other areas.
240 unapproved relative foster carers; 16 fewer than Q3 2019
211 (88%) of the unapproved relative foster carers had a child placed with them for longer than
12 weeks, 12 fewer than Q3 2019 (223).
94% (199) had an allocated link worker, down four percentage points from Q3 2019; 12 awaiting
allocation across three areas (7 more than Q3)
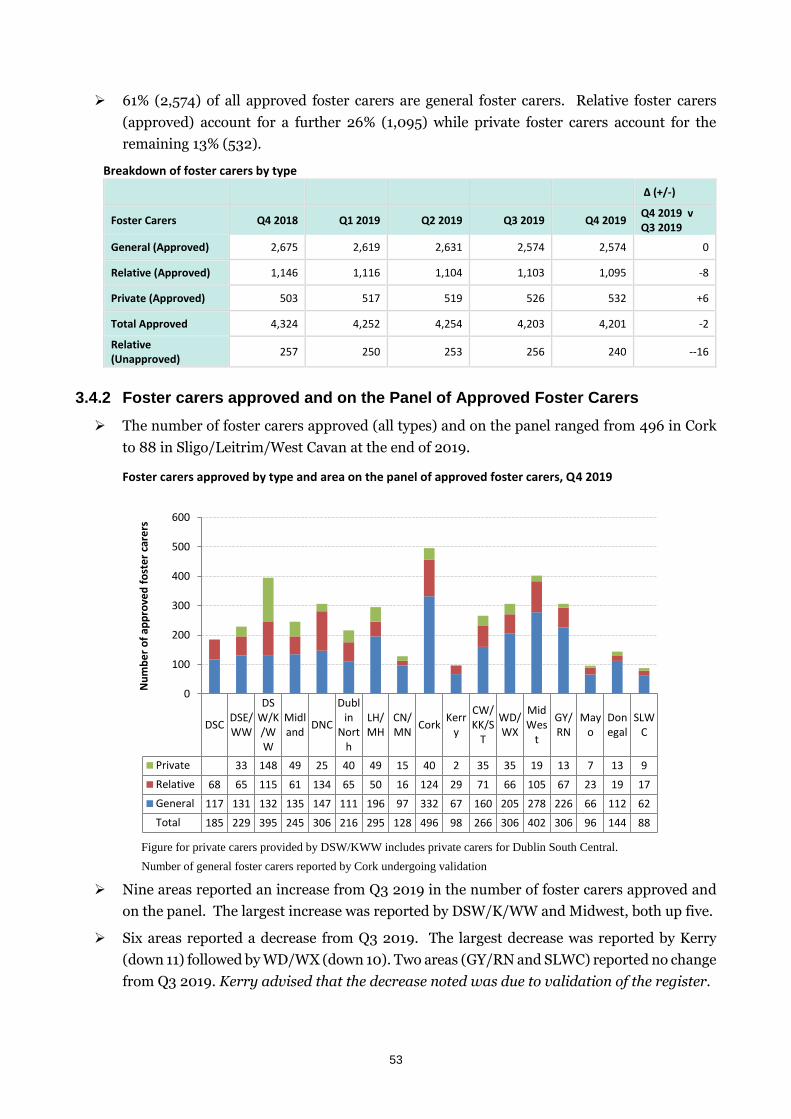
53
61% (2,574) of all approved foster carers are general foster carers. Relative foster carers
(approved) account for a further 26% (1,095) while private foster carers account for the
remaining 13% (532).
Breakdown of foster carers by type
Δ (+/-)
Foster Carers Q4 2018 Q1 2019 Q2 2019 Q3 2019 Q4 2019 Q4 2019 v Q3 2019
General (Approved) 2,675 2,619 2,631 2,574 2,574 0
Relative (Approved) 1,146 1,116 1,104 1,103 1,095 -8
Private (Approved) 503 517 519 526 532 +6
Total Approved 4,324 4,252 4,254 4,203 4,201 -2
Relative (Unapproved)
257 250 253 256 240 --16
3.4.2 Foster carers approved and on the Panel of Approved Foster Carers
The number of foster carers approved (all types) and on the panel ranged from 496 in Cork
to 88 in Sligo/Leitrim/West Cavan at the end of 2019.
Foster carers approved by type and area on the panel of approved foster carers, Q4 2019
Figure for private carers provided by DSW/KWW includes private carers for Dublin South Central.
Number of general foster carers reported by Cork undergoing validation
Nine areas reported an increase from Q3 2019 in the number of foster carers approved and
on the panel. The largest increase was reported by DSW/K/WW and Midwest, both up five.
Six areas reported a decrease from Q3 2019. The largest decrease was reported by Kerry
(down 11) followed by WD/WX (down 10). Two areas (GY/RN and SLWC) reported no change
from Q3 2019. Kerry advised that the decrease noted was due to validation of the register.
DSCDSE/WW
DSW/K/WW
Midland
DNC
Dublin
North
LH/MH
CN/MN
CorkKerr
y
CW/KK/S
T
WD/WX
MidWes
t
GY/RN
Mayo
Donegal
SLWC
Private 33 148 49 25 40 49 15 40 2 35 35 19 13 7 13 9
Relative 68 65 115 61 134 65 50 16 124 29 71 66 105 67 23 19 17
General 117 131 132 135 147 111 196 97 332 67 160 205 278 226 66 112 62
Total 185 229 395 245 306 216 295 128 496 98 266 306 402 306 96 144 88
0
100
200
300
400
500
600
Nu
mb
er
of
app
rove
d f
ost
er
care
rs
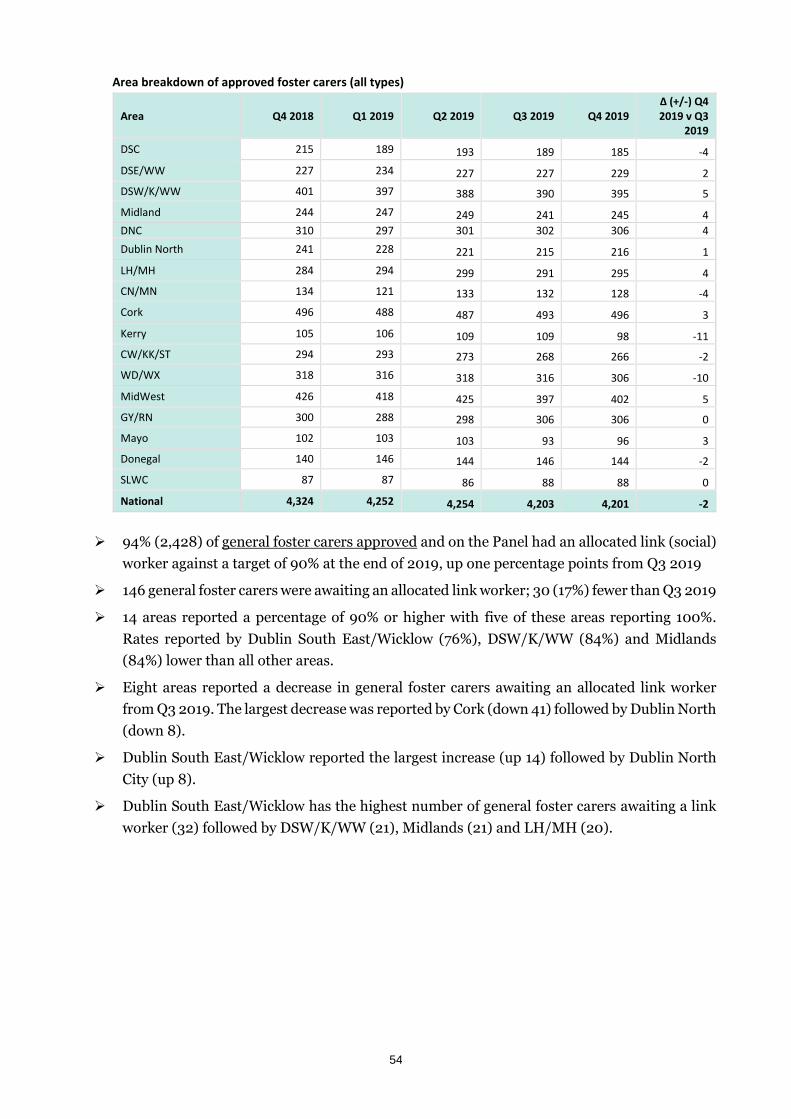
54
Area breakdown of approved foster carers (all types)
Area Q4 2018 Q1 2019 Q2 2019 Q3 2019 Q4 2019 Δ (+/-) Q4 2019 v Q3
2019
DSC 215 189 193 189 185 -4
DSE/WW 227 234 227 227 229 2
DSW/K/WW 401 397 388 390 395 5
Midland 244 247 249 241 245 4
DNC 310 297 301 302 306 4
Dublin North 241 228 221 215 216 1
LH/MH 284 294 299 291 295 4
CN/MN 134 121 133 132 128 -4
Cork 496 488 487 493 496 3
Kerry 105 106 109 109 98 -11
CW/KK/ST 294 293 273 268 266 -2
WD/WX 318 316 318 316 306 -10
MidWest 426 418 425 397 402 5
GY/RN 300 288 298 306 306 0
Mayo 102 103 103 93 96 3
Donegal 140 146 144 146 144 -2
SLWC 87 87 86 88 88 0
National 4,324 4,252 4,254 4,203 4,201 -2
94% (2,428) of general foster carers approved and on the Panel had an allocated link (social)
worker against a target of 90% at the end of 2019, up one percentage points from Q3 2019
146 general foster carers were awaiting an allocated link worker; 30 (17%) fewer than Q3 2019
14 areas reported a percentage of 90% or higher with five of these areas reporting 100%.
Rates reported by Dublin South East/Wicklow (76%), DSW/K/WW (84%) and Midlands
(84%) lower than all other areas.
Eight areas reported a decrease in general foster carers awaiting an allocated link worker
from Q3 2019. The largest decrease was reported by Cork (down 41) followed by Dublin North
(down 8).
Dublin South East/Wicklow reported the largest increase (up 14) followed by Dublin North
City (up 8).
Dublin South East/Wicklow has the highest number of general foster carers awaiting a link
worker (32) followed by DSW/K/WW (21), Midlands (21) and LH/MH (20).
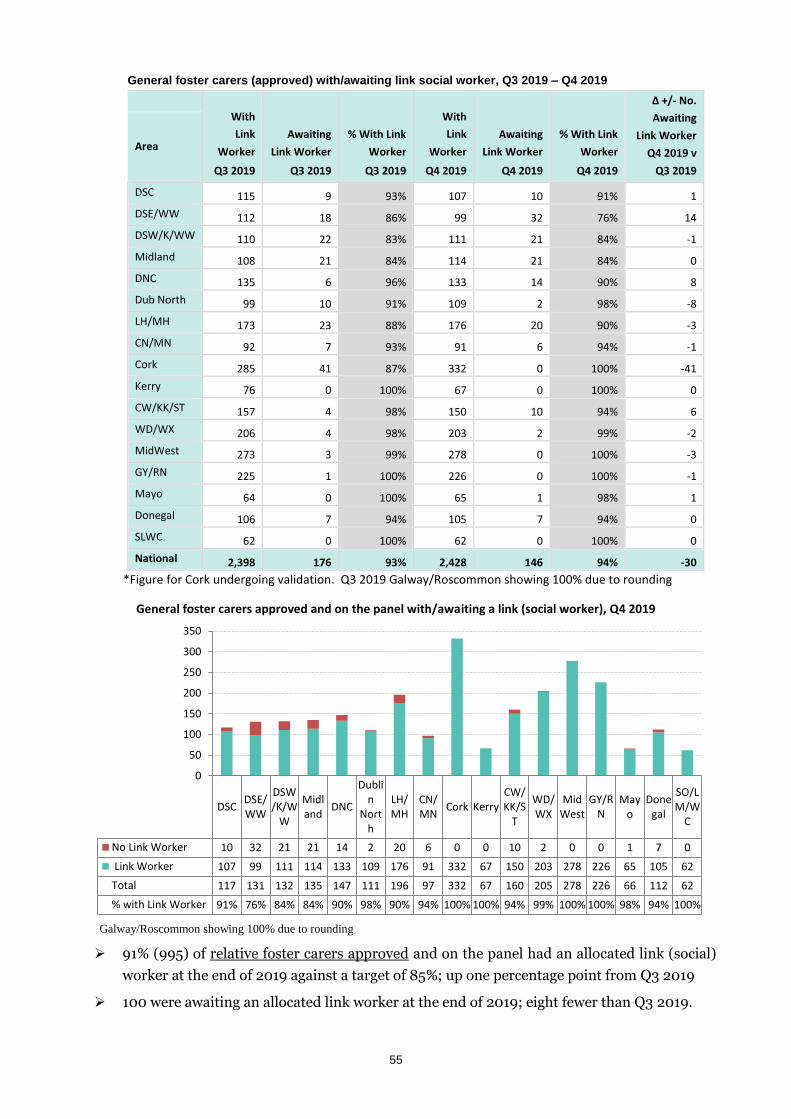
55
General foster carers (approved) with/awaiting link social worker, Q3 2019 – Q4 2019
With
Link
Worker
Q3 2019
Awaiting
Link Worker
Q3 2019
% With Link
Worker
Q3 2019
With
Link
Worker
Q4 2019
Awaiting
Link Worker
Q4 2019
% With Link
Worker
Q4 2019
Δ +/- No.
Awaiting
Link Worker
Q4 2019 v
Q3 2019
Area
DSC 115 9 93% 107 10 91% 1
DSE/WW 112 18 86% 99 32 76% 14
DSW/K/WW 110 22 83% 111 21 84% -1
Midland 108 21 84% 114 21 84% 0
DNC 135 6 96% 133 14 90% 8
Dub North 99 10 91% 109 2 98% -8
LH/MH 173 23 88% 176 20 90% -3
CN/MN 92 7 93% 91 6 94% -1
Cork 285 41 87% 332 0 100% -41
Kerry 76 0 100% 67 0 100% 0
CW/KK/ST 157 4 98% 150 10 94% 6
WD/WX 206 4 98% 203 2 99% -2
MidWest 273 3 99% 278 0 100% -3
GY/RN 225 1 100% 226 0 100% -1
Mayo 64 0 100% 65 1 98% 1
Donegal 106 7 94% 105 7 94% 0
SLWC 62 0 100% 62 0 100% 0
National 2,398 176 93% 2,428 146 94% -30
*Figure for Cork undergoing validation. Q3 2019 Galway/Roscommon showing 100% due to rounding
General foster carers approved and on the panel with/awaiting a link (social worker), Q4 2019
Galway/Roscommon showing 100% due to rounding
91% (995) of relative foster carers approved and on the panel had an allocated link (social)
worker at the end of 2019 against a target of 85%; up one percentage point from Q3 2019
100 were awaiting an allocated link worker at the end of 2019; eight fewer than Q3 2019.
DSCDSE/WW
DSW/K/W
W
Midland
DNC
Dublin
North
LH/MH
CN/MN
Cork KerryCW/KK/S
T
WD/WX
MidWest
GY/RN
Mayo
Donegal
SO/LM/W
C
No Link Worker 10 32 21 21 14 2 20 6 0 0 10 2 0 0 1 7 0
Link Worker 107 99 111 114 133 109 176 91 332 67 150 203 278 226 65 105 62
Total 117 131 132 135 147 111 196 97 332 67 160 205 278 226 66 112 62
% with Link Worker 91% 76% 84% 84% 90% 98% 90% 94% 100% 100% 94% 99% 100% 100% 98% 94% 100%
0
50
100
150
200
250
300
350
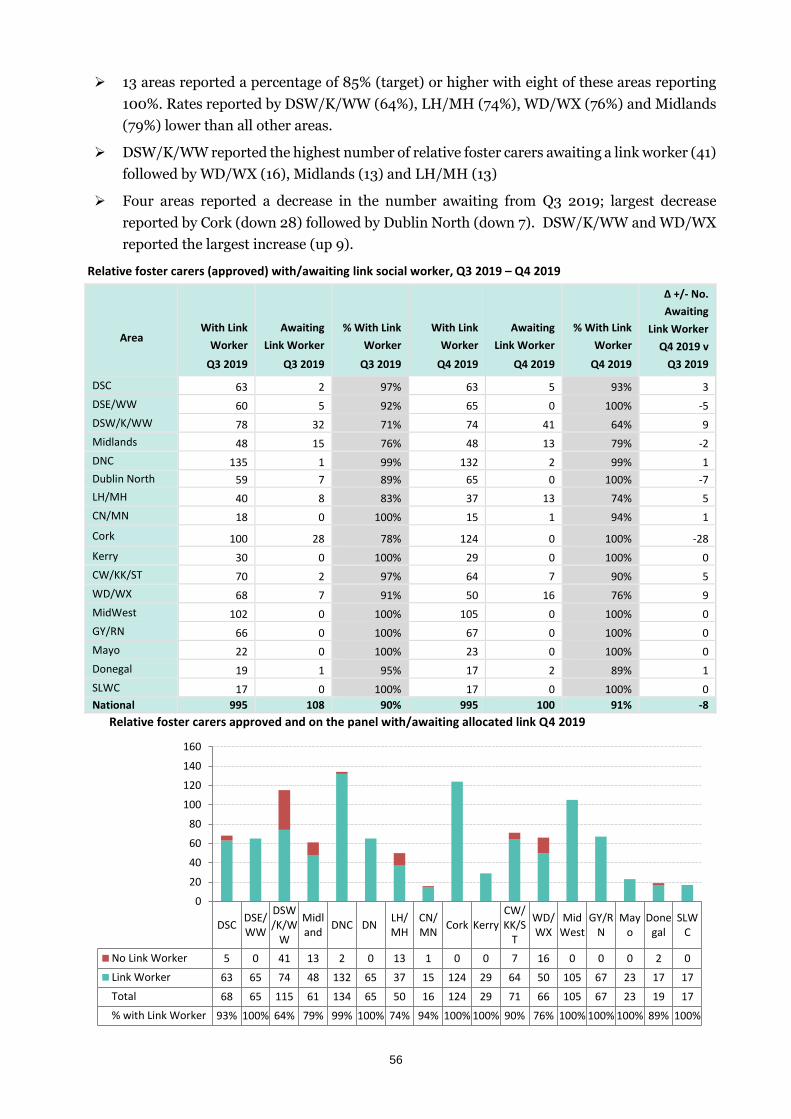
56
13 areas reported a percentage of 85% (target) or higher with eight of these areas reporting
100%. Rates reported by DSW/K/WW (64%), LH/MH (74%), WD/WX (76%) and Midlands
(79%) lower than all other areas.
DSW/K/WW reported the highest number of relative foster carers awaiting a link worker (41)
followed by WD/WX (16), Midlands (13) and LH/MH (13)
Four areas reported a decrease in the number awaiting from Q3 2019; largest decrease
reported by Cork (down 28) followed by Dublin North (down 7). DSW/K/WW and WD/WX
reported the largest increase (up 9).
Relative foster carers (approved) with/awaiting link social worker, Q3 2019 – Q4 2019
Relative foster carers approved and on the panel with/awaiting allocated link Q4 2019
DSCDSE/WW
DSW/K/W
W
Midland
DNC DNLH/MH
CN/MN
Cork KerryCW/KK/S
T
WD/WX
MidWest
GY/RN
Mayo
Donegal
SLWC
No Link Worker 5 0 41 13 2 0 13 1 0 0 7 16 0 0 0 2 0
Link Worker 63 65 74 48 132 65 37 15 124 29 64 50 105 67 23 17 17
Total 68 65 115 61 134 65 50 16 124 29 71 66 105 67 23 19 17
% with Link Worker 93% 100% 64% 79% 99% 100% 74% 94% 100% 100% 90% 76% 100% 100% 100% 89% 100%
0
20
40
60
80
100
120
140
160
Area
With Link
Worker
Q3 2019
Awaiting
Link Worker
Q3 2019
% With Link
Worker
Q3 2019
With Link
Worker
Q4 2019
Awaiting
Link Worker
Q4 2019
% With Link
Worker
Q4 2019
Δ +/- No.
Awaiting
Link Worker
Q4 2019 v
Q3 2019
DSC 63 2 97% 63 5 93% 3
DSE/WW 60 5 92% 65 0 100% -5
DSW/K/WW 78 32 71% 74 41 64% 9
Midlands 48 15 76% 48 13 79% -2
DNC 135 1 99% 132 2 99% 1
Dublin North 59 7 89% 65 0 100% -7
LH/MH 40 8 83% 37 13 74% 5
CN/MN 18 0 100% 15 1 94% 1
Cork 100 28 78% 124 0 100% -28
Kerry 30 0 100% 29 0 100% 0
CW/KK/ST 70 2 97% 64 7 90% 5
WD/WX 68 7 91% 50 16 76% 9
MidWest 102 0 100% 105 0 100% 0
GY/RN 66 0 100% 67 0 100% 0
Mayo 22 0 100% 23 0 100% 0
Donegal 19 1 95% 17 2 89% 1
SLWC 17 0 100% 17 0 100% 0
National 995 108 90% 995 100 91% -8
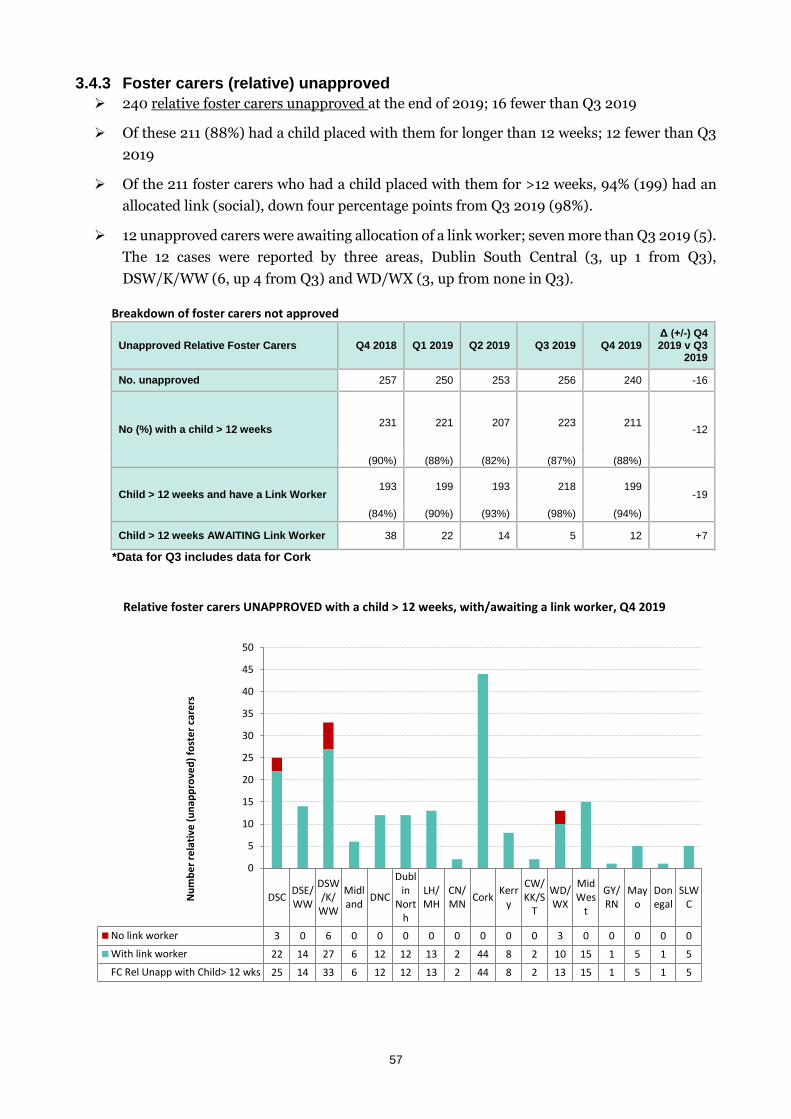
57
3.4.3 Foster carers (relative) unapproved
240 relative foster carers unapproved at the end of 2019; 16 fewer than Q3 2019
Of these 211 (88%) had a child placed with them for longer than 12 weeks; 12 fewer than Q3
2019
Of the 211 foster carers who had a child placed with them for >12 weeks, 94% (199) had an
allocated link (social), down four percentage points from Q3 2019 (98%).
12 unapproved carers were awaiting allocation of a link worker; seven more than Q3 2019 (5).
The 12 cases were reported by three areas, Dublin South Central (3, up 1 from Q3),
DSW/K/WW (6, up 4 from Q3) and WD/WX (3, up from none in Q3).
Breakdown of foster carers not approved
Unapproved Relative Foster Carers Q4 2018 Q1 2019 Q2 2019 Q3 2019 Q4 2019 Δ (+/-) Q4 2019 v Q3
2019
No. unapproved 257 250 253 256 240 -16
No (%) with a child > 12 weeks 231
221
207 223
211
-12
(90%) (88%) (82%) (87%) (88%)
Child > 12 weeks and have a Link Worker 193 199 193 218
199
-19
(84%) (90%) (93%) (98%) (94%)
Child > 12 weeks AWAITING Link Worker 38 22 14 5 12 +7
*Data for Q3 includes data for Cork
Relative foster carers UNAPPROVED with a child > 12 weeks, with/awaiting a link worker, Q4 2019
DSCDSE/WW
DSW/K/
WW
Midland
DNC
Dublin
North
LH/MH
CN/MN
CorkKerr
y
CW/KK/S
T
WD/WX
MidWes
t
GY/RN
Mayo
Donegal
SLWC
No link worker 3 0 6 0 0 0 0 0 0 0 0 3 0 0 0 0 0
With link worker 22 14 27 6 12 12 13 2 44 8 2 10 15 1 5 1 5
FC Rel Unapp with Child> 12 wks 25 14 33 6 12 12 13 2 44 8 2 13 15 1 5 1 5
0
5
10
15
20
25
30
35
40
45
50
Nu
mb
er
rela
tive
(u
nap
pro
ved
) fo
ste
r ca
rers
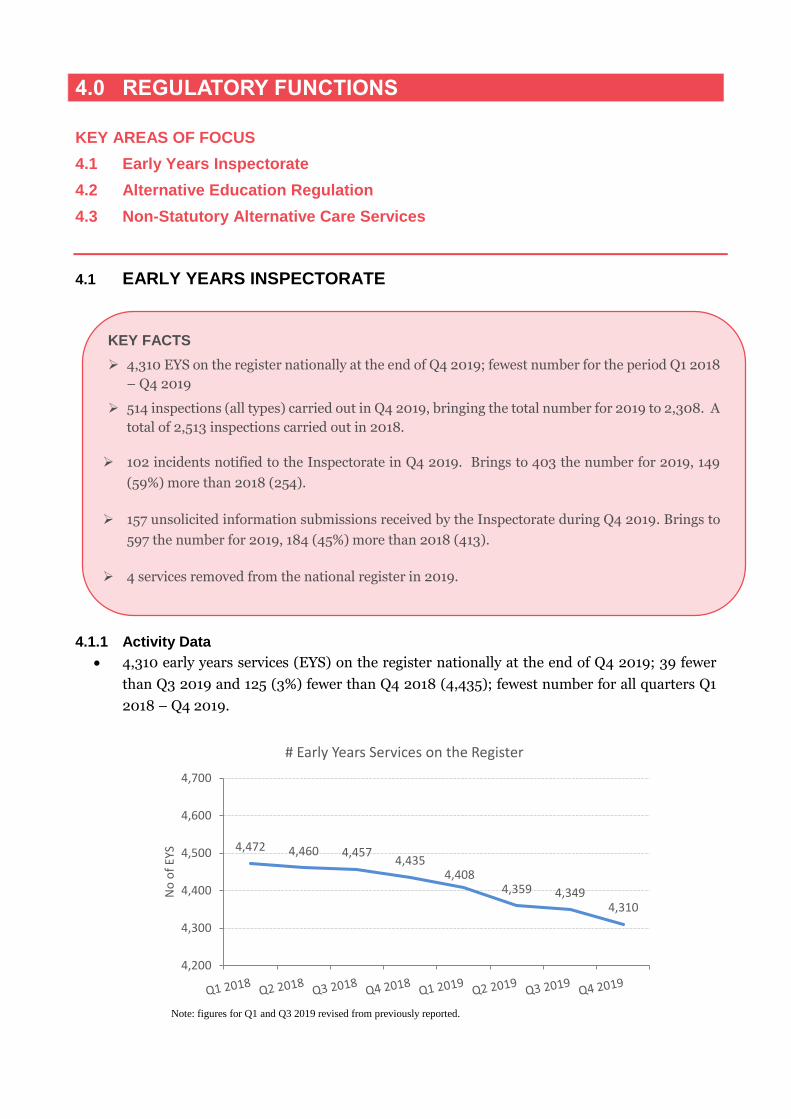
4.0 REGULATORY FUNCTIONS
KEY AREAS OF FOCUS
4.1 Early Years Inspectorate
4.2 Alternative Education Regulation
4.3 Non-Statutory Alternative Care Services
4.1 EARLY YEARS INSPECTORATE
4.1.1 Activity Data
4,310 early years services (EYS) on the register nationally at the end of Q4 2019; 39 fewer
than Q3 2019 and 125 (3%) fewer than Q4 2018 (4,435); fewest number for all quarters Q1
2018 – Q4 2019.
Note: figures for Q1 and Q3 2019 revised from previously reported.
4,472 4,460 4,4574,435
4,4084,359 4,349
4,310
4,200
4,300
4,400
4,500
4,600
4,700
No
of
EYS
# Early Years Services on the Register
KEY FACTS
4,310 EYS on the register nationally at the end of Q4 2019; fewest number for the period Q1 2018
– Q4 2019
514 inspections (all types) carried out in Q4 2019, bringing the total number for 2019 to 2,308. A
total of 2,513 inspections carried out in 2018.
102 incidents notified to the Inspectorate in Q4 2019. Brings to 403 the number for 2019, 149
(59%) more than 2018 (254).
157 unsolicited information submissions received by the Inspectorate during Q4 2019. Brings to
597 the number for 2019, 184 (45%) more than 2018 (413).
4 services removed from the national register in 2019.
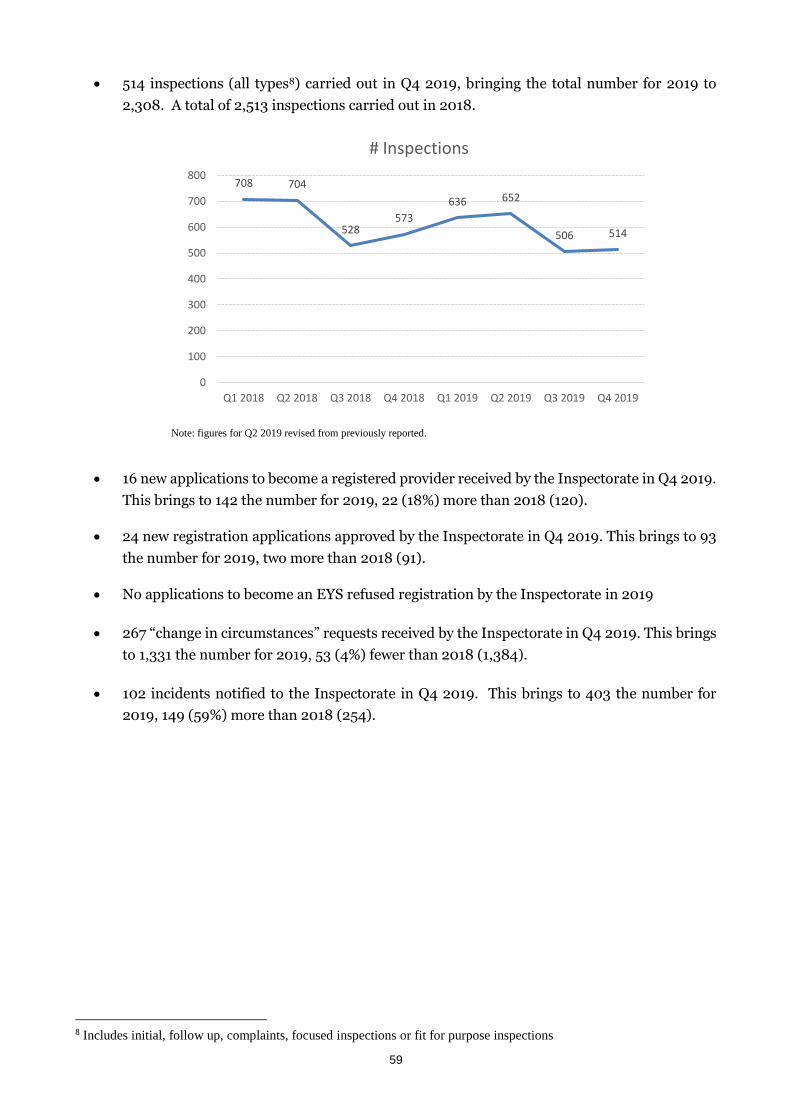
59
514 inspections (all types8) carried out in Q4 2019, bringing the total number for 2019 to
2,308. A total of 2,513 inspections carried out in 2018.
Note: figures for Q2 2019 revised from previously reported.
16 new applications to become a registered provider received by the Inspectorate in Q4 2019.
This brings to 142 the number for 2019, 22 (18%) more than 2018 (120).
24 new registration applications approved by the Inspectorate in Q4 2019. This brings to 93
the number for 2019, two more than 2018 (91).
No applications to become an EYS refused registration by the Inspectorate in 2019
267 “change in circumstances” requests received by the Inspectorate in Q4 2019. This brings
to 1,331 the number for 2019, 53 (4%) fewer than 2018 (1,384).
102 incidents notified to the Inspectorate in Q4 2019. This brings to 403 the number for
2019, 149 (59%) more than 2018 (254).
8 Includes initial, follow up, complaints, focused inspections or fit for purpose inspections
708 704
528573
636 652
506 514
0
100
200
300
400
500
600
700
800
Q1 2018 Q2 2018 Q3 2018 Q4 2018 Q1 2019 Q2 2019 Q3 2019 Q4 2019
# Inspections
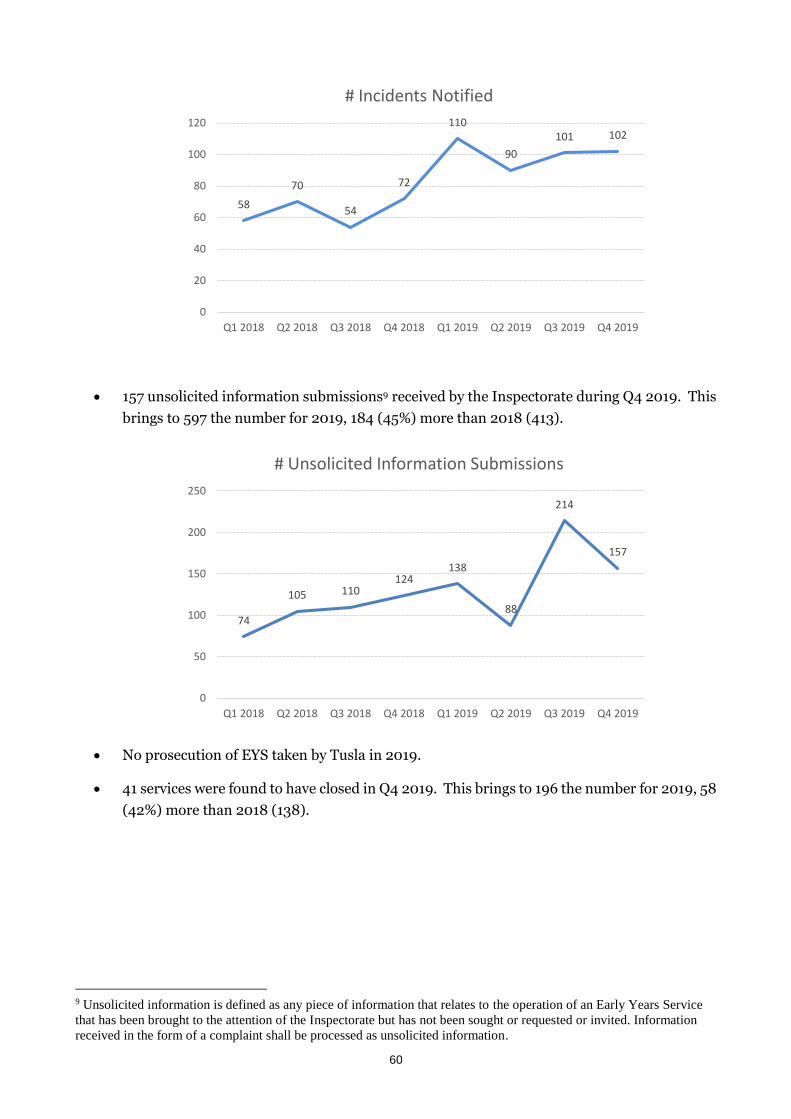
60
157 unsolicited information submissions9 received by the Inspectorate during Q4 2019. This
brings to 597 the number for 2019, 184 (45%) more than 2018 (413).
No prosecution of EYS taken by Tusla in 2019.
41 services were found to have closed in Q4 2019. This brings to 196 the number for 2019, 58
(42%) more than 2018 (138).
9 Unsolicited information is defined as any piece of information that relates to the operation of an Early Years Service
that has been brought to the attention of the Inspectorate but has not been sought or requested or invited. Information
received in the form of a complaint shall be processed as unsolicited information.
58
70
54
72
110
90
101 102
0
20
40
60
80
100
120
Q1 2018 Q2 2018 Q3 2018 Q4 2018 Q1 2019 Q2 2019 Q3 2019 Q4 2019
# Incidents Notified
74
105 110124
138
88
214
157
0
50
100
150
200
250
Q1 2018 Q2 2018 Q3 2018 Q4 2018 Q1 2019 Q2 2019 Q3 2019 Q4 2019
# Unsolicited Information Submissions
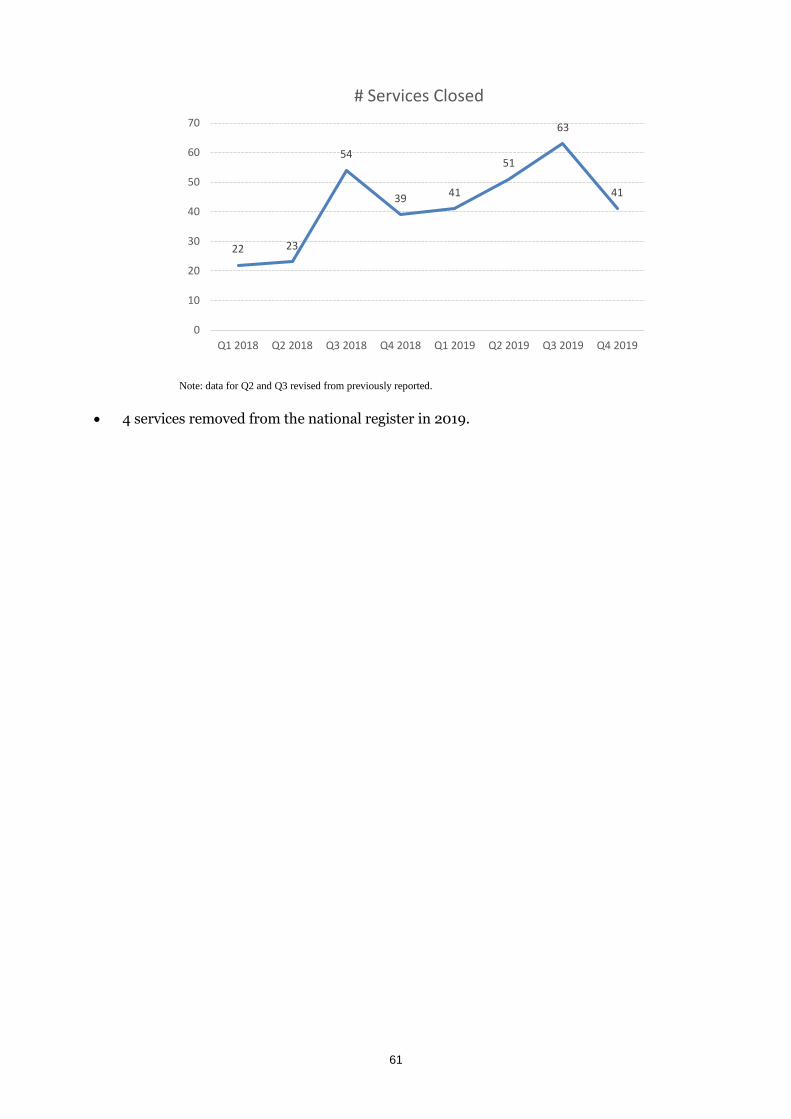
61
Note: data for Q2 and Q3 revised from previously reported.
4 services removed from the national register in 2019.
22 23
54
39 41
51
63
41
0
10
20
30
40
50
60
70
Q1 2018 Q2 2018 Q3 2018 Q4 2018 Q1 2019 Q2 2019 Q3 2019 Q4 2019
# Services Closed
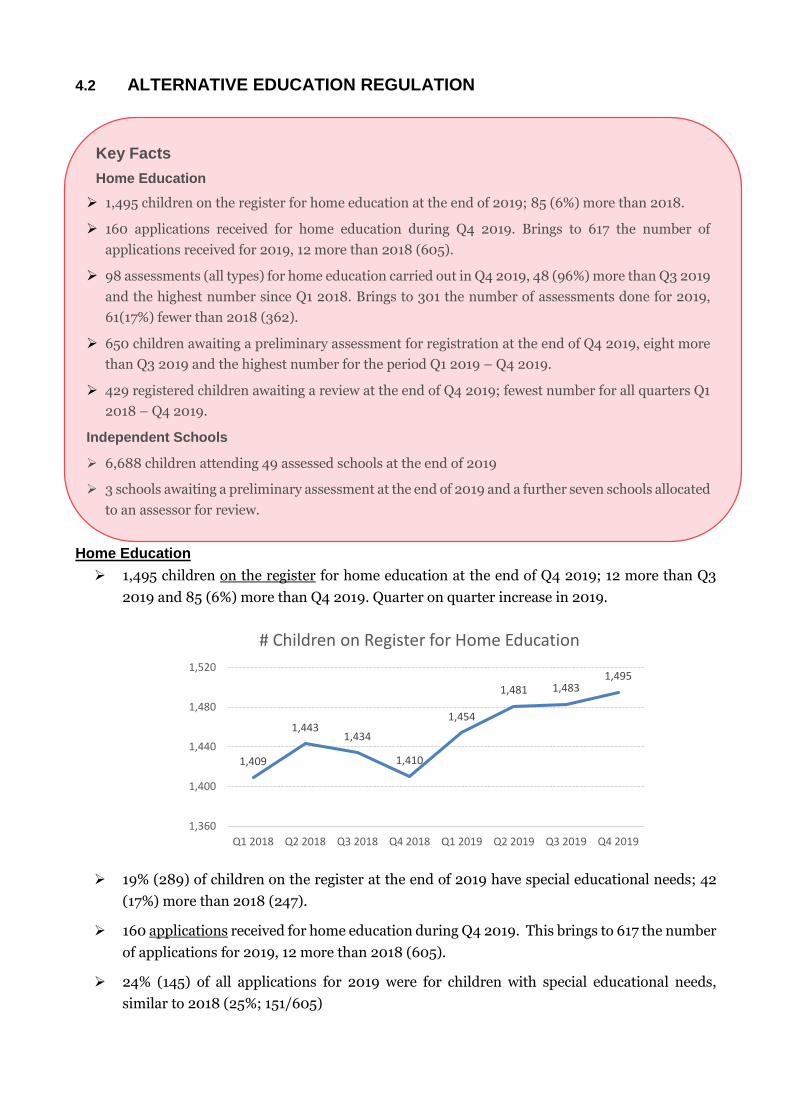
4.2 ALTERNATIVE EDUCATION REGULATION
Home Education
1,495 children on the register for home education at the end of Q4 2019; 12 more than Q3
2019 and 85 (6%) more than Q4 2019. Quarter on quarter increase in 2019.
19% (289) of children on the register at the end of 2019 have special educational needs; 42
(17%) more than 2018 (247).
160 applications received for home education during Q4 2019. This brings to 617 the number
of applications for 2019, 12 more than 2018 (605).
24% (145) of all applications for 2019 were for children with special educational needs,
similar to 2018 (25%; 151/605)
1,409
1,4431,434
1,410
1,454
1,481 1,4831,495
1,360
1,400
1,440
1,480
1,520
Q1 2018 Q2 2018 Q3 2018 Q4 2018 Q1 2019 Q2 2019 Q3 2019 Q4 2019
# Children on Register for Home Education
Key Facts
Home Education
1,495 children on the register for home education at the end of 2019; 85 (6%) more than 2018.
160 applications received for home education during Q4 2019. Brings to 617 the number of
applications received for 2019, 12 more than 2018 (605).
98 assessments (all types) for home education carried out in Q4 2019, 48 (96%) more than Q3 2019
and the highest number since Q1 2018. Brings to 301 the number of assessments done for 2019,
61(17%) fewer than 2018 (362).
650 children awaiting a preliminary assessment for registration at the end of Q4 2019, eight more
than Q3 2019 and the highest number for the period Q1 2019 – Q4 2019.
429 registered children awaiting a review at the end of Q4 2019; fewest number for all quarters Q1
2018 – Q4 2019.
Independent Schools
6,688 children attending 49 assessed schools at the end of 2019
3 schools awaiting a preliminary assessment at the end of 2019 and a further seven schools allocated
to an assessor for review.
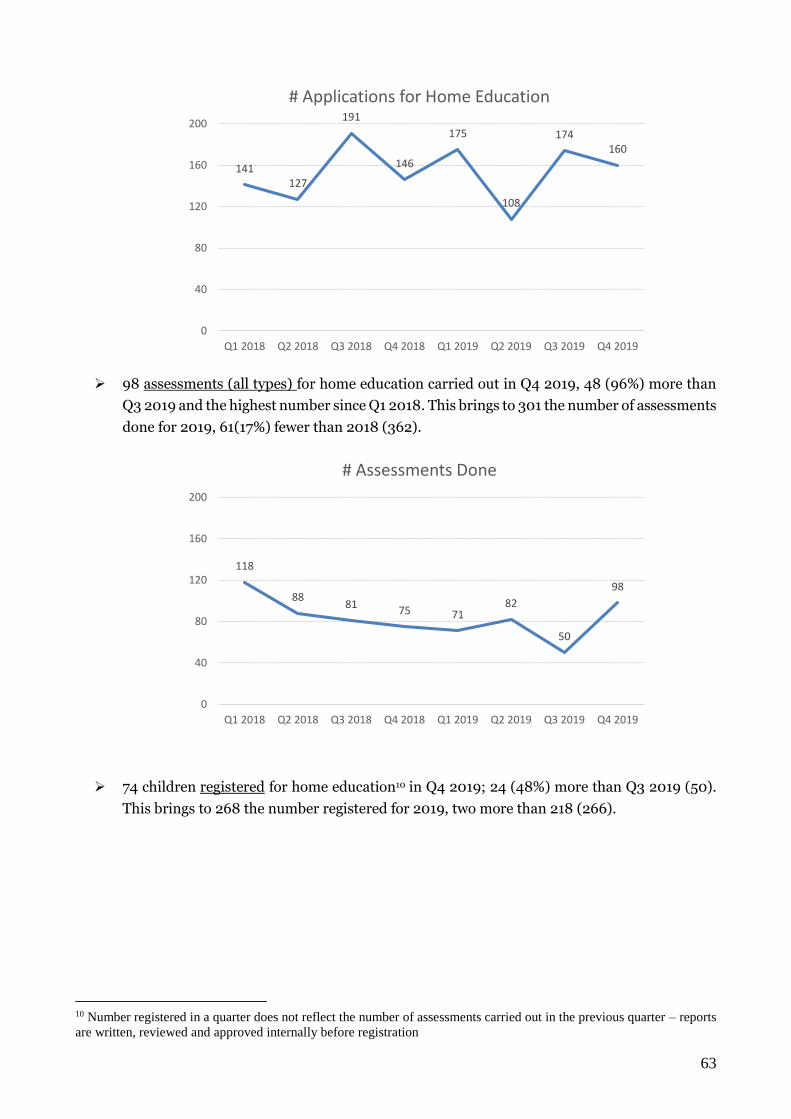
63
98 assessments (all types) for home education carried out in Q4 2019, 48 (96%) more than
Q3 2019 and the highest number since Q1 2018. This brings to 301 the number of assessments
done for 2019, 61(17%) fewer than 2018 (362).
74 children registered for home education10 in Q4 2019; 24 (48%) more than Q3 2019 (50).
This brings to 268 the number registered for 2019, two more than 218 (266).
10 Number registered in a quarter does not reflect the number of assessments carried out in the previous quarter – reports
are written, reviewed and approved internally before registration
141127
191
146
175
108
174160
0
40
80
120
160
200
Q1 2018 Q2 2018 Q3 2018 Q4 2018 Q1 2019 Q2 2019 Q3 2019 Q4 2019
# Applications for Home Education
118
8881
75 7182
50
98
0
40
80
120
160
200
Q1 2018 Q2 2018 Q3 2018 Q4 2018 Q1 2019 Q2 2019 Q3 2019 Q4 2019
# Assessments Done
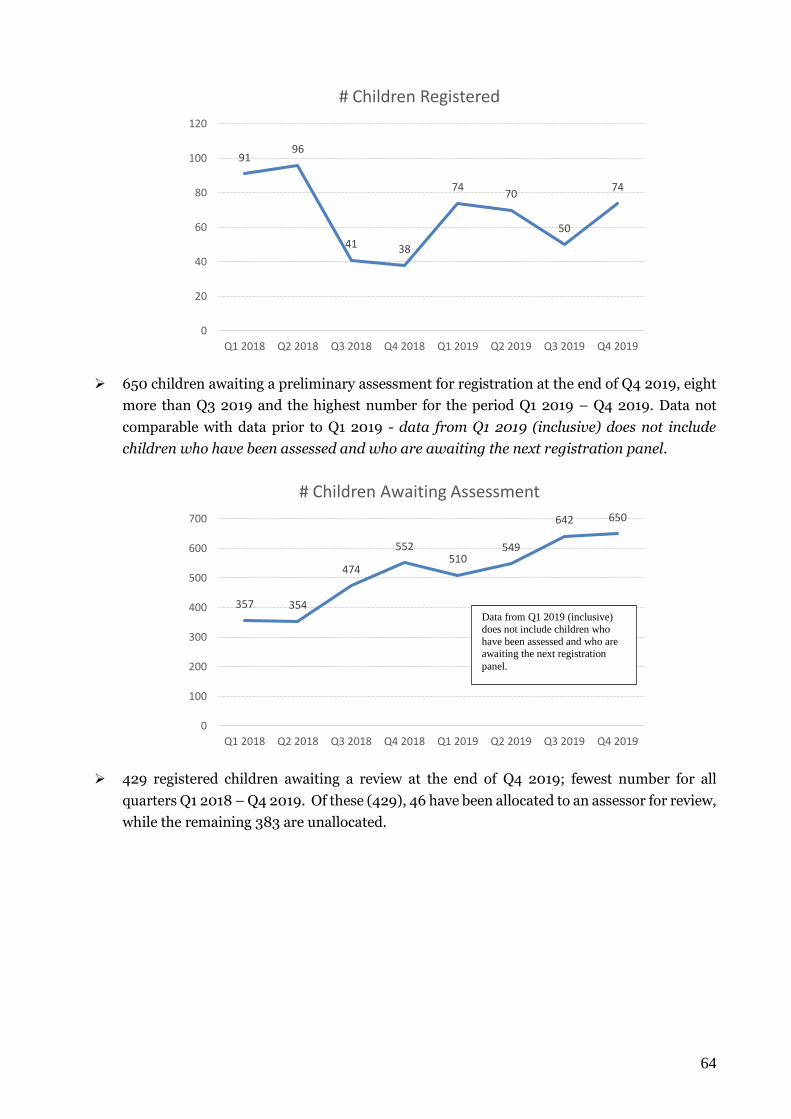
64
650 children awaiting a preliminary assessment for registration at the end of Q4 2019, eight
more than Q3 2019 and the highest number for the period Q1 2019 – Q4 2019. Data not
comparable with data prior to Q1 2019 - data from Q1 2019 (inclusive) does not include
children who have been assessed and who are awaiting the next registration panel.
429 registered children awaiting a review at the end of Q4 2019; fewest number for all
quarters Q1 2018 – Q4 2019. Of these (429), 46 have been allocated to an assessor for review,
while the remaining 383 are unallocated.
9196
41 38
7470
50
74
0
20
40
60
80
100
120
Q1 2018 Q2 2018 Q3 2018 Q4 2018 Q1 2019 Q2 2019 Q3 2019 Q4 2019
# Children Registered
357 354
474
552510
549
642 650
0
100
200
300
400
500
600
700
Q1 2018 Q2 2018 Q3 2018 Q4 2018 Q1 2019 Q2 2019 Q3 2019 Q4 2019
# Children Awaiting Assessment
Data from Q1 2019 (inclusive)
does not include children who
have been assessed and who are awaiting the next registration
panel.
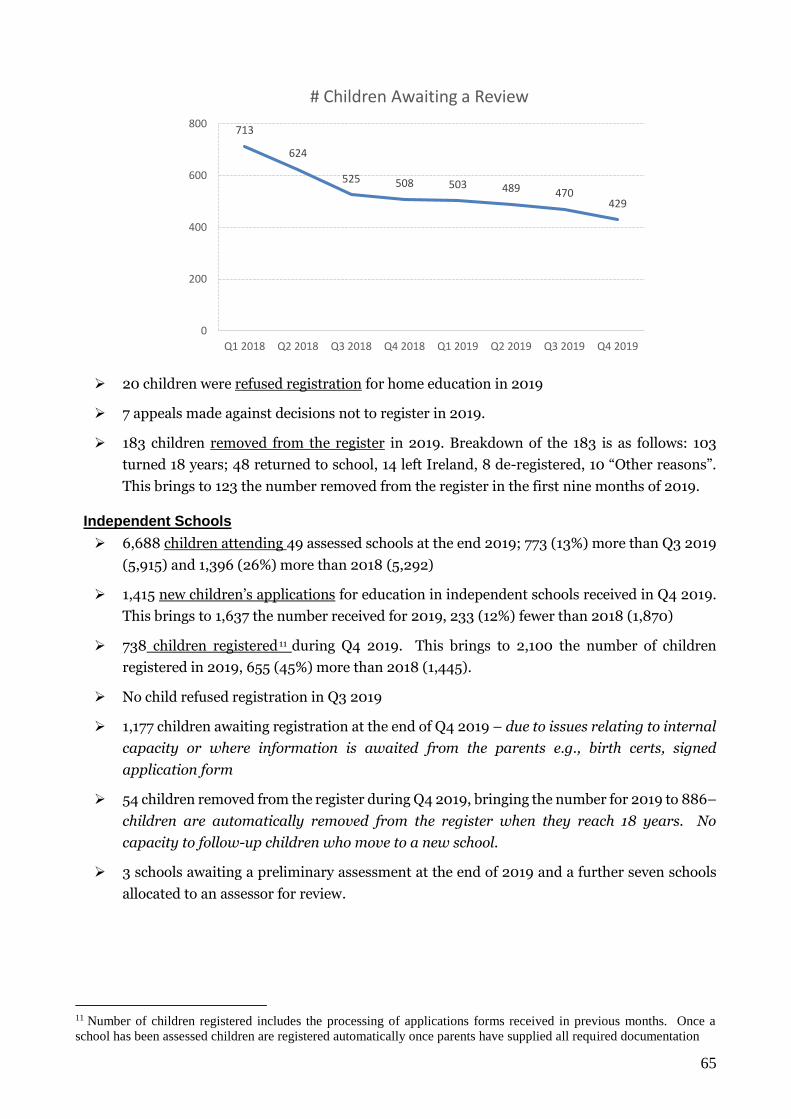
65
20 children were refused registration for home education in 2019
7 appeals made against decisions not to register in 2019.
183 children removed from the register in 2019. Breakdown of the 183 is as follows: 103
turned 18 years; 48 returned to school, 14 left Ireland, 8 de-registered, 10 “Other reasons”.
This brings to 123 the number removed from the register in the first nine months of 2019.
Independent Schools
6,688 children attending 49 assessed schools at the end 2019; 773 (13%) more than Q3 2019
(5,915) and 1,396 (26%) more than 2018 (5,292)
1,415 new children’s applications for education in independent schools received in Q4 2019.
This brings to 1,637 the number received for 2019, 233 (12%) fewer than 2018 (1,870)
738 children registered 11 during Q4 2019. This brings to 2,100 the number of children
registered in 2019, 655 (45%) more than 2018 (1,445).
No child refused registration in Q3 2019
1,177 children awaiting registration at the end of Q4 2019 – due to issues relating to internal
capacity or where information is awaited from the parents e.g., birth certs, signed
application form
54 children removed from the register during Q4 2019, bringing the number for 2019 to 886–
children are automatically removed from the register when they reach 18 years. No
capacity to follow-up children who move to a new school.
3 schools awaiting a preliminary assessment at the end of 2019 and a further seven schools
allocated to an assessor for review.
11 Number of children registered includes the processing of applications forms received in previous months. Once a
school has been assessed children are registered automatically once parents have supplied all required documentation
713
624
525 508 503 489 470429
0
200
400
600
800
Q1 2018 Q2 2018 Q3 2018 Q4 2018 Q1 2019 Q2 2019 Q3 2019 Q4 2019
# Children Awaiting a Review
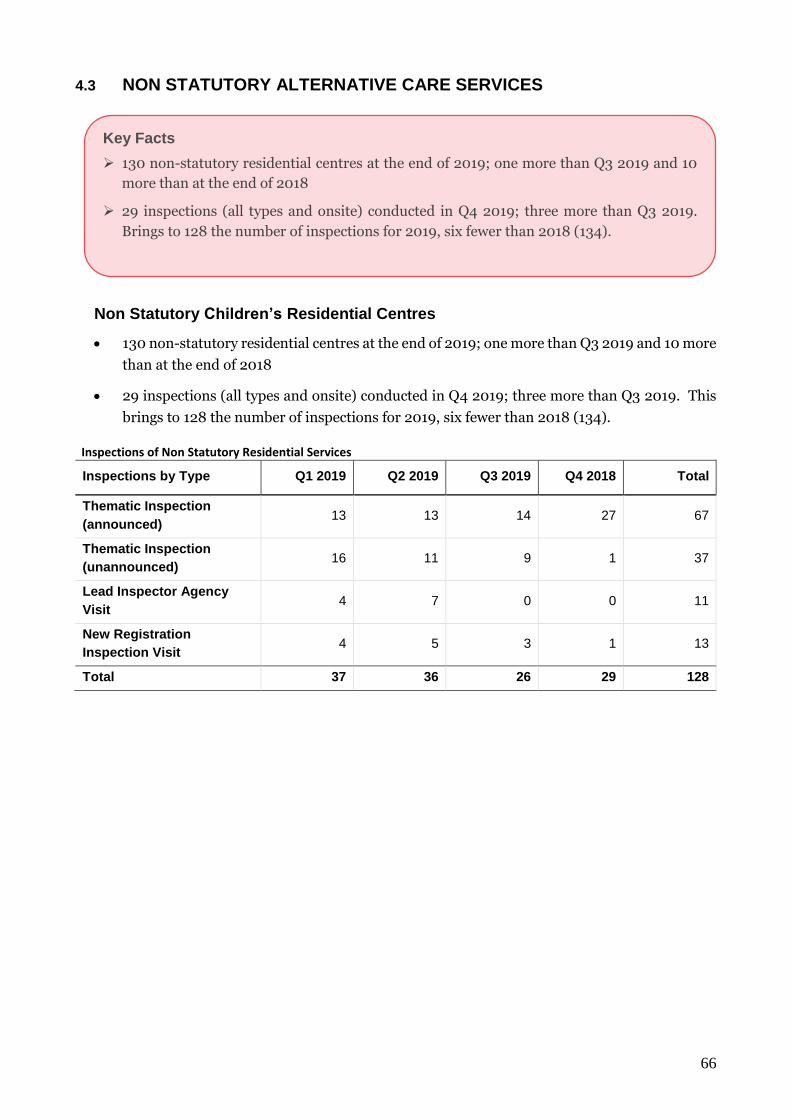
66
4.3 NON STATUTORY ALTERNATIVE CARE SERVICES
Non Statutory Children’s Residential Centres
130 non-statutory residential centres at the end of 2019; one more than Q3 2019 and 10 more
than at the end of 2018
29 inspections (all types and onsite) conducted in Q4 2019; three more than Q3 2019. This
brings to 128 the number of inspections for 2019, six fewer than 2018 (134).
Inspections of Non Statutory Residential Services
Inspections by Type Q1 2019 Q2 2019 Q3 2019 Q4 2018 Total
Thematic Inspection
(announced) 13 13 14 27 67
Thematic Inspection
(unannounced) 16 11 9 1 37
Lead Inspector Agency
Visit 4 7 0 0 11
New Registration
Inspection Visit 4 5 3 1 13
Total 37 36 26 29 128
Key Facts
130 non-statutory residential centres at the end of 2019; one more than Q3 2019 and 10
more than at the end of 2018
29 inspections (all types and onsite) conducted in Q4 2019; three more than Q3 2019.
Brings to 128 the number of inspections for 2019, six fewer than 2018 (134).
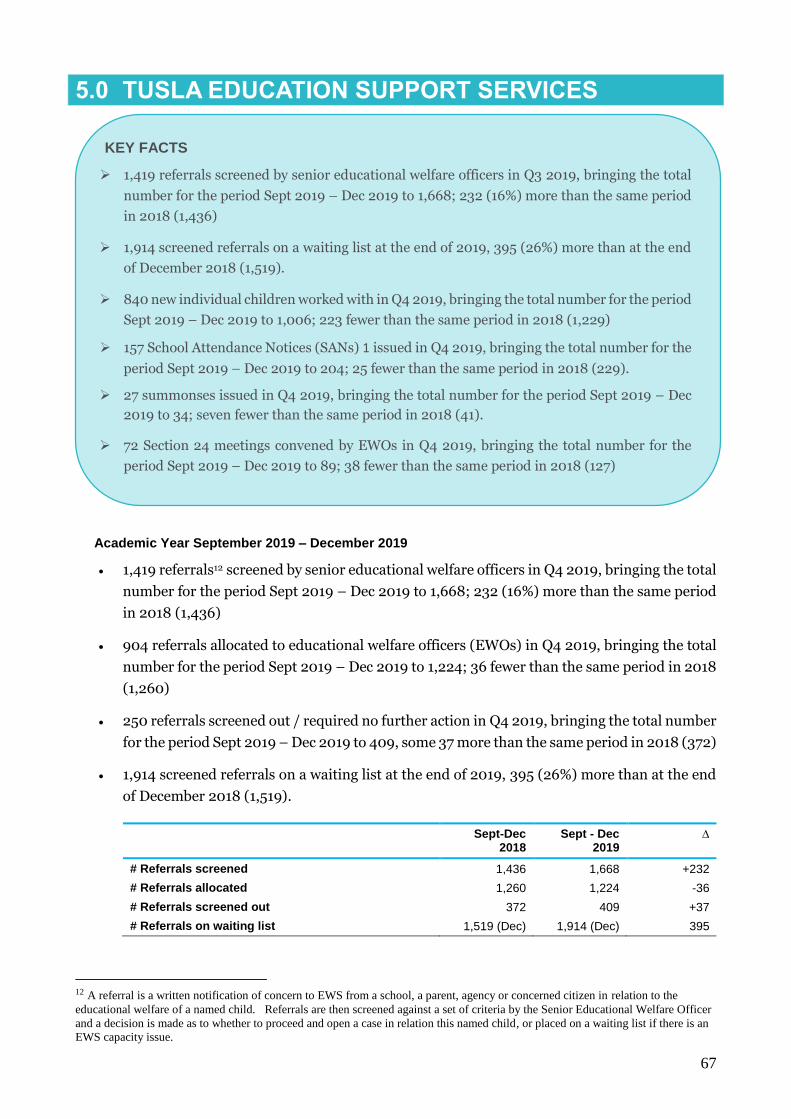
67
5.0 TUSLA EDUCATION SUPPORT SERVICES
Academic Year September 2019 – December 2019
1,419 referrals12 screened by senior educational welfare officers in Q4 2019, bringing the total
number for the period Sept 2019 – Dec 2019 to 1,668; 232 (16%) more than the same period
in 2018 (1,436)
904 referrals allocated to educational welfare officers (EWOs) in Q4 2019, bringing the total
number for the period Sept 2019 – Dec 2019 to 1,224; 36 fewer than the same period in 2018
(1,260)
250 referrals screened out / required no further action in Q4 2019, bringing the total number
for the period Sept 2019 – Dec 2019 to 409, some 37 more than the same period in 2018 (372)
1,914 screened referrals on a waiting list at the end of 2019, 395 (26%) more than at the end
of December 2018 (1,519).
Sept-Dec 2018
Sept - Dec 2019
∆
# Referrals screened 1,436 1,668 +232
# Referrals allocated 1,260 1,224 -36
# Referrals screened out 372 409 +37
# Referrals on waiting list 1,519 (Dec) 1,914 (Dec) 395
12 A referral is a written notification of concern to EWS from a school, a parent, agency or concerned citizen in relation to the
educational welfare of a named child. Referrals are then screened against a set of criteria by the Senior Educational Welfare Officer
and a decision is made as to whether to proceed and open a case in relation this named child, or placed on a waiting list if there is an
EWS capacity issue.
KEY FACTS
1,419 referrals screened by senior educational welfare officers in Q3 2019, bringing the total
number for the period Sept 2019 – Dec 2019 to 1,668; 232 (16%) more than the same period
in 2018 (1,436)
1,914 screened referrals on a waiting list at the end of 2019, 395 (26%) more than at the end
of December 2018 (1,519).
840 new individual children worked with in Q4 2019, bringing the total number for the period
Sept 2019 – Dec 2019 to 1,006; 223 fewer than the same period in 2018 (1,229)
157 School Attendance Notices (SANs) 1 issued in Q4 2019, bringing the total number for the
period Sept 2019 – Dec 2019 to 204; 25 fewer than the same period in 2018 (229).
27 summonses issued in Q4 2019, bringing the total number for the period Sept 2019 – Dec
2019 to 34; seven fewer than the same period in 2018 (41).
72 Section 24 meetings convened by EWOs in Q4 2019, bringing the total number for the
period Sept 2019 – Dec 2019 to 89; 38 fewer than the same period in 2018 (127)
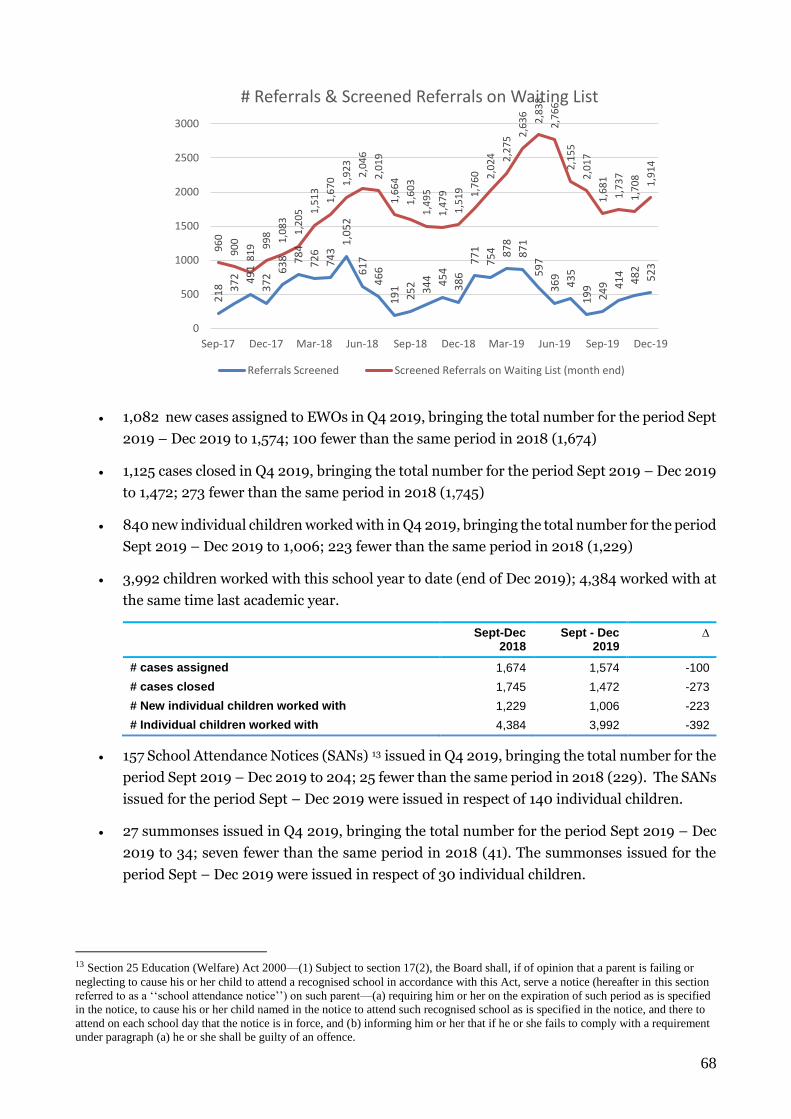
68
1,082 new cases assigned to EWOs in Q4 2019, bringing the total number for the period Sept
2019 – Dec 2019 to 1,574; 100 fewer than the same period in 2018 (1,674)
1,125 cases closed in Q4 2019, bringing the total number for the period Sept 2019 – Dec 2019
to 1,472; 273 fewer than the same period in 2018 (1,745)
840 new individual children worked with in Q4 2019, bringing the total number for the period
Sept 2019 – Dec 2019 to 1,006; 223 fewer than the same period in 2018 (1,229)
3,992 children worked with this school year to date (end of Dec 2019); 4,384 worked with at
the same time last academic year.
Sept-Dec 2018
Sept - Dec 2019
∆
# cases assigned 1,674 1,574 -100
# cases closed 1,745 1,472 -273
# New individual children worked with 1,229 1,006 -223
# Individual children worked with 4,384 3,992 -392
157 School Attendance Notices (SANs) 13 issued in Q4 2019, bringing the total number for the
period Sept 2019 – Dec 2019 to 204; 25 fewer than the same period in 2018 (229). The SANs
issued for the period Sept – Dec 2019 were issued in respect of 140 individual children.
27 summonses issued in Q4 2019, bringing the total number for the period Sept 2019 – Dec
2019 to 34; seven fewer than the same period in 2018 (41). The summonses issued for the
period Sept – Dec 2019 were issued in respect of 30 individual children.
13 Section 25 Education (Welfare) Act 2000—(1) Subject to section 17(2), the Board shall, if of opinion that a parent is failing or
neglecting to cause his or her child to attend a recognised school in accordance with this Act, serve a notice (hereafter in this section
referred to as a ‘‘school attendance notice’’) on such parent—(a) requiring him or her on the expiration of such period as is specified
in the notice, to cause his or her child named in the notice to attend such recognised school as is specified in the notice, and there to
attend on each school day that the notice is in force, and (b) informing him or her that if he or she fails to comply with a requirement
under paragraph (a) he or she shall be guilty of an offence.
21
8 37
2 49
1
37
2
63
8 78
4
72
6
74
3
1,0
52
61
7
46
6
19
1
25
2 34
4 45
4
38
6
77
1
75
4 87
8
87
1
59
7
36
9
43
5
19
9
24
9 41
4
48
2
52
3
96
0
90
0
81
9 99
8
1,0
83
1,2
05 1
,51
3
1,6
70 1,9
23
2,0
46
2,0
19
1,6
64
1,6
03
1,4
95
1,4
79
1,5
19 1,7
60 2,0
24 2,2
75 2
,63
6
2,8
38
2,7
66
2,1
55
2,0
17
1,6
81
1,7
37
1,7
08
1,9
14
0
500
1000
1500
2000
2500
3000
Sep-17 Dec-17 Mar-18 Jun-18 Sep-18 Dec-18 Mar-19 Jun-19 Sep-19 Dec-19
# Referrals & Screened Referrals on Waiting List
Referrals Screened Screened Referrals on Waiting List (month end)
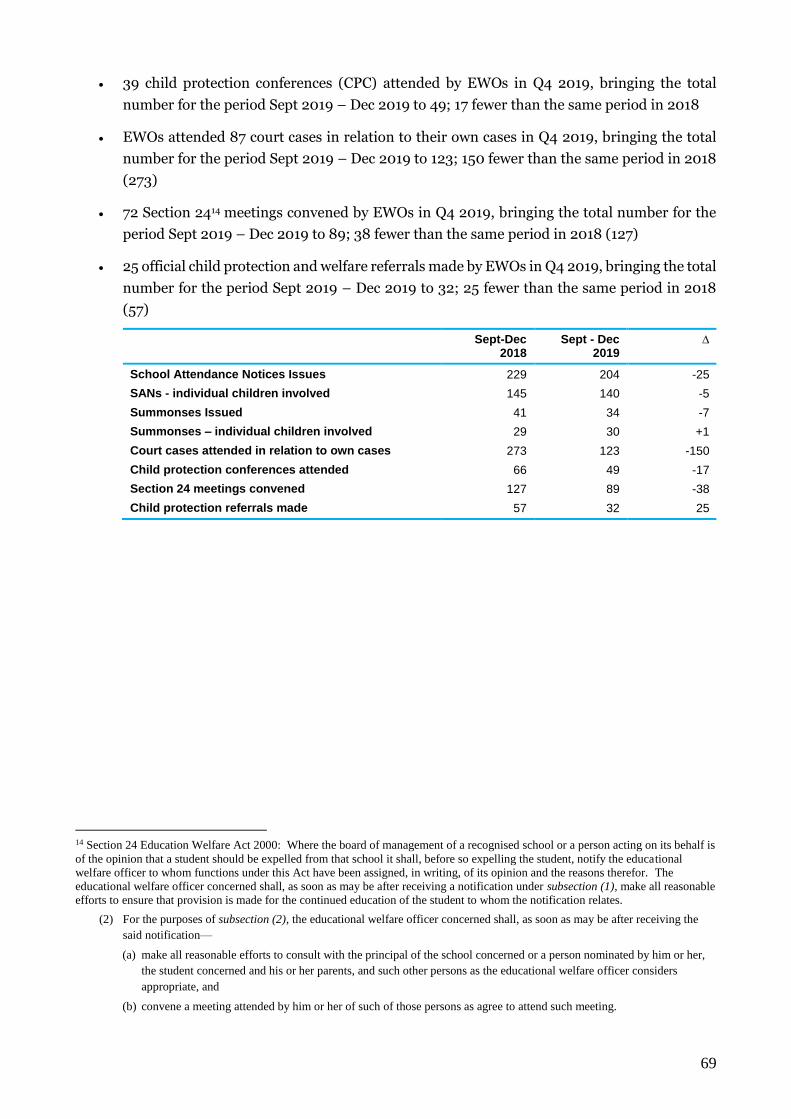
69
39 child protection conferences (CPC) attended by EWOs in Q4 2019, bringing the total
number for the period Sept 2019 – Dec 2019 to 49; 17 fewer than the same period in 2018
EWOs attended 87 court cases in relation to their own cases in Q4 2019, bringing the total
number for the period Sept 2019 – Dec 2019 to 123; 150 fewer than the same period in 2018
(273)
72 Section 2414 meetings convened by EWOs in Q4 2019, bringing the total number for the
period Sept 2019 – Dec 2019 to 89; 38 fewer than the same period in 2018 (127)
25 official child protection and welfare referrals made by EWOs in Q4 2019, bringing the total
number for the period Sept 2019 – Dec 2019 to 32; 25 fewer than the same period in 2018
(57)
Sept-Dec 2018
Sept - Dec 2019
∆
School Attendance Notices Issues 229 204 -25
SANs - individual children involved 145 140 -5
Summonses Issued 41 34 -7
Summonses – individual children involved 29 30 +1
Court cases attended in relation to own cases 273 123 -150
Child protection conferences attended 66 49 -17
Section 24 meetings convened 127 89 -38
Child protection referrals made 57 32 25
14 Section 24 Education Welfare Act 2000: Where the board of management of a recognised school or a person acting on its behalf is
of the opinion that a student should be expelled from that school it shall, before so expelling the student, notify the educational
welfare officer to whom functions under this Act have been assigned, in writing, of its opinion and the reasons therefor. The
educational welfare officer concerned shall, as soon as may be after receiving a notification under subsection (1), make all reasonable
efforts to ensure that provision is made for the continued education of the student to whom the notification relates.
(2) For the purposes of subsection (2), the educational welfare officer concerned shall, as soon as may be after receiving the
said notification—
(a) make all reasonable efforts to consult with the principal of the school concerned or a person nominated by him or her,
the student concerned and his or her parents, and such other persons as the educational welfare officer considers
appropriate, and
(b) convene a meeting attended by him or her of such of those persons as agree to attend such meeting.
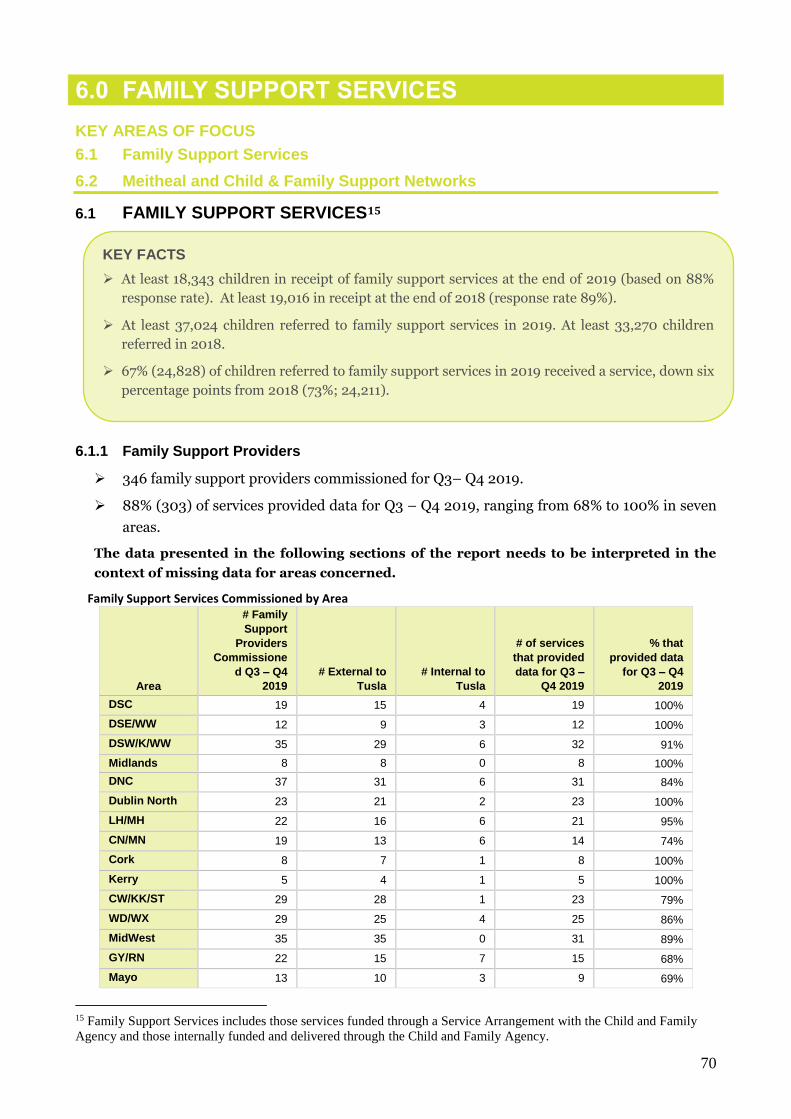
70
6.0 FAMILY SUPPORT SERVICES
KEY AREAS OF FOCUS
6.1 Family Support Services
6.2 Meitheal and Child & Family Support Networks
6.1 FAMILY SUPPORT SERVICES15
6.1.1 Family Support Providers
346 family support providers commissioned for Q3– Q4 2019.
88% (303) of services provided data for Q3 – Q4 2019, ranging from 68% to 100% in seven
areas.
The data presented in the following sections of the report needs to be interpreted in the
context of missing data for areas concerned.
Family Support Services Commissioned by Area
Area
# Family
Support
Providers
Commissione
d Q3 – Q4
2019
# External to
Tusla
# Internal to
Tusla
# of services
that provided
data for Q3 –
Q4 2019
% that
provided data
for Q3 – Q4
2019
DSC 19 15 4 19 100%
DSE/WW 12 9 3 12 100%
DSW/K/WW 35 29 6 32 91%
Midlands 8 8 0 8 100%
DNC 37 31 6 31 84%
Dublin North 23 21 2 23 100%
LH/MH 22 16 6 21 95%
CN/MN 19 13 6 14 74%
Cork 8 7 1 8 100%
Kerry 5 4 1 5 100%
CW/KK/ST 29 28 1 23 79%
WD/WX 29 25 4 25 86%
MidWest 35 35 0 31 89%
GY/RN 22 15 7 15 68%
Mayo 13 10 3 9 69%
15 Family Support Services includes those services funded through a Service Arrangement with the Child and Family
Agency and those internally funded and delivered through the Child and Family Agency.
KEY FACTS
At least 18,343 children in receipt of family support services at the end of 2019 (based on 88%
response rate). At least 19,016 in receipt at the end of 2018 (response rate 89%).
At least 37,024 children referred to family support services in 2019. At least 33,270 children
referred in 2018.
67% (24,828) of children referred to family support services in 2019 received a service, down six
percentage points from 2018 (73%; 24,211).
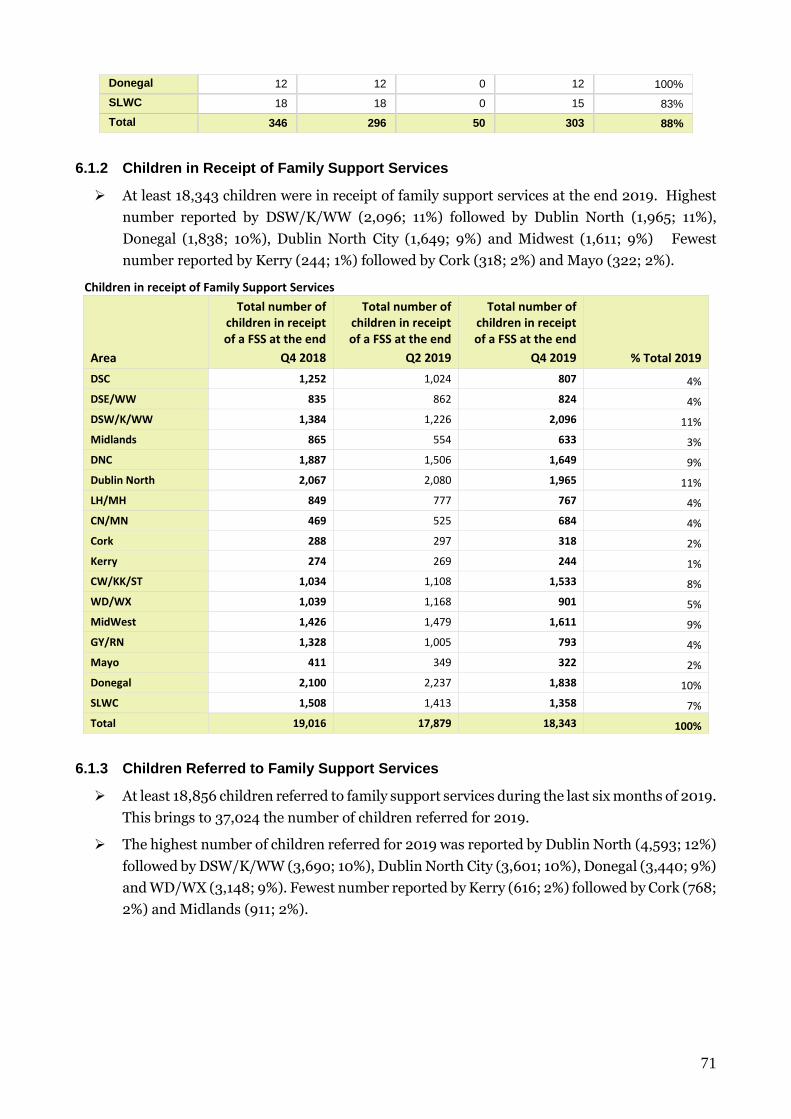
71
Donegal 12 12 0 12 100%
SLWC 18 18 0 15 83%
Total 346 296 50 303 88%
6.1.2 Children in Receipt of Family Support Services
At least 18,343 children were in receipt of family support services at the end 2019. Highest
number reported by DSW/K/WW (2,096; 11%) followed by Dublin North (1,965; 11%),
Donegal (1,838; 10%), Dublin North City (1,649; 9%) and Midwest (1,611; 9%) Fewest
number reported by Kerry (244; 1%) followed by Cork (318; 2%) and Mayo (322; 2%).
Children in receipt of Family Support Services
Area
Total number of children in receipt of a FSS at the end
Q4 2018
Total number of children in receipt of a FSS at the end
Q2 2019
Total number of children in receipt of a FSS at the end
Q4 2019 % Total 2019
DSC 1,252 1,024 807 4%
DSE/WW 835 862 824 4%
DSW/K/WW 1,384 1,226 2,096 11%
Midlands 865 554 633 3%
DNC 1,887 1,506 1,649 9%
Dublin North 2,067 2,080 1,965 11%
LH/MH 849 777 767 4%
CN/MN 469 525 684 4%
Cork 288 297 318 2%
Kerry 274 269 244 1%
CW/KK/ST 1,034 1,108 1,533 8%
WD/WX 1,039 1,168 901 5%
MidWest 1,426 1,479 1,611 9%
GY/RN 1,328 1,005 793 4%
Mayo 411 349 322 2%
Donegal 2,100 2,237 1,838 10%
SLWC 1,508 1,413 1,358 7%
Total 19,016 17,879 18,343 100%
6.1.3 Children Referred to Family Support Services
At least 18,856 children referred to family support services during the last six months of 2019.
This brings to 37,024 the number of children referred for 2019.
The highest number of children referred for 2019 was reported by Dublin North (4,593; 12%)
followed by DSW/K/WW (3,690; 10%), Dublin North City (3,601; 10%), Donegal (3,440; 9%)
and WD/WX (3,148; 9%). Fewest number reported by Kerry (616; 2%) followed by Cork (768;
2%) and Midlands (911; 2%).
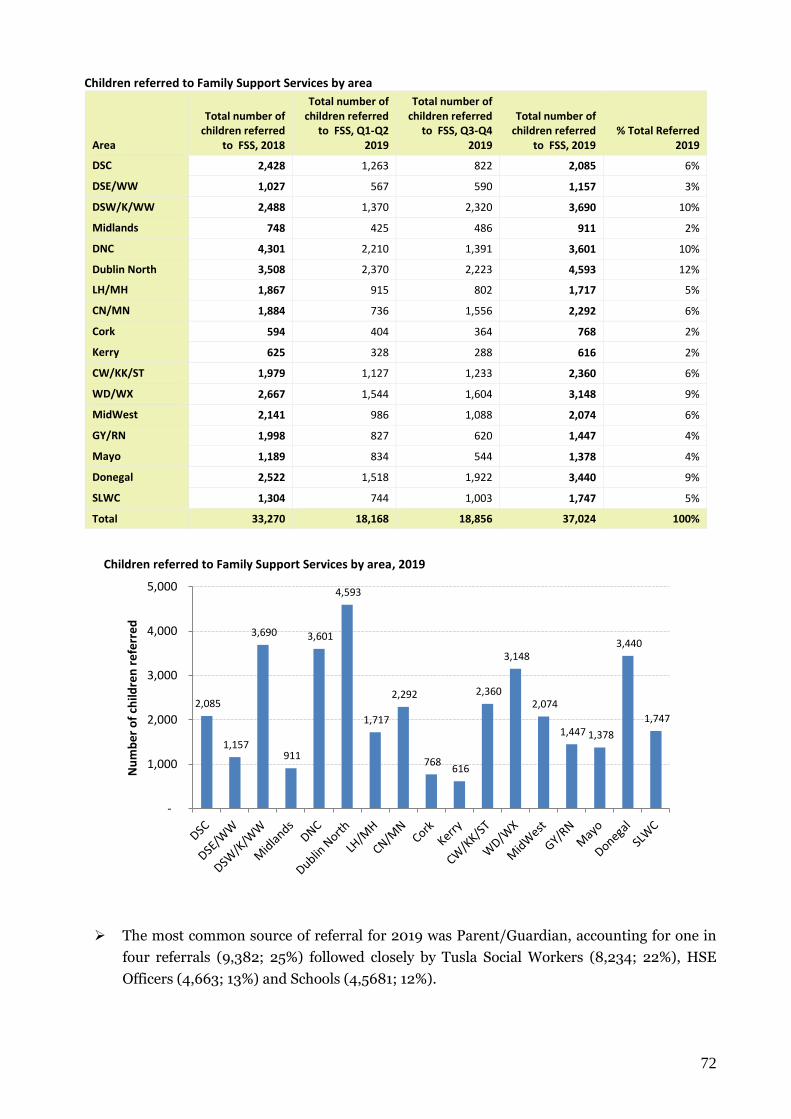
72
Children referred to Family Support Services by area
Area
Total number of children referred
to FSS, 2018
Total number of children referred
to FSS, Q1-Q2 2019
Total number of children referred
to FSS, Q3-Q4 2019
Total number of children referred
to FSS, 2019 % Total Referred
2019
DSC 2,428 1,263 822 2,085 6%
DSE/WW 1,027 567 590 1,157 3%
DSW/K/WW 2,488 1,370 2,320 3,690 10%
Midlands 748 425 486 911 2%
DNC 4,301 2,210 1,391 3,601 10%
Dublin North 3,508 2,370 2,223 4,593 12%
LH/MH 1,867 915 802 1,717 5%
CN/MN 1,884 736 1,556 2,292 6%
Cork 594 404 364 768 2%
Kerry 625 328 288 616 2%
CW/KK/ST 1,979 1,127 1,233 2,360 6%
WD/WX 2,667 1,544 1,604 3,148 9%
MidWest 2,141 986 1,088 2,074 6%
GY/RN 1,998 827 620 1,447 4%
Mayo 1,189 834 544 1,378 4%
Donegal 2,522 1,518 1,922 3,440 9%
SLWC 1,304 744 1,003 1,747 5%
Total 33,270 18,168 18,856 37,024 100%
Children referred to Family Support Services by area, 2019
The most common source of referral for 2019 was Parent/Guardian, accounting for one in
four referrals (9,382; 25%) followed closely by Tusla Social Workers (8,234; 22%), HSE
Officers (4,663; 13%) and Schools (4,5681; 12%).
2,085
1,157
3,690
911
3,601
4,593
1,717
2,292
768 616
2,360
3,148
2,074
1,447 1,378
3,440
1,747
-
1,000
2,000
3,000
4,000
5,000
Nu
mb
er
of
child
ren
re
ferr
ed
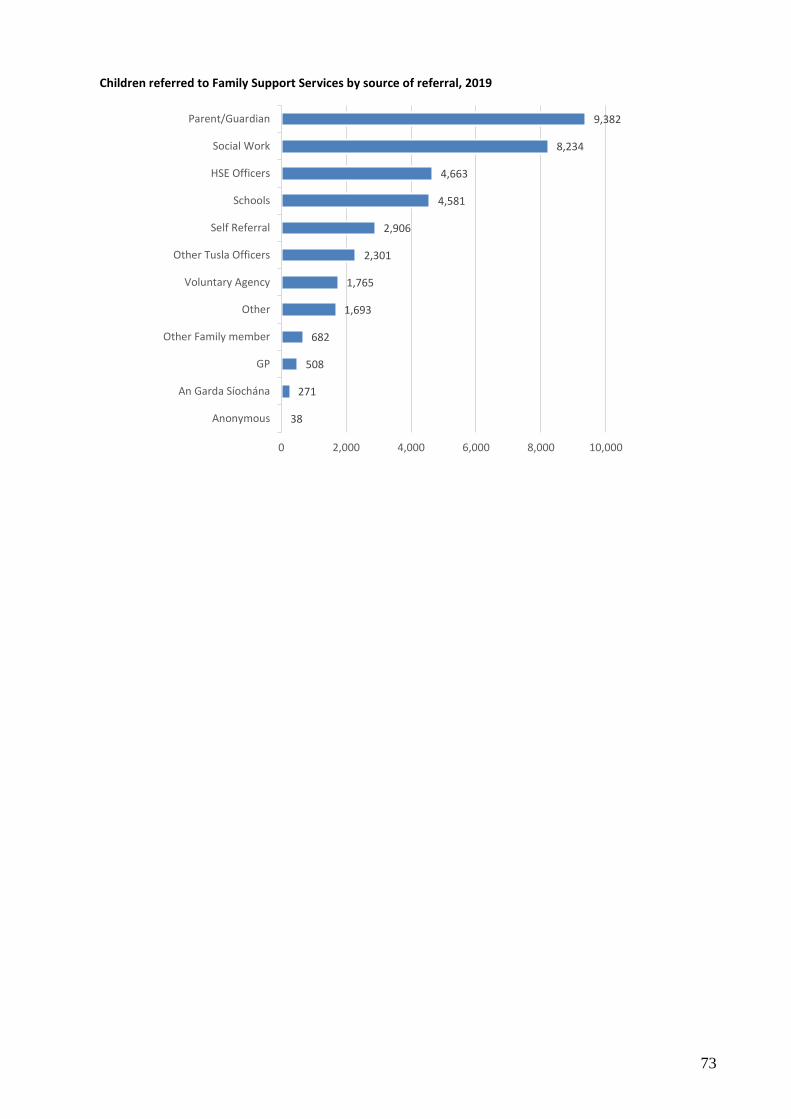
73
Children referred to Family Support Services by source of referral, 2019
9,382
8,234
4,663
4,581
2,906
2,301
1,765
1,693
682
508
271
38
Parent/Guardian
Social Work
HSE Officers
Schools
Self Referral
Other Tusla Officers
Voluntary Agency
Other
Other Family member
GP
An Garda Síochána
Anonymous
0 2,000 4,000 6,000 8,000 10,000
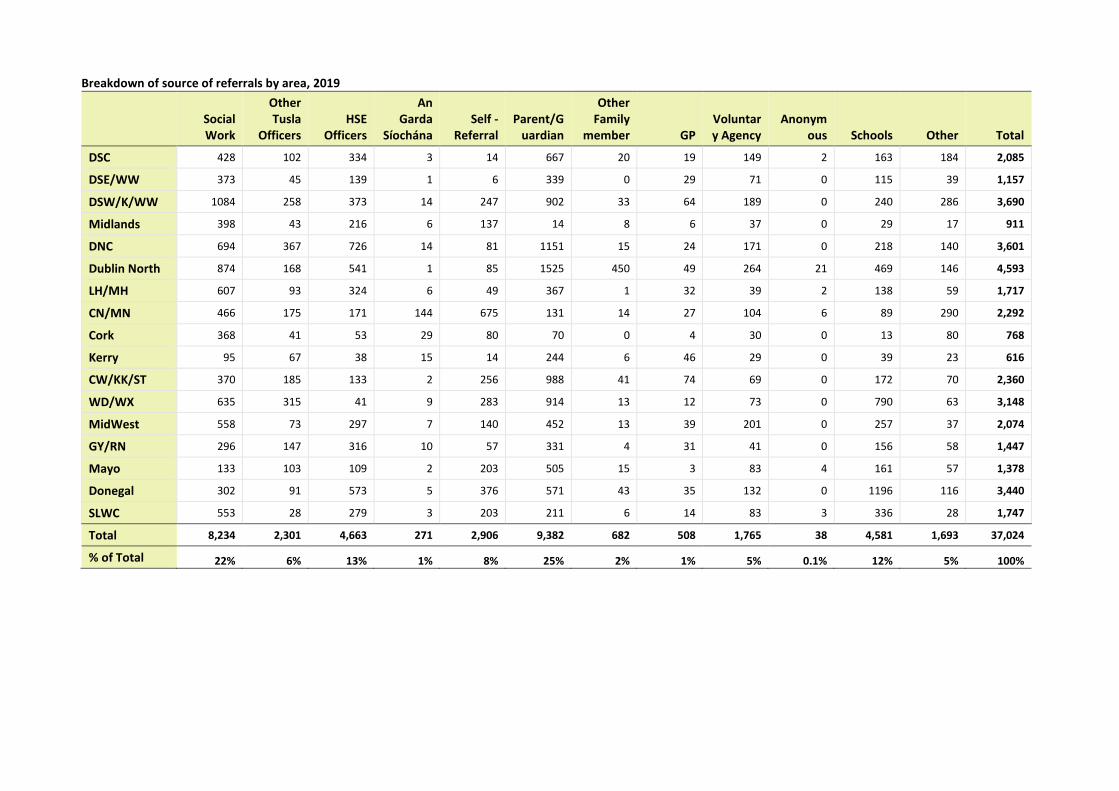
Breakdown of source of referrals by area, 2019
Social Work
Other Tusla
Officers HSE
Officers
An Garda
Síochána Self -
Referral Parent/G
uardian
Other Family
member GP Voluntary Agency
Anonymous Schools Other Total
DSC 428 102 334 3 14 667 20 19 149 2 163 184 2,085
DSE/WW 373 45 139 1 6 339 0 29 71 0 115 39 1,157
DSW/K/WW 1084 258 373 14 247 902 33 64 189 0 240 286 3,690
Midlands 398 43 216 6 137 14 8 6 37 0 29 17 911
DNC 694 367 726 14 81 1151 15 24 171 0 218 140 3,601
Dublin North 874 168 541 1 85 1525 450 49 264 21 469 146 4,593
LH/MH 607 93 324 6 49 367 1 32 39 2 138 59 1,717
CN/MN 466 175 171 144 675 131 14 27 104 6 89 290 2,292
Cork 368 41 53 29 80 70 0 4 30 0 13 80 768
Kerry 95 67 38 15 14 244 6 46 29 0 39 23 616
CW/KK/ST 370 185 133 2 256 988 41 74 69 0 172 70 2,360
WD/WX 635 315 41 9 283 914 13 12 73 0 790 63 3,148
MidWest 558 73 297 7 140 452 13 39 201 0 257 37 2,074
GY/RN 296 147 316 10 57 331 4 31 41 0 156 58 1,447
Mayo 133 103 109 2 203 505 15 3 83 4 161 57 1,378
Donegal 302 91 573 5 376 571 43 35 132 0 1196 116 3,440
SLWC 553 28 279 3 203 211 6 14 83 3 336 28 1,747
Total 8,234 2,301 4,663 271 2,906 9,382 682 508 1,765 38 4,581 1,693 37,024
% of Total 22% 6% 13% 1% 8% 25% 2% 1% 5% 0.1% 12% 5% 100%
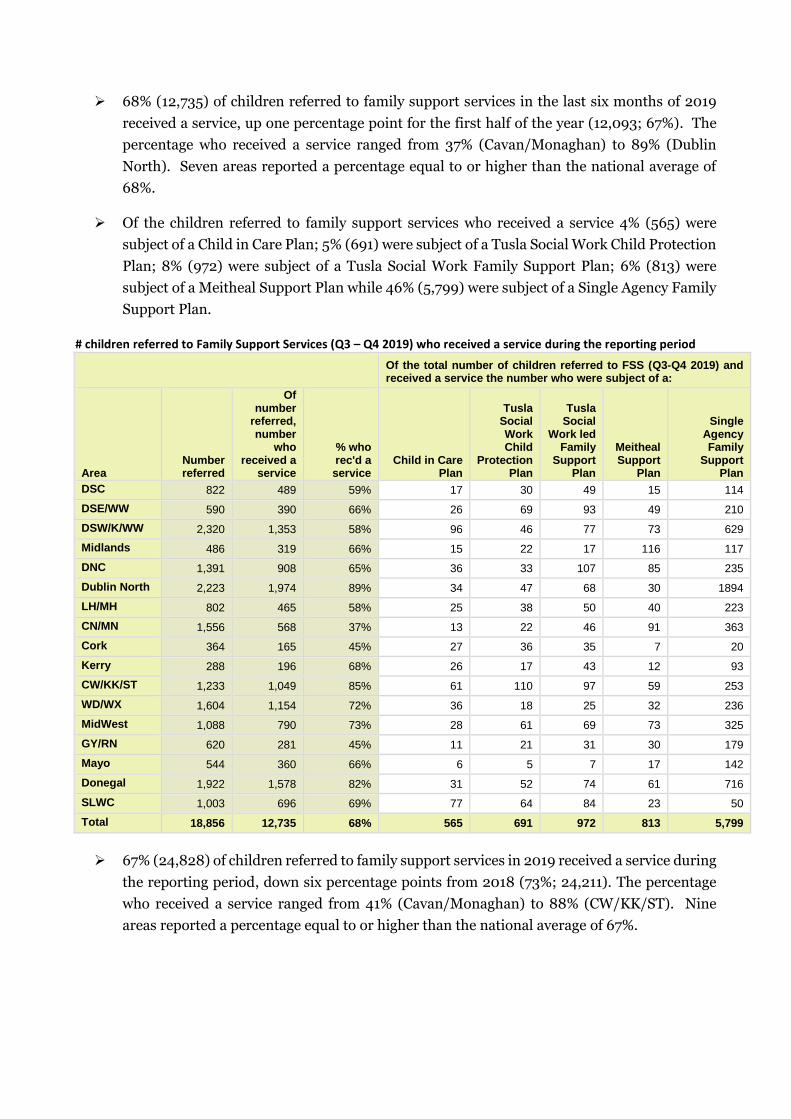
68% (12,735) of children referred to family support services in the last six months of 2019
received a service, up one percentage point for the first half of the year (12,093; 67%). The
percentage who received a service ranged from 37% (Cavan/Monaghan) to 89% (Dublin
North). Seven areas reported a percentage equal to or higher than the national average of
68%.
Of the children referred to family support services who received a service 4% (565) were
subject of a Child in Care Plan; 5% (691) were subject of a Tusla Social Work Child Protection
Plan; 8% (972) were subject of a Tusla Social Work Family Support Plan; 6% (813) were
subject of a Meitheal Support Plan while 46% (5,799) were subject of a Single Agency Family
Support Plan.
# children referred to Family Support Services (Q3 – Q4 2019) who received a service during the reporting period
Of the total number of children referred to FSS (Q3-Q4 2019) and received a service the number who were subject of a:
Area Number referred
Of number
referred, number
who received a
service
% who rec'd a service
Child in Care Plan
Tusla Social Work Child
Protection Plan
Tusla Social
Work led Family
Support Plan
Meitheal Support
Plan
Single Agency Family
Support Plan
DSC 822 489 59% 17 30 49 15 114
DSE/WW 590 390 66% 26 69 93 49 210
DSW/K/WW 2,320 1,353 58% 96 46 77 73 629
Midlands 486 319 66% 15 22 17 116 117
DNC 1,391 908 65% 36 33 107 85 235
Dublin North 2,223 1,974 89% 34 47 68 30 1894
LH/MH 802 465 58% 25 38 50 40 223
CN/MN 1,556 568 37% 13 22 46 91 363
Cork 364 165 45% 27 36 35 7 20
Kerry 288 196 68% 26 17 43 12 93
CW/KK/ST 1,233 1,049 85% 61 110 97 59 253
WD/WX 1,604 1,154 72% 36 18 25 32 236
MidWest 1,088 790 73% 28 61 69 73 325
GY/RN 620 281 45% 11 21 31 30 179
Mayo 544 360 66% 6 5 7 17 142
Donegal 1,922 1,578 82% 31 52 74 61 716
SLWC 1,003 696 69% 77 64 84 23 50
Total 18,856 12,735 68% 565 691 972 813 5,799
67% (24,828) of children referred to family support services in 2019 received a service during
the reporting period, down six percentage points from 2018 (73%; 24,211). The percentage
who received a service ranged from 41% (Cavan/Monaghan) to 88% (CW/KK/ST). Nine
areas reported a percentage equal to or higher than the national average of 67%.
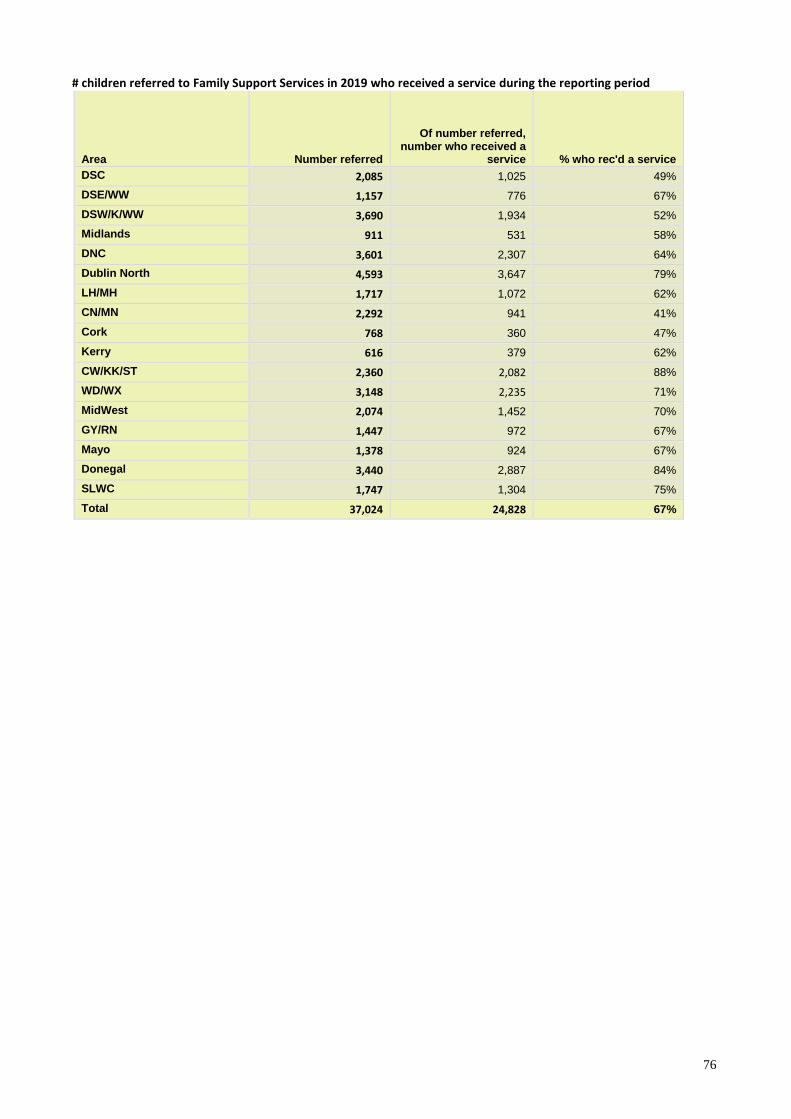
76
# children referred to Family Support Services in 2019 who received a service during the reporting period
Area Number referred
Of number referred, number who received a
service % who rec'd a service
DSC 2,085 1,025 49%
DSE/WW 1,157 776 67%
DSW/K/WW 3,690 1,934 52%
Midlands 911 531 58%
DNC 3,601 2,307 64%
Dublin North 4,593 3,647 79%
LH/MH 1,717 1,072 62%
CN/MN 2,292 941 41%
Cork 768 360 47%
Kerry 616 379 62%
CW/KK/ST 2,360 2,082 88%
WD/WX 3,148 2,235 71%
MidWest 2,074 1,452 70%
GY/RN 1,447 972 67%
Mayo 1,378 924 67%
Donegal 3,440 2,887 84%
SLWC 1,747 1,304 75%
Total 37,024 24,828 67%
77
6.2 MEITHEAL
A key component of Tusla’s Prevention, Partnership and Family Support (PPFS) programme
of work is the roll-out of Meitheal - a national practice model (common approach to
practice) for all agencies working with children, young people and their families. This model
is designed to ensure that the needs and strengths of children and their families are effectively
identified and understood and responded to in a timely way so that children and families get
the help and support needed to improve children’s outcomes and realise their rights. It is an
early intervention response tailored to the needs of an individual child or young person and
is used where more than one agency involvement is needed. There are three stages of the
Meitheal process; preparation, discussion and delivery.
6.2.1 Meitheal Activity Data
1,055 Meitheal processes requested during the last six months of 2019, 220 (17%) fewer than
the first six months (1,275). This brings to 2,330 the number for 2019, 596 (34%) more than
2018 (1,734)
Highest number of requests for 2019 was reported by Dublin North (565; 24%) followed by
Cork (289; 12%), Waterford/Wexford (179; 8%), CW/K/ST (153; 7%) and GY/RN (147; 6%).
The fewest number was reported by Sligo/Leitrim/West Cavan (42; 2%) followed by Dublin
South Central (43; 2%).
Two areas reported fewer than 50 requests, seven areas reported 50-100 requests with the
remaining eight areas reporting between 100 – 200 requests.
KEY FACTS
2,330 Meitheal processes requested in 2019; 596 (34%) more than 2018 (1,734)
72% (1,670) of requests requested through Direct Access, 18% (413) requested through
Social Work Diversion and 11% (247) Social Work Step Down
82% (1,921) of Meitheal requests received in 2019 proceeded to Stage 2 (Discussion Stage),
up from 67% (1,164/1,734) in 2018.
1,534 the number of Meitheal processes reached completion of Stage Two in 2019.
58% (889) of processes reaching completion of Stage Two, proceeded to delivery (Stage 3)
1,654 Meitheals closed in 2019, 597 (56%) more than 2018 (1,057). 35% (577) were closed
following submission of a Meitheal request form (Stage 1). 31% (520) were closed
following completion of the Strengths and Needs Form (Stage 2). 10% (169) were closed
following commencement of Meitheal Support Meetings (Stage 3) and 23% (388) were
closed post-delivery.
115 Child and Family Support Networks1 (CFSN) operating at the end of 2019; nine more
than 2018. A further 17 CFSNs are planned.
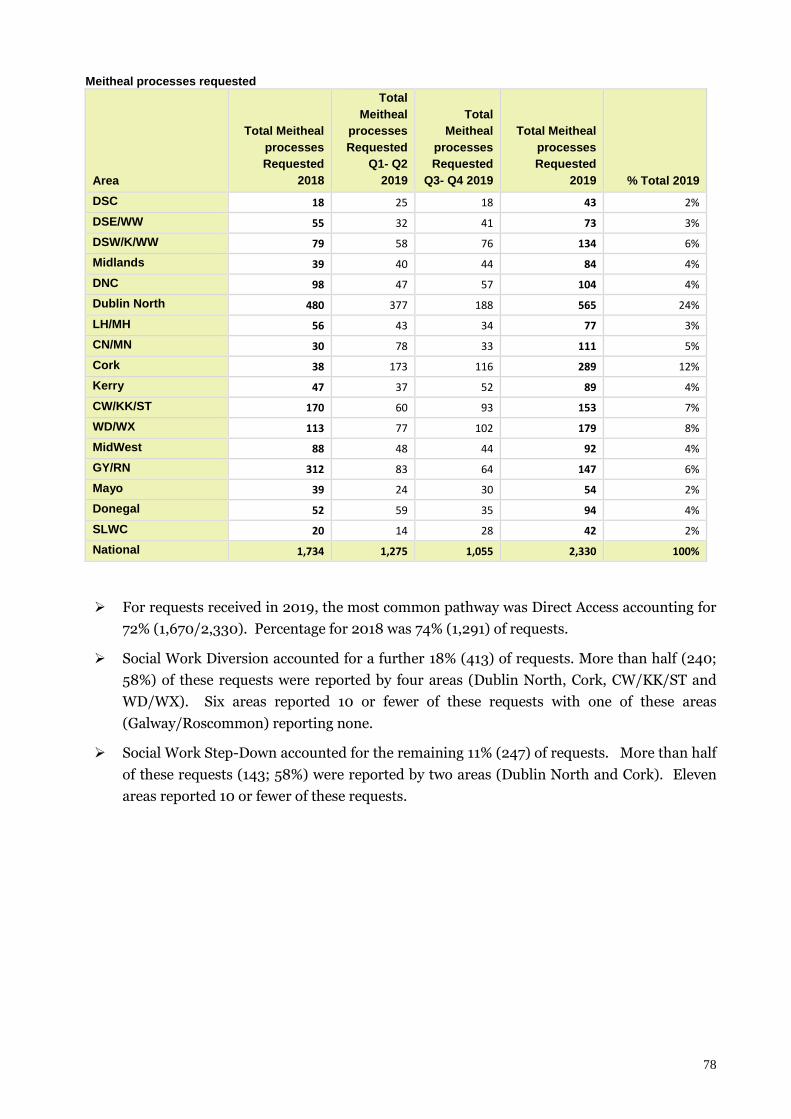
78
Meitheal processes requested
Area
Total Meitheal
processes
Requested
2018
Total
Meitheal
processes
Requested
Q1- Q2
2019
Total
Meitheal
processes
Requested
Q3- Q4 2019
Total Meitheal
processes
Requested
2019 % Total 2019
DSC 18 25 18 43 2%
DSE/WW 55 32 41 73 3%
DSW/K/WW 79 58 76 134 6%
Midlands 39 40 44 84 4%
DNC 98 47 57 104 4%
Dublin North 480 377 188 565 24%
LH/MH 56 43 34 77 3%
CN/MN 30 78 33 111 5%
Cork 38 173 116 289 12%
Kerry 47 37 52 89 4%
CW/KK/ST 170 60 93 153 7%
WD/WX 113 77 102 179 8%
MidWest 88 48 44 92 4%
GY/RN 312 83 64 147 6%
Mayo 39 24 30 54 2%
Donegal 52 59 35 94 4%
SLWC 20 14 28 42 2%
National 1,734 1,275 1,055 2,330 100%
For requests received in 2019, the most common pathway was Direct Access accounting for
72% (1,670/2,330). Percentage for 2018 was 74% (1,291) of requests.
Social Work Diversion accounted for a further 18% (413) of requests. More than half (240;
58%) of these requests were reported by four areas (Dublin North, Cork, CW/KK/ST and
WD/WX). Six areas reported 10 or fewer of these requests with one of these areas
(Galway/Roscommon) reporting none.
Social Work Step-Down accounted for the remaining 11% (247) of requests. More than half
of these requests (143; 58%) were reported by two areas (Dublin North and Cork). Eleven
areas reported 10 or fewer of these requests.
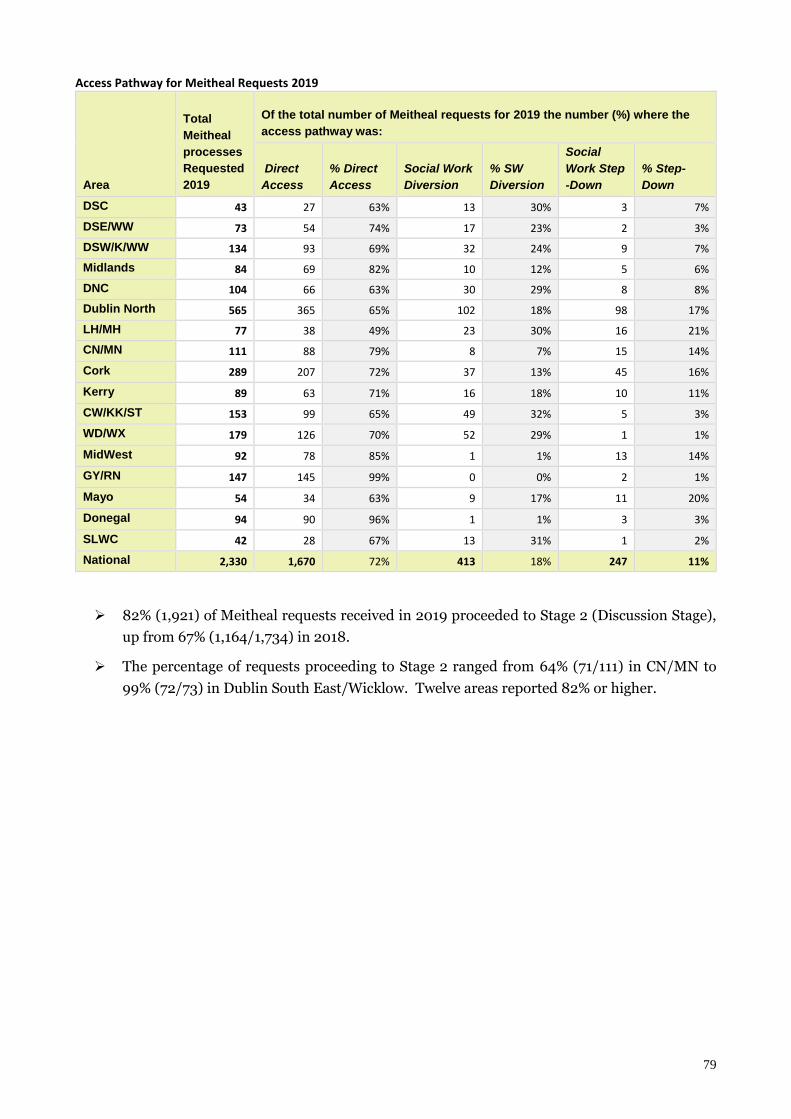
79
Access Pathway for Meitheal Requests 2019
Area
Total
Meitheal
processes
Requested
2019
Of the total number of Meitheal requests for 2019 the number (%) where the
access pathway was:
Direct
Access
% Direct
Access
Social Work
Diversion
% SW
Diversion
Social
Work Step
-Down
% Step-
Down
DSC 43 27 63% 13 30% 3 7%
DSE/WW 73 54 74% 17 23% 2 3%
DSW/K/WW 134 93 69% 32 24% 9 7%
Midlands 84 69 82% 10 12% 5 6%
DNC 104 66 63% 30 29% 8 8%
Dublin North 565 365 65% 102 18% 98 17%
LH/MH 77 38 49% 23 30% 16 21%
CN/MN 111 88 79% 8 7% 15 14%
Cork 289 207 72% 37 13% 45 16%
Kerry 89 63 71% 16 18% 10 11%
CW/KK/ST 153 99 65% 49 32% 5 3%
WD/WX 179 126 70% 52 29% 1 1%
MidWest 92 78 85% 1 1% 13 14%
GY/RN 147 145 99% 0 0% 2 1%
Mayo 54 34 63% 9 17% 11 20%
Donegal 94 90 96% 1 1% 3 3%
SLWC 42 28 67% 13 31% 1 2%
National 2,330 1,670 72% 413 18% 247 11%
82% (1,921) of Meitheal requests received in 2019 proceeded to Stage 2 (Discussion Stage),
up from 67% (1,164/1,734) in 2018.
The percentage of requests proceeding to Stage 2 ranged from 64% (71/111) in CN/MN to
99% (72/73) in Dublin South East/Wicklow. Twelve areas reported 82% or higher.
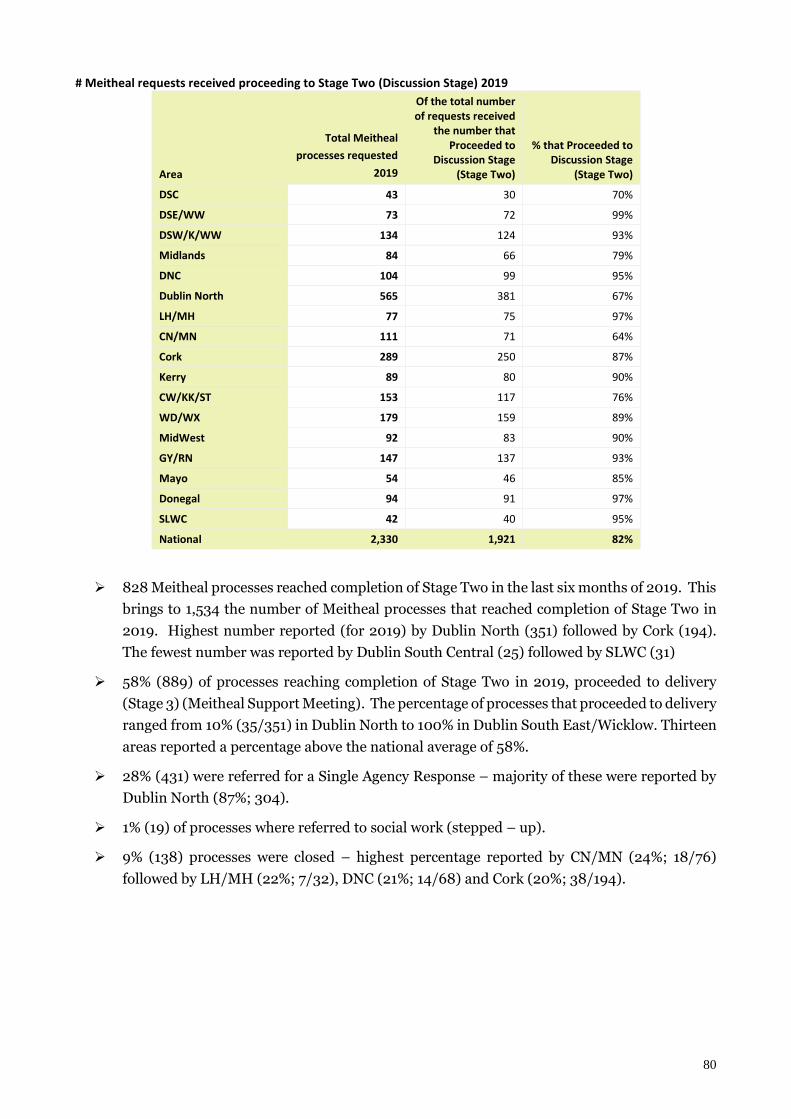
80
# Meitheal requests received proceeding to Stage Two (Discussion Stage) 2019
Area
Total Meitheal
processes requested
2019
Of the total number of requests received
the number that Proceeded to
Discussion Stage (Stage Two)
% that Proceeded to Discussion Stage
(Stage Two)
DSC 43 30 70%
DSE/WW 73 72 99%
DSW/K/WW 134 124 93%
Midlands 84 66 79%
DNC 104 99 95%
Dublin North 565 381 67%
LH/MH 77 75 97%
CN/MN 111 71 64%
Cork 289 250 87%
Kerry 89 80 90%
CW/KK/ST 153 117 76%
WD/WX 179 159 89%
MidWest 92 83 90%
GY/RN 147 137 93%
Mayo 54 46 85%
Donegal 94 91 97%
SLWC 42 40 95%
National 2,330 1,921 82%
828 Meitheal processes reached completion of Stage Two in the last six months of 2019. This
brings to 1,534 the number of Meitheal processes that reached completion of Stage Two in
2019. Highest number reported (for 2019) by Dublin North (351) followed by Cork (194).
The fewest number was reported by Dublin South Central (25) followed by SLWC (31)
58% (889) of processes reaching completion of Stage Two in 2019, proceeded to delivery
(Stage 3) (Meitheal Support Meeting). The percentage of processes that proceeded to delivery
ranged from 10% (35/351) in Dublin North to 100% in Dublin South East/Wicklow. Thirteen
areas reported a percentage above the national average of 58%.
28% (431) were referred for a Single Agency Response – majority of these were reported by
Dublin North (87%; 304).
1% (19) of processes where referred to social work (stepped – up).
9% (138) processes were closed – highest percentage reported by CN/MN (24%; 18/76)
followed by LH/MH (22%; 7/32), DNC (21%; 14/68) and Cork (20%; 38/194).
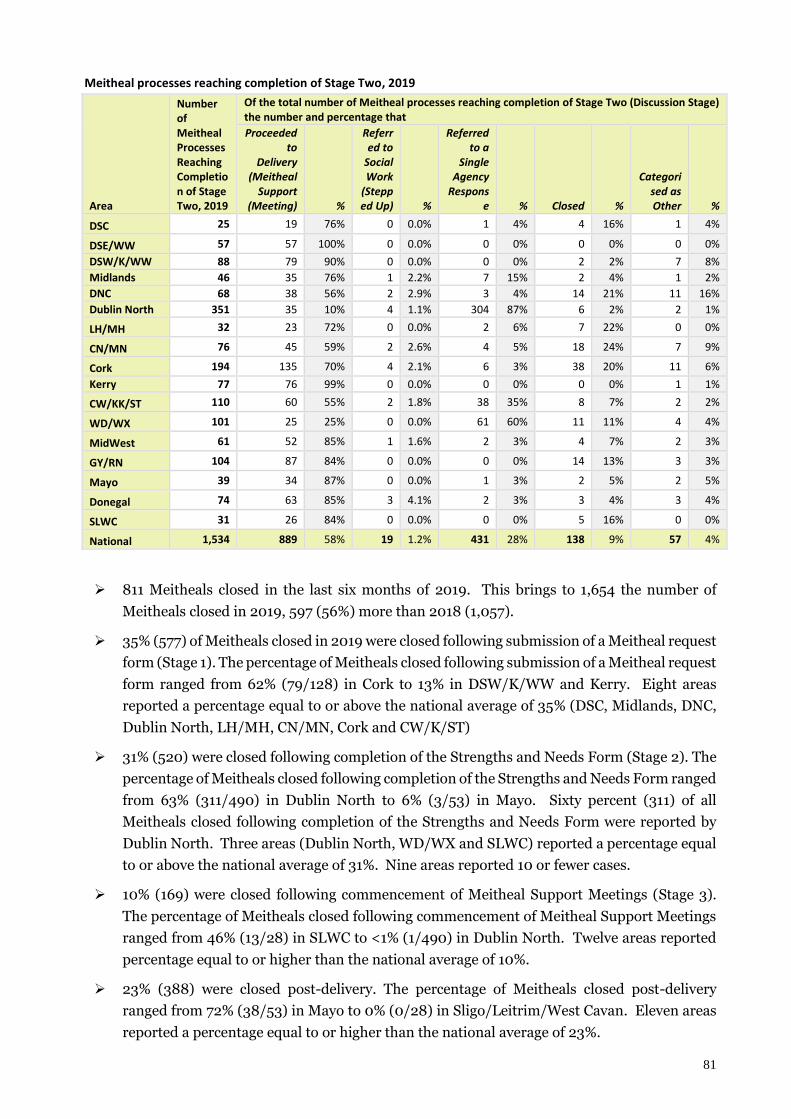
81
Meitheal processes reaching completion of Stage Two, 2019
Area
Number of Meitheal Processes Reaching Completion of Stage Two, 2019
Of the total number of Meitheal processes reaching completion of Stage Two (Discussion Stage) the number and percentage that
Proceeded to
Delivery (Meitheal
Support (Meeting) %
Referred to
Social Work
(Stepped Up) %
Referred to a
Single Agency
Response % Closed %
Categorised as Other %
DSC 25 19 76% 0 0.0% 1 4% 4 16% 1 4%
DSE/WW 57 57 100% 0 0.0% 0 0% 0 0% 0 0%
DSW/K/WW 88 79 90% 0 0.0% 0 0% 2 2% 7 8%
Midlands 46 35 76% 1 2.2% 7 15% 2 4% 1 2%
DNC 68 38 56% 2 2.9% 3 4% 14 21% 11 16%
Dublin North 351 35 10% 4 1.1% 304 87% 6 2% 2 1%
LH/MH 32 23 72% 0 0.0% 2 6% 7 22% 0 0%
CN/MN 76 45 59% 2 2.6% 4 5% 18 24% 7 9%
Cork 194 135 70% 4 2.1% 6 3% 38 20% 11 6%
Kerry 77 76 99% 0 0.0% 0 0% 0 0% 1 1%
CW/KK/ST 110 60 55% 2 1.8% 38 35% 8 7% 2 2%
WD/WX 101 25 25% 0 0.0% 61 60% 11 11% 4 4%
MidWest 61 52 85% 1 1.6% 2 3% 4 7% 2 3%
GY/RN 104 87 84% 0 0.0% 0 0% 14 13% 3 3%
Mayo 39 34 87% 0 0.0% 1 3% 2 5% 2 5%
Donegal 74 63 85% 3 4.1% 2 3% 3 4% 3 4%
SLWC 31 26 84% 0 0.0% 0 0% 5 16% 0 0%
National 1,534 889 58% 19 1.2% 431 28% 138 9% 57 4%
811 Meitheals closed in the last six months of 2019. This brings to 1,654 the number of
Meitheals closed in 2019, 597 (56%) more than 2018 (1,057).
35% (577) of Meitheals closed in 2019 were closed following submission of a Meitheal request
form (Stage 1). The percentage of Meitheals closed following submission of a Meitheal request
form ranged from 62% (79/128) in Cork to 13% in DSW/K/WW and Kerry. Eight areas
reported a percentage equal to or above the national average of 35% (DSC, Midlands, DNC,
Dublin North, LH/MH, CN/MN, Cork and CW/K/ST)
31% (520) were closed following completion of the Strengths and Needs Form (Stage 2). The
percentage of Meitheals closed following completion of the Strengths and Needs Form ranged
from 63% (311/490) in Dublin North to 6% (3/53) in Mayo. Sixty percent (311) of all
Meitheals closed following completion of the Strengths and Needs Form were reported by
Dublin North. Three areas (Dublin North, WD/WX and SLWC) reported a percentage equal
to or above the national average of 31%. Nine areas reported 10 or fewer cases.
10% (169) were closed following commencement of Meitheal Support Meetings (Stage 3).
The percentage of Meitheals closed following commencement of Meitheal Support Meetings
ranged from 46% (13/28) in SLWC to <1% (1/490) in Dublin North. Twelve areas reported
percentage equal to or higher than the national average of 10%.
23% (388) were closed post-delivery. The percentage of Meitheals closed post-delivery
ranged from 72% (38/53) in Mayo to 0% (0/28) in Sligo/Leitrim/West Cavan. Eleven areas
reported a percentage equal to or higher than the national average of 23%.
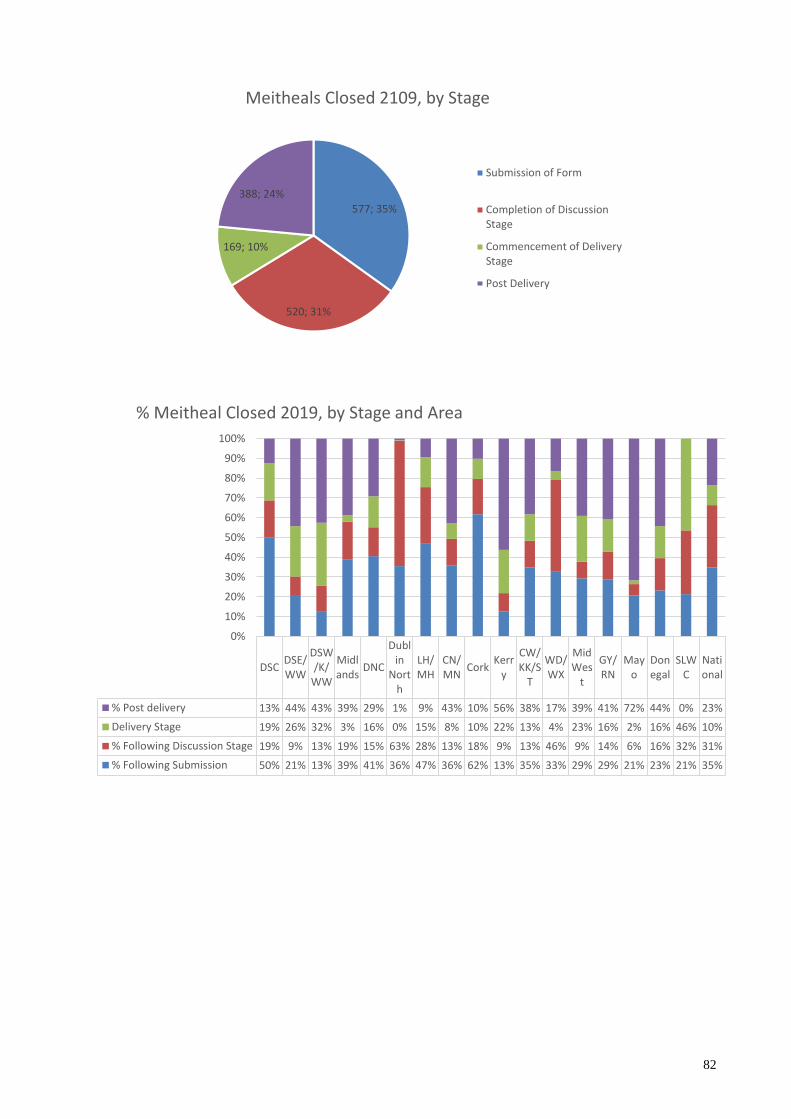
82
577; 35%
520; 31%
169; 10%
388; 24%
Meitheals Closed 2109, by Stage
Submission of Form
Completion of DiscussionStage
Commencement of DeliveryStage
Post Delivery
DSCDSE/WW
DSW/K/
WW
Midlands
DNC
Dublin
North
LH/MH
CN/MN
CorkKerr
y
CW/KK/S
T
WD/WX
MidWes
t
GY/RN
Mayo
Donegal
SLWC
National
% Post delivery 13% 44% 43% 39% 29% 1% 9% 43% 10% 56% 38% 17% 39% 41% 72% 44% 0% 23%
Delivery Stage 19% 26% 32% 3% 16% 0% 15% 8% 10% 22% 13% 4% 23% 16% 2% 16% 46% 10%
% Following Discussion Stage 19% 9% 13% 19% 15% 63% 28% 13% 18% 9% 13% 46% 9% 14% 6% 16% 32% 31%
% Following Submission 50% 21% 13% 39% 41% 36% 47% 36% 62% 13% 35% 33% 29% 29% 21% 23% 21% 35%
0%
10%
20%
30%
40%
50%
60%
70%
80%
90%
100%
% Meitheal Closed 2019, by Stage and Area
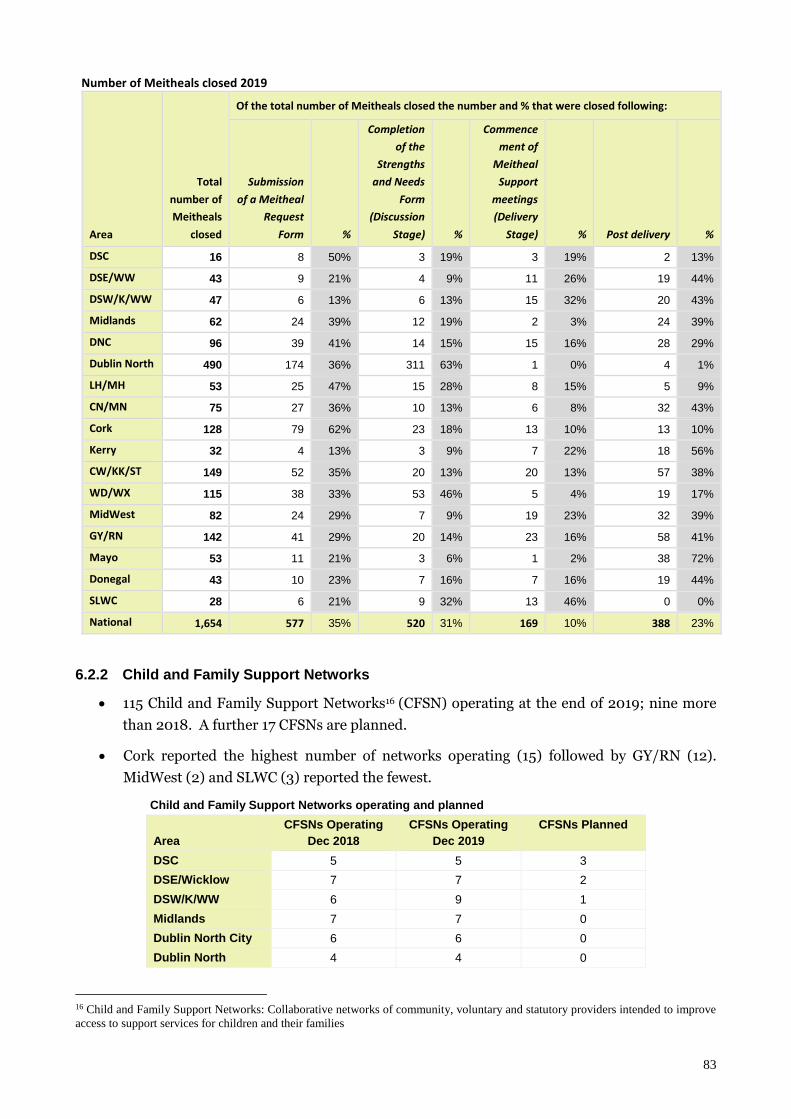
83
Number of Meitheals closed 2019
Area
Total
number of
Meitheals
closed
Of the total number of Meitheals closed the number and % that were closed following:
Submission
of a Meitheal
Request
Form %
Completion
of the
Strengths
and Needs
Form
(Discussion
Stage) %
Commence
ment of
Meitheal
Support
meetings
(Delivery
Stage) % Post delivery %
DSC 16 8 50% 3 19% 3 19% 2 13%
DSE/WW 43 9 21% 4 9% 11 26% 19 44%
DSW/K/WW 47 6 13% 6 13% 15 32% 20 43%
Midlands 62 24 39% 12 19% 2 3% 24 39%
DNC 96 39 41% 14 15% 15 16% 28 29%
Dublin North 490 174 36% 311 63% 1 0% 4 1%
LH/MH 53 25 47% 15 28% 8 15% 5 9%
CN/MN 75 27 36% 10 13% 6 8% 32 43%
Cork 128 79 62% 23 18% 13 10% 13 10%
Kerry 32 4 13% 3 9% 7 22% 18 56%
CW/KK/ST 149 52 35% 20 13% 20 13% 57 38%
WD/WX 115 38 33% 53 46% 5 4% 19 17%
MidWest 82 24 29% 7 9% 19 23% 32 39%
GY/RN 142 41 29% 20 14% 23 16% 58 41%
Mayo 53 11 21% 3 6% 1 2% 38 72%
Donegal 43 10 23% 7 16% 7 16% 19 44%
SLWC 28 6 21% 9 32% 13 46% 0 0%
National 1,654 577 35% 520 31% 169 10% 388 23%
6.2.2 Child and Family Support Networks
115 Child and Family Support Networks16 (CFSN) operating at the end of 2019; nine more
than 2018. A further 17 CFSNs are planned.
Cork reported the highest number of networks operating (15) followed by GY/RN (12).
MidWest (2) and SLWC (3) reported the fewest.
Child and Family Support Networks operating and planned
Area
CFSNs Operating
Dec 2018
CFSNs Operating
Dec 2019
CFSNs Planned
DSC 5 5 3
DSE/Wicklow 7 7 2
DSW/K/WW 6 9 1
Midlands 7 7 0
Dublin North City 6 6 0
Dublin North 4 4 0
16 Child and Family Support Networks: Collaborative networks of community, voluntary and statutory providers intended to improve
access to support services for children and their families
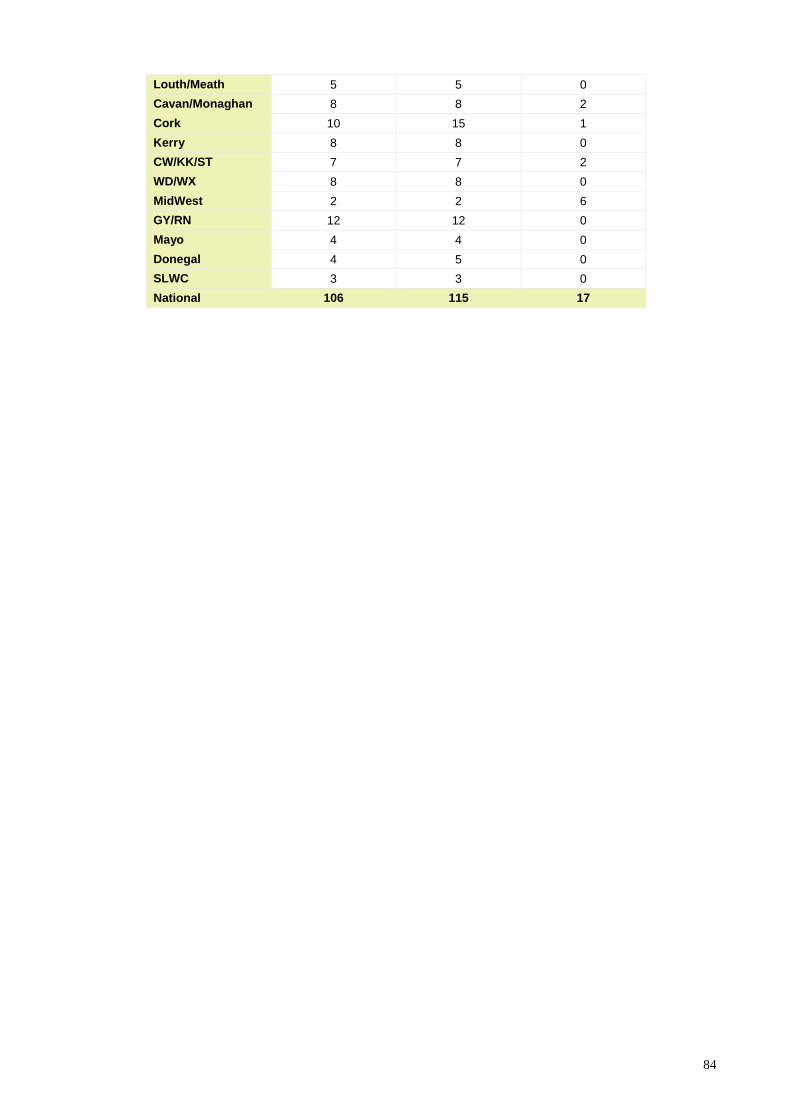
84
Louth/Meath 5 5 0
Cavan/Monaghan 8 8 2
Cork 10 15 1
Kerry 8 8 0
CW/KK/ST 7 7 2
WD/WX 8 8 0
MidWest 2 2 6
GY/RN 12 12 0
Mayo 4 4 0
Donegal 4 5 0
SLWC 3 3 0
National 106 115 17
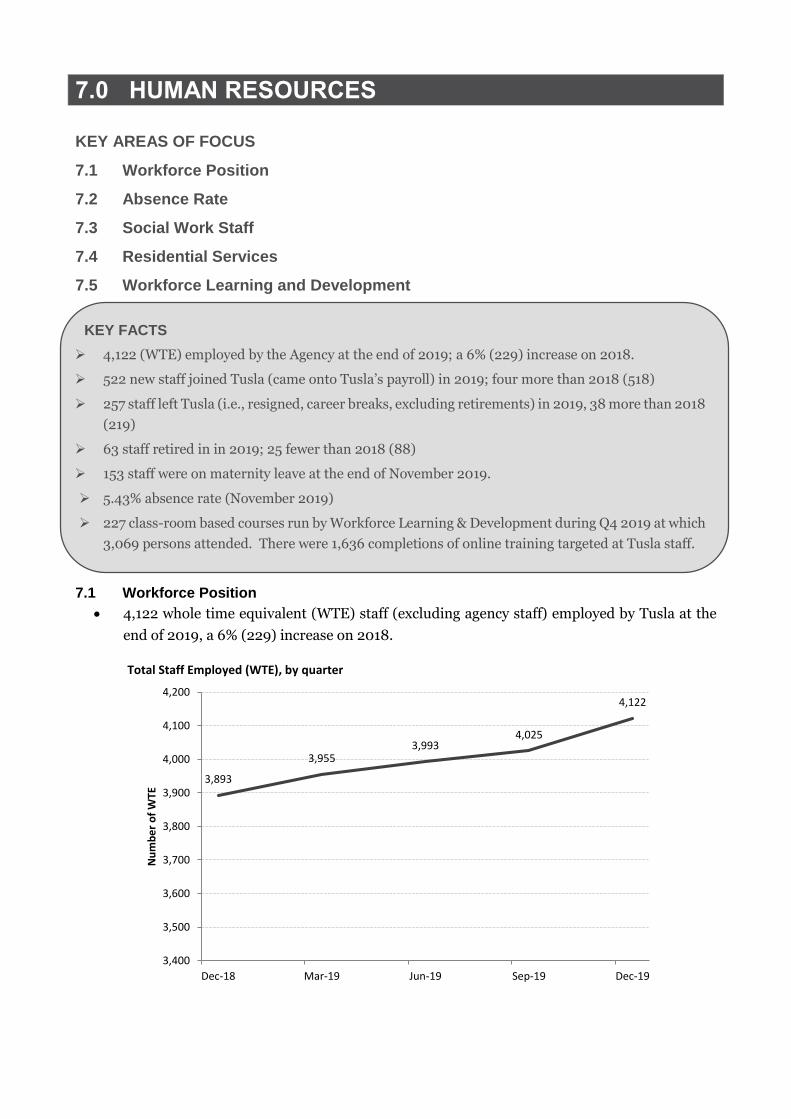
7.0 HUMAN RESOURCES
KEY AREAS OF FOCUS
7.1 Workforce Position
7.2 Absence Rate
7.3 Social Work Staff
7.4 Residential Services
7.5 Workforce Learning and Development
7.1 Workforce Position
4,122 whole time equivalent (WTE) staff (excluding agency staff) employed by Tusla at the
end of 2019, a 6% (229) increase on 2018.
Total Staff Employed (WTE), by quarter
3,893
3,9553,993
4,025
4,122
3,400
3,500
3,600
3,700
3,800
3,900
4,000
4,100
4,200
Dec-18 Mar-19 Jun-19 Sep-19 Dec-19
Nu
mb
er
of
WTE
KEY FACTS
4,122 (WTE) employed by the Agency at the end of 2019; a 6% (229) increase on 2018.
522 new staff joined Tusla (came onto Tusla’s payroll) in 2019; four more than 2018 (518)
257 staff left Tusla (i.e., resigned, career breaks, excluding retirements) in 2019, 38 more than 2018
(219)
63 staff retired in in 2019; 25 fewer than 2018 (88)
153 staff were on maternity leave at the end of November 2019.
5.43% absence rate (November 2019)
227 class-room based courses run by Workforce Learning & Development during Q4 2019 at which
3,069 persons attended. There were 1,636 completions of online training targeted at Tusla staff.
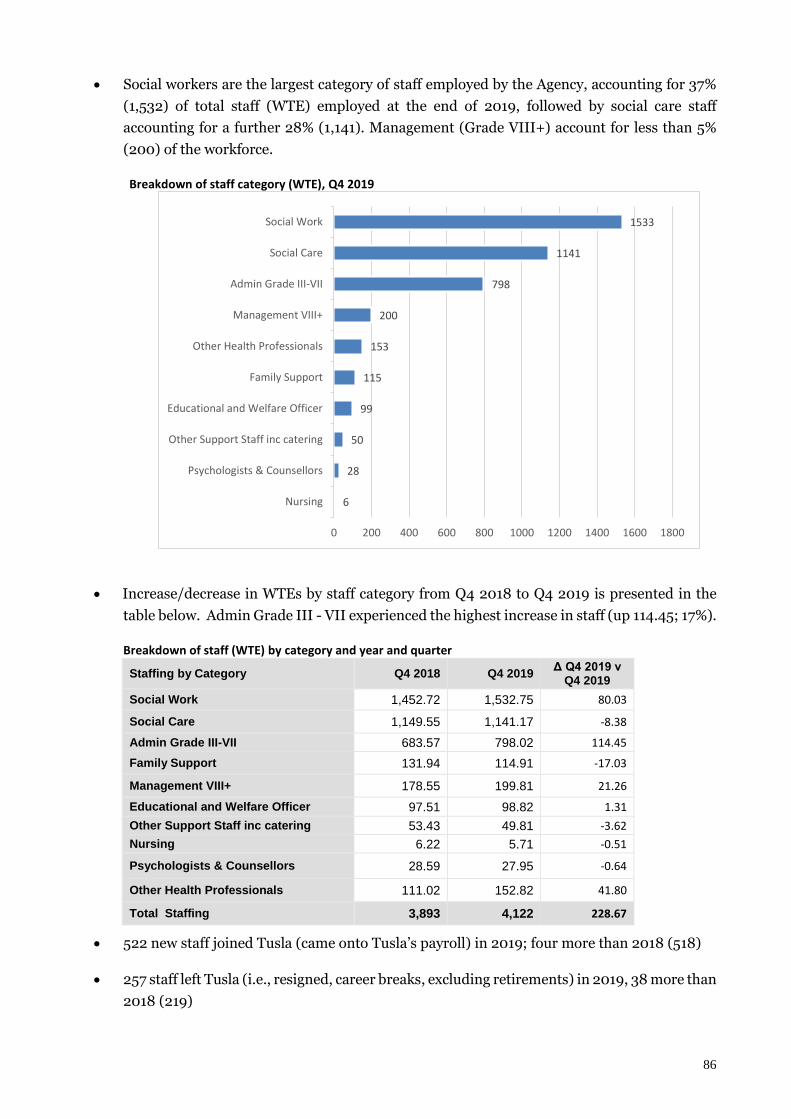
86
Social workers are the largest category of staff employed by the Agency, accounting for 37%
(1,532) of total staff (WTE) employed at the end of 2019, followed by social care staff
accounting for a further 28% (1,141). Management (Grade VIII+) account for less than 5%
(200) of the workforce.
Breakdown of staff category (WTE), Q4 2019
Increase/decrease in WTEs by staff category from Q4 2018 to Q4 2019 is presented in the
table below. Admin Grade III - VII experienced the highest increase in staff (up 114.45; 17%).
Breakdown of staff (WTE) by category and year and quarter
Staffing by Category Q4 2018 Q4 2019 Δ Q4 2019 v
Q4 2019
Social Work 1,452.72 1,532.75 80.03
Social Care 1,149.55 1,141.17 -8.38
Admin Grade III-VII 683.57 798.02 114.45
Family Support 131.94 114.91 -17.03
Management VIII+ 178.55 199.81 21.26
Educational and Welfare Officer 97.51 98.82 1.31
Other Support Staff inc catering 53.43 49.81 -3.62
Nursing 6.22 5.71 -0.51
Psychologists & Counsellors 28.59 27.95 -0.64
Other Health Professionals 111.02 152.82 41.80
Total Staffing 3,893 4,122 228.67
522 new staff joined Tusla (came onto Tusla’s payroll) in 2019; four more than 2018 (518)
257 staff left Tusla (i.e., resigned, career breaks, excluding retirements) in 2019, 38 more than
2018 (219)
1533
1141
798
200
153
115
99
50
28
6
Social Work
Social Care
Admin Grade III-VII
Management VIII+
Other Health Professionals
Family Support
Educational and Welfare Officer
Other Support Staff inc catering
Psychologists & Counsellors
Nursing
0 200 400 600 800 1000 1200 1400 1600 1800
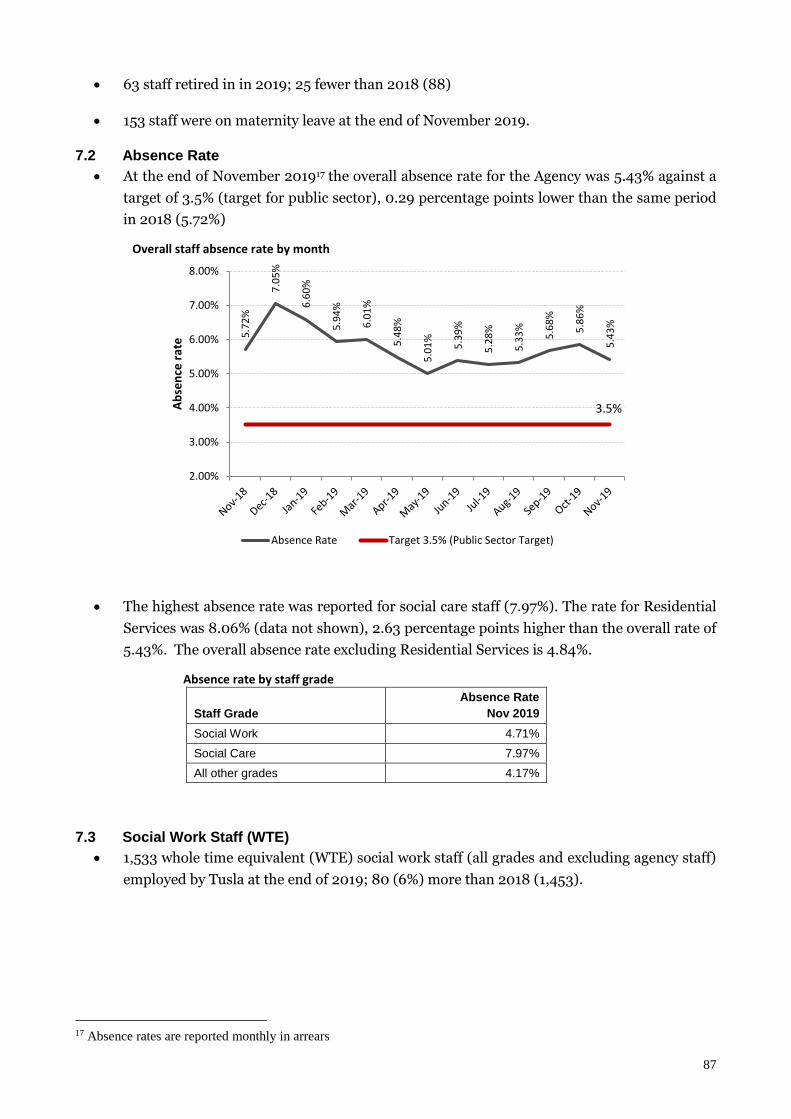
87
63 staff retired in in 2019; 25 fewer than 2018 (88)
153 staff were on maternity leave at the end of November 2019.
7.2 Absence Rate
At the end of November 201917 the overall absence rate for the Agency was 5.43% against a
target of 3.5% (target for public sector), 0.29 percentage points lower than the same period
in 2018 (5.72%)
Overall staff absence rate by month
The highest absence rate was reported for social care staff (7.97%). The rate for Residential
Services was 8.06% (data not shown), 2.63 percentage points higher than the overall rate of
5.43%. The overall absence rate excluding Residential Services is 4.84%.
Absence rate by staff grade
Staff Grade
Absence Rate
Nov 2019
Social Work 4.71%
Social Care 7.97%
All other grades 4.17%
7.3 Social Work Staff (WTE)
1,533 whole time equivalent (WTE) social work staff (all grades and excluding agency staff)
employed by Tusla at the end of 2019; 80 (6%) more than 2018 (1,453).
17 Absence rates are reported monthly in arrears
5.7
2%
7.0
5%
6.6
0%
5.9
4%
6.0
1%
5.4
8%
5.0
1%
5.3
9%
5.2
8%
5.3
3%
5.6
8%
5.8
6%
5.4
3%
3.5%
2.00%
3.00%
4.00%
5.00%
6.00%
7.00%
8.00%
Ab
sen
ce r
ate
Absence Rate Target 3.5% (Public Sector Target)
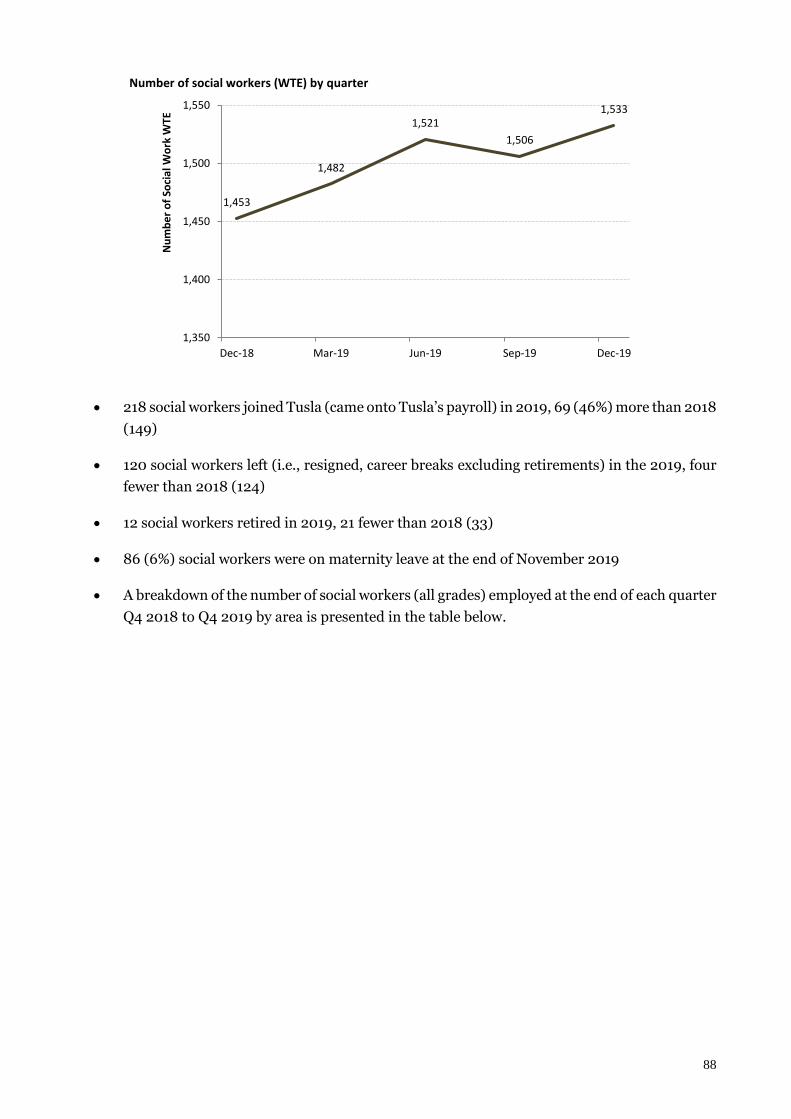
88
Number of social workers (WTE) by quarter
218 social workers joined Tusla (came onto Tusla’s payroll) in 2019, 69 (46%) more than 2018
(149)
120 social workers left (i.e., resigned, career breaks excluding retirements) in the 2019, four
fewer than 2018 (124)
12 social workers retired in 2019, 21 fewer than 2018 (33)
86 (6%) social workers were on maternity leave at the end of November 2019
A breakdown of the number of social workers (all grades) employed at the end of each quarter
Q4 2018 to Q4 2019 by area is presented in the table below.
1,453
1,482
1,521
1,506
1,533
1,350
1,400
1,450
1,500
1,550
Dec-18 Mar-19 Jun-19 Sep-19 Dec-19
Nu
mb
er
of
Soci
al W
ork
WTE
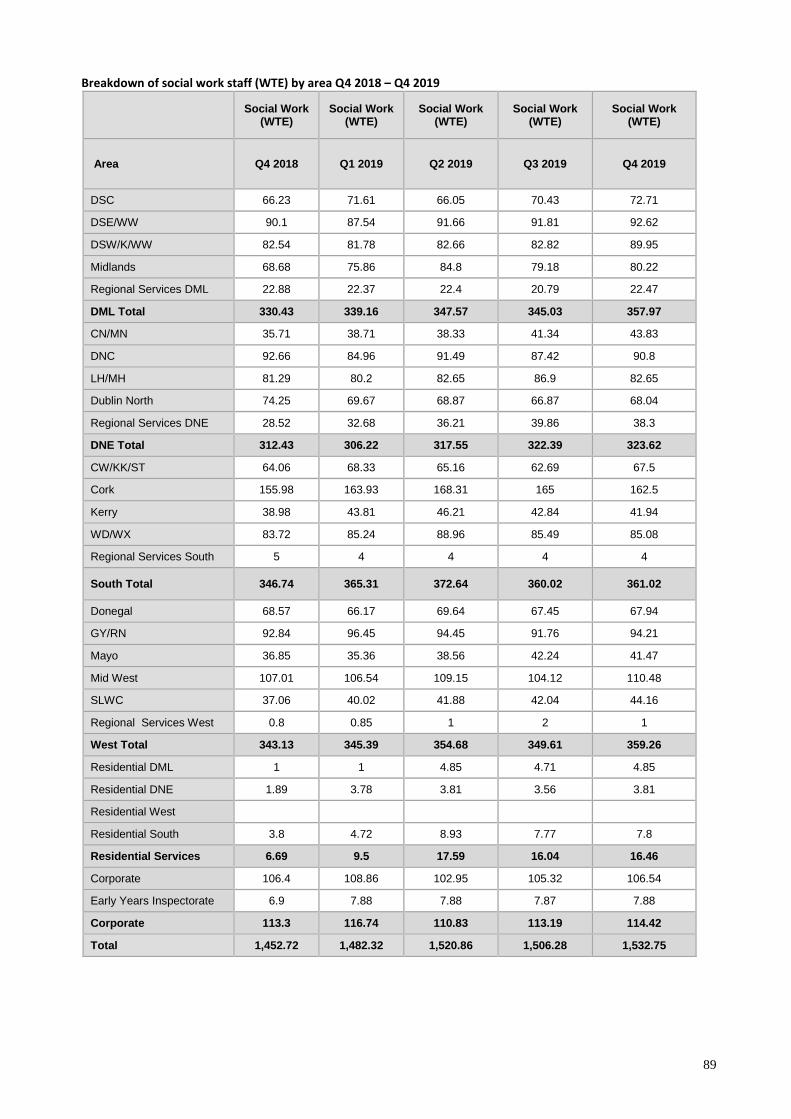
89
Breakdown of social work staff (WTE) by area Q4 2018 – Q4 2019
Social Work
(WTE) Social Work
(WTE) Social Work
(WTE) Social Work
(WTE) Social Work
(WTE)
Area Q4 2018 Q1 2019 Q2 2019 Q3 2019 Q4 2019
DSC 66.23 71.61 66.05 70.43 72.71
DSE/WW 90.1 87.54 91.66 91.81 92.62
DSW/K/WW 82.54 81.78 82.66 82.82 89.95
Midlands 68.68 75.86 84.8 79.18 80.22
Regional Services DML 22.88 22.37 22.4 20.79 22.47
DML Total 330.43 339.16 347.57 345.03 357.97
CN/MN 35.71 38.71 38.33 41.34 43.83
DNC 92.66 84.96 91.49 87.42 90.8
LH/MH 81.29 80.2 82.65 86.9 82.65
Dublin North 74.25 69.67 68.87 66.87 68.04
Regional Services DNE 28.52 32.68 36.21 39.86 38.3
DNE Total 312.43 306.22 317.55 322.39 323.62
CW/KK/ST 64.06 68.33 65.16 62.69 67.5
Cork 155.98 163.93 168.31 165 162.5
Kerry 38.98 43.81 46.21 42.84 41.94
WD/WX 83.72 85.24 88.96 85.49 85.08
Regional Services South 5 4 4 4 4
South Total 346.74 365.31 372.64 360.02 361.02
Donegal 68.57 66.17 69.64 67.45 67.94
GY/RN 92.84 96.45 94.45 91.76 94.21
Mayo 36.85 35.36 38.56 42.24 41.47
Mid West 107.01 106.54 109.15 104.12 110.48
SLWC 37.06 40.02 41.88 42.04 44.16
Regional Services West 0.8 0.85 1 2 1
West Total 343.13 345.39 354.68 349.61 359.26
Residential DML 1 1 4.85 4.71 4.85
Residential DNE 1.89 3.78 3.81 3.56 3.81
Residential West
Residential South 3.8 4.72 8.93 7.77 7.8
Residential Services 6.69 9.5 17.59 16.04 16.46
Corporate 106.4 108.86 102.95 105.32 106.54
Early Years Inspectorate 6.9 7.88 7.88 7.87 7.88
Corporate 113.3 116.74 110.83 113.19 114.42
Total 1,452.72 1,482.32 1,520.86 1,506.28 1,532.75
90
7.4 Workforce Learning and Development
During the months October to December 2019, Workforce Learning and Development
(WLD) ran a total of 227 classroom-based events for which 3,069 persons attended. A
summary of the course and attendee breakdown is presented in the table below.
During Q4, 2019 the most frequently run course was ‘Meitheal Standardised Briefing’ with
40 events.
The training with the highest number of attendees in Q4 was ‘Permanency Planning
Workshops’ with 474 attending 16 workshops.
There were 33 events that were categorised as ‘Other’ courses. These courses which constitute
14.5% of all the classroom-based courses, refer to a range of locally delivered courses that are
developed in response to particular needs and requests in areas such as working with young
people who have experienced trauma, domestic violence etc.
Online training targeted at Tusla staff was completed by 1,636 people in Q4. Of completed
programmes in this period ‘Complaints Handling in Tusla’ had most completions with 580.
This was followed by Health and ‘Safety Awareness for Tusla Staff’ with 293.
Other Developments in Q4
WLD supported Tusla operations in design and delivery of information and consultation
Workshops to 474 Tusla staff on the implementation of Permanency Policy
WLD staff and management lead Tusla’s engagement with the HSE on the development and
launch of The Hidden Harm Strategic Statement, Practice Guide and the E-learning
programme ‘Hidden Harm-The Impact of Parental Alcohol and Other Drugs Misuse on
Children’
Tusla’s ‘Introduction to Children First’ E-learning programme was successful in achieving
the Brandon Hall Bronze Award for ‘Best Unique or Innovative Learning and Development
programme’.
A second E-learning programme to support the handling of complaints by Tusla staff was
launched in December.
A number of PPFS related activities occurred in Q4: Launch of the Parental Participation E-
learning Programme; a successful ‘Parent Support Champions Symposium’ was held;
Meitheal Trainers Audit completed in Oct. identifying 75 trainers available nationally to
deliver Meitheal standardised training.
With a WLD Manager assigned to Signs of Safety the recruitment of further L&D staff was
completed and the team is now at full complement; a National Safety Planning Workshop
was held where staff were supported to implement the approach by working with open cases
in real time; redesign of the Signs of Safety 2-day program with a view to Tusla staff rolling
out this training in 2020
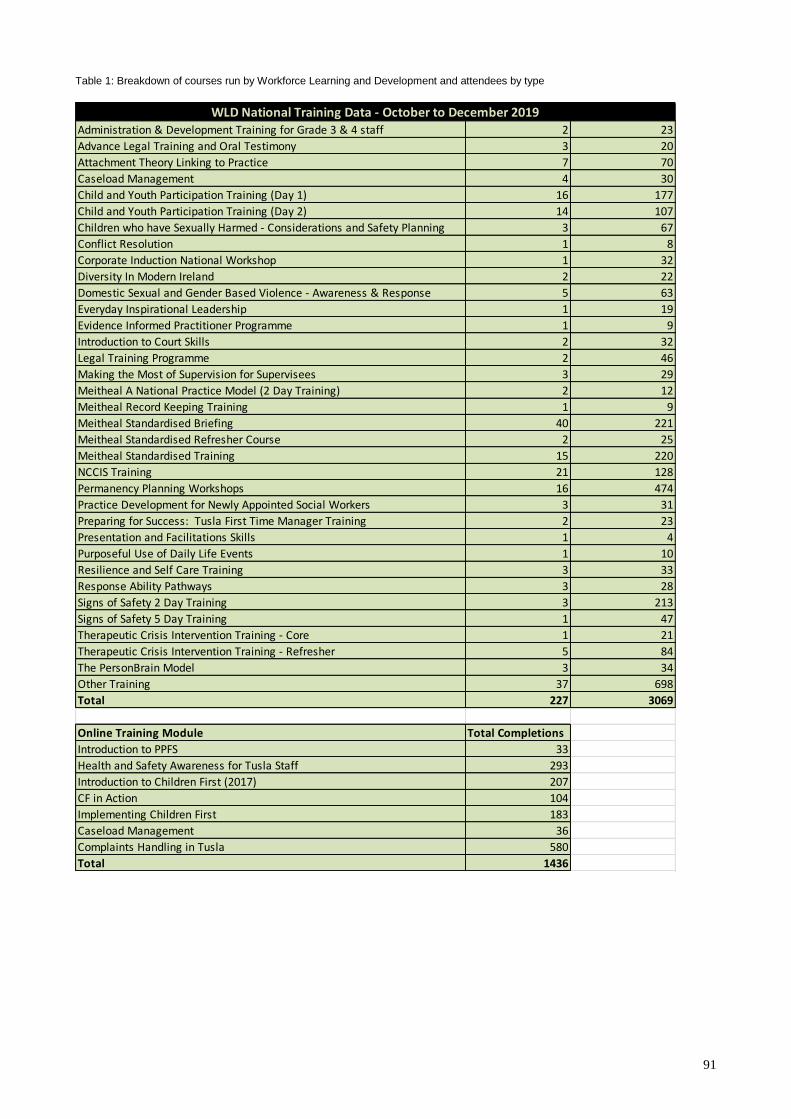
91
Table 1: Breakdown of courses run by Workforce Learning and Development and attendees by type
Administration & Development Training for Grade 3 & 4 staff 2 23
Advance Legal Training and Oral Testimony 3 20
Attachment Theory Linking to Practice 7 70
Caseload Management 4 30
Child and Youth Participation Training (Day 1) 16 177
Child and Youth Participation Training (Day 2) 14 107
Children who have Sexually Harmed - Considerations and Safety Planning 3 67
Conflict Resolution 1 8
Corporate Induction National Workshop 1 32
Diversity In Modern Ireland 2 22
Domestic Sexual and Gender Based Violence - Awareness & Response 5 63
Everyday Inspirational Leadership 1 19
Evidence Informed Practitioner Programme 1 9
Introduction to Court Skills 2 32
Legal Training Programme 2 46
Making the Most of Supervision for Supervisees 3 29
Meitheal A National Practice Model (2 Day Training) 2 12
Meitheal Record Keeping Training 1 9
Meitheal Standardised Briefing 40 221
Meitheal Standardised Refresher Course 2 25
Meitheal Standardised Training 15 220
NCCIS Training 21 128
Permanency Planning Workshops 16 474
Practice Development for Newly Appointed Social Workers 3 31
Preparing for Success: Tusla First Time Manager Training 2 23
Presentation and Facilitations Skills 1 4
Purposeful Use of Daily Life Events 1 10
Resilience and Self Care Training 3 33
Response Ability Pathways 3 28
Signs of Safety 2 Day Training 3 213
Signs of Safety 5 Day Training 1 47
Therapeutic Crisis Intervention Training - Core 1 21
Therapeutic Crisis Intervention Training - Refresher 5 84
The PersonBrain Model 3 34
Other Training 37 698
Total 227 3069
Online Training Module Total Completions
Introduction to PPFS 33
Health and Safety Awareness for Tusla Staff 293
Introduction to Children First (2017) 207
CF in Action 104
Implementing Children First 183
Caseload Management 36
Complaints Handling in Tusla 580
Total 1436
WLD National Training Data - October to December 2019
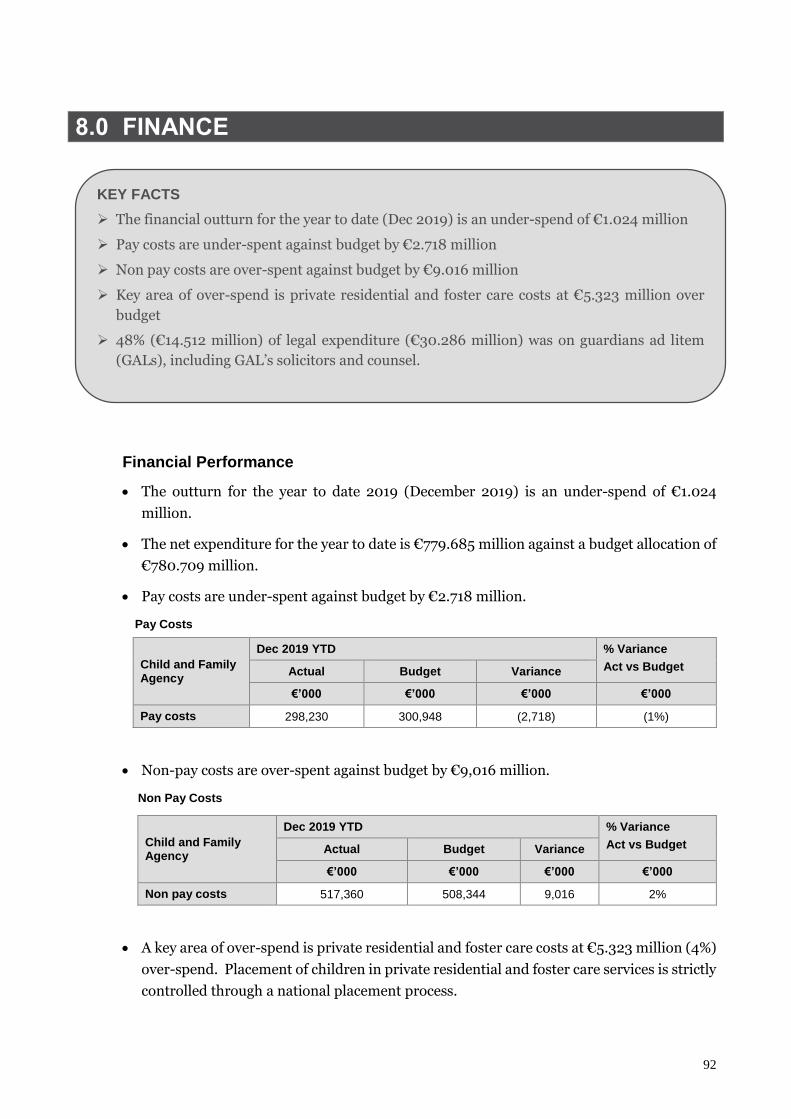
92
8.0 FINANCE
Financial Performance
The outturn for the year to date 2019 (December 2019) is an under-spend of €1.024
million.
The net expenditure for the year to date is €779.685 million against a budget allocation of
€780.709 million.
Pay costs are under-spent against budget by €2.718 million.
Pay Costs
Non-pay costs are over-spent against budget by €9,016 million.
Non Pay Costs
A key area of over-spend is private residential and foster care costs at €5.323 million (4%)
over-spend. Placement of children in private residential and foster care services is strictly
controlled through a national placement process.
Child and Family Agency
Dec 2019 YTD % Variance
Act vs Budget Actual Budget Variance
€’000 €’000 €’000 €’000
Pay costs 298,230 300,948 (2,718) (1%)
Child and Family Agency
Dec 2019 YTD % Variance
Act vs Budget Actual Budget Variance
€’000 €’000 €’000 €’000
Non pay costs 517,360 508,344 9,016 2%
KEY FACTS
The financial outturn for the year to date (Dec 2019) is an under-spend of €1.024 million
Pay costs are under-spent against budget by €2.718 million
Non pay costs are over-spent against budget by €9.016 million
Key area of over-spend is private residential and foster care costs at €5.323 million over
budget
48% (€14.512 million) of legal expenditure (€30.286 million) was on guardians ad litem
(GALs), including GAL’s solicitors and counsel.
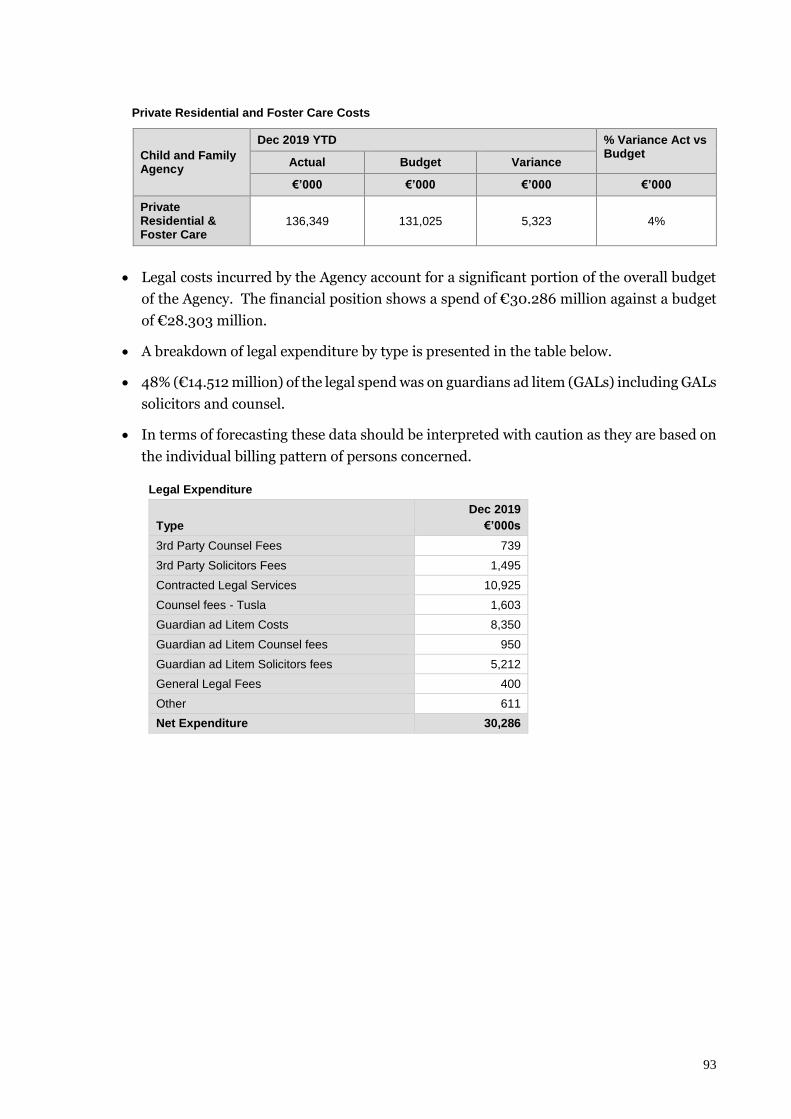
93
Private Residential and Foster Care Costs
Legal costs incurred by the Agency account for a significant portion of the overall budget
of the Agency. The financial position shows a spend of €30.286 million against a budget
of €28.303 million.
A breakdown of legal expenditure by type is presented in the table below.
48% (€14.512 million) of the legal spend was on guardians ad litem (GALs) including GALs
solicitors and counsel.
In terms of forecasting these data should be interpreted with caution as they are based on
the individual billing pattern of persons concerned.
Legal Expenditure
Type
Dec 2019
€’000s
3rd Party Counsel Fees 739
3rd Party Solicitors Fees 1,495
Contracted Legal Services 10,925
Counsel fees - Tusla 1,603
Guardian ad Litem Costs 8,350
Guardian ad Litem Counsel fees 950
Guardian ad Litem Solicitors fees 5,212
General Legal Fees 400
Other 611
Net Expenditure 30,286
Child and Family Agency
Dec 2019 YTD % Variance Act vs Budget
Actual Budget Variance
€’000 €’000 €’000 €’000
Private Residential & Foster Care
136,349 131,025 5,323 4%
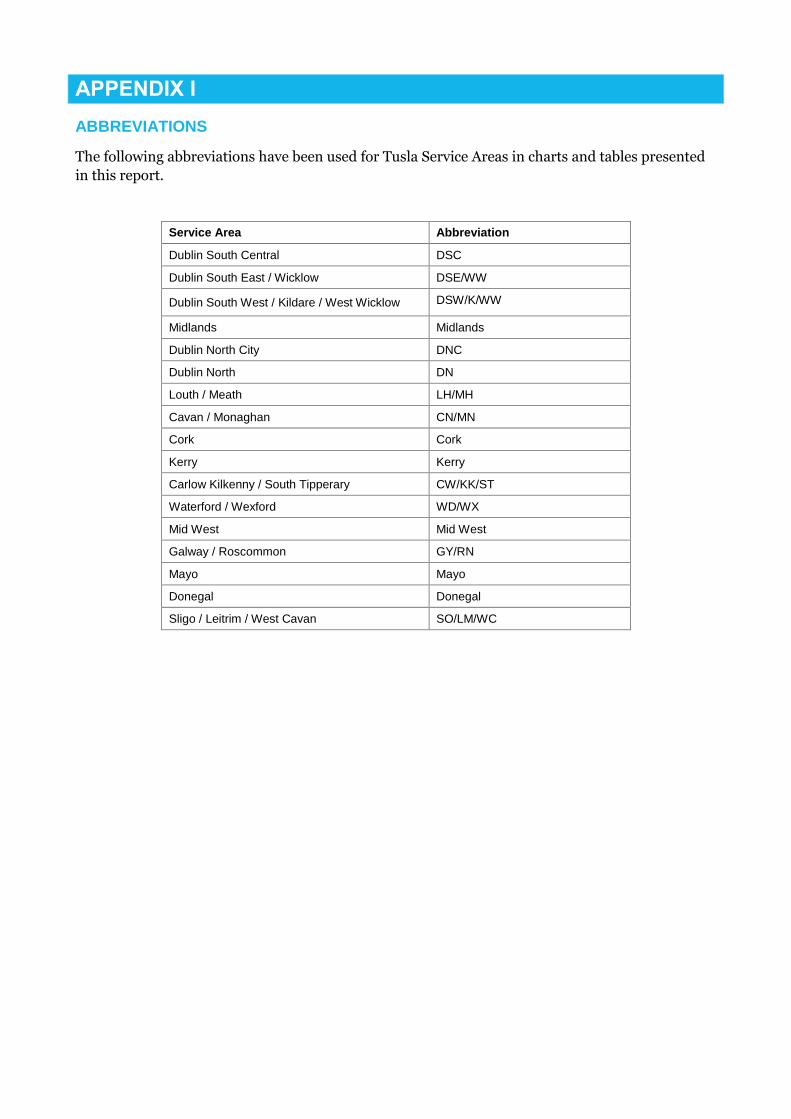
APPENDIX I
ABBREVIATIONS
The following abbreviations have been used for Tusla Service Areas in charts and tables presented
in this report.
Service Area Abbreviation
Dublin South Central DSC
Dublin South East / Wicklow DSE/WW
Dublin South West / Kildare / West Wicklow DSW/K/WW
Midlands Midlands
Dublin North City DNC
Dublin North DN
Louth / Meath LH/MH
Cavan / Monaghan CN/MN
Cork Cork
Kerry Kerry
Carlow Kilkenny / South Tipperary CW/KK/ST
Waterford / Wexford WD/WX
Mid West Mid West
Galway / Roscommon GY/RN
Mayo Mayo
Donegal Donegal
Sligo / Leitrim / West Cavan SO/LM/WC