q2central bank quarterly bulletin
TRANSCRIPT

Q2 Central Bank Quarterly Bulletin AP
RIL
14
Quarte
rly Bulle
tin 2
April 14 C
entra
l Bank o
f Irela
nd
T +353 1 224 6278 F +353 1 671 6561 www.centralbank.ie [email protected]
Bosca OP 559, Sráid an Dáma, Baile Átha Cliath 2, Éire PO Box 559, Dame Street, Dublin 2, Ireland


Quarterly Bulletin 02 / April 14
© Central Bank of Ireland 2014
Central Bank of Ireland


Contents
Section 1
Forecast Summary Table 6
Comment 7
The Domestic Economy 9 Box A: Irish Agriculture in 2013 15 Box B: Recent Employment Recovery 19
An Timpeallacht Gheilleagrach 27
Financing Developments in the Irish Economy 29 Box A: Recent Trends in NFC Desposits 31
Developments in the International and Euro Area Economy 45 Box A: Examining the sensitivity of inflation to the output gap across euro area Member States 50 Box B: Has the AQR affected the Monetary Financial Institutions’ Balance Sheets in the EA? 54
Section 2
Analysis of Recent Monetary Operations & Financial Market Developments 62 Brian Gallagher and Paul Johnston
Irish Results of the BIS Foreign Exchange and Interest Rate Derivatives Survey 2013 78 Aisling Menton
Central Bank Communications: A Comparative Study 95 Danielle Kedan and Rebecca Stuart
Section 3
Statistical Appendix

Notes
1. The permission of the Government has been obtained for the use in this Bulletin of certain material compiled by the Central Statistics Office and Government Departments. The Bulletin also contains material which has been made available by the courtesy of licensed banks and other financial institutions.
2. Unless otherwise stated, statistics refer to the State, i.e., Ireland exclusive of Northern Ireland.
3. In some cases, owing to the rounding of figures, components do not add to the totals shown.
4. The method of seasonal adjustment used in the Bank is that of the US Bureau of the Census X-11 variant.
5. Annual rates of change are annual extrapolations of specific period-to-period percentage changes.
6. The following symbols are used:
e estimated n.a. not available
p provisional . . no figure to be expected
r revised – nil or negligible
q quarter f forecast
7. Data on euro exchange rates are available on our website at www.centralbank.ie and by telephone at 353 1 2246380.
Designed by: Clondalkin Pharma & Healthcare (Glasnevin) Ltd.
Cover Photograph: Stuart Bradfield
Enquiries relating to this Bulletin should be addressed to: Central Bank of Ireland (Publications), P.O. Box No. 559, Dame Street, Dublin 2. Phone 353 1 2246278; Fax 6716561 www.centralbank.ie Email: [email protected]
ISSN 0332-2645

5Quarterly Bulletin 02 / April 14Section 1
6
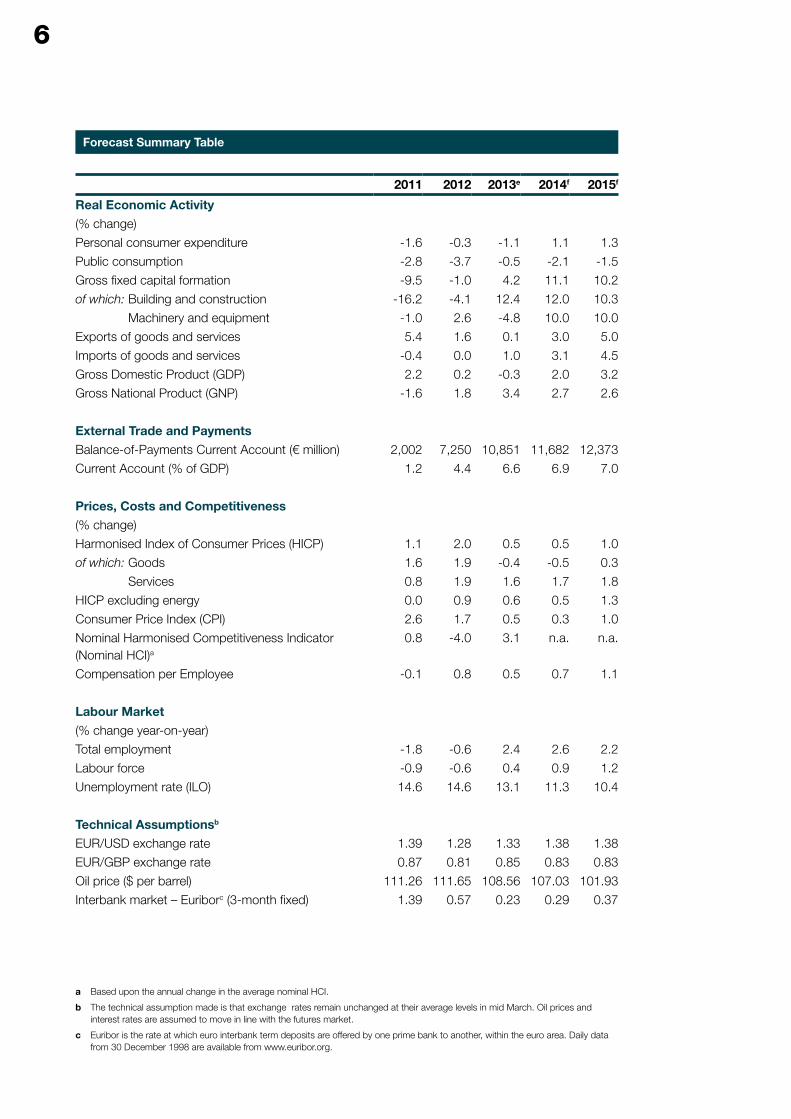
Forecast Summary Table
2011 2012 2013e 2014f 2015f
Real Economic Activity(% change)
Personal consumer expenditure -1.6 -0.3 -1.1 1.1 1.3
Public consumption -2.8 -3.7 -0.5 -2.1 -1.5
Gross fixed capital formation -9.5 -1.0 4.2 11.1 10.2
of which: Building and construction -16.2 -4.1 12.4 12.0 10.3
Machinery and equipment -1.0 2.6 -4.8 10.0 10.0
Exports of goods and services 5.4 1.6 0.1 3.0 5.0
Imports of goods and services -0.4 0.0 1.0 3.1 4.5
Gross Domestic Product (GDP) 2.2 0.2 -0.3 2.0 3.2
Gross National Product (GNP) -1.6 1.8 3.4 2.7 2.6
External Trade and PaymentsBalance-of-Payments Current Account (€ million) 2,002 7,250 10,851 11,682 12,373
Current Account (% of GDP) 1.2 4.4 6.6 6.9 7.0
Prices, Costs and Competitiveness(% change)
Harmonised Index of Consumer Prices (HICP) 1.1 2.0 0.5 0.5 1.0
of which: Goods 1.6 1.9 -0.4 -0.5 0.3
Services 0.8 1.9 1.6 1.7 1.8
HICP excluding energy 0.0 0.9 0.6 0.5 1.3
Consumer Price Index (CPI) 2.6 1.7 0.5 0.3 1.0
Nominal Harmonised Competitiveness Indicator (Nominal HCI)a
0.8 -4.0 3.1 n.a. n.a.
Compensation per Employee -0.1 0.8 0.5 0.7 1.1
Labour Market(% change year-on-year)
Total employment -1.8 -0.6 2.4 2.6 2.2
Labour force -0.9 -0.6 0.4 0.9 1.2
Unemployment rate (ILO) 14.6 14.6 13.1 11.3 10.4
Technical Assumptionsb
EUR/USD exchange rate 1.39 1.28 1.33 1.38 1.38
EUR/GBP exchange rate 0.87 0.81 0.85 0.83 0.83
Oil price ($ per barrel) 111.26 111.65 108.56 107.03 101.93
Interbank market – Euriborc (3-month fixed) 1.39 0.57 0.23 0.29 0.37
a Based upon the annual change in the average nominal HCI.
b The technical assumption made is that exchange rates remain unchanged at their average levels in mid March. Oil prices and interest rates are assumed to move in line with the futures market.
c Euribor is the rate at which euro interbank term deposits are offered by one prime bank to another, within the euro area. Daily data from 30 December 1998 are available from www.euribor.org.
7
Despite these developments, however, preliminary National accounts data for 2013 indicate that GDP, the most commonly cited measure of overall economic activity, declined marginally last year. The recorded fall in GDP in 2013 primarily reflected the negative impact of the expiry of some important pharmaceutical patents. The statistical treatment of the newly off-patent drugs has resulted in a large measured decline in both production and exports from the pharmaceutical sector, though there has been little impact on employment in that sector. In terms of activity as measured by GNP, however, the picture is somewhat different. With the impact of patent expirations being offset by a reduction in associated profit outflows, the outturn for GNP growth in 2013 was much stronger. At present, the direction of change in activity signalled by GNP, though probably not the scale, is more consistent with the higher level of activity to be seen in labour market and other data than the marginal contraction signalled by GDP.
Looking ahead, with patent expirations expected to have a continuing, but declining impact, improving external demand conditions are projected to support stronger export growth this year and next. In addition, domestic demand, which broadly stabilised in 2013, is forecast to make a modest positive contribution to growth this year. Continued employment growth is likely to support household incomes and consumer confidence and, given this prospect, modest positive growth in consumer spending is projected for 2014. Investment
spending has gathered strength, which is forecast to be maintained this year. Together with the outlook for consumer spending, this points to some increase in domestic demand in 2014, though this is likely to be modest given that many headwinds to recovery still remain.
On balance, this suggests little change to the outlook for GDP growth for 2013 and 2014 as compared to the forecasts published in the previous Bulletin. GDP growth of 2.0 per cent is now projected for this year, with growth of 3.2 per cent projected for 2015, representing a small downward revision of 0.1 per cent to the forecast for this year and no change to the projection for next year. On the basis of some continuing impact from patent expirations in 2014, the forecast for GNP growth has been raised slightly for this year. The 2015 growth projections are based on consensus assumptions from the main international institutions, which forecast a recovery in external demand back towards its long run trend. Uncertainty attaches to these forecasts, however, and they remain sensitive to developments in the international and European economy.
Turning to policy issues, Ireland has made a smooth exit from the EU/IMF Programme, benefitting from continued market confidence in the outlook for economic performance and policy prospects. This has helped the Sovereign and domestic banks to gain greater access to market funding at more favourable rates. Strong policy implementation and the prospect of an
CommentWhile different measures of economic activity present contrasting pictures of the performance of the Irish economy, the balance of evidence from a range of indicators signals that the recovery in economic activity is continuing. The clearest sign of this recovery is provided by labour market data, which indicate that employment has grown strongly over the last five quarters, helping to reduce the unemployment rate to just below 12 per cent from a peak of over 15 per cent in early 2012. Initially, the recovery in employment was confined to part-time jobs, however, recent quarters have seen steady growth in full-time employment, which seems broadly based. Signs of improvement are also visible in investment data, business and consumer survey measures and in more positive retail spending data.
8 Quarterly Bulletin 02 / April 14Comment
emerging economic recovery have underpinned these favourable developments and continuing to build on the achievements of recent years will be crucial. Successfully exiting the EU/IMF Programme has been an important step along the road to recovery but it is not an end. Further progress in terms of policy implementation across a range of areas is required to ensure a sustainable return to steady growth.
With respect to the public finances, while figures have yet to be finalised, the latest indications are that the outturn for the General Government Deficit in 2013 should be slightly below the 7.5 per cent of GDP target under the Excessive Deficit Procedure. In addition, projections indicate that the debt-to-GDP ratio peaked in 2013 and should now start to gradually fall. Debt and deficit levels remain very high and further consolidation will be needed in coming years to put debt firmly on a downward path. Over the years of the EU/IMF Programme, financial markets have been calmed by the firm action taken by Government to implement all of the fiscal targets set in the Programme. To ensure that this confidence remains, it will be more important than ever that the Government prepare budgetary plans for 2015 that will convince observers that Ireland remains on track for fiscal consolidation. Securing debt sustainability is necessary to underpin a more durable recovery and also reinforce market confidence in Ireland’s creditworthiness and maintain favourable access to market funding.
In the banking sector, liquidity and funding positions are continuing to improve and are generally returning to a more sustainable profile. Bank profitability is also gradually showing signs of recovering. The key issues, however, continue to revolve around progress in dealing with impaired loans. Using the mortgage arrears resolution targets, the Central Bank has required the banks to make progress in putting in place sustainable long-term arrangements with customers in arrears. Gradually, progress is being made, with long-term arrears starting to decrease, although there continues to be migration of loans into the very long-term arrears category. The Central Bank is also monitoring the progress of banks in resolving the complex issue of distressed commercial portfolios. Gradually, in this way, the balance sheets of the banks and their borrowers are being repaired, which is an essential prerequisite for continued wider economic recovery and to underpin the return to sustainable growth.
While domestic demand is projected to begin to contribute to the recovery, a strong external performance will remain central to ensuring a sustainable return to steady growth and rising living standards in the future. In recent years, moderate wage growth and reductions to the cost base of the economy have helped restore some of the competitiveness lost during the boom. Looking ahead, further improvements in productivity and competitiveness would help to boost Ireland’s growth potential and support further employment growth.
9
The Domestic Economy
Overview
n Preliminary National Accounts data for 2013 point to a volume decline in GDP of 0.3 per cent and an increase in real GNP of 3.4 per cent. The dominant factor underlying the outturn of GDP last year was the flat performance of exports which reflected both weak external demand and, more significantly, the impact on merchandise exports of the expiration of a number of important drug patents. This factor also accounted, in the main, for the divergent trends in GDP and GNP during 2013.
n The statistical treatment of the newly off-patent drugs has resulted in a large measured decline in both production and exports from the pharmaceutical sector notwithstanding the maintenance of a similar or even higher level of employment. Reflecting the size of the pharmaceutical sector, the negative impact on headline GDP growth was significant but a corresponding decline in related profit outflows increased GNP by a similar amount. As a consequence, the positive growth in GNP was, on balance, more reflective of the underlying trend in the Irish economy last year than the decline in headline GDP.
n In 2014, projected growth in GDP and GNP of about 2 per cent and 2.7 per cent, respectively, is predicated on a recovery in export growth, underpinned by stronger external demand conditions and a less significant impact from patent expiry on merchandise exports. In addition, domestic demand, which was broadly stable last year, is expected to make a modest positive contribution to GDP growth. This should be led by a strong rebound in investment and modest growth in consumer expenditure supported by a further strengthening in labour market conditions.
n The positive trend in external demand conditions is expected to continue into 2015 with a consequent support for export growth. This should be complemented by further expansion in the domestic economy, increasing overall GDP growth to about 3.2 per cent while GNP growth is forecast at about 2.6 per cent. This should sustain a further improvement in labour market conditions.
n The improvement in the labour market was one of the most encouraging aspects of Ireland’s economic performance in 2013. The numbers at work increased by 2.4 per cent, with the rate of job creation accelerating as the year progressed. This outturn was better than expected and has prompted an upward revision to the labour market outlook with overall employment forecast to rise by 2.6 per cent in 2014 and by 2.2 per cent in 2015.
n The return to employment growth has resulted in a steady decline in the rate of unemployment which fell from a peak of 15.1 per cent in Q1 2012 to 12.1 in the final quarter of 2013. On the basis of the forecasts for employment and the labour force, the unemployment rate could fall to just over 11 per cent this year with a further reduction to just over 10 per cent in prospect for 2015.
n The improvement in labour market conditions has not as yet led to any upward pay pressures in the economy and this is reflected in well contained domestic inflation. With external factors such as energy prices also weak, the outlook for inflation is muted over the forecast horizon. HICP inflation is projected to average 0.5 per cent and 1 per cent in 2014 and 2015 respectively, well below already low euro area HICP projections.
10 Quarterly Bulletin 02 / April 14The Domestic Economy
Demand
Consumer spending
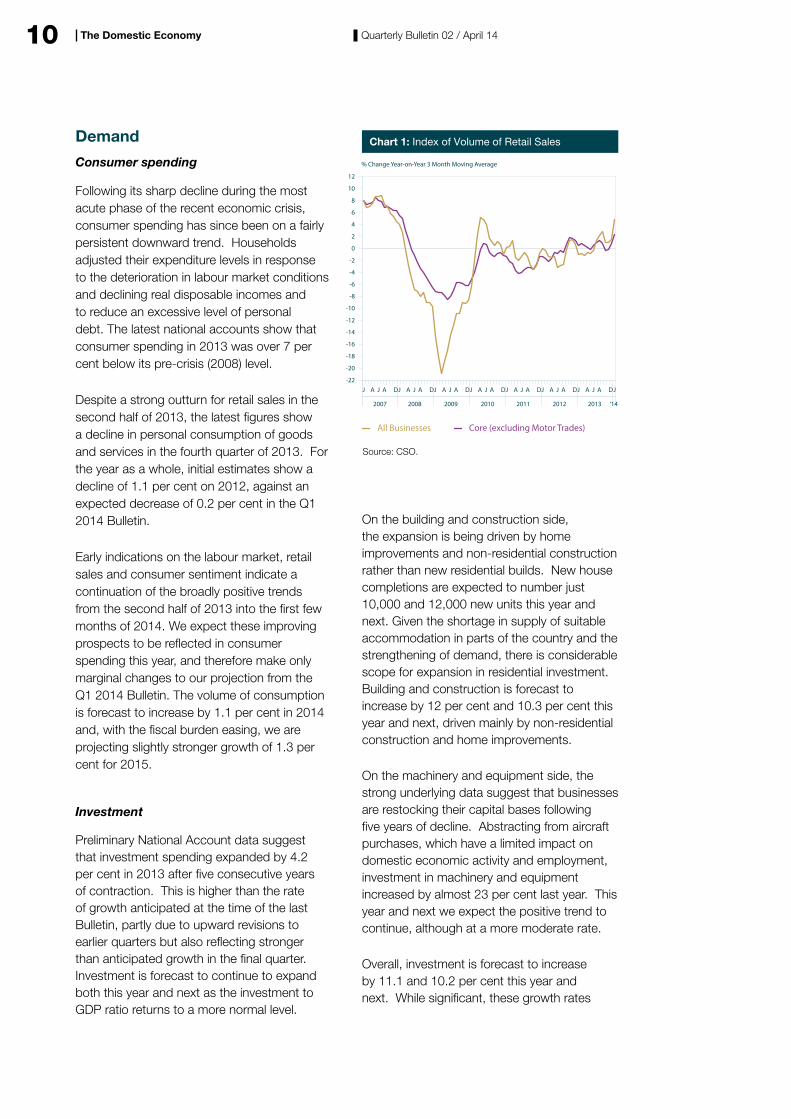
Following its sharp decline during the most acute phase of the recent economic crisis, consumer spending has since been on a fairly persistent downward trend. Households adjusted their expenditure levels in response to the deterioration in labour market conditions and declining real disposable incomes and to reduce an excessive level of personal debt. The latest national accounts show that consumer spending in 2013 was over 7 per cent below its pre-crisis (2008) level.
Despite a strong outturn for retail sales in the second half of 2013, the latest figures show a decline in personal consumption of goods and services in the fourth quarter of 2013. For the year as a whole, initial estimates show a decline of 1.1 per cent on 2012, against an expected decrease of 0.2 per cent in the Q1 2014 Bulletin.
Early indications on the labour market, retail sales and consumer sentiment indicate a continuation of the broadly positive trends from the second half of 2013 into the first few months of 2014. We expect these improving prospects to be reflected in consumer spending this year, and therefore make only marginal changes to our projection from the Q1 2014 Bulletin. The volume of consumption is forecast to increase by 1.1 per cent in 2014 and, with the fiscal burden easing, we are projecting slightly stronger growth of 1.3 per cent for 2015.
Investment
Preliminary National Account data suggest that investment spending expanded by 4.2 per cent in 2013 after five consecutive years of contraction. This is higher than the rate of growth anticipated at the time of the last Bulletin, partly due to upward revisions to earlier quarters but also reflecting stronger than anticipated growth in the final quarter. Investment is forecast to continue to expand both this year and next as the investment to GDP ratio returns to a more normal level.
On the building and construction side, the expansion is being driven by home improvements and non-residential construction rather than new residential builds. New house completions are expected to number just 10,000 and 12,000 new units this year and next. Given the shortage in supply of suitable accommodation in parts of the country and the strengthening of demand, there is considerable scope for expansion in residential investment. Building and construction is forecast to increase by 12 per cent and 10.3 per cent this year and next, driven mainly by non-residential construction and home improvements.
On the machinery and equipment side, the strong underlying data suggest that businesses are restocking their capital bases following five years of decline. Abstracting from aircraft purchases, which have a limited impact on domestic economic activity and employment, investment in machinery and equipment increased by almost 23 per cent last year. This year and next we expect the positive trend to continue, although at a more moderate rate.
Overall, investment is forecast to increase by 11.1 and 10.2 per cent this year and next. While significant, these growth rates
-22
-20
-18
-16
-14
-12
-10
-8
-6
-4
-2
0
2
4
6
8
10
12
Source: CSO.
Chart 1: Index of Volume of Retail Sales
All Businesses Core (excluding Motor Trades)
% Change Year-on-Year 3 Month Moving Average
2007 2008 2009 2010 2011 2012 2013 ‘14
J A J A DJ A J A DJ A J A DJ A J A DJ A J A DJ A J A DJ JA J A D
11Quarterly Bulletin 02 / April 14The Domestic Economy
are coming from a very low base and are still not sufficient to return the investment to GDP ratio to a more normal level. At less than 14 per cent of GDP, the investment ratio would still be significantly below the long run and international norm of about 20 per cent of GDP.
Stock Changes
Stock changes are estimated to have made a small positive contribution to growth in 2013 of about 0.1 percentage point and are expected to have a broadly neutral impact on the change in GDP in 2014 and 2015.
Government Consumption
According to the latest Quarterly National Accounts (QNA), government consumption declined by 0.5 per cent in real terms in 2013. Taking account of measures announced in detail in Budget 2014 and outlined in general terms for next year, the real level of government
consumption is projected to decline by 2.1 per cent and 1.5 per cent, respectively, in 2014 and 2015.
External Demand and the Balance of Payments
Merchandise Trade
Ireland's merchandise exports performed relatively poorly in 2013, contracting by 3.9 per cent in real terms, according to the QNA. This decline is almost entirely due to the fall in the volume of pharmaceutical products exported, as a number of these products manufactured in Ireland moved off patent in their main markets. Partially offsetting this impact of the so called pharmaceutical patent cliff was strong growth in exports of food and related products as well as computer hardware.
A number of indicators continue to support our projection of a less adverse performance for merchandise exports in 2014 than in 2013.
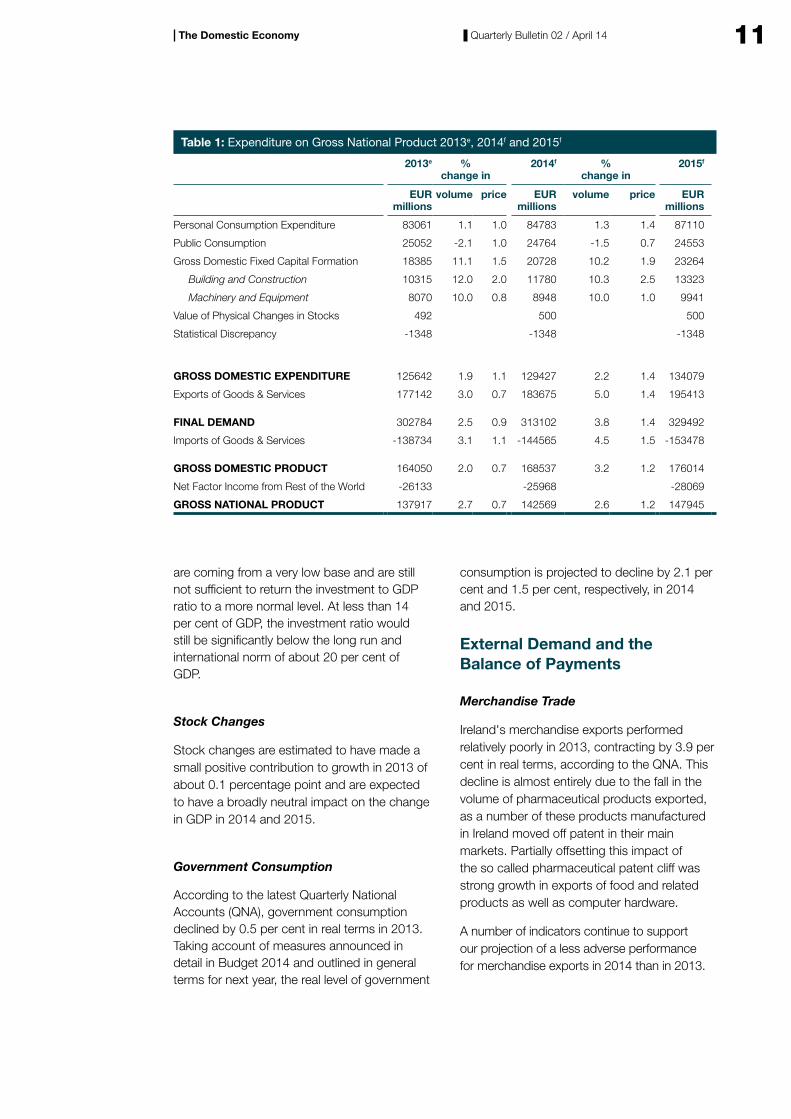
Table 1: Expenditure on Gross National Product 2013e, 2014f and 2015f
2013e % change in
2014f % change in
2015f
EUR millions
volume price EUR millions
volume price EUR millions
Personal Consumption Expenditure 83061 1.1 1.0 84783 1.3 1.4 87110
Public Consumption 25052 -2.1 1.0 24764 -1.5 0.7 24553
Gross Domestic Fixed Capital Formation 18385 11.1 1.5 20728 10.2 1.9 23264
Building and Construction 10315 12.0 2.0 11780 10.3 2.5 13323
Machinery and Equipment 8070 10.0 0.8 8948 10.0 1.0 9941
Value of Physical Changes in Stocks 492 500 500
Statistical Discrepancy -1348 -1348 -1348
GROSS DOMESTIC EXPENDITURE 125642 1.9 1.1 129427 2.2 1.4 134079
Exports of Goods & Services 177142 3.0 0.7 183675 5.0 1.4 195413
FINAL DEMAND 302784 2.5 0.9 313102 3.8 1.4 329492
Imports of Goods & Services -138734 3.1 1.1 -144565 4.5 1.5 -153478
GROSS DOMESTIC PRODUCT 164050 2.0 0.7 168537 3.2 1.2 176014
Net Factor Income from Rest of the World -26133 -25968 -28069
GROSS NATIONAL PRODUCT 137917 2.7 0.7 142569 2.6 1.2 147945
12 Quarterly Bulletin 02 / April 14The Domestic Economy
Sentiment in the manufacturing sector has maintained a strong positive trend, which according to the Investec Manufacturing PMI survey has been driven by increased levels of export orders in recent months. In terms of the pharmaceutical sector, publically available information on products due to come off patent would suggest that the most severe impact for Ireland from the patent cliff has now passed. The extent of this remains uncertain however, as commercial sensitivity limits the information available on the issue. We assume the patent cliff will continue to exert some drag on merchandise exports this year, but to a much lower degree than 2013 and decreasing further over the forecast horizon.
The latest external demand assumptions imply a recovery in trade volumes, albeit slower than assumed in our previous forecast for 2014. The projected recovery in broad external demand is in line with the continued growth expected in our major trading partners, although the import response to that growth is now anticipated to be lower than previously expected, particularly in the UK. Provided that the assumptions on external demand and the patent cliff effect materialise, merchandise exports are expected to decline marginally (0.5 per cent) in 2014 and rise by 0.8 per cent in 2015.
Merchandise imports grew in real terms by 1 per cent in 2013, dominated by a particularly strong final quarter. The impact of weak consumption and export performance throughout the year was offset by a rise in import intensive investment activity, which saw the value of capital goods imports rise significantly in the second half of 2013 compared with the same
period in 2012. As external and domestic demand recover through 2014, an expansion in merchandise imports of 1 per cent is expected this year, rising to 2.6 per cent growth in 2015.
Services, Factor Incomes and International Transfers
Exports of services continued to outperform those of goods in 2013, with growth of 3.9 per cent in volume terms for the year reported in the latest QNA, buoyed by a particularly strong final quarter. Data from the Balance of Payments statistics show that computer and business services sectors continued to be the major contributors to this expansion, growing in value
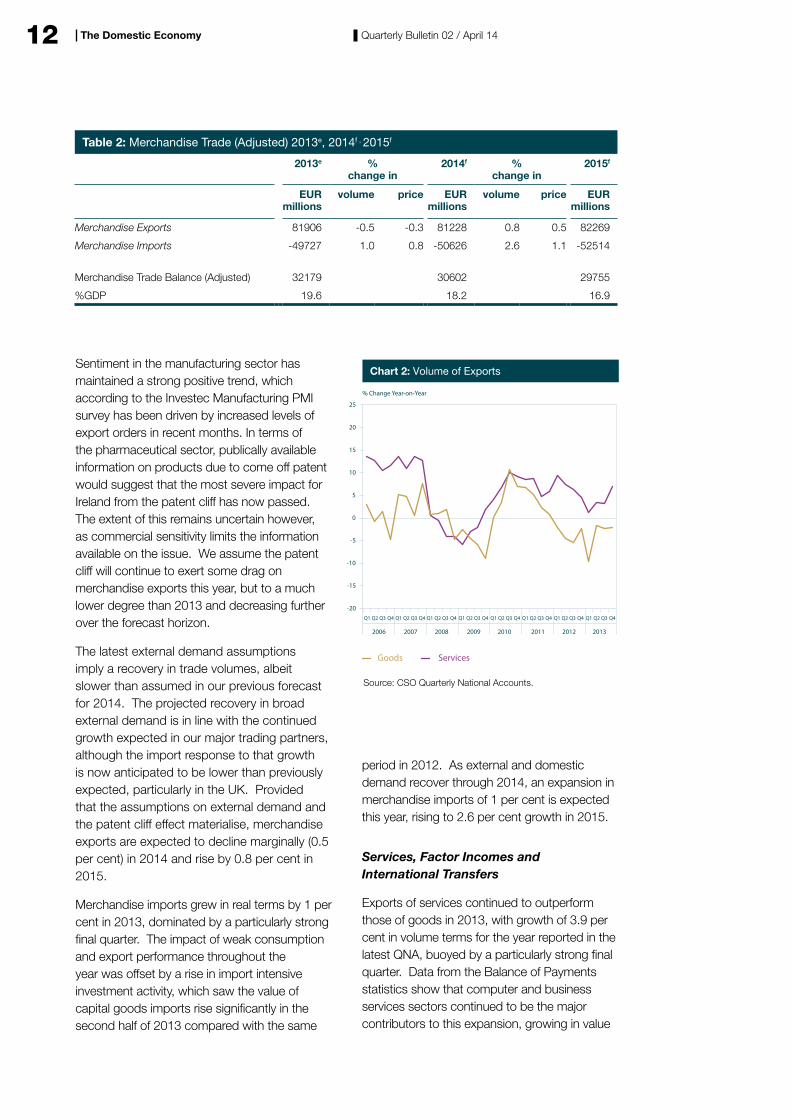
Table 2: Merchandise Trade (Adjusted) 2013e, 2014f , 2015f
2013e % change in
2014f % change in
2015f
EUR millions
volume price EUR millions
volume price EUR millions
Merchandise Exports 81906 -0.5 -0.3 81228 0.8 0.5 82269
Merchandise Imports -49727 1.0 0.8 -50626 2.6 1.1 -52514
Merchandise Trade Balance (Adjusted) 32179 30602 29755
%GDP 19.6 18.2 16.9
2006 2007 2008 2009 2010 2011 2012 2013
% Change Year-on-Year
Chart 2: Volume of Exports
Goods Services
-20
-15
-10
-5
0
5
10
15
20
25
Source: CSO Quarterly National Accounts.
Q4Q3Q2Q1 Q4Q3Q2Q1 Q4Q3Q2Q1 Q4Q3Q2Q1 Q4Q3Q2Q1 Q4Q3Q2Q1 Q4Q3Q2Q1 Q4Q3Q2Q1
13Quarterly Bulletin 02 / April 14The Domestic Economy
terms by 8.6 and 4.5 per cent respectively. The value of employment intensive tourism and travel exports rose by 10.4 per cent over the year.
The positive momentum of the strong growth in services exports in the final quarter of 2013 leads to a positive carryover effect into 2014, which supports our expectation of further services export growth for this year. Reflecting the persistently positive sentiment for export driven expansion expressed in recent PMI surveys, and the expected rise in external demand discussed above, we anticipate services export growth of 6 per cent in 2014. This is slightly lower than the forecast in our previous Bulletin, with this downward revision due to the slower pace of external demand growth now projected. We expect services export growth to rise further in 2015 to 8.3 per cent.
The volume of services imports rose by 0.9 per cent in 2013. Similar to the merchandise side, there is a significant import content to services exports, mostly through royalties/licenses imports which continued to grow strongly over 2013. Consequently, the return to faster services export growth over the forecast horizon is expected to contribute to an increase in the pace of services import growth.
The developments in services trade during 2013 led to the continued growth of the surplus in services trade balance over the year. On the merchandise side the trade surplus narrowed over the year, particularly so in the final quarter, bringing the overall annual trade balance to €38.2 billion, a reduction of 3.4 per cent. Meanwhile net factor income flows became
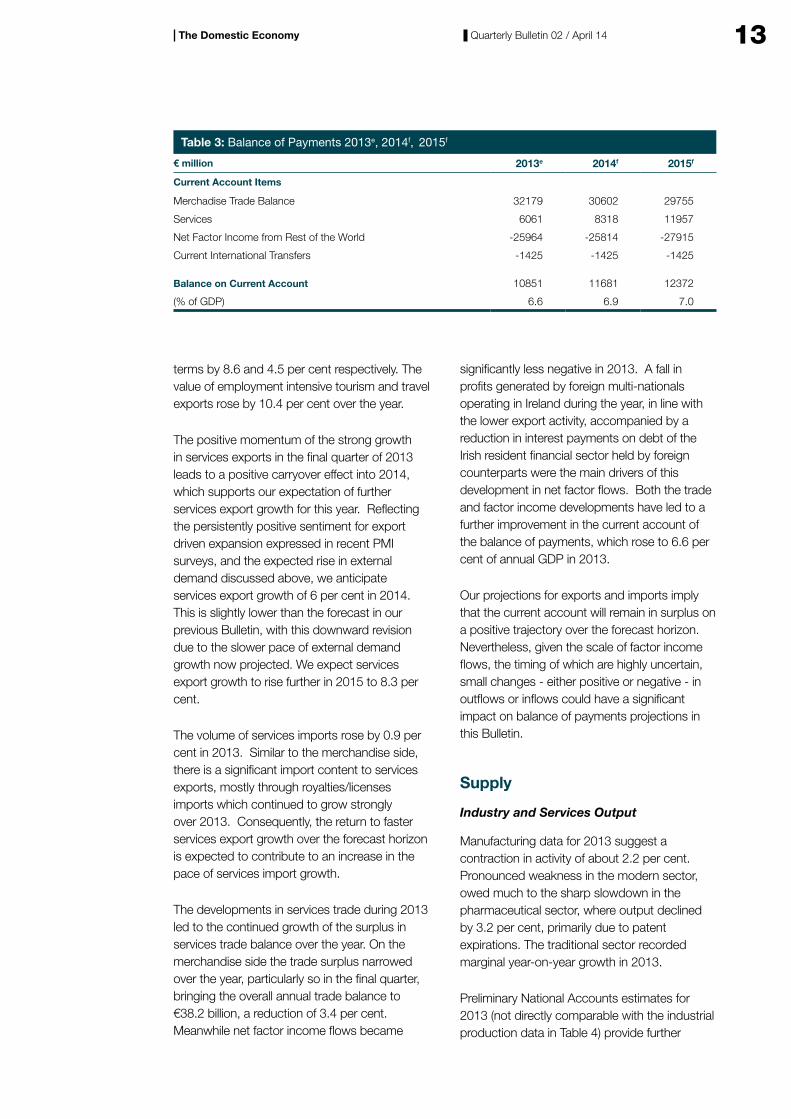
significantly less negative in 2013. A fall in profits generated by foreign multi-nationals operating in Ireland during the year, in line with the lower export activity, accompanied by a reduction in interest payments on debt of the Irish resident financial sector held by foreign counterparts were the main drivers of this development in net factor flows. Both the trade and factor income developments have led to a further improvement in the current account of the balance of payments, which rose to 6.6 per cent of annual GDP in 2013.
Our projections for exports and imports imply that the current account will remain in surplus on a positive trajectory over the forecast horizon. Nevertheless, given the scale of factor income flows, the timing of which are highly uncertain, small changes - either positive or negative - in outflows or inflows could have a significant impact on balance of payments projections in this Bulletin.
Supply
Industry and Services Output
Manufacturing data for 2013 suggest a contraction in activity of about 2.2 per cent. Pronounced weakness in the modern sector, owed much to the sharp slowdown in the pharmaceutical sector, where output declined by 3.2 per cent, primarily due to patent expirations. The traditional sector recorded marginal year-on-year growth in 2013.
Preliminary National Accounts estimates for 2013 (not directly comparable with the industrial production data in Table 4) provide further
Table 3: Balance of Payments 2013e, 2014f, 2015f
€ million 2013e 2014f 2015f
Current Account Items
Merchadise Trade Balance 32179 30602 29755
Services 6061 8318 11957
Net Factor Income from Rest of the World -25964 -25814 -27915
Current International Transfers -1425 -1425 -1425
Balance on Current Account 10851 11681 12372
(% of GDP) 6.6 6.9 7.0
14 Quarterly Bulletin 02 / April 14The Domestic Economy
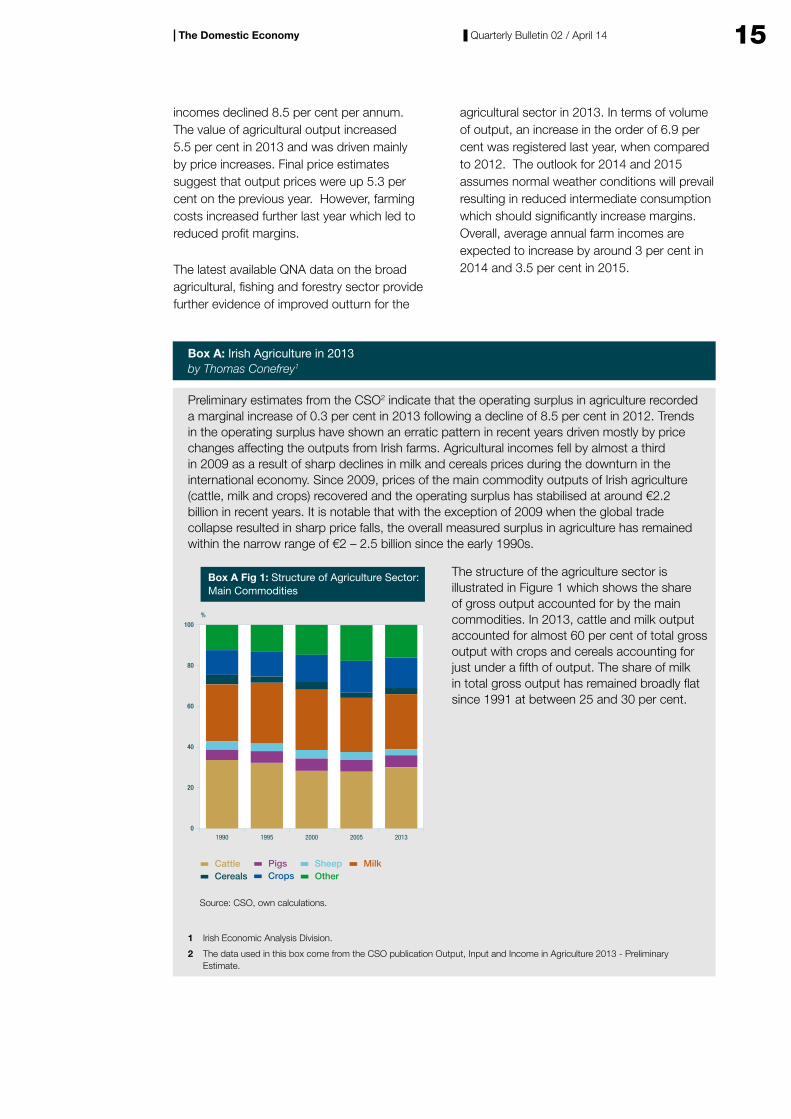
evidence of a negative outturn for the industrial sector last year. Output declined by 3.3 per cent in 2013, compared to a fall of 0.8 per cent in 2012.
PMI data for manufacturing appear somewhat at variance with official data and suggests that production and new orders continued to grow during 2013, albeit with a marginal slowdown in output growth in January this year. Improved demand from both domestic and export clients served to increase production volumes which had a positive knock-on-effect on employment levels.
An improvement in the external environment should serve to improve the outlook for industrial output notwithstanding a continuing but moderating impact from patent expiry. Industrial output is projected to decline by 0.6 per cent in 2014, but a marginal increase is projected for 2015.
On the services side, the latest QNA point to an increase in the output of Other Services (including rent) of 3.1 per cent in the 2013. However, the relatively smaller distribution, transport and communications sector contracted by 2.5 per cent. The Investec Services PMI pointed to strong growth in services output in 2013 and the most recent index for January 2014 remained in positive territory. Activity has increased in line with higher new orders both domestically and abroad, with exports recording their highest growth since June 2002. This improvement in business activity resulted in higher employment levels due
to increased orders and expectations of further improved economic conditions.
Agricultural Output
Preliminary estimates on Output, Input and Income in Agriculture for 2013 recently published by the CSO signal a slight improvement for the agricultural sector (see Box A). In particular a marginal increase of 0.3 per cent in agricultural income (as measured by operating surplus) was recorded last year, representing a considerable improvement from the poor performance of 2012 when farm
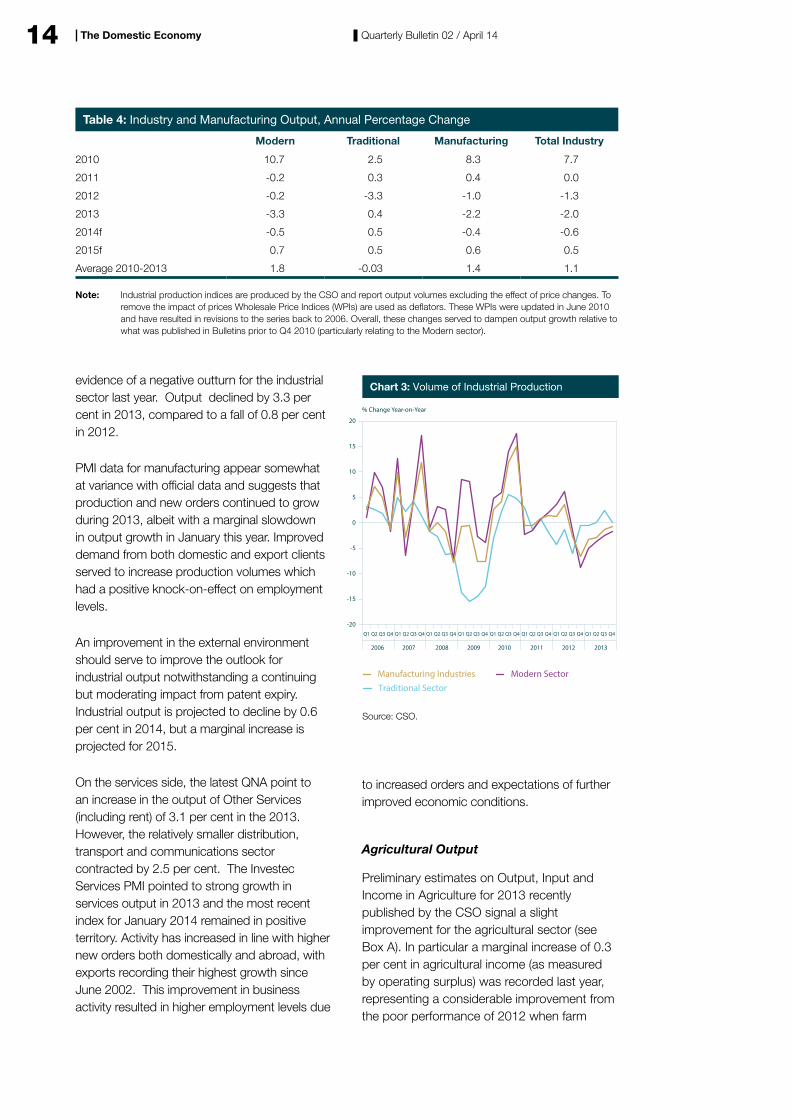
Table 4: Industry and Manufacturing Output, Annual Percentage Change
Modern Traditional Manufacturing Total Industry
2010 10.7 2.5 8.3 7.7
2011 -0.2 0.3 0.4 0.0
2012 -0.2 -3.3 -1.0 -1.3
2013 -3.3 0.4 -2.2 -2.0
2014f -0.5 0.5 -0.4 -0.6
2015f 0.7 0.5 0.6 0.5
Average 2010-2013 1.8 -0.03 1.4 1.1
Note: Industrial production indices are produced by the CSO and report output volumes excluding the effect of price changes. To remove the impact of prices Wholesale Price Indices (WPIs) are used as deflators. These WPIs were updated in June 2010 and have resulted in revisions to the series back to 2006. Overall, these changes served to dampen output growth relative to what was published in Bulletins prior to Q4 2010 (particularly relating to the Modern sector).
-20
-15
-10
-5
0
5
10
15
20
Q4Q3Q2Q1 Q4Q3Q2Q1 Q4Q3Q2Q1 Q4Q3Q2Q1 Q4Q3Q2Q1 Q4Q3Q2Q1 Q4Q3Q2Q1 Q4Q3Q2Q1
2006 2007 2008 2009 2010 2011 2012 2013
Manufacturing Industries Modern Sector
Traditional Sector
% Change Year-on-Year
Chart 3: Volume of Industrial Production
Source: CSO.
15Quarterly Bulletin 02 / April 14
incomes declined 8.5 per cent per annum. The value of agricultural output increased 5.5 per cent in 2013 and was driven mainly by price increases. Final price estimates suggest that output prices were up 5.3 per cent on the previous year. However, farming costs increased further last year which led to reduced profit margins.
The latest available QNA data on the broad agricultural, fishing and forestry sector provide further evidence of improved outturn for the
agricultural sector in 2013. In terms of volume of output, an increase in the order of 6.9 per cent was registered last year, when compared to 2012. The outlook for 2014 and 2015 assumes normal weather conditions will prevail resulting in reduced intermediate consumption which should significantly increase margins. Overall, average annual farm incomes are expected to increase by around 3 per cent in 2014 and 3.5 per cent in 2015.
The Domestic Economy
Box A: Irish Agriculture in 2013 by Thomas Conefrey1
Preliminary estimates from the CSO2 indicate that the operating surplus in agriculture recorded a marginal increase of 0.3 per cent in 2013 following a decline of 8.5 per cent in 2012. Trends in the operating surplus have shown an erratic pattern in recent years driven mostly by price changes affecting the outputs from Irish farms. Agricultural incomes fell by almost a third in 2009 as a result of sharp declines in milk and cereals prices during the downturn in the international economy. Since 2009, prices of the main commodity outputs of Irish agriculture (cattle, milk and crops) recovered and the operating surplus has stabilised at around €2.2 billion in recent years. It is notable that with the exception of 2009 when the global trade collapse resulted in sharp price falls, the overall measured surplus in agriculture has remained within the narrow range of €2 – 2.5 billion since the early 1990s.
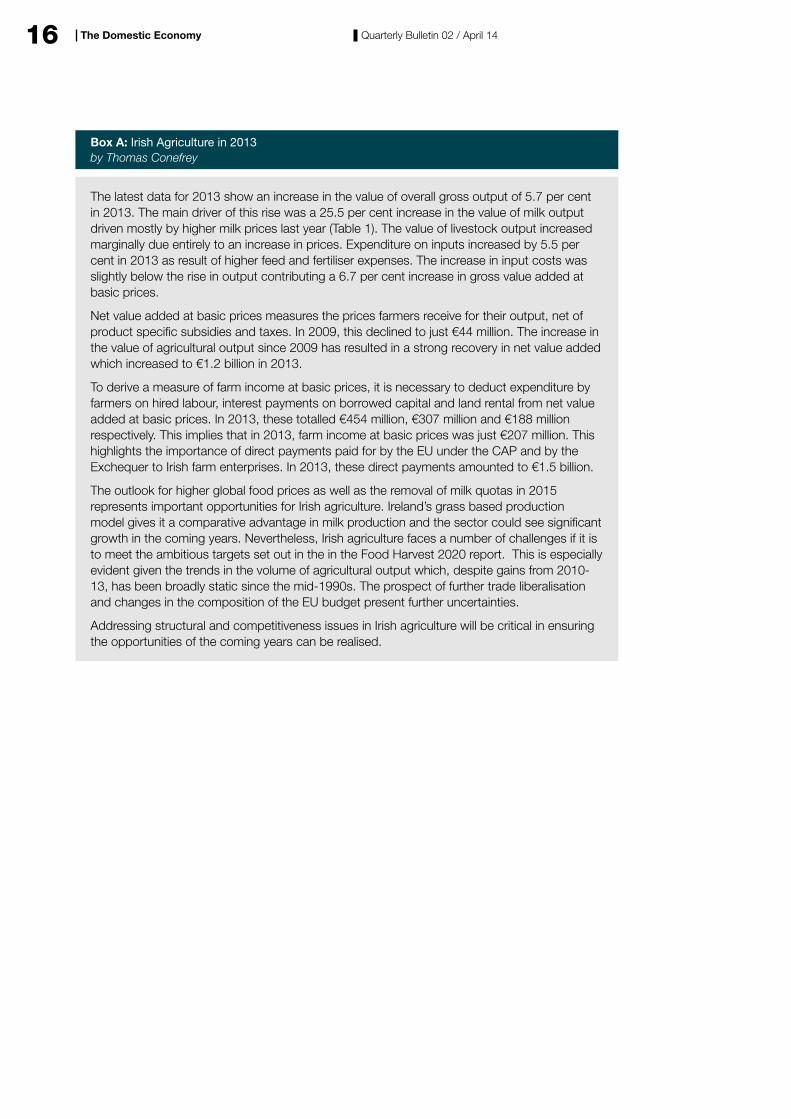
0
20
40
60
80
100
20132005200019951990
%
Source: CSO, own calculations.
Box A Fig 1: Structure of Agriculture Sector:Main Commodities
Cattle Pigs Sheep MilkCereals Crops Other
The structure of the agriculture sector is illustrated in Figure 1 which shows the share of gross output accounted for by the main commodities. In 2013, cattle and milk output accounted for almost 60 per cent of total gross output with crops and cereals accounting for just under a fifth of output. The share of milk in total gross output has remained broadly flat since 1991 at between 25 and 30 per cent.
1 Irish Economic Analysis Division.
2 The data used in this box come from the CSO publication Output, Input and Income in Agriculture 2013 - Preliminary Estimate.
16 Quarterly Bulletin 02 / April 14The Domestic Economy
Box A: Irish Agriculture in 2013 by Thomas Conefrey
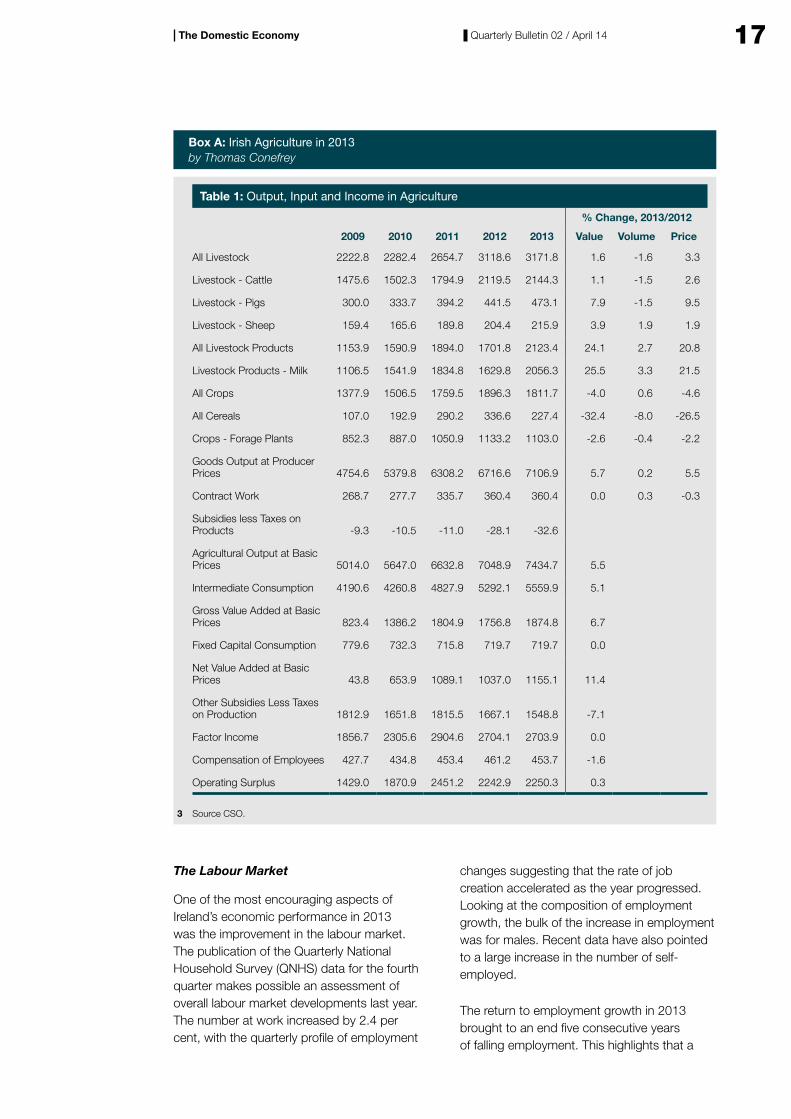
The latest data for 2013 show an increase in the value of overall gross output of 5.7 per cent in 2013. The main driver of this rise was a 25.5 per cent increase in the value of milk output driven mostly by higher milk prices last year (Table 1). The value of livestock output increased marginally due entirely to an increase in prices. Expenditure on inputs increased by 5.5 per cent in 2013 as result of higher feed and fertiliser expenses. The increase in input costs was slightly below the rise in output contributing a 6.7 per cent increase in gross value added at basic prices.
Net value added at basic prices measures the prices farmers receive for their output, net of product specific subsidies and taxes. In 2009, this declined to just €44 million. The increase in the value of agricultural output since 2009 has resulted in a strong recovery in net value added which increased to €1.2 billion in 2013.
To derive a measure of farm income at basic prices, it is necessary to deduct expenditure by farmers on hired labour, interest payments on borrowed capital and land rental from net value added at basic prices. In 2013, these totalled €454 million, €307 million and €188 million respectively. This implies that in 2013, farm income at basic prices was just €207 million. This highlights the importance of direct payments paid for by the EU under the CAP and by the Exchequer to Irish farm enterprises. In 2013, these direct payments amounted to €1.5 billion.
The outlook for higher global food prices as well as the removal of milk quotas in 2015 represents important opportunities for Irish agriculture. Ireland’s grass based production model gives it a comparative advantage in milk production and the sector could see significant growth in the coming years. Nevertheless, Irish agriculture faces a number of challenges if it is to meet the ambitious targets set out in the in the Food Harvest 2020 report. This is especially evident given the trends in the volume of agricultural output which, despite gains from 2010-13, has been broadly static since the mid-1990s. The prospect of further trade liberalisation and changes in the composition of the EU budget present further uncertainties.
Addressing structural and competitiveness issues in Irish agriculture will be critical in ensuring the opportunities of the coming years can be realised.
17Quarterly Bulletin 02 / April 14The Domestic Economy
The Labour Market
One of the most encouraging aspects of Ireland’s economic performance in 2013 was the improvement in the labour market. The publication of the Quarterly National Household Survey (QNHS) data for the fourth quarter makes possible an assessment of overall labour market developments last year. The number at work increased by 2.4 per cent, with the quarterly profile of employment
changes suggesting that the rate of job creation accelerated as the year progressed. Looking at the composition of employment growth, the bulk of the increase in employment was for males. Recent data have also pointed to a large increase in the number of self-employed.
The return to employment growth in 2013 brought to an end five consecutive years of falling employment. This highlights that a
Box A: Irish Agriculture in 2013 by Thomas Conefrey
Table 1: Output, Input and Income in Agriculture
% Change, 2013/2012
2009 2010 2011 2012 2013 Value Volume Price
All Livestock 2222.8 2282.4 2654.7 3118.6 3171.8 1.6 -1.6 3.3
Livestock - Cattle 1475.6 1502.3 1794.9 2119.5 2144.3 1.1 -1.5 2.6
Livestock - Pigs 300.0 333.7 394.2 441.5 473.1 7.9 -1.5 9.5
Livestock - Sheep 159.4 165.6 189.8 204.4 215.9 3.9 1.9 1.9
All Livestock Products 1153.9 1590.9 1894.0 1701.8 2123.4 24.1 2.7 20.8
Livestock Products - Milk 1106.5 1541.9 1834.8 1629.8 2056.3 25.5 3.3 21.5
All Crops 1377.9 1506.5 1759.5 1896.3 1811.7 -4.0 0.6 -4.6
All Cereals 107.0 192.9 290.2 336.6 227.4 -32.4 -8.0 -26.5
Crops - Forage Plants 852.3 887.0 1050.9 1133.2 1103.0 -2.6 -0.4 -2.2
Goods Output at Producer Prices 4754.6 5379.8 6308.2 6716.6 7106.9 5.7 0.2 5.5
Contract Work 268.7 277.7 335.7 360.4 360.4 0.0 0.3 -0.3
Subsidies less Taxes on Products -9.3 -10.5 -11.0 -28.1 -32.6
Agricultural Output at Basic Prices 5014.0 5647.0 6632.8 7048.9 7434.7 5.5
Intermediate Consumption 4190.6 4260.8 4827.9 5292.1 5559.9 5.1
Gross Value Added at Basic Prices 823.4 1386.2 1804.9 1756.8 1874.8 6.7
Fixed Capital Consumption 779.6 732.3 715.8 719.7 719.7 0.0
Net Value Added at Basic Prices 43.8 653.9 1089.1 1037.0 1155.1 11.4
Other Subsidies Less Taxes on Production 1812.9 1651.8 1815.5 1667.1 1548.8 -7.1
Factor Income 1856.7 2305.6 2904.6 2704.1 2703.9 0.0
Compensation of Employees 427.7 434.8 453.4 461.2 453.7 -1.6
Operating Surplus 1429.0 1870.9 2451.2 2242.9 2250.3 0.3
3 Source CSO.
18 Quarterly Bulletin 02 / April 14The Domestic Economy
prolonged period of sustained employment growth will be required to make good the losses incurred during the crisis.
The return to employment growth has resulted in a steady decline in the rate of unemployment which fell from a peak of 15.1 per cent in Q1 2012 to 12.1 per cent in the final quarter of 2013. Monthly data from the live register show a fall in the number signing on for the twentieth consecutive month in February, bringing the standardised unemployment rate to 11.9 per cent. The long-term unemployment rate also fell in 2013 by over 1 percentage point to 7.8 per cent.
What makes the recent falls in the unemployment rate more significant is that they have been accompanied by increases in the size of the labour force. The labour force participation rate stood at just under 60 per cent in Q4 2012 but increased to 61.4 per cent in the last quarter of 2013. The increase in the participation rate helped to offset a continued fall in the size of the working age population resulting in a small overall increase in the labour force of 0.4 per cent in 2013.
Another striking feature of employment developments has been the sharp increase in self-employment, as evidenced by the year-on-year increase of 11.5 per cent registered in the final quarter of 2013. Self-employment accounted for just over half of the rise in total employment over this period, taking its share of overall employment to 15.7 per cent. Recent employment gains have also been characterised by a change in structure, with
a clear shift toward full-time positions. Full-time and part-time employment both rose over the period from second quarter of 2013 through to the final quarter of 2013, with full-time positions accounting for around 90 per cent of net employment gains annually in the third and fourth quarters of 2013. This suggests that confidence levels have improved amid sustained demand for firms' goods and services. It is also noteworthy that sizable year-on-year declines in part-time underemployment have been recorded since the second quarter of 2013 amid the recent recovery in labour demand. This is to be expected given the counter-cyclicality of part-time underemployment.
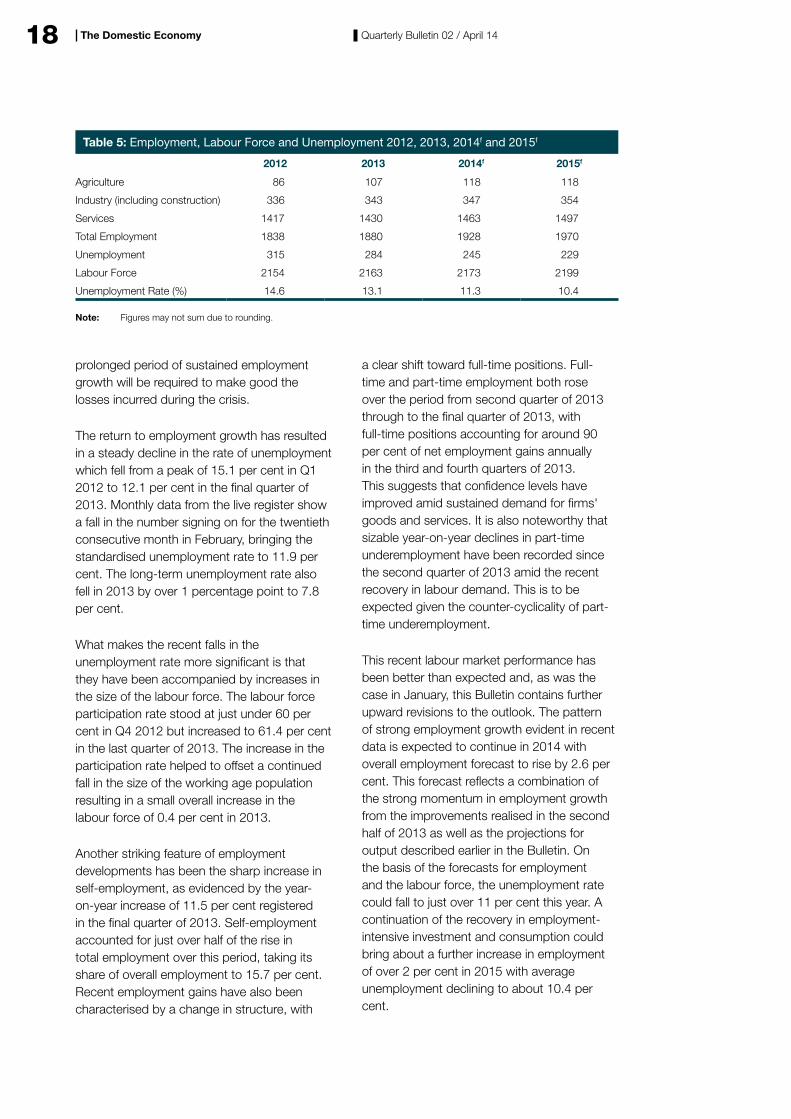
This recent labour market performance has been better than expected and, as was the case in January, this Bulletin contains further upward revisions to the outlook. The pattern of strong employment growth evident in recent data is expected to continue in 2014 with overall employment forecast to rise by 2.6 per cent. This forecast reflects a combination of the strong momentum in employment growth from the improvements realised in the second half of 2013 as well as the projections for output described earlier in the Bulletin. On the basis of the forecasts for employment and the labour force, the unemployment rate could fall to just over 11 per cent this year. A continuation of the recovery in employment-intensive investment and consumption could bring about a further increase in employment of over 2 per cent in 2015 with average unemployment declining to about 10.4 per cent.
Table 5: Employment, Labour Force and Unemployment 2012, 2013, 2014f and 2015f
2012 2013 2014f 2015f
Agriculture 86 107 118 118
Industry (including construction) 336 343 347 354
Services 1417 1430 1463 1497
Total Employment 1838 1880 1928 1970
Unemployment 315 284 245 229
Labour Force 2154 2163 2173 2199
Unemployment Rate (%) 14.6 13.1 11.3 10.4
Note: Figures may not sum due to rounding.
19Quarterly Bulletin 02 / April 14The Domestic Economy
Box B: Recent Employment Recovery by Thomas Conefrey and Suzanne Linehan4
The single most noticeable aspect of recent labour market developments has been the strong growth in employment. The recovery in employment, from its onset in the final quarter of 2012 through to the final quarter of 2013, has produced a net increase totalling 72,100 jobs, a sizable increase over a relatively short period of time. Such growth represents around 18 per cent of the total number of jobs lost during the crisis, returning overall employment levels to those of end-2004.
The recovery in employment has taken hold surprisingly quickly and at a faster pace than previously envisaged. Looking at developments in the macro economy over the course of 2013, the reasons for the recent progress are not obvious. In particular, it was previously expected that strong employment growth would not be observed until labour intensive domestic demand recovered. Preliminary National Accounts data for 2013 show that, although investment grew, overall domestic demand contracted. Moreover, it had been expected that a recovery in employment would lag that of output as firms tend to increase capacity utilisation and hours worked before they begin to hire again. Some decoupling of the employment-output relationship has, however, become apparent over recent times, as evidenced by the fact that five consecutive quarters of net employment gains have been registered amid a weak and in some quarters contracting output performance. Such decoupling partly reflects sectoral developments, specifically, the volatility of output in the pharmaceutical sector arising from the expiry of a number of patents.
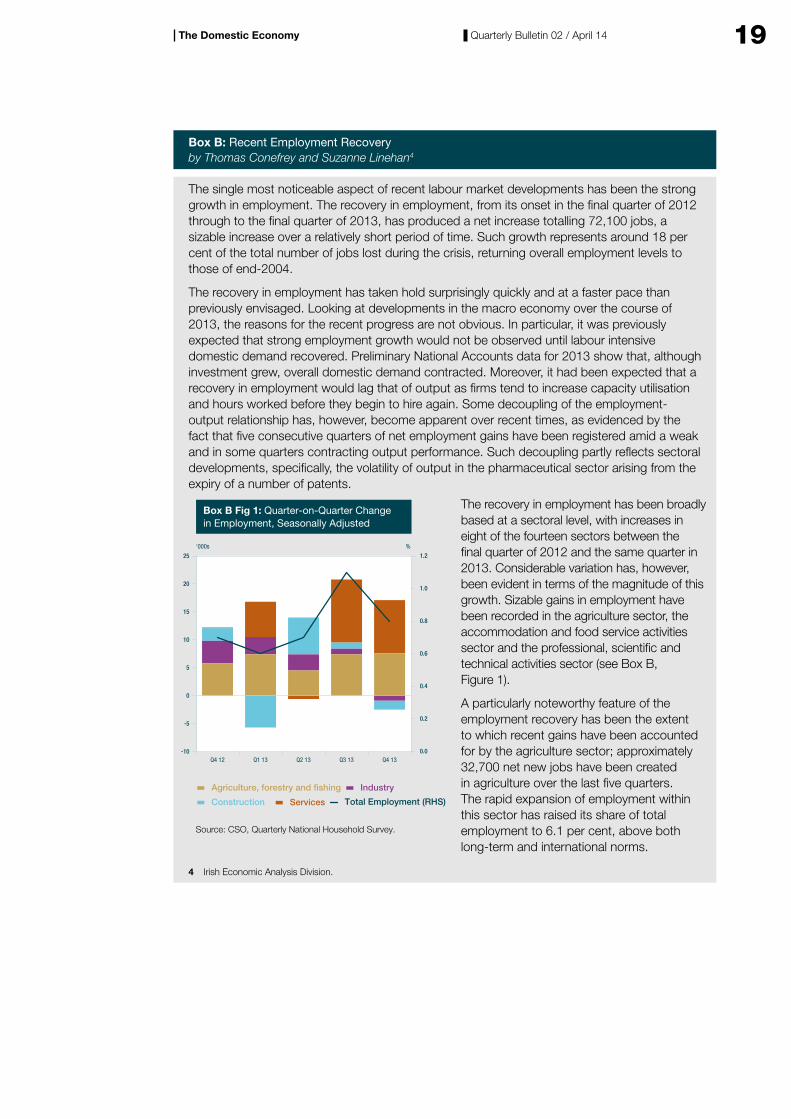
0.0
0.2
0.4
0.6
0.8
1.0
1.2
Q4 13Q3 13Q2 13Q1 13Q4 12
%
Agriculture, forestry and shing Industry
Construction Services Total Employment (RHS)
‘000s
Source: CSO, Quarterly National Household Survey.
Box B Fig 1: Quarter-on-Quarter Changein Employment, Seasonally Adjusted
-10
-5
0
5
10
15
20
25
The recovery in employment has been broadly based at a sectoral level, with increases in eight of the fourteen sectors between the final quarter of 2012 and the same quarter in 2013. Considerable variation has, however, been evident in terms of the magnitude of this growth. Sizable gains in employment have been recorded in the agriculture sector, the accommodation and food service activities sector and the professional, scientific and technical activities sector (see Box B, Figure 1).
A particularly noteworthy feature of the employment recovery has been the extent to which recent gains have been accounted for by the agriculture sector; approximately 32,700 net new jobs have been created in agriculture over the last five quarters. The rapid expansion of employment within this sector has raised its share of total employment to 6.1 per cent, above both long-term and international norms.
4 Irish Economic Analysis Division.
20 Quarterly Bulletin 02 / April 14The Domestic Economy
Box B: Recent Employment Recovery by Thomas Conefrey and Suzanne Linehan
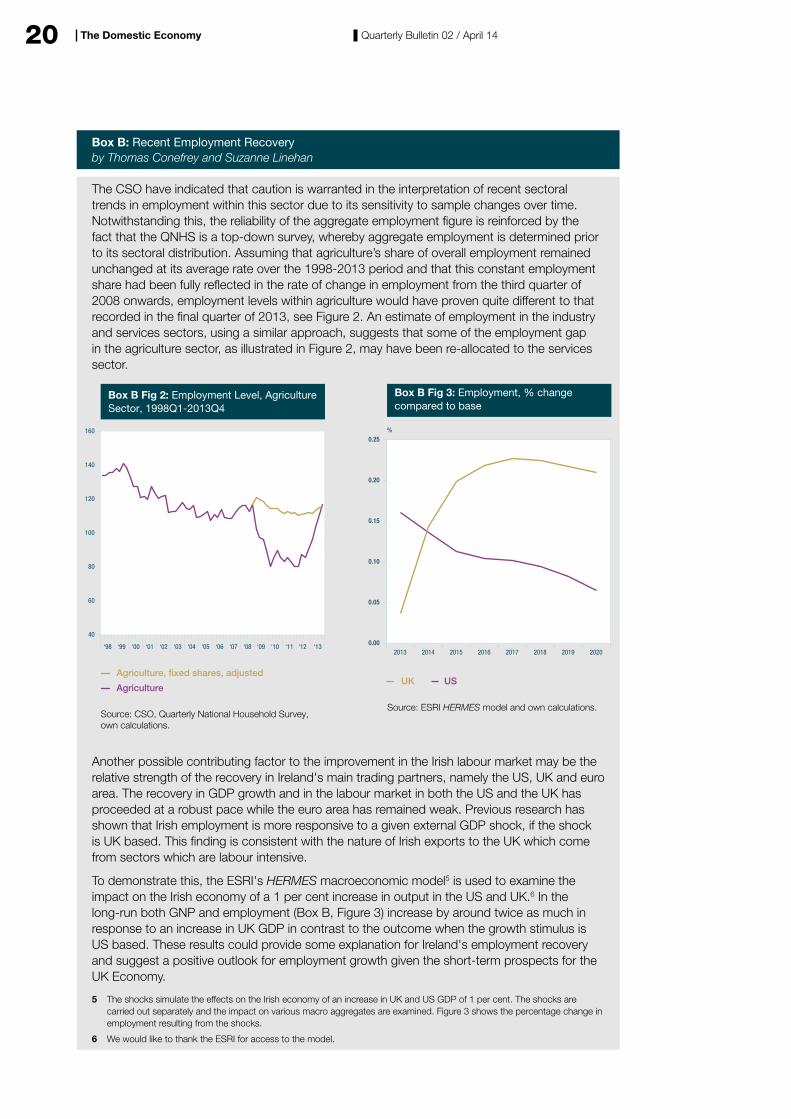
The CSO have indicated that caution is warranted in the interpretation of recent sectoral trends in employment within this sector due to its sensitivity to sample changes over time. Notwithstanding this, the reliability of the aggregate employment figure is reinforced by the fact that the QNHS is a top-down survey, whereby aggregate employment is determined prior to its sectoral distribution. Assuming that agriculture’s share of overall employment remained unchanged at its average rate over the 1998-2013 period and that this constant employment share had been fully reflected in the rate of change in employment from the third quarter of 2008 onwards, employment levels within agriculture would have proven quite different to that recorded in the final quarter of 2013, see Figure 2. An estimate of employment in the industry and services sectors, using a similar approach, suggests that some of the employment gap in the agriculture sector, as illustrated in Figure 2, may have been re-allocated to the services sector.
40
60
80
100
120
140
160
Box B Fig 2: Employment Level, AgricultureSector, 1998Q1-2013Q4
Source: CSO, Quarterly National Household Survey,own calculations.
Agriculture, �xed shares, adjusted
Agriculture
‘11‘10‘09‘08‘07‘06‘05‘04‘03‘02‘01‘00‘99‘98 ‘12 ‘13 0.00
0.05
0.10
0.15
0.20
0.25
20202019201820172016201520142013
UK US
%
Source: ESRI HERMES model and own calculations.
Box B Fig 3: Employment, % changecompared to base
Another possible contributing factor to the improvement in the Irish labour market may be the relative strength of the recovery in Ireland's main trading partners, namely the US, UK and euro area. The recovery in GDP growth and in the labour market in both the US and the UK has proceeded at a robust pace while the euro area has remained weak. Previous research has shown that Irish employment is more responsive to a given external GDP shock, if the shock is UK based. This finding is consistent with the nature of Irish exports to the UK which come from sectors which are labour intensive.
To demonstrate this, the ESRI's HERMES macroeconomic model5 is used to examine the impact on the Irish economy of a 1 per cent increase in output in the US and UK.6 In the long-run both GNP and employment (Box B, Figure 3) increase by around twice as much in response to an increase in UK GDP in contrast to the outcome when the growth stimulus is US based. These results could provide some explanation for Ireland's employment recovery and suggest a positive outlook for employment growth given the short-term prospects for the UK Economy.
5 The shocks simulate the effects on the Irish economy of an increase in UK and US GDP of 1 per cent. The shocks are carried out separately and the impact on various macro aggregates are examined. Figure 3 shows the percentage change in employment resulting from the shocks.
6 We would like to thank the ESRI for access to the model.
21Quarterly Bulletin 02 / April 14The Domestic Economy
Pay
Data for 2013 show that hourly earnings in the economy declined by 0.6 per cent in 2013 following a small rise in the previous year. The data show that earnings growth weakened as the year progressed with hourly pay falling on an annual basis by 1.5 per cent in the second half of 2013. The overall reduction in hourly earnings masks differing trends in pay in the public and private sectors. In the private sector, hourly earnings increased by 0.4 per cent in 2013 while in the public sector earnings fell by 1.3 per cent. The fall in public sector hourly pay was recorded from mid-year onwards and likely reflects the impact of the Haddington Road agreement.
Annual reductions in hourly pay during the second half of 2013 have coincided with strong growth in employment and a general improvement in labour market conditions. The sluggish earnings growth may be due to a combination of factors. From 2009-11, changes in the composition of the workforce boosted average earnings as employment losses were concentrated in lower paid occupations. The reverse of this process may now be taking pace such that, although employment is growing, the bulk of new jobs being created may be in lower paid sectors with the result that overall pay pressures are subdued.
The improving outlook for output and employment, as well as a smaller negative drag from the public sector, should bring about a small increase in compensation per employee in 2014. The pace of earnings growth is expected to pick-up over the forecast horizon, providing support to household disposable incomes and purchasing power in the economy.
Inflation
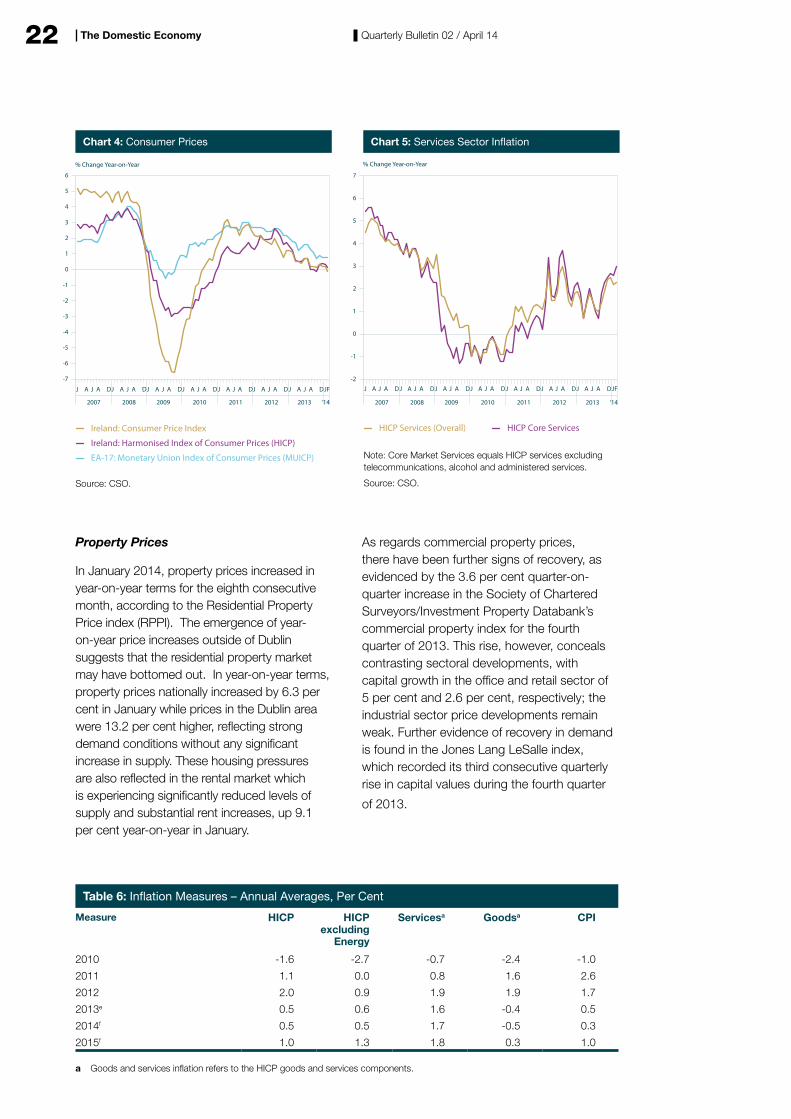
Irish HICP inflation slowed sharply during 2013 to an average rate of 0.5 per cent from
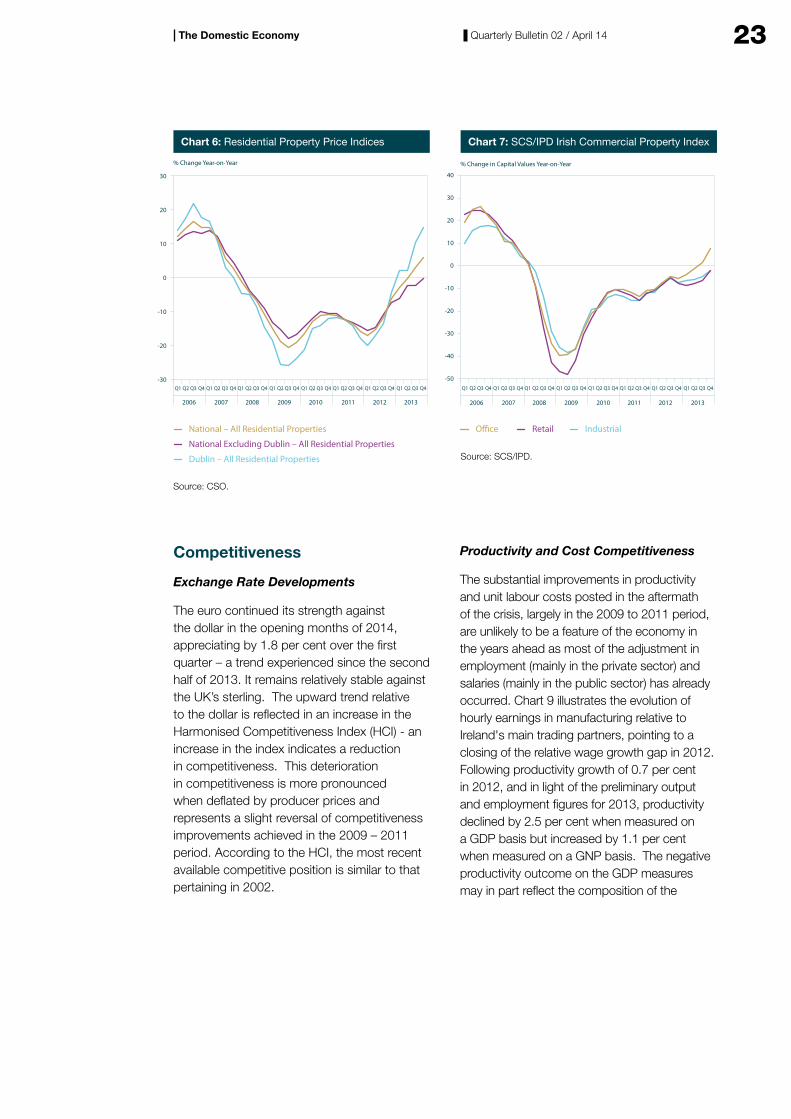
1.9 per cent in 2012. As highlighted in the previous Bulletin, the weaker outturn for 2013 was largely driven by downward pressure from international factors, specifically falling energy prices and weaker unprocessed food prices. The outturn for the first two months of 2014 has been consistent with a continuation of these downward pressures, with HICP inflation averaging 0.2 per cent, year-on-year, during January and February. The lower annual inflation recorded for the first two months of this year, to a large extent, reflects negative rates of change in energy prices together with a further falloff in unprocessed food price inflation. HICP inflation excluding the volatile energy and unprocessed food components also moderated, albeit to a somewhat lesser extent than headline inflation. In contrast, domestically generated inflation, as proxied by the HICP services index, made a more significant contribution to overall inflation, with price increases averaging 2.4 per cent in annual terms during January and February 2014.
Inflationary pressures are expected to remain muted over the projection horizon as downward pressure on the price level from external factors seems set to persist. HICP inflation is projected to be unchanged at 0.5 percent in 2014, followed by a gradual upward movement to around 1 per cent in 2015. The corresponding forecasts for the Consumer Price Index (CPI) are 0.3 per cent and 1 per cent in 2014 and 2015, respectively. Underlying price pressures are also expected to remain subdued this year, with the HICP excluding energy and unprocessed food projected to average 0.5 per cent. Technical assumptions imply only a marginal direct impact of exchange rates and international commodity prices beyond a one year horizon. As a result, domestic factors are likely to dominate inflation developments in 2015, with the envisaged continued recovery in consumer demand reflected in the projected rise in the HICP price level of 1.1 per cent.
22 Quarterly Bulletin 02 / April 14The Domestic Economy
Property Prices
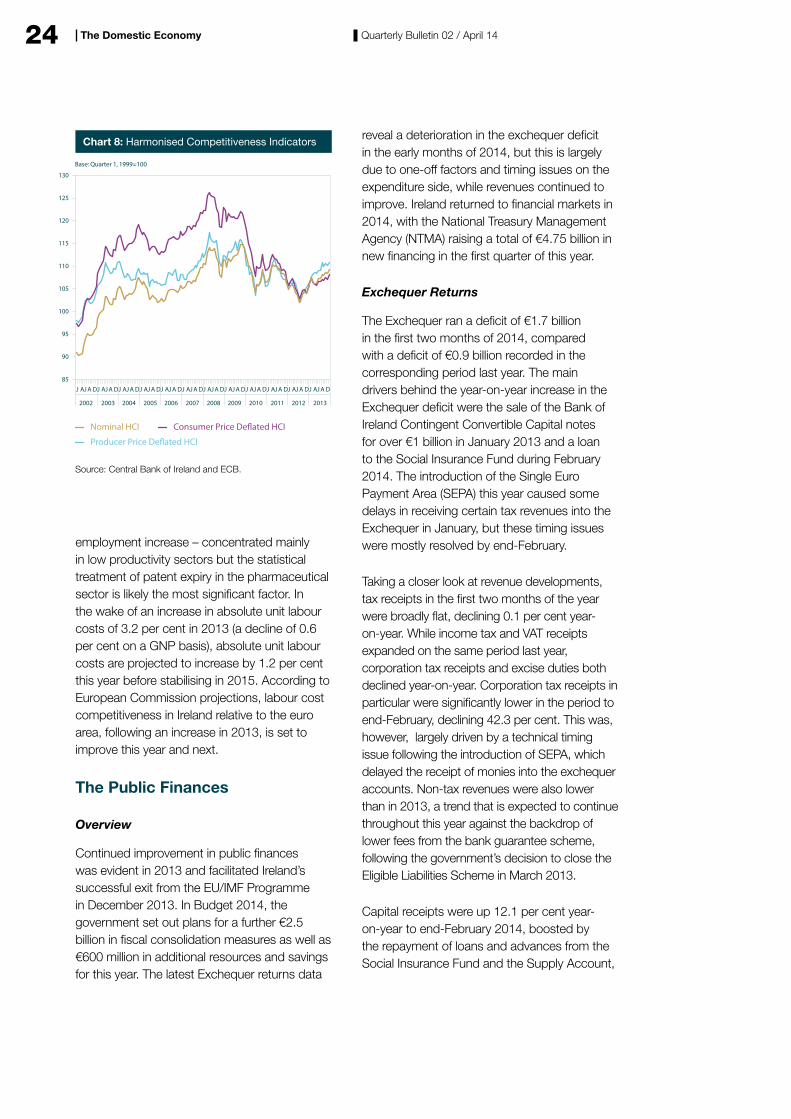
In January 2014, property prices increased in year-on-year terms for the eighth consecutive month, according to the Residential Property Price index (RPPI). The emergence of year-on-year price increases outside of Dublin suggests that the residential property market may have bottomed out. In year-on-year terms, property prices nationally increased by 6.3 per cent in January while prices in the Dublin area were 13.2 per cent higher, reflecting strong demand conditions without any significant increase in supply. These housing pressures are also reflected in the rental market which is experiencing significantly reduced levels of supply and substantial rent increases, up 9.1 per cent year-on-year in January.
As regards commercial property prices, there have been further signs of recovery, as evidenced by the 3.6 per cent quarter-on-quarter increase in the Society of Chartered Surveyors/Investment Property Databank’s commercial property index for the fourth quarter of 2013. This rise, however, conceals contrasting sectoral developments, with capital growth in the office and retail sector of 5 per cent and 2.6 per cent, respectively; the industrial sector price developments remain weak. Further evidence of recovery in demand is found in the Jones Lang LeSalle index, which recorded its third consecutive quarterly rise in capital values during the fourth quarter
of 2013.
Table 6: Inflation Measures – Annual Averages, Per Cent
Measure HICP HICP excluding
Energy
Servicesa Goodsa CPI
2010 -1.6 -2.7 -0.7 -2.4 -1.0
2011 1.1 0.0 0.8 1.6 2.6
2012 2.0 0.9 1.9 1.9 1.7
2013e 0.5 0.6 1.6 -0.4 0.5
2014f 0.5 0.5 1.7 -0.5 0.3
2015f 1.0 1.3 1.8 0.3 1.0
a Goods and services inflation refers to the HICP goods and services components.
J A J A DJ A J A DJ A J A DJ A J A DJ A J A DJ A J A DJ A JFJ A D
2007 2008 2009 2010 2011 2012 2013 ‘14
Ireland: Consumer Price Index
Ireland: Harmonised Index of Consumer Prices (HICP)
EA-17: Monetary Union Index of Consumer Prices (MUICP)
% Change Year-on-Year
-7
-6
-5
-4
-3
-2
-1
0
1
2
3
4
5
6
Chart 4: Consumer Prices
Source: CSO.
-2
-1
0
1
2
3
4
5
6
7
% Change Year-on-Year
Chart 5: Services Sector In�ation
HICP Services (Overall) HICP Core Services
Note: Core Market Services equals HICP services excludingtelecommunications, alcohol and administered services.
Source: CSO.
J A J A DJ A J A DJ A J A DJ A J A DJ A J A DJ A J A DJ A J JFA D
2007 2008 2009 2010 2011 2012 2013 ‘14
23Quarterly Bulletin 02 / April 14The Domestic Economy
Competitiveness
Exchange Rate Developments
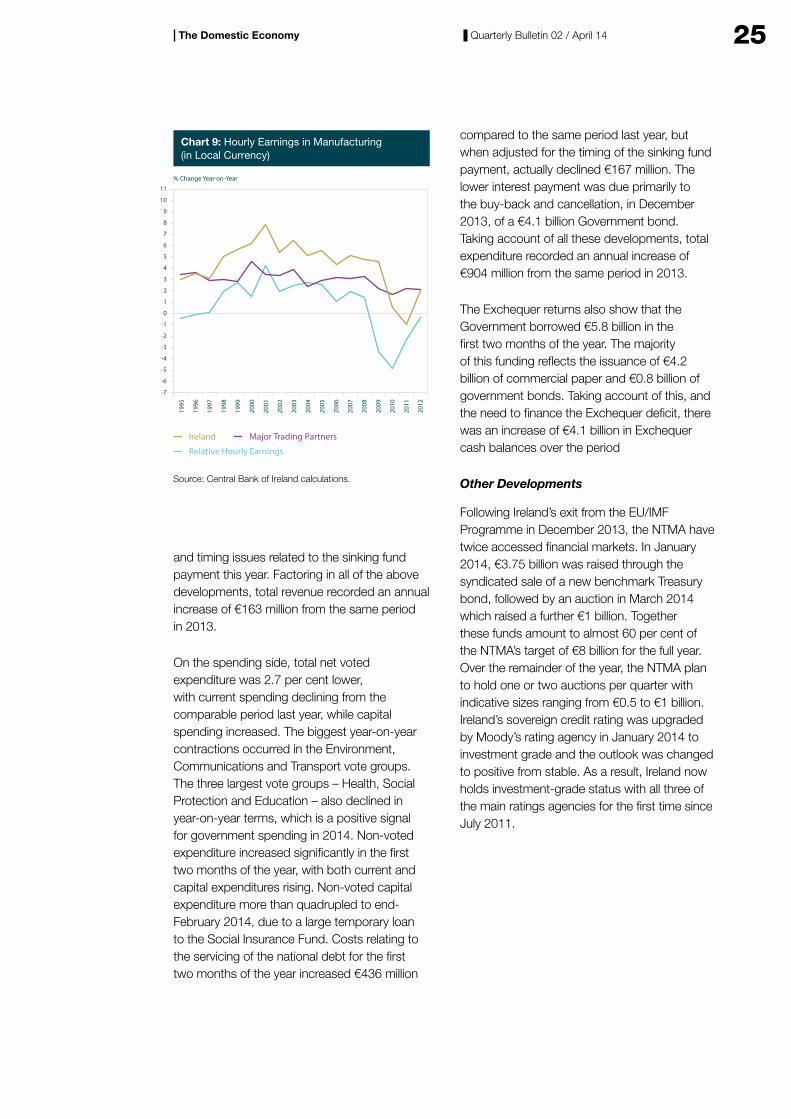
The euro continued its strength against the dollar in the opening months of 2014, appreciating by 1.8 per cent over the first quarter – a trend experienced since the second half of 2013. It remains relatively stable against the UK’s sterling. The upward trend relative to the dollar is reflected in an increase in the Harmonised Competitiveness Index (HCI) - an increase in the index indicates a reduction in competitiveness. This deterioration in competitiveness is more pronounced when deflated by producer prices and represents a slight reversal of competitiveness improvements achieved in the 2009 – 2011 period. According to the HCI, the most recent available competitive position is similar to that pertaining in 2002.
Productivity and Cost Competitiveness
The substantial improvements in productivity and unit labour costs posted in the aftermath of the crisis, largely in the 2009 to 2011 period, are unlikely to be a feature of the economy in the years ahead as most of the adjustment in employment (mainly in the private sector) and salaries (mainly in the public sector) has already occurred. Chart 9 illustrates the evolution of hourly earnings in manufacturing relative to Ireland's main trading partners, pointing to a closing of the relative wage growth gap in 2012. Following productivity growth of 0.7 per cent in 2012, and in light of the preliminary output and employment figures for 2013, productivity declined by 2.5 per cent when measured on a GDP basis but increased by 1.1 per cent when measured on a GNP basis. The negative productivity outcome on the GDP measures may in part reflect the composition of the
2006 2007 2008 2009 2010 2011 2012 2013
-30
-20
-10
0
10
20
30
National – All Residential Properties
National Excluding Dublin – All Residential Properties
Dublin – All Residential Properties
% Change Year-on-Year
Chart 6: Residential Property Price Indices
Source: CSO.
Q4Q3Q2Q1 Q4Q3Q2Q1 Q4Q3Q2Q1 Q4Q3Q2Q1 Q4Q3Q2Q1 Q4Q3Q2Q1 Q4Q3Q2Q1 Q4Q3Q2Q1
Office Retail Industrial
% Change in Capital Values Year-on-Year
-50
-40
-30
-20
-10
0
10
20
30
40
Chart 7: SCS/IPD Irish Commercial Property Index
Source: SCS/IPD.
2006 2007 2008 2009 2010 2011 2012 2013
Q4Q3Q2Q1 Q4Q3Q2Q1 Q4Q3Q2Q1 Q4Q3Q2Q1 Q4Q3Q2Q1 Q4Q3Q2Q1 Q4Q3Q2Q1 Q4Q3Q2Q1
24 Quarterly Bulletin 02 / April 14The Domestic Economy
employment increase – concentrated mainly in low productivity sectors but the statistical treatment of patent expiry in the pharmaceutical sector is likely the most significant factor. In the wake of an increase in absolute unit labour costs of 3.2 per cent in 2013 (a decline of 0.6 per cent on a GNP basis), absolute unit labour costs are projected to increase by 1.2 per cent this year before stabilising in 2015. According to European Commission projections, labour cost competitiveness in Ireland relative to the euro area, following an increase in 2013, is set to improve this year and next.
The Public Finances
Overview
Continued improvement in public finances was evident in 2013 and facilitated Ireland’s successful exit from the EU/IMF Programme in December 2013. In Budget 2014, the government set out plans for a further €2.5 billion in fiscal consolidation measures as well as €600 million in additional resources and savings for this year. The latest Exchequer returns data
reveal a deterioration in the exchequer deficit in the early months of 2014, but this is largely due to one-off factors and timing issues on the expenditure side, while revenues continued to improve. Ireland returned to financial markets in 2014, with the National Treasury Management Agency (NTMA) raising a total of €4.75 billion in new financing in the first quarter of this year.
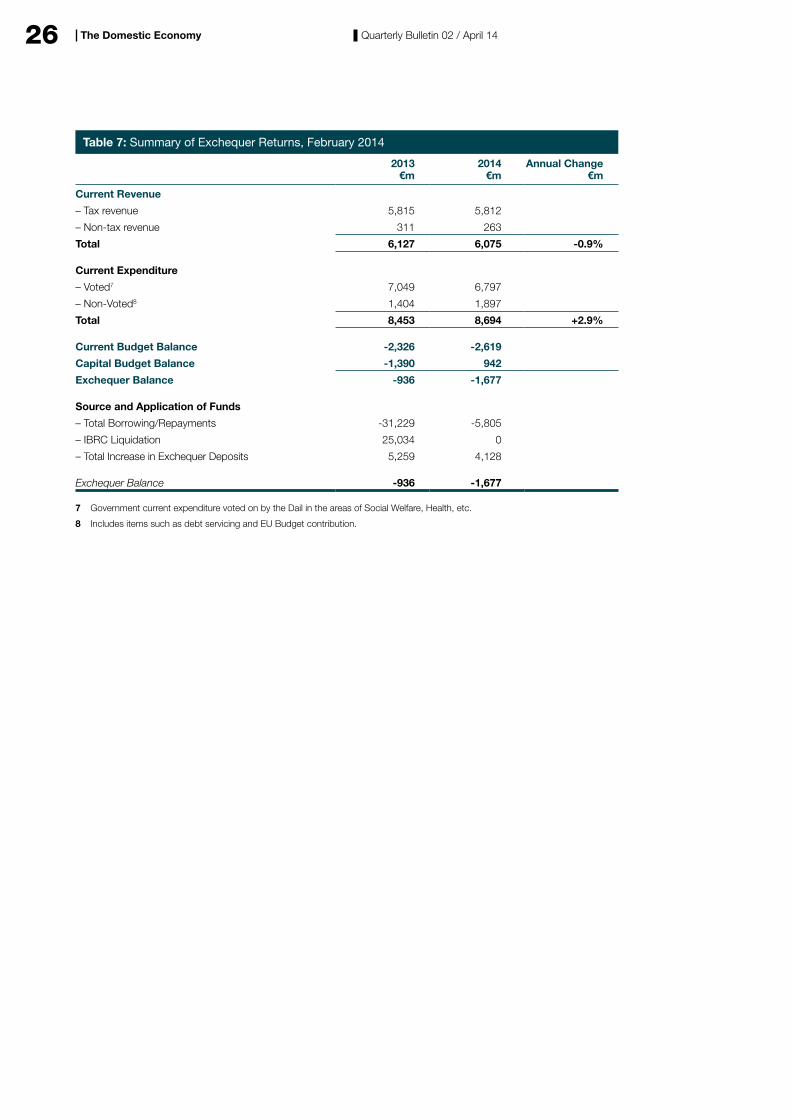
Exchequer Returns
The Exchequer ran a deficit of €1.7 billion in the first two months of 2014, compared with a deficit of €0.9 billion recorded in the corresponding period last year. The main drivers behind the year-on-year increase in the Exchequer deficit were the sale of the Bank of Ireland Contingent Convertible Capital notes for over €1 billion in January 2013 and a loan to the Social Insurance Fund during February 2014. The introduction of the Single Euro Payment Area (SEPA) this year caused some delays in receiving certain tax revenues into the Exchequer in January, but these timing issues were mostly resolved by end-February.
Taking a closer look at revenue developments, tax receipts in the first two months of the year were broadly flat, declining 0.1 per cent year-on-year. While income tax and VAT receipts expanded on the same period last year, corporation tax receipts and excise duties both declined year-on-year. Corporation tax receipts in particular were significantly lower in the period to end-February, declining 42.3 per cent. This was, however, largely driven by a technical timing issue following the introduction of SEPA, which delayed the receipt of monies into the exchequer accounts. Non-tax revenues were also lower than in 2013, a trend that is expected to continue throughout this year against the backdrop of lower fees from the bank guarantee scheme, following the government’s decision to close the Eligible Liabilities Scheme in March 2013.
Capital receipts were up 12.1 per cent year-on-year to end-February 2014, boosted by the repayment of loans and advances from the Social Insurance Fund and the Supply Account,
J AJ A DJ AJ A DJ AJ A DJ AJ A DJ AJ A DJ AJ A DJ AJ A DJ AJ A DJ AJ A DJ AJ A DJ AJ A DJ AJ A D
2002 2003 2004 2005 2006 2007 2008 2009 2010 2011 2012
Nominal HCI
Producer Price Deflated HCI
Consumer Price Deflated HCI
Base: Quarter 1, 1999=100
85
90
95
100
105
110
115
120
125
130
Chart 8: Harmonised Competitiveness Indicators
Source: Central Bank of Ireland and ECB.
2013
25Quarterly Bulletin 02 / April 14The Domestic Economy
and timing issues related to the sinking fund payment this year. Factoring in all of the above developments, total revenue recorded an annual increase of €163 million from the same period in 2013.
On the spending side, total net voted expenditure was 2.7 per cent lower, with current spending declining from the comparable period last year, while capital spending increased. The biggest year-on-year contractions occurred in the Environment, Communications and Transport vote groups. The three largest vote groups – Health, Social Protection and Education – also declined in year-on-year terms, which is a positive signal for government spending in 2014. Non-voted expenditure increased significantly in the first two months of the year, with both current and capital expenditures rising. Non-voted capital expenditure more than quadrupled to end-February 2014, due to a large temporary loan to the Social Insurance Fund. Costs relating to the servicing of the national debt for the first two months of the year increased €436 million
compared to the same period last year, but when adjusted for the timing of the sinking fund payment, actually declined €167 million. The lower interest payment was due primarily to the buy-back and cancellation, in December 2013, of a €4.1 billion Government bond. Taking account of all these developments, total expenditure recorded an annual increase of €904 million from the same period in 2013.
The Exchequer returns also show that the Government borrowed €5.8 billion in the first two months of the year. The majority of this funding reflects the issuance of €4.2 billion of commercial paper and €0.8 billion of government bonds. Taking account of this, and the need to finance the Exchequer deficit, there was an increase of €4.1 billion in Exchequer cash balances over the period
Other Developments
Following Ireland’s exit from the EU/IMF Programme in December 2013, the NTMA have twice accessed financial markets. In January 2014, €3.75 billion was raised through the syndicated sale of a new benchmark Treasury bond, followed by an auction in March 2014 which raised a further €1 billion. Together these funds amount to almost 60 per cent of the NTMA’s target of €8 billion for the full year. Over the remainder of the year, the NTMA plan to hold one or two auctions per quarter with indicative sizes ranging from €0.5 to €1 billion. Ireland’s sovereign credit rating was upgraded by Moody’s rating agency in January 2014 to investment grade and the outlook was changed to positive from stable. As a result, Ireland now holds investment-grade status with all three of the main ratings agencies for the first time since July 2011.
1995
1996
1997
1998
1999
2000
2001
2002
2003
2004
2005
2006
2007
2008
2009
2010
2011
2012
Ireland Major Trading Partners
Relative Hourly Earnings
% Change Year-on-Year
-7
-6
-5
-4
-3
-2
-1
0
1
2
3
4
5
6
7
8
9
10
11
Source: Central Bank of Ireland calculations.
Chart 9: Hourly Earnings in Manufacturing(in Local Currency)
26 Quarterly Bulletin 02 / April 14The Domestic Economy
Table 7: Summary of Exchequer Returns, February 2014
2013 €m
2014 €m
Annual Change €m
Current Revenue
– Tax revenue 5,815 5,812
– Non-tax revenue 311 263
Total 6,127 6,075 -0.9%
Current Expenditure
– Voted7 7,049 6,797
– Non-Voted8 1,404 1,897
Total 8,453 8,694 +2.9%
Current Budget Balance -2,326 -2,619
Capital Budget Balance -1,390 942
Exchequer Balance -936 -1,677
Source and Application of Funds
– Total Borrowing/Repayments -31,229 -5,805
– IBRC Liquidation 25,034 0
– Total Increase in Exchequer Deposits 5,259 4,128
Exchequer Balance -936 -1,677
7 Government current expenditure voted on by the Dail in the areas of Social Welfare, Health, etc.
8 Includes items such as debt servicing and EU Budget contribution.
27
D'ainneoin na bhforbairtí seo, áfach, tugtar le fios leis na réamhshonraí cuntas náisiúnta do 2013 gur tháinig laghdú beag ar OTI anuraidh, an tomhas is coitianta a úsáidtear maidir le gníomhaíocht eacnamaíoch. Léirítear go príomha sa laghdú taifeadta ar OTI in 2013 an iarmhairt dhiúltach a bhí ag deireadh thréimhsí paitinní áirithe san earnáil cógaisíochta. Tháinig laghdú mór tomhaiste ar tháirgeadh agus ar onnmhairí ón earnáil cógaisíochta de thoradh ionramháil staidrimh maidir le drugaí nua-chineálacha cé gur beag iarmhairt a bhí aici ar fhostaíocht san earnáil sin. I dtéarmaí gníomhaíochta arna tomhas le OTN, áfach, ní hamhlaidh atá an scéal. Ó tharla go raibh iarmhairt dheirí thréimhsí paitinne á fritháireamh le laghdú ar shreafaí gaolmhara brabúis, bhí an toradh ar fhás OTN ní ba láidre in 2013. Faoi láthair, tá treo an athraithe ar ghníomhaíocht arna chur in iúl le OTN, ag luí níos mó leis an leibhéal gníomhaíochta is airde a fheictear i sonraí an mhargaidh saothair agus i sonraí eile ná an cúngú beag arna chur in iúl le OTI.
Ag féachaint romhainn, meastar go dtacóidh dálaí feabhsaithe an éilimh eachtraigh le fás onnmhairí níos láidre i mbliana agus an bhliain seo chugainn, ó tharla go bhfuiltear ag súil go mbeidh tionchar leanúnach ach tionchar laghdaitheach ag deirí thréimhsí paitinne. Ina theannta sin, meastar go rannchuideoidh an t-éileamh intíre, arna chobhsú a bheag nó
a mhór in 2013, leis an bhfás i mbliana ar mhodh dearfach, neamhthoirtéiseach. Is dócha go dtacóidh an méadú ar fhostaíocht le hioncaim teaghlach agus le muinín tomhaltóirí agus, bunaithe ar an ionchas sin, meastar go mbeidh fás measartha dearfach ar chaiteachas tomhaltóirí in 2014. Tá neartú tagtha ar an gcaiteachas infheistíochta agus tuartar go leanfaidh sé sin i mbliana. Mar aon leis an ionchas do chaiteachas tomhaltóirí, tugann sé seo le fios go mbeidh méadú áirithe ar an éileamh intíre in 2014, cé gur dócha go mbeidh an méadú sin neamhthoirtéiseach toisc go bhfuil neart bacainní ar an téarnamh fós ann.
Tríd is tríd, tugann sé seo le tuiscint gur beag athrú a bheidh ar an ionchas d'fhás OTI do 2013 agus 2014 i gcomparáid leis na réamhaisnéisí arna bhfoilsiú san Fhaisnéis Ráithiúil roimhe seo. Meastar anois go mbeidh fás 2.0 faoin gcéad ar an OTI don bhliain seo, agus go mbeidh fás 3.2 faoin gcéad uirthi in 2015, is é sin athbhreithniú beag anuas de 0.1 faoin gcéad ar an réamhaisnéis roimhe seo don bhliain seo agus gan athrú ar bith ar an réamh-mheastachán don bhliain seo chugainn. Ar bhonn na hiarmhairte leanúnaí a bheidh ag deirí threimhsí paitinne in 2014, ardaíodh beagán an réamhaisnéis d'fhás OTN don bhliain seo. Tá na meastacháin fáis do 2015 bunaithe ar thoimhdí comhdhearcaidh ó na príomh-institiúidí eacnamaíocha go mbeidh
An Timpeallacht GheilleagrachCé go gcuireann na tomhais éagsúla ar fheidhmíocht gheilleagar na hÉireann pictiúir chodarsnacha in iúl, tugann an fhianaise ó raon táscairí le fios, tríd is tríd, go bhfuil ag leanúint leis an téarnamh ar an ngníomhaíocht eacnamaíoch. Is iad na sonraí ón margadh saothair a léiríonn an comhartha is soiléire den téarnamh sin agus tugann siad le fios go bhfuil fás láidir tagtha ar fhostaíocht le cúig ráithe anuas, rud a chuidíonn leis an ráta dífhostaíochta a laghdú faoi bhun 12 faoin gcéad, anuas ó bhuaicphointe 15 faoin gcéad ag tús 2012. Ar dtús, bhí an téarnamh ar fhostaíocht srianta do phoist pháirtaimseartha ach le ráithí beaga anuas chonacthas fás cothrom ar fhostaíocht lánaimseartha agus is cosúil go bhfuil bonn níos leithne faoin bhfás sin. Tá comharthaí feabhais le feiceáil freisin i sonraí infheistíochta, i dtomhais suirbhéanna ar ghnóthaí agus ar thomhaltóirí agus i sonraí níos dearfaí maidir le caiteachas miondíola.
28 Quarterly Bulletin 02 / April 14An Timpeallacht Gheilleagrach
téarnamh ar an éileamh seachtrach sa mhéid go bhfillfidh sé ar a threocht fadtréimhseach. Baineann éiginnteacht leis na réamhaisnéisí seo, áfach, agus beidh tionchar ag forbairtí sa gheilleagar Eorpach agus sa gheilleagar idirnáisiúnta orthu.
Maidir le saincheisteanna beartais, tá Éire tar éis imeacht as Clár AE/CAI ar mhodh rianúil, agus í ag tairbhiú den mhuinín leanúnach atá ag an margadh as an ionchas d'fheidhmíocht eacnamaíoch agus as ionchais beartais. Cuidíonn sé seo leis an Stát agus le bainc intíre rochtain níos fearr a fháil ar mhaoiniú margaidh ag rátaí níos fabhraí. Tá cur chun feidhme láidir beartas agus an t-ionchas do théarnamh eacnamaíoch mar bhuntaca leis na forbairtí fabhracha seo agus tá sé ríthábhachtach go gcuirfear leis an méid atá bainte amach le blianta beaga anuas. Ba chéim thábhachtach ar bhóthar an téarnaimh í imeacht as Clár AE/CAI ach tá achar le triall go fóill. Is gá dul chun cinn breise a dhéanamh i dtéarmaí chur chun feidhme beartas thar raon réimsí chun filleadh inmharthana ar fhás cothrom a áirithiú.
Maidir leis an airgeadas poiblí, cé nach bhfuil na figiúirí go léir ar fáil go fóill, tugann na tásca is déanaí le tuiscint gur cheart go mbeadh an tEasnamh Rialtais Ghinearálta do 2013 beagáinín faoi bhun na sprice atá leagtha síos faoin Nós Imeachta um Easnamh Iomarcach, eadhon 7.5 faoin gcéad den OTI. Ina theannta sin, tugann na réamh-mheastacháin le tuiscint gur baineadh buaic-chóimheas easnaimh-OTI amach in 2013 agus gur ceart go dtiocfaidh laghdú de réir a chéile air anois. Tá na leibhéil easnaimh agus fiachais an-ard i gcónaí agus is gá comhdhlúthú breise a dhéanamh sna blianta atá le teacht chun go n-imeoidh an fiachas le fána. Le linn thréimhse Chlár AE/CAI, ceansaíodh na margaí airgeadais leis na bearta daingne arna nglacadh ag an Rialtas chun na spriocanna fioscacha go léir sa Chlár a chur chun feidhme. Chun a áirithiú go mairfidh an mhuinín seo, tá sé ríthábhachtach go n-ullmhóidh an Rialtas pleananna buiséadacha lena gcuirfear ina luí ar bhreathnadóirí go bhfuil Éire fós ag gluaiseacht sa treo ceart i dtaca
le comhdhlúthú fioscach. Tá sé riachtanach go mbainfear inbhuanaitheacht fiachais amach chun taca a chur faoi théarnamh níos marthanaí agus chun muinín an mhargaidh as acmhainneacht creidmheasa na hÉireann a threisiú agus rochtain fhabhrach ar mhaoiniú margaidh a chothabháil.
San earnáil baincéireachta, leanann an feabhas atá ag teacht ar staideanna leachtachta agus maoiniúcháin agus, tríd is tríd, tá na staideanna sin ag filleadh ar phróifíl níos inmharthana. Tá comharthaí ann go bhfuil téarnamh ag teacht de réir a chéile ar bhrabúsacht na mbanc freisin. Ar a shon sin, baineann na príomh-shaincheisteanna go fóill leis an dul cinn i dtaca le hiasachtaí lagaithe a láimhseáil. Agus úsáid á baint aige as na spriocanna réitigh do riaráistí morgáiste, cheangail an Banc Ceannais ar na bainc dul chun cinn a dhéanamh maidir le socruithe fadtéarmacha inmharthana a chur i bhfeidhm do chustaiméirí a bhfuil riaráistí acu. Tá dul chun cinn á dhéanamh de réir a chéile sa mhéid go bhfuil laghdú ag teacht ar riaráistí cé go bhfuil iasachtaí á n-aistriú chuig aicme na riaráistí fadtéarmacha go fóill. Chomh maith leis sin, tá monatóireacht á déanamh ag an mBanc Ceannais ar dhul chun cinn na mbanc maidir leis an tsaincheist chasta seo a réiteach. Tá cláir chomhardaithe na mbanc agus a gcuid iasachtaithe á ndeisiú de réir a chéile ar an gcaoi sin, rud atá ina réamhriachtanas don téarnamh eacnamaíoch i gcoitinne agus don fhilleadh ar fhás inmharthana.
Fad a mheastar go rannchuideoidh an t-éileamh intíre leis an téarnamh, beidh feidhmíocht sheachtrach láidir ríthábhachtach chun filleadh inmharthana ar fhás cothrom a áirithiú. Le blianta beaga anuas, chuidigh an fás measartha ar phá agus na laghduithe ar bhonn costais an gheilleagair le cuid den iomaíochas a cailleadh le linn an bhorrtha a aisghabháil. Ag féachaint romhainn, neartófaí cumas fáis na hÉireann agus thacófaí le tuilleadh fáis ar fhostaíocht trí bhíthin feabhsuithe breise ar tháirgiúlacht agus ar iomaíochas.
29
The domestic market credit institutions are becoming increasingly Irish-focussed. Credit to the domestic private sector now accounts for 55 per cent of total assets, a level not consistently seen since 2003 as the institutions withdraw from foreign activities.
Deleveraging also continued in the broader economy reflecting net repayments of loans by all NFCs and by SMEs. The monthly net flow of credit to the NFC sector from resident credit institutions averaged minus €406 million over the last six months. While agriculture accounted for over one quarter of all new loans to SMEs in 2013, the sector still repaid over 4 per cent of outstanding borrowing during 2013. NFC debt as a percentage of GDP declined to 214 per cent in Q3 2013 – a fall of 4.8 percentage points. Household debt as a proportion of disposable income also decreased, by more than 2 percentage points to 196 per cent. Meanwhile, household investment in financial assets of €0.4 billion over Q3 2013 was the lowest since Q4 2011.
The trend emerging among longer-term mortgage arrears continues to be of particular
concern as the number of principal dwelling houses (PDH) accounts in arrears of over 720 days rose to 33,589, a 5.5 per cent increase on the previous quarter. Nevertheless, there are some positive signs emerging, with the number of mortgage holders entering early arrears continuing to decline in Q4 2013. The number of mortgage accounts in arrears of over 90 days also decreased over the quarter, representing the first decline in this category since the series began in September 2009.
Monetary Financial Institutions
Credit Institutions
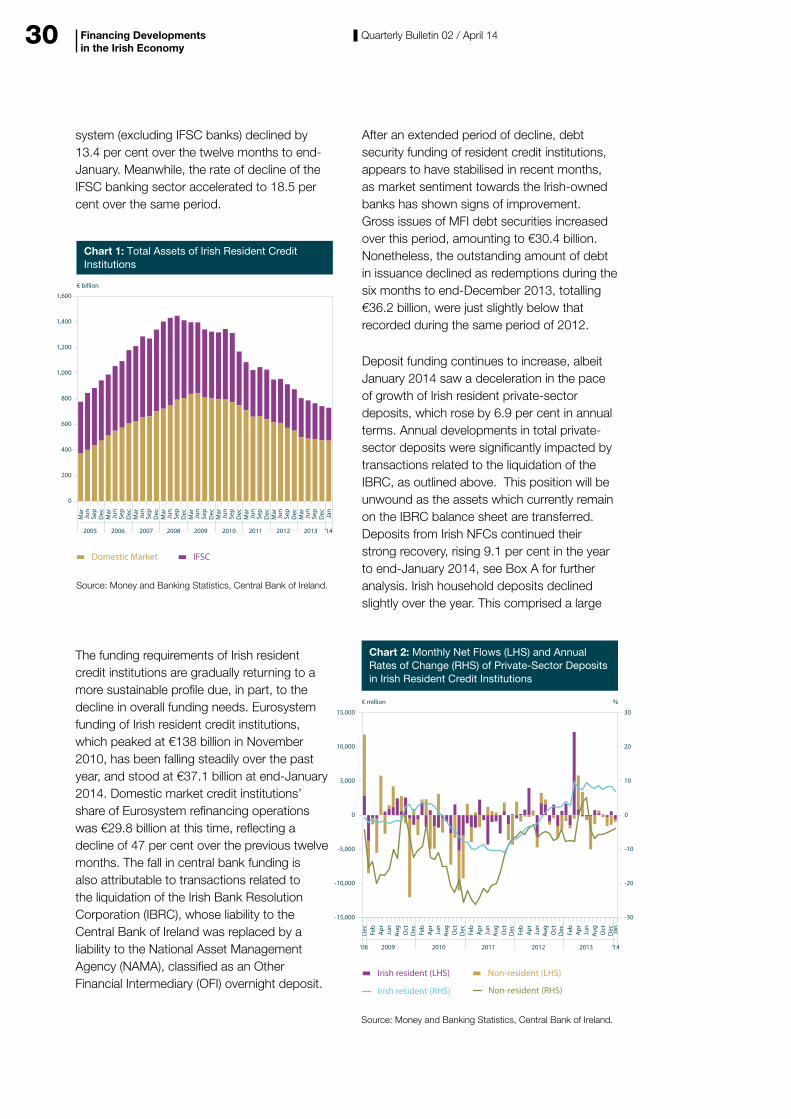
The banking system in Ireland has continued to contract reflecting the ongoing deleveraging efforts by the Irish-owned credit institutions, as well as the wider retrenchment of all banks to their domestic markets. Total assets of credit institutions operating in Ireland were €728 billion at end-January 2014, a reduction of 15.3 per cent over the previous twelve months. The total assets of the Irish resident banks now stand at half of the 2008 peak. Total assets of the domestic market’s banking
Financing Developments in the Irish Economy
Overview
The total assets of Irish resident credit institutions now stand at half of their 2008 peak. As a result of this continuing deleveraging activity, the funding structure of Irish banks is returning to a more sustainable profile but new lending continues to be depressed. However, market sentiment towards Ireland continues to improve on the back of a return to investment grade rating by Moody’s, while debt security funding of resident credit institutions appears to have stabilised in recent months. Eurosystem funding of the domestic market credit institutions’ has declined by 47 per cent over the previous twelve months. Growth in total private-sector deposits remains strong, albeit somewhat inflated by transactions related to the liquidation of IBRC which are expected to reverse over the coming months. Nonetheless, deposits from Irish NFCs are growing particularly strongly despite an ongoing decline in deposit rates. Meanwhile, retail interest rates on new lending to households and NFCs have not fallen which has allowed for some expansion in net interest margins generated by credit institutions in Ireland.
30 Quarterly Bulletin 02 / April 14
system (excluding IFSC banks) declined by 13.4 per cent over the twelve months to end-January. Meanwhile, the rate of decline of the IFSC banking sector accelerated to 18.5 per cent over the same period.
The funding requirements of Irish resident credit institutions are gradually returning to a more sustainable profile due, in part, to the decline in overall funding needs. Eurosystem funding of Irish resident credit institutions, which peaked at €138 billion in November 2010, has been falling steadily over the past year, and stood at €37.1 billion at end-January 2014. Domestic market credit institutions’ share of Eurosystem refinancing operations was €29.8 billion at this time, reflecting a decline of 47 per cent over the previous twelve months. The fall in central bank funding is also attributable to transactions related to the liquidation of the Irish Bank Resolution Corporation (IBRC), whose liability to the Central Bank of Ireland was replaced by a liability to the National Asset Management Agency (NAMA), classified as an Other Financial Intermediary (OFI) overnight deposit.
After an extended period of decline, debt security funding of resident credit institutions, appears to have stabilised in recent months, as market sentiment towards the Irish-owned banks has shown signs of improvement. Gross issues of MFI debt securities increased over this period, amounting to €30.4 billion. Nonetheless, the outstanding amount of debt in issuance declined as redemptions during the six months to end-December 2013, totalling €36.2 billion, were just slightly below that recorded during the same period of 2012.
Deposit funding continues to increase, albeit January 2014 saw a deceleration in the pace of growth of Irish resident private-sector deposits, which rose by 6.9 per cent in annual terms. Annual developments in total private-sector deposits were significantly impacted by transactions related to the liquidation of the IBRC, as outlined above. This position will be unwound as the assets which currently remain on the IBRC balance sheet are transferred. Deposits from Irish NFCs continued their strong recovery, rising 9.1 per cent in the year to end-January 2014, see Box A for further analysis. Irish household deposits declined slightly over the year. This comprised a large
Financing Developments in the Irish Economy
0
200
400
600
800
1,000
1,200
1,400
1,600
Chart 1: Total Assets of Irish Resident CreditInstitutions
Domestic Market IFSC
Source: Money and Banking Statistics, Central Bank of Ireland.
€ billion
Mar
Jun
Sep
Dec
Mar
Jun
Sep
Dec
Mar
Jun
Sep
Dec
Mar
Jun
Sep
Dec
Mar
Jun
Sep
Dec
Mar
Jun
Sep
Dec
Mar
Jun
Sep
Dec
Mar
Jun
Sep
Dec
Mar Jan
Jun
Sep
Dec
2008200720062005 2009 2010 2011 2012 2013 ‘14
Chart 2: Monthly Net Flows (LHS) and AnnualRates of Change (RHS) of Private-Sector Depositsin Irish Resident Credit Institutions
2009 2010 2011 2012 2013
Feb
Apr Jun
Aug
Oct
Dec Feb
Apr Jun
Aug
Oct
Dec Feb
Apr Jun
Aug
Oct
Dec Feb
Apr Jun
Aug
Oct
Dec Feb
Apr Jun
Jan
Aug
Oct
Dec
‘08
Dec
Non-resident (LHS)Irish resident (LHS)
Non-resident (RHS)Irish resident (RHS)
Source: Money and Banking Statistics, Central Bank of Ireland.
€ million %
-30
-20
-10
0
10
20
30
-15,000
-10,000
-5,000
0
5,000
10,000
15,000
‘14
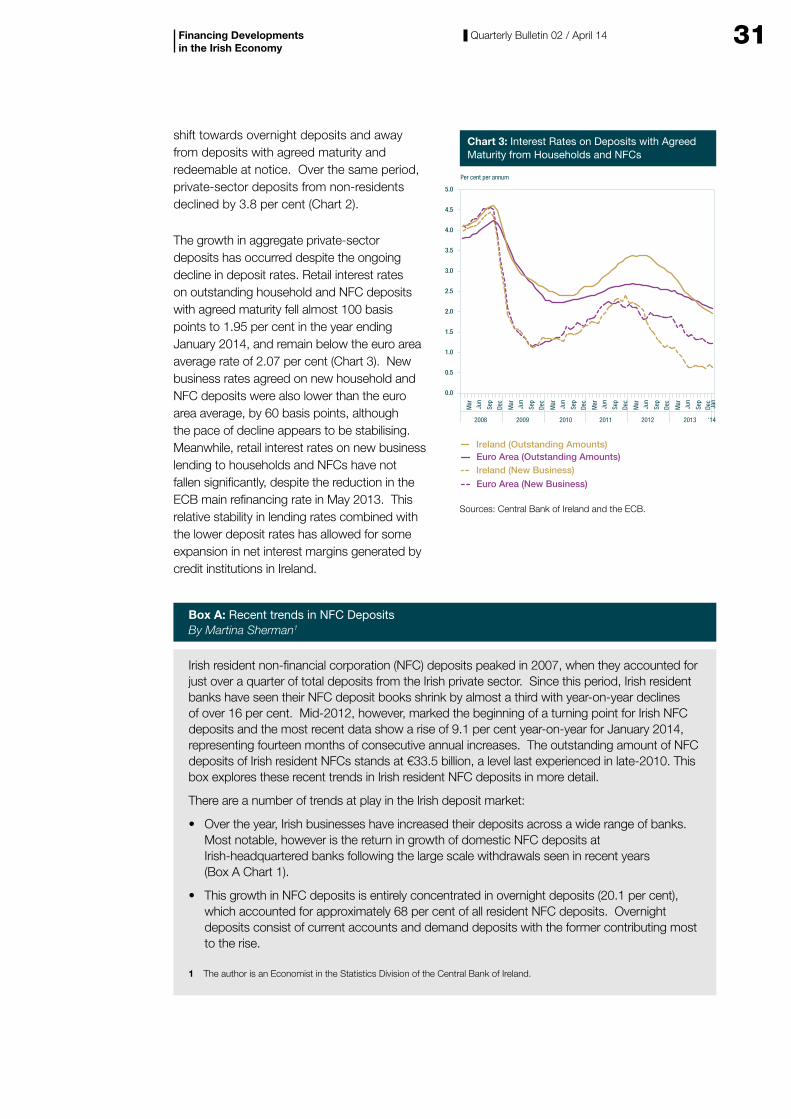
31Quarterly Bulletin 02 / April 14
shift towards overnight deposits and away from deposits with agreed maturity and redeemable at notice. Over the same period, private-sector deposits from non-residents declined by 3.8 per cent (Chart 2).
The growth in aggregate private-sector deposits has occurred despite the ongoing decline in deposit rates. Retail interest rates on outstanding household and NFC deposits with agreed maturity fell almost 100 basis points to 1.95 per cent in the year ending January 2014, and remain below the euro area average rate of 2.07 per cent (Chart 3). New business rates agreed on new household and NFC deposits were also lower than the euro area average, by 60 basis points, although the pace of decline appears to be stabilising. Meanwhile, retail interest rates on new business lending to households and NFCs have not fallen significantly, despite the reduction in the ECB main refinancing rate in May 2013. This relative stability in lending rates combined with the lower deposit rates has allowed for some expansion in net interest margins generated by credit institutions in Ireland.
Financing Developments in the Irish Economy
0.0
0.5
1.0
1.5
2.0
2.5
3.0
3.5
4.0
4.5
5.0
Mar Jun
Sep
Dec
Mar Jun
Sep
Dec
Mar Jun
Sep
Dec
Mar Jun
Sep
Dec
Mar Jun
Sep
Dec
Mar Jun
Sep
Dec
Jan
2008 2009 2010 2011 2012 2013 ‘14
Ireland (Outstanding Amounts)Euro Area (Outstanding Amounts)Ireland (New Business)
Euro Area (New Business)
Per cent per annum
Chart 3: Interest Rates on Deposits with AgreedMaturity from Households and NFCs
Sources: Central Bank of Ireland and the ECB.
Box A: Recent trends in NFC Deposits By Martina Sherman1
Irish resident non-financial corporation (NFC) deposits peaked in 2007, when they accounted for just over a quarter of total deposits from the Irish private sector. Since this period, Irish resident banks have seen their NFC deposit books shrink by almost a third with year-on-year declines of over 16 per cent. Mid-2012, however, marked the beginning of a turning point for Irish NFC deposits and the most recent data show a rise of 9.1 per cent year-on-year for January 2014, representing fourteen months of consecutive annual increases. The outstanding amount of NFC deposits of Irish resident NFCs stands at €33.5 billion, a level last experienced in late-2010. This box explores these recent trends in Irish resident NFC deposits in more detail.
There are a number of trends at play in the Irish deposit market:
• Over the year, Irish businesses have increased their deposits across a wide range of banks. Most notable, however is the return in growth of domestic NFC deposits at Irish-headquartered banks following the large scale withdrawals seen in recent years (Box A Chart 1).
• This growth in NFC deposits is entirely concentrated in overnight deposits (20.1 per cent), which accounted for approximately 68 per cent of all resident NFC deposits. Overnight deposits consist of current accounts and demand deposits with the former contributing most to the rise.
1 The author is an Economist in the Statistics Division of the Central Bank of Ireland.
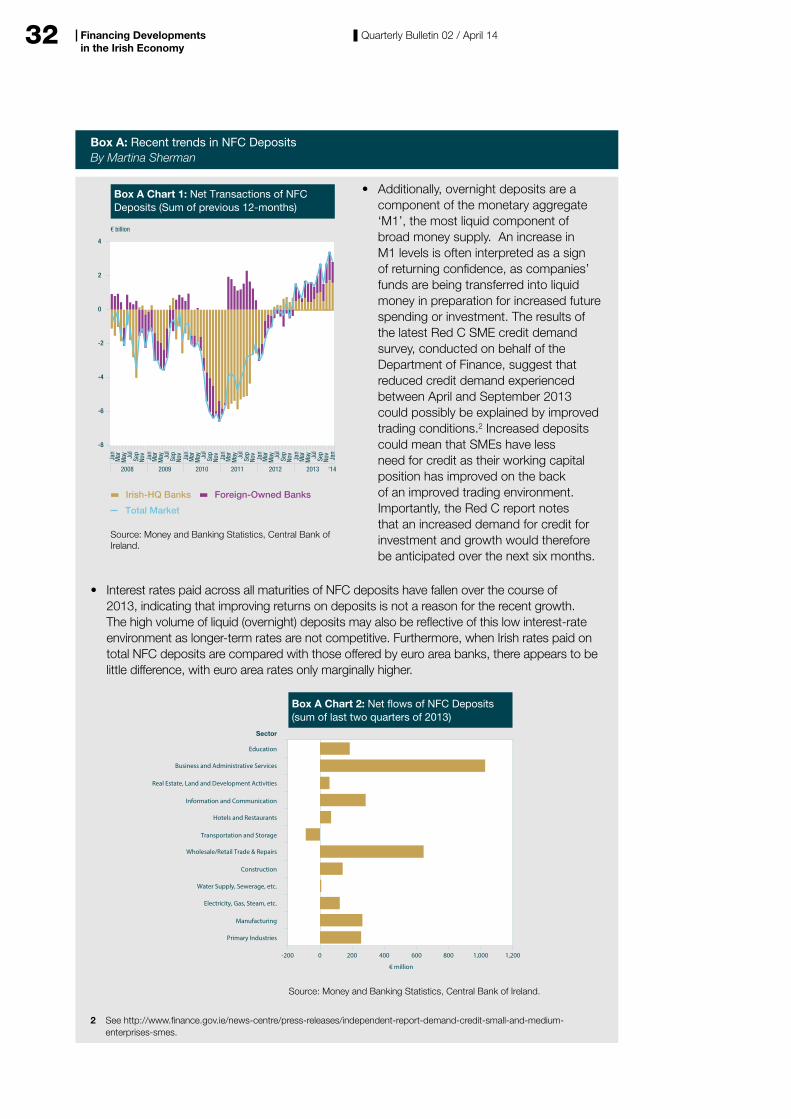
32 Quarterly Bulletin 02 / April 14Financing Developments in the Irish Economy
Box A: Recent trends in NFC Deposits By Martina Sherman
Jan
Mar
May Ju
lSe
pNo
vJa
nM
arM
ay Jul
Sep
Nov
Irish-HQ Banks Foreign-Owned Banks
Total Market
2008 2009 2011 2012 20132010
-8
-6
-4
-2
0
2
4
‘14
Source: Money and Banking Statistics, Central Bank of Ireland.
Jan
Mar
May Ju
lSe
pNo
vJa
nM
arM
ay Jul
Sep
Nov
Jan
Mar
May Ju
lSe
pNo
vJa
n
Jan
Mar
May Ju
lSe
pNo
v
Box A Chart 1: Net Transactions of NFCDeposits (Sum of previous 12-months)
€ billion
• Additionally, overnight deposits are a component of the monetary aggregate ‘M1’, the most liquid component of broad money supply. An increase in M1 levels is often interpreted as a sign of returning confidence, as companies’ funds are being transferred into liquid money in preparation for increased future spending or investment. The results of the latest Red C SME credit demand survey, conducted on behalf of the Department of Finance, suggest that reduced credit demand experienced between April and September 2013 could possibly be explained by improved trading conditions.2 Increased deposits could mean that SMEs have less need for credit as their working capital position has improved on the back of an improved trading environment. Importantly, the Red C report notes that an increased demand for credit for investment and growth would therefore be anticipated over the next six months.
• Interest rates paid across all maturities of NFC deposits have fallen over the course of 2013, indicating that improving returns on deposits is not a reason for the recent growth. The high volume of liquid (overnight) deposits may also be reflective of this low interest-rate environment as longer-term rates are not competitive. Furthermore, when Irish rates paid on total NFC deposits are compared with those offered by euro area banks, there appears to be little difference, with euro area rates only marginally higher.
-200
Primary Industries
Manufacturing
Electricity, Gas, Steam, etc.
Water Supply, Sewerage, etc.
Construction
Wholesale/Retail Trade & Repairs
Transportation and Storage
Hotels and Restaurants
Information and Communication
Real Estate, Land and Development Activities
Business and Administrative Services
Education
Sector
0 200 400 600 800 1,000 1,200
Source: Money and Banking Statistics, Central Bank of Ireland.
Box A Chart 2: Net �ows of NFC Deposits(sum of last two quarters of 2013)
€ million
2 See http://www.finance.gov.ie/news-centre/press-releases/independent-report-demand-credit-small-and-medium-enterprises-smes.
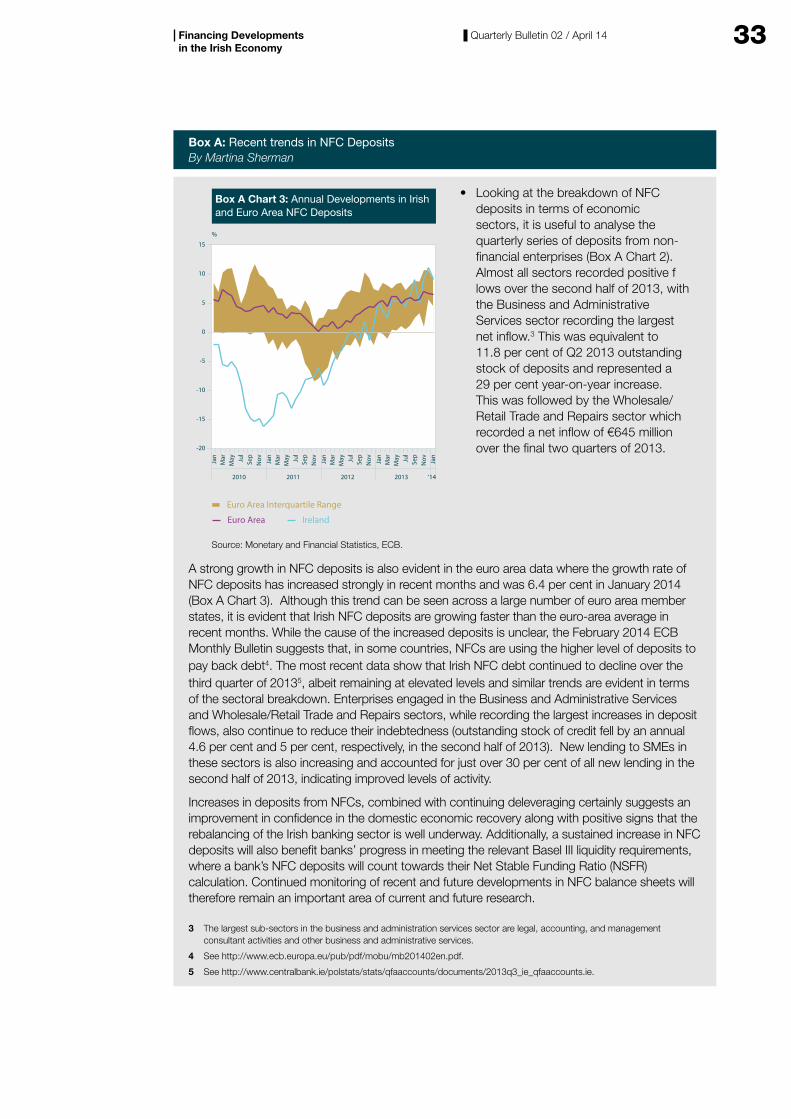
33Quarterly Bulletin 02 / April 14Financing Developments in the Irish Economy
Box A: Recent trends in NFC Deposits By Martina Sherman
Jan
Mar
May Ju
lSe
pN
ov Jan
Mar
May Ju
lSe
pN
ov Jan
Mar
May Ju
lSe
pN
ov Jan
Jan
Mar
May Ju
lSe
pN
ov
Euro Area Interquartile Range
Euro Area Ireland
2010 2011 2012 2013
-20
-15
-10
-5
0
5
10
15
Box A Chart 3: Annual Developments in Irishand Euro Area NFC Deposits
%
‘14
Source: Monetary and Financial Statistics, ECB.
• Looking at the breakdown of NFC deposits in terms of economic sectors, it is useful to analyse the quarterly series of deposits from non-financial enterprises (Box A Chart 2). Almost all sectors recorded positive f lows over the second half of 2013, with the Business and Administrative Services sector recording the largest net inflow.3 This was equivalent to 11.8 per cent of Q2 2013 outstanding stock of deposits and represented a 29 per cent year-on-year increase. This was followed by the Wholesale/Retail Trade and Repairs sector which recorded a net inflow of €645 million over the final two quarters of 2013.
A strong growth in NFC deposits is also evident in the euro area data where the growth rate of NFC deposits has increased strongly in recent months and was 6.4 per cent in January 2014 (Box A Chart 3). Although this trend can be seen across a large number of euro area member states, it is evident that Irish NFC deposits are growing faster than the euro-area average in recent months. While the cause of the increased deposits is unclear, the February 2014 ECB Monthly Bulletin suggests that, in some countries, NFCs are using the higher level of deposits to pay back debt4. The most recent data show that Irish NFC debt continued to decline over the third quarter of 20135, albeit remaining at elevated levels and similar trends are evident in terms of the sectoral breakdown. Enterprises engaged in the Business and Administrative Services and Wholesale/Retail Trade and Repairs sectors, while recording the largest increases in deposit flows, also continue to reduce their indebtedness (outstanding stock of credit fell by an annual 4.6 per cent and 5 per cent, respectively, in the second half of 2013). New lending to SMEs in these sectors is also increasing and accounted for just over 30 per cent of all new lending in the second half of 2013, indicating improved levels of activity.
Increases in deposits from NFCs, combined with continuing deleveraging certainly suggests an improvement in confidence in the domestic economic recovery along with positive signs that the rebalancing of the Irish banking sector is well underway. Additionally, a sustained increase in NFC deposits will also benefit banks’ progress in meeting the relevant Basel III liquidity requirements, where a bank’s NFC deposits will count towards their Net Stable Funding Ratio (NSFR) calculation. Continued monitoring of recent and future developments in NFC balance sheets will therefore remain an important area of current and future research.
3 The largest sub-sectors in the business and administration services sector are legal, accounting, and management consultant activities and other business and administrative services.
4 See http://www.ecb.europa.eu/pub/pdf/mobu/mb201402en.pdf.
5 See http://www.centralbank.ie/polstats/stats/qfaaccounts/documents/2013q3_ie_qfaaccounts.ie.
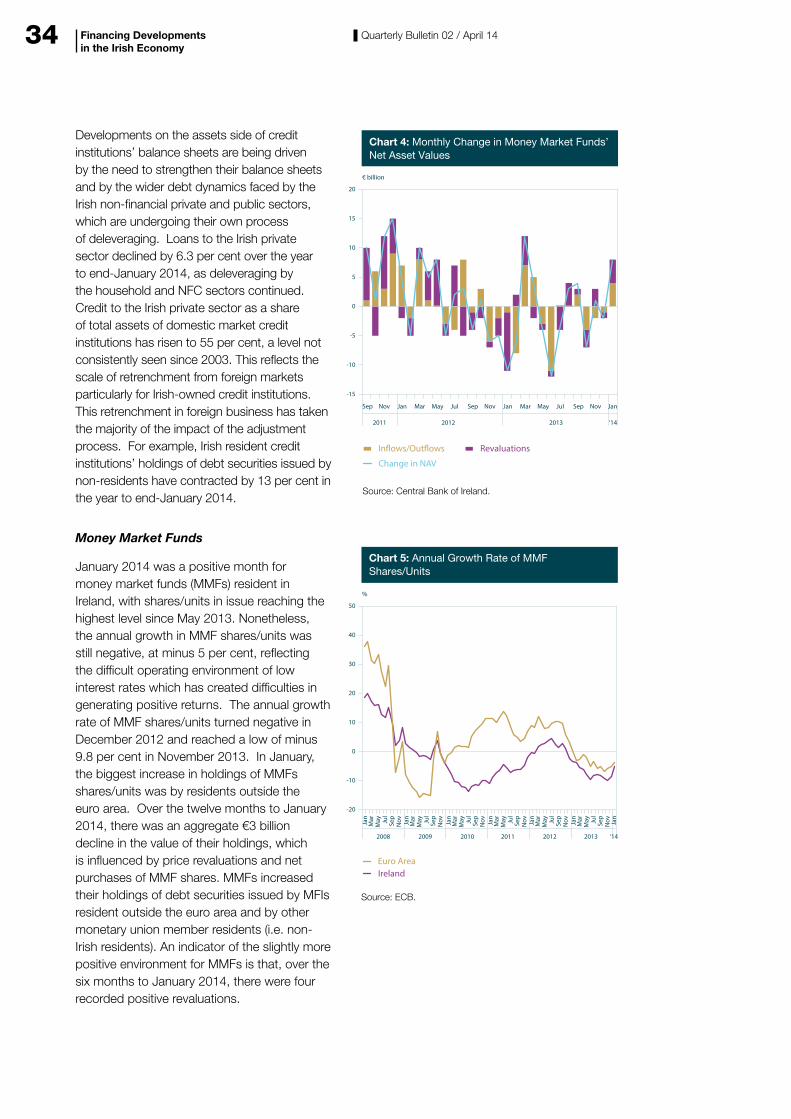
34 Quarterly Bulletin 02 / April 14
Developments on the assets side of credit institutions’ balance sheets are being driven by the need to strengthen their balance sheets and by the wider debt dynamics faced by the Irish non-financial private and public sectors, which are undergoing their own process of deleveraging. Loans to the Irish private sector declined by 6.3 per cent over the year to end-January 2014, as deleveraging by the household and NFC sectors continued. Credit to the Irish private sector as a share of total assets of domestic market credit institutions has risen to 55 per cent, a level not consistently seen since 2003. This reflects the scale of retrenchment from foreign markets particularly for Irish-owned credit institutions. This retrenchment in foreign business has taken the majority of the impact of the adjustment process. For example, Irish resident credit institutions’ holdings of debt securities issued by non-residents have contracted by 13 per cent in the year to end-January 2014.
Money Market Funds
January 2014 was a positive month for money market funds (MMFs) resident in Ireland, with shares/units in issue reaching the highest level since May 2013. Nonetheless, the annual growth in MMF shares/units was still negative, at minus 5 per cent, reflecting the difficult operating environment of low interest rates which has created difficulties in generating positive returns. The annual growth rate of MMF shares/units turned negative in December 2012 and reached a low of minus 9.8 per cent in November 2013. In January, the biggest increase in holdings of MMFs shares/units was by residents outside the euro area. Over the twelve months to January 2014, there was an aggregate €3 billion decline in the value of their holdings, which is influenced by price revaluations and net purchases of MMF shares. MMFs increased their holdings of debt securities issued by MFIs resident outside the euro area and by other monetary union member residents (i.e. non-Irish residents). An indicator of the slightly more positive environment for MMFs is that, over the six months to January 2014, there were four recorded positive revaluations.
Financing Developments in the Irish Economy
-15
-10
-5
0
5
10
15
20
2011 2012 2013 ‘14
Sep Nov Sep NovJan Mar May Jul Sep NovJan JanMar May Jul
In�ows/Out�ows Revaluations
Change in NAV
Source: Central Bank of Ireland.
€ billion
Chart 4: Monthly Change in Money Market Funds’Net Asset Values
-20
-10
0
10
20
30
40
50
Jan
Mar
May Ju
lSe
pN
ov Jan
Mar
May Ju
lSe
pN
ov Jan
Mar
May Ju
lSe
pN
ov Jan
Mar
May Ju
lSe
pN
ov Jan
Mar
May Ju
lSe
pN
ov Jan
Jan
Mar
May Ju
lSe
pN
ov
2008 2009 2010 2011 2012 2013 ‘14
Euro AreaIreland
%
Chart 5: Annual Growth Rate of MMFShares/Units
Source: ECB.
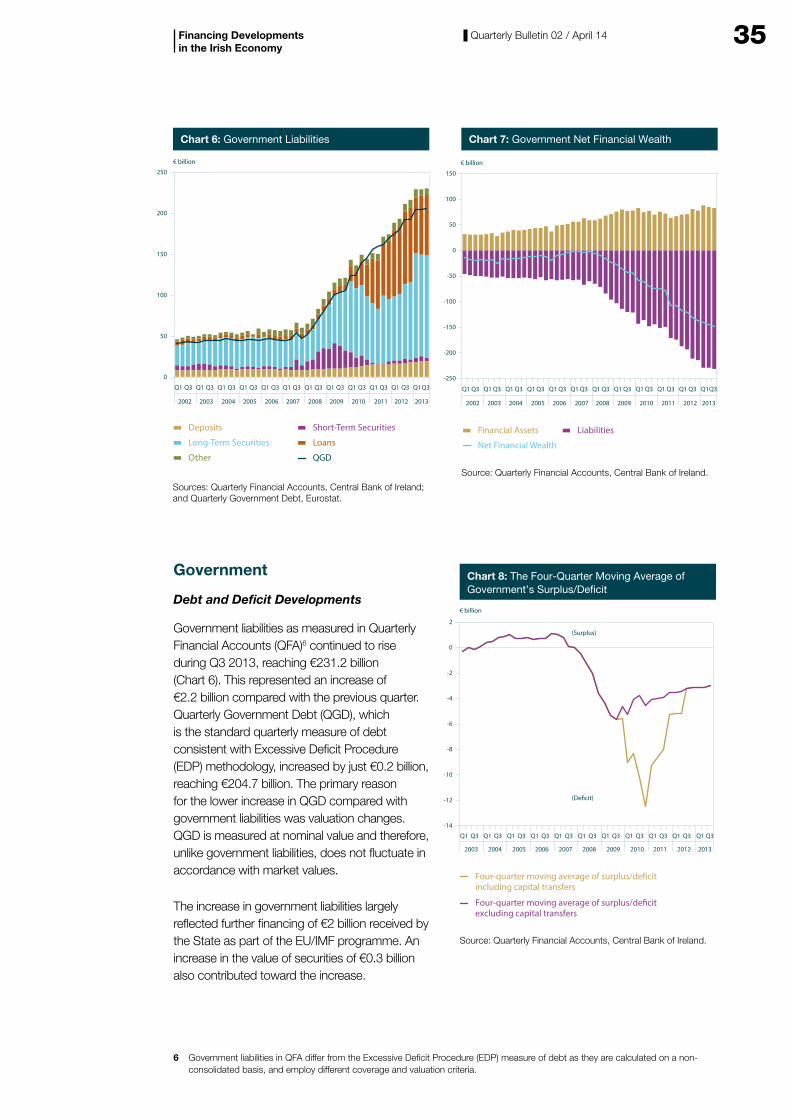
35Quarterly Bulletin 02 / April 14Financing Developments in the Irish Economy
Government
Debt and Deficit Developments
Government liabilities as measured in Quarterly Financial Accounts (QFA)6 continued to rise during Q3 2013, reaching €231.2 billion (Chart 6). This represented an increase of €2.2 billion compared with the previous quarter. Quarterly Government Debt (QGD), which is the standard quarterly measure of debt consistent with Excessive Deficit Procedure (EDP) methodology, increased by just €0.2 billion, reaching €204.7 billion. The primary reason for the lower increase in QGD compared with government liabilities was valuation changes. QGD is measured at nominal value and therefore, unlike government liabilities, does not fluctuate in accordance with market values.
The increase in government liabilities largely reflected further financing of €2 billion received by the State as part of the EU/IMF programme. An increase in the value of securities of €0.3 billion also contributed toward the increase.
0
50
100
150
200
250
Deposits Short-Term Securities
Long-Term Securities
Other
Loans
QGD
€ billion
Chart 6: Government Liabilities
Sources: Quarterly Financial Accounts, Central Bank of Ireland;and Quarterly Government Debt, Eurostat.
Q3Q1 Q3Q1 Q3Q1 Q3Q1 Q3Q1 Q3Q1 Q3Q1 Q3Q1 Q3Q1 Q3Q1 Q3Q1 Q3Q1
200720062005200420032002 2008 2010 2011 2012 20132009
Q3Q1 Q3Q1 Q3Q1 Q3Q1 Q3Q1 Q3Q1 Q3Q1 Q3Q1 Q3Q1 Q3Q1 Q3Q1 Q1
200720062005200420032002 2008 2010 2011 2012 20132009
Financial Assets Liabilities
Net Financial Wealth
Source: Quarterly Financial Accounts, Central Bank of Ireland.
€ billion
Chart 7: Government Net Financial Wealth
-250
-200
-150
-100
-50
0
50
100
150
Q3
Q1 Q3 Q1 Q3 Q1 Q3 Q1 Q3 Q1 Q3 Q1 Q3 Q1 Q3 Q1 Q3 Q1 Q3 Q1 Q3 Q1 Q3
2003 2004 2005 2006
(De�cit)
(Surplus)
2007 2008 2009 2010 2011 2012 2013
-14
-12
-10
-8
-6
-4
-2
0
2
Four-quarter moving average of surplus/deficit including capital transfers
Four-quarter moving average of surplus/deficit excluding capital transfers
Source: Quarterly Financial Accounts, Central Bank of Ireland.
€ billion
Chart 8: The Four-Quarter Moving Average ofGovernment’s Surplus/De�cit
6 Government liabilities in QFA differ from the Excessive Deficit Procedure (EDP) measure of debt as they are calculated on a non-consolidated basis, and employ different coverage and valuation criteria.
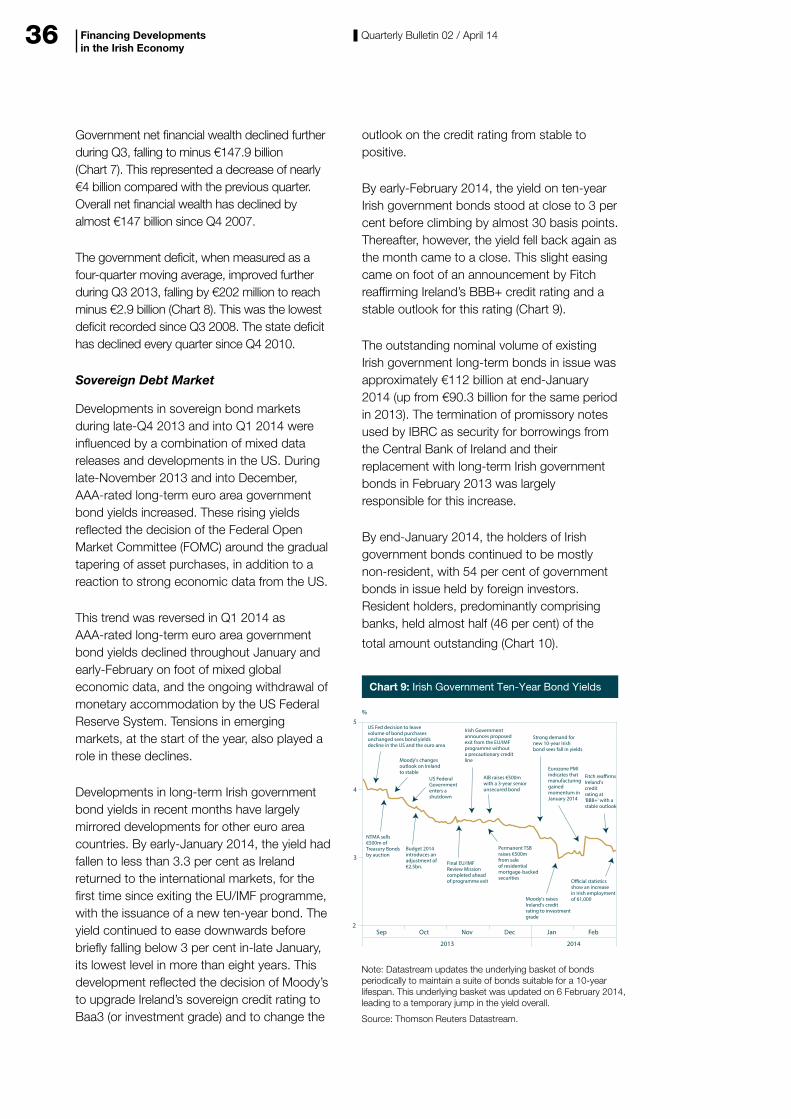
36 Quarterly Bulletin 02 / April 14Financing Developments in the Irish Economy
Government net financial wealth declined further during Q3, falling to minus €147.9 billion (Chart 7). This represented a decrease of nearly €4 billion compared with the previous quarter. Overall net financial wealth has declined by almost €147 billion since Q4 2007.
The government deficit, when measured as a four-quarter moving average, improved further during Q3 2013, falling by €202 million to reach minus €2.9 billion (Chart 8). This was the lowest deficit recorded since Q3 2008. The state deficit has declined every quarter since Q4 2010.
Sovereign Debt Market
Developments in sovereign bond markets during late-Q4 2013 and into Q1 2014 were influenced by a combination of mixed data releases and developments in the US. During late-November 2013 and into December, AAA-rated long-term euro area government bond yields increased. These rising yields reflected the decision of the Federal Open Market Committee (FOMC) around the gradual tapering of asset purchases, in addition to a reaction to strong economic data from the US.
This trend was reversed in Q1 2014 as AAA-rated long-term euro area government bond yields declined throughout January and early-February on foot of mixed global economic data, and the ongoing withdrawal of monetary accommodation by the US Federal Reserve System. Tensions in emerging markets, at the start of the year, also played a role in these declines.
Developments in long-term Irish government bond yields in recent months have largely mirrored developments for other euro area countries. By early-January 2014, the yield had fallen to less than 3.3 per cent as Ireland returned to the international markets, for the first time since exiting the EU/IMF programme, with the issuance of a new ten-year bond. The yield continued to ease downwards before briefly falling below 3 per cent in-late January, its lowest level in more than eight years. This development reflected the decision of Moody’s to upgrade Ireland’s sovereign credit rating to Baa3 (or investment grade) and to change the
outlook on the credit rating from stable to positive.
By early-February 2014, the yield on ten-year Irish government bonds stood at close to 3 per cent before climbing by almost 30 basis points. Thereafter, however, the yield fell back again as the month came to a close. This slight easing came on foot of an announcement by Fitch reaffirming Ireland’s BBB+ credit rating and a stable outlook for this rating (Chart 9).
The outstanding nominal volume of existing Irish government long-term bonds in issue was approximately €112 billion at end-January 2014 (up from €90.3 billion for the same period in 2013). The termination of promissory notes used by IBRC as security for borrowings from the Central Bank of Ireland and their replacement with long-term Irish government bonds in February 2013 was largely responsible for this increase.
By end-January 2014, the holders of Irish government bonds continued to be mostly non-resident, with 54 per cent of government bonds in issue held by foreign investors. Resident holders, predominantly comprising banks, held almost half (46 per cent) of the
total amount outstanding (Chart 10).
2
3
4
5
2013 2014
Sep Oct Nov Dec Jan Feb
Chart 9: Irish Government Ten-Year Bond Yields
%
US Fed decision to leavevolume of bond purchasesunchanged sees bond yieldsdecline in the US and the euro area
NTMA sells€500m ofTreasury Bondsby auction
Budget 2014introduces anadjustment of€2.5bn.
Final EU/IMFReview Missioncompleted aheadof programme exit
Permanent TSBraises €500mfrom saleof residentialmortgage-backedsecurities
Moody's raisesIreland's creditrating to investmentgrade
O�cial statisticsshow an increasein Irish employmentof 61,000
Moody's changesoutlook on Irelandto stable
US FederalGovernmententers ashutdown
Irish Governmentannounces proposedexit from the EU/IMFprogramme withouta precautionary creditline
AIB raises €500mwith a 3-year seniorunsecured bond
Strong demand fornew 10-year Irishbond sees fall in yields
Eurozone PMIindicates thatmanufacturinggainedmomentum inJanuary 2014
Fitch rea�rmsIreland'screditrating at'BBB+' with astable outlook
Note: Datastream updates the underlying basket of bondsperiodically to maintain a suite of bonds suitable for a 10-yearlifespan. This underlying basket was updated on 6 February 2014,leading to a temporary jump in the yield overall.
Source: Thomson Reuters Datastream.
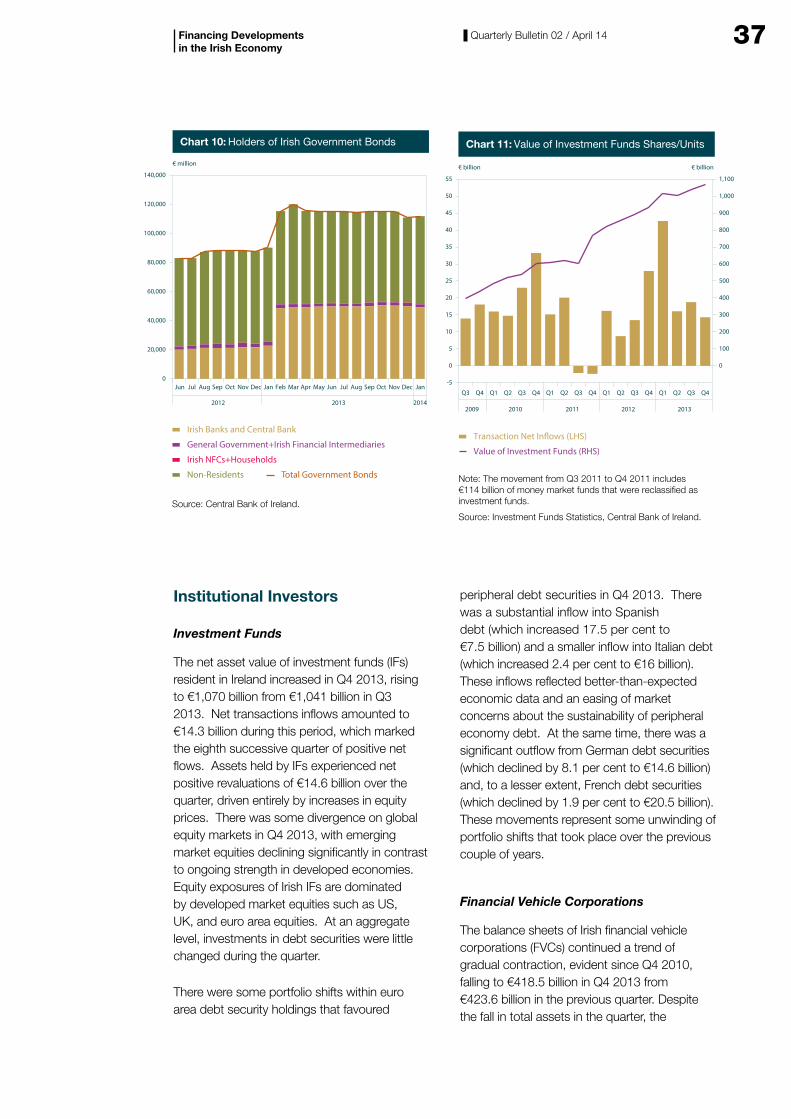
37Quarterly Bulletin 02 / April 14
Institutional Investors
Investment Funds
The net asset value of investment funds (IFs) resident in Ireland increased in Q4 2013, rising to €1,070 billion from €1,041 billion in Q3 2013. Net transactions inflows amounted to €14.3 billion during this period, which marked the eighth successive quarter of positive net flows. Assets held by IFs experienced net positive revaluations of €14.6 billion over the quarter, driven entirely by increases in equity prices. There was some divergence on global equity markets in Q4 2013, with emerging market equities declining significantly in contrast to ongoing strength in developed economies. Equity exposures of Irish IFs are dominated by developed market equities such as US, UK, and euro area equities. At an aggregate level, investments in debt securities were little changed during the quarter.
There were some portfolio shifts within euro area debt security holdings that favoured
peripheral debt securities in Q4 2013. There was a substantial inflow into Spanish debt (which increased 17.5 per cent to €7.5 billion) and a smaller inflow into Italian debt (which increased 2.4 per cent to €16 billion). These inflows reflected better-than-expected economic data and an easing of market concerns about the sustainability of peripheral economy debt. At the same time, there was a significant outflow from German debt securities (which declined by 8.1 per cent to €14.6 billion) and, to a lesser extent, French debt securities (which declined by 1.9 per cent to €20.5 billion). These movements represent some unwinding of portfolio shifts that took place over the previous couple of years.
Financial Vehicle Corporations
The balance sheets of Irish financial vehicle corporations (FVCs) continued a trend of gradual contraction, evident since Q4 2010, falling to €418.5 billion in Q4 2013 from €423.6 billion in the previous quarter. Despite the fall in total assets in the quarter, the
Financing Developments in the Irish Economy
Q4Q3Q2Q1Q4Q3Q2Q1Q4Q3Q2Q1Q4Q3Q2Q1Q4Q3
-5
0
5
10
15
20
25
30
35
40
45
50
55
2009 2010 2011 2012 2013
0
100
200
300
400
500
600
700
800
900
1,000
1,100
€ billion € billion
Chart 11: Value of Investment Funds Shares/Units
Transaction Net In�ows (LHS)
Value of Investment Funds (RHS)
Note: The movement from Q3 2011 to Q4 2011 includes€114 billion of money market funds that were reclassified asinvestment funds.
Source: Investment Funds Statistics, Central Bank of Ireland.
0
20,000
40,000
60,000
80,000
100,000
120,000
140,000
€ million
Chart 10: Holders of Irish Government Bonds
Irish Banks and Central Bank
General Government+Irish Financial Intermediaries
Irish NFCs+Households
Non-Residents Total Government Bonds
Source: Central Bank of Ireland.
2012 2013 2014
MarFebJan JanApr MayJun Jul Aug Sep Oct Nov Dec Jun Jul Aug Sep Oct Nov Dec
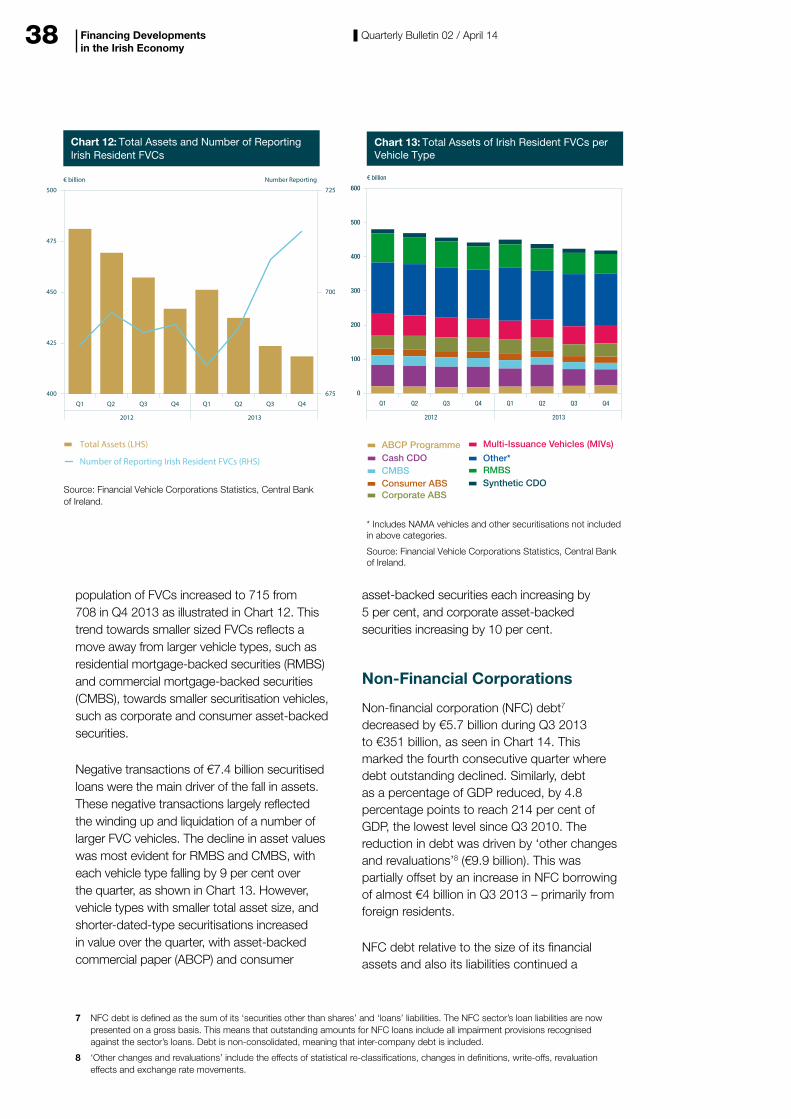
38 Quarterly Bulletin 02 / April 14Financing Developments in the Irish Economy
population of FVCs increased to 715 from 708 in Q4 2013 as illustrated in Chart 12. This trend towards smaller sized FVCs reflects a move away from larger vehicle types, such as residential mortgage-backed securities (RMBS) and commercial mortgage-backed securities (CMBS), towards smaller securitisation vehicles, such as corporate and consumer asset-backed securities.
Negative transactions of €7.4 billion securitised loans were the main driver of the fall in assets. These negative transactions largely reflected the winding up and liquidation of a number of larger FVC vehicles. The decline in asset values was most evident for RMBS and CMBS, with each vehicle type falling by 9 per cent over the quarter, as shown in Chart 13. However, vehicle types with smaller total asset size, and shorter-dated-type securitisations increased in value over the quarter, with asset-backed commercial paper (ABCP) and consumer
asset-backed securities each increasing by 5 per cent, and corporate asset-backed securities increasing by 10 per cent.
Non-Financial Corporations
Non-financial corporation (NFC) debt7 decreased by €5.7 billion during Q3 2013 to €351 billion, as seen in Chart 14. This marked the fourth consecutive quarter where debt outstanding declined. Similarly, debt as a percentage of GDP reduced, by 4.8 percentage points to reach 214 per cent of GDP, the lowest level since Q3 2010. The reduction in debt was driven by ‘other changes and revaluations’8 (€9.9 billion). This was partially offset by an increase in NFC borrowing of almost €4 billion in Q3 2013 – primarily from foreign residents.
NFC debt relative to the size of its financial assets and also its liabilities continued a
Q4Q3Q2Q1 Q4 Q3
2012 2013
Q2 Q1
0
100
200
300
400
500
600
Chart 13: Total Assets of Irish Resident FVCs perVehicle Type
* Includes NAMA vehicles and other securitisations not includedin above categories.
Source: Financial Vehicle Corporations Statistics, Central Bank of Ireland.
ABCP ProgrammeCash CDOCMBSConsumer ABSCorporate ABS
Multi-Issuance Vehicles (MIVs)
Synthetic CDO
Other*RMBS
€ billion
400
425
450
475
500
Q4Q3Q2Q1Q4Q3Q2 Q1
675
700
725
2012 2013
Total Assets (LHS)
Number of Reporting Irish Resident FVCs (RHS)
€ billion Number Reporting
Chart 12: Total Assets and Number of ReportingIrish Resident FVCs
Source: Financial Vehicle Corporations Statistics, Central Bankof Ireland.
7 NFC debt is defined as the sum of its ‘securities other than shares’ and ‘loans’ liabilities. The NFC sector’s loan liabilities are now presented on a gross basis. This means that outstanding amounts for NFC loans include all impairment provisions recognised against the sector’s loans. Debt is non-consolidated, meaning that inter-company debt is included.
8 ‘Other changes and revaluations’ include the effects of statistical re-classifications, changes in definitions, write-offs, revaluation effects and exchange rate movements.
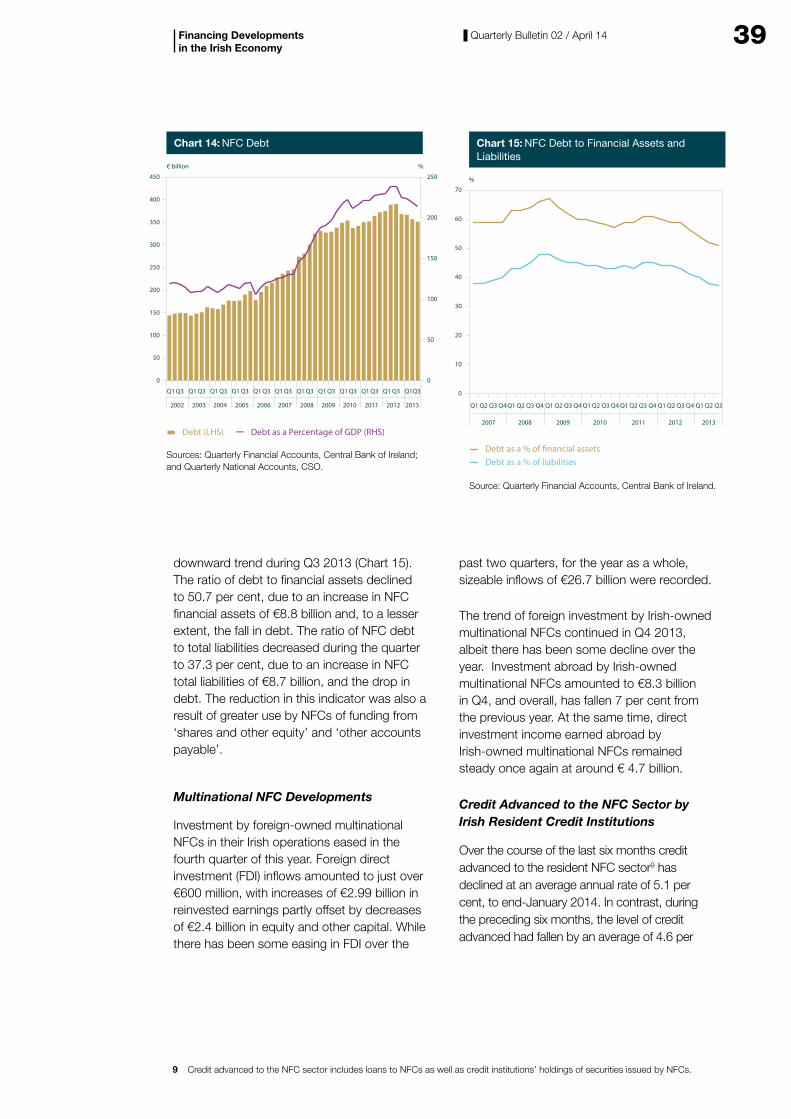
39Quarterly Bulletin 02 / April 14
downward trend during Q3 2013 (Chart 15). The ratio of debt to financial assets declined to 50.7 per cent, due to an increase in NFC financial assets of €8.8 billion and, to a lesser extent, the fall in debt. The ratio of NFC debt to total liabilities decreased during the quarter to 37.3 per cent, due to an increase in NFC total liabilities of €8.7 billion, and the drop in debt. The reduction in this indicator was also a result of greater use by NFCs of funding from ‘shares and other equity’ and ‘other accounts payable’.
Multinational NFC Developments
Investment by foreign-owned multinational NFCs in their Irish operations eased in the fourth quarter of this year. Foreign direct investment (FDI) inflows amounted to just over €600 million, with increases of €2.99 billion in reinvested earnings partly offset by decreases of €2.4 billion in equity and other capital. While there has been some easing in FDI over the
past two quarters, for the year as a whole, sizeable inflows of €26.7 billion were recorded.
The trend of foreign investment by Irish-owned multinational NFCs continued in Q4 2013, albeit there has been some decline over the year. Investment abroad by Irish-owned multinational NFCs amounted to €8.3 billion in Q4, and overall, has fallen 7 per cent from the previous year. At the same time, direct investment income earned abroad by Irish-owned multinational NFCs remained steady once again at around € 4.7 billion.
Credit Advanced to the NFC Sector by Irish Resident Credit Institutions
Over the course of the last six months credit advanced to the resident NFC sector9 has declined at an average annual rate of 5.1 per cent, to end-January 2014. In contrast, during the preceding six months, the level of credit advanced had fallen by an average of 4.6 per
Financing Developments in the Irish Economy
Q1 Q3Q2 Q4 Q1 Q3Q2 Q4 Q1 Q3Q2 Q4 Q1 Q3Q2 Q4 Q1 Q3Q2 Q4 Q1 Q3Q2 Q1 Q3Q2Q4
2007 2008 2009 2010 2011 2012 2013
0
10
20
30
40
50
60
70
Debt as a % of liabilitiesDebt as a % of �nancial assets
%
Source: Quarterly Financial Accounts, Central Bank of Ireland.
Chart 15: NFC Debt to Financial Assets andLiabilities
0
50
100
150
200
250
300
350
400
450
0
50
100
150
200
250
Q3Q1 Q3Q1 Q3Q1 Q3Q1 Q3Q1 Q3Q1 Q3Q1 Q3Q1 Q3Q1 Q3Q1 Q3Q1 Q3Q1
20032002 2004 2005 2006 2007 2008 2009 2010 2011 2012 2013
€ billion %
Debt (LHS) Debt as a Percentage of GDP (RHS)
Sources: Quarterly Financial Accounts, Central Bank of Ireland;and Quarterly National Accounts, CSO.
Chart 14: NFC Debt
9 Credit advanced to the NFC sector includes loans to NFCs as well as credit institutions’ holdings of securities issued by NFCs.
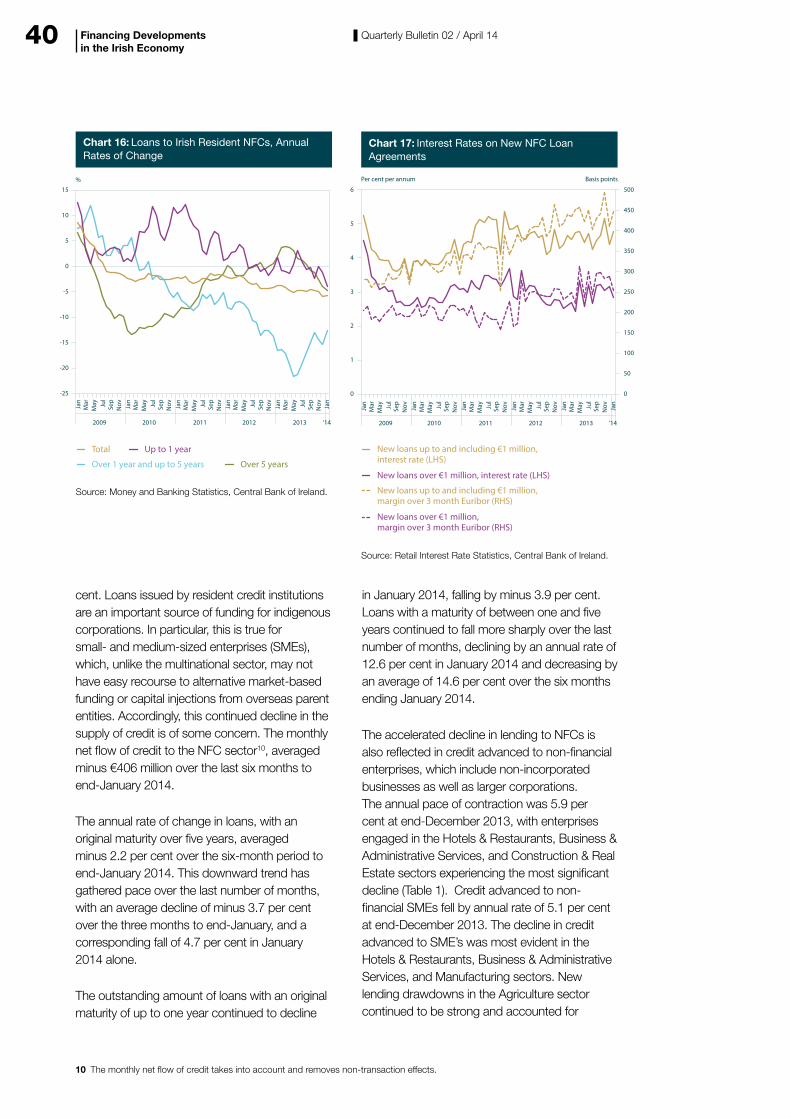
40 Quarterly Bulletin 02 / April 14
cent. Loans issued by resident credit institutions are an important source of funding for indigenous corporations. In particular, this is true for small- and medium-sized enterprises (SMEs), which, unlike the multinational sector, may not have easy recourse to alternative market-based funding or capital injections from overseas parent entities. Accordingly, this continued decline in the supply of credit is of some concern. The monthly net flow of credit to the NFC sector10, averaged minus €406 million over the last six months to end-January 2014.
The annual rate of change in loans, with an original maturity over five years, averaged minus 2.2 per cent over the six-month period to end-January 2014. This downward trend has gathered pace over the last number of months, with an average decline of minus 3.7 per cent over the three months to end-January, and a corresponding fall of 4.7 per cent in January 2014 alone.
The outstanding amount of loans with an original maturity of up to one year continued to decline
in January 2014, falling by minus 3.9 per cent. Loans with a maturity of between one and five years continued to fall more sharply over the last number of months, declining by an annual rate of 12.6 per cent in January 2014 and decreasing by an average of 14.6 per cent over the six months ending January 2014.
The accelerated decline in lending to NFCs is also reflected in credit advanced to non-financial enterprises, which include non-incorporated businesses as well as larger corporations. The annual pace of contraction was 5.9 per cent at end-December 2013, with enterprises engaged in the Hotels & Restaurants, Business & Administrative Services, and Construction & Real Estate sectors experiencing the most significant decline (Table 1). Credit advanced to non-financial SMEs fell by annual rate of 5.1 per cent at end-December 2013. The decline in credit advanced to SME’s was most evident in the Hotels & Restaurants, Business & Administrative Services, and Manufacturing sectors. New lending drawdowns in the Agriculture sector continued to be strong and accounted for
Financing Developments in the Irish Economy
500
Jan
Mar
May Ju
lSe
pN
ov Jan
Mar
May Ju
lSe
pN
ov Jan
Mar
May Ju
lSe
pN
ov Jan
Mar
May Ju
lSe
pN
ov Jan
Jan
Mar
May Ju
lSe
pN
ov
2009 2010 2011 2012 2013 ‘14
0
1
2
3
4
5
6
0
50
100
150
200
250
300
350
400
450
New loans up to and including €1 million, interest rate (LHS)
New loans over €1 million, interest rate (LHS)
New loans up to and including €1 million, margin over 3 month Euribor (RHS)
New loans over €1 million, margin over 3 month Euribor (RHS)
Per cent per annum Basis points
Source: Retail Interest Rate Statistics, Central Bank of Ireland.
Chart 17: Interest Rates on New NFC LoanAgreements
-25
-20
-15
-10
-5
0
5
10
15
Jan
Mar
May Ju
lSe
pN
ov Jan
Mar
May Ju
lSe
pN
ov Jan
Mar
May Ju
lSe
pN
ov Jan
Mar
May Ju
lSe
pN
ov Jan
Jan
Mar
May Ju
lSe
pN
ov
2009 2010 2011 2012 2013 ‘14
Source: Money and Banking Statistics, Central Bank of Ireland.
Total Up to 1 year
Over 1 year and up to 5 years Over 5 years
%
Chart 16: Loans to Irish Resident NFCs, AnnualRates of Change
10 The monthly net flow of credit takes into account and removes non-transaction effects.
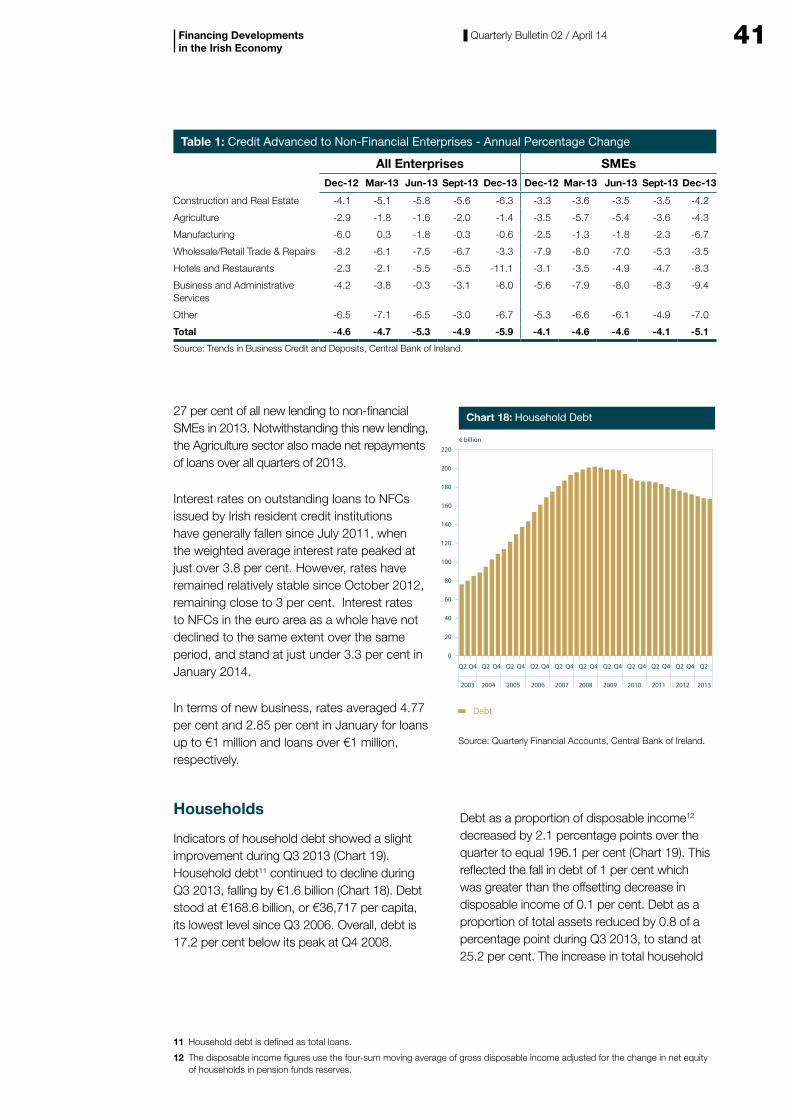
41Quarterly Bulletin 02 / April 14
27 per cent of all new lending to non-financial SMEs in 2013. Notwithstanding this new lending, the Agriculture sector also made net repayments of loans over all quarters of 2013.
Interest rates on outstanding loans to NFCs issued by Irish resident credit institutions have generally fallen since July 2011, when the weighted average interest rate peaked at just over 3.8 per cent. However, rates have remained relatively stable since October 2012, remaining close to 3 per cent. Interest rates to NFCs in the euro area as a whole have not declined to the same extent over the same period, and stand at just under 3.3 per cent in January 2014.
In terms of new business, rates averaged 4.77 per cent and 2.85 per cent in January for loans up to €1 million and loans over €1 million, respectively.
Households
Indicators of household debt showed a slight improvement during Q3 2013 (Chart 19). Household debt11 continued to decline during Q3 2013, falling by €1.6 billion (Chart 18). Debt stood at €168.6 billion, or €36,717 per capita, its lowest level since Q3 2006. Overall, debt is 17.2 per cent below its peak at Q4 2008.
Debt as a proportion of disposable income12 decreased by 2.1 percentage points over the quarter to equal 196.1 per cent (Chart 19). This reflected the fall in debt of 1 per cent which was greater than the offsetting decrease in disposable income of 0.1 per cent. Debt as a proportion of total assets reduced by 0.8 of a percentage point during Q3 2013, to stand at 25.2 per cent. The increase in total household
Financing Developments in the Irish Economy
Q2 Q4 Q2 Q4 Q2 Q4 Q2 Q4 Q2 Q4 Q2 Q4 Q2 Q4 Q2 Q4 Q2 Q4 Q2 Q4 Q2
2003 2004 2005 2006 2007 2008 2009 2010 2011 2012 2013
0
20
40
60
80
100
120
140
160
180
200
220
Debt
€ billion
Chart 18: Household Debt
Source: Quarterly Financial Accounts, Central Bank of Ireland.
Table 1: Credit Advanced to Non-Financial Enterprises - Annual Percentage Change
All Enterprises SMEsDec-12 Mar-13 Jun-13 Sept-13 Dec-13 Dec-12 Mar-13 Jun-13 Sept-13 Dec-13
Construction and Real Estate -4.1 -5.1 -5.8 -5.6 -6.3 -3.3 -3.6 -3.5 -3.5 -4.2
Agriculture -2.9 -1.8 -1.6 -2.0 -1.4 -3.5 -5.7 -5.4 -3.6 -4.3
Manufacturing -6.0 0.3 -1.8 -0.3 -0.6 -2.5 -1.3 -1.8 -2.3 -6.7
Wholesale/Retail Trade & Repairs -8.2 -6.1 -7.5 -6.7 -3.3 -7.9 -8.0 -7.0 -5.3 -3.5
Hotels and Restaurants -2.3 -2.1 -5.5 -5.5 -11.1 -3.1 -3.5 -4.9 -4.7 -8.3
Business and Administrative Services
-4.2 -3.8 -0.3 -3.1 -6.0 -5.6 -7.9 -8.0 -8.3 -9.4
Other -6.5 -7.1 -6.5 -3.0 -6.7 -5.3 -6.6 -6.1 -4.9 -7.0
Total -4.6 -4.7 -5.3 -4.9 -5.9 -4.1 -4.6 -4.6 -4.1 -5.1
Source: Trends in Business Credit and Deposits, Central Bank of Ireland.
11 Household debt is defined as total loans.
12 The disposable income figures use the four-sum moving average of gross disposable income adjusted for the change in net equity of households in pension funds reserves.
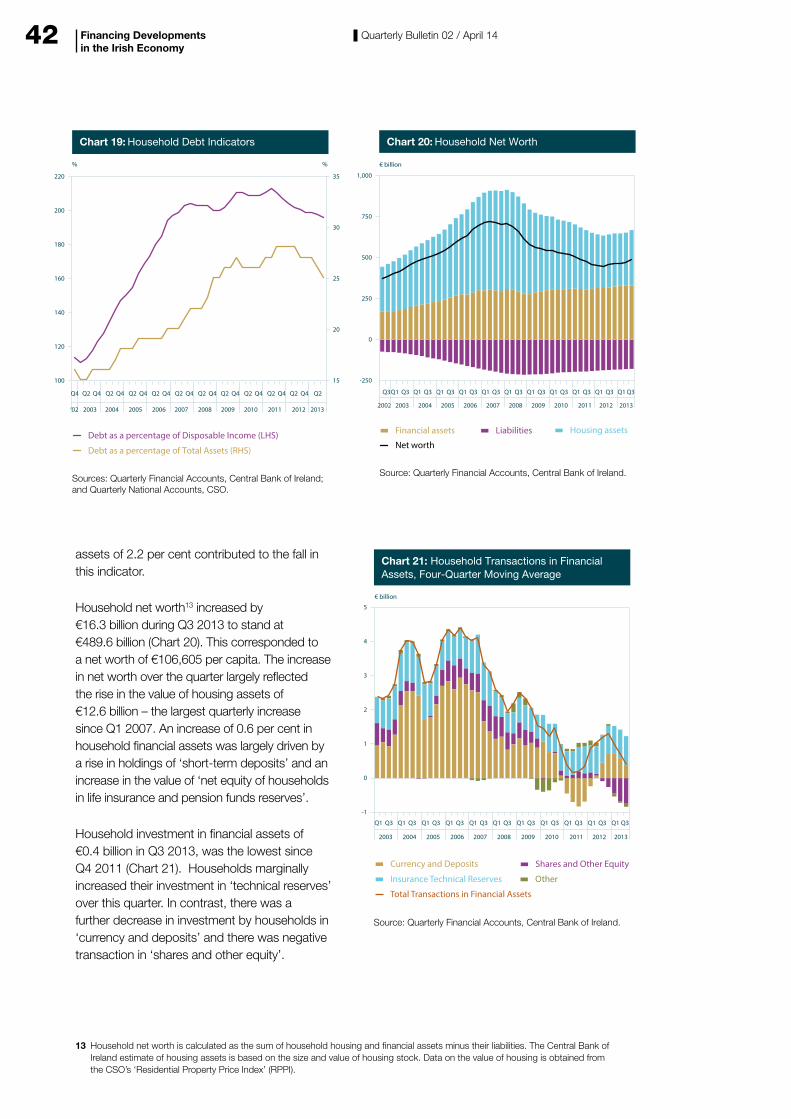
42 Quarterly Bulletin 02 / April 14
assets of 2.2 per cent contributed to the fall in this indicator.
Household net worth13 increased by €16.3 billion during Q3 2013 to stand at €489.6 billion (Chart 20). This corresponded to a net worth of €106,605 per capita. The increase in net worth over the quarter largely reflected the rise in the value of housing assets of €12.6 billion – the largest quarterly increase since Q1 2007. An increase of 0.6 per cent in household financial assets was largely driven by a rise in holdings of ‘short-term deposits’ and an increase in the value of ‘net equity of households in life insurance and pension funds reserves’.
Household investment in financial assets of €0.4 billion in Q3 2013, was the lowest since Q4 2011 (Chart 21). Households marginally increased their investment in ‘technical reserves’ over this quarter. In contrast, there was a further decrease in investment by households in ‘currency and deposits’ and there was negative transaction in ‘shares and other equity’.
Financing Developments in the Irish Economy
100
120
140
160
180
200
220
2003
Q2Q4 Q4 Q2 Q4 Q2 Q4 Q2 Q4 Q2 Q4 Q2 Q4 Q2 Q4 Q2 Q4 Q2 Q4 Q2 Q4 Q2
2004 2005 2006 2007 2008 2009 2010 2011 2012 2013
Debt as a percentage of Disposable Income (LHS)
Debt as a percentage of Total Assets (RHS)
% %
Sources: Quarterly Financial Accounts, Central Bank of Ireland;and Quarterly National Accounts, CSO.
Chart 19: Household Debt Indicators
15
20
25
30
35
‘02
-250
0
250
500
750
1,000
€ billion
Chart 20: Household Net Worth
Source: Quarterly Financial Accounts, Central Bank of Ireland.
Financial assets Liabilities Housing assets
Net worth
20032002
Q3 Q3Q1 Q3Q1 Q3Q1 Q3Q1 Q3Q1 Q3Q1 Q3Q1 Q3Q1 Q3Q1 Q3Q1 Q3Q1
2004 2005 2006 2007 2008 2009 2010 2011 2012 2013
200820072006200520042003 2009 2010 2011 2012 2013
-1
0
1
2
3
4
5
Shares and Other Equity
Insurance Technical Reserves
Currency and Deposits
Total Transactions in Financial Assets
Other
Source: Quarterly Financial Accounts, Central Bank of Ireland.
€ billion
Chart 21: Household Transactions in FinancialAssets, Four-Quarter Moving Average
Q3Q1 Q3Q1 Q3Q1 Q3Q1 Q3Q1 Q3Q1 Q3Q1 Q3Q1 Q3Q1 Q3Q1 Q3Q1
13 Household net worth is calculated as the sum of household housing and financial assets minus their liabilities. The Central Bank of Ireland estimate of housing assets is based on the size and value of housing stock. Data on the value of housing is obtained from the CSO’s ‘Residential Property Price Index’ (RPPI).
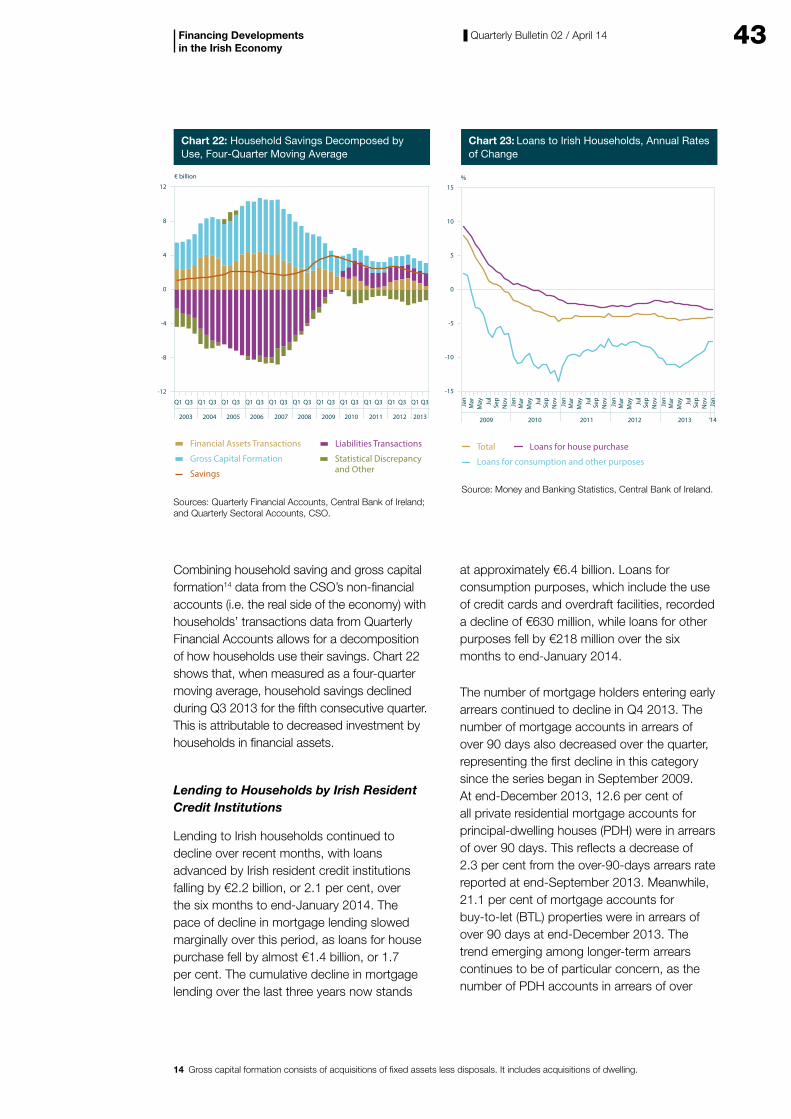
43Quarterly Bulletin 02 / April 14
Combining household saving and gross capital formation14 data from the CSO’s non-financial accounts (i.e. the real side of the economy) with households’ transactions data from Quarterly Financial Accounts allows for a decomposition of how households use their savings. Chart 22 shows that, when measured as a four-quarter moving average, household savings declined during Q3 2013 for the fifth consecutive quarter. This is attributable to decreased investment by households in financial assets.
Lending to Households by Irish Resident Credit Institutions
Lending to Irish households continued to decline over recent months, with loans advanced by Irish resident credit institutions falling by €2.2 billion, or 2.1 per cent, over the six months to end-January 2014. The pace of decline in mortgage lending slowed marginally over this period, as loans for house purchase fell by almost €1.4 billion, or 1.7 per cent. The cumulative decline in mortgage lending over the last three years now stands
at approximately €6.4 billion. Loans for consumption purposes, which include the use of credit cards and overdraft facilities, recorded a decline of €630 million, while loans for other purposes fell by €218 million over the six months to end-January 2014.
The number of mortgage holders entering early arrears continued to decline in Q4 2013. The number of mortgage accounts in arrears of over 90 days also decreased over the quarter, representing the first decline in this category since the series began in September 2009. At end-December 2013, 12.6 per cent of all private residential mortgage accounts for principal-dwelling houses (PDH) were in arrears of over 90 days. This reflects a decrease of 2.3 per cent from the over-90-days arrears rate reported at end-September 2013. Meanwhile, 21.1 per cent of mortgage accounts for buy-to-let (BTL) properties were in arrears of over 90 days at end-December 2013. The trend emerging among longer-term arrears continues to be of particular concern, as the number of PDH accounts in arrears of over
Financing Developments in the Irish Economy
-12
-8
-4
0
4
8
12
Liabilities Transactions
Gross Capital Formation
Financial Assets Transactions
Savings
Statistical Discrepancyand Other
Sources: Quarterly Financial Accounts, Central Bank of Ireland;and Quarterly Sectoral Accounts, CSO.
€ billion
Chart 22: Household Savings Decomposed byUse, Four-Quarter Moving Average
200820072006200520042003
Q3Q1 Q3Q1 Q3Q1 Q3Q1 Q3Q1 Q3Q1 Q3Q1 Q3Q1 Q3Q1 Q3Q1 Q3Q1
2009 2010 2011 2012 2013
Jan
Mar
May Ju
lSe
pN
ov Jan
Mar
May Ju
lSe
pN
ov Jan
Mar
May Ju
lSe
pN
ov Jan
Mar
May Ju
lSe
pN
ov Jan
Jan
Mar
May Ju
lSe
pN
ov
2009 2010 2011 2012 2013 ‘14
-15
-10
-5
0
5
10
15
Total Loans for house purchase
Loans for consumption and other purposes
%
Source: Money and Banking Statistics, Central Bank of Ireland.
Chart 23: Loans to Irish Households, Annual Ratesof Change
14 Gross capital formation consists of acquisitions of fixed assets less disposals. It includes acquisitions of dwelling.
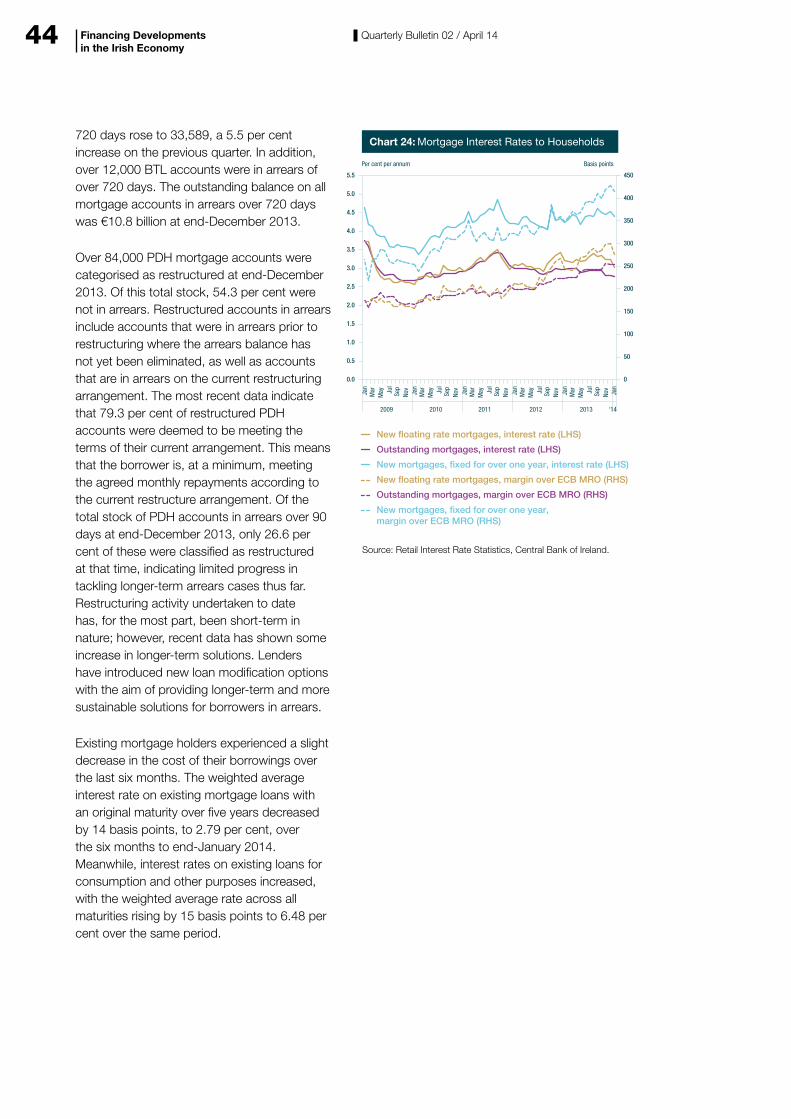
44 Quarterly Bulletin 02 / April 14
720 days rose to 33,589, a 5.5 per cent increase on the previous quarter. In addition, over 12,000 BTL accounts were in arrears of over 720 days. The outstanding balance on all mortgage accounts in arrears over 720 days was €10.8 billion at end-December 2013.
Over 84,000 PDH mortgage accounts were categorised as restructured at end-December 2013. Of this total stock, 54.3 per cent were not in arrears. Restructured accounts in arrears include accounts that were in arrears prior to restructuring where the arrears balance has not yet been eliminated, as well as accounts that are in arrears on the current restructuring arrangement. The most recent data indicate that 79.3 per cent of restructured PDH accounts were deemed to be meeting the terms of their current arrangement. This means that the borrower is, at a minimum, meeting the agreed monthly repayments according to the current restructure arrangement. Of the total stock of PDH accounts in arrears over 90 days at end-December 2013, only 26.6 per cent of these were classified as restructured at that time, indicating limited progress in tackling longer-term arrears cases thus far. Restructuring activity undertaken to date has, for the most part, been short-term in nature; however, recent data has shown some increase in longer-term solutions. Lenders have introduced new loan modification options with the aim of providing longer-term and more sustainable solutions for borrowers in arrears.
Existing mortgage holders experienced a slight decrease in the cost of their borrowings over the last six months. The weighted average interest rate on existing mortgage loans with an original maturity over five years decreased by 14 basis points, to 2.79 per cent, over the six months to end-January 2014. Meanwhile, interest rates on existing loans for consumption and other purposes increased, with the weighted average rate across all maturities rising by 15 basis points to 6.48 per cent over the same period.
Financing Developments in the Irish Economy
0
50
100
150
200
250
300
350
400
450
New �oating rate mortgages, interest rate (LHS)
Outstanding mortgages, interest rate (LHS)
New mortgages, �xed for over one year, interest rate (LHS)
Outstanding mortgages, margin over ECB MRO (RHS)
New �oating rate mortgages, margin over ECB MRO (RHS)
New mortgages, �xed for over one year,margin over ECB MRO (RHS)
0.0
0.5
1.0
1.5
2.0
2.5
3.0
3.5
4.0
4.5
5.0
5.5
Per cent per annum Basis points
Chart 24: Mortgage Interest Rates to Households
Source: Retail Interest Rate Statistics, Central Bank of Ireland.
Jan
Mar
May Ju
lSe
pNo
vJa
nM
arM
ay Jul
Sep
Nov
Jan
Mar
May Ju
lSe
pNo
vJa
nM
arM
ay Jul
Sep
Nov
Jan
Jan
Mar
May Ju
lSe
pNo
v
2009 2010 2011 2012 2013 ‘14
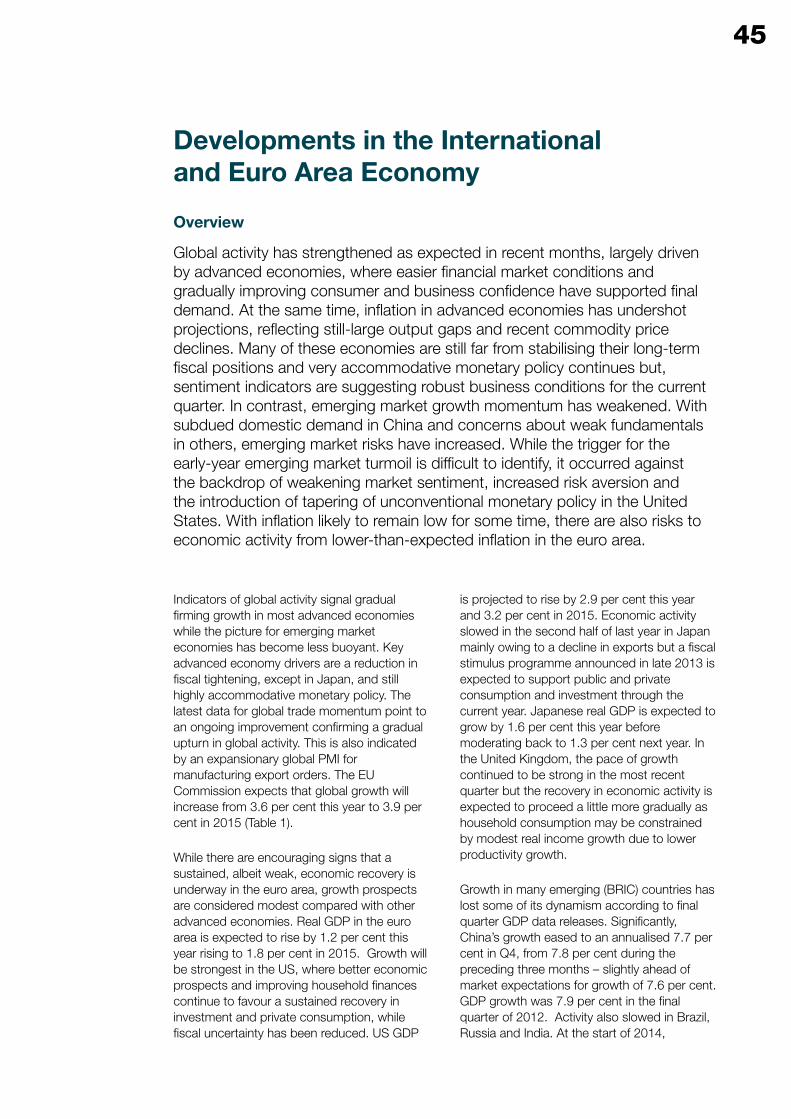
45
Indicators of global activity signal gradual firming growth in most advanced economies while the picture for emerging market economies has become less buoyant. Key advanced economy drivers are a reduction in fiscal tightening, except in Japan, and still highly accommodative monetary policy. The latest data for global trade momentum point to an ongoing improvement confirming a gradual upturn in global activity. This is also indicated by an expansionary global PMI for manufacturing export orders. The EU Commission expects that global growth will increase from 3.6 per cent this year to 3.9 per cent in 2015 (Table 1).
While there are encouraging signs that a sustained, albeit weak, economic recovery is underway in the euro area, growth prospects are considered modest compared with other advanced economies. Real GDP in the euro area is expected to rise by 1.2 per cent this year rising to 1.8 per cent in 2015. Growth will be strongest in the US, where better economic prospects and improving household finances continue to favour a sustained recovery in investment and private consumption, while fiscal uncertainty has been reduced. US GDP
is projected to rise by 2.9 per cent this year and 3.2 per cent in 2015. Economic activity slowed in the second half of last year in Japan mainly owing to a decline in exports but a fiscal stimulus programme announced in late 2013 is expected to support public and private consumption and investment through the current year. Japanese real GDP is expected to grow by 1.6 per cent this year before moderating back to 1.3 per cent next year. In the United Kingdom, the pace of growth continued to be strong in the most recent quarter but the recovery in economic activity is expected to proceed a little more gradually as household consumption may be constrained by modest real income growth due to lower productivity growth.
Growth in many emerging (BRIC) countries has lost some of its dynamism according to final quarter GDP data releases. Significantly, China’s growth eased to an annualised 7.7 per cent in Q4, from 7.8 per cent during the preceding three months – slightly ahead of market expectations for growth of 7.6 per cent. GDP growth was 7.9 per cent in the final quarter of 2012. Activity also slowed in Brazil, Russia and India. At the start of 2014,
Developments in the International and Euro Area Economy
Overview
Global activity has strengthened as expected in recent months, largely driven by advanced economies, where easier financial market conditions and gradually improving consumer and business confidence have supported final demand. At the same time, inflation in advanced economies has undershot projections, reflecting still-large output gaps and recent commodity price declines. Many of these economies are still far from stabilising their long-term fiscal positions and very accommodative monetary policy continues but, sentiment indicators are suggesting robust business conditions for the current quarter. In contrast, emerging market growth momentum has weakened. With subdued domestic demand in China and concerns about weak fundamentals in others, emerging market risks have increased. While the trigger for the early-year emerging market turmoil is difficult to identify, it occurred against the backdrop of weakening market sentiment, increased risk aversion and the introduction of tapering of unconventional monetary policy in the United States. With inflation likely to remain low for some time, there are also risks to economic activity from lower-than-expected inflation in the euro area.
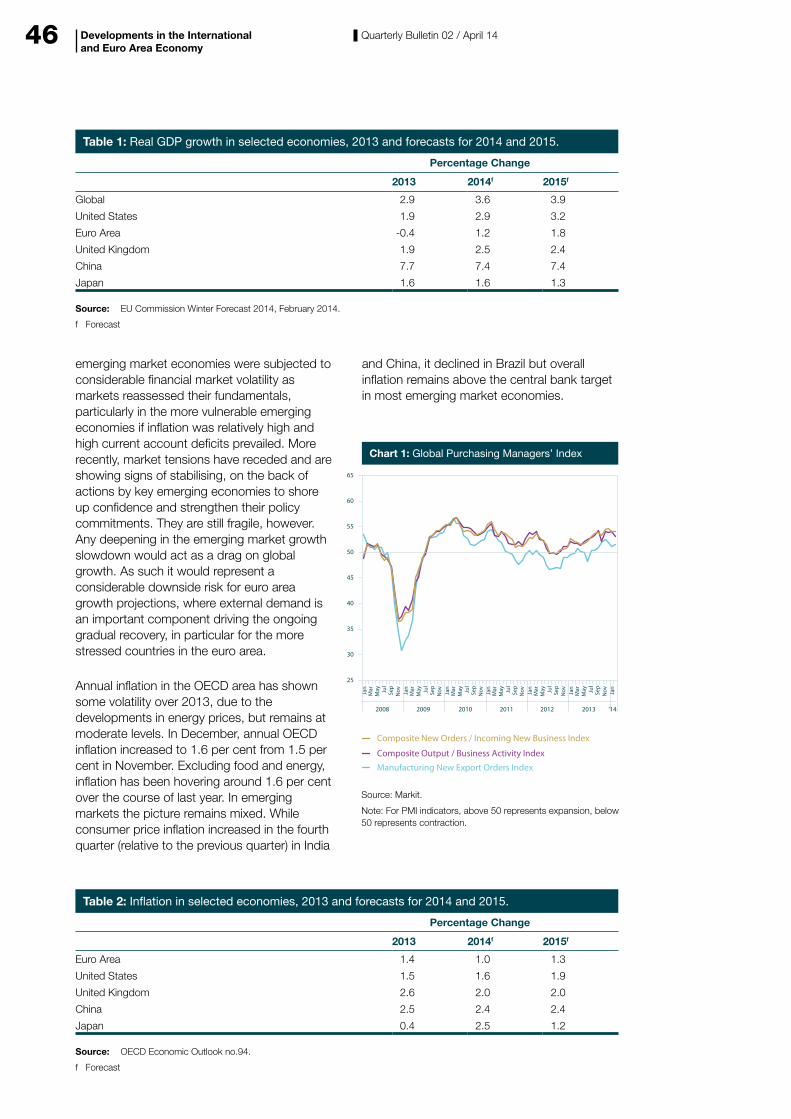
46 Quarterly Bulletin 02 / April 14Developments in the International and Euro Area Economy
emerging market economies were subjected to considerable financial market volatility as markets reassessed their fundamentals, particularly in the more vulnerable emerging economies if inflation was relatively high and high current account deficits prevailed. More recently, market tensions have receded and are showing signs of stabilising, on the back of actions by key emerging economies to shore up confidence and strengthen their policy commitments. They are still fragile, however. Any deepening in the emerging market growth slowdown would act as a drag on global growth. As such it would represent a considerable downside risk for euro area growth projections, where external demand is an important component driving the ongoing gradual recovery, in particular for the more stressed countries in the euro area.
Annual inflation in the OECD area has shown some volatility over 2013, due to the developments in energy prices, but remains at moderate levels. In December, annual OECD inflation increased to 1.6 per cent from 1.5 per cent in November. Excluding food and energy, inflation has been hovering around 1.6 per cent over the course of last year. In emerging markets the picture remains mixed. While consumer price inflation increased in the fourth quarter (relative to the previous quarter) in India
and China, it declined in Brazil but overall inflation remains above the central bank target in most emerging market economies.
2008 2009 2010 2011 2012 2013
Chart 1: Global Purchasing Managers’ Index
Composite Output / Business Activity Index
Composite New Orders / Incoming New Business Index
Manufacturing New Export Orders Index
Source: Markit.
Note: For PMI indicators, above 50 represents expansion, below50 represents contraction.
25
30
35
40
45
50
55
60
65
‘14
Mar
May Ju
lSe
pN
ovJan
Mar
May Ju
lSe
pN
ovJan
Mar
May Ju
lSe
pN
ovJan
Mar
May Ju
lSe
pN
ovJan
Mar
May Ju
lSe
pN
ovJan
Mar
May Ju
lSe
pN
ovJan
Jan
Table 1: Real GDP growth in selected economies, 2013 and forecasts for 2014 and 2015.
Percentage Change
2013 2014f 2015f
Global 2.9 3.6 3.9
United States 1.9 2.9 3.2
Euro Area -0.4 1.2 1.8
United Kingdom 1.9 2.5 2.4
China 7.7 7.4 7.4
Japan 1.6 1.6 1.3
Source: EU Commission Winter Forecast 2014, February 2014.
f Forecast
Table 2: Inflation in selected economies, 2013 and forecasts for 2014 and 2015.
Percentage Change
2013 2014f 2015f
Euro Area 1.4 1.0 1.3
United States 1.5 1.6 1.9
United Kingdom 2.6 2.0 2.0
China 2.5 2.4 2.4
Japan 0.4 2.5 1.2
Source: OECD Economic Outlook no.94.
f Forecast
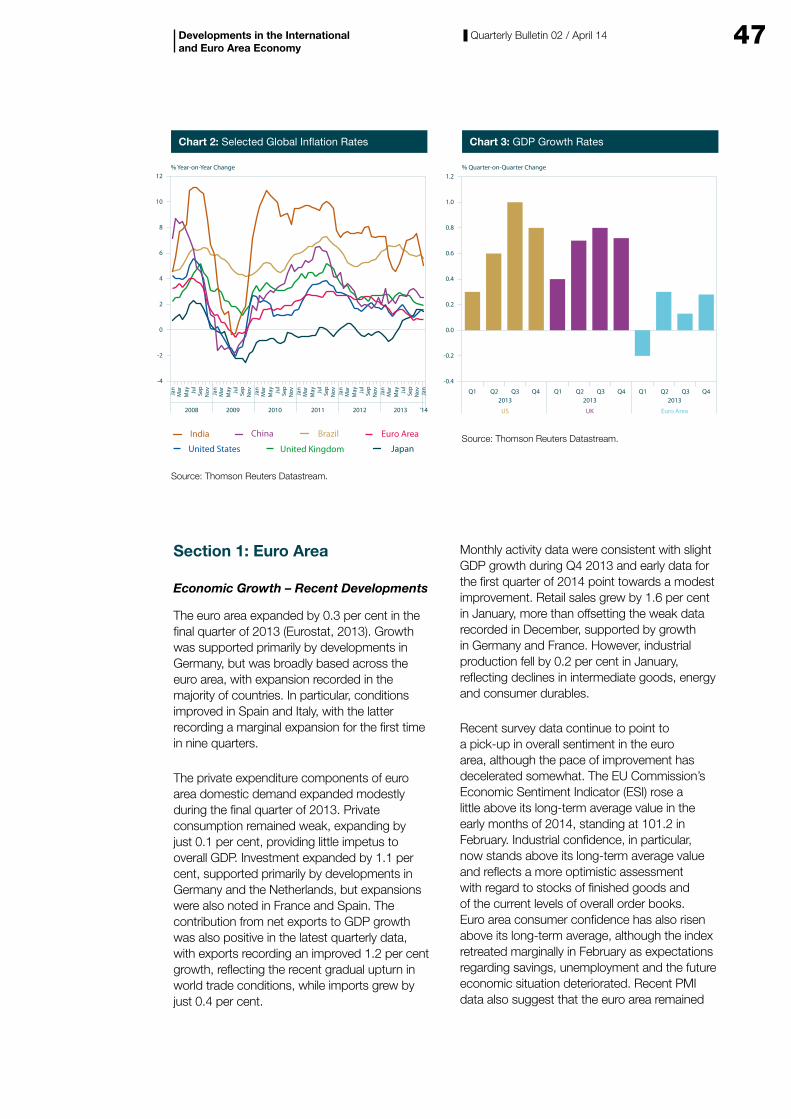
47Quarterly Bulletin 02 / April 14Developments in the International and Euro Area Economy
Section 1: Euro Area
Economic Growth – Recent Developments
The euro area expanded by 0.3 per cent in the final quarter of 2013 (Eurostat, 2013). Growth was supported primarily by developments in Germany, but was broadly based across the euro area, with expansion recorded in the majority of countries. In particular, conditions improved in Spain and Italy, with the latter recording a marginal expansion for the first time in nine quarters.
The private expenditure components of euro area domestic demand expanded modestly during the final quarter of 2013. Private consumption remained weak, expanding by just 0.1 per cent, providing little impetus to overall GDP. Investment expanded by 1.1 per cent, supported primarily by developments in Germany and the Netherlands, but expansions were also noted in France and Spain. The contribution from net exports to GDP growth was also positive in the latest quarterly data, with exports recording an improved 1.2 per cent growth, reflecting the recent gradual upturn in world trade conditions, while imports grew by just 0.4 per cent.
Monthly activity data were consistent with slight GDP growth during Q4 2013 and early data for the first quarter of 2014 point towards a modest improvement. Retail sales grew by 1.6 per cent in January, more than offsetting the weak data recorded in December, supported by growth in Germany and France. However, industrial production fell by 0.2 per cent in January, reflecting declines in intermediate goods, energy and consumer durables.
Recent survey data continue to point to a pick-up in overall sentiment in the euro area, although the pace of improvement has decelerated somewhat. The EU Commission’s Economic Sentiment Indicator (ESI) rose a little above its long-term average value in the early months of 2014, standing at 101.2 in February. Industrial confidence, in particular, now stands above its long-term average value and reflects a more optimistic assessment with regard to stocks of finished goods and of the current levels of overall order books. Euro area consumer confidence has also risen above its long-term average, although the index retreated marginally in February as expectations regarding savings, unemployment and the future economic situation deteriorated. Recent PMI data also suggest that the euro area remained
% Year-on-Year Change
Chart 2: Selected Global In�ation Rates
Source: Thomson Reuters Datastream.
-4
-2
0
2
4
6
8
10
12
2008 2009 2010 2011 2012 2013
Mar
May Ju
lSe
pN
ov Mar
May Ju
lSe
pN
ov Mar
May Ju
lSe
pN
ov Mar
May Ju
lSe
pN
ov Mar
May Ju
lSe
pN
ov Mar
May Ju
lSe
pN
ov Jan
‘14
Jan
Jan
Jan
Jan
Jan
Jan
JapanUnited KingdomUnited States
Euro Area BrazilChinaIndia
US UK Euro Area
2013 2013 2013
Source: Thomson Reuters Datastream.
-0.4
-0.2
0.0
0.2
0.4
0.6
0.8
1.0
1.2
Q1 Q2 Q3 Q4 Q1 Q2 Q3 Q4 Q1 Q2 Q3 Q4
% Quarter-on-Quarter Change
Chart 3: GDP Growth Rates
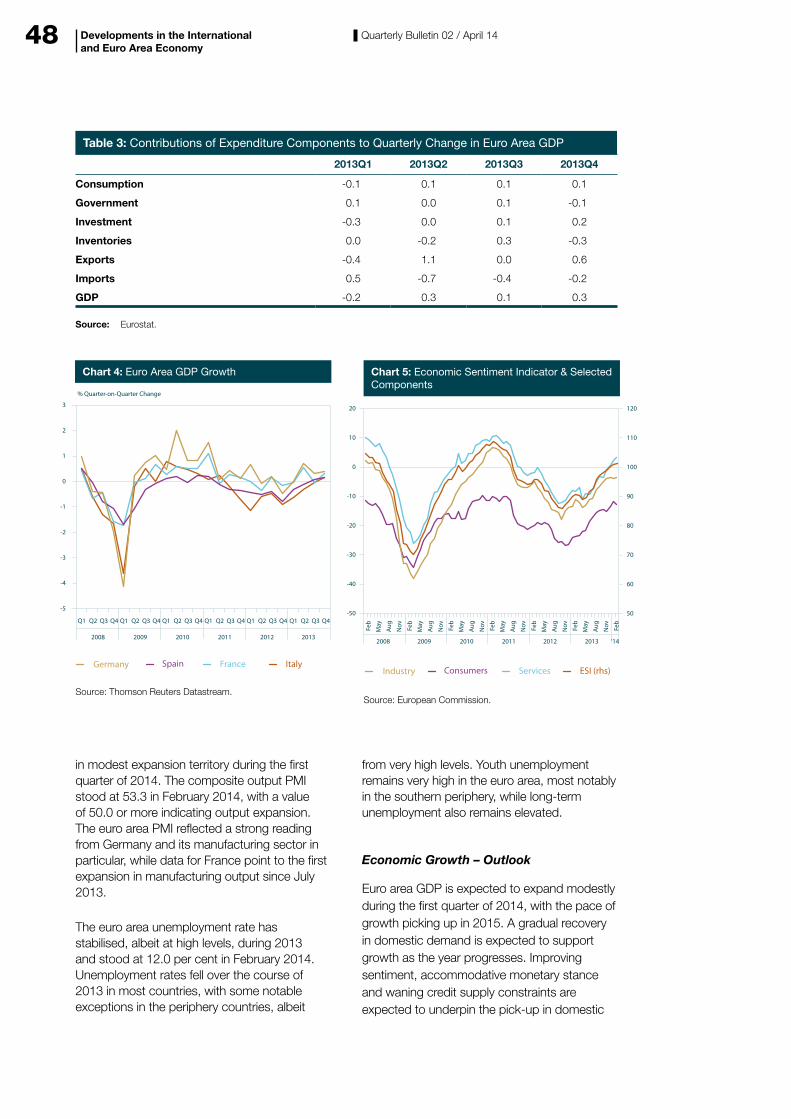
48 Quarterly Bulletin 02 / April 14
in modest expansion territory during the first quarter of 2014. The composite output PMI stood at 53.3 in February 2014, with a value of 50.0 or more indicating output expansion. The euro area PMI reflected a strong reading from Germany and its manufacturing sector in particular, while data for France point to the first expansion in manufacturing output since July 2013.
The euro area unemployment rate has stabilised, albeit at high levels, during 2013 and stood at 12.0 per cent in February 2014. Unemployment rates fell over the course of 2013 in most countries, with some notable exceptions in the periphery countries, albeit
from very high levels. Youth unemployment remains very high in the euro area, most notably in the southern periphery, while long-term unemployment also remains elevated.
Economic Growth – Outlook
Euro area GDP is expected to expand modestly during the first quarter of 2014, with the pace of growth picking up in 2015. A gradual recovery in domestic demand is expected to support growth as the year progresses. Improving sentiment, accommodative monetary stance and waning credit supply constraints are expected to underpin the pick-up in domestic
Developments in the International and Euro Area Economy
% Quarter-on-Quarter Change
Chart 4: Euro Area GDP Growth
France Germany Spain Italy
Source: Thomson Reuters Datastream.
-5
-4
-3
-2
-1
0
1
2
3
Q4Q3Q2Q1
2008
Q4Q3Q2Q1
2009
Q4Q3Q2Q1
2010
Q4Q3Q2Q1
2011
Q4Q3Q2Q1
2012
Q4Q3Q2Q1
2013
Services Industry Consumers ESI (rhs)
Source: European Commission.
Chart 5: Economic Sentiment Indicator & SelectedComponents
-50
-40
-30
-20
-10
0
10
20
60
50
70
80
90
100
110
120
2008 2009 2010 2011 2012 ‘142013
Feb
May
Aug
Nov Fe
b
May
Aug
Nov Fe
b
May
Aug
Nov Fe
b
May
Aug
Nov Fe
b
May
Aug
Nov Fe
b
May
Aug
Nov Fe
b
Table 3: Contributions of Expenditure Components to Quarterly Change in Euro Area GDP
2013Q1 2013Q2 2013Q3 2013Q4
Consumption -0.1 0.1 0.1 0.1
Government 0.1 0.0 0.1 -0.1
Investment -0.3 0.0 0.1 0.2
Inventories 0.0 -0.2 0.3 -0.3
Exports -0.4 1.1 0.0 0.6
Imports 0.5 -0.7 -0.4 -0.2
GDP -0.2 0.3 0.1 0.3
Source: Eurostat.
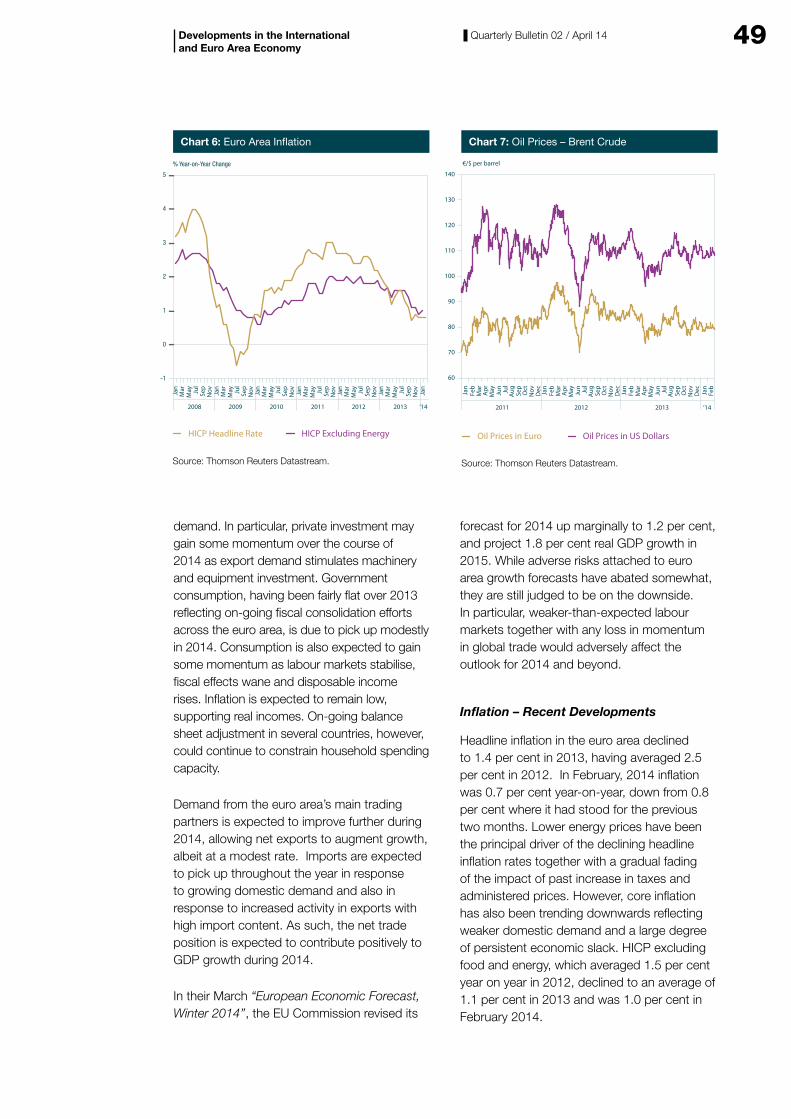
49Quarterly Bulletin 02 / April 14
demand. In particular, private investment may gain some momentum over the course of 2014 as export demand stimulates machinery and equipment investment. Government consumption, having been fairly flat over 2013 reflecting on-going fiscal consolidation efforts across the euro area, is due to pick up modestly in 2014. Consumption is also expected to gain some momentum as labour markets stabilise, fiscal effects wane and disposable income rises. Inflation is expected to remain low, supporting real incomes. On-going balance sheet adjustment in several countries, however, could continue to constrain household spending capacity.
Demand from the euro area’s main trading partners is expected to improve further during 2014, allowing net exports to augment growth, albeit at a modest rate. Imports are expected to pick up throughout the year in response to growing domestic demand and also in response to increased activity in exports with high import content. As such, the net trade position is expected to contribute positively to GDP growth during 2014.
In their March “European Economic Forecast, Winter 2014’’, the EU Commission revised its
forecast for 2014 up marginally to 1.2 per cent, and project 1.8 per cent real GDP growth in 2015. While adverse risks attached to euro area growth forecasts have abated somewhat, they are still judged to be on the downside. In particular, weaker-than-expected labour markets together with any loss in momentum in global trade would adversely affect the outlook for 2014 and beyond.
Inflation – Recent Developments
Headline inflation in the euro area declined to 1.4 per cent in 2013, having averaged 2.5 per cent in 2012. In February, 2014 inflation was 0.7 per cent year-on-year, down from 0.8 per cent where it had stood for the previous two months. Lower energy prices have been the principal driver of the declining headline inflation rates together with a gradual fading of the impact of past increase in taxes and administered prices. However, core inflation has also been trending downwards reflecting weaker domestic demand and a large degree of persistent economic slack. HICP excluding food and energy, which averaged 1.5 per cent year on year in 2012, declined to an average of 1.1 per cent in 2013 and was 1.0 per cent in February 2014.
Developments in the International and Euro Area Economy
% Year-on-Year Change
Chart 6: Euro Area In�ation
HICP Headline Rate HICP Excluding Energy
Source: Thomson Reuters Datastream.
2008 2009 2010 2011 2012 2013
Mar
May Ju
lSe
pN
ov Mar
May Ju
lSe
pN
ov Mar
May Ju
lSe
pN
ov Mar
May Ju
lSe
pN
ov Mar
May Ju
lSe
pN
ov Mar
May Ju
lSe
pN
ov
-1
0
1
2
3
4
5Ja
n
Jan
Jan
Jan
Jan
Jan
Jan
‘14 2011 2012 2013 ‘14
Oil Prices in Euro Oil Prices in US Dollars
Source: Thomson Reuters Datastream.
€/$ per barrel
Chart 7: Oil Prices – Brent Crude
Jan
Feb
Mar
Apr Jun
May Ju
lA
ug Sep
Oct
Nov Dec Jan
Feb
Mar
Apr Jun
May Ju
lA
ug Sep
Oct
Nov Dec Jan
Feb
Mar
Apr Jun
May Ju
lA
ug Sep
Oct
Nov Dec Jan
Feb
60
70
80
90
100
110
120
130
140
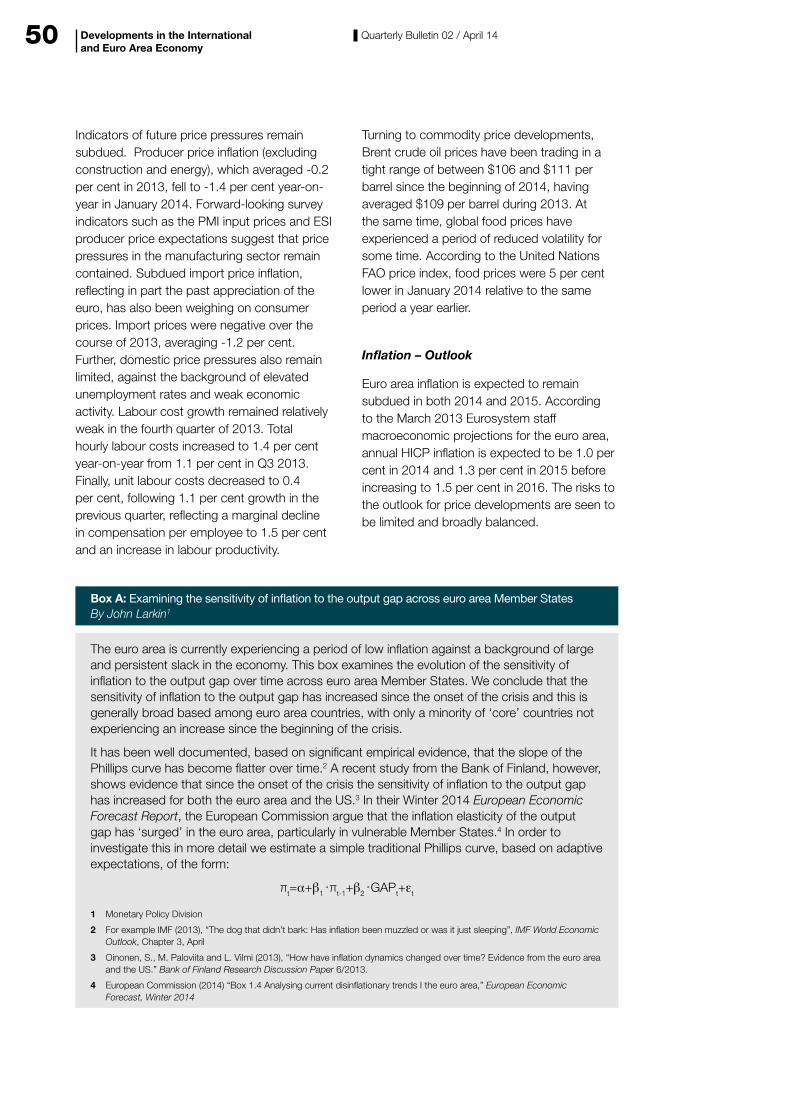
50 Quarterly Bulletin 02 / April 14
Indicators of future price pressures remain subdued. Producer price inflation (excluding construction and energy), which averaged -0.2 per cent in 2013, fell to -1.4 per cent year-on-year in January 2014. Forward-looking survey indicators such as the PMI input prices and ESI producer price expectations suggest that price pressures in the manufacturing sector remain contained. Subdued import price inflation, reflecting in part the past appreciation of the euro, has also been weighing on consumer prices. Import prices were negative over the course of 2013, averaging -1.2 per cent. Further, domestic price pressures also remain limited, against the background of elevated unemployment rates and weak economic activity. Labour cost growth remained relatively weak in the fourth quarter of 2013. Total hourly labour costs increased to 1.4 per cent year-on-year from 1.1 per cent in Q3 2013. Finally, unit labour costs decreased to 0.4 per cent, following 1.1 per cent growth in the previous quarter, reflecting a marginal decline in compensation per employee to 1.5 per cent and an increase in labour productivity.
Turning to commodity price developments, Brent crude oil prices have been trading in a tight range of between $106 and $111 per barrel since the beginning of 2014, having averaged $109 per barrel during 2013. At the same time, global food prices have experienced a period of reduced volatility for some time. According to the United Nations FAO price index, food prices were 5 per cent lower in January 2014 relative to the same period a year earlier.
Inflation – Outlook
Euro area inflation is expected to remain subdued in both 2014 and 2015. According to the March 2013 Eurosystem staff macroeconomic projections for the euro area, annual HICP inflation is expected to be 1.0 per cent in 2014 and 1.3 per cent in 2015 before increasing to 1.5 per cent in 2016. The risks to the outlook for price developments are seen to be limited and broadly balanced.
Developments in the International and Euro Area Economy
Box A: Examining the sensitivity of inflation to the output gap across euro area Member States By John Larkin1
The euro area is currently experiencing a period of low inflation against a background of large and persistent slack in the economy. This box examines the evolution of the sensitivity of inflation to the output gap over time across euro area Member States. We conclude that the sensitivity of inflation to the output gap has increased since the onset of the crisis and this is generally broad based among euro area countries, with only a minority of ‘core’ countries not experiencing an increase since the beginning of the crisis.
It has been well documented, based on significant empirical evidence, that the slope of the Phillips curve has become flatter over time.2 A recent study from the Bank of Finland, however, shows evidence that since the onset of the crisis the sensitivity of inflation to the output gap has increased for both the euro area and the US.3 In their Winter 2014 European Economic Forecast Report, the European Commission argue that the inflation elasticity of the output gap has ‘surged’ in the euro area, particularly in vulnerable Member States.4 In order to investigate this in more detail we estimate a simple traditional Phillips curve, based on adaptive expectations, of the form:
πt=α+β1� πt-1+β2� GAPt+εt
1 Monetary Policy Division
2 For example IMF (2013), “The dog that didn’t bark: Has inflation been muzzled or was it just sleeping”, IMF World Economic Outlook, Chapter 3, April
3 Oinonen, S., M. Paloviita and L. Vilmi (2013), “How have inflation dynamics changed over time? Evidence from the euro area and the US.” Bank of Finland Research Discussion Paper 6/2013.
4 European Commission (2014) “Box 1.4 Analysing current disinflationary trends I the euro area,” European Economic Forecast, Winter 2014
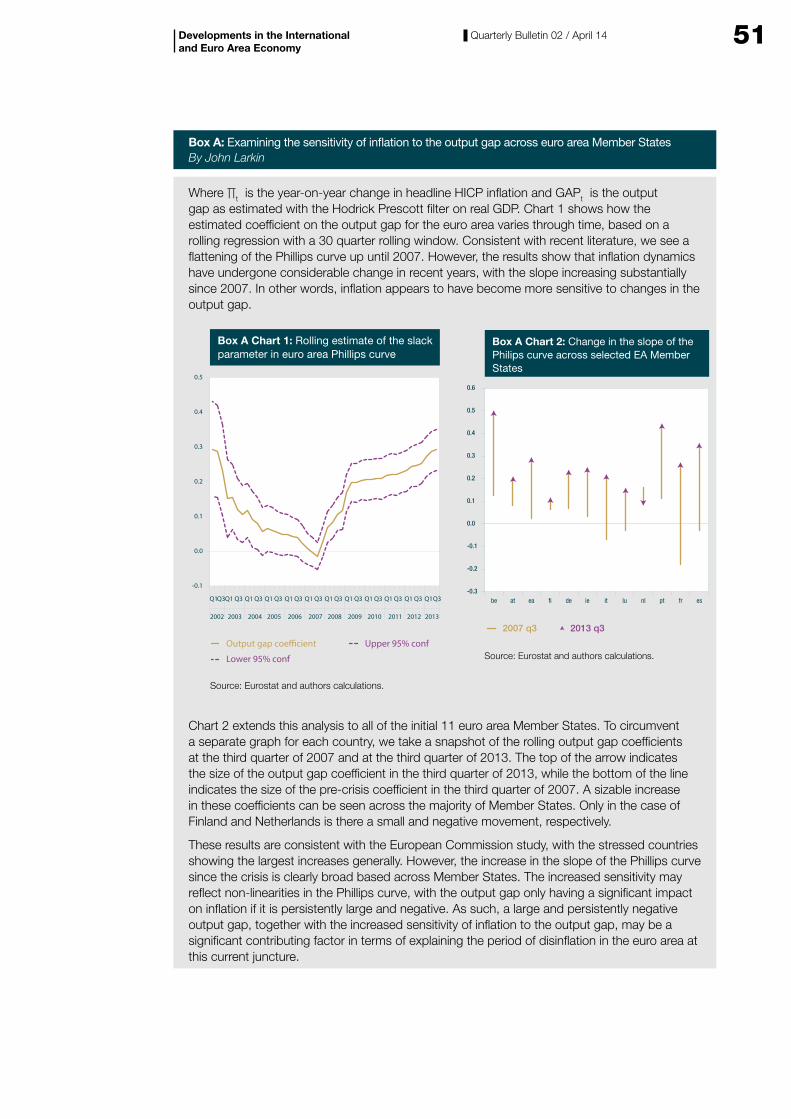
51Quarterly Bulletin 02 / April 14Developments in the International and Euro Area Economy
Box A: Examining the sensitivity of inflation to the output gap across euro area Member States By John Larkin
Where Πt is the year-on-year change in headline HICP inflation and GAPt is the output gap as estimated with the Hodrick Prescott filter on real GDP. Chart 1 shows how the estimated coefficient on the output gap for the euro area varies through time, based on a rolling regression with a 30 quarter rolling window. Consistent with recent literature, we see a flattening of the Phillips curve up until 2007. However, the results show that inflation dynamics have undergone considerable change in recent years, with the slope increasing substantially since 2007. In other words, inflation appears to have become more sensitive to changes in the output gap.
-0.1
0.0
0.1
0.2
0.3
0.4
0.5
Box A Chart 1: Rolling estimate of the slackparameter in euro area Phillips curve
Source: Eurostat and authors calculations.
200920082007
Output gap coe�cient Upper 95% conf
Lower 95% conf
20062005200420032002 2010 2011 2012 2013
Q1 Q3 Q1 Q3 Q1 Q3 Q1 Q3 Q1 Q3 Q1 Q3 Q1 Q3 Q1 Q3 Q1 Q3 Q1 Q3 Q1Q3Q1Q3-0.3
-0.2
-0.1
0.0
0.1
0.2
0.3
0.4
0.5
0.6
esfrptnlluitiede�eaatbe
2007 q3 2013 q3
Box A Chart 2: Change in the slope of thePhilips curve across selected EA MemberStates
Source: Eurostat and authors calculations.
Chart 2 extends this analysis to all of the initial 11 euro area Member States. To circumvent a separate graph for each country, we take a snapshot of the rolling output gap coefficients at the third quarter of 2007 and at the third quarter of 2013. The top of the arrow indicates the size of the output gap coefficient in the third quarter of 2013, while the bottom of the line indicates the size of the pre-crisis coefficient in the third quarter of 2007. A sizable increase in these coefficients can be seen across the majority of Member States. Only in the case of Finland and Netherlands is there a small and negative movement, respectively.
These results are consistent with the European Commission study, with the stressed countries showing the largest increases generally. However, the increase in the slope of the Phillips curve since the crisis is clearly broad based across Member States. The increased sensitivity may reflect non-linearities in the Phillips curve, with the output gap only having a significant impact on inflation if it is persistently large and negative. As such, a large and persistently negative output gap, together with the increased sensitivity of inflation to the output gap, may be a significant contributing factor in terms of explaining the period of disinflation in the euro area at this current juncture.
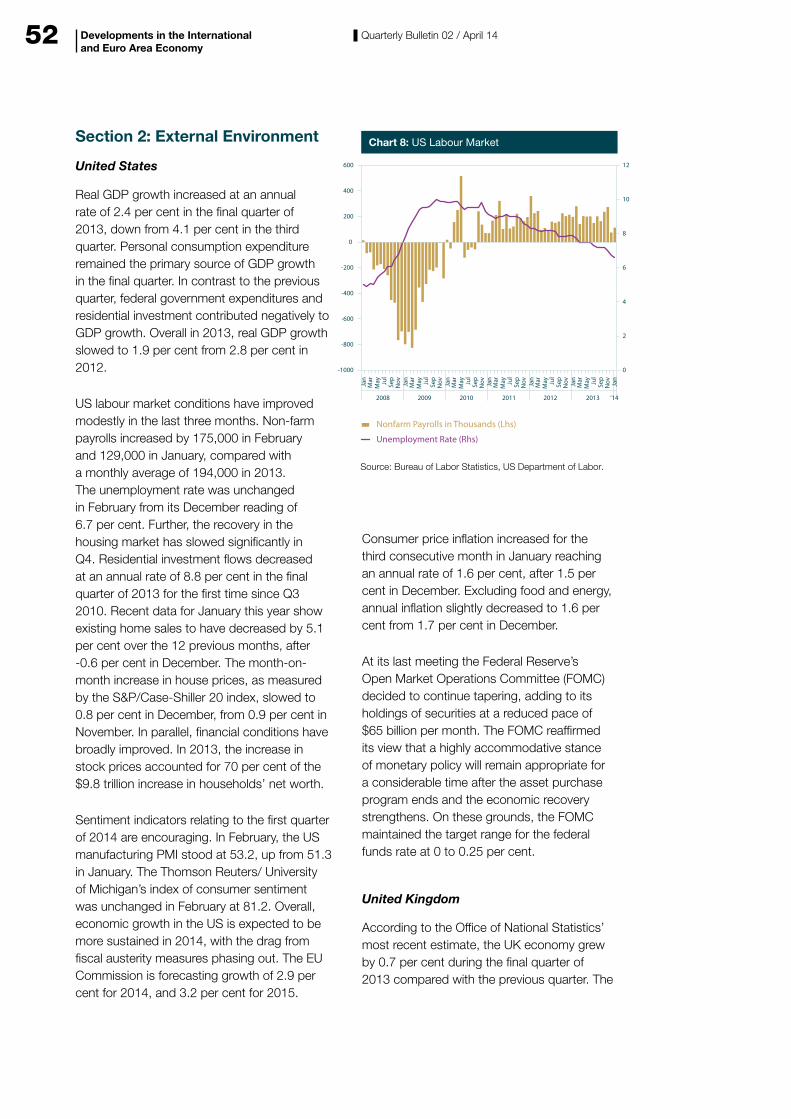
52 Quarterly Bulletin 02 / April 14
Section 2: External Environment
United States
Real GDP growth increased at an annual rate of 2.4 per cent in the final quarter of 2013, down from 4.1 per cent in the third quarter. Personal consumption expenditure remained the primary source of GDP growth in the final quarter. In contrast to the previous quarter, federal government expenditures and residential investment contributed negatively to GDP growth. Overall in 2013, real GDP growth slowed to 1.9 per cent from 2.8 per cent in 2012.
US labour market conditions have improved modestly in the last three months. Non-farm payrolls increased by 175,000 in February and 129,000 in January, compared with a monthly average of 194,000 in 2013. The unemployment rate was unchanged in February from its December reading of 6.7 per cent. Further, the recovery in the housing market has slowed significantly in Q4. Residential investment flows decreased at an annual rate of 8.8 per cent in the final quarter of 2013 for the first time since Q3 2010. Recent data for January this year show existing home sales to have decreased by 5.1 per cent over the 12 previous months, after -0.6 per cent in December. The month-on-month increase in house prices, as measured by the S&P/Case-Shiller 20 index, slowed to 0.8 per cent in December, from 0.9 per cent in November. In parallel, financial conditions have broadly improved. In 2013, the increase in stock prices accounted for 70 per cent of the $9.8 trillion increase in households’ net worth.
Sentiment indicators relating to the first quarter of 2014 are encouraging. In February, the US manufacturing PMI stood at 53.2, up from 51.3 in January. The Thomson Reuters/ University of Michigan’s index of consumer sentiment was unchanged in February at 81.2. Overall, economic growth in the US is expected to be more sustained in 2014, with the drag from fiscal austerity measures phasing out. The EU Commission is forecasting growth of 2.9 per cent for 2014, and 3.2 per cent for 2015.
Consumer price inflation increased for the third consecutive month in January reaching an annual rate of 1.6 per cent, after 1.5 per cent in December. Excluding food and energy, annual inflation slightly decreased to 1.6 per cent from 1.7 per cent in December.
At its last meeting the Federal Reserve’s Open Market Operations Committee (FOMC) decided to continue tapering, adding to its holdings of securities at a reduced pace of $65 billion per month. The FOMC reaffirmed its view that a highly accommodative stance of monetary policy will remain appropriate for a considerable time after the asset purchase program ends and the economic recovery strengthens. On these grounds, the FOMC maintained the target range for the federal funds rate at 0 to 0.25 per cent.
United Kingdom
According to the Office of National Statistics’ most recent estimate, the UK economy grew by 0.7 per cent during the final quarter of 2013 compared with the previous quarter. The
Developments in the International and Euro Area Economy
Nonfarm Payrolls in Thousands (Lhs)
Unemployment Rate (Rhs)
Source: Bureau of Labor Statistics, US Department of Labor.
Chart 8: US Labour Market
2008 2009 2010 2011 2012 2013
Mar
May Ju
lSe
pN
ov Mar
May Ju
lSe
pN
ov Mar
May Ju
lSe
pN
ov Mar
May Ju
lSe
pN
ov Mar
May Ju
lSe
pN
ov Mar
May Ju
lSe
pN
ov
-1000
-800
-600
-400
-200
0
200
400
600
0
2
4
6
8
10
12
Jan
Jan
Jan
Jan
Jan
Jan
Jan
‘14
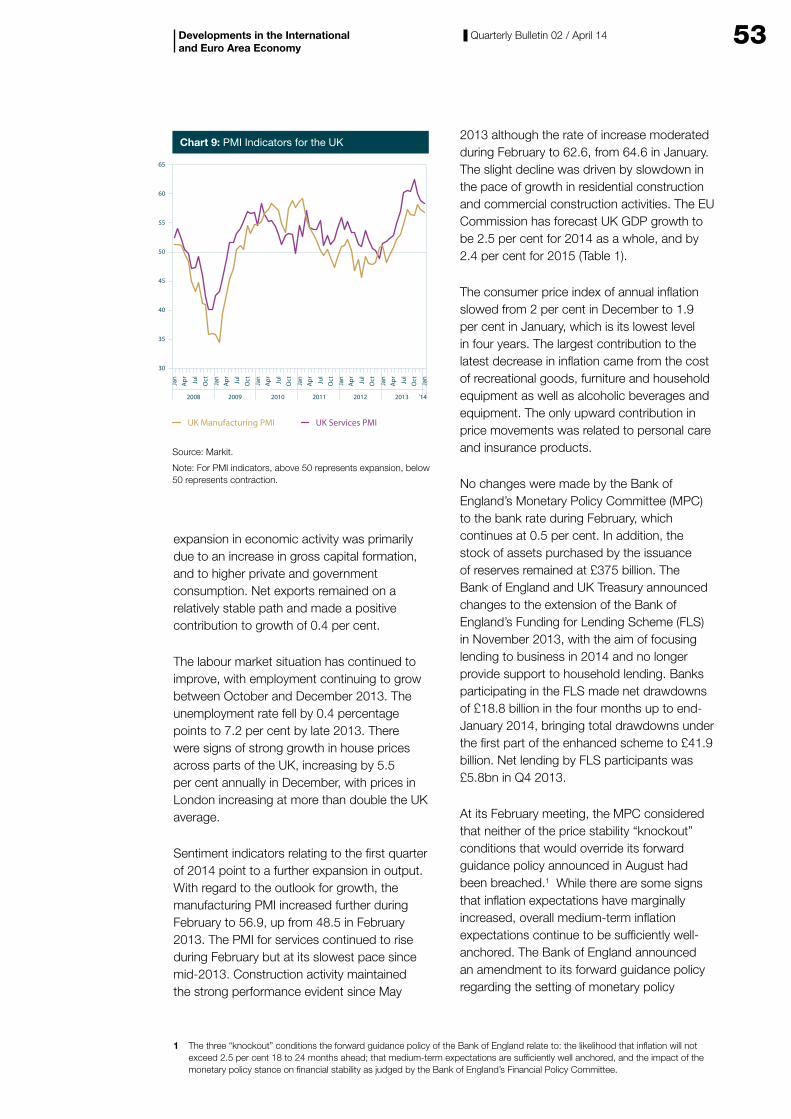
53Quarterly Bulletin 02 / April 14
expansion in economic activity was primarily due to an increase in gross capital formation, and to higher private and government consumption. Net exports remained on a relatively stable path and made a positive contribution to growth of 0.4 per cent.
The labour market situation has continued to improve, with employment continuing to grow between October and December 2013. The unemployment rate fell by 0.4 percentage points to 7.2 per cent by late 2013. There were signs of strong growth in house prices across parts of the UK, increasing by 5.5 per cent annually in December, with prices in London increasing at more than double the UK average.
Sentiment indicators relating to the first quarter of 2014 point to a further expansion in output. With regard to the outlook for growth, the manufacturing PMI increased further during February to 56.9, up from 48.5 in February 2013. The PMI for services continued to rise during February but at its slowest pace since mid-2013. Construction activity maintained the strong performance evident since May
2013 although the rate of increase moderated during February to 62.6, from 64.6 in January. The slight decline was driven by slowdown in the pace of growth in residential construction and commercial construction activities. The EU Commission has forecast UK GDP growth to be 2.5 per cent for 2014 as a whole, and by 2.4 per cent for 2015 (Table 1).
The consumer price index of annual inflation slowed from 2 per cent in December to 1.9 per cent in January, which is its lowest level in four years. The largest contribution to the latest decrease in inflation came from the cost of recreational goods, furniture and household equipment as well as alcoholic beverages and equipment. The only upward contribution in price movements was related to personal care and insurance products.
No changes were made by the Bank of England’s Monetary Policy Committee (MPC) to the bank rate during February, which continues at 0.5 per cent. In addition, the stock of assets purchased by the issuance of reserves remained at £375 billion. The Bank of England and UK Treasury announced changes to the extension of the Bank of England’s Funding for Lending Scheme (FLS) in November 2013, with the aim of focusing lending to business in 2014 and no longer provide support to household lending. Banks participating in the FLS made net drawdowns of £18.8 billion in the four months up to end-January 2014, bringing total drawdowns under the first part of the enhanced scheme to £41.9 billion. Net lending by FLS participants was £5.8bn in Q4 2013.
At its February meeting, the MPC considered that neither of the price stability “knockout” conditions that would override its forward guidance policy announced in August had been breached.1 While there are some signs that inflation expectations have marginally increased, overall medium-term inflation expectations continue to be sufficiently well-anchored. The Bank of England announced an amendment to its forward guidance policy regarding the setting of monetary policy
Developments in the International and Euro Area Economy
1 The three “knockout” conditions the forward guidance policy of the Bank of England relate to: the likelihood that inflation will not exceed 2.5 per cent 18 to 24 months ahead; that medium-term expectations are sufficiently well anchored, and the impact of the monetary policy stance on financial stability as judged by the Bank of England’s Financial Policy Committee.
Chart 9: PMI Indicators for the UK
UK Manufacturing PMI UK Services PMI
Source: Markit.
Note: For PMI indicators, above 50 represents expansion, below50 represents contraction.
2008 2009 2010 2011 2012 2013
Apr Ju
l
Oct
Apr Ju
l
Oct
Apr Ju
l
Oct
Apr Ju
l
Oct
Apr Ju
l
Oct
Apr Ju
l
Oct
30
35
40
45
50
55
60
65Ja
n
Jan
Jan
Jan
Jan
Jan
Jan
‘14
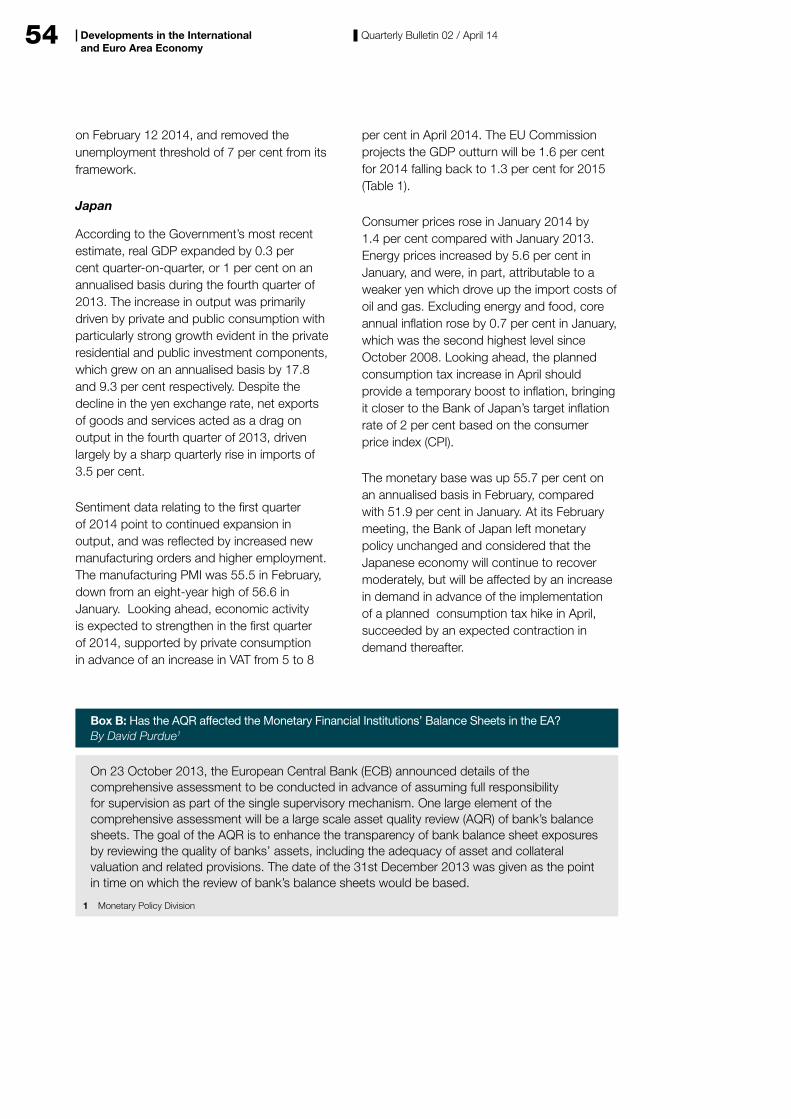
54 Quarterly Bulletin 02 / April 14Developments in the International and Euro Area Economy
on February 12 2014, and removed the unemployment threshold of 7 per cent from its framework.
Japan
According to the Government’s most recent estimate, real GDP expanded by 0.3 per cent quarter-on-quarter, or 1 per cent on an annualised basis during the fourth quarter of 2013. The increase in output was primarily driven by private and public consumption with particularly strong growth evident in the private residential and public investment components, which grew on an annualised basis by 17.8 and 9.3 per cent respectively. Despite the decline in the yen exchange rate, net exports of goods and services acted as a drag on output in the fourth quarter of 2013, driven largely by a sharp quarterly rise in imports of 3.5 per cent.
Sentiment data relating to the first quarter of 2014 point to continued expansion in output, and was reflected by increased new manufacturing orders and higher employment. The manufacturing PMI was 55.5 in February, down from an eight-year high of 56.6 in January. Looking ahead, economic activity is expected to strengthen in the first quarter of 2014, supported by private consumption in advance of an increase in VAT from 5 to 8
per cent in April 2014. The EU Commission projects the GDP outturn will be 1.6 per cent for 2014 falling back to 1.3 per cent for 2015 (Table 1).
Consumer prices rose in January 2014 by 1.4 per cent compared with January 2013. Energy prices increased by 5.6 per cent in January, and were, in part, attributable to a weaker yen which drove up the import costs of oil and gas. Excluding energy and food, core annual inflation rose by 0.7 per cent in January, which was the second highest level since October 2008. Looking ahead, the planned consumption tax increase in April should provide a temporary boost to inflation, bringing it closer to the Bank of Japan’s target inflation rate of 2 per cent based on the consumer price index (CPI).
The monetary base was up 55.7 per cent on an annualised basis in February, compared with 51.9 per cent in January. At its February meeting, the Bank of Japan left monetary policy unchanged and considered that the Japanese economy will continue to recover moderately, but will be affected by an increase in demand in advance of the implementation of a planned consumption tax hike in April, succeeded by an expected contraction in demand thereafter.
Box B: Has the AQR affected the Monetary Financial Institutions’ Balance Sheets in the EA? By David Purdue1
On 23 October 2013, the European Central Bank (ECB) announced details of the comprehensive assessment to be conducted in advance of assuming full responsibility for supervision as part of the single supervisory mechanism. One large element of the comprehensive assessment will be a large scale asset quality review (AQR) of bank’s balance sheets. The goal of the AQR is to enhance the transparency of bank balance sheet exposures by reviewing the quality of banks’ assets, including the adequacy of asset and collateral valuation and related provisions. The date of the 31st December 2013 was given as the point in time on which the review of bank’s balance sheets would be based.
1 Monetary Policy Division
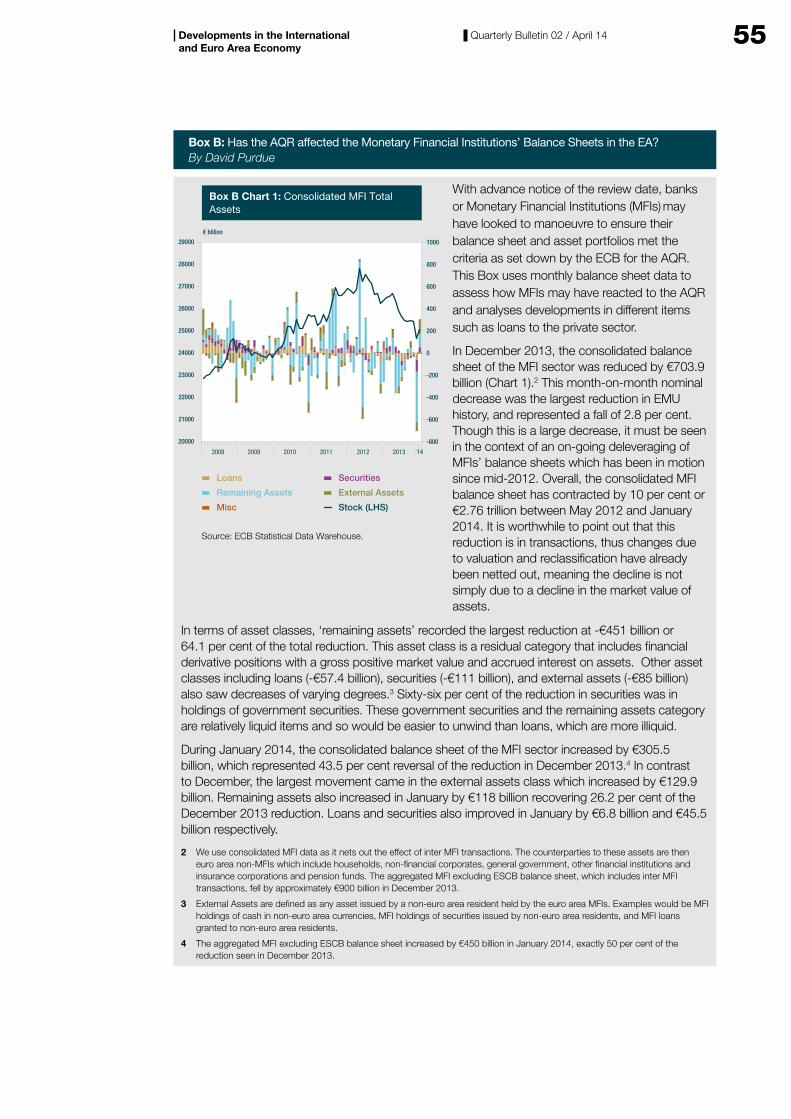
55Quarterly Bulletin 02 / April 14Developments in the International and Euro Area Economy
Box B: Has the AQR affected the Monetary Financial Institutions’ Balance Sheets in the EA? By David Purdue
Loans Securities
Remaining Assets
Misc
External Assets
Stock (LHS)
2008 2009 2010 2011 2012 2013
20000
21000
22000
23000
24000
25000
26000
27000
28000
29000
€ billion
‘14
Box B Chart 1: Consolidated MFI TotalAssets
Source: ECB Statistical Data Warehouse.
-800
-600
-400
-200
0
200
400
600
800
1000
With advance notice of the review date, banks or Monetary Financial Institutions (MFIs) may have looked to manoeuvre to ensure their balance sheet and asset portfolios met the criteria as set down by the ECB for the AQR. This Box uses monthly balance sheet data to assess how MFIs may have reacted to the AQR and analyses developments in different items such as loans to the private sector.
In December 2013, the consolidated balance sheet of the MFI sector was reduced by €703.9 billion (Chart 1).2 This month-on-month nominal decrease was the largest reduction in EMU history, and represented a fall of 2.8 per cent. Though this is a large decrease, it must be seen in the context of an on-going deleveraging of MFIs’ balance sheets which has been in motion since mid-2012. Overall, the consolidated MFI balance sheet has contracted by 10 per cent or €2.76 trillion between May 2012 and January 2014. It is worthwhile to point out that this reduction is in transactions, thus changes due to valuation and reclassification have already been netted out, meaning the decline is not simply due to a decline in the market value of assets.
In terms of asset classes, ‘remaining assets’ recorded the largest reduction at -€451 billion or 64.1 per cent of the total reduction. This asset class is a residual category that includes financial derivative positions with a gross positive market value and accrued interest on assets. Other asset classes including loans (-€57.4 billion), securities (-€111 billion), and external assets (-€85 billion) also saw decreases of varying degrees.3 Sixty-six per cent of the reduction in securities was in holdings of government securities. These government securities and the remaining assets category are relatively liquid items and so would be easier to unwind than loans, which are more illiquid.
During January 2014, the consolidated balance sheet of the MFI sector increased by €305.5 billion, which represented 43.5 per cent reversal of the reduction in December 2013.4 In contrast to December, the largest movement came in the external assets class which increased by €129.9 billion. Remaining assets also increased in January by €118 billion recovering 26.2 per cent of the December 2013 reduction. Loans and securities also improved in January by €6.8 billion and €45.5 billion respectively.
2 We use consolidated MFI data as it nets out the effect of inter MFI transactions. The counterparties to these assets are then euro area non-MFIs which include households, non-financial corporates, general government, other financial institutions and insurance corporations and pension funds. The aggregated MFI excluding ESCB balance sheet, which includes inter MFI transactions, fell by approximately €900 billion in December 2013.
3 External Assets are defined as any asset issued by a non-euro area resident held by the euro area MFIs. Examples would be MFI holdings of cash in non-euro area currencies, MFI holdings of securities issued by non-euro area residents, and MFI loans granted to non-euro area residents.
4 The aggregated MFI excluding ESCB balance sheet increased by €450 billion in January 2014, exactly 50 per cent of the reduction seen in December 2013.
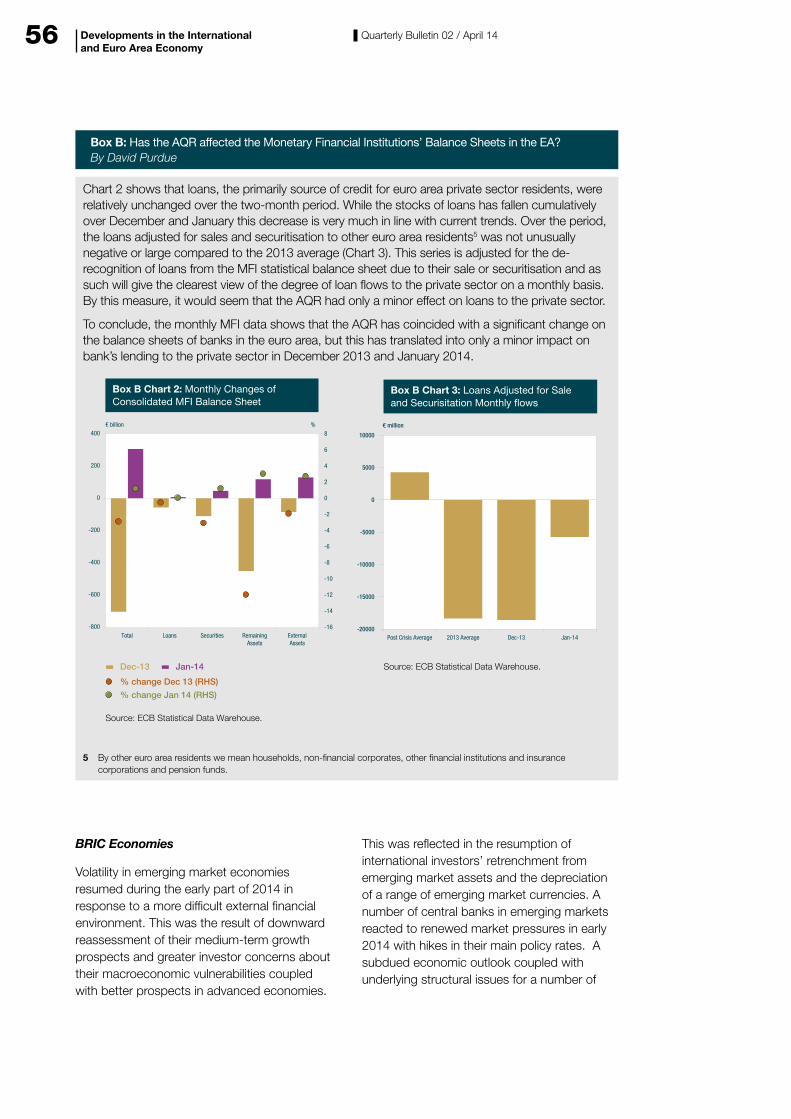
56 Quarterly Bulletin 02 / April 14Developments in the International and Euro Area Economy
BRIC Economies
Volatility in emerging market economies resumed during the early part of 2014 in response to a more difficult external financial environment. This was the result of downward reassessment of their medium-term growth prospects and greater investor concerns about their macroeconomic vulnerabilities coupled with better prospects in advanced economies.
This was reflected in the resumption of international investors’ retrenchment from emerging market assets and the depreciation of a range of emerging market currencies. A number of central banks in emerging markets reacted to renewed market pressures in early 2014 with hikes in their main policy rates. A subdued economic outlook coupled with underlying structural issues for a number of
Box B: Has the AQR affected the Monetary Financial Institutions’ Balance Sheets in the EA? By David Purdue
Chart 2 shows that loans, the primarily source of credit for euro area private sector residents, were relatively unchanged over the two-month period. While the stocks of loans has fallen cumulatively over December and January this decrease is very much in line with current trends. Over the period, the loans adjusted for sales and securitisation to other euro area residents5 was not unusually negative or large compared to the 2013 average (Chart 3). This series is adjusted for the de-recognition of loans from the MFI statistical balance sheet due to their sale or securitisation and as such will give the clearest view of the degree of loan flows to the private sector on a monthly basis. By this measure, it would seem that the AQR had only a minor effect on loans to the private sector.
To conclude, the monthly MFI data shows that the AQR has coincided with a significant change on the balance sheets of banks in the euro area, but this has translated into only a minor impact on bank’s lending to the private sector in December 2013 and January 2014.
Dec-13 Jan-14
% change Dec 13 (RHS)
% change Jan 14 (RHS)
€ billion %
Box B Chart 2: Monthly Changes ofConsolidated MFI Balance Sheet
Source: ECB Statistical Data Warehouse.
-800
-600
-400
-200
0
200
400
ExternalAssets
RemainingAssets
SecuritiesLoansTotal-16
-14
-12
-10
-8
-6
-4
-2
0
2
4
6
8
-20000
-15000
-10000
-5000
0
5000
10000
€ million
Jan-14Dec-132013 AveragePost Crisis Average
Box B Chart 3: Loans Adjusted for Saleand Securisitation Monthly ows
Source: ECB Statistical Data Warehouse.
5 By other euro area residents we mean households, non-financial corporates, other financial institutions and insurance corporations and pension funds.
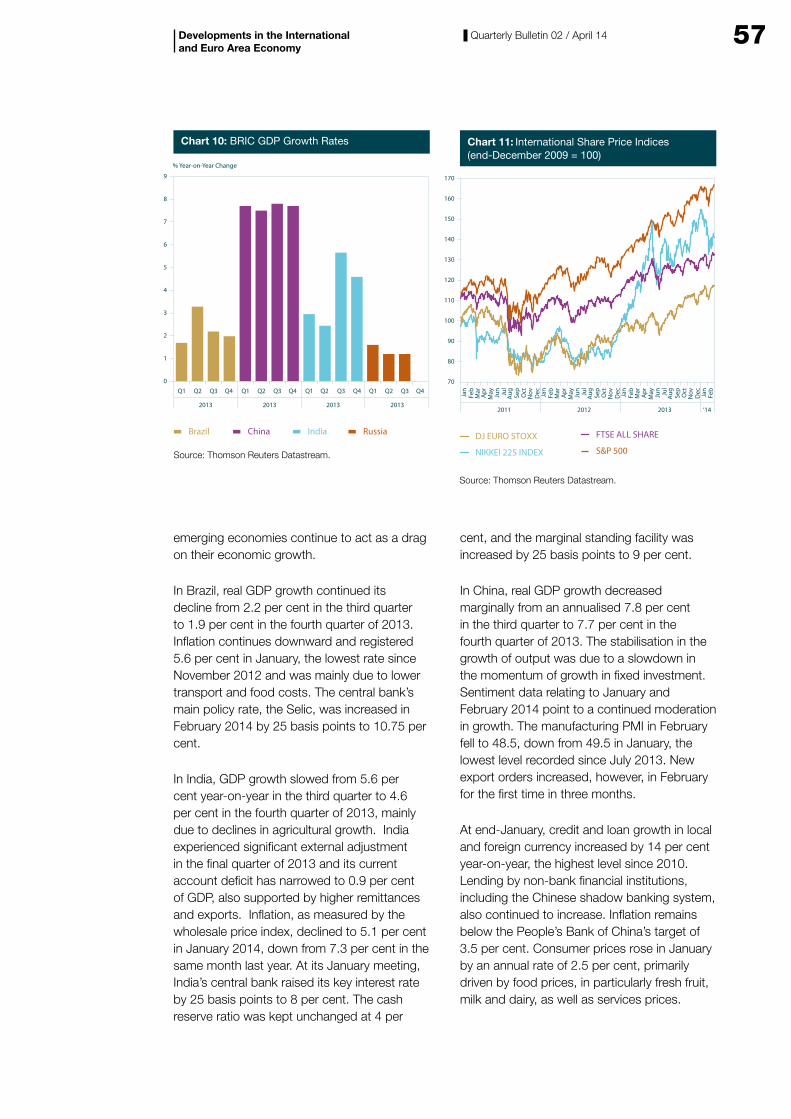
57Quarterly Bulletin 02 / April 14Developments in the International and Euro Area Economy
emerging economies continue to act as a drag on their economic growth.
In Brazil, real GDP growth continued its decline from 2.2 per cent in the third quarter to 1.9 per cent in the fourth quarter of 2013. Inflation continues downward and registered 5.6 per cent in January, the lowest rate since November 2012 and was mainly due to lower transport and food costs. The central bank’s main policy rate, the Selic, was increased in February 2014 by 25 basis points to 10.75 per cent.
In India, GDP growth slowed from 5.6 per cent year-on-year in the third quarter to 4.6 per cent in the fourth quarter of 2013, mainly due to declines in agricultural growth. India experienced significant external adjustment in the final quarter of 2013 and its current account deficit has narrowed to 0.9 per cent of GDP, also supported by higher remittances and exports. Inflation, as measured by the wholesale price index, declined to 5.1 per cent in January 2014, down from 7.3 per cent in the same month last year. At its January meeting, India’s central bank raised its key interest rate by 25 basis points to 8 per cent. The cash reserve ratio was kept unchanged at 4 per
cent, and the marginal standing facility was increased by 25 basis points to 9 per cent.
In China, real GDP growth decreased marginally from an annualised 7.8 per cent in the third quarter to 7.7 per cent in the fourth quarter of 2013. The stabilisation in the growth of output was due to a slowdown in the momentum of growth in fixed investment. Sentiment data relating to January and February 2014 point to a continued moderation in growth. The manufacturing PMI in February fell to 48.5, down from 49.5 in January, the lowest level recorded since July 2013. New export orders increased, however, in February for the first time in three months.
At end-January, credit and loan growth in local and foreign currency increased by 14 per cent year-on-year, the highest level since 2010. Lending by non-bank financial institutions, including the Chinese shadow banking system, also continued to increase. Inflation remains below the People’s Bank of China’s target of 3.5 per cent. Consumer prices rose in January by an annual rate of 2.5 per cent, primarily driven by food prices, in particularly fresh fruit, milk and dairy, as well as services prices.
Brazil China India Russia
% Year-on-Year Change
Chart 10: BRIC GDP Growth Rates
Source: Thomson Reuters Datastream.
Q4 Q3Q2Q1Q4Q3Q2 Q1Q4 Q3Q2Q1Q4 Q3Q2Q1
2013 20132013 2013
0
1
2
3
4
5
6
7
8
9
Chart 11: International Share Price Indices(end-December 2009 = 100)
DJ EURO STOXX FTSE ALL SHARE
NIKKEI 225 INDEX S&P 500
Source: Thomson Reuters Datastream.
Jan
Feb
Mar
Apr Jun
May Ju
lA
ug Sep
Oct
Nov Dec Jan
Feb
Mar
Apr Jun
May Ju
lA
ug Sep
Oct
Nov Dec Jan
Feb
Mar
Apr Jun
May Ju
lA
ug Sep
Oct
Nov Dec Jan
Feb
2011 2012 2013 ‘14
70
80
90
100
110
120
130
140
150
160
170
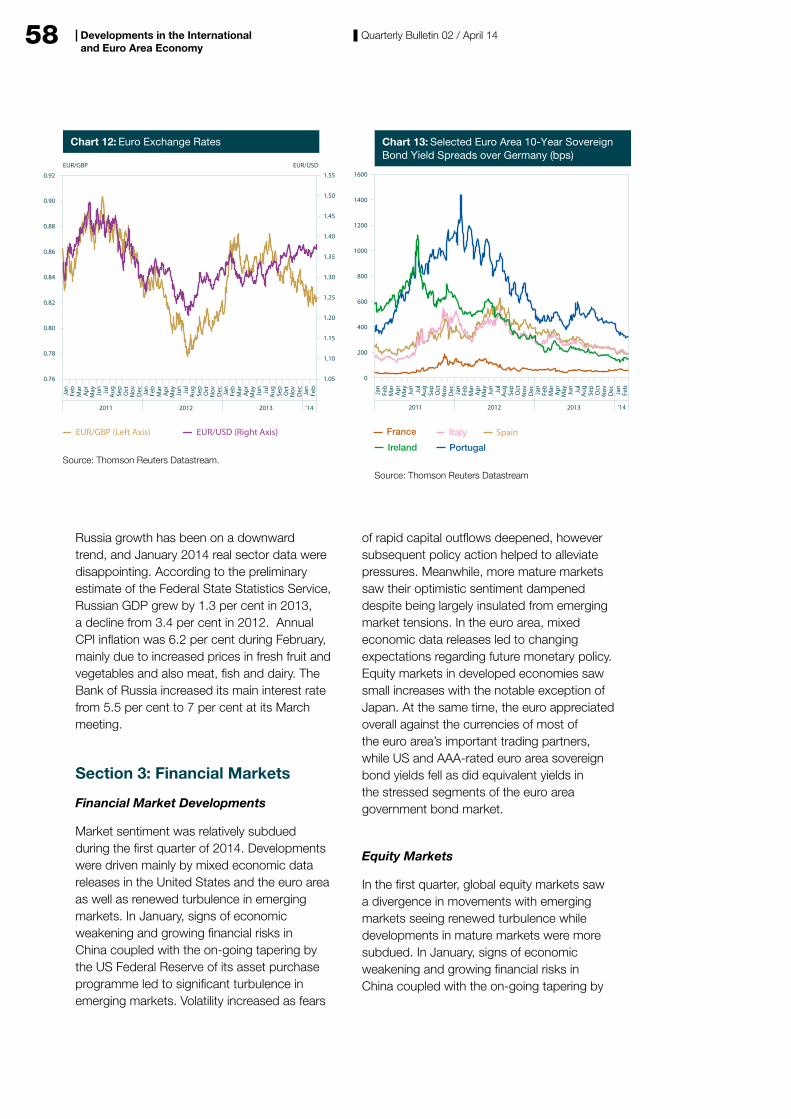
58 Quarterly Bulletin 02 / April 14Developments in the International and Euro Area Economy
Russia growth has been on a downward trend, and January 2014 real sector data were disappointing. According to the preliminary estimate of the Federal State Statistics Service, Russian GDP grew by 1.3 per cent in 2013, a decline from 3.4 per cent in 2012. Annual CPI inflation was 6.2 per cent during February, mainly due to increased prices in fresh fruit and vegetables and also meat, fish and dairy. The Bank of Russia increased its main interest rate from 5.5 per cent to 7 per cent at its March meeting.
Section 3: Financial Markets
Financial Market Developments
Market sentiment was relatively subdued during the first quarter of 2014. Developments were driven mainly by mixed economic data releases in the United States and the euro area as well as renewed turbulence in emerging markets. In January, signs of economic weakening and growing financial risks in China coupled with the on-going tapering by the US Federal Reserve of its asset purchase programme led to significant turbulence in emerging markets. Volatility increased as fears
of rapid capital outflows deepened, however subsequent policy action helped to alleviate pressures. Meanwhile, more mature markets saw their optimistic sentiment dampened despite being largely insulated from emerging market tensions. In the euro area, mixed economic data releases led to changing expectations regarding future monetary policy. Equity markets in developed economies saw small increases with the notable exception of Japan. At the same time, the euro appreciated overall against the currencies of most of the euro area’s important trading partners, while US and AAA-rated euro area sovereign bond yields fell as did equivalent yields in the stressed segments of the euro area government bond market.
Equity Markets
In the first quarter, global equity markets saw a divergence in movements with emerging markets seeing renewed turbulence while developments in mature markets were more subdued. In January, signs of economic weakening and growing financial risks in China coupled with the on-going tapering by
EUR/GBP (Left Axis) EUR/USD (Right Axis)
Source: Thomson Reuters Datastream.
Chart 12: Euro Exchange Rates
EUR/GBP EUR/USD
2011 2012 2013 ‘14
Jan
Feb
Mar
Apr Jun
May Ju
lA
ug Sep
Oct
Nov Dec Jan
Feb
Mar
Apr Jun
May Ju
lA
ug Sep
Oct
Nov Dec Jan
Feb
Mar
Apr Jun
May Ju
lA
ug Sep
Oct
Nov Dec Jan
Feb
0.76
0.78
0.80
0.82
0.84
0.86
0.88
0.90
0.92
1.05
1.10
1.15
1.20
1.25
1.30
1.35
1.40
1.45
1.50
1.55
SpainItalyFrance
PortugalIreland
Source: Thomson Reuters Datastream
Chart 13: Selected Euro Area 10-Year SovereignBond Yield Spreads over Germany (bps)
2011 2012 2013 ‘14
Jan
Feb
Mar
Apr Jun
May Ju
lA
ug Sep
Oct
Nov Dec Jan
Feb
Mar
Apr Jun
May Ju
lA
ug Sep
Oct
Nov Dec Jan
Feb
Mar
Apr Jun
May Ju
lA
ug Sep
Oct
Nov Dec Jan
Feb
0
200
400
600
800
1000
1200
1400
1600
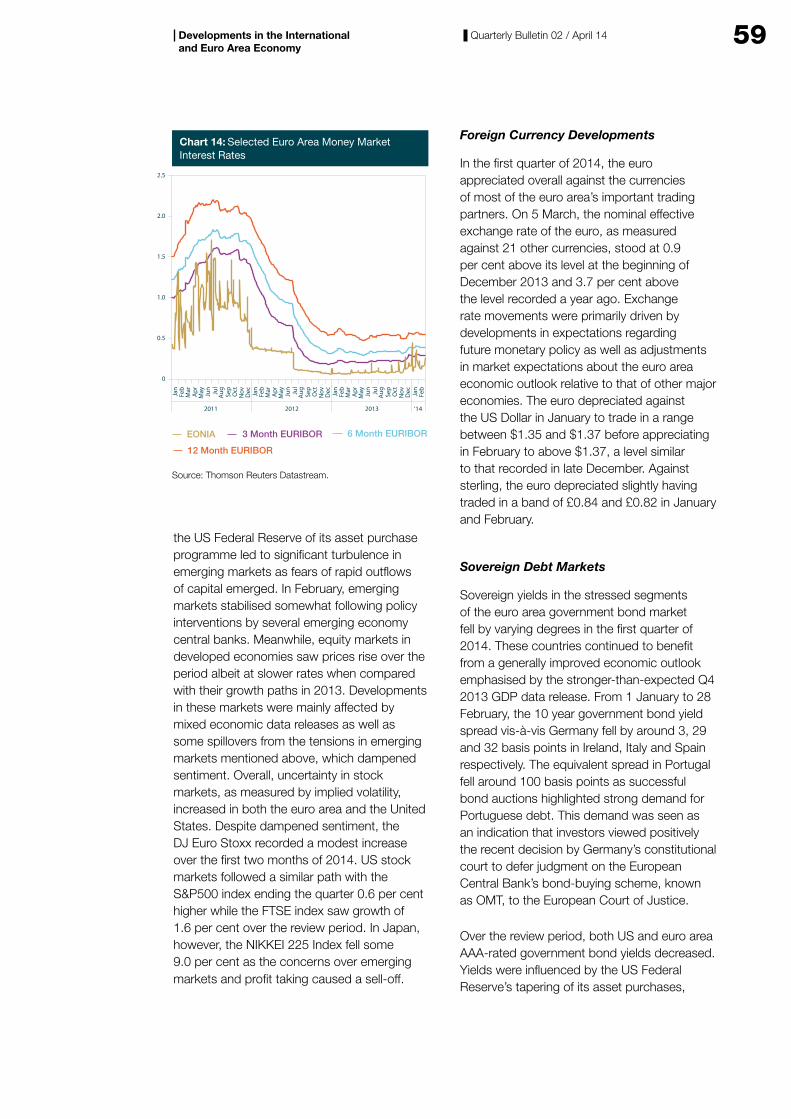
59Quarterly Bulletin 02 / April 14
the US Federal Reserve of its asset purchase programme led to significant turbulence in emerging markets as fears of rapid outflows of capital emerged. In February, emerging markets stabilised somewhat following policy interventions by several emerging economy central banks. Meanwhile, equity markets in developed economies saw prices rise over the period albeit at slower rates when compared with their growth paths in 2013. Developments in these markets were mainly affected by mixed economic data releases as well as some spillovers from the tensions in emerging markets mentioned above, which dampened sentiment. Overall, uncertainty in stock markets, as measured by implied volatility, increased in both the euro area and the United States. Despite dampened sentiment, the DJ Euro Stoxx recorded a modest increase over the first two months of 2014. US stock markets followed a similar path with the S&P500 index ending the quarter 0.6 per cent higher while the FTSE index saw growth of 1.6 per cent over the review period. In Japan, however, the NIKKEI 225 Index fell some 9.0 per cent as the concerns over emerging markets and profit taking caused a sell-off.
Foreign Currency Developments
In the first quarter of 2014, the euro appreciated overall against the currencies of most of the euro area’s important trading partners. On 5 March, the nominal effective exchange rate of the euro, as measured against 21 other currencies, stood at 0.9 per cent above its level at the beginning of December 2013 and 3.7 per cent above the level recorded a year ago. Exchange rate movements were primarily driven by developments in expectations regarding future monetary policy as well as adjustments in market expectations about the euro area economic outlook relative to that of other major economies. The euro depreciated against the US Dollar in January to trade in a range between $1.35 and $1.37 before appreciating in February to above $1.37, a level similar to that recorded in late December. Against sterling, the euro depreciated slightly having traded in a band of £0.84 and £0.82 in January and February.
Sovereign Debt Markets
Sovereign yields in the stressed segments of the euro area government bond market fell by varying degrees in the first quarter of 2014. These countries continued to benefit from a generally improved economic outlook emphasised by the stronger-than-expected Q4 2013 GDP data release. From 1 January to 28 February, the 10 year government bond yield spread vis-à-vis Germany fell by around 3, 29 and 32 basis points in Ireland, Italy and Spain respectively. The equivalent spread in Portugal fell around 100 basis points as successful bond auctions highlighted strong demand for Portuguese debt. This demand was seen as an indication that investors viewed positively the recent decision by Germany’s constitutional court to defer judgment on the European Central Bank’s bond-buying scheme, known as OMT, to the European Court of Justice.
Over the review period, both US and euro area AAA-rated government bond yields decreased. Yields were influenced by the US Federal Reserve’s tapering of its asset purchases,
Developments in the International and Euro Area Economy
Chart 14: Selected Euro Area Money MarketInterest Rates
12 Month EURIBOR
6 Month EURIBOR3 Month EURIBOREONIA
Source: Thomson Reuters Datastream.
2011 2012 2013 ‘14
Jan
Feb
Mar
Apr Jun
May Ju
lA
ug Sep
Oct
Nov Dec Jan
Feb
Mar
Apr Jun
May Ju
lA
ug Sep
Oct
Nov Dec Jan
Feb
Mar
Apr Jun
May Ju
lA
ug Sep
Oct
Nov Dec Jan
Feb
0
0.5
1.0
1.5
2.0
2.5
60 Quarterly Bulletin 02 / April 14Developments in the International and Euro Area Economy
mixed economic data releases for the global economy and the turbulence in emerging markets. The uncertainty in emerging markets led to safe haven flows into higher rated securities on both sides of the Atlantic, thus depressing yields. For example, the 10-year German government bond yield fell by around 30 basis points across January and February while US yields fell by similar amounts.
Money Markets
In January and February 2014, short-term money market interest rates increased slightly and were relatively volatile against the background of lower levels of excess liquidity. In the period 2 January to 28 February 2014, EONIA, the unsecured overnight money market interest rate rose by 10 basis points. The one-month EURIBOR interest rate rose slightly in the period with longer-term rates remaining broadly unchanged. The increased volatility seen in EONIA during the middle of January can be attributed to low excess liquidity coupled with the frontloading of liquidity by some market participants to meet their reserve requirements early in the first maintenance period of 2014.

61Quarterly Bulletin 02 / April 14
The articles in this section are in the series of signed articles on monetary and general economic topics introduced in the autumn 1969 issue of the Bank’s Bulletin. Any views expressed in these articles are not necessarily those held by the Bank and are the personal responsibility of the author.
Section 2
Signed Articles
62
Analysis of Recent Monetary Operations & Financial Market DevelopmentsBrian Gallagher and Paul Johnston, Financial Markets Division1
Abstract
In 2013, developments in the European periphery and emerging markets remained a focus for market participants. Meanwhile, monetary policy announcements by the key central banks continued to be a driver of financial market developments. In this article we review 2013 and early 2014, examining the main changes to the ECB’s operational framework and the evolution of Eurosystem lending, particularly the Early Repayment Operations (EROs) relating to the two 3-year Longer Term Refinancing Operations (LTROs). The article studies the use of the ECB’s standing facilities, while it also reports on the improvements in money markets over the review period. Finally, we also examine the Irish sovereign’s on-going return to debt markets before briefly analysing changes in TARGET2 balances over 2013.
1 The authors would like to acknowledge, with thanks, the helpful comments and suggestions of John Rowe, Thomas Brophy, John Nash and other colleagues in the Financial Markets Division of the Central Bank of Ireland.
63Quarterly Bulletin 02 / April 14Analysis of Recent Monetary Operations & Financial Market Developments
Overview
Financial markets remained volatile in 2013 with policy announcements by central banks among the key drivers, while the European periphery and emerging markets were also in focus. In early 2013, market sentiment was positive following a political agreement in the US which averted the “fiscal cliff”. Market conditions worsened in the first quarter and the beginning of the second quarter, amid signs of a potential re-emergence of euro area risks, partly related to developments in Cyprus; however, market contagion was limited with improving sentiment towards the periphery making it more resilient to shocks. Market sentiment remained generally positive towards the periphery throughout 2013 and improved demand for peripheral debt led to a significant tightening towards the core, amid rising safe haven bond yields. Risk appetite deteriorated sharply in late May, amid concerns that the Fed would consider “tapering” its bond purchase programme, with emerging markets in particular experiencing a significant sell off around this time. Speculation around the reduction of the Fed asset purchase programme remained a significant driver of markets for the remainder of the year. However equity markets were generally stronger in 2013, with a number of indices, including the FTSE and S&P 500, hitting record highs in late 2013 and early 2014. Meanwhile, Asian markets benefitted from the Bank of Japan’s (BOJ) expansionary policy, with the central bank announcing that it would conduct money market operations so that the monetary base would increase at an annual pace of about 60-70 trillion yen to end 2014.
At the beginning of 2013 European peripheral bond yields tightened to German bond yields, continuing a trend that began in mid-2012. However, by the end of Q1 2013, peripheral bond yields had risen sharply following comments suggesting that the bailout in Cyprus would form the template for any subsequent bailouts of Eurozone economies, wherein depositors and bond holders would take losses. Prior to these comments, the other peripheral countries had experienced a very limited impact from the crisis in Cyprus. Tensions briefly eased after ECB President Draghi insisted that the bailout would not form the basis of any future funding programmes. However, a number of weak data releases and low inflation expectations resulted in the ECB reducing its
main policy rate to a record low of 0.5% at the May Governing Council meeting.
Political tensions in Italy and Portugal sparked sharp rises in these countries' bond yields, after the coalition governments in both countries came under pressure following some high profile resignations. Other peripheral bond yields remained largely unaffected, suggesting that the periphery was becoming more resilient to shocks and less prone to contagion effects.
Expectations for a reduction of the Fed’s asset purchase programme arose following a series of strong economic data releases from the US in the first half of 2013, although most analysts did not expect such a move to take place until Q1 2014. At the Federal Open Market Committee (FOMC) meeting on 22 May, Fed Chairman Ben Bernanke suggested that should the economic recovery in the US continue the Fed could begin to reduce its bond purchases in the next few meetings. Following Mr Bernanke’s comments, most analysts adjusted their expectations, with a majority believing that tapering would begin by September 2013. The announcement led to a broad based sell off in financial markets, amid a sharp decline in investor sentiment. The Fed maintained this stance at subsequent meetings and as a result positive data releases had at times an adverse effect on market sentiment throughout the rest of the year.
Emerging markets in particular experienced a significant sell-off with the MSCI Emerging Market Equity Index losing 10% of its value in the period from the initial speculation of Fed tapering (22 May) to the end of June. The escalating civil war in Syria exacerbated the situation for emerging markets, pushing commodity prices higher, with oil prices in particular rising sharply. In countries such as Brazil, Indonesia, Turkey and India, equity markets sold off, bond yields rose significantly and currencies fell sharply.
In contrast, bond yields in peripheral Europe remained more stable, although euro area money market rates began to rise in line with increasing US rates. At the Governing Council meeting on 4 July, the ECB introduced forward guidance and committed to keeping interest rates “at present or lower levels for an extended period of time”.
64 Quarterly Bulletin 02 / April 14Analysis of Recent Monetary Operations & Financial Market Developments
In August, the Bank of England also introduced forward guidance, with the Monetary Policy Committee (MPC) stating that it did not intend to raise the policy rate from the current 0.5% at least until the unemployment rate had fallen to a threshold of 7%, subject to inflation and economic growth remaining in line with the Bank of England’s projections. As data on the UK economy improved throughout 2013, including a fall in the unemployment rate to 7.1% in December, speculation increased that the Bank of England would raise interest rates. However, the MPC decided to maintain interest rates at subsequent meetings, and updated forward guidance to focus on a broader range of economic measures.
In September, the Fed surprised markets again by maintaining bond purchases at $85bn a month, in contrast to market expectations of a reduction of between $5bn and $15bn a month. The Fed argued that more evidence of lasting improvement in the economy was required, particularly in the labour market, to justify a reduction. In its statement the Fed sought to ease concerns around the tapering of bond purchases through enhanced forward guidance, stating that interest rates would not rise until the jobless rate was “considerably below” 6.5%. Market sentiment improved in the wake of the announcement, however the rally was short lived following the release of more “hawkish” than expected minutes from the FOMC and a shift in market focus to the US government shutdown and debt ceiling negotiations. The Fed ultimately began to taper its bond purchase programme in December, committing to reduce the programme by $10bn to $75bn a month, noting that reductions would continue at a steady rate at subsequent FOMC meetings but reiterating that rates would remain low, even after the end of the bond purchase programme. Market reaction to the announcement was relatively muted with a number of analysts suggesting that the reduction had been priced in by markets, while the small size of the cut and the continued accommodative policy also helped to calm markets.
Money market volatility in the second half of the year resulted in increased speculation that the ECB would introduce further non-standard measures, after President Draghi said the ECB would use “all available tools”, including
a possible new VLTRO. In November the ECB cut the policy rate to a new low of 0.25% and maintained the deposit rate at 0.0%, narrowing the monetary policy corridor. The cuts came after the release of data which showed that euro area inflation had fallen to 0.7%. As low inflation readings continued in subsequent releases there was increased market speculation that the ECB may adopt a negative deposit rate or implement new non-standard measures such as adopting a “Funding for Lending” type scheme or suspending the liquidity sterilisation operation in relation to the Eurosystem Securities Market Programme (SMP) holdings.
Money market rates continued to be volatile towards year end, with EONIA rising above the ECB’s main policy rate. The ECB’s SMP sterilisation operations failed to fully absorb the intended amount on a number of occasions in December, as excess liquidity in the Eurozone fell throughout the final quarter of the year. Declining Eurosystem borrowings in 2013, in part due to repayments from the 3-year LTROs beginning in January of that year, reduced the level of excess liquidity and put upward pressure on money market rates.
Money market rates fell and volatility eased following the 2013 year-end period as excess liquidity stabilised and market participants started to price in some further easing measures by the ECB. Strong economic data releases, in particular improved peripheral manufacturing data, were highlighted by President Draghi as a sign that many euro area economies were recovering. As a result, the periphery in particular benefitted, with analysts reporting a shift from euro area core to peripheral debt as investor risk appetite improved.
Through the end of 2013 and into early 2014, peripheral bond yields declined and generally outperformed core bond yields with Irish, Italian and Spanish 10-year spreads to Germany tightening. Italian and Spanish 10-year yields fell below 4% at the beginning of 2014, hitting 8-month and two and a half year lows respectively. Irish bond yields decoupled somewhat from these countries, ending the year with yields 30-64bps lower than Spain across the curve and 24-61bps below Italian bonds.
65Quarterly Bulletin 02 / April 14
Market sentiment towards Ireland was further improved towards year end as it was announced that Ireland would become the first European economy to leave its external funding programme and would not be seeking a precautionary credit line. There was further positive news for Ireland when rating agency Moody’s upgraded Irish sovereign debt by one notch to investment grade (Baa3) in January 2014, citing the growth potential of the economy as the main rationale for the upgrade.
Also in January 2014, Ireland returned to the debt markets for the first time since the exit from the funding programme, selling €3.75bn of a new 10-year bond. Demand was strong with investors bidding more than €14bn for the bond and investor interest was reportedly very broad. Following the issuance, Irish sovereign yields were lower across the curve with the 10-year yield 10bps lower at the close of business.
In Section 1 of this paper, we give an overview of the ECB’s key monetary policy decisions over 2013 and Q1 2014. Section 2 discusses money market developments over the same period, while Section 3 looks at overall trends in Eurosytem lending and the use of the ECB’s standing facilities. In Section 4 we examine developments in Ireland with regard to Eurosystem lending as well as the Sovereign and domestic banks return to debt markets. Section 5 reviews movements in TARGET2 balances over 2013 and finally Section 6 gives an outlook for 2014.
1 ECB’s Key Policy Decisions in 2013 & Q1 2014
In 2013 monetary policy announcements by key central banks were a major focus for market participants. In the euro area declining levels of excess liquidity, concerns over low levels of inflation and higher EONIA fixings towards year end, sparked speculation that the ECB may introduce further non-standard measures. Political uncertainty and weak growth in some European economies threatened to adversely affect the recovery in the euro area, while inflation figures significantly below the ECB’s objective resulted in interest rate cuts and increased anticipation of non-standard measures.
The following section summarises some of the measures introduced by the ECB throughout 2013 and early 2014.
On 22 March, the Governing Council adopted Decision ECB/2013/6, which prevents, as of 1 March 2015, the use as collateral in Eurosystem monetary policy operations of uncovered government-guaranteed bank bonds that have been issued by the counterparty itself or an entity closely linked to that counterparty.
On 2 May, the Governing Council reduced the main refinancing operation (MRO) rate by 25bps to 0.5%, and narrowed the interest rate corridor when it cut the marginal lending facility rate by 50bps to 1.00%. The deposit facility rate remained unchanged at 0.0%. In addition the Governing Council decided to continue its main refinancing operation and the maintenance period and 3-month longer-term refinancing operations as fixed rate tender procedures with full allotment as long as necessary and at least until the end of the second quarter of 2014. These decisions were consistent with low underlying price pressures over the medium term and weak economic sentiment.
On 4 July, President Draghi announced that the Governing Council expected key rates to remain at “present or lower levels for an extended period of time”.
On 18 July, the Governing Council decided to further strengthen its risk control framework, by adjusting the eligibility criteria and haircuts applied to collateral accepted in Eurosystem monetary policy operations and adopting certain additional measures to improve the overall consistency of the framework and its practical implementation. The Governing Council decided in particular to:
• Update the haircuts for marketable and non-marketable instruments;
• Adjust the risk control measures for retained covered bonds;
• Replace the current requirement of two ‘triple A’ ratings with the requirement of two ‘single A’ ratings for the six classes of asset-
Analysis of Recent Monetary Operations & Financial Market Developments
66 Quarterly Bulletin 02 / April 14
backed securities (ABSs) subject to loan level reporting requirements;
• Reduce the haircuts applicable to eligible ABS under the permanent and temporary Eurosystem collateral framework.
In addition, the Governing Council adjusted the eligibility criteria and haircuts applied by National Central Banks (NCBs) to pools of credit claims and certain types of the additional credit claims (ACC) eligible under the temporary Eurosystem collateral framework.
These measures entered into force on 1 October.
On 5 September, President Draghi confirmed that the monetary policy stance would “remain accommodative for as long as necessary, in line with the forward guidance provided in July.”
On 9 September, the Governing Council decided to enhance the loan-level reporting requirements for residential mortgage-backed securities (RMBS), and ABSs backed by loans to small and medium-sized enterprises that are used as collateral in monetary policy operations. As of 16 October 2013, the Eurosystem may temporarily accept as eligible collateral non-compliant residential mortgage-backed securities (RMBS) and ABSs backed by small to medium sized enterprises on a case-by-case basis and subject to the provision of adequate explanations about the reason for the failure to satisfy the 3 January 2013 deadline. For each adequate explanation the Eurosystem will specify a maximum tolerance level and a tolerance horizon. The tolerance horizon indicates that the ABS data quality must improve within the specified time period.
On 16 September, the Governing Council decided, in agreement with the Bank of England, to extend the liquidity swap arrangement with the Bank of England up to 30 September 2014. The swap facility was established on 17 December 2010 as a precautionary measure.
On 19 September, the Governing Council decided to introduce loan-level reporting
requirements for ABSs backed by credit-card receivables, when these are used as collateral in the Eurosystem’s monetary policy operations. The provision of loan-level information for these instruments is mandatory as of 1 April 2014, with a nine-month phasing-in period.
On 10 October, the ECB and the People’s Bank of China established a bilateral currency swap agreement. Under the agreement, which will be valid for three years, the swap line will have a maximum size of 350 billion Chinese yuan and €45 billion. This swap line will serve as a backstop facility.
On 31 October, the ECB established standing swap arrangements with the Bank of Canada, the Bank of England, the Bank of Japan, the Swiss National Bank and the US Federal Reserve. The temporary bilateral liquidity swap arrangements which existed before this agreement were converted to standing arrangements, allowing for the provision of liquidity in any of the five currencies foreign to that jurisdiction.
On 7 November, the Governing Council reduced the MRO rate by 25bps to 0.25%, and cut the marginal lending facility rate by 25bps to 0.75%. The deposit facility rate remained unchanged at 0.0%. These decisions were in line with the Governing Council’s forward guidance of July 2013 and the diminishing underlying price pressures in the euro area over the medium term.
On 8 November, the Governing Council decided to continue its MROs as fixed rate tender procedures with full allotment for as long as necessary, and at least until the end of the 6th maintenance period of 2015 on 7 July 2015. The Governing Council also decided to conduct the three-month LTROs to be allotted every month from 30 July 2014 to 24 June 2015 as fixed rate tender procedures with full allotment.
On 24 January 2014, the Governing Council, in cooperation with the Bank of England, the Bank of Japan and the Swiss National Bank, decided to gradually reduce the offering of US dollar liquidity-providing operations. The decision was made in view of the considerable
Analysis of Recent Monetary Operations & Financial Market Developments
67Quarterly Bulletin 02 / April 14
improvement in US dollar funding conditions and the low demand for US dollar liquidity-providing operations. Operations with a maturity of three months will continue until 30 April 2014, those with a maturity of one week will continue to be conducted until 31 July 2014. The ECB will continue to assess the need for one-week US dollar operations beyond 31 July 2014, taking into account the fact that the recently established swap lines provide a framework for the reintroduction of US dollar liquidity-providing operations if warranted by market conditions.
2 Money Market Developments
Euro area money markets continued to stabilise over the course of 2013, strongly influenced by accommodative ECB policy decisions, the declining but still relatively high levels of excess liquidity within the euro area and the continued improvement in banks’ overall funding conditions. Rates remained low and broadly stable over the course of the year, reflecting accommodative liquidity conditions despite the decline in the liquidity surplus, while longer maturities have been more volatile, amid some instability in US money market rates and market uncertainty regarding the impact of 3-year LTRO repayments on excess liquidity.
The accommodative policy stance maintained by the ECB in 2013 was perceived to have had a positive effect in easing money market fragmentation. The ECB cut the policy rate twice in 2013, while tightening the monetary policy corridor to the current 0.0% for the Deposit Facility, 0.25% Policy Rate, and 0.75% Marginal Lending Rate. This tightening of the corridor saw EONIA fixing at between 0 and 25bps for most of the year. In addition, the ECB announced forward guidance with an embedded downward bias on policy rates, and extended the fixed rate full allotment policy in its MROs to mid-2015. These measures helped to keep EONIA at historically low levels, averaging 8.9bps over the course of 2013 compared to 23.1bps a year previously.
The liquidity injected by the ECB via the two 3-year LTROs in December 2011 and February 2012 continued to have a stabilising effect on the money market, addressing short to medium term bank refinancing and funding
risks. Liquidity provided through Eurosystem operations peaked at nearly €1.3tn in mid-2012, and remained around €1.2tn through January 2013, when the ECB introduced the opportunity to repay 3-year LTROs through the Early Repayment Operations (EROs).
As banks throughout the Eurosystem began to repay long term funding through the EROs, the level of excess liquidity in the system began to fall. Despite declining levels of excess liquidity, there was little effect seen in interbank markets until November and December, when EONIA rose to an average of circa 14bps, although this was likely due to year-end effects.
EONIA became more volatile in early 2014 as excess liquidity declined by around €40bn on 14 January to a low of €125bn, a level last seen in September 2011. This decline was mainly due to a reduction in ECB borrowing in the prior week. Market commentators suggested the effect of the reduced liquidity was likely amplified as it occurred at the beginning of the reserve period when banks may have been focused on building up reserves to meet their reserve requirement and in turn were less likely to lend in the interbank market. EONIA rose by 20bps to a peak of 36bps on Monday 20 January, before returning to a stable level of around 15bps after banks took additional funding through ECB operations. Notably, there was a failure to fully absorb excess liquidity through the ECB’s SMP-related fine-tuning operations (FTOs) in late 2013 and early 2014. This is discussed further in section 3.2.
EONIA volumes averaged circa €20.8bn in 2013, compared to circa €24.5bn during 2012, and may continue to be adversely affected by the continuing withdrawals of contributing banks from the EONIA panel. The number of participants has fallen from 42 at the beginning of 2013 to 34 at the end of the year. With the falling number of panel banks, market participants are reportedly showing an increased interest in the repo market indicators, such as Eurex repo indices and the ICAP/MTS Repo fund Rate indices.
The increased volatility in money market rates in late 2013 did not appear to have an impact on the volumes traded between banks in either
Analysis of Recent Monetary Operations & Financial Market Developments
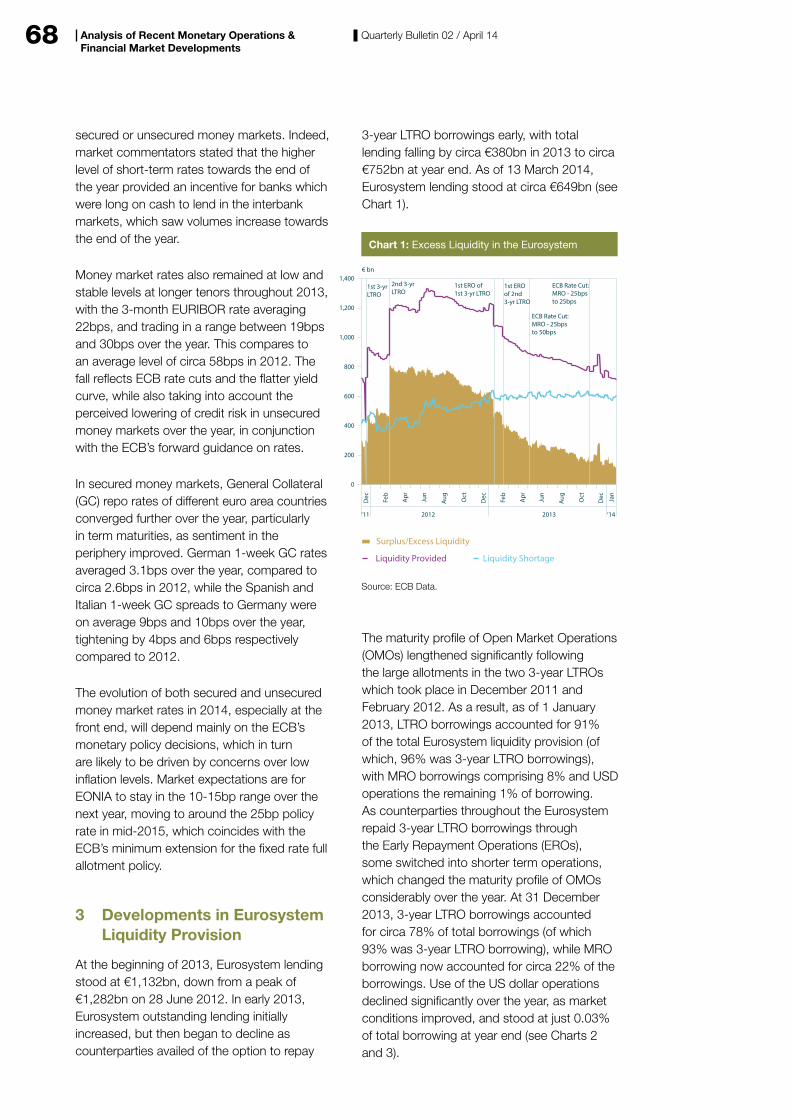
68 Quarterly Bulletin 02 / April 14
secured or unsecured money markets. Indeed, market commentators stated that the higher level of short-term rates towards the end of the year provided an incentive for banks which were long on cash to lend in the interbank markets, which saw volumes increase towards the end of the year.
Money market rates also remained at low and stable levels at longer tenors throughout 2013, with the 3-month EURIBOR rate averaging 22bps, and trading in a range between 19bps and 30bps over the year. This compares to an average level of circa 58bps in 2012. The fall reflects ECB rate cuts and the flatter yield curve, while also taking into account the perceived lowering of credit risk in unsecured money markets over the year, in conjunction with the ECB’s forward guidance on rates.
In secured money markets, General Collateral (GC) repo rates of different euro area countries converged further over the year, particularly in term maturities, as sentiment in the periphery improved. German 1-week GC rates averaged 3.1bps over the year, compared to circa 2.6bps in 2012, while the Spanish and Italian 1-week GC spreads to Germany were on average 9bps and 10bps over the year, tightening by 4bps and 6bps respectively compared to 2012.
The evolution of both secured and unsecured money market rates in 2014, especially at the front end, will depend mainly on the ECB’s monetary policy decisions, which in turn are likely to be driven by concerns over low inflation levels. Market expectations are for EONIA to stay in the 10-15bp range over the next year, moving to around the 25bp policy rate in mid-2015, which coincides with the ECB’s minimum extension for the fixed rate full allotment policy.
3 Developments in Eurosystem Liquidity Provision
At the beginning of 2013, Eurosystem lending stood at €1,132bn, down from a peak of €1,282bn on 28 June 2012. In early 2013, Eurosystem outstanding lending initially increased, but then began to decline as counterparties availed of the option to repay
3-year LTRO borrowings early, with total lending falling by circa €380bn in 2013 to circa €752bn at year end. As of 13 March 2014, Eurosystem lending stood at circa €649bn (see Chart 1).
The maturity profile of Open Market Operations (OMOs) lengthened significantly following the large allotments in the two 3-year LTROs which took place in December 2011 and February 2012. As a result, as of 1 January 2013, LTRO borrowings accounted for 91% of the total Eurosystem liquidity provision (of which, 96% was 3-year LTRO borrowings), with MRO borrowings comprising 8% and USD operations the remaining 1% of borrowing. As counterparties throughout the Eurosystem repaid 3-year LTRO borrowings through the Early Repayment Operations (EROs), some switched into shorter term operations, which changed the maturity profile of OMOs considerably over the year. At 31 December 2013, 3-year LTRO borrowings accounted for circa 78% of total borrowings (of which 93% was 3-year LTRO borrowing), while MRO borrowing now accounted for circa 22% of the borrowings. Use of the US dollar operations declined significantly over the year, as market conditions improved, and stood at just 0.03% of total borrowing at year end (see Charts 2 and 3).
0
200
400
600
800
1,000
1,200
1,400
Liquidity ShortageLiquidity Provided
Chart 1: Excess Liquidity in the Eurosystem
€ bn
Source: ECB Data.
2012 2013
Apr Jun
Aug
Oct
DecFeb
Apr Jun
Aug
Oct
DecFeb
Dec Jan
‘11 ‘14
Surplus/Excess Liquidity
1st 3-yrLTRO
2nd 3-yrLTRO
1st ERO of1st 3-yr LTRO
1st EROof 2nd3-yr LTRO
ECB Rate Cut:MRO - 25bpsto 50bps
ECB Rate Cut:MRO - 25bpsto 25bps
Analysis of Recent Monetary Operations & Financial Market Developments
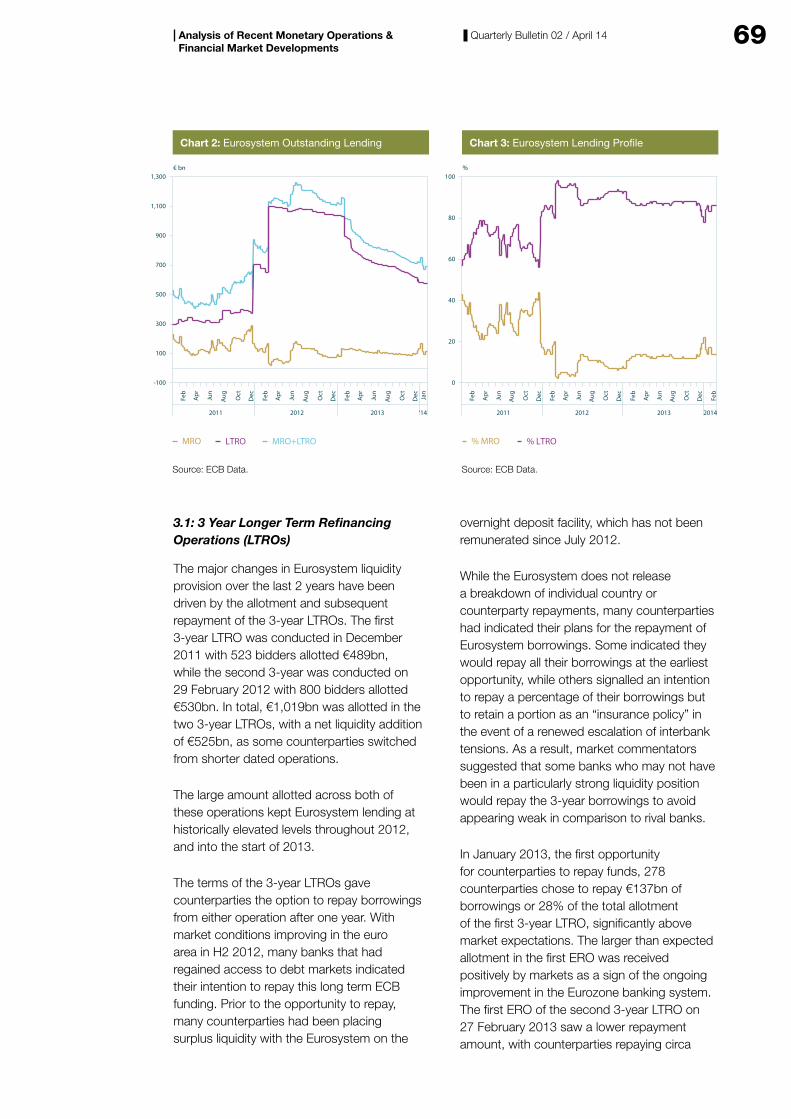
69Quarterly Bulletin 02 / April 14
3.1: 3 Year Longer Term Refinancing Operations (LTROs)
The major changes in Eurosystem liquidity provision over the last 2 years have been driven by the allotment and subsequent repayment of the 3-year LTROs. The first 3-year LTRO was conducted in December 2011 with 523 bidders allotted €489bn, while the second 3-year was conducted on 29 February 2012 with 800 bidders allotted €530bn. In total, €1,019bn was allotted in the two 3-year LTROs, with a net liquidity addition of €525bn, as some counterparties switched from shorter dated operations.
The large amount allotted across both of these operations kept Eurosystem lending at historically elevated levels throughout 2012, and into the start of 2013.
The terms of the 3-year LTROs gave counterparties the option to repay borrowings from either operation after one year. With market conditions improving in the euro area in H2 2012, many banks that had regained access to debt markets indicated their intention to repay this long term ECB funding. Prior to the opportunity to repay, many counterparties had been placing surplus liquidity with the Eurosystem on the
overnight deposit facility, which has not been remunerated since July 2012.
While the Eurosystem does not release a breakdown of individual country or counterparty repayments, many counterparties had indicated their plans for the repayment of Eurosystem borrowings. Some indicated they would repay all their borrowings at the earliest opportunity, while others signalled an intention to repay a percentage of their borrowings but to retain a portion as an “insurance policy” in the event of a renewed escalation of interbank tensions. As a result, market commentators suggested that some banks who may not have been in a particularly strong liquidity position would repay the 3-year borrowings to avoid appearing weak in comparison to rival banks.
In January 2013, the first opportunity for counterparties to repay funds, 278 counterparties chose to repay €137bn of borrowings or 28% of the total allotment of the first 3-year LTRO, significantly above market expectations. The larger than expected allotment in the first ERO was received positively by markets as a sign of the ongoing improvement in the Eurozone banking system. The first ERO of the second 3-year LTRO on 27 February 2013 saw a lower repayment amount, with counterparties repaying circa
% LTRO% MRO
Chart 3: Eurosystem Lending Pro�le
%
Source: ECB Data.
2011 2012 2013 2014
Apr Jun
Aug
Oct
DecFeb
Apr Jun
Aug
Oct
DecFeb
Apr Jun
Aug
Oct
DecFeb
Feb
0
20
40
60
80
100
-100
100
300
500
700
900
1,100
1,300
MRO+LTROLTROMRO
Chart 2: Eurosystem Outstanding Lending
€ bn
Source: ECB Data.
2011 2012 2013 ‘14
Apr Jun
Aug
Oct
DecFeb
Apr Jun
Aug
Oct
DecFeb
Apr Jun
Aug
Oct
DecFeb
Jan
Analysis of Recent Monetary Operations & Financial Market Developments
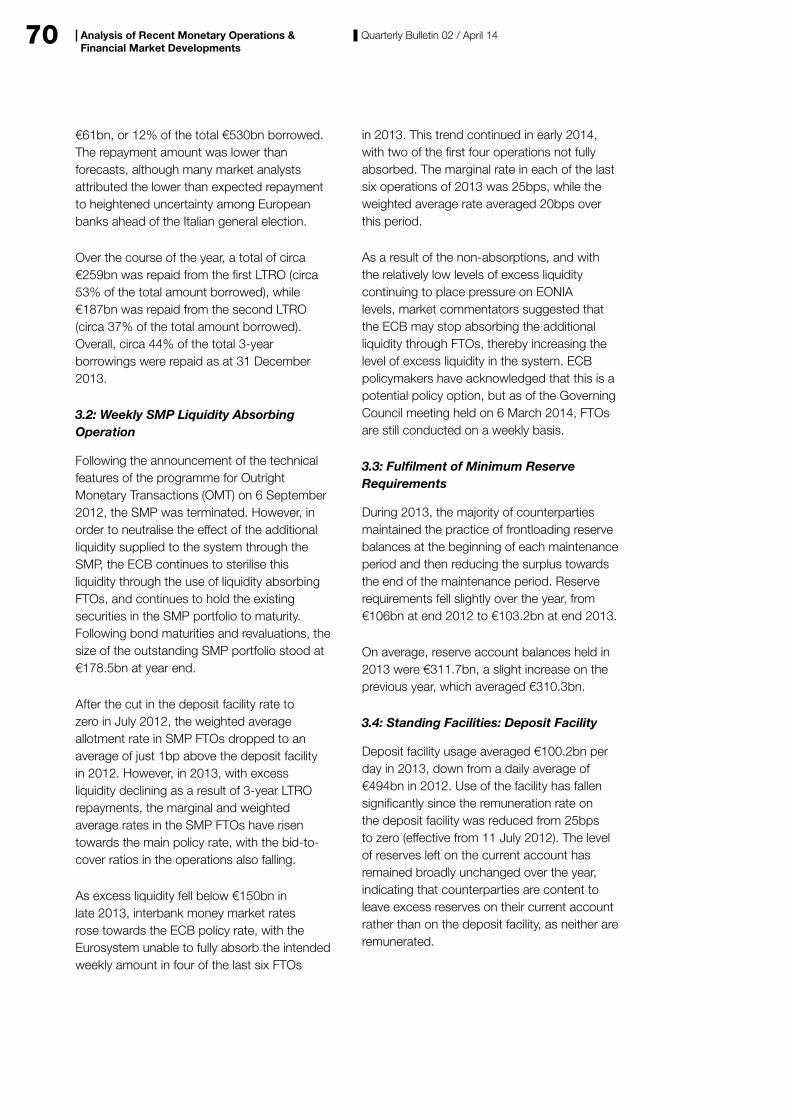
70 Quarterly Bulletin 02 / April 14
€61bn, or 12% of the total €530bn borrowed. The repayment amount was lower than forecasts, although many market analysts attributed the lower than expected repayment to heightened uncertainty among European banks ahead of the Italian general election.
Over the course of the year, a total of circa €259bn was repaid from the first LTRO (circa 53% of the total amount borrowed), while €187bn was repaid from the second LTRO (circa 37% of the total amount borrowed). Overall, circa 44% of the total 3-year borrowings were repaid as at 31 December 2013.
3.2: Weekly SMP Liquidity Absorbing Operation
Following the announcement of the technical features of the programme for Outright Monetary Transactions (OMT) on 6 September 2012, the SMP was terminated. However, in order to neutralise the effect of the additional liquidity supplied to the system through the SMP, the ECB continues to sterilise this liquidity through the use of liquidity absorbing FTOs, and continues to hold the existing securities in the SMP portfolio to maturity. Following bond maturities and revaluations, the size of the outstanding SMP portfolio stood at €178.5bn at year end.
After the cut in the deposit facility rate to zero in July 2012, the weighted average allotment rate in SMP FTOs dropped to an average of just 1bp above the deposit facility in 2012. However, in 2013, with excess liquidity declining as a result of 3-year LTRO repayments, the marginal and weighted average rates in the SMP FTOs have risen towards the main policy rate, with the bid-to-cover ratios in the operations also falling.
As excess liquidity fell below €150bn in late 2013, interbank money market rates rose towards the ECB policy rate, with the Eurosystem unable to fully absorb the intended weekly amount in four of the last six FTOs
in 2013. This trend continued in early 2014, with two of the first four operations not fully absorbed. The marginal rate in each of the last six operations of 2013 was 25bps, while the weighted average rate averaged 20bps over this period.
As a result of the non-absorptions, and with the relatively low levels of excess liquidity continuing to place pressure on EONIA levels, market commentators suggested that the ECB may stop absorbing the additional liquidity through FTOs, thereby increasing the level of excess liquidity in the system. ECB policymakers have acknowledged that this is a potential policy option, but as of the Governing Council meeting held on 6 March 2014, FTOs are still conducted on a weekly basis.
3.3: Fulfilment of Minimum Reserve Requirements
During 2013, the majority of counterparties maintained the practice of frontloading reserve balances at the beginning of each maintenance period and then reducing the surplus towards the end of the maintenance period. Reserve requirements fell slightly over the year, from €106bn at end 2012 to €103.2bn at end 2013.
On average, reserve account balances held in 2013 were €311.7bn, a slight increase on the previous year, which averaged €310.3bn.
3.4: Standing Facilities: Deposit Facility
Deposit facility usage averaged €100.2bn per day in 2013, down from a daily average of €494bn in 2012. Use of the facility has fallen significantly since the remuneration rate on the deposit facility was reduced from 25bps to zero (effective from 11 July 2012). The level of reserves left on the current account has remained broadly unchanged over the year, indicating that counterparties are content to leave excess reserves on their current account rather than on the deposit facility, as neither are remunerated.
Analysis of Recent Monetary Operations & Financial Market Developments
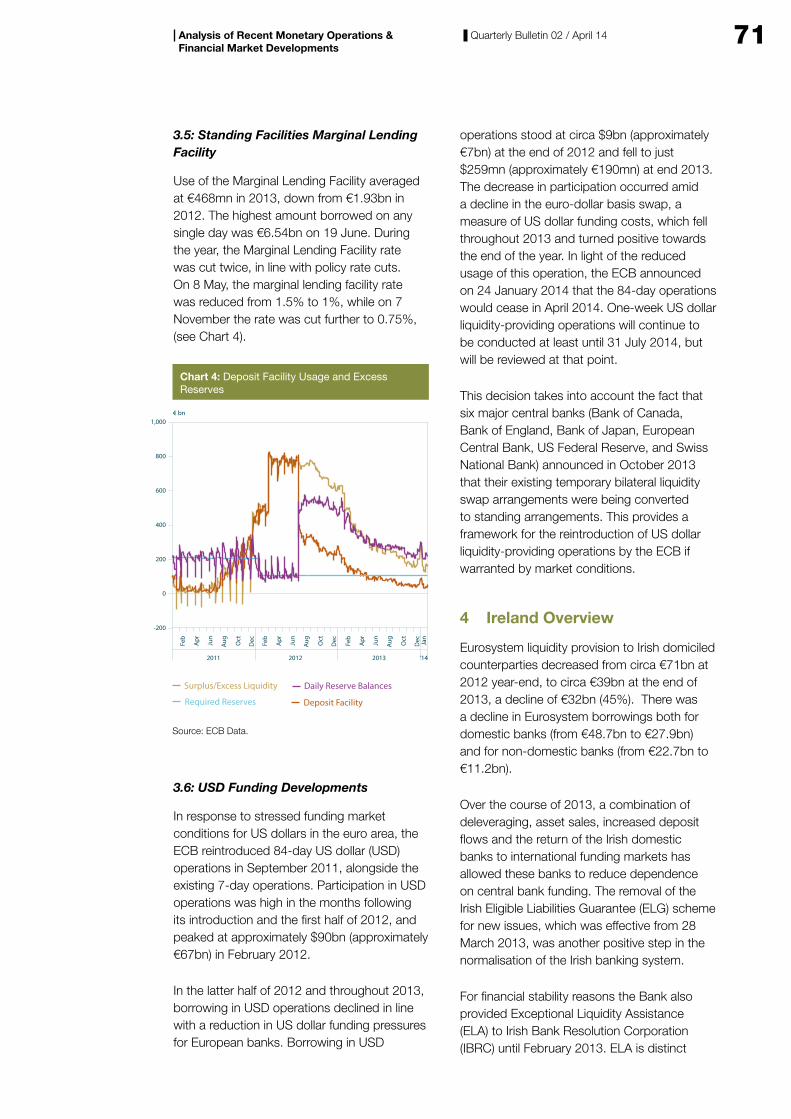
71Quarterly Bulletin 02 / April 14
3.5: Standing Facilities Marginal Lending Facility
Use of the Marginal Lending Facility averaged at €468mn in 2013, down from €1.93bn in 2012. The highest amount borrowed on any single day was €6.54bn on 19 June. During the year, the Marginal Lending Facility rate was cut twice, in line with policy rate cuts. On 8 May, the marginal lending facility rate was reduced from 1.5% to 1%, while on 7 November the rate was cut further to 0.75%, (see Chart 4).
3.6: USD Funding Developments
In response to stressed funding market conditions for US dollars in the euro area, the ECB reintroduced 84-day US dollar (USD) operations in September 2011, alongside the existing 7-day operations. Participation in USD operations was high in the months following its introduction and the first half of 2012, and peaked at approximately $90bn (approximately €67bn) in February 2012.
In the latter half of 2012 and throughout 2013, borrowing in USD operations declined in line with a reduction in US dollar funding pressures for European banks. Borrowing in USD
operations stood at circa $9bn (approximately €7bn) at the end of 2012 and fell to just $259mn (approximately €190mn) at end 2013. The decrease in participation occurred amid a decline in the euro-dollar basis swap, a measure of US dollar funding costs, which fell throughout 2013 and turned positive towards the end of the year. In light of the reduced usage of this operation, the ECB announced on 24 January 2014 that the 84-day operations would cease in April 2014. One-week US dollar liquidity-providing operations will continue to be conducted at least until 31 July 2014, but will be reviewed at that point.
This decision takes into account the fact that six major central banks (Bank of Canada, Bank of England, Bank of Japan, European Central Bank, US Federal Reserve, and Swiss National Bank) announced in October 2013 that their existing temporary bilateral liquidity swap arrangements were being converted to standing arrangements. This provides a framework for the reintroduction of US dollar liquidity-providing operations by the ECB if warranted by market conditions.
4 Ireland Overview
Eurosystem liquidity provision to Irish domiciled counterparties decreased from circa €71bn at 2012 year-end, to circa €39bn at the end of 2013, a decline of €32bn (45%). There was a decline in Eurosystem borrowings both for domestic banks (from €48.7bn to €27.9bn) and for non-domestic banks (from €22.7bn to €11.2bn).
Over the course of 2013, a combination of deleveraging, asset sales, increased deposit flows and the return of the Irish domestic banks to international funding markets has allowed these banks to reduce dependence on central bank funding. The removal of the Irish Eligible Liabilities Guarantee (ELG) scheme for new issues, which was effective from 28 March 2013, was another positive step in the normalisation of the Irish banking system.
For financial stability reasons the Bank also provided Exceptional Liquidity Assistance (ELA) to Irish Bank Resolution Corporation (IBRC) until February 2013. ELA is distinct
-200
0
200
400
600
800
1,000
Deposit FacilityRequired Reserves
Daily Reserve BalancesSurplus/Excess Liquidity
Chart 4: Deposit Facility Usage and ExcessReserves
€ bn
Source: ECB Data.
2011 2012 2013
Apr Jun
Aug
Oct
DecFeb
Apr Jun
Aug
Oct
DecFeb
Apr Jun
Aug
Oct
Dec Jan
Feb
‘14
Analysis of Recent Monetary Operations & Financial Market Developments
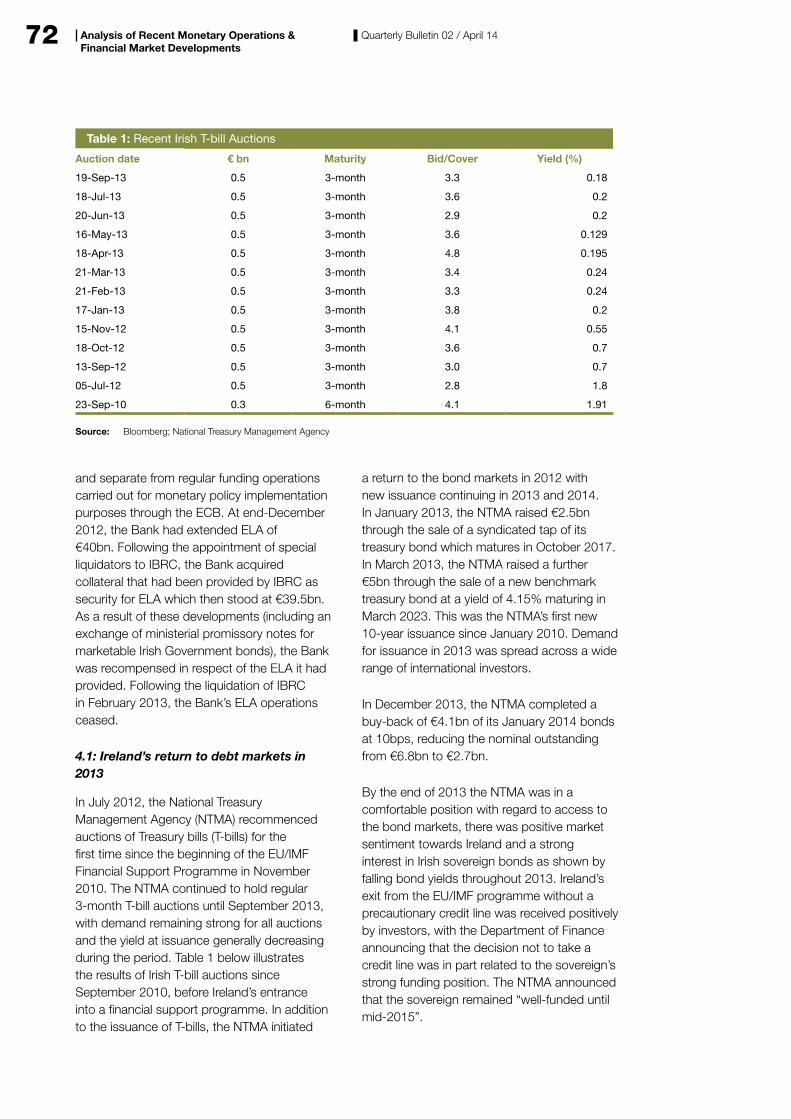
72 Quarterly Bulletin 02 / April 14
and separate from regular funding operations carried out for monetary policy implementation purposes through the ECB. At end-December 2012, the Bank had extended ELA of €40bn. Following the appointment of special liquidators to IBRC, the Bank acquired collateral that had been provided by IBRC as security for ELA which then stood at €39.5bn. As a result of these developments (including an exchange of ministerial promissory notes for marketable Irish Government bonds), the Bank was recompensed in respect of the ELA it had provided. Following the liquidation of IBRC in February 2013, the Bank’s ELA operations ceased.
4.1: Ireland’s return to debt markets in 2013
In July 2012, the National Treasury Management Agency (NTMA) recommenced auctions of Treasury bills (T-bills) for the first time since the beginning of the EU/IMF Financial Support Programme in November 2010. The NTMA continued to hold regular 3-month T-bill auctions until September 2013, with demand remaining strong for all auctions and the yield at issuance generally decreasing during the period. Table 1 below illustrates the results of Irish T-bill auctions since September 2010, before Ireland’s entrance into a financial support programme. In addition to the issuance of T-bills, the NTMA initiated
a return to the bond markets in 2012 with new issuance continuing in 2013 and 2014. In January 2013, the NTMA raised €2.5bn through the sale of a syndicated tap of its treasury bond which matures in October 2017. In March 2013, the NTMA raised a further €5bn through the sale of a new benchmark treasury bond at a yield of 4.15% maturing in March 2023. This was the NTMA’s first new 10-year issuance since January 2010. Demand for issuance in 2013 was spread across a wide range of international investors.
In December 2013, the NTMA completed a buy-back of €4.1bn of its January 2014 bonds at 10bps, reducing the nominal outstanding from €6.8bn to €2.7bn.
By the end of 2013 the NTMA was in a comfortable position with regard to access to the bond markets, there was positive market sentiment towards Ireland and a strong interest in Irish sovereign bonds as shown by falling bond yields throughout 2013. Ireland’s exit from the EU/IMF programme without a precautionary credit line was received positively by investors, with the Department of Finance announcing that the decision not to take a credit line was in part related to the sovereign’s strong funding position. The NTMA announced that the sovereign remained “well-funded until mid-2015”.
Table 1: Recent Irish T-bill Auctions
Auction date € bn Maturity Bid/Cover Yield (%)
19-Sep-13 0.5 3-month 3.3 0.18
18-Jul-13 0.5 3-month 3.6 0.2
20-Jun-13 0.5 3-month 2.9 0.2
16-May-13 0.5 3-month 3.6 0.129
18-Apr-13 0.5 3-month 4.8 0.195
21-Mar-13 0.5 3-month 3.4 0.24
21-Feb-13 0.5 3-month 3.3 0.24
17-Jan-13 0.5 3-month 3.8 0.2
15-Nov-12 0.5 3-month 4.1 0.55
18-Oct-12 0.5 3-month 3.6 0.7
13-Sep-12 0.5 3-month 3.0 0.7
05-Jul-12 0.5 3-month 2.8 1.8
23-Sep-10 0.3 6-month 4.1 1.91
Source: Bloomberg; National Treasury Management Agency
Analysis of Recent Monetary Operations & Financial Market Developments
73Quarterly Bulletin 02 / April 14
On 7 January 2014, the NTMA successfully returned to the bond markets for the first time since the end of the IMF/EU Funding Programme, selling €3.75bn of a new 10-year syndicated bond at a yield of 3.54%, receiving a total bid in excess of €14bn for the bond. The majority of issuance was sold overseas (83%) while interest reportedly came from a broad range of international investors. The NTMA noted that it intended to issue a total of €6-8bn of bonds in 2014, indicating that the 10-year issuance achieved around 50% of 2014’s funding requirements.
The improved funding conditions of the Irish sovereign and banks added to Moody’s decision to upgrade the Irish sovereign rating to Baa3 (from Ba1) on 17 January. The move was positive for Irish bond issuance as it meant that all major ratings agencies held Ireland as investment grade, opening up a broader investor base which previously would have been closed to Irish sovereign debt due to its sub-investment rating from Moody’s. Market analysts noted that there has been an increased demand for Irish sovereign debt from Asian and Middle Eastern investors, including fund managers and pension funds.
4.2: Irish Bank Bonds and Other Debt Issuance
The improvement in investor sentiment towards Ireland was also seen in the Irish domestic bank bond markets, with Bank of Ireland (BOI) and Allied Irish Banks (AIB) experiencing strong demand for a number of bond issuances in 2013. Both banks successfully issued their first senior unsecured bonds since 2009 and 2008 respectively, while the Electricity Supply Board (ESB) also issued bonds in November 2013.
On 9 January 2013, the Irish government sold €1bn of its Bank of Ireland Contingent Capital Bonds (CoCos). The sale was almost five times oversubscribed with a yield of 9.62%.
In May, Bank of Ireland issued its first senior unsecured bond since September 2009 selling a 3-year €500mn senior unsecured bond at a yield of 2.8%. The issuance received strong demand with orders exceeding €1.25bn. AIB also returned to the debt markets with a 3-year €500mn senior unsecured bond issuance in November. This was the bank’s first such issuance since 2008. The AIB issuance also saw strong demand, with the price 15bps tighter than initial projections at 2.91%.
Bank of Ireland returned to the bond markets in early 2014, selling a €750mn 5-year senior unsecured bond on 8 January 2014 at a yield of 3.34%. The issuance was five times oversubscribed, receiving €3.75bn worth of orders, 97% of which were said to be from overseas investors.
AIB issued two covered bonds in 2013. The first, a €500mn 3.5-year covered bond was issued on 22 January 2013 by AIB Mortgage Bank at a yield of 2.65%. Then on 3 September, AIB issued €500mn of a new 5-year ACS covered bond, at a yield of 3.22%, 22bps above the equivalent Irish government bond at the time. The yield on both bonds fell after issuance as strong demand in secondary markets, in part due to positive market sentiment towards Ireland, pushed prices higher.
Bank of Ireland was also active in the covered bond market, selling a total of €2bn in covered bonds through three issuances in 2013. On 15 March, Bank of Ireland concluded the sale of €500mn of new 5-year covered bonds, backed by Irish retail mortgages, at a yield of 2.82%. On 25 September Bank of Ireland issued a €500mn 7-year covered bond at a yield of 3.55% and a €1bn 3.5-year covered bond on 6 November at a yield of 1.74%. As with the AIB covered bond issuance, the yields fell after issue in the secondary market.
On 20 November, PTSB raised €500mn from the sale of Irish residential mortgage backed
Analysis of Recent Monetary Operations & Financial Market Developments
74 Quarterly Bulletin 02 / April 14
securities (RMBS). This was the first publically placed new issuance of this kind by an Irish bank since 2007 and the first by PTSB since 2006. The RMBS sold at a yield of 1.87%, significantly inside the secondary market for Irish RMBS at the time (2.5-2.7%).
In other non-financial bond issuance, ESB returned to the market on 5 November 2013 issuing a €300mn 10-year senior unsecured note at 3.5% slightly below the equivalent sovereign yield at the time of 3.55%.
4.3: Stress Tests
In 2014, the ECB will conduct a comprehensive assessment of the European banking sector ahead of assuming full responsibility for supervision as part of the Single Supervisory Mechanism (SSM). The assessment will seek to enhance the quality of information available on the condition of banks and will identify risks and implement necessary corrective actions with the goal of restoring confidence in the stability of the European banking sector. The exercise will comprise of an Asset Quality Review (AQR), a full supervisory risk assessment and stress tests applied to 128 significant banks across Europe, and is due to be completed by November 2014.
5 TARGET2 balances
TARGET2 (T2) is the payment system of the euro that is operated by the central banks of the Eurosystem. All payments are settled in central bank money (that is to say they are booked on the accounts that banks hold with their central bank) and are settled in real time. The payments are primarily between banks and ancillary systems (e.g. security settlement systems, central counterparties, retail payment systems) as well as payments as part of Eurosystem operations such as OMOs.
The T2 balances of national central banks (NCBs) reflect cross-border euro transfers.
When an NCB has a T2 claim, it implies that there has been an inflow of euro funds to that country’s banking system, whereas a T2 liability balance implies that an outflow has taken place. The settlement of such cross-border transfers between banks in the euro area in T2 thus results in intra-Eurosystem balances (which are netted off with the ECB). As a result, some NCBs have a T2 claim (asset) and others a T2 liability vis-à-vis the ECB.
5.1: The main changes in T2 balances in 2013
T2 imbalances gradually decreased over the year with a general flow of funds back from the core countries to the periphery, which had amassed significant T2 liabilities between 2010-2012. Following comments by President Draghi in July 2012, and the subsequent announcement of OMT in August 2012, euro area tensions eased somewhat and T2 imbalances narrowed in the later stages of the year and into 2013. The narrowing of imbalances continued at a steady pace through 2013, highlighting a gradual reduction in fragmentation which has been observed across European markets.
The most notable changes in 2013 were on the balance sheets of the Bundesbank and the Banco de España. Over the course of the year the German T2 claim decreased by €145bn to €510bn while the Spanish T2 liability fell by €124bn to €214bn. The Dutch T2 claim fell by €75bn to €46bn and the Irish T2 liability fell by €24bn to €55bn, while the Italian and French liabilities also fell, by €26bn and €39bn respectively. Ireland’s T2 liability has fallen by nearly two-thirds from the end of 2010, when it stood at €145bn (See Chart 5).
The €24bn reduction in Ireland’s T2 liability in 2013 results from a number of different factors; the inflow of programme funds from the EU and the IMF, the sale of sovereign debt to foreign investors, deleveraging receipts and an increase in Irish banks’ access to the international funding market.
Analysis of Recent Monetary Operations & Financial Market Developments
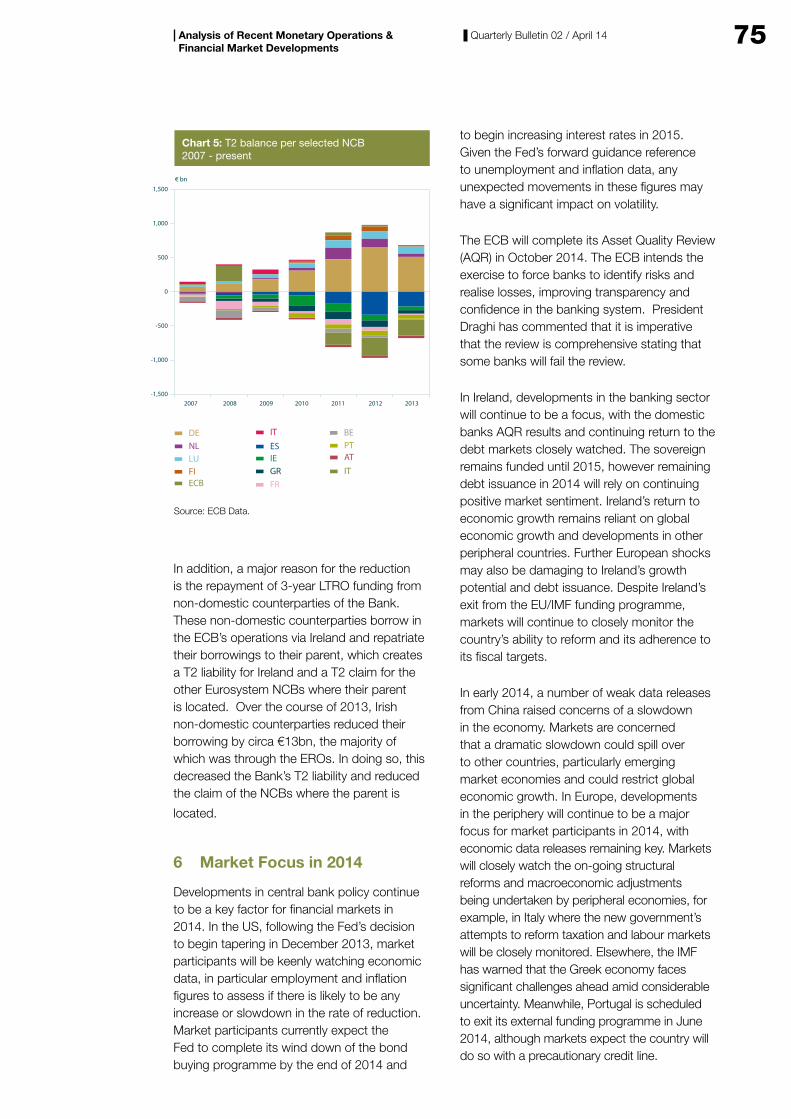
75Quarterly Bulletin 02 / April 14
In addition, a major reason for the reduction is the repayment of 3-year LTRO funding from non-domestic counterparties of the Bank. These non-domestic counterparties borrow in the ECB’s operations via Ireland and repatriate their borrowings to their parent, which creates a T2 liability for Ireland and a T2 claim for the other Eurosystem NCBs where their parent is located. Over the course of 2013, Irish non-domestic counterparties reduced their borrowing by circa €13bn, the majority of which was through the EROs. In doing so, this decreased the Bank’s T2 liability and reduced the claim of the NCBs where the parent is
located.
6 Market Focus in 2014
Developments in central bank policy continue to be a key factor for financial markets in 2014. In the US, following the Fed’s decision to begin tapering in December 2013, market participants will be keenly watching economic data, in particular employment and inflation figures to assess if there is likely to be any increase or slowdown in the rate of reduction. Market participants currently expect the Fed to complete its wind down of the bond buying programme by the end of 2014 and
to begin increasing interest rates in 2015. Given the Fed’s forward guidance reference to unemployment and inflation data, any unexpected movements in these figures may have a significant impact on volatility.
The ECB will complete its Asset Quality Review (AQR) in October 2014. The ECB intends the exercise to force banks to identify risks and realise losses, improving transparency and confidence in the banking system. President Draghi has commented that it is imperative that the review is comprehensive stating that some banks will fail the review.
In Ireland, developments in the banking sector will continue to be a focus, with the domestic banks AQR results and continuing return to the debt markets closely watched. The sovereign remains funded until 2015, however remaining debt issuance in 2014 will rely on continuing positive market sentiment. Ireland’s return to economic growth remains reliant on global economic growth and developments in other peripheral countries. Further European shocks may also be damaging to Ireland’s growth potential and debt issuance. Despite Ireland’s exit from the EU/IMF funding programme, markets will continue to closely monitor the country’s ability to reform and its adherence to its fiscal targets.
In early 2014, a number of weak data releases from China raised concerns of a slowdown in the economy. Markets are concerned that a dramatic slowdown could spill over to other countries, particularly emerging market economies and could restrict global economic growth. In Europe, developments in the periphery will continue to be a major focus for market participants in 2014, with economic data releases remaining key. Markets will closely watch the on-going structural reforms and macroeconomic adjustments being undertaken by peripheral economies, for example, in Italy where the new government’s attempts to reform taxation and labour markets will be closely monitored. Elsewhere, the IMF has warned that the Greek economy faces significant challenges ahead amid considerable uncertainty. Meanwhile, Portugal is scheduled to exit its external funding programme in June 2014, although markets expect the country will do so with a precautionary credit line.
-1,500
-1,000
-500
0
500
1,000
1,500
BEPTATIT
DENLLUFIECB
IT
GRFR
ESIE
Chart 5: T2 balance per selected NCB2007 - present
€ bn
Source: ECB Data.
2007 2008 2009 2010 2011 2012 2013
Analysis of Recent Monetary Operations & Financial Market Developments

76 Quarterly Bulletin 02 / April 14
Annex 1: Glossary of Terms
EONIA (Euro Overnight Index Average) is a market index computed as the weighted average of overnight unsecured lending transactions undertaken by a representative panel of banks.
EURIBOR (Euro Interbank Offered Rate) is the rate at which interbank term deposits are offered by one prime bank to another prime bank. This is often the reference rate for maturities of one, two and three weeks, and for maturities of one to twelve months.
Excess liquidity arises when the supply of liquidity (as provided via ECB open market operations and the marginal lending facility), exceeds the demand for liquidity (as dictated by minimum reserve requirements and autonomous factors outside the direct control of individual NCBs), there is said to be excess liquidity in the banking system. In this situation, the excess will likely end up being deposited with the ECB via deposit facility usage or via the weekly fine-tuning operation.
Excess Reserves: Current account holdings in excess of the average minimum reserve requirements.
Liquidity Provided: The net amount of liquidity provided by the ECB through its open market operations.
Liquidity Shortage: This is determined by the minimum reserve requirements and autonomous factors outside the direct control of individual NCBs.
Maintenance period (MP): The period over which compliance with reserve requirements is calculated. The MP begins on the settlement day of the first MRO following the policy meeting of the Governing Council.
Minimum reserves are determined on the basis of the institutions’ average daily reserve holdings (calculated on the basis of certain balance sheet liabilities) over a maintenance period of about one month. Each bank in the Eurosystem is required to maintain a balance with their respective NCB. The required
reserve holdings are remunerated at a level corresponding to the average interest rate over the maintenance period of the MROs of the Eurosystem.
Open Market Operations (OMO’s) include Main Refinancing Operations, Longer-Term Refinancing Operations, Fine-Tuning Operations, structural operations and the Early Repayment Operations, as defined below.
(i) Main refinancing operations (MRO) are regular liquidity-providing reverse transactions with a frequency and maturity of one week. The MRO rate is currently 0.25%
(ii) Longer-Term Refinancing Operations (LTRO) are liquidity-providing reverse transactions that are regularly conducted with a monthly frequency and a maturity of three months. Longer-Term Refinancing Operations are conducted at irregular intervals or with other maturities, e.g. the length of one maintenance period, six months, twelve months or thirty-six months are also possible. The ECB conducted two 36-month operations (VLTROs) the first in December 2011 and the second February 2012, the terms of these operations gave counterparties the opportunity to repay any part of the amount they were allotted after one year. In January 2013, the ECB conducted the first Early Repayment Operation (ERO) allowing banks to repay some or all of their borrowings from the first 36-month LTRO (transacted in December 2011) before the stated maturity date of the LTRO. Throughout the rest of 2013, the ECB conducted weekly EROs (one for the each of the two 36-month LTROs) at the discretion of the Governing Council.
(iii) Fine-Tuning Operations (FTO) can be executed on an ad hoc basis to manage the liquidity situation in the market and to steer interest rates. In particular, they aim to smooth the effects on interest rates caused by unexpected liquidity fluctuations. Fine-Tuning Operations are primarily executed as reverse transactions, but may also take the form of outright transactions, foreign exchange swaps and collection of fixed-term deposits. Since May 2010, a weekly FTO has been held to absorb the liquidity provided through the
Analysis of Recent Monetary Operations & Financial Market Developments

77Quarterly Bulletin 02 / April 14
Securities Markets Programme (SMP), which involved purchases of sovereign debt in the secondary market.
(iv) Structural operations are executed by the Eurosystem mainly in order to adjust the structural liquidity position of the financial sector vis-à-vis the Eurosystem. They can be carried out through reverse transactions, outright transactions and the issuance of debt certificates.
Standing facilities aim to provide and absorb overnight liquidity, signal the general monetary policy stance and bound overnight market interest rates. Two standing facilities, which are administered in a decentralised manner by the NCBs, are available to eligible counterparties on their own initiative:
(i) Marginal Lending Facility (MLF): Counterparties can use the MLF to obtain overnight liquidity from the NCBs against eligible assets. The interest rate on the MLF is currently 0.75% (50bps above the MRO rate) and normally provides a ceiling for the overnight market interest rate.
(ii) Deposit Facility (DF): Counterparties can use the deposit facility to make overnight deposits with the NCBs. The interest rate on the deposit facility is currently 0.0% (25bps below the MRO rate) and normally provides a floor for the overnight market interest rate Variable rate allotment: In normal circumstances, the Eurosystem, when conducting its OMO’s, assesses the total liquidity need of the banking sector and, in competitive tenders, allots this amount. Usually these tenders are conducted as variable rate tenders, meaning that banks pay the interest rate that they offer when they make their bids.
The Eurosystem may also execute its tenders in the form of fixed rate tenders, where the interest rate is specified in advance and banks bid the amount of money they wish to transact at the fixed interest rate.
In exceptional circumstances, the ECB may decide in advance to allot the full amount of liquidity that banks request, i.e. to accommodate all bids, at a fixed interest rate (known as fixed rate full allotment). The ECB currently operates a fixed rate full allotment policy for all refinancing operations.
Analysis of Recent Monetary Operations & Financial Market Developments
78
Irish Results of the BIS Foreign Exchange and Interest Rate Derivatives Survey 2013 Aisling Menton1
Abstract
The Central Bank of Ireland participated in the most recent survey of global turnover in foreign exchange and over-the-counter single-currency interest rate derivatives. The survey is coordinated by the Bank for International Settlements every three years, and Ireland has participated since 1995. The survey results for Ireland show a sharp fall in turnover in both foreign exchange and interest rate derivatives since the last survey in 2010. There are two driving factors behind the decline between 2010 and 2013. Firstly, the landscape of the Irish banking sector has changed dramatically; banks have exited the Irish market, through liquidation or wind down. There has also been significant restructuring of the Irish banking system, with deleveraging of overseas assets. Less cross-border exposure reduces the need for hedging of currencies or interest rate risks. In contrast, the results of the global survey indicate that April 2013 was one of the most active months in trading of foreign exchange derivatives, partly due to a regime shift in monetary policy by the Bank of Japan.
1 The author is a Senior Economist in the Statistics Division of the Central Bank of Ireland. The views expressed in this article are solely the views of the author and are not necessarily those held by the Central Bank of Ireland or the European System of Central Banks. The author would like to thank Maura Finnie for her help with the survey.
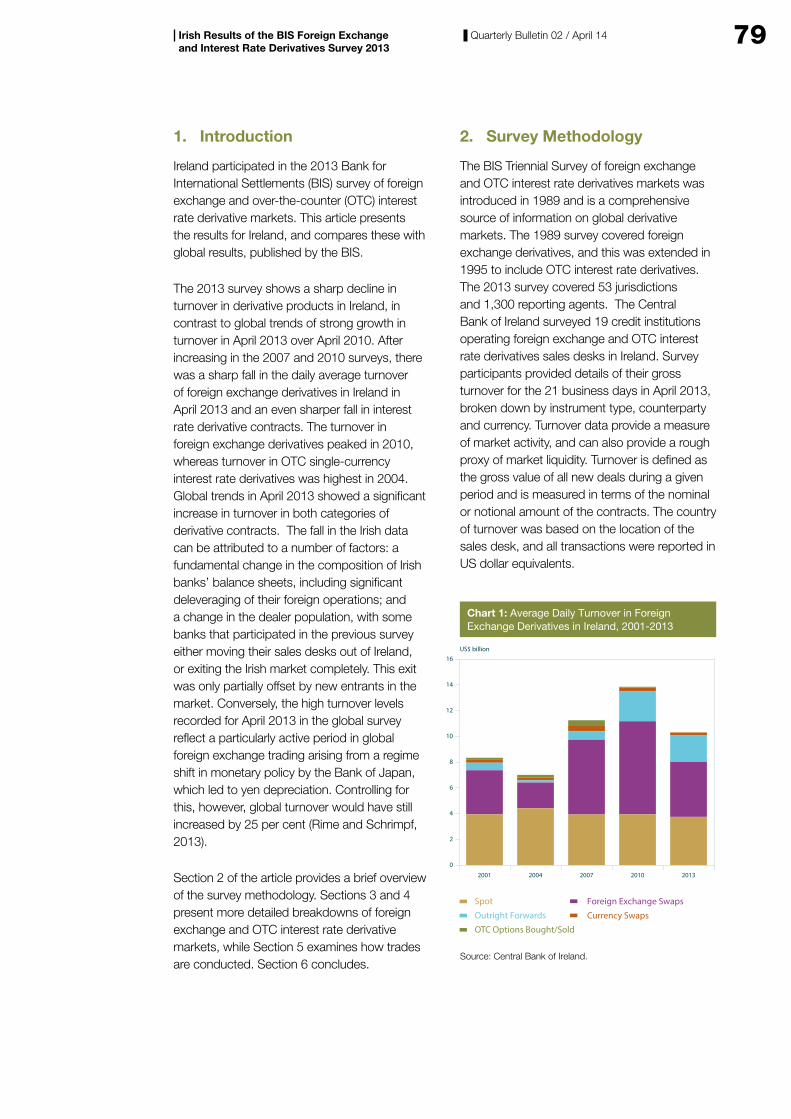
79Quarterly Bulletin 02 / April 14Irish Results of the BIS Foreign Exchange and Interest Rate Derivatives Survey 2013
1. Introduction
Ireland participated in the 2013 Bank for International Settlements (BIS) survey of foreign exchange and over-the-counter (OTC) interest rate derivative markets. This article presents the results for Ireland, and compares these with global results, published by the BIS.
The 2013 survey shows a sharp decline in turnover in derivative products in Ireland, in contrast to global trends of strong growth in turnover in April 2013 over April 2010. After increasing in the 2007 and 2010 surveys, there was a sharp fall in the daily average turnover of foreign exchange derivatives in Ireland in April 2013 and an even sharper fall in interest rate derivative contracts. The turnover in foreign exchange derivatives peaked in 2010, whereas turnover in OTC single-currency interest rate derivatives was highest in 2004. Global trends in April 2013 showed a significant increase in turnover in both categories of derivative contracts. The fall in the Irish data can be attributed to a number of factors: a fundamental change in the composition of Irish banks’ balance sheets, including significant deleveraging of their foreign operations; and a change in the dealer population, with some banks that participated in the previous survey either moving their sales desks out of Ireland, or exiting the Irish market completely. This exit was only partially offset by new entrants in the market. Conversely, the high turnover levels recorded for April 2013 in the global survey reflect a particularly active period in global foreign exchange trading arising from a regime shift in monetary policy by the Bank of Japan, which led to yen depreciation. Controlling for this, however, global turnover would have still increased by 25 per cent (Rime and Schrimpf, 2013).
Section 2 of the article provides a brief overview of the survey methodology. Sections 3 and 4 present more detailed breakdowns of foreign exchange and OTC interest rate derivative markets, while Section 5 examines how trades are conducted. Section 6 concludes.
2. Survey Methodology
The BIS Triennial Survey of foreign exchange and OTC interest rate derivatives markets was introduced in 1989 and is a comprehensive source of information on global derivative markets. The 1989 survey covered foreign exchange derivatives, and this was extended in 1995 to include OTC interest rate derivatives. The 2013 survey covered 53 jurisdictions and 1,300 reporting agents. The Central Bank of Ireland surveyed 19 credit institutions operating foreign exchange and OTC interest rate derivatives sales desks in Ireland. Survey participants provided details of their gross turnover for the 21 business days in April 2013, broken down by instrument type, counterparty and currency. Turnover data provide a measure of market activity, and can also provide a rough proxy of market liquidity. Turnover is defined as the gross value of all new deals during a given period and is measured in terms of the nominal or notional amount of the contracts. The country of turnover was based on the location of the sales desk, and all transactions were reported in US dollar equivalents.
US$ billion
Chart 1: Average Daily Turnover in ForeignExchange Derivatives in Ireland, 2001-2013
Foreign Exchange SwapsSpot
Currency SwapsOutright Forwards
OTC Options Bought/Sold
Source: Central Bank of Ireland.
0
2
4
6
8
10
12
14
16
20132010200720042001
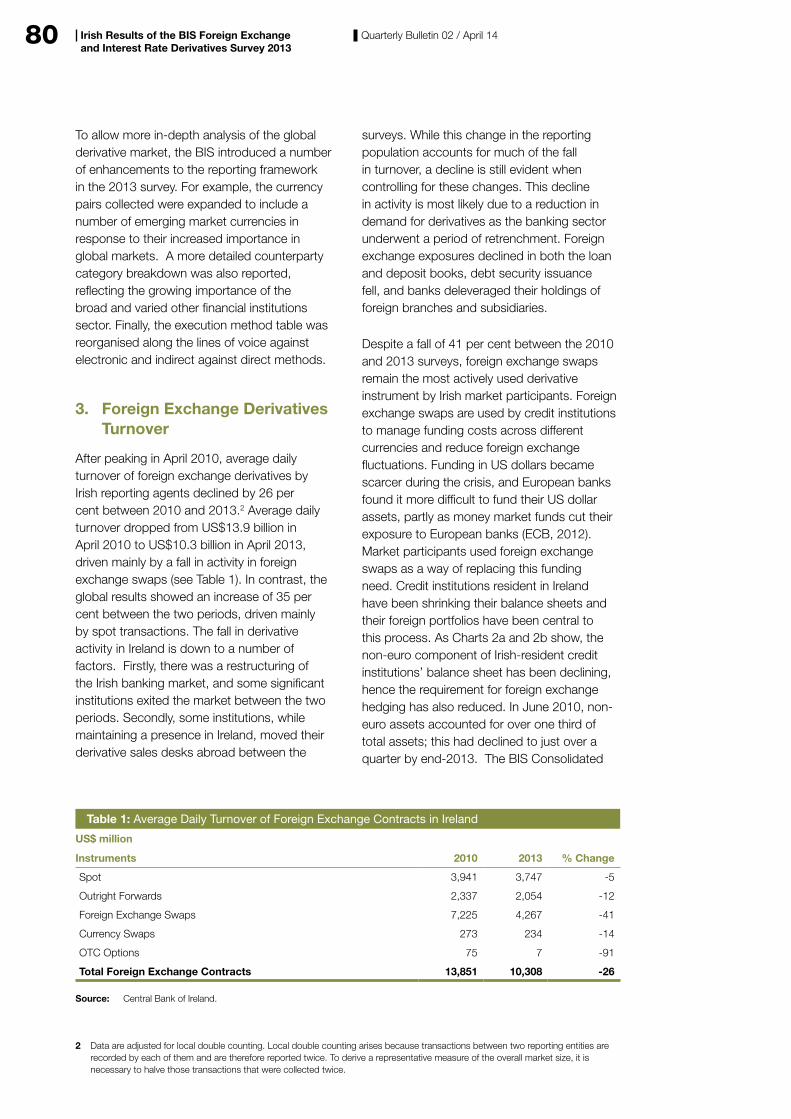
80 Quarterly Bulletin 02 / April 14
To allow more in-depth analysis of the global derivative market, the BIS introduced a number of enhancements to the reporting framework in the 2013 survey. For example, the currency pairs collected were expanded to include a number of emerging market currencies in response to their increased importance in global markets. A more detailed counterparty category breakdown was also reported, reflecting the growing importance of the broad and varied other financial institutions sector. Finally, the execution method table was reorganised along the lines of voice against electronic and indirect against direct methods.
3. Foreign Exchange Derivatives Turnover
After peaking in April 2010, average daily turnover of foreign exchange derivatives by Irish reporting agents declined by 26 per cent between 2010 and 2013.2 Average daily turnover dropped from US$13.9 billion in April 2010 to US$10.3 billion in April 2013, driven mainly by a fall in activity in foreign exchange swaps (see Table 1). In contrast, the global results showed an increase of 35 per cent between the two periods, driven mainly by spot transactions. The fall in derivative activity in Ireland is down to a number of factors. Firstly, there was a restructuring of the Irish banking market, and some significant institutions exited the market between the two periods. Secondly, some institutions, while maintaining a presence in Ireland, moved their derivative sales desks abroad between the
surveys. While this change in the reporting population accounts for much of the fall in turnover, a decline is still evident when controlling for these changes. This decline in activity is most likely due to a reduction in demand for derivatives as the banking sector underwent a period of retrenchment. Foreign exchange exposures declined in both the loan and deposit books, debt security issuance fell, and banks deleveraged their holdings of foreign branches and subsidiaries.
Despite a fall of 41 per cent between the 2010 and 2013 surveys, foreign exchange swaps remain the most actively used derivative instrument by Irish market participants. Foreign exchange swaps are used by credit institutions to manage funding costs across different currencies and reduce foreign exchange fluctuations. Funding in US dollars became scarcer during the crisis, and European banks found it more difficult to fund their US dollar assets, partly as money market funds cut their exposure to European banks (ECB, 2012). Market participants used foreign exchange swaps as a way of replacing this funding need. Credit institutions resident in Ireland have been shrinking their balance sheets and their foreign portfolios have been central to this process. As Charts 2a and 2b show, the non-euro component of Irish-resident credit institutions’ balance sheet has been declining, hence the requirement for foreign exchange hedging has also reduced. In June 2010, non-euro assets accounted for over one third of total assets; this had declined to just over a quarter by end-2013. The BIS Consolidated
Irish Results of the BIS Foreign Exchange and Interest Rate Derivatives Survey 2013
2 Data are adjusted for local double counting. Local double counting arises because transactions between two reporting entities are recorded by each of them and are therefore reported twice. To derive a representative measure of the overall market size, it is necessary to halve those transactions that were collected twice.
Table 1: Average Daily Turnover of Foreign Exchange Contracts in Ireland
US$ million
Instruments 2010 2013 % Change
Spot 3,941 3,747 -5
Outright Forwards 2,337 2,054 -12
Foreign Exchange Swaps 7,225 4,267 -41
Currency Swaps 273 234 -14
OTC Options 75 7 -91
Total Foreign Exchange Contracts 13,851 10,308 -26
Source: Central Bank of Ireland.
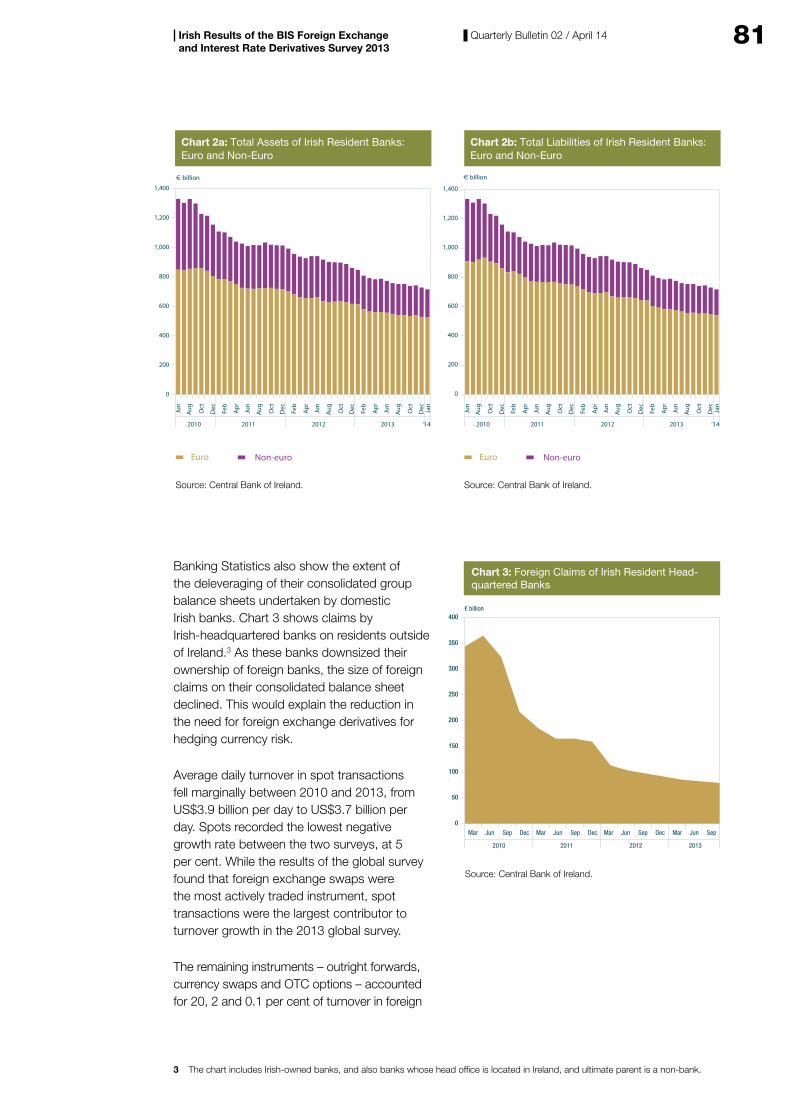
81Quarterly Bulletin 02 / April 14Irish Results of the BIS Foreign Exchange and Interest Rate Derivatives Survey 2013
Banking Statistics also show the extent of the deleveraging of their consolidated group balance sheets undertaken by domestic Irish banks. Chart 3 shows claims by Irish-headquartered banks on residents outside of Ireland.3 As these banks downsized their ownership of foreign banks, the size of foreign claims on their consolidated balance sheet declined. This would explain the reduction in the need for foreign exchange derivatives for hedging currency risk.
Average daily turnover in spot transactions fell marginally between 2010 and 2013, from US$3.9 billion per day to US$3.7 billion per day. Spots recorded the lowest negative growth rate between the two surveys, at 5 per cent. While the results of the global survey found that foreign exchange swaps were the most actively traded instrument, spot transactions were the largest contributor to turnover growth in the 2013 global survey.
The remaining instruments – outright forwards, currency swaps and OTC options – accounted for 20, 2 and 0.1 per cent of turnover in foreign
3 The chart includes Irish-owned banks, and also banks whose head office is located in Ireland, and ultimate parent is a non-bank.
€ billion
Chart 2a: Total Assets of Irish Resident Banks:Euro and Non-Euro
Non-euroEuro
Source: Central Bank of Ireland.
2010 2011 2012 2013
Aug
Oct
Dec Apr Jun
Aug
Oct
DecJun
Feb
Apr Jun
Aug
Oct
DecFeb
Apr Jun
Aug
Oct
DecFeb
Jan
0
200
400
600
800
1,000
1,200
1,400
‘14
€ billion
Chart 2b: Total Liabilities of Irish Resident Banks:Euro and Non-Euro
Non-euroEuro
Source: Central Bank of Ireland.
0
200
400
600
800
1,000
1,200
1,400
2010 2011 2012 2013
Aug
Oct
Dec Apr Jun
Aug
Oct
DecJun
Feb
Apr Jun
Aug
Oct
DecFeb
Apr Jun
Aug
Oct
DecFeb
Jan
‘14
Source: Central Bank of Ireland.
Mar Jun
2010 2011 2012 2013
Sep Dec Mar Jun Sep Dec Mar Jun Sep Dec Mar Jun Sep
Chart 3: Foreign Claims of Irish Resident Head-quartered Banks
€ billion
0
50
100
150
200
250
300
350
400
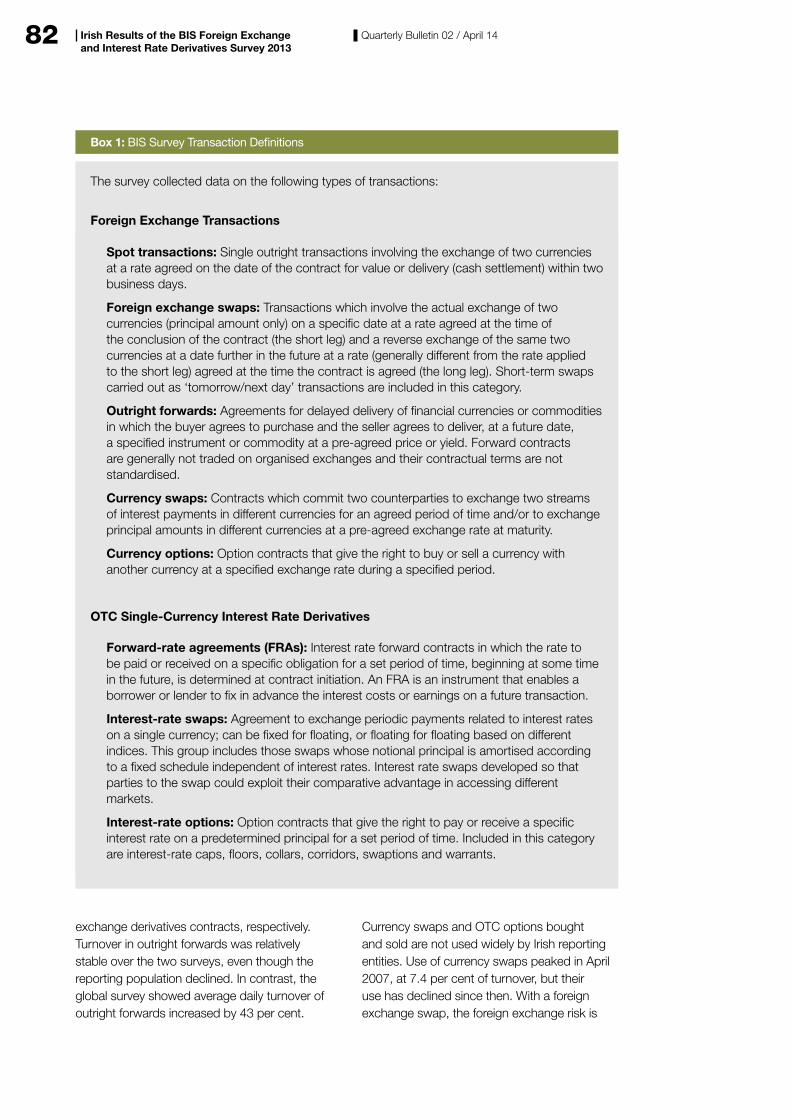
82 Quarterly Bulletin 02 / April 14Irish Results of the BIS Foreign Exchange and Interest Rate Derivatives Survey 2013
exchange derivatives contracts, respectively. Turnover in outright forwards was relatively stable over the two surveys, even though the reporting population declined. In contrast, the global survey showed average daily turnover of outright forwards increased by 43 per cent.
Currency swaps and OTC options bought and sold are not used widely by Irish reporting entities. Use of currency swaps peaked in April 2007, at 7.4 per cent of turnover, but their use has declined since then. With a foreign exchange swap, the foreign exchange risk is
Box 1: BIS Survey Transaction Definitions
The survey collected data on the following types of transactions:
Foreign Exchange Transactions
Spot transactions: Single outright transactions involving the exchange of two currencies at a rate agreed on the date of the contract for value or delivery (cash settlement) within two business days.
Foreign exchange swaps: Transactions which involve the actual exchange of two currencies (principal amount only) on a specific date at a rate agreed at the time of the conclusion of the contract (the short leg) and a reverse exchange of the same two currencies at a date further in the future at a rate (generally different from the rate applied to the short leg) agreed at the time the contract is agreed (the long leg). Short-term swaps carried out as ‘tomorrow/next day’ transactions are included in this category.
Outright forwards: Agreements for delayed delivery of financial currencies or commodities in which the buyer agrees to purchase and the seller agrees to deliver, at a future date, a specified instrument or commodity at a pre-agreed price or yield. Forward contracts are generally not traded on organised exchanges and their contractual terms are not standardised.
Currency swaps: Contracts which commit two counterparties to exchange two streams of interest payments in different currencies for an agreed period of time and/or to exchange principal amounts in different currencies at a pre-agreed exchange rate at maturity.
Currency options: Option contracts that give the right to buy or sell a currency with another currency at a specified exchange rate during a specified period.
OTC Single-Currency Interest Rate Derivatives
Forward-rate agreements (FRAs): Interest rate forward contracts in which the rate to be paid or received on a specific obligation for a set period of time, beginning at some time in the future, is determined at contract initiation. An FRA is an instrument that enables a borrower or lender to fix in advance the interest costs or earnings on a future transaction.
Interest-rate swaps: Agreement to exchange periodic payments related to interest rates on a single currency; can be fixed for floating, or floating for floating based on different indices. This group includes those swaps whose notional principal is amortised according to a fixed schedule independent of interest rates. Interest rate swaps developed so that parties to the swap could exploit their comparative advantage in accessing different markets.
Interest-rate options: Option contracts that give the right to pay or receive a specific interest rate on a predetermined principal for a set period of time. Included in this category are interest-rate caps, floors, collars, corridors, swaptions and warrants.
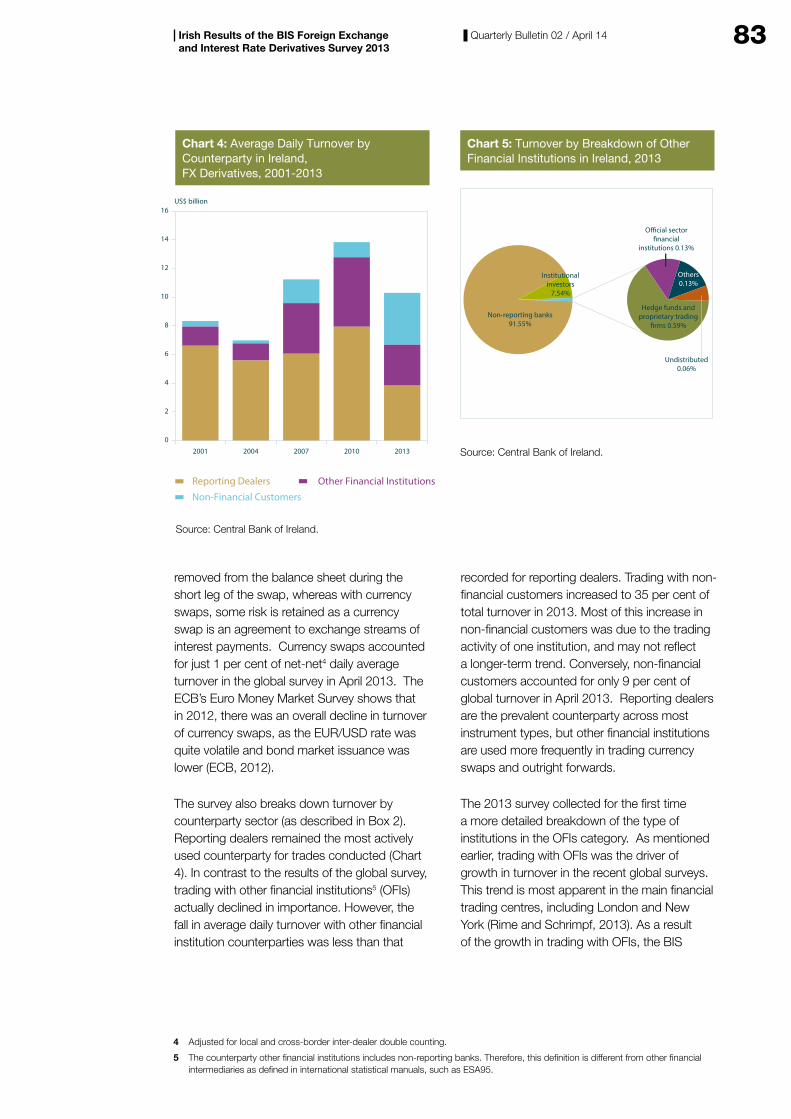
83Quarterly Bulletin 02 / April 14Irish Results of the BIS Foreign Exchange and Interest Rate Derivatives Survey 2013
removed from the balance sheet during the short leg of the swap, whereas with currency swaps, some risk is retained as a currency swap is an agreement to exchange streams of interest payments. Currency swaps accounted for just 1 per cent of net-net4 daily average turnover in the global survey in April 2013. The ECB’s Euro Money Market Survey shows that in 2012, there was an overall decline in turnover of currency swaps, as the EUR/USD rate was quite volatile and bond market issuance was lower (ECB, 2012).
The survey also breaks down turnover by counterparty sector (as described in Box 2). Reporting dealers remained the most actively used counterparty for trades conducted (Chart 4). In contrast to the results of the global survey, trading with other financial institutions5 (OFIs) actually declined in importance. However, the fall in average daily turnover with other financial institution counterparties was less than that
recorded for reporting dealers. Trading with non-financial customers increased to 35 per cent of total turnover in 2013. Most of this increase in non-financial customers was due to the trading activity of one institution, and may not reflect a longer-term trend. Conversely, non-financial customers accounted for only 9 per cent of global turnover in April 2013. Reporting dealers are the prevalent counterparty across most instrument types, but other financial institutions are used more frequently in trading currency swaps and outright forwards.
The 2013 survey collected for the first time a more detailed breakdown of the type of institutions in the OFIs category. As mentioned earlier, trading with OFIs was the driver of growth in turnover in the recent global surveys. This trend is most apparent in the main financial trading centres, including London and New York (Rime and Schrimpf, 2013). As a result of the growth in trading with OFIs, the BIS
4 Adjusted for local and cross-border inter-dealer double counting.
5 The counterparty other financial institutions includes non-reporting banks. Therefore, this definition is different from other financial intermediaries as defined in international statistical manuals, such as ESA95.
US$ billion
Chart 4: Average Daily Turnover byCounterparty in Ireland,FX Derivatives, 2001-2013
Other Financial InstitutionsReporting Dealers
Non-Financial Customers
Source: Central Bank of Ireland.
0
2
4
6
8
10
12
14
16
20132010200720042001 Source: Central Bank of Ireland.
Chart 5: Turnover by Breakdown of OtherFinancial Institutions in Ireland, 2013
Institutionalinvestors
7.54%
Non-reporting banks91.55%
Hedge funds andproprietary trading
�rms 0.59%
O�cial sector�nancial
institutions 0.13%
Undistributed0.06%
Others0.13%
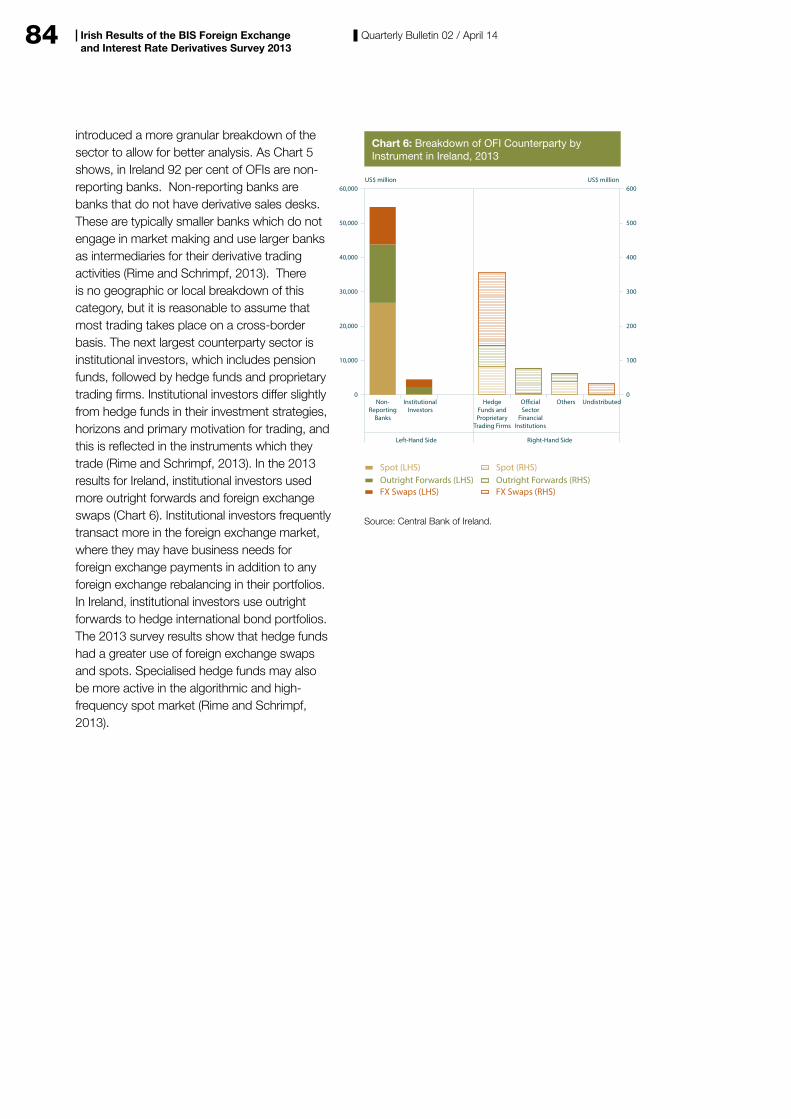
84 Quarterly Bulletin 02 / April 14Irish Results of the BIS Foreign Exchange and Interest Rate Derivatives Survey 2013
introduced a more granular breakdown of the sector to allow for better analysis. As Chart 5 shows, in Ireland 92 per cent of OFIs are non-reporting banks. Non-reporting banks are banks that do not have derivative sales desks. These are typically smaller banks which do not engage in market making and use larger banks as intermediaries for their derivative trading activities (Rime and Schrimpf, 2013). There is no geographic or local breakdown of this category, but it is reasonable to assume that most trading takes place on a cross-border basis. The next largest counterparty sector is institutional investors, which includes pension funds, followed by hedge funds and proprietary trading firms. Institutional investors differ slightly from hedge funds in their investment strategies, horizons and primary motivation for trading, and this is reflected in the instruments which they trade (Rime and Schrimpf, 2013). In the 2013 results for Ireland, institutional investors used more outright forwards and foreign exchange swaps (Chart 6). Institutional investors frequently transact more in the foreign exchange market, where they may have business needs for foreign exchange payments in addition to any foreign exchange rebalancing in their portfolios. In Ireland, institutional investors use outright forwards to hedge international bond portfolios. The 2013 survey results show that hedge funds had a greater use of foreign exchange swaps and spots. Specialised hedge funds may also be more active in the algorithmic and high-frequency spot market (Rime and Schrimpf, 2013).
0
10,000
20,000
30,000
40,000
50,000
60,000
0
100
200
300
400
500
600
Spot (LHS)Outright Forwards (LHS)FX Swaps (LHS)
Spot (RHS)Outright Forwards (RHS)FX Swaps (RHS)
Non-Reporting
Banks
Left-Hand Side Right-Hand Side
InstitutionalInvestors
HedgeFunds andProprietary
Trading Firms
O�cialSector
FinancialInstitutions
Others Undistributed
Chart 6: Breakdown of OFI Counterparty byInstrument in Ireland, 2013
US$ million US$ million
Source: Central Bank of Ireland.

85Quarterly Bulletin 02 / April 14Irish Results of the BIS Foreign Exchange and Interest Rate Derivatives Survey 2013
Box 2: Detailed Description of Counterparties
Reporting Dealers Financial institutions that participate as reporters in the Triennial Survey. These are mainly large commercial and investment banks and securities houses that participate in the inter-dealer market and/or have an active business with large customers, such as large corporate firms, governments and non-reporting financial institutions; in other words, reporting dealers are institutions that actively buy and sell currency and OTC derivatives both for their own account and/or in meeting customer demand. In practice, reporting dealers are often those institutions that actively or regularly deal through electronic platforms, such as EBS or Reuters dealing facilities. This category also includes the branches and subsidiaries of institutions operating in multiple locations that do not have a trading desk but do have a sales desk in those locations that conduct active business with large customers.
Other Financial Institutions Financial institutions that are not classified as reporting dealers in the survey. These are typically regarded as foreign exchange and interest rate derivatives markets end users. They are subdivided into the following categories for the first time in the 2013 survey:
Non-Reporting Banks Smaller or regional commercial banks, publicly owned banks, securities firms or investment banks not directly participating as reporting dealers.
Institutional Investors Institutional investors such as mutual funds, pension funds, insurance and reinsurance companies and endowments. Primary motives for market participation are to trade foreign exchange instruments e.g. for hedging, investing and risk management purposes.
Hedge Funds and Proprietary Trading Firms (i) Investment funds and various types of money managers, including commodity trading advisers which share a combination of the following characteristics:
- they often follow a relatively broad range of investment strategies that are not subject to borrowing and leverage restrictions, with many of them using high levels of leverage;
- they often have a different regulatory mandate than “institutional investors” and typically cater to sophisticated investors such as high net worth individuals or institutions; and
- they often hold long and short positions in various markets, asset classes and instruments, with frequent use of derivatives for speculative purposes.
(ii) Proprietary trading firms that invest, hedge or speculate for their own account. This category may include, for example, specialised high-frequency trading firms that employ high-speed algorithmic trading strategies characterised by numerous frequent trades and very short holding periods.
Official Sector Financial Institutions Central banks, sovereign wealth funds, international financial institutions of the public sector (BIS, IMF, etc.), development banks and agencies.
Other All remaining financial institutions (e.g. retail aggregators) that cannot be classified in any of the four above-mentioned sub-categories for other financial institutions.
Non-Financial Customers Any counterparty other than those described above, i.e. mainly non-financial end users, such as corporations and non-financial government entities. May also include private individuals who directly transact with reporting dealers for investment purposes, either on the online retail trading platforms operated by the reporting dealers or by other means (e.g. giving trading instructions by phone).
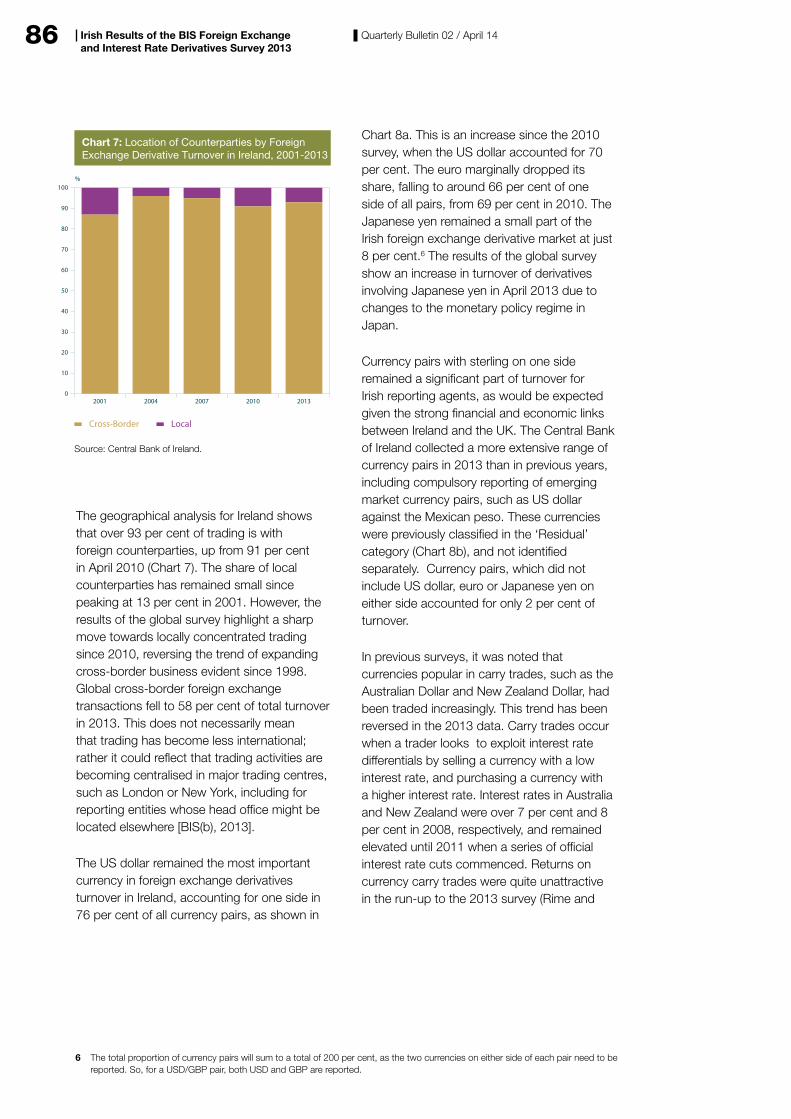
86 Quarterly Bulletin 02 / April 14Irish Results of the BIS Foreign Exchange and Interest Rate Derivatives Survey 2013
The geographical analysis for Ireland shows that over 93 per cent of trading is with foreign counterparties, up from 91 per cent in April 2010 (Chart 7). The share of local counterparties has remained small since peaking at 13 per cent in 2001. However, the results of the global survey highlight a sharp move towards locally concentrated trading since 2010, reversing the trend of expanding cross-border business evident since 1998. Global cross-border foreign exchange transactions fell to 58 per cent of total turnover in 2013. This does not necessarily mean that trading has become less international; rather it could reflect that trading activities are becoming centralised in major trading centres, such as London or New York, including for reporting entities whose head office might be located elsewhere [BIS(b), 2013].
The US dollar remained the most important currency in foreign exchange derivatives turnover in Ireland, accounting for one side in 76 per cent of all currency pairs, as shown in
Chart 8a. This is an increase since the 2010 survey, when the US dollar accounted for 70 per cent. The euro marginally dropped its share, falling to around 66 per cent of one side of all pairs, from 69 per cent in 2010. The Japanese yen remained a small part of the Irish foreign exchange derivative market at just 8 per cent.6 The results of the global survey show an increase in turnover of derivatives involving Japanese yen in April 2013 due to changes to the monetary policy regime in Japan.
Currency pairs with sterling on one side remained a significant part of turnover for Irish reporting agents, as would be expected given the strong financial and economic links between Ireland and the UK. The Central Bank of Ireland collected a more extensive range of currency pairs in 2013 than in previous years, including compulsory reporting of emerging market currency pairs, such as US dollar against the Mexican peso. These currencies were previously classified in the ‘Residual’ category (Chart 8b), and not identified separately. Currency pairs, which did not include US dollar, euro or Japanese yen on either side accounted for only 2 per cent of turnover.
In previous surveys, it was noted that currencies popular in carry trades, such as the Australian Dollar and New Zealand Dollar, had been traded increasingly. This trend has been reversed in the 2013 data. Carry trades occur when a trader looks to exploit interest rate differentials by selling a currency with a low interest rate, and purchasing a currency with a higher interest rate. Interest rates in Australia and New Zealand were over 7 per cent and 8 per cent in 2008, respectively, and remained elevated until 2011 when a series of official interest rate cuts commenced. Returns on currency carry trades were quite unattractive in the run-up to the 2013 survey (Rime and
6 The total proportion of currency pairs will sum to a total of 200 per cent, as the two currencies on either side of each pair need to be reported. So, for a USD/GBP pair, both USD and GBP are reported.
0
10
20
30
40
50
60
70
80
90
100
20132010200720042001
Chart 7: Location of Counterparties by ForeignExchange Derivative Turnover in Ireland, 2001-2013
%
Cross-Border Local
Source: Central Bank of Ireland.
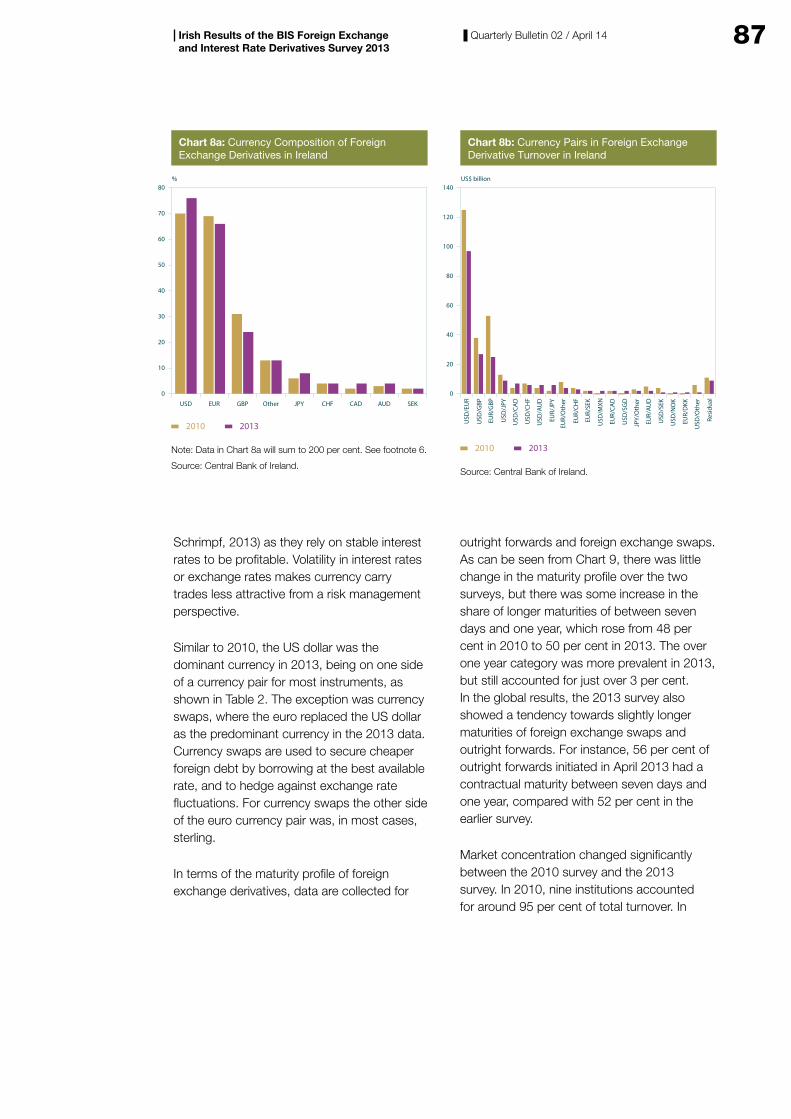
87Quarterly Bulletin 02 / April 14Irish Results of the BIS Foreign Exchange and Interest Rate Derivatives Survey 2013
Schrimpf, 2013) as they rely on stable interest rates to be profitable. Volatility in interest rates or exchange rates makes currency carry trades less attractive from a risk management perspective.
Similar to 2010, the US dollar was the dominant currency in 2013, being on one side of a currency pair for most instruments, as shown in Table 2. The exception was currency swaps, where the euro replaced the US dollar as the predominant currency in the 2013 data. Currency swaps are used to secure cheaper foreign debt by borrowing at the best available rate, and to hedge against exchange rate fluctuations. For currency swaps the other side of the euro currency pair was, in most cases, sterling.
In terms of the maturity profile of foreign exchange derivatives, data are collected for
outright forwards and foreign exchange swaps. As can be seen from Chart 9, there was little change in the maturity profile over the two surveys, but there was some increase in the share of longer maturities of between seven days and one year, which rose from 48 per cent in 2010 to 50 per cent in 2013. The over one year category was more prevalent in 2013, but still accounted for just over 3 per cent. In the global results, the 2013 survey also showed a tendency towards slightly longer maturities of foreign exchange swaps and outright forwards. For instance, 56 per cent of outright forwards initiated in April 2013 had a contractual maturity between seven days and one year, compared with 52 per cent in the earlier survey.
Market concentration changed significantly between the 2010 survey and the 2013 survey. In 2010, nine institutions accounted for around 95 per cent of total turnover. In
0
10
20
30
40
50
60
70
80
SEKAUDCADCHFJPYOtherGBPEURUSD
Chart 8a: Currency Composition of ForeignExchange Derivatives in Ireland
%
2010 2013
Note: Data in Chart 8a will sum to 200 per cent. See footnote 6.
Source: Central Bank of Ireland.
0
20
40
60
80
100
120
140
Resi
dual
USD
/Oth
er
EUR/
DKK
USD
/NO
K
USD
/SEK
EUR/
AUD
JPY/
Oth
er
USD
/SG
D
EUR/
CAD
USD
/MXN
EUR/
SEK
EUR/
CHF
EUR/
Oth
er
EUR/
JPY
USD
/AU
D
USD
/CH
F
USD
/CA
D
USD
/JPY
EUR/
GBP
USD
/GBP
USD
/EU
R
Chart 8b: Currency Pairs in Foreign ExchangeDerivative Turnover in Ireland
US$ billion
2010 2013
Source: Central Bank of Ireland.
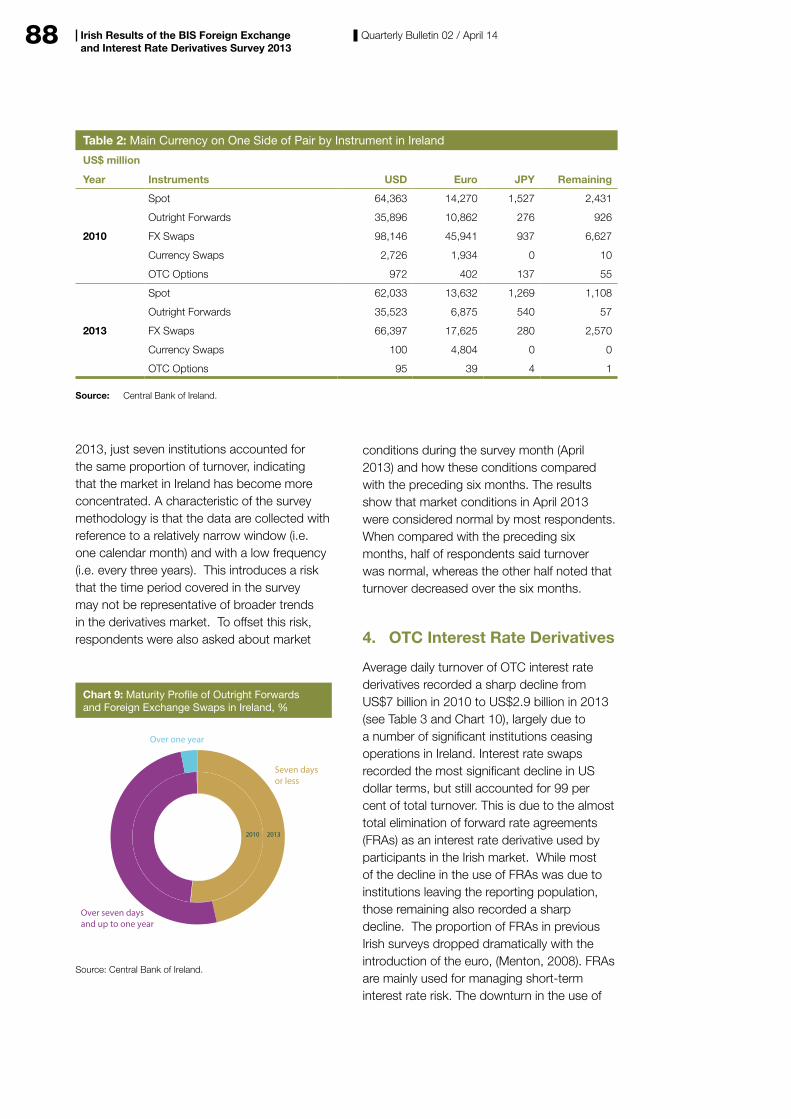
88 Quarterly Bulletin 02 / April 14Irish Results of the BIS Foreign Exchange and Interest Rate Derivatives Survey 2013
2013, just seven institutions accounted for the same proportion of turnover, indicating that the market in Ireland has become more concentrated. A characteristic of the survey methodology is that the data are collected with reference to a relatively narrow window (i.e. one calendar month) and with a low frequency (i.e. every three years). This introduces a risk that the time period covered in the survey may not be representative of broader trends in the derivatives market. To offset this risk, respondents were also asked about market
conditions during the survey month (April 2013) and how these conditions compared with the preceding six months. The results show that market conditions in April 2013 were considered normal by most respondents. When compared with the preceding six months, half of respondents said turnover was normal, whereas the other half noted that turnover decreased over the six months.
4. OTC Interest Rate Derivatives
Average daily turnover of OTC interest rate derivatives recorded a sharp decline from US$7 billion in 2010 to US$2.9 billion in 2013 (see Table 3 and Chart 10), largely due to a number of significant institutions ceasing operations in Ireland. Interest rate swaps recorded the most significant decline in US dollar terms, but still accounted for 99 per cent of total turnover. This is due to the almost total elimination of forward rate agreements (FRAs) as an interest rate derivative used by participants in the Irish market. While most of the decline in the use of FRAs was due to institutions leaving the reporting population, those remaining also recorded a sharp decline. The proportion of FRAs in previous Irish surveys dropped dramatically with the introduction of the euro, (Menton, 2008). FRAs are mainly used for managing short-term interest rate risk. The downturn in the use of
Chart 9: Maturity Pro�le of Outright Forwardsand Foreign Exchange Swaps in Ireland, %
Source: Central Bank of Ireland.
Over one year
Over seven daysand up to one year
Seven daysor less
2010 2013
Table 2: Main Currency on One Side of Pair by Instrument in Ireland
US$ million
Year Instruments USD Euro JPY Remaining
Spot 64,363 14,270 1,527 2,431
Outright Forwards 35,896 10,862 276 926
2010 FX Swaps 98,146 45,941 937 6,627
Currency Swaps 2,726 1,934 0 10
OTC Options 972 402 137 55
Spot 62,033 13,632 1,269 1,108
Outright Forwards 35,523 6,875 540 57
2013 FX Swaps 66,397 17,625 280 2,570
Currency Swaps 100 4,804 0 0
OTC Options 95 39 4 1
Source: Central Bank of Ireland.
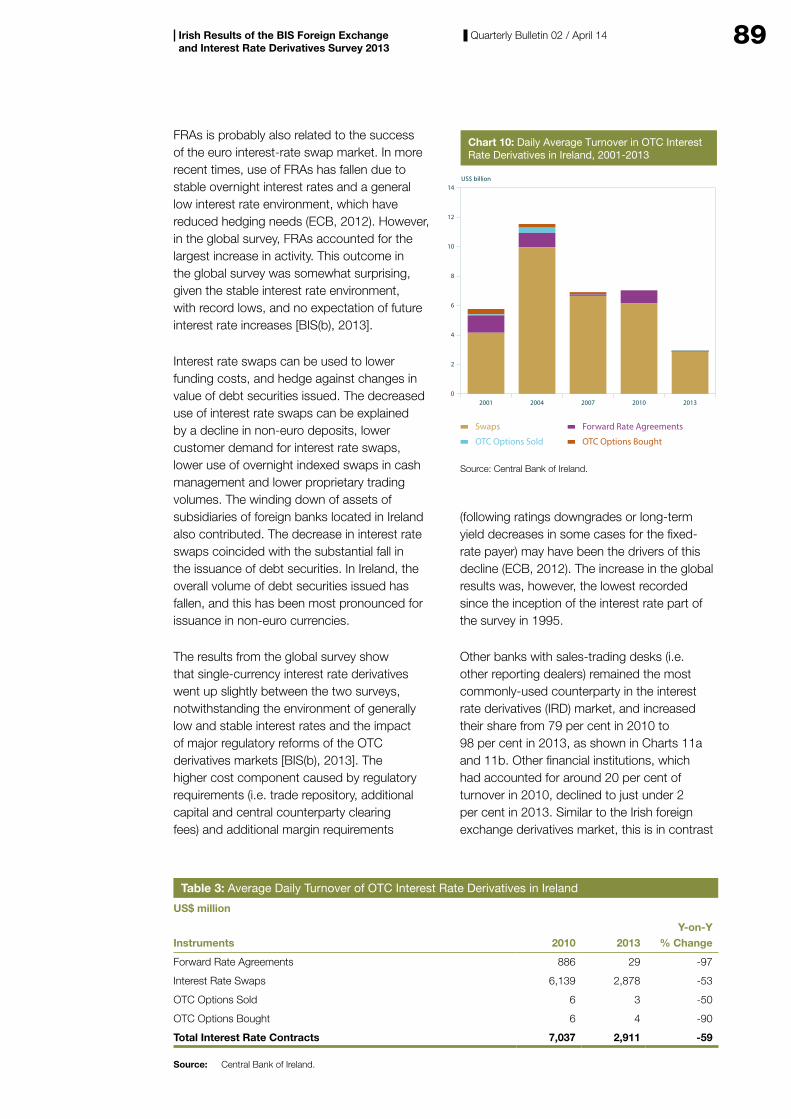
89Quarterly Bulletin 02 / April 14Irish Results of the BIS Foreign Exchange and Interest Rate Derivatives Survey 2013
FRAs is probably also related to the success of the euro interest-rate swap market. In more recent times, use of FRAs has fallen due to stable overnight interest rates and a general low interest rate environment, which have reduced hedging needs (ECB, 2012). However, in the global survey, FRAs accounted for the largest increase in activity. This outcome in the global survey was somewhat surprising, given the stable interest rate environment, with record lows, and no expectation of future interest rate increases [BIS(b), 2013].
Interest rate swaps can be used to lower funding costs, and hedge against changes in value of debt securities issued. The decreased use of interest rate swaps can be explained by a decline in non-euro deposits, lower customer demand for interest rate swaps, lower use of overnight indexed swaps in cash management and lower proprietary trading volumes. The winding down of assets of subsidiaries of foreign banks located in Ireland also contributed. The decrease in interest rate swaps coincided with the substantial fall in the issuance of debt securities. In Ireland, the overall volume of debt securities issued has fallen, and this has been most pronounced for issuance in non-euro currencies.
The results from the global survey show that single-currency interest rate derivatives went up slightly between the two surveys, notwithstanding the environment of generally low and stable interest rates and the impact of major regulatory reforms of the OTC derivatives markets [BIS(b), 2013]. The higher cost component caused by regulatory requirements (i.e. trade repository, additional capital and central counterparty clearing fees) and additional margin requirements
(following ratings downgrades or long-term yield decreases in some cases for the fixed-rate payer) may have been the drivers of this decline (ECB, 2012). The increase in the global results was, however, the lowest recorded since the inception of the interest rate part of the survey in 1995.
Other banks with sales-trading desks (i.e. other reporting dealers) remained the most commonly-used counterparty in the interest rate derivatives (IRD) market, and increased their share from 79 per cent in 2010 to 98 per cent in 2013, as shown in Charts 11a and 11b. Other financial institutions, which had accounted for around 20 per cent of turnover in 2010, declined to just under 2 per cent in 2013. Similar to the Irish foreign exchange derivatives market, this is in contrast
0
2
4
6
8
10
12
14
20132010200720042001
Swaps Forward Rate Agreements
OTC Options Sold OTC Options Bought
Chart 10: Daily Average Turnover in OTC InterestRate Derivatives in Ireland, 2001-2013
US$ billion
Source: Central Bank of Ireland.
Table 3: Average Daily Turnover of OTC Interest Rate Derivatives in Ireland
US$ million
Instruments 2010 2013Y-on-Y
% Change
Forward Rate Agreements 886 29 -97
Interest Rate Swaps 6,139 2,878 -53
OTC Options Sold 6 3 -50
OTC Options Bought 6 4 -90
Total Interest Rate Contracts 7,037 2,911 -59
Source: Central Bank of Ireland.
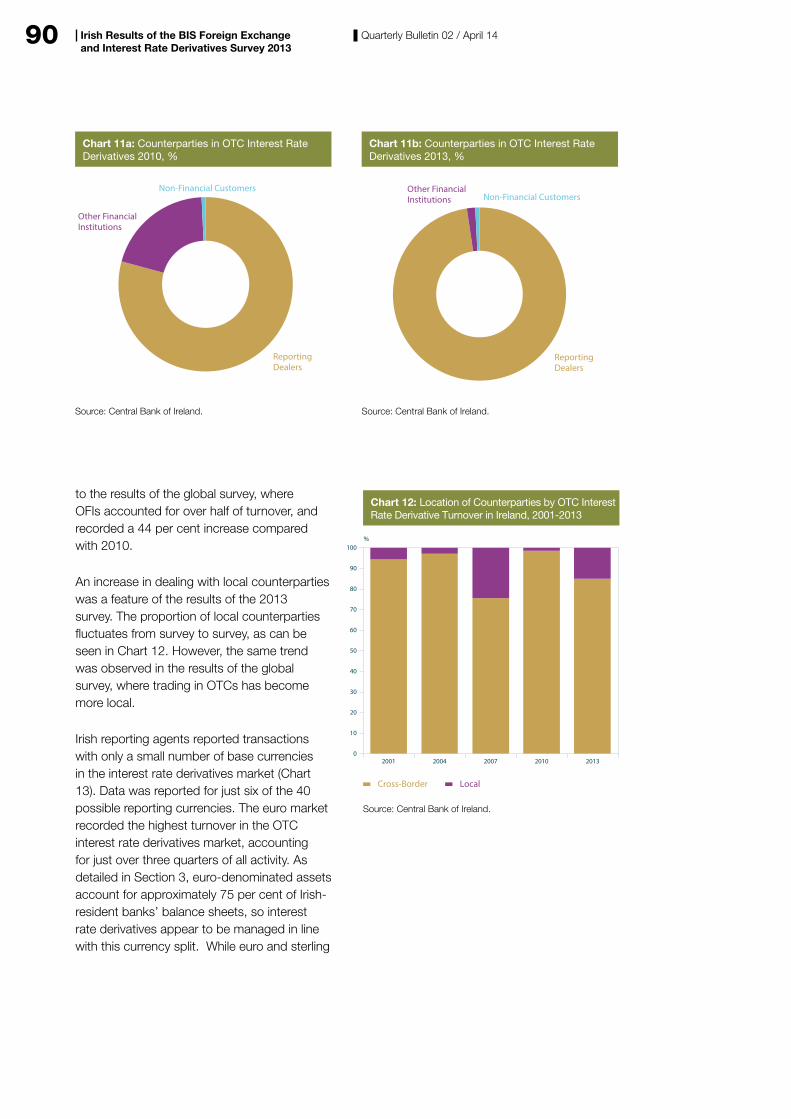
90 Quarterly Bulletin 02 / April 14Irish Results of the BIS Foreign Exchange and Interest Rate Derivatives Survey 2013
to the results of the global survey, where OFIs accounted for over half of turnover, and recorded a 44 per cent increase compared with 2010.
An increase in dealing with local counterparties was a feature of the results of the 2013 survey. The proportion of local counterparties fluctuates from survey to survey, as can be seen in Chart 12. However, the same trend was observed in the results of the global survey, where trading in OTCs has become more local.
Irish reporting agents reported transactions with only a small number of base currencies in the interest rate derivatives market (Chart 13). Data was reported for just six of the 40 possible reporting currencies. The euro market recorded the highest turnover in the OTC interest rate derivatives market, accounting for just over three quarters of all activity. As detailed in Section 3, euro-denominated assets account for approximately 75 per cent of Irish-resident banks’ balance sheets, so interest rate derivatives appear to be managed in line with this currency split. While euro and sterling
Chart 11a: Counterparties in OTC Interest RateDerivatives 2010, %
Source: Central Bank of Ireland.
ReportingDealers
Other FinancialInstitutions
Non-Financial Customers
Chart 11b: Counterparties in OTC Interest RateDerivatives 2013, %
Source: Central Bank of Ireland.
ReportingDealers
Other FinancialInstitutions Non-Financial Customers
0
10
20
30
40
50
60
70
80
90
100
20132010200720042001
Chart 12: Location of Counterparties by OTC InterestRate Derivative Turnover in Ireland, 2001-2013
%
Cross-Border Local
Source: Central Bank of Ireland.
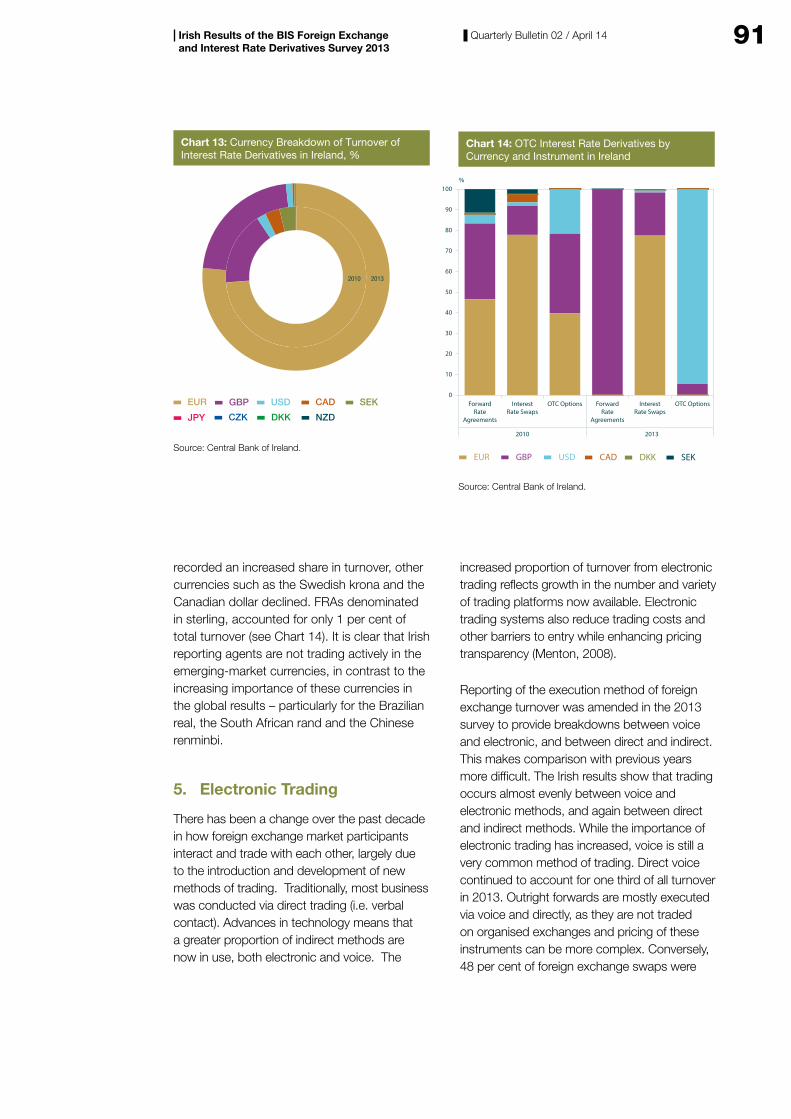
91Quarterly Bulletin 02 / April 14Irish Results of the BIS Foreign Exchange and Interest Rate Derivatives Survey 2013
recorded an increased share in turnover, other currencies such as the Swedish krona and the Canadian dollar declined. FRAs denominated in sterling, accounted for only 1 per cent of total turnover (see Chart 14). It is clear that Irish reporting agents are not trading actively in the emerging-market currencies, in contrast to the increasing importance of these currencies in the global results – particularly for the Brazilian real, the South African rand and the Chinese renminbi.
5. Electronic Trading
There has been a change over the past decade in how foreign exchange market participants interact and trade with each other, largely due to the introduction and development of new methods of trading. Traditionally, most business was conducted via direct trading (i.e. verbal contact). Advances in technology means that a greater proportion of indirect methods are now in use, both electronic and voice. The
increased proportion of turnover from electronic trading reflects growth in the number and variety of trading platforms now available. Electronic trading systems also reduce trading costs and other barriers to entry while enhancing pricing transparency (Menton, 2008).
Reporting of the execution method of foreign exchange turnover was amended in the 2013 survey to provide breakdowns between voice and electronic, and between direct and indirect. This makes comparison with previous years more difficult. The Irish results show that trading occurs almost evenly between voice and electronic methods, and again between direct and indirect methods. While the importance of electronic trading has increased, voice is still a very common method of trading. Direct voice continued to account for one third of all turnover in 2013. Outright forwards are mostly executed via voice and directly, as they are not traded on organised exchanges and pricing of these instruments can be more complex. Conversely, 48 per cent of foreign exchange swaps were
Chart 13: Currency Breakdown of Turnover ofInterest Rate Derivatives in Ireland, %
Source: Central Bank of Ireland.
EUR GBP USD CAD SEK
JPY NZDCZK DKK
2010 2013
0
10
20
30
40
50
60
70
80
90
100
OTC OptionsInterestRate Swaps
ForwardRate
Agreements
OTC OptionsInterestRate Swaps
ForwardRate
Agreements
EUR GBP DKK SEKUSD CAD
2010 2013
Chart 14: OTC Interest Rate Derivatives byCurrency and Instrument in Ireland
%
Source: Central Bank of Ireland.
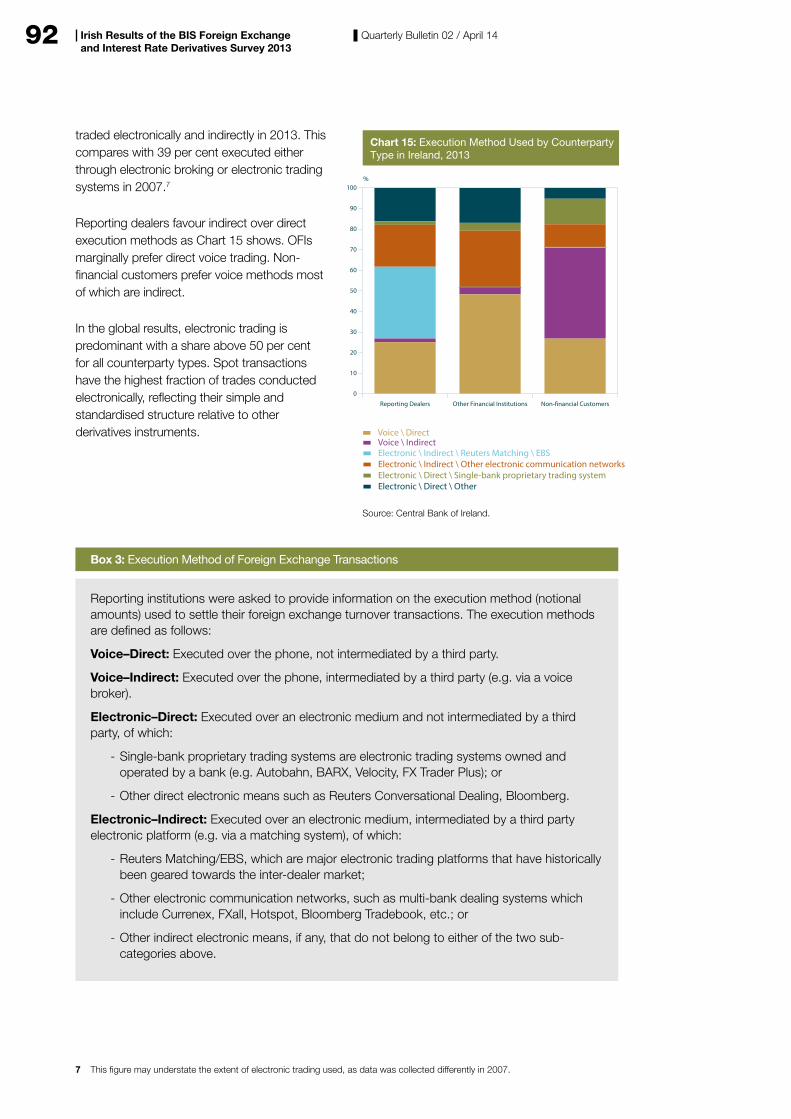
92 Quarterly Bulletin 02 / April 14Irish Results of the BIS Foreign Exchange and Interest Rate Derivatives Survey 2013
traded electronically and indirectly in 2013. This compares with 39 per cent executed either through electronic broking or electronic trading systems in 2007.7
Reporting dealers favour indirect over direct execution methods as Chart 15 shows. OFIs marginally prefer direct voice trading. Non-financial customers prefer voice methods most of which are indirect.
In the global results, electronic trading is predominant with a share above 50 per cent for all counterparty types. Spot transactions have the highest fraction of trades conducted electronically, reflecting their simple and standardised structure relative to other derivatives instruments.
7 This figure may understate the extent of electronic trading used, as data was collected differently in 2007.
0
10
20
30
40
50
60
70
80
90
100
Non-�nancial CustomersOther Financial InstitutionsReporting Dealers
Voice \ DirectVoice \ IndirectElectronic \ Indirect \ Reuters Matching \ EBSElectronic \ Indirect \ Other electronic communication networksElectronic \ Direct \ Single-bank proprietary trading systemElectronic \ Direct \ Other
Chart 15: Execution Method Used by CounterpartyType in Ireland, 2013
%
Source: Central Bank of Ireland.
Box 3: Execution Method of Foreign Exchange Transactions
Reporting institutions were asked to provide information on the execution method (notional amounts) used to settle their foreign exchange turnover transactions. The execution methods are defined as follows:
Voice–Direct: Executed over the phone, not intermediated by a third party.
Voice–Indirect: Executed over the phone, intermediated by a third party (e.g. via a voice broker).
Electronic–Direct: Executed over an electronic medium and not intermediated by a third party, of which:
- Single-bank proprietary trading systems are electronic trading systems owned and operated by a bank (e.g. Autobahn, BARX, Velocity, FX Trader Plus); or
- Other direct electronic means such as Reuters Conversational Dealing, Bloomberg.
Electronic–Indirect: Executed over an electronic medium, intermediated by a third party electronic platform (e.g. via a matching system), of which:
- Reuters Matching/EBS, which are major electronic trading platforms that have historically been geared towards the inter-dealer market;
- Other electronic communication networks, such as multi-bank dealing systems which include Currenex, FXall, Hotspot, Bloomberg Tradebook, etc.; or
- Other indirect electronic means, if any, that do not belong to either of the two sub-categories above.
93Quarterly Bulletin 02 / April 14Irish Results of the BIS Foreign Exchange and Interest Rate Derivatives Survey 2013
6. Conclusion
The article presents Irish and global results of the most recent BIS Triennial Survey of global turnover in foreign exchange and over-the-counter single-currency interest rate derivatives. The survey results for Ireland show a sharp fall in turnover in both foreign exchange and interest rate derivatives since the last survey in 2010, which contrasts with increases for both categories globally. There are two driving factors behind the decline in turnover in Ireland between 2010 and 2013. Firstly, there was a restructuring of the Irish banking market, with some significant institutions exiting the market or moving their sales desk out of Ireland. This was in line with international trends for centralising activities in the major financial centres. Secondly, there was a reduction in derivative activity as the banking sector underwent a period of retrenchment. This retrenchment was most concentrated in the foreign portfolios of domestic banks, thereby reducing the need for hedging of foreign currency and interest rate exposures. Similarly, a restructure of the domestic banking market also contributed to falls in OTC interest rate derivative activity. Derivative transactions in Ireland in 2013 were concentrated in a small number of base currencies, contrary to global
trends, where emerging-market currencies increased in importance. Similar to previous surveys, the dollar remained the predominant currency in foreign exchange derivatives, accounting for one side in three quarters of all currency pairs. Electronic trading has also gained in importance, reflecting an increase in the number and variety of trading platforms, although this increase does not apply to all derivative products. For instance, outright forwards are still executed primarily through direct voice methods.

94 Quarterly Bulletin 02 / April 14Irish Results of the BIS Foreign Exchange and Interest Rate Derivatives Survey 2013
Bibliography
BIS(a), (2013), ‘Triennial Central Bank Survey: Foreign Exchange Turnover in April 2013: Preliminary Global Results’. Monetary and Economic Department, September. www.bis.org
BIS(b), (2013), ‘Triennial Central Bank Survey: OTC Interest Rate Derivatives Turnover in April 2013: Preliminary Global Results’. Monetary and Economic Department, September. www.bis.org
ECB, (2012), ‘Euro Money Market Study’. December. www.ecb.int
Lowes, J. and T. Nenova, (2013), ‘The Foreign Exchange and Over-the-Counter Interest Rate Derivatives Market in the United Kingdom’. Bank of England, Quarterly Bulletin, Q4.
Menton, A. (2008), ‘Irish Results of the BIS Foreign Exchange and Over-the-Counter Derivatives Survey 2007’. Central Bank of Ireland, Quarterly Bulletin No. 2, April.
Rime, D. and A. Schrimpf, (2013), ‘The Anatomy of the Global FX Market Through the Lens of the 2013 Triennial Survey’. BIS Quarterly Review, December.
95
Central Bank Communications: A Comparative StudyBy Danielle Kedan and Rebecca Stuart
Abstract
Central bank communication has increased significantly over the past two decades and has continued to evolve since the onset of the financial crisis. We first discuss the theoretical and empirically measured merits of central bank transparency. We then survey the communication practices of central banks in ten advanced economies, comparing and contrasting their frameworks across press conferences and statements, the publication of minutes and transcripts, the horizon and scope of the forecasts that they publish and the use of forward guidance in its various forms. While the survey provides a snap shot of central banks’ communications at a point in time, where possible we place this in the context of the changing communication environment following the crisis.
The authors work in the Monetary Policy Division. The views expressed are those of the authors and are not necessarily shared by the Central Bank of Ireland or the ESCB. The authors would like to thank John Flynn, Stefan Gerlach and Gillian Phelan for helpful comments.
96 Quarterly Bulletin 02 / April 14
1 Introduction
Central bank communication has increased significantly over the past two decades and has continued to evolve since the onset of the financial crisis. Historically, central banking has carried a certain mystique, inspiring books such as Secrets of the Temple (Greider 1987). Today, however, the Reserve Bank of New York blogs, the Bank of England tweets, the Central Bank of Ireland is on Facebook and Sveriges Riksbank holds live webchats.
In this article we survey the current communications of ten central banks in advanced economies, to compare and contrast the various frameworks.1 We find that while most central banks use similar communication tools, such as press releases and press conferences, the publication of forecasts and minutes, and, more recently, forward guidance, exactly how these tools are employed differs considerably across central banks. For instance, while all central banks communicate using speeches and press releases, the use and timing of press conferences varies across central banks. There is less consensus on the publication of meeting minutes; only half of the ten central banks publish minutes on a timely basis, with varying levels of detail. Many central banks have changed their approach to “forward guidance” since the onset of the financial crisis in 2008. While some central banks provided interest rate forecasts as far back as 1997, the crisis has led to an increase in the use of “forward guidance” on the expected future path of interest rates by central banks, especially as a tool at the zero lower bound.
This article proceeds as follows: we briefly provide a context for the discussion by reviewing the debate on the merits of central bank transparency in Section 2. Section 3 summarises the key features of ten central banks’ current communications practices. The various communications tools are discussed comparatively and in the context of the academic literature. While the analysis provides
a snap shot of central banks’ communications at a point in time, where possible we try to show the impact of the crisis on the communication frameworks of central banks. Section 4 concludes.
2 The evolution of central bank transparency
Prior to the 1990s, the general view within central banking was that monetary policymakers should “say as little as possible, and say it cryptically” (Blinder et al. 2008, p. 2). The shift towards greater transparency was aided by the advent of inflation targeting and the information this conveyed in terms of the policy goals of central banks. In 1993, the Bank of England began publishing its quarterly Inflation Report, which sets out detailed economic analysis and inflation projections on which the Monetary Policy Committee bases its interest rate decisions, a move which influenced the development of other central banks’ publications.2 The Reserve Bank of New Zealand, Norges Bank and Sveriges Riksbank took communications to a new level by introducing a form of forward guidance with the publication of an expected future path for interest rates in 1997, 2005 and 2007, respectively.
The financial crisis has accelerated the shift towards greater transparency and has further increased central banks’ communication. As traditional monetary policy tools, particularly interest rates, have been exhausted, central banks have turned to other means to affect the yield curve. Communication has been one of the main tools used in this respect. Nonetheless, central banks remain extremely careful about how, when and what they communicate. There are good reasons for this; poor communication can lead to misunderstandings within financial markets and with the public, with the result that the effectiveness of policy can be weakened considerably.
Central Bank Communications: A Comparative Study
1 The banks surveyed are: the European Central Bank, Bank of England, Federal Reserve, Bank of Japan, Swiss National Bank, Bank of Canada, Sveriges Riksbank, Norges Bank, Reserve Bank of Australia and Reserve Bank of New Zealand.
2 See Mishkin and Posen (1998).
97Quarterly Bulletin 02 / April 14
2.1 Motivation for transparency
Central bank transparency is a means of reducing information asymmetries between policymakers and markets; in this respect, communication can enhance transparency. There is broad consensus in the literature that transparency may help to enhance policy effectiveness (Bernanke et al. 1999, Cobham et al. 2010) and improve the predictability of monetary policy decisions (Blinder et al. 2008). As suggested by the expectations hypothesis of the term structure of interest rates, monetary policy expectations impact not only short-term interest rates but also long-term interest rates. This is well established in the empirical literature and suggests an important role for central bank communications. Influencing market expectations is a key channel through which monetary policy operates, and policy transparency can allow for better anticipation of central bank actions (Woodford 2005). As noted by Bernanke (2004), monetary policy will be more effective and risk in financial markets should be reduced if communication helps financial markets develop more accurate expectations of the likely future course of policy.
By increasing accountability and serving as a form of self-discipline for policymakers, transparency can further enhance policy effectiveness by supporting the credibility of a central bank in meeting its objectives. This in turn can reinforce support for central bank independence. With a high degree of credibility, central banks can even induce changes in interest rates through a change in the target rate without conducting open market operations. This is explored in the literature on “open mouth” operations (e.g. Guthrie and Wright 2000, Taylor 2001 and Thornton 2004).
Transparency does not imply that perfect information symmetry is necessary or desirable, however. Mishkin (2007, p. 104), for example, describes transparency as a “virtue” but warns that it can go too far if it complicates communication with the public. As noted by Vayid (2013, p. 4), it is important that there is
value in what a central bank communicates. The author makes the distinction between quality and quantity of communications; the former is of course much harder to evaluate than the latter. Following Blinder et al. (2008), central bank communications should only be used to the extent that they raise the “signal-to-noise” ratio by increasing the predictability of central bank actions, thus enabling market participants to make more efficient decisions. Caution is also needed to ensure that communication about its objectives and decision-making process does not jeopardise a central bank’s flexibility to respond to economic shocks.
Transparency is now largely valued by monetary policy makers. A survey of 94 central banks by Fry et al. (2000) shows that 74% consider transparency to be a “vital” or “very important” part of their monetary policy frameworks. Another survey of 84 central bankers by Blinder (2000) indicates that central banks view openness as very important in establishing or maintaining credibility.
2.2 The effects of transparency
A number of researchers have tried to quantify the degree and development of transparency across central banks by constructing “transparency indices”. Eijffinger and Geraats (2006) propose an index that comprises political, economic, procedural, policy and operational aspects of central banking. Their index is compiled for nine major central banks and shows a general trend towards greater transparency over time. Dincer and Eichengreen (2009) construct indices of central bank transparency following the work of Eijffinger and Geraats (2006) for 100 countries and use regression analysis to characterise differences in transparency across countries over time. Their results suggest that transparency is associated with less inflation variability, though not with less inflation persistence. In contrast, van der Cruijsen and Demertzis (2007) find that higher transparency is associated with less inflation persistence in their analysis of inflation for eight industrialised countries.
Central Bank Communications: A Comparative Study
98 Quarterly Bulletin 02 / April 14
Demertzis and Hallett (2007) develop a model of transparency showing that increases in the degree of transparency would decrease volatility in both inflation and output gap levels, but would not affect the average levels of inflation and output achieved. They test their predictions against a numerical transparency index for nine OECD countries using the Eijffinger-Geraats index (2006) to measure transparency and find that all predictions are verified except for the reduction in output volatility; the latter appears to rise as transparency increases.
Chortareas et al. (2002) assess the benefits of transparency, defined with respect to central bank inflation forecasts and forward-looking analysis. Using a dataset for 87 countries, they find that an increase in the detail with which central banks publish forecasts is associated with a lower level and variability of inflation. Their results show a negative, but statistically insignificant, correlation between transparency and output volatility. Nevertheless, they highlight that this provides fairly strong prima facie evidence against claims that increasing transparency would increase output volatility.
Geraats (2009) conducts an extensive review of the theoretical literature on central bank transparency and analyses transparency trends throughout the world and across monetary policy frameworks. Three stylised facts about
monetary policy transparency over the past decade arise from the study: (i) there has been a substantial increase in the disclosure of information by central banks, especially with respect to policy decisions and macroeconomic analysis; (ii) significant differences exist between the degree of information disclosures across monetary policy frameworks, with inflation-targeting central banks experiencing the highest average level and increase in transparency; and (iii) the increase in transparency has been significantly positively correlated with the initial level of inflation and the level of GDP per capita, while there is a significantly negative correlation between transparency and subsequent inflation.
3 Comparative study of current communications practices of major central banks
In this section we analyse the communications of central banks in ten advanced economies, compare their various communication strategies and build a picture of how the modern central bank communicates with financial markets and the broader public.
Before proceeding, it is important to note that this assessment provides a snap shot of communications as they stand in 2014. It does not attempt to judge the quality of those
Central Bank Communications: A Comparative Study
3 We detail some of the major changes in central bank communications during the crisis but do not conduct a comprehensive analysis of all changes in all surveyed countries.
Box 1: Recent changes in communication by the Federal Reserve Board
The Federal Reserve has changed its communication significantly in recent decades. Indeed, Federal Reserve Board Chairman Yellen recently referred to changes in its communication as a “revolution”.4 Only in February 1994 did the Federal Open Market Committee (FOMC) first start announcing changes in the target federal funds rate after its meetings, with further changes in communication adopted over the years since. However, the crisis increased the need for communication. Former Federal Reserve Board Chairman Bernanke was also an advocate for communication in central banking. As early as 2007, Federal Reserve communication on forecasts was increased. In addition to this, the Federal Reserve has detailed its monetary policy strategy, the Chairman now holds a press conference after some FOMC meetings and the Federal Reserve has issued “forward guidance’’ on the expected future path of interest rates.
4 See Yellen (2012) for a discussion.
99Quarterly Bulletin 02 / April 14
communications; this is beyond the scope of the current exercise. Furthermore, as previously noted, there has been a recent shift towards greater communications particularly by central banks in economies most affected by the financial crisis of 2008. Policymakers in these economies have turned to communications as a means of reassuring financial markets that the stance of monetary policy will remain accommodative for as long as warranted by economic conditions. The Federal Reserve is a particularly striking example of this, and Box 1 outlines the changes in its strategy.3
3.1 Verbal communication and press statements
Central banks directly communicate with the public through a number of channels. Table
1 sets out the main tools that the ten central banks in our survey use to communicate. All the central banks, for example, use speeches as a means of communicating their views on topics of relevance to monetary policy and explaining in more detail their stance and outlook. All of the central banks also publish a press release after each policy meeting, regardless of whether or not interest rates are changed. These press releases convey the motivation for each monetary policy decision. This allows the public to form a view on the central bank’s perception of economic conditions and, to some extent, the central bank’s reaction function if there is consistency over time in the central bank’s response to changes in economic conditions. Except for the Reserve Bank of Australia, all of the surveyed central banks also hold press conferences after policy-setting meetings or
Central Bank Communications: A Comparative Study
6 See Vayid (2013) for a discussion.
Box 1: Recent changes in communication by the Federal Reserve Board
The Federal Reserve Act specifies the statutory objectives of maximum employment, stable prices and moderate long-term interest rates. However, the FOMC never explicitly set out its interpretation of this mandate until January 2012, when it issued a statement indicating that it understands price stability as corresponding to a 2% longer-term inflation goal and that it makes its best assessment of the maximum level of employment at any given time, recognising that such assessments are necessarily uncertain and subject to revision. The FOMC also clarified that the personal consumption expenditures index was the inflation measure it focused on. The FOMC reaffirmed this assessment of its strategy in January 2013.
Since 2011, the Chairman holds a press briefing four times a year. Prior to this, a statement was issued after each of the eight annual FOMC meetings. The introduction of regular press briefings was intended to “further enhance the clarity and timeliness of the Federal Reserve’s monetary policy communication”.5
In terms of forecasts, from October 2007 a detailed summary of individual FOMC meeting participants’ economic projections was included as an addendum to the meeting minutes which were published three weeks after the meeting. Since April 2011, an advance version of this table on the ranges and central tendencies of the participants’ projections is released in conjunction with the Chairman’s post-meeting press conference. The survey now also includes participants’ projections of the path of the future short-term interest rates that they see as most likely to achieve the Committee’s goals.
In addition, the Federal Reserve has been iterating on various forms of forward guidance since December 2008. This is discussed in more detail in Section 3.4.
5 See: http://www.federalreserve.gov/newsevents/press/monetary/20110324a.htm.
100 Quarterly Bulletin 02 / April 14
the publication of certain reports. This provides another opportunity for them to explain in detail their reasoning for the current stance of monetary policy and to convey their views on the outlook for policy given their economic projections and broader expectations. In addition, a number of central banks, including the Bank of England, the Bank of Canada, the Federal Reserve and the ECB observe a “blackout” or “purdah” period in advance of rate-setting meetings during which decision-makers do not speak publicly to ensure that the message from the meeting is communicated as clearly as possible.6
3.2 Minutes of monetary policy committee meetings
Monetary policy is set by a committee in all of the surveyed central banks.7 These committees meet to decide interest rates and other policy measures following a discussion of the economic outlook. The way in which these policy deliberations are recorded and published varies across central banks. Publishing meeting minutes and transcripts adds another layer of transparency to monetary policy.
Five of the central banks surveyed release minutes within a few weeks of policy meetings. Current rules for the ECB and Norges Bank only allow the publication of minutes after thirty years and twelve years, respectively. However, over the past year ECB policymakers have publicly discussed publishing accounts of meetings on a timely basis.8 Minutes provide insight into the internal deliberations of policymakers in deciding on the stance of monetary policy. Except for the Reserve Bank of Australia, the minutes of the surveyed central banks provide a breakdown of the number of members voting in favour of or against the decision, as well as the names of the members associated with each position. Sveriges Riksbank’s minutes go one step
further, attributing comments to individual members of the rate-setting committee. Meeting transcripts, which provide much more detail on policy discussions, are released by the Federal Reserve and the Bank of Japan with a lag of five years and ten years, respectively.
There seems to be broad agreement in the academic literature that committee meeting minutes provide useful additional information to market participants and the public. Rosa (2013) finds evidence that the publication of FOMC meeting minutes provides market-relevant information. Boukas and Rosenberg (2006) show that themes in FOMC meeting minutes are correlated with current and future economic conditions. Gerlach-Kristen (2004) shows that the voting record of the Bank of England’s Monetary Policy Committee helps predict future policy changes. Similarly, Apel and Grimaldi (2012) find that information in meeting minutes of the Sveriges Riksbank’s monetary policy committee is also useful in predicting future policy changes.
Does the publication of minutes change the content of what people will say in monetary policy committee meetings? Meade and Stasavage (2008) find that the decision to publish transcripts of FOMC meetings may have resulted in a reluctance among members to offer dissenting opinions. Issing (2005) and Gersbach and Hahn (2013) note that in a currency union, the publication of individual votes could create pressure on individual members to adopt a more national view. On the other hand, Gersbach and Hahn (2008) argue that the publication of minutes with attributed comments or votes increases accountability and thus strengthens members’ incentives to prepare for meetings. Furthermore, a survey of Riksbank monetary policy committee members conducted by Apel et al. (2010) indicated that members generally
Central Bank Communications: A Comparative Study
7 We refer to these generically as “monetary policy committees”, although they have official titles in each central bank; for instance, in the Federal Reserve, the monetary policy committee is called the Federal Open Market Committee (FOMC) and in the ECB it is referred to as the Governing Council.
8 ECB Executive Board members Benoît Cœuré and Jörg Asmussen indicated their personal opinions about the publication of meeting accounts in a joint interview with Süddeutsche Zeitung and Le Figaro published on 29 July 2013 (ECB 2013a). Mr Asmussen reiterated his opinion in a speech on 10 September 2013 (Asmussen 2013). President Draghi stated that “we have started working in the Executive Board and we are continuing to work” on the question of accounts at a post-Governing Council meeting press conference on 5 December 2013 (ECB 2013b).
101Quarterly Bulletin 02 / April 14Central Bank Communications: A Comparative Study
did not support the view that publishing minutes had inhibited the discussion at meetings.
Finally, there are differing opinions about communications by individual members of a policy committee as opposed to the channelling of communications through a single member (e.g. the president or chairman of a board). Bernanke (2004) points out that releasing information on the views of individual members, for example through the publication of minutes, can convey useful information about the diversity of views and the balance of opinion on a committee. However, as Blinder (2007, p. 114) states: “A central bank that speaks with a cacophony of voices may, in effect, have no voice at all.” Apel et al. (2013) provide an interesting contrast between the collegial committee structure of the Norges Bank, and the individualistic committee structure of the Sveriges Riksbank.9 While the Norges Bank monetary policy committee members responded in a way agreeing to
Blinder’s “cacophony problem”, Riksbank monetary policy committee members saw the publication of differing views as a way of improving the public’s understanding of the economic situation. The authors conclude that there may be a status quo bias.
3.3 Macroeconomic forecasts/projections
All of the central banks publish forecasts, analysis and other articles in various formats, such as the Bank of England’s quarterly Inflation Report, the ECB’s Monthly Bulletin and the Reserve Bank of New Zealand’s Monetary Policy Statement.
The main variables for which central banks publish forecasts are headline inflation and GDP.10 In general, the forecast horizon is between 2 and 3 years. However, the Federal Reserve also provides a longer-term forecast. The ECB has recently increased its forecast horizon, and also broadened the scope of its
9 In this setting, an individualistic committee is one in which members are individually accountable for their voting, and decisions are made by majority voting. In contrast, a collegial committee is one which tries to reach unanimity and in the event of conflicting opinions, it publicly stands unified behind the decision.
10 The Bank of Japan forecasts headline CPI excluding fresh food, while the Swiss National Bank is the only central bank not to provide a forecast of GDP.
Box 2: Recent changes to the publication of ECB projections
In June 2013, the ECB published its macroeconomic projections in the form of midpoints and ranges; prior to this, only ranges were published. As noted in the text accompanying the projections: “The publication of midpoints is expected to enhance transparency and further facilitate the communication of the projection results, while ranges should be seen as a means to reflect the uncertainty surrounding the projections” (ECB 2013c, p. 1). The information content of the ECB projections exercise was expanded in late December 2013 with the publication of forecasts for additional variables. Previously, the ECB only published projections for headline HICP and real GDP and its components. From December 2013, projections for employment, unemployment, measures of core inflation, compensation per employee, labour productivity, government budget balances, government debt and current account balances were published.
In March 2014, the ECB extended the horizon of its projection publications, releasing forecasts for 2016. In previous years, the ECB only released its projections for a new year in the December publication of projections. Although forecasts over such a long horizon are subject to greater uncertainty, publishing forecasts further into the future conveys additional information to the public about the central bank’s current expectations for future economic conditions. By releasing the 2016 projections in March of this year, the ECB has lengthened its maximum projection horizon to 2.75 years from 2 years, bringing it more in line with the practice of most of the other surveyed central banks.
102 Quarterly Bulletin 02 / April 14Central Bank Communications: A Comparative Study
projections, which is discussed in Box 2. Most central banks provide a point estimate for their forecasts, sometimes adding a confidence interval around this. In addition, seven of the central banks publish “fan charts” which indicate not only the point forecast but also the degree of confidence attached to this forecast. The Federal Reserve differs somewhat, providing the range of the forecast estimates of individual FOMC members.
Some central banks publish forecasts of other indicators of inflation, the labour market and economic activity. Seven of the surveyed banks publish forecasts of core inflation, which is a narrower and less volatile measure than headline inflation. Five central banks publish forecasts of employment or unemployment, and of these banks, the ECB, Sveriges Riksbank, Norges Bank and the Reserve Bank of New Zealand also publish forecasts of wages or labour costs. These four central banks and the Bank of Canada also forecast some components of GDP and/or potential output or the output gap.
An interesting question is whether an assumption of unchanged monetary policy underlies the forecasts a central bank publishes. The interpretation of projections will be different depending on whether it is assumed that the interest rate moves to address any deviations from target of inflation and, if mandated, output. If the assumption is that monetary policy will be unchanged, then the projection will perhaps indicate inflation above target at some point along the forecast horizon. However, if the forecast incorporates changes in monetary policy, it is less likely that inflation would be significantly above target anywhere in the forecast horizon since it will be assumed that monetary policy will address any deviations to bring inflation back to target. Of the surveyed central banks, the Bank of England, Swiss National Bank and the Reserve Bank of Australia assume unchanged monetary policy, while the others do not.
Some central banks publish a forecast for the interest rate, thus directly providing guidance on its future path. The Reserve Bank of New Zealand (RBNZ), Norges Bank and Sveriges Riksbank all publish interest rate forecasts. The value of these projections is much debated. Winkelmann (2010) shows that the publication of projections by the Norges Bank has reduced financial market participants’ revisions of the expected future policy path. Moessner and Nelson (2008) find that the RBNZ’s interest rate projections have a statistically significant impact on future rates on the announcement day. However, others suggest that interest rate projections may not provide additional information to market participants. Goodhart and Wen (2011) show that the RBNZ’s rate projections are inefficient for horizons greater than two quarters. Mirkov and Natvik (2013) find that policymakers may be constrained in their interest rate decision by their most recently published forecasts.
3.4 Forward guidance
The publication of interest rate projections is one type of “forward guidance”, as they provide explicit information on the central bank’s expected path of future interest rates. A different form was issued by the Federal Reserve through 2003 and 2004. Usually information is provided following a meeting of the FOMC on the stance of monetary policy for the period until the next meeting, however, at that time the FOMC repeatedly issued statements setting out the likely policy stance for a period beyond the next meeting. For instance, in August 2003 it was announced, “policy accommodation can be maintained for a considerable period”.11 During the crisis, iterations of this type of forward guidance have been used as a tool at the zero lower bound by the Federal Reserve, the Bank of Canada, the ECB and the Bank of England.12
The Federal Reserve has been particularly active in this area since 2008, refining and altering the wording of its forward guidance
11 For a discussion, see Contessi and Li (2013).
12 The Bank of Japan was the first central bank to use forward guidance as a tool at the zero lower bound, stating in 1999 that it was committed to a zero interest rate policy “until deflationary concerns are dispelled”. See Okina (2000).
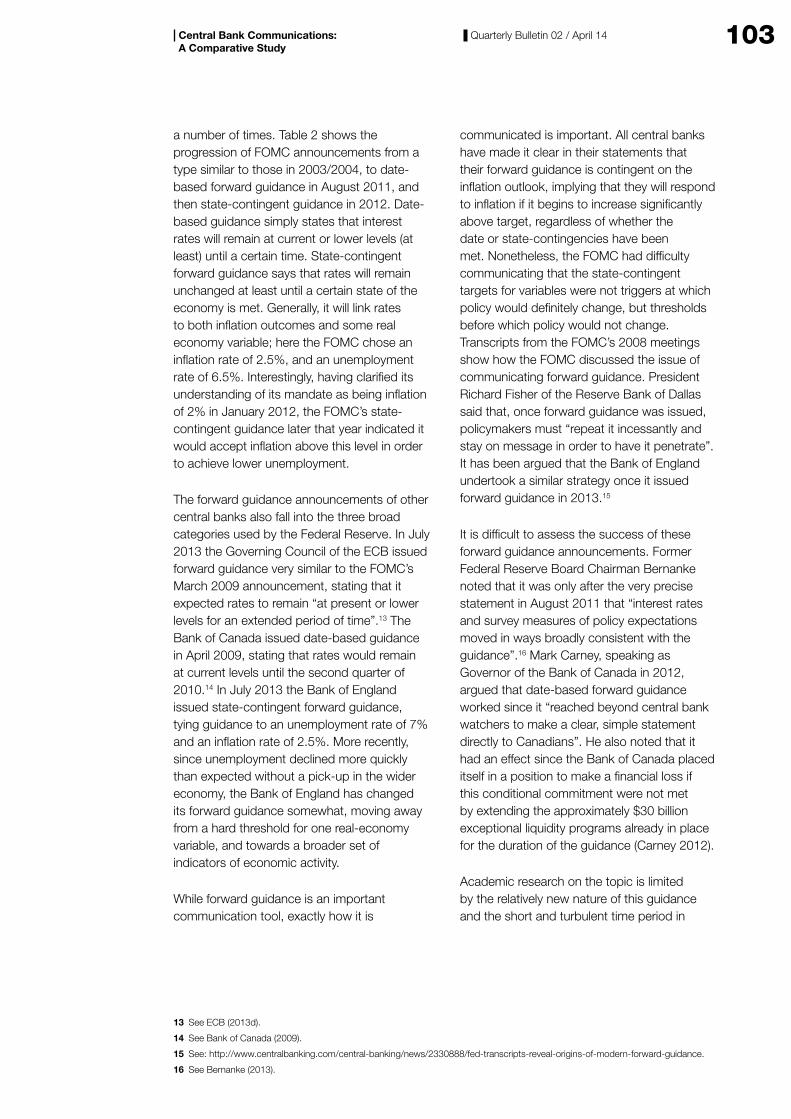
103Quarterly Bulletin 02 / April 14Central Bank Communications: A Comparative Study
a number of times. Table 2 shows the progression of FOMC announcements from a type similar to those in 2003/2004, to date-based forward guidance in August 2011, and then state-contingent guidance in 2012. Date-based guidance simply states that interest rates will remain at current or lower levels (at least) until a certain time. State-contingent forward guidance says that rates will remain unchanged at least until a certain state of the economy is met. Generally, it will link rates to both inflation outcomes and some real economy variable; here the FOMC chose an inflation rate of 2.5%, and an unemployment rate of 6.5%. Interestingly, having clarified its understanding of its mandate as being inflation of 2% in January 2012, the FOMC’s state-contingent guidance later that year indicated it would accept inflation above this level in order to achieve lower unemployment.
The forward guidance announcements of other central banks also fall into the three broad categories used by the Federal Reserve. In July 2013 the Governing Council of the ECB issued forward guidance very similar to the FOMC’s March 2009 announcement, stating that it expected rates to remain “at present or lower levels for an extended period of time”.13 The Bank of Canada issued date-based guidance in April 2009, stating that rates would remain at current levels until the second quarter of 2010.14 In July 2013 the Bank of England issued state-contingent forward guidance, tying guidance to an unemployment rate of 7% and an inflation rate of 2.5%. More recently, since unemployment declined more quickly than expected without a pick-up in the wider economy, the Bank of England has changed its forward guidance somewhat, moving away from a hard threshold for one real-economy variable, and towards a broader set of indicators of economic activity.
While forward guidance is an important communication tool, exactly how it is
communicated is important. All central banks have made it clear in their statements that their forward guidance is contingent on the inflation outlook, implying that they will respond to inflation if it begins to increase significantly above target, regardless of whether the date or state-contingencies have been met. Nonetheless, the FOMC had difficulty communicating that the state-contingent targets for variables were not triggers at which policy would definitely change, but thresholds before which policy would not change. Transcripts from the FOMC’s 2008 meetings show how the FOMC discussed the issue of communicating forward guidance. President Richard Fisher of the Reserve Bank of Dallas said that, once forward guidance was issued, policymakers must “repeat it incessantly and stay on message in order to have it penetrate”. It has been argued that the Bank of England undertook a similar strategy once it issued forward guidance in 2013.15
It is difficult to assess the success of these forward guidance announcements. Former Federal Reserve Board Chairman Bernanke noted that it was only after the very precise statement in August 2011 that “interest rates and survey measures of policy expectations moved in ways broadly consistent with the guidance”.16 Mark Carney, speaking as Governor of the Bank of Canada in 2012, argued that date-based forward guidance worked since it “reached beyond central bank watchers to make a clear, simple statement directly to Canadians”. He also noted that it had an effect since the Bank of Canada placed itself in a position to make a financial loss if this conditional commitment were not met by extending the approximately $30 billion exceptional liquidity programs already in place for the duration of the guidance (Carney 2012).
Academic research on the topic is limited by the relatively new nature of this guidance and the short and turbulent time period in
13 See ECB (2013d).
14 See Bank of Canada (2009).
15 See: http://www.centralbanking.com/central-banking/news/2330888/fed-transcripts-reveal-origins-of-modern-forward-guidance.
16 See Bernanke (2013).
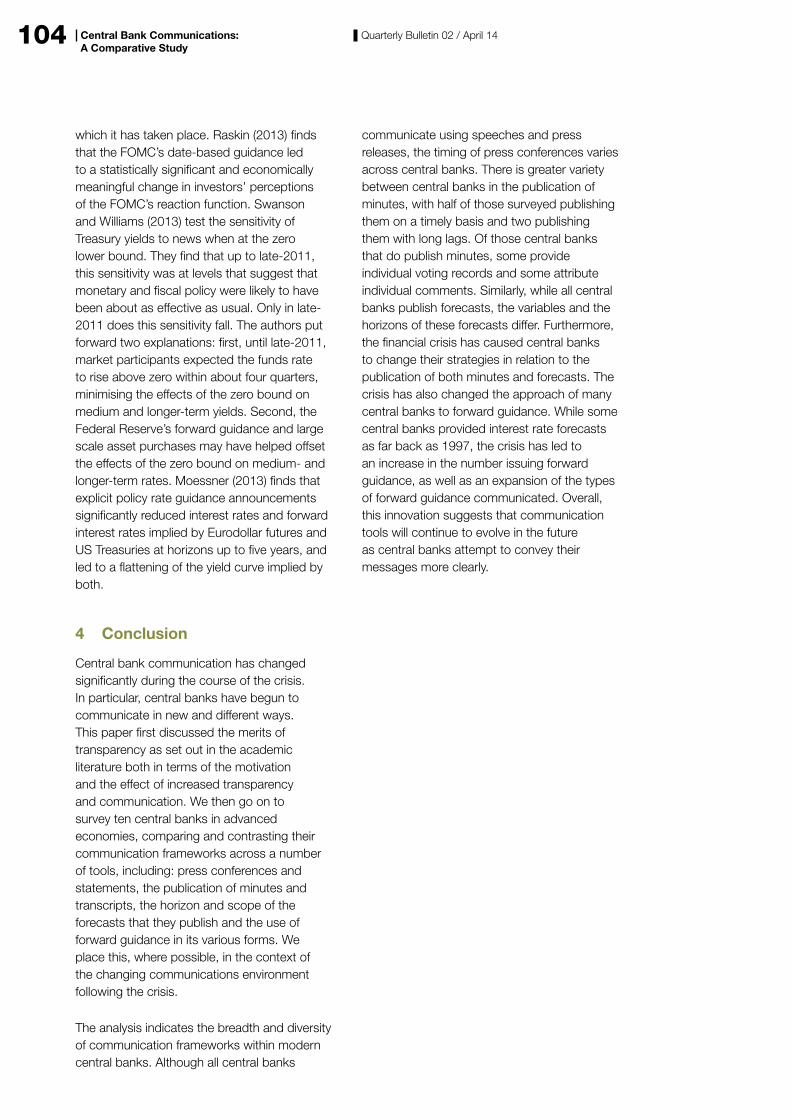
104 Quarterly Bulletin 02 / April 14Central Bank Communications: A Comparative Study
which it has taken place. Raskin (2013) finds that the FOMC’s date-based guidance led to a statistically significant and economically meaningful change in investors’ perceptions of the FOMC’s reaction function. Swanson and Williams (2013) test the sensitivity of Treasury yields to news when at the zero lower bound. They find that up to late-2011, this sensitivity was at levels that suggest that monetary and fiscal policy were likely to have been about as effective as usual. Only in late-2011 does this sensitivity fall. The authors put forward two explanations: first, until late-2011, market participants expected the funds rate to rise above zero within about four quarters, minimising the effects of the zero bound on medium and longer-term yields. Second, the Federal Reserve’s forward guidance and large scale asset purchases may have helped offset the effects of the zero bound on medium- and longer-term rates. Moessner (2013) finds that explicit policy rate guidance announcements significantly reduced interest rates and forward interest rates implied by Eurodollar futures and US Treasuries at horizons up to five years, and led to a flattening of the yield curve implied by both.
4 Conclusion
Central bank communication has changed significantly during the course of the crisis. In particular, central banks have begun to communicate in new and different ways. This paper first discussed the merits of transparency as set out in the academic literature both in terms of the motivation and the effect of increased transparency and communication. We then go on to survey ten central banks in advanced economies, comparing and contrasting their communication frameworks across a number of tools, including: press conferences and statements, the publication of minutes and transcripts, the horizon and scope of the forecasts that they publish and the use of forward guidance in its various forms. We place this, where possible, in the context of the changing communications environment following the crisis.
The analysis indicates the breadth and diversity of communication frameworks within modern central banks. Although all central banks
communicate using speeches and press releases, the timing of press conferences varies across central banks. There is greater variety between central banks in the publication of minutes, with half of those surveyed publishing them on a timely basis and two publishing them with long lags. Of those central banks that do publish minutes, some provide individual voting records and some attribute individual comments. Similarly, while all central banks publish forecasts, the variables and the horizons of these forecasts differ. Furthermore, the financial crisis has caused central banks to change their strategies in relation to the publication of both minutes and forecasts. The crisis has also changed the approach of many central banks to forward guidance. While some central banks provided interest rate forecasts as far back as 1997, the crisis has led to an increase in the number issuing forward guidance, as well as an expansion of the types of forward guidance communicated. Overall, this innovation suggests that communication tools will continue to evolve in the future as central banks attempt to convey their messages more clearly.
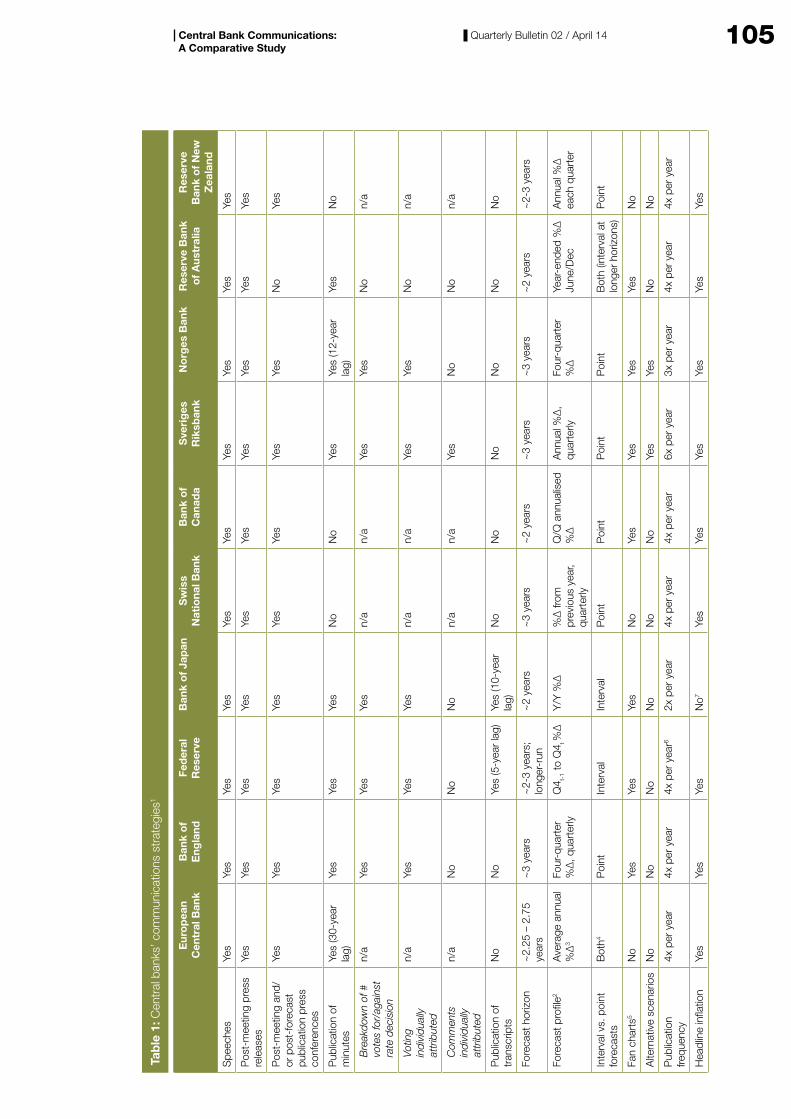
105Quarterly Bulletin 02 / April 14Central Bank Communications: A Comparative Study
Eur
op
ean
Cen
tral
Ban
kB
ank
of
Eng
land
Fed
eral
R
eser
veB
ank
of
Jap
anS
wis
s N
atio
nal B
ank
Ban
k o
f C
anad
aS
veri
ges
R
iksb
ank
No
rges
Ban
kR
eser
ve B
ank
of
Aus
tral
iaR
eser
ve
Ban
k o
f N
ew
Zea
land
Spe
eche
sYe
sYe
sYe
sYe
sYe
sYe
sYe
sYe
sYe
sYe
s
Pos
t-m
eetin
g pr
ess
rele
ases
Yes
Yes
Yes
Yes
Yes
Yes
Yes
Yes
Yes
Yes
Pos
t-m
eetin
g an
d/or
pos
t-fo
reca
st
publ
icat
ion
pres
s co
nfer
ence
s
Yes
Yes
Yes
Yes
Yes
Yes
Yes
Yes
No
Yes
Pub
licat
ion
of
min
utes
Yes
(30-
year
la
g)Ye
sYe
sYe
sN
oN
oYe
sYe
s (1
2-ye
ar
lag)
Yes
No
Bre
akdo
wn
of #
vo
tes
for/
agai
nst
rate
dec
isio
n
n/a
Yes
Yes
Yes
n/a
n/a
Yes
Yes
No
n/a
Votin
g in
divi
dual
ly
attr
ibut
ed
n/a
Yes
Yes
Yes
n/a
n/a
Yes
Yes
No
n/a
Com
men
ts
indi
vidu
ally
at
trib
uted
n/a
No
No
No
n/a
n/a
Yes
No
No
n/a
Pub
licat
ion
of
tran
scrip
tsN
oN
oYe
s (5
-yea
r la
g)Ye
s (1
0-ye
ar
lag)
No
No
No
No
No
No
Fore
cast
hor
izon
~2.
25 –
2.7
5 ye
ars
~3
year
s~
2-3
year
s;
long
er-r
un~
2 ye
ars
~3
year
s~
2 ye
ars
~3
year
s~
3 ye
ars
~2
year
s~
2-3
year
s
Fore
cast
pro
file2
Ave
rage
ann
ual
%Δ
3
Four
-qua
rter
%
Δ, q
uart
erly
Q4 t-
1 to
Q4 t %
ΔY
/Y %
Δ%
Δ fr
om
prev
ious
yea
r, qu
arte
rly
Q/Q
ann
ualis
ed
%Δ
Ann
ual %
Δ,
quar
terly
Four
-qua
rter
%
ΔYe
ar-e
nded
%Δ
Ju
ne/D
ecA
nnua
l %Δ
ea
ch q
uart
er
Inte
rval
vs.
poi
nt
fore
cast
sB
oth4
Poi
ntIn
terv
alIn
terv
alP
oint
Poi
ntP
oint
Poi
ntB
oth
(inte
rval
at
long
er h
oriz
ons)
Poi
nt
Fan
char
ts5
No
Yes
Yes
Yes
No
Yes
Yes
Yes
Yes
No
Alte
rnat
ive
scen
ario
sN
oN
oN
oN
oN
oN
oYe
sYe
sN
oN
o
Pub
licat
ion
frequ
ency
4x p
er y
ear
4x p
er y
ear
4x p
er y
ear6
2x p
er y
ear
4x p
er y
ear
4x p
er y
ear
6x p
er y
ear
3x p
er y
ear
4x p
er y
ear
4x p
er y
ear
Hea
dlin
e in
flatio
nYe
sYe
sYe
sN
o7Ye
sYe
sYe
sYe
sYe
sYe
s
Tab
le 1
: Cen
tral
ban
ks’ c
omm
unic
atio
ns s
trat
egie
s1
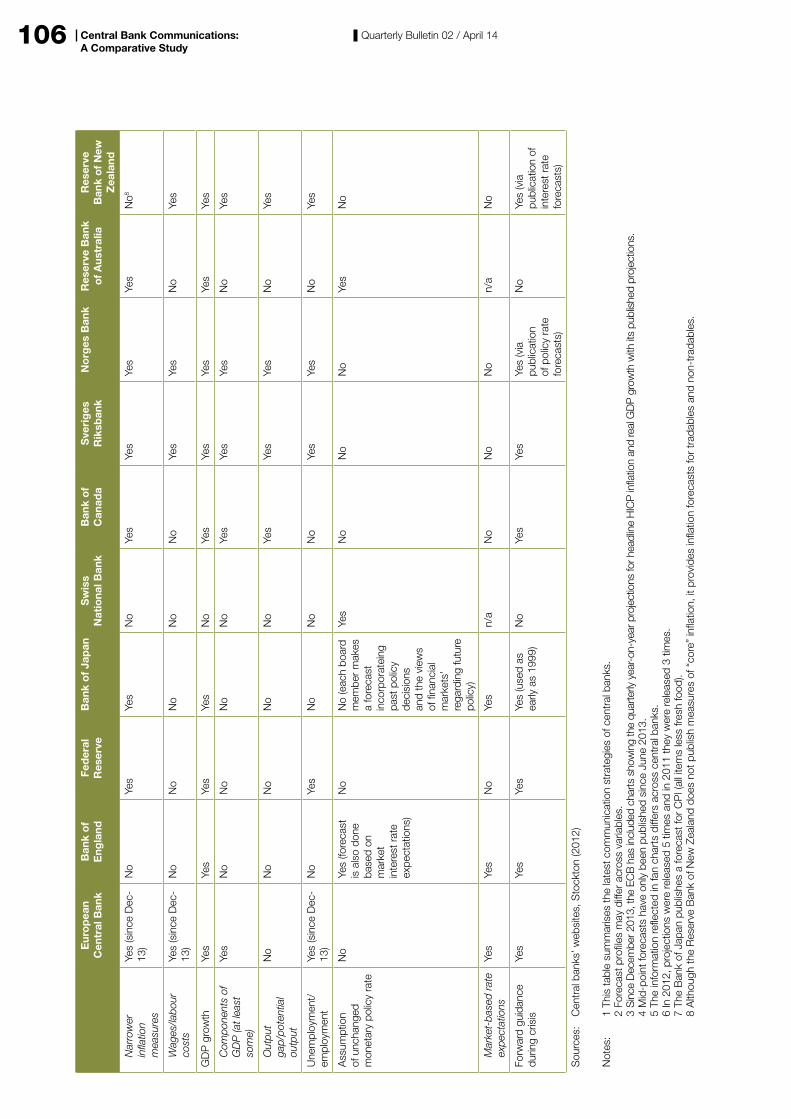
106 Quarterly Bulletin 02 / April 14
Eur
op
ean
Cen
tral
Ban
kB
ank
of
Eng
land
Fed
eral
R
eser
veB
ank
of
Jap
anS
wis
s N
atio
nal B
ank
Ban
k o
f C
anad
aS
veri
ges
R
iksb
ank
No
rges
Ban
kR
eser
ve B
ank
of
Aus
tral
iaR
eser
ve
Ban
k o
f N
ew
Zea
land
Nar
row
er
infla
tion
mea
sure
s
Yes
(sin
ce D
ec-
13)
No
Yes
Yes
No
Yes
Yes
Yes
Yes
No8
Wag
es/la
bour
co
sts
Yes
(sin
ce D
ec-
13)
No
No
No
No
No
Yes
Yes
No
Yes
GD
P g
row
thYe
sYe
sYe
sYe
sN
oYe
sYe
sYe
sYe
sYe
s
Com
pone
nts
of
GD
P (a
t lea
st
som
e)
Yes
No
No
No
No
Yes
Yes
Yes
No
Yes
Out
put
gap/
pote
ntia
l ou
tput
No
No
No
No
No
Yes
Yes
Yes
No
Yes
Une
mpl
oym
ent/
em
ploy
men
tYe
s (s
ince
Dec
-13
)N
oYe
sN
oN
oN
oYe
sYe
sN
oYe
s
Ass
umpt
ion
of u
ncha
nged
m
onet
ary
polic
y ra
te
No
Yes
(fore
cast
is
als
o do
ne
base
d on
m
arke
t in
tere
st r
ate
expe
ctat
ions
)
No
No
(eac
h bo
ard
mem
ber
mak
es
a fo
reca
st
inco
rpor
atei
ng
past
pol
icy
deci
sion
s an
d th
e vi
ews
of fi
nanc
ial
mar
kets
’ re
gard
ing
futu
re
polic
y)
Yes
No
No
No
Yes
No
Mar
ket-
base
d ra
te
expe
ctat
ions
Yes
Yes
No
Yes
n/a
No
No
No
n/a
No
Forw
ard
guid
ance
du
ring
cris
isYe
sYe
sYe
sYe
s (u
sed
as
early
as
1999
)N
oYe
sYe
sYe
s (v
ia
publ
icat
ion
of p
olic
y ra
te
fore
cast
s)
No
Yes
(via
pu
blic
atio
n of
in
tere
st r
ate
fore
cast
s)
Sou
rces
: C
entr
al b
anks
’ web
site
s, S
tock
ton
(201
2)
Not
es:
1 Th
is ta
ble
sum
mar
ises
the
late
st c
omm
unic
atio
n st
rate
gies
of c
entr
al b
anks
. 2
Fore
cast
pro
files
may
diff
er a
cros
s va
riabl
es.
3 S
ince
Dec
embe
r 201
3, th
e EC
B h
as in
clud
ed c
harts
sho
win
g th
e qu
arte
rly y
ear-o
n-ye
ar p
roje
ctio
ns fo
r hea
dlin
e H
ICP
infla
tion
and
real
GD
P g
row
th w
ith it
s pu
blis
hed
proj
ectio
ns.
4 M
id-p
oint
fore
cast
s ha
ve o
nly
been
pub
lishe
d si
nce
June
201
3.
5 Th
e in
form
atio
n re
flect
ed in
fan
char
ts d
iffer
s ac
ross
cen
tral
ban
ks.
6 In
201
2, p
roje
ctio
ns w
ere
rele
ased
5 ti
mes
and
in 2
011
they
wer
e re
leas
ed 3
tim
es.
7 Th
e B
ank
of J
apan
pub
lishe
s a
fore
cast
for
CP
I (al
l ite
ms
less
fres
h fo
od).
8 A
lthou
gh th
e R
eser
ve B
ank
of N
ew Z
eala
nd d
oes
not p
ublis
h m
easu
res
of “
core
” in
flatio
n, it
pro
vide
s in
flatio
n fo
reca
sts
for
trad
able
s an
d no
n-tr
adab
les.
Central Bank Communications: A Comparative Study
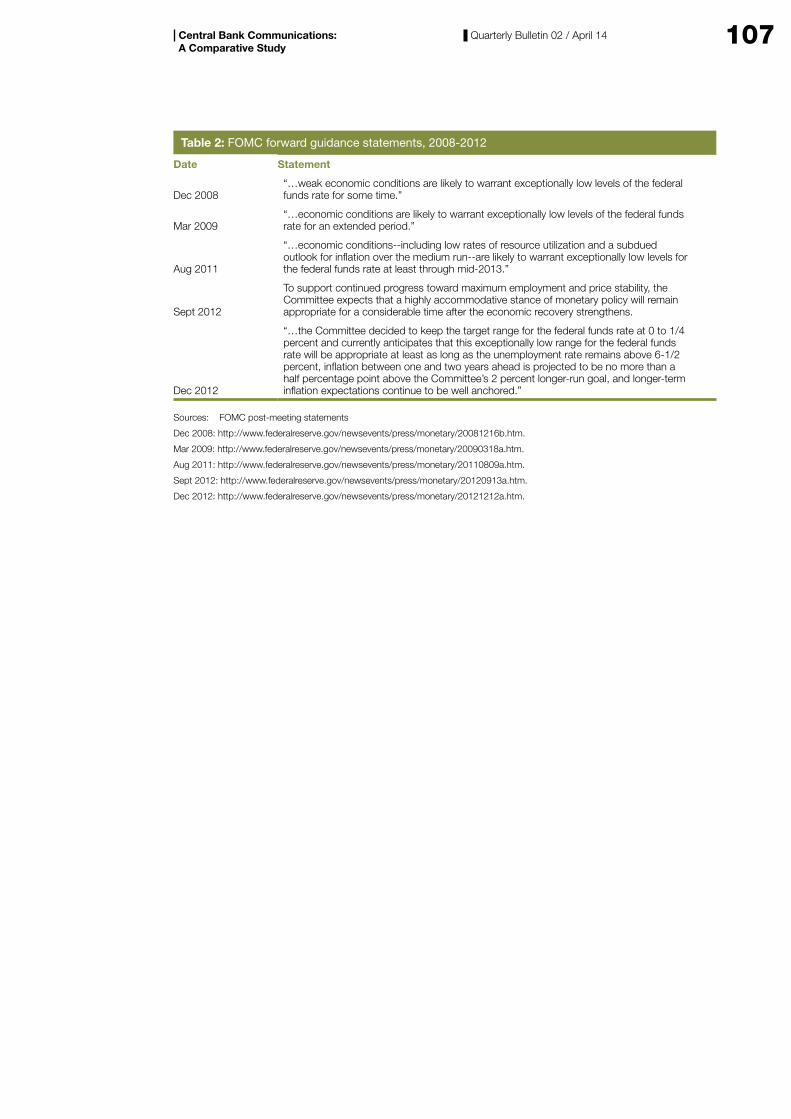
107Quarterly Bulletin 02 / April 14Central Bank Communications: A Comparative Study
Table 2: FOMC forward guidance statements, 2008-2012
Date Statement
Dec 2008“…weak economic conditions are likely to warrant exceptionally low levels of the federal funds rate for some time.”
Mar 2009“…economic conditions are likely to warrant exceptionally low levels of the federal funds rate for an extended period.”
Aug 2011
“…economic conditions--including low rates of resource utilization and a subdued outlook for inflation over the medium run--are likely to warrant exceptionally low levels for the federal funds rate at least through mid-2013.”
Sept 2012
To support continued progress toward maximum employment and price stability, the Committee expects that a highly accommodative stance of monetary policy will remain appropriate for a considerable time after the economic recovery strengthens.
Dec 2012
“…the Committee decided to keep the target range for the federal funds rate at 0 to 1/4 percent and currently anticipates that this exceptionally low range for the federal funds rate will be appropriate at least as long as the unemployment rate remains above 6-1/2 percent, inflation between one and two years ahead is projected to be no more than a half percentage point above the Committee’s 2 percent longer-run goal, and longer-term inflation expectations continue to be well anchored.”
Sources: FOMC post-meeting statements
Dec 2008: http://www.federalreserve.gov/newsevents/press/monetary/20081216b.htm.
Mar 2009: http://www.federalreserve.gov/newsevents/press/monetary/20090318a.htm.
Aug 2011: http://www.federalreserve.gov/newsevents/press/monetary/20110809a.htm.
Sept 2012: http://www.federalreserve.gov/newsevents/press/monetary/20120913a.htm.
Dec 2012: http://www.federalreserve.gov/newsevents/press/monetary/20121212a.htm.

108 Quarterly Bulletin 02 / April 14
References
Apel, M., C. A. Claussen and P. Lennartsdotter (2006). “Picking the Brains of MPC Members”, Sveriges Riksbank Working Paper Series No. 237.
Apel, M. and M. Blix Grimaldi (2012). “The Information Content of Central Bank Minutes”, Sveriges Riksbank Working Paper Series, No. 261.
Apel M., C. A. Claussen, P. Gerlach-Kristen, P. Lennartsdotter and Ø. Røisland (2013). “Monetary policy decisions – comparing theory and ‘inside’ information from MPC members”, Norges Bank Research Working Paper, 2013|03.
Asmussen J. (2013). “The global monetary policy stance: what are the risks?”, remarks at the Bruegel Annual Meeting, Brussels, 10 September.
Bank of Canada (2009). “Bank of Canada lowers overnight rate target by 1/4 percentage point to 1/4 per cent and, conditional on the inflation outlook, commits to hold current policy rate until the end of the second quarter of 2010”, press release, 21 April.
Bernanke, B., T. Laubach, F. S. Mishkin and A. Posen (1999). Inflation Targeting: Lessons from the International Experience, Princeton University Press: Princeton.
Bernanke, B. (2004). “Fedspeak”, remarks at the meetings of the American Economics Association, San Diego, 3 January.
Bernanke, B. (2013). “Communication and Monetary Policy”, remarks at the National Economists Club Annual Dinner, Herbert Stein Memorial Lecture, Washington DC, 19 November.
Blinder, A. S. (2000). “Central-Bank Credibility: Why Do We Care? How Do We Build It?”, American Economic Review, 90(5), p.1421-1431.
Blinder, A. S. (2007). “Monetary Policy by Committee: Why and How?”, European Journal of Political Economy, 23(1), p. 106-123.
Blinder, A. S., M. Ehrmann, M. Fratzscher, J. De Haan and D. J. Jansen (2008). “Central Bank Communication and Monetary Policy: A Survey of Theory and Evidence”, NBER Working Paper, No. 13932.
Boukas, E. and J. V. Rosenberg (2006). “The Information Content of FOMC Minutes”, unpublished paper, Federal Reserve Bank of New York.
Carney, M. (2012). “Guidance”, remarks at CFA Society, Toronto, 11 December.
Chortareas, G., D. Stasavage and G. Sterne (2002). “Does it pay to be transparent? International evidence from central bank forecasts”, Federal Reserve Bank of St. Louis Review, July/August, p. 99-118.
Cobham, D., Ø. Eitrheim, S. Gerlach and J. F. Qvigstad (2010). Twenty years of inflation targeting: Lessons learned and future prospects, Cambridge University Press: Cambridge.
Contessi, S. and L. Li (2013). “Forward Guidance 101A: A Roadmap of the US Experience”, Federal Reserve Bank of St. Louis Economic Synopses, No. 25.
Cruijsen, C. van der and M. Demertzis (2007). “The impact of central bank transparency on inflation expectations”, European Journal of Political Economy, 23(1), p. 51-66.
Demertzis, M. and A. Hallett (2007). “Central bank transparency in theory and practice”, Journal of Macroeconomics, 29(4), p. 760-789.
Dincer, N. and B. Eichengreen (2009). “Central bank transparency: causes, consequences and updates”, NBER Working Paper, No. 14791.
Central Bank Communications: A Comparative Study

109Quarterly Bulletin 02 / April 14
ECB (2013a). “Interview with Süddeutsche Zeitung and Le Figaro”, transcript of joint interview with Benoît Cœuré and Jörg Asmussen conducted by Andrea Rexer (Süddeutsche Zeitung) and Jean-Pierre Robin (Le Figaro) on 23 July and published 29 July.
ECB (2013b). “Introductory statement to the press conference (with Q&A)”, Frankfurt am Main, 5 December.
ECB (2013c). “Eurosystem staff macroeconomic projections for the euro area”, June, https://www.ecb.europa.eu/pub/pdf/other/eurosystemstaffprojections201306en.pdf.
ECB (2013d). “Introductory statement to the press conference”, 4 July, http://www.ecb.europa.eu/press/pressconf/2013/html/is130704.en.html.
Eijffinger, S. and P. Geraats (2006). “How transparent are central banks?” European Journal of Political Economy, 22(1), p. 1-21.
Fry, M., J. Deanne, L. Mahadeva, S. Roger and G. Sterne (2000). “Key issues in the choice of monetary policy framework,” in L. Mahadeva and G. Sterne (eds.), Monetary Policy Frameworks in a Global Context. London: Routledge, p. 1-216.
Geraats, P. (2009). “Trends in Monetary Policy Transparency”, International Finance, 12(2), p. 235-268.
Gerlach-Kristen, P. (2004). “Is the MPC’s Voting Record Informative about Future UK Monetary Policy?”, Scandinavian Journal of Economics, 106, p. 299-313.
Gersbach, H. and V. Hahn (2008). “Information acquisition and Transparency in Committees”, Centre for Economic Policy Research, Discussion paper 6677.
Gersbach, H. and V. Hahn (2013). “Should the ECB publish its minutes?”, Vox article, http://www.voxeu.org/article/should-ecb-minutes-be-published.
Goodhart, C.A.E. and B. L. Wen (2011). “Interest Rate Forecasts: A Pathology”, International Journal of Central Banking, 7(2), p. 3-39.
Greider, W. (1987). Secrets of the Temple: How the Federal Reserve Runs the Country, Simon & Schuster: New York.
Guthrie, G. and J. Wright (2000). “Open mouth operations”, Journal of Monetary Economics, 46, p. 489-516.
Issing, O. (2005). “Communication, Transparency, Accountability: Monetary Policy in the Twenty-First Century”, Federal Reserve Bank of St Louis Review, March/April, 87, p. 65-83.
Meade, E. E. and D. Stasavage (2008). “Publicity of Debate and the Incentive to Dissent: evidence from the US Federal Reserve”, The Economic Journal, 118, p. 695-717.
Mirkov, N. and G. J. Natvik (2013). “Announcements of Interest Rate Forecasts: Do Policymakers Stick to Them?” Norges Bank Research Working Paper, 2013|11.
Mishkin, F. S. and A. Posen (1998). “Inflation Targeting: Lessons from Four Countries”, NBER Working Paper, No. 6126.
Mishkin, F. S. (2007). “Can Central Bank Transparency Go Too Far?”, in Mishkin (ed.), Monetary Policy Strategy. MIT Press: Cambridge, p. 89-107.
Moessner, R. and W. R. Nelson (2008). “Central Bank Policy Rate Guidance and Financial Market Functioning”, International Journal of Central Banking, 4(4), p. 193-226.
Moessner, R. (2013). “Effects of Explicit FOMC Policy Rate Guidance on Market Interest Rates”, DNB Working Paper, No. 384, July.
Okina, K. (2000). “Monetary Policy under Zero Interest Rate: Current Situation and Future Perspective”, lecture presented at Keizai Koho Center, 6 June.
Central Bank Communications: A Comparative Study

110 Quarterly Bulletin 02 / April 14Central Bank Communications: A Comparative Study
Raskin, M. D. (2013). “The Effects of the Federal Reserve’s Date-Based Forward Guidance”, Finance and Economics Discussion series Divisions of Research & Statistics and Monetary Affairs Federal Reserve Board, Washington, D.C., 2013-37.
Rosa, C. (2013). “The Financial Market Effect of FOMC Minutes”, Federal Reserve Board of New York Economic Policy Review, December, p. 67-81.
Stockton, D. (2012). “Review of the Monetary Policy Committee’s Forecasting Capability”, paper presented to the Court of the Bank of England, October.
Swanson, E. T. and J. C. Williams (2013). “Measuring the Effect of the Zero Lower Bound On Medium- and Longer-Term Interest Rates”, Federal Reserve Bank of San Francisco, Working Paper 2012-03, January.
Taylor, J. (2001). “Expectations, Open Market Operations, and Changes in the Federal Funds Rate”, Federal Reserve Bank of St. Louis Review, July/August, p. 33-47.
Thornton, D. (2004). “The Fed and short-term rates: Is it open market operations, open mouth operations or interest rate smoothing?”, Journal of Banking & Finance, 28, p. 475-498.
Vayid, I. (2013). “Central Bank Communications Before, During and After the Crisis: From Open-Market Operations to Open-Mouth Policy”, Bank of Canada Working Paper 2013-41.
Winkelmann, L. (2010). “The Norges Bank’s key rate projections and the news element of monetary policy: a wavelet based jump detection approach”, Humboldt University Berlin SFB Working paper, 62.
Woodford, M. (2005). “Central bank communication and policy effectiveness”, Proceedings – Economic Policy Symposium – Jackson Hole, Federal Reserve Bank of Kansas City, p. 399-474.
Yellen, J. (2012). “Revolution and Evolution in Central Bank Communications”, remarks at Haas School of Business, University of California, November 13.

1Quarterly Bulletin 02 / April 14Section 3
Statistical Appendix

2 Statistical Appendix Quarterly Bulletin 02 / April 14
Statistical AppendixThe publication of the Statistical Appendix of the Quarterly Bulletin was discontinued from Quarterly Bulletin 1 2014. Statistical data compiled by the Central Bank are accessible on the Statistics page of the Central Bank’s website, http://www.centralbank.ie/polstats/stats/Pages/default.aspx. Some tables, previously published in the Statistical Appendix, have been expanded to provide more comprehensive data. A number of statistical tables, which were not published in earlier Bulletins, have also been added.
The list of statistical tables and links to access them on the website are given on the following page.
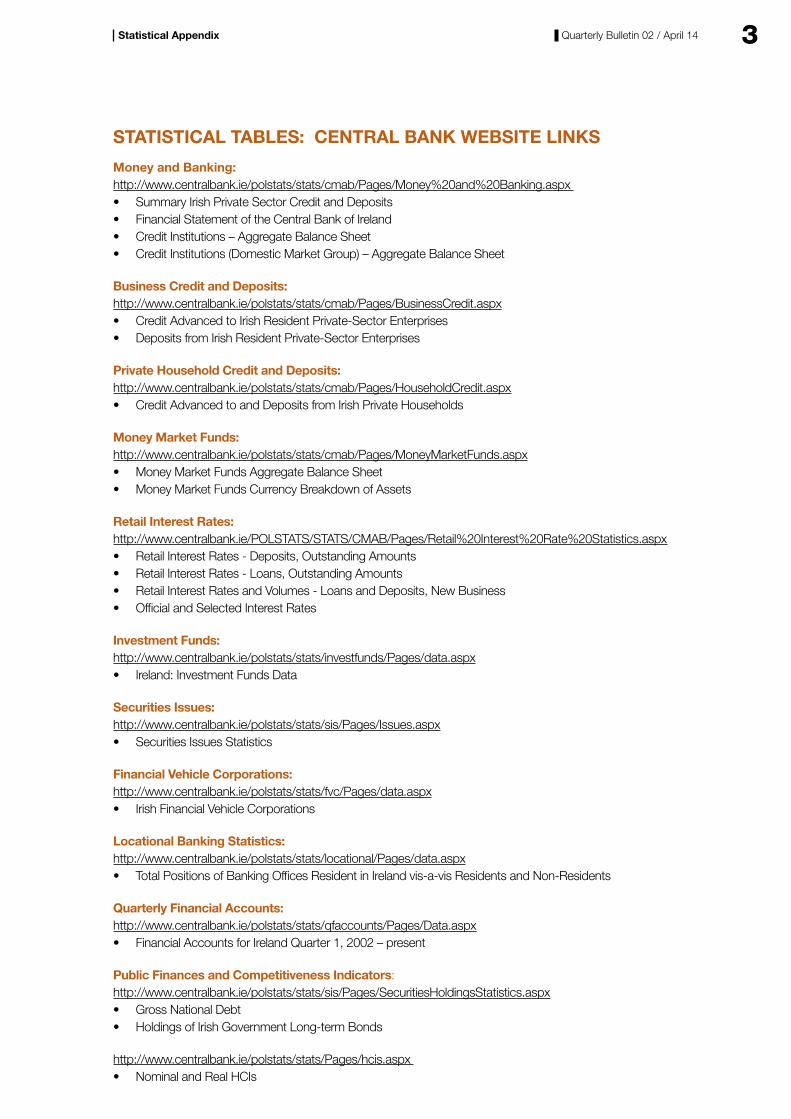
3Quarterly Bulletin 02 / April 14Statistical Appendix
STATISTICAL TABLES: CENTRAL BANK WEBSITE LINKS
Money and Banking: http://www.centralbank.ie/polstats/stats/cmab/Pages/Money%20and%20Banking.aspx • Summary Irish Private Sector Credit and Deposits • Financial Statement of the Central Bank of Ireland • Credit Institutions – Aggregate Balance Sheet • Credit Institutions (Domestic Market Group) – Aggregate Balance Sheet
Business Credit and Deposits: http://www.centralbank.ie/polstats/stats/cmab/Pages/BusinessCredit.aspx • Credit Advanced to Irish Resident Private-Sector Enterprises • Deposits from Irish Resident Private-Sector Enterprises
Private Household Credit and Deposits: http://www.centralbank.ie/polstats/stats/cmab/Pages/HouseholdCredit.aspx • Credit Advanced to and Deposits from Irish Private Households
Money Market Funds: http://www.centralbank.ie/polstats/stats/cmab/Pages/MoneyMarketFunds.aspx • Money Market Funds Aggregate Balance Sheet • Money Market Funds Currency Breakdown of Assets
Retail Interest Rates: http://www.centralbank.ie/POLSTATS/STATS/CMAB/Pages/Retail%20Interest%20Rate%20Statistics.aspx • Retail Interest Rates - Deposits, Outstanding Amounts • Retail Interest Rates - Loans, Outstanding Amounts • Retail Interest Rates and Volumes - Loans and Deposits, New Business • Official and Selected Interest Rates
Investment Funds: http://www.centralbank.ie/polstats/stats/investfunds/Pages/data.aspx • Ireland: Investment Funds Data
Securities Issues: http://www.centralbank.ie/polstats/stats/sis/Pages/Issues.aspx • Securities Issues Statistics
Financial Vehicle Corporations: http://www.centralbank.ie/polstats/stats/fvc/Pages/data.aspx • Irish Financial Vehicle Corporations
Locational Banking Statistics: http://www.centralbank.ie/polstats/stats/locational/Pages/data.aspx • Total Positions of Banking Offices Resident in Ireland vis-a-vis Residents and Non-Residents
Quarterly Financial Accounts: http://www.centralbank.ie/polstats/stats/qfaccounts/Pages/Data.aspx • Financial Accounts for Ireland Quarter 1, 2002 – present
Public Finances and Competitiveness Indicators: http://www.centralbank.ie/polstats/stats/sis/Pages/SecuritiesHoldingsStatistics.aspx • Gross National Debt • Holdings of Irish Government Long-term Bonds
http://www.centralbank.ie/polstats/stats/Pages/hcis.aspx • Nominal and Real HCIs

4 Statistical Appendix Quarterly Bulletin 02 / April 14

5Quarterly Bulletin 02 / April 14Statistical Appendix

6 Statistical Appendix Quarterly Bulletin 02 / April 14


Q2 Central Bank Quarterly Bulletin AP
RIL
14
Quarte
rly Bulle
tin 2
April 14 C
entra
l Bank o
f Irela
nd
T +353 1 224 6278 F +353 1 671 6561 www.centralbank.ie [email protected]
Bosca OP 559, Sráid an Dáma, Baile Átha Cliath 2, Éire PO Box 559, Dame Street, Dublin 2, Ireland