jpl quarterly technical review
TRANSCRIPT
JPL QuarterlyTechnical ReviewVolume 2 April 1972 Number 1
Contents
1 A View of the Moon
R. G. Brereton
12 Mariner Venus-Mercury 1973 Mission Solar ProtonEnvironment: Fluence and Dose
J. R. Thomas
29 JPL Lithium-Doped Solar Cell Development Program
P. A. Berman
37 Methods for Utilizing Maximum Power From a SolarArray
D. K. Decker
49 Mariner Mars 1971 Scan Platform Pointing Calibration
G. D. Pace, G. I. Jaivin, and R.A. Virzi
58 Analysis of Morgantown Vehicle Steering Control
H. S. Lin and E. L. Marsh
72 Lifetime Estimates for Sterilizable Silver-Zinc BatterySeparators
E. F. Cuddihy, D. E. Walmsley, and J. Moacanin
82 Analysis of the Failure of a Polyester Peripheral DriveBelt on the Mariner Mars 1971 Flight Tape Recorder
E. F. Cuddihy

100 Studies on the Frictional Behavior of Magnetic Record-ing Tapes
S. H. Kalfayan, R. H. Silver, and J. K. Hoffman
107 Minimum Impulse Tests of 0.45-N Liquid HydrazineCatalytic Thrusters
P. I. Moynihan
113 Mariner 9 Propulsion Subsystem Performance DuringInterplanetary Cruise and Mars Orbit Insertion
M. J. Cork, R. L. French, C. J. Leising, and D. D. Schmit
123
135
143
152
Surface Tension of Propellants
R. Razouk
Operating Executive for the DSI F Tracking SubsystemSoftware
P. L. Poulson
Interplex: An Analysis of Optimized Power Allocationsfor rwo- and Three-Channel PSK/PM Telecommunications
Systems
B. K. Levitt
Miniature Biotelemeter Gives Multichannel WidebandBiomedical Data
J. B. Carraway
Bibliography of Current Reporting
168 Author Index With Abstracts
261 Subject Index
279 Publication Index
ii
JPL Quarterly Technical Review Volume 2, Number 1 April 1972
Index: Apollo Project, lunar interior,
lunar surface, meteors, soil sciences,solar phenomena
A View of the Moon
R. G. Brereton
Advanced Technical Studies Office
Apollo information on lunar science is now voluminous, and NASA has recognized
the need for a task that would collate and interpret Apollo results and provide a
synthesized view of the Moon. The initial conclusions of such a task carried out at
JPL are reviewed here. In summary, whereas most of the Earth's surface is highly
mobile because of dynamic endogenic and exogenic processes, the hmar surface is
old, stable, and coexists with the ambient environment of space.
The Moon is essentially quiet seismically, does not have a heavy solid or liquid
core, and has a much cooler internal temperature than Earth. The lunar lithosphere
is both old and strong and appears to have been little modified by volcanic or
tectonic activity for more than three billion years.
Introduction
This paper presents some of the pertinent facts of our present knowledgeabout the Moon. From these facts conclusions about the Moon's origin,
history, structure, and processes can be deduced. The most recent source forlunar scientific information was the Third Lunar Science Conference held at
the Manned Spacecraft Center, Houston, Texas, January 10 through January
13, 1972. Proceedings of the First Lunar Science Conference, held in 1970,
have now been published by Pergamon Press (Reference 1). Summaries ofthe scientific achievements of Apollos 11 through 1,5have been published in
Science (Reference 2), and special NASA publications (References 3-6).
Geology and Lunar Rocks
Geomorphically the surface of the Moon can be divided into the dark
mare regions and the lighter-appearing highland regions. The Apollo 11 and
12 samples, as well as the Russian Luna 16 samples, were taken from the
dark mare regions. Apollo 14 Fra Mauro samples appear to represent
material that was gouged out of the lunar crust during the event that formed
the Imbrium Basin. It is highly brecciated and broken, and it is not like the
mare basalts in either composition or texture. The Apollo 15 rocks from
around the Hadley Rille are typically basaltic; however, rocks collected

closerto theApennineFrontarebrecciasliketheApollo14rocksbutwithdifferencesin composition and texture.
The surface of the Moon at the Apollo, Surveyor, Luna 16, and Luna 17
landing sites consists of a regolith of fine particulate material and rocks of
varying size. Weathering is occurring due to the impacts of primary and
secondary particles, and so with prolonged exposure sharp features become
subdued; rocks are progressively comminuted; bright rays fade; and the
regolith thickens. Small primary impacts with velocities of greater than 2
km/s are responsible for the microscopic glass-lined "zap" craters found on
the surfaces of the returned lunar rocks. Larger primaries may have caused
the meter-sized craters with glass on the bottom. The round glass spherules
in the lunar soil are probably melted crater ejecta that froze in flight. Green
glassy sphendes can be recognized in all the Apollo 15 soil samples. Some
rocks are also partly covered with glass that hit the rock while molten and
froze later. The seismometer data indicate that impacts are still occurring.
The fragmental debris layer comprising the lunar "soil" or regolith varies
from perhaps one to several meters deep in the mare landing sites. Most of
the debris layer is comprised of material from local mare rocks; however,
evidence for a foreign component, possibly derived as ejecta from distant
impacts, is very strong. The regolith at the Fra Mauro site is considerably
thicker than at the mare sites. The Active Seismic Experiment suggests a
depth of 8_A m. The greater depth of soil here probably represents a greater
age for Fra Mauro than for the maria; however, the fragmental nature of the
whole Fra Mauro formation has probably made it more susceptible to lunar
surface comminution processes. The regolith at the Apollo 15 site ranged in
thickness from a surface exposure of bedrock along the rim of Hadley Rille
to several tens of meters in areas receiving debris from the Apennine
mountains. The surface exposure of bedrock at the Apollo 15 site was of
great interest, as this was the first time such a feature has been accessible to
direct sampling. The soil from the Hadley Rille area is composed primarily
of reworked mare-type basaltic material, but the soils from sites closer to the
Apennine Front appear to be composed of debris from bedded deposits with
very little mare material evidenced.
The carbon concentration in hmar soils appears to be of the order of 200
parts/106 with much of the carbon appearing in the form of carbon
monoxide. Analysis by several techniques has failed to show organic
compounds in lunar soils. No viable organism has been found in the lunarsamples, and there is no evidence of fossil material. Evidently the lunar
regolith has always been devoid of life.
The Apollo 11 samples from Tranquillity Base consisted of basaltic
igneous rocks, soil, and microbreccias, which are a mechanical mixture of
the soil and sl;lall rock fragments compacted into a coherent rock. The age
of the igneous material is about 3.7 billion years. With regard to the major
elements and texture, the lunar igneous material resembles terrestrial
basalts, with the notable exceptions of high titanium and iron, and low silicaand sodium content. Relative to both cosmic and terrestrial atmndances,

lunarbasaltsaredepletedinwaterandothervolatileelementsandcontainahigherproportionof refractoryelements,includingtitaniumandrare-earthelements.Themainmineralphasesarepyroxene,plagioclase,olivine,andilmenite.Theplagioclasein the Moonbasalts,however,is almostpureanorthite,whereastheplagioclasein terrestrialbasaltsis a solidsolutionseriesformedof a mixtureof albiteand anorthite.Laboratorystudiesindicatethatthemagmafromwhichthelunarbasaltsformedwasverydryandhighlyreducing.Crystallizationoccurredquicklyoverthetemperaturerangeof 1100to 1000°C.Theviscosityof the magmawasanorderofmagnitudelessthanterrestrialbasalts,soit probablyflowedveryeasily.Theconstantassociationof ilmenite,troilite, andnativeiron in theserockssuggeststhat thesemineralsareanequilibriumassemblage,andonethatmusthaveformedin a stronglyreducingenvironmentwith low oxygenfugacity.Thisinformation,inconjunctionwith theconspicuousabsenceofanyhydroxyl-bearingminerals,verylowalkalicontent,andprobablehightemperatureofthemagma,seemsto indicatethatthechemicalcompositionofthesourceofthelunarmarebasaltswassignificantlydifferentfromthosethatcharacterizeterrestrialbasalts.
TheApollo12samplesfromOceanusProcellarumareverysimilarto theApollo11samples,withthemajorexceptionsthattheycontainsignificantlylesstitaniumandareapproximately0.5billionyearsyounger.Generally,theProcellarumbasaltsexhibita greaterrangein mineralcompositionandtexturethanothermarebasalts.Thisrangeinpropertiescanbeattributedtosamplingfromseveralchemicallydistinctbasaltunitsthatwereemplacedsequentially,andcooledatdifferentrates.Evidentlythedarkregionsof theMoon,themarebasins,wereformedfrommanyindividuallavaflowsornearsurfaceintrusionsofbasalticmaterialsome3to4billionyearsago.
Thesourceofthemarebasaltsisakeyscientificquestion.Studiesof thesystematicsofbothmajorandminorelementdistributionsindicatethatthelunarbasalticlavawasgeneratedasapartialmeltofa primordialmaterialseveralhundredkilometersdeepin the lunarinterior.Sincethe basaltsprobablycannotexistatdepthsgreaterthan-300kmwithoutundergoingaphasetransformationto a moredensemineralassemblage(onethatis toodensefortheMoon),it seemsthatmostofwhathasbeenreturnedfromtheMoonsofarprobablyrepresentsaminutedifferentiatedfractionofthelunarinteriorcomposition.
TheApollo14rocksarequitedifferentfromtheApollo11and12rocks,andalsofromtheLuna16material,in color,texture,age,andcomposition.Ingeneral,theFraMaurosampleischaracterizedbyascarcityofcrystallineigneousrocks,muchclasticmaterialor breccia,anda lightercolor.It ishigherinsiliconandaluminumandlowerin iron,titanium,andmagnesiumthanthe basalts.Thecrystallinityandtextureobservedin manyof thefragmentalrocksiscompatiblewitha derivationfroma verylargeimpacteventin whichmuchshockandsubsequentannealingtookplacewithinathickhotejectablanketorbasesurge.Asidefromtheshockandannealingeffects,however,thedifferencesin mineralandchemicalcomposition

betweenthe Apollo14materialandthe marebasaltsaresuchthat theApollo14rocksmustbe regardedasrepresentingadistincttypeof lunarmaterial.Whetheror nottheApollo14rocksrepresentasamplefromanextensiveandhomogeneouslunarsourcematerialcannotyetbespecified.Thesamplingofotherejectablanketsof largeeventswouldberequiredtosolvethisproblem.
CertainlytheFraMauromaterialisnotrepresentativeofuplandmaterial.TheSurveyor7automatedchemicalanalysisofuplandmaterialnearTychoshowstheFraMauromaterialtobericherin titanium,iron,magnesium,andsilicon.Orbitalremotesensinginstrumentsalsoshowadifference.
TheApollo15samplescanbegenerallyclassifiedasbasalts,breccias,andsoil.Thebasaltspredominateattherille collectionsites,whereasbrecciaspredominateatthesitescloserto theApennineFront.Asindicatedearlier,thesoil in theareaof theHadleyRilleappearsto representcomminutedbasalt,whereasthesoilscollectedfromsitescloserto theApennineFrontarebelievedtobecomposedofdebrisfromearlierbeddeddeposits.
Theapparentbeddingor terracingobservedbytheApollo15astronauts,bothfrom orbitandfromthelunarsurface,certainlysuggestsa layeredMoon.ScottandIrwinvividlydescribedandphotographedthe layeringalongthesidesofthescarpof4-km(13,000-ft)HadleyDelta,4.6-km(15,000-ft) Mr.Hadley,andthesidesof HadleyRille.SimilarfeatureswereobservedbyWordenin thecentralpeakof thegiantfarsidecraterTsiolkovsky,andtheyhavebeeninferredfromearlierorbiterphotography.Whetherthisapparentbeddingresultsfromsedimentaryprocesses,individuallavaflows,orrepresentssometypeoffoliationor lineationstructure,isnotyetcertain.As the mariaarebelievedto be layeredby numerouslava flowsandinduratedregolith,somaytheancientpre-marecrustbelayered,andtheImbriumeventhasexposeda greatscarpof thisrockthatis morethan4billionyearsold.
Oneofthemostimportantcontributionsof Apolloto lunarscienceisthatit hasmadepossibletheabsoluteage-datingofselectedlunarmaterial.Priorto the Apollosamplereturnflights,the energy-frequencydistributionofmeteoritesandcratercountstatisticswereusedtodeterminethe"'relative"ageanderosionrateforlunarstratigraphicunits.Althoughthisdataisuseful,it needsto betiedtogetherbyabsoluteage-dates.Isotopicallyderivedage-dates,usingavarietyof techniques,havenowbeendeterminedfor severallunareventsandrockunits.Theageof theTranquillitatisbasaltsis reliablyacceptedas3.7billionyears,theProcellarumbasalts3.2billionyears,whiletheImbriumevent,whichscatteredtheFraMaurorocks,appearsto dateat3.9billionyears.
Theoldestandmostcomplexrockyet acquiredfromthe mareareas(Apollo12,Rock13)iscomposedofangularfragmentsofbasaltcontainedina matrixof lighter coloredmaterial,parts of which are granitic incomposition.It is of interestin terrestrialgeologicstudiesthat graniticmaterialapparentlycanformfromigneousprocesseswithoutgoingthrough

a geosynelinecycleof sedimentationandsubsequentmelting.ThelightermaterialinRock12013appearstohaveinvadedandpartiallyassimilatedthebasalt.The eventoccurredabout4 billion yearsago and reset theradioactiveclocksforboththebasaltandtheinvadingmaterial.
Theoldestrockyetacquiredanddated,theso-called"genesisrock,"waspickedupbyastronautScottonthesecondextravehicularactivity(EVA)oftheApollo15missionwhileheandIrwinwereexploringalongthebaseoftheApennineMountains.Therockhasanapparentageof4.15billionyearsand is closeto anorthositein composition.The"'GreatScott" basaltapparentlydateswiththeProcellarumbasaltsatabout3.2billionyearsold.
Our bestmodelof lunarhistorysuggestsa majorlunar-widechemicalfractionationat about4.6billionyearsago.By analogywith meteoritesamplesandtheEarth,bothofwhichapparentlyformedapproximately4.6billionyearsago,oneconcludesthattheMoonformedat thesametimeastheseotherbodies.It isbelievedthatchemicaldifferentiationformedanancientlow-densitycruston theMoon.Theuplandson thefrontsideandmuchof thebacksidearecomprisedof thismaterialandform theoldestobservablelunarterrain.Greatmeteoritesimpactedtheancientsurfaceandformedthemarebasins.TheImbriumeventis datedby theFra Mauroejectablanketwhichapparentlyhaditsradioactivetimeclockresetatabout3.9billionyearsago.MareHumorumappearsto beolderthanthis,whereasthewest-limbbasinMareOrientaleappearstobeyounger.At anyrate,themajorbasinsontheMoonappeartodatefromthetimeofcrustformationtonearly4billionyearsago.
Sometimeafterthebasinswereformed,theywerefilledwith basalticlava.Basinfillingwasaccomplishedby manythinveryfluidsurfacelavaflowsor shallowintrusions,andthesemaypossiblyalternatewith weldedregolith.Themarelava-flowsweregeneratedmillionsof yearssubsequenttobasinformationandrepresenta majorperiodof lunarvolcanism,lastingfromapproximately3.7billionyearsagotoperhaps3billionyearsago.
Cratercountstatisticssuggestthatmanyuplandcraterswerefilledwithahigheralbedomaterial,withmorphologicalexpressionssimilarto themarebasalts,prior to themajorepisodesof marebasaltflooding.TheDescartesmissionof Apollo16willbetargetedtosamplethistypeofmaterial.
Geophysics
We have approximately two years of seismic data on the Moon. The
Apollo 11 seismometer worked for about 21 days to give the first clue to the
unusual seismic environment of the Moon. The Apollo 12 seismometer has
been operating since November 1969. It was joined by the Apollo 14
instrument in February 1971, and the Apollo 15 instrument in early August
1971, to form a three-station array operating simultaneously on the Moon.
The Apollo 12 and 14 instruments are separated by 181 km, while the Apollo
15 instrument is located approximately 1100 km to the north. This network
of three stations now makes it possible to determine the distance and

location of both meteorite impacts and moonquakes, and it also provides
more qualitative data for studying lunar interior structure and seismicity.
Several hundred seismic signals resulting from moonquakes and meteor-ites have now been observed. In addition to the natural events, several rather
large artificial seismic events have been produced by the impact of the
Apollo 12 hmar module (LM), the Apollo 13 S-IVB, the Apollo 14 S-IVB andLM, and the Apollo 15 S-IVB and LM. The overall characteristics of the
signal for these events are not only mutually similar but also similar to many
natural events. Generally the signals begin small and reach a maximum
intensity after several minutes. The signals for the larger S-IVB impacts as
compared to those for the LM are perhaps 20 to 30 times larger and 4 times
longer (approximately 4 hours versus 1 hour). Similar signals on Earth would
last about 5 min. Apparently the duration of a lunar seismic signal can be
related to the magnitude of the source.
A significant fact revealed by the seismic data is that the Moon isseismically quiet as compared to the Earth. The detected average over the
24 months of operation is approximately 1.5 event per day (1 to 2 magnitude
on the Richter scale). On Earth, several hundred such events occur every
day. Some of these lunar events are caused by moonquakes and some by
meteorites. There appears to be a correlation between events and the
Moon's closest approach to the Earth. The absence of significant seismic
activity within the Moon implies the absence of tectonic processes similar to
those associated with major crustal movements on the Earth, and further
implies lower specific thermal energy ill the hmar interior than is present inthe interior of the Earth.
The lunar seismic net has now located about a dozen epicenters for
moonquakes. The depth of focus for one moonquake area now appears to be
between 700 and 800 km. The deepest known earthquakes are at a depth of
about 700 km. Moonquakes are triggered by the tidal effects of the Earth,
but what processes are operating deep within the Moon to cause an
apparently linear huildup of stress is unknown. The association of some small
moonquakes into "swarms" or groups with characteristics similar to
terrestrial volcanic earthquakes does suggest, however, that volcanic activity
is still taking place on the Moon, and this may be related to the buildup ofcrustal stress.
A second significant fact is the ease with which the Moon transmits
seismic energy. The Moon is a very efficient conductor of seismic energy,
and its transmission properties are far superior to those of the Earth. For
example, the impact of the Apollo 15 LM (26.36°N, 0.25°E) was detected at
the Apollo 15 seismometer located some 93 km away, but it was also
detected at both the Apollo 12 and 14 stations located more than 10(_) km to
the south. On the Earth, signals from such an impact would not be detected
at a range of more than about I(X) kin.
The impact of a meteorite onto the hmar surface gives a seismic signature
similar to those observed for the LM and S-IVB impacts. Many of these have
now beenrecordedanda cumulativemassspectrumfor meteoroidsimpactingtheMoonhasbeenconstructedfromthedata.It seemsthatthetotalmeteoroidmassfluxisafactorof 20lessthanpreviouslyestimated.Intermsof sizeandenergyof the impactingbodies,thesedataindicatethattheMoongetsseveralgrapefruit-sizemeteoriteseveryyear,andapproxi-matelyoneimpactperyearwithkineticenergyequalto thatof theS-IVBimpact.Smallerimpacts,of course,areoccurring.Theseimpactsprobablyrepresenttheprimaryagentfortillingthelunarregolithandgraduallyagingandsubduingtheoutlineofsurfacefeatures.
Theoverallplanetarymagneticfieldof theMoonisnowverysmall.Thiswassuspectedfromboththeoryandearlierdatafromautomatedprobes,butit remainedtobeprovenbyApollo.TheApollo15subsatellitemagnetome-ter data,andalsothe Explorer35orbitalmagnetometermeasurements,indicatea lunarmagneticfieldandperhapsasmuchas3 gamma;however,localizedfieldsthataremuchhigherhavebeenmeasuredonthesurface.Itseemsprobablethat the overalllunar magneticfield, asmeasuredbyorbitingspacecraft,is madeup of localizedfieldscausedby magnetizedmaterialthat acquiredremanenceduringanancientlunarepochwheninducingfieldswerepresentattheMoon.
Measurementsof the magneticfield on the lunar surfaceby the3-componentApollo12magnetometershowasteadyfieldofapproximately38 + 3 gamma, and located within 200 km from the measuring site. The
portable magnetometer used by the astronauts on Apollo 14 measured a
steady magnetic field of 103 _+5 gamma at a site near the LM, and a steady
magnetic field of 43 _+6 gamma 1.12 km distant from the first site along thetraverse in the direction of cone crater. The steady magnetic field being
recorded at the Apollo 15 site is apparently very small, measuring less than
10 gamma.
It seems quite probable that the lunar field as now observed by orbital and
Apollo surface missions represents a fossil remnant of a stronger field
originally frozen into the lunar lavas. Magnetic measurements on lunar
samples indicate that they possibly cooled in a magnetic environment
amounting to about one tenth of the present Earth's field-about 3000
gammas. The source of this ancient inducing field may have been a lunar
magnetic field or electric currents from solar plasma.
Transient solar magnetic fields measured by the Apollo surface magne-
tometer have been analyzed to determine the electrical conductivity of a
three-layered model of the Moon. Analysis of many transients indicates a
best fit to the model for an outer nonconducting layer less than 87 km thick,
an inner spherical shell between 1042 and 1651 km in radius, and a highly
conducting inner core. Putting this in another way, the interplanetary
magnetic field of the solar wind causes a potential difference between the
dark and light side of the Moon, resulting in currents that may be as large as
100,000 A to flow in and through the Moon.
ThemagneticsignalsgeneratedfromsuchcurrentscanbeinterpretedintermsoftheMoon'selectricalconductivity,temperature,composition,anddepth.AnapproximatecalculationforanolivineMoonpresentlysuggestsatemperaturegradientin the outerpart of the Moonof 2°C/kmandamaximumcentraltemperatureof about1000°C.On Earththe averagecrustalgradientisapproximately30°C/kinandthecentraltemperatureisoftheorderof3000°K.
TheLaserRangingRetroreflector(LR3)at theApollo15siteismadeupof300cornerprisms.TheApollo11and14LR3eachhave100corners.TheMcDonaldObservatoryisnowrangingsuccessfullyonall threearrays.TheApollo15arrayis thekeyarrayin thenetworkandis usedfirstin eachsession,sinceit ismoreeasilyacquiredandpermitsaquickcalibrationoftheground-basedinstrumentation,thussimplifyingrangingto theotherarrays.RecentreturnsfromtheApollo11arrayindicatethattherehasbeennomeasurabledegradationto thereflectorsinceitsemplacement.Apollo15completedplansfor emplacingthis experiment,with retroreflectorsdisplacedinbothlatitudeandlongitudeonthelunarsurface.Theinitialdatafrom theApollo11 retroreflectorprovidedrangingaccuraciesof a fewmeters,but continuedobservationsusingthethreestationshavereducedthisto afewcentimeters.Thesignificanceof thesedataisverygreatforprovidinginformationonthemotions,interactions,andbodyphysicsofboththeEarthandtheMoon.Thesedatamayeventuallyprovideamuchbetterdefinitionof theoscillationof theaxisof the Earth(knownasChandler'swobble),andonthepresentrateofcontinentaldrift.
SeveralApolloexperimentsaredesignedto provideinformationaboutthefieldsandparticlesenvironmentoftheMoon.Wehavealreadydiscussedthemagnetometerdata,but threeotherexperiments--theSuprathermalIonDetectorExperiment(SIDE),theSolarWindSpectrometer(SWS),andtheColdCathodeGaugeExperiment(CCGE)--alsohaveprovidedimportantinformation.
TheSIDEs,inadditiontoprovidingdataonnaturallunarionphenomena,haveprovedtobesosensitivethattheyalsodetectionsgeneratedbyimpactevents.Thusimpactsof all theApollostages,aswellasa relativelylargemeteoriteimpactthatwasalsorecordedby the Apollo14seismometer,havenow beenstudied.Of particularinterestin the SIDEdata is thereporteddetectionof whatisbelievedto havebeena transientcloudofwatervapor.ThephenomenonwasdetectedonboththeApollo12and14SIDEinstruments.Thecloudpersistedfora periodof about14hours,andseemsto haveoccurredsimultaneouslywith an extendedperiod ofmoonquakes.It isspeculatedthatthelunarquakingpermittedwaterinsomeformto finditswayto thesurfacewhereit wasimmediatelyvaporizedinthehmarvacuumandsubsequentlyionizedbysolarradiation.
TheColdCathodeGaugeExperiment,alsoreferredto as the lunaratmospheredetector,hasproducedsomeinterestingdataon thedensityofneutralatomicparticlesat thelunarsurfaceandthevariationsin densitythatoccurasaresultof lunarphases,solaractivity,meteoriteimpactand

perhapssurfacegasventing.Theinstrumentmeasurestheneutralparticledensityandthe ambienttemperatureand from this data the lunaratmosphericpressurecanbe calculated.Ambientpressureon the lunarsurfaceappearsto beabout6.7× 10-l° N/mz (5 × 10 -12 torr), however,
there appear to be many transients in this value. Some of these pressure
changes have been correlated with activities on the other particle detectors,and with seismic activities.
The surface SWS at the Apollo 12 Procellarum site has now been
operating for approximately two years. It was joined by the Apollo 15
instrument in August 1971 to form a two-station array. Analysis of the SWS
data shows that the plasma environment of the lunar surface changes during
a lunation as a function of the positions of the Sun, Earth, and Moon. Four
plasma regions or periods have now been recognized. Thus during two
periods of a typical lunation the SWS instruments detect no plasma. One of
these, called the lunar wake, occurs during the entire 14-day lunar nightwhen the Moon itself shields the instrument site from the Sun. The second,
lasting for 4.5 days, occurs when the body of the Earth is between the Moon
SWS site and the Sun. In this configuration the geomagnetic tail region of
the Earth excludes the bulk of the plasma. On either side of the tail region is
a transition region where plasma that has been less strongly perturbed by
the Earth's field is measured for a duration of about three days. Finally, there
are five days when the observed plasma parameters are consistent with those
that have been observed on various space probes far away from any
planetary body, confirming that the undisturbed solar plasma does reach the
lunar surface during these periods.
As indicated, transient gas clouds have been measured by some of the
Apollo Lunar Surface Experiments Package (ALSEP) instruments. Astronaut
Worden, during his time in orbit, spotted volcanic cinder cones at several
points on the surface. This information, plus numerous color flashes and gas
clouds previously observed from Earth and the moonquake swarms, suggest
that local volcanic activity may still be taking place on the Moon. A site
which apparently displays such volcanic manifestations is a candidate for the
Apollo 17 mission.
Orbital Science
All data now show that the farside of the Moon is different from the
frontside in many significant ways-structurally, chemically, and topographi-
cally. The Laser Altimeter on Apollo 15, along with precision tracking
information, clearly shows that the frontside of the Moon is depressed
between 2 and 5 km below what might be called the lunar geoid or sea level,
while the farside is elevated by a similar amount. Also the lunar center of
mass appears to be displaced about 2 km in a direction 37°E of the direction
of the Earth. There are also smaller-scale topographic differences. The
craters on the farside appear to be steeper walled than frontside craters. The
deepest crater yet measured, Gagarin, is located on the farside, and it is
about 6.5 km deep. There are other large farside circular basins such as
9

Apollo, Hertzsprung, and Korolev, to name only a few; however, thesecraters are not filled with dark mare material as similar frontside structures
are, but rather they are apparently "dry," or at most only partially filledwith material of higher albedo than mare basalt.
The subsatellite magnetometer, launched by Apollo 15, confirms the
presence of a small regional backside magnetic anomaly, and this is certainly
consistent with the previous data in indicating a fundamental difference in
the crustal structure between the two hemispheres of the Moon.
The name "mascon" was originally coined as an acronym for the apparentmass concentrations found within certain frontside circular mare basins. The
subsatellite S-band transponder launched by Apollo 15 is providing newmascon data. Numerous gravity anomalies resulting from these features have
now been mapped. Mascons represent a load on the lunar crust that has
apparently been maintained for several billion years. This suggests that the
crust of the Moon is comparatively stable, rigid, and strong. In contrast, theEarth's crust is mobile, overlies a subjacent asthenosphere, and is renewed
over a time cycle of a few hundred million years. The heat engine of theMoon is much less active than the Earth's.
The X-Ray Spectrometer, carried by Apollo 15 in orbit around the Moon,
shows the highlands of the Moon to be richer in aluminum than the mare
basins. The eastern highlands are two to three times higher in aluminumcontent than are the mare basins. The aluminum-silicon ratios for the
highlands east of the Sea of Fertility correspond to those for anorthosite or
gabbroic anorthosite. The lunar farside highlands are apparently very high in
aluminum content, whereas the Apennine highlands are lower in aluminum
than eastern frontside highlands, but higher than any of the circular maria.
From all of these observations, a picture of the Moon has emerged which,
though much more definitive than previous knowledge would permit, still
leaves unanswered some major questions as to the origin and constitution ofthe Moon. In particular, the question of fission, capture, or joint accretion
with Earth remains unsettled. However, our acceptable range of models for
the Moon has been greatly narrowed, and this is important progress in thefield of planetology.
References
1. Proceedings of the Apollo 11 Lunar Science Conference, Vols. I, II,
and III, Pergamon Press, New York, 1970.
2. Science, Vol. 167, No. 3918, Jan. 30, 1970.
3. Apollo 11 Preliminary Science Report, NASA SP-214, National
Aeronautics and Space Administration, Washington, D.C., 1969.
4. Apollo 12 Preliminary Science Report, NASA SP-235, National
Aeronautics and Space Administration, Washington, D.C., 1970.
lO

.
.
Apollo 14 Preliminary Science Report, NASA SP-272, National
Aeronautics and Space Administration, Washington, D.C., 1971.
Apollo 15 Preliminary Science Report, NASA SP-289, National
Aeronautics and Space Administration, Washington, D.C. (in press).
11
JPL Quarterly Technical Review Volume 2, Number 1 April 1972
Index: Mariner Venus-Mercury
1973 Project, solar phenomena
Mariner Venus-Mercury 1973 Mission SolarProton Environment: Fluence and Dose
J. R. Thomas
The Boeing Company
The solar proton environment of Mariner Venus-Mercury 1973 (MVM73) may be
the most severe yet encountered in space missions, because the trajectory by
Mercury brings the spacecraft significantly closer to the Sun than that of any
previous exploration. This study presents a derivation of proton fluence over the
duration of the mission in terms of a relatively constant low-energy component, the
solar wind, and a probabilistic high-energy component from discrete solar events. An
updated correlation of yearly energetic proton fluence with yearly average sunspot
number is presented. This correlation and sunspot cycle forecasts for the period of
the MVM73 mission (late 1973 through early 1975) form the basis for the high-
energy proton fluence estimates with various confidence levels. Uncertainties in the
probability estimates and in calculation of the scaling with distance from the Sun are
discussed. Selection of a particular 95-percentile model as the design constraint is
recommended along with reasons for not using the worst-case model. Interior
fluences are calculated and expressed in terms expected to be useful for spacecraft
design.
Introduction
The solar proton flux is the major possible radiation hazard to the MVM73
mission, for the following reasons:
(1) MVM73 will fly closer to the Sun than any previous mission.
(2) The physics of proton acceleration by the Sun and proton propaga-tion from Sun to Earth is not well understood.
(3) On occasion (albeit infrequently) the Sun has produced hazardous
fuxes of energetic protons (typically 1 MeV to 1 GeV) in flare events.
(4) The proton component of the steady solar wind (around 1 keV) is
sufficiently intense in the vicinity of Mercury to impose design
constraints on spacecraft surfaces.
In the following sections, a derivation of expected proton fluences is
presented with estimated probabilities that these fluences will not be
12

exceeded. Fluence is the flux integrated over the duration of the mission and
is, of course, a function of proton energy. Specifically, integral fluence
(fluence of protons of energies greater than a given energy E) is tabulated
and graphed in the following sections. Since the average proton energy
spectrum is relatively soft (i.e., the integral fluence decreases rapidly with
energy), the description of the radiation environment can be conveniently
divided into two categories: the low-energy solar wind fluence and the
energetic solar proton fluence.
The fluence, by definition, depends on the mission. For the followingcalculations the mission is assumed to include the extended mission to
second encounter. Thus, launch from Earth is assumed to be about
November 1973, followed by a five-month trip to Mercury, a six-month solar
orbit, and then returning to Mercury about February 1975.
Solar Wind Fluence
The solar wind protons (< 10 keV) flow rather steadily, and their flux
varies on a yearly average only by a factor of about 2. The average density
and velocity at Earth are 5 protons/cm 3 and 400 km/s corresponding to a
yearly fluence of 6 × 10¹⁵ protons cm -2 (References 1, 2). Hence, during thetime of the MVM73 mission, the probability for this solar wind fluence to
exceed 1016 cm -z is quite low (estimated to be _<0.05). Furthermore, the
solar wind flow is quite well understood (Reference 3). Continuity of flow
implies that a given parcel of solar wind expands so that its flux is inversely
proportional to the square of the distance r from the Sun. Therefore, on a
long-term (yearly) average the solar wind flux scales as r -z. An average of r -2
along the trajectory from Earth past Venus to Mercury in five months, plusan additional six months to second encounter at Mercury, yields a mission
fluence of approximately six times the fluence observed at Earth in one year.
Thus, the fluence of protons with energies E _ 1 keV during the mission is
estimated to be 6 × 1016 cm -2 for both 95-percentile and worst-case models.
Prediction of Solar Event Protons
The moderate-to-high-energy component of solar protons is calledvariously by such names as solar event protons, solar cosmic rays (high
energy) and solar energetic storm particles (moderate energy), or solar flare
protons. The last name is least suitable because, although energetic protons
are emitted only as an accompaniment of solar flares (i.e., optical brighten-
ing of local regions), the flux of protons is not well correlated with flare size
or brightness. In fact, the large majority of flares produce no energetic
protons at Earth. The predictability of the occurrence and magnitude of a
solar proton event is very poor, even on a short-term (-i day) basis.However, a reasonable correlation of yearly energetic proton fluence with
yearly average sunspot number has been found (References 4, 5). Physically,
this result may be interpreted as meaning that the average sunspot number,
a known general indicator of solar activity, provides a fair measure of the
13

productof expectednumberof solarprotoneventstimesthefluenceperevent.
Figure1 showsthecorrelationasestablishedby WebberandThomas(Reference4)ondatafortheyears1956through1965.Data(Reference6)at10and30MeVfortheyears1966through1969havebeenaddedduringthisstudyandareindicatedby circleswith radialticks.Thesepointsfurthersubstantiatetheapparentcorrelation.Thedashedlinesareusedhereasthebasisfor prediction.Notethatmostofthedatapointslie slightlybelowthecurves.However,datafortheyears1956through1958werederivedfromground-basedmeasurementsandareprobablylowerthantruevaluesthatwouldhavebeenobtainedwithgoodmeasurementsin space.Theyears1962and1963aresomewhatanomalous.Sincethepredictionisbasedonaratherarbitraryyearlydivision,thisanomalymaybepartlyresolvedif 1962and1963areaveragedovertheirtotaltwo-yearspan.
SeveralotherpointsshouldbemadeconcerningFigure1.First,notethatthereisnearlyanorderofmagnitudedifferencein fluencebetweenthepeakyearof cycle19(i.e.,1959)andthepeakyearsof cycle20 (i.e.,1968to
1013 I I I I
1012
1011 61
108
107
GALACTIC
COSMIC J-RAYS |
FLUXES WITH ENERGIES >200 MeV"
• > 1MeV
o • 10MeV t REFERENCE4® • 30 MeV
_( • 10 MeV t REFERENCE 6
_1_ • 30 MeV
106 I I I I0 50 100 150 200 250
Y£ARLY AVERAGE SUNSPOT NUMBER
Figure 1. Yearly solar proton fluxes at Earth as a function of sunspot number for
the years 1956 to 1969
14
1969). This provides further evidence of correlation of energetic proton
emission with solar activity as indicated by sunspot number. Thus, a fluence
of -1012 protons per cm 2 above 1 MeV corresponds to the peak of the
exceptionally high sunspot cycle (namely 19) and represents not only: (1) aworst case since observations have been recorded, but also, (2) based on the
correlation, probably the worst case over a period of _188 years-the long-
period solar cycle. Finally, the integral galactic cosmic ray flux above 200
MeV varies over a small range, around l0 s cm -2 yr -1 (Reference 7), in
anticorrelation with solar activity. This flux in any case represents a lower
bound on the level to which spacecraft must be resistant.
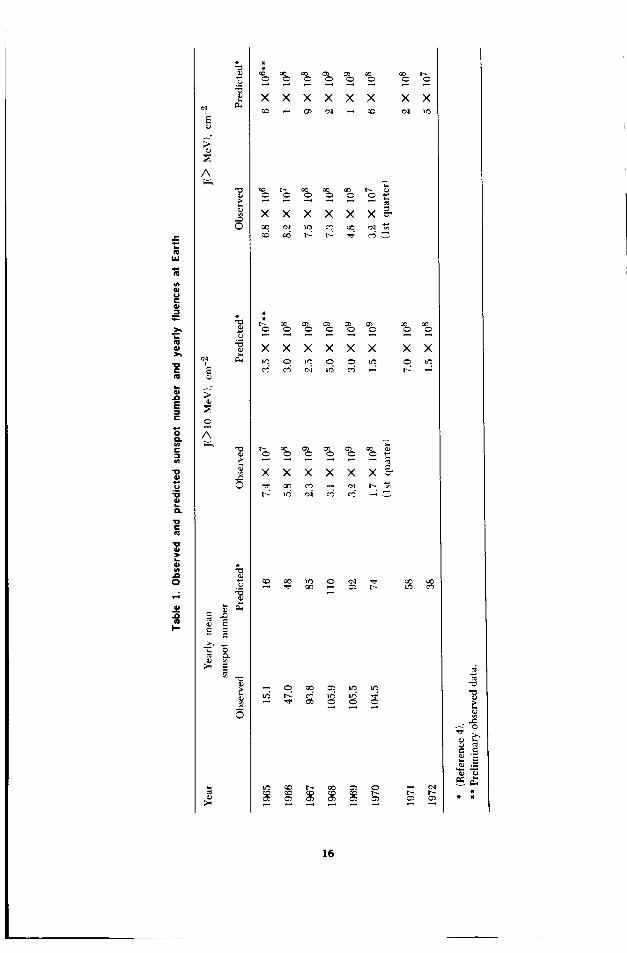
Further evidence of the correlation of sunspot number and yearly fluence
and some indication of the predictability of these quantities a few years inthe future is provided by Table 1. The predictions were formulated in the
summer of 1966 (Reference 4). However, the documented predictions
referred to fluxes above 10 and 40 MeV, and an interpolation to 30 MeV was
necessary for comparison with the data. The predicted values for 1965 were
really preliminary values of observed data. Proton flux observations are
included only through the first quarter of 1970, and the first quarter numbers
should be multiplied by a factor of 4 for comparison with prediction.
The fluences in Table 1 depend on sunspot number prediction through the
correlations previously discussed. At the beginning of a new cycle,prediction of the forthcoming sunspot peak is rather uncertain. However,
prediction of the next sunspot minimum level and time from the current
point in the decreasing portion of the cycle is possible with considerably
greater confidence. The general nature of the regularity of the sunspot cycleis illustrated in Figure 2. It shows that time between sunspot minima is
regular to about _+1 year and that there are several longer-period cycles
imposed on the basic ll-year cycle. Figure 3 then shows details of sunspot
number variations during the last two cycles superimposed on typical high,
medium, and low cycles as derived by Waldmeier (Reference 8). Cycle 19
had a peak sunspot number of -200 (off scale at the top of the graph), which
is much higher than the peak during a typical high sunspot number cycle. In
contrast, the peak of cycle 20 is only slightly above a typical medium peak,although the duration of the peak of cycle 20 is longer than usual. Thus, on
the grounds that sunspot number is a rough indicator of absolute solar
activity as established by a variety of correlations, predictions based on peakvalues of cycle 19 are not appropriate to cycle 20.
Probability Estimates
Two methods are used here to obtain estimates of the probability that thefluence at Earth will not exceed certain levels during the MVM73 mission.
The first method is based on the shape of recent sunspot cycles. From our
study of prediction methods for f_ature cycles, the following deductions havebeen drawn:
(1) The average sunspot number during the MVM73 mission (late 1973
through 1974) will be less than 30, with a probability of 0.5.
15
e-
W
e-
B
f-
,.0
Ee-
C
.=
Q.
'Ue-
,.Do
,,D
I'--
a
/Sv
©
©
©
X X X X X X
xxxxxx_
% _ % % % %
X X X X X X
X X X X X X
% %
X X
X X
J
16

i
I
Io
i I I
J
J
c--
I I I
o
o
o _ o o o
_I3_]WNN J.OdSNN$ NV:IW lVnNNV
$f--4
O
C
.O
E3C
C
O
t-
O
17

120
I
HIGH
I I I
OBSERVED THREE-MONTH MEANS_
• •• CYCLE 20
ooo CYCLE 19
(1954.4 TO 1964.6)
4O
2O
HIGH, MEDIUM, LOWACCORDING TO WALDMEIER(1936)
0 I I I I I I I1964 1965 1966 1967 1968 1969 1970 1971 1972 1973
YEAR
Figure 3. Temporal variation of sunspot number placed on a time scale for cycle 20
(2) By comparison with cycle 19, which oscillated to sunspot numbers
approaching 40 very late in the cycle, and from the unusual character
of cycle 19, which places the probability of such occurrence roughlyabove the standard deviation in the upper tail of the (assumed
gaussian) distribution, the sunspot number will be less than 40 with a
probability of 0.84.
(3) From consideration of the maximum observed variation in both time
of occurrence and level of minimum in all the past 20 cycles (Figure2), the average sunspot number is found to be less than 50 with a
probability of 0.95.
The fluence levels at Earth (Table 2) are derived from the correlations
shown in Figalre 1 and assigned probabilities according to the foregoing
deductions (1), (2), and (3). Note that the sunspot predictions of Figure 3 are
in essential agreement with predictions based on the method of McNish and
Lincoln (Reference 9). The latter predictions are derived from a regression
analysis based on cycles 8 through 19, and are published in Solar-
Geophysical Data. According to the July 1971 issue, the predicted values
are decreasing throughout the period of the MVM mission from 24.2 +_21 in
November 1973 to 11.0 _+15 in February 1975. The _+figure represents the90% confidence interval.
The second method of estimating probabilities is based on the calculated
root-mean-square deviation in logarithm of the fluence about the dashed
18

curvesforthedatapointsshowninFigure1(exceptdatafor 1956through1958werenotused).Thissamplestandarddeviationwasapproximatelythesamefor eachcurve,andthevalueobtainedbyincludingdatapointsfromallthecurvesinonesamplesetis
o (log10 yearly fluence) = 0.47 _ loglo 3
It has been suggested that the distribution of event fluences within a solar
cycle follow a log-normal distribution. If we assume that the yearly fluence
distribution is also log normal with a mean that depends on sunspot number
(e.g., as given by correlation of Figure 1) and a constant standard deviation,
then the probability of exceeding the most probable fluence (i.e., 50-
percentile fluence based on a normal distribution) by a factor of 3 is 0.5 +0.34 = 0.84 or a factor of 32 = 10 is 0.5 + 0.475 = 0.975. Hence, if the 50-
percentile fluences are taken as in the foregoing from the most probable
projection of the current solar cycle, then the 84- and 95-percentile fluences
should be larger by factors of about 3 and 10, respectively. The at-Earth
fluences in Table 2 agree reasonably with this second method also.
Scaling to Mercury
The final step in establishing solar proton estimates for MVM73 involves
scaling the predicted fluences from the vicinity of Earth to that along the
spacecraft trajectory, which travels to within about 0.4 AU of the Sun. The
propagation of energetic protons from solar events is only partially
understood, but several physical processes affect the propagation. The radial
flow of the solar wind and the rotation of the Sun draw the solar magnetic
field lines into the well-known "garden-hose" or Archimedes spiral. Inaddition, fluctuations in the solar-wind flow induce stochastic variations in
the field. The high-energy particles (of much lower total energy density) are
then channeled in this spiral field but with anisotropic energy-dependent
diffusion caused by the variations.
Several models have been formulated to describe this propagation and
diffusion. Webber and Thomas (Reference 10) pointed out that isotropic
diffusion, filling a conical volume, leads to a 1/r 3 dependence of peak flux
and total fluence, while highly anisotropic (radial dominant) diffusion leads
to a 1/r _ dependence. Englade (Reference 11) has formulated a much more
detailed computational model that includes anisotropic energy-dependent
diffusion in a stochastic interplanetary magnetic field and adiabatic
deceleration produced by the solar wind, plus many other physical
mechanisms. Deceleration can be a significant mechanism in changing the
radial dependence of flux above a given energy with the typical steeply
falling spectra of solar proton events. In any case, the model of Englade
depends on a considerable number of input parameters, and the impact of
the choice of these has not been fully explored. However, for some "typical"
choice, Englade (Reference 12) found an increase from 1 to 0.4 AU in
expected event fluence of a factor of 15 for i0 MeV protons and a factor of
19

@
,q. _-r,,
,.o
2a.
t-,cp
B
r-@
._EW
,.amI-"
_v
A
;>
A
;>
>
A
;>
A
% %X X
X X X X
X X X X
o q q
X X X X
% %X X
% % % %
X X X X
O
-_ % % %X X X X
X X X X
q o _ q
;>
A_
;>
%
;>
A
;>
A
>
.,...,
X
X
X
X
X
X
:::s
II
2O

10 for 100 MeV protons. These factors correspond to scaling in proportion
to r -3 and r -zS, respectively. Therefore, we have scaled to Mercury orbit asr-3 for the 1 and 10 MeV fluences in Table 2 and as r -2-5 for the 30 and 100
MeV fluences.
These calculations probably tend toward the severe end of the range of
hazard estimates. In a similar way the use of the probability levels at Earth
for those at Mercury is severe, because the mission spends its duration over a
range of distances from Earth to Mercury and this would bias the mission
probability to lower fluences (i.e., between Mercury and Earth fluences).
Worst Case
In addition to fluences associated with estimated probabilities discussed
above, a worst-case fluence has been included in Table 2. This worst case at
Earth is the fluence observed during the week of July 10-16, 1959
(Reference 13). A continuing series of three events in that week produced
about 75% of the energetic proton fluence observed in 1959, and the proton
fluence in 1959 is the largest occurring in one year since particle fluxes havebeen recorded.
Although the possibility of occurrence of a similar event during the
MVM73 mission cannot be disproved (perhaps because of incomplete
knowledge of solar physics), the likelihood of such occurrence appearsextremely remote. It would be contrary to: (1) the correlation of proton flux
with solar activity, (2) the fact that solar cycle 19 with the highest average
sunspot number observed in over 200 years of recorded data produced about
8 major proton events, whereas the current cycle 20 with a near-average
peak has produced no events within a factor of --5 in fluence of those 8major ones, and (3) mission schedules, in which the MVM73 launch date in
November 1973 is just 16 months before the next predicted solar minimum,
because no major events have been observed at such solar quiet times. Two
solar proton events, namely those of March 1942 and February 1956 havebeen cited as evidence for the invalidity of point (3). However, the average
sunspot number in February 1956 was 97, and the event in March 1942 at an
average sunspot level of 54 (2 years before minimum) was probably not a
major event in the sense of the 8 proton events in cycle 19. (Fluence data on
these pre-space-era events were obtained chiefly from ground-based neutron
monitors and are consequently much less accurate.)
For these reasons, we do not believe the worst-case model should be
chosen as a design model. It should be realized that such a choice does
depend on our (somewhat intuitive) knowledge that the worst case would
impose severe penalties in terms of cost and weight. We recommend the 95-
percentile model as offering a chance of success at least as good as thatassociated with several other essential systems, yet probably without major
design penalties.
21
Interior Environment
The Boeing SPARES (Space Radiation Environment and Shielding) codewas utilized to calculate interior environments and conversion to dose and
damage equivalent fluence for the 95-percentile and worst-case models.
Figures 4 and 5 present the interior environment corresponding to the
worst-case and 95-percentile exterior environments, respectively. Figures 6and 7 provide conversion of these fluences to ionization dose in silicon and
an equivalent fluence of 15 MeV protons for displacement damage to P-type
silicon of resistivity 1 l'l-cm. Equivalent damage is defined as the same
decrease in minority carrier lifetime as that produced by 15-MeV protons.
This damage depends on proton energy, material resistivity and tempera-ture, etc.
This equivalent fluence is a typical measure of the proton displacement
damage to semiconductor devices, especially 1-I2-cm N/P solar cells. On the
other hand, surface damage is better correlated with ionization dose than
with displacement damage and is strongly dependent on operating condi-tions.
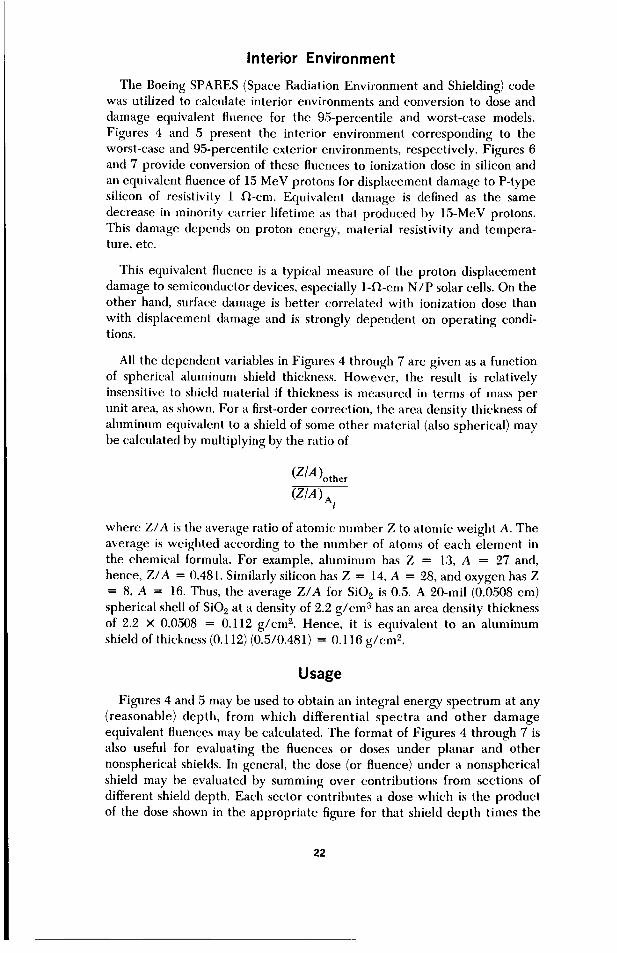
All the dependent variables in Figures 4 through 7 are given as a function
of spherical aluminum shield thickness. However, the result is relatively
insensitive to shield material if thickness is measured in terms of mass per
unit area, as shown. For a first-order correction, the area density thickness of
aluminum equivalent to a shield of some other material (also spherical) maybe calculated by multiplying by the ratio of
(Z/A)other
(Z/A)A,
where Z/A is the average ratio of atomic number Z to atomic weight A. Theaverage is weighted according to the number of atoms of each element in
the chemical formula. For example, aluminum has Z = 13, A = 27 and,
hence, Z/A = 0.481. Similarly silicon has Z = 14, A = 28, and oxygen has Z= 8, A = 16. Thus, the average Z/A for SiO2 is 0.5. A 20-mil (0.0508 cm)
spherical shell of SiO2 at a density of 2.2 g/cm 3 has an area density thickness
of 2.2 x 0.0508 = 0.112 g/cm 2. Hence, it is equivalent to an aluminum
shield of thickness (0.112) (0.5/0.481) = 0.116 g/cm 2.
Usage
Figures 4 and 5 may be used to obtain an integral energy spectrum at any
(reasonable) depth, from which differential spectra and other damage
equivalent fluences may be calculated. The format of Figures 4 through 7 is
also useful for evaluating the fluences or doses under planar and other
nonspherical shields. In general, the dose (or fluence) under a nonspherical
shield may be evaluated by summing over contributions from sections of
different shield depth. Each sector contributes a dose which is the product
of the dose shown in the appropriate figure for that shield depth times the
22

1o 13 I I I If I I I I I I
101
WORST-CASE MODEL
INTERIOR FLUENCES ABOVE ENERGIESIN MeVAS INDICATED
o
w"uZ
._Ju_
10111--
6
4
2
1010
6
4
10
20
30
70
TO CONVERT TO THICKNESS IN cm,
DIVIDE BY DENSITY IN g/cm 3
10-2 2 4 6 10-1 2 4 6 100 2 4 6 101
AREA DENSITY THICKNESS, g/cm 2
Figure 4. Interior fluences as a function of shield thickness for worst-case model
fraction of the total 4¢r solid angle subtended by that sector about the dose
point.
Calculation of dose, for example, under a planar shield may be done easily
if the dose versus depth is approximated satisfactorily by a straight line on a
log-log plot. Inspection of Figures 6 and 7 show that this approximation isreasonable for the fluences or doses presented here. In such a case, the
differential dose dD from a sector of solid angle 21r sin 0 dO (where O is the
angle of incidence of the proton as measured from normal to the plane)
through a planar shield of thickness t is given by
27r sin 0 dOdD = Dsp h (f/cos 0) 4rr
sin 0 dO= Osp h (t) cos t/0
where Dsp h (t) is the spherical dose function of Figure 6, and n is its negative
slope in log-log form. (That is, Dsp h (t) o: t-,. For thicknesses > 0.2 g/cm 2,
23

101
I
0
I i II I i I I I I
95-PERCE NTILE MODEL
INTERIOR FLUENCES ABOVE ENERGIESIN MeV AS INDICATED
101 10
20
30
70
108
6
4
TO CONVERT TO THICKNESS IN cm,
DIVIDE BY DENSITY IN g/cm 3
107
10-2 2 4 6 10-1 2 4 6 100 2 4 6 101
AREA DENSITY THICKNESS, g/cm 2
Figure 5. Interior fluences as a function of shield thickness for 95-percentile model
the 95-percentile case in Figure 6 is well approximated by n = 1.34). The
differential dose may then be integrated to obtain the dose at a point
sandwiched between two large planar shields, each of thickness t, as
Dsph (t)
DP i(t) - n+ 1
Again, more complicated cases of combination of sectors including a planar
shield and other shapes may be handled by adding the contributions of each.
Effect of Solar Latitude on Proton Fluence
Since the MVM73 mission will proceed to higher solar latitudes (-11 °)
than any previous space mission, a question arose as to whether latitude
dependence of proton fluence could affect the foregoing estimates. The solar
equator is inclined 7° 15' to the ecliptic, and so a range of +_7° has been
explored from Earth without the finding of a noticeable latitude effect.
Possible detection of a scarcely measurable effect on the solar wind has been
24

107
6
4
2
106
I I II I I I II I I
IONIZATION DOSE IN SILICONINSIDE SPHERICAL ALUMINUM SHIELD
I I_
o
O
I0 WORST CASE
10
95 PERCENTILE
102
10-2 2 4 6 10-1 2 4 6 100 2 4 6 101
AREA DENSITY THICKNESS, g/cm 2
Figure 6. Ionization dose as a function of shield thickness
25

u2uZ
._iu_
2
1013
6
4
2
1012
6
4
2
1011
I I I I I I I I I I I I II
EQUIVALENT FLUENCE OF 15-MeV PROTONS
FOR DISPLACEMENT DAMAGE TO N,/PSILICON DOPED TO I ,O.-cm
WORST CASE
I01
6
4
95 PERCENTILE
10°2 2 4 6 10-1 2 4 6 100 2 4 6 101
AREA DENSITY THICKNESS, g/cm 2
Figure 7. Damage equivalent fluence as a function of shield thickness
26

z"O
5
30-
20-
10-
X
0105
I I
x
x
I I I I )_ I
x
o
o
)0
oo
o
x
ooo
oo o go
oo o_xooo o
o< o xo
xx xaD
XX
X
0
I I II
X
x
o 12 x3/'8×
x
y ox
XX
0 11/2/69
X
0 4/10/69
I I I I I
X11/15/60 -
11/12/60 X
x 5/lO/59
2/23/56,_7/I0/59
O 11/18/68 --
7/14/59x
X 7/16/59
X -- CYCLE 19
O = CYCLE 20
I I II I109
I I I I I I I I L I I I I I I I106 107 108
EVENT FLUENCE ABOVE 30 MeV, protons/cm 2
Figure 8. Scatter plot of heliocentric latitude of source flare versus proton fluence
reported recently (Reference 14). Furthermore, any possible small correla-
tion between observed event fluence and latitude of the flare source region
is overwhelmed by the large variation in event size, as Figure 8 illustrates.
The fluence of protons at Earth is plotted for all the recorded proton events
of cycles 19 and 20. (Many more optical flares produced no protons detected
at Earth.) The latitude plotted is absolute value of heliocentric latitude of
the optical source flare on the visible disk. Note also that the largest events
are listed by date on Figure 8 to illustrate that cycle 20 events have been
significantly smaller than the largest ones of cycle 19.
.
2.
.
4.
References
Dessler, A. J., "Solar Wind and Interplanetary Magnetic Field," Rev.
Geophys., Vol. 5, pp. 1-41, 1967.
Hundhausen, A. J., "Composition and Dynamics of the Solar Wind
Plasma," Rev. Geophys. Space Phys., Vol. 8, pp. 729-791, 1970.
Parker, E. N., "Recent Developments in Theory of Solar Wind," Rev.
Geophys. Space Phys., Vol. 9, pp. 825-835, 1949.
Webber, W. R., and Thomas, J. R., Sunspot Number and Solar
Cosmic Ray Predictions for Cycle 20 (1965-1975) with Preliminary
Estimates for Cycle 21, Document D2-113522-1. The Boeing Com-
pany, Seattle, Wash., May 1967.
27
5. Lanzerotti, L. J., "'Solar Flare Particle Radiation," in Proceedings of
the National Symposium on Natural and Man-Made Radiation in
Space, held in Las Vegas, Nev., March 1971, NASA TMX-2440.National Aeronautics and Space Administration, Washington, D.C.,
January 1972.
6. Atwell, W., "The Significant Solar Proton Events in the 20th Solar
Cycle for the Period October 1964 to March 1970," in Proceedings of
the National Symposium on Natural and Man-Made Radiation in
Space, held in Las Vegas, Nev., March 1971, NASA TMX-2440, pp.
329-335. National Aeronautics and Space Administration, Washing-
ton, D.C., January 1972. (See also Document 645D.21.070. Lockheed
Electronics Company, Houston, Texas, March 1971).
7. Webber, W. R., "The Spectrum and Charge Composition of the
Primary Cosmic Radiation," Handbuch der Physik, Vol. XLVI/2, pp.181-264, 1967.
8. Waldmeier, M., "Prognose fur das nachste Sonnenfleckenmaximum,"
Astron. Nachrichten, Vol. 259, p. 267, 1936.
9. McNish, A. G., and Lincoln, J. V., "Prediction of Sunspot Numbers,"
Trans. Am. Geophys. Union, Vol. 30, pp. 673-685, 1949.
10. Webber, W. R., and Thomas, J. R., Spatial Variations in Solar-
Cosmic-Ray Intensities in Interplanetary Space, Document D2-
114459-1. The Boeing Company, Seattle, Wash., February 1969.
11. Englade, R. C., "A Computation Model for Solar Flare Particle
Propagation," 1. Geophys. Res., Vol. 76, pp. 768-791, 1971.
12. Simpson, J. A., et al., Energetic Particle Measurements at the
Environment of Mercury and Venus, Final Report of the Energetic
Particles Experiment Team for the Venus/Mercury Flyby in 1973,
Document 615-5, April 1970 (JPL internal document).
13. Webber, W. R., An Evaluation of the Radiation Hazard Due to
Solar Particle Events, Document D2-90469. The Boeing Company,Seattle, Wash., December 1963.
14. Hundhausen, A. J., Bame, S. J., and Montgomery, M. D., "Variations ofSolar-Wind Plasma Properties: Vela Observations of a Possible
Heliographic Latitude Dependence," J. Geophys. Res., Vol. 76, pp.5145-5154, 1971.
28

JPL Quarterly Technical Review Volume 2, Number 1 April 1972
Index: industrial processes and
equipment, power sources
JPL Lithium-Doped Solar Cell DevelopmentProgram
P. A. Berman
Guidance and Control Division
One of the most significant problems encountered in the use of silicon solar cells in
space has been the sensitivity of the device to electron and proton radiation
exposure. A major advancement was achieved when the P diffused into N-base solar
cells were replaced with the more radiation-tolerant N diffused into P-base solar
cells. Another advancement in achieving greater radiation tolerance was the
discovery that the addition of lithium to N-base silicon resulted in what appeared to
be annealing of radiation-induced defects. This phenomenon is being exploited to
develop a high-efficiency radiation-resistant lithium-doped solar cell. In this
investigation, lithium-doped solar cells fabricated from oxygen-lean and oxygen-rich
silicon have been obtained with average initial efficiencies of 11.9% at air mass zero
and 28°C, as compared to state-of-the-art N/P cells fabricated from 10-O-cm silicon
with average efficiences of 11.3% under similar conditions. Lithium-doped cells have
demonstrated the ability to withstand three to five times the fluence of 1-MeV
electrons before degrading to a power equivalent to state-of-the-art solar cells. This
article discusses the principal investigations carried out with respect to fabrication
of high-efficiency radiation-resistant lithium-doped cells, including starting material,
P/N junction diffusion, lithium source introduction, and lithium diffusion.
Introduction
Increasing the radiation tolerance of solar cells is important in any solararray system since it results in greater reliability, reduction in array size and
weight, and, if cell costs do not increase significantly, greater economy.While these factors are important for all missions, they become extremely
important for those missions which require large-area solar arrays (such as
manned orbiters, electric propulsion missions, and Jupiter flyby missions)
because a specific percentage reduction in the number of cells required
represents a significant absolute cost reduction. The amount of radiation
anticipated for a particular mission is, of course, dependent upon the
mission trajectory, time of launch (with respect to the solar cycle), andmission duration. However, there is always a probability of exposure to a
29

significant amount of radiation from such sources as the Van Allen belts and
solar proton flares.
State-of-the-art solar cells used in spacecraft solar array power systemsdegrade with electron and proton irradiation which occurs in near-Earth
space as a result of the Van Allen belts and in deep space as a result of solar
proton flares. The amount of degradation is quite dependent upon the
irradiation spectrum and fluence. This problem is presently circumvented
by overdesigning the panels with respect to the initial power output, so that
the degraded output will meet or exceed mission requirements. This
approach is oftentimes used in conjunction with thick coverglasses whichattenuate some of the radiation. Thus, tradeoffs must be made between the
power and useful lifetime of a solar array and its allowable size, weight, and
cost. Effort has therefore been directed to develop an improved radiation-
hardened solar cell, and there has been significant progress to date to suggestthat the lithium-doped solar cell can be developed to the status of a practical
device. Preliminary tests have shown that lithium-doped P/N solar cells can
be designed and fabricated to be significantly more radiation-resistant thanconventional silicon N/P solar cells at temperatures above 30°C. They can
also be made reproducibly with initial conversion efficiencies equal to or
better than those of the state-of-the-art cells. The present data indicate that
these lithium-doped solar cells, when properly optimized for a particular
mission environment, can be effectively 3 times more radiation-resistant to
electrons and 10 times more radiation-resistant to protons and neutrons thanpresent-day conventional 10-f_-cm N/P solar cells, with little increase incost.
The JPL lithium-doped cell program has been in existence for about 4 yr
and has involved subcontracts to 10 industrial organizations and 5 universi-
ties. Due to the summary nature of this document, the information reportedhere is concerned only with the most pragmatic aspects of lithium-doped
cell fabrication and does not include the underlying physics of the
interaction among lithium, silicon, oxygen, and radiation-induced effects.
The advancements made with respect to lithium-doped cell development
have clearly shown the power of the interdisciplinary approach which was
adopted throughout the life of the program. Problems such as cell instability,
low efficiency, poor process control, unpredictability of recovery charac-
teristics, variations in recovery rate, cell size limitations, etc., that at one
time appeared to be all but insoluble, appear to be falling by the wayside.
These problems could not have been solved without the involvement of the
multi-expert team represented by the organizations participating in this
program. Each organization isolated the problems with respect to its own
area of expertise, and the resultant body of information was coordinated and
distributed to the other organizations by JPL. It is strongly felt that such an
approach is applicable to many other programs (e.g., application of space
technology to the economic generation of terrestrial power by means of
solar energy conversion) and should prove to be of immense value in the
ma)ority of cases.
30
The results of the investigations carried out during the past two years
represent the most significant achievements attained thus far with respect to
the lithium-doped solar cell program. Lithium-doped solar cells fabricated
from oxygen-lean and oxygen-rich silicon have been obtained with average
initial efficiencies of 11.9% at air mass zero and 28°C, as compared to state-
of-the-art N/P cells fabricated from 10-_-cm silicon with average efficiencesof 11.3% under similar conditions.
Objectives
The major objectives of the program discussed in this article were to
optimize the P/N lithium-doped solar cell with respect to initial efficiency
and efficiency after recovery from exposure to electron radiation, and to
compare these characteristics with those of the state-of-the-art N/P solarcells.
In order to achieve these major objectives, it was necessary to determine
the effects of cell design and processing parameters on the pre- and post-irradiation cell characteristics and to develop methods of reproducibly
effecting the desired cell design. This involved yet another objective,
namely, development of analytical techniques to correlate cell design and
processing with the observed effects on the pre- and post-irradiation cellcharacteristics. During the course of the program it became clear that
understanding and/or improvements of four major aspects of lithium-doped
cell design would be required if the P/N lithium-doped solar cell were ever
to be competitive with the N/P state-of-the-art solar cell; namely, (1)
starting material, (2) P/N junction diffusion, (3) lithium source introduction,and (4) lithium diffusion schedule. The successful attainment of these goals isdescribed below.
Lithium-Doped Cell Fabrication
Starting Material
Three major forms of silicon were investigated for use in lithium-doped
cell fabrication: crucible grown, float zone refined, and Lopex. The latter
two types of silicon are quite similar to one another except that the
dislocation density of Lopex silicon is much lower.
The general characteristics of the crucible-grown silicon are:
(1) High oxygen content.
(2) Low dislocation count.
(3) Economical production.
(4) Amenability to large-area cells.
(5) Slow recovery of lithium-doped cells.
(6) No apparent instability of resultant lithium-doped cells.
31

Crucible-grown silicon is particularly adaptable to use in large-area cells
because it can be grown with relatively large diameters. There is no
apparent degradation of cells fabricated from crucible silicon after storage
at room temperature for periods exceeding 500 days.
The general characteristics of float-zone silicon are as follows:
(1) Low oxygen content.
(2) High dislocation count.
(3) Less economical than crncible-grown material.
(4) Less amenable to use in large-area cells because of smaller diameters.
(5) Fast recovery rate of highly doped lithium cells.
(6) Instability of highly doped lithium cells, especially after recovery of
radiation-induced damage.
Lopex silicon has the same characteristics as float-zone silicon with the
exception that it has a low rather than high dislocation count.
Extensive analysis has been performed on the effect of starting material onthe action of lithium in irradiated silicon, but the results and conclusions are
too complex to be reported in detail in this summary paper. Suffice it to saythat the lithium interacts with radiation-induced defects to form configura-
tions which are dependent upon the oxygen content of the silicon. However,
the major difference, as far as cell behavior is concerned, is a slower
recovery rate in lithium-doped oxygen-rich silicon due to a higher activation
energy and correspondingly lower lithium difl_lsion constant. That is to say,
it takes longer for the lithium to diffuse through the silicon and associate
itself with the radiation-induced defect in oxygen-rich silicon (crucible
grown) than it does for the lithium to diffuse through oxygen-lean silicon
(float zone and Lopex). On the other hand, lithium-doped cells fabricated
from oxygen-rich silicon are far more stable than those fabricated from
oxygen-lean silicon and appear to be more uniform in their electricalcharacteristics.
P/N Junction Diffusion
Lithium-doped solar cells are produced by diffusing the lithium into
N-type silicon. Prior to the introduction of the lithium, a P/N junction is
formed in N-doped silicon by high-temperature (of the order of 1000°C)
diffusion of boron to a depth of approximately 300 nm (30(X) ,8,), thus giving
a P/N cell configuration. When cells are fabricated in this manner,
significant low-temperature (28 to 100°C) annealing of radiation damage
induced by exposure to electrons having an energy of 1 MeV has been
observed. Similar results have also been obtained after exposure to neutrons
and protons.
One of the original problems encountered with lithium-doped solar cells
was an initial cell efficiency so low that even after complete recovery, the
32

cells had much less power after irradiation than the state-of-the-art cells.
Recently, lithium-doped cells have been fabricated which have initial
efficieneies significantly higher than the state-of-the-art N/P cells.
One of the primary areas of investigation was concerned with the
diffusion of boron into the silicon blank to form the P/N junction. The state-
of-the-art boron trichloride (BCI3) source results in an undesirable etching
action and induces strains and dislocations in the silicon material. Investiga-
tions were carried out to develop an alternate boron junction diffusion
technique, preferably one which would not etch the silicon blank surfacesand which would introduce fewer strains.
Two major investigations of alternative diffusion techniques were
undertaken: (1) investigation of boron tribromide (BBr3) as a diffusion source,
and (2) investigation of modification of BC13 source deposition time
schedule. The results of the BBr 3 source investigation indicated that while
the number of etch pits and the amount of induced strains were greatlyreduced, the resultant cell outputs were lower than obtained with the
standard diffusion. The results of the second investigation also showed a very
great reduction in dislocation density and induced stresses, but in this case
significant improvements in cell efl_ciencies were also obtained, especially
for cells fabricated from oxygen-lean silicon. Consequently, work on the
BBr 3 diffusions was terminated and emphasis was placed on optimizing theboron deposition time in the BC13 diffusions.
As a result of the P/N junction diffusion investigation, lithium-doped
silicon solar cells having dimensions as large as 12 cm z are now possible, due
to the improved boron-diffusion techniques, which stress the cells far less
than techniques used previously. A large increase was observed in the short-
circuit current measured in tungsten (long wavelength) light for cells that
were fabricated using the improved diffusion techniques as compared with
previous cells, indicating a preservation of minority carrier diffusion length
in the base region of the former cells. Sintering (at about 600°C) of the
contacts of lithium-doped cells fabricated from Lopex silicon resulted in
large increases in maximum power (of between 1 and 4 mW), mainly due to
an open-circuit voltage improvement, over non-sintered cells. Efficiencies as
high as 12.8% were observed, with-the average efficiency being about 11.9%.
The sample is small, but the efficiency is significantly higher than the
average efficiency of 10-_-cm N/P cells (state-of-the-art), which is about11.3%.
Lithium Source Introduction
One method of introducing lithium into silicon is to utilize a paint-on
source which consists of lithium powder suspended in an oil. After the
lithium is painted on the back surface of the cell, the cell is heated in a
furnace to alloy the lithium and drive it into the silicon. In many cases the
cell is then removed from the furnace, the lithium alloy region removed by
etching, and the cell returned to the furnace for additional heat treatment.
33
This is termed redistribution, since it redistributes the lithium within the
base region and changes the lithium concentration profile.
Painting the lithium-oil suspension onto the back surface of the cell is a
critical operation, since thick layers can form spheres of lithium which cause
the formation of large alloy pits when the lithium-coated cells are heated in
the diffusion furnace. These alloy pits can result in large stresses which in
extreme cases are of sufficient magnitude to break the cell. Even when the
painted layer is kept thin, it is still possible for conglomerations of lithium,
small pits, and possible stressing of the cell to develop. To a great extent the
use of a lithium aluminum hydride solution has alleviated most of the
problems associated with the oil suspension method, except for the
cumbersome task of individually painting the sofution on the back face ofeach cell.
While the paint-on technique is quite adequate for fabrication of cells in
small lots, it presented a bottleneck for larger lots and was highly operator-
dependent (more of an art than a science). Consequently, a major effort was
expended to develop a technique for evaporating the lithium onto the back
surface of cell batches. While high-efficiency cells were attainable using this
technique, initially the yield of such cells was lower than obtained from the
paint-on technique. Through additional effort, however, the yields were
increased so that they now are equal to or better than those obtained from
the paint-on technique. The evaporation technique is more amenable to
high-volume production and should, if properly controlled, give greater
reproducibility than the paint-on teclmique which has been used in the past.
Lithium Diffusion Schedule
As mentioned above, one technique for lithium dithision involves a two-
cycle lithium alloy-redistribution schedule. The major investigation during
the course of this program was centered around optimizing the lithium
diffusion to achieve highest initial and post-irradiation-recovered cell
efficiency. The time and temperature of both cycles were systematically
varied and it appeared that the best result was achieved for an alloy cycle of
90 min and a redistribution cycle of 60 min, both carried out at a
temperature of 425°C.
Subsequently, efforts were directed toward investigation of single-cycle
lithium diffusion schedules. Again, the times and temperatures weresystematically varied and the resultant cells analyzed with respect to initial-
and post-irradiation recovery characteristics. It was found that lowering the
diffusion temperatures to between 350 and 380°C and increasing the
diffusion time to between 180 and 480 min yielded cells with higher initial-
and post-irradiation-recovered power than those obtained from the best
two-cycle schedules. The single-cycle lithium diffusion technique not only
reduced the complexity of the lithium diffusion over the two-cycle
technique, but resulted in a greater degree of uniformity in the resultant cellcharacteristics.
34

The time-temperature schedule of lithium diffusion determines the
distribution of the lithium within the body of the cell. A very convenient
method for determining the lithium concentration near the junction ismeasurement of capacitance versus voltage as the cell is reversed-biased.
This technique is applicable to a distance of up to 10 nm from the junction,
depending upon the silicon resistivity, after which the cell goes into "reverse
breakdown." As a result of very thorough and extensive analysis, it is
possible to predict quantitatively the lithium-doped cell radiation recovery
characteristics by measurement of the lithium concentration gradient within
this narrow region adjacent to the P/N junction by means of the non-
destructive and relatively convenient capacitance-voltage measurement. (It
should be noted that the modifying term "relatively convenient" appliesbecause the measurement does take some time to make, and while it is
possible to measure small quantities of cells on a 100% basis, it would be
prohibitive for large production lots except on a sampling basis.) Once the
power of the capacitance-voltage relationship was fully realized and
utilized, many of the results which previously appeared to be anomalous
became readily explainable. The most important of these was the different
recovery behavior among cells from the same lot (which were supposedlyidentical). It was found that, in fact, the cells were not identical, but that the
lithium density gradient could vary by a factor of up to 70. When the cells
were reordered to correspond to their lithium density gradient rather than
their lithium diffusion schedule, the results were found to be entirelypredictable. This led to the selection of lithium diffusion schedules which
not only gave cells with high initial efficieneies but also with similarly high
radiation recovery capabilities. The capacitance-voltage analysis, the single
most important breakthrough of the program, showed that two-cycle
lithium diffusion schedules, and single-cycle lithium diffusion schedules
utilizing times greater than 3 h, can result in high-efficiency, high-recovery
cells, but also tend to yield wider variations in lithium density gradient and
consequently in cell recovery capabilities. On the other hand, single-cycle
lithium diffilsion schedules for times between 2 and 3 h give very uniform
(within about a factor of two) lithium density gradients and high recovery
capability.
Concluding Remarks
The results of the investigations carried out during this program represent
significant achievements with respect to the lithium-doped solar cell.
Lithium-doped solar cells fabricated from oxygen-lean and oxygen-rich
silicon have been obtained with average initial efl_ciencies of 11.9% at airmass zero and 28°C, as compared to the state-of-the-art N/P cells fabricated
from 10-_-cm silicon with average efficiencies of 11.3% under similar
conditions. Improvements in cell-processing techniques have made possible
the fabrication of large-area lithium-doped cells. Excellent progress has been
made in quantitative predictions of post-irradiation lithium-doped cell
characteristics as a function of cell design by means of capacitance-voltagemeasurements, and this information has been used to achieve further
35

improvements in cell design. Specifically, analysis of irradiated lithium-
doped cells has shown that the recovery characteristics can be very well
predicted by the lithium density gradient near the junction and that very
good cell-to-cell reproducibility of lithium density gradient can be obtained
with single-cycle 2- to 3-h lithium diffusion schedules.
Since the radiation damage annealing rate for lithium cells is a function of
cell operating temperature and oxygen concentration in the silicon, the
design of the lithium-doped cell must accommodate the desired annealing
rate with respect to the cell operating temperature. Lithium-doped cells
would probably not be appropriate for missions involving extended
equilibrium temperatures below 30°C unless some means of auxiliary cell
heating is provided.
The lithium-doped solar cell represents the most significant improvementin solar cell radiation resistance since the advent of the N diffused into
P-base solar cell developed in the early 1960s.
36
JPL Quarterly Technical Review Volume 2, Number 1 April 1972
Index: electronic components andcircuits, power sources, electric pro-pulsion
Methods for Utilizing Maximum Power From aSolar Array
D. K. Decker
Guidance and Control Division
Ion thrusters are being considered for outer-planet spacecraft propulsion for
future missions. In a typical mission, the spacecraft primary energy source may be
required to deliver as high as 16 kW of power to the thruster system. This power
level is quite high compared to system power levels developed in the past. It is
therefore very important to utilize the maximum available power from the energysource at all times.
A preliminary study of maximum power utilization methods was performed for an
outer-planet spacecraft using an ion thruster propulsion system and a solar array as
the primary energy source. The problems which arise from operating the array at or
near the maximum power point of its I-V characteristic are discussed. Two closed-
loop system configurations which use extremum regulators to track the array
maximum power point are presented. Also, three open-loop systems are presented
that either (1) measure the maximum power of each array section and compute the
total array power, (2) utilize a reference array to predict the characteristics of the
solar array, or (3) utilize impedance measurements to predict the maximum power
utilization. The advantages and disadvantages of each system are discussed and
recommendations for further development are made.
Introduction
This article summarizes the results of a preliminary study of maximum
power utilization methods for an outer-planet spacecraft using an ion
thruster propulsion system and a solar array as the primary energy source. A
block diagram of a typical power system with ion thruster power condition-
ing circuitry and spacecraft "housekeeping" subsystem is shown in Figure 1.
Power required by the ion thrusters is regulated by dc-to-dc converters
within the propulsion power conditioner. In a typical mission, the total array
power required by the thruster power conditioner can be as high as 16 kW,
which is quite large compared to power systems developed in the past. The
spacecraft loads typically require 500 to 1000 W of power. If the total
power required by the spacecraft exceeds the available array power, the
37

battery will support only the spacecraft loads since a battery large enough to
provide 16 kW for any significant period of time is too bulky to be desirable.
Maximum Power Point Operating Problem
The I-V characteristics of a typical converter input, along with the
corresponding output characteristics of a solar array, are shown in Figure 2.
The voltage Vn in the figure is the solar array voltage above which the
converter regulates its output voltage. During the regulating mode of
operation, the converter functions as a constant power load on the solar
array. Note, also, that the converter exhibits a negative resistance character-
istic in this mode. Below Vn, the converter output voltage is not regulated,
and the converter simulates a resistive load on the solar array. When voltage
is initially applied to the converter input, the current required by the
converter at Vn must be less than the available solar array current at VR to
obtain the regulating mode. This condition is illustrated by load line curve 1
in Figure 2, and point A is the resultant operating point. If the Converter
load power is increased after initial startup, load line curve 2 with three
possible operating points can be obtained. Point B is the desirable operating
point. Point C is an unstable operating point due to the negative resistance
characteristic of the converter and the high resistance of the solar array at
that point (see Reference 1). A converter operating at point C can be driven
to either point B or D depending upon the direction of the perturl)ating
signal. Point D is a stable operating point on the nonregadating portion of
the curve. Curve 3 illustrates a converter load line with two possible
operating points. Point E is the maximum power point of the solar array.
Any incremental increase in power from curve 3 will cause the converter to
snap to point F, which would be the nonregulating operating point. The
system power demand would then need to be reduced to curve 1 to allow a
desirable operating point on the solar array (I-V) curve.
ARRAY I POWERCONDITIONING THRUSTERS
SPACECRAFT _ SPACECRAFT
._ POWERCONDITIONING LOADS
PS&L POWER SWITCHING AND LOGIC
Figure 1. Block diagram of a solar electric propulsion spacecraft
38

Tt.)
CONVERTER
_-_ SOLAR ARRAY
\
V R
VOLTAGE
Figure 2. Solar array-converter operating points
The above discussion leads to the conclusion that active electronic
systems are needed to operate at or near the solar array maximum power.
To operate at the maximum power point, the active system can be a closed-
loop system where a device is employed within the power system to "track"
the array maximum power and constantly adjust the power system
characteristics. Such a system must utilize a variable load in conjunctionwith the converter constant load to adjust for system fluctuations. An
alternative approach that allows operation near the maximum power point
is to use an open-loop system that either (1) measures the maximum power
of an array section and computes the total array power, (2) utilizes a
reference array to predict the characteristics of the solar array, or (3) utilizes
impedance measurements to predict the maximum power utilization.
Closed-Loop Systems
Maximum power point trackers (MPPTs) fall into a general category of
control systems called adaptive control systems. The MPPT is more
precisely known as an extremum regulator. The extremum regulator differs
39

from a normal regulator which compares a controlled parameter (voltage or
current) to a fixed reference. The extremum regulator continuously searches
for the extremum position of the controlled parameter (power in this ease)
and maintains the system at that point regardless of the extremumvariations.
There are two system configurations that can be considered for this
application: a series tracker (Figure 3) and a parallel tracker (Figure 4). Theblock labeled MPPT in Figures 3 and 4 can be expanded into the functional
|)lock diagram in Figalre 5 to provide a basic understanding of MPPT designprinciples (References 2-4). The block labeled T is a transducer which
measures either the deviation of solar array power from the maximum
power point or the derivative of power with respect to voltage. The outputof T is called the search error signal. Block C is a control device whichreverses the search direction. The control device must also determine either
the time or sign of the search reversal, or produce an output proportional to
the search error signal, depending on the type of system. Block E, the
effector, produces the automatic search signal from either a small external
continuous perturbation signal or directly from the feedback properties of
the control loop. The effector must provide a constant output, about which
the search signal oscillates, that corresponds to the extremum position. The
effector is therefore an integrator. Block R is the regulator unit. This
regulator is a pulse-width modulator. The regulator duty cycle is varied by
the effector output such that the load impedance is matched to the array
impedance and maximum power is thereby transferred. The accuracy of the
extremum regulator depends primarily on the amplitude of the search
oscillation. This amplitude is a function of transducer sensitivity and timedelays within the control loop. System noise, in turn, determines the
minimum allowable search oscillation amplitude. Extremum regulators are
usually low frequency devices for this reason. Previously designed systemshave tracked the maximum power within 1% (References 5-13).
Comparison of Series and Parallel Trackers
The series tracker's most desirable feature is operating point stability.
Power detecting problems are reduced since system noise is isolated from
the power detecting transducer by the series configuration. Also, since the
total system power is controlled by the series tracker, the maximum power
point can always be recovered after load transients (assuming that the
variable load power remains greater than zero). This condition is not true for
the parallel tracker. The parallel tracker is susceptible to the stability
problem previously discussed (Figure 2). Heavy load transients may cause
the parallel tracker system to "lock-up" at point D or F of Figure 2, since
the power delivered to the thruster power conditioning is not controlled by
the tracker. A parallel tracker system requirement, therefore, is that the
system response time is fast enough to prevent the instability under all load
transient and system noise conditions. This requirement could be quite
severe since the extremum regulator is typically a low-frequency device aspreviously discussed.
40

SOLAR J_
ARRAY I I MPPT
BATTERY J-_
MPPT = MAXIMUM POWER POINT TRACKERS
PS&L = POWER SWITCHING AND LOGIC
_'I PROPULSION
/ POWER I I THRUSTERSI
/ CON0'T'ON'NGI I
,_ VARIABLE
POWER J
LOAD J
- SPA.C,! CRAFT J _JSPACECRAFT
-k_°_'_"'°=°7"1_°_°_IFigure 3. Series MPPT configuration
I SOLAR iARRAY
POWER BUS J PS&L
BAT ['ERY I
i-iTHRUSTERPOWER
CONDITIONING
_ SPACECRAFT
POWERCONDITIONING
MPPT - MAXIMUM POWER POINT TRACKERS
PS&L- POWER SWITCHING AND LOGIC
Figure 4. Parallel MPPT configuration
THRUSTERS J
SPACECRAFTLOADS
mlw
SOLAR
ARRAY
THc E(TRANSDUCERS) (CONTROL) (EFFECTOR)
Figure 5. Extremum regulator functional block diagram
OUTPUT TOLOADS
EXTERNAL
41
The main disadvantage of the series tracker is that the total array power
must flow through the tracker. A pulse-width-modulated regulator is
typically 90% efficient. Therefore, a maximum of 1440 W will be dissipated
by the series tracker. This amount of power creates a severe thermal
problem which requires heavy heat sinks and large electronic components.
The series tracker design does not appear feasible for this reason. Also the
10% power loss compares unfavorably with open-loop systems which could
probably predict the maximum power point within 10% with smaller, less
dissipative circuitry.
The size of the parallel tracker depends primarily upon the power
margin. The power margin can be defined as the difference between the
maximum array power and the power consumed by the thruster and
spacecraft power conditioning. The variable power load must then equal the
power margin to allow the maximum power point operation. The minimum
allowable power margin is determined as follows:
Power margin (min) = transient power + noise power + tracking error
where
Transient power = maximum system instantaneous step load change
Noise power = maximum instantaneous power from system noise
Tracking error = maximum error of the power tracking system
The power margin due to transients and noise is estimated to be 2%. If the
tracking error is 1%, then the variable power load must be 16 kW x 3% =
480 W minimum at beginning of life. A variable power load of 1 kW
appears reasonable. This load is quite large and there is no useful load on the
spacecraft which could be employed; therefore, a dummy load must be
used. This load could possibly cause thermal problems if it were constantly
drawing power. A solution to this problem would be to track the maximum
power just long enough to obtain a reading and adjust the system
accordingly.
In summary, the series tracker has been determined to be unfeasible
because of its thermal problem and excessive power loss. Further analysis of
the parallel tracker instability problem is required to determine the
feasibility of the parallel tracker. Its main advantage is its lower power
dissipation. The parallel tracker approach will be compared to open-loop
systems later.
Open-Loop Systems
Open-loop systems measure one or more array parameters and determine
or predict the array maximum power point from this data. Three types of
open-loop systems are discussed here: array section measurements, refer-
ence array measurements, and source-to-load impedance comparison. Other
42

methods such as array temperature and illumination measurements were
reviewed and appeared to be too indirect for this application.
Array Section Measurements
One method of maximum power point detection is to measure the power
of each array section and add the results. This method is presently being
developed at JPL. A brief description of this method follows. The solar array
to be measured is divided into a number of sections. Each section is normally
connected to the solar array bus through an isolation diode. A transistor loadis connected to one section at a time and the load is increased until the
maximum power point of that section is traversed. The maximum power is
measured with a peak detector and recorded. The load is stepped through
each section and the process is repeated. As each section is loaded, its power
is removed from the solar array bus by the isolation diode. The spacecraft
power demands must therefore be reduced by the corresponding power
contribution of each section prior to loading so that the remaining array
power is not exceeded.
If the section maximum power points do not occur at the same voltage,
they cannot be directly added to determine the total array maximum power
since each array section is forced to operate at the same voltage during
actual system operation. Each section must then be remeasured to
determine its power at the established operating voltage of the array. The
maximum power point voltage is primarily a function of temperature.
Therefore, if large temperature gradients across the array are present during
the power measurements, inaccuracies in the summation process are
possible.
Reference Array
A second method of predicting the array characteristics is to place test
cells at representative positions within each array section. The cells are
connected to form a reference array which is electrically isolated from the
actual array. The reference array can then be scanned to determine the
maximum power point. The accuracy of the system depends mainly on the
ability of the reference array to simulate actual array conditions. The size
and location of the reference array sections are therefore very critical. The
array cost is the primary factor that limits the size. The cost 1 is estimated at
$350/W. Therefore, to be practical, the array size is limited to the 50-W
range, which is 0.25% of the actual array size. The electronic circuitry
required to measure the maximum power point of a 50-W reference array
can be quite simple and lightweight. A peak power detector and a scanning
circuit are basically all that is required.
1Personal communications from w. A. Hasbach, JPL Photovoltaics Group, Spacecraft PowerSection.
43
Impedance Comparison
A third method of maximum power prediction is accomplished by
comparison of the load impedance and the solar array impedance. The array
power can be expressed as
PA =V[ (1)
and
dPa _ VdI + .dV (2)dV dV 1_
At the maximum power point,
Therefore,
- 0 (3)dV
VdI + IdV=O
or
V dV
I d/(4)
Equation 4 states that the load resistance determined by the de operating
point is equal to the dynamic resistance, or slope, of the solar array I-V
curve at the maximum power point. It can be concluded that the load
impedance to array impedance ratio is an index of the power mismatch. The
degree of mismatch is dependent upon the shape of the solar array I-V
curve. If the array I-V characteristics were linear, the power mismatch
could be calculated within the accuracy of the impedance measuring
devices. Unfortunately, this is not the case. For the case under consideration,
the solar array characteristic may vary from the curve of Figure 2 to almost
a straight line. Some additional information about the array characteristic,
such as end points, is therefore needed to determine the shape of the I-V
curve. Possibly the array open-circuit voltage and short-circuit current data
from the transducers already on the spacecraft would provide suflqcient
accuracy.
The technique for measuring the solar array dynamic resistance is shown
in Figure 6. A small perturbing signal e_c is introduced onto the array bus
through the transformer T. If the reactance of C is much less than the load
resistance Rt. at the perturbing frequency, the solar array is, in effect,
directly across the secondary of T. If e_c is constant in amplitude, then 1/r,,
44

the solar array conductance, is proportional to is. Therefore, is can be
measured to determine the array dynamic resistance ra.
Comparison of Open.Loop Systems
In this section the various open-loop measuring techniques are examined
and the advantages and disadvantages presented in the system operation are
discussed. The array section measurement system is probably the most
accurate of the three systems if the temperature of each section is the same.
The system accuracy then depends upon the sweep rate and the sensitivity
of the power measuring circuitry. This system is the most complex of the
three and must dissipate the array section power (up to 1.5 kW) for short
periods of time. The necessity of reducing the power demands of the system
during the maximum power measurement is also a disadvantage. However,
this reduction in power is not a serious disadvantage if the maximum power
measurements are infrequent.
The accuracy of the reference array system is questionable. The reference
array maximum power can be calibrated to the actual array maximumpower at the beginning of a mission. However, degradation due to space
irradiation is unknown and damage from micrometeorites, etc., will always
remain uncertain. The main advantage of this system is that the circuitry
involved can be lightweight and easily designed.
The main advantage of the impedance comparison system is that it
presents an actual array measurement which provides an index of power
mismatch while the system is operating. A disadvantage is that the accuracy
depends upon some outside knowledge of the array I-V characteristics
which may be difficult to predict. It appears that the development of the
actual hardware will also present some difficulties. The capacitor C of
Figure 6 must be quite large and withstand an array voltage of up to 400 V.
Also system noise may affect the accuracy of the dynamic resistancemeasurement.
In summary, further investigation of the reference array and impedance
comparison system accuracies is required to determine the feasibility of thesystems. The array section measurement system appears to be the most
accurate of the three. However, this system is much more complex than the
_a
s
R L
eac
Figure6. Solar array dynamic resistance measurement
45

other two and is larger in size and weight. The reference array system is the
least complex and smallest in size and weight.
Comparison of Closed-Loop and Open-Loop Systems
The main advantage of the closed-loop system is the continuous accurate
tracking of the maximum power point. However, the application of a
maximum power point tracker design to an outer-planet spacecraft presents
a number of problems. The solar array power output continuously varies
with time which requires variable tracker characteristics and reference
inputs. To accomplish this requirement, complex circuitry must be
employed in conjunction with continuous power dissipating elements to
force the system to operate at the maximum power point. Another
disadvantage is the susceptibility of the tracker design to the anticipated
high noise and transients present on the power lines from the thruster
subsystem.
The array section measurement system compares closely with the tracker
accuracy if the solar array section temperatures are all the same. This
system is equally as complex as the parallel tracker and also has the
disadvantage of system power reduction during operation. The system must
dissipate the array section power which is approximately 1.5 kW. There-
fore, it probably will require larger and heavier components than the
parallel tracker, depending upon the time required for measurement.
The reference array and impedance comparison systems are much less
complex and are much lighter than the parallel tracker. Again, the feasibility
of these two systems depends upon further investigation of their accuracies.
Table 1. Summary of open-loop and closed-loop systems
Method Type Advantages Disadvantages
Series tracker Closed Contixmous accurate
loop tracking of the maxi-
mum power point
Parallel tracker Closed Continuous accurate
loop tracking of the maxi-
mum power point
Reference array Open Simplicity, lightweight
loop
Impedance Open Provides power mis-
comparison loop match index
Direct array Open Provides actual arraymeasurement loop measurement
Thermal problem, excessive
power losses, requires dummy
load, and complex circuitry
Complex circuitry, requires
dummy load, operating point
stability problem
Accuracy is dit_cult to deter-mine
Accuracy is difficult to deter-
mine, possible component prob-lems
Power reduction is required, cir-
cuitry is complex, and array sec-
tion temperatures must be the
same
46
Summary
The various types of systems are listed in Table 1 with their advantages
and disadvantages. Unfortunately, not one single system uniquely provides asolution to the power tracking problem. As previously stated, the direct
array measurement system is presently being developed. Further develop-ment of the other systems is required before a conclusion can be made as to
which system is best for this application.
.
.
°
4.
.
.
.
°
.
10.
11.
References
Millman, J., and Taub, H., Pulse, Digital, and Switching Waveforms,
Chapter 13, p. 476. McGraw-Hill Book Co., Inc., New York, 1965.
Ostrovski, Iv. I., "Extremum Regulation," Automat. Rem. Contr., Vol.
18, No. 9, p. 900, 1957.
Morosanov, I. S., "Methods of Extremum Control," Automat. Rem.
Contr., Vol. 18, No. 11, p. 1077, 1957.
Wescott, J. H., "An Exposition of Adaptive Control," in Proceedings
of Symposium Held at the Imperial College of Science and Technol-
ogy, London, 1961. Pergamon Press, New York, 1962.
Dumont, A., et al., Development of an Advanced Control Circuit for
Satellite Power Systems, First Progress Report. European Space
Research Organization, Charleroi, Belgium, 1969.
Non-Dissipative Solar Array Optimum Charge Regulator, First
Quarterly Report No. P65-125. Hughes Aircraft Co., Culver City,Calif., Oct. 1965.
Engelhardt, R. A., "Optimized Solar-Array-Battery-Space Power
System," IEEE Twelfth East Coast Conference on Aerospace and
Navigational Electronics, Oct. 1965.
Paulkovich, J., Slope Detection as a Method of Determining the Peak
Power Point of Solar Arrays, X-636-64-282. Goddard Space FlightCenter, Greenbelt, Md., Oct. 1964.
Boehringer, A. F., "Self Adapting dc Converter for Solar Spacecraft
Power Supply," IEEE Trans. Aerospace and Electronic Systems, Vol.AES-4, No. 1, Jan. 1968.
Final Report for Optimum Charging System Study Program, Report
No. 1906. Gulton Industries, Hawthorne, Calif., Aug. 1, 1966.
Advanced Voltage Regulator Techniques as Applied to Maximum
Power Point Tracking for the NIMB US Meteorological Satellite, Final
Report AED R-3221. Radio Corporation of America, New York, Oct.1967.
47
12.
13.
Knauer,P.,"AutomaticImpedanceMatchingin dc Circuits,"IEEETrans. Aerospace and Electronic Systems, Vol. AES-2, No. 6, Nov.1966.
Hartman, D. A., "Adaptive Power Conditioning for Solar Cell Arrays,"
IEEE Trans. Aerospace and Electronic Systems, Vol. AES-2, No. 6,Nov. 1966.
48

JPL Quarterly Technical Review Volume 2, Number 1 April 1972
Index: control and guidance, Mari-ner Mars 1971 Project, scientific in-struments
Mariner Mars 1971 Scan Platform PointingCalibration
G. D. Pace, G. I. Jaivin, and R. A. Virzi
Guidance and Control Division
Accurate calibration is required to meet the pointing accuracy requirements of
science instruments mounted on a spacecraft scan platform. Calibration methods
used on previous missions required excessive system-test time and did not achieve the
desired accuracy. Therefore, a new technique was devised for the Mariner Mars 1971
mission wherein both ground and in-flight calibrations were performed. A more
analytical approach was used for ground calibration, and in-flight calibration was
performed using narrow-angle television pictures of stars. The results were
outstanding, indicating the potential of this technique for future missions when
imaging experiments are flown. The Mariner Mars 1971 calibration technique andresults are summarized in this article.
Introduction
A 2-deg-of-freedom scan platform is utilized to point the Mariner Mars1971 science instruments. Pointing of the platform relative to the spacecraft
is accomplished by articulating the platform about its two control axes,
clock and cone. The spacecraft attitude is stabilized in three axes by
orienting celestial sensors to the Sun and the star Canopus. The locations of
the scan platform, science instruments, and sensors on the spacecraft are
shown in Figure 1.
One axis of the scan control subsystem is shown in Figure 2. Commands
are received to step the platform in 0.25-deg steps. A stepper motor moves
the wiper on a reference potentiometer to create a reference voltage. The
analog servo loop responds until the feedback voltage cancels the reference
voltage. Potentiometers geared to the gimbal provide feedback and
telemetry measurements.
Errors in pointing the platform are caused by attitude sensor electrome-
chanical offsets, clock and cone gimbal offsets and misalignments, spacecraft
and platform structural misalignments, and scan control loop offsets.
Determination of these errors by accurate calibration of platform pointing
49

50

STEP I_ ELECTRONICS ICOMMANDS
II
: IIREFERENCE
POTENTIOMETER _- v _-_
REFERENCE TELEMETRY
POTENTIOMETER
T
GEAR RATIO
----- GEAR SHAFT
SCAN OFF
O
__,,.,...,,.O_-_ TEL EM ETRY
O ON
GIMBAL
CLUTCH II
FEEDBACK
POTE NTIOMETER
II
._1___ TE LEM ET Ry
COARSE
TELEMETRY
POTENTIOMETER
Figure 2. Single-axis scan control loop
was necessary to meet the pointing accuracy requirements of the science
instruments. An a priori pointing control accuracy of 0.5 deg (30-) and an a
posteriori knowledge of where the platform pointed of 0.25 deg (30-) weredesired.
Experience on previous missions dictated that a new calibration tech-
nique be devised to meet these requirements. Most calibration data from
previous missions were obtained by taking numerous electrical and
mechanical measurements with the spacecraft in a full system configuration.
This involved much effort and consumed much system-testing time. In
addition, the results did not achieve the desired accuracy. Inaccuracies arosefrom the test instrumentation and from the fact that the scan actuators could
not support the platform weight in a 1-g field. The test setup devised to
support the platform was found to introduce mechanical distortions in the
spacecraft and platform structure on the order of the biases being measured.
To overcome these drawbacks for the Mariner Mars 1971 mission, a two-
part scheme was devised wherein the offsets and misalignments that cause
pointing errors were combined into eight biases to be estimated in both
51

ground and in-flight calibrations (References 1 and 2). The ground calibra-
tion combined analytically the separate calibrations of the scan pointingelements. This allowed calibration to proceed simultaneously among several
subsystems independently. System-level tests were limited to determining
subsystem electromechanical interactions and verifying the analysis. The in-
flight calibration, which utilized narrow-angle television pictures of stars,
provided an end-to-end system calibration with an accuracy sufficient toensure that science instrument pointing requirements could be met.
Ground Calibrations
The ground calibration plan consisted of three parts: telemetry calibra-
tion, control loop calibration, and calibration of the fixed electromechanical
offsets. The subsystems and elements involved in the calibrations are
illustrated in Figure 3 and discussed below.
SCAN CONTROL SUBSYSTEM
rII
J i REFERENCE ]AND STEPPER
SCAN CONTROL
CLOCK
ELECTRONICS
INPUT I
STEPS I
I SCAN CONTROLCONE
ELECTRONICS
1REFERENCE
POTENTIOMETER
AND STEPPER
ATTITUDE-CONTROL
SUBSYSTEM
I
J [ ATT IT U DE -CO NTRO L J.__._.__,
]l [SENSORS I l_ I
----4 ISTRUCTURE J_ -- -- -- I
SUBSYSTEMI _ JSPACECRAFT
STRUCTURE J
CLO!K
.__t__ACTUATOR,
FEEDBACK
POTENTIOMETER,
AND TELEMETRY
POTENTIOMETERS
ACTUATOR,
FEEDBACK
POTENTIOMETER,
AND TELEMETRY
POTE NTIOMETERS
AxlstlI
TELEMETR'_
AXIS
I --
I II SCANPLATFORM II I STRUCTUREI IJ I I ISC,ENCE
I I I ,NSTRUMENT
J -[ L suBSYSTEM
' F- t- E..... iALIGNMENT L_ SCIENC J
MIRROR J Ii I INSTRUMENTS
1 J
Figure 3. Subsystemsand elements involved in scan platform ground calibration
52

TelemetryCalibration
Accurate telemetry calibration was required as part of the ground
calibration, since limited improvement was possible in the in-flight
calibration. The attitude-control sensor telemetry output versus error angle
was fitted with a third-order polynomial to an accuracy of 0.015 deg. The
scan coarse telemetry potentiometer output versus actuator output angle
was fitted with a third-order polynomial to an accuracy of 0.08 deg.
Calibration of the fine telemetry potentiometer was complicated by the
gear train system. Undefined resistance regions occurred on the potentiome-ter as it completed a revolution. Center-to-center gear radius variations and
ellipticity introduced harmonics which affected the calibration. A sequentialminimum-variance estimator with interactive data editing was programmed
to provide a third-order fit and account for these factors. The resulting fine
telemetry potentiometer calibration accuracy was 0.06 deg.
During telemetry calibration, two scan actuators exhibited high hysteresis.
These were interchanged with actuators with low hysteresis. No recalibra-
tion was necessary since the plan allowed for exchange of subsystemelements.
Control Loop Calibration
Control loop calibration data were obtained on the reference and
feedback potentiometers. Nonlinearities in the feedback potentiometers
were causing errors of 0.3 deg when the data were fitted with a third-order
polynomial. This polynomial fitting was replaced by a table lookup routine
so that in-flight data could be included. The resulting accuracy was 0.1 deg.
Electromechanical Offset Calibration
Calibration data to determine the fixed electromechanical offsets were
obtained from the structure, science instruments, and attitude-controlsensors. Attitude-control sensor and science instrument offsets were
measured relative to the mounting surface. Mechanical misalignments of the
mounting surfaces relative to the spacecraft and platform structure weremeasured. Also, misalignments between the spacecraft and platform
structure were measured. These measurements were analytically combined
to provide overall instrument pointing offsets. These offsets were related to
the scan gimbal telemetry in the final system-level testing. The overall
accuracy of these calibrations indicated an uncertainty as large as 0.5 degcould exist. This was subsequently confirmed in the in-flight calibration.
The attitude-control Sun sensor nulls were expected to change by aging as
much as 0.1 deg, with 90% of the change expected to occur after 6-wk
operation. In-flight calibration was required to measure this change.
53
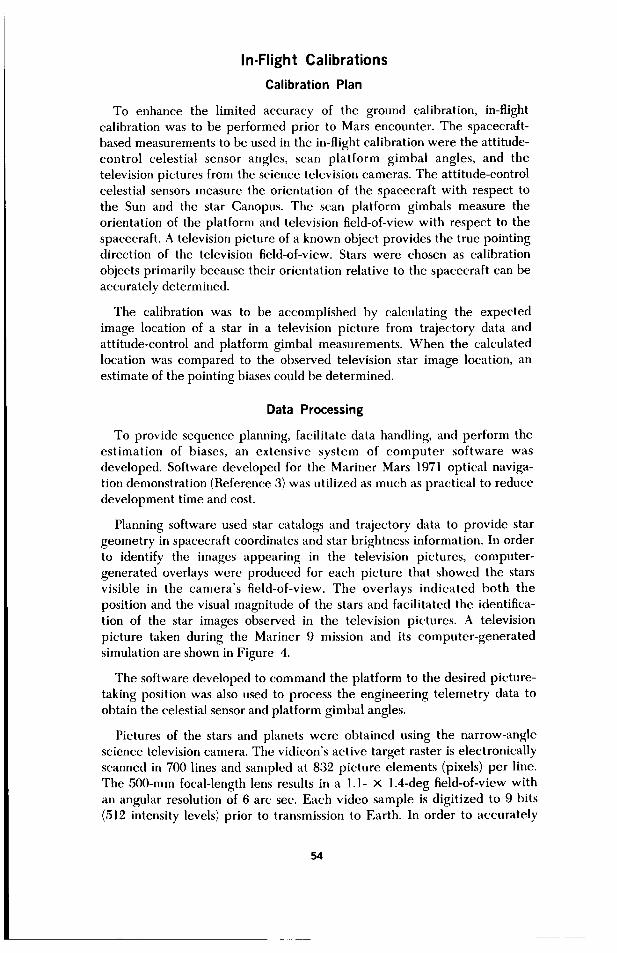
In.Flight Calibrations
Calibration Plan
To enhance the limited accuracy of the ground calibration, in-flight
calibration was to be performed prior to Mars encounter. The spacecraft-
based measurements to be used in the in-flight calibration were the attitude-
control celestial sensor angles, scan platform gimbal angles, and the
television pictures from the science television cameras. The attitude-control
celestial sensors measure the orientation of the spacecraft with respect to
the Sun and the star Canopus. The scan platform gimbals measure the
orientation of the platform and television field-of-view with respect to the
spacecraft. A television picture of a known object provides the true pointingdirection of the television field-of-view. Stars were chosen as calibration
objects primarily because their orientation relative to the spacecraft can be
accurately determined.
The calibration was to be accomplished by calculating the expected
image location of a star in a television picture from trajectory data and
attitude-control and platform gimbal measurements. When the calculated
location was compared to the observed television star image location, an
estimate of the pointing biases could be determined.
Data Processing
To provide sequence planning, facilitate data handling, and perform the
estimation of biases, an extensive system of computer software was
developed. Software developed for the Mariner Mars 1971 optical naviga-
tion demonstration (Reference 3) was utilized as much as practical to reduce
development time and cost.
Planning software used star catalogs and trajectory data to provide star
geometry in spacecraft coordinates and star brightness information. In order
to identify the images appearing in the television pictures, computer-
generated overlays were produced for each picture that showed the stars
visible in the camera's field-of-view. The overlays indicated both the
position and the visual magnitude of the stars and facilitated the identifica-
tion of the star images observed in the television pictures. A television
picture taken during the Mariner 9 mission and its computer-generated
simulation are shown in Figure 4.
The software developed to command the platform to the desired picture-
taking position was also used to process the engineering telemetry data to
obtain the celestial sensor and platform gimbal angles.
Pictures of the stars and planets were obtained using the narrow-angle
science television camera. The vidicon's active target raster is electronically
scanned in 700 lines and sampled at 832 picture elements (pixels) per line.
The 500-mm focal-length lens results in a 1.1- × 1.4-deg field-of-view with
an angular resolution of 6 arc sec. Each video sample is digitized to 9 bits
(512 intensity levels) prior to transmission to Earth. In order to accurately
54

I I I I I I I I I
I
Figure 4. Star cluster Pleiades: (a) Mariner 9 television picture, (b) computer- generated simulation
55

measure the location of star images on the television picture, an image
processing computer program was used to examine each picture in detail.
This program generated both tabulated digital television data and contour
maps of each star image (Figure 5). By this means, it was possible to
determine the center of star images to _+1 pixel.
An estimation program provided a minimum-variance estimate of the
biases in selected error parameters from the observed and expected
positions of the images in the television pictures. An a posteriori estimate of
the pointing error and its associated covariance matrix and an updated set of
television picture orientation angles were computed for each picture.
Calibration Sequences During the Mission
Two calibration sequences were performed. The first sequence, per-
formed 40 days prior to Mars encounter, consisted of taking 31 pictures
targeted at bright stars, Saturn, and a bright compact star cluster. An
overlapping picture pattern was chosen for this sequence to ensure the
acquisition of an initial set of data that would allow the determination of any
gross biases in the platform pointing system. A typical television picture
from the first scan calibration sequence was shown in Figure 4a. The results
of this calibration indicated a 0.5-deg post-launch bias in the platform cone
gimbal null offset.
478
476
474
472
Z
-- 470...1
468
466
I IARC LABEL CONTOUR VALUE
A 20.0B 30.0
C 40.0D 50.0E 60.0
464
635 640 645 650 655
PIXEL NUMBER
Figure 5. Video intensity contour plot of a 6.9-rnagnitude star
56

Achievement of an initial recalibration of the platform pointing system
and the excellent vidicon sensitivity observed in the first set of pictures
permitted some retargeting to optimize the second calibration sequence of
pictures 7 days later. Targets for these 31 pictures were selected so as to
require camera pointing over the entire dynamic range of scan platform
motion. Two or more images were detected in 28 of these pictures, while a
single image was observed in the remaining three.
Results and Conclusion
The ground calibrations were combined to provide the eight pointingoffsets. The estimated accuracy of the ground calibration was 0.8 deg (3o')
for scan pointing control and 0.6 deg (3o') for pointing knowledge. The
accuracy was limited by the polynomial fitting errors in the control loop
calibration and the large uncertainties in the calibration of the electrome-chanical offsets.
Of the eight separate biases determined from the in-flight calibration,
major ones were a cone gimbal null offset of 0.48 deg and a clock gimbal null
offset of 0.28 deg. Had the in-flight calibration not been performed, a scan
pointing control error of 0.7 deg would have existed. Analysis of the second
calibration sequence, using the biases determined in-flight, indicated that a
scan pointing control accuracy of 0.49 deg (3o') and a pointing knowledge
accuracy of 0.16 deg (3o')had been achieved, as compared to the desiredvalues of 0.5 and 0.25 deg (3o-), respectively.
Thus, the results of the combined ground and in-flight calibrations were
outstanding. The ground calibration technique saved a considerable amount
of system-test time. In addition, it isolated problems and allowed subsystemelements to be interchanged without having to repeat major calibration
tests. The in-flight calibration technique provided accuracy better than that
required. On the basis of the success achieved for the Mariner Mars 1971mission, it can be concluded that these techniques will be valuable on future
missions when imaging experiments are flown.
References
1. "[Mariner Mars 1971] Scan Calibration Plan," in Flight Projects,
Space Programs Summary, 37-61, Vol. I, pp. 12-14. Jet Propulsion
Laboratory, Pasadena, Calif., Jan. 31, 1970.
2. Mariner Mars 1971 Scan Platform Control Calibration and Align-
ment Plan, 610-126, June 18, 1970 (JPL internal document).
3. Acton, C. H., Processing On-Board Optical Data ,for Planetary
Approach Navigation, AIAA Paper 72-53, presented at the AIAA 10th
Aerospace Sciences Meeting, San Diego, Calif., Jan. 17-19, 1972.
57

JPL Quarterly Technical Review Volume 2, Number 1 April 1972
Index: control and guidance, math-ematical sciences
Analysis of Morgantown Vehicle Steering
H. S. Lin and E. L. Marsh
Guidance and Control Division
Control
The proposed Morgantown public transportation system will use a fleet of
computer-controlled vehicles operating on a separate dedicated network of
roadways called a "gnideway." An automatic steering system on each vehicle will
enable the traversal of the proposed route of various gnideway sections.
This article describes a preliminary study made at JPL to analyze the steering
control for the Morgantown vehicles. The primary requirement was to design an
automatic steering system that would achieve a smooth ride and simultaneously
eliminate the need for excess margin in the gnideway width, a significant factor in
overall system cost. Front- and rear-wheel steering and front and rear sensing
capabilities were assumed in the analysis. The system finally adopted-front- and
rear-wheel steering and front sensing-was shown by computer simulations and by
Boeing Company vehicle steering experiments to be adequate.
Introduction
The proposed Morgantown public transportation system will use a fleet of
computer-controlled vehicles operating on a separate dedicated network of
roadways called a "guideway." An automatic steering system on each
vehicle will enable the traversal of the proposed route of various guidewaysections.
A preliminary study was made at JPL to analyze the steering control forthe Morgantown vehicles. The primary requirement was to design an
automatic steering system that would achieve a smooth ride and simulta-
neously eliminate the need for excess margin in the guideway width, a
significant factor in overall system cost.
The analysis presented here begins with a derivation of the basic
equations of motion governing the vehicle's travel along the guideway and
proceeds through a discussion of the stability of a linearized system, the
determination of the appropriate system control law, and a description of
the system response.
58

Equations of Motion
The terms relevant to this analysis of the Morgantown vehicle and
guideway are defined in Figure I and below:
B0 =
B i =
S i
p* =
V =
V i
_X) ----
g(x) ----
O_ i
vehicle body designation
wheel designationi = 1,3 for front wheels
i = 2,4 for rear wheels
sensor-guideway contact designation
vehicle mass center
velocity vector of p*
velocity vector of center of wheel
equation for left edge of guideway
equation for right edge of guideway
wheel sideslip angle
vehicle sideslip angle
wheel steering angle
In Figure 1, axes X and Y are fixed in an inertial reference frame N, with unitvectors nx and ny. Unit vectors nl, nz, and n 3 are fixed in the vehicle body
B0. With n 3 also fixed in N, the vehicle can experience neither roll nor pitch
motion. Thus, only those forces and torques that can influence yaw-lateral
motion are shown in Figure 1.
A wind force W - Wn 2 is assumed to act parallel to n 2. Forces exerted
over the contact patch of a single wheel can be replaced by the equivalent
system of a single force passing through the contact patch center and a
couple. In Figure 1, the component parallel to the X-Y plane of theresultant force exerted on wheel Bi is denoted Fi, and the component
parallel to n 3 of the couple exerted on wheel Bi is denoted T i. Forces exerted
on Si are equated to a single force and couple, where the surface plane and
n 3 components are denoted fi and ti, respectively.
Usually, Fi is further resolved into a component parallel to the wheel
plane (the traction force) and a component normal to the wheel plane (the
lateral force). In the ensuing analysis, the traction force is ignored.
Furthermore, Ti is assumed to be negligible. As a final simplification, the
sensor reaction forces and couples fi and ti are assumed to be small. The
vehicle yaw attitude and lateral displacement are then governed entirely bythe lateral wheel forces.
The equations of lateral and yaw motion are:
59

_F/+W-M_ r_ .n 2=0i=l
(1)
(_ r, x F i - I0Jn3) -n 3 = 0i=1
(2)
where M and I are the mass and yaw-axis inertia, respectively, of B0, and ri is
the position vector of the center of the wheel contact patch with respect to
p*. More explicitly, when the following relationships are established:
(1) Fi expressed as a function of slip angle ai.
(2) _z expressed in terms of the kinematic variables fl and $.
(3) Slip angle ai expressed in terms of the kinematic variables fl and
and steering angles 8_.
(4) Steering angles 3 i related to sensor errors via the steering control law.
then, upon linearizing along the nominal trajectory of the vehicle center,
which in this case is the center of the guideway, the following two equationsresult:
_ Ca+2C(L-a) MV]_-2C [(K, +K3)(a+c)2--#- V
+ (K2 + K,0 (_ - a + d)l * -MVfi - 4C(3 (3)
-2C(K 1 +K 2 +K 3 +K4)v=-W
C 2
I_'-2 F[a -(L-a) 2]_-2C[a(a+c)K 1-(L-a)(a+c)K 3
+ a(L - a + d)K 2 - (L - a) (L - a + d)K 4 ] _ - 2C(L - a)2_ (4)
-2C[aK 1 +aK 2 -(L-a)K 3-(L-a)K 4] y =0
The parameter C is referred to as the wheel cornering power coefficient, the
variable y is the distance between the center of the vehicle and the center of
the guideway, and the Kj's are control-system gain parameters associatedwith the assumed control law
6F= KIDF + K2Dn t
fiR = K3DF + K4DR
(5)
6O
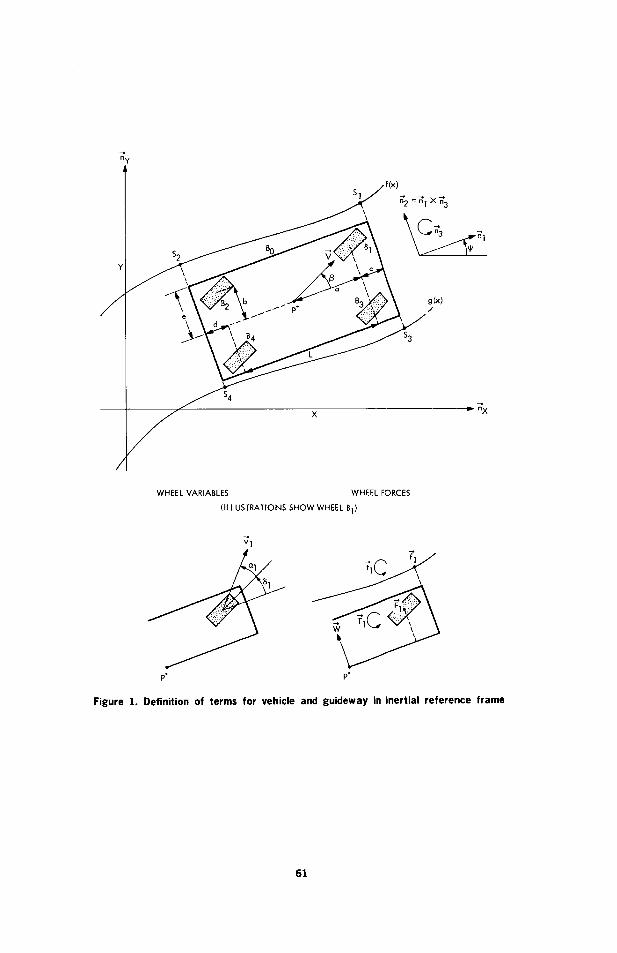
J
/
/f(x)s 1
_ nx
WHEEL VARIABLES WHEEL FORCES
(ILLUSTRATIONS SHOW WHEEL B1)
p° p*
Figure 1. Definition of terms for vehicle and guideway in inertial reference frame
61

where 8e and 8R are the front and rear steering angles, respectively (i.e., 8e
= 81 = 83, 8 R = 82 = 84), and De and DR are the front and rear sensing
errors. On a straight guideway, De and DR can be further expressed as
D F =-[y + (a + c)_] 1
tD n =-[v-(L-a+d)ff]}
(6)
The kinematical relationship
3_= V(_O + :3) (7)
together with Equations 3 and 4 form a consistent set of equations that canbe rewritten in vector form as
u = Au (8)
where u is a (1 × 4) vector with components
b/1 = _'/' l/2 = _' //3 =_' U4 =y (9)
and A is a constant (4 × 4) matrix whose elements are functions of the
following system parameters1:
L = 2.794 m (9.167 ft)
a = 1.397 m (4.584 ft)
c,d = 0.59 m (1.92 ft)
e = 0.9145 m (3.0 ft)
V varies parametrically (0 < V < 13.4 m/s)
M = 3409.1 kg (233.6 slugs)
I = 3607.4 kg-m 2 (2658.33 slug-fi e)
C = 87,273.7 N (19,620 lb)
W = 0
Stability of the Linearized System
The system of Equations 8 is asymptotically stable if the eigenwdues of A
have negative real parts. This can easily be determined by applying the
Routh criteria to the characteristic equation
1 Values in customary units are included in parentheses after values in S1 (International System)
units if the customary units were used in the measurements or calculations.
62

IA- s/1= 0 (10)
In more detail, the general characteristic equation derived from theequations of motion is2
C(S) = 0.00008432 VS 4 + 0.08177S 3
+S2[18.304/V+O.O1478V(K l +K 2 +K 3 +K 4)
+ 0.0371 V(K 1 - K 2 - K 3 + K4) ]
+S[9.152(K l +K 2 +K 3 +K 4) + 13.000(K l -K 2 -K 3 +K4)]
+ 2.000V(K 1 + K 2 - K 3 -/(4) + 26.000V(K1K 4 - K2K3)
(11)
The
are:
(1)
(2)
(3)
(4)
(5)
five special cases of practical interest that were investigated in detail
Front-wheel steering based on front sensing (K2 = K 3 = K4 = 0).
Front- and rear-wheel steering based on front sensing (K z = K4 = 0).
Front- and rear-wheel steering based on front and rear sensing,
respectively (K z = K 3 = 0).
Front- and rear-wheel steering through the same angle, but in
opposite directions, based on front and rear sensing (K 1 = -K 3, K 2 ----K4).
Front- and rear-wheel steering in parallel, based on front and rear
sensing (Kl = K3, K2 = K4).
The stability regions for cases 2-4 are shown in Figures 2-4. Case 1 is a
special case of case 2 or 3; case 5 is always unstable (in the sense that
asymptotic stability can never be achieved), as can be shown from the
system equations of motion (Equations 8). In the above cases, the speed of
the vehicle, V, is assumed to be 13.4 m/s (44 ft/s). It can be shown by a
direct application of the Routh criteria that, for this configuration, if the
steering system is stable for V = 13.4 m/s, it is stable for all 0 < V _ 13.4
m/s (44 ft/s). The stability plots provide a convenient reference for choosing
gain parameters K/, since only the sets of K/within the stable regions would
guarantee a stable system. In selecting K/, the system transient response andits steady-state errors should also be taken into consideration.
2 All coefficients in Equation 11 were calculated in the slug-ft-s system.
63

K!
- K3 =0
K3
K12+ 0.07143 K 1 - 0.8049 K1K 3 + O. 1978 K3 + O. 1097 K32 = 0
IFigure 2. Stability region for case of front- and rear-wheel steering based on front
sensing
K4 = -0.3264
KlK4+88 K1 -88K 4 =0
ii_il
0.4 0.6K4
+"4j +03263(K,+K4)02_8(K1- K4)-3.3,2"1"4:o
Figure 3. Stability region for case of front- and rear-wheel steering based on front
and rear sensing, respectively
64
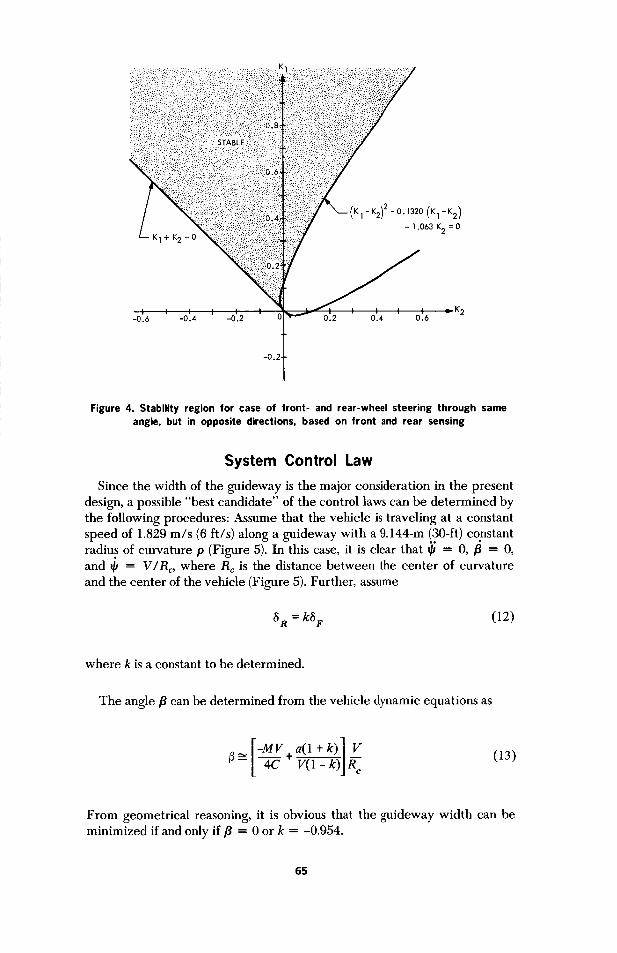
)2-01320(K1-K2)- 1.063 K2 = 0
Figure 4. Stability region for case of front- and rear-wheel steering through same
angle, but in opposite directions, based on front and rear sensing
System Control Law
Since the width of the guideway is the major consideration in the present
design, a possible "best candidate" of the control laws can be determined by
the following procedures: Assume that the vehicle is traveling at a constantspeed of 1.829 m/s (6 ft/s) along a guideway with a 9.144-m (30-ft) constant
radius of curvature p (Figure 5). In this case, it is clear that 0J - 0,/3 = 0,
and _ = V/Rc, where Rc is the distance between the center of curvature
and the center of the vehicle (Figure 5). Further, assume
6 R = k6 e (12)
where k is a constant to be determined.
The angle/3 can be determined from the vehicle dynamic equations as
-MV a(l+k)] V(13)
From geometrical reasoning, it is obvious that the guideway width can be
minimized if and only if/3 = 0 or k = -0.954.
65

a + c-lm
DR _ _ Y D F
_ 2h
Figure 5. Definition of terms for vehicle on guideway with constant radius ofcurvature p
For convenience in hardware mechanization, the factor k is chosen to be
-1; i.e., the rear wheels would be steered through an angle of the same
magnitude but in the opposite direction with respect to the front wheels.
The value of/3 in this case turns out to be approximately -0.0035 rad.
Using the value/3 _ 0 and the geometry of Figure 5, the values of r, 2h, R,
and y can be determined to be
r = 8.132 m (26.679 ft)
2h = 2.024 m (6.642 ft)
R = 10.156 m (33.321 ft)
y = -0.0978 m (-0.321 ft)
(14)
The front- and rear-wheel steering angles corresponding to the case k = -1
and/3 _ 0 are
a
_F = -Sn =R--- = 0.154 rad (15)¢
For the sake of simplicity, front sensing (i.e., K 2 -- K4 = 0) will be assumed.
The front sensing error DF can also be determined from the geometry shown
in Figure 5.
66

(a + ¢)2
DF _ 2 × 9.144 +y
= 0.117 m (0.384 ft)
Thus, the control law can be determined to be
K 1 = -K 3 = 5F/D F = 1.312 m -I (0.4 ft-l)t
5F l'312DF
5R =-1.312D F
(16)
(17)
System Response
The transient response of the steering system was predicted from root-
locus plots generated by a computer. 3 In these plots, only the positive
imaginary axis appears since root loci are symmetrical to the real axis.
Reproductions of two such plots corresponding to vehicle speeds V = 1.829
and 13.4 m/s (6 and 44 ft/s) are shown in Figures 6 and 7, respectively. From
these figures, it was concluded that the system is well damped at low speed
(1.829 m/s); however, at high speed (13.4 m/s), the damping factor
decreases to approximately 0.38. The fact that the system tends to be less
stable at a higher speed can easily be understood from the variation of the
system's open-loop poles and zeros positions as a function of speed V (Table1).
3 All quantities in the root-locus plots were calculated in the slug-ft-s system.
>-
z
O
2.5
2.0
1.5
ilO.
-4.0 -3.5
CLOSED-LOOP DOMINANT POLES /
__ FORK 1 = -K 3 =0.4 /UNDAMPED NATURALFREQUENCY = 1.82 Hz
DAMPING FACTOR = 0.95
]-3.0 -2.5 -2.0
KI[= -K 3 =10.4
K2 = K4 = 0 ]
V = 1.829m/s ]
(6 ft/s)
I//- --
-I.5 -1.0 _.5 0 0.5 1.0
REAL
Figure 6. Root loci for low-speed travel with front- and rear-wheel steering (positive
imaginary axis only)
67

18
>-
Z
O
10
-16
K I - -K 3 = 0.4
-- K2 = K4 = 0
V = 13.4 m/s( 44 ft/s )
/KI = 0.4
CLOSED-LOOP DOMINANT POLES
J FOR K1 = -K 3 = 0.4
.3 UNDAMPED NATURAL "-7FREQUENCY = 7.80 Hz / --
DAMPING FACTOR = 0.38 //02 \
, /
KI = . _X O.2
\
oPE_-LooPZERO---X\ '_ O. 1
\\\\
j j y _7-- OPEN-LOOPPOLES__,\
-12 -I0 -8 -6 -4 -2 0
REAL
Figure 7. Root loci for high-speed travel with front- and rear-wheel steering
(positive imaginary axis only)
68
E
t_e-
o
"0c-
OQ.
n00
e-4)CI.
o
J:3_S
k"
s.,
©
0
o
©
• °
I
_- i_- h- _-
I
c-,I _'3
L_
c_
69
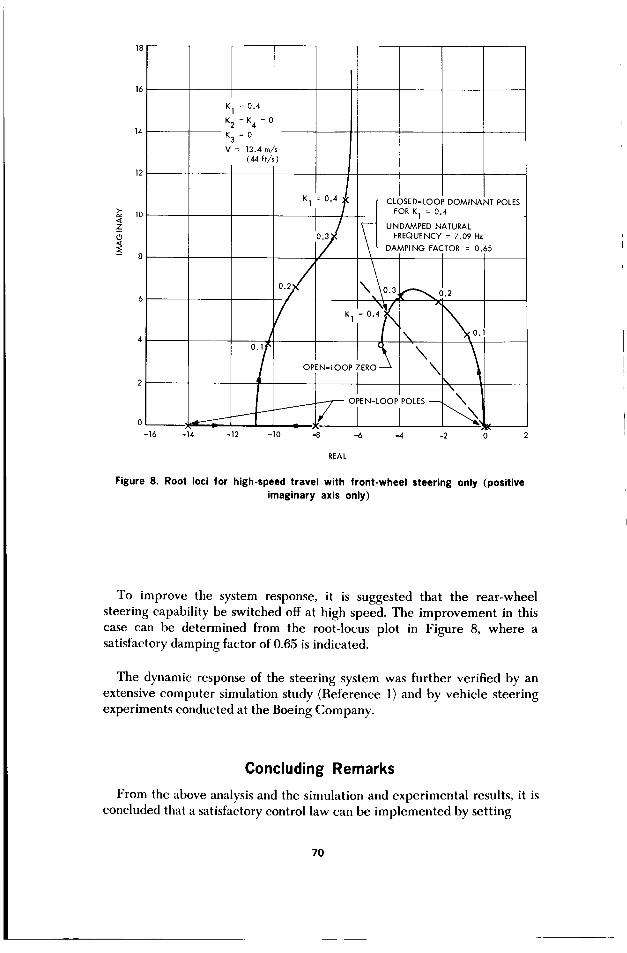
REAL
Figure 8. Root loci for high-speed travel with front-wheel steering only (positive
imaginary axis only)
To improve the system response, it is suggested that the rear-wheel
steering capability be switched off at high speed. The improvement in this
case can be determined from the root-locus plot in Figure 8, where asatisfactory damping factor of 0.65 is indicated.
The dynamic response of the steering system was further verified by an
extensive computer simulation study (Reference 1) and by vehicle steering
experiments conducted at the Boeing Company.
Concluding Remarks
From the above analysis and the simulation and experimental results, it is
concluded that a satisfactory control law can be implemented by setting
7o
8F = 1.312D e )
/
fir -1.312D e at low speed_/
0 at high speed J
(18)
However, it should be noted that the control law was analyzed and simulatedunder idealized conditions:
(1) A linearized model of vehicle dynamics was assumed.
(2) The speed of the vehicle was assumed to be constant.
(3) The sensing device was considered to be perfect, i.e., no sensor lag
and perfect calibration (no mismatch).
(4) No coupling of the yaw-lateral motion with other degrees of
freedom (e.g., roll) was considered.
Any variation from these conditions could have serious impact on the
guideway width determination.
.
Reference
Lin, H. S., and Marsh, E. L., Steering Problems Associated With the
Morgantown Vehicle, Engineering Memorandum 344-339-HSL/ELM,
Apr. 14, 1971 (JPL internal document).
71
JPL Quarterly Technical Review Volume 2, Number 1 April 1972
Index: chemistry, energy storage,nonmetallic materials
Lifetime Estimates for Sterilizable Silver-Zinc
Battery Separators
E. F. Cuddihy, D. E. Walmsley, and J. Moacanin
Propulsion Division
The lifetime of currently employed separator membrane in the electrolyte
environment of JPL silver-zinc batteries has been estimated at 3 to 5 yr. The
separator membranes are crosslinked polyethylene film containing grafted poly(po-
tassium acrylate) (PKA), the latter being the hydrophilic agent which promotes
electrolyte ion transport. The lifetime was estimated by monitoring the rate of loss
of PKA from the separators, caused by chemical attack of the electrolyte, and
relating this loss rate to a known relationship between battery performance and PKA
concentration in the separators.
Introduction
Sterilizable separator membranes for silver-zinc batteries can be pre-
pared by grafting poly(potassium acrylate) (PKA) onto a thin film of
crosslinked polyethylene (PE). The crosslinked PE film provides the
mechanical strength and heat stability while the PKA provides the required
hydrophilic character for electrolyte ion transport. In service, the separators
become black because of the oxidizing effect of the 45% KOH electrolyte
solution which contains dissolved silver ions (_-30 mg/liter). The resulting
silver deposition (References 1-8) within the membrane is paralleled with a
continuous loss of PKA. Inasmuch as battery performance depends on ion
transport through the hydrophilic PKA phase, deterioration of battery
performance is tied directly to the rate of loss of PKA.
Details of the loss of PKA, the relationship between PKA concentration
and battery performance, and the interrelationship between these twowhich forms the basis for the lifetime estimate are discussed. Also presented
are recent experimental data which are not in concert with the accepted
mechanism of PKA loss, causing a re-examination of the loss mechanism.
Finally, preliminary results are given which indicate that a new potential
hydrophilic agent, poly(potassium methacrylate), may be more stable to
battery electrolyte than PKA.
72
Results and Discussion
Separator Lifetime
The half-life of these separators (identified as GX-152 membranes),
expressed in terms of PKA loss, has been found to be 957 days (2.62 yr) at
25°C. This was determined experimentally by monitoring the loss of PKA at
135, 95, and 65°C. These data (Table 1) were found to obey first-order
kinetics and are shown plotted in Figure 1. Rate constants were determined
and plotted in Figure 2 according to the Arrhenius relationship.
Details of the experimental techniques and method of analysis of PKA in
the separators have been previously discussed (References 6, 7, and 8).
Battery performance
The ease of electrolyte ion transport through a separator membrane can
be measured in terms of a parameter called membrane resistance. This
parameter is measured as follows. The resistance of a 40% KOH electrolytesolution between two electrodes is first measured. A separator membrane is
then placed between the electrodes and the additional resistance which is
measured above the separator-free value is taken as the membraneresistance.
In Figure 3 a plot of membrane resistance versus percent PKA graft is
reproduced from the literature (Reference 9). This data shows that minimumresistance is achieved above 40% PKA, whereas as PKA decreases below this
value, the resistance begins to increase rapidly. At 20% PKA, the resistance
curve rises almost vertically, implying a shutoff of battery performance as
PKA concentrations go below 20%.
The current JPL separators are prepared with an initial PKA concentra-
tion of near 45%. Using the half-life data, the PKA concentration will drop at
ambient to near 22.5% in 957 days (2.62 yr) and to near 11% in another 957
days. The implication of Figure 3 is that the current JPL separator will
cause a cessation of battery operation after 3-5 yr of service.
PKA Loss Mechanism
Heretofore it has been accepted that the PKA loss mechanism occurred
through oxidative attack of the dissolved silver ions, resulting in deposition
within the membrane of reduced metallic silver and chemical cleavage of
the PKA. It was also known that some PKA was lost through exposure of themembranes to sterilization for 120 h at 135°C in 45% KOH, but it was felt
that this PKA was residual homopolymer left after the grafting reaction.
Some recent experimental data, however, have necessitated a reexamina-
tion of this simple picture of PKA loss by silver ion oxidation. Samples of
pure poly(potassium acrylate) homopolymer were dissolved in 45% KOH
and a silver-oxide-saturated 45% KOH solution, and the specific viscosities
monitored as a function of time at 95°C. The specific viscosities are related
to the molecular weight of the dissolved polymer, and decreases in
73

"0
-,t
o
o"0
0
xo
r..
EE
c_Ju_w_
0.N •
i.. m
.c_ __r. g.i
.o.,m.ll
E--i
I. v.
"Oc-
O
c_m
E'll.D
Q.V
ClO.
V_
.0
In
o_c_
oo t_- _o _t _ _ _
._=
N _
N _ _
7,4
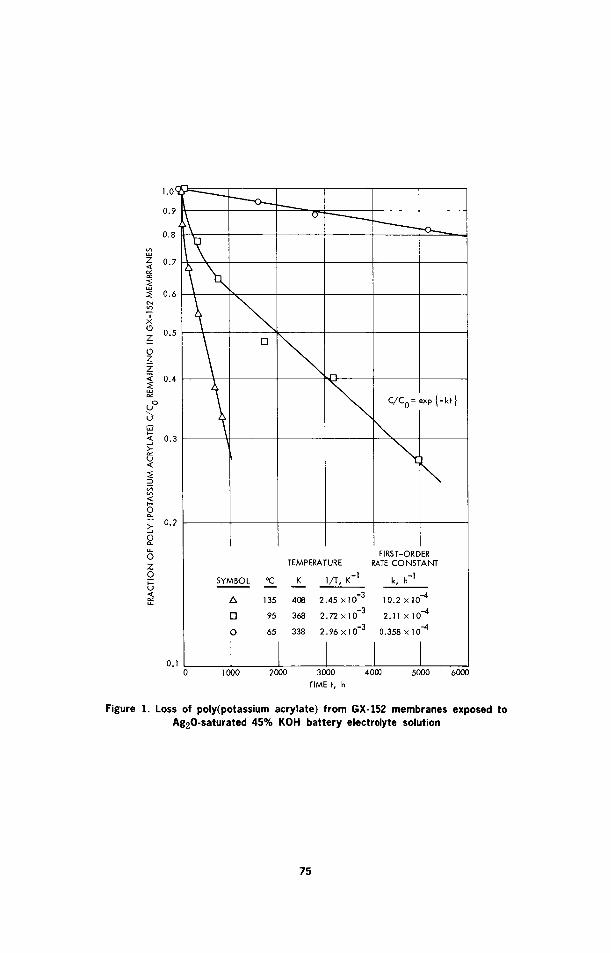
Z
ix0Z
0ZmZ
uob
u<[
m
v
>obZ0
1.0(, _..._.._.._ ,,..,,_
0.9
0.8
0.7
0.6 "_
0.5
0.4
0.3
0.2
0"
\C/C 0 = exp {-kt }
\\
0.1
SYMBOL
FIRST-ORDERTEMPERATURE RATE CONSTANT
eC K l/T, K -1 k, h-1
135 408 2.45 xlO -3 10.2 x 10⁻⁴
[] 95 368 2.72 x 10 -3 2.11 x10⁻⁴
0 65 338 2.96 x 10 -3 0.358 × 10⁻⁴
lO00 2000 3000 4000 5000 6000
TIME t, h
Figure 1. Loss of poly(potassium acrylate) from GX-152 membranes exposed toAg20-saturated 45% KOH battery electrolyte solution
75
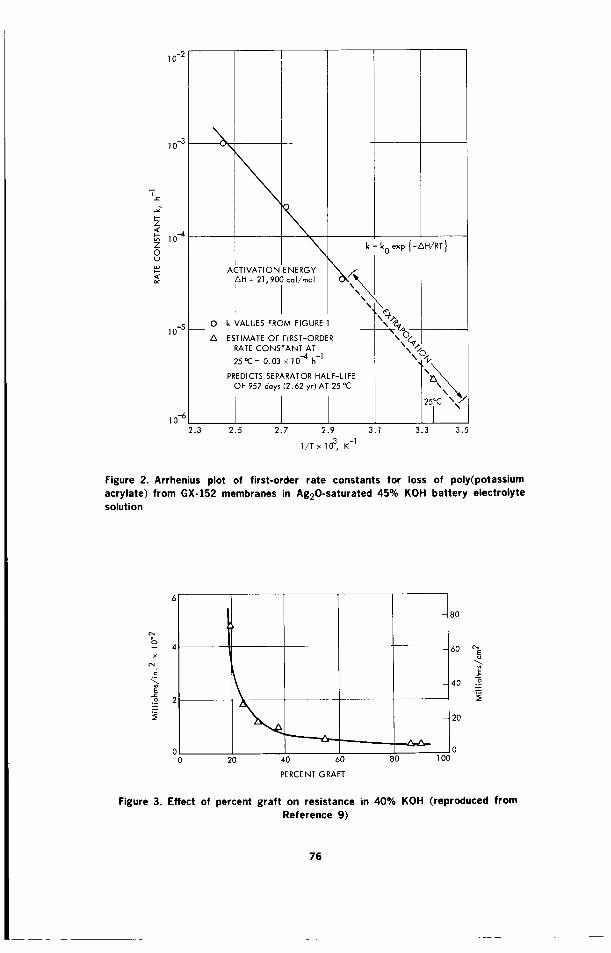
10 -2
10 -3
%
,_ lO-4ZOu
10-5 --
\k = k0 exp {-AH/RT}
ACTIVATION ENERGY _,
AH = 21,900 cal/mol
/, L/._O k VALUES FROM FIGURE /\_'__,._A ESTIMATE OF FIRST-ORDER "_O¢,
I
RATE CONSTANT AT ,,>,\\1
25°C = 0.03 x 10"4 h -1 _J_"x
PREDICTS SEPARATOR HALF-LIFE \_
OF 957 days (2.62 yr)AT 25 °C
25oc \ >,'
I "3.3 3.5
10 -6 i2.3 2.5 2.7 2.9 3.1
1/T x 103, K -1
Figure 2. Arrhenius plot of first-order rate constants for loss of poly(potassium
acrylate) from GX-152 membranes in Ag20-saturated 45% KOH battery electrolytesolution
%×
c_
0
C0 80
\20 40 60
PERCENT GRAFT
8O
6o
40 .9
2O
01O0
Figure 3. Effect of percent graft on resistance in 40% KOH (reproduced fromReference 9)
76

viscosity are caused by the degradation of the polymer in the solution. The
specific viscosity results are given in Table 2, with the surprising and
unexpected result that the decreases in specific viscosity are the same for
both the silver-oxide-free and silver-oxide-saturated KOH solutions. This
means that KOH alone appears to be the predominant degrader of PKA,
not dissolved silver. This does not mean that silver is not oxidatively
attacking PKA; the results only mean that PKA is so dominating that the
contribution of silver is lost in the data.
Some further evidence for this can be found in Figure 4 and Table 3 for
the loss of PKA at 135 and 95°C from membranes in KOH solution
containing no silver. At 135°C, the loss of PKA from membranes in silver-
free and silver-saturated solution is almost identical. At this temperature,
dissolved silver has some but very little additional degradation effect above
KOH, thus providing additional support for the KOH degradation mecha-
nism. At 95°C, however, silver apparently has control with negligible KOH
degradation. The cause of this effect must lie in the difference in
accessibility of PKA in the membrane as controlled by the crystalline
melting (110°C) of the polyethylene matrix. Below the melting point, PKA is
strongly held within the crystalline structure, where it is sterically protected,
thus permitting the slower attack of silver ion in its passage through the
membrane to have dominance. Above the melting point, however, KOH
accessibility to the PKA is increased, but not quite to the same extent as for
free PKA homopolymer in solution. This is evident by comparing the 135°C
results in Figure 4 with the specific viscosity results in Table 2.
Table 2. Change in specific viscosities of solutions of poly(potassium acrylate) and
poly(potassium methacrylate) in battery electrolyte at 95°C
Poly(potassium
methacrylate) a
Poly(potassium acrylate) b
Specific Specific
viscosity viscosity
Time, h in 45% KOH Time, h in 45% KOH
solution solution
Specific
viscosity
in Ag20 KOH
solution
0 0.25
312 0.25
480 0.28
0 1.04 1.04
168 0.70 0.83
336 0.56 0.69
504 0.49 0.38
774 0.36 0.40
a initial mol wt, 42,200; solution concentration, 0.420 g/100 ml.
b Initial tool wt, 820,000; solution concentration, 0.380 g/100 ml.
77

Z
"TX
O
Z
O
Z
Z
@b
u
m
a.
o
Z
O
U
1.0_
0.9
0.8
0.7
0.6
0.5
0.4
0.3
0.2
\
_o
[]
\
\
\
\
\
I A IN Ag20 SATURATED, k = 10.2 × 10 -4 h -1
135°(:
I A INKOHONLY, k=8.25x10⁻⁴h -1
r O IN Ag20 SATURATED, k = 2.11 x 10 -4 h -1
95 °C
k • IN KOH ONLY, k = 0.115 x 10⁻⁴ h -1
0.1
0 1000 2000 3000 4000 5000 6000
TIME t, h
Figure 4. Comparison of loss rate of poly(potassium acrylate) from GX-152membranes exposed to 45% KOH and Ag20-saturated 45% KOH batteryelectrolyte solutions
78

Table3. Lossofpoly(potassiumacrylate)fromsterilizedaGX-152membranesexposedto silver-free45%KOHbatteryelectrolytesolution
135°C 95°C
Initial a PKA Initial a PKA
Time, h remaining in Time, h remaining in
separator, % separator, %
0 100
120 76
340 71
630 63
1300 34
1560 27
0 100
288 96
1704 84
4912 81
a See Footnote a, Table 1. PKA remaining in separator samples after sterilizationwas taken as the initial levels.
The foregoing has demonstrated that KOH is a stronger degrader of PKA
as compared to silver ion. But the relative rate of attack is dependent on
accessibility of PKA. With increasing inaccessibility of PKA within the
membrane, the degradation by KOH is diminished, and can be so decreased
to such an extent that the slower degradation by silver ion can emerge as the
dominant mechanism.
Silver Paradox
Simultaneously with the PKA loss, there is deposition within the separator
of metallic silver, presumably the end product of the oxidation reaction.
Because of this, silver deposition has been conventionally expressed as a
ratio of silver deposited to PKA lost. These ratios are given in Table 1, which
shows that the amount of silver depositing at 135 and 95°C is the same for
the same loss of PKA. Yet at 135°C, PKA is being lost from the membrane
almost exclusively by KOH. It is no longer exactly clear how silver deposits
into the membranes. Its understanding is important, however, because
battery performance, as influenced by electrolyte ion transport, is affected
by both PKA loss and blockage of the separator by silver deposits. The effect
of the latter and the full mechanism of silver deposition certainly has not
been completely explored.
Stability of Poly(Potassium Methacrylate)
The PKA studies have demonstrated that if increases in separator lifetime
are to be achieved, the PKA would have to be replaced with another
hydrophilic polymer having increased KOH stability. Very preliminary work
79
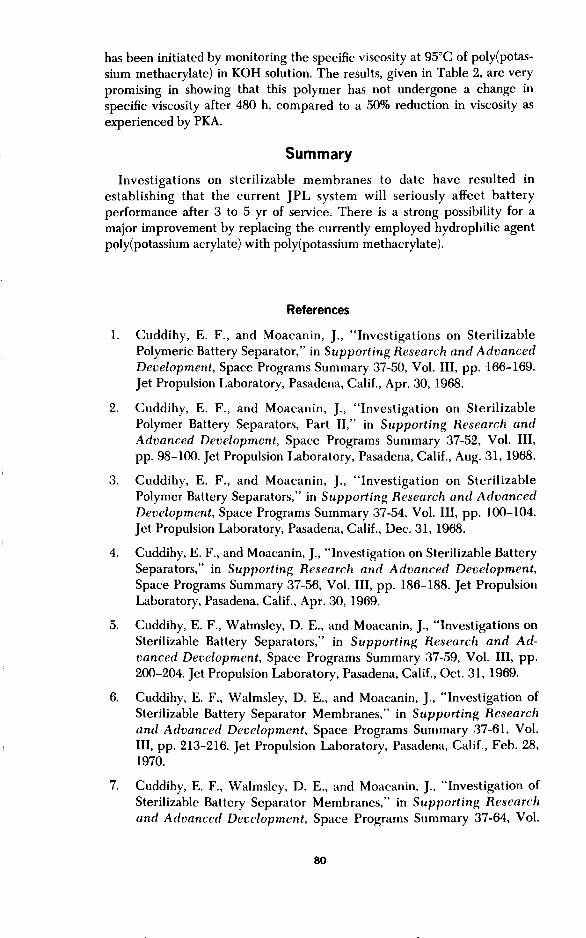
has been initiated by monitoring the specific viscosity at 95°C of poly(potas-
sium methacrylate) in KOH solution. The results, given in Table 2, are very
promising in showing that this polymer has not undergone a change in
specific viscosity after 480 h, compared to a 50% reduction in viscosity as
experienced by PKA.
Summary
Investigations on sterilizable membranes to date have resulted in
establishing that the current JPL system will seriously affect battery
performance after 3 to 5 yr of service. There is a strong possibility for a
major improvement by replacing the currently employed hydrophilic agent
poly(potassium acrylate) with poly(potassium methacrylate).
References
1. Cuddihy, E. F., and Moacanin, J., "Investigations on SterilizablePolymeric Battery Separator," in Supporting Research and Advanced
Development, Space Programs Summary 37-50, Vol. III, pp. 166-169.
Jet Propulsion Laboratory, Pasadena, Calif., Apr. 30, 1968.
2. Cuddihy, E. F., and Moacanin, j., "Investigation on SterilizablePolymer Battery Separators, Part II," in Supporting Research and
Advanced Development, Space Programs Summary 37-52, Vol. III,
pp. 98-100. Jet Propulsion Laboratory, Pasadena, Calif., Aug. 31, 1968.
3. Cuddihy, E. F., and Moacanin, J., "'Investigation on Sterilizable
Polymer Battery Separators," in Supporting Research and Advanced
Development, Space Programs Summary 37-54, Vol. III, pp. 100-104.
Jet Propulsion Laboratory, Pasadena, Calif., Dec. 31, 1968.
4. Cuddihy, E. F., and Moacanin, j., "Investigation on Sterilizable Battery
Separators," in Supporting Research and Advanced Development,
Space Programs Summary 37-56, Vol. III, pp. 186-188. Jet Propulsion
Laboratory, Pasadena, Calif., Apr. 30, 1969.
5. Cuddihy, E. F., Walmsley, D. E., and Moacanin, J., "Investigations on
Sterilizable Battery Separators," in Supporting Research and Ad-
vanced Development, Space Programs Summary 37-59, Vol. III, pp.
200-204. Jet Propulsion Laboratory, Pasadena, Calif., Oct. 31, 1969.
6. Cuddihy, E. F., Walmsley, D. E., and Moacanin, J., "Investigation of
Sterilizable Battery Separator Membranes," in Supporting Research
and Advanced Development, Space Programs Summary 37-61, Vol.
III, pp. 213-216. Jet Propulsion Laboratory, Pasadena, Calif., Feb. 28,1970.
7. Cuddihy, E. F., Walmsley, D. E., and Moacanin, J., "Investigation of
Sterilizable Battery Separator Membranes," in Supporting Research
and Advanced Development, Space Programs Summary 37-64, Vol.
80

III, pp. 136-138. Jet Propulsion Laboratory, Pasadena, Calif., Aug. 31,1970.
8. Cuddihy, E. F., Walmsley, D. E., Moacanin, J., and Tom, H. Y.,
"Investigation of Sterilizable Battery Separators," in Supporting
Research and Advanced Development, Space Programs Summary 37-
65, Vol. III, pp. 171-176. Jet Propulsion Laboratory, Pasadena, Calif.,Oct. 31, 1970.
9. D'Agostino, V., "Procedures and Controls in Preparing Grafted
Membranes," Proceedings of the Symposium on Battery Separators,
The Columbus Section of the Electrochemical Society, BattelleMemorial Institute, Columbus, Ohio, Feb. 1970.
81
JPL Quarterly Technical Review Volume 2, Number 1 April 1972
Index: information storage devices,
Mariner Mars 1971 Project, non-metallic materials
Analysis of the Failure of a Polyester Peripheral
Drive Belt on the Mariner Mars 1971 Flight
Tape Recorder
E. F. Cuddihy
Propulsion Division
A polyester peripheral drive belt on the Mariner Mars 1971 flight tape recorder
failed when a thin longitudinal strip separated off along one edge. Analysis showed
that the most probable cause of failure occurred from flexural fatigue initiating in
mechanically weak locations which are introduced into the belt during fabrication.
Also, methyl ethyl ketone (MEK), which is employed as a cleaning solvent during
fabrication, was found to cause permanent reduction in engineering properties of
polyester and could have contributed to the reduction of the fatigue resistance. This
article reviews fatigue properties of the polyester drive belt for the specific
operating condition, as well as the sensitivity of polyester to cleaning solvents and
the origin of the mechanically weak locations introduced during fabrication.
Introduction
The failure of a polyester peripheral drive belt (p-belt) on the Mariner
Mars 1971 flight tape recorder precipitated a general investigation of the
cause involving both a study of material and mechanical reasons for the
failure. The results of the material investigation are detailed in this article. It
should be pointed out that parallel with this activity additional p-belts were
subjected to tape recorder operation without failure, although these belts
did develop the same symptoms and appearance which characterized the
failed p-belt. The studies which are reported here do not prove the cause of
failure but strongly suggest the mode of failure in highlighting those
weaknesses of polyester which were in operation at the time of the failure.
At the very minimum, this article should contribute to avoiding certain
problems associated with polyester in future use by JPL for flight
applications.
A review of the conditions imposed on the p-belt during use and of the
techniques of manufacturing suggests that, if faihtre occurred because of a
material limitation, the most probable causes would be:
82

(1) Failure from flexural fatigue.
(2) Damage to material from sensitivity to methyl ethyl ketone (MEK)
cleaning solvent.
(3) Nick in edge of p-belt.
(4) Combinations of above.
Analyses of these factors demonstrate that only the flexural fatigue
properties of polyester film could be correlated with the failure history of
the failed p-belt. In the absence of any other demonstrable cause, failure by
flexural fatigue must be considered'as primary.
Although not the primary cause of failure, MEK cleaning solvent can
damage polyester film even to the extent where partial, but permanent, loss
of engineering properties occurs after exposure. Its contribution to
weakening the flexural fatigue resistance of polyester film can be significant.
Its use as a cleaning solvent has been eliminated and replaced with the
compatible solvent Freon-TE.
Failure from the growth of a nick in the edge of the belt is always a
possibility. Its presence could have been missed during inspection. Nick
studies showed that for the stress levels in the p-belt during operation,
failure occurs when the nick depth is approximately 10% of the belt width.
Since this depth is almost equal to the width of the longitudinal strip which
peeled off the failed p-belt, an argument against a nick failure mechanism
emerges. At 10% nick depth, the belt cannot support the stress level and
would have failed by catastrophic tearing across the width. Failure by a nick,
considering this argument and the many inspection steps, seems unlikely.
Background
This section reviews the p-belt operation on a tape recorder and the cause
of the flexing mode. Also discussed is the technique of belt fabrication and
the cause of mechanically weak locations fabricated into the belt. The
fatigue properties and sensitivity to MEK cleaning solvent of the weaklocations are discussed in subsequent sections.
Recorder Operation
Thin plastic belts [10.2mm (0.4 in.) 1 wide × 23.4/xm (0.00092 in.) thick]
prepared from polyester material are employed on JPL flight tape recorders
as the means of driving the reels of recording tape. A typical flight recorder
equipped with a polyester drive belt is shown in Figure 1, where it can be
seen that the belt path carries it over the back side of the reels and in direct
contact with the recording tape. When the belt is moving, the direct contact
is the mechanism for driving the reels of recorder tape. The two hollow
guides shown in Figure 1 are the driving idlers for the belt, while the two
1 Values in customary units are included in parentheses after values in SI (International System)
units if the customary units were used in the measurements or calculations.
83
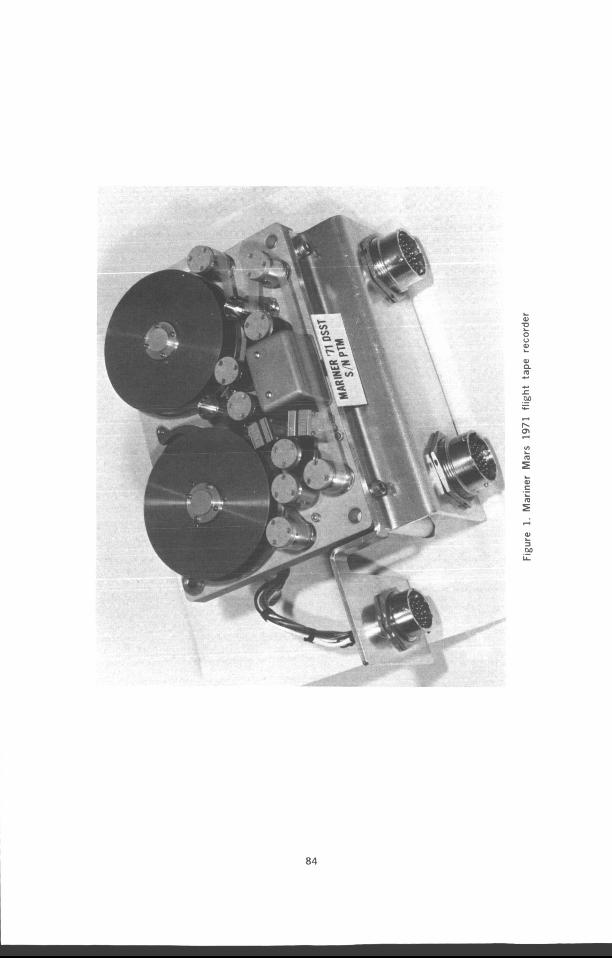
L al ; E
L
al c .- L
i E M .- y.
84

guides in the front of the recorder (between which runs the long portion ofthe belt) are crowned guiding idlers which act to keep the belt centered as ittraverses the recorder.
Examination of an operating p-belt on the flight tape recorder revealed
that as the belt passed over the crowned guiding idlers, the polyester
material was undergoing extensive wrinkling and that the edges of the belt
were being lifted off the surface of the idler. The width of the lifted edgeswas about 1.27 mm (0.050 in.). With continued operation, two frost lines
began to develop longitudinally at these edge locations, and the failure was
caused by a splitting off of a longitudinal strip around the belt along one ofthe frost lines.
Further examination revealed that the belts were fiat and wrinkle-free on
all other guides and idlers. Thus, as the belt travelled around the recorder,
the edges were experiencing flexure by being cyclically wrinkled and liftedoff the crowned guiding idlers. These observations strongly suggested failure
from flexural fatigue.
Belt Fabrication
Belts for the Mariner Mars 1971 flight tape recorder were prepared from
a 23.4-/zm (0.92-mil) sheet of a polyester material (Mylar "A," DuPont)
according to the scheme detailed in Figure 2. A washer of the properdimension is cut from the sheet stock, placed on a stretching device, and
stretched until the inside edge is brought equal to the outside edge. The
stretching operation was carried out above 135°C. At various stages in the
fabrication, methyl ethyl ketone (MEK) solvent was employed both as a
cleaning agent and as a medium to draw off accumulated static electricity.
The potential of solvent damage from MEK was considered and included for
study.
Belt Properties
The mechanical properties of commercial Mylar "A" are not uniform
when these properties are measured as a function of angle around a given
point in the sheet. The commercial process for preparing polyester sheets
results in a higher modulus in the machine direction (see Figure 3) as
compared to the transverse direction. Mylar "A" of 23.4-/zm (0.92-mil)thickness was found to have a machine direction modulus of near 3.72 x 10⁵
N/cm 2 (540,000 psi) compared to 2.76 × 10⁵ N/cm 2 (400,000 psi) in thetransverse direction.
The absence of circular symmetry of modulus in Mylar "A" directly
results in the occurrence of a mechanically unbalanced p-belt, where now
the longitudinal properties of the final belt are exactly the starting circular
properties of the Mylar "A." The process of stretching a washer to a beltabove 135°C does not appear to change either the distribution or lcvel ofmodulus in the belt from that in the sheet. The correlation between the
85

I iI
_l A WASHER C_ IS CUT FROM AIi
I I SHEET OF POLYESTER FILM (_)I II I AND STRETCHED ON ROLLERS (_I II I
TO FINAL BELT (_
Figure 2. General details for preparing polyester seamless belts
_ROLL WIDTH
TOP OR INSIDE
SURFA, -CORE
Figure 3. Nomenclature for rolls of polyester film
86
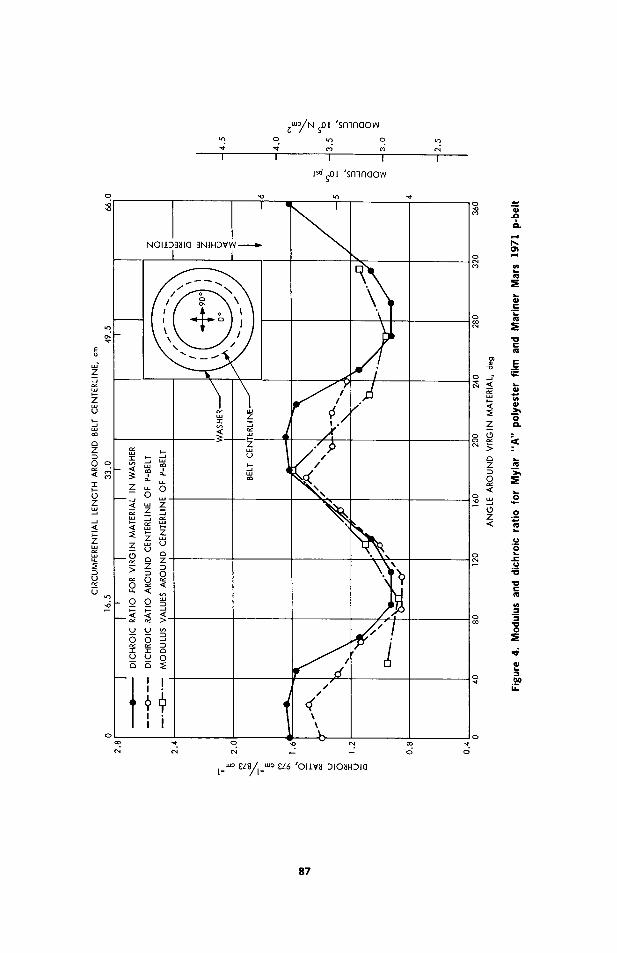
,q.
5w"z
z
u.l_o
Z
0 o
0Z
mi-.7
u
z z(_I c_
o _
_o :u u _
_u u or_ O _E
-- I
I
I
NOIID3_Ia
c)o0
(-4
:INIHDVW-----_
I I
7"
z
_W_/N _01 'snqnaow
o i._ o
I I I I
!_ _01 'snlnaow
I
/
./,6
i e"
o ,o o4
c4 _
[_wo £Z8/l_WO _Z6 'OIIWl DIO_II_DIO
f"
-o
z
o
c_
.?O.
"Oc
.m
0i.,i
h_
0
0
87

circular dependence of modulus in the starting sheet and the longitudinal
modulus in a final belt is given in Figure 4. 2
It can be seen that as a result of the fabrication process p-belts are
prepared having an unbalanced modulus distribution. This results in two
weak locations (defined by low modulus) in the belt which are approximately
180 deg apart from each other. The studies carried out in this investigation
demonstrated that the resistance of polyester to failure from flex fatigue and
damage from MEK cleaning solvent decreased with decreasing modulus of
the polyester. Thus, the two low modulus sites in the failed p-belt were
highly susceptible to potential failure from the operational flexing and the
use of MEK during fabrication.
Fatigue Characteristics of Polyester
The results presented in this section will argue a strong case in support of
flexural fatigue as the primary cause of the p-belt failure. It is the only mode
of failure which satisfactorily correlates with the known failure history of
the belt. The correlation arguments are:
(1) The appearance of the strong frost lines running longitudinallyaround the belt where the material lifted off the Crown idlers. The
frost lines are indications of material damage.
(2) The p-belt at failure experienced nearly 75,000 flexural cycles from
wrinkling each time it passed over a Crown idler. In a laboratory test
evaluating the flexural fatigue properties of polyester, it was found
that for the conditions of flexing which created frostiness in the
material the test specimens failed in flexural fatigue at this samenumber of cycles when the specimens were exposed to stress fields
comparable to an operating p-belt.
For the fatigue studies, test specimens were cut out of a sheet of Mylar
"A" in the modulus weak transverse direction. Preliminary flexural testing
demonstrated that the low modulus direction was significantly weaker in
resistance to flexural failure than the corresponding high modulus direction.The flexural fatigue studies were carried out by bending a strip of the
material through some test angle while at the same time applying a tensile
stress. The fatigue property was recorded as the number of cycles to failure
as a function of the flexing angle and the applied stress.
Effect of Flexing Angle
The fexing angle, at constant stress, is related to the severity of flexure
which the material experiences in application, and, therefore, it becomes
2 Included in Figure 4 is a parameter called dichroic ratio, which was also measured on boththe starting film and a p-belt. Dichroic ratio is measured from a nondestructive techniqueemploying polarized infrared radiation and gives direct information on modulus. Thetechnique, detailed in the section on Infrared Dichroism, became the principal method formonitoring modulus distribution ill filmsand belts.
88

very important to properly select this angle such that a close approximation
to application, i.e., the p-belt wrinkling and flexing in this case, is achieved.
This is usually difficult, but polyester film fortunately exhibited a simple
behavioral characteristic when the fatigue property was measured as a
function of increasing flexing angle at constant stress. This is illustrated in
Figure 5.
With increasing flexing angle at constant stress, the dependence of cycles
to failure on angle decreased rapidly until a critical angle was surpassed,where a greatly reduced dependence was encountered. This latter zone,
above the critical angle, also resulted in obtaining frostiness along the
crease line. The severity of flexure on polyester thus divides conveniently
into two zones: (1) the noncritical zone, where polyester strongly resists
fatigue failure, and (2) the critical zone, where polyester is most affected
by flexure, with the additional advantage of having very little dependence
of flexing angle on cycles to failure. Thus, shoosing a bending angle within
the critical zone to measure the cycles to failure versus stress should givebehavior characteristic of this whole zone.
Fatigue Curve
The fatigue curve for polyester, defined as the number of cycles to failure
versus stress at constant bending angle, is given in Figure 6. The bending
angle selected was within the critical zone.
O
d
ta_ v
..x._
_S CRITICAL
FLEXURE
ZONE
J SPECIMENS BECOEMLEINF_OSTY
ICRITICAL TEST ANGLE
Ii
EXPERIMENTAL TEST ANGLE,INCREASING SEVERITY OF FLEXURE
Figure 5. General fatigue characteristic of polyester as a function of experimental
test angle at constant stress
89

2
U>-U
_o
u.
io6 °
I05
10 4
1 02
STRESS, N/cm 2
I000 2000 3000 4000 5000 6000 7000 8000 9000 I0000 11000 12000
I I I I I I I I I I
..... O '_-"_C _-_
- FATIGUE ENDURANCE
LIMIT (ELASTIC LIMIT)
POLYESTER MATERIAL: 92 GAUGE MYLAR "A" ( O_ 0
1 01
STRESS _T BREAK - -_ _t,/_1 00
0 2000 4000 6000 8000 10000 12000 14000 161 18000
STRESS, psi
Figure 6. Fatigue curve for polyester tested at flexing angle within critical zone
This curve is characterized by two zones: the first at low stress, where the
number of cycles to failure is essentially constant, until a stress, called the
fatigue endurance limit, is exceeded at which point the cycles to failure
falls rapidly with increasing stress.
The information in this curve is significant. The p-belt that failed had
undergone 150 tape passes, which corresponds to around 75,000 flexural
cycles. 3 Inspection of Figure 6 reveals that the stress levels required to fail
the material at this number of cycles is in the stress region 6.21 × 10³ - 6.89
× 103 N/cm 2 (9,000-10,000 psi) which the p-belt was operating when it
failed. Since the data in this curve was measured within the critical flexural
zone of polyester, operating at different bending angles would not greatly
change the data. Only until the bending angle was decreased enough to
approach the critical angle would there be a great departure from this basic
data.
3 Calculated as follows: The recording tape is 167.64 m (550 ft) long compared to the belt
length of 67.15 cm (26.437 in.). Hence, each tape pass corresponds to (167.64) (1(_))/(67.15)
= 250 belt passes [(550) (12)/(26.437) = 250 belt passes]. Since there are two Crown idlers,
the belt at failure made (250) (2) (150) = 75,000 passes over the Crown idlers, each time
experiencing a flexural cycle.
90

Hence, this data can provide a strong argument for failure from flexural
fatigue, especially if the wrinkling and bending of the p-belt was sufficientlysevere to locate the material within the "critical" flexural zone. That the
material was indeed undergoing severe flexing is to be concluded from the
strong frostiness that was observed in the failed p-belt.
A point on the relationship between laboratory testing and the recorderoperation should be made. On the recorder, the belt experienced multi-axial
bending and fexing, whereas only a uniaxial flex could be generated in thelaboratory testing. Thus, the severity of flexure in the recorder is an
accumulation of all the wrinkling and.bending modes, more or less of which
can shift the material's flexure response into or out of critical flexure
behavior. The bending angle employed in laboratory uniaxial testing is only
a means to create and study critical flexure behavior in the polyester
material and bears no relationship to any actual wrinkling or bending angles
which would be observed on the recorder. Strong frostiness did occur alongthe fracture line of laboratory samples tested within the critical flexure
zone, but not for samples tested outside the critical zone. In fact, a sample ofpolyester was flexed at an angle outside the critical zone and at a stress level
10.3 × 10³ N/cm 2 (15,000 psi) (this is within 10% of the normal stress-at-
break for this material), and the material would not break. The test was
finally terminated after 200,000 cycles when inspection of the material
showed no signs of wear, fatigue, or frost.
Solvent Studies
The study of the effect of solvents, particularly MEK, on polyester are
discussed in this section. The principal findings are:
(1) MEK can significantly damage polyester, with the following effectsbeing observed:
(a) In the presence of MEK, the stress-at-break of polyester isreduced from 11.4 x 10³ to 5.9 × 10³ N/cm 2 (16,500 to 8,500
psi). MEK is a strong solvent-stress-cracking agent.
(b) Polyester, after exposure to MEK, was observed to have suffered
partial, but permanent, loss of engineering properties.
(2) The use of MEK as a cleaning solvent should be avoided. Another
solvent, Freon-TE, was found to be compatible with polyester for all
cleaning applications.
The details of the solvent study and other observations are given below,
and unless otherwise stated, all test specimens were cut from the low
modulus direction of the polyester sheet stock.
MEK Sensitivity
The sensitivity of polyester to MEK was detected by measuring the stress-
strain curve of this material while completely immersed in the solvent. In
Figure 7 this curve is compared to a stress-strain curve measured in air. The
91

effect of MEK on polyester is readily apparent. MEK is a strong stress-
cracking solvent which results in a significant reduction of the engineering
properties. Its use as a solvent should be avoided.
Directional MEK Sensitivity
The effect of MEK on samples cut from the strong direction of Mylar "A"
is shown in Figure 8. Very little effect is observed, demonstrating that the
principal damage to polyester occurs along the material's low modulusdirection.
Partial but Permanent Damage
Samples of polyester were exposed to MEK for periods ranging from 1
min to 96 h, after which the samples were removed from the solvent, air-dried 24 h, and then subjected to stress-strain measurements. The results,
given in Figure 9, clearly demonstrate the occurrence of partial, but
permanent, loss of engineering properties. Even after only 1 min of
exposure, there was a significant decrease in the yield strength and stress atbreak.
20000
K
16000
12000
_,X
/X S_
"_CONTROL: X'S LOCATE
RANGE OF FAILURES
ENCOUNTERED FORSAMPLES TESTED IN AIR
12000
- 10000
- 80O0
8OOO
4O00
6OOO
-- CURVE MEASURED FORSAMPLES WHILE
-- 4000COMPLETELY IMMERSED
INMEK DEMONSTRATESTHAT MEK IS A STRONGSTRESS-CRACKING SOLVENT--
FOR MYLAR "A"2OOO
STRAIN RATE = 2.54 cm/min (1.0 in./min)
00 20 40 60 80
STRAIN, %
0100
Figure 7. Effect of MEK on 92-gauge Mylar "A"
c_E
92

v_
280OO
- 18000
XI
24000 ×
_/ 16000
20000 -- --
'//[/ _'-IN MEK
_f _X -- 12000
]6000 _E
-- ]0000 _
J _IN AIR
12000 __WEAK DIRECTION
8000
4000
STRAIN RATE = 2.54 cm/min (1.0in./mln)
2O00
0 00 20 40 60 80 100
STRAIN, %
Figure 8. Effect of MEK on 92-gauge Mylar "A" directional properties
93

2O000
16000
12000
8000
4000
s_X (A)
I (D)(E)
ALL STRESS-STRAIN CURVES MEASURED IN AIRAFTER FOLLOWING TREATMENT:
__(A) NONE: X'S LOCATE RANGE OF FAILURES --ENCOUNTERED FOR CONTROL SAMPLES
(B) 1-min SOAK IN MEK
(C) AVERAGE LOCATION FOR SAMPLESSOAKED 5 mln TO4 h IN MEK
(D) SOAKED 96 h IN MEK
(E) SOAKED 96 h IN MEK
I I I ISTRAIN RATE - 2.54 cm/min (1.0 [n./min)
1 10 20 40 60 80
STRAIN, %
- 12000
10000
8000
6000
4OOO
20OO
0100
e_E
Figure 9. Change in properties of 92-gauge Mylar "A" after MEK exposure
Figure 10 compares in more detail the initial portions of the stress-strain
curves of polyester tested with no exposure and the average curve (curve C,
Figure 9) obtained after 5 min to 4 h of MEK exposure. Exposure resulted in
a reduction in modulus and yield stress, respectively, from 2.76 × 10⁵ and
8.27 x 10³ N/cm 2 (400,000 and 12,000 psi) to near 2.24 x 10⁵ and 6.89 x 10³
N/cm 2 (325,000 and 10,000 psi). This reduction in modulus resulting from
the MEK exposure would only act to further reduce the resistance to flex
fatigue (Reference 1). It can only be conjectured that perhaps the failed
p-belt experienced above average MEK exposure during fabrication, enough
perhaps to affect the wrinkling characteristics and shift the material intocritical flexure behavior.
Compatible Solvents for Polyester
The stress-strain curves of polyester were measured in a series of solvents
with the intention of selecting compatible fluids. The results are docu-
mented in both Figure 11 and Table 1, which reveal that solvent effects on
polyester can be broken down into three general classes. The first, called
Class I solvents, which are shown in Figure 1 la, is the worst, causing serious
damage with loss of engineering properties. Their use on polyester should
always be avoided. The second, called Class II solvents (Figure 1 lb), affects
94

18000
16000
I I I ISTRAIN RATE = 0.13 cm/mln (0.05 in./mln)
CURVES SHOWN TO ONLY 8% OF STRAIN
I
-- 1OOOO
ELASTIC LIMIT OF MYLAR:
12000 5.86 × 10³ N/cm 2 (8500 psi) __ -- 8000
AT2.4%STRAIN -_ j _,,....._._ _ I_INITIAL PORTION OF
8000 __ CiRVE C, FIGURE 9 6000EK EXPOSURE REDUCES ELASTIC
// LIMIT TO 4.96 × 10³ N/cm 2 (7200 ps0 4000
4000 /_ AT2.2%STRAIN 2000
0 00 1 2 3 4 5 6 7 8
STRAIN, %
i.-
Figure 10. Comparison of initial portions of stress-strain curves for Mylar "A" in
air and after 4-h exposure to MEK (both curves tested in air)
only the plastic draw region and do not result in a loss of engineering
properties. These solvents may be used for brief exposure periods. The third,
Class III solvents, may be safely used on polyester for all applications, with
the result in Figure llc indicating that the best cleaning solvent is Freon-TE.
Infrared Dichroism
This section describes the use of infrared dichroism as a nondestructive
technique for measuring the modulus of polyester films.
The p-belt failure drew attention to the fact that these belts have highly
anisotropic mechanical properties, particularly modulus, occurring in the
longitudinal direction around the belt. Modulus values ranging from as lowas 2.76 × 10⁵ N/cm 2 (400,000 psi) to as high as 3.72 × 10⁵ N/cm 2 (540,000
psi) have been measured. To measure modulus requires sacrificing a belt to
prepare tensile specimens, a destructive practice not possible to do on a
candidate flight belt. Therefore, a nondestructive test technique capability
called in_frared dichroism has been incorporated into the procedures of the
JPL analytical group. This technique permits the measuring of a nondestruc-
tive parameter called dichroic ratio, which is directly related to the
modulus of the material. Further, unlike tensile testing, the dichroic ratio
can be measured as a point property, and, therefore, the modulus values of
belts can be easily monitored at any position in both the longitudinal andtransverse directions.
95

_W_/N 'SS3_IJ.S
o
\2
U-ZZ
$oou_Lu_u___
oZom
i.- 1-- i.-i i i uJ
Z Z Z Zo .<O0 _0
--_-LIJ- i -Lu--_,m_ _ mLu_ u_ _u_ i
: \Y
I I Iw
_z
_.0
w
_huJ_-
_Uu
Z
o
I I
o O_U _
'_--_-_Z 0_--0-o _
>'- O Z) '_
___ L
I I I
o
!sd 'SS3_IJ.S
z"
ii
Z
_ °°
0
r-
_>
0
a-
96

Table 1. Ranking of solvents relative to compatibility with Mylar "A"
Class h
(1) MEK
(2) Aeetone
(3) MEK/Freon
(4) Toluene
(5) Ethanol
Solvent stress cracking
agents; use to be avoided.
(6) Isopropyl alcohol
Class II: Selectively compatible;exercise care in use.
(1) Hexane
(2) Freon-TA-11
(3) M-50 (1,1,1-trichloroethane)
(4) Freon-TE-35
(5) Freon-TP-35
Class III: Compatible for all
applications.(1) Freon-TF
(2) Freon-TE
Principles
The modulus level of polyester is directly related to the relative
proportion of the molecules which are aligned or oriented in the same
direction at which the modulus is being measured. It follows, therefore, that
the distribution of the orientation of the molecules in the material directly
controls the distribution of the modulus. Think of the molecules in polyester
as pencils (see Figure 12). If all the pencils are lined up in the same
direction, then the maximum tensile strength and modulus of the stack of
pencils will be in the longitudinal direction, with essentially no strength
existing at right angles. This situation describes "tensilized" polyester film
where a very high proportion of the molecules are all aligned or oriented in
the same direction. The modulus and strength in that preferentially oriented
direction is very high compared to values measured at right angles.
If the pencils are now uniformly oriented (see Figure 12) as a function of
angle, and since the proportions are the same in any direction contributing
to strength, the modulus would be found to be uniform and invariant in any
direction. This situation describes commercial polyester film where presum-
ably the molecules, and therefore the modulus, are uniform. Thus, molecular
orientation of the polyester molecules control the orientation characteristics
of the material's modulus, and alternately measuring the modulus at various
directions in polyester film gives direct information about the molecular
orientation.
97

TENSILIZED
DIRECTIO NALLYORIENTED
MOLECULES
STRONG
(MODULUS)
WEAK
BALANCED
UNIFORM
ORIENTATIONOF MOLECULES
POLYESTERMOLECULES
MODULUSUNIFORM
IN ALLDIRECTIONS
Figure 12. Relationship between molecular orientation and modulus
Now infrared dichroism, a technique employing polarized infrared light,
also detects directly the molecular orientation of the polyester molecules,and, therefore, also the orientational characteristics of the modulus. It works
as follows. A chemical grouping exists in the polyester molecule which
strongly absorbs infrared radiation at a frequency 4 of exactly 973 cm -1.
Chemical groups absorb infrared radiation by having internal motions whose
energy levels are related to a fixed frequency (energy, Plank's Law E = hv) in
the infrared spectrum. When that frequency is employed, a resonance
occurs with the group absorbing energy, causing an attenuation of the initial
beam intensity. This attenuation can be detected, which provides testimony
to the presence of the group as well as indicating the concentration of the
group by the extent of attenuation. Now the internal motion of the chemical
group in polyester which causes the resonance at 973 cm -1 is uniquely
aligned along the long axis of the polymer molecules. Thus, the capability
exists for measuring molecular orientation by employing polarized infrared
frequency of 973 cm -t. This polarized source will interact and resonate with
only those chemical groupings which are also aligned in the direction of the
plane of polarization of the incident infrared radiation. The extent of
attenuation of the beam is now directly proportional to the proportion of
polyester molecules which are aligned in the direction of the plane of
4 This is really a frequency. Convention in infrared spectroscopy is to quote wavelengths or
reciprocal wavelengths of the infrared radiation rather than its frequency. Common practice
generally employs reciprocal wavelengths, 1/h in cm-1, because these values vary directly as
frequency !f_ l/h from the relationship .fh=C), as well as providing a direct measure of
wavelength which is preferentially desired for analysis by spectroscopists.
98
polarization. Hence, directional variations in the level of attenuation of the
incident polarized infrared radiation are directly relatable to the variation inthe modulus of the material.
One last remark is needed. Attenuation of the infrared radiation is also
caused by the thickness of the polyester film. To eliminate thickness effects,absorbance at 973 cm -l is divided by another absorption peak at 873 cm-l;
this ratio, called the dichroic ratio, is invariant to sample thickness and can
be related linearly to modulus.
Summary
Commercial polyester films from which p-belts are prepared are not
mechanically balanced, but are characterized by directional differences in
modulus with usually the directions of highest and lowest modulus being
perpendicular to each other. This study revealed that p-belts retain this
modulus variation, and that the resistance of polyester to failure from flex
fatigue and damage by MEK decreased with decreasing modulus. Thus, the
failed p-belt, fabricated with low modulus locations, and operating with
flexural modes after MEK exposure, had all the potential for failure.
1.
Reference
Cuddihy, E. F., "Fatigue of Teflon Bladder Bag Materials," in IPL
Quarterly Technical Review, Vol. 1, No. 1, pp. 57-63. Jet Propulsion
Laboratory, Pasadena, Calif., Apr. 1971.
99

JPL Quarterly Technical Review Volume 2, Number 1 April 1972
Index: information storage devices,metallic materials, nonmetallic ma-terials
Studies on the Frictional Behavior of MagneticRecording Tapes
S. H. Kalfayan and R. H. Silver
Propulsion Division
J. K. Hoffman
Astrionics Division
Magnetic tape recorders exhibit various failure modes. Those ascribable to
friction between tape and magnetic head cause phenomena such as seizure (stick)
and seizure and release (stick-slip). Methods have been developed at JPL for the
measurement of frictional forces acting on the tape while in motion or at rest, as
well as the extent of stick-slip. The effects of factors such as temperature, humidity,
kind of gaseous atmosphere, tape speed, etc., on the frictional i,lteraction between
various tapes and heads have been investigated. Results were instrumental in the
selection of a tape for Mariner Mars 1971 spacecraft. This article primarily discusses
recent studies on the stick-slip behavior of tapes, and the performance of a metallic
tape as compared to the usual plastic tapes.
Introduction
The frictional behavior of magnetic recording tapes have been under
study at JPL for some time (Reference 1). The coefficient of friction, /x, orthe quantity /z/3 (see below) of numerous candidate tapes was measured
under experimental conditions using different kinds of magnetic heads. The
following equation (Reference 2) for flexible band friction was used tocalculate/z or g/3:
F2=FleU_ (1)
where
F 2 = force necessary to sustain motion of tape
F l = supported weight
bt = coefficient of sliding friction
100

/3 = contact or wrap angle, rad
A diagram of the setup used for these measurements is shown in Figure 1.
For convenience, the quantity /z/3, rather than /z, was used for tape
evaluation. Its value varied within a wide range, 0.2 to 3.4, depending upon
the nature of the tape, the kind of magnetic head used, and the environmen-tal conditions. Most tapes showed an increase in /z/3 with the number of
passes. Moisture, even at 25% relative humidity level, increased the /z/3
values in a majority of cases. Brass- and Monel-bracketted magnetic heads
showed higher/x/3 values than heads bracketted with aluminum or Havarshielded-aluminum.
The/x/3 value is indicative of the magnitude of the frictional (drag) forces
in operation during the passage of the tape over the magnetic heads.
Complete seizure (stick) and mechanical failure of the tape occur when it
reaches high values.
Another phenomenon associated with tape friction is seizure-and-release
(stick-slip). This can manifest itself in the variation of the tape-to-head
speed. Sticking will decrease and slipping will increase the instantaneousspeed of the tape as it passes over the magnetic heads. The determination of
the instantaneous speed would, therefore, indicate the existence and the
extent of stick-slip. The direct measurement of the instantaneous speed is
difficult. An indirect method, namely, the measurement of the change in the
apparent period of a signal prerecorded on the tape, is relatively simple.
1,/,/,,i,/,/,
FRICTIONLESS _ _LOADCELL
h
wE,G.T "--MA gg, "E? .SOUCE ,LOWER INSTRON | l
CROSSHEAD-_._ [l
Figure 1. Diagram of setup for determination of coefficient of friction of tapes
lol

Theapparentperiodof aprerecordedsignalwill changewith thespeedofthetape.Theamountof variationin theperiod,or thefrequencyof thesignalwill indicatetheextentofstick-slip.
Environmentsunderwhichtapesweretestedincluded:dryargon,heliumandnitrogen,moistargon,andair.Measurementsweremademostlyat25and55°C,butothertemperatureswereusedalso.Theeffectsoftapespeedandoutgassingofthetapesonthefrictionalbehaviorwerealsostudied.
Resultsof theseexperimentsshowedthatoneofthetapes,i.e.,3M20250,a tapebackedwithMylar(polyethyleneterephthalate),surpassedothersinperformance.Thismagnetictapewaseventuallyselectedfor flightontheMariner9mission,takingintoconsiderationotherfactorsaswell.
Theresultsof thestudyof thefrictionalbehaviorof tapesandmagneticheadsis discussedin detailin Reference3. In thepresentarticlerecentstudiescorrelatingthedataobtainedforthedeterminationof stick-slipfromvelocity(orfrequency)andfrictionalforcemeasurementswill bediscussed,aswellastheevaluationof ametallictape,knownastheUnivacMagneticTape.
Results from Velocity and Frictional Force Measurements
Earlier in this study, a fluctuation in the electrical output of the loadcell
was observed, which meant that the frictional force was changing. It was
suspected that this might be due to the so-called stick-slip phenomenon.
Recently the output of the loadcell or the "force transducer" was amplified,
for a clearer examination of these fluctuations. Meanwhile, the "velocity
transducer," consisting of a magnetic head and a tape specimen with a
prerecorded signal, was used to detect the instantaneous variations in tape
speed. The change in tape speed would be manifested in the change of the
frequency of the prerecorded signal. Sticking would decrease and slipping
would increase the frequency of the prerecorded signal.
The simultaneous electrical outputs of the velocity and force transducers
are shown by graphs I and II, respectively, in Figure 2. They were obtainedby using 3M 20294 tape and brass-bracketted magnetic heads at 22 + I°C, in
air. This particular combination was chosen as a worse situation, so that
results would be pronounced. The data of Figure 2 was gathered when thell0-g weight was moving downward, a situation that simulates the tension
on a tape in an actual spacecraft tape recorder. The tape was not allowed to
contact the magnetic heads when the weight was moving upward. Outputs
from only runs 4-7 are shown. Runs 1-3 being similar to run 4, and thosefollowing run 7 being similar to it, were omitted. The construction of the
recorder caused an apparent lag in the graphical output of the forcetransducer.
Figmre 2 allows the following observations and deductions:
(1) Fluctuations in both the frequency and the force graphs point to the
existence of stick-slip.
102

(2) Even during a smooth run like No. 4, there is a variation in frequencyof +_1 Hz. This indicates that stick-slip is always present, although to a
small extent (graph I). A similar variation in the frictional force
(graph II) is not as obvious, because of the lesser sensitivity of theforce transducer.
(3) When there is a decrease in the frictional force there is an increase in
frequency (or speed) and vice versa. (Compare points Pl, P2, and P3,
P4). This result would be expected if the tape experienced stick-slip.
(4) The magnitude of the perturbations increases with the number of
runs, indicating significant changes on the surface of the magnetic
coating.
(5) The frictional force exerted on the tape approaches but never
exceeds 110 g. Reaching this value would mean complete seizure.
Similarly, the frequency approaches zero; reaching it would also
mean complete seizure.
Evaluation of the Univac Metallic Tape
This magnetic tape is phosphor-bronze based and cobalt-nickel plated.
Samples lubricated with Vac-Kote, as well as unlubricated ones, were tested.
The amount of available tape limited the number of experiments. Tests
were conducted in dry argon at 25 and 55°C, using only heads that wereMonel bracketted and aluminum bracketted with Havar shields. Results are
shown in Figures 3 and 4. For comparison, curves obtained for 3M 20250
(the tape used in the Mariner 9 mission) tested under the same conditions
and with the same magnetic heads used with Univac tape, are also included.
The following observations may be made from Figures 3 and 4:
(1) The/x/3 values obtained for the lubricated and unlubricated Univac
tape, at both temperatures, with both magnetic heads, rangesbetween 0.35 and 0.55. This is within the range of experimental
error. The significance of this fact is that the difference between the
frictional performance of the lubricated and unlubricated metallic
tape is not much; the temperature change does not affect the /x_8
values significantly, nor does the kind of magnetic head make adifference. On the other hand, the frictional behavior of 3M 20250, a
plastic-backed tape with an organic polymer coating, is significantly
affected by the change in temperature (/x/3 values are much lower at55°C), and the type of magnetic head influences its frictional
performance considerably. (Monel bracketted heads show higher/x/3values than aluminum-bracketted heads with Havar shields).
(2) The frictional performance of the metallic tape is comparable to that
of 3M 20250 at 55°C, and is superior to the latter at 25°C.
(3) Whereas the /_/3 value of the 3M 20250 tape increases with the
number of passes, that of the metallic tape remains constant,
103

I I
0_ve-
E
0
0
e-
¢_
o
v
e_
e-
E0
104

2.0
1.8-ag.::k
1.60Z,,<
1.4
× 1.2
Z
o 1.o
0.8
_ 0.6
u.lu
_ 0.4
u0.2
0
0
I I I I I I I I I I I I
_0
.... -O
mO
UNLUBRICATED METALLIC TAPE ON MONEL HEADSLUBRICATED METALLIC TAPE ON MONEL HEADS
UNLUBRICATED METALLIC TAPE ON HAVAR HEADS
LUBRICATED METALLIC TAPE ON HAVAR HEADS
3M 20250 TAPE ON MONEL HEADS
3M 20250 TAPE ON HAVAR HEADS
I I I I I I I I I I I I5 13 21 29 37 45 53 61 69 77 85 93 99
NUMBER OF PASSES
Figure 3. Frictional behavior of metallic tape compared with 3M 20250 tape at 25°C
1.6:L
_ 1.40Z
1.2
_ 1.0x
Z
_o o.8
0.6
b_ 0.4u.io_ 0.2
u 00
I I I I I I I I I I I I
_,4+1-h'eele_
mO
.... "0
m.. 0
UNLUBRICATED METALLIC TAPE ON MONEL HEADS
LUBRICATED METALLIC TAPE ON MONEL HEADS
UNLUBRICATED METALLIC TAPE ON HAVAR HEADS
LUBRICATED METALLIC TAPE ON HAVAR HEADS
3M 20250 TAPE ON MONEL HEADS3M 20250 TAPE ON HAVAR HEADS
I I I I I I I I I I I I5 13 21 29 37 45 53 6! 69 77 85 93 99
NUMBER OF PASSES
Figure 4. Frictional behavior of metallic tape compared with 3M 20250 tape at 55°C
105

indicating that changes on the contacting surface of the tape are
absent or insignificant, during the test period.
Conclusions
The results of these tests indicate that:
(1) The phenomenon of stick-slip can be detected and measured by
either a force transducer (loadcell) or a velocity transducer; the latter
is the preferred method.
(2) Stick-slip is always present in plastic tapes in motion, although it maybe to a small extent and without deleterious effects.
(3) Factors that increase the drag properties (or the/_fl values) of plastic
tapes, also increase the extent of stick-slip.
(4) Environmental factors have minimal effects on the frictional per-
formance of the Univac metallic magnetic tape.
(5) Unlike the plastic-backed tapes, the metallic tape does not show anyincrease in the coefficient of friction with the number of passes usedin these tests.
References
1. Kalfayan, S. H., Silver, R. H., and Hoffman, J. K., "Evaluation of
Spacecraft Magnetic Recording Tapes," in Supporting Research and
Advanced Development, Space Programs Summary 37-63, Vol. III,
pp. 209-214. Jet Propulsion Laboratory, Pasadena, California, June 30,1970.
2. Cox, C. N., and Plumtree, W. C., Engineering Mechanics, Second
Edition p. 117. D. Van Nostrand Co., Inc., New York, February 1959.
3. Kalfayan, S. H., Silver, R. H., and Hoffman, J. K., "A Study of the
Frictional and Stick-Slip Behavior of Magnetic Recording Tapes,"
Technical Report 32-1548. Jet Propulsion Laboratory, Pasadena, Calif.,
April 1, 1972.
106
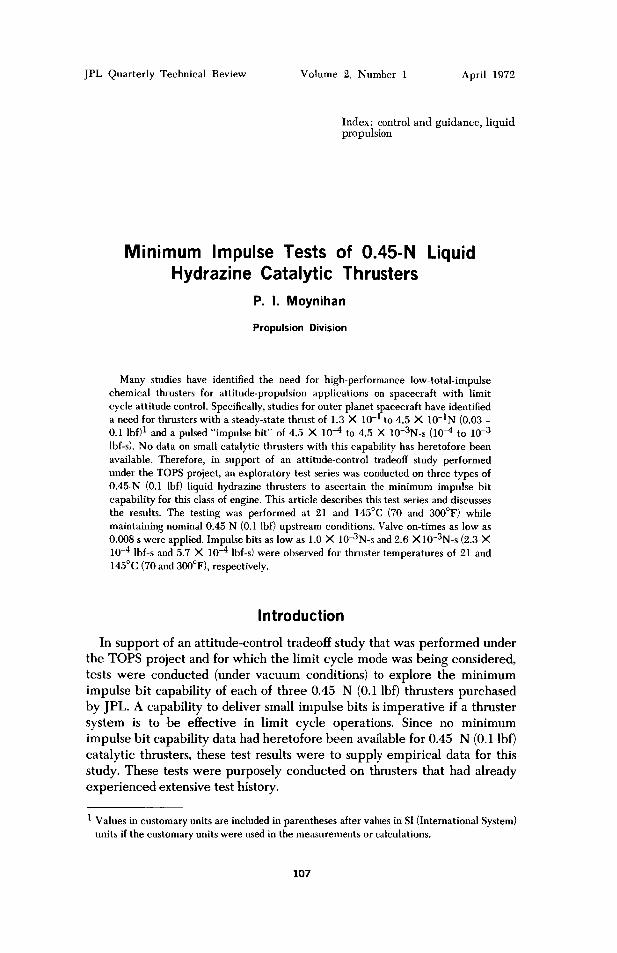
JPL Quarterly Technical Review Volume 2, Number 1 April 1972
Index: control and guidance, liquidpropulsion
Minimum Impulse Tests of 0.45-N Liquid
Hydrazine Catalytic Thrusters
P. I. Moynihan
Propulsion Division
Many studies have identified the need for high-performance low-total-impulse
chemical thrusters for attitude-propulsion applications on spacecraft with limit
cycle attitude control. Specifically, studies for outer planet spacecraft have identified1 1
a need for thrusters with a steady-state thrust of 1.3 X 10- to 4.5 X 10- N (0.03 -
0.1 lbf) 1 and a pulsed "impulse bit" of 4.5 X 10 -4 to 4.5 X 10⁻³N-s (10 -4 to 10 -3
lbf-s). No data on small catalytic thrusters with this capability has heretofore been
available. Therefore, in support of an attitude-control tradeoff study performed
under the TOPS project, an exploratory test series was conducted on three types of
0.45-N (0.1 lbf) liquid hydrazine thrusters to ascertain the minimum impulse bit
capability for this class of engine. This article describes this test series and discusses
the results. The testing was performed at 21 and 145°C (70 and 300°F) while
maintaining nominal 0.45 N (0.1 lbf) upstream conditions. Valve on-times as low as
0.008 s were applied. Impulse bits as low as 1.0 )< 10-3N-s and 2.6 X10⁻³N-s (2.3 X
10 -4 lbf-s and 5.7 X 10 -4 lbf-s) were observed for thruster temperatures of 21 and
145°C (70 and 300°F), respectively.
Introduction
In support of an attitude-control tradeoff study that was performed under
the TOPS project and for which the limit cycle mode was being considered,
tests were conducted (under vacuum conditions) to explore the minimum
impulse bit capability of each of three 0.45 N (0.1 lbf) thrusters purchased
by JPL. A capability to deliver small impulse bits is imperative if a thruster
system is to be effective in limit cycle operations. Since no minimum
impulse bit capability data had heretofore been available for 0.45 N (0.1 lbf)
catalytic thrusters, these test results were to supply empirical data for this
study. These tests were purposely conducted on thrusters that had already
experienced extensive test history.
I Values in customary units are included in parentheses after values in SI (International System)
units if the customary units were used in the measurements or calculations.
107

Test Objectives
The objective of this test series was to impart a single pulse to the thruster
valve for the desired valve on-times given in Table 1. Valve on-time is
defined as the time the valve is actually open during an actuation. An
impulse bit was obtained for each valve on-time at both 21 and 145°C (70
and 300°F). The 21°C (70°F) temperature was obtained by chilling the
thruster body with an external GN 2 purge. The 145°C (300°F) temperature
was obtained by a firing of each thruster for approximately one second so
that the thruster temperature exceeded 145°C (300°F) slightly. The pulse
data was taken when the thruster temperature decayed to 145°C (300°F).
At the time of this series the Rocket Research and Hamilton-Standard
thrusters had each accumulated about 1000 cold starts, with the thruster and
propellant temperature below 32°C (90°F). The Marquardt unit, which was
the one selected to demonstrate 2600 cold starts, had accumulated more
than 1700 at this time.
Test Results
Figures 1 through 3 show impulse as a function of actual valve on-time for
the Hamilton-Standard, Marquardt, and Rocket Research 0.45-N (0.1 lbf)
thrusters, respectively. The impulse was calculated by multiplying the
integral of chamber pressure by the thrust coefficient Cy and thrust area A t.
The C[ and A t used in this calculation were based on a 30-s steady-state test
Table 1. Valve on-time for minimum impulse bit tests of three 0.45-N (0.1-1bt)thrusters
Commanded Actual valve on-times, s
valve
on-times, Moog valve Parker valve Parker valve
s (Rocket Research (Hamilton-Standard (Marquardt
thruster) thruster) thruster)
0.100 0.105 0.115 0.124
0.070 0.074 0.085 0.095
0.050 0.059 0.065 0.074
0.040 0.043 0.053 0.065
0.030 0.033 0.044 0.055
0.025 0.028 0.040 0.051
0.020 0.023 0.033 0.045
0.015 0.017 0.030 0.041
0.010 0.013 0.024 0.033
0.005 0.007 0.011 0.015
108

that was conducted on each thruster after obtaining the impulse data, and
hence render a more conservative (i.e., slightly larger) impulse bit than
really existed. However, for comparison, the corresponding integral of
chamber pressure (Pc bit) is presented on the opposite axis. The variance
in CyAt for each thruster is reflected by the different locations of the Pc bitscales in the three figures.
Figures 4 and 5 are "normalizations" of these results for which thenominal 0.45-N (0.1-1bf) thrust level has been factored out to enable one to
more readily estimate minimum impulse bits for thrusters with an average
thrust other than 0.45-N (0.1-1bf). Although thrust-level limitations below
0.18-N (0.04 lbf) have not been thoroughly explored for these thrusters, they
are being approached with the present designs. However, lower nominal
operating points are obtainable with minimal design changes. Since the
Rocket Research thruster operated at approximately twice the chamber
pressure as the other two thrusters and has, therefore, incorporated a thicker
body design (larger thermal mass), the data spread in Figure 4 appears to
reflect a difference in utilization of available energy for the lower impulse
bits at 21°C (70°F) between the Rocket Research thruster and both the
Hamilton-Standard and Marquardt thrusters, which operate at approxi-
mately the same chamber pressures. However, the minimum impulse bit per
unit thrust at elevated temperatures (Figure 5) appears to be independent of
thruster design.
There was very little chamber pressure response at 21°C (70°F) for valve
actuations below 0.015 s. However, the actual impulse bit for given inlet
conditions at the elevated bed temperature appears to be limited primarily
%×
Z
ma_
w
2
4O
2O
10
6
2
11-
/
0.2
4 6 10
y
/
,.O-
/
MODEL I0-12
I.D. SVSK77657-1SN002
I I I INOMINAL STEADY-STATE
-- THRUST LEVEL: 0.47 N (0. 1037 Ibf')'
O THRUSTER TEMPERATURE 300°F 0.2[] THRUSTER TEMPERATURE 70°F -I I I I I
20 40 60 I00 200
VALVE ON-TIME, ms
6.0
4.0
t'
2.0
1.0 '_
0.6
0.4 _
u
0.2
Figure 1. Hamilton-Standard 0.45 N (O.l-lbf) thruster impulse bit as a function of
valve on-time at thruster temperatures of 145 and 21°C (300 and 70°F)
109

%x
Z
60
40
2O
10
6
4
%x
2:E
/
4 6 10
--MODEL 12-25A---PN T-I 7412
SN002I I I
NOM INAL STEADY-STATETHRUST LEVEL: 0.40 N (0.0889 IbQ--
O THRUSTER TEMPERATURE 300°F
[] THRUSTER TEMPERATURE 70°FI I I I I
20 40 60 100 200
VALVE ON-TIME, ms
10.0
6.0
4.0'r
Z2.0 --
a_
1.0
0.6 _
0.4 _
D.2
Figure 2. Marquardt 0.45 N (0.1-1bf) thruster impulse bit as a function of valve on-
time at thruster temperatures of 145 and 21°C (300 and 70°F)
%x
Z
4O
2O
%10 x
6 _-"
4 __
2
1
10.0 NO/_IN_,L STEADY-ST,_TE I- THRUSTLEVEL:0.4_N (0.0982Ibf>-
_.oo THRUSTERTEMPERATORE_00°E--[] _HRU_TE_TEMPERAIU__o.Z
4.0-- - MODEL MR-47 _' i
I.D. 25917-301-11 ,._ l_
2.0 SN001 S /
o
/// /0.4
0.24 6 10 20 40 60
VALVE ON-TIME, ms
/..-_ 715"°
f-'l ii0. 0
6.0
4.0
2.0
1.0
0.6
0.4
I00 200
10.0
6.0
4.0
2.0
.0
0.6
0.4
0.2
Figure 3. Rocket Research 0.45 N (0.1-1bf) thruster impulse bit as a function of
valve on-time at thruster temperatures of 145 and 21°C (300 and 70°F)
u
110

100
80 _t_
020
/ oZ
_" 10
_ 8
/ 0.45 N (0. l-lbf) THRUSTERS
HAMILTON-STANDARD
[] MARQUARDT
O ROCKET RESEARCH
THRUSTER TEMPERATURE = 70°1:
I I I4 6 8 l0 20 40 60 80 100 200
VALVE ON-TIME, ms
Figure 4. Impulse bit per unit thrust for three thruster designs as a function of
valve on-time at thruster temperature of 21°C (70°F)
by valve response. Chamber pressure response was experienced at 145°C(300°F) at a valve on-time as low as 0.008 s for the Rocket Research
thruster, which utilized the Moog in-line solenoid valve P/N 010-58723-1.
This valve has an opening response of approximately 0.0035 s and a closingresponse of 0.003 s from command initiation to valve actuation. Both the
Hamilton-Standard and Marquardt thrusters are equipped with a version ofthe Parker-Hannifin valve (P/N 5696050 for Hamilton-Standard and P/N
5675207 for Marquardt) with opening and closing responses on the order of0.007 s.
Conclusions
These tests have demonstrated the small impulse bits that are readily
obtainable for liquid hydrazine catalytic thrusters of the 0.45-N (0.1 lbf) size,
and have inferred a practical lower level approaching 4.5 x 10⁻⁴N-s (10 -4
lbf-s). Although smaller impulse bits are realized for a cold thruster [1.1 N-sX 10-3 (2.5 x 10 -4 lbf-s) for the Rocket Research thruster] than were
obtained for a warm thruster, the total life is expected to be less than that of
a similar duty cycle with a heated catalyst bed.
111
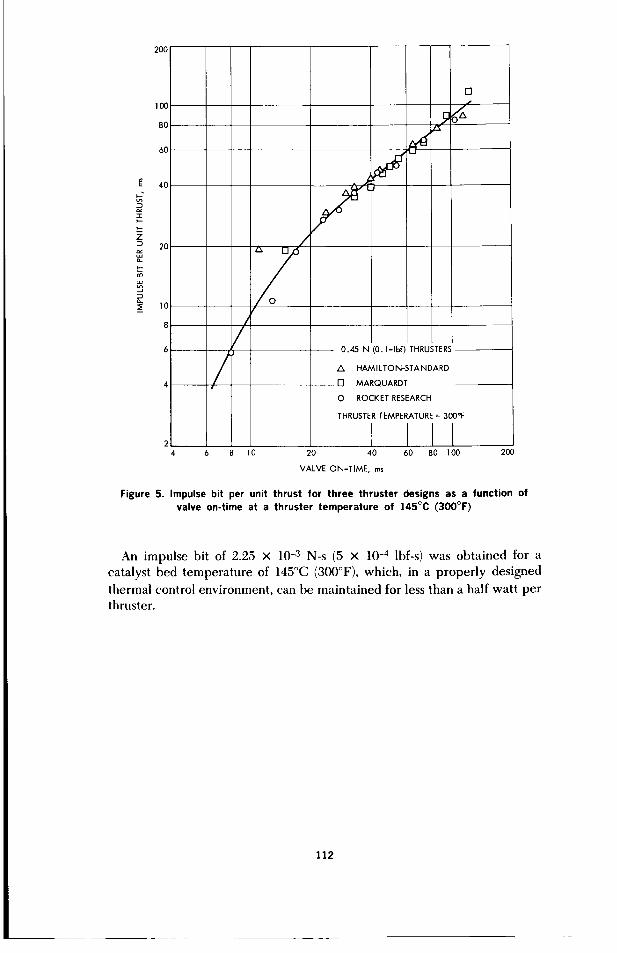
20O
Z
._12
100
80
60
4O
20
10
/0.45 N (0.1-1bf) THRUSTERS
Z_ HAMILTON-STANDARD[] MARQUARDT
O ROCKET RESEARCH
THRUSTER TEMPERATURE = 300°1:
4 6 8 10 20 40 60 80 100 200
VALVE ON-TIME, ms
Figure 5. Impulse bit per unit thrust for three thruster designs as a function ofvalve on-time at a thruster temperature of 145°C (300°F)
An impulse bit of 2.25 x 10 -3 N-s (5 x 10 -4 lbf-s) was obtained for a
catalyst bed temperature of 145°C (300°F), which, in a properly designed
thermal control environment, can be maintained for less than a half watt per
thruster.
112
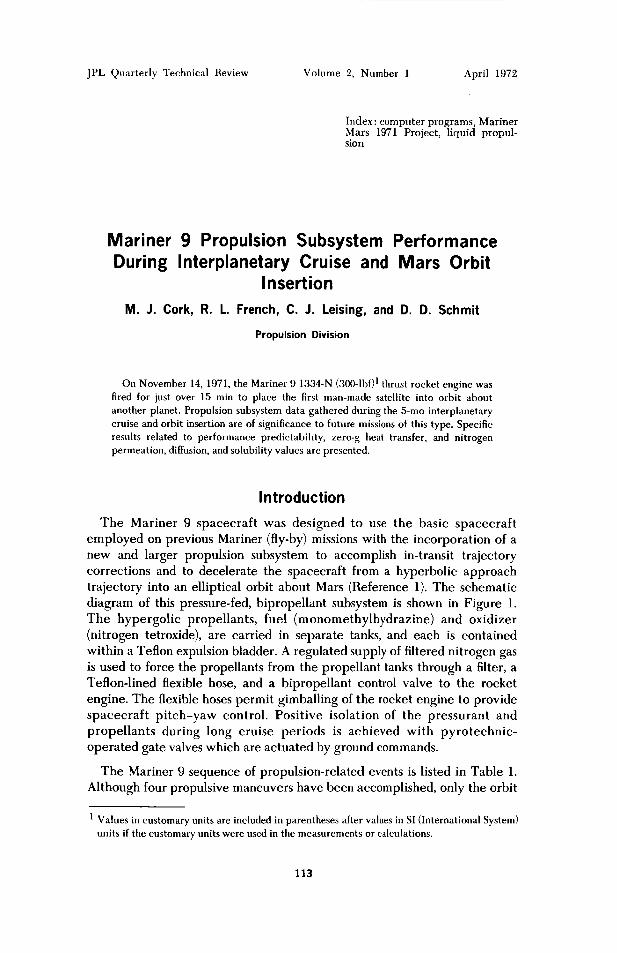
JPL Quarterly Technical Review Volume 2, Number 1 April 1972
Index: computer programs, MarinerMars 1971 Project, liquid propul-sion
Mariner 9 Propulsion SubsystemDuring Interplanetary Cruise and
Insertion
Performance
Mars Orbit
M. J. Cork, R. L. French, C. J. Leising, and D. D. Schmit
Propulsion Division
On November 14, 1971, the Mariner 9 1334-N (300-1bf) 1 thrust rocket engine was
fired for just over 15 min to place the first man-made satellite into orbit about
another planet. Propulsion subsystem data gathered during the 5-mo interplanetary
cruise and orbit insertion are of significance to future missions of this type. Specific
results related to performance predictability, zero-g heat transfer, and nitrogen
permeation, diffusion, and solubility values are presented.
Introduction
The Mariner 9 spacecraft was designed to use the basic spacecraft
employed on previous Mariner (fly-by) missions with the incorporation of a
new and larger propulsion subsystem to accomplish in-transit trajectory
corrections and to decelerate the spacecraft from a hyperbolic approach
trajectory into an elliptical orbit about Mars (Reference 1). The schematic
diagram of this pressure-fed, bipropellant subsystem is shown in Figure 1.
The hypergolic propellants, fuel (monomethylhydrazine) and oxidizer
(nitrogen tetroxide), are carried in separate tanks, and each is contained
within a Teflon expulsion bladder. A regulated supply of filtered nitrogen gas
is used to force the propellants from the propellant tanks through a filter, a
Teflon-lined flexible hose, and a bipropellant control valve to the rocket
engine. The flexible hoses permit gimballing of the rocket engine to provide
spacecraft pitch-yaw control. Positive isolation of the pressurant and
propellants during long cruise periods is achieved with pyrotechnic-
operated gate valves which are actuated by ground commands.
The Mariner 9 sequence of propulsion-related events is listed in Table 1.
Although four propulsive maneuvers have been accomplished, only the orbit
1 Values in customary units are included in parentheses after values in SI (International System)
units if the customary units were used in the measurements or calculations.
113
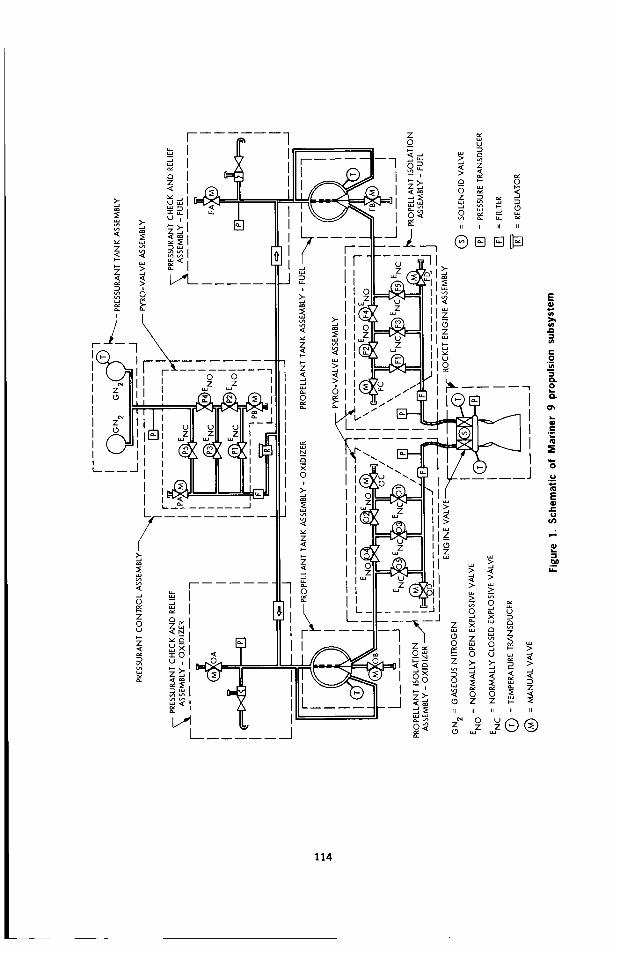
u
o _
z_ii ii II ii
114

insertion maneuver was long enough to provide suflqcient data for a thorough
comparison with pre-flight predictions. The tank pressures during the
interplanetary cruise period (events 5 to 7 of Table 1) provided data for
analyses of nitrogen mass transport properties.
Mars Orbit Insertion Results
A Propulsion Subsystem Operation and Performance (PSOP) digital
computer program was developed to support Mariner 9 flight analysis
(Reference 2). PSOP is a low-frequency simulation model of the complete
propulsion subsystem which predicts system pressures, temperatures,
propellant and pressurant flow rates, thrust, spacecraft mass distribution,
acceleration, total velocity change, and thrust pointing angles as functions of
time. PSOP was used with empirical input data obtained from the Mariner 9
and similar propulsion subsystems to calculate the pre-orbit insertion
predictions of Table 2. All parameters are average values for the burn
period.
A review of the computer inputs after orbit insertion revealed a regulator-
data input error; this is corrected in the second column of Table 2. A
weighted-least-squares fit of the flight data and predictions resulted in the
best-fit data list of Table 2. Also listed is the estimated 1-o" uncertainty of
each parameter in the best-fit column. Burn time, chamber pressure, and
engine mixture ratio are all within 0.5% of pre-burn predictions. The flight
Table 1. Propulsion event sequence
Event Date
1. Launch with propellant tanks at May 30, 1971
low pressure
2. Vent air from liquid lines Jun 1, 1971
3. Pyro valves open (P1, O1, F1) to Jun 3, 1971
pressurize tanks and lines
4. Midcourse 1 firing (5.1 s) Jun 4, 1971
5. Pyro valve closed (P2) to isolate Jun 6, 1971
gas supply from propellant tanks
6. Pyro valves closed (02, F2) to Jun 14, 1971
isolate propellants from engine
7. Pyro valves open (P3, 03, F3) to Nov 1, 1971
repressurize system
8. Orbit insertion firin R (915 s) Nov 13, 1971
9. Orbit trim 1 firing (6.4 s) Nov 15, 1971
10. Pyro valve closed (P4) to isolate Nov 17, 1971
gas supply from propellant tanks
11. Orbit trim 2 firing (17.3 s) in Dec 30, 1971blowdown mode
115

0
cm
EE
u
E8
O.
i-0
"N0,.0
cC
.__
c3e_
o
mF-
b _
% %
× ×
%
X
X
×
_4
X_
X__uq
x_.
×
g_
×
×
×
_rz
%
×
×
e4_
X
e4_
X
_ z _
_
g_
_.._
_._
e'_ >
= 2,
116
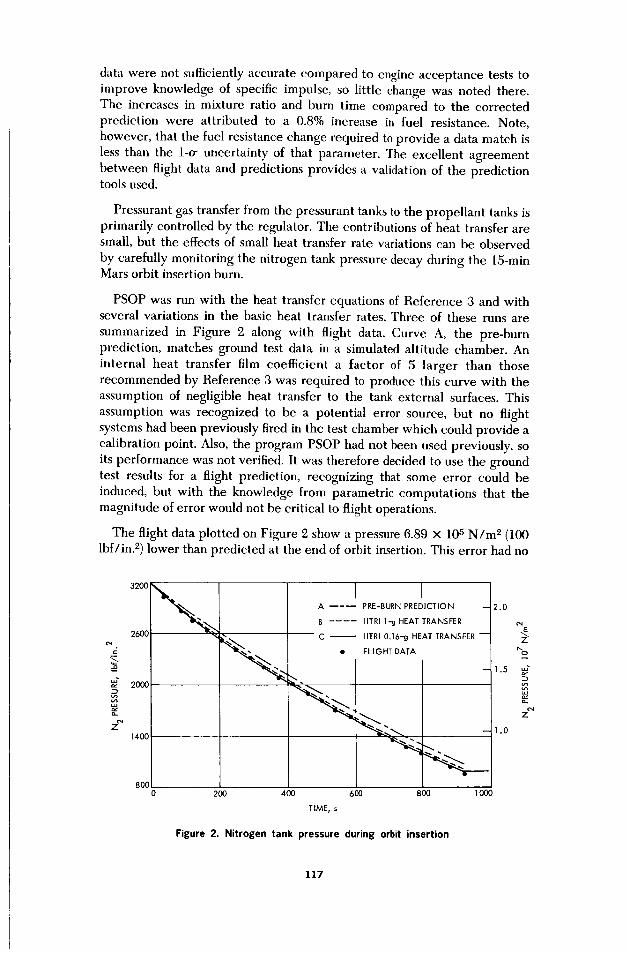
data were not sufficiently accurate compared to engine acceptance tests to
improve knowledge of specific impulse, so little change was noted there.
The increases in mixture ratio and burn time compared to the correctedprediction were attributed to a 0.8% increase in fuel resistance. Note,
however, that the fuel resistance change required to provide a data match is
less than the 1-o" uncertainty of that parameter. The excellent agreement
between flight data and predictions provides a validation of the predictiontools used.
Pressurant gas transfer from the pressurant tanks to the propellant tanks isprimarily controlled by the regulator. The contributions of heat transfer are
small, but the effects of small heat transfer rate variations can be observed
by carefully monitoring the nitrogen tank pressure decay during the 15-minMars orbit insertion burn.
PSOP was run with the heat transfer equations of Reference 3 and withseveral variations in the basic heat transfer rates. Three of these runs are
summarized in Figure 2 along with flight data. Curve A, the pre-burnprediction, matches ground test data in a simulated altitude chamber. An
internal heat transfer film coefficient a factor of 5 larger than those
recommended by Reference 3 was required to produce this curve with theassumption of negligible heat transfer to the tank external surfaces. This
assumption was recognized to be a potential error source, but no flight
systems had been previously fired in the test chamber which could provide a
calibration point. Also, the program PSOP had not been used previously, so
its performance was not verified. It was therefore decided to use the ground
test results for a flight prediction, recognizing that some error could be
induced, but with the knowledge from parametric computations that the
magnitude of error would not be critical to flight operations.
The flight data plotted on Figure 2 show a pressure 6.89 × 10⁵ N/m 2 (100
lbf/in. 2) lower than predicted at the end of orbit insertion. This error had no
z_
3200
260G
200(3
1400
8OO
A B___
B ....
C_
IPRE-BURN PREDICTION -- 2.0
IITRI 1-g HEAT TRANSFER
IITRI 0.16-g HEAT TRANSFER --
FLIGHT DATA
-- 1.5
--1.0
200 400 600 800 1000
rwl_ci UVlL t $
Figure 2. Nitrogen tank pressure during orbit insertion
c_E
o.
117

impact on system operation, but the flight data provide an opportunity tocalibrate the test cell and model. Curve C, which incorporates the filmcoefficients recommended in Reference 3 for internal heat transfer under a
0.16-g environmental acceleration as existed in flight, shows excellent
agreement with flight data. Curve B was calculated with Reference 3 heattransfer coefficients modified for 1-g test conditions to evaluate theacceleration-field effect on internal convective heat transfer. The change
between curves B and C is small compared to that between curves A and C.
It is concluded that the primary error source was convective heat transfer
outside the pressurant and propellant tanks lint within the test cell.
Correlation of tile rocket engine valve post-tmrn temperature transient with
similar test data also indicates test cell heat transfer greater than inflight.
For future ground testing, careful evaluation of the environment should
precede any modifications to the basic Reference 3 equations.
Nitrogen Mass Transport Properties
A portion of the nitrogen pressurant gas used in the Mariner IX
propulsion subsystem went into solution during the interplanetary cruise
phase. The actual amount in solution was of interest because full saturation
of the oxidizer at a tank pressure of 1.72 × 10⁶ N/m z (250 llff/in. 2) will
decrease operating mixture ratio about 6% from the unsaturated operation
point. Pre-flight testing with an oxidizer flow bench which simulated the
propulsion subsystem hydraulic circuit showed that (1) the engine injector is
the only component which exhibits significant resistance increase due to the
two-phase flow caused by gas coming out of solution, and (2) such a
resistance increase does not occur until the partial pressure of N2 in solution
exceeds the injector inlet pressure, less vapor pressure.
The injector resistance increase is plotted in Figure 3 as a function of gas
out of solution. This same curve was found to apply to the fuel circuit, but
lower solubility causes the effect of filel saturation to be only about 25% that
of the oxidizer. Gas out of solution may be calculated as follows:
Mout = Mtank - K (Pi.i- Pt,)
where
Mo,t = specific mass of N 2 out of solution, kg (N2)/kg (prop)
Mtank = specific mass of N 2 in solution at the propellant tank,
kg (N2)/kg (prop)
K = Henry's solubility constant, kg (N2)-m2/N-kg (prop)
Pi,,i = injector inlet pressure, N/m e
P_, = propelhmt vapor pressure, N/m e
118

O 1.4i--
Z.<
1.2t_
Z 1.2
1.1
1.00.1
VOLUME OF NITROGEN OUT OF SOLUTION UPSTREAM
OF INJECTOR ORIFICES, crn3 (N2)/g (prop)
0.2
Figure 3. Injector resistance ratio for nitrogen-saturated propellants
Knowledge of injector inlet pressure and gas properties allows calculation
of specific volume of gas out of solution and the corresponding resistancefactor. This model was included in PSOP for simultaneous solution with the
other equations required to define system operating characteristics.Predictions of saturation level were input to the program for each burn.
Pre-flight predictions of saturation level at orbit insertion were calculated
using the spherical permeation/diffusion model described in Reference 4
and the parameter values listed in Table 3. Launch saturation levels were
equal to the observed propellant tank pad pressures, less vapor pressure.
Average saturation level was calculated as a function of time by integratingthe mass transfer equations through a constant pressure period (Items 3 to 5
of Table 1), a constant mass period (Items 5 to 7), and another constant
pressure period (Items 7 to 8). Predicted propellant tank pressures obtained
from this analysis for the constant-mass period are plotted, along with flight
data, in Figures 4 and 5 for the oxidizer and fuel tanks, respectively. Note
that a significant difference in curve shape and final pressure exists in Figure
4, while only the rate of pressure decay is different in Figure 5.
Since orbit-insertion saturation predictions were calculated by integrating
from the end of the constant-mass period, it was desirable to update the
model to match the observed pressure decay curves. Pressure profiles which
matched the flight data were obtained with the permeation/diffusion
119
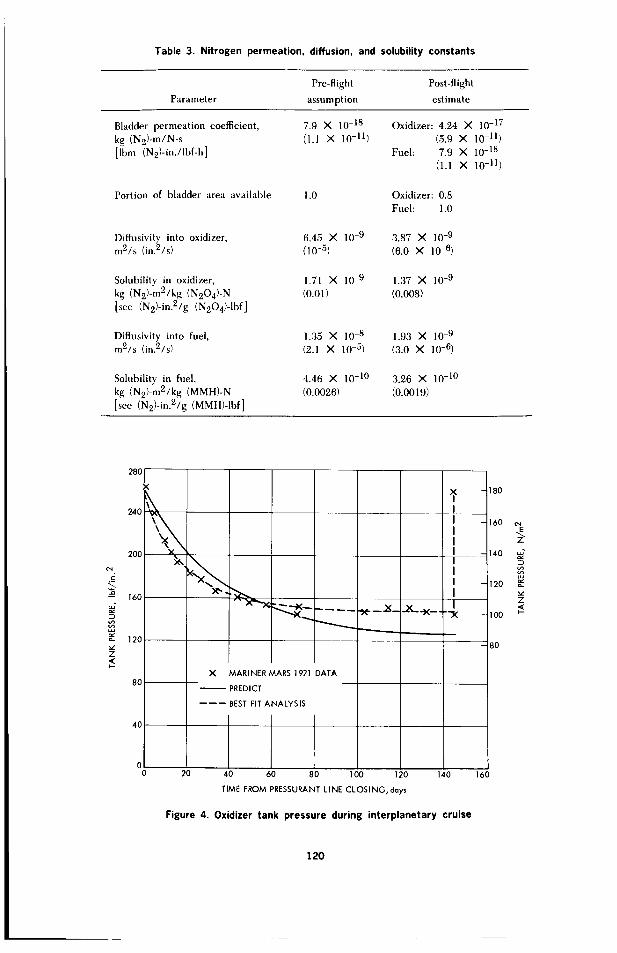
Table 3. Nitrogen permeation, diffusion, and solubility constants
Pre-flight Post-flight
Parameter assumption estimate
Bladder permeation coefficient, 7.9 X 10 -18 Oxidizer: 4.24 X 10 -17
kg (N2)-m/N-s (1.1 X 10 -11) (5.9 X 10 -11)
[Ibm (N2)-in./Ibf-h ] Fuel: 7.9 X 10 -18
(1.1 X 10 -11 )
Portion of bladder area available 1.0 Oxidizer: 0.8
Fuel: 1.0
Diffalsivity into oxidizer, 6.45 X 10 -9 3.87 X 10 -9
m2/s (in.2/s) (10 -5) (6.0 X 10 -6)
1.71 X 10 -9 1.37 X 10 -9
(0.01) (0.008)
Solubility in oxidizer,
kg (N2)-m2/kg (N204)-N
[scc (N2)-in.2/g (N204)-Ibf ]
Diffusivity into fuel, 1.35 X 10 -8 1.93 X 10 -9
m2/s (in,2/s) (2.1 X 10 -5) (3.0 X 10 -6)
4.46 X 10 -l° 3.26 X 10 -l°
(0.0026) (0.0019)
Solubility in tirol,
kg (N2)-m2/kg (MMH)-N
[see (N2)-in.Z/g (MMH)-Ibf]
t-_,
280
240
200
160
120
80
40
\\
....
X MARINER MARS 1971 DATA
PREDICT
------ _ESTFIT ANALYSIS
)_ 18o
_].__J 160
I 4I z
I 14oIII 12o
I _,-'_( 1O0
8O
00 20 40 60 80 100 120 140
TIME FROM PRESSURANTLINE CLOSING, days
Figure 4. Oxidizer tank pressure during interplanetary cruise
160
120

t_
280
200
160
120
80
40
X_x_
- _X" _ 1-" _ _ --l_._ Y._ __v.___
X MARINER MARS 1971
_REDICT
------ BEST FIT ANALYSIS
DATA
iX -180
I
II -16oII 140
X
120
100
8O
%
0 20 40 60 80 I00 120 140 160
TIME FROM PRESSURANT LINE CLOSING, days
Figure 5. Fuel tank pressure during interplanetary cruise
computer model by assuming different values for bladder area available,diffusion rate, and solubility. Table 3 lists the final solubility and rateconstants used to match the data. The increase in N2 permeation rate for
Teflon in NzO4 is a result of laboratory data (obtained after Reference 4)
which showed that Teflon saturated with N204 had larger N2 permeation
rates than dry Teflon. Diffusion constants were reduced from the upper edge
of the pre-flight uncertainty band toward the lower edge in order to obtain abetter data fit. The specific values used were obtained from theoretical
diffusion rate calculations. The changes in solubility between the pre- and
post-flight estimates are within the range of variation in laboratory test data.
Although some uncertainty exists in any one of the parameters listed in
Table 3, the set of values listed provides a good data fit and exhibits
consistency between the fuel and oxidizer solutions.
The revised constants were used to calculate N 2 saturation pressures at
orbit insertion of 1.17 X 10⁶ N/m 2 (170 lbf/in. 2) fo] the oxidizer and 1.47 x
106 N/m z (213 lbf/in, z) for the fuel. The oxidizer saturation level is very
nearly equal to injector inlet pressure, so only a small amount of excess N2
would be expected to come out of solution. No mixture ratio shift whichcould be attributed to excessive saturation was observed during orbit
insertion. The flight data tend to enforce the ground-test-derived model of a
saturation effects threshold as previously discussed, but they do not allow an
evaluation of saturation effects per se because the threshold was not
exceeded. The combination of ground and flight data, however, should be
especially useful to future programs which use N2 as a pressurant gas.
121

Conclusions
The excellent agreement between observed engine performance during
orbit insertion and pre-flight predictions lends credence to the characteriza-
tion of propulsion performance parameters obtained from development and
qualification test programs. The demonstrated ability to match flight data by
making small adjustments to independent variables in analytical models
demonstrated the validity of those models. These results should improve the
predictability of similar propulsion subsystems used in future programs.
2.
3.
4.
References
Stocky, J. F., "Mariner Mars 1971 Orbiter Propulsion Subsystem Type
Approval Test Program," in JPL Quarterly Technical Review, Vol. 1,
No. 2, pp. 47-53. Jet Propulsion Laboratory, Pasadena, Calif., July1971.
"Propulsion Subsystem," in Flight Proiects, Space Programs Summary
37-62, Vol. I, pp. 25-26. Jet Propulsion Laboratory, Pasadena, Calif.,Mar. 31, 1970.
Design Guide [or Pressurized Gas Systems: Task 7, Report No.
IITRI-C6070-20. Illinois Institute of Technology Research Institute(IITRI), Chicago, I11., June 1967.
"Analysis of Pressurant Gas Solubility in the Mariner Mars 1971
Propellant Tanks," in Flight Projects', Space Programs Summary 37-65,
Vol. I, pp. 35-38. Jet Propulsion Laboratory, Pasadena, Calif., Sept. 30,1970.
122
JPL Quarterly Technical Review Volume 2, Number 1 April 1972
Index: chemistry, liquid propulsion,
test facilities and equipment
Surface Tension of Propellants
R. Razouk _
Propulsion Division
The design and successful performance of surface tension type propellant
management systems for spacecraft necessitate the knowledge of propellant surface
tension and contact angle values, and of the behavior of these parameters under
various conditions of temperature, pressure, gravitational forees, and aging. The
present work is concerned with the measurement of surface tension. An apparatus is
described for determining the surface tension of propellants by measuring the
maximum bubble pressure using two capillaries of different bores. The innovation is
the use of a pressure transducer coupled to a bridge supply and a strip chart recorder
for registering the development of the pressure dif[erence as the bubble is formed
and released. This enables the measurements to be made under controlled atmo-
spheres and to be remotely operated. Preliminary experiments were done on
propellant-grade hydrazine and monomethylhydrazine, and on purified hydrazine, at
temperatures between 275.4 and 353.2 K. Straight-line expressions and logarithmic
expressions reproduce equally well the variation of surface tension with tempera-
ture. Contaminated hydrazine, pre-exposed to coupons of 6AI-4V titanium alloy for
long periods, gives slightly higher values of surface tension.
Introduction
Surface tension technology has been applied in recent years to the
retention and control of propellants for liquid propulsion systems used in
space vehicles. The reason is that propellant management devices based on
the capillary concept possess the features of light weight, simplicity in
design, and good reliability. They are also characterized by high expulsion
eflqciency under the conditions of zero- or low-g encountered during coast,attitude control maneuvers, trajectory correction, and orbit injection.
Capillary retention and control devices utilize the familiar phenomena
involved in the rise of liquids in capillary tubes, and in the retention of
bubbles of gas in liquids by means of screens. The behavior of such systems is
primarily determined by the surface tension of the liquid, and the contact
angle that the liquid forms with the wetted surface.
1 Professor, Chemistry Department, California State College at Los Angeles
123

The design and successful performance of surface tension type propellant
acquisition systems for spacecraft necessitate, therefore, an informed
knowledge of the surface tension of the propellant, and of the propellant/
container (usually metallic) contact angle, and, in addition, the behavior of
these parameters under various conditions of temperature, pressure, and
reduced gravity. Furthermore, the propellant/tank material compatibility is
a dominant factor for long-life missions of several years; thus, it is of primeimportance to ascertain the effect of any resulting decomposition and
contamination of the propellant on these properties.
Limited work has been done on the determination of the surface tension
and contact angles of Earth-storable and space-storable propellants, and
there are occasionally discrepancies in some of the published data. The
effect of temperature over a wide range has scarcely been investigated, and
no studies have yet been made on the effects of gas evolution and ofcontamination accompanying extended contact of the propellant with the
equipment.
The present work is confined to the measurement of surface tension. An
apparatus for measuring the surface tension of propellants is described, and
preliminary results of experiments on hydrazine and monomethylhydrazine
(MMH) are reported.
The apparatus is based on the principle of Sugden's maximum bubble
pressure method involving two capillaries of different radii immersed in the
liquid to the same depth (Reference 1). The method has the advantage that it
does not depend on contact angle and that the depth of the capillaries and
the radius of the narrow capillary need not be known. Only the radius of the
larger capillary and the density of the liquid must be known, but not
necessarily to a high degree of exactness, since they appear as correctionterms.
According to Sugden (Reference 1) the surface tension is given by
7=A-AP(l+0.69_ D-)(1)
where y is the surface tension (N-m-l), Ap the difference in the maximum
pressures necessary to form the bubbles at the narrow and wide tubes (N-
m-2), r the radius of the wide tube (m), g the acceleration due to gravity
(9.807 m-s-2), D the density of the propellant (kg-m-3), and A a characteristic
constant of the apparatus (m).
The innovation in the present method is the use of a pressure transducer
coupled to a bridge supply and strip chart recorder for registering the
pressure differences as the gas bubbles are formed and detached at the tips
of the two tubes alternately. This arrangement circumvents the difficulty of
simultaneous reading of the two levels of an ordinary manometer, and
eliminates the errors arising from the lag of the manometer fluid. It also
enables the measurements to be made under controlled atmospheres and to
124
be remotely operated. These features are of particular interest because of
the noxious nature of propellants, and because of the adaptability of the
method to the study of surface tension under high-pressure conditions which
require an all-metal apparatus.
Experimental
Apparatus
Measurements of surface tension were made with the aid of the apparatus
shown schematically in Figure 1. A double-jacketed cylindrical pyrex cell (a)
with a carefully ground long and wide neck contained the propellant at
constant temperature. The ground joint stopper had two similar tubes (b and
b') passing through it. Tube b was fitted with a Teflon stopcock at its upper
end. The lower end of tube b' was sealed to a short capillary of 3 × 10⁻³-m
length. The lower tips of the two tubes were cut sharply at right angles to
their axes at exactly the same level and were finely ground. The diameters ofthe tubes were 4.070 x 10 -3 and 0.269 × 10 -3 m. The tubes were connected
together above the stopcock into a common tube (c) which led to the
pressure side of the transducer (d). A side tube (e) allowed the introduction
of a stream of nitrogen gas. The stopper also had a ground joint opening (f)
for a thermometer, and an outlet tube (g) connected to the reference side ofthe transducer. The outlet tube contained a small vent to maintain the
pressure of the surrounding atmosphere on this side of the transducer.
The pressure transducer used was a Statham Type PM60TC _+ 1-350. It
was connected to a Dynamics bridge supply Model 6343A. The electric
signal was recorded on a Hewlett-Packard Moseley 7100B strip chartrecorder Model 17501A.
The transducer was excited by an electric potential difference of 10 V. It
was calibrated by measuring the electric output for different pressure
standards. The bridge and recorder were adjusted so that a signal of 2.54 cm(1 in.) on the chart corresponded to a pressure difference of 1.730 × 10³
N-m -2 (1.730 × 10³ dyne-cm-2). This arrangement permitted measurements
of surface tension to an accuracy of 10 -4 N-m -l , which corresponded
approximately to 0.2% of the surface tension measured (vide infra).
Procedure
The measurements were carried out in an atmosphere of dry nitrogen in
order to eliminate errors resulting from absorption of water vapor by the
propellant and oxidation with atmospheric oxygen.
A slow stream of dry nitrogen regulated by a system of needle valves was
passed through a copper coil at the temperature of the experiment and then
through the capillaries of the cell. The rate was adjusted to 2-4 bubbles of
nitrogen per minute. The gas was first allowed to pass through the widertube, and the development of the pressure difference was recorded for
several cycles of growth and release of the bubbles. The stopcock of tube b
125
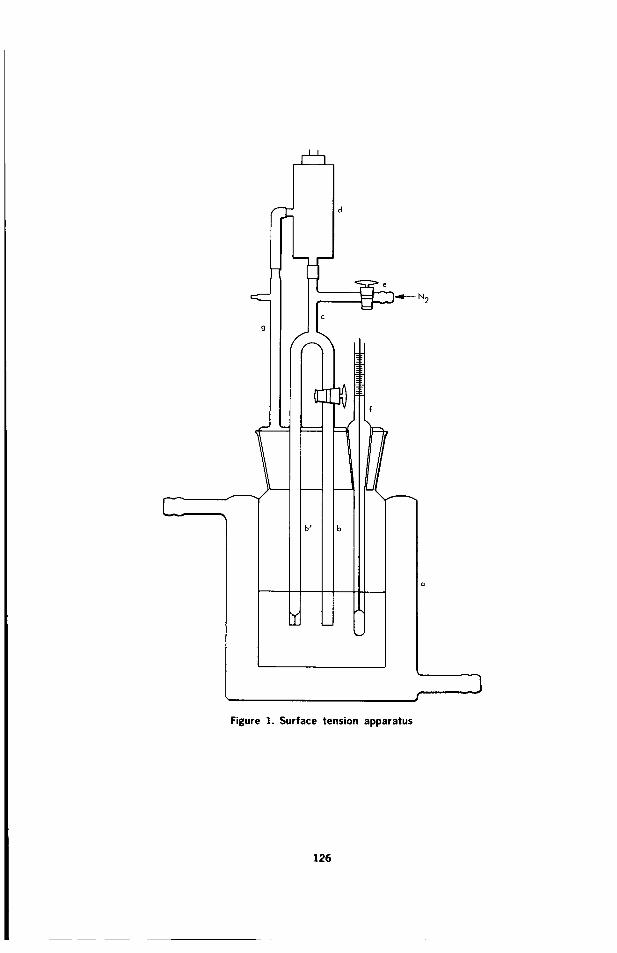
"k
,d
i
0:11f
!!t
b
III
III_M
Figure 1. Surface tension apparatus
126

was closed next and nitrogen was passed through the narrow tube, and again
the development of the pressure difference was recorded.
Figure 2 shows typical recordings of two experiments on hydrazine at283.2 and 343.2 K. As the gas bubbles were formed and detached, the
pressure increased to a maximum and then decreased. But the cyclic
pressure changes depended on the bore of the capillary, the depth of theorifice, and the rate of gas bubbling. The pressure in the narrow tube
increased steadily to a maximum, when the bubble assumed the hemispheri-
cal shape, and then dropped sharply as the bubble was released. On the
other hand, the pressure in the larger tube increased to a maximum and
diminished slowly as the bubble grew and flattened and finally became
unstable and detached; the pressure then showed a sudden drop. This
behavior is frequently overlooked in the familiar bubble point experiments
for determining surface tension by measuring the gas pressure at the instant
of detachment of a gas bubble.
Materials
Experiments were carried out on samples of propellant-grade, purified,and contaminated hydrazine, and of propellant-grade monomethylhydra-zine.
Hydrazine I was propellant-grade Mathieson quality. Analysis showed
that at the time of the experiments it contained 0.2% water, 0.1% ammonia,and 0.2% aniline.
Hydrazine H was a purified sample prepared as follows. Propellant-grade
hydrazine was treated with barium oxide for several hours; then the vapor
and gases were pumped off until the volume of the liquid was reduced by
20%. The liquid was then distilled from the mixture in vacuo at ambient
temperature, and collected at dry-ice temperature. Finally, hydrazine was
redistilled in vacuo into bulbs which were sealed off and stored at dry-ice
temperature until used. The bulbs were broken in a glove box under an
atmosphere of dry nitrogen and the hydrazine transferred into the surface
tension cell. Typical analysis gave 0.1% water, 0.06% ammonia, and less than
5-ppm aniline.
Contaminated hydrazine was a product obtained from hydrazine
compatibility experiments of a current program. Propellant-grade hydrazinewas introduced into capsules containing a coupon of 6AI-4V titanium alloy,
and the capsules were kept at dry-ice temperature, degassed, and sealed.
They were stored at 316.5 K until a pressure of about 3.5 × 10⁵ N-m -2 wasdeveloped inside the capsules, at which time they were moved to a box at
dry-ice temperature. The capsules were broken, the pressure released, andthe liquid transferred to the surface tension apparatus. The contaminated
hydrazine had a brownish color and a density about 5% higher than that of
the parent liquid. It also contained considerable amounts of particulate
matter in suspension visible to the naked eye. Samples were taken from
127

%x
Z
UZ
B£21
o.
12
10
NARROW TUBE
283.2 K
m
WIDE TUBE
I I
NARROW TUBE
343.2 K
-- WIDE TUBE --
o I I I I0 20 40 60 0 20 40 60
TIME, s
Figure 2. The development of pressure difference in cycles of growth anddetachment of gas bubbles
128

three capsules. The ammonia content of the propellant at the end of the
experiments was 0.2, 2.8, and 1.5%.
Propellant-grade monomethylhydrazine was Olin-Mathieson quality. It
contained 0.2% water and 0.2% ammonia at the time of the experiment.
Results and Discussion
The apparatus constant A was determined by measuring the maximum
bubble pressure differences for liquids of known surface tension at 303.2 K.
The following results were obtained: water, 6.80 × 10 -5 m; methanol, 6.73× 10 -5 m; benzene, 6.74 × 10⁻⁵ m; carbon tetrachloride, 6.80 × 10⁻⁵ m;
10% by volume aqueous ethanol solution, 6.79 × 10⁻⁵ m; and 20% by volume
aqueous ethanol solution, 6.75 × 10⁻⁵ m. The average value of 6.77 ×10⁻⁵ m was used.
Table 1 shows the results of measurements of the surface tension of
hydrazine and monomethylhydrazine over a temperature range of about80 K. Contamination appears to produce small changes in the surface
tension of hydrazine. Both the propellant-grade quality and contaminated
hydrazine obtained from compatibility experiments have surface tensions
that differ slightly from the value of the purified propellant. Such small
differences should have little effect on the performance of surface tension
type acquisition devices designed on the basis of surface tension values for
pure hydrazine, provided that the contact angle of the hydrazine/container
material is not sensibly altered in the meantime. However, the experimental
results do not necessarily imply that there is no deterioration of the surface
tension of hydrazine when the latter is saturated with ammonia, nitrogen,
and hydrogen under the high pressures which may be developed during
extended periods of propellant contact with the tank material. Measure-ments of surface tension under these conditions have to be made before
drawing definite conclusions. Furthermore, it is more likely that difficulties
would arise from the narrowing or clogging of the capillaries and the screen
perforations of the equipment by the particulate materials which have been
observed in the contaminated propellant.
Surface tension values for Hydrazine II and MMH are also plotted in
Figures 3 and 4. Good linear relations are found between surface tension and
temperature. For Hydrazine II the relationship is represented by
T (K)7(N -m-l ) =129-1X 10 -3 1-_]
[3' (dyne -cm-1) = 73.3 - 0.2044t (°C)]
(2)
where y is the surface tension at temperature T in kelvin (t in degrees
Celsius). For MMH the relationship is
129

T (K)_3'(N-m-I)=65.8X 10⁻³ I--_]
[3"(dyne-cm -1) = 36.1 - 0.1088t (°C)]
(3)
The constants of Equations 2 and 3 differ somewhat from the values
calculated for hydrazine (138.7 x 10 -3 N-m -1, 572 K) and for MMH (63.2 ×
10 -3 N-m -1, 641 K) using the data of Bernard and Goudeau (Reference 2)
and Lawrence (Reference 3, Table 18), respectively.
The surface tension of pure liquids decreases with rise of temperature,
and it should vanish at the critical temperature To. Based on Equations 2 and
3, the critical temperatures of hydrazine and MMH would be 632 and
606 K, respectively. These values are much closer to the corresponding
experimental critical temperatures of 653.2 K (Reference 4) and 585.2 K(Reference 3, Table 3) than the values of 572 and 641 K calculated from the
data of Bernard and Goudeau (Reference 2) and Lawrence (Reference 3,
Table 18), respectively.
Nevertheless, it is obvious that although the linear relation fits the data
over the temperature range of the experiments, it is inadequate at higher
temperatures. A better empirical relation between surface tension and
temperature has been developed on the basis of the principle of correspond-
ing states, namely,
"7'= _'o 1 - (4)
where r is a constant equal to 0.234 (van der Waals, Reference 5), 0.21
(Ferguson, References 6 and 7), and 2/9 (Guggenheim, Reference 8). This
relationship is assumed to apply only to spherically symmetrical homopolar
molecules. Cahn and Hilliard (Reference 9) pointed out that r = 0.21 in the
region T/Tc = 0.6 but that in the neighborhood of Tc it approaches 0.5.Grosse (Reference 10) found that for metals r varies between 1.28 (sodium)
and 0.25 (cadmium).
Equation 4 has been tested by plotting log y versus log (1 - T/T_) in
Figures 5 and 6. The straight lines are very satisfactorily represented by
3' (N-m-l) = 130.5 X 10 -3 (1 -T/653.2) 1"°6s
[3' (dyne-cm -1) = 0.1311 (380 - t) l'06s ]
(5)
for hydrazine II, and by
130

Table 1. Surface tension of hydrazine and MMH
Surface tension 3_ X 103 N-m -1
Temperature,
K Hydrazine I Hydrazine II Contaminated hydrazine MMH
(propellant- (purified)
grade)
275.4 71.8 72.8 35.9
283.2 70.3 71.2 35.0
293.2 68.5 69.2 34.0
303.2 66.5 67.2 68.5; 68.8; 67.3 32.9
313.2 64.6 65.1 31.8
323.2 62.7 63.0 30.7
333.2 60.7 61.0 29.6
343.2 58.7 58.9 28.5
353.2 56.7 57.0 27.4
75 I I 1 I I I 1 I• HYDRAZINE I (PROPELLANT-GRADE)
O HYDRAZINE 11"
"T,E
Z
%
x
zo
,,<
to
70
60
55 I I I I I I 1270 280 290 300 310 320 330 340 350 360
TEMPERATURE, K
Figure 3. Linear variation of the surface tension of Hydrazine I (propellant-grade)
and Hydrazine II with temperature
131

T,E
z
%X
zo
w
S
4O
35
2527O
I _ I I I I I I
I I I I I I I I280 290 300 310 320 330 340 350 360
TEMPERATURE,K
Figure 4. Linear variation of the surface tension of MMH with temperature
I
1.25
1.20
1.15 --
1.100.20
I I0.25 0.30 0.35
Figure 5. Logarithmic relationship between the surface tension of Hydrazine II and
temperature
132

1.60 i i I
I. 55 -
.__ 1.50--!
1.45 --
] .401 I I I0.25 0.30 0.35 0.40 0.45
Figure 6. Logarithmic relationship between the surface tension of MMH and
temperature
3' (N -m-l) = 65.2 X 10 -3 (1 - T/585.2) 0"937
[3' (dYne'cm-1) = 0.1668 (312 - t) 0"937 ]
(6)
for MMH.
Both the straight-line expressions (Equations 2 and 3) and the logarithmic
expressions (Equations 5 and 6) reproduce the experimental results equally
well, and give values of 70 close to within 1%. However, at higher
temperatures one would expect that the logarithmic expression fits the
results better, since the surface tension vanishes at the true critical
temperature.
The EiStv6s constant (Reference 11) and the parachor (Reference 12) were
calculated for hydrazine and MMH by using the respective expressions; bothvalues indicated considerable association of the molecules of the two liquids,
and the decrease of the extent of association with rise of temperature.
Acknowledgment
The author wishes to express his thanks to Mr. Stephen P. Vango for the
preparation of purified hydrazine, and his appreciation to Mr. GeorgeYankura for useful discussions.
133

References
1. Sugden, S., ]. Chem. Soc., Vol. 125, p. 1177, 1924.
2. Bernard, M. L., and Goudeau, J. C., ]. Chim. Phys., Vol. 62, p. 732,1965.
3. Lawrence, R. W., Handbook o[ the Properties of Unsymmetrical
Dimethylhydrazine and Monomethylhydrazine, Aerojet Project No.
1292. Aerojet-General Corporation, El Monte, Calif., May 1958.
4. Clark, C. C., Hydrazine,,p. 21. Mathieson Chemical Corporation,Baltimore, Md., 1953.
5. van der Waals, J. D., Z. Physik. Chem., Vol. 13, p. 657, 1894.
6. Ferguson, A., Trans. Faraday Soe., Vol. 19, p. 407, 1923.
7. Ferguson, A., Proc. Phys. Soe., Vol. 52, p. 759, 1940.
8. Guggenheim, E. A., ]. Chem. Phys., Vol. 13, p. 253, 1945.
9. Cahn, J. W., and Hilliard, J. E., ]. Chem. Phys., Vol. 28, p. 258, 1958.
10. Grosse, A. V., ]. Inorg. Nuel. Chem., Vol. 24, p. 147, 1962.
11. Von E6tv6s, R., Ann. Physik, Vol. 27, p. 448, 1886.
12. Sugden, S., ]. Chem. Sot., Vol. 125, p. 32, 1924
134

JPL Quarterly Technical Review Volume 2, Number 1 April 1972
Index: computer applications andequipment, computer programs,tracking
Operating Executive for the DSIF TrackingSubsystem Software
P. L. Poulson
Data Systems Division
The advanced engineering model of the DSIF tracking subsystem (DTS) is
currently being developed by the Deep Space Instrumentation Facility. The DTS
will provide effective and reliable tracking and data acquisition support for the
complex planetary and interplanetary spaceflight missions planned for the 1970
decade. The nucleus of the subsystem is a Honeywell H832 digital computer. This
article describes the design and capabilities of the real-time operating executive
software being developed for this subsystem.
Introduction
The DSIF tracking subsystem comprises the digital capabilities required
at a deep space station for the purposes of tracking data acquisition and
validation and subsequent transmission to the SFOF. Initial requirements
include the real-time handling and control of doppler, ranging, angle,
predict, validation, and others. The subsystem must handle a variety of
digital and analog input and output as well as provide control services to
many DSIF subassemblies. This multifunctional environment of data and
services is being centrally controlled by the H832 computer, which, in turn,
requires a unified software operating system or executive. The primary
purpose of the operating executive (EXEC) is the management of computer
resources, such as central processing unit (CPU), memory, and input-output.
The real-time environment, with its multiplicity of asynchronous events and
quasi-servo processes, imposes stringent design constraints upon theoperational software. The DTS EXEC must handle high- and low-rate
asynchronous input and output, activate the appropriate processing,
respond to a host of configuration control messages, service display requests,insure that all time-critical requirements are met through a time-dependent
priority structure, and provide services for data storage and retrieval.
Finally, an important consideration in the design philosophy of the EXEC
was the fact that it would operate within a relatively stable and unchanging
complement of functional software.
135

For a more detailed description, see Reference 1.
Hardware
Much of the computer hardware is of the everyday variety. However,
there are certain features that require special mention because of their
impact upon the design of the EXEC.
The H832 is a multi-processor computer, with the present configuration
consisting of two CPUs and two input-output processors (IOPs), each
operating as dictated by stored and sequentially ordered instructions
(program). Additionally, both the CPU and the lOP can each operate at
sixteen priority states or levels, which, in effect, is a hardware determined
queue of software. The EXEC incorporates a two-dimensional program
queuing structure based upon this characteristic and is described in moredetail later on.
Control of CPU or IOP activity is accomplished by the multi-process
controller (MPC) which specifies the level at which CPU or IOP is to
operate. Both CPU and lOP are equipped with control process orders(instructions) which, when executed, are delivered to the MPC, which, in
turn, effects a change of state in the CPU or IOP. Thus, through software,
either CPU or lOP can effect the operating level of any of the computer
processors. Each CPU operating level has a priority position and operates in
one of four activity states: stopped, enabled, committed, or sequencing.
Likewise, each lOP level can operate in one of four activity states: stopped,
waiting, engaged, or sequencing. The hardware can thus accommodate the
various interruptive and I/O traffic.
Finally, the computer establishes its interface with the external DSIF
environment through the digital/analog input/output (DAIOS) subsystem
which provides a capability of transferring data between an lOP and a large
number of discrete and analog lines, including GCF traffic. The DAIOS isthe sole interface between the H832 and the DSIF subassemblies. It has 8
channels for each of 8 subsystems, with each channel having 64 subchannels,or 4096 subchannels in all.
Software
Like many such computer-based support facilities, the existence of
independent and diverse programs, all operating at the same time, requires
central controlling software. Such control is vested in the EXEC which, in
turn, controls all functional support programs, the design of which is as
much determined by the EXEC as by the hardware. The questions are: How
much control should be exercised by an EXEC? How large should it be
allowed to get? What are the limits of services it should provide? Such
considerations are practically boundless, and it is a well-known phenomenon
that nothing so proliferates as computer operating systems.
136
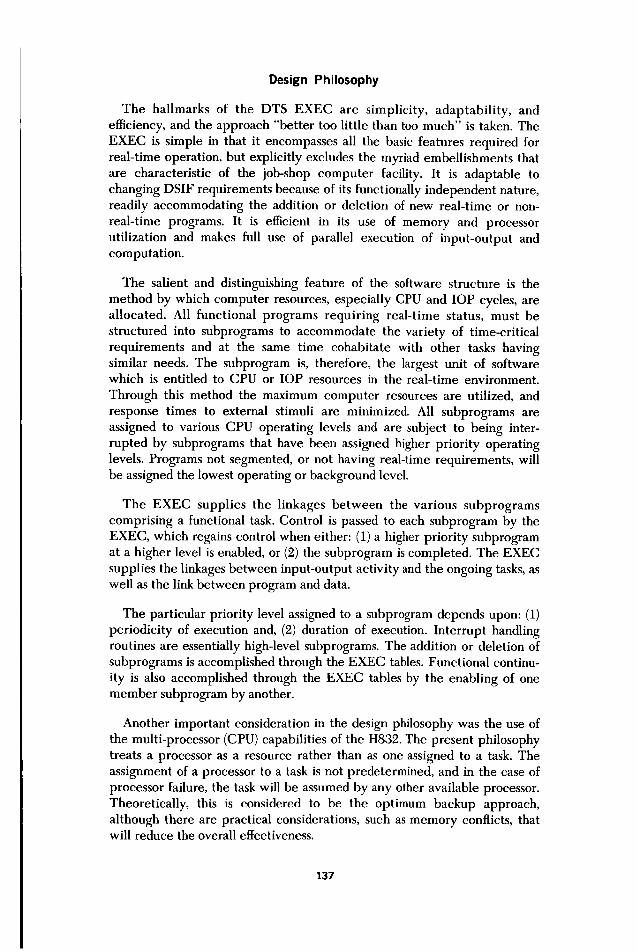
Design Philosophy
The hallmarks of the DTS EXEC are simplicity, adaptability, and
efficiency, and the approach "better too little than too much" is taken. The
EXEC is simple in that it encompasses all the basic features required for
real-time operation, but explicitly excludes the myriad embellishments that
are characteristic of the job-shop computer facility. It is adaptable to
changing DSIF requirements because of its functionally independent nature,
readily accommodating the addition or deletion of new real-time or non-
real-time programs. It is eflqcient in its use of memory and processor
utilization and makes full use of parallel execution of input-output and
computation.
The salient and distinguishing feature of the software structure is the
method by which computer resources, especially CPU and IOP cycles, are
allocated. All functional programs requiring real-time status, must be
structured into subprograms to accommodate the variety of time-critical
requirements and at the same time cohabitate with other tasks having
similar needs. The subprogram is, therefore, the largest unit of softwarewhich is entitled to CPU or IOP resources in the real-time environment.
Through this method the maximum computer resources are utilized, and
response times to external stimuli are minimized. All subprograms are
assigned to various CPU operating levels and are subject to being inter-
rupted by subprograms that have been assigned higher priority operating
levels. Programs not segmented, or not having real-time requirements, will
be assigned the lowest operating or background level.
The EXEC supplies the linkages between the various subprograms
comprising a functional task. Control is passed to each subprogram by the
EXEC, which regains control when either: (1) a higher priority subprogramat a higher level is enabled, or (2) the subprogram is completed. The EXEC
supplies the linkages between input-output activity and the ongoing tasks, aswell as the link between program and data.
The particular priority level assigned to a subprogram depends upon: (1)
periodicity of execution and, (2) duration of execution. Interrupt handling
routines are essentially high-level subprograms. The addition or deletion ofsubprograms is accomplished through the EXEC tables. Functional continu-
ity is also accomplished through the EXEC tables by the enabling of one
member subprogram by another.
Another important consideration in the design philosophy was the use of
the multi-processor (CPU) capabilities of the H832. The present philosophy
treats a processor as a resource rather than as one assigned to a task. The
assignment of a processor to a task is not predetermined, and in the case of
processor failure, the task will be assumed by any other available processor.
Theoretically, this is considered to be the optimum backup approach,
although there are practical considerations, such as memory conflicts, thatwill reduce the overall effectiveness.
137

Design Characteristics
Job Queue Controller
Control is assigned through the use of the job queue controller, which
allocates CPU resources according to priority and status. This is accom-
plished through the use of a job queue which is merely an ordering of
subprograms. Each entry in a queue represents a subprogram which may or
may not be active. Processor control is allocated through the queue and
never from one subprogram to another. The queue itself is a two-
dimensional hierarchal ordering of subtasks within the CPU processing level
structure. The H832 accomplishes level switching through control process
orders to the multi-process controller (MPC). Execution of subtasks at
different CPU operating levels, or interlevel ordered, is done automatically
by the MPC. Execution of subtasks residing at the same CPU level, or
intralevel ordered, is accomplished through a software queue of subpro-
grams, each level having a separate job queue. All subprograms at CP level
N have interruptive priority over any subprogram at CP level N + 1, N +
2, etc. Intralevel-ordered subprograms have noninterruptive priority at that
level. The four lowest (12, 13, 14, 15) CP levels are reserved for execution of
user subprograms. Level 15, being the lowest level, is always sequencing and
operates in a batch-type mode (Figure 1).
Subprogram Entry Tables (SET)
This is the subprogram queue. There is a SET for levels 12, 13, 14, and 15,
and scanning takes place only at that level. Each SET is scanned from the
top by an EXEC processor that is re-entrant. Upon completion of a scan, the
currently sequencing level is suspended and the next lower active level
resumes sequencing. Subprograms in the SET are referred to symbolically
with no restrictions as to their activation from other subprograms. Thus a
subprogram at level 14 may activate, through the SET, another subprogramat level 12.
Table of Executive Directives (TOED)
The TOED comprises directives to be performed at fixed time intervals
by the EXEC. The purpose of the TOED is to activate various internal
processors and subprograms corresponding with the appropriate periodic
external stimuli. Non-periodic stimuli will usually be handled by dedicated
interrupt processors. Executive directives may be of three types: requests to
log data, requests for DAIOS output, and requests to execute user
subprograms. Each block in the TOED contains three types of entries:
execution rate, execution time, and directives (i.e., subprogram, data log, or
data output). All directives in any block are activated at the same time.
TOED scanning is accomplished by CP level 1 every 10 ms, and at CP
level 2, every 1 s. These particular scan rates have been chosen more or less
arbitrarily as most appropriate for the DSIF tracking function and are in no
way a design constraint.
138
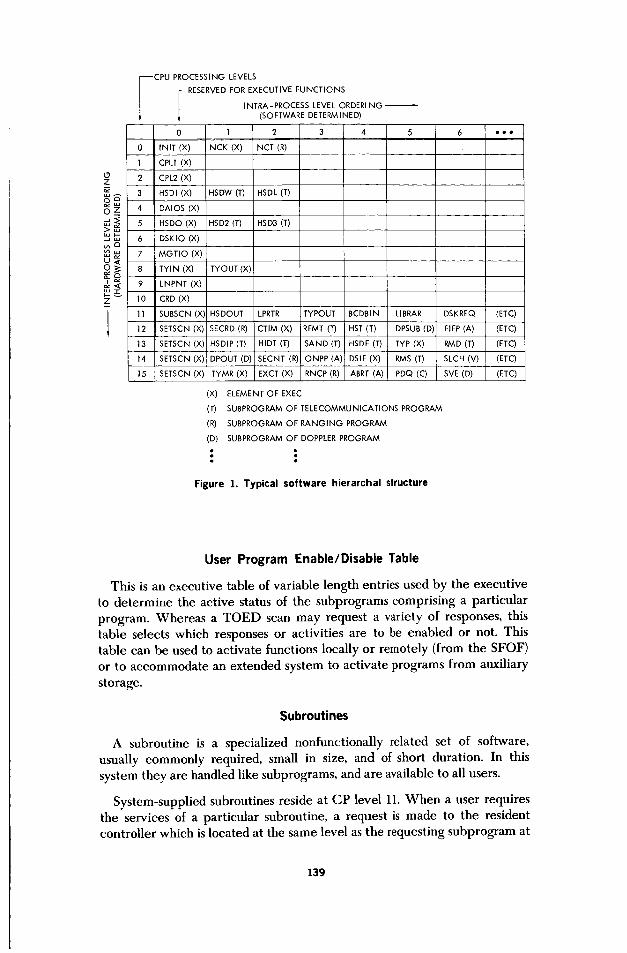
07
_uJoz
t_at_ w
03
_'<
Z
_CPU PRiCESSING LEVELS
RESERVED FOR EXECUTIVE FUNCTIONS
INTRA-PROCESS LEVEL ORDERI NG
(SOFTWARE DETERMINED)
0 1 2 3 4 5 6 eoe
0 INIT (X) NCK (X) NCT (R)
1 CPL1 (x)
2 CPL2 (X)
3 HSDI (X) HSDW (T) HSDL (1")
4 DAIOS (X)
5 HSDO (X) HSD2 (T) HSD3 (T)
6 DSKIO (X)
7 MGTIO (X)
8 TYIN (X) TYOUT (X)
9 LNPNT (X)
I 0 CRD (X)
11 I SUBSCN (X', HSDOUT LPRTR TYPOUT BCDBIN LIBRAR DSKREQ (ETC)
12 SETSCN (X) SECRD (R) CTIM (X) RFMT (T) HST (T) DPSUB (D) FIFP (A) (ETC)
13 SETSCN (X) HSDIP (T) HIDT (T) SAND (T) HSDF (T) TYP (X) RMD (T) (ETC)
14 SETSCN(X)IDPOUT(D) SECNT (R) ONPP(A)I DSIF(X) RMS (T) SLCH (V) (ETC)
15 SETSCN (X) TYMR (X) EXCT (X) RNCP (R) ABRT (A) PDQ (C) SVE (D) (ETC)
(X) ELEMENT OF EXEC
(I") SUBPROGRAM OF TELECOMMUNICATIONS PROGRAM
(R) SUBPROGRAM OF RANGING PROGRAM
(D) SUBPROGRAM OF DOPPLER PROGRAM
Figure 1. Typical software hierarchal structure
User Program Enable/Disable Table
This is an executive table of variable length entries used by the executive
to determine the active status of the subprograms comprising a particular
program. Whereas a TOED scan may request a variety of responses, thistable selects which responses or activities are to be enabled or not. This
table can be used to activate functions locally or remotely (from the SFOF)
or to accommodate an extended system to activate programs from auxiliary
storage.
Subroutines
A subroutine is a specialized nonfunctionally related set of software,
usually commonly required, small in size, and of short duration. In this
system they are handled like subprograms, and are available to all users.
System-supplied subroutines reside at CP level 11. When a user requiresthe services of a particular subroutine, a request is made to the resident
controller which is located at the same level as the requesting subprogram at
139

levels 12, 13, 14, or 15. Control is then passed to CP level 11, insuring that
completion takes place before other requests can be serviced. Upon
completion, control returns to the lower level and to the requesting
subprogram. By this method, subroutines may be used in common without
requiring that they be coded re-entrant.
Input/Output Processor (lOP)
In a multiple real-time environment, input and output responses become
the determining factors. DTS incorporates two I/O processors to handle
input and output. Each lOP is a modified single-address word organized
stored program computer that effects transfer of data between primary
memory and input and output device controllers.
Input/Output Categories
The EXEC classes I/O into 3 categories: (1) peripheral, (2) synchronous,
(3) asynchronous. All peripheral I/O, such as mag tape, disk, typewriter,
CRT with keyboard, card reader, printer, etc., is handled by EXEC lOP
channel programs and is available to any user. The user, in turn, is required
to utilize the peripherals through the EXEC. Synchronous I/O is defined as
that which is controlled by predictable and periodic interrupts, such as a 10-
ms doppler sample. The EXEC will usually handle such traffic, although the
user is allowed to supply his own interrupt and channel software. Asynchro-
nous I/O is most often task peculiar and usually requires special interruptsand channel software supplied by the user under control of the EXEC to
resolve possible I/O conflicts. Some DTS asynchronous I/O, such as the
high-speed data, is handled as a service by the EXEC because of its
commonality to other functions.
I/0 Operation
All I/O within the DTS operates essentially as follows: user requests or
external interrupts will cause the CPU to sequence (cycle) at a particular
level. The resident EXEC processor at that level initiates an IOP channel
program. The CPU continues with other work while data transfer takes
place under control of the IOP. When data transfer is complete, IOP notifies
the CPU and terminates, whereupon the appropriate CPU processing levelis restarted.
Data-Handling Services
Data services supplied by the EXEC include the reception, storage, and
retrieval of data for the purposes of recall, analysis, and archival histories.
Such data may be either externally derived or internally generated. The
services are used jointly by all user programs as well as the EXEC itself.
Interface requirements between separate programs can easily be satisfied
through the storage and retrieval services supplied on both disk and tape.
140

Data Librarian and Storage
The librarians, for disk and tape, are designed to coordinate and handle
the required data bookkeeping and resolve apparent conflicts arising from
multiple users of the disk and tape services. It is a two-sided approach: the
EXEC supplies automatic storage of real-time data and at the same time
allows the user the prerogatives of independent disk or tape usage.
Data within the system is classified as either real or non-real-time data.
Real-time logging is identical for both tape and disk, and is stored in 900-
word records or tracks, each track consisting of fifteen 60-word logical
records. Real-time data is filled from memory in these 60-word records by
data type and time, which also serve as the librarians' retrieve parameters.
Cataloging is accomplished through internally maintained tables which refer
to externally stored tables which, in turn, locate the desired data.
Non-real-time data, or any user data for that matter, is stored and
retrieved according to files, which are opened and closed for the user
through requests to the librarians.
Conclusion
The arrival of a new third-generation computer to be adapted to DSIF
functions not yet computerized presented a good opportunity for a fresh
approach to systems software development. The manufacturer had no
applicable real-time system, supplying only the basic tools for software
development. Some of the work remains undone, and a few areas have been
implemented in an expedient fashion, but most of the features described
herein have been implemented and are more or less operational. Programs
currently operating under the EXEC, or that are in development, support
the functions of dual doppler handling, telecommunications, ranging, and
antenna pointing. The CPU and memory impact of the EXEC upon these
programs is gratifyingly small and adheres to the basic design criteria ofsimplicity, adaptability, and efficiency.
One of the most fundamental features of software is its ability to adapt
general-purpose hardware to specific applications. Attempts to fully
generalize the software on top of generalized hardware results in reducing
the power and versatility of the computer. Rather than achieving a
functionally independent and negotiable product, this philosophy invariably
results in a system with an overhead that continuously proliferates at great
cost accompanied by increasing levels of uncertainty.
The DTS EXEC was designed in the middle ground somewhere between
the philosophy of total generality and no philosophy at all. Unfortunately,
the middle ground with its lack of definable boundaries and its inherent
instability is vulnerable to the pressures of generalization on the one hand,
or to the detailed requirements of the application on the other. Although not
fully implemented, the EXEC is expected to contain all the features
described herein and has the capability to accommodate any DSIF function
without major modifications.
141

1.
Reference
Urban, I., et al., DSIF Tracking Subsystem, Document 900-483, Nov.
30, 1971 (JPL internal document).
142

JPL Quarterly Technical Review Volume 2, Number 1 April 1972
Index: mathematical sciences, tel-emetry and command, wave propa-gation
Interplex: An Analysis of Optimized PowerAllocations for Two- and Three-Channel PSK/PM
Telecommunications Systems
B. K. Levitt
Telecommunications Division
Under certain conditions, interplex modulation techniques can significantly
improve the performance of a multichannel phase-shift-keyed/phase-modulated
(PSK/PM) telemetry system by increasing the useful available power relative to
conventional PSK/PM systems. However, previous efforts to compare the two
modulation schemes and provide a measure of this improvement have occasionally
fostered the false impression that the total average signal power and the channel
modulation indices were common to both systems. In practice, in designing either
modulation system for a deep space telecommunications link, optimal modulation
indices are selected to minimize the total average signal power subject to certain
minimum requirements on the average telemetry channel and carrier powers. This
article illustrates these optimal design concepts for two- and three-channel telemetry
modes in the context of the Mariner Venus-Mercury 1973 mission and provides a
more realistic measure of the usefulness of interplex. These ideas are then applied as
an example to one particular Mariner Venus-Mercury 1973 telemetry mode to
demonstrate that interplex can reduce the required total average power by more
than 2 dB in some cases.
Introduction
It has recently been suggested that, under certain conditions, the
performance of a multichannel phase-shift-keyed/phase-modulated (PSK/
PM) telemetry system can be significantly improved by the use of a new
modulation technique called interplex (References 1-4). Relative to
conventional PSK/PM systems, interplex reduces that portion of the total
average signal power lost as cross modulation, thereby increasing the useful
available power. However, quantitative comparisons of conventional and
interplex modulation systems have fostered some false impressions which
will be discussed below. It is the object of this article to provide some insightinto the optimal design of two- and three-channel deep space PSK/PM
telecommunications systems, and to produce a more realistic measure of the
usefulness of interplex modulation.
143
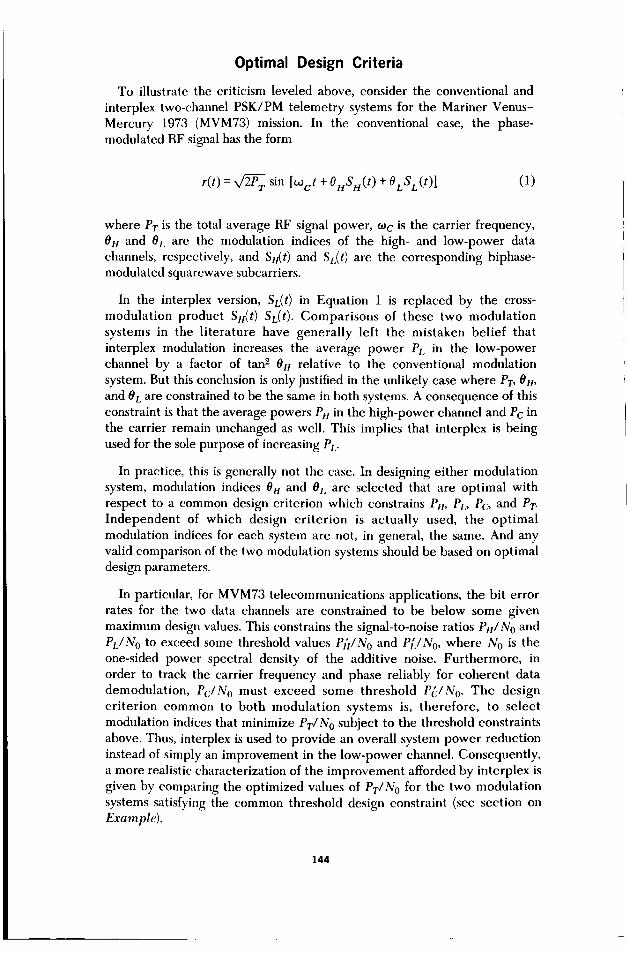
Optimal Design Criteria
To illustrate the criticism leveled above, consider the conventional and
interplex two-channel PSK/PM telemetry systems for the Mariner Venus-
Mercury 1973 (MVM73) mission. In the conventional case, the phase-
modulated RF signal has the form
r(t) = _T sin [6Oct + OHSt4(t ) + OLSL (t)] (1)
where PT is the total average RF signal power, coc is the carrier frequency,
On and OL are the modulation indices of the high- and low-power data
channels, respectively, and So{t) and SL(t) are the corresponding biphase-
modulated squarewave subcarriers.
In the interplex version, SL(t) in Equation 1 is replaced by the cross-
modulation product SO{t) SL(t). Comparisons of these two modulation
systems in the literature have generally left the mistaken belief that
interplex modulation increases the average power PL in the low-power
channel by a factor of tan 2 On relative to the conventional modulation
system. But this conclusion is only justified in the unlikely case where PT, On,
and OL are constrained to be the same in both systems. A consequence of this
constraint is that the average powers Ptt in the high-power channel and Pc in
the carrier remain unchanged as well. This implies that interplex is being
used for the sole purpose of increasing Pt,.
In practice, this is generally not the case. In designing either modulation
system, modulation indices On and Or, are selected that are optimal with
respect to a common design criterion which constrains Pn, PL, Pc, and PT"
Independent of which design criterion is actually used, the optimal
modulation indices for each system are not, in general, the same. And any
valid comparison of the two modulation systems should be based on optimal
design parameters.
In particular, for MVM73 telecommunications applications, the bit errorrates for the two data channels are constrained to be below some given
maximum design values. This constrains the signal-to-noise ratios Pn/N o andPt/No to exceed some threshold values P[t/N o and ['[,/No, where N O is the
one-sided power spectral density of the additive noise. Furthermore, in
order to track the carrier frequency and phase reliably for coherent datademodulation, Pc/N o must exceed some threshold P_/No. The design
criterion common to both modulation systems is, therefore, to select
modulation indices that minimize PT/No subject to the threshold constraints
above. Thus, interplex is used to provide an overall system power reduction
instead of simply an improvement in the low-power channel. Consequently,
a more realistic characterization of the improvement afforded by interplex is
given by comparing the optimized values of PT/N o for the two modulation
systems satisfying the common threshold design constraint (see section onExample).
144

With the inclusion of a ranging channel, the MVM73 telemetry modesbecome three-channel PSK/PM systems. The conventional phase-modulated
RF signal has the form
r(t) = vt-_r sin [tact + OnS_l(t) + Ot SL (t) + OnSn (t)] (2)
where the subscript R denotes the ranging channel. In a partial interplex
scheme, SL(t) in Equation 2 is replaced by Sn(t) SL(t). To realize the full
potential of interplex, however, it may also be advantageous to replace SR(t)
by Sn(t) SR(t), depending on the channel and carrier power requirements.
Again, to provide reliable ranging information, PR/N o must be constrained to
exceed some threshold P[_/No. The design procedure in the three-channel
case is completely analogous to that for the two-channel situation.
Analysis
In this section the optimal power allocations are determined for the two-
and three-channel MVM73 telemetry modes subject to the design criteria
presented above.
Conventional Two-Channel System
The average powers Pn, PL, and Pc can be expressed in terms of PT, On,
and OL, using Equation 1. Eliminating On and OL, it can then be shown that
Pc
eT (3)
The optimization problem is to minimize PT/N o subject to the thresholdconstraints on Pn/No, PL/N o, and Pc�No. From Equation 3, it is evident that
PT/N o is minimized over Pn/No and PL/N o when these two parameters are
set to their threshold values, independent of Pc�No. Under this condition,
PT/N o need only be minimized over Pc�No, subject to a threshold constraint.
Differentiating Equation 3 with respect to Pc�No, with Pn/N o and PL/No setto their threshold values, it is found that PT/N o has an absolute minimum at
N O N O(4)
As indicated in Figure 1, there are two cases to consider, depending on the
relative values of the absolute minimum in Equation 4 and the threshold P_/
N O. The desired value of Pc/No is
145
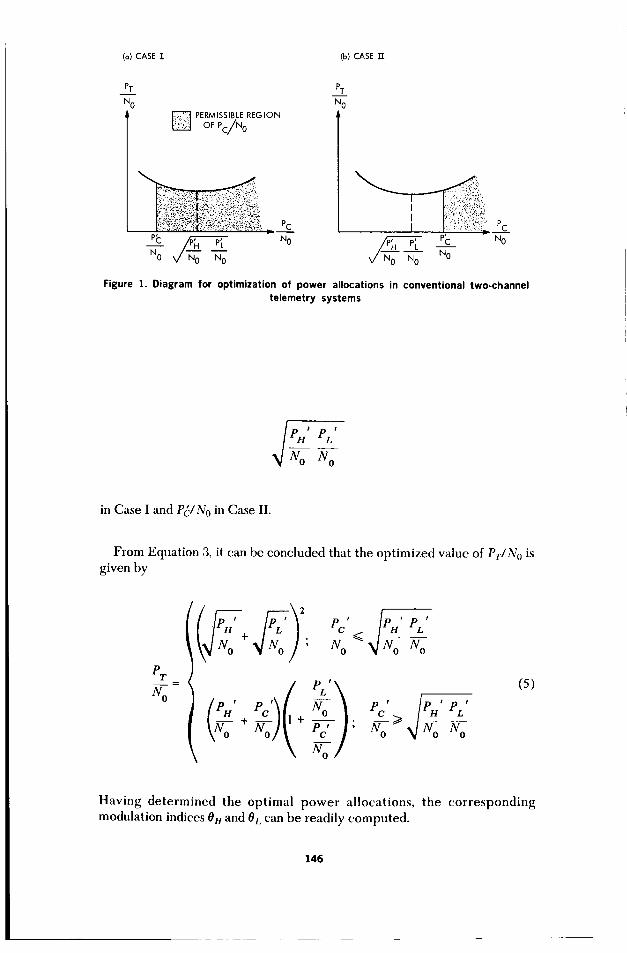
(a) CASE I (b) CASE TT
PT PI"
N N o
_ PERMISSIBLE REGIONOF Pc/N0
_o _P_L_ h Pi. No _ NoNO N O _/ N O N O
PC
NO
Figure 1. Diagram for optimization of power allocations in conventional two-channel
telemetry systems
_ PH' PL'No No
in Case I and P_/N Oin Case II.
From Equation 3, it can be concluded that the optimized value of PT/N o isgiven by
PT
No
_o '+ _ No N O
+No, } ec' e.'e,/
+ ec ]; _o_> NoNo_o
(5)
Having determined the optimal power allocations, the corresponding
modulation indices OH and 01. can be readily computed.
146

Interplex Two.Channel System
In place of Equation 3, the starting point is now
_o
(6)
Comparing Equations 3 and 6, it is evident that the design analysis in thissection mirrors that of the previous section with PH/No and Pc/N o
interchanging their roles. Therefore, by inspection, the optimal system hasPL/No and Pc�No set to their threshold values, and PH/N o set to either P[I/N o
or
N O N O
depending on the relative magnitudes of these last two parameters. Then the
optimum value of PT/No satisfies the relation
PTmE
No
t
+ PH _<_L'Pc '
\'_ Uo _ Uo _o "__ No NO
\u° _o)' _/UoNo
(7)
and again the optimal modulation indices can be computed.
Conventional Three-Channel System
From Equation 2, the relation
e+_ e,,+No Noo
Yo _o
(8)
can be derived. As before, PT/No is minimized subject to threshold
constraints on the remaining signal-to-noise ratios in Equation 8. Therefore,
147
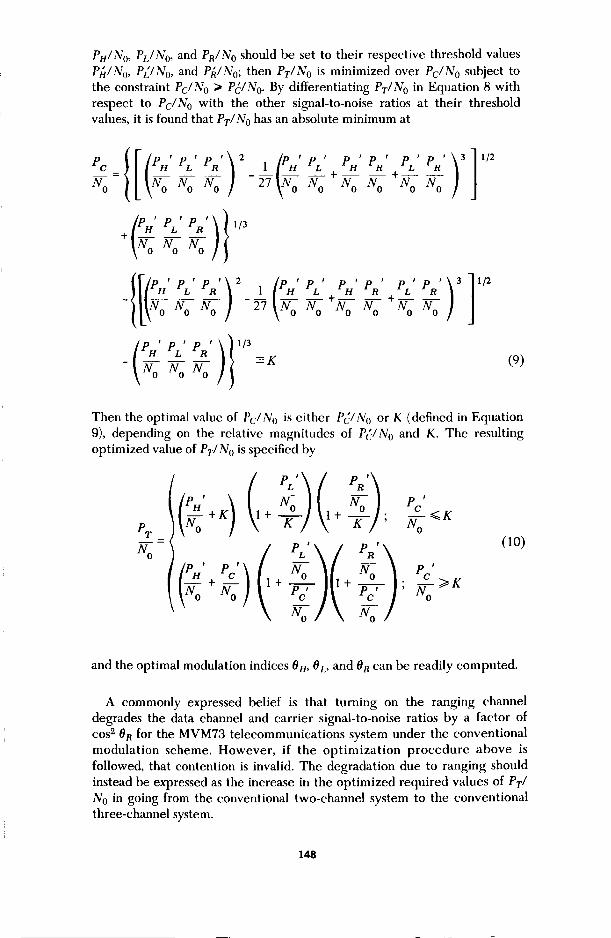
PHINo, PLIN o, and PRIN o should be set to their respective threshold values
P[_/No, P[JNo, and P[_/No; then PT/N o is minimized over Pc�No subject to
the constraint Pc�No • P_/N o. By differentiating PT/N o in Equation 8 with
respect to Pc�No with the other signal-to-noise ratios at their threshold
values, it is found that PT/No has an absolute minimum at
ec e. eL eR e,_,eL e. eR eL e_- _ +-- +
No No No _ No No No No
)t+ e.' eL'e _ ,/3NoNo
5, eL ?. e. eL e. eR+_L ?.No No No No No No No
)lPH PL PR - K- -_-oN °
,/2
(9)
Then the optimal value of Pc�No is either P_/No or K (defined in Equation
9), depending on the relative magnitudes of P:/N o and K. The resulting
optimized value of Pv/No is specified by
e_Wo
_o + +
No/',, K]
P
Pc____<_K
No(10)
_>K
and the optimal modulation indices On, 0L, and On can be readily computed.
A commonly expressed belief is that turning on the ranging channel
degrades the data channel and carrier signal-to-noise ratios by a factor of
cos 2 0R for the MVM73 telecommunications system under the conventional
modulation scheme. However, if the optimization procedure above is
followed, that contention is invalid. The degradation due to ranging should
instead be expressed as the increase in the optimized required values of Pr/
N0 in going from the conventional two-channel system to the conventional
three-channel system.
148

e_N
\NO/
NO "No NO--) V P"- P_'
PH P_'I / NO- NO
_o-No / e__e_
pc __(_ _,_,/_ / No- '%
L NO/
PC _CP[-1/3 (PR1/3 PC PC
-_-0 -\N0 / \N0] -_0 = N"_" _ e._._
C_LI_/__ _o\_0] \No]
Figure 2. Optimal selection of high-power channel and carrier signal-to-noise ratios
for partial interplex three-channel telemetry systems
Partial Interplex Three-Channel System
From Equation 2, with SL(t ) replaced by SH(t)SL(t), it can be shown that
(11)
According to the established design criterion,. PL/N o and PR/N o must be
set to their threshold values, leaving PT/No to be optimized jointly over Pn/
N o and Pc/N o subject to their threshold constraints. Taking partial
derivatives of PT/N o with respect to Pn/No and Pc/N o, it is found that there
are four cases to consider, each with a unique optimal PH/No and Pc�No, as
shown in the diagram of Figure 2. The optimal values of PT/N o, On, eL, and
OR then follow.
Interplex Three.Channel System
The analysis here is similar to that for the conventional three-channelsystem. Using Equation 2 with SL(t) and SR(t) replaced by Sn(t) SL(t) and
Sn(t) SR(t), respectively, it can be shown that
,)(-)= + + + "_--H_o _o_o _o
(12)
149

Therefore, PI/N o, PR/No, and Pc/N o are set to their threshold values, and
PH/N o set to K'if P{I/No exceeds K; or to P[JN o otherwise; K'is equal to K in
Equation 9, with Ph/No replaced by P_/N o. Again, the corresponding
optimal values of PT/N o, 0 u, OL, and OR can be readily calculated.
Example
To illustrate some of the ideas presented in this article, consider this
example. A two-channel PSK/PM telemetry system for MVM73 is to be
designed according to the following nominal specifications. The high-power
channel must have a data rate Rn of 22.05 kbps, a threshold bit error rate of
5 in 102, and is uncoded. The low-power channel must have an information
rate R_ of 2.45 kbps, a threshold bit error rate of 1 in 104, and use a (32,6)
biorthogonal block code. The bit error rate requirements define minimum
signal-to-noise ratios Ptt/RHN o and Pt/RtN o of 1.32 and 5.24 dB, respec-
tively; Rtt and RL can be expressed as 43.43 and 33.89 dB. Therefore, the
threshold values of Pn/N o and Pt/N o are 44.75 and 39.13 dB. To ensure
adequate carrier tracking for MVM73 telecommunications systems, a
threshold value of Pc/N o of 30.80 dB is usually considered in the design.
Using the optimal design procedures developed for the conventional two-
channel and interplex two-channel systems, the optimal conventional and
interplex systems have the power allocations and modulation indices as
listed in Table 1.
Thus, in this example, interplex reduces the nominal required value of PT/
No hy 2.44 dB, although Pu/No and Pt/N o remain unchanged.
Concluding Remarks
This article has derived optimal design concepts for two- and three-
channel PSK/PM telemetry systems for deep space applications. It was also
demonstrated that a valid measure of the system improvement provided by
interplex is the decrease in optimized total RF signal-to-noise ratio PT'/No
Table 1. Optimal power allocations and modulation indices for conventional and
interplex two-channel MVM73 telemetry systems
Conventional lnterplex
PIt�No = 44.75 dB
PL/N o = 39.13 dB
Pc/.Vo = 41.94 dB
PT/N o = 48.41 dB
01! = 54.1 deg,
0 L = 35.9 deg
P/t/N o = 44.75 dB
PL/.VO = 39.13 dB
Pc�No = 30.80 dB
PT/No = 45.97 dB
011 = 78.7 de E
Oi. = 27.6 de E
150

relative to conventional modulation. Using a two-channel telemetry mode
for MVM73 as an example, it was shown that the reduction in PT/N o due to
interplex could exceed 2 dB in some cases.
Acknowledgment
The author wishes to express his appreciation to Dr. S. Butman, JPLTelecommunications Division, for his contributions in the formulation of the
identities in Equations 3, 6, 8, 11, and 12.
References
1. Butman, S., and Timor, U., "Coding and Synchronization Research:
Interplex-An Efficient Two-Channel Telemetry System for Space
Exploration," in Supporting Research and Advanced Development,
Space Programs Summary 37-62, Vol. III, pp. 57-60. Jet Propulsion
Laboratory, Pasadena, Calif., Apr. 30. 1970.
2. Butman, S., and Timor, U., "Coding and Synchronization Research:
Efficient Multichannel Space Telemetry," in Supporting Research
and Advanced Development, Space Programs Summary 37-63, Vol.
III, pp. 34-37. Jet Propulsion Laboratory, Pasadena, Calif., June 30,1970.
3. Timor, U., "Optimum Configurations for PSK/PM Systems," in
Supporting Research and Advanced Development, Space Programs
Summary 37-66, Vol. III, pp. 33-36. Jet Propulsion Laboratory,Pasadena, Calif., Dec. 31, 1970.
4. Butman, S., and Timor, U., "Interplex Modulation," in IPL Quarterly
Technical Review, Vol. 1, No. 1, pp. 97-105. Jet Propulsion Labora-
tory, Pasadena, Calif., Apr. 1971.
151

JPL Quarterly Technical Review Volume 2, Number 1 April 1972
Index: bioengineering, electronic
components and circuits, packagingand cabling
Miniature Biotelemeter GivesWideband Biomedical
J. B. Carraway
Multichannel
Data
Telecommunications Division
A miniature biotelemeter has been developed for sensing and transmitting
multiple channels of biomedical d',ita over a radio link. Doctors and biologists have
expressed need for the ability to monitor vital physiological functions from human
and animal subjects unrestrained by wires. JPL responded under NASA Technology
Applications Office sponsorship in developing an advanced device suitable for a wide
variety of medical and biological research applications. The design of this miniature,
12-cm 3, 10-channel, wideband (5 kHz/channel), pulse amplitude modulation/
frequency modulation biotelemeter takes advantage of modern device technology
(e.g., integrated circuit operational amplifiers, complementary symmetry/metal
oxide semiconductor logic, and solid-state switches) and hybrid packaging tech-
niques. The telemeter is currently being used for monitoring 10 channels of neuron
firings from specific regions of the brain in rats implanted with chronic electrodes.
Multichannel telemetry of electroencephalograms, electrocardiograms, electromyo-
grams, state functions, and dynamic processes such as blood flow and body chemistry
are all possible follow-on applications. Design, fabrication, and testing of an
engineering model biotelemeter are described in this article.
Introduction
The remote measurement of biological parameters from animals and
humans is an important requirement in many fields of biomedical research.Behavioral data from free moving animals, clinical data from unrestrained
patients, and physiological data from implanted sensors are immediate
examples. Phenomena to be measured include pressure, temperature, and
various biopotentials that vary from microvolt neural impulses to myopoten-
tials (muscular signals) in the tens of millivolts.
Collecting data by radiotelemetry offers experimenters several desirablefeatures:
(1) Monitoring is permitted of subjects that are unrestrained by wires.
(2) The subject is isolated from power signal pickup and shock hazard.
152

(3) The telemeter signal sensor/amplifiers can be located on the subject, close to the signal source, giving the best possible signal-to-noise ratio.
(4) Cable flex artifacts and pickup are eliminated, resulting in maximum signal fidelity.
(5) Data from implanted sensors can be transmitted through the skin, eliminating the risk of infection inherent in running wires through the skin.
The goal of designing an advanced biotelemeter that is smaller, lighter, lower power, more sensitive, and of greater information bandwidth than examples in current use was met in the development of the biotelemeter pictured in Figure 1, which achieves the characteristics described in Table 1.
Figure 1. Miniature biotelemeter monitoring 10 channels of neuron firings from chronically implanted rat
153

Table 1. Telemeter specifications
Multichannel
Wideband
High sensitivity
Miniature
Low power
Wireless
10 channels of physiological data
5-kHz data bandwidth per channel
20,000 samples/s per channel
Less than 8-p,V rms noise
referenced to input
12 em 3 (3/4 in.3)
16 g
7 mW
Pulse amplitude modulation/
frequency modulation (PAM/FM)
single carrier radio link uses
VHF frequencies
This device utilizes newly available, commercial monolithic, operational
amplifiers, low-power complementary symmetry/metal oxide semiconduc-
tor medium scale integration (COS/MOS MSI) digital logic, and miniatu-
rized chip components to achieve goals of low power, small size, and
reliability. Packaging of the microeleetronics employs state-of-the-art hybrid
mounting techniques to achieve volumetric efficiency without compromis-
ing manufacturability or ease of maintenance. An example of this fact is that
the integrated circuits (ICs) are individually replaceable.
System Description
A block diagram of the telemetry system is shown in Figure 2. The upper
section of the figure shows the telemeter that is carried by the subject. The
lower section of the figure shows the receiver/demultiplexer equipment that
provides reconstructed output signals for recording or display purposes.
A pulse amplitude modulation/frequency modulation (PAM/FM) teleme-
ter operates on multiple-signal inputs by sequentially sampling each, one at
a time. This is accomplished through use of solid-state switches controlled
by the sequencer, one switch for each input channel. The samples are
combined with reference sync pulses to form a composite wavetrain of
pulses which are amplitude modulated by input data. This waveform, in
turn, frequency modulates a radio frequency (RF) transmitter.
The RF signal is sensed by a receiving antenna and demodulated by an FM
receiver and discriminator to yield a composite PAM waveforin. The sync
pulse is detected from this pulse train and used as reference for the
denmltiplexer. The function of the demultiplexer is to unscramble the
composite waveform and separate sample pulses corresponding to each
input channel. Finally, each sampled waveform is passed through an
154

10 SENSOR_-----IAMPLIFICATIONJ-----J SOLID-STATE
N SWITCHES
: lii i I
J SEQUENCER I
TRANSMITTER
DEMU LTIPLEXERINTERPOLATING_ I 0 OUTPUT
FILTERS _ SIGNALS
SYNC DETECTOR
Figure 2. Telemetry system block diagram
interpolation filter for smoothing, and the data signal corresponding to that
particular input is reproduced.
Telemeter Electrical Design
Input Signal Conditioning
Input signals can come from a variety of different sources. Some typical
examples are surface electrodes contacting the skin through electrolytic
paste [electrocardiograms (ECGs)], needle electrodes inserted directly into
muscles [electromyograms (EMGs)], electrodes which just pierce the surface
of the scalp [electroencephalograms (EEGs)], and microelectrodes less than
20/zm in tip diameter, carefully inserted into specific regions of the brain.
The telemeter provides an operational amplifier for each input to permit
signal conditioning tailored to each signal's characteristics. For instance,
low-level, high-frequency neuron firings are amplified by a gain of 1500 and
bandpassed between 350 Hz and 5 kHz. The low-frequency cutoff is chosen
to filter out ot and /3 wave frequencies (approximately 10 Hz and 30 Hz,
respectively) as well as 60-Hz pickup frequency. The high-frequency cutoff
filters out wideband noise and holds the input below the Nyquist frequency
of the following commutator, while amplifying signals in the 2- to 3-kHz
range (characteristic frequency range of neuron firings). The amplifiers alsoact as isolators between the source and the commutator switch transients.
These switch transients could cause brain stimulation through the chroni-
cally implanted electrodes. Capacitive coupling is used to prevent cell
polarization by amplifier leakage current.
Sampling Switches
Each input signal after amplification and band-limiting is sampled at the
rate of 20,000 samples per second through field effect transistor (FET)
155

switches controlled by the sequencer logic. These are n-channel junction
FETs with low pinch-off voltages (-1 V).
Sequencer
Switch control is provided by the sequencer shown in Figure 3,
mechanized from three COS/MOS chips. The sequencer consists of:
(1) A 12-stage shift register that circulates a single 1 to sequence the
sampling by the FET switches.
(2) A 4-stage shift register used as a ring counter to start the 12-stage
register.
(3) A clock oscillator built from two NOR gates with an RC time
constant added. The oscillator operates at 240 kHz with a stability of0.1%.
Transmitter
The transmitter is a negative-resistance oscillator with an LC ringingcircuit between transistor collectors. The inductive element of this, a 3.18-
cm (1.25-in.) 1diameter circular loop, also acts as the transmitting antenna.The oscillator configuration chosen offers several desirable features:
1 Values in customary units are included in parentheses after values in SI (International System)
units if the customary units were used in the measurements or calculations.
12-STAGESHIFT
REGISTER
INITIALIZATIONLOGIC
CLOCK tt
TO SWITCHES
?
TO SWITCHES TO SWITCHES
? ?
REGISTER _,,_),
I CD4°15 I
?
51 kg_ 15 pF
Figure 3. Telemeter sequencer
RESET
156

(1) The frequency tends to be independent of the bias voltage, since
lower switchover voltage corresponds to lower drive voltage.
(2) Frequency stability is enhanced by operating the active elementseither full-on or full-off.
(3) Power dissipation is minimized since either current or voltage is zeromost of the time. Measured transmitter power dissipation is 1.8 mW.
The transmitter is frequency modulated by the PAM output of the
switches. The modulating signal is applied across a transistor collector-base
junction, causing its capacitance to vary. A high frequency of operation was
required to provide a 1-MHz data bandwidth. The transmitting frequencychosen (185 MHz) lies in the middle of the commercial television spectrum
(channel 8). This permits use of any readily available, inexpensive televisionfront end as a receiver.
Telemeter Mechanical Design
The physical characteristics of a biotelemeter are of major importance. A
device to be used to monitor biological data on unrestrained animals shouldnot affect or inhibit natural behavior. The special environmental conditions
associated with biological research and clinical medicine require creative
packaging.
Efficient soldering, bonding, adhesive, and assembly techniques were used
to achieve a miniature package with high volumetric efficiency, without
sacrificing manufacturability or maintainability. An interesting comparison
of packaging efficiency for space electronics that have flown is given inTable 2.
Miniaturization improves performance by locating amplifiers near critical
points. Also, vulnerability to shock and vibration is reduced because of the
reduction in mass and length of leads.
Packaging Approach
The packaging approach taken was to design a stack assembly of four
miniature printed circuit boards (see Figure 4). The circuit boards each
Table 2. Packaging efficiency of various systems
Number of functioning parts
System per cubic inch
Surveyor electronics
Mariner 4 Cordwood module
Mariner Mars 1969 Data
Acquisition System
JPL miniature biotelemeter
20
37
41
886
157
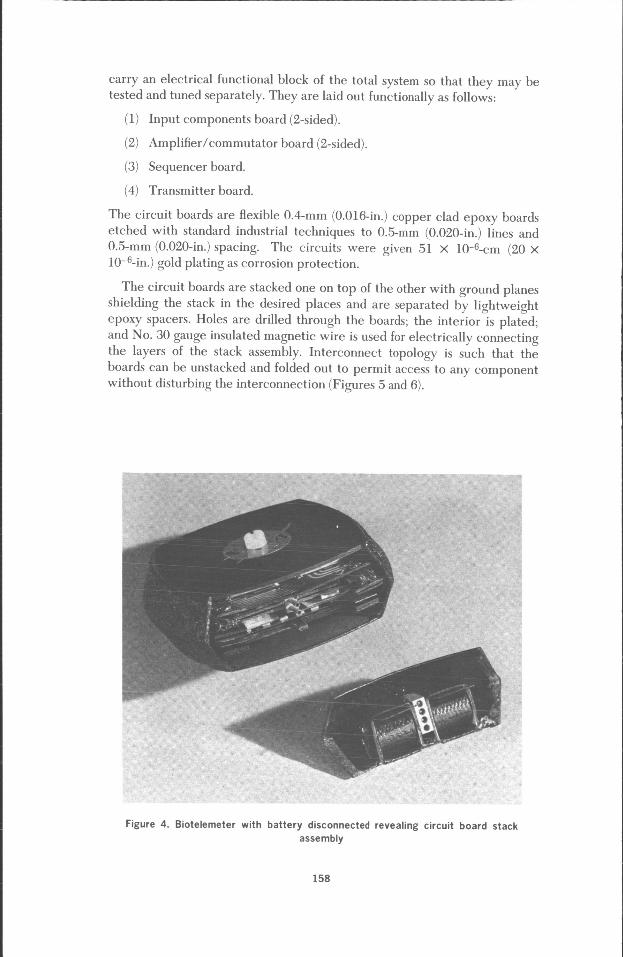

Figure 5. Bottom view of unfolded circuit boards
159

Figure 6. l o p view of unfolded circuit boards
160

Parts Attachment Technique
The operational amplifiers and FET switches are bought in chip form and mounted on separate microminiature ceramic carriers [leadless inverted devices (LIDS)] (Figure 7). This process involves a sequence of operations that includes die bonding the chips to the carrier, thermocompression bonding of wire leads connecting die pads to carrier pads (the die end of the wire is ball-bonded and the carrier end wedge-bonded), and encapsulation. LID assembly was done in the JPL Hybrid Circuits Laboratory in a clean room environment with quality assurance inspection and test support.
Once the LID is encapsulated, it may be soldered directly to the miniature circuit boards. The thick film resistors, monolithic capacitors, and transistors are commercially available, mounted in hermetically sealed solderable carriers. The three COS/MOS digital chips are mounted as flat packs. Thus, all parts are mounted onto the circuit board by simple soldering, requiring only a miniature iron and low-temperature solder paste.
Module Housing
Because the module housing should be lightweight, rigid, low cost, and easily adaptable to different shapes, the housing was fabricated from low- pressure laminated glass-epoxy 0.5 mm (0.020 in.) thick. Each housing was made from a universal construction ring. Segments were cut from the ring in different lengths depending on what final shape was required. The bonded assembly is flexible enough so that the electronic assembly can be inserted, but rigid enough to hold the envelope dimensions accurately.
Figure 7 . Operational amplifier chip mounted on ceramic carrier
161

Battery
The battery is constructed of laminated epoxy cylinders and boxes. The
boxes each hold one cylinder, which in turn holds two small 1.5-V hearing-
aid cells. The epoxy boxes are lined on two sides with gold-plated copper-
clad epoxy laminate to form all contacts. The inherent spring of the epoxylaminate box is sufficient to hold the contacts against the cells. There are two
flexible tabs bonded to the boxes to facilitate removal of the cylinders. Thebattery is mated to the board stack with a miniature connector and a built-in
probe and slot. The slot is in the battery; the probe protrudes from the inputboard edge.
Receiver/Decommutator Design
The receiver/decommutator is pictured, fimctionally, in Figure 8. The
receiver utilizes a commercial television front end. An IF amplifier was
added to the front end to increase sensitivity, and a wideband (5 MHz)
limiter and discriminator were substituted in place of the relatively
narrowband (_+25 kHz) television audio FM detector. The signal-to-noise
ratio in the IF amplifier is high enough so that noise suppression will occur
in both the limiter and the discriminator. By assuring that the incoming
signal is of sufficient amplitude to saturate the limiter circuitry, the output
signal level becomes independent of changes in received signal amplitude.
The discriminator output is the reproduced PAM composite waveform.
The composite PAM waveform is presented to the decommutator for
separation into samples corresponding to each input channel. This separa-
tion is accomplished by a level detector which senses a sync pulse sent every
10 samples. A sequencer circuit in the decommutator (identical to the
telemeter COS/MOS sequencer) is phase-locked to the periodic sync pulse
through the action of a simple phase-locked loop. The loop achieves
decommutator frequency and phase synchronization with the telemeter and
tracks any small shifts in the sampling rate.
The sampling pulses (used to gate the analog switches) are made narrower
than the original telemeter sampling pulses (2.1/xs versus 4.2/zs) to reduce
adjacent channel crosstalk. The sequence of sampled values corresponding to
each input is smoothed by low-passing through an interpolation filter. The
output waveforms of the 10 interpolation filters represent amplifiedreproductions of the 10 telemeter data input signals and are of sufficient
amplitude to drive recording and display equipment.
Testing
A three-stage approach was taken toward telemeter hardware develop-ment and test (see Figure 9). First, an operational breadboard was fabricated
using discrete components. This device interfaced circuit design, checked
system design concepts, and provided system performance test data. Thediscrete breadboard was developed, through test, into the final electrical
configuration design.
162

--J_::_UZ_
z o
7_
u_
-J>-
u_
-L
ttlt
s_
t!j1: I----I _': _u
T
_-ZZD
o_-u.
]
u ,-H,o
I
ZZ
Z
EEg
P_
E
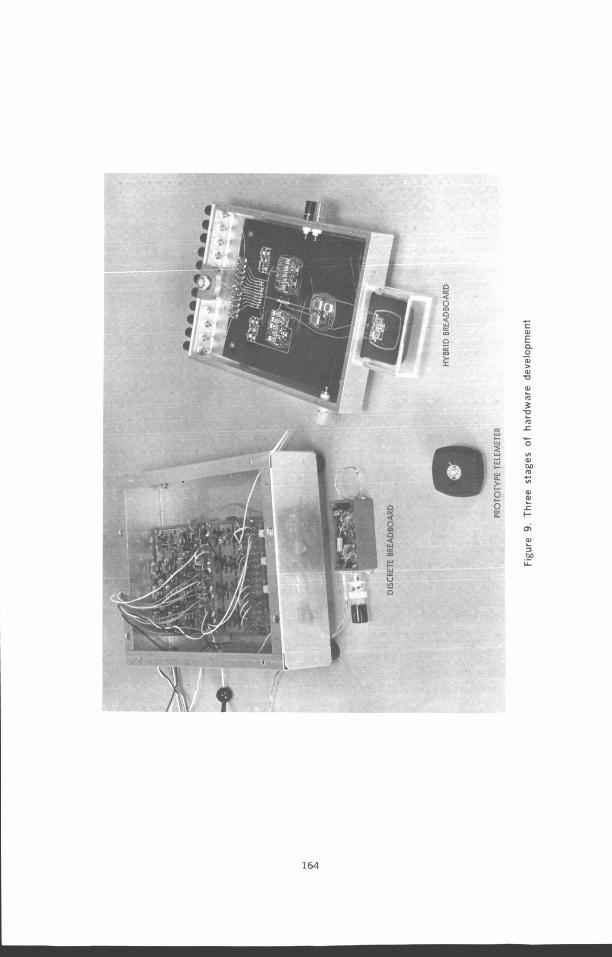

Stage two was the fabrication of a hybrid breadboard using miniaturized chip components mounted on a single board which was a two-dimensional layout of the third-stage printed circuit configuration. The hybrid bread- board tested IC mounting techniques, verified printed circuit layout, and established chip component performance characteristics.
The third and final stage of hardware development and test was the fabrication and test of a prototype miniature telemeter. The hybrid stack assembly was packaged and tested using simulated physiological signals (Figure 10). The approach chosen for evaluating the biotelemeter on a live source was to apply it to a particular user’s requirements: those of Dr. James Olds of the Caltech Psychobiology Department.
Doctor Olds is a neurophysiologist, concerned with the monitoring of neuron waveforms in specific regions of the brain. His research is presently being carried out by using white rats that have been implanted with chronic electrodes in specific regions of their brains. The voltage spikes produced by neurons are wideband, extremely low-level signals coming from a high- impedance source and as such represent worst-case waveforms for a biotelemeter. In addition, environmental and size restrictions imposed by the use of rats for this research are worst case when compared to the use of larger subjects, such as dogs, cats, and humans. It was felt that the successful application of the miniature biotelemeter to this problem represented a realistic test of its limits of performance.
Figure 11 shows telemetered neuron waveforms from a live animal. Two channels of the 10 monitored by telemetry are shown together with signals from a hardwire system for comparison.
0.5 rnsfd iv is ion
Figure 10. Telemetered simulated neuron firings
165
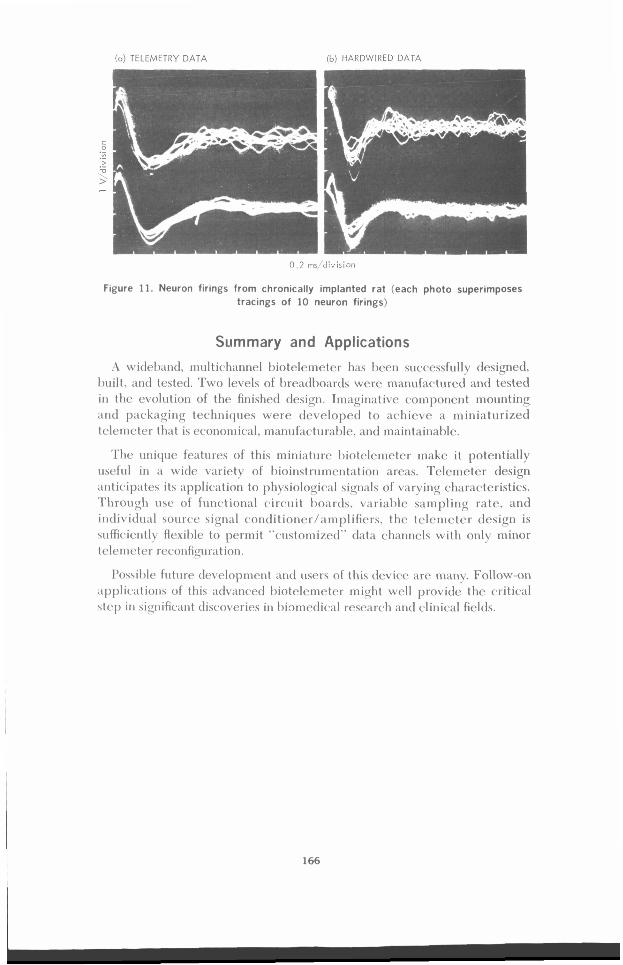
(a) TELEMETRY DATA (b) HARDWIRED DATA
F
/ I . .’ , ~ i ~ , , / ~ ! i v ~ i ; > c m
Figure 11. Neuron firings from chronically implanted rat (each photo superimposes tracings of 10 neuron firings)
Summary and Applications
A witlelxintl, midtichannel I)ioteIemeter lxis Ilcen siiccessfidly designed, h i l t , and tested. Two levels of l)readl)oartls were manufactured and tested in thc evolution of the finished design. h i g i n a t ivc coinponent mounting ;ind pnck;iging t cc h tiiques were devel oped to achieve a m i 11 i ;I t iir ized telemeter that is economical, inanufactiiral~le, and inaintaina1)le.
’The iiiiicluc features of this miniature I)iotelemeter make i t potentially riscfiil i i i a wide varictv of I~ioitistriitnetit~itioti areas. Telemeter design anticipates its application to physiological signals of varying characteristics. 1 hroiigli w e of fiinc.tion;il circ*riit t)oartls. v;iriahlc saiiipliiig rate, and i ndi v i ( h i d soil rce signal (so tidi t i otter / a 111 111 i fie rs, t hc t elc me t c r design is srifficicntlv Hexitdc to pcrmit “c~itstoriiizetl” tlat;i channels with ouly minor
r .
telcmcter rccotifipir 21 t ’ 1011.
1’ossil)lc fiitiire devcloprueiit uiitl users of this tlevicc :ire niaiiy. Follow-on applicatioris of this :idvancetl I)iolelctnetcr might well provitle the critical stcp in significant discoveries in l)i:~rnedical rese;irch and clinical fields.
166

Bibliographyof Current Reporting

Author Index With Abstracts
AKLONIS, J. J.
A01 Viscoelastic Behavior of Polymers Undergoing CrosslinkingReactions
J. Moacanin and J. J. Aklonis (University of Southern
California)
J. Polym. Sci., Pt. C: Polym. Sym., No. 35, pp. 71-76, 1971
For abstract, see Moacanin, J.
ANDERSON, J. D.
A02 Determination of Astrodynamic Constants and a Test of the
General Relativistic Time Delay With S.Band Range and
Doppler Data From Mariners 6 and 7
J. D. Anderson, P. B. Esposito, W. Martin, and
D. O. Muhleman (California Institute of Technology)
Space Research Xl, pp. 105-112, Akademie-Verlag, Berlin,1971
Range and doppler tracking data from Mariners 6 and 7 have beenused to obtain information on the ratio /_-l of the mass of theEarth to the mass of the Moon and on the mass and ephemeris of
Mars. Based on data from five Mariner and two Pioneer spacecraft,
the best value for /z -I is 81.3007 _+0.0005. The best value of theratio of the mass of the sun to the mass of Mars was obtained by
Null from analyses of the Mariner 4 data. This value (3098714 -+ 5)
has been substantiated by the Mariner 6 data which give 3098697
_+ 72. By combining the Mariner 6 range data with optical and
radar data of the planets, it is possible to deduce that the mean
equatorial radius of Mars is 3393.0 -+ 1.7 km.
Range data around the time of solar superior conjunction have
yielded a test of the general relativistic time delay to the level of

_+10%.Additionalpost-conjunctiondatawillsignificantlyimprovetheaccuracyof thistest.
ANNO, G. H.
A03 Nuclear Radiation Sources On-Board Outerplanet Spacecraft
E. L. Noon, G. H. Anno, and M. A. Dore
IEEE Trans. Nucl. Sci., Vol. NS-18, No. 5, pp. 50-57,
October 1971
For abstract, see Noon, E. L.
ANSPAUGH, B. E.
A04 ATS-5 Solar Cell Experiment Results After One Year in
Synchronous Orbit
B. E. Anspaugh
Technical Memorandum 33-522, January 1, 1972
The results of the ATS-5 solar cell experiment after one year in
synchronous orbit are reported. A partial failure in the experimen-tal electronics package has caused a loss of data from half of the 80
experimental solar cells. Procedures for extracting data due to a
partial spacecraft failure are described and discussed. Data from
the remaining 40 solar cells, including 15 mounted on a thinflexible structure, are analyzed. Data are corrected to a solar
intensity of 140 mW/cm 2 and a temperature of 25°C.
After one year in synchronous orbit: (1) cells with 1.52-mm-thick
coverslides did not show a clear-cut advantage over those with
0.15-mm coverslides, (2) cells with solderless grid lines are degrad-
ing at the same rate as are cells with solder-dipped grid lines, (3)
cells not quite completely covered with coverslides suffered a large
power loss in comparison to cells fully covered, (4) no clear-cut
advantage of 10-1_-cm cells over 2-1_-cm cells has yet been ob-
served, (5) cells mounted on the flexible panel with relatively little
backshielding did not degrade any faster than those with substan-
tial backshielding, and (6) the flight data in large part confirms the
adequacy of the ground-based techniques used in the preflight
radiation test program.
169
v
AVIZIENIS, A.
A05 The STAR (Self.Testing and Repairing) Computer: An
Investigation of the Theory and Practice of Fault-Tolerant
Computer Design
A. Avi_ienis, G. C. Gilley, F. P. Mathur, D. A. Rennels,
J. A. Rohr, and D. K. Rubin
IEEE Trans. Computers, Vol. C-20, No. 11, pp. 1312-1321,November 1971
This article presents the results obtained in a continuing investiga-
tion of fault-tolerant computing being conducted at JPL. Initial
studies led to the decision to design and construct an experimental
computer with dynamic (standby) redundancy, including replace-
able subsystems and a program rollback provision to eliminate
transient errors. This system, called the STAR computer, began
operation in 1969. The following aspects of the STAR system are
described: architecture, reliability analysis, software, automatic
maintenance of peripheral systems, and adaptation to serve as the
central computer of an outer-planet spacecraft.
A06 Arithmetic Error Codes: Cost and Effectiveness Studies for
Application in Digital System Design
._4. .A. Avmems
IEEE Trans. Computers, Vol. C-20, No. 11, pp. 1322-1331,November 1971
The application of error-detecting or error-correcting codes indigital computer design requires studies of cost and effectiveness
trade-offs to supplement the knowledge of their theoretical prop-erties. General criteria for cost and effectiveness studies of error
codes are developed, and results are presented for arithmetic errorcodes with the low-cost cheek modulus 2" - 1. Both separate
(residue) and nonseparate (AN) codes are considered. The class of
multiple arithmetic error codes is developed as an extension of
low-cost single codes.
BACK,
B01
L° H°
Viscous Slipstream Flow Downstream of a Centerline MachReflection
L. H. Back and R. F. Cuffel
AIAA J., Vol. 9, No. 10, pp. 2107-2109, October 1971
An important aspect of supersonic flows with shock waves is tile
reflections of these waves at boundaries such as along centerlines,
170

B02
B03
along surfaces, and along free jet extremities. The frst of theseinteractions is considered in this article for a situation where the
reflection from the centerline in an axisymmetric flow is through a
shock stem (Mach reflection). The purpose of this investigation wasto determine the mean structure of the viscous flowfield down-
stream of the intersection from Pitot and static pressure probe
measurements. There was virtually no experimental informationavailable on the structure of such a shear flow and on the size of
the subsonic flow region that is imbedded in the supersonic flow.
Turbulent Boundary Layer and Heat Transfer Measurements
Along a Convergent-Divergent Nozzle
L. H. Back and R. F. Cuffel
Trans. ASME, Ser. C: J. Heat Transf., Vol. 93, No. 4,
pp. 397-407, November 1971
This article presents boundary layer and heat transfer measure-
ments along a cooled, conical nozzle with a convergent and a
divergent half-angle of 10 deg. Semi-empirical analyses are consid-
ered in conjunction with the measurements. The heat transfer is
found to be describable by using the integral form of the energy
equation once the relationship between the Stanton number and
energy thickness Reynolds number has been established from themeasurements. The friction coefficient, however, is not described
accurately along the entire nozzle by the existing formulationsconsidered.
Partially Ionized Gas Flow and Heat Transfer in the
Separation, Reattachment, and Redevelopment Regions
Downstream of an Abrupt Circular Channel Expansion
L. H. Back, P. F. Massier, and F. J. Roschke
Trans. ASME, Ser. C: J. Heat Transf., Vol. 94, No. 1,
pp. 119-127, February 1972
Heat transfer and pressure measurements obtained in the separa-
tion, reattachment, and redevelopment regions along a tube and
nozzle located downstream of an abrupt channel expansion are
presented for a very-high-enthalpy flow of argon. The ionization
energy fraction extended up to 0.6 at the tube inlet just down-stream of the arc heater. Reattaehment resulted from the growth
of an instability in the vortex sheet-like shear layer between the
central jet that discharged into the tube and the reverse flow along
the wall at the lower Reynolds numbers, as indicated by water
flow visualization studies which were found to dynamically model
the high-temperature gas flow. A reasonably good prediction of
the heat transfer in the reattachment region where the highest
171

heat transfer occurred and in the redevelopment region down-
stream can be made by using existing laminar-boundary-layer the-
ory for a partially ionized gas. In the experiments, as much as 90%of the inlet energy was lost by heat transfer to the tube and thenozzle wall.
BAHM,
B04
E. J°
Magnetic Tape Recorder for Long Operating Life in Space
E. J. Bahm and J. K. Hoffman
IEEE Trans. Magnetics, Vol. MAG-7, No. 3, pp. 517-520,
September 1971
Magnetic tape recorders have long been used on satellites and
spacecraft for onboard storage of large quantities of data. Assatellites enter into commercial service, long operating life at high
reliability becomes important. Also, the presently planned long-
duration space flights to the outer planets require long-life tape
recorders. Past satellite tape recorders have achieved a less-than-
satisfactory performance record and the operating life of other
spacecraft tape recorders has been relatively short and unpredict-able. Most failures have resulted from malfunctions of the mechan-
ical tape transport.
Recent advances in electric motors and static memories have
allowed the development of the new tape recorder reported in this
article. This recorder uses a very simple tape transport with few
possible failure modes. It consists of only two brushless dc motors,
two tape guides, and the recording heads. Relatively low tape
tension, wide torque capability, and precise speed control facili-
tate design for mechanical reliability to match that of tape-re-corder electronics.
BAUMAN, A. J.
B05 Isolation and Characterization of Keto.Carotenoids From the
Neutral Extract of Algal Mat Communities of a Desert Soil
A. J. Bauman, H. G. Boettger, A. M. Kelly,
R. E. Cameron, and H. Yokoyama (U.S. Department of
Agriculture)
Eur. J. Biochem., Vol. 22, No. 2, pp. 287-293,
September 1971
The carotenoid pigments of surficial algal mat communities of a
California absolute subtropical desert were isolated and character-
ized principally by means of high resolution mass spectrometry.
172

B06
B07
The pigments were all oxidized keto-types, predominantly can-
thaxanthin, its isomers, and eehinone. The carotenoid pattern sug-gests that the mats represent an old climax ecosystem in which the
algal cells at the time of collection were starved for nitrogen.
Absence of Porphyrins in an Apollo 12 Lunar Surface Sample
J. H. Rho, A. J. Bauman, T. F. Yen (University of Southern
California), and J. Bonner (California Institute of
Technology)
Proceedings of the Second Lunar Science Conference,
Houston, Texas, January 11-14, 1971, Vol. 2,
pp. 1875-1877, The M.I.T. Press, Cambridge, 1971
For abstract, see Rho, J. H.
A Simple Electrostatic Model for the Chromatographic
Behavior of the Primary Dithizonates
A. J. Bauman and J. H. Richards
Separ. Sci., Vol. 6, No. 5, pp. 715-725, October 1971
A simple electrostatic model of the reactive sites of primary metal
dithizonates which fits their published chromatographic behavior isdescribed. Coordination with a metal ion tends to increase the
formal charge on the hindered imino hydrogens in the molecule.This increase is a function of the individual metal's Sanderson
electronegativity. Plots of R m versus electronegativity are rectilin-
ear, have the same form for all systems and adsorbents described,
and place dithizonates of similar molecular geometry on separate
curves. The results of this study suggest that the dithizonates are a
heterogeneous group of compounds which differ in coordination
configuration and geometry.
BAUMERT, L. D.
B08 A Combinatorial Packing Problem
L. D. Baumert
SIAM/AMS (Society for Industrial and Applied Mathematics/
American Mathematical Society) Book Series, Vol. IV,
pp. 97-108, 1970
This article is concerned with the efficient packing of squares of
side two into the p x p torus. Of more general interest is the
analogous n-dimensional problem: that of packing n-dimensionaltwo-cubes efficiently into a p x p x... x p torus. Of course, when
p is even, the problem is trivial. (Then, the simplest possible
173

alignment of the cubes completely fills the torus.) Thus, p here is
restricted to be an odd integer. Further, it should be .pointed out
that the primary interest here is in determining the maximum
number [=o_ (Cp")] of cubes which can be packed into the torusand of only secondary concern are the actual structural details of
any particular maximal packing.
BECK, A. J.
B09 Jupiter Trapped Radiation Belts
A. J. Beck
JPL Quarterly Technical Review, Vol. 1, No. 4, pp. 78-88,
January 1972
Previously developed models for trapped electron radiation belts
and trapped proton radiation belts in the Jovian magnetosphere
are described. The spatial distribution of flux and the L-shell
dependence of the characteristic energy are displayed for bothmodels. Based on these models, the fluence accumulated by a
Jupiter flyby spacecraft is given in terms of the equivalent 3-MeV
fluence for electrons and the equivalent 20-MeV proton fluence for
protons. Finally, some impacts of these fluences on outer-planetmissions are described.
BEER,
BIO
R.
Astronomical Infrared Spectroscopy With a Connes-TypeInterferometer: I. Instrumental
R. Beer, R. H. Norton, and C. H. Seaman
Rev. Sci. Instr., Vol. 42, No. 10, pp. 1393-1403,October 1971
Shortly after P. and J. Connes had completed the first model oftheir now well-known Fourier spectrometer, JPL undertook the
construction of a similar instrument. The JPL instrument differs
significantly from the original. In this article, the construction and
operation of the JPL instrument are discussed in an astronomical
context, and a sample is given of the type of spectra obtained with
the system.
174

BEJCZY,A. K.
Bll AnalyticalMethodsfor PerformanceEvaluationof Nonlinearfilters
A. K. Bejczy and R. Sridhar (University of California, Los
Angeles)
J. Math. Anal. AppI., Vol. 36, No. 3, pp. 477-505,December 1971
The investigation described in this article is addressed to the
question of developing analytical methods for evaluating the per-
formance of suboptimal nonlinear filters such that the filters' struc-
ture is fixed by postulating a simple form for it. The filtering
problem is considered in the continuous time domain. The postu-
lated simple suboptimal nonlinear filter structure closely parallels
the structure of the Kalman-Bucy optimal linear filter algorithm.
Two filter performance evaluation methods are developed based
on the Kolmogorov equations for the transition density of Markov
processes. The expansions in the approximations for the nonlinear
system and observation functions are, in effect, carried out up tosecond-order terms in both methods. The difference between the
methods is the sequencing of expansions and averaging. The de-
scription of the filters' performance is sought in terms of second-
order statistics (mean and covariance) in both methods. The equa-
tions for the mean and covariance of the filtering error resulting
from the two methods are different. The resulting equations of
both methods have, however, an important common feature: They
are deterministic differential equations describing the time evolu-
tion of the mean and covariance of the filtering error process for
the fixed filter structure in terms of the known (postulated) filter
gain and system and ffoise parameters. The developed determinis-tic differential equations can also be utilized to determine appro-
priate (deterministic) filter gains for the fixed structure nonlinear
filter. The salient features of the new performance evaluation (and
filter gain construction) methods are illustrated with two examples.
BILLINGSLEY, F. C.
B12 Apollo 12 Multispectral Photography Experiment
A. F. H. Goetz, F. C. Billingsley, J. W. Head (Bellcomm,
Inc.), T. B. McCord (Massachusetts Institute of Technology),
and E. Yost (Long Island University)
175

Proceedings of the Second Lunar Science Conference,
Houston, Texas, January 11-14, 1971, Vol. 3,
pp. 2301-2310, The M.I.T. Press, 1971
For abstract, see Goetz, A. F. H.
BLAIR,
B13
e. M,
Discoloration and Lunar Dust Contamination of Surveyor IIISurfaces
W. F. Carroll and P. M. Blair (Hughes Aircraft Corporation)
Proceedings of the Second Lunar Science Conference,
Houston, Texas, January 11-14, 1971, Vol. 3,
pp. 2735-2742, The M.I.T. Press, Cambridge, 1971
For abstract, see Carroll, W. F.
BOETTGER, H. G.
B14 Isolation and Characterization of Keto-Carotenoids From the
Neutral Extract of Algal Mat Communities of a Desert Soil
A. J. Bauman, H. G. Boettger, A. M. Kelly,
R. E. Cameron, and H. Yokoyama (U.S. Department ofAgriculture)
Eur. J. Biochem., Vol. 22, No. 2, pp. 287-293,September 1971
For abstract, see Bauman, A. J.
BONNER, J.
B15 Absence of Porphyrins in an Apollo 12 Lunar Surface Sample
J. H. Rho, A. J. Bauman, T. F. Yen (University of SouthernCalifornia), and J. Bonner (California Institute of
Technology)
Proceedings of the Second Lunar Science Conference,
Houston, Texas, January 11-14, 1971, Vol. 2,
pp. 1875-1877, The M.I.T. Press, Cambridge, 1971
For abstract, see Rho, J. H.
176

BOWERS, M. T.
B16 Dependence of the Rates on Ion Kinetic Energy for theReactions D2+ + D2 and HD + + HD
W. T. Huntress, Jr., D. D. Elleman, and
M. T. Bowers (University of California, Santa Barbara)
J. Chem. Phys., Vol. 55, No. 11, pp. 5413-5414,
December 1, 1971
For abstract, see Huntress, W. T., Jr.
BUECHLER, G.
B17 A Surface-Layer Representation of the Lunar Gravitational Field
L. Wong (Aerospace Corporation), G. Buechler (Aerospace
Corporation), W. Downs (Aerospace Corporation),
W. L. Sjogren, P. M. Muller, and P. Gottlieb
J. Geophys. Res., Vol. 76, No. 26, pp. 6220-6236,
September 10, 1971
For abstract, see Wong, L.
CAMERON, R. E.
C01 Isolation and Characterization of Keto-Carotenoids From the
Neutral Extract of Algal Mat Communities of a Desert Soil
A. J. Bauman, H. G. Boettger, A. M. Kelly,
R. E. Cameron, and H. Yokoyama (U.S. Department of
Agriculture)
Eur. J. Biochem., Vol. 22, No. 2, pp. 287-293,
September 1971
For abstract, see Bauman, A. J.
CANNON, W. A.
C02 Fixation of Virgin Lunar Surface Soil
J. M. Conley, R. Frazer, and W. A. Cannon
Technical Memorandum 33-521, February 1, 1972
For abstract, see Conley, J. M.
C03 Physical Adsorption of Rare Gas on Terrigenous Sediments
F. P. Fanale and W. A. Cannon
177
Earth Planet. Sci. Lett., Vol. 11, No. 5, pp. 362-368,August 1971
For abstract, see Fanale, F. P.
CARON, L. G.
C04 Bernal Model: A Simple Equilibrium Theory of Close.PackedLiquids
L. G. Caron
J. Chem. Phys., Vol. 55, No. 11, pp. 5227-5232,December 1, 1971
The Bernal model of a hard-sphere liquid is used in conjunction
with an extension of the cell method to predict the behavior of
liquid argon near melting. The entropy of disorder associated with
the Bernal state is deduced. The model is found to be applicable toliquid metals.
C05 Electron Correlations at Large Densities
L. G. Caron
Phys. Rev., Pt. B: Solid State, Vol. 5, No. 1, pp. 238-240,
January 1, 1972
In two papers, Singwi, et al., presented a self-consistent scheme to
calculate the dielectric function of an electron gas at metallic
densities. An improvement made to obtain results that better
satisfied the compressibility sum rules was presented in the second
paper; this improvement, however, led to a great increase in
computational time. In an attempt to reduce this time and yet
retain the improved features of the dielectric function, an approxi-mate scheme for numerical calculation of the dielectric function of
an electron gas in the theory of Singwi, et al., was formulated. This
scheme and the numerical results of its application are presentedin this article.
CARROLL, W. F.
C06 Discoloration and Lunar Dust Contamination of Surveyor IIISurfaces
W. F. Carroll and P. M. Blair (Hughes Aircraft Corporation)
178

Proceedings of the Second Lunar Science Conference,Houston, Texas, January 11-14, 1971, Vol. 3,
pp. 2735-2742, The M.I.T. Press, Cambridge, 1971
As discussed in this article, the discoloration of Surveyor 3 surfaces
observed by the Apollo 12 astronauts during their examination of
the spacecraft on the Moon and clearly evident on the returned
hardware has been analyzed and shown to be due to expected
radiation darkening and a heavier-than-expected layer of lunarfines. Lunar surface material disturbed by the Apollo 12 lunar
module (LM) landing 155 m away reached the Surveyor spacecraft
and produced significant changes in its surfaces.
C07
CHADWICK, H. D.
A Markov Chain Technique for Determining the Acquisition
Behavior of a Digital Tracking Loop
H. D. Chadwick
JPL Quarterly Technical Review, Vol. 1, No. 4, pp. 49-57,
January 1972
Tracking loops have two characteristic modes of operation: acqui-sition and steady-state tracking. The steady-state behavior of such
nonlinear tracking loops as the phase-locked loop has been the
subject of considerable analysis. The acquisition behavior of a loop,the transition period between turning the loop on and the steady
state, has resisted analysis for all but the simplest configurations.
An iterative procedure is presented for determining the acquisition
behavior of discrete or digital implementations of the tracking
loop. The technique is based on the theory of Markov chains and
provides the cumulative probability of acquisition in the loop as afunction of time in the presence of noise and a given set of initial
condition probabilities. A digital second-order tracking loop to be
used in the Viking command receiver for continuous tracking ofthe command subcarrier phase has been analyzed using this tech-
nique, and the results agree closely with experimental data. Possi-ble extensions of the technique include the analysis of continuous
loops using discrete approximations.
CO8 The Error Probability of a Wide-Band FSK Receiver in the
Presence of Multipath Fading
H. D. Chadwick
IEEE Trans. Commun. Technol., Vol. COM-19, No. 5,
pp. 699-707, October 1971
Calculations are made for the probability of error of a wide-band
FSK (frequency-shift-keyed) receiver of the type used in space
179

telemetry when multipath reflections off the planetary surface
cause signal fading. The error probability is found for both low and
high fading bandwidths and for small or large reflected path delays.
CHAN,
C09
ClO
S. I.
Ferromagnetic Resonance of Lunar Samples
F.-D. Tsay (California Institute of Technology),
S. I. Chan (California Institute of Technology), andS. L. Manatt
Geochim. Cosmochim. Acta, Vol. 35, No. 9, pp. 865-875,
September 1971
For abstract, see Tsay, F.-D.
Magnetic Resonance Studies of Apollo 11 and Apollo 12Samples
F.-D. Tsay (California Institute of Technology),
S. I. Chan (California Institute of Technology), andS. L. Manatt
Proceedings of the Second Lunar Science Conference,
Houston, Texas, January 11-14, 1971, Vol. 3,
pp. 2515-2528, The M.I.T. Press, Cambridge, 1971
For abstract, see Tsay, F.-D.
CHAPMAN, A. K.
Cll DSN Progress Report for November-December 1971: ApolloBistatic Radar Investigation
A. K. Chapman
Technical Report 32-1526, Vol. VII, pp. 190-194,February 15, 1972
The first bistatic Moon radar experiments were conducted by the
Stanford Center for Radar Astronomy, using Lunar Orbiter space-
craft. Apollo not only provides stronger signals, but provides for
conduct of the experiment on two frequency bands. The JPL 64-
m-diameter tracking antenna at Goldstone is uniquely suited to the
reception of the S-band signals involved, and has been used on
both Apollo 14 and Apollo 15 for the bistatic investigation.
18o
CHASE,
C12
S.C.,JR.
Mariner 1969 Infrared Radiometer Results: Temperatures and
Thermal Properties of the Martian Surface
G. Neugebauer (California Institute of Technology),
G. M_inch (California Institute of Technology),
H. Kieffer (University of California, Los Angeles),
S. C. Chase, Jr. (Santa Barbara Research Center), andE. Miner
Astron. J., Vol. 76, No. 8, pp. 719-749, October 1971
For abstract, see Neugebauer, G.
CHELSON, P. O.
C13 Failure-Rate Computations Based on Mariner Mars 1969
Spacecraft Data
P. O. Chelson
Technical Report 32-1544, December 1, 1971
This report describes an analysis of in-flight spacecraft part hours
and failure data from the Mariner Mars 1969 Project. It contains
failure rates computed from these data for all electronic and
electromagnetic parts on the Mariner 6 and 7 spacecraft. Also
included are failure rates based on combining flight data fromMariner 4-7.
CHEN,
C14
C. J.
Raman Scattering Cross Section for N204
C. J. Chen and F. Wu (State University of New York,
Buffalo)
Appl. Phys. Lett., Vol. 19, No. 11, pp. 452-453,
December 1, 1971
As reported in this article, the Raman scattering cross section forN204 at a Raman shift of 1360 cm -I has been measured by using a
Q-switched ruby laser as an excitation source. The cross section forN2 at a Raman shift of 2330 cm -l has also been measured. The
latter measurement is compared with a previous measurement
reported elsewhere, and the result is normalized to the
wavelength.
181
CHEUNG, C. S.
C15 Calculations of Geometries of Organic Molecules Using theCNDO/2 Method: I. Empirical Correlations Between Observed
and Calculated Bond Lengths in Simple Acyclics, Strained
Cycloalkenes and Some Polycyclic Molecules
C. S. Cheung, M. A. Cooper, and S. L. Manatt
Tetrahedron, Vol. 27, No. _,, pp. 689-700, February 1971
In this article, it is shown that calculations of C-C and C-H bond
lengths in hydrocarbons using the CNDO/2 send-empirical MOmethod exhibit systematic deviations from the observed values. An
empirical correlation relating the observed and calculated bond
lengths with the number of substituents attached to the bond may
be devised. This correlation is capable of providing theoretical
bond lengths within 0.008 A of the experimental for a wide rangeof simple acyclic molecules. Furthermore, calculations of molecu-
lar geometries for some strained cycloalkenes and also some larger
molecules, e.g., naphthalene, biphenylene, and azulene, are simi-
larly found to be in good agreement with experiment.
C16 Calculations of Geometries of Organic Molecules Using theCNDO/2 Molecular Orbital Method: II. Structural Predictions
for the Benzocycloalkenes, and a Theoretical Rationalization
of Their Proton-Proton Spin-Spin Coupling Constants
C. S. Cheung, M. A. Cooper, and S. L. Manatt
Tetrahedron, Vol. 27, No. 4, pp. 701-709, February 1971
In this article, the CNDO/2 semiempirical MO method is applied
to calculations of the geometries of some strained benzocycloalke-
nes. The strain-induced bond-length distortions predicted are indisagreement with earlier work, although the lack of accurate
experimental data precludes a decision as to the validity of eithertreatment. The CNDO/2 wavefunctions are examined for features
which may throw light on previous qualitative descriptions which
have been proposed to account for recent experimental data on
this series, such as nuclear-magnetic-resonance and electron-spin-
resonance spectra, and rates of electrophilic substitution. In partic-ular, trends in the proton-proton spin-spin coupling constants in
the benzocycloalkenes and also benzene, naphthalene, and bi-
pheuylene are well-accounted-for by the CNDO/2 wavefunctions.
182

CHITTY, W. H.
C17 Development and Testing of the Flight Command Subsystemfor the Mariner Mars 1971 Spacecraft
W. H. Chitty
Technical Memorandum 33-531, March 15, 1972
The flight command subsystem for the Mariner Mars 1971 space-
craft is of the same basic design and construction as that for the
Mariner Mars 1969 spacecraft, except for its expanded capability.
Its primary purpose is to provide remote control for the space-
craft. This memorandum briefly describes the design changes,
fabrication, and significant problems associated with the develop-
ment of the Mariner Mars 1971 flight command subsystem.
CLEMENTS, P. A.
C18 DSN Progress -Report for November-December 1971: Electrical
Length Stability of Coaxial Cable in a Field Environment
P. A. Clements
Technical Report 32-1526, Vol. VII, pp. 97-100,
February 15, 1972
Various environmental conditions will cause a coaxial cable to
change electrical length. In the past, the effects of these changes
were not important; however, recent requirements for future DSS
accuracies have forced their consideration. Preliminary studies on
the effects due to temperature changes and mechanical stress have
been made. Results to date indicate some problem areas.
CONEL, J. E.
C19 Luminescence and Reflectance of Apollo 12 Samples
D. B. Nash and J. E. Conel
Proceedings of the Second Lunar Science Conference,
Houston, Texas, January 11-14, 1971, Vol. 3,
pp. 2235-2244, The M.I.T. Press, Cambridge, 1971
For abstract, see Nash, D. B.
C20 Objectives and Requirements of Unmanned Rover Explorationof the Moon
D. B. Nash, J. E. Conel, and F. P. Fanale
183

The Moon, Vol. 3, No. 2, pp. 221-230, August 1971
For abstract, see Nash, D. B.
CONLEY, J. M.
C21 Fixation of Virgin Lunar Surface Soil
J. M. Conley, R. Frazer, and W. A. Cannon
Technical Memorandum 33-521, February 1, 1972
Two systems have been shown to be suitable for fixing loose
particulate soils with a polymer film without visually detectabledisturbance of the soil particle spatial relationships. A two-compo-
nent system uses a gas monomer condensible at the soil tempera-ture and a gas-phase catalyst acting to polymerize the monomer. A
one-component system uses a monomer which polymerizes sponta-
neously on and within the top few millimeters of the soil.
The two-component system may result in a simpler apparatus, but
has been demonstrated to operate over a narrower temperature
range, i.e., approximately -40 to -10°C. Other two-component
polymer systems have been identified which may operate at soil
temperatures as high as + 100°C, but still over relatively narrow
temperature ranges of approximately 30°C. The one-component
system has been demonstrated to operate successfully with initial
soil temperatures from -70°C or lower to + 150°C.
CONNES, J.
C22 Fourier Spectroscopy With a One.Million-Point Transformation
(Translation From the Original Published in the Nouvelle
Revue d'Optique Appliqu_e, Vol. 1, pp. 3-22, 1970)
J. Connes (National Center for Scientific Research, Orsay,
France), H. Delouis (National Center for Scientific Research,
Orsay, France), P. Connes (National Center for ScientificResearch, Orsay, France), G. Guelachvili (National Center
for Scientific Research, Orsay, France), J.-P. Maillard
(National Center for Scientific Research, Orsay, France),and G. Michel (National Center for Scientific Research,
Orsay, France)
Technical Memorandum 33-525, March 15, 1972
A new type of interferometer for use in Fourier spectroscopy hasbeen devised at the Aim6 Cotton Laboratory of the National
Center for Scientific Research (CNRS), Orsay, France. With this
interferometer and with computational techniques developed by
the Regional Interdisciplinary Center for Electronic Calculation
184
(CIRCE) at the CNRS, interferograms comprising as many as 106
samples can now be transformed. The techniques are described,
and examples of spectra of thorium and holmium, derived from
106-point interferograms, are presented in this paper, which was
translated by R. Beer of JPL.
CONNES, P.
C23 Fourier Spectroscopy With a One-Million-Point Transformation
(Translation From the Original Published in the Nouvelle
Revue d'Optique Appliqu_e, Vol. 1, pp. 3-22, 1970)
J. Connes (National Center for Scientific Research, Orsay,
France), H. Delouis (National Center for Scientific Research,
Orsay, France), P. Connes (National Center for Scientific
Research, Orsay, France), G. Guelachvili (National Center
for Scientific Research, Orsay, France), J.-P. Maillard
(National Center for Scientific Research, Orsay, France),
and G. Michel (National Center for Scientific Research,
Orsay, France)
Technical Memorandum 33-525, March 15, 1972
For abstract, see Connes, J.
COOPER, M. A.
C24 Calculations of Geometries of Organic Molecules Using theCNDO/2 Method: I. Empirical Correlations Between Observed
and Calculated Bond Lengths in Simple Acyclics, Strained
Cycloalkenes and Some Polycyclic Molecules
C. S. Cheung, M. A. Cooper, and S. L. Manatt
Tetrahedron, Vol. 27, No. 4, pp. 689-700, February 1971
For abstract, see Cheung, C. S.
C25 Calculations of Geometries of Organic Molecules Using theCNDO/2 Molecular Orbital Method: I1. Structural Predictions
for the Benzocycloalkenes, and a Theoretical Rationalization
of Their Proton-Proton Spin-Spin Coupling Constants
C. S. Cheung, M. A. Cooper, and S. L. Manatt
Tetrahedron, Vol. 27, No. 4, pp. 701-709, February 1971
For abstract, see Cheung, C. S.
185

CUFFEL,R. F.
C26 ViscousSlipstreamFlowDownstreamof a CenterlineMachReflection
L. H. Back and R. F. Cuffel
AIAA J., Vol. 9, No. 10, pp. 2107-2109, October 1971
For abstract, see Back, L. H.
C27 Turbulent Boundary Layer and Heat Transfer Measurements
Along a Convergent-Divergent Nozzle
L. H. Back and R. F. Cuffel
Trans. ASME, Ser. C: J. Heat Transf., Vol. 93, No. 4,
pp. 397-407, November 1971
For abstract, see Back, L. H.
DALLAS, S. S.
D01 DSN Progress Report for November-December 1971: A
Comparison of Cowell's Method and a Variation-of-Parameters
Method for the Computation of Precision Satellite Orbits:Addendum 1
S. S. Dallas and E. A. Rinderle
Technical Report 32-1526, Vol. VII, pp. 32-36,
February 15, 1972
Additional test cases using a precision special perturbations pro-
gram employing either Cowell's method or a variation-of-parame-ters method to compute an elliptical orbit are analyzed to deter-mine which method is more efficient. The results obtained indicate
that the variation-of-parameters method with a predict-only inte-
grator and Cowell's method with a predict-partial-correct integra-
tor are equally efficient and both are significantly more efficientthan Cowell's method with a predict-correct integrator. Either of
these two methods for computing precision satellite orbits offers
the potential for reducing the total costs of computations during
orbit design and computer execution time during real-time mission
operations for future orbiter projects.
DAVIS, D. P.
D02 Initiation System for Low Thrust Motor Igniter
L. D. Strand, D. P. Davis, and J. I. Shafer
186

Technical Memorandum 33-520, January 1, 1972
For abstract, see Strand, L. D.
DeGENNARO, L. I.
DO3 DSN Progress Report for November-December 1971:
Occultation Recording Assembly Implementation
L. I. DeGennaro
Technical Report 32-1526, Vol. VII, pp. 175-181,
February 15, 1972
The Mariner Mars 1971 occultation experiment, in order to expe-
dite data reduction and analysis, required real-time digital tape
recordings of the Mars Deep Space Station (DSS) open loop
receiver signal and nonreal-time digital tape conversion of the
analog tapes (of the open loop receivers) produced by the Woo-
mera DSS (Australia) and the Cebreros DSS (Spain). This article
presents a description of the implementation of the two occulta-
tion recording assemblies, which were used to satisfy these
requirements.
DELOUIS, H.
DO4 Fourier Spectroscopy With a One.Million-Point Transformation
(Translation From the Original Published in the Nouvelle
Revue d'Optique Appliqu_e, Vol. 1, pp. 3-22, 1970)
J. Connes (National Center for Scientific Research, Orsay,France), H. Delouis (National Center for Scientific Research,
Orsay, France), P. Connes (National Center for Scientific
Research, Orsay, France), G. Guelachvili (National Center
for Scientific Research, Orsay, France), J.-P. Maillard
(National Center for Scientific Research, Orsay, France),and G. Michel (National Center for Scientific Research,
Orsay, France)
Technical Memorandum 33-525, March 15, 1972
For abstract, see Connes, J.
DeMORE, W. B.
DO5 Photolysis of CO x at 1849
W. B. DeMore and M. M. Mosesman
187
J. Atmos. Sci., Vol. 28, No. 6, pp. 842-846,
September 1971
Photolysis of CO2 at 1849 A (Hg lamp) has been studied at
pressures in the range 65-800 psi at room temperature. The
primary dissociation quantum yield is 1.0, as determined by experi-
ments in which the atomic oxygen product was scavenged in theform of 03. At high pressures (-400 psi), 03 photolysis at 2537 )k
gave appreciable CO 3 formation by the reaction
O(1D) + CO 2 + M---," CO 3 + M
as evidenced by loss of 03 . To observe quantitative 03 production,
it was therefore necessary to filter out the 2537-A light. The
products CO and 02 could not be recovered in 100% yield in most
of the experiments. No satisfactory mechanism can be given for
the product losses, although a number of possibilities can be ruled
out. In particular, CO3 did not oxidize CO to CO2. The CO yield
could be increased to nearly 100% by coating the cell walls with
KeI-F grease, whereas the Oz yield simultaneously dropped to
zero. The quantum yield results at 1849 A suggest that CO2
dissociates at all wavelengths where absorption is appreciable.
DEVLIN, J. D.
!)06 Dry-Heat Resistance of Bacillus Subtilis Var. Niger Spores onMated Surfaces
G. J. Simko, J. D. Devlin, and M. D. Wardle
Appl. Microbiol., Vol. 22, No. 4, pp. 491-495, October 1971
For abstract, see Simko, G. J.
DORE, M. A.
DO7 Nuclear Radiation Sources On.Board Outerplanet Spacecraft
E. L. Noon, G. H. Anno, and M. A. Dore
IEEE Trans. Nucl. Sci., Vol. NS-18, No. 5, pp. 50-57,October 1971
For abstract, see Noon, E. L.
188

DOWNS, G. S.
DO8 Mars Radar Observations, a Preliminary Report
G. S. Downs, R. M. Goldstein, R. R. Green, andG. A. Morris
Science, Vol. 174, No. 4016, pp. 1324-1327,December 24, 1971
Radar observations of narrow belt of the surface of Mars, centered
at 16° south latitude, show a very rugged terrain, with elevation
differences greater than 13 km from peak to valley. For nearbypoints, the relative altitude is measured to 40 m at best; the
precision is worse for points at different latitudes, or widely sepa-rated in longitude, because of orbital uncertainties. Some of the
larger craters have been resolved, and their depth and, in some
cases, the height of the raised rim have been measured. Where
high-resolution photographs are available, the correlation isexcellent.
DOWNS, W.
DO9 A Surface-Layer Representation of the Lunar Gravitational Field
L. Wong (Aerospace Corporation), G. Buechler (Aerospace
Corporation), W. Downs (Aerospace Corporation),
W. L. Sjogren, P. M. Muller, and P. Gottlieb
J. Geophys. Res., Vol. 76, No. 26, pp. 6220-6236,
September 10, 1971
For abstract, see Wong, L.
DUXBURY, T. C.
DIO In-Flight Calibration of an Interplanetary NavigationInstrument
T. C. Duxbury and H. Ohtakay
J. Spacecraft Rockets, Vol. 8, No. 10, pp. 1038-1042,October 1971
This article presents the results of an analytical investigation that
demonstrates the feasibility of geometrically calibrating a naviga-
tion instrument during interplanetary flight to arc-see accuracy.The instrument, similar to a television camera, would view se-
lected natural satellites and reference stars simultaneously for
navigating to the outer planets. An 11 × 11 reseau grid, etchedonto the target raster of a vidicon tube, would be used to remove
electromagnetic distortion from the satellite and reference star
189

data to less than 1.2 arc-sec /lo-) in each and every data frame,
independent of reseau data from any other data frame. Taking
advantage of expected optical distortion stability, 50 star images
obtained from many data frames would be used to determine
optical distortion to less than 4.3 arc-sec (lo'). Therefore, the use
of the reseau grid and star images could enable the navigation
measurements to be geometrically calibrated to an accuracy of 5arc-sec (lo-).
DYER, P.
Dll A Computational Algorithm for Sequential Estimation
R. J. Hanson and P. Dyer (Imperial Chemical Industries
Ltd.)
Comput. J., Vol. 14, No. 3, pp. 285-290, August 1971
For abstract, see Hanson, R. J.
EASTON, R. A.
EO1 Centralized Data Handling for Grand Tour Missions
R. A. Easton
Advan. Astronaut. Sci., Vol. 29, No. II, pp. 367-376, 1971
This article describes an adaptive self-testing and repairing central-
ized data system incorporating the flexibility and reliability neces-
sary for the Grand Tour class of deep-space missions. It wasdeveloped as part of the Thermoelectric Outer-Planet Spacecraft
(TOPS) effort at JPL. The data system consists of a programmable
adaptive computer-aided telemetry system (CATS) called the mea-
surement processor, a 2 × 109-bit data storage system consisting ofa buffer plus single-speed tape recorders, science instrument inter-
face units customized to each instrument, a ground command
decoder, a central timing source, and a self-testing and repairing(STAR) control computer that coordinates the operations of the
other parts of the system and of the spacecraft.
This data system is organized such that the measurement processor
performs all repetitive high-speed data gathering and reduction
functions, alerting the STAR computer through a shared two-port
memory if any abnormal readings are noted. It also routes com-pressed spacecraft data to data storage for periodic data dump
transmissions to the ground while some data are transmitted to the
ground in real time. Meanwhile, the STAR computer performs
non-routine data handling functions and issues commands to the
spacecraft as needed. It can also back-up failed portions of the
190

datasystemat areducedcapability.If theSTARcomputeris thespacecraft'sbrain,thenCATSis its nervoussystem.Thisdivisionof laborallowsa substantialreductionin thepower,weight,andcomplexityof theoverallsystemasopposedto usingonegeneral-purposecomputerfor all functions.TheCATSandSTARcom-puterhavebeenbreadboardedatJPL.
ELLEMAN, D. D.
E02 Dependence of the Rates on Ion Kinetic Energy for the
Reactions D2÷ + D2 and HD ÷ + HD
W. T. Huntress, Jr., D. D. Elleman, and
M. T. Bowers (University of California, Santa Barbara)
J. Chem. Phys., Vol. 55, No. 11, pp. 5413-5414,
December 1, 1971
For abstract, see Huntress, W. T., Jr.
ERICKSON, D. E.
E03 DSN Progress Report for November-December 1971: The
SAPDP Program Set for Sigma 5 Assembly
D. E. Erickson
Technical Report 32-1526, Vol. VII, pp. 91-96,
February 15, 1972
This article describes a set of programs that have been written to
enable the Sigma 5 computer to assemble programs for the PDP-
11 minicomputer. It consists of two parts: a system proceduredeck, which allows SIGMA METASYMBOL to assemble a source
language similar to PDP's own PAL-11; and a secondary loader,which reformats the Sigma 5 load module into PDP-11 absolute
binary format and punches it onto paper tape. The syntacticdifferences between this assembler and PAL-11 are described, as
well as the process of generating a PDP-11 program using this
program set on the Sigma 5.
ERPENBACH, H.
E04 DSN Progress Report for November-December 1971: High
Output Power for Hydrogen Maser Frequency Standards
H. Erpenbach and C. Finnie
191

TechnicalReport32-1526,Vol.VII, pp. 106-108,February15, 1972This article describes the use of an FEP and TFE Teflon mixture
to form duplicable storage bulb wall coatings for hydrogen maser
frequency standards. The use of this mixture has resulted in wall
coatings more efficient than previous coatings fabricated at this
facility. A hydrogen maser has been optimized for high-power
operation using these new storage bulbs, and a power output levelof -80 dBmW has been achieved.
ESPOSITO, P. B.
E05 Determination of Astrodynamic Constants and a Test of the
General Relativistic Time Delay With S.Band Range andDoppler Data From Mariners 6 and 7
J. D. Anderson, P. B. Esposito, W. Martin, and
D. O. Muhleman (California Institute of Technology)
Space Research X/, pp. 105-112, Akademie-Verlag, Berlin,1971
For abstract, see Anderson, J. D.
FANALE, F. P.
FO1 Physical Adsorption of Rare Gas on Terrigenous Sediments
F. P. Fanale and W. A. Cannon
Earth Planet. Sci. Lett., Vol. 11, No. 5, pp. 362-368,
August 1971
A physical-chemical explanation is offered for the paucity of Xc in
the Earth's atmosphere and for the recently reported enrichmentsof heavy rare gases in shales. Brunauer-Emmett-Teller (BET) plots
for N 2 adsorption at -195°C and Freundlich plots for Kr and Xe
adsorption at 25 and 0°C were determined for shale samples. The
results, together with geological considerations, suggest that Xe has
been significantly depleted from the Earth's atmosphere, relative
to other rare gases, by physical adsorption on terrigenoussediments.
F02 History of Martian Volatiles: Implications for Organic
Synthesis
F. P. Fanale
Icarus, Vol. 15, No. 2, pp. 279-303, October 1971
192

As described in this article, a theoretical reconstruction of the
history of Martian volatiles indicates that Mars probably possessed
a substantial reducing atmosphere at the outset of its history and
that its present tenuous and more oxidized atmosphere is the result
of extensive chemical evolution. As a consequence, it is probable
that Martian atmospheric chemical conditions, now hostile with
respect to abiotic organic synthesis in the gas phase, were initially
favorable. Evidence indicating the chronology and degradational
history of Martian surface features, surface mineralogy, bulk vola-tile content, internal mass distribution, and thermal history sug-
gests that Mars catastrophically developed a substantial reducing
atmosphere as the result of rapid accretion. This atmosphere
probably persisted-despite the direct and indirect effects of hy-
drogen escape-for a geologically short time interval during, and
immediately following, Martian accretion. That was the only por-
tion of Martian history when the atmospheric environment could
have been chemically suited for organic synthesis in the gas phase.
Subsequent gradual degassing of the Martian interior throughout
Martian history could not sustain a reducing atmosphere due to the
low intensity of planet-wide orogenic activity and the short atmo-
spheric mean residence time of hydrogen on Mars. During the
post-accretion history of Mars, the combined effects of planetary
hydrogen escape, solar-wind sweeping, and reincorporation ofvolatiles into the Martian surface produced and maintained the
present atmosphere.
F03 Objectives and Requirements of Unmanned Rover Exploration
of the Moon
D. B. Nash, J. E. Conel, and F. P. Fanale
The Moon, Vol. 3, No. 2, pp. 221-230, August 1971
For abstract, see Nash, D. B.
FARMER, C. B.
F04 Global Studies of Atmospheric Pollutants and Trace
Constituents
R. A. Toth (California Institute of Technology)and
C. B. Farmer (California Institute of Technology)
193
AIAAPreprint71-1109,ACS(AmericanChemicalSociety)/AIAA(AmericanInstituteof Aeronauticsand Astronautics)/EPA(EnvironmentalProtectionAgency)/IEEE(InstituteofElectricaland ElectronicEngineers)/ISA(InstrumentSocietyof America)/NASA(NationalAeronauticsand SpaceAdministration)/NOAA(NationalOceanographicandAtmosphericAdministration)Joint Conferenceon SensingofEnvironmentalPollutants,PaloAlto,California,November8-10, 1971
For abstract, see Toth, R. A.
F05
F06
The Infrared Investigations on the Outer Planets Grand Tour
C. B. Farmer
Advan. Astronaut. Sci., Vol. 29, No. I, pp. 589-599, 1971
The infrared experiments being planned for the outer-planet
Grand Tour include fimdamental investigations in planetary radia-
tion balance, atmospheric composition, structures and dynamics,
and compositional and physical properties of the satellites. The
multiple-planet missions to the outer solar system provide signifi-
cant advantages to infrared experiments in terms of spatial resolu-
tion and planetary phase angle coverage over the limitations to
Earth-based observations. The experiment and instrument design
are based on the requirements of those investigations which can
best exploit these advantages in a multiple-planet opportunity, as
opposed to single-planet missions. The infrared instrument is a
combined multi-channel radiometer and low-resolution spectrome-
ter, covering the range from visible wavelengths out to 100/z.
The Strengths of H20 Lines in the 8200 _ Region and Their
Application to High Dispersion Spectra of Mars
C. B. Farmer
Icarus, Vol. 15, No. 2, pp. 190-196, October 1971
The improvement in the quality of spectroscopic plates taken in
recent years in the search for water vapor in the atmosphere of
Mars has dictated the need for improved laboratory data with
which to interpret the spectra. This article presents the results of
measurements of the strengths of 41 lines of the 8200-A (211)
water vapor band. The measured values show evidence of vibra-
tion-rotation interactions on the line intensities beyond the princi-
pal stretching effect. The value of the vibrational baud strengthderived from the results is 9.46 _+0.5 x 10 -22 cm-l-mol-l-cm 2.
194

FAVERO, M S.
F07 Microbiological Sampling of Returned Surveyor III Electrical
Cabling
M. D. Knittel, R. H. Green, and M. S. Favero (U.S. Public
Health Department)
Proceedings of the Second Lunar Science Conference,Houston, Texas, January 11-14, 1971, Vol. 3,
pp. 2715-2719, The MA.T. Press, 1971
For abstract, see Knittel, M. D.
FINNEGAN, E. J.
F08 DSN Progress Report for November-December 1971: A New
Crowbar Logic Unit
E. J. Finnegan
Technical Report 32-1526, Vol. VII, pp. 136-138,
February 15, 1972
A new crowbar logic unit has been designed and installed for the
Mars Deep Space Station 400-kW transmitter utilizing integrated
circuits and plug-in modular construction. The logic unit of the
crowbar consists of four detecting channels that generate and
shape a new pulse which is used to trigger the crowbar. The
crowbar is a device that short-circuits the power supply when a
high-voltage arc threatens to destroy the output klystron.
FINNIE, C.
F09 DSN Progress Report for November-December 1971: High
Output Power for Hydrogen Maser Frequency Standards
H. Erpenbach and C. Finnie
Technical Report 32-1526, Vol. VII, pp. 106-108,
February 15, 1972
For abstract, see Erpenbach, H.
FJELDBO, G.
FIO Summary of Mariner 6 and 7 Radio Occultation Results on the
Atmosphere of Mars
A. J. Kliore, G. Fjeldbo, and B. L. Seidel
195

Space Research Xl, pp. 165-175, Akademie-Verlag, Berlin,1971
For abstract, see Kliore, A. J.
FRAZER, R.
Fll Fixation of Virgin Lunar Surface Soil
J. M. Conley, R. Frazer, and W. A. Cannon
Technical Memorandum 33-521, February 1, 1972
For abstract, see Conley, J. M.
FYMAT, A. L.
F12 Jones's Matrix Representation of Optical Instruments:
2. Fourier Interferometers (Spectrometers and
Spectropolarimeters)
A. L. Fymat
Appl. Opt., Vol. 10, No. 12, pp. 2711-2716, December 1971
The author's method of matrix synthesis of optical components and
instruments is applied to the derivation of Jones's matrices appro-
priate for Fourier interferometers (spectrometers and spectropo-larimeters). These matrices are obtained for both the source beam
and the detector beam. In the course of synthesis, Jones's matrices
of the various refectors (plane mirrors; retroreflectors: roofed
mirror, trihedral and prism cube corner, cat's eye) used by theseinterferometers are also obtained.
GALE, G.
GO1 DSN Progress Report for November-December 1971: Overseas
64.m Hydrostatic Bearing Performance
G. Gale
Technical Report 32-1526, Vol. VII, pp. 154-158,
February 15, 1972
The first azimuth rotation of the 64-m antenna under construction
at the Ballima Deep Space Station (Australia) was made June 12,
1971. Film height records, profile records, and a bull gear refer-
ence level survey were made during this and subsequent rotations.
This article includes the summary of data collected during theserotations.
196
GALLILY, I.
GO2 On the Orientation of Nonspherical Particles at Solid Surfaces:
A Method of Analysis
I. Gallily
J. Colloid Interface Sci., Vol. 37, No. 2, pp. 403-409,
October 1971
The relation between the projected and true linear measures of
nonspherical particles at solid surfaces is discussed in terms of anorientation distribution function. It is shown that this function can
be determined by a geometric method, which is tested on spheroi-
dal bacterial spores.
GILLEY,
GO3
G. C°
The STAR (Self.Testing and Repairing) Computer: An
Investigation of the Theory and Practice of Fault-Tolerant
Computer Design
A. Avi}ienis, G. C. Gilley, F. P. Mathur, D. A. Rennels,
J. A. Rohr, and D. K. Rubin
IEEE Trans. Computers, Vol. C-20, No. 11, pp. 1312-1321,November 1971
For abstract, see Avi_ienis, A.
GOETZ,
GO4
A. F. H.
Apollo 12 Multispectral Photography Experiment
A. F. H. Goetz, F. C. Billingsley, J. W. Head (Bellcomm,
Inc.), T. B. McCord (Massachusetts Institute of Technology),
and E. Yost (Long Island University)
Proceedings of the Second Lunar Science Conference,
Houston, Texas, January 11-14, 1971, Vol. 3,
pp. 2301-2310, The M.I.T. Press, 1971
Apollo 12 carried a four-band camera system for orbital lunar
surface photography. New image processing techniques were de-
veloped to delineate accurately subtle spectral reflectivity differ-
ences, independent of brightness differences within selected areasof the lunar surface. Ground-based photoelectric photometry was
used to verify large area color differences.
In general, the highlands areas covered are quite uniform in nor-
malized spectral reflectivity on a 200-m scale. Differences weredetected in the Descartes region, which can be attributed to
197

exposed rock in the ejecta blanket of Dollond E. No color differ-
ence was detected across the mare-highland boundary at Fra
Mauro. With few exceptions, the highlands areas studied are
extremely uniform and the variation in spectral reflectivity in the
wavelength region covered seen in any frame is less than that
found in some Apollo 12 core samples.
GOLDSTEIN, R. M.
G05 Mars Radar Observations, a Preliminary Report
G. S. Downs, R. M. Goldstein, R. R. Green, andG. A. Morris
Science, Vol. 174, No. 4016, pp. 1324-1327,December 24, 1971
For abstract, see Downs, G. S.
GOODWIN, P. S.
GO6 DSN Progress Report for November-December 1971: Helios
Mission Support
P. S. Goodwin
Technical Report 32-1526, Vol. VII, pp. 17-24,February 15, 1972
Project Helios is a joint Deep Space Project between the Federal
Republic of West Germany and the United States. Two solar
orbiting spacecraft are planned: the first to be launched in mid-
1974 and the second in late 1975. The spacecraft will have a
perihelion of approximately 0.25 AU and an aphelion of 1.0 AU.
These highly elliptical orbits will come closer to tile Sun than any
known or presently planned deep space venture to date. Prior
volumes of this report have provided the reader with an overview
of the division of responsibilities between West Germany and the
United States, the Project management organization, and the
spacecraft design-including a functional description of its radio
system and the latter's interface with the Deep Space Network.
This article highlights the supporting activities of the TDS organi-
zation during the Fifth Helios Joint Working Group meeting,
which was held October 20-27, 1971 at Oberpfaffenhofen, West
Germany.
198

GOTTLIEB, P.
G07 A Surface.Layer Representation of the Lunar Gravitational Field
L. Wong (Aerospace Corporation), G. Buechler (Aerospace
Corporation), W. Downs (Aerospace Corporation),
W. L. Sjogren, P. M. Muller, and P. Gottlieb
J. Geophys. Res., Vol. 76, No. 26, pp. 6220-6236,
September 10, 1971
For abstract, see Wong, L.
GREEN, R. H.
G08 Microbiological Sampling of Returned Surveyor III Electrical
Cabling
M. D. Knittel, R. H. Green, and M. S. Favero (U.S. Public
Health Department)
Proceedings of the Second Lunar Science Conference,
Houston, Texas, January I1-14, 1971, Vol. 3,
pp. 2715-2719, The M.I.T. Press, 1971
For abstract, see Knittel, M. D.
GREEN, R. R.
GO9 Mars Radar Observations, a Preliminary Report
G. S. Downs, R. M. Goldstein, R. R. Green, andG. A. Morris
Science, Vol. 174, No. 4016, pp. 1324-1327,
December 24, 1971
For abstract, see Downs, G. S.
GUELACHVILI, G.
GIO Fourier Spectroscopy With a One-Million-Point Transformation
(Translation From the Original Published in the Nouvelle
Revue d'Optique Appliqu_e, Vol. 1, pp. 3-22, 1970)
J. Connes (National Center for Scientific Research, Orsay,
France), H. Delouis (National Center for Scientific Research,
Orsay, France), P. Connes (National Center for Scientific
Research, Orsay, France), G. Guelachvili (National Center
for Scientific Research, Orsay, France), J.-P. Maillard
(National Center for Scientific Research, Orsay,
199
France), and G. Michel (National Center for Scientific
Research, Orsay, France)
Technical Memorandum 33-525, March 15, 1972
For abstract, see Connes, J.
GULKIS, S.
Gll Radio Emission From the Major Planets--The Thermal
Component
S. Gulkis
Advan. Astronaut. Sci., Vol. 29, No. I, pp. 203-222, 1971
Measurements of the radio emission from all the major planets
have been reported at millimeter and centimeter wavelengths, and
from Jupiter and Saturn at decimeter wavelengths as well. This
achievement has become possible with the development of low-
noise receivers and large aperture radiotelescopes. The measured
brightness temperatures deduced from these measurements exceed
the expected effective temperatures calculated from solar heating,
and the observed spectra of the individual planets do not follow
the classical blackbody spectral form. Nevertheless, the observed
radiation is believed to be of thermal origin, except for the planet
Jupiter, where a non-thermal component is known to contribute to
its spectrum. The observed spectra are believed to depart from the
simple blackbody form because of the dependence of the atmo-
spheric emissivity on wavelength. The gross features of the major
planet radio spectra can be explained in terms of thermal emission
by an atmosphere whose temperature increases with depth and in
which ammonia is assumed to be the principal source of opacity.
HAMILTON, G.
HO1 DSN Progress Report for November-December 1971: Post-
Detection Subcarrier Recording Equipment Implementation for
Analog Recording Playback
G. Hamilton
Technical Report 32-1526, Vol. VII, pp. 182-184,
February 15, 1972
The post-detection subcarrier recording reproduce capability has
been implemented at the playback facility for playback of analog
tapes recorded at stations in the Deep Space Instrumentation
Facility. The primary purpose for this facility is to reproduce the
analog tape data (which could not be played back at the stations) if
a failure in the station subcarrier demodulator assembly or on the
200
spacecraft occurs. The analog data is used to produce digital data
tapes and to generate data for input to the Space Flight Opera-
tions Facility. Reproduce modes of baseband playback and teleme-
try data bit stream playback are discussed.
HANSON, R. J.
H02 A Computational Algorithm for Sequential Estimation
R. J. Hanson and P. Dyer (Imperial Chemical Industries
Ltd.)
Comput. J., Vol. 14, No. 3, pp. 285-290, August 1971
This article details a highly reliable computational algorithm for
sequential least-squares estimation (filtering) with process noise.
The various modular components of the algorithm are described in
detail so that their conversion to computer code is straightforward.
These components can also be used to solve any least-squares
problem with possibly rank-deficient coefficient matrices.
HEAD,
H03
J. W.
Apollo 12 Multispectral Photography Experiment
A. F. H. Goetz, F. C. Billingsley, J. W. Head (Bellcomm,
Inc.), T. B. McCord (Massachusetts Institute of Technology),
and E. Yost (Long Island University)
Proceedings of the Second Lunar Science Conference,
Houston, Texas, January 11-14, 1971, Vol. 3,
pp. 2301-2310, The M.I.T. Press, 1971
For abstract, see Goetz, A. F. H.
HOEHN, F. W.
HO4 Liquid.Phase Mixing of Bipropellant Doublets
F. W. Hoehn, J. H. Rupe, and J. G. Sotter
Technical Report 32-1546, February 15, 1972
Comparisons of cold-flow mixing efficiency for sprays formed by
unlike impinging doublet injector elements comprising circularand nohcircular orifices have recently been reported by other
investigators. It was concluded that noncircular elements produce
significantly better mixing efficiencies than a circular unlike dou-blet at equivalent design conditions. The fact that the mixing
efficiency for the circular-orifice unlike doublet was significantly
lower than typical values for a number of other circular-orifice
201
doublets suggested that factors other than orifice shape might have
been present in the comparisons.
Experimental results of unlike doublet mixing obtained at JPL arecorrelated with an analytically derived equation predicting fluid
cavitation. The correlation relates the minimum orifice pressure
drop required to initiate cavitation to the system back pressure,cold-flow simulant vapor pressure, and orifice flow discharge and
contraction coefficients. Stream flow instabilities are also visually
correlated with cavitation and orifice discharge coefficientmeasurements.
In addition, the influence of cavitation on the characteristic phe-
nomenon of hydraulic flip is observed for both circular and noncir-
cular orifices. For particular orifice lengths, some noncircular
shapes are shown to produce more fully developed flows (shorter
recovery lengths) and therefore provide slightly higher cold-flow
mixing uniformities than circular orifices of equal length. The
particular noncircular elements evaluated, however, are shown to
be more sensitive to liquid-stream misimpingement than the corre-
sponding circular orifices.
HOFFMAN, J. K.
H05 A Study of the Frictional and Stick-Slip Behavior of Magnetic
Recording Tapes
S. H. Kalfayan, R. H. Silver, and J. K. Hoffman
Technical Report 32-1548, April 1, 1972
For abstract, see Kalfayan, S. H.
H06 Magnetic Tape Recorder for Long Operating Life in Space
E. J. Bahm and J. K. Hoffman
IEEE Trans. Magnetics, Vol. MAG-7, No. 3, pp. 517-520,
September 1971
For abstract, see Bahm, E. J.
HOLDRIDGE, D. B.
H07 Simultaneous Solution for the Masses of the Principal Planets
From Analysis of Optical, Radar, and Radio Tracking Data
J. H. Lieske, W. G. Melbourne, D. A. O'Handley,
D. B. Holdridge, D. E. Johnson, and W. S. Sinclair
202

Celest. Mech., Vol. 4, No. 2, pp. 233-245, October 1971
For abstract, see Lieske, J. H.
HUGHES, R. S.
H08 Spacecraft S-Band 10-100 W rf Amplifier Tubes
R. S. Hughes
Progr. Astronaut. Aeronaut., Vol. 25, pp. 19-41, 1971
The results of electrical, environmental, and life tests on several
S-band power amplifier tubes operated under saturated conditions
are presented. These amplifiers operate in the 2.3-GHz region and
are intended for spacecraft applications. The amplifiers tested
include the amplitron, Raytheon Model QKS 1300; several travel-
ing wave tubes, Hughes Aircraft Co. Models 216H and 242H;
Watkins-Johnson Models 274-1, 274-6, and 395-3; and an electro-
statically focused amplifier, Eimac Model X-3064. Overall effl-
ciencies of 25 to 50% are exhibited; the Watkins-Johnson 395-3and Eimac X-3064 100-W tubes exhibit overall efflciencies of 47
and 39%, respectively. The Eimac X-3064 tube employs a unique
radiation-cooled collector which radiates heat through a sapphire
window. Three 25-W amplitrons tested exhibited an average life of
about 2350 h. Life tests on several 10- to 20-W traveling wavetubes have shown these tubes to have excellent life characteristics,
which at present range up to 40,000 h.
HUNT,
H09
G° E,
Laboratory Simulation of Absorption Spectra in Cloudy
Atmospheres
D. J. McCleese, J. S. Margolis, and G. E. Hunt
Nature Phys. Sci., Vol. 233, No. 40, pp. 102-103,October 4, 1971
For abstract, see McCleese, D. J.
HUNTRESS, W. T., JR.
HIO Dependence of the Rates on Ion Kinetic Energy for the
Reactions D2÷ + D2 and HD ÷ + HD
W. T. Huntress, Jr., D. D. Elleman, and
M. T. Bowers (University of California, Santa Barbara)
203

J. Chem. Phys, Vol. 55, No. 11, pp. 5413-5414,December 1, 1971
The kinetic energy dependence of the reactions of H2 +, D2 +, and
HD + ions with most of the isotopic variants of the hydrogenmolecule has been studied, and several interesting dynamic fea-
tures have been noted. There still remains some disagreement,
however, on the kinetic energy dependence of the rates for some
of the isotopic reactions. It is the purpose of this article to report
some prelimin_,ry work which helps to alleviate some of this
controversy.
HUTCHISON, R. B.
HI! Automated Analysis of Astronomical Spectra
R. B. Hutchison
Astron. J., Vol. 76, No. 8, pp. 711-718, October 1971
A description is given of a computer program that automates the
analysis of high-resolution, infrared astronomical spectra. Proce-
dures for the detection of spectral features and for the determina-
tion of accurate line frequencies, line depths, and equivalent
widths are presented. Line profile analysis, identification, and other
specialized operations are discussed.
H12 Turbulence Velocities in the Atmosphere of Alpha Orionis
R. B. Hutchison
Astrophys. J., Vol. 170, No. 3, Pt. 1, pp. 551-555,December 15, 1971
The curve of line-width correlation has been applied to OH lines
in the spectrum of a Orionis, characteristic microturbulence, ma-
croturbulence, and thermal velocities in the atmosphere of this starhave been determined to be 9.9 _+2.0, <3, and 21.8 km/s, respec-
tively. Implications of these results are discussed in this article.
INGHAM, J. D.
I01 New Polymer Systems: Chain Extension By Dianhydrides
R. A. Rhein and J. D. Ingham
JPL Quarterly Technical Review, Vol. 1, No. 4, pp. 97-103,
January 1972
For abstract, see Rhein, R. A.
204
JACKSON,E.B.
JO1 DSNProgressReportfor November-December1971:DSNResearchandTechnologySupportE. B. Jackson
Technical Report 32-1526, Vol. VII, pp. 124-125,
February 15, 1972
The major current activities of the Development Support Group at
both the Venus Deep Space Station and the Microwave Test
Facility are presented, and accomplishments and progress are
described. Activities include pulsar measurements, tri-cone imple-
mentation, precision antenna gain measurement (26-m antenna),
weak source observations, Faraday rotation measurements on Ap-
plications Technology Satellite 1 (ATS-1), clock synchronization
transmissions, and Block IV receiver/exciter testing anddemonstration.
JAFFE,
J02
J03
L. D,
Results of Recent Manned and Unmanned Lunar Exploration
L. D. Jaffe
Space Research XI, pp. 31-49, Akademie-Verlag, Berlin,1971
Important data about the Moon obtained from spacecraft during
the past year include the age-dating and chemical analyses of
samples returned by Apollos 11 and 12. The material of the surface
fragmental layer was differentiated 4.6 × 10⁹ yr ago. The surfacesof Mare Tranquillitatis and Oceanus Procellarum solidified 3.7 ×
109 and about 3 × 10⁹ yr ago from lava of very low viscosity which
had undergone extensive chemical fractionation. The lunar interioris of different composition from these surfaces. The Moon is
tectonically rather quiet. The rate impact of moderate-sized ob-
jects was much greater before the mare formation than since.Micrometeorite impact has produced rock erosion, pitting, shock,
melting, vitrification, and induration in the surface layer. Pictures,
taken by Apollo astronauts, of the lunar surface disturbed by
Surveyor 3 show that little change has occurred in 31 mo.
Bearing Strength of Lunar Soil
L. D. Jaffe
The Moon, Vol. 3, No. 3, pp. 337-345, December 1971
Bearing load versus penetration curves have been obtained using a
1.3-g sample of lunar soil from the scoop of the Surveyor 3 soil
205

mechanics surface sampler and a circular indentor 2 mm in diame-
ter. Measurements were made in an Earth laboratory, in air. This
sample provided a unique opportunity to evaluate earlier, re-
motely controlled, in-situ measurements of lunar surface bearing
properties. Bearing capacity, measured at a penetration equal tothe indentor diameter, varied from 0.02-0.04 N-cm -2 at bulk
densities of 1.15 g-cm -3 to 30-100 N-cm -2 at 1.9 g-cm -3. Deforma-
tion was by compression directly below the indentor at bulk
densities below 1.61 g-cm -3, by outward displacement at bulk
densities over 1.62 g-cm -3. Preliminary comparison of in-situ re-mote measurements with those on returned material indicates
good agreement if the lunar regolith at Surveyor 3 has a bulk
density of 1.6 g-cm -3 at a depth of 2.5 cm. Definitive comparison
awaits both better data on bulk density of the undisturbed hmar
soil and additional mechanical-property measurements on returnedmaterial.
JET PROPULSION LABORATORY:
MARINER MARS 1971 SCIENCE EXPERIMENTER TEAMS
J04 Mariner Mars 1971 Project Final Report: Preliminary ScienceResults
Mariner Mars 1971 Science Experimenter Teams
Technical Report 32-1550, Vol. II, February 1, 1972
This volume is the second of four volumes comprising the Mariner
Mars 1971 Project Final Report. Presented in this volume are the
preliminary science results for the Mariner 9 television, infrared
spectroscopy, infrared radiometry, ultraviolet spectrometer,
S-band occultation, and celestial mechanics experiments. Theseresults, derived from data evaluation to December 14, 1971 (30
days after orbit insertion), have also been published in Science,
Vol. 175, January 1972.
Volume I of this series describes project development through
launch and the trajectory-correction maneuver; Volume III de-
scribes flight operations after the trajectory-correction maneuver
and during the basic 90-day orbital mission; and Volume IV de-scribes the science results derived from the basic 90-day orbital
mission and the experimenters' interpretations of the data.
JOHNSON, D. E.
J05 Simultaneous Solution for the Masses of the Principal Planets
From Analysis of Optical, Radar, and Radio Tracking Data
J. H. Lieske, W. G. Melbourne, D. A. O'Handley,
D. B. Holdridge, D. E. Johnson, and W. S. Sinclair
206

Celest. Mech., Vol. 4, No. 2, pp. 233-245, October 1971
For abstract, see Lieske, J. H.
JOHNSTON, A. R.
J06 Stark.Effect Modulation of a CO2 Laser by NH2D
A. R. Johnston and R. D. S. Melville, Jr.
Appl. Phys. Lett., Vol. 19, No. 12, pp. 503-506,
December 15, 1971
The molecular Stark effect in NH2D was used to modulate the
10.6-/_ P(20) line of a CO2 laser, yielding a modulation depth of
40% from a 200-V-cm -l rms signal applied to a 19.7-cm gas cell
external to the laser. NH2D was prepared by mixing ND 3 and
NH 3. The absorption coefficient of the M = 4 Stark-split line was
measured as a function of mixing ratio and pressure. The observed
pressure-broadening coefficient was 32.5 MHz/torr.
KALFAYAN, S. H.
KO1 A Study of the Frictional and Stick-Slip Behavior of Magnetic
Recording Tapes
S. H. Kalfayan, R. H. Silver, and J. K. Hoffman
Technical Report 32-1548, April 1, 1972
Methods were developed to determine the coefficient of friction
and the extent of stick-slip of magnetic recording tapes. After a
preliminary phase during which experimental procedures were
established and screening of candidate tapes was carried out, the
frictional and stick-slip behavior of four selected tapes, using four
different kinds of magnetic heads, was studied at various tempera-
tures, under dry and humid conditions, and in various gaseous
atmospheres such as argon, helium, nitrogen, and air. The effects
of tape speed and outgassing on the drag properties of the tapeswere also studied.
A rank was assigned to each tape and magnetic head as a result of
these tests. This study helped in the selection of a magnetic tape
for a flight project and will be useful in the consideration of tapes
and magnetic heads for future spacecraft applications.
207

KELLY,
K02
A. M,
Isolation and Characterization of Keto-Carotenoids From the
Neutral Extract of Algal Mat Communities of a Desert Soil
A. J. Bauman, H. G. Boettger, A. M. Kelly,R. E. Cameron, and H. Yokoyama (U.S. Department of
Agriculture)
Eur. J. Biochem., Vol. 22, No. 2, pp. 287-293,
September 1971
For abstract, see Bauman, A. J.
KIEFFER, H.
K03 Mariner 1969 Infrared Radiometer Results: Temperatures and
Thermal Properties of the Martian Surface
G. Neugebauer (California Institute of Technology),G. M_inch (California Institute of Technology),
H. Kieffer (University of California, Los Angeles),
S. C. Chase, Jr. (Santa Barbara Research Center), andE. Miner
Astron. J., Vol. 76, No. 8, pp. 719-749, October 1971
For abstract, see Neugebauer, G.
KLASCIUS, A. F.
K04 Microwave Radiation Protective Suit
A. F. Klascius
Am. Ind. Hygiene Assoc. J., Vol. 32, No. 11, pp. 771-774,November 1971
The use of a Navy-developed microwave radiation protective suit
in a JPL project is described. The composition of the suit material
is analyzed, and the amount of radiation absorbed by the various
parts of the suit is measured. The effects of microwave radiation
on the human body are considered, and the degree of protection
provided by the suit during actual entry into a microwave field isevaluated.
KLIMASAUSKAS, C. C.
K05 DSN Progress Report for November-December 1971: The
X930 Program Set for Sigma 5 Assembly
C. C. Klimasauskas
208
Technical Report 32-1526, Vol. VII, pp. 86-90,
February 15, 1972
This article describes a set of programs that have been written to
enable the Sigma 5 computer to assemble programs for the XDS
920/930 computers. It consists of two parts: a system proceduredeck which allows SIGMA METASYMBOL to assemble a source
language similar to the XDS 900-series METASYMBOL, and a
secondary loader which reformats the Sigma 5 load module into
the Universal Binary Language of the 900-series machines and
writes it to cards or magnetic tape. The syntactic differencesbetween this assembler and the 900-series METASYMBOL are
described, as well as the process of generating a 920 program using
this program set and the Sigma 5.
KLIORE, A. J.
K06 Summary of Mariner 6 and 7 Radio Occultation Results on the
Atmosphere of Mars
A. J. Kliore, G. Fjelclbo, and B. L. Seidel
Space Research XI, pp. 165-175, Akademie-Verlag, Berlin,1971
During the close flyby of Mars by Mariners 6 and 7 in the summer
of 1969, their S-band radio beams were used to probe the atmo-
sphere of Mars at four locations. These measurements indicate
surface pressures ranging from a high of 7.3 mb in the Amazonis/Arcadia area to a low of 4.2 mb near the southern end of Helles-
pontus, indicating a range of local elevation differences of about 6
kin. The surface temperatures range from about 250°K, measured
near the equator in the afternoon, to about 173°K, in the north
polar region at night. The temperature profiles suggest that con-
densation of CO2 is probable at an altitude of about 15 km near
the north pole and at altitudes ranging from 27 to 38 km in
equatorial and temperate latitudes. The daytime measurements
also show the existence of an ionosphere with a primary layer ofabout 1.7 × 10⁵ el cm -3 at an altitude of about 135 km. The
topside scale height indicates a plasma temperature of about 400-500°K if CO2 + is assumed to be the dominant ion.
KNITTEL, M. D.
K07 Microbiological Sampling of Returned Surveyor III Electrical
Cabling
M. D. Knittel, R. H. Green, and M. S. Favero (U.S. Public
Health Department)
209

Proceedings of the Second Lunar Science Conference,
Houston, Texas, January 11-14, 1971, Vol. 3,
pp. 2715-2719, The M.I.T. Press, 1971
A piece of electrical cabling was retrieved from the Surveyor 3
spacecraft by the crew of Apollo 12 and subjected to microbiologi-
cal analysis for surviving terrestrial microorganisms. The experi-ment was done in a sealed environmental chamber to protect
against contamination. No viable microorganisms were found on
the wiring bundle samples.
KNOELL, A. C.
K08 Vibration and Buckling Analysis of Composite Plates andShells
J. A. McEIman (Lowell Technological Institute) andA. C. Knoell
J. Compos. Mater., Vol. 5, pp. 529-532, October 1971
For abstract, see McElman, J. A.
KROLL,
K09
G. G.
DSN Progress Report for November-December 1971: Fire
Protection and Safety Activities Throughout the Deep SpaceNetwork
G. G. Kroll
Technical Report 32-1526, Vol. VII, pp. 213-216,
February 15, 1972
Comprehensive fire and safety studies have been initiated to deter-
mine the effort required to protect the tracking network from loss
of life, property, and operational continuity due to fire. The studies
recommend the installation of water storage tanks, new water
mains and fire hydrants, fire hose cabinets, automatic early fire
warning devices, automatic smoke detectors, and manual alarm
stations. The protection offered to the Deep Space Network with
the installation of this equipment will be equal to the highly
protective risk category used by private industry to describe maxi-
mum installed protection against loss of life and property. This
article describes the scope of the initial surveys, the follow-on
preliminary engineering reports, and the design/constructionefforts.
210
KRUGER,G. W.
KIO ExperimentalEvaluationof High-Thrust,Throttleable,MonopropellantHydrazineReactors
R. W. Rieblingand G. W. Kruger
Technical Report 32-1551, March 1, 1972
For abstract, see Riebling, R. W.
LAESER, R. P.
L01 DSN Progress Report for November-December 1971: Mariner
Mars 1971 Mission Support
R. P. Laeser
Technical Report 32-1526, Vol. VII, pp. 25-28,
February 15, 1972
At the start of the Mariner 9 orbit operations, some confusion
existed over the varying number of bit errors observed in the
picture transmissions. This article presents a summary of observa-
tions made in an attempt to clarify the situation.
LAING,
L02
P. A.
Lunar Gravity Analysis From Long-Term Effects
A. S. Liu and P. A. Laing
Science, Vol. 173, No. 4001, pp. 1017-1020,
September 10, 1971
For abstract, see Liu, A. S.
LAYLAND, J. W.
L03 DSN Progress Report for November-December 1971: An
Introduction to Minicomputer Software Support
J. W. Layland
Technical Report 32-1526, Vol. VII, pp. 84-85,
February 15, 1972
This article discusses some problems associated with generating
software for a possible deep space station configuration with a
multiplicity of computers, and briefly describes an effort underway
to help reduce those problems. It is a general introduction to "The
X930 Program Set for Sigma 5 Assembly," and "The SAPDP
211
L04
Program Set for Sigma 5 Assembly," which describe specific re-
sults from the development effort.
A Flexible High-Speed Sequential Decoder for Deep SpaceChannels
J. W. Layland and W. A. Lushbaugh
IEEE Trans. Commun. Technol., Vol. COM-19, No. 5,
pp. 813-820, October 1971
This article describes a sequential decoding machine, built at JPL,
which uses a 3-bit quantization of the code symbols and achieves acomputation rate of MHz. This machine is flexible and can be
programmed to decode any complementary convolutional codewith rates down to 1/4 and constraint lengths up to 32. In addition,
metric programmability is provided for optimization of decoder
performance with respect to channel parameter variations.
LEIBOWITZ, L. P.
L05 Nonequilibrium Ionization Measurements in Hydrogen-HeliumMixtures
L. P. Leibowitz
JPL Quarterly Technical Review, Vol. 1, No. 4, pp. 13-18,
January 1972
Time-resolved emission measurements of several atomic line and
continuum radiation channels have been made behind the incident
shock wave of the JPL electric arc shock tube. Test times and
nonequilibrium ionization times were obtained for shock velocities
up to 2.5 x 10⁴ m/s in a 0.2 H2-0.8 He gas mixture. The shock-
heated test gas was found to be free from driver gas contamina-
tion, and the test times were adequate to achieve steady-state
conditions. An activation energy of 4 eV was obtained from the
nonequilibrium ionization time measurements. Modifications to
experimental technique to determine the effect of test gas impu-
rity level on ionization time measurements are discussed.
LESH, J. R.
L06 DSN Progress Report for November-December 1971:Correlated Sampling With Application to Carrier Power
Estimation Accuracy
J. R. Lesh
212
Technical Report 32-1526, Vol. VII, pp. 195-206,
February 15, 1972
In this article the total sampling time and number of samples
required to produce a sample mean having a specified variance isevaluated for various sampling intervals. The samples are assumed
to be the correlated outputs of either a first- or second-order
system having a white gaussian noise input. It is found that areduction in both the total time and the number of samples can
often be obtained for a given variance and sampling interval if the
sampling is performed at the output of a second order system.These results are then applied to the automatic gain control
sampling presently being used for carrier power estimation to
show how its accuracy can be improved.
LEU, R. L.
L07 DSN Progress Report for November-December 1971: 400-kWHarmonic Filter
R. L. Leu
Technical Report 32-1526, Vol. VII, pp. 131-135,
February 15, 1972
The low-power test data on the new 400-kW harmonic filter
design shows that the new filter meets or exceeds the performance
of the existing filters. This will not insure that the fourth harmonicfrom the 400-kW transmitter will not affect the X-band receiver
performance. Additional fourth harmonic filters may be required.
LEVY,
L08
R.
DSN Progress Report for November-December 1971: ImprovedCondensation Methods for Eigenvalue Problems
R. Levy
Technical Report 32-1526, Vol. VII, pp. 142-153,
February 15, 1972
The conventional procedure used to condense the solution of
eigenvalue problems for recovery of the lowest modes is tested by
application to practical example structures. Evaluations are made
of eigenvalue accuracy with respect to numbers of retained solu-tion vectors. It is shown that solutions are likely to be inaccurate
except in the special case of when prior knowledge of the mode
shapes is available. One improvement for recovering the lowest
modes is to supplement the retained vectors with static loading
displacement functions. A further remedy is to perform iterative
213

repetitions of the solution procedure. Great improvements in
accuracy can be achieved with only a few iterative cycles. These
improvements are effective in the typical case of when only a few
valid lowest-mode solutions are required and the order of the
problem is large so that it becomes important to minimize the
computational time by means of solution condensation.
LIESKE, J. H.
L09 Simultaneous Solution for the Masses of the Principal Planets
From Analysis of Optical, Radar, and Radio Tracking Data
J. H. Lieske, W. G. Melbourne, D. A. O'Handley,D. B. Holdridge, D. E. Johnson, and W. S. Sinclair
Celest. Mech., Vol. 4, No. 2, pp. 233-245, October 1971
JPL has developed a set of computer programs known as the Solar
System Data Processing System (SSDPS) which is employed in
improving the ephemerides of the major planets and for improving
the values of several associated astronomical constants. A group of
solutions for the masses of the major planets, together with the AU
and radii of Mercury, Venus, and Mars, is presented. These solu-
tions based upon optical, radar, and spacecraft radio tracking data
are preliminary. The relative power of radar and radio tracking
data vis-'h-vis purely optical data in a solution is shown. The
problems which could arise by adopting solutions based upon a
single data type are demonstrated.
LINDLEY, P. L.
L10 DSN Progress Report for November-December 1971: DSIF
Tracking and Monitor and Control Subsystem: PrototypeImplementation
P. L. Lindley
Technical Report 32-1526, Vol. VII, pp. 159-167,
February 15, 1972
A developmental model Deep Space Instrumentation Facility
Tracking and Monitor and Control Subsystem has been installedand used in the support of the Mariner Mars 1971 mission. The
hardware and software necessary to support doppler measure-ments, including the ability to record the data locally as well as
send it to the Space Flight Operations Facility both in real-time
and recall (replay) modes, are operating. Checkout of other fimc-tions is in process.
214

LINNES,K.W.
Lll DSNProgressReportfor November-December1971:RadioScienceSupportK. W. Linnes
TechnicalReport32-1526,Vol.VII, pp.29-31,February15, 1972
Since 1967, radio scientists have used the Deep Space Network 26-
and 64-m antenna stations to investigate pulsars, to study the effect
of solar corona on radio signals, and to observe radio emissions
from X-ray sources. More recently, very long baseline interferome-
try (VLBI) techniques have been used for high-resolution studies of
quasars. During the reporting period, VLBI observations were
made in support of investigations of quasars. Support was also
provided from the 64-m antenna for the mapping of nearby spiral
galaxies.
LIU, A.
L12
S,
Lunar Gravity Analysis From Long-Term Effects
A. S. Liu and P. A. Laing
Science, Vol. 173, No. 4001, pp. 1017-1020,
September 10, 1971
As described in this article, the global lunar gravity field was
determined from a weighted least-squares analysis of the averaged
classical element of the five Lunar Orbiter spacecraft. The ob-
served-minus-computed residuals have been reduced by a factor of
10 from a previously derived gravity field. The values of the
second-degree zonal and sectorial harmonics are compatible withthose derived from libration data.
LOVELOCK, J. E.
L13 Rare Gases of the Atmosphere: Gas Chromatography Using a
Thermal Conductivity Detector and a PalladiumTransmodulator
J. E. Lovelock, P. G. Simmonds, and G. R. Shoemake
Anal. Chem., Vol. 43, No. 14, pp. 1958-1961,December 1971
This article reports on the application of the palladium transmodu-
lator combined with a small-volume thermal conductivity detector
to the determination of the rare gases in air. The analysis was
performed directly on a 10-ml sample of air using a single column
215

operated at room temperature. A gain in sensitivity of 103 is
demonstrated. The system described was developed for planetary
atmospheric analysis, but is of general use wherever gas analysis at
high sensitivity is required.
LUSHBAUGH, W. A.
L14 A Flexible High.Speed Sequential Decoder for Deep SpaceChannels
J. W. Layland and W. A. Lushbaugh
IEEE Trans. Comrnun. Technol., Vol. COM-19, No. 5,
pp. 813-820, October 1971
For abstract, see Layland, J. W.
LUTES,
L15
G.
DSN Progress Report for November-December 1971: Hydrogen
Maser: Low Phase Noise, L-Band Frequency Multiplier
G. Lutes, J. MacConnell, and R. Meyer
Technical Report 32-1526, Vol. VII, pp. 81-83,
February 15, 1972
A 100- to 1400-MHz discrete component ×14 frequency multiplier
was developed to determine the lowest phase noise achievable
with present technology. The 1/f phase noise spectrum of the
multiplier measured 11 dB lower than the hydrogen maser fre-
quency standard and 13 dB better than a high-quality step recov-
ery diode multiplier.
MacCONNELL, J.
MO1 DSN Progress Report for November-December 1971: Hydrogen
Maser: Low Phase Noise, L-Band Frequency Multiplier
G. Lutes, J. MacConnell, and R. Meyer
Technical Report 32-1526, Vol. VII, pp. 81-83,
February 15, 1972
For abstract, see Lutes, G.
216
MAILLARD,J.-P.
M02 Fourier Spectroscopy With a One-Million-Point Transformation
(Translation From the Original Published in the Nouvelle
Revue d'Optique Appliquee, Vol. 1, pp. 3-22, 1970)
J. Connes (National Center for Scientific Research, Orsay,
France), H. Delouis (National Center for Scientific Research,
Orsay, France), P. Connes (National Center for Scientific
Research, Orsay, France), G. Guelachvili (National Center
for Scientific Research, Orsay, France), J.-P. Maillard
(National Center for Scientific Research, Orsay, France),
and G. Michel (National Center for Scientific Research,
Orsay, France)
Technical Memorandum 33-525, March 15, 1972
For abstract, see Connes, J.
MANATT, S. L.
M03 Ferromagnetic Resonance of Lunar Samples
F. D. Tsay (California Institute of Technology),
S. I. Chan (California Institute of Technology), andS. L. Manatt
Geochim. Cosmochim. Acta, Vol. 35, No. 9, pp. 865-875,
September 1971
For abstract, see Tsay, F.-D.
M04 Magnetic Resonance Studies of Apollo 11 and Apollo 12
Samples
F. D. Tsay (California Institute of Technology),
S. I. Chan (California institute of Technology), andS. L. Manatt
Proceedings of the Second Lunar Science Conference,Houston, Texas, January 11-14, 1971, Vol. 3,
pp. 2515-2528, The M.I.T. Press, Cambridge, 1971
For abstract, see Tsay, F.-D.
M05 Calculations of Geometries of Organic Molecules Using the
CNDO/2 Method: I. Empirical Correlations Between Observed
and Calculated Bond Lengths in Simple Acyclics, Strained
Cycloalkenes and Some Polycyclic Molecules
C. S. Cheung, M. A. Cooper, and S. L. Manatt
217

M06
Tetrahedron, Vol. 27, No. 4, pp. 689-700, February 1971
For abstract, see Cheung, C. S.
Calculations of Geometries of Organic Molecules Using theCNDO/2 Molecular Orbital Method: I1. Structural Predictions
for the Benzocycloalkenes, and a Theoretical Rationalization
of Their Proton-Proton Spin-Spin Coupling Constants
C. S. Cheung, M. A. Cooper, and S. L. Manatt
Tetrahedron, Vol. 27, No. 4, pp. 701-709, February 1971
For abstract, see Cheung, C. S.
MANCINI, R. A.
MO7 DSN Progress Report for November-December 1971: Data
Decoder Assembly Implementation Status
R. A. Mancini
Technical Report 32-1526, Vol. VII, pp. 168-174,
February 15, 1972
Twelve data decoder assemblies have been acceptance-tested,
delivered to the Deep Space Network stations, and are undergoing
installation/testing and incorporation of field modifications in
preparation for the Pioneer F mission. Eight additional data de-
coder assemblies are in different stages of testing and implementa-
tion. This article describes their present status.
MARGOLIS, J. S.
M08 High Dispersion Spectroscopic Studies of Mars: V. A Search
for Oxygen in the Atmosphere of Mars
J. S. Margolis, R. A. J. Schorn, and L. D. G. Young
Icarus, Vol. 15, No. 2, pp. 197-203, October 1971
In order to set a new upper limit on the amount of oxygen in the
atmosphere of Mars, a number of high-dispersion spectra of the
7620-)_ band of oxygen obtained during the 1969 apparition of
Mars have been reduced by the authors. The new upper limit is w= 15 cm-atm (STP) for the Martian abundance in a single vertical
path. This result confirms and lowers the 1963 upper limit of w =
70 cm-atm (STP) by Kaplan, Miinch, and Spinrad. The features
reported by Hunten and Belton do not appear in the authors'
spectra. Furthermore, by measuring the pressure shift of the A
band in the laboratory, the authors found that the shift required by
218

M09
Hunten's and Belton's tentative identification of oxygen in theMartian atmosphere does not exist.
Laboratory Simulation of Absorption Spectra in Cloudy
Atmospheres
D. J. McCleese, J. S. Margolis, and G. E. Hunt
Nature Phys. Sci., Vol. 233, No. 40, pp. 102-103,October 4, 1971
For abstract, see McCleese, D. J.
MARTIN, W.
MIO Determination of Astrodynamic Constants and a Test of the
General Relativistic Time Delay With S-Band Range and
Doppler Data From Mariners 6 and 7
J. D. Anderson, P. B. Esposito, W. Martin, and
D. O. Muhleman (California Institute of Technology)
Space Research XI, pp. 105-112, Akademie-Verlag, Berlin,1971
For abstract, see Anderson, J. D.
MASSIER, P. F.
Mll Partially Ionized Gas Flow and Heat Transfer in the
Separation, Reattachment, and Redevelopment Regions
Downstream of an Abrupt Circular Channel Expansion
L. H. Back, P. F. Massier, and E. J. Roschke
Trans. ASME, Set. C: J. Heat Transf., Vol. 94, No. 1,
pp. 119-127, February 1972
For abstract, see Back, L. H.
MATHUR, F. P.
M12 The STAR (Self.Testing and Repairing) Computer: An
Investigation of the Theory and Practice of Fault-Tolerant
Computer Design
A. Avi_ienis, G. C. Gilley, F. P. Mathur, D. A. Re,,,,els,
J. A. Rohr, and D. K. Rubin
219

M13
IEEE Trans. Computers, Vol. C-20, No. 11, pp. 1312-1321,November 1971
For abstract, see Avi_ienis, A.
On Reliability Modeling and Analysis of Ultrareliable Fault-
Tolerant Digital Systems
F. P. Mathur
IEEE Trans. Computers, Vol. C-20, No. 11, pp. 1376-1382,November 1971
The processes of protective redundancy, namely, standby replace-
ment redundancy and hybrid redundancy (a combination ofstandby replacement and multiple-line voting redundancy), find
application in the architecture of fault-tolerant digital computers
and enable them to be ultrareliable and self-repairing. The claims
to ultrareliability lead to the challenge of quantitatively evaluating
and assigning a value to the probability of survival as a function of
the mission durations intended. This article presents various math-
ematical models and derives and displays quantitative evaluations
of system reliability as a function of various mission parameters of
interest to the system designer.
McCLEP_SE, D. J.
M14 Laboratory Simulation of Absorption Spectra in CloudyAtmospheres
D. J. McCleese, J. S. Margolis, and G. E. Hunt
Nature Phys. Sci., Vol. 233, No. 40, pp. 102-103,October 4, 1971
This article describes a laboratory investigation of diffuse reflec-
tivity from a suspension of polymer latex spheres in a medium of
variable absorption. This investigation was carried out in order to
simulate the formation of absorption lines in cloudy planetary
atmospheres. The experimental techniques derived may be gener-
alized to situations which are too complicated for present compu-
tational techniques (for example, atmospheres which contain non-
spherical scatterers, where the distribution of scatterers is inhomo-
geneous, or atmospheres with a complete structure).
McCORD, T. B.
M15 Apollo 12 Multispectral Photography Experiment
A. F. H. Goetz, F. C. Billingsley, J. W. Head (Bellcomm,
220

Inc.), T. B. McCord (Massachusetts Institute of Technology),
and E. Yost (Long Island University)
Proceedings of the Second Lunar Science Conference,
Houston, Texas, January 11-14, 1971, Vol. 3,
pp. 2301-2310, The M.I.T. Press, 1971
For abstract, see Goetz, A. F. H.
McELIECE, R. J.
M16 DSN Progress Report for November-December 1971: Hidingand Covering in a Compact Metric Space
R. J. McEliece and E. C. Posner
Technical Report 32-1526, Vol. VII, pp. 101-105,
February 15, 1972
This article investigates the relationship between games of search
on a compact metric space X and the absolute epsilon entropyI(X) of X. The main result is that
I(X) = -log v L ,
vL being the lower value of a game on X we call "restricted hideand seek."
McELMAN, J. A.
M17 Vibration and Buckling Analysis of Composite Plates andShells
J. A. McEIman (Lowell Technological Institute) andA. C. Knoell
J. Compos. Mater., Vol. 5, pp. 529-532, October 1971
In the analysis of laminated composites, it is known that a coupling
exists between extension and bending if the plies are not balancedin number and fiber orientation. This effect for the bending, vibra-
tion, and buckling of two-, four-, and six-ply laminates was exam-
ined elsewhere in the literature. The purpose of this article is to
investigate the magnitude of this effect for buckling and vibrationof doubly curved monocoque plates and shells of positive and
negative gaussian curvature. In addition, the effect of stackingsequence (the order in which individual plies are laid up) is
examined. This effect is considered since it is analogous to that of
eccentric stiffening of isotropic cylinders. Solutions are presented
221
which provide a means of simply and economically assessing the
magnitude of the coupling and stacking effects for various compos-
ite materials and geometric configurations.
McKINLEY, E. L.
M18 Mariner Venus-Mercury 1973 Midcourse Velocity Requirements
and Delivery Accuracy
E. L. McKinley
JPL Quarterly Technical Review, Vol. 1, No. 4, pp. 104-115,January 1972
The Mariner Venus-Mercury 1973 mission represents the first
attempt to navigate a single spacecraft to more than one planet.The primary mission consists of encounters with Venus and Mer-
cury (with a second encounter with Mercury also possible). In this
study, the expected navigation sequences are simulated with a
Monte Carlo computer program for the purpose of determining
midcourse correction velocity requirements and delivery accura-
cies. These simulations provide the sensitivity of the velocity
requirements and delivery accuracies to the error sources affecting
the navigation process. The orbit determination capability at thefinal pre-Venus maneuver is shown to be the dominant contributor
to the velocity requirements for the primary mission. Similarly, the
orbit determination capability at the final pre-Mercury maneuver
is shown to be the dominant contributor to the delivery accuracy
at Mercury.
M19
McRONALD, A. D.
On the Possibility of Earth Re-entry Simulation of Shallow
Angle Jupiter Entry
A. D. McRonald
JPL Quarterly Technical Review, Vol. 1, No. 4, pp. 19-29,January 1972
Possible Earth re-entry simulation of shallow angle (3- to 30-deg)
Jupiter entry has been investigated in terms of four parameters of
the bow shock layer ahead of a blunt vehicle: peak (equilibrium)
temperature, peak pressure, peak inward radiative flux, and time-
integrated radiative flux. The comparison shows that simulation
ranging from fair to good can be achieved, generally the easiest
(lowest Earth re-entry speed) at steep Earth re-entry, in the Earth
entry speed range of 15-22 km/s for both the Jupiter "nominal"
and "cool" atmospheres. Increasing Earth speed is required, gener-
ally, for increasing Jupiter entry angle, and for temperature, radia-
222

tive flux, time-integrated flux, and pressure, in that order. It ap-
pears that a meaningful simulation test could be done using a
launch vehicle with the speed and payload capability of the TitanIIID/Centaur/BII.
MELBOURNE, W. G.
M20 Simultaneous Solution for the Masses of the Principal Planets
From Analysis of Optical, Radar, and Radio Tracking Data
J. H. Lieske, W. G. Melbourne, D. A. 0'Handley,
D. B. Holdridge, D. E. Johnson, and W. S. Sinclair
Celest. Mech., Vol. 4, No. 2, pp. 233-245, October 1971
For abstract, see Lieske, J. H.
MELVILLE, R. D. S., JR.
M21 Stark-Effect Modulation of a CO2 Laser by NH2D
A. R. Johnston and R. D. S. Melville, Jr.
Appl. Phys. Lett., Vol. 19, No. 12, pp. 503-506,
December 15, 1971
For abstract, see Johnston, A. R.
MENARD, W. A.
M22 A Higher Performance Electric-Arc-Driven Shock Tube
W. A. Menard
AIAA J., Vol. 9, No. 10, pp. 2096-2098, October 1971
Simulation of Jupiter and Saturn atmospheric entry has been
difficult because entry velocities range from 25 to 48 km/s. Shock
tube velocities have been limited to about 15 km/s. The purpose
of this article is to report the development of an electric are-
driven shock tube which has increased shock velocity by a factor
of three. The new driver has a conical internal design of small
volume and uses lightweight diaphragms. Data obtained from a15.2-cm-diam driven tube show little shock wave attenuation.
Shock velocities of 45 km/s with test times in excess of 4/zs havebeen attained.
223

MENICHELLI,V. J.
M23 ElectrothermalFollowDisplayApparatusfor ElectroexplosiveDeviceTesting
L. A. Rosenthal (Rutgers University) and V. J. Menichelli
Technical Report 32-1554, March 15, 1972
For abstract, see Rosenthal, L. A.
M24 Fault Determinations in Electroexplosive Devices by
Nondestructive Techniques
V. J. Menichelli and L. A. Rosenthal (Rutgers University)
Technical Report 32-1553, March 15, 1972
Several nondestructive test techniques have been developed for
electroexplosive devices. The bridgewire responds, when pulsed
with a safe-level current, by generating a characteristic heating
curve. The response is indicative of the electrothermal behavior of
the bridgewire-explosive interface. Bridgewires that deviate from
the characteristic heating curve have been dissected and examined
to determine the cause for the abnormality. Deliberate faults have
been fabricated into squibs. The relationship of the specific abnor-
mality and the fault associated with it is demonstrated.
M25 Detonation of Insensitive High Explosives by a Q-Switched
Ruby Laser
L. C. Yang and V. J. Menichelli
Appl. Phys. Lett., Vol. 19, No. 11, pp. 473-475,December 1, 1971
For abstract, see Yang, L. C.
MEYER, R.
M26 DSN Progress Report for November-December 1971: Hydrogen
Maser: Low Phase Noise, L.Band Frequency Multiplier
G. Lutes, J. MacConnell, and R. Meyer
Technical Report 32-1526, Vol. VII, pp. 81-83,
February 15, 1972
For abstract, see Lutes, G.
224

MICClO, J. A.
M27 DSN Progress Report for November-December 1971: DSN
Traceability and Reporting Program: Micrographic Application
J. A. Miccio
Technical Report 32-1526, Vol. VII, pp. 185-189,
February 15, 1972
Technology has advanced the development and utilization of
higher and faster data fates for deep space satellite research;
machine computation and analysis have been relied upon by inves-
tigators and analysts for a greater percentage of the data reduction.
The investigator, analyst, and end user, however, still face a mas-
sive volume of output data. The longevity of spacecraft systems in
high data transmission modes and the "one of a kind" nature of the
data being returned increase the desire for extensive data acquisi-
tion and retention of scientific and engineering information. The
result of increased volumes of data being processed with corre-
sponding increases in magnetic tape and tab paper output poses
cost and storage problems for the processing facility and the data
analyst. An efficient and expeditious method for data reduction,
retention, and retrieval is mandatory.
Micrographic technology, i.e., microfilm processes, microforms,
and retrieval systems, combined with current computing tech-niques, affords the data user quick-look profiles and trend informa-
tion in relatively short turnaround time, as well as accessibility to
larger and more detailed data bases.
MICHEL, G.
M28 Fourier Spectroscopy With a One-Million-Point Transformation
(Translation From the Original Published in the Nouvelle
Revue d'Optique Appliqu_e, Vol. 1, pp. 3-22, 1970)
J. Connes (National Center for Scientific Research, Orsay,
France), H. Delouis (National Center for Scientific Research,
Orsay, France), P. Connes (National Center for Scientific
Research, Orsay, France), G. Guelachvili (National Centerfor Scientific Research, Orsay, France), J.-P. Maillard
(National Center for Scientific Research, Orsay, France),
and G. Michel (National Center for Scientific Research,
Orsay, France)
Technical Memorandum 33-525, March 15, 1972
For abstract, see Connes, J.
225

MINER,E.
M29 Mariner1969InfraredRadiometerResults:TemperaturesandThermalPropertiesof the MartianSurface
G. Neugebauer (California Institute of Technology),
G. M{]nch (California Institute of Technology),
H. Kieffer (University of California, Los Angeles),
S. C. Chase, Jr. (Santa Barbara Research Center), andE. Miner
Astron. J, Vol. 76, No. 8, pp. 719-749, October 1971
For abstract, see Neugebauer, G.
MOACANIN, J.
M30 Viscoelastic Behavior of Polymers Undergoing CrosslinkingReactions
J. Moacanin and J. J. Aklonis (University of SouthernCalifornia)
J Polym. Sci, Pt C: Polym. Sym, No. 35, pp. 71-76, 1971
A method was previously developed for predicting the viscoelastic
response of polymers undergoing scission reactions. In this article,
these results are now extended to include crosslinking reactions. As
for scission, at any given time the character of the network chains
is determined by the instantaneous crosslink density. For scission,
all chains were assumed to carry the same stress; for crosslinking,however, the stress is distributed between the "'new" and "old"
chains. Equations for calculating the creep response of a system
which experiences a step increase in crosslink density are derived.
M31
MORRIS, G. A.
Mars Radar Observations, a Preliminary Report
G. S. Downs, R. M. Goldstein, R. R. Green, andG. A. Morris
Science, Vol. 174, No. 4016, pp. 1324-1327,
December 24, 1971
For abstract, see Downs, G. S.
MOSESMAN, M. M.
M32 Photolysis of C02 at 1849
W. B. DeMore and M. M. Mosesman
226
J. Atmos. Sci., Vol. 28, No. 6, pp. 842-846,
September 1971
For abstract, see DeMore, W. B.
MUHLEMAN, D. O.
M33 Determination of Astrodynamic Constants and a Test of the
General Relativistic Time Delay With S-Band Range and
Doppler Data From Mariners 6 and 7
J. D. Anderson, P. B. Esposito, W. Martin, and
D. O. Muhleman (California Institute of Technology)
Space Research XI, pp. 105-112, Akademie-Verlag, Berlin,1971
For abstract, see Anderson, J. D.
MULHALL, B. D.
M34 DSN Progress Report for November-December 1971: Local and
Transcontinental Mapping of Total Electron Content
Measurements of the Earth's Ionosphere
K. W. Yip and B. D. Mulhall
Technical Report 32-1526, Vol. VII, pp. 61-67,
February 15, 1972
For abstract, see Yip, K. W.
MULLER, P. M.
M35 A Surface-Layer Representation of the Lunar Gravitational Field
L. Wong (Aerospace Corporation), G. Buechler (Aerospace
Corporation), W. Downs (Aerospace Corporation),
W. L. Sjogren, P. M. Muller, and P. Gottlieb
J. Geophys. Res., Vol. 76, No. 26, pp. 6220-6236,
September 10, 1971
For abstract, see Wong, L.
MtJNCH, G.
M36 Mariner 1969 Infrared Radiometer Results: Temperatures and
Thermal Properties of the Martian Surface
G. Neugebauer (California Institute of Technology),
G. MUnch (California Institute of Technology),
227

H. Kieffer (University of California, Los Angeles),
S. C. Chase, Jr. (Santa Barbara Research Center), andE. Miner
Astron. J., Vol. 76, No. 8, pp. 719-749, October 1971
For abstract, see Neugebauer, G.
NASH,
N01
N02
D. B.
Luminescence and Reflectance of Apollo 12 Samples
D. B. Nash and J. E. Conel
Proceedings of the Second Lunar Science Conference,
Houston, Texas, January 11-14, 1971, Vol. 3,
pp. 2235-2244, The M.I.T. Press, Cambridge, 1971
The objectives of the laboratory measurements reported in thisarticle were to: (1) compare the luminescence and reflectance
properties of Apollo 12 surface and core-sample material withthose of the surface material of Apollo 11, (2) obtain a better
estimate of the average luminescence characteristics of the lunar
surface under solar irradiation, and (3) obtain additional spectral
reflectance data on lunar samples for more accurate interpretationof telescopic observations of the lunar surface. It was found that
luminescence, thermoluminescence, and spectral reflectance prop-
erties of samples from Oceanus Procellarum are qualitatively simi-
lar to those of Mare Tranquillitatis samples. Detailed differences
are controlled by mineralogy; fines from Procellarum have higher
plagioclase content relative to glass and opaques and higher pyrox-
ene content relative to plagioclase than fines from Tranquillity.
Luminescence properties and reflectance do not vary systemati-cally with depth in the core. The variations observed are attributa-
ble to differences in relative abundances of mineral and glass
phases and are not indicative of variations in particle size, radia-
tion damage, or surface coatings on individual grains.
Objectives and Requirements of Unmanned Rover Explorationof the Moon
D. B. Nash, J. E. Conel, and F,. P. Fanale
The Moon, Vol. 3, No. 2, pp. 221-230, August 1971
The scientific value of unmanned rovers for continued lunar explo-
ration is considered in light of Apollo findings which suggest that
the Moon's surface is more heterogeneous than expected. Major
questions and investigations involving composition, internal stnlc-
ture, and thermal history are presented that form a scientific
rationale for use of unmanned rovers in the post-Apollo period of
228

lunar exploration. Visual, petrologic, chemical, and geophysicalmeasurements that are essential for an unmanned rover traverse
over previously unexplored lunar terrain are discussed. Unmanned
rovers are well-suited for low-cost, low-risk preliminary reconnais-sance where measurement of a few definitive parameters over a
wide area is more important than obtaining a wide array of
detailed results at a given site.
NEUGEBAUER, G.
NO3 Mariner 1969 Infrared Radiometer Results: Temperatures and
Thermal Properties of the Martian Surface
G. Neugebauer (California Institute of Technology),
G. M0nch (California Institute of Technology),
H. Kieffer (University of California, Los Angeles),
S. C. Chase, Jr. (Santa Barbara Research Center), andE. Miner
Astron. J., Vol. 76, No. 8, pp. 719-749, October 1971
The reduced data of the Mariner 6 and 7 infrared radiometer
experiments are presented, along with a discussion of the reduc-
tion and calibration procedures. Evidence is presented showing
that the surface of Mars is strongly nonhomogeneous in its thermal
properties, on scales ranging from those of the classical light anddark areas to the limit of resolution of the radiometers. On the
sunlit side, the mean thermal inertia, for admissible bolometric
albedos, is 0.006 (cal-cm-2-s-l/2-°K-1). The dark areas Syrtis Major
and Mare Tyrrhenum, observed at night, require thermal inertias
as high as 0.010. The temperatures measured over the circular
basin Hellas require a boiometric albedo of 0.40 and also a high
thermal inertia. The temperature measured over the south polar
cap, 148°K, provides evidence that the major constituent of the
frost deposit is CO2.
NICKLE, N. L.
NO4 Surveyer III Material Analysis Program
N. L. Nickle
Proceedings of the Second Lunar Science Conference,Houston, Texas, January 11-14, 1971, Vol. 3,
pp. 2683-2697, The M.I.T. Press, Cambridge, 1971
The Surveyor 3 components returned from the Moon by the
Apollo 12 astronauts were released for scientific investigation by
NASA on June 18, 1970. This article provides background informa-tion on return of the Surveyor 3 material and subsequent plans for
229

analysis of the returned parts. Also discussed are the environmental
conditions to which the returned material was subjected, exposure
of the spacecraft and the returned parts to solar radiation, orienta-
tion of the spacecraft, results of investigations, and future plans forthe remaining parts.
NOON,
NO5
E. L.
Nuclear Radiation Sources On.Board Outerplanet Spacecraft
E. L. Noon, G. H. Anno, and M. A. Dote
IEEE Trans. Nucl. Sci., Vol. NS-18, No. 5, pp. 50-57,October 1971
Radioisotope thermoelectric generators (RTGs) and radiation
heater units (RHUs) are presently being used or considered for
sources of electrical power and heat for the Apollo, Pioneer, andViking Projects. Both RTGs and RHUs have considerable merit if
proper precautions are taken to compensate for overall systemresponse to the nuclear radiation sources.
This article summarizes the nuclear characteristics of plutoniumfilel, which gives rise to the radiation from both RTGs and RHUs;
gives Monte Carlo estimates of the neutron and gamnm isodoseprofiles from a 2200-W(th) HELIPAK (General Electric Co. con-
ceptual-model tradename) thermoelectric generator; and concludes
with a presentation sumulary of shield thicknesses required for
several sensitive radiation experiments due to combined RTG-
RHU fields. This study is a part of a continuing program of analysis
at JPL on the evaluation of RTG radiation fields on an outerplanetspacecraft.
NORTON, R. H.
NO6 Astronomical Infrared Spectroscopy With a Connes-TypeInterferometer: I. Instrumental
R. Beer, R. H. Norton, and C. H. Seaman
Rev. Sci. Instr., Vol. 42, No. 10, pp. 1393-1403,October 1971
For abstract, see Beer, R.
23O
O'HANDLEY,D. A.
001 SimultaneousSolutionfor the Massesof thePrincipalPlanetsFromAnalysisof Optical,Radar,andRadioTrackingData
J. H. Lieske,W. G. Melbourne,D. A. O'Handley,
D. B. Holdridge, D. E. Johnson, and W. S. Sinclair
Celest. Mech., Vol. 4, No. 2, pp. 233-245, October 1971
For abstract, see Lieske, J. H.
OHTAKAY, H.
002 In-Flight Calibration of an Interplanetary NavigationInstrument
T. C. Duxbury and H. Ohtakay
J. Spacecraft Rockets, Vol. 8, No. 10, pp. 1038-1042,October 1971
For abstract, see Duxbury, T. C.
ONDRASIK, V. J.
003 DSN Progress Report for November-December 1971: Improved
Navigation Capability Utilizing Two-Station Tracking
Techniques for a Low-Declination Distant Spacecraft
K. H. Rourke and V. J. Ondrasik
Technical Report 32-1526, Vol. VII, pp. 51-60,
February 15, 1972
For abstract, see Rourke, K. H.
004 Application of New Radio Tracking Data Types to Critical
Spacecraft Navigation Problems
V. J. Ondrasik and K. H. Rourke
JPL Quarterly Technical Review, Vol. 1, No. 4, pp. 116-132,
January 1972
This article is concerned with newly envisioned Earth-based radio
tracking data types involving simultaneous or near-simultaneous
spacecraft tracking from widely separated tracking stations. These
data types are conventional tracking instrumentation analogs of the
very-long-baseline interferometry (VLBI) of radio astronomy-
hence, the name quasi-VLBI. Quasi-VLBI promises to help allevi-
ate two particularly troublesome problems encountered in inter-
planetary orbit determination: the zero declination and process
231
noise problems. This article motivates quasi-VLBI with a prelimi-
nary analysis using simplified tracking data models. The results of
accuracy analysis studies are then presented for a representativemission, Viking 1975. The results indicate that, contingent on
projected, not overly optimistic future tracking system accuracy,
quasi-VLBI can be expected to significantly improve navigationperformance over that expected of conventional tracking data
types.
OTOSH
005
I, T. Y.
A Precision Compact Rotary Vane Attenuator
T. Y. Otoshi and C. T. $telzried
IEEE Trans. Microwave Theor. Techniq., Vol. MTT-19,
No. 11, pp. 843-854, November 1971
The accurate attenuation range of many precision rotary vaneattenuators is limited to about 40 dB because of a transmission
error term not accounted for in the familiar cos 2 attenuation law.
This article presents a modified law that makes it possible to
extend the useful dynamic attenuation range. The same modified
law also makes it practical to reduce the length of the rotor
section and, therefore, to develop compact rotary vane attenuatorsthat are accurate over reduced dynamic attenuation ranges. The
modified law requires the additional calibrations of the incremental
attenuation and incremental phase change at the 90-deg vaneangle setting.
To verify the modified law, a precision compact WR 112 rotaryvane attenuator was fabricated and tested. The attenuator has a
total dynamic attenuation range of about 30 dB and a rotor section
length approximately one-third that of a conventional WR 112
attenuator. Application of the modified law resulted in good agree-ment between theoretical and measured incremental attenuations
over the total dynamic attenuation range.
PLAUNT, J. R.
PO1 Adaptive Variable-Length Coding for Efficient Compression ofSpacecraft Television Data
R. F. Rice and J. R. Plaunt
IEEE Trans. Commun. Technol., Vol. COM-19, No. 6,
pp. 889-897, December 1971
For abstract, see Rice, R. F.
232
POSNER,E.C.
P02 DSNProgressReportfor November-December1971:HidingandCoveringin a CompactMetricSpaceR. J. McElieceand E. C. Posner
Technical Report 32-1526, Vol. VII, pp. 101-105,
February 15, 1972
For abstract, see McEliece, R. J.
RATHBUN, T. W.
R01 DSN Progress Report for November-December 1971: High
Voltage Control for 400.kW Transmitter
T. W. Rathbun
Technical Report 32-1526, Vol. VII, pp. 139-141,
February 15, 1972
This article describes a high-voltage control unit, whose functions
are to bring the high voltage to a required level, provide voltage
regulation, and reduce beam modulation. This unit, which has beeninstalled in the 400-kW transmitter subsystem at two deep space
stations, utilizes all solid-state devices mounted on printed circuit
boards. The motorized potentiometer is modularized for ease of
replacement. This feature and the printed-circuit-board replace-
ment capability necessitate a minimum of maintenance by the
operators, and repairs are made by module replacement at thefield level.
REIER,
R02
M,
The Response of Covered Silicon Detectors to Monoenergetic
Gamma Rays
M. Reier
Technical Memorandum 33-524, January 15, 1972
Measurements have been made of the efficiency in detecting
gamma rays of 0.3-, 3-, and 5-mm silicon detectors covered withdifferent absorbers. Calibrated sources covering the range from279 keV to 2.75 MeV were used. The need for the absorbers to
obtain meaningful results and their contribution to the response ofthe detectors at electron biases from 50 to 200 keV are discussed
in detail. It is shown that the results are virtually independent ofthe atomic number of the absorber. In addition, the role of the
absorber in increasing the efficiency with increasing photon energy
for low bias settings is demonstrated for the 0.3-mm crystal. Quail-
233
tative explanations are given for the shapes of all curves of effi-
ciency versus energy at each bias.
RENNELS, D. A.
R03 The STAR (Self-Testing and Repairing) Computer: An
Investigation of the Theory and Practice of Fault-TolerantComputer Design
A. Avi_ienis, G. C. Gilley, F. P. Mathur, D. A. Rennels,
J. A. Rohr, and D. K. Rubin
IEEE Trans. Computers, Vol. C-20, No. 11, pp. 1312-1321,November 1971
For abstract, see Avi_ienis, A.
RENZETTI, N. A.
R04 DSN Progress Report for November-December 1971: DSNFunctions and Facilities
N. A. Renzetti
Technical Report 32-1526, Vol. VII, pp. 1-4,
February 15, 1972
The Deep Space Network (DSN), established by the NASA Office
of Tracking and Data Acquisition and under the system manage-
ment and technical direction of JPL, is designed for two-way
communications with unmanned spacecraft traveling approxi-
mately 16,000 km (10,000 mi) from earth to planetary distances.
The objectives, functions, and organization of the DSN are summa-
rized, and its three facilities-the Deep Space Instrumentation
Facility, the Ground Communications Facility, and the Space
Flight Operations Facility--are described.
R05 Tracking and Data System Final Report for the Mariner Mars
1971 Project
N. A. Renzetti
Technical Memorandum 33-523, Vol. I, March 15, 1972
The Tracking and Data System support for the Mariner Mars 1971Project was planned and implemented in close cooperation with
the project's Mission Operations and Spacecraft Systems. The
configuration of each Deep Space Network system supporting the
project is described.
Also described are new features of the Tracking and Data System
for this project, such as the new Deep Space Network comnmnd
234

system, the high-rate telemetry system, the 4800-bit/s modem
high-speed data lines from all deep space stations to the JPL Space
Flight Operations Facility and the Goddard Space Flight Center,and the 50,000-bit/s wideband data lines from the Mars Deep
Space Station to the Space Flight Operations Facility.
The Tracking and Data System performed prelaunch training and
testing and provided support for the Mariner Mars 1971/Mission
Operations System training and testing. The facilities of the Air
Force Eastern Test Range, the Deep Space Network Compatibil-
ity Test Station at Cape Kennedy, and Manned Space Flight
Network stations provided flight support coverage at launch and
during the near-Earth phase. The Deep Space Network provided
the deep-space phase support from the launch date, May 30, 1971,
through the first trajectory correction maneuver on June 4, 1971,
the end of the period covered in this volume.
Analysis of the support performance shows that all tracking and
telemetry data received on Earth were acquired, processed, and
delivered to the project. All commands were transmitted
successfully.
REY, R. D.
R06 DSN Progress Report for November-December 1971:
Automatic Angle Tracking: Angle Error Analysis and Tests
R. D. Rey
Technical Report 32-1526, Vol. VII, pp. 207-212,
February 15, 1972
Tests are being developed to measure the angle errors of the 26-
m-diameter antenna stations. Analysis is performed in order to
define performance requirements. Receiver degradation due to the
mean and variance of the angle error is determined using an
approximation of the antenna gain pattern. The equation for the
angle error variance is determined. Measured data were comparedwith the theoretical results and were found to agree well.
RHEIN,
RO7
R. A.
New Polymer Systems: Chain Extension By Dianhydrides
R. A. Rhein and J. D. Ingham
JPL Quarterly Technical Review, Vol. 1, No. 4, pp. 97-103,
January 1972
New highly stable polymers are required for materials applications
on future long-term planetary missions. This article presents the
235

results of a systematic investigation on the use of anhydrides to
prepare stable elastomeric materials using mild reaction condi-
tions. The three anhydrides investigated were found to provide
effective chain extension of hydroxy-terminated poly(alkylene ox-
ides) and poly(butadienes). These were tetrahydrofuran tetracar-
boxylic dianhydride, pyromellitic dianhydride, and benzophenone
tetracarboxylic dianhydride. The most effective catalyst investi-
gated was ferric acetylacetonate, which resulted in chain extension
at 333 K (60°C). A novel feature of these anhydride reactants isthat they are difunctional as anhydrides, but tetrafunctional if
conditions are selected that lead to reaction of all carboxyl groups.Therefore, chain extension can be effected and then followed by
crosslinking via the residual carboxyl groups.
RHO, J. H.
R08 Absence of Porphyrins in an Apollo 12 Lunar Surface Sample
J. H. Rho, A. J. Bauman, T. F. Yen (University of Southern
California), and J. Bonner (California Institute of
Technology)
Proceedings of the Second Lunar Science Conference,
Houston, Texas, January 11-14, 1971, Vol. 2,
pp. 1875-1877, The M.I.T. Press, Cambridge, 1971
As described in this article, no porphyrins were found in 15 g of
the Apollo 12 lunar fines from the Ocean of Storms under the
conditions in which porphyrins would have been detected had they
been present in amounts as small as 10 -14 mole. An instrumental
artifact at 600, 630, and 680 nm that resembled porphyrin peaks
was observed in the control sample in which no porphyrins were
present. This was produced by the interaction of grating anomalies
with light scattering materials and was associated with a definite
plane of polarization. When the data from the grating monochro-
mator were corrected, or when prism monochromator data wereused, no fluorescence attributable to the presence of porphyrinswas found.
However, in the organic phase of the lunar sample extract, specieswhich fluoresced at 365 to 380 nm when activated at 300 nm were
found to be present. The corresponding aqueous phase of the
sample extract also contained a material which exhibits a fluores-cence maximum at 415 nm. All fluorescence attributable to or-
ganic materials in the lunar sample was also found in the Lunar
Receiving Laboratory sand blank in equivalent amounts.
236
RICE,R. F.
R09 AdaptiveVariable-LengthCodingfor EfficientCompressionofSpacecraftTelevisionDataR. F. Rice and J. R. Plaunt
IEEE Trans. Commun. Technol., Vol. COM-19, No. 6,
pp. 889-897, December 1971
An adaptive variable-length coding system is presented. Although
developed primarily for the proposed Grand Tour missions, many
features of this system clearly indicate a much wider applicability.
Using sample-to-sample prediction, the coding system produces
output rates within 0.25 bit/picture element (pixel) of the one-
dimensional difference entropy for entropy values ranging from
0-8 bits/pixel. This is accomplished without the necessity of stor-
ing any code words. Performance improvements of 0.5 bit/pixel
can be simply achieved by utilizing previous line correlation.
A basic compressor, using concatenated codes, adapts to rapid
changes in source statistics by automatically selecting one of three
codes to use for each block of 21 pixels. The system adapts to less
frequent, but more dramatic, changes in source statistics by adjust-
ing the mode in which the basic compressor operates on a line-to-
line basis. Furthermore, the compression system is independent of
the quantization requirements of the pulse-code modulation
system
RICHARDS, J. H.
R10 A Simple Electrostatic Model for the Chromatographic
Behavior of the Primary Dithizonates
A. J. Bauman and J. H. Richards
Separ. Sci., Vol. 6, No. 5, pp. 715-725, October 1971
For abstract, see Bauman, A. J.
RIEBLING, R. W.
Rll Experimental Evaluation of High.Thrust, Throttleable,
Monopropellant Hydrazine Reactors
R. W. Riebling and G. W. Kruger
Technical Report 32-1551, March 1, 1972
Throttleable monopropellant hydrazine catalytic reactors of a size
applicable to a planetary landing vehicle have been designed,fabricated, and tested. An experimental evaluation of two 2670-N
237

(600-1bf) reactor designs has been conducted. The steady-state and
dynamic characteristics of the thruster/valve combinations have
been determined. The results of the testing, including the engine
characteristic velocity, smoothness of combustion, insensitivity to
heat sterilization, and response during various simulated duty cy-
cles, are presented and discussed. No problems of a fundamental
nature were encountered as a result of rapid dynamic throttling ofthese large hydrazine reactors.
RINDERLE, E. A.
R12 DSN Progress Report for November-December 1971: A
Comparison of Cowell's Method and a Variation-of-Parameters
Method for the Computation of Precision Satellite Orbits:Addendum 1
S. S. Dallas and E. A. Rinderle
Technical Report 32-1526, Vol. VII, pp. 32-36,February 15, 1972
For abstract, see Dallas, S. S.
ROHR,
R13
J. A,
The STAR (Self.Testing and Repairing) Computer: AnInvestigation of the Theory and Practice of Fault.Tolerant
Computer Design
A. Avi_ienis, G. C. Gilley, F. P. Mathur, D. A. Rennels,
J. A. Rohr, and D. K. Rubin
IEEE Trans. Computers, Vol. C-20, No. 11, pp. 1312-1321,November 1971
For abstract, see Avi_ienis, A.
ROSCHKE, E. J.
R14 Partially Ionized Gas Flow and Heat Transfer in the
Separation, Reattachment, and Redevelopment RegionsDownstream of an Abrupt Circular Channel Expansion
L. H. Back, P. F. Massier, and E. J. Roschke
Trans. ASME, Ser. C: J. Heat Transl., Vol. 94, No. 1,
pp. 119-127, February 1972
For abstract, see Back, L. H.
238

ROSENTHAL,L. A.
R15 ElectrothermalFollowDisplayApparatusfor ElectroexplosiveDeviceTesting
L. A. Rosenthal (Rutgers University) and V. J. Menichelli
Technical Report 32-1554, March 15, 1972
By employing a self-balancing bridge, it is possible to ascertain the
electrothermal and nonlinear behavior of an electroexplosive de-
vice. A sinusoidal current is passed through the device that pro-
vides a signal in the form of a unique Lissa}ous display. This
display can be qualitatively evaluated, and abnormal units can be
readily detected. This technique for evaluating electroexplosive
devices is described in this report.
R16 Fault Determinations in Electroexplosive Devices by
Nondestructive Techniques
V. J. Menichelli and L. A. Rosenthal (Rutgers University)
Technical Report 32-1553, March 15, 1972
For abstract, see Menichelli, V. J.
ROURKE, K. H.
R17 DSN Progress Report for November-December 1971: Improved
Navigation Capability Utilizing Two-Station Tracking
Techniques for a Low-Declination Distant Spacecraft
K. H. Rourke and V. J. Ondrasik
Technical Report 32-1526, Vol. VII, pp. 51-60,
February 15, 1972
This article presents the results of an uncompromised accuracy
analysis study investigating the advantages of using two-stationsimultaneous tracking (quasi very long baseline interferometry)
techniques to determine the far-approach orbit of a distant space-
craft at a low declination angle. The analysis is restricted to batch
filtering techniques, but includes the effects of unmodeled space-
craft accelerations. By properly processing the simultaneous dop-pler and simultaneous range data, the errors resulting from the
low-declination geometry are reduced by a factor of two to four,
and the errors resulting from unmodeled spacecraft accelerations
are reduced by two orders of magnitude.
R18 Application of New Radio Tracking Data Types to Critical
Spacecraft Navigation Problems
239
V. J. Ondrasik and K. H. Rourke
JPL Quarterly Technical Review, Vol. 1, No. 4, pp. 116-132,
January 1972
For abstract, see Ondrasik, V. J.
ROWE, W. M.
R19 Stress Analysis and Design of Silicon Solar Cell Arrays and
Related Material Properties
A. M. Salama, W. M. Rowe, and R. K. Yasui
Technical Report 32-1552, March 1, 1972
For abstract, see Salama, A. M.
RUBIN, D. K.
R20 The STAR (Self.Testing and Repairing) Computer: An
Investigation of the Theory and Practice of Fault.Tolerant
Computer Design
A. Avi_ienis, G. C. Gilley, F. P. Mathur, D. A. Rennels,
J. A. Rohr, and D. K. Rubin
IEEE Trans. Computers, Vol. C-20, No. 11, pp. 1312-1321,November 1971
For abstract, see Avi_ienis, A.
RUPE, J. H.
R21 Liquid-Phase Mixing of Bipropellant Doublets
F. W. Hoehn, J. H. Rupe, and J. G. Sotter
Technical Report 32-1546, February 15, 1972
For abstract, see Hoehn, F. W.
SALAMA, A. M.
S01 Stress Analysis and Design of Silicon Solar Cell Arrays and
Related Material Properties
A. M. Salama, W. M. Rowe, and R. K. Yasui
Technical Report 32-1552, March 1, 1972
Mechanical failures that may arise in components of composite
solar cell arrays in a thermal environment can be avoided by
240

properly selecting compatible material for the components and
introducing certain geometric changes in a proposed design. This
report provides the solar cell array designer with a rational system-
atic approach. A prerequisite to this approach is the characteriza-
tion of material properties at different temperatures. Significantdata were obtained for the thermal behavior of the silicon solar
cell material and adhesives. Upon determining the mechanical and
thermal material properties of the components of the solar cell
array, utilizing a finite-element idealization for predicting the
stress fields in the components, and employing the von Mises
failure criterion, potential failure areas in various design configu-
rations in a given thermal environment can be identified. Guide-
lines and means to optimize a given design are illustrated by two
examples.
SCHORN, R. A. J.
S02 High Dispersion Spectroscopic Studies of Mars: V. A Search
for Oxygen in the Atmosphere of Mars
J. S. Margolis, R. A. J. Schorn, and L. D. G. Young
Icarus, Vol. 15, No. 2, pp. 197-203, October 1971
For abstract, see Margolis, J. S.
SCHURMEIER, H. M.
S03 The 1969 Mariner View of Mars
H. M. Schurmeier
Proceedings of the Twenty-First International Astronautical
Congress, Constance, Germany, October 4-10, 1970,pp. 193-210, North-Holland Publishing Co., Amsterdam,1971
The second step in the U.S. program to explore Mars by spacecraft
was completed by the Mariner mission in 1969. This article pre-
sents a brief summary of that mission, highlighting the planetary
encounter and discussing the various scientific experiments. Thescientific results analyzed to date are also summarized.
SEAMAN, C. H.
S04 Astronomical Infrared Spectroscopy With a Connes-TypeInterferometer: I. Instrumental
R. Beer, R. H. Norton, and C. H. Seaman
241

Rev. Sci. Instr., Vol. 42, No. 10, pp. 1393-1403,October 1971
For abstract, see Beer, R.
SEIDEL, B. L.
S05 Summary of Mariner 6 and 7 Radio Occultation Results on the
Atmosphere of Mars
A. J. Ktiore, G. Fjeldbo, and B. L. Seidel
Space Research XI, pp. 165-175, Akademie-Verlag, Berlin,1971
For abstract, see Kliore, A. J.
SHAFER, J. I.
S06 Initiation System for Low Thrust Motor Igniter
L. D. Strand, D. P. Davis, and J. I. Shafer
Technical Memorandum 33-520, January 1, 1972
For abstract, see Strand, L. D.
S07 Solid.Propellant Motors for High-Incremental-Velocity Low-
Acceleration Maneuvers in Space
J. I. Shafer
Technical Memorandum 33-528, March 1, 1972
Recent advancements in motor technology offer promise of extend-
ing the applicability of solid-propellant rockets into a regime of
high-performance long-burning tasks beyond the capability of ex-
isting motors. Successful static test firings have demonstrated the
feasibility of: (1) utilizing fully case-bonded end-burning propellant
charges without mechanical stress relief, (2) using an all-carbon
radiative nozzle markedly lighter than the flight-weight ablative
nozzle it replaces, and (3) producing low spacecraft acceleration
rates during the thrust transient through a controlled-flow igniter
that promotes operation beyond the L ° combustion limit. It re-
mains now to show that a 350-kg-sized motor, with all features
integrated, performs reliably and produces the predicted motorperformance, a mass fraction of 0.92 with a vacuum specific
impulse of 2840 N/kg.
242
SHINOZUKA,M.
S08 Onthe FirstExcursionProbabilityin StationaryNarrow-BandRandomVibration
J.-N. Yang and M. Shinozuka (Columbia University)
Trans. ASME, Ser. E: J. Appl. Mech., Vol. 38, No. 4,
pp. 1017-1022, December 1971
For abstract, see Yang, J.-N.
SHOEMAKE, G. R.
S09 Rare Gases of the Atmosphere: Gas Chromatography Using a
Thermal Conductivity Detector and a PalladiumTransmodulator
J. E. Lovelock, P. G. Simmonds, and G. R. Shoemake
Anal. Chem., Vol. 43, No. 14, pp. 1958-1961,December 1971
For abstract, see Lovelock, J. E.
SIEGMETH, A. J.
$10 DSN Progress Report for November-December 1971: Pioneer
Mission Support
A. J. Siegmeth
Technical Report 32-1526, Vol. VII, pp. 5-16,
February 15, 1972
The Pioneer F and G missions are planned to extend the explora-
tion of the solar system toward the outer planets. The major
objectives will be the first penetration of the asteroid belt and a
Jupiter flyby. Since Jupiter missions require new types of solar
orbits, some adaptations o[ the tracking and data acquisition capa-
bilities and resources are necessary to meet effectively the require-
ments of these new challenges. The Pioneer F and G missioncharacteristics and the near-Earth and deep-space phase support
plans are delineated in this article.
SILVER, R. H.
$11 A Study of the Frictional and Stick-Slip Behavior of Magnetic
Recording Tapes
S. H. Kalfayan, R. H. Silver, and J. K. Hoffman
243

TechnicalReport32-1548, April 1, 1972
For abstract, see Kalfayan, S. H.
SIMKO, G. J.
$12 Dry-Heat Resistance of Bacillus Subtilis Var. Niger Spores onMated Surfaces
G. J. Simko, J. D. Devlin, and M. D. Wardle
Appl. Microbiol., Vol. 22, No. 4, pp. 491-495, October 1971
Bacillus subtilis var. niger spores were placed on the surfaces of
test coupons manufactured from typical spacecraft materials (stain-
less steel, magnesium, titanium, and aluminum). These coupons
were then juxtaposed at the inoculated surfaces and subjected to
test pressures of 0, 1000, 5000, and 10,000 psi. Tests were con-
ducted in ambient, nitrogen, and helium atmospheres. While under
the test pressure condition, the spores were exposed to 125°C for
intervals of 5, 10, 20, 50, or 80 min, with survivor data being
subjected to a linear regression analysis that calculated decimal
reduction times. Differences in the dry-heat resistance of the test
organism resulting from pressure, atmosphere, and material wereobserved.
SIMMONDS, P. G.
$13 Rare Gases of the Atmosphere: Gas Chromatography Using aThermal Conductivity Detector and a PalladiumTransmodulator
J. E. Lovelock, P. G. Simmonds, and G. R. Shoemake
Anal. Chem., Vol. 43, No. 14, pp. 1958-1961,December 1971
For abstract, see Lovelock, J. E.
SIMON, M. K.
$14 On the Selection of an Optimum Design Point for Phase-
Coherent Receivers Employing Band.Pass Limiters
M. K. Simon
JPL Quarterly Technical Review, Vol. 1, No. 4, pp. 69-77,January 1972
In the design of phase-coherent receivers employing band-pass
limiters, it is customary to specify system performance relative to
its value at a fixed design point. For a given design point, an
244
optimum tradeoff can be found between the power allocated to
the carrier and the sideband signals. This article describes an
attempt to further improve the performance of such coherent
carrier systems by optimizing the design point based upon a given
practical optimizing criterion. The single-channel system is treatedin detail, and a brief discussion is given on how to extend the
technique to a two-channel system.
SIMON, W.
S15 Nozzle Exhaust Plume Backscatter Experiment Using the JPL
Molsink Facility
W. Simon
JPL Quarterly Technical Review, Vol. 1, No. 4, pp. 89-96,
January 1972
The flow field of gases and scattered particulates in the forward
direction from a rocket nozzle is not presently predictable on a
quantitative basis. Qualitative tests have been made with water
injected through the nozzle wall and the droplet trajectories ob-
served photographically. These tests were conducted for nozzles
where the boundary layer is a significant portion of the flow. The
tests indicated that both gases and particulate matter will be found
in the region outside of the plume boundaries that can be calcu-
lated using current analytical techniques. A test program is being
conducted in the JPL Molsink facility to measure the distribution
of exhaust gases from small nozzles using an electron beam/
photomultiplier system and a matrix of quartz crystal microbal-
ances. Analysis of data from these tests, using nitrogen, will result
in a better understanding of the backscattering flow field. Calibra-
tion tests of the Molsink, using simulated hydrazine exhaust pro-
duct gas mixtures, have also been conducted, and future tests with
small hydrazine thrusters are being considered. The test program
and results of the pumping calibration tests with hydrazine (simu-
lated hydrazine exhaust products) are reported.
SINCLAIR, W. S.
$16 Simultaneous Solution for the Masses of the Principal Planets
From Analysis of Optical, Radar, and Radio Tracking Data
J. H. Lieske, W. G. Melbourne, D. A. O'Handley,
D. B. Holdridge, D. E. Johnson, and W. S. Sinclair
Celest. Mech., Vol. 4, No. 2, pp. 233-245, October 1971
For abstract, see Lieske, J. H.
245

SJOGREN,W. L.
$17 A Surface-LayerRepresentationof theLunarGravitationalField
L. Wong (Aerospace Corporation), G. Buechler (Aerospace
Corporation), W. Downs (Aerospace Corporation),
W. L. Sjogren, P. M. Muller, and P. Gottlieb
J. Geophys. Res., Vol. 76, No. 26, pp. 6220-6236,
September 10, 1971
For abstract, see Wong, L.
$18 Lunar Gravity Estimate: Independent Confirmation
W. L. Sjogren
J. Geophys. Res., Vol. 76, No. 29, pp. 7021-7026,October 10, 1971
Reduction of 2% days of Lunar Orbiter 4 radio tracking data has
provided an independent estimate of the low-degree sphericalharmonic coefficients in the lunar potential model. The estimate is
in good agreement with previous results and confirms that the
Moon is essentially homogeneous. These doppler data, never incor-
porated in other gravity estimates, were obtained at relatively high
spacecraft altitudes (2700-6000 kin). These high-altitude data al-
lowed the model to fit to the noise level of 1 mm/s unlike previous
results, where systematic residuals of tens of millimeters per sec-
ond occurred, owing to local gravity anomalies detectable at low
spacecraft altitudes (= 100 kin).
SLAUGHTER, D. W.
$19 DSN Progress Report for November-December 1971: Hi-Rel
Integrated Circuit Packaging Development
D. W. Slaughter
Technical Report 32-1526, Vol. VII, pp. 113-123,
February 15, 1972
Standardized modular hardware for the packaging of Deep Space
Instrumentation Facility integrated circuit logic systems is de-
scribed. The status of development is reported, and a schedule is
given for the production of station-quality hardware.
246
SMITH,
$20
J° G.
Bias and Spread in Extreme V_lue Theory Measurements of
Probability of Error
J. G. Smith
JPL Quarterly Technical Review, Vol. 1, No. 4, pp. 58-68,
January 1972
Performance tests of communication systems characterized by low
bit rates and high data reliability requirements frequently utilizeclassical extreme value theory (EVT) to avoid the excessive test
times required by bit error rate (BER) tests. If the underlying noise
is gaussian or perturbed gaussian, EVT will produce results eitherbiased or with excessive spread if an insufficient number of test
samples are used. This article examines EVT to explain the causeof the bias and spread, gives experimental verification, and points
out procedures that minimize these effects. Even under theseconditions, however, EVT test results are not particularly more
significant than BER test results.
SOTTER, J. G.
$21 Liquid-Phase Mixing of Bipropellant Doublets
F. W. Hoehn, J. H. Rupe, and J. G. S0tter
Technical Report 32-1546, February 15, 1972
For abstract, see Hoehn, F. W.
SRIDHAR, R.
$22 Analytical Methods for Performance Evaluation of Nonlinearfilters
A. K. Bejczy and R. Sridhar (University of California, Los
Angeles)
J. Math. Anal. Appl., Vol. 36, No. 3, pp. 477-505,December 1971
For abstract, see Bejczy, A. K.
STELZRIED, C. T.
$23 A Precision Compact Rotary Vane Attenuator
T. Y. Otoshi and C. T. Stelzried
247
IEEE Trans. Microwave Theor. Techniq., Vol. MTT-19,
No. 11, pp. 843-854, November 1971
For abstract, see Otoshi, T. Y.
STIVER, R A
$24 DSN Progress Report for November-December 1971: Mark IliA
IBM Computer Configuration Expansion
R. A. Stiver
Technical Report 32-1526, Vol VII, pp 126-130,
February 15, 1972
In order to meet Pioneer Project requirements while continuing to
support the Mariner Mars 1971 mission, it has been necessary to
expand the Space Flight Operations Facility computer configura-
tion. This expansion has been implemented in the following areas:
high-speed data input/output interface, display control and switch-
ing, subchannel extension and user device switching, and magnetic
tape drives. Expansion was accomplished with minimum impact
on operating system design.
STRAND, L. D.
$25 Initiation System for Low Thrust Motor Igniter
L. D. Strand, D. P. Davis, and J. I. Shafer
Technical Memorandum 33-520, January 1, 1972
A test program was carried out to demonstrate an igniter motor
initiation system utilizing the bimetallic material Pyrofuze (trade-
mark of Pyrofuze Corporation) for a solid-propellant rocket with
controlled low rate of thrust buildup. The program consisted of a
series of vacuum ignition tests using a slab burning window motor
that simulated the principal initial ballistic parameters of the full-
scale igniter motor. A Pyrofuze/pyrotechnic igniter system wasdemonstrated that uses a relatively low electrical current level for
initiation and that eliminates the necessity of a pyrotechnic squib,
with its accompanying accidental firing hazards and the typical
basket of pyrotechnic pellets. The Pyrofuze ignition system does
require an initial constraining of the igniter motor nozzle flow,
and, at the low initiating electrical current level, the ignition delay
time of this system was found to be quite sensitive to factors
affecting the local heat generation or loss rates.
248
SWARD,A.
$26 Measurementof thePowerSpectralDensityof Phaseof theHydrogenMaser
A. Sward
JPL Quarterly Technical Review, Vol. 1, No. 4, pp. 30-33,
January 1972
Hydrogen masers are being developed by JPL to satisfy the needs
of the Deep Space Network for improved frequency standards in
order to achieve better timing accuracies, reduced doppler residu-
als, and lower phase noise in the tracking system. Performance
data for the JPL hydrogen masers are given in two forms: time-
domain performance, useful for analyzing time-keeping systems
and doppler systems; and frequency-domain performance, useful
for analyzing tracking systems. Particular attention is given to
frequency-domain performance, as obtained from both time-do-main measurements and direct measurements.
THOMAS, J. B.
TO1 DSN Progress Report for November-December 1971: An
Analysis of Long Baseline Radio Interferometry
J. B. Thomas
Technical Report 32-1526, Vol. VII, pp 37-50,
February 15, 1972
The VLBI (very long baseline interferometer) cross-correlation
procedure is analyzed for both a natural point source and a com-
pletely incoherent extended source. The analysis is based on a
plane wave description of a radio signal that consists of stationaryrandom noise. A formulation of the time delay is developed on the
basis of plane wave phase. A brief discussion is devoted to small
time delay corrections that are generated by relativistic differencesin clock rates in the various coordinate frames. The correlation
analysis, which includes electronic factors such as amplitude and
phase modulation and the heterodyne process, leads to expressions
for fringe amplitude and fringe phase. It is shown that the cross-correlation function for an extended source is identical to the
point-source expression if one adjusts the fringe amplitude to
include the transform of the brightness distribution. Examples of
diurnal paths in the u-v plane are presented for various baselines
and source locations. Finally, delay and delay rate measurement
accuracy is briefly discussed.
249

THOMPSON, T. W.
TO2 Map of Lunar Radar Reflectivity at 7.5-m Wavelength
T. W. Thompson (CornelI-Sydney University AstronomyCenter)
Icarus, Vol. 13, No. 3, pp. 363-370, November 1970
The radar reflectivity of a substantial portion of the Earth-visible
lunar surface has been mapped at a wavelength of 7.5 m. This
mapping-the first to use interferometric techniques in lunar obser-
vations-demonstrated that delay-doppler mapping of the Moon is
possible at wavelengths of several meters. In the map that was
obtained, the maria at a given angle of incidence had echo powers
approximately half of those of highlands at the same angle ofincidence. Also, an enhancement associated with the lunar crater
Tycho was observed.
TOTH,
T03
R. A,
Global Studies of Atmospheric Pollutants and TraceConstituents
R. A. Toth (California Institute of Technology) and
C. B. Farmer (California Institute of Technology)
AIAA Preprint 71-1109, ACS (American Chemical Society)/
AIAA (American Institute of Aeronautics and Astronautics)/
EPA (Environmental Protection Agency)/IEEE (Institute of
Electrical and Electronic Engineers)/ISA (Instrument Society
of America)/NASA (National Aeronautics and Space
Administration)/NOAA (National Oceanographic andAtmospheric Administration) Joint Conference on Sensing of
Environmental Pollutants, Palo Alto, California,
November 8-10, 1971
A high-speed, high-resolution, Fourier interferometer operating in
the 1- to 5-/x spectral region can best meet the needs for remotely
detecting and monitoring various molecular species in the atmo-
sphere. An operational breadboard version of the instrument exists.
Spectra obtained from ground sites in the Los Angeles area dem-
onstrate the presence of several gases in the atmosphere. Spectra
in the 2.1- and 2.3-/z regions are presented, from which relativeabundances of carbon dioxide and carbon monoxide are derived.
Ground-based operations and aircraft flights with the present in-
strument verify the potential operational capacity for a satellite
instrument. A discussion is presented on the use of the instrument
from a spacecraft.
250

TO4 Line Strengths of N20 in the 2.9 Micron Region
R. A. Toth
J. Molec. Spectrosc., Vol. 40, No. 3, pp. 588-604,December 1971
The line strengths of the bands 10°1-00°0, 02°1-00°0, and 11q-
0110 of N20 have been measured with low sample pressures and
high resolution (0.031-0.33 cm-1). The data are analyzed to deter-
mine the band strengths and dipole moment matrix elements. At
300°K the strengths: of the two E-E bands in order of increasing
frequency are 1.77 and 36.9 cm-Z-atm -1. The band strength of the1r-Tr band is 4.25 cm-2-atm -1 at 300°K. Five lines of the band 0600 -
00°0 and two lines of the 060-0000 bands have been observed in
the spectrum of the 10°1-00°0 band. The strengths and frequenciesof these lines have been measured. These results are used in
conjunction with perturbation theory to determine the Fermi
interaction term W. Molecular constants and the band strength ofthe 0600-0000 band are obtained from W and the data. The band
strength of the 0600-0000 band is 0.0092 cm-Z-atm -1 at 300°K.
TO5 Self-Broadened and N 2 Broadened Linewidths of N20
R. A. Toth
J. Molec. Spectrosc., Vol. 40, No. 3, pp. 605-615,December 1971
The self and Nz-broadened linewidths of N20 have been measured
directly in the 10°1-00°0 and 02°1-00°0 bands of N20 at 297°Kwith a resolution of 0.03 cm -1. The experimental results are com-
pared with linewidths calculated from Anderson's impact theory as
amplified by Tsao and Curnutte. The agreement between experi-
ment and theory is good for both types of broadening. Best-fit
values for the quadrupole moments and hard-sphere diameters of
N20 and N 2 are listed and compared with previous values. Thebest-fit values were used to calculate the N20 + N 2 linewidths at
temperatures of 180, 220, and 260°K.
TSAY, F.-D.
TO6 Ferromagnetic Resonance of Lunar Samples
F.-D. Tsay (California Institute of Technology),S. I. Chan (California Institute of Technology), and
S. L. Manatt
251

Geochim. Cosmochim. Acta, Vol. 35, No. 9, pp. 865-875,
September ]97]
Evidence is presented to show that the electron-spin-resonance
spectra observed for a selection of Apollo 11 lunar samples arise
from the ferromagnetic centers consisting of metallic Fe. A model
study to simulate the polycrystalline spectra has been carried out,
from which it was possible to ascertain with some degree of
certainty the size and shape of the ferromagnetic centers as well asthe metallic iron content. Some variations in the metallic Fe
content have been noted in these samples, e.g., between rocks andfine soil.
T07 Magnetic Resonance Studies of Apollo 11 and Apollo 12Samples
F.-D. Tsay (California Institute of Technology),
S. I. Chan (California Institute of Technology), andS. L. Manatt
Proceedings of the Second Lunar Science Conference,
Houston, Texas, January 11-14, 1971, Vol. 3,
pp. 2515-2528, The M.I.T. Press, Cambridge, 1971
This article describes the electron-spin-resonance (ESR) studies at
both X-band (9.5 GHz) and K-band (34.8 GHz) frequencies that
have been carried out on a selection of Apollo 11 and Apollo 12
lunar samples. On the basis that no significant temperature depen-
dence of the absorption intensity is noted, together with the result
that the signal intensity is at least three orders of magnitude
greater than that expected for possible paramagnetism, the broad,
asymmetric resonance signal centered at g = 2.09 _+0.03 has been
assigned to ferromagnetic centers. A model study to simulate the
polycrystalline spectra using computer simulation techniques has
been carried out, from which it was possible to ascertain with
some degree of certainty the size and shape of the ferromagnetic
centers and to ascertain that the ferromagnetism is due to metallic
Fe particles. Metallic Fe contents have been measured for all lunar
samples studied, and these range in concentration from 0.001 to
0.50 wt%. These results suggest an apparent correlation between
the metallic Fe contents and the geological and surface exposureages of the samples.
Weak paramagnetic resonances attributable to octahedraily coor-dinated Mn z+ ions have also been observed in some samples in
which the metallic Fe content is either low or partially removed.
From the g value (2.002 _+0.002) and the nuclear hyperfine cou-
pling constant (-95.0 _+2.0 gauss), it appears that these resonances
originate from Mn(H20)62+. No ESR signals ascribable to free
252

electrons and/or holes, which would be indicative of radiation
damage, or Ti 3+ have been detected in these samples.
VAN DER CAPELLEN, A. G.
•VOI Development of a 20-W Solid-State S-Band Power Amplifier
A. G. van der Capellen
JPL Quarterly Technical Review, Vol. 1, No. 4, pp. 43-48,
January 1972
As an alternative to the use of traveling-wave-tube amplifiers in
spacecraft with long-life mission requirements, JPL is developing asolid-state 20-W S-band power amplifier. Traveling-wave-tube am-
plifiers have limited reliability because of the relative short life ofthe cathode and the complexity of the power supply. A solid-state
amplifier with an output of 20 W at 2295 MHz, a dc/RF efficiency
of 38%, and a gain of 27 dB has been developed. This article
describes the physical and electrical performance of the solid-state
amplifier.
VON ROOS, O. H.
V02 Method for the Solution of Electromagnetic Scattering
Problems for Inhomogeneous Dielectrics as a Power Series in
the Ratio (Dimension of Scatterer)/Wavelength
O. H. yon Roos
J. Appl. Phys., Vol. 42, No. 11, pp. 4197-4201,October 1971
In this article, the definitive work of Stevenson for the Rayleigh
series expansion of electromagnetic scattering from homogeneousscatterers is extended to inhomogeneous scatterers. Furthermore, it
is shown that a determination of the strength of the multipoles
induced by the incident radiation is sufficient to determine the farfield and, therefore, the scattering cross section, without relying on
an awkward expansion and subsequent matching of far and nearfields. The calculations are thus enormously simplified.
WANG, J. T.
WOl Cold.Welding Test Environment
J. T. Wang
253

Technical Report 32-1547, February 1, 1972
Spacecraft designers concerned with the development of excessive
friction or cold-welding in mechanisms with moving parts operat-
ing in space vacuum for an extended period should consider cold-
weld qualification tests. To establish requirements for effective test
programs, a flight test was conducted, and the results were com-
pared with ground test data from various facilities. Sixteen typical
spacecraft material couples were mounted on an experimental
research satellite (ERS-20), where a motor intermittently drove the
spherical moving specimens across the faces of the flat fixed
specimens in an oscillating motion. Friction coefficients were mea-
sured over a period of 14-too orbital time. Surface-to-surface
sliding was found to be the controlling factor of generating friction
in a vacuum environment. Friction appears to be independent of
passive vacuum exposure time.
Prelaunch and postlaunch tests identical to the flight test were
performed in a TRW oil-diffusion-pumped ultrahigh vacuum (1.33X 10 -6 N/m 2) chamber. Only 50% of the resultant data agreed
with the flight data due to pump oil contamination. Subsequently,
identical ground tests were run in the JPL Molsink, a unique
ultrahigh vacuum facility, and a TRW ion-pumped vacuum cham-
ber. The agreement (,90%) between data from these tests and the
flight data established the adequacy of these test environments andfacilities.
WARDLE, M. D.
W02 Dry.Heat Resistance of Bacillus Subtilis Var. Niger Spores onMated Surfaces
G. J. Simko, J. D. Devlin, and M. D. Wardle
Appl. Microbiol., Vol. 22, No. 4, pp. 491-495, October 1971
For abstract, see Simko, G. J.
WELLS, R. A.
W03 DSN Progress Report for November-December 1971: High.Rate
Telemetry Preprocessor for the SFOF 360/75 Computers
R. A. Wells
Technical Report 32-]526, Vol. VII, pp. 109-112,
February 15, 1972
The concluding phase has been reached for an advanced develop-
ment task to determine the feasibility of implementing a com-
puter-based system to preprocess digitally encoded block-format-
254
ted video data at serial rates up to 250 kbits/s. A software model
has been completed showing that under typical mission conditions
the Space Flight Operations Facility (SFOF) 360/75 primary com-
puter would be virtually preempted by raw video data at this rate.
A high-rate telemetry preprocessor or some similar concept would
relieve the primary computer in the central processing system of
the severe loading that could result from injecting unpreprocessed
video information directly into the SFOF 360/75 serial inputchannels in a real-time or near-real-time environment. A recom-
mendation is made that the technique of video preprocessing be
pursued in order to meet the known objectives of future missions.
W04
WILLIAMS, W. F.
Reduction of Near-In Sidelobes Using Phase Reversal Aperture
Rings
W. F. Williams
JPL Quarterly Technical Review, Voh 1, No. 4, pp. 34-42,
January 1972
Spacecraft antennas having high gain and extremely low sidelobes
will be needed for communications satellites. Low sidelobe per-
formance is needed to isolate beams of multibeam systems using
the same carrier frequency (frequency re-use). Because of a limited
allowable spectrum for transmission, frequency re-use may be
necessary. A technique for reducing near-in lobes by cancellation is
described. This technique takes a small portion of the radiation
from the antenna aperture and generates the near-in lobes, which
are then fed out-of-phase relative to the main signal. Results of
sample cases indicate that the first three lobes can be nearly
eliminated at a 40% reduction in aperture efficiency.
WINKELSTEIN, R.
W05 DSN Progress Report for November-December 1971: Spectral
Estimate Variance Reduction by Averaging Fast-Fourier
Transform Spectra of Overlapped Time Series Data
R. Winkelstein
Technical Report 32-1526, Vol. VII, pp. 74-80,
February 15, 1972
An analysis is made of the variance of the spectral estimates
calculated in the DSN by two methods, namely the correlationmethod and the Fast Fourier Transform (FFT) method. It is shown
that the FFT method using consecutive sequences of data samples
produces the same variance as the correlation method. However, a
255
reduction of over 20% in variance can be obtained by using the
FFT method with overlapped sequences of data. A relationship is
derived giving the variance reduction as a function of the amount
of data sequence overlap.
WlNN,
W06
F. B.
DSN Progress Report for November-December 1971:
Tropospheric Refraction Calibrations and Their Significance on
Radio.Metric Doppler Reductions
F. B. Winn
Technical Report 32-1526, Vol. VII, pp. 68-73,
February 15, 1972
This article describes the tropospheric refraction algorithm used in
the Mariner Mars 1971 tracking data reductions and orbit determi-
nation effort; this algorithm differs from models used to support
past missions and performs two times better than the stated mis-
sion requirement. Although single-pass reductions of doppler track-
ing data are extremely influenced by tropospheric refraction mod-
els, fits to doppler acquired over large time periods, weeks or
months, are influenced only slightly, in that the tropospheric
refraction corruption of the doppler observables simply is left in
the after-the-fit observed minus computed residuals.
WONG, L.
W07 A Surface-Layer Representation of the Lunar Gravitational Field
L. Wong (Aerospace Corporation), G. Buechler (Aerospace
Corporation), W. Downs (Aerospace Corporation),
W. L. Sjogren, P. M. Muller, and P. Gottlieb
J. Geophys. Res., Vol. 76, No. 26, pp. 6220-6236,
September 10, 1971
A surface-layer representation of the lunar gravitational field has
been derived dynamically from the analysis of doppler observa-
tions on both polar and equatorial lunar orbiters. The force modelcontained 600 discrete masses located on the mean hmar surface
between the approximate boundaries of _+60-deg latitude and _+95-
deg longitude. The derived major mascons were generally in agree-ment with a model based on polar orbits alone. A technique for
combining the discrete mass gravitational field for the front side
with a spherical harmonics expansion for the back side is de-
scribed. Harmonic analysis of the resultant field shows that the
higher end of the power spectrum roughly follows the decay rule
predicted by W. M. Kaula in 1963.
256

WU, F.
W08 RamanScatteringCrossSectionfor N204
C. J. Chenand F. Wu (StateUniversityof NewYork,Buffalo)
Appl. Phys. Lett., Vol. 19, No. 11, pp. 452-453,December 1, 1971
For abstract, see Chen, C. J.
YANG,
Y01
J,'N°
Nonstationary Envelope Process and First Excursion Probability
J.-N. Yang
JPL Quarterly Technical Review, Vol. 1, No. 4, pp. 1-12,
January 1972
A definition of the envelope of nonstationary random processes is
proposed. The establishment of the envelope definition makes it
possible to simulate the nonstationary random envelope directly.
The envelope statistics, such as the density function, the joint
density function, the moment function, and the level crossing rate,
relevant to the analyses of the catastrophic failure, fatigue, and
crack propagation of structures, are derived. Applications of the
envelope statistics to the prediction of structural reliability under
random loadings are demonstrated in detail.
Y02 On the First Excursion Probability in Stationary Narrow-BandRandom Vibration
J.-N. Yang and M. Shinozuka (Columbia University)
Trans. ASME, Set. E: J. Appl. Mech., Vol. 38, IkJo. 4,
pp. 1017-1022, December 1971
Dealing with a stationary narrow-band gaussian process X(t) with
mean zero, this paper derives a number of approximate solutions
on the basis of the point-process approach. In particular, upper
and lower bounds sharper than those presently available are estab-
lished, an approximation based on the Markov point process is
obtained, and the clump size approach is also used for approxima-
tion. These approximations are checked against the results of
semisimulations performed elsewhere. Some remarks are also
made on the use of the principle of maximum entropy.
257

YANG,
Y03
L. C.
Detonation of Insensitive High Explosives by a Q-Switched
Ruby Laser
L. C. Yang and V. J. Menichelli
Appl. Phys. Lett., Vol. 19, No. 11, pp. 473-475,
December 1, 1971
Immediate longitudinal detonations have been observed in con-
fined small-diameter columns of PETN, RDX, and tetryl by using a
focused Q-switched ruby laser. The energy ranged from 0.8 to 4.0 Jin a pulse width of 25 ns. A 1000-A-thick aluminum film deposited
on a glass window was used to generate a shock wave at the
window-explosive interface when irradiated by the laser. In some
cases steady-state detonations were reached in less than 1/2 /zs
with less than 10% variation in the detonation velocity.
YASUI, R. K.
Y04 Stress Analysis and Design of Silicon Solar Cell Arrays and
Related Material Properties
A. M. Salama, W. M. Rowe, and R. K. Yasui
Technical Report 32-1552, March 1, 1972
For abstract, see Salama, A. M.
YEN, T. F.
Y05 Absence of Porphyrins in an Apollo 12 Lunar Surface Sample
J. H. Rho, A. J. Bauman, T. F. Yen (University of SouthernCalifornia), and J. Bonner (California Institute of
Technology)
Proceedings of the Second Lunar Science Conference,
Houston, Texas, January 11-14, 1971, Vol. 2,
pp. 1875-1877, The M.I.T. Press, Cambridge, 1971
For abstract, see Rho, J. H.
YIP, K. W.
Y06 DSN Progress Report for November-December 1971: Local and
Transcontinental Mapping of Total Electron Content
Measurements of the Earth's Ionosphere
K. W. Yip and B. D. Mulhall
258

Technical Report 32-1526, Vol. VII, pp. 61-67,
February 15, 1972
The interchangeability of total electron content data for the pur-
pose of ionospheric calibration of deep space radio metric data,both locally and across the North American Continent, is demon-
strated. Comparisons were made between calibrations produced
from Faraday rotation data recorded at Stanford and Goldstone inCalifornia and at Hamilton in Massachusetts for simulated missions
to Mars. The results, in terms of equivalent station location errors,
are shown. The averages of the differences between the tracking
station spin radius errors are below 1 m with standard deviations ofabout 1 m for both data sources. The averages of the differences of
ionospheric effect on longitude changes are also less than 1 m withuncertainties of 2-3 m. Transcontinental mapping of Faraday
rotation measurements is concluded to be a competitive calibra-
tion scheme with local mapping. However, because of the large
scatter in the longitude changes, the improvement in this coordi-
nate using the electron data from another station is at best
marginal.
The geomagnetic latitude factor used in the mapping is also
investigated. This factor is found essential to the mapping
procedure.
YOKOYAMA, H.
Y07 Isolation and Characterization of Keto.Carotenoids From the
Neutral Extract of Algal Mat Communities of a Desert Soil
A. J. Bauman, H. G. Boettger, A. M. Kelly,
R. E. Cameron, and H. Yokoyama (U.S. Department of
Agriculture)
Eur. J. Biochem., Vol. 22, No. 2, pp. 287-293,
September 1971
For abstract, see Bauman, A. J.
YOST, E.
Y08 Apollo 12 Multispectral Photography Experiment
A. F. H. Goetz, F. C. Billingsley, J. W. Head (Bellcomm,
Inc.), T. B. McCord (Massachusetts Institute of Technology),
and E. Yost (Long Island University)
259

Proceedings of the Second Lunar Science Conference,
Houston, Texas, January 11-14, 1971, Vol. 3,
pp. 2301-2310, The M.I.T. Press, 1971
For abstract, see Goetz, A. F. H.
YOUNG, L. D. G.
Y09 High Dispersion Spectroscopic Studies of Mars: V. A Search
for Oxygen in the Atmosphere of Mars
J. S. Margolis, R. A. J. Schorn, and I_. D. G. Young
Icarus, Vol. 15, No. 2, pp. 197-203, October 1971
For abstract, see Margolis, J. S.
26o

Subject Index
Subject Categories
Antennas and Transmission Lines
Apollo Project
Atmospheric Entry
Biology
Chemistry
Computer Applications and
Equipment
Computer ProgramsControl and Guidance
Earth AtmosphereEarth Interior
Earth Surface
Electronic Components andCircuits
Environmental Sciences
Facility EngineeringFluid Mechanics
Helios Project
Industrial Processes and
EquipmentInformation Distribution
and Displayhfformation Storage Devices
Information Theory
Lunar Exploration,Advanced
Lunar Interior
Lunar Motion
Lunar Orbiter Project
Lunar Spacecraft, AdvancedLunar Surface
Management Systems
Mariner Mars 1969 Project
Mariner Mars 1971 Project
Mariner Venus-Mercury
1973 ProjectMasers and Lasers
Materials, Nonmetallic
Mathematical Sciences
Mechanics
Mechanisms
Meteors
Optics
Orbits and Trajectories
Packaging and Cabling
Particle Physics
Photography
Pioneer Project
Planetary Atmospheres
Planetary Exploration,Advanced
Planetary Interiors
Planetary Motion
Planetary Quarantine
Planetary Surfaces
Plasma Physics
261
Power Sources
Propulsion, Liquid
Propulsion, Solid
Pyrotechnics
Quality Assurance and
Reliability
Radar
Radio Astronomy
Relativity
Safety EngineeringScientific Instruments
ShieldingSoil Sciences
Solid-State Physics
SpectrometryStandards, ReferenceSterilization
Structural Engineering
Surveyor Project
Telemetry and CommandTest Facilities and
Equipment
ThermodynamicsThermoelectric Outer-Planet
Spacecraft (TOPS)
Tracking
Viking Project
Wave Propagation
Subjects
Subject Entry
Antennas and Transmission Lines
electrical-length stability of coaxial cable ill fieldenvironment .............................................................................................. C 18
performance testing of hydrostatic bearing for 64-mantenna ...................................................................................................... G01
4(X)-kW harmonic filter for 64-m antennas .......................................... L07
precision compact rotary-vane attenuator ............................................ O05
26-m antenna automatic-angle-tracking error analysis andtests ............................................................................................................ R06
use of phase-reversal aperture rings to reduce near-in
sidelobes of spacecraft antennas ......................................................... W04
Apollo Project
studies of Surveyor 3 parts retrieved by Apollo 12 .......................... C06
K07
N04
Apollo lunar bistatic-radar experiments ................................................. Cll
Apollo 12 multispectral photography of lunar surface ..................... G04
science results .............................................................................................. J02
hmar surface sample studies .................................................................... N01
R08
T07
262

Subject Entry
Atmospheric Entry
nonequilibrium ionization measurements in hydrogen-
helium mixtures in simulation of Jupiter atmospheric-
entry conditions ....................................................................................... L05
Earth-atmospheric-entry simulation of Jupiter atmospheric
entry ........................................................................................................... M19
high-performance electric-arc-driven shock tube for
simulation of atmospheric entry conditions ..................................... M22
Biology
high-resolution mass spectrometry used to study chemistryof desert-soil surface life ...................................................................... B05
history of Martian volatiles with implications for organic
synthesis .................................................................................................... F02
geometrical method for determining sizes of nonspherical
particles such as bacteria ..................................................................... G02
microbiological sampling of returned Surveyor 3 cabling ................ K07
dry-heat resistance of Bacillus subtilis var. niger sporeson mated surfaces ................................................................................... S12
Chemistry
high-resolution mass spectrometry used to study chemistryof desert-soil surface life ...................................................................... B05
simple electrostatic model for chromatographic behavior
of primary dithizonates ......................................................................... B07
calculations of geometries of organic molecules usingCNDO/2 molecular orbital method ................................................... C15
C16
proposed polymer-fixation of virgin lunar surface-soil
samples ...................................................................................................... C21
photolysis of CO2 at 1849 A .................................................................. D05
physical adsorption of atmospheric rare gas on terrigenoussediments ................................................................................................... F01
history of Martian volatiles with implications for organicsynthesis .................................................................................................... F02
dependence of the rates on ion kinetic energy for the
reactions D2 + + D 2 and HD ÷ + HD ............................................. HI0
improved sensitivity in gas chromatography using a
thermal-conductivity detector and a palladiumtransmodulator ......................................................................................... L13
viscoelastic behavior of polymers undergoing crosslinkingreactions .................................................................................................... M30
use of anhydrides to make stable elastomeric materials to
be used as solid-propellant binders .................................................... R07
line strengths of N20 ................................................................................ T04
self-broadened and N 2 broadened linewidths of N20 ....................... T05
263

Subject Entry
Computer Applications and Equipment
nltrareliable self-testing and repairing computer ................................ A05
cost and effectiveness of arithmetic error codes applied to
digital-systems design ............................................................................. A06
occultation recording assembly ................................................................ D03
Thermoelectric Outer-Planet Spacecraft (TOPS) centralized
data-handling system for use on Grand Tour mission ................... E01
new crowbar logic unit for 400-kW transmitter ................................ F08
post-detection subcarrier recording equipment for analog-
recording playback ................................................................................. H01
friction and stick-slip of magnetic recording tapes on
various magnetic heads and in various environments .................... K01
minicomputer use and software .............................................................. L03
Deep Space Instrumentation Facility Tracking and
Monitor and Control Subsystem prototype
implementation ........................................................................................ LI0
DSN data-decoder assembly implementation for support ofPioneer F mission ................................................................................... M07
reliability modeling and analysis of ultrareliable fault-
tolerant digital systems .......................................................................... M I3
Space Flight Operations Facility Mark IliA IBM
computer configuration expansion ....................................................... $24
high-rate telemetry preprocessor ............................................................ W03
Computer Programs
software for self-testing and repairing computer ............................... A05
assembly programs for Sigma 5 computer ........................................... E03K05
algorithm and subroutines for sequential estimation .......................... H02
program for automated analysis of astronomical spectra ................. Hl l
minicomputer use and software .............................................................. L03
software for implementing improved condensation methods
in eigenvalue problems ......................................................................... L08
programs for improving emphemerides and other constants
of the major planets .............................................................................. L09
DSN traceability and reporting program ............................................. M27
Control and Guidance
analytical methods for performance evaluation of nonlinearfilters .......................................................................................................... BI 1
in-flight calibration of television instrument used in optical
spacecraft navigation .............................................................................. D10
improved spacecraft navigation using two-station tracking .............. RI7
Earth Atmosphere
physical adsorption of atmospheric rare gas on terrigenoussediments ................................................................................................... FO1
264

Subject Entry
improved sensitivity in gas chromatography using athermal-conductivity detector and a palladium
transmodulator .......... ............................................................................... L13
global studies of atmospheric pollutants and traceconstituents ............................................................................................... T03
tropospheric-refraction calibrations with significance to
radiometric doppler reductions ........................................................... W06
mapping of total electron content of ionosphere .............................. Y06
Earth Interior
relative masses of Earth, Moon, and Mars determined
from Mariner Mars 1969 tracking data ............................................ A02
Earth Surface
high-resolution mass spectrometry used to study chemistryof desert-soil surface life ...................................................................... B05
Electronic Components and Circuits
development and testing of Mariner Mars 1971 flight
command subsystem ............................................................................... C17
new crowbar logic unit for 400-kW transmitter ................................ F08
post-detection subcarrier recording equipment for analog-
recording playback ................................................................................. H01
tests of spacecraft radio amplifier tubes ............................................... H08
flexible high-speed sequential-decoding machine ................................. L04400-kW harmonic filter for 64-m antennas .......................................... L07
low-phase-noise L-band frequency multiplier for hydrogen-
maser frequency standard ..................................................................... L15
precision compact rotary-vane attenuator ............................................ O05
high-voltage control unit for 400-kW transmitter .............................. R01
method for selection of optimum design point for phase-
coherent receivers using band-pass limiters ..................................... $14
high-reliability integrated-circuit packaging .......................................... S19
development of 20-W solid-state S-band power amplifier ............... V01
Environmental Sciences
possible basis for rapid field-analysis method for detecting
trace metals in polluted waters .......................................................... B07
global studies of atmospheric pollutants and traceconstituents ............................................................................................... T03
Facility Engineering
Venus Deep Space Station (DSS 13) operations ................................ J01
Deep Space Instrumentation Facility fire-protection studies ........... K09
Fluid Mechanics
viscous-slipstream flow downstream of a centerline Machreflection ................................................................................................... B01
265
Subject Entry
turbulent boundary layer and heat transfer along a
convergent-divergent nozzle ................................................................ B02
partially ionized gas flow and heat transfer downstreamfrom circular channel expansion ......................................................... B03
liquid-phase mixing of bipropellant doublets ....................................... H04
JPL Molsink used to study nozzle exhaust-plumebackscatter ................................................................................................ S15
Helios Project
DSN support ................................................................................................ G06
Industrial Processes and Equipment
Teflon coating of storage sphere for hydrogen-maser
frequency standard .................................................................................. E04
Information Distribution and Display
DSN traceability and reporting program ............................................. M27
Information Storage Devices
magnetic tape recorder for long operating life in space ................. B04
Information Theory
combinatorial packing problem ............................................................... B08
flexible high-speed sequential-decoding machine ................................. L04
correlated sampling with application to carrier estimationaccuracy .................................................................................................... L06
hiding and covering in a compact metric space ................................ M16
adaptive variable-length coding for efficient compressionof spacecraft television data ................................................................ R09
Lunar Exploration, Advanced
proposed polymer-fixation of virgin lunar surface-soil
samples ...................................................................................................... C21
objectives and requirements of unmanned rover
exploration of Moon .............................................................................. N02
Lunar Interior
relative masses of Earth, Moon, and Mars determined
from Mariner Mars 1969 tracking data ............................................ A02
science results of recent lunar exploration .......................................... J02
derivation of global lunar gravity field from tracking data ............. L12
lunar-gravity estimate from tracking data ............................................ S18
surface-layer representation of lunar gravity field derivedfrom tracking data .................................................................................. W07
Lunar Motion
science results of recent lunar exploration .......................................... J02
Lunar Orbiter Projectscience results .............................................................................................. J02
266
Subject Entry
Lunar Spacecraft, Advanced
objectives and requirements of unmanned rover
exploration of Moon .............................................................................. N02
Lunar Surface
electrical and structural properties of lunar surface
determined by Apollo bistatie-radar experiments ........................... Cll
proposed polymer-fixation of virgin lunar surface-soil
samples ...................................................................................................... C21
Apollo 12 multispectral photography of lunar surface ..................... G04
science results of recent lunar exploration .......................................... J02
bearing strength of lunar soil determined from laboratorytests ............................................................................................................ J03
lunar surface sample studies .................................................................... N01R08
T07
map of lunar radar reflectivity at 7.5-m wavelength ........................ Tog
ferromagnetic resonance of lunar samples ........................................... T06
Management Systems
Helios Project organization ....................................................................... G06
DSN organization ........................................................................................ R04
Mariner Mars 1969 Project
general relativity results from Mariner 6 and 7 trackingdata ............................................................................................................ A02
relative masses and ephemerides of Earth, Moon, and
Mars from Mariner 6 and 7 tracking data ...................................... A02
failure-rate computations ........................................................................... C13
results of Mars radio-occultation experiment ....................................... K06
infrared radiometer results: temperatures and thermal
properties of Martian surface .............................................................. N03
testing of spacecraft rocket engine ........................................................ Rllscientific results of missions ..................................................................... S03
Mariner Mars 1971 Project
development and testing of flight command subsystem ................... C17
occultation recording assembly ................................................................ D03
preliminary science results ....................................................................... J04
DSN support ................................................................................................ L01L10
R05
DSN micrographic data-storage for project support ......................... M27
Mariner Venus-Mercury 1973 Project
midcourse-velocity requirements and delivery accuracy ................... M18
267
Subject Entry
Masers and Lasers
laser apparatus to test Haman-scattering cross section forN204 .......................................................................................................... C14
Teflon coating on storage sphere for higher-powerhydrogen-maser frequency standard .................................................... E04
Stark-effect modulation of CO z laser by NHzD ................................. J06
low-phase-noise L-band frequency multiplier for hydrogen-
maser frequency standard ..................................................................... LI5
measurement of the power-spectral-density-of-phase of
hydrogen maser for frequency standard ............................................ $26
detonation of explosives by laser ...................... i ..................................... Y03
Materials, Nonmetallic
Teflon coating of storage sphere for hydrogen-maserfrequency standard .................................................................................. E04
vibration and buckling analysis of composite plates andshells ........................................................................................................... M17
viscoelastic behavior of polymers undergoing crosslinkingreactions .................................................................................................... M30
use of anhydrides to make stable elastomeric materials to
be used as solid-propellant binders .................................................... R07
Mathematical Sciences
cost and effectiveness of arithmetic error codes applied to
digital-systems design ............................................................................. A06
combinatorial packing problem ............................................................... B08
analytical methods for performance evaluation of nonlinearfilters .......................................................................................................... BI1
Markov chain technique for determining acquisition
behavior of digital tracking loop ........................................................ C07
error probability of a wide-band FSK receiver in presenceof multipath fading ................................................................................ C08
Mariner Mars 1969 failure-rate computations ..................................... C13
matrix representation of Fourier interferometer ................................. F12
analysis of orientation of nonspherical particles on solidsurfaces ...................................................................................................... G02
computational algorithm for sequential estimation ............................. H02
correlated sampling with application to carrier estimation
accuracy .................................................................................................... L06
improved condensation methods for eigenvalue problems
in structural engineering ....................................................................... L08
derivation of global lunar gravity field from tracking data ............. L12
reliability modeling and analysis of ultrareliable fault-
tolerant digital systems .......................................................................... M13
hiding and covering in a compact metric space ................................ MI6
vibration and buckling analysis of composite plates andshells ........................................................................................................... M 17
268

Subject Entry
analysis of automatic angle-tracking errors in 26-mantennas ..................................................................................................... R06
method for selection of optimum design point for phase-
coherent receivers using band-pass limiters ..................................... S14
bias and spread in extreme-value-theory measurements of
probability of error ................................................................................ $20
analysis of long-baseline radio interferometry ..................................... T01method for solution of electromagnetic scattering
problems for inhomogeneous dielectrics as a powerseries in the dimension-of-scatterer/wavelength ratio ................... V02
spectral estimate variance reduction by averaging fast-Fourier transform spectra of overlapped time seriesdata ............................................................................................................ W05
structural reliability in terms of nonstationary envelope
process and first-excursion probability ............................................... ¥01
first excursion probability in stationary narrow-bandrandom vibration ..................................................................................... Y02
Mechanics
structural reliability in terms of nonstationary envelope
process and first-excursion probability ............................................... Y01first excursion probability in stationary narrow-band
random vibration ..................................................................................... Y02
Mechanisms
high-vacuum space-simulation tests of friction and cold
welding in mechanisms ......................................................................... W01
Meteors
comparison of primordial rare-gas concentrations innormal chondrites with inferred values for bulk Earth
material ..................................................................................................... F01
Optics
infrared Connes-type interferometer ...................................................... B10
Raman-scattering cross section for NzO4 .............................................. C14
matrix representation of Fourier interferometer ................................. F12
Martian optical characteristics from Mariner Mars 1971data ............................................................................................................ J04
Stark-effect modulation of CO2 laser by NH2D ................................. J06
apparatus for measuring nonequilibrium ionization in
hydrogen-helium mixtures .................................................................... L05
Orbits and Trajectoriescomparison of Cowell's method and a variation-of-
parameters method for computation of precisionsatellite orbits .......................................................................................... D01
Mariner Venus-Mercury 1973 midcourse-velocity
requirements and delivery accuracy ................................................... M18
269

Subject Entry
Packaging and Cabling
high-reliability integrated-circuit packaging .......................................... $19
Particle Physics
equilibrium theory of close-packed liquids ........................................... C04
approximate scheme for numerical calculation of dielectric
function of electron gas ........................................................................ C05
dependence of the rates on ion kinetic energy for thereactions D2 + + D 2 and HD ÷ + HD ............................................. H10
radiation characteristics and shielding requirements for aradioisotope thermoelectric generator ............................................... N05
response of covered silicon detectors to monoenergeticgamma rays .............................................................................................. R02
Photography
Apollo 12 multispectral photography of lunar surface ..................... G04
Mariner Mars 1971 preliminary science results .................................. J04
DSN micrographic information-storage and retrieval ........................ M27
adaptive variable-length coding for efficient compression
of spacecraft television data ................................................................ R09
Mariner Mars 1969 photographs of Mars ............................................. S03
Pioneer Project
DSN data-decoder assembly implementation for support ofPioneer F mission ................................................................................... M07
DSN support ................................................................................................ S10
Planetary Atmospheres
Jupiter trapped-radiation belts ................................................................ B09
Raman-scattering cross section for N204 .............................................. C14
photolysis of CO2 at 1849 ,_, a possible mechanism of
Mars' atmosphere .................................................................................... D05
history of Martian volatiles with implications for organicsynthesis .................................................................................................... F02
planned infrared investigations of outer planets duringGrand Tour mission ............................................................................... F05
strengths of H20 lines in the 8200-A region and their
application to high-dispersion spectra of Mars ............................... F06
thermal component of radio emission from the majorplanets ....................................................................................................... G11
Mariner Mars 1971 preliminary science results .................................. J04
results of Mars radio-occultation experiment by Mariner
Mars 1969 spacecraft ............................................................................. K06
improved sensitivity in gas chromatography using a
thermal-conductivity detector and a palladiumtransmodulator ......................................................................................... L13
high-resolution spectra of Mars ............................................................... M08
270
Subject Entry
laboratory simulation of absorption spectra in cloudy
atmospheres .............................................................................................. M14scientific results of Mariner Mars 1969 missions ................................ S03
Planetary Exploration, Advanced
study of Jupiter trapped-radiation belts as futurespacecraft environment .......................................................................... B09
nonequilibrium ionization measurements in hydrogen-
helium mixtures in simulation of Jupiter atmospheric-
entry conditions ....................................................................................... L05
Planetary Interiorsrelative masses of Earth, Moon, and Mars determined
from Mariner Mars 1969 tracking data ............................................ A02
Martian gravity-field measurements from Mariner Mars1971 data .................................................................................................. J04
simultaneous solution for masses and ephemerides of the
principal planets from analysis of optical, radar, and
radio tracking data ................................................................................. L09
Planetary Motion
simultaneous solution for masses and ephemerides of the
principal planets from analysis of optical, radar, and
radio tracking data ................................................................................. L09
Planetary Quarantine
microbiological sampling of returned Surveyor 3 cabling ................ K07
dry-heat resistance of Bacillus subtilis var. niger sporeson mated surfaces ................................................................................... S12
Planetary SurfacesEarth-based radar observations of Mars ................................................ D08
Mariner Mars 1971 preliminary science results .................................. J04Mariner Mars 1969 infrared radiometer results:
temperatures and thermal properties of Martian surface ............ N03scientific results of Mariner Mars 1969 missions ................................ S03
Plasma Physics
partially ionized gas flow and heat transfer downstreamfrom circular channel expansion ......................................................... B03
nonequilibrium ionization measurements in hydrogen-helium mixtures ....................................................................................... L05
Power Sources
results of solar-cell tests after one year in orbit ................................ A04
radiation characteristics and shielding requirements for a
radioisotope thermoelectric generator ............................................... N05
thermal-stress analysis in the design of solar cell arrays .................. S01
271
Subject Entry
Propulsion, Liquid
liquid-phase mixing of bipropellant doublets ....................................... H04
experimental evaluation of high-thrust, throttleable,
monopropellant hydrazine rocket engines ........................................ Rll
JPL Molsink used to study nozzle exhaust-plumebackscatter ................................................................................................ $15
Propulsion, Solid
use of anhydrides to make stable elastomeric materials tobe used as solid-propellant binders .................................................... R07
high-incremental-velocity low-acceleration solid-propellant
rocket engines .......................................................................................... S07
initiation system for low-thrust solid-propellant rocket-
motor igniter ............................................................................................ $25
Pyrotechnics
nondestructive testing of electroexplosive devices .............................. M24R15
initiation system for low-thrust solid-propellant rocket-
motor igniter ............................................................................................ $25
detonation of explosives by laser ............................................................ Y03
Quality Assurance and Reliability
ultrareliable self-testing and repairing computer ................................ A05
magnetic tape recorder for long operating life in space ................. B04
Mariner Mars 1969 failure-rate computations ..................................... C13
tests of spacecraft radio amplifier tubes ............................................... H08
reliability modeling and analysis of ultrareliable fault-
tolerant digital systems .......................................................................... M13
high-reliability integrated-circuit packaging .......................................... S19
high-vacuum space-simulation tests of friction and cold
welding in mechanisms ......................................................................... W01
structural reliability in terms of nonstationary envelope
process and first-excursion probability ............................................... Y01
Radar
Apollo lunar bistatic-radar experiments ................................................. CllEarth-based radar observations of Mars: ............................................... D08
simultaneous solution for masses and ephemerides of the
principal planets from analysis of optical, radar, and
radio tracking data ................................................................................. L09
map of lunar radar reflectivity at 7.5-m wavelength ........................ T02
Radio Astronomy
thermal component of radio emission from the majorplanets ....................................................................................................... G 11
DSN radio science support ...................................................................... J01Lll
272
Subject Entry
results of Mars radio-occultation experiment by Mariner
Mars 1969 spacecraft ............................................................................. K06
simultaneous solution for masses and ephemerides of the
principal planets from analysis of optical, radar, and
radio tracking data ................................................................................. L09
analysis of long-baseline radio interferometry ..................................... T01
Relativity
general relativity results from Mariner Mars 1969 trackingdata ............................................................................................................ A02
scientific results of Mariner Mars 1969 missions ................................ S03
Safety Engineering
microwave radiation protective suit ...................................................... K04
Deep Space Instrumentation Facility fire-protection studies ........... K09
Scientific Instruments
infrared Connes-type interferometer ...................................................... B10
new Fourier spectroscope with million-point
transformation ability ............................................................................. C22
instruments for planned infrared investigations of outer
planets during Grand Tour mission .................................................... F05
matrix representation of Fourier interferometer ................................. F12
response of covered silicon detectors to monoenergetic
gamma rays .............................................................................................. R02
Shielding
radiation characteristics and shielding requirements for a
radioisotope thermoelectric generator ............................................... N05
Soil Sciences
high-resolution mass spectrometry used to study chemistryof desert-soil surface life ...................................................................... B05
possible basis for rapid field-analysis method for detecting
trace metals in polluted waters .......................................................... B07
proposed polymer-fixation of virgin lunar surface-soil
samples ...................................................................................................... C21
physical adsorption of atmospheric rare gas on terrigenoussediments ................................................................................................... F01
science results of recent lunar exploration .......................................... J02
bearing strength of lunar soil determined from laboratorytests ............................................................................................................ J03
lunar surface sample studies .................................................................... N01R08
T07
objectives and requirements of unmanned rover
exploration of Moon .............................................................................. N02
ferromagnetic resonance of lunar samples ........................................... T06
273
Subject Entry
Solid-State Physics
approximate scheme for numerical calculation of dielectric
function of electron gas ........................................................................ C05
vibration and buckling analysis of composite plates andshells ........................................................................................................... M 17
viscoelastic behavior of polymers undergoing crosslinkingreactions .................................................................................................... M30
response of covered silicon detectors to monoenergeticgamma rays .............................................................................................. R02
Speetrometry
high-resolution mass spectrometry used to study chemistryof desert-soil surface life ...................................................................... B05
infrared Connes-type interferometer ...................................................... B10
Raman-scattering cross section for N204 .............................................. C14
new Fourier spectroscope with million-point
transformation ability ............................................................................. C22
planned infrared investigations of outer planets duringGrand Tour mission ............................................................................... F05
strengths of H20 lines in the 8200-A region and theirapplication to high-dispersion spectra of Mars ............................... F06
matrix representation of Fourier interferometer ................................. F12
computer program for automated analysis of astronomical
spectra ....................................................................................................... Hll
turbulence velocities in atmosphere of a Orionis .............................. H12
Mariner Mars 1971 preliminary science results .................................. J04
Stark-effect modulation of CO2 laser by NH2D ................................. J06
apparatus for measuring nonequilibrium ionization in
hydrogen-helium mixtures .................................................................... L05
high-resolution spectra of Mars ............................................................... M08
laboratory simulation of absorption spectra in cloudyatmospheres .............................................................................................. M14
line strengths of N20 ................................................................................ T04
self-broadened and N 2 broadened linewidths of N20 ....................... T05
Standards, Reference
relative masses and ephemerides of Earth, Moon, and
Mars from Mariner Mars 1969 tracking data .................................. A02
electrical-length stability of coaxial cable in fieldenvironment .............................................................................................. C18
Teflon coating on storage sphere for higher-power
hydrogen-maser frequency standard .................................................... E04
Venus Deep Space Station (DSS 13) 100-kW clock
synchronization ........................................................................................ J01
Venus Deep Space Station (DSS 13) precision antenna-
gain measurement ................................................................................... J01
274
Subject Entry
simultaneous solution for masses and ephemerides of the
principal planets from analysis of optical, radar, and
radio tracking data ................................................................................. L09
low-phase-noise L-band frequency multiplier for hydrogen-
maser frequency standard ..................................................................... L15
measurement of the power-spectral-density-of-phase of
hydrogen maser for frequency standard ............................................ $26
Sterilization
dry-heat resistance of Bacillus subtilis var. niger sporeson mated surfaces ................................................................................... S12
Structural Engineering
combinatorial packing problem ............................................................... B08
improved condensation methods for eigenvalue problems
in structural engineering ....................................................................... L08
vibration and buckling analysis of composite plates andshells ........................................................................................................... M 17
thermal-stress analysis in the design of solar cell arrays .................. S01
structural reliability in terms of nonstationary envelope
process and first-excursion probability ............................................... YO1
first excursion probability in stationary narrow-bandrandom vibration ..................................................................................... Y02
Surveyor Projectstudies of Surveyor 3 parts retrieved by Apollo 12 .......................... C06
K07
N04
science results .............................................................................................. J02
tests on soil retrieved from scoop ......................................................... J03
Telemetry and Command
error probability of a wide-band FSK receiver in presence
of multipath fading ................................................................................ C08
development and testing of Mariner Mars 1971 flight
command subsystem ............................................................................... C17
DSN support of Helios Project ............................................................... G06
DSN support of Mariner Mars 1971 Project ...................................... L01L10
R05
flexible high-speed sequential-decoding machine ................................. L04DSN functions and facilities .................................................................... R04
DSN support of Pioneer Project ............................................................ S10
extreme-value-theory measurements of probability of error
in digital communications systems ..................................................... $20
Test Facilities and Equipment
equipment for measuring turbulent boundary layer and
heat transfer along a convergent-divergent nozzle ........................ B02
275

Subject Entry
apparatus for measuring partially ionized gas flow andheat transfer downstream from circular channel
expansion ................................................................................................... B03
laser apparatus to test Raman-scattering cross section forN204 .......................................................................................................... C14
laboratory equipment for testing bearing strength of lunar
soil .............................................................................................................. J03
apparatus for testing Stark-effect modulation of a CO 2
laser by NHzD ........................................................................................ J06
equipment for testing friction and stick-slip of magnetic
recording tape in various environments ............................................ K01
apparatus for measuring nonequilibrium ionization in
hydrogen-helium mixtures .................................................................... L05
improved sensitivity in gas chromatography using a
thermal-conductivity detector and a palladiumtransmodulator ......................................................................................... L13
high-performance electric-arc-driven shock tube for
simulation of atmospheric entry conditions ..................................... M22
facilities for testing liquid-propellant rocket engines ......................... Rll
equipment for nondestructive testing of electroexplosivedevices ....................................................................................................... RI5
equipment for testing dry-heat resistance of Bacillus
subtilis var. niger spores on mated surfaces .................................. S12
JPL Molsink used to study nozzle exhaust-plumebackscatter ................................................................................................ S15
apparatus for testing solid-propellant ignition ..................................... $25
JPL Molsink test facility ........................................................................... W01
high-vacuum test facilities used for simulation of space
conditions in friction and cold-welding tests ................................... W01
apparatus for observing detonation of explosives by laser ............... Y03
Thermodynamics
turbulent boundary layer and heat transfer along aconvergent-divergent nozzle ................................................................ B02
partially ionized gas flow and heat transfer downstream
from circular channel expansion ......................................................... B03
equilibrium theory of close-packed liquids ........................................... C04
Thermoelectric Outer-Planet Spacecraft (TOPS)
ultrareliable onboard computer ............................................................... A05
centralized data-handling system for use on Grand Tourmission ....................................................................................................... E01
Tracking
relative masses and ephemerides of Earth, Moon, and
Mars from Mariner Mars 1969 tracking data .................................. A02Markov chain technique for determining acquisition
behavior of digital tracking loop ........................................................ C07
276
Subject Entry
DSN support of Helios Project ............................................................... G06
computational algorithm for estimating state vector of a
noisy system ............................................................................................. H02
DSN support of Mariner Mars 1971 Project ...................................... L01L10
R05
correlated sampling with application to carrier estimation
aceuracy .................................................................................................... L06
simultaneous solution for masses and ephemerides of the
principal planets from analysis of optical, radar, and
radio tracking data ................................................................................. L09
derivation of global lunar gravity field from tracking data ............. L12
long-baseline interferometry tracking ..................................................... 004DSN functions and facilities .................................................................... R04
26-m antenna automatic-angle-tracking error analysis andtests ............................................................................................................ R06
improved spacecraft navigation using two-station tracking .............. R17
DSN support of Pioneer Project ............................................................ S10
lunar-gravity estimate from tracking data ............................................ S18
spectral estimate variance reduction by averaging fast-
Fourier transform spectra of overlapped time seriesdata ............................................................................................................ W05
tropospheric-refraction calibrations with significance to
radiometric doppler reductions ........................................................... W06
surface-layer representation of lunar gravity field derived
from tracking data .................................................................................. W07
mapping of total electron content of ionosphere .............................. Y06
Viking Project
Markov chain technique for determining acquisition
behavior of digital tracking loop to be used in Vikingcommand receiver .................................................................................. C07
Wave Propagation
Markov chain technique for determining acquisition
behavior of digital tracking loop ........................................................ C07
error probability of a wide-band FSK receiver in presenceof multipath fading ................................................................................ C08
electrical-length stability of coaxial cable in fieldenvironment .............................................................................................. C18
tests of spacecraft radio amplifier tubes ............................................... H08
correlated sampling with application to carrier estimation
accuracy .................................................................................................... L06400-kW harmonic filter for 64-m antennas .......................................... L07
low-phase-noise L-band frequency multiplier for hydrogen-
maser frequency standard ..................................................................... L15
277

Subject Entry
method for selection of optimum design point for phase-
coherent receivers using band-pass limiters ..................................... S14
analysis of long-baseline radio interferometry ..................................... T01
method for solution of electromagnetic scattering
problems for inhomogeneous dielectrics as a power
series in the dimension-of-scatterer/wavelength ratio ................... V02
use of phase-reversal aperture rings to reduce near-insidelobes of spacecraft antennas ......................................................... W04
spectral estimate variance reduction by averaging fast-Fourier transform spectra of overlapped time seriesdata ............................................................................................................ W05
278

Publication Index
Technical Reports
Number Entry
32-1544 ................................................................................................................ C13
32-1546 ................................................................................................................ H04
32-1547 ............................................................................................................... W01
32-1548 ................................................................................................................ K01
32-1550, Vol. II .................................................................................................. J04
32-1551 ................................................................................................................ Rll
32-1552 ................................................................................................................. S01
32-1553 ............................................................................................................... M24
32-1554 ................................................................................................................ R15
DSN Progress Report for November-December 1971
(Technical Report 32-1526, Vol. VII)
JPL Technical Section Entry
331 Communications Systems Research .................................................. C18E03
K05
L03
L15
M16
W05
332 DSIF Engineering ................................................................................. G01K09
279

332 DSIF Engineering ................................................................................. L08
333 Communications Elements Research ................................................ E04
335 R. F. Systems Development .............................................................. F08jolL07
R01
337 DSIF Operations ................................................................................... CllL06
R06
338 DSIF Digital Systems Development ................................................ D03H01
L10
M07
S19
391 Tracking and Orbit Determination .................................................. R17T01
W06
Y06
392 Navigation and Mission Design ......................................................... D01
401 DSN Engineering and Operations Office ........................................ M27
420 Mission Support Office ........................................................................ G06L01
Lll
R04
S10
751 TIDD Support ....................................................................................... M27
915 Flight Operations and DSN Programming ..................................... D01
918 SFOF/GCF Development ................................................................... $24W03
Technical Memorandums
Number Entry
33-520 ................................................................................................................... $25
33-521 .................................................................................................................. C21
33-522 .................................................................................................................. A04
33-523, Vol. I .................................................................................................... R05
33-524 .................................................................................................................. R02
280

33-525 .................................................................................................................. C22
33-528 ................................................................................................................... S07
33-531 .................................................................................................................. C17
JPL Quarterly Technical Review, Vol. 1, No. 4
JPL Technical Division
290
330
35O
37O
380
390
Entry
Project Engineering .............................................................................. B09
Telecommunications ............................................................................. C07
$14
$20
$26
V01
W04
Engineering Mechanics ........................................................................ Y01
Environmental Sciences ....................................................................... L05
M19
Propulsion ............................................................................................... R07S15
Mission Analysis .................................................................................... M18004
Open Literature Reporting
ACS/AIAA/EPA/IEEE/ISA/NASA/NOAA Joint Conference
on Sensing of Environmental Pollutants, Palo Alto,California, November 8-10, 1971 Entry
AIAA Preprint 71-1109 ................................................................................... T03
Advan. Astronaut. Sci. Entry
Vol. 29, No. I, pp. 203-222 .......................................................................... Gll
Vol. 29, No. I, pp. 589-599 .......................................................................... F05
Vol. 29, No. II, pp. 367-376 ........................................................................ E01
AIAA J. Entry
Vol. 9, No. 10, pp. 2096-2098 .................................................................... M22
281

Vol. 9, No. 10, pp. 2107-2109 ..................................................................... B01
Am. Ind. Hygiene Assoc. J. Entry
Vol. 32, No. 11, pp. 771-774 ....................................................................... K04
Anal. Chem. Entry
Vol. 43, No. 14, pp. 1958-1961 ................................................................... L13
Appl. Microbiol. Entry
Vol. 22, No. 4, pp. 491-495 .......................................................................... $12
Appl. Opt. Entry
Vol. 10, No. 12, pp. 2711-2716 ................................................................... F12
Appl. Phys. Lett. Entry
Vol. 19, No. 11, pp. 452-453 ........... _........................................................... C14
Vol. 19, No. 11, pp. 473-475 ....................................................................... Y03
Vol. 19, No. 12, pp. 503-506 ........................................................................ J06
Astron. J. Entry
Vol. 76, No. 8, pp. 711-718 ......................................................................... Hll
Vol. 76, No. 8, pp. 719-749 ......................................................................... N03
Astrophys. J. Entry
Vol. 170, No. 3, Pt. 1, pp. 551-555 ........................................................... H12
Celest. Mech. Entry
Vol. 4, No. 2, pp. 233-245 ........................................................................... L09
Comput. J. Entry
Vol. 14, No. 3, pp. 285-290 ......................................................................... H02
Earth Planet. Sci. Lett. Entry
Vol. 11, No. 5, pp. 362-368 ......................................................................... F01
282
Eur.J. Biochem. Entry
Vol. 22, No. 2, pp. 287-293 .......................................................................... B05
Geochim. Cosmochim. Acta Entry
Vol. 35, No. 9, pp. 865-875 ......................................................................... T06
Icarus Entry
Vol. 13, No. 3, pp. 363-370 ......................................................................... T02
Vol. 15, No. 2, pp. 190-196 ......................................................................... F06
Vol. 15, No. 2, pp. 197-203 ........................................................................ M08
Vol. 15, No. 2, pp. 279-303 ......................................................................... F02
IEEE Trans. Commun. Technol. Entry
Vol. COM-19, No. 5, pp. 699-707 .............................................................. C08
Vol. COM-19, No. 5, pp. 813-820 .............................................................. L04
Vol. COM-19, No. 6, pp. 889-897 .............................................................. R09
IEEE Trans. Computers Entry
Vol. C-20, No. 11, pp. 1312-1321 ............................................................... A05
Vol. C-20, No. 11, pp. 1322-1331 ............................................................... A06
Vol. C-20, No. 11, pp. 1376-1382 .............................................................. M13
IEEE Trans. Magnetics Entry
Vol. MAG-7, No. 3, pp. 517-520 ................................................................. B04
IEEE Trans. Microwave Theor. Techniq. Entry
Vol. MTT-19, No. 11, pp. 843-854 ............................................................. 005
IEEE Trans. Nucl. Sci. Entry
Vol. NS-18, No. 5, pp. 50-57 ...................................................................... N05
J. Appl. Phys. Entry
Vol. 42, No. 11, pp. 4197-4201 ................................................................... V02
283

J. Atmos.Sci. Entry
Vol. 28, No. 6, pp. 842-846 ......................................................................... D05
J. Chem. Phys. Entry
Vol. 55, No. 11, pp. 5227-5232 ................................................................... C04
Vol. 55, No. 11, pp. 5413-5414 ................................................................... H10
J. Colloid Interface Sci. Entry
Vol. 37, No. 2, pp. 403-409 ......................................................................... G02
J. Compos. Mater. Entry
Vol. 5, pp. 529-532 ........................................................................................ M17
J. Geophys. Res. Entry
Vol. 76, No. 26, pp. 6220-6236 ................................................................. W07
Vol. 76, No. 29, pp. 7021-7026 .................................................................... S18
J. Math. Anal. Appl. Entry
Vol. 36, No. 3, pp. 477-505 .......................................................................... Bll
J. Molec. Spectrosc. Entry
Vol. 40, No. 3, pp. 588-604 ......................................................................... T04
Vol. 40, No. 3, pp. 605-615 ......................................................................... T05
J. Polym. Sci., Pt. C: Polym. Sym. Entry
No. 35, pp. 71-76 ........................................................................................... M30
J. Spacecraft Rockets Entry
Vol. 8, No. 10, pp. 1038-1042 ..................................................................... DI0
Nature Phys. Sci. Entry
Vol. 233, No. 40, pp. 102-103 .................................................................... M14
Phys. Rev., Pt. B: Solid State Entry
Vol. 5, No. 1, pp. 238-240 ........................................................................... C05
284

Proceedingsof the SecondLunarScienceConference,Houston,Texas,January11-14,1971 Entry
Vol. 2, pp. 1875-1877 ..................................................................................... R08
Vol. 3, pp. 2235-2244 .................................................................................... NO1
Vol. 3, pp. 2301-2310 ..................................................................................... GO4
Vol. 3, pp. 2515-2528 ..................................................................................... T07
Vol. 3, pp. 2683-2697 .................................................................................... NO4
Vol. 3, pp. 2715-2719 ..................................................................................... K07
Vol. 3, pp. 2735-2742 ..................................................................................... C06
Proceedings of the Twenty.First International Congress,
Constance, Germany, October 4-10, 1970 Entry
pp. 193-210 ........................................................................................................ S03
Progr. Astronaut. Aeronaut. Entry
Vol. 25, pp. 19-41 ........................................................................................... H08
Rev. Sci. Instr. Entry
Vol. 42, No. 10, pp. 1393-1403 ................................................................... BIO
Science Entry
Vol. 173, No. 4001, pp. 1017-1020 ............................................................. L12
Vol. 174, No. 4016, pp. 1324-1327 ............................................................ DO8
Separ. Sci. Entry
Vol. 6, No. 5, pp. 715-725 ............................................................................ B07
SIAM/AMS Book Series Entry
Vol. IV, pp. 97-108 ......................................................................................... B08
Space Research Xl Entry
pp. 31-49 ............................................................................................................. J02
pp. 105-]12 ....................................................................................................... A02
pp. 165-175 ........................................................................................................ K06
285
Tetrahedron Entry
Vol. 27, No. 4, pp. 689-700 ......................................................................... C15
Vol. 27, No. 4, pp. 701-709 ......................................................................... C16
The Moon Entry
Vol. 3, No. 2, pp. 221-230 ........................................................................... N02
Vol. 3, No. 3, pp. 337-345 ............................................................................ J03
Trans. ASME, Ser. C: J. Heat Transf. Entry
Vol. 93, No. 4, pp. 397-407 .......................................................................... B02
Vol. 94, No. 1, pp. 119-127 .......................................................................... B03
Trans. ASME, Ser. E: J. Appl. Mech. Entry
Vol. 38, No. 4, pp. 1017-1022 ..................................................................... Y02
286
NASA -- JPt -- Coral., L.A., Collf.
TECHNICAL REPORT STANDARD TITLE PAGE
1. Report No. Vol. 2, No. 1 2. Government Accession No. 3. Reclplent's Catalog No.
5. Report DateApril 1972
4. Title and Subtitle
JPL QUARTERLY TECHNICAL REVIEW6. Performing Organization Code
7. Author(s) 8. Performing Organization Report No.JPL Staff
10. Work Unit No.9. Per_rming Organization Name and Address
JET PROPULSION LABORATORY
California Institute of Technology
4800 Oak Grove Drive
Pasadena, California 91103
12. Sponsoring Agency Name and Address
NATIONAL AERONAUTICS AND SPACE ADMINISTRATION
Washington, D.C. 20546
11. Contract or Grant No.
NAS 7-100
13. Type of Report and Period Covered
JPL Querterly TechnicalReview
14. Sponsoring Agency Code
15. Supplementary Notes
16. Abstract
The QTR is comprised of two parts: (I) brief technical articles describing
recent JPL-sponsored work, and (2) a bibliography of the Laboratory's re-
cently distributed external publications and those open literature articles
_itten under JPL sponsorship.
17. Key Words (Selected by Author(s))
Not applicable for this type of
report
18. DistributionStatement
Unclassified -- Unlimited
19. Security Cl_slf. _f this report)
Unclassified
20. Securlty Cl_s|f. _fthis page)
Unclassified
21. No. of Pages
286
22. Price