spillovers from china - quarterly bulletin - bank of england
TRANSCRIPT
Quarterly Bulletin2018 Q2
© Bank of England 2018ISSN 2399-4568
Topical articleFrom the Middle Kingdom to the United Kingdom: spillovers from China
Topical articles Spillovers from China 1
From the Middle Kingdom to the United Kingdom: spillovers from ChinaBy Robert Gilhooly, Jen Han, Simon Lloyd, Niamh Reynolds and David Young of the Bank’s International Directorate.(1)
• China’screditboomisoneofthelargestandlongestrunningeverrecorded.Similarcreditboomshavetypicallyprecededcrisesinothercountries.
• ThisarticleprovidesanupdatedassessmentofhowashocktotheChineseeconomycouldaffecttheUKeconomyviastandardtransmissionchannels—suchastradeandfinanciallinkages.Itthenconsidershowamplificationmechanisms,whichcouldplausiblyoperateintheeventofaparticularlylargeshock,couldfurtherincreasetheimpactontheUKfromaneconomiccrisiswithinChina.
• WefindthattheeffectsviastandardchannelsfromamodestfallinChineseGDParelargerthanourpreviousestimates,primarilyduetoChina’sincreasingroleinglobaltrade.Amoreextremeshockwhichtriggersamplificationmechanisms—suchasalargerfinancialmarketreaction—couldpotentiallydoubletheeffectsfromthestandardchannelsalone.
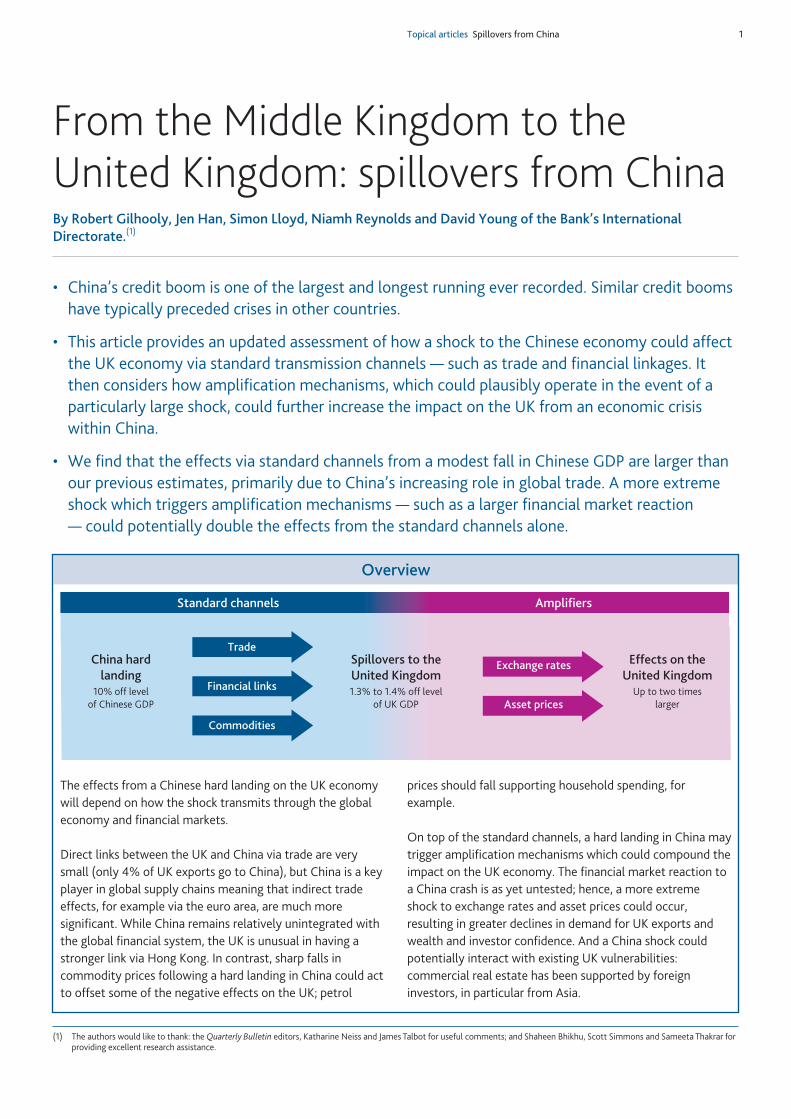
Overview
TheeffectsfromaChinesehardlandingontheUKeconomywilldependonhowtheshocktransmitsthroughtheglobaleconomyandfinancialmarkets.
DirectlinksbetweentheUKandChinaviatradeareverysmall(only4%ofUKexportsgotoChina),butChinaisakeyplayeringlobalsupplychainsmeaningthatindirecttradeeffects,forexampleviatheeuroarea,aremuchmoresignificant.WhileChinaremainsrelativelyunintegratedwiththeglobalfinancialsystem,theUKisunusualinhavingastrongerlinkviaHongKong.Incontrast,sharpfallsincommoditypricesfollowingahardlandinginChinacouldacttooffsetsomeofthenegativeeffectsontheUK;petrol
pricesshouldfallsupportinghouseholdspending,forexample.
Ontopofthestandardchannels,ahardlandinginChinamaytriggeramplificationmechanismswhichcouldcompoundtheimpactontheUKeconomy.ThefinancialmarketreactiontoaChinacrashisasyetuntested;hence,amoreextremeshocktoexchangeratesandassetpricescouldoccur,resultingingreaterdeclinesindemandforUKexportsandwealthandinvestorconfidence.AndaChinashockcouldpotentiallyinteractwithexistingUKvulnerabilities:commercialrealestatehasbeensupportedbyforeigninvestors,inparticularfromAsia.
(1) Theauthorswouldliketothank:theQuarterly Bulletineditors,KatharineNeissandJamesTalbotforusefulcomments;andShaheenBhikhu,ScottSimmonsandSameetaThakrarforprovidingexcellentresearchassistance.
AmplifiersStandard channels
Trade
Financial links
Commodities
China hardlanding
10% off levelof Chinese GDP
Up to two timeslargerAsset prices
Exchange rates Effects on theUnited Kingdom
1.3% to 1.4% off levelof UK GDP
Spillovers to theUnited Kingdom
Quarterly Bulletin 2018 Q2 2
Introduction
China’seconomicgrowthandintegrationintotheglobaleconomyhasbeenparticularlyrapid.Chinaaccountedforjust2%ofglobalGDPin1990,butnowmakesup15%ofglobalGDP(in2017USdollarterms).FollowingaccessiontotheWorldTradeOrganisation(WTO)in2001,Chinahasbecometheworld’slargestexporterofgoods.AndChinaisamajorproducerandconsumerofcommodities.
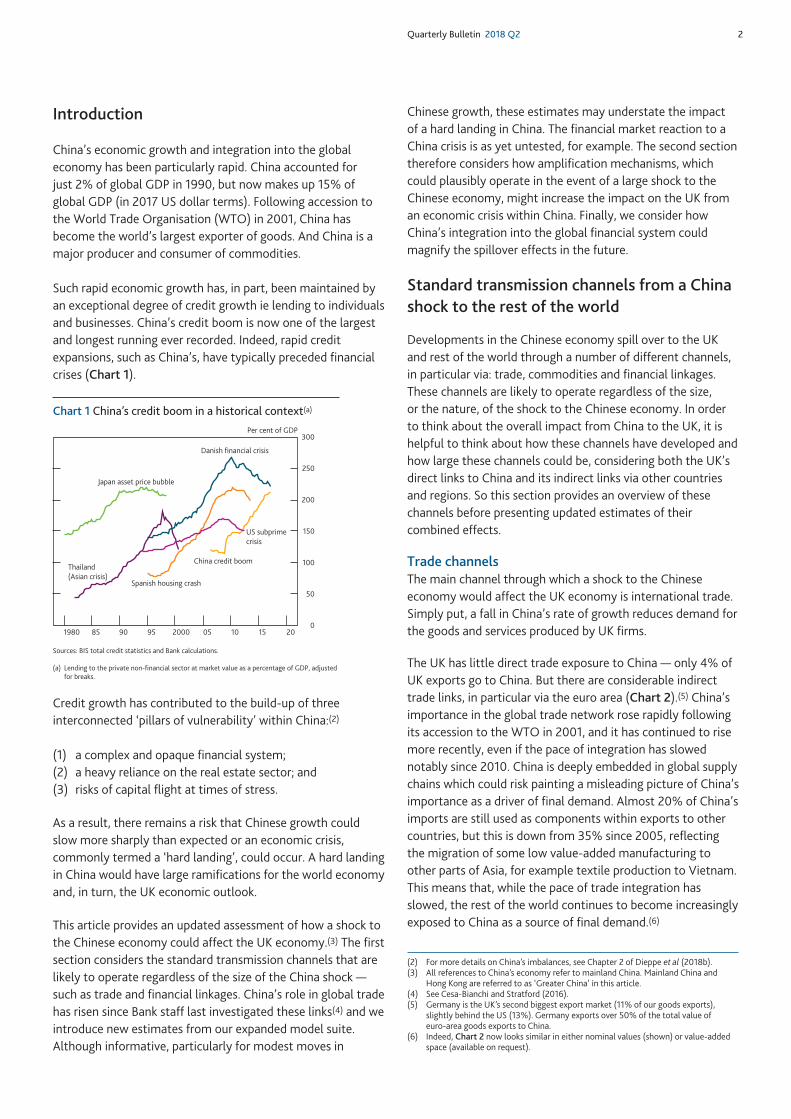
Suchrapideconomicgrowthhas,inpart,beenmaintainedbyanexceptionaldegreeofcreditgrowthielendingtoindividualsandbusinesses.China’screditboomisnowoneofthelargestandlongestrunningeverrecorded.Indeed,rapidcreditexpansions,suchasChina’s,havetypicallyprecededfinancialcrises(Chart 1).
Creditgrowthhascontributedtothebuild-upofthreeinterconnected‘pillarsofvulnerability’withinChina:(2)
(1) acomplexandopaquefinancialsystem;(2) aheavyrelianceontherealestatesector;and(3) risksofcapitalflightattimesofstress.
Asaresult,thereremainsariskthatChinesegrowthcouldslowmoresharplythanexpectedoraneconomiccrisis,commonlytermeda‘hardlanding’,couldoccur.AhardlandinginChinawouldhavelargeramificationsfortheworldeconomyand,inturn,theUKeconomicoutlook.
ThisarticleprovidesanupdatedassessmentofhowashocktotheChineseeconomycouldaffecttheUKeconomy.(3)ThefirstsectionconsidersthestandardtransmissionchannelsthatarelikelytooperateregardlessofthesizeoftheChinashock—suchastradeandfinanciallinkages.China’sroleinglobaltradehasrisensinceBankstafflastinvestigatedtheselinks(4)andweintroducenewestimatesfromourexpandedmodelsuite.Althoughinformative,particularlyformodestmovesin
Chinesegrowth,theseestimatesmayunderstatetheimpactofahardlandinginChina.ThefinancialmarketreactiontoaChinacrisisisasyetuntested,forexample.Thesecondsectionthereforeconsidershowamplificationmechanisms,whichcouldplausiblyoperateintheeventofalargeshocktotheChineseeconomy,mightincreasetheimpactontheUKfromaneconomiccrisiswithinChina.Finally,weconsiderhowChina’sintegrationintotheglobalfinancialsystemcouldmagnifythespillovereffectsinthefuture.
Standard transmission channels from a China shock to the rest of the world
DevelopmentsintheChineseeconomyspillovertotheUKandrestoftheworldthroughanumberofdifferentchannels,inparticularvia:trade,commoditiesandfinanciallinkages.Thesechannelsarelikelytooperateregardlessofthesize,orthenature,oftheshocktotheChineseeconomy.InordertothinkabouttheoverallimpactfromChinatotheUK,itishelpfultothinkabouthowthesechannelshavedevelopedandhowlargethesechannelscouldbe,consideringboththeUK’sdirectlinkstoChinaanditsindirectlinksviaothercountriesandregions.Sothissectionprovidesanoverviewofthesechannelsbeforepresentingupdatedestimatesoftheircombinedeffects.
Trade channelsThemainchannelthroughwhichashocktotheChineseeconomywouldaffecttheUKeconomyisinternationaltrade.Simplyput,afallinChina’srateofgrowthreducesdemandforthegoodsandservicesproducedbyUKfirms.
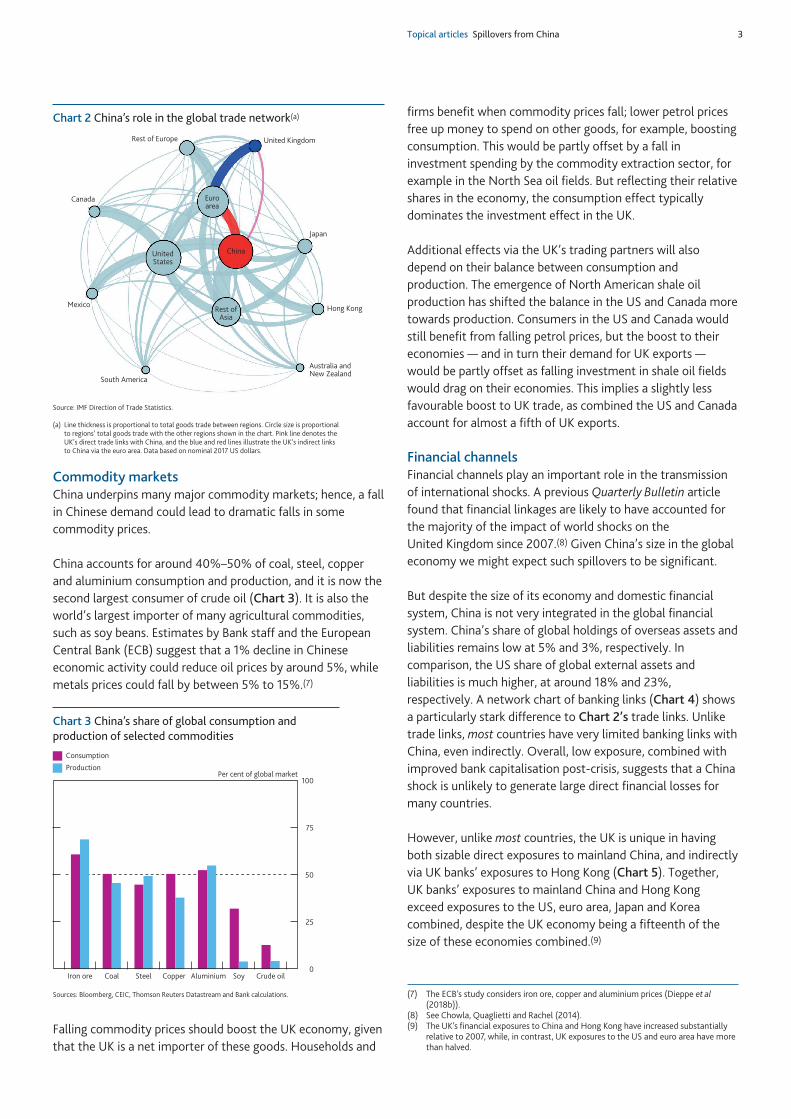
TheUKhaslittledirecttradeexposuretoChina—only4%ofUKexportsgotoChina.Butthereareconsiderableindirecttradelinks,inparticularviatheeuroarea(Chart 2).(5)China’simportanceintheglobaltradenetworkroserapidlyfollowingitsaccessiontotheWTOin2001,andithascontinuedtorisemorerecently,evenifthepaceofintegrationhasslowednotablysince2010.ChinaisdeeplyembeddedinglobalsupplychainswhichcouldriskpaintingamisleadingpictureofChina’simportanceasadriveroffinaldemand.Almost20%ofChina’simportsarestillusedascomponentswithinexportstoothercountries,butthisisdownfrom35%since2005,reflectingthemigrationofsomelowvalue-addedmanufacturingtootherpartsofAsia,forexampletextileproductiontoVietnam.Thismeansthat,whilethepaceoftradeintegrationhasslowed,therestoftheworldcontinuestobecomeincreasinglyexposedtoChinaasasourceoffinaldemand.(6)
0
50
100
150
200
250
300
1980 85 90 95 2000 05 10 15 20
Per cent of GDP
Japan asset price bubble
Danish financial crisis
China credit boom
US subprimecrisis
Spanish housing crash
Thailand(Asian crisis)
Chart 1 China’s credit boom in a historical context(a)
Sources:BIStotalcreditstatisticsandBankcalculations.
(a) Lendingtotheprivatenon-financialsectoratmarketvalueasapercentageofGDP,adjustedforbreaks.
(2) FormoredetailsonChina’simbalances,seeChapter2ofDieppeet al(2018b).(3) AllreferencestoChina’seconomyrefertomainlandChina.MainlandChinaand
HongKongarereferredtoas‘GreaterChina’inthisarticle.(4) SeeCesa-BianchiandStratford(2016).(5) GermanyistheUK’ssecondbiggestexportmarket(11%ofourgoodsexports),
slightlybehindtheUS(13%).Germanyexportsover50%ofthetotalvalueofeuro-areagoodsexportstoChina.
(6) Indeed,Chart 2nowlookssimilarineithernominalvalues(shown)orvalue-addedspace(availableonrequest).
Topical articles Spillovers from China 3
Commodity marketsChinaunderpinsmanymajorcommoditymarkets;hence,afallinChinesedemandcouldleadtodramaticfallsinsomecommodityprices.
Chinaaccountsforaround40%–50%ofcoal,steel,copperandaluminiumconsumptionandproduction,anditisnowthesecondlargestconsumerofcrudeoil(Chart 3).Itisalsotheworld’slargestimporterofmanyagriculturalcommodities,suchassoybeans.EstimatesbyBankstaffandtheEuropeanCentralBank(ECB)suggestthata1%declineinChineseeconomicactivitycouldreduceoilpricesbyaround5%,whilemetalspricescouldfallbybetween5%to15%.(7)
FallingcommoditypricesshouldboosttheUKeconomy,giventhattheUKisanetimporterofthesegoods.Householdsand
firmsbenefitwhencommoditypricesfall;lowerpetrolpricesfreeupmoneytospendonothergoods,forexample,boostingconsumption.Thiswouldbepartlyoffsetbyafallininvestmentspendingbythecommodityextractionsector,forexampleintheNorthSeaoilfields.Butreflectingtheirrelativesharesintheeconomy,theconsumptioneffecttypicallydominatestheinvestmenteffectintheUK.
AdditionaleffectsviatheUK’stradingpartnerswillalsodependontheirbalancebetweenconsumptionandproduction.TheemergenceofNorthAmericanshaleoilproductionhasshiftedthebalanceintheUSandCanadamoretowardsproduction.ConsumersintheUSandCanadawouldstillbenefitfromfallingpetrolprices,buttheboosttotheireconomies—andinturntheirdemandforUKexports—wouldbepartlyoffsetasfallinginvestmentinshaleoilfieldswoulddragontheireconomies.ThisimpliesaslightlylessfavourableboosttoUKtrade,ascombinedtheUSandCanadaaccountforalmostafifthofUKexports.
Financial channelsFinancialchannelsplayanimportantroleinthetransmissionofinternationalshocks.ApreviousQuarterly BulletinarticlefoundthatfinanciallinkagesarelikelytohaveaccountedforthemajorityoftheimpactofworldshocksontheUnitedKingdomsince2007.(8)GivenChina’ssizeintheglobaleconomywemightexpectsuchspilloverstobesignificant.
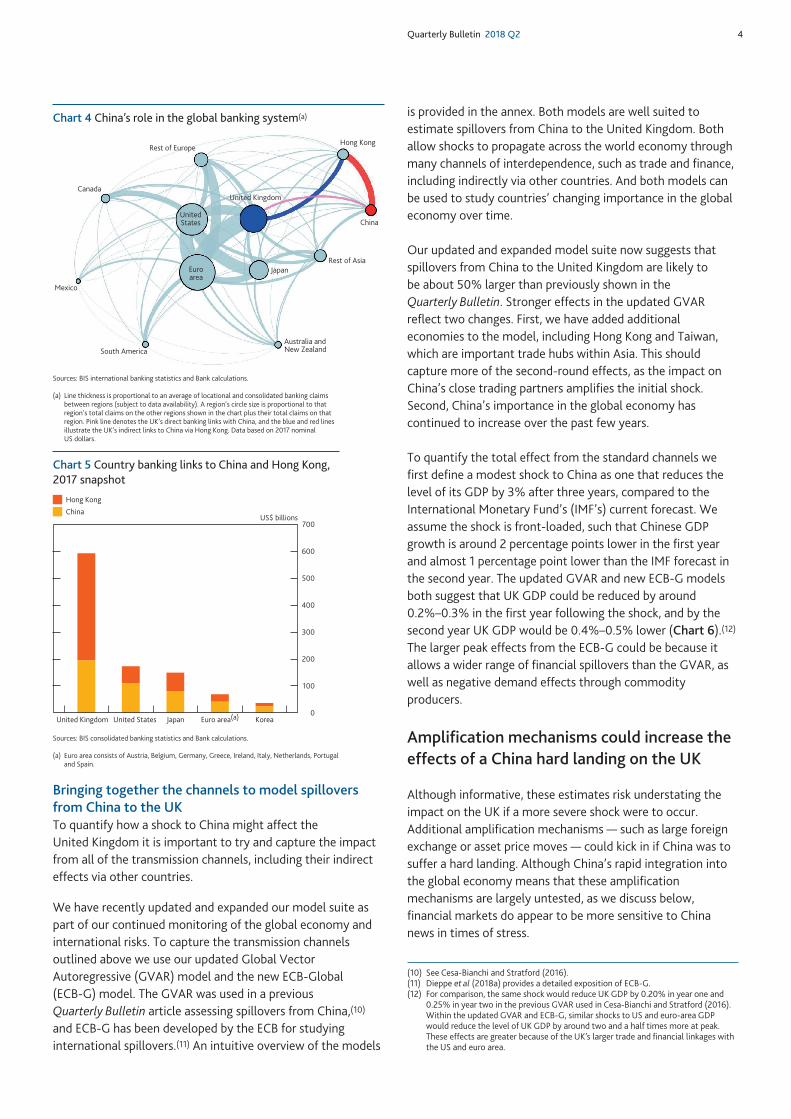
Butdespitethesizeofitseconomyanddomesticfinancialsystem,Chinaisnotveryintegratedintheglobalfinancialsystem.China’sshareofglobalholdingsofoverseasassetsandliabilitiesremainslowat5%and3%,respectively.Incomparison,theUSshareofglobalexternalassetsandliabilitiesismuchhigher,ataround18%and23%,respectively.Anetworkchartofbankinglinks(Chart 4)showsaparticularlystarkdifferencetoChart 2’stradelinks.Unliketradelinks,mostcountrieshaveverylimitedbankinglinkswithChina,evenindirectly.Overall,lowexposure,combinedwithimprovedbankcapitalisationpost-crisis,suggeststhataChinashockisunlikelytogeneratelargedirectfinanciallossesformanycountries.
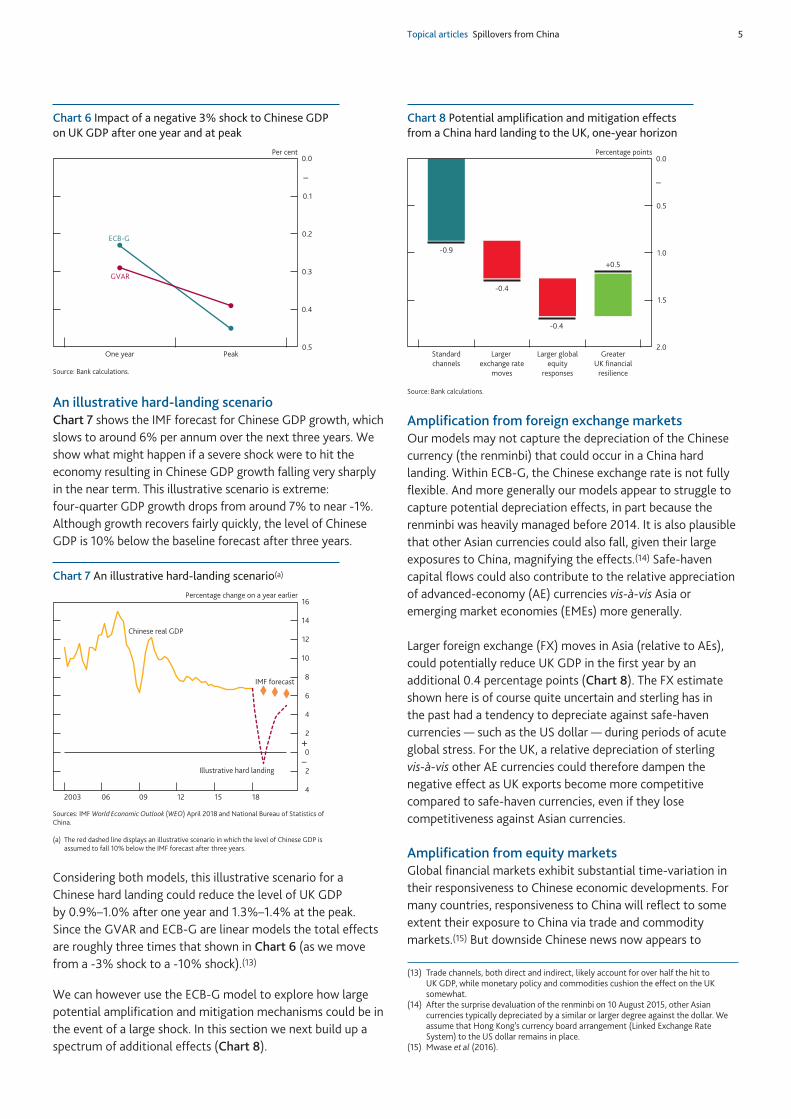
However,unlikemostcountries,theUKisuniqueinhavingbothsizabledirectexposurestomainlandChina,andindirectlyviaUKbanks’exposurestoHongKong(Chart 5).Together,UKbanks’exposurestomainlandChinaandHongKongexceedexposurestotheUS,euroarea,JapanandKoreacombined,despitetheUKeconomybeingafifteenthofthesizeoftheseeconomiescombined.(9)
Rest of Europe United Kingdom
ChinaUnitedStates
Rest ofAsia
Australia andNew Zealand
Hong Kong
Japan
Canada
Mexico
South America
Euroarea
Chart 2 China’s role in the global trade network(a)
Source:IMFDirectionofTradeStatistics.
(a) Linethicknessisproportionaltototalgoodstradebetweenregions.Circlesizeisproportionaltoregions’totalgoodstradewiththeotherregionsshowninthechart.PinklinedenotestheUK’sdirecttradelinkswithChina,andtheblueandredlinesillustratetheUK’sindirectlinkstoChinaviatheeuroarea.Databasedonnominal2017USdollars.
(7) TheECB’sstudyconsidersironore,copperandaluminiumprices(Dieppeet al(2018b)).
(8) SeeChowla,QuagliettiandRachel(2014).(9) TheUK’sfinancialexposurestoChinaandHongKonghaveincreasedsubstantially
relativeto2007,while,incontrast,UKexposurestotheUSandeuroareahavemorethanhalved.
0
25
50
75
100
Iron ore Coal Steel Copper Aluminium Soy Crude oil
Per cent of global marketProduction
Consumption
Chart 3 China’s share of global consumption and production of selected commodities
Sources:Bloomberg,CEIC,ThomsonReutersDatastreamandBankcalculations.
Quarterly Bulletin 2018 Q2 4
Bringing together the channels to model spillovers from China to the UKToquantifyhowashocktoChinamightaffecttheUnitedKingdomitisimportanttotryandcapturetheimpactfromallofthetransmissionchannels,includingtheirindirecteffectsviaothercountries.
Wehaverecentlyupdatedandexpandedourmodelsuiteaspartofourcontinuedmonitoringoftheglobaleconomyandinternationalrisks.TocapturethetransmissionchannelsoutlinedaboveweuseourupdatedGlobalVectorAutoregressive(GVAR)modelandthenewECB-Global(ECB-G)model.TheGVARwasusedinapreviousQuarterly BulletinarticleassessingspilloversfromChina,(10)andECB-GhasbeendevelopedbytheECBforstudyinginternationalspillovers.(11)Anintuitiveoverviewofthemodels
isprovidedintheannex.BothmodelsarewellsuitedtoestimatespilloversfromChinatotheUnitedKingdom.Bothallowshockstopropagateacrosstheworldeconomythroughmanychannelsofinterdependence,suchastradeandfinance,includingindirectlyviaothercountries.Andbothmodelscanbeusedtostudycountries’changingimportanceintheglobaleconomyovertime.
OurupdatedandexpandedmodelsuitenowsuggeststhatspilloversfromChinatotheUnitedKingdomarelikelytobeabout50%largerthanpreviouslyshownintheQuarterly Bulletin.StrongereffectsintheupdatedGVARreflecttwochanges.First,wehaveaddedadditionaleconomiestothemodel,includingHongKongandTaiwan,whichareimportanttradehubswithinAsia.Thisshouldcapturemoreofthesecond-roundeffects,astheimpactonChina’sclosetradingpartnersamplifiestheinitialshock.Second,China’simportanceintheglobaleconomyhascontinuedtoincreaseoverthepastfewyears.
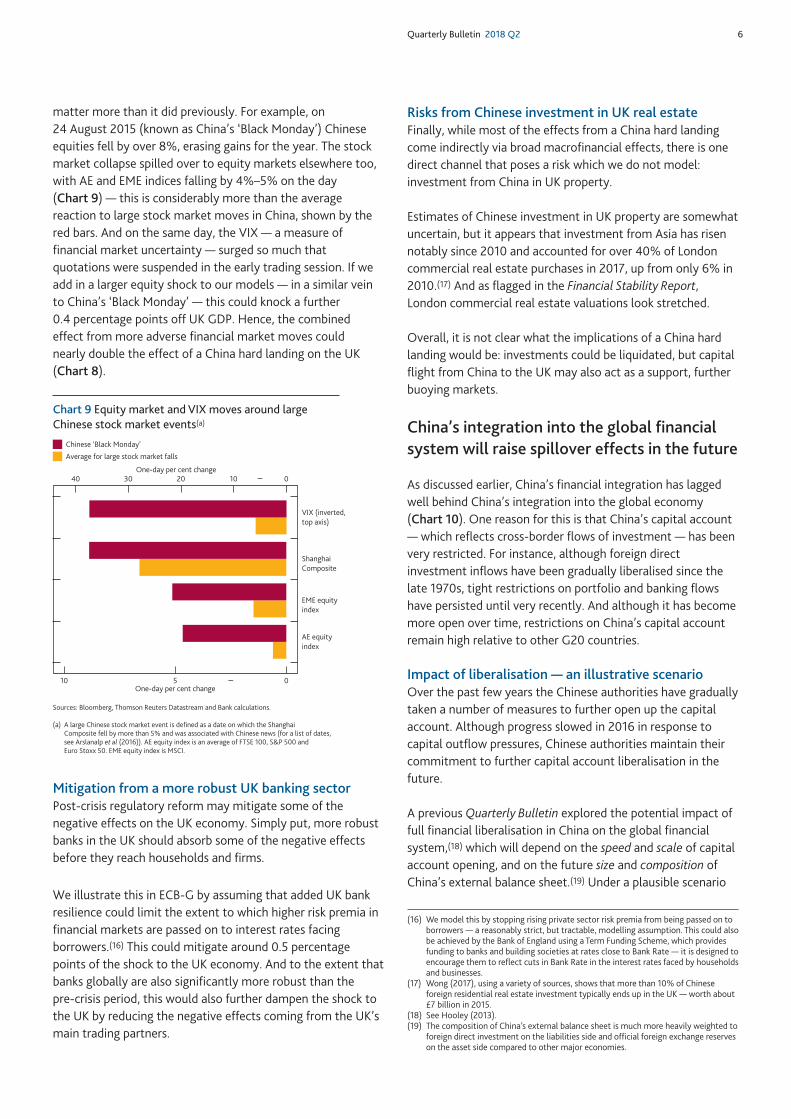
ToquantifythetotaleffectfromthestandardchannelswefirstdefineamodestshocktoChinaasonethatreducesthelevelofitsGDPby3%afterthreeyears,comparedtotheInternationalMonetaryFund’s(IMF’s)currentforecast.Weassumetheshockisfront-loaded,suchthatChineseGDPgrowthisaround2percentagepointslowerinthefirstyearandalmost1percentagepointlowerthantheIMFforecastinthesecondyear.TheupdatedGVARandnewECB-GmodelsbothsuggestthatUKGDPcouldbereducedbyaround0.2%–0.3%inthefirstyearfollowingtheshock,andbythesecondyearUKGDPwouldbe0.4%–0.5%lower(Chart 6).(12)ThelargerpeakeffectsfromtheECB-GcouldbebecauseitallowsawiderrangeoffinancialspilloversthantheGVAR,aswellasnegativedemandeffectsthroughcommodityproducers.
Amplification mechanisms could increase the effects of a China hard landing on the UK
Althoughinformative,theseestimatesriskunderstatingtheimpactontheUKifamoresevereshockweretooccur.Additionalamplificationmechanisms—suchaslargeforeignexchangeorassetpricemoves—couldkickinifChinawastosufferahardlanding.AlthoughChina’srapidintegrationintotheglobaleconomymeansthattheseamplificationmechanismsarelargelyuntested,aswediscussbelow,financialmarketsdoappeartobemoresensitivetoChinanewsintimesofstress.
UnitedStates
Rest of EuropeHong Kong
China
Rest of AsiaJapanEuro
areaMexico
CanadaUnited Kingdom
Australia andNew Zealand South America
Chart 4 China’s role in the global banking system(a)
Sources:BISinternationalbankingstatisticsandBankcalculations.
(a) Linethicknessisproportionaltoanaverageoflocationalandconsolidatedbankingclaimsbetweenregions(subjecttodataavailability).Aregion’scirclesizeisproportionaltothatregion’stotalclaimsontheotherregionsshowninthechartplustheirtotalclaimsonthatregion.PinklinedenotestheUK’sdirectbankinglinkswithChina,andtheblueandredlinesillustratetheUK’sindirectlinkstoChinaviaHongKong.Databasedon2017nominalUSdollars.
0
100
200
300
400
500
600
700
United Kingdom United States Japan Euro area(a) Korea
US$ billions
Hong Kong
China
Chart 5 Country banking links to China and Hong Kong, 2017 snapshot
Sources:BISconsolidatedbankingstatisticsandBankcalculations.
(a) EuroareaconsistsofAustria,Belgium,Germany,Greece,Ireland,Italy,Netherlands,PortugalandSpain.
(10) SeeCesa-BianchiandStratford(2016).(11) Dieppeet al(2018a)providesadetailedexpositionofECB-G.(12) Forcomparison,thesameshockwouldreduceUKGDPby0.20%inyearoneand
0.25%inyeartwointhepreviousGVARusedinCesa-BianchiandStratford(2016).WithintheupdatedGVARandECB-G,similarshockstoUSandeuro-areaGDPwouldreducethelevelofUKGDPbyaroundtwoandahalftimesmoreatpeak.TheseeffectsaregreaterbecauseoftheUK’slargertradeandfinanciallinkageswiththeUSandeuroarea.
Topical articles Spillovers from China 5
An illustrative hard-landing scenarioChart 7showstheIMFforecastforChineseGDPgrowth,whichslowstoaround6%perannumoverthenextthreeyears.WeshowwhatmighthappenifasevereshockweretohittheeconomyresultinginChineseGDPgrowthfallingverysharplyinthenearterm.Thisillustrativescenarioisextreme:four-quarterGDPgrowthdropsfromaround7%tonear-1%.Althoughgrowthrecoversfairlyquickly,thelevelofChineseGDPis10%belowthebaselineforecastafterthreeyears.
Consideringbothmodels,thisillustrativescenarioforaChinesehardlandingcouldreducethelevelofUKGDPby0.9%–1.0%afteroneyearand1.3%–1.4%atthepeak.SincetheGVARandECB-GarelinearmodelsthetotaleffectsareroughlythreetimesthatshowninChart 6(aswemovefroma-3%shocktoa-10%shock).(13)
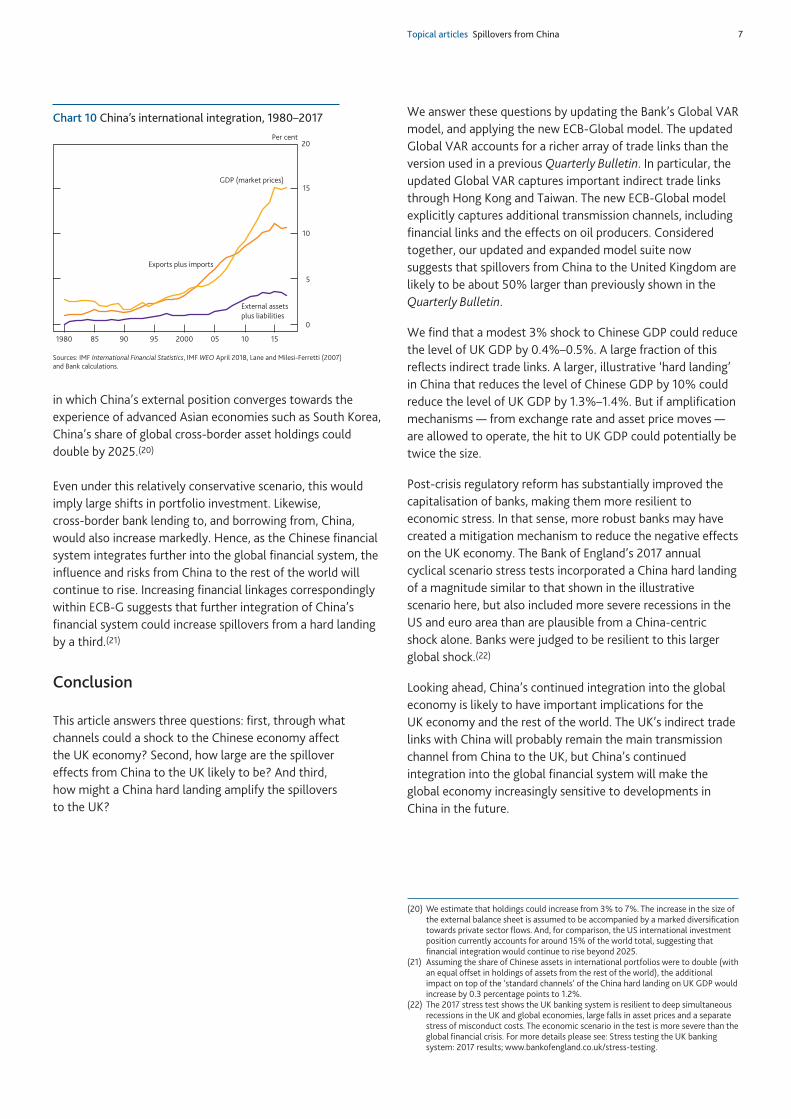
WecanhoweverusetheECB-Gmodeltoexplorehowlargepotentialamplificationandmitigationmechanismscouldbeintheeventofalargeshock.Inthissectionwenextbuildupaspectrumofadditionaleffects(Chart 8).
Amplification from foreign exchange marketsOurmodelsmaynotcapturethedepreciationoftheChinesecurrency(therenminbi)thatcouldoccurinaChinahardlanding.WithinECB-G,theChineseexchangerateisnotfullyflexible.Andmoregenerallyourmodelsappeartostruggletocapturepotentialdepreciationeffects,inpartbecausetherenminbiwasheavilymanagedbefore2014.ItisalsoplausiblethatotherAsiancurrenciescouldalsofall,giventheirlargeexposurestoChina,magnifyingtheeffects.(14)Safe-havencapitalflowscouldalsocontributetotherelativeappreciationofadvanced-economy(AE)currenciesvis-à-visAsiaoremergingmarketeconomies(EMEs)moregenerally.
Largerforeignexchange(FX)movesinAsia(relativetoAEs),couldpotentiallyreduceUKGDPinthefirstyearbyanadditional0.4percentagepoints(Chart 8).TheFXestimateshownhereisofcoursequiteuncertainandsterlinghasinthepasthadatendencytodepreciateagainstsafe-havencurrencies—suchastheUSdollar—duringperiodsofacuteglobalstress.FortheUK,arelativedepreciationofsterlingvis-à-visotherAEcurrenciescouldthereforedampenthenegativeeffectasUKexportsbecomemorecompetitivecomparedtosafe-havencurrencies,eveniftheylosecompetitivenessagainstAsiancurrencies.
Amplification from equity markets Globalfinancialmarketsexhibitsubstantialtime-variationintheirresponsivenesstoChineseeconomicdevelopments.Formanycountries,responsivenesstoChinawillreflecttosomeextenttheirexposuretoChinaviatradeandcommoditymarkets.(15)ButdownsideChinesenewsnowappearsto
(13) Tradechannels,bothdirectandindirect,likelyaccountforoverhalfthehittoUKGDP,whilemonetarypolicyandcommoditiescushiontheeffectontheUKsomewhat.
(14) Afterthesurprisedevaluationoftherenminbion10August2015,otherAsiancurrenciestypicallydepreciatedbyasimilarorlargerdegreeagainstthedollar.WeassumethatHongKong’scurrencyboardarrangement(LinkedExchangeRateSystem)totheUSdollarremainsinplace.
(15) Mwaseet al(2016).
0.5
0.4
0.3
0.2
0.1
0.0Per cent
One year Peak
–
GVAR
ECB-G
Chart 6 Impact of a negative 3% shock to Chinese GDP on UK GDP after one year and at peak
Source:Bankcalculations.
4
2
0
2
4
6
8
10
12
14
16
2003 06 09 12 15 18
Chinese real GDP
IMF forecast
Percentage change on a year earlier
Illustrative hard landing
+
–
Chart 7 An illustrative hard-landing scenario(a)
Sources:IMFWorld Economic Outlook (WEO)April2018 andNationalBureauofStatisticsofChina.
(a) ThereddashedlinedisplaysanillustrativescenarioinwhichthelevelofChineseGDPisassumedtofall10%belowtheIMFforecastafterthreeyears.
2.0
1.5
1.0
0.5
0.0
Standardchannels
Larger exchange rate
moves
Larger globalequity
responses
GreaterUK financial
resilience
Percentage points
–
-0.9
-0.4
-0.4
+0.5
Chart 8 Potential amplification and mitigation effects from a China hard landing to the UK, one-year horizon
Source:Bankcalculations.
Quarterly Bulletin 2018 Q2 6
mattermorethanitdidpreviously.Forexample,on24August2015(knownasChina’s‘BlackMonday’)Chineseequitiesfellbyover8%,erasinggainsfortheyear.Thestockmarketcollapsespilledovertoequitymarketselsewheretoo,withAEandEMEindicesfallingby4%–5%ontheday(Chart 9)—thisisconsiderablymorethantheaveragereactiontolargestockmarketmovesinChina,shownbytheredbars.Andonthesameday,theVIX—ameasureoffinancialmarketuncertainty—surgedsomuchthatquotationsweresuspendedintheearlytradingsession.Ifweaddinalargerequityshocktoourmodels—inasimilarveintoChina’s‘BlackMonday’—thiscouldknockafurther0.4percentagepointsoffUKGDP.Hence,thecombinedeffectfrommoreadversefinancialmarketmovescouldnearlydoubletheeffectofaChinahardlandingontheUK(Chart 8).
Mitigation from a more robust UK banking sector Post-crisisregulatoryreformmaymitigatesomeofthenegativeeffectsontheUKeconomy.Simplyput,morerobustbanksintheUKshouldabsorbsomeofthenegativeeffectsbeforetheyreachhouseholdsandfirms.
WeillustratethisinECB-GbyassumingthataddedUKbankresiliencecouldlimittheextenttowhichhigherriskpremiainfinancialmarketsarepassedontointerestratesfacingborrowers.(16)Thiscouldmitigatearound0.5percentagepointsoftheshocktotheUKeconomy.Andtotheextentthatbanksgloballyarealsosignificantlymorerobustthanthepre-crisisperiod,thiswouldalsofurtherdampentheshocktotheUKbyreducingthenegativeeffectscomingfromtheUK’smaintradingpartners.
Risks from Chinese investment in UK real estate Finally,whilemostoftheeffectsfromaChinahardlandingcomeindirectlyviabroadmacrofinancialeffects,thereisonedirectchannelthatposesariskwhichwedonotmodel:investmentfromChinainUKproperty.
EstimatesofChineseinvestmentinUKpropertyaresomewhatuncertain,butitappearsthatinvestmentfromAsiahasrisennotablysince2010andaccountedforover40%ofLondoncommercialrealestatepurchasesin2017,upfromonly6%in2010.(17)AndasflaggedintheFinancial Stability Report,Londoncommercialrealestatevaluationslookstretched.
Overall,itisnotclearwhattheimplicationsofaChinahardlandingwouldbe:investmentscouldbeliquidated,butcapitalflightfromChinatotheUKmayalsoactasasupport,furtherbuoyingmarkets.
China’s integration into the global financial system will raise spillover effects in the future
Asdiscussedearlier,China’sfinancialintegrationhaslaggedwellbehindChina’sintegrationintotheglobaleconomy(Chart 10).OnereasonforthisisthatChina’scapitalaccount—whichreflectscross-borderflowsofinvestment—hasbeenveryrestricted.Forinstance,althoughforeigndirectinvestmentinflowshavebeengraduallyliberalisedsincethelate1970s,tightrestrictionsonportfolioandbankingflowshavepersisteduntilveryrecently.Andalthoughithasbecomemoreopenovertime,restrictionsonChina’scapitalaccountremainhighrelativetootherG20countries.
Impact of liberalisation — an illustrative scenarioOverthepastfewyearstheChineseauthoritieshavegraduallytakenanumberofmeasurestofurtheropenupthecapitalaccount.Althoughprogressslowedin2016inresponsetocapitaloutflowpressures,Chineseauthoritiesmaintaintheircommitmenttofurthercapitalaccountliberalisationinthefuture.
ApreviousQuarterly BulletinexploredthepotentialimpactoffullfinancialliberalisationinChinaontheglobalfinancialsystem,(18)whichwilldependonthespeedandscaleofcapitalaccountopening,andonthefuturesizeandcompositionofChina’sexternalbalancesheet.(19)Underaplausiblescenario
40 30 20 10 –
–
0
VIX (inverted,top axis)
AE equityindex
EME equityindex
ShanghaiComposite
10 5 0
One-day per cent change
One-day per cent change
Chinese ‘Black Monday’
Average for large stock market falls
Chart 9 Equity market and VIX moves around large Chinese stock market events(a)
Sources:Bloomberg,ThomsonReutersDatastreamandBankcalculations.
(a) AlargeChinesestockmarketeventisdefinedasadateonwhichtheShanghaiCompositefellbymorethan5%andwasassociatedwithChinesenews(foralistofdates,seeArslanalpet al(2016)).AEequityindexisanaverageofFTSE100,S&P500andEuroStoxx50.EMEequityindexisMSCI.
(16) Wemodelthisbystoppingrisingprivatesectorriskpremiafrombeingpassedontoborrowers—areasonablystrict,buttractable,modellingassumption.ThiscouldalsobeachievedbytheBankofEnglandusingaTermFundingScheme,whichprovidesfundingtobanksandbuildingsocietiesatratesclosetoBankRate—itisdesignedtoencouragethemtoreflectcutsinBankRateintheinterestratesfacedbyhouseholdsandbusinesses.
(17) Wong(2017),usingavarietyofsources,showsthatmorethan10%ofChineseforeignresidentialrealestateinvestmenttypicallyendsupintheUK—worthabout£7billionin2015.
(18) SeeHooley(2013).(19) ThecompositionofChina’sexternalbalancesheetismuchmoreheavilyweightedto
foreigndirectinvestmentontheliabilitiessideandofficialforeignexchangereservesontheassetsidecomparedtoothermajoreconomies.
Topical articles Spillovers from China 7
inwhichChina’sexternalpositionconvergestowardstheexperienceofadvancedAsianeconomiessuchasSouthKorea,China’sshareofglobalcross-borderassetholdingscoulddoubleby2025.(20)
Evenunderthisrelativelyconservativescenario,thiswouldimplylargeshiftsinportfolioinvestment.Likewise,cross-borderbanklendingto,andborrowingfrom,China,wouldalsoincreasemarkedly.Hence,astheChinesefinancialsystemintegratesfurtherintotheglobalfinancialsystem,theinfluenceandrisksfromChinatotherestoftheworldwillcontinuetorise.IncreasingfinanciallinkagescorrespondinglywithinECB-GsuggeststhatfurtherintegrationofChina’sfinancialsystemcouldincreasespilloversfromahardlandingbyathird.(21)
Conclusion
Thisarticleanswersthreequestions:first,throughwhatchannelscouldashocktotheChineseeconomyaffecttheUKeconomy?Second,howlargearethespillovereffectsfromChinatotheUKlikelytobe?Andthird,howmightaChinahardlandingamplifythespilloverstotheUK?
WeanswerthesequestionsbyupdatingtheBank’sGlobalVARmodel,andapplyingthenewECB-Globalmodel.TheupdatedGlobalVARaccountsforaricherarrayoftradelinksthantheversionusedinapreviousQuarterly Bulletin.Inparticular,theupdatedGlobalVARcapturesimportantindirecttradelinksthroughHongKongandTaiwan.ThenewECB-Globalmodelexplicitlycapturesadditionaltransmissionchannels,includingfinanciallinksandtheeffectsonoilproducers.Consideredtogether,ourupdatedandexpandedmodelsuitenowsuggeststhatspilloversfromChinatotheUnitedKingdomarelikelytobeabout50%largerthanpreviouslyshownintheQuarterly Bulletin.
Wefindthatamodest3%shocktoChineseGDPcouldreducethelevelofUKGDPby0.4%–0.5%.Alargefractionofthisreflectsindirecttradelinks.Alarger,illustrative‘hardlanding’inChinathatreducesthelevelofChineseGDPby10%couldreducethelevelofUKGDPby1.3%–1.4%.Butifamplificationmechanisms—fromexchangerateandassetpricemoves—areallowedtooperate,thehittoUKGDPcouldpotentiallybetwicethesize.
Post-crisisregulatoryreformhassubstantiallyimprovedthecapitalisationofbanks,makingthemmoreresilienttoeconomicstress.Inthatsense,morerobustbanksmayhavecreatedamitigationmechanismtoreducethenegativeeffectsontheUKeconomy.TheBankofEngland’s2017annualcyclicalscenariostresstestsincorporatedaChinahardlandingofamagnitudesimilartothatshownintheillustrativescenariohere,butalsoincludedmoresevererecessionsintheUSandeuroareathanareplausiblefromaChina-centricshockalone.Bankswerejudgedtoberesilienttothislargerglobalshock.(22)
Lookingahead,China’scontinuedintegrationintotheglobaleconomyislikelytohaveimportantimplicationsfortheUKeconomyandtherestoftheworld.TheUK’sindirecttradelinkswithChinawillprobablyremainthemaintransmissionchannelfromChinatotheUK,butChina’scontinuedintegrationintotheglobalfinancialsystemwillmaketheglobaleconomyincreasinglysensitivetodevelopmentsinChinainthefuture.
0
5
10
20
15
1980 85 90 95 2000 05 10 15
Exports plus imports
GDP (market prices)
External assetsplus liabilities
Per cent
Chart 10 China’s international integration, 1980–2017
Sources:IMFInternational Financial Statistics,IMFWEOApril2018,LaneandMilesi-Ferretti(2007)andBankcalculations.
(20)Weestimatethatholdingscouldincreasefrom3%to7%.Theincreaseinthesizeoftheexternalbalancesheetisassumedtobeaccompaniedbyamarkeddiversificationtowardsprivatesectorflows.And,forcomparison,theUSinternationalinvestmentpositioncurrentlyaccountsforaround15%oftheworldtotal,suggestingthatfinancialintegrationwouldcontinuetorisebeyond2025.
(21) AssumingtheshareofChineseassetsininternationalportfoliosweretodouble(withanequaloffsetinholdingsofassetsfromtherestoftheworld),theadditionalimpactontopofthe‘standardchannels’oftheChinahardlandingonUKGDPwouldincreaseby0.3percentagepointsto1.2%.
(22) The2017stresstestshowstheUKbankingsystemisresilienttodeepsimultaneousrecessionsintheUKandglobaleconomies,largefallsinassetpricesandaseparatestressofmisconductcosts.Theeconomicscenariointhetestismoreseverethantheglobalfinancialcrisis.Formoredetailspleasesee:StresstestingtheUKbankingsystem:2017results;www.bankofengland.co.uk/stress-testing.
Quarterly Bulletin 2018 Q2 8
AnnexA quick overview of the models
The Global VAR(GVAR)isanempiricalmodelestimatedwithhistoricaldata.Itshouldcapturetheaveragespilloversfromshocksthathavebeenseeninthepast.Themodelallowsshockstopropagateacrosstheworldthroughmanychannels,includingdirectandindirectspilloversthroughtradeaswellassomeassetandcommoditypricelinks.
ApreviousQuarterly BulletinarticledescribedGVARestimatesofthespilloversfromChinatotheUKeconomy.ThatarticlealsoincludesamoredetaileddiscussionoftheadvantagesanddisadvantagesoftheGVARmodellingapproach.Themodelisestimatedintwosteps.First,individualmodelsarebuiltforalargenumberofeconomies.Inthesemodels,anumberofkeydomesticvariables—realGDP,inflation,equityprices,interestratesandtheexchangerate—areallaffectedbyeachother,aswellasbyinternationalvariablesliketheoilprice,worldGDPandworldinflation.Second,individualcountrymodelsarelinkedwithinternationalvariablestocreateaglobalmodelfortheworldeconomy.
The ECB-Global(ECB-G)modelisarichmulti-countrymodelfortheeuroarea,theUS,theUK,Japan,China,oil-producingeconomies,andtherestoftheworld.LiketheGVAR,shocks
canpropagateacrosstheworldthroughdirectandindirecttradechannelsinECB-G.Inaddition,ECB-Gincludesmoredetailedcross-countryfinanciallinksthantheGVAR.
WithinECB-G,coredomesticmacroeconomicvariables,likeinflationandGDP,aredeterminedbywell-knownstructuralrelationshipsthatunderpinaggregatedemandandaggregatesupplyineacheconomy.Tradeflowsarealsoaccountedforusingdataoncountries’bilateraltradeflows.Asaconsequence,areductioninoneregion’sGDP(egChina)canspillovertotheUKthroughboththedirecttradinglinksbetweenChinaandtheUK,andindirecttradinglinksthroughthirdcountries(egtradebetweenChinaandtheeuroareaand,inturn,tradebetweentheeuroareaandUK).
Themodelcoreisenrichedbyequationswhichcapture,amongotherthings,therelationshipsbetweenfinancialriskpremiaandthestateoftheeconomy.Theriskpremiaaremodelledtoreplicaterealisticrelationshipsbetweenassetpricesandthestateoftheeconomy.Forinstance,financialriskpremiaareassumedtoincreasewheneconomicactivitywithinacountryfalls.Reflectinginternationalfinanciallinks,changesinfinancialriskpremiainoneregion(egChina)canspillovertotheUKwithinthemodel.Aswiththetradelinks,financialspilloverscanbedirectorindirectandaredeterminedbyregions’internationalfinancialexposures.
Topical articles Spillovers from China 9
References
Arslanalp, S, Liao, W, Piao, S and Seneviratne, D (2016),‘China’sgrowinginfluenceonAsianfinancialmarkets’,IMF Working Paper WP/16/173,August.
Cesa-Bianchi, A and Stratford, K (2016),‘HowcouldashocktogrowthinChinaaffectgrowthintheUnitedKingdom?’,Bank of England Quarterly Bulletin,2016Q1;www.bankofengland.co.uk/quarterly-bulletin/2016/q1/how-could-a-shock-to-growth-in-china-affect-growth-in-the-united-kingdom.
Chowla, S, Quaglietti, L and Rachel, Ł (2014),‘HowhaveworldshocksaffectedtheUKeconomy?’,Bank of England Quarterly Bulletin,2014Q2;www.bankofengland.co.uk/quarterly-bulletin/2014/q2/how-have-world-shocks-affected-the-uk-economy.
Dieppe, A, Georgiadis, G, Ricci, M, Van Robays, I and Van Roye, B (2018a),‘ECB-Global:IntroducingtheECB’sglobalmacroeconomicmodelforspilloveranalysis’,Economic Modelling,inpress.
Dieppe, A, Gilhooly, R, Han, J, Korhonen, I and Lodge, D (2018b),‘ThetransitionofChinatosustainablegrowth—implicationsfortheglobaleconomyandtheeuroarea’,European Central Bank Occasional PaperNo. 206,January;www.ecb.europa.eu/pub/pdf/scpops/ecb.op206.en.pdf.
Hooley, J (2013),‘BringingdowntheGreatWall?GlobalimplicationsofcapitalaccountliberalisationinChina’,Bank of England Quarterly Bulletin,2013Q4;www.bankofengland.co.uk/quarterly-bulletin/2013/q4/bringing-down-the-great-wall-global-implications-of-capital-account-liberalisation-in-china.
Lane, P and Milesi-Ferretti, G (2007),‘TheexternalwealthofnationsmarkII:revisedandextendedestimatesofforeignassetsandliabilities,1970–2004’,Journal of International Economics, Vol.73,November,pages223–50.
Mwase, N, N’Diaye, P, Oura, H, Ricka, F, Svirydzenka, K and Zhang, Y (2016),‘SpilloversfromChina:financialchannels’,Spillover Notes No. 5,InternationalMonetaryFund.
Wong, A (2017),‘China’scurrentaccount:externalrebalancingorcapitalflight?’,International Finance Discussion Papers No. 1208,BoardofGovernorsoftheFederalReserveSystem,June.