quantitative fluoroscopy and the mechanics of the lumbar spine - ou masters dissertation
TRANSCRIPT

1
Quantitative fluoroscopy and the mechanics of the lumbar spine
A report submitted as the examined component of the project module S810 within the Open University’s postgraduate awards in Science.
Alexander Breen, BSc (Hons) – PI: A4548242
30th of September 2011
Word count (Introduction to Conclusion) 13,643
Appendices 3,307

2
Acknowledgements
I would like to say thank you to the IMRCI research group and the Anglo-European College of
Chiropractic for their support throughout this MSc in the form of the time, space and
training that has made this dissertation possible. Thanks also go to those people who proof
read this document and offered constructive criticism.

3
Abstract
Study Design Validity and repeatability studies of an automated tracking system for
vertebral segments were undertaken to assess quantitative fluoroscopy (QF) for the
measurement of continuous motion of the lumbar spine utilising videofluoroscopy. Two
cadaveric models and 20 volunteer subjects where imaged while undergoing flexion-
extension motion.
Objectives To assess the validity and the repeatability of QF for measuring three types of
inter-vertebral movement in the lumbar spine in the sagittal plane.
Summary of Background Data Instability of the lumbar spine is thought to be associated
with low back pain, but the diagnosis remains difficult. Functional radiographs have been
used for diagnosis of spinal instability measured as a function of range of movement of a
subject’s full voluntary bending angle, but limitations exist. However, (QF) is an emerging
technology which provides continuous information throughout the range of motion. This
may shed light on the biomechanical definition of spinal instability by measuring changes of
inter-segmental movement throughout a subject;s motion. QF has been shown to
automatically track the rotational motion of a vertebral segment with high reproducibility.
Methods; Validity (In vitro) and repeatability (in vivo) of QF were evaluated for translation,
disc height change and positions of the Instantaneous axes of rotation (IAR). Intervertebral
flexion and extension images were assessed in two cadaveric calibration models and 20
randomly selected human volunteers. Accuracy was measured using the calibration models
which underwent video-fluoroscopy. Model 1 was rotated through 18° about a fixed point
and the superior vertebra of the calibration. Model 2 was translated through 17mm along
the plane of the vertebral disc space.
Repeatability in terms of agreement was calculated as the standard error or measurement
[SEM] along with the 95% limits of agreement. Reliability was expressed as intraclass
correlations (ICC) between observation sets from volunteer studies currently in progress.
These volunteers underwent video-fluoroscopy of their lumbar spines during passive,
recumbent flexion-extension motion through 80° using a motor-driven motion table .
Approximately 230 consecutive images of segments L2–S1 were captured per participant,
and the position of each vertebra was tracked throughout the sequence using automated

4
frame-to-frame registration to find the range of translational range of motion, anterior disc
height change and IAR position in adjacent vertebral segments. Intra and Inter examiner
studies were carried out using 2 sets of observations.
Results Accuracy across the 2 models for translation ranged from 0.1 to 2.0mm, for disc
height less than 1.0mm and for IAR position less than 0.01mm and 0.4mm in the X and Y
directions respectively.
Intra and inter-examiner disagreement in the measurement of translation were found to be
less than 1mm, with 95% limits of agreement less than 3.5mm. Reliability was also high with
intraclass correlations above 0.7.
For disc height, the standard error or measurement was consistently below 1mm. However,
the 95% limits of agreement were sometimes over 6mm for extension sequences and the
ICC’s showed only moderate reliability. This suggests that further development is necessary
for the measurement of disc height at all vertebral levels of the low back.
This study also found very high accuracy for IAR position (error<0.5mm), but due to the low
number of segments with sufficient rotation to make them available for examination, SEM
and ICC could not be calculated. However, the root-mean-square difference between
observations by the same observer and between two observers for this parameter was
consistently less than 1mm.
Conclusions These studies indicate generally high accuracy and repeatability of this
technology for the measurement of these three indicators of lumbar spine stability in the
sagittal plane. Further development of the method for some levels, directions and indices is
needed as well as studies with larger numbers to replicate and increase the transferability of
this work.

5
Objectives
Assess the validity and reliability of the diagnostic technique OSMIA (Objective
Spinal Motion Imaging Assessment) for measuring inter-vertebral movement of the
lumbar spine in the sagittal plane.
Express the measurement of anterior inter-vertebral disc height change,
translational range and instantaneous axes of rotation in 20 volunteers.
Describe the use of lumbar spine phantom calibration models for calculation of
validity.
Evaluate the benefits of this technology against the stochastic risks arising from the
ionising radiation delivered to the patient.
Review the role of quantitative fluoroscopy in the investigation of lower spine
mechanics.

6
Introduction
There are a number of methods for measuring the spine in motion, and the objective of this
report is to assess the validity and repeatability of one such technique called OSMIA
(Objective Spinal Motion Imaging Assessment). This technique uses moving video x-rays
(fluoroscopy) to measure inter-vertebral movement of the lumbar spine in the sagittal plane.
The measures used were anterior inter-vertebral disc height change, translational range and
average Instantaneous Axes of Rotation (IAR). Repeatability was assessed from the lower
spine motion of 20 volunteers by two independent observers and validity by the use of two
lumbar spine phantom calibration models. The study endeavoured to evaluate the utility of
this technology to measure continuous inter-vertebral motion, in view of the stochastic risks
arising from the ionising radiation delivered to the patient as a contribution to the
understanding of the role of quantitative fluoroscopy in the investigation of lower spine
mechanics.

7
Glossary of terms:
Orientation
Axial Plane: transverse section (green).
Sagittal Plane: Front to back (red)
Coronal Plane: Left and right (blue)
Anterior: Front
Posterior: Back
Superior: Towards the head
Inferior: Towards the feet
Weight-Bearing: The body is sitting or standing erect
Recumbent: The body is lying down
Supine: Lying face up
Prone: Lying face down
Figure 1: Planes of human anatomy. (Image from
http://en.wikipedia.org/wiki/File:Human_anatomy_planes.svg)

8
Abbreviations
%VBD Percentage of superior Vertebra Body Depth2D Two dimensional3D Three dimensional6 degrees of
FreedomAECC Anglo-European College of ChiropracticCI Confidence intervalCLBP Chronic low back painCNSLBP Chronic non specific low back painCT-scan Computed tomography scanDJD Degenerative joint diseaseEqv mm Equivalent Millimetres. Where 100%VBD = 35 eqv mmEZ Elastic ZoneICC Intraclass correlation coefficient
IMRCIIVF Intervertebral foramenL1 Lumbar vertebrae 1L2 Lumbar vertebrae 2L3 Lumbar vertebrae 3L4 Lumbar vertebrae 4L5 Lumbar vertebrae 5LBP Low back painLOA limits of AgreementMATLAB MATrix LABoratorymm MillimetresMRI Magnetic resonance imagingn Number of subjectsNICE OSMIA Objective Spinal Motion Imaging AssessmentQF Quantitative fluoroscopyRMS Root Mean SquareRoM Range of motionS1 Sacral segment 1SAP superior articular processSD Standard deviationSEM Standard error of measurementSoP Standard operating procedureSPSS Statistical Package for the Social SciencesUK United KingdomVBU Vertebral body unitsWHO World Health Organisationx̄ Sample mean
The directions of motion of a spinal segment (figure
2)
Institute for Musculoskeletal Research and Clinical
Implementation
National Institute for Health and Clinical Excellence

9
Movement between two vertebrae can be in multiple directions and either rotational or translational.
Translational movements are anterior/posterior, superior/inferior, and left/right. Rotation
includes axial rotation (twisting), flexion/extension (forwards backwards – sagittal plane),
and lateral bending (left right coronal plane).
When the spine is free to move in all these directions it is said to have 6 degrees of freedom
[1] (See Figure 2).
Figure 2: Degrees of freedom of motion for inter-vertebral segments

10
Table of Contents
ACKNOWLEDGEMENTS ................................................................................................................... 2
ABSTRACT ............................................................................................................................................ 3
OBJECTIVES ......................................................................................................................................... 5
INTRODUCTION .................................................................................................................................. 6
GLOSSARY OF TERMS: ..................................................................................................................... 7
ORIENTATION ....................................................................................................................................... 7 ABBREVIATIONS ................................................................................................................................... 8
LIST OF FIGURES .............................................................................................................................. 12
LIST OF TABLES ................................................................................................................................ 13
METHODOLOGY OF THE LITERATURE REVIEW .................................................................. 14
METHODOLOGY OF THE LITERATURE REVIEW .................................................................. 14
BACKGROUND ................................................................................................................................... 15
IMAGING THE SPINE: ........................................................................................................................... 18 MEASUREMENT METHODS: ................................................................................................................. 18
Goniometry .................................................................................................................................... 20 Roentgen Stereophotogrammetric Analysis (RSA): ....................................................................... 21 Measurements from radiographs ................................................................................................... 22
Translation ............................................................................................................................... 22 Disc height ............................................................................................................................... 27 Instantaneous Axes of Rotation (IAR) ..................................................................................... 30
Video fluoroscopy & OSMIA (Quantitative Fluoroscopy) ............................................................. 32 REPEATABILITY AND VALIDITY: ......................................................................................................... 34
METHODS: .......................................................................................................................................... 35
MATERIALS: ....................................................................................................................................... 35 Validity: ......................................................................................................................................... 35
Fixed centre of rotation calibration model (model 1) ............................................................... 35 Translating calibration model (bespoke model 2) .................................................................... 36
PROCEDURES ...................................................................................................................................... 38 Validity: ......................................................................................................................................... 38
Image sequence acquisition ...................................................................................................... 38 Repeatability: ................................................................................................................................. 39
Subject imaging ........................................................................................................................ 39 IMAGE ANALYSIS; ............................................................................................................................... 40
Image enhancement ....................................................................................................................... 40 Analysis and image registration .................................................................................................... 41 Data analysis ................................................................................................................................. 42
Translation Calculations ........................................................................................................... 42 Disc height calculations ........................................................................................................... 43 IAR calculations ....................................................................................................................... 44
DATA EXTRACTION AND TRACKING VERIFICATION ............................................................................. 47 VALIDITY STUDY: ............................................................................................................................... 48 REPEATABILITY STUDIES: ................................................................................................................... 49
Intra-observer study; ..................................................................................................................... 49 Inter-observer study; ..................................................................................................................... 49

11
STATISTICAL ANALYSIS ...................................................................................................................... 50 VALIDITY: ........................................................................................................................................... 51 REPEATABILITY: ................................................................................................................................. 54
Translation: ................................................................................................................................... 54 Disc height change: ....................................................................................................................... 57 IAR ................................................................................................................................................. 59
DISCUSSION; ...................................................................................................................................... 61
TRANSLATION ..................................................................................................................................... 61 DISC HEIGHT ....................................................................................................................................... 62 IAR ..................................................................................................................................................... 63
CONCLUSION ..................................................................................................................................... 66
REFERENCES ..................................................................................................................................... 67
APPENDIX 1 ........................................................................................................................................ 73
APPENDIX 2 ........................................................................................................................................ 75
APPENDIX 3 ........................................................................................................................................ 80
APPENDIX 4 ........................................................................................................................................ 89
INTRA-OBSERVER REPEATABILITY RESULTS........................................................................................ 89 Translation ..................................................................................................................................... 89 Disc height ..................................................................................................................................... 90 Instantaneous axes of rotation ....................................................................................................... 91
INTER-OBSERVER REPEATABILITY RESULTS ........................................................................................ 92 Translation ..................................................................................................................................... 92 Disc height ..................................................................................................................................... 93 Instantaneous axes of rotation ....................................................................................................... 94
APPENDIX 5 ........................................................................................................................................ 95
INTRA-OBSERVER REPEATABILITY 95% LOA BLAND-ALTMAN PLOTS ............................................... 95 Translation ..................................................................................................................................... 95 Disc height ................................................................................................................................... 101
INTER-OBSERVER REPEATABILITY 95% LOA BLAND-ALTMAN PLOTS ............................................. 107 Translation ................................................................................................................................... 107 Disc height ................................................................................................................................... 113

12
List of Figures FIGURE 1: PLANES OF HUMAN ANATOMY. (IMAGE FROM
HTTP://EN.WIKIPEDIA.ORG/WIKI/FILE:HUMAN_ANATOMY_PLANES.SVG) .............................................. 7 FIGURE 2: DEGREES OF FREEDOM OF MOTION FOR INTER-VERTEBRAL SEGMENTS ........................................ 9 FIGURE 3: NEUTRAL ZONE AND ELASTIC ZONE THEORY, [30] ..................................................................... 17 FIGURE 4: STANDARD (UNIVERSAL GONIOMETER) [53] .............................................................................. 20 FIGURE 5: DUALER IQ INCLINOMETER [54] ............................................................................................. 20 FIGURE 6: REPRESENTATION OF INCLINOMETER SET UP ON SKIN OF PATIENT.............................................. 20 FIGURE 7: MEYERDING METHOD OF DEFINING GRADES OF SPONDYLOLISTHESIS [49] ................................. 22 FIGURE 8: GRAPHICAL REPRESENTATION TRANSLATION MEASUREMENT TECHNIQUES [47]. ......................... 23 FIGURE 9: GRAPHICAL REPRESENTATION OF TWO LUMBAR VERTEBRA UNDERGOING EXTENSION IN THE
LATERAL PLANE................................................................................................................................ 25 FIGURE 10: GRAPHICAL REPRESENTATION OF THE FROBIN METHOD OF MEASURING TRANSLATION ............. 25 FIGURE 11: DEPICTION OF 5 DISC HEIGHT MEASUREMENT METHODS EVALUATED BY POPE (1977) [50] ..... 27 FIGURE 12: GRAPHICAL REPRESENTATION OF THE FROBIN METHOD OF MEASURING DISC HEIGHT ............. 28 FIGURE 13: A) SIMPLIFIED OUTLINE OF A VERTEBRAL BODY PAIR USED TO CALCULATE IAR POSITION
BETWEEN TWO IMAGES B) GRAPHICAL REPRESENTATION OF IAR CALCULATIONS FROM SUPERIMPOSED
RADIOGRAPHIC FILMS. ..................................................................................................................... 30 FIGURE 14: GRAPHICAL REPRESENTATION OF SUBJECTS POSITIONING........................................................ 33 FIGURE 15: IMAGE SHOWING SUBJECTS POSITIONING ................................................................................ 33 FIGURE 16: FIXED ROTATION POINT CALIBRATION MODEL ......................................................................... 35 FIGURE 17: TRANSLATION CALIBRATION MODEL ........................................................................................ 36 FIGURE 18: EXPERIMENTAL SET UP ........................................................................................................... 37 FIGURE 19: A SIEMENS ARCADIS AVANTIC PORTABLE C-ARM FLUOROSCOPE, SIEMENS GMBH, GERMANY.[85]
....................................................................................................................................................... 38 FIGURE 20: IMAGE ENHANCEMENT GUI .................................................................................................... 40 FIGURE 21: GUI FOR MANUALLY IDENTIFYING VERTEBRAL BODIES IN THE FIRST IMAGE OF A SEQUENCE
....................................................................................................................................................... 41 FIGURE 22: VARIOUS DEPICTIONS OF IAR POSITIONS ................................................................................ 45 FIGURE 23: IAR POSITION ON THE FIRST IMAGE OF THE IMAGE PAIR USED ................................................. 46 FIGURE 24: IAR POSITION ON THE SECOND IMAGE OF THE IMAGE PAIR USED. ............................................ 46 FIGURE 25: GUI DISPLAYING THE IAR POSITIONS RELATIVE TO THE INFERIOR VERTEBRA IN A PAIR ............. 46 FIGURE 26: TRANSLATION AND DISC HEIGHT CHANGE OF AN INTER-VERTEBRAL SEGMENT UNDERGOING
MOTION. .......................................................................................................................................... 48 FIGURE 27: RADIOGRAPHIC IMAGES OF MODELS 1 AND 2 DISPLAYING THE COMPUTER GENERATED IAR,
ANTERIOR DISC HEIGHT AND TRANSLATION RESULTS .......................................................................... 53 FIGURE 28: COMPUTER GENERATED POSITIONS OF BISECTRIX OF L3/L4, L4/L5 & L5/S1. .......................... 64 FIGURE 29: MEASUREMENTS OF MODEL 1; THEORETICAL PLACEMENTS OF BISECTRIX AND MIDLINES FOR
CALCULATIONS ................................................................................................................................ 75 FIGURE 30: MEASURED INITIAL DISC HEIGHT AND THERE RELATIVE VALUES AS A FUNCTION OF MEAN
VERTEBRAL BODY DEPTH .................................................................................................................. 76 FIGURE 31: CALCULATED DISTANCES FROM FIXED CENTRE OF ROTATION TO VERTEBRAL BODY CORNERS .... 77 FIGURE 32: MEASURING MAXIMUM DISC HEIGHT CHANGE RELATIVE TO BISECTRIX ..................................... 78

13
List of Tables TABLE 1: ACCURACY OF DETERMINATION OF INTER-VERTEBRAL DISPLACEMENTS FOR TRANSLATION AND DISC
HEIGHT MOTION AND X AND Y IAR LOCATIONS IN TWO CALIBRATION MODELS* .................................. 51 TABLE 2: CALIBRATION STUDY; RMS DIFFERENCE BETWEEN MEASURED VALUES AND THOSE CALCULATED IN
THE MATLAB ENVIRONMENT, EXPRESSED IN MM ................................................................................ 52 TABLE 3: CALIBRATION STUDY; RMS DIFFERENCE BETWEEN MEASURED VALUES AND THOSE CALCULATED IN
THE MATLAB ENVIRONMENT, EXPRESSED IN EQUIVALENT MM ............................................................ 52 TABLE 4: INTRA-OBSERVER REPEATABILITY OF TRANSLATIONAL MOTION MEASUREMENT FOR 4 INTER-
VERTEBRAL LEVELS (L2-L3, L3-L4, L4-L5, AND L5-S1) .................................................................... 56 TABLE 5: INTER-OBSERVER REPEATABILITY OF TRANSLATIONAL MOTION MEASUREMENT FOR 4 INTER-
VERTEBRAL LEVELS (L2-L3, L3-L4, L4-L5, AND L5-S1) .................................................................... 56 TABLE 6: INTRA-OBSERVER REPEATABILITY OF DISC HEIGHT MOTION MEASUREMENT FOR 4 INTER-VERTEBRAL
LEVELS (L2-L3, L3-L4, L4-L5, AND L5-S1) ...................................................................................... 58 TABLE 7: INTER-OBSERVER REPEATABILITY OF DISC HEIGHT MOTION MEASUREMENT FOR 4 INTER-VERTEBRAL
LEVELS (L2-L3, L3-L4, L4-L5, AND L5-S1) ...................................................................................... 58 TABLE 8: INTRA-OBSERVER REPEATABILITY OF DETERMINATION OF X AND Y IAR LOCATION FOR 4 INTER-
VERTEBRAL LEVELS (L2-L3, L3-L4, L4-L5, L5-S1)* (ROOT-MEAN SQUARE DIFFERENCE BETWEEN
OBSERVATIONS) ............................................................................................................................... 60 TABLE 9: INTER-OBSERVER REPEATABILITY OF DETERMINATION OF X AND Y IAR LOCATION FOR 4 INTER-
VERTEBRAL LEVELS (L2-L3, L3-L4, L4-L5, L5-S1)* (ROOT-MEAN SQUARE DIFFERENCE BETWEEN
OBSERVATIONS) ............................................................................................................................... 60 TABLE 10: INTRA-OBSERVER REPEATABILITY OF TRANSLATION IN EXTENSION OF THE LUMBAR SEGMENTS L2-
L3, L3-L4, L5-S1 USING QF EXPRESSED IN SEM, 95% LOA, ICC AND 95% CI ................................ 89 TABLE 11: INTRA-OBSERVER REPEATABILITY OF TRANSLATION IN FLEXION OF THE LUMBAR SEGMENTS L2-L3,
L3-L4, L5-S1 USING QF EXPRESSED IN SEM, 95% LOA, ICC AND 95% CI ...................................... 89 TABLE 12: INTRA-OBSERVER REPEATABILITY OF DISC HEIGHT CHANGE IN EXTENSION OF THE LUMBAR
SEGMENTS L2-L3, L3-L4, L5-S1USING QF EXPRESSED IN SEM, 95% LOA, ICC AND 95% CI .......... 90 TABLE 13: INTRA-OBSERVER REPEATABILITY OF DISC HEIGHT CHANGE IN FLEXION OF THE LUMBAR
SEGMENTS L2-L3, L3-L4, L5-S1USING QF EXPRESSED IN SEM, 95% LOA, ICC AND 95% CI .......... 90 TABLE 14: INTRA-OBSERVER REPEATABILITY OF IAR IN EXTENSION OF THE LUMBAR SEGMENTS L2-L3, L3-
L4, L5-S1USING QF EXPRESSED IN RMS. ......................................................................................... 91 TABLE 15: INTRA-OBSERVER REPEATABILITY OF IAR IN FLEXION OF THE LUMBAR SEGMENTS L2-L3, L3-L4,
L5-S1USING QF EXPRESSED IN RMS. ............................................................................................... 91 TABLE 16: INTER-OBSERVER REPEATABILITY OF TRANSLATION IN EXTENSION OF THE LUMBAR SEGMENTS L2-
L3, L3-L4, L5-S1USING QF EXPRESSED IN SEM, 95% LOA, ICC AND 95% CI ................................. 92 TABLE 17: INTER-OBSERVER REPEATABILITY OF TRANSLATION IN EXTENSION OF THE LUMBAR SEGMENTS L2-
L3, L3-L4, L5-S1USING QF EXPRESSED IN SEM, 95% LOA, ICC AND 95% CI ................................. 92 TABLE 18: INTER-OBSERVER REPEATABILITY OF DISC HEIGHT CHANGE IN FLEXION OF THE LUMBAR
SEGMENTS L2-L3, L3-L4, L5-S1USING QF EXPRESSED IN SEM, 95% LOA, ICC AND 95% CI S1USING
QF EXPRESSED IN SEM, 95% LOA, ICC AND 95% CI ...................................................................... 93 TABLE 19: INTER-OBSERVER REPEATABILITY OF DISC HEIGHT CHANGE IN FLEXION OF THE LUMBAR
SEGMENTS L2-L3, L3-L4, L5-S1USING QF EXPRESSED IN SEM, 95% LOA, ICC AND 95% CI .......... 93 TABLE 20: INTER-OBSERVER REPEATABILITY OF IAR IN EXTENSION OF THE LUMBAR SEGMENTS L2-L3, L3-
L4, L5-S1 USING QF EXPRESSED IN RMS. ........................................................................................ 94 TABLE 21: INTER-OBSERVER REPEATABILITY OF IAR IN FLEXION OF THE LUMBAR SEGMENTS L2-L3, L3-L4,
L5-S1 USING QF EXPRESSED IN RMS. .............................................................................................. 94

14
Methodology of the literature review
Initial searches were performed using the website Medline/PubMed for articles relating to
“Lumbar vertebra motion diagnosis”. Many of these articles had the phrase ‘low back pain’
in the title so a MeSH term search for “low back pain” was undertaken. The sub headings
‘diagnosis’ & ‘radiography’ were selected and added to the PubMed search. Other Mesh
terms were used and expanded searches were used to gain further material. The low yield of
results revealed that this is a niche subject. These references were hand searched and
citations obtained if they were not already included. It was found that many had references
in common. These common references described methodologies for data collection,
calculation of inter-vertebral movement and references to cadaveric studies that gave
reference values for modelled inter-vertebral movement. Further refinements were added
to the first search separately; “translation” OR “sagittal plane displacement”, “disc height”
OR “disc space”, “centre of rotation” OR “axes of rotation”. Furthermore, accuracy and
validity methodologies were described or referred to [2-6]. Titles, authors and references
from these bibliographies were hand searched to gain further background understanding of
this niche subject.
Moreover, I have searched out Shareware Software/ User interface (UI) programs on the
internet were also searched using the search engine Google to help in my development of
MatLab interfaces and Arduino I/O board programs for measuring output and control of the
calibration model systems. There are many open source codes available from
www.Matlabcentral.comand www.arduino.cc which have proven useful in the development
of this project.

15
Background
The spine is an extraordinary structure which maintains several vital functions such as
providing support for vital organs, freedom of movement and protection for the spinal cord,
all while absorbing shock and allowing motion in three planes (sagittal, coronal and axial see
Figure 2). This is achieved through the contribution of a series of individual joint linkages.
Each linkage is made up of three joints; an inter-vertebral disc and two facet joints.
It has long been suspected that abnormalities in the mechanics of spine may be linked to
pain related to ‘instability’. However, the meaning of spinal instability varies between
specialists such as clinicians, bioengineers and radiologists [7] [8].
Clinical instability has been defined as the loss of the ability of the spine under physiologic
loads to maintain its pattern of displacement so that there is no initial or additional
neurological dysfunction[9]. Measures such as palpation [10] and ‘instability tests’ [11-13]
are used in practice to check for instability in patients who exhibit signs and symptoms
during examination, however, the credibility of such tests remains uncertain [14].
Radiological instability is defined as excessive motion between segments, and is commonly
investigated with functional radiography (flexion extension x-rays taken at the extreme of
trunk bending). This remains the most common method of assessing instability within living
patients (in vivo) [15] but has low reliability and validity [16-18]. The relationship between
clinical and radiographic instability has been studied with functional radiography but the
agreement was poor.[19] However its accessibility explains its’ continued clinical and
research use.
A biomechanical definition states that instability is a lack of resistance to force whilst the
spine is at, or near, the neutral position [9]. This is known as the neutral zone (NZ) theory
and has been validated from cadaveric studies [20, 21]. However the neutral zone cannot be
demonstrated in human studies using functional radiography or other static imaging
methods such as MRI. This is due to the fact that these modalities take an anatomical
snapshot of a physiological problem. It follows that back pain which is made better or worse
by movement or position (known as mechanical back pain) [22] would be better assessed by
measuring function rather than anatomy. There is now a technique which can do this in vivo
using low dose video x-rays and automated measurement algorithms. This technique, known
as quantitative fluoroscopy (QF), can measure both rotation and translation (sliding)

16
between vertebrae (known as inter-vertebral motion). This has allowed the NZ theory to be
tested in vivo with promising initial results [23-27]
As depicted in Figure 3 the total range of motion (ROM) of a joint is subdivided into the
neutral zone (NZ) and the elastic zone (EZ). The zone with minimal resistance to force is
called the Neutral-zone (NZ) and the elastic zone (EZ) follows the neutral zone, where the
passive restraints due to molecular bonds in ligaments, joint capsules and muscles impinges
upon segmental motion causing elastic restraint.
Panjabi (1992) [28] found in cadaveric studies that if a segment is unstable, the neutral zone
will be increased, this is known as ‘laxity’. Mellor et al. (2009) [29] express the laxity of an
inter-vertebral segment by directly comparing inter-vertebral motion per level to the whole
trunk motion of a subject undergoing coronal sequences while using QF. If an inter-
vertebral segment moves at a rate similar to the trunk, it therefore follows that there is a
lack of resistant forces acting upon that segment. Due to the non linear relationship
between segmental motion and trunk bending at large ranges of motion (greater than 10°of
trunk motion), the linear correlation between the first 10° of trunk motion (incorporating
the neutral zone) against that of inter-segmental was observed. The theory was (as
prescribed by Panjabi (1992)) that the less passive holding elements acting upon the
segment in question the higher the correlation between the segmental and trunk motion. It
was noted [29] that muscle contraction might lead to false positive about the quality of
inter-vertebral motion due to voluntary or involuntary contractions (guarding or muscle
spasm). The theory is that examining a patient in the recumbent position will reduce the
involvement of muscular and motor activity and will not limit the overall range of motion.

17
Figure 3: Neutral zone and elastic zone theory, [30]
However, further work is needed to establish normal motion in vivo and to determine
whether spinal motion is related to chronic non specific low back pain (CNSLBP). The
importance of knowing this would lead to better diagnosis of CNSLBP and possible
identification of biomechanical patient subgroups which could better inform treatment [31].
For those who accept instability is definable, a classification of this system would be one of
the keys to gaining control of CNSLBP [32]. It is generally accepted that instability consists of
both mechanical derangement and clinical consequences [33] but the relationships between
these and pain are still unknown.

18
Imaging the spine:
Vertebral motion in the lumbar spine is traditionally analysed using functional radiography -
for instance to check the outcome of surgical fusion. It is apparent from the literature that
some imaging modalities are good at depicting spinal anatomy (CT, MRI, plain film
radiographs) but these are unable to capture functional information relating to how the
spine moves at a rate which is meaningful in the assessment of patients with mechanical
back pain. Furthermore, measurements obtained by these methods have high variability
and poor sensitivity and specificity in relation to symptoms [34, 35]. Most studies that have
accurately measured motion using these techniques have been restricted to measurements
of end range positions[36-39] and some are associated with high radiation dosage ([40] i.e.
CT). With the establishment of continuous kinematic data a better understanding of spinal
motion and its relation to pain in vivo might be gained if the method is found to be reliable
and accurate. Attempts have also been made to do this using MRI [41, 42], but the time
needed to acquire an image, which extends for the open coil/upright scanners needed to
allow trunk motion, has prevented the collection of continuous motion data for now [43]. A
more accessible low dose alternative, if measurements were found to be repeatable and
valid, would be the use of fluoroscopy sequences. This is the topic of this study.
Measurement methods:
Many attempts have been made to establish the relationship between motion and LBP.
Some kinds of low back pain, such as mechanical LBP are thought to be related to abnormal
(or unstable) motion of the spine expressed as the range or pattern of the tilting (rotation)
or sliding (translation) between individual vertebrae [22]. Inter-vertebral motion is more
complicated than merely two vertebrae pivoting about a central point located at the centre
of the disc space. It is a complex motion combining rotation and translation of the vertebrae
relative to each other throughout the range of motion. Many previous studies relating to
spinal motion seem to have concentrated mainly on the documenting of rotational and
translational ranges of motion (RoM) separately [44] [45]. The rationale of these studies was
to provide a normative database to be used as a basis for detection of abnormalities, for
example an excessive or reduced range of motion at an inter-vertebral level. These studies
mainly concluded that overall rotational RoM was so highly variable it was impossible to
distinguish normal from abnormal. Thus other methods of measurement clearly need to be
investigated. Unfortunately, many of these studies did not state standard deviations of the

19
ranges of motion collected or present inter- or intra observer errors. As such, their findings
can not be used for direct comparison with other studies, such as the present one.
One method of measurement that combines both translation and rotation would be to
identify the Instantaneous Axes of Rotation (IAR), a point (or a locus of points), usually found
to be in the posterior third of the inferior vertebra [46] [47] [48] in healthy spines and about
which the superior vertebra rotates and translates over the inferior one. (A diagrammatic
representation can be seen in Figure 13 b of this report.) While the position of the IAR shows
the axes around which one vertebra rotates with respect to another, its position will alter
superiorly (towards the head) and inferiorly (towards the base of the spine) with translation.
The construction of IAR’s may provide insight into the function of the spine and into the
deformation of the discs and ligaments resulting from motion.
Measurements of disc height are often used to evaluate degenerative changes in the disc,
which in turn may lead to treatment (on the assumption that loss in disc height is related to
pain [49]). Standard radiography is the most frequent method used for routine evaluation of
the lumbar spine despite known difficulties, both in interpretation and in the clinical
significance of findings [50]. There is wide variation in the interpretation of lumbar
radiographs and because of this various methods of measuring the inter-vertebral disc space
have been developed in order to improve the variability/reliability. Most methods focus on
the identification of the bony landmarks adjacent to the disc space in question [50] [51].
These landmarks are difficult to objectively identify if the direction of the radiation beam is
not orthogonal to the inter-vertebral disc space. This leads to poor superimposition of the
vertebral endplates if body position and vertebral position are not strictly controlled.
Pope (1977) [50] evaluated five methods of measuring inter-vertebral disc height in
experiments locating specific vertebral pairs in intact human cadavers, and in vivo. Frobin et
al. (1997) [52] described a precision measurement of disc height which has several
advantages over the five methods reviewed by Pope et al. (1977). Both Frobin and Pope
attempted to control for magnification and distortion of radiographic images. The methods
which were evaluated by Pope and Frobin are explained in greater detail in a later section
this report (Measurements from radiographs).
Until recently, the most common method used in clinical practice to assess inter-vertebral
motion was involved manually drawing lines on vertebral body images on plain radiographs.
Other methods of measuring motion of the human spine exist (Goniometry, Roentgen

20
Stereophotogrammetric Analysis (RSA)), however RSA is invasive (due to the need to implant
metal beads) and goniometry can only measure surface motion. Furthermore, these may
not be sensitive enough to measure inter-vertebral motion with any accuracy with the
exception of RSA, which, while it is currently considered the gold standard, can be
undesirable due to the need for surgical intervention.
Goniometry
Figure 4 (below): Standard (universal
goniometer) [53]
Figure 5 (below): Dualer IQ inclinometer [54]
Figure 6 (below): Representation of
inclinometer set up on skin of patient
A goniometer comprises of a moving arm,
stationary arm, and a fulcrum (Figure
4). The fulcrum is placed over the joint
being measured. The stationary arm is
aligned with a reference point while the
moving arm is positioned on the section
of the body which is moved.
Alternately, an inclinometer (Figure 5) can be used to the same effect positioned as shown in
Figure 6 to find the global range of motion. While this technique gives a fair description of
global motion, inter-vertebral motion is unclear as factors which include muscle, fat and skin
movement generate errors. A more accurate surgical option is a potentiometric goniometer
attached to pins which are surgically implanted into the spinous processes of the vertebrae.
This involves surgical intervention. Therefore, while the goniometric techniques that do not

21
penetrate the skin have been found to have poor repeatability, those that do are
undesirable because of their invasiveness [55-57]
Roentgen Stereophotogrammetric Analysis (RSA):
With this technique, metal balls are surgically implanted into the patient's vertebrae and
radiography or fluoroscopy is used to image and measure their motion. RSA is currently used
in the detection of loosening of surgical fusions of the lumbar spine and to evaluate joint
replacement implant designs. However, it cannot be used without breaking the skin, which
rules it out for research and for the majority of the population (i.e. pre-surgical patients,
non-surgical patients and healthy controls.[58])

22
Measurements from radiographs
Translation
Radiographs, otherwise called X-rays or ‘roentgenograms’ [45], have traditionally been used
as the main technique for measuring inter vertebral motion with varying rates of
repeatability dependent on the method used[59]. A common method of displaying gross
translation between two vertebra in a clinical setting is the ‘Meyerding’ method (see Figure
7, simply grades translation into one of 4 grades where each grade is a distance equal to a
quarter of the anterior-posterior depth of the superior border of the inferior vertebra. The
measures are taken between lines drawn on radiographs on the posterior borders of the two
adjacent vertebrae. This defines grades of severity of a spondylolisthesis (vertebral slippage).
However, due to its inherent lack of objectivity, more recent studies [60-62] have attempted
to define the range of translation between two vertebrae in more continuous, as opposed to
proportional terms.
Figure 7: Meyerding method of defining grades of spondylolisthesis [49]

23
With these methods, lines are drawn either through the vertebral end plates or through the
posterior aspects of the vertebral bodies, comparing the positions of vertebrae in two or
more radiographs [60-62].
Figure 8: Graphical representation translation measurement techniques [47].
Figure 8 shows seven methods of measuring inter-vertebral movement in lateral view
images of the lumbar spine;
1. Lines are drawn on the posterior borders of the adjacent vertebral bodies and a
third line is drawn on the inferior border of the superior vertebra. Translation is
calculated as the distance between the first two lines along the third line.
2. A line is drawn along the anterior border of the inferior vertebral body and
translation is calculated from a perpendicular line from this to the inferior anterior
corner if the superior vertebra.
3. As within method 1 a line is drawn on the posterior border of the vertebral body and
a third line drawn on the superior border of the inferior vertebra. Translation is
calculated as the distance between the first two lines along the third line. This is
transformed into dimensionless units to compensate for magnification by expressing
the distance found as a fraction of the superior vertebra’s posteroanterior depth.

24
4. Similar to methods 1 and 3 a line is drawn on the posterior border of the vertebral
body and a third line drawn on the inferior border of the superior vertebra.
Translation is calculated as the distance between the first two lines along the third
line. This is, as with method 3, transformed into dimensionless units to compensate
for magnification by expressing the distance found as a fraction of the superior
vertebra’s posteroanterior depth.
5. A line is drawn on the posterior border of the vertebral body and a third line drawn
on the superior border of the inferior vertebra. Translation is calculated as the
distance between the first two lines along the third line.
6. Calculates the angle between two vertebrae as the angle between the inferior
border of the superior vertebra and the superior border of the inferior vertebra.
7. Lines are drawn on the posterior border of the vertebral bodies and a third line is
drawn that bisects the inter-vertebral disc space. Translation is calculated as the
distance between the first two lines along the third line
Due to the irregularity of the vertebral borders and variations in image quality, positioning,
and magnification between images, these techniques are dependent on the ability of
observers to repeatedly select a series of landmarks in an image (intra observer and inter
observer reliability). However, the reliability of this process is said to be low[59]. Further
issues arise with visualisation of the bony anatomy due to out-of-plane effects, overlapping
tissues, or the presence of surgical implants that can cause degradation of image quality or
uncertainty of landmark positions. Frobins’ method for “Precision measurements from
lumbar radiographs” [4] describes a way to measure inter-vertebral joint displacements in a
fashion which compensates for radiographic distortion and magnification and is known as
‘Distortion-Compensated Radiographic Assessment’ (DCRA). As such, according to Frobin et
al. (1996) special control of patient alignment to the radiographic source and detector is not
required [51].

25
Figure 9: Graphical representation of two lumbar vertebra undergoing extension in the lateral plane
Graphical representation of two lumbar
vertebrae undergoing extension in the sagittal
plane with a four point reference template
marked on the corner of each vertebra to
calculate the bisectrix, which is to be used as a
basis of calculation of disc height and
translation changes (using the Frobin
Method).
This protocol (shown in Figure 9) is based
on landmarks identified on the vertebral
body ‘corners’ and the mean depth of the
vertebra as defined by the average
distances between corners 1,4 and 1,3.
Subsequent measurements are defined as
a function of this mean depth, and thus
are expressed as a dimensionless number
(known as Percentage Vertebral Body
Depth or %VBD). The vertebral midlines
shown in Figure 9 are defined as lines
running through the midpoints between
corners 1-2 and 3-4 respectively.
The average gradient and y axes crossover
of the two midlines calculated for a
vertebral pair is called the bisectrix. This
should pass through the inter-vertebral
disc space
Figure 10: Graphical representation of the Frobin method of measuring translation
Using the method described in
Figure 9 a line is drawn from the
centre of each vertebra to the
coinciding bisectrix. These lines
each cross the bisectrix at 90
degrees to the bisectors’ gradient.
Translation is calculated as the
distance between where these two
lines cross the bisectrix along the
bisectrix itself.
The methods defined by Frobin et al. and outlined here are used to tackle systematic errors
in measurements caused by coupled motion (the tendency for tilting vertebrae to also
rotate in the axial plane, causing out of plane distortion). As rotation and translation usually
happen at the same time in vivo but may not change at the same rate, this method is able to

26
measure both translation and disc height changes in a way which removes the effect of
rotation on translational motion measurements and translation on disc height change
measurements. The methods by which these measurements are calculated (illustrated in
Figure 10 and Figure 12) are outlined in detail in the “Data analysis” part of the “Methods”
section of this report. In previous techniques [45] translation was measured as a function of
the angle between the posterior borders of the vertebral bodies of adjacent levels and the
distances between them (see Figure 8). These methods outlined by Shaffer et al. (1990) [45]
were prone to high errors. For example; Wall et al (1995)[63] reports errors in displacement
at the L5/S1 joint between 3% and 11 % of vertebral body depth (VBD), Danielson et al
(1988) reported an error at the same level near 15% VBD, Nachemson (1981) found a
measurement error of 4mm and Kalebo et al (1989) reported a 2.5% VBD error in
repeatability when measuring two successive radiographs taken under standardised,
identical conditions. Frobins’ method however, makes use of a bisecting line (the “bisectrix”)
as a moving reference plane allowing the motion calculated to remain independent of
motion in other planes. By expressing the motion as a function of the vertebral depth of the
superior vertebra, it is able to adjust for magnification distortion errors. As such this method
is able to measure translation within an error of 1.5% VBD. For a vertebra of 35mm depth
this measurement corresponds to an error of 0.5mm.
27
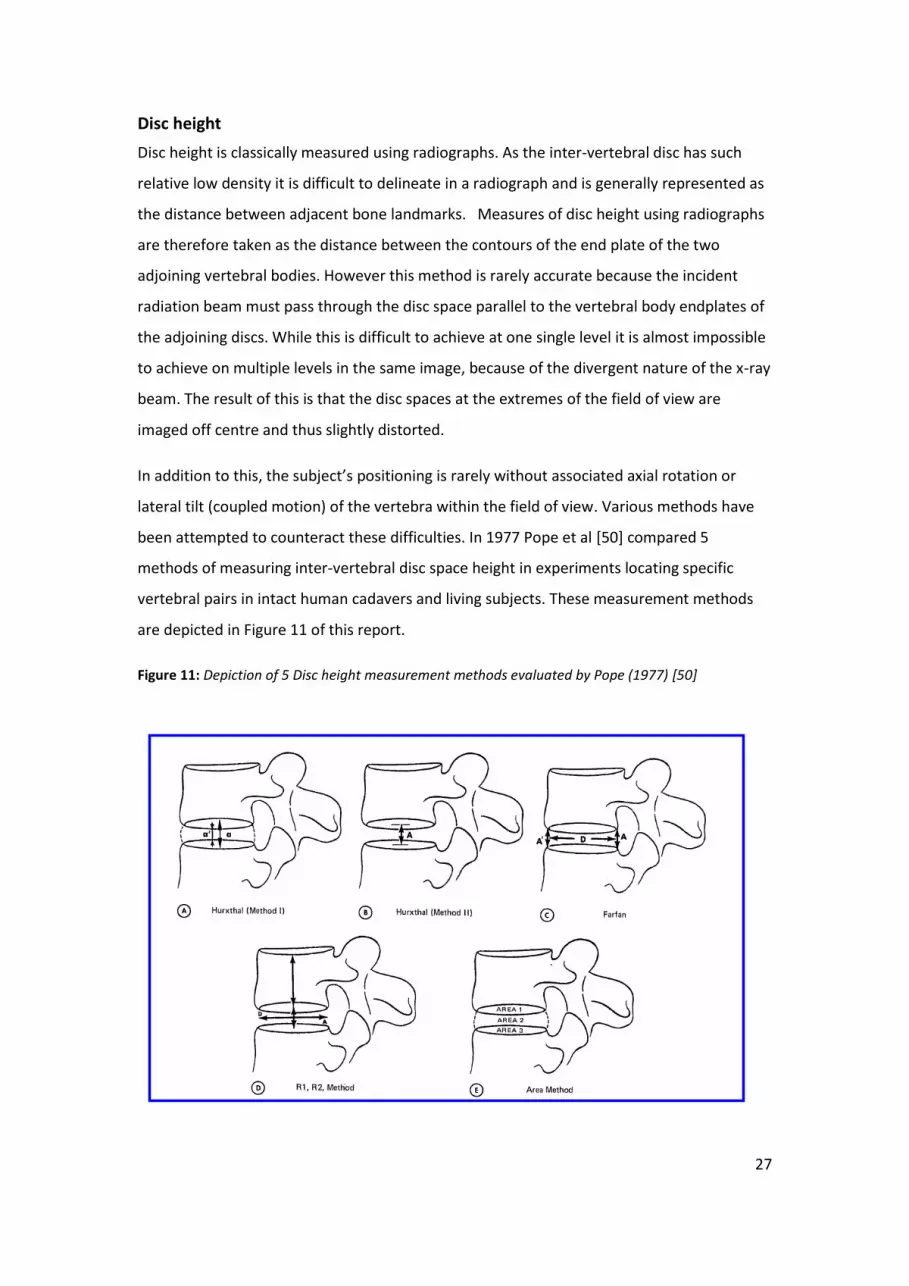
Disc height
Disc height is classically measured using radiographs. As the inter-vertebral disc has such
relative low density it is difficult to delineate in a radiograph and is generally represented as
the distance between adjacent bone landmarks. Measures of disc height using radiographs
are therefore taken as the distance between the contours of the end plate of the two
adjoining vertebral bodies. However this method is rarely accurate because the incident
radiation beam must pass through the disc space parallel to the vertebral body endplates of
the adjoining discs. While this is difficult to achieve at one single level it is almost impossible
to achieve on multiple levels in the same image, because of the divergent nature of the x-ray
beam. The result of this is that the disc spaces at the extremes of the field of view are
imaged off centre and thus slightly distorted.
In addition to this, the subject’s positioning is rarely without associated axial rotation or
lateral tilt (coupled motion) of the vertebra within the field of view. Various methods have
been attempted to counteract these difficulties. In 1977 Pope et al [50] compared 5
methods of measuring inter-vertebral disc space height in experiments locating specific
vertebral pairs in intact human cadavers and living subjects. These measurement methods
are depicted in Figure 11 of this report.
Figure 11: Depiction of 5 Disc height measurement methods evaluated by Pope (1977) [50]

28
Pope et al. [50] concluded that only those methods which corrected for radiographic
distortion were reliable (methods C and D of Figure 11) and all were limited by subject
positioning. It was found impossible to measure disc height at levels where out of plane
rotation was excessive because superimposition of two vertebral bodies made identifying
anatomical landmarks untenable. It was concluded [50] that both the ‘Farfan’ method
(Figure 11 C) and the ‘R1,R2,’ method (Figure 11 D) generated results within 0.5mm of the
actual height of the inter-vertebral disc space. Dabbs and Dabbs (1990)[49] investigated the
correlation between disc height decrease and low back pain using the methods outlined by
Pope et al. and found no correlation between disc height decrease and symptoms of back
pain. However, whether this result is due to the limited accuracy of these measurement
techniques or that disc height decrease may only be one factor in the causes of back pain
has led some authors to think this result controversial [51] and it has been proposed that
tears in the annular rings of cartilage within the disc are more relevant to pain than loss of
height alone ([64], [65]).
Figure 12: Graphical representation of the Frobin method of measuring Disc height
Frobin et al. [51] attempts
to account for radiographic
magnification and distortion
in the same way as outlined
for their translation
measurements by relating
the radiographically
measured disc height to the
mean depth of the superior vertebra. Based on the method described in Figure 12 a line is
drawn from the anterior corner of each vertebra adjacent to the disc space to the coinciding
bisectrix, these lines each cross the bisectrix at 90 degrees to the bisectrixs’ gradient . Disc
height is calculated as the sum of the length of these two lines from their origin at the
vertebral body corner to where they cross the bisectrix.
Frobin et al. [51] argues that this method has several advantages over previous methods:
1. This method solely relies on the identification of vertebral body corners as reference
landmarks. These landmarks are more prominent on radiographic images than the
contours of the vertebral endplates.

29
2. These landmarks and subsequent geometric measures (midlines and their bisectrix)
are identifiable on the image virtually free from distortions which arise from
deviations from the ideal positioning of the vertebral body pair measured which may
derive from axial or lateral bending or incident beam divergence. It follows that
independence of distortion also holds for disc height. Allowing all on a lateral view
to be measured not only those discs close to the central beam.
3. The geometric measures are derived from these objectively located landmarks
(vertebral body corners) and as such minimises subjective influence on the
calculated results.
4. Generating disc height results as a function of the mean depth of a vertebral body
eliminates the influence of radiographic magnification and variation of subject
stature.
5. By finding the perpendicular distance from the bisectrix to the anterior corners of
the vertebrae rather than measuring the direct corner to corner distance removes
the effects of translation in spondolisthesis (forward slippage) or retrolisthesis
(backward slippage) so that these measures can be taken separately and exclusive of
each other.
6. Since this method accounts for deviations or out of plane rotation during positioning
of the patient and distortion due to beam/vertebral body alignment, no special
arrangements which would require additional training have to be made when taking
these images. Furthermore, this method will work retrospectively with existing
images where exposure geometry, posture, magnification and stature are generally
unknown

30
Instantaneous Axes of Rotation (IAR)
Figure 13: a) (left) simplified outline of a vertebral body pair used to calculate IAR position between
two images b) (Right) graphical representation of IAR calculations from superimposed radiographic
films.
Many peer reviewed papers have
been published in the subject of
Instantaneous Axis of Rotation
(IAR), although they are given
many names including, Centre Of
Rotation (COR), Finite Centre of
Rotation (FCR) and Instantaneous
Centre of Rotation (ICR). Studies have been performed in the cervical spine [47, 66-68] and
in the lumbar spine [46, 69, 70] using very similar techniques. However, most authors who
have researched IARs between vertebrae have not assessed repeatability or validity. Instead
they have presented average locations in populations, usually in the sagittal plane [69, 71-
73]. In each of these studies, with the exception of McCane et al. (2005/2006)[74] [70] and
Van Mameren et al. (1992)[68] IARs are manually calculated from radiograph films. The
standard method used goes as follows;
A minimum of two images are taken of a vertebral pair which have undergone
rotation using tracing paper or similar materials to register the vertebral body
positions of both vertebrae in one image.
The outlines are moved to the second image and the inferior vertebra of the pair is
superimposed to use as a reference.
The superior vertebra as shown on the second image is outlined in its new position
in relation to the superimposed outline of the inferior vertebra.
A minimum of two arbitrary points (usually vertebral body corners) are identified on
both outlines of the superior vertebra.
A line is drawn between each of these points and its counterpart from the
subsequent image.
The midpoint of each line is found and second line drawn at right angles to each line
passing though these midpoints.

31
The position where these lines meet is the centre/axes of rotation of these two
vertebrae as they have moved.
A graphic representation of this calculation method is shown in Figure 13 ‘a’ and ‘b’ above.
While Van Mameren et al. (1992)[68] uses the above method when investigating the IAR
location of cervical vertebra in a population, in this method the calculations are performed
across 20 images collected from cineradiographic images (fluoroscopy) where the inter-
vertebral angle is greater than 7 degrees. Van Mameren et al. presents the IAR results across
multiple images in two ways; “Averaged” IAR (aIAR), defined as the mean cluster of IARs,
and “standard” IARs (stIAR) deduced from only the two extreme frames of the
cineradiographic film. In conclusion Van Mameren et al. found that Averaged IARs are more
reproducible than standard IARs. With aIARs having an average of 0.3mm standard deviation
across a population and stIARs having an average of 0.5mm standard deviation across a
population. Although the present study will not be comparable to Van Mamerens’ method
due to the fact that we are comparing both different types of vertebra and the present study
is not looking at reproducibility across a population, this study will be using a similar method
to that of aIARs to establish the validity and repeatability of this technique.
McCane et al. (2005/2006)[70, 74], on the other hand, were able to identify vertebral body
positions automatically on digitised radiographs of the lumbar vertebra using edge detection
techniques. From these outlines they identified vertebral body corner positions to account
for distortion in the same way as described above (when discussing translation and disc
height change) using the Frobin et al. method [52]. Using Matlab, a least squares derivation
of the angle of rotation and the position of the IAR are calculated
In all studies a lower limit is placed on the intervertebral angle which a segmental pair must
rotate by to be considered for IAR calculations. This is because it is nearly impossible to
measure the overall changes in vertebral body position at small degrees of rotation. The
rotational limitation given by the authors reviewed here was between 5 and 7 degrees, in
this current study a lower limit was placed at 5 degrees of rotation to be consistent with the
literature, however, during this study it become apparent that the methods used in the
current study may be able to detect IAR position at an inter vertebral angle of only 3 degrees
if there is a significant translation component involved in the inter vertebral motion.

32
Video fluoroscopy & OSMIA (Quantitative Fluoroscopy)
With quantitative fluoroscopy (QF), low dose video x-ray images are acquired of the area of
interest at a steady frame rate as the subject undergoes motion of the lumbar spine. (Due to
the shadows caused by the subjects’ ribs, images of the thoracic spine cannot be used, so
this method is limited to lumbar and cervical motion.) The motion captured in these images
is tracked either manually by a user recalculating vertebral orientations in each image, or by
an automated method which is able to follow individual vertebrae throughout the image
sequence which gives an objective output of the motion [70, 75-80].
The Anglo European College of Chiropractic (AECC)’s Institute for Musculoskeletal Research
and Clinical Implementation (IMRCI) developed a fluoroscopic method for quantifying inter-
vertebral motion called OSMIA (an Objective Spinal Motion Imaging Assessment). This can
be used to measure continuous inter-vertebral motion during trunk bending using low dose
pulsed fluoroscopy combined with automated tracking algorithms. While the literature on
spinal mechanics contains many studies of the measurement of inter-vertebral movement
from trunk end-range images, continuous motion is suggested to be a better way of
measuring spinal stability [9] due its ability to objectively display the motion patterns of
inter-vertebral joints at different stages . Furthermore, QF gives the operator access to
when the maximum range of motion of an intervertebral segment is achieved which may not
occur at the same time as maximum trunk bending.
In 2006 the Institute for Musculoskeletal Research and Clinical Implementation published a
study [81] describing the repeatability and validity of inter-vertebral motion measurement
using OSMIA in a passive recumbent protocol in the coronal plane. Figure 14 and Figure 15)
this allows the subject’s muscles to be relaxed and inactive. In this study, both inter-observer
and intra-subject repeatability were determined. At the time of this study, the outputs of
this process were the range of motion (ROM) expressed as inter-vertebral angles (IVA) in
side bending. It was found that this method for measuring inter-vertebral range of rotation
was accurate to within 1 degree, with inter-observer and intra-subject errors of fewer than 3
degrees in the coronal plane. But limitations in the imaging and processing at the time
meant that sagittal plane images could not be analysed.

33
Figure 14: Graphical representation of subjects positioning
Figure 15: Image showing subjects positioning
These images were provided
courtesy of Ortho Kinematics Inc [82]
QF uses low-dose fluoroscopy (around 0.4 mSv per single plane, i.e. sagittal) to acquire
images which makes it a relatively low-risk tool for its use in live subjects [81]. These image
sequences are post-processed for better recognition of the bones by a set of tracking
algorithms that have been developed to follow and record the positions of individual
vertebral images, then calculate their continuous displacements.
The average dose across 53 subjects who have undergone this examination protocol (20 of
which are analysed in the present study); undergoing fluoroscopic imaging in the sagittal
plane during passive motion is 404cGy.cm2 (SD 108cGy.cm2) which converts to 0.4 mSv (SD
0.11mSv) using the tissue weighting factors from the ICRP publication 36 [83]. This is
equivalent to approximately nine weeks of UK average background radiation [40]. (Where
the UK average is 2.2mSv per year: regional averages range from 1.5 - 7.5 mSv per year[40]).
As a comparison, the typical dose received during an x-ray examination of the Hip is 0.3mSv,
equivalent to 7 weeks background radiation or additional lifetime risk of 1 in 67,000 fatal
cancer per examination. An x-ray examination of the thoracic spine is 0.7mSv (4 months
background radiation or 1 in 30,000 lifetime risk of fatal cancer per examination) and an
examination of the lumbar spine is 1.3mSv (7 months background radiation, 1 in 15,000
lifetime risk) [40].
The fluoroscope captures X-rays pulsed at 15 frames per second. These pass through the
patient as they undergo controlled motion of around 15 seconds duration. Flexion and

34
extension are imaged as separate sequences, and each sequence contains approximately
230 individual frames.
Since IMRCIs’ 2006 publication both the method of acquisition and the algorithms used to
calculate inter-vertebral movement have been improved (a significant proportion of the
algorithms by myself) to increase the automation, speed and resolution of the motion
calculations. This present project breaks new ground by calculating the validity and intra and
inter-observer repeatability of this improved method to measure commonly used indices of
spine stability (translation, disc height, plus the positions of the IARs) between adjacent
vertebrae, at sub-second intervals using patented tracking programs in the Matlab
environment, and Frobins’ method of landmark identification outlined in the Measurements
from radiographs and Data analysis sections of this report.
Repeatability and validity:
There is little material to be found when searching the literature for ‘repeatability’ and
‘validity’ studies of spinal motion measurement. There is also little uniformity. Inter and
intra observer repeatability have been expressed in a variety of units and ‘repeatability’,
‘agreement’ and ‘reliability’ although different concepts, [84] are often used
interchangeably.
‘Validity’ refers to accuracy against a reference, or ‘gold’ standard. This is generally reported
as the root-mean square of the differences between observed and reference values [2-6].
Both ‘reliability’ and ‘agreement’ relate to measurements which are reproducible or not in
test-retest situations. ‘Agreement’ gives the measurement error, expressed as the standard
deviation (SD) of test-retest measurement differences, while ‘reliability’ measurements are
related to the variability between subjects[4, 5] and are expressed as intra-class correlation
coefficients (ICC).
This study used the OSMIA technology to assess the inter-vertebral motion of subjects in the
same recumbent positions[29]. The exclusion of muscle activity makes it possible to assess
the visco-elastic behaviour of the passive holding elements which has been a problem in
previous studies.

35
Methods:
For this study validity and reliability of the OSMIA (Objective Spinal Motion Imaging
Assessment) system were measured using data collected from two phantom calibration
models as well as data collected from 20 volunteer subjects. The validity study used one of
the calibration models from the 2006 study which allowed rotation only [81] and a second
bespoke model provided the reference standard for anterior-posterior translation.
Materials:
Validity:
Two calibration models consisting each of a pair of human lumbar vertebrae were imaged
using a Siemens Avantic C-arm fluoroscope during known motion both in the sagittal and
coronal planes. The reference data from the models were compared to the motion
calculated from processing the images
Fixed centre of rotation calibration model (model 1)
Figure 16: Fixed rotation point calibration model
A calibration model built for a
previous study [81] was used as it has a fixed
centre of rotation at the centre of the disc
space between the two vertebrae (Figure 16).
Eighteen degrees of rotational motion was
induced in this model using a rotating disk on
a vertical X-ray bucky (Atlas Clinical Ltd -
Lichfield, UK).
Due to the known centre of rotation we know the translation of the vertebra is zero. The
disc height change was mathematically calculated (outlined in Appendix 2) from the angles
acquired from the motion and vertebral body dimension measurements (the latter taken
using electronic callipers (Axminster Instruments Ltd.)). The centre of rotation, visible as a
fixed point on the fluoroscopic images, was used along with the measured distance (using
electronic callipers (Axminster Instruments Ltd.)) of the joint from the superior-posterior
corner of the inferior vertebra verify the IAR.

36
Translating calibration model (bespoke model 2)
Figure 17: Translation calibration model
Translation calibration model positioned in front of the motion control apparatus
The second model is depicted above in Figure 17 and also comprises of two human lumbar
vertebrae. The inferior vertebra was fixed to an acrylic block and unlike the first model a
groove was cut into the inferior vertebral body which allowed a remote controlled arm to
slide the superior vertebra over the inferior vertebrae from anterior to posterior and back
again. This motion was controlled by a servo motor which controls translational motion
concurrently with measured angular rotation.
The superior vertebra of the pair was fixed by a universal joint allowing both translation and
rotation to occur at the same time, or to control these individually. The translation arm was
driven by a motor and sensor apparatus connected to a laptop computer to deliver and
measure translation with a measurement precision of 0.01mm (Arduino Software Ltd.). The
algorithms writhen in the Arduino environment can be seen in Appendix 3.
The reference translation of this model was determined as the percentage of the anterior-
posterior depth of the upper vertebral body, by measuring the mean depth of the upper and
lower end-plates with an electronic calliper (Axminster instruments – spatial resolution +/-
Tilt sensor
Vertebra connected
by universal joint and
translator arm
Rotating beam and
connector rod
Actuator motor

37
0.02mm). This was used as the denominator to divide the translation obtained during the
testing to obtain this percentage.
Figure 18: Experimental set up
The models were mounted on a rigid base
with their vertebral centres positioned
approximately 15cm from a rotating disk on
a vertical X-ray bucky (Atlas Clinical Ltd -
Lichfield ,UK) driven by a controller using
bespoke software (Daqfactory V5C –
Heatherose Electronics Ltd – Newark, UK).
To rotate the model at a standard rate and
range, the rotating disc was connected to
the upper vertebra via a transverse arm
from which a rod projected downward and connected to the superior vertebra (Figure 18).
This apparatus could deliver precise translation and rotation in flexion-extension.
Experimental set up of the fixed centre of
rotation calibration model With C-arm in place

38
Procedures
Validity:
Image sequence acquisition
Figure 19: A Siemens Arcadis Avantic portable C-arm fluoroscope, Siemens Gmbh, Germany.[85]
A Siemens Arcadis Avantic portable C-arm fluoroscope (Siemens Gmbh, Germany Figure
19[85]) was used to acquire the images, with a soft tissue substitute (a sample of ground
bovine meat for the translation model and bag of porcine sausages on the fixed centre of
rotation model ) interposed between the X-ray source, the model and the image intensifier
to impose image degradation due to soft tissue scatter. Each model in turn was aligned with
the primary X-ray beam passing through the universal joint.
The calibration models were placed at an object detector distance to so that the images
acquired displayed a vertebral body size approximately the same size as those seen when
imaging in vivo. When imaging volunteer subjects, the detector is placed as close as possible
to the volunteer without impinging on subjects’ movement, this reduces magnification and
increases the number of vertebrae in the field of view which allows positional data to be
calculated for as many vertebral bodies as possible throughout the motion sequence.
However the use of the Frobin method of ‘Distortion-Compensated Radiographic
Assessment’ (DCRA) means it is not necessary to account for deviations in exposure
geometry and, magnification so there is no need to measure the source to object neither
(SOD) distance nor the object to image receptor (OID) distance.
Images were transferred from the fluoroscope via a USB Flash drive to a server ready for
analysis.

39
Repeatability:
Subject imaging
Image sequences from subjects were obtained from an ongoing research studies in which I
participated. This study received favourable ethical opinion from the National Research
Ethics Service approval (REC number 09/H0502/99). 20 subjects were randomly sampled (by
drawing lots from a hat) from a population of 53.
In this protocol subjects’ are positioned on the table lying on their side with their torso
stabilised while their hips and pelvis are on the lower part of the table which moves through
a controlled arc of up to 40degrees each way. The superior anterior corner of the 4th lumbar
vertebra was aligned with the fulcrum of the table and the fluoroscopic C-arm was
positioned so the 2nd lumbar vertebrae through to the sacral-lumber vertebra (L2-S1) would
be in the field of view throughout the image sequence as the subject was moved. The
subject was taken to the full range of the motion table (40°) in a practice run to ensure
comfort and compliance, and to also relax the muscles and thus prevent any tensing. During
this run, a low dose image (fluoro-grab) at the end of range was obtained to ensure out of
plane rotation had not occurred and L2-S1 remains in the field of view. Once the range of
table motion had been set the QF began. Images were acquired at 15 frames per second on
the passive motion table which was designed to move the subjects’ legs and hips in a 40
degree arc in each direction of flexion-extension which were imaged separately. There were
typically 230 individual DICOM images in each fluoroscopy sequence.
The patients were positioned with their knees and hips bent - effectively placing them into
partial flexion by flattening the lumbar lordosis, to allow stability during the passive motion.
(Figure 14 and Figure 15)

40
Image analysis;
Image enhancement
The Images were enhanced using graphic user interfaces (GUIs) written or adapted
by the author within the MatLab environment during the OSMIA development at IMRCI. The
initial enhancement GUI shown in Figure 20 gives the user a choice of 5 standard
enhancement stacks which can be altered further to gain the best possible edge
enhancement of the images to improve tracking quality.
Figure 20: Image enhancement GUI
These enhancements allow for easier
identification of the vertebral bodies,
which are outlined in the first image of
the sequence by a skilled observer.
Further enhancements which highlight
the vertebral body edges facilitate the
algorithms to identify the vertebral
body positions in subsequent images.
Manual registration of vertebral bodies
in the first image is then followed by automatic vertebral tracking in the subsequent frames
[25].

41
Analysis and image registration
Following edge enhancement of the images, individual vertebrae in each image
sequence were tracked by patented pixel recognition and cross correlation software written
in the MatLab environment. This involves an observer marking the borders of each vertebra
with two templates (see Figure 21).
Figure 21: GUI for manually identifying vertebral bodies in the first image of a sequence
The first template is a snug outline of the vertebral body. This is used to track the position of
the vertebra as it moves through each image. Values for the angular rotation of the vertebra
are taken from the positions of these templates. The second template is a four point
template which marks the four corners of the vertebra. These templates are called the
reference templates and are used in the calculation of other vertebral motion parameters.
This is done using the ‘Frobin method’ [52] which describes translation, disc height and IARs
as a function of the four corner positions of each vertebrae in measurement units as defined
by the average vertebral body depth of the superior vertebra.

42
Data analysis
Frobins’ method shown in Figure 9, a four point reference template positioned on each
vertebra; these “reference templates” model the dimensions of the vertebral body. How this
is done is outlined in the “Measurements from radiographs” –“Translation” section of this
reports Background. An example of this can be seen in Following edge enhancement of the
images, individual vertebrae in each image sequence were tracked by patented pixel
recognition and cross correlation software written in the MatLab environment. This involves
an observer marking the borders of each vertebra with two templates (see Figure 21).
Figure 21.
Translation Calculations
Figure 10 (Background) describes the method in which translation is calculated; by finding
the mean of the 4 corner positions of each vertebra it is possible to derive the centre
position of each vertebral body. A line is then calculated which passes perpendicular to the
bisectrix from these centre positions of adjacent vertebrae. As the gradient of the bisector is
known (mB), any line which lies perpendicular to it must have a gradient equal to its
negative inverse
Equation 1
.
Knowing the equation of a straight line in Cartesian co-ordinates;
Equation 2
When two lines cross perpendicular to each other, co-ordinates of this crossover position
can be calculated when the gradient and crossover of one line is known and a co-ordinate
that the second line passes through is also known. This can be expressed by the following
equations (See Appendix 1 for Derivation)
Equation 3 Equation 4
&

43
This method can be performed to find the co-ordinates at which lines from each vertebral
centre meets the bisectrix at 90 degrees. The distance between these two points represents
translation in this study.

44
Equation 5 Equation 6
Disc height calculations
Figure 12 (Background) describes the method by which anterior disc height is calculated.
Lines are drawn between the anterior corners closest to the disc space for each vertebra and
the bisectrix. These lines as before pass through the bisectrix perpendicular to it, using the
equations derived above the points at which theses lines intersect the bisectrix can be
calculated. Where x1 and y1 are the coordinates for the corner used x' and y' are the
corresponding coordinates where this line passes through the bisectrix at 90 degrees.
Frobins’ method describes anterior disc height as the sum of the lengths of these two lines.
This method is used as it removes the effects of translation on the disc height change when
compared to a direct corner to corner measurement.

45
IAR calculations
Figure 13 (Background) demonstrates how IAR positions can be drawn on a plain x-ray
image. Previous studies using plain films use two images of a vertebral pair which have
undergone rotation using tracing paper or some other medium to register the vertebral
body positions of both vertebrae in one image. Then the outlines are moved to the second
image and the inferior vertebra of the pair is superimposed to use as a reference. Then the
superior vertebra is outlined in its new relative position.
Within the Matlab environment the four corner reference template positions for two
adjacent vertebrae are taken and re-positioned so that the inferior vertebras position is
superimposed. From these coordinate positions, the axis of rotation between the two
images is calculated by finding the least squares solution between each of the four corners
and their partners from the second image. The positions at which each of these least
squares solutions meet is taken as the IAR for those two vertebrae between those two
images. The axis of rotation can then be displayed in one of three ways;
IAR position on the first image of the image pair used
IAR position on the second image of the image pair used.
Graphical user interface displaying the IAR positions relative to the inferior vertebra
in a pair

46
Figure 22: Various depictions of IAR positions
a (top left), represents the IAR
position on the first image of the
image pair used.
b (top right), represents the IAR
position on the second image of the
image pair used.
c (bottom left) & d (bottom right),
represents the IAR the position is
relative to the inferior vertebra in a
pair.
Results for this report are given in terms of the IAR position relative to the inferior vertebra
in a pair. As in Figure 22 c, the position of the IAR can be identified as a function of the four-
corner template on the inferior vertebra. The superior-posterior corner of the inferior
vertebra is taken as the origin (O) for this reference field where the X-axis is along the
template points on the vertebras’ superior border and the Y-axis is perpendicular to the X-
axis and passes though the origin. Figure 22 d, shows the IAR position in terms of the
reference field shown in Figure 22 c. The unit of distance used is the proportion of the
average vertebral body depth of superior vertebra (due to the non uniform shape of the
sacral template) where the origin of this co-ordinate system is the anterior-superior corner
of the inferior vertebra.
For example, in Figure 22d, the IAR position is depicted at co ordinates (15% X,-10% Y) as a
percentage of vertebral body depth (%VBD). An example of how these types of results may
be depicted using one of the subjects from the present study is shown in the following three
figures, where the IAR position for this level L2-L3 is 39%VBD in the X direction and 10%VBD
in the Y direction from the origin (superior-posterior corner of the inferior vertebra) .

47
Figure 23: IAR position on the first image of the image pair used
Figure 24: IAR position on the second image of the image pair used.
Figure 25: GUI displaying the IAR positions relative to the inferior vertebra in a pair

48
IAR positional data are calculated between any two template positions where the inter-
vertebral angle is greater than 5 degrees. (As IVA (inter vertebral angle) decreases the
variation in IAR position increases. This is a systematic error due to the way in which the IAR
positions are calculated.)
As IAR positional data can be found between any image frames if the 5 degree rotation
condition is met, it was decided to measure IAR between the first frame of the image
sequence and the image frame where angular rotation was at its maximum (+/- 0.5 degrees)
and then calculate the average IAR position found in all subsequent frame pairs. The limit of
+/- 0.5 degrees was selected as this is the increment through which the tracking templates
rotate when calculating vertebral body position within each image. These results are
presented as the average position of the IAR in X and Y co ordinates [68].
Data extraction and tracking verification
As these image sequences contain on average over 200 images, statistical analysis of the
whole motion pattern made by each segment for each subject is unfeasible. Therefore, the
translation and disc height results for this study are presented in terms of their end-ranges
of motion (ROM) expressed as a percentage of average vertebral body depth of the superior
vertebra (%VBD).
Inter-vertebral range of motion data from these studies were displayed graphically as the
change in translation or disc height from the initially marked image. In

49
Figure 26 are two graphs which demonstrate how these data may be viewed. The X-axis of
each graph refers to the image numbers at which each range result was acquired. The Y axis
is the change in position described as a fraction of the superior vertebral depth (VBU).
Each vertebra was marked 5 times (Test A-E). The scatter shown in each line contains the
positions found for all vertebral pair tests. (For example L2’s test A to L3’s Test A, L2’s test A
to L3’s Test B, etc ...). In total, as each vertebra was marked 5 times. This generated 25
positional values for each inter-vertebral motion type for each level as is shown in

50
Figure 26 as the scatter about the average position. As described in the Analysis and section
of this report, these results are reviewed by the user and any aberrant results were
removed.

51
Figure 26: Translation (left) and Disc Height change (right) of an inter-vertebral segment undergoing
motion.
(Left) Translation of L2 over L3 during extension. Where posterior translation of the superior vertebra
over the inferior is expressed as the negative change in position.
(Right) Disc Height change of the L2-L3 inter vertebral disc during extension of the lumbar spine. An
increase of anterior disc height is shown here as positive movement.
IAR was expressed in terms of X and Y positional data (as defined in the

52
IAR calculations section of this methodology Figure 22) between end range of rotation
images and the first image in a sequence. End range of rotation images were defined as the
images/reference template positions where the relevant inter-vertebral segment reached its
end range of rotation ±0.5 degrees. (Repeatability and validity of rotational motion of inter-
vertebral pairs have been verified for this technology in previous studies [81] which found an
RMS difference between reference and computed inter-vertebral angles in the same model
as used in this study (model 1) of 0.52 degrees for flexion-extension and an RMS inter-
observer variation of 1.94 degrees.)
Validity Study:
This procedure was repeated 10 times for each calibration model. The fixed axis of rotation
of the first calibration model meant that translation was zero thus the IAR calculated was in
a fixed position throughout the motion sequence. Furthermore, the disc height ranges can
be calculated as a function of the range of rotation that the model was put through and of
the dimensions of the model (these calculations are outlined in Appendix 2). By measuring
these ranges and dimensions with electronic callipers and the average body depth of the
superior vertebra in the pair these values can be expressed as vertebral body units (VBUs)
where 1 VBU is the average vertebral body depth of the superior vertebra in a pair (or %VBD
where 1VBU = 100%VBD). The second translating calibration model’s dimensions were also
measured with electronic callipers and the distance by which the superior vertebra moved
was known as a function of how far the translation control motor arm moved. The known
ranges of movement for each model was compared those calculated from the fluoroscopic
images within the Matlab environment.
Repeatability studies:
Two observers separately analysed the 40 image sequences (2 sequences per subject for 20
subjects). One observer (Observer A) performed this analysis twice to generate data used in
the intra-observer study. Data collected from each analysed sequence and verified by the
observer who originally performed that analysis. If more than 2 tests were deemed to not
have tracked properly a re-test was performed per vertebra. These retests would constitute
re-enhancements and/or remarking of tracking templates from greater than 5 images before
tracking failed. It is impossible to bias results between observations, partially due to the
large amount of data produced. This would make it impracticable to match results mainly

53
due to the observer having no control over how the positioning the initial templates would
influence the results. Due to the time constraints of this project only one retest was
performed per sequence when needed. This unfortunately meant that some results were
unobtainable and thus could not be used in the reliability studies. A greater time frame
would have allowed each observer to re-place templates which had initially failed gaining
more results.
Intra-observer study;
One observer (Observer A) generated a set of results for each fluoroscopy sequence. Once
completed these sequences were tracked a second time by the same observer. The results
of the two analyses were compared using the statistical method described in the ‘Statistical
analysis’ section of this report to calculate intra-observer repeatability in terms of
agreement and reliability [84].
Inter-observer study;
A second observer (Observer B) generated a set of results for the same sequences as
Observer A. These were compared to the first of the two result sets that were marked up in
the Intra-observer study. The results were compared using the statistical analysis methods
described in the ‘Statistical analysis’ section of this report.
Statistical analysis
The validity for all parameters was expressed as the root-mean-squares (RMS) of the
differences between reference and observed values over 10 measurements per parameter.
Reliability was expressed as agreement within and between observers by the standard error
of measurement (SEM) [84] and the 95% limits of agreement (LOA) between observation
sets [6]. Reliability between data sets was expressed as the intra-class correlation
coefficients of test-retest data and their 95% confidence intervals [86, 87], [88].
SEM = SD difference/ √2 to 95% limits of agreement
95% LOA = x ̄± 1.96 x SD difference (Bland-Altman-Plot)
ICC = SD1/ (SD1 + SD difference)
intra-observer: 1-way random effect
inter-observer: 2-way random effect

54
95% CI = x ̄± 1.96 x SD/√n (x ̄= sample mean, SD=Standard deviation n= number of subjects)

55
Results:
Validity:
Table 1 shows the root-mean--square (RMS) difference between the reference and
computed inter-vertebral translation and disc height range. The average vertebral body
depth was 28.77mm for the fixed centre of rotation model (model 1) and 34.66mm for the
translating model (model 2). Results were standardised by expressing them as a percentage
of the superior vertebra’s average body depth. These values are also displayed as equivalent
millimetres (eqv mm). Equivalent millimetres are derived from an average lumbar vertebral
body depth of 35mm [51]
For translation, the RMS difference between the computed and reference values was around
0.1 mm (0.358%VBD) for the model with a fixed centre of rotation (Model 1). For the
translating model (Model 2), where the upper vertebra was moved though half the depth of
the lower one, this discrepancy was of the order of 2 mm (6.237 %VBD).
For disc height, the discrepancy between computed and reference values was less than 1mm
for both models, also indicating acceptable accuracy given that an average disc height is in
the region of 10mm.
Table 1: Accuracy of determination of inter-vertebral displacements for translation and disc height
motion and X and Y IAR locations in two calibration models*
Root mean Square differences between reference and computed measures - 10 observations
Model 1 Model 2
measure RMS (%VBU) RMS (%VBU)
Translation 0.358 6.237
Disc Height 2.282 0.051
xIAR 0.021 N/A
yIAR 1.13 N/A
* All units are expressing in % vertebral body depth

56
For IAR position using the fixed centre of rotation model (Model 1), the x IAR discrepancy
was very small and the y IAR discrepancy only around 0.3mm (derived from its measured
average vertebral body depth of 28.77mm), indicating excellent accuracy (Table 2) with the
greatest RMS difference being 0.66mm in disc height change.
Table 2: Calibration study; RMS difference between measured values and those calculated in the
Matlab environment, expressed in mm
Model 1 Model 2
measure RMS (mm) RMS (mm)
Translation 0.103 2.162
Disc Height 0.657 0.018
xIAR 0.006 N/A
yIAR 0.325 N/A
Model 2 demonstrates a lower accuracy in translation than its fixed centre of rotation
counterpart. This may be due to the input motion of the motor controlled translation arm
not being in line with the plane in which translation is measured. By way of explanation,
there is a known 4%VBD decrease in disc height though the motion (measured using
electronic callipers) due to the construction of the Model not being sufficiently aligned.
Table 3 expresses the same results as Table 1 and Table 2 in terms of equivalent millimetre
(eqv mm) derived from the assumed average vertebral body depth of 35 mm. This contrasts
the values derived from true range (in millimetres) to those expressed in equivalent
millimetres.
Table 3: Calibration study; RMS difference between measured values and those calculated in the
Matlab environment, expressed in equivalent mm
Model 1 Model 2
measure RMS (eqv mm) RMS (eqv mm)
Translation 0.125 2.183
Disc Height 0.799 0.018
xIAR 0.007 N/A
yIAR 0.396 N/A

57
Figure 27: Radiographic images of models 1 and 2 displaying the computer generated IAR, anterior
disc height and translation results

58
Repeatability:
Inter-observer and intra-observer agreement was determined using; Standard Error of
Measurement (SEM), Bland-Altman plots,, 95% limits of Agreement (95% LOA) expressed as
%VBD., The reliability of measurements was expressed as intraclass Correlation Coefficients
(ICC), which are dimensionless numbers, and their 95% CIs The Intra-observer results for
pooled intervertebral levels for translation and disc height change are shown in Reliability
(ICC) analysis can be graded as; slight (0.0-0.20), fair (0.21-0.40), moderate (0.41-0.60),
substantial (0.61-0.80), and almost perfect (0.81-1.00) [89]. The average ICC of intra-
observer flexion and extension translation indicated excellent reliability (ICC=0.803) and all
results acquired for all levels in both bending modes achieved a moderate, good or excellent
grade ranging between 0.533 and 0.988 (Appendix 4 Table 10 and Table 11). The best result
for ICC was achieved in flexion at L2-L3 (0.988) and the least favourable result was also
achieved in flexion at L3-L4 (moderate) (0.533).
The overall 95% CI range shows good agreement for both inter and intra observer. However,
when compared by inter-vertebral level, as shown in Appendix 4 Table 10 and Table 11, the
agreement decreases with relation to the number of mutual observations (n) the worst
results appearing at Intra-observer L5-S1 for extension (-0.344 - 0.910). The confidence
interval width for L5-S1 extension, despite the small sample, may indicate a problem with
reliability due to image quality at this level.

59
Table 4 to Table 7.
The results below are given in terms of SEM 95%, LOA and ICC (95% CI) for all levels. Results
per level are also displayed in Appendix 4.
Translation:
Standard Error of Measurement (SEM) for translation results in both the flexion and
extension bending directions. Reliability (ICC) analysis can be graded as; slight (0.0-0.20), fair
(0.21-0.40), moderate (0.41-0.60), substantial (0.61-0.80), and almost perfect (0.81-1.00)
[89]. The average ICC of intra-observer flexion and extension translation indicated excellent
reliability (ICC=0.803) and all results acquired for all levels in both bending modes achieved a
moderate, good or excellent grade ranging between 0.533 and 0.988 (Appendix 4 Table 10
and Table 11). The best result for ICC was achieved in flexion at L2-L3 (0.988) and the least
favourable result was also achieved in flexion at L3-L4 (moderate) (0.533).
The overall 95% CI range shows good agreement for both inter and intra observer. However,
when compared by inter-vertebral level, as shown in Appendix 4 Table 10 and Table 11, the
agreement decreases with relation to the number of mutual observations (n) the worst
results appearing at Intra-observer L5-S1 for extension (-0.344 - 0.910). The confidence
interval width for L5-S1 extension, despite the small sample, may indicate a problem with
reliability due to image quality at this level.

60
Table 4 and Table 5 suggest good agreement, with the greatest measurement error being
1.958%VBD (0.69eqv mm). The largest error found per level was found at L5-S1 in extension
with an intra-observer error of 3.260%VBD (1.14eqv mm) (Appendix 4 Table 10). In both
flexion and extension, L5-S1 produces the greatest SEM.
The best agreement (the smallest 95% LOA range) for all levels was achieved in the Intra-
observer study of flexion -3.943 to 3.967 %VBU (-1.38 to 1.39eqv mm) and the least
agreement (the biggest 95% LOA range) in the Intra-observer extension study -5.855 to
4.998 %VBU (-2.05 to 1.75eqv mm) (Reliability (ICC) analysis can be graded as; slight (0.0-
0.20), fair (0.21-0.40), moderate (0.41-0.60), substantial (0.61-0.80), and almost perfect
(0.81-1.00) [89]. The average ICC of intra-observer flexion and extension translation
indicated excellent reliability (ICC=0.803) and all results acquired for all levels in both
bending modes achieved a moderate, good or excellent grade ranging between 0.533 and
0.988 (Appendix 4 Table 10 and Table 11). The best result for ICC was achieved in flexion at
L2-L3 (0.988) and the least favourable result was also achieved in flexion at L3-L4 (moderate)
(0.533).
The overall 95% CI range shows good agreement for both inter and intra observer. However,
when compared by inter-vertebral level, as shown in Appendix 4 Table 10 and Table 11, the
agreement decreases with relation to the number of mutual observations (n) the worst
results appearing at Intra-observer L5-S1 for extension (-0.344 - 0.910). The confidence
interval width for L5-S1 extension, despite the small sample, may indicate a problem with
reliability due to image quality at this level.

61
Table 4 and Table 5). However, per inter-vertebral level, the best agreement (the smallest
95% LOA range) was achieved in inter-observer L2-L3 extension (-1.5973 to 1.151%VBU) and
the least agreement (the biggest 95% LOA range) was obtained in L5-S1 intra-observer
extension (-10.791 to 7.282 %VBU) (Appendix 4 Table 10 and Table 11). The L5-S1
disagreement between observations could therefore reach 17% of VBD, which is in the
region of the cut-off for abnormality. This indicates that improvement is necessary in
measurement at this level, where in the lateral view, super imposition of the pelvis impede
the tracking of L5-S1. The Bland-Altman plots used to calculate 95% LOA can be seen in
Appendix 5.
Reliability (ICC) analysis can be graded as; slight (0.0-0.20), fair (0.21-0.40), moderate (0.41-
0.60), substantial (0.61-0.80), and almost perfect (0.81-1.00) [89]. The average ICC of intra-
observer flexion and extension translation indicated excellent reliability (ICC=0.803) and all
results acquired for all levels in both bending modes achieved a moderate, good or excellent
grade ranging between 0.533 and 0.988 (Appendix 4 Table 10 and Table 11). The best result
for ICC was achieved in flexion at L2-L3 (0.988) and the least favourable result was also
achieved in flexion at L3-L4 (moderate) (0.533).
The overall 95% CI range shows good agreement for both inter and intra observer. However,
when compared by inter-vertebral level, as shown in Appendix 4 Table 10 and Table 11, the
agreement decreases with relation to the number of mutual observations (n) the worst
results appearing at Intra-observer L5-S1 for extension (-0.344 - 0.910). The confidence
interval width for L5-S1 extension, despite the small sample, may indicate a problem with
reliability due to image quality at this level.

62
Table 4: Intra-observer repeatability of translational motion measurement for 4 inter-vertebral levels
(L2-L3, L3-L4, L4-L5, and L5-S1)
Within Observers
Direction n Agreement (% Vertebral Body Depth Reliability
SEM 95% Limits of Agreement Intra Class Correlation
Flexion 49 1.427 -3.943 to 3.967 0.859 (0.751 - 0.920)
Extension 40 1.958 -5.855 to 4.998 0.782 (0.589 - 0.884)
Table 5: Inter-observer repeatability of translational motion measurement for 4 inter-vertebral levels
(L2-L3, L3-L4, L4-L5, and L5-S1)
Between Observers
Direction n Agreement (% Vertebral Body Depth Reliability
SEM 95% Limits of Agreement Intra Class Correlation
Flexion 48 1.674 -4.297 to 4.985 0.806 (0.654 - 0.891)
Extension 33 1.736 -5.575 to 4.051 0.861 (0.718 - 0.931)

63
Disc height change:
Standard error of measurement (SEM for disc height motion results in both the flexion and
extension bending directions for intra- and inter-observer studies (Table 6 and Table 7) seem
to suggest good repeatability with a greatest error being 3.907%VBD (0.69eqv mm).
While repeatability is good both when displayed overall and by inter-vertebral level there is
a general decrease of agreement when results are compared by inter-vertebral levels where
the number of mutual observations (n) is low. The overall agreement for Inter-observer
(Table 7) extension is quite large (-12.380 to 9.277) due to low agreement at L5-S1 of -23.53
to 13.50 %VBD (Appendix 4 Table 12) while the next lowest agreement for inter observer
Extension is 2.15 to 1.671 %VBD at L4-L5.
This is also reflected in the ICC (95% CI) results where, while repeatability remains good or
better, the agreement (95% CI) is low due to very large ranges at singular levels. The
reliability of intra-observer flexion disc height change was poor at some inter-vertebral
levels. Where 2 levels (L2-L3 and L4-L5) produced low ICCs and large confidence intervals
this may also be due to the low number of available results for each level (n=4 and 5
respectively).
Overall, these results depict good-excellent agreement and reasonable reliability at most
levels and directions for disc height change.

64
Table 6: Intra-observer repeatability of disc height motion measurement for 4 inter-vertebral levels
(L2-L3, L3-L4, L4-L5, and L5-S1)
Within Observers
Direction n Agreement (% Vertebral Body Depth Reliability
SEM 95% Limits of Agreement Intra Class Correlation
Flexion 21 0.755 -1.982 to 2.202 0.531(-0.138 - 0.808)
Extension 46 1.113 -3.167 to 3.006 0.895 (0.811 - 0.942)
Table 7: Inter-observer repeatability of disc height motion measurement for 4 inter-vertebral levels
(L2-L3, L3-L4, L4-L5, and L5-S1)
Between Observers
Direction n Agreement (% Vertebral Body Depth Reliability
SEM 95% Limits of Agreement Intra Class Correlation
Flexion 15 0.361 -0.979 to 1.024 0.866 (0.600 - 0.955)
Extension 44 3.907 -12.380 to 9.277 0.609 (0.284 - 0.787)

65
IAR
Due to the low number of mutual trackings of individual vertebral pairs between observers
that reached a rotational range of greater than 5 degrees (the lowered limit cut off defined
for this study) the use of the statistical calculation used in translation and disc height motion
would not be representative here. Therefore, RMS difference between average IAR locations
in the x and y co-ordinates of the reference field have been displayed below in Table 8 and
Table 9 (by level in Appendix 4 Instantaneous axes of rotation
Table 20 and Table 21).
Table 8 and Table 9 below show that overall, both inter and intra observer agreement is
very good with a greatest variance at Inter- observer extension of 2.08 %VBD giving a sub
millimetre accuracy of 0.728eqv mm.
A substantial displacement of the IAR from its normal position in the posterior 1/2 of the
disc space ([90] [91] [46]) would begin at around 17.5mm, placing the reaction force of
weight-bearing (if IAR is found posteriorly) close to the facet joints and if IAR is found to
move inferiorly, (in the inferior vertebral body) this denotes a combination of translation
with rotation. These results indicate repeatability that could detect this and can therefore
be considered acceptable.

66
Table 8: Intra-observer repeatability of determination of X and Y IAR location for 4 inter-vertebral
levels (L2-L3, L3-L4, L4-L5, L5-S1)* (Root-Mean Square difference between observations)
Within Observers
Direction n IARx (%VBD) IARy (%VBD)
Flexion 30 1.09 0.15
Extension 21 1.63 1.75
* Expressed as the distance from the posterior- superior corner of the inferior vertebra in
each pair in percentage units of vertebral body depth
Table 9: Inter-observer repeatability of determination of X and Y IAR location for 4 inter-vertebral
levels (L2-L3, L3-L4, L4-L5, L5-S1)* (Root-Mean Square difference between observations)
Between Observers
Direction n IARx (%VBD) IARy (%VBD)
Flexion 24 2.08 0.85
Extension 20 0.55 1.63
* Expressed as the distance from the posterior- superior corner of the inferior vertebra in
each pair in percentage units of vertebral body depth

67
Discussion;
This study shows that it is feasible to make accurate and reliable measurements of
translation, disc height motion and Instantaneous axis of rotation with quantitative
fluoroscopy (QF) of the lumbar spine in flexion and extension using the OSMIA technique.
No prior studies have measured continuous motion in vivo using these parameters, nor have
they assessed the accuracy or observer repeatability of continuous motion sequences.
Translation
Shaffer et al (1990) [45] measured the consistency and accuracy of 7 different methods for
measuring sagittal translation using plain film x-rays. It was found that using plain film x-rays
as a basis for diagnosing instability can often lead to errors in classification due to
magnification or distortion within the image field. Morgan and King [92] described the most
accurate and repeatable of the seven methods outlined by Shaffer et al., (Figure 8.2,) finding
the translation between two vertebra using plane film x-rays by drawing a line along the
anterior border of the inferior vertebra and finding the perpendicular distance from this line
to the inferior-anterior corner of the superior vertebra. While this was shown to produce the
fewest classification errors it is the reverse where the posterior border contains the
reference line that seems to be recommended most frequently (Figure 8.4) [93-96].
In this study, with the exception of L5-S1, the measurement error for translation (SEM) was
generally below 2%VBD (0.7eqv mm) for all levels and directions and is comparable to that
of static in vivo methods of measuring translation. The maximum SEM is found with inter-
observer extension L5-S1 of 3.26%VBD (1.14eqv mm). Abbott et al, (2006) [97] using the
Frobin method [51] , reports a repeatability coefficient of 0.046 vertebral body units
(4.6%VBD or 1.61eqvmm) which is comparable to Frobins results of 0.034 vertebral body
units (3.4%VBD or 1.19eqvmm). The level of repeatability of this study has been improved by
averaging. The tracking of inter-vertebral motion is typically repeated 5 times, with 5
separate templates which makes it adequate for normative and clinical studies. The error
found in this study while measuring translation against a reference standard (models 1 and
2) was 0.36 to 6.237%VBD (0.13 to 2.18eqv mm) respectively.
Clinically the most widely used method for expressing translation is the traditional
Meyerding Method [98], using a calculation of the anterior posterior body depth of the
superior vertebra (%VBD) or describing the distances in millimetres. These values are usually

68
gained from direct manual measurements from radiographic films using pencils and rulers
[97] [51] [46].
The present study generally indicates high reliability (ICC) in translation above 0.80 for most
the levels with few exceptions; intra-observer extension at L5-S1 and inter-observer
extension L2-L3 and L5-S1 where the ICC’s for these sequences show moderate (L5-S1 and
L2-L3 inter-observer extension) and fair (L5-S1 intra-observer extension) reliability.
With these exceptions there seems to be no great difference between the repeatability
parameters of inter- vs. intra –observer studies, this may be due to the small number of
levels available for analysis or an indicator that once an observer is sufficiently trained the
results produced by the methods used are reliable. Repeating this study with a bigger
sample size would provide the answer.
Disc height
Few papers addressing the reliability of measuring inter-vertebral disc height were found
and of those that were, few papers both expressed their results in terms of measurement
errors (SEM) or described how these measurements were mathematically obtained. Frobin
[52, 99] whose method was the basis of this study’s vertebral measurements, in his 1997
paper [52] explains the method for a “precision measurement of disc height, vertebral
height and sagittal plane displacement (translation) from lateral radiographic views of the
lumbar spine” and finds an overall error, averaged across all inter-vertebral (L2-S1) levels, of
4.15%VBD with greatest error reported was 4.61% VBD at L5-S1. In comparison to the
present study which reported an overall SEM ranging from 0.76 to 3.91%VBD and greatest of
SEM of 6.68% VBD at L5-S1 of its Inter observer, extension sequences. Thus, applying a
method originally intended for plain film radiography is comparable when applied to
fluoroscopic sequences with the exception of the L5-S1.
Frobin also performs the same calculations for accuracy on a phantom model and achieves
an error of 2.80%VBD, compared to 2.28% VBD for the present study.
Boos et al. 1996 used two methods to calculate disc height from images acquired from
magnetic resonance imaging. Boos et al. found an intra observer error of 0.27mm
(0.77%VBD) and 0.34mm (0.97%VBD) for their two methods and 0.36mm (1.03%VBD) in
their inter-observer study. Comparing this to Frobins 4.15% error encountered when
measuring disc height from lateral radiographic views and the present study’s 0.76-

69
3.91%VBD (0.27eqvmm–1.37eqv mm) we find that measurement precision from magnetic
resonance images is superior to QF and Frobin studies. Furthermore, it is pointed out that,
magnetic resonance imaging induces no radiation hazard. However, the MRI is currently
unable to produce dynamic motion information.
IAR
It has been difficult to compare validity and repeatability of IAR locations with other studies
in this field. This is mainly due to method in which IAR has been measured by drawing the
lines tracing paper with a pencil and ruler by superimposing the traced outlines on each of
the radiographic images (similar to method shown in Figure 15). Furthermore, most people
who have researched IARs between vertebrae have not presented any data on reliability or
validity. Instead they have presented average locations in populations, usually in the sagittal
plane [69, 71-73]. Exceptions to this are Amevo et al. (1991) [66] [67] and McCane [70].
Amevo presented an inter and Intra observer study of the measurement of IARs in a
population measured both by hand and using digitisation techniques. McCane (2006) [70],
in addition to calculating standard IAR locations (called ‘Finite Centres of Rotation’ (FCR))
using radiographs, also performed a calibration study using their method of automatically
detecting vertebral body positions.
Amevo 1991 [67], found for the entire process of plotting IARs, inter- and intra-observer
differences, an average variation of less than 0.5mm Although McCane [70] presented an
average error of ±8.5mm when measuring IAR in a calibration study and ±7.4mm in an inter
operator repeatability study, he describes this to be a superior method of calculating IAR
positions using the automated vertebral body finding technique. This result seems
contradictory as this error (±8.5mm) equates to almost a quarter of a standard vertebral
body depth (35mm). The calculations used for both McCane [70] and the present study are
the same and come from McCane’s 2005 paper “On calculating the finite centre of rotation
for rigid planar motion” [74]. When McCane’s results are compared to the findings of the
present study it appears that the technique utilised here is far superior for calculating IAR
positions.
The error (RMS) in the present validity study was 0.396eqv mm (y axis IAR co ordinate
position) and 0.007eqv mm (x axis IAR), the greatest error (RMS) in the intra-observer
repeatability study equated to 0.613eqv mm (y axis IAR), and 0.728eqv mm (x axis IAR) in
the inter-observer study.

70
Overall, the lower translation and disc height repeatability values for extension may be due
to lower quality images which are more difficult to track or as may well be the case for L5-
S1, difficulty in tracking can be caused by interposed bone from the Ilium degrading the
images at this level. It has been noted that in lateral views using low dose x-rays, it is
sometimes difficult for the observer or tracking software to identify L5 and S1 landmarks as
they move between the ilia. These erroneous results at the S1 level however, maybe due to
the difficulty in positioning the S1 template caused in part by difficulty identifying the
inferior border of S1.
In Figure 28 (below) the bisectrix between adjacent vertebrae as calculated in the Matlab
environment is shown for 4 adjacent intervertebral segments (From the top down L3 (mainly
off screen), L4, L5 and S1). While the bisectrix calculated for L3/L4 and L4/L5 pass between
the two vertebrae in the disc space as is expected, the bisectrix for L5/S1 passes through S1
its self. This may be the cause of some of the large errors in the disc height results. Future
methodologies may need to account for this issue.
Figure 28: Computer generated positions of bisectrix of L3/L4, L4/L5 & L5/S1.
Previous authors [46] using functional radiography was able to identify the S1/S2 vestigial
disc when placing template corner points. However, due to the lower quality images of QF,
this vestigial joint is rarely identifiable in the fluoroscopic images. One solution may be
similar to Frobin et als’ 2002 [52, 99] method of finding the generating a bisectrix for

71
another non uniform vertebral segment, C2 (The second cervical body in the neck). In this
method the translation and disc height of C2/C3 is measured across a line called “parallel to
bisectrix”. This bisectrix is generated from the mid line of C3 (similarly to what is calculated
in the present study) and only two points from C2 (across the inferior border) the gradient is
calculated as the average of these two lines and the bisectrix is drawn I the disc space.
While other repeatability and accuracy studies may be comparable to the method used in
the present study, the static film, end range of voluntary bending angle methods fail to take
the dynamic aspect of inter-vertebral motion into account. In previous studies, spinal
instability was measured with end-range radiographic neutral, flexion and extension views
(Abbott et al, 2006) [97], however important information about segmental motion such as in
the neutral zone (Figure 3) might be missed out.
Further study using these techniques with greater subject numbers and less time restrictions
would help to gain a greater number of inter-vertebral level results and therefore assist in
developing a greater understanding of the limitations of these techniques and also how the
neutral zone may be applied in vivo to increase our understanding of what instability of the
spine really means and how it can be accurately measured.
Due to the nature of the continuous motion data available in the OSMIA technique, much
more data is available for analysis. Future studies should therefore concentrate on which
measurements are of value to clinicians, researchers and patients. It is already clear that end
of range measurements are of little value (ref back to the introduction). Suggestions for
measurements which should be investigated include assessing the rate of change and
regularity of spinal motion patterns and an appreciation of how the spine behaves as a
multi-directional series of joints which are influenced by each other and work together
rather than simply the range of motion of individual, inter-vertebral segments.
Spinal motion measurements from QF need to be standardised, particularly in terms of
defining the normal parameters of angulations, translation, disc height and IAR’s. This can
only be achieved with a wide normative study of video-fluoroscopy sequences undertaken
on healthy subjects; such a study is currently underway at the IMRCI.

72
Conclusion
Low back pain (LBP) is a costly economic problem. The majority of it will resolve in 6 weeks
but that which continues or becomes episodic has the highest societal impact [100]. The
issue appears to be centred around accurate diagnosis, with most of chronic low back pain
(CLBP) labelled non specific because no correlation can be found between results from
objective examination findings, such as from imaging, and the symptoms. However, most
chronic non-specific low back pain (CNSLBP) is thought to be mechanical because it is made
better or worse by movement or position [22].
One problem however is that the methods used for measuring back mechanics use static
images to address what is a dynamic, functional problem. This study found high repeatability
and accuracy for a quantitative fluoroscopy (QF) technology used in the objective
measurement of three indicators of lumbar spine inter-vertebral function in the sagittal
plane: translation, disc height and the location of the instantaneous axis of rotation. This
information was derived dynamically, throughout the motion under study.
The levels of repeatability and accuracy found suggest that continuous measurement of
inter-vertebral motion using QF technology represents new possibilities for assessment and
insight into suspected spinal dysfunction and the effects of joint degeneration. This can be
used for diagnosis and monitoring, for example before and after surgical or physical therapy
interventions.
This area of work in spine kinematics research may provide useful measures against which
treatment goals and methods could be developed and assessed. Such dynamic studies, if
found to be repeatable and accurate, may provide better and more objective evidence with
which to improve our understanding of CNSLBP. However, further work is needed to assess
the repeatability and accuracy of a range of other kinematic measures that can be assessed
by QF technology. These might include motion pattern analysis, neutral zone laxity
assessment and other data transformations that describe the functional integrity of the
spine.

73
References
1. White, A.A. and M.M. Panjabi, The basic kinematics of the human spine; a review of past and current knowledge. Spine, 1978. 3: p. 12-20.
2. Chinn, S., The assessment of methods of measurement. Statistics in Medicine, 1990. 9: p. 351-362.
3. Guyatt, G.H., Juniper, E.F., Walter, S.D., Griffith, L.E., Goldstein, R.S., Education and debate: Interpreting treatment effects in randomised trials. British Medical Journal, 1998. 316(28 February): p. 690-693.
4. Stratford, P.W., Goldsmith, C.H., Use of the Standard Error as a Reliability Index of Interest: An Applied Example Using Elbow Flexor Strength Data. Physical Therapy, 1997. 77(7): p. 745-750.
5. de Vet, H.C.W., Terwee, C.B., Knol, D.L., Bouter, L.M., When to use agreement versus reliability measures. Journal of Clinical Epidemiology, 2006. 59(10): p. 1033-1039.
6. Bland, J.M., Altman, D.G., Measuring agreement in method comparison studies. Statistical Methods in Medical Research, 1999. 8: p. 135-160.
7. Leone, A., Guglielmi, G., Cassar-Pullicino, V. N., Bonomo, L., Lumbar intervertebral instability: a review. Radiology, 2007. 245(1): p. 62-77.
8. Reeves, N.P., Narendra, K. S., Cholewicki, J, Spine stability: The six blind men and the elephant. Clinical Biomechanics, 2007. 22: p. 266-274.
9. Panjabi, M.M., The stabilising system of the spine - Part 2: Neutral zone and instability hypothesis. Journal of Spinal Disorders, 1992. 5(4): p. 390-397.
10. Abbott, J.H., et al., Manual physical assessment of spinal segmental motion: Intent and validity. Manual Therapy, 2009. 14(1): p. 36-44.
11. McGill, S., Low Back Disorders: Evidence-Based Prevention and Rehabilitation. Second edition. 2nd ed. 2007: Human Kinetics.
12. Wadsworth, C.T., Manual Examination and Treatment of the Spine and Extremities. 1988, Baltimore:: Williams & Wilkens.
13. Delitto, A., R. Erhard, and R. Bowling, A treatment based classification approach to low back syndrome: identifying and staging patients for conservative treatment. Physical Therapy, 1995. 75: p. 470-489.
14. Beneck, G.J., et al., The relationship between lumbar segmental motion and pain response produced by a posterior-to-anterior force in persons with nonspecific low back pain. J Orthop Sports Phys Ther, 2005. 35(4): p. 203-209.
15. Leone, A., et al., Degenerative lumbar intervertebral instability: what is it and how does imaging contribute? Skeletal Radiology, 2009. 38(6): p. 529-533.
16. Boden, S.D., Current Concepts Review - The Use of Radiographic Imaging Studies in the Evaluation of Patients Who Have Degenerative Disorders of the Lumbar Spine. Journal of Bone and Joint Surgery, 1996. 78(1): p. 114-24.
17. Hayes, M.A., et al., Roentgenographic evaluation of lumbar spine flexion-extension in asymptomatic individuals. Spine, 1989. 14(3): p. 327-332.
18. Soini, J., et al., Disc degeneration and angular movement of the lumbar spine: comparative study using plain and flexion-extension radiography and discography. Journal of Spinal Disorders, 1991. 4(2): p. 183-1877.
19. Fritz, J.M., S.R. Piva, and J.D. Childs, Accuracy of the clinical examination to predict radiographic instability of the lumbar spine. Eur Spine J, 2005. 14(8): p. 743-50.
20. Gay, R.E., et al., The effect of loading rate and degeneration on neutral region motion in human cadaveric lumbar motion segments. Clinical Biomechanics, 2008. 23(1): p. 1-7.

74
21. Crawford, N.R., J.D. Peles, and C.A. Dickman, The spinal lax zone and neutral zone: measurement techniques and parameter comparisons. Journal of Spinal Disorders, 1998. 11: p. 416-429.
22. NHS, Back pain - low (without radiculopathy) - Management. 2010, Clinic Knowledge Summaries. p. http://www.cks.nhs.uk/back_pain_low_without_radiculopathy/management/scenario_diagnosis/view_full_scenario#398843006.
23. Breen, A., J. Muggleton, and F. Mellor, An objective spinal motion imaging assessment (OSMIA): reliability, accuracy and exposure data. BMC Musculoskeletal Disorders, 2006. 7(1): p. 1-10.
24. Teyhen, D.S., et al., A new technique for digital fluoroscopic video assessment of sagittal plane lumbar spine motion. Spine, 2005. 30(14): p. E406-E413.
25. Mellor, F.E., et al., Midlumbar Lateral Flexion Stability Measured in Healthy Volunteers by In Vivo Fluoroscopy. Spine, 2009. 34(22): p. E811-E817.
26. Wong, K., et al., Continuous dynamic spinal motion analysis. Spine, 2006. 31(4): p. 414-419.
27. Lee, S., et al., Development and Validation of a New Technique for Assessing Lumbar Spine Motion. Spine, 2002. 27(8): p. E215-E220.
28. Panjabi, M.M., The stabilising system of the spine - Part 1: Function, dysfunction, adaptation and enhancement. Journal of Spinal Disorders, 1992. 5(4): p. 383-389.
29. Mellor, F., Muggleton, J.M., Bagust, J., Mason, W., Thomas, P.W., Breen, A.C., Mid-lumbar lateral flexion stability measured in healthy volunteers by in-vivo fluoroscopy. Spine, 2009. 34(22): p. E811-E817.
30. Panjabi, M.M., Lumbar spine instability: a biomechanical challenge - Biomechanics Masterclass 2. Current Orthopaedics, 1994. 8: p. 100-105.
31. Teyhen, D.S., et al., Arthrokinematics in a Subgroup of Patients Likely to Benefit From a Lumbar Stabilization Exercise Program. Physical Therapy, 2007. 87(3): p. 313-325.
32. Morris, C.E., Low Back Syndromes: Integrated clinical management. 2006, New York: McGraw-Hill Medical Publishing Division.
33. Panjabi, M.M., et al., Clinical Spinal Instability Resulting from Injury and Degeneration, in The Lumbar Spine 3rd Ed, H. Herkowitz, Dvorak, J., Bell, G.R., Nordin, M., Editor. 2004, Lippincott, Williams and Wilkins: Philadelphia PA.
34. Deyo, R.A., McNeish, L.M., Cone, R.O. 3rd., Observer variability in the interpretation of lumbar spine radiographs. Arthritis and Rheumatism, 1985. 1528: p. 1066-1070.
35. Jarvik, J.G. and R.A. Deyo, Diagnostic evaluation of low back pain with emphasis on imaging. Ann Intern Med, 2002. 137: p. 586-597.
36. Panjabi, M.M., Hybrid multidirectional test method to evaluate spinal adjacent-level effects. Clinical Biomechanics, 2007. 22(3): p. 257-265.
37. Adams, M.A., Freeman, B.J., Morrison, H.P., Nelson, I.W., Dolan, P., Mechanical initiation of intervertebral disc degeneration. Spine, 2000. 25: p. 1625-1636.
38. Patwardhan, A.G., Havey, R.M., Meade, K.P., Lee, B., Dunlap, B., A follower load increases the load-carrying capacity of the lumbar spine in compression. Spine, 1999. 24: p. 1003-1009.
39. Adams, M.A. and P. Dolan, A technique for quantifying the bending moment acting on the lumbar spine in vivo. Journal of Biomechanics, 1991. 24(2): p. 117-126.
40. HPA. Patient Dose information. 2010 [cited 2010 24.08]; Available from: http://www.hpa.org.uk/web/HPAweb&HPAwebStandard/HPAweb_C/1195733826941.

75
41. Powers, C.M., Kulig, K., Harrison, J., Bergman, G., Segmental mobility of the lumbar spine during a posterior to anterior mobilization: assessment using dynamic MRI. Clinical Biomechanics, 2003. 18: p. 80-83.
42. Kulig, K., Powers, C., Landel, R., Chen, H., Fredericson, M., Guillet, M., Butts, K., Segmental lumbar mobility in individuals with low back pain: in vivo assessment during manual and self-imposed motion using dynamic MRI. BMC Musculoskeletal Disorders, 2007. 8(1): p. 8.
43. McGregor, A.H., Anderton, L.D., Gedroyc, W.M., Johnson, J., Hughes, S. , The Use of Interventional Open MRI to Assess the Kinematics of the Lumbar Spine in Patients With Spondylolisthesis. Spine, 2002. 27(14): p. 1582-1586.
44. Miyasaka, K., Ohmori, K., Suzuki, K., Inoue, H., Radiographic Analysis of Lumbar Motion in Relation to Lumbosacral Stability: Investigation of Moderate and Maximum Motion. Spine, 2000. 25(6): p. 732-737.
45. Shaffer, W.O., Spratt, K. F., Weinstein, J. D., Lehmann, T. R., Goel, V . 1990 Volvo Award in Clinical Sciences: The Consistency and Accuracy of Roentgenograms for Measuring Sagittal Translation in the Lumbar Vertebral Motion Segment: An Experimental Model. Spine, 1990. 15(8): p. 741-750.
46. Pearcy, M., Bogduk, N., Instantaneous axes of rotation of the lumbar intervertebral joint. Spine, 1988. 13(9): p. 1033-1041.
47. Amevo, B., Worth, D., Bogduk, N., Instantaneous axes of rotation of the typical cervical motion segments: a study in normal volunteers. Clinical Biomechanics, 1991. 6: p. 111-117.
48. Bogduk, N., Amevo, B., Pearcy, M., A Biological basis for instantaneous centres of rotation of the vertebral column. Proc Instn Mech Engineers, 1995. 209: p. 177-183.
49. Dabbs, V.M., Dabbs, L.G., Correlation between Disc Height Narrowing and Low-Back Pain. Spine, 1990. 15(12): p. 1366-1369.
50. Pope, M.H., Hanley, E.N., Matteri, R.E., Wilder, D.G., Frymoyer, J.W., Measurement of Intervertebral Disc Space Height. Spine, 1977. 2(4): p. 282-286.
51. Frobin, F., Brinckmann, P., Lievseth, G., Biggemann, M., Reikeras, O., Precision measurement of segmental motion from flexion-extension radiographs of the lumbar spine. Clinical Biomechanics, 1996. 11(8): p. 457-465.
52. Frobin, W., Brinckmann, P., Biggemann, M., Tillotson, M., Burton, K., Precision measurement of disc height, vertebral height and sagittal plane displacement from lateral radiographic views of the lumbar spine. Clincial Biomechanics, 1997. 12(Suppl.1): p. S22-S30.
53. Webpage, Department of Physical Therapy - University of Scranton. 54. Webpage, J-Tech Dualer IQ. 55. Kaigle, A.M., Wesberg, P., Hansson, T.H., Muscular and kinematic behavior of the
lumbar spine during flexion-extension. Journal of Spinal Disorders, 1998. 11(2): p. 163-174.
56. Steffen, T., Rubin, R.K., Baramki, H.G., Antoniou, J., Marchesi, D., Aebi, M., A new technique for measuring lumbar segmental motion in vivo: method, accuracy and preliminary results. Spine, 1997. 22: p. 156-166.
57. Steffen, T., Rubin, R., Baramki, H., Antoniou, J., Marchesi, D., Aebi, M. 3-D lumbar spinal kinematic measurements: method, validation and results. 2002 [cited 2002.
58. Olsson, T.H., Selvik, G., Willner, S., Mobility in lumbosacral spine after fusion studies with the aid of roentgen stereophotogrammetry. Clinical Orthopaedics and Related Research, 1977. 129: p. 181-190.

76
59. Lim, M.R., Loder, R.T., Huang, R.C., Lyman, S., Zhang, K., Sama, A., Papadopoulos, E.C., Warner, K., Girardi, F.P., Cammisa, F.P., Measurement Error of Lumbar Total Disc Replacement Range of Motion. Spine, 2006. 31(10): p. E291-E297.
60. Zhao, K., Yang, C., Zhao, C., An, K-N., Assessment of non-invasive intervertebral motion measurements in the lumbar spine. Journal of Biomechanics, 2005. 38: p. 1943-1946.
61. McAfee, P.C., Boden, S.D., Brantigan, J.W., Fraser, R.D., Kuslich, S.D., Oxland, T.R., Panjabi, M.M., Ray, C.D., Zdeblick, T.A.,, A critical discrepancy-A criteria of successful arthrodesis following interbody spinal fusions: Symposium. Spine, 2001. 26(3): p. 320-334.
62. Harvey, S.B., Hukins, D.W., Measurement of lumbar spinal flexion-extension kinematics from lateral radiographs: simulation of the effects of out-of-plane movement and errors in reference point placement. Medical Engineering and Physics, 1998. 20: p. 403-409.
63. Wall, S.M., Oppenheim, W.L., Measurement error of spondylolisthesis as a function of radiographic beam angle. Journal of Pediatric Orthopaedics, 1995. 15(2): p. 193-198.
64. Videman, T., Nurminen, M., The occurrence of anular tears and their relation to lifetime back pain history: a cadaveric study suing barium sulfate discography. Spine, 2004. 29(23): p. 2668-2676.
65. Ernst, C.W., Stadnik, T.W., Peeters, E., Bruecq, C., Osteaux, M.J.C., Prevalence of annular tears and disc herniations on MR images of the cervical spine in symptom free volunteers. European Journal of Radiology, 2005. 55: p. 409-414.
66. Amevo, B., Macintosh, J.E., Worth, D., Bogduk, N., Instantaneous axes of rotation of the typical cervical motion segments: I. an empirical study of technical errors. Clinical Biomechanics, 1991. 6: p. 31-37.
67. Amevo, B., Worth, D., Bogduk, N., Instantaneous axes of rotation of the typical cervical motion segments. II. optimisation of technical errors. Clinical Biomechanics, 1991. 6: p. 38-46.
68. van Mameren, H., Sanches, H., Beursgens, J., Drukker, J., Cervical spine motion in the sagittal plane II: position of segmental averaged instantaneous centres of rotation - a cineradiographic study. Spine, 1992. 17(5): p. 467-474.
69. Yoshioka, T., Tsuji, H., Hirano, N., Sainoh, S., Motion characteristic of the normal lumbar spine in your adults: instantaneous axis of rotation and vertebral centre motion analyses. Journal of Spinal Disorders, 1990. 3(2): p. 103-113.
70. McCane, B., King, T.I., Abbott, J.H., Calculating the 2D motion of lumbar vertebrae using splines. Journal of Biomechanics, 2006. 39: p. 2703-2708.
71. Rousseau, M., Bradford, D., Hadi, T., Pedersen, K., Lotz, J. , The instant axis of rotation influences facet forces at L5/S1 during flexion/extension and lateral bending. Eur Spine J, 2006. 15: p. 299-307.
72. Gertzbein, S.D., Seligman, J., Holtby, R., Chan, K.W., Ogstone, N., Kapasouri, A., Tile, M., Centrode characteristics of the lumbar spine as a function of segmental instability. Clinical Orthopaedics and Related Research, 1986. 208(July): p. 48-51.
73. Ogston, N.G., King, G.J., Gertzbein, S.D., Tile, M., Kapasouri, A., Rubinstein, J.D., Centrode patterns in the lumbar spine: baseline studies in normal subjects. Spine, 1986. 11(6): p. 591-595.
74. McCane, B., Abbott, J.H., King, T., On calculating the finite centre of rotation for rigid planar motion. Medical Engineering and Physics, 2005. 27(1): p. 75-79.

77
75. Teyhen, D.S., Flynn, T.W., Childs, J.D., Kuklo, T.R., Rosner, M.K., Polly, D.W., Abraham, L.D., Fluoroscopic Video to Identify Aberrant Lumbar Motion. . Spine, 2007. 32(7): p. E220-E229.
76. Teyhen, D.S., Flynn, T.W., Bovik, A.C., Abraham, L.D., A new technique for digital fluoroscopic video assessment of sagittal plane lumbar spine motion. Spine, 2005. 30(14): p. E406-E413.
77. Muggleton, J.M., Allen, R., Automatic location of vertebrae in digitised videofluoroscopic images of the lumbar spine. Medical Engineering & Physics, 1997. 19(1): p. 77-89.
78. Zheng, Y., Nixon, M.S., Allen, R., Lumbar spine visualisation based on kinematic analysis from videofluoroscopic imaging. Medical Engineering and Physics, 2003. 25: p. 171-179.
79. Wong, K., Luk, K., Leong, J., Wong, S., Wong, K., Continuous dynamic spinal motion analysis. Spine, 2006. 31(4): p. 414-419.
80. Ahmadi, A., Maroufi, N.,m Behtash, H., Zekavat, H., Parnianour, M., Kinematic analysis of dynamic lumbar motion in patients with lumbar segmental instability using digital videofluoroscopy. European Spine Journal, 2009. 18: p. 1677-1685.
81. Breen, A., Muggleton, J., Mellor, F. , An objective spinal motion imaging assessment (OSMIA): reliability, accuracy and exposure data. BMC Musculoskeletal Disorders, 2006. 7(1): p. 1-10.
82. Seay, J.F., Van Emmerik, R.E.A., Hamill, J., Low back pain status affects pelvis-trunk coordination and variability during walking and running. Clinical Biomechanics, 2011. 26(6): p. 572-578.
83. ICRP, Protection against Ionizing Radiation in the Teaching of Science. ICRP Publication 36, 1980. Ann. ICRP 10 (1).
84. de Vet, H.C.W., Observer Reliability and Agreement, in Enclyopedia of Statistics, P. Armitage, Colton, T. (Eds), Editor. 1998, John Wiley & Sons: Chichester. p. 3123-3127.
85. Siemens. A Siemens Arcadis Avantic portable C-arm fluoroscope Siemens Gmbh, Germany. . [cited; Available from: http://www.medical.siemens.com/webapp/wcs/stores/servlet/ProductDisplay~q_catalogId~e_-1~a_catTree~e_100010,1007660,12760,14264~a_langId~e_-1~a_productId~e_145439~a_storeId~e_10001.htm.
86. Bartko, J.J., The intraclass correlation coefficient as a measure of reliability. Psychological Reports, 1966. 19: p. 3-11.
87. Fleiss, J.L., Shrout, P.E., Approximate interval estimation for a certain intraclass correlation coefficient. Psychometrika, 1978. 43(2): p. 259-262.
88. Shrout, P.E., Fleiss, J.L., Intraclass correlations: uses in assessing rater reliability. Psychological Bulletin, 1979. 86(2): p. 420-428.
89. Mlchael Ellaszlw, S.L.Y., M Gall Woodbury, Karen FrydayFleld, Statistical Methodology for the Concurrent Assessment of Interrater and Intrarater Reliability: Using Goniometric Measurements as an Fxample. Physical Therapy, 1994. Volume 74( Number 8): p. 89.
90. Gertzbein, S.D., Holtby, R., Tile, M., Kapasouri, A., Chan, K.W., Cruickshank, B., Determination of a locus of instantaneous centres of rotation of the lumbar disc by Moire fringes: a new technique. Spine, 1984. 9(4): p. 409-413.
91. Haher, T.R., Obrien, M., Felmly, W.T., Welin, D., Perrier, G., Choueka, J., Devlin, V., Vassiliou, A., Chow, G., Instantaneous axis of rotation as a function of the three columns of the spine. Spine, 1992. 17: p. S149-154.

78
92. Morgan, F.P., King, I., Primary instability of lumbar vetebrae as a common cause of low back pain. Journal of Bone and Joint Surgery, 1957. 39B(1): p. 6-22.
93. Dupuis, P.R., Yong-Hing, K., Cassidy, J.D., Kirkaldy-Willis, W.H., Radiologic diagnosis of degenerative lumbar spinal instability. Spine, 1985. 10(3): p. 262-276.
94. Stokes, I.A.F., Frymoyer, J.W., Segmental motion and instability. Spine, 1987. 12(7): p. 688-691.
95. Boden, S.D., Wiesel, S.W., Lumbosacral segmental motion in normal individuals - have we been measuring instability properly? Spine, 1990. 15: p. 571-576.
96. Dvorak, J., Panjabi, M.M., Chang, D.G., Theiler, R., Grob, D., Functional radiographic diagnosis of the lumbar spine: flexion-extension and lateral bending. Spine, 1991. 16(5): p. 562-571.
97. Abbott, J., Fritz, J., McCane, B., Shultz, B., Herbison, P., Lyons, B., Stefanko, G., Walsh, R., Lumbar segmental mobility disorders: comparison of two methods of defining abnormal displacement kinematics in a cohort of patients with non-specific mechanical low back pain. BMC Musculoskeletal Disorders, 2006. 7(1): p. 45.
98. Meyerding, H.W., Spondylolisthesis. Surgery, Gynecology and Obstetrics, 1932. 54: p. 371-377.
99. Frobin, W., Leivseth, G., Biggemann, M., Brinckmann, P., Vertebral height, disc height, posteroanterior displacement and dens-atlas gap in the cervical spine: precision measurement protocol and normal data. Clincial Biomechanics, 2002. 17: p. 423-431.
100. C.S.A.G., Epidemiology Review: The epidemiology and cost of back pain. 1994, Department of Health: London.

79
Appendix 1
As the gradient of the bisector is known (mB), and any line which lies perpendicular to it
must have a gradient equal to its negative inverse .
Knowing the equation of a straight line in Cartesian co-ordinates;
We can combine these two equations to represent the line which passes perpendicular to
the bisectrix and though the canter point of one of the vertebra.
As centre point co-ordinates & ) are known this lines y-axis crossover point ( ) can
be calculated.
The point in which the line from the centre point intersects the bisectrix both equations
& can be said to be true.
As intersect co-ordinates ( & ) are true for both equations is the same for both
equations so they can be merged.

80
Or, as
As is known, can be found by;
This method can be repeated using the centre point co-ordinates of the other vertebra in
the pair giving the co-ordinates at which both lines meet the bisectrix. The distance between
these two points is what is used to describe translation in this study.
Or

81
Appendix 2
Measurement of Fixed centre of rotation models change in disc height is achieved by
measuring (with electronic callipers in millimetres) the dimensions of the calibration model
10 times.
The Mean vertebral body depth is found to be 28.77mm.
The position of the universal joint is found to be 5.35mm from the superior border of the
inferior vertebra 14.54mm along the superior border of the inferior vertebra from the
posterior corner.
The initial direct corner to corner distance between the anterior corners close to the disc
space between the two vertebrae was 6.11mm.
Figure 29: Measurements of model 1; theoretical placements of bisectrix and midlines for calculations
Bisectrix line is assumed to pass through the centre of rotation and have half the gradient
that the superior vertebras midline would as inferior vertebra is fixed at horizontal.
The dimensional measurement values where converted to fractions of superior vertebral
body depth.

82
Figure 30: Measured initial disc height and there relative values as a function of mean vertebral body
depth
So;
IAR X position= 14.54mm
IAR Y position= -5.35mm
Initial Disc height= 6.11mm
Therefore centre of rotation to inferior vertebra corner vertical distance = IAR Y position
= -5.35mm
Therefore centre of rotation to superior vertebra corner vertical distance = Initial Disc height
- IAR Y position = 0.76mm
Distance from centre of rotation to anterior corner of inferior vertebra horizontally
= 28.77- 14.54mm = 14.24mm
Therefore the direct distance from centre of rotation to anterior-inferior corner of superior
vertebra ‘Hyp1’ = ((14.54mm *14.54mm) + (14.24mm *14.24mm)) = 14.26
Therefore the direct distance from centre of rotation to anterior-superior corner of the
inferior vertebra ‘Hyp2’ = ((-5.35mm *-5.35mm) + (14.24mm *14.24mm)) = 15.21mm
As the distance form the centre of rotation to vertebral corners remains constant and we
know the change in angle from initial position to last position is 16 degrees. (Or -13 degrees
from horizontal to 3 degrees horizontal) as read off the attached protractor.

83
Figure 31: Calculated distances from fixed centre of rotation to vertebral body corners
At initial;
Initial angle ‘θ1’ = -13 degrees / -0.227 radians (rads)
Gradient of superior body midline (m1) = tan (angle of vertebra from horizontal) = -0.231
Gradient of inferior body midline ‘m2’= 0
Bisector gradient ‘mB’= average of superior and inferior midline gradients = (-0.231+0) ÷ 2 =
-0.115
Bisector angle ‘θB’ = Tan-1(mB) = Tan-1(-0.115) = -0.1149
Angle of Hyp1 from horizontal ‘θ (Hyp1)’ = Tan-1(0.76÷ 14.24) = 0.0532
Angle of Hyp2 from horizontal ‘θ (Hyp2)’ = Tan-1(-5.35÷ 14.24) = -0.3594
Angle between Bisectrix and Hyp1 ‘θ (Hyp1 - mB)’ = 0.1682
Angle between Bisectrix and Hyp1 ‘θ (Hyp2 - mB)’ = -0.2444
Perpendicular distance between bisectrix and Superior corner = Sin (θ (Hyp1 - mB)) x Hyp1
= 2.39mm
Perpendicular distance between bisectrix and inferior corner = Sin (θ (Hyp2 - mB)) x Hyp2
= --3.68mm
Total distance = 6.07mm

84
Figure 32: Measuring maximum disc height change relative to bisectrix
Final position;
Initial angle ‘θ1’ = 3 degrees / 0.0524 rads
Gradient of superior body midline (m1) = tan (angle of vertebra from horizontal) = 0.0524
Gradient of inferior body midline ‘m2’= 0
Bisector gradient ‘mB’= average of superior and inferior midline gradients = 0.0524
+0) ÷ 2 = 0.0262
Bisector angle ‘θB’ = Tan-1(mB) = Tan-1(0.0262) = 0.0262
Angle of Hyp1 from horizontal ‘θ (Hyp1)’ = Δ θ1+‘θ (Hyp1)’ = 0.3325
Angle of Hyp2 from horizontal ‘θ (Hyp2)’ = Tan-1(-14.24÷ 0.76) = -0.3594
Angle between Bisectrix and Hyp1 ‘θ (Hyp1 - mB)’ = 0.3063
Angle between Bisectrix and Hyp1 ‘θ (Hyp2 - mB)’ -0.3856
Perpendicular distance between bisectrix and Superior corner = Sin (θ (Hyp1 - mB)) x Hyp1
= 4.30mm
Perpendicular distance between bisectrix and inferior corner = Sin (θ (Hyp2 - mB)) x Hyp2

85
= --5.72
Total distance = 10.02
Change in disc height=3.95mm
(Disc height change ÷ average vertebral body depth) *100
= (3.95mm÷28.77mm.)*100= 13.73 percent vertebral body depth (%VBD)

86
Appendix 3
Calibration Model motor control software
int pwm_a = 3; //PWM control for motor outputs 1 and 2 is on digital pin 3
int pwm_b = 11; //PWM control for motor outputs 3 and 4 is on digital pin 11
int dir_a = 12; //dir control for motor outputs 1 and 2 is on digital pin 12
int dir_b = 13; //dir control for motor outputs 3 and 4 is on digital pin 13
const int numReadings = 10;
int var = 0;
int var2 = 0;
int readings[numReadings]; // the readings from the analog input
int index = 0; // the index of the current reading
int total = 0; // the running total
int average = 0; // the average
int average2 = 0; // the average
int average3 = 0; // the average
int motorout = 0;
//variables in limits
// speed of motor movement 50-255 (less than 50 will not move)
int speed1 = 50; // speed =50 (slowest consistant value)
// Motor distance 0-1023 (realisticaly 50- 1022)
int ExtLim=1000; // full reach (to ensure no motor twist)
int FlexLim=150; // full retraction (to ensure no motor twist)
int VarLim=0; // variable motor limit to be based of tilt sensor
int motorout1=0;
const int inputPin = A0; //inputpin A0 for sensor
const int motor = 9; //ditigal pin9
int inByte = 0;
void setup() {
// initialize serial communication with computer:
Serial.begin(9600);
for (int thisReading = 0; thisReading < numReadings; thisReading++)
readings[thisReading] = 0;

87
pinMode(pwm_a, OUTPUT); //Set control pins to be outputs
pinMode(pwm_b, OUTPUT);
pinMode(dir_a, OUTPUT);
pinMode(dir_b, OUTPUT);
analogWrite(pwm_a, 0);
analogWrite(pwm_b, 0);
}
void loop()
{
if (Serial.available() > 0) {
int inByte = Serial.read();
var = 0;
var2 = 0;
switch (inByte){
while (var < 1) {
case 'e'://extension translation only
analogWrite(pwm_a, speed1);
analogWrite(pwm_b, speed1);
digitalWrite(dir_a, LOW); //Set motor direction, 1 low, 2 high
digitalWrite(dir_b, LOW); //Set motor direction, 3 high, 4 low
while (var2 < 1000) {
motorout = analogRead(motor);
Serial.println(motorout, DEC);
Serial.print("");
delay(10);
var2++;
if (motorout>ExtLim){
var2=1000;
analogWrite(pwm_a, 0);
analogWrite(pwm_b, 0);
}
}

88
var2=0;
delay(1000);
analogWrite(pwm_a, speed1);
analogWrite(pwm_b, speed1);
digitalWrite(dir_a, HIGH); //Set motor direction, 1 low, 2 high
digitalWrite(dir_b, HIGH); //Set motor direction, 3 high, 4 low
while (var2 < 1000) {
motorout = analogRead(motor);
Serial.println(motorout, DEC);
Serial.print("");
delay(10);
var2++;
if (motorout<FlexLim){
var2=1000;
analogWrite(pwm_a, 0);
analogWrite(pwm_b, 0);
}
}
var=10;
}
break;
while (var < 1) {
case 'f':////flexion translation onlyy
analogWrite(pwm_a, speed1);
analogWrite(pwm_b, speed1);
digitalWrite(dir_a, HIGH); //Set motor direction, 1 low, 2 high
digitalWrite(dir_b, HIGH); //Set motor direction, 3 high, 4 low
while (var2 < 1000) {
motorout = analogRead(motor);
Serial.println(motorout, DEC);
Serial.print("");
delay(10);
var2++;
if (motorout<FlexLim){
var2=1000;

89
analogWrite(pwm_a, 0);
analogWrite(pwm_b, 0);
}
}
var2=0;
delay(1000);
analogWrite(pwm_a, speed1);
analogWrite(pwm_b, speed1);
digitalWrite(dir_a, LOW); //Set motor direction, 1 low, 2 high
digitalWrite(dir_b, LOW); //Set motor direction, 3 high, 4 low
while (var2 < 1000) {
motorout = analogRead(motor);
Serial.println(motorout, DEC);
Serial.print("");
delay(10);
var2++;
if (motorout>ExtLim){
var2=1000;
analogWrite(pwm_a, 0);
analogWrite(pwm_b, 0);
}
}
var=10;
}
break;
while (var < 1) {
case 'q'://Move to the opposite extreem of translation motion
motorout = analogRead(motor);
motorout1=motorout;
if (motorout1>FlexLim){
while (motorout>FlexLim){
analogWrite(pwm_a, speed1);
analogWrite(pwm_b, speed1);
digitalWrite(dir_a, HIGH); //Set motor direction, 1 low, 2 high
digitalWrite(dir_b, HIGH); //Set motor direction, 3 high, 4 low

90
motorout = analogRead(motor);
}
analogWrite(pwm_a, 0);
analogWrite(pwm_b, 0);
}
if (motorout1<ExtLim){
while (motorout<ExtLim){
analogWrite(pwm_a, speed1);
analogWrite(pwm_b, speed1);
digitalWrite(dir_a, LOW); //Set motor direction, 1 low, 2 high
digitalWrite(dir_b, LOW); //Set motor direction, 3 high, 4 low
motorout = analogRead(motor);
}
analogWrite(pwm_a, 0);
analogWrite(pwm_b, 0);
}
var=10;
}
break;
while (var < 1000) {
case 'v'://variable translation based on rotation
// subtract the last reading:
total= total - readings[index];
// read from the sensor:
readings[index] = analogRead(inputPin);
// add the reading to the total:
total= total + readings[index];
// advance to the next position in the array:
index = index + 1;
// if we're at the end of the array...
if (index >= numReadings)
// ...wrap around to the beginning:
index = 0;
// calculate the average:
average = total / numReadings;

91
// send it to the computer (as ASCII digits)
average = map(average, 0, 1023, 60, 121);
Serial.println(average, DEC);
Serial.print("");
average = map(average, 60, 121, FlexLim, ExtLim); //change back for motor
Serial.print("");
motorout = analogRead(motor);
Serial.print(motorout, DEC);
Serial.print("\t");
average2=average+round((ExtLim-FlexLim)/(121-60));
average3=average-round((ExtLim-FlexLim)/(121-60));
motorout1 = motorout;
if (motorout1>average2){
analogWrite(pwm_a, speed1);
analogWrite(pwm_b, speed1);
digitalWrite(dir_a, HIGH); //Set motor direction, 1 low, 2 high
digitalWrite(dir_b, HIGH); //Set motor direction, 3 high, 4 low
delay(50);
analogWrite(pwm_a, 0);
analogWrite(pwm_b, 0);
}
else if (motorout1<average3){
analogWrite(pwm_a, speed1);
analogWrite(pwm_b, speed1);
digitalWrite(dir_a, LOW); //Set motor direction, 1 low, 2 high
digitalWrite(dir_b, LOW); //Set motor direction, 3 high, 4 low
delay(50);
analogWrite(pwm_a, 0);
analogWrite(pwm_b, 0);
}
else if (average3<motorout1<average2){
analogWrite(pwm_a, 0);
analogWrite(pwm_b, 0);
}
else if (motorout1>ExtLim){
analogWrite(pwm_a, speed1);

92
analogWrite(pwm_b, speed1);
digitalWrite(dir_a, LOW); //Set motor direction, 1 low, 2 high
digitalWrite(dir_b, LOW); //Set motor direction, 3 high, 4 low
}
else if (motorout1<FlexLim){
analogWrite(pwm_a, speed1);
analogWrite(pwm_b, speed1);
digitalWrite(dir_a, HIGH); //Set motor direction, 1 low, 2 high
digitalWrite(dir_b, HIGH); //Set motor direction, 3 high, 4 low
}
var++;
}
break;
case 's':// sensor only
var2=0;
while (var <500){
// subtract the last reading:
total= total - readings[index];
// read from the sensor:
readings[index] = analogRead(inputPin);
// add the reading to the total:
total= total + readings[index];
// advance to the next position in the array:
index = index + 1;
// if we're at the end of the array...
if (index >= numReadings) {
// ...wrap around to the beginning:
index = 0;
}
// calculate the average:
average = total / numReadings;
// send it to the computer (as ASCII digits)
average = map(average, 0, 1023, 60, 121);
Serial.println(average, DEC);
Serial.print(" ");

93
delay(50);
var++;
}
break;
while (var < 1) {
case 'c'://go the other way
motorout = analogRead(motor);
motorout1=motorout;
Serial.print("initial: ");
Serial.println(motorout, DEC);
Serial.print("\t");
if (motorout1>FlexLim){
while (motorout>FlexLim){
analogWrite(pwm_a, speed1);
analogWrite(pwm_b, speed1);
digitalWrite(dir_a, HIGH); //Set motor direction, 1 low, 2 high
digitalWrite(dir_b, HIGH); //Set motor direction, 3 high, 4 low
motorout = analogRead(motor);
}
analogWrite(pwm_a, 0);
analogWrite(pwm_b, 0);
}
if (motorout1<ExtLim){
while (motorout<ExtLim){
analogWrite(pwm_a, speed1);
analogWrite(pwm_b, speed1);
digitalWrite(dir_a, LOW); //Set motor direction, 1 low, 2 high
digitalWrite(dir_b, LOW); //Set motor direction, 3 high, 4 low
motorout = analogRead(motor);
}
analogWrite(pwm_a, 0);
analogWrite(pwm_b, 0);
}
motorout = analogRead(motor);
Serial.print("final: ");

94
Serial.println(motorout, DEC);
Serial.print(" ");
var=10;
}
break;
}
}
}

95
Appendix 4
Intra-observer repeatability results
Translation
Table 10: Intra-observer repeatability of translation in extension of the Lumbar segments L2-L3, L3-L4,
L5-S1 using QF expressed in SEM, 95% LOA, ICC and 95% CI
Extension Translation
SEM1 95% LOA2 ICC3 (95% CI4)
n (%VBD) (%VBD) ICC
7 L2-L3 0.593 -1.896 to 1.392 0.935 (0.671 - 0.989)
13 L3-L4 1.156 -2.958 to 3.448 0.742 (0.185 - 0.920)
10 L4-L5 1.610 -4.563 to 4.359 0.899 (0.619 - 0.975)
10 L5-S1 3.260 -10.791 to 7.282 0.644 (-0.344 - 0.910)
40 Overall 1.958 -5.855 to 4.998 0.782 (0.589 - 0.884)
Table 11: Intra-observer repeatability of translation in flexion of the Lumbar segments L2-L3, L3-L4,
L5-S1 using QF expressed in SEM, 95% LOA, ICC and 95% CI
Flexion Translation
SEM1 95% LOA2 ICC3 (95% CI4)
n (%VBD) (%VBD) ICC
11 L2-L3 0.517 -1.365 to 1.410 0.988 (0.958 - 0.997)
14 L3-L4 1.234 -3.716 to 3.123 0.533 (0.406 - 0.849)
11 L4-L5 1.109 -2.322 to 3.825 0.853 (0.483 - 0.960)
13 L5-S1 2.209 -6.450 to 5.794 0.828 (0.456 - 0.947)
49 Overall 1.427 -3.943 to 3.967 0.859 (0.751 - 0.920)

96
Disc height
Table 12: Intra-observer repeatability of disc height change in extension of the Lumbar segments L2-
L3, L3-L4, L5-S1using QF expressed in SEM, 95% LOA, ICC and 95% CI
Extension Disc Height change
SEM1 95% LOA2 ICC3 (95% CI4)
n (%VBD) (%VBD) ICC
6 L2-L3 1.504 -3.094 to 5.242 0.650 (-1.099 - 0.950)
12 L3-L4 0.252 -0.791 to 0.603 0.965 (0.895 - 0.991)
15 L4-L5 0.717 -1.883 to 2.091 0.971 (0.915 - 0.990)
13 L5-S1 1.550 -5.111 to 3.483 0.829 (0.462 - 0.947)
46 Overall 1.113 -3.167 to 3.006 0.895 (0.811 - 0.942)
Table 13: Intra-observer repeatability of disc height change in flexion of the Lumbar segments L2-L3,
L3-L4, L5-S1using QF expressed in SEM, 95% LOA, ICC and 95% CI
Flexion Disc Height change
SEM1 95% LOA2 ICC3 (95% CI4)
n (%VBD) (%VBD) ICC
4 L2-L3 1.059 -1.729 to 4.143 0.236 (-6.630 - 0.950)
3 L3-L4 0.518 -1.448 to 1.424 0.651 (-4.600 - 0.991)
5 L4-L5 0.858 -2.636 to 2.123 -5.37 (-46.046 - 0.320)
9 L5-S1 0.435 -1.338 to 1.071 0.879 (0.503 - 0.972)
21 Overall 0.755 -1.982 to 2.202 0.531(-0.138 - 0.808)

97
Instantaneous axes of rotation
Table 14: Intra-observer repeatability of IAR in extension of the Lumbar segments L2-L3, L3-L4, L5-S1using QF expressed in RMS.
Table 15: Intra-observer repeatability of IAR in flexion of the Lumbar segments L2-L3, L3-L4, L5-S1using QF expressed in RMS.
Extension Instantaneous Axis of Rotation (IAR) RMS difference in position Intra-observer described as percentage
of superior vertebral body depth (%VBD)
L2-L3 L3-L4 L4-L5 L5-S1 Overall
n 4 1 10 6 21
X( %VBU) 1.38 3.80 1.61 6.84 1.63
y (%VBU) 3.06 11.93 4.34 5.14 1.75
Flexion Instantaneous Axis of Rotation (IAR) RMS difference in position Intra-observer described as
percentage of superior vertebral body depth (%VBD)
L2-L3 L3-L4 L4-L5 L5-S1 Overall
n 1 9 12 8 30
X( %VBU) 2.93 1.09 0.35 5.46 1.09
y (%VBU) 0.22 2.59 3.72 2.13 0.15

98
Inter-observer repeatability results
Translation
Table 16: Inter-observer repeatability of translation in extension of the Lumbar segments L2-L3, L3-L4,
L5-S1using QF expressed in SEM, 95% LOA, ICC and 95% CI
Extension Translation
SEM1 95% LOA2 ICC3 (95% CI4)
n (%VBD) (%VBD) ICC
6 L2-L3 0.496 -1.5973 to 1.151 0.932 (0.514- 0.990)
12 L3-L4 0.999 -3.426 to 2.112 0.809 (0.337 - 0.945)
7 L4-L5 1.871 -3.843 to 6.531 0.916 (0.512 - 0.986)
8 L5-S1 1.839 -8.264 to 1.931 0.910 (0.553 - 0.982)
33 Overall 1.736 -5.575 to 4.051 0.861 (0.718 - 0.931)
Table 17: Inter-observer repeatability of translation in extension of the Lumbar segments L2-L3, L3-L4,
L5-S1using QF expressed in SEM, 95% LOA, ICC and 95% CI
Flexion Translation
SEM1 95% LOA2 ICC3 (95% CI4)
n (%VBD) (%VBD) ICC
11 L2-L3 1.468 -4.357 to 3.783 0.865 (0.499 - 0.964)
14 L3-L4 1.302 -3.561 to 3.654 0.570 (-0.339 - 0.862)
11 L4-L5 1.766 -4.299 to 5.491 0.700 (-0.115 - 0.919)
12 L5-S1 2.152 -4.929 to 7.002 0.844 (0.458 - 0.955)
48 Overall 1.674 -4.297 to 4.985 0.806 (0.654 - 0.891)

99
Disc height
Table 18: Inter-observer repeatability of disc height change in flexion of the Lumbar segments L2-L3,
L3-L4, L5-S1using QF expressed in SEM, 95% LOA, ICC and 95% CI S1using QF expressed in SEM, 95%
LOA, ICC and 95% CI
Table 19: Inter-observer repeatability of disc height change in flexion of the Lumbar segments L2-L3,
L3-L4, L5-S1using QF expressed in SEM, 95% LOA, ICC and 95% CI
Flexion Disc Height change
SEM1 95% LOA2 ICC3 (95% CI4)
N (%VBD) (%VBD) ICC
4 L2-L3 0.287 -1.115 to 0.474 0.953 (0.271 - 0.997)
2 L3-L4 0.131 -0.238 to 0.488 0.852 (-95.175 – 1.000)
3 L4-L5 0.032 0.164t o 0.343 0.995 (0.792 – 1.000)
6 L5-S1 0.493 -1.266 to 1.469 0.639 (-1.583 - 0.949)
15 Overall 0.361 -0.979 to 1.024 0.866 (0.600 - 0.955)
Extension Disc Height change
SEM1 95% LOA2 ICC3 (95% CI4)
N (%VBD) (%VBD) ICC
6 L2-L3 0.618 -1.597 to 1.832 0.968 (0.773 - 0.996)
11 L3-L4 0.427 -1.223 to 1.142 0.918 (0.695 - 0.978)
14 L4-L5 0.691 -2.152 to 1.679 0.957 (0.865- 0.986)
13 L5-S1 6.679 -23.529 to 13.496 0.487 (-0.683 - 0.843)
44 Overall 3.907 -12.380 to 9.277 0.609 (0.284 - 0.787)

100
Instantaneous axes of rotation
Table 20: Inter-observer repeatability of IAR in extension of the Lumbar segments L2-L3, L3-L4, L5-S1
using QF expressed in RMS.
Table 21: Inter-observer repeatability of IAR in flexion of the Lumbar segments L2-L3, L3-L4, L5-S1
using QF expressed in RMS.
SEM = SD difference/ √2 to 95% limits of agreement
2 95% LOA = x ̄± 1.96 x SD difference (Bland-Altman-Plot)
3 ICC = SD1/ (SD1 + SD difference) intra-observer: 1-way random effect inter-observer: 2-way random effect 4 95% CI = x ̄± 1.96 x SD/√n (x ̄= sample mean, SD=Standard deviation n= number of subjects)
Extension Instantaneous Axis of Rotation (IAR) RMS difference in position Inter-observer described as
percentage of superior vertebral body depth (%VBD)
L2-L3 L3-L4 L4-L5 L5-S1 Overall
n 5 1 9 5 20
X( %VBU) 2.80 5.23 0.19 0.77 0.55
y (%VBU) 4.03 0.41 4.16 3.13 1.63
Flexion Instantaneous Axis of Rotation (IAR) RMS difference in position Inter-observer described as
percentage of superior vertebral body depth (%VBD)
L2-L3 L3-L4 L4-L5 L5-S1 Overall
n 1 7 10 6 24
X( %VBU) 1.69 0.21 1.58 10.90 2.08
y (%VBU) 2.47 1.05 2.59 7.11 0.85

101
Appendix 5
Intra-observer repeatability 95% LOA Bland-Altman plots
Translation
Flexion L2-L3;
95% LOA (%VBD) = -1.365 to 1.410
-6 -4 -2 0 2 4-8.0
-5.5
-3.0
-0.5
2.0
4.5
Mean ((Flexion + Flexion) / 2)
Difference (Flexion - Flexion) mean difference ± 95% limits of agreement
Flexion L3-L4;
95% LOA (%VBD) =-3.716 to 3.123
-2 0 2 4 6-4.0
-2.4
-0.8
0.8
2.4
4.0
5.6
Mean ((M + N) / 2)
Difference (M - N) mean difference ± 95% limits of agreement

102
Flexion L4-L5;
95% LOA (%VBD) =-2.322 to 3.825
-4.0 -2.4 -0.8 0.8 2.4 4.0 5.6-5.0
-2.5
0.0
2.5
5.0
7.5
Mean ((M + N) / 2)
Difference (M - N) mean difference ± 95% limits of agreement
Flexion L5-S1;
95% LOA (%VBD)= -6.450 to 5.794
-6 -1 4 9-5
0
5
10
Mean ((M + N) / 2)
Difference (M - N) mean difference ± 95% limits of agreement

103
Flexion Overall;
95% LOA (%VBD) =-3.943 to 3.967
-6 -1 4 9-7
-2
3
8
Mean ((M + N) / 2)
Difference (M - N) mean difference ± 95% limits of agreement

104
Extension L2-L3;
95% LOA (%VBD) = -1.896 to 1.392
-6 -5 -4 -3 -2 -1-2
-1
0
1
2
Mean ((Extension + Extension) / 2)
Difference (Extension - Extension) mean difference ± 95% limits of agreement
Extension L3-L4;
95% LOA (%VBD) = -2.958 to 3.448
-4 -2 0 2 4-5.0
-2.5
0.0
2.5
5.0
Mean ((A + B) / 2)
Difference (A - B) mean difference ± 95% limits of agreement

105
Extension L4-L5;
95% LOA (%VBD) = -4.563 to 4.359
-9.0 -6.5 -4.0 -1.5 1.0 3.5-8.0
-5.5
-3.0
-0.5
2.0
4.5
Mean ((A + B) / 2)
Difference (A - B) mean difference ± 95% limits of agreement
Extension L5-S1;
95% LOA (%VBD) = -10.791 to 7.282
-10.0 -7.5 -5.0 -2.5 0.0 2.5-15
-10
-5
0
5
10
Mean ((A + B) / 2)
Difference (A - B) mean difference ± 95% limits of agreement

106
Extension Overall;
95% LOA (%VBD) = -5.855 to 4.998
-10 -5 0 5-20
-15
-10
-5
0
5
Mean ((Extension + Extension) / 2)
Difference (Extension - Extension) mean difference ± 95% limits of agreement

107
Disc height
Flexion L2-L3;
95% LOA (%VBD) =-1.729 to 4.143
-2.2 -1.7 -1.2 -0.7 -0.2 0.3-2
0
2
4
6
Mean ((A + B) / 2)
Difference (A - B) mean difference ± 95% limits of agreement
Flexion L3-L4;
95% LOA (%VBD) = -1.448 to 1.424
-0.20 0.05 0.30 0.55 0.80 1.05-2
-1
0
1
2
Mean ((A + B) / 2)
Difference (A - B) mean difference ± 95% limits of agreement

108
Flexion L4-L5;
95% LOA (%VBD) = -2.636 to 2.123
-0.2 0.0 0.2 0.4-3
-2
-1
0
1
2
3
Mean ((A + B) / 2)
Difference (A - B) mean difference ± 95% limits of agreement
Flexion L5-S1;
95% LOA (%VBD) = -1.338 to 1.071
-1.5 -0.5 0.5 1.5-2.0
-1.2
-0.4
0.4
1.2
Mean ((A + B) / 2)
Difference (A - B) mean difference ± 95% limits of agreement

109
Flexion Overall;
95% LOA (%VBD) = -1.982 to 2.202
-2.5 -1.5 -0.5 0.5 1.5-2
0
2
4
Mean ((A + B) / 2)
Difference (A - B) mean difference ± 95% limits of agreement

110
Extension L2-L3;
95% LOA (%VBD) = -3.094 to 5.242
0 2 4 6 8-4
-2
0
2
4
6
Mean ((A + B) / 2)
Difference (A - B) mean difference ± 95% limits of agreement
Extension L3-L4;
95% LOA (%VBD) = -0.791 to 0.603
2 3 4 5 6 7-1.0
-0.6
-0.2
0.2
0.6
Mean ((A + B) / 2)
Difference (A - B) mean difference ± 95% limits of agreement

111
Extension L4-L5;
95% LOA (%VBD) = -1.883 to 2.091
-2 0 2 4 6 8-2
0
2
4
Mean ((A + B) / 2)
Difference (A - B) mean difference ± 95% limits of agreement
Extension L5-S1;
95% LOA (%VBD) = -5.111 to 3.483
2 4 6 8 10 12-6
-4
-2
0
2
4
Mean ((A + B) / 2)
Difference (A - B) mean difference ± 95% limits of agreement

112
Extension Overall;
95% LOA (%VBD) = -3.167 to 3.006
-2 3 8 13-6
-3
0
3
6
Mean ((A + B) / 2)
Difference (A - B) mean difference ± 95% limits of agreement

113
Inter-observer repeatability 95% LOA Bland-Altman plots
Translation
Flexion L2-L3;
95% LOA (%VBD) =-4.357 to 3.783
-6 -4 -2 0 2 4-8.0
-5.5
-3.0
-0.5
2.0
4.5
Mean ((Flexion + Flexion) / 2)
Difference (Flexion - Flexion) mean difference ± 95% limits of agreement
Flexion L3-L4;
95% LOA (%VBD) =-3.561 to 3.654
-2 0 2 4 6-4.0
-2.4
-0.8
0.8
2.4
4.0
5.6
Mean ((M + N) / 2)
Difference (M - N) mean difference ± 95% limits of agreement

114
Flexion L4-L5;
95% LOA (%VBD)= -4.299 to 5.491
-4.0 -2.4 -0.8 0.8 2.4 4.0 5.6-5.0
-2.5
0.0
2.5
5.0
7.5
Mean ((M + N) / 2)
Difference (M - N) mean difference ± 95% limits of agreement
Flexion L5-S1;
95% LOA (%VBD)= -4.929 to 7.002
-6 -1 4 9-5
0
5
10
Mean ((M + N) / 2)
Difference (M - N) mean difference ± 95% limits of agreement

115
Flexion Overall ;
95% LOA (%VBD)= -4.297 to 4.985
-6 -1 4 9-7
-2
3
8
Mean ((M + N) / 2)
Difference (M - N) mean difference ± 95% limits of agreement

116
Extension L2-L3;
95% LOA (%VBD) = -1.5973 to 1.151
-6 -5 -4 -3 -2 -1-2.0
-1.2
-0.4
0.4
1.2
Mean ((Extension + Extension) / 2)
Difference (Extension - Extension) mean difference ± 95% limits of agreement
Extension L3-L4;
95% LOA (%VBD) = -3.426 to 2.112
-3 -2 -1 0 1 2 3-5.0
-2.5
0.0
2.5
Mean ((E + F) / 2)
Difference (E - F) mean difference ± 95% limits of agreement

117
Extension L4-L5;
95% LOA (%VBD) = -3.843 to 6.531
-9.0 -6.5 -4.0 -1.5 1.0 3.5-5.0
-2.5
0.0
2.5
5.0
7.5
Mean ((E + F) / 2)
Difference (E - F) mean difference ± 95% limits of agreement
Extension L5-S1;
95% LOA (%VBD) = -8.264 to 1.931
-10 -5 0 5 10-10.0
-7.5
-5.0
-2.5
0.0
2.5
Mean ((E + F) / 2)
Difference (E - F) mean difference ± 95% limits of agreement

118
Extension Overall;
95% LOA (%VBD) = -5.575 to 4.051
-10 -5 0 5 10-8
-3
2
7
Mean ((E + F) / 2)
Difference (E - F) mean difference ± 95% limits of agreement

119
Disc height
Flexion L2-L3;
95% LOA (%VBD) = -1.115 to 0.474
-2.1 -1.6 -1.1 -0.6 -0.1 0.4-1.50
-0.75
0.00
0.75
Mean ((E + F) / 2)
Difference (E - F) mean difference ± 95% limits of agreement
Flexion L3-L4;
95% LOA (%VBD) = -0.238 to 0.488
-0.11 -0.01 0.09 0.19 0.29-0.50
-0.25
0.00
0.25
0.50
Mean ((E + F) / 2)
Difference (E - F) mean difference ± 95% limits of agreement

120
Flexion L4-L5;
95% LOA (%VBD) = 0.164t o 0.343
0.0 0.2 0.4 0.6 0.80.16
0.21
0.26
0.31
0.36
Mean ((E + F) / 2)
Difference (E - F) mean difference ± 95% limits of agreement
Flexion L5-S1;
95% LOA (%VBD) = -1.266 to 1.469
-0.8 -0.3 0.2 0.7 1.2-1.5
-0.5
0.5
1.5
Mean ((E + F) / 2)
Difference (E - F) mean difference ± 95% limits of agreement

121
Flexion Overall;
95% LOA (%VBD) = -0.979 to 1.024
-2.5 -1.5 -0.5 0.5 1.5-1.0
-0.5
0.0
0.5
1.0
1.5
Mean ((E + F) / 2)
Difference (E - F) mean difference ± 95% limits of agreement

122
Extension L2-L3;
95% LOA (%VBD) = -1.597 to 1.832
0 2 4 6 8-2
-1
0
1
2
Mean ((E + F) / 2)
Difference (E - F) mean difference ± 95% limits of agreement
Extension L3-L4;
95% LOA (%VBD) = -1.223 to 1.142
2 3 4 5 6 7-2.0
-1.2
-0.4
0.4
1.2
Mean ((E + F) / 2)
Difference (E - F) mean difference ± 95% limits of agreement

123
Extension L4-L5;
95% LOA (%VBD) = -2.152 to 1.679
0 3 6 9-4
-2
0
2
Mean ((E + F) / 2)
Difference (E - F) mean difference ± 95% limits of agreement
Extension L5-S1;
95% LOA (%VBD) = -23.529 to 13.496
1 6 11 16 21 26-30
-20
-10
0
10
20
Mean ((E + F) / 2)
Difference (E - F) mean difference ± 95% limits of agreement

124
Extension Overall;
95% LOA (%VBD) =-12.380 to 9.277
0 5 10 15 20 25-30
-20
-10
0
10
Mean ((E + F) / 2)
Difference (E - F) mean difference ± 95% limits of agreement