masters final work - utl repository
TRANSCRIPT
i
MASTER OF SCIENCE IN
FINANCE
MASTERS FINAL WORK
PROJECT
EQUITY RESEARCH
NOVABASE SGPS SA
AUTHOR JOSÉ PEDRO GOMES MOTA PINTO DE ABREU
Supervisor
VICTOR MAURÍLIO SILVA BARROS
OCTOBER 2015

ii
Acknowledgements
This project is the result of a long and hard but very rewarding journey, which would not be
possible without the permanent support of my family, professors and friends.
To my parents and my girlfriend who supported me unconditionally at all stages of my
educational and professional path.
To Professor Clara Raposo for the interest and the consent to carry out this project through the
CFA recommended format.
Last but not least, to my supervisor Victor Barros for the guidance, the knowledge shared and
the long hours given to this cause over the past months.
iii
Index Abstract ....................................................................................................................................... iv Resumo ........................................................................................................................................ v Index of Figures .......................................................................................................................... vi Index of Tables .......................................................................................................................... viii 1. Research Snapshot ................................................................................................................. 1 2. Investment Summary ............................................................................................................... 2 3. Business Structure and Competititve Position ......................................................................... 3 4. Macroeconomic Overview........................................................................................................ 6 5. Industry Analysis ...................................................................................................................... 8 6. Historical Financial Performance ........................................................................................... 10 7. Valuation ................................................................................................................................ 15 8. Forecast ................................................................................................................................. 19 9. Investment Risks ................................................................................................................... 21 Appendix A: Statement of Financial Position ............................................................................. 24 Appendix B: Income Statement .................................................................................................. 25 Appendix C: DuPont Identity ...................................................................................................... 28 Appendix D: Cash Flow Statement ............................................................................................ 29 Appendix E: Key Financial Ratios .............................................................................................. 30 Appendix F: Revenue Forecast .................................................................................................. 31 Appendix G: WACC ................................................................................................................... 34 Appendix H: UFCF / EV ............................................................................................................. 36 Appendix I: Market Approach ..................................................................................................... 37 Appendix J: Effective Tax Rate .................................................................................................. 40 Appendix K: Corporate Tree ...................................................................................................... 41 Appendix L: References ............................................................................................................. 42 Appendix M: Abbreviations ........................................................................................................ 44
iv
Abstract
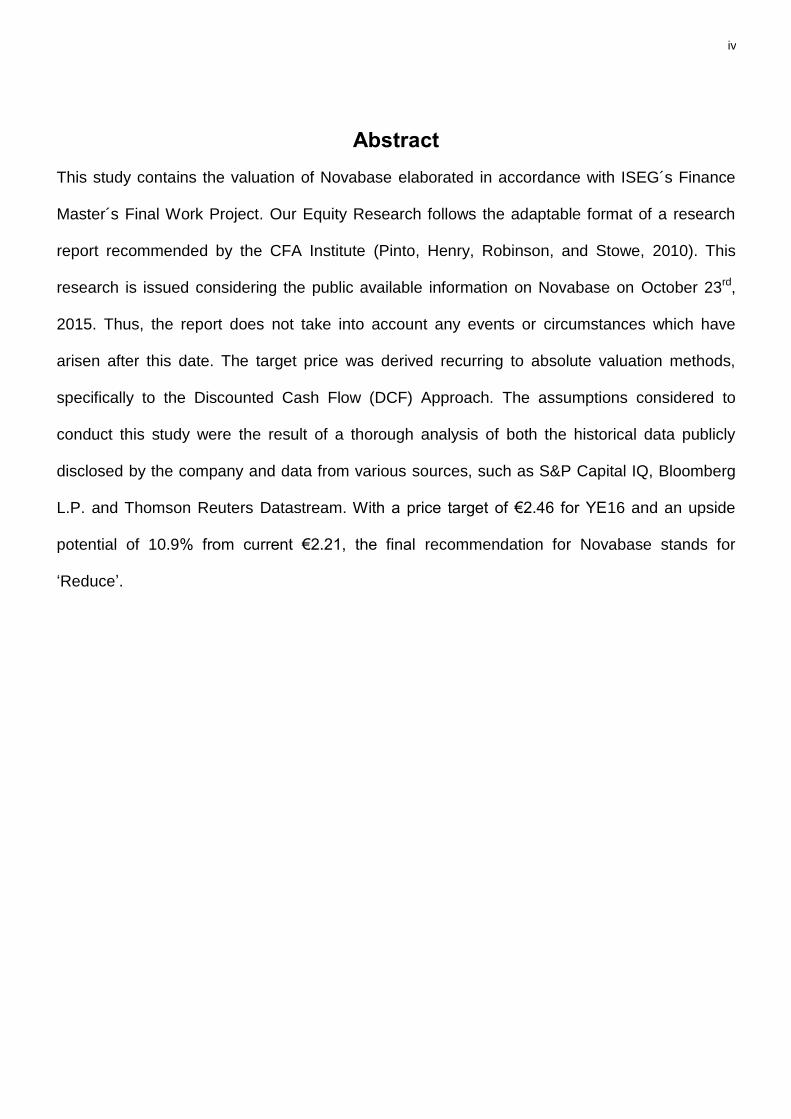
This study contains the valuation of Novabase elaborated in accordance with ISEG´s Finance
Master´s Final Work Project. Our Equity Research follows the adaptable format of a research
report recommended by the CFA Institute (Pinto, Henry, Robinson, and Stowe, 2010). This
research is issued considering the public available information on Novabase on October 23rd,
2015. Thus, the report does not take into account any events or circumstances which have
arisen after this date. The target price was derived recurring to absolute valuation methods,
specifically to the Discounted Cash Flow (DCF) Approach. The assumptions considered to
conduct this study were the result of a thorough analysis of both the historical data publicly
disclosed by the company and data from various sources, such as S&P Capital IQ, Bloomberg
L.P. and Thomson Reuters Datastream. With a price target of €2.46 for YE16 and an upside
potential of 10.9% from current €2.21, the final recommendation for Novabase stands for
‘Reduce’.
v
Resumo
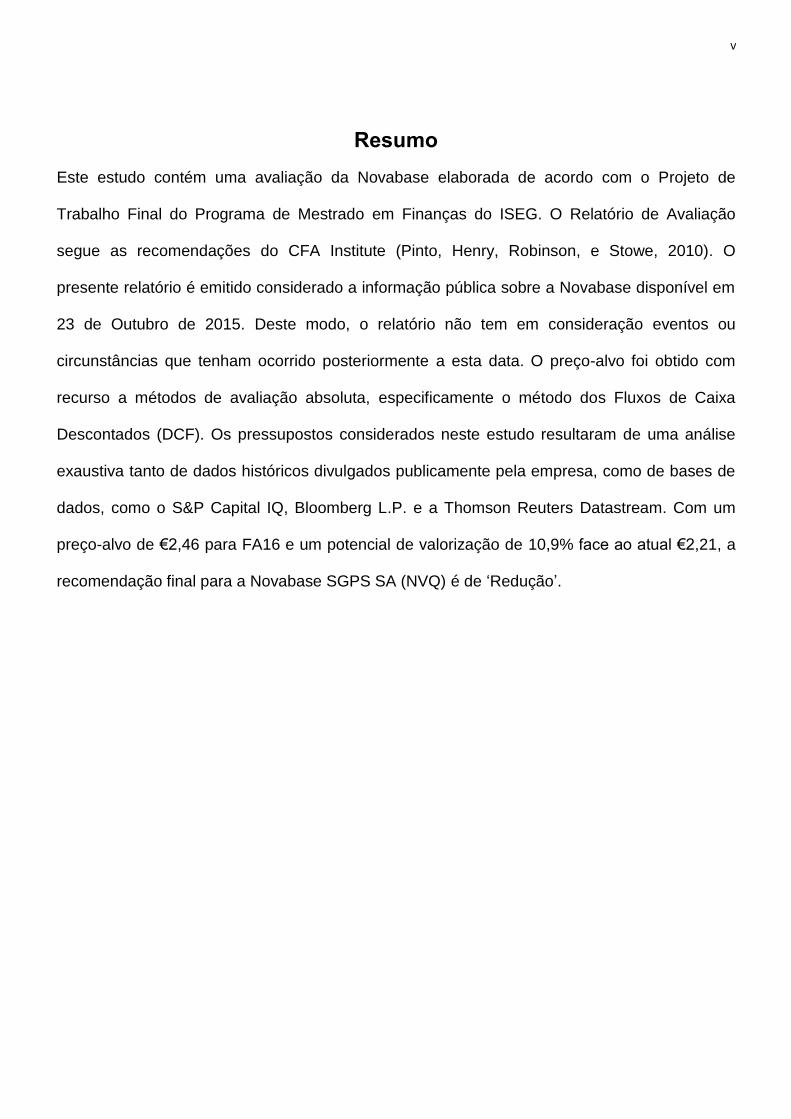
Este estudo contém uma avaliação da Novabase elaborada de acordo com o Projeto de
Trabalho Final do Programa de Mestrado em Finanças do ISEG. O Relatório de Avaliação
segue as recomendações do CFA Institute (Pinto, Henry, Robinson, e Stowe, 2010). O
presente relatório é emitido considerado a informação pública sobre a Novabase disponível em
23 de Outubro de 2015. Deste modo, o relatório não tem em consideração eventos ou
circunstâncias que tenham ocorrido posteriormente a esta data. O preço-alvo foi obtido com
recurso a métodos de avaliação absoluta, especificamente o método dos Fluxos de Caixa
Descontados (DCF). Os pressupostos considerados neste estudo resultaram de uma análise
exaustiva tanto de dados históricos divulgados publicamente pela empresa, como de bases de
dados, como o S&P Capital IQ, Bloomberg L.P. e a Thomson Reuters Datastream. Com um
preço-alvo de €2,46 para FA16 e um potencial de valorização de 10,9% face ao atual €2,21, a
recomendação final para a Novabase SGPS SA (NVQ) é de ‘Redução’.
vi
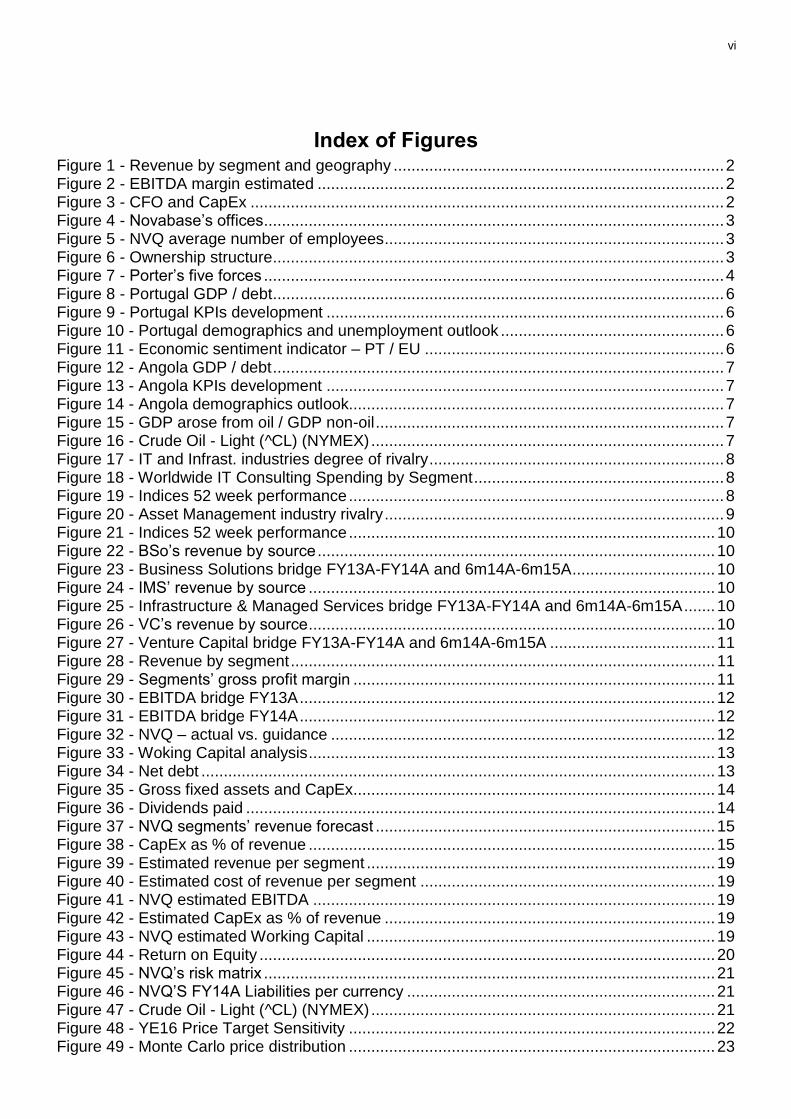
Index of Figures Figure 1 - Revenue by segment and geography .......................................................................... 2 Figure 2 - EBITDA margin estimated ........................................................................................... 2 Figure 3 - CFO and CapEx .......................................................................................................... 2 Figure 4 - Novabase’s offices ....................................................................................................... 3 Figure 5 - NVQ average number of employees ............................................................................ 3 Figure 6 - Ownership structure ..................................................................................................... 3 Figure 7 - Porter’s five forces ....................................................................................................... 4 Figure 8 - Portugal GDP / debt ..................................................................................................... 6 Figure 9 - Portugal KPIs development ......................................................................................... 6 Figure 10 - Portugal demographics and unemployment outlook .................................................. 6 Figure 11 - Economic sentiment indicator – PT / EU ................................................................... 6 Figure 12 - Angola GDP / debt ..................................................................................................... 7 Figure 13 - Angola KPIs development ......................................................................................... 7 Figure 14 - Angola demographics outlook.................................................................................... 7 Figure 15 - GDP arose from oil / GDP non-oil .............................................................................. 7 Figure 16 - Crude Oil - Light (^CL) (NYMEX) ............................................................................... 7 Figure 17 - IT and Infrast. industries degree of rivalry .................................................................. 8 Figure 18 - Worldwide IT Consulting Spending by Segment ........................................................ 8 Figure 19 - Indices 52 week performance .................................................................................... 8 Figure 20 - Asset Management industry rivalry ............................................................................ 9 Figure 21 - Indices 52 week performance .................................................................................. 10 Figure 22 - BSo’s revenue by source ......................................................................................... 10 Figure 23 - Business Solutions bridge FY13A-FY14A and 6m14A-6m15A ................................ 10 Figure 24 - IMS’ revenue by source ........................................................................................... 10 Figure 25 - Infrastructure & Managed Services bridge FY13A-FY14A and 6m14A-6m15A ....... 10 Figure 26 - VC’s revenue by source ........................................................................................... 10 Figure 27 - Venture Capital bridge FY13A-FY14A and 6m14A-6m15A ..................................... 11 Figure 28 - Revenue by segment ............................................................................................... 11 Figure 29 - Segments’ gross profit margin ................................................................................. 11 Figure 30 - EBITDA bridge FY13A ............................................................................................. 12 Figure 31 - EBITDA bridge FY14A ............................................................................................. 12 Figure 32 - NVQ – actual vs. guidance ...................................................................................... 12 Figure 33 - Woking Capital analysis ........................................................................................... 13 Figure 34 - Net debt ................................................................................................................... 13 Figure 35 - Gross fixed assets and CapEx ................................................................................. 14 Figure 36 - Dividends paid ......................................................................................................... 14 Figure 37 - NVQ segments’ revenue forecast ............................................................................ 15 Figure 38 - CapEx as % of revenue ........................................................................................... 15 Figure 39 - Estimated revenue per segment .............................................................................. 19 Figure 40 - Estimated cost of revenue per segment .................................................................. 19 Figure 41 - NVQ estimated EBITDA .......................................................................................... 19 Figure 42 - Estimated CapEx as % of revenue .......................................................................... 19 Figure 43 - NVQ estimated Working Capital .............................................................................. 19 Figure 44 - Return on Equity ...................................................................................................... 20 Figure 45 - NVQ’s risk matrix ..................................................................................................... 21 Figure 46 - NVQ’S FY14A Liabilities per currency ..................................................................... 21 Figure 47 - Crude Oil - Light (^CL) (NYMEX) ............................................................................. 21 Figure 48 - YE16 Price Target Sensitivity .................................................................................. 22 Figure 49 - Monte Carlo price distribution .................................................................................. 23

vii
Figure 50 - BSo’s EV through multiples valuation ...................................................................... 37 Figure 51 - IMS’ EV through multiples valuation ........................................................................ 38 Figure 52 - VC’s EV through multiples valuation ........................................................................ 39 Figure 53 - NVQ’s corporate tree ............................................................................................... 41
viii
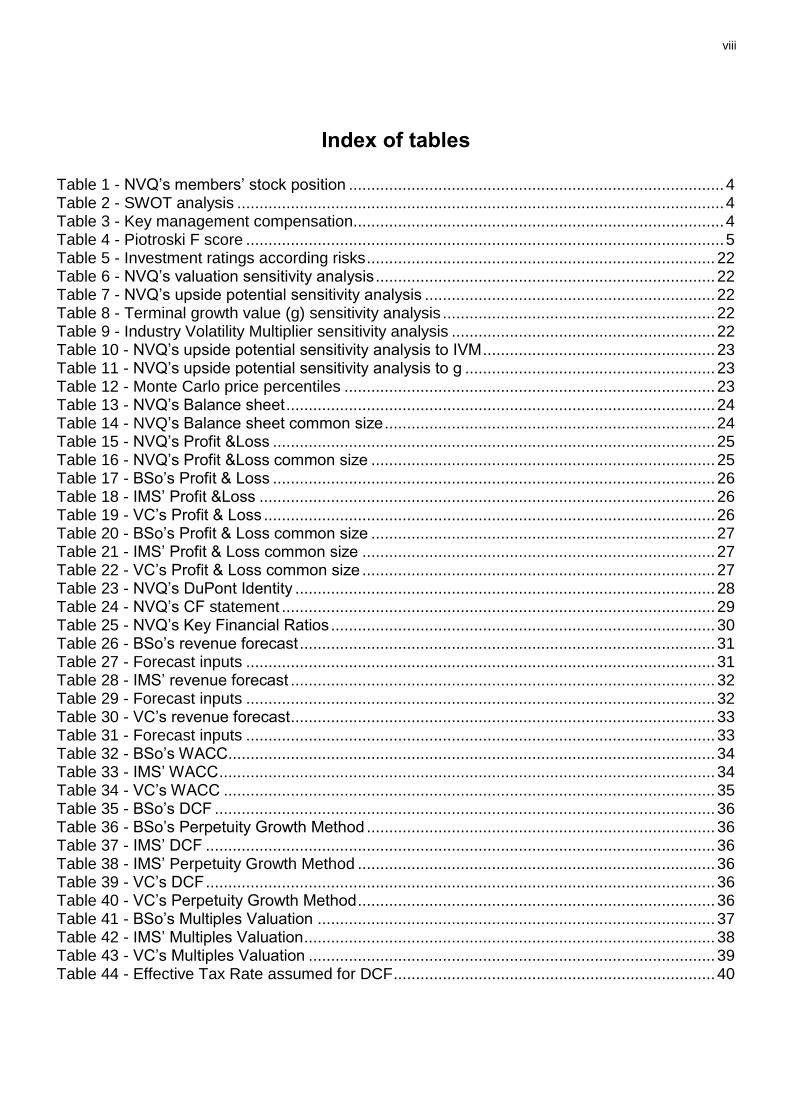
Index of tables Table 1 - NVQ’s members’ stock position .................................................................................... 4 Table 2 - SWOT analysis ............................................................................................................. 4 Table 3 - Key management compensation................................................................................... 4 Table 4 - Piotroski F score ........................................................................................................... 5 Table 5 - Investment ratings according risks .............................................................................. 22 Table 6 - NVQ’s valuation sensitivity analysis ............................................................................ 22 Table 7 - NVQ’s upside potential sensitivity analysis ................................................................. 22 Table 8 - Terminal growth value (g) sensitivity analysis ............................................................. 22 Table 9 - Industry Volatility Multiplier sensitivity analysis ........................................................... 22 Table 10 - NVQ’s upside potential sensitivity analysis to IVM .................................................... 23 Table 11 - NVQ’s upside potential sensitivity analysis to g ........................................................ 23 Table 12 - Monte Carlo price percentiles ................................................................................... 23 Table 13 - NVQ’s Balance sheet ................................................................................................ 24 Table 14 - NVQ’s Balance sheet common size .......................................................................... 24 Table 15 - NVQ’s Profit &Loss ................................................................................................... 25 Table 16 - NVQ’s Profit &Loss common size ............................................................................. 25 Table 17 - BSo’s Profit & Loss ................................................................................................... 26 Table 18 - IMS’ Profit &Loss ...................................................................................................... 26 Table 19 - VC’s Profit & Loss ..................................................................................................... 26 Table 20 - BSo’s Profit & Loss common size ............................................................................. 27 Table 21 - IMS’ Profit & Loss common size ............................................................................... 27 Table 22 - VC’s Profit & Loss common size ............................................................................... 27 Table 23 - NVQ’s DuPont Identity .............................................................................................. 28 Table 24 - NVQ’s CF statement ................................................................................................. 29 Table 25 - NVQ’s Key Financial Ratios ...................................................................................... 30 Table 26 - BSo’s revenue forecast ............................................................................................. 31 Table 27 - Forecast inputs ......................................................................................................... 31 Table 28 - IMS’ revenue forecast ............................................................................................... 32 Table 29 - Forecast inputs ......................................................................................................... 32 Table 30 - VC’s revenue forecast ............................................................................................... 33 Table 31 - Forecast inputs ......................................................................................................... 33 Table 32 - BSo’s WACC ............................................................................................................. 34 Table 33 - IMS’ WACC ............................................................................................................... 34 Table 34 - VC’s WACC .............................................................................................................. 35 Table 35 - BSo’s DCF ................................................................................................................ 36 Table 36 - BSo’s Perpetuity Growth Method .............................................................................. 36 Table 37 - IMS’ DCF .................................................................................................................. 36 Table 38 - IMS’ Perpetuity Growth Method ................................................................................ 36 Table 39 - VC’s DCF .................................................................................................................. 36 Table 40 - VC’s Perpetuity Growth Method ................................................................................ 36 Table 41 - BSo’s Multiples Valuation ......................................................................................... 37 Table 42 - IMS’ Multiples Valuation ............................................................................................ 38 Table 43 - VC’s Multiples Valuation ........................................................................................... 39 Table 44 - Effective Tax Rate assumed for DCF ........................................................................ 40
1 Research Snapshot
NVQ’s valuation sensitivity analysis
Market Risk Premium (MRP)
Co
un
try
rat
ing
€2.46 4.0% 4.5% 5.0% 5.5% 6.0% 6.5% 7.0%
BBB €3.40 €3.19 €3.00 €2.83 €2.68 €2.54 €2.42
BBB- €3.12 €2.94 €2.77 €2.63 €2.50 €2.38 €2.27
BB+ €2.88 €2.72 €2.58 €2.46 €2.34 €2.24 €2.14
BB €2.55 €2.43 €2.32 €2.21 €2.12 €2.04 €1.96
BB- €2.25 €2.15 €2.06 €1.98 €1.91 €1.84 €1.77
Source: JPA analysis
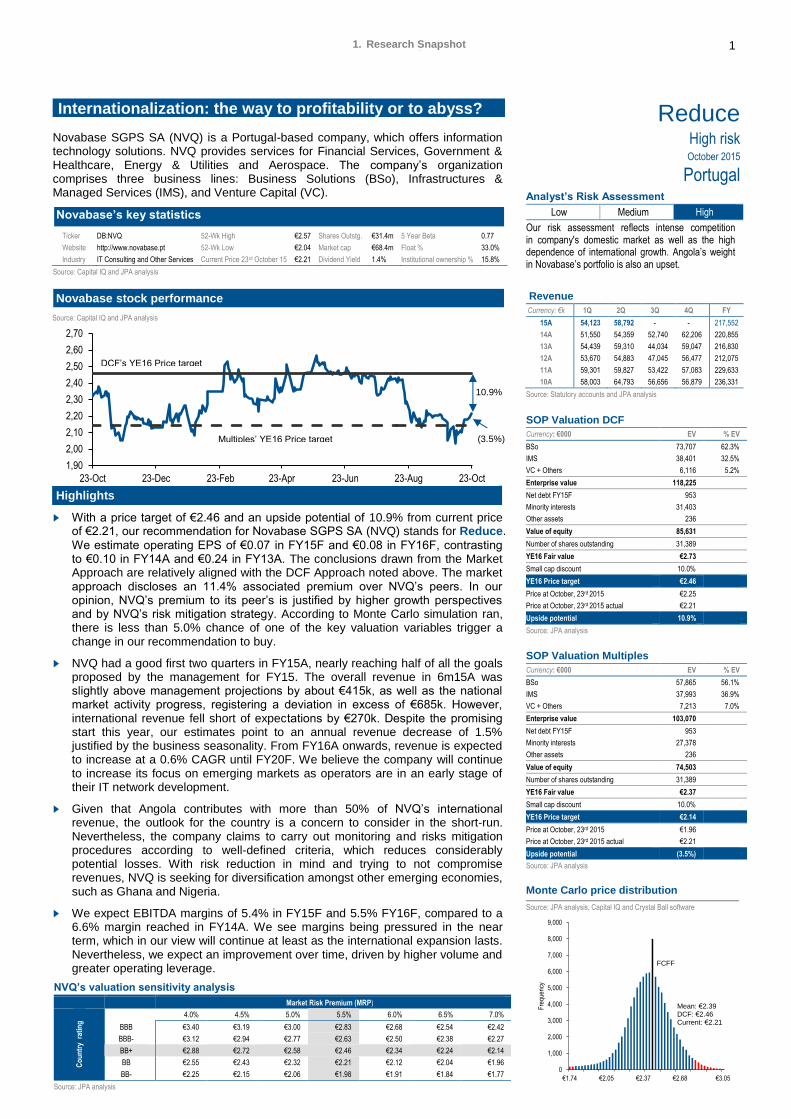
Novabase SGPS SA (NVQ) is a Portugal-based company, which offers information technology solutions. NVQ provides services for Financial Services, Government & Healthcare, Energy & Utilities and Aerospace. The company’s organization comprises three business lines: Business Solutions (BSo), Infrastructures & Managed Services (IMS), and Venture Capital (VC).
Highlights
► With a price target of €2.46 and an upside potential of 10.9% from current price of €2.21, our recommendation for Novabase SGPS SA (NVQ) stands for Reduce.
We estimate operating EPS of €0.07 in FY15F and €0.08 in FY16F, contrasting to €0.10 in FY14A and €0.24 in FY13A. The conclusions drawn from the Market Approach are relatively aligned with the DCF Approach noted above. The market approach discloses an 11.4% associated premium over NVQ’s peers. In our opinion, NVQ’s premium to its peer’s is justified by higher growth perspectives and by NVQ’s risk mitigation strategy. According to Monte Carlo simulation ran, there is less than 5.0% chance of one of the key valuation variables trigger a change in our recommendation to buy.
► NVQ had a good first two quarters in FY15A, nearly reaching half of all the goals proposed by the management for FY15. The overall revenue in 6m15A was slightly above management projections by about €415k, as well as the national market activity progress, registering a deviation in excess of €685k. However, international revenue fell short of expectations by €270k. Despite the promising start this year, our estimates point to an annual revenue decrease of 1.5% justified by the business seasonality. From FY16A onwards, revenue is expected to increase at a 0.6% CAGR until FY20F. We believe the company will continue to increase its focus on emerging markets as operators are in an early stage of their IT network development.
► Given that Angola contributes with more than 50% of NVQ’s international revenue, the outlook for the country is a concern to consider in the short-run. Nevertheless, the company claims to carry out monitoring and risks mitigation procedures according to well-defined criteria, which reduces considerably potential losses. With risk reduction in mind and trying to not compromise revenues, NVQ is seeking for diversification amongst other emerging economies, such as Ghana and Nigeria.
► We expect EBITDA margins of 5.4% in FY15F and 5.5% FY16F, compared to a 6.6% margin reached in FY14A. We see margins being pressured in the near term, which in our view will continue at least as the international expansion lasts. Nevertheless, we expect an improvement over time, driven by higher volume and greater operating leverage.
1. Research Snapshot
Internationalization: the way to profitability or to abyss?
Novabase stock performance
Source: Capital IQ and JPA analysis
1,90
2,00
2,10
2,20
2,30
2,40
2,50
2,60
2,70
23-Oct 23-Dec 23-Feb 23-Apr 23-Jun 23-Aug 23-Oct
Novabase’s key statistics
Ticker DB:NVQ 52-Wk High €2.57 Shares Outstg. €31.4m 5 Year Beta 0.77
Website http://www.novabase.pt 52-Wk Low €2.04 Market cap €68.4m Float % 33.0%
Industry IT Consulting and Other Services Current Price 23rd October 15 €2.21 Dividend Yield 1.4% Institutional ownership % 15.8%
Source: Capital IQ and JPA analysis
Reduce
High risk
October 2015
Portugal Analyst’s Risk Assessment
Low Medium High
Our risk assessment reflects intense competition in company's domestic market as well as the high dependence of international growth. Angola’s weight in Novabase’s portfolio is also an upset.
Revenue
Currency: €k 1Q 2Q 3Q 4Q FY
15A 54,123 58,792 - - 217,552
14A 51,550 54,359 52,740 62,206 220,855
13A 54,439 59,310 44,034 59,047 216,830
12A 53,670 54,883 47,045 56,477 212,075
11A 59,301 59,827 53,422 57,083 229,633
10A 58,003 64,793 56,656 56,879 236,331
Source: Statutory accounts and JPA analysis
SOP Valuation DCF
Currency: €000 EV % EV
BSo 73,707 62.3%
IMS 38,401 32.5%
VC + Others 6,116 5.2%
Enterprise value 118,225
Net debt FY15F 953
Minority interests 31,403
Other assets 236
Value of equity 85,631
Number of shares outstanding 31,389
YE16 Fair value €2.73
Small cap discount 10.0%
YE16 Price target €2.46
Price at October, 23rd 2015 €2.25
Price at October, 23rd 2015 actual €2.21
Upside potential 10.9%
Source: JPA analysis
SOP Valuation Multiples
Currency: €000 EV % EV
BSo 57,865 56.1%
IMS 37,993 36.9%
VC + Others 7,213 7.0%
Enterprise value 103,070
Net debt FY15F 953
Minority interests 27,378
Other assets 236
Value of equity 74,503
Number of shares outstanding 31,389
YE16 Fair value €2.37
Small cap discount 10.0%
YE16 Price target €2.14
Price at October, 23rd 2015 €1.96
Price at October, 23rd 2015 actual €2.21
Upside potential (3.5%)
Source: JPA analysis
Monte Carlo price distribution
Source: JPA analysis, Capital IQ and Crystal Ball software
0
1,000
2,000
3,000
4,000
5,000
6,000
7,000
8,000
9,000
€1.74 €2.05 €2.37 €2.68 €3.05
Fre
quen
cy
Mean: €2.39DCF: €2.46Current: €2.21
FCFF
DCF’s YE16 Price target
Multiples’ YE16 Price target
10.9%
(3.5%)
2 Investment Summary
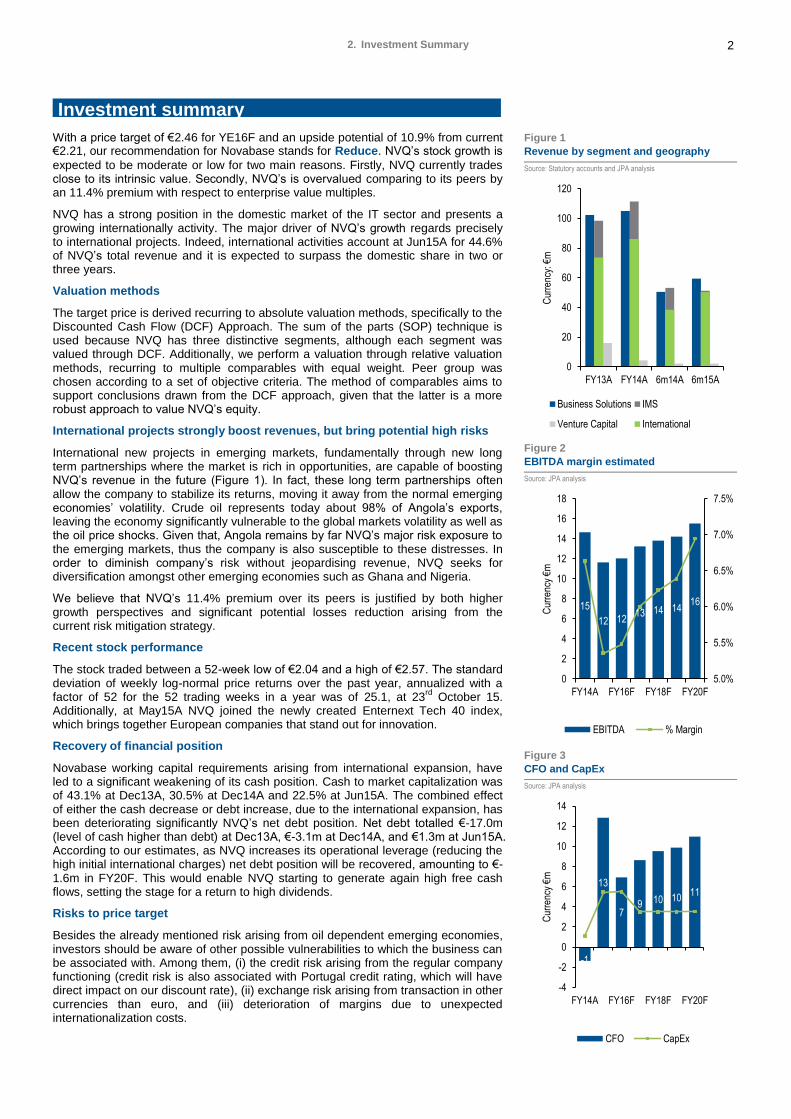
With a price target of €2.46 for YE16F and an upside potential of 10.9% from current €2.21, our recommendation for Novabase stands for Reduce. NVQ’s stock growth is
expected to be moderate or low for two main reasons. Firstly, NVQ currently trades close to its intrinsic value. Secondly, NVQ’s is overvalued comparing to its peers by an 11.4% premium with respect to enterprise value multiples.
NVQ has a strong position in the domestic market of the IT sector and presents a growing internationally activity. The major driver of NVQ’s growth regards precisely to international projects. Indeed, international activities account at Jun15A for 44.6% of NVQ’s total revenue and it is expected to surpass the domestic share in two or three years.
Valuation methods
The target price is derived recurring to absolute valuation methods, specifically to the Discounted Cash Flow (DCF) Approach. The sum of the parts (SOP) technique is used because NVQ has three distinctive segments, although each segment was valued through DCF. Additionally, we perform a valuation through relative valuation methods, recurring to multiple comparables with equal weight. Peer group was chosen according to a set of objective criteria. The method of comparables aims to support conclusions drawn from the DCF approach, given that the latter is a more robust approach to value NVQ’s equity.
International projects strongly boost revenues, but bring potential high risks
International new projects in emerging markets, fundamentally through new long term partnerships where the market is rich in opportunities, are capable of boosting NVQ’s revenue in the future (Figure 1). In fact, these long term partnerships often allow the company to stabilize its returns, moving it away from the normal emerging economies’ volatility. Crude oil represents today about 98% of Angola’s exports, leaving the economy significantly vulnerable to the global markets volatility as well as the oil price shocks. Given that, Angola remains by far NVQ’s major risk exposure to the emerging markets, thus the company is also susceptible to these distresses. In order to diminish company’s risk without jeopardising revenue, NVQ seeks for diversification amongst other emerging economies such as Ghana and Nigeria.
We believe that NVQ’s 11.4% premium over its peers is justified by both higher growth perspectives and significant potential losses reduction arising from the current risk mitigation strategy.
Recent stock performance
The stock traded between a 52-week low of €2.04 and a high of €2.57. The standard deviation of weekly log-normal price returns over the past year, annualized with a factor of 52 for the 52 trading weeks in a year was of 25.1, at 23
rd October 15.
Additionally, at May15A NVQ joined the newly created Enternext Tech 40 index, which brings together European companies that stand out for innovation.
Recovery of financial position
Novabase working capital requirements arising from international expansion, have led to a significant weakening of its cash position. Cash to market capitalization was of 43.1% at Dec13A, 30.5% at Dec14A and 22.5% at Jun15A. The combined effect of either the cash decrease or debt increase, due to the international expansion, has been deteriorating significantly NVQ’s net debt position. Net debt totalled €-17.0m (level of cash higher than debt) at Dec13A, €-3.1m at Dec14A, and €1.3m at Jun15A. According to our estimates, as NVQ increases its operational leverage (reducing the high initial international charges) net debt position will be recovered, amounting to €-1.6m in FY20F. This would enable NVQ starting to generate again high free cash flows, setting the stage for a return to high dividends.
Risks to price target
Besides the already mentioned risk arising from oil dependent emerging economies, investors should be aware of other possible vulnerabilities to which the business can be associated with. Among them, (i) the credit risk arising from the regular company functioning (credit risk is also associated with Portugal credit rating, which will have direct impact on our discount rate), (ii) exchange risk arising from transaction in other currencies than euro, and (iii) deterioration of margins due to unexpected internationalization costs.
2. Investment Summary
Investment summary
Figure 1
Revenue by segment and geography
Source: Statutory accounts and JPA analysis
0
20
40
60
80
100
120
FY13A FY14A 6m14A 6m15A
Cur
renc
y: €
m
Business Solutions IMS
Venture Capital International
Figure 2
EBITDA margin estimated
Source: JPA analysis
15
12 1213 14 14
16
5.0%
5.5%
6.0%
6.5%
7.0%
7.5%
0
2
4
6
8
10
12
14
16
18
FY14A FY16F FY18F FY20F
Cur
renc
y €m
EBITDA % Margin
Figure 3
CFO and CapEx
Source: JPA analysis
-1
13
79 10 10
11
-4
-2
0
2
4
6
8
10
12
14
FY14A FY16F FY18F FY20F
Cur
renc
y €m
CFO CapEx
3 3. Business Structure and Competitive Position
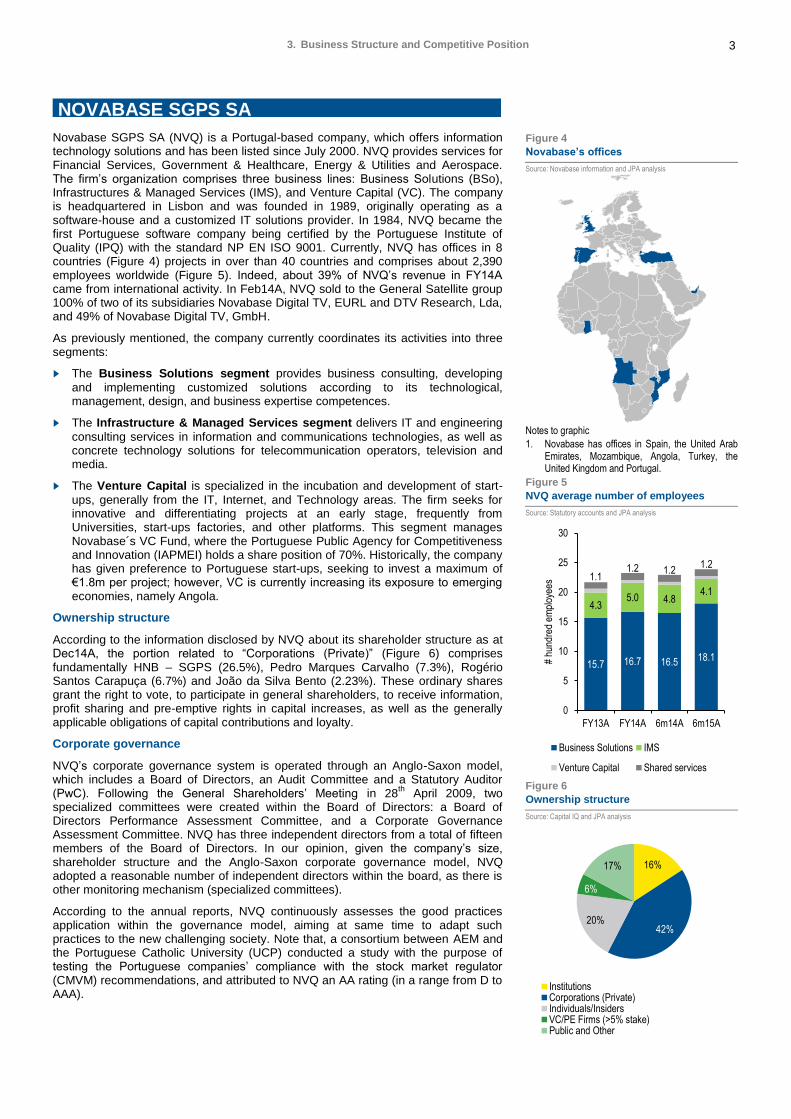
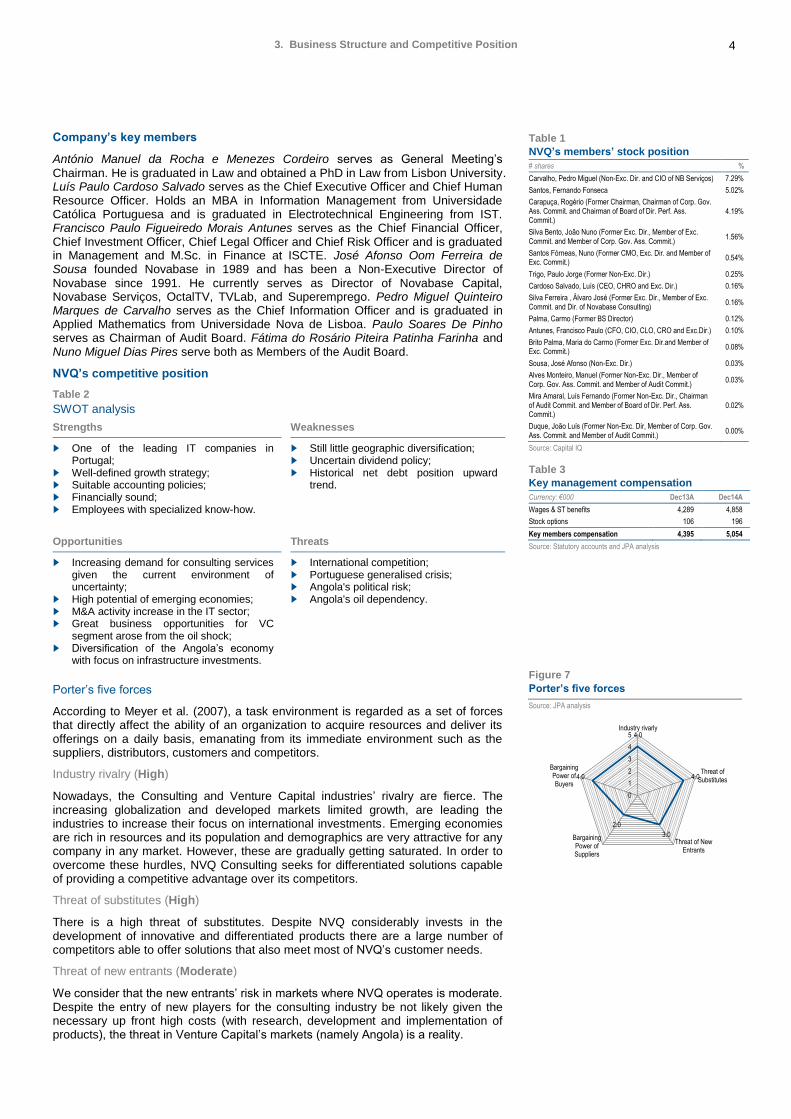
Novabase SGPS SA (NVQ) is a Portugal-based company, which offers information technology solutions and has been listed since July 2000. NVQ provides services for Financial Services, Government & Healthcare, Energy & Utilities and Aerospace. The firm’s organization comprises three business lines: Business Solutions (BSo), Infrastructures & Managed Services (IMS), and Venture Capital (VC). The company is headquartered in Lisbon and was founded in 1989, originally operating as a software-house and a customized IT solutions provider. In 1984, NVQ became the first Portuguese software company being certified by the Portuguese Institute of Quality (IPQ) with the standard NP EN ISO 9001. Currently, NVQ has offices in 8 countries (Figure 4) projects in over than 40 countries and comprises about 2,390 employees worldwide (Figure 5). Indeed, about 39% of NVQ’s revenue in FY14A came from international activity. In Feb14A, NVQ sold to the General Satellite group 100% of two of its subsidiaries Novabase Digital TV, EURL and DTV Research, Lda, and 49% of Novabase Digital TV, GmbH.
As previously mentioned, the company currently coordinates its activities into three segments:
► The Business Solutions segment provides business consulting, developing
and implementing customized solutions according to its technological, management, design, and business expertise competences.
► The Infrastructure & Managed Services segment delivers IT and engineering
consulting services in information and communications technologies, as well as concrete technology solutions for telecommunication operators, television and media.
► The Venture Capital is specialized in the incubation and development of start-
ups, generally from the IT, Internet, and Technology areas. The firm seeks for innovative and differentiating projects at an early stage, frequently from Universities, start-ups factories, and other platforms. This segment manages Novabase´s VC Fund, where the Portuguese Public Agency for Competitiveness and Innovation (IAPMEI) holds a share position of 70%. Historically, the company has given preference to Portuguese start-ups, seeking to invest a maximum of €1.8m per project; however, VC is currently increasing its exposure to emerging economies, namely Angola.
Ownership structure
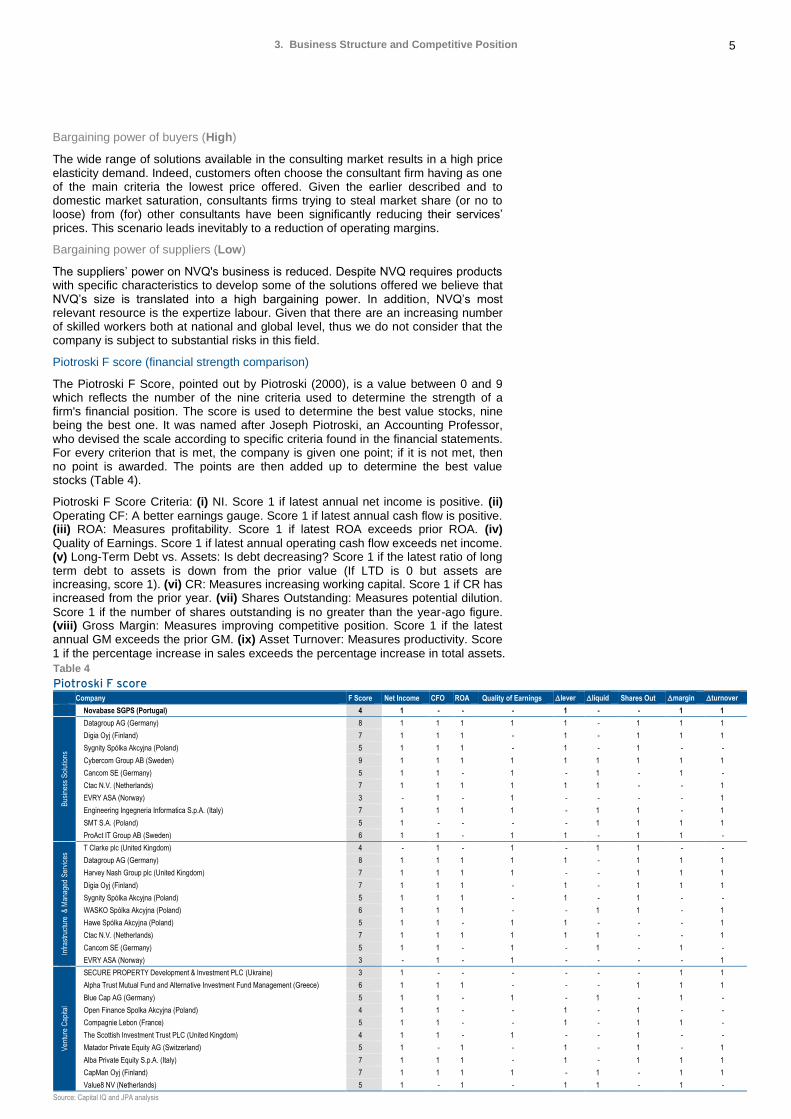
According to the information disclosed by NVQ about its shareholder structure as at Dec14A, the portion related to “Corporations (Private)” (Figure 6) comprises fundamentally HNB – SGPS (26.5%), Pedro Marques Carvalho (7.3%), Rogério Santos Carapuça (6.7%) and João da Silva Bento (2.23%). These ordinary shares grant the right to vote, to participate in general shareholders, to receive information, profit sharing and pre-emptive rights in capital increases, as well as the generally applicable obligations of capital contributions and loyalty.
Corporate governance
NVQ’s corporate governance system is operated through an Anglo-Saxon model, which includes a Board of Directors, an Audit Committee and a Statutory Auditor (PwC). Following the General Shareholders’ Meeting in 28
th April 2009, two
specialized committees were created within the Board of Directors: a Board of Directors Performance Assessment Committee, and a Corporate Governance Assessment Committee. NVQ has three independent directors from a total of fifteen members of the Board of Directors. In our opinion, given the company’s size, shareholder structure and the Anglo-Saxon corporate governance model, NVQ adopted a reasonable number of independent directors within the board, as there is other monitoring mechanism (specialized committees).
According to the annual reports, NVQ continuously assesses the good practices application within the governance model, aiming at same time to adapt such practices to the new challenging society. Note that, a consortium between AEM and the Portuguese Catholic University (UCP) conducted a study with the purpose of testing the Portuguese companies’ compliance with the stock market regulator (CMVM) recommendations, and attributed to NVQ an AA rating (in a range from D to AAA).
3. Business Structure and Competitive Position
NOVABASE SGPS SA
Figure 4
Novabase’s offices
Source: Novabase information and JPA analysis
Notes to graphic
1. Novabase has offices in Spain, the United Arab Emirates, Mozambique, Angola, Turkey, the United Kingdom and Portugal.
Figure 5
NVQ average number of employees
Source: Statutory accounts and JPA analysis
15.7 16.7 16.5 18.1
4.35.0 4.8
4.1
1.11.2 1.2
1.2
0
5
10
15
20
25
30
FY13A FY14A 6m14A 6m15A
# hu
ndre
d em
ploy
ees
Business Solutions IMS
Venture Capital Shared services
Figure 6
Ownership structure
Source: Capital IQ and JPA analysis
16%
42%20%
6%
17%
InstitutionsCorporations (Private)Individuals/InsidersVC/PE Firms (>5% stake)Public and Other
4 3. Business Structure and Competitive Position
Company’s key members
António Manuel da Rocha e Menezes Cordeiro serves as General Meeting’s
Chairman. He is graduated in Law and obtained a PhD in Law from Lisbon University. Luís Paulo Cardoso Salvado serves as the Chief Executive Officer and Chief Human Resource Officer. Holds an MBA in Information Management from Universidade Católica Portuguesa and is graduated in Electrotechnical Engineering from IST. Francisco Paulo Figueiredo Morais Antunes serves as the Chief Financial Officer, Chief Investment Officer, Chief Legal Officer and Chief Risk Officer and is graduated in Management and M.Sc. in Finance at ISCTE. José Afonso Oom Ferreira de Sousa founded Novabase in 1989 and has been a Non-Executive Director of
Novabase since 1991. He currently serves as Director of Novabase Capital, Novabase Serviços, OctalTV, TVLab, and Superemprego. Pedro Miguel Quinteiro Marques de Carvalho serves as the Chief Information Officer and is graduated in Applied Mathematics from Universidade Nova de Lisboa. Paulo Soares De Pinho serves as Chairman of Audit Board. Fátima do Rosário Piteira Patinha Farinha and Nuno Miguel Dias Pires serve both as Members of the Audit Board.
NVQ’s competitive position
Table 2
SWOT analysis
Strengths Weaknesses
► One of the leading IT companies in Portugal;
► Well-defined growth strategy; ► Suitable accounting policies; ► Financially sound; ► Employees with specialized know-how.
► Still little geographic diversification; ► Uncertain dividend policy; ► Historical net debt position upward
trend.
Opportunities Threats
► Increasing demand for consulting services given the current environment of uncertainty;
► High potential of emerging economies; ► M&A activity increase in the IT sector; ► Great business opportunities for VC
segment arose from the oil shock; ► Diversification of the Angola’s economy
with focus on infrastructure investments.
► International competition; ► Portuguese generalised crisis; ► Angola's political risk; ► Angola's oil dependency.
Porter’s five forces
According to Meyer et al. (2007), a task environment is regarded as a set of forces that directly affect the ability of an organization to acquire resources and deliver its offerings on a daily basis, emanating from its immediate environment such as the suppliers, distributors, customers and competitors.
Industry rivalry (High)
Nowadays, the Consulting and Venture Capital industries’ rivalry are fierce. The increasing globalization and developed markets limited growth, are leading the industries to increase their focus on international investments. Emerging economies are rich in resources and its population and demographics are very attractive for any company in any market. However, these are gradually getting saturated. In order to overcome these hurdles, NVQ Consulting seeks for differentiated solutions capable of providing a competitive advantage over its competitors.
Threat of substitutes (High)
There is a high threat of substitutes. Despite NVQ considerably invests in the development of innovative and differentiated products there are a large number of competitors able to offer solutions that also meet most of NVQ’s customer needs.
Threat of new entrants (Moderate)
We consider that the new entrants’ risk in markets where NVQ operates is moderate. Despite the entry of new players for the consulting industry be not likely given the necessary up front high costs (with research, development and implementation of products), the threat in Venture Capital’s markets (namely Angola) is a reality.
Figure 7
Porter’s five forces
Source: JPA analysis
4.0
4.0
3.0
2.0
4.0
0
1
2
3
4
5Industry rivarly
Threat ofSubstitutes
Threat of NewEntrants
BargainingPower ofSuppliers
BargainingPower ofBuyers
Table 1
NVQ’s members’ stock position
# shares %
Carvalho, Pedro Miguel (Non-Exc. Dir. and CIO of NB Serviços) 7.29%
Santos, Fernando Fonseca 5.02%
Carapuça, Rogério (Former Chairman, Chairman of Corp. Gov. Ass. Commit. and Chairman of Board of Dir. Perf. Ass. Commit.)
4.19%
Silva Bento, João Nuno (Former Exc. Dir., Member of Exc. Commit. and Member of Corp. Gov. Ass. Commit.)
1.56%
Santos Fórneas, Nuno (Former CMO, Exc. Dir. and Member of Exc. Commit.)
0.54%
Trigo, Paulo Jorge (Former Non-Exc. Dir.) 0.25%
Cardoso Salvado, Luís (CEO, CHRO and Exc. Dir.) 0.16%
Silva Ferreira , Álvaro José (Former Exc. Dir., Member of Exc. Commit. and Dir. of Novabase Consulting)
0.16%
Palma, Carmo (Former BS Director) 0.12%
Antunes, Francisco Paulo (CFO, CIO, CLO, CRO and Exc.Dir.) 0.10%
Brito Palma, Maria do Carmo (Former Exc. Dir.and Member of Exc. Commit.)
0.08%
Sousa, José Afonso (Non-Exc. Dir.) 0.03%
Alves Monteiro, Manuel (Former Non-Exc. Dir., Member of Corp. Gov. Ass. Commit. and Member of Audit Commit.)
0.03%
Mira Amaral, Luís Fernando (Former Non-Exc. Dir., Chairman of Audit Commit. and Member of Board of Dir. Perf. Ass. Commit.)
0.02%
Duque, João Luís (Former Non-Exc. Dir, Member of Corp. Gov. Ass. Commit. and Member of Audit Commit.)
0.00%
Source: Capital IQ
Table 3
Key management compensation
Currency: €000 Dec13A Dec14A
Wages & ST benefits 4,289 4,858
Stock options 106 196
Key members compensation 4,395 5,054
Source: Statutory accounts and JPA analysis
5 3. Business Structure and Competitive Position
Table 4
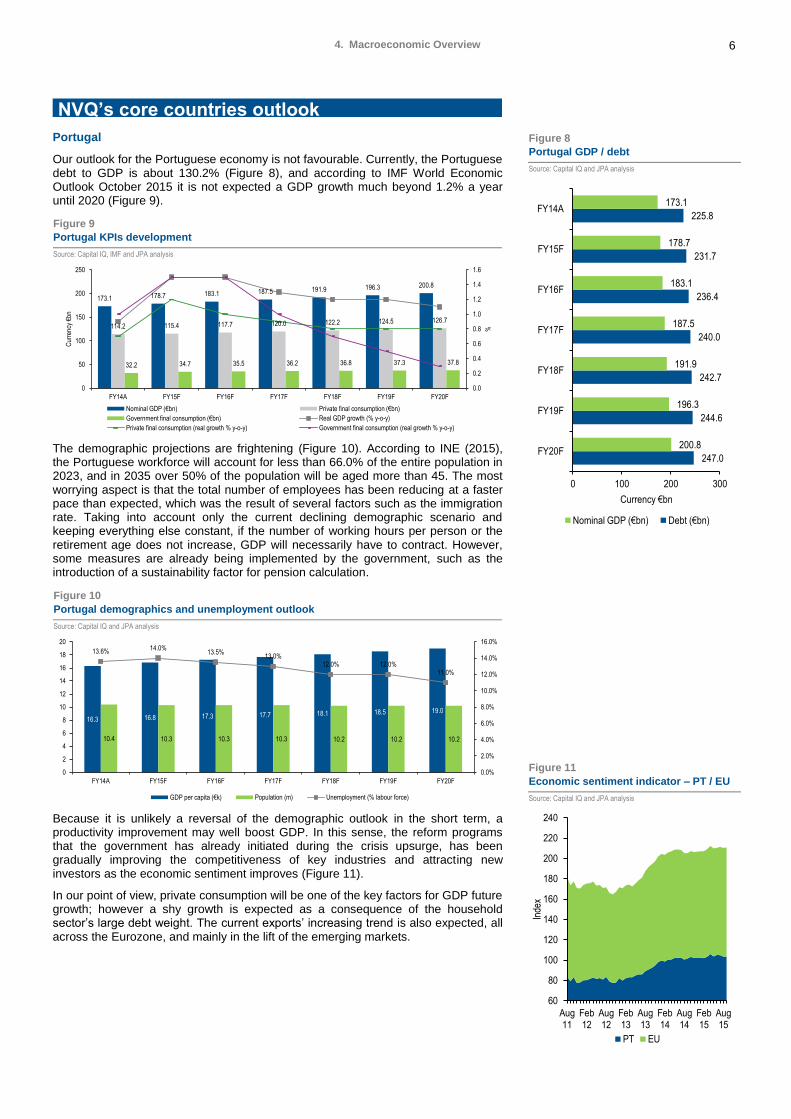
Piotroski F score Company F Score Net Income CFO ROA Quality of Earnings lever liquid Shares Out margin turnover
Novabase SGPS (Portugal) 4 1 - - - 1 - - 1 1
Bus
ines
s S
olut
ions
Datagroup AG (Germany) 8 1 1 1 1 1 - 1 1 1
Digia Oyj (Finland) 7 1 1 1 - 1 - 1 1 1
Sygnity Spólka Akcyjna (Poland) 5 1 1 1 - 1 - 1 - -
Cybercom Group AB (Sweden) 9 1 1 1 1 1 1 1 1 1
Cancom SE (Germany) 5 1 1 - 1 - 1 - 1 -
Ctac N.V. (Netherlands) 7 1 1 1 1 1 1 - - 1
EVRY ASA (Norway) 3 - 1 - 1 - - - - 1
Engineering Ingegneria Informatica S.p.A. (Italy) 7 1 1 1 1 - 1 1 - 1
SMT S.A. (Poland) 5 1 - - - - 1 1 1 1
ProAct IT Group AB (Sweden) 6 1 1 - 1 1 - 1 1 -
Infr
astr
uctu
re &
Man
aged
Ser
vice
s
T Clarke plc (United Kingdom) 4 - 1 - 1 - 1 1 - -
Datagroup AG (Germany) 8 1 1 1 1 1 - 1 1 1
Harvey Nash Group plc (United Kingdom) 7 1 1 1 1 - - 1 1 1
Digia Oyj (Finland) 7 1 1 1 - 1 - 1 1 1
Sygnity Spólka Akcyjna (Poland) 5 1 1 1 - 1 - 1 - -
WASKO Spólka Akcyjna (Poland) 6 1 1 1 - - 1 1 - 1
Hawe Spólka Akcyjna (Poland) 5 1 1 - 1 1 - - - 1
Ctac N.V. (Netherlands) 7 1 1 1 1 1 1 - - 1
Cancom SE (Germany) 5 1 1 - 1 - 1 - 1 -
EVRY ASA (Norway) 3 - 1 - 1 - - - - 1
Ven
ture
Cap
ital
SECURE PROPERTY Development & Investment PLC (Ukraine) 3 1 - - - - - - 1 1
Alpha Trust Mutual Fund and Alternative Investment Fund Management (Greece) 6 1 1 1 - - - 1 1 1
Blue Cap AG (Germany) 5 1 1 - 1 - 1 - 1 -
Open Finance Spolka Akcyjna (Poland) 4 1 1 - - 1 - 1 - -
Compagnie Lebon (France) 5 1 1 - - 1 - 1 1 -
The Scottish Investment Trust PLC (United Kingdom) 4 1 1 - 1 - - 1 - -
Matador Private Equity AG (Switzerland) 5 1 - 1 - 1 - 1 - 1
Alba Private Equity S.p.A. (Italy) 7 1 1 1 - 1 - 1 1 1
CapMan Oyj (Finland) 7 1 1 1 1 - 1 - 1 1
Value8 NV (Netherlands) 5 1 - 1 - 1 1 - 1 -
Source: Capital IQ and JPA analysis
Bargaining power of buyers (High)
The wide range of solutions available in the consulting market results in a high price elasticity demand. Indeed, customers often choose the consultant firm having as one of the main criteria the lowest price offered. Given the earlier described and to domestic market saturation, consultants firms trying to steal market share (or no to loose) from (for) other consultants have been significantly reducing their services’ prices. This scenario leads inevitably to a reduction of operating margins.
Bargaining power of suppliers (Low)
The suppliers’ power on NVQ's business is reduced. Despite NVQ requires products with specific characteristics to develop some of the solutions offered we believe that NVQ’s size is translated into a high bargaining power. In addition, NVQ’s most relevant resource is the expertize labour. Given that there are an increasing number of skilled workers both at national and global level, thus we do not consider that the company is subject to substantial risks in this field.
Piotroski F score (financial strength comparison)
The Piotroski F Score, pointed out by Piotroski (2000), is a value between 0 and 9 which reflects the number of the nine criteria used to determine the strength of a firm's financial position. The score is used to determine the best value stocks, nine being the best one. It was named after Joseph Piotroski, an Accounting Professor, who devised the scale according to specific criteria found in the financial statements. For every criterion that is met, the company is given one point; if it is not met, then no point is awarded. The points are then added up to determine the best value stocks (Table 4).
Piotroski F Score Criteria: (i) NI. Score 1 if latest annual net income is positive. (ii)
Operating CF: A better earnings gauge. Score 1 if latest annual cash flow is positive. (iii) ROA: Measures profitability. Score 1 if latest ROA exceeds prior ROA. (iv)
Quality of Earnings. Score 1 if latest annual operating cash flow exceeds net income. (v) Long-Term Debt vs. Assets: Is debt decreasing? Score 1 if the latest ratio of long
term debt to assets is down from the prior value (If LTD is 0 but assets are increasing, score 1). (vi) CR: Measures increasing working capital. Score 1 if CR has increased from the prior year. (vii) Shares Outstanding: Measures potential dilution.
Score 1 if the number of shares outstanding is no greater than the year-ago figure. (viii) Gross Margin: Measures improving competitive position. Score 1 if the latest annual GM exceeds the prior GM. (ix) Asset Turnover: Measures productivity. Score
1 if the percentage increase in sales exceeds the percentage increase in total assets.
6 4. Macroeconomic Overview
Portugal
Our outlook for the Portuguese economy is not favourable. Currently, the Portuguese debt to GDP is about 130.2% (Figure 8), and according to IMF World Economic Outlook October 2015 it is not expected a GDP growth much beyond 1.2% a year until 2020 (Figure 9).
The demographic projections are frightening (Figure 10). According to INE (2015), the Portuguese workforce will account for less than 66.0% of the entire population in 2023, and in 2035 over 50% of the population will be aged more than 45. The most worrying aspect is that the total number of employees has been reducing at a faster pace than expected, which was the result of several factors such as the immigration rate. Taking into account only the current declining demographic scenario and keeping everything else constant, if the number of working hours per person or the retirement age does not increase, GDP will necessarily have to contract. However, some measures are already being implemented by the government, such as the introduction of a sustainability factor for pension calculation.
Because it is unlikely a reversal of the demographic outlook in the short term, a productivity improvement may well boost GDP. In this sense, the reform programs that the government has already initiated during the crisis upsurge, has been gradually improving the competitiveness of key industries and attracting new investors as the economic sentiment improves (Figure 11).
In our point of view, private consumption will be one of the key factors for GDP future growth; however a shy growth is expected as a consequence of the household sector’s large debt weight. The current exports’ increasing trend is also expected, all across the Eurozone, and mainly in the lift of the emerging markets.
4. Macroeconomic Overview
NVQ’s core countries outlook
Figure 9
Portugal KPIs development
Source: Capital IQ, IMF and JPA analysis
173.1 178.7 183.1 187.5 191.9 196.3 200.8
114.2 115.4 117.7 120.0 122.2 124.5 126.7
32.2 34.7 35.5 36.2 36.8 37.3 37.8
0.0
0.2
0.4
0.6
0.8
1.0
1.2
1.4
1.6
0
50
100
150
200
250
FY14A FY15F FY16F FY17F FY18F FY19F FY20F
%
Cur
renc
y €b
n
Nominal GDP (€bn) Private final consumption (€bn)
Government final consumption (€bn) Real GDP growth (% y-o-y)
Private final consumption (real growth % y-o-y) Government final consumption (real growth % y-o-y)
Figure 10
Portugal demographics and unemployment outlook
Source: Capital IQ and JPA analysis
16.3 16.8 17.3 17.7 18.1 18.5 19.0
10.4 10.3 10.3 10.3 10.2 10.2 10.2
13.6% 14.0%13.5%
13.0%12.0% 12.0%
11.0%
0.0%
2.0%
4.0%
6.0%
8.0%
10.0%
12.0%
14.0%
16.0%
0
2
4
6
8
10
12
14
16
18
20
FY14A FY15F FY16F FY17F FY18F FY19F FY20F
GDP per capita (€k) Population (m) Unemployment (% labour force)
Figure 8
Portugal GDP / debt
Source: Capital IQ and JPA analysis
247.0
244.6
242.7
240.0
236.4
231.7
225.8
200.8
196.3
191.9
187.5
183.1
178.7
173.1
0 100 200 300
FY20F
FY19F
FY18F
FY17F
FY16F
FY15F
FY14A
Currency €bn
Nominal GDP (€bn) Debt (€bn)
Figure 11
Economic sentiment indicator – PT / EU
Source: Capital IQ and JPA analysis
60
80
100
120
140
160
180
200
220
240
Aug11
Feb12
Aug12
Feb13
Aug13
Feb14
Aug14
Feb15
Aug15
Inde
x
PT EU
7 4. Macroeconomic Overview
Angola
Our outlook for the Angolan economy is for a moderate growth. Angola has been
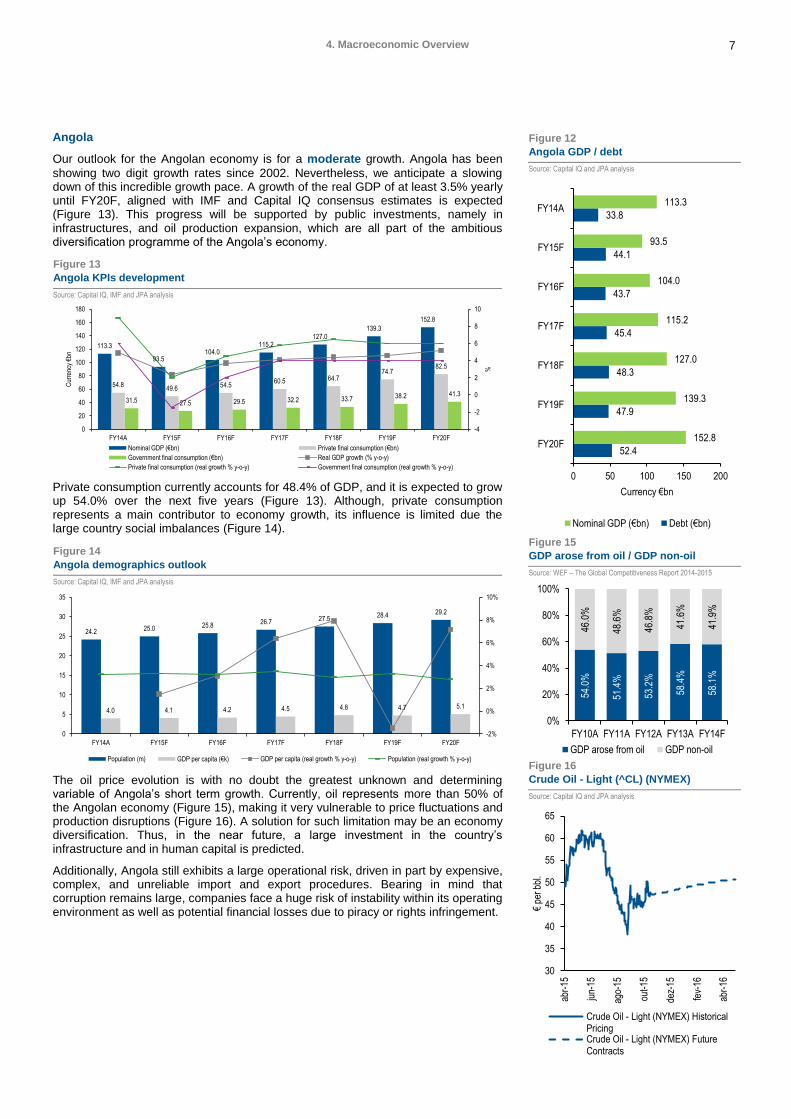
showing two digit growth rates since 2002. Nevertheless, we anticipate a slowing down of this incredible growth pace. A growth of the real GDP of at least 3.5% yearly until FY20F, aligned with IMF and Capital IQ consensus estimates is expected (Figure 13). This progress will be supported by public investments, namely in infrastructures, and oil production expansion, which are all part of the ambitious diversification programme of the Angola’s economy.
Private consumption currently accounts for 48.4% of GDP, and it is expected to grow up 54.0% over the next five years (Figure 13). Although, private consumption represents a main contributor to economy growth, its influence is limited due the large country social imbalances (Figure 14).
The oil price evolution is with no doubt the greatest unknown and determining variable of Angola’s short term growth. Currently, oil represents more than 50% of the Angolan economy (Figure 15), making it very vulnerable to price fluctuations and production disruptions (Figure 16). A solution for such limitation may be an economy diversification. Thus, in the near future, a large investment in the country’s infrastructure and in human capital is predicted.
Additionally, Angola still exhibits a large operational risk, driven in part by expensive, complex, and unreliable import and export procedures. Bearing in mind that corruption remains large, companies face a huge risk of instability within its operating environment as well as potential financial losses due to piracy or rights infringement.
Figure 13
Angola KPIs development
Source: Capital IQ, IMF and JPA analysis
113.3
93.5104.0
115.2127.0
139.3
152.8
54.849.6 54.5
60.5 64.774.7
82.5
31.5 27.5 29.5 32.2 33.7 38.2 41.3
-4
-2
0
2
4
6
8
10
0
20
40
60
80
100
120
140
160
180
FY14A FY15F FY16F FY17F FY18F FY19F FY20F
%
Cur
renc
y €b
n
Nominal GDP (€bn) Private final consumption (€bn)
Government final consumption (€bn) Real GDP growth (% y-o-y)
Private final consumption (real growth % y-o-y) Government final consumption (real growth % y-o-y)
Figure 14
Angola demographics outlook
Source: Capital IQ, IMF and JPA analysis
24.2 25.0 25.826.7 27.5
28.4 29.2
4.0 4.1 4.2 4.5 4.8 4.7 5.1
-2%
0%
2%
4%
6%
8%
10%
0
5
10
15
20
25
30
35
FY14A FY15F FY16F FY17F FY18F FY19F FY20F
Population (m) GDP per capita (€k) GDP per capita (real growth % y-o-y) Population (real growth % y-o-y)
Figure 12
Angola GDP / debt
Source: Capital IQ and JPA analysis
52.4
47.9
48.3
45.4
43.7
44.1
33.8
152.8
139.3
127.0
115.2
104.0
93.5
113.3
0 50 100 150 200
FY20F
FY19F
FY18F
FY17F
FY16F
FY15F
FY14A
Currency €bn
Nominal GDP (€bn) Debt (€bn)
Figure 15
GDP arose from oil / GDP non-oil
Source: WEF – The Global Competitiveness Report 2014-2015
54.0
%
51.4
%
53.2
%
58.4
%
58.1
%
46.0
%
48.6
%
46.8
%
41.6
%
41.9
%0%
20%
40%
60%
80%
100%
FY10A FY11A FY12A FY13A FY14F
GDP arose from oil GDP non-oil
Figure 16
Crude Oil - Light (^CL) (NYMEX)
Source: Capital IQ and JPA analysis
30
35
40
45
50
55
60
65
abr-
15
jun-
15
ago-
15
out-
15
dez-
15
fev-
16
abr-
16
€pe
r bbl
.
Crude Oil - Light (NYMEX) HistoricalPricingCrude Oil - Light (NYMEX) FutureContracts
8 5. Industry Analysis
IT Consulting & Other and Infrastructure services
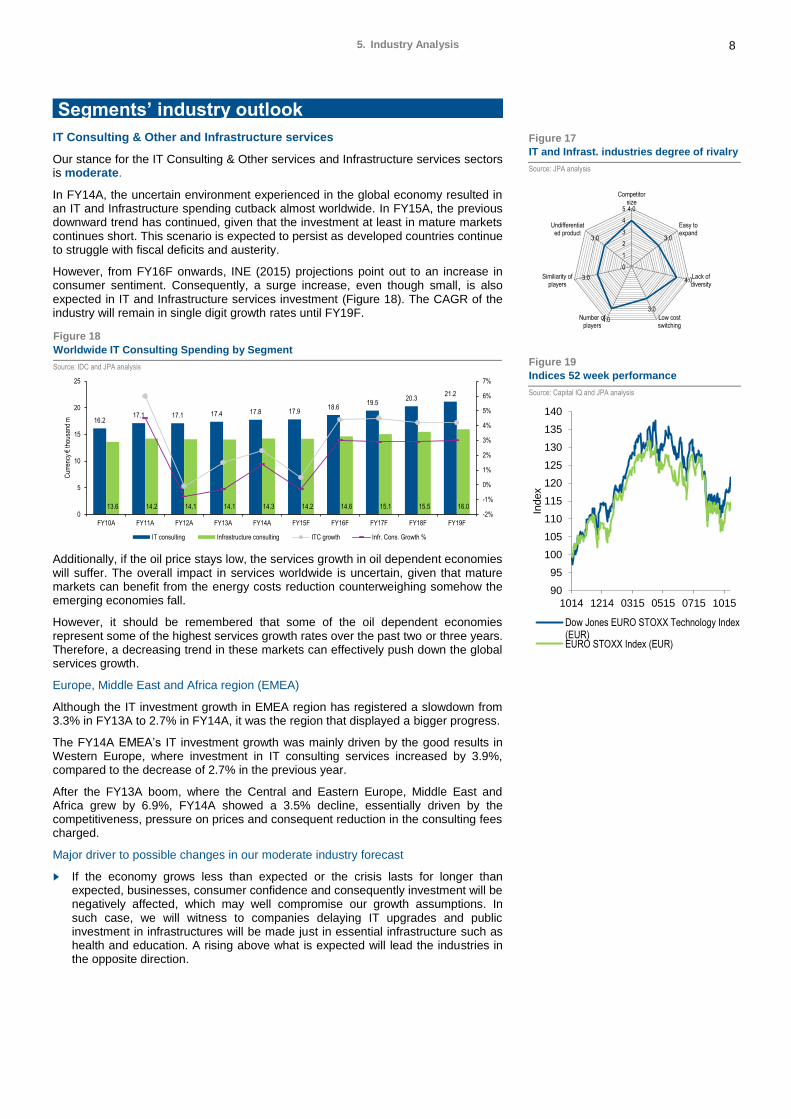
Our stance for the IT Consulting & Other services and Infrastructure services sectors is moderate.
In FY14A, the uncertain environment experienced in the global economy resulted in an IT and Infrastructure spending cutback almost worldwide. In FY15A, the previous downward trend has continued, given that the investment at least in mature markets continues short. This scenario is expected to persist as developed countries continue to struggle with fiscal deficits and austerity.
However, from FY16F onwards, INE (2015) projections point out to an increase in consumer sentiment. Consequently, a surge increase, even though small, is also expected in IT and Infrastructure services investment (Figure 18). The CAGR of the industry will remain in single digit growth rates until FY19F.
Additionally, if the oil price stays low, the services growth in oil dependent economies will suffer. The overall impact in services worldwide is uncertain, given that mature markets can benefit from the energy costs reduction counterweighing somehow the emerging economies fall.
However, it should be remembered that some of the oil dependent economies represent some of the highest services growth rates over the past two or three years. Therefore, a decreasing trend in these markets can effectively push down the global services growth.
Europe, Middle East and Africa region (EMEA)
Although the IT investment growth in EMEA region has registered a slowdown from 3.3% in FY13A to 2.7% in FY14A, it was the region that displayed a bigger progress.
The FY14A EMEA’s IT investment growth was mainly driven by the good results in Western Europe, where investment in IT consulting services increased by 3.9%, compared to the decrease of 2.7% in the previous year.
After the FY13A boom, where the Central and Eastern Europe, Middle East and Africa grew by 6.9%, FY14A showed a 3.5% decline, essentially driven by the competitiveness, pressure on prices and consequent reduction in the consulting fees charged.
Major driver to possible changes in our moderate industry forecast
► If the economy grows less than expected or the crisis lasts for longer than expected, businesses, consumer confidence and consequently investment will be negatively affected, which may well compromise our growth assumptions. In such case, we will witness to companies delaying IT upgrades and public investment in infrastructures will be made just in essential infrastructure such as health and education. A rising above what is expected will lead the industries in the opposite direction.
5. Industry Analysis
Segments’ industry outlook
Figure 18
Worldwide IT Consulting Spending by Segment
Source: IDC and JPA analysis
16.217.1 17.1 17.4 17.8 17.9
18.619.5
20.321.2
13.6 14.2 14.1 14.1 14.3 14.2 14.6 15.1 15.5 16.0-2%
-1%
0%
1%
2%
3%
4%
5%
6%
7%
0
5
10
15
20
25
FY10A FY11A FY12A FY13A FY14A FY15F FY16F FY17F FY18F FY19F
Cur
renc
y €
thou
sand
m
IT consulting Infrastructure consulting ITC growth Infr. Cons. Growth %
Figure 17
IT and Infrast. industries degree of rivalry
Source: JPA analysis
4.0
3.0
4.0
3.0
4.0
3.0
3.0
0
1
2
3
4
5
Competitorsize
Easy toexpand
Lack ofdiversity
Low costswitching
Number ofplayers
Similiarity ofplayers
Undifferentiated product
Figure 19
Indices 52 week performance
Source: Capital IQ and JPA analysis
90
95
100
105
110
115
120
125
130
135
140
1014 1214 0315 0515 0715 1015
Index
Dow Jones EURO STOXX Technology Index(EUR)EURO STOXX Index (EUR)
9 5. Industry Analysis
Venture Capital
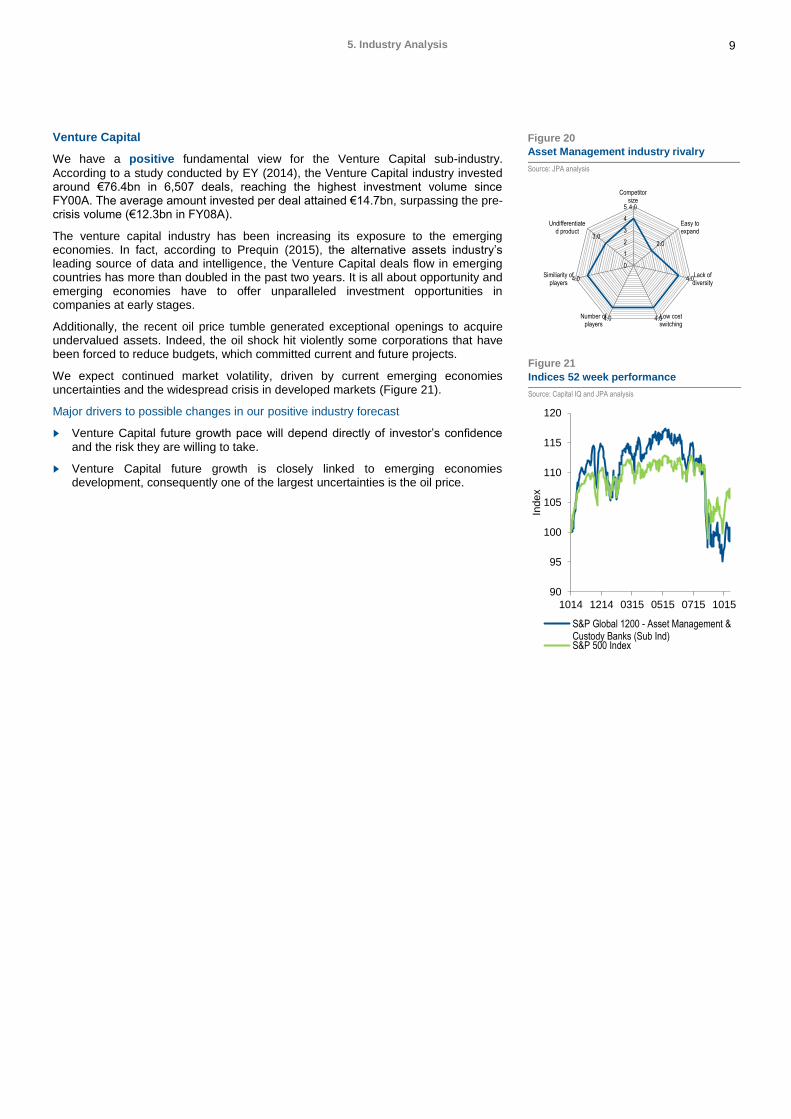
We have a positive fundamental view for the Venture Capital sub-industry.
According to a study conducted by EY (2014), the Venture Capital industry invested around €76.4bn in 6,507 deals, reaching the highest investment volume since FY00A. The average amount invested per deal attained €14.7bn, surpassing the pre-crisis volume (€12.3bn in FY08A).
The venture capital industry has been increasing its exposure to the emerging economies. In fact, according to Prequin (2015), the alternative assets industry’s leading source of data and intelligence, the Venture Capital deals flow in emerging countries has more than doubled in the past two years. It is all about opportunity and emerging economies have to offer unparalleled investment opportunities in companies at early stages.
Additionally, the recent oil price tumble generated exceptional openings to acquire undervalued assets. Indeed, the oil shock hit violently some corporations that have been forced to reduce budgets, which committed current and future projects.
We expect continued market volatility, driven by current emerging economies uncertainties and the widespread crisis in developed markets (Figure 21).
Major drivers to possible changes in our positive industry forecast
► Venture Capital future growth pace will depend directly of investor’s confidence and the risk they are willing to take.
► Venture Capital future growth is closely linked to emerging economies development, consequently one of the largest uncertainties is the oil price.
Figure 20
Asset Management industry rivalry
Source: JPA analysis
4.0
2.0
4.0
4.0 4.0
4.0
3.0
0
1
2
3
4
5
Competitorsize
Easy toexpand
Lack ofdiversity
Low costswitching
Number ofplayers
Similiarity ofplayers
Undifferentiated product
Figure 21
Indices 52 week performance
Source: Capital IQ and JPA analysis
90
95
100
105
110
115
120
1014 1214 0315 0515 0715 1015
Index
S&P Global 1200 - Asset Management &Custody Banks (Sub Ind)S&P 500 Index
10 6. Historical Financial Performance
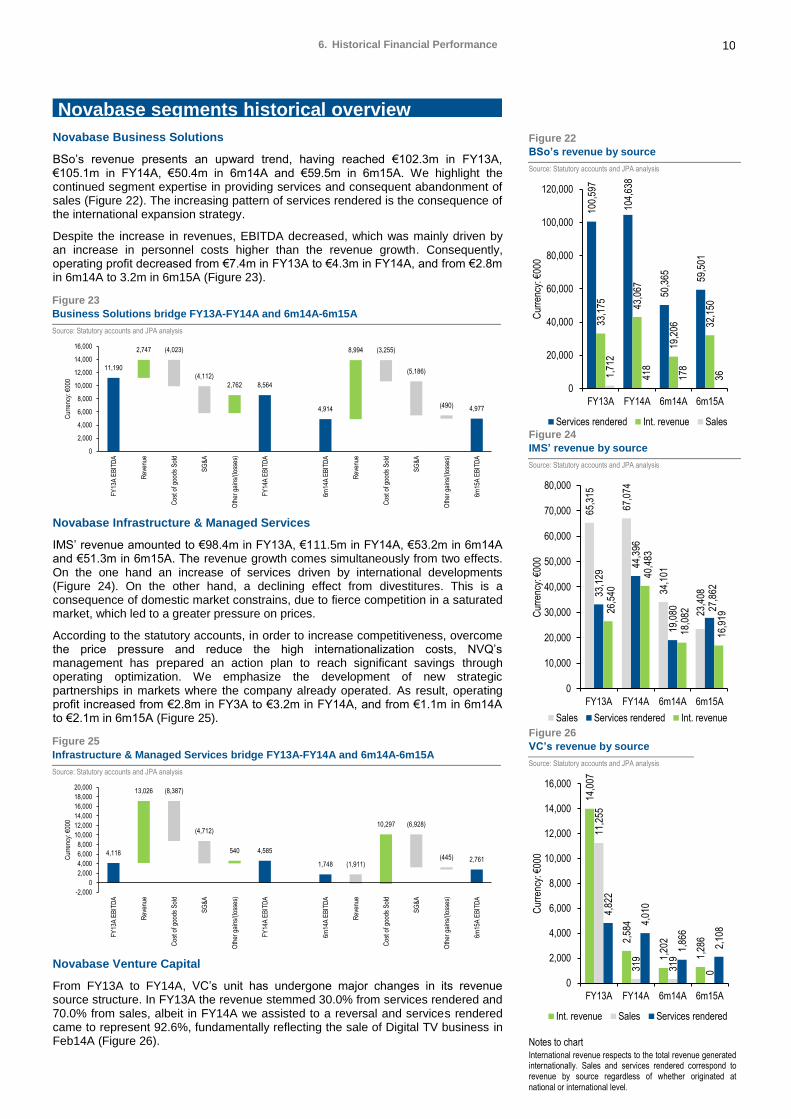
Novabase Business Solutions
BSo’s revenue presents an upward trend, having reached €102.3m in FY13A, €105.1m in FY14A, €50.4m in 6m14A and €59.5m in 6m15A. We highlight the continued segment expertise in providing services and consequent abandonment of sales (Figure 22). The increasing pattern of services rendered is the consequence of the international expansion strategy.
Despite the increase in revenues, EBITDA decreased, which was mainly driven by an increase in personnel costs higher than the revenue growth. Consequently, operating profit decreased from €7.4m in FY13A to €4.3m in FY14A, and from €2.8m in 6m14A to 3.2m in 6m15A (Figure 23).
Novabase Infrastructure & Managed Services
IMS’ revenue amounted to €98.4m in FY13A, €111.5m in FY14A, €53.2m in 6m14A and €51.3m in 6m15A. The revenue growth comes simultaneously from two effects. On the one hand an increase of services driven by international developments (Figure 24). On the other hand, a declining effect from divestitures. This is a consequence of domestic market constrains, due to fierce competition in a saturated market, which led to a greater pressure on prices.
According to the statutory accounts, in order to increase competitiveness, overcome the price pressure and reduce the high internationalization costs, NVQ’s management has prepared an action plan to reach significant savings through operating optimization. We emphasize the development of new strategic partnerships in markets where the company already operated. As result, operating profit increased from €2.8m in FY3A to €3.2m in FY14A, and from €1.1m in 6m14A to €2.1m in 6m15A (Figure 25).
Novabase Venture Capital
From FY13A to FY14A, VC’s unit has undergone major changes in its revenue source structure. In FY13A the revenue stemmed 30.0% from services rendered and 70.0% from sales, albeit in FY14A we assisted to a reversal and services rendered came to represent 92.6%, fundamentally reflecting the sale of Digital TV business in Feb14A (Figure 26).
6. Historical Financial Performance
Novabase segments historical overview
Figure 23
Business Solutions bridge FY13A-FY14A and 6m14A-6m15A
Source: Statutory accounts and JPA analysis
11,190
2,747 (4,023)
(4,112)
2,762 8,564
4,914
8,994 (3,255)
(5,186)
(490) 4,977
0
2,000
4,000
6,000
8,000
10,000
12,000
14,000
16,000
FY
13A
EB
ITD
A
Rev
enue
Cos
t of g
oods
Sol
d
SG
&A
Oth
er g
ains
/(lo
sses
)
FY
14A
EB
ITD
A
6m14
A E
BIT
DA
Rev
enue
Cos
t of g
oods
Sol
d
SG
&A
Oth
er g
ains
/(lo
sses
)
6m15
A E
BIT
DA
Cur
renc
y: €
000
Figure 25
Infrastructure & Managed Services bridge FY13A-FY14A and 6m14A-6m15A
Source: Statutory accounts and JPA analysis
4,118
13,026 (8,387)
(4,712)
540 4,585
1,748 (1,911)
10,297 (6,928)
(445) 2,761
-2,000
0
2,000
4,000
6,000
8,000
10,000
12,000
14,000
16,000
18,000
20,000
FY
13A
EB
ITD
A
Rev
enue
Cos
t of g
oods
Sol
d
SG
&A
Oth
er g
ains
/(lo
sses
)
FY
14A
EB
ITD
A
6m14
A E
BIT
DA
Rev
enue
Cos
t of g
oods
Sol
d
SG
&A
Oth
er g
ains
/(lo
sses
)
6m15
A E
BIT
DA
Cur
renc
y: €
000
Figure 22
BSo’s revenue by source
Source: Statutory accounts and JPA analysis
100,
597
104,
638
50,3
65 59,5
01
33,1
75 43,0
67
19,2
06 32,1
50
1,71
2
418
178
36
0
20,000
40,000
60,000
80,000
100,000
120,000
FY13A FY14A 6m14A 6m15A
Cur
renc
y: €
000
Services rendered Int. revenue Sales
Figure 24
IMS’ revenue by source
Source: Statutory accounts and JPA analysis
65,3
15
67,0
74
34,1
01
23,4
0833,1
29
44,3
96
19,0
80 27,8
62
26,5
40
40,4
83
18,0
82
16,9
19
0
10,000
20,000
30,000
40,000
50,000
60,000
70,000
80,000
FY13A FY14A 6m14A 6m15A
Cur
renc
y: €
000
Sales Services rendered Int. revenue
Figure 26
VC’s revenue by source
Source: Statutory accounts and JPA analysis
Notes to chart International revenue respects to the total revenue generated internationally. Sales and services rendered correspond to revenue by source regardless of whether originated at national or international level.
14,0
07
2,58
4
1,20
2
1,28
6
11,2
55
319
319
0
4,82
2
4,01
0
1,86
6
2,10
8
0
2,000
4,000
6,000
8,000
10,000
12,000
14,000
16,000
FY13A FY14A 6m14A 6m15A
Cur
renc
y: €
000
Int. revenue Sales Services rendered
11 6. Historical Financial Performance
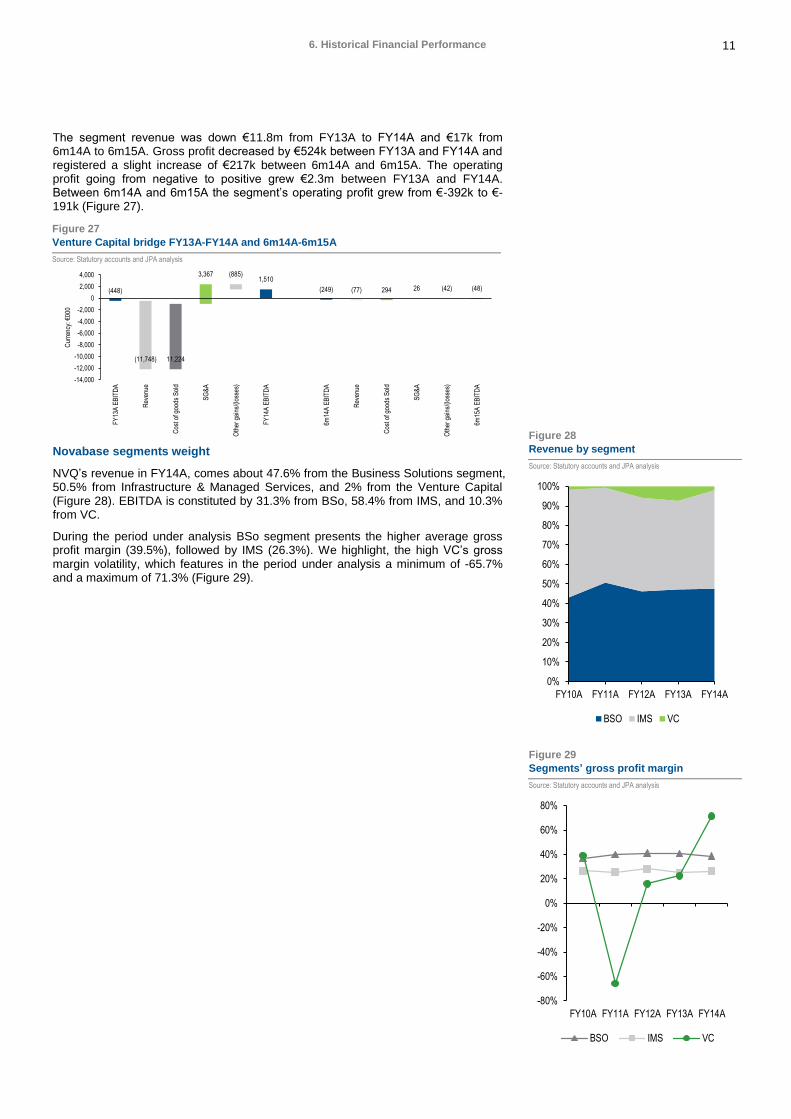
The segment revenue was down €11.8m from FY13A to FY14A and €17k from 6m14A to 6m15A. Gross profit decreased by €524k between FY13A and FY14A and registered a slight increase of €217k between 6m14A and 6m15A. The operating profit going from negative to positive grew €2.3m between FY13A and FY14A. Between 6m14A and 6m15A the segment’s operating profit grew from €-392k to €-191k (Figure 27).
Novabase segments weight
NVQ’s revenue in FY14A, comes about 47.6% from the Business Solutions segment, 50.5% from Infrastructure & Managed Services, and 2% from the Venture Capital (Figure 28). EBITDA is constituted by 31.3% from BSo, 58.4% from IMS, and 10.3% from VC.
During the period under analysis BSo segment presents the higher average gross profit margin (39.5%), followed by IMS (26.3%). We highlight, the high VC’s gross margin volatility, which features in the period under analysis a minimum of -65.7% and a maximum of 71.3% (Figure 29).
Figure 27
Venture Capital bridge FY13A-FY14A and 6m14A-6m15A
Source: Statutory accounts and JPA analysis
(448)
(11,748) 11,224
3,367 (885)1,510
(249) (77) 294 26 (42) (48)
-14,000
-12,000
-10,000
-8,000
-6,000
-4,000
-2,000
0
2,000
4,000
FY
13A
EB
ITD
A
Rev
enue
Cos
t of g
oods
Sol
d
SG
&A
Oth
er g
ains
/(lo
sses
)
FY
14A
EB
ITD
A
6m14
A E
BIT
DA
Rev
enue
Cos
t of g
oods
Sol
d
SG
&A
Oth
er g
ains
/(lo
sses
)
6m15
A E
BIT
DA
Cur
renc
y: €
000
Figure 28
Revenue by segment
Source: Statutory accounts and JPA analysis
0%
10%
20%
30%
40%
50%
60%
70%
80%
90%
100%
FY10A FY11A FY12A FY13A FY14A
BSO IMS VC
Figure 29
Segments’ gross profit margin
Source: Statutory accounts and JPA analysis
-80%
-60%
-40%
-20%
0%
20%
40%
60%
80%
FY10A FY11A FY12A FY13A FY14A
BSO IMS VC
12 6. Historical Financial Performance
Profit & Loss
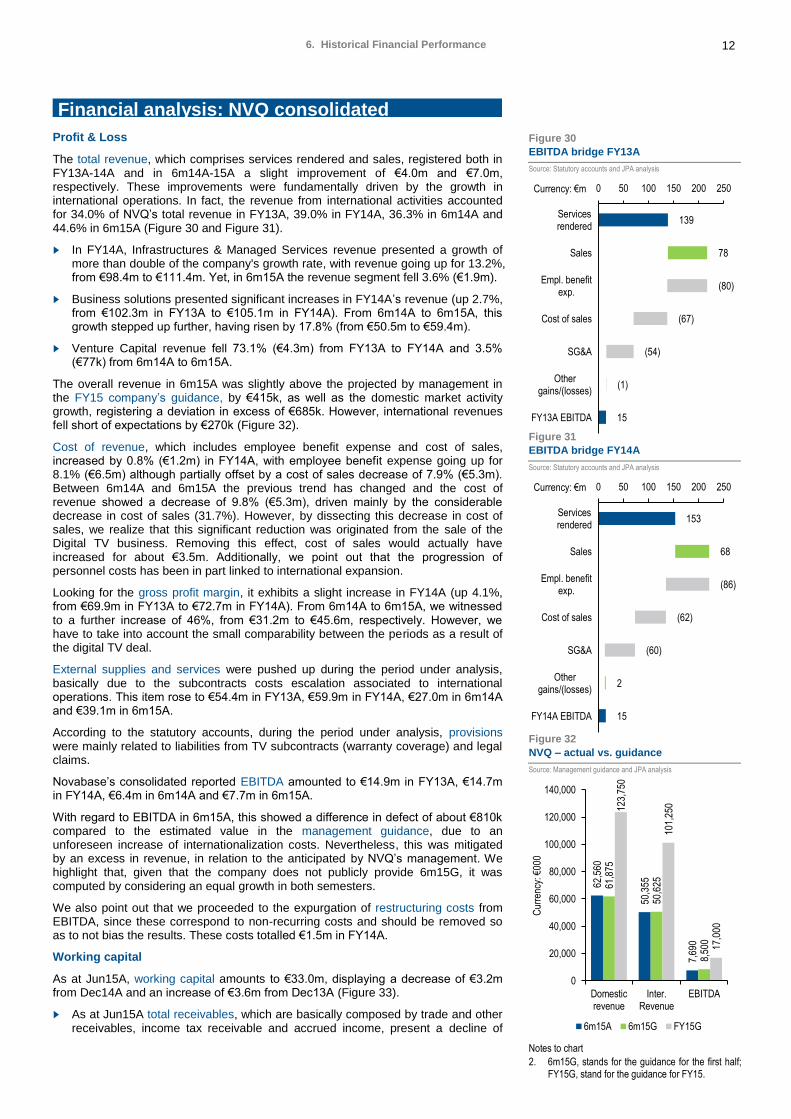
The total revenue, which comprises services rendered and sales, registered both in FY13A-14A and in 6m14A-15A a slight improvement of €4.0m and €7.0m, respectively. These improvements were fundamentally driven by the growth in international operations. In fact, the revenue from international activities accounted for 34.0% of NVQ’s total revenue in FY13A, 39.0% in FY14A, 36.3% in 6m14A and 44.6% in 6m15A (Figure 30 and Figure 31).
► In FY14A, Infrastructures & Managed Services revenue presented a growth of more than double of the company's growth rate, with revenue going up for 13.2%, from €98.4m to €111.4m. Yet, in 6m15A the revenue segment fell 3.6% (€1.9m).
► Business solutions presented significant increases in FY14A’s revenue (up 2.7%, from €102.3m in FY13A to €105.1m in FY14A). From 6m14A to 6m15A, this growth stepped up further, having risen by 17.8% (from €50.5m to €59.4m).
► Venture Capital revenue fell 73.1% (€4.3m) from FY13A to FY14A and 3.5% (€77k) from 6m14A to 6m15A.
The overall revenue in 6m15A was slightly above the projected by management in the FY15 company’s guidance, by €415k, as well as the domestic market activity growth, registering a deviation in excess of €685k. However, international revenues fell short of expectations by €270k (Figure 32).
Cost of revenue, which includes employee benefit expense and cost of sales, increased by 0.8% (€1.2m) in FY14A, with employee benefit expense going up for 8.1% (€6.5m) although partially offset by a cost of sales decrease of 7.9% (€5.3m). Between 6m14A and 6m15A the previous trend has changed and the cost of revenue showed a decrease of 9.8% (€5.3m), driven mainly by the considerable decrease in cost of sales (31.7%). However, by dissecting this decrease in cost of sales, we realize that this significant reduction was originated from the sale of the Digital TV business. Removing this effect, cost of sales would actually have increased for about €3.5m. Additionally, we point out that the progression of personnel costs has been in part linked to international expansion.
Looking for the gross profit margin, it exhibits a slight increase in FY14A (up 4.1%, from €69.9m in FY13A to €72.7m in FY14A). From 6m14A to 6m15A, we witnessed to a further increase of 46%, from €31.2m to €45.6m, respectively. However, we have to take into account the small comparability between the periods as a result of the digital TV deal.
External supplies and services were pushed up during the period under analysis, basically due to the subcontracts costs escalation associated to international operations. This item rose to €54.4m in FY13A, €59.9m in FY14A, €27.0m in 6m14A and €39.1m in 6m15A.
According to the statutory accounts, during the period under analysis, provisions were mainly related to liabilities from TV subcontracts (warranty coverage) and legal claims.
Novabase’s consolidated reported EBITDA amounted to €14.9m in FY13A, €14.7m in FY14A, €6.4m in 6m14A and €7.7m in 6m15A.
With regard to EBITDA in 6m15A, this showed a difference in defect of about €810k compared to the estimated value in the management guidance, due to an unforeseen increase of internationalization costs. Nevertheless, this was mitigated by an excess in revenue, in relation to the anticipated by NVQ’s management. We highlight that, given that the company does not publicly provide 6m15G, it was computed by considering an equal growth in both semesters.
We also point out that we proceeded to the expurgation of restructuring costs from EBITDA, since these correspond to non-recurring costs and should be removed so as to not bias the results. These costs totalled €1.5m in FY14A.
Working capital
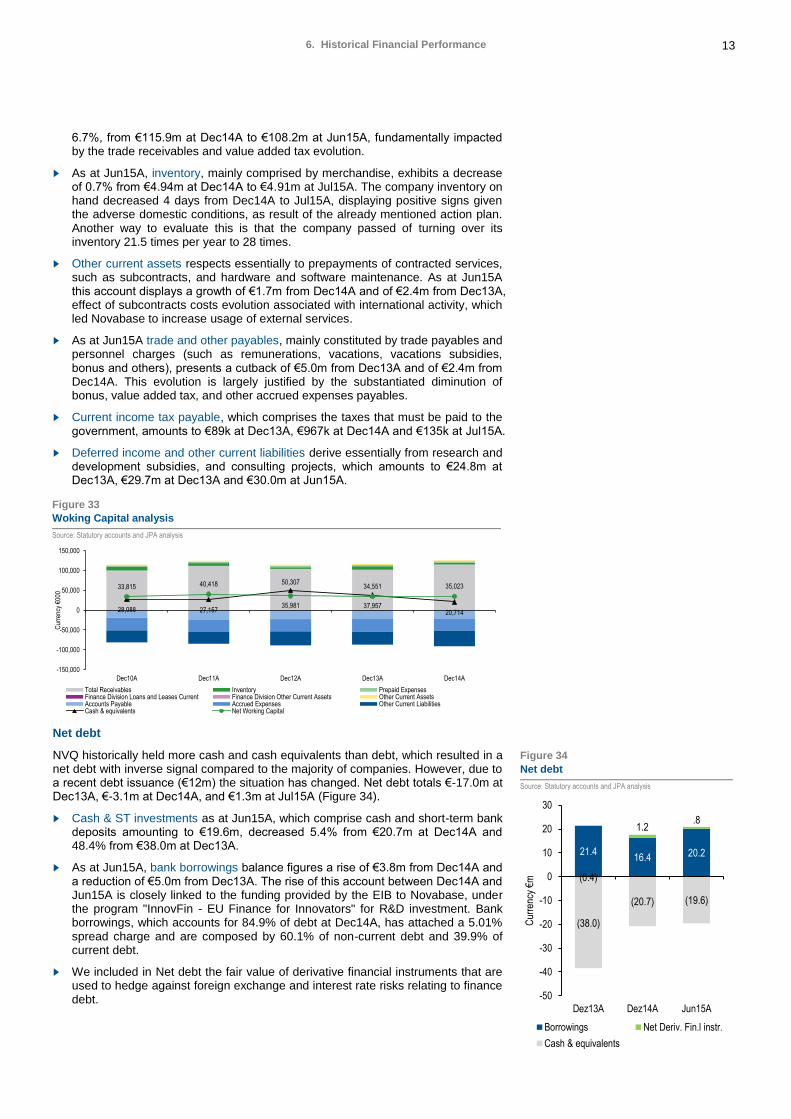
As at Jun15A, working capital amounts to €33.0m, displaying a decrease of €3.2m from Dec14A and an increase of €3.6m from Dec13A (Figure 33).
► As at Jun15A total receivables, which are basically composed by trade and other receivables, income tax receivable and accrued income, present a decline of
Financial analysis: NVQ consolidated Figure 30
EBITDA bridge FY13A
Source: Statutory accounts and JPA analysis
139
78
(80)
(67)
(54)
(1)
15
0 50 100 150 200 250
Servicesrendered
Sales
Empl. benefitexp.
Cost of sales
SG&A
Othergains/(losses)
FY13A EBITDA
Currency: €m
Figure 31
EBITDA bridge FY14A
Source: Statutory accounts and JPA analysis
153
68
(86)
(62)
(60)
2
15
0 50 100 150 200 250
Servicesrendered
Sales
Empl. benefitexp.
Cost of sales
SG&A
Othergains/(losses)
FY14A EBITDA
Currency: €m
Figure 32
NVQ – actual vs. guidance
Source: Management guidance and JPA analysis
Notes to chart
2. 6m15G, stands for the guidance for the first half; FY15G, stand for the guidance for FY15.
62,5
60
50,3
55
7,69
0
61,8
75
50,6
25
8,50
0
123,
750
101,
250
17,0
00
0
20,000
40,000
60,000
80,000
100,000
120,000
140,000
Domesticrevenue
Inter.Revenue
EBITDA
Cur
renc
y: €
000
6m15A 6m15G FY15G
13 6. Historical Financial Performance
6.7%, from €115.9m at Dec14A to €108.2m at Jun15A, fundamentally impacted by the trade receivables and value added tax evolution.
► As at Jun15A, inventory, mainly comprised by merchandise, exhibits a decrease of 0.7% from €4.94m at Dec14A to €4.91m at Jul15A. The company inventory on hand decreased 4 days from Dec14A to Jul15A, displaying positive signs given the adverse domestic conditions, as result of the already mentioned action plan. Another way to evaluate this is that the company passed of turning over its inventory 21.5 times per year to 28 times.
► Other current assets respects essentially to prepayments of contracted services, such as subcontracts, and hardware and software maintenance. As at Jun15A this account displays a growth of €1.7m from Dec14A and of €2.4m from Dec13A, effect of subcontracts costs evolution associated with international activity, which led Novabase to increase usage of external services.
► As at Jun15A trade and other payables, mainly constituted by trade payables and personnel charges (such as remunerations, vacations, vacations subsidies, bonus and others), presents a cutback of €5.0m from Dec13A and of €2.4m from Dec14A. This evolution is largely justified by the substantiated diminution of bonus, value added tax, and other accrued expenses payables.
► Current income tax payable, which comprises the taxes that must be paid to the government, amounts to €89k at Dec13A, €967k at Dec14A and €135k at Jul15A.
► Deferred income and other current liabilities derive essentially from research and development subsidies, and consulting projects, which amounts to €24.8m at Dec13A, €29.7m at Dec13A and €30.0m at Jun15A.
Net debt
NVQ historically held more cash and cash equivalents than debt, which resulted in a net debt with inverse signal compared to the majority of companies. However, due to a recent debt issuance (€12m) the situation has changed. Net debt totals €-17.0m at Dec13A, €-3.1m at Dec14A, and €1.3m at Jul15A (Figure 34).
► Cash & ST investments as at Jun15A, which comprise cash and short-term bank deposits amounting to €19.6m, decreased 5.4% from €20.7m at Dec14A and 48.4% from €38.0m at Dec13A.
► As at Jun15A, bank borrowings balance figures a rise of €3.8m from Dec14A and a reduction of €5.0m from Dec13A. The rise of this account between Dec14A and Jun15A is closely linked to the funding provided by the EIB to Novabase, under the program "InnovFin - EU Finance for Innovators" for R&D investment. Bank borrowings, which accounts for 84.9% of debt at Dec14A, has attached a 5.01% spread charge and are composed by 60.1% of non-current debt and 39.9% of current debt.
► We included in Net debt the fair value of derivative financial instruments that are used to hedge against foreign exchange and interest rate risks relating to finance debt.
Figure 33
Woking Capital analysis
Source: Statutory accounts and JPA analysis
28,088 27,157
50,307
37,95720,714
33,815 40,418
35,981
34,551 35,023
-150,000
-100,000
-50,000
0
50,000
100,000
150,000
Dec10A Dec11A Dec12A Dec13A Dec14A
Cur
renc
y €0
00
Total Receivables Inventory Prepaid ExpensesFinance Division Loans and Leases Current Finance Division Other Current Assets Other Current AssetsAccounts Payable Accrued Expenses Other Current LiabilitiesCash & equivalents Net Working Capital
Figure 34
Net debt
Source: Statutory accounts and JPA analysis
21.416.4 20.2
(0.4)
1.2 .8
(38.0)
(20.7) (19.6)
-50
-40
-30
-20
-10
0
10
20
30
Dez13A Dez14A Jun15A
Cur
renc
y €m
Borrowings Net Deriv. Fin.l instr.
Cash & equivalents
14 6. Historical Financial Performance
Fixed assets
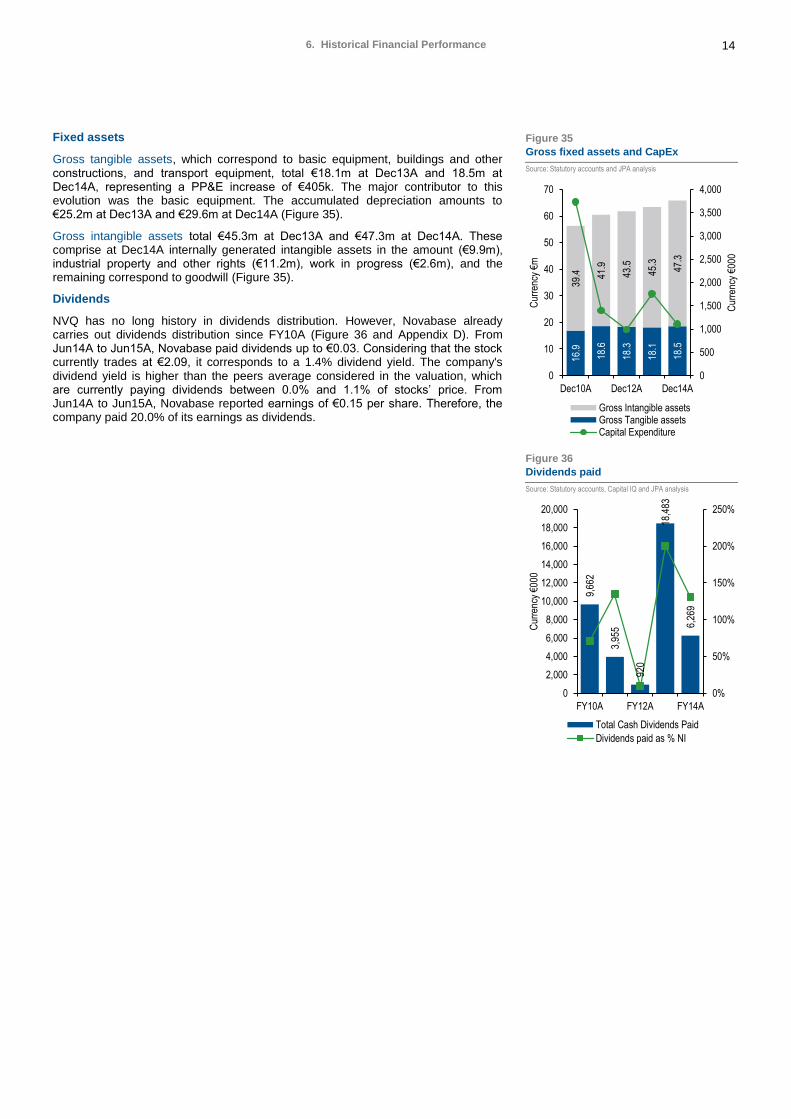
Gross tangible assets, which correspond to basic equipment, buildings and other constructions, and transport equipment, total €18.1m at Dec13A and 18.5m at Dec14A, representing a PP&E increase of €405k. The major contributor to this evolution was the basic equipment. The accumulated depreciation amounts to €25.2m at Dec13A and €29.6m at Dec14A (Figure 35).
Gross intangible assets total €45.3m at Dec13A and €47.3m at Dec14A. These comprise at Dec14A internally generated intangible assets in the amount (€9.9m), industrial property and other rights (€11.2m), work in progress (€2.6m), and the remaining correspond to goodwill (Figure 35).
Dividends
NVQ has no long history in dividends distribution. However, Novabase already carries out dividends distribution since FY10A (Figure 36 and Appendix D). From Jun14A to Jun15A, Novabase paid dividends up to €0.03. Considering that the stock currently trades at €2.09, it corresponds to a 1.4% dividend yield. The company's dividend yield is higher than the peers average considered in the valuation, which are currently paying dividends between 0.0% and 1.1% of stocks’ price. From Jun14A to Jun15A, Novabase reported earnings of €0.15 per share. Therefore, the company paid 20.0% of its earnings as dividends.
Figure 35
Gross fixed assets and CapEx
Source: Statutory accounts and JPA analysis
16.9
18.6
18.3
18.1
18.5
39.4 41
.9
43.5
45.3
47.3
0
500
1,000
1,500
2,000
2,500
3,000
3,500
4,000
0
10
20
30
40
50
60
70
Dec10A Dec12A Dec14A
Cur
renc
y €0
00
Cur
renc
y €m
Gross Intangible assetsGross Tangible assetsCapital Expenditure
Figure 36
Dividends paid
Source: Statutory accounts, Capital IQ and JPA analysis
9,66
2
3,95
5
920
18,4
83
6,26
90%
50%
100%
150%
200%
250%
0
2,000
4,000
6,000
8,000
10,000
12,000
14,000
16,000
18,000
20,000
FY10A FY12A FY14A
Cur
renc
y €0
00
Total Cash Dividends Paid
Dividends paid as % NI
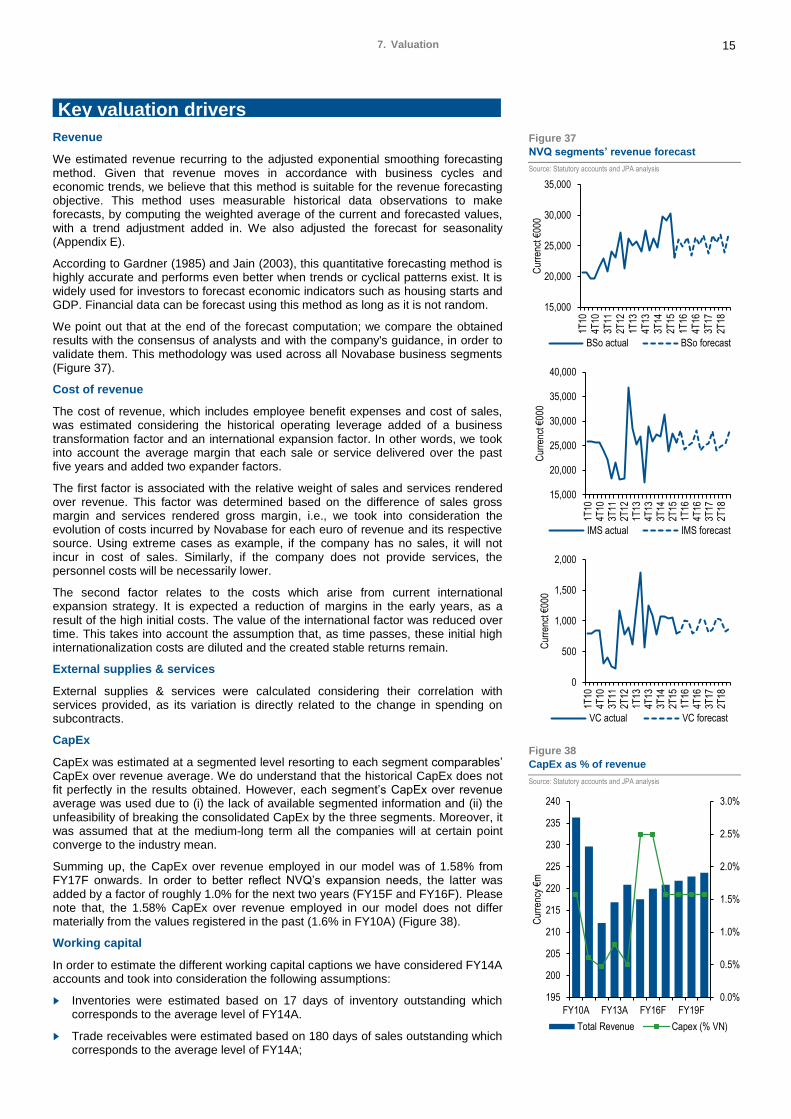
15 7. Valuation
Revenue
We estimated revenue recurring to the adjusted exponential smoothing forecasting method. Given that revenue moves in accordance with business cycles and economic trends, we believe that this method is suitable for the revenue forecasting objective. This method uses measurable historical data observations to make forecasts, by computing the weighted average of the current and forecasted values, with a trend adjustment added in. We also adjusted the forecast for seasonality (Appendix E).
According to Gardner (1985) and Jain (2003), this quantitative forecasting method is highly accurate and performs even better when trends or cyclical patterns exist. It is widely used for investors to forecast economic indicators such as housing starts and GDP. Financial data can be forecast using this method as long as it is not random.
We point out that at the end of the forecast computation; we compare the obtained results with the consensus of analysts and with the company's guidance, in order to validate them. This methodology was used across all Novabase business segments (Figure 37).
Cost of revenue
The cost of revenue, which includes employee benefit expenses and cost of sales, was estimated considering the historical operating leverage added of a business transformation factor and an international expansion factor. In other words, we took into account the average margin that each sale or service delivered over the past five years and added two expander factors.
The first factor is associated with the relative weight of sales and services rendered over revenue. This factor was determined based on the difference of sales gross margin and services rendered gross margin, i.e., we took into consideration the evolution of costs incurred by Novabase for each euro of revenue and its respective source. Using extreme cases as example, if the company has no sales, it will not incur in cost of sales. Similarly, if the company does not provide services, the personnel costs will be necessarily lower.
The second factor relates to the costs which arise from current international expansion strategy. It is expected a reduction of margins in the early years, as a result of the high initial costs. The value of the international factor was reduced over time. This takes into account the assumption that, as time passes, these initial high internationalization costs are diluted and the created stable returns remain.
External supplies & services
External supplies & services were calculated considering their correlation with services provided, as its variation is directly related to the change in spending on subcontracts.
CapEx
CapEx was estimated at a segmented level resorting to each segment comparables’ CapEx over revenue average. We do understand that the historical CapEx does not fit perfectly in the results obtained. However, each segment’s CapEx over revenue average was used due to (i) the lack of available segmented information and (ii) the unfeasibility of breaking the consolidated CapEx by the three segments. Moreover, it was assumed that at the medium-long term all the companies will at certain point converge to the industry mean.
Summing up, the CapEx over revenue employed in our model was of 1.58% from FY17F onwards. In order to better reflect NVQ’s expansion needs, the latter was added by a factor of roughly 1.0% for the next two years (FY15F and FY16F). Please note that, the 1.58% CapEx over revenue employed in our model does not differ materially from the values registered in the past (1.6% in FY10A) (Figure 38).
Working capital
In order to estimate the different working capital captions we have considered FY14A accounts and took into consideration the following assumptions:
► Inventories were estimated based on 17 days of inventory outstanding which corresponds to the average level of FY14A.
► Trade receivables were estimated based on 180 days of sales outstanding which corresponds to the average level of FY14A;
7. Valuation
Key valuation drivers
Figure 37
NVQ segments’ revenue forecast
Source: Statutory accounts and JPA analysis
15,000
20,000
25,000
30,000
35,000
1T10
4T10
3T11
2T12
1T13
4T13
3T14
2T15
1T16
4T16
3T17
2T18
Cur
renc
t €00
0
BSo actual BSo forecast
0
500
1,000
1,500
2,000
1T10
4T10
3T11
2T12
1T13
4T13
3T14
2T15
1T16
4T16
3T17
2T18
Cur
renc
t €00
0
VC actual VC forecast
15,000
20,000
25,000
30,000
35,000
40,000
1T10
4T10
3T11
2T12
1T13
4T13
3T14
2T15
1T16
4T16
3T17
2T18
Cur
renc
t €00
0IMS actual IMS forecast
Figure 38
CapEx as % of revenue
Source: Statutory accounts and JPA analysis
0.0%
0.5%
1.0%
1.5%
2.0%
2.5%
3.0%
195
200
205
210
215
220
225
230
235
240
FY10A FY13A FY16F FY19F
Cur
renc
y €m
Total Revenue Capex (% VN)
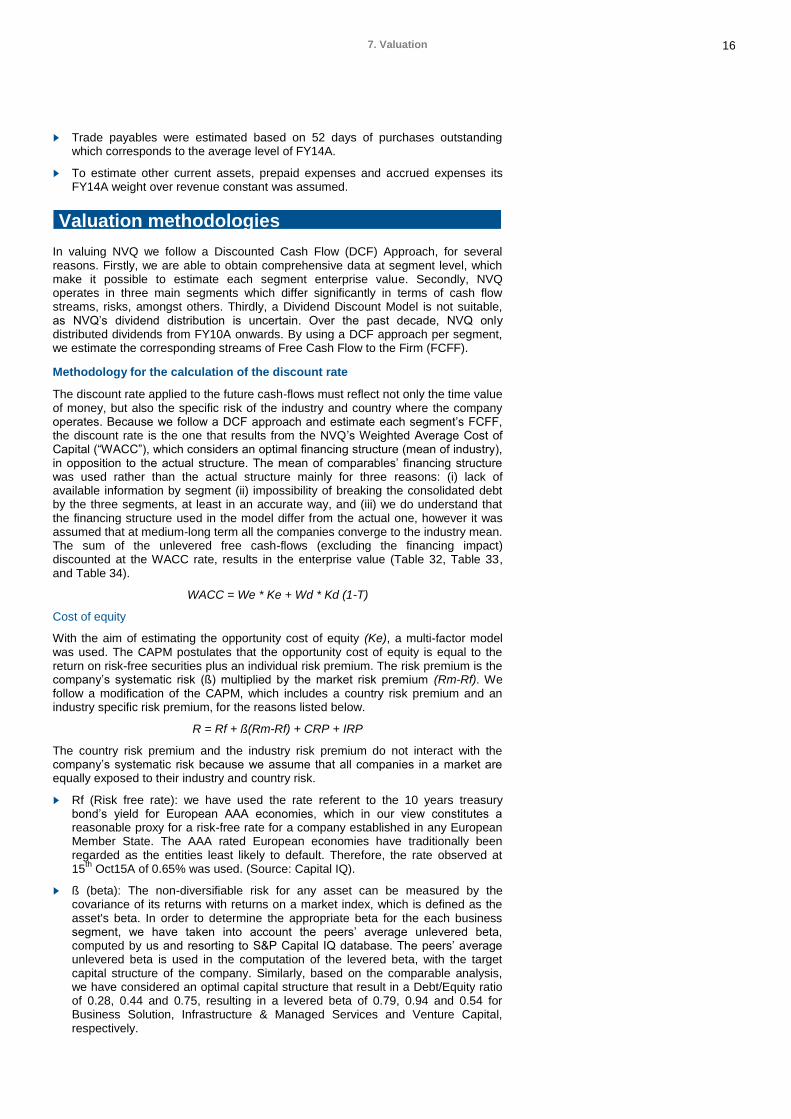
16 7. Valuation
► Trade payables were estimated based on 52 days of purchases outstanding which corresponds to the average level of FY14A.
► To estimate other current assets, prepaid expenses and accrued expenses its FY14A weight over revenue constant was assumed.
In valuing NVQ we follow a Discounted Cash Flow (DCF) Approach, for several reasons. Firstly, we are able to obtain comprehensive data at segment level, which make it possible to estimate each segment enterprise value. Secondly, NVQ operates in three main segments which differ significantly in terms of cash flow streams, risks, amongst others. Thirdly, a Dividend Discount Model is not suitable, as NVQ’s dividend distribution is uncertain. Over the past decade, NVQ only distributed dividends from FY10A onwards. By using a DCF approach per segment, we estimate the corresponding streams of Free Cash Flow to the Firm (FCFF).
Methodology for the calculation of the discount rate
The discount rate applied to the future cash-flows must reflect not only the time value of money, but also the specific risk of the industry and country where the company operates. Because we follow a DCF approach and estimate each segment’s FCFF, the discount rate is the one that results from the NVQ’s Weighted Average Cost of Capital (“WACC”), which considers an optimal financing structure (mean of industry), in opposition to the actual structure. The mean of comparables’ financing structure was used rather than the actual structure mainly for three reasons: (i) lack of available information by segment (ii) impossibility of breaking the consolidated debt by the three segments, at least in an accurate way, and (iii) we do understand that the financing structure used in the model differ from the actual one, however it was assumed that at medium-long term all the companies converge to the industry mean. The sum of the unlevered free cash-flows (excluding the financing impact) discounted at the WACC rate, results in the enterprise value (Table 32, Table 33, and Table 34).
WACC = We * Ke + Wd * Kd (1-T)
Cost of equity
With the aim of estimating the opportunity cost of equity (Ke), a multi-factor model was used. The CAPM postulates that the opportunity cost of equity is equal to the return on risk-free securities plus an individual risk premium. The risk premium is the company’s systematic risk (ß) multiplied by the market risk premium (Rm-Rf). We follow a modification of the CAPM, which includes a country risk premium and an industry specific risk premium, for the reasons listed below.
R = Rf + ß(Rm-Rf) + CRP + IRP
The country risk premium and the industry risk premium do not interact with the company’s systematic risk because we assume that all companies in a market are equally exposed to their industry and country risk.
► Rf (Risk free rate): we have used the rate referent to the 10 years treasury bond’s yield for European AAA economies, which in our view constitutes a reasonable proxy for a risk-free rate for a company established in any European Member State. The AAA rated European economies have traditionally been regarded as the entities least likely to default. Therefore, the rate observed at 15
th Oct15A of 0.65% was used. (Source: Capital IQ).
► ß (beta): The non-diversifiable risk for any asset can be measured by the covariance of its returns with returns on a market index, which is defined as the asset's beta. In order to determine the appropriate beta for the each business segment, we have taken into account the peers’ average unlevered beta, computed by us and resorting to S&P Capital IQ database. The peers’ average unlevered beta is used in the computation of the levered beta, with the target capital structure of the company. Similarly, based on the comparable analysis, we have considered an optimal capital structure that result in a Debt/Equity ratio of 0.28, 0.44 and 0.75, resulting in a levered beta of 0.79, 0.94 and 0.54 for Business Solution, Infrastructure & Managed Services and Venture Capital, respectively.
Valuation methodologies
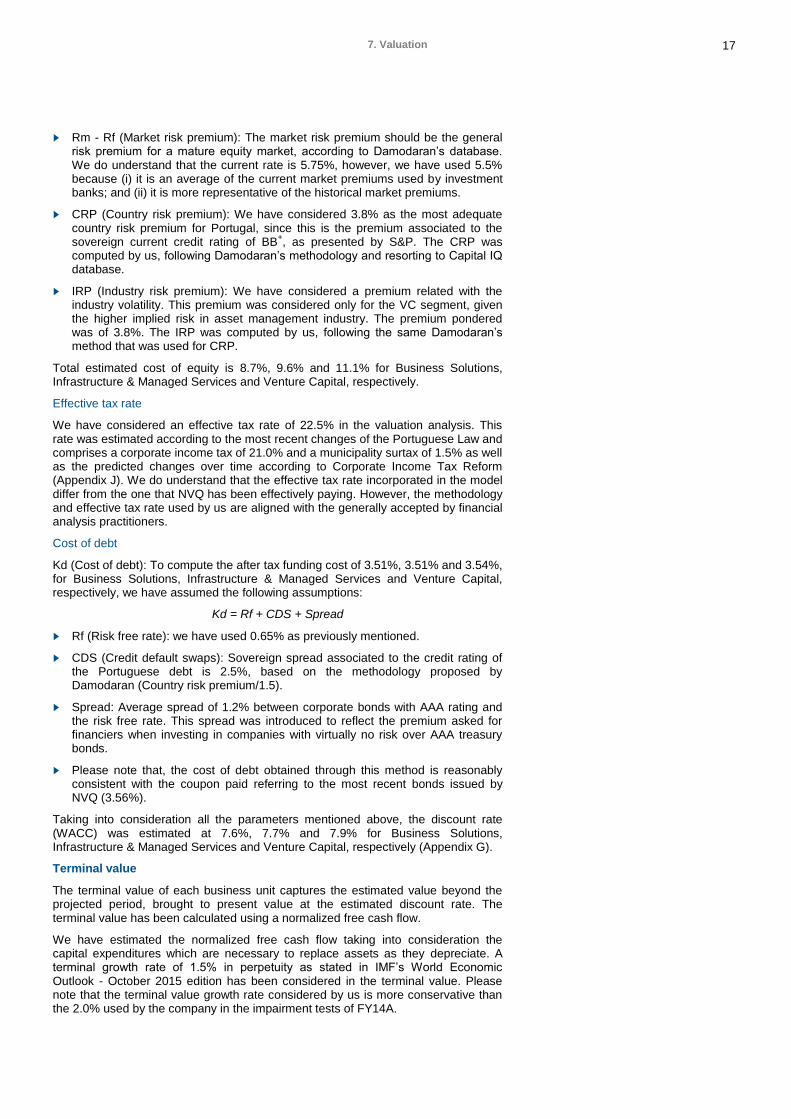
17 7. Valuation
► Rm - Rf (Market risk premium): The market risk premium should be the general risk premium for a mature equity market, according to Damodaran’s database. We do understand that the current rate is 5.75%, however, we have used 5.5% because (i) it is an average of the current market premiums used by investment banks; and (ii) it is more representative of the historical market premiums.
► CRP (Country risk premium): We have considered 3.8% as the most adequate country risk premium for Portugal, since this is the premium associated to the sovereign current credit rating of BB
+, as presented by S&P. The CRP was
computed by us, following Damodaran’s methodology and resorting to Capital IQ database.
► IRP (Industry risk premium): We have considered a premium related with the industry volatility. This premium was considered only for the VC segment, given the higher implied risk in asset management industry. The premium pondered was of 3.8%. The IRP was computed by us, following the same Damodaran’s method that was used for CRP.
Total estimated cost of equity is 8.7%, 9.6% and 11.1% for Business Solutions, Infrastructure & Managed Services and Venture Capital, respectively.
Effective tax rate
We have considered an effective tax rate of 22.5% in the valuation analysis. This rate was estimated according to the most recent changes of the Portuguese Law and comprises a corporate income tax of 21.0% and a municipality surtax of 1.5% as well as the predicted changes over time according to Corporate Income Tax Reform (Appendix J). We do understand that the effective tax rate incorporated in the model differ from the one that NVQ has been effectively paying. However, the methodology and effective tax rate used by us are aligned with the generally accepted by financial analysis practitioners.
Cost of debt
Kd (Cost of debt): To compute the after tax funding cost of 3.51%, 3.51% and 3.54%, for Business Solutions, Infrastructure & Managed Services and Venture Capital, respectively, we have assumed the following assumptions:
Kd = Rf + CDS + Spread
► Rf (Risk free rate): we have used 0.65% as previously mentioned.
► CDS (Credit default swaps): Sovereign spread associated to the credit rating of the Portuguese debt is 2.5%, based on the methodology proposed by Damodaran (Country risk premium/1.5).
► Spread: Average spread of 1.2% between corporate bonds with AAA rating and the risk free rate. This spread was introduced to reflect the premium asked for financiers when investing in companies with virtually no risk over AAA treasury bonds.
► Please note that, the cost of debt obtained through this method is reasonably consistent with the coupon paid referring to the most recent bonds issued by NVQ (3.56%).
Taking into consideration all the parameters mentioned above, the discount rate (WACC) was estimated at 7.6%, 7.7% and 7.9% for Business Solutions, Infrastructure & Managed Services and Venture Capital, respectively (Appendix G).
Terminal value
The terminal value of each business unit captures the estimated value beyond the projected period, brought to present value at the estimated discount rate. The terminal value has been calculated using a normalized free cash flow.
We have estimated the normalized free cash flow taking into consideration the capital expenditures which are necessary to replace assets as they depreciate. A terminal growth rate of 1.5% in perpetuity as stated in IMF’s World Economic Outlook - October 2015 edition has been considered in the terminal value. Please note that the terminal value growth rate considered by us is more conservative than the 2.0% used by the company in the impairment tests of FY14A.
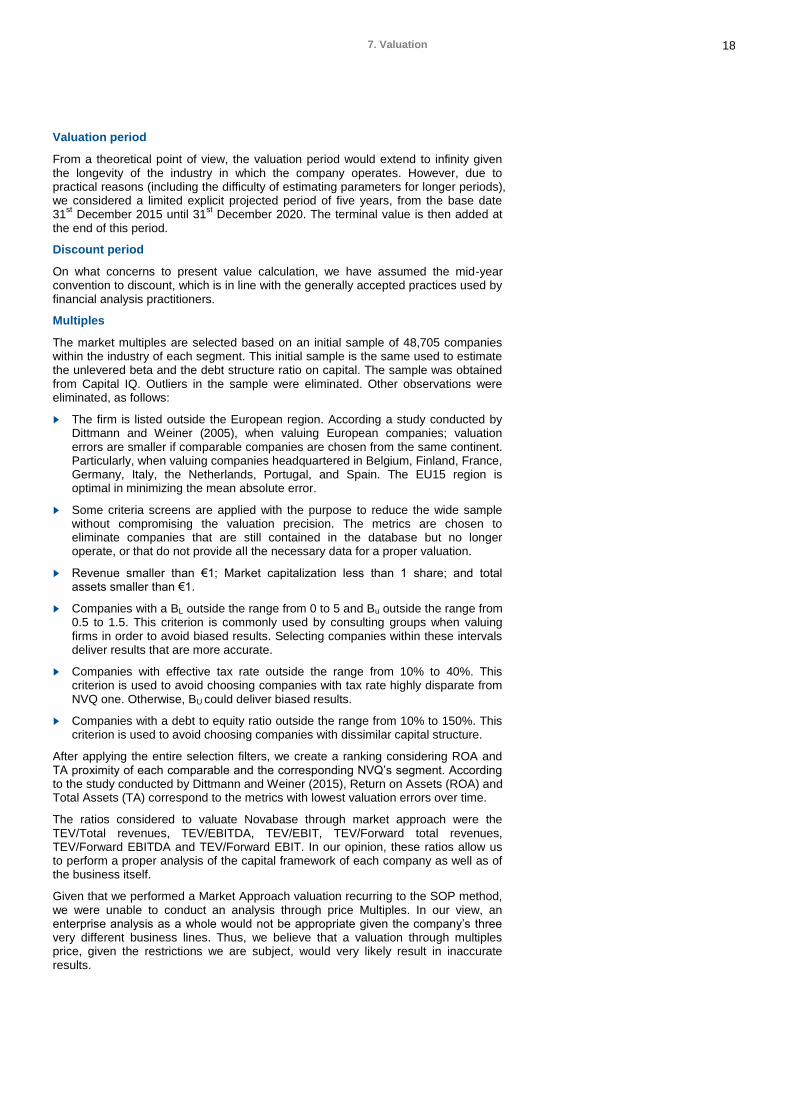
18 7. Valuation
Valuation period
From a theoretical point of view, the valuation period would extend to infinity given the longevity of the industry in which the company operates. However, due to practical reasons (including the difficulty of estimating parameters for longer periods), we considered a limited explicit projected period of five years, from the base date 31
st December 2015 until 31
st December 2020. The terminal value is then added at
the end of this period.
Discount period
On what concerns to present value calculation, we have assumed the mid-year convention to discount, which is in line with the generally accepted practices used by financial analysis practitioners.
Multiples
The market multiples are selected based on an initial sample of 48,705 companies within the industry of each segment. This initial sample is the same used to estimate the unlevered beta and the debt structure ratio on capital. The sample was obtained from Capital IQ. Outliers in the sample were eliminated. Other observations were eliminated, as follows:
► The firm is listed outside the European region. According a study conducted by Dittmann and Weiner (2005), when valuing European companies; valuation errors are smaller if comparable companies are chosen from the same continent. Particularly, when valuing companies headquartered in Belgium, Finland, France, Germany, Italy, the Netherlands, Portugal, and Spain. The EU15 region is optimal in minimizing the mean absolute error.
► Some criteria screens are applied with the purpose to reduce the wide sample without compromising the valuation precision. The metrics are chosen to eliminate companies that are still contained in the database but no longer operate, or that do not provide all the necessary data for a proper valuation.
► Revenue smaller than €1; Market capitalization less than 1 share; and total assets smaller than €1.
► Companies with a BL outside the range from 0 to 5 and Bu outside the range from 0.5 to 1.5. This criterion is commonly used by consulting groups when valuing firms in order to avoid biased results. Selecting companies within these intervals deliver results that are more accurate.
► Companies with effective tax rate outside the range from 10% to 40%. This criterion is used to avoid choosing companies with tax rate highly disparate from NVQ one. Otherwise, BU could deliver biased results.
► Companies with a debt to equity ratio outside the range from 10% to 150%. This criterion is used to avoid choosing companies with dissimilar capital structure.
After applying the entire selection filters, we create a ranking considering ROA and TA proximity of each comparable and the corresponding NVQ’s segment. According to the study conducted by Dittmann and Weiner (2015), Return on Assets (ROA) and Total Assets (TA) correspond to the metrics with lowest valuation errors over time.
The ratios considered to valuate Novabase through market approach were the TEV/Total revenues, TEV/EBITDA, TEV/EBIT, TEV/Forward total revenues, TEV/Forward EBITDA and TEV/Forward EBIT. In our opinion, these ratios allow us to perform a proper analysis of the capital framework of each company as well as of the business itself.
Given that we performed a Market Approach valuation recurring to the SOP method, we were unable to conduct an analysis through price Multiples. In our view, an enterprise analysis as a whole would not be appropriate given the company’s three very different business lines. Thus, we believe that a valuation through multiples price, given the restrictions we are subject, would very likely result in inaccurate results.
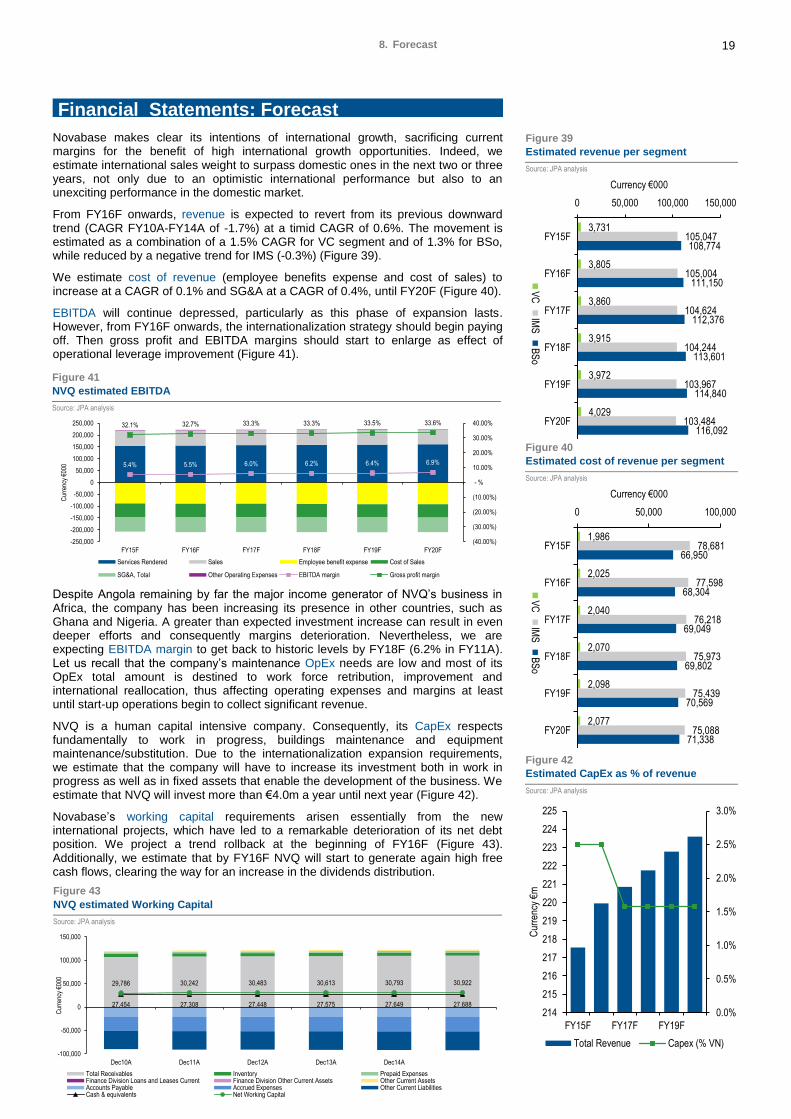
19 8. Forecast
Figure 43
NVQ estimated Working Capital
Source: JPA analysis
27,454 27,308 27,448 27,575 27,649 27,688
29,786 30,242 30,483 30,613 30,793 30,922
-100,000
-50,000
0
50,000
100,000
150,000
Dec10A Dec11A Dec12A Dec13A Dec14A
Cur
renc
y €0
00
Total Receivables Inventory Prepaid ExpensesFinance Division Loans and Leases Current Finance Division Other Current Assets Other Current AssetsAccounts Payable Accrued Expenses Other Current LiabilitiesCash & equivalents Net Working Capital
Novabase makes clear its intentions of international growth, sacrificing current margins for the benefit of high international growth opportunities. Indeed, we estimate international sales weight to surpass domestic ones in the next two or three years, not only due to an optimistic international performance but also to an unexciting performance in the domestic market.
From FY16F onwards, revenue is expected to revert from its previous downward trend (CAGR FY10A-FY14A of -1.7%) at a timid CAGR of 0.6%. The movement is estimated as a combination of a 1.5% CAGR for VC segment and of 1.3% for BSo, while reduced by a negative trend for IMS (-0.3%) (Figure 39).
We estimate cost of revenue (employee benefits expense and cost of sales) to increase at a CAGR of 0.1% and SG&A at a CAGR of 0.4%, until FY20F (Figure 40).
EBITDA will continue depressed, particularly as this phase of expansion lasts. However, from FY16F onwards, the internationalization strategy should begin paying off. Then gross profit and EBITDA margins should start to enlarge as effect of operational leverage improvement (Figure 41).
Despite Angola remaining by far the major income generator of NVQ’s business in Africa, the company has been increasing its presence in other countries, such as Ghana and Nigeria. A greater than expected investment increase can result in even deeper efforts and consequently margins deterioration. Nevertheless, we are expecting EBITDA margin to get back to historic levels by FY18F (6.2% in FY11A). Let us recall that the company’s maintenance OpEx needs are low and most of its OpEx total amount is destined to work force retribution, improvement and international reallocation, thus affecting operating expenses and margins at least until start-up operations begin to collect significant revenue.
NVQ is a human capital intensive company. Consequently, its CapEx respects fundamentally to work in progress, buildings maintenance and equipment maintenance/substitution. Due to the internationalization expansion requirements, we estimate that the company will have to increase its investment both in work in progress as well as in fixed assets that enable the development of the business. We estimate that NVQ will invest more than €4.0m a year until next year (Figure 42).
Novabase’s working capital requirements arisen essentially from the new international projects, which have led to a remarkable deterioration of its net debt position. We project a trend rollback at the beginning of FY16F (Figure 43). Additionally, we estimate that by FY16F NVQ will start to generate again high free cash flows, clearing the way for an increase in the dividends distribution.
8. Forecast
Financial Statements: Forecast
Figure 41
NVQ estimated EBITDA
Source: JPA analysis
5.4% 5.5% 6.0% 6.2% 6.4% 6.9%
32.1% 32.7% 33.3% 33.3% 33.5% 33.6%
(40.00%)
(30.00%)
(20.00%)
(10.00%)
- %
10.00%
20.00%
30.00%
40.00%
-250,000
-200,000
-150,000
-100,000
-50,000
0
50,000
100,000
150,000
200,000
250,000
FY15F FY16F FY17F FY18F FY19F FY20F
Cur
renc
y €0
00
Services Rendered Sales Employee benefit expense Cost of Sales
SG&A, Total Other Operating Expenses EBITDA margin Gross profit margin
Figure 39
Estimated revenue per segment
Source: JPA analysis
3,731
3,805
3,860
3,915
3,972
4,029
105,047
105,004
104,624
104,244
103,967
103,484
108,774
111,150
112,376
113,601
114,840
116,092
0 50,000 100,000 150,000
FY15F
FY16F
FY17F
FY18F
FY19F
FY20F
Currency €000
VC
IMS
BS
o
Figure 40
Estimated cost of revenue per segment
Source: JPA analysis
1,986
2,025
2,040
2,070
2,098
2,077
78,681
77,598
76,218
75,973
75,439
75,088
66,950
68,304
69,049
69,802
70,569
71,338
0 50,000 100,000
FY15F
FY16F
FY17F
FY18F
FY19F
FY20F
Currency €000
VC
IMS
BS
o
Figure 42
Estimated CapEx as % of revenue
Source: JPA analysis
0.0%
0.5%
1.0%
1.5%
2.0%
2.5%
3.0%
214
215
216
217
218
219
220
221
222
223
224
225
FY15F FY17F FY19F
Cur
renc
y €m
Total Revenue Capex (% VN)
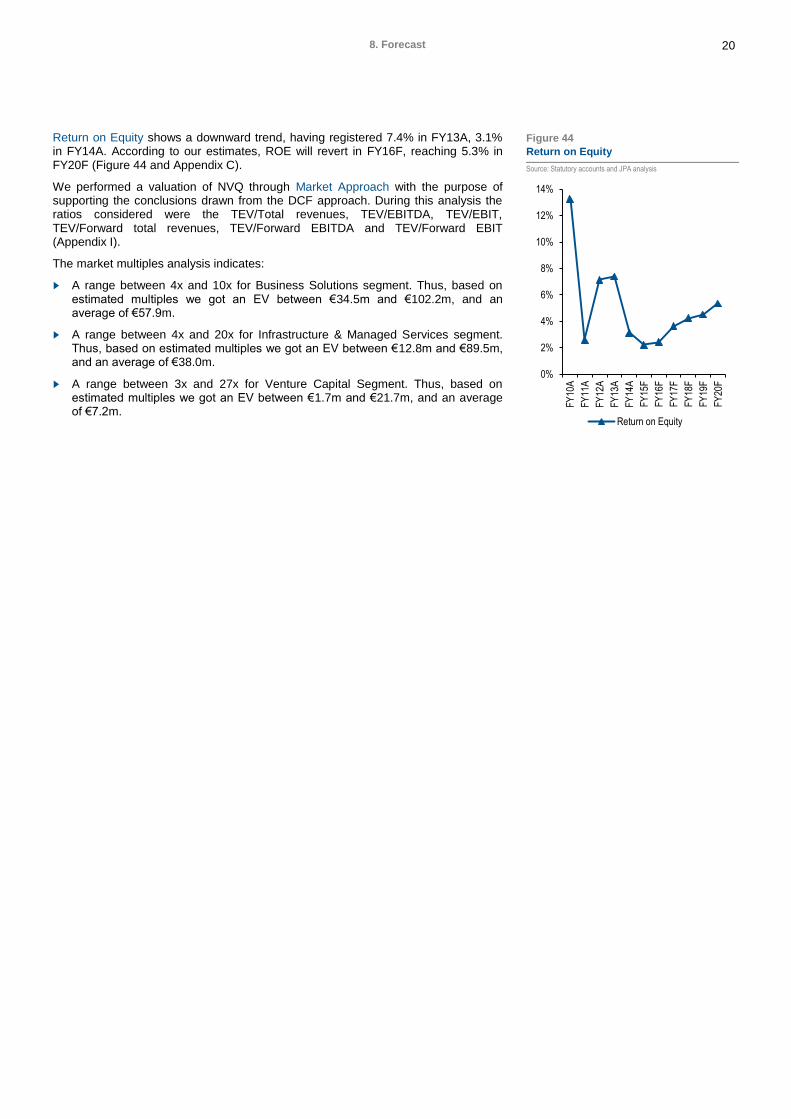
20 8. Forecast
Return on Equity shows a downward trend, having registered 7.4% in FY13A, 3.1% in FY14A. According to our estimates, ROE will revert in FY16F, reaching 5.3% in FY20F (Figure 44 and Appendix C).
We performed a valuation of NVQ through Market Approach with the purpose of supporting the conclusions drawn from the DCF approach. During this analysis the ratios considered were the TEV/Total revenues, TEV/EBITDA, TEV/EBIT, TEV/Forward total revenues, TEV/Forward EBITDA and TEV/Forward EBIT (Appendix I).
The market multiples analysis indicates:
► A range between 4x and 10x for Business Solutions segment. Thus, based on estimated multiples we got an EV between €34.5m and €102.2m, and an average of €57.9m.
► A range between 4x and 20x for Infrastructure & Managed Services segment. Thus, based on estimated multiples we got an EV between €12.8m and €89.5m, and an average of €38.0m.
► A range between 3x and 27x for Venture Capital Segment. Thus, based on estimated multiples we got an EV between €1.7m and €21.7m, and an average of €7.2m.
Figure 44
Return on Equity
Source: Statutory accounts and JPA analysis
0%
2%
4%
6%
8%
10%
12%
14%
FY
10A
FY
11A
FY
12A
FY
13A
FY
14A
FY
15F
FY
16F
FY
17F
FY
18F
FY
19F
FY
20F
Return on Equity
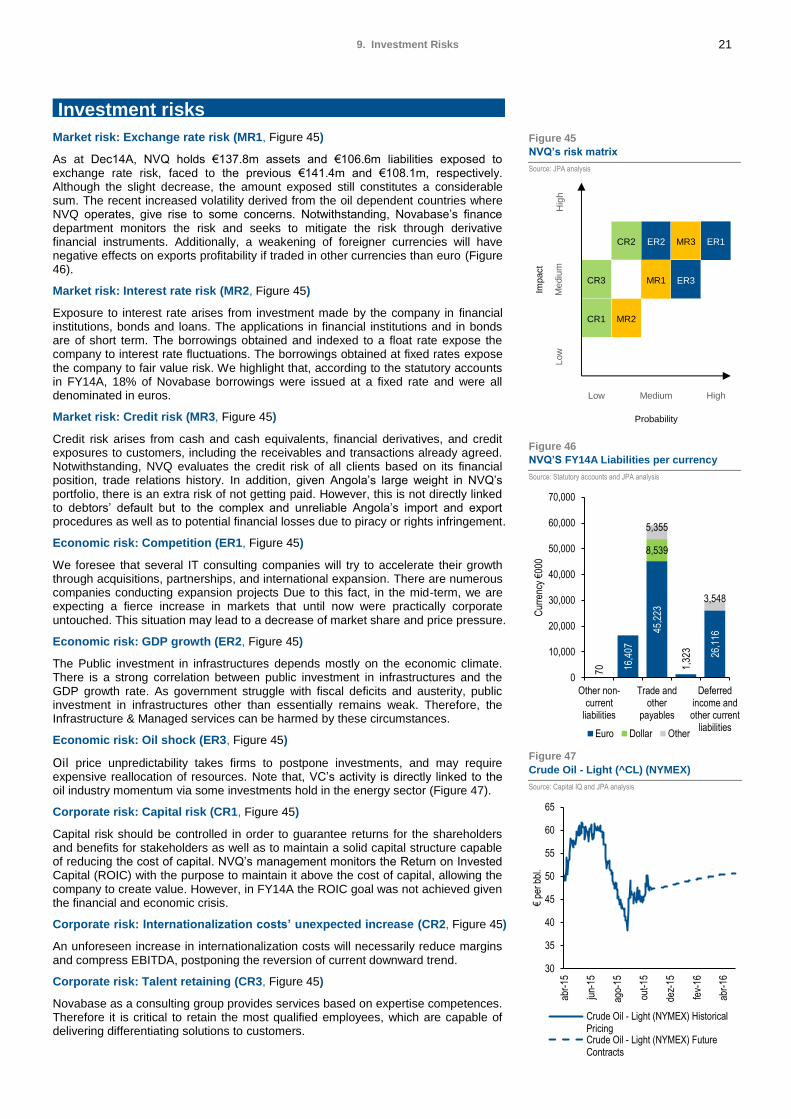
21 Investment Risks
Market risk: Exchange rate risk (MR1, Figure 45)
As at Dec14A, NVQ holds €137.8m assets and €106.6m liabilities exposed to exchange rate risk, faced to the previous €141.4m and €108.1m, respectively. Although the slight decrease, the amount exposed still constitutes a considerable sum. The recent increased volatility derived from the oil dependent countries where NVQ operates, give rise to some concerns. Notwithstanding, Novabase’s finance department monitors the risk and seeks to mitigate the risk through derivative financial instruments. Additionally, a weakening of foreigner currencies will have negative effects on exports profitability if traded in other currencies than euro (Figure 46).
Market risk: Interest rate risk (MR2, Figure 45)
Exposure to interest rate arises from investment made by the company in financial institutions, bonds and loans. The applications in financial institutions and in bonds are of short term. The borrowings obtained and indexed to a float rate expose the company to interest rate fluctuations. The borrowings obtained at fixed rates expose the company to fair value risk. We highlight that, according to the statutory accounts in FY14A, 18% of Novabase borrowings were issued at a fixed rate and were all denominated in euros.
Market risk: Credit risk (MR3, Figure 45)
Credit risk arises from cash and cash equivalents, financial derivatives, and credit exposures to customers, including the receivables and transactions already agreed. Notwithstanding, NVQ evaluates the credit risk of all clients based on its financial position, trade relations history. In addition, given Angola’s large weight in NVQ’s portfolio, there is an extra risk of not getting paid. However, this is not directly linked to debtors’ default but to the complex and unreliable Angola’s import and export procedures as well as to potential financial losses due to piracy or rights infringement.
Economic risk: Competition (ER1, Figure 45)
We foresee that several IT consulting companies will try to accelerate their growth through acquisitions, partnerships, and international expansion. There are numerous companies conducting expansion projects Due to this fact, in the mid-term, we are expecting a fierce increase in markets that until now were practically corporate untouched. This situation may lead to a decrease of market share and price pressure.
Economic risk: GDP growth (ER2, Figure 45)
The Public investment in infrastructures depends mostly on the economic climate. There is a strong correlation between public investment in infrastructures and the GDP growth rate. As government struggle with fiscal deficits and austerity, public investment in infrastructures other than essentially remains weak. Therefore, the Infrastructure & Managed services can be harmed by these circumstances.
Economic risk: Oil shock (ER3, Figure 45)
Oil price unpredictability takes firms to postpone investments, and may require expensive reallocation of resources. Note that, VC’s activity is directly linked to the oil industry momentum via some investments hold in the energy sector (Figure 47).
Corporate risk: Capital risk (CR1, Figure 45)
Capital risk should be controlled in order to guarantee returns for the shareholders and benefits for stakeholders as well as to maintain a solid capital structure capable of reducing the cost of capital. NVQ’s management monitors the Return on Invested Capital (ROIC) with the purpose to maintain it above the cost of capital, allowing the company to create value. However, in FY14A the ROIC goal was not achieved given the financial and economic crisis.
Corporate risk: Internationalization costs’ unexpected increase (CR2, Figure 45)
An unforeseen increase in internationalization costs will necessarily reduce margins and compress EBITDA, postponing the reversion of current downward trend.
Corporate risk: Talent retaining (CR3, Figure 45)
Novabase as a consulting group provides services based on expertise competences. Therefore it is critical to retain the most qualified employees, which are capable of delivering differentiating solutions to customers.
9. Investment Risks
Investment risks
Figure 45
NVQ’s risk matrix
Source: JPA analysis
ER1
MR1
MR2
CR3
CR1
Low Medium High
Probability
Low
Mediu
mH
igh
Impact
MR3ER2
ER3
CR2
Figure 46
NVQ’S FY14A Liabilities per currency
Source: Statutory accounts and JPA analysis
70 16,4
07
45,2
23
1,32
3 26,1
16
8,539
5,355
3,548
0
10,000
20,000
30,000
40,000
50,000
60,000
70,000
Other non-current
liabilities
Trade andother
payables
Deferredincome andother current
liabilities
Cur
renc
y €0
00
Euro Dollar Other
Figure 47
Crude Oil - Light (^CL) (NYMEX)
Source: Capital IQ and JPA analysis
30
35
40
45
50
55
60
65
abr-
15
jun-
15
ago-
15
out-
15
dez-
15
fev-
16
abr-
16
€pe
r bb
l.
Crude Oil - Light (NYMEX) HistoricalPricingCrude Oil - Light (NYMEX) FutureContracts
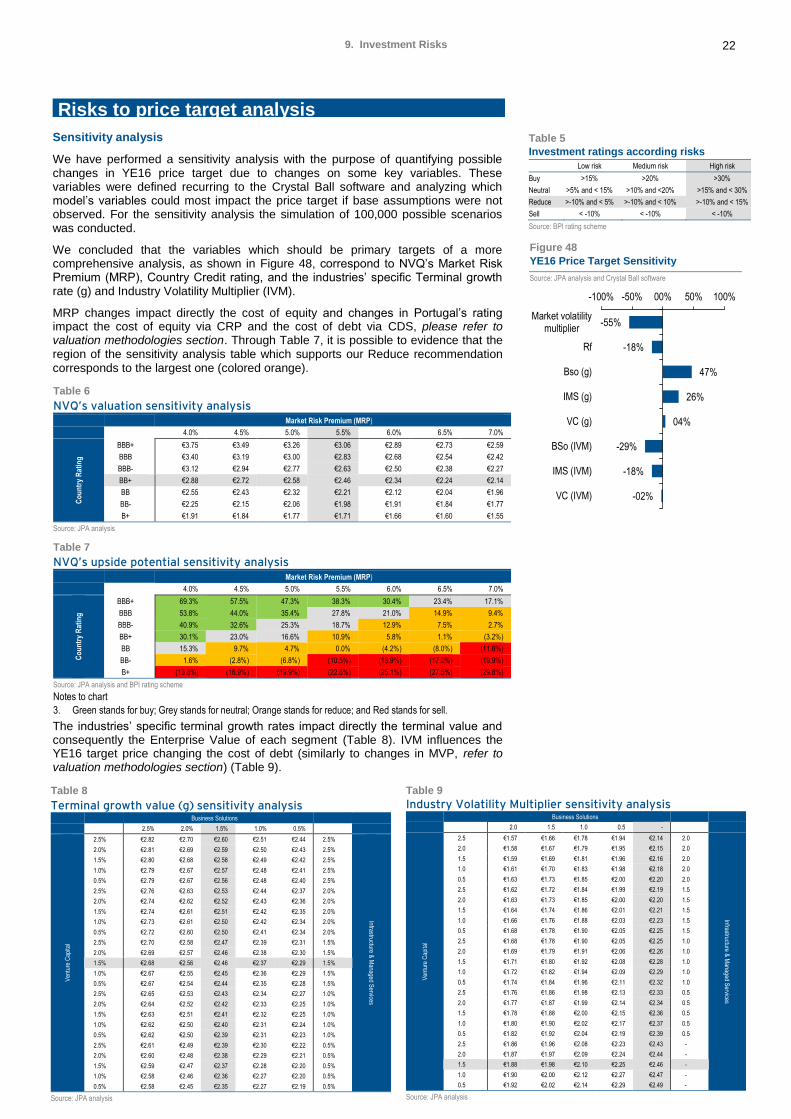
22 9. Investment Risks
Sensitivity analysis
We have performed a sensitivity analysis with the purpose of quantifying possible changes in YE16 price target due to changes on some key variables. These variables were defined recurring to the Crystal Ball software and analyzing which model’s variables could most impact the price target if base assumptions were not observed. For the sensitivity analysis the simulation of 100,000 possible scenarios was conducted.
We concluded that the variables which should be primary targets of a more comprehensive analysis, as shown in Figure 48, correspond to NVQ’s Market Risk Premium (MRP), Country Credit rating, and the industries’ specific Terminal growth rate (g) and Industry Volatility Multiplier (IVM).
MRP changes impact directly the cost of equity and changes in Portugal’s rating impact the cost of equity via CRP and the cost of debt via CDS, please refer to valuation methodologies section. Through Table 7, it is possible to evidence that the region of the sensitivity analysis table which supports our Reduce recommendation corresponds to the largest one (colored orange).
The industries’ specific terminal growth rates impact directly the terminal value and consequently the Enterprise Value of each segment (Table 8). IVM influences the YE16 target price changing the cost of debt (similarly to changes in MVP, refer to valuation methodologies section) (Table 9).
Risks to price target analysis
Table 8
Terminal growth value (g) sensitivity analysis
Business Solutions
2.5% 2.0% 1.5% 1.0% 0.5%
Ven
ture
Cap
ital
2.5% €2.82 €2.70 €2.60 €2.51 €2.44 2.5%
Infrastructure & M
anaged Services
2.0% €2.81 €2.69 €2.59 €2.50 €2.43 2.5%
1.5% €2.80 €2.68 €2.58 €2.49 €2.42 2.5%
1.0% €2.79 €2.67 €2.57 €2.48 €2.41 2.5%
0.5% €2.79 €2.67 €2.56 €2.48 €2.40 2.5%
2.5% €2.76 €2.63 €2.53 €2.44 €2.37 2.0%
2.0% €2.74 €2.62 €2.52 €2.43 €2.36 2.0%
1.5% €2.74 €2.61 €2.51 €2.42 €2.35 2.0%
1.0% €2.73 €2.61 €2.50 €2.42 €2.34 2.0%
0.5% €2.72 €2.60 €2.50 €2.41 €2.34 2.0%
2.5% €2.70 €2.58 €2.47 €2.39 €2.31 1.5%
2.0% €2.69 €2.57 €2.46 €2.38 €2.30 1.5%
1.5% €2.68 €2.56 €2.46 €2.37 €2.29 1.5%
1.0% €2.67 €2.55 €2.45 €2.36 €2.29 1.5%
0.5% €2.67 €2.54 €2.44 €2.35 €2.28 1.5%
2.5% €2.65 €2.53 €2.43 €2.34 €2.27 1.0%
2.0% €2.64 €2.52 €2.42 €2.33 €2.25 1.0%
1.5% €2.63 €2.51 €2.41 €2.32 €2.25 1.0%
1.0% €2.62 €2.50 €2.40 €2.31 €2.24 1.0%
0.5% €2.62 €2.50 €2.39 €2.31 €2.23 1.0%
2.5% €2.61 €2.49 €2.39 €2.30 €2.22 0.5%
2.0% €2.60 €2.48 €2.38 €2.29 €2.21 0.5%
1.5% €2.59 €2.47 €2.37 €2.28 €2.20 0.5%
1.0% €2.58 €2.46 €2.36 €2.27 €2.20 0.5%
0.5% €2.58 €2.45 €2.35 €2.27 €2.19 0.5%
Source: JPA analysis
Table 9
Industry Volatility Multiplier sensitivity analysis
Business Solutions
2.0 1.5 1.0 0.5 -
Ven
ture
Cap
ital
2.5 €1.57 €1.66 €1.78 €1.94 €2.14 2.0
Infrastructure & M
anaged Services
2.0 €1.58 €1.67 €1.79 €1.95 €2.15 2.0
1.5 €1.59 €1.69 €1.81 €1.96 €2.16 2.0
1.0 €1.61 €1.70 €1.83 €1.98 €2.18 2.0
0.5 €1.63 €1.73 €1.85 €2.00 €2.20 2.0
2.5 €1.62 €1.72 €1.84 €1.99 €2.19 1.5
2.0 €1.63 €1.73 €1.85 €2.00 €2.20 1.5
1.5 €1.64 €1.74 €1.86 €2.01 €2.21 1.5
1.0 €1.66 €1.76 €1.88 €2.03 €2.23 1.5
0.5 €1.68 €1.78 €1.90 €2.05 €2.25 1.5
2.5 €1.68 €1.78 €1.90 €2.05 €2.25 1.0
2.0 €1.69 €1.79 €1.91 €2.06 €2.26 1.0
1.5 €1.71 €1.80 €1.92 €2.08 €2.28 1.0
1.0 €1.72 €1.82 €1.94 €2.09 €2.29 1.0
0.5 €1.74 €1.84 €1.96 €2.11 €2.32 1.0
2.5 €1.76 €1.86 €1.98 €2.13 €2.33 0.5
2.0 €1.77 €1.87 €1.99 €2.14 €2.34 0.5
1.5 €1.78 €1.88 €2.00 €2.15 €2.36 0.5
1.0 €1.80 €1.90 €2.02 €2.17 €2.37 0.5
0.5 €1.82 €1.92 €2.04 €2.19 €2.39 0.5
2.5 €1.86 €1.96 €2.08 €2.23 €2.43 -
2.0 €1.87 €1.97 €2.09 €2.24 €2.44 -
1.5 €1.88 €1.98 €2.10 €2.25 €2.46 -
1.0 €1.90 €2.00 €2.12 €2.27 €2.47 -
0.5 €1.92 €2.02 €2.14 €2.29 €2.49 -
Source: JPA analysis
Table 6
NVQ’s valuation sensitivity analysis
Market Risk Premium (MRP)
€2.46 4.0% 4.5% 5.0% 5.5% 6.0% 6.5% 7.0%
Co
un
try
Rat
ing
BBB+ €3.75 €3.49 €3.26 €3.06 €2.89 €2.73 €2.59
BBB €3.40 €3.19 €3.00 €2.83 €2.68 €2.54 €2.42
BBB- €3.12 €2.94 €2.77 €2.63 €2.50 €2.38 €2.27
BB+ €2.88 €2.72 €2.58 €2.46 €2.34 €2.24 €2.14
BB €2.55 €2.43 €2.32 €2.21 €2.12 €2.04 €1.96
BB- €2.25 €2.15 €2.06 €1.98 €1.91 €1.84 €1.77
B+ €1.91 €1.84 €1.77 €1.71 €1.66 €1.60 €1.55
Source: JPA analysis
Table 7
NVQ’s upside potential sensitivity analysis
Market Risk Premium (MRP)
€2.46 4.0% 4.5% 5.0% 5.5% 6.0% 6.5% 7.0%
Co
un
try
Rat
ing
BBB+ 69.3% 57.5% 47.3% 38.3% 30.4% 23.4% 17.1%
BBB 53.8% 44.0% 35.4% 27.8% 21.0% 14.9% 9.4%
BBB- 40.9% 32.6% 25.3% 18.7% 12.9% 7.5% 2.7%
BB+ 30.1% 23.0% 16.6% 10.9% 5.8% 1.1% (3.2%)
BB 15.3% 9.7% 4.7% 0.0% (4.2%) (8.0%) (11.6%)
BB- 1.6% (2.8%) (6.8%) (10.5%) (13.9%) (17.0%) (19.9%)
B+ (13.8%) (16.9%) (19.9%) (22.6%) (25.1%) (27.5%) (29.8%)
Source: JPA analysis and BPI rating scheme
Notes to chart
3. Green stands for buy; Grey stands for neutral; Orange stands for reduce; and Red stands for sell.
Table 5
Investment ratings according risks
Low risk Medium risk High risk
Buy >15% >20% >30%
Neutral >5% and < 15% >10% and <20% >15% and < 30%
Reduce >-10% and < 5% >-10% and < 10% >-10% and < 15%
Sell < -10% < -10% < -10%
Source: BPI rating scheme
Figure 48
YE16 Price Target Sensitivity
Source: JPA analysis and Crystal Ball software
-55%
-18%
47%
26%
04%
-29%
-18%
-02%
-100% -50% 00% 50% 100%
Market volatilitymultiplier
Rf
Bso (g)
IMS (g)
VC (g)
BSo (IVM)
IMS (IVM)
VC (IVM)
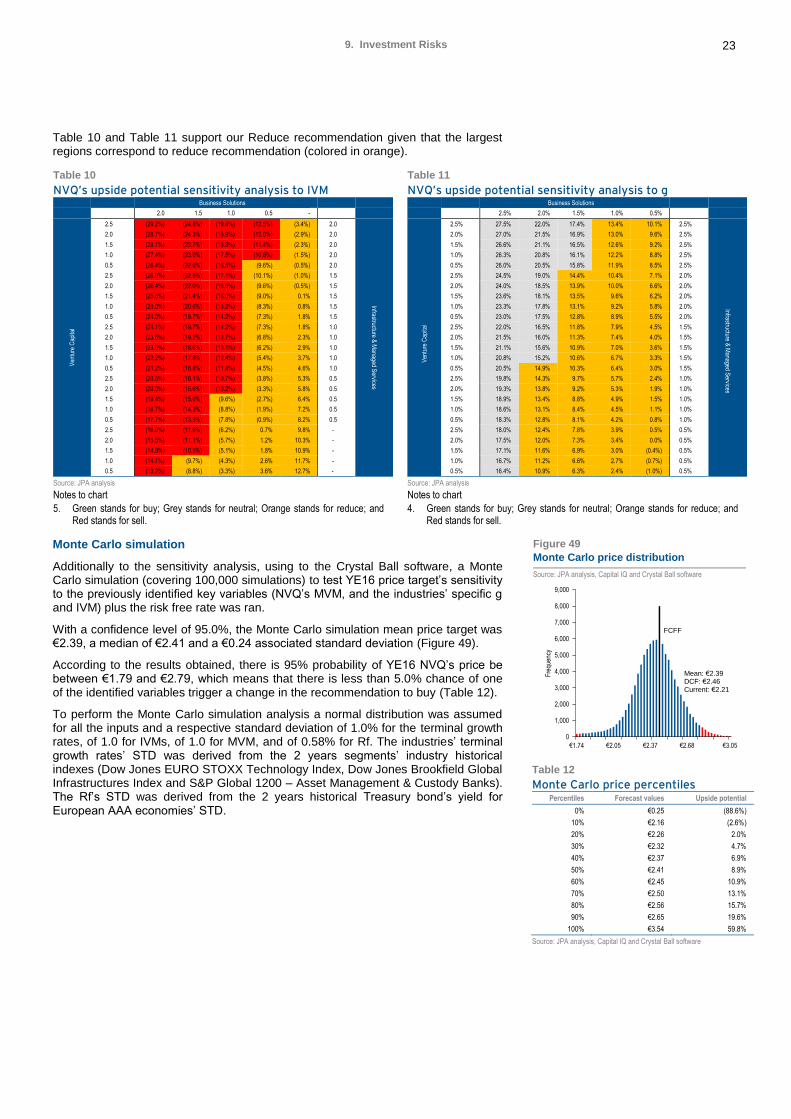
23 9. Investment Risks
Table 10 and Table 11 support our Reduce recommendation given that the largest regions correspond to reduce recommendation (colored in orange).
Monte Carlo simulation
Additionally to the sensitivity analysis, using to the Crystal Ball software, a Monte Carlo simulation (covering 100,000 simulations) to test YE16 price target’s sensitivity to the previously identified key variables (NVQ’s MVM, and the industries’ specific g and IVM) plus the risk free rate was ran.
With a confidence level of 95.0%, the Monte Carlo simulation mean price target was €2.39, a median of €2.41 and a €0.24 associated standard deviation (Figure 49).
According to the results obtained, there is 95% probability of YE16 NVQ’s price be between €1.79 and €2.79, which means that there is less than 5.0% chance of one of the identified variables trigger a change in the recommendation to buy (Table 12).
To perform the Monte Carlo simulation analysis a normal distribution was assumed for all the inputs and a respective standard deviation of 1.0% for the terminal growth rates, of 1.0 for IVMs, of 1.0 for MVM, and of 0.58% for Rf. The industries’ terminal growth rates’ STD was derived from the 2 years segments’ industry historical indexes (Dow Jones EURO STOXX Technology Index, Dow Jones Brookfield Global Infrastructures Index and S&P Global 1200 – Asset Management & Custody Banks). The Rf’s STD was derived from the 2 years historical Treasury bond’s yield for European AAA economies’ STD.
Table 11
NVQ’s upside potential sensitivity analysis to g
Business Solutions
2.5% 2.0% 1.5% 1.0% 0.5%
Ven
ture
Cap
ital
2.5% 27.5% 22.0% 17.4% 13.4% 10.1% 2.5%
Infrastructure & M
anaged Services
2.0% 27.0% 21.5% 16.9% 13.0% 9.6% 2.5%
1.5% 26.6% 21.1% 16.5% 12.6% 9.2% 2.5%
1.0% 26.3% 20.8% 16.1% 12.2% 8.8% 2.5%
0.5% 26.0% 20.5% 15.8% 11.9% 8.5% 2.5%
2.5% 24.5% 19.0% 14.4% 10.4% 7.1% 2.0%
2.0% 24.0% 18.5% 13.9% 10.0% 6.6% 2.0%
1.5% 23.6% 18.1% 13.5% 9.6% 6.2% 2.0%
1.0% 23.3% 17.8% 13.1% 9.2% 5.8% 2.0%
0.5% 23.0% 17.5% 12.8% 8.9% 5.5% 2.0%
2.5% 22.0% 16.5% 11.8% 7.9% 4.5% 1.5%
2.0% 21.5% 16.0% 11.3% 7.4% 4.0% 1.5%
1.5% 21.1% 15.6% 10.9% 7.0% 3.6% 1.5%
1.0% 20.8% 15.2% 10.6% 6.7% 3.3% 1.5%
0.5% 20.5% 14.9% 10.3% 6.4% 3.0% 1.5%
2.5% 19.8% 14.3% 9.7% 5.7% 2.4% 1.0%
2.0% 19.3% 13.8% 9.2% 5.3% 1.9% 1.0%
1.5% 18.9% 13.4% 8.8% 4.9% 1.5% 1.0%
1.0% 18.6% 13.1% 8.4% 4.5% 1.1% 1.0%
0.5% 18.3% 12.8% 8.1% 4.2% 0.8% 1.0%
2.5% 18.0% 12.4% 7.8% 3.9% 0.5% 0.5%
2.0% 17.5% 12.0% 7.3% 3.4% 0.0% 0.5%
1.5% 17.1% 11.6% 6.9% 3.0% (0.4%) 0.5%
1.0% 16.7% 11.2% 6.6% 2.7% (0.7%) 0.5%
0.5% 16.4% 10.9% 6.3% 2.4% (1.0%) 0.5%
Source: JPA analysis
Notes to chart
4. Green stands for buy; Grey stands for neutral; Orange stands for reduce; and Red stands for sell.
Table 10
NVQ’s upside potential sensitivity analysis to IVM
Business Solutions
2.0 1.5 1.0 0.5 -
Ven
ture
Cap
ital
2.5 (29.2%) (24.8%) (19.4%) (12.5%) (3.4%) 2.0
Infrastructure & M
anaged Services
2.0 (28.7%) (24.3%) (18.9%) (12.0%) (2.9%) 2.0
1.5 (28.1%) (23.7%) (18.3%) (11.4%) (2.3%) 2.0
1.0 (27.4%) (23.0%) (17.5%) (10.6%) (1.5%) 2.0
0.5 (26.4%) (22.0%) (16.5%) (9.6%) (0.5%) 2.0
2.5 (26.9%) (22.5%) (17.1%) (10.1%) (1.0%) 1.5
2.0 (26.4%) (22.0%) (16.6%) (9.6%) (0.5%) 1.5
1.5 (25.8%) (21.4%) (16.0%) (9.0%) 0.1% 1.5
1.0 (25.0%) (20.6%) (15.2%) (8.3%) 0.8% 1.5
0.5 (24.0%) (19.7%) (14.2%) (7.3%) 1.8% 1.5
2.5 (24.1%) (19.7%) (14.2%) (7.3%) 1.8% 1.0
2.0 (23.6%) (19.2%) (13.7%) (6.8%) 2.3% 1.0
1.5 (23.0%) (18.6%) (13.1%) (6.2%) 2.9% 1.0
1.0 (22.2%) (17.8%) (12.4%) (5.4%) 3.7% 1.0
0.5 (21.2%) (16.8%) (11.4%) (4.5%) 4.6% 1.0
2.5 (20.5%) (16.1%) (10.7%) (3.8%) 5.3% 0.5
2.0 (20.0%) (15.6%) (10.2%) (3.3%) 5.8% 0.5
1.5 (19.4%) (15.0%) (9.6%) (2.7%) 6.4% 0.5
1.0 (18.7%) (14.3%) (8.8%) (1.9%) 7.2% 0.5
0.5 (17.7%) (13.3%) (7.8%) (0.9%) 8.2% 0.5
2.5 (16.0%) (11.6%) (6.2%) 0.7% 9.8% -
2.0 (15.5%) (11.1%) (5.7%) 1.2% 10.3% -
1.5 (14.9%) (10.5%) (5.1%) 1.8% 10.9% -
1.0 (14.1%) (9.7%) (4.3%) 2.6% 11.7% -
0.5 (13.2%) (8.8%) (3.3%) 3.6% 12.7% -
Source: JPA analysis
Notes to chart
5. Green stands for buy; Grey stands for neutral; Orange stands for reduce; and Red stands for sell.
Table 12
Monte Carlo price percentiles Percentiles Forecast values Upside potential
0% €0.25 (88.6%)
10% €2.16 (2.6%)
20% €2.26 2.0%
30% €2.32 4.7%
40% €2.37 6.9%
50% €2.41 8.9%
60% €2.45 10.9%
70% €2.50 13.1%
80% €2.56 15.7%
90% €2.65 19.6%
100% €3.54 59.8%
Source: JPA analysis, Capital IQ and Crystal Ball software
Figure 49
Monte Carlo price distribution
Source: JPA analysis, Capital IQ and Crystal Ball software
0
1,000
2,000
3,000
4,000
5,000
6,000
7,000
8,000
9,000
€1.74 €2.05 €2.37 €2.68 €3.05
Fre
quen
cy
Mean: €2.39DCF: €2.46Current: €2.21
FCFF
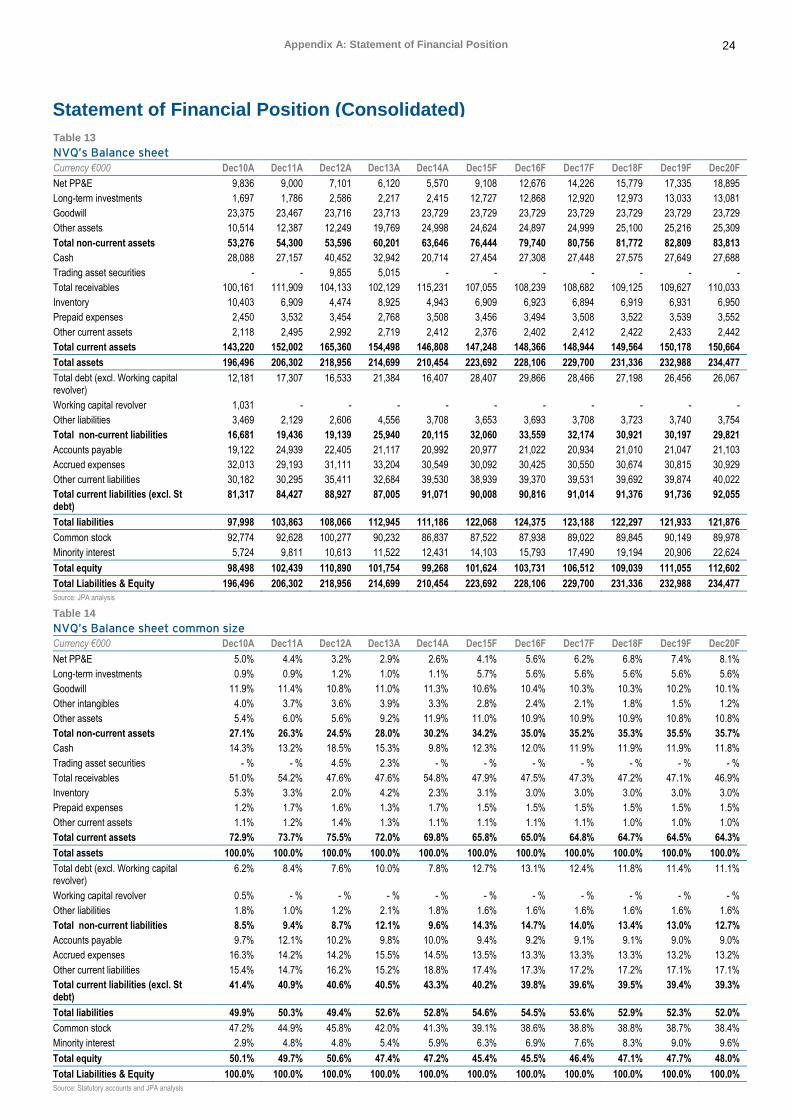
24 Appendix A: Statement of Financial Position
Appendix A: Statement of Financial Position
Statement of Financial Position (Consolidated)
Table 13
NVQ’s Balance sheet Currency €000 Dec10A Dec11A Dec12A Dec13A Dec14A Dec15F Dec16F Dec17F Dec18F Dec19F Dec20F
Net PP&E 9,836 9,000 7,101 6,120 5,570 9,108 12,676 14,226 15,779 17,335 18,895
Long-term investments 1,697 1,786 2,586 2,217 2,415 12,727 12,868 12,920 12,973 13,033 13,081
Goodwill 23,375 23,467 23,716 23,713 23,729 23,729 23,729 23,729 23,729 23,729 23,729
Other assets 10,514 12,387 12,249 19,769 24,998 24,624 24,897 24,999 25,100 25,216 25,309
Total non-current assets 53,276 54,300 53,596 60,201 63,646 76,444 79,740 80,756 81,772 82,809 83,813
Cash 28,088 27,157 40,452 32,942 20,714 27,454 27,308 27,448 27,575 27,649 27,688
Trading asset securities - - 9,855 5,015 - - - - - - -
Total receivables 100,161 111,909 104,133 102,129 115,231 107,055 108,239 108,682 109,125 109,627 110,033
Inventory 10,403 6,909 4,474 8,925 4,943 6,909 6,923 6,894 6,919 6,931 6,950
Prepaid expenses 2,450 3,532 3,454 2,768 3,508 3,456 3,494 3,508 3,522 3,539 3,552
Other current assets 2,118 2,495 2,992 2,719 2,412 2,376 2,402 2,412 2,422 2,433 2,442
Total current assets 143,220 152,002 165,360 154,498 146,808 147,248 148,366 148,944 149,564 150,178 150,664
Total assets 196,496 206,302 218,956 214,699 210,454 223,692 228,106 229,700 231,336 232,988 234,477
Total debt (excl. Working capital revolver)
12,181 17,307 16,533 21,384 16,407 28,407 29,866 28,466 27,198 26,456 26,067
Working capital revolver 1,031 - - - - - - - - - -
Other liabilities 3,469 2,129 2,606 4,556 3,708 3,653 3,693 3,708 3,723 3,740 3,754
Total non-current liabilities 16,681 19,436 19,139 25,940 20,115 32,060 33,559 32,174 30,921 30,197 29,821
Accounts payable 19,122 24,939 22,405 21,117 20,992 20,977 21,022 20,934 21,010 21,047 21,103
Accrued expenses 32,013 29,193 31,111 33,204 30,549 30,092 30,425 30,550 30,674 30,815 30,929
Other current liabilities 30,182 30,295 35,411 32,684 39,530 38,939 39,370 39,531 39,692 39,874 40,022
Total current liabilities (excl. St debt)
81,317 84,427 88,927 87,005 91,071 90,008 90,816 91,014 91,376 91,736 92,055
Total liabilities 97,998 103,863 108,066 112,945 111,186 122,068 124,375 123,188 122,297 121,933 121,876
Common stock 92,774 92,628 100,277 90,232 86,837 87,522 87,938 89,022 89,845 90,149 89,978
Minority interest 5,724 9,811 10,613 11,522 12,431 14,103 15,793 17,490 19,194 20,906 22,624
Total equity 98,498 102,439 110,890 101,754 99,268 101,624 103,731 106,512 109,039 111,055 112,602
Total Liabilities & Equity 196,496 206,302 218,956 214,699 210,454 223,692 228,106 229,700 231,336 232,988 234,477
Source: JPA analysis
Table 14
NVQ’s Balance sheet common size Currency €000 Dec10A Dec11A Dec12A Dec13A Dec14A Dec15F Dec16F Dec17F Dec18F Dec19F Dec20F
Net PP&E 5.0% 4.4% 3.2% 2.9% 2.6% 4.1% 5.6% 6.2% 6.8% 7.4% 8.1%
Long-term investments 0.9% 0.9% 1.2% 1.0% 1.1% 5.7% 5.6% 5.6% 5.6% 5.6% 5.6%
Goodwill 11.9% 11.4% 10.8% 11.0% 11.3% 10.6% 10.4% 10.3% 10.3% 10.2% 10.1%
Other intangibles 4.0% 3.7% 3.6% 3.9% 3.3% 2.8% 2.4% 2.1% 1.8% 1.5% 1.2%
Other assets 5.4% 6.0% 5.6% 9.2% 11.9% 11.0% 10.9% 10.9% 10.9% 10.8% 10.8%
Total non-current assets 27.1% 26.3% 24.5% 28.0% 30.2% 34.2% 35.0% 35.2% 35.3% 35.5% 35.7%
Cash 14.3% 13.2% 18.5% 15.3% 9.8% 12.3% 12.0% 11.9% 11.9% 11.9% 11.8%
Trading asset securities - % - % 4.5% 2.3% - % - % - % - % - % - % - %
Total receivables 51.0% 54.2% 47.6% 47.6% 54.8% 47.9% 47.5% 47.3% 47.2% 47.1% 46.9%
Inventory 5.3% 3.3% 2.0% 4.2% 2.3% 3.1% 3.0% 3.0% 3.0% 3.0% 3.0%
Prepaid expenses 1.2% 1.7% 1.6% 1.3% 1.7% 1.5% 1.5% 1.5% 1.5% 1.5% 1.5%
Other current assets 1.1% 1.2% 1.4% 1.3% 1.1% 1.1% 1.1% 1.1% 1.0% 1.0% 1.0%
Total current assets 72.9% 73.7% 75.5% 72.0% 69.8% 65.8% 65.0% 64.8% 64.7% 64.5% 64.3%
Total assets 100.0% 100.0% 100.0% 100.0% 100.0% 100.0% 100.0% 100.0% 100.0% 100.0% 100.0%
Total debt (excl. Working capital revolver)
6.2% 8.4% 7.6% 10.0% 7.8% 12.7% 13.1% 12.4% 11.8% 11.4% 11.1%
Working capital revolver 0.5% - % - % - % - % - % - % - % - % - % - %
Other liabilities 1.8% 1.0% 1.2% 2.1% 1.8% 1.6% 1.6% 1.6% 1.6% 1.6% 1.6%
Total non-current liabilities 8.5% 9.4% 8.7% 12.1% 9.6% 14.3% 14.7% 14.0% 13.4% 13.0% 12.7%
Accounts payable 9.7% 12.1% 10.2% 9.8% 10.0% 9.4% 9.2% 9.1% 9.1% 9.0% 9.0%
Accrued expenses 16.3% 14.2% 14.2% 15.5% 14.5% 13.5% 13.3% 13.3% 13.3% 13.2% 13.2%
Other current liabilities 15.4% 14.7% 16.2% 15.2% 18.8% 17.4% 17.3% 17.2% 17.2% 17.1% 17.1%
Total current liabilities (excl. St debt)
41.4% 40.9% 40.6% 40.5% 43.3% 40.2% 39.8% 39.6% 39.5% 39.4% 39.3%
Total liabilities 49.9% 50.3% 49.4% 52.6% 52.8% 54.6% 54.5% 53.6% 52.9% 52.3% 52.0%
Common stock 47.2% 44.9% 45.8% 42.0% 41.3% 39.1% 38.6% 38.8% 38.8% 38.7% 38.4%
Minority interest 2.9% 4.8% 4.8% 5.4% 5.9% 6.3% 6.9% 7.6% 8.3% 9.0% 9.6%
Total equity 50.1% 49.7% 50.6% 47.4% 47.2% 45.4% 45.5% 46.4% 47.1% 47.7% 48.0%
Total Liabilities & Equity 100.0% 100.0% 100.0% 100.0% 100.0% 100.0% 100.0% 100.0% 100.0% 100.0% 100.0%
Source: Statutory accounts and JPA analysis
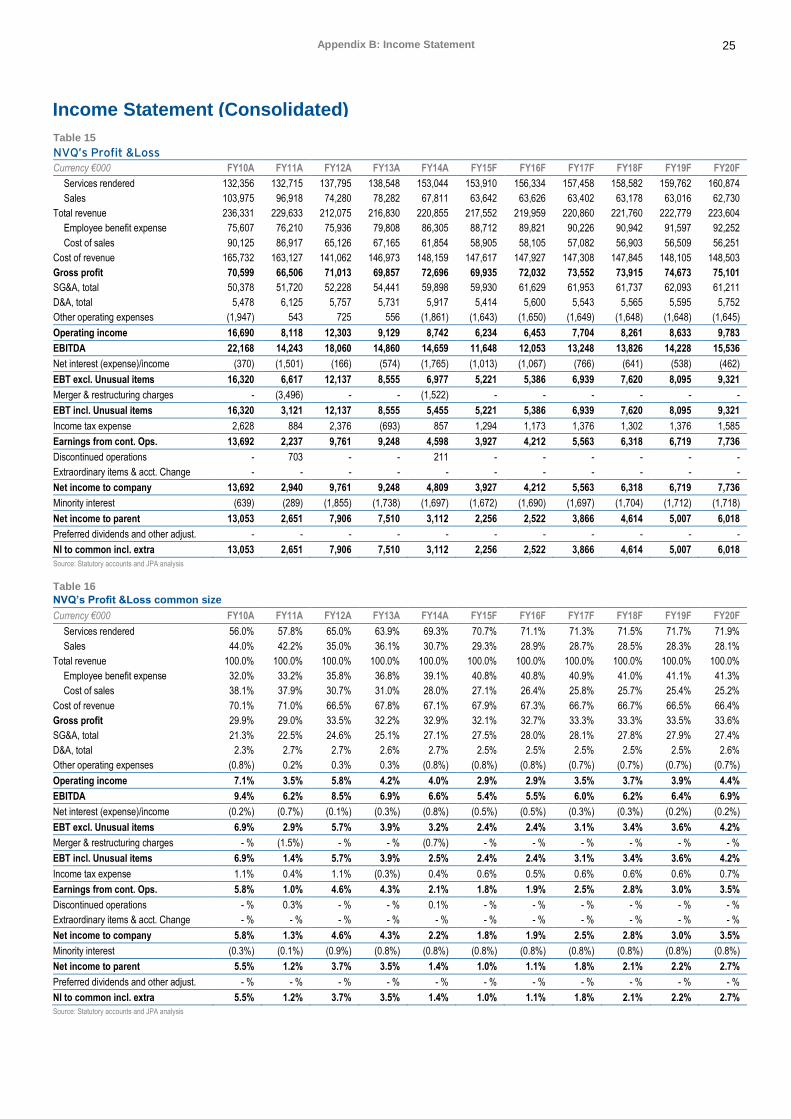
25 Appendix B: Income Statement
Appendix B: Income Statement
Income Statement (Consolidated)
Table 15
NVQ’s Profit &Loss
Currency €000 FY10A FY11A FY12A FY13A FY14A FY15F FY16F FY17F FY18F FY19F FY20F
Services rendered 132,356 132,715 137,795 138,548 153,044 153,910 156,334 157,458 158,582 159,762 160,874
Sales 103,975 96,918 74,280 78,282 67,811 63,642 63,626 63,402 63,178 63,016 62,730
Total revenue 236,331 229,633 212,075 216,830 220,855 217,552 219,959 220,860 221,760 222,779 223,604
Employee benefit expense 75,607 76,210 75,936 79,808 86,305 88,712 89,821 90,226 90,942 91,597 92,252
Cost of sales 90,125 86,917 65,126 67,165 61,854 58,905 58,105 57,082 56,903 56,509 56,251
Cost of revenue 165,732 163,127 141,062 146,973 148,159 147,617 147,927 147,308 147,845 148,105 148,503
Gross profit 70,599 66,506 71,013 69,857 72,696 69,935 72,032 73,552 73,915 74,673 75,101
SG&A, total 50,378 51,720 52,228 54,441 59,898 59,930 61,629 61,953 61,737 62,093 61,211
D&A, total 5,478 6,125 5,757 5,731 5,917 5,414 5,600 5,543 5,565 5,595 5,752
Other operating expenses (1,947) 543 725 556 (1,861) (1,643) (1,650) (1,649) (1,648) (1,648) (1,645)
Operating income 16,690 8,118 12,303 9,129 8,742 6,234 6,453 7,704 8,261 8,633 9,783
EBITDA 22,168 14,243 18,060 14,860 14,659 11,648 12,053 13,248 13,826 14,228 15,536
Net interest (expense)/income (370) (1,501) (166) (574) (1,765) (1,013) (1,067) (766) (641) (538) (462)
EBT excl. Unusual items 16,320 6,617 12,137 8,555 6,977 5,221 5,386 6,939 7,620 8,095 9,321
Merger & restructuring charges - (3,496) - - (1,522) - - - - - -
EBT incl. Unusual items 16,320 3,121 12,137 8,555 5,455 5,221 5,386 6,939 7,620 8,095 9,321
Income tax expense 2,628 884 2,376 (693) 857 1,294 1,173 1,376 1,302 1,376 1,585
Earnings from cont. Ops. 13,692 2,237 9,761 9,248 4,598 3,927 4,212 5,563 6,318 6,719 7,736
Discontinued operations - 703 - - 211 - - - - - -
Extraordinary items & acct. Change - - - - - - - - - - -
Net income to company 13,692 2,940 9,761 9,248 4,809 3,927 4,212 5,563 6,318 6,719 7,736
Minority interest (639) (289) (1,855) (1,738) (1,697) (1,672) (1,690) (1,697) (1,704) (1,712) (1,718)
Net income to parent 13,053 2,651 7,906 7,510 3,112 2,256 2,522 3,866 4,614 5,007 6,018
Preferred dividends and other adjust. - - - - - - - - - - -
NI to common incl. extra 13,053 2,651 7,906 7,510 3,112 2,256 2,522 3,866 4,614 5,007 6,018
Source: Statutory accounts and JPA analysis
Table 16
NVQ’s Profit &Loss common size
Currency €000 FY10A FY11A FY12A FY13A FY14A FY15F FY16F FY17F FY18F FY19F FY20F
Services rendered 56.0% 57.8% 65.0% 63.9% 69.3% 70.7% 71.1% 71.3% 71.5% 71.7% 71.9%
Sales 44.0% 42.2% 35.0% 36.1% 30.7% 29.3% 28.9% 28.7% 28.5% 28.3% 28.1%
Total revenue 100.0% 100.0% 100.0% 100.0% 100.0% 100.0% 100.0% 100.0% 100.0% 100.0% 100.0%
Employee benefit expense 32.0% 33.2% 35.8% 36.8% 39.1% 40.8% 40.8% 40.9% 41.0% 41.1% 41.3%
Cost of sales 38.1% 37.9% 30.7% 31.0% 28.0% 27.1% 26.4% 25.8% 25.7% 25.4% 25.2%
Cost of revenue 70.1% 71.0% 66.5% 67.8% 67.1% 67.9% 67.3% 66.7% 66.7% 66.5% 66.4%
Gross profit 29.9% 29.0% 33.5% 32.2% 32.9% 32.1% 32.7% 33.3% 33.3% 33.5% 33.6%
SG&A, total 21.3% 22.5% 24.6% 25.1% 27.1% 27.5% 28.0% 28.1% 27.8% 27.9% 27.4%
D&A, total 2.3% 2.7% 2.7% 2.6% 2.7% 2.5% 2.5% 2.5% 2.5% 2.5% 2.6%
Other operating expenses (0.8%) 0.2% 0.3% 0.3% (0.8%) (0.8%) (0.8%) (0.7%) (0.7%) (0.7%) (0.7%)
Operating income 7.1% 3.5% 5.8% 4.2% 4.0% 2.9% 2.9% 3.5% 3.7% 3.9% 4.4%
EBITDA 9.4% 6.2% 8.5% 6.9% 6.6% 5.4% 5.5% 6.0% 6.2% 6.4% 6.9%
Net interest (expense)/income (0.2%) (0.7%) (0.1%) (0.3%) (0.8%) (0.5%) (0.5%) (0.3%) (0.3%) (0.2%) (0.2%)
EBT excl. Unusual items 6.9% 2.9% 5.7% 3.9% 3.2% 2.4% 2.4% 3.1% 3.4% 3.6% 4.2%
Merger & restructuring charges - % (1.5%) - % - % (0.7%) - % - % - % - % - % - %
EBT incl. Unusual items 6.9% 1.4% 5.7% 3.9% 2.5% 2.4% 2.4% 3.1% 3.4% 3.6% 4.2%
Income tax expense 1.1% 0.4% 1.1% (0.3%) 0.4% 0.6% 0.5% 0.6% 0.6% 0.6% 0.7%
Earnings from cont. Ops. 5.8% 1.0% 4.6% 4.3% 2.1% 1.8% 1.9% 2.5% 2.8% 3.0% 3.5%
Discontinued operations - % 0.3% - % - % 0.1% - % - % - % - % - % - %
Extraordinary items & acct. Change - % - % - % - % - % - % - % - % - % - % - %
Net income to company 5.8% 1.3% 4.6% 4.3% 2.2% 1.8% 1.9% 2.5% 2.8% 3.0% 3.5%
Minority interest (0.3%) (0.1%) (0.9%) (0.8%) (0.8%) (0.8%) (0.8%) (0.8%) (0.8%) (0.8%) (0.8%)
Net income to parent 5.5% 1.2% 3.7% 3.5% 1.4% 1.0% 1.1% 1.8% 2.1% 2.2% 2.7%
Preferred dividends and other adjust. - % - % - % - % - % - % - % - % - % - % - %
NI to common incl. extra 5.5% 1.2% 3.7% 3.5% 1.4% 1.0% 1.1% 1.8% 2.1% 2.2% 2.7%
Source: Statutory accounts and JPA analysis
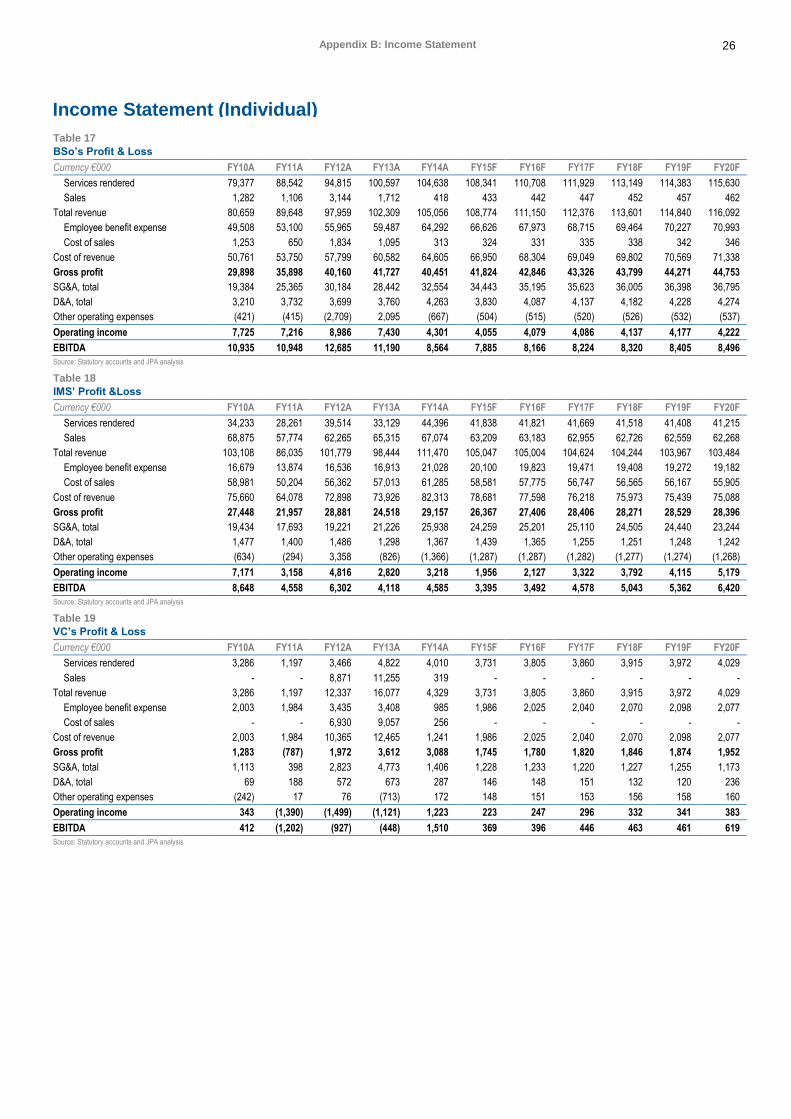
26 Appendix B: Income Statement
Income Statement (Individual)
Table 17
BSo’s Profit & Loss
Currency €000 FY10A FY11A FY12A FY13A FY14A FY15F FY16F FY17F FY18F FY19F FY20F
Services rendered 79,377 88,542 94,815 100,597 104,638 108,341 110,708 111,929 113,149 114,383 115,630
Sales 1,282 1,106 3,144 1,712 418 433 442 447 452 457 462
Total revenue 80,659 89,648 97,959 102,309 105,056 108,774 111,150 112,376 113,601 114,840 116,092
Employee benefit expense 49,508 53,100 55,965 59,487 64,292 66,626 67,973 68,715 69,464 70,227 70,993
Cost of sales 1,253 650 1,834 1,095 313 324 331 335 338 342 346
Cost of revenue 50,761 53,750 57,799 60,582 64,605 66,950 68,304 69,049 69,802 70,569 71,338
Gross profit 29,898 35,898 40,160 41,727 40,451 41,824 42,846 43,326 43,799 44,271 44,753
SG&A, total 19,384 25,365 30,184 28,442 32,554 34,443 35,195 35,623 36,005 36,398 36,795
D&A, total 3,210 3,732 3,699 3,760 4,263 3,830 4,087 4,137 4,182 4,228 4,274
Other operating expenses (421) (415) (2,709) 2,095 (667) (504) (515) (520) (526) (532) (537)
Operating income 7,725 7,216 8,986 7,430 4,301 4,055 4,079 4,086 4,137 4,177 4,222
EBITDA 10,935 10,948 12,685 11,190 8,564 7,885 8,166 8,224 8,320 8,405 8,496
Source: Statutory accounts and JPA analysis
Table 18
IMS’ Profit &Loss
Currency €000 FY10A FY11A FY12A FY13A FY14A FY15F FY16F FY17F FY18F FY19F FY20F
Services rendered 34,233 28,261 39,514 33,129 44,396 41,838 41,821 41,669 41,518 41,408 41,215
Sales 68,875 57,774 62,265 65,315 67,074 63,209 63,183 62,955 62,726 62,559 62,268
Total revenue 103,108 86,035 101,779 98,444 111,470 105,047 105,004 104,624 104,244 103,967 103,484
Employee benefit expense 16,679 13,874 16,536 16,913 21,028 20,100 19,823 19,471 19,408 19,272 19,182
Cost of sales 58,981 50,204 56,362 57,013 61,285 58,581 57,775 56,747 56,565 56,167 55,905
Cost of revenue 75,660 64,078 72,898 73,926 82,313 78,681 77,598 76,218 75,973 75,439 75,088
Gross profit 27,448 21,957 28,881 24,518 29,157 26,367 27,406 28,406 28,271 28,529 28,396
SG&A, total 19,434 17,693 19,221 21,226 25,938 24,259 25,201 25,110 24,505 24,440 23,244
D&A, total 1,477 1,400 1,486 1,298 1,367 1,439 1,365 1,255 1,251 1,248 1,242
Other operating expenses (634) (294) 3,358 (826) (1,366) (1,287) (1,287) (1,282) (1,277) (1,274) (1,268)
Operating income 7,171 3,158 4,816 2,820 3,218 1,956 2,127 3,322 3,792 4,115 5,179
EBITDA 8,648 4,558 6,302 4,118 4,585 3,395 3,492 4,578 5,043 5,362 6,420
Source: Statutory accounts and JPA analysis
Table 19
VC’s Profit & Loss
Currency €000 FY10A FY11A FY12A FY13A FY14A FY15F FY16F FY17F FY18F FY19F FY20F
Services rendered 3,286 1,197 3,466 4,822 4,010 3,731 3,805 3,860 3,915 3,972 4,029
Sales - - 8,871 11,255 319 - - - - - -
Total revenue 3,286 1,197 12,337 16,077 4,329 3,731 3,805 3,860 3,915 3,972 4,029
Employee benefit expense 2,003 1,984 3,435 3,408 985 1,986 2,025 2,040 2,070 2,098 2,077
Cost of sales - - 6,930 9,057 256 - - - - - -
Cost of revenue 2,003 1,984 10,365 12,465 1,241 1,986 2,025 2,040 2,070 2,098 2,077
Gross profit 1,283 (787) 1,972 3,612 3,088 1,745 1,780 1,820 1,846 1,874 1,952
SG&A, total 1,113 398 2,823 4,773 1,406 1,228 1,233 1,220 1,227 1,255 1,173
D&A, total 69 188 572 673 287 146 148 151 132 120 236
Other operating expenses (242) 17 76 (713) 172 148 151 153 156 158 160
Operating income 343 (1,390) (1,499) (1,121) 1,223 223 247 296 332 341 383
EBITDA 412 (1,202) (927) (448) 1,510 369 396 446 463 461 619
Source: Statutory accounts and JPA analysis
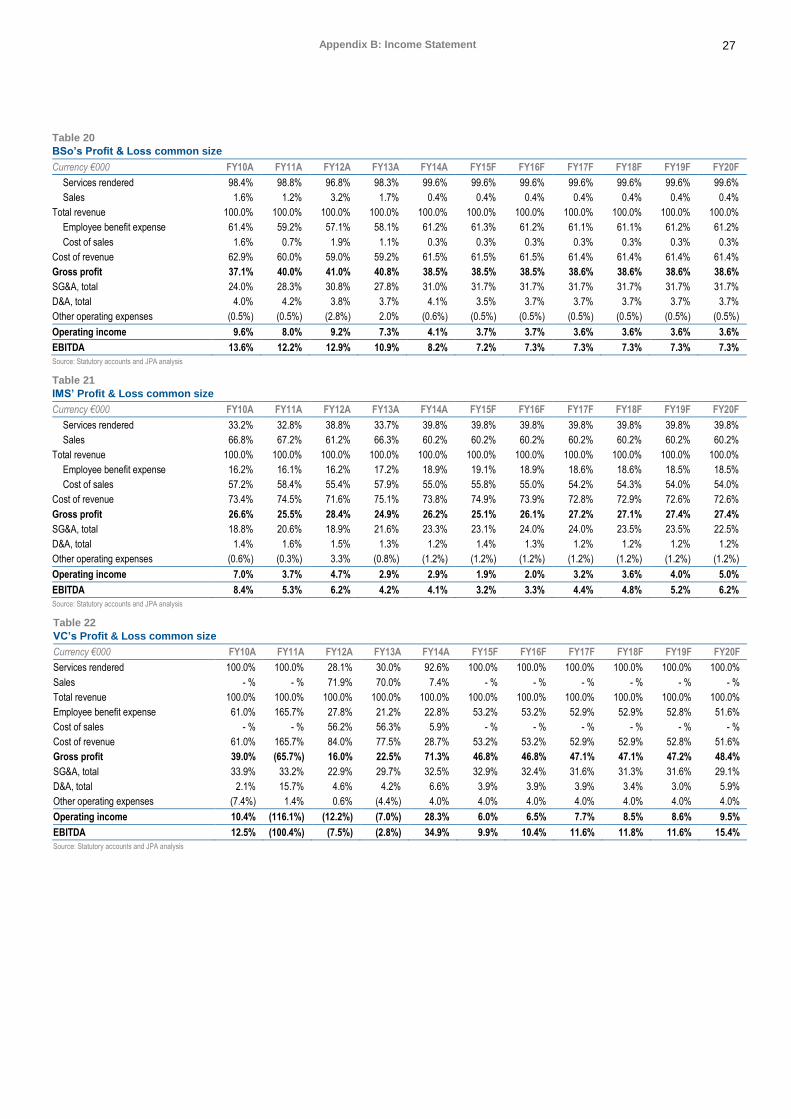
27 Appendix B: Income Statement
Table 20
BSo’s Profit & Loss common size
Currency €000 FY10A FY11A FY12A FY13A FY14A FY15F FY16F FY17F FY18F FY19F FY20F
Services rendered 98.4% 98.8% 96.8% 98.3% 99.6% 99.6% 99.6% 99.6% 99.6% 99.6% 99.6%
Sales 1.6% 1.2% 3.2% 1.7% 0.4% 0.4% 0.4% 0.4% 0.4% 0.4% 0.4%
Total revenue 100.0% 100.0% 100.0% 100.0% 100.0% 100.0% 100.0% 100.0% 100.0% 100.0% 100.0%
Employee benefit expense 61.4% 59.2% 57.1% 58.1% 61.2% 61.3% 61.2% 61.1% 61.1% 61.2% 61.2%
Cost of sales 1.6% 0.7% 1.9% 1.1% 0.3% 0.3% 0.3% 0.3% 0.3% 0.3% 0.3%
Cost of revenue 62.9% 60.0% 59.0% 59.2% 61.5% 61.5% 61.5% 61.4% 61.4% 61.4% 61.4%
Gross profit 37.1% 40.0% 41.0% 40.8% 38.5% 38.5% 38.5% 38.6% 38.6% 38.6% 38.6%
SG&A, total 24.0% 28.3% 30.8% 27.8% 31.0% 31.7% 31.7% 31.7% 31.7% 31.7% 31.7%
D&A, total 4.0% 4.2% 3.8% 3.7% 4.1% 3.5% 3.7% 3.7% 3.7% 3.7% 3.7%
Other operating expenses (0.5%) (0.5%) (2.8%) 2.0% (0.6%) (0.5%) (0.5%) (0.5%) (0.5%) (0.5%) (0.5%)
Operating income 9.6% 8.0% 9.2% 7.3% 4.1% 3.7% 3.7% 3.6% 3.6% 3.6% 3.6%
EBITDA 13.6% 12.2% 12.9% 10.9% 8.2% 7.2% 7.3% 7.3% 7.3% 7.3% 7.3%
Source: Statutory accounts and JPA analysis
Table 21
IMS’ Profit & Loss common size
Currency €000 FY10A FY11A FY12A FY13A FY14A FY15F FY16F FY17F FY18F FY19F FY20F
Services rendered 33.2% 32.8% 38.8% 33.7% 39.8% 39.8% 39.8% 39.8% 39.8% 39.8% 39.8%
Sales 66.8% 67.2% 61.2% 66.3% 60.2% 60.2% 60.2% 60.2% 60.2% 60.2% 60.2%
Total revenue 100.0% 100.0% 100.0% 100.0% 100.0% 100.0% 100.0% 100.0% 100.0% 100.0% 100.0%
Employee benefit expense 16.2% 16.1% 16.2% 17.2% 18.9% 19.1% 18.9% 18.6% 18.6% 18.5% 18.5%
Cost of sales 57.2% 58.4% 55.4% 57.9% 55.0% 55.8% 55.0% 54.2% 54.3% 54.0% 54.0%
Cost of revenue 73.4% 74.5% 71.6% 75.1% 73.8% 74.9% 73.9% 72.8% 72.9% 72.6% 72.6%
Gross profit 26.6% 25.5% 28.4% 24.9% 26.2% 25.1% 26.1% 27.2% 27.1% 27.4% 27.4%
SG&A, total 18.8% 20.6% 18.9% 21.6% 23.3% 23.1% 24.0% 24.0% 23.5% 23.5% 22.5%
D&A, total 1.4% 1.6% 1.5% 1.3% 1.2% 1.4% 1.3% 1.2% 1.2% 1.2% 1.2%
Other operating expenses (0.6%) (0.3%) 3.3% (0.8%) (1.2%) (1.2%) (1.2%) (1.2%) (1.2%) (1.2%) (1.2%)
Operating income 7.0% 3.7% 4.7% 2.9% 2.9% 1.9% 2.0% 3.2% 3.6% 4.0% 5.0%
EBITDA 8.4% 5.3% 6.2% 4.2% 4.1% 3.2% 3.3% 4.4% 4.8% 5.2% 6.2%
Source: Statutory accounts and JPA analysis
Table 22
VC’s Profit & Loss common size
Currency €000 FY10A FY11A FY12A FY13A FY14A FY15F FY16F FY17F FY18F FY19F FY20F
Services rendered 100.0% 100.0% 28.1% 30.0% 92.6% 100.0% 100.0% 100.0% 100.0% 100.0% 100.0%
Sales - % - % 71.9% 70.0% 7.4% - % - % - % - % - % - %
Total revenue 100.0% 100.0% 100.0% 100.0% 100.0% 100.0% 100.0% 100.0% 100.0% 100.0% 100.0%
Employee benefit expense 61.0% 165.7% 27.8% 21.2% 22.8% 53.2% 53.2% 52.9% 52.9% 52.8% 51.6%
Cost of sales - % - % 56.2% 56.3% 5.9% - % - % - % - % - % - %
Cost of revenue 61.0% 165.7% 84.0% 77.5% 28.7% 53.2% 53.2% 52.9% 52.9% 52.8% 51.6%
Gross profit 39.0% (65.7%) 16.0% 22.5% 71.3% 46.8% 46.8% 47.1% 47.1% 47.2% 48.4%
SG&A, total 33.9% 33.2% 22.9% 29.7% 32.5% 32.9% 32.4% 31.6% 31.3% 31.6% 29.1%
D&A, total 2.1% 15.7% 4.6% 4.2% 6.6% 3.9% 3.9% 3.9% 3.4% 3.0% 5.9%
Other operating expenses (7.4%) 1.4% 0.6% (4.4%) 4.0% 4.0% 4.0% 4.0% 4.0% 4.0% 4.0%
Operating income 10.4% (116.1%) (12.2%) (7.0%) 28.3% 6.0% 6.5% 7.7% 8.5% 8.6% 9.5%
EBITDA 12.5% (100.4%) (7.5%) (2.8%) 34.9% 9.9% 10.4% 11.6% 11.8% 11.6% 15.4%
Source: Statutory accounts and JPA analysis
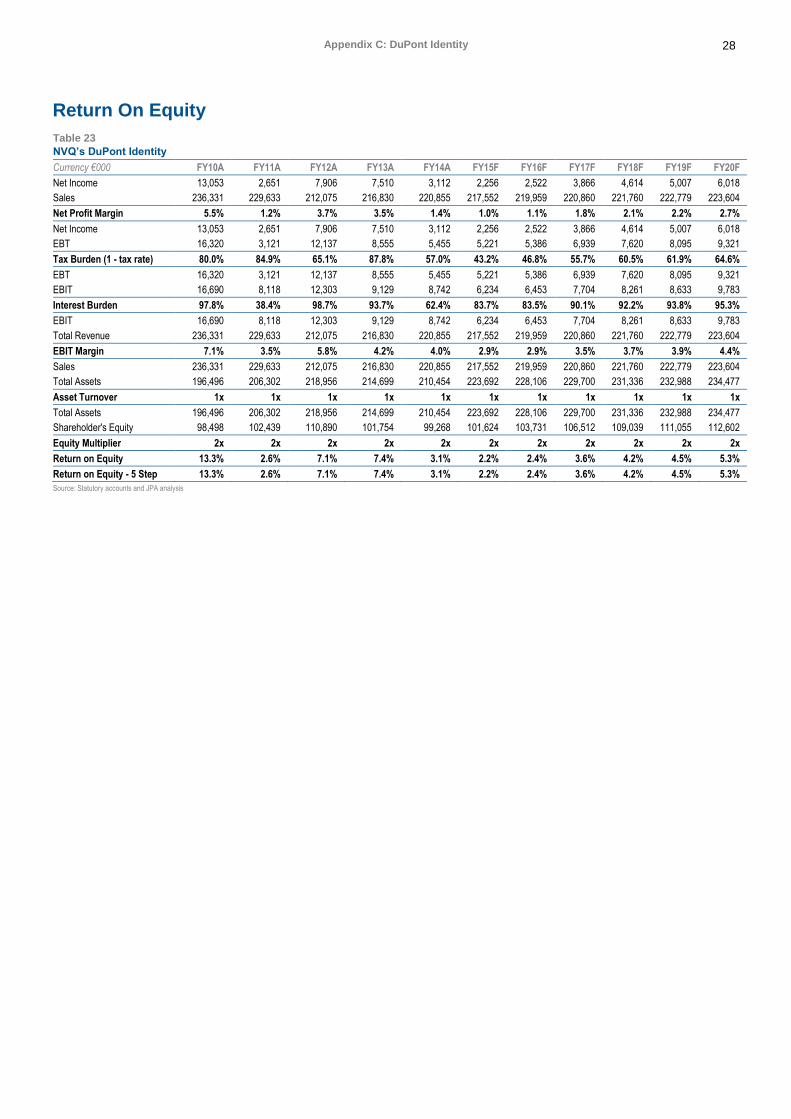
28 Appendix C: DuPont Identity
Appendix C: DuPont Identity
Return On Equity
Table 23
NVQ’s DuPont Identity
Currency €000 FY10A FY11A FY12A FY13A FY14A FY15F FY16F FY17F FY18F FY19F FY20F
Net Income 13,053 2,651 7,906 7,510 3,112 2,256 2,522 3,866 4,614 5,007 6,018
Sales 236,331 229,633 212,075 216,830 220,855 217,552 219,959 220,860 221,760 222,779 223,604
Net Profit Margin 5.5% 1.2% 3.7% 3.5% 1.4% 1.0% 1.1% 1.8% 2.1% 2.2% 2.7%
Net Income 13,053 2,651 7,906 7,510 3,112 2,256 2,522 3,866 4,614 5,007 6,018
EBT 16,320 3,121 12,137 8,555 5,455 5,221 5,386 6,939 7,620 8,095 9,321
Tax Burden (1 - tax rate) 80.0% 84.9% 65.1% 87.8% 57.0% 43.2% 46.8% 55.7% 60.5% 61.9% 64.6%
EBT 16,320 3,121 12,137 8,555 5,455 5,221 5,386 6,939 7,620 8,095 9,321
EBIT 16,690 8,118 12,303 9,129 8,742 6,234 6,453 7,704 8,261 8,633 9,783
Interest Burden 97.8% 38.4% 98.7% 93.7% 62.4% 83.7% 83.5% 90.1% 92.2% 93.8% 95.3%
EBIT 16,690 8,118 12,303 9,129 8,742 6,234 6,453 7,704 8,261 8,633 9,783
Total Revenue 236,331 229,633 212,075 216,830 220,855 217,552 219,959 220,860 221,760 222,779 223,604
EBIT Margin 7.1% 3.5% 5.8% 4.2% 4.0% 2.9% 2.9% 3.5% 3.7% 3.9% 4.4%
Sales 236,331 229,633 212,075 216,830 220,855 217,552 219,959 220,860 221,760 222,779 223,604
Total Assets 196,496 206,302 218,956 214,699 210,454 223,692 228,106 229,700 231,336 232,988 234,477
Asset Turnover 1x 1x 1x 1x 1x 1x 1x 1x 1x 1x 1x
Total Assets 196,496 206,302 218,956 214,699 210,454 223,692 228,106 229,700 231,336 232,988 234,477
Shareholder's Equity 98,498 102,439 110,890 101,754 99,268 101,624 103,731 106,512 109,039 111,055 112,602
Equity Multiplier 2x 2x 2x 2x 2x 2x 2x 2x 2x 2x 2x
Return on Equity 13.3% 2.6% 7.1% 7.4% 3.1% 2.2% 2.4% 3.6% 4.2% 4.5% 5.3%
Return on Equity - 5 Step 13.3% 2.6% 7.1% 7.4% 3.1% 2.2% 2.4% 3.6% 4.2% 4.5% 5.3%
Source: Statutory accounts and JPA analysis
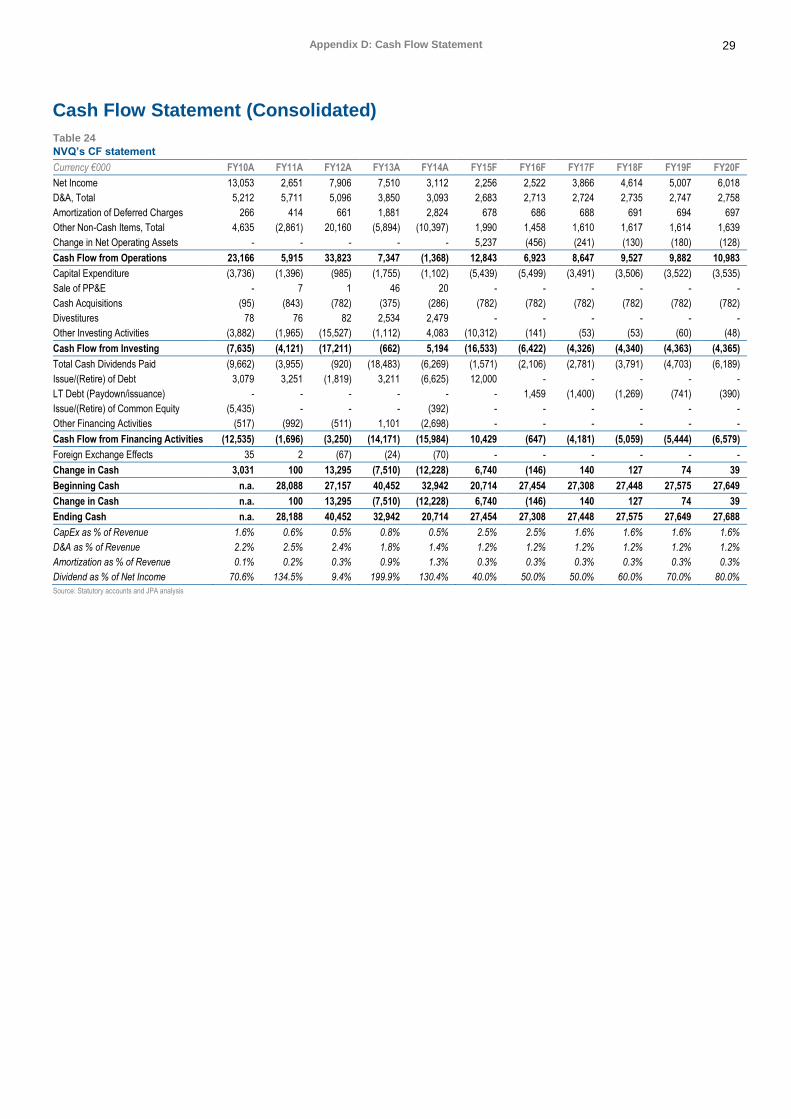
29 Appendix D: Cash Flow Statement
Appendix D: Cash Flow Statement
Cash Flow Statement (Consolidated)
Table 24
NVQ’s CF statement
Currency €000 FY10A FY11A FY12A FY13A FY14A FY15F FY16F FY17F FY18F FY19F FY20F
Net Income 13,053 2,651 7,906 7,510 3,112 2,256 2,522 3,866 4,614 5,007 6,018
D&A, Total 5,212 5,711 5,096 3,850 3,093 2,683 2,713 2,724 2,735 2,747 2,758
Amortization of Deferred Charges 266 414 661 1,881 2,824 678 686 688 691 694 697
Other Non-Cash Items, Total 4,635 (2,861) 20,160 (5,894) (10,397) 1,990 1,458 1,610 1,617 1,614 1,639
Change in Net Operating Assets - - - - - 5,237 (456) (241) (130) (180) (128)
Cash Flow from Operations 23,166 5,915 33,823 7,347 (1,368) 12,843 6,923 8,647 9,527 9,882 10,983
Capital Expenditure (3,736) (1,396) (985) (1,755) (1,102) (5,439) (5,499) (3,491) (3,506) (3,522) (3,535)
Sale of PP&E - 7 1 46 20 - - - - - -
Cash Acquisitions (95) (843) (782) (375) (286) (782) (782) (782) (782) (782) (782)
Divestitures 78 76 82 2,534 2,479 - - - - - -
Other Investing Activities (3,882) (1,965) (15,527) (1,112) 4,083 (10,312) (141) (53) (53) (60) (48)
Cash Flow from Investing (7,635) (4,121) (17,211) (662) 5,194 (16,533) (6,422) (4,326) (4,340) (4,363) (4,365)
Total Cash Dividends Paid (9,662) (3,955) (920) (18,483) (6,269) (1,571) (2,106) (2,781) (3,791) (4,703) (6,189)
Issue/(Retire) of Debt 3,079 3,251 (1,819) 3,211 (6,625) 12,000 - - - - -
LT Debt (Paydown/issuance) - - - - - - 1,459 (1,400) (1,269) (741) (390)
Issue/(Retire) of Common Equity (5,435) - - - (392) - - - - - -
Other Financing Activities (517) (992) (511) 1,101 (2,698) - - - - - -
Cash Flow from Financing Activities (12,535) (1,696) (3,250) (14,171) (15,984) 10,429 (647) (4,181) (5,059) (5,444) (6,579)
Foreign Exchange Effects 35 2 (67) (24) (70) - - - - - -
Change in Cash 3,031 100 13,295 (7,510) (12,228) 6,740 (146) 140 127 74 39
Beginning Cash n.a. 28,088 27,157 40,452 32,942 20,714 27,454 27,308 27,448 27,575 27,649
Change in Cash n.a. 100 13,295 (7,510) (12,228) 6,740 (146) 140 127 74 39
Ending Cash n.a. 28,188 40,452 32,942 20,714 27,454 27,308 27,448 27,575 27,649 27,688
CapEx as % of Revenue 1.6% 0.6% 0.5% 0.8% 0.5% 2.5% 2.5% 1.6% 1.6% 1.6% 1.6%
D&A as % of Revenue 2.2% 2.5% 2.4% 1.8% 1.4% 1.2% 1.2% 1.2% 1.2% 1.2% 1.2%
Amortization as % of Revenue 0.1% 0.2% 0.3% 0.9% 1.3% 0.3% 0.3% 0.3% 0.3% 0.3% 0.3%
Dividend as % of Net Income 70.6% 134.5% 9.4% 199.9% 130.4% 40.0% 50.0% 50.0% 60.0% 70.0% 80.0%
Source: Statutory accounts and JPA analysis
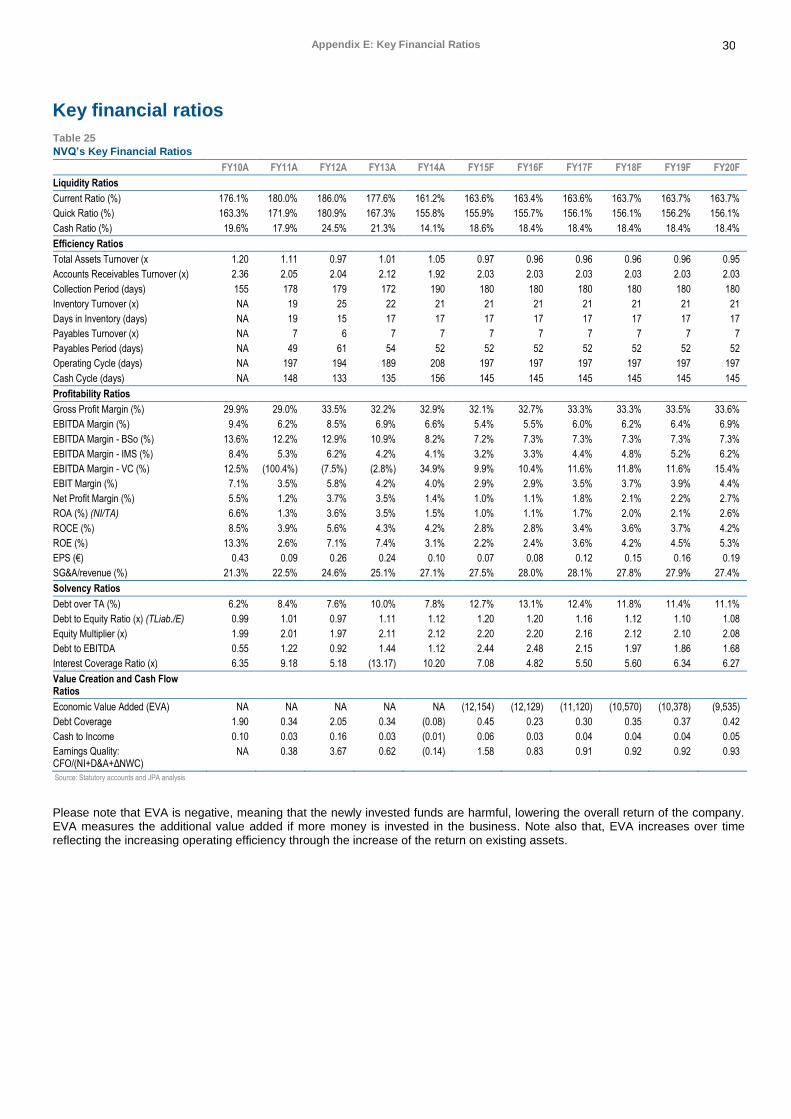
30 Appendix E: Key Financial Ratios
Please note that EVA is negative, meaning that the newly invested funds are harmful, lowering the overall return of the company. EVA measures the additional value added if more money is invested in the business. Note also that, EVA increases over time reflecting the increasing operating efficiency through the increase of the return on existing assets.
Appendix E: Key Financial Ratios
Key financial ratios
Table 25
NVQ’s Key Financial Ratios
FY10A FY11A FY12A FY13A FY14A FY15F FY16F FY17F FY18F FY19F FY20F
Liquidity Ratios
Current Ratio (%) 176.1% 180.0% 186.0% 177.6% 161.2% 163.6% 163.4% 163.6% 163.7% 163.7% 163.7%
Quick Ratio (%) 163.3% 171.9% 180.9% 167.3% 155.8% 155.9% 155.7% 156.1% 156.1% 156.2% 156.1%
Cash Ratio (%) 19.6% 17.9% 24.5% 21.3% 14.1% 18.6% 18.4% 18.4% 18.4% 18.4% 18.4%
Efficiency Ratios
Total Assets Turnover (x 1.20 1.11 0.97 1.01 1.05 0.97 0.96 0.96 0.96 0.96 0.95
Accounts Receivables Turnover (x) 2.36 2.05 2.04 2.12 1.92 2.03 2.03 2.03 2.03 2.03 2.03
Collection Period (days) 155 178 179 172 190 180 180 180 180 180 180
Inventory Turnover (x) NA 19 25 22 21 21 21 21 21 21 21
Days in Inventory (days) NA 19 15 17 17 17 17 17 17 17 17
Payables Turnover (x) NA 7 6 7 7 7 7 7 7 7 7
Payables Period (days) NA 49 61 54 52 52 52 52 52 52 52
Operating Cycle (days) NA 197 194 189 208 197 197 197 197 197 197
Cash Cycle (days) NA 148 133 135 156 145 145 145 145 145 145
Profitability Ratios
Gross Profit Margin (%) 29.9% 29.0% 33.5% 32.2% 32.9% 32.1% 32.7% 33.3% 33.3% 33.5% 33.6%
EBITDA Margin (%) 9.4% 6.2% 8.5% 6.9% 6.6% 5.4% 5.5% 6.0% 6.2% 6.4% 6.9%
EBITDA Margin - BSo (%) 13.6% 12.2% 12.9% 10.9% 8.2% 7.2% 7.3% 7.3% 7.3% 7.3% 7.3%
EBITDA Margin - IMS (%) 8.4% 5.3% 6.2% 4.2% 4.1% 3.2% 3.3% 4.4% 4.8% 5.2% 6.2%
EBITDA Margin - VC (%) 12.5% (100.4%) (7.5%) (2.8%) 34.9% 9.9% 10.4% 11.6% 11.8% 11.6% 15.4%
EBIT Margin (%) 7.1% 3.5% 5.8% 4.2% 4.0% 2.9% 2.9% 3.5% 3.7% 3.9% 4.4%
Net Profit Margin (%) 5.5% 1.2% 3.7% 3.5% 1.4% 1.0% 1.1% 1.8% 2.1% 2.2% 2.7%
ROA (%) (NI/TA) 6.6% 1.3% 3.6% 3.5% 1.5% 1.0% 1.1% 1.7% 2.0% 2.1% 2.6%
ROCE (%) 8.5% 3.9% 5.6% 4.3% 4.2% 2.8% 2.8% 3.4% 3.6% 3.7% 4.2%
ROE (%) 13.3% 2.6% 7.1% 7.4% 3.1% 2.2% 2.4% 3.6% 4.2% 4.5% 5.3%
EPS (€) 0.43 0.09 0.26 0.24 0.10 0.07 0.08 0.12 0.15 0.16 0.19
SG&A/revenue (%) 21.3% 22.5% 24.6% 25.1% 27.1% 27.5% 28.0% 28.1% 27.8% 27.9% 27.4%
Solvency Ratios
Debt over TA (%) 6.2% 8.4% 7.6% 10.0% 7.8% 12.7% 13.1% 12.4% 11.8% 11.4% 11.1%
Debt to Equity Ratio (x) (TLiab./E) 0.99 1.01 0.97 1.11 1.12 1.20 1.20 1.16 1.12 1.10 1.08
Equity Multiplier (x) 1.99 2.01 1.97 2.11 2.12 2.20 2.20 2.16 2.12 2.10 2.08
Debt to EBITDA 0.55 1.22 0.92 1.44 1.12 2.44 2.48 2.15 1.97 1.86 1.68
Interest Coverage Ratio (x) 6.35 9.18 5.18 (13.17) 10.20 7.08 4.82 5.50 5.60 6.34 6.27
Value Creation and Cash Flow Ratios
Economic Value Added (EVA) NA NA NA NA NA (12,154) (12,129) (11,120) (10,570) (10,378) (9,535)
Debt Coverage 1.90 0.34 2.05 0.34 (0.08) 0.45 0.23 0.30 0.35 0.37 0.42
Cash to Income 0.10 0.03 0.16 0.03 (0.01) 0.06 0.03 0.04 0.04 0.04 0.05
Earnings Quality: CFO/(NI+D&A+ΔNWC)
NA 0.38 3.67 0.62 (0.14) 1.58 0.83 0.91 0.92 0.92 0.93
Source: Statutory accounts and JPA analysis
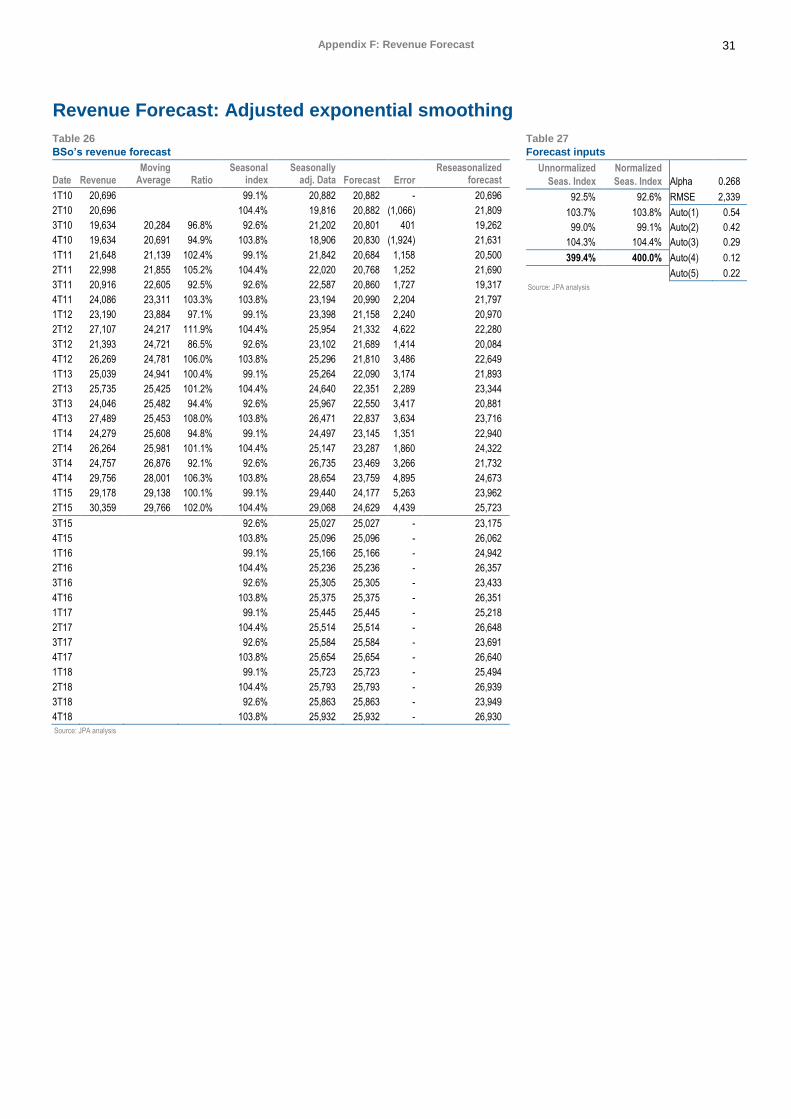
31 Appendix F: Revenue Forecast
Appendix F: Revenue Forecast
Revenue Forecast: Adjusted exponential smoothing
Table 27
Forecast inputs
Unnormalized
Seas. Index
Normalized
Seas. Index Alpha 0.268
92.5% 92.6% RMSE 2,339
103.7% 103.8% Auto(1) 0.54
99.0% 99.1% Auto(2) 0.42
104.3% 104.4% Auto(3) 0.29
399.4% 400.0% Auto(4) 0.12
Auto(5) 0.22
Source: JPA analysis
Table 26
BSo’s revenue forecast
Date Revenue Moving
Average Ratio Seasonal
index Seasonally
adj. Data Forecast Error Reseasonalized
forecast
1T10 20,696 99.1% 20,882 20,882 - 20,696
2T10 20,696 104.4% 19,816 20,882 (1,066) 21,809
3T10 19,634 20,284 96.8% 92.6% 21,202 20,801 401 19,262
4T10 19,634 20,691 94.9% 103.8% 18,906 20,830 (1,924) 21,631
1T11 21,648 21,139 102.4% 99.1% 21,842 20,684 1,158 20,500
2T11 22,998 21,855 105.2% 104.4% 22,020 20,768 1,252 21,690
3T11 20,916 22,605 92.5% 92.6% 22,587 20,860 1,727 19,317
4T11 24,086 23,311 103.3% 103.8% 23,194 20,990 2,204 21,797
1T12 23,190 23,884 97.1% 99.1% 23,398 21,158 2,240 20,970
2T12 27,107 24,217 111.9% 104.4% 25,954 21,332 4,622 22,280
3T12 21,393 24,721 86.5% 92.6% 23,102 21,689 1,414 20,084
4T12 26,269 24,781 106.0% 103.8% 25,296 21,810 3,486 22,649
1T13 25,039 24,941 100.4% 99.1% 25,264 22,090 3,174 21,893
2T13 25,735 25,425 101.2% 104.4% 24,640 22,351 2,289 23,344
3T13 24,046 25,482 94.4% 92.6% 25,967 22,550 3,417 20,881
4T13 27,489 25,453 108.0% 103.8% 26,471 22,837 3,634 23,716
1T14 24,279 25,608 94.8% 99.1% 24,497 23,145 1,351 22,940
2T14 26,264 25,981 101.1% 104.4% 25,147 23,287 1,860 24,322
3T14 24,757 26,876 92.1% 92.6% 26,735 23,469 3,266 21,732
4T14 29,756 28,001 106.3% 103.8% 28,654 23,759 4,895 24,673
1T15 29,178 29,138 100.1% 99.1% 29,440 24,177 5,263 23,962
2T15 30,359 29,766 102.0% 104.4% 29,068 24,629 4,439 25,723
3T15 92.6% 25,027 25,027 - 23,175
4T15 103.8% 25,096 25,096 - 26,062
1T16 99.1% 25,166 25,166 - 24,942
2T16 104.4% 25,236 25,236 - 26,357
3T16 92.6% 25,305 25,305 - 23,433
4T16 103.8% 25,375 25,375 - 26,351
1T17 99.1% 25,445 25,445 - 25,218
2T17 104.4% 25,514 25,514 - 26,648
3T17 92.6% 25,584 25,584 - 23,691
4T17 103.8% 25,654 25,654 - 26,640
1T18 99.1% 25,723 25,723 - 25,494
2T18
104.4% 25,793 25,793 - 26,939
3T18
92.6% 25,863 25,863 - 23,949
4T18 103.8% 25,932 25,932 - 26,930
Source: JPA analysis
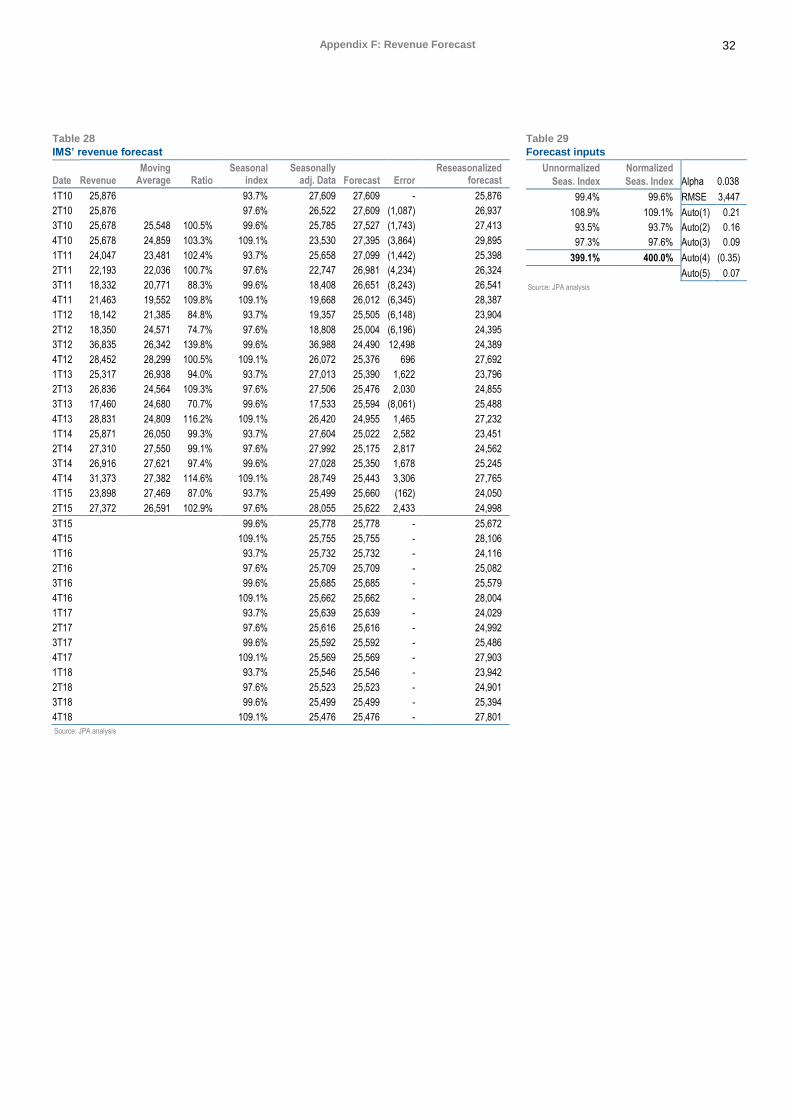
32 Appendix F: Revenue Forecast
Table 29
Forecast inputs
Unnormalized
Seas. Index
Normalized
Seas. Index Alpha 0.038
99.4% 99.6% RMSE 3,447
108.9% 109.1% Auto(1) 0.21
93.5% 93.7% Auto(2) 0.16
97.3% 97.6% Auto(3) 0.09
399.1% 400.0% Auto(4) (0.35)
Auto(5) 0.07
Source: JPA analysis
Table 28
IMS’ revenue forecast
Date Revenue Moving
Average Ratio Seasonal
index Seasonally
adj. Data Forecast Error Reseasonalized
forecast
1T10 25,876 93.7% 27,609 27,609 - 25,876
2T10 25,876 97.6% 26,522 27,609 (1,087) 26,937
3T10 25,678 25,548 100.5% 99.6% 25,785 27,527 (1,743) 27,413
4T10 25,678 24,859 103.3% 109.1% 23,530 27,395 (3,864) 29,895
1T11 24,047 23,481 102.4% 93.7% 25,658 27,099 (1,442) 25,398
2T11 22,193 22,036 100.7% 97.6% 22,747 26,981 (4,234) 26,324
3T11 18,332 20,771 88.3% 99.6% 18,408 26,651 (8,243) 26,541
4T11 21,463 19,552 109.8% 109.1% 19,668 26,012 (6,345) 28,387
1T12 18,142 21,385 84.8% 93.7% 19,357 25,505 (6,148) 23,904
2T12 18,350 24,571 74.7% 97.6% 18,808 25,004 (6,196) 24,395
3T12 36,835 26,342 139.8% 99.6% 36,988 24,490 12,498 24,389
4T12 28,452 28,299 100.5% 109.1% 26,072 25,376 696 27,692
1T13 25,317 26,938 94.0% 93.7% 27,013 25,390 1,622 23,796
2T13 26,836 24,564 109.3% 97.6% 27,506 25,476 2,030 24,855
3T13 17,460 24,680 70.7% 99.6% 17,533 25,594 (8,061) 25,488
4T13 28,831 24,809 116.2% 109.1% 26,420 24,955 1,465 27,232
1T14 25,871 26,050 99.3% 93.7% 27,604 25,022 2,582 23,451
2T14 27,310 27,550 99.1% 97.6% 27,992 25,175 2,817 24,562
3T14 26,916 27,621 97.4% 99.6% 27,028 25,350 1,678 25,245
4T14 31,373 27,382 114.6% 109.1% 28,749 25,443 3,306 27,765
1T15 23,898 27,469 87.0% 93.7% 25,499 25,660 (162) 24,050
2T15 27,372 26,591 102.9% 97.6% 28,055 25,622 2,433 24,998
3T15 99.6% 25,778 25,778 - 25,672
4T15 109.1% 25,755 25,755 - 28,106
1T16 93.7% 25,732 25,732 - 24,116
2T16 97.6% 25,709 25,709 - 25,082
3T16 99.6% 25,685 25,685 - 25,579
4T16 109.1% 25,662 25,662 - 28,004
1T17 93.7% 25,639 25,639 - 24,029
2T17 97.6% 25,616 25,616 - 24,992
3T17 99.6% 25,592 25,592 - 25,486
4T17 109.1% 25,569 25,569 - 27,903
1T18 93.7% 25,546 25,546 - 23,942
2T18
97.6% 25,523 25,523 - 24,901
3T18
99.6% 25,499 25,499 - 25,394
4T18
109.1% 25,476 25,476 - 27,801
Source: JPA analysis
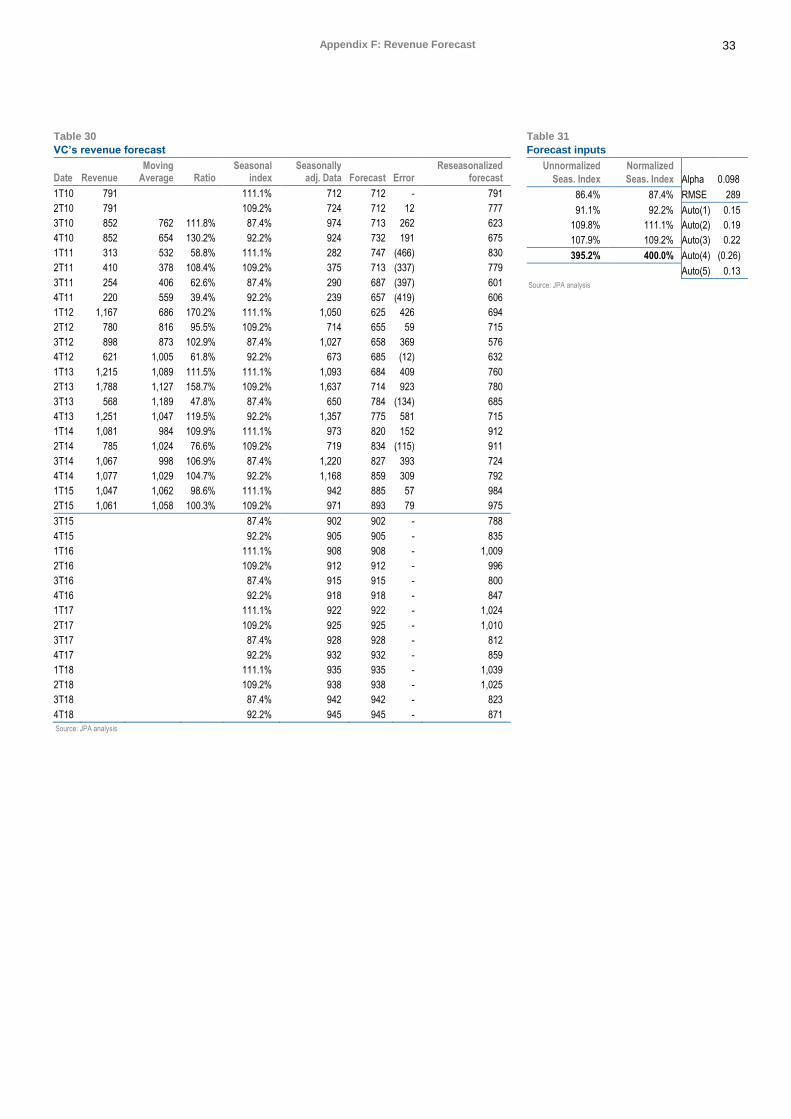
33 Appendix F: Revenue Forecast
Table 31
Forecast inputs
Unnormalized
Seas. Index
Normalized
Seas. Index Alpha 0.098
86.4% 87.4% RMSE 289
91.1% 92.2% Auto(1) 0.15
109.8% 111.1% Auto(2) 0.19
107.9% 109.2% Auto(3) 0.22
395.2% 400.0% Auto(4) (0.26)
Auto(5) 0.13
Source: JPA analysis
Table 30
VC’s revenue forecast
Date Revenue Moving
Average Ratio Seasonal
index Seasonally
adj. Data Forecast Error Reseasonalized
forecast
1T10 791 111.1% 712 712 - 791
2T10 791 109.2% 724 712 12 777
3T10 852 762 111.8% 87.4% 974 713 262 623
4T10 852 654 130.2% 92.2% 924 732 191 675
1T11 313 532 58.8% 111.1% 282 747 (466) 830
2T11 410 378 108.4% 109.2% 375 713 (337) 779
3T11 254 406 62.6% 87.4% 290 687 (397) 601
4T11 220 559 39.4% 92.2% 239 657 (419) 606
1T12 1,167 686 170.2% 111.1% 1,050 625 426 694
2T12 780 816 95.5% 109.2% 714 655 59 715
3T12 898 873 102.9% 87.4% 1,027 658 369 576
4T12 621 1,005 61.8% 92.2% 673 685 (12) 632
1T13 1,215 1,089 111.5% 111.1% 1,093 684 409 760
2T13 1,788 1,127 158.7% 109.2% 1,637 714 923 780
3T13 568 1,189 47.8% 87.4% 650 784 (134) 685
4T13 1,251 1,047 119.5% 92.2% 1,357 775 581 715
1T14 1,081 984 109.9% 111.1% 973 820 152 912
2T14 785 1,024 76.6% 109.2% 719 834 (115) 911
3T14 1,067 998 106.9% 87.4% 1,220 827 393 724
4T14 1,077 1,029 104.7% 92.2% 1,168 859 309 792
1T15 1,047 1,062 98.6% 111.1% 942 885 57 984
2T15 1,061 1,058 100.3% 109.2% 971 893 79 975
3T15 87.4% 902 902 - 788
4T15 92.2% 905 905 - 835
1T16 111.1% 908 908 - 1,009
2T16 109.2% 912 912 - 996
3T16 87.4% 915 915 - 800
4T16 92.2% 918 918 - 847
1T17 111.1% 922 922 - 1,024
2T17 109.2% 925 925 - 1,010
3T17 87.4% 928 928 - 812
4T17 92.2% 932 932 - 859
1T18 111.1% 935 935 - 1,039
2T18
109.2% 938 938 - 1,025
3T18
87.4% 942 942 - 823
4T18 92.2% 945 945 - 871
Source: JPA analysis
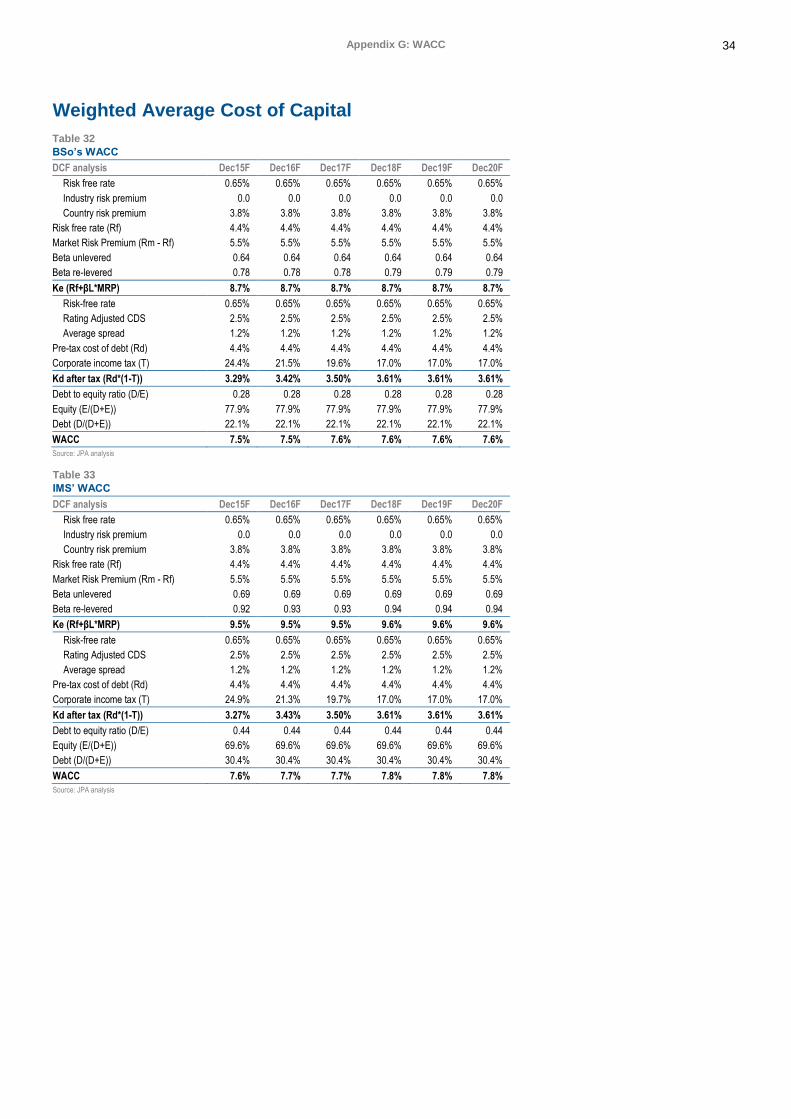
34 Appendix G: WACC
Appendix G: WACC
Weighted Average Cost of Capital
Table 32
BSo’s WACC
DCF analysis Dec15F Dec16F Dec17F Dec18F Dec19F Dec20F
Risk free rate 0.65% 0.65% 0.65% 0.65% 0.65% 0.65%
Industry risk premium 0.0 0.0 0.0 0.0 0.0 0.0
Country risk premium 3.8% 3.8% 3.8% 3.8% 3.8% 3.8%
Risk free rate (Rf) 4.4% 4.4% 4.4% 4.4% 4.4% 4.4%
Market Risk Premium (Rm - Rf) 5.5% 5.5% 5.5% 5.5% 5.5% 5.5%
Beta unlevered 0.64 0.64 0.64 0.64 0.64 0.64
Beta re-levered 0.78 0.78 0.78 0.79 0.79 0.79
Ke (Rf+βL*MRP) 8.7% 8.7% 8.7% 8.7% 8.7% 8.7%
Risk-free rate 0.65% 0.65% 0.65% 0.65% 0.65% 0.65%
Rating Adjusted CDS 2.5% 2.5% 2.5% 2.5% 2.5% 2.5%
Average spread 1.2% 1.2% 1.2% 1.2% 1.2% 1.2%
Pre-tax cost of debt (Rd) 4.4% 4.4% 4.4% 4.4% 4.4% 4.4%
Corporate income tax (T) 24.4% 21.5% 19.6% 17.0% 17.0% 17.0%
Kd after tax (Rd*(1-T)) 3.29% 3.42% 3.50% 3.61% 3.61% 3.61%
Debt to equity ratio (D/E) 0.28 0.28 0.28 0.28 0.28 0.28
Equity (E/(D+E)) 77.9% 77.9% 77.9% 77.9% 77.9% 77.9%
Debt (D/(D+E)) 22.1% 22.1% 22.1% 22.1% 22.1% 22.1%
WACC 7.5% 7.5% 7.6% 7.6% 7.6% 7.6%
Source: JPA analysis
Table 33
IMS’ WACC
DCF analysis Dec15F Dec16F Dec17F Dec18F Dec19F Dec20F
Risk free rate 0.65% 0.65% 0.65% 0.65% 0.65% 0.65%
Industry risk premium 0.0 0.0 0.0 0.0 0.0 0.0
Country risk premium 3.8% 3.8% 3.8% 3.8% 3.8% 3.8%
Risk free rate (Rf) 4.4% 4.4% 4.4% 4.4% 4.4% 4.4%
Market Risk Premium (Rm - Rf) 5.5% 5.5% 5.5% 5.5% 5.5% 5.5%
Beta unlevered 0.69 0.69 0.69 0.69 0.69 0.69
Beta re-levered 0.92 0.93 0.93 0.94 0.94 0.94
Ke (Rf+βL*MRP) 9.5% 9.5% 9.5% 9.6% 9.6% 9.6%
Risk-free rate 0.65% 0.65% 0.65% 0.65% 0.65% 0.65%
Rating Adjusted CDS 2.5% 2.5% 2.5% 2.5% 2.5% 2.5%
Average spread 1.2% 1.2% 1.2% 1.2% 1.2% 1.2%
Pre-tax cost of debt (Rd) 4.4% 4.4% 4.4% 4.4% 4.4% 4.4%
Corporate income tax (T) 24.9% 21.3% 19.7% 17.0% 17.0% 17.0%
Kd after tax (Rd*(1-T)) 3.27% 3.43% 3.50% 3.61% 3.61% 3.61%
Debt to equity ratio (D/E) 0.44 0.44 0.44 0.44 0.44 0.44
Equity (E/(D+E)) 69.6% 69.6% 69.6% 69.6% 69.6% 69.6%
Debt (D/(D+E)) 30.4% 30.4% 30.4% 30.4% 30.4% 30.4%
WACC 7.6% 7.7% 7.7% 7.8% 7.8% 7.8%
Source: JPA analysis
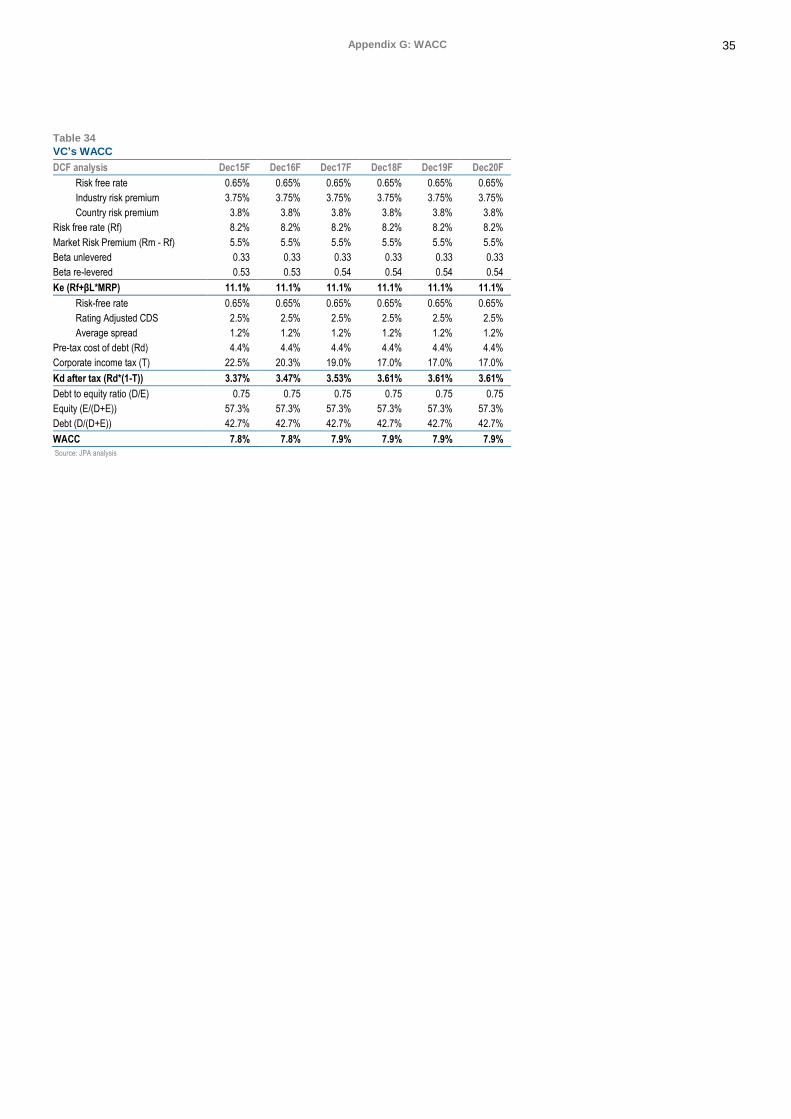
35 Appendix G: WACC
Table 34
VC’s WACC
DCF analysis Dec15F Dec16F Dec17F Dec18F Dec19F Dec20F
Risk free rate 0.65% 0.65% 0.65% 0.65% 0.65% 0.65%
Industry risk premium 3.75% 3.75% 3.75% 3.75% 3.75% 3.75%
Country risk premium 3.8% 3.8% 3.8% 3.8% 3.8% 3.8%
Risk free rate (Rf) 8.2% 8.2% 8.2% 8.2% 8.2% 8.2%
Market Risk Premium (Rm - Rf) 5.5% 5.5% 5.5% 5.5% 5.5% 5.5%
Beta unlevered 0.33 0.33 0.33 0.33 0.33 0.33
Beta re-levered 0.53 0.53 0.54 0.54 0.54 0.54
Ke (Rf+βL*MRP) 11.1% 11.1% 11.1% 11.1% 11.1% 11.1%
Risk-free rate 0.65% 0.65% 0.65% 0.65% 0.65% 0.65%
Rating Adjusted CDS 2.5% 2.5% 2.5% 2.5% 2.5% 2.5%
Average spread 1.2% 1.2% 1.2% 1.2% 1.2% 1.2%
Pre-tax cost of debt (Rd) 4.4% 4.4% 4.4% 4.4% 4.4% 4.4%
Corporate income tax (T) 22.5% 20.3% 19.0% 17.0% 17.0% 17.0%
Kd after tax (Rd*(1-T)) 3.37% 3.47% 3.53% 3.61% 3.61% 3.61%
Debt to equity ratio (D/E) 0.75 0.75 0.75 0.75 0.75 0.75
Equity (E/(D+E)) 57.3% 57.3% 57.3% 57.3% 57.3% 57.3%
Debt (D/(D+E)) 42.7% 42.7% 42.7% 42.7% 42.7% 42.7%
WACC 7.8% 7.8% 7.9% 7.9% 7.9% 7.9%
Source: JPA analysis
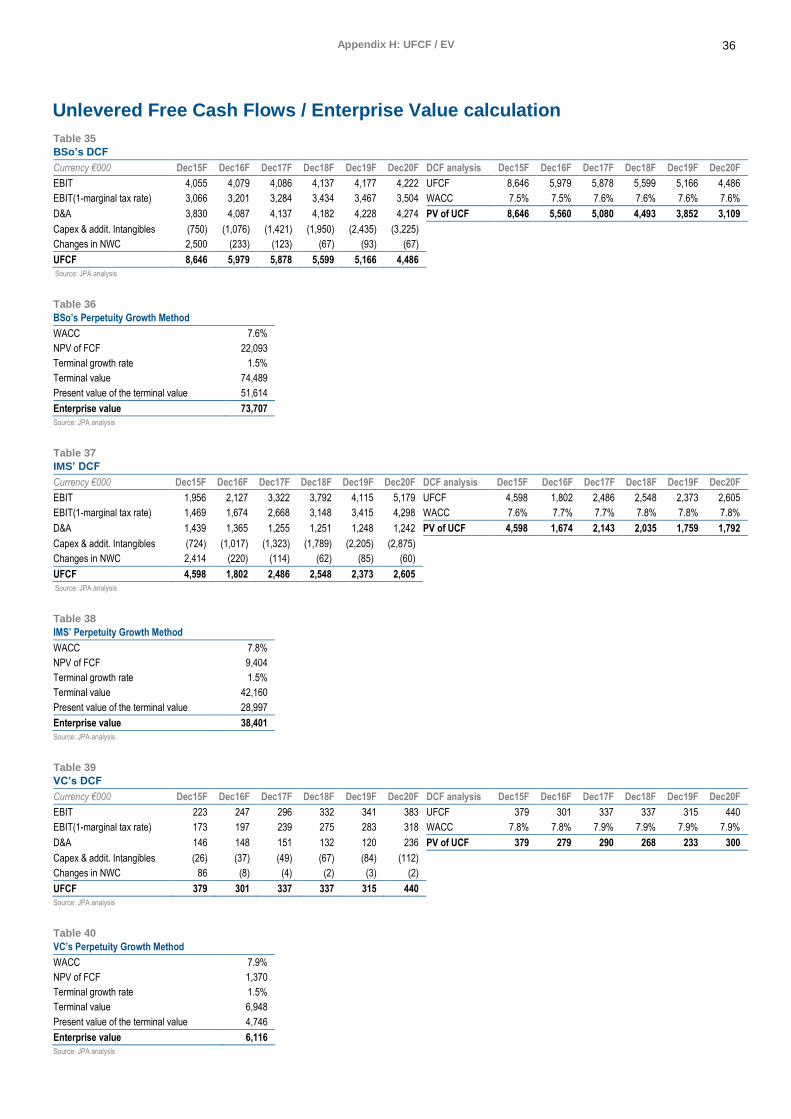
36 Appendix H: UFCF / EV
Appendix H: UFCF / EV
Unlevered Free Cash Flows / Enterprise Value calculation
Table 35
BSo’s DCF
Currency €000 Dec15F Dec16F Dec17F Dec18F Dec19F Dec20F DCF analysis Dec15F Dec16F Dec17F Dec18F Dec19F Dec20F
EBIT 4,055 4,079 4,086 4,137 4,177 4,222 UFCF 8,646 5,979 5,878 5,599 5,166 4,486
EBIT(1-marginal tax rate) 3,066 3,201 3,284 3,434 3,467 3,504 WACC 7.5% 7.5% 7.6% 7.6% 7.6% 7.6%
D&A 3,830 4,087 4,137 4,182 4,228 4,274 PV of UCF 8,646 5,560 5,080 4,493 3,852 3,109
Capex & addit. Intangibles (750) (1,076) (1,421) (1,950) (2,435) (3,225)
Changes in NWC 2,500 (233) (123) (67) (93) (67)
UFCF 8,646 5,979 5,878 5,599 5,166 4,486
Source: JPA analysis
Table 36
BSo’s Perpetuity Growth Method
WACC 7.6%
NPV of FCF 22,093
Terminal growth rate 1.5%
Terminal value 74,489
Present value of the terminal value 51,614
Enterprise value 73,707
Source: JPA analysis
Table 37
IMS’ DCF
Currency €000 Dec15F Dec16F Dec17F Dec18F Dec19F Dec20F DCF analysis Dec15F Dec16F Dec17F Dec18F Dec19F Dec20F
EBIT 1,956 2,127 3,322 3,792 4,115 5,179 UFCF 4,598 1,802 2,486 2,548 2,373 2,605
EBIT(1-marginal tax rate) 1,469 1,674 2,668 3,148 3,415 4,298 WACC 7.6% 7.7% 7.7% 7.8% 7.8% 7.8%
D&A 1,439 1,365 1,255 1,251 1,248 1,242 PV of UCF 4,598 1,674 2,143 2,035 1,759 1,792
Capex & addit. Intangibles (724) (1,017) (1,323) (1,789) (2,205) (2,875)
Changes in NWC 2,414 (220) (114) (62) (85) (60)
UFCF 4,598 1,802 2,486 2,548 2,373 2,605
Source: JPA analysis
Table 38
IMS’ Perpetuity Growth Method
WACC 7.8%
NPV of FCF 9,404
Terminal growth rate 1.5%
Terminal value 42,160
Present value of the terminal value 28,997
Enterprise value 38,401
Source: JPA analysis
Table 39
VC’s DCF
Currency €000 Dec15F Dec16F Dec17F Dec18F Dec19F Dec20F DCF analysis Dec15F Dec16F Dec17F Dec18F Dec19F Dec20F
EBIT 223 247 296 332 341 383 UFCF 379 301 337 337 315 440
EBIT(1-marginal tax rate) 173 197 239 275 283 318 WACC 7.8% 7.8% 7.9% 7.9% 7.9% 7.9%
D&A 146 148 151 132 120 236 PV of UCF 379 279 290 268 233 300
Capex & addit. Intangibles (26) (37) (49) (67) (84) (112)
Changes in NWC 86 (8) (4) (2) (3) (2)
UFCF 379 301 337 337 315 440
Source: JPA analysis
Table 40
VC’s Perpetuity Growth Method
WACC 7.9%
NPV of FCF 1,370
Terminal growth rate 1.5%
Terminal value 6,948
Present value of the terminal value 4,746
Enterprise value 6,116
Source: JPA analysis
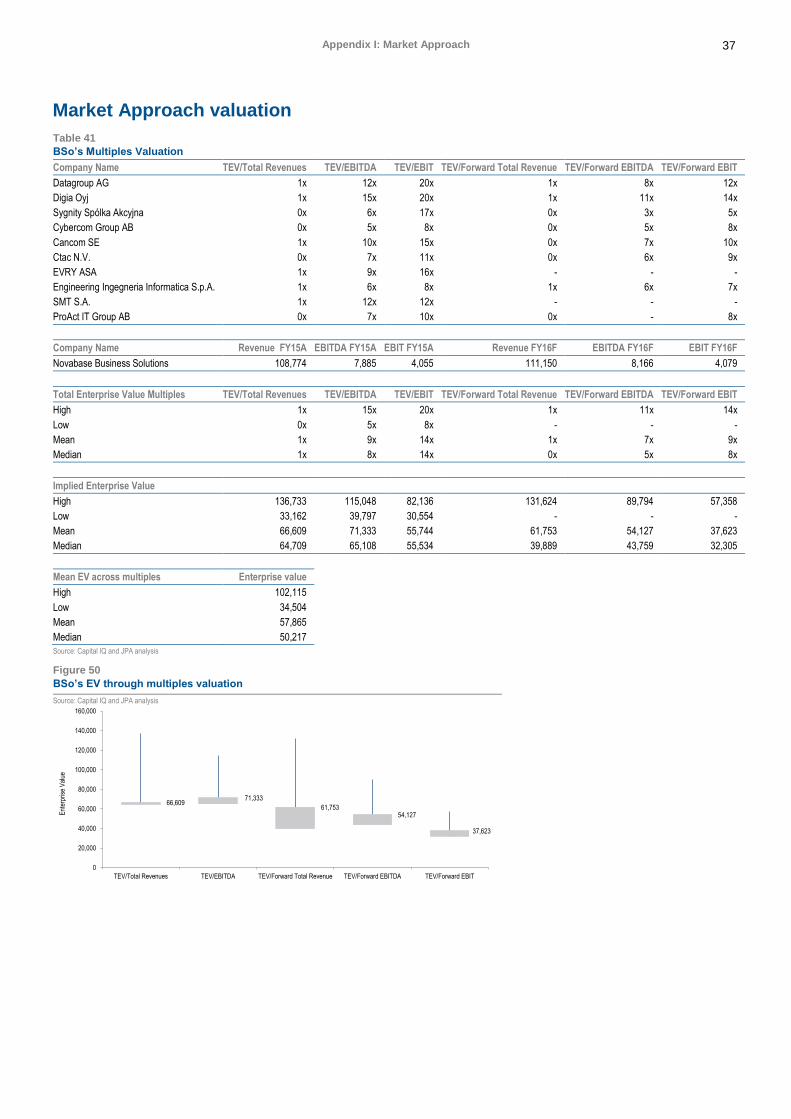
37 Appendix I: Market Approach
Appendix I: Market Approach
Market Approach valuation
Table 41
BSo’s Multiples Valuation
Company Name TEV/Total Revenues TEV/EBITDA TEV/EBIT TEV/Forward Total Revenue TEV/Forward EBITDA TEV/Forward EBIT
Datagroup AG 1x 12x 20x 1x 8x 12x
Digia Oyj 1x 15x 20x 1x 11x 14x
Sygnity Spólka Akcyjna 0x 6x 17x 0x 3x 5x
Cybercom Group AB 0x 5x 8x 0x 5x 8x
Cancom SE 1x 10x 15x 0x 7x 10x
Ctac N.V. 0x 7x 11x 0x 6x 9x
EVRY ASA 1x 9x 16x - - -
Engineering Ingegneria Informatica S.p.A. 1x 6x 8x 1x 6x 7x
SMT S.A. 1x 12x 12x - - -
ProAct IT Group AB 0x 7x 10x 0x - 8x
Company Name Revenue FY15A EBITDA FY15A EBIT FY15A Revenue FY16F EBITDA FY16F EBIT FY16F
Novabase Business Solutions 108,774 7,885 4,055 111,150 8,166 4,079
Total Enterprise Value Multiples TEV/Total Revenues TEV/EBITDA TEV/EBIT TEV/Forward Total Revenue TEV/Forward EBITDA TEV/Forward EBIT
High 1x 15x 20x 1x 11x 14x
Low 0x 5x 8x - - -
Mean 1x 9x 14x 1x 7x 9x
Median 1x 8x 14x 0x 5x 8x
Implied Enterprise Value
High 136,733 115,048 82,136 131,624 89,794 57,358
Low 33,162 39,797 30,554 - - -
Mean 66,609 71,333 55,744 61,753 54,127 37,623
Median 64,709 65,108 55,534 39,889 43,759 32,305
Mean EV across multiples Enterprise value
High 102,115
Low 34,504
Mean 57,865
Median 50,217
Source: Capital IQ and JPA analysis
Figure 50
BSo’s EV through multiples valuation
Source: Capital IQ and JPA analysis
66,60971,333
61,75354,127
37,623
0
20,000
40,000
60,000
80,000
100,000
120,000
140,000
160,000
TEV/Total Revenues TEV/EBITDA TEV/Forward Total Revenue TEV/Forward EBITDA TEV/Forward EBIT
Ent
erpr
ise
Val
ue
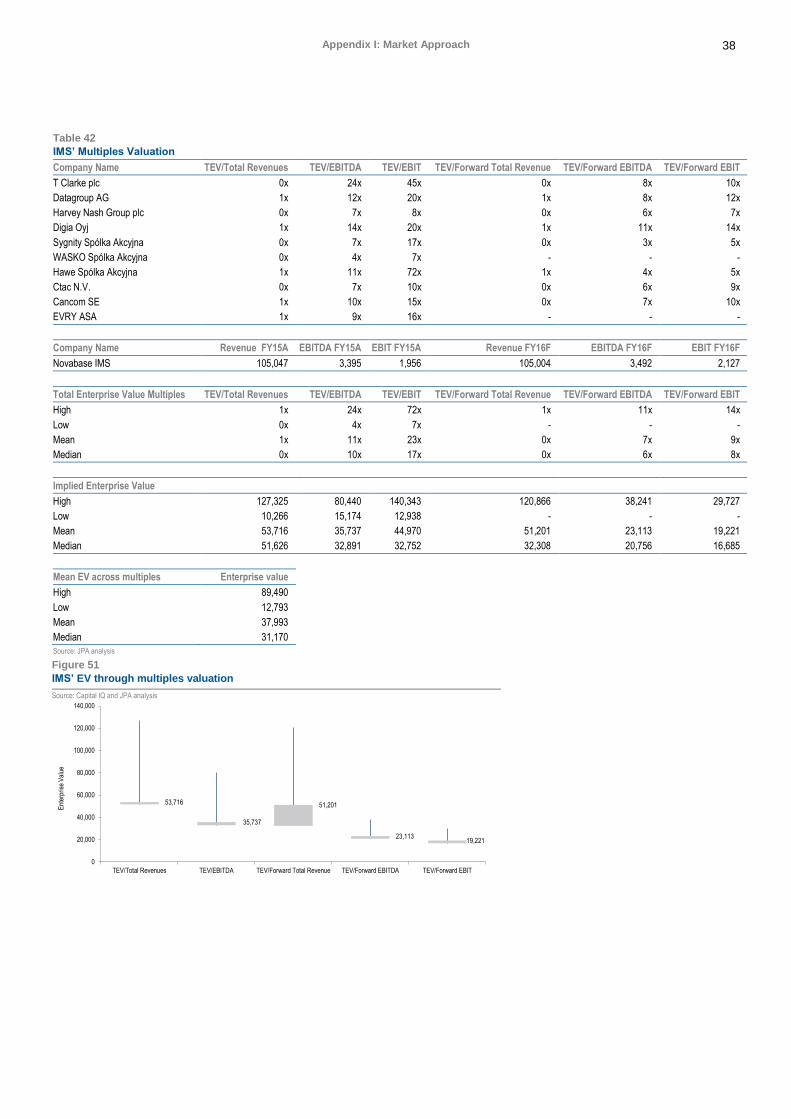
38 Appendix I: Market Approach
Table 42
IMS’ Multiples Valuation
Company Name TEV/Total Revenues TEV/EBITDA TEV/EBIT TEV/Forward Total Revenue TEV/Forward EBITDA TEV/Forward EBIT
T Clarke plc 0x 24x 45x 0x 8x 10x
Datagroup AG 1x 12x 20x 1x 8x 12x
Harvey Nash Group plc 0x 7x 8x 0x 6x 7x
Digia Oyj 1x 14x 20x 1x 11x 14x
Sygnity Spólka Akcyjna 0x 7x 17x 0x 3x 5x
WASKO Spólka Akcyjna 0x 4x 7x - - -
Hawe Spólka Akcyjna 1x 11x 72x 1x 4x 5x
Ctac N.V. 0x 7x 10x 0x 6x 9x
Cancom SE 1x 10x 15x 0x 7x 10x
EVRY ASA 1x 9x 16x - - -
Company Name Revenue FY15A EBITDA FY15A EBIT FY15A Revenue FY16F EBITDA FY16F EBIT FY16F
Novabase IMS 105,047 3,395 1,956 105,004 3,492 2,127
Total Enterprise Value Multiples TEV/Total Revenues TEV/EBITDA TEV/EBIT TEV/Forward Total Revenue TEV/Forward EBITDA TEV/Forward EBIT
High 1x 24x 72x 1x 11x 14x
Low 0x 4x 7x - - -
Mean 1x 11x 23x 0x 7x 9x
Median 0x 10x 17x 0x 6x 8x
Implied Enterprise Value
High 127,325 80,440 140,343 120,866 38,241 29,727
Low 10,266 15,174 12,938 - - -
Mean 53,716 35,737 44,970 51,201 23,113 19,221
Median 51,626 32,891 32,752 32,308 20,756 16,685
Mean EV across multiples Enterprise value
High 89,490
Low 12,793
Mean 37,993
Median 31,170
Source: JPA analysis
Figure 51
IMS’ EV through multiples valuation
Source: Capital IQ and JPA analysis
53,716
35,737
51,201
23,11319,221
0
20,000
40,000
60,000
80,000
100,000
120,000
140,000
TEV/Total Revenues TEV/EBITDA TEV/Forward Total Revenue TEV/Forward EBITDA TEV/Forward EBIT
Ent
erpr
ise
Val
ue
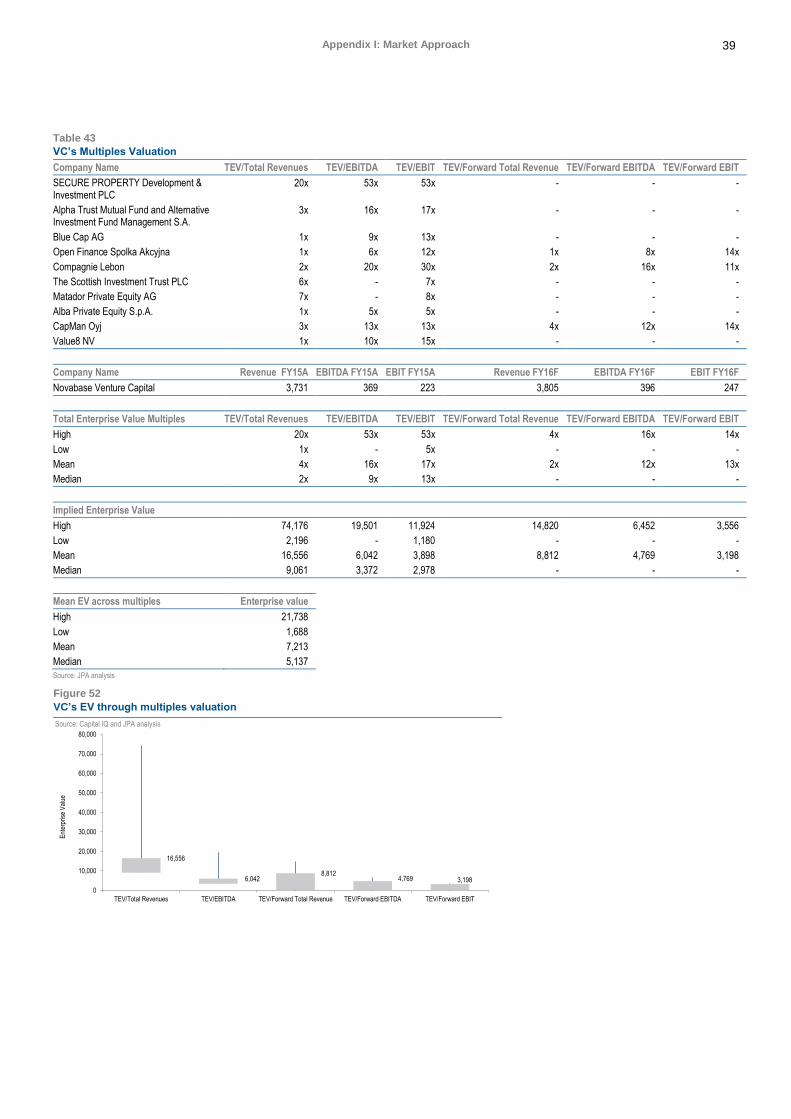
39 Appendix I: Market Approach
Table 43
VC’s Multiples Valuation
Company Name TEV/Total Revenues TEV/EBITDA TEV/EBIT TEV/Forward Total Revenue TEV/Forward EBITDA TEV/Forward EBIT
SECURE PROPERTY Development & Investment PLC
20x 53x 53x - - -
Alpha Trust Mutual Fund and Alternative Investment Fund Management S.A.
3x 16x 17x - - -
Blue Cap AG 1x 9x 13x - - -
Open Finance Spolka Akcyjna 1x 6x 12x 1x 8x 14x
Compagnie Lebon 2x 20x 30x 2x 16x 11x
The Scottish Investment Trust PLC 6x - 7x - - -
Matador Private Equity AG 7x - 8x - - -
Alba Private Equity S.p.A. 1x 5x 5x - - -
CapMan Oyj 3x 13x 13x 4x 12x 14x
Value8 NV 1x 10x 15x - - -
Company Name Revenue FY15A EBITDA FY15A EBIT FY15A Revenue FY16F EBITDA FY16F EBIT FY16F
Novabase Venture Capital 3,731 369 223 3,805 396 247
Total Enterprise Value Multiples TEV/Total Revenues TEV/EBITDA TEV/EBIT TEV/Forward Total Revenue TEV/Forward EBITDA TEV/Forward EBIT
High 20x 53x 53x 4x 16x 14x
Low 1x - 5x - - -
Mean 4x 16x 17x 2x 12x 13x
Median 2x 9x 13x - - -
Implied Enterprise Value
High 74,176 19,501 11,924 14,820 6,452 3,556
Low 2,196 - 1,180 - - -
Mean 16,556 6,042 3,898 8,812 4,769 3,198
Median 9,061 3,372 2,978 - - -
Mean EV across multiples Enterprise value
High 21,738
Low 1,688
Mean 7,213
Median 5,137
Source: JPA analysis
Figure 52
VC’s EV through multiples valuation
Source: Capital IQ and JPA analysis
16,556
6,0428,812
4,769 3,198
0
10,000
20,000
30,000
40,000
50,000
60,000
70,000
80,000
TEV/Total Revenues TEV/EBITDA TEV/Forward Total Revenue TEV/Forward EBITDA TEV/Forward EBIT
Ent
erpr
ise
Val
ue
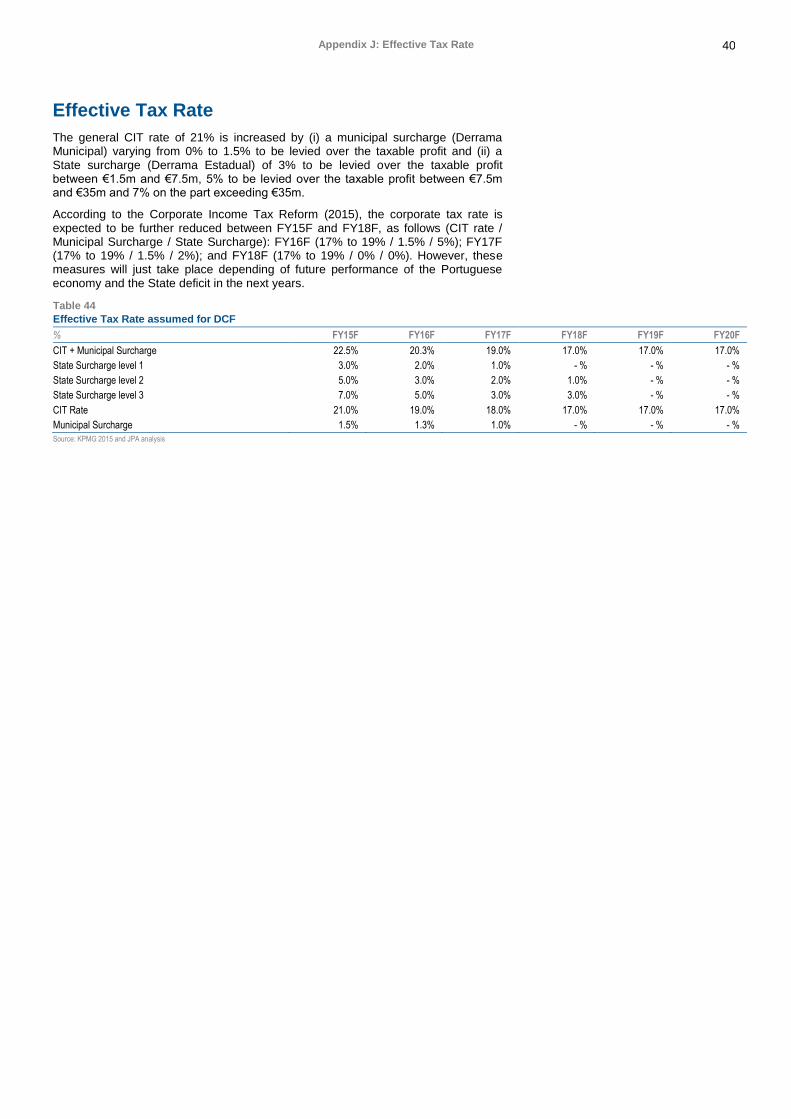
40 Appendix J: Effective Tax Rate
The general CIT rate of 21% is increased by (i) a municipal surcharge (Derrama Municipal) varying from 0% to 1.5% to be levied over the taxable profit and (ii) a State surcharge (Derrama Estadual) of 3% to be levied over the taxable profit between €1.5m and €7.5m, 5% to be levied over the taxable profit between €7.5m and €35m and 7% on the part exceeding €35m.
According to the Corporate Income Tax Reform (2015), the corporate tax rate is expected to be further reduced between FY15F and FY18F, as follows (CIT rate / Municipal Surcharge / State Surcharge): FY16F (17% to 19% / 1.5% / 5%); FY17F (17% to 19% / 1.5% / 2%); and FY18F (17% to 19% / 0% / 0%). However, these measures will just take place depending of future performance of the Portuguese economy and the State deficit in the next years.
Appendix J: Effective Tax Rate
Effective Tax Rate
Table 44
Effective Tax Rate assumed for DCF
% FY15F FY16F FY17F FY18F FY19F FY20F
CIT + Municipal Surcharge 22.5% 20.3% 19.0% 17.0% 17.0% 17.0%
State Surcharge level 1 3.0% 2.0% 1.0% - % - % - %
State Surcharge level 2 5.0% 3.0% 2.0% 1.0% - % - %
State Surcharge level 3 7.0% 5.0% 3.0% 3.0% - % - %
CIT Rate 21.0% 19.0% 18.0% 17.0% 17.0% 17.0%
Municipal Surcharge 1.5% 1.3% 1.0% - % - % - %
Source: KPMG 2015 and JPA analysis
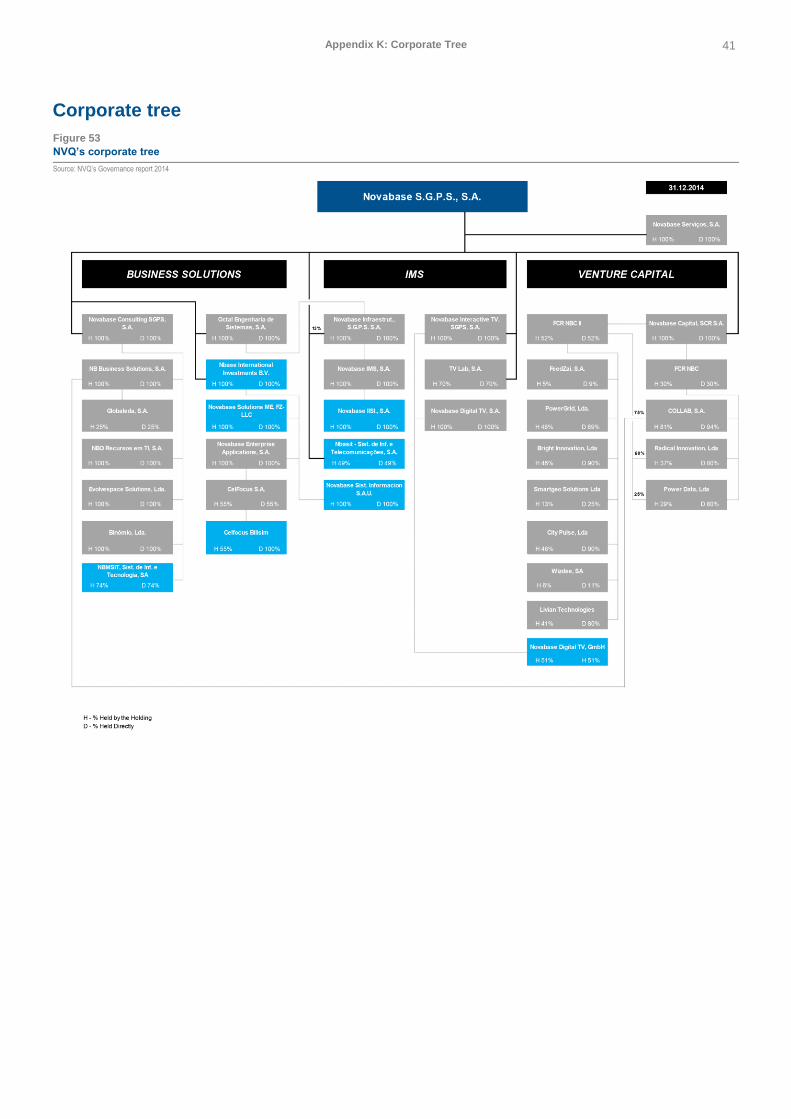
41 Appendix K: Corporate Tree
Appendix K: Corporate Tree
Corporate tree
Figure 53
NVQ’s corporate tree
Source: NVQ’s Governance report 2014
42 Appendix L: References
Alford, A. W. (1992), The effect of the set of comparable firms on the accuracy of the price-earnings valuation method. Journal of Accounting Research, 30 (1), 94-108.
Baker, M. R. and Ruback, R. (1999), Estimating industry multiples. Working Paper, Harvard Business School, Boston.
Benninga, S. Z. and Sarig, O. H. (1997), Corporate Finance: A Valuation Approach. 1st edition, McGraw-Hill.
Benninga, S. Z. (2008), Financial Modelling. 3rd
edition, Massachusetts Institute of Technology.
Bhojraj, S., and Lee, C. M. C. (2002), Who Is My Peer? A Valuation-Based Approach to the Selection of Comparable Firms. Journal of Accounting Research, 40 (2), 407-439.
BMI Research, Independent Research Agency Database.
Damodaran, A. (1994), Damodaran on valuation: Security analysis for investment and corporate finance. 1st edition, John Wiley
& Sons.
Damodaran, A. (1997), Corporate Finance - Theory and practice. 1st edition, John Wiley & Sons.
Damodaran, A. (1999), Estimating Risk Parameters. Working Paper, Stern School of Business.
Damodaran, A. (2008), Equity Risk Premiums (ERP): Determinants, Estimation and Implications. Working Paper, Stern School of Business.
Damodaran, A. (2012), Investment Valuation: Tools and Techniques for determining the value of any asset. 3rd
edition, John
Wiley & Sons.
Defusco, R. A., Mcleavey, D. W. and Pinto, J. E. (2007), Quantitative Investment Analysis. CFA Institute Investment Series, 2nd
edition, John Wiley & Sons.
Dittmann, I. and Weidner, C. (2005), Selecting Comparables for the Valuation of European Firms. SFB 649 Economic Risk,
February 10, 2005.
Emis, Demographic and Geopolitical Indicators Database.
Ernst & Young (2014), Venture Capital Insights – 4Q14. Global VC investment landscape. Report.
Fama, E. F., and French, K. R. (1997), Industry costs of equity. Journal of Financial Economics, 43 (2), 153-193.
Factiva, Company, Industry, Business News Database.
Gardner, Jr. E.S. (1985), Exponential Smoothing: The state of the Art. Journal of forecasting. Journal of Forecasting, 4, 1-28.
IDC, Information Technology Market Trends Database.
IMF World Economic Outlook October 2015 Database.
Jain, C. L. (2003), Business Forecasting Practices in 2003. The Journal of Business Forecasting Methods & Systems, 23 (3), 2-6.
Kaplan, S. N. and Ruback, R. S. (1995), The valuation of cash flow forecasts: An empirical analysis. Journal of Finance, 50 (4), 1059–1093.
Koller, T., Goedhart, M. and Wessels, D. (2010), Valuation, Measuring and Managing the Value of Companies. 5th edition,
McKinsey & Company.
Koeplin, J., Sarin, A. and Shapiro, A C. (2000), The private company discount. Journal of Applied Corporate Finance, 12 (4), 94-101.
KPMG (2015), Corporate Income Tax Reform. Report.
Liu, J., Nissim, D. and Thomas, J. (2002), Equity Valuation Using Multiples. Journal of Accounting Research, 40 (1), 135-172.
Liu, J., Nissim, D. and Thomas, J. (2004), Price multiples based on forecasts and reported values of earnings, dividends, sales, and cash flows: An international analysis. Working Paper, Yale University.
Massari, M., Gianfrate, G. and Zanetti, L. (2014), The Valuation of Financial Companies: Tools and Techniques to Measure the Value of Banks, Insurance Companies and Other Financial Institutions. 1
st edition, Wiley Finance Series.
Novabase’s Reports & Accounts from 2010 to 2014.
Novabase’s Consolidated Results 6m2010, 6m2011, 6m2012, 6m2013, 6m2014 and 6m2015.
Novabase’s Management Guidance 2015.
Pinto, J. E., Henry, E., Robinson, T. R. and Stowe, J.D. (2010), Equity Asset Valuation. CFA Institute Investment Series, 2nd
edition, John Wiley & Sons.
Piotroski, J. (2000), Value investing: the use of historical financial statement information to separate winners from losers. Journal of Accounting Research, 38, 43-51.
PwC (2014), Asset Management 2020. A Brave New World. Report.
Appendix L: References
References

43 Appendix L: References
Prequin (2015), Private Equity & Venture Capital. Report.
Robinson, T. R., Greuning, H. V., Henry, E and Broihahn, M. A. (2009), International Financial Statement Analysis. CFA Institute
Investment Series, 2nd
edition, John Wiley & Sons.
S&P Capital IQ, Capital IQ Market Insight Database.
ThomsonONE, Public/Private Company Overviews Database.
44 Appendix M: Abbreviations
€ Euro
€…k Thousand euros
€…m Million euros
6mxxA Actual figures as at 31 June 20xx
6mxxG Management Guidance for 31 June 20xx
A Actual
AEM Associação de Empresas Emitentes de Valores Cotados em Mercado
Beta
BL Beta Levered
BS Balance sheet
BSo Business Solutions
Bu Beta unlevered
CAGR Compound Annual Growth Rate
CapEx Capital Expenditure
CAPM Capital Asset Pricing Model
CDS Country Default Swap
CFF Cash Flow from Financing Activities
CFI Cash Flow from Investing
CFO Cash Flow from Operations
CIT Corporate Income Tax
CMVM Comissão do Mercado de Valores Mobiliários
CR Current Ratio
CRP Country Risk Premium
D Debt
D&A Depreciations & Amortizations
DCF Discounted Cash Flow
DecxxA Actual figures as at 31 December 20xx
DecxxF Forecasted figures as at 31 December 20xx
DPO Days payable outstanding
DSCR Debt Service Cover Ratio
DSO Days sales outstanding
E Equity
EBIT Earnings before Interest and Tax
EBITDA Earnings before Interest, Tax, Depreciation & Amortization
EBT Earnings before Tax
EMEA Europe, Middle East and Africa Region
ESS External services and supplies
EU15 European Union of the fifteen
EV Enterprise Value
EY Ernst & Young
FCF Free cash flow
FCFF Free cash flow to the Firm
Appendix M: Abbreviations
Abbreviations
45 Appendix M: Abbreviations
FiT Feed-in-tariff
Forward EBIT EBIT consensus estimates for the next year end
Forward EBITDA EBITDA consensus estimates for the next year end
FY Fiscal Year
FYxxA Financial years ended as at 31 December 20xx
FYxxF Financial years forecasted for 31 December 20xx
FYxxG Financial years Management Guidance for 31 December 20xx
g Terminal growth rate
GAAP Generally accepted accounting principles
GBV Gross book value
GDP Gross Domestic Product
GM Gross Margin
IAPMEI Agência para a Competitividade e Inovação, I.P.
IDC International Data Corporation
IMF International Monetary Fund
IMS Infrastructure & Managed Services
INE Instituto Nacional de Estatística
IPQ Portuguese Institute of Quality
IRP Industry Risk Premium
ISCTE ISCTE Business School
ISEG Lisbon School of Economics & Management
IT Information Technology
IVM Industry Volatility Multiplier
JunxxA Actual figures as at 31 June 20xx
Kd Cost of debt
Ke Cost of equity
KPI Key Performance Indicator
LT Long term
LTD Long Term Debt
MayxxA Actual figures as at 31 May 20xx
MPT Municipal Property Tax
MRP Market Risk Premium
MVP Market Volatility Multiplier
NBV Net book value
NI Net Income
NVQ Novabase SGPS SA
NWC Net working capital
O&M Operation and maintenance expenses
OpEx Operational Expenditure
PIT Personal income tax
PL Profit & Loss
PP&E Property, Plant and Equipment

46 Appendix M: Abbreviations
PwC PricewaterhouseCoopers
R Return
Rd Cost of debt
Rf Risk free rate
Rm Market return
RMSE Root Mean Squared Error
ROA Return on Assets
S&P Standard & Poor's
SG&A Selling, General & Administrative Expense
SOP Sum of the Parts
SS Social Security
ST Short term
STD Standard Deviation
T Corporate income tax rate
TA Total Assets
TEV Total Enterprise Value
UCP Portuguese Catholic University
UFCF Unlevered Free Cash Flows
VAT Value Added Tax
VC Venture Capital
VN Turnover
WACC Weighted Average Cost of Capital
WC Working Capital
Wd Weight of debt
We Weight of equity
xxx margin xxx over Revenue
YExx Year ending as at 31 December 20xx
YExxF Year ending forecasted for 31 December 20xx