quantifying sympathetic nerve activity: problems, pitfalls and the need for standardization
TRANSCRIPT
Exp Physiol 95.1 pp 41–50 41
Experimental Physiology – Symposium Reports
Quantifying sympathetic nerve activity: problems, pitfallsand the need for standardization
Sarah-Jane Guild1, Carolyn J. Barrett1, Fiona D. McBryde1, Bruce N. Van Vliet2, Geoffrey A. Head3,Sandra L. Burke3 and Simon C. Malpas1,4
1Circulatory Control Laboratory, Department of Physiology and Bioengineering Institute, University of Auckland, Auckland, New Zealand2BioMedical Sciences Division, Memorial University of Newfoundland, Canada3Baker IDI Heart and Diabetes Institute, Melbourne, Victoria, Australia4Telemetry Research Ltd, Auckland, New Zealand
Since the first recording of sympathetic nerve activity (SNA) early last century, numerousmethods for presentation of the resulting data have developed. In this paper, we discuss thecommon ways of describing SNA and their application to chronic recordings. Suggestions onassessing the quality of SNA are made, including the use of arterial pressure wave-triggeredaverages and nasopharyngeal stimuli. Calculation of the zero level of the SNA signal fromrecordings during ganglionic blockade, the average level between bursts and the minimum ofarterial pressure wave-triggered averages are compared and shown to be equivalent. The useof normalization between zero and maximal SNA levels to allow comparison between groupsis discussed. We recommend that measured microvolt levels of integrated SNA be presented(with the zero/noise level subtracted), along with burst amplitude and frequency informationwhenever possible. We propose that standardization of the quantifying/reporting of SNA willallow better comparison between disease models and between research groups and ultimatelyallow data to be more reflective of the human situation.
(Received 24 June 2009; accepted after revision 20 August 2009; first published online 21 August 2009)Corresponding author S.-J. Guild: Circulatory Control Laboratory, Department of Physiology, University of Auckland,Private Bag 92019, Auckland 1142, New Zealand. Email: [email protected]
In the 1930s, Bronk et al. (1936) noted that ‘a directanalysis of the behavior of the sympathetic nerve cellsis especially valuable because it is difficult to determinetheir functional characteristics from the response of theorgans which they supply.’ More than 70 years later, thisstatement is just as valid, since a growing number ofresearchers wish to measure sympathetic nerve activity(SNA) directly. Interest in direct recordings in animalsand humans has continued to grow as it has beenrecognized that sympathetic activity is increased in a hostof cardiovascular diseases (Hasking et al. 1986; Andersonet al. 1989; Esler, 2000). Yet the basic technique forrecording SNA in animals has remained fundamentally thesame since the 1930s; a wire is brought into contact withan isolated nerve, insulated from the surrounding tissue,and then the grouped action potentials are amplified.One major analytical problem in the assessment of SNAarises from the fact that the signal is measured inmicrovolts and a number of factors, including differencesin contact between the nerve and the electrode, could
lead to differences in the amplitude of the recordedsignal. The most common approach to quantify SNAhas been to report changes after some intervention asa percentage of the baseline level in the same animal.Although this approach is well suited to within-animalcomparisons using short-term recordings lasting severalhours, more recently a variety of groups have begun torecord SNA over much longer time periods (Miki et al.2002; Barrett et al. 2003; Ramchandra et al. 2008; VanVliet et al. 2008; Yoshimoto et al. 2008). The developmentof new technology for remotely recording SNA andblood pressure in freely moving animals opens the doorto measuring SNA within the same animal throughoutthe disease progression or between animals in differentdisease states. The problem is that by measuring SNAas a percentage of the baseline, any differences betweenanimals are masked. Thus the question arises of howwe, as a community, should be quantifying SNA. Is itpossible to develop a set of accepted standard methods forreporting SNA? The aim of this publication is to discuss
C© 2009 The Authors. Journal compilation C© 2010 The Physiological Society DOI: 10.1113/expphysiol.2008.046300
) at University of Auckland on July 1, 2013ep.physoc.orgDownloaded from Exp Physiol (
42 S.-J. Guild and others Exp Physiol 95.1 pp 41–50
the validity of different approaches for assessing andquantifying SNA. This paper focuses on the methodologyof chronic long-term recordings of SNA in animal modelsof disease. Recordings of SNA from humans are notdiscussed in depth here, but there are many specific reviewson the topic (e.g. Grassi & Esler, 1999; Vallbo et al. 2004;Wallin & Charkoudian, 2007). We will largely focus onSNA recordings made in rabbits from the renal nervesor other sympathetic nerves that consist predominantlyof vasomotor fibres that are under baroreflex control.However, many of the concepts discussed in this contextare expected to be applicable to other species and recordingsites.
Long-term measurement of SNA: what is possible?
Until recently, it was thought that it was not possibleto record SNA in rats for longer than 5–10 days. Therewere three reasons generally advanced: the nerve died;there was growth of connective tissue between the nerveand recording electrode which acted as insulation; orthe electrode moved away from the nerve, resultingin the loss of contact. Recently, however, a variety ofindependent groups have been able to make recordingsof SNA (generally to the kidney) in rats for periods ofup to a month (Miki et al. 2002; Van Vliet et al. 2008;Yoshimoto et al. 2008). It is reasonable to assume that
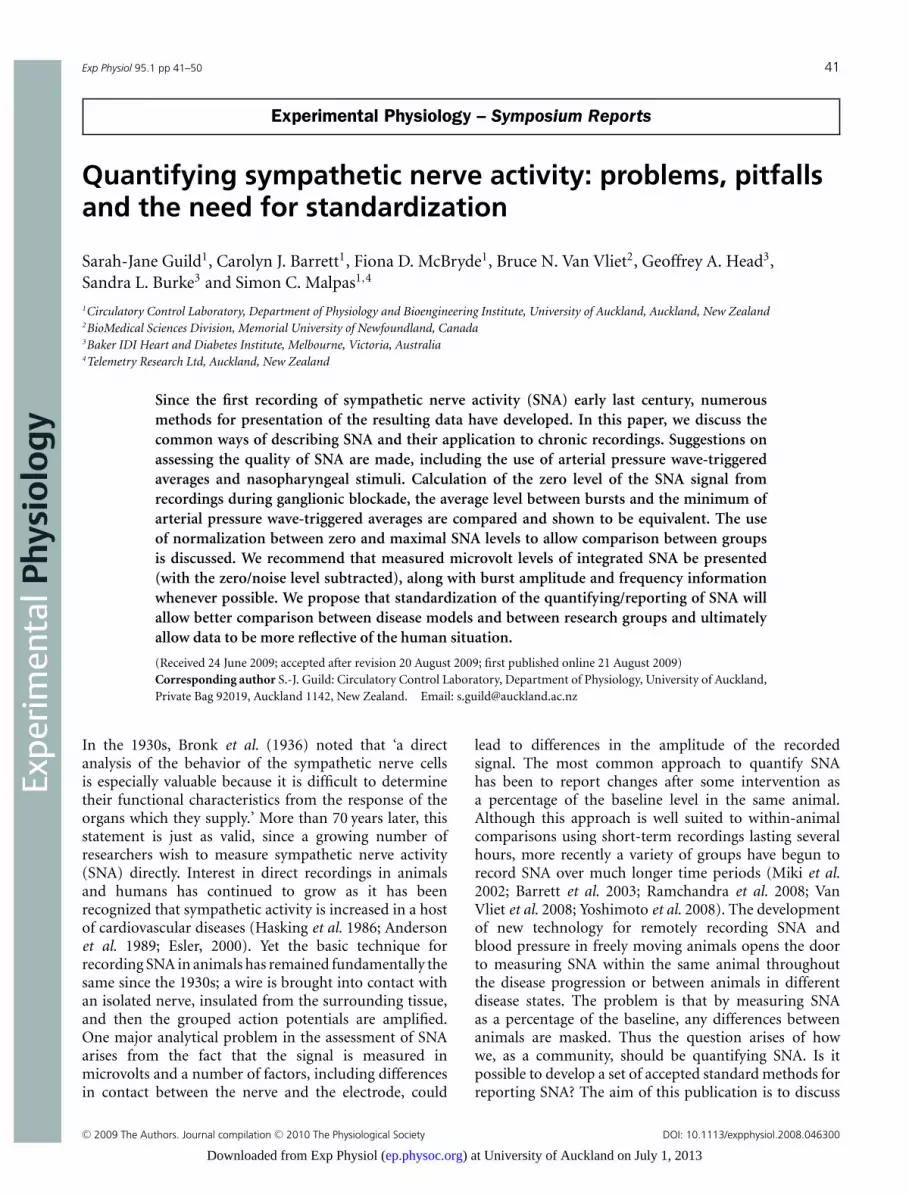
Figure 1. Integrated renal SNA (top), renal SNA (middle) and arterial pressure (bottom) recorded bytelemetry from a conscious rat 65 days after implantation of the recording electrodes
the initial inflammatory and connective tissue regrowthoccurs quite quickly after implantation. Thus, if SNArecordings are possible >4 weeks after implantation, thepossible longevity of sympathetic recordings needs to bereassessed. Figure 1 illustrates a telemetry-based recordingof renal SNA from a rat obtained 65 days after implantationof the electrode. While the percentage of recordings thatlast this duration is relatively small, it illustrates thatrecordings in a small number of animals can be maintainedfor much longer than previously thought, perhaps evenindefinitely.
While placement of electrodes on a sympathetic nerveis always likely to be a challenge owing to the small sizeand frailty of the nerves, there are several key aspectsthat researchers can employ to improve the likelihood ofobtaining viable signals, as follows:
• Take extreme care to avoid stretching or crushing thenerve, or disrupting its blood supply, when freeing it fromthe surrounding tissue.
• Use sutures or adhesive to attach the electrode firmlyto the underlying tissue.
• Use only the smallest amount of silicone elastomerto cover the nerve–electrode assembly. This ensures thatmovement of the assembly is unlikely to result in the nervebeing stretched as it enters the silicone.
While long-term recordings seemingly open up newfrontiers in exploration of the interaction of thesympathetic nervous system with the environment, diet,
C© 2009 The Authors. Journal compilation C© 2010 The Physiological Society
) at University of Auckland on July 1, 2013ep.physoc.orgDownloaded from Exp Physiol (
Exp Physiol 95.1 pp 41–50 Quantifying sympathetic nerve activity 43
therapies and disease progression, there are several pitfallsthat must be addressed.
Assessing what is good nerve activity
Multifibre nerve recordings of vasomotor sympatheticactivity contain conspicuous bursts of SNA occurring ina cyclic fashion with the cardiac cycle. These bursts arecaused by the individual fibres of the nerve bundle firing
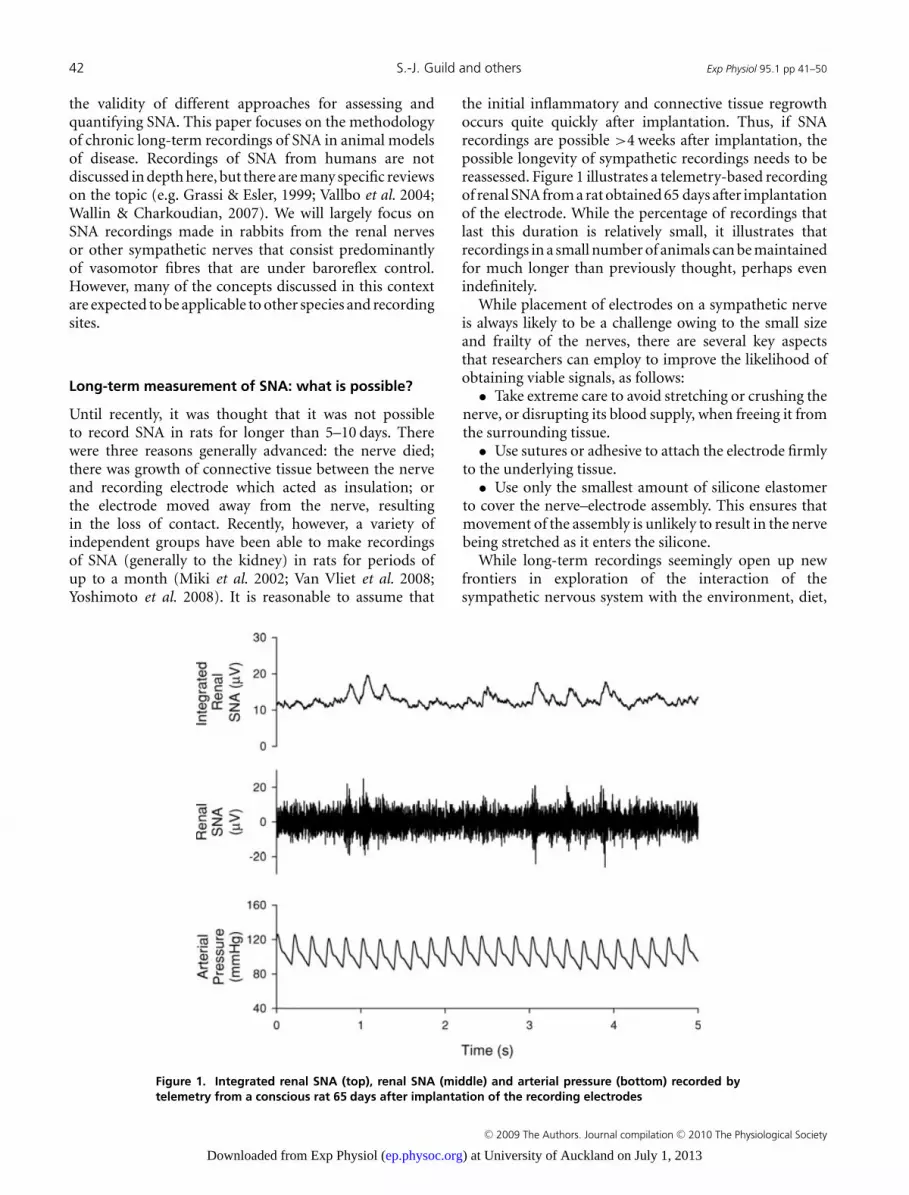
Figure 2. Short (4 s) recordings of integrated renal SNA, renal SNA (often termed raw SNA) and arterialpressure, along with (bottom plots) systolic pressure-triggered averaged records of arterial pressure(dashed lines) and renal SNA (continous lines)Examples are shown from four rabbits with ‘good’ SNA signal (A), poor SNA signal (B), ECG on the SNA signal(C) and during ganglionic blockade using pentolinium tartrate (25 mg kg−1 I.V.; D). Note that each recording wasobtained from a different animal, hence the different scales.
at approximately the same time in the cardiac cycle. Therelatively low firing rates of the individual fibres combineto form the bursts seen in multifibre recordings (Malpas,1998). The optimal method for assessing such activityinitially is simply to listen to the audible nature of thedischarges. In addition, when using the systolic pressurewaveform as a trigger and multiple sweeps of SNA to obtainan average signal, it is possible to see the rhythmic natureof the sympathetic discharges. Figure 2 shows examplerecordings of renal SNA in four rabbits, along with
C© 2009 The Authors. Journal compilation C© 2010 The Physiological Society
) at University of Auckland on July 1, 2013ep.physoc.orgDownloaded from Exp Physiol (
44 S.-J. Guild and others Exp Physiol 95.1 pp 41–50
the systolic wave-triggered averaged records of arterialpressure and renal SNA. In a ‘good’ sympathetic recording,where bursts can be seen in the filtered SNA (sometimestermed original SNA) signal and in the integrated SNAdata, the systolic wave-triggered averages show a distinctphasic relationship between arterial pressure and the renalSNA (Malpas et al. 2006). This can be compared withthe signal (Fig. 2B) where no distinct bursts can be seenand there is no phasic relationship between the SNAsignal and the arterial pressure pulse. Such a poor SNAsignal would probably exclude the animal from furtherprotocols. However, it should be noted that we have foundthat animals that are well-recovered from surgery and areundisturbed in their home cage may well have an SNAsignal with very few distinct bursts but will respond tostimuli such as a decrease in arterial pressure (e.g. infusionof sodium nitroprusside) or nasopharyngeal activation. Itis therefore prudent to determine whether a SNA signalresponds to such a stimulus before removing an animalfrom further study. Sometimes SNA recordings appearto contain ECG information, which can be identifiedby distinct sharp spikes in both the raw and integratedSNA signals (Fig. 2C). When these signals are examinedas systolic wave-triggered averages, the SNA shows muchsharper peaks than a typical ‘good’ SNA signal. Nervepreamplifiers are usually used in a differential mode thatamplifies the difference in the signals registered at thetwo recording electrodes and rejects the signals (e.g. ECG,
Ori
gin
al S
NA
(μV
)
-10
0
10
Inte
gra
ted
SN
A (
μ V)
0
5
10
Time (s)
0.0 0.5 1.0 1.5 2.0
SN
A (
μ V)
0
5
10
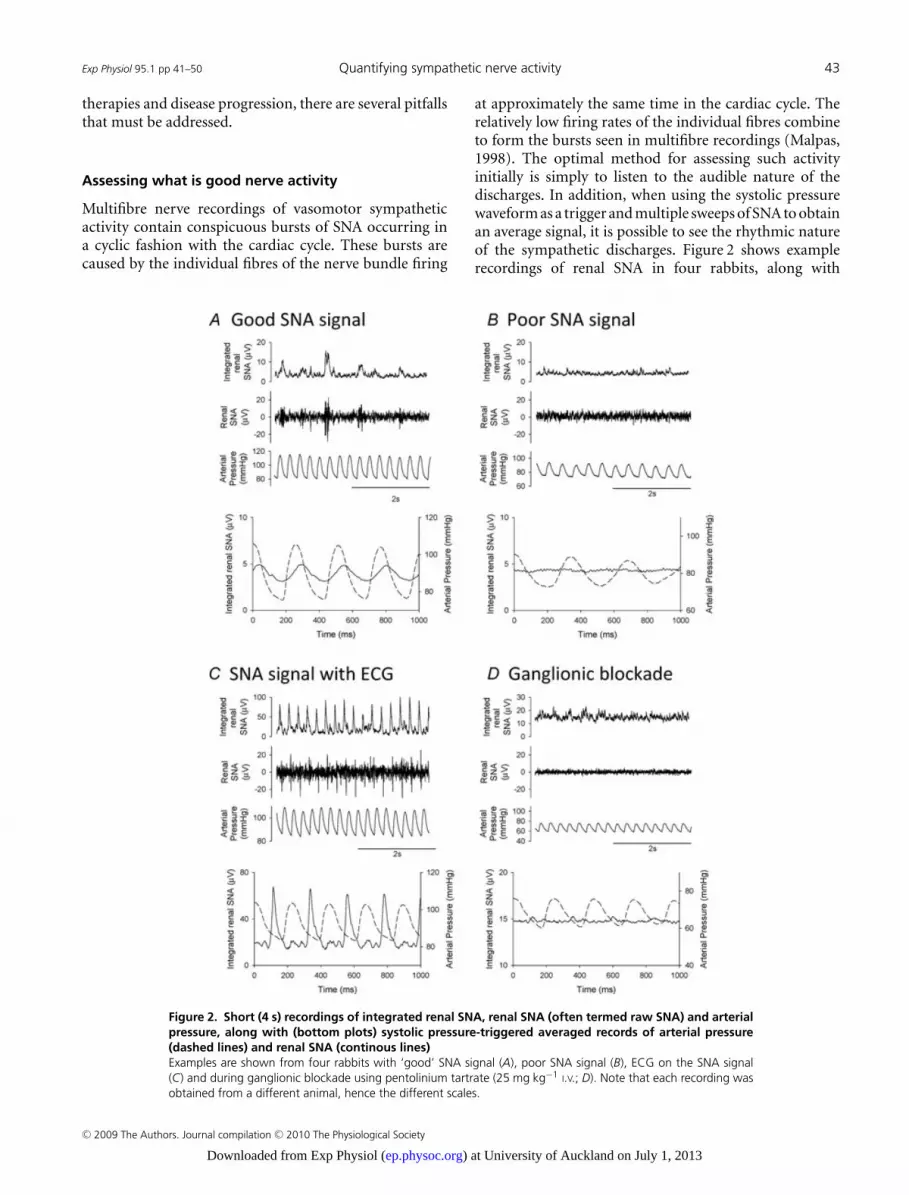
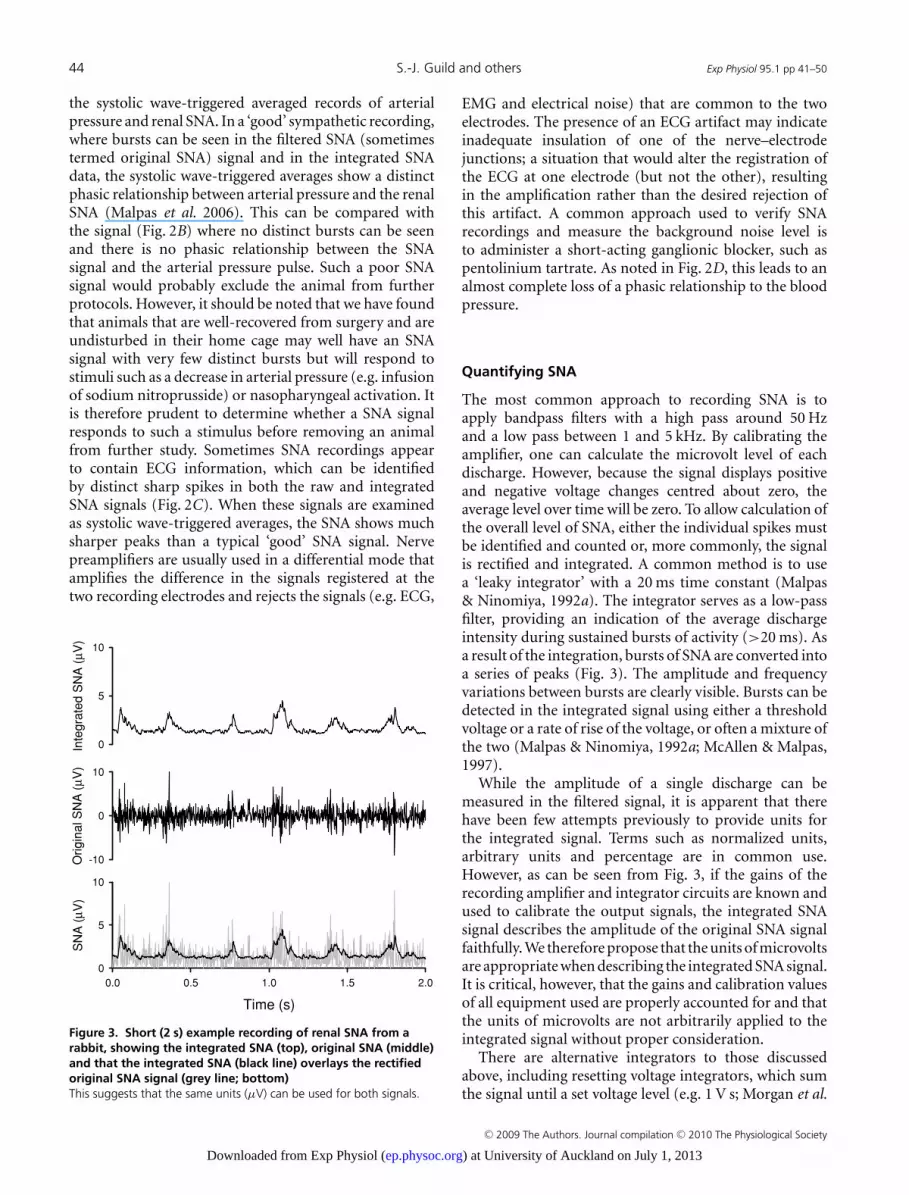
Figure 3. Short (2 s) example recording of renal SNA from arabbit, showing the integrated SNA (top), original SNA (middle)and that the integrated SNA (black line) overlays the rectifiedoriginal SNA signal (grey line; bottom)This suggests that the same units (μV) can be used for both signals.
EMG and electrical noise) that are common to the twoelectrodes. The presence of an ECG artifact may indicateinadequate insulation of one of the nerve–electrodejunctions; a situation that would alter the registration ofthe ECG at one electrode (but not the other), resultingin the amplification rather than the desired rejection ofthis artifact. A common approach used to verify SNArecordings and measure the background noise level isto administer a short-acting ganglionic blocker, such aspentolinium tartrate. As noted in Fig. 2D, this leads to analmost complete loss of a phasic relationship to the bloodpressure.
Quantifying SNA
The most common approach to recording SNA is toapply bandpass filters with a high pass around 50 Hzand a low pass between 1 and 5 kHz. By calibrating theamplifier, one can calculate the microvolt level of eachdischarge. However, because the signal displays positiveand negative voltage changes centred about zero, theaverage level over time will be zero. To allow calculation ofthe overall level of SNA, either the individual spikes mustbe identified and counted or, more commonly, the signalis rectified and integrated. A common method is to usea ‘leaky integrator’ with a 20 ms time constant (Malpas& Ninomiya, 1992a). The integrator serves as a low-passfilter, providing an indication of the average dischargeintensity during sustained bursts of activity (>20 ms). Asa result of the integration, bursts of SNA are converted intoa series of peaks (Fig. 3). The amplitude and frequencyvariations between bursts are clearly visible. Bursts can bedetected in the integrated signal using either a thresholdvoltage or a rate of rise of the voltage, or often a mixture ofthe two (Malpas & Ninomiya, 1992a; McAllen & Malpas,1997).
While the amplitude of a single discharge can bemeasured in the filtered signal, it is apparent that therehave been few attempts previously to provide units forthe integrated signal. Terms such as normalized units,arbitrary units and percentage are in common use.However, as can be seen from Fig. 3, if the gains of therecording amplifier and integrator circuits are known andused to calibrate the output signals, the integrated SNAsignal describes the amplitude of the original SNA signalfaithfully. We therefore propose that the units of microvoltsare appropriate when describing the integrated SNA signal.It is critical, however, that the gains and calibration valuesof all equipment used are properly accounted for and thatthe units of microvolts are not arbitrarily applied to theintegrated signal without proper consideration.
There are alternative integrators to those discussedabove, including resetting voltage integrators, which sumthe signal until a set voltage level (e.g. 1 V s; Morgan et al.
C© 2009 The Authors. Journal compilation C© 2010 The Physiological Society
) at University of Auckland on July 1, 2013ep.physoc.orgDownloaded from Exp Physiol (
Exp Physiol 95.1 pp 41–50 Quantifying sympathetic nerve activity 45
1995) is reached and then reset to zero. The output fromthese integrators is quite different to that seen in Fig. 3.Rather than an outline of the original SNA signal, theintegrated signal looks like a saw-tooth pattern, with thenumber of ‘teeth’ being relative to the size of the signal.Clearly, some information, such as the burst size, shapeand frequency, are lost, although an absolute averagelevel of the signal can be calculated. A similar signal isachieved using a resetting integrator that resets after aset amount of time rather than voltage level (e.g. Liu& Zucker, 1999). Regardless of the integration methodused, it is important that the signal properties are properlyunderstood and that data are presented in a fashion to bestallow comparison between studies. We propose that thisis best done using units of microvolts and appropriatelycalibrated equipment.
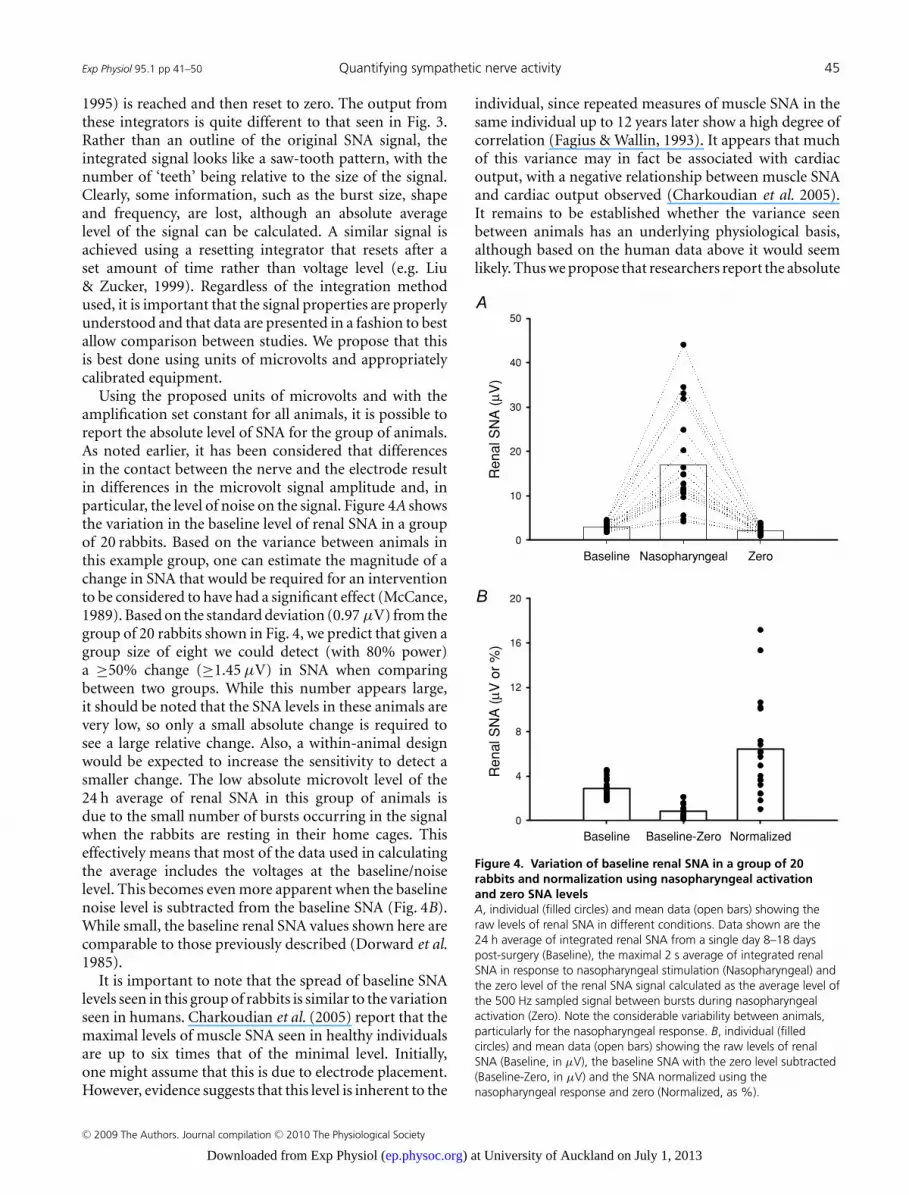
Using the proposed units of microvolts and with theamplification set constant for all animals, it is possible toreport the absolute level of SNA for the group of animals.As noted earlier, it has been considered that differencesin the contact between the nerve and the electrode resultin differences in the microvolt signal amplitude and, inparticular, the level of noise on the signal. Figure 4A showsthe variation in the baseline level of renal SNA in a groupof 20 rabbits. Based on the variance between animals inthis example group, one can estimate the magnitude of achange in SNA that would be required for an interventionto be considered to have had a significant effect (McCance,1989). Based on the standard deviation (0.97 μV) from thegroup of 20 rabbits shown in Fig. 4, we predict that given agroup size of eight we could detect (with 80% power)a ≥50% change (≥1.45 μV) in SNA when comparingbetween two groups. While this number appears large,it should be noted that the SNA levels in these animals arevery low, so only a small absolute change is required tosee a large relative change. Also, a within-animal designwould be expected to increase the sensitivity to detect asmaller change. The low absolute microvolt level of the24 h average of renal SNA in this group of animals isdue to the small number of bursts occurring in the signalwhen the rabbits are resting in their home cages. Thiseffectively means that most of the data used in calculatingthe average includes the voltages at the baseline/noiselevel. This becomes even more apparent when the baselinenoise level is subtracted from the baseline SNA (Fig. 4B).While small, the baseline renal SNA values shown here arecomparable to those previously described (Dorward et al.1985).
It is important to note that the spread of baseline SNAlevels seen in this group of rabbits is similar to the variationseen in humans. Charkoudian et al. (2005) report that themaximal levels of muscle SNA seen in healthy individualsare up to six times that of the minimal level. Initially,one might assume that this is due to electrode placement.However, evidence suggests that this level is inherent to the
individual, since repeated measures of muscle SNA in thesame individual up to 12 years later show a high degree ofcorrelation (Fagius & Wallin, 1993). It appears that muchof this variance may in fact be associated with cardiacoutput, with a negative relationship between muscle SNAand cardiac output observed (Charkoudian et al. 2005).It remains to be established whether the variance seenbetween animals has an underlying physiological basis,although based on the human data above it would seemlikely. Thus we propose that researchers report the absolute
Baseline Baseline-Zero Normalized
Re
na
l S
NA
(μ V
or
%)
0
4
8
12
16
20
Baseline Nasopharyngeal Zero
Re
na
l S
NA
(μ V
)
0
10
20
30
40
50
Figure 4. Variation of baseline renal SNA in a group of 20rabbits and normalization using nasopharyngeal activationand zero SNA levelsA, individual (filled circles) and mean data (open bars) showing theraw levels of renal SNA in different conditions. Data shown are the24 h average of integrated renal SNA from a single day 8–18 dayspost-surgery (Baseline), the maximal 2 s average of integrated renalSNA in response to nasopharyngeal stimulation (Nasopharyngeal) andthe zero level of the renal SNA signal calculated as the average level ofthe 500 Hz sampled signal between bursts during nasopharyngealactivation (Zero). Note the considerable variability between animals,particularly for the nasopharyngeal response. B, individual (filledcircles) and mean data (open bars) showing the raw levels of renalSNA (Baseline, in μV), the baseline SNA with the zero level subtracted(Baseline-Zero, in μV) and the SNA normalized using thenasopharyngeal response and zero (Normalized, as %).
C© 2009 The Authors. Journal compilation C© 2010 The Physiological Society
) at University of Auckland on July 1, 2013ep.physoc.orgDownloaded from Exp Physiol (
46 S.-J. Guild and others Exp Physiol 95.1 pp 41–50
level of SNA from the integrated signal in microvolts andshow the variance between baseline levels of individualanimals.
Scaling SNA. A variety of approaches have been usedin attempts to scale the SNA signal. For example, thebaseline level has been given an arbitrary value of 100%and then changes have been referenced to this level.Alternatively, baroreceptor unloading or nasopharyngealstimuli (via a small puff of smoke to the face of theanimal) have been used to increase SNA, and the resultinglevel has been classified as 100% (Burke & Head, 2003).The nasopharyngeal stimulus evokes the largest knownrecruitment of renal nerve fibres (Dorward et al. 1985) andhas been found to be highly reproducible within a rabbit(Burke & Head, 2003). Using this stimulus, where meanrenal SNA can increase up to fivefold, it has been estimatedthat resting nerve activity may only comprise the activationof 10–20% of the nerves in the bundle (Malpas et al.1996b). Burke & Head (2003) showed that normalizationusing the SNA response to the nasopharyngeal stimulationcould remove differences in the baroreflex curves obtainedin two groups of rabbits separated on the basis of havingeither low or high baseline SNA. Furthermore, this formof normalization could also remove the 50% decay thatthey observed in baseline SNA over 5 week recordings.They also showed that calibration of renal SNA against theresponse to nasopharyngeal stimulation, when comparinga group of hypertensive rabbits with a control group,revealed the blunting of the baroreflex in the hypertensiveanimals (Burke & Head, 2003). This blunted responsewas not detectable when the SNA was calibrated usingother methods, such as airjet stress, the upper plateauof the baroreflex curve or the baseline level of SNA. Thissuggests that nasopharyngeal stimulation of SNA providesa means to calibrate SNA both between groups of animalsand during within-animal chronic experiments. We haveused this technique extensively in rabbits and found it tobe both easy to administer and reproducible. However,we caution that, to our knowledge, the technique has yetto be examined in detail and validated in other species,including the rat.
If the nasopharyngeal response gives the ‘maximal’calibration value of 100% for SNA, then the noise level (e.g.measured using ganglionic blockade or phenylephrineinfusion) can be considered to represent 0%, and theresting SNA level expressed in relation to these values.Thus, one normalized unit reflects 1% of the differencebetween minimal and maximal SNA. This approach canbe useful in quantifying the changes in SNA within thesame animal over an extended period of time, e.g. weeks.However, it does rely on the assumption that the responsesto the nasopharyngeal stimuli are not altered by thetreatment or time, which may not always be valid.
Determining the zero (baseline) level. A commonapproach to estimating the baseline zero level of SNA is touse the reduced level of SNA that occurs during baroreflexactivation in response to administration of a selectivevasoconstrictor, such as phenylephrine (Watson et al. 2007;Burke & Head, 2009). We would recommend cautionwhen using this technique, however, since it is possiblethat this level may change in different experimentalconditions. For example, exercise (Miki et al. 2003) andairjet stress (Burke & Head, 2009) have both been shownto increase the minimal renal SNA level recorded duringphenylephrine infusion, i.e. increase the lower plateau ofthe mean arterial pressure–renal SNA baroreflex curve.While these are both acute conditions, the possibilityexists that there may also be chronic conditions that alterthe suppression of SNA using phenylephrine, especiallythose where SNA is elevated. Using phenylephrine todetermine the baseline zero may potentially mask anyincrease in baseline nerve activity which is not baroreflexmediated.
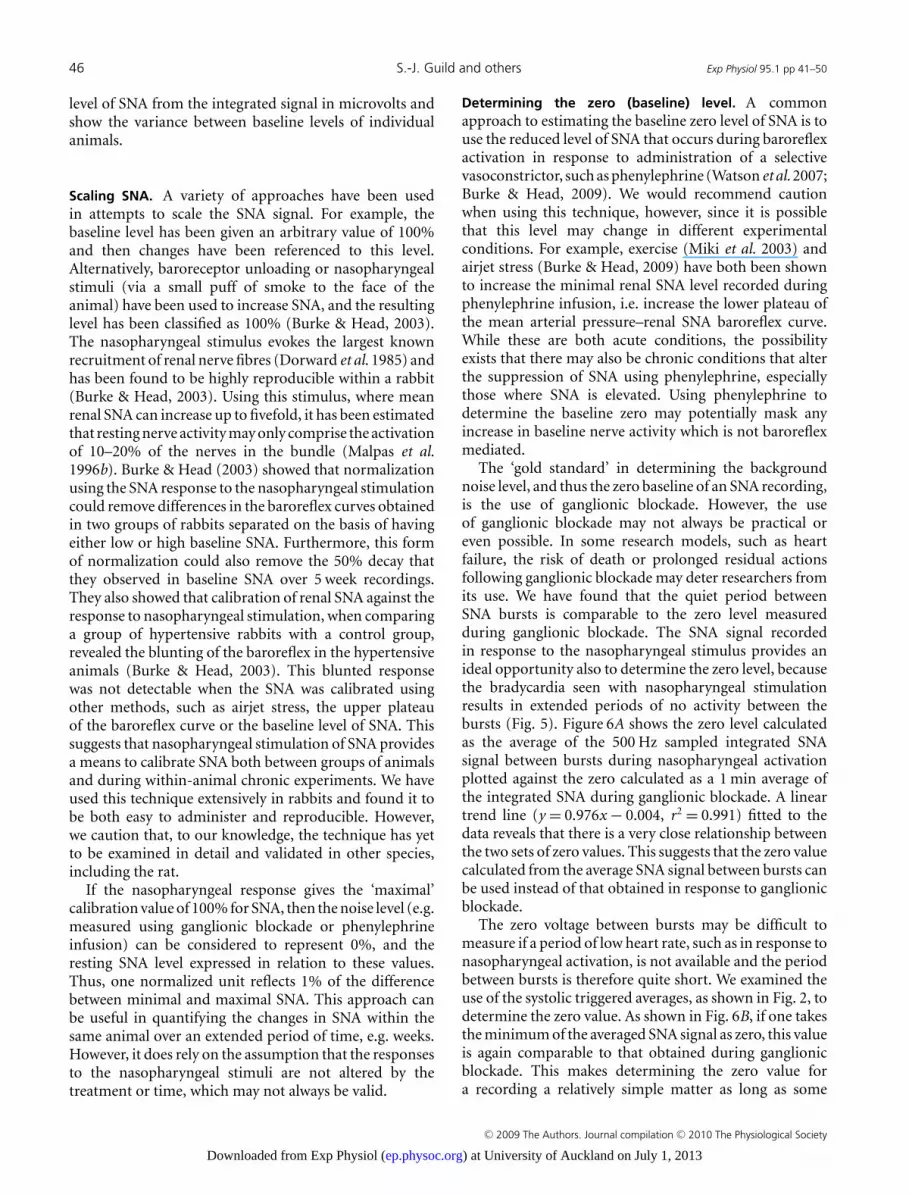
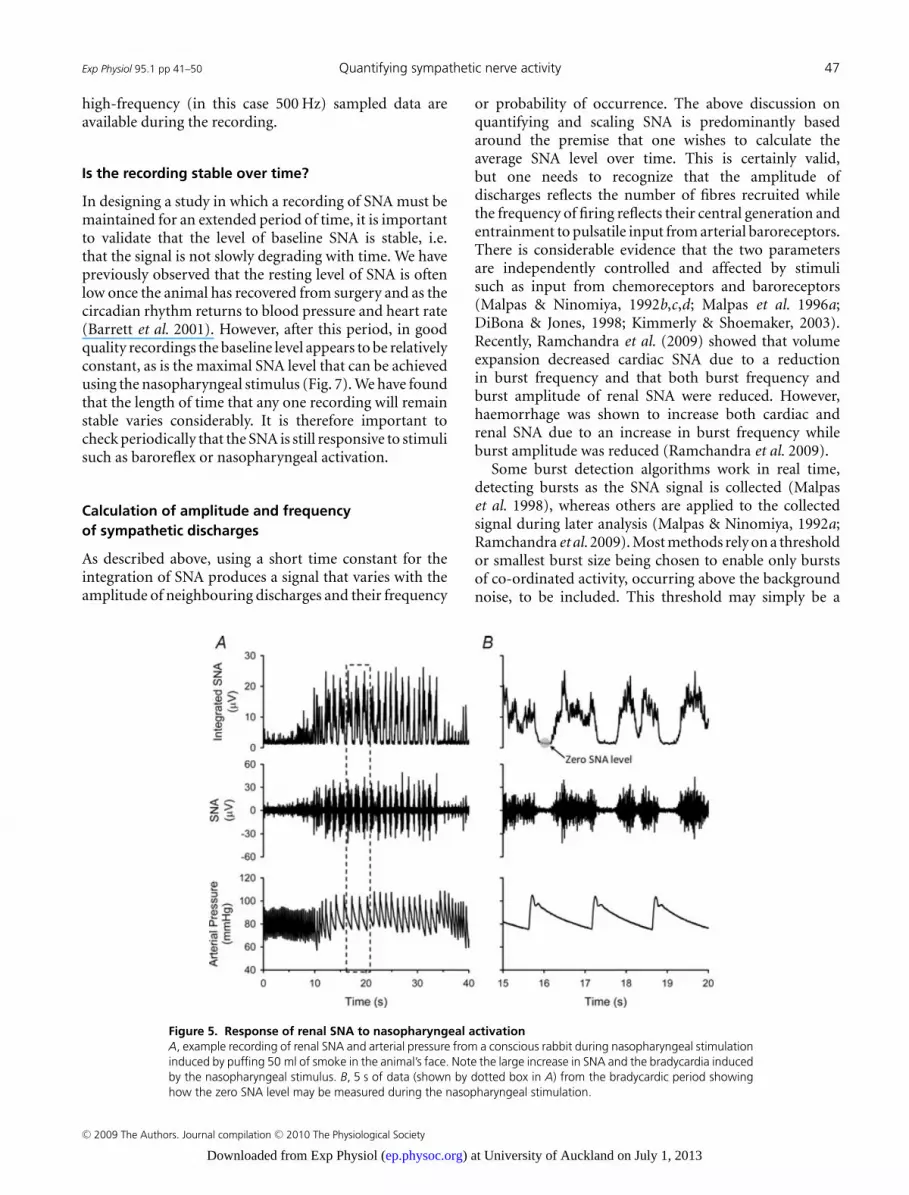
The ‘gold standard’ in determining the backgroundnoise level, and thus the zero baseline of an SNA recording,is the use of ganglionic blockade. However, the useof ganglionic blockade may not always be practical oreven possible. In some research models, such as heartfailure, the risk of death or prolonged residual actionsfollowing ganglionic blockade may deter researchers fromits use. We have found that the quiet period betweenSNA bursts is comparable to the zero level measuredduring ganglionic blockade. The SNA signal recordedin response to the nasopharyngeal stimulus provides anideal opportunity also to determine the zero level, becausethe bradycardia seen with nasopharyngeal stimulationresults in extended periods of no activity between thebursts (Fig. 5). Figure 6A shows the zero level calculatedas the average of the 500 Hz sampled integrated SNAsignal between bursts during nasopharyngeal activationplotted against the zero calculated as a 1 min average ofthe integrated SNA during ganglionic blockade. A lineartrend line (y = 0.976x − 0.004, r2 = 0.991) fitted to thedata reveals that there is a very close relationship betweenthe two sets of zero values. This suggests that the zero valuecalculated from the average SNA signal between bursts canbe used instead of that obtained in response to ganglionicblockade.
The zero voltage between bursts may be difficult tomeasure if a period of low heart rate, such as in response tonasopharyngeal activation, is not available and the periodbetween bursts is therefore quite short. We examined theuse of the systolic triggered averages, as shown in Fig. 2, todetermine the zero value. As shown in Fig. 6B, if one takesthe minimum of the averaged SNA signal as zero, this valueis again comparable to that obtained during ganglionicblockade. This makes determining the zero value fora recording a relatively simple matter as long as some
C© 2009 The Authors. Journal compilation C© 2010 The Physiological Society
) at University of Auckland on July 1, 2013ep.physoc.orgDownloaded from Exp Physiol (
Exp Physiol 95.1 pp 41–50 Quantifying sympathetic nerve activity 47
high-frequency (in this case 500 Hz) sampled data areavailable during the recording.
Is the recording stable over time?
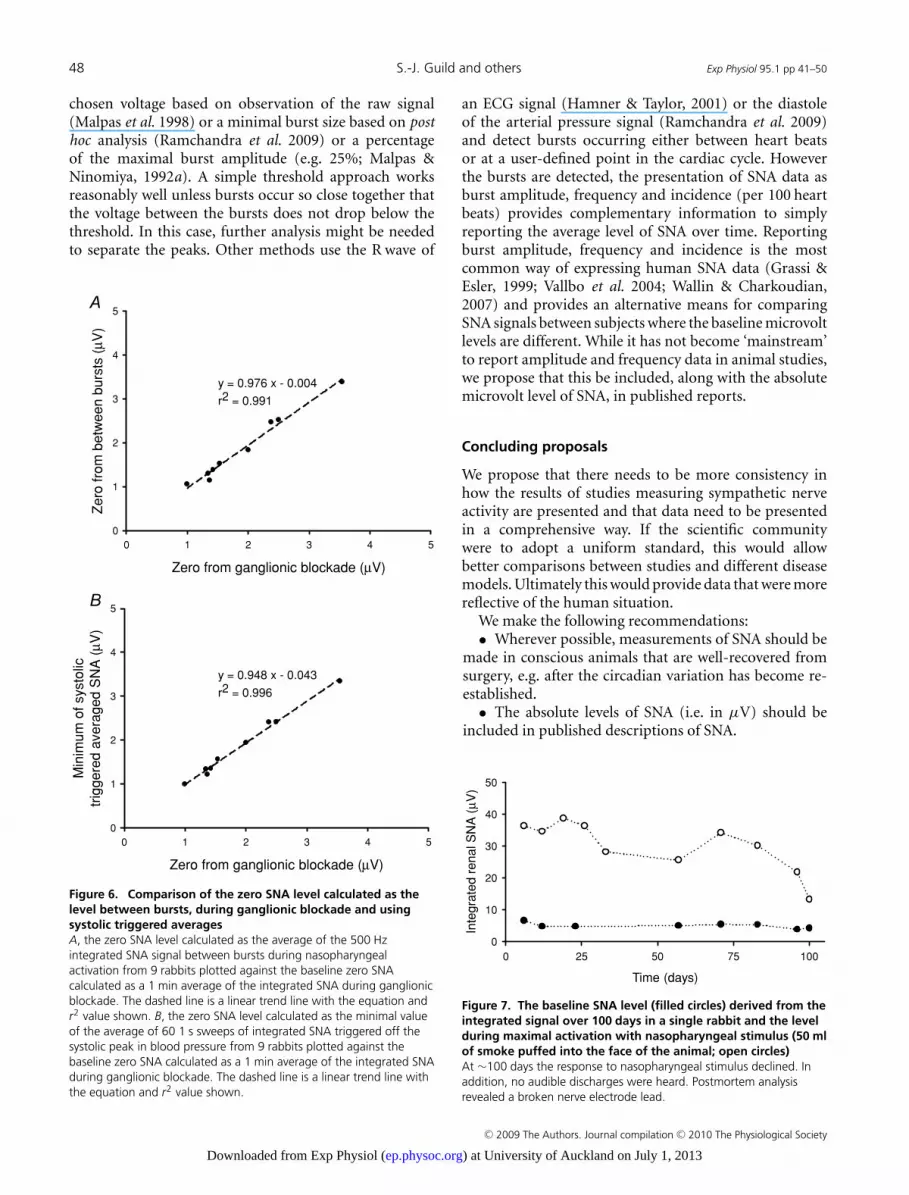
In designing a study in which a recording of SNA must bemaintained for an extended period of time, it is importantto validate that the level of baseline SNA is stable, i.e.that the signal is not slowly degrading with time. We havepreviously observed that the resting level of SNA is oftenlow once the animal has recovered from surgery and as thecircadian rhythm returns to blood pressure and heart rate(Barrett et al. 2001). However, after this period, in goodquality recordings the baseline level appears to be relativelyconstant, as is the maximal SNA level that can be achievedusing the nasopharyngeal stimulus (Fig. 7). We have foundthat the length of time that any one recording will remainstable varies considerably. It is therefore important tocheck periodically that the SNA is still responsive to stimulisuch as baroreflex or nasopharyngeal activation.
Calculation of amplitude and frequencyof sympathetic discharges
As described above, using a short time constant for theintegration of SNA produces a signal that varies with theamplitude of neighbouring discharges and their frequency
Figure 5. Response of renal SNA to nasopharyngeal activationA, example recording of renal SNA and arterial pressure from a conscious rabbit during nasopharyngeal stimulationinduced by puffing 50 ml of smoke in the animal’s face. Note the large increase in SNA and the bradycardia inducedby the nasopharyngeal stimulus. B, 5 s of data (shown by dotted box in A) from the bradycardic period showinghow the zero SNA level may be measured during the nasopharyngeal stimulation.
or probability of occurrence. The above discussion onquantifying and scaling SNA is predominantly basedaround the premise that one wishes to calculate theaverage SNA level over time. This is certainly valid,but one needs to recognize that the amplitude ofdischarges reflects the number of fibres recruited whilethe frequency of firing reflects their central generation andentrainment to pulsatile input from arterial baroreceptors.There is considerable evidence that the two parametersare independently controlled and affected by stimulisuch as input from chemoreceptors and baroreceptors(Malpas & Ninomiya, 1992b,c,d; Malpas et al. 1996a;DiBona & Jones, 1998; Kimmerly & Shoemaker, 2003).Recently, Ramchandra et al. (2009) showed that volumeexpansion decreased cardiac SNA due to a reductionin burst frequency and that both burst frequency andburst amplitude of renal SNA were reduced. However,haemorrhage was shown to increase both cardiac andrenal SNA due to an increase in burst frequency whileburst amplitude was reduced (Ramchandra et al. 2009).
Some burst detection algorithms work in real time,detecting bursts as the SNA signal is collected (Malpaset al. 1998), whereas others are applied to the collectedsignal during later analysis (Malpas & Ninomiya, 1992a;Ramchandra et al. 2009). Most methods rely on a thresholdor smallest burst size being chosen to enable only burstsof co-ordinated activity, occurring above the backgroundnoise, to be included. This threshold may simply be a
C© 2009 The Authors. Journal compilation C© 2010 The Physiological Society
) at University of Auckland on July 1, 2013ep.physoc.orgDownloaded from Exp Physiol (
48 S.-J. Guild and others Exp Physiol 95.1 pp 41–50
chosen voltage based on observation of the raw signal(Malpas et al. 1998) or a minimal burst size based on posthoc analysis (Ramchandra et al. 2009) or a percentageof the maximal burst amplitude (e.g. 25%; Malpas &Ninomiya, 1992a). A simple threshold approach worksreasonably well unless bursts occur so close together thatthe voltage between the bursts does not drop below thethreshold. In this case, further analysis might be neededto separate the peaks. Other methods use the R wave of
Zero from ganglionic blockade (μV)
0 1 2 3 4 5
Zero
fro
m b
etw
een b
urs
ts (
μ V)
0
1
2
3
4
5
y = 0.976 x - 0.004
r2 = 0.991
Zero from ganglionic blockade (μV)
0 1 2 3 4 5
Min
imu
m o
f sys
tolic
trig
gere
d a
vera
ged S
NA
(μ V
)
0
1
2
3
4
5
y = 0.948 x - 0.043
r2 = 0.996
Figure 6. Comparison of the zero SNA level calculated as thelevel between bursts, during ganglionic blockade and usingsystolic triggered averagesA, the zero SNA level calculated as the average of the 500 Hzintegrated SNA signal between bursts during nasopharyngealactivation from 9 rabbits plotted against the baseline zero SNAcalculated as a 1 min average of the integrated SNA during ganglionicblockade. The dashed line is a linear trend line with the equation andr2 value shown. B, the zero SNA level calculated as the minimal valueof the average of 60 1 s sweeps of integrated SNA triggered off thesystolic peak in blood pressure from 9 rabbits plotted against thebaseline zero SNA calculated as a 1 min average of the integrated SNAduring ganglionic blockade. The dashed line is a linear trend line withthe equation and r2 value shown.
an ECG signal (Hamner & Taylor, 2001) or the diastoleof the arterial pressure signal (Ramchandra et al. 2009)and detect bursts occurring either between heart beatsor at a user-defined point in the cardiac cycle. Howeverthe bursts are detected, the presentation of SNA data asburst amplitude, frequency and incidence (per 100 heartbeats) provides complementary information to simplyreporting the average level of SNA over time. Reportingburst amplitude, frequency and incidence is the mostcommon way of expressing human SNA data (Grassi &Esler, 1999; Vallbo et al. 2004; Wallin & Charkoudian,2007) and provides an alternative means for comparingSNA signals between subjects where the baseline microvoltlevels are different. While it has not become ‘mainstream’to report amplitude and frequency data in animal studies,we propose that this be included, along with the absolutemicrovolt level of SNA, in published reports.
Concluding proposals
We propose that there needs to be more consistency inhow the results of studies measuring sympathetic nerveactivity are presented and that data need to be presentedin a comprehensive way. If the scientific communitywere to adopt a uniform standard, this would allowbetter comparisons between studies and different diseasemodels. Ultimately this would provide data that were morereflective of the human situation.
We make the following recommendations:• Wherever possible, measurements of SNA should be
made in conscious animals that are well-recovered fromsurgery, e.g. after the circadian variation has become re-established.
• The absolute levels of SNA (i.e. in μV) should beincluded in published descriptions of SNA.
Time (days)
0 25 50 75 100
Inte
gra
ted r
enal S
NA
(μV
)
0
10
20
30
40
50
Figure 7. The baseline SNA level (filled circles) derived from theintegrated signal over 100 days in a single rabbit and the levelduring maximal activation with nasopharyngeal stimulus (50 mlof smoke puffed into the face of the animal; open circles)At ∼100 days the response to nasopharyngeal stimulus declined. Inaddition, no audible discharges were heard. Postmortem analysisrevealed a broken nerve electrode lead.
C© 2009 The Authors. Journal compilation C© 2010 The Physiological Society
) at University of Auckland on July 1, 2013ep.physoc.orgDownloaded from Exp Physiol (
Exp Physiol 95.1 pp 41–50 Quantifying sympathetic nerve activity 49
• Noise levels (zero) should be reported and subtractedfrom SNA data.
• Nasopharyngeal stimulation, or similar stimuli thatincrease SNA, should be used to validate that the SNAsignal is not degrading over time.
• If presenting data as a percentage between zero and amaximum (e.g. nasopharyngeal activation), the absolutemicrovolt level of SNA should also be presented.
• For comprehensive assessment of SNA, the burstamplitude, incidence and frequency information shouldbe presented along with mean microvolt levels of SNA.
References
Anderson EA, Sinkey CA, Lawton WJ & Mark AL (1989).Elevated sympathetic nerve activity in borderlinehypertensive humans: evidence from direct intraneuralrecordings. Hypertension 14, 177–183.
Barrett CJ, Navakatikyan MA & Malpas SC (2001). Long-termcontrol of renal blood flow: what is the role of the renalnerves? Am J Physiol Regul Integr Comp Physiol 280,R1534–R1268.
Barrett CJ, Ramchandra R, Guild SJ, Lala A, Budgett DM &Malpas SC (2003). What sets the long-term level of renalsympathetic nerve activity: a role for angiotensin II andbaroreflexes? Circ Res 92, 1330–1336.
Bronk DW, Ferguson LK, Margaria R & Solant DY (1936). Theactivity of the cardiac sympathetic centers. Am J Physiol 117,237–249.
Burke SL & Head GA (2003). Method for in vivo calibration ofrenal sympathetic nerve activity in rabbits. J NeurosciMethods 127, 63–74.
Burke SL & Head GA (2009). Cardiac and renal baroreflexcontrol during stress in conscious renovascular hypertensiverabbits: effect of rilmenidine. J Hypertens 27,132–141.
Charkoudian N, Joyner MJ, Johnson CP, Eisenach JH, DietzNM & Wallin BG (2005). Balance between cardiac outputand sympathetic nerve activity in resting humans: role inarterial pressure regulation. J Physiol 568, 315–321.
DiBona GF & Jones SY (1998). Reflex effects on components ofsynchronized renal sympathetic nerve activity. Am J PhysiolRenal Physiol 275, F441–F446.
Dorward PK, Riedel W, Burke SL, Gipps J & Korner PI (1985).The renal sympathetic baroreflex in the rabbit. Arterial andcardiac baroreceptor influences, resetting, and effect ofanesthesia. Circ Res 57, 618–633.
Esler M (2000). The sympathetic system and hypertension. AmJ Hypertens 13, 99S–105S.
Fagius J & Wallin BG (1993). Long-term variability andreproducibility of resting human muscle nerve sympatheticactivity at rest, as reassessed after a decade. Clin Auton Res 3,201–205.
Grassi G & Esler M (1999). How to assess sympathetic activityin humans. J Hypertens 17, 719–734.
Hamner JW & Taylor JA (2001). Automated quantification ofsympathetic beat-by-beat activity, independent of signalquality. J Appl Physiol 91, 1199–1206.
Hasking GJ, Esler MD, Jennings GL, Burton D, Johns JA &Korner PI (1986). Norepinephrine spillover to plasma inpatients with congestive heart failure: evidence of increasedoverall and cardiorenal sympathetic nervous activity.Circulation 73, 615–621.
Kimmerly DS & Shoemaker JK (2003). Hypovolemia andMSNA discharge patterns: assessing and interpretingsympathetic responses. Am J Physiol Heart Circ Physiol 284,H1198–H1204.
Liu JL & Zucker IH (1999). Regulation of sympathetic nerveactivity in heart failure: a role for nitric oxide andangiotensin II. Circ Res 84, 417–423.
McAllen RM & Malpas SC (1997). Sympathetic burst activity:characteristics and significance. Clin Exp Pharmacol Physiol24, 791–799.
McCance I (1989). The number of animals. News Physiol Sci 4,172–176.
Malpas SC (1998). The rhythmicity of sympathetic nerveactivity. Prog Neurobiol 56, 65–96.
Malpas SC, Bendle RD, Head GA & Ricketts JH (1996a).Frequency and amplitude of sympathetic discharges bybaroreflexes during hypoxia in conscious rabbits. Am JPhysiol Heart Circ Physiol 271, H2563–H2574.
Malpas SC, Evans RG, Head GA & Lukoshkova EV (1998).Contribution of renal nerves to renal blood flow variabilityduring hemorrhage. Am J Physiol Regul Integr Comp Physiol274, R1283–R1294.
Malpas SC & Ninomiya I (1992a). A new approach to analysisof synchronized sympathetic nerve activity. Am J PhysiolHeart Circ Physiol 263, H1311–H1317.
Malpas SC & Ninomiya I (1992b). Effect of chemoreceptorstimulation on the periodicity of renal sympathetic nerveactivity in anesthetized cats. J Auton Nerv Syst 37, 19–28.
Malpas SC & Ninomiya I (1992c). The amplitude andperiodicity of synchronized renal sympathetic nervedischarges in anesthetized cats: differential effect ofbaroreceptor activity. J Auton Nerv Syst 40, 189–198.
Malpas SC & Ninomiya I (1992d). Effect of asphyxia on thefrequency and amplitude modulation of synchronized renalnerve activity in the cat. J Auton Nerv Syst 40,199–205.
Malpas SC, Ramchandra R, Guild S-J, Budgett DM & BarrettCJ (2006). Baroreflex mechanisms regulating mean level ofSNA differ from those regulating the timing andentrainment of the sympathetic discharges in rabbits. Am JPhysiol Regul Integr Comp Physiol 291, R400–R409.
Malpas SC, Shweta A, Anderson WP & Head GA (1996b).Functional response to graded increases in renal nerveactivity during hypoxia in conscious rabbits. Am J PhysiolRegul Integr Comp Physiol 271, R1489–R1499.
Miki K, Kosho A & Hayashida Y (2002). Method forcontinuous measurements of renal sympathetic nerveactivity and cardiovascular function during exercise in rats.Exp Physiol 87, 33–39.
Miki K, Yoshimoto M & Tanimizu M (2003). Acute shifts ofbaroreflex control of renal sympathetic nerve activityinduced by treadmill exercise in rats. J Physiol 548, 313–322.
Morgan DA, Anderson EA & Mark AL (1995). Renalsympathetic nerve activity is increased in obese Zucker rats.Hypertension 25, 834–838.
C© 2009 The Authors. Journal compilation C© 2010 The Physiological Society
) at University of Auckland on July 1, 2013ep.physoc.orgDownloaded from Exp Physiol (
50 S.-J. Guild and others Exp Physiol 95.1 pp 41–50
Ramchandra R, Hood SG, Frithiof R & May CN (2009).Discharge properties of cardiac and renal sympathetic nervesand the impaired control of blood volume in heart failure.Am J Physiol Regul Integr Comp Physiol 297, R665–674.
Ramchandra R, Hood SG, Watson AM & May CN (2008).Responses of cardiac sympathetic nerve activity to changes incirculating volume differ in normal and heart failure sheep.Am J Physiol Regul Integr Comp Physiol 295, R719–R726.
Vallbo AB, Hagbarth KE & Wallin BG (2004).Microneurography: how the technique developed and itsrole in the investigation of the sympathetic nervous system.J Appl Physiol 96, 1262–1269.
Van Vliet BN, Guild S-J, Barrett C, McBryde F & Malpas S(2008). Long-term recording of renal sympathetic nerveactivity in conscious rats via telemetry. FASEB J 22,738.710.
Wallin BG & Charkoudian N (2007). Sympathetic neuralcontrol of integrated cardiovascular function: insights frommeasurement of human sympathetic nerve activity. MuscleNerve 36, 595–614.
Watson AM, Hood SG, Ramchandra R, McAllen RM & MayCN (2007). Increased cardiac sympathetic nerve activity inheart failure is not due to desensitization of the arterialbaroreflex. Am J Physiol Heart Circ Physiol 293, H798–H804.
Yoshimoto M, Miki K & Osborn JW (2008). Continuouslong-term recording of renal (RSNA) and lumber (LSNA)sympathetic nerve activity and arterial pressure (AP) inconscious rats: responses to chronic angiotensin II (AngII)administration. FASEB J 22, 969.935.
Acknowledgements
This work was supported by the Auckland Medical ResearchFoundation, the Health Research Council of New Zealand andthe University of Auckland. Simon Malpas is a Director in thecompany Telemetry Research Ltd, which provides implantabletelemetry devices for recording SNA and other physiologicalsignals.
C© 2009 The Authors. Journal compilation C© 2010 The Physiological Society
) at University of Auckland on July 1, 2013ep.physoc.orgDownloaded from Exp Physiol (