quality assessment of affymetrix genechip data using the em algorithm and a naive bayes classifier
TRANSCRIPT

Quality Assessment of Affymetrix GeneChip Datausing the EM Algorithm and a Naive Bayes Classifier
Brian E. HowardBioinformatics Research CenterNorth Carolina State University
Raleigh, North [email protected]
Beate SickInstitute of Data Analysis and Process Design
Zurich University ofApplied Science WinterthurWinterthur, Switzerland
Abstract- Recent research has demonstrated the utility of usingsupervised classification systems for automatic identification oflow quality microarray data. However, this approach requiresannotation of a large training set by a qualified expert. In thispaper we demonstrate the utility of an unsupervisedclassification technique based on the Expectation-Maximization(EM) algorithm and naive Bayes classification. On our test set,this system exhibits performance comparable to that of ananalogous supervised learner constructed from the same trainingdata.
Keywords-microarray, quality control, EM algorithm, NaiveBayes
I. INTRODUCTION
Several recent studies have focused on the importance ofquality control in microarray experiments [20,21]. Whilemost microarray platforms are capable of generating valuable,reproducible data when employed by experienced researchersusing standardized protocols [16], it is assumed that perhapsmore than 20% of the data currently available in publicrepositories may be of questionable quality [15]. Therefore, itis of highest importance to develop robust analysis methods,as well as tools and techniques to detect corrupted data; evenwith robust analysis methods, excluding low quality data froman analysis may significantly improve the quality of theresults. (See [20] for an example where discarding corruptedchips lowers the false discovery rate and simultaneouslyincreases the number of differentially expressed genes.)
In this paper we restrict our discussion to AffymetrixGeneChips. The benchmark tests recommended byAffymetrix [22] can be used to identify suspicious chips, butstudies have shown that the power of these tests is limited[17]. The R Bioconductor package [5] goes farther, and offersseveral valuable functions for computing diagnostic plots and
Imara Perera, Yang Ju Im, Heike Winter-SederoffDepartment of Plant Biology
North Carolina State UniversityRaleigh, North Carolina
{iperera, yangju_im, heike winter}lunity.ncsu.edu
Steffen HeberDepartment of Computer ScienceNorth Carolina State University
Raleigh, North [email protected]
statistics that can be used to identify chips with unacceptablelevels of anomalous variation. However, using thesediagnostics generally requires not only R programmingexpertise, but also expert interpretation of the results.Recently, several groups have developed software systemswhich automate the generation of such diagnostic plots [2, 3].In addition, the RACE system [1, 20] employs a supervisedlearning method to automatically detect low-quality "outlier"chips with an accuracy of around 96%. However, because thisapproach requires expert annotation of large training data setsfor use in the development of the underlying classifier, thismethodology suffers from severe limitations. First, the rapidpace of technological advancement in the field ofbioinformatics means that new chip technologies areconstantly becoming available. In order for such a system toremain up-to-date, it becomes necessary to repeatedly employan expert to annotate new data sets and re-train the supervisedclassifier. Second, even when an expert is available, it isusually desirable to have an independent and unbiasedassessment of that expert's annotations.
For these reasons, we explore in this paper an approach toautomated quality control based on an unsupervised classifiertrained with unannotated training data. More specifically, ourapproach employs the Expectation-Maximization (EM)algorithm to estimate the parameters of a Gaussian mixturemodel applied to various quality control features. Once theconditional distribution of each feature is estimated, givenboth good quality and "outlier" chips, we then construct anaive Bayes classifier designed to automatically assign aquality judgment label to unannotated data. This techniquehas proven to be successful in other problem domains[8,9,10]. Furthermore, the use of mixture models has beendescribed in conjunction with microarray data analysis, forexample, in the contexts of assessing image spot quality,
1-4244-1509-8/07/$25.00 02007 IEEE 145
Authorized licensed use limited to: North Carolina State University. Downloaded on August 24, 2009 at 19:12 from IEEE Xplore. Restrictions apply.

[11,12], modeling differentially expressed genes [13], and intests for concordance of data between independent studies[14]. However, to the best of our knowledge, this techniquehas not been applied to the problem of automated qualityclassification at the GeneChip level.
II. METHODS
A. Quality Control MetricsThe Bioconductor "affyPLM" [23] and "affy" [24] R
packages offer facilities for producing a variety of diagnosticplots that can serve as a starting point for assessment ofAffymetrix data quality. Previous research has describedsoftware systems that utilize these libraries to produce avariety of quality plots for interpretation by an expert user orto generate inputs to an automated classifier capable ofmaking the judgment as to which chips are of questionablequality [1, 2, 3, 20]. In this study, our classifier is constructedfrom features extracted from six of these diagnostic plots (seeFig. la-f.)
The 5' to 3' intensity bias plot (Fig. la) displays theaverage PM signal intensity prior to normalization plottedagainst probe position. This plot can reveal irregularities inthe data due to inconsistent levels of RNA degradationbetween chips. Distribution plots of the pre-normalized (Fig.lb) and post-normalized (Fig. Ic) intensity distributionsreveal chips that deviate too much from the others. Morevariance is to be expected prior to normalization; afternormalization the distributions of all chips should be nearlyidentical, with outlier chips showing significant deviationfrom the other chips in the batch. As discussed in [4], theprobe-level fit of the chips during normalization can alsoreveal valuable information in an assessment of chip quality.Shown in Fig. Id and Fig. le are plots of the PLM fitresiduals and weights. In the residuals plot, large residuals(dark blue or red areas in a color plot) reveal poor fits to themodel. Likewise, an excess of significantly down-weightedprobes, visible as a large dark area in the PLM weights plot, isoften evidence of a low quality chip. The relative logintensity of expression (RLE) box plot (Fig. If) shows thedistribution of expression levels of each array's genes relativeto the median expression levels across all arrays. Suspiciousarrays may have non-zero medians, with large variance. Adetailed description of the usage of these diagnostic plots forquality assessment of microarrays is described in [4].
Based partly on past experience building supervisedclassifiers for this data set, and motivated partly from a desireto select exactly one feature to summarize each graph for thepurposes of developing, in the future, a facility toautomatically identify the diagnostic plots that are mostindicative of the classification results, we selected six featuresfor classification.
The first feature, denoted throughout the remainder of thisdocument as "SCORE.sd.raw.int," is defined as follows. Let-raw intensitybe a vector of the sample standard deviations of raw
intensity levels for chips in an experiment, with the value
corresponding to the jth chip denoted by ', . Theraw intensity
"SCORE.sd.raw.int" feature, which measures the variabilityof a particular chip's raw intensity signal relative to that of theother chips in an experiment, is defined as follows:
raw intensity median(8raw intensity)SCORE(8raw intensity' I) r aw(8intintesity
mad((raw intensity)
where the mad( function is the median absolute deviation.Similarly, we also used the SCORE( function of the
following features for classification: the 95th percentiles of thenormalized intensity distribution for each chip("SCORE.q.95.norm.int"), the slopes of the 5' to 3' intensitybias plots ("SCORE.slope.bias"), and the interquartile rangesof the RLE plots ("SCORE.RLE.interQuartile".) In addition,we used the 1 st percentile of the PLM fit weights("PLM.w.q.0.01") and the 99th percentile of the PLM fitresiduals ("PLM.res.q.0.99".)
Using an expert-annotated data set containing 705Affymetrix CEL files from a variety of chip types includingvarious human, mouse, rat, and arabidopsis GeneChips, eachlabeled "good" (602 instances) or "outlier" (103 instances), weapplied the Bioconductor rma( normalization function tonormalize the entire batch of data and then computed the set offeatures described above using R code developed using theBioconductor "affy" and "affyPLM" packages. Aftercomputing these features, it was then possible to compare theperformance of a supervised classifier to the performance of anunsupervised classifier trained with the same data but with theclass-label hidden. (See Results section III.B.)
B. Mixture Model Estimation Using the EMAlgorithmIn the case of unlabeled data, under the assumption that the
conditional distribution of each of the selected features (giventhe unknown class label) is approximately Gaussian, the EMalgorithm [6] can be used to estimate the parameters of theunderlying distributions. The algorithm finds the maximumlikelihood estimator for the conditional distributions, assuminga marginal multinomial distribution for the unknown classlabels. The result, for each feature, is an estimate of the meanand variance of two separate normal distributions - onemodeling the good chips and one modeling the outlier chips.Each feature is estimated separately, and for each feature anestimate of the marginal probability that a chip is an outlier isalso computed. During the construction of the naive Bayesclassifier, the marginal estimates are averaged across allfeatures to estimate the prior probability for outlier and goodchips. The code to perform the EM estimation was written inMatlab following the detailed procedural description outlinedin [7].
C. Naive Bayes ClassifierOnce the EM algorithm has been applied to an unlabeled
training data set, a variety of techniques could conceivably beemployed to classify novel unlabeled instances. We chose tobuild a simple naive Bayes classifier because previous studies
1-4244-1509-8/07/$25.00 02007 IEEE 146
Authorized licensed use limited to: North Carolina State University. Downloaded on August 24, 2009 at 19:12 from IEEE Xplore. Restrictions apply.

RNA 6 end to 3'end biasCh1D A-H
0 2 4 £ 8 11
Prbe Number
Densigr d PM-intensEles I-scale} before normal izaton
h,>. AH1
.,
R=_ ,1.-e '
t*""-
_ ., '".
'''- ',
Wk%W
'_X 9 Hs k
mg. .
+
F_
x
,,> K . w * ;iEE n ' s t- v +
* %' %S wV 8, _
6M;10 q2 gdig
os l1Sity
Dellsity of 13hliosiaes ilag-calel after tltQnnaFrzabtoR
>>rWe: W-Hr i
.,'Sv '
,.41-r. #,6
r.. $'0 .> ,1t.'' it z E1e ,tSSr,
fi
WrE, 4g-01 *Ml?r F-aNd §'y, g
_ ,wo I'
@ i'Iz t-S
',E Ie76 8ShE.,, h ,
% . f
S piZ
} . *, Sr , .. wX ,,,m.', N.N
S W
.#, " .
_ .,,E, _ e {F l' ,l .yWi ffi '-
4 6 8 10 12 141
RLE Relative Log Expression
f
Figure 1. Diagnostic Plots: a) 5' to 3' intensity bias plot, b) pre-
normalized intensity distribution, c) post-normalized intensity distribution, d)PLM residuals, e) PLM weights, and f) Relative Log Expression box plot.
1-4244-1509-8/07/$25.00 02007 IEEE
da
b
147
Authorized licensed use limited to: North Carolina State University. Downloaded on August 24, 2009 at 19:12 from IEEE Xplore. Restrictions apply.

have shown that it exhibits good performance on expert-labeled microarray quality data [20], and because it is easy toexplain the classification results to users [18, 19].
Naive Bayes is a simple classification scheme whichattempts to directly approximate the Bayes optimal decisionrule by estimating the conditional probability of each possibleclass label for an unlabeled instance, given the observedfeatures. By making the simplifying assumption that all theclassification features are conditionally independent, for anyunlabeled instance, x, where x is a vector of features, we canapply Bayes' rule to compute the conditional probability thatthe unknown class label C(x) is c:
p
f Pr{xi C(x) = c}Pr{C(x) = c}Pr{C(x) = c x} = 1=P
Pr{x}
0.4Distribution: SCORE.sd.raw.int
Combined Data (Unlabeled)
0.35 - - - ksdensity fit - Normal chipsksdensity - Outliers
0.3
0.25
0.2
0.15
-6 -4 -2 0 2 4 6
wherep is the number of features under consideration, and themarginal probability of a particular combination of featurevalues, Pr{x}, is equal to:
Figure 2. Distribution of values for feature SCORE.sd.raw.int.
0.5
0.45
0.4
K p
Pr{x} = fl Pr{x, C(x) = k}Pr{C(x) = k}k-l i=l
where K is the number of distinct classes. For a two classproblem, this algorithm assigns class c to an unlabeledinstance x, if Pr{C(x) = c x} > t where t is a thresholdparameter, which is ordinarily set to .5 by default.
TABLE I. CLASSIFICATION FEATURE DISTRIBUTION ESTIMATES
SCORE.sd.raw.int Normal chips
Actual DataEM
--- MLE
0.35
0.3
0.25
0.2
0.15
0.1
0.05
O.
0.35
Figure 3. EM and MLE parameter estimation forSCORE.sd.raw.int feature in normal chips.
SCORE.sd.raw.int Outlier chips
Actual DataEM
0.3 --- MLE
0.25
0.2
0.15
0.1 H
Figure 4. EM and MLE parameter estimation for SCORE.sd.raw.intfeature in outlier chips.
1-4244-1509-8/07/$25.00 02007 IEEE
F
148
Authorized licensed use limited to: North Carolina State University. Downloaded on August 24, 2009 at 19:12 from IEEE Xplore. Restrictions apply.
Distnbution: PLM.res.q.0.991.8
1.6
1.4
1.2
0.8
0.6
0.4
0.2
OL0
ath1121501hgul33amgu74a-rgu34a
0.5 1.5 2 2.5 3 3.5
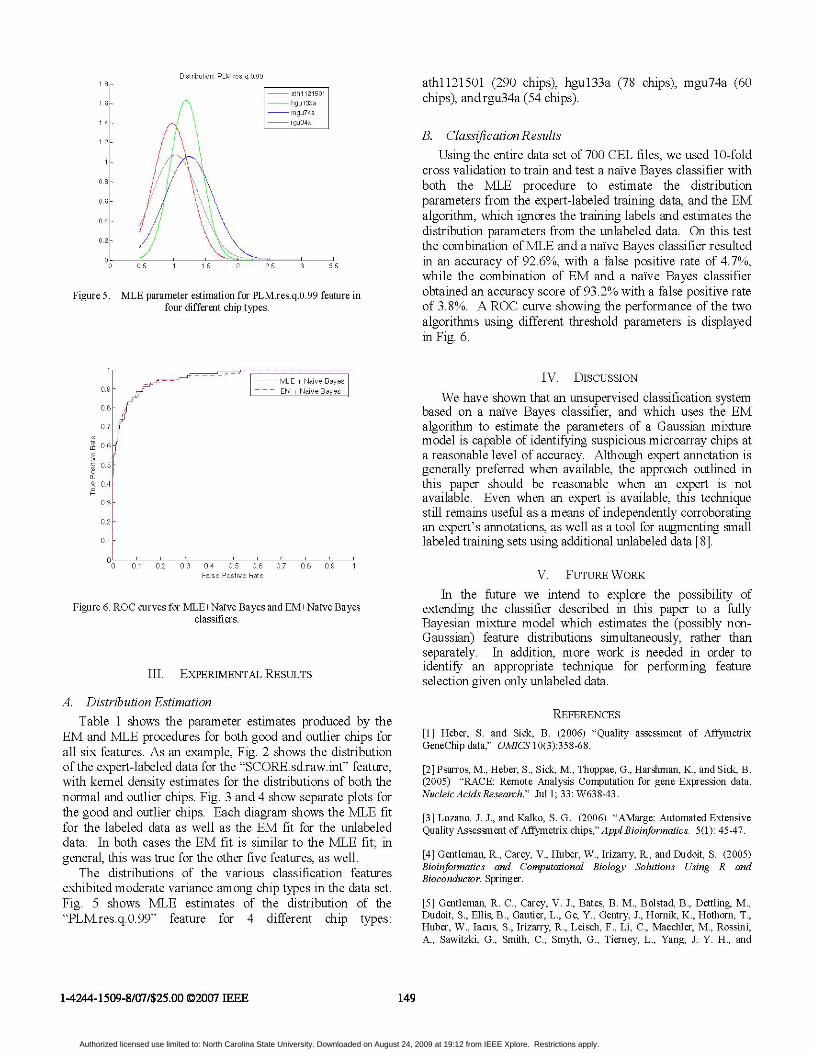
Figure 5. MLE parameter estimation for PLM.res.q.0.99 feature infour different chip types.
0.9 - X- - -
MLE + Naive Bayes0.9 ~~~~~~~~~~EM+ Naive Bayes
0.8 r
0.7
% 0.6
0.5
~04
0.3
0.2
0.1
O00 0.1 0.2 0.3 0.4 0.5 0.6 0.7 0.8 0.9False Postive Rate
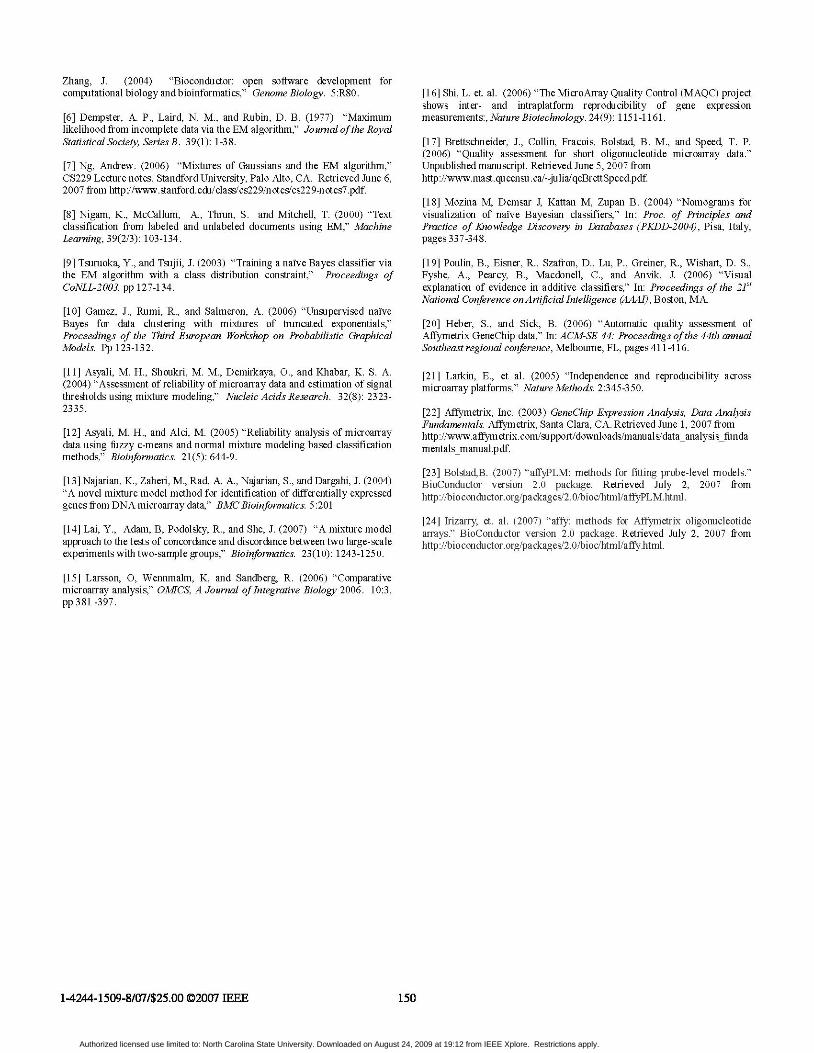
Figure 6. ROC curves for MLE+Naive Bayes and EM+Naive Bayesclassifiers.
III. EXPERIMENTAL RESULTS
A. Distribution EstimationTable 1 shows the parameter estimates produced by the
EM and MLE procedures for both good and outlier chips forall six features. As an example, Fig. 2 shows the distributionof the expert-labeled data for the "SCORE.sd.raw.int" feature,with kernel density estimates for the distributions of both thenormal and outlier chips. Fig. 3 and 4 show separate plots forthe good and outlier chips. Each diagram shows the MLE fitfor the labeled data as well as the EM fit for the unlabeleddata. In both cases the EM fit is similar to the MLE fit; ingeneral, this was true for the other five features, as well.
The distributions of the various classification featuresexhibited moderate variance among chip types in the data set.Fig. 5 shows MLE estimates of the distribution of the"PLM.res.q.0.99" feature for 4 different chip types:
athll21501 (290 chips), hgul33a (78 chips), mgu74a (60chips), and rgu34a (54 chips).
B. Classification ResultsUsing the entire data set of 700 CEL files, we used 10-fold
cross validation to train and test a naive Bayes classifier withboth the MLE procedure to estimate the distributionparameters from the expert-labeled training data, and the EMalgorithm, which ignores the training labels and estimates thedistribution parameters from the unlabeled data. On this testthe combination ofMLE and a naive Bayes classifier resultedin an accuracy of 92.6%, with a false positive rate of 4.700,while the combination of EM and a naive Bayes classifierobtained an accuracy score of 93.2% with a false positive rateof 3.8%. A ROC curve showing the performance of the twoalgorithms using different threshold parameters is displayedin Fig. 6.
IV. DISCUSSION
We have shown that an unsupervised classification systembased on a naYve Bayes classifier, and which uses the EMalgorithm to estimate the parameters of a Gaussian mixturemodel is capable of identifying suspicious microarray chips ata reasonable level of accuracy. Although expert annotation isgenerally preferred when available, the approach outlined inthis paper should be reasonable when an expert is notavailable. Even when an expert is available, this techniquestill remains useful as a means of independently corroboratingan expert's annotations, as well as a tool for augmenting smalllabeled training sets using additional unlabeled data [8].
V. FUTURE WORKIn the future we intend to explore the possibility of
extending the classifier described in this paper to a fullyBayesian mixture model which estimates the (possibly non-Gaussian) feature distributions simultaneously, rather thanseparately. In addition, more work is needed in order toidentify an appropriate technique for performing featureselection given only unlabeled data.
REFERENCES[1] Heber, S. and Sick, B. (2006) "Quality assessment of AffymetrixGeneChip data,: OMICS 10(3):358-68.
[2] Psarros, M., Heber, S., Sick, M., Thoppae, G., Harshman, K., and Sick, B.(2005) "RACE: Remote Analysis Computation for gene Expression data.Nucleic Acids Research," Jul 1; 33: W638-43.
[3] Lozano, J. J., and Kalko, S. G. (2006) "AMarge: Automated ExtensiveQuality Assessment of Affymetrix chips," Appl Bioinformatics. 5(1): 45-47.
[4] Gentleman, R., Carey, V., Huber, W., Irizarry, R., and Dudoit, s. (2005)Bioinformatics and Computational Biology Solutions Using R andBioconductor. Springer.
[5] Gentleman, R. C., Carey, V. J., Bates, B. M., Bolstad, B., Dettling, M.,Dudoit, S., Ellis, B., Gautier, L., Ge, Y., Gentry, J., Hornik, K., Hothorn, T.,Huber, W., lacus, S., Irizarry, R., Leisch, F., Li, C., Maechler, M., Rossini,A., Sawitzki, G., Smith, C., Smyth, G., Tierney, L., Yang, J. Y. H., and
1-4244-1509-8/07/$25.00 02007 IEEE 149
Authorized licensed use limited to: North Carolina State University. Downloaded on August 24, 2009 at 19:12 from IEEE Xplore. Restrictions apply.
Zhang, J. (2004) "Bioconductor: open software development forcomputational biology and bioinformatics," Genome Biology. 5:R80.
[6] Dempster, A. P., Laird, N. M., and Rubin, D. B. (1977) "Maximumlikelihood from incomplete data via the EM algorithm," Journal ofthe RoyalStatistical Society, Series B. 39(1): 1-38.
[7] Ng, Andrew. (2006) "Mixtures of Gaussians and the EM algorithm,"CS229 Lecture notes. Standford University, Palo Alto, CA. Retrieved June 6,2007 from http://www.stanford.edu/class/cs229/notes/cs229-notes7.pdf
[8] Nigam, K., McCallum, A., Thrun, S. and Mitchell, T. (2000) "Textclassification from labeled and unlabeled documents using EM," MachineLearning, 39(2/3): 103-134.
[9] Tsuruoka, Y., and Tsujii, J. (2003) "Training a naive Bayes classifier viathe EM algorithm with a class distribution constraint," Proceedings ofCoNLL-2003. pp 127-134.
[10] Gamez, J., Rumi, R., and Salmeron, A. (2006) "Unsupervised naiveBayes for data clustering with mixtures of truncated exponentials,"Proceedings of the Third European Workshop on Probabilistic GraphicalModels. Pp 123-132.
[11] Asyali, M. H., Shoukri, M. M., Demirkaya, O., and Khabar, K. S. A.(2004) "Assessment of reliability of microarray data and estimation of signalthresholds using mixture modeling," Nucleic Acids Research. 32(8): 2323-2335.
[12] Asyali, M. H., and Alci, M. (2005) "Reliability analysis of microarraydata using fuzzy c-means and normal mixture modeling based classificationmethods," Bioinformatics. 21(5): 644-9.
[13] Najarian, K., Zaheri, M., Rad, A. A., Najarian, S., and Dargahi, J. (2004)"A novel mixture model method for identification of differentially expressedgenes from DNA microarray data," BMC Bioinformatics. 5:201
[14] Lai, Y., Adam, B, Podolsky, R., and She, J. (2007) "A mixture modelapproach to the tests of concordance and discordance between two large-scaleexperiments with two-sample groups," Bioinformatics. 23(10): 1243-1250.
[16] Shi, L. et. al. (2006) "The MicroArray Quality Control (MAQC) projectshows inter- and intraplatform reproducibility of gene expressionmeasurements:, Nature Biotechnology. 24(9): 1151-116 1.
[17] Brettschneider, J., Collin, Fracois, Bolstad, B. M., and Speed, T. P.(2006) "Quality assessment for short oligonucleotide microarray data."Unpublished manuscript. Retrieved June 5, 2007 fromhttp://www.mast. queensu. ca/-julia/qcBrettSpeed.pdf
[18] Mozina M, Demsar J, Kattan M, Zupan B. (2004) "Nomograms forvisualization of naive Bayesian classifiers," In: Proc. of Principles andPractice of Knowledge Discovery in Databases (PKDD-2004), Pisa, Italy,pages 337-348.
[19] Poulin, B., Eisner, R., Szafron, D., Lu, P., Greiner, R., Wishart, D. S.,Fyshe, A., Pearcy, B., Macdonell, C., and Anvik, J. (2006) "Visualexplanation of evidence in additive classifiers," In: Proceedings of the 21s'National Conference on Artificial Intelligence (AAAI), Boston, MA.
[20] Heber, S., and Sick, B. (2006) "Automatic quality assessment ofAffymetrix GeneChip data," In: ACM-SE 44: Proceedings ofthe 44th annualSoutheast regional conference, Melbourne, FL, pages 411-416.
[21] Larkin, E., et al. (2005) "Independence and reproducibility acrossmicroarray platforms," Nature Methods. 2:345-350.
[22] Affymetrix, Inc. (2003) GeneChip Expression Analysis, Data AnalysisFundamentals. Affymetrix, Santa Clara, CA. Retrieved June 1, 2007 fromhttp:/www.affymetrix.com/support/downloads/manuals/data analysis fundamentals_manual.pdf
[23] Bolstad,B. (2007) "affyPLM[ methods for fitting probe-level models."BioConductor version 2.0 package. Retrieved July 2, 2007 fromhttp //bioconductor.org/packages2 .0/bioc/html/atfyPLM. html.
[24] Irizarry, et. al. (2007) "affy: rethods for Affymetrix oligonucleotidearrays." BioConductor version 2.0 package. Retrieved July 2, 2007 fromhttp //b oconductor.org/packages/2.0/bioc/htmi/affy .html.
[15] Larsson, 0, Wennmalm, K, and Sandberg, R. (2006) "Comparativemicroarray analysis," OMICS, A Journal ofIntegrative Biology 2006. 10:3,pp 381 -397.
1-4244-1509-8/07/$25.00 02007 IEEE 150
Authorized licensed use limited to: North Carolina State University. Downloaded on August 24, 2009 at 19:12 from IEEE Xplore. Restrictions apply.