purification of strom water using sand filter
TRANSCRIPT
Purification of Strom Water Using Sand Filter
األمطار باستخدام المرشح الرمليتنقية مياه
Submitted By
Kamel Hajjaj
Supervised By
Dr. Abdelmajeed Nassar
A thesis submitted in partial fulfillment of the requirement for Degree of
Master of Science in Infrastructure Engineering
November 2011
Islamic University of Gaza
High Studies Deanery
Faculty of Engineering
Master in Science
Infrastructure Engineering

ii
الرحيم الرحمن هللا بسم
ينالله}ي رفع ينمنكمآمن واالذ خبي{نتعملوباواللهدرجاتالعلمأوتواوالذ
11ةياآلاجملادلة
يمالعظاهللصدق

iii
DEDICATION
I would like to dedicate this work to my family
specially my father and mother who supported me
in all stages of my life, to my brothers and sisters
and to my loving caring wife, for their sacrifice
and endless support, finally to my children Roaa
and Mohammed.

iv
ACKNOWLEDGMENT
I extend my sincere appreciation and special thanks to my supervisor Dr. Abdelmajeed
Nassar, for his guidance, patience and encouragement.
I would like to thank all lecturers at Islamic University in Gaza, who have helped me
during my study of Infrastructure Civil Engineering Master Program. They are Prof. Dr.
Shafik Jendia, Dr. Abdelmajid Nassar, Dr. Fahid Rabah, Dr. Essam H. Almasri, Dr.
Nabil I. El-Sawalhi, Dr. Husam Al-najar.
Finally, I would like to thank all the staff of the Material and soil Lab. at the Islamic
university of Gaza especially Eng. Ahmed Al Kurd, Eng. Adel Hamad and Mr. Amjad
Abu Shamalla and thank all the staff of the Laboratory of Environment and Earth
Sciences, especially Mr. Raed M. Al-khaldi, Mr. Azmy Abu Daggah and Mr. Alaa al
Juaab who have supported and encouraged me to accomplish this work.
v
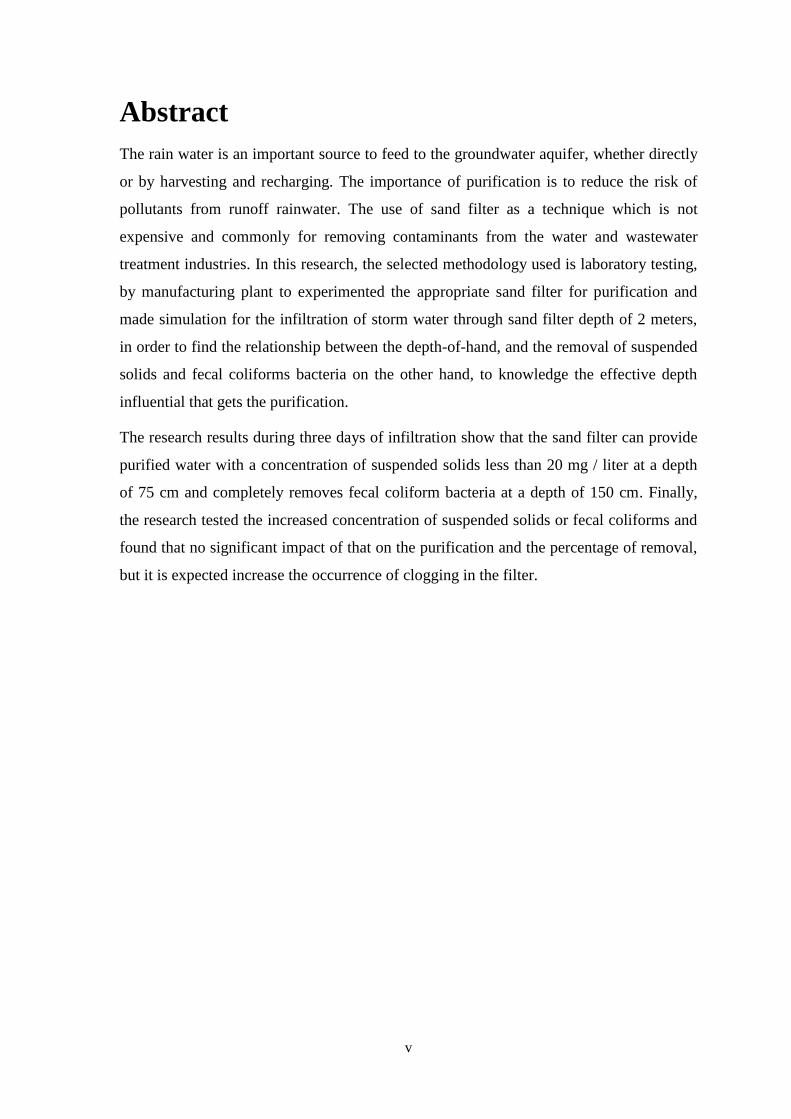
Abstract
The rain water is an important source to feed to the groundwater aquifer, whether directly
or by harvesting and recharging. The importance of purification is to reduce the risk of
pollutants from runoff rainwater. The use of sand filter as a technique which is not
expensive and commonly for removing contaminants from the water and wastewater
treatment industries. In this research, the selected methodology used is laboratory testing,
by manufacturing plant to experimented the appropriate sand filter for purification and
made simulation for the infiltration of storm water through sand filter depth of 2 meters,
in order to find the relationship between the depth-of-hand, and the removal of suspended
solids and fecal coliforms bacteria on the other hand, to knowledge the effective depth
influential that gets the purification.
The research results during three days of infiltration show that the sand filter can provide
purified water with a concentration of suspended solids less than 20 mg / liter at a depth
of 75 cm and completely removes fecal coliform bacteria at a depth of 150 cm. Finally,
the research tested the increased concentration of suspended solids or fecal coliforms and
found that no significant impact of that on the purification and the percentage of removal,
but it is expected increase the occurrence of clogging in the filter.

vi
ملخص البحث
رى ي حما، حجع انا رى إعادة أ خى أ كاج طبعت ساء انجفت انخضااث نخغزت او يصذس االيطاس يا
حمت يا األيطاس حك ف حمهم انخاطش اناحجت ي انهراث انخ حخعشض نا أراء انسشا عه أت فئ
انصشف األيطاس يا نخمت انشائعت انكهفت غش انطشق ي كخمت عخبش انشيه انششح اسخخذاو إ األسض،
يحاكاة يخبش نهخعشف عه فعانت انششح انشيه رنك ي خالل عم حى عم فحص انبحذ زا ف. انصح
ي كم إصانت ب احت ي انعك ب انعاللت إجاد بغشض يخش، 2 عم سيه يششح ف األيطاس يا نخششح
عهت انخمت بكفاءة عانت. ف حخى انز انؤرش انعك يعشفت أخش احت ي انمنت انبكخشا انعانمت اناد
عط يا انشيه انششح أ أاو رالرت يخاصم نذة حششح عم خالل ي حى انحصل عها انخ حؤكذ انخائج
عذ انمنت انبكخشا كايم بشكم ضم سى 57 عك عذ انعانمت اناد ي نخش/يج 22 ي ألم حشكض ححخ عه
أرش ال أ انمنت انبكخشا أ انعانمت اناد حشكض صادة كا أظشث انخائج ي خالل فحص سى، 072 عك
إسذاد ف انششح انشيه. حذد حضذ ي احخانت أ ك نك اإلصانت سبت انخمت عه نزنك يحسط
vii
TABLE OF CONTENTS
CHAPTER 1 INTRODUCTION 1
1.1 BACKGROUND ........................................................................................................ 1
1.2 STATEMENT OF THE PROBLEM ................................................................................ 2
1.3 RESEARCH SCOPE AND OBJECTIVES ....................................................................... 3
1.3.1 Scope ................................................................................................................. 3
1.3.2 Objectives .......................................................................................................... 3
1.4 METHODOLOGY ...................................................................................................... 3
1.5 TENTATIVE TABLE OF CONTENTS FOR THE THESIS ................................................. 5
CHAPTER 2 LITERATURE REVIEW 6
2.1 POLLUTANTS IN STORM WATER .............................................................................. 6
2.2 FILTER MEDIA ........................................................................................................ 8
2.3 FACTORS INFLUENCING ON FILTRATION AND PERFORMANCE .................................. 8
2.4 TYPE OF SAND FILTER ............................................................................................. 9
2.4.1 Slow Sand Filter ................................................................................................ 9
2.4.2 Rapid Sand Filter ............................................................................................ 10
2.5 FILTRATION PROCESS THEORY ............................................................................. 10
2.5.1 Mechanism in Rapid Sand Filtration .............................................................. 11
2.5.2 Mechanism in Slow Sand Filtration ................................................................ 12
2.6 PRESENT REMOVAL BY FILTRATION ...................................................................... 12
2.7 SUSPENDED SOLIDS .............................................................................................. 13
2.8 FECAL COLIFORMS ............................................................................................... 13
2.9 DEPTH OF FILTER .................................................................................................. 14
CHAPTER 3 METHODOLOGY 15
3.1 EXPERIMENTAL DESCRIPTION ............................................................................... 15
3.2 MATERIALS .......................................................................................................... 16
3.3 EXPERIMENTAL APPARATUS ................................................................................. 16
3.4 EXPERIMENTAL SCENARIOS .................................................................................. 17
3.5 TESTING PARAMETERS ......................................................................................... 17
3.6 SAMPLES COLLECTION ......................................................................................... 17
3.7 SYSTEM OPERATION ............................................................................................. 18
viii
3.8 THE EXPECTED RESULTS ....................................................................................... 20
3.9 CALCULATIONS..................................................................................................... 20
3.10 SAMPLES TESTS METHODS .................................................................................... 20
3.10.1 Fecal coliforms ............................................................................................... 20
3.10.2 Suspended Solid .............................................................................................. 21
CHAPTER 4 RESULTS AND DISCUSSION 23
4.1 SIEVE ANALYSIS FOR FILTER'S MEDIA ................................................................... 23
4.2 RESULTS OF CONTINUOUS THREE DAYS OF INFILTRATION ..................................... 23
4.2.1 Fecal coliforms removal in the three days of infiltration ............................... 25
4.2.2 Suspended solid removal along the three days of infiltration ......................... 31
4.3 EFFECT OF DIFFERENT CONCENTRATIONS OF FECAL COLIFORMS ........................... 36
4.4 EFFECT OF DIFFERENT CONCENTRATIONS OF SUSPENDED SOLID ........................... 42
CHAPTER 5 CONCLUSIONS AND RECOMMENDATIONS 46
5.1 CONCLUSIONS ....................................................................................................... 46
5.2 RECOMMENDATIONS ............................................................................................. 47
REFERENCES 48
APPENDIX: PHOTOS SHOW THE METHOD OF THE WORK IN THE
LABORATORY 51
ix
LIST OF FIGURES
Figure 1.1: Flow chart of the research methodology ..................................................... 4
Figure 2.1: Schematic of basic filtration principles (Schmitt & Shinault, 1998) ............. 11
Figure 2.2: Concentrations of fecal for all urban land uses (Pitt & Maestre, 2005) ......... 14
Figure 3.1: Schematic diagram of the system ............................................................. 15
Figure 3.2: Collecting of water effluent .................................................................... 18
Figure 3.3: Petri dishes after being incubated for fecal coliforms colonies count ........... 21
Figure 4.1: Grain size distribution of filter materials .................................................. 23
Figure 4.2: the left bottle (influent of storm water) versus the right bottle (effluent of
treated storm water at depth 2m) .............................................................................. 25
Figure 4.3: Percent removal of fecal coliforms along three days of infiltration .............. 25
Figure 4.4: Percent removal of fecal coliforms vs specified depths in the first day ......... 26
Figure 4.5: Percent removal of fecal coliforms vs specified depths in the second day ..... 26
Figure 4.6: Percent removal of fecal coliforms vs specified depths in the third day ........ 26
Figure 4.7: Number of fecal coliforms effluent vs each depthin the first day ................. 27
Figure 4.8: Number of fecal coliforms in the effluent vs each depth in the secod day ..... 27
Figure 4.9: Number of fecal coliforms in the effluent vs each depth in the third day ...... 28
Figure 4.10: Relationship between the depth of filter and the FC average % removal ..... 29
Figure 4.11: Petri dishes for one of the fecal coliforms tests ........................................ 30
Figure 4.12: Surface layer of filter before infiltration (right) and after (left) .................. 30
Figure 4.13: Percent removal of suspended solid along three days of infiltration ........... 31
Figure 4.14: Percent of removal of suspended solid vs each depth in the first day .......... 31
Figure 4.15: Percent of removal of suspended solid vs each depth in the second day ..... 32
Figure 4.16: Percent removal of suspended solid vs each depth in the third day ............. 32
Figure 4.17: Concentration of suspended solid effluents vs each depth in first day ........ 33
x
Figure 4.18: Concentration of suspended solid effluents vs each depth in second day .... 33
Figure 4.19: Concentration of suspended solid effluents vs each depth in third day........ 33
Figure 4.20: Relationship between the depth of filter and the SS average % removal ..... 35
Figure 4.21: Percent removal of fecal coliforms at influent 36000 col./100 ml .............. 37
Figure 4.22: Depth percent removal of fecal coliforms at influent 36000 col./100 ml ..... 38
Figure 4.23: Number of fecal coliforms (col./100ml) at influent 36000 col./100 ml ....... 39
Figure 4.24: Percent removal of fecal coliforms at influent 74000 col./100 ml .............. 40
Figure 4.25: Depth percent removal of fecal coliforms at influent 74000 col./100 ml ..... 41
Figure 4.26: Number of fecal coliforms (col./100 ml) at influent 74000 col./100 ml ...... 42
Figure 4.27: Depth percent removal of suspended solid at influent 1468 mg/l ............... 44
Figure 4.28: Depth percent removal of suspended solid at influent 1468 mg/l ............... 44
Figure 4.29: Concentration of suspended solid in the effluent at different depths ........... 45
xi
LIST OF TABLES
Table 2.1: Typical Pollutant Concentrations in Urban Storm water (Schueler, 1997) ....... 7
Table 2.2: Median Values for Pollutants of different land areas (Pitt et al. 2003) ............. 7
Table 3.1: Sieves size for sand filter media................................................................ 16
Table 4.1: The results of three continuous days of infiltration ...................................... 24
Table 4.2: Analysis of fecal coliforms in the efflent at each depth along three days ...... 28
Table 4.3: Depth grouping for results and analysis of fecal coliforms in the effluent ...... 29
Table 4.4: Analysis of effluent suspended solid along three days ................................. 34
Table 4.5: Depth grouping for results analysis of effluent suspended solid .................... 36
Table 4.6: Percent removal of fecal coliforms at influent 36000 col./100 ml ................. 37
Table 4.7: Percent removal of fecal coliforms at influent 74000 col./100 ml ................. 40
Table 4.8: Percent removal of suspended solid at influent 1468 mg/l ........................... 43

xii
LIST OF ABBREVIATIONS
APHA American Public Health Association
AWWA American Water Works Association
BMP Best Management Particle
BOD Biological Oxygen Demand
CFU Colony Forming Unit
CMWU Coastal Municipalities Water Utility
DEP Department Of Environmental Protection
COD Chemical Oxygen Demand
CSOs Combined Sewer Overflow
DOC Dissolved Organic Carbon
EPA Environmental Protection Agency
FC Fecal Coliform
KFUPM King Fahd University of Petroleum and Minerals
MECC Mountain Empire Community College
MPN Most Probable Number
NTU Nephelometric Turbidity Unit
PCBS Palestinian Central Beauru of Statistics
PCSWM Pierce County Storm Water Management
PVC-U Polyvinyl Chloride - Unplasticized
SS Suspended Solids
TSS Total Suspended Solids
WEF Water Environment Federation

Chapter 1 Introduction
1
Chapter 1 Introduction
1.1 Background
Gaza strip located at the eastern edge of the Mediterranean in a semi-arid region where
rainfall is falling in the winter season from October to April, the rate of rainfall is varying
in the Gaza Strip and ranges between 200mm/year in the south to about 400mm/year in
the north, while the long term average rainfall rate in all over the Gaza Strip is about
317mm/year(CMWU, 2010), the strip consider as the densest populated areas of the
world 1.5 million and growth rate 3.5%(PCBS, 2008), in an area of 365 km2, it is one of
the scarce water countries. The groundwater aquifer which is part of the coastal aquifer
that naturally recharged from rainfall consider as the only resource of the water that
supply ofall kind of human usage in the Gaza Strip (domestic, agricultural and industrial).
The Gaza Strip has been suffering from an increasing shortage of water, the demand water
much exceeds water supply, the renewable amount of water from rainfall that replenishes
the aquifer is much less than the water demand(Hamdan, et al. 2007), the reasons for that
shortage are growing demands by continuous increasing of population lead to
overdrafting from aquifer, resulted in dramatic urban expansion, which has a direct
influence in reducing groundwater recharge and increasing the surface run-off.
Sand filtration is a commonly-used technique for removing contaminants from the water
and wastewater treatment industries, during the last decade, the use of sand filters has also
become an accepted treatment technique for stormwater, particularly in situations where
high property values reduce the cost-effectiveness (Ellis, 1984).
In the Gaza Strip there are several sites of infiltration applied, including Sheikh Radwan
basin which was constructed to collect stormwater from Gaza city and diverts it to this
basin, where water was supposed to be injected through special wells close to the basin.In
1997 and 1998, two projects were launched, the first one is treatment plant in Gaza city,
where part of the effluent is diverted to infiltration basins which have infiltration capacity
less than the effluent flow. The rest of effluent is pumped to the sea. The second project is
the storm water collection in North Gaza, where storm water is collected in retention
basin in Jabalia City and then pumped to infiltration basins located close to the existing
wastewater treatment plant at BeitLahia. This project has been started few years ago in
Khan Yunis area, where stormwater will be collected from all areas in the City and will be
Chapter 1 Introduction
2
diverted or pumped to a large infiltration basin in the west of the City. Furthermore, other
two small infiltration basins inside Khanyonis camp will be used in this project.
Infiltration of treated wastewater is planned to be implemented in spread basins besides
the proposed wastewater treatment plants of both Khanyonis and Rafah (Hamdan & Jaber,
2001).
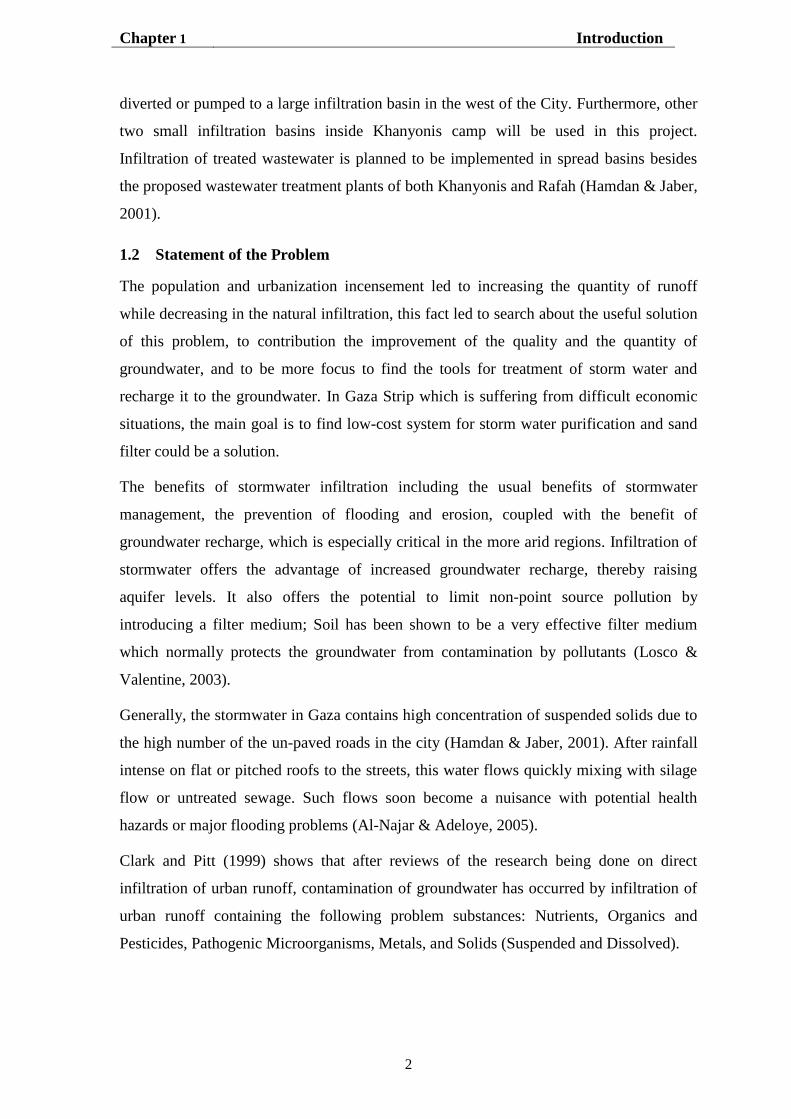
1.2 Statement of the Problem
The population and urbanization incensement led to increasing the quantity of runoff
while decreasing in the natural infiltration, this fact led to search about the useful solution
of this problem, to contribution the improvement of the quality and the quantity of
groundwater, and to be more focus to find the tools for treatment of storm water and
recharge it to the groundwater. In Gaza Strip which is suffering from difficult economic
situations, the main goal is to find low-cost system for storm water purification and sand
filter could be a solution.
The benefits of stormwater infiltration including the usual benefits of stormwater
management, the prevention of flooding and erosion, coupled with the benefit of
groundwater recharge, which is especially critical in the more arid regions. Infiltration of
stormwater offers the advantage of increased groundwater recharge, thereby raising
aquifer levels. It also offers the potential to limit non-point source pollution by
introducing a filter medium; Soil has been shown to be a very effective filter medium
which normally protects the groundwater from contamination by pollutants (Losco &
Valentine, 2003).
Generally, the stormwater in Gaza contains high concentration of suspended solids due to
the high number of the un-paved roads in the city (Hamdan & Jaber, 2001). After rainfall
intense on flat or pitched roofs to the streets, this water flows quickly mixing with silage
flow or untreated sewage. Such flows soon become a nuisance with potential health
hazards or major flooding problems (Al-Najar & Adeloye, 2005).
Clark and Pitt (1999) shows that after reviews of the research being done on direct
infiltration of urban runoff, contamination of groundwater has occurred by infiltration of
urban runoff containing the following problem substances: Nutrients, Organics and
Pesticides, Pathogenic Microorganisms, Metals, and Solids (Suspended and Dissolved).
Chapter 1 Introduction
3
1.3 Research Scope and Objectives
1.3.1 Scope
The main goal of this research is to investigate the feasibility of using sand filter for
purification of storm water.
1.3.2 Objectives
The primary aim of this research is to reach the optimum efficiency of using sand filter for
purification of stormwater, by examining the depth of the media and then investigating the
treatment efficiency by choosing two parameters; physical parameter (i.e. suspended
solid, and biological parameter (i.e. fecal coliforms).
More specifically, the research work is intended to achieve the following objectives:
Identify the relationship between the depth of sand filter and percent of suspended
solid removal.
Identify the relationship between the depth of sand filter and percent of fecal
coliforms removal.
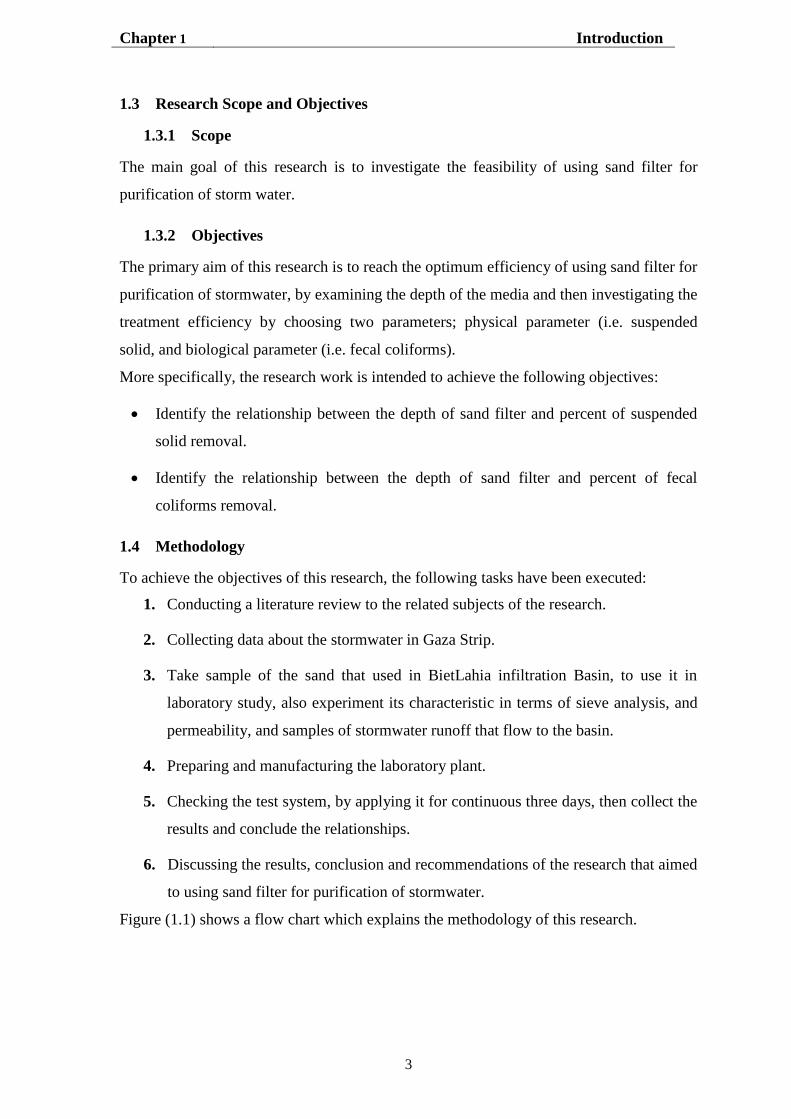
1.4 Methodology
To achieve the objectives of this research, the following tasks have been executed:
1. Conducting a literature review to the related subjects of the research.
2. Collecting data about the stormwater in Gaza Strip.
3. Take sample of the sand that used in BietLahia infiltration Basin, to use it in
laboratory study, also experiment its characteristic in terms of sieve analysis, and
permeability, and samples of stormwater runoff that flow to the basin.
4. Preparing and manufacturing the laboratory plant.
5. Checking the test system, by applying it for continuous three days, then collect the
results and conclude the relationships.
6. Discussing the results, conclusion and recommendations of the research that aimed
to using sand filter for purification of stormwater.
Figure (1.1) shows a flow chart which explains the methodology of this research.
Chapter 1 Introduction
4
Literature reviews
Data Collection and
Sample selecting
Experimental Program
Sample testing Preparing a laboratory
plant
Checking the test system
Discussing the testing
results
Conclusions and
Recommendations
Figure 1.1: Flow chart of the research methodology
Chapter 1 Introduction
5
1.5 Tentative Table of Contents for the Thesis
The research is organized into different chapters that range from chapter 1 to 5 as follows:
Chapter 1(Introduction): this chapter consists of a general introduction with an overview
of the stormwater infiltration, problem identification, objectives and methodology of the
research.
Chapter 2 (Literature Review): this chapter begins with a brief literature review of
pollutants in storm water, filter media, filtration performance and mechanism, type of
sand filter, percent removal and effect of depth of sand filter.
Chapter 3 (Methodology): this chapter describes the experimental program in laboratory,
and test method.
Chapter 4 (Results and Discussions): this chapter includes a summary of the
experimental results, and discussion of the laboratory analysis.
Chapter 5 (Conclusions and Recommendations): this chapter gives conclusions and
recommendations about the research.
Chapter 2 Literature Review
6
Chapter 2 Literature Review
Filtration with sand media has been used for over a century to treat water and wastewater.
The use of sand filtration for treatment of storm water has developed recently, generally
to treat runoff from streets, parking lots, and residential areas (PCSWM, 2009).
Storm water runoff picks up debris, sediment, and other contaminants as it seeks low
areas, where it can pool and cause flooding problems. Common contaminants of storm
water runoff include sediment, nutrients, toxic substances, oxygen-demanding materials,
and bacteria all of which can seriously degrade the quality of receiving waters (Balousek,
2002).
Filtration defined as an interaction between a suspension and a filtering material,
pollutants are removed from the solution when they become attached to the media or to
previously captured particles, using of sand filtration is common for drinking water and
wastewater treatment, Sand filters also popular as storm water runoff treatment (Clark and
Pitt,1999).
Storm water infiltration into the soil is a viable and practical method of storm water
management on many sites. The soil can provide an excellent filter medium to remove
contaminants and protect groundwater from pollution while slowing the introduction of
water into the water table and surface waters and providing groundwater recharge. (Losco
& Valentine, 2003).
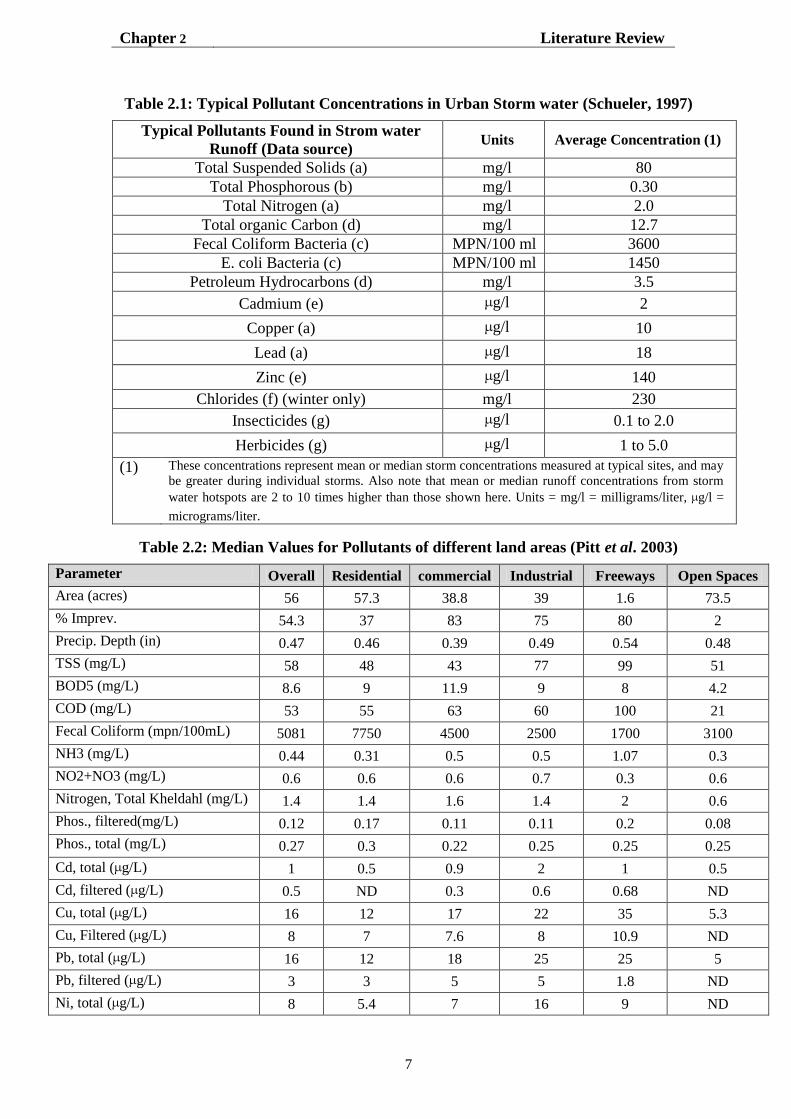
2.1 Pollutants in Stormwater
Storm water constituents: Sediment, Nutrients: nitrogen and phosphorous, Oil ,grease, and
organic chemicals, Bacteria and viruses, Salt, and Metals (Buechter, 2008). Schueler
(1997) summarized typical pollutant concentrations found in urban storm water as
illustrated in Table (2.1); Pitt et al. (2003) summarized the median values for selected
parameters pollutants of different land areas illustrated in Table (2.2).
Chapter 2 Literature Review
7
Table 2.1: Typical Pollutant Concentrations in Urban Storm water (Schueler, 1997)
Typical Pollutants Found in Strom water
Runoff (Data source) Units Average Concentration (1)
Total Suspended Solids (a) mg/l 80
Total Phosphorous (b) mg/l 0.30
Total Nitrogen (a) mg/l 2.0
Total organic Carbon (d) mg/l 12.7
Fecal Coliform Bacteria (c) MPN/100 ml 3600
E. coli Bacteria (c) MPN/100 ml 1450
Petroleum Hydrocarbons (d) mg/l 3.5
Cadmium (e) µg/l 2
Copper (a) µg/l 10
Lead (a) µg/l 18
Zinc (e) µg/l 140
Chlorides (f) (winter only) mg/l 230
Insecticides (g) µg/l 0.1 to 2.0
Herbicides (g) µg/l 1 to 5.0
(1) These concentrations represent mean or median storm concentrations measured at typical sites, and may
be greater during individual storms. Also note that mean or median runoff concentrations from storm
water hotspots are 2 to 10 times higher than those shown here. Units = mg/l = milligrams/liter, µg/l =
micrograms/liter.
Table 2.2: Median Values for Pollutants of different land areas (Pitt et al. 2003)
Parameter Overall Residential commercial Industrial Freeways Open Spaces
Area (acres) 56 57.3 38.8 39 1.6 73.5
% Imprev. 54.3 37 83 75 80 2
Precip. Depth (in) 0.47 0.46 0.39 0.49 0.54 0.48
TSS (mg/L) 58 48 43 77 99 51
BOD5 (mg/L) 8.6 9 11.9 9 8 4.2
COD (mg/L) 53 55 63 60 100 21
Fecal Coliform (mpn/100mL) 5081 7750 4500 2500 1700 3100
NH3 (mg/L) 0.44 0.31 0.5 0.5 1.07 0.3
NO2+NO3 (mg/L) 0.6 0.6 0.6 0.7 0.3 0.6
Nitrogen, Total Kheldahl (mg/L) 1.4 1.4 1.6 1.4 2 0.6
Phos., filtered(mg/L) 0.12 0.17 0.11 0.11 0.2 0.08
Phos., total (mg/L) 0.27 0.3 0.22 0.25 0.25 0.25
Cd, total (µg/L) 1 0.5 0.9 2 1 0.5
Cd, filtered (µg/L) 0.5 ND 0.3 0.6 0.68 ND
Cu, total (µg/L) 16 12 17 22 35 5.3
Cu, Filtered (µg/L) 8 7 7.6 8 10.9 ND
Pb, total (µg/L) 16 12 18 25 25 5
Pb, filtered (µg/L) 3 3 5 5 1.8 ND
Ni, total (µg/L) 8 5.4 7 16 9 ND
Chapter 2 Literature Review
8
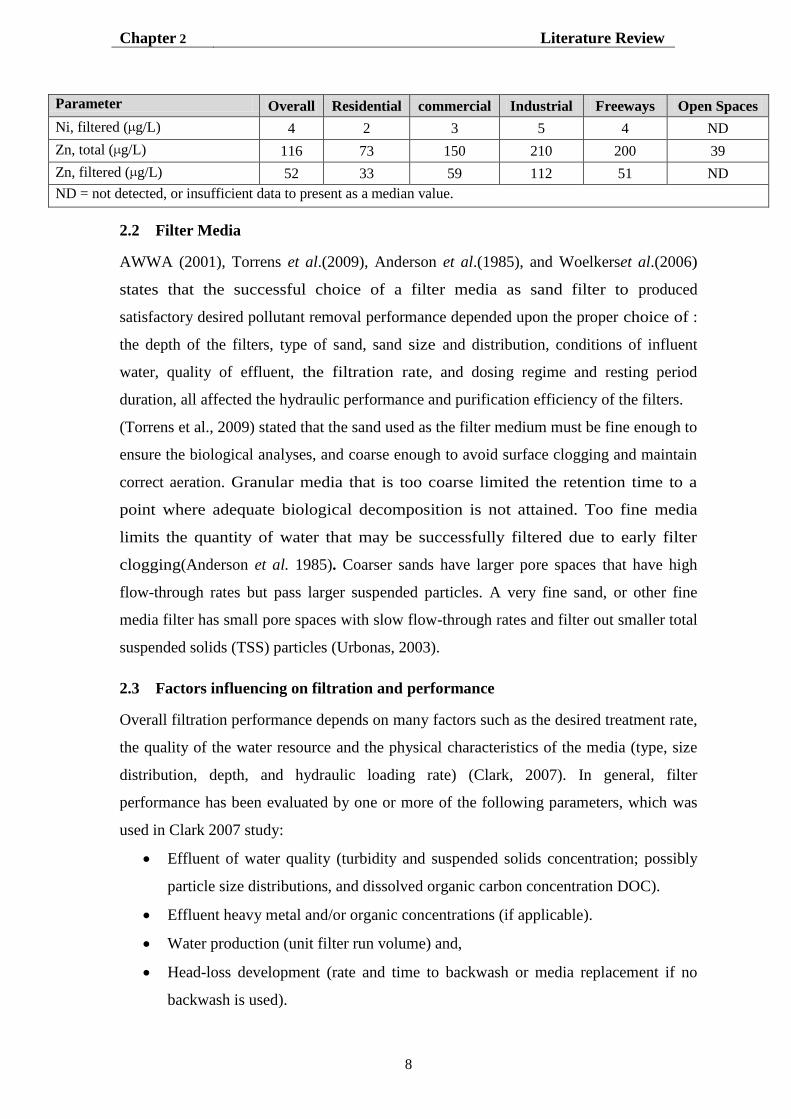
Parameter Overall Residential commercial Industrial Freeways Open Spaces
Ni, filtered (µg/L) 4 2 3 5 4 ND
Zn, total (µg/L) 116 73 150 210 200 39
Zn, filtered (µg/L) 52 33 59 112 51 ND
ND = not detected, or insufficient data to present as a median value.
2.2 Filter Media
AWWA (2001), Torrens et al.(2009), Anderson et al.(1985), and Woelkerset al.(2006)
states that the successful choice of a filter media as sand filter to produced
satisfactory desired pollutant removal performance depended upon the proper choice of :
the depth of the filters, type of sand, sand size and distribution, conditions of influent
water, quality of effluent, the filtration rate, and dosing regime and resting period
duration, all affected the hydraulic performance and purification efficiency of the filters.
(Torrens et al., 2009) stated that the sand used as the filter medium must be fine enough to
ensure the biological analyses, and coarse enough to avoid surface clogging and maintain
correct aeration. Granular media that is too coarse limited the retention time to a
point where adequate biological decomposition is not attained. Too fine media
limits the quantity of water that may be successfully filtered due to early filter
clogging(Anderson et al. 1985). Coarser sands have larger pore spaces that have high
flow-through rates but pass larger suspended particles. A very fine sand, or other fine
media filter has small pore spaces with slow flow-through rates and filter out smaller total
suspended solids (TSS) particles (Urbonas, 2003).
2.3 Factors influencing on filtration and performance
Overall filtration performance depends on many factors such as the desired treatment rate,
the quality of the water resource and the physical characteristics of the media (type, size
distribution, depth, and hydraulic loading rate) (Clark, 2007). In general, filter
performance has been evaluated by one or more of the following parameters, which was
used in Clark 2007 study:
Effluent of water quality (turbidity and suspended solids concentration; possibly
particle size distributions, and dissolved organic carbon concentration DOC).
Effluent heavy metal and/or organic concentrations (if applicable).
Water production (unit filter run volume) and,
Head-loss development (rate and time to backwash or media replacement if no
backwash is used).
Chapter 2 Literature Review
9
Culp et al. (1978) concluded that the main factors influencing the filtering and trapping
processes are:
Suspended particle size: Filtration efficiency improves with larger particulate size.
Pore size: The space between the grains determines the size of particulate that can
be trapped.
Grain shape: Angular grains participate more in the mechanical straining process.
Filtration velocity: Filtration efficiency decreases with increasing velocity.
Temperature of liquid: The higher the water temperature is the more efficient
filtration is, although it normally cannot be controlled.
Chemical properties of the water and particle: A chemical filter aid may be added
to promote adhesion.
Flow rate is considered also from factors influencing the filtering performance; Khan
(1995) concluded from his study that the removal efficiency of coliphage decreased from
79 % to 75 % when the flow rate increased from 10 to 20 l/min keeping the sand depth and
sand size constant. Similar trends of reduced efficiencies at increased flow rates were
found for total coliforms, fecal coliforms and standard plate counts at 150 cm sand depth
and 0.5 mm of sand size.
2.4 Type of sand filter
Two types of filtration systems may be applied to construct storm water treatment: rapid
and slow.
2.4.1 Slow Sand Filter
HUISMAN & WOOD (1974)illustrated that in slow filtration, the media used is
considered as a fine sand, and the designed rate of downward flow of the water under
treatment normally lies between 0.1 and 0.4 m3/h per square meter of surface, The sand
media used has size of 0.2 to 0.4 mm (KFUPM, 2008).
It is the oldest type of large-scale filter, the sand removes particles from the water through
adsorption and straining, also removed a great deal of turbidity from water using
biological action. A layer of dirt, debris, and microorganisms builds up on the top of the
sand. This layer is known as schmutzdecke, which is German for "dirty skin. "The
schmutzdecke breaks down organic particles in the water biologically, and is also very
effective in straining out even very small inorganic particles from water (MECC, 2002).
Chapter 2 Literature Review
10
The filter of this type may run for weeks or even months without cleaning. The suspended
solids and colloidal matter are deposited at the very top of the bed, from which they can
be removed by scraping off the surface layer to a depth of one or two centimeters. This
infrequent operation may be carried out by unskilled laborers using hand tools or by
mechanical equipment (HUISMAN & WOOD, 1974).
Slow sand filter according to its specifications have very low hydraulic rates, because they
do not have backwash systems. Slow sand filter generally has been used to treat storm
water, and considered mechanically simple in comparison to rapid sand filtration but
requires a much larger filter area (PCSWM, 2009).
2.4.2 Rapid Sand Filter
HUISMAN & WOOD (1974)illustrated that in rapid filtration, the media used
considerably coarser with an effective grain size of 0.6-2.0 mm. The interstices between
the grains are larger, providing less resistance to the downward flow, and thus permitting
higher velocities, usually in the range 5-15 m3 /m
2 /h.
Rapid sand filter can achieve relatively high hydraulic flow rates and clean automatically
using backwash the systems to remove accumulated solids(PCSWM, 2009).The
mechanism of particle does not use biological filtration and depend primarily on
adsorption and some straining (MECC, 2002).
The necessity for cleaning is to restore the capacity of the filter and the quality of the
effluent, which occurs at frequent intervals (often only one or two days).To clean
throughout its whole depth, by practical method in which high-pressure water is forced
upwards through the whole bed and compressed air or mechanical agitation is used to
scour the individual grains so that the accumulated impurities can be flushed away
(HUISMAN & WOOD, 1974).
2.5 Filtration Process Theory
The mechanism of filtration and removal depended on the type of sand filter which is
either slow or rapid.
Anderson et al. (1985) summarized the mechanism process that occurs to some degree
within the filter as physical, chemical, and biological treatment processes.
Straining, sedimentation, inertial impaction, interception, adhesion, flocculation,
diffusion, adsorption and biological activity have been suggested as mechanisms
of contaminant removal in filtration.
Chapter 2 Literature Review
11
Straining: involves a mechanical sieve action as well as lodging of
particles in crevices.
Sedimentation: occurs as gravity settling takes place in the interstices of
the media.
Inertial impaction, interception, and adhesion: occur as particles moving
through the filter strike media granules and are removed.
Flocculation: Particles moving through the pores will also collide with each
other and flocculate causing subsequent removal by other mechanisms.
Diffusion: is important in the removal of very small particles such. as
viruses, and occurs because of the small interstices in porous media and
the fact that laminar flow exists.
Physical adsorption: of pollutants takes place on media surfaces due to
electrostatic, electrokinetic and van der Waals forces while chemical
adsorption occurs due to bonding and chemical interaction between
polluted water constituents and the filter media.
Biological activity: on the filter media results in removal of polluting
materials by biological assimilation and biosynthesis.
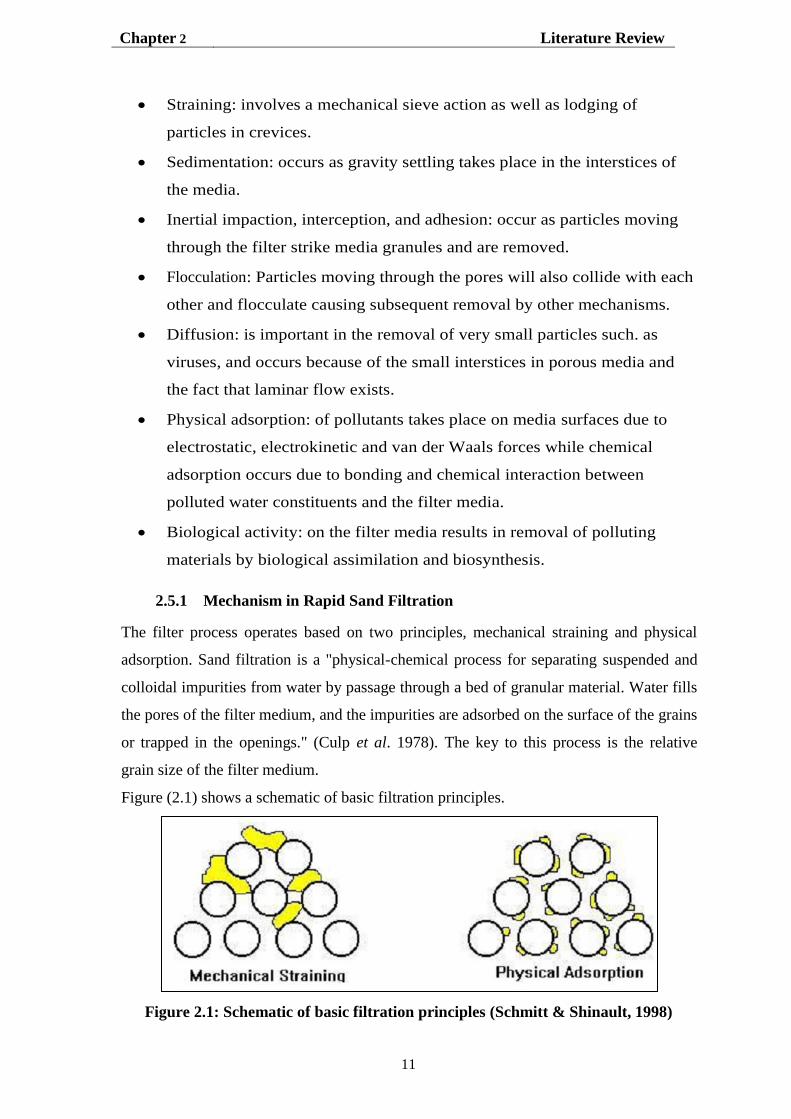
2.5.1 Mechanism in Rapid Sand Filtration
The filter process operates based on two principles, mechanical straining and physical
adsorption. Sand filtration is a "physical-chemical process for separating suspended and
colloidal impurities from water by passage through a bed of granular material. Water fills
the pores of the filter medium, and the impurities are adsorbed on the surface of the grains
or trapped in the openings." (Culp et al. 1978). The key to this process is the relative
grain size of the filter medium.
Figure (2.1) shows a schematic of basic filtration principles.
Figure 2.1: Schematic of basic filtration principles (Schmitt & Shinault, 1998)

Chapter 2 Literature Review
12
2.5.2 Mechanism in Slow Sand Filtration
The purification achieved in a slow sand filter may be considered to be principally the
result of straining through the developed filter skin and the top few millimeters of sand,
together with biological activity. However, Huisman (1978) suggested mechanical
straining, sedimentation, adsorption, and chemical and biological activity as the important
process of slow sand filtration:
Sedimentation and straining take place usually during the first few days of operational.
The supernatant water above the sand bed is about 100 - 150 cm deep, depending upon
the design of filters. The average time that the sample remains above the sand bed ranges
from 3 to 12 hours, depending upon the filtration rate. The heavier particles of suspended
matter start to settle while the lighter particles are drawn into the pores between the sand
grains and removed by straining on the top few millimeters. During the filtration process,
a layer of inert deposits and biological matter forms on the top layer of the sand bed. This
layer is referred to as Schmutzdecke. Moreover, biological growth also occurs within the
sand bed and within the gravel support. Both the schmutzdecke and the biological growth
have significant effect in the purification mechanism (Farooqet al. 1993).
2.6 Present removal by filtration
The primary removal mechanisms of suspended solids are physical filtration and
sedimentation. Infiltration systems provide filtration of runoff but the percent removal of
solids depends on, among other variables, particle size and the size of the pore opening
between soil particles (Weiss et al. 2008).
Hsieh & Davis (2005) conducted both laboratory column tests and field studies. Column
percent removal of suspended solids ranged from 29% to greater than 96% and removal at
six field sites ranged from 77% to 99%.
Khan (1995) conducted field studies shows the average removal efficiencies among
fourteen different operational conditions ranged from 68% to 86%for coliphage, 78% to
99% for total coliforms, 79% to 99% for fecal coli forms, 82% to 96% for standard plate
counts, 22% to 64% for suspended solids and 33% to 62%for turbidity. The samples at
various sand depths of each filter were taken to study the removal of coliphage and
bacteria. It was found that most of the removal of coliphage and bacteria occurred in the
top layers of sand bed (75 cm) of the filter where low flow rates and coarse sand was
used. In case of high flow rates the maximum removal was achieved at 100 cm for both
Chapter 2 Literature Review
13
coarse and fine sand filters. The influent concentrations of suspended solids and turbidity
ranged from 8 to 22 mg/l and 0.20 to 0.95 NTU respectively.
2.7 Suspended Solids
Total Suspended Solids (TSS) are solids in water that can be trapped by a filter. TSS can
include a wide variety of materials, such as silt, decaying plant and animal matter,
industrial wastes, and sewage. High concentrations of suspended solids can cause many
problems for stream health and aquatic life (Buechter, 2008).
Suspended solids, which are almost found in storm water runoff samples, can degrade
water quality(EPA, 1999).Construction and land-disturbing activities are the leading
source of suspended solids in storm water(EPA, 1999).Because metals, pesticides, and
petroleum hydrocarbons often are sorbed to solid surfaces, solids provide a means of
transport and accumulation of pollutants (EPA, 1999).
Woelkerset al. (2006) states that the likely minimum effluent concentrations are as
follows: 10 mg/L for suspended solids, 50 HACH color units, and 10 NTU for turbidity.
TSS concentration less than 20 mg/l consider water to be clear. Water with TSS levels
between 40 and 80 mg/l tends to appear cloudy, while water with concentrations over 150
mg/l usually appears dirty. The nature of the particles that comprise the suspended solids
may cause these numbers to vary (Pitt et al. 2003). EPA Committee on Water Quality
Criteria < 25 mg/L: no harmful effects or high level protection (Buechter, 2008).
DEP (1996) shows that total suspended solids was selected as the target pollutant
constituent for a removal standard because of its widespread contribution to water quality
and aquatic habitat degradation, because many other pollutant constituents including
heavy metals, bacteria, and organic chemicals sorb to sediment particles, and because
available data sets for BMP removal efficiency reveal that TSS has been the most
frequently and consistently sampled constituent, i.e.Bruijn and Clark (2003) concluded
that there are correlations between TSS and particulate runoff concentrations of
chromium, copper, and zinc, indicating that solids removal may reduce total metals
concentrations, therefore specific storm water treatment goals usually specify about 80%
reductions in suspended solids concentrations.
2.8 FecalColiforms
As part of the National Urban Runoff Program, fecal coliform was evaluated at 17 sites
for 156 storm events and, based on the results, concluded that coliform bacteria are
Chapter 2 Literature Review
14
present at high levels in urban runoff and may exceed EPA water quality criteria during
and after storm events, (EPA, 1999).
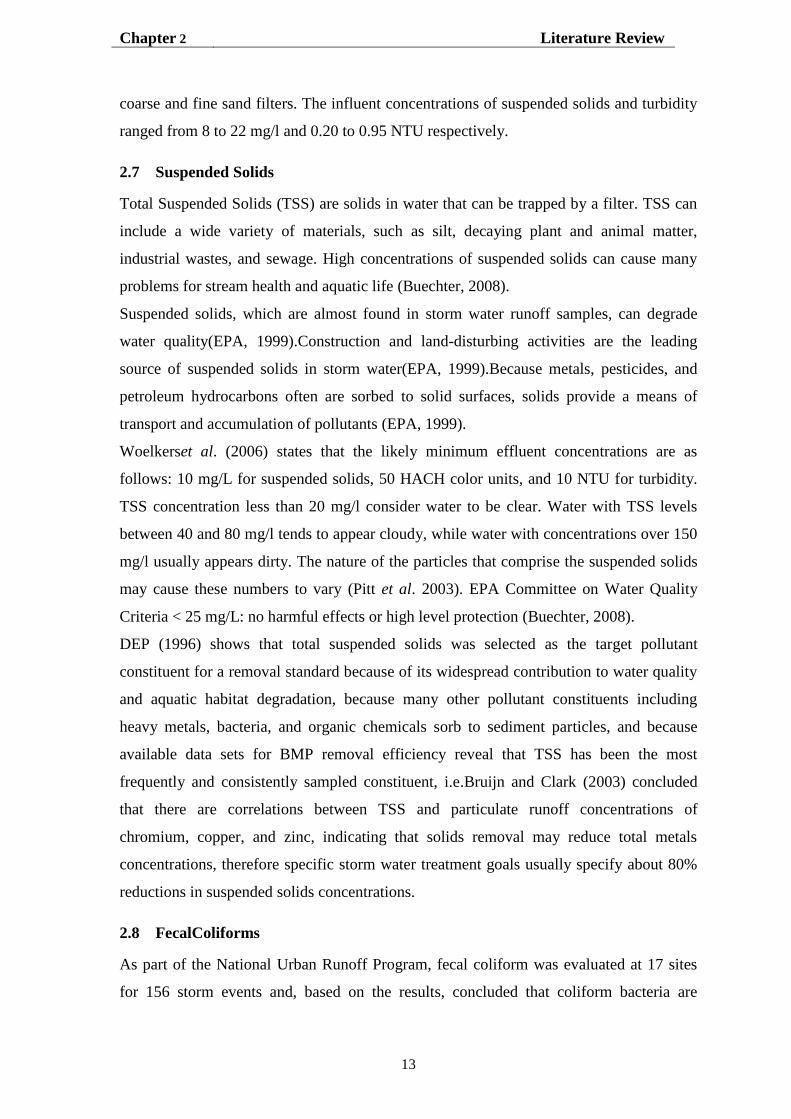
Pitt &Maestre (2005) illustrated that the urban storm water has surprisingly high
concentrations of fecal coliform bacteria. Figure (2.2) summarizes data from several
studies, shows concentrations of fecal coliforms are well above the water quality standard
for all urban land uses. The primary sources of fecal coliform bacteria include pet waste,
wildlife, septic systems, illicit discharges, and combined sewer overflows (CSOs).
Figure 2.2: Concentrations of fecal for all urban land uses (Pitt &Maestre, 2005)
2.9 Depth of filter
From the past experience, it is learned that biological activity decreases with reducing the
filter’s depth. In other words, the biological activity is enhanced with increasing depths.
Therefore, the viruses and other suspended and organic matter have to travel more through
the sand bed and the possibility of removal of these impurities is significantly increasing.
Therefore, higher removal efficiency is expected at higher sand depths (Ellis, 1984).
Khan (1995) conducted field studies at most various comparisons made of sand size and
flow rate concluded that with respect to effect of sand depth, the removal of coliphage,
total coliforms, fecal coliforms and plate counts decreased when the sand depth was
decreased from 150 cm to 80 cm to 50 cm respectively. In most of the cases the trends
were higher removal efficiencies were obtained at lower flow rates, higher sand depths
and smaller sand size, respectively. In most of the cases indicated no significant effect of
flow rate and sand depth on removal of suspended solids.. .
Chapter 3 Methodology
15
Chapter 3 Methodology
The aim of this study is to investigate and to reach the optimum efficiency of using sand
filter for purification of storm water, by testing in laboratory the quality of effluent of
filtrated storm water samples at different depths of the sand filter media and by
investigating the efficiency of purification. The study considers two parameters; physical
parameter (i.e. suspended solids) and biological parameter (i.e. fecal coliforms) to reflect
the range of storm water purification along 2 meter of the sand filter.
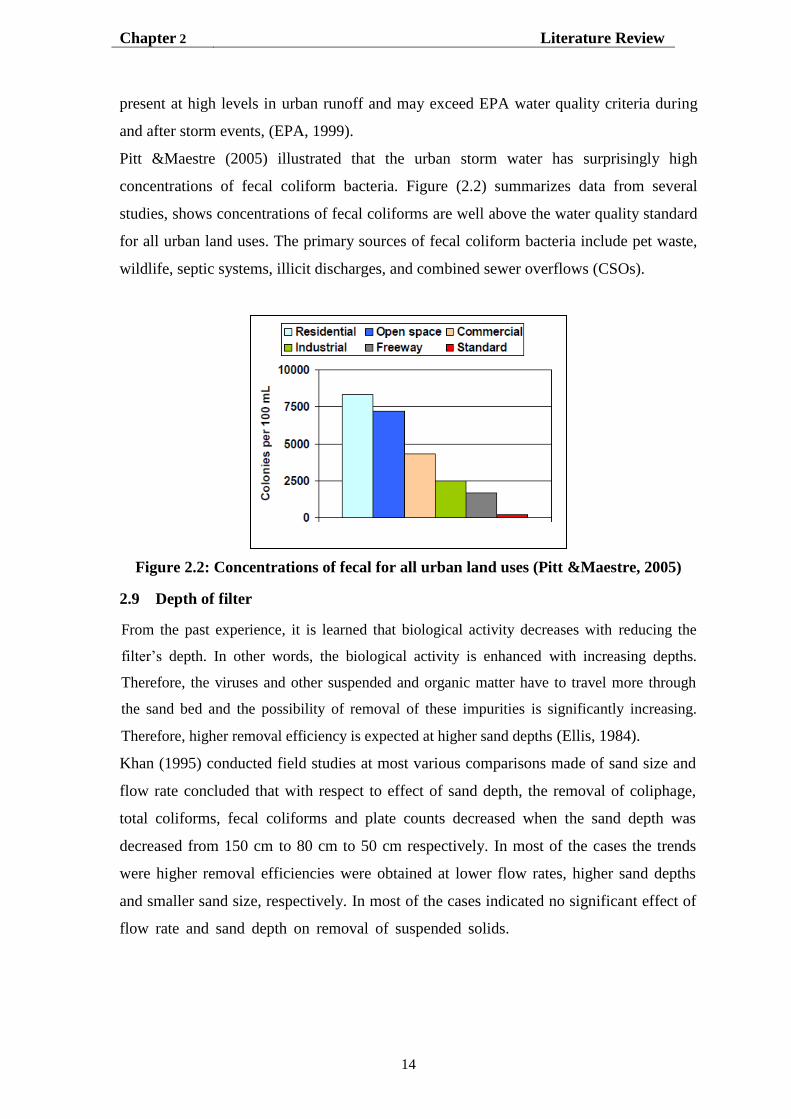
3.1 Experimental description
A laboratory plant was locally manufactured and used in this study. Figure 3.1 shows a
schematic diagram of the system.
Figure 3.1: Schematic diagram of the system
The system consists of the following; 2.3 meters cylindrical PVC-U pipe with 8 inch
diameter, storm water tank, motion fan to avoid the settling of sediments, overflow tank to
collect the exceeded water, glass window with 5cm width and 50 cm height to monitor the
media, and 3/4 PE pipes to connect the different units together so water flows through the
system as designed.
12.5 cm
25 cm
37.5 cm
50 cm
75 cm
100 cm
150 cm
200 cm
Chapter 3 Methodology
16
The 8-inch cylindrical PVC-U pipe is filled with 200 cm height of sand media. The pipe
contains a number of valves at varying distances from the upper surface of the media; at
12.5 cm, 25 cm, 37.5 cm, 50 cm, 75 cm, 100 cm, 150 cm, and 200 cm respectively.
The sand filter media used in this system was collected from BietLahia infiltration basin
and was tested in the lab so as to determine its characteristics in terms of sieve analysis.
In the first stage, the experiment was continuously conducted having certain properties for
a period of three days. In the second stage, the system was operated with changing two
parameters; with increasing the concentration of suspended solids and once another with
increasing the concentration of coliforms bacteria.
Concentration of suspended solids and fecal coliforms are the main parameters used
during the operation to illustrate the relationship between them and the removal
efficiency.
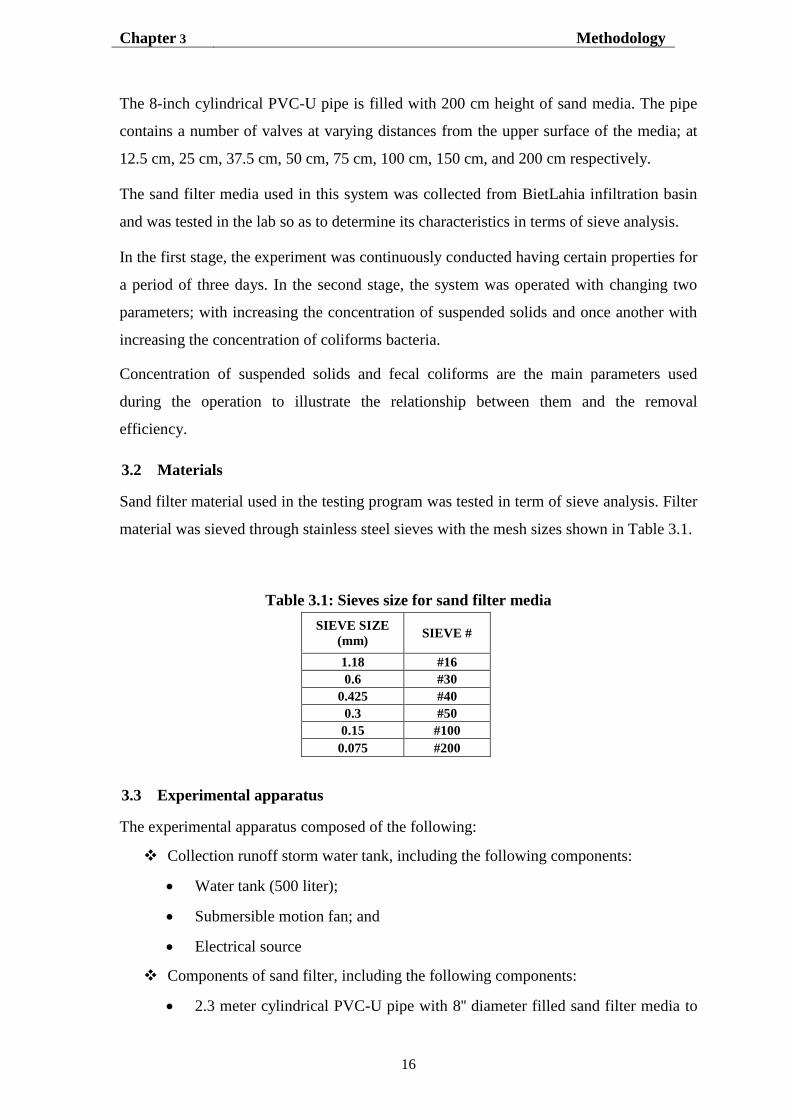
3.2 Materials
Sand filter material used in the testing program was tested in term of sieve analysis. Filter
material was sieved through stainless steel sieves with the mesh sizes shown in Table 3.1.
Table 3.1: Sieves size for sand filter media
3.3 Experimental apparatus
The experimental apparatus composed of the following:
Collection runoff storm water tank, including the following components:
Water tank (500 liter);
Submersible motion fan; and
Electrical source
Components of sand filter, including the following components:
2.3 meter cylindrical PVC-U pipe with 8'' diameter filled sand filter media to
SIEVE SIZE
(mm) SIEVE #
1.18 #16
0.6 #30
0.425 #40
0.3 #50
0.15 #100
0.075 #200
Chapter 3 Methodology
17
depth of 2 m.
. The pipe contains a number of valves at varying distances from the upper
surface of the media; at 12.5 cm, 25 cm, 37.5 cm, 50 cm, 75 cm, 100 cm, 150 cm,
and 200 cm respectively.
Brass pipe connectors to connect between pipes and each valve.
Wire mesh was used between filter material and each valve in pipe.
Glass window 5cm x 50cm
Inlet and outlet pipes in the upper part of pipe
Polly ethylene pipe with a diameter of 3/4 inch to connect between the
components of the plant.
Water tank (200 liter) to collect overflow of water.
Valves for inlet and outlet of water to control the flow.
3.4 Experimental Scenarios
The experimental study used the following scenarios to study the purification of storm
water by sand filter:
1. Continuous three days of infiltration.
2. Increasing the number of fecal coliforms.
3. High concentration of suspended solid.
3.5 Testing Parameters
The following parameters were tested in the study:
1- Physical parameters (Suspended Solids).
2- Biological parameter (Fecal Coliforms).
3.6 Samples Collection
Samples were collected using sterilized 500 ml plastic bottles from both the influent and
the effluent outlets of the filters (see Figure 3.2). Samples collected for microbiological
analysis then were placed in an ice box with ice packs to maintain the temperature of 4°C.
Strict sterilized conditions were maintained throughout the collection and transportation
of these samples.
Each valve was opened at least one minute prior to sample collection so as to flush any
pollutant that may exist around each of depth valve Thus, accurate results can be obtained.

Chapter 3 Methodology
18
The sterilize bottles were numbered and labeled. Attention was also paid during sampling
to avoid mixing effluents as this could lead to a change in the percentage of fecal
coliforms.
For well and proper sampling, it was necessary to sterilize the sample bottles through
submerging them in boiling water for 5 minutes each. Representative samples were made
by taking three samples for each effluent depth valve and then mixing them to get a
composite sample.
The samples bottles were then immediately brought to the lab for analysis in term of fecal
coliforms and suspended solid concentrations. For suspended solids analysis, the samples
were separated in 100 ml bottles.
Figure 3.2: Collecting of water effluent
3.7 System Operation
After testing the sand filter media, the apparatus was assembled. Following this,
the system was operated first using clean water so that to wash the sand filter
media and to remove any impurities that may exist on it; this step continued till
reaching a steady state flow and till water runs clean.
The collector tank of 500 liters then was filled with storm water and all the valves
were closed excepting the drainage valve. The controlling of the influent storm
water flow was done through the tank valve as well.
Chapter 3 Methodology
19
In the first stage of the laboratory study, the infiltration test was continuously
conducted for three days to ensure continuity of the infiltration. To avoid clogging
of media, a low influent flow rate was adopted. The suspended solid removal and
fecal coliforms removal, at each different depth specified above were measured
and calculated.
In the second stage of the laboratory study, the effect of different concentrations of
fecal coliforms on filtration and treatment performance was investigated and
tested. The concentration of fecal coliforms in the influent storm water was
increased by adding specific and measured amount of wastewater. The added
wastewater was collected from one of the wastewater pumping stations and it had
at least two millions of coliforms per 100 ml. The system then was operated and
fecal coliforms removal were measured and calculated at the different depths.
In the third stage of laboratory study, the effect of different concentrations of fecal
coliforms on filtration and treatment performance was investigated similarly as in
stage 2 but by double increasing the concentration of fecal coliforms to the
influent storm water of the collection storm water tank. Specified and measured
quantities of wastewater were added as in step 2 then the system was operated. For
each depth, fecal coliforms removal were measured and calculated.
In the fourth stage of laboratory study, the effect of different concentrations of
suspended solids on filtration and treatment performance was investigated through
adding specified amounts of soil fillers and then operating the system. For each
depth suspended solid removals were measured and calculated to investigate the
effect of high concentration of suspended solids on filtration and treatment
performance.
It was important to wash the media after each experiment stage and to remove the
top layer of dirt on the surface of sand filter so as to reflect the actual performance
of the system and to ensure obtaining accurate results for infiltration and treatment
performance.
The results then have been presented and different relationships have been made
between them so that they can be easily discussed and analyzed, and from which
conclusions can be drawn.
Chapter 3 Methodology
20
3.8 The expected results
The expected results from this laboratory study are summarized below:
1. Continuous three days of infiltration.
1.1. Percent of suspended solid & fecal coliforms removal per day.
1.2. Concentration of suspended solid & fecal coliforms per day.
2. Effect of different concentrations of suspended solid.
3. Effect of increasing the number of fecal coliforms.
The relationships will be concluded and illustrated in charts and tables so that findings
can be better understood and discussed.
3.9 Calculations
Based on the experiment measurements, some items were calculated. The following
formulas are used for calculating the items;
Percent of suspended solid removal:
Percent of fecal coliforms removal:
3.10 Samples tests methods
3.10.1 Fecal coliforms
The membrane filter method (APHA, AWWA, WEF. 1998,Standard Methods for the
Examination of Water and Wastewater, 20 th Edition 9222 D) provides direct
enumeration of the fecal coliform group without enrichment or subsequent testing. The
results of the membrane filter test are obtained in 24 hours. An appropriate volume of
water sample or its dilution is passed through a membrane filter that retains the bacteria
present in the sample. The filter containing the microorganisms is placed on MFC agar in
Chapter 3 Methodology
21
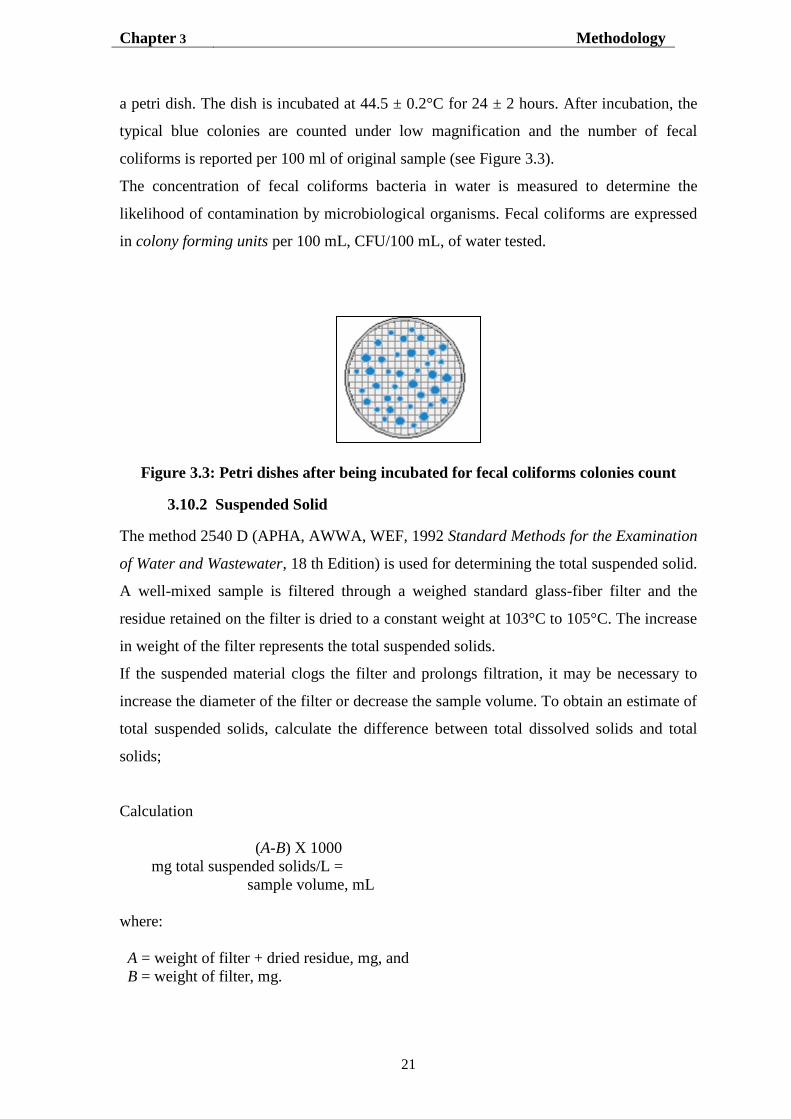
a petri dish. The dish is incubated at 44.5 ± 0.2°C for 24 ± 2 hours. After incubation, the
typical blue colonies are counted under low magnification and the number of fecal
coliforms is reported per 100 ml of original sample (see Figure 3.3).
The concentration of fecal coliforms bacteria in water is measured to determine the
likelihood of contamination by microbiological organisms. Fecal coliforms are expressed
in colony forming units per 100 mL, CFU/100 mL, of water tested.
Figure 3.3: Petri dishes after being incubated for fecal coliforms colonies count
3.10.2 Suspended Solid
The method 2540 D (APHA, AWWA, WEF, 1992 Standard Methods for the Examination
of Water and Wastewater, 18 th Edition) is used for determining the total suspended solid.
A well-mixed sample is filtered through a weighed standard glass-fiber filter and the
residue retained on the filter is dried to a constant weight at 103°C to 105°C. The increase
in weight of the filter represents the total suspended solids.
If the suspended material clogs the filter and prolongs filtration, it may be necessary to
increase the diameter of the filter or decrease the sample volume. To obtain an estimate of
total suspended solids, calculate the difference between total dissolved solids and total
solids;
Calculation
(A-B) X 1000
mg total suspended solids/L =
sample volume, mL
where:
A = weight of filter + dried residue, mg, and
B = weight of filter, mg.

Chapter 3 Methodology
22
Method 208 E (APHA, AWWA, WEF, 1975, Standard Methods for the Examination of
Water and Wastewater, 14 th Edition); the residue from Method 2540 D is ignited to a
constant weight at 550+ 50 o C. The remaining solids represent the fixed suspended solids
while the weight loss on ignition represents the suspended volatile solids.
Chapter 4 Results and Discussion
23
Chapter 4 Results and Discussion
The investigation of feasibility and performance of purification process by infiltration was
done by using filter made from PVC-U pipe filled with 200 cm height of sand media with
operating system.
Flow rate, concentration of suspended solids and fecal coliforms are the main parameters
used during the operation to illustrate the relationship between them and the removal
efficiency.
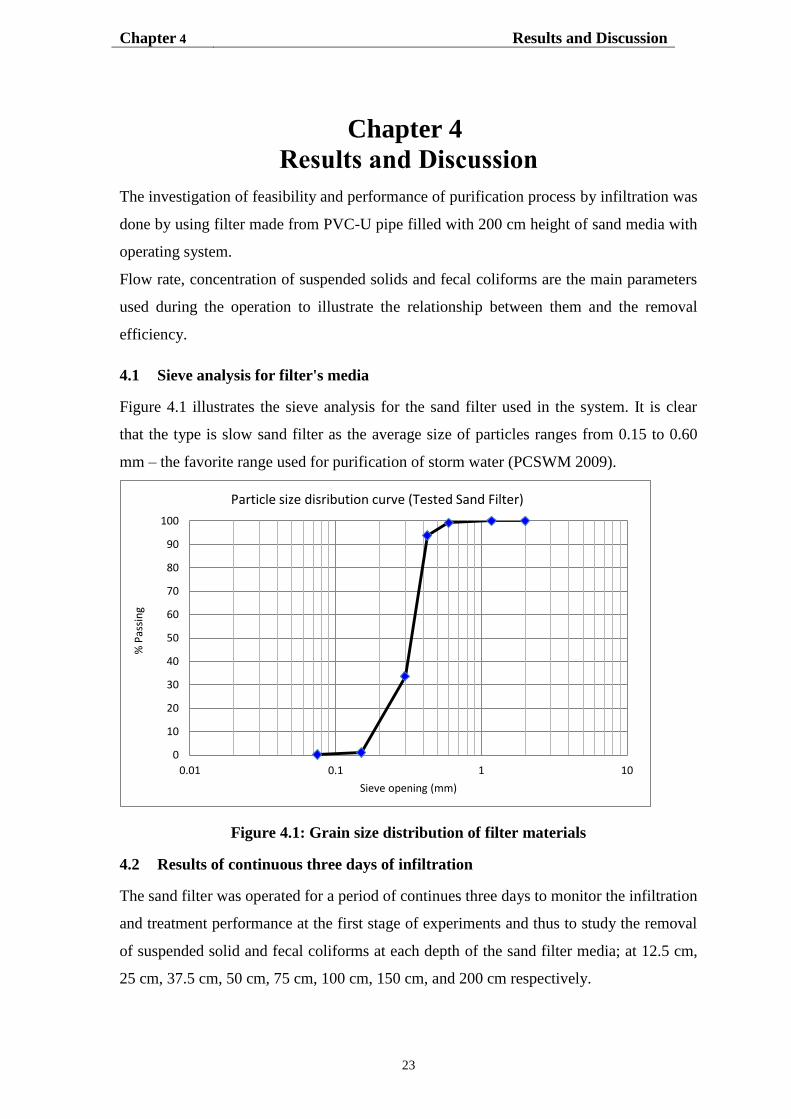
4.1 Sieve analysis for filter's media
Figure 4.1 illustrates the sieve analysis for the sand filter used in the system. It is clear
that the type is slow sand filter as the average size of particles ranges from 0.15 to 0.60
mm – the favorite range used for purification of storm water (PCSWM 2009).
Figure 4.1: Grain size distribution of filter materials
4.2 Results of continuous three days of infiltration
The sand filter was operated for a period of continues three days to monitor the infiltration
and treatment performance at the first stage of experiments and thus to study the removal
of suspended solid and fecal coliforms at each depth of the sand filter media; at 12.5 cm,
25 cm, 37.5 cm, 50 cm, 75 cm, 100 cm, 150 cm, and 200 cm respectively.
0
10
20
30
40
50
60
70
80
90
100
0.01 0.1 1 10
% P
assi
ng
Sieve opening (mm)
Particle size disribution curve (Tested Sand Filter)
Chapter 4 Results and Discussion
24
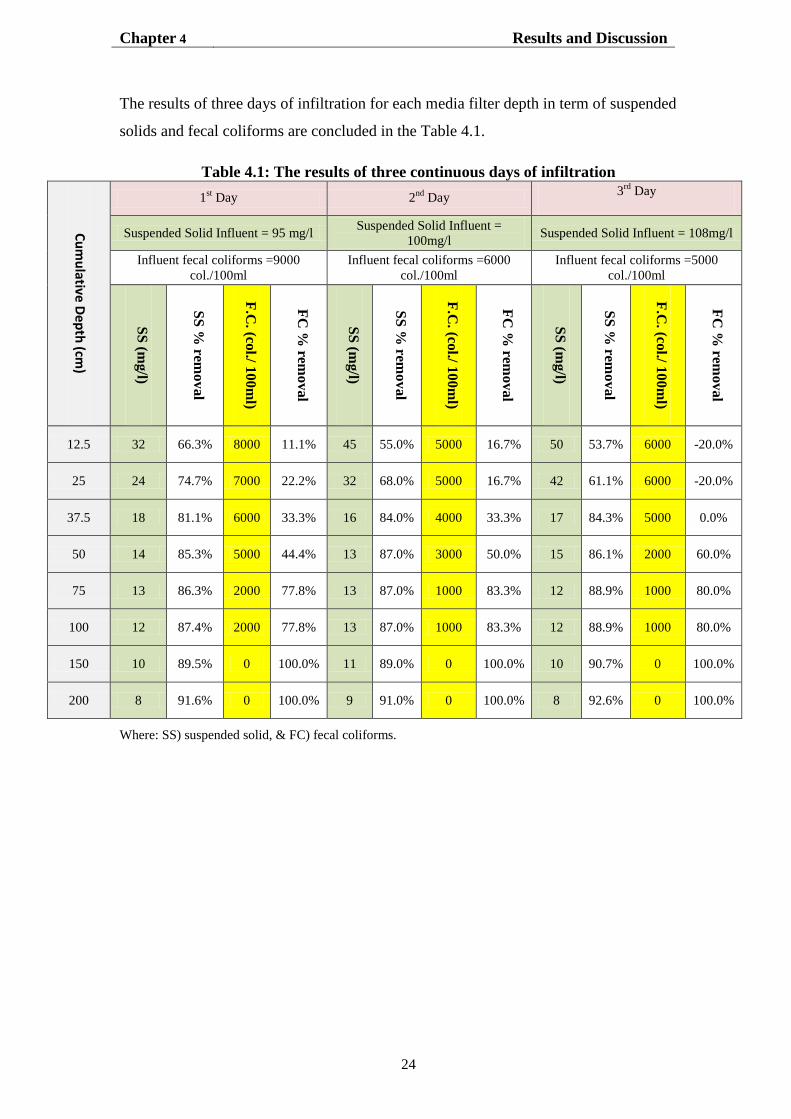
The results of three days of infiltration for each media filter depth in term of suspended
solids and fecal coliforms are concluded in the Table 4.1.
Table 4.1: The results of three continuous days of infiltration
Cu
mu
lative De
pth
(cm)
1st Day 2
nd Day
3rd
Day
Suspended Solid Influent = 95 mg/l Suspended Solid Influent =
100mg/l Suspended Solid Influent = 108mg/l
Influent fecal coliforms =9000
col./100ml
Influent fecal coliforms =6000
col./100ml
Influent fecal coliforms =5000
col./100ml
SS
(mg/l)
SS
% rem
ov
al
F.C
. (col./ 1
00
ml)
FC
% rem
ov
al
SS
(mg/l)
SS
% rem
ov
al
F.C
. (col./ 1
00
ml)
FC
% rem
ov
al
SS
(mg/l)
SS
% rem
ov
al
F.C
. (col./ 1
00
ml)
FC
% rem
ov
al
12.5 32 66.3% 8000 11.1% 45 55.0% 5000 16.7% 50 53.7% 6000 -20.0%
25 24 74.7% 7000 22.2% 32 68.0% 5000 16.7% 42 61.1% 6000 -20.0%
37.5 18 81.1% 6000 33.3% 16 84.0% 4000 33.3% 17 84.3% 5000 0.0%
50 14 85.3% 5000 44.4% 13 87.0% 3000 50.0% 15 86.1% 2000 60.0%
75 13 86.3% 2000 77.8% 13 87.0% 1000 83.3% 12 88.9% 1000 80.0%
100 12 87.4% 2000 77.8% 13 87.0% 1000 83.3% 12 88.9% 1000 80.0%
150 10 89.5% 0 100.0% 11 89.0% 0 100.0% 10 90.7% 0 100.0%
200 8 91.6% 0 100.0% 9 91.0% 0 100.0% 8 92.6% 0 100.0%
Where: SS) suspended solid, & FC) fecal coliforms.
Chapter 4 Results and Discussion
25
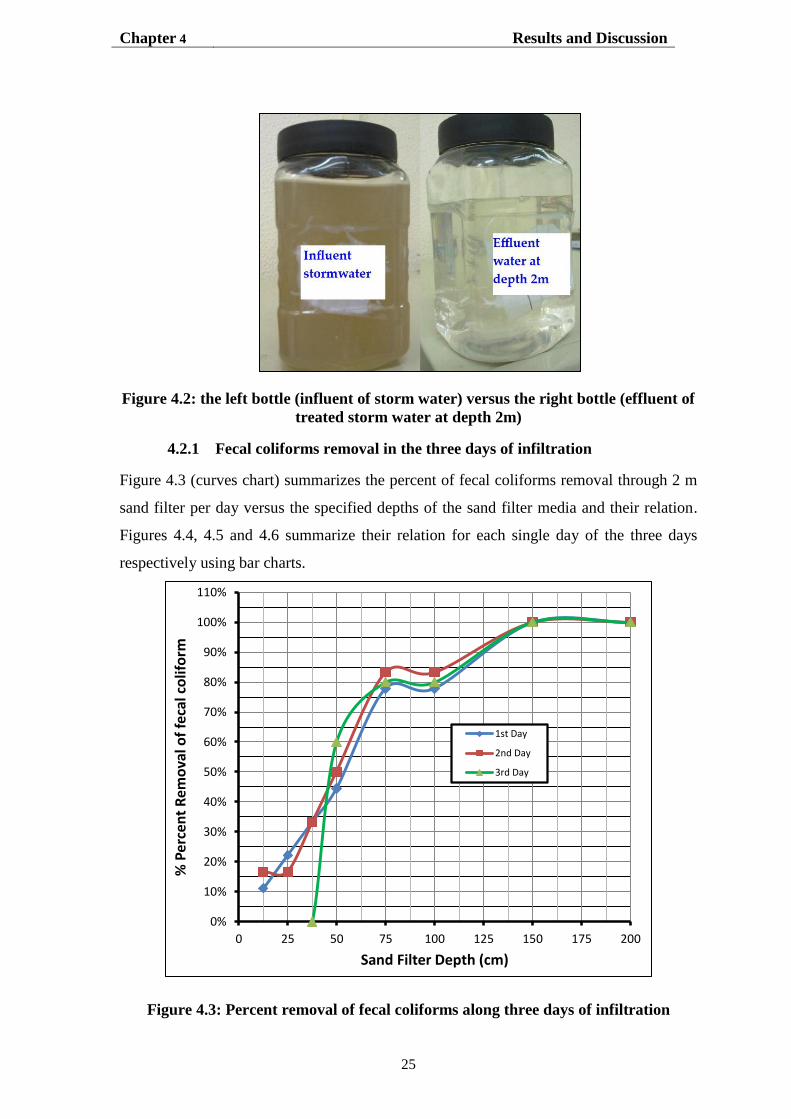
Figure 4.2: the left bottle (influent of storm water) versus the right bottle (effluent of
treated storm water at depth 2m)
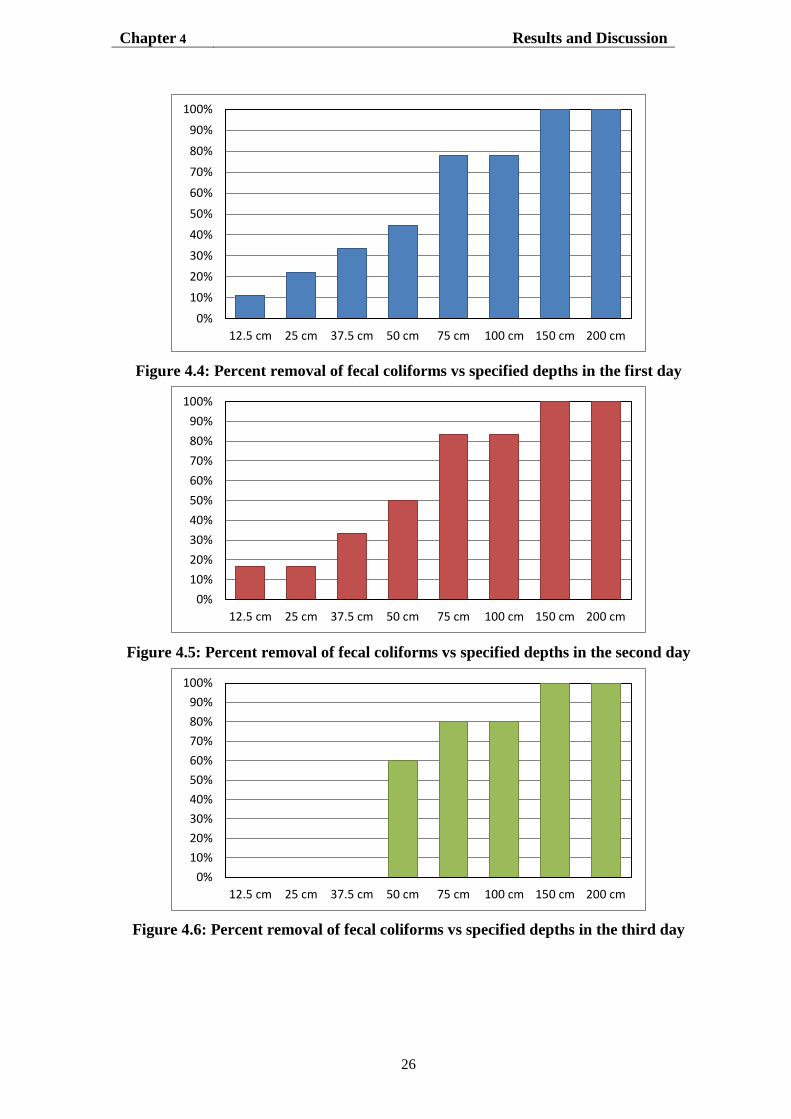
4.2.1 Fecal coliforms removal in the three days of infiltration
Figure 4.3 (curves chart) summarizes the percent of fecal coliforms removal through 2 m
sand filter per day versus the specified depths of the sand filter media and their relation.
Figures 4.4, 4.5 and 4.6 summarize their relation for each single day of the three days
respectively using bar charts.
Figure 4.3: Percent removal of fecal coliforms along three days of infiltration
0%
10%
20%
30%
40%
50%
60%
70%
80%
90%
100%
110%
0 25 50 75 100 125 150 175 200
% P
erce
nt
Rem
ova
l of
feca
l co
lifo
rm
Sand Filter Depth (cm)
1st Day
2nd Day
3rd Day
Chapter 4 Results and Discussion
26
Figure 4.4: Percent removal of fecal coliforms vs specified depths in the first day
Figure 4.5: Percent removal of fecal coliforms vs specified depths in the second day
Figure 4.6: Percent removal of fecal coliforms vs specified depths in the third day
0%
10%
20%
30%
40%
50%
60%
70%
80%
90%
100%
12.5 cm 25 cm 37.5 cm 50 cm 75 cm 100 cm 150 cm 200 cm
0%
10%
20%
30%
40%
50%
60%
70%
80%
90%
100%
12.5 cm 25 cm 37.5 cm 50 cm 75 cm 100 cm 150 cm 200 cm
0%
10%
20%
30%
40%
50%
60%
70%
80%
90%
100%
12.5 cm 25 cm 37.5 cm 50 cm 75 cm 100 cm 150 cm 200 cm
Chapter 4 Results and Discussion
27
The change of removal from depth to depth varies from day to day, but in general they
have a close pattern and there is no significant difference in the percentage of removal
between these three days with exception to the upper depths on the first day.
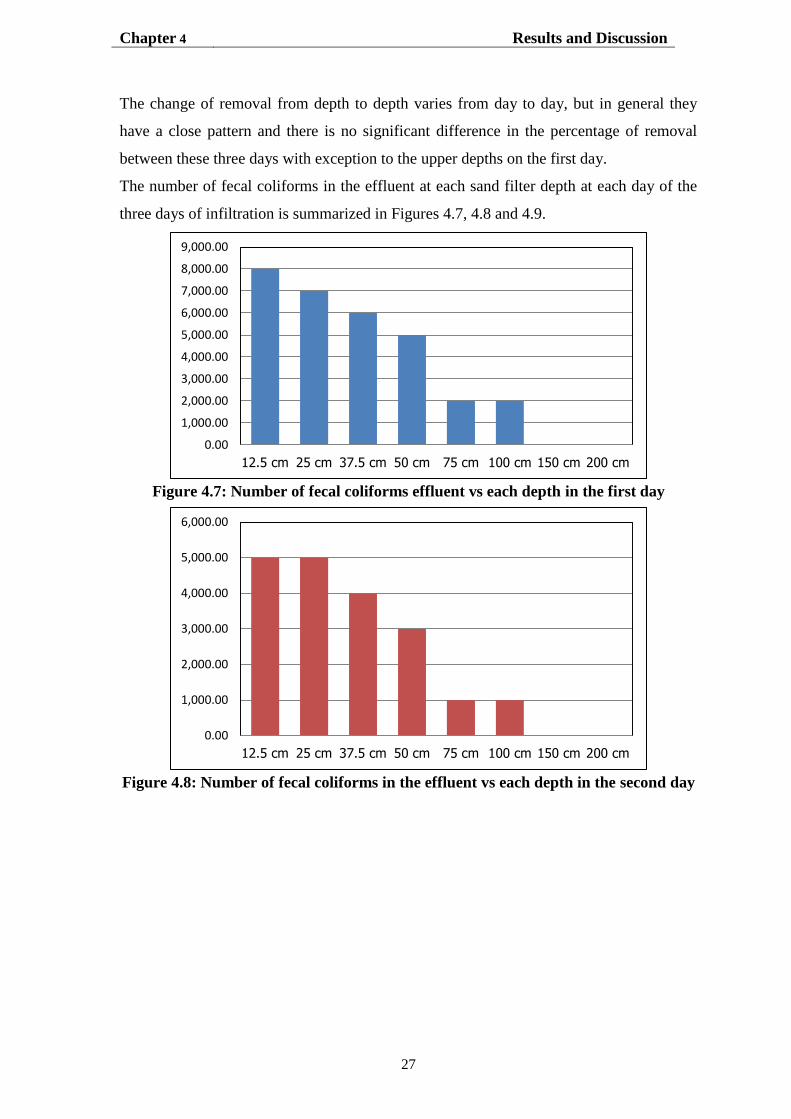
The number of fecal coliforms in the effluent at each sand filter depth at each day of the
three days of infiltration is summarized in Figures 4.7, 4.8 and 4.9.
Figure 4.7: Number of fecal coliforms effluent vs each depth in the first day
Figure 4.8: Number of fecal coliforms in the effluent vs each depth in the second day
0.00
1,000.00
2,000.00
3,000.00
4,000.00
5,000.00
6,000.00
7,000.00
8,000.00
9,000.00
12.5 cm 25 cm 37.5 cm 50 cm 75 cm 100 cm 150 cm 200 cm
0.00
1,000.00
2,000.00
3,000.00
4,000.00
5,000.00
6,000.00
12.5 cm 25 cm 37.5 cm 50 cm 75 cm 100 cm 150 cm 200 cm
Chapter 4 Results and Discussion
28
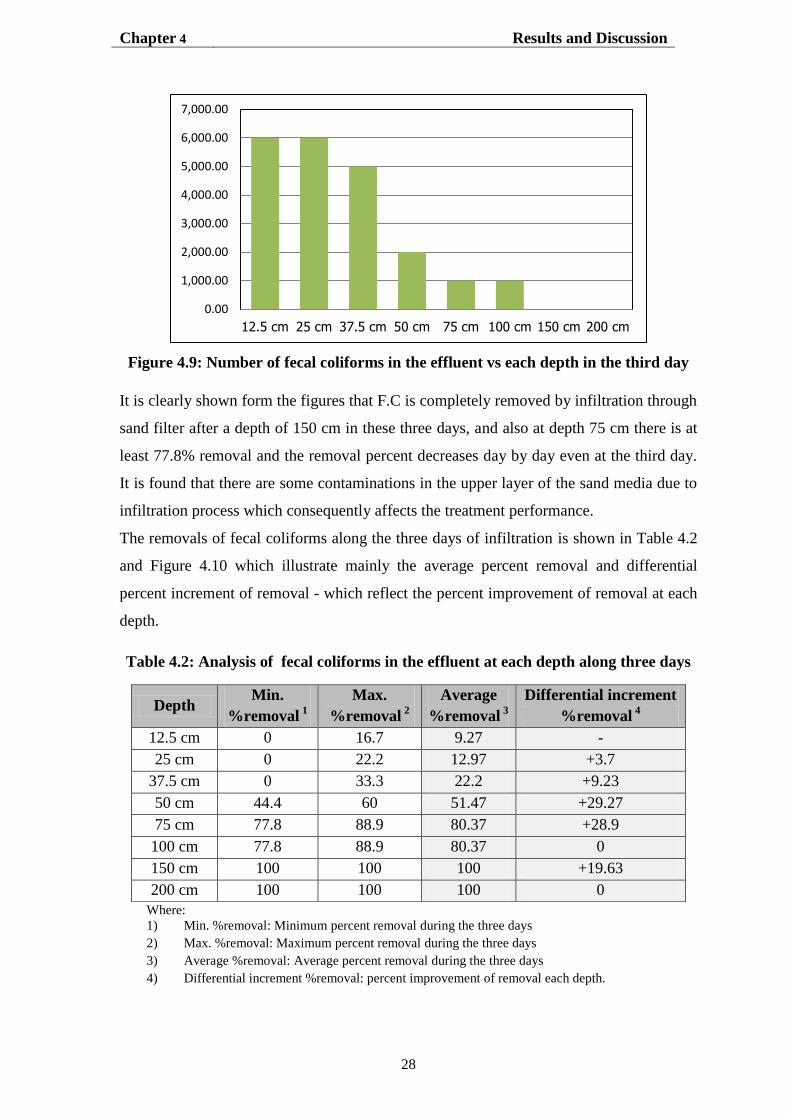
Figure 4.9: Number of fecal coliforms in the effluent vs each depth in the third day
It is clearly shown form the figures that F.C is completely removed by infiltration through
sand filter after a depth of 150 cm in these three days, and also at depth 75 cm there is at
least 77.8% removal and the removal percent decreases day by day even at the third day.
It is found that there are some contaminations in the upper layer of the sand media due to
infiltration process which consequently affects the treatment performance.
The removals of fecal coliforms along the three days of infiltration is shown in Table 4.2
and Figure 4.10 which illustrate mainly the average percent removal and differential
percent increment of removal - which reflect the percent improvement of removal at each
depth.
Table 4.2: Analysis of fecal coliforms in the effluent at each depth along three days
Where:
1) Min. %removal: Minimum percent removal during the three days
2) Max. %removal: Maximum percent removal during the three days
3) Average %removal: Average percent removal during the three days
4) Differential increment %removal: percent improvement of removal each depth.
0.00
1,000.00
2,000.00
3,000.00
4,000.00
5,000.00
6,000.00
7,000.00
12.5 cm 25 cm 37.5 cm 50 cm 75 cm 100 cm 150 cm 200 cm
Depth Min.
%removal 1
Max.
%removal 2
Average
%removal 3
Differential increment
%removal 4
12.5 cm 0 16.7 9.27 -
25 cm 0 22.2 12.97 +3.7
37.5 cm 0 33.3 22.2 +9.23
50 cm 44.4 60 51.47 +29.27
75 cm 77.8 88.9 80.37 +28.9
100 cm 77.8 88.9 80.37 0
150 cm 100 100 100 +19.63
200 cm 100 100 100 0
Chapter 4 Results and Discussion
29
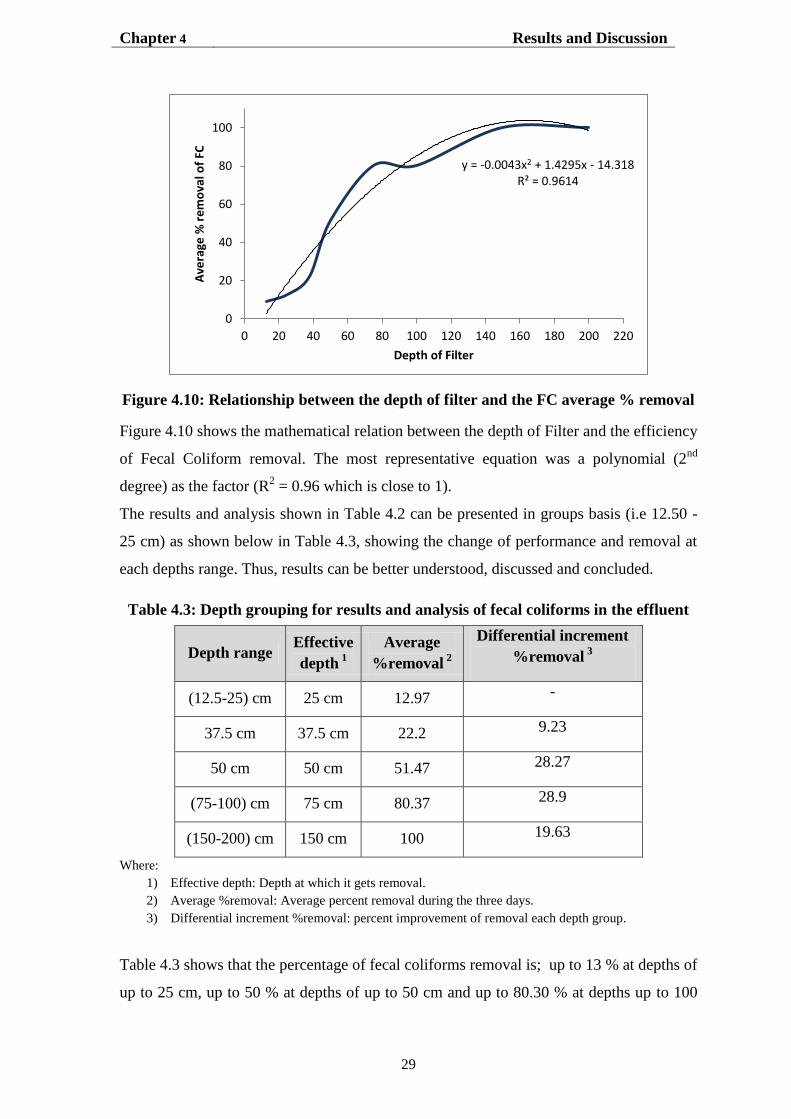
Figure 4.10: Relationship between the depth of filter and the FC average % removal
Figure 4.10 shows the mathematical relation between the depth of Filter and the efficiency
of Fecal Coliform removal. The most representative equation was a polynomial (2nd
degree) as the factor (R2 = 0.96 which is close to 1).
The results and analysis shown in Table 4.2 can be presented in groups basis (i.e 12.50 -
25 cm) as shown below in Table 4.3, showing the change of performance and removal at
each depths range. Thus, results can be better understood, discussed and concluded.
Table 4.3: Depth grouping for results and analysis of fecal coliforms in the effluent
Depth range Effective
depth 1
Average
%removal 2
Differential increment
%removal 3
(12.5-25) cm 25 cm 12.97 -
37.5 cm 37.5 cm 22.2 9.23
50 cm 50 cm 51.47 28.27
(75-100) cm 75 cm 80.37 28.9
(150-200) cm 150 cm 100 19.63
Where:
1) Effective depth: Depth at which it gets removal.
2) Average %removal: Average percent removal during the three days.
3) Differential increment %removal: percent improvement of removal each depth group.
Table 4.3 shows that the percentage of fecal coliforms removal is; up to 13 % at depths of
up to 25 cm, up to 50 % at depths of up to 50 cm and up to 80.30 % at depths up to 100
y = -0.0043x2 + 1.4295x - 14.318 R² = 0.9614
0
20
40
60
80
100
0 20 40 60 80 100 120 140 160 180 200 220
Ave
rage
% r
em
ova
l of
FC
Depth of Filter
Chapter 4 Results and Discussion
30
cm. It is also shown on Table 4.3 that the differential increment removal at effective
depths 50 cm and 75 cm are 28.27 % and 28.90 % respectively and thus both together
accounting for 60 % of removal of fecal coliforms in the system.
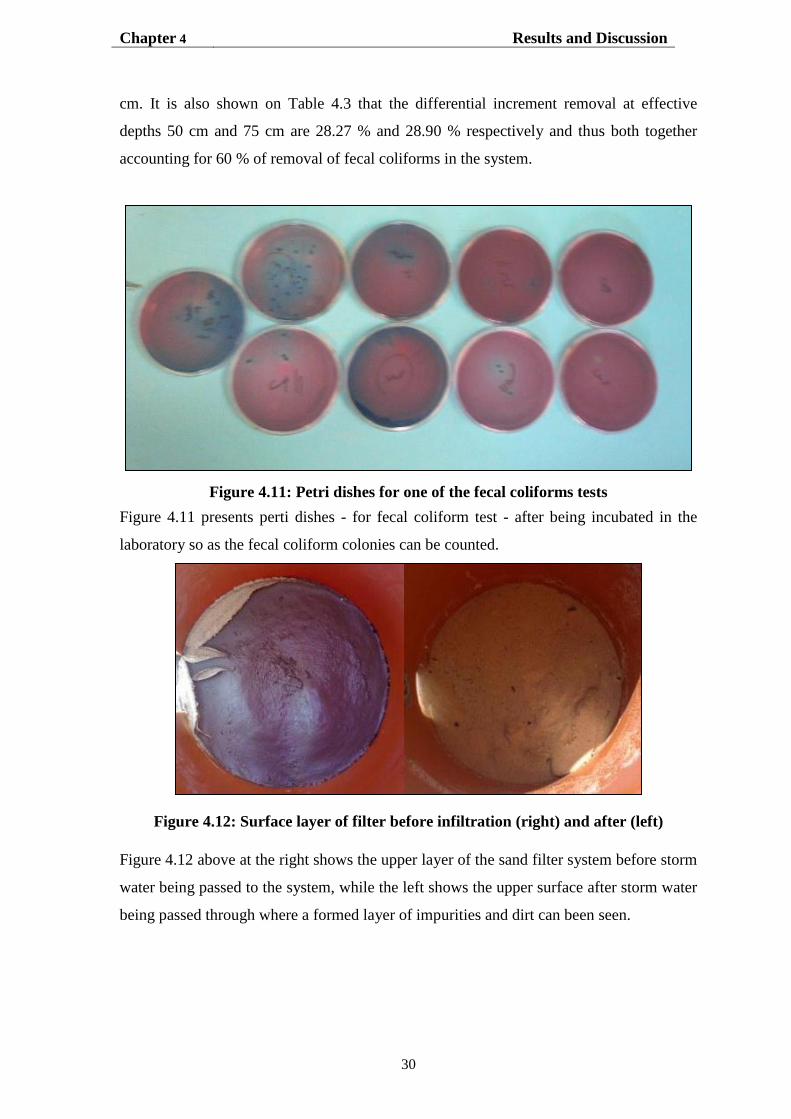
Figure 4.11: Petri dishes for one of the fecal coliforms tests
Figure 4.11 presents perti dishes - for fecal coliform test - after being incubated in the
laboratory so as the fecal coliform colonies can be counted.
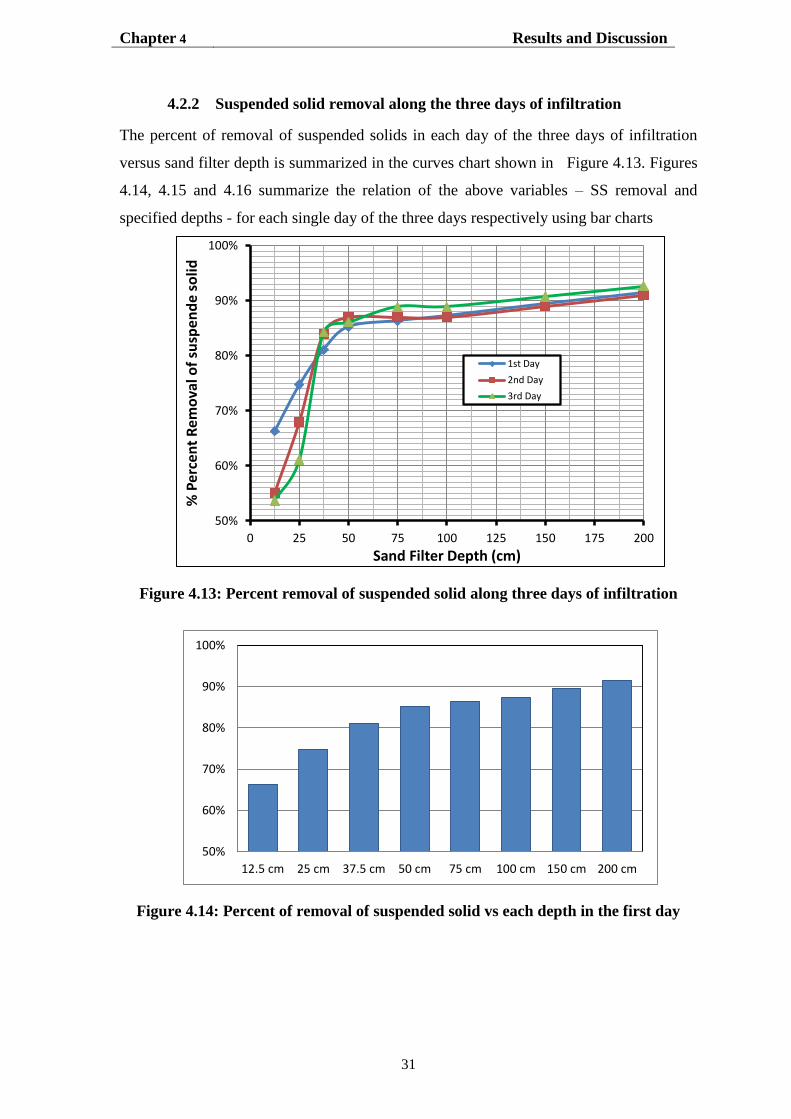
Figure 4.12: Surface layer of filter before infiltration (right) and after (left)
Figure 4.12 above at the right shows the upper layer of the sand filter system before storm
water being passed to the system, while the left shows the upper surface after storm water
being passed through where a formed layer of impurities and dirt can been seen.
Chapter 4 Results and Discussion
31
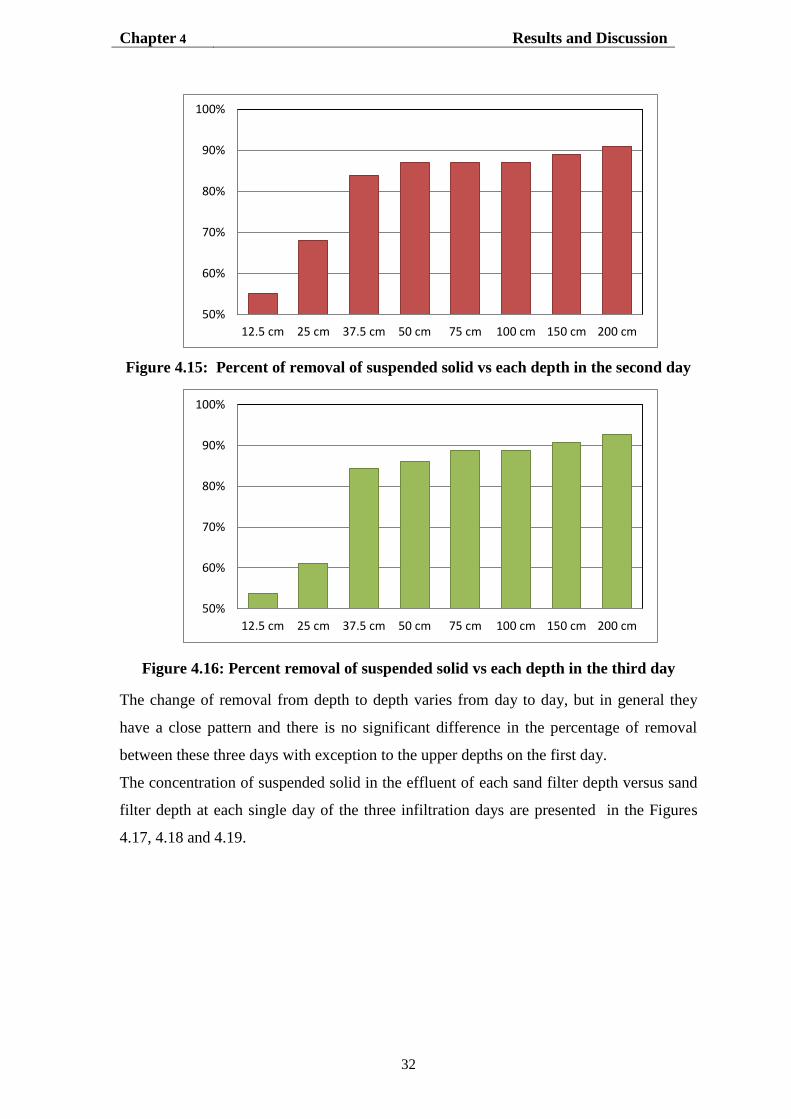
4.2.2 Suspended solid removal along the three days of infiltration
The percent of removal of suspended solids in each day of the three days of infiltration
versus sand filter depth is summarized in the curves chart shown in Figure 4.13. Figures
4.14, 4.15 and 4.16 summarize the relation of the above variables – SS removal and
specified depths - for each single day of the three days respectively using bar charts
Figure 4.13: Percent removal of suspended solid along three days of infiltration
Figure 4.14: Percent of removal of suspended solid vs each depth in the first day
50%
60%
70%
80%
90%
100%
0 25 50 75 100 125 150 175 200
% P
erc
en
t R
em
ova
l of
susp
en
de
so
lid
Sand Filter Depth (cm)
1st Day
2nd Day
3rd Day
50%
60%
70%
80%
90%
100%
12.5 cm 25 cm 37.5 cm 50 cm 75 cm 100 cm 150 cm 200 cm
Chapter 4 Results and Discussion
32
Figure 4.15: Percent of removal of suspended solid vs each depth in the second day
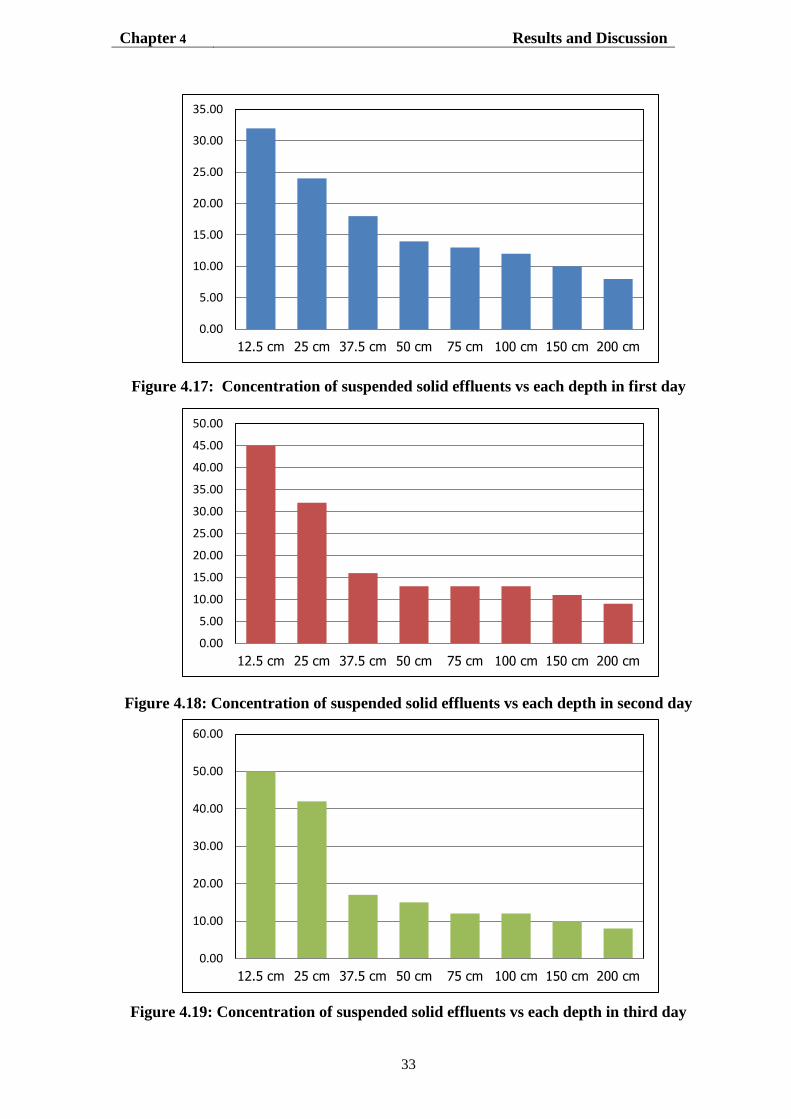
Figure 4.16: Percent removal of suspended solid vs each depth in the third day
The change of removal from depth to depth varies from day to day, but in general they
have a close pattern and there is no significant difference in the percentage of removal
between these three days with exception to the upper depths on the first day.
The concentration of suspended solid in the effluent of each sand filter depth versus sand
filter depth at each single day of the three infiltration days are presented in the Figures
4.17, 4.18 and 4.19.
50%
60%
70%
80%
90%
100%
12.5 cm 25 cm 37.5 cm 50 cm 75 cm 100 cm 150 cm 200 cm
50%
60%
70%
80%
90%
100%
12.5 cm 25 cm 37.5 cm 50 cm 75 cm 100 cm 150 cm 200 cm
Chapter 4 Results and Discussion
33
Figure 4.17: Concentration of suspended solid effluents vs each depth in first day
Figure 4.18: Concentration of suspended solid effluents vs each depth in second day
Figure 4.19: Concentration of suspended solid effluents vs each depth in third day
0.00
5.00
10.00
15.00
20.00
25.00
30.00
35.00
12.5 cm 25 cm 37.5 cm 50 cm 75 cm 100 cm 150 cm 200 cm
0.00
5.00
10.00
15.00
20.00
25.00
30.00
35.00
40.00
45.00
50.00
12.5 cm 25 cm 37.5 cm 50 cm 75 cm 100 cm 150 cm 200 cm
0.00
10.00
20.00
30.00
40.00
50.00
60.00
12.5 cm 25 cm 37.5 cm 50 cm 75 cm 100 cm 150 cm 200 cm
Chapter 4 Results and Discussion
34
The concentration of suspended solids in each effluent at the first two depths or valves (at
depths of 12.5 and 25 cm) is a function of concentration of suspended solids in the
influent as shown in Figure 4.16 through 4.18. At later depths up to 100 cm (37.50 – 100
cm) the concentration of SS in the effluents are all close and less than 20 mg /lr. At depths
150 cm and 200 cm , concentration of SS in the effluents are in the same range and little
less than 10 mg / lr.
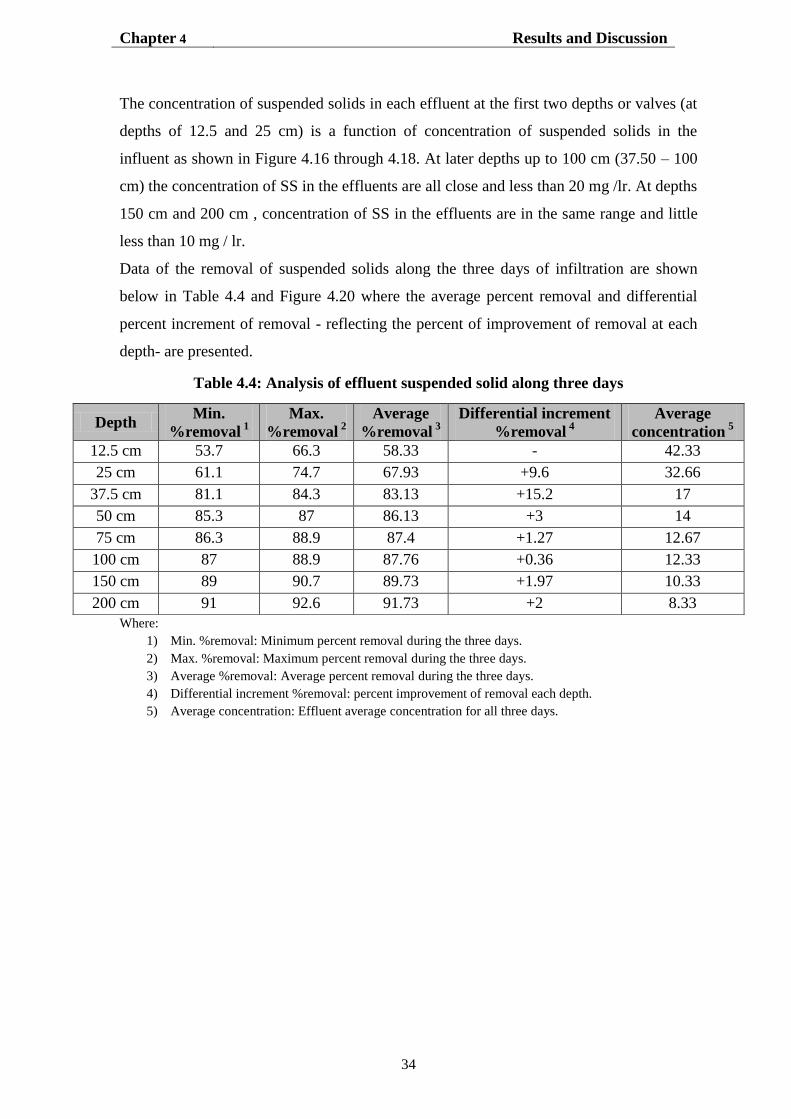
Data of the removal of suspended solids along the three days of infiltration are shown
below in Table 4.4 and Figure 4.20 where the average percent removal and differential
percent increment of removal - reflecting the percent of improvement of removal at each
depth- are presented.
Table 4.4: Analysis of effluent suspended solid along three days
Where:
1) Min. %removal: Minimum percent removal during the three days.
2) Max. %removal: Maximum percent removal during the three days.
3) Average %removal: Average percent removal during the three days.
4) Differential increment %removal: percent improvement of removal each depth.
5) Average concentration: Effluent average concentration for all three days.
Depth Min.
%removal 1
Max.
%removal 2
Average
%removal 3
Differential increment
%removal 4
Average
concentration 5
12.5 cm 53.7 66.3 58.33 - 42.33
25 cm 61.1 74.7 67.93 +9.6 32.66
37.5 cm 81.1 84.3 83.13 +15.2 17
50 cm 85.3 87 86.13 +3 14
75 cm 86.3 88.9 87.4 +1.27 12.67
100 cm 87 88.9 87.76 +0.36 12.33
150 cm 89 90.7 89.73 +1.97 10.33
200 cm 91 92.6 91.73 +2 8.33
Chapter 4 Results and Discussion
35
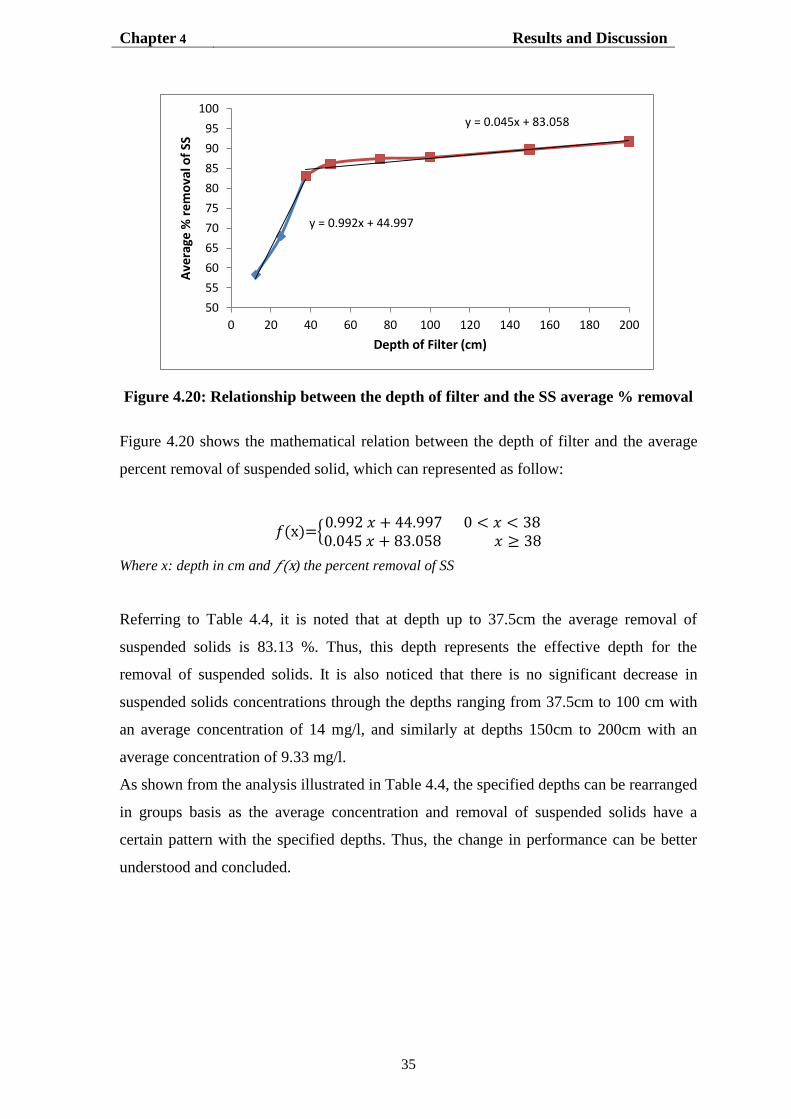
Figure 4.20: Relationship between the depth of filter and the SS average % removal
Figure 4.20 shows the mathematical relation between the depth of filter and the average
percent removal of suspended solid, which can represented as follow:
𝑓(x)={
Where x: depth in cm and 𝑓(x) the percent removal of SS
Referring to Table 4.4, it is noted that at depth up to 37.5cm the average removal of
suspended solids is 83.13 %. Thus, this depth represents the effective depth for the
removal of suspended solids. It is also noticed that there is no significant decrease in
suspended solids concentrations through the depths ranging from 37.5cm to 100 cm with
an average concentration of 14 mg/l, and similarly at depths 150cm to 200cm with an
average concentration of 9.33 mg/l.
As shown from the analysis illustrated in Table 4.4, the specified depths can be rearranged
in groups basis as the average concentration and removal of suspended solids have a
certain pattern with the specified depths. Thus, the change in performance can be better
understood and concluded.
y = 0.992x + 44.997
y = 0.045x + 83.058
50
55
60
65
70
75
80
85
90
95
100
0 20 40 60 80 100 120 140 160 180 200
Ave
rage
% r
em
ova
l of
SS
Depth of Filter (cm)
Chapter 4 Results and Discussion
36
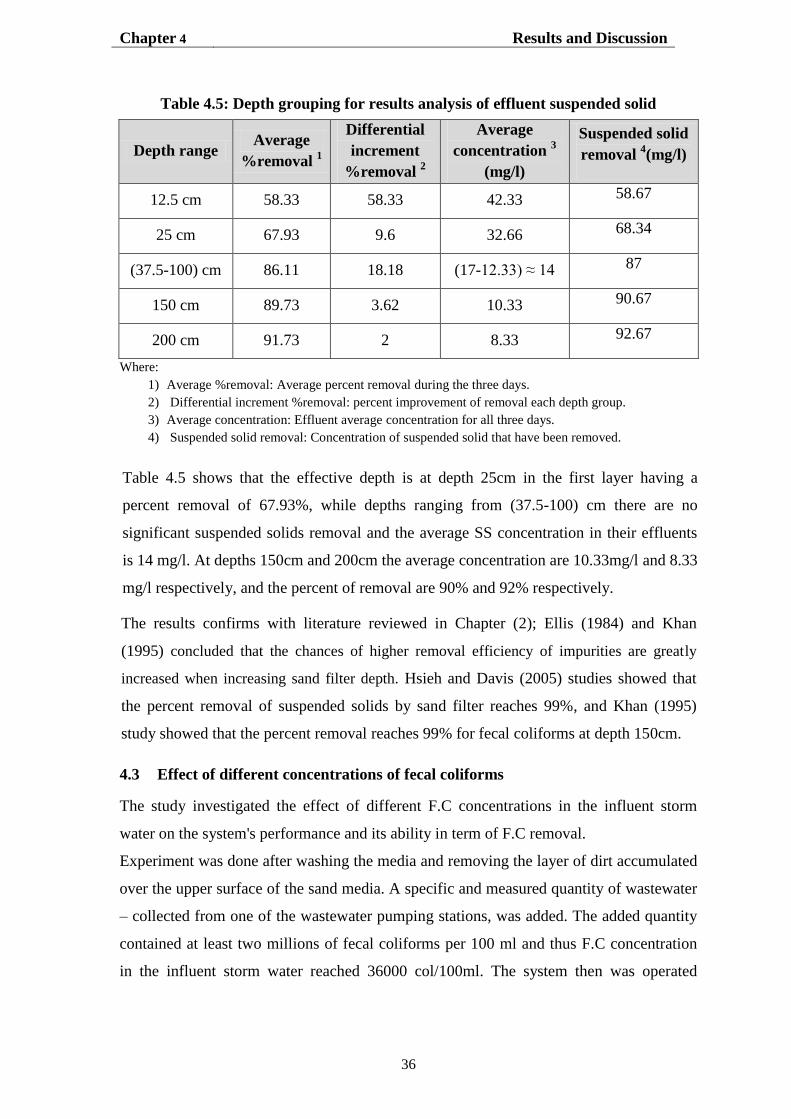
Table 4.5: Depth grouping for results analysis of effluent suspended solid
Depth range Average
%removal 1
Differential
increment
%removal 2
Average
concentration 3
(mg/l)
Suspended solid
removal 4(mg/l)
12.5 cm 58.33 58.33 42.33 58.67
25 cm 67.93 9.6 32.66 68.34
(37.5-100) cm 86.11 18.18 (17-12.33) ≈ 14 87
150 cm 89.73 3.62 10.33 90.67
200 cm 91.73 2 8.33 92.67
Where:
1) Average %removal: Average percent removal during the three days.
2) Differential increment %removal: percent improvement of removal each depth group.
3) Average concentration: Effluent average concentration for all three days.
4) Suspended solid removal: Concentration of suspended solid that have been removed.
Table 4.5 shows that the effective depth is at depth 25cm in the first layer having a
percent removal of 67.93%, while depths ranging from (37.5-100) cm there are no
significant suspended solids removal and the average SS concentration in their effluents
is 14 mg/l. At depths 150cm and 200cm the average concentration are 10.33mg/l and 8.33
mg/l respectively, and the percent of removal are 90% and 92% respectively.
The results confirms with literature reviewed in Chapter (2); Ellis (1984) and Khan
(1995) concluded that the chances of higher removal efficiency of impurities are greatly
increased when increasing sand filter depth. Hsieh and Davis (2005) studies showed that
the percent removal of suspended solids by sand filter reaches 99%, and Khan (1995)
study showed that the percent removal reaches 99% for fecal coliforms at depth 150cm.
4.3 Effect of different concentrations of fecal coliforms
The study investigated the effect of different F.C concentrations in the influent storm
water on the system's performance and its ability in term of F.C removal.
Experiment was done after washing the media and removing the layer of dirt accumulated
over the upper surface of the sand media. A specific and measured quantity of wastewater
– collected from one of the wastewater pumping stations, was added. The added quantity
contained at least two millions of fecal coliforms per 100 ml and thus F.C concentration
in the influent storm water reached 36000 col/100ml. The system then was operated
Chapter 4 Results and Discussion
37
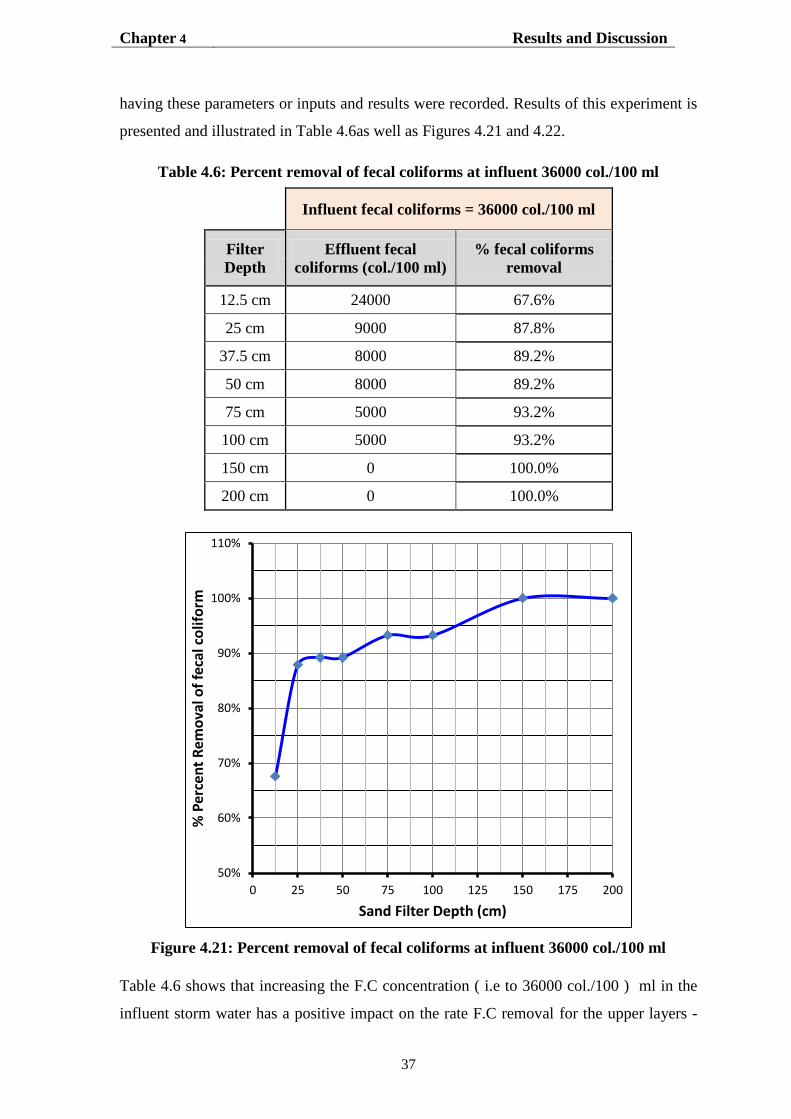
having these parameters or inputs and results were recorded. Results of this experiment is
presented and illustrated in Table 4.6as well as Figures 4.21 and 4.22.
Table 4.6: Percent removal of fecal coliforms at influent 36000 col./100 ml
Influent fecal coliforms = 36000 col./100 ml
Filter
Depth
Effluent fecal
coliforms (col./100 ml)
% fecal coliforms
removal
12.5 cm 24000 67.6%
25 cm 9000 87.8%
37.5 cm 8000 89.2%
50 cm 8000 89.2%
75 cm 5000 93.2%
100 cm 5000 93.2%
150 cm 0 100.0%
200 cm 0 100.0%
Figure 4.21: Percent removal of fecal coliforms at influent 36000 col./100 ml
Table 4.6 shows that increasing the F.C concentration ( i.e to 36000 col./100 ) ml in the
influent storm water has a positive impact on the rate F.C removal for the upper layers -
50%
60%
70%
80%
90%
100%
110%
0 25 50 75 100 125 150 175 200
% P
erce
nt
Rem
ova
l of
feca
l co
lifo
rm
Sand Filter Depth (cm)

Chapter 4 Results and Discussion
38
compared with the previously obtained results for three days of continuous filtration;
where at depth of 12.5 cm, recorded removal of F.C was 12000 col./100ml of fecal
coliforms accounting for a total removal of 67.6% ; at depth of 25 cm, recorded removal
was 27000 col/100ml accounting for total F.C removal of 87.8%. Those results reflect a
significant difference from what was obtained in the previous experiments of continues
three days of infiltration as the recorded average F.C removal was 9.27 % and 12.97 at
depths 12.5 and 25 cm respectively.
Despite the high percentage removal and results discussed earlier, there were significant
concentrations of fecal coliforms at depth ranging from (37.5cm to 100cm) with an
average concentration of 6500 col./100ml and this figure is close to previous results
obtained from three days infiltration test with an average approximately 4000 col./100ml.
Figure 4.22: Depth percent removal of fecal coliforms at influent 36000 col./100 ml
As shown below in Figure 4.23; depths of filter deeper than 25 cm, effluents produced
have relatively low concentration of fecal coliforms (i.e. at depths 37.5 cm and 50cm, the
concentration of F.C is about 8000 FC/per 100 ml compared to F.C concentration in the
influent of 36000 col/100 ml). This improvement in the removal of F.C may be referred to
the nature of F.C. as it exists in the solid parts inside the storm water. Also, the sand filter
is efficient in pending these solid particles which includes high percent of FC.
Furthermore, it is clear that fecal coliforms are completely removed at depths beyond the
150 cm despite influent containing 36000 FC/100 ml.
50%
60%
70%
80%
90%
100%
12.5 cm 25 cm 37.5 cm 50 cm 75 cm 100 cm 150 cm 200 cm
Pe
rce
nt
FC r
em
ova
l
Filter Depths
Chapter 4 Results and Discussion
39
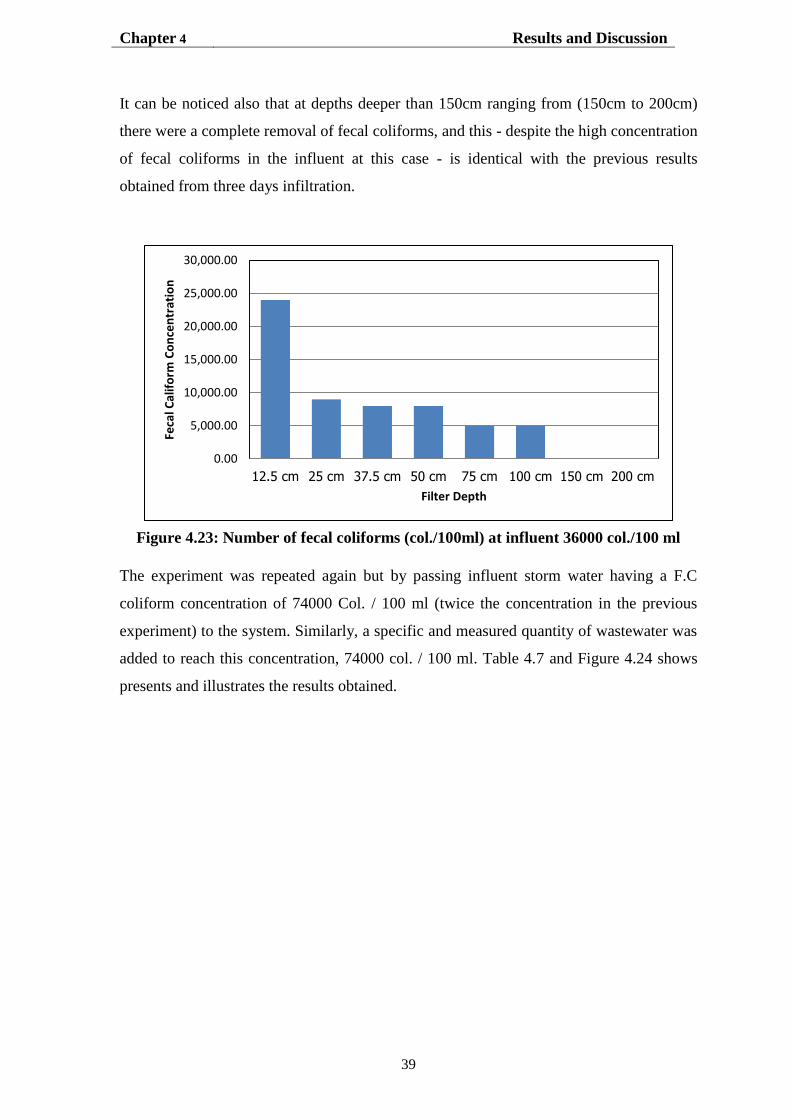
It can be noticed also that at depths deeper than 150cm ranging from (150cm to 200cm)
there were a complete removal of fecal coliforms, and this - despite the high concentration
of fecal coliforms in the influent at this case - is identical with the previous results
obtained from three days infiltration.
Figure 4.23: Number of fecal coliforms (col./100ml) at influent 36000 col./100 ml
The experiment was repeated again but by passing influent storm water having a F.C
coliform concentration of 74000 Col. / 100 ml (twice the concentration in the previous
experiment) to the system. Similarly, a specific and measured quantity of wastewater was
added to reach this concentration, 74000 col. / 100 ml. Table 4.7 and Figure 4.24 shows
presents and illustrates the results obtained.
0.00
5,000.00
10,000.00
15,000.00
20,000.00
25,000.00
30,000.00
12.5 cm 25 cm 37.5 cm 50 cm 75 cm 100 cm 150 cm 200 cm
Feca
l Cal
ifo
rm C
on
cen
trat
ion
Filter Depth
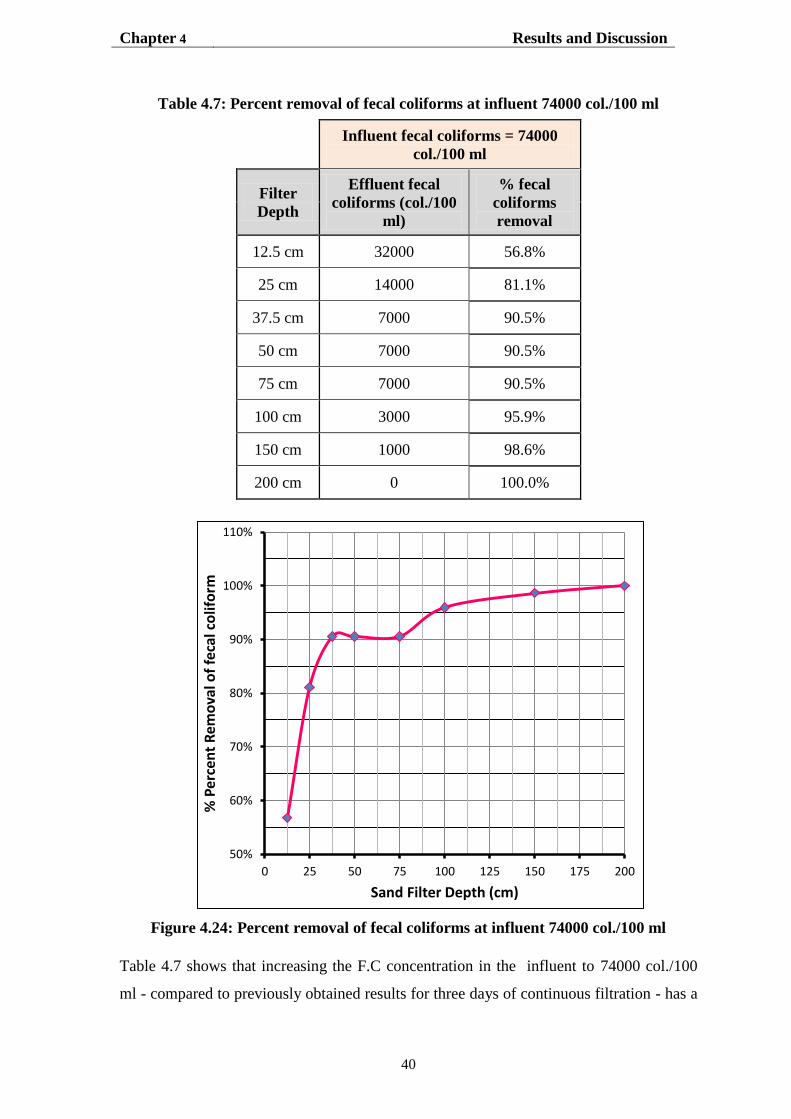
Chapter 4 Results and Discussion
40
Table 4.7: Percent removal of fecal coliforms at influent 74000 col./100 ml
Influent fecal coliforms = 74000
col./100 ml
Filter
Depth
Effluent fecal
coliforms (col./100
ml)
% fecal
coliforms
removal
12.5 cm 32000 56.8%
25 cm 14000 81.1%
37.5 cm 7000 90.5%
50 cm 7000 90.5%
75 cm 7000 90.5%
100 cm 3000 95.9%
150 cm 1000 98.6%
200 cm 0 100.0%
Figure 4.24: Percent removal of fecal coliforms at influent 74000 col./100 ml
Table 4.7 shows that increasing the F.C concentration in the influent to 74000 col./100
ml - compared to previously obtained results for three days of continuous filtration - has a
50%
60%
70%
80%
90%
100%
110%
0 25 50 75 100 125 150 175 200
% P
erce
nt
Rem
ova
l of
feca
l co
lifo
rm
Sand Filter Depth (cm)
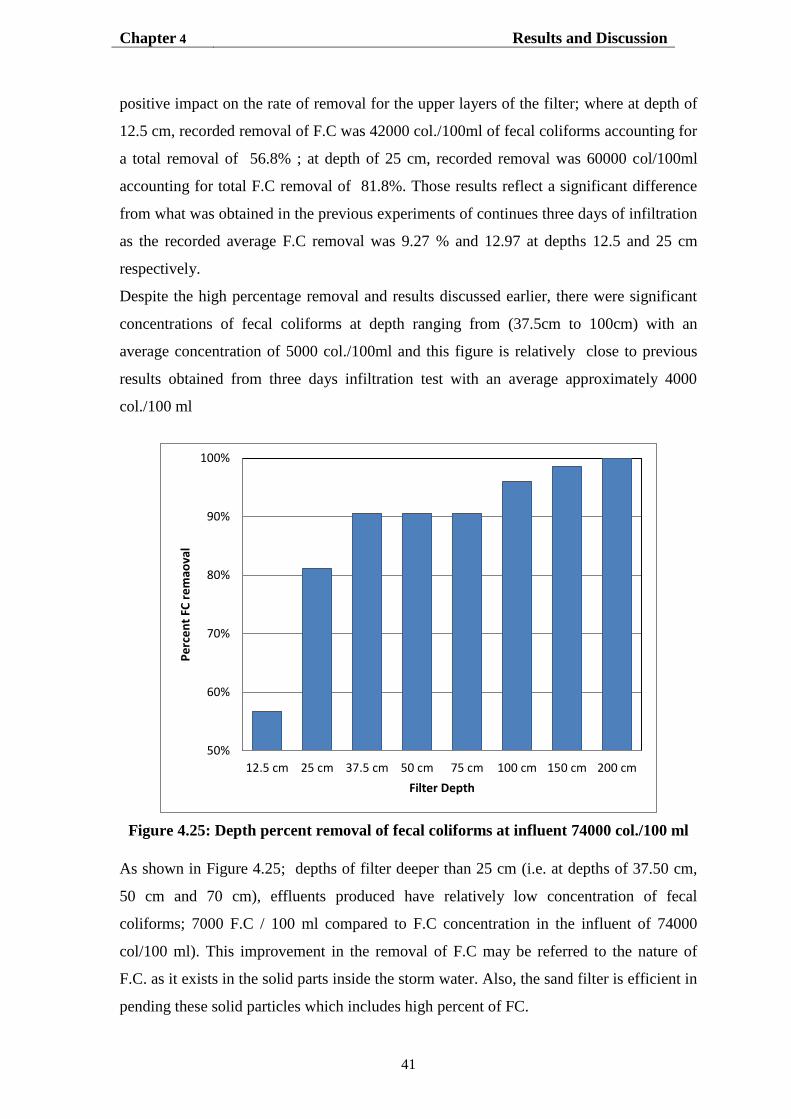
Chapter 4 Results and Discussion
41
positive impact on the rate of removal for the upper layers of the filter; where at depth of
12.5 cm, recorded removal of F.C was 42000 col./100ml of fecal coliforms accounting for
a total removal of 56.8% ; at depth of 25 cm, recorded removal was 60000 col/100ml
accounting for total F.C removal of 81.8%. Those results reflect a significant difference
from what was obtained in the previous experiments of continues three days of infiltration
as the recorded average F.C removal was 9.27 % and 12.97 at depths 12.5 and 25 cm
respectively.
Despite the high percentage removal and results discussed earlier, there were significant
concentrations of fecal coliforms at depth ranging from (37.5cm to 100cm) with an
average concentration of 5000 col./100ml and this figure is relatively close to previous
results obtained from three days infiltration test with an average approximately 4000
col./100 ml
Figure 4.25: Depth percent removal of fecal coliforms at influent 74000 col./100 ml
As shown in Figure 4.25; depths of filter deeper than 25 cm (i.e. at depths of 37.50 cm,
50 cm and 70 cm), effluents produced have relatively low concentration of fecal
coliforms; 7000 F.C / 100 ml compared to F.C concentration in the influent of 74000
col/100 ml). This improvement in the removal of F.C may be referred to the nature of
F.C. as it exists in the solid parts inside the storm water. Also, the sand filter is efficient in
pending these solid particles which includes high percent of FC.
50%
60%
70%
80%
90%
100%
12.5 cm 25 cm 37.5 cm 50 cm 75 cm 100 cm 150 cm 200 cm
Pe
rce
nt
FC r
em
aova
l
Filter Depth
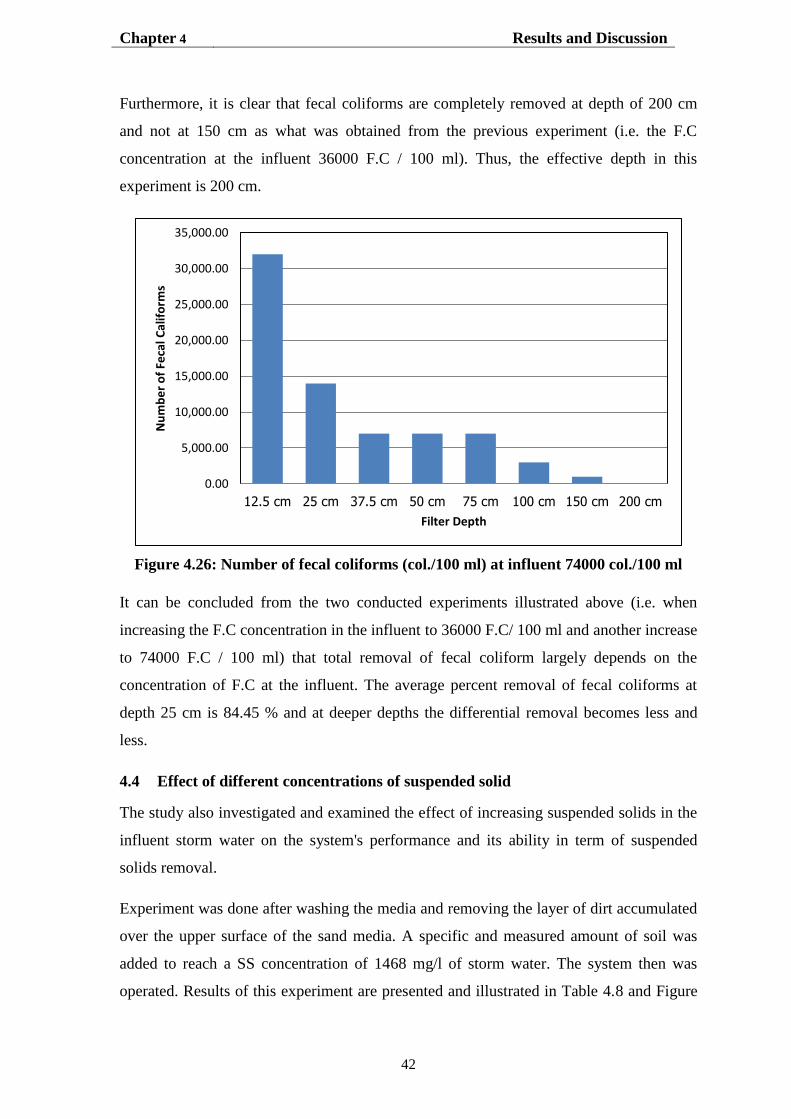
Chapter 4 Results and Discussion
42
Furthermore, it is clear that fecal coliforms are completely removed at depth of 200 cm
and not at 150 cm as what was obtained from the previous experiment (i.e. the F.C
concentration at the influent 36000 F.C / 100 ml). Thus, the effective depth in this
experiment is 200 cm.
Figure 4.26: Number of fecal coliforms (col./100 ml) at influent 74000 col./100 ml
It can be concluded from the two conducted experiments illustrated above (i.e. when
increasing the F.C concentration in the influent to 36000 F.C/ 100 ml and another increase
to 74000 F.C / 100 ml) that total removal of fecal coliform largely depends on the
concentration of F.C at the influent. The average percent removal of fecal coliforms at
depth 25 cm is 84.45 % and at deeper depths the differential removal becomes less and
less.
4.4 Effect of different concentrations of suspended solid
The study also investigated and examined the effect of increasing suspended solids in the
influent storm water on the system's performance and its ability in term of suspended
solids removal.
Experiment was done after washing the media and removing the layer of dirt accumulated
over the upper surface of the sand media. A specific and measured amount of soil was
added to reach a SS concentration of 1468 mg/l of storm water. The system then was
operated. Results of this experiment are presented and illustrated in Table 4.8 and Figure
0.00
5,000.00
10,000.00
15,000.00
20,000.00
25,000.00
30,000.00
35,000.00
12.5 cm 25 cm 37.5 cm 50 cm 75 cm 100 cm 150 cm 200 cm
Nu
mb
er
of
Feca
l Cal
ifo
rms
Filter Depth
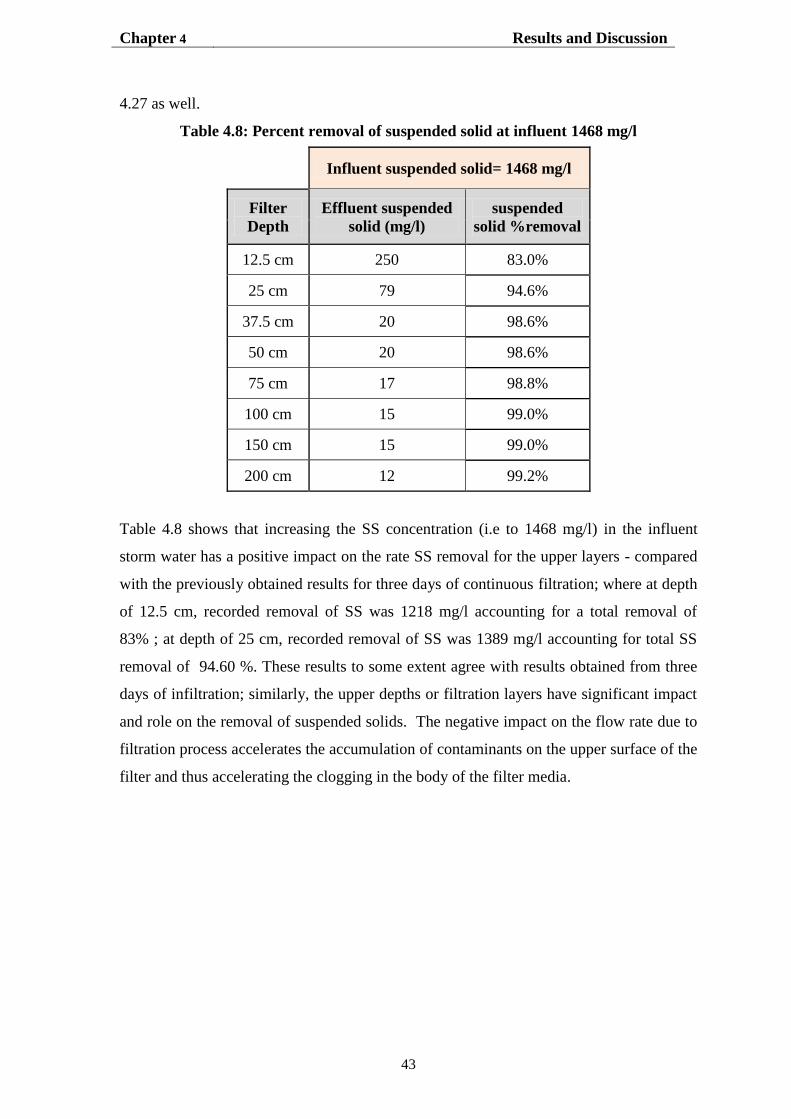
Chapter 4 Results and Discussion
43
4.27 as well.
Table 4.8: Percent removal of suspended solid at influent 1468 mg/l
Influent suspended solid= 1468 mg/l
Filter
Depth
Effluent suspended
solid (mg/l)
suspended
solid %removal
12.5 cm 250 83.0%
25 cm 79 94.6%
37.5 cm 20 98.6%
50 cm 20 98.6%
75 cm 17 98.8%
100 cm 15 99.0%
150 cm 15 99.0%
200 cm 12 99.2%
Table 4.8 shows that increasing the SS concentration (i.e to 1468 mg/l) in the influent
storm water has a positive impact on the rate SS removal for the upper layers - compared
with the previously obtained results for three days of continuous filtration; where at depth
of 12.5 cm, recorded removal of SS was 1218 mg/l accounting for a total removal of
83% ; at depth of 25 cm, recorded removal of SS was 1389 mg/l accounting for total SS
removal of 94.60 %. These results to some extent agree with results obtained from three
days of infiltration; similarly, the upper depths or filtration layers have significant impact
and role on the removal of suspended solids. The negative impact on the flow rate due to
filtration process accelerates the accumulation of contaminants on the upper surface of the
filter and thus accelerating the clogging in the body of the filter media.
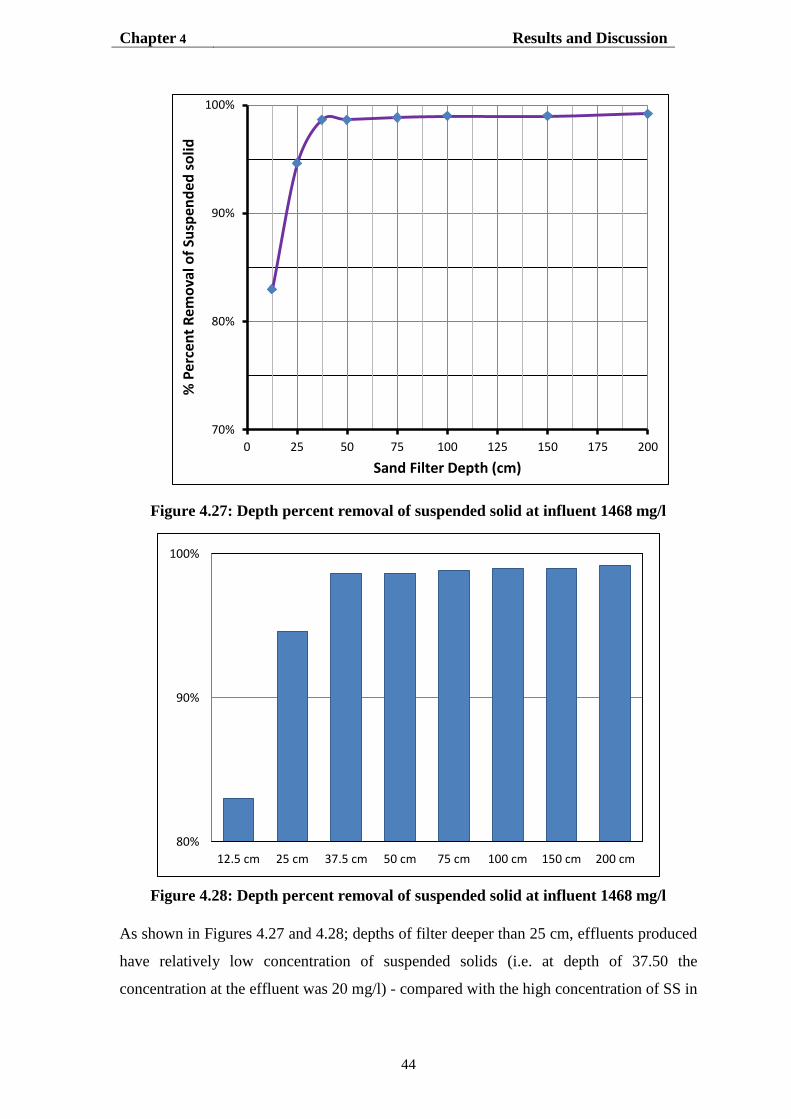
Chapter 4 Results and Discussion
44
Figure 4.27: Depth percent removal of suspended solid at influent 1468 mg/l
Figure 4.28: Depth percent removal of suspended solid at influent 1468 mg/l
As shown in Figures 4.27 and 4.28; depths of filter deeper than 25 cm, effluents produced
have relatively low concentration of suspended solids (i.e. at depth of 37.50 the
concentration at the effluent was 20 mg/l) - compared with the high concentration of SS in
70%
80%
90%
100%
0 25 50 75 100 125 150 175 200
% P
erc
en
t R
em
ova
l of
Susp
en
de
d s
oli
d
Sand Filter Depth (cm)
80%
90%
100%
12.5 cm 25 cm 37.5 cm 50 cm 75 cm 100 cm 150 cm 200 cm
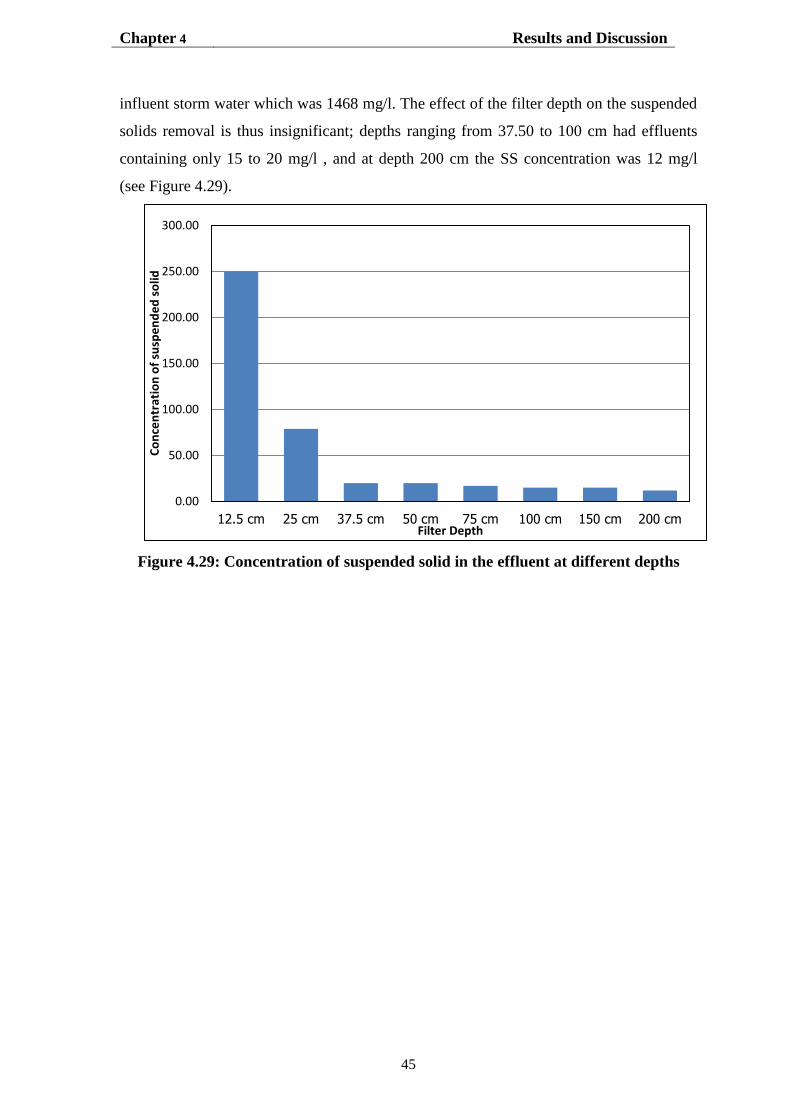
Chapter 4 Results and Discussion
45
influent storm water which was 1468 mg/l. The effect of the filter depth on the suspended
solids removal is thus insignificant; depths ranging from 37.50 to 100 cm had effluents
containing only 15 to 20 mg/l , and at depth 200 cm the SS concentration was 12 mg/l
(see Figure 4.29).
Figure 4.29: Concentration of suspended solid in the effluent at different depths
0.00
50.00
100.00
150.00
200.00
250.00
300.00
12.5 cm 25 cm 37.5 cm 50 cm 75 cm 100 cm 150 cm 200 cm
Co
nce
ntr
atio
n o
f su
spe
nd
ed
so
lid
Filter Depth
46
Chapter 5 Conclusions and Recommendations
5.1 Conclusions
As a result of this research project, the following points can be concluded:
1. This laboratory research studied and investigated the capability of sand filters to
purify storm water through using a 2 m sand filter. Two parameters were used in
this investigation; suspended solids and fecal coliforms. Finding, the sand filter
was capable of achieving a good results in term of suspended solids and fecal
coliforms removal.
2. Used sand filter was able to completely remove fecal coliforms at depth of 150 cm
and was able to produce effluent having acceptable concentration of suspended
solid at depth 75, less than 20mg/l.
3. Percent removal of fecal coliforms by infiltration using sand filter media increased
as the depth of the sand filter increased.
4. Using sand filter for the removal of suspended solid is effective and there is a
significant effect of increasing the filter depth.
5. About 80% of the removal of fecal coliforms occurred at depth 75cm, and about
83% percent removal of suspended solid occurred at depth 37.5cm.
6. High concentrations of suspended solids or fecal coliforms were not the major
factor in term of removal efficiency. At short term, it had a positive role in
increasing the percent of removal at upper depths of sand filter. At long term
however it had a negative impact as it accelerated the occurrence of clogging in
the filter.
47
5.2 Recommendations
Following this study there are a number of recommendations that are made forfurther
work:
1. It is recommended to use other parameters in the investigation to better measure
the percent removal achieved by sand filter such as (Metals, BOD, NH3…).
2. It is recommended to apply the experiment in large scale for example using tank
filled with media.
3. Through the work of laboratory tests, it is seemed the importance of the subject of
maintenance for sand filter, therefor it is recommended to giving this issue a
priority by bodies which responsible to operation such treatment facility .
48
References
1. Al-Najar, H., & Adeloye, J. (2005). The effect of urban expansion on groundwater
as a renewable resource in the Gaza Strip Volume 5. RICS.
2. Al-Yousef, F., Allayla, A., & Ishaq, M. (1993). Tertiary Treatment of Sewage
Effluent via Pilot Scale Slow Sand Filtration. In Environmental Technology, Vol.
15, pp. 15-28.
3. Anderson, D., Siegrist, R., & Otis, R. (1985). Technology Assessment of
Intermlti'ent Sand Filters. Research Division. Municipal Environmental Research
Laboratory,EPA.
4. AWWA. (2001, October 30). AWWA Standard Forgranular Filter Material,. USA.
5. Balousek, J. (2002). Potential Water Quality Impacts of Storm water Infiltration,
Dane County, Wisconsin, Erosion & Storm water Documents. Retrieved
September 15, 2011,.
http://www.countyofdane.com/lwrd/landconservation/papers/impactsofswinfiltrati
6. Bruijn, H. and S.E. Clark (2003). Research And Development Of Effective
Suspended Solids Removal From Storm Water Runoff In Collection Systems Using
In-Line Lamella Plate Separators. Terre Hill stormwater system reasearch papers.
7. Michael T. Buechter, P.E. (2008), Stormwater Quality Primer, “Let us pursue
things which make for peace and the building up of one another.” ASCE, March
14th, 2008.
8. S.E. Clark (2007) , “Runoff polishing by natural media filtration: Upflow vs.
downflow.” M. Pratap, S.E. Clark, R. Pitt, U. Khambhammettu, C. Roenning, D.
Treese, C.Y.S. Siu. Pennsylvania Stormwater Management Symposium, Villanova
Urban Stormwater Partnership, Villanova, PA, October 17-18, 2007. CD-ROM
9. Clark, S. and Pitt. R. (1999), Stormwater Runoff Treatment: Evaluation of
Filtration Media. EPA-600/R-00/010; U.S. Environmental Protection Agency,
Water Supply and Water Resources Division, National Risk Management
Research Laboratory, Cincinnati, OH.
10. CMWU. (2010). Water Status in the Gaza Strip and Future Plans. Gaza: CMWU.
11. Culp, R., Wesner, G., & Culp, G. (1978). Advanced Wastewater Treatment. New
York: Van Nostrand Reinhold Company.
49
12. Davis, H. (2005). Evaluation and Optimization of Bioretention Media
forTreatment of Urban Storm Water Runoff. Environmental Engineering, Vol.
131, pp.1521-1531.
13. DEP. (1996). Storm water Management Policy. Department Of Environmental
Protection. Wetlands Protection Program Policy
14. Ellis, V. (1984). Slow sand filtration. 315-354. CRC Critical Reviews in
Environmental Control 15(4): 315-354.
15. EPA, U. (1999). Preliminary Data Summary of Urban Storm Water Best
Management Practices. EPA-821-R-99–012.
16. Hamdan, S., Troeger, U., & Nassar, A. (2007). Storm water availability in the
Gaza Strip. Environment and Health, Vol. 1, No. 4, 580-594.
17. Huisman, L. (1978). Developments of Village-Scale Slow Sand Filtration. In
Prog. Water Technol. (india), Vol 11, pp. 159-165.
18. Huisman, L. (1978). Developments of Village-Scale Slow Sand Filtration. In
Prog. Water Technol. 11 (p. 159).
19. HUISMAN, L., & WOOD, W. (1974). Slow Sand Filtration F.I.C.E.,World
Health Organization. Geneva.
20. Jaber, I., & Hamdan, S. (2001). Artificial Infiltration Of Groundwater. A tool
towards the Sustainability of Water resources in the Gaza Strip. Sixth
International Water Technology Conference, IWTC, pp. 225-236. Alexandria,
Egypt.
21. KFUPM. (2008). Filtration. Retrieved 2011, from pages created by faculty of the
King Fahd University of Petroleum and Minerals.(kfupm):
http://faculty.kfupm.edu.sa/CE/mhmalack/CE%20370%20-
%20Filtration%20(2).pps
22. Khan, A. M. (1995). Removal of Coliphage and Bacteria Through, Slow Sand
Filtration.Dhahran, saudi arabia: Thesies in faculty of the college of graduate
studies,king fahd university of petroleum.
23. Losco, R., & Valentine, J. (2003). Storm water Infiltration and the Soil Landscape
Connection. Pennsylvania Association of Professional Soil Scientists.
24. Maestre, P., & Morquecho, R. (2003). The National Storm water Quality
Database. Water Environment Federation Technical Exposition and Conference.
Los Angeles.
25. MECC. (2002). Types of Filters. Retrieved 2011, from Water/Wastewater
Distance Learning:. "http://water.me.vccs.edu/concepts/filters.html" ,Mountain
50
Empire Community College.
26. Antonina Torrens, Pascal Molle, Catherine Boutin, and Miquel Salgot (2009),
Impact of design and operation variables on the performance of vertical-flow
constructed wetlands and intermittent sand filters treating pond effluent, Water
Research, Elsevier Ltd. Volume 43, pp. 1851-1858.
27. PCBS. (2008). Palestinian Central Beauru of Statistics. Palestine.
28. PCSWM. (2009). Pierce County Draft Stormwater Management and Site
Development Manual, Volume II Construction Storm water Pollution Prevention.
Ordinance No. 2008–59S, August 2008 ,Effective Date: March 1, 2009.
29. Schmitt, D., & Shinault, C. (1998, February 24). Rapid Sand Filtration. Retrieved
September 17, 2011, from
http://www.cee.vt.edu/ewr/environmental/teach/wtprimer/rapid/rapid.html
30. Schueler. (1997). Bacterial Levels in Urban Storm water. Watershed Protection
Techniques.
31. Ben R. Urbonas (2008), Stormwater Sand Filter Sizing and Design A Unit
Operations Approach, e-Bookfro m:
http://www.udfcd.org/downloads/pdf/tech_papers/Sand-flt-paper.pdf
32. Valentine, J., & Losco, R. (2003). Storm water Infiltration and the Soil Landscape
Connection. Association of Professional Soil Scientists.
33. Weiss, P., LeFevre, G., & Gulliver, J. (2008). Contamination of Soil and
Groundwater Due to Storm water Infiltration Practices. Retrieved September 15,
2011, from Minnesota Pollution Control Agency St. Paul, MN:
http://www.pca.state.mn.us/index.php/view-document.html?gid=7732
34. Woelkers, D., Pitt, B., & Clark, S. (2006). Storm water Treatment Filtration As A
Storm water Control. Stormcon Denver, CO.

51
Appendix: Photos Show the Method of the
Work in the Laboratory
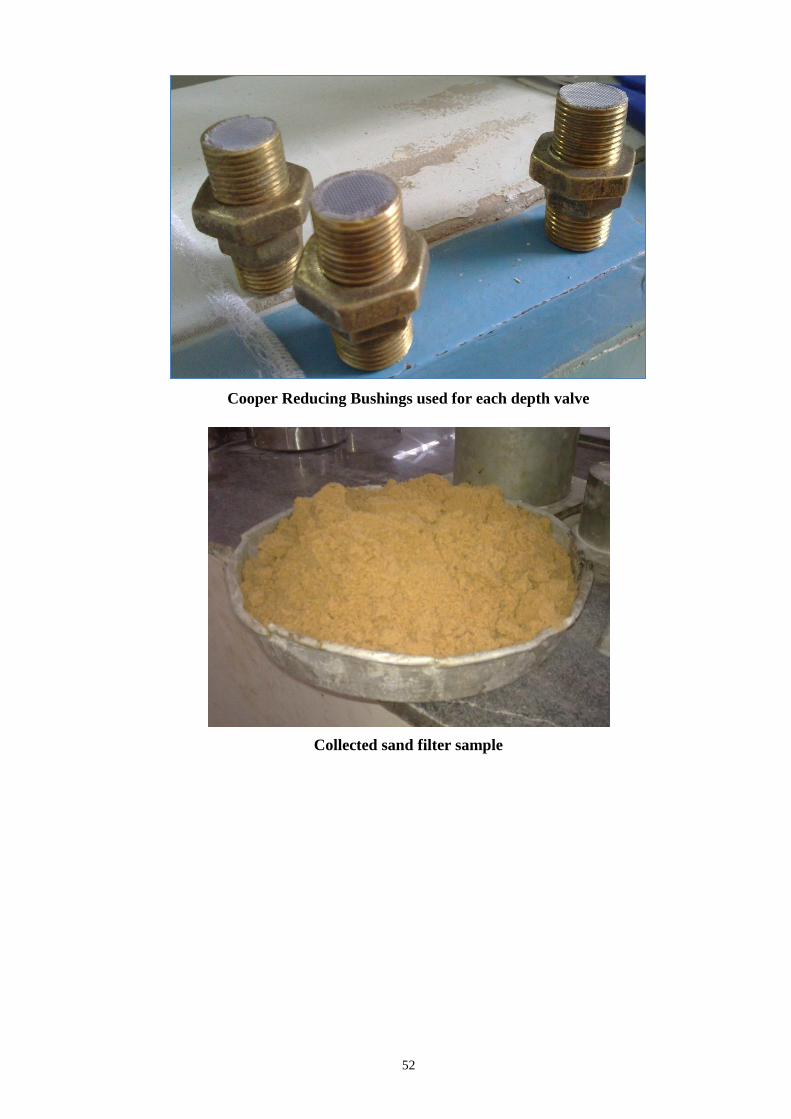
52
Cooper Reducing Bushings used for each depth valve
Collected sand filter sample
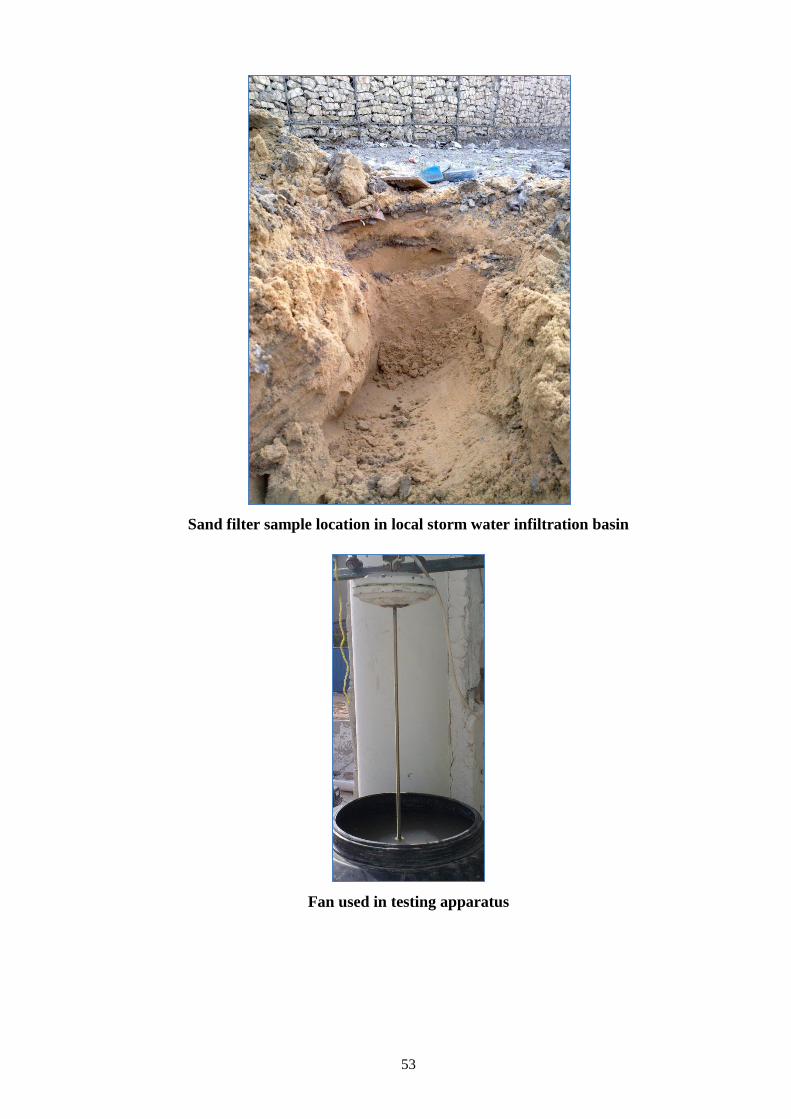
53
Sand filter sample location in local storm water infiltration basin
Fan used in testing apparatus
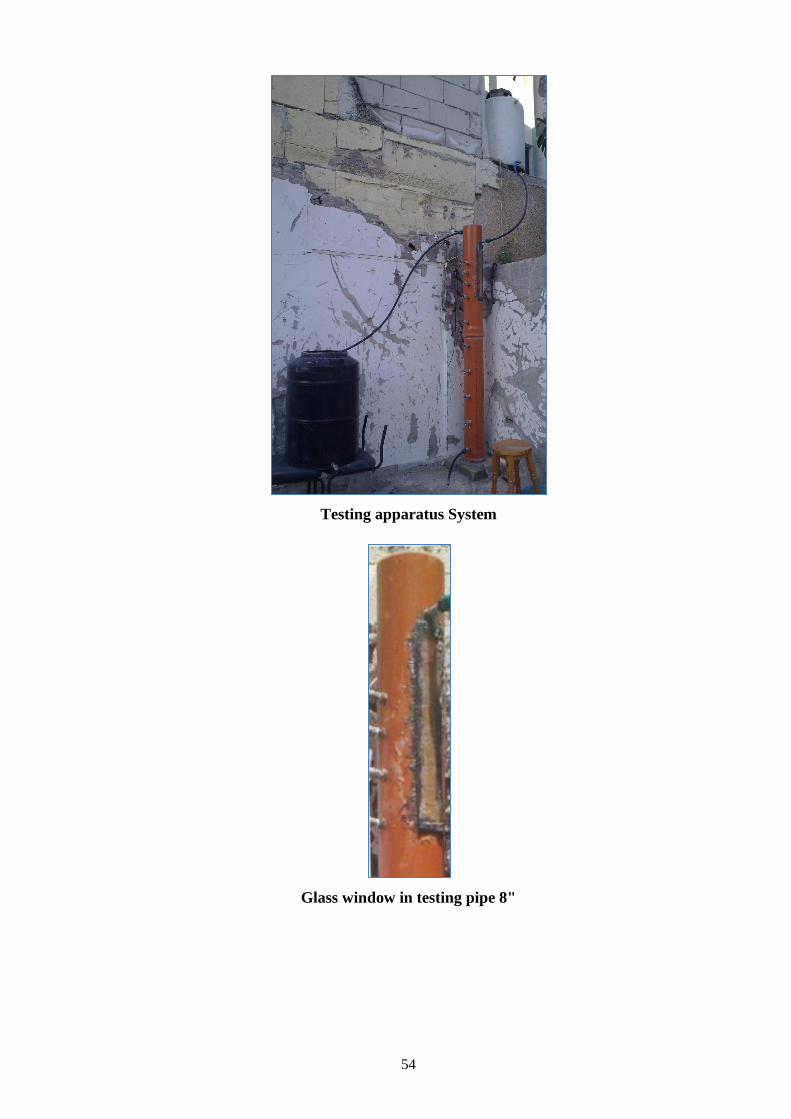
54
Testing apparatus System
Glass window in testing pipe 8"