silica sand quarry expansion project
TRANSCRIPT

OCTOBER 2020
SILICA SAND QUARRY
EXPANSION PROJECT
ENVIRONMENTAL PERFORMANCE
REPORT AND MANAGEMENT PLAN

ES-i
TABLE OF CONTENTS
EXECUTIVE SUMMARY .................................................................................................................................... 1
ES-1. PROJECT FACT SHEET ....................................................................................................................... 1
ES-2. PROJECT BACKGROUND .................................................................................................................... 1
ES-3. PROJECT SIZE .................................................................................................................................. 2
ES-4. PROJECT COMPONENTS ................................................................................................................... 2
ES-4.1. MAJOR PROJECT COMPONENTS .................................................................................................. 2
ES-4.1.1. QUARRY ............................................................................................................................... 2
ES-4.1.2. HAUL ROADS ........................................................................................................................ 2
ES-4.1.3. DRAINAGE ............................................................................................................................ 3
ES-4.1.4. TOPSOIL AND WASTE MATERIAL STOCKPILES ........................................................................... 3
ES-4.1.5. NURSERY .............................................................................................................................. 3
ES-4.1.6. QUARRY ADMINISTRATION BUILDING ...................................................................................... 3
ES-4.2. POLLUTION CONTROL FACILITIES AND MANAGEMENT SYSTEMS ..................................................... 3
ES-5. EIA PROCESS DOCUMENTATION ....................................................................................................... 4
ES-6. LIMITATIONS OF THE STUDY.............................................................................................................. 5
ES-7. EIA TEAM ...................................................................................................................................... 5
ES-8. EIA STUDY SCHEDULE AND AREA ...................................................................................................... 5
ES-9. EIA METHODOLOGY ........................................................................................................................ 5
ES-10. PUBLIC PARTICIPATION .................................................................................................................... 6
ES-11. EIA SUMMARY ................................................................................................................................ 7
1 Project Description .............................................................................................................................. 1-1
1.1 Project location and area ............................................................................................................. 1-1
1.1.1 Project Location ................................................................................................................. 1-1
1.1.2 Project Accessibility ........................................................................................................... 1-4
1.2 Project rationale .......................................................................................................................... 1-4
1.3 Project alternatives ...................................................................................................................... 1-7
1.3.1 Siting .................................................................................................................................. 1-8
1.3.2 Technology selection/operation processes and design selection ..................................... 1-8
1.3.3 No Project Option .............................................................................................................. 1-9
1.4 Project Components .................................................................................................................... 1-9
1.4.1 Quarry .............................................................................................................................. 1-11
1.4.2 Haul Roads ....................................................................................................................... 1-18
1.4.3 Drainage ........................................................................................................................... 1-20
1.4.4 Topsoil and Waste Material Stockpiles ............................................................................ 1-22
1.4.5 Nursery ............................................................................................................................ 1-23
1.4.6 Quarry Administration Building ....................................................................................... 1-23
1.4.7 Pollution control facilities and management system ...................................................... 1-23

EPRMP | TABLE OF CONTENTS Silica Sand Quarry Expansion Project
ii
1.5 Resource requirement ............................................................................................................... 1-27
1.5.1 Power Requirement ......................................................................................................... 1-27
1.5.2 Water Requirement ......................................................................................................... 1-27
1.6 Process / Technology ................................................................................................................. 1-28
1.6.1 Quarrying ......................................................................................................................... 1-28
1.7 Project Size ................................................................................................................................ 1-28
1.8 Development Plan, Description of Project Phases and Corresponding Timeframes ................. 1-29
1.8.1 Project preparation phase ............................................................................................... 1-29
1.8.2 Project development phase ............................................................................................. 1-29
1.8.3 Operations Phase ............................................................................................................. 1-30
1.8.4 Decommissioning / Abandonment / Rehabilitation ........................................................ 1-31
1.9 Manpower ................................................................................................................................. 1-33
1.10 Project investment/cost ........................................................................................................ 1-34
2 Assessment of Environmental Impacts ............................................................................................... 2-1
2.1 Land ............................................................................................................................................. 2-1
2.1.1 Land Use and Classification................................................................................................ 2-1
2.1.2 Geology ............................................................................................................................ 2-11
2.1.3 Pedology .......................................................................................................................... 2-44
2.1.4 Terrestrial Ecology ........................................................................................................... 2-51
2.2 Water ......................................................................................................................................... 2-72
2.2.1 Hydrology and Hydrogeology .......................................................................................... 2-72
2.2.2 Water Quality ................................................................................................................... 2-77
2.3 Air............................................................................................................................................... 2-85
2.3.1 Meteorology .................................................................................................................... 2-85
2.3.2 Air Quality ...................................................................................................................... 2-105
2.3.3 Noise Quality .................................................................................................................. 2-128
2.4 People ...................................................................................................................................... 2-138
2.4.1 Methodology ................................................................................................................. 2-138
2.4.2 Results ............................................................................................................................ 2-140
3 Environmental Management Plan ...................................................................................................... 3-1
4 Environmental Risk Assessment (ERA) & Emergency Response Policy and Guidelines ...................... 4-1
4.1 Risk Assessment ........................................................................................................................... 4-1
4.1.1 Consequence Rating .......................................................................................................... 4-2
4.1.2 Likelihood Rating................................................................................................................ 4-3
4.1.3 Qualitative Risk Matrix ....................................................................................................... 4-3
4.1.4 Results of Risk Assessment ................................................................................................ 4-4
4.2 Risk Management ........................................................................................................................ 4-9
4.3 Safety Performance ................................................................................................................... 4-10
4.4 Emergency Preparedness and Response Guidelines ................................................................. 4-11

EPRMP | TABLE OF CONTENTS Silica Sand Quarry Expansion Project
iii
4.4.1 Reference Documents ..................................................................................................... 4-11
4.4.2 Responsibilities and Authorities ...................................................................................... 4-11
4.4.3 Guidelines ........................................................................................................................ 4-13
5 Social Development Plan/Framework (SDP) and IEC Framework ....................................................... 5-1
5.1 Social Development Plan ............................................................................................................. 5-1
5.1.1 Indicative Social Development Plan ................................................................................... 5-1
5.1.2 Implemented Social Development Programs .................................................................... 5-5
5.1.3 SDMP Cost.......................................................................................................................... 5-5
5.2 Information, Education and Communication (IEC) Framework................................................... 5-5
6 Environmental Compliance Monitoring .............................................................................................. 6-1
6.1 Environmental Performance ........................................................................................................ 6-1
6.1.1 Project Environmental Performance ................................................................................. 6-1
6.1.2 Compliance to ECC Conditions and EMP Commitment ..................................................... 6-4
6.2 Environmental Monitoring Plan .................................................................................................. 6-9
6.3 Multi-Sectoral Monitoring Framework ...................................................................................... 6-12
6.4 Environmental Guarantee and Monitoring Fund Commitments .............................................. 6-13
7 Abandonment and Decommissioning / Rehabilitation Policy ............................................................. 7-1
7.1 Site Management Plan ................................................................................................................. 7-1
7.2 Final Land Use of Site and for Each Identified Mine Concept ..................................................... 7-3
7.3 Mine Closure Criteria and Performance Standards ..................................................................... 7-3
7.4 Details of the Decommissioning Plan .......................................................................................... 7-4
7.4.1 List of Areas and Equipment that Require Decommissioning ........................................... 7-4
7.4.2 Decommissioning Strategy ................................................................................................ 7-4
7.4.3 Decommissioning and Rehabilitation of Quarry Areas ...................................................... 7-7
7.4.4 Decommissioning of Various Heavy Equipment, Quarry Machineries, and Structures .... 7-7
7.5 Detail of final mine rehabilitation ................................................................................................ 7-8
7.5.1 Rehabilitation strategy, schedule and techniques ............................................................. 7-9
7.6 After Closure Social Plan ............................................................................................................ 7-11
7.6.1 Retrenchment Packages and Retirement Plans ............................................................... 7-14
7.6.2 Labor Support Policies and Programs .............................................................................. 7-15
7.6.3 Transfer of Social Assets .................................................................................................. 7-16
7.7 Maintenance and Monitoring Plans .......................................................................................... 7-16
7.7.1 Maintenance and Monitoring Program and Procedures ................................................. 7-17
8 Institutional Plan for EMP Implementation ........................................................................................ 8-1

ES-1
EXECUTIVE SUMMARY
ES-1. PROJECT FACT SHEET
ES-2. PROJECT BACKGROUND
The SEDC Silica Sand Quarry Expansion Project proposes an amendment increasing the annual
production capacity from 200,000 MT to 660,000 MT. This shall be sourced out from the existing
production area of 229.50 hectares located within MPSA 314-2010-VII and MPSA 323-2010-VII. The
existing production area and production capacity is covered by the existing ECC with Ref. No. CO-1512-
0027 which was issued on 17 June 2016.
Since 2016, there was no quarrying activity or any major development conducted as SEDC is still
applying for a DMPF. A small scale mining located in Barangay Duangan was done by a different
proponent under a different ECC.
PROJECT NAME Silica Sand Quarry Expansion Project
NATURE OF PROJECT Quarrying - Extraction of Non-metallic minerals: Silica Sand deposits
PROJECT LOCATION/S Barangays of Duangan, Lut-od, Punod, Sibago and Guimbawian,
Municipality of Pinamungajan, Province of Cebu, Region VII, Philippines
PROJECT SCALE/LIMIT Annual Production Capacity of 660,000 MT of Silica Sand
PROJECT COST PhP 61,120,000.00
PROPONENT’S NAME Solid Earth Development Corporation (SEDC)
OFFICE ADDRESS 9th Floor Insular Life Business Center, Cebu Business Park, Cebu City
AUTHORIZED
SIGNATORY
Atty. Dennis B. Tenefrancia
President
CONTACT DETAILS Tel. No.: (032) 350 290/Fax. No. (032) 234 2795
EPRMP PREPARERS RHR Consult Services, Inc.
OFFICE ADDRESS Unit 606, 6th Floor, FSS Building II, Scout Tuazon corner Scout Castor,
Barangay Laging Handa, Quezon City
AUTHORIZED
SIGNATORY
Jess M. Addawe
Project Director
CONTACT DETAILS
(02) 7798-0020

EPRMP | EXECUTIVE SUMMARY Silica Sand Quarry Expansion Project
ES-2
ES-3. PROJECT SIZE
Existing and Proposed Modification on the Annual Production Capacity of Silica Sand Quarry
Expansion
MPSA 314 MPSA 323
LOCATION Municipality of Pinamungahan, Province of Cebu
1. Barangay Duangan
2. Barangay Binabag*
1. Barangay Lut-od
2. Barangay Punod
3. Barangay Sibago
4. Barangay Guimbawi-an
ECC AREA
(in hectares)
Existing: 389.44 has
84 has 305.44 has
For Amendment: 389.44 has (NO CHANGES)
EXISTING PRODUCTION AREA
(in hectares) 229.50 has
PRODUCTION AREA
(in hectares) 229.50 has (NO CHANGES)
ANNUAL PRODUCTION Existing= 200,000MT
Proposed Amendment = 660,000 MT
MINERAL RESERVES 2,000,000 9,000,000
Total = 11,000,000MT Silica Sand
*Barangay Binabag is included in MPSA 314 but not in the production area.
ES-4. PROJECT COMPONENTS ES-4.1. MAJOR PROJECT COMPONENTS
ES-4.1.1. QUARRY The Silica Sand deposits will be extracted using an open cut mining method using backhoes, front-end
loaders, and dump trucks for earthworks. The quarry operation shall use backhoes for the ripping and
stockpiling; backhoes and payloaders for loading into trucks; and dump trucks for transporting the
extracted materials to the crusher. The existing production area within MPSA 314-2010-VII and MPSA
323-2010-VII has a total area of 229.50 hectares and will have no change for the ECC amendment.
Three quarry sites were identified within the project area: Lut-Od, Pun-Od, and Dungan.
ES-4.1.2. HAUL ROADS The quarry area has existing access roads that connect to barangay and provincial roads that directly
connect to the Natalio B. Bacalso South National Highway along which the TCPI cement processing
plant is located, with total length of about 21 kilometers. The Provincial Road traversing the quarry
site has average width of approximately 7 meters. For materials sourced from Pinamungajan and San
Fernando quarries, this haul road is capable of handling the volume of haul trucks serving the quarry
site. Minimal new access road openings are perceived to bring production to the main road, as the
quarry is close to the main road.

EPRMP | EXECUTIVE SUMMARY Silica Sand Quarry Expansion Project
ES-3
ES-4.1.3. DRAINAGE Drainage from the quarry sections will be through the contour canals along base of the slope face.
Benches would be cut to allow the bench floor for positive drainage (5-degree fall away from the cut
surface) approximately 1mx1m (contour canal cross-section) to reduce surface water flow over the
cut face and bench, and limit soil erosion potential. Surface run-off from benches would be directed
to rock-lined water channels; forming a drainage system on quarry floor as necessary and directed
toward the settling ponds designed sufficiently to contain expected surface run-off from the opened
quarry area. Background area surface run-off will be directed toward the natural waterways.
ES-4.1.4. TOPSOIL AND WASTE MATERIAL STOCKPILES Topsoil stockpiles and waste materials stockpiles will be properly situated in locations with minimal
additional disturbed area, areas with minimal tree and vegetation cover, will require no tree cutting
and in relatively higher elevation that is easy to provide earth bunds or surrounding compacted
embankment soil barriers. Three stockpile sites will be located within the quarry area for efficient
operations for sectional rehabilitation, and within the buffer zone. While each stockpile area may hold
the topsoil overburden and the waste materials, these two items will not be allowed to mix, physical
the stockpile slope will be kept at low angle and safe height to minimize slumping. The proposed height
of the stockpile will be finally determined by the angle-of-repose of the materials, observed to average
approximately three meters. Angle of repose is the maximum angle of descent or dip of the stockpile
slope relative to the horizontal plane. This is to ensure that the maximum volume materials will be
stockpiled without sacrificing safety.
ES-4.1.5. NURSERY Small “satellite” nurseries proximate to the planting area and near a surface water source will need to
be established and will be stocked with fruit and forest trees through contract planting and
maintenance with landowner-partners living in the local community. Recommended tree species
under the NGP and native species originally found in the Project site will be propagated in the
nurseries.
ES-4.1.6. QUARRY ADMINISTRATION BUILDING SEDC will construct one small site management office with footprint area of approximately one
hundred square meters, and a small maintenance shed made for emergency on-site materials
requirement. The site office will be equipped with sanitary facilities for use of the project staff and
occasional visitors. Construction of these structures will be in accordance with the National Building
Code.
ES-4.2. POLLUTION CONTROL FACILITIES AND MANAGEMENT SYSTEMS Siltation Control
For the proposed expansion, the project will utilize a combination of contour canals and 22 siltation ponds to
meet Class C TSS value (DAO 35). The contour canal dimension shall be 0.5- meter wide and 0.5-meter deep,
with settling sumps 1.0-meter-deep with stone pile “baffles” or water velocity decelerators at every 700 meters
interval. The contour canals will hug the land side of the slope being quarried and will have horizontal slope
alignment between 2% - 3% gradient only. The contour canals will be interconnected such that excess surface is
directed toward the settling pond before the water exits the quarry zone. Twenty two (22) siltation ponds (10 x
30 x 3) with a capacity of 900 m3 will be constructed to recover considerable volume of sand and silt in order to

EPRMP | EXECUTIVE SUMMARY Silica Sand Quarry Expansion Project
ES-4
reduce the Total Suspended Solids (TSS) going to the Main Silt Pond (MSP). Periodic desilting of the MSP will be
done to improve its efficiency. Figure 1 7 shows the location of the siltation ponds.
Waste Management
SEDC will implement its Waste Management Procedure to ensure proper handling, segregation, collection and
disposal of all types of waste generated from the company’s administrative and operational activities. One
Materials Recovery Facility will be built in Duangan Quarry to cater the wastes during operation.
Air and Noise Pollution Control
Dust emissions during operations especially during the hot dry season (from March to May) is more likely to be
rampant and harmful to worker’s health. SEDC shall also ensure continuous implementation of road watering
and spraying to control dust suspension in the air. Tree Planting shall be conducted to improve air quality and
compensate for the emissions coming from trucks and heavy equipment. Regular Preventive Maintenance
Strategies/Systems (PMS) for all equipment and hauling trucks are to be employed to minimize noise impact to
the community as well as reduce their dust emissions.
ES-5. EIA PROCESS DOCUMENTATION Solid Earth Development Corporation (SEDC) commissioned the RHR Consult Services, Inc. to conduct
an Environmental Impact Assessment (EIA) and prepare an Environmental Performance Report and
Management Plan (EPRMP) for the proposed Silica Sand Quarry Expansion Project to be located in the
Barangays of Duangan, Lut-od, Punod, Sibago and Guimbawian, Municipality of Pinamungajan,
Province of Cebu, Region VII, Philippines.
This EPRMP will guide SEDC in implementing environmental management strategies to address the
adverse impacts of the project. These strategies will determine the extent of development that will be
allowed in the project site. This EPRMP contains the following:
• Project Description
• Analysis of Key Environmental Impacts
• Impact Management Plan
• Social Development Plan and IEC Framework
• Environmental Compliance Monitoring
• Emergency Response Policy and Guidelines
• Abandonment/Decommissioning/Rehabilitation Plan
• Institutional Plan for EMP Implementation
A participative process was adopted through various means public consultations, perception surveys,
key informant interviews, and IEC activities. The conduct of EIA is based on the issues, concerns, and
suggestions by the stakeholders collected during the public scoping and the requirements of the EIA
Review Committee in the Technical Scoping Checklist. Implicit in the approach was allowing the
various project stakeholders to provide their inputs and ideas from which the Impact Management
and Monitoring Plan.

EPRMP | EXECUTIVE SUMMARY Silica Sand Quarry Expansion Project
ES-5
ES-6. LIMITATIONS OF THE STUDY The scoping process essentially determined the coverage of the study. Sensitive issues as well as other
applicable parameters were included in the scoping activity. The study was limited to the primary and
secondary data gathered on-site, other related literatures and fieldwork conducted. The provision of
precise data determines the effectiveness of the report in supplying all the appropriate conclusion and
recommendations. The study team put forth its thoroughness in completing the entire EIS. Details on
the scoping checklist were carefully considered to generate a reliable and accurate report.
ES-7. EIA TEAM Table ES-4: EIA Team Members
TEAM MEMBER EXPERTISE/MODULE IPCO NO.
JESS M. ADDAWE Project Management, EIA Process, GIS Mapping 056
RONALD S. PAHUNANG Air Quality and Noise; Meteorology; Oceanography 173
ARMANDO V. GILLADO, Jr. Terrestrial Ecology- Flora 312
RUSSEL D. BANIQUED Terrestrial Ecology- Fauna 157
HENRY JAMES P. BOTENGAN Socio-Economic/ People Module 063
CATHERINE L. ADDAWE Water Quality 055
GILBERT B. BELASON Mining Engineering 504
JORI P. LENTIJAS EIA Process 503
ES-8. EIA STUDY SCHEDULE AND AREA The EIA Study was undertaken within the vicinity of the proposed project area and its identified impact
areas, particularly in Barangays of Duangan, Lut-od, Punod, Sibago and Guimbawian, Municipality of
Pinamungajan, Cebu. The coverage of the EIA study is based on the agreed scope of the EIA Review
Committee (EIARC) during the technical scoping activity conducted on 29 April 2019.
ES-9. EIA METHODOLOGY The approach and methodology adopted to complete this EPRMP is in accordance with the prescribed
methods of DENR-EMB and the procedural manual for DAO 2003-30. The table below provides the
methodology used for each module:
Table ES-5: EIA Methodology
MODULE METHODOLOGY
Land Use and
Classification
Geology and
Geomorphology
Pedology
-Review of secondary data
-Site observation and validation
-SEDC Feasibility Studies
-SEDC Exploration Reports
Geological Hazards -Review of PHIVOLCS Hazards Maps
-Generation of Hazard data and maps from Hazard Hunter PH
(https://hazardhunter.georisk.gov.ph/)

EPRMP | EXECUTIVE SUMMARY Silica Sand Quarry Expansion Project
ES-6
MODULE METHODOLOGY
Terrestrial Ecology -
FLora
-Gathering of data and validation of secondary data from previous
SEDC EIS in 2016.
-Site observation and species inventory
-Random plot method
-Transect walk method
-Vegetation characterization, analysis
Terrestrial Ecology-
Fauna
-Gathering of data and validation of secondary data from previous
SEDC EIS in 2016.
-Site observation and species inventory
-Random plot method
-Transect Surveys
Hydrology and
Hydrogeology
-Site observation
-Gathering of Secondary data
Water Quality -Site observation
-Gathering and review of data from SMR and CMR Reports
-Ambient Water Quality monitoring in July 2019
Climate -Gathering of Secondary data from PAGASA weather station in Mactan
Island, Cebu.
Air Quality -Site observation
-Gathering and review of data from SEDC monitoring data in 2017 and
2018
-Ambient Air monitoring by ACES in July 2019
Ambient Noise -Gathering and review of data from ambient noise data from SMR
Reports
-Measurement of Sound levels using Peak Sound Level Meter
Socio-Economic
Profile
-Review of Secondary information
-Site visit/Ocular inspection
-Household and perception survey
-Focus Group Discussion (FGD)
-Key Informant Interview (KII)
-Public Scoping and consultations
ES-10. PUBLIC PARTICIPATION Stakeholder participation was ensured to determine the current situation of the affected residents,
including issues and concerns they are experiencing in their community.
Table ES-6: Public Participation Activities Conducted
ACTIVITY DATE VENUE PARTICIPANTS
Perception Survey 22 November–
30 November 2018
Municipality of Pinamungajan
1. Barangay Duangan
2. Barangay Lut-od
100

EPRMP | EXECUTIVE SUMMARY Silica Sand Quarry Expansion Project
ES-7
ACTIVITY DATE VENUE PARTICIPANTS
3. Barangay Punod
4. Barangay Sibago
5. Barangay Guimbawian
(using
Purposive
Sampling)
Information, Education,
and Communication
(IEC) Activities
14 November – 03
December 2018.
Municipality of Pinamungajan
1. Brgy. Sibago
2. Brgy.Duangan
3. Pinamungajan Mun. Hall
39
Public Scoping 27 March 2019 Duangan Basketball Court,
Barangay Duangan,
Pinamungajan, Cebu
56
ES-11. EIA SUMMARY The summary of project activities with the corresponding environmental impacts and mitigation
measures is presented below:

EPRMP | EXECUTIVE SUMMARY Silica Sand Quarry Expansion Project
ES-8
Table ES-7: Impact Management Plan
PROJECT ACTIVITY POTENTIAL IMPACT MITIGATING MEASURES TARGET EFFICIENCY
DEVELOPMENT PHASE
Site preparation, site clearing, excavation, and filling
Vegetation removal and loss of habitat Displacement of fauna species due to loss of habitat
All statutory requirements relating to tree cutting permits shall be secured from the DENR prior to any clearing operations.
Establish at least a 10-meter buffer zone around and within the perimeter of the project site
Progressive and planned/necessary clearing of land will be undertaken to minimize total area of land that will be disturbed at any one time (maximum of 50 hectares)
100% Felled trees and cleared vegetation will be replaced with appropriate species
Development of access roads, quarry areas and support facilities
Degradation of surface water quality due to siltation brought about by earthmoving activities
Installation of silt traps at strategic locations, and spoils to be properly contoured to prevent runoff.
Construction of proper and adequate drainage systems.
100% no siltation of receiving waterbody
Degradation of water quality due to runoff from sanitary sewage, wastewater, solid wastes, and other construction materials
Removal of debris along the waterways will be conducted, all construction wastes will be properly disposed, silt traps at strategic locations and spoils will be properly contoured to prevent erosion.
Portalets will be provided for use of the workers and its corresponding wastewater will be properly disposed.
Implementation of Solid waste management program and Hazardous waste management program.
Use of DENR accredited haulers/TSD companies.
100% compliance to proper solid waste management
Air pollution from fugitive dust resulting from ground clearing operations, site preparation and vehicle movement.
Implement dust suppression measures in active construction areas such as road surface watering to minimize dust.
100% Ambient air quality within DENR Air Quality Guideline Values

EPRMP | EXECUTIVE SUMMARY Silica Sand Quarry Expansion Project
ES-9
PROJECT ACTIVITY POTENTIAL IMPACT MITIGATING MEASURES TARGET EFFICIENCY
Provision of tarpaulin cover on trucks loaded with construction materials
Immediate hauling of spoils
Impose speed restrictions/limits and proper signages
Air pollution from SO2 and NO2 emissions from heavy equipment used in site preparation.
Regular maintenance of heavy equipment, motor vehicles and all emission generating equipment
100% Ambient air quality within DENR Standards
OPERATIONAL PHASE
Quarry operations (bulldozing and materials handling, grading, hauling)
Degradation of air quality Dust generation
Planting of trees at the quarry/s periphery; Enhance buffer strip or tree buffer around and along the boundaries of the project site
Continue monitoring of wind speed and wind directions as part of the environmental management plan to lessen or minimize release of fugitive dusts
Regular watering of haul roads during dry condition; visual inspection of fugitive dust
Maintenance of quarry roads
Speed limits of vehicles (light and heavy) will be controlled to a maximum of 30 km/hr at the quarry site
Regular maintenance of trucks to reduce or maintain tailpipe emissions
Provide wheel washing facilities for vehicles leaving the quarry and project site. The wheel washing facility should be used to remove muds at the tires of trucks and heavy equipment
In case of very dry weather condition where wetting of dry surfaces would be effective for short duration, consider re-routing of vehicles away from area sensitive receptors (households or residences)
100% Ambient air quality within DENR Standards

EPRMP | EXECUTIVE SUMMARY Silica Sand Quarry Expansion Project
ES-10
PROJECT ACTIVITY POTENTIAL IMPACT MITIGATING MEASURES TARGET EFFICIENCY
Generation of wastes Water pollution, land contamination, health hazards
Daily monitoring of waste generated from the quarry operations
Arrange disposal and treatment of hazardous waste to DENR accredited transporter/treater
Arrange disposal of scrap materials with accredited buyer
Continuous segregation/collection of combustible materials for kiln feeding at the TCPI cement plant; Combustible waste recycling
Workers will be provided with adequate and environmentally sound domestic facilities.
100% compliance to proper solid waste management
Increase in ambient noise level Install effective mufflers on all heavy equipment and other equipment using internal combustion engines
Impose speed limits at quarry and along access roads (30 kph)
Daytime quarry operation; Restrict use of equipment at nighttime especially equipment that emits high noise levels
Construct temporary noise barriers between households and quarry, when necessary
Progressive planting in mined-out areas and planting of trees at the buffer zone; Enhance buffer strips or tree buffers around and along project boundaries
100% compliance to noise standard

EPRMP | EXECUTIVE SUMMARY Silica Sand Quarry Expansion Project
ES-11
PROJECT ACTIVITY POTENTIAL IMPACT MITIGATING MEASURES TARGET EFFICIENCY
Quarry operations (bulldozing and materials handling, grading, hauling)
Siltation / degradation of surface water quality
Construction of settling ponds and silt traps Provision of storm drainage canals to prevent
rain water from eroding the quarry area.
Desilting of settling ponds as needed. Sediments will be used for road surfacing within quarry areas or to Barangays in need.
Topsoil stockpile slope shall not exceed its angle of repose.
Mobile heavy equipment and vehicles shall have a designated holding area for removal of excess silt and mud from the tires and underbellies. The holding area shall have adequate drainage and traps to contain the washed sediments.
100% Ambient water quality within DENR Water Quality Guideline Values
Quarry development Land clearing, alteration of topography / natural drainage
Progressive rehabilitation of the mined-out areas, through reforestation
Establishment of SEDC nursery. The company shall also practice community-
based reforestation on areas outside the mined-out areas.
Weekly maintenance/inspection of the existing drainage system
100% Compliance to planned progressive mine plan and rehabilitation
Quarry development Removal of vegetation cover and loss of habitat
Limit the quarrying activities within direct impact area only to avoid vegetation removal of adjacent areas
Continuous seedling production, regular tree planting, replanting, donations of seedlings and partnership with private, NGO and government organizations is recommended
100% Compliance to planned progressive mine plan and rehabilitation

EPRMP | EXECUTIVE SUMMARY Silica Sand Quarry Expansion Project
ES-12
PROJECT ACTIVITY POTENTIAL IMPACT MITIGATING MEASURES TARGET EFFICIENCY
Threat to existence and/or loss of important local species
Continuous seedling production, regular tree planting, replanting, donations of seedlings and partnership with private, NGO and government organizations
Monitor replacement planting to ensure growth and survival
Threat to abundance, frequency and distribution of important species
Continuous seedling production, regular tree planting, replanting, donations of seedlings and partnership with private, NGO and government organizations are recommended
Monitor replacement planting to ensure growth and survival
Continuous allocation of annual budget for these activities is likewise recommended to allow sustainability of the mitigation activity
Proliferation of invasive species
Immediate revegetation with preference to indigenous plant species within the cleared and opened areas should be conducted
Generate list of invasive species and avoid its reintroduction on site
DECOMMISIONING / REHABILITATION PHASE
Mine closure / abandonment Loss of livelihood of local workforce Reduction/loss of company support for some services Decrease in economic activity in the area (i.e. reduced business profits due to project closure therefore reduced market consumers)
Provide psycho-social services to project-affected families
Re-training and enhancement of alternative livelihood programs for workers in the affected areas
100% Compliance to approved FMRDP
Clearing / removal of support facilities
Removal of structures may result to accidental spillage of toxic and hazardous wastes
Proper implementation of the approved Final Mine Rehabilitation and Decommissioning Plan (FMRDP)
100% Compliance to approved FMRDP

EPRMP | EXECUTIVE SUMMARY Silica Sand Quarry Expansion Project
ES-13
PROJECT ACTIVITY POTENTIAL IMPACT MITIGATING MEASURES TARGET EFFICIENCY
Use of DENR-accredited haulers/TSD companies for hazardous wastes

1-1
1 PROJECT DESCRIPTION
Solid Earth Development Company (SEDC) is a Philippine-based company engaged in quarrying and
mining of cement raw materials such as clay, limestone, and silica sand. SEDC is the proponent of the
Silica Sand Quarrying Expansion.
On 10 February 2010, SEDC entered into a Mineral Production Sharing Agreement (MPSA) with the
Philippine Government docketed as MPSA 314-2010-VII covering 84.1453 hectares. Subsequently on
26 February 2010, SEDC entered another agreement docketed as MPSA 323-2010-VII with 1,257.1831
hectares.
On 17 June 2016, the Department of Environment and Natural Resources – Environmental
Management Bureau issued the Environmental Compliance Certificate with Ref. No. CO-1512-0027
(ECC CO-1512-0027) covering a quarry operation with an annual rate of 200,000 MT of Silica Sand
within the 229.50 hectares of production area located in MPSA 314-2010-VII and MPSA 323-2010-VII.
Since 2016, there was no quarrying activity or any major development conducted as SEDC is still
applying for a DMPF. A small scale mining located in Barangay Duangan was done by a different
proponent under a different ECC.
As a response to the growing infrastructure developments in the country stimulated by the “Build
Build Build” Program, SEDC moves for an ECC amendment increasing the annual production rate to
660,000 MT of silica sand from the currently approved annual production of 200,000 MT. No increase
in the production area is proposed.
1.1 PROJECT LOCATION AND AREA
1.1.1 PROJECT LOCATION The Proposed Silica Sand Quarry Expansion is within MPSA 314-2010-VII and MPSA 323-2010-VII;
specifically in Barangays of Duangan, Lut-od, Punod, Sibago and Guimbawian, Municipality of
Pinamungajan, Cebu Province.
The quarry area is approximately 21 kilometers from the TCPI’s Plant in Municipality of San Fernando,
Cebu. The quarry sits at 60 meters to 270 meters above sea level (masl).
Figure 1-1 shows the general location of the quarry area while shows the current ECC and Production
Areas. Table 1-1 to Table 1-3 contains the geographical coordinates of MPSA 314-2010-VII and MPSA
323-2010-VII.
Table 1-1. Geographical Coordinates of MPSA 314-2010-VII
POINT LATITUDE LONGTITUDE
1 10°15'30" 123°37'30"
2 10°16'00.00" 123°37'31"
3 10°16'00.00" 123°38'00"
4 10°15'30" 123°38'00"

EPRMP | CHAPTER 1 PROJECT DESCRIPTION Silica Sand Quarry Expansion Project
1-2
Table 1-2. Geographical Coordinates of MPSA 323-2010-VII (Area 1)
POINT LATITUDE LONGTITUDE
1 10°16'00.00" 123°37'00"
2 10°17'00.00" 123°37'00"
3 10°17'00.00" 123°37'30"
4 10°16'30.00" 123°37'30"
4A 10°16'21.41" 123°37'36.35
4B 10°16'15.23" 123°37'37.07"
4C 10°16'12.49" 123°37'38.37"
4D 10°16'10.59" 123°37'43.79"
4E 10°16'11.36" 123°37'44.05"
4G 10°16'14.08" 123°37'45.15"
4H 10°16'16.22" 123°37'41.57"
4I 10°16'21.55" 123°37'38.70"
4J 10°16'21.41" 123°37'36.35"
4K 10°16'30.00" 123°37'36.43
5 10°16'30.00" 123°38'00"
6 10°17'00.00" 123°38'00"
7 10°17'00.00" 123°39'00"
8 10°16'00.00" 123°39'00"
Table 1-3. Geographical Coordinates of MPSA 323-2010-VII (Area 2)
POINT LATITUDE LONGTITUDE
1 10°14'00.00" 123°37'00"
2 10°15'30.00"" 123°37'00"
3 10°15'30.00"" 123°37'30"
4 10°15'00.00" 123°37'30"
5 10°15'00.00" 123°38'00.00"
6 10°14'30.00" 123°38'00.00"
7 10°14'30.00" 123°38'30.00"
8 10°15'00.00" 123°38'30.00"
9 10°15'00.00" 123°39'00.00"
10 10°14'00.00" 123°39'00.00"

EPRMP | CHAPTER 1 PROJECT DESCRIPTION Silica Sand Quarry Expansion Project
1-3
Figure 1-1. General Location Map of Silica Sand Quarry

EPRMP | CHAPTER 1 PROJECT DESCRIPTION Silica Sand Quarry Expansion Project
1-4
1.1.2 PROJECT ACCESSIBILITY The project area is located within Barangays of Duangan, Lut-od, Punod, Sibago and Guimbawian,
Municipality of Pinamungajan, Cebu Province. The quarry area is approximately 11 kilometers from
the cement manufacturing plant of TCPI in Municipality of San Fernando, Cebu. The host municipality,
Pinamungajan, is approximately 70 kilometers from the province’s capital- Cebu City.
The project can be reached via the Cebu South Road through the Naga-Toledo- Pinamungajan access
road or the Manipis Road along the Mananga watershed. Travel time from Pinamungajan is about two
hours going to Cebu City, depending on the traffic. It would take another 10 minutes to reach Barangay
Lut-od, the nearest section claim. Buses and other public utility vehicles are plying the Cebu City-
Pinamungajan route. To reach the mountainous areas, one can hire motorbike which is locally known
as “habal-habal”.
The project site does not have a private airport facility, but the province is accessible by a 1-hour flight
from Manila through its nearest airport ─ Mactan-Cebu International Airport (MCIA). MCIA is
approximately 42 kilometers away from the project site.
Furthermore, the project is more than 35 kilometers away from the Cebu International Port making it
accessible by a 20-hour maritime travel to Manila.
1.2 PROJECT RATIONALE
Based on the geological explorations conducted, the land areas defined by MPSA 314-2010-VII and
MPSA 323-2010-VII contain significant amount of Silica Sand deposits that are technically and
economically viable for the manufacture of cement. Cement is important for construction and
infrastructure development which catalyzes economic progress especially in the rural areas.
The Philippine Government, through the Department of Trade and Industry (DTI) and in cooperation
with the Cement Manufacturer’s Association of the Philippines (CEMAP), has recently charted the
Philippine Cement Industry Roadmap with respect to the country’s infrastructure development
program. CEMAP’s study regarding this matter concluded that:
1. The Philippines must import cement due to a severe shortfall of domestic supply against the
Philippine development requirement;
2. The Philippines must be self-sufficient in quality cement supply in the long term;
3. The Philippines must benefit from the jobs from the massive infrastructure program; and
4. The Philippines must benefit from taxes generated by the construction and cement industry
under the “Build- Build-Build Program”.
Foreign exchange payments for the purchase of imported cement diminishes the country’s foreign
(currency) reserves which may impact the Philippine peso valuation particularly that the former
Philippine gold production has declined and the Philippine dollar reserves and therefore importation
is only a last recourse. The recent issues related to low quality imported cement highlights the need
to assure good cement quality for Philippine infrastructure program which is taken-on with huge
national indebtedness.

EPRMP | CHAPTER 1 PROJECT DESCRIPTION Silica Sand Quarry Expansion Project
1-5
Cement Production in the Philippines
CeMAP reported that there are 16 local cement plants operating in the country as of 2013 with a total
capacity of 21,047,000 metric tons per year. TCPI have recorded consistent kiln capacity of
approximately 840,000 metric tons per year from 2009 to 2013 (Table 1-4). Still, cement imports
increased from 1,000 metric tons in 2009 to 159,000 metric tons in 2013; In contrary to this, the
cement exports decreased from 197,000 metric tons to nothing in 2009 and 2013, respectively (Table
1-5).
Table 1-4. Operating Local Cement Plants from 2009 to 2013
COMPANY NAME KILN CAPACITY IN MILLION TONS
2009 2010 2011 2012 2013
1. Cemex Philippines
a. Apo Cement Corporation 2.400 2.400 2.400 2.792 2.792
b. Solid Cement Corporation, Antipolo 1.860 1.860 1.860 2.102 2.102
c. Rizal Cement Company, Binangonan 0.375 0.375 0.375 0.388 0.388
2. Holcim
a. La Union Plant 1.020 1.020 1.020 1.020 1.020
b. Bulacan Plant 2.694 2.694 2.694 2.694 2.694
c. Davao Plant 1.742 1.742 1.742 1.742 1.742
d. Lugait Plant 1.782 1.782 1.782 1.782 1.782
3. LaFarge Cement
a. Fortune Cement Corporation, Batangas:
i. Batangas Plant
1.260 1.260 1.100 1.100 1.100
b. FR Cement Corporation, Teresa, Rizal 1.530 1.530 1.100 1.100 1.100
c. Republic Cement Corporation, Bulacan 1.575 1.575 1.100 1.100 1.100
d. Iligan Cement Corporation 0.465 0.465 0.500 0.500 0.500
e. Mindanao Cement Corporation, Iligan 0.450 0.450 0.500 0.500 0.500
4. Taiheiyo Cement Philippines 0.840 0.840 0.840 0.840 0.840
5. Pacific Cement Company 0.180 0.255 0.250 0.270 0.270
6. Northern Cement Corporation 0.960 0.960 0.960 0.960 0.960
7. Goodfound Cement Corporation 0.350 0.350 0.350 0.350 0.350
Total Capacity, in million tons 18.847 19.547 19.547 21.047 21.047
No. of Operating Plants 16 16 16 16
Table 1-5. Cement Importation and Exportation in metric tons from 2009 to 2013.
IMPORTS IN METRIC TONS
YEAR 2009 2010 2011 2012 2013
TOTAL 1,000 1,000 30,000 39,000 159,000
EXPORTS IN METRIC TONS
YEAR 2009 2010 2011 2012 2013
TOTAL 197,000 4,000 0 0 0
Since 2010, the demand for cement continued to escalate. To date, the annual volume of local sales
and imports consistently remained higher than the total volume of sales and exports. In 2013, the
domestic sales and export of the commodity was reported at 19,445MT while local sales and import
was at 19,604 MT. Mean annual growth rate in local sales and exports from 2010 to 2013 was 7%,
while the annual growth rate in local sales and imports was 8% for the same period. This was catalyzed

EPRMP | CHAPTER 1 PROJECT DESCRIPTION Silica Sand Quarry Expansion Project
1-6
by the increase in construction works especially of the Private sector. CeMAP reported that the growth
in the construction industry is at 14.4% during the same period.
Table 1-6. Cement Production, Sales and Consumption in metric tons from 2009 to 2013.
YEAR PRODUCTION SALES CONSUMPTION PRICE/BAG
2009 14,865,000 14,666,000 14,470,000 P165.00
2010 15,900,000 15,449,000 15,450,000 P170.00
2011 16,063,000 15,595,000 15,625,000 P176.00
2012 18,907,000 18,356,000 18,395,000 P188.00
2013 20,150,000 19,445,000 19,604,000 P193.00
The demand that cannot be supplied by domestic production is filled by importation. Hence, retarding
the economic development associated to domestic production such as: job creation, import
substitution, increase in internal revenues, and increase in sources of support for local social
development and development or improvement of carbon sink. Furthermore, CeMAP has recorded in
2019 that the demand for cement reached 30.92 Million metric tons (Table 1-8); and this is projected
to escalate more in the coming years to keep pace with the infrastructure development in the
Philippines brought by President Duterte’s “Build Build Build” program.
Based on actual local cement consumption from year 2015-2019, the estimated raw materials
production is presented in Table 1-7.
Table 1-7. Estimated Raw Materials Production 2015-2019
Year
Cement
Consumption
(DMT)
Limestone Production Siliceous Clay
Production Silica Production
DMT
(70% of
Cement)
WMT
(12%
Moisture)
DMT
(20% of
Cement)
WMT
(22%
Moisture)
DMT
(10% of
Cement)
WMT
(15%
Moisture)
2015 24,360,000 17,052,000 19,377,000 4,872,000 6,246,000 2,436,000 2,866,000
2016 25,960,000 18,172,000 20,650,000 5,192,000 6,656,000 2,596,000 3,054,000
2017 27,520,000 19,264,000 21,891,000 5,504,000 7,056,000 2,752,000 3,238,000
2018 29,170,000 20,419,000 23,203,000 5,834,000 7,479,000 2,917,000 3,432,000
2019 30,920,000 21,644,000 24,595,000 6,184,000 7,928,000 3,092,000 3,638,000
Average 27,586,000 19,310,000 21,943,000 5,517,000 7,073,000 2,758,000 3,245,000
Based on the actual cement consumption from 2015-2019, there is a substantial increase in demand
per year of 1,312,000 metric tons. Below are the actual cement consumption from year 2015 to year
2019 showing the increase in demand per year.
Table 1-8. Increase in Cement Demand per Year
Year Cement Consumption (DMT) Difference (DMT)
2015 24,360,000
2016 25,960,000 +1,600,000
2017 27,520,000 +1,560,000
2018 29,170,000 +1,650,000
2019 30,920,000 +1,750,000
Total increase in demand +6,560,000
Increase in demand per year +1,312,000 Consumption: Domestic Sales plus Imports

EPRMP | CHAPTER 1 PROJECT DESCRIPTION Silica Sand Quarry Expansion Project
1-7
Source: Cement Manufacturers’ Association of the Philippines (CeMAP)
Then, the projected cement production and the corresponding raw materials requirement are shown
below based on 1,312,000 metric tons per year increase in demand of cement consumption.
Table 1-9. Projected Raw Materials Requirement for the next 10 years
Year
Cement
Production
(MT)
Limestone
Requirement
Siliceous Clay
Requirement
Silica
Requirement
DMT
(70% of
Cement
Production)
WMT
(12%
Moisture)
DMT
(20% of
Cement
Production)
WMT
(22%
Moisture)
DMT
(10% of
Cement
Production)
WMT
(15%
Moisture)
2020 32,232,000 22,562,400 25,639,000 6,446,400 8,264,600 3,223,200 3,792,000
2021 33,544,000 23,480,800 26,682,700 6,708,800 8,601,000 3,354,400 3,946,300
2022 34,856,000 24,399,200 27,726,300 6,971,200 8,937,400 3,485,600 4,100,700
2023 36,168,000 25,317,600 28,770,000 7,233,600 9,273,800 3,616,800 4,255,000
2024 37,480,000 26,236,000 29,813,600 7,496,000 9,610,200 3,748,000 4,409,400
2025 38,792,000 27,154,400 30,857,200 7,758,400 9,946,600 3,879,200 4,563,700
2026 40,104,000 28,072,800 31,900,900 8,020,800 10,283,000 4,010,400 4,718,100
2027 41,416,000 28,991,200 32,944,500 8,283,200 10,619,400 4,141,600 4,872,400
2028 42,728,000 29,909,600 33,988,100 8,545,600 10,955,800 4,272,800 5,026,800
2029 44,040,000 30,828,000 35,031,800 8,808,000 11,292,300 4,404,000 5,181,100
In April 10, 2019, the Philippine News Agency reported that new local construction projects were
deferred because of the current cement shortage; clearly manifesting the importance of speeding the
expansion on local productions. In response to this situation, Solid Earth Development Corporation
aims to increase their production capacity of cement raw materials; hereby, applying for the Silica
Sand Quarry Expansion Project. The project promotes rural development by boosting local
employment and providing livelihood opportunities to the local communities while at the same time
generating revenues for the local and national government. The project will likewise help in minimizing
the importation which will strengthen the economic stand of the country in the infrastructure and
cement industry.
1.3 PROJECT ALTERNATIVES
SEDC plans to increase the production rate of silica sand to meet the demand of its sister company,
Taiheiyo Cement Philippines, Inc. (TCPI). Considering the demand for cement production, no project
alternatives are foreseen other than to resume and expand the production of silica sand quarrying
operations. Deviating from the nature of the production would not be cost-efficient as the existing
project components and facilities are solely for extraction of non-metallic minerals, specifically silica
sand.

EPRMP | CHAPTER 1 PROJECT DESCRIPTION Silica Sand Quarry Expansion Project
1-8
Based on the results of geological exploration conducted, the project MPSAs satisfies the material
quality criteria for the cement manufacture of its sister company, TCPI. The exploration activities were
undertaken covering various promising locations within the MPSAs, and only the areas proposed
herein are deemed most feasible at the moment for the quarry operations due to the material quality,
quarriable volume, and contiguity of the proposed extraction area which contributes to operational
efficiency and better profitability profile. Major project components are limited to quarry of silica sand
and materials transport by land.
1.3.1 SITING The geological explorations conducted ensured that the quarry sites within MPSA 314-2010-VII and
MPSA 323-2010-VII will meet the material quality criteria and are economically viable for the
operations of TCPI. The following are the criteria used for site and technology selection:
Functionality of the site location which refers to accessibility and mobility of the ore body with
respect to the transport system to the market and the resources available essential for the
sustained operations of the quarry and the manufacturing counterpart.
Complementarity, and compatibility between and with various uses of adjacent lands, and
associated activities they serve.
Consistency with the natural resources plans and policies, and environmental regulations that
guide the cities, province, region, and the national government.
Mining facility design and operational requirements as established by others, including the
Mining and Geosciences Bureau, the industry, and requirements of the market, among others.
Implied in the choice of area would be the relatively stable peace and order situation.
Input and participation from local stakeholders, and appropriate regional and national
oversight agencies.
Cost effectiveness – the value returned to the proponent for the investments to be made, and
the contributions to the national and local governments, and the other stakeholders, including
contributions to social development and management, environmental protection and
enhancement, safety and health, mine rehabilitation and decommissioning.
Development design factored in provisions for health and human safety, including the
provisions for mining operations as provided by the Mines and Geosciences Bureau for set
back; and guidelines to protect humans, and their sources of livelihood, for example providing
allowances to protect equipment used to minimize environmental impact due to operations.
1.3.2 TECHNOLOGY SELECTION/OPERATION PROCESSES AND DESIGN SELECTION The nature, location of the ore, the host matrix earth form and characteristics, prevailing
environmental requirements and economic conditions defined the project technology to be applied
and its components. The quarry method most suitable for sandy materials particularly with thin
overburden is surface extraction. The method of extracting the target materials by benching and
terracing the affected surface area entails less environmental consequences than random excavation
targeting only the desired silica grades, as observed to be utilized by applied by small scale quarries in
the area.

EPRMP | CHAPTER 1 PROJECT DESCRIPTION Silica Sand Quarry Expansion Project
1-9
This project involves simple extraction of surface earth materials for cement manufacturing, by
excavators and pay loaders; loading of extracted materials to waiting dump trucks for hauling to the
cement manufacturing plant approximately 21 kilometers away; and stabilization and rehabilitation
of mined-out areas. The equipment and manpower skills needed are readily available on site as SEDC
has been undertaking the activity since the past decade. This project does not include any processing
of the extracted silica sand. No other facilities need to be established for this project as the
manufacturing cement plant already exists. For this reason, this simple project technology is preferred
by the Proponent.
1.3.2.1 STAGES OF MINING OPERATION
1.3.2.1.1 DEVELOPMENT STAGE This involves the construction of sub-access and main access roads leading towards the targeted
elevation of the minable area. Upon reaching the desired elevation, undesirable overburden is
stripped off to expose the needed rock materials using backhoe or bulldozer if needed. Stripped waste
materials loaded to dump trucks and stockpiled.
1.3.2.1.2 PRODUCTION STAGE Prepared benches are then scheduled for cutting by backhoe hoe and will be loaded directly. Front
end loader is also utilized to load the excavated rock materials to the dump trucks which are then
delivered to the crusher.
1.3.2.2 DESCRIPTION OF THE MINING METHOD A conventional method of Open Cut Mining shall be continued with the utilization of bulldozers,
backhoe, dump trucks and payloader for earthworks. Working benches are designed as 5 meters in
height. Final bench should be limited to 5 meters in height with 70º slope. Lowest working level would
be maintained at +60 meters above sea level.
1.3.3 NO PROJECT OPTION Not proceeding with the expansion project will result to lower production of local cement; hence, an
additional importation and a decrease on exportation. Consequently, this shall cause delays on the
construction and infrastructure programs of the Philippine government; therefore, delaying the
economic development of the country.
The social development programs of the host communities which shall be supported by SEDC as the
expansion project operates will either remain the same or will be hampered due to lack of additional
support projected under the said expansion. Not proceeding with the project also means loss of
additional employment and livelihood opportunities for the constituents of Pinamungajan especially
of the host barangays.
1.4 PROJECT COMPONENTS
SEDC seeks for an ECC amendment increasing the annual production rate to 660,000 MT of silica sand
from the currently approved annual production of 200,000 MT. No increase in the production area is
proposed.
There was no major development in the two MPSAs covered by the ECC since 2016. Hence, majority
of the components presented in this section are proposed as seen on Figure 1-2.

EPRMP | CHAPTER 1 PROJECT DESCRIPTION Silica Sand Quarry Expansion Project
1-10
Figure 1-2. Site Development Map of Silica Sand Quarry

EPRMP | CHAPTER 1 PROJECT DESCRIPTION Silica Sand Quarry Expansion Project
1-11
1.4.1 QUARRY The existing production area within MPSA 314-2010-VII and MPSA 323-2010-VII has a total area of
229.50 hectares and will have no change for the ECC amendment. Three quarry sites were identified
within the project area: Lut-Od, Pun-Od, and Dungan (Figure 1-2).
The Silica Sand deposits will be extracted using an open cut mining method using backhoes, front-end
loaders, and dump trucks for earthworks. The quarry operation shall use backhoes for the ripping and
stockpiling; backhoes and payloaders for loading into trucks; and 20-tonner dump trucks for
transporting the extracted materials to the crusher. The quarry operations will produce silica sand
suitable for cement manufacture, with a Silica (SiO2) cut-off grade of 70%. The lowest working level
will be maintained at +60 meters above sea level (masl). The benches shall be limited to 5 meters in
height with 70-degrees slope. The final pit figure will be terraced to prevent sloughing of materials
from higher elevations. Final pit bottom will not be lower than the existing national road elevation.
Cut-off drainage channels with baffles or rock pile velocity decelerators/sediment settling sumps will
be established to separate background surface run-off from quarry areas; then channel these to
natural surface drainage systems to reduce the load and silt spill-over coming from the settling ponds.
A canal will be constructed within the quarry zone adjacent to and parallel to the public road in order
to prevent sediment overtopping on public roadway. The following are considerations for the pit
design and stripping ratio:
Table 1-10. Pit Design and Stripping Ratio Considerations of Silica Sand Quarry Expansion Project
Parameters Remarks
Bench Width 5 meters
Bench Height 5 meters
Bench slope 70 degrees
Pit slope 45 degrees
An initial quarry area of 40 hectares has been defined taking into account the presence of roads,
minimizing direct impact on creeks, houses, schools, farms, etc. Its pit bottom will either be the
nearest public road or creek level, whichever is shallower. The average overburden is one meter thick
and waste material accounts for about 1%. Silica sand weighs about 1,220 kg per cubic meter, with
about 20% moisture content.
The first phase of mining will be concentrated in Lut-od-Duangan Area where the small-scale quarry
is located and the computed mineable reserve according to the subject exploration report is
11,000,000 MT. Below are other quarry design considerations:
1. Final pit bottom will not be lower than existing national road elevation
2. Cut-off drainage channels with baffles or rock pile velocity decelerators / sediment settling
sumps will be created to separate background surface run-off from project quarry areas,
channel these to natural surface drainage systems to reduce the load and silt spill over from
project settling ponds
3. A canal or depression will be provided within the quarry zone adjacent to and parallel to the
public roadway to prevent project sediment overtopping on public road
4. Surface drainage course within the quarry zone are to be maintained freely flowing
5. Settling Pond Surface Area are always to be equivalent to 10% of opened areas

EPRMP | CHAPTER 1 PROJECT DESCRIPTION Silica Sand Quarry Expansion Project
1-12
6. Total Settling Pond Capacity per sub-catchment area is to be equivalent to 110% of highest
normal monthly rainfall volume for the disturbed quarry area
7. Topsoil and Waste stockpiles will not be situated on areas with live trees
The table below shows the five-year production schedule for the project. In its first year, a total of
150,000 MT of sand while 1% (1,500 MT) of topsoil or waste materials will be produced. During second
to fifth year, 660,000 MT of silica sand and 6,600 MT of waste will be produced annually. The section
details of three silica quarries (Figure 1-3) located in Lut-od, Duangan, and Pun-od are presented in
Figure 1-4 to Figure 1-6.
Table 1-11. Five-Year Production Schedule

EPRMP | CHAPTER 1 PROJECT DESCRIPTION Silica Sand Quarry Expansion Project
1-13
Figure 1-3. Silica Sand Quarry Expansion Five-Year Production Plan

EPRMP | CHAPTER 1 PROJECT DESCRIPTION Silica Sand Quarry Expansion Project
1-14
Figure 1-4. Duangan Area Section
Figure 1-5. Lut-od Area Section

EPRMP | CHAPTER 1 PROJECT DESCRIPTION Silica Sand Quarry Expansion Project
1-15
Figure 1-6. Pun-od Area Section

EPRMP | CHAPTER 1 PROJECT DESCRIPTION Silica Sand Quarry Expansion Project
1-16
The table below details the major equipment necessary for the project:
Table 1-12. Existing and Proposed Major Equipment for Development and Production Stage of Silica Sand
Quarry Expansion Project
Phase Equipment
Type
Existing Proposed Ownership Use
Capacity No. of Units Capacity No. of Units
Development Backhoe - - 1.5 metric ton 1 Leased For access road
excavation, material
loading and siltation
pond construction
Dump trucks - - 17 metric ton 2 For hauling
Production Bulldozer 8 ton 2 5 metric ton 1 Contractor For hauling
Backhoe 1.5 metric ton 2 1.5 metric ton 2 For excavation &
loading
Payloader 4.5 metric ton 1 4.5 metric ton 1 For road maintenance
Road Grader 4.5 metric ton 1 4.5 metric ton 1 For dozing, stockpiling
and road repair
Dump truck 18 metric ton 10 20-25 metric ton 26 For loading
Water Truck 12,000 liter 1 12,000 liter 1 For wetting haul roads
Lube Truck - - 4,000 liter 1 For onsite refill
services
Service
Vehicle
4.5 metric ton - Isuzu Elf 1 For personnel
transport
Note: Preventive Maintenance Servicing (PMS): For heavy equipment - frequency is every 500 engine running hours, & for dump truck - frequency is
every 5,000 kms.
The process flow of the Silica Sand Quarry Expansion is shown in the following figure:

EPRMP | CHAPTER 1 PROJECT DESCRIPTION Silica Sand Quarry Expansion Project
1-17
Figure 1-7. Silica Sand Quarry Process Flow
EXTRACTION
LOADING
HAULING
Quarrying starts by extracting the
raw materials using Backhoes and
Hydraulic Excavators.
The excavated materials are
then loaded to hauling trucks
using Payloader or Backhoe
loader.
The excavated materials
loaded in the Hauling
trucks/dump trucks are
delivered to the Cement
Manufacturing Plant for
Crushing and Milling
operations.

EPRMP | CHAPTER 1 PROJECT DESCRIPTION Silica Sand Quarry Expansion Project
1-18
1.4.2 HAUL ROADS The quarry area has existing access roads that connect to barangay and provincial roads that directly
connect to the Natalio B. Bacalso South National Highway along which the TCPI cement processing
plant is located, with total length of about 21 kilometers. The Provincial Road traversing the quarry
site has average width of approximately 7 meters. For materials sourced from Pinamungajan and San
Fernando quarries, this haul road is capable of handling the volume of haul trucks serving the quarry
site. New access roads will be constructed to bring production to the main road, as the quarry is close
to the main road. Figure 1-8 shows the haul road map for the project.

EPRMP | CHAPTER 1 PROJECT DESCRIPTION Silica Sand Quarry Expansion Project
1-19
Figure 1-8. Haul Route Map

EPRMP | CHAPTER 1 PROJECT DESCRIPTION Silica Sand Quarry Expansion Project
1-20
1.4.3 DRAINAGE Drainage from the quarry sections will be through the contour canals along base of the slope face.
Benches would be cut to allow the bench floor for positive drainage (5-degree fall away from the cut
surface) approximately 1mx1m (contour canal cross-section) to reduce surface water flow over the
cut face and bench, and limit soil erosion potential. Surface run-off from benches would be directed
to rock-lined water channels; forming a drainage system on quarry floor as necessary and directed
toward the settling ponds designed sufficiently to contain expected surface run-off from the opened
quarry area. Background area surface run-off will be directed toward the natural waterways. Due to
the nature of the deposits which occur consistently from elevation +60 masl and above, the quarry
activities will be a continuous extraction process until a pre-deter quarry elevation and quarry
boundary limit is attained, after which quarry rehabilitation activities commence at each elevation
level.

EPRMP | CHAPTER 1 PROJECT DESCRIPTION Silica Sand Quarry Expansion Project
1-21
Figure 1-9. Drainage Map

EPRMP | CHAPTER 1 PROJECT DESCRIPTION Silica Sand Quarry Expansion Project
1-22
1.4.3.1 STOCKPILE DRAINAGE Stockpile drainage will serve as a water catchment basin to address possible problems related to
damage of nearby farms and exceedance of the water quality standard; stockpile areas will be
carefully selected to have proper natural drainage features (Figure 1-10).
Figure 1-10. Ideal Natural Drainage Features of Stockpile Area
Figure 1-11. Drainage Provisional Plan for Stockpile
1.4.4 TOPSOIL AND WASTE MATERIAL STOCKPILES The stockpiles that will be created will be of organically-rich topsoil for compensation planting and
nursery operations, and for the waste materials which are set aside of road maintenance and for use
by the public needing backfill materials for land development, with estimated volume of 34,000 cubic
meters.

EPRMP | CHAPTER 1 PROJECT DESCRIPTION Silica Sand Quarry Expansion Project
1-23
Topsoil stockpiles and waste materials stockpiles will be properly situated in locations with minimal
additional disturbed area, areas with minimal tree and vegetation cover, will require no tree cutting
and in relatively higher elevation that is easy to provide earth bunds or surrounding compacted
embankment soil barriers. Three stockpile sites will be located within the quarry area for efficient
operations for sectional rehabilitation, and within the buffer zone. While each stockpile area may hold
the topsoil overburden and the waste materials, these two items will not be allowed to mix, physical
the stockpile slope will be kept at low angle and safe height to minimize slumping. The proposed height
of the stockpile will be finally determined by the angle-of-repose of the materials, observed to average
approximately three meters. Angle of repose is the maximum angle of descent or dip of the stockpile
slope relative to the horizontal plane. This is to ensure that the maximum volume materials will be
stockpiled without sacrificing safety.
1.4.5 NURSERY Small “satellite” nurseries proximate to the planting area and near a surface water source will need to
be established and will be stocked with fruit and forest trees through contract planting and
maintenance with landowner-partners living in the local community. Recommended tree species
under the NGP and native species originally found in the Project site will be propagated in the
nurseries.
1.4.6 QUARRY ADMINISTRATION BUILDING SEDC will construct one small site management office with footprint area of approximately one
hundred square meters, and a small maintenance shed made for emergency on-site materials
requirement. The site office will be equipped with sanitary facilities for use of the project staff and
occasional visitors. Construction of these structures will be in accordance with the National Building
Code.
1.4.7 POLLUTION CONTROL FACILITIES AND MANAGEMENT SYSTEM
1.4.7.1 SILTATION CONTROL
For the proposed expansion, the project will utilize a combination of contour canals and 22 siltation
ponds to meet Class C TSS value (DAO 35). The contour canal dimension shall be 0.5- meter wide and
0.5-meter deep, with settling sumps 1.0-meter-deep with stone pile “baffles” or water velocity
decelerators at every 700 meters interval. The contour canals will hug the land side of the slope being
quarried and will have horizontal slope alignment between 2% - 3% gradient only. The contour canals
will be interconnected such that excess surface is directed toward the settling pond before the water
exits the quarry zone. Twenty two (22) siltation ponds (10 x 30 x 3) with a capacity of 900 m3 will be
constructed to recover considerable volume of sand and silt in order to reduce the Total Suspended
Solids (TSS) going to the Main Silt Pond (MSP). Periodic desilting of the MSP will be done to improve
its efficiency. Figure 1-9 shows the location of the siltation ponds.
Table 1-13. Siltation Pond Specifications for the proposed Silica Sand Expansion Project
Parameters Existing
(Under SSQ Permit by LGU)
Proposed
(MPSA under DMPF)
No. of Siltation Pond 2 22
Dimension 3 x 4 x 3 10 x 30 x 3

EPRMP | CHAPTER 1 PROJECT DESCRIPTION Silica Sand Quarry Expansion Project
1-24
Parameters Existing
(Under SSQ Permit by LGU)
Proposed
(MPSA under DMPF)
Capacity, m3 36 900
Total Capacity, m3 72 19,800
1.4.7.2 WASTE MANAGEMENT SEDC will implement its Waste Management Procedure to ensure proper handling, segregation,
collection and disposal of all types of waste generated from the company’s administrative and
operational activities. Presented below is SEDC's Waste Management Procedure (Figure 1-12) and the
recovery facility (Figure 1-13). Based on the Waste Management Procedure, all employees must
properly identify their wastes generated as categorized in Table 1-14 prior to the next step- Waste
Segregation. The Pollution Control Officer must ensure that proper segregation and storage is strictly
implemented. Segregated wastes will be collected and disposed as scheduled by the Administration
Manager; while wastes that are not segregated shall be retained until proper segregation is done.
Pollution Control Officer shall facilitate the coordination with LGUs to ensure timely collection and
disposal, and with accredited traders for the separate collection of recyclable and hazardous wastes.

EPRMP | CHAPTER 1 PROJECT DESCRIPTION Silica Sand Quarry Expansion Project
1-25
Figure 1-12. Flowchart of Waste Segregation and Responsible Personnel
Figure 1-13. Material Recovery Facility for Waste Management

EPRMP | CHAPTER 1 PROJECT DESCRIPTION Silica Sand Quarry Expansion Project
1-26
Table 1-14. Waste Classification, Collection, and Disposal Matrix
Type Source Collection
Frequency
Segregation
System
Disposal
Method
Disposal
Point
Biodegradable-
Wastes that can be
decomposed in a
reasonable amount
of time (Paper
related products)
Administrative
office
Daily Trash bin/MRF Kiln Feeding Per disposal
determination
point or
delineation line
Satellite Office Daily Trash bin/MRF Kiln Feeding
Nursery Semi-monthly Trash bin/MRF Kiln Feeding
Quarry Area
Weekly
Trash bin/MRF
Kiln Feeding
Non-Biodegradable-
Wastes that cannot
be decomposed into
organic and
environmentally
safe products
(Plastic related
products)
Administrative
office
Daily Trash bin/MRF LGU
Collection
Per disposal
determination
point or
delineation line
Satellite Office Daily Trash bin/MRF LGU
Collection
Nursery Semi-monthly Trash bin/MRF LGU
Collection
Quarry Area
Weekly
Trash bin/MRF
LGU
Collection
Recyclable-
Materials that can
be processed or
used again (metal,
steels, tires)
Administrative
office,
Satellite
Office,
Nursery,
Quarry Area
As per request MRF Sold to
scrap buyer
point or
delineation line
Hazardous-
Substances that
have hazardous
characteristics such
as flammable,
corrosive, reactive,
toxic, radioactive,
poisonous,
carcinogenic, or
infectious; materials
with potential risk to
humans and/or
environment.
(batteries, empty ink
cartridges, used oil)
Administrative
office, Satellite
Office,
Nursery,
Quarry Area
As per request MRF Accredited
treater
If desired
quantities are
attained
Electronic Waste-
discarded electrical
or electronic devices
(discarded
computers/printers)
Administrative
office, Satellite
Office,
Nursery,
Quarry Area
As per request MRF Accredited
treater
If storage
period reaches
1 year
Quarry Site Waste-
waste generated
from site clearing
activities (displace
trees, vegetation,
Quarry Area As per request Stockpile Area Sold to
interested
buyers
-
Nursery As per request Stockpile Area - End of every
project

EPRMP | CHAPTER 1 PROJECT DESCRIPTION Silica Sand Quarry Expansion Project
1-27
Type Source Collection
Frequency
Segregation
System
Disposal
Method
Disposal
Point
top soil, hard rocks,
boulders, etc.)
Special Wastes-
wastes that require
special handling,
trained people,
and/or special
disposing methods.
It may be special
because of its
quantity,
concentration, or
physical, chemical,
or biological
characteristics.
(dead animals/toilet
wastes)
Quarry Area As per request - Septage
collector
-
1.4.7.3 AIR AND NOISE POLLUTION CONTROL Dust emissions during operations especially during the hot dry season (from March to May) is more
likely to be rampant and harmful to worker’s health. SEDC shall also ensure continuous
implementation of road watering and spraying to control dust suspension in the air. Tree planting shall
be conducted to improve air quality and compensate for the emissions coming from trucks and heavy
equipment. Regular Preventive Maintenance Strategies/Systems (PMS) for all equipment and hauling
trucks are to be employed to minimize noise impact to the community as well as reduce their dust
emissions.
1.5 RESOURCE REQUIREMENT
1.5.1 POWER REQUIREMENT No generator set will be necessary as the project is right beside the Provincial road and power supply
from the Visayas Electric Company (VECO) is readily available. The project will also operate primarily
using day light, with operations at most starting at 6am and ending in 6pm in maximum condition.
Back-up illumination of one or two LED beacon lights are expected to be used for lighting dusk
operations (at 6pm) only if these become necessary.
1.5.2 WATER REQUIREMENT Water requirement on worst case is 288.8 m3 per day. Likewise, the Project will pursue progressive
compensation planting to fulfill the requirements of EO 26, and to offset project carbon emissions in
support of the Philippine Government programs to address climate change as called-for by Republic
Act 9729, and both activities will require water resources. The requirement for dust suppression in 1
was confirmed after the conduct of an inventory of particulate matter emissions and the GHG
emissions from operation that will require carbon sequestration and thus the watering of additional
tree plantations.

EPRMP | CHAPTER 1 PROJECT DESCRIPTION Silica Sand Quarry Expansion Project
1-28
The Project personnel will also be utilizing water for day stay at the office (i.e., washing, domestic use),
and sprinkling of active quarry sections. For these an estimated volume of about 13.2 m3/day will be
needed. Drinking water will be brought-in from a local purified water supplier.
1.6 PROCESS / TECHNOLOGY
The nature, location of the ore, the host matrix earth form and characteristics, prevailing
environmental requirements and economic conditions defined the project and its components. The
quarry method most suitable for sandy materials particularly with thin overburden is surface
extraction. The method of extracting the target materials by benching and terracing the affected
surface area entails less environmental consequences than random excavation targeting only the
desired silica grades, as observed to be utilized by applied by small scale quarries in the area.
1.6.1 QUARRYING This project involves simple extraction of surface earth materials for cement manufacturing, by
excavators and pay loaders; loading of extracted materials to waiting dump trucks for hauling to the
TCPI cement manufacturing plant approximately twenty-one (21) kms away; stabilization and
rehabilitation of mined-out areas. The equipment and manpower skills needed are readily available
on site as the Proponent has been undertaking the activity since the past decade. This project does
not include any processing of the extracted silica sand. No other facilities need to be established for
this project as the manufacturing cement plant already exists. For this reason, this simple project
technology is preferred by the Proponent. The general quarry process is shown in Figure 1-14.
Figure 1-14. Quarry Operations Activity Flowchart
1.7 PROJECT SIZE
Based on the result of the exploration conducted by SEDC, the two (2) MPSAs has total combined
mineable reserve of silica sand deposit of about 11,000,000 Metric Tons with an average grade of 75%
SiO2 and a cut-off grade of 70%. Increase in annual production of 660,000 MT from 200,000 MT shall

EPRMP | CHAPTER 1 PROJECT DESCRIPTION Silica Sand Quarry Expansion Project
1-29
be sourced from the existing production area of 229.50 hectares. A summary is presented in the table
below:
Table 1-15. Summary of Existing and Proposed Changes in the Silica Sand Quarry
MPSA 314 MPSA 323
LOCATION Barangay Duangan 3. Barangay Lut-od 4. Barangay Punod 5. Barangay Sibago 6. Barangay Guimbawi-an
ECC AREA (in hectares)
Existing= 389.44 has
84 has 305.44 has
For Amendment= 389.44 has (NO CHANGES)
EXISTING PRODUCTION AREA (in hectares)
229.50 has
FOR AMENDMENT PRODUCTION AREA (in hectares)
229.50 has (NO CHANGES)
ANNUAL PRODUCTION (in metric tons)
Existing= 200,000MT
For Amendment = 660,000 MT
MINERAL RESERVES 2,000,000 9,000,000
Total Silica = 11,000,000MT
1.8 DEVELOPMENT PLAN, DESCRIPTION OF PROJECT PHASES AND CORRESPONDING
TIMEFRAMES
The project will be implemented in several phases namely, a) project preparation phase; b) project
development phase; c) quarry operations phase; and d) abandonment phase. The details of these
project phases are summarized in the sections below.
1.8.1 PROJECT PREPARATION PHASE These are the pre-construction activities necessary to proceed to the project development phase.
• Procurement of Equipment
• Land Acquisition
• Permit Application and Acquisition
• Stakeholder consultations
• Geological explorations
• Feasibility study and Planning
1.8.2 PROJECT DEVELOPMENT PHASE The project development phase will include the following:
• Construction of additional access roads
• Construction of quarry administration facilities
• Construction/Installation of pollution control devices/facilities
1.8.2.1 ACCESS ROAD CONSTRUCTION AND HAUL ROADS IMPROVEMENTS Access roads are used to ease and fasten the movement of quarry materials from its source towards
the provincial road. These will be constructed connecting the quarry site/s to the provincial road.
Existing access roads in initial quarry sections will be improved through widening activities. Short
access road sections will be opened as the quarry operations progress inward the quarry site. The

EPRMP | CHAPTER 1 PROJECT DESCRIPTION Silica Sand Quarry Expansion Project
1-30
access roads development will be simple direct cut, matting, leveling and compaction. To keep the
run-off flow on the roadsides and reduce damage on the roadway center, contour canals will be part
of the design. The design of the access roads and haul roads are designed sufficiently to carry the load
of production and ensure efficiency during transport operations.
1.8.2.2 CONSTRUCTION OF QUARRY ADMINISTRATION FACILITIES The construction of quarry administration facilities will be simple and straightforward like the common
construction procedure for a simple single-story dwelling structure with concrete flooring and walls
and galvanized iron sheet roofing. Facilities like these are meant to provide comfort and shelter for
employees involved in administrative works and resting place during operational recess or breaks.
1.8.2.3 SETTLING PONDS Settling ponds are the silt control measures to be installed in the project site. These will be constructed
at the base of quarry benches where it can collect run-off water coming from the contour canals of
the quarry blocks. Each settling pond location shall have a series of two or three cascading basins to
adequately detain sediments before releasing the quarry drainage water, meeting the requirement of
Class C water quality guidelines.
1.8.3 OPERATIONS PHASE 1.8.3.1 CLEARING OF VEGETATED TOPSOIL OR OVERBURDEN Land clearing would entail clearing, balling, and transfer of trees less than 15cm diameter at breast
height (DBH), timber recovery of trees above 15cm DBH, chipping/mulching of removed vegetation to
be added to top soil heap, and the separation and haul out of humus (topsoil). Bulldozers, front-end
loaders, and trucks would be deployed to undertake these clearing works. Stockpiling of the removed
overburden at designated areas for future re-use would preserve the mulched vegetation and the
topsoil. The overburden, topsoil, and other organic remnants are necessary requirement for the
rehabilitation activities such as re-soiling and re-vegetation.
1.8.3.2 OVERBURDEN REMOVAL With the use of appropriate heavy equipment (i.e. backhoe, bulldozers, etc.), the overburden layer
would be removed from the ground, loaded on 10-ton haul trucks, and piled at waste stockpile areas
or transported for benching and contouring of quarried out areas.
1.8.3.3 QUARRY /MATERIAL EXTRACTION The overburden in the production area is declared by the Proponent to be very thin, averaging
10cm.The waste material is reported to be nil, estimated to be 2%. After the overburden is stripped,
the silica sand will be excavated using an excavator in backhoe mode. In view of the moderately rolling
terrain of the landform hosting the target materials; quarrying or material extraction will start from
mid-elevation (bench elevation +80m) in Lutod, progressing downward to the last bench at elevation
+30m. Extraction shall progress downwards. The quarry elevation equivalent to the top bench will be
gradually totally extracted, and. Then a lower bench shall be begun, and the enter bench will again be
extracted before the next level is begun. If the slope is too steep for safe digging, the slope will be
dozed down in horizontal layers until a staging platform is achieved.
Once extracted, the materials will be loaded in waiting dump trucks. Material quality control will aim
to ensure haulage of suitable materials to the plant and avoid sending silica sand to the waste dumps.
Suitable materials will be immediately hauled to the TCPI cement plant. There will be no stock piling

EPRMP | CHAPTER 1 PROJECT DESCRIPTION Silica Sand Quarry Expansion Project
1-31
at the quarry site. Waste materials will be hauled out to the stockpile location within the quarry, for
later use in final slope rehabilitation. At each bench level where applicable, a plateau will be created,
and mined-out upper slopes will be stabilized by contouring and benching. Temporary slopes in
advancing the working face inland will have an over-all slope of about 80 degrees from toe to top of
the quarry section. The batter slope angle shall be between 60 deg to 75 degrees Levels of terraces
will result as the quarry elevation progresses downward. The resulting landform shall be like an
engineered valley, designed to be stable and having efficient drainage design, so as not to exclude the
possibility for the area to be suitable for housing development. The final pit elevation will not be lower
than the nearest road and slightly higher than the surface water course (creek) that drains the area.
The land surface will be sloped to drain toward the creek.
1.8.3.4 DRAINAGE SYSTEMS Drainage from the quarry sections will be through the contour canals along base of the slope face.
Benches would be cut to allow the bench floor for positive drainage (5-degree fall away from the cut
surface) approximately 1mx1m (contour canal cross-section) to reduce surface water flow over the
cut face and bench, and limit soil erosion potential. Surface run-off from benches would be directed
to rock-lined water channels; forming a drainage system on quarry floor as necessary and directed
toward the settling ponds designed sufficiently to contain expected surface run-off from the opened
quarry area. Background area surface run-off will be directed toward the natural waterways. Due to
the nature of the deposits which occur consistently from elevation +60 masl and above, the quarry
activities will be a continuous extraction process until a pre-deter quarry elevation and quarry
boundary limit is attained, after which quarry rehabilitation activities commence at each elevation
level.
1.8.4 DECOMMISSIONING / ABANDONMENT / REHABILITATION A final mine rehabilitation and decommissioning plan will be prepared to address concerns on planned
and/or unplanned closure, and care and maintenance scenarios. The plan must be consistent with the
company’s closure policy, and with the provisions and relevant rules and regulations of the Republic
Act no. 7942, known as the Philippine Mining Act of 1995.
Decommissioning activity will commence after the operating life of the project. This involves
dismantling of company infrastructures and machineries. Simultaneously, rehabilitation will be carried
out. Aside from the rehabilitation activities that were progressively done during the operation, a final
rehabilitation shall be conducted succeeding the project’s operation period. Stabilization of steep
slopes, backfilling, grading and reforestation of mined-out areas, among others, will be performed as
part of the Rehabilitation.
The Abandonment phase will follow as the mined-out sections are environmentally restored, ensuring
its stability and sustainability, with respect to the mine relinquishment guidelines from Mines and
Geoscience Bureau (DENR-MGB). The following are activities involved in abandonment phase:
1. Topsoil
enrichment and
preparation
− This is done before restoring/re-soiling the mined-out areas. This is to
support the nourishing and growing vegetative and tree cover in the
future. Soil analysis (chemical and physical properties) including x-ray
fluorescence are to be undertaken to determine soil suitability.

EPRMP | CHAPTER 1 PROJECT DESCRIPTION Silica Sand Quarry Expansion Project
1-32
2. Final benching and
contouring
− This is conducted to achieve the slope stability all through the benches
and terraces; following the slope gradient from toe to edge of benches
to
top-most point of about ±83.3% (40 degrees) or as approved by the
Mines and Geosciences Bureau.
3. Restoring, and
spreading of
enriched topsoil
− The enriched topsoil to be spread on the bench panels with 0.25m
thickness with 50cm bench edge barrier for storm drainage control,
with the 2% inward slope.
4. Re-vegetating of
benches
− This is implemented if the local government unit opted to classify the
area as an agricultural land.
5. Bench and slope
assessment
− The slope condition and benches are assessed to ensure that the
bench edges possess the enough run-off control barrier features.
6. Tree planting − This is undertaken especially on mined-out areas with highest
elevation to increase the rainfall infiltration and ensure sufficient
water catchment function. This shall be undertaken with the
participation of local communities.
7. Turn-over of
infrastructures
− Depending on the agreement between the proponent and local
communities, there shall be a turn-over of infrastructures like roads
and buildings to the Local Government Unit/s or relevant government
agencies. Structures that are not beneficial for the LGUs may be
dismantled and hauled out.
To ensure the plan’s proper implementation, the budget for decommissioning, abandonment, and
rehabilitation shall be deposited in a government depository bank. The said funding is established in
accordance with the provisions of the Philippine Mining Act of 1995.
The table below shows the Project Schedule of the Silica Sand Quarry Expansion Project.

EPRMP | CHAPTER 1 PROJECT DESCRIPTION Silica Sand Quarry Expansion Project
1-33
Table 1-16. Project Schedule of the Proposed Silica Sand Quarry Expansion Project
1.9 MANPOWER
Once the project will be implemented, as may be observed from Table 1-17, employment
opportunities supported by this project totals 69 positions. Out of 69 positions, 58 may be filled by
males and 42 by females. The constraints for female employees in certain positions are also listed in
the same table. Workforce to fill employee replacements or fill day-work (extra) job opportunities are
sourced by SEDC from a pool of qualified workers recommended from the Local Government Units.
Table 1-17. Manpower needed by the Project
Description
Quarry/
Production Services Security Hauling Total Gender
No M F No M F No M F No M F No M F
Manager 1 x x 0 0 0 1 1 1
Safety Officer 1 x x 0 0 0 1 1 1
Supervisor 1 x x 1 x x 1 x x 1 x x 4 4 4
Foreman 0 1 x x 0 0 1 1 1
Mechanic 4 x 0 0 1 x 3 3 0
Equipment
Operators
3 x 0 0 0 3 3 0
Drivers 10 x 2 x x 0 4 x 16 7 1
Welder 2 x 0 0 0 2 1 0

EPRMP | CHAPTER 1 PROJECT DESCRIPTION Silica Sand Quarry Expansion Project
1-34
Description
Quarry/
Production Services Security Hauling Total Gender
No M F No M F No M F No M F No M F
Electrician 2 x 0 0 0 2 1 0
Equipment
Spotters
2 x x 0 0 0 2 2 2
Utility Aide 2 x x 4 x x 0 4 x 6 6 4
Survey Aide 0 8 x x 0 0 8 8 8
Accounting
Staff
2 x 0 0 0 2 2 2
Administrative
Staff
2 x x 0 0 0 2 2 2
Plant Nursery
Staff
0 2 x x 0 0 2 2 2
Security
Guards
0 0 14 x x 0 14 14 14
TOTAL 32 19 7 18 10 10 15 8 8 10 5 1 69 58 42
1.10 PROJECT INVESTMENT/COST
The estimated Volume of Investment for the Silica Sand Quarry Expansion Project is approximately
PhP 61,120,000.00 covering the mining properties and equipment. The estimated Production Costs
are pegged at the following first 10 commercial production years:
Year 1 : P 342.00 / MT
Year 2 : P 356.00 / MT
Year 3 : P 370.00 / MT
Year 4 : P 385.00 / MT
Year 5 : P 400.00 / MT
Year 6 : P 416.00 / MT
Year 7 : P 433.00 /MT
Year 8 : P 450.00 / MT
Year 9 : P 468.00 / MT
Year 10 : P 487.00 / MT

2-1
2 ASSESSMENT OF ENVIRONMENTAL IMPACTS
2.1 LAND
2.1.1 LAND USE AND CLASSIFICATION The Silica Sand Quarry Expansion Project is located within the Municipality of Pinamungajan, Province
of Cebu which is in the Southwestern coastline portion of Cebu. Pinamungajan is a 2nd class
municipality sharing its boundaries with municipalities of Toledo, Naga, Aloguinsan, San Fernando,
and Carcar. It has a total land area of 11,725.27 hectares occupied by 26 barangays. The project is in
barangays of Duangan, Lut-od, Punod, Sibago, and Guimbawian.
Table 2-1 shows the existing land use distribution in the municipality. As observed, the largest
percentage (33.59%) is used for agricultural purposes while the smallest percentage is used for
tourism. 3.68% of the total land area is used for industrial purposes.
Table 2-1. Existing Land Use Distribution in Pinamungajan, Cebu
LAND USE AREA (in has) % TO TOTAL LAND
AREA
Agricultural 3,939 33.59%
Timberland 3,242 27.66%
Protection Forest 3,200 27.29%
Built-up Area/Commercial 365 3.12%
Industrial 431 3.68%
Tourism 20 0.17%
Mangroves 150 1.28%
Fishponds 377.5 3.21%
TOTAL 11,725.27 100.00%
Source: Official Website of Pinamungajan, Cebu (www.pinamungajan.gov.ph)
2.1.1.1 LAND CLASSIFICATION The project areas in Pinamungahan, Cebu are classified as Alienable and Disposable Lands and Forest
Lands. The distribution of forest land and alienable and disposable land within the MPSA Areas is
shown in
Figure 2-1.
Land classification refers to the establishment of boundaries between alienable and disposable lands
and other land uses. Presidential Decree (P.D.) 705 defined Alienable and Disposable Lands as lands
of the public domain which have been subjected to the present classification system and declared as
not needed for forest purposes, and national parks. Claims or titles may be applied by private
individuals over these lands for settlement, agricultural and other production purposes unlike forest
lands which cannot be titled.

EPRMP | CHAPTER 2 ANALYSIS OF ENVIRONMENTAL IMPACTS Silica Sand Quarry Expansion Project
2-2
Figure 2-1. Land Classification of Project Area
(Source: DENR Region VII)

EPRMP | CHAPTER 2 ANALYSIS OF ENVIRONMENTAL IMPACTS Silica Sand Quarry Expansion Project
2-3
2.1.1.2 LAND TENURE Figure 2-2 presents the existing tenurial instruments while Figure 2-3 presents the existing
Community-Based Forest Management Agreement (CBFMA) in Cebu. Special Land Use Permit exists
in the municipality but not within the areas of the proposed Silica Sand expansion. Other instruments
such as Sustainable Integrated Area and Development (SIAD), Certificate of Ancestral Domain Title
(CADT), Forest Land Use Agreement (FLAG), Forest Land Management Agreement (FLMA),
Memorandum of Agreement (MOA), Socialized Industrial Forest Management Agreement (SIFMA),
and Tree Farm Lease Agreement (TFLA) are also not present within the boundaries Pinamungajan,
Cebu. A Community-Based Forest Management Agreement (CBFMA) is identified in the boundary of
Pinamungajan interconnected with the boundary of Toledo City. However, this CBFMA is not within
and not covered by the project area.
Figure 2-4 shows the Protected Areas in Cebu namely, the Tañon Strait Protected Seascape covering
521,018 hectares; and the Central Cebu Protected Landscape which is approximately 38 kilometers
away from Pinamungajan. The Tañon Strait Protected Seascape is more than 15 kilometers from the
host barangays.
No tenurial issues are raised and recorded during the social consultations and surveys conducted.

EPRMP | CHAPTER 2 ANALYSIS OF ENVIRONMENTAL IMPACTS Silica Sand Quarry Expansion Project
2-4
Figure 2-2. Tenurial Instruments in Cebu
(Source: DENR Region VII)

EPRMP | CHAPTER 2 ANALYSIS OF ENVIRONMENTAL IMPACTS Silica Sand Quarry Expansion Project
2-5
Figure 2-3. CBFMA in Cebu
(Source: DENR Region VII)

EPRMP | CHAPTER 2 ANALYSIS OF ENVIRONMENTAL IMPACTS Silica Sand Quarry Expansion Project
2-6
Figure 2-4. Protected Areas in Cebu
(Source: DENR Region VII)

EPRMP | CHAPTER 2 ANALYSIS OF ENVIRONMENTAL IMPACTS Silica Sand Quarry Expansion Project
2-7
Table 2-2. Assessment of Presence or Absence of Environmentally Critical Areas (ECAs) in the Project Area
ECA CATEGORIES TECHNICAL DESCRIPTION
(BASED ON ANNEX 2-1A OF THE REVISED PROCEDURAL MANUAL OF DAO 2003-30)
PRESENT IN PROJECT AREA?
REMARKS
1 Areas declared by law as national
parks, watershed reserves, wildlife
preserves, sanctuaries
The laws referred to by this provision are Presidential
Decree No. 705, as amended, otherwise called as the
Revised Forestry Code, Republic Act 7586 or the NIPAS
Act, and other issuances including other proclamations,
executive orders, local ordinances, and international
commitments and declarations.
No Present outside the Project Area.
The project barangays are more
than 15 kilometers away from the
protected area (Figure 2-4).
2 Areas set aside as aesthetic
potential tourist spots
Aesthetic potential tourist spots declared and reserved by
the DOT or other appropriate authorities for tourism
development.
No There are no existing tourist spots
declared or reserved by the DOT
or LGU within the project area.
3 Areas that constitute the habitat of
any endangered or threatened
species of Philippine wildlife (flora
and fauna)
This refers to areas considered as wilderness areas and
areas identified by the PAWB to be natural habitats of
endangered or threatened, rare, and indeterminate
species of flora and fauna, as defined by PAWB.
No There are no wilderness areas or
natural habitats of ecologically
significant species as identified
and defined by PAWB.
4 Areas of unique historic,
archaeological, or scientific
interest
This refers to areas that are more than 100 years old (now
superseded by new law RA 10066, reduced to 50 years
old) and declared by the National Historical Institute,
National Museum, or National Commission for Culture
and the Arts, through national or local laws or ordinances
as areas of cultural, historical, and scientific significance
to the nation, (e.g., declared national historical
landmarks, geological monuments, and paleontological
and anthropological reservations).
No There are no cultural heritage
areas within the project site.

EPRMP | CHAPTER 2 ANALYSIS OF ENVIRONMENTAL IMPACTS Silica Sand Quarry Expansion Project
2-8
ECA CATEGORIES TECHNICAL DESCRIPTION
(BASED ON ANNEX 2-1A OF THE REVISED PROCEDURAL MANUAL OF DAO 2003-30)
PRESENT IN PROJECT AREA?
REMARKS
5 Areas that are traditionally
occupied by cultural communities
or tribes
This refers to all ancestral lands of the National Cultural
Communities in Section 1 of Presidential Decree No. 410
and settlements designed, implemented, and maintained
by the PANAMIN for national minorities (non-Muslim hill
tribes referred to in Presidential Decree No. 719) as may
be amended by Republic Act 8371 or the Indigenous
Peoples Rights Act of 1997 and its Implementing Rules
and Regulations.
No There are no CADT/CALC areas
and no IP communities within the
project area.
6 Areas frequently visited and/or
hard-hit by natural calamities
(geologic hazards, floods,
typhoons, volcanic activity, etc.)
The area shall be so characterized if any of the following
conditions exist:
- Geologic hazard areas: This refers to all areas
identified by the Mines Geosciences Bureau (MGB) as
geologic hazard areas.
- Flood-prone areas: This refers to low-lying areas
usually adjacent to large active water bodies
experiencing inundation of at least 2 m, twice a year
for the last five years prior to the year of reckoning.
For example, a determination made in 2007 will
consider the weather records from 2002 to 2006.
- Areas frequently visited or hard-hit by typhoons: This
refers to all areas where typhoon signal No. 4 was
hoisted for at least twice a year during the last five
years prior to the year of reckoning.
- Areas prone to volcanic activities/ earthquakes: This
refers to all areas identified as such by the Philippine
Institute of Volcanology and Seismology (PHIVOLCS)
Yes Risk to climatological hazards:
- Low risk to flooding (flooding
will be limited to the mining
pit)
- High risk to rain-induced
landslide of mining slopes and
benches.
Risk to geologic hazards:
- High risk to earthquake-
induced landslides of mining
slopes and benches
- Ground shaking – PEIS Intensity
VI destructive ground shaking
- No risk to volcanic eruptions
- Low susceptibility to
liquefaction

EPRMP | CHAPTER 2 ANALYSIS OF ENVIRONMENTAL IMPACTS Silica Sand Quarry Expansion Project
2-9
ECA CATEGORIES TECHNICAL DESCRIPTION
(BASED ON ANNEX 2-1A OF THE REVISED PROCEDURAL MANUAL OF DAO 2003-30)
PRESENT IN PROJECT AREA?
REMARKS
(e.g., areas within permanent exclusion zones of
active volcanoes or areas within the required
minimum buffer zone of fault zones as determined by
PHIVOLCS).
7 Areas with critical slopes This refers to all lands with slopes of 50% or more
classified as geohazard by MGB. Such slope conditions
favor their natural susceptibility to geohazards such as
landslides.
Yes The project area has steep slopes
more than 50% at elevations
ranging from 0 to 200 masl
8 Areas classified as prime
agricultural lands
Prime agricultural lands refer to lands that can be used
for various or specific agricultural activities and can
provide optimum sustainable yield with minimum inputs
and development costs as determined by the Department
of Agriculture.
No There are no prime agricultural
lands within the project area.
9 Recharge areas of aquifers Refers to sources of water replenishment where
rainwater or seepage actually enters the aquifers. Areas
under this classification shall be limited to all local or non-
national watersheds and geothermal reservations.
No There are no recharge areas of
aquifer within the project site.
10 Water bodies characterized by one
or any combination of the
following: tapped for domestic
purposes; within the controlled
and/or protected areas declared
by appropriate authorities; which
support wildlife and fishery
activities
Water bodies shall refer to waters that are tapped for
domestic purposes or those which support wildlife and
fishery activities within declared protected areas,
including the buffer zones.
No There are no water bodies that
are tapped for domestic purposes

EPRMP | CHAPTER 2 ANALYSIS OF ENVIRONMENTAL IMPACTS Silica Sand Quarry Expansion Project
2-10
ECA CATEGORIES TECHNICAL DESCRIPTION
(BASED ON ANNEX 2-1A OF THE REVISED PROCEDURAL MANUAL OF DAO 2003-30)
PRESENT IN PROJECT AREA?
REMARKS
11 Mangrove areas characterized by
one or any combination of the
following conditions: with primary
pristine and dense young growth;
adjoining mouth of major river
systems; near or adjacent to
traditional productive fry or fishing
grounds; areas which act as natural
buffers against shore erosion,
strong winds and storm floods;
areas on which people are
dependent for their livelihood.
Mangrove areas shall be characterized by one or any
combination of the following conditions:
- With primary pristine and dense young growth
- Adjoining mouth of major river systems;
- Near or adjacent to traditional productive fry or
fishing grounds;
- Areas that act as natural buffers against shore
erosion, strong winds and storm floods; and
- Areas on which people are dependent for their
livelihood, pursuant to and taking into consideration
Republic Act 7161, which prohibits the cutting of
mangrove species.
No The project is more than 3
kilometers away from the nearest
coastal area (Figure 2-4).
12 Coral reefs characterized by one or
any combination of the following
conditions:
- With 50% and above live
coralline cover;
- Spawning and nursery
grounds for fish;
- Act as natural breakwater of
coastlines
Characterized by one or any combination of the following
conditions:
- With 50% and above live coralline cover; Spawning
nursery grounds for fish; and Act as natural
breakwater of coastlines.
No The project is more than 3
kilometers away from the nearest
coastal areas (Figure 2-4).

EPRMP | CHAPTER 2 ANALYSIS OF ENVIRONMENTAL IMPACTS Silica Sand Quarry Expansion Project
2-11
2.1.1.3 IMPACTS AND MITIGATING MEASURES
2.1.1.3.1 IMPAIRMENT OF VISUAL AESTHETICS The proposed Silica Sand Quarry Expansion project is perceived to cause impairment of visual
aesthetics in the area. Progressive Rehabilitation is to be conducted to minimize visual impacts as well
as gradually assist the area’s recovery. Upon mine closure, facilities and structures will either be
decommissioned or removed from the quarry site or be transferred to the community or LGU for their
own beneficial use depending on the agreed closure plan. Visual amenity is defined by the community
expectations. Hence, the rehabilitation plan shall be consulted with the host community.
2.1.1.3.2 LAND DEVALUATION DUE TO IMPROPER WASTE MANAGEMENT Solid waste generation is expected due to normal routine of employees and quarry operations. SEDC
strictly implements the company’s Waste Management Procedure to ensure proper segregation
according to waste category, and consistency on collection schedules. The segregation and collection
schedules will be strictly supervised by the Pollution Control Officer. Color-coded receptacles or trash
bins were regularly provided to accommodate different type of wastes: biodegradable, non-
biodegradable and recyclable wastes. Biodegradable wastes are subjected to Kiln Feeding while Non-
biodegradable are collected by responsible LGUs. Recyclable wastes, debris from construction and
demolition are collected by an outsourced scrap buyer. Hazardous and Electronic wastes are disposed
through a DENR-accredited Treater.
The SEDC Waste Management Procedure is formulated in compliance with the Republic Act 9003-
Ecological Waste Management Act, and Republic Act 6969- Hazardous, Nuclear, and Chemical Waste
Management Act.
2.1.2 GEOLOGY
2.1.2.1 LOCAL GEOLOGY The middle Miocene Luka Formation underlies an area along the mid-section of the valley. It is along
the axis of the north-northeast trending anticline. The formation is composed of sandstone and
mudstone interbeds with conglomerate and limestone lenses (BMG, 1983). Conformably overlying the
Luka Formation is the middle Miocene Uling Limestone. It occupies portions of the northeastern blocks
of the claim (approx. 60 hectares). The limestone is generally hard and locally bedded. It exhibits
various shades of color from cream to reddish. It is partly porous and coralline. The Uling Limestone
is one of the sources of raw materials in the furniture and marble industry in Cebu.
The middle Miocene Toledo Formation mainly occupies the northeast blocks and a portion of the
southeast blocks of the claim. It consists of thin to thick bedded sandstone and shale with occasional
lenses of conglomeratic limestone and calcarenite. Exposures show cream colored calcareous siltstone
and fine-grained sandstone intercalation. The formation also has a tuffaceous facies. Unconformably
overlying the older formations is the late Miocene Maingit Formation. The formation is composed of
granule to cobble conglomerate with intercalated shale, sandstone, limestone and conglomeratic
limestone in the lower part (BMG, First Edition, 1983). The sandstones are generally fine-grained and
show variuo colors ranging from dirty white to orange brown. The conglomerates are matrix
supported and clasts have smooth edges. The formation occupies the middle portion of the northern
blocks of the claim and portions of two blocks of the southern blocks of the claim. Approximate total
area occupied by the formation is 215 hectares.

EPRMP | CHAPTER 2 ANALYSIS OF ENVIRONMENTAL IMPACTS Silica Sand Quarry Expansion Project
2-12
A small portion (approximately 14 hectares) in the southernmost section of the claim is underlain by
the late Miocene to Pliocene Upper Marl Member of the Barili Formation. It is poorly bedded, brown,
and slightly sandy with thin limestone lenses. It shows various colors from cream to light gray. The
beds are calcareous and have micro-fossils (forams). The formation unconformably overlies the older
rock formations.
The eastern and southern section of the blocks is underlain by the Plio-Pleistocene Carcar (Limestone)
Formation. Except for the Barili Formation, the Carcar Formation unconformably overly the older rock
formations. Carcar Formation is dominantly a coralline limestone and poorly bedded to massive.
Inclination of bedded facies range from almost flat to 30° which generally dips towards the coastline
(northwest). The formation contains abundant micro and mega fossils. Large and small caverns and
other types of solution cavities characterized the formation.
Exposures show small cavities and sharp surfaces and edges. The limestone in the Carcar Formation
is the main raw material in the manufacture of cement in the province. Quaternary Alluvium covers
portions of the northern blocks of the claim and a small section in the south. It is composed of detrital
deposits of varying size (clay to gravel) laid along and adjacent to Duangan Creek.
On a macro level, the Maingit Formation appears to occupy the western lower flank of a 4-5 km. wide
valley. Clastic sedimentary rock formations mainly underlie the valley section while the upper flanks
are occupied by the Plio-Pleistocene Carcar Formation (western and south sides) and Middle Miocene
Uling Limestone (eastern side). It is apparent that the clastic sedimentary rocks are more readily
eroded compared to the limestone formations on the upper flanks of the valley. Soil cover in the area
range from 10.0 cm. to 40.0 cm. The flat lying areas and portions adjacent to the creeks or rivers are
cultivated and planted with rice.

EPRMP | CHAPTER 2 ANALYSIS OF ENVIRONMENTAL IMPACTS Silica Sand Quarry Expansion Project
2-13
Figure 2-5. Geologic Map of Cebu

EPRMP | CHAPTER 2 ANALYSIS OF ENVIRONMENTAL IMPACTS Silica Sand Quarry Expansion Project
2-14
2.1.2.2 TOPOGRAPHY Generally, Cebu province has a rugged topography characterized by highlands that are especially
dominant in the central area of the province with narrow land strips along its coast. 62% of the
province is identified to be hilly to mountainous with slopes greater than 18% while the remaining
38% is accounted for the flat and rolling lands.
The Municipality of Pinamungajan has mixed topographic reliefs. Inland areas are predominantly hilly
but with decreasing elevation and steepness towards the coast. The project area is in the mid to
upland portion of Pinamungajan and sits within 75 to 110 masl. The project area has steep slopes
more than 50%.
Figure 2-6 shows the topographic features of the project area Pinamungajan, Cebu.
Figure 2-6. 3D Map of Topographic Features of the Project Area
2.1.2.3 GEOMORPHOLOGY The Cebu mainland narrowly extends 200 kilometers north to south and 20 to 40 kilometers east to
west; and is about 40 kilometers wide. The mainland is centrally located in the Philippine
physiographic province and surrounded by the Visayan Sea Basin. Bohol Strait separates the Cebu
Island from Bohol Island while Negros is separated by the Tañon Strait. Likewise, Leyte is separated
from Cebu by the Camotes Sea.

EPRMP | CHAPTER 2 ANALYSIS OF ENVIRONMENTAL IMPACTS Silica Sand Quarry Expansion Project
2-15
Cebu mainland has mountainous backbone sustained on NNE-SSW axis, parallel to arc-trench system
of Sulu Zamboanga-Masbate. The center line or axis of Cebu is approximately 160 kilometers long.
This is bordered by intermediated highlands and is heavily dissected by deep narrow valleys with steep
slopes. The mountainous backbone was separated into two by slow saddles of about 300 meters high
at the narrow waist of the Cebu Island. Maximum elevation in the northern part is 1,013 meters and
884 meters in the Southern part (MGB, 1981). Structurally, it is divided into three areas by Northeast-
Southwest trending faults accompanied by minor but vital fault structures. These structural faults
dominantly had vertical movements between Cretaceous to Tertiary but later exhibited left-lateral
strike-slip displacement during the Pliocene period.
As for the Central highland area, rotational movement of a rhombic fault block consisting of basement
rock units has been recorded. Despite of the intrusion of Utopian Diorite, the locus of serpentinite
slivers and occurrence of metallic mineralization were controlled by faulting and rifting in the geologic
past. The folding of the Pliocene-Pleistocene sediments generally follows the Northeastern trend of
fold axes. Meanwhile, the Northern Cebu follows the northwest to north-south fold axes. The coastal
plains are limited with coastlines with straight and few harbors− indicating a young wave erosion
stage. The shallow marine sedimentary rocks capping the island confirms that a record of emergence
towards the Southern part of the Visayan Sea Basin. According to the report of Bureau of Soils, the
following are the major landforms and soil types that developed in Cebu:
1. Active Tidal Flats - Having soil material composed of mix river and sea current deposits,
characterized by deep, submerged soils with organic fragments such
as animal, plant and pronounced micro relief.
2. Broad Alluvial
Plains
- Whose slope ranges from 0 to 3% - clayey to clay loam, soil
accumulation of clay, silt, sand, gravel and fragments of mix volcanic
and sedimentary origin, composed of upper river terrace, lower river
terrace and coastal alluvial plain.
3. Residual slopes - Nearly level to gently sloping, elevation in limestone area and coastal
limestone terrace ranging from 50 to 200 meter above sea level (masl)
with slope up to 14%, with clay loam to clay texture. Erosion is slight
to moderate.
4. Foot slopes - With elevations ranging from 20 to 25 masl. Erosion is slightly
hazardous. Soil at lower foot slope lies on shale/sandstone. Soil is silt
loam to clayey soil.
5. Karst Plain Type
Rock
- Consisting of boulders/stoniness, escarpments and sinkholes in
limestone.
6. Plateau - This landform is formed through erosion from higher areas. Elevation
ranges from 300 to 365 masl. Sedimentary plateau is moderately deep
to very deep soils of clay to clay loam. Erosion is very slight.
7. Sedimentary Hills - Have significant relief and formed by folding and margins of rocks
being uplifted by tectonic and volcanic forces. Consisting of slightly
dissected limestone hills with low relief, with clay to clay loam;
moderately dissected terrain hills with steep escarpments; slightly
dissected terrain on limey shale/sandstone low relief; moderately

EPRMP | CHAPTER 2 ANALYSIS OF ENVIRONMENTAL IMPACTS Silica Sand Quarry Expansion Project
2-16
dissected terrain on limey shale/sandstone; High Relief, soils
developed from shale and sandstone ranging from 6 to 38%, soils are
moderate to well drained silty clay loam,clay loam to clay; minor karst
with predominant sinkhole and infilled, narrow valleys, clay to clay
loam soils are severely to excessively eroded; and High Denudation
Limestone and Igneous Rock form small and large hills, moderately to
highly dissected terrain, shallow soils severely eroded with rock
outcrops, slope ranging from 25% to 35% and with elevation ranging
from 77 to 170 masl. Major Karst occurs in Pinamungajan Municipality
over shallow areas with rock boulders in the surface; and Meta-
Sedimentary Rock units with very steep topography and severely
eroded boulders; and
8. Mountains - that are well-drained clayey soils consisting of Highly Dissected Steep
to Very Steep Limestone Mountain and Highly Steep and Sharp
Peaked/Ridge Meta-Volcanic Mountains that are severely eroded with
40 to 60% slopes and with shallow clayey soil.

EPRMP | CHAPTER 2 ANALYSIS OF ENVIRONMENTAL IMPACTS Silica Sand Quarry Expansion Project
2-17
Figure 2-7. Topographic Map of the Project Area

EPRMP | CHAPTER 2 ANALYSIS OF ENVIRONMENTAL IMPACTS Silica Sand Quarry Expansion Project
2-18
Figure 2-8. Slope Map of the Project Area

EPRMP | CHAPTER 2 ANALYSIS OF ENVIRONMENTAL IMPACTS Silica Sand Quarry Expansion Project
2-19
2.1.2.4 LITHOLOGY/STRATIGRAPHY The Lithology and Stratigraphy Column of Cebu (Figure 2-9) shows that the province’s pre-cretaceous
basement rock is represented by metamorphic Jurassic Tunlob Schist comprising chlorite, mica, and
amphibolite. The Jurassic Tunlob is carpeted by Cretaceous ophiolite rocks and Mananga Group with
inter-tonguing units of Early Cretaceous Cansi Volcanic comprised by massive flows, breccias, and
pillow lavas. The Cretaceous rocks are covered by the Tertiary Paleocene Eocene, Oligocene, Miocene,
and Pliocene sedimentary formations; consisting of Paleocene Pandan Formation comprised of
shallow marine sediments and limestone with intercalated volcanic flows, Eocene-Baye Formation,
Early Oligocene-Lutak Hill Formation, and Late Oligocene Cebu Formation, Early-Miocene
Malubog/Linut-od Formation, Middle-Miocene Toledo Formation and Bulacao Andesite and Late
Miocene Maingit Formations with Talamban Diorite Peridotite; and Pliocene-Barili Formation with
limestone; and Quaternary Pleistocene Carcar Formation with Limestone, and Quaternary Holocene
Alluvium.
Resurgences of island arc volcanism are indicated by the extrusion of the Bulacao Andesite and
intrusions of the Talamban, Bulacao, and Lutopan intrusions and volcanics. Subsequent emergence
and submergence of the Visayan Sea basin is stipulated by the series of deposition and erosion of the
sedimentary rock formations during Tertiary Era to Pleistocene Epoch. Recent and Quaternary
Alluvium are dispersed in the coastal, deltaic and alluvial plains and riverbeds. The notable difference
between the coastal limestone and the limestone in the interior highlands is a clear evidence of
subsequent submergence and emergence influenced by diastrophism.
Figure 2-9 Lithographic and Stratigraphic Column of Cebu

EPRMP | CHAPTER 2 ANALYSIS OF ENVIRONMENTAL IMPACTS Silica Sand Quarry Expansion Project
2-20
The Mines and Geoscience Bureau (MGB) of DENR conducted quadrangle geologic mapping to validate
the lithological delineations existing in Pinamungajan, Cebu:
Table 2-3. Rock Formations in Pinamungajan, Cebu
ROCK FORMATION PERIOD DESCRIPTION
Quaternary
Alluvium (QAI)
Recent The alluvium is detrital materials, from weathering, erosion
and transportation as silt, sand and gravel in riverbanks.
Carcar Formation
(CaF)
Pliocene-
Pleistocene
The Formation is dated Plio-Pleistocene and overlies
unconformably the Maingit Formation and is found on
both flanks of the island. It is a dominantly coralline
limestone, poorly bedded to massive and partly dolomitic.
Maingit Formation Late Miocene Unconformable overlying the Uling limestone and Toledo
Formation are granule to cobble conglomerates with inter-
bedded shale, sandstone, limestone and conglomeratic
limestone in the lower part.
Uling Limestone Middle
Miocene
This limestone is generally hard, massive, partly porous
and coralline with a pinkish to reddish colored facie at
places.
Toledo Formation Middle
Miocene
As described in the MGB VII report, the formation is
composed of granule to cobble conglomerate with
interbedded shale, sandstone, limestone and
conglomeratic limestone in the lower part.
2.1.2.5 TECTONICS The Philippine Archipelago is in a dynamic setting due to the convergence of the Pacific and Philippine
Sea Plates in the East with the Continental Eurasian and Indo-Australian Plates from the West and
Southwest of the Proto-Philippine Island Arc (Figure 2-10). The uplifting movement of the Philippine
plate is caused by the tectonic activities of its surrounding plates (Figure 2-11). This results to various
formations such as oceanic trenches, mountain ranges, and volcanic belts. Cebu is tectonically
bounded on the east side by the sinistral Philippine Fault system also known as the left-lateral slip. It
is also bounded on the west by the West-Facing Quaternary Volcano-Plutonic arc which is connected
to the Negros Trench.
2.1.2.6 EARTHQUAKE GENERATORS Within 200 kilometer radius from the project site, at least 5 earthquake generators were identified by
Philippine Institute of Volcanology and Seismology (PHIVOLCS) with four (4) active trenches: Philippine
Fault Zone (middle segment), Negros Trench (west of Negros Island), Philippine Trench, and Cotabato
Trench (Figure 2-12).
Figure 2-13 shows the map of the active fault and trenches in the Philippines while Figure 2-14 shows
the active faults and trenches specific in VII. As observed, there is no major fault line that crosses the
project site, which indicates that the area is relatively stable.
2.1.2.7 SEISMICITY Table 2-4 contains the PHIVOLCS Earthquake Intensity Scale (PEIS) providing the perceived shaking
and description per intensity level. Table 2-5 shows the 4 destructive earthquakes recorded by

EPRMP | CHAPTER 2 ANALYSIS OF ENVIRONMENTAL IMPACTS Silica Sand Quarry Expansion Project
2-21
PHIVOLCS as observed in Cebu from 1948-2014. The strongest earthquake that hit the Visayan region
occurred on January 1948 which recorded a magnitude of 8.3. There are no registered earthquakes of
volcanic origin.
Table 2-4. The PHIVOLCS Earthquake Intensity Scale (PEIS)
Table 2-5. Destructive Earthquakes observed in Cebu
TIME DATE INTENSITY MAGNITUDE EPICENTER ORIGIN
- 01-01-1948 VII 8.3 Antique Tectonic
7:30 PM 01-11-1971 VI 5.5 86 km NNW Cebu Tectonic
3:15 PM 02-08-1990 VI 6.5 24 km from Tagbiliran
Bohol
Tectonic
8:12 AM 10-15-2013 VII 7.2 09.86⁰N; 124.07⁰E- 6 km
S24⁰W of Sagbayan,
Bohol
Tectonic

EPRMP | CHAPTER 2 ANALYSIS OF ENVIRONMENTAL IMPACTS Silica Sand Quarry Expansion Project
2-22
Figure 2-10. Tectonic Plates Surrounding the Philippine Plate
Source: USGS (http://pubs.usgs.gov/publications/text/slabs.html)
Figure 2-11. Digital Tectonic Activity Map of Earth
Source: National Aeronautics and Space Administration

EPRMP | CHAPTER 2 ANALYSIS OF ENVIRONMENTAL IMPACTS Silica Sand Quarry Expansion Project
2-23
Figure 2-12. Philippine Mobile Belt
Source: Philippine Institute of Volcanology and Seismology

EPRMP | CHAPTER 2 ANALYSIS OF ENVIRONMENTAL IMPACTS Silica Sand Quarry Expansion Project
2-24
Figure 2-13. Active Faults and Trenches Map of the Philippines
Source: Philippine Institute of Volcanology and Seismology (PHIVOLCS)

EPRMP | CHAPTER 2 ANALYSIS OF ENVIRONMENTAL IMPACTS Silica Sand Quarry Expansion Project
2-25
Figure 2-14. Distribution of Active Faults in Region VII
Source: PHIVOLCS (2018)

EPRMP | CHAPTER 2 ANALYSIS OF ENVIRONMENTAL IMPACTS Silica Sand Quarry Expansion Project
2-26
2.1.2.8 SITE GEOLOGY The dominant geologic formation underlying the general area of Pinamungajan is the Carcar
Formation (CaF), the Maingit Formation (MiF), the Toledo Formation (Tf), the Quarternary Alluvium
(QAl) and the Barili Formation (BiF). The rocks underlying the MPSA 314 and 323 areas include:
Carcar Formation (541 ha or 40.4%), followed by the Maingit Formation (357.7 ha or 26.7%), Toledo
Formation (220.1 ha or 16.4%), Quarternary Alluvium (118.5 ha or 8.8%), Barili Formation (82.5 or
6.1%) and Uling and Luka Formations (0.9% and 0.7% respectively). There are only two rocks found
underlying the production area, the dominant of which is the Maingit Formation (BIF) with a total
surface area of 206.8 ha (90.1% of total area), and the Carcar formation (CaF) with a surface area of
22.7 ha (9.9% of total area). Table 2-6 contains the details of the geologic formation found within the
Project MPSAs and the Production area.
Quarternary Alluvium (QAl) is composed of coral reef and detrital deposits, mostly sand and gravel in
beaches, alluvial plains and riverbeds. Carcar Formation (CaF) which makes up most of the MPSA area
are dominantly coralline limestone; poorly bedded to massive, partly dolomitic and contains abundant
marine fossils.
Maingit Formation (MiF) which mostly underlines the production area, are granule to cobble
conglomerate with interbedded shale, sandstone, limestone and conglomeratic limestone in the lower
part. The Toledo Formation (Tf) on the other hand, is thin to thick bedded sandstone and shale with
occasional lenses of conglomeratic limestone and calcarenite. Barili Formation (BIF) is composed of a
Lower Limestone Member – generally light brown, hard, coralline and locally porous; and an Upper
Marl Member – poorly bedded, generally brown and slightly sandy with thin beds of limestone; age
range from Late Miocene to Pliocene. The Uling Limestone (UL) is generally hard, massive limestone;
in part porous and coralline, while the Luka Formation (LF) is interbedded sandstone and mudstone
with conglomerate and limestone lenses.
MPSA 330 and MPSA 348 Area Geological Map (Figure 2-5) shows the areal extent of the two (2)
geological formations present within the area namely; the Maingit Formation and the Carcar
Formation.
Table 2-6. Geologic Formations within the MPSAs Area
Code Geologic
Formation
MPSA 314-2010-VII MPSA 323-2010-VII % of
Total
MPSA
Area
% of Total
Production
Area
MPSA
Area
Production
Area
MPSA
Area
Production
Area
BIF Barili
Formation
-- -- 82.5 0 6.1 --
CaF Carcar
Formation
11.0 11.0 530.3 11.7 40.4 9.9
Tf Toledo
Formation
-- -- 220.1 -- 16.4 --
UL Uling
Limestone
-- -- 12.1 -- 0.9 --
MiF Maingit 73.1 73.1 284.6 133.7 26.7 90.1

EPRMP | CHAPTER 2 ANALYSIS OF ENVIRONMENTAL IMPACTS Silica Sand Quarry Expansion Project
2-27
Code Geologic
Formation
MPSA 314-2010-VII MPSA 323-2010-VII % of
Total
MPSA
Area
% of Total
Production
Area
MPSA
Area
Production
Area
MPSA
Area
Production
Area
Formation
Lf Luka
Formation
-- -- 9.1 -- 0.7 --
QAI Quarternary
Alluvium
-- -- 118.5 -- 8.8
Total 84.1 84.1 1,257.2 145.4 100 100
2.1.2.9 MINERALIZATION The major mineral deposits within MPSA 314 and 323 are silica sand, clay, and limestone.
2.1.2.9.1 SILICA DEPOSIT There are two types of silica deposits in the area namely the detrital deposit and siliceous sedimentary
rocks. To facilitate discussion, the former will be referred to as Type A and the latter as Type B.
Type A deposits are likely products of mechanical weathering of the rocks belonging to the Maingit
Formation. Type A is usually deposited along or near creeks, creek banks and drainage channels. The
silica along the creek and drainage channels has dirty white color. These are primarily fine to coarse-
grained silica sand and can be considered as washed. Type A also includes the detrital pebble to cobble
size siliceous rocks noted in some areas within the claim. The rocks (stones) are rounded with smooth
edges and can be considered as semi-precious. The semi-precious stones include chert (reddish),
chalcedony, opal, agate and other varieties of quartz. Accordingly, locals used to gather the silica sand
using shovels and sell them to buyers from the town proper. Presently, silica sand is still gathered
occasionally for personal use.
Type B deposits refer to the siliceous sandstone, conglomeratic sandstone and conglomerate within
the Maingit Formation. The sandstone is fine to coarse grained and color range from dirty white to
brownish orange.
The grains are mainly quartz in composition with minor occurrence of dark colored minerals. Outcrops
from an abandoned and an active small-scale quarry show an intercalation of siliceous sandstone and
conglomeratic sandstone. The pebble to cobble size clasts of the conglomeratic sandstone are
rounded with smooth edges indicating a provenance far from the area. The clasts are composed of
chert, agate, chalcedony, opal and other varities of quartz. The siliceous materials were likely derived
from the weathering of the older rock formations in Central Cebu area. A small-scale quarry for silica
is operating at the northeast section of the block. The silica is mainly delivered to the cement plant of
Taheiyo Cement Philippines, Inc., located in South Poblacion, San Fernando, Cebu, Philippines.
2.1.2.9.2 LIMESTONE DEPOSIT The limestone deposit belongs to Plio-Pleistocene Carcar Formation and the middle Miocene Uling
Limestone. The former occupies the eastern and southern portions of the claim. The limestone is
coralline, porous and bedded to massive. Bedded sections generally trend towards the northeast and
dips 15° to 30° northwest. Color varies from white, cream, beige and light brown. Roadcut exposures

EPRMP | CHAPTER 2 ANALYSIS OF ENVIRONMENTAL IMPACTS Silica Sand Quarry Expansion Project
2-28
show rubbly and marly facies. Close examination shows the rocks have abundant mega and micro
fossils. The mega fossils are mainly corals and mollusks. Exposed bedrock is usually hard and
characterized by small solution cavities. Highest elevation in areas occupied by the formation is more
than 300 meters above mean sea level. Total area occupied by the limestone deposit is approximately
687 hectares.
The limestone deposit of the Uling Limestone (Formation) is generally hard and massive. Bedded
sections are also noted. Color of the limestone varies from cream to pinkish red. The limestone shows
a smooth surface when cut, resembling marble. Sliced or cut surfaces show presence of fossils which
indicate the rock is not marbleized. The limestone is a popular source of raw materials in the marble
and furniture industry. Adjacent areas (outside of the claim) are presently quarried. The formation
occupies portions of northeastern blocks of the claim. Highest elevation occupied by the limestone is
about 155 meters above mean sea level. Approximate area occupied by the deposit is 60 hectares.
2.1.2.9.3 CLAY DEPOSIT Areas underlain by the Middle Miocene Toledo Formation and Late Miocene to Pliocene Upper Marl
Member of the Barili Formation are possible sources of the clay component in cement manufacture.
Megascopically, the clastic rock members of the two rock formations show various shades of color
from cream to gray. The grayish colored facies are likely to have higher organic matter content. The
rocks are generally calcareous and contains abundant forams (micro fossils). Highest elevation
occupied by the Toledo Formation is 220 meters above mean sea level at the southeastern section of
the claim while the Upper Bsrili Marl is about 260 meters above sea level at the mid-south section of
the claim. Approximate area occupied by the clastic rocks is 175 hectares. The company has active
quarry sites (San Fernando) in areas underlain by these two rock formations.
2.1.2.10 GEOLOGIC HAZARDS Geologic Hazards are extreme natural events in the Earth’s crust posing threat to life and properties.
Examples are volcanic eruptions, tsunamis, flooding, landslides, and earthquake hazards. Table 2-7
and Table 2-8 show the hazard assessments for the direct impact barangays in Pinamungajan, Cebu.
These assessments are generated using the Hazard Hunter PH- a tool that can be used to generate
indicative hazard assessment reports on the user's specified location. It is helpful as a reference of
property owners, buyers, land developers, planners, and other stakeholders needing immediate
hazard information and assessment. It aims to increase people's awareness to natural hazards and
advocates the implementation of plans to prepare for and mitigate the effects of hazards.
All information used for the calculation of hazard assessment results are based on the most recent
updates provided by the corresponding mandated government agencies through
the GeoRiskPH Integrated System. GeoRisk Philippines is a multi-agency initiative led by DOST-
PHIVOLCS and participated by DOST-PAGASA, DOST-ASTI, DENR-MGB, DENR-NAMRIA, DND-OCD, and
DepEd. GeoRiskPH acknowledges the valuable contribution of the Geological Survey of Japan for
training the team in developing the application.

EPRMP | CHAPTER 2 ANALYSIS OF ENVIRONMENTAL IMPACTS Silica Sand Quarry Expansion Project
2-29
Table 2-7. Hazard Assessments of Direct Impact Barangays (Duangan, Lut-od, and Punod) in Pinamungajan, Cebu
Source: HazardHunterPH (https://hazardhunter.georisk.gov.ph/)
Barangay Duangan Barangay Lut-od Barangay Punod

EPRMP | CHAPTER 2 ANALYSIS OF ENVIRONMENTAL IMPACTS Silica Sand Quarry Expansion Project
2-30
Table 2-8. Hazard Assessments of Direct Impact Barangays (Guimbawian and Sibago) in Pinamungajan, Cebu
Source: HazardHunterPH (https://hazardhunter.georisk.gov.ph/)
Barangay Guimbawian Barangay Sibago

EPRMP | CHAPTER 2 ANALYSIS OF ENVIRONMENTAL IMPACTS Silica Sand Quarry Expansion Project
2-31
2.1.2.10.1 FLOODING An analysis of the flooding potential in the project site was undertaken though a review of the
topographic contours of the area hosting the project, the result shown in Figure 2-15.
As observed, a small portion, of 121 hectares or 9.02% of the MPSAs area is slightly susceptible to
flooding (F1) due to slopes 0-3%. The baseline condition of the production area is totally without risk
of flooding (F0). The larger portion of the MPSA area has mostly no susceptibility to flooding at
1,220.29 hectares representing 90.98% (F0) of total area owing to attendant slopes of 3-8% and above
which provide good drainage features.
The flooding potential in the area will not be increased with the alteration of land slope gradients. It
is part of the quarry plan to maintain the waterways and lead the drainage ways created within the
quarry site, to the settling pond before these drain toward the natural waterways.
2.1.2.10.2 RAIN-INDUCED LANDSLIDES A small portion of the MPSA 323-2010-VII lies within the flood prone zone specifically along the main
tributary of the Cabiangon River (Figure 2-15). The production area is not affected by the flooding
hazard and is mostly within low and moderate susceptibility to landslide areas. Based on the
assessments generated by Hazard Hunter PH, all direct impact barangays are moderately susceptible
to rain-induced landslides.

EPRMP | CHAPTER 2 ANALYSIS OF ENVIRONMENTAL IMPACTS Silica Sand Quarry Expansion Project
2-32
Figure 2-15. Landslide and Flood Susceptibility Map

EPRMP | CHAPTER 2 ANALYSIS OF ENVIRONMENTAL IMPACTS Silica Sand Quarry Expansion Project
2-33
2.1.2.10.3 EARTHQUAKE AND SEISMIC HAZARDS 2.1.2.10.3.1 TSUNAMIS Tsunamis are defined by the Philippine Institute of Volcanology and Seismology (PHIVOLCS) as series
of waves commonly generated by earthquakes under the sea. These waves can reach more than 5
meters in height. It can occur when earthquake is shallow-seated and strong enough to displace
seabed parts and disturb mass of water over it. Aside from under the sea earthquakes, it can also be
produced by underwater landslides, volcanic eruptions, and very rare meteorite impacts in the ocean.
Tsunamis are usually mistaken for tidal waves and storm surges. There are two types of tsunami
generation: Local Tsunami and Far Field or Distant Tsunami. The coastal areas in the Philippines
especially those facing the Pacific Ocean, South China Sea, Sulu Sea and Celebes Sea can be affected
by tsunamis that may be generated by local earthquakes. Local tsunamis are confined to coasts within
a hundred kilometers of the source usually earthquakes and a landslide or a pyroclastics flow. It can
reach the shoreline within 2 to 5 minutes. While Far Field Tsunamis are mainly coming from countries
bordering the Pacific Ocean and can travel from 1 to 24 hours before reaching the coast of nearby
countries.
Philippines is frequently visited by tsunamis. On 17 August 1976, a magnitude 7.9 earthquake in Moro
Gulf produced up to 9-meter high tsunamis which devastated the southwest coast of Mindanao and
left more than 3,000 people dead, with at least 1,000 people missing. The Mindoro Earthquake on 15
November 1994 generated tsunamis that left 49 casualties.
Figure 2-17 shows the Tsunami Prone Areas in the country. As observed, Cebu Province is prone to
offshore fault and submarine landslide related tsunamis. Figure 2-16 shows the Tsunami Hazard Map
of Pinamungajan. The Municipality of Pinamungajan may experience tsunami inundations with height
of 1 meter to 4.9 meters. The project sites in Barangay Sibago and Guimbawi-an in Pinamungajan is in
central portion which is approximately 7 to 9 kilometers away from the coasts, making it less prone as
well.

EPRMP | CHAPTER 2 ANALYSIS OF ENVIRONMENTAL IMPACTS Silica Sand Quarry Expansion Project
2-34
Figure 2-16. Tsunami Hazard Map of Pinamungajan, Cebu
Source: Philippine Institute of Volcanology and Seismology (PHIVOLCS)

EPRMP | CHAPTER 2 ANALYSIS OF ENVIRONMENTAL IMPACTS Silica Sand Quarry Expansion Project
2-35
Figure 2-17. Tsunami Prone Areas Map of the Philippines
Source: Philippine Institute of Volcanology and Seismology (PHIVOLCS)

EPRMP | CHAPTER 2 ANALYSIS OF ENVIRONMENTAL IMPACTS Silica Sand Quarry Expansion Project
2-36
2.1.2.10.3.2 GROUND RUPTURE AND GROUND SHAKING Ground rupture is the primary earthquake hazard. This is the deformation on the ground when the
fault rupture extends to the earth’s surface. The HazardHunterPH revealed that project sites in
Pinamungajan are safe from ground rupture hazards.
Ground shaking is the second earthquake hazard described as the disruptive upward and downward
movement and sideways vibrations of the ground during an earthquake. This may result to damage
and collapse of structures and may consequently cause hazards such as liquefaction and landslides.
The intensity of ground shaking depends on the magnitude of the earthquake, distance of the
epicenter, and the soil conditions of the site. Ground shaking is more intense when the earthquake’s
magnitude is high, the epicenter is near the site, and if the ground is composed of loose materials.
On 16 July 2012, a magnitude 8.2 earthquake occurred with the epicenter in Bohol. No unusual strong
ground shaking was observed in the project site. However, the PHIVOLCS (HazardHunterPH) revealed
that Pinamungajan is prone to ground shaking with intensity VII as its highest level.
The Ground Shaking Hazard Map in Figure 2-18 support the assessment produced by the PHIVOLCS.

EPRMP | CHAPTER 2 ANALYSIS OF ENVIRONMENTAL IMPACTS Silica Sand Quarry Expansion Project
2-37
Figure 2-18. Ground Shaking Hazard Map of Pinamungajan, Cebu
Source: Philippine Institute of Volcanology and Seismology (PHIVOLCS)

EPRMP | CHAPTER 2 ANALYSIS OF ENVIRONMENTAL IMPACTS Silica Sand Quarry Expansion Project
2-38
2.1.2.10.3.3 EARTHQUAKE-INDUCED LANDSLIDES Earthquake-Induced Landslide is the down slope movement of rocks, solid, and other debris as
triggered by strong shakings caused by earthquakes.
In Figure 2-19, Pinamungajan is also lowly to moderately susceptible to earthquake-induced
landslides. Barangays Duangan, Lut-od, and Guimbawian have most areas with low to moderate
susceptibility to earthquake-induced landslides as compared to Barangay Punod and Sibago with only
few areas having same susceptibility level.

EPRMP | CHAPTER 2 ANALYSIS OF ENVIRONMENTAL IMPACTS Silica Sand Quarry Expansion Project
2-39
Figure 2-19. Earthquake-induced Landslide Hazard Map of Pinamungajan, Cebu
Source: Philippine Institute of Volcanology and Seismology (PHIVOLCS)

EPRMP | CHAPTER 2 ANALYSIS OF ENVIRONMENTAL IMPACTS Silica Sand Quarry Expansion Project
2-40
2.1.2.10.3.4 LIQUEFACTION A seismic hazard phenomenon wherein sediments that are near bodies of water behave like liquid like
a quicksand. Liquefaction results to sinking or tilting of structures standing above the sediment. This
may also result to fissuring and sand boil. Figure 2-20 show that project sites in Pinamungajan are safe
from liquefaction hazard due to its distance from the coast. The host barangays are centrally located
making them less prone to the said hazard.

EPRMP | CHAPTER 2 ANALYSIS OF ENVIRONMENTAL IMPACTS Silica Sand Quarry Expansion Project
2-41
Figure 2-20. Liquefaction Hazard Map of Pinamungajan, Cebu
Source: Philippine Institute of Volcanology and Seismology (PHIVOLCS)

EPRMP | CHAPTER 2 ANALYSIS OF ENVIRONMENTAL IMPACTS Silica Sand Quarry Expansion Project
2-42
2.1.2.11 VOLCANIC HAZARDS Figure 2-21 shows the active and potential active volcanoes in the Philippines. As observed, the
nearest active volcano to San Fernando and Pinamungajan is the Mount Kanlaon. Mount Kanlaon is a
stratovolcano located in Negros Oriental, Philippines.
Based on the Volcanic Hazard Assessments in Table 2-9, Mount Kanlaon is about 58 to 60 kilometers
away from the host barangays in Pinamungajan and approximately 62 to 64 kilometers away from the
host barangays in San Fernando. The project sites are outside the Permanent Danger Zone; Hence, are
safe from lahar, lava, and pyroclastic flow. No earthquakes of volcanic origin were recorded.
Table 2-9. Volcanic Hazards Assessment of Pinamungajan, Cebu
VOLCANIC HAZARDS ASSESSMENT
BARANGAY
NEAREST ACTIVE
VOLCANO LAHAR LAVA
PYROCLASTIC
FLOW
PERMANENT
DANGER ZONE
Duangan Mount Kanlaon (56.3 km) Safe Safe Safe Outside
Lut-od Mount Kanlaon
(57.1 km)
Safe Safe Safe Outside
Guimbawian Mount Kanlaon
(58.5 km)
Safe Safe Safe Outside
Punod Mount Kanlaon (58.2 km) Safe Safe Safe Outside
Sibago Mount Kanlaon (59.7 km) Safe Safe Safe Outside
Source: HazardHunterPH (https://hazardhunter.georisk.gov.ph/)

EPRMP | CHAPTER 2 ANALYSIS OF ENVIRONMENTAL IMPACTS Silica Sand Quarry Expansion Project
2-43
Figure 2-21. Active and Potentially Active Volcanoes in the Philippines
Source: Philippine Institute of Volcanology and Seismology (PHIVOLCS)

EPRMP | CHAPTER 2 ANALYSIS OF ENVIRONMENTAL IMPACTS Silica Sand Quarry Expansion Project
2-44
2.1.2.12 MASS MOVEMENTS Mass movements refer to creeps and slides. Creep is the gradual or slow movement of a ground mass
through gravity, regardless if its rock or soil, or a combination of the two. On the other hand, Slide is
the rapid movement of ground materials as stimulated by water flow. The former may occur in gullies
that were filled during site grading activities while the latter may occur in steep slopes rendered by
cutting.
No landslides leading to any mass movement have been experienced and recorded within the SEDC
mine area in San Fernando since the beginning of the quarry operations. The project engineers claimed
that this is due to the stiff soil material of the project site. Similarly, Pinamungajan has not recorded
any mass movement incidents in the quarry area.
The proponent shall prevent potential landslides and mass movements through careful and
methodical slope excavation and by sophisticated designing of drainage, contour canals, and water
ways. The contour canals shall maintain a 2-3% vertical alignment of slope to hasten the draining
process of surface run-off towards the settling pumps and manage the infiltration of actively quarried
slopes. Naturally steep slopes will be modified and stabilized. A batter height of 5 meters with bench
width of 5 meters will reduce area susceptibility to landslide by reducing the sections with critical
slopes (more than 18% gradient).
2.1.3 PEDOLOGY Soils are critical component of landscapes and terrestrial ecosystems. It is the mixture of minerals,
organic matter, gases, liquids, and organisms that has developed over geologic time with the
interaction of climatic elements, relief (elevation, aspect or orientation, and terrain slope), biotic
activities, and parent materials (origin minerals). Over time, soils develop characteristics that are
location-specific which are associated to climate and vegetation that were acted upon by numerous
physical, chemical, and biological processes (e.g. weathering, erosion, and sedimentation).
Soil performs four important functions: 1) medium for plant growth- a means for water absorption,
storage, supply and purification; 2) modifier of atmosphere; 3) habitat for organisms that take part in
decomposition of organic matter and the creation of a habitat for new organisms, and 4) management
of which are all essential to environmental sustainability of post-mine site rehabilitation. The
interactions between the abiotic (geo-system) and the biotic (bio-system) components of ecosystems
coupled with human influence (anthropogenic/socio-economic system) produce soil in an ecosystem.
Because soil formation is a very slow process (Jenny, 1941), the soil is deemed as a non-renewable
natural resource and a fragile component of a certain ecosystems such as watersheds.
2.1.3.1 SOIL TYPES IN PINAMUNGAJAN The municipality of Pinamungajan is covered by 7 soil types as shown in Table 2-10. Almost half of the
total municipal land area is covered by the Lugo Clay which is the residual soil developed from lime
and shale. It has a characteristic of black surface soil that is thin averaging to 15 cm. deep. This soil
type is usually found in upland roughly rolling to hilly areas which is dissected by numerous gullies and
creeks. Though the soil becomes easily wet, water logging or stagnant water in the area do not exist.
Soil erosion is severe on this soil type that a greater part of the surface soil, especially along the slopes,
has been washed down. The absence of stone or rock outcrops and fine granular structure of the
surface make plowing easy, but this plowing causes the high erodibility of the soil. Lugo Clay is highly

EPRMP | CHAPTER 2 ANALYSIS OF ENVIRONMENTAL IMPACTS Silica Sand Quarry Expansion Project
2-45
suitable for sugar cane, coconut, tobacco, and banana. Banana seems to grow well when grown along
gullies.
Manduae Clay Loam is light brown to dark color depending on the amount of organic matter and
moisture content. It ranges from 25 to 30 cm in thickness. It is friable when moist, thick, sticky and
soft when wet and hard when dry. The substratum is made up of compact clay loam. The greater part
of this soil type is planted to lowland rice. The other part which is better drained is devoted to corn,
coconut, cassava, and sugar cane or fruit trees.
Beach Sand is an accumulation of wave and current erosion materials from the sea. The scarring effect
of the wave against the shores causes the rocks to peel off into fine materials. Such materials are
carried by the sea currents, which sort and grind them and later unload them along the shoreline. This
soil type is less suitable for agriculture instead it affords excellent site for habitation. The common
types of vegetation which grow in this soil type are the creeping legume vines, Bermuda grass, arena
shrubs, api-api and wild maguey. Coconut seems to be very well adapted to this soil type Vegetables
fertilized and irrigated, also may do well.
Hydrosol type is accumulation or deposit of fine silt, clay and sand forming themselves into a low delta.
This have a very poor agricultural value because of their poor drainage and high salt content. The plant
accumulation found is the mangrove type consisting of bakuan, api-api, pagatpat, tangal, langoray,
nipa palms, and lagolo.
The Faraon Clay Steep Phase is characterized to have very steep slopes as much as 100% with narrow
and sharp hill tops. This type is well-drained and is generally more elevated than Faraon Clay type. On
the other hand, the Faraon Clay type is with black soil derived from the decomposition of coralline
limestone. Water is drained more externally but internal drainage occurs as well. Due to the bulk of
water externally drained, the surface soil becomes very plastic and sticky when wet with 10-15 cm in
depth. Sugarcane and legumes grow in this soil type due to acid and alkaline reactions taking place in
the soil. However, the principal crop grown by local communities are coconut due to its commercial
importance; nevertheless, it also helps in protecting soil from erosion.
Bolinao’s Clay is clayey, red to bright red in color, with 15 to 20 cm in depth. This soil type is moderately
friable, granular when dry, slightly sticky when wet, but does not shrink or crack in open drying.
Bolinao’s Clay is rich in iron content and organic matter. Hence, can cultivate wide varieties of
economically important crops. However, coconut does not grow well in this soil type unless planted
near the seashore.
Table 2-10. Soil Types and Area Covered in Pinamungajan, Cebu
SOIL TYPE AREA IN HECTARES % TO TOTAL LAND AREA
Lugo Clay 5,793.35 49.4094
Bolinao Clay 2,253.15 19.2162
Faraon Clay Steep Phase 1,513.00 13.5413
Faraon Clay 1,122.75 9.7555
Beach Sand 459.15 3.9159
Mandaue Clay Loam 355.95 3.0357
Hydrosol 153.15 1.3062
TOTAL 11,725.25 100% Source: Pinamungajan CLUP 1996-2005

EPRMP | CHAPTER 2 ANALYSIS OF ENVIRONMENTAL IMPACTS Silica Sand Quarry Expansion Project
2-46
2.1.3.2 SOIL TYPES IN PROJECT AREA A review of information from the Bureau of Soils and Water Management indicate that the MPSAs
largely straddle areas within the “Shale/Sandstone hills”, and Major Karst”. The “Shale/sandstone” is
further divided into two slope categories namely, according to importance: a) Shale / Sandstone Hill
with Low Relief with 3-8% slope of 653.2 hectares (48.7% of MPSAs); and b) Shale / Sandstone Hills
with Low Relief having 8-18% slopes encompassing 31.42 hectares (2.34% of MPSAs). The Major karst
with slopes between 30-50% makes up 535.66 hectares (39.94% of MPSA). The other land
management unit category found within the MPSAs is the “Upper River Terrace” with slopes 0-3%
with slopes 3-8% slope comprising 121.04 hectares or 9.02% of the MPSAs.
The soil types within the low elevations in the production area belong to the Bolinao clay and Faraon
clay series associated with shale and sandstone hills and soils in higher elevations (>250 masl), are
members with association to karst parent material. The soil characteristics, as influenced by slope
aspect and the parent material are the major factor in determining the Land Management Units
(LMUs). A land management unit (LMU) is a recurring pattern of land that possesses similar physical
characteristics such as landform, parent material, slope, erosion potential, elevation, soil and surface
conditions associated with a relatively uniform land use suitability and vegetation cover.
The Project area is predominantly on low relief sandstone hill (48.7% of MPSA area) and the
production area is likewise mostly on low relief shale/sandstone hills (80% of production
areas). Inasmuch as only the production area will be inevitably changed, focus is trained on the
production area whose remaining parts are 20% steep (30-50% slope) major karst.
Table 2-11 details the land management units in the Project Area while Figure 2-22 provides a
graphical representation of the information.

EPRMP | CHAPTER 2 ANALYSIS OF ENVIRONMENTAL IMPACTS Silica Sand Quarry Expansion Project
2-47
Figure 2-22. Soil/LMU Map of Project Area
Table 2-11. Land Management Units in the Project Area
Slope
(%) LMU
MPSA 323-2010-VII MPSA 323-2010-VII TOTAL AREA %
MPSA
Area
Production
Area
MPSA
Area
Production
Area
Buffer
Zone
MPSA
Area
Production
Area
Buffer
Zone
MPSA
Area
Production
Area
Buffer
Zone
0-3 7 M - 124.9 2.2 39.6 124.9 2.2 39.6 9.1 0.90 24.0
3-8 43 N 78.7 78.7 585.9 122 54.5 664.6 200.7 54.5 48.3 86.7 33.1
8-18 43 O - - 33.1 - - 33.1 - - 2.4 0.00 0.00
18-30
44 P - - - - - - - - 0.00 0.00 0.00
30-50
49 Q 8.5 8.5 546 20 70.8 554.5 28.5 70.8 40.3 12.30 42.9
>50 88 R - - - - - - - - 0.00 0.00 0.00
Total 87.2 87.2 1,289.8 144.2 164.8 1,377.0 231.4 164.8 100 100 100 Source: Bureau of Soil and Water Management, Department of Agriculture
Legend: 07 M Upper River Terrace; 41 N- Limestone Hill, Low Relief; 43 N - Shale / Sandstone Hill, Low Relief, 43 O - Shale / Sandstone Hill,
Low Relief; 44 P - Shale / Sandstone Hill, High Relief ; 88 P - Major Karst; 49 Q -Meta-Volcanic Mountain; 88 R - Meta-Volcanic Mountain
2.1.3.3 SOIL FERTILITY Area slope, soil parent material, aspect, utilization, land use and cover all influence soil fertility level,
the major factors being the parent material, slope and land cover. Based on information from the
BSWM-DA, slightly more than half 743.2 hectares of the project area (55.4% of MPSAs) have moderate
fertility, while the remaining 598.1 hectares (44.6%) has naturally low fertility level. It can be further

EPRMP | CHAPTER 2 ANALYSIS OF ENVIRONMENTAL IMPACTS Silica Sand Quarry Expansion Project
2-48
noted that most of the Production area (201.2 ha or 87.6%) fall within the section with moderate
fertility level. Figure 2-23 shows the soil fertility map, while Table 2-12 provides details on the soil
fertility for all portions of the MPSA areas.
Table 2-12. Soil Fertility
Slope
(%) Tag 2
MPSA 323-2010-VII MPSA 323-2010-VII TOTAL AREA %
MPSA
Area
Production
Area
MPSA
Area
Production
Area
Buffer
Zone
MPSA
Area
Production
Area
Buffer
Zone
MPSA
Area
Production
Area
Buffer
Zone
3-8 Moderate
Fertility 75.8 75.8 667.4 125.4 94.8 743.2 201.2 94.8 55.4 87.6 57.1
30-
50
Low
Fertility 8.4 8.4 589.7 20 71.2 598.1 28.4 71.2 44.6 12.4 42.9
TOTAL 84.1 84.1 1257.2 145.4 166 1341.3 229.6 166 100 100 100

EPRMP | CHAPTER 2 ANALYSIS OF ENVIRONMENTAL IMPACTS Silica Sand Quarry Expansion Project
2-49
Figure 2-23. Soil Fertility Map

EPRMP | CHAPTER 2 ANALYSIS OF ENVIRONMENTAL IMPACTS Silica Sand Quarry Expansion Project
2-50
2.1.3.4 SLOPE The table below shows the Slope Categories and area covered in Pinamungajan, Cebu.
Table 2-13. Slope Categories and Area Covered in Pinamungajan, Cebu
SLOPE (%) DESCRIPTION AREA % TO TOTAL
0-3 Level to nearly level 2,040.00 17.40
3-8 Gently sloping to undulating 1,860.00 15.86
8-18 Undulating to rolling 1,215.00 10.36
18-30 Rolling to steep 1,365.00 11.64
30-50 Steep 1,935.00 16.50
50 and above Very steep 3,242.77 27.66
Built-up Area 67.50 0.58
TOTAL 11,725.27 100.00
Source: Pinamungajan CLUP 1996-2005
2.1.3.5 EROSION POTENTIAL The table below shows the erosion potential categories and area covered in Pinamungajan, Cebu.
Table 2-14. Erosion Potential Categories and Area Covered in Pinamungajan, Cebu
DESCRIPTION AREA (in has) % TO TOTAL AREA
No Erosion 2,264.20 19.31
Slightly 86.60 0.75
Moderately 525.27 4.47
Severely 8,849.20 75.47
TOTAL 11,725.27 100%
Source: Pinamungajan CLUP 1996-2005
2.1.3.6 POTENTIAL IMPACTS TO SOIL AND MITIGATION MEASURES
2.1.3.6.1 CHANGE IN SOIL FERTILITY AND PRODUCTIVITY The previous small-scale quarry operations have altered the surface soil conditions of the area. The
changes in soil conditions are because of the removal of surface materials with relatively higher
organic contents. The underlying soil which is rich in CaO and SiO2 is exposed but this is not beneficial
for plant growth. This results to decline of soil productivity.
To address this, surface soil restoration with intervention of soil conservation measures will be
performed to allow the plant growth and develop a new or re-establish a land use that is beneficial to
the local communities. It is expected that population and development pressure from Cebu City will
require the development of more areas for mixed use such as for residential purpose, food production,
forestation, and institutional structures. Areas identified for food production and agro-forestation will
be capped with one-meter thick organically enriched topsoil (through mulching, introduction and
maintenance of earthworms, and mixing with bacteria-rich soil from creeks and stream beds) to
enable these designated areas support healthy vegetation as planned. The topsoil is important in
rehabilitating quarry areas; hence, the removed topsoil during the operation will be used for
rehabilitation.

EPRMP | CHAPTER 2 ANALYSIS OF ENVIRONMENTAL IMPACTS Silica Sand Quarry Expansion Project
2-51
2.1.3.6.2 CHANGE IN SOIL CHARACTERISTICS (SLOPE, AGGREGATION, AND POROSITY) Quarrying will involve land modification of land surface topography; hence, affecting slope
characteristics of the area. Stripping of topsoil, clearing of vegetation, and quarrying may cause
accelerated erosion especially on areas with steep slopes. Land cover serves as protection from
erosion; thus, clearing and grubbing of vegetation will increase soil erosion by exposing the bare soil
to erosive agents such as run-off. The stripped topsoil is loose and highly erodible if no intervention is
applied. The exposed soil is more erodible due to low organic matter content and poor soil structure.
The removal of overburden will result to unproductive area which is not suitable for vegetative
growth. The excavation activities also compromise the soil aggregation and porosity. Movement of
trucks and large machineries is expected to lead to soil compaction causing the infiltration and
percolation rates to decline. Furthermore, as the run-off or water is unable to percolate down the soil,
it will move across the landscape as surface run-off which increases the possibility of contamination
of proximal water bodies or aquatic systems.
To minimize these projected erosion and impacts, progressive rehabilitation must be implemented
with proper soil conservation measures. Unnecessary removal of vegetation and land cover shall be
avoided. Diversion canals and water ways will be established in disturbed areas to protect them from
surface run-off. Lastly, drainage canals shall be constructed to drain “contact run-off” within the
disturbed areas.
2.1.4 TERRESTRIAL ECOLOGY
2.1.4.1 TERRESTRIAL FLORA The proposed Silica Sand Quarry Expansion is to be located at Barangays of Duangan, Guimbawian,
Lut-od, Punod, and Sibago in the Municipality of Pinamungajan.
For this study, the following were employed: (1) vegetation analysis of direct and indirect impact areas
to conduct inventory of floral species present in the area; (2) assessment and evaluation the existing
vegetation, specifically, determination of the biodiversity of the area through computation of
applicable and biodiversity indices; (3) review of publicly available information about the project (e.g.
previous EIS, monitoring reports, etc) (4) use of baseline data and review of information gathered to
determine the possible impacts the project may induce, (4) recommendation of prevention and
mitigation measures.
2.1.4.1.1 METHODOLOGY 2.1.4.1.1.1 SITE DESCRIPTION The sampling was done on June 29-30, 2019 on the direct and indirect impact areas of the proposed
project. Two (2) transects with at least three (3) plots each were established within the Project Area
and its vicinity to determine the characteristic of the existing vegetation in consideration of the site’s
forest cover, land use, and land classification.
As required in Section 1.4 of the approved Technical Scoping Checklist (TSC) for the Project dated 29
April 2019, quadrat sampling was employed for the study. Nestled plots of 10 x 10 m, 5 x 5 m, and 1 x
1 m were laid out according to the vegetation stratification (layers). The distance between sampling
plots was approximately 0.5 km depending on the accessibility and terrain of each transect.

EPRMP | CHAPTER 2 ANALYSIS OF ENVIRONMENTAL IMPACTS Silica Sand Quarry Expansion Project
2-52
The three layers in a forest or vegetation, namely: Canopy/overstorey, intermediate, and understorey/
undergrowth layers were assessed. Table 2-15 presents the criteria used for plant layer classification.
For the canopy layer, a 10 m x 10 m plot was used and trees greater than or equal to 15 cm diameter
at breast height (DBH) were measured and recorded. For the intermediate layer, a 5 m × 5 m plot was
established randomly inside the canopy plot. Shrubs and saplings were recorded inside the
intermediate plot. Lastly, a 1 m × 1 m plot for the understorey layer inside the intermediate plot was
established randomly to account for the number of species that included wildlings, herbs, vines,
grasses, and shrubs.
Table 2-15. Criteria for the Plant Classification
CLASSIFICATION DBH (cm) HEIGHT (m)
Trees ≥ 15 DBH ≥ 3
Saplings, intermediate species* < 15 DBH ≥ 1
Saplings, undergrowth species** < 15 DBH ≤ 1
Note: * Tree species and shrubs ** Wildlings of trees, herbs, shrubs, vines, and grasses
Flora species outside established plots were also documented to characterize the vegetation type of
the sampling area but not included in computations of ecological parameters. Tracks and coordinates
of the sampling stations were recorded using a handheld GPS. Geotagging of photos was also taken as
a visual reference of the site.
Table 2-16 presents the geographic coordinates of the flora sampling plots for each transect.
Meanwhile, the flora sampling map is presented in Figure 2-24.
Table 2-16. Flora Sampling Stations
TRANSECT PLOT NORTHING EASTING
1 1 N 10⁰ 16' 4" E 123⁰ 38'3"
2 N 10⁰ 16' 13" E 123⁰ 37' 45"
3 N 10⁰ 16' 27" E 123⁰ 37' 38"
4 N 10⁰ 16' 11" E 123⁰ 37' 44"
5 N 10⁰ 15' 49" E 123⁰ 38' 14"
2 1 N 10⁰ 14' 40" E 123⁰ 38' 19"
2 N 10⁰ 14' 25" E 123⁰ 38' 20"
3 N 10⁰ 14' 13" E 123⁰ 38' 10"

EPRMP | CHAPTER 2 ANALYSIS OF ENVIRONMENTAL IMPACTS Silica Sand Quarry Expansion Project
2-53
Figure 2-24. Flora Sampling Map

EPRMP | CHAPTER 2 ANALYSIS OF ENVIRONMENTAL IMPACTS Silica Sand Quarry Expansion Project
2-54
2.1.4.1.1.2 VEGETATION CHARACTERIZATION A desktop review of publicly available information was conducted to have an overview of the existing
vegetation of the Project area. Reviewed data were validated during the field assessment. Using the
results of baseline data and desktop review, vegetation cover was described, and the sites were
characterized i.e. secondary forest, grassland, and agro-ecosystem type.
Plants found in each sampling plot were identified and classified either as trees or saplings using the
criteria in Table 2-15. Species that could not be identified onsite were documented properly. Photos of
and description of morphological features of the plant were recorded and verified using available
published taxonomic literature and the National Herbarium images to identify the species.
Conservation Status
After species identification, the conservation status of each species was checked using the DENR
Department Administrative Order (DAO) 2017-11 list and the latest International Union for
Conservation of Nature (IUCN) Red List of Threatened Species (www.iucnredlist.org). Conservation
status pertains to the probability of a species to survive in the present and in the future with two major
categories: threatened and non-threatened. IUCN defined a threatened species as those that fall
under categories of either Vulnerable, Endangered, or Critically Endangered. Other categories used by
the IUCN are Near Threatened, Least Concern, and Data Deficient.
Endemism
Endemism refers to the restriction of a taxon or species to a particular geographical area of the world.
A species is classified as endemic if it is unique to a particular geographic location, i.e., province or
country. An indigenous species, on the other hand, is found elsewhere. Introduced species or exotic
species are plants that are not native in the area but are planted or cultivated.
The species recorded on the sampling sites were classified into Endemic (En), Indigenous (Ind) and
Introduced (Int) based on books and online sources (IUCN database, 2019).
Invasiveness
Invasive species are species that colonize in an area that usually outcompete the naturally growing
vegetation. Their presence may result in potential damage to the environment, human economy, or
human health.
Using the latest Global Invasive Species Database (www.iucngisd.org), species recorded in the project
site were classified as Invasive or Non-invasive.
Biodiversity Indices
The purpose of determining diversity indices is simply to have a quantitative comparison between
habitats/ecosystems. In this case, species richness and evenness are the common concepts used.
i. Species richness (n) is a number of plant species in a given area1
Species richness (n) = 𝑛𝑢𝑚𝑏𝑒𝑟 𝑜𝑓 𝑠𝑝𝑒𝑐𝑖𝑒𝑠
𝑡𝑟𝑎𝑛𝑠𝑒𝑐𝑡 𝑙𝑖𝑛𝑒
ii. Shannon diversity index (H’)
1 Wilsey, B. J. and Potvin, C. (2000), Biodiversity and Ecosystem Functioning: Importance of Species Evenness in
an Old Field. Ecology, 81: 887–892. doi:10.1890/0012-9658(2000)081[0887:BAEFIO]2.0.CO;2

EPRMP | CHAPTER 2 ANALYSIS OF ENVIRONMENTAL IMPACTS Silica Sand Quarry Expansion Project
2-55
N
in
lni
n )(H'Index Diversity
iii. Evenness (e’) refers to how well-distributed the individuals within a community over different species.
Evenness (e’) = 𝐻′
𝑙𝑛𝑙𝑛 (𝑆)
Indices for plant species diversity and evenness were classified using Fernando et al (1998) diversity relative
values categories presented in Table 2-17.
Table 2-17. Relative values for plant species diversity (Fernando et. al, 1998)
Relative values Species diversity (H’) Evenness index (e’)
Very high 3.50 – 4.00 0.75 - 1.00
High 3.00 – 3.49 0.50 – 0.74
Moderate 2.50 – 2.99 0.25 – 0.49
Low 2.00 – 2.49 0.15 – 0.24
Very low 1.99 and below 0.14 and below
Importance Value Index (IV)
Importance value (IV) index is used to determine the overall importance of each species in the
community structure. It reflects the influence a species exerts on the ecosystem. The formulas
adapted from Magurran (1988) were used to compute for the following parameters:
Population Density is the population count, density per 100 m²
Population Density (De) = 𝑡𝑜𝑡𝑎𝑙 𝑛𝑢𝑚𝑏𝑒𝑟 𝑜𝑓 𝑖𝑛𝑑𝑖𝑣𝑖𝑑𝑢𝑎𝑙𝑠 𝑓𝑟𝑜𝑚 𝑎𝑙𝑙 𝑠𝑝𝑒𝑐𝑖𝑒𝑠
100 𝑚2 𝑜𝑟 ℎ𝑒𝑐𝑡𝑎𝑟𝑒𝑠
Relative Density (RDe) = 𝑑𝑒𝑛𝑠𝑖𝑡𝑦 𝑜𝑓 𝑎 𝑠𝑝𝑒𝑐𝑖𝑒𝑠
𝑡𝑜𝑡𝑎𝑙 𝑑𝑒𝑛𝑠𝑖𝑡𝑦 𝑓𝑜𝑟 𝑎𝑙𝑙 𝑠𝑝𝑒𝑐𝑖𝑒𝑠
Frequency is the number of times the species encountered
Absolute Frequency (Fr) = (𝑁𝑜.𝑜𝑓 𝑠𝑝𝑒𝑐𝑖𝑒𝑠 𝑜𝑐𝑐𝑢𝑟𝑒𝑛𝑐𝑒 𝑖𝑛 𝑎 𝑡𝑟𝑎𝑛𝑠𝑒𝑐𝑡
𝑛𝑜.𝑜𝑓 𝑝𝑙𝑜𝑡𝑠 𝑖𝑛 𝑒𝑎𝑐ℎ 𝑡𝑟𝑎𝑛𝑠𝑒𝑐𝑡) 𝑥 100
Relative Frequency (RF) = 𝐴𝑏𝑠𝑜𝑙𝑢𝑡𝑒 𝑓𝑟𝑒𝑞𝑢𝑒𝑛𝑐𝑦 𝑜𝑓 𝑎 𝑠𝑝𝑒𝑐𝑖𝑒𝑠
𝑇𝑜𝑡𝑎𝑙 𝑓𝑟𝑒𝑞𝑢𝑒𝑛𝑐𝑦 𝑓𝑜𝑟 𝑎𝑙𝑙 𝑠𝑝𝑒𝑐𝑖𝑒𝑠
Species Dominance is the coverage/basal area of a species
Species Dominance (Do) = 0.7854 (𝐷𝐵𝐻 𝑖𝑛 𝑐𝑚2𝑜𝑟 𝑏𝑎𝑠𝑎𝑙 𝑎𝑟𝑒𝑎)
Relative Dominance (RDo) = (𝑑𝑜𝑚𝑖𝑛𝑎𝑛𝑐𝑒 𝑜𝑓 𝑎 𝑠𝑝𝑒𝑐𝑖𝑒𝑠
𝑑𝑜𝑚𝑖𝑛𝑎𝑛𝑐𝑒 𝑣𝑎𝑙𝑢𝑒 𝑓𝑜𝑟 𝑎𝑙𝑙 𝑠𝑝𝑒𝑐𝑖𝑒𝑠) 𝑥 100
Importance Value
Importance Value IV = RDe + RF + RDo
2.1.4.1.2 RESULTS 2.1.4.1.2.1 EXISTING VEGETATION The proposed Silica Sand Quarry Project is located in Barangays Lut-od, Punod, and Duangan in the
Municipality of Pinamungajan. Based on the Land Cover Map of Pinamungajan, Cebu (Figure 2-25),

EPRMP | CHAPTER 2 ANALYSIS OF ENVIRONMENTAL IMPACTS Silica Sand Quarry Expansion Project
2-56
the project area is composed of perennial crop and shrubland. This has been confirmed during field
sampling as agro-ecosystem, composed of both annual and perennial crop, was observed in most of
the project area. Shrub areas were also observed within the steep area and near the river system.
Complete photo documentation of the project area is presented in the following discussions.
Plate 2-1. Transect 1 Photos
Transect 1 is a direct impact area traversing the quarry area and its adjacent vegetation. In general, the ecosystem in this area can be described as agro-ecosystem. Planted mangoes (Mangifera indica), coconut (Cocos nucifera) and farmland of banana (Musa sp.) were recorded. Communities or local settlement were also present in the project site hence agricultural activities are common. The quarry area was already stripped of vegetation but patches of Auri (Acacia auriculiformis) were still recorded.
Plate 2-2. Transect 2 Photos
Transect 2 is an indirect impact area with agro-ecosystem. It is located south of the project area. Perennial crops such as banana and coconut were common in this area. Planting of annual crops such as maize and cassava were also recorded.

EPRMP | CHAPTER 2 ANALYSIS OF ENVIRONMENTAL IMPACTS Silica Sand Quarry Expansion Project
2-57
Figure 2-25. Land Cover Map Showing Flora Sampling Stations

EPRMP | CHAPTER 2 ANALYSIS OF ENVIRONMENTAL IMPACTS Silica Sand Quarry Expansion Project
2-58
Floral Taxonomy
There are at least 442 individuals recorded during the field assessment, 43 species belong to 38 genera
under 27 families (Table 2-18). Most of the species recorded belong to Family MORACEAE (16.3% of
the total number of species) which mostly consist of genus Ficus. It was followed by EUPHORBIACEAE
and MYRTACEAE (9.3% and 7.0%, respectively, of the total number of species) that mainly composed
of trees (Figure 2-26). A complete list of species recorded within established transects in the project
area is presented in Appendix A.
Table 2-18. Taxa Richness
Category Count
Individuals 442
Species 43
Genus 38
Family 27
Figure 2-26. Family distribution of flora species recorded
Habit
Among the plant habit groups, trees have the largest percentage with 81.4% of the total observed
species in the sampling sites. These trees, however, do not necessarily have 15 cm and above DBH,
rather some are at the sapling and seedling stage that were observed within the understorey and
intermediate layer. Another plant group with a large number of individuals are herbs (21.3%) which
are mainly composed of groundcover.

EPRMP | CHAPTER 2 ANALYSIS OF ENVIRONMENTAL IMPACTS Silica Sand Quarry Expansion Project
2-59
Figure 2-27. Plant habit
2.1.4.1.2.2 EXISTENCE OF IMPORTANT LOCAL SPECIES Majority or 57.5% of the total species in the project area are indigenous while 35% is comprised of
exotic or introduced species. Antipolo (Artocarpus blancoi), is-is (Ficus ulmifolia) and toog
(Petersianthus quadrialatus Merr.) were the only endemic species (7.5%) out of the total 43 species
recorded in the project area. Antipolo is widespread across the country in the lowland seasonal forest
and thicket. Fruits and seeds of this species are traditionally cooked and eaten. Is-is is a shrub to small
tree species distributed in different provinces in the country. The puberulous leaves of this species are
very hard and rough commonly used for cleaning cooking utensils and scouring hardwood floors,
stairs, windowsills as an alternative to sandpaper2. Toog, however, abounds in Agusan, Surigao, Davao
del Norte, Leyte, Samar, Negros and Masbate and fairly common and scattered in primary rainforests,
near riverbanks or on the hillside, in swampy and cool places. Toog, or the Philippine rosewood, is
known for its high-quality wood3.
2 http://www.tropical.theferns.info/viewtropical.php?id=Ficus+ulmifolia
3 Florido, H (2004). Research Information Series on Ecosystems, Vol 16 Jan-Apr 2004. Retrieved June
16, 2017 from erdb.denr.gov.ph/files/publications/rise/r_v16n1.pdf

EPRMP | CHAPTER 2 ANALYSIS OF ENVIRONMENTAL IMPACTS Silica Sand Quarry Expansion Project
2-60
Figure 2-28. Ecological distribution of flora species recorded
Conservation Status
Three (3) threatened species that were recorded in the sampling sites fall under the “vulnerable”
category of IUCN Red List of Threatened Species: Antipolo (Artocarpus blancoi) in transect 1, Is-is (Ficus
ulmifolia) in transect 2 and Mahogany (Swietenia macrophylla) in all transects. All three species are
widespread across the country. Antipolo fruits and seeds, as mentioned earlier, are being eaten and
cooked while Mahogany is a priced wood for their wood quality. Mahogany is an introduced plantation
species being used also as reforestation species by the government. No species was recorded as
threatened based on DAO 2017-11 or the Updated National List of Threatened Philippine Plants and
Their Categories.
Table 2-19. List of threatened species recorded within the project area and its vicinity
Scientific Name Common
Name Family Name
Conservation Status Transect
IUCN Red List DAO 2017-11
Artocarpus blancoi Antipolo MORACEAE Vulnerable - 1
Swietenia macrophylla Mahogany MELIACEAE Vulnerable - 1,2
Ficus ulmifolia Is-is MORACEAE Vulnerable - 2
Invasive Species
Seven (7) species found on the project site were classified as invasive by the IUCN- Global Invasive
Species Database (IUCN-GISD) as presented in Table 2-20. Invasive species were present in all transects
established. Transect 1 has the most number of invasive species present. Guava (Psidium guajava)
were found in all four transects.
Table 2-20. List of invasive species recorded in the project area
Scientific Name Family Common Name Count Transect
Acacia mangium Willd. MIMOSACEAE Mangium 1 1

EPRMP | CHAPTER 2 ANALYSIS OF ENVIRONMENTAL IMPACTS Silica Sand Quarry Expansion Project
2-61
Scientific Name Family Common Name Count Transect
Leucaena leucocephala (Lam) de Witt
MIMOSACEAE Sablot 9 1
Litsea glutinosa (Lour.) C.B. Rob. LAURACEAE Binunga 1 1
Melia azedarach L. MELIACEAE Bagalunga 2 1
Psidium guajava L. MYRTACEAE Guava/ Bayabas 15 1,2
Ricinus communis EUPHORBIACEAE Castor plant 2 2
Spathodea campanulata Beauv. BIGNONIACEAE African tulip 1 2
2.1.4.1.2.3 ECOLOGICAL PARAMETERS AND DIVERSITY INDICES Diversity and Indices Based on Fernando et al (1998) relative measure of diversity scale, the diversity of the Project site
ranges from very low to moderate (H’=1.127 – 2.854) as presented in Figure 2-29.
Overstorey layer ranged from H’=2.533 – 2.854, intermediate layer H’=2.308 to 2.637, understorey
H’=1.127 to 2.254. The low flora diversity values may be primarily affected by land use, which is mostly
agro-ecosystem as well as the presence of invasive plant species. Vila et al (2011) stated that invasive
species can reduce the local plant species diversity4 of an area. Prolonged dry season this year may
also have contributed to the low diversity of plant, especially on the undergrowth layer that has
shallow roots and can be easily affected by the dry season.
Species evenness (e‘) recorded in four transects is found to have very high (0.813 to 0.979) evenness.
High values of evenness indicate that the flora species are well distributed in the area.
4 Vilà, M., Espinar, J. L., Hejda, M., Hulme, P. E., Jarošík, V., Maron, J. L., Pergl, J., Schaffner, U., Sun, Y.
and Pyšek, P. (2011), Ecological impacts of invasive alien plants: a meta-analysis of their effects on
species, communities and ecosystems. Ecology Letters, 14: 702–708. doi:10.1111/j.1461-
0248.2011.01628.x

EPRMP | CHAPTER 2 ANALYSIS OF ENVIRONMENTAL IMPACTS Silica Sand Quarry Expansion Project
2-62
Figure 2-29. Diversity indices
Importance Value (IV)
Importance value (IV) index is used to determine the overall importance of each species in the
community structure. It reflects the influence a species exerts on the ecosystem. It takes into account
the density, frequency, and basal area for the overstorey layer (Curtis, 1959). The intermediate and
undergrowth layers only require density and frequency. List of species with highest recorded IV is
presented in Table 2-21.
Most of the dominant species recorded are agroforestry plants that are being cultivated in the area.
Banana (Musa sp.) and Mahogany were the dominant overstorey species in transects 1 and 2,
respectively. For the intermediate layer, pioneer forest species such as subiang (Bridelia sp.) and
paguringon (Cratoxylum sumatranum (Jack) Blume), were the dominant intermediate species.
Undergrowth species such as Hauili (Ficus septica Burm.f.), and malunggay (Moringa oleifera Lam.)
were the dominant species.
Table 2-21. List of species with highest IV within established transects
Transect/
Layer Family Scientific name
Common
name IV
T1 (10x10) MUSACEAE Musa sp. Banana 67.5
T1 (5x5) PHYLLANTHACEAE Bridelia sp. Subiang 26.7
T1 (1x1) MORACEAE Ficus septica Burm.f. var. septica Hauili 33.3
T1 (1x1) MORINGACEAE Moringa oleifera Lam. Malunggai 33.3
T2 (10x10) MELIACEAE Swietenia mahogani (L.) jacq. Mahogany 91.5
T2 (5x5) CLUSIACEAE Cratoxylum sumatranum (Jack) Paguringon 31.6

EPRMP | CHAPTER 2 ANALYSIS OF ENVIRONMENTAL IMPACTS Silica Sand Quarry Expansion Project
2-63
Transect/
Layer Family Scientific name
Common
name IV
Blume
T2 (1x1) MORACEAE Ficus septica Burm.f. var. septica Hauili 90.0
2.1.4.1.2.4 BIODIVERSITY PERFORMANCE Results of 2019 flora assessment recorded a decrease in terms of the number of species as compared
to March 2016 EIS. Similarly, the number of recorded endemic species and threatened species also
decreased. This can be attributed to the method employed, level of effort, season and location of
sampling activities and disturbances occurred in the area. The 2019 flora sampling used the TSC
required method (quadrat sampling) with two transects established.
Diversity values, on the other hand, cannot be compared as the previous study was presented on a
transect basis while the latest results were presented on forest layer basis in each transect.
Dominant species in 2017 and 2019 flora sampling were both agroforestry species suggesting that the
project area maintained the land cover with dominantly production area or agro-ecosystem.
Table 2-22. Performance of biodiversity within impact areas
Parameters March 2016 July 2019
Taxa Richness • 176 species
• 442 individuals
• 43 species
• 38genera
• 27 families
Endemism • Anubing (Artocarpus ovatus Blanco)
• Pugahan (Caryota cumingii Lodd.)
• Takipan (Caryota rumphiana C
Martius)
• Is is (Ficus ulmifolia Lamk)
• Mali-mali (Leea guineensis G. Don)
• Hamindang (Macaranga bicolor
Muell.-Arg.)
Toog (Petersianthus quadrialatus
Merr.)
• Bayag-usa (Voacanga globosa
(Blanco) Merr.)
• Salagong (Wikstroemia lanceolata
Merr.)
• Is is (Ficus ulmifolia Lamk)
• Antipolo (Artocarpus blancoi)
• Toog (Petersianthus
quadrialatus)
Threatened
species
• Hamindang (Macaranga bicolor
Muell.-Arg.)
• Is is (Ficus ulmifolia Lamk)
• Molave (Vitex parviflora Juss.)
• Banuyo (Wallaceodendron
celebicum Koord.)
• Narra (Pterocarpus indicus)
• Antipolo (Artocarpus blancoi)
• Antipolo (Artocarpus blancoi)
• Mahogany (Swietenia
macrophylla)
• Is is (Ficus ulmifolia Lamk)

EPRMP | CHAPTER 2 ANALYSIS OF ENVIRONMENTAL IMPACTS Silica Sand Quarry Expansion Project
2-64
Parameters March 2016 July 2019
Dominant plant
habit
Trees (48.8%) and Herbs (14.7%) Trees (81.4%) and Herbs (9.3%)
Diversity indices High to Very High Very Low to Moderate
Evenness Very high Very High
Importance value • Niog (Cocos nucifera)
• Bayabas (Psidium guajava)
• Balat buaia (Fagraea racemosa Jack
ex Wall.)
Overstorey:
• Mahogany (Swietenia
macrophylla) and Banana
(Musa sp.)
Intermediate:
● Subiang (Bridelia sp) and
paguringon (Cratoxylum
sumatranum (Jack) Blume)
Undergrowth:
● Hauili (Ficus septica Burm.f.
var. septica)
2.1.4.2 TERRESTRIAL FAUNA
2.1.4.2.1 METHODOLOGY Available secondary data on fauna species within and nearby the project site were reviewed to initially
determine and characterize the fauna assemblage likely to be recorded on site. Google earth and
actual site reconnaissance were conducted to determine strategic sampling sites for the fauna
assessment vis-a-vis the location of proposed developments. Primary sampling was conducted on 29
June to 02 July 2019.
2.1.4.2.1.1 SAMPLING SITES Geographically, the project is located in the central part of Cebu Island, which covers parts of three
barangays namely Lut-od, Punod, Guimbawian, Sibago, and Duangan within the Municipality of San
Fernando, Province of Cebu. The coordinates of the transects surveyed in the 2016 EIA was not
available in the EIS and were not surveyed in this study. Hence, two new transects were established
to assess the existing fauna assemblage within the direct and indirect impact areas (Table 2-23).
Indicative location of the sampling sites is presented in Figure 2-30.

EPRMP | CHAPTER 2 ANALYSIS OF ENVIRONMENTAL IMPACTS Silica Sand Quarry Expansion Project
2-65
Table 2-23. Fauna Transect locations
Transect Coordinates Locality Description Photo
T1 10.263611° N, 123.637222° E
10.275210° N, 123.625600° E
Barangays Lut-od and Punod, Pinamungajan, Cebu
This is the direct impact area characterized by an agro-ecosystem, which is mostly coconut, banana, and mango farms.
T2 10.247171° N, 123.646305° E
10.247147° N, 123.654758° E
Barangay Sibago, Pinamungajan, Cebu
This is an indirect impact area characterized by perennial crops (i.e. coconut, banana) intercropped with annual crops (i.e. corn).

EPRMP | CHAPTER 2 ANALYSIS OF ENVIRONMENTAL IMPACTS Silica Sand Quarry Expansion Project
2-66
Figure 2-30. Fauna Sampling Map

EPRMP | CHAPTER 2 ANALYSIS OF ENVIRONMENTAL IMPACTS Silica Sand Quarry Expansion Project
2-67
2.1.4.2.1.2 SAMPLING METHODS Transect surveys were conducted to assess the fauna assemblage within the project site particularly
birds and other fauna groups. Transects were established along access roads and trails in areas were
fauna especially birds are likely to aggregate. All birds seen and/or heard were listed, counted and
identified to lowest possible taxa. Opportunistic species listing was also implemented to record other
fauna groups such as mammals, amphibians, and reptiles during the survey period.
Meanwhile, mist nets and traps for birds and mammals were set in possible routes, passage, and
flyways. These were left overnight and retrieved for trapped individuals early the following morning.
Species were identified to lowest possible taxa, photo-documented and then released back in the wild
(if any).
Additional information on the fauna assemblage within the project site was collected through
interview with the locals.
2.1.4.2.1.3 CONSERVATION STATUS The conservation status of each species recorded during the fauna assessment was determined using
the Department of Environment and Natural Resources (DENR) DAO 2004-15 National List of
Threatened Fauna Species and their Categories, International Union for the Conservation of Nature
(IUCN) Red List of Threatened Species, and the Convention on International Trade in Endangered
Species of Wild Fauna and Flora (CITES) Appendices.
2.1.4.2.2 RESULTS 2.1.4.2.2.1 EXISTING CONDITION A total of 41 fauna species was recorded during the fauna survey. It is composed of 34 birds; four
mammals, and three herpetofauna (amphibians and reptiles) see Figure 2-31. Appendix B lists the
fauna species recorded during the fauna survey.
Figure 2-31. Percent composition of fauna groups recorded during the survey
In terms of distribution, most of the species recorded are resident/native (27) to the Philippines
followed by endemic (11), introduced (2) and the least by migrant (1), see Figure 2-32. Resident/native
species are common, widespread, and naturally distributed in the Philippines and other countries.
Endemics are species that can only be found within the Philippines. Introduced are species not
naturally distributed in the Philippines but were deliberately or inadvertently brought to the

EPRMP | CHAPTER 2 ANALYSIS OF ENVIRONMENTAL IMPACTS Silica Sand Quarry Expansion Project
2-68
Philippines while migrants are species that travel across long-distance during certain times of the year
in response to seasonal changes from its place origin.
It was expected that resident/native species would dominate the list since these species are
widespread and are adapted to a wide range of habitats from forests to disturbed habitats. Unlike
resident/native species, endemics are species with limited distribution and usually have certain
ecological requirements for survival. The presence of endemic species on-site indicates the availability
of suitable habitats. This may also indicate minimal or insignificant impact of the project operation to
fauna species. Introduced species indicate the presence of human settlements and anthropogenic
activities. A migrant species was recorded despite that the survey was conducted during off-migration
season because the recorded migrant species has resident populations in the Philippines.
Figure 2-32. Distribution of fauna species recorded during the survey
Birds
Thirty-four (34) bird species was recorded during the fauna survey. This is the most represented fauna
group when compared with mammals and herpetofauna since they are the most conspicuous group.
As expected, majority of the birds recorded are resident (23) followed by endemic (9), and the least
by introduced and migrant with one species each (Figure 2-33). High abundance of resident species
reflects their widespread distribution and capability to occupy a wide range of habitats. Presence and
abundance of endemic species indicates the availability of suitable habitats that cater the ecological
requirements of these species despite the project operation. The presence of introduced species is
expected due to the existence of human settlements and anthropogenic disturbances. In addition, the
migrant species recorded has resident populations in the country hence it was recorded although the
survey was during off migration season.
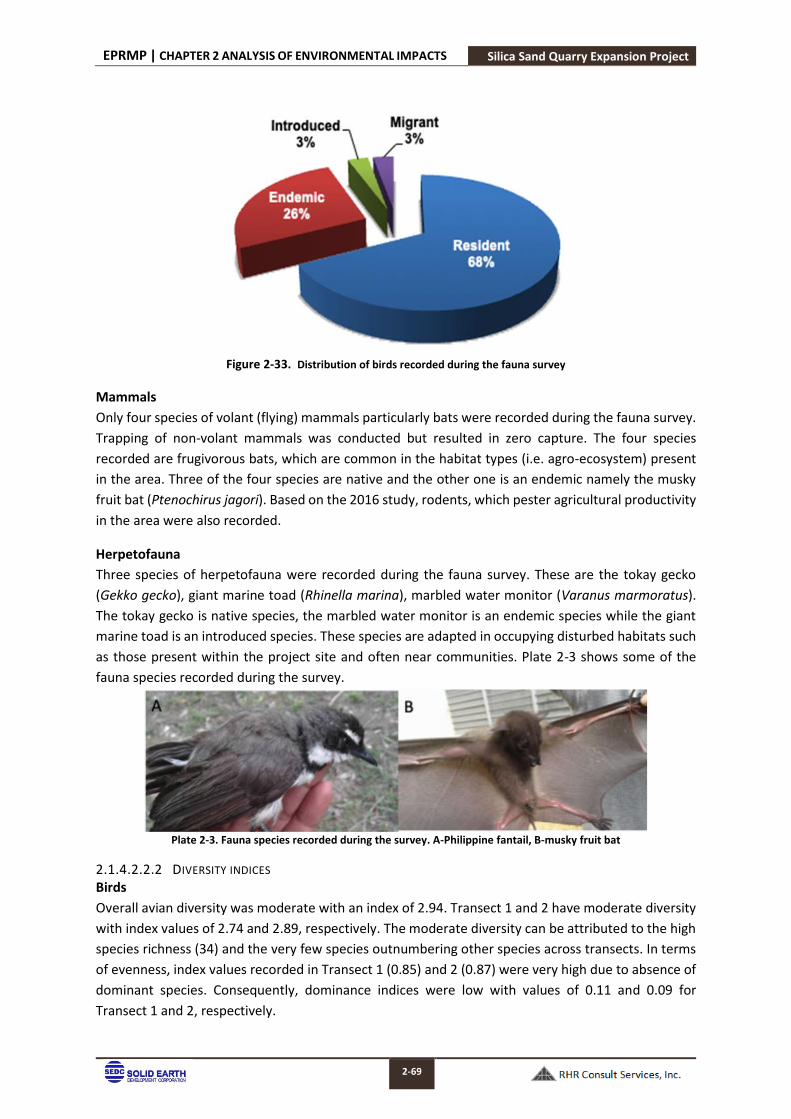
EPRMP | CHAPTER 2 ANALYSIS OF ENVIRONMENTAL IMPACTS Silica Sand Quarry Expansion Project
2-69
Figure 2-33. Distribution of birds recorded during the fauna survey
Mammals
Only four species of volant (flying) mammals particularly bats were recorded during the fauna survey.
Trapping of non-volant mammals was conducted but resulted in zero capture. The four species
recorded are frugivorous bats, which are common in the habitat types (i.e. agro-ecosystem) present
in the area. Three of the four species are native and the other one is an endemic namely the musky
fruit bat (Ptenochirus jagori). Based on the 2016 study, rodents, which pester agricultural productivity
in the area were also recorded.
Herpetofauna
Three species of herpetofauna were recorded during the fauna survey. These are the tokay gecko
(Gekko gecko), giant marine toad (Rhinella marina), marbled water monitor (Varanus marmoratus).
The tokay gecko is native species, the marbled water monitor is an endemic species while the giant
marine toad is an introduced species. These species are adapted in occupying disturbed habitats such
as those present within the project site and often near communities. Plate 2-3 shows some of the
fauna species recorded during the survey.
Plate 2-3. Fauna species recorded during the survey. A-Philippine fantail, B-musky fruit bat
2.1.4.2.2.2 DIVERSITY INDICES Birds
Overall avian diversity was moderate with an index of 2.94. Transect 1 and 2 have moderate diversity
with index values of 2.74 and 2.89, respectively. The moderate diversity can be attributed to the high
species richness (34) and the very few species outnumbering other species across transects. In terms
of evenness, index values recorded in Transect 1 (0.85) and 2 (0.87) were very high due to absence of
dominant species. Consequently, dominance indices were low with values of 0.11 and 0.09 for
Transect 1 and 2, respectively.

EPRMP | CHAPTER 2 ANALYSIS OF ENVIRONMENTAL IMPACTS Silica Sand Quarry Expansion Project
2-70
Mammals
There were only four mammalian species recorded during the fauna survey, which reflects very low
diversity. With the disturbed conditions and the agro-ecosystem habitat in the area, it is expected that
there would be low mammalian diversity. Only common and disturbance-resilient species such as
those recorded during the fauna survey will thrive.
Herpetofauna
Only three herpetofauna species was recorded during the fauna survey, which may indicate low
diversity. The low species richness recorded during the survey could just be due to seasonal
conditions. It should be noted that potential habitats (i.e. swamps, rivers, streams) for herpetofauna
were dry during the survey. Sampling during the wet season may result to relatively higher species
diversity.
2.1.4.2.2.3 SPECIES OF CONSERVATION IMPORTANCE There are two noteworthy species recorded during the fauna survey namely, the brahminy kite
(Haliastur indus) and the marbled water monitor (Varanus marmoratus). These species were assessed
as least concern under the IUCN Red List of Threatened Species but were listed under Appendix II of
the CITES which qualifies them to be categorized as Endangered species under the DENR DAO 2004-
15 or also known as the list of terrestrial threatened species and their categories, and the list of other
wildlife species. Both species are threatened by hunting for sports or as food to locals and pet trade.
2.1.4.2.2.4 HISTORICAL OCCURRENCE OF FIRE OR PEST INFESTATION No major forest/grass fire occurrence and/or pest infestation was recorded on site.
2.1.4.2.2.5 COMPARISON OF FAUNA DATA ON THE 2016 EIS AND 2019 STUDY The coordinates of the transects surveyed during the 2016 EIA were not available in the EIS hence,
these transects were not covered in the 2019 study. This limits comparability of the two data. A total
of 52 fauna species was recorded in 2016 while only 41 species was recorded on the 2019 study. The
difference in species richness can be attributed to different transects surveyed for each sampling
period, drier conditions in rivers/streams in the 2019 study which limited the record of herpetofauna,
and observer bias. Nevertheless, species composition in the 2016 study is almost similar with the 2019
study. A notable mention in the 2016 study is the record of a tortoise wherein fact that there is no
naturally occurring population of tortoise in the Philippines. It could be a terrestrial turtle likely the
Southeast Asian box turtle (Cuora amboinensis). Endemic and threatened species remain present on
site despite the operation of the project indicating insignificant impact of the project to fauna
assemblage on site.
In terms of diversity, birds recorded in the 2016 study was highly diverse with an index value of 3.05
while a moderate diversity was recorded in the 2019 study with an index value of 2.94. Difference in
diversity indices can be due to the abundance of several species, which outnumbers other birds during
the 2019 study. In other words, bird populations are more evenly distributed during the 2016 study
and/or a result of observer bias.
2.1.4.3 IMPACTS AND MITIGATION MEASURES The proposed expansion only involves an increase in production rate and no additional footprint is
expected other than those project components detailed in the 2016 EIS. Impacts identified in the 2016
EIS were vegetation removal, loss of habitat, threat to existence. This study showed that the flora

EPRMP | CHAPTER 2 ANALYSIS OF ENVIRONMENTAL IMPACTS Silica Sand Quarry Expansion Project
2-71
species and land cover of the project were still agro-ecosystem. The fauna assemblage on-site and
that species were minimally or insignificantly affected by the operations of the project, which can be
due to effective mitigation measures in place. SEDC should continue to implement the following
measures as suggested in the 2016 EIS to conserve fauna species in the area:
• Securing of Tree Cutting Permit prior to the cutting of any affected trees and use of a DENR-
Permitted Chain Saw from the Community Environment and Natural Resources Office in charge
of Pinamungajan Municipality located in Argao Municipality.
• Save as much as practicable young trees by earth balling, transplanting and nurturing them to
the designated reforestation zones in higher elevations at the perimeter of the quarry area
• Develop and Protect portions of the Buffer zone and areas feasible in terms of poor mineral
content with well-preserved vegetative cover will be converted into a nature park, a gene bank
for important local plant species, as a habitat for wildlife and ecotourism area useful for
educational tours to showcase how responsible mining and environmental protection with the
support of the Barangay Government Unit.
• Rehabilitate the banks of the Banban creek outside of the MPSA area by replanting the area with
appropriate bamboo species, and conduct regular maintenance activities until the bamboo plants
have grown and stabilized
• Whenever possible, wildlings of endangered, vulnerable and threatened endemic flora will be
collected from the site, carefully transferred to the nursery, and maintained to become genetic
stock for the propagation of planting materials that will be replanted into areas needing land
rehabilitation
• Avoidance/minimization of unnecessary clearing of fauna habitats especially vegetated areas
• Forest and habitat protection/enhancement through tree planting
• Maintenance of nursery as a source of seedlings for reforestation
• Establishment and maintenance of buffer zones as a refuge for fauna species
• Prohibition on hunting, gathering, and buying of wildlife resources
• Wildlife rescue particularly on endangered, vulnerable and threatened species
• Establishment/maintenance of permanent transects for impact monitoring and eco-tourism
purposes
• Implementation of speed limits
• Conduct Information, Education, and Communication (IEC) programs focusing on biodiversity
value and conservation

EPRMP | CHAPTER 2 ANALYSIS OF ENVIRONMENTAL IMPACTS Silica Sand Quarry Expansion Project
2-72
2.2 WATER
2.2.1 HYDROLOGY AND HYDROGEOLOGY The Project site is located at the headwaters of 3 rivers which drain westward toward the Tañon Strait.
The watersheds straddled by the project area with waters flowing into the Tañon Strait are the
Banban, Cabiangon and Mangoto watersheds. The Cabiangon watershed is the biggest watershed in
the project area with a total catchment area of 66.98 km2 (6,698 hectares) followed by the Banban
watershed with 15.07 km2 (1,507 hectares), and the Mangoto watershed with 23.86 km2 (2,386
hectares). Much of the Project site (MPSA 314-2010-VII and MPSA 323-2010-VII) are located in the
headwaters of the Cabiangon river (505.2 km2) which drain 37.6% of total MPSA area. The next largest
watershed within the MPSA is drained by the Mangoto River (437.9 hectares or 32.6% of total project
area). Figure 2-34 contains the watershed catchment map of MPSA 314-2010-VII and MPSA 323-2010-
VII.
The watersheds of Cabiangon, Mangoto and Banban Rivers are all elongated in shape with Westward
direction, and all drains into the Tañon Strait at the shores of the Municipality of Pinamungajan.
Furthermore, the Cabiangon River is the longer of the two other natural drainages. The Cabiangon and
Mangoto rivers start at the highlands of San Fernando municipality and flow for about ten kilometers
westward toward Tañon Straight thru the municipality of Pinamungajan. The Banban River originates
in Pinamungajan, with dendritic tributaries from within this Municipality, extending westward and
drains also to Tañon Straight about seven (7) kilometers from the production site.
Approximately seventy four percent (74.4%) of production site or about 1.62 km2 is located in 2
Banban sub catchments, occupying 10.8%% of the total watershed area. The remaining portion of the
Production Area (0.557km2 or 55.7 hectares or 25.6%) is found in the watershed of Cabiangon River.
About 120.6 hectares (74.5%) of the quarry area is located in two sub catchments of the Banban River.
This sub catchment has two sections, A and B (Table 2-24) with area of 20.77 hectares and 99.84
hectares respectively. The remaining portion of the quarry area (41.3 hectares or 25.5%) is located
within a sub catchment of the Cabiangon River. Details of the watersheds and proportion of the MPSA
Area, the Production area and the Quarry Area within these catchments and sub catchments are found
in Table 2-24. Figure 2-34 to Figure 2-35 are maps showing the watershed boundaries of the
watershed catchments around the MPSA areas, the surface water flow directions in watersheds
hosting the MPSA and the surface flow directions in the quarry area, respectively.
Table 2-24. Watersheds in the Project Area
Name of River
Watershed Catchment Affected by MPSA
Sub catchments Affected by Production and Quarry Area
Watershed Number
Total Watershed Area (has)
Sub
catchment No.
Sub
catchment
Total Area
(has)
% Sub
catchment
in Total
Watershed
Production
Area in Sub
catchment
(has)
%
Production Area
Quarry
Area in
Sub
catchment
(has)
%
Quarry
Area
Banban River
1 1,507 1A 396.7 26.3 22.7 10.4 20.77 12.8
1 1,507 1B 617.9 41.0 139.4 64.0 99.84 61.7
Cabiangon
River 2 6,698 2 774.0 11.6 55.7 25.6 41.30 25.5
Mangoto 3 2,386 None None NA NA NA NA NA

EPRMP | CHAPTER 2 ANALYSIS OF ENVIRONMENTAL IMPACTS Silica Sand Quarry Expansion Project
2-73
Name of River
Watershed Catchment Affected by MPSA
Sub catchments Affected by Production and Quarry Area
Watershed Number
Total Watershed Area (has)
Sub
catchment No.
Sub
catchment
Total Area
(has)
% Sub
catchment
in Total
Watershed
Production
Area in Sub
catchment
(has)
%
Production Area
Quarry
Area in
Sub
catchment
(has)
%
Quarry
Area
River Data source: measurements from NAMRIA topographic map 1:50,000
2.2.1.1 WATER RESOURCES
2.2.1.1.1 SPRING INVENTORY No springs were found within the proposed quarry area.
2.2.1.1.2 WELLS An inventory of springs and wells in Pinamungajan from LGU data was undertaken and it was found
that there is no private or public well within the quarry zone (Silica Sand Quarry Project EIS, 2016). A
review of the data on wells, springs and any other note-worthy water resources in Pinamungajan,
Cebu from the National Water Resources Board NWRB (see Annex 9) indicated that a lone well is
registered in NWRB in Pinamungajan and the location is outside of the MPSA. The NWRB well data
summary indicates twenty eight (28) wells existed in Pinamungajan ( 1982), mostly located in the
lower elevations along the coastal corridor with average static water level of a little over eighteen
(18.57) meters below ground surface. Random interviews with residents near and within the
production area revealed that while water supply is not abundant in Pinamungajan, water available
from artisan and deep wells are sufficient for household needs. The SEDC personnel declared that
there are no wells within the production area; the wells used by the populace are outside of the
boundary of MPSA 314 and 323.

EPRMP | CHAPTER 2 ANALYSIS OF ENVIRONMENTAL IMPACTS Silica Sand Quarry Expansion Project
2-74
Figure 2-34. Major Watershed in the Project Area

EPRMP | CHAPTER 2 ANALYSIS OF ENVIRONMENTAL IMPACTS Silica Sand Quarry Expansion Project
2-75
Figure 2-35. Subwatershed Catchments and Surface Drainage Direction in the Project MPSA

EPRMP | CHAPTER 2 ANALYSIS OF ENVIRONMENTAL IMPACTS Silica Sand Quarry Expansion Project
2-76
2.2.1.1.3 GROUND WATER RESOURCES The production area is within sub catchment A of Banban Watershed (Figure 2-35). The ground water
resources of catchment A of Banban Watershed is ample. Banban watershed also hosts the proposed
natural water source. The ground water recharge of catchment A of Banban watershed is estimated
in Table 2-25 using the Soil Moisture Balance approach.
Table 2-25. Estimation of Annual Ground Water Recharge Potential of Subcatchment A of Cabiangon Watershed
Recharge Values
a. Rainfall
Annual Precipitation (R) 1.5645
Precipitation Coef. (p) 0.75
Infiltration Coef. (N) 0.25
Catchment (A, m2) 4,615,000.00
Recharge from rainfall (Qr) 1,353,781.41
b. River Seepage 1,353,781.41
Annual Precipitation (R) 1.5645
Infiltration coef. (i) 0.55
Infiltration Volume/unit length (q) 0.860475
River length (l) 2,785.00
Wet day per year (t) 146
River Seepage (Qrv) 349,877.74
TOTAL ANNUAL RECHARGE (mt) 1,703,659.15
While the recharge potential of subcatchment A of Banban watershed is considerable, much of this
resource is not readily accessible to the population in the host community. The ground water
resources are largely accessed through wells and springs in lower elevations because of poor aquifer
underlying much of the island of Cebu.
2.2.1.1.4 COMPUTATION OF PEAK RUN OFF VOLUME Peak run-off volume in Banban catchment area and in the quarry area is roughly estimated to derive
reference in deciding on the quarry drainage design to enable project facilities detain a reasonable
degree of sediment-laden run-off from in extreme climate, allow sufficient residence time the larger
portion of storm drain as a measure in managing quarry discharge water quality. The Rational Method
was used in calculating peak run-off using extreme climate data in Table 2-31.
The Rational Formula: Q= C*I*A
Where:
Q = runoff rate [m³/sec]
C =Runoff coefficient of 0.5 (for “Other land, cultivated, perennial crop”)
I = Rainfall intensity [mm/hr.], maximum in Table 2-31, divided by 24 hrs. +20% adjustment for climate change conditions
A = Drainage area [m²]

EPRMP | CHAPTER 2 ANALYSIS OF ENVIRONMENTAL IMPACTS Silica Sand Quarry Expansion Project
2-77
Assumptions in this assessment
Banban sub catchment A and B are considered as separate single units,
the flow volume is estimated at the most downstream point of the quarry area
that rainfall is uniformly distributed over the watershed sub catchment in an event;
that the predicted peak discharge has the same probability of occurrence (return period) as the used rainfall intensity (I),
that the runoff coefficient (C) is constant during the rain, and
That the recession time is equal to the time of rise.
Table 2-26. Computed Peak Run-Off Volume
PEAK RUN OFF VOLUME ON QUARRY SITE
MPSA 323-2010-VII MPSA 314-2010-VII
Peak Hourly Rainfall 13.81 mm 13.81
Precipitation Coef. (p) 0.75 0.75
Run off Coef. (N) 0.45 0.45
Area of Quarry Section (A) 500,000 m2 220,000 m2
In sub-subcatchment
Run off 2,329.59 m3/hr. 1,025.02 m3/hr.
Per Opened Square Meter (m3) /hr. 0.004659 0.004659
Assuming that a cut-off channel is provided to divert background surface run-off toward natural
waterways and away from opened quarry areas, the quarry site as proposed herein, through its
settling ponds and properly-sized contour canals, can have sufficient capacity to provide residence
time for storm run-off to drop sediments and for quarry drainage water to comply with DAO 34 Class
C beneficial use water quality standard suitable to agricultural irrigation.
2.2.2 WATER QUALITY A small stream traverses the Production area, originating from an intermittent stream within the quarry
zone (Figure 2-36). This natural drainage feature is part of the headwaters of the Banban River, which flows
into the Tañon Strait. The current use of these waterways is for drainage of adjacent agricultural areas, and
channel for domestic waste disposal. The water quality of this small stream was determined thru the
laboratory analysis of samples taken in two separate seasons. The dry season samples taken on 29 April
2013 yield a Class A water quality for the small creek for most of all the selected physical analytical
parameters, except for the bacteriological analysis. The amount of fecal and total coliform far exceeds the
DENR Class D standards. It is most probable that the stream is used as disposal channel for black water or
septage. Details of the dry season water quality analysis are found in Table 2-27 and Figure 2-36 is a map
showing the water quality sampling locations. There are two other small intermittent streams that flow
from the Production area based on old maps; however, these had no water during two seasons of water
sampling.
Table 2-27. Water Quality of Waterways in the Production Area during the Dry Season
Parameters Unit
Sampling Stations DENR Class
A Standard
DENR Class
D Standard
Remarks W1 W2
Oil & Grease mg/l <1 <1 1 5 Class A

EPRMP | CHAPTER 2 ANALYSIS OF ENVIRONMENTAL IMPACTS Silica Sand Quarry Expansion Project
2-78
Parameters Unit
Sampling Stations DENR Class
A Standard
DENR Class
D Standard
Remarks W1 W2
Total Suspended Solids (TSS)
mg/l <1 <1 50 * Class A
Dissolved Oxygen (DO) mg/l 6 6 5 3 Class A
Biological Oxygen Demand (BOD) mg/l 3 10 5 10 (15)
W1 Class A; W2
Class D
Hexavalent Chromium mg/l <0.025 <0.025 0.05 - Class A
Arsenic mg/l <0.01 <0.01 0.05 0.01 Class A
Mercury mg/l <0.0005 <0.0005 0.002 0.002 Class A
Cadmium2 mg/l <0.0005 <0.0005 0.01 0.05 Class A
Lead mg/l <0.01 <0.01 0.05 - Class A
Potassium mg/l 1.5 2.3 - - -
Nitrogen mg/l <0.2 <0.2 10 - Class A
Phosphorus mg/l 0.08 0.5 0.1 - W1 Class A
Total Coliform MPN 2,400 7,900 1,000 5,000
W1 Class D; W2
fails Class D
Fecal Coliform MPN/ml 790 460 100 - Fails Class D *Not more than 60mg/l increase
Table 2-28. Water Quality of Waterways in the Production Area during the Wet Season
Parameters
Unit
Sampling Station DENR Class
A Standard
DENR Class D Standard
Remarks
W1 W2
Total Suspended Solids (TSS)
mg/l 30 29 50 Class A
Dissolved Oxygen (DO) mg/l 7.9 7.4 5 3 Class A
Biological Oxygen Demand (BOD)
mg/l 7 5 5 10 (15) W1 Class D; W2 Class A
Oil and Grease mg/l <1 <1 1 5 Class A
Total Coliform MPN 2018 2200 1,000 5,000 Class D
Fecal Coliform MPN/ml 520 600 100 - Fails Class D
Wet season water quality sampling was conducted on 23 January 2014. Two samples were taken
from the stream within the Production site, corresponding to locations upstream and downstream
of the Production area. This stream bounds the northeast portion of the quarry zone that will
produce from 2016 to 2021. This time, only the project impact parameters were requested for
laboratory analysis. The results of the test show that the surface water samples almost meet
DENR Class A standards, except for BOD5 of station 1 (upstream of Production area) which has a
value of 7mg/l which is exceeds the threshold limit of 5mg/l. Field observation revealed that there
were lot of waste sources (i.e. from farm animals, human waste).
Since the project is still in the acquisition of the Declaration of Mining Project Feasibility (DMPF),
a water quality sampling was conducted last 30 July 2019 to update the baseline water quality of

EPRMP | CHAPTER 2 ANALYSIS OF ENVIRONMENTAL IMPACTS Silica Sand Quarry Expansion Project
2-79
the project area. Results of the water sampling are indicated Table 2-29 while the location of the
stations are shown in Figure 2-38.
Table 2-29. 2019 Water Quality Sampling Results
Parameter
SW1 SW2 SW3 SW4 SW5 DAO 08-2016 Class C
WQG 10° 16’ 46.0’ N
123° 37’ 52.5” E 10° 15’ 45.8” N 123° 38’ 04.5” E
10° 13’ 46.4” N 123° 40’ 01.3” E
10° 13’ 21.6” N 123° 39’ 37” E
10° 12’ 43.9” N 123° 39’ 14.8” E
pH 8.11 8.18 7.61 7.94 8.12 6.5-9.0
Temp, °C 30.4 31.1 29.6 31.7 30.9 25-31
DO, mg/L (minimum)
6.62 6.07 5.19 5.31 5.46 5
Color (CU) 5 10 5 5 10 75
Phosphate, mg/L 0.05 <0.01 0.13 0.07 <0.01 0.5
Surfactants, mg/L <0.03 <0.03 <0.03 <0.03 <0.03 1.5
Ammonia, mg/L <0.03 0.04 0.05 0.03 <0.03 0.05
Nitrate, mg/L 0.40 0.19 1.14 0.36 0.26 7
BOD5, mg/L 2 1 2 2 2 7
COD, mg/L 7 9 7 12 13 NGV
TSS, mg/L 14 12 5 4 20 80
Oil and Grease, mg/L <1 <1 <1 1 <1 2
Chloride, mg/L 18.6 18.6 18.6 13.9 11.4 350
Fecal Coliform, MPN/100 mL
>8.0 >8.0 >8.0 8.0 4.6 200
Chromium, mg/L <0.02 <0.02 <0.02 <0.02 <0.02 NGV
Lead (Pb), mg/L <0.01 <0.01 <0.01 0.05 <0.01 0.05
Zinc, mg/L 0.028 0.042 <0.003 0.034 <0.003 2
Cadmium (Cd), mg/L <0.003 <0.003 <0.003 <0.003 <0.003 0.005
Copper (Cu), mg/L <0.005 <0.005 <0.005 <0.005 <0.005 0.02

EPRMP | CHAPTER 2 ANALYSIS OF ENVIRONMENTAL IMPACTS Silica Sand Quarry Expansion Project
2-80
Figure 2-36. Water Quality and Benthos Sampling Location

EPRMP | CHAPTER 2 ANALYSIS OF ENVIRONMENTAL IMPACTS Silica Sand Quarry Expansion Project
2-81
Figure 2-37. Water Quality Sampling Station W2, Wet Weather Condition

EPRMP | CHAPTER 2 ANALYSIS OF ENVIRONMENTAL IMPACTS Silica Sand Quarry Expansion Project
2-82
Figure 2-38. 2019 Water Quality Sampling Map

EPRMP | CHAPTER 2 ANALYSIS OF ENVIRONMENTAL IMPACTS Silica Sand Quarry Expansion Project
2-83
2.2.2.1 IMPACT ASSESSMENT
2.2.2.1.1 SEDIMENT TRANSPORT The natural rate of silt deposition within production area is governed by pre-development land
uses within the catchment areas and the slope of the land. In calculating the empirical sediment
influx, the mean sediment yield of a particular land use is considered in proportion to the extent
of the affected area. Using the Modified Universal Soil Loss Equation (modified USLE), the average
sediment yield for each type of land surface was computed and multiplied by the area of each
catchment to determine the annual sediment yield. The total silt contributed by each catchment
that may enter the public drainage system as a result of natural erosion amounts to about 372.18
m3 per year in Year 5.
Aside from natural erosion, minor sediment sources are also considered. About 75.5 hectares in
the Production area are used for subsistence agriculture. Cassava and corn cultivation loosen the
soil which in turn are susceptible to transport by surface-water run-off towards the existing
waterways such as the stream traversing the Production area. On flat lands, insignificant amounts
of siltation are introduced into the streams. The natural low topography along the streams
restricts downward migration of sediments toward the flood plains, forming small depositional
basins. Cultivation on existing 2.17 has. area (0-3% slope) found within the production area is
expected to have caused a negligible amount of sediment, while those farm areas within the
200.70 ha. of the production area with 3-8% slope, yield sediments around 1.05 MT/ha. per year.
2.2.2.1.2 SEDIMENT IN QUARRY AREA Open surfaces render soil materials vulnerable to wind and rain erosion. Vehicular and equipment
movement within the quarry will further add to land vulnerability to erosion. Erosion is undesired
due to its potential to shallow downstream streams and creeks alter surface run-off patters which
can damage crops and agricultural areas.
The estimated sediment yield in quarry area is 372.18 mt per year starting year five (5). The quarry
area falls within the Banban and Cabiangon sub catchments which finally drains into the Banban
and Cabiangon Rivers. The settling ponds for the entire 14.2-hectare initial quarry area will be
regularly desilted to maintain silt holding capacity. The primary agent in water quality
deterioration through sedimentation is heavy rainfall which triggers strong run-off velocity. Run-
off velocity decelerators such rock/stone baffles / mounds in contour canals and sumps to trap
large sediments, will help control sediment flow from quarry area.
To reduce peripheral load on the settling ponds in the quarry area, a cut-off channel or berm ditch
is recommended to be made at the boundary of the quarry zone, to divert background surface
run-off toward a separate settling pond and reduce scouring elements from further eroding open
quarry surfaces and increase downstream sedimentation.
2.2.2.1.3 AQUATIC ECOLOGY The Banban creek is used as disposal area of farm wastes, mostly coming from a nearby small scale
pig farm. Interviews of local residents as to food materials harvested from Banban creek revealed that
no edible materials are taken from Banban creek. In view of the present water resource use of Banban
creek and its limited structure, only a study of the baseline benthos population was made.

EPRMP | CHAPTER 2 ANALYSIS OF ENVIRONMENTAL IMPACTS Silica Sand Quarry Expansion Project
2-84
Siltation of the aquatic habitat will be the major threat to the aquatic fauna not only for vertebrate
fauna but also for the invertebrate fauna present in the area. Most of the frogs inhabit clear streams
and rivers especially on the larval stage of the organism as it is entirely dependent on water for growth
and development. Fishes will also be affected by the changes on the physical characteristic of the
river/streams. During the survey, a single fish was caught from the stream that crisscrossed Brgy.
Duangan. Organisms that are dependent on water downstream will also be affected in case siltation
will occur.
Aquatic species are most sensitive to habitat removal/destruction since their movement is limited only
within similar habitat. The distributional range also of the organism is also dependent on the size of
the available habitat. Removal/destruction of habitat will also increase the organism’s chances of
being a target for predation.
The Project will restore the waterways within the quarry zone that will be affected by the lowering of
land surface as a result of quarry. The aquatic species that will be affected by altered riverbed and soil
nutrient conditions as a result of the quarry will continue to exist in downstream areas of Banban River
if sedimentation of waterways is controlled. The settling ponds, contour canals and inverse elevated
benches are intended to control waterway siltation. Regular monitoring of water quality and
sedimentation of the section of Banban River as it exits the MPSA will be undertaken.
2.2.2.1.4 RESOURCE USE COMPETITION Cebu has limited water resources due to its porous limestone substrate. The water resources
proposed to be used for the minimum project requirements of 288.8 m3 daily will be from harvested
rainwater, accumulated from rainfall.
The effective rainfall and run-off volume will be adequate to meet project requirements for dust
control and irrigation. At 3 meter depth, the settling ponds can fully serve as the primary source of
water for road dust suppression in the dry months of February to May. Water requirement will be
reduced to serve only nursery and vegetation maintenance, and the demand can also be managed to
support controlled drip irrigation to some farms downstream of the quarry by gravity through
perforated hose, which may be purchased under the SDMP.
The settling ponds will be adequate to detain at least 80% of the eroded sediments (surface soil lost)
and retard / detain the accelerated flow of peak storm run-off from the quarry areas to downstream
sections to mitigate accelerated surface run off when quarry surfaces are cleared and leveled.
A large allowance for sediment storage in the settling pond is recommended, to avoid sediment
overflow that is complained by the public as gleaned from the household survey responses and focus
group discussions, and provide allowance to disturb accumulated silt in a protracted length of rainy
days when it is difficult to desilt the settling ponds.

EPRMP | CHAPTER 2 ANALYSIS OF ENVIRONMENTAL IMPACTS Silica Sand Quarry Expansion Project
2-85
2.3 AIR
2.3.1 METEOROLOGY
2.3.1.1 SCOPE This section presents the following as required in the Technical Scoping Checklist for this project.
• Change in local micro-climate – presented are the climatological normal and extremes,
specifically on monthly average rainfall, air temperature, and wind speeds and wind directions.
Wind rose diagrams and frequencies of tropical cyclones are also discussed as required. Also
presented are the climate change projections in the project area using the recent climate study
by PAGASA (2018); and
• Contribution in terms of greenhouse gas (GHG) emissions (or GHG mitigation potential)
2.3.1.2 METHODOLOGY Meteorological data from the weather station of Philippine Atmospheric Geophysical Services
Administration (PAGASA) in Mactan Island, Cebu (herein referred as “PAGASA-Mactan Station”),
which is located about 35 km northeast of the project site (Figure 2-39), were used to characterize the
climatological normals and extremes of rainfall, air temperature, wind speeds, and wind directions,
including the projected change of climate of the said climatic factors.
In addition, prognostic meteorological data generated by Lakes Environmental Software, Inc. for the
project using the Pennsylvania State University/National Center for Atmospheric Research Mesoscale
Model (or MM5) were used to determine the prevailing annual and monthly wind flows, including the
three-hourly wind patterns. RHR Consult Services, Inc. purchased the prognostic MM5 data covering
the period January 1, 2014 to December 31, 2016 from Lakes Environmental Software, Inc. Table 2-30
shows the list of meteorological data used in the study.
Table 2-30. Meteorological data and information used in this study
Data Period Covered
Climate map of the Philippines (1951 to 2010) 1951 to 2010
Climatological normals for PAGASA-Mactan Station (Table 2-20) 1981 to 2010
Climatological extremes for PAGASA-Mactan Station (Table 2-21) As of 2014
Climate projections of rainfall, temperature and extreme weather events Climate projections
MM5 data January 1, 2014 to Dec. 31, 2016
Tropical cyclone map PAGASA and Manila Observatory

EPRMP | CHAPTER 2 ANALYSIS OF ENVIRONMENTAL IMPACTS Silica Sand Quarry Expansion Project
2-86
Figure 2-39. Locations of PAGASA-Mactan Station and the project site

EPRMP | CHAPTER 2 ANALYSIS OF ENVIRONMENTAL IMPACTS Silica Sand Quarry Expansion Project
2-87
Table 2-31. Climatological Normals for Cebu City (1981-2010)
Month
Rainfall Temperature (°C) Vapor
Pressure (mbar)
%RH MLSP
(mbar)
Wind Cloud Amt.
(okta)
No. of Days
Amount (mm)
No. of Rainy Days
Max Min Mean Dry Bulb
Wet Bulb
Dew Pt.
Direction (16pt)
Speed (m/s)
TSTM
LTNG
JAN 105.2 12 29.8 23.9 26.8 26.7 24.4 23.6 29.0 83 1012 NE 3 6 1 0
FEB 69.6 9 30.2 24 27.1 26.9 24.4 23.5 28.8 81 1012 NE 3 5 1 1
MAR 58.6 8 31.1 24.5 27.8 27.8 24.9 23.9 29.5 79 1012 NE 3 5 1 1
APR 48.1 6 32.3 25.4 28.8 28.9 25.6 24.5 30.5 77 1011 NE 3 4 3 2
MAY 95 10 32.8 25.8 29.3 29.3 26.1 25.1 31.6 78 1010 E 2 5 9 8
JUN 175.6 14 32.1 25.4 28.8 28.6 25.9 25 31.5 81 1010 SW 2 6 11 9
JUL 192.9 16 31.5 24.9 28.2 28 25.6 24.8 31.2 82 1009 SW 2 6 13 9
AUG 143.5 14 31.7 25 28.4 28.1 25.5 24.6 30.8 81 1009 SW 3 6 11 7
SEP 179.6 15 31.8 24.9 28.3 28.1 25.6 24.8 31.1 82 1010 SW 2 6 14 10
OCT 194.8 16 31.4 24.8 28.1 27.9 25.6 24.8 31.2 83 1010 NE 2 6 14 10
NOV 161.9 14 31 24.7 27.8 27.7 25.4 24.6 30.8 83 1010 NE 3 6 6 6
DEC 139.7 14 30.2 24.3 27.3 27.1 24.9 24.1 30.0 84 1011 NE 3 5 3 2
Annual 1564.5 146 31.3 24.8 28.1 27.9 25.3 24.4 30.5 81 1010 NE 3 6 87 65 Source: Climate and Agrometeorology Division, PAGASA
Coordinates and Elevation of PAGASA-Mactan Station Latitude: 10°19’20.8” N Longitude: 122°58’48.47” E Elevation: 25.703 m Notes: 1) RH – relative humidity 2) MSLP – mean sea level pressure 3) TSTM – thunderstorm 4) LTNG – lightning

EPRMP | CHAPTER 2 ANALYSIS OF ENVIRONMENTAL IMPACTS Silica Sand Quarry Expansion Project
2-88
Table 2-32. Climatological Extremes for Mactan International Airport in Mactan, Cebu City (as of 2014)
Month Temperature (°C)
Greatest Daily Rainfall (mm)
Highest Wind (m/s) Sea Level Pressure (mb)
High Date Low Date Amount Date Speed Dir Date High Date Low Date
Jan 33.5 01-03-1988 19.8 01-21-1997 126.6 01-08-1999 30 NE 01-24-1975 1019.8 01-29-1998 995.3 01-24-1975
Feb 33.4 02-12-2011 20.0 02-16-2004 107.2 02-08-2012 22 E 02-18-1988 1019.8 02-01-1998 1003.8 02-18-2001
Mar 33.9 03-31-2004 20.0 03-02-2000 141.3 03-26-1982 25 SW 03-26-1982 1018.9 03-23-1998 996.0 03-26-1982
Apr 35.6 04-15-1992 22.1 04-01-2003 174.0 04-04-1994 30 SW 04-04-1994 1018.1 04-05-1998 998.1 03-26-1982
May 37.0 05-31-2010 22.0 05-27-2007 106.0 05-27-2000 20 W 05-17-1987 1015.4 05-02-1998 1000.2 05-21-1976
Jun 36.4 06-07-2010 20.2 06-20-1997 87.8 06-09-1984 18 SW 06-25-1992 1016.5 06-07-1997 1000.5 06-29-2004
Jul 35.3 07-20-1973 20.8 07-05-1990 135.0 07-08-2012 20 SE 07-17-1998 1015.9 07-11-1979 997.9 07-03-2001
Aug 35.6 08-27-1998 21.1 08-19-1981 96.6 08-17-1982 25 SW 08-15-1986 1015.7 08-11-1997 1001.5 08-01-1986
Sep 34.6 09-06-1978 21.5 09-18-1972 127.0 09-26-1989 48 NE 09-02-1984 1015.8 09-28-1997 983.4 09-02-1984
Oct 34.4 10-22-1987 22.0 10-13-2009 166.1 10-28-1995 25 SW 10-28-1995 1016.8 10-05-1987 996.8 10-28-1995
Nov 33.8 11-02-1993 20.4 11-22-1998 276.1 11-12-1990 55 S 11-12-1990 1017.4 11-08-1997 971.1 11-12-1990
Dec 34.0 12-01-2006 20.0 12-28-1996 185.4 12-05-2001 42 S 12-26-1993 1018.3 12-12-2002 995.1 12-26-1993
Annual 37.0 05-31-2010 19.8 01-21-1997 276.1 11-12-1990 55 S 11-12-1990 1019.8 01-29-1998 971.1 11-12-1990
1019.8 02-01-1998
Period of Record
1972 - 2014 1972 - 2014 1972 - 2014 1972 - 2014
Source: Climate and Agrometeorology Division, PAGASA Coordinates and Elevation of PAGASA-Mactan Station: Latitude: 10°19'20.80''N Longitude: 123°58'48.47''E Elevation: 25.703 m

EPRMP | CHAPTER 2 ANALYSIS OF ENVIRONMENTAL IMPACTS Silica Sand Quarry Expansion Project
2-89
2.3.1.3 CHANGE IN LOCAL CLIMATE
2.3.1.3.1 BASELINE METEOROLOGICAL DATA 2.3.1.3.1.1 CLIMATE The climate of the project site belongs to Type III climate based on the Modified Coronas Classification
of Philippine Climate (Figure 2-40). There is no pronounced maximum rain period for areas zoned as
Type III climate. Dry season for Type III climate lasts generally from one to three (3) months.
Figure 2-40. Climate map of the Philippines showing the locations of the project site and PAGASA-Mactan Station (Source: PAGASA 2015)

EPRMP | CHAPTER 2 ANALYSIS OF ENVIRONMENTAL IMPACTS Silica Sand Quarry Expansion Project
2-90
2.3.1.3.1.2 RAINFALL The annual average rainfall at PAGASA-Mactan Station of 1564.5 mm is lower than the average annual
rainfall in the Philippines of 2,562.5 mm. The highest average monthly rainfall at PAGASA-Mactan
Station is 194.8 mm in October followed by 192.9 mm in July (Figure 2-41). It appears that months
with relatively higher rainfall fall within the southwest monsoon (June to September) and during
transition period from October to December.
The month with least rainfall is April with 48.1 mm and the second lowest is March with 58.6 mm of
mean monthly rainfall. These months fall within the dry season of the year. Months with higher
number of rainy days are also those months with higher monthly rainfall. Rainy days are days with
rainfall (from 8:00 A.M. to 8:00 A.M of next day) with recorded rainfall of at least 0.1 mm.
Figure 2-41. Monthly average rainfall and number of rainy days from 1981 to 2010
Extreme Recorded Rainfall Events
Based on rainfall recorded at PAGASA-Mactan Station from 1972 to 2014, the highest recorded rainfall
was 276.1 mm on November 12, 1990. This was due to the passage of Typhoon Mike (or otherwise
known in the Philippines as Typhoon Ruping) that crossed Cebu in November 1990 (Figure 2-42). The
second highest recorded daily rainfall occurred on April 4, 1994, which is within the dry season. This
unusual high rainfall during dry season was due to Typhoon Bising (Owen), which crossed Visayas in
April 1994.
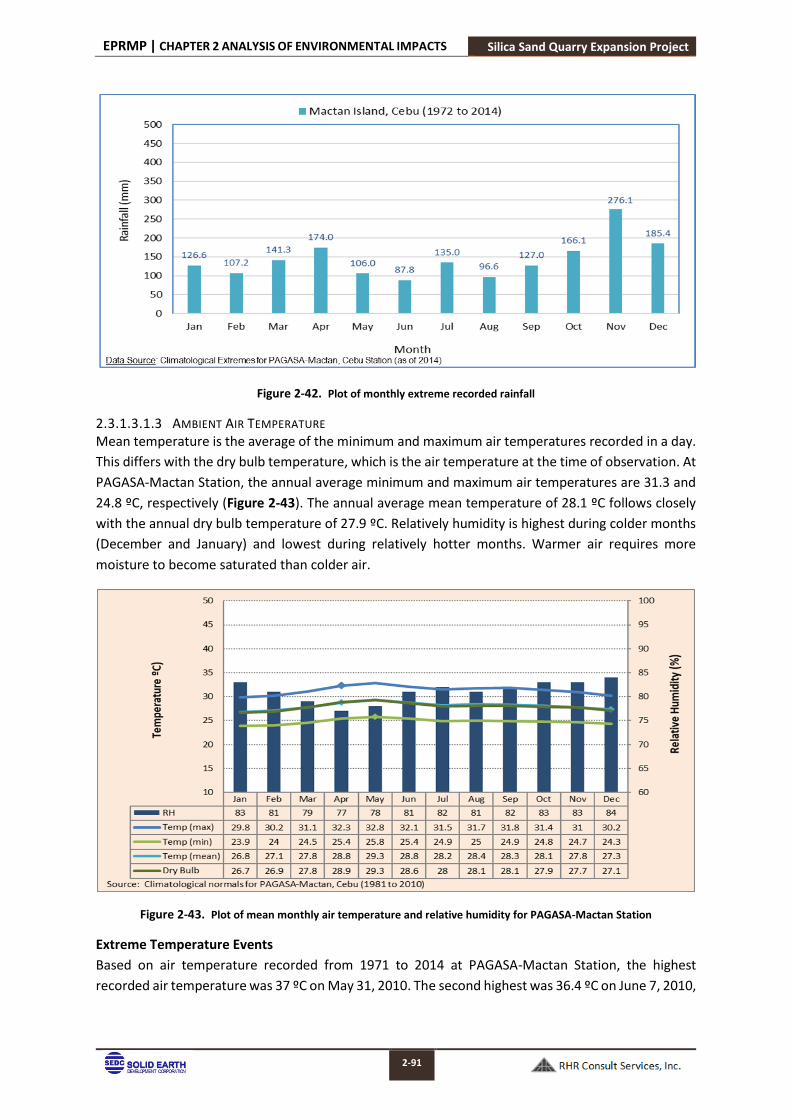
EPRMP | CHAPTER 2 ANALYSIS OF ENVIRONMENTAL IMPACTS Silica Sand Quarry Expansion Project
2-91
Figure 2-42. Plot of monthly extreme recorded rainfall
2.3.1.3.1.3 AMBIENT AIR TEMPERATURE Mean temperature is the average of the minimum and maximum air temperatures recorded in a day.
This differs with the dry bulb temperature, which is the air temperature at the time of observation. At
PAGASA-Mactan Station, the annual average minimum and maximum air temperatures are 31.3 and
24.8 ºC, respectively (Figure 2-43). The annual average mean temperature of 28.1 ºC follows closely
with the annual dry bulb temperature of 27.9 ºC. Relatively humidity is highest during colder months
(December and January) and lowest during relatively hotter months. Warmer air requires more
moisture to become saturated than colder air.
Figure 2-43. Plot of mean monthly air temperature and relative humidity for PAGASA-Mactan Station
Extreme Temperature Events
Based on air temperature recorded from 1971 to 2014 at PAGASA-Mactan Station, the highest
recorded air temperature was 37 ºC on May 31, 2010. The second highest was 36.4 ºC on June 7, 2010,

EPRMP | CHAPTER 2 ANALYSIS OF ENVIRONMENTAL IMPACTS Silica Sand Quarry Expansion Project
2-92
and the third highest was 35.6 ºC April 15, 2004. These observed extreme temperature readings
generally occurred during months with high mean temperature, as shown in Figure 2-44.
Figure 2-44. Highest recorded daily temperature and mean maximum monthly temperature for PAGASA-Mactan Station
2.3.1.3.1.4 WIND SPEED AND WIND DIRECTIONS Climatological normals of wind speeds and wind directions for PAGASA-Mactan Station (Table 2-33)
show prevailing winds from the northeast (NE) from October to April and southwest (SW) from June
to September. Easterly winds prevail in May. Mean monthly wind speeds range from 2 to 3 m/s.
Table 2-33. Climatological monthly average wind speed and directions at PAGASA-Mactan Station (1981 to 2010)
Month Wind Direction Wind Speed (m/s)
January NE 3
February NE 3
March NE 3
April NE 3
May E 2
June SW 2
July SW 2
August SW 3
September SW 2
October NE 2
November NE 3
December NE 3
Annual NE 3
Data Source: PAGASA Climatological Normals

EPRMP | CHAPTER 2 ANALYSIS OF ENVIRONMENTAL IMPACTS Silica Sand Quarry Expansion Project
2-93
Annual Wind Roses
Based on the three-year sequential hourly prognostic meteorological data (2014 to 2016) generated
by Lakes Environmental Software for the project, the most prevailing winds are light to moderate
winds coming from the East, which occurred about 18% of time (Figure 2-45). Light to moderate winds
from the east-northeast were the second most dominant winds occurring about 15% of the time.
In 2014 and 2015, easterly and east-northeasterly winds prevailed over the area at 14 and 16% of the
time. In 2015, east-northeasterly winds reduced to 6% while the easterly winds increased to about
25% (Figure 2-45).
Light winds (1 to 5 m/s) generally prevailed at the project site, which occurred about 77% of the time
(Figure 2-46). Moderate winds from 5 to 9 m/s occurred about 17% of the time while calms (winds
less than 1 m/s) at 6.1%. Strong winds (winds greater than 9 m/s) only occurred about 0.2% of the
time.
Monthly Wind Roses
The monthly wind roses appear to follow the seasonal wind flow patterns in the country, although
wind directions at the project site slightly deflect from those recorded at PAGASA-Mactan Station
(Figure 2-47 and Figure 2-48).
The dominant winds from November to May are from the east and east-northeast. In June, winds
prevail from the southeast, and from the southwest and west-southwest in July and August,
respectively. Winds from the west tend to dominate in September.
In October, which is usually the transition month from southwest to northeast monsoons, winds from
the east increase in frequency, although winds from the S-W quadrant appear to dominate during this
month
In terms of monthly wind class frequency distribution (Figure 2-49 and Figure 2-50), light winds from
1 to 5 m/s dominate over the area throughout the year. Moderate winds from 5 to 9 m/s are the
second most dominant winds, except in June and September wherein calms (winds less than 1 m/s)
are more frequent than the former.
Three-hourly wind roses
Three-hourly wind roses were also generated to possibly determine occurrences of local wind
circulation patterns, such as land and sea breezes. As shown in Figure 2-51 and Figure 2-52, there
appears an increase of easterly winds from early morning (4:00 A.M. to 6:00 A.M.) at 14% to about
15% in early afternoon (1:00 P.M. to 3:00 P.M.). In late afternoon (4:00 P.M. to 6:00 P.M.) until
nighttime, winds from the west (or from the land) appear to slightly increase during this period.
The foregoing wind occurrences or patterns generally follow the characteristics of land and sea
breezes, which locally occur over coastal areas due to formation of high and low pressure areas over
the land and sea during daytime, respectively, and reverses in direction at nighttime.
Extreme Recorded Winds
The greatest recorded wind speed at PAGASA-Mactan station was 55 m/s on November 1990 (

EPRMP | CHAPTER 2 ANALYSIS OF ENVIRONMENTAL IMPACTS Silica Sand Quarry Expansion Project
2-94
Table 2-32). This was due to Typhoon Mike (or otherwise known in the Philippines as Typhoon Ruping)
that crossed Cebu in November 1990. Highest recorded rainfall at PAGASA-Mactan Station also
occurred during passage of Typhoon Ruping.
Frequency of Tropical Cyclones
Figure 2-53 shows the monthly average tropical cyclone tracks and the frequency of tropical cyclones
that entered the Philippine Area of Responsibility (PAR). The monthly average tropical cyclone tracks
and its frequencies appear closer and higher in the province of Cebu from October to December. The
cyclone tracks are also in vicinities of Cebu from January to April, but at lower frequencies. During the
southwest monsoon season, the tropical cyclone tracks are generally on the northern part of Luzon
and Visayas.
Based on risk maps of the Manila Observatory and the DENR, the province of Cebu is within a zone
classified as low risk to typhoons.
Figure 2-45. Annual wind rose diagrams for the project site

EPRMP | CHAPTER 2 ANALYSIS OF ENVIRONMENTAL IMPACTS Silica Sand Quarry Expansion Project
2-95
Figure 2-46. Annual wind class frequency distribution for the project site

EPRMP | CHAPTER 2 ANALYSIS OF ENVIRONMENTAL IMPACTS Silica Sand Quarry Expansion Project
2-96
Figure 2-47. Wind roses for the project site from January to June

EPRMP | CHAPTER 2 ANALYSIS OF ENVIRONMENTAL IMPACTS Silica Sand Quarry Expansion Project
2-97
Figure 2-48. Wind roses for the project site from July to December

EPRMP | CHAPTER 2 ANALYSIS OF ENVIRONMENTAL IMPACTS Silica Sand Quarry Expansion Project
2-98
Figure 2-49. Wind class frequency class distribution for the project site for January to June

EPRMP | CHAPTER 2 ANALYSIS OF ENVIRONMENTAL IMPACTS Silica Sand Quarry Expansion Project
2-99
Figure 2-50. Wind class frequency distribution for the project site from July to December

EPRMP | CHAPTER 2 ANALYSIS OF ENVIRONMENTAL IMPACTS Silica Sand Quarry Expansion Project
2-100
Figure 2-51. Three-hourly wind roses for the project site from 1:00 A.M. to 12:00 P.M.

EPRMP | CHAPTER 2 ANALYSIS OF ENVIRONMENTAL IMPACTS Silica Sand Quarry Expansion Project
2-101
Figure 2-52. Three-hourly wind roses for the project site from 1:00 P.M.to 12:00 A.M.

EPRMP | CHAPTER 2 ANALYSIS OF ENVIRONMENTAL IMPACTS Silica Sand Quarry Expansion Project
2-102
Figure 2-53. Frequency of tropical cyclones
2.3.1.3.2 PROJECTED CHANGE IN CLIMATE 2.3.1.3.2.1 PROJECTED CHANGE OF RAINFALL IN 2036 TO 2065 PAGASA (2018) noted that the western sections of Visayas, northern sections of Luzon and central and
western sections of Mindanao have declining rainfall trend from1951 to 2010 in three (3) periods, as
follows:
● March to May,
● June to August, and
● September to November
The western section of Visayas included Cebu, which has declining rainfall trend based on data from
1971 to 2010.

EPRMP | CHAPTER 2 ANALYSIS OF ENVIRONMENTAL IMPACTS Silica Sand Quarry Expansion Project
2-103
Rainfall in Cebu is projected to increase in all periods (upper bound) and in December to February and
March to May (median) under moderate emission scenario, but tend to decrease in June to August
and September to November (lower and median) (Figure 2-54). There is no consistent trend, however,
as regard to increase or decrease of rainfall (medium and high emission scenarios).
Figure 2-54. Project change in rainfall for the province of Cebu (Data Source: PAGASA, 2018)
2.3.1.3.2.2 PROJECTED CHANGE OF AIR TEMPERATURE IN 2036 TO 2065 PAGASA (2018) noted that air temperature is projected to increase uniformly and minimally across
the Philippines under moderate and high emission scenarios. In Cebu, air temperature is projected to
increase in all periods (lower to upper bounds) (Figure 2-55). The projected increase in temperature
are as follows:
● Moderate emission scenario – 1.1 to 1.2 °C (median) and 1.1 to 1.7 (upper bound)
● High emission scenario – 1.1 to 1.6 °C (median) 2.1 to 2.2 °C (upper bound)

EPRMP | CHAPTER 2 ANALYSIS OF ENVIRONMENTAL IMPACTS Silica Sand Quarry Expansion Project
2-104
Figure 2-55. Projected change in temperature for the province of Cebu (Data Source: PAGASA, 2018)
2.3.1.4 CONTRIBUTION IN TERMS OF GREENHOUSE GAS EMISSIONS
2.3.1.4.1 SCOPE This section presents the a) estimated greenhouse gases (GHG) of the project using spreadsheets
developed by the World Research Institute (WRI), and the b) mitigation measures or practices by the
project proponent to reduce GHG emissions. Recommended measures to further lessen GHG
emissions are also discussed in this section.
2.3.1.4.2 METHODOLOGY Emission of GHG focused on the equipment to be used for the quarry project, regardless of whether
it is directly or indirectly owned by the proponent. GHG emissions were estimated using the WRI

EPRMP | CHAPTER 2 ANALYSIS OF ENVIRONMENTAL IMPACTS Silica Sand Quarry Expansion Project
2-105
(2015): GHG Protocol tool for mobile combustion. Version 2.6 – computation of GHG emissions from
mobile sources (heavy equipment, trucks, and other vehicles).
The above-mentioned tool can provide good estimate of GHG emission by providing the type fuel and
the estimated fuel consumption per year. On estimating the fuel consumption for each vehicle type,
this was done using the method by Klanfar, et. al. (2016). This reference provides good estimates of
fuel consumption rate based on calculated load factor.
2.3.1.4.3 GHG EMISSIONS OF THE PROJECT The estimated GHG emissions for the current and proposed productions are 3,277.371 and 3,707.199
tons per year of CO2e, respectively (Table 2-34). The proposed production is projected to increase
CO2e emissions by about 11.6%.
The list of equipment, corresponding fuel consumption and the screenshots of the estimated GHG
emissions are presented in Annex A and Annex B.
Table 2-34. Estimated GHG emissions (tons of CO2e per year) for the current and proposed production
Sources Current Production Proposed Production
Quarry equipment 3,277.371 3,707.199
2.3.1.5 MITIGATION MEASURES AND MONITORING PROGRAM The proponent is yet to establish a comprehensive program on GHG accounting and reduction,
although there are practices that are noted to reduce GHG emissions. These are as follows, including
the proposed mitigation and monitoring program on GHG.
i. Optimize location of run-of-mine (ROM) and overburden to limit the amount of haul distance,
and consequently, fuel consumption;
ii. Regular maintenance of haul roads to reduce rolling resistance;
iii. Regular schedule of vehicles and heavy equipment used in quarrying and hauling;
iv. Offset GHG emissions by implementing reforestation program for the project;
v. Reduce idling time of vehicles and heavy equipment;
vi. Minimize opening of vegetated areas and use of existing bare areas (if any);
vii. Replenish or replant opened space cleared for quarrying as soon as necessary; and
viii. Implement monitoring program on GHG by regular recording (i.e., daily) of the following.
● Vehicle type;
● Vehicle ID (e.g., plate number or body number);
● Location and hours of operation;
● Fuel consumption (liters per day).; and
● Maintenance schedule
2.3.2 AIR QUALITY
2.3.2.1 DEGRADATION OF AIR QUALITY
2.3.2.1.1 SCOPE This air quality modular report focused on the following as provided in the Screening Form for the
project

EPRMP | CHAPTER 2 ANALYSIS OF ENVIRONMENTAL IMPACTS Silica Sand Quarry Expansion Project
2-106
● Characterization of the background air quality at the project site and vicinities; and
● Determination of impact on the air environment, and proposed mitigation measures and
monitoring program – details on estimation of emissions of particulates and other regulated
air pollutants are included in the assessment
2.3.2.1.2 METHODOLOGY 2.3.2.1.2.1 ENVIRONMENTAL PERFORMANCE/BACKGROUND AIR QUALITY MONITORING TSP Monthly Monitoring The environmental performance of the project (SEDC) on ambient air quality was assessed based on
the air quality monitoring data from 2017 to 2018. SEDC has been conducting monthly and/or
quarterly monitoring of total suspended particulates (TSP) at and in vicinities for its quarry site in San
Fernando.
Table 2-35 and Figure 2-56 present the description and sampling locations of the monitoring stations,
respectively. Note that all of the air monitoring stations is included in the assessment as expected
increase of air emissions emanating from the operation of the silica quarry project includes areas in
vicinities of the haul roads from the project site in Pinamungajan, Cebu to the cement plant in San
Fernando, Cebu.
Air monitoring by SEDC involved sampling using a high-volume sampler. Samples of particulates were
collected for one-hour using the high-volume sampler and were brought to a DENR-EMB accredited
laboratory for analysis.
Table 2-35. Locations and descriptions of monitoring stations
Station ID Station Name Latitude (deg) Longitude (deg)
Stn 1 Upper Tonggo
Stn 2 LowerTonggo 10.161748 123.69294
Stn 7 Tinubdan Basketball Court
Stn 8 Upper Kapangian
Stn 12 Sitio Tapon
Bugho Clay Quarry
Magsico Clay Quarry
Silica Sand Quarry

EPRMP | CHAPTER 2 ANALYSIS OF ENVIRONMENTAL IMPACTS Silica Sand Quarry Expansion Project
2-107
Figure 2-56. Locations Of Monitoring Stations

EPRMP | CHAPTER 2 ANALYSIS OF ENVIRONMENTAL IMPACTS Silica Sand Quarry Expansion Project
2-108
Monitoring on July 2019 ACES Distribution & Consulting Services, Inc. (ACES) was commissioned by RHR Consult Services, Inc. to conduct ambient air of TSP, PM10, SO2, and NO2 at eight (8) locations (Figure 2-56 and Table 2-36). Table 2-37 shows the methods of air sampling and analysis, the details of which are presented below. Plate 2-4 to Plate 2-11 show the photographs of the air samplers at the monitoring stations. Annexes A to C show the calibration certificates of the air samplers, field data sheets and laboratory certificates of analysis.
Table 2-36. Locations and descriptions of monitoring stations
Station Location Date / Time of
Sampling Description of Location
AQ1 Panadtaran, San Fernando July 29, 2019 /
1437H-1537H
Located on grassy road area and no
rainfall was observed during sampling.
AQ2 Sitio Pantalan South Poblacion July 29, 2019 /
1610H-1710H
Located on a cemented area beside a
road; no rainfall was observed during
sampling.
AQ3 Daungan, Pinamungajan Elem.
School.
July 30, 2019 /
0924H-1024H
Located on a rocky and grassy area
beside a road; no rainfall was observed
during sampling.
AQ4 Brgy. Guimbawian,
Pinamungajan Covered Court
July 30, 2019 /
1045H-1145H
Located on cemented beside a road; no
rainfall was observed during sampling.
AQ5 Brgy. Bugho San Fernando July 30, 2019 /
1220H-1320H
Located on rocky road area and no
rainfall was observed during sampling.
AQ6 Magsico Basketball Court San
fernando
July 30, 2019 /
1345H-1445H
Located on cemented road area and no
rainfall was observed during sampling.
AQ7 Tinubdan, Elementary School July 30, 2019 /
1510H-1610H
Located on cement road area and no
rainfall was observed during sampling.
AQ8 Sitio Kapangian, Brgy. South
Poblacion,San Fernando
July 30, 2019 /
1647H-1747H
Located on a grassy road area and no
rainfall was observed during sampling.
Weather conditions at the time of monitoring were also recorded. These included the sky condition, occurrence of rainfall, and wind speed and wind directions. Table 2-38and Table 2-39 show the criteria in determining cloud condition and rainfall description, respectively
Table 2-37. Methods of ambient air sampling and analysis
Parameters Methodology / Analysis
Total Suspended Particulates (TSP) High Volume – Gravimetric Method
Particulate Matter 10 (PM10) High Volume – Gravimetric Method
Sulfur Dioxide (SO2) Bubbler – Pararosaniline Method
Nitrogen Dioxide (NO2) Bubbler – Griess-Saltzman Reaction Method
Reference: USEPA 40 CFR, Part 50
Sulfur Dioxide (SO2)
SO2 samples were taken using a handy gas sampler by aspirating air into a solution of sodium
tetrachloromercurate (TCM) through an impinger. Samples were then brought to a DENR accredited
laboratory for analysis. SO2 concentration was determined by the difference between the absorbance

EPRMP | CHAPTER 2 ANALYSIS OF ENVIRONMENTAL IMPACTS Silica Sand Quarry Expansion Project
2-109
of the sample and blank multiplied by the calibration factor and divided by the total volume of air
sampled corrected to normal temperature and pressure.
Nitrogen Dioxide (NO2)
NO2 samples were taken using a handy gas sampler by aspirating air into an azo dye forming reagent.
The difference between the absorbance of the sample and the blank multiplied by the calibration
factor over the total volume of air sampled gave the concentration of NO2 in ambient air.
Total Suspended Particulates (TSP)
TSP samples were taken using a high-volume sampler by drawing air through a glass-fiber filter paper
and desiccated for 24-hours after sampling and prior to final weighing. The concentration of TSP in
ambient air was calculated by dividing the total weight of particulates collected by the normal volume
of air sampled.
Particulate Matter Less Than 10 Microns (PM10)
PM10 samples were taken using a high-volume sampler with a specially shaped cyclone inlet where
larger particulates were separated from PM10 size range. The filter paper with retained particulates
was recovered after sampling and desiccated for 24 hours prior to weighing. The concentration of
PM10 in ambient air was the weight of the particulates collected divided by the total normal volume
of air sampled.
Table 2-38. Cloud Description
Sky Condition Definition / Description
Clear or Sunny Skies
● State of the sky when it is cloudless, totally clear or with a few small light clouds visible.
● Has a total cloud cover of less than one octa.
Partly Cloudy ● State of the sky is within 2-5 octa’s total cloud cover or has between 30% to 70% cover of the celestial dome.
Partly Cloudy to at Times Cloudy
● Mostly partly cloudy but there are times when more than 70% of the celestial dome is covered with clouds.
Mostly or Mainly Cloudy
● The sky is mostly covered with clouds but with possible brief periods of sunshine. ● The total cloud cover is ranges between 6 to 8 octas.
Cloudy ● The sky is covered with clouds between 6 to 8 octa’s or has more than 70% cloud cover.
● Predominantly more clouds than clear sky. ● For a longer period during the day, the sun is obscured by clouds.
Overcast ● The sky is totally or completely covered with thick and opaque clouds, 8 octa’s or around 100% cloud cover.
Source: PAGASA
Table 2-39. Rain Description
Rain Description Definition / Description
Very Light Rains ● Scattered drops that do not completely wet an exposed surface regardless of duration.
Light Rains ● The rate of fall is from trace to 2.5 mm per hour. ● Individual drops easily identified and puddles (small muddy pools)
form slowly. ● Small streams may flow in gutters.
Moderate Rains ● The rate of fall is between 2.5 mm to 7.5 mm per hour.

EPRMP | CHAPTER 2 ANALYSIS OF ENVIRONMENTAL IMPACTS Silica Sand Quarry Expansion Project
2-110
Rain Description Definition / Description
● Puddles rapidly forming and down pipes flowing freely.
Heavy Rains ● The rate of fall is greater than 7.5 mm per hour. ● The sky is overcast, there is a continuous precipitation. ● Falls in sheets, misty spray over hard surfaces. ● May cause roaring noise on roofs.
Monsoon Rains ● Heavy and continuous precipitation attributed to either the Southwest or Northeast Monsoon.
Occasional Rains ● Not frequent but is recurrent precipitation.
Widespread Rains ● Precipitation occurring extensively throughout an area.
Frequent rains ● Precipitation occurring regularly and often throughout the time duration.
Intermittent Rains ● Precipitation which ceases at times and re-occur again.
Source: PAGASA
Plate 2-4. Station AQ1 – Panadtaran, San Fernando

EPRMP | CHAPTER 2 ANALYSIS OF ENVIRONMENTAL IMPACTS Silica Sand Quarry Expansion Project
2-111
Plate 2-5. Station AQ2 – Sitio Panatalan, South Poblacion
Plate 2-6. Station AQ3 – Daungan, Pinamungajan Elementary School

EPRMP | CHAPTER 2 ANALYSIS OF ENVIRONMENTAL IMPACTS Silica Sand Quarry Expansion Project
2-112
Plate 2-7. Station AQ4 – Barangay Guimbawian, Pinamungajan Covered Court
Plate 2-8. Station AQ5 – Barangay Bugho, San Fernando

EPRMP | CHAPTER 2 ANALYSIS OF ENVIRONMENTAL IMPACTS Silica Sand Quarry Expansion Project
2-113
Plate 2-9. Station AQ6 – Magsico Basketball Court
Plate 2-10. Station AQ7 – Tinubdan Elementary School

EPRMP | CHAPTER 2 ANALYSIS OF ENVIRONMENTAL IMPACTS Silica Sand Quarry Expansion Project
2-114
Plate 2-11. Station AQ8 – Sitio Kapangian, Barangay South Poblacion, San Fernando
2.3.2.1.2.2 EMISSION ESTIMATES Emission rates of air pollutants were estimated using emission factors of the U.S.EPA and the National
Pollution Inventory (NPI) of the Australian Government. Emission estimates focused on fugitive
emissions or particulates as the significant air emissions generated by quarrying, and the emissions of
gaseous air pollutants (CO, NOX, SO2, and total) emanating from tailpipes of the quarrying equipment.
i. Bulldozing
The emission factors of TSP, PM10 and PM2.5 (in kg/hr) arising from bulldozing activities were
based on AP-42 Emission factor (Table 11.9-2), as follows:
𝐸𝐹𝑇𝑆𝑃(𝑏𝑢𝑙𝑙𝑑𝑜𝑧𝑖𝑛𝑔) =2.6𝑠1.2
𝑀1.3 Equation 1
𝐸𝐹𝑃𝑀10(𝑏𝑢𝑙𝑙𝑑𝑜𝑧𝑖𝑛𝑔) = 0.75𝑥0.45 𝑠1.5
𝑀1..4 Equation 2
𝐸𝐹𝑃𝑀2.5(𝑏𝑢𝑙𝑙𝑑𝑜𝑧𝑖𝑛𝑔) = 0.105 𝑥 𝐸𝑇𝑆𝑃 =0.273 𝑠1.2
𝑀1.3 Equation 3
where: s, is the material silt content (%) and, M is the material moisture content (%).
ii. Materials Handling Emission factors for TSP, PM10 and PM2.5 (in kg/ton) arising from movement of haul-trucks and
front-end loaders/shovels for the unloading/loading of materials were estimated using
Section 13.2.4 of AP-42, as follows.

EPRMP | CHAPTER 2 ANALYSIS OF ENVIRONMENTAL IMPACTS Silica Sand Quarry Expansion Project
2-115
𝐸𝐹𝑀𝑎𝑡𝑒𝑟𝑖𝑎𝑙𝑠 𝐻𝑎𝑛𝑑𝑙𝑖𝑛𝑔 = 𝑘 (0.0016)(
𝑈
2.2)
1.3
(𝑀
2)
1.4 Equation 4
where U and M are the mean wind speed (m/s) and the material moisture content (%), respectively. The
particle size multiplier, k, is 0.74 for TSP, 0.35 for PM10 and 0.053 for PM2.5.
iii. Grading Emission factors for TSP (in kg/vehicle kilometer travelled) for grading and scraping of
unpaved roads were based on Table 11.9-2 of AP-42, as follows:
𝐸𝑇𝑆𝑃𝑔𝑟𝑎𝑑𝑖𝑛𝑔−𝑠𝑐𝑟𝑎𝑝𝑖𝑛𝑔 = 0.0034 𝑥 𝑆2.5 Equation 5
where, S, is the mean vehicle speed (km/h). For PM10, the emission factor (in kg/vehicle
kilometer travelled) is,
𝐸𝑃𝑀10𝑔𝑟𝑎𝑑𝑖𝑛𝑔−𝑠𝑐𝑟𝑎𝑝𝑖𝑛𝑔 = 0.6 𝑥 0.0056 𝑥 𝑆2.0 Equation 6
iv. Haul Trucks Along Unpaved Roads
Emission factors arising from operation of trucks (e.g., hauling of materials) along unpaved
access roads (in lb/vehicle mile travelled) were obtained from Chapter 13.2 of AP-42, as
follows:
𝐸𝐹𝑈𝑛𝑝𝑎𝑣𝑒𝑑𝑅𝑜𝑎𝑑 = 𝑘 (𝑠
12)
𝑎
(𝑊
3)
𝑏
Equation 7
where k, a, and, b, are constants shown in Table 2-40.
Table 2-40. Constants used on emission factors for unpaved roads
Constant Industrial Roads
PM30* PM10 PM2.5
K (lb/VMT) 4.9 1.5 0.15
a 0.7 0.9 0.9
b 0.45 0.45 0.45
*Assumed equivalent to total suspended particulate matter (TSP)
Source: Table 13.2.2-2 of AP-42
The above equations and constants were converted to metric units to obtain the emission factors in
vehicle kilometer travelled (or kg/VKT).
The emission factor (Equation 7) was adjusted to account for the natural mitigation by rainfall using
the formula,
𝐸𝐹𝑢𝑛𝑝𝑎𝑣𝑒𝑑(𝑐𝑜𝑟) = 𝐸𝐹𝑢𝑛𝑝𝑎𝑣𝑒𝑑 (365−𝑃
365) Equation 8
Where:
● EFunpaved(cor)= the annual size specific emission factor extrapolated for natural mitigation
(lb/VMT), and
● P = number of days in a year with at least 0.254 mm (0.01 in) of rainfall

EPRMP | CHAPTER 2 ANALYSIS OF ENVIRONMENTAL IMPACTS Silica Sand Quarry Expansion Project
2-116
v. Paved Roads
Emissions of haul trucks passing along unpaved roads (in g/VKT) were obtained from AP-42
(Chapter 13.2), as follows:
𝐸𝑝𝑎𝑣𝑒𝑑𝑅𝑜𝑎𝑑 = 𝑘 (𝑠𝐿)0.91(𝑊)1.02 Equation 9
Where:
K = particle size multiplier for particle size range
sL = road surface silt loading (g/m2);
W = average weight (tons) of the vehicles travelling the road
The particle size multiplier for TSP and PM10 are 3.23 and 0.62, respectively.
The emission factor (Equation 6) was adjusted to account for the natural mitigation by rainfall
using the formula,
𝐸𝑝𝑎𝑣𝑒𝑑𝑅𝑜𝑎𝑑(𝑐𝑜𝑟) = 𝑘 (𝑠𝐿)0.91(𝑊)1.02(1 −𝑃
4𝑁) Equation 10
Where:
P = number of “wet” days with at least 0.254 mm (0.01 in) of rainfall, and
N = number of hours in the averaging period
vi. Motor Vehicle Combustion Tailpipe emissions emanating from operation of heavy equipment were estimated using
emission factors prescribed in NPI Emission Estimation Technique l for Combustion Engine V3.0
(June 2008). Table 2-41 shows list of heavy equipment used for quarry operation, engine rated
power, average load factor and emission factors based on NPI.

EPRMP | CHAPTER 2 ANALYSIS OF ENVIRONMENTAL IMPACTS Silica Sand Quarry Expansion Project
2-117
Table 2-41. Rated power, average load factor, and emission factor of quarrying equipment
Source Rated Power (kW)
Average Load
Factor
Emission factor (kg/kWH)
Reference Total Particulates
PM10 PM2.5 CO NOX SO2 Total VOC
Existing Production
Backhoe CAT330 204 0.56 0.001144 0.00088 0.00081 0.003 0.012 0.0000075 0.0015 Table 32 of NPI
Backhoe CAT 330 (spare) 204 0.56 0.001144 0.00088 0.00081 0.003 0.012 0.0000075 0.0015 Table 32 of NPI
Dumptruck (Isuzu) 257 0.23 0.00234 0.0018 0.0017 0.0068 0.023 0.000017 0.0018 Table 21 of NPI
Proposed Production
Backhoe CAT330 204 0.56 0.001144 0.00088 0.00081 0.003 0.012 0.0000075 0.0015 Table 32 of NPI
Backhoe CAT 330 (spare) 204 0.56 0.001144 0.00088 0.00081 0.003 0.012 0.0000075 0.0015 Table 32 of NPI
Dumptruck (Howo) 257 0.23 0.00234 0.0018 0.0017 0.0068 0.023 0.000017 0.0018 Table 21 of NPI
Payloader 140.9 0.50 0.00143 0.0011 0.00099 0.0036 0.012 0.0000075 0.0016 Table 31 of NPI
Grader 100.7 0.50 0.001092 0.00084 0.00077 0.0021 0.0096 0.0000075 0.00048 Table 30 of NPI

EPRMP | CHAPTER 2 ANALYSIS OF ENVIRONMENTAL IMPACTS Silica Sand Quarry Expansion Project
2-118
2.3.2.1.3 ENVIRONMENTAL PERFORMANCE/BACKGROUND AIR QUALITY The environmental performance of the silica quarry project ambient air quality was assessed based
on the monitoring data from 2017 to 2018 and the air monitoring in July 2019.
2.3.2.1.3.1 MONTHLY MONITORING OF TSP Figure 2-57 shows the measured TSP concentrations at nine (9) locations located in Pinamungajan and
San Fernando, Cebu. The monitoring stations in San Fernando, Cebu were included as hauling of
materials from the silica project is expected to generate air emissions along and in vicinities of the
haul roads. The statistics of results are presented in Table 2-42.
Results show that measured concentrations of TSP were all within the ambient air quality standard
set for TSP at 300 µg/Nm3. The lowest TSP concentration was 12.9 µg/Nm3 and the highest was 222.3
µg/Nm3. The average concentrations of TSP range from 31.8 to 128.2 µg/Nm3.
The plots of measured TSP concentrations show relatively higher levels during the dry season,
particularly in February 2018 and April 2018.
Table 2-42. Statistics of measured TSP (in µg/Nm3)
Station ID Station Name Minimum Maximum Average
Stn 1 Upper Tonggo 54.8 145.7 113.9
Stn 2 LowerTonggo 18.4 222.3 110.1
Stn 6 Lower Panadtaran 44.5 214.3 128.2
Stn 7 Tinubdan Basketball Court 70.2 89.0 78.3
Stn 8 Upper Kapangian 55.4 109.3 77.1
Stn 9 (Sitio Kapangian 25.8 160.9 84.5
Stn 12 Sitio Tapon 17.7 189.6 121.3
Bugho Clay Quarry 85.1 118.4 96.8
Silica Sand Quarry 12.9 50.0 31.8
NAAQS for TSP = 300 µg/Nm3

EPRMP | CHAPTER 2 ANALYSIS OF ENVIRONMENTAL IMPACTS Silica Sand Quarry Expansion Project
2-119
Figure 2-57. Measured TSP concentrations at the ten (10) monitoring stations

EPRMP | CHAPTER 2 ANALYSIS OF ENVIRONMENTAL IMPACTS Silica Sand Quarry Expansion Project
2-120
2.3.2.1.3.2 JULY 2019 MONITORING Table 2-43 shows the measured concentrations of TSP, PM10, SO2, and NO2 on July 29-30, 2019 at eight
(8) locations. Particulate air pollutants range from 12.8 to 147.1 µg/Nm3 and 18 to 5.5 µg/Nm3for TSP
and PM10, respectively. These concentrations are way below the ambient standards set at 300 and 200
µg/Nm3 for TSP and PM10, respectively.
For the gaseous air pollutants (SO2 and NO2), measured concentrations were generally less than the
detection limits.
Light air (Beaufort number 1) coming from the S-W were the prevailing winds at the time of monitoring
(Table 2-44). There was no occurrence of rainfall during monitoring with sunny to partly cloudy skies.
Table 2-43. Measured concentrations of TSP, PM10, SO2 and NO2 (µg/Nm3)
Station Location Date / Time of Sampling
TSP PM10 SO2 NO2
AQ1 Panadtaran, San Fernando July 29, 2019 / 1437H-1537H
47.6 3.7 13.2 < 3.1
AQ2 Sitio Pantalan South Poblacion July 29, 2019 / 1610H-1710H
34.7 5.5 < 8.7 < 3.1
AQ3 Daungan, Pinamungajan Elem. School.
July 30, 2019 / 0924H-1024H
21.8 1.8 < 8.6 < 3.1
AQ4 Brgy. Guimbawian, Pinamungajan Covered Court
July 30, 2019 / 1045H-1145H
48.2 1.9 < 10.9
< 3.2
AQ5 Brgy. Bugho San Fernando July 30, 2019 / 1220H-1320H
16.8 1.9 < 8.9 < 3.2
AQ6 Magsico Basketball Court San fernando
July 30, 2019 / 1345H-1445H
12.8 1.8 < 8.7 < 4.7
AQ7 Tinubdan, Elementary School July 30, 2019 / 1510H-1610H
38.3 1.8 < 10.6
4.3
AQ8 Sitio Kapangian, Brgy. South Poblacion,San Fernando
July 30, 2019 / 1647H-1747H
147.1 10.8 < 8.7 < 3.1
DENR NAAQS for Source Specific Air Pollutants based on 60 minutes averaging time
300 200 340 260
Note: The detection limit value of the parameters was used for the computation of non-detected concentrations
Table 2-44. Observed meteorological condition during sampling on 1-Hr Ambient Air Monitoring Locations and Observed Meteorological Conditions
Station Location Date/Time Wind
Direction Wind Speed
Cloud Description
Rain Description
AQ1 Panadtaran, San Fernando
July 29, 2019 / 1437H-1537H
SW BF1 Partly cloudy
None
AQ2 Sitio Pantalan South Poblacion
July 29, 2019 / 1610H-
SW BF1 Cloudy None

EPRMP | CHAPTER 2 ANALYSIS OF ENVIRONMENTAL IMPACTS Silica Sand Quarry Expansion Project
2-121
Station Location Date/Time Wind
Direction Wind Speed
Cloud Description
Rain Description
1710H
AQ3 Daungan, Pinamungajan Elem. School.
July 30, 2019 / 0924H-1024H
SW BF1 Sunny with partly cloudy skies
None
AQ4 Brgy. Guimbawian, Pinamungajan Covered Court
July 30, 2019 / 1045H-1145H
SW BF1 Sunny with partly cloudy skies
None
AQ5 Brgy. Bugho San Fernando
July 30, 2019 / 1220H-1320H
SW BF1 Sunny with partly cloudy skies
None
AQ6 Magsico Basketball Court San fernando
July 30, 2019 / 1345H-1445H
SW BF1 Sunny with partly cloudy skies
None
AQ7 Tinubdan, Elementary School
July 30, 2019 / 1510H-1610H
SW BF1 Sunny with partly cloudy skies
None
AQ8 Sitio Kapangian, Brgy. South Poblacion,San Fernando
July 30, 2019 / 1647H-1747H
SW BF1 Sunny with partly cloudy skies
None
2.3.2.2 IMPACT ASSESSMENT AND MITIGATION MEASURES As discussed in the methodology, estimation of air emissions emanating from the existing and the
proposed productions of the project were performed using available emission factors of the U.S.EPA
AP-42 and the NPI. Emission estimates focused on particulate emissions (total particulates, PM10, and
PM2.5) from the following significant quarrying activities.
● Bulldozing;
● Materials handling (mine site);
● Grading;
● Travel of haul trucks along unpaved road;
● Travel of haul trucks along paved road; and
● Tailpipe emissions from vehicles;
Gaseous air pollutants (CO, NOX, SO2, VOC) from tailpipe emissions of vehicles (quarry equipment)
were also included in the emission estimates.
A spreadsheet was developed to calculate the above-mentioned air pollutants emanating from
current and proposed productions. Annex D shows the screenshots of the spreadsheets indicating the
assumptions, emission factors, and results of calculations. The results were summarized and
presented as graphs in Figure 2-58 to Figure 2-65.

EPRMP | CHAPTER 2 ANALYSIS OF ENVIRONMENTAL IMPACTS Silica Sand Quarry Expansion Project
2-122
Frequency of dump trucks travelling from the quarry site to the stockpile in the cement plant will
increase from 5 dump trucks per hour (current production) to 15 dump trucks per hour (proposed
production). Only one (1) backhoe will be added for the proposed production giving total of three (3)
backhoes from two (2) backhoes for the current production. The other vehicles/quarry equipment for
the silica proposed production are one (1) unit of payloader and one (1) unit of grader. Bulldozer was
also included in the proposed production.
Conservative default values for silt content of 15% and moisture content of 0.5% were used in
estimating uncontrolled particulate emissions. These values were based from the Emissions Inventory
Guidance for Mineral Handling and Processing Industries of Mojave Air Quality Management District
published in 2010 (herein referred as Mojave, 2010). Silt content default value for this project,
however, was assumed at 15% (50% of 30% based from Mojave, 2010). Estimates of fugitive emissions
at varying silt contents, moisture contents and wind speeds are shown in Figure 2-60 to Figure 2-62
and Table 2-45 to Table 2-47.
Uncontrolled particulate emissions (TSP) was estimated to increase from its current emission of 777.1
tons per year to about 2502.7 tons per year for the proposed production (Figure 2-60) The estimated
increase of emission rate of TSP for the proposed production was about 3 times more than the current
production. For PM10 and PM2.5, the estimated increase in emission rates were about 3 and 2.7 times
than the existing production
Hauling of materials by dump trucks along roads contributed to large percentage of fugitive emissions
(Figure 2-60 to Figure 2-65) with emissions from paved roads representing the highest emissions. This
is because of the considerable length of the paved road (access road from silica project site to the
cement plant) of about 16.5 km while the unpaved road is about 4.5 km.
By applying mitigation measures to control fugitive particulates wherein control efficiencies range
from 75% to 90%, the controlled particulate emissions (TSP) were significantly reduced from 777.1
tons per year to 170.4 tons per year for the current production, and from 2,502.7 tons per year to
about 5,823 tons per year for the proposed production. The results show that there is still substantial
amount of fugitive emissions as control efficiencies were set from 75% to 90%. This suggest the
difficulty of controlling fugitive emissions along roads, particularly during dry weather conditions, and
the need to continuously implement dust control measures to minimize fugitive emissions.

EPRMP | CHAPTER 2 ANALYSIS OF ENVIRONMENTAL IMPACTS Silica Sand Quarry Expansion Project
2-123
Figure 2-58. Estimated particulate emissions for the current and proposed production (kg/hr)
Figure 2-59. Estimated particulate emissions for the current and proposed production (tons per year)

EPRMP | CHAPTER 2 ANALYSIS OF ENVIRONMENTAL IMPACTS Silica Sand Quarry Expansion Project
2-124
Figure 2-60. Estimated emissions of total particulates (uncontrolled) for the current and proposed production
Figure 2-61. Estimated emissions of total particulates (controlled) for the current and proposed production
Figure 2-62. Estimated emissions of PM10 (uncontrolled) for the current and proposed production

EPRMP | CHAPTER 2 ANALYSIS OF ENVIRONMENTAL IMPACTS Silica Sand Quarry Expansion Project
2-125
Figure 2-63. Estimated emissions of PM10 (controlled) for the current and proposed production
Figure 2-64. Estimated emissions of PM2.5 (uncontrolled) for the current and proposed production
Figure 2-65. Estimated emissions of PM2.5 (controlled) for the current and proposed production

EPRMP | CHAPTER 2 ANALYSIS OF ENVIRONMENTAL IMPACTS Silica Sand Quarry Expansion Project
2-126
Figure 2-59. TSP emission rates (kg/hr) emanating from bulldozing at various moisture (0.25 to 2.5%) and silt contents (0.5 to 70%)
Figure 2-60. PM10 emission rates (kg/hr) emanating from bulldozing at various moisture (0.25 to 2.5%) and silt contents (0.5 to 70%)

EPRMP | CHAPTER 2 ANALYSIS OF ENVIRONMENTAL IMPACTS Silica Sand Quarry Expansion Project
2-127
Figure 2-61. PM2.5 Emission rates (kg/hr) emanating from bulldozing at various moisture (0.25 to 2.5%) and silt contents (0.5 to 70%)
Table 2-45. TSP emission rates (kg/hr) for materials handling at various wind speed (2.2 to 11.2 m/s) and moisture content (0.25 to 2.5%
Moisture Content (%)
Wind speed (m/s)
2.2 3.1 4.5 5.6 6.7 8.9 11.2
0.25 5.554 8.601 13.675 18.277 23.165 33.671 45.003
0.50 2.104 3.259 5.182 6.926 8.778 12.759 17.053
0.75 1.193 1.847 2.937 3.926 4.976 7.232 9.667
1.00 0.797 1.235 1.964 2.624 3.326 4.835 6.462
1.50 0.452 0.700 1.113 1.488 1.885 2.741 3.663
2.00 0.302 0.468 0.744 0.994 1.260 1.832 2.449
2.50 0.221 0.342 0.544 0.728 0.922 1.340 1.792
Table 2-46. PM10 emission rates (kg/hr) for materials handling at various wind speed (2.2 to 11.2 m/s) and moisture
content (0.25 to 2.5%
Moisture Content (%)
Wind speed (m/s)
2.2 3.1 4.5 5.6 6.7 8.9 11.2
0.25 2.627 4.068 6.468 8.644 10.957 15.926 21.285
0.50 0.995 1.541 2.451 3.276 4.152 6.035 8.066
0.75 0.564 0.874 1.389 1.857 2.353 3.421 4.572
1.00 0.377 0.584 0.929 1.241 1.573 2.287 3.056
1.50 0.214 0.331 0.526 0.704 0.892 1.296 1.732
2.00 0.143 0.221 0.352 0.470 0.596 0.866 1.158
2.50 0.105 0.162 0.257 0.344 0.436 0.634 0.847

EPRMP | CHAPTER 2 ANALYSIS OF ENVIRONMENTAL IMPACTS Silica Sand Quarry Expansion Project
2-128
Table 2-47. PM2.5 emission rates (kg/hr) for materials handling at various wind speed (2.2 to 11.2 m/s) and moisture content (0.25 to 2.5%
Moisture Content (%)
Wind speed (m/s)
2.2 3.1 4.5 5.6 6.7 8.9 11.2
0.25 0.398 0.616 0.979 1.309 1.659 2.412 3.223
0.50 0.151 0.233 0.371 0.496 0.629 0.914 1.221
0.75 0.085 0.132 0.210 0.281 0.356 0.518 0.692
1.00 0.057 0.088 0.141 0.188 0.238 0.346 0.463
1.50 0.032 0.050 0.080 0.107 0.135 0.196 0.262
2.00 0.022 0.034 0.053 0.071 0.090 0.131 0.175
2.50 0.016 0.025 0.039 0.052 0.066 0.096 0.128
2.3.2.2.1 MITIGATION MEASURES The following are the activities and corresponding mitigation measures that are in placed or to be
implemented for the project, specific for SEDC operation.
a) Bulldozing and materials handling – wet suppression or water spraying, reduction of wind
speeds by installing temporary wind barriers during high wind condition
b) Grading – wet suppression or water spraying, and phasing with the hauling activities to reduce
cumulative increase of fugitive dusts
c) Haul trucks (unpaved roads)
▪ Wet suppression or water spraying,
▪ Strictly implement speed limits,
▪ Provide trucks with appropriate cover, when necessary,
▪ Provide wheel washing facilities for vehicles leaving the quarry and project site. The
wheel washing facility should be used to remove muds at the tires of trucks and heavy
equipment
▪ In case of very dry weather condition where wetting of dry surfaces would be effective
for short duration, consider re-routing of vehicles away from area sensitive receptors
(households or residences), and
▪ Regular maintenance of trucks to reduce or maintain tailpipe emissions
2.3.3 NOISE QUALITY
2.3.3.1 SCOPE This section deals on the following as required in Item 3.2.2 (Increase in ambient noise level) in the
screening form for the project
▪ Characterization of ambient noise levels; and
▪ Environmental performance/background noise levels in the vicinities of the project site
2.3.3.2 METHODOLOGY
2.3.3.2.1 AMBIENT NOISE STANDARDS The then National Pollution Control Commission (NPCC) in 1978 established the ambient noise quality
standards in general areas, as shown in Table 2-48. In 1980, NPCC issued Memorandum Circular No.

EPRMP | CHAPTER 2 ANALYSIS OF ENVIRONMENTAL IMPACTS Silica Sand Quarry Expansion Project
2-129
2, Series of 1980 (NPCC 1980), which amended Sections 75 to 78 in Article 1 (Noise Control Regulation)
of the NPCC (1978) rules and regulations, by inclusion of corrector factors on areas directly facing
roads.
There are, however, inconsistencies in NPCC (1980) on the correction factors for areas directly facing
roads and the definition of heavy industrial area. NPCC (1980) provided correction factors of +5 dBA
and 10 dBA for both four-lane roads, but none for two-lane roads. Further, heavy industrial area is
zoned as Class B and Class D in NPCC (1980), however, commercial area should be zoned as Class B as
originally defined in NPCC (1978).
Table 2-48. Environmental quality standards for noise in general areas (NPCC 1980)
Category
Maximum Allowable Noise (dBA) by time periods
Daytime
(9:00 A.M. to 6:00 P.M).
Morning/Evening
(5:00 A.M. to 9:00 AM/
6:00 P.M. to 10:00 P.M.
Nighttime
(10:00 P.M. to 5:00 A.M).
AA 50 45 40
A 55 50 45
B 65 60 55
C 70 65 60
D 75 70 65 ● Class AA- a section of contiguous area which requires quietness, such as areas within 100 meters from school
site, nursery schools, hospitals and special house for the aged ● Class A - a section of contiguous area which is primarily used for residential area ● Class B - a section of contiguous area which is primarily a commercial area ● Class C - a section of contiguous area reserved as light industrial area ● Class D – a section of contiguous area reserved for heavy industrial area
2.3.3.2.2 BACKGROUND NOISE LEVELS A Peak Meter Sound Level Meter (SLM) was used to measure sound levels from July 29-30, 2019 at
eight (8) locations (Figure 2-66). Sound measurements were done by manual recording of total of fifty
(50) sound levels that appeared in the screen every ten (10) seconds.
Sound level data were then processed and analyzed to determine the equivalent sound levels (Leq),
median of the seven (7) highest noise readings, and other noise descriptors. The equivalent noise level
(Leq) was calculated using the following formula
n
i
Li
N 1
1010eq 10
1log10L
where, Leq = equivalent noise level,
Li = instantaneous noise level, and
N = total number of noise data
The other noise descriptions are L90 and L10, which are defined as follows:
● L90 level – the sound level exceeded 90% of the time. Corresponds to the residual noise level, as defined
by Wilson (1989), and
● L10 level – the sound level exceeded 10% of the time. This also corresponds to peaks of noise in a
particular period

EPRMP | CHAPTER 2 ANALYSIS OF ENVIRONMENTAL IMPACTS Silica Sand Quarry Expansion Project
2-130
Figure 2-66. Locations of noise sampling stations

EPRMP | CHAPTER 2 ANALYSIS OF ENVIRONMENTAL IMPACTS Silica Sand Quarry Expansion Project
2-131
2.3.3.3 BACKGROUND NOISE LEVELS Sound level monitoring was conducted using a Peak SLM eight (8) locations on July 29-30. Measured
sound pressure levels shown in Figure 2-68 to Figure 2-75 were processed to determine the statiscal
noise descriptions, namely: Leq, L10, L90 and median of the seven (7) highest readings. The summary
of noise descriptors are shown in Figure 2-71.
The Leq at Stations N4, N8, and N1 were 51.8, 54.1 and 54.2 dBA, respectively (Figure 2-71). These Leq
are lower than the 55 dBA or equivalent to daytime noise standard set for residental areas. The highest
Leq was at Station N3 with 76.5 dBA followed by Station N2 (65.6 dBA) and Station N6 (60.7 dBA).
Sources of high noise levels at Station N1 were from students practicing drum and lyre and from
passing motorcyles (Table 2-49). At Station N1, sources of noise were from animals and birds, children
playing and from passing motorcycles.
L10 sound levels are levels that exceeded 10% of the time. L10 levels were all higher than Leq suggesting
slight fluctuations of sound levels during noise measurements. The highest L10 level was also at
Station N3 with 78 dBA while the lowest also at Station N4 with 54.2 dBA.
L90 sound levels or sometimes referred as “background noise levels” were lower than 50 dBA at five
(5) stations and lower than 55 dBA at one (1) station. The stations or locations with L90 levels lower
than 55 dBA are as follows:
● Station N1 – 44.6 dBA,
● Station N5 – 45 dBA,
● Station N6 – 46.8 dBA,
● Station N8 – 47.0 dBA,
● Station N4 – 47.9 dBA, and
● Station N7 – 51.7 dBA
The above L90 levels show that without the temporary or passing high noise sources, i.e., passing
motorcycles, the background noise levels (L90) at the above six (6) locations were relatively lower,
and with Station N1 and N5 registering L90 levels equal or lower than the ambient noise standard for
residential areas set at 45 dBA. This suggests that background noise levels could be lower at nighttime
and early evening periods, in which there is expected reduction or absence of noise coming from
vehicles and from community noise.
In comparison with the ambient daytime noise standard set for residential areas, the medians of the
seven (7) highest noise readings at the eight (8) sampling stations were all greater than the
corresponding ambient noise standard (Table 2-49). It should be noted that the NPCC ambient noise
standards are related to “peaks of noise levels” as it only relates to the 4th highest measured noise
levels. The NPCC noise standard are also applicable at the property boundaries of the source being
monitored or at nearest receptor. For example, for a cement plant, the NPCC standard applies at the
property boundary of the cement plant or at the nearest household from the cement plant.
Thus, L90 levels are indicators of background noise levels as it specifies sound levels exceeded 90% of
the time. This indicates lower sound levels than L10, Leq or the median values.

EPRMP | CHAPTER 2 ANALYSIS OF ENVIRONMENTAL IMPACTS Silica Sand Quarry Expansion Project
2-132
Figure 2-67. Statistics of noise descriptors at the eight (8) monitoring stations
Table 2-49. Median of 7 highest noise readings in comparison with the noise standards set for residential areas
Station Location Date / Time Noise Level (dBA)
NPCC Standard
(dBA) Remarks
N1 Panadtaran, San Fernando July 29, 2019 / 1538H-1548H
56.3 55 Greater than NPCC
standard
N2 Sitio Pantalan South Poblacion July 29, 2019 / 1600H-1610H
69.4 55 -do-
N3 Daungan, Pinamungajan Elem. School.
July 30, 2019 / 0914H-0924H
80.3 50 -do-
N4 Brgy. Guimbawian, Pinamungajan Covered Court
July 30, 2019/ 1035H-1045H
55.3 55 -do-
N5 Brgy. Bugho San Fernando July 30, 2019/ 1210H-1220H
63.7 55 -do-
N6 Magsico Basketball Court San Fernando
July 30, 2019/ 1335H-1345H
68.9 55 -do-
N7 Tinubdan, Elementary School July 30, 2019/ 1500H-1510H
64.5 50 -do-
N8 Sitio Kapangian, Brgy. South Poblacion,San Fernando
July 30, 2019/ 1637H-1647H
57.1 55 -do-
A Class A area (a section which is primarily used for residential purposes)
Class AA area (a section which requires quietness)

EPRMP | CHAPTER 2 ANALYSIS OF ENVIRONMENTAL IMPACTS Silica Sand Quarry Expansion Project
2-133
Table 2-50. Primary sources of noise during monitoring on July 29-30, 2019
Station Location Sources of Noise
N1 Panadtaran, San Fernando Birds and animal noise (dogs and goat), children playing, and passing motorcycles.
N2 Sitio Pantalan South Poblacion Passing motorcycles, boats at the sea, and residential activities.
N3 Daungan, Pinamungajan Elem. School.
Students practicing drum and lyre and passing motorcycles.
N4 Brgy. Guimbawian, Pinamungajan Covered Court
Passing light vehicles and birds.
N5 Brgy. Bugho San Fernando Passing light vehicles and birds.
N6 Magsico Basketball Court San Fernando
Passing light vehicles, chicken and birds.
N7 Tinubdan, Elementary School Students playing basketball, residential activities, passing motorcycle and birds.
N8 Sitio Kapangian, Brgy. South Poblacion,San Fernando
Passing vehicles, residential activities like playing volleyball and dog barks .
Figure 2-68. Measured sound levels at Station N1

EPRMP | CHAPTER 2 ANALYSIS OF ENVIRONMENTAL IMPACTS Silica Sand Quarry Expansion Project
2-134
Figure 2-69. Measured sound levels at Station N2
Figure 2-70. Measured sound levels at Station N3
Figure 2-71. Measured sound levels at Station N4

EPRMP | CHAPTER 2 ANALYSIS OF ENVIRONMENTAL IMPACTS Silica Sand Quarry Expansion Project
2-135
Figure 2-72. Measured sound levels at Station N5
Figure 2-73. Measured sound levels at Station N6
Figure 2-74. Measured sound levels at Station N7

EPRMP | CHAPTER 2 ANALYSIS OF ENVIRONMENTAL IMPACTS Silica Sand Quarry Expansion Project
2-136
Figure 2-75. Measured sound levels at Station N8
2.3.3.4 IDENTIFICATION AND ASSESSMENT OF IMPACTS The operation of quarry equipment, e.g., backhoe and payloaders at the silica quarry site, the
transport of quarried materials by dump trucks from the project site to the cement plant, and travel
of empty dumptrucks to the project site, are expected to increase the background noise levels in the
vicinities of the access road and the quarry site.
The increase in background noise levels at the noise sensitive receptors (NSRs) depends on the type
of equipment used and the distance between NSRs and the quarrying equipment. At a distance of 50
of 15.24 m from the equipment, sound pressure level for each one one (1) unit of backhoe, dozer,
dump truck, front end loader, and grader ranges from 80 to 85 dBA (Table 2-51). For the breaker,
sound pressure level at the 10 m is about 94 dBA.
Table 2-51. Attenuated noise levels at 50 ft (15.24 m) from quarry equipment
Equipment Description Specification Lmax at 50 ft
Backhoe 80
Dozer 85
Dump truck 84
Front end loader 80
Grader 85
Breaker 94*
Source: U.S. FHWA Final Report, 2006
*Sound pressure level at 10 m (Source: www.epiroc.om)
The increase in production capacity will increase the number of dump trucks travelling from the
cement plan site to the quarry site (silica). The number of dump trucks in the current production is
about 5 trucks per hour and for the proposed production is about 15 trucks per hour. Hence, there is
expected increase in background noise levels at households or NSRs adjacent access roads where
materials will be transported. At about 15.24 m from the dump truck, the maximum sound pressure

EPRMP | CHAPTER 2 ANALYSIS OF ENVIRONMENTAL IMPACTS Silica Sand Quarry Expansion Project
2-137
level is 84 dBA, however, though this will immediately cease after the truck travels at considerable
distance from the NSRs (say 100 m).
Table 2-52 shows that the noise level increases and the corresponding impact categories. Increase of
background noise levels greater than 10 dBA will have significant to severe impact while below 5 dBA
with none to minor impact. During nighttime wherein background noise levels are lower, significant
increase of background noise levels could cause nuisance to residences residing near the access roads.
Table 2-52. Noise level increases and corresponding impact categories (Source: Wilson, 1986)
Category Increase (dBA) Effect
I < 5 None to Minor
II 5 to 10 Moderate
III > 10 Significant to Severe
2.3.3.4.1 MITIGATION MEASURES AND MONITORING PROGRAM Based on assessment above, it appears that the proposed project expansion will have perceived
significant increase in background noise levels. It is recommended to provide mitigation measures to
avoid nuisance or complaints from households residing along the access road and adjacent quarry site.
The following mitigation measures are recommended.
● Require all heavy equipment using internal combustion engines (e.g., dump trucks) install
effective mufflers. Mufflers will effectively;
● Strictly impose speed limits at access roads near residential areas;
● Limit use of equipment at nighttime, especially equipment that emits high noise levels, when such
activity could cause nuisance at nearby households; and
● Provide enclosures for high noise emitting equipment (e.g., breakers) with temporary barriers and
sound absorbing materials, when necessary
It is recommended to conduct ambient noise monitoring at households nearest the quarry and access
or haul roads. Noise monitoring should be conducted at four (4) time periods specified in NPCC (1978)
and NPCC (1980).

EPRMP | CHAPTER 2 ANALYSIS OF ENVIRONMENTAL IMPACTS Silica Sand Quarry Expansion Project
2-138
2.4 PEOPLE
The study focuses on the impact areas of the proposed project namely: Barangays Duangan, Lut-od,
Punod, Sibago, and Guimbawian of the Municipality of Pinamungahan in Cebu. These barangays are
deemed as direct impact areas where the project components are to be located. The following
sections present the demographic and socio-economic profile of the impact area as well as the
issues/concerns/possible impacts regarding the project and corresponding proposed
mitigation/enhancement measures.
2.4.1 METHODOLOGY Various methods were employed in gathering information on the socio-economic conditions of the
impact area. These methods include:
Table 2-53. Methodologies used for People Module
METHODOLOGY
USED DATE VENUE REMARKS
Secondary Data
Gathering
Legal and official documents from relevant Government Units and
Agencies
Site Visit/Ocular
Inspection/Area
Reconnaissance
14 November-
03 December, 2018
Municipality of Pinamungajan
1. Barangay Duangan
2. Barangay Lut-od
3. Barangay Punod
4. Barangay Sibago
5. Barangay Guimbawian
--
Public Scoping 27 March 2019 Duangan Basketball Court,
Barangay Duangan,
Pinamungajan, Cebu
56 Participants
Perception Survey 22 November–
30 November 2018
Municipality of Pinamungajan
1. Barangay Duangan
2. Barangay Lut-od
3. Barangay Punod
4. Barangay Sibago
5. Barangay Guimbawian
100 Participants
(using Purposive
Sampling)
Key Informant
Interview
19 November 2018 Barangay Hall of Duangan Respondents:
Barangay
Secretary
Focus Group
Discussion (FGD)
15 November 2018
10 AM to 12 Noon
Barangay Hall of Duangan Respondents:
Barangay Officials
(6 Participants)
2.4.1.1 SITE VISIT/RECONNAISSANCE During the reconnaissance survey, the general condition of the Impact area and community was
observed and noted. In this method, one can generalize the socio-economic and demographic
conditions of the covered areas and communities. Brief random interviews of the residents within the
area were also conducted to research on the general situation of the area and the communities and

EPRMP | CHAPTER 2 ANALYSIS OF ENVIRONMENTAL IMPACTS Silica Sand Quarry Expansion Project
2-139
help determine the perception of the respondents towards the project. The Site Visit/Ocular
Inspection/ Area reconnaissance/ Preliminary Survey was conducted on November 14 – December 3,
2018.
2.4.1.2 PUBLIC SCOPING There are 5 barangays covered by the project, Barangays Duangan, Lut-od, Punod, Sibago, and
Guimbawian. The public scoping was conducted on March 27, 2019. Further details of the Public
Scoping are shown in Table 2-53.
2.4.1.3 REVIEW OF SECONDARY DATA Socio-demographic and economic data and information were procured from pertinent documents
from respective government institutions such as from the provincial municipal LGU of Pinamungajan,
as well as online sources for background information. All sources of such information were exhausted
in this report.
2.4.1.4 PERCEPTION SURVEY A Perception Survey was conducted in the Direct Impact Barangays of the proposed project namely:
Barangays Duangan, Lut-od, Punod, Sibago, and Guimbawian of the Municipality of Pinamungajan in
Cebu. This was conducted from 22 November– 30 November 2018. Table 2-54 presents the summary
of Perception Survey conducted for the proposed project. Further details and photo documentation
are shown in the succeeding sections.
The methodology used for the perception survey conducted was purposive sampling. The respondents
were selected based on the criteria of their present residency’s, property’s, lifestyle/cultural activities’
and livelihood’s distance and accessibility-in-relation to the project site. Also considered are factors
such as those that may be most affected by the project’s impacts, upon the Ocular Inspection/Site
Visit/Area Reconnaissance of the Study Team and Specialists, thru their consultations, and in
coordination with Key Agency/Office Authorities and Community Leaders, IP Elders and Stakeholder
Representatives.
Table 2-54. Methods used for Perception Survey
METHOD DATE OF SURVEY LOCATION NO. OF
RESPONDENTS
Purposive Sampling
22 November–
30 November 2018
Municipality of Pinamungajan
1. Barangay Duangan
2. Barangay Lut-od
3. Barangay Punod
4. Barangay Sibago
5. Barangay Guimbawian
100
2.4.1.5 KEY INFORMANT INTERVIEW (KII) Key Informant Interview (KII) was also conducted on 19 November 2018 to provide an in-depth
discussion on the condition of the community and to determine the perceptions and interests of
several groups in the host barangay. This was administered to the knowledgeable and influential
people in the locale. Among those interviewed were residents and barangay officials in the Direct
Impact Barangay. A questionnaire consisting of both closed and open-ended questions was prepared
for the purpose.

EPRMP | CHAPTER 2 ANALYSIS OF ENVIRONMENTAL IMPACTS Silica Sand Quarry Expansion Project
2-140
2.4.1.6 FOCUS GROUP DISCUSSION A Focus Group Discussion (FGD) was conducted on 15 November 2018 in the Barangay Hall of Duangan,
with the officials of the direct impact barangays.
2.4.2 RESULTS
2.4.2.1 BASELINE SOCIO-ECONOMIC CONDITIONS
2.4.2.1.1 DEMOGRAPHIC PROFILE 2.4.2.1.1.1 POPULATION AND HOUSEHOLD PROFILE The Municipality of Pinamungajan is a 2nd class municipality in the province of Cebu, Philippines.
According to the 2015 census, it has a population of 65,955 people and the number of households are
13,874. This represented 2.24% of the total population of Cebu province, or 0.89% of the overall
population of the Central Visayas region.
Table 2-55. Total population
BARANGAY POPULATION (2015) POPULATION PERCENTAGE (2015)
Anislag 1,597 2.42%
Anopog 3,797 5.76%
Binabag 2,142 3.25%
Buhingtubig 1,763 2.67%
Busay 1,117 1.69%
Butong 2,035 3.09%
Cabiangon 1,000 1.52%
Camugao 2,048 3.11%
Duangan 1,400 2.12%
Guimbawian 1,894 2.87%
Lamac 5,953 9.03%
Lut-od 3,112 4.72%
Mangoto 2,602 3.95%
Opao 503 0.76%
Pandacan 5,890 8.93%
Poblacion 6,754 10.24%
Punod 1,781 2.70%
Rizal 2,418 3.67%
Sacsac 1,533 2.32%
Sambagon 1,233 1.87%
Sibago 2,261 3.43%
Tajao 6,915 10.48%
Tangub 880 1.33%
Tanibag 2,002 3.04%
Tupas 864 1.31%

EPRMP | CHAPTER 2 ANALYSIS OF ENVIRONMENTAL IMPACTS Silica Sand Quarry Expansion Project
2-141
BARANGAY POPULATION (2015) POPULATION PERCENTAGE (2015)
Tutay 2,461 3.73%
Source: Philippine Statistics Authority (2015 census of population)
2.4.2.1.1.2 POPULATION DENSITY The population density is computed at 604 inhabitants per square kilometer or 1,565 inhabitants per
square mile.
2.4.2.1.1.3 POPULATION GROWTH As shown on the table below, it can be observed that the municipality’s population increases from
2010-2015. A sharp increase was noted in barangay Lut-od (impact barangay) with an increase of 6.71
percent. Another significant increase was observed in barangay Lamac with an increase of 5.61
percent.
Table 2-56. Population Growth, Municipality of Pinamungahan, Cebu (2010-2015)
BARANGAY POPULATION
(2010)
POPULATION
(2015)
ANNUAL POPULATION
GROWTH RATE (2010-2015)
Anislag 1,434 1,597 2.07%
Anopog 3,116 3,797 3.84%
Binabag 2,032 2,142 1.01%
Buhingtubig 1,691 1,763 0.80%
Busay 1,128 1,117 -0.19%
Butong 1,848 2,035 1.85%
Cabiangon 891 1,000 2.22%
Camugao 2,007 2,048 0.39%
Duangan 1,264 1,400 1.96%
Guimbawian 1,698 1,894 2.10%
Lamac 4,470 5,953 5.61%
Lut-od 2,213 3,112 6.71%
Mangoto 2,172 2,602 3.50%
Opao 511 503 -0.30%
Pandacan 5,291 5,890 2.06%
Poblacion 5,925 6,754 2.52%
Punod 1,870 1,781 -0.92%
Rizal 2,341 2,418 0.62%
Sacsac 1,415 1,533 1.54%
Sambagon 1,074 1,233 2.66%
Sibago 1,830 2,261 4.11%
Tajao 5,648 6,915 3.93%
Tangub 1,000 880 -2.40%
Tanibag 1,686 2,002 3.32%
Tupas 817 864 1.07%

EPRMP | CHAPTER 2 ANALYSIS OF ENVIRONMENTAL IMPACTS Silica Sand Quarry Expansion Project
2-142
BARANGAY POPULATION
(2010)
POPULATION
(2015)
ANNUAL POPULATION
GROWTH RATE (2010-2015)
Tutay 2,625 2,461 -1.22%
57,997 65,955 2.48%
Source: PSA
2.4.2.1.1.4 GENDER AND AGE PROFILE According to the 2015 Census, the age group with the highest population in Pinamungajan is 5 to 9,
with 8,160 individuals. Conversely, the age group with the lowest population is 80 and over, with 590
individuals.
Table 2-57. Age Profile
Age group Population (2015)
Under 1 1,572
1 to 4 6,267
5 to 9 8,160
10 to 14 7,529
15 to 19 6,684
20 to 24 5,976
25 to 29 5,127
30 to 34 4,264
35 to 39 3,893
40 to 44 3,361
45 to 49 2,993
50 to 54 2,711
55 to 59 2,239
60 to 64 1,767
65 to 69 1,211
70 to 74 980
75 to 79 631
80 and over 590
Total 65,955
Source: PhilAtlas (web)
2.4.2.1.2 CULTURE/LIFESTYLE 2.4.2.1.2.1 EXISTING CULTURE The Pinamuohan Festival is one of the highlights of the annual fiesta celebration every May 4, in honor
of Sta. Monica in Pinamungajan. The town festival is a celebration of bountiful harvests from land and
sea, as well as the hardwork of its people. It was started in 2008 in line with the thrust of then governor
and now Congresswoman Gwendolyn Garcia, who pushed for each Cebu town and city to hold a
festival as part of local culture and heritage.

EPRMP | CHAPTER 2 ANALYSIS OF ENVIRONMENTAL IMPACTS Silica Sand Quarry Expansion Project
2-143
2.4.2.1.3 PUBLIC/SOCIAL SERVICES 2.4.2.1.3.1 WATER SUPPLY The Pinamungajan Water District supplies safe and potable water to 15 covered barangays of
Pinamungajan, Cebu. Water sources in the impact barangays are from water wells and spring water.
2.4.2.1.3.2 POWER SUPPLY The supply of electricity in the municipality is operated by Cebu Electric Cooperative Inc. (CEBECO)
serving ten (10) barangays.
2.4.2.1.3.3 COMMUNICATION The post office, telephone, telex and telegraphic serve the communication needs of the municipality
of Pinamungajan as shown in Table 2-58.
Table 2-58. Communication Facilities
TYPE OF SERVICES NUMBER OF STATION/OFFICE
Post Office 1
Telephone station 1
Telex Services 1
Telegraphic station 1 Source: Municipal Government of Pinamungajan (web)
2.4.2.1.3.4 TRANSPORTATION The available public vehicles in the municipality are buses, jeepneys, tricycle and trisikads as shown below:
Table 2-59. Transportation Facilities
TRANSPORTATION SERVICES NUMBER OF VEHICLES
Buses 17
Jeepneys 47
Tricycles 49
Trisikads 61 Source: Official Website of Municipal Government of Pinamungajan
2.4.2.1.3.5 EDUCATIONAL FACILITIES The Municipality of Pinamungajan has a complete educational level wherein there are 24 Elementary
Schools; a private and a public school. There are also 6 secondary schools and 1 Tertiary School.
Aside from the existing schools in the municipality there are also 2 public libraries.
2.4.2.1.3.6 RECREATIONAL FACILITIES The municipality is equipped with 20 courts/centers like gymnasium, athletic field, basketball, and
volleyball courts. There are also 25 multi-purpose buildings in the municipality.
2.4.2.1.4 SOCIO-ECONOMIC 2.4.2.1.4.1 AGRICULTURE Cultivating the land with various crops, and breeding of animals through livestock and poultry farms,
are necessities to sustain life in a community. And these are things that remain visibly well maintained,
promoted, and protected in Pinamungajan, even as other sources of living such as trading and

EPRMP | CHAPTER 2 ANALYSIS OF ENVIRONMENTAL IMPACTS Silica Sand Quarry Expansion Project
2-144
manufacturing have gained ground in the town. In fact, Pinamungajan is home to a few of the most
advanced and modern farms of their kind.
Raw materials available within the area:
Types of Materials:
● Root Crops
● Corn
● Banana
● Legumes
● Rice
● Fish/Prawn farms
● Coco Midribs
● Vegetables
● Coconut
● Tikog
● Bamboo
Existing Commercial Farms within the area:
● Baricuatro Poultry
● Carvellida Poultry
● Malusay Poultry
● Tellidua Poultry
● Intong Poultry
● L. Alpas Poultry
● P. Gepitulan Poultry
● Cuaycong Poultry
● E. Yapha Livestock
● Tangarorang Livestock
2.4.2.1.4.2 COMMERCIAL ESTABLISHMENTS Another source of the economy of the Municipality is the presence of the various commercial
establishments in the area Table 2-60. These establishments provide the sources of income to the
people in the area. Two hundred twelve (212) sari-sari stores are present in the area, followed by the
22 fresh fish and meat retailers and 20 restaurants and cafeterias within the municipality. Other types
of commercial establishments in the Municipality are the bakeries, drugstores, shops, gasoline
stations. Others could be further discerned in the table.
Table 2-60. Commercial Establishments
TYPE OF ESTABLISHMENT/S NO. OF ESTABLISHMENTS
Sari-sari store 212
Restaurants & Cafeterias 20
Fresh Fish & Meat Retailers 22
General Merchandising 2
Service and Repair Shops 7
Tailoring & Dress Shops 4

EPRMP | CHAPTER 2 ANALYSIS OF ENVIRONMENTAL IMPACTS Silica Sand Quarry Expansion Project
2-145
TYPE OF ESTABLISHMENT/S NO. OF ESTABLISHMENTS
Pawnshops & Lending Investments 1
Lumber and Hardwares 3
Pharmacies and Drug Stores 1
Marketing Firms(Appliances, furniture, etc. 1
Gasoline Station 2
Bakeries 5
Photo Shops & Beauty Parlors- 1 Source: Municipal Government of Pinamungajan (web)
2.4.2.1.4.3 BANKING AND FINANCIAL INSTITUTIONS There is only one rural bank, 1 lending/financing institution and 16 cooperatives within the
municipality of Pinamungajan.
2.4.2.2 PUBLIC SCOPING The Public Scoping of the proposed Silica Sand Quarry Expansion Project was held at Duangan
Basketball Court, Barangay Duangan, Pinamungajan, Cebu. The program started at 10:00 AM. In
attendance were fifty-six (56) representatives in various sectors and/or organizations.
The issues and concerns raised during the Public Scoping is presented in the following table:

EPRMP | CHAPTER 2 ANALYSIS OF ENVIRONMENTAL IMPACTS Silica Sand Quarry Expansion Project
2-146
Table 2-61. Issues and Concerns raised during the Public Scoping
NAME - AGENCY/BRGY.
and POSITION ISSUES/CONCERNS RESPONSE
Project Description
Mr. Jaime Ponting –
Farmer’s Association
President
How long will the quarry operations last? Engr. Sombelon answered that MPSA has a lifespan of 25 years renewable
once for another 25 years. This activity is a long process, very premature to
specifically pinpoint which households are directly affected by mining
activity. Nonetheless, by the time mining plans are in placed, SEDC will
inform the residents through LGU, which of those households are affected
and whose are not.
Will the quarry operations reach the households
in Duangan?
Mr. Felix Bagahansol –
Punod Brgy. Captain
How will the SEDC mine the area in Punod if the
elevation in the said barangay is already low?
Engr. Sombelon answered that SEDC has a survey team to conduct as built
topographic survey of the area. Topographic map is a basic tool in the
preparations and making of mining plans. A minimum of 5 meter difference
in elevation from the elevation of rice field areas is usually established. In
the making of mining plan, SEDC will consider the natural structures like
gullies, creeks and rivers. SEDC will establish the recommended buffer zone
to ensure that these water receiving bodies will not be disturbed once the
mining activity commences.
Engr. Campo also added that existing structures will definitely not be
disturbed. However, there is also a program, if the farmers will allow it, that
would convert rice fields into paddy fields since it will be considered as a flat
area. But if the farmers won't allow, just like Engr. Joel said, a 5 meter
difference in elevation will serve as a limit during the mining activity. As a
conclusion, from time to time the company will ask and consider every
landowner's decision as to what will be their final plan on their respective
land areas.

EPRMP | CHAPTER 2 ANALYSIS OF ENVIRONMENTAL IMPACTS Silica Sand Quarry Expansion Project
2-147
NAME - AGENCY/BRGY.
and POSITION ISSUES/CONCERNS RESPONSE
People
Ms. Gina Gadiano -
MSWDO
What are the benefits that vulnerable sectors
may get from this project since they will be
affected once the quarry operation
commences?
Ms. Carin responded that as mandated by the Philippine Mining Act of 1995,
mining companies, like SEDC, are required to establish a Social Development
and Management Program. There are also specific programs under SDMP
which need to be implemented like livelihood, access to health and health
support, education programs and IEC. For the program to be sustainable,
SEDC will consult with the affected sectors, main purpose of which, is to
enhance the development of the host community. Since technical personnel
are more needed in a mining company like SEDC, one of the programs SEDC
has implemented is the Scholarship Program, main goal of which, is to
eventually capacitate the said community. She further stated that SDMP
should be community-driven and that is why SEDC consults and forges
partnership with the host and neighboring communities.
Can the residents of the affected barangays get
a job once the project commences?
Engr. Campo added that one example of the benefits that the host
community may get is the scholarship program from which they already
started through their Community Development Program. Another benefit
he mentioned is that SEDC will soon inquire to the senior citizens and
persons with disabilities of the host community on what projects they want
and SEDC will support and make a budget for it. He also added that for
Safety and Health, SEDC already started the medical mission and will soon
conduct a medical mission again to other affected barangays.
Mr. Ariel Bagahansol –
Brgy. Punod
What are the safety measures for Brgy. Punod? Engr. Sombelon answered that SEDC will not start the operation on target
areas unless the mining plan is in placed already. The plan includes the area
of extraction, and the haul roads. SEDC has a department whose in-charge
of land acquisition, if there’s a need to negotiate with the landowners for
the affected or inside production areas to clear or free from hazards and

EPRMP | CHAPTER 2 ANALYSIS OF ENVIRONMENTAL IMPACTS Silica Sand Quarry Expansion Project
2-148
NAME - AGENCY/BRGY.
and POSITION ISSUES/CONCERNS RESPONSE
risks. But as of now, SEDC cannot still pinpoint the affected land and the
structures in it.
Ms. Fructosa Maquiling -
OSCA
Recommended that SEDC should go and visit the
area and inform the people that a quarry
operation will take place since showing the map
won't be understood by the non-technical
people.
Engr. Sombelon answered that from time to time, SEDC personnel will visit
the area and inform the people whose area will be directly affected by the
mining activity or not. This process is also part of the EIA activity.
Ms. Anette Navarro -
Brgy. Capt. Duangan
She recounted that around 4-5 years ago, a team
of technical experts from SEDC and TCPI
thoroughly surveyed and studied the Duangan
and Lut-od areas and suggested that the old
Duangan Elementary School be transferred as
the foundation of the school is not stable since
it is composed of silica. They requested MGB to
perform a geological survey of the area and
MGB confirmed the recommendations of the
Japanese experts that the school must be
transferred to a more stable area. The school
was immediately transferred with the help of
SEDC and is now located beside the provincial
road. The Barangay Captain added that people
should listen to the recommendations of the
experts in their respective fields so as to avoid
damages.
Noted by facilitator.

EPRMP | CHAPTER 3 ENVIRONMENTAL MANAGEMENT PLAN Silica Sand Quarry Expansion Project
2-149
2.4.2.3 PERCEPTION SURVEY The perception survey was conducted with a total of 100 respondents from the impact barangays.
2.4.2.3.1 DEMOGRAPHIC DATA The respondents were composed of 14% male and 86% female.
Figure 2-76. Gender of the respondents
Most of the respondents interviewed were in the 21-30 age group (36%); followed by the 31-40 age group (29%); 18% belonging to age group of 41-50 age group. Only 9% comprises the 51-50 age group; 4% for the 61-70 age group and 4% to less than 20 years old respondents.
Figure 2-77. Age of the respondents
As observed in the following figure, 94% of the people interviewed were born in the barangay they lived in today while 4% are migrants from the same province and 2% from other parts of Visayas.
Figure 2-78. Place of Birth of the respondents
Male14%
Female86%
<20 - 204%
21 TO 3036%
31 TO 4029%
41 TO 5018%
51 TO 609%
61 TO 704%
Same Area94%
Same Province4%
Visayas2%

EPRMP | CHAPTER 3 ENVIRONMENTAL MANAGEMENT PLAN Silica Sand Quarry Expansion Project
2-150
Majority of the respondents belong to a 1- to 2-member households.
Figure 2-79. Number of Household Members
Ninety six percent (96%) of the total respondents interviewed are Roman Catholic practitioners while 4% are of Islam faith.
Figure 2-80. Religion of respondents
Ninety-two percent (92%) of the total respondents are Bisaya, 5% are Igorot, 2% are Ilocano, and 1% are Tagalog.
Figure 2-81. Ethnic Origin of the respondents
121%
221%
311%
413%
511%
69%
78%
81%
92%
10 UP3%
Roman Catholic
96%
Islam4%
Ilocano2%
Tagalog1%
Visaya92%
Igorot5%

EPRMP | CHAPTER 3 ENVIRONMENTAL MANAGEMENT PLAN Silica Sand Quarry Expansion Project
2-151
Thirty three percent (33%) of the total respondents have resided in the Barangay for 21-30 years already. Moreover, approximately 20% of the total respondents have been living in the barangay for 11-20 years.
Figure 2-82. Years of residence
2.4.2.3.2 SOCIO-ECONOMIC PROFILE OF RESPONDENTS The majority primary means of living is from being vendor (24%) and doing construction (24%),
followed by selling with 10%. On the other hand, 55% of the respondents stated that the male head is
the primary earner in the household while 10% has the female head as the primary earner.
Figure 2-83. Source of income of respondents
Figure 2-84. Breadwinner
2 YEARS8% 3-5
6% 6-1010%
11-2020%
21-3033%
31-407%
41-506%
51-607%
61 UP3%
Carbon Vendor
32%
Store Owner10%
Construction
24%
Teacher9%
None25%
Head Male55%
Head Female10%Relative Male
4%
Relative Female5%
Sibling Male4%
Sibling Female3%
Child Male11%
Child Female8%

EPRMP | CHAPTER 3 ENVIRONMENTAL MANAGEMENT PLAN Silica Sand Quarry Expansion Project
2-152
The monthly poverty threshold for a family of five, according to NSO5, is an average income of
Php10,481 per month. This amount is enough to cover a single family’s basic food and non-food needs.
Poverty threshold refers to the minimum income a family or individual must earn in order to be
considered “not poor”.
In figure below, more than 14% of the respondents claim that they receive higher than the poverty
threshold. Hence, about 86% of the interviewed respondents are classified as “poor”.
Figure 2-85. Monthly Income of the respondents
High School graduates comprise the largest percentage (23%) of the respondents followed by
Highschool undergraduate (23%) and Elementary graduates (20%).
Figure 2-86. Educational Attainment
Fifty-three percent (53%) own their land, 40% are tenants only, and 7% are renting.
Figure 2-87. Tenurial Status of Residence
5 NSO (2019). Food and Poverty Thresholds. Retrieved from https://psa.gov.ph/poverty-press-releases/nid/138411
Below 2k36%
3K26%
4k-5k15%
6k-10k9%
11k-15k7%
16k-20k1%
21k-25k3%
26k-30k3%
Elementary Graduate
20%
Elementary Graduate14%
High School Undergraduate
19%
High School Graduate
23%
Vocational5%
College Undergraduate6%
College Graduate13%
Owned53%
Rent7%
Not owned
but free use40%

EPRMP | CHAPTER 3 ENVIRONMENTAL MANAGEMENT PLAN Silica Sand Quarry Expansion Project
2-153
For the previous year, 53% of the respondents have at least one of their household members who got
ill. Fever (30%) and cough (30%) combined are the most prevalent in the area. Sixty nine percent (69%)
of the respondents stated that the primary source of treatment for such illnesses in the household
was in the community and 20% in the nearest hospital.
Figure 2-88. Number of Illness
Figure 2-89. Type of Illness
Figure 2-90. Source of Treatment
024%
153%
29%
33% 4
11%
High Blood7% Diarrhea
8%
Colds23%
Cough30%
Fever30%
Others2%
Home4%
Herbalist1%
Community69%
Private Clinic
6%
Hospital20%

EPRMP | CHAPTER 3 ENVIRONMENTAL MANAGEMENT PLAN Silica Sand Quarry Expansion Project
2-154
Figure 2-91. Water Source
Figure 2-92. Toilet Facility
2.4.2.3.3 PERCEPTION ON THE PROJECT 2.4.2.3.3.1 PERCEIVED POSITIVE IMPACTS:
● Employment
● Barangay Income
● Improvement of Communications Network
2.4.2.3.3.2 PERCEIVED NEGATIVE IMPACTS: ● Damage to Road Network
● Landslide/Erosion
● Damage to nearby houses
● Noise Pollution
2.4.2.3.3.3 SUGGESTIONS WITH REGARDS TO THE PROPOSED EXPANSION: ● Take care of dangerous/accident prone/hazardous areas
● Avoid Landslides
● Signage in dangerous/accident prone/hazardous areas
● Tree planting as protection against landslides in other areas
● Provide access roads. Separate for the hauling, and for the community
● Relocation and housing to those affected
● Tree Replacement/Reforestation/Rehabilitation
● Concrete Slope Protection
● Petition for a flower garden in Lut-od
None24%
Water System72%
Deep Well4%
None17%
Flush Toilet 26%
Water Sealed
57%

EPRMP | CHAPTER 3 ENVIRONMENTAL MANAGEMENT PLAN Silica Sand Quarry Expansion Project
2-155
● In rehabilitation, create/gear towards tourist spot or eco-park
● Deepen/Strengthen the community relations
2.4.2.4 IMPACTS AND MITIGATION MEASURES The proposed increase in annual production of 660,000 MT from 200,000 MT will not affect the
current status socio-economic condition of the direct and indirect impact areas of the Project. The
impacts and mitigations presented below are the impacts of the existing project and it is deemed that
with the project modification, the Project will have the same impacts thus the implementation of the
same mitigation measures currently being implemented.
2.4.2.4.1 EMPLOYMENT The project provides direct and indirect employment and income to the host communities. The direct
economic impact of construction to the local community will be significant and will provide
employment opportunities to skilled and unskilled members of labor force. On the other hand, the
impact of workers’ consumer expenditures, which will be derived from their wages as employees, will
generate indirect employment in other sectors of the local economy, the immediate sectors being
agriculture and retail.
2.4.2.4.2 MIGRATION The employment opportunities of the project bring in migrants, mostly job-seekers some of whom are
accompanied by their families. This employment-driven migration would displace and push aside local
jobseekers and even in the short-term, burden existing public services. The anonymous characters and
varied backgrounds of migrants would diminish the community cohesion and social control.
Informal settling and non-conforming land uses may be established by migrant who cannot be
accommodated by SEDC and who decide to settle while waiting for chances to be employed.
The proponent institutes a local first hiring policy to lessen the likelihood of massive migration to the
project-affected communities, and thereby avoid the stress and competition on local resources, job
opportunities, and public services because of newcomers.
2.4.2.4.3 HEALTH AND SAFETY Various activities during the operational phase will generate nuisance that may expose and affect
workers and even adjacent communities.
There could also be potential spread of microorganisms, infectious diseases, biologically contaminated
waste materials due to indiscriminate and improper disposal of biological waste products or by-
products potentially contaminated with microbes, and inadequate toilet facilities and access to safe
water supply.
There will be potential ergonomic problem for workers because the operations of the quarry involve
processes that entail transport and machinery operations. Ergonomic problem may arise from poor
match between people and machines and other work situations that could cause poor productivity
and adverse health conditions, e.g. repetitive strain injury, low back pain.
The project could also cause indirect health impacts, which may include economic dislocation,
inadequacy or disruption of social services, community disintegration because of development caused
by factors that include in-migration into the community because of availability of work, increasing

EPRMP | CHAPTER 3 ENVIRONMENTAL MANAGEMENT PLAN Silica Sand Quarry Expansion Project
2-156
demand for limited community health resources and other services, increasing criminality and social
problems like drugs, alcohol, gambling, and prostitution. These effects on health are indirect but
pervasive since it affects all members of the community.
Compliance with EMP is being implemented by SEDC. Safety, Health, Environment Department (SHED)
is tasked to oversee the implementation of other related programs.
2.4.2.4.4 TRAFFIC CONGESTION The project will cause an increase in traffic given the number of haul trucks to be employed for the
delivery of the quarry materials to the TCPI plant. This has the potential to add traffic congestion and
affect sensitive receptors such as schools and community centers and may potentially cause road
accidents. Heavy loads traversing infrastructure may also be over or near load bearing limits.
To mitigate traffic congestion and road safety concerns, a traffic management plan, in coordination
with concerned LGUs and DPWH, will be prepared and implemented. IEC will also be conducted to
communicate traffic impact and management plan to the community especially the host and
neighboring barangays. Proper scheduling of delivery quarry materials will also be implemented to
avoid peak hours/ traffic congestion and minimize the occurrence of accidents. Safety warnings and
signages shall be installed.
2.4.2.4.5 GENERATION OF LOCAL BENEFITS FROM THE PROJECT The operation of the project will somehow provide opportunities for the improvement of services on
education and health. The education, health, as well as the social welfare services and public
infrastructures will be enhanced due to the additional income opportunities of the LGUs from the
taxes and fees to be collected from the proposed project as well as the mandatory assistance of the
proponent through the Social Development and Management Program and Corporate Social
Responsibility Program.

3-1
3 ENVIRONMENTAL MANAGEMENT PLAN
This chapter presents the appropriate mitigation and management measures implemented by SEDC
to address the identified key impacts of the Silica Sand Quarry Expansion Project as discussed in
Chapter 2- Assessment of Environmental Impacts.

EPRMP | CHAPTER 3 ENVIRONMENTAL MANAGEMENT PLAN Silica Sand Quarry Expansion Project
3-2
Table 3-1. Impact Management Plan
PROJECT PHASE/ ENVIRONMENTAL
ASPECT
ENVIRONMENTAL COMPONENT LIKELY TO BE
AFFECTED
POTENTIAL IMPACT
OPTIONS FOR PREVENTION, MITIGATION OR ENHANCEMENT
RESPONSIBLE ENTITY
COST GUARANTEE /
FINANCIAL AGREEMENT
Operation Phase
Quarry operations (bulldozing and materials handling, grading, hauling)
Air – Air quality Degradation of air quality Dust generation
Planting of trees at the quarry/s periphery; Enhance buffer strip or tree buffer around and along the boundaries of the project site
SEDC Part of EPEP cost
EPEP commitment
Continue monitoring of wind speed and wind directions as part of the environmental management plan to lessen or minimize release of fugitive dusts
SEDC Part of EPEP cost
EPEP commitment
Regular watering of haul roads during dry condition; visual inspection of fugitive dust
SEDC Part of EPEP cost
EPEP commitment
Maintenance of quarry roads SEDC Part of EPEP cost
EPEP commitment
Speed limits of vehicles (light and heavy) will be controlled to a maximum of 30 km/hr at the quarry site
SEDC / SEDC Contractor
None SEDC Safety Protocol
Regular maintenance of trucks to reduce or maintain tailpipe emissions
SEDC / SEDC Contractor
Incorporated in cost of contractor service
SEDC Safety Protocol
Provide wheel washing facilities for vehicles leaving the quarry and project site. The wheel washing facility should be used to remove muds at the tires of trucks and heavy equipment
SEDC Part of EPEP cost EPEP commitment
In case of very dry weather condition where wetting of dry surfaces would be effective for short duration, consider re-routing of vehicles away from area sensitive receptors (households or residences)
SEDC Part of operating expenses
SEDC Work Program
Dampen lose soil or cover loose soil pile SEDC Part of EPEP cost EPEP commitment

EPRMP | CHAPTER 3 ENVIRONMENTAL MANAGEMENT PLAN Silica Sand Quarry Expansion Project
3-3
PROJECT PHASE/ ENVIRONMENTAL
ASPECT
ENVIRONMENTAL COMPONENT LIKELY TO BE
AFFECTED
POTENTIAL IMPACT
OPTIONS FOR PREVENTION, MITIGATION OR ENHANCEMENT
RESPONSIBLE ENTITY
COST GUARANTEE /
FINANCIAL AGREEMENT
Air / People Increase in ambient noise level
Install effective mufflers on all heavy equipment and other equipment using internal combustion engines
SEDC / SEDC Contractor
Incorporated in cost of contractor service
SEDC Work Program
Impose speed limits at quarry and along access roads (30 kph)
SEDC None SEDC Safety Protocol
Daytime quarry operation; Restrict use of equipment at nighttime especially equipment that emits high noise levels
SEDC None SEDC Work Program
Construct temporary noise barriers between households and quarry, when necessary
SEDC Part of EPEP cost EPEP commitment
Progressive planting in mined-out areas and planting of trees at the buffer zone; Enhance buffer strips or tree buffers around and along project boundaries
SEDC Part of EPEP cost EPEP commitment
Generation and stockpiling of loose materials
Water – Water Quality
Siltation / degradation of surface water quality
Construction of settling ponds and silt traps SEDC Part of EPEP cost EPEP commitment
Desilting of settling ponds or as needed. Sediments will be used for road surfacing within quarry areas or to Barangays in need.
SEDC Part of EPEP cost
EPEP commitment
Mobile heavy equipment and vehicles shall have a designated holding area for removal of excess silt and mud from the tires and underbellies. The holding area shall have adequate drainage and traps to contain the washed sediments.
SEDC Part of EPEP cost EPEP commitment
Excavation, digging and stockpiling of raw materials
Land – Geology / Soil
Soil erosion Provision of storm drainage canals to prevent rain water from eroding the quarry area.
SEDC Part of EPEP cost EPEP commitment
Maintenance of quarry waste dump site
SEDC Part of EPEP cost
EPEP commitment

EPRMP | CHAPTER 3 ENVIRONMENTAL MANAGEMENT PLAN Silica Sand Quarry Expansion Project
3-4
PROJECT PHASE/ ENVIRONMENTAL
ASPECT
ENVIRONMENTAL COMPONENT LIKELY TO BE
AFFECTED
POTENTIAL IMPACT
OPTIONS FOR PREVENTION, MITIGATION OR ENHANCEMENT
RESPONSIBLE ENTITY
COST GUARANTEE /
FINANCIAL AGREEMENT
Topsoil stockpile slope shall not exceed its angle of repose.
Progressive resoiling or revegetation will be implemented to maintain a limited stock of loose waste material.
SEDC Part of EPEP cost
EPEP commitment
Use of heavy equipment
Land – Geology / Soil
Soil compaction Compacted mined out portions will be ripped before resoiling to allow infiltration.
SEDC Part of EPEP cost EPEP commitment
Quarrying Land – Geology / Soil
Alteration of topography / natural drainage
Resoiling / rehabilitation through implementation of reforestation program.
SEDC Part of EPEP cost
EPEP commitment
Establishment of SEDC nursery.
The company shall also practice community-based reforestation on areas outside the mined-out areas.
Maintenance of the existing drainage system consisting of drainage canals Regular desilting of settling ponds
SEDC Part of EPEP cost
EPEP commitment
Lowest level of the quarry operation shall be maintained at +35 masl
SEDC None SEDC Work Program
Change in land use
Quarrying operations can be considered as temporary land use. Progressive rehabilitation of the mined-out areas, through reforestation, shall be implemented
SEDC Part of EPEP cost
EPEP/FMRDP commitment
Removal of vegetation cover
Land – Flora & Fauna
Vegetation removal and loss of habitat
Limit the quarrying activities within direct impact area only to avoid vegetation removal of adjacent areas
SEDC Part of EPEP cost
EPEP commitment
Continuous seedling production, regular tree planting, replanting, donations of seedlings and partnership with private, NGO and government organizations is recommended

EPRMP | CHAPTER 3 ENVIRONMENTAL MANAGEMENT PLAN Silica Sand Quarry Expansion Project
3-5
PROJECT PHASE/ ENVIRONMENTAL
ASPECT
ENVIRONMENTAL COMPONENT LIKELY TO BE
AFFECTED
POTENTIAL IMPACT
OPTIONS FOR PREVENTION, MITIGATION OR ENHANCEMENT
RESPONSIBLE ENTITY
COST GUARANTEE /
FINANCIAL AGREEMENT
Threat to existence and/or loss of important local species
Continuous seedling production, regular tree planting, replanting, donations of seedlings and partnership with private, NGO and government organizations is recommended
Monitor replacement planting to ensure growth and survival
Threat to abundance, frequency and distribution of important species
Continuous seedling production, regular tree planting, replanting, donations of seedlings and partnership with private, NGO and government organizations are recommended
Monitor replacement planting to ensure growth and survival
Continuous allocation of annual budget for these activities is likewise recommended to allow sustainability of the mitigation activity
Proliferation of invasive species
Immediate revegetation with preference to indigenous plant species within the cleared and opened areas should be conducted
Generate list of invasive species and avoid its reintroduction on site
Abandonment Phase
Mine closure / abandonment
People – Livelihood
Loss of livelihood of local workforce Reduction/loss of company support for some services
Provide psycho-social services to project-affected families
SEDC Part of SDMP cost SDMP commitment
Re-training and enhancement of alternative livelihood programs for workers in the affected areas
SEDC Part of SDMP cost SDMP commitment

EPRMP | CHAPTER 3 ENVIRONMENTAL MANAGEMENT PLAN Silica Sand Quarry Expansion Project
3-6
PROJECT PHASE/ ENVIRONMENTAL
ASPECT
ENVIRONMENTAL COMPONENT LIKELY TO BE
AFFECTED
POTENTIAL IMPACT
OPTIONS FOR PREVENTION, MITIGATION OR ENHANCEMENT
RESPONSIBLE ENTITY
COST GUARANTEE /
FINANCIAL AGREEMENT
Decrease in economic activity in the area (i.e. reduced business profits due to project closure therefore reduced market consumers)
Disposal of scrap materials
People – Safety Threat to public safety
IEC implementation to the community SEDC Part of SDMP cost SDMP commitment
Injury or fatality of local community due to unauthorized access to site
Proper implementation of the abandonment/ decommissioning plan
SEDC Part of FMRDP cost FMRDP commitment
Clearing / removal of support facilities
Land / Water / People
Removal of structures may result to accidental spillage of toxic and hazardous wastes
Proper implementation of the approved rehabilitation and abandonment plan Use of DENR-accredited haulers/TSD companies for hazardous wastes
SEDC Part of FMRDP cost FMRDP commitment
Abandonment Land Proliferation of invasive species on opened areas
Rehabilitation of disturbed areas through revegetation (i.e., indigenous tree planting, cover crops planting) Avoid use and deliberate introduction of invasive species
SEDC Part of FMRDP cost FMRDP commitment

4-1
4 ENVIRONMENTAL RISK ASSESSMENT (ERA) & EMERGENCY RESPONSE POLICY
AND GUIDELINES This Environmental Risk Assessment (ERA) was conducted for the Silica Sand Quarry Expansion Project
with reference to the prescribed methodology outlined in Annex 2-7e of the Revised Procedural
Manual of DAO 2003-30, DMC 2010-14, and the Technical Screening Checklist for the Project. The
Revised Procedural Manual (RPM) of DENR Administrative Order (DAO) 2003–30 defines the
Environmental Risk Assessment (ERA) as a process of analyzing and describing the risks associated
with a project or activity to the ecosystems, human health and welfare.
During the risk assessment, hazards are evaluated in terms of the likelihood that a problem may occur
and the damage it would cause if such an event did occur. Adequate safety and emergency
preparedness require considering all the possible hazards that could be encountered. Some hazards,
however, are more likely to cause problems than others at a given time and some would result in
greater damage than others. For mining and mineral processing operations, an agreement on how to
recognize the various types of risks encountered and the management practices to address these risks
is vital for the sustainability of mining activities.
4.1 RISK ASSESSMENT
The ERA conducted for the project applies the generic framework of Australia and New Zealand
(AS/NZS 4360:2004) for establishing the context, identifying, analyzing, evaluating, treating,
monitoring, and communicating risk. Specifically, this ERA makes use of the Qualitative Method which
is a quick and relatively easy to use method. Broad consequences and likelihoods can be identified.
The qualitative risk assessment can provide a general understanding of comparative risk between risk
events, and the risk matrix can be used to separate risk events into risk classes (ratings). Qualitative
methods use descriptive terms to identify and record consequences and likelihoods of events and
resultant risk.
Figure 4-1 outlines the AS/NZS 4360:2004 Risk Management Standard process for identifying,
analyzing and managing risks, including technical risk. It also emphasizes the importance of
stakeholder engagement, risk communication and community consultation processes at each stage.
The objective of risk analysis is to produce outputs that can be used to evaluate the nature and
distribution of risk, and to develop appropriate strategies to manage the risk.

EPRMP | CHAPTER 4 ERA & ERP Silica Sand Quarry Expansion Project
4-2
Figure 4-1. AS/NZS 4360:2004 Risk management steps
4.1.1 CONSEQUENCE RATING
Qualitative measures of “Consequence” or impact (based on AS/NZS 4360:1999).
LEVEL DESCRIPTOR CONSEQUENCE
1 Insignificant Minimal, if any impact for some workers, communities. Potentially some
impact for a small number of (<10) individuals.
Denoting an insignificant or trivial effect as a result of an event occurring
2 Minor Low level impact for some workers, communities, or high impact for a small
number (<10) of individuals.
Denoting small effects following the occurrence of an event or series of
events
3 Moderate High level impact for some workers, communities, or moderate impact for
communities (Barangay level)
Defined as noticeable event or a series of events that can be rectified in the
long term
4 Major High level of impact for workers, communities (Barangay level)
Describing key events leading to fatalities, breakdown of social order, loss
of abundance and/or loss of species, and widespread contamination
resulting to reduction of air and water qualities
5 Catastrophic High level of impact (Municipal level)

EPRMP | CHAPTER 4 ERA & ERP Silica Sand Quarry Expansion Project
4-3
LEVEL DESCRIPTOR CONSEQUENCE
Describing disastrous events that would lead to multiple fatalities, complete
breakdown of social order, local extinction of population and widespread
contamination that cannot be immediately remediated
4.1.2 LIKELIHOOD RATING
Qualitative measures of “Likelihood”
LEVEL DESCRIPTOR DESCRIPTION
A Almost certain Is expected to occur in most circumstances (80 - < 100%)
B Likely Will probably occur in most circumstances (60 - < 80%)
C Possible Might occur at some time (40 - < 60%)
D Unlikely Could occur at some time (20 - < 40%)
E Rare May occur only in exceptional circumstances (< 20%)
4.1.3 QUALITATIVE RISK MATRIX
Extreme Risk Immediate action required.
High Risk Management measures must be employed.
Moderate Risk Management measures must be identified.
Low Risk Manage by routine procedures.

EPRMP | CHAPTER 4 ERA & ERP Silica Sand Quarry Expansion Project
4-4
4.1.4 RESULTS OF RISK ASSESSMENT
Table 4-1. Sources of Risks and Corresponding Management Measures
Potential Hazard
Cause / Triggers Impact / Possible
consequences What / Who will
be affected
Without Controls Proposed / Existing
Controls
With Controls
CR* LR* Risk Level CR* LR* Risk
Level
High wall / bench slope
� Heavy rains � Earthquake
� Landslides � Soil erosion
Safety � Workers � Nearby
community
3 C C3
(High)
� Strict enforcement of benching design
3 E E3
(Moderate)
Falls from benches
� Non-observance of safety precautions; unsafe acts/ conditions
� Body injury or death
Safety � Workers
5 D D5
(Extreme)
� Strict implementation of safety guidelines
� Conduct relevant safety trainings and seminars regularly
� Daily safety briefing (pep talks)
5 E E5
(High)
Vehicular accidents
� Reckless driving,
� Poor maintenance of vehicle
� lack of safety warning devices
� Body injury or death
Safety � Workers
5 D D5
(Extreme)
� Strict implementation speed limits
� Install safety signage � Conduct relevant
safety trainings and seminars regularly
� Daily safety briefing (pep talks)
5 E E5 (High)
Noise � Equipment operation
� Health problem Health � Workers � Nearby
community
1 D D1
(Low)
� Limit operation during daytime
� Use mufflers � Provide PPEs to
workers � Regular
maintenance of vehicles/ equipment
1 E E1
(Low)

EPRMP | CHAPTER 4 ERA & ERP Silica Sand Quarry Expansion Project
4-5
Potential Hazard
Cause / Triggers Impact / Possible
consequences What / Who will
be affected
Without Controls Proposed / Existing
Controls
With Controls
CR* LR* Risk Level CR* LR* Risk
Level
Silt / Sediments from stockpiles and waste dumps
� Heavy rains � Siltation Environment � Luknay Creek � Coastal area of
San Fernando
2 C C2
(Moderate)
� Construct drainage canals leading to settling ponds with adequate capacities
� Regular maintenance/ desilting of drainage canals and settling ponds
� Maintain vegetative buffers
� Waste Management
2 E E2
(Low)
Flooding � Heavy rains � Site clearing
and development/ deforestation
� Damage to properties
Safety/ Environment � Low-lying areas
near the coast
2 D D2
(Low)
� Limit disturbed areas � Progressive
rehabilitation of the quarry area and enhancement planting of the surrounding areas
� Regular cleaning of natural drainage channels – Luknay Creek and Sabang River
� Climate Change Mitigation and Adaptation (National Greening Program)
2 E E2
(Low)
Fire / Explosion
*the
� Unsafe acts � Interaction of
chemicals � Faulty
electrical
� Damage to properties
� Body injury or death
Safety � Workers � Nearby
community (at the port)
4 D C4 � Implementation of planned or scheduled preventive maintenance of
4 E E4

EPRMP | CHAPTER 4 ERA & ERP Silica Sand Quarry Expansion Project
4-6
Potential Hazard
Cause / Triggers Impact / Possible
consequences What / Who will
be affected
Without Controls Proposed / Existing
Controls
With Controls
CR* LR* Risk Level CR* LR* Risk
Level
operations quarry will not implement blasting (no explosives)
wiring � Mechanical
fire due to excessive stress / overuse
equipment � Provide proper
ventilation for equipment to avoid overheating
� Construction of facilities following the guidelines stipulated in Fire Code of the Philippines
� Implementation of Emergency Preparedness and Response Plan
� Conduct fire emergency drills regularly
� Regular inspection of Fire Alarm System, emergency equipment such as fire extinguishers, fire hose and other firefighting equipment
Exhaust from equipment
� Running time of equipment
� Lack of proper equipment maintenance
� Pollution � Health problems
Health/ Environment � Air quality � Workers � Community
1 D D1
(Low)
� Limit movement of equipment only as required
� Provide PPEs to workers
� Preventive maintenance of
1 E E1
(Low)

EPRMP | CHAPTER 4 ERA & ERP Silica Sand Quarry Expansion Project
4-7
Potential Hazard
Cause / Triggers Impact / Possible
consequences What / Who will
be affected
Without Controls Proposed / Existing
Controls
With Controls
CR* LR* Risk Level CR* LR* Risk
Level
vehicles/ equipment
Fugitive dust � Hauling operations
� Air pollution � Health problem � Smothering of
vegetation
Health/ Environment � Workers � Community
2 B B2
(High)
� Set speed limits � Periodic road
watering � Cover haul trucks � Provide PPEs to
workers
2 D D2
(Low)
Natural hazards (calamities)
� catastrophic events like typhoon, earthquake, etc.
� Stoppage of operation
Socio-economic � Workers � Operations
3 D D3
(Moderate)
� Implement Emergency Response Plan
� Implement disaster risk reduction programs
2 D D2
(Low)
Issuance of a Ceased and Desist Order (CDO)
� Stoppage of project due to noncompliance with regulatory requirements.
� Stoppage of project operation. Penalties. Filing of court cases
� Loss of income
Socio-economic � Workers � Operations
5 D D5
(Extreme)
� Continuous implementation of the approved IMP and compliance to government regulations.
� Regular training of PCOs
� Conduct IEC programs for workers regarding environmental compliance
5 E E5
(High)
Increase in anti-project sentiments, strained relationship with the LGU
� Unpopularity of the project implementation due to poor Project-LGU relationship
� Delays in project implementation
� Loss of income � Protests/ rallies
Socio-economic � Workers � Operations
3 C C3
(High)
� Implementation of the SDMP during operations.
� Harmonized relationship with the host community through regular IEC
3 E E3
(Moderate)

EPRMP | CHAPTER 4 ERA & ERP Silica Sand Quarry Expansion Project
4-8
Potential Hazard
Cause / Triggers Impact / Possible
consequences What / Who will
be affected
Without Controls Proposed / Existing
Controls
With Controls
CR* LR* Risk Level CR* LR* Risk
Level
Campaign � Implement EPEP
commitments
*Note: CR - Consequence Rating; LR – Likelihood Rating

EPRMP | CHAPTER 4 ERA & ERP Silica Sand Quarry Expansion Project
4-9
4.2 RISK MANAGEMENT
SEDC will implement the following Risk Action Plan to manage the risks related to the Project.
Table 4-2. Risk Management - Safety
RISK ASSESSMENT MITIGATING MEASURE REMARKS
● Equipment falling at the edge
of the benches
● Siltation and dust associated
to operations (loading and
hauling)
● Workers being struck/
entrapped/ pinned by moving
vehicles
● Slope/ face instability giving
rise to rock falls or slides
● Moving vehicle pose hazards
to workers. The risk of
entrapping/ pinning/ striking
workers would greatly
increase if operators of
moving vehicles are not skilled
or qualified operators
● Face instability will cause rock
falls and/or slides. It can
happen due to adverse
geologic condition or
inappropriate work methods.
Those at greatest risks are the
workers exposed or near these
slopes.
● Provision of signages, or safety
cordon, or provision of safety
berm
● Provision of storm water
drainage to manage silted
waters during heavy rainfall.
● Provision of safety signage on
areas where risks are present
such as high wall edges, areas
below high wall and areas
where there is possibility of
falling rocks.
● Brief the workers to follow
company procedures.
Violators will be dealt
accordingly to avoid repeat of
similar violations.
● Only qualified operators will
be allowed. Proper
coordination of vehicle
movement in the work area.
● Regular inspection of the
benches for signs of instability.
● Implementation of Mining
Program benches design.
The effectively of the
measures will be
determined through:
● Daily monitoring
of hazard areas
● Analysis of safety
accident reports
● Review and
revisions of
Mining
methodology
Table 4-3. Risk Management - Environment
RISK ASSESSMENT MITIGATING MEASURE REMARKS
● Slumping/landslide of slopes in
the quarry
● Vegetation of areas where there
is high water runoff
The effectively of the
measures will be
determined

EPRMP | CHAPTER 4 ERA & ERP Silica Sand Quarry Expansion Project
4-10
RISK ASSESSMENT MITIGATING MEASURE REMARKS
● Ineffective drainage system in
the quarry area
● Failure of pollution control
facilities (Silt ponds)
● Construction of silt traps and
drainage canals to divert excess
runoff
● Maintain drainage system and
ensure that its design serve its
purpose
● Regular cleaning and desilting of
drainage canals and silt traps
● Progressive rehabilitation of
affected areas
through:
● Daily monitoring of
hazard areas
● Analysis of
environmental
monitoring reports
Table 4-4. Risk Management - Social
RISK ASSESSMENT MITIGATING MEASURE REMARKS
● Premature closure of company
● Negative sentiments to mining
of some sectors
● Strained relationship with the
LGU caused by unpopularity of
the project implementation
due to poor Project-LGU
relationship
● Monitor/ implement SDMP
● Conduct regular IEC for the
stakeholders to fully
understand the project
● Help the stakeholders with
their need, coordinate with
LGU and NGO for the
implementation of the project
and assist the community with
their social and economic
development that will directly
minimize if not eliminate their
negative outlook to mining.
The effectively of the
measures will be
determined through:
● Monitoring and
analysis of the
progress of the
project
4.3 SAFETY PERFORMANCE
Since the project has not been implemented, no safety performance is available. However, it is SEDC’s
commitment, through its Health and Safety Policy, to manage a safe and responsible mining
operations by providing safe and healthy working conditions to its employees and outsource
process/service providers and adhering to safety and health standards. Incident prevention is the
corporate goal of the Safety and Health Program. It aims to eliminate/minimize potential pre-
determined hazards and risks associated in each stage of SEDC operations through established
operational controls and strategies for continual improvement. SEDC initiates efforts to cooperate

EPRMP | CHAPTER 4 ERA & ERP Silica Sand Quarry Expansion Project
4-11
with the government, public and private sectors in seeking solutions to safety and health problems
and related community issues.
Adhering to its Health and Safety Policy, SEDC was awarded with the Safest Quarry Operation Award
by the Philippine Mine Safety and Environment Association and the Department of Environment and
Natural Resources - Mines and Geosciences Bureau for three consecutive years from 2014 to 2016.
Below is the list of awards given to SEDC for its safe mining operations.
● Zero Lost Time Accident Award (PMSEA)
- Fiscal Year 2004-2005
- Fiscal Year 2006-2007
- Fiscal Year 2008-2009
- Fiscal Year 2009-2010
● Zero Lost Time Awardee, Region VII (Quarry Operations Category)
- Fiscal Year 2013-2014 by DENR-MGB VII
● 2014 Safest Mines Award (Quarry Operations Category) by DENR-MGB VII
● Safest Quarry Operations Award by PMSEA
- November 14, 2014
- November 20, 2015
- November 18, 2016
● Safest Mining Operation: Non-Metallic Category by PMSEA
- November 18, 2016
● SEDC’s 5-year Safety Statistics
4.4 EMERGENCY PREPAREDNESS AND RESPONSE GUIDELINES
The purpose of the Emergency Preparedness and Response procedure of SEDC is to maintain a system
for carrying out emergency preparedness and response actions within the premises of the company
and areas of its operations, with the aim of minimizing the impacts of emergency situations towards
the environment including risks and injuries to employees, outsourced process/ service providers and
other interested parties.
This procedure is applicable to all emergency situations which can have significant impacts to the
environment, including occupational health and safety risks to employees and other personnel
working for or in behalf of Solid Earth Development Corporation in conformance to the requirements
of ISO 14001:2015 Environmental Management System.
4.4.1 REFERENCE DOCUMENTS ● Annual Safety and Health Program
● Oil Spill Contingency Plan
● Incident Reporting and Investigation
4.4.2 RESPONSIBILITIES AND AUTHORITIES
4.4.2.1 TOP MANAGEMENT The top management is responsible for providing resources related to the effective implementation
of the company's Emergency Response Preparedness Plan (ERPP).

EPRMP | CHAPTER 4 ERA & ERP Silica Sand Quarry Expansion Project
4-12
4.4.2.2 SAFETY, HEALTH AND ENVIRONMENT DEPARTMENT MANAGER AND SAFETY, HEALTH AND
ENVIRONMENT OFFICER The Safety, Health and Environment (SHE) Department Manager and SHE Officer are responsible for
ensuring that this procedure is implemented consistently and effectively throughout the company and
other personnel working for or in behalf of Solid Earth Development Corporation.
4.4.2.3 EMERGENCY RESPONSE TEAM ● Emergency Response Coordinator is responsible for handling and managing the Emergency
Response Team (ERT) and implementing emergency response procedures.
o Directs the overall execution of the ERPP.
o Provides regular updates to Management on the development and progress taking
place on site.
o Coordinates and maintain efficient communication with the TCPI-ESD Manager/Staff
for immediate assistance.
o Overall in-charge of information relay and coordination with stakeholders as well as
documentation and reporting.
o Clear all outgoing communications and acts as spoke-person of the company.
o Submits Final Report to Management which is essential for claims (including costs and
lessons learned).
● Alternate/Co-Alternate ERC
o Assist the ERC in the execution of the plan.
o Advise the ERC on matters pertaining to Safety, Health and Environment Management
to ensure that health and safety of the response teams is not compromised during
the activity.
o Act as ERC in his absence.
● Team Leader
o Evaluate and determine extend and severity of the situation.
o Assume command over all emergency response teams at the site to carry out actions
as per ERPP.
o Liaise and update the ERC of the actions carried out on site.
o Ensures that heavy equipment are readily available for whatever aggravating situation
that needs special attention.
o Supervise the teams under him.
● Members of the Emergency Response Team (ERT) On-Duty
o Responsible for ensuring proper implementation of the company's emergency
response plans.
o Execute the plan safely as directed by the Team Leader.
o Coordinates and maintain efficient communication with the Team Leader.
● Herstal Security Head Guard On-Duty
o Receives instructions and relays information to concerned parties as directed by the
ERC.
o Guides the Local Disaster Coordinating Council (LDCC) as directed by the ERC.
o Advise the ERC on matters pertaining to Security.
o Ensures that unauthorized personnel are kept out from the site.

EPRMP | CHAPTER 4 ERA & ERP Silica Sand Quarry Expansion Project
4-13
4.4.3 GUIDELINES
4.4.3.1 EMERGENCY SCENARIO IDENTIFICATION ● The Safety, Health and Environment Officer, in coordination with other department heads,
shall identify all potential emergency situations or scenarios arising from the risk assessment
associated with the company's activities, operations and processes including the means to
eliminate, control and minimize the hazards and risk associated with it.
● All identified emergency scenarios shall be developed, registered and maintained specifying
the activities, operations and processes including the hazards, risks and appropriate controls.
4.4.3.2 EMERGENCY RESPONSE TEAM ● An Emergency Response Team (ERT) shall be formed and maintained to ensure the company's
readiness in the event of incidents and other emergency situations affecting the environment
and health & safety of art personnel as well as company properties.
● The ERT shall be headed by an assigned "Emergency Response Coordinator" and shall be
organized in accordance with "Emergency Response Team Structure", which identifies the key
emergency responders in the overall Emergency Response Preparedness Plan (ERPP).
● Members of the ERT shall be qualified and trained in matters related to emergency
preparedness & response actions to mitigate severe impacts to the environment and its
associated risk in the event of its occurrence. Emergency trainings shall be planned and
coordinated by the Safety, Health and Environment Manager with qualified trainers.
4.4.3.3 EMERGENCY CLASSIFICATION AND NOTIFICATION ● All emergency situations will be assessed by the Emergency Response Coordinator, Safety,
Health and Department Manager and Safety, Health and Environment Officer who shall
determine the level of emergency according to the classification specified in "Emergency
Classification".
● Appropriate communications shall be performed by the Safety, Health and Department
Manager and Safety, Health and Environment Officer with all relevant authorities depending
on the classification level of emergency.
● For Level 2 & Level 3, refer to Action Flow of Communication and Response indicated in the
Annual Safety and Health Program.
Table 4-5. Classification of emergency scenarios
LEVEL OF EMERGENCY DESCRIPTION
LEVEL 1 An emergency has occurred and can be controlled by the company's
ERT.
LEVEL 2 An emergency has occurred. However, the situation is not under control
but is confined within facility premised. The emergency is confined to a
small area or to a fixed site and does not posed a threat of spreading to
a larger area or off-site. The company's ERT shall take the necessary
response for controlling the situation.
LEVEL 3 An emergency has occurred where the situation is not under control and
protective action may be necessary to protect the surrounding or offsite
area. A site area emergency involves events in process or which have
occurred that result in actual or likely major failures of safety functions.

EPRMP | CHAPTER 4 ERA & ERP Silica Sand Quarry Expansion Project
4-14
LEVEL OF EMERGENCY DESCRIPTION
The company's ERT together with other relevant agencies shall take the
necessary response for controlling the situation.
4.4.3.4 COMMUNICATIONS AND EMERGENCY INFORMATION FLOW ● Communication lines through radios, telephones and mobile phones shall be accessible,
readily usable and maintained to facilitate proper communication with relevant authorities.
● In addition, emergency contact numbers of key personnel, including ambulance, police and
fire departments shall be posted for quick reference.
● All occurrences of environmental and OH&S emergency situations and incidents shall be
communicated immediately to the Safety, Health and Environment Department,
Environmental Management Representative and/ or Technical Adviser/ Director.
4.4.3.5 EMERGENCY DRILLS ● The Safety, Health and Environment Manager, in coordination with the Environmental
Management Representative and Top Management, including all other departments in the
organization, shall plan and conduct a company-wide emergency drills at least once every 6
months.
● Emergency drills and trainings shall cover all but not limited to different types of emergencies
as follows:
o Evacuation;
o Firefighting;
o Oil Spill;
o Earthquake;
o First Aid;
o Bomb threat;
● Designated fire exits and evacuation areas (or "assembly points") within or near the company
premises shall be clearly marked and made clear to all personnel. Selected and assigned
personnel (referred to as "fire wardens") shall supervise the evacuation, including headcount.
● Where appropriate, an evacuation plan and vicinity map or site layout shall be posted in
strategic locations of the company premises for the general awareness of everyone. The maps
should show evacuation routes, recovery routes, closest exits, fire protection equipment
location and whatever is applicable. All employees should follow these instructions and be
familiar with the evacuation map.
● If planned results are not achieved, appropriate corrective actions shall be planned and
earned out.
● The Safety, Health and Environment Department shall prepare and maintain records of
"Emergency Drill Report" duly signed by the EMR and/or Technical Adviser.
4.4.3.6 EMERGENCY EQUIPMENT MONITORING AND INSPECTION The Safety, Health and Environment Manager shall ensure that appropriate emergency equipment is
provided, deployed and easily accessible in strategic areas of the company premises where a potential
environmental emergency and associated risks could potentially occur.
Emergency equipment shall cover all but not limited to the following:

EPRMP | CHAPTER 4 ERA & ERP Silica Sand Quarry Expansion Project
4-15
− Fire Extinguishers
− Fire Alarms (system is dependent with TCPI)
− Fire Hose (system is dependent with TCPl) -check MOA
− Emergency lights
− Spill kits (in the event of chemical/oil spills)
− First Aid Kit
− Fire Fighting Equipment
The Safety, Health and Environment Manager and/or its assigned officer shall periodically check and
monitor all emergency equipment using the "Emergency Equipment Monitoring Sheet” (Portable Fire
Extinguisher, Oil Spin Response Equipment, Fire Fighting, First Aid Kit. Frequency of inspection and
maintenance shall be specified in the list.
It shall be the responsibility of the Safety, Health and Environment Manager and his designated officer
to ensure that all emergency equipment is in good operational condition and easily accessible in the
event of an incident and other emergency situation.
4.4.3.7 EMERGENCY RESPONSE ● At the sound of an Emergency Evacuation Alarm, all personnel shall stop working except those
with designated duties in this PLAN and shall proceed in an orderly movement towards the
designated EVACUATION AREAS.
● An announcement by the TCPI Emergency Response Coordinator (ERC) will be affected right
after the emergency alarm is sounded to disseminate information and instructions for proper
guidance. The highest-ranking personnel should conduct headcount at once and report it to
the SEDC Emergency Response Coordinator (ERC) to ascertain accountability of personnel.
4.4.3.8 AFTERMATH CLEAN-UP PROCEDURES It is important that after any eventuality, full concern for the protection of public health, safety and
the environment are immediately taken cared-of as corrective measures.
The following guidelines are formulated to meet adherence to this intent:
● Area Inspection – An Inspection Team composed of technical personnel as directed by the
Technical Director shall immediately conduct thorough inspection to determine the extent of
damage and other related data in relation to the stability of structures, prevailing and
impending environmental aspects-impacts, safety and conclusively recommends whatever
normalization measures are to be undertaken.
● Cleaning/ Demolition – A Composite Team shall then be tasked to undertake these cleaning/
demolition activities.
● Waste Disposal – Waste generated from the demolition and cleaning shall conform to the
established procedure in Waste Management.
4.4.3.9 REPORTING AND MEETING ● The EMR, Safety, Health and Environment Manager and other relevant personnel shall review
and discuss any reported incident and shall plan corrective measures to avoid recurrence of
the same environmental and OH&S emergency and incident.
● Emergency procedures shall be reviewed and revised as necessary to reflect continual
improvement on the company’s EPRP

EPRMP | CHAPTER 4 ERA & ERP Silica Sand Quarry Expansion Project
4-16
● All matters discussed shall be communicated to all interested parties such as employees,
outsourced process/ service providers, government offices and other persons working for or
in behalf of the company through meetings and bulletin boards for general awareness.

5-1
5 SOCIAL DEVELOPMENT PLAN/FRAMEWORK (SDP) AND IEC FRAMEWORK
5.1 SOCIAL DEVELOPMENT PLAN
5.1.1 INDICATIVE SOCIAL DEVELOPMENT PLAN Indicative social development planning is necessary in formulating programs and strategies that would
mitigate the major impacts of the project. This would guide the proponent in preventing/mitigating
and/or enhancing a project’s adverse and positive impacts on people’s livelihood, health and
environment.
Social Development Plan (SDP) aims to assess and identify the basic needs of the communities which
will be affected by the project. SDP should be patterned in the Municipal and Barangay Development
Plans of the host communities and in accordance with the mandated Corporate Social Responsibility.
It aims to establish a strong relationship between the Project Proponent, community institutions, and
stakeholders towards the goal of achieving an improved quality of life of the residents of the host
localities.
The issues garnered from the perception survey conducted on November 14 – December 3, 2018 were
considered and addressed in the formulation of the SDP. These are the following:
• Employment
• Barangay Income
• Improvement of Communications Network
• Damage to Road Network
• Landslide/Erosion
• Damage to nearby houses
• Noise Pollution
• Take care of dangerous/accident prone/hazardous areas
• Avoid Landslides
• Signage in dangerous/accident prone/hazardous areas
• Tree planting as protection against landslides in other areas
• Provide access roads. Separate for the hauling, and for the community
• Relocation and housing to those affected
• Tree Replacement/Reforestation/Rehabilitation
• Concrete Slope Protection
• Petition for a flower garden in Lut-od
• In rehabilitation, create/gear towards tourist spot or eco-park
• Deepen/Strengthen the community relations
The Indicative Social Development Plan (SDP) presenting the major programs and activities is
presented in Table 5-1. As mandated under DENR Administrative Order No. 2000-99, a Comprehensive
Social Development and Management Program (SDMP) will be formulated and implemented in
partnership and discussion with various stakeholders. While the SDMP and SDP may be similar in
efforts for the company to realize its corporate social responsibility, it must be emphasized that the
SDP is impact-based as a result of the EIA. This SDP therefore is rationalized within the purview of the

EPRMP | CHAPTER 5 SOCIAL DEVELOPMENT PLAN & IEC FRAMEWORK Silica Sand Quarry Expansion Project
5-2
PEISS addressing all the possible socio-economic impacts that may arise during and after the operation
of the mine as a result of significantly technical impacts. The company through its experienced
Community Development or Social Work Officer will implement the SDP in coordination with all
stakeholders. A periodic monitoring and evaluation of SDP projects and activities will be carried out in
partnership with other stakeholders. Moreover, coordination with the Project-affected barangays and
the Municipal LGU of San Fernando will also be carried out to ensure conformity of activities and
projects to the development thrust of the local government. The SDP as a framework plan shall be an
indicative set of programs that will:
● Identify the key concerns to be addressed (including those of the second level scoping issues
and concerns);
● Recommend and design measures in response to these concerns;
● Indicate the responsible agency or organization with respect to these measures; and
● Plan broad timelines to make these measures happen.

EPRMP | CHAPTER 5 SOCIAL DEVELOPMENT PLAN & IEC FRAMEWORK Silica Sand Quarry Expansion Project
5-3
Table 5-1. Indicative Social Development Plan/Framework
CONCERN PROGRAM ACTIONS LEAD
ORGANIZATION
RESPONSIBLE COMMUNITY
MEMBER/BENEFICIARY
INDICATIVE TIMELINE
SOURCE OF FUND
1. Economic empowerment
● Set-up barangay public employment/business services offices
● Seminar and educational tour on sustainable agriculture, agroforestry, and organic farming:
- Pro-poor Livelihood programs - Program for the elderly - Technical skills for women
● Livelihood project and enterprise development projects for women, elderly and out of school youth
- Piggery and poultry - Handicraft training/seminar - Backyard gardening
SEDC, DA, TESDA, MSWD
● Barangay Committees
● Communities within impact barangay
● POs and NGOs of impact barangays
Pre-construction
Construction
Operation
SEDC
2. Health
● Set-up community health program at project affected areas; regular monitoring and consultation on medical services
● IEC on sanitation and distribution of toilet construction materials to residents without toilets
● Quarterly Health Education and Sanitation Program ● Health & Safety Training for employees ● Maternal Care and Child Health Care: Prenatal, Intranatal,
Postnatal, Child birth in health centers or hospitals ● Nutrition Program: Supplemental feeding and In-school
Supplemental Feeding Program ● Health Care prioritizing non-employees of the company in
health centers or hospitals
SEDC, DOH, DepEd, Municipal Health Officer
● Barangay Committee on Health, Barangay Health Workers
● Residents affected by the project
● POs and NGOs of impact barangay
● Employees of the project
● Barangay Nutrition scholars and Health
● Workers; Women and children of the affected barangays
Pre-construction
Construction
Operation
SEDC
3. Hazards and disaster
preparedness
● Disaster Risk Management Plan ● IEC on Disaster Risk Management ● Seminars/training for communities and mining workers on
Disaster Risk Preparedness and Mitigation
SEDC in partnership with local authorities and community
● Communities of impact barangays
● SEDC Employees
Pre-construction
Construction

EPRMP | CHAPTER 5 SOCIAL DEVELOPMENT PLAN & IEC FRAMEWORK Silica Sand Quarry Expansion Project
5-4
CONCERN PROGRAM ACTIONS LEAD
ORGANIZATION
RESPONSIBLE COMMUNITY
MEMBER/BENEFICIARY
INDICATIVE TIMELINE
SOURCE OF FUND
● Provision of equipment and aid in response and recovery of affected communities
● IEC and consultation on community
organizations Operation
Abandonment
4. Transportation ● Improvement of roads ● Constant and frequent water sprinkling along unpaved
roads
SEDC in partnership with local authorities and community organizations
● Barangay Committees
● Communities within impact barangay
● POs and NGOs of impact barangay
Pre-construction
Construction
Operation
5. Water supply
● Assistance for the development of water sources for the community;
SEDC in partnership with local authorities and community organizations
● Barangay Committees
● Communities within impact barangay
● POs and NGOs of impact barangay
Pre-construction
Construction
Operation
6. Peace and Order ● Provision of seminars and workshops ● Provision of equipment and facilities as aid in keeping order
in the community
SEDC, PNP, Barangay LGU - Tanod
● Barangay Committees
● Communities within impact barangay
● POs and NGOs of impact barangay
Pre-construction
Construction
Operation
SEDC
7. Mining closure ● Psycho-social services to Project-affected families ● Re-training and enhancement of alternative livelihood
programs for workers in the affected areas
SEDC, DTI ● Employees of the company
Abandonment

EPRMP | CHAPTER 5 SOCIAL DEVELOPMENT PLAN & IEC FRAMEWORK Silica Sand Quarry Expansion Project
5-5
5.1.2 IMPLEMENTED SOCIAL DEVELOPMENT PROGRAMS As per latest CMR has not yet implemented since the status of the existing project is under
DMPF.
5.1.3 SDMP COST The table below shows the Social Development and Management Program (SDMP) Cost per category project or program actions:
PROGRAM / PROJECT YEAR 1 YEAR 2 YEAR 3 TOTAL
1. Livelihood Project (15%) 615,000 630,000 660,000 3,300,000
2. Infrastructure Project (15%) 615,000 630,000 660,000 3,300,000
3. Health Program (15%) 615,000 630,000 660,000 3,300,000
4. Education Program (20%) 820,000 840,000 880,000 4,400,000
5. Community Support (10%) 410,000 420,000 440,000 2,200,000
5. Development of Mining
Technology (10%) 410,000 420,000 440,000 2,200,000
5. IEC Program (15%) 615,000 630,000 660,000 3,300,000
TOTAL BUDGET 4,100,000 4,200,000 4,400,000 22,000,000
Parameters:
Annual Production 660,000 660,000 660,000 3,300,000
Operating Cost 406 422 439 439
Minimum Requirement (1.5%) 4,019,400 4,177,800 4,346,100 21,760,200
5.2 INFORMATION, EDUCATION AND COMMUNICATION (IEC) FRAMEWORK
A comprehensive and intensive Information Education and Communication (IEC) Campaign is designed
for the better information and education of the communities and the general public pertaining the
objectives, necessity and benefits of the project, and the processes involved with the construction and
operation of the proposed project. These shall be done through the distribution and posting of written
materials such as brochures, newsletters, media statements and articles, bulletins and posters,
comics, and online presence. Moreover, non-written types such as fora, symposia, conferences,
workshops, community discussions and hearings, interpersonal focus discussions, house-to-house and
purok-to-purok information drives, information desk/center, community seminars, mine visits audio
visual presentations, radio and TV programs and/or guestings, etc., can also be used for the campaign.
The IEC materials and activities will also serve as a venue for continuous dialogue, feedback and check
and balance mechanism for the parties involved. Table 5-2 presents the proposed IEC Plan for the
Project.
SEDC has its Complaints Management Guideline to ensure that complaints from any of the interested
parties (i.e. stakeholders, employees, customer, community, government agencies/offices and other
related entities who wish to express their dissatisfaction pertaining to the effects of the company’s
operations) are properly communicated and addressed. Below is a summary of the Complaints
Management Guideline of SEDC.
5.2.1.1 RESPONSIBILITIES AND AUTHORITIES

EPRMP | CHAPTER 5 SOCIAL DEVELOPMENT PLAN & IEC FRAMEWORK Silica Sand Quarry Expansion Project
5-6
Legal Assistant - is responsible in recording complaints received such as complainant's information,
complaint's details, source, date and time raised in the complaints blotter (logbook). It is his/ her
responsibility to initially assess, notify the concerned department, follow through actions taken, and
monitor its effectiveness. Thereafter, closing of complaints once settled and safekeeping of records.
Grievance Committee - is a team of Division/ Department Managers and Legal Assistant who is
responsible to respond, investigate and validate complaints.
Concerned Department (Process Owner) - is responsible to initiate and implement immediate/
corrective actions and ensures consistency of actions deployed.
5.2.1.2 RECEIVING A COMPLAINT Complaints are received verbally or in writing at any of the following:
● at any SEDC Office
● via any of SEDC's contact numbers
● via any of SEDC's advertised email address and fax numbers
● via SEDC's website or official page
Personal information is collected, stored, used and disclosed. Any information transferred outside the
company without the consent of the complainant may be a breach of information privacy.
Privacy Statement:
"Solid Earth Development Corporation is collecting your personal details for the purpose of responding
to your complaint. Your information will not be disclosed to a third party without your consent unless
required or authorized to do so by law."
5.2.1.3 RECORDING OF A COMPLAINT Recordkeeping is the responsibility of the Legal Assistant. All complaints received shall be recorded in
the Complaints Blotter. They are retained and destroyed under an approved retention and disposal
schedule. Records/ files with confidential, sensitive and/ or personal information must be saved within
the recordkeeping system with appropriate security classifications and security access controls.
5.2.1.4 ASSESSING A COMPLAINT After receiving a complaint, it is assessed to determine:
• if it will be managed under this procedure;
• if it will be accepted;
• how, where and by whom it should be managed.
The issues raised, the relevant information provided, the actions undertaken so far and the outcome
requested must be considered to understand the complaint based on the complainant’s perspective.
In addition, to be able to determine how to manage the complaint, factors such as the significance of
the issues, the reasoning for any decisions or actions made so far, any relevant legislative, policy or
process requirements, the likely outcome or remedy and any potential corrective actions or
improvement must be considered.
To ensure that complaints are managed consistently and appropriately, the nature and implication of
the issues raised must be reviewed to determine the best classification of the complaint. Below are
the classification levels of complaints:

EPRMP | CHAPTER 5 SOCIAL DEVELOPMENT PLAN & IEC FRAMEWORK Silica Sand Quarry Expansion Project
5-7
Typical Complaint – assessed as having a low level of risk and/or minimal level of detriment to the
complainant or to the company. These complaints normally involve minimal investigation.
Intermediate Complaint – assessed as having a medium level of risk and/or moderate level of
detriment to the complainant or to the company. These complaints may involve detailed investigation
and may require referral to the senior/executive management.
Complex Complaint – assessed as being serious or significant, with a high or extreme level of
detriment to the complainant or to the company. These complaints may involve extensive
investigation and require immediate attention of the senior/executive management.
5.2.1.5 INVESTIGATING A COMPLAINT The key steps of the investigation process are the following:
• Identify the key issues;
• Assess if there is conflict of interest;
• Plan the investigation;
• Gather and evaluate evidences; and
• Make a decision.
5.2.1.6 RESPONDING TO AND REPORTING A COMPLAINT Following an investigation, a timely and meaningful feedback must be provided to the complainant
and any relevant staff or business areas involved and/ or that might be affected by any findings or
corrective actions.
Complaints are consistently and systematically categorized and reported to the top management.

EPRMP | CHAPTER 5 SOCIAL DEVELOPMENT PLAN & IEC FRAMEWORK Silica Sand Quarry Expansion Project
5-8
Table 5-2. IEC Plan/Framework for the Project
TARGET SECTOR
IDENTIFIED AS
NEEDING PROJECT IEC
MAJOR TOPIC/S OF CONCERN
IN RELATION TO PROJECT
IEC SCHEME/ STRATEGY/
METHODS
INFORMATION
MEDIUM
INDICATIVE
TIMELINES AND
FREQUENCY
INDICATIVE COST
Communities of impact
barangay; SEDC
employees, LGUs, POs,
NGOs
Project details/ background;
Proponent
Scope of the project
Schedule of activities
Project development
Benefits from the Project
• Conduct of Seminars,
• Mine tours/visits,
conference, forum and
workshops, meetings with
LGUs, Local newspaper,
press releases, Leaflets,
Billboards;
• Distribution of info
materials
• Maintenance of Information
desk and center
Print Media,
Posters,
brochures,
Comics
Multi-media
press releases,
broadcast, TV
spots and social
media
Pre-construction
15% of the SDMP
Fund as
mandated
under the DAO
2010-13
Communities of impact
barangay; LGUs, POs,
NGOs, Contractors
EIA Results
Compliance with the
DENR requirements
Environmental
Management Plan
Environmental
Compliance and Monitoring
Environmental laws and
related regulations on EPEP,
FMRDP, MMT, MRFC, ECC,
etc
Clean-Air Act, Clean Water
Act, Ecological Solid Waste
• Public Meetings
• Purok-to-purok information
drive
• Distribution of info
materials
• Maintenance of Information
desk and center
Print Media,
Posters,
brochures,
Comics
Multi-media
press releases,
broadcast, TV
spots and social
media
Pre-construction
Construction
Operation
Abandonment
15% of the SDMP
Fund as
mandated
under the DAO
2010-13

EPRMP | CHAPTER 5 SOCIAL DEVELOPMENT PLAN & IEC FRAMEWORK Silica Sand Quarry Expansion Project
5-9
TARGET SECTOR
IDENTIFIED AS
NEEDING PROJECT IEC
MAJOR TOPIC/S OF CONCERN
IN RELATION TO PROJECT
IEC SCHEME/ STRATEGY/
METHODS
INFORMATION
MEDIUM
INDICATIVE
TIMELINES AND
FREQUENCY
INDICATIVE COST
Management Act and other
laws and regulations.
Communities of impact
barangay; LGUs, POs,
NGOs; Employees of
SEDC, school children
The program of implementing
the Social Development and
Management Program such as:
Environmental Health and
Sanitation
Environmental
Conservation, Protection
and Management
Disaster Risk Preparedness
Solid Waste Management on
Schools and Households
• Information dissemination
during meetings of
organized and assisted POs
and sector;
• House-to-house and schools
information dissemination;
• School workshops
• Community seminar/
trainings
• Purok-to-purok information
drive.
• Distribution of info
materials
• Maintenance of Information
desk and center
Print Media,
Posters,
brochures,
Comics
Multi-media
press releases,
broadcast, TV
spots and social
media
Pre-construction
Construction
Operation
Abandonment
15% of the SDMP
Fund as
mandated
under the DAO
2010-13

6-1
6 ENVIRONMENTAL COMPLIANCE MONITORING
6.1 ENVIRONMENTAL PERFORMANCE
SEDC continuously implements the mitigating measures committed in the EMP and the ECC Conditions
are well monitored and complied. Based on the submitted monitoring reports, the project is still in
the developmental stage particularly in the acquisition of the Project Declaration of Mining Project
Feasibility (DMPF) so they can proceed with the project operational stage.
6.1.1 PROJECT ENVIRONMENTAL PERFORMANCE Although the ECC for the existing project was awarded in 2016, there was no major development in
the two MPSAs covered by the ECC. The project has an on-going DMPF application. Thus, monitoring
data available were limited for comparison and trend analysis. The succeeding sections discuss the
comparison of available data (baseline in 2014-2015).
6.1.1.1 TERRESTRIAL ECOLOGY
6.1.1.1.1 BIODIVERSITY PERFORMANCE 6.1.1.1.1.1 FLORA A decrease in number of species as compared to March 2016 EIS was recorded based on the results
of 2019 flora assessment. The number of recorded endemic species and threatened species also
decreased. This can be attributed to the method employed, level of effort, season and location of
sampling activities and disturbances occurred in the area.
Dominant species in 2017 and 2019 flora sampling were both agroforestry species suggesting that the
project area maintained the land cover with dominantly production area or agro-ecosystem.
No monitoring data of terrestrial ecology was available during the small-scale mining operations of
the project.
6.1.1.1.1.2 FAUNA A total of 52 fauna species was recorded in 2016 while only 41 species was recorded on the 2019
study. The difference in species richness can be attributed to different transects surveyed for each
sampling period, drier conditions in rivers/streams in the 2019 study which limited the record of
herpetofauna, and observer bias. Nevertheless, species composition in the 2016 study is almost similar
with the 2019 study. Endemic and threatened species remain present on site despite the operation of
the project indicating insignificant impact of the project to fauna assemblage on site.
In terms of diversity, birds recorded in the 2016 study was highly diverse with an index value of 3.05
while a moderate diversity was recorded in the 2019 study with an index value of 2.94. Difference in
diversity indices can be due to the abundance of several species, which outnumbers other birds during
the 2019 study. In other words, bird populations are more evenly distributed during the 2016 study
and/or a result of observer bias.
6.1.1.1.2 PROGRESSIVE REHABILITATION As of November 2017, SEDC has planted 3,500 assorted trees (Star Apple, Tamarind, Caimito) at
Duangan, Pinamungahan. On the other hand, 3,500 assorted trees (Duhat, Tamarind, Lomboy) were
planted at Duangan, Pinamungan in July 2018 and 3,000 assorted trees (Caimito, Tamarind, Lomboy)
at Duangan, Pinamungan in November 2018. Thus, since 2016, a total of 10,100 seedlings were
planted by the company and 3,950 were replanted.

EPRMP | CHAPTER 6 ENVIRONMENTAL COMPLIANCE MONITORING Silica Sand Quarry Expansion Project
6-2
A total of 6,000 seedlings were donated by SEDC from 2016-2019 as part of its rehabilitation program.
A satellite nursery was established in Duangan Area that supplies the seedlings for the rehabilitation.

EPRMP | CHAPTER 6 ENVIRONMENTAL COMPLIANCE MONITORING Silica Sand Quarry Expansion Project
6-3
Figure 6-1. Progressive Rehabilitation conducted by SEDC 2016-2019
6.1.1.2 WATER QUALITY

EPRMP | CHAPTER 6 ENVIRONMENTAL COMPLIANCE MONITORING Silica Sand Quarry Expansion Project
6-4
6.1.1.3 GHG EMISSIONS OF THE PROJECT The estimated GHG emissions for the current and proposed productions (quarry equipment) are
3,277.371 and 3,707.199 tons per year of CO2e, respectively. The proposed production is projected to
increase CO2e emissions by about 11.6%.
The proponent is yet to establish a comprehensive program on GHG accounting and reduction,
although there are practices that are noted to reduce GHG emissions. The proposed mitigating
measures were discussed in Section 2.3.1.5.
6.1.1.4 AIR QUALITY
6.1.1.5 NOISE QUALITY
6.1.2 COMPLIANCE TO ECC CONDITIONS AND EMP COMMITMENT
Table 6-1. Summary Status of Project Compliance
REQUIREMENT STATUS OF COMPLIANCE
Project coverage/limits
The certificate shall cover the quarry operation with
an annual production rate of 200,000 DMT of silica
sand for a total of 229.5 hectares / production area.
The quarry operation shall be done in surface mining
and shall not include blasting.
COMPLIED - At present, the proponent's
MPSA 314-2010-VII and MPSA 323-2010-VII
is under Pre-development stage. On-going
DMPF application.
Components
The project shall have the following components:
quarry area, access roads, top soil stockpile area,
waste material stockpile area, quarry drainage
system and settling ponds.
COMPLIED - At present, the proponent's
MPSA 314-2010-VII and MPSA 323-2010-VII
is under Pre-development stage. On-going
DMPF application.
All the commitments appropriate mitigating/
enhancement measures and monitoring
requirements contained in the EPRMP particularly in
the EMoP shall be fully instituted to minimize any
adverse impact of the project.
COMPLIED - Safety, Health and
Environment Department is tasked to
oversee the implementation and
monitoring of all the necessary
environmental and other related programs
formed as based in the EMoP.
Undertake an effective and continuing Information,
Education and Communication (IEC) Program to
inform to all stakeholders regarding the projects'
operations, EMP for greater awareness,
understanding and sustained acceptance of the
project.
COMPLIED - The proponent in coordination
with the Brgy. officials conducts a semi -
annual general assembly which is solely
participated by the community.
No other activities shall be undertaken other than
what was stipulated in the EPRMP document. Should
Complied - No other activities were
conducted. Same as planned.

EPRMP | CHAPTER 6 ENVIRONMENTAL COMPLIANCE MONITORING Silica Sand Quarry Expansion Project
6-5
REQUIREMENT STATUS OF COMPLIANCE
there be an expansion or modification of the Project
beyond the project description or any change in the
activity shall be made subject to a new EIA study.
Transfer of ownership of this project carries the same
conditions and restrictions.
No transfer of ownership took place.
Table 6-2. Summary Status of Project Compliance to ECC Conditions
REQUIREMENT STATUS OF COMPLIANCE
All commitments, appropriate
mitigating/enhancement measures and monitoring
requirements contained in the EPRMP, particularly in
the Environmental Management and Monitoring Plan
(EMMoP), as approved by the EMB, shall be fully
implemented to minimize any adverse impact of the
entire project including its components, to the
environment, which shall include the following:
1. The proponent shall observe appropriate mining
and vegetative restoration practices, land use, soil
and water management, which shall include among
others:
a. Proper stockpiling and disposal of materials
generated from the quarry site, silt materials
scooped-out from the settling ponds, and other solid
nonhazardous waste in permanent, stabilized areas
away from any water body and drainage systems, as
well as maintained is a safe and non-polluting
condition;
b. Strictly effect stabilization and erosion control of all
side slopes of the mining sites, settling ponds, roads
and nearby gullies, creeks and rivers within the
project site;
c. Use the recovered topsoil for re-soiling or as soil
cover on waste dumps and other disturbed areas for
rehabilitation and revegetation. Temporary stockpiles
shall be maintained and managed below the angle of
repose;
d. Provision of necessary catchment, storm drainage
and diversion canals, concrete culverts, and other
flood control measures to adequately receive and
channel the silt-laden runoff away from natural
receiving bodies of water especially during heavy
MPSA 314-2010-VII and MPSA 323-2010-
VII is under Pre-development stage. On-
going DMPF application.

EPRMP | CHAPTER 6 ENVIRONMENTAL COMPLIANCE MONITORING Silica Sand Quarry Expansion Project
6-6
REQUIREMENT STATUS OF COMPLIANCE
rainfall
Establish appropriate measures and buffer zones of
fifteen (15) meters along the entire periphery of the
project site with appropriate Species/dense
vegetation cover to serve as noise, vibration and dust
buffers;
The proponent recently conducted a tree
growing activity at Magsico Eco – Park last
June 19, 2019. A total of 2,500 seedlings
were planted.
The proponent shall implement climate change
initiatives including the initial reforestation of 250
hectares in 25 years to offset greenhouse gas (GHG)
emissions of the Project in line with the DENR's thrust
for GHG emission reduction programs, in
coordination with EMB Region VII, DENR Provincial
Environment and Natural Resources Office (PENRO)
and/or Community Environment and Natural
Resources Office (CENRO) concerned. The program
shall be submitted within six (6) months from receipt
hereof to EMB Central Office for approval, and
implementation shall proceed one (1) month from the
start of operation;
MPSA 314-2010-VII and MPSA 323-2010-
VII is under Pre-development stage. On-
going DMPF application.
Undertake effective and continuing Information,
Education and Communication (IEC) Program to
inform all stakeholders, especially the local residents
regarding the projects’ operation, Environmental
Management Plan (EMP) for greater awareness,
understanding and sustained acceptance of the
project. The proponent shall formulate and
implement a detailed IEC program within six (6)
months from receipt hereof in coordination with the
Mines and Geoscience Bureau Regional Office (MGB
Region VII) and EMB Region VII. The program shall be
submitted to EMB Central Office on an annual IEC
within thirty (30) days from the start of every years'
operation;
MPSA 314-2010-VII and MPSA 323-2010-
VII is under Pre-development stage. On-
going DMPF application. However, the
proponent continuously conduct an IEC
annually with stakeholders and other local
residents.
The proponent shall protect the natural springs that
are being utilized as sources of potable and domestic
water by the community. The proponent shall secure
clearance from CENRO and or NWRB prior to
MPSA 314-2010-VII and MPSA 323-2010-
VII is under Pre-development stage. On-
going DMPF application.

EPRMP | CHAPTER 6 ENVIRONMENTAL COMPLIANCE MONITORING Silica Sand Quarry Expansion Project
6-7
REQUIREMENT STATUS OF COMPLIANCE
implementation of development activities in natural
springs, creeks and waterways;
Construction of the settling ponds and other siltation
control measures/facilities shall be in accordance with
appropriate geotechnical engineering works
Construction of settling ponds were
provided within the MPSA. Regular
monitoring is conducted through SHED.
Desilting of pond will be coordinated to
outsource service provider.
The entire operations shall conform with the
provisions of RA No. 6969 (Toxic Substances and
Hazardous and Nuclear Wastes Control Act of 1990),
RA No. 8749 (Philippine Clean Air Act of 1999), RA No.
9003 (Ecological Solid Waste Management Program
Act of 2000), and RA No. 9275 (Philippine Clean Water
Act of 2OO4)
MPSA 314-2010-VII and MPSA 323-2010-
VII is under Pre-development stage. On-
going DMPF application.
The proponent shall comply with the environmental
management and protection requirements of the
Philippine Mining Act of 1995 (RA No. 7942) and its
Implementing Rules and Regulations (DAO 2OIO-21),
and Harmonization of the Implementation of the
Philippine Environmental Impact Statement System
and the Philippine Mining Act of 1995 (DAO 2OI5-
O21,such as, but not limited to, the following:
a. Submission to the MGB Central Office for approval
the Environmental Protection and Enhancement
Program (EPEP),with the Final Mine Rehabilitation
and/or Decommissioning Plan (FMRDP);
b. Establishment of the Multipartite Monitoring Team
(MMT) with representatives from the concerned Local
Government Units (LGUs), NonGovernment
Organization (NGOs), People's Organizations (POs)
among others as members.
c. Establishment of Contingent Liability and
Rehabilitation Fund (CLRF) and Environmental Trust
Fund (ETF) with in sixty (60) days from receipt of this
Certificate. The EMB Central Office shall be furnished
proof of compliance within fifteen (15) days from
establishment thereof;
d. Submission of a Comprehensive Social
Development and Management Program (SDMP)
covering the entire project within thirty (30) days
from receipt of this Certificate to the MGB Central
Office for approval, copy furnished the EMB Central
Office and EMB Region VII; e. Creation of a Mine
The existing Multipartite Monitoring Team
(MMT) for the SEDC Limestone Project
includes the inspection of the Silica Sand
Mining Project during the quarterly
monitoring by the MMT members.

EPRMP | CHAPTER 6 ENVIRONMENTAL COMPLIANCE MONITORING Silica Sand Quarry Expansion Project
6-8
REQUIREMENT STATUS OF COMPLIANCE
Environmental Protection and Enhancement office
(MEPEO) within thirty (30) days from receipt hereof,
which shall competently handle all environment-
related aspects of the project. In addition to the
compliance monitoring requirements as specified in
the EMMoP, the MEPEO shall also monitor the actual
project impacts vis-avis the predicted impacts and
management measures stated in the EPRMP and
submit Compliance Monitoring Reports (CMR)to EMB
Central Office among others in accordance with the
format prescribed under the Implementing Rules and
Regulations(IRR)of the Philippine Environmental
Impact Statement System(PEISS);
The proponent shall ensure that its contractors and
sub-contractors strictly comply with the relevant
conditions of this Certificate;
Representative from each contractors and
sub-contractor are members of SEDC
Central Safety, Health and Environment
Committee Meeting.
The quarry operation shall be done by surface mining
and shall not include blasting
No blasting activity shall be conducted as
part of the mining operations.
Secure endorsement approval of concerned
Sanggunian prior to project implementation pursuant
to the provisions of Section 27 of the Local
Government Code. Proof of which shall be submitted
to EMB Central Office within sixty (60) days after
issuance thereof by said the concerned Sanggunian.
MPSA 314-2010-VII and MPSA 323-2010-
VII is under Pre-development stage. On-
going DMPF application.
No other activities shall be undertaken other than
what was stipulated in the EPRMP document. Should
there be an expansion or modification of the Project
beyond the project description or any change in the
activity shall be made subject to a new EIA study; and
MPSA 314-2010-VII and MPSA 323-2010-
VII is under Pre-development stage. On-
going DMPF application. The proposed
expansion is being covered by this ECC
amendment application.
Transfer of ownership of this project carries the same
conditions and restrictions, for which, written
notification shall be made by herein grantee to EMB
within fifteen (15) days from such transfer.
No transfer of ownership.

EPRMP | CHAPTER 6 ENVIRONMENTAL COMPLIANCE MONITORING Silica Sand Quarry Expansion Project
6-9
6.2 ENVIRONMENTAL MONITORING PLAN
Table 6-2. Environmental Monitoring Plan of SEDC Silica Sand Quarry Expansion Project
Environmental Aspects per
Project Phase
Potential Impacts per Environment
al Sector
Parameter to be Monitored
Sampling & Measurement Plan Lead
Person
Annual
Estimated
Cost
EQPL Management Scheme
EPQL Range Management Measure
Method Frequency Location Alert Action Limit Alert Action Limit
Operation Phase
Extraction Land Landform and soil management
Site
inspection
Quarterly Quarry area PCO 10,000 Quarry land form as per approved plan Deviation from approved plan needs to be justified
Deterioration of Surface Water
TSS
O&G
Grab
sampling
Quarterly WQ1
WQ2
PCO 35,000 72 mg/L for TSS
4 mg/L for O&G
71 mg/L for TSS
4 mg/L for O&G
81 mg/L for TSS
mg/L for 0&
80 mg/L for TSS
mg/L for 0&
90mg/L for TSS
5 mg/L for O&G
89mg/L for TSS
5 mg/L for O&G
Identification of sources of sediments/ silt and other pollutants such as O&G;
Check if cross- drains are installed and adequate for peak storm Institute O&G audit and waste management monitoring
Reconfigure drainage to ensure runoff drains toward settling ponds
Provide cutoff channel if necessary, as bypass for Background run-off;
Only quarry equipment will be
maintained at quarry site
Increase dimensions of contour canals, drainage canals and settling ponds.
Install gabion check dams (rainy season
values, or +40mg/L over non-impact waterways)
(rainy season values, or +560mg/L over nonimpact waterways)
(rainy season values, or +60mg/L over non-impact waterways)
Flooding and water ponding
Location of, and construction of silt ponds cum storm water detention and water reservoir ponds
Site
inspection
Quarterly Quarry site PCO 10,000 Ponding area is >40m wide
Ponding area has depth >1m or >45 m2
Ponding area has depth >1m or >50m2
Backfill
depressed area
Properly size contour canals to contribute to storm water detention; Provide contour canals with stone heaps d also decelerate storm drain velocity.
Provide
drainage course toward settling pond, add to capacity of rain
harvesting / water detention basins
Safety record and accident occurrence
Safety record,
Accident/
fatality
Record
keeping
Daily quarry site Safety
Officer
10,000 Lost time due to minor injury
Occurrence of major injury due to
Occurrence of fatality due to accident
Conduct regular safety briefing and
Conduct daily inspection of construction
Construction stoppage and conduct

EPRMP | CHAPTER 6 ENVIRONMENTAL COMPLIANCE MONITORING Silica Sand Quarry Expansion Project
6-10
Environmental Aspects per
Project Phase
Potential Impacts per Environment
al Sector
Parameter to be Monitored
Sampling & Measurement Plan Lead
Person
Annual
Estimated
Cost
EQPL Management Scheme
EPQL Range Management Measure
Method Frequency Location Alert Action Limit Alert Action Limit
incidence/
occurrence
accident orientation to laborers and workers
Installation of safety signage along accident prone areas within the construction site
area
Conduct daily briefing on safety program
of investigation
Increase noise level
Noise level (dBA)
Noise Meter Monthly At populated area along roadside near quarry
PCO 20,000 55 dBA morning and daytime
Limit work between 7am to 6pm
40 dBA nighttime
Strictly impose noise standard if work needs to extend to night time
Equipment maintenance, adjustment, installation of noise reduction apparatus such as sound deadening sheets on noise source engines, engines or
No night time operations
Extraction and Hauling
Air pollution Total
Suspended Particulates (TSP) and PM10
1-hour and 24-hours Ambient air quality sampling
Quarterly At Locations to be identified by MMT, expected to progressively change according to location of active quarry areas.
PCO 400,000 260µg/Ncm TSP, (lhr sampling)
200µg/Ncm
TSP
130 µg/Ncm PM10 (24hr sampling)
280µg/Ncm TSP (lhr sampling)
210µg/l\lcm
TSP
130 µg/Ncm PM10 (24hr sampling)
300 µ/Ncm TSP
230 µg/Ncm TSP
150 µg/Ncm PM10
from 24hr sampling 90 µg/Ncm TSP
60 µg/Ncm PMio
1 yr. average
Seed siltation ponds with algae to develop microbiotic filaments in water for spraying, for soil crusting. Monitor road watering is done daily in dry season
Mandatory maintenance of all equipment engines - check unrestricted airflow, engine
Water the dusty areas until dust resuspension is controlled as per visual observation. Measure water usage per m2 road area and count daily frequency of road watering until dust is controlled
Apply flocculants for dust suppression

EPRMP | CHAPTER 6 ENVIRONMENTAL COMPLIANCE MONITORING Silica Sand Quarry Expansion Project
6-11
Environmental Aspects per
Project Phase
Potential Impacts per Environment
al Sector
Parameter to be Monitored
Sampling & Measurement Plan Lead
Person
Annual
Estimated
Cost
EQPL Management Scheme
EPQL Range Management Measure
Method Frequency Location Alert Action Limit Alert Action Limit
injection timing, injection timing, reduce flow of exhaust gas
recirculation devices, check performance of fuel oxidation catalyst, check engine compression pressures and if necessary calibrate
injection pumps.
Air Quality Carbon sequestration- Number of trees planted Number of trees
maintained Number of trees surviving
GPS tagging of plantation, regular site inspection, Record keeping by photograph per block basis
Quarterly Inspection in buffer zone
PCO 10,000 10% less than target trees surviving
15% less than target trees surviving
20% less than target trees surviving
Review seedling propagation and nursery maintenance procedure for correct practices and adequate water supply
If nursery operations are acceptable, increase nursery and tree planting activities to factor-in mortality rate and result to target # trees surviving and thriving
Conduct reforestation program audit
Social Development Projects
Progress against plan, learnings, resolution of issues
Document review, participatory
Project Benefit Monitoring and Evaluation
Annual With leaders from partner barangays
MEPEO 100,000 100% on target disbursement, 30% below target social satisfaction rating
100% on target disbursement, 40% below target social satisfaction rating
100% on target disbursement, 50% below target social satisfaction rating
Conduct community consultation for program improvement
Review internal SDMP disbursement and utilization guidelines, and actual implementation experience
Conduct SDMP audit

EPRMP | CHAPTER 7 ABANDONMENT PLAN Silica Sand Quarry Expansion Project
6-12
6.3 MULTI-SECTORAL MONITORING FRAMEWORK
As provided in DAO 2003-30, a Multipartite Monitoring Team (MMT) will be organized to regularly
monitor the activities stipulated in the approved EMP and conditions set in the ECC. The MMT for this
project shall be composed of the different stakeholders to include but not limited to the following:
Representative from the MGB Regional Office No. VII
Representative from the DENR Regional Office No. VII
Representative from the Proponent
Representative from the affected communities (Barangay and Municipal LGU)
Representative from the concerned NGOs operating in the area
MMT Member MMT Role Responsibilities / Activities
MGB Regional Office No. VII
Chairman Team leadership to monitor the Proponent’s compliance with the EPEP.
Strengthening of monitoring, analytical, and reporting capabilities of the Team.
Resolution of any conflicts and issues within the Team.
Management of the Monitoring Trust Fund.
Reporting of MMT activities and accomplishments to the MRF Committee
DENR Regional Office No. VII
Member Ensure compliances to environmental laws, rules, and regulations
Provides information necessary for compliances with environmental requirements and commitments
Preparation and review of MMT reports
SEDC Member Provision of monitoring budget to the MMT
Provides information necessary for compliances with environmental requirements and commitments
Coordination with MMT members
Preparation and review of MMT reports
Municipal ENRO Member Participation in actual monitoring activities
Provision of information to the MMT about the environmental and socio-economic conditions as well as issues, problems, and suggestions of the stakeholders
Preparation and review of MMT reports
Barangay Local Government
Member Participation in actual monitoring activities
Provision of information to the MMT about the environmental and socio-economic conditions as well as issues, problems, and suggestions of the stakeholders
Preparation and review of MMT reports
Representative of People’s Organization (POs)
Member Participation in actual monitoring activities
Provision of information on policies, plans, and programs of the POs particularly to affected areas of the Project
Advice to MMT of any complaints, issues, and recommendations concerning the project
Preparation and review of MMT reports

EPRMP | CHAPTER 7 ABANDONMENT PLAN Silica Sand Quarry Expansion Project
6-13
6.4 ENVIRONMENTAL GUARANTEE AND MONITORING FUND COMMITMENTS
The Philippine Mining Act (1995 and its IRR) requires for the establishment of the Contingent Liability
and Rehabilitation Fund (CLRF) which is the financial mechanism for the multi-partite monitoring,
progressive mine rehabilitation and compensation for claims and damages. The CLRF ensures just and
timely compensation for damages and progressive and sustainable rehabilitation for any adverse
effect a mining operation or related activity may cause. The CLRF is broken-down in three (3) forms
such as the Mine Rehabilitation Fund (MRF), Mine Wastes and Tailings Fund (MWTF), and Final Mine
Rehabilitation and Decommissioning Plan (FMRDP).
The MRF is established and maintained by each operating mine as sufficient environmental deposit to
ensure the availability of funds for the satisfactory compliance and implementation of its
Environmental Protection and Enhancement Program (EPEP). The MRF is utilized for the regular
monitoring of mining operations, physical rehabilitation of mining affected areas and research on the
technical and preventive aspects of rehabilitation. The MRF is further broken down into:
Monitoring Trust Fund (MTF) - This fund shall be exclusively used in the monitoring program
approved by the MRF Committee. It shall be in cash and in an amount to be determined by
the MRF Committee, which shall not be less than the amount of ONE HUNDRED FIFTY
THOUSAND PESOS (Php 150,000.00). Replenishment of this amount shall be done quarterly
to correspond to the expenses incurred by the monitoring team for the quarter.
Rehabilitation Cash Fund (RCF) - This fund shall be set up for a designated amount to ensure
compliance with the approved rehabilitation activities and schedules for specific mining
project phase including research programs as defined in the EPEP/AEPEP. The RCF shall be
equivalent to percent (10%) of the approved total amount needed to implement EPEP. In the
event of withdrawals from the RCF, the SEDC shall annually replenish the RCF so as to maintain
the minimum required amount thereof.
Mine Waste Fees (MWF) – The company shall diligently comply with the remittance to the
MGB of its Mine Waste Fees (MWF) based on its sworn semiannual report on the amount of
waste it produces, disposed, contained, and/or utilized. The amount of MWF collected shall
accrue to the Mine Waste and Tailings (MWT) Reserve Fund to be used for payment for
compensation for damages caused by mining pollution.
Environmental Trust Fund (ETF) – The company shall put up an ETF in the form of Insurance
Policy amounting to Php 500,000.00 and in cash amounting to Php 100,000.00 to ensure
payment of compensable damages, as may be adjudicated by the CLRF Steering Committee
to be not compensable under the MWT Reserve Fund.
The FMRDF is established by each operating mining company to ensure the implementation of the
approved Final Mine Rehabilitation and Decommissioning Plan. The FMRDF is accrued before the end
of the operating life of the mine and is deposited in a Government depository bank for the sole
purpose of FMR/DP implementation.

7-1
7 ABANDONMENT AND DECOMMISSIONING / REHABILITATION POLICY The environmental conditions that the Proponent intends to achieve in the quarry area upon
abandonment of quarry operations and quarry decommissioning stage include but not limited to the
following:
1. Stable contoured, terraced and benched slopes, with low or almost no land slide potential
Slope faces will be planted with appropriate vegetation for slope stability
2. Area will have proper drainage design that prevents area flooding, ponding or inundation
3. With properly situated storm run-off detention basins to prevent flashfloods in downstream
areas. These may serve local irrigation purposes as needed in the locality.
4. Top slopes that may have value as storm wind breaker will not be lowered or altered, but
densely planted with trees to serve ambient micro atmospheric temperature buffer
5. Where possible such in the surrounding benched and terraced slopes at the perimeter of the
flat final pit, agroforestry activities may be promoted with the cooperation of the local
community, for local food production and tree maintenance. Tree species are expected to
have economic value to be cared-for into perpetuity by local partner communities.
The Final Mine Rehabilitation and Decommissioning Plan (FMRDP) is already prepared but still under
consultation; and shall take guidance from the policies that will be given in the project ECC. The
subsequent sections shall compose the FMRDP of the Silica Sand Quarry Expansion Project.
7.1 SITE MANAGEMENT PLAN
The management of the site refers to the management of the rehabilitated area. The management
will be done by the management of Solid Earth Development Corp. or its assignee. There shall be an
office in the field which will be called Mine Environmental Rehabilitation Office or MERO which will
be headed by a Mine Environmental Rehabilitation Officer (MERO). The primary function of the MERO
is to see to it that all plans and programs related to the approved FMRDP will be implemented
efficiently and effectively.
Under the MERO will be three staff with the following functions:
1. IEC / COMREL Officer;
2. MEPEO / Monitoring Section; and
3. SAFETY Officer
Depending upon the scope, magnitude and necessity of the works, each section shall have at most
three pick up laborer.
In the Management of the site, the MERO will also be responsible for the following:
Ensure the success of the reforestation;
See to it that no illegal cutting be done in the rehabilitated area;
Make sure that illegal entry is avoided; and
Recommend to the SEDC Top Management (or its assignee) any activities that will improve
the rehabilitation and management of the site.

EPRMP | CHAPTER 8 INSTITUTIONAL PLAN Silica Sand Quarry Expansion Project
7-2
Figure 7-1. Organizational Arrangement of MERO
The table below details the responsibilities of the Mine Environmental Rehabilitation Office:
Table 7-1. Roles and Responsibilities of MERO
Department Roles and Responsibilities
MERO
Will act as the over-all overseer or manager of the mine rehabilitation
activities.
He should see to it that the planned and approved programs are
implemented effectively.
Harmonize the functions of the three (3) sections under him; the
IEC/COMREL, Tree Planting and Maintenance Crew; and the Safety and
Monitoring
Report to the Board of Directors of SEDC regarding the progress of the
Rehabilitation.
Act as the representative of SEDC in transacting with different government
agencies.
Request for amendment of the approved plans if he finds of any approved
activity irrelevant.
See to it that the funds are appropriately disbursed.
COMREL
This section will be responsible for informing the public on what is
happening in the rehabilitation activities.
This section will also see to it that the community’s concerns are addressed
properly.
Report to the MERO of any suggestions, complaints or observations made
by the neighbors and other relevant stakeholders.
Constantly conduct stakeholders’ analysis (as the need arises)
In the absence of the MERO the COMREL may represent the company
especially in representation to the LGU and NGO.
MEPEO This is responsible of the tree planting component of the rehabilitation.

EPRMP | CHAPTER 8 INSTITUTIONAL PLAN Silica Sand Quarry Expansion Project
7-3
Department Roles and Responsibilities
Conduct regular inspection of the planted trees and immediately do re
planting if necessary.
Recommend to the MERO appropriate interventions to ensure the high
survival of the tree plantation
Safety
This will be responsible for monitoring of the working crew and ensure the
safety of every worker.
Recommend policy or directives to the MERO for issuance of a
memorandum so that the workers will be protected and safe.
Monitor all areas and report to the maintenance crew any hazardous
condition.
7.2 FINAL LAND USE OF SITE AND FOR EACH IDENTIFIED MINE CONCEPT
The final land use of the site and each identified Mine Component is to convert the mined-out area
into an agroforestry and crop plantation. The Mine Components that will be replanting and subject
for agro forestry and crop plantation include the following:
Quarry Loading Area
Waste Dump Area
Hauling Roads
Silt Ponds
Quarry Field Office
Quarry Periphery
Benches
Creeks and natural water ways
This intended final land use suits well to the physical characteristics of the affected land. For the tree
planting, a planting hole will be made and filled which mounded up to the root collar with a soil media
(a mixture of 50% topsoil, 30% sand and 20% organic fertilizer).
The proponent will turn-over the use of the properties to the lot owners for their agricultural projects
or for whatever plans of the local government relating to farming or agriculture. To this end and prior
to said turn-over, the proponent shall prepare the area suitable and conducive to such agricultural
purposes or use by the lot owners, or community later.
7.3 MINE CLOSURE CRITERIA AND PERFORMANCE STANDARDS
The mine closure criteria presented are specific to the project component being rehabilitated or
closed. These criteria are a set rehabilitation indicator which, upon being met, will demonstrate
successful rehabilitation of a site. The re-vegetation of the forty (40) hectares mined out quarry project
area will be the final criteria. The survival rate of the plants used for plantation will dictate the
performance standards. Rehabilitation Indicators provides a basis for monitoring and reviewing the
effectiveness of the system. It also helps identify activities that need corrective action and
improvement. Typical Indicators are the following:
1. Surface and Groundwater Indicators:

EPRMP | CHAPTER 8 INSTITUTIONAL PLAN Silica Sand Quarry Expansion Project
7-4
Typically, criteria or standards are applied to surface and groundwater quality whereby water being
discharged, or at some compliance point within the receiving rivers, must be of a quality equal to or
better than a defined chemistry. Such standards are threshold indicators in a scalar value of
concentrations. Because of total assimilative load limitations for receiving rivers, the permissible
discharges are sometimes specified as loads and not as concentrations. Other indicators include seep
coloration, odor and taste.
2. Stability and Erosion Indicators
Indicators and criteria are also typically applied to ensure the integrity and long-term stability of
structures. Typically, civil engineering safety standards (such as a factor of safety of 1.5 for slope
stability) will be applied during the operating life of the mine. Durability of structure is dependent on
the durability of the materials the structure relies upon for stability. Structures are under the continual
attack of both perpetual forces such as weathering and corrosion, erosion by wing and water,
sedimentation, biotic action by roots and burrowing animals and frost action.
3. Land Use and Socio-economic Indicators
The post mining land use and socio-economic impacts are extremely important issues for
consideration in closure planning. Mine site development is often responsible for significant changes
in the local social and economic conditions in an area. To the extent reasonably achievable, mine
closure must address the facilities and conditions that should be maintained post mining, to sustain
the social and economic benefits generated during mining. While it is not possible to select closure
criteria for all these issues, comparative assessments using indicators such as maintenance of access
and power and on-going protection of health and safety should be completed.
7.4 DETAILS OF THE DECOMMISSIONING PLAN
7.4.1 LIST OF AREAS AND EQUIPMENT THAT REQUIRE DECOMMISSIONING Only heavy equipment and quarry machineries including the equipment repair shop are due for
decommissioning after the life of MPSA. Other mine components will be retained and maintained like
Silt Ponds and Field Office. However, the decommissioning of heavy equipment is at the expense of
the Quarry Contractor and at no cost to SEDC.
Below is the list of equipment that requires decommissioning:
Name of Equipment No. of Units
Backhoe 2
Payloader 1
Dump Truck 10
Road Grader 1
Water Truck 1
7.4.2 DECOMMISSIONING STRATEGY The following will be the decommissioning strategy:
A. Inventory of all equipment and facilities for decommissioning;
The MEPEO together with the personnel of the quarry will do the actual inventory or simple
counting of the equipment and facilities.
B. Assessment of the conditions of equipment and facilities;

EPRMP | CHAPTER 8 INSTITUTIONAL PLAN Silica Sand Quarry Expansion Project
7-5
The assessment of all the equipment and facilities present in the quarry area will involve
checking the conditions of the engine and major parts of the equipment. The equipment
that is in good condition may immediately be removed from the site. Those that are not in
running condition will be further evaluated and planning for the removal of such will be
done, perhaps with the use of trailers.
C. Planning and review of decommissioning procedure vis-à-vis the standard operating
procedures. Coordination with equipment/ facilities supplier. Consultation with
stakeholders thru the MRFC; This is an office activity just to make sure that safety is always
adhered to in conducting the demolition of building (if there will be any). If there is a need
to move dilapidated vehicle or equipment, proper procedure should be reviewed. The
output of this activity will be a memorandum to be issued by the resident manager outlining
the safety procedure of demolition. As of the moment, it is difficult to draft the
memorandum because this will be dependent on the result of the assessment.
D. Identification of personnel requirement and qualification required to implement the
decommissioning. Cross matching with company employees and qualified residents within
the host community; This is also the job of the human resources department or personnel.
The existing employees (during the final year of the operation) will be evaluated according
to their expertise. Those that will qualify for the jobs during the rehabilitation and
demolition will be retained while those that will not will have to avail the retrenchment
package.
E. Briefing and training (when necessary) of the selected personnel;
After the HRD had chosen the personnel to be retained, the safety department will be
conducting the safety training of these employees. The training will involve proper handling
of materials and equipment, proper positioning when lifting, use of right PPE at the right
time, place and activity, use of fire extinguishers, first aid, proper lifting of patient, and many
more.
F. Decommissioning of equipment and facilities under the supervision of the MEPEO. Among
the activities involved are the removal of non-essential fixed equipment and facilities,
demolishing and non-essential facilities, etc.; After the personnel had undergone training
and the necessary protocol or plan for the decommissioning had taken place, the next
activity will be the implementation of the decommissioning. Decommissioning of the fixed
structures will require close supervision of the safety men/officer. All safety rules and
regulation applicable to the kind of activity during that time will be implemented.
G. Post assessment of the decommissioned equipment, facilities and areas;
After the fixed facilities, mobile equipment and every improvement in the quarry had been
removed/decommissioned, the next activity will be the final evaluation by the top
management of the final scenario. This will involve actual inspection and decision on the
commencement of the rehabilitation. If there are things that need to be done prior to the
actual rehabilitation or tree planting, then the top management will formulate the
procedure to fully attain the condition of the area that will be suitable for rehabilitation.
H. Issuance of clearance for rehabilitation of the areas affected by the decommissioned
equipment/facility by the MEPEO. This is the result of the evaluation mentioned above. This
is the final declaration that the area is safe for rehabilitation. A memorandum signed by the
top management will serve as go signal of the rehabilitation.

EPRMP | CHAPTER 8 INSTITUTIONAL PLAN Silica Sand Quarry Expansion Project
7-6
Table 7-2. Summary Matrix of Decommissioning Strategy
ACTIVITY Environmental
IMPACTS
MITIGATING
MEASURES
INSTITUTIONAL
ARRANGEMENT
1. Inventory None None This will be purely ocular
inspection
2. Assessment of
equipment &
Structures in the quarry
None None This is purely ocular
inspection.
3. Review and
formulation of
applicable procedures
None None This is purely office work
4.Personnel Selection None None This is purely office work.
5. Training None None The training will be held in
the office.
6. Actual
Decommissioning
Generation of
Wastes
-Proper collection of
wastes materials.
The activity should conform
to the formulated safety
protocol/procedures.
7. Post-
decommissioning
assessment
none None This is an ocular
verification/inspection of
the site.
8. Issuance of
Clearance
none None This is purely paperwork.
Demobilization safety will be implemented such as:
A. Trucks will be used to haul or transport equipment and quarry machineries from the Quarry to
the Plant.
B. Heavy items will be loaded by Backhoe and will be tightened by binders for them not to move
while traveling. Unloading will be done by a crane at plant site.
C. In case of very heavy load (like Backhoe), service vehicle will be provided ahead of the truck,
equipped with two-way radio in order to warn the driver about the situation ahead; and
D. Safety Rules and Regulations will be implemented specially Chapter XX, Section 72 of DENR DAO
No. 2000-98 and all the safety measures during the duration of mobilization.
The Mine Components subject for Decommissioning are the following:
1. Quarry Benches: Quarry Benches are narrow, strip of land cut into the side of an open-cut
mine. These step-like zones are created along the walls for access and mining. During
decommissioning, the quarry bottom will be stabilized and re-contour the slope outside or
below final bench floor to avoid erosion or soil movement to ensure public safety and
environmentally stable condition compatible with surrounding environment.
2. Silting Ponds: Silting Ponds are earthen structure using sedimentation to remove settleable
matter and turbidity from wastewater. The basins are used to control water pollution. During
decommissioning, the silt ponds will be filled with topsoil in preparation for reforestation.
3. Equipment and Machineries: Majority of heavy equipment involved in quarrying are mobile
equipment such as backhoe, payloader, bulldozer, dump trucks, grader and water trucks.

EPRMP | CHAPTER 8 INSTITUTIONAL PLAN Silica Sand Quarry Expansion Project
7-7
During decommissioning, this equipment will be demobilized and transport them to the motor
pool.
7.4.3 DECOMMISSIONING AND REHABILITATION OF QUARRY AREAS A. Objectives
To stabilize quarry bottom
To re-contour slope outside or below final bench floor to avoid erosion or soil
movement and siltation;
To ensure public health and safety; and
To ensure environmentally stable condition compatible with surrounding
environment.
B. Decommissioning and Rehabilitation Strategy
Reinforcement of Quarry area edges;
Re-vegetation and tree planting along the mined out quarry area;
Application of Geotechnical reinforcement technique if needed or required;
Planting of Leguminous shrubs species to further enhance the slopes;
Monitoring and maintenance of planted trees.
C. Active / Passive Care
Continuous tree planting/ mortality replacement activities;
Constant monitoring and inspection of protective fences;
Monitoring of high wall for any movement or irregularities.
Discouraging firewood gatherers and illegal settlers; and
Employing local personnel to maintain, monitor and guard the area.
D. Criteria for Measuring Objectives
Photo-documentation starting from the implementation period and yearly
comparison, taken from a fixed point;
Survival rate of planted trees; and
Incidence of erosion along floor slopes.
7.4.4 DECOMMISSIONING OF VARIOUS HEAVY EQUIPMENT, QUARRY MACHINERIES, AND STRUCTURES Majority of heavy equipment involved in Quarrying are mobile equipment such as backhoe, payloader,
bulldozer, dump trucks, grader and water trucks. Structures were also constructed like satellite field
office and guard house. These structures have no electrical installations.
A. Objective of Decommissioning
To ensure that the area is free from machineries and equipment;
To clear the area from unwanted tools, equipment and waste materials
B. Decommissioning and rehabilitation Strategy
Demobilize equipment, machineries and waste materials by loading them into
trucks and transport them to the plant;
Remove all unwanted tools, equipment and waste materials by loading these
into trucks and transport them to the plant; and
Rehabilitate the area as planned.
C. Active / Passive Care

EPRMP | CHAPTER 8 INSTITUTIONAL PLAN Silica Sand Quarry Expansion Project
7-8
Re-vegetate the area previously erected with structures;
Continued maintenance of planted trees to ensure high survival rate, and
replacement of some, if needed; and
Maintain personnel to monitor, care and guard the area
D. Criteria for Measuring Against Objective
Pictures from a fixed point taken before and after demobilization;
Survival of planted species
7.5 DETAIL OF FINAL MINE REHABILITATION
The Final Mine Rehabilitation Plan identifies the activities and research required to address on-going
rehabilitation and include strategies to address long-term stability and sustainability and timeframes
for the assessment of rehabilitation activities. The activities to be undertaken during rehabilitation
are divided into three phases, namely;
I. Pre-implementation Phase:
a. Surface preparation through site clearing, leveling and stabilizing the
mined-out areas.
b. Planting hole excavation and spreading of soil mix media (a mixture of
50% topsoil, 30% sand, and 20% fertilizer) at the mining floor for grass
plantation and tree planting.
c. Road network provisions with drainage system.
II. Implementation Phase:
a. Tree and Fruit Plantation by random planting
i. Madre de Cacao – 5m x 5m spacing
ii. Mahogany – 4m x 4m spacing
iii. Narra – 5m x 5m spacing
iv. Jackfruit – 5m x 5m spacing
v. Mango – 10m x 10m spacing
b. Shrubs
i. Banana – 5m x 5m spacing
c. Grass and Vines Plantation by random planting
i. Bamboo – 10m x 10m spacing
d. Employing local personnel to maintain, monitor and guard the area.
III. Evaluation Phase:
a. Continuous planting/mortality replacement activities
b. Constant monitoring and inspection of re-vegetated area.
c. Monitoring of high wall for any movement or irregularities.

EPRMP | CHAPTER 8 INSTITUTIONAL PLAN Silica Sand Quarry Expansion Project
7-9
7.5.1 REHABILITATION STRATEGY, SCHEDULE AND TECHNIQUES To ensure the success of rehabilitation, the area will be cleared of loose rocks, structures and non-
biodegradable materials detrimental to plant growth. The final land configuration will incorporate
road network to make as many areas accessible as possible with provisions for drainage system. Below
are the other activities to be undertaken:
Continuous planting/ mortality replacement activities;
Constant monitoring and inspection of re-vegetated area;
Monitoring of high wall for any movement or irregularities;
Discouraging firewood gatherers and illegal, settlers; and
Employing local personnel to maintain monitor and guard the area.
7.5.1.1 CRITERIA FOR MEASURING OBJECTIVES Below are the criteria for measuring the objectives:
Photo-documentation starting from the implementation period and yearly comparison,
taken from a fixed point;
Survival rate of plants ; and
Incident of erosion along floor slopes.
7.5.1.2 DETAILS OF MATERIALS, OPERATIONAL, AND FINANCIAL RESOURCES REQUIRED
7.5.1.2.1 BACKFILLING MATERIALS The materials to be used for backfilling will be sourced from the top soil stripped during mining
operations and stockpiled at designated areas. The total volume of topsoil needed for reforestation is
computed below:
1. Tree Holes backfilling: For the tree plantation, a hole will be excavated and backfilled which will
be mounded up the root collar with a mixture of 50% topsoil, 30% sand and 20% organic fertilizer.
a. 14,650 holes x 0.10 cu.m. x 0.50 = 732 cu.m.
7.5.1.2.2 SAND Sand will be sourced from the desilted materials at Silting Ponds. The total requirement is computed
below:
a. 14,650 holes x 0.10 cu.m. x 0.30 = 440 cu.m.
7.5.1.2.3 ORGANIC FERTILIZER The organic fertilizer will be sourced from the poultry farm in San Fernando, Cebu. The application of
organic fertilizer will be done at every plant at a ratio of 20% per hole or equivalent to 293 cu.m.
7.5.1.2.4 SEEDLINGS The seedlings to be used for progressive rehabilitation will be sourced from the plant nursery to be
constructed in Duangan, Pinamungajan, Cebu about two (2) km away from the siliceous sand quarry.
However, since the tree planting will start as soon as the quarry operation started and the nursery
plant is not yet available, then all seedlings will be taken first from the company-owned plant nursery
situated in Magsico, San Fernando, Cebu twenty one (21) km away from the project.
Size of Nursery : 20m x 30m = 600 sq. m.
Capacity : 50,000 seedlings
Infrastructure : Nursery Building and Water Reservoir

EPRMP | CHAPTER 8 INSTITUTIONAL PLAN Silica Sand Quarry Expansion Project
7-10
Below, are the tabulated species for tree planting with corresponding planting design, plantation area,
and number of seedlings to be planted:
Table 7-3. Seedlings used for Progressive Rehabilitation
Species Spacing (m) Plantation area (has.) No. of
Seedlings
Endemic Trees
Madre de Cacao 5 x 5 3 1,200
Timber Trees
Mahogany 4 x 4 5 3,125
Narra 5 x 5 5 2,000
Fruit Trees
Jackfruit 5 x 5 10 4,000
Mango 10 x 10 10 1,000
Shrubs
Banana 4 x 4 5 3,125
Grasses
Bamboo 10 x 10 2 200
TOTAL 40 14,650
7.5.1.2.5 MANPOWER The tree planting activities will be participated by the local residents including the barangay officials
of the direct impact barangays particularly barangay Duangan of the Municipality of Pinamungajan.
7.5.1.2.6 EQUIPMENT The equipment used during quarrying like off road dump truck, dozers, loaders will be utilized for
rehabilitation.
7.5.1.2.7 FINANCIAL The financial requirements of the rehabilitation will be provided by the company through the Final
Mine Rehabilitation and Decommissioning Fund.
7.5.1.2.8 DETAILS OF MONITORING PROGRAM The Mine Rehabilitation Fund Committee (MRFC) through the Multi-partite Monitoring Team (MMT)
shall monitor the implementation of the FMR/DP. The contingent Liability Rehabilitation Fund Steering
Committee and/or the Mines and Geosciences Bureau (MGB) will audit the implementation of the
FMR/DP. An in-house monitoring headed by the MEPEO will be likewise implemented. Significant
Impacts to be monitored are the following:
a. Area disturbed by Quarrying Operations
b. Drainage System
c. Water Quality
d. Area Rehabilitated by Reforestation
Table 7-4 presents the parameters to be monitored, methodology, frequency and who will monitor the
mine components and impacts during the rehabilitation and decommissioning stage of the project:

EPRMP | CHAPTER 8 INSTITUTIONAL PLAN Silica Sand Quarry Expansion Project
7-11
Table 7-4. Environmental Impacts to be Monitored
MINE
COMPONENTS
PARAMETERS TO
BE MONITORED METHODOLOGY
FREQUENCY MONITORED
BY:
Quarry Benches Bench slope, Bench
height, Bench
width
Measured using
survey instruments
and working map.
Monthly/
Quarterly
MEPEO/
MMT
Canals & Silting
Ponds
Silt level
Ocular Inspection Monthly/
Quarterly
MEPEO/
MMT
Effluent pH, TSS, Oil &
Grease
Water samples will be
taken on the point of
discharge as agreed
by MMT.
Monthly/
Quarterly
MEPEO/
MMT
Growth of Trees Height of Trees Actual measurement
using meter stick
Monthly/
Quarterly
MEPEO/
MMT
The sampling point will be at the silt pond discharge leading to the river. TSS, pH, Oil and Grease are
also included in water analysis.
7.6 AFTER CLOSURE SOCIAL PLAN
Typically, mine closure means a drop in the standard of living for the local community, and the nearby
localities. Thus, it is important to plan prior to the mine closure. The positive social legacies that are
left behind by the company include the skills development and training programs. The company’s
social plan is focused mainly on its employees and the host communities. Part of the company’s social
responsibility is to promote information, education and communication (IEC) to the residents of the
eight (8) impact barangays and proper information will be given to the affected contracted service
provider. One year, prior to the mine closure, SEDC will start implementing the activities stipulated in
this social plan.
The company’s 5-Year Social Development Management Program (which is renewable for every five
years) is also being considered as the preparatory move towards the betterment of the community
and in preparation to the future closure of the mining company, particularly, for the affected
communities. Programs like, scholarship grants (better education would help decrease poverty in the
area), infrastructures, livelihood programs – goat-raising, loom-weaving, fishing, etc.
Table 7-5. Summary Matrix of the Social Plan before Closure
Month Description of
activity Objective Responsibility Expected Output
1st Mo. 1. Presentation of
IEC Program to
SEDC
Management
2. Consultation /
Meeting with the
Barangay
1. To inform the
Management of
the IEC Program
and seek their
approval.
1. Anchor Group
2. Company’s
Representative,
MEPEO/ CRO and
1. Approved Plan and
Budget of the Program
2. The Barangay Heads
will have a clear
understanding for the

EPRMP | CHAPTER 8 INSTITUTIONAL PLAN Silica Sand Quarry Expansion Project
7-12
Month Description of
activity Objective Responsibility Expected Output
Chairpersons of
the affected
Barangays
3. General
Assembly/Forum
with the
employees
4. Assessment and
counseling with
the employees
5. Inform the
Contractor who
provide services
to SEDC.
6. Communicate
with the
Government
Agencies
concerned, thru
personal visit or
by sending a
formal letter.
2. To properly
inform the Heads
of the impact
barangays in
relation to the
mine closure.
3. To inform well
the employees of
the company’s
mine closure and
to have an
effective discussion
between the
company’s
management and
its employees.
4. To include
discussion
pertaining to the
Retirement Plan
and the
Retrenchment
package.
5. To let the
Contractor aware
of SEDC’s plan for
the stoppage of its
operation.
6. To inform the
Government
Agencies
concerned with
mining activities,
e.g. DENR, Local
government units,
DOLE, etc.
the Barangay
Chairpersons
3. Company’s Top
Management and
all employees
4. Top
management,
HRD and all
employees
5. Company’s
Representative /
MEPEO / CRO
6. Company’s
Representative /
MEPEO / CRO
company’s mine
closure.
3. Company’s
employees are made
aware of the mine
closure, and the Top
management is aware
of the needs of its
employees. Discussion
by both parties is
effective, in a win-win
situation.
4. Employees have a
clear understanding
on the company’s
Retirement Plan and
the Retrenchment
package.
5. Contractor would
be ready for the mine
closure of SEDC.
6. Company
management has a
clear understanding
on the statutory and
regulatory laws and
policies, for effective
implementation.
2nd Mo.
Consultation/
Forum with the
Barangay Council
To be able to
determine,
synthesize and
Company’s
Representatives,
MEPEO / CRO,
Barangay Council
Members and BCO’s
are made aware of the

EPRMP | CHAPTER 8 INSTITUTIONAL PLAN Silica Sand Quarry Expansion Project
7-13
Month Description of
activity Objective Responsibility Expected Output
Members and the
Barangay
Community
Officers
formulate possible
recommendations
on the issues that
will be raised by
the group.
Barangay Council
Members and
Barangay
Community
Officers
mine closure, and
recommendations on
the issues raised are
formulated.
3rd, 4th
and 5th
months
1. Conduct survey
using structured
questions that are
derived from the
workshop with
the Barangay
Officials
2. Implement skills
development
programs to
employees, thru
trainings, that
would be
beneficial to the
employees and
would create a re-
employment or
livelihood
1. To gather
information from
the residents
within the affected
barangays
2. To train the
employees in
preparation to the
closure of mine.
To teach / train
employees for any
possible livelihood
programs
MEPEO / CRO
TESDA, Training
Institution,
MEPEO/ CRO
Factual information is
gathered.
Employees are
prepared and would
have diversities in
earning for a living.
Employees will either
find a new job, or start
to implement its
livelihood projects.
6th Mo. 1. Analysis of the
survey results
2. Continue
implementing the
Training / skills
devt. Programs
1. To analyze the
results of surveys
2. To continuously
implement the
learning process.
MEPEO and CRO
TESDA, Training
Institution,
MEPEO/ CRO
Accurate information
is being gathered and
effective solutions will
be formulated
Preparedness of the
employees prior to
the mine closure
7th, 8th,
9th and
10th
months
Implementation of
the mitigating
measures. These
measures are
unpredictable as
of to-date.
Evaluation of the
training
conducted.
To start the
implementation of
the identified
measures, without
unjustifiable delay.
To evaluate the
effectiveness of the
training conducted.
MEPEO and CRO
TESDA, Training
Institution,
Company HRD and
Full understanding
between the company
and the affected
communities,
regarding the
stoppage of the
operation.
Qualifications of the
trained employees are
upgraded.

EPRMP | CHAPTER 8 INSTITUTIONAL PLAN Silica Sand Quarry Expansion Project
7-14
Month Description of
activity Objective Responsibility Expected Output
the Department
heads
Employees can easily
find a job.
11th Review on the
results of the
implemented
measures
To thoroughly
evaluate the
effectiveness of the
measures being
implemented.
MEPEO and CRO The degree of
acceptance is being
determined.
12th Farewell meeting
with the Barangay
Heads, the
Contractor
Company and
SEDC Top Officials
and its members
Farewell meeting
/ party with the
company
employees
To formally thank
the leaders of the
host barangays and
the Contractor
company and say
goodbye to them.
To formally say
goodbye to the
company’s
employees.
Barangay Heads of
the impact
barangays,
Contractor
Company and
SEDC Top Officials
and its members.
Top management,
company’s
employees
Better relationship
between SEDC and the
affected Barangays
would still be in place,
even if the company
will soon stop its
operation.
Better relationship
between top
management and its
employees would still
be present, even if the
company will stop its
operation.
7.6.1 RETRENCHMENT PACKAGES AND RETIREMENT PLANS The company will notify the employees and the Department of Labor and Employment for the
company closure, by serving a written notice, at least one (1) month before the intended date thereof.
The separation pay due to company closure that will be given to each employee shall be equivalent to
his / her one month pay or to at least one-half (1/2) month pay for every year of service, whichever is
higher. A fraction of at least six (6) months shall be considered one (1) whole year. In addition, the
company gives what is due to the employees as mandated by Labor law such as:
5 days incentive leave per year of services;
5 days per year of services for monthly employees;
13 days per year of service for daily employees;
13 month pay;
Withholding pay;
Unused sick leave and vacation leave ; and
Prorated sick leave and vacation leave
The company will also established a retirement fund to provide for the payment of benefits of its
employees when they are retired, disabled, or separated from service, or in the event of death, the

EPRMP | CHAPTER 8 INSTITUTIONAL PLAN Silica Sand Quarry Expansion Project
7-15
payment of definite amounts to their beneficiaries subject to the conditions and limitations set forth
in the retirement plan rules and regulations. (Please see Annex “11.6” for the Retirement Plan)
The following are the benefits provided in the plan:
1. Retirement - Upon retirement, a Member shall be entitled to a retirement benefit in an
amount equivalent to 100% of his Final Monthly Basic Salary times the number of years of
his Credited Service.
2. Death and Disability -
a. In the event of death of a Member while still in active service, his Beneficiary shall
be entitled to a benefit computed in the plan. Any payment to the Beneficiary
shall be made in accordance with and pursuant to the procedure presently
prescribed in Article 105 (b) of the Labor Code.
b. A member who is separated from employment on account of permanent total
disability shall be entitled to a benefit computed in accordance with the
retirement benefit formula.
c. Should the death or disability of a Member arise on account of self-inflicted
injuries, suicide, or any criminal act attributable to him, no death or disability
benefits shall be paid under the Plan.
3. Resignation Benefit - Any Member who voluntarily and unconditionally resigns from the
service of the company upon completion of at least ten (10) years of service, shall be
entitled to a benefit computed in accordance with the schedule stated in the plan.
4. Involuntary Separation - Any Member who is involuntarily separated from the service by
the Company for any reason or cause not due to his own fault, wrongdoing, misconduct,
negligence, fraud, malfeasance or nonfeasance shall be entitled to a benefit calculated in
accordance with the retirement benefit formula of the Labor Code, whichever is higher.
Although there is no scheduled termination date for the Plan, it may be amended suspended or
terminated at any time by the Company (in its sole and absolute discretion) on account of (a) business
necessity or adverse economic conditions, or any other factors beyond its control or (b) if at any time
during the existence of the Plan, any new amendatory legislation or statue shall grant to Employees
pension, annuities, retirement gratuities or similar government – sponsored benefits (to which the
Company contributes a material amount, or is required to participate and to so contribute), and such
benefits (and the company’s contributions thereto) are substantial, or, are equal, or almost equal to
the benefits given to the participants, or the contributions of the Company under the Plan, but no
such action of the Company shall operate to permit any part of the assets of the Fund to be used for,
or diverted to, purposes other than for the exclusive benefit of the Members or their Beneficiaries.
Neither shall it be applied retroactively so as to adversely affect or reduce in any way the benefit that
may have accrued to any Member on account of service prior to the date such amendment,
suspension or termination. In no event shall any part of the assets of the fund revert to the Company
before all liabilities of the Plan have been satisfied.
7.6.2 LABOR SUPPORT POLICIES AND PROGRAMS The company believes that every employee is one of its assets and a partner in the business. The
company will develop a training plan and program for its employees, one (1) year prior to the

EPRMP | CHAPTER 8 INSTITUTIONAL PLAN Silica Sand Quarry Expansion Project
7-16
expiration of the company’s MPSA. The training plan and program shall focus on skills development
and livelihood aspects and shall be coordinated with TESDA or with other training institution.
Employees of Solid Earth Development Corporation as well as the impacted communities of
Pinamungajan, Cebu, where the company is located, will be greatly affected by the mine closure. In
order to lessen the impacts of mine closure such as loss on employment, loss on revenues and loss on
social services, mitigating measures that will add value to the human capital will be adopted by the
company. These are to help workers and the impacted communities manage themselves socially and
economically when the mine finally closes. These involve providing retraining skills and creating
opportunities for employees of Solid Earth Development Corporation and providing community
employment and economic opportunities. Retraining skills or education programs that will be given
to employees will involve skills on mechanical trade, construction and administration. Concepts on
business enterprise or entrepreneurship will also be introduced for employees to consider self-
employment as an alternative to finding a replacement job. Various skills training and workshops
about farming, welding, electricity and fishing will also be provided to the impacted communities to
give them other means of making a living once the mine closes. Hiring of local residents to undertake
the mine closure activities such as planting trees, site security, establishing drainage system and
reclamation of mine site will also be undertaken by the company to help address the concern on loss
of revenues. And finally, counseling activities will be provided to employees for them to be mentally
prepared on the mine closure and will therefore focus on money related matters and property
management.
7.6.3 TRANSFER OF SOCIAL ASSETS One of the socio-economic impacts of mine closure is the loss of social services. And, as a socially
responsible company, Solid Earth Development Corporation as part of its mine closure plan will be
donating various equipment and facilities to local government units and schools in Pinamungajan,
Cebu. The mine facilities/structure/equipment that will be turned over to the community are the
following: (1) Field Office, (2) Computers and Printers, (3) Office Tables and Chairs. Mine facilities that
will be turned over to the community like computers and printers, will be provided with a
Memorandum of Agreement (MOA) and assist in the formulation of a Management and Sustainability
Plan for continuous operations of the said facilities. On the general welfare of the community, it will
now be the responsibility of the local government of Pinamungajan to maintain the local infrastructure
and to provide the services previously provided by the company. Solid Earth Development Corporation
will also consider transferring the mine farm to the government. Such transfer of asset will be very
beneficial for the government’s agricultural livelihood projects for mountain barangays.
7.7 MAINTENANCE AND MONITORING PLANS
This plan covers the period when the reforestation is already completed. The following maintenance
activities will be undertaken:
Replanting where seedling failed to survive;
Pest and weed control ;
Watering of plants in drier areas;
application of fertilizers

EPRMP | CHAPTER 8 INSTITUTIONAL PLAN Silica Sand Quarry Expansion Project
7-17
Objective:
To determine the level of success and compliance by the company with the planned tree planting and
area stabilization of the disturbed area.
Components of the success criteria could include:
Physical;
Biological; and
Water quality of the nearby creek.
Monitoring Procedure:
Monitoring will cover the entire projected mined out area that is subject of rehabilitation: This is fifty
(50) hectares.
Table 7-6. Matrix Rehabilitation Parameters to be Monitored
Components to be
monitored
Parameters to be
Monitored
Method of
Monitoring
Frequency To be
monitored by:
Stability of the
Final Bench slopes
Bench slope,
Bench height,
Bench width
Measured using
survey instruments
and working map.
Monthly/
Quarterly
MEPEO/ MMT
Conditions of the
drainage
Silt level Ocular Inspection Monthly/
Quarterly
MEPEO/ MMT
Quality of the
water flowing in
the Mangoto
River, Cabiangon
River, Banban
River
pH, TSS, Oil &
Grease
Water samples will be
taken on the point of
discharge as agreed
by MMT.
Monthly/
Quarterly
MEPEO/ MMT
Growth of the
trees
Height of Trees Actual measurement
using meterstick
Monthly/
Quarterly
MEPEO/ MMT
7.7.1 MAINTENANCE AND MONITORING PROGRAM AND PROCEDURES
7.7.1.1 MONITORING Monitoring shall include:
Safety of the site;
Growth rate and the density of the plants including the return of non-sown desirable
species and weeds;
Return of native flora and fauna;
Evidence of erosion or land degradation;
Water quality;
Structural condition of surrounding land;
Social Plan;

EPRMP | CHAPTER 8 INSTITUTIONAL PLAN Silica Sand Quarry Expansion Project
7-18
Air quality
7.7.1.2 MAINTENANCE Maintenance activities other than re-working rehabilitated areas that failed would include:
Provision of fences and signages to discourage entry to the area;
Watering the seedlings to ensure their survival and sustained growth;
Control pest and weed accumulation;
Fertilize as needed; and
Conduct annual or semi-annual inventory of planted species on every plantation area.

8-1
8 INSTITUTIONAL PLAN FOR EMP IMPLEMENTATION
The Environmental Management Bureau Region VII (EMB VII) Office is the instrumentality of the
Department of Environment and Natural Resources (DENR) that exercise jurisdiction over
environmental management matters in the Province of Cebu. This office is coordinating with the
Mines and Geo-Sciences Bureau Region VII (MGB VII) Office that regulates the mining industry in the
Region which covers quarry operations including the Proposed Silica Sand Quarry Expansion Project.
MGB VII has already approved the MPSA 314-2010-VII and MPSA 323-2010-VII covering the proposed
production area of the quarry site. DENR R7 has under its organization the CENRO Toledo City, which
conducts regular monitoring of natural resources and environment matters at the city/municipal level
including the Municipality of Pinamungajan where the project is located.
The proponent, SEDC has its Environmental Management Unit (EMU) that is responsible for all
environmental concerns of the company. The EMU is imbedded in the Mine Environmental and
Enhancement Office (MEPEO). The MEPEO unit handles the environmental compliance concerns of
SEDC and of the sister company, TCPI. It is manned by key personnel and is responsible for ensuring
that the Company meets environmental requirements for smooth project operation. The MEPEO
assigns respective staff interfaces with the Mine Rehabilitation Fund Committee (MRFC) and the
Multipartite Monitoring Team (MMT), prepare the periodic Self-Monitoring Reports and take charge
of the counterpart secretariat work for the MRFC and the MMT. The existing MMT that monitors the
existing project of SEDC and TCPI will accommodate the monitoring of this project. Figure 8-1 contains
the organizational structure of the MEPEO.
The quarry and hauling activities will mostly be implemented through Contractors and Subcontractors.
The Proponent will do well to include in its operating Contracts specific provisions to comply with the
environmental management measures committed in the Environmental Performance Report and
Management Plan. `

EPRMP | CHAPTER 8 INSTITUTIONAL PLAN Silica Sand Quarry Expansion Project
8-2
Figure 8-1. Organizational Structure of the SEDC MEPEO
SEDC MRFC Representative
MEPEO
SEDC MRFC Alternate Member / MMT Representative
Plant Nursery
- Monitors the propagation of seedlings for Reforestation
Tree Planting and Maintenance
- Supervises Tree Planting activities and
monitors planted trees maintenance.
Environmental Monitoring
-Monitors Quarry roads, drainage system, silt ponds, noise level, ambient air and water quality
monitoring
Waste
Monitoring
- Monitors the operation of Quarry Waste Dumpsites/Solid Wastes
MRFC/MMT FACILITATOR
MINE ENVIRONMENTAL
PROTECTION & ENHANCEMENT
OFFICE (MEPEO)