manufactured sand workshop - sintef
TRANSCRIPT
. . . . . . . . .
MANUFACTURED SAND WORKSHOP
STAVANGER, NORWAY, OCTOBER 30T H AND 31S T 2008
S U M M A RY O F P R E S E N TA T I O N S
Preliminary COIN Version
November 2008

MANUFACTURED SAND - WORKSHOP Stavanger, Norway, October 30th and 31st 2008
Introduction
As part of the COIN project, an International Workshop on the topic of production and use of manufactured sand aggregates was held at Hummeren hotel in Stavanger, Norway, on October 30th and 31st 2008.. The motivation for this workshop is the increasing miss balance between the need for aggregates in the society and the availability of traditionally suitable geologic sources. We see a strong need for developing and implementing technology that can enable the use of alternative resources, reduce the need for transport and present zero waste concepts for the aggregate and concrete industry. The main aim of this workshop was to create opportunity for professional development, for information sharing and dissemination. We wanted this workshop to be an arena for interactive exchange of experiences between the participant., regarding one of the following topics: • Sustainability and environmental challenges • Geological and mineralogical issues • Production (extraction, crushing, sieving, washing) • Use of manufactured sand in concrete; mix design • Characterization and testing of fines • Standards and specifications • Alternative utilization of fines • Cases In total 25 participants from 9 countries participated in the workshop, where a total of 18 lectures were presented. The participations represented various parties of the aggregate business, from production to utilisation, including; geologists, aggregate producers, machinery engineers (producers and users), concrete admixture producers, researchers and concrete producers. This report contains the slides presented at the workshop, including short abstracts for some of the presentations.
Manufactured Sand - Workshop
Page 1 of 277 Stavanger, Norway, October 30th & 31st 2008 Page of presentation:

Manufactured Sand - Workshop
Page 2 of 277 Stavanger, Norway, October 30th & 31st 2008 Page of presentation:

MANUFACTURED SAND - WORKSHOP Stavanger, Norway, October 30th and 31st 2008
Participants
Name Company Country
Chris Rogers Canada
Jouni Mähönen Metso Minerals Finland
Jarmo Eloranta Metso Minerals Finland
Guðmundur Símonarsson Björgun Iceland
Makoto Hashimoto Kotobuki Engineering and Manufacturing Co. Ltd Japan
Takato Kaya Kotobuki Engineering and Manufacturing Co. Ltd Japan
Torben Jepsen JGO-Betong Norway
Peer Richard Neeb NGU Norway
Dan Arve Juvik Rescon Mapei Norway
Bård Pedersen NorStone Norway
Svein Willy Danielsen SINTEF Byggforsk Norway
Odd Hotvedt Kolo Veidekke Norway
Lillian Uthus Mathisen Kolo Veidekke Norway
Gaute Veland NorStone Norway
Børge JohannesWigum Norwegian University of Science and Technology Norway
Roar Nålsund Norwegian University of Science and Technology Norway
Lukasz Debny Grace Poland
Niklas Skoog Sand & Grus AB Jehander Sweden
Hans-Erik Gram Cementa Sweden
Bjørn Schouenborg CBI Betonginstitutet Sweden
Sven-Henrik Norman Metso Minerals Sweden
Per Hedvall Sandvik Sweden
Magnus Evertsson Chalmers University of Technology Sweden
Jose M. Cuevas AIDICO Spain
Hugo Pettingell Hugo Pettingell Mineral Services UK
Manufactured Sand - Workshop
Page 3 of 277 Stavanger, Norway, October 30th & 31st 2008 Page of presentation:

MANUFACTURED SAND - WORKSHOP Stavanger, Norway, October 30th and 31st 2008
Participants: Upper row from left: Sven-Henrik Norman, Jarmo Eloranta, Guðmundur Símonarsson, Chris Rogers, Børge Johannes Wigum, Magnus Evertsson, Per Hedvall, Bjørn Schouenborg. Lower row from left: Jouni Mähönen, Gaute Veland, Svein Willy Danielsen, Bård Pedersen, Dan Arve Juvik, Odd Hotvedt, Niklas Skoog, Lukasz Debny, Hans-Erik Gram, Makoto Hashimoto, Hugo Pettingell, Jose M. Cuevas, Takato Kaya. In front from left: Per-Richard Neeb and Roar Nålsund. Not present: Lillian Uthus Mathisen and Torben Jepsen.
Organizers
COIN - Concrete Innovation Centre The workshop is arranged as part of the COIN project. COIN stands for Concrete Innovation Centre and is one of 14 Norwegian centres for research-based innovation (CRIs) that was established by the Research Council of Norway in 2006. The vision of COIN is creation of more attractive concrete buildings and constructions. Attractiveness implies – among others – aesthetics, functionality, sustainability, energy efficiency and cost efficiency during the whole service life. The primary goal is to fulfil this vision by bringing the development a major leap forward by more fundamental understanding of the mechanisms in order to develop advanced materials, efficient construction techniques and durable design concepts combined with more environmentally friendly material production. The corporate partners are leading multinational companies in the cement and building industry and the aim of COIN is to increase their value creation and strengthen their research activities in Norway. COIN will run from 2007 to 2014 with a total budget of about €25 million. Organizing committee: Svein Willy Danielsen, SINTEF Building and Infrastructure Børge Johannes Wigum, Norwegian University of Science and Technology Odd Hotvedt, Kolo Veidekke Bård Pedersen, NorStone
Manufactured Sand - Workshop
Page 4 of 277 Stavanger, Norway, October 30th & 31st 2008 Page of presentation:
MANUFACTURED SAND - WORKSHOP Stavanger, Norway, October 30th and 31st 2008
Content of Presentations
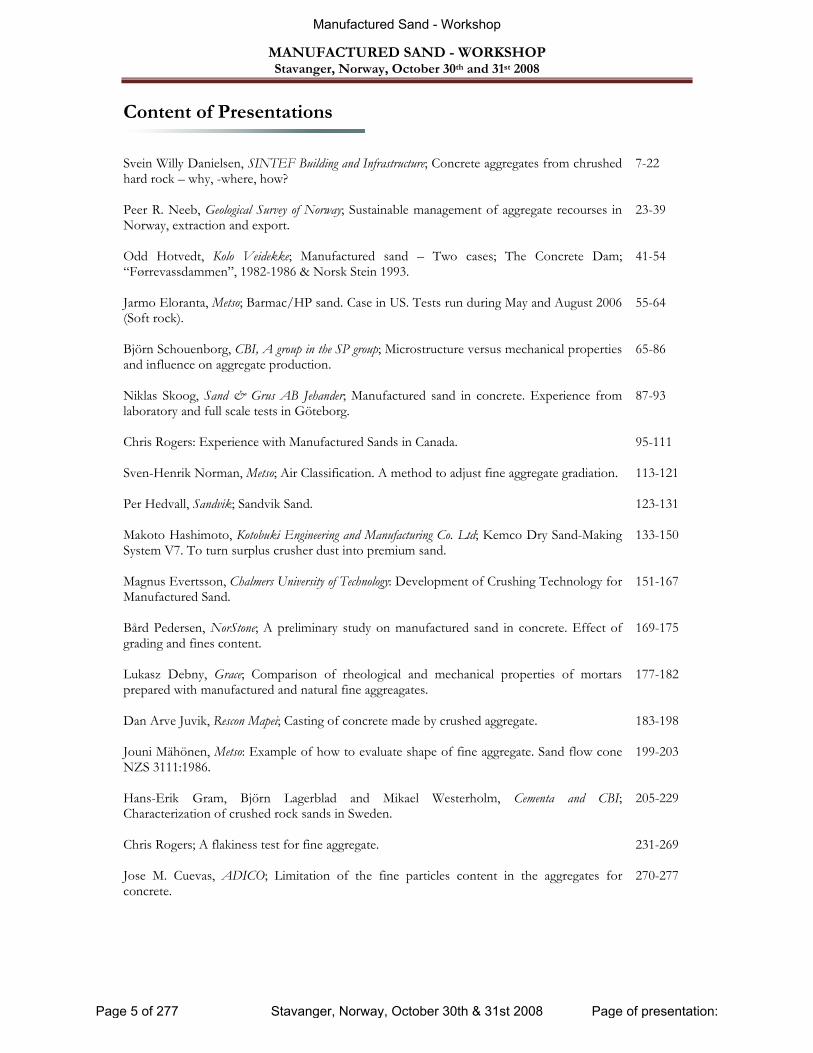
Svein Willy Danielsen, SINTEF Building and Infrastructure; Concrete aggregates from chrushed hard rock – why, -where, how?
7-22
Peer R. Neeb, Geological Survey of Norway; Sustainable management of aggregate recourses in Norway, extraction and export.
23-39
Odd Hotvedt, Kolo Veidekke; Manufactured sand – Two cases; The Concrete Dam; “Førrevassdammen”, 1982-1986 & Norsk Stein 1993.
41-54
Jarmo Eloranta, Metso; Barmac/HP sand. Case in US. Tests run during May and August 2006 (Soft rock).
55-64
Björn Schouenborg, CBI, A group in the SP group; Microstructure versus mechanical properties and influence on aggregate production.
65-86
Niklas Skoog, Sand & Grus AB Jehander; Manufactured sand in concrete. Experience from laboratory and full scale tests in Göteborg.
87-93
Chris Rogers: Experience with Manufactured Sands in Canada.
95-111
Sven-Henrik Norman, Metso; Air Classification. A method to adjust fine aggregate gradiation.
113-121
Per Hedvall, Sandvik; Sandvik Sand.
123-131
Makoto Hashimoto, Kotobuki Engineering and Manufacturing Co. Ltd; Kemco Dry Sand-Making System V7. To turn surplus crusher dust into premium sand.
133-150
Magnus Evertsson, Chalmers University of Technology: Development of Crushing Technology for Manufactured Sand.
151-167
Bård Pedersen, NorStone; A preliminary study on manufactured sand in concrete. Effect of grading and fines content.
169-175
Lukasz Debny, Grace; Comparison of rheological and mechanical properties of mortars prepared with manufactured and natural fine aggreagates.
177-182
Dan Arve Juvik, Rescon Mapei; Casting of concrete made by crushed aggregate.
183-198
Jouni Mähönen, Metso: Example of how to evaluate shape of fine aggregate. Sand flow cone NZS 3111:1986.
199-203
Hans-Erik Gram, Björn Lagerblad and Mikael Westerholm, Cementa and CBI; Characterization of crushed rock sands in Sweden.
205-229
Chris Rogers; A flakiness test for fine aggregate.
231-269
Jose M. Cuevas, ADICO; Limitation of the fine particles content in the aggregates for concrete.
270-277
Manufactured Sand - Workshop
Page 5 of 277 Stavanger, Norway, October 30th & 31st 2008 Page of presentation:

Manufactured Sand - Workshop
Page 6 of 277 Stavanger, Norway, October 30th & 31st 2008 Page of presentation:
1
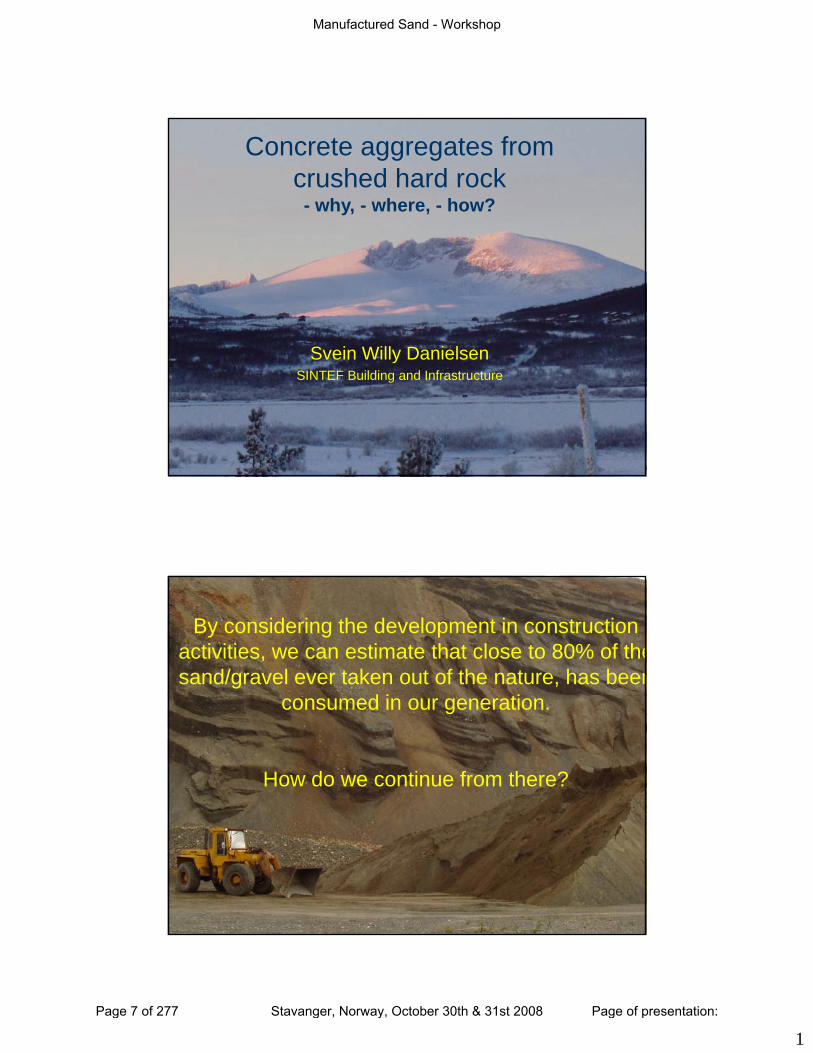
Concrete aggregates from crushed hard rock
- why, - where, - how?
Svein Willy Danielsen
SINTEF Building and Infrastructure 1
Svein Willy DanielsenSINTEF Building and Infrastructure
By considering the development in construction activities, we can estimate that close to 80% of thesand/gravel ever taken out of the nature, has been
d i ticonsumed in our generation.
How do we continue from there?
SINTEF Building and Infrastructure 2
Manufactured Sand - Workshop
Page 7 of 277 Stavanger, Norway, October 30th & 31st 2008 Page of presentation:

2
The availability of materials will be one ofmaterials will be one of
the important global market drivers in the
years to come
SINTEF Building and Infrastructure 3
y(Prof. Roger Flanagan UK)
Mineral aggregates can only be extracted where nature has placed them
So quarries may have to be located in the countryside where constraints against development are intense.
SINTEF Building and Infrastructure 4
Or alternatively in densely populated areas with protests against dust, noise and traffic
Manufactured Sand - Workshop
Page 8 of 277 Stavanger, Norway, October 30th & 31st 2008 Page of presentation:
3
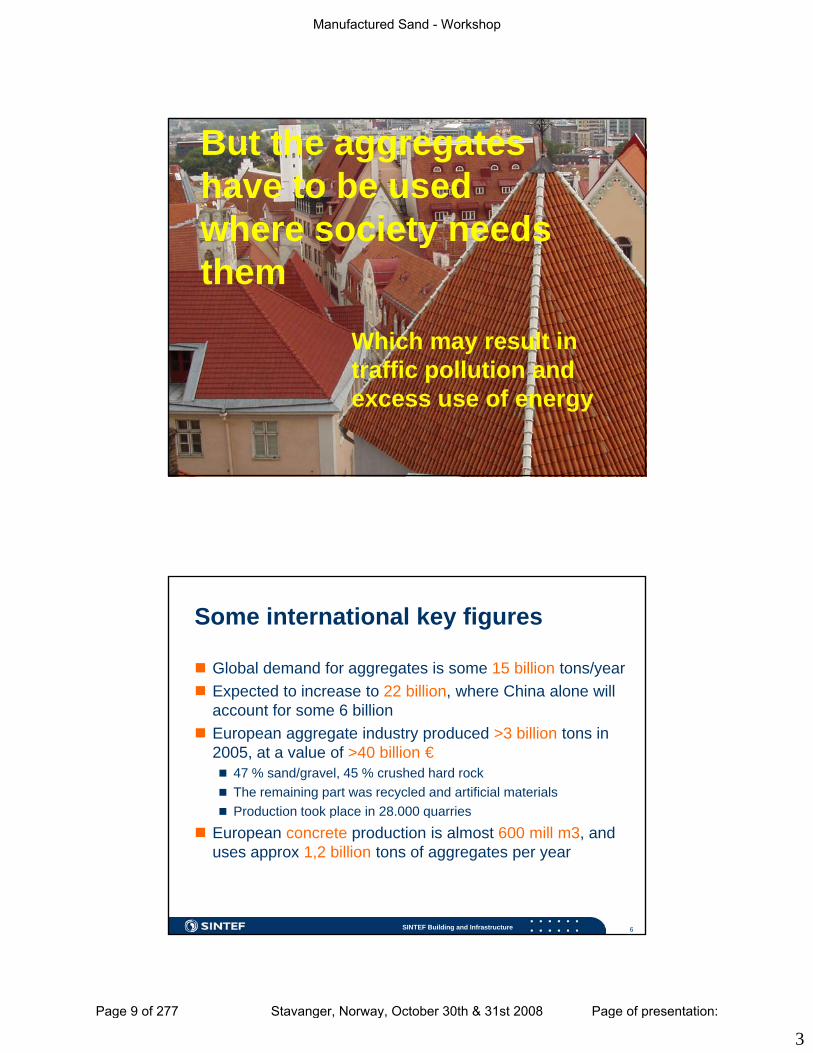
But the aggregates have to be used where society needswhere society needs them
Which may result in
SINTEF Building and Infrastructure 5
traffic pollution and excess use of energy
Some international key figures
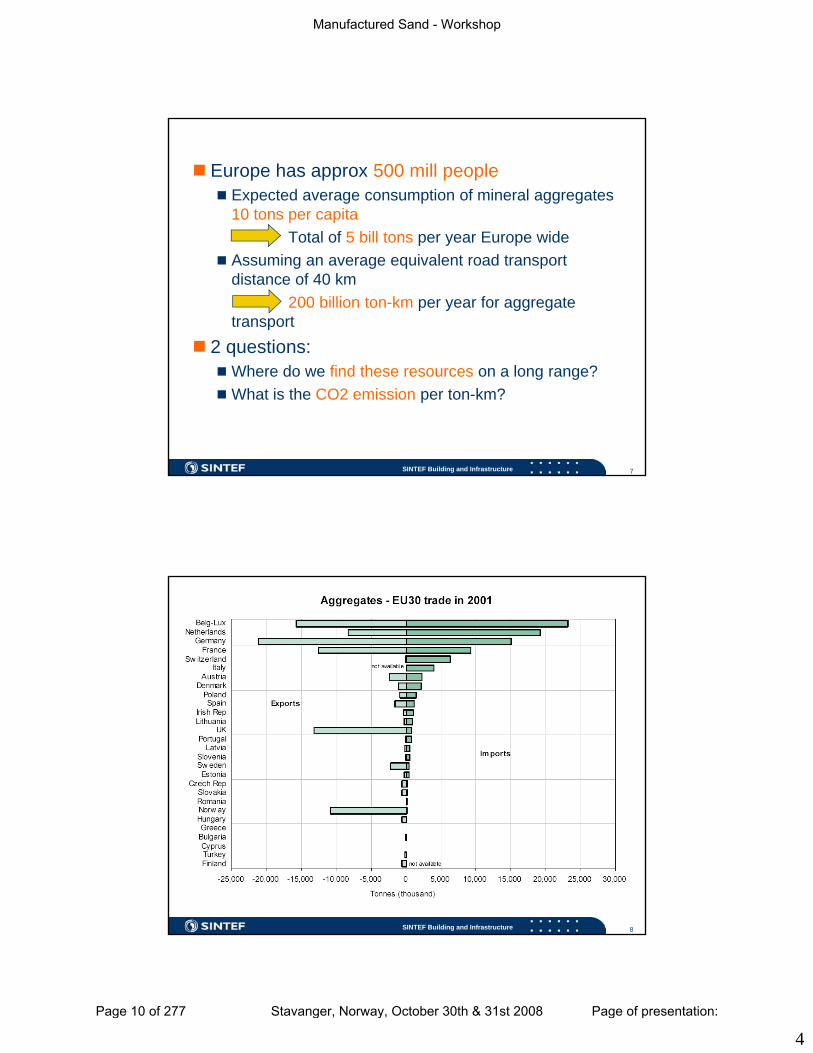
Global demand for aggregates is some 15 billion tons/yearExpected to increase to 22 billion, where China alone willExpected to increase to 22 billion, where China alone will account for some 6 billionEuropean aggregate industry produced >3 billion tons in 2005, at a value of >40 billion €
47 % sand/gravel, 45 % crushed hard rockThe remaining part was recycled and artificial materialsProduction took place in 28.000 quarries
SINTEF Building and Infrastructure 6
Production took place in 28.000 quarries
European concrete production is almost 600 mill m3, and uses approx 1,2 billion tons of aggregates per year
Manufactured Sand - Workshop
Page 9 of 277 Stavanger, Norway, October 30th & 31st 2008 Page of presentation:
4
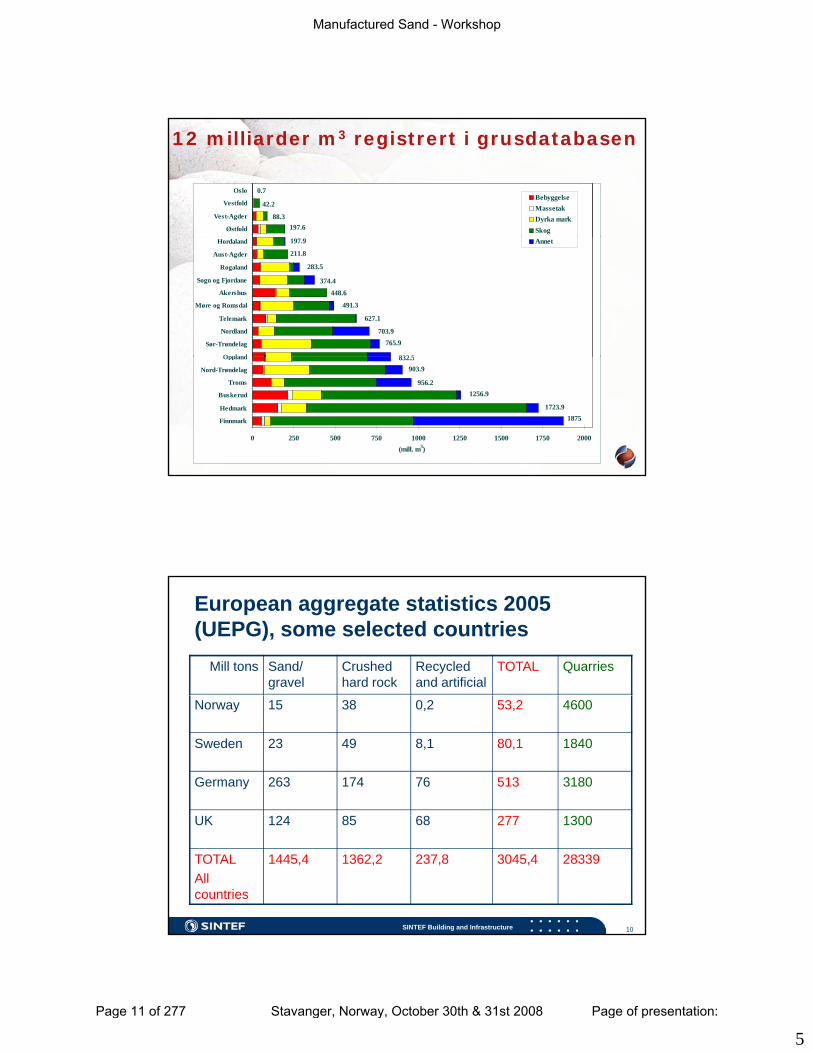
Europe has approx 500 mill peopleExpected average consumption of mineral aggregates 10 tons per capita
Total of 5 bill tons per year Europe wideTotal of 5 bill tons per year Europe wideAssuming an average equivalent road transport distance of 40 km
200 billion ton-km per year for aggregate transport
2 questions:
SINTEF Building and Infrastructure 7
Where do we find these resources on a long range?What is the CO2 emission per ton-km?
SINTEF Building and Infrastructure 8
Manufactured Sand - Workshop
Page 10 of 277 Stavanger, Norway, October 30th & 31st 2008 Page of presentation:
5
12 milliarder m3 registrert i grusdatabasen
Østfold
Vest-Agder
Vestfold
OsloBebyggelseMassetakDyrka markSkog
0.7
42.2
88.3197.6
Oppland
Sør-Trøndelag
Nordland
Telemark
Møre og Romsdal
Akershus
Sogn og Fjordane
Rogaland
Aust-Agder
Hordaland Annet
283.5
197.9
211.8
374.4
448.6
491.3
627.1
703.9765.9
832 5
SINTEF Building and Infrastructure 9
0 250 500 750 1000 1250 1500 1750 2000
Finnmark
Hedmark
Buskerud
Troms
Nord-Trøndelag
Oppland
(mill. m3)
832.5903.9
956.21256.9
1723.91875
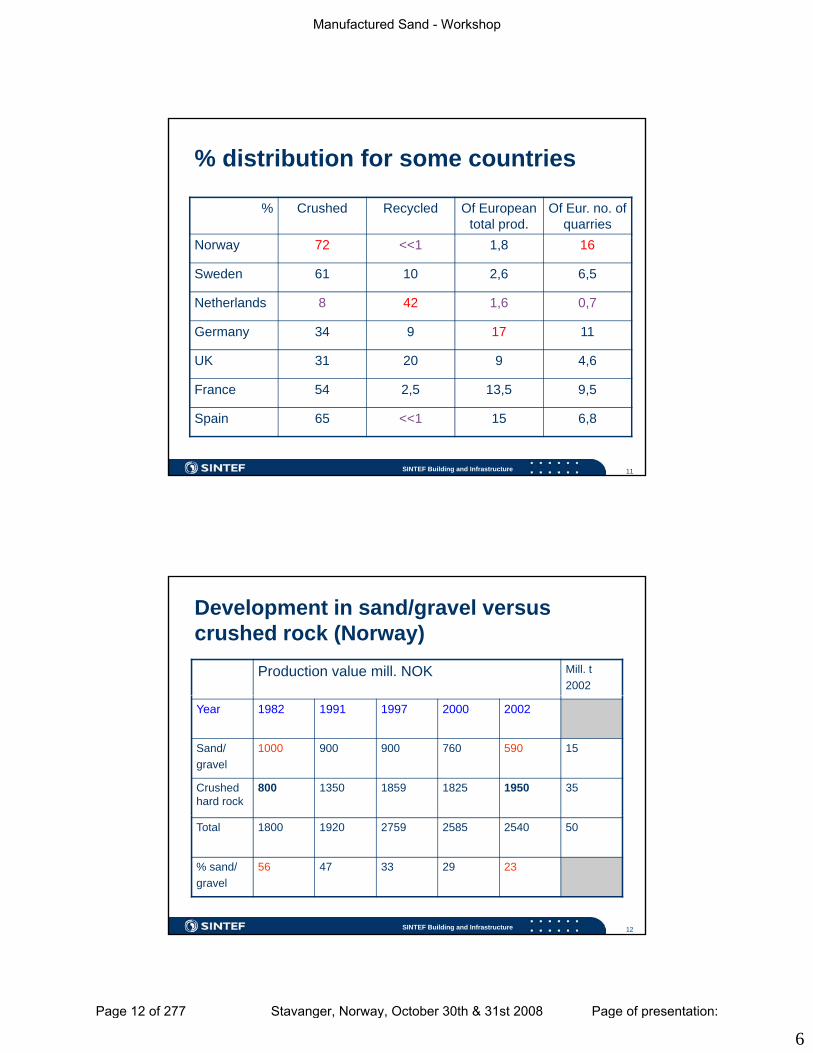
European aggregate statistics 2005 (UEPG), some selected countries
Mill tons Sand/ gravel
Crushed hard rock
Recycled and artificial
TOTAL Quarries
Norway 15 38 0,2 53,2 4600
Sweden 23 49 8,1 80,1 1840
Germany 263 174 76 513 3180
SINTEF Building and Infrastructure 10
UK 124 85 68 277 1300
TOTALAll countries
1445,4 1362,2 237,8 3045,4 28339
Manufactured Sand - Workshop
Page 11 of 277 Stavanger, Norway, October 30th & 31st 2008 Page of presentation:
6
% distribution for some countries
% Crushed Recycled Of European total prod.
Of Eur. no. of quarries
Norway 72 <<1 1,8 16
Sweden 61 10 2,6 6,5
Netherlands 8 42 1,6 0,7
Germany 34 9 17 11
UK 31 20 9 4 6
SINTEF Building and Infrastructure 11
UK 31 20 9 4,6
France 54 2,5 13,5 9,5
Spain 65 <<1 15 6,8
Development in sand/gravel versus crushed rock (Norway)
Production value mill. NOK Mill. t2002
Year 1982 1991 1997 2000 2002
Sand/gravel
1000 900 900 760 590 15
Crushed hard rock
800 1350 1859 1825 1950 35
SINTEF Building and Infrastructure 12
Total 1800 1920 2759 2585 2540 50
% sand/gravel
56 47 33 29 23
Manufactured Sand - Workshop
Page 12 of 277 Stavanger, Norway, October 30th & 31st 2008 Page of presentation:

7
Some key items to be handled Local resources, local production – to reduce long range, polluting transportHow do we handle that when existing resources are gdepleted – and access to new ones are limited?“Secondary materials”, and the use of all available sizes –for a zero-waste productionAdaptation of requirements and materials design to the local resources available – instead of standard “ideal” designsC ( d t ) i t ll t i l
SINTEF Building and Infrastructure 13
Can we (and must we) invent an all-new materials technology?Densely populated areas – combining sub surface quarrying with the cities’ need for underground space?
Sustainability:
Resource management is the keykey
– access to resources the main challenge.
Any encroach upon nature should be
SINTEF Building and Infrastructure 14
Any encroach upon nature should be justified by increased values for the society, both relating to the products made and to the area left for later use.
Manufactured Sand - Workshop
Page 13 of 277 Stavanger, Norway, October 30th & 31st 2008 Page of presentation:

8
Four essential phasesin aggregate business
1. Inventory and planning2. Quarrying and production3. Use of aggregates in construction4. Reclamation of mined-out area
SINTEF Building and Infrastructure 15
Inventory and planning:1.Geological mapping
2.Regulatory issues
3 Pl i f th f t l ti d i3.Planning of the future exploration and quarrying
4.Planning of the future land reclamation
SINTEF Building and Infrastructure 16
Manufactured Sand - Workshop
Page 14 of 277 Stavanger, Norway, October 30th & 31st 2008 Page of presentation:

9
Quarries will always be temporary – thebusiness is to extract resources not tobusiness is to extract resources, not topossess land
SINTEF Building and Infrastructure 17
But society deserves a well planned and performed land reclamation
Aggregate technology
Materials technologyMaterials technology•The use of aggregates
The basic interdependency in aggregate technology
SINTEF Building and Infrastructure 18
Production technology•The processing of aggregates
Knowledge of geology•The basis for aggregates sources
Manufactured Sand - Workshop
Page 15 of 277 Stavanger, Norway, October 30th & 31st 2008 Page of presentation:
10
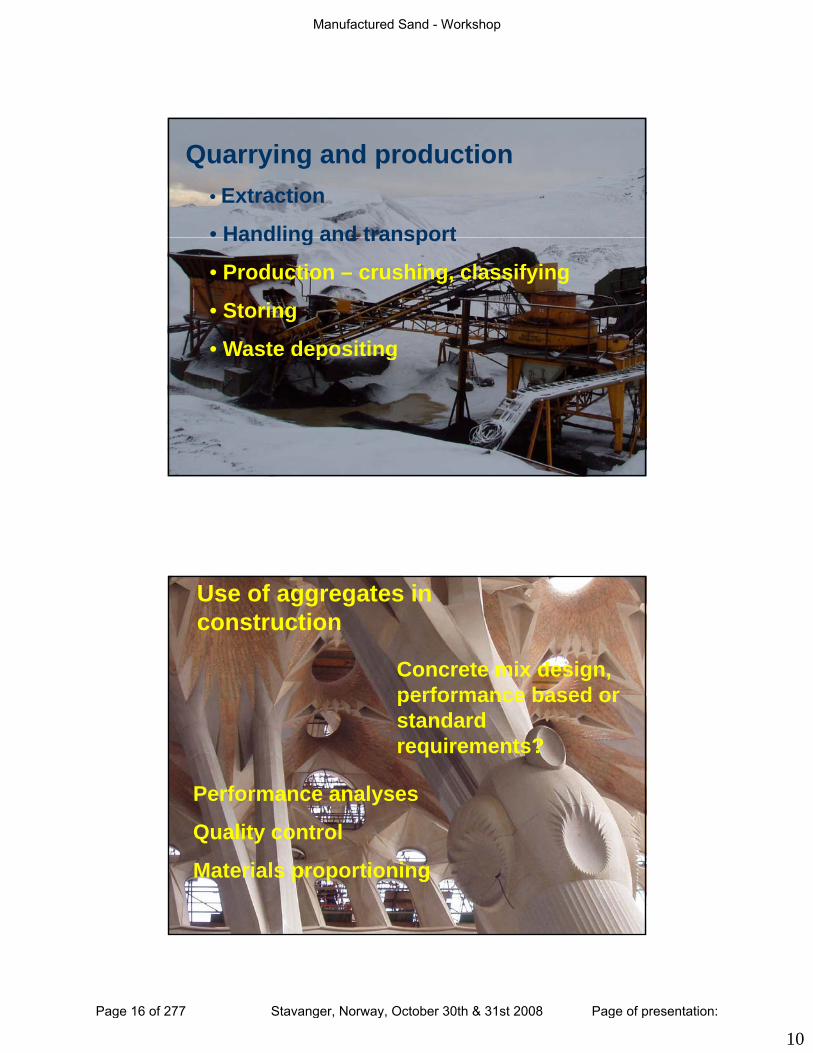
Quarrying and production• Extraction
• Handling and transportHandling and transport
• Production – crushing, classifying
• Storing
• Waste depositing
SINTEF Building and Infrastructure 19
p g
Use of aggregates in construction
Concrete mix design, performance based orperformance based or standard requirements?
Performance analyses
SINTEF Building and Infrastructure 20
Quality control
Materials proportioning
Manufactured Sand - Workshop
Page 16 of 277 Stavanger, Norway, October 30th & 31st 2008 Page of presentation:
11
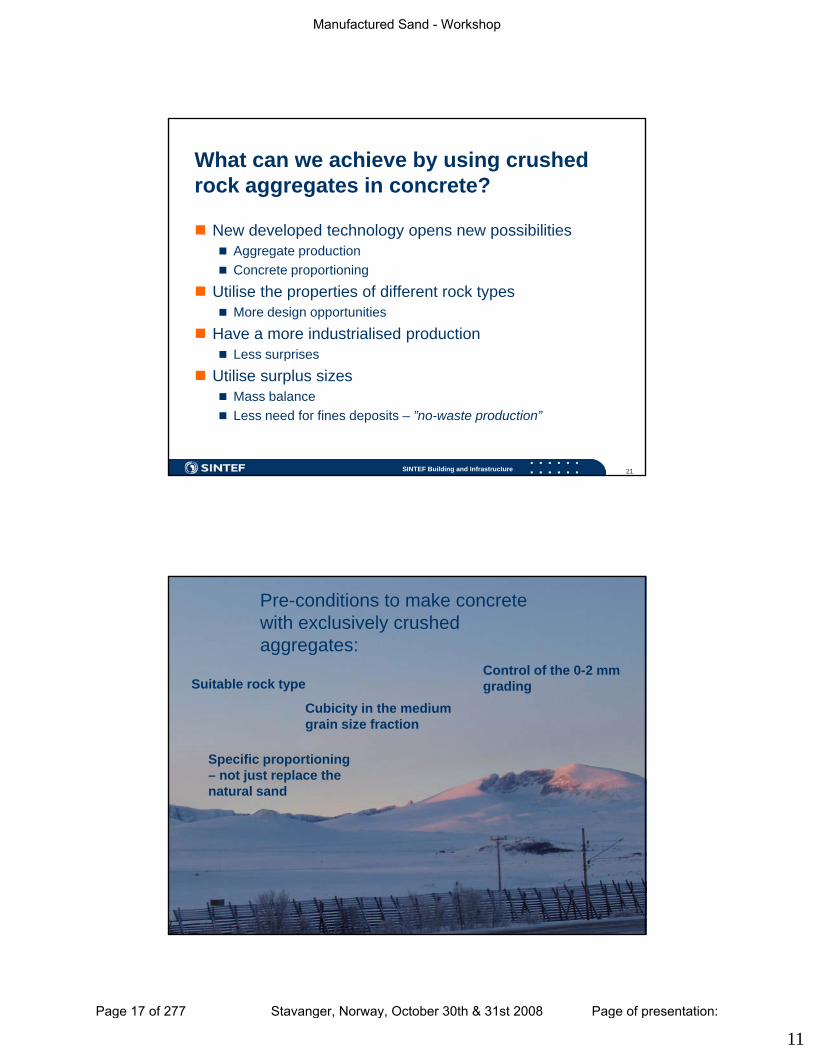
What can we achieve by using crushed rock aggregates in concrete?
New developed technology opens new possibilitiesp gy p pAggregate productionConcrete proportioning
Utilise the properties of different rock typesMore design opportunities
Have a more industrialised productionLess surprises
SINTEF Building and Infrastructure 21
Less surprises
Utilise surplus sizesMass balanceLess need for fines deposits – ”no-waste production”
Pre-conditions to make concrete with exclusively crushed aggregates:
Suitable rock typeControl of the 0-2 mm grading
Cubicity in the medium grain size fraction
Specific proportioning – not just replace the natural sand
SINTEF Building and Infrastructure 22
Manufactured Sand - Workshop
Page 17 of 277 Stavanger, Norway, October 30th & 31st 2008 Page of presentation:
12
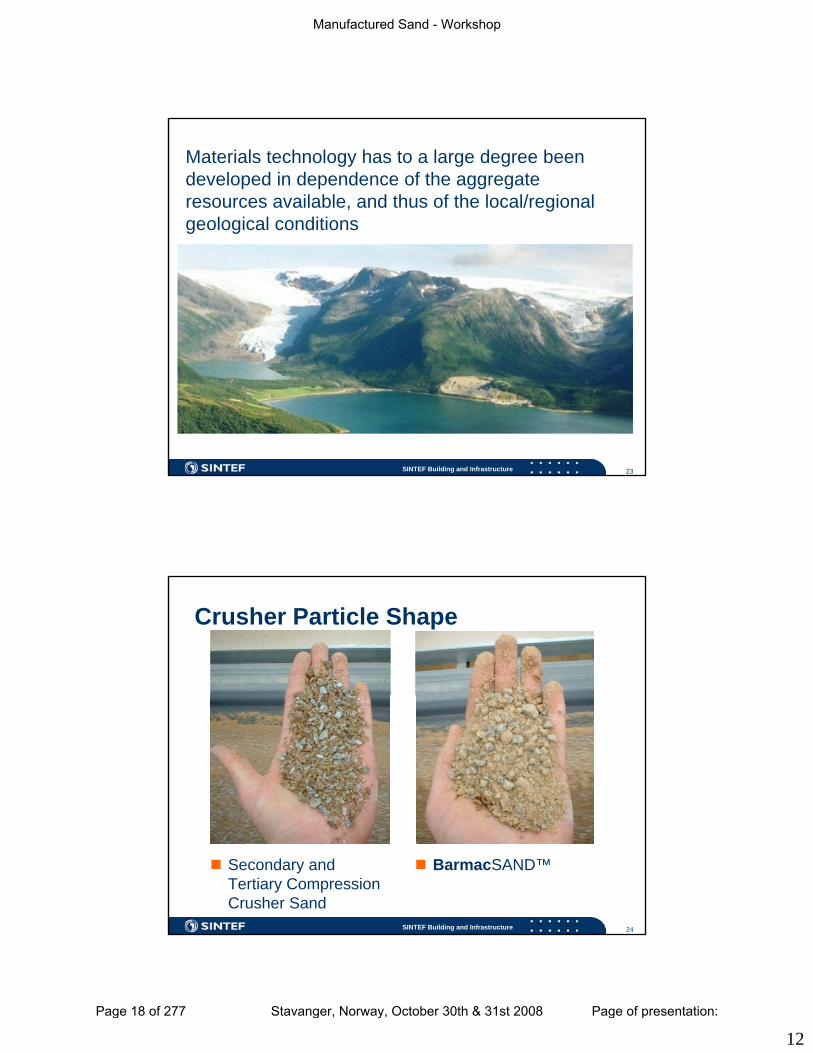
Materials technology has to a large degree been developed in dependence of the aggregate resources available, and thus of the local/regional geological conditions
SINTEF Building and Infrastructure 23
Crusher Particle Shape
SINTEF Building and Infrastructure 24
Secondary and Tertiary Compression Crusher Sand
BarmacSAND™
Manufactured Sand - Workshop
Page 18 of 277 Stavanger, Norway, October 30th & 31st 2008 Page of presentation:
13
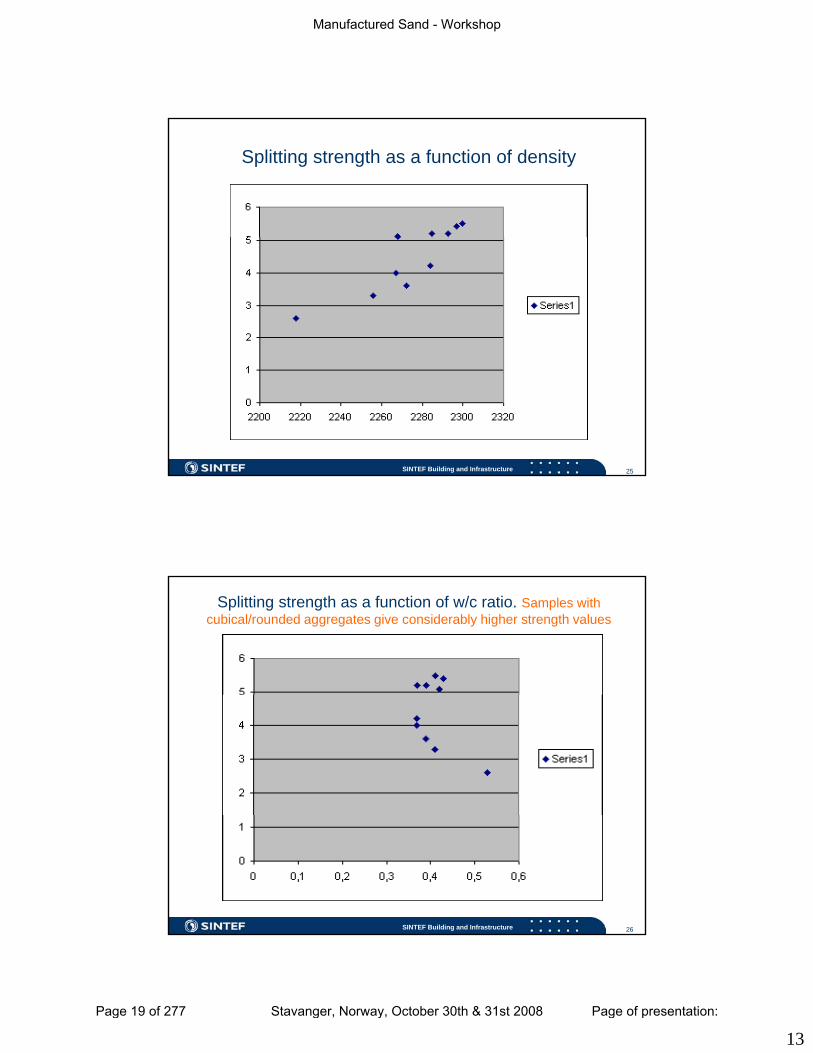
Splitting strength as a function of density
SINTEF Building and Infrastructure 25
Splitting strength as a function of w/c ratio. Samples with cubical/rounded aggregates give considerably higher strength values
SINTEF Building and Infrastructure 26
Manufactured Sand - Workshop
Page 19 of 277 Stavanger, Norway, October 30th & 31st 2008 Page of presentation:
14
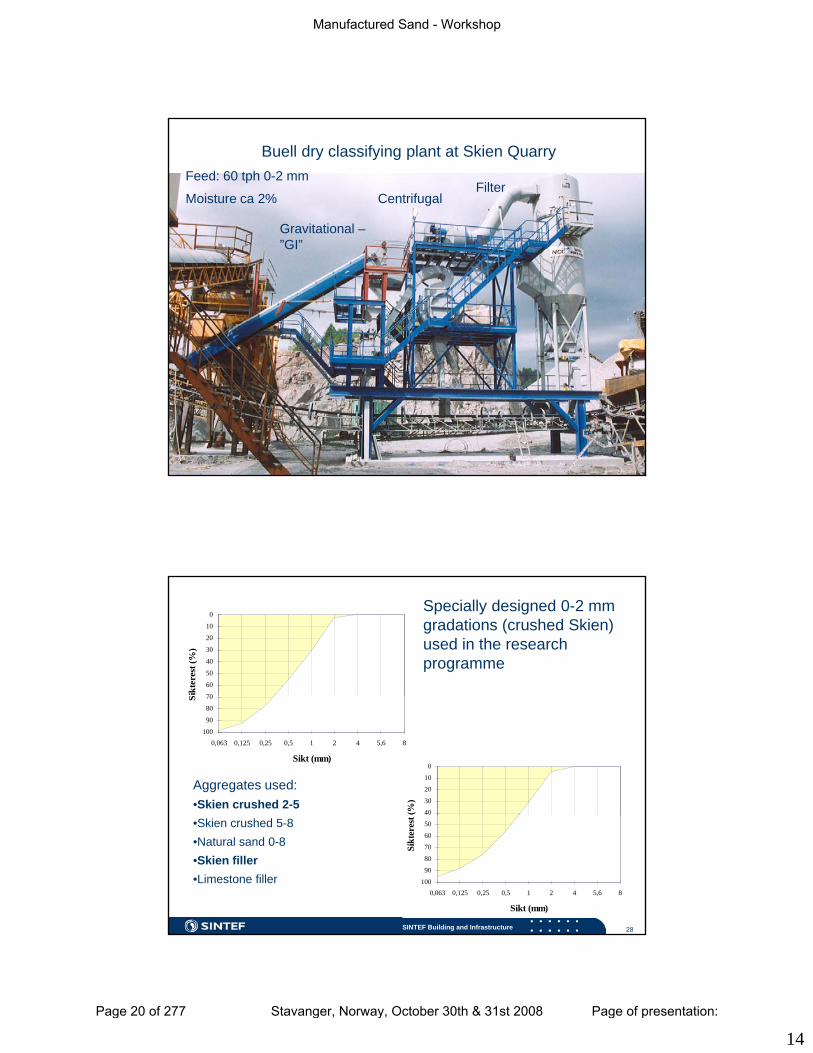
Buell dry classifying plant at Skien QuarryFeed: 60 tph 0-2 mm
Moisture ca 2%
Gravitational –
CentrifugalFilter
”GI”
SINTEF Building and Infrastructure 27
0
10
20
30
40
50
60
70ikte
rest
(%)
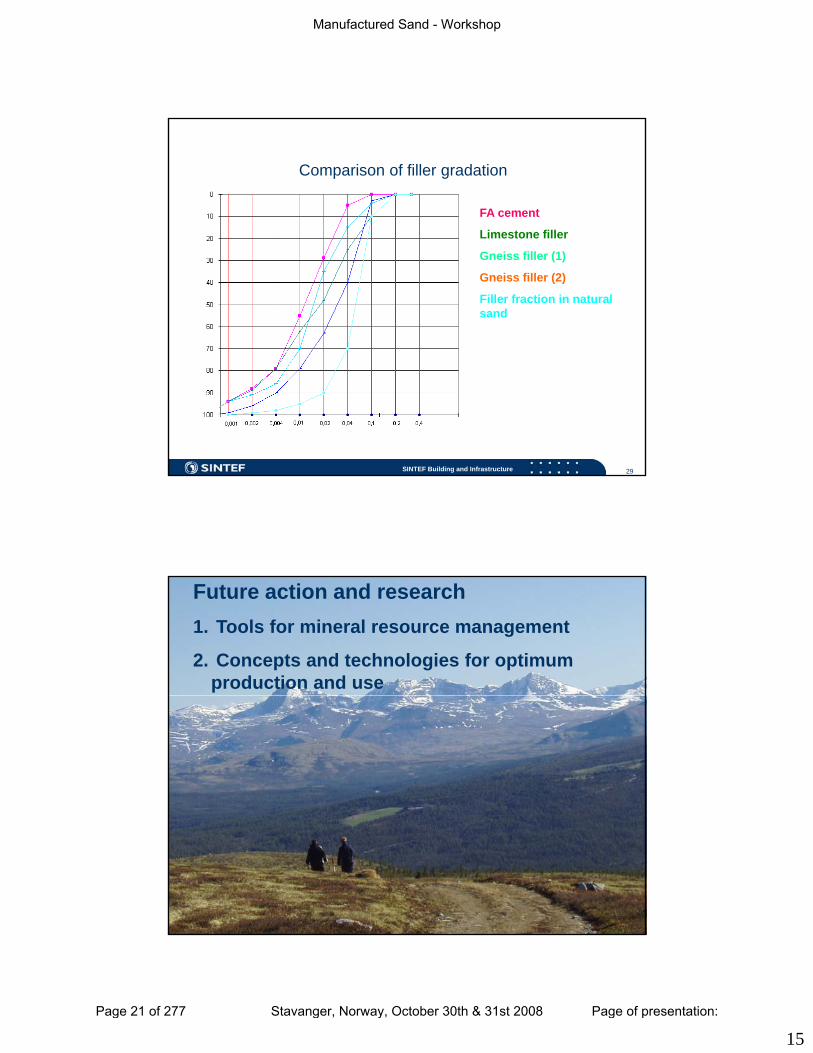
Specially designed 0-2 mm gradations (crushed Skien) used in the research programme
0
10
20
30
40(%)
70
80
90
10085,64210,50,250,1250,063
Sikt (mm)
S
Aggregates used:•Skien crushed 2-5
SINTEF Building and Infrastructure 28
50
60
70
80
90
10085,64210,50,250,1250,063
Sikt (mm)
Sikt
eres
t •Skien crushed 5-8•Natural sand 0-8•Skien filler•Limestone filler
Manufactured Sand - Workshop
Page 20 of 277 Stavanger, Norway, October 30th & 31st 2008 Page of presentation:
15
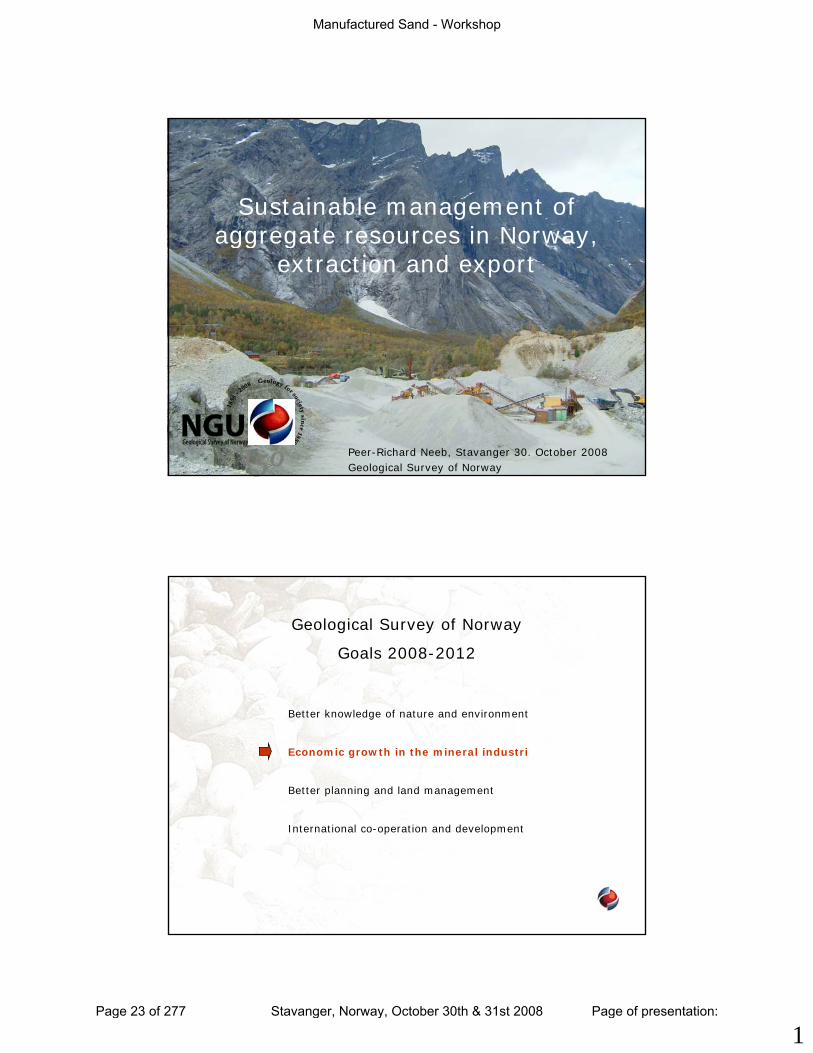
Comparison of filler gradation
FA cement
Limestone fillerLimestone filler
Gneiss filler (1)
Gneiss filler (2)
Filler fraction in natural sand
SINTEF Building and Infrastructure 29
Future action and research1. Tools for mineral resource management
2. Concepts and technologies for optimum production and use
SINTEF Building and Infrastructure 30
Manufactured Sand - Workshop
Page 21 of 277 Stavanger, Norway, October 30th & 31st 2008 Page of presentation:

16
Research topics•Concepts for competitive use of manufactured aggregates
•Technology to benefit from specific rock properties
•Utilisation of secondary aggregates /marginal•Utilisation of secondary aggregates /marginal resources
•Concepts to constantly obtain mass balance (100% utilisation)
•Concepts to use more kinds of local materials, all new materials technology?
SINTEF Building and Infrastructure 31
gy
•Integrated plant concepts, with cost effective production
•More economically feasible subsurface quarrying, combined with establishing underground space
Crushed hard rock aggregates for concrete
SINTEF Building and Infrastructure 32
• A need
• A challenge
• And an opportunity
Manufactured Sand - Workshop
Page 22 of 277 Stavanger, Norway, October 30th & 31st 2008 Page of presentation:
1
Sustainable management of aggregate resources in Norway aggregate resources in Norway,
extraction and export
Peer-Richard Neeb, Stavanger 30. October 2008Geological Survey of Norway
Geological Survey of Norway
Goals 2008-2012
Better knowledge of nature and environment
Economic growth in the mineral industri
Better planning and land management
International co-operation and development
Manufactured Sand - Workshop
Page 23 of 277 Stavanger, Norway, October 30th & 31st 2008 Page of presentation:

2
Mineral resources in Norway
The mining and quarrying industry comprises companies engaged in extracting and processing minerals and rocks from bedrock or superficial deposits.
industrial minerals (e.g. limestone, quartz and nepheline syenite)
building stone derived from dimension stone (e.g. larvikite, granite and flagstone)
Five categories of raw materials are distinguished:
raw materials for construction (sand, gravel, crushed rock and clay)
metallic ores (iron, nickel and titanium oxide)energy minerals (coal).
Mineral raw materials in use
Manufactured Sand - Workshop
Page 24 of 277 Stavanger, Norway, October 30th & 31st 2008 Page of presentation:
3
Norway’s aggregate industry in 2007
• Total turnover: € 500 million.• 51 million tonnes hard rock.• 15 million tonnes sand and gravel.• Export sales: € 83 million.• 13 million tonnes exported.• 640 operators, ranging from
small enterprises to international companies.small enterprises to international companies.• Provides the backbone of many communities. • Export from coastal areas. • Potential for further growth.
Information on resources –Data acquisition
• Fieldwork, mapping• Laboratory investigationsLaboratory investigations
– Los Angeles method – Polished Stone Value– Nordic abrasion value– Micro-deval– Microscopy– Etc.
• Data interpretation• Data presentation
Manufactured Sand - Workshop
Page 25 of 277 Stavanger, Norway, October 30th & 31st 2008 Page of presentation:
4
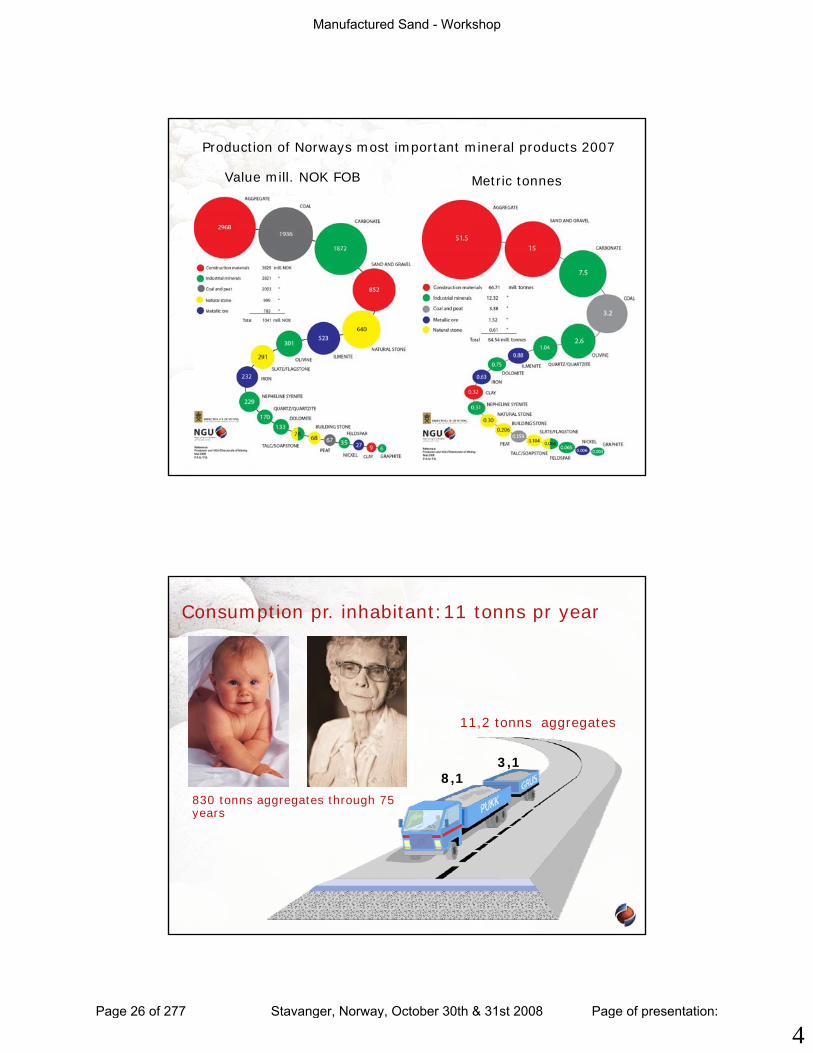
Production of Norways most important mineral products 2007
Value mill. NOK FOB Metric tonnes
LegendPERMIANROCKS (OSLO REGION)(250to290million years)CALEDONIAN ROC KS(400to650milliony ears)PRECAMBRIANRO CKS(BASEMENT)IMPORTANTNORW EGIANAGGREGATEDEP OSITSINPRODUCTION(600to2900million years)
DEVONIAN ROCKS(350to400milliony ears)Nordmarki te, larvikite, graniteBasalt,rho mbeporphyryGranite,tr ondhjemiteGabbro,a northosite, amphiboliteSchist,mic aceous slatesGreenston eSandstone , schistMarbleGraniteGabbro,a northosite, amphiboliteBasalt,rhy oliteSandstone , micaceous schistGneiss,m igmatite
Sandstone , conglomerate
Aggregate prod uctionAggregatefore xport 2005Skien,gneiss Himberg/Freste,syeniteHellev ik,anorth ositeHausvik, gneissDirdal, gn eissEspevik,gr aniteHyll estad Tron dhjemiteAuster pollenGranite /gneissRausandgneiss
and Lia
Løddingensyenite BergnesetgabbroB allangen, gabbro
HønefossgneissBrekke,gneissDal, gneissFjordstein, Gabbro Kragerø, gabbroOSLO
Ålesund, gneissVisnes, eco giteViken/Fræna, gneissHalsvik, g neissBremang er, DyrstadBremang er, Gulestøsandston eSandston e-FlorøJelsa, gn eissTau,Qua rtzdioriteEikefet, g neiss Juve,graniteVinterbro,gneissFeiring,gneissSTAVA NGER
Otte rsbo,quartziteBjugn, gneissNord-Fosen, gneiss Mosjøen, gabbroVassfjelletgabbroTRONDHEIM
BODØ Kvalsund,Bø,gabbroSortland, gne issTromsø,gneiss quartzite Bjørnevatn,gneiT ROMSØ
Hedrum / Tjølling/Svartbuk t, larvikite Sand/gravelfor export 2005Årdal,sand/gravelHelle,sand/gravel
Ørsjødal,sand/gravel
Frafjord,sand/gravel
Consumption pr. inhabitant:11 tonns pr year
830 tonns aggregates through 75 years
8,13,1
11,2 tonns aggregates
years
Manufactured Sand - Workshop
Page 26 of 277 Stavanger, Norway, October 30th & 31st 2008 Page of presentation:
5
Hard Rock Aggregate Sand and gravel
Consumption 2007
31 %
19 %12 %
38 %
Road Making
Asphalt
Concrete
Other uses
16 %
9 %
51 %
24 %
Road MakingAsphalt
Concrete
Export value (mill. 2007-NOK)
The export value of minerals in 2007:
NOK 6,1 billion, 762 million EUR.
Coal
Eksport value 2007
Talc/soapstone
Quartz/quartzite
Dolomite
Nepheline …
Iron
Olivine
Ilmenite
Natural stone
Aggregate/gravel
Carbonate
0 500 1000 1500 2000
Peat
Graphite
Nickel
Feldspar
Slate/flagstone
/ p
Mill. NOK
Manufactured Sand - Workshop
Page 27 of 277 Stavanger, Norway, October 30th & 31st 2008 Page of presentation:
6
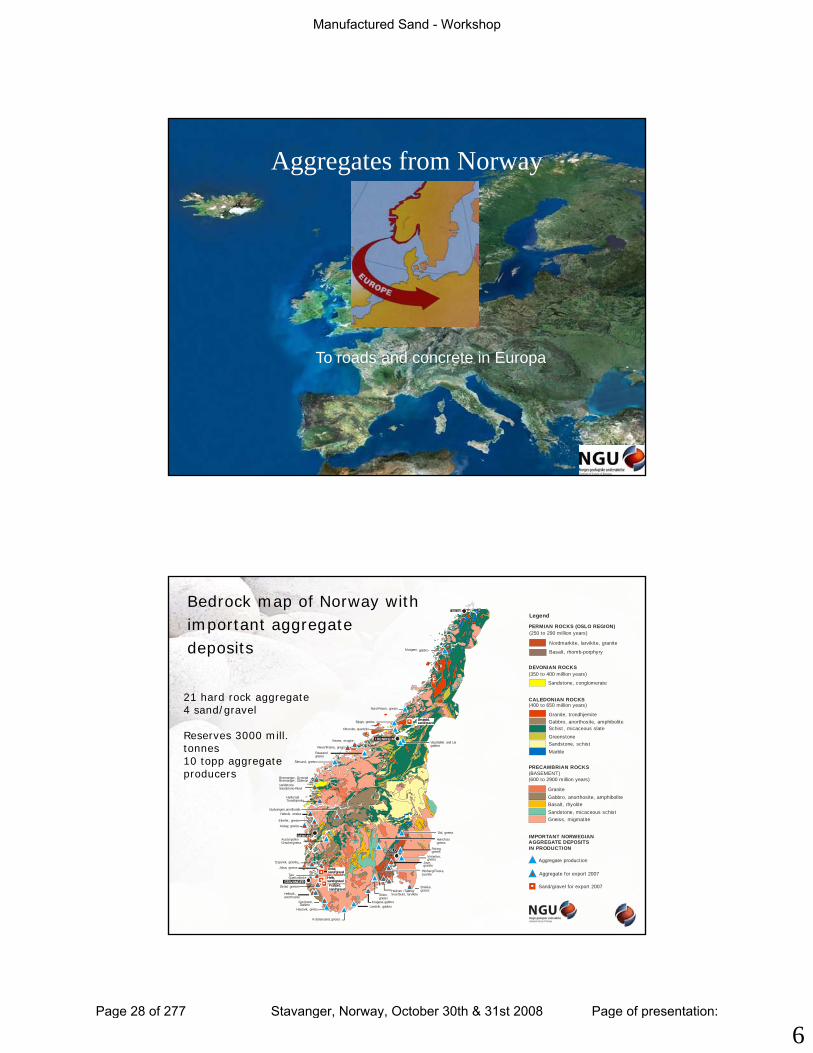
Aggregates from Norway
To roads and concrete in EuropaTo roads and concrete in Europa
Bedrock map of Norway with important aggregate deposits
Legend
PERMIAN ROCKS (OSLO REGION)(250 to 290 million years)
DEVONIAN ROCKS(350 to 400 million years)
Nordmarkite, larvikite, granite
Basalt, rhomb-porphyry
Sandstone, conglomerate
Mosjøen, gabbro
BODØ
21 hard rock aggregate CALEDONIAN ROCKS(400 to 650 million years)
PRECAMBRIAN ROCKS(BASEMENT)(600 to 2900 million years)
Granite, trondhjemiteGabbro, anorthosite, amphiboliteSchist , micaceous slateGreenstoneSandstone, schistMarble
GraniteGabbro, anorthosite, amphiboliteBasalt, rhyoliteSandstone, micaceous schist
Hyllestad Trondhjemite
Gudvangen, anorthosite
Rausandgneiss
and Lia
Ålesund, gneiss
Visnes, ecogite
Viken/Fræna, gneiss
Halsvik, gneiss
Bremanger, DyrstadBremanger, GulestøsandstoneSandstone-Florø
Ottersbo, quartzite
Bjugn, gneiss
Nord-Fosen, gneiss
Vassfjelletgabbro
TRONDHEIM
Ørsjødal,sand/gravelØrsjødal,sand/gravel
21 hard rock aggregate4 sand/gravel
Reserves 3000 mill. tonnes10 topp aggregate producers
IMPORTANT NORWEGIANAGGREGATE DEPOSITSIN PRODUCTION
Gneiss, migmatite
Aggregate production
Aggregate for export 2007
Skien,gneiss
Himberg/Freste,syenite
Landvik, gabbro
Hellevik,anorthosite
Hausvik, gneiss
Dirdal, gneiss
Espevik, granite
AusterpollenGranite/gneiss
Hønefossgneiss
Brekke,gneiss
Dal, gneiss
gneiss
Fjordstein, Gabbro
Kristiansand,
Kragerø, gabbro
OSLO
, g
Jelsa, gneiss
Tau,Quartzdiorite
Eikefet, gneissAskøy, gneiss
Juve,granite
Vinterbro,gneiss
Feiring,gneiss
BERGEN
STAVANGER
Hedrum /Tjølling/Svartbukt, larvikite
Sand/gravel for export 2007
Helle,sand/gravelFrafjord,sand/gravel
Årdal,sand/gravelÅrdal,sand/gravelHelle,sand/gravelFrafjord,sand/gravel
Manufactured Sand - Workshop
Page 28 of 277 Stavanger, Norway, October 30th & 31st 2008 Page of presentation:

7
Norwegian aggregate export 2007
Aggregate/armourstone 13,4 mill. tonnes
Sand/gravel 0,2 mill. tonnes
Exportvalue 660 mill. NOK/83 mill EUR
Offshore aggregate 2,0 mill. tonnes
NOR GE FINLAND0.002(0.004) Russland0.027(0.003)Kalingrad(0.01)
FÆRØ ENE0.1 21(0.1 1)1.80(1.47)FRANK RIKE0.4 3(0.2 7) PO LEN0 .329( 0.17)
Latvia0.091(0)TSJEKKIA0.0003(0.0005)BEL GIA0 .112(0 .006)LUXEMBOU RG0.065TYSK LAND3. 57(3.2 6)N EDERLAND2.21(1.67)
ISLAND0.118(0.11) OF FSHOREN ORGE2.1(2.12)
STOR-BRITANIAIRLAND0
Aggr egate/armou rstone 11,5 m ill tonnsSand /gravel 0.2 m ill tonnsExpo rt value 463 m ill NOK/58 m ill EUROffsh ore-aggrega te 2,1 mill ton ns
NORGE FINLAND0.002(0.004)Ru ssland0.027( 0.003)Ka lingrad( 0.01)
FÆRØE NE0.121(0.11 )1.80(1.47)FRANKRI KE0.43(0.27) POLEN0.329(0.17) Latvia0.091(0)TSJEKKIA0.0003(0.0005)BELG IA0.112(0.00 6)LUXEMBOURG0.065TYSKLAN D3.57(3.26)NED ERLAND2.21(1.67)
ISLAND0.118(0.11) OFFS HORENO RGE2 .1(2 .12)
STOR-BRITANIAIRLAND0
Aggre gate/armourst one 11,5 mill t onnsSand/g ravel 0.2 mill tonnsExport value 463 mill NOK/58 mill E UROffsho re-aggregate 2,1 mill tonns
Norsk Stein, Jelsa
Year production :
18 %
Aggregates - Norwegian export (incl. offshore)2007 (x1000 tons)
4.9 mill. tonnes i 2007
8 mill. tonnes 2009
10 mill. tonnes 2010
22 %
41 %
18 %19 %
Concrete Roads Offshore Other
Norwegianexport ofaggregates2007 (2006)2007 (2006)
Betong Vei Offshore Annet
Eksport av grus og pukk (x 1000 tonn)
20…
Manufactured Sand - Workshop
Page 29 of 277 Stavanger, Norway, October 30th & 31st 2008 Page of presentation:
8
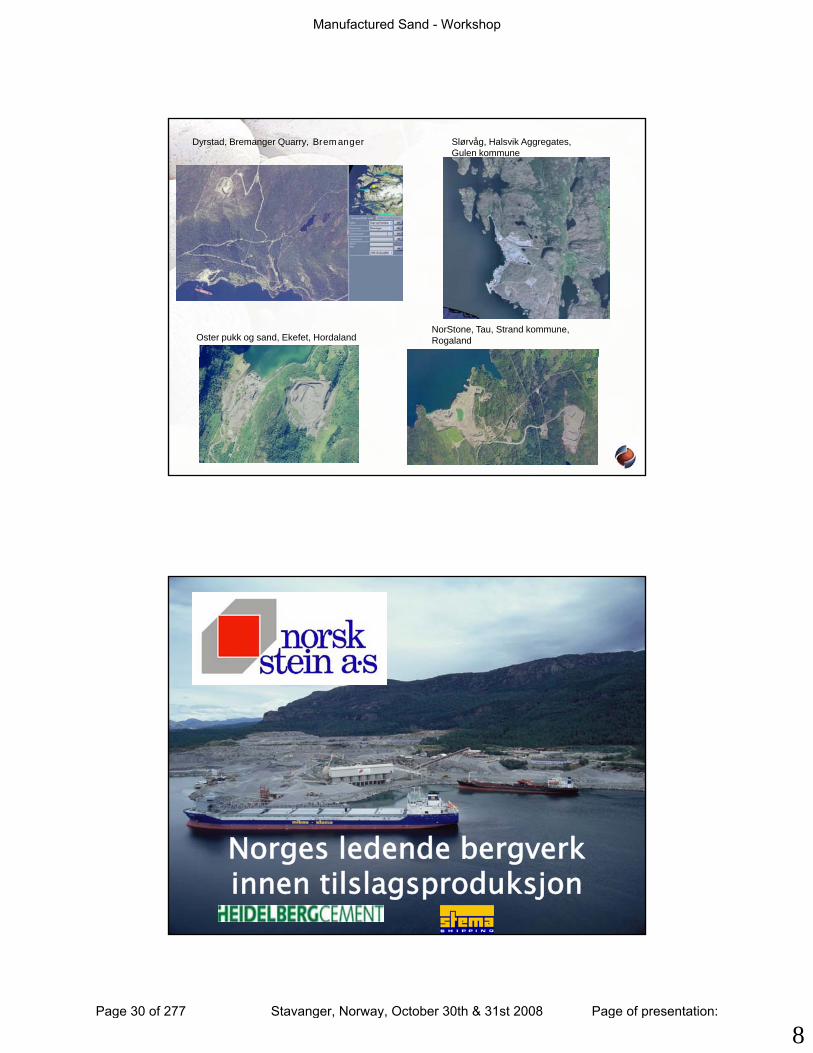
Slørvåg, Halsvik Aggregates, Gulen kommune
Dyrstad, Bremanger Quarry, Bremanger
Oster pukk og sand, Ekefet, HordalandNorStone, Tau, Strand kommune, Rogaland
15
16
Norges ledende bergverk innen tilslagsproduksjon
Manufactured Sand - Workshop
Page 30 of 277 Stavanger, Norway, October 30th & 31st 2008 Page of presentation:
9
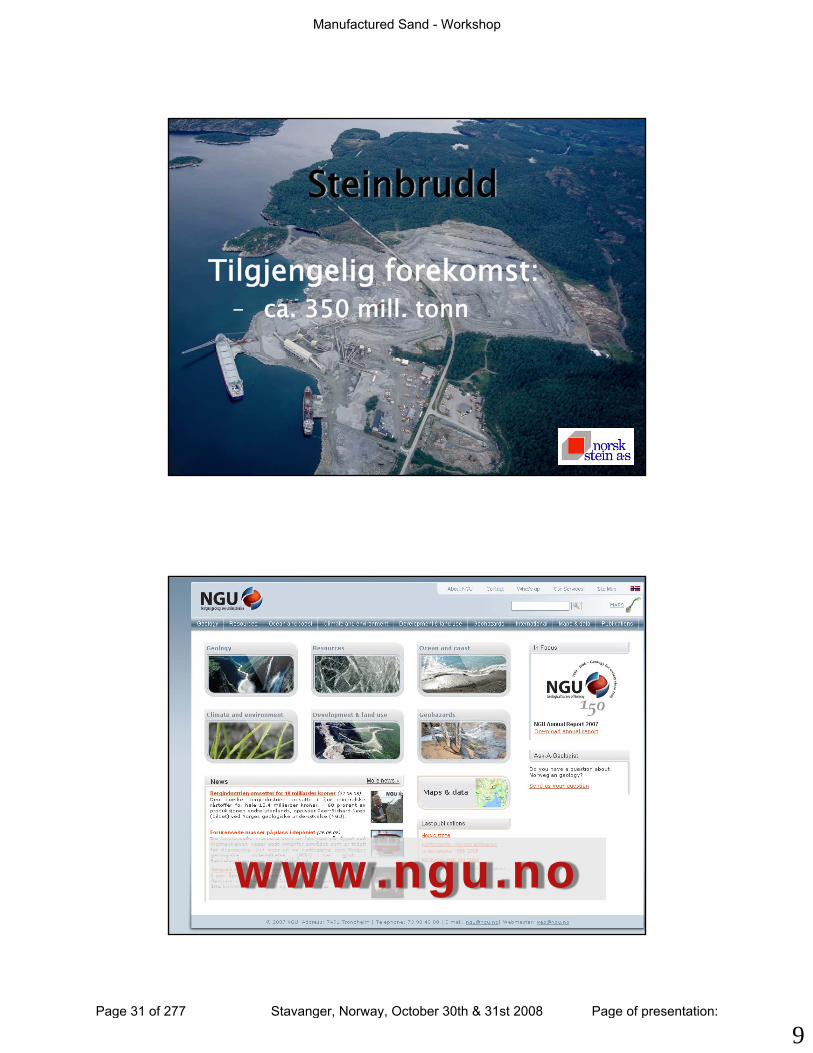
Steinbrudd
Tilgjengelig forekomst:– ca. 350 mill. tonn
17
www.ngu.no
Manufactured Sand - Workshop
Page 31 of 277 Stavanger, Norway, October 30th & 31st 2008 Page of presentation:

10
Sand, gravel and aggregate deposits of national interest
Sand, gravel and aggregate deposits of regional interest
Manufactured Sand - Workshop
Page 32 of 277 Stavanger, Norway, October 30th & 31st 2008 Page of presentation:

11
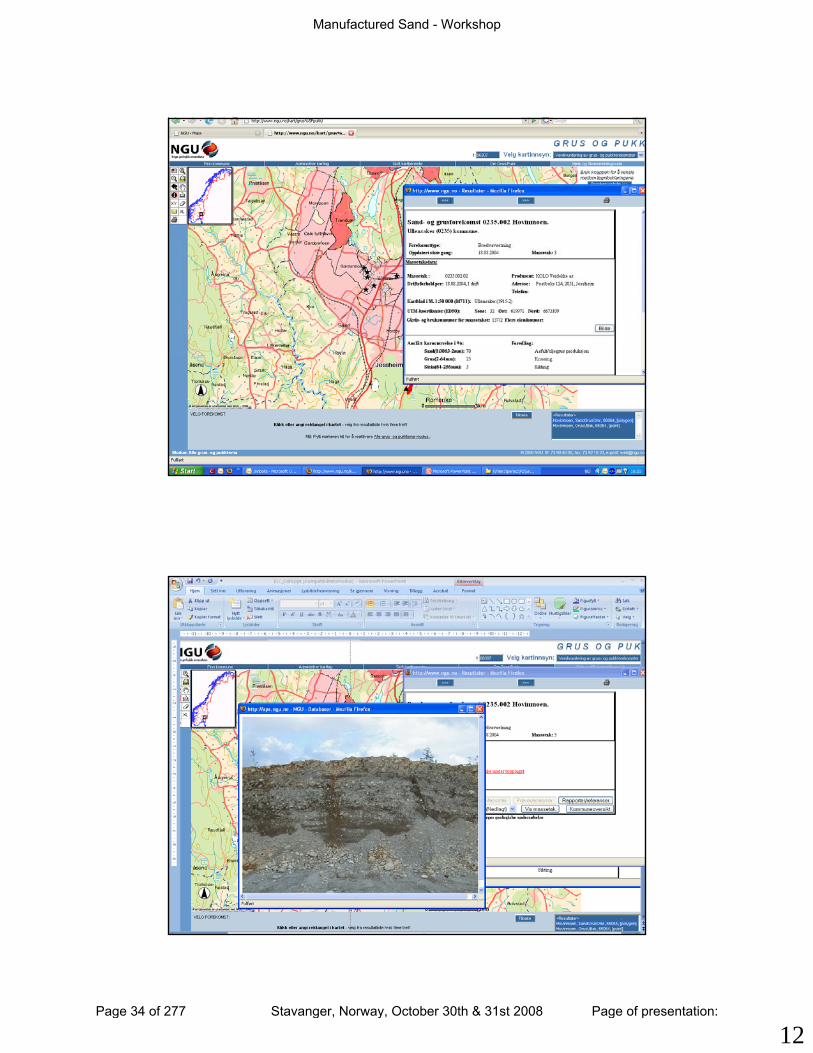
Accessible databases
• Screendumps• Screendumps
Manufactured Sand - Workshop
Page 33 of 277 Stavanger, Norway, October 30th & 31st 2008 Page of presentation:
12
Manufactured Sand - Workshop
Page 34 of 277 Stavanger, Norway, October 30th & 31st 2008 Page of presentation:
13
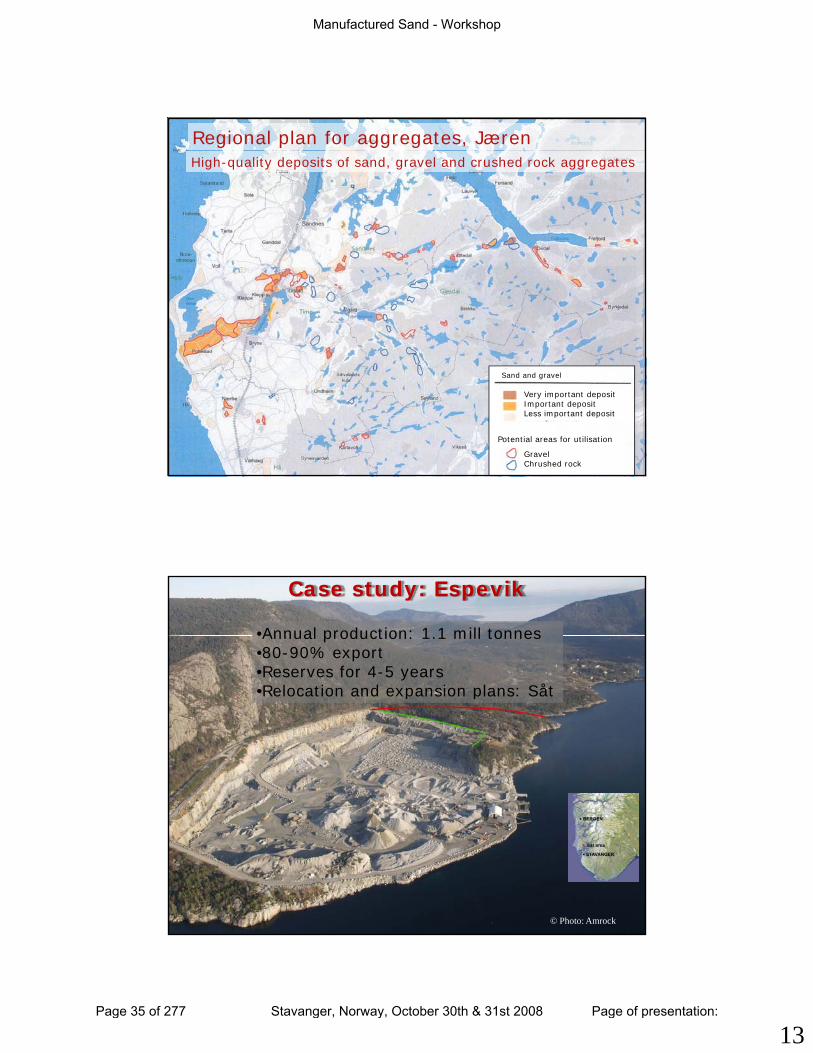
Regional plan for aggregates, JærenHigh-quality deposits of sand, gravel and crushed rock aggregates
Sand and gravel
Very important depositImportant depositLess important deposit
Potential areas for utilisation
GravelChrushed rock
Case study: Espevik
•Annual production: 1.1 mill tonnes•80-90% export•Reserves for 4-5 years•Relocation and expansion plans: SåtRelocation and expansion plans: Såt
© Photo: Amrock
Manufactured Sand - Workshop
Page 35 of 277 Stavanger, Norway, October 30th & 31st 2008 Page of presentation:

14
Såt
Bedrock map of Såt
area
Manufactured Sand - Workshop
Page 36 of 277 Stavanger, Norway, October 30th & 31st 2008 Page of presentation:

15
Competing land use interests
• NIMBY• Urbanisation• Conservation acts• Tourism in unspoiled areas• Tourism in unspoiled areas• Sustainable management requires
balanced land use planning.• Land use planning requires unbiased
information on resources.
Manufactured Sand - Workshop
Page 37 of 277 Stavanger, Norway, October 30th & 31st 2008 Page of presentation:
16
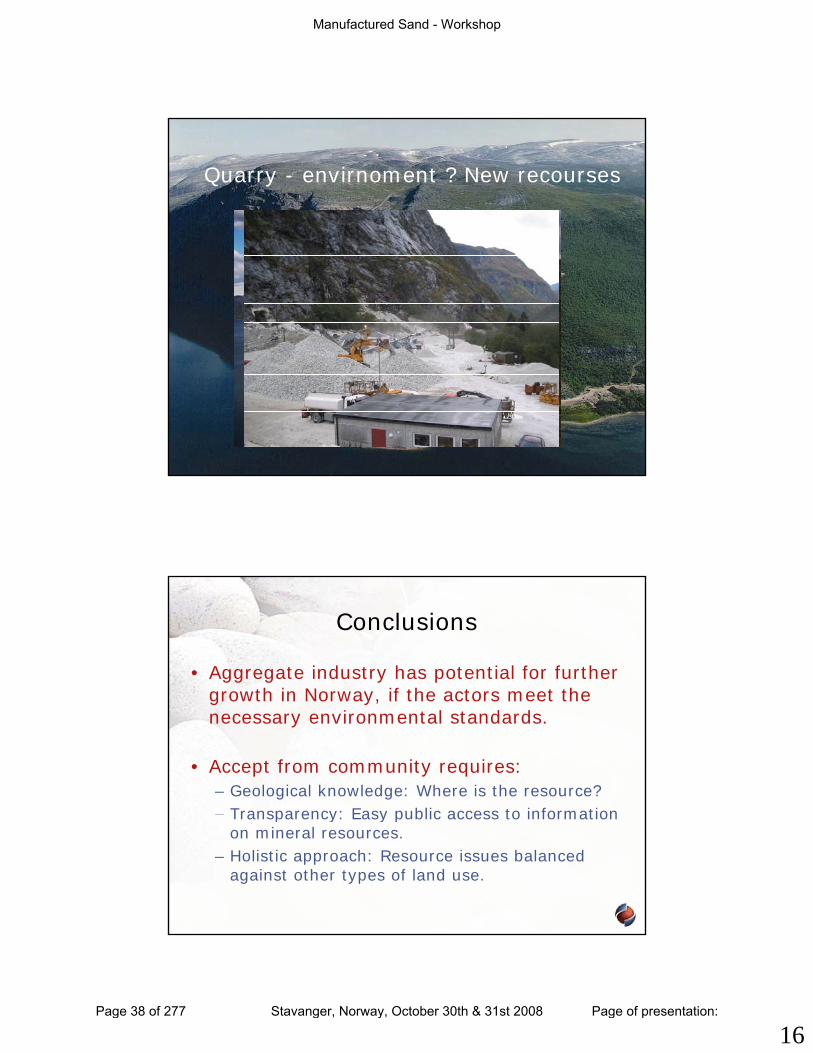
Quarry - envirnoment ? New recourses
Conclusions
• Aggregate industry has potential for further growth in Norway if the actors meet the growth in Norway, if the actors meet the necessary environmental standards.
• Accept from community requires:– Geological knowledge: Where is the resource?– Transparency: Easy public access to information Transparency: Easy public access to information
on mineral resources.– Holistic approach: Resource issues balanced
against other types of land use.
Manufactured Sand - Workshop
Page 38 of 277 Stavanger, Norway, October 30th & 31st 2008 Page of presentation:

17
Thank you for your attentionattention
www.ngu.no/grusogpukk
Manufactured Sand - Workshop
Page 39 of 277 Stavanger, Norway, October 30th & 31st 2008 Page of presentation:

Manufactured Sand - Workshop
Page 40 of 277 Stavanger, Norway, October 30th & 31st 2008 Page of presentation:
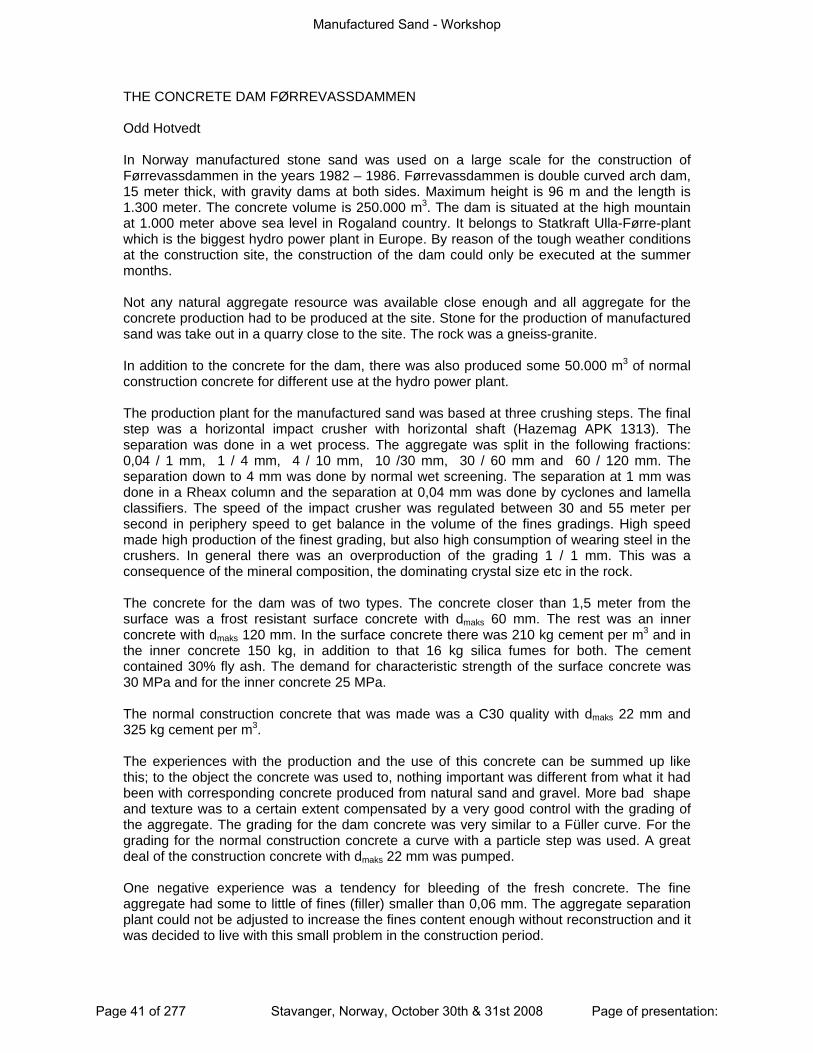
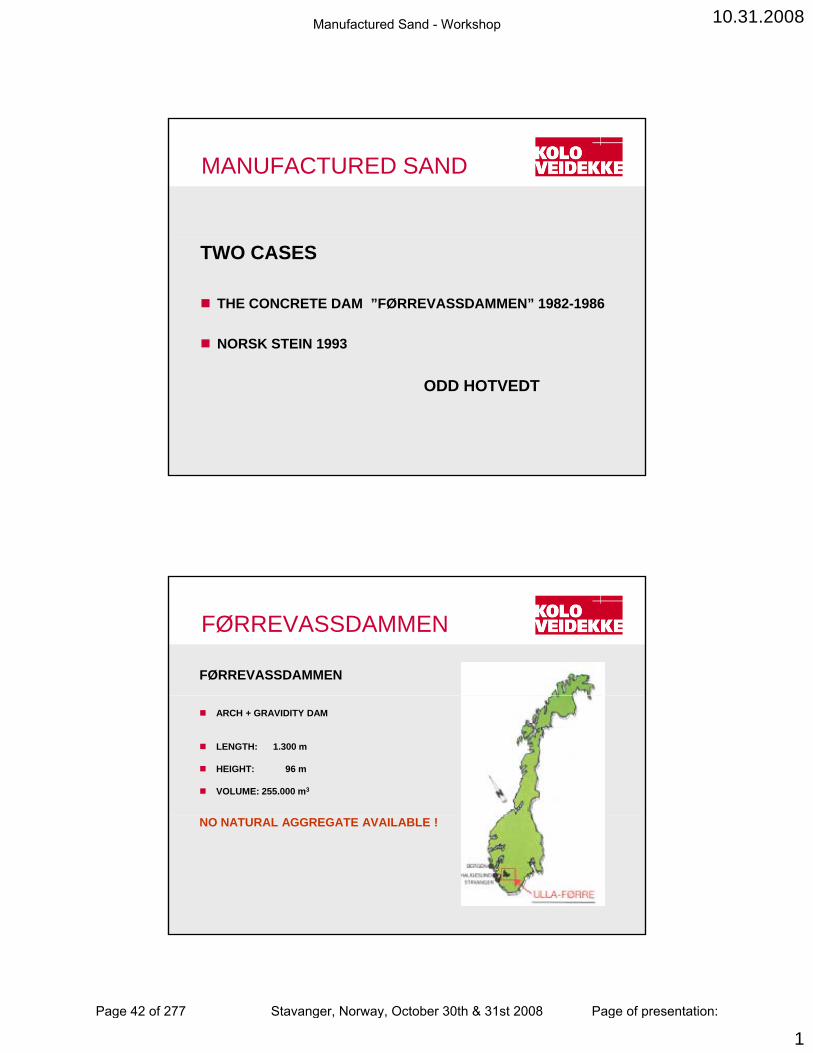
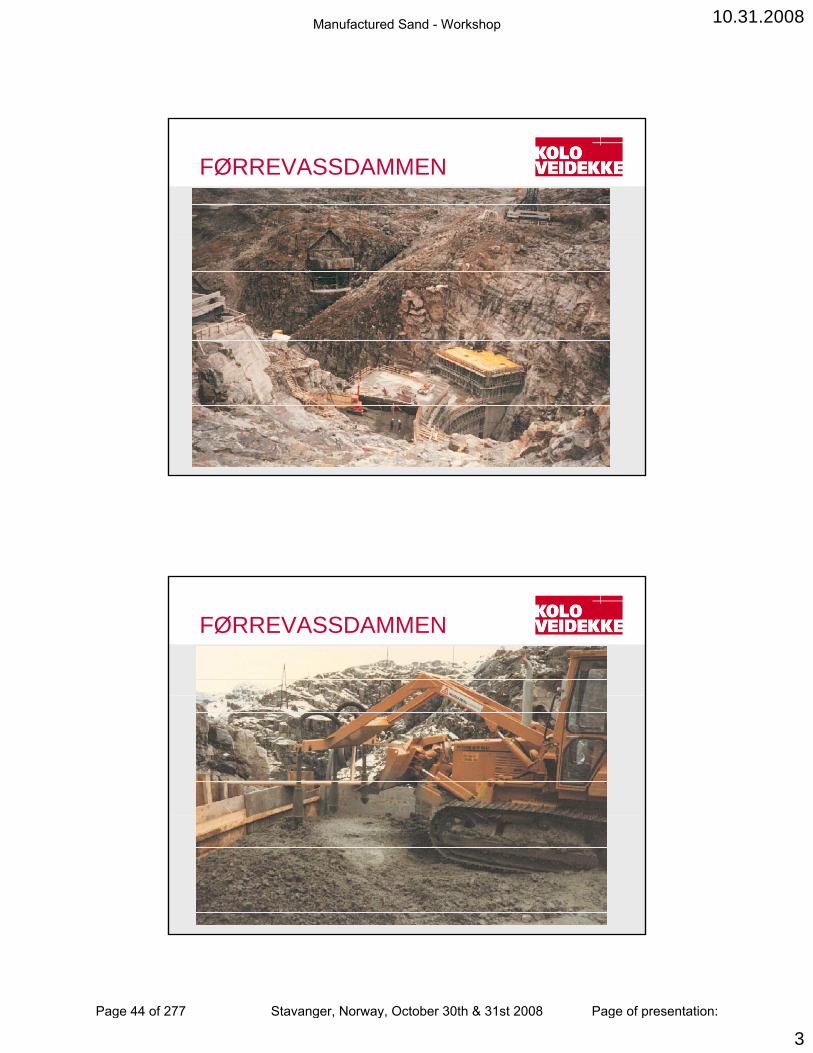
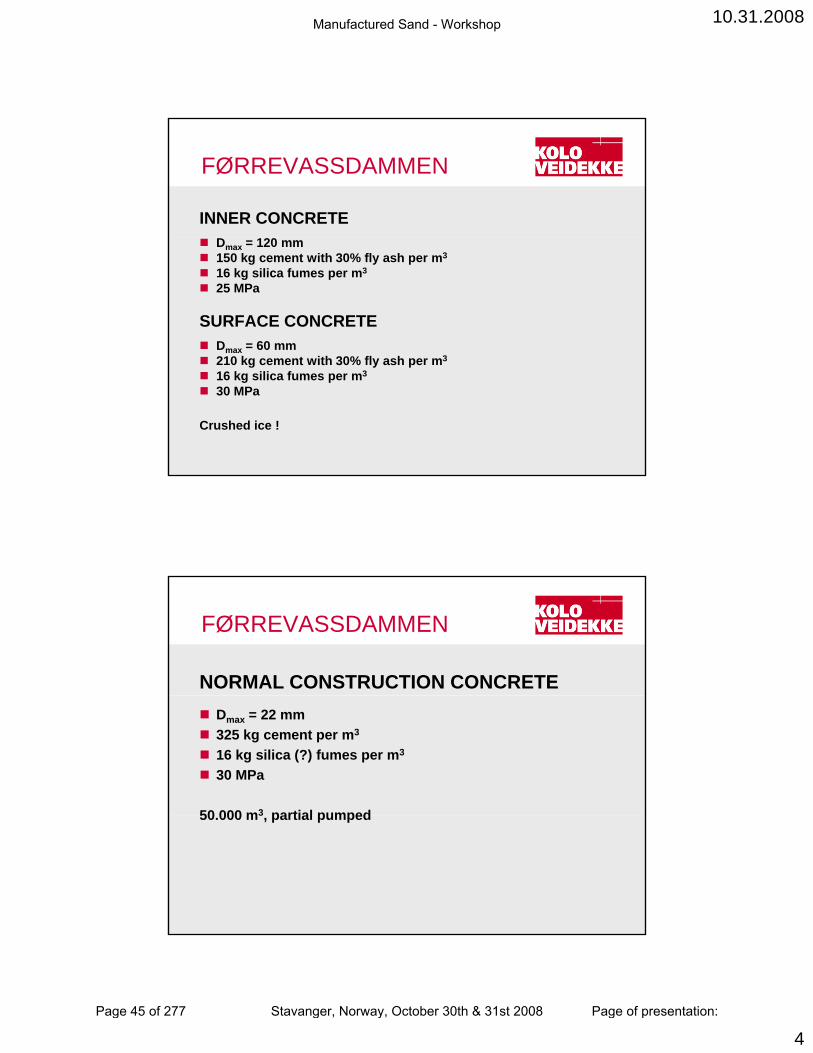
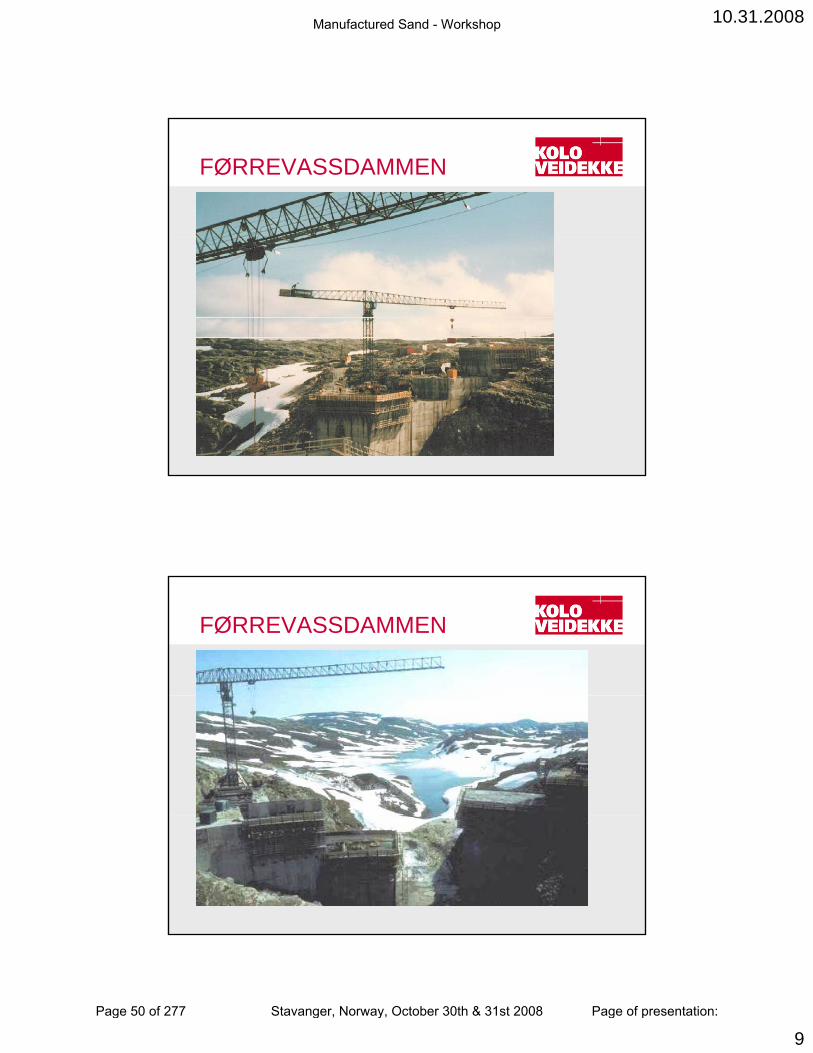
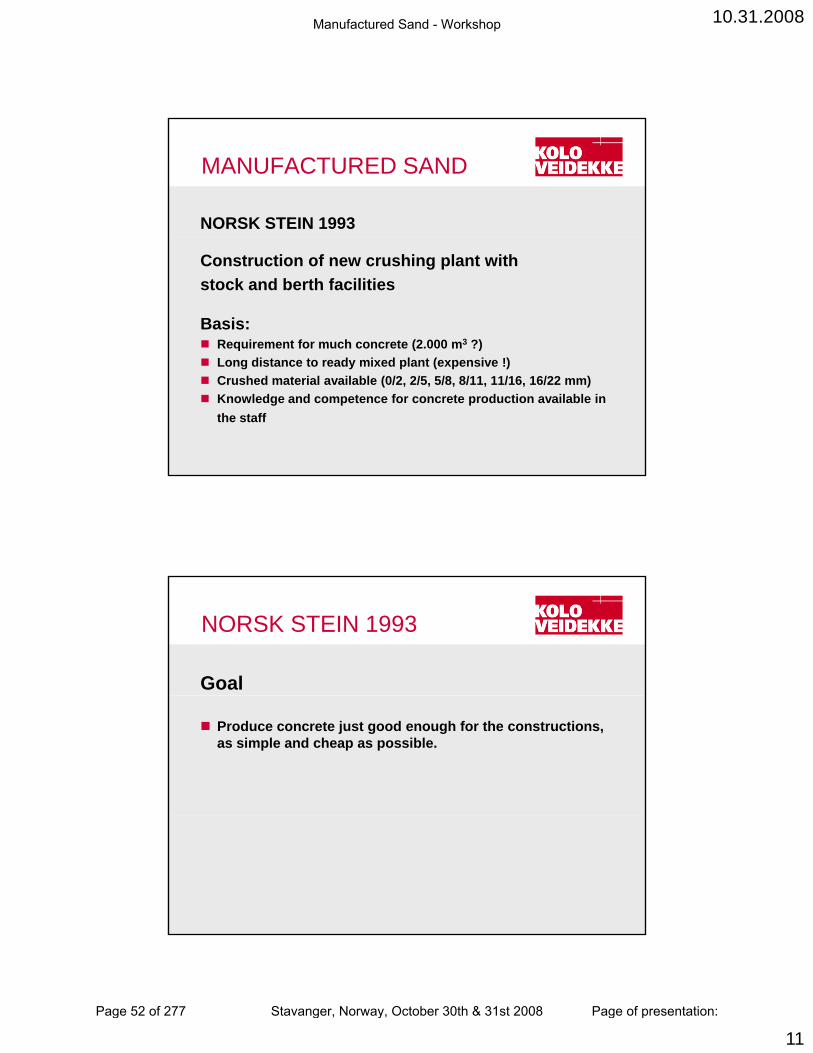
THE CONCRETE DAM FØRREVASSDAMMEN Odd Hotvedt In Norway manufactured stone sand was used on a large scale for the construction of Førrevassdammen in the years 1982 – 1986. Førrevassdammen is double curved arch dam, 15 meter thick, with gravity dams at both sides. Maximum height is 96 m and the length is 1.300 meter. The concrete volume is 250.000 m3. The dam is situated at the high mountain at 1.000 meter above sea level in Rogaland country. It belongs to Statkraft Ulla-Førre-plant which is the biggest hydro power plant in Europe. By reason of the tough weather conditions at the construction site, the construction of the dam could only be executed at the summer months. Not any natural aggregate resource was available close enough and all aggregate for the concrete production had to be produced at the site. Stone for the production of manufactured sand was take out in a quarry close to the site. The rock was a gneiss-granite. In addition to the concrete for the dam, there was also produced some 50.000 m3 of normal construction concrete for different use at the hydro power plant. The production plant for the manufactured sand was based at three crushing steps. The final step was a horizontal impact crusher with horizontal shaft (Hazemag APK 1313). The separation was done in a wet process. The aggregate was split in the following fractions: 0,04 / 1 mm, 1 / 4 mm, 4 / 10 mm, 10 /30 mm, 30 / 60 mm and 60 / 120 mm. The separation down to 4 mm was done by normal wet screening. The separation at 1 mm was done in a Rheax column and the separation at 0,04 mm was done by cyclones and lamella classifiers. The speed of the impact crusher was regulated between 30 and 55 meter per second in periphery speed to get balance in the volume of the fines gradings. High speed made high production of the finest grading, but also high consumption of wearing steel in the crushers. In general there was an overproduction of the grading 1 / 1 mm. This was a consequence of the mineral composition, the dominating crystal size etc in the rock. The concrete for the dam was of two types. The concrete closer than 1,5 meter from the surface was a frost resistant surface concrete with dmaks 60 mm. The rest was an inner concrete with dmaks 120 mm. In the surface concrete there was 210 kg cement per m3 and in the inner concrete 150 kg, in addition to that 16 kg silica fumes for both. The cement contained 30% fly ash. The demand for characteristic strength of the surface concrete was 30 MPa and for the inner concrete 25 MPa. The normal construction concrete that was made was a C30 quality with dmaks 22 mm and 325 kg cement per m3. The experiences with the production and the use of this concrete can be summed up like this; to the object the concrete was used to, nothing important was different from what it had been with corresponding concrete produced from natural sand and gravel. More bad shape and texture was to a certain extent compensated by a very good control with the grading of the aggregate. The grading for the dam concrete was very similar to a Füller curve. For the grading for the normal construction concrete a curve with a particle step was used. A great deal of the construction concrete with dmaks 22 mm was pumped. One negative experience was a tendency for bleeding of the fresh concrete. The fine aggregate had some to little of fines (filler) smaller than 0,06 mm. The aggregate separation plant could not be adjusted to increase the fines content enough without reconstruction and it was decided to live with this small problem in the construction period.
Manufactured Sand - Workshop
Page 41 of 277 Stavanger, Norway, October 30th & 31st 2008 Page of presentation:
10.31.2008
1
MANUFACTURED SAND
TWO CASES
THE CONCRETE DAM ”FØRREVASSDAMMEN” 1982-1986
NORSK STEIN 1993
ODD HOTVEDT
FØRREVASSDAMMEN
FØRREVASSDAMMEN
ARCH + GRAVIDITY DAM
LENGTH: 1.300 m
HEIGHT: 96 m
VOLUME: 255.000 m3
NO NATURAL AGGREGATE AVAILABLE !
Manufactured Sand - Workshop
Page 42 of 277 Stavanger, Norway, October 30th & 31st 2008 Page of presentation:

10.31.2008
2
MANUFACTURED SAND
Manufactured Sand - Workshop
Page 43 of 277 Stavanger, Norway, October 30th & 31st 2008 Page of presentation:
10.31.2008
3
FØRREVASSDAMMEN
FØRREVASSDAMMEN
Manufactured Sand - Workshop
Page 44 of 277 Stavanger, Norway, October 30th & 31st 2008 Page of presentation:
10.31.2008
4
FØRREVASSDAMMEN
INNER CONCRETEDmax = 120 mm150 kg cement with 30% fly ash per m3
16 kg silica fumes per m3
25 MPa
SURFACE CONCRETEDmax = 60 mm210 k t ith 30% fl h 3210 kg cement with 30% fly ash per m3
16 kg silica fumes per m3
30 MPa
Crushed ice !
FØRREVASSDAMMEN
NORMAL CONSTRUCTION CONCRETEDmax = 22 mm325 kg cement per m3
16 kg silica (?) fumes per m3
30 MPa
50 000 m3 partial pumped50.000 m3, partial pumped
Manufactured Sand - Workshop
Page 45 of 277 Stavanger, Norway, October 30th & 31st 2008 Page of presentation:
10.31.2008
5
FØRREVASSDAMMEN
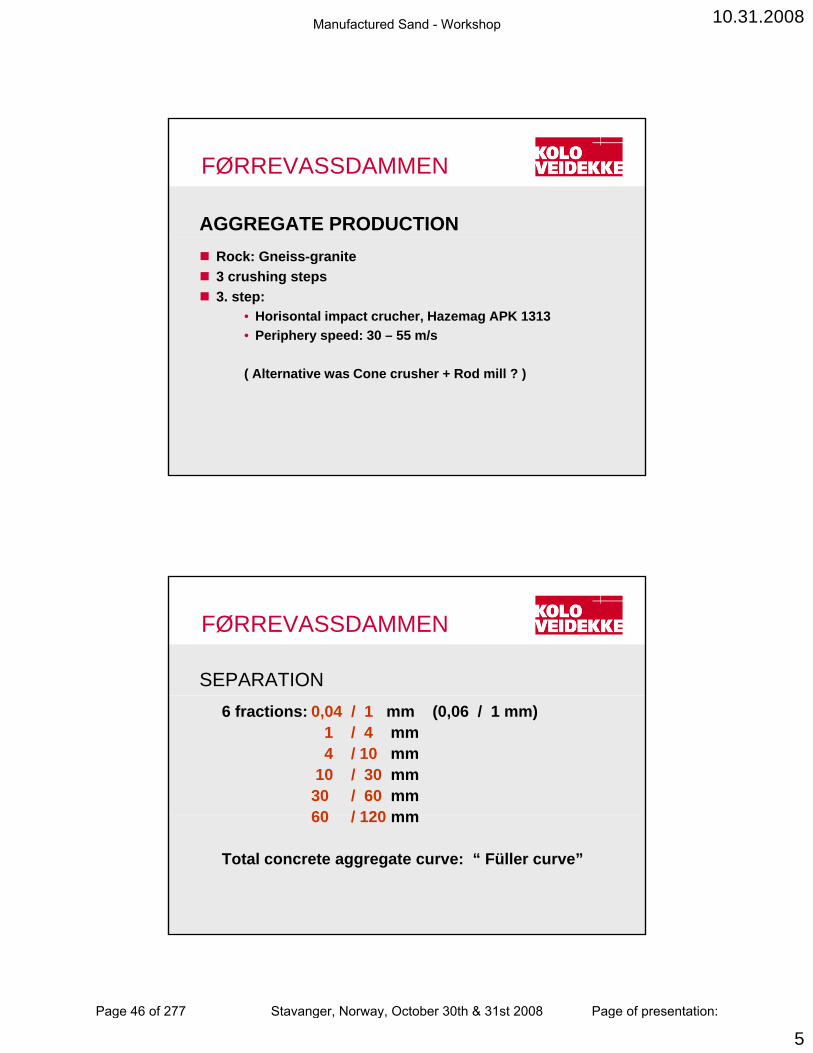
AGGREGATE PRODUCTIONRock: Gneiss-granite3 crushing steps3. step:
• Horisontal impact crucher, Hazemag APK 1313• Periphery speed: 30 – 55 m/s
( Alternative was Cone crusher + Rod mill ? )
FØRREVASSDAMMEN
SEPARATION6 fractions: 0,04 / 1 mm (0,06 / 1 mm)
1 / 4 mm4 / 10 mm
10 / 30 mm30 / 60 mm60 / 120 mm60 / 120 mm
Total concrete aggregate curve: “ Füller curve”
Manufactured Sand - Workshop
Page 46 of 277 Stavanger, Norway, October 30th & 31st 2008 Page of presentation:
10.31.2008
6
FØRREVASSDAMMEN
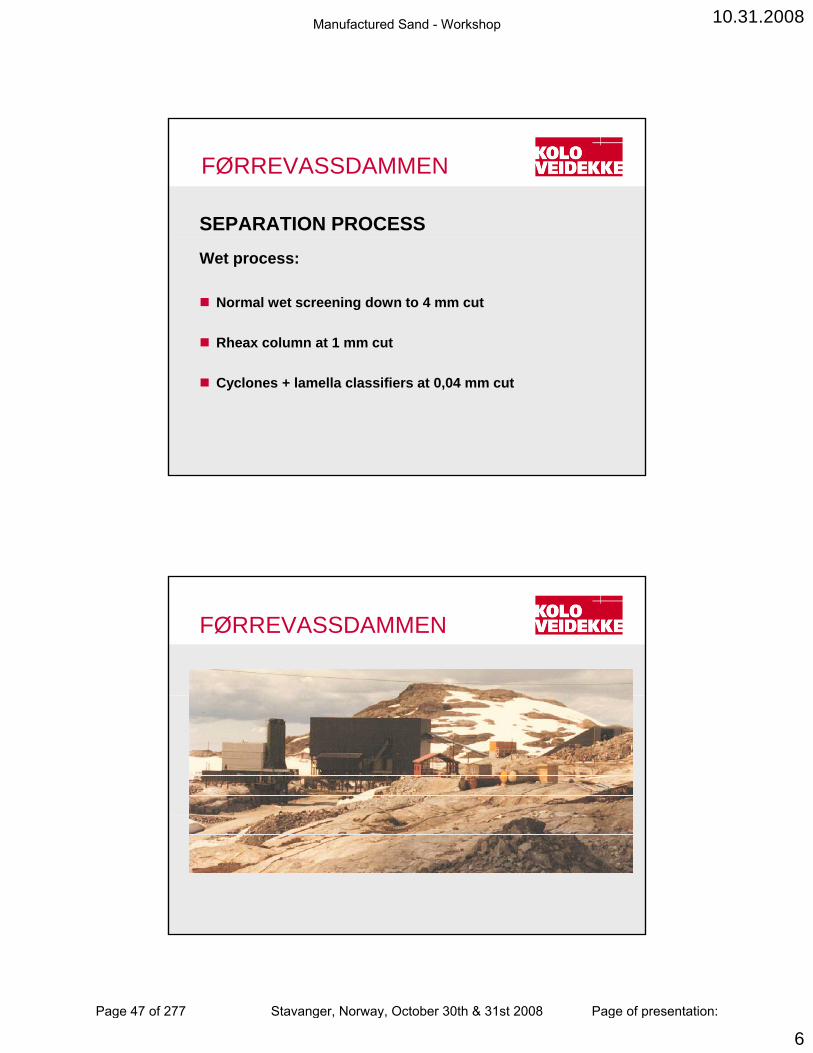
SEPARATION PROCESSWet process:
Normal wet screening down to 4 mm cut
Rheax column at 1 mm cut
Cyclones + lamella classifiers at 0,04 mm cut
FØRREVASSDAMMEN
Manufactured Sand - Workshop
Page 47 of 277 Stavanger, Norway, October 30th & 31st 2008 Page of presentation:
10.31.2008
7
FØRREVASSDAMMEN
FØRREVASSDAMMEN
Manufactured Sand - Workshop
Page 48 of 277 Stavanger, Norway, October 30th & 31st 2008 Page of presentation:
10.31.2008
8
FØRREVASSDAMMEN
FØRREVASSDAMMEN
EXPERIENCES
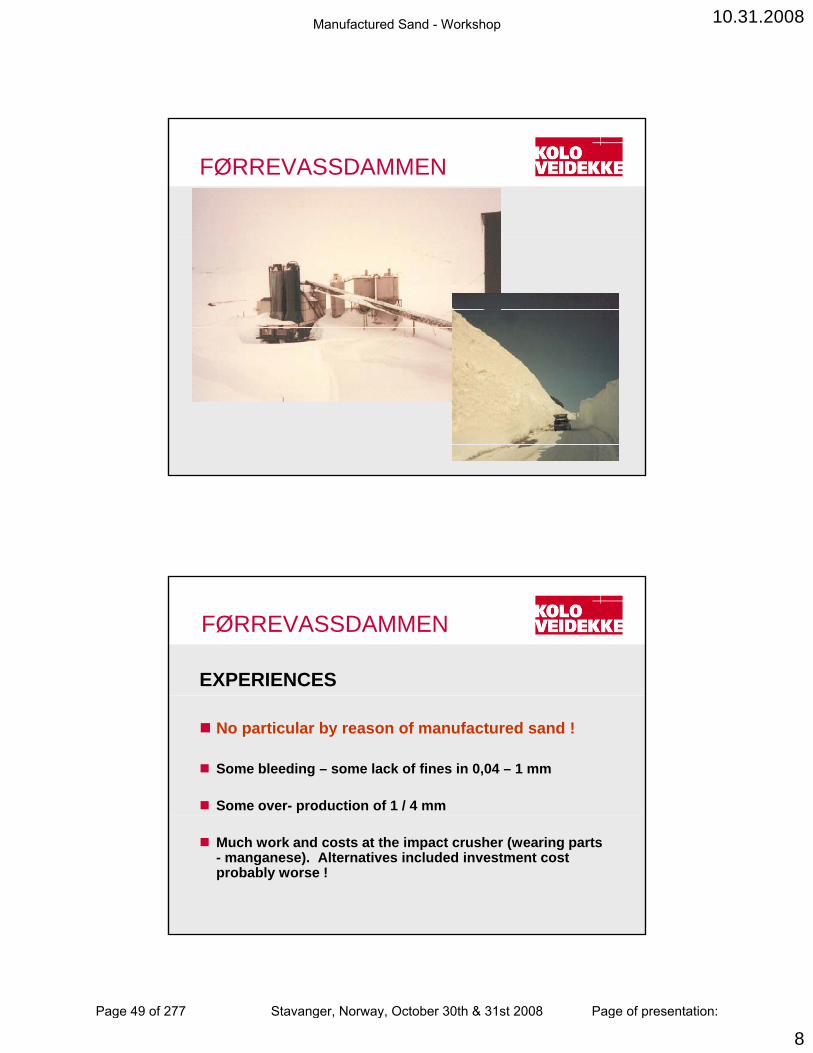
No particular by reason of manufactured sand !
Some bleeding – some lack of fines in 0,04 – 1 mm
Some over- production of 1 / 4 mm
Much work and costs at the impact crusher (wearing parts - manganese). Alternatives included investment cost probably worse !
Manufactured Sand - Workshop
Page 49 of 277 Stavanger, Norway, October 30th & 31st 2008 Page of presentation:
10.31.2008
9
FØRREVASSDAMMEN
FØRREVASSDAMMEN
Manufactured Sand - Workshop
Page 50 of 277 Stavanger, Norway, October 30th & 31st 2008 Page of presentation:

10.31.2008
10
FØRREVASSDAMMEN
FØRREVASSDAMMEN
Manufactured Sand - Workshop
Page 51 of 277 Stavanger, Norway, October 30th & 31st 2008 Page of presentation:
10.31.2008
11
MANUFACTURED SAND
NORSK STEIN 1993
Construction of new crushing plant with stock and berth facilities
Basis:Requirement for much concrete (2.000 m3 ?)Long distance to ready mixed plant (expensive !)Crushed material available (0/2, 2/5, 5/8, 8/11, 11/16, 16/22 mm)Knowledge and competence for concrete production available in the staff
NORSK STEIN 1993
Goal
Produce concrete just good enough for the constructions, as simple and cheap as possible.
Manufactured Sand - Workshop
Page 52 of 277 Stavanger, Norway, October 30th & 31st 2008 Page of presentation:

10.31.2008
12
NORSK STEIN 1993
Aggregate
Rock: Granodioritt / Gneiss-granite Gradings: 0/2, 2/5, 5/8, 8/11, 11/16, 16/22 mm– 0/2 was not washed or dry processed– Cone crushers in the final crushing step.– The shape of the fine fractions was not particular good
Concrete production plant:p p
Very simple, silos for 3 gradingsProduction fully certificated
NORSK STEIN 1993Best result for fresh concreteD max= 22mm with step-grading;Step: 5 / 8 mmStep: 5 / 8 mm
Manufactured Sand - Workshop
Page 53 of 277 Stavanger, Norway, October 30th & 31st 2008 Page of presentation:
10.31.2008
13
NORSK STEIN 1993
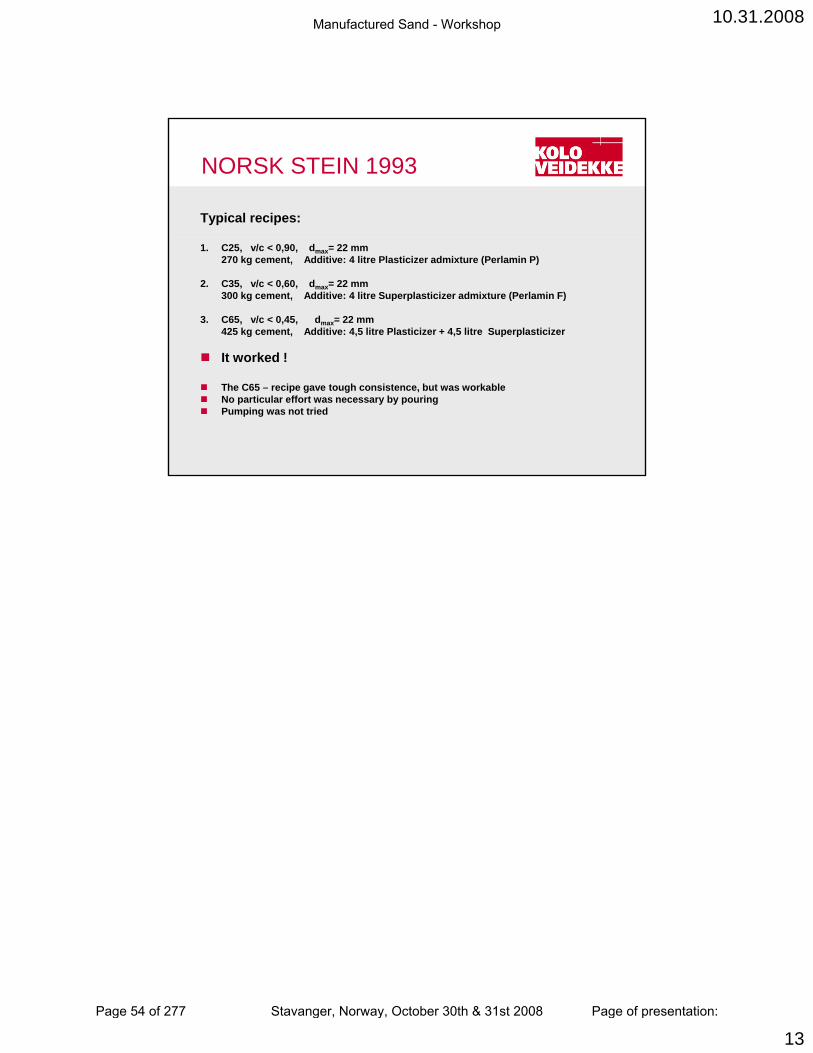
Typical recipes:
1. C25, v/c < 0,90, dmax= 22 mm270 kg cement, Additive: 4 litre Plasticizer admixture (Perlamin P)
2. C35, v/c < 0,60, dmax= 22 mm300 kg cement, Additive: 4 litre Superplasticizer admixture (Perlamin F)
3. C65, v/c < 0,45, dmax= 22 mm425 kg cement, Additive: 4,5 litre Plasticizer + 4,5 litre Superplasticizer
It worked !It worked !
The C65 – recipe gave tough consistence, but was workable No particular effort was necessary by pouring Pumping was not tried
Manufactured Sand - Workshop
Page 54 of 277 Stavanger, Norway, October 30th & 31st 2008 Page of presentation:
Abstract
Metso presentations on manufactured sand at COIN workshop Stavanger Oct 30-31
Background:
Metso Minerals has been following the global trend of increasing use of manufactured sand in concrete for the past 10-15 years in order to develop machines and solutions that fit the market needs, Recommending the most cost effective solution for a given customer and application is a complex procedure with many aspects. We will highlight three important aspects in our presentations.
Presentations:
1. Example of how to evaluate shape of fine aggregate
In this presentation, Jouni Mahonen will give the background to the NZ flow cone and present results that indicate that the level of fines will have impact on results on flow time and void content of fine aggregate. These are important parameters for how the sand will perform in concrete
2.Barmac / HP sand Case in US
This presentation by Jarmo Eloranta will look at results from a recent test in USA where a Barmac VSI crusher and HP type cone crusher were compared in performance from different aspects. Aspects like yield of sand, power consumption, amount of fines produced and shape of the sand. Since there is no internationally recognized and widely used standard for evaluating shape, the NZ flow cone test method was used.
3. Air Classification. A method to to adjust fine aggregate gradation
Manufactured sand, especially sand with very good shape properties, have a higher level of fines (minus 125 micron) than what is required in most concrete mix designs.
The conventional way to reduce the amount of fines in fine aggregate has been by washing. In recent years however dry classification has entered the market as a strong alternative. Sven-Henrik Norman will present Metso’s solution for air classification.
Conclusion:
The production technology for manufactuing sand/fine aggregate for concrete is more advanced than normal production of aggregates, but still incorporates the same basic crushing and screening equipment. With the addition of classification tools are available for production of high quality manufactured sand for concrete.
Metso Minerals would like to see development of test methods for fine aggregate. As an equipment and solutions provider, it is important to know more about the exact shape and gradation requiremnts of end users/concrete producers so that the right equipment recommendation can be made to the aggregate / sand producer.
Manufactured Sand - Workshop
Page 55 of 277 Stavanger, Norway, October 30th & 31st 2008 Page of presentation:
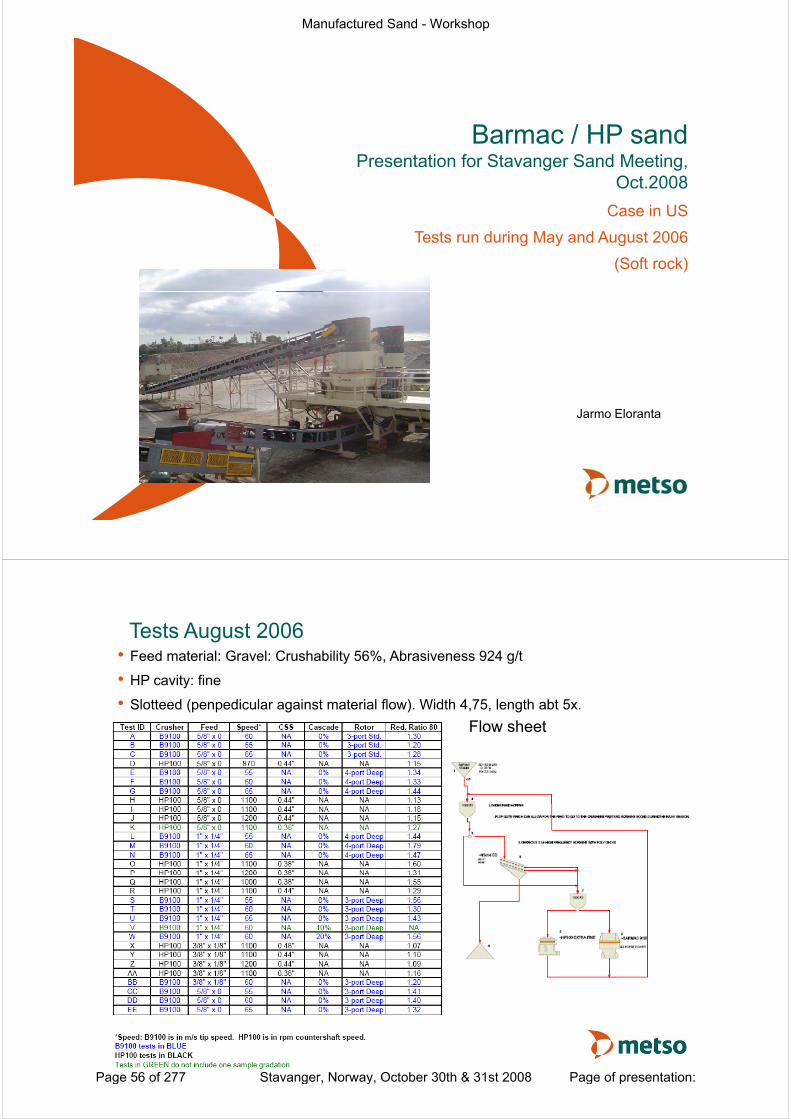
Barmac / HP sand Presentation for Stavanger Sand Meeting,
O t 2008Oct.2008Case in US
Tests run during May and August 2006 g y g(Soft rock)
Jarmo Eloranta
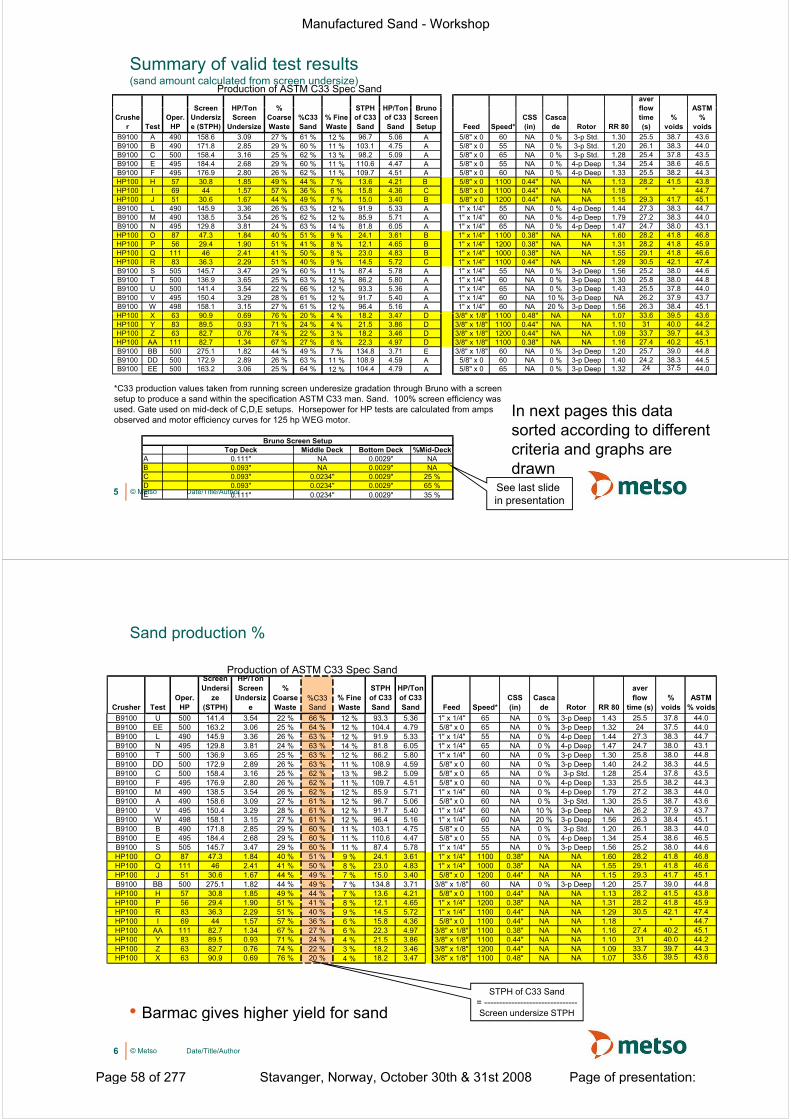
Tests August 2006• Feed material: Gravel: Crushability 56%, Abrasiveness 924 g/t
• HP cavity: fine
• Slotteed (penpedicular against material flow). Width 4,75, length abt 5x. Flow sheet
© Metso2 Date/Title/Author
Manufactured Sand - Workshop
Page 56 of 277 Stavanger, Norway, October 30th & 31st 2008 Page of presentation:

FeedFeedFeed
90.0
100.0
60.0
70.0
80.0
30.0
40.0
50.0%
0.0
10.0
20.0
0.01 0.10 1.00 10.00 100.00
mmA B C D E F G H I J K L M N O PQ R S T U V W X Y Z AA BB CC DD EE
© Metso3 Date/Title/Author
Q R S T U V W X Y Z AA BB CC DD EE
ProductCrusher productp
90,0
100,0
60,0
70,0
80,0
20 0
30,0
40,0
50,0%
0,0
10,0
20,0
0 01 0 10 1 00 10 00 100 000,01 0,10 1,00 10,00 100,00
mmA B C D E F G H I J K L M N O PQ R S T U V W X Y Z AA BB CC DD EE
© Metso4 Date/Title/Author
Manufactured Sand - Workshop
Page 57 of 277 Stavanger, Norway, October 30th & 31st 2008 Page of presentation:
Summary of valid test results (sand amount calculated from screen undersize)
Screen HP/Ton % STPH HP/Ton Brunoaver flow ASTM
Production of ASTM C33 Spec Sand
Crusher Test
Oper. HP
ScreenUndersize (STPH)
HP/TonScreen
Undersize
%Coarse Waste
%C33 Sand
% Fine Waste
STPHof C33 Sand
HP/Tonof C33 Sand
BrunoScreen Setup Feed Speed*
CSS(in)
Cascade Rotor RR 80
flowtime (s)
%voids
ASTM%
voidsB9100 A 490 158.6 3.09 27 % 61 % 12 % 96.7 5.06 A 5/8" x 0 60 NA 0 % 3-p Std. 1.30 25.5 38.7 43.6B9100 B 490 171.8 2.85 29 % 60 % 11 % 103.1 4.75 A 5/8" x 0 55 NA 0 % 3-p Std. 1.20 26.1 38.3 44.0B9100 C 500 158.4 3.16 25 % 62 % 13 % 98.2 5.09 A 5/8" x 0 65 NA 0 % 3-p Std. 1.28 25.4 37.8 43.5B9100 E 495 184.4 2.68 29 % 60 % 11 % 110.6 4.47 A 5/8" x 0 55 NA 0 % 4-p Deep 1.34 25.4 38.6 46.5B9100 F 495 176.9 2.80 26 % 62 % 11 % 109.7 4.51 A 5/8" x 0 60 NA 0 % 4-p Deep 1.33 25.5 38.2 44.3p pHP100 H 57 30.8 1.85 49 % 44 % 7 % 13.6 4.21 B 5/8" x 0 1100 0.44" NA NA 1.13 28.2 41.5 43.8HP100 I 69 44 1.57 57 % 36 % 6 % 15.8 4.36 C 5/8" x 0 1100 0.44" NA NA 1.18 * * 44.7HP100 J 51 30.6 1.67 44 % 49 % 7 % 15.0 3.40 B 5/8" x 0 1200 0.44" NA NA 1.15 29.3 41.7 45.1B9100 L 490 145.9 3.36 26 % 63 % 12 % 91.9 5.33 A 1" x 1/4" 55 NA 0 % 4-p Deep 1.44 27.3 38.3 44.7B9100 M 490 138.5 3.54 26 % 62 % 12 % 85.9 5.71 A 1" x 1/4" 60 NA 0 % 4-p Deep 1.79 27.2 38.3 44.0B9100 N 495 129.8 3.81 24 % 63 % 14 % 81.8 6.05 A 1" x 1/4" 65 NA 0 % 4-p Deep 1.47 24.7 38.0 43.1HP100 O 87 47.3 1.84 40 % 51 % 9 % 24.1 3.61 B 1" x 1/4" 1100 0.38" NA NA 1.60 28.2 41.8 46.8HP100 P 56 29 4 1 90 51 % 41 % 8 % 12 1 4 65 B 1" x 1/4" 1200 0 38" NA NA 1 31 28 2 41 8 45 9HP100 P 56 29.4 1.90 51 % 41 % 8 % 12.1 4.65 B 1 x 1/4 1200 0.38 NA NA 1.31 28.2 41.8 45.9HP100 Q 111 46 2.41 41 % 50 % 8 % 23.0 4.83 B 1" x 1/4" 1000 0.38" NA NA 1.55 29.1 41.8 46.6HP100 R 83 36.3 2.29 51 % 40 % 9 % 14.5 5.72 C 1" x 1/4" 1100 0.44" NA NA 1.29 30.5 42.1 47.4B9100 S 505 145.7 3.47 29 % 60 % 11 % 87.4 5.78 A 1" x 1/4" 55 NA 0 % 3-p Deep 1.56 25.2 38.0 44.6B9100 T 500 136.9 3.65 25 % 63 % 12 % 86.2 5.80 A 1" x 1/4" 60 NA 0 % 3-p Deep 1.30 25.8 38.0 44.8B9100 U 500 141.4 3.54 22 % 66 % 12 % 93.3 5.36 A 1" x 1/4" 65 NA 0 % 3-p Deep 1.43 25.5 37.8 44.0B9100 V 495 150.4 3.29 28 % 61 % 12 % 91.7 5.40 A 1" x 1/4" 60 NA 10 % 3-p Deep NA 26.2 37.9 43.7B9100 W 498 158.1 3.15 27 % 61 % 12 % 96.4 5.16 A 1" x 1/4" 60 NA 20 % 3-p Deep 1.56 26.3 38.4 45.1HP100 X 63 90 9 0 69 76 % 20 % 4 % 18 2 3 47 D 3/8" 1/8" 1100 0 48" NA NA 1 07 33 6 39 5 43 6HP100 X 63 90.9 0.69 76 % 20 % 4 % 18.2 3.47 D 3/8" x 1/8" 1100 0.48" NA NA 1.07 33.6 39.5 43.6HP100 Y 83 89.5 0.93 71 % 24 % 4 % 21.5 3.86 D 3/8" x 1/8" 1100 0.44" NA NA 1.10 31 40.0 44.2HP100 Z 63 82.7 0.76 74 % 22 % 3 % 18.2 3.46 D 3/8" x 1/8" 1200 0.44" NA NA 1.09 33.7 39.7 44.3HP100 AA 111 82.7 1.34 67 % 27 % 6 % 22.3 4.97 D 3/8" x 1/8" 1100 0.38" NA NA 1.16 27.4 40.2 45.1B9100 BB 500 275.1 1.82 44 % 49 % 7 % 134.8 3.71 E 3/8" x 1/8" 60 NA 0 % 3-p Deep 1.20 25.7 39.0 44.8B9100 DD 500 172.9 2.89 26 % 63 % 11 % 108.9 4.59 A 5/8" x 0 60 NA 0 % 3-p Deep 1.40 24.2 38.3 44.5B9100 EE 500 163.2 3.06 25 % 64 % 12 % 104.4 4.79 A 5/8" x 0 65 NA 0 % 3-p Deep 1.32 24 37.5 44.0
*C33 production values taken from running screen underesize gradation through Bruno with a screensetup to produce a sand within the specification ASTM C33 man. Sand. 100% screen efficiency wasused. Gate used on mid-deck of C,D,E setups. Horsepower for HP tests are calculated from amps observed and motor efficiency curves for 125 hp WEG motor.
%Mid-DeckBottom DeckMiddle DeckTop DeckBruno Screen Setup
In next pages this data sorted according to differentcriteria and graphs are
© Metso5 Date/Title/Author
ABCDE 0.111"
0.0234"NANA0.111"
0.093"0.093"0.093" 0.0029"
0.0029"0.0234"0.0234"
NA25 %
0.0029"0.0029"
65 %35 %
0.0029"%Mid DeckBottom DeckMiddle DeckTop Deck
NAcriteria and graphs aredrawn
See last slide in presentation
Sand production %
P d ti f ASTM C33 S S d
Crusher TestOper.
HP
Screen Undersi
ze (STPH)
HP/Ton Screen
Undersize
%Coarse Waste
%C33 Sand
% Fine Waste
STPH of C33 Sand
HP/Ton of C33 Sand Feed Speed*
CSS (in)
Cascade Rotor RR 80
aver flow
time (s)%
voidsASTM
% voidsB9100 U 500 141.4 3.54 22 % 66 % 12 % 93.3 5.36 1" x 1/4" 65 NA 0 % 3-p Deep 1.43 25.5 37.8 44.0B9100 EE 500 163.2 3.06 25 % 64 % 12 % 104.4 4.79 5/8" x 0 65 NA 0 % 3-p Deep 1.32 24 37.5 44.0B9100 L 490 145 9 3 36 26 % 63 % 12 % 91 9 5 33 1" x 1/4" 55 NA 0 % 4 p Deep 1 44 27 3 38 3 44 7
Production of ASTM C33 Spec Sand
B9100 L 490 145.9 3.36 26 % 63 % 12 % 91.9 5.33 1" x 1/4" 55 NA 0 % 4-p Deep 1.44 27.3 38.3 44.7B9100 N 495 129.8 3.81 24 % 63 % 14 % 81.8 6.05 1" x 1/4" 65 NA 0 % 4-p Deep 1.47 24.7 38.0 43.1B9100 T 500 136.9 3.65 25 % 63 % 12 % 86.2 5.80 1" x 1/4" 60 NA 0 % 3-p Deep 1.30 25.8 38.0 44.8B9100 DD 500 172.9 2.89 26 % 63 % 11 % 108.9 4.59 5/8" x 0 60 NA 0 % 3-p Deep 1.40 24.2 38.3 44.5B9100 C 500 158.4 3.16 25 % 62 % 13 % 98.2 5.09 5/8" x 0 65 NA 0 % 3-p Std. 1.28 25.4 37.8 43.5B9100 F 495 176.9 2.80 26 % 62 % 11 % 109.7 4.51 5/8" x 0 60 NA 0 % 4-p Deep 1.33 25.5 38.2 44.3B9100 M 490 138.5 3.54 26 % 62 % 12 % 85.9 5.71 1" x 1/4" 60 NA 0 % 4-p Deep 1.79 27.2 38.3 44.0B9100 A 490 158.6 3.09 27 % 61 % 12 % 96.7 5.06 5/8" x 0 60 NA 0 % 3-p Std. 1.30 25.5 38.7 43.6pB9100 V 495 150.4 3.29 28 % 61 % 12 % 91.7 5.40 1" x 1/4" 60 NA 10 % 3-p Deep NA 26.2 37.9 43.7B9100 W 498 158.1 3.15 27 % 61 % 12 % 96.4 5.16 1" x 1/4" 60 NA 20 % 3-p Deep 1.56 26.3 38.4 45.1B9100 B 490 171.8 2.85 29 % 60 % 11 % 103.1 4.75 5/8" x 0 55 NA 0 % 3-p Std. 1.20 26.1 38.3 44.0B9100 E 495 184.4 2.68 29 % 60 % 11 % 110.6 4.47 5/8" x 0 55 NA 0 % 4-p Deep 1.34 25.4 38.6 46.5B9100 S 505 145.7 3.47 29 % 60 % 11 % 87.4 5.78 1" x 1/4" 55 NA 0 % 3-p Deep 1.56 25.2 38.0 44.6HP100 O 87 47.3 1.84 40 % 51 % 9 % 24.1 3.61 1" x 1/4" 1100 0.38" NA NA 1.60 28.2 41.8 46.8HP100 Q 111 46 2.41 41 % 50 % 8 % 23.0 4.83 1" x 1/4" 1000 0.38" NA NA 1.55 29.1 41.8 46.6HP100 J 51 30 6 1 67 44 % 49 % 7 % 15 0 3 40 5/8" 0 1200 0 44" NA NA 1 15 29 3 41 7 45 1HP100 J 51 30.6 1.67 44 % 49 % 7 % 15.0 3.40 5/8" x 0 1200 0.44" NA NA 1.15 29.3 41.7 45.1B9100 BB 500 275.1 1.82 44 % 49 % 7 % 134.8 3.71 3/8" x 1/8" 60 NA 0 % 3-p Deep 1.20 25.7 39.0 44.8HP100 H 57 30.8 1.85 49 % 44 % 7 % 13.6 4.21 5/8" x 0 1100 0.44" NA NA 1.13 28.2 41.5 43.8HP100 P 56 29.4 1.90 51 % 41 % 8 % 12.1 4.65 1" x 1/4" 1200 0.38" NA NA 1.31 28.2 41.8 45.9HP100 R 83 36.3 2.29 51 % 40 % 9 % 14.5 5.72 1" x 1/4" 1100 0.44" NA NA 1.29 30.5 42.1 47.4HP100 I 69 44 1.57 57 % 36 % 6 % 15.8 4.36 5/8" x 0 1100 0.44" NA NA 1.18 * * 44.7HP100 AA 111 82.7 1.34 67 % 27 % 6 % 22.3 4.97 3/8" x 1/8" 1100 0.38" NA NA 1.16 27.4 40.2 45.1HP100 Y 83 89.5 0.93 71 % 24 % 4 % 21.5 3.86 3/8" x 1/8" 1100 0.44" NA NA 1.10 31 40.0 44.2
• Barmac gives higher yield for sand
HP100 Y 83 89.5 0.93 71 % 24 % 4 % 21.5 3.86 3/8 x 1/8 1100 0.44 NA NA 1.10 31 40.0 44.2HP100 Z 63 82.7 0.76 74 % 22 % 3 % 18.2 3.46 3/8" x 1/8" 1200 0.44" NA NA 1.09 33.7 39.7 44.3HP100 X 63 90.9 0.69 76 % 20 % 4 % 18.2 3.47 3/8" x 1/8" 1100 0.48" NA NA 1.07 33.6 39.5 43.6
STPH of C33 Sand= -------------------------------S d i STPH
© Metso
• Barmac gives higher yield for sand
6 Date/Title/Author
Screen undersize STPH
Manufactured Sand - Workshop
Page 58 of 277 Stavanger, Norway, October 30th & 31st 2008 Page of presentation:

HP / ton of sandP d ti f ASTM C33 S S d
Crusher TestOper.
HP
Screen Undersize (STPH)
HP/Ton
Screen Unders
%Coarse Waste
%C33Sand
% Fine Waste
STPH of C33 Sand
HP/Ton of C33 Sand Feed Speed* CSS (in)
Cascade Rotor RR 80
aver flow time (s)
%voids
ASTM % voids
HP100 J 51 30.6 1.67 44 % 49 % 7 % 15.0 3.40 5/8" x 0 1200 0.44" NA NA 1.15 29.3 41.7 45.1HP100 Z 63 82.7 0.76 74 % 22 % 3 % 18.2 3.46 3/8" x 1/8" 1200 0.44" NA NA 1.09 33.7 39.7 44.3
Production of ASTM C33 Spec Sand
HP100 X 63 90.9 0.69 76 % 20 % 4 % 18.2 3.47 3/8" x 1/8" 1100 0.48" NA NA 1.07 33.6 39.5 43.6HP100 O 87 47.3 1.84 40 % 51 % 9 % 24.1 3.61 1" x 1/4" 1100 0.38" NA NA 1.60 28.2 41.8 46.8B9100 BB 500 275.1 1.82 44 % 49 % 7 % 134.8 3.71 3/8" x 1/8" 60 NA 0 % 3-p Deep 1.20 25.7 39.0 44.8HP100 Y 83 89.5 0.93 71 % 24 % 4 % 21.5 3.86 3/8" x 1/8" 1100 0.44" NA NA 1.10 31 40.0 44.2HP100 H 57 30.8 1.85 49 % 44 % 7 % 13.6 4.21 5/8" x 0 1100 0.44" NA NA 1.13 28.2 41.5 43.8HP100 I 69 44 1.57 57 % 36 % 6 % 15.8 4.36 5/8" x 0 1100 0.44" NA NA 1.18 * * 44.7B9100 E 495 184.4 2.68 29 % 60 % 11 % 110.6 4.47 5/8" x 0 55 NA 0 % 4-p Deep 1.34 25.4 38.6 46.5p pB9100 F 495 176.9 2.80 26 % 62 % 11 % 109.7 4.51 5/8" x 0 60 NA 0 % 4-p Deep 1.33 25.5 38.2 44.3B9100 DD 500 172.9 2.89 26 % 63 % 11 % 108.9 4.59 5/8" x 0 60 NA 0 % 3-p Deep 1.40 24.2 38.3 44.5HP100 P 56 29.4 1.90 51 % 41 % 8 % 12.1 4.65 1" x 1/4" 1200 0.38" NA NA 1.31 28.2 41.8 45.9B9100 B 490 171.8 2.85 29 % 60 % 11 % 103.1 4.75 5/8" x 0 55 NA 0 % 3-p Std. 1.20 26.1 38.3 44.0B9100 EE 500 163.2 3.06 25 % 64 % 12 % 104.4 4.79 5/8" x 0 65 NA 0 % 3-p Deep 1.32 24 37.5 44.0HP100 Q 111 46 2.41 41 % 50 % 8 % 23.0 4.83 1" x 1/4" 1000 0.38" NA NA 1.55 29.1 41.8 46.6HP100 AA 111 82.7 1.34 67 % 27 % 6 % 22.3 4.97 3/8" x 1/8" 1100 0.38" NA NA 1.16 27.4 40.2 45.1B9100 A 490 158.6 3.09 27 % 61 % 12 % 96.7 5.06 5/8" x 0 60 NA 0 % 3-p Std. 1.30 25.5 38.7 43.6B9100 C 500 158.4 3.16 25 % 62 % 13 % 98.2 5.09 5/8" x 0 65 NA 0 % 3-p Std. 1.28 25.4 37.8 43.5B9100 W 498 158.1 3.15 27 % 61 % 12 % 96.4 5.16 1" x 1/4" 60 NA 20 % 3-p Deep 1.56 26.3 38.4 45.1B9100 L 490 145.9 3.36 26 % 63 % 12 % 91.9 5.33 1" x 1/4" 55 NA 0 % 4-p Deep 1.44 27.3 38.3 44.7B9100 U 500 141.4 3.54 22 % 66 % 12 % 93.3 5.36 1" x 1/4" 65 NA 0 % 3-p Deep 1.43 25.5 37.8 44.0B9100 V 495 150.4 3.29 28 % 61 % 12 % 91.7 5.40 1" x 1/4" 60 NA 10 % 3-p Deep NA 26.2 37.9 43.7B9100 M 490 138.5 3.54 26 % 62 % 12 % 85.9 5.71 1" x 1/4" 60 NA 0 % 4-p Deep 1.79 27.2 38.3 44.0p pHP100 R 83 36.3 2.29 51 % 40 % 9 % 14.5 5.72 1" x 1/4" 1100 0.44" NA NA 1.29 30.5 42.1 47.4B9100 S 505 145.7 3.47 29 % 60 % 11 % 87.4 5.78 1" x 1/4" 55 NA 0 % 3-p Deep 1.56 25.2 38.0 44.6B9100 T 500 136.9 3.65 25 % 63 % 12 % 86.2 5.80 1" x 1/4" 60 NA 0 % 3-p Deep 1.30 25.8 38.0 44.8B9100 N 495 129.8 3.81 24 % 63 % 14 % 81.8 6.05 1" x 1/4" 65 NA 0 % 4-p Deep 1.47 24.7 38.0 43.1
© Metso
• HP uses less energy/produced sand ton7 Date/Title/Author
Fine waste %
Crusher Test
Oper. HP
Screen Undersize (STPH)
HP/TonScreen
Undersize
%Coarse Waste
%C33 Sand
% Fine Waste
STPH of C33
Sand
HP/Ton of C33 Sand Feed Speed*
CSS (in)
Cascade Rotor RR 80
aver flow
time (s) % voidsASTM
% voidsHP100 Z 63 82.7 0.76 74 % 22 % 3 % 18.2 3.46 3/8" x 1/8" 1200 0.44" NA NA 1.09 33.7 39.7 44.3HP100 X 63 90 9 0 69 76 % 20 % 4 % 18 2 3 47 3/8" 1/8" 1100 0 48" NA NA 1 07 33 6 39 5 43 6
Production of ASTM C33 Spec Sand
HP100 X 63 90.9 0.69 76 % 20 % 4 % 18.2 3.47 3/8" x 1/8" 1100 0.48" NA NA 1.07 33.6 39.5 43.6HP100 Y 83 89.5 0.93 71 % 24 % 4 % 21.5 3.86 3/8" x 1/8" 1100 0.44" NA NA 1.10 31 40.0 44.2HP100 I 69 44 1.57 57 % 36 % 6 % 15.8 4.36 5/8" x 0 1100 0.44" NA NA 1.18 * * 44.7HP100 AA 111 82.7 1.34 67 % 27 % 6 % 22.3 4.97 3/8" x 1/8" 1100 0.38" NA NA 1.16 27.4 40.2 45.1HP100 H 57 30.8 1.85 49 % 44 % 7 % 13.6 4.21 5/8" x 0 1100 0.44" NA NA 1.13 28.2 41.5 43.8HP100 J 51 30.6 1.67 44 % 49 % 7 % 15.0 3.40 5/8" x 0 1200 0.44" NA NA 1.15 29.3 41.7 45.1B9100 BB 500 275.1 1.82 44 % 49 % 7 % 134.8 3.71 3/8" x 1/8" 60 NA 0 % 3-p Deep 1.20 25.7 39.0 44.8HP100 P 56 29.4 1.90 51 % 41 % 8 % 12.1 4.65 1" x 1/4" 1200 0.38" NA NA 1.31 28.2 41.8 45.9HP100 P 56 29.4 1.90 51 % 41 % 8 % 12.1 4.65 1 x 1/4 1200 0.38 NA NA 1.31 8 8 5 9HP100 Q 111 46 2.41 41 % 50 % 8 % 23.0 4.83 1" x 1/4" 1000 0.38" NA NA 1.55 29.1 41.8 46.6HP100 O 87 47.3 1.84 40 % 51 % 9 % 24.1 3.61 1" x 1/4" 1100 0.38" NA NA 1.60 28.2 41.8 46.8HP100 R 83 36.3 2.29 51 % 40 % 9 % 14.5 5.72 1" x 1/4" 1100 0.44" NA NA 1.29 30.5 42.1 47.4B9100 B 490 171.8 2.85 29 % 60 % 11 % 103.1 4.75 5/8" x 0 55 NA 0 % 3-p Std. 1.20 26.1 38.3 44.0B9100 E 495 184.4 2.68 29 % 60 % 11 % 110.6 4.47 5/8" x 0 55 NA 0 % 4-p Deep 1.34 25.4 38.6 46.5B9100 F 495 176.9 2.80 26 % 62 % 11 % 109.7 4.51 5/8" x 0 60 NA 0 % 4-p Deep 1.33 25.5 38.2 44.3B9100 S 505 145.7 3.47 29 % 60 % 11 % 87.4 5.78 1" x 1/4" 55 NA 0 % 3-p Deep 1.56 25.2 38.0 44.6B9100 DD 500 172 9 2 89 26 % 63 % 11 % 108 9 4 59 5/8" 0 60 NA 0 % 3 D 1 40 24 2 38 3 44 5B9100 DD 500 172.9 2.89 26 % 63 % 11 % 108.9 4.59 5/8" x 0 60 NA 0 % 3-p Deep 1.40 24.2 38.3 44.5B9100 A 490 158.6 3.09 27 % 61 % 12 % 96.7 5.06 5/8" x 0 60 NA 0 % 3-p Std. 1.30 25.5 38.7 43.6B9100 L 490 145.9 3.36 26 % 63 % 12 % 91.9 5.33 1" x 1/4" 55 NA 0 % 4-p Deep 1.44 27.3 38.3 44.7B9100 M 490 138.5 3.54 26 % 62 % 12 % 85.9 5.71 1" x 1/4" 60 NA 0 % 4-p Deep 1.79 27.2 38.3 44.0B9100 T 500 136.9 3.65 25 % 63 % 12 % 86.2 5.80 1" x 1/4" 60 NA 0 % 3-p Deep 1.30 25.8 38.0 44.8B9100 U 500 141.4 3.54 22 % 66 % 12 % 93.3 5.36 1" x 1/4" 65 NA 0 % 3-p Deep 1.43 25.5 37.8 44.0B9100 V 495 150.4 3.29 28 % 61 % 12 % 91.7 5.40 1" x 1/4" 60 NA 10 % 3-p Deep NA 26.2 37.9 43.7B9100 W 498 158.1 3.15 27 % 61 % 12 % 96.4 5.16 1" x 1/4" 60 NA 20 % 3-p Deep 1.56 26.3 38.4 45.1
• Share of fines (<0 07mm = 0 0029in) is less with HP
B9100 W 498 158.1 3.15 27 % 61 % 12 % 96.4 5.16 1 x 1/4 60 NA 20 % 3 p Deep 1.56 26.3 38.4 45.1B9100 EE 500 163.2 3.06 25 % 64 % 12 % 104.4 4.79 5/8" x 0 65 NA 0 % 3-p Deep 1.32 24 37.5 44.0B9100 C 500 158.4 3.16 25 % 62 % 13 % 98.2 5.09 5/8" x 0 65 NA 0 % 3-p Std. 1.28 25.4 37.8 43.5B9100 N 495 129.8 3.81 24 % 63 % 14 % 81.8 6.05 1" x 1/4" 65 NA 0 % 4-p Deep 1.47 24.7 38.0 43.1
© Metso
Share of fines (<0.07mm = 0.0029in) is less with HP
8 Date/Title/Author
Manufactured Sand - Workshop
Page 59 of 277 Stavanger, Norway, October 30th & 31st 2008 Page of presentation:
Coarse waste %
Crusher TestOper.
HP
Screen Undersi
ze (STPH)
HP/Ton Screen Undersi
ze
%Coarse Waste
%C33Sand
% Fine Waste
STPH of C33 Sand
HP/Ton of C33 Sand
Bruno Screen Setup Feed Speed* CSS (in)
Cascade Rotor RR 80
aver flow
time (s)%
voidsASTM %
voidsB9100 U 500 141.4 3.54 22 % 66 % 12 % 93.3 5.36 A 1" x 1/4" 65 NA 0 % 3-p Deep 1.43 25.5 37.8 44.0B9100 N 495 129.8 3.81 24 % 63 % 14 % 81.8 6.05 A 1" x 1/4" 65 NA 0 % 4-p Deep 1.47 24.7 38.0 43.1
Production of ASTM C33 Spec Sand
B9100 C 500 158.4 3.16 25 % 62 % 13 % 98.2 5.09 A 5/8" x 0 65 NA 0 % 3-p Std. 1.28 25.4 37.8 43.5B9100 T 500 136.9 3.65 25 % 63 % 12 % 86.2 5.80 A 1" x 1/4" 60 NA 0 % 3-p Deep 1.30 25.8 38.0 44.8B9100 EE 500 163.2 3.06 25 % 64 % 12 % 104.4 4.79 A 5/8" x 0 65 NA 0 % 3-p Deep 1.32 24 37.5 44.0B9100 F 495 176.9 2.80 26 % 62 % 11 % 109.7 4.51 A 5/8" x 0 60 NA 0 % 4-p Deep 1.33 25.5 38.2 44.3B9100 L 490 145.9 3.36 26 % 63 % 12 % 91.9 5.33 A 1" x 1/4" 55 NA 0 % 4-p Deep 1.44 27.3 38.3 44.7B9100 M 490 138.5 3.54 26 % 62 % 12 % 85.9 5.71 A 1" x 1/4" 60 NA 0 % 4-p Deep 1.79 27.2 38.3 44.0B9100 DD 500 172.9 2.89 26 % 63 % 11 % 108.9 4.59 A 5/8" x 0 60 NA 0 % 3-p Deep 1.40 24.2 38.3 44.5B9100 A 490 158.6 3.09 27 % 61 % 12 % 96.7 5.06 A 5/8" x 0 60 NA 0 % 3-p Std. 1.30 25.5 38.7 43.6pB9100 W 498 158.1 3.15 27 % 61 % 12 % 96.4 5.16 A 1" x 1/4" 60 NA 20 % 3-p Deep 1.56 26.3 38.4 45.1B9100 V 495 150.4 3.29 28 % 61 % 12 % 91.7 5.40 A 1" x 1/4" 60 NA 10 % 3-p Deep NA 26.2 37.9 43.7B9100 B 490 171.8 2.85 29 % 60 % 11 % 103.1 4.75 A 5/8" x 0 55 NA 0 % 3-p Std. 1.20 26.1 38.3 44.0B9100 E 495 184.4 2.68 29 % 60 % 11 % 110.6 4.47 A 5/8" x 0 55 NA 0 % 4-p Deep 1.34 25.4 38.6 46.5B9100 S 505 145.7 3.47 29 % 60 % 11 % 87.4 5.78 A 1" x 1/4" 55 NA 0 % 3-p Deep 1.56 25.2 38.0 44.6HP100 O 87 47.3 1.84 40 % 51 % 9 % 24.1 3.61 B 1" x 1/4" 1100 0.38" NA NA 1.60 28.2 41.8 46.8HP100 Q 111 46 2.41 41 % 50 % 8 % 23.0 4.83 B 1" x 1/4" 1000 0.38" NA NA 1.55 29.1 41.8 46.6HP100 J 51 30 6 1 67 44 % 49 % 7 % 15 0 3 40 B 5/8" x 0 1200 0 44" NA NA 1 15 29 3 41 7 45 1HP100 J 51 30.6 1.67 44 % 49 % 7 % 15.0 3.40 B 5/8 x 0 1200 0.44 NA NA 1.15 29.3 41.7 45.1B9100 BB 500 275.1 1.82 44 % 49 % 7 % 134.8 3.71 E 3/8" x 1/8" 60 NA 0 % 3-p Deep 1.20 25.7 39.0 44.8HP100 H 57 30.8 1.85 49 % 44 % 7 % 13.6 4.21 B 5/8" x 0 1100 0.44" NA NA 1.13 28.2 41.5 43.8HP100 P 56 29.4 1.90 51 % 41 % 8 % 12.1 4.65 B 1" x 1/4" 1200 0.38" NA NA 1.31 28.2 41.8 45.9HP100 R 83 36.3 2.29 51 % 40 % 9 % 14.5 5.72 C 1" x 1/4" 1100 0.44" NA NA 1.29 30.5 42.1 47.4HP100 I 69 44 1.57 57 % 36 % 6 % 15.8 4.36 C 5/8" x 0 1100 0.44" NA NA 1.18 * * 44.7HP100 AA 111 82.7 1.34 67 % 27 % 6 % 22.3 4.97 D 3/8" x 1/8" 1100 0.38" NA NA 1.16 27.4 40.2 45.1HP100 Y 83 89.5 0.93 71 % 24 % 4 % 21.5 3.86 D 3/8" x 1/8" 1100 0.44" NA NA 1.10 31 40.0 44.2HP100 Z 63 82 7 0 76 74 % 22 % 3 % 18 2 3 46 D 3/8" x 1/8" 1200 0 44" NA NA 1 09 33 7 39 7 44 3
• Share of coarse waste (oversize) is less with Barmac
HP100 Z 63 82.7 0.76 74 % 22 % 3 % 18.2 3.46 D 3/8" x 1/8" 1200 0.44" NA NA 1.09 33.7 39.7 44.3HP100 X 63 90.9 0.69 76 % 20 % 4 % 18.2 3.47 D 3/8" x 1/8" 1100 0.48" NA NA 1.07 33.6 39.5 43.6
© Metso
( )
9 Date/Title/Author
Average flow time (sand flow cone)
Crusher TestOper.
HP
Screen Undersize (STPH)
HP/TonScreen
Undersize
%Coarse Waste
%C33 Sand
% Fine Waste
STPH of C33
Sand
HP/Ton of C33 Sand Feed Speed*
CSS(in)
Cascade Rotor RR 80
aver flow
time (s) % voids
ASTM %
voidsB9100 EE 500 163.2 3.06 25 % 64 % 12 % 104.4 4.79 5/8" x 0 65 NA 0 % 3-p Deep 1.32 24 37.5 44.0B9100 DD 500 172.9 2.89 26 % 63 % 11 % 108.9 4.59 5/8" x 0 60 NA 0 % 3-p Deep 1.40 24.2 38.3 44.5
Production of ASTM C33 Spec Sand
B9100 N 495 129.8 3.81 24 % 63 % 14 % 81.8 6.05 1" x 1/4" 65 NA 0 % 4-p Deep 1.47 24.7 38.0 43.1B9100 S 505 145.7 3.47 29 % 60 % 11 % 87.4 5.78 1" x 1/4" 55 NA 0 % 3-p Deep 1.56 25.2 38.0 44.6B9100 E 495 184.4 2.68 29 % 60 % 11 % 110.6 4.47 5/8" x 0 55 NA 0 % 4-p Deep 1.34 25.4 38.6 46.5B9100 C 500 158.4 3.16 25 % 62 % 13 % 98.2 5.09 5/8" x 0 65 NA 0 % 3-p Std. 1.28 25.4 37.8 43.5B9100 F 495 176.9 2.80 26 % 62 % 11 % 109.7 4.51 5/8" x 0 60 NA 0 % 4-p Deep 1.33 25.5 38.2 44.3B9100 A 490 158.6 3.09 27 % 61 % 12 % 96.7 5.06 5/8" x 0 60 NA 0 % 3-p Std. 1.30 25.5 38.7 43.6B9100 U 500 141.4 3.54 22 % 66 % 12 % 93.3 5.36 1" x 1/4" 65 NA 0 % 3-p Deep 1.43 25.5 37.8 44.0B9100 BB 500 275.1 1.82 44 % 49 % 7 % 134.8 3.71 3/8" x 1/8" 60 NA 0 % 3-p Deep 1.20 25.7 39.0 44.8p pB9100 T 500 136.9 3.65 25 % 63 % 12 % 86.2 5.80 1" x 1/4" 60 NA 0 % 3-p Deep 1.30 25.8 38.0 44.8B9100 B 490 171.8 2.85 29 % 60 % 11 % 103.1 4.75 5/8" x 0 55 NA 0 % 3-p Std. 1.20 26.1 38.3 44.0B9100 V 495 150.4 3.29 28 % 61 % 12 % 91.7 5.40 1" x 1/4" 60 NA 10 % 3-p Deep NA 26.2 37.9 43.7B9100 W 498 158.1 3.15 27 % 61 % 12 % 96.4 5.16 1" x 1/4" 60 NA 20 % 3-p Deep 1.56 26.3 38.4 45.1B9100 M 490 138.5 3.54 26 % 62 % 12 % 85.9 5.71 1" x 1/4" 60 NA 0 % 4-p Deep 1.79 27.2 38.3 44.0B9100 L 490 145.9 3.36 26 % 63 % 12 % 91.9 5.33 1" x 1/4" 55 NA 0 % 4-p Deep 1.44 27.3 38.3 44.7HP100 AA 111 82.7 1.34 67 % 27 % 6 % 22.3 4.97 3/8" x 1/8" 1100 0.38" NA NA 1.16 27.4 40.2 45.1HP100 O 87 47 3 1 84 40 % 51 % 9 % 24 1 3 61 1" x 1/4" 1100 0 38" NA NA 1 60 28 2 41 8 46 8HP100 O 87 47.3 1.84 40 % 51 % 9 % 24.1 3.61 1 x 1/4 1100 0.38 NA NA 1.60 28.2 41.8 46.8HP100 H 57 30.8 1.85 49 % 44 % 7 % 13.6 4.21 5/8" x 0 1100 0.44" NA NA 1.13 28.2 41.5 43.8HP100 P 56 29.4 1.90 51 % 41 % 8 % 12.1 4.65 1" x 1/4" 1200 0.38" NA NA 1.31 28.2 41.8 45.9HP100 Q 111 46 2.41 41 % 50 % 8 % 23.0 4.83 1" x 1/4" 1000 0.38" NA NA 1.55 29.1 41.8 46.6HP100 J 51 30.6 1.67 44 % 49 % 7 % 15.0 3.40 5/8" x 0 1200 0.44" NA NA 1.15 29.3 41.7 45.1HP100 R 83 36.3 2.29 51 % 40 % 9 % 14.5 5.72 1" x 1/4" 1100 0.44" NA NA 1.29 30.5 42.1 47.4HP100 Y 83 89.5 0.93 71 % 24 % 4 % 21.5 3.86 3/8" x 1/8" 1100 0.44" NA NA 1.10 31 40.0 44.2HP100 X 63 90.9 0.69 76 % 20 % 4 % 18.2 3.47 3/8" x 1/8" 1100 0.48" NA NA 1.07 33.6 39.5 43.6HP100 Z 63 82 7 0 76 74 % 22 % 3 % 18 2 3 46 3/8" 1/8" 1200 0 44" NA NA 1 09 33 7 39 7 44 3
• Barmac sand flows faster through flowcone (rounder shape)
HP100 Z 63 82.7 0.76 74 % 22 % 3 % 18.2 3.46 3/8" x 1/8" 1200 0.44" NA NA 1.09 33.7 39.7 44.3HP100 I 69 44 1.57 57 % 36 % 6 % 15.8 4.36 5/8" x 0 1100 0.44" NA NA 1.18 * * 44.7
© Metso10 Date/Title/Author
Manufactured Sand - Workshop
Page 60 of 277 Stavanger, Norway, October 30th & 31st 2008 Page of presentation:

NZ void %
Crusher Test
Oper. HP
ScreenUndersi
ze (STPH)
HP/Ton ScreenUndersi
ze
%CoarseWaste
%C33Sand
% Fine Waste
STPH of C33 Sand
HP/Ton of C33 Sand
Bruno ScreenSetup Feed Speed*
CSS(in)
Cascade Rotor RR 80
aver flow
time (s) % voidsASTM %
voidsB9100 EE 500 163.2 3.06 25 % 64 % 12 % 104.4 4.79 A 5/8" x 0 65 NA 0 % 3-p Deep 1.32 24 37.5 44.0B9100 C 500 158.4 3.16 25 % 62 % 13 % 98.2 5.09 A 5/8" x 0 65 NA 0 % 3-p Std. 1.28 25.4 37.8 43.5
Production of ASTM C33 Spec Sand
pB9100 U 500 141.4 3.54 22 % 66 % 12 % 93.3 5.36 A 1" x 1/4" 65 NA 0 % 3-p Deep 1.43 25.5 37.8 44.0B9100 V 495 150.4 3.29 28 % 61 % 12 % 91.7 5.40 A 1" x 1/4" 60 NA 10 % 3-p Deep NA 26.2 37.9 43.7B9100 N 495 129.8 3.81 24 % 63 % 14 % 81.8 6.05 A 1" x 1/4" 65 NA 0 % 4-p Deep 1.47 24.7 38.0 43.1B9100 S 505 145.7 3.47 29 % 60 % 11 % 87.4 5.78 A 1" x 1/4" 55 NA 0 % 3-p Deep 1.56 25.2 38.0 44.6B9100 T 500 136.9 3.65 25 % 63 % 12 % 86.2 5.80 A 1" x 1/4" 60 NA 0 % 3-p Deep 1.30 25.8 38.0 44.8B9100 F 495 176.9 2.80 26 % 62 % 11 % 109.7 4.51 A 5/8" x 0 60 NA 0 % 4-p Deep 1.33 25.5 38.2 44.3B9100 B 490 171.8 2.85 29 % 60 % 11 % 103.1 4.75 A 5/8" x 0 55 NA 0 % 3-p Std. 1.20 26.1 38.3 44.0B9100 L 490 145 9 3 36 26 % 63 % 12 % 91 9 5 33 A 1" x 1/4" 55 NA 0 % 4 p Deep 1 44 27 3 38 3 44 7B9100 L 490 145.9 3.36 26 % 63 % 12 % 91.9 5.33 A 1 x 1/4 55 NA 0 % 4-p Deep 1.44 27.3 38.3 44.7B9100 M 490 138.5 3.54 26 % 62 % 12 % 85.9 5.71 A 1" x 1/4" 60 NA 0 % 4-p Deep 1.79 27.2 38.3 44.0B9100 DD 500 172.9 2.89 26 % 63 % 11 % 108.9 4.59 A 5/8" x 0 60 NA 0 % 3-p Deep 1.40 24.2 38.3 44.5B9100 W 498 158.1 3.15 27 % 61 % 12 % 96.4 5.16 A 1" x 1/4" 60 NA 20 % 3-p Deep 1.56 26.3 38.4 45.1B9100 E 495 184.4 2.68 29 % 60 % 11 % 110.6 4.47 A 5/8" x 0 55 NA 0 % 4-p Deep 1.34 25.4 38.6 46.5B9100 A 490 158.6 3.09 27 % 61 % 12 % 96.7 5.06 A 5/8" x 0 60 NA 0 % 3-p Std. 1.30 25.5 38.7 43.6B9100 BB 500 275.1 1.82 44 % 49 % 7 % 134.8 3.71 E 3/8" x 1/8" 60 NA 0 % 3-p Deep 1.20 25.7 39.0 44.8HP100 X 63 90.9 0.69 76 % 20 % 4 % 18.2 3.47 D 3/8" x 1/8" 1100 0.48" NA NA 1.07 33.6 39.5 43.6HP100 Z 63 82.7 0.76 74 % 22 % 3 % 18.2 3.46 D 3/8" x 1/8" 1200 0.44" NA NA 1.09 33.7 39.7 44.3HP100 Y 83 89.5 0.93 71 % 24 % 4 % 21.5 3.86 D 3/8" x 1/8" 1100 0.44" NA NA 1.10 31 40.0 44.2HP100 AA 111 82.7 1.34 67 % 27 % 6 % 22.3 4.97 D 3/8" x 1/8" 1100 0.38" NA NA 1.16 27.4 40.2 45.1HP100 H 57 30.8 1.85 49 % 44 % 7 % 13.6 4.21 B 5/8" x 0 1100 0.44" NA NA 1.13 28.2 41.5 43.8HP100 J 51 30.6 1.67 44 % 49 % 7 % 15.0 3.40 B 5/8" x 0 1200 0.44" NA NA 1.15 29.3 41.7 45.1HP100 O 87 47.3 1.84 40 % 51 % 9 % 24.1 3.61 B 1" x 1/4" 1100 0.38" NA NA 1.60 28.2 41.8 46.8HP100 P 56 29.4 1.90 51 % 41 % 8 % 12.1 4.65 B 1" x 1/4" 1200 0.38" NA NA 1.31 28.2 41.8 45.9HP100 Q 111 46 2 41 41 % 50 % 8 % 23 0 4 83 B 1" x 1/4" 1000 0 38" NA NA 1 55 29 1 41 8 46 6
• Barmac sand gives lower void % (rounder shape)
HP100 Q 111 46 2.41 41 % 50 % 8 % 23.0 4.83 B 1 x 1/4 1000 0.38 NA NA 1.55 29.1 41.8 46.6HP100 R 83 36.3 2.29 51 % 40 % 9 % 14.5 5.72 C 1" x 1/4" 1100 0.44" NA NA 1.29 30.5 42.1 47.4HP100 I 69 44 1.57 57 % 36 % 6 % 15.8 4.36 C 5/8" x 0 1100 0.44" NA NA 1.18 * * 44.7
© Metso
Barmac sand gives lower void % (rounder shape)
11 Date/Title/Author
Some averagesCalculated from Screen undersize)
Production of ASTM C33 Spec Sand
Crusher TestOper.
HP
Screen Undersi
ze (STPH)
HP/TonScreen Undersi
ze
%Coarse Waste
%C33 Sand
% Fine Waste
STPH of C33 Sand
HP/Ton of C33 Sand
Bruno Screen Setup Feed Speed* CSS (in)
Cascade Rotor RR 80
aver flow
time (s)%
voidsASTM
% voidsB9100 EE 500 163.2 3.06 25 % 64 % 12 % 104.4 4.79 A 5/8" x 0 65 NA 0 % 3-p Deep 1.32 24 37.5 44.0B9100 DD 500 172.9 2.89 26 % 63 % 11 % 108.9 4.59 A 5/8" x 0 60 NA 0 % 3-p Deep 1.40 24.2 38.3 44.5B9100 N 495 129.8 3.81 24 % 63 % 14 % 81.8 6.05 A 1" x 1/4" 65 NA 0 % 4-p Deep 1.47 24.7 38.0 43.1B9100 S 505 145 7 3 47 29 % 60 % 11 % 87 4 5 78 A 1" x 1/4" 55 NA 0 % 3 p Deep 1 56 25 2 38 0 44 6
Production of ASTM C33 Spec Sand
B9100 S 505 145.7 3.47 29 % 60 % 11 % 87.4 5.78 A 1 x 1/4 55 NA 0 % 3-p Deep 1.56 25.2 38.0 44.6B9100 C 500 158.4 3.16 25 % 62 % 13 % 98.2 5.09 A 5/8" x 0 65 NA 0 % 3-p Std. 1.28 25.4 37.8 43.5B9100 E 495 184.4 2.68 29 % 60 % 11 % 110.6 4.47 A 5/8" x 0 55 NA 0 % 4-p Deep 1.34 25.4 38.6 46.5B9100 A 490 158.6 3.09 27 % 61 % 12 % 96.7 5.06 A 5/8" x 0 60 NA 0 % 3-p Std. 1.30 25.5 38.7 43.6B9100 F 495 176.9 2.80 26 % 62 % 11 % 109.7 4.51 A 5/8" x 0 60 NA 0 % 4-p Deep 1.33 25.5 38.2 44.3B9100 U 500 141.4 3.54 22 % 66 % 12 % 93.3 5.36 A 1" x 1/4" 65 NA 0 % 3-p Deep 1.43 25.5 37.8 44.0B9100 BB 500 275.1 1.82 44 % 49 % 7 % 134.8 3.71 E 3/8" x 1/8" 60 NA 0 % 3-p Deep 1.20 25.7 39.0 44.8B9100 T 500 136.9 3.65 25 % 63 % 12 % 86.2 5.80 A 1" x 1/4" 60 NA 0 % 3-p Deep 1.30 25.8 38.0 44.8B9100 B 490 171 8 2 85 29 % 60 % 11 % 103 1 4 75 A 5/8" 0 55 NA 0 % 3 Std 1 20 26 1 38 3 44 0B9100 B 490 171.8 2.85 29 % 60 % 11 % 103.1 4.75 A 5/8" x 0 55 NA 0 % 3-p Std. 1.20 26.1 38.3 44.0B9100 V 495 150.4 3.29 28 % 61 % 12 % 91.7 5.40 A 1" x 1/4" 60 NA 10 % 3-p Deep NA 26.2 37.9 43.7B9100 W 498 158.1 3.15 27 % 61 % 12 % 96.4 5.16 A 1" x 1/4" 60 NA 20 % 3-p Deep 1.56 26.3 38.4 45.1B9100 M 490 138.5 3.54 26 % 62 % 12 % 85.9 5.71 A 1" x 1/4" 60 NA 0 % 4-p Deep 1.79 27.2 38.3 44.0B9100 L 490 145.9 3.36 26 % 63 % 12 % 91.9 5.33 A 1" x 1/4" 55 NA 0 % 4-p Deep 1.44 27.3 38.3 44.7
496.4 163.0 3.13 0.27 0.61 0.12 98.8 5.10 # 60.0 0.02 1.39 25.63 38.19 44.31
HP100 AA 111 82.7 1.34 67 % 27 % 6 % 22.3 4.97 D 3/8" x 1/8" 1100 0.38" NA NA 1.16 27.4 40.2 45.1HP100 H 57 30.8 1.85 49 % 44 % 7 % 13.6 4.21 B 5/8" x 0 1100 0.44" NA NA 1.13 28.2 41.5 43.8HP100 P 56 29.4 1.90 51 % 41 % 8 % 12.1 4.65 B 1" x 1/4" 1200 0.38" NA NA 1.31 28.2 41.8 45.9HP100 O 87 47.3 1.84 40 % 51 % 9 % 24.1 3.61 B 1" x 1/4" 1100 0.38" NA NA 1.60 28.2 41.8 46.8HP100 Q 111 46 2.41 41 % 50 % 8 % 23.0 4.83 B 1" x 1/4" 1000 0.38" NA NA 1.55 29.1 41.8 46.6HP100 J 51 30.6 1.67 44 % 49 % 7 % 15.0 3.40 B 5/8" x 0 1200 0.44" NA NA 1.15 29.3 41.7 45.1HP100 R 83 36.3 2.29 51 % 40 % 9 % 14.5 5.72 C 1" x 1/4" 1100 0.44" NA NA 1.29 30.5 42.1 47.4HP100 Y 83 89.5 0.93 71 % 24 % 4 % 21.5 3.86 D 3/8" x 1/8" 1100 0.44" NA NA 1.10 31 40.0 44.2HP100 X 63 90.9 0.69 76 % 20 % 4 % 18.2 3.47 D 3/8" x 1/8" 1100 0.48" NA NA 1.07 33.6 39.5 43.6
• Barmac makes better quality sand with somewhat higher reduction ratio
HP100 X 63 90.9 0.69 76 % 20 % 4 % 18.2 3.47 D 3/8 x 1/8 1100 0.48 NA NA 1.07 33.6 39.5 43.6HP100 Z 63 82.7 0.76 74 % 22 % 3 % 18.2 3.46 D 3/8" x 1/8" 1200 0.44" NA NA 1.09 33.7 39.7 44.3HP100 I 69 44 1.57 57 % 36 % 6 % 15.8 4.36 C 5/8" x 0 1100 0.44" NA NA 1.18 * * 44.7
75.8 55.5 1.57 0.56 0.37 0.06 18.0 4.23 # 1118.2 1.24 29.92 41.01 45.23
© Metso
• Barmac produces twice so much fines as HP. HP produces oversize twice Barmac
12 Date/Title/Author
Manufactured Sand - Workshop
Page 61 of 277 Stavanger, Norway, October 30th & 31st 2008 Page of presentation:

Flow time vs void % comparisonscomparisons
• Barmac has lower values
NZ cone
30
40
me
10
20
flow
tim Barmac
HP
037.0 38.0 39.0 40.0 41.0 42.0 43.0
void%
© Metso13 Date/Title/Author
Flow time vs void % comparisonscomparisons
• Finer feed gives in general better flow cone and void content values = shape of sand is bettervalues = shape of sand is better
NZ cone
25303540
me feed 1in
510152025
flow
tim feed 1in
feed 3/8feed 5/8
05
37.0 38.0 39.0 40.0 41.0 42.0 43.0
void%
© Metso14 Date/Title/Author
Manufactured Sand - Workshop
Page 62 of 277 Stavanger, Norway, October 30th & 31st 2008 Page of presentation:
Flow time vs void % comparisons
CONCLUSIONS_OF_MAY_AUGUST_2006_TESTS.PPT
• Barmac gives better void % with coarser feed
• As to sand quality Barmac is not so responsive to coarser feed as HP
• HP behaviour is somewhat unlogical because fi t f d i l t fl ti Rfinest feed gives longest flowtime. Reasonseems to be coarser 3/8” feed.
• All Barmac sand fullfills NZ flowcone criteria. 50% of HP sand fullfills same criteria
NZ flow time vs void content %
40
20
25303540
ow ti
me
feed 1", Barmacfeed 1", HP100feed 3/8, Barmacf d 3/8 HP100
05
1015
NZ
flo feed 3/8, HP100feed 5/8, Barmacfeed 5/8, HP100
© Metso15 Date/Title/Author
36.0 38.0 40.0 42.0 44.0
void %
Void content / flow time vs. reduction ratio Void content % vs Reduction ratio
43 0• Some reduction ratio is needed to improve flowtime
• With coarser feed Barmac gives better void content and even with 40.0
41.0
42.0
43.0
cont
ent
feed 1", Barmacfeed 1", HP100feed 3/8, Barmacfeed 3/8 HP100higher red.ratio
• Average reduction ratio with Barmac is higher and sand quality in average is better than with HP (see also
t bl b f )37.0
38.0
39.0
1 00 1 20 1 40 1 60 1 80 2 00
Void
feed 3/8, HP100feed 5/8, Barmacfeed 5/8, HP100
average table before)
• Barmac results are more consistent when feed fraction changes
1.00 1.20 1.40 1.60 1.80 2.00
RR80
NZ fl ti d ti tifl ti (NZ) d ti 80%
3/8 feed hadabt 50% of NZ flowtime vs reduction ratio
29313335
feed 1", Barmacfeed 1" HP100
flow time (NZ) vs reduction80%
30
35
feed 1 in
abt 50% offinal product in
the feed
171921232527
Flow
tim
e feed 1 , HP100feed 3/8, Barmacfeed 3/8, HP100feed 5/8, Barmacfeed 5/8, HP100
15
20
25
flow
time
feed 3/8
feed 5/8
Linear (feed 3/8)
Linear (feed 5/8)
Linear (feed 1 in)
© Metso16 Date/Title/Author
1517
1.00 1.20 1.40 1.60 1.80 2.00
RR80
100.00 0.50 1.00 1.50 2.00
RR80
Manufactured Sand - Workshop
Page 63 of 277 Stavanger, Norway, October 30th & 31st 2008 Page of presentation:
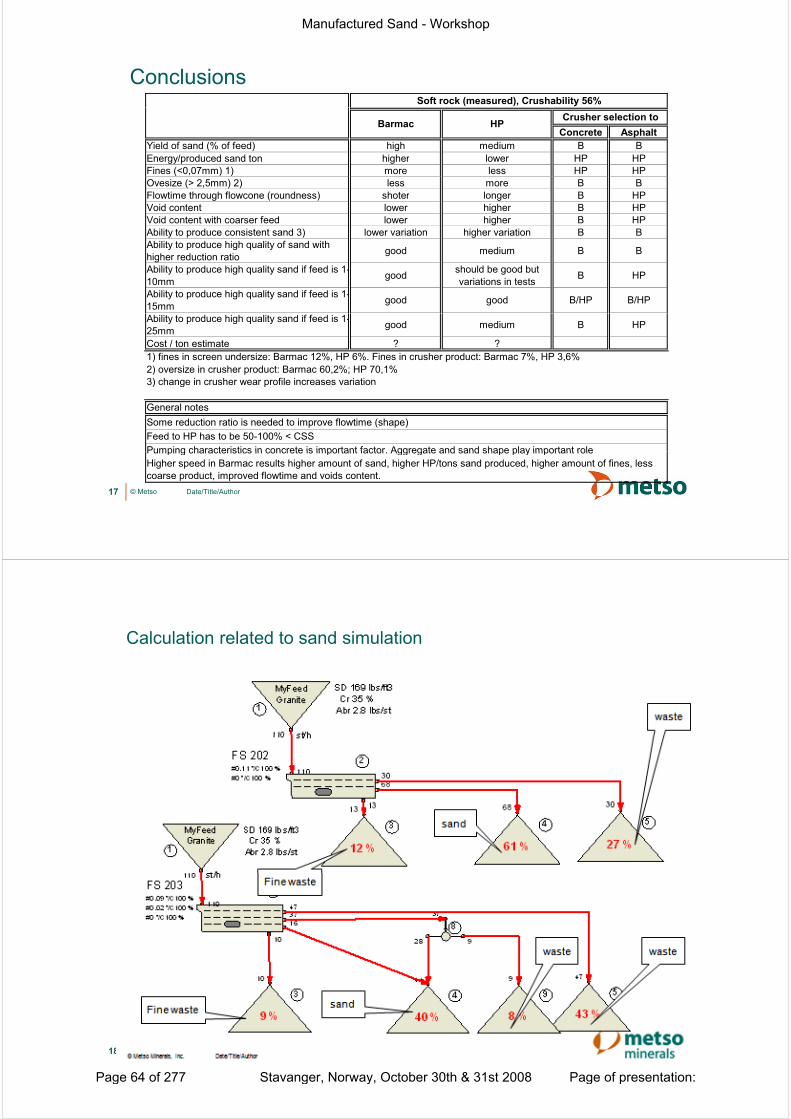
ConclusionsSoft rock (measured), Crushability 56%
Concrete AsphaltYield of sand (% of feed) high medium B BEnergy/produced sand ton higher lower HP HPFines (<0,07mm) 1) more less HP HP
Barmac HP Crusher selection to
Ovesize (> 2,5mm) 2) less more B BFlowtime through flowcone (roundness) shoter longer B HPVoid content lower higher B HPVoid content with coarser feed lower higher B HPAbility to produce consistent sand 3) lower variation higher variation B BAbility to produce high quality of sand withAbility to produce high quality of sand withhigher reduction ratio good medium B B
Ability to produce high quality sand if feed is 1-10mm good should be good but
variations in tests B HP
Ability to produce high quality sand if feed is 1-15mm good good B/HP B/HP
Ability to produce high quality sand if feed is 1-25mm good medium B HP
Cost / ton estimate ? ?1) fines in screen undersize: Barmac 12%, HP 6%. Fines in crusher product: Barmac 7%, HP 3,6%2) oversize in crusher product: Barmac 60,2%; HP 70,1% 3) change in crusher wear profile increases variation3) change in crusher wear profile increases variation
Feed to HP has to be 50-100% < CSSPumping characteristics in concrete is important factor Aggregate and sand shape play important role
General notesSome reduction ratio is needed to improve flowtime (shape)
© Metso17 Date/Title/Author
Pumping characteristics in concrete is important factor. Aggregate and sand shape play important roleHigher speed in Barmac results higher amount of sand, higher HP/tons sand produced, higher amount of fines, less coarse product, improved flowtime and voids content.
Calculation related to sand simulation
© Metso18 Date/Title/Author
Manufactured Sand - Workshop
Page 64 of 277 Stavanger, Norway, October 30th & 31st 2008 Page of presentation:
30/10/2008
1
arch
Inst
itute
COIN, 30 - 31 October 2008Stavanger, Norway
ent a
nd C
oncr
ete
Res
eaC
BI,
Swed
ish
Cem
e
Microstructure versus mechanical properties and influence on aggregate production
(A contribution to project planning and collaboration)
arch
Inst
itute
SP, Technical Research Institute of Sweden
ent a
nd C
oncr
ete
Res
eaCBI, A company in the SP group
CB
I, Sw
edis
h C
eme
Björn Schouenborg & Urban Åkesson”Swedish Competence Centre for Rock Materials”
Tang Luping, Chalmers
Manufactured Sand - Workshop
Page 65 of 277 Stavanger, Norway, October 30th & 31st 2008 Page of presentation:

30/10/2008
2
arch
Inst
itute
• Background – national and international needs• Suitable raw material - Characterization of the bedrock
Aggregate production crushing techniques
Contents
ent a
nd C
oncr
ete
Res
ea• Aggregate production, crushing techniques• Characterization of aggregates, microstructure and
more• Concrete production: Cement improvement, rheology of
concrete, stability of the mix• Innovative solutions – Future collaboration possibilities
CB
I, Sw
edis
h C
eme
I have also used material from e.g.:
Tang Luping, SP (Concrete)
Urban Åkesson, SP (Image analysis of aggregates)
Svein Willy Danielsen, SINTEF (a lot! Seen here today as well)
Many thanks!
arch
Inst
itute
Vision of the European Construction Technology Platform (ECTP)
from ”A vision for a sustainable and competitive construction sector by 2030”
ent a
nd C
oncr
ete
Res
ea
"In the year 2030, Europe’s built environment is designed, built and maintained by a successful knowledge- and demand-driven sector, well known for its ability to satisfy all the needs of its clients and society, providing a high quality of life and demonstrating its long-term responsibility to mankind’s environment”.
CB
I, Sw
edis
h C
eme
“The negative impacts of construction’s whole life-cycle on the environment are radically reduced”
http://www.ectp.org/
Manufactured Sand - Workshop
Page 66 of 277 Stavanger, Norway, October 30th & 31st 2008 Page of presentation:
30/10/2008
3
arch
Inst
itute
Needs of the industry and society?
A sustainable concrete production with 100 % crushed aggregates in several areas.
ent a
nd C
oncr
ete
Res
ea
Sustainble means profitable, cost efficient and environmentally friendly. This requires that:
• We don’t want to increase the use of cement and additives. • We don’t want to have long transportation distances of
aggregates or other components.• We want to be able to use locally available materials
CB
I, Sw
edis
h C
eme
• We also need to help the industry develop simple and quick test methods for their process control.
• We need to develop a methodology suitable for all crushed rock producers. Most of them being SMEs
arch
Inst
ituteConcrete
production
S lf Fib
A holistic view is needed when re-engineering the concrete production ”construction’s whole life-cycle ”
ent a
nd C
oncr
ete
Res
ea
Aggregates Cement Admixtures Fibres
Self compacting
concrete
Recycledmaterials and
Secondary sources
Fibre reinforcedconcrete
CB
I, Sw
edis
h C
eme
Sand/gravel Crushed rock
BedrockCrushing
and Sorting
Manufactured Sand - Workshop
Page 67 of 277 Stavanger, Norway, October 30th & 31st 2008 Page of presentation:
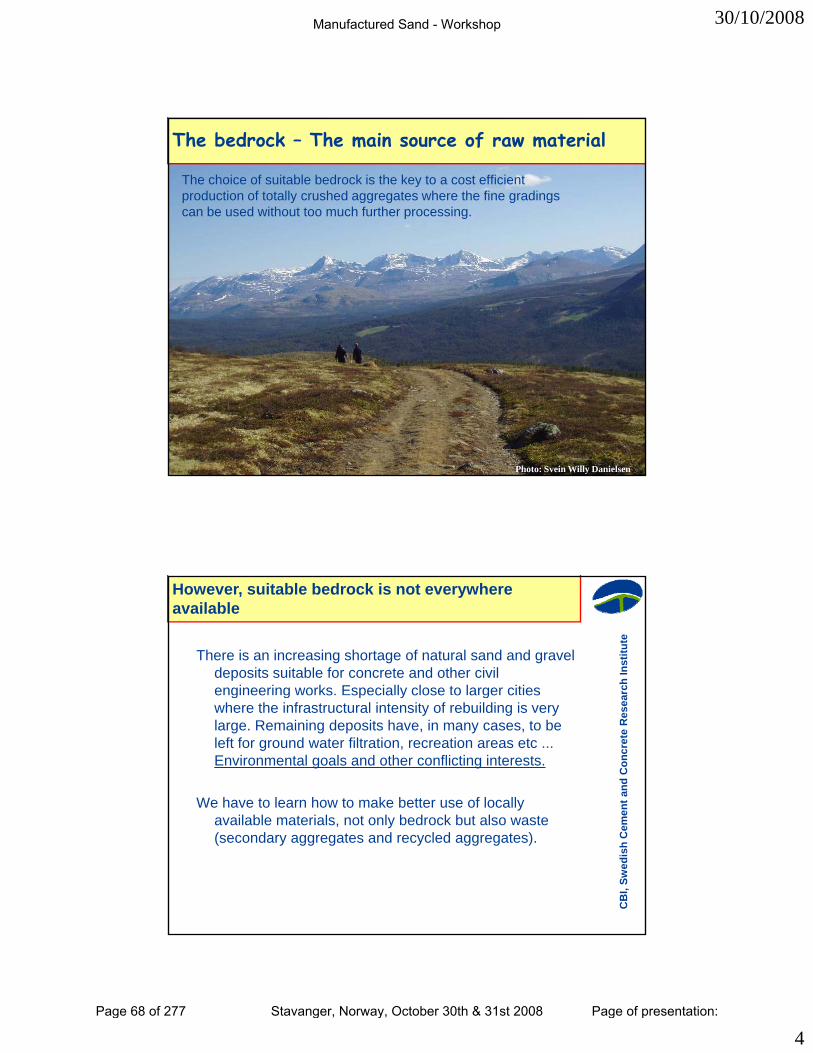
30/10/2008
4
arch
Inst
ituteThe choice of suitable bedrock is the key to a cost efficient
production of totally crushed aggregates where the fine gradings can be used without too much further processing.
The bedrock – The main source of raw material
ent a
nd C
oncr
ete
Res
eaC
BI,
Swed
ish
Cem
e
Photo: Svein Willy Danielsen
arch
Inst
itute
There is an increasing shortage of natural sand and gravel deposits suitable for concrete and other civil engineering works. Especially close to larger cities
However, suitable bedrock is not everywhere available
ent a
nd C
oncr
ete
Res
ea
e g ee g o s spec a y c ose o a ge c eswhere the infrastructural intensity of rebuilding is very large. Remaining deposits have, in many cases, to be left for ground water filtration, recreation areas etc ... Environmental goals and other conflicting interests.
We have to learn how to make better use of locally il bl t i l t l b d k b t l t
CB
I, Sw
edis
h C
emeavailable materials, not only bedrock but also waste
(secondary aggregates and recycled aggregates).
Manufactured Sand - Workshop
Page 68 of 277 Stavanger, Norway, October 30th & 31st 2008 Page of presentation:
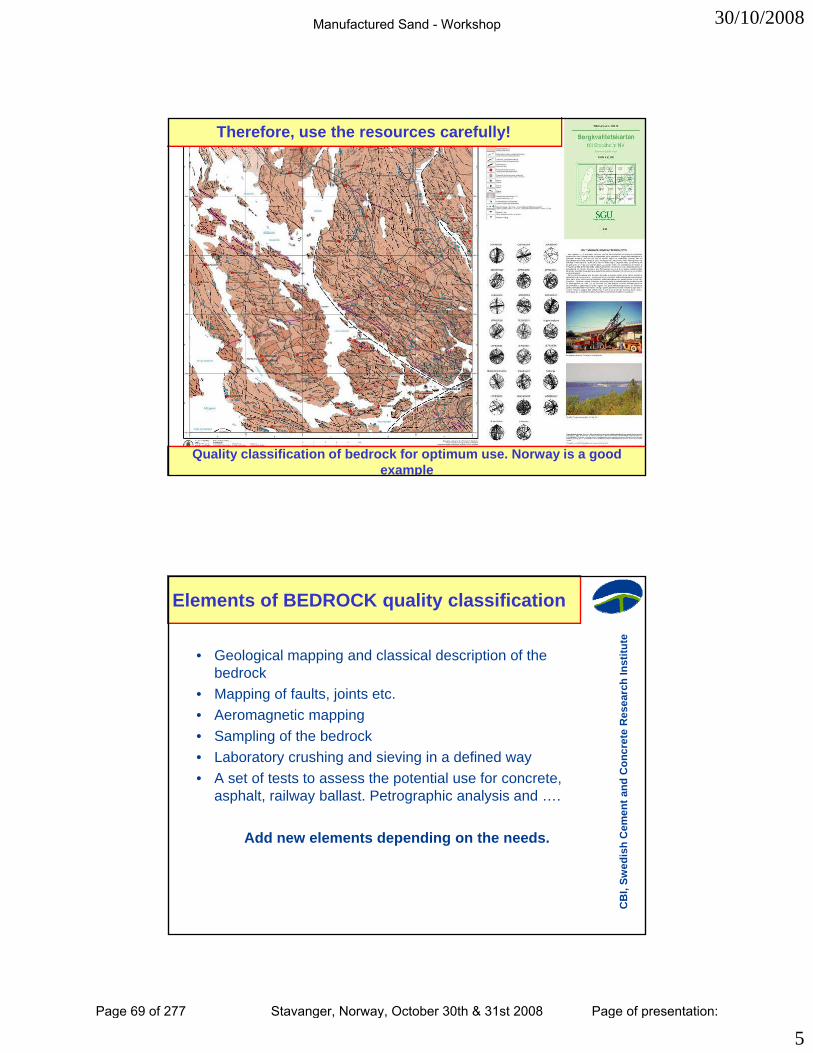
30/10/2008
5
arch
Inst
itute
Therefore, use the resources carefully!
ent a
nd C
oncr
ete
Res
eaC
BI,
Swed
ish
Cem
e
Quality classification of bedrock for optimum use. Norway is a good example
arch
Inst
itute
• Geological mapping and classical description of the bedrock
• Mapping of faults joints etc
Elements of BEDROCK quality classificationen
t and
Con
cret
e R
esea
• Mapping of faults, joints etc.• Aeromagnetic mapping• Sampling of the bedrock• Laboratory crushing and sieving in a defined way• A set of tests to assess the potential use for concrete,
asphalt, railway ballast. Petrographic analysis and ….
CB
I, Sw
edis
h C
eme
Add new elements depending on the needs.
Manufactured Sand - Workshop
Page 69 of 277 Stavanger, Norway, October 30th & 31st 2008 Page of presentation:
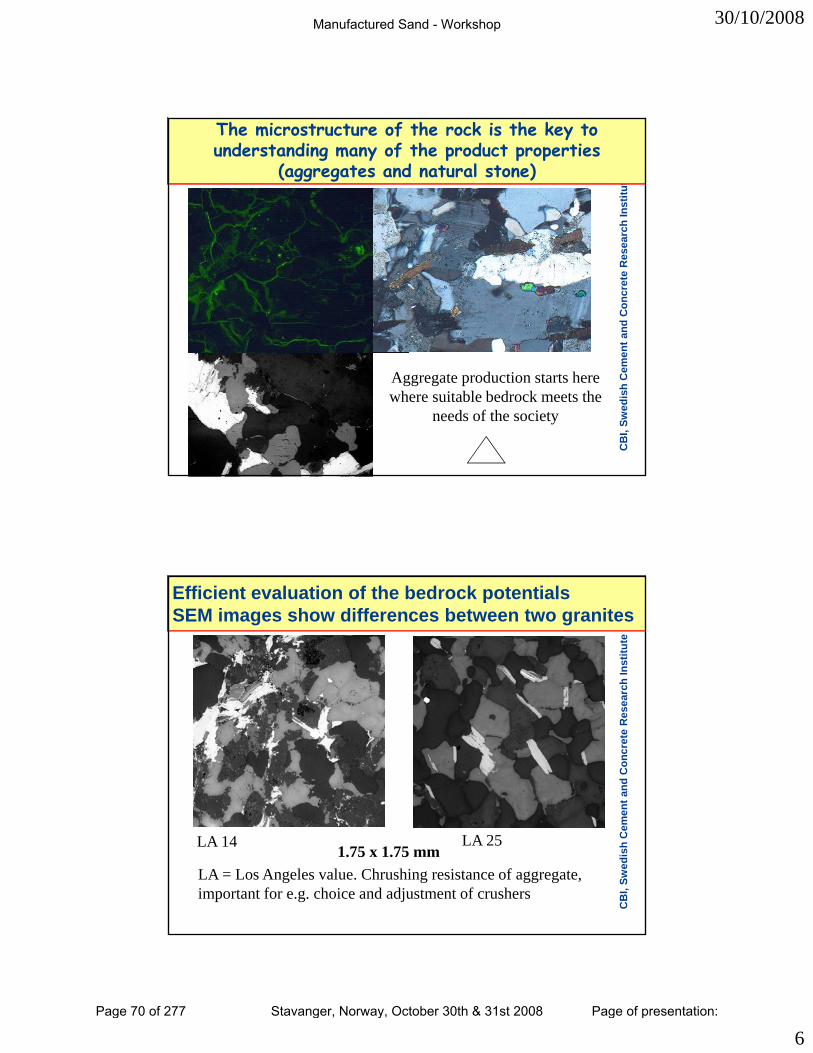
30/10/2008
6
arch
Inst
itute
The microstructure of the rock is the key to understanding many of the product properties
(aggregates and natural stone)
ent a
nd C
oncr
ete
Res
eaC
BI,
Swed
ish
Cem
e
Aggregate production starts here where suitable bedrock meets the
needs of the society
arch
Inst
itute
Efficient evaluation of the bedrock potentialsSEM images show differences between two granites
ent a
nd C
oncr
ete
Res
eaC
BI,
Swed
ish
Cem
e
1.75 x 1.75 mmLA 14 LA 25
LA = Los Angeles value. Chrushing resistance of aggregate, important for e.g. choice and adjustment of crushers
Manufactured Sand - Workshop
Page 70 of 277 Stavanger, Norway, October 30th & 31st 2008 Page of presentation:

30/10/2008
7
arch
Inst
itute
Relationships between microstructure and mechanical properties (LA-value)
ent a
nd C
oncr
ete
Res
eaC
BI,
Swed
ish
Cem
ear
ch In
stitu
te
Many granites have a foliationen
t and
Con
cret
e R
esea
CB
I, Sw
edis
h C
eme
Manufactured Sand - Workshop
Page 71 of 277 Stavanger, Norway, October 30th & 31st 2008 Page of presentation:
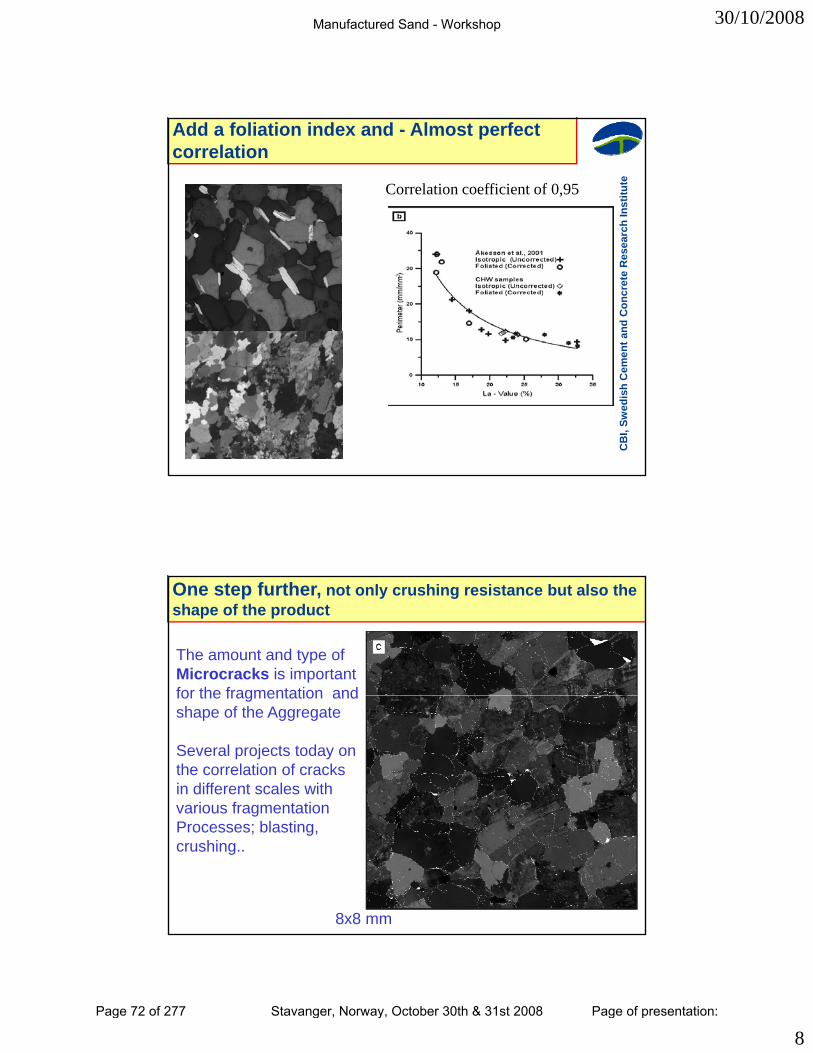
30/10/2008
8
arch
Inst
itute
Add a foliation index and - Almost perfect correlation
Correlation coefficient of 0,95
ent a
nd C
oncr
ete
Res
eaC
BI,
Swed
ish
Cem
ear
ch In
stitu
te
One step further, not only crushing resistance but also the shape of the product
The amount and type ofMicrocracks is important for the fragmentation and
ent a
nd C
oncr
ete
Res
ea
for the fragmentation and shape of the Aggregate
Several projects today on the correlation of cracks in different scales with various fragmentation
CB
I, Sw
edis
h C
eme
8x8 mm
gProcesses; blasting, crushing..
Manufactured Sand - Workshop
Page 72 of 277 Stavanger, Norway, October 30th & 31st 2008 Page of presentation:
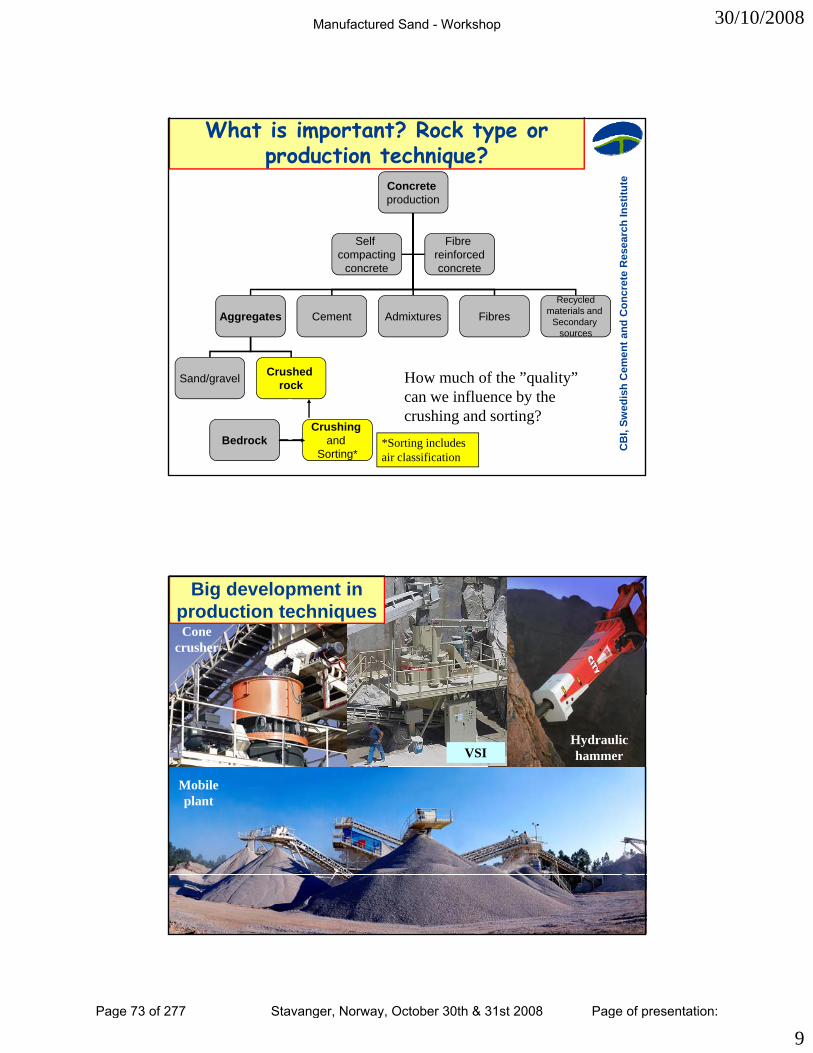
30/10/2008
9
arch
Inst
ituteConcrete
production
S lf Fib
What is important? Rock type or production technique?
ent a
nd C
oncr
ete
Res
ea
Aggregates Cement Admixtures Fibres
Self compacting
concrete
Recycledmaterials and
Secondary sources
Fibre reinforcedconcrete
CB
I, Sw
edis
h C
eme
Sand/gravel Crushed rock
BedrockCrushing
and Sorting*
How much of the ”quality” can we influence by the crushing and sorting?
*Sorting includes air classification
arch
Inst
itute
Cone crusher
Big development in production techniques
ent a
nd C
oncr
ete
Res
ea
VSIHydraulic hammer
Mobile plant
CB
I, Sw
edis
h C
eme
Manufactured Sand - Workshop
Page 73 of 277 Stavanger, Norway, October 30th & 31st 2008 Page of presentation:
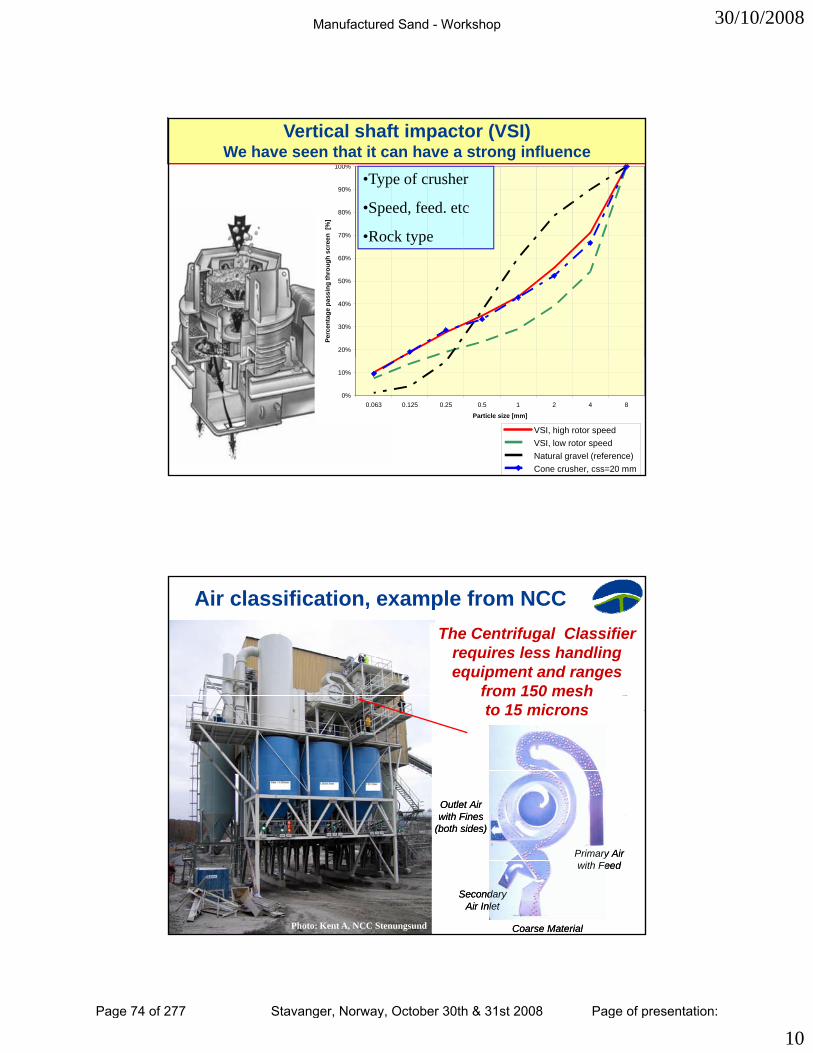
30/10/2008
10
arch
Inst
itute
Vertical shaft impactor (VSI)We have seen that it can have a strong influence
70%
80%
90%
100%
n [%
]
•Type of crusher
•Speed, feed. etc
•Rock type
ent a
nd C
oncr
ete
Res
ea
20%
30%
40%
50%
60%
70%
Perc
enta
ge p
assi
ng th
roug
h sc
ree •Rock type
CB
I, Sw
edis
h C
eme
VSI, high rotor speedVSI, low rotor speedNatural gravel (reference)Cone crusher, css=20 mm
0%
10%
84210.50.250.1250.063
Particle size [mm]
arch
Inst
itute
Air classification, example from NCCThe Centrifugal Classifier
requires less handlingequipment and ranges
from 150 mesh
ent a
nd C
oncr
ete
Res
ea
Outlet Airwith FinesOutlet Airwith Fines
from 150 meshto 15 microns
CB
I, Sw
edis
h C
eme
Coarse Material
SecondaryAir Inlet
Primary Airwith Feed
with Fines(both sides)
Coarse Material
SecondaryAir Inlet
Primary Airwith Feed
with Fines(both sides)
Photo: Kent A, NCC Stenungsund
Manufactured Sand - Workshop
Page 74 of 277 Stavanger, Norway, October 30th & 31st 2008 Page of presentation:
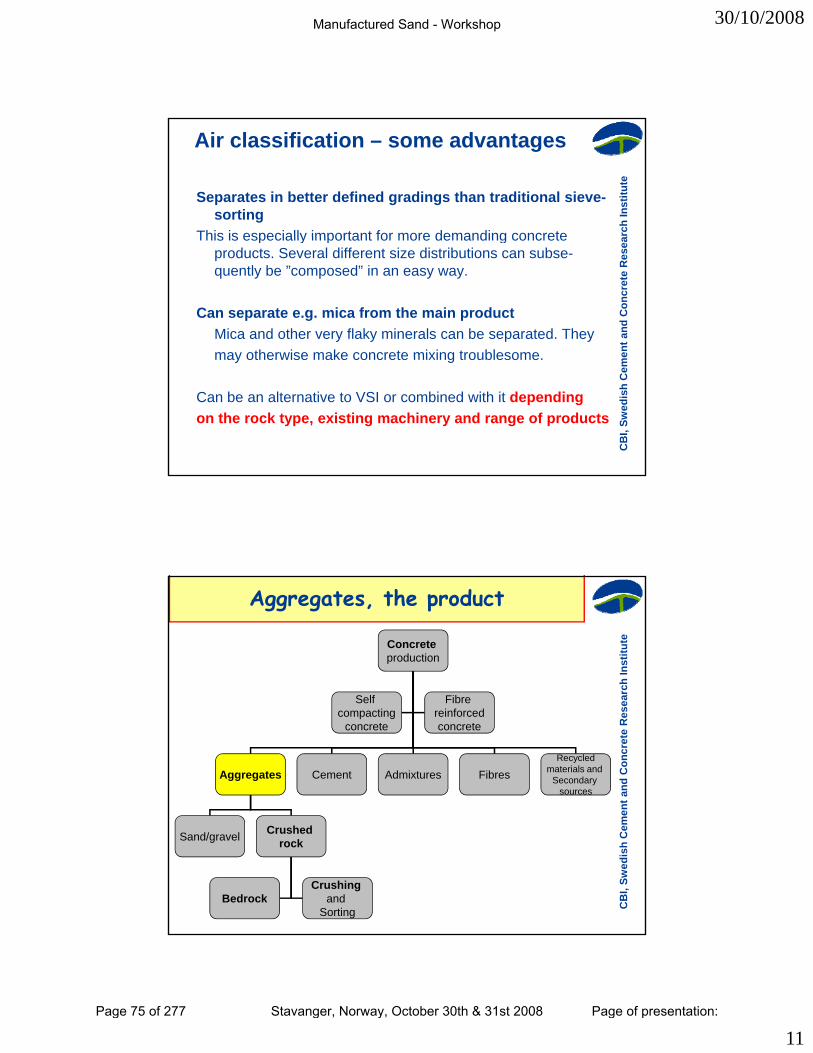
30/10/2008
11
arch
Inst
itute
Air classification – some advantages
Separates in better defined gradings than traditional sieve-sorting
This is especially important for more demanding concrete
ent a
nd C
oncr
ete
Res
ea
This is especially important for more demanding concrete products. Several different size distributions can subse-quently be ”composed” in an easy way.
Can separate e.g. mica from the main productMica and other very flaky minerals can be separated. They may otherwise make concrete mixing troublesome
CB
I, Sw
edis
h C
ememay otherwise make concrete mixing troublesome.
Can be an alternative to VSI or combined with it depending on the rock type, existing machinery and range of products
arch
Inst
ituteConcrete
production
S lf Fib
Aggregates, the producten
t and
Con
cret
e R
esea
Aggregates Cement Admixtures Fibres
Self compacting
concrete
Recycledmaterials and
Secondary sources
Fibre reinforcedconcrete
CB
I, Sw
edis
h C
eme
Sand/gravel Crushed rock
BedrockCrushing
and Sorting
Manufactured Sand - Workshop
Page 75 of 277 Stavanger, Norway, October 30th & 31st 2008 Page of presentation:

30/10/2008
12
arch
Inst
itute
Aggregate characterisation: Shape, size and flow
Fluorescent epoxy impregnated thin sections+250-500 microns
ent a
nd C
oncr
ete
Res
eaC
BI,
Swed
ish
Cem
e
Cone Crusher Natural Gravel VSI
arch
Inst
ituteScanning electron microscopy
and computer aided image analysis are used for detailed characterisation of the fine
Aggregate characterisation: quantification of critical parameters
ent a
nd C
oncr
ete
Res
eaaggregates.
The particle size distribution and the shape are measured.
36-63 micron
80
100
%)
Sw e V (0,59)
Normsand (0,60)
CB
I, Sw
edis
h C
eme
0
20
40
60
80
0 0,1 0,2 0,3 0,4 0,5 0,6 0,7 0,8 0,9 1Fmin/Fmax
Kum
ulat
iv fö
rdel
ning
(% Brazil (0,54)
Sw e N (0,49)
V, N crushed granites
Manufactured Sand - Workshop
Page 76 of 277 Stavanger, Norway, October 30th & 31st 2008 Page of presentation:
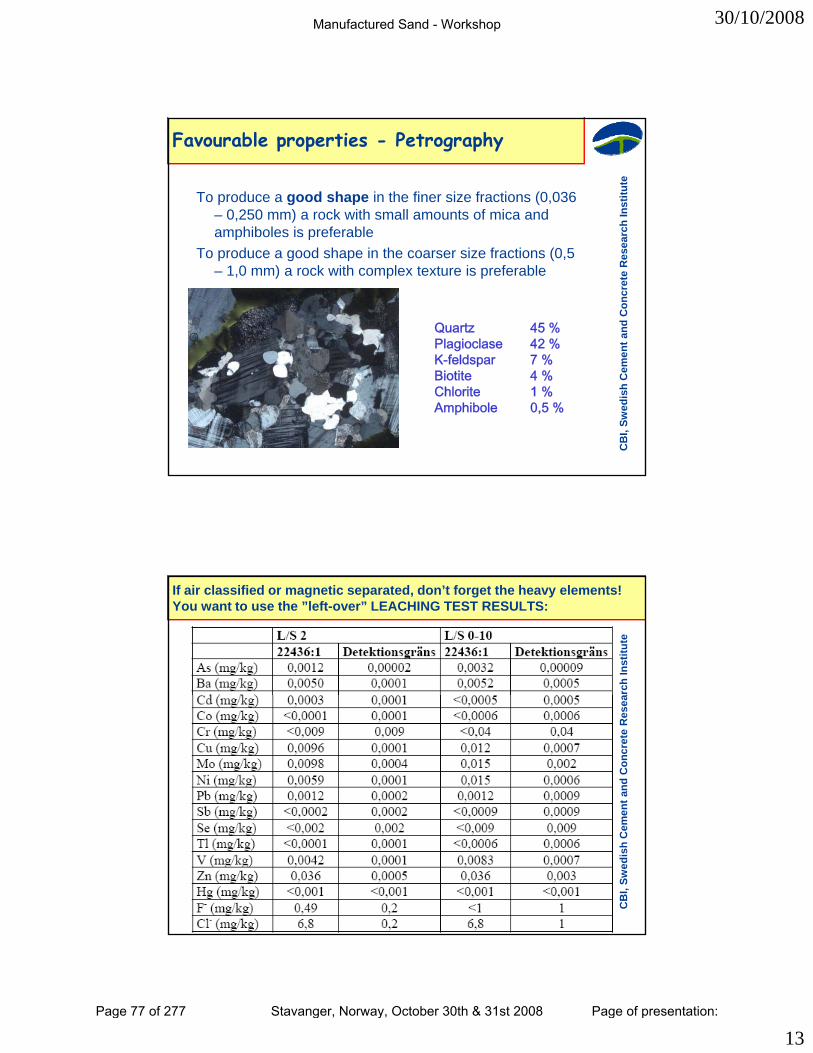
30/10/2008
13
arch
Inst
itute
To produce a good shape in the finer size fractions (0,036 – 0,250 mm) a rock with small amounts of mica and amphiboles is preferable
Favourable properties - Petrography
ent a
nd C
oncr
ete
Res
ea
a p bo es s p e e ab eTo produce a good shape in the coarser size fractions (0,5
– 1,0 mm) a rock with complex texture is preferable
Quartz 45 %Plagioclase 42 %K f ld 7 %
CB
I, Sw
edis
h C
emeK-feldspar 7 %
Biotite 4 %Chlorite 1 %Amphibole 0,5 %
arch
Inst
itute
If air classified or magnetic separated, don’t forget the heavy elements! You want to use the ”left-over” LEACHING TEST RESULTS:
ent a
nd C
oncr
ete
Res
eaC
BI,
Swed
ish
Cem
e
Manufactured Sand - Workshop
Page 77 of 277 Stavanger, Norway, October 30th & 31st 2008 Page of presentation:
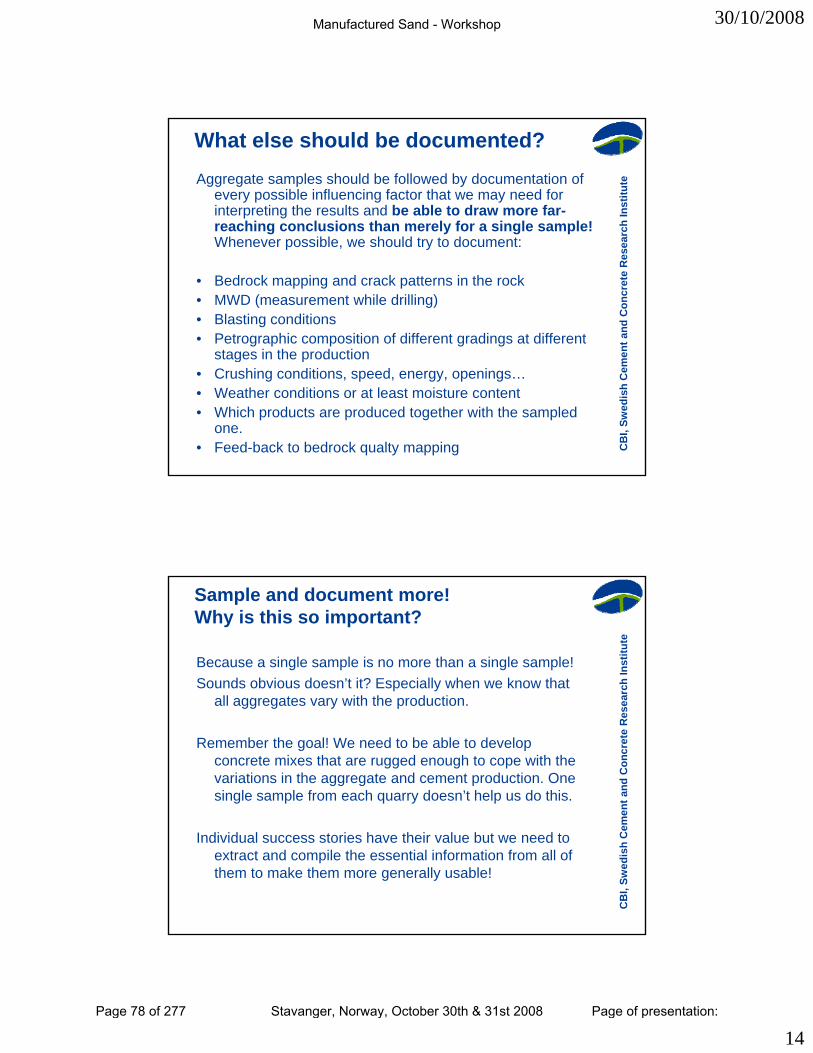
30/10/2008
14
arch
Inst
itute
What else should be documented?Aggregate samples should be followed by documentation of
every possible influencing factor that we may need for interpreting the results and be able to draw more far-reaching conclusions than merely for a single sample!Wh ibl h ld t t d t
ent a
nd C
oncr
ete
Res
eaWhenever possible, we should try to document:
• Bedrock mapping and crack patterns in the rock• MWD (measurement while drilling)• Blasting conditions• Petrographic composition of different gradings at different
stages in the production
CB
I, Sw
edis
h C
emestages in the production
• Crushing conditions, speed, energy, openings…• Weather conditions or at least moisture content • Which products are produced together with the sampled
one.• Feed-back to bedrock qualty mapping
arch
Inst
itute
Sample and document more! Why is this so important?
Because a single sample is no more than a single sample!Sounds obvious doesn’t it? Especially when we know that
ll i h h d i
ent a
nd C
oncr
ete
Res
eaall aggregates vary with the production.
Remember the goal! We need to be able to develop concrete mixes that are rugged enough to cope with the variations in the aggregate and cement production. One single sample from each quarry doesn’t help us do this.
CB
I, Sw
edis
h C
eme
Individual success stories have their value but we need to extract and compile the essential information from all of them to make them more generally usable!
Manufactured Sand - Workshop
Page 78 of 277 Stavanger, Norway, October 30th & 31st 2008 Page of presentation:
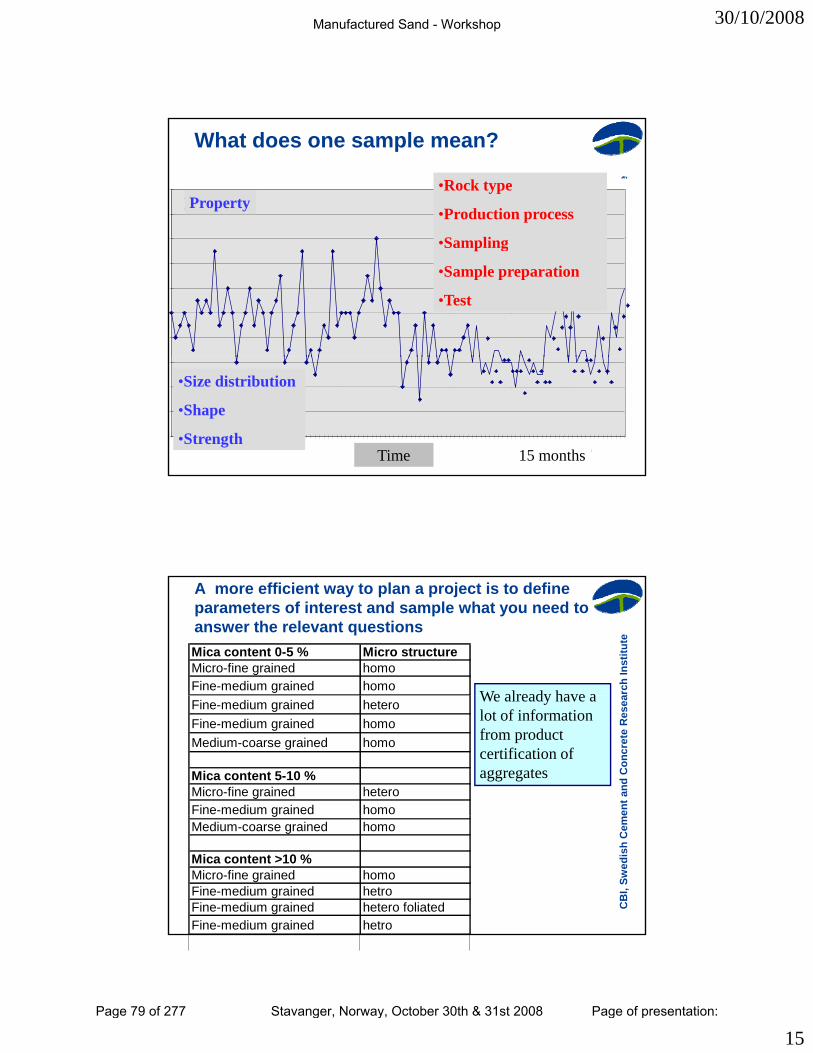
30/10/2008
15
arch
Inst
itute
What does one sample mean?
Egenskap BergetProcessen
•Rock type
•Production process
S i
Property
ent a
nd C
oncr
ete
Res
eaProvtagning
ProvberedningProvning
•Sampling
•Sample preparation
•Test
CB
I, Sw
edis
h C
eme
Tidsaxel
Siktkurva
15 månader
KornformHållfasthet
Time 15 months
•Size distribution
•Shape
•Strength
arch
Inst
itute
A more efficient way to plan a project is to define parameters of interest and sample what you need to answer the relevant questionsMica content 0-5 % Micro structureMicro-fine grained homoFine-medium grained homo
We already have a
ent a
nd C
oncr
ete
Res
eaFine-medium grained heteroFine-medium grained homoMedium-coarse grained homo
Mica content 5-10 %Micro-fine grained heteroFine-medium grained homo
We already have a lot of information from product certification of aggregates
CB
I, Sw
edis
h C
emeg
Medium-coarse grained homo
Mica content >10 %Micro-fine grained homoFine-medium grained hetroFine-medium grained hetero foliatedFine-medium grained hetro
Manufactured Sand - Workshop
Page 79 of 277 Stavanger, Norway, October 30th & 31st 2008 Page of presentation:
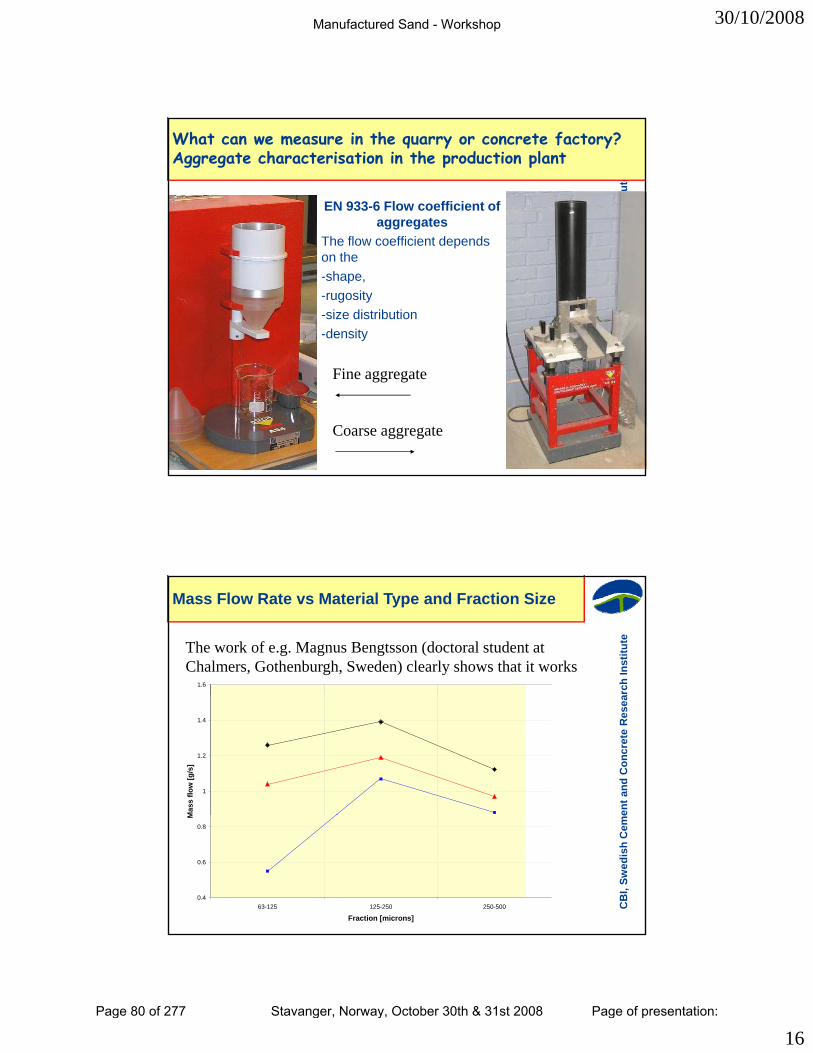
30/10/2008
16
arch
Inst
itute
a
EN 933-6 Flow coefficient of aggregates
Th fl ffi i t d d
What can we measure in the quarry or concrete factory?Aggregate characterisation in the production plant
ent a
nd C
oncr
ete
Res
eaThe flow coefficient depends on the -shape, -rugosity-size distribution-density
CB
I, Sw
edis
h C
eme
Fine aggregate
Coarse aggregate
arch
Inst
itute
1.6
Mass Flow Rate vs Material Type and Fraction Size
The work of e.g. Magnus Bengtsson (doctoral student at Chalmers, Gothenburgh, Sweden) clearly shows that it works
ent a
nd C
oncr
ete
Res
ea
1
1.2
1.4
Mas
s flo
w [g
/s]
CB
I, Sw
edis
h C
eme
0.4
0.6
0.8
250-500125-25063-125
Fraction [microns]
M
Manufactured Sand - Workshop
Page 80 of 277 Stavanger, Norway, October 30th & 31st 2008 Page of presentation:
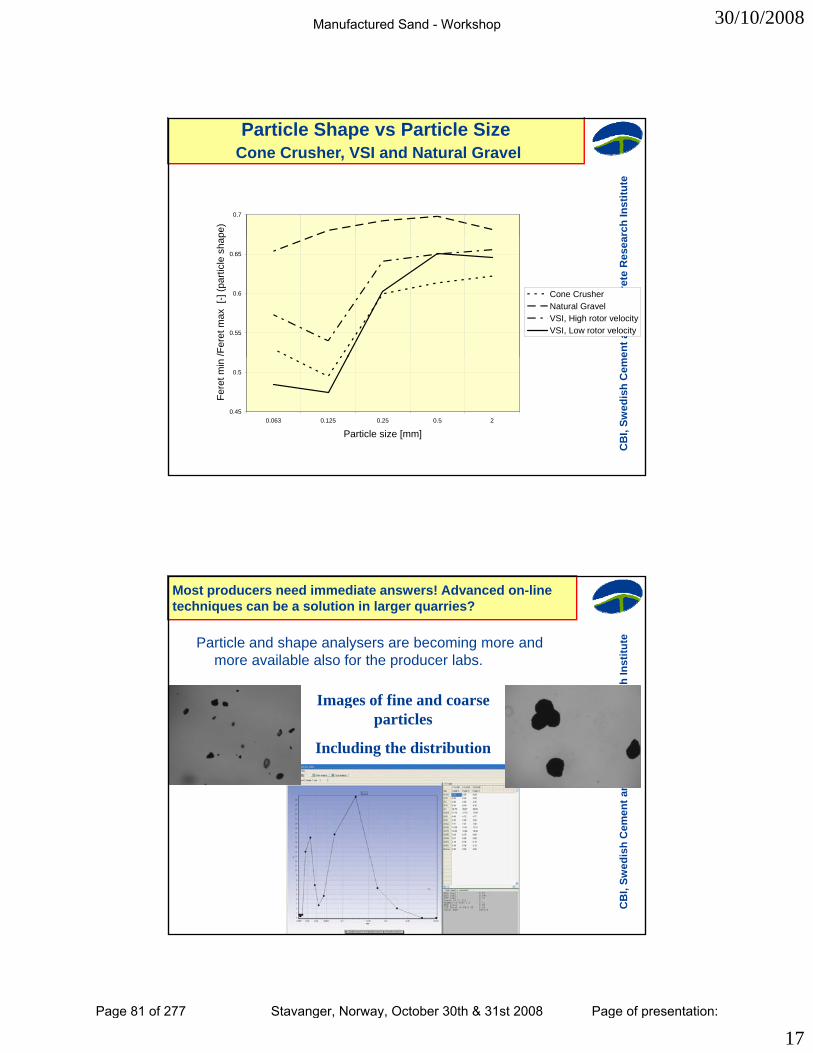
30/10/2008
17
arch
Inst
itute
Particle Shape vs Particle SizeCone Crusher, VSI and Natural Gravel
0.7pe
)
ent a
nd C
oncr
ete
Res
ea
0.55
0.6
0.65
/Fer
et m
ax [
-] (p
artic
le s
hap
Cone CrusherNatural GravelVSI, High rotor velocityVSI, Low rotor velocity
CB
I, Sw
edis
h C
eme
0.45
0.5
20.50.250.1250.063
Particle size [mm]
Fere
t min
arch
Inst
itute
Most producers need immediate answers! Advanced on-line techniques can be a solution in larger quarries?
Particle and shape analysers are becoming more and more available also for the producer labs.
I f fi d
ent a
nd C
oncr
ete
Res
eaImages of fine and coarse particles
Including the distribution
CB
I, Sw
edis
h C
eme
Manufactured Sand - Workshop
Page 81 of 277 Stavanger, Norway, October 30th & 31st 2008 Page of presentation:
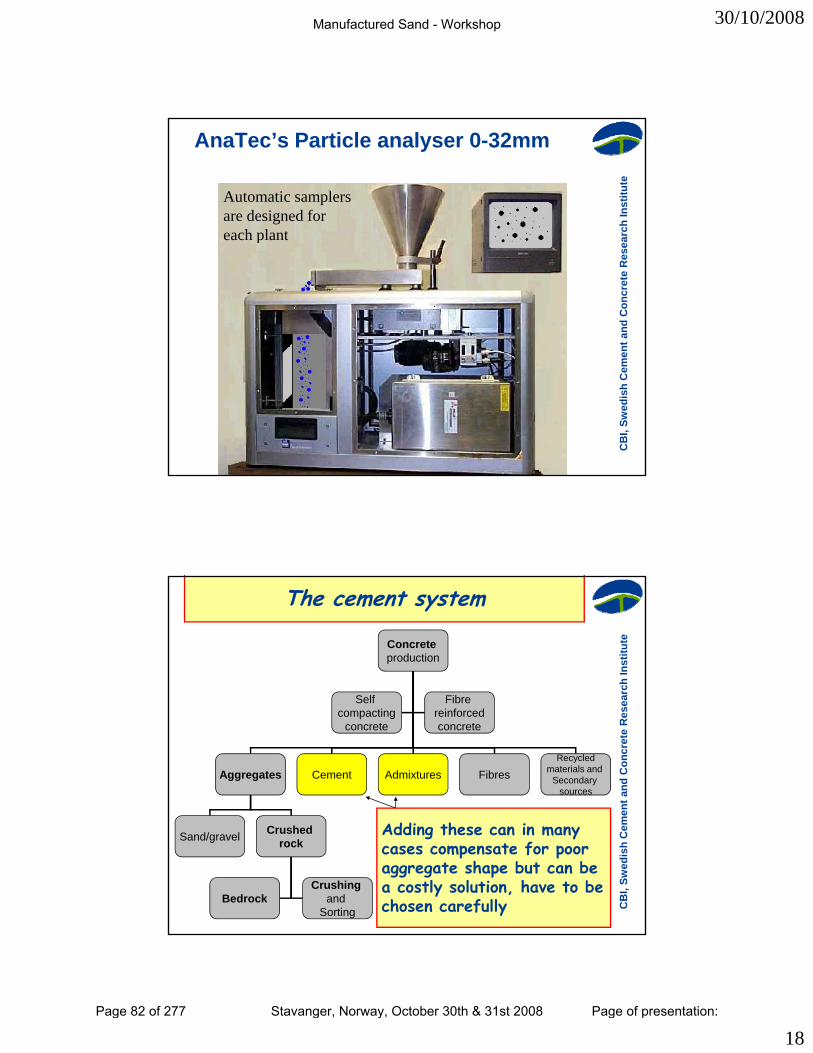
30/10/2008
18
arch
Inst
itute
AnaTec’s Particle analyser 0-32mm
Automatic samplers are designed for each plant
ent a
nd C
oncr
ete
Res
ea
each plant
CB
I, Sw
edis
h C
eme
arch
Inst
ituteConcrete
production
S lf Fib
The cement systemen
t and
Con
cret
e R
esea
Aggregates Cement Admixtures Fibres
Self compacting
concrete
Recycledmaterials and
Secondary sources
Fibre reinforcedconcrete
CB
I, Sw
edis
h C
eme
Sand/gravel Crushed rock
BedrockCrushing
and Sorting
Adding these can in many cases compensate for poor aggregate shape but can be a costly solution, have to be chosen carefully
Manufactured Sand - Workshop
Page 82 of 277 Stavanger, Norway, October 30th & 31st 2008 Page of presentation:
30/10/2008
19
arch
Inst
ituteConcrete
production
S lf Fib
Concrete – e.g. Self compacting concrete
Advanced lab. testing leading to simple F t t ti
ent a
nd C
oncr
ete
Res
ea
Aggregates Cement Admixtures Fibres
Self compacting
concrete
Recycledmaterials and
Secondary sources
Fibre reinforcedconcrete
Factory testing
CB
I, Sw
edis
h C
eme
Sand/gravel Crushed rock
BedrockCrushing
and Sorting
arch
Inst
itute
Advanced laboratory tests
Rheology in cement paste, mortar and then concrete
Tixotropy, etc
ent a
nd C
oncr
ete
Res
ea
Tixotropy, etc
Leading to quicker
and more simple
production
CB
I, Sw
edis
h C
eme
tests
Photos from Mapei Milano
Manufactured Sand - Workshop
Page 83 of 277 Stavanger, Norway, October 30th & 31st 2008 Page of presentation:
30/10/2008
20
arch
Inst
ituteThe rheology of the concrete and its stability are of crucial
importance and should be possible to measure in the production plant!
Filling ability
Factory tests of fresh concrete properties
New Nordic standardNT BUILD 507
ent a
nd C
oncr
ete
Res
eaFilling ability Methods: slump flow, J-ring, V-funnel, etc.
Passing abilityMethods: L-box, J-ring, etc.
Stability (Resistance to segregation)Methods: sieve stability test, J-ring, etc.
BlockingBJ = ΣΔhi/4 − Δh0
NT BUILD 507 for industrial QC
CB
I, Sw
edis
h C
eme
Δh0 ΔhiΔhi
SJ
arch
Inst
itute
Test of stability with the J-ring, a few minutes after
The concrete, continued
Top part of sample Bottom part of sampleen
t and
Con
cret
e R
esea
u es a emixing.
The method is suitable for both lab. and field analysis
Top sample Bottom sample
Small difference – stability is ok.
CB
I, Sw
edis
h C
eme
Significant difference – stability is not ok
The consisteny has to be stable from the production plant all the way out to the construction site!
Manufactured Sand - Workshop
Page 84 of 277 Stavanger, Norway, October 30th & 31st 2008 Page of presentation:
30/10/2008
21
arch
Inst
itute
Knowledge-based concrete proportioning as the central part to design concrete mixtures based on performance based requirements with optimised use of local raw
t i l d l l d (i l l d t i l )
The new material/production chain: Avoid trial and error! Transfer the knowledge from one place to the other
ent a
nd C
oncr
ete
Res
eamaterials and local producers (incl. recycled materials):Knowledge-based rock characterisation of crucial parameters
for cost efficient production of totally crushed aggregates suitable for concrete
Knowledge based aggregate production/rock crushing with the techniques maximally fulfilling the optimised requirements from concrete proportioning.
Optimised particle shape characterisation with the help of SEM
CB
I, Sw
edis
h C
emep p p p
and image analysis, conversion to tests applicable in the industry such as, e.g. Flow coefficient
Optimised particle size distribution of aggregates with the help of non-spherical packing algorithm. Not based on natural sand distributions!
arch
Inst
itute
Knowledge-based cement, fibre and admixtureproduction/development for maximally fulfilling the functional requirements of concrete.
The new material/production chain, continued:en
t and
Con
cret
e R
esea
u c o a equ e e s o co c e eOptimised use of cementitious materials (cement and
various pozzolanic by-products) with the help of LCA for maximum reduction of CO2 emission;
Optimised use of fibres for functions of reinforcement, cracking resistance, fire resistance, etc.;
Optimised use of admixtures for proper workability, frost resistance corrosion resistance etc
CB
I, Sw
edis
h C
emeresistance, corrosion resistance, etc.
Knowledge-based recycling for maximal reuse of demolished concrete.
Instrumented QA system from raw materials to final product of concrete.
Manufactured Sand - Workshop
Page 85 of 277 Stavanger, Norway, October 30th & 31st 2008 Page of presentation:

30/10/2008
22
arch
Inst
ituteAnyone interested in collaboration in this area is welcome to use these contacts:
[email protected]@sp.se
@
Join E2B and influence the future European research!
•http://www.e2b-jti.eu/
ent a
nd C
oncr
ete
Res
[email protected]@sintef.no
Attend the next ECTP FA Materials Meeting,18th Dec. in Brussels
CB
I, Sw
edis
h C
eme
Thank you for your attention and for arranging this important workshop!!
Manufactured Sand - Workshop
Page 86 of 277 Stavanger, Norway, October 30th & 31st 2008 Page of presentation:

Experience of the utilisation of crushed rock as concrete aggregates in Göteborg Governmental restrictions and uncertain future resources of natural sand have made the search for alternative materials an urgent matter in order to secure the future supply of concrete aggregates in the Göteborg region. A project was thus initiated to find a long term aggregate solution. Even though a few different alternatives have been assessed within the project the main focus has been to utilise manufactured sand from the Jehander pit in Kållered, just south of Göteborg. Preliminary results from laboratory concrete tests showed that the replacement of natural sand 0/8 with corresponding manufactured fraction resulted in a substantial increase of the water demand as well as reduced workability for the concrete. The differences were believed to be due to an increased amount of fines <0,063 mm in combination with poorer particle shapes of the crushed material. Some alternative measures to improve the crushed sand were thus assessed and a production process that included the use of a so called VSI-crusher in combination with air classification was eventually selected. Full scale tests verified that VSI-crushing improved the particle shape. Another important effect of the selected crushing method was to even out the particle size distribution, see figure 1. It was further verified that the content of fines could be significantly reduced by air classification, see figure 2. Figure 1 Figure 2 Results from laboratory and full scale concrete tests verified that the above described measures were sufficient to reduce the water demand to a level close to that of natural sand concrete. Moreover, the workability of the manufactured sand concrete was found to be satisfactory, see figure 3. Figure 3 – Measured slump (left) and drops with Powers remolding test (right).
0
10
20
30
40
50
60
70
80
90
100
0,01 0,1 1 10
Maskvidd (mm)
Pass
eran
de (%
)
NaturKrossNaturKross
0
10
20
30
40
50
60
70
80
90
100
0,01 0,1 1 10
Maskvidd (mm)
Pass
eran
de (%
)
0/8 NVSI
0
10
20
30
40
50
60
70
80
90
100
0,01 0,1 1 10
Maskvidd (mm)
Pass
eran
de (%
)
0/8 NVSI0/8 NVSI
0
10
20
30
40
50
60
70
80
90
100
0,01 0,1 1 10
Maskvidd (mm)
Pass
eran
de (%
)
NaturKross
0
10
20
30
40
50
60
70
80
90
100
0,01 0,1 1 10
Maskvidd (mm)
Pass
eran
de (%
)
NaturKrossNaturKross
0
10
20
30
40
50
60
70
80
90
100
0,01 0,1 1 10
Maskvidd (mm)
Pass
eran
de (%
)
0/8 NClassified VSI
”Normal” crushed sand
VSI-sand
0
50
100
150
200
250
0/8 N VSI Class VSI
Sättm
ått (
mm
)
0
5
10
15
20
0/8 N VSI Class VSI
Om
form
ning
(sla
g)
Manufactured Sand - Workshop
Page 87 of 277 Stavanger, Norway, October 30th & 31st 2008 Page of presentation:
30/10/2008
1
M f t d d i tManufactured sand in concrete
Experiences from laboratory and full scale tests in Göteborg
Stavanger 2008-10-29
Niklas SkoogNiklas SkoogSand & Grus AB Jehander
The Quarry in Kållered
Slide 2 - 30-31.10.2008Concrete with crushed rock aggregates – Jonas Carlswärd
Manufactured Sand - Workshop
Page 88 of 277 Stavanger, Norway, October 30th & 31st 2008 Page of presentation:
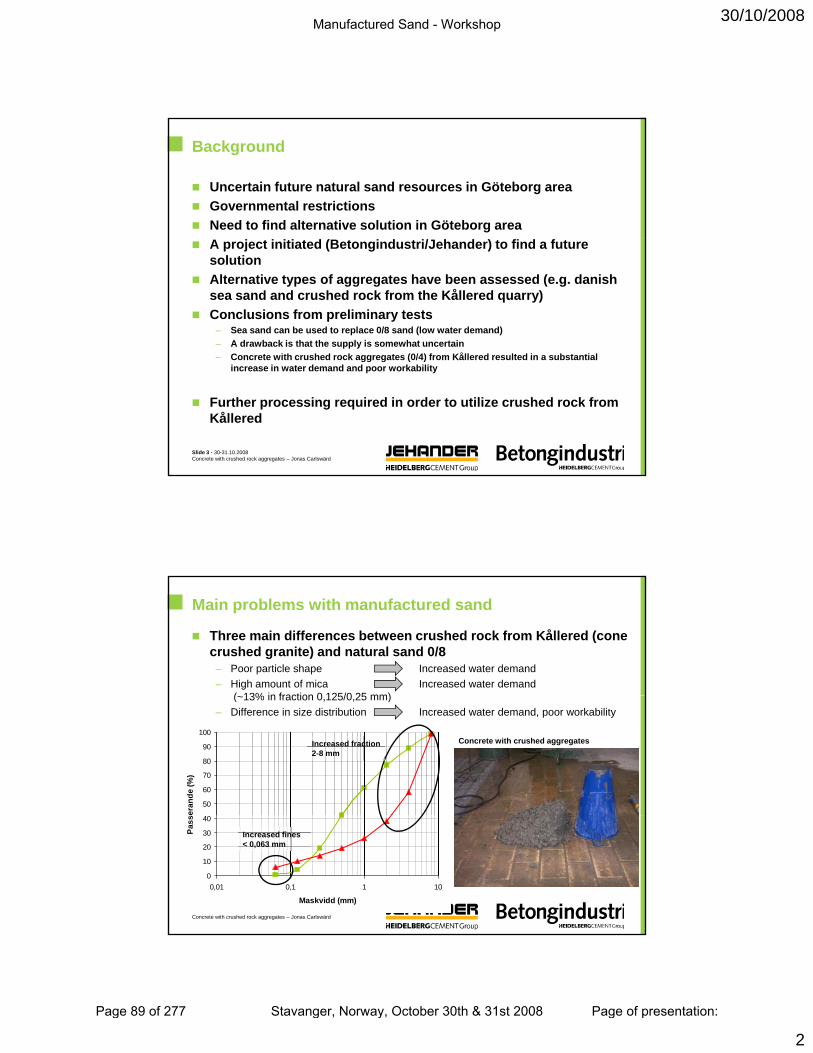
30/10/2008
2
Background
Uncertain future natural sand resources in Göteborg areaGovernmental restrictionsNeed to find alternative solution in Göteborg areaA project initiated (Betongindustri/Jehander) to find a future solutionAlternative types of aggregates have been assessed (e.g. danish sea sand and crushed rock from the Kållered quarry)Conclusions from preliminary tests
– Sea sand can be used to replace 0/8 sand (low water demand)– A drawback is that the supply is somewhat uncertain
Concrete with crushed rock aggregates (0/4) from Kållered resulted in a substantial
Slide 3 - 30-31.10.2008Concrete with crushed rock aggregates – Jonas Carlswärd
– Concrete with crushed rock aggregates (0/4) from Kållered resulted in a substantial increase in water demand and poor workability
Further processing required in order to utilize crushed rock from Kållered
Main problems with manufactured sand
Three main differences between crushed rock from Kållered (cone crushed granite) and natural sand 0/8
– Poor particle shape Increased water demand– High amount of mica Increased water demand
( 13% in fraction 0 125/0 25 mm)
50
60
70
80
90
100
eran
de (%
)
(~13% in fraction 0,125/0,25 mm) – Difference in size distribution Increased water demand, poor workability
Concrete with crushed aggregatesIncreased fraction 2-8 mm
Slide 4 - 30-31.10.2008Concrete with crushed rock aggregates – Jonas Carlswärd
0
10
20
30
40
0,01 0,1 1 10
Maskvidd (mm)
Pass
e
Increased fines < 0,063 mm
Manufactured Sand - Workshop
Page 89 of 277 Stavanger, Norway, October 30th & 31st 2008 Page of presentation:
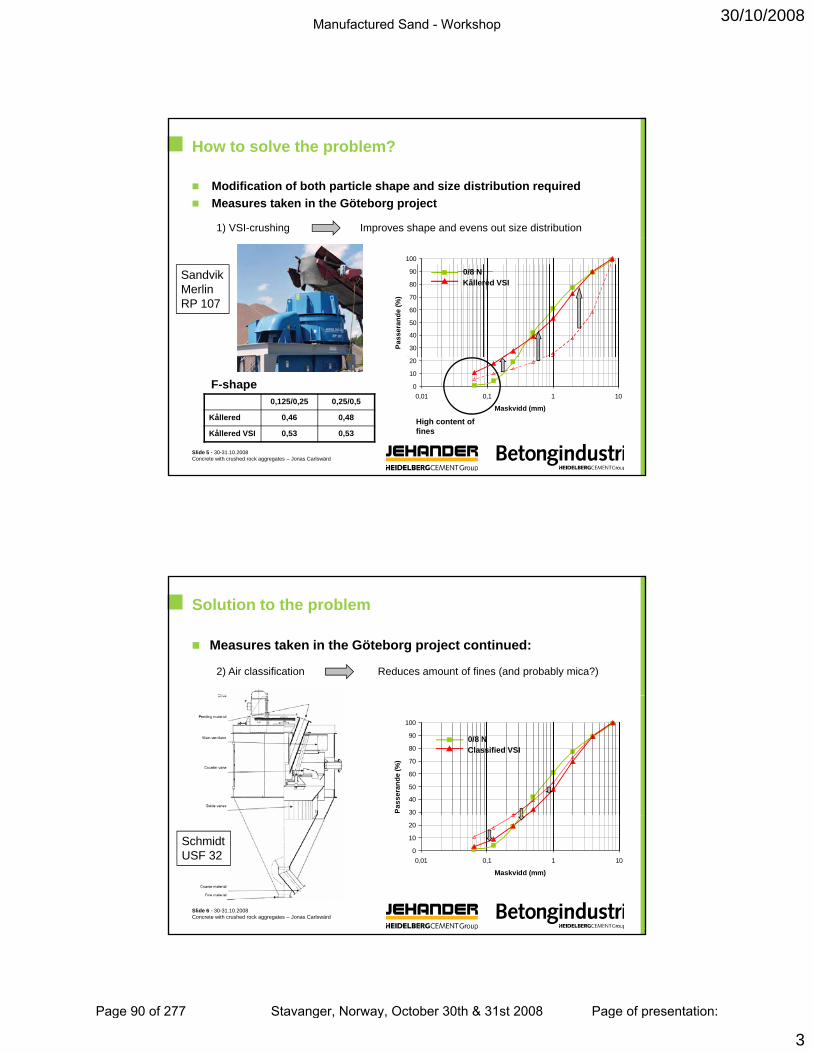
30/10/2008
3
How to solve the problem?
Modification of both particle shape and size distribution requiredMeasures taken in the Göteborg project
1) VSI-crushing Improves shape and evens out size distribution
30
40
50
60
70
80
90
100
Pass
eran
de (%
)
0/8 NKållered
30
40
50
60
70
80
90
100
Pass
eran
de (%
)
0/8 NKållered VSI
SandvikMerlinRP 107
Slide 5 - 30-31.10.2008Concrete with crushed rock aggregates – Jonas Carlswärd
0
10
20
0,01 0,1 1 10
Maskvidd (mm)
0
10
20
0,01 0,1 1 10
Maskvidd (mm)
High content of fines
0,125/0,25 0,25/0,5
Kållered 0,46 0,48
Kållered VSI 0,53 0,53
F-shape
Solution to the problem
Measures taken in the Göteborg project continued:
2) Air classification Reduces amount of fines (and probably mica?)
30
40
50
60
70
80
90
100
Pass
eran
de (%
)
0/8 NClassified VSI
30
40
50
60
70
80
90
100
Pas
sera
nde
(%)
0/8 NClassified VSI
Slide 6 - 30-31.10.2008Concrete with crushed rock aggregates – Jonas Carlswärd
0
10
20
30
0,01 0,1 1 10
Maskvidd (mm)
0
10
20
0,01 0,1 1 10
Maskvidd (mm)
SchmidtUSF 32
Manufactured Sand - Workshop
Page 90 of 277 Stavanger, Norway, October 30th & 31st 2008 Page of presentation:
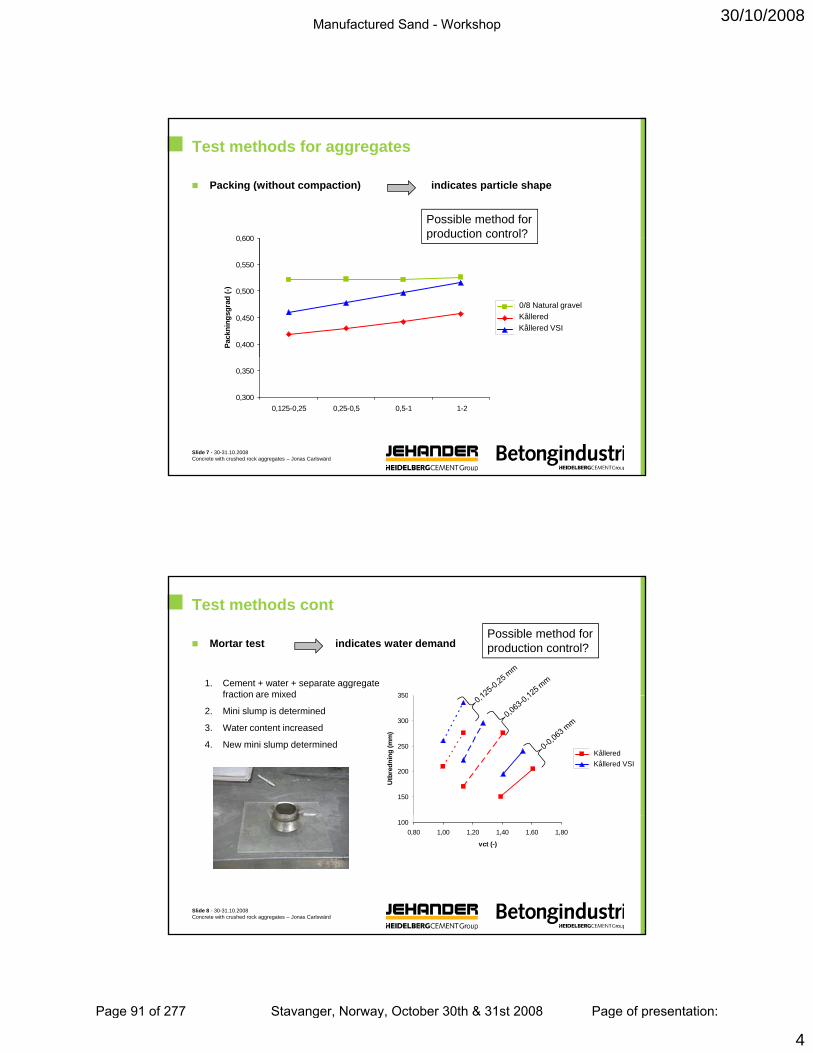
30/10/2008
4
Test methods for aggregates
Packing (without compaction) indicates particle shape
0 600
Possible method forproduction control?
0,400
0,450
0,500
0,550
0,600Pa
ckni
ngsg
rad
(-)
NaturKrossVSI-kross
0/8 Natural gravelKålleredKållered VSI
production control?
Slide 7 - 30-31.10.2008Concrete with crushed rock aggregates – Jonas Carlswärd
0,300
0,350
0,125-0,25 0,25-0,5 0,5-1 1-2
Test methods cont
Mortar test indicates water demand
350
1. Cement + water + separate aggregate fraction are mixed
Possible method forproduction control?
150
200
250
300
350
Utb
redn
ing
(mm
)
KrossVSI-kross
fraction are mixed
2. Mini slump is determined
3. Water content increased
4. New mini slump determinedKålleredKållered VSI
Slide 8 - 30-31.10.2008Concrete with crushed rock aggregates – Jonas Carlswärd
1000,80 1,00 1,20 1,40 1,60 1,80
vct (-)
Manufactured Sand - Workshop
Page 91 of 277 Stavanger, Norway, October 30th & 31st 2008 Page of presentation:

30/10/2008
5
Concrete tests
Concrete with VSI-crushed and air classified aggregatesBtg C25/30 16 S3
Material 0/8N VSI
VSI
VSI+air
Cement 310 kg/m3
Water 198 kg/m3
w/c 0,64 Plasticizer 0,3 %
SlumpRemoulding number 11Add water
w/c
310 kg/m3
12
0,69
Sl 135
VSI before add water
VSI after add water
198 kg/m3
0,64
0,3 %
198 kg/m3
0,64
0,3 %
210 mm 70 mm 190 mm
12
17 kg/m3
310 kg/m3
Slide 9 - 30-31.10.2008Concrete with crushed rock aggregates – Jonas Carlswärd
Slump 135 mm
Powers remoulding test
Remoulding number 15
Full scale verification
Full scale test to verify pumpability, workability and other characteristics in the fresh and hardened state
C25/30 16 S3C25/30 16 S3
Cement Bygg
Water
S 56
w/c
Slump
Slump45 min
Material
306 kg/m3
194 kg/m3
0,45 %
0,63
200 mm
170 mm Remoulding
b 8 slag
Slump 5 min Slump 45 min
Slide 10 - 30-31.10.2008Concrete with crushed rock aggregates – Jonas Carlswärd
number 8 slag
Strength, 28d 36 MPa
Density 2360 kg/m3
Manufactured Sand - Workshop
Page 92 of 277 Stavanger, Norway, October 30th & 31st 2008 Page of presentation:

30/10/2008
6
Conclusions
We believe we have a concept for manufacturing sand from the quarry in Kållered (VSI crusher + air classifier)
T f th dRequirement specification for manufactured sand :
– Size distribution, shape, surface structure, mineral content (mica?)…
– Are the characteristics of 0/8 natural gravel also the optimum for manufactured
Optimize a plant for manufactured sand:
– Optimum input material, type and position (replace the cone crusher in the third crusher step?) and settings of the VSI-crusher?
– Optimum type, input
To go further we need:
Cooperation
Slide 11 - 30-31.10.2008Concrete with crushed rock aggregates – Jonas Carlswärd
sand? material and settings of the air classifier?
Simple method for production
control?
Manufactured Sand - Workshop
Page 93 of 277 Stavanger, Norway, October 30th & 31st 2008 Page of presentation:

Manufactured Sand - Workshop
Page 94 of 277 Stavanger, Norway, October 30th & 31st 2008 Page of presentation:

EXPERIENCE WITH MANUFACTURED SANDS IN CANADA
Chris Rogers Post Office Box 185, 161 Centre Street, Beeton, Ontario, Canada, L0G 1A0 E-mail [email protected] Phone 905-729-4768
ABSTRACT
Manufactured sands have been used in Canada for over 50 years. One of the first recorded instances was
for the supply of concrete sand for parts of the St Lawrence Seaway in the 1950’s. In this case there were
no suitably graded sands locally available for lock or dam construction. Crusher screenings from local
limestone quarries were washed and blended with locally available quartz rich raised beach sands. The
beach sands were predominantly sized pass 600 µm. This ensured that there were adequate amounts (a
minimum of 10 %) of material passing the 300 µm sieve so that adequate workability and concrete
bleeding behaviour were achieved. Since the 1950’s manufactured sands have been rarely used in
hydraulic cement concrete. The reason is the generally unsuitable behaviour of such sands in concrete, the
high cost of manufacture and the general availability of natural sands. Even in markets where natural
sands are not locally available, natural sands will be brought into the market rather than adopt the use of
locally made manufactured sands. Concrete sand probably only makes up about 10 % of the combined
market for concrete and hot mix asphalt fine aggregate.
Manufactured sands have been extensively used in high performance asphalt concrete for the past 20
years. The angular shape of manufactured sands is necessary to provide the necessary resistance to
deformation and rutting. High truck axle loads and high tire pressures have had a major impact on
deformation rutting of asphalt concrete made with rounded and sub-angular natural sands. Generally
manufactured sands for this application are made by blending approximately equal amounts of washed
and unwashed crusher screenings. This results in a blended fine aggregate with an optimal amount of
about 5 to 6 % material pass the 75 µm sieve. Such blending usually takes place at the asphalt plant in the
feed system into the aggregate drier. Because much of the asphalt made today contains either crusher
screenings blended with natural sand or manufactured sand, aggregate suppliers are seeing a relative
decline in the demand for natural sands for asphalt.
Three interesting technical problems have arisen with the use of manufactured sands:
• Manufactured sands made of carbonate rocks (limestone and dolomite) are very susceptible to
polishing in pavement surfaces compared with natural sands that normally contain large amounts
of hard minerals such as quartz and feldspar. The Ontario Ministry of Transportation has a
Manufactured Sand - Workshop
Page 95 of 277 Stavanger, Norway, October 30th & 31st 2008 Page of presentation:
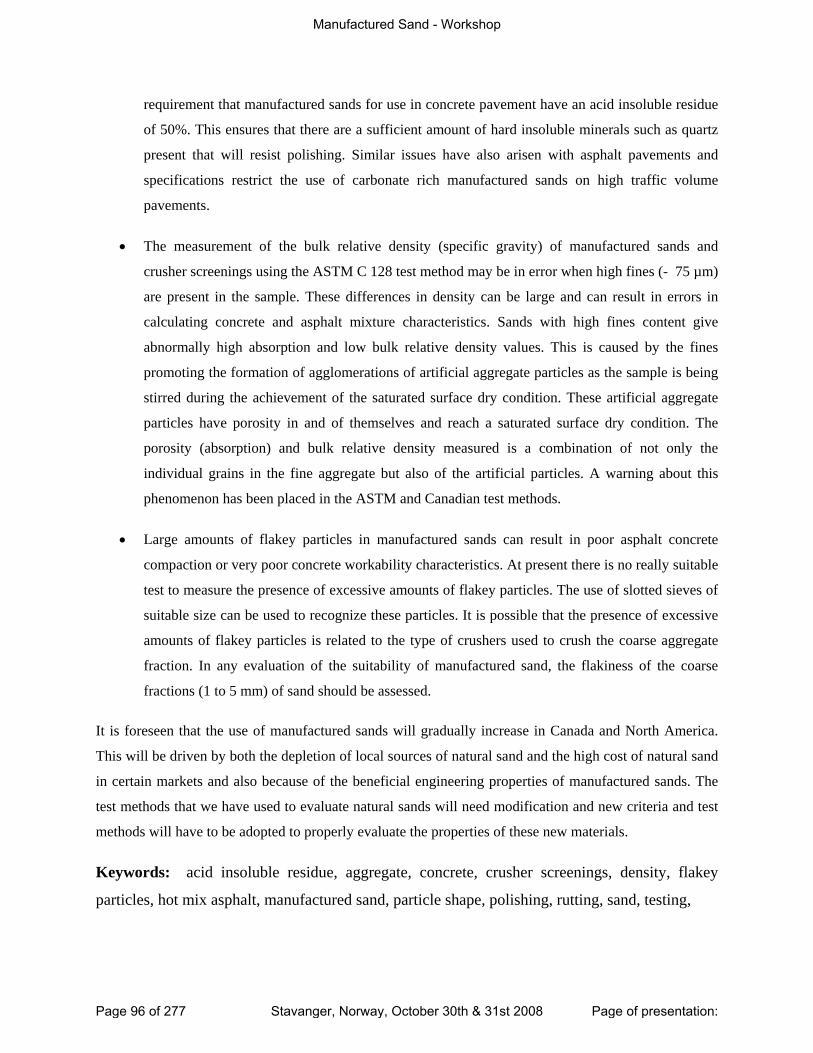
requirement that manufactured sands for use in concrete pavement have an acid insoluble residue
of 50%. This ensures that there are a sufficient amount of hard insoluble minerals such as quartz
present that will resist polishing. Similar issues have also arisen with asphalt pavements and
specifications restrict the use of carbonate rich manufactured sands on high traffic volume
pavements.
• The measurement of the bulk relative density (specific gravity) of manufactured sands and
crusher screenings using the ASTM C 128 test method may be in error when high fines (- 75 µm)
are present in the sample. These differences in density can be large and can result in errors in
calculating concrete and asphalt mixture characteristics. Sands with high fines content give
abnormally high absorption and low bulk relative density values. This is caused by the fines
promoting the formation of agglomerations of artificial aggregate particles as the sample is being
stirred during the achievement of the saturated surface dry condition. These artificial aggregate
particles have porosity in and of themselves and reach a saturated surface dry condition. The
porosity (absorption) and bulk relative density measured is a combination of not only the
individual grains in the fine aggregate but also of the artificial particles. A warning about this
phenomenon has been placed in the ASTM and Canadian test methods.
• Large amounts of flakey particles in manufactured sands can result in poor asphalt concrete
compaction or very poor concrete workability characteristics. At present there is no really suitable
test to measure the presence of excessive amounts of flakey particles. The use of slotted sieves of
suitable size can be used to recognize these particles. It is possible that the presence of excessive
amounts of flakey particles is related to the type of crushers used to crush the coarse aggregate
fraction. In any evaluation of the suitability of manufactured sand, the flakiness of the coarse
fractions (1 to 5 mm) of sand should be assessed.
It is foreseen that the use of manufactured sands will gradually increase in Canada and North America.
This will be driven by both the depletion of local sources of natural sand and the high cost of natural sand
in certain markets and also because of the beneficial engineering properties of manufactured sands. The
test methods that we have used to evaluate natural sands will need modification and new criteria and test
methods will have to be adopted to properly evaluate the properties of these new materials.
Keywords: acid insoluble residue, aggregate, concrete, crusher screenings, density, flakey
particles, hot mix asphalt, manufactured sand, particle shape, polishing, rutting, sand, testing,
Manufactured Sand - Workshop
Page 96 of 277 Stavanger, Norway, October 30th & 31st 2008 Page of presentation:
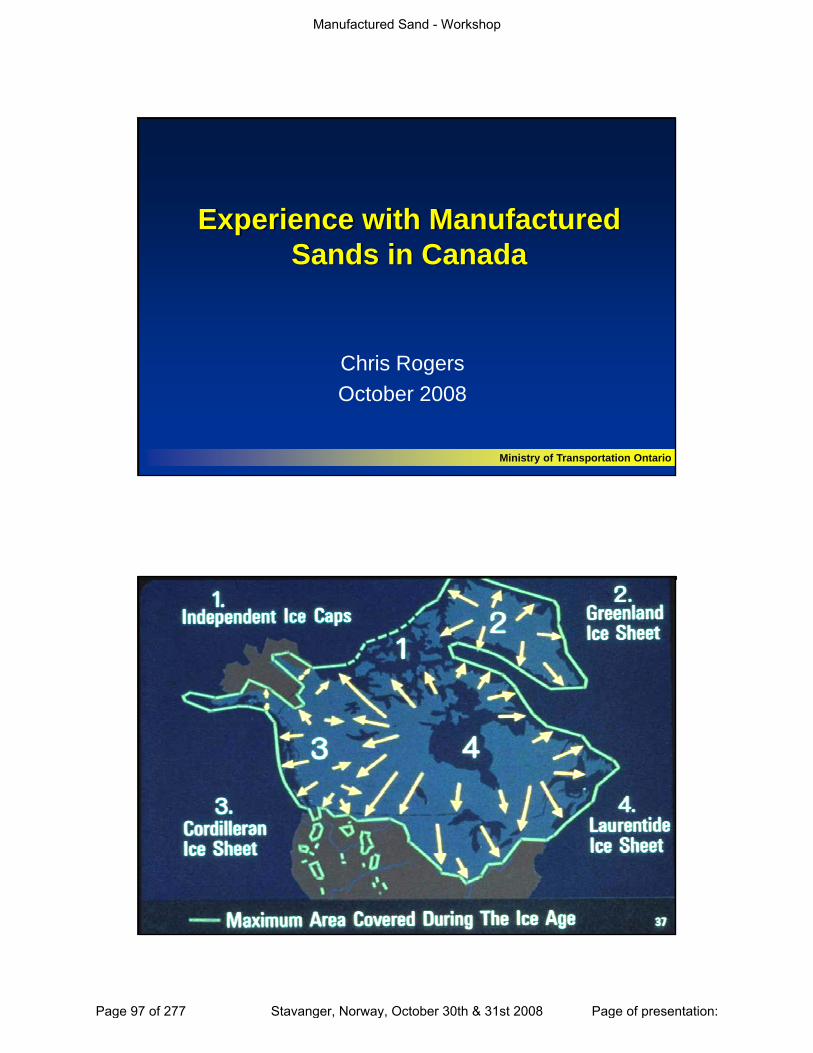
Experience with Manufactured Sands in Canada
Ch i R
Ministry of Transportation Ontario
Chris RogersOctober 2008
Ministry of Transportation Ontario
Manufactured Sand - Workshop
Page 97 of 277 Stavanger, Norway, October 30th & 31st 2008 Page of presentation:
Manufactured sand – Concrete use• Extensive sources of natural sand in NA.
Concrete sand is a small % of all aggregates.• Early use of Manufactured sand on St
Lawrence Seaway c 1957 – limestone crusher sand with local quartz rich sand from raised beach (mainly finer than 600um).
• Little use of manufactured sand in concrete since. Relative cost and ease of transport has
Ministry of Transportation Ontario3
pimproved (highways, trucks).
• Niagara area, only one sand source (close to depleted) – natural sand is trucked in.
• Loss of beach sand on Caribbean Islands.
Seaway construction1955 - 1960
Ministry of Transportation Ontario
Niagara area
Manufactured Sand - Workshop
Page 98 of 277 Stavanger, Norway, October 30th & 31st 2008 Page of presentation:
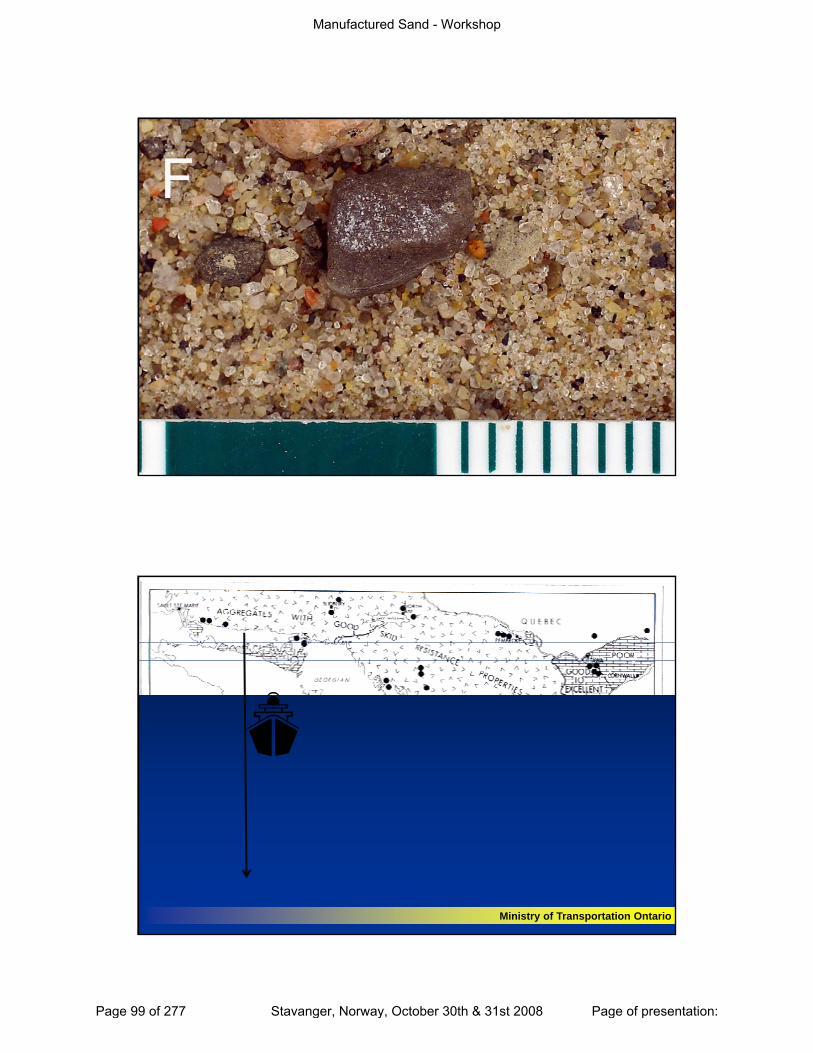
Ministry of Transportation Ontario5
Ministry of Transportation Ontario
Manufactured Sand - Workshop
Page 99 of 277 Stavanger, Norway, October 30th & 31st 2008 Page of presentation:
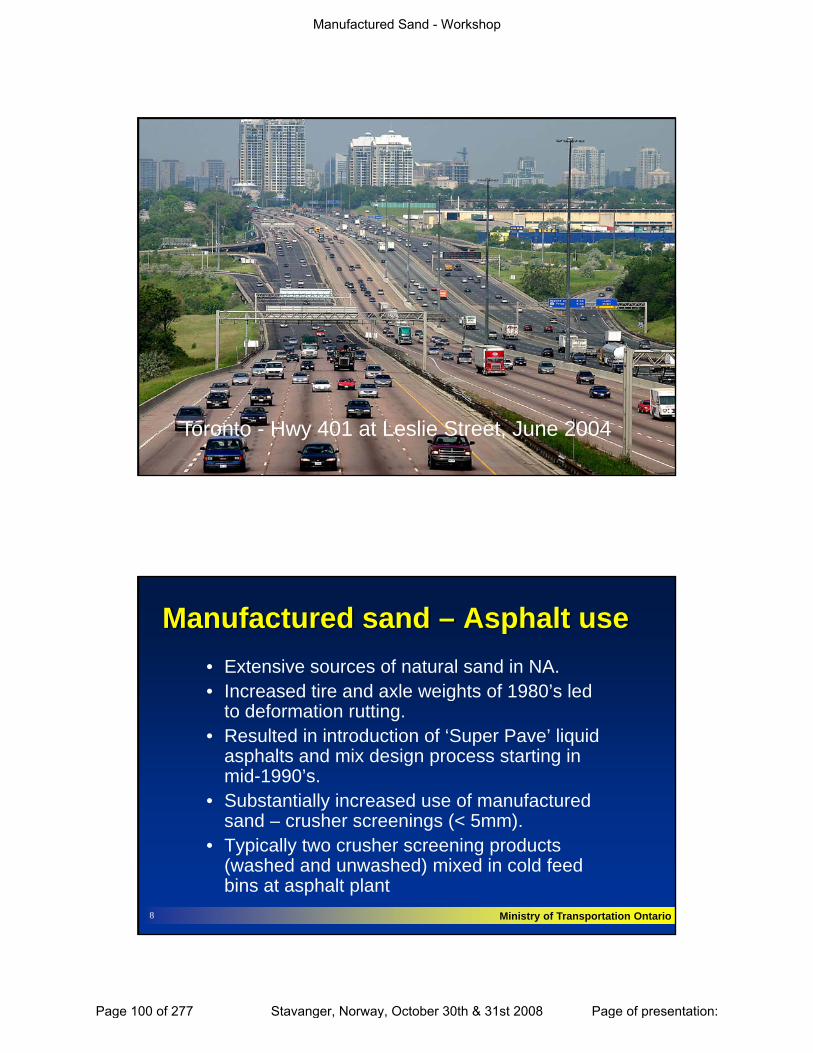
Ministry of Transportation Ontario
Toronto - Hwy 401 at Leslie Street, June 2004
Manufactured sand – Asphalt use• Extensive sources of natural sand in NA.• Increased tire and axle weights of 1980’s ledIncreased tire and axle weights of 1980 s led
to deformation rutting.• Resulted in introduction of ‘Super Pave’ liquid
asphalts and mix design process starting in mid-1990’s.
• Substantially increased use of manufactured d h i ( 5 )
Ministry of Transportation Ontario8
sand – crusher screenings (< 5mm).• Typically two crusher screening products
(washed and unwashed) mixed in cold feed bins at asphalt plant
Manufactured Sand - Workshop
Page 100 of 277 Stavanger, Norway, October 30th & 31st 2008 Page of presentation:
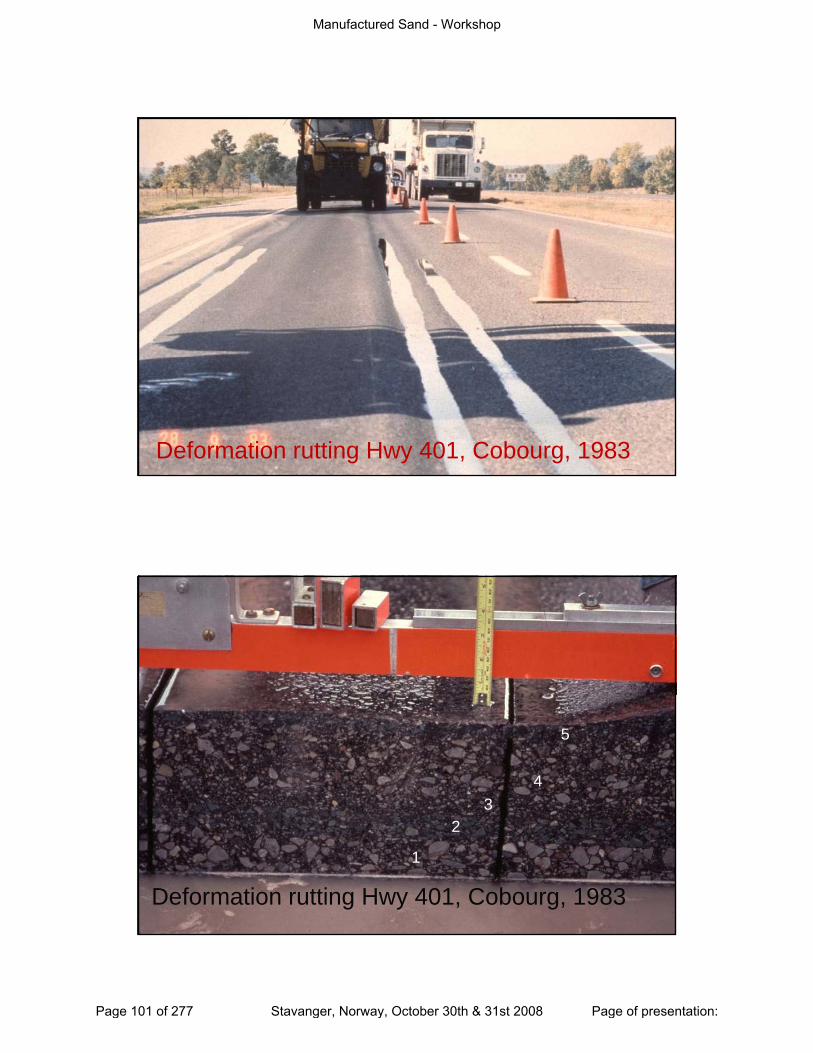
Ministry of Transportation OntarioDeformation rutting Hwy 401, Cobourg, 1983
34
5
Ministry of Transportation OntarioDeformation rutting Hwy 401, Cobourg, 1983
1
2
Manufactured Sand - Workshop
Page 101 of 277 Stavanger, Norway, October 30th & 31st 2008 Page of presentation:
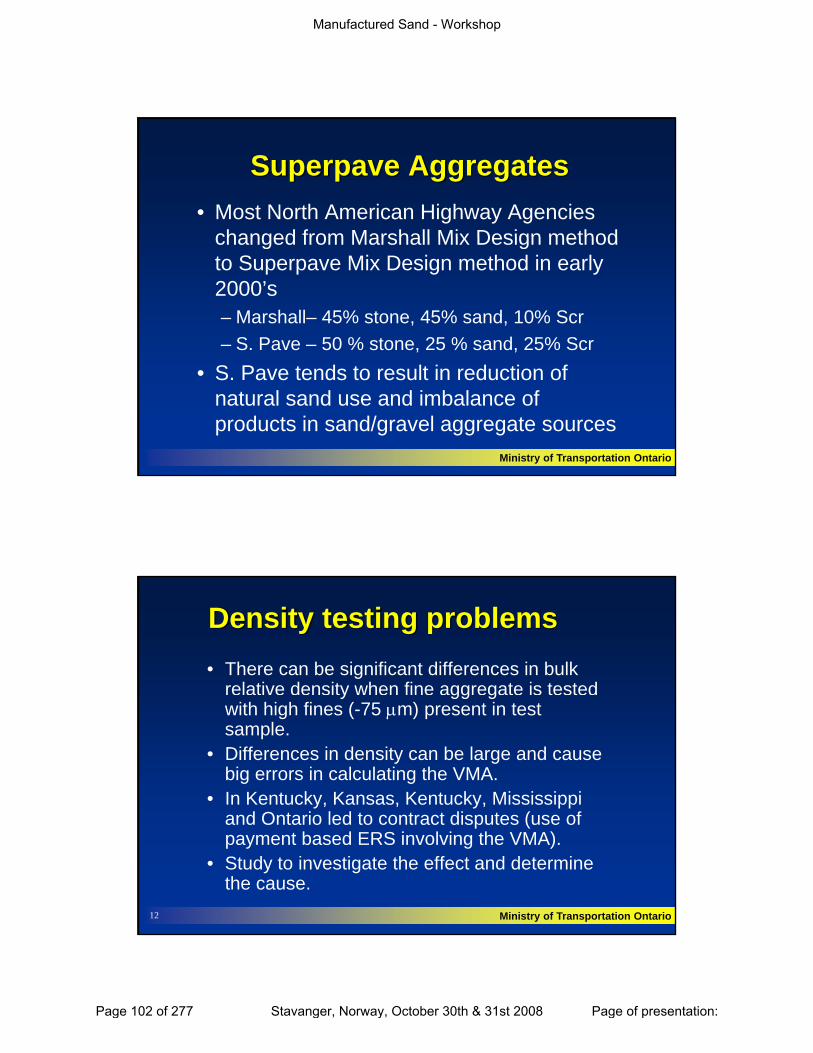
Superpave Aggregates• Most North American Highway Agencies
changed from Marshall Mix Design methodchanged from Marshall Mix Design method to Superpave Mix Design method in early 2000’s– Marshall– 45% stone, 45% sand, 10% Scr– S. Pave – 50 % stone, 25 % sand, 25% Scr
Ministry of Transportation Ontario
• S. Pave tends to result in reduction of natural sand use and imbalance of products in sand/gravel aggregate sources
Density testing problems• There can be significant differences in bulk
relative density when fine aggregate is tested y gg gwith high fines (-75 μm) present in test sample.
• Differences in density can be large and cause big errors in calculating the VMA.
• In Kentucky, Kansas, Kentucky, Mississippi and Ontario led to contract disp tes ( se of
Ministry of Transportation Ontario12
and Ontario led to contract disputes (use of payment based ERS involving the VMA).
• Study to investigate the effect and determine the cause.
Manufactured Sand - Workshop
Page 102 of 277 Stavanger, Norway, October 30th & 31st 2008 Page of presentation:

Aggregate Type
0.1
0.12
0.14
ScreeningsManufactured SandNatural Sand
sity
fin
e ag
greg
ate
Relative Density(SG) depends onfines content
– as fines increases we obtain lower bulk densities
0.02
0.04
0.06
0.08
Diff
eren
ce in
den
shed
ver
sus
unw
ashe
d f
Ministry of Transportation Ontario13
compared with unwashed sample-0.02
0
0 2 4 6 8 10 12 14
was
Per cent pass 75um in unwashed sample
Rock Type
l i i0.08
0.1
0.12
0.14
SilicateCarbonateMix
nsity
fin
e ag
greg
ate
Relative Density (SG) depends on fines content– as fines increases we obtain lower bulk densities 0
0.02
0.04
0.06
0.08
Diff
eren
ce in
den
shed
ver
sus
unw
ashe
d f
Ministry of Transportation Ontario14
compared with unwashed sample-0.02
0 2 4 6 8 10 12 14
was
Per cent pass 75 um in unwashed sample
Manufactured Sand - Workshop
Page 103 of 277 Stavanger, Norway, October 30th & 31st 2008 Page of presentation:
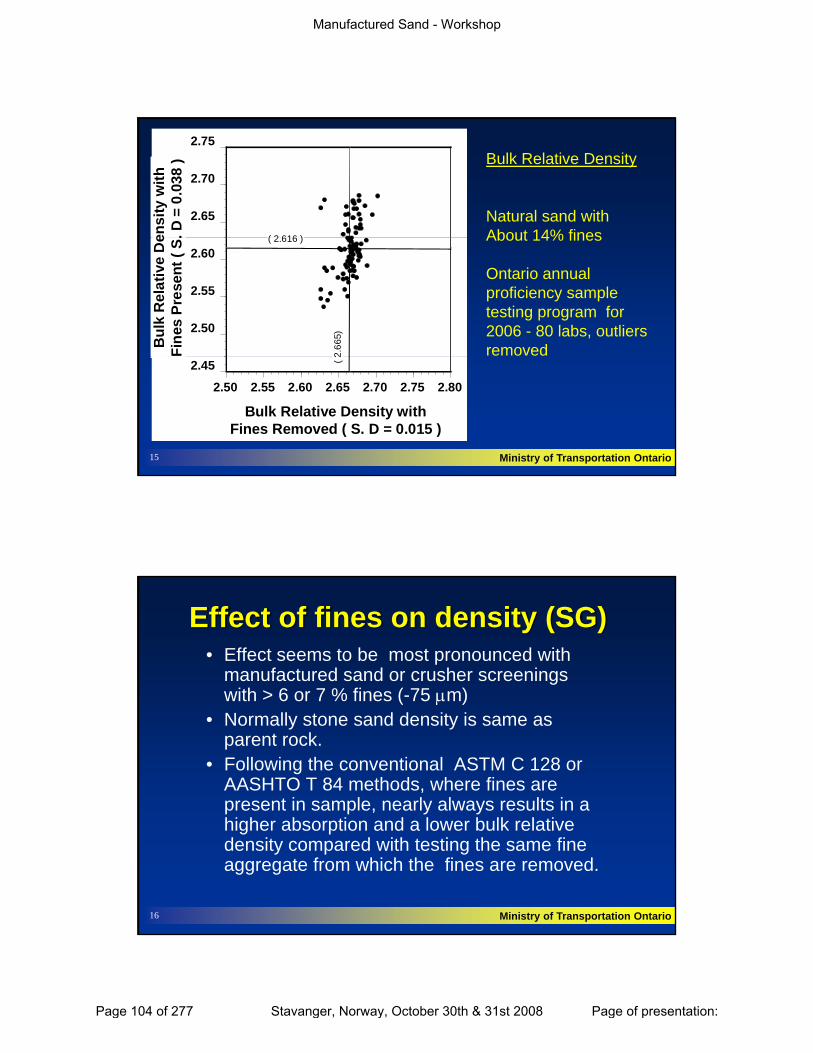
2.65
2.70
2.75en
sity
with
. D =
0.0
38 )
( 2 616 )
Bulk Relative Density
Natural sand with About 14% fines
2.50
2.55
2.60
Bul
k R
elat
ive
De
Fine
s Pr
esen
t ( S
. ( 2.616 )
2.66
5)
About 14% fines
Ontario annual proficiency sample testing program for 2006 - 80 labs, outliers removed
Ministry of Transportation Ontario15
2.45
2.50 2.55 2.60 2.65 2.70 2.75 2.80
Bulk Relative Density withFines Removed ( S. D = 0.015 )
( 2
Effect of fines on density (SG)• Effect seems to be most pronounced with
manufactured sand or crusher screenings with > 6 or 7 % fines ( 75 μm)with > 6 or 7 % fines (-75 μm)
• Normally stone sand density is same as parent rock.
• Following the conventional ASTM C 128 or AASHTO T 84 methods, where fines are present in sample, nearly always results in a
Ministry of Transportation Ontario16
higher absorption and a lower bulk relative density compared with testing the same fine aggregate from which the fines are removed.
Manufactured Sand - Workshop
Page 104 of 277 Stavanger, Norway, October 30th & 31st 2008 Page of presentation:
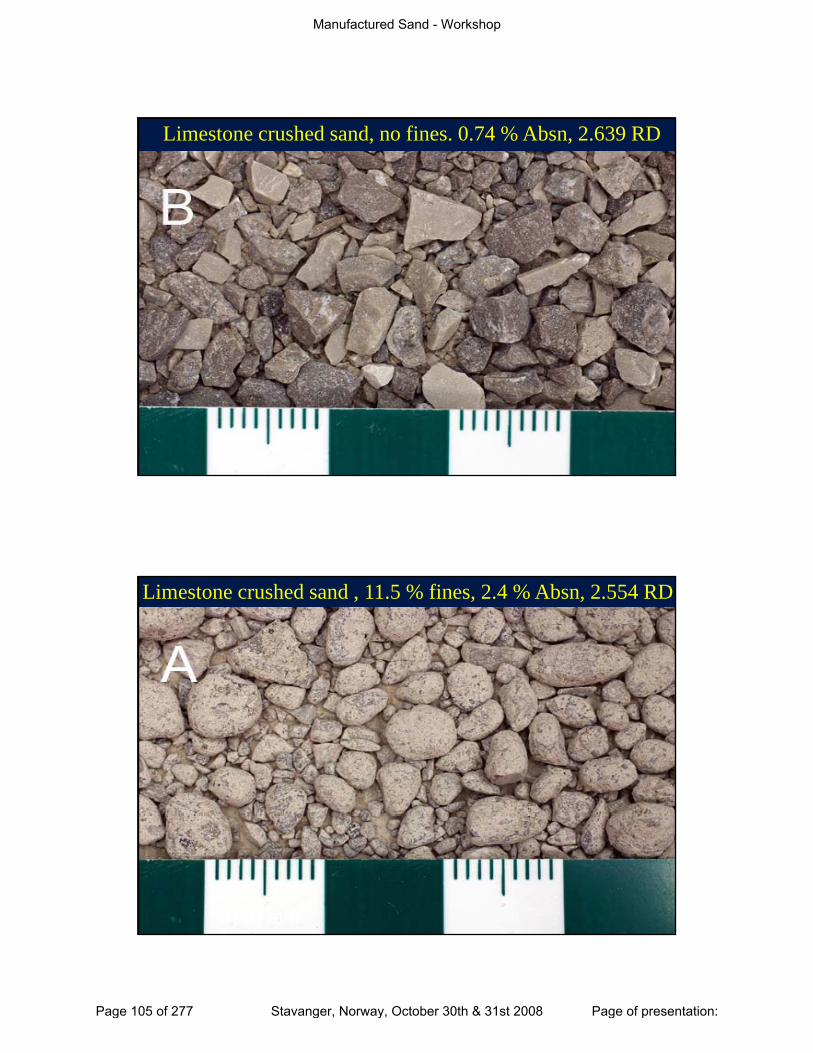
Limestone crushed sand, no fines. 0.74 % Absn, 2.639 RD
Ministry of Transportation Ontario17 1
Limestone crushed sand , 11.5 % fines, 2.4 % Absn, 2.554 RD
Ministry of Transportation Ontario18 10 mm
Manufactured Sand - Workshop
Page 105 of 277 Stavanger, Norway, October 30th & 31st 2008 Page of presentation:
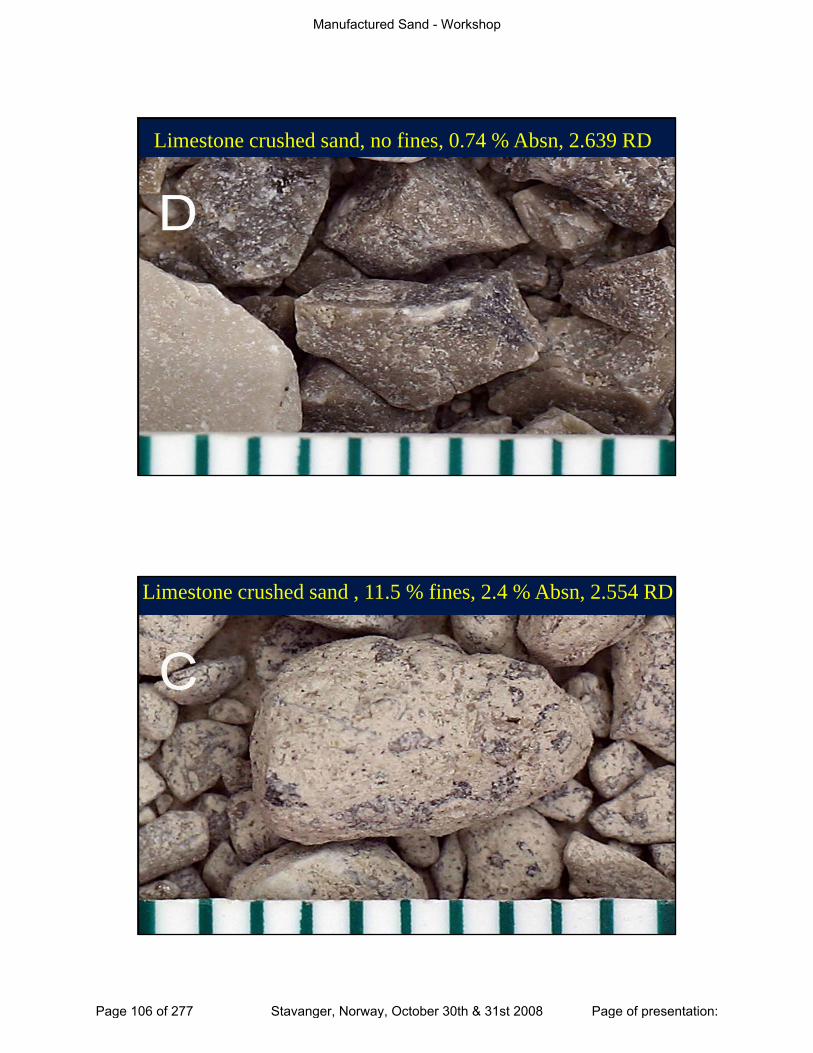
Limestone crushed sand, no fines, 0.74 % Absn, 2.639 RD
Ministry of Transportation Ontario19
Limestone crushed sand , 11.5 % fines, 2.4 % Absn, 2.554 RD
Ministry of Transportation Ontario20
Manufactured Sand - Workshop
Page 106 of 277 Stavanger, Norway, October 30th & 31st 2008 Page of presentation:
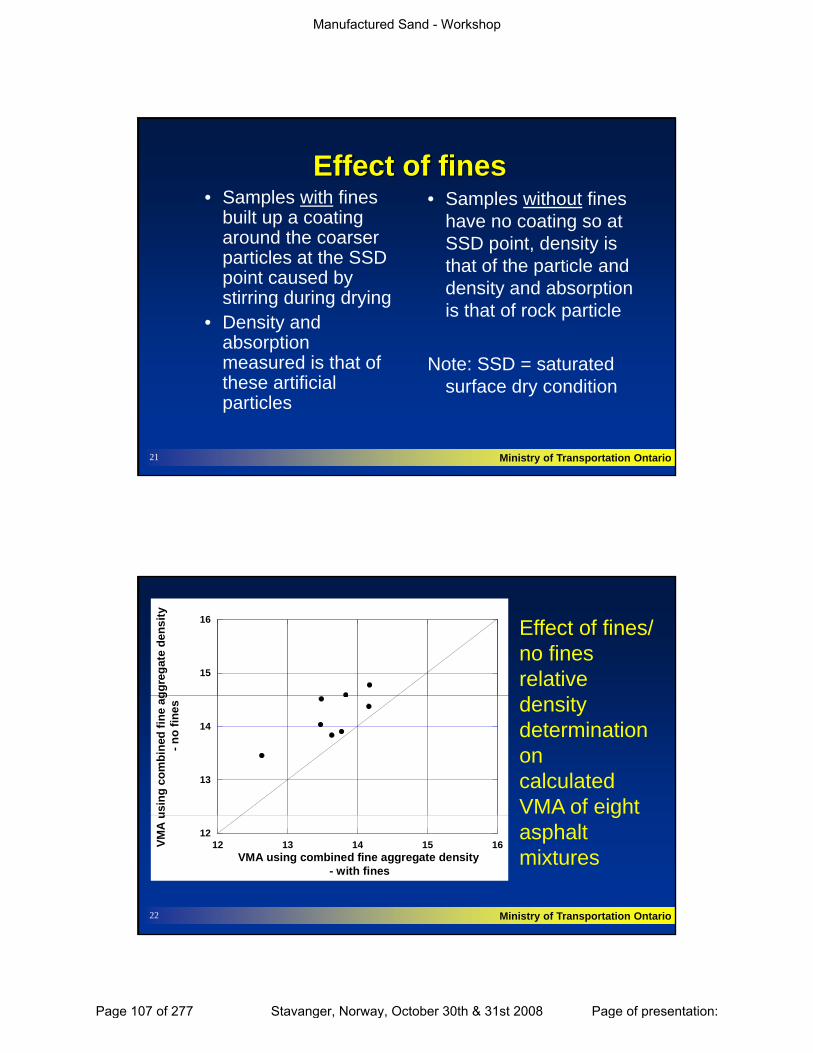
Effect of fines• Samples with fines
built up a coating around the coarser
• Samples without fines have no coating so at SSD i t d it iaround the coarser
particles at the SSD point caused by stirring during drying
• Density and absorption
d i th t f
SSD point, density is that of the particle and density and absorption is that of rock particle
SS
Ministry of Transportation Ontario21
measured is that of these artificial particles
Note: SSD = saturated surface dry condition
15
16
ggre
gate
den
sity
Effect of fines/no fines relative
13
14
usin
g co
mbi
ned
fine
ag -
no fi
nes density
determination on calculated VMA of eight
Ministry of Transportation Ontario22
1212 13 14 15 16VM
A u
VMA using combined fine aggregate density - with fines
gasphalt mixtures
Manufactured Sand - Workshop
Page 107 of 277 Stavanger, Norway, October 30th & 31st 2008 Page of presentation:
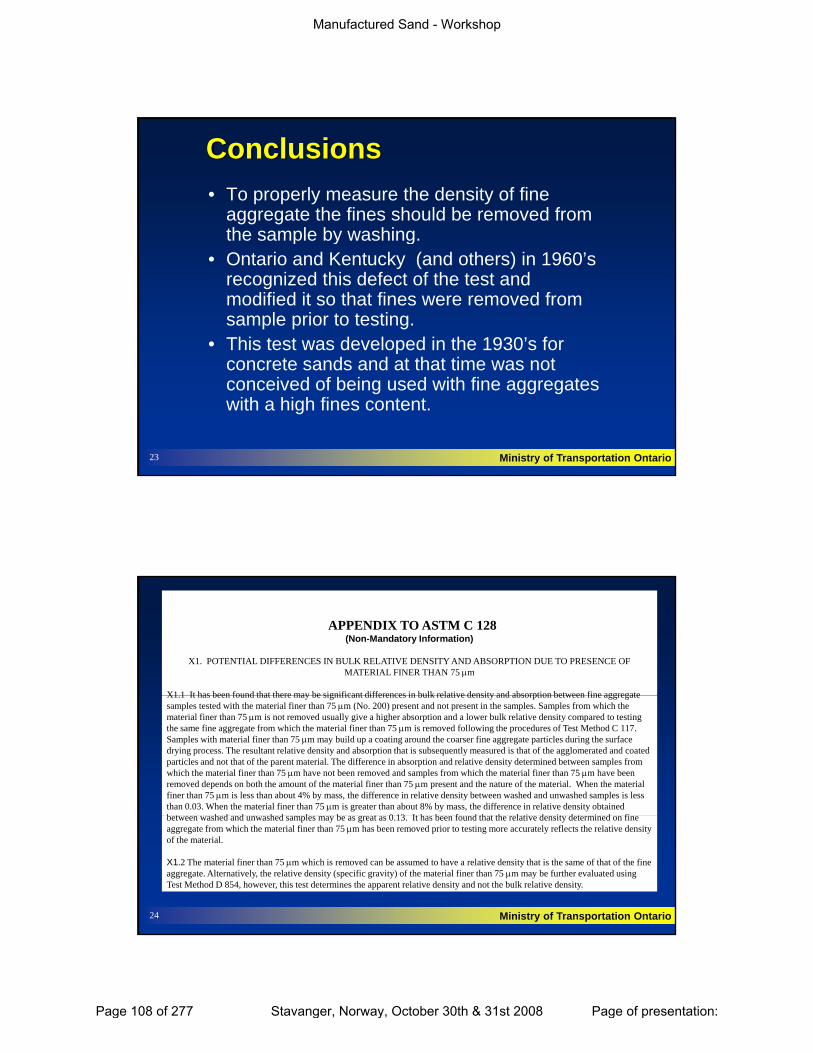
Conclusions• To properly measure the density of fine
aggregate the fines should be removed from the sample by washingthe sample by washing.
• Ontario and Kentucky (and others) in 1960’s recognized this defect of the test and modified it so that fines were removed from sample prior to testing.
• This test was developed in the 1930’s for
Ministry of Transportation Ontario23
concrete sands and at that time was not conceived of being used with fine aggregates with a high fines content.
APPENDIXAPPENDIX TO ASTM C 128
(Non-Mandatory Information)
X1. POTENTIAL DIFFERENCES IN BULK RELATIVE DENSITY AND ABSORPTION DUE TO PRESENCE OF MATERIAL FINER THAN 75 μm
X1 1 It has been found that there may be significant differences in bulk relative density and absorption between fine aggregateX1.1 It has been found that there may be significant differences in bulk relative density and absorption between fine aggregatesamples tested with the material finer than 75 μm (No. 200) present and not present in the samples. Samples from which the material finer than 75 μm is not removed usually give a higher absorption and a lower bulk relative density compared to testing the same fine aggregate from which the material finer than 75 μm is removed following the procedures of Test Method C 117. Samples with material finer than 75 μm may build up a coating around the coarser fine aggregate particles during the surface drying process. The resultant relative density and absorption that is subsequently measured is that of the agglomerated and coated particles and not that of the parent material. The difference in absorption and relative density determined between samples fromwhich the material finer than 75 μm have not been removed and samples from which the material finer than 75 μm have been removed depends on both the amount of the material finer than 75 μm present and the nature of the material. When the material finer than 75 μm is less than about 4% by mass, the difference in relative density between washed and unwashed samples is less than 0.03. When the material finer than 75 μm is greater than about 8% by mass, the difference in relative density obtained b t h d d h d l b t 0 13 It h b f d th t th l ti d it d t i d fi
Ministry of Transportation Ontario24
between washed and unwashed samples may be as great as 0.13. It has been found that the relative density determined on fine aggregate from which the material finer than 75 μm has been removed prior to testing more accurately reflects the relative density of the material.
X1.2 The material finer than 75 μm which is removed can be assumed to have a relative density that is the same of that of the fine aggregate. Alternatively, the relative density (specific gravity) of the material finer than 75 μm may be further evaluated using Test Method D 854, however, this test determines the apparent relative density and not the bulk relative density.
Manufactured Sand - Workshop
Page 108 of 277 Stavanger, Norway, October 30th & 31st 2008 Page of presentation:
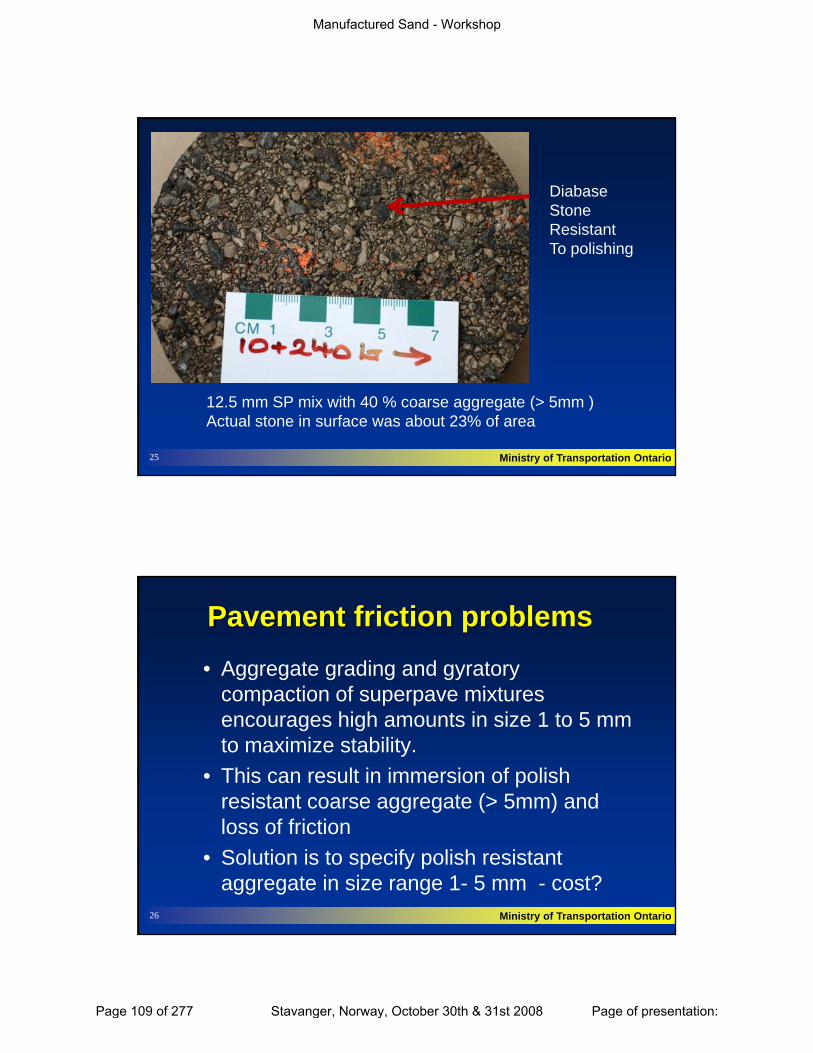
DiabaseStoneResistant To polishing
Ministry of Transportation Ontario25
12.5 mm SP mix with 40 % coarse aggregate (> 5mm )Actual stone in surface was about 23% of area
Pavement friction problems• Aggregate grading and gyratory
compaction of superpave mixturescompaction of superpave mixtures encourages high amounts in size 1 to 5 mm to maximize stability.
• This can result in immersion of polish resistant coarse aggregate (> 5mm) and
Ministry of Transportation Ontario
loss of friction• Solution is to specify polish resistant
aggregate in size range 1- 5 mm - cost? 26
Manufactured Sand - Workshop
Page 109 of 277 Stavanger, Norway, October 30th & 31st 2008 Page of presentation:
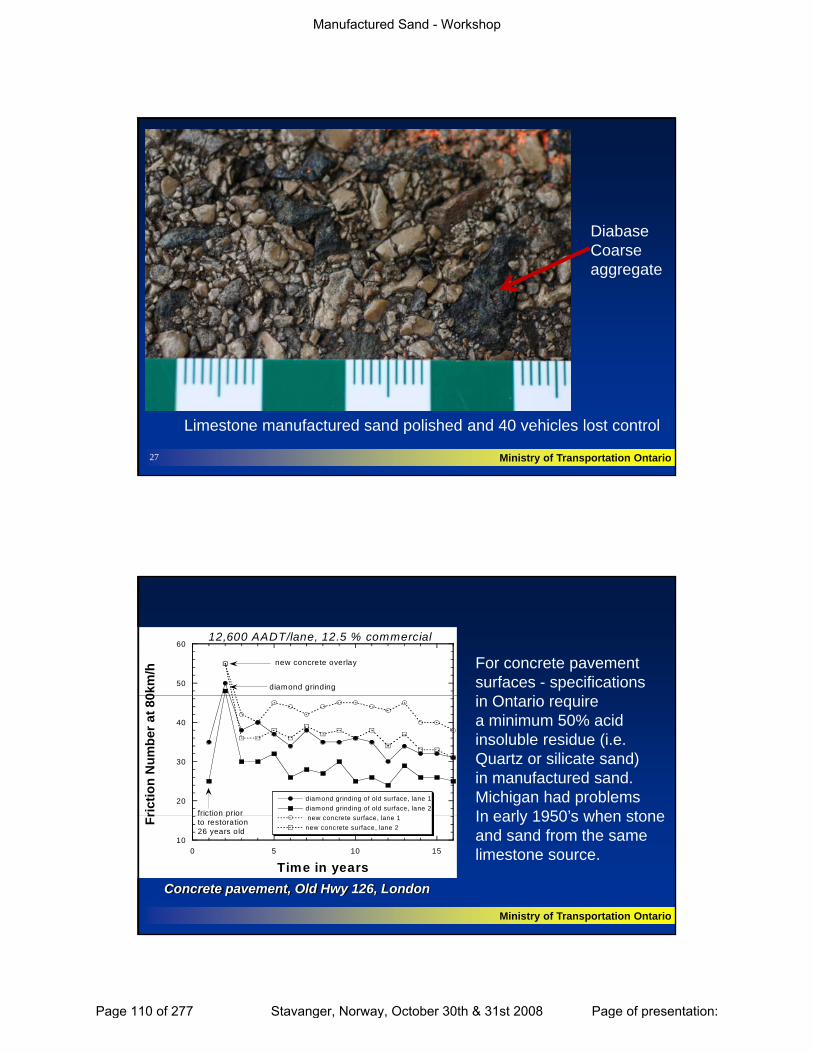
Diabase Coarseaggregate
Ministry of Transportation Ontario27
Limestone manufactured sand polished and 40 vehicles lost control
50
60
0km
/h
diamond grinding
new concrete overlay
12,600 AADT/lane, 12.5 % commercial
For concrete pavement surfaces - specificationsi O i i
20
30
40
diamond grinding of old surface, lane 1diamond grinding of old surface, lane 2ric
tion
Num
ber a
t 80
friction prior
in Ontario requirea minimum 50% acidinsoluble residue (i.e.Quartz or silicate sand)in manufactured sand.Michigan had problemsIn early 1950’s when stone
Ministry of Transportation Ontario
100 5 10 15
new concrete surface, lane 1new concrete surface, lane 2
Fr
Time in years
friction prior to restoration26 years old
Concrete pavement, Old Hwy 126, London
In early 1950 s when stoneand sand from the samelimestone source.
Manufactured Sand - Workshop
Page 110 of 277 Stavanger, Norway, October 30th & 31st 2008 Page of presentation:
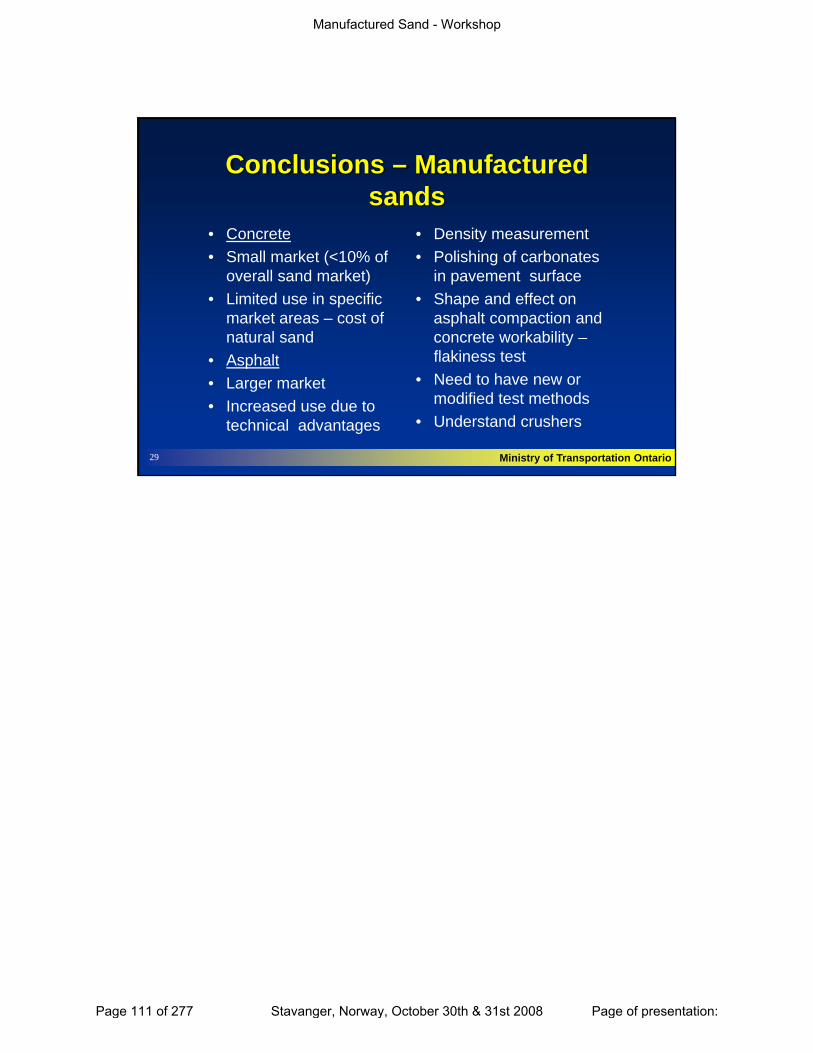
Conclusions – Manufactured sands
• Concrete • Density measurementConcrete• Small market (<10% of
overall sand market)• Limited use in specific
market areas – cost of natural sandA h lt
Density measurement• Polishing of carbonates
in pavement surface• Shape and effect on
asphalt compaction and concrete workability –flakiness test
Ministry of Transportation Ontario
• Asphalt• Larger market• Increased use due to
technical advantages
flakiness test• Need to have new or
modified test methods• Understand crushers
29
Manufactured Sand - Workshop
Page 111 of 277 Stavanger, Norway, October 30th & 31st 2008 Page of presentation:

Manufactured Sand - Workshop
Page 112 of 277 Stavanger, Norway, October 30th & 31st 2008 Page of presentation:
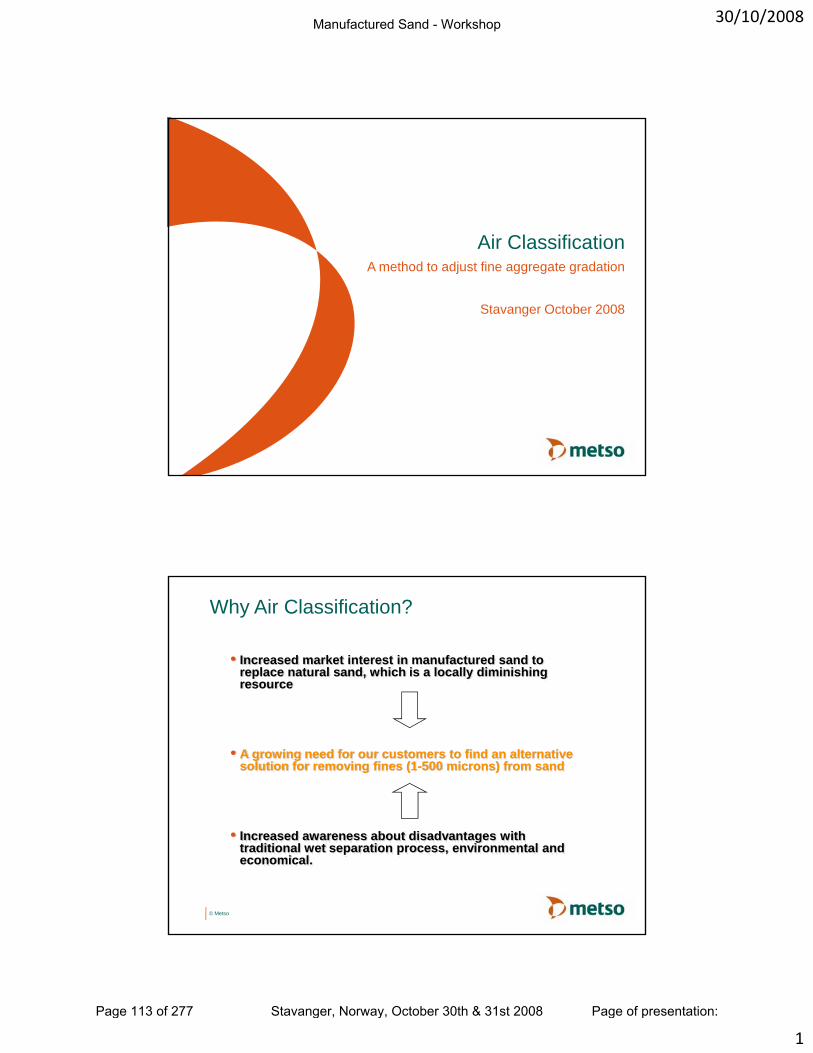
30/10/2008
1
Ai Cl ifi tiAir ClassificationA method to adjust fine aggregate gradation
Stavanger October 2008
• Increased market interest in manufactured sand to replace natural sand, which is a locally diminishing resource
Why Air Classification?
• A growing need for our customers to find an alternative solution for removing fines (1-500 microns) from sand
© Metso
• Increased awareness about disadvantages with traditional wet separation process, environmental and economical.
Manufactured Sand - Workshop
Page 113 of 277 Stavanger, Norway, October 30th & 31st 2008 Page of presentation:
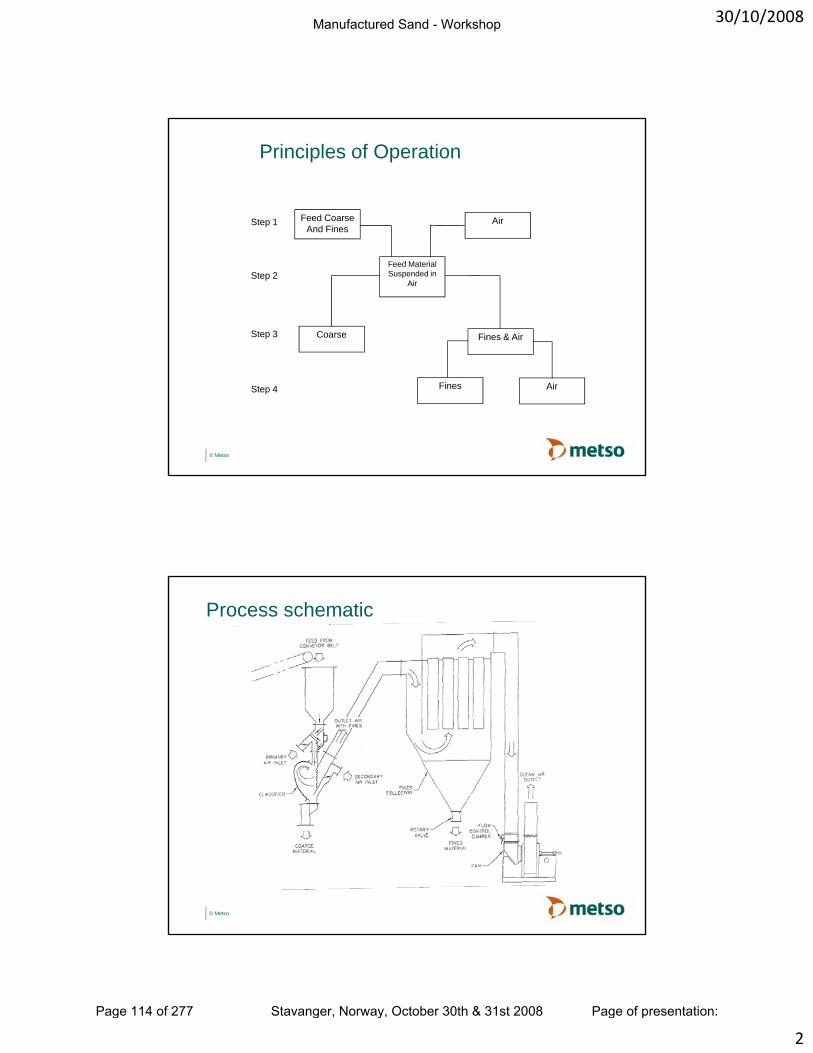
30/10/2008
2
Principles of Operation
AirFeed CoarseAnd Fines
Step 1
Feed Material Suspended in
Air
Coarse Fines & Air
Step 2
Step 3
© Metso
Fines AirStep 4
Process schematic
© Metso
Manufactured Sand - Workshop
Page 114 of 277 Stavanger, Norway, October 30th & 31st 2008 Page of presentation:
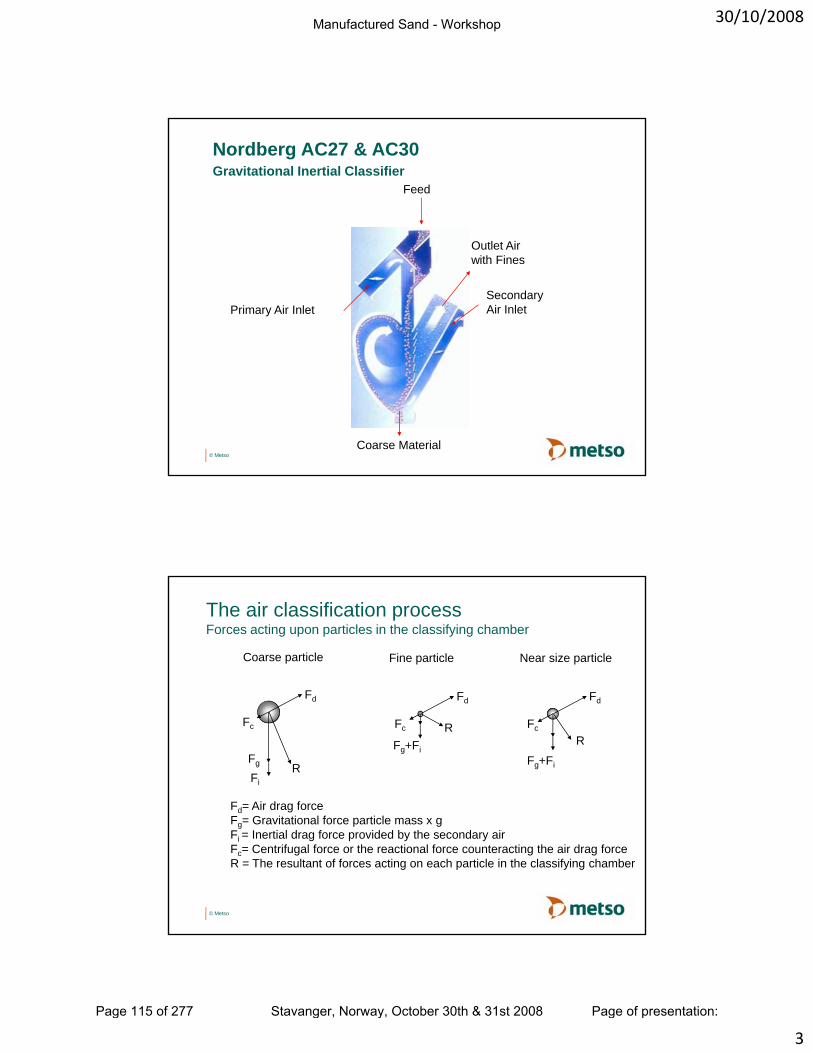
30/10/2008
3
Nordberg AC27 & AC30Gravitational Inertial Classifier
Feed
Primary Air InletSecondary Air Inlet
Outlet Air with Fines
© MetsoCoarse Material
The air classification processForces acting upon particles in the classifying chamber
F
Coarse particle
F
Near size particle
F
Fine particle
Fd
Fc
RFg
Fi
Fd
Fc
R
Fg+Fi
Fd
Fc RFg+Fi
Fd= Air drag force
© Metso
Fg= Gravitational force particle mass x gFi = Inertial drag force provided by the secondary airFc= Centrifugal force or the reactional force counteracting the air drag forceR = The resultant of forces acting on each particle in the classifying chamber
Manufactured Sand - Workshop
Page 115 of 277 Stavanger, Norway, October 30th & 31st 2008 Page of presentation:
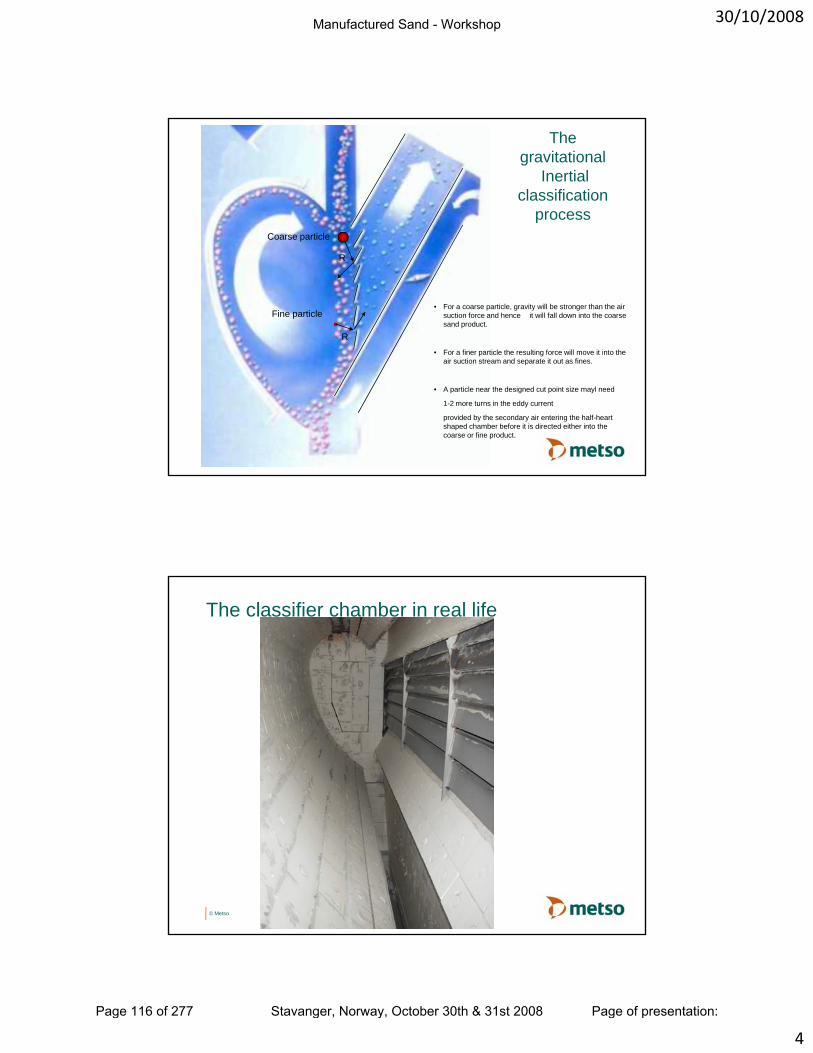
30/10/2008
4
Coarse particle
The gravitational
Inertial classification
process
R
Fine particle
R
Coarse particle
• For a coarse particle, gravity will be stronger than the air suction force and hence it will fall down into the coarse sand product.
• For a finer particle the resulting force will move it into the
© Metso
air suction stream and separate it out as fines.
• A particle near the designed cut point size mayl need
1-2 more turns in the eddy current
provided by the secondary air entering the half-heart shaped chamber before it is directed either into the coarse or fine product.
The classifier chamber in real life
© Metso
Manufactured Sand - Workshop
Page 116 of 277 Stavanger, Norway, October 30th & 31st 2008 Page of presentation:
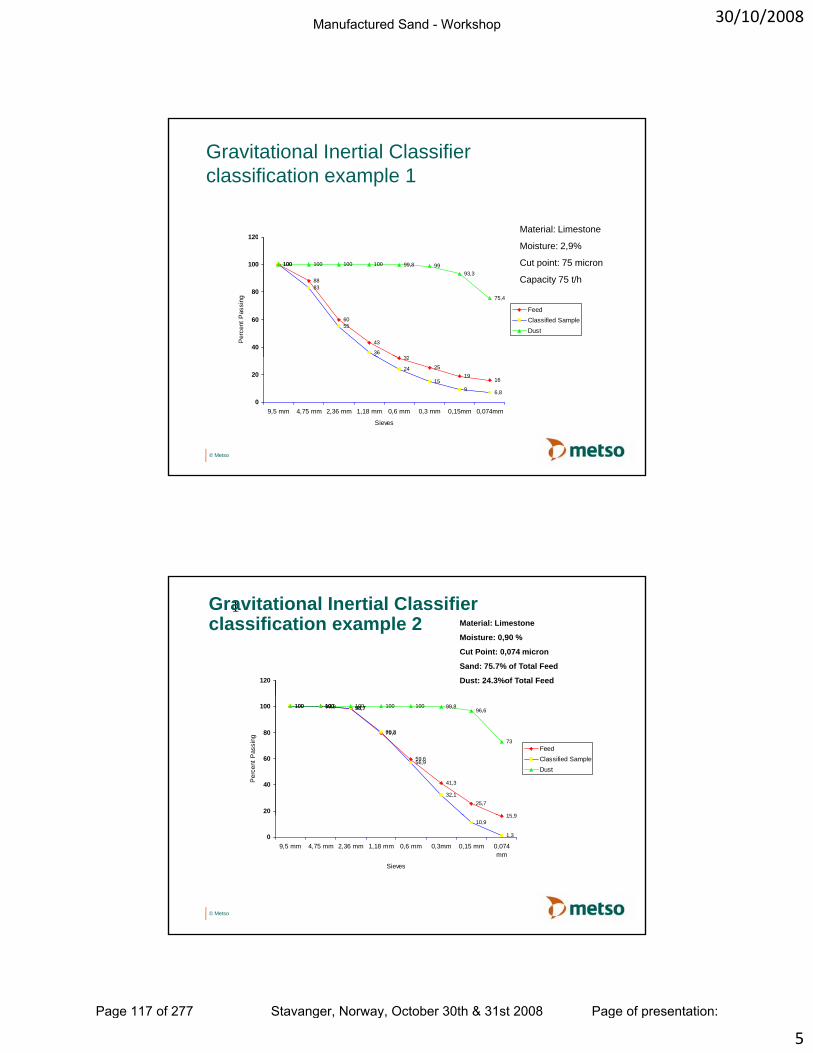
30/10/2008
5
Gravitational Inertial Classifierclassification example 1
120Material: Limestone
100
88
60
43
32
100
83
55
36
100 100 100 99,8 9993,3
75,4
40
60
80
100
120P
erce
nt P
assi
ng
FeedClassified SampleDust
Moisture: 2,9%
Cut point: 75 micron
Capacity 75 t/h
© Metso
32
2519
16
24
159 6,8
0
20
9,5 mm 4,75 mm 2,36 mm 1,18 mm 0,6 mm 0,3 mm 0,15mm 0,074mm
Sieves
120
Material: Limestone
Moisture: 0,90 %
Cut Point: 0,074 micron
Sand: 75.7% of Total Feed
Dust: 24.3%of Total Feed
1Gravitational Inertial Classifierclassification example 2
100 100 98,7
79,6
59,6
41,3
25,7
15 9
100 99,9 98,7
80,3
56,9
32,1
100 100 100 100 99,896,6
73
20
40
60
80
100
Per
cent
Pas
sing
FeedClassified SampleDust
© Metso
15,910,9
1,309,5 mm 4,75 mm 2,36 mm 1,18 mm 0,6 mm 0,3mm 0,15 mm 0,074
mm
Sieves
Manufactured Sand - Workshop
Page 117 of 277 Stavanger, Norway, October 30th & 31st 2008 Page of presentation:
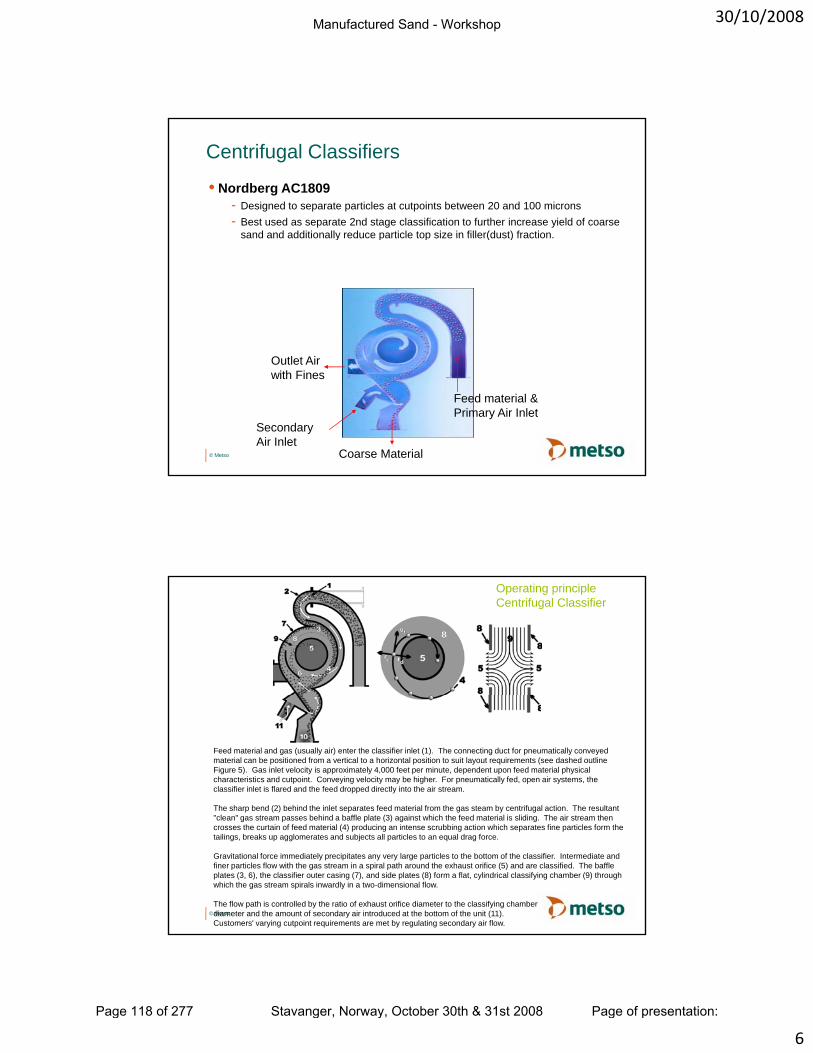
30/10/2008
6
Centrifugal Classifiers
• Nordberg AC1809- Designed to separate particles at cutpoints between 20 and 100 microns- Best used as separate 2nd stage classification to further increase yield of coarse
sand and additionally reduce particle top size in filler(dust) fraction.sand and additionally reduce particle top size in filler(dust) fraction.
O tl t Ai
© Metso
Feed material &Primary Air Inlet
Coarse Material
Secondary Air Inlet
Outlet Air with Fines
Operating principleCentrifugal Classifier
Feed material and gas (usually air) enter the classifier inlet (1). The connecting duct for pneumatically conveyed material can be positioned from a vertical to a horizontal position to suit layout requirements (see dashed outline Figure 5). Gas inlet velocity is approximately 4,000 feet per minute, dependent upon feed material physical characteristics and cutpoint. Conveying velocity may be higher. For pneumatically fed, open air systems, the classifier inlet is flared and the feed dropped directly into the air stream.
The sharp bend (2) behind the inlet separates feed material from the gas steam by centrifugal action. The resultant " l " t b hi d b ffl l t (3) i t hi h th f d t i l i lidi Th i t th
© Metso
"clean" gas stream passes behind a baffle plate (3) against which the feed material is sliding. The air stream then crosses the curtain of feed material (4) producing an intense scrubbing action which separates fine particles form the tailings, breaks up agglomerates and subjects all particles to an equal drag force.
Gravitational force immediately precipitates any very large particles to the bottom of the classifier. Intermediate and finer particles flow with the gas stream in a spiral path around the exhaust orifice (5) and are classified. The baffle plates (3, 6), the classifier outer casing (7), and side plates (8) form a flat, cylindrical classifying chamber (9) through which the gas stream spirals inwardly in a two-dimensional flow.
The flow path is controlled by the ratio of exhaust orifice diameter to the classifying chamber diameter and the amount of secondary air introduced at the bottom of the unit (11). Customers' varying cutpoint requirements are met by regulating secondary air flow.
Manufactured Sand - Workshop
Page 118 of 277 Stavanger, Norway, October 30th & 31st 2008 Page of presentation:

30/10/2008
7
• 60tph of minus 2mm.• Moisture 2%.
2 stage Fixed Plant – Norway
Centrifugal Classifier Bag house
© Metso
Gravitational Inertial Classifier
2 stage Fixed Plant – Norway
Gravitational Inertial ClassifierCutting @ 0.50mm
© Metso
Centrifugal ClassifierCutting @ 0.063mm
Manufactured Sand - Workshop
Page 119 of 277 Stavanger, Norway, October 30th & 31st 2008 Page of presentation:
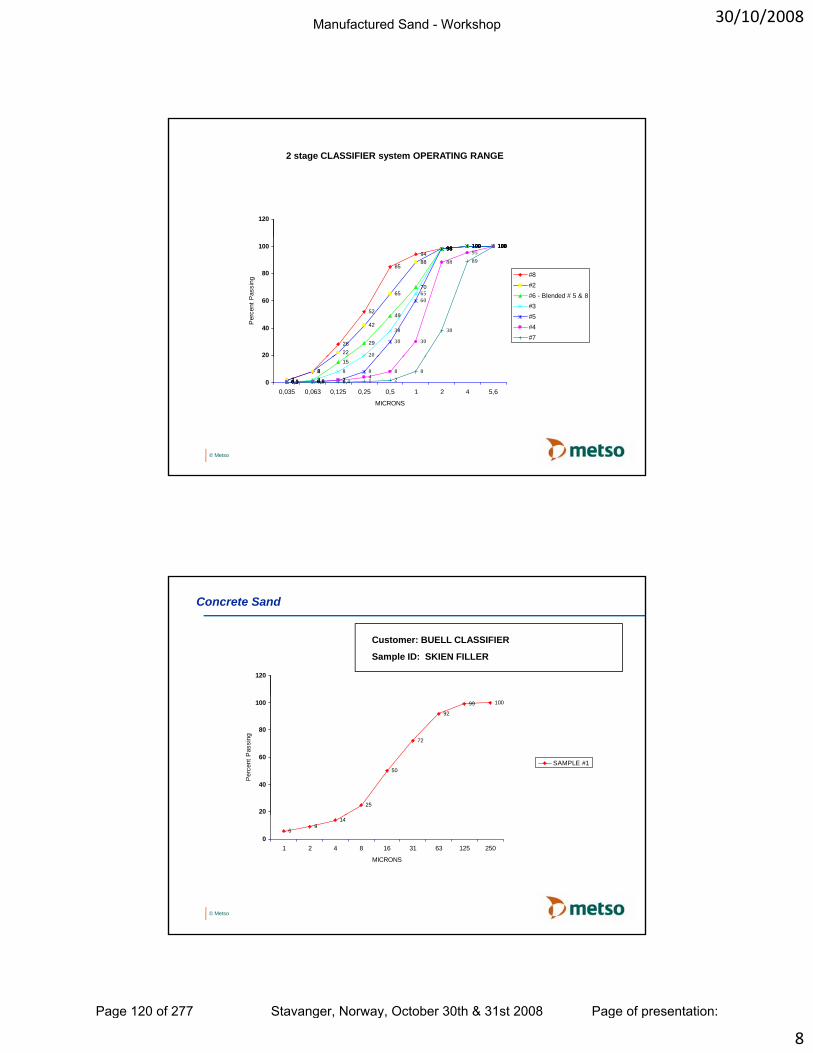
30/10/2008
8
120
2 stage CLASSIFIER system OPERATING RANGE
28
52
85
9498 100 100
22
42
65
88
98 100 100
29
49
70
98 100 100
20
38
65
98 100 100
30
60
98 100 100
30
88
95100
38
89
100
20
40
60
80
100P
erce
nt P
assi
ng
#8#2#6 - Blended # 5 & 8#3#5#4#7
© Metso
28
282
15
0,5 28
0,5 0,6 28
0,5 0,6 2 48
0,2 0,3 0,4 1 28
0
20
0,035 0,063 0,125 0,25 0,5 1 2 4 5,6
MICRONS
Concrete Sand
120
Customer: BUELL CLASSIFIER
Sample ID: SKIEN FILLER
25
50
72
92
99 100
20
40
60
80
100
Per
cent
Pas
sing
SAMPLE #1
© Metso
69
14
01 2 4 8 16 31 63 125 250
MICRONS
Manufactured Sand - Workshop
Page 120 of 277 Stavanger, Norway, October 30th & 31st 2008 Page of presentation:
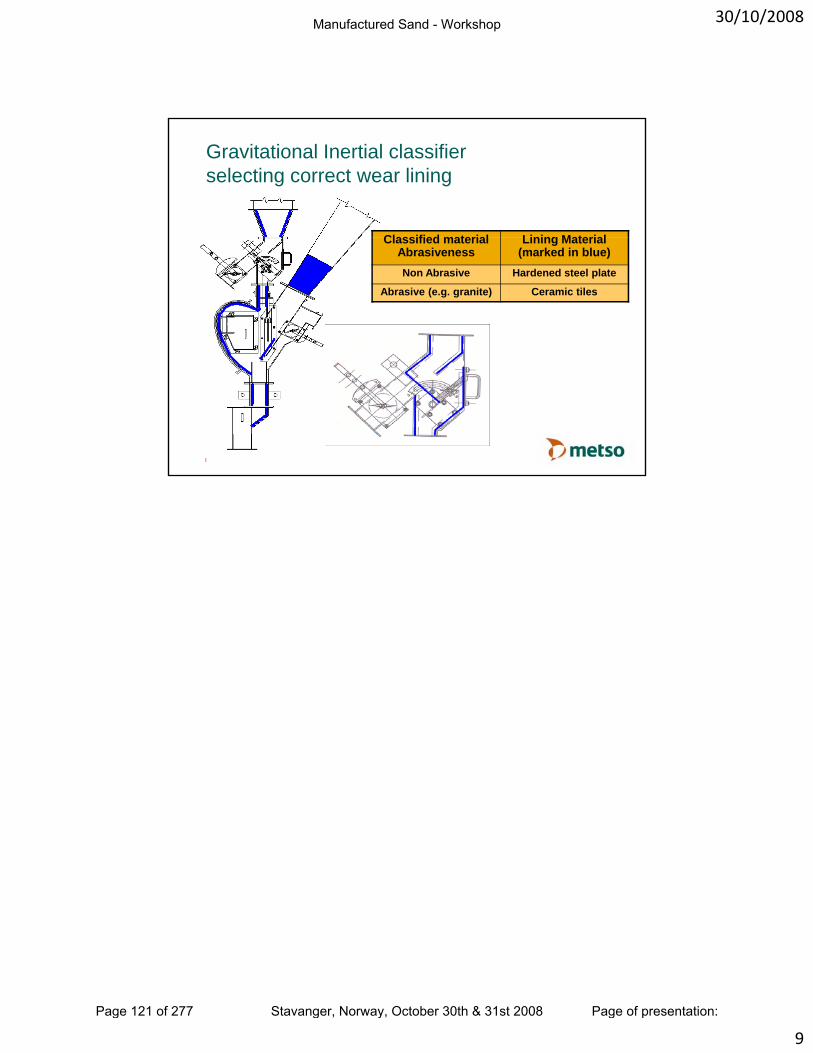
30/10/2008
9
Gravitational Inertial classifier selecting correct wear lining
Classified material Lining MaterialClassified material Abrasiveness
Lining Material (marked in blue)
Non Abrasive Hardened steel plate
Abrasive (e.g. granite) Ceramic tiles
© Metso
Manufactured Sand - Workshop
Page 121 of 277 Stavanger, Norway, October 30th & 31st 2008 Page of presentation:

Manufactured Sand - Workshop
Page 122 of 277 Stavanger, Norway, October 30th & 31st 2008 Page of presentation:
30/10/2008
1
Sandvik Sand
Per Hedvall
Sandvik Mining and Construction1
Per HedvallGeneral Manager Process Technology
Rock Excavating and Processing ExpertiseSandvik Mining and Construction
The year is 2084All natural sand production has stopped Globally
Imagine
All natural sand production has stopped GloballyThere are only a few options left
Sandvik Mining and Construction2
Manufactured Sand - Workshop
Page 123 of 277 Stavanger, Norway, October 30th & 31st 2008 Page of presentation:
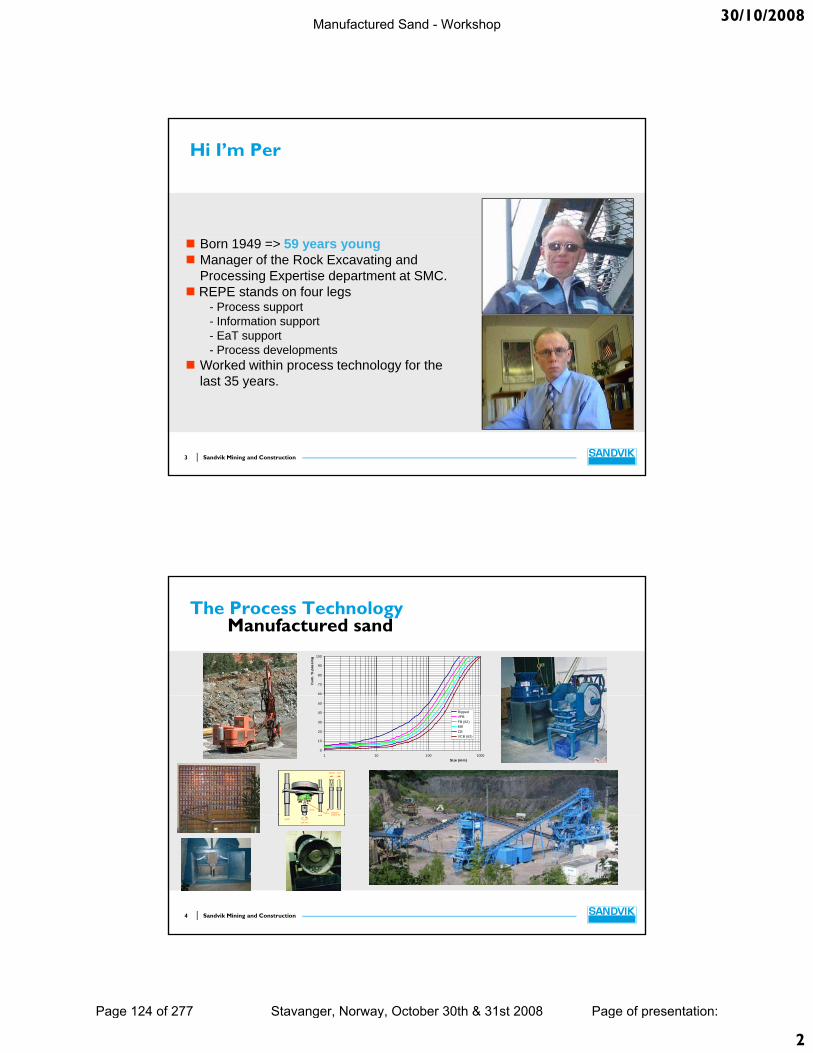
30/10/2008
2
Hi I’m Per
Born 1949 => 59 years youngManager of the Rock Excavating and Processing Expertise department at SMC.REPE stands on four legs
- Process support- Information support- EaT support- Process developments
Sandvik Mining and Construction3
Worked within process technology for the last 35 years.
The Process TechnologyManufactured sand
60
70
80
90
100
Cum
. % p
assi
ng
0
10
20
30
40
50
1 10 100 1000Size (mm)
RippedVFBFB (62)MBCBVCB (63)
chuck
guidetungsten carbide bit
8.5mm 110g
20 kg
chuck
guidetungsten carbide bit
8.5mm 110g
20 kg
Sandvik Mining and Construction4
guide carbide bit
guide
200 revs
guide carbide bit
guide
200 revs
Manufactured Sand - Workshop
Page 124 of 277 Stavanger, Norway, October 30th & 31st 2008 Page of presentation:
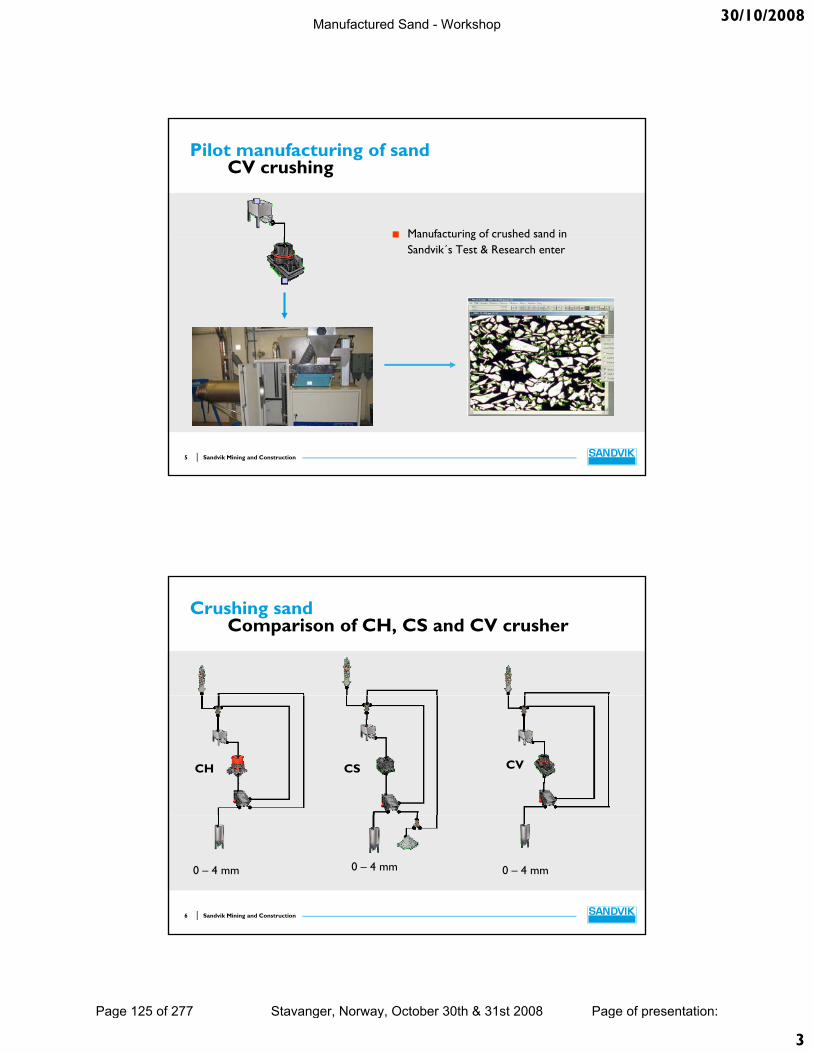
30/10/2008
3
Manufacturing of crushed sand in
Pilot manufacturing of sandCV crushing
Manufacturing of crushed sand in Sandvik´s Test & Research enter
Sandvik Mining and Construction5
Crushing sandComparison of CH, CS and CV crusher
CH CS CV
Sandvik Mining and Construction6
0 – 4 mm 0 – 4 mm 0 – 4 mm
Manufactured Sand - Workshop
Page 125 of 277 Stavanger, Norway, October 30th & 31st 2008 Page of presentation:
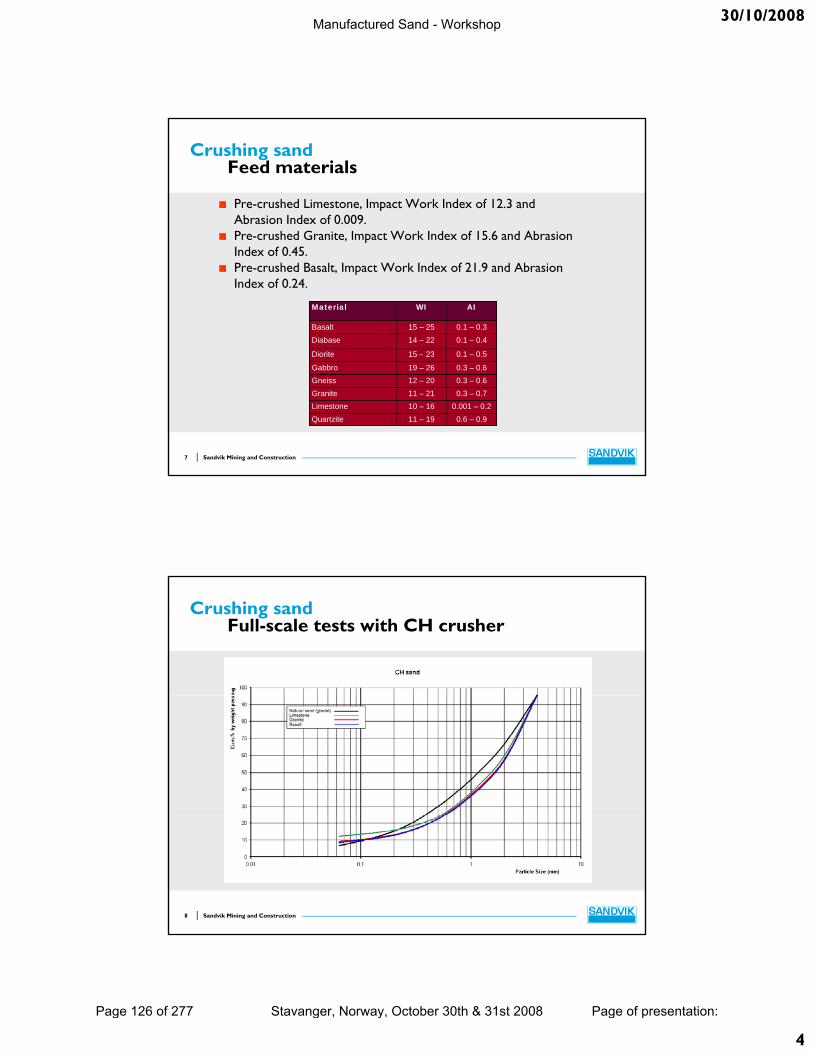
30/10/2008
4
Crushing sandFeed materials
Pre-crushed Limestone, Impact Work Index of 12.3 and Abrasion Index of 0.009.Pre-crushed Granite Impact Work Index of 15 6 and Abrasion Pre-crushed Granite, Impact Work Index of 15.6 and Abrasion Index of 0.45.Pre-crushed Basalt, Impact Work Index of 21.9 and Abrasion Index of 0.24.
0.1 – 0.5 15 – 23Diorite
0.1 – 0.414 – 22Diabase0.1 – 0.315 – 25 Basalt
AIWIMaterial
0.1 – 0.5 15 – 23Diorite
0.1 – 0.414 – 22Diabase0.1 – 0.315 – 25 Basalt
AIWIMaterial
Sandvik Mining and Construction7
0.3 – 0.612 – 20Gneiss0.3 – 0.711 – 21Granite
0.001 – 0.210 – 16Limestone0.6 – 0.911 – 19Quartzite
0.3 – 0.619 – 26Gabbro
0 0 55 3o e
0.3 – 0.612 – 20Gneiss0.3 – 0.711 – 21Granite
0.001 – 0.210 – 16Limestone0.6 – 0.911 – 19Quartzite
0.3 – 0.619 – 26Gabbro
0 0 55 3o e
Crushing sandFull-scale tests with CH crusher
Sandvik Mining and Construction8
Manufactured Sand - Workshop
Page 126 of 277 Stavanger, Norway, October 30th & 31st 2008 Page of presentation:
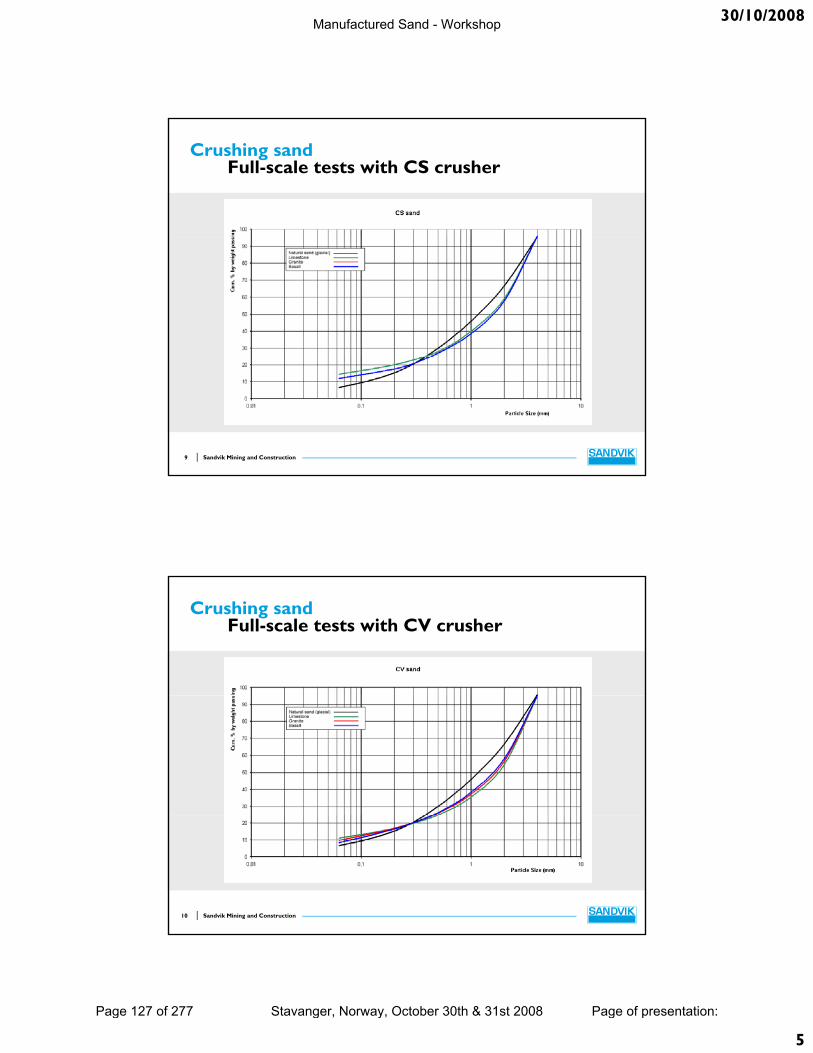
30/10/2008
5
Crushing sandFull-scale tests with CS crusher
Sandvik Mining and Construction9
Crushing sandFull-scale tests with CV crusher
Sandvik Mining and Construction10
Manufactured Sand - Workshop
Page 127 of 277 Stavanger, Norway, October 30th & 31st 2008 Page of presentation:
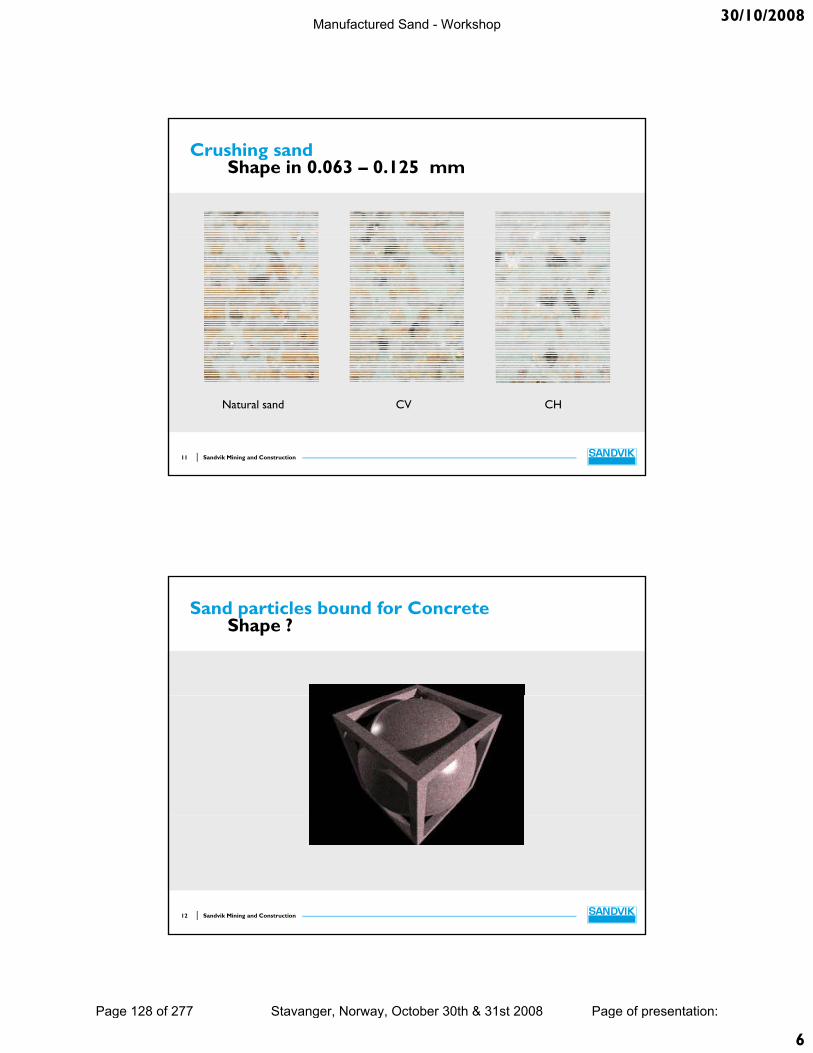
30/10/2008
6
Crushing sandShape in 0.063 – 0.125 mm
Sandvik Mining and Construction11
Natural sand CV CH
Sand particles bound for Concrete Shape ?
Sandvik Mining and Construction12
Manufactured Sand - Workshop
Page 128 of 277 Stavanger, Norway, October 30th & 31st 2008 Page of presentation:

30/10/2008
7
Sand particles bound for Concrete Ratio -- Area/Volume
Sandvik Mining and Construction13
Pilot manufacturing of sandDedusting
Sandvik Mining and Construction14
Manufactured Sand - Workshop
Page 129 of 277 Stavanger, Norway, October 30th & 31st 2008 Page of presentation:
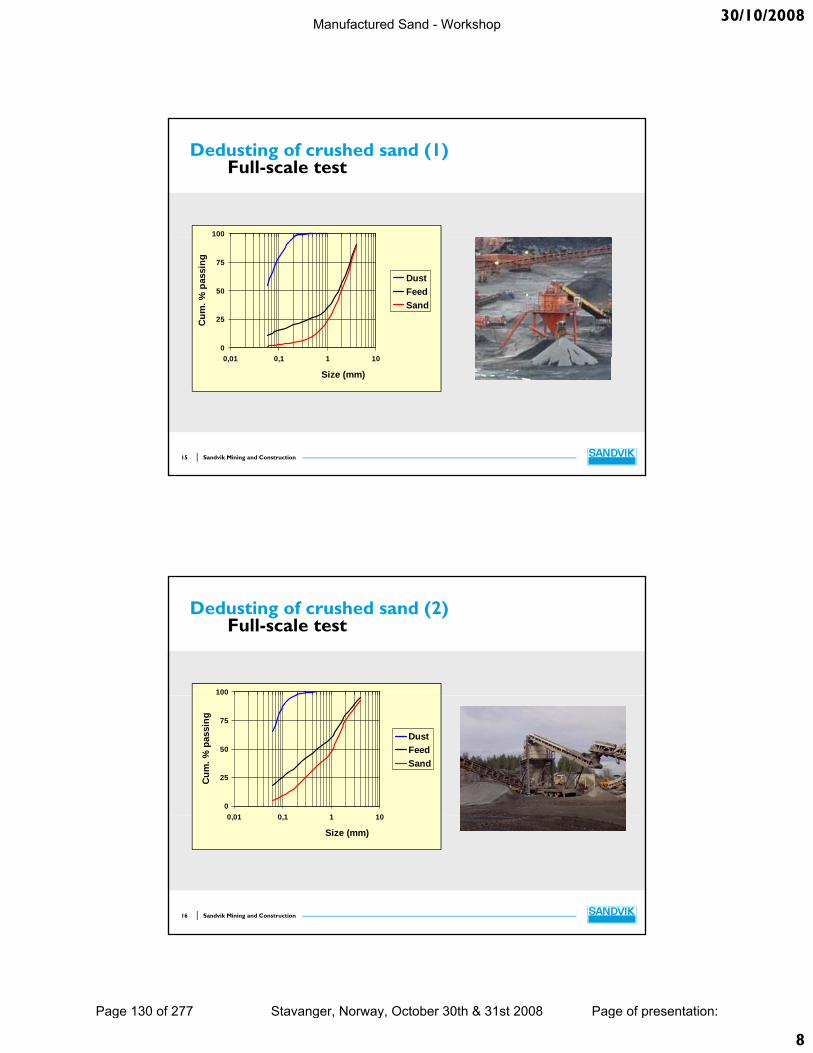
30/10/2008
8
Dedusting of crushed sand (1)Full-scale test
100
0
25
50
75
0 01 0 1 1 10
Cum
. % p
assi
ng
DustFeedSand
Sandvik Mining and Construction15
0,01 0,1 1 10
Size (mm)
Dedusting of crushed sand (2)Full-scale test
100
0
25
50
75
0 01 0 1 1 10
Cum
. % p
assi
ng
DustFeedSand
Sandvik Mining and Construction16
0,01 0,1 1 10
Size (mm)
Manufactured Sand - Workshop
Page 130 of 277 Stavanger, Norway, October 30th & 31st 2008 Page of presentation:

30/10/2008
9
George Fensome+ 44 773 312 0472
Natural sand will be a limit resource in the future.
but
The manufactured sand must be as good as or better than
Sandvik Mining and Construction17
be as good as or better than Natural sand.
The Beginning of the new Era
“An ostrich with its head in the Sand is just as blind to opportunity as to disaster”
Sandvik Mining and Construction18
Manufactured Sand - Workshop
Page 131 of 277 Stavanger, Norway, October 30th & 31st 2008 Page of presentation:

Manufactured Sand - Workshop
Page 132 of 277 Stavanger, Norway, October 30th & 31st 2008 Page of presentation:

Manufactured sand workshop, Stavanger, Norway October 2008
Abstract of Kemco Presentation
THE DEVELOPMENT OF CRUSHED SAND IN JAPAN
AND THE DIRECTION OF OUR RESEARCH
1. HISTORY OF FINE AGGREGATE USE AND DEVELOPMENT:
Japan was totally devastated as a result of World War II, with extensive destruction of buildings and
infrastructure. However, we immediately started the reconstruction of the Nation, and that led to the
first economic boom in around 1955. The consumption of concrete and fine aggregate dramatically
increased, and reached its first peak when we had the Tokyo Olympic Games in 1964.
Initially, we mainly used river sand as a fine aggregate, but that caused many critical problems including
the collapse of bridges and other structures. The use of river sand was therefore restricted, even though
the demand for fine aggregate kept on increasing. Instead, we used pit sand and sea-dredged sand, and
crushed sand was also slowly introduced. For environmental reasons, the use of sea sand began to be
restricted in many places from around 1990, and the development of sand manufacture from crushed
rock became inevitable.
2. THE CURRENT SITUATION IN CRUSHED SAND MANUFACTURE IN JAPAN.
Initially we used wet systems; more recently dry sand production has been recognized as advantageous.
Consideration of advantages and disadvantages of the both of wet system and dry system, and the reputation of
both in Japan.
Manufactured Sand - Workshop
Page 133 of 277 Stavanger, Norway, October 30th & 31st 2008 Page of presentation:

3. TECHNICAL AND COMMERCIAL EXPLANATION OF V7 DRY SAND MAKING
SYSTEM:
Explanation of V7 technology, and the comparison of V7 sand with natural sand.
4. THE QUESTION OF FILLER:
Crushing rock to make sand unavoidably produces filler (normally considered to be all material <75µm),
which is becoming a critical problem in Japanese applications.
Explanation of our current research into the advantageous use of filler.
5. COMMERCIAL CONSIDERATIONS IN SAND PRODUCTION.
Analysis of suitability and economic efficiency of available technology
Manufactured Sand - Workshop
Page 134 of 277 Stavanger, Norway, October 30th & 31st 2008 Page of presentation:

30/10/2008
1
Manufactured Sand-WorkshopStavanger, Norway – Oct 30th and 31st, 2008
P-1
Kemco Dry Sand-Making System V7
<To turn surplus crusher dust into premium sand>
Kotobuki Engineering &
Manufacturing Co.,ltd. Japan
Kemco presentation P-2
HOW CRUSHED SAND WAS DEVELOPED IN JAPAN
AND WHAT ARE WE DOING NOW - 5 MAIN POINTS:
1. History of the use of fine aggregate and the current situation in Japan.
2.The current situation of crushed sand making machines in Japan.
3 Technical and commercial explanation of V7 dry sand 3.Technical and commercial explanation of V7 dry sand making system.
4.The filler problem.
5.What is commercially most preferable sand?
Manufactured Sand - Workshop
Page 135 of 277 Stavanger, Norway, October 30th & 31st 2008 Page of presentation:
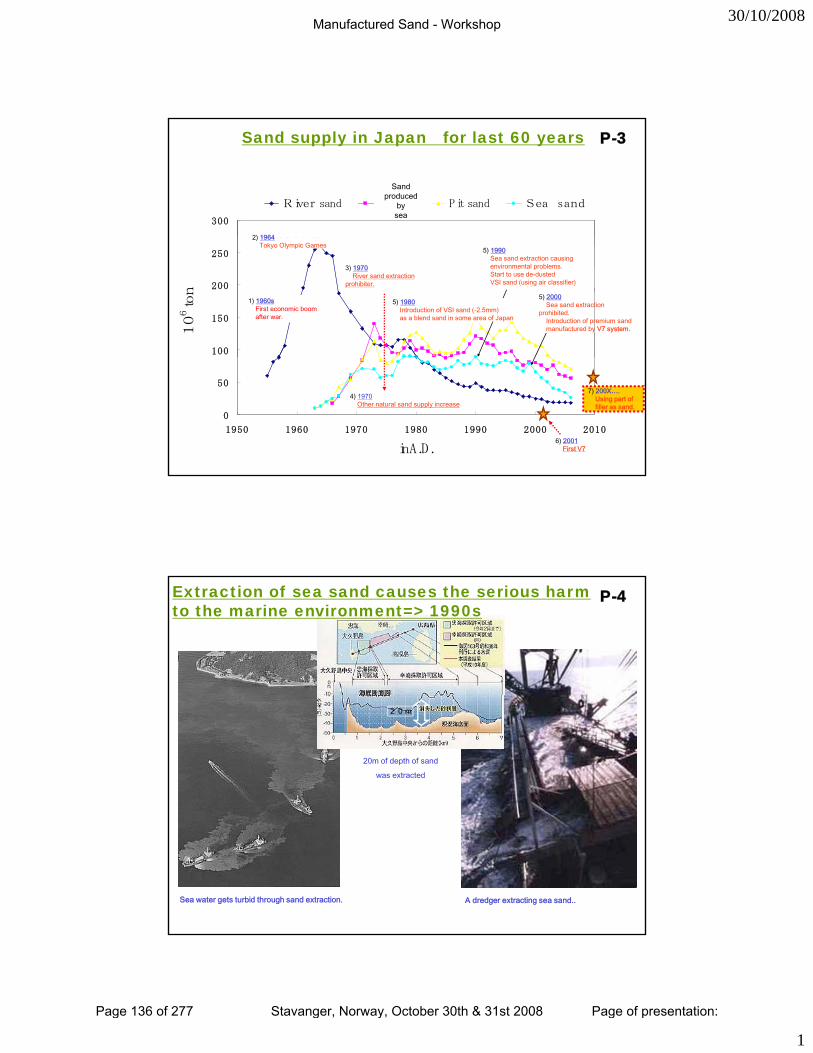
30/10/2008
1
Sand supply in Japan for last 60 years
300
River sand Hillsand Pit sand Sea sand
2)東京オリンピック
P-3
2) 1964
Sand produced
by sea
100
150
200
250
10
6ton
1)高度経済成長
3)川砂利採取規制
5)VSIの2.5m m以下を増量砂として利用
6)海砂採取が問題視される VSIの分級砂始まる
7)海砂採取規制始まる良質な砕砂の需要高まる
2)東京オリンピック2) 1964Tokyo Olympic Games
5) 1980Introduction of VSI sand (-2.5mm)as a blend sand in some area of Japan
3) 1970River sand extraction
prohibiter.
5) 1990Sea sand extraction causing environmental problems.Start to use de-dusted VSI sand (using air classifier)
5) 2000Sea sand extraction
prohibited.Introduction of premium sand manufactured by V7 system.
1) 1960sFirst economic boom after war.
0
50
1950 1960 1970 1980 1990 2000 2010
inA.D .
4)他天然砂利採取始まる4) 1970
Other natural sand supply increase
6) 2001First V7
7) 200X….Using part of filler as sand.
Extraction of sea sand causes the serious harmto the marine environment=> 1990s
P-4
20m of depth of sand
was extracted
20m
Sea water gets turbid through sand extraction. A dredger extracting sea sand..
Manufactured Sand - Workshop
Page 136 of 277 Stavanger, Norway, October 30th & 31st 2008 Page of presentation:
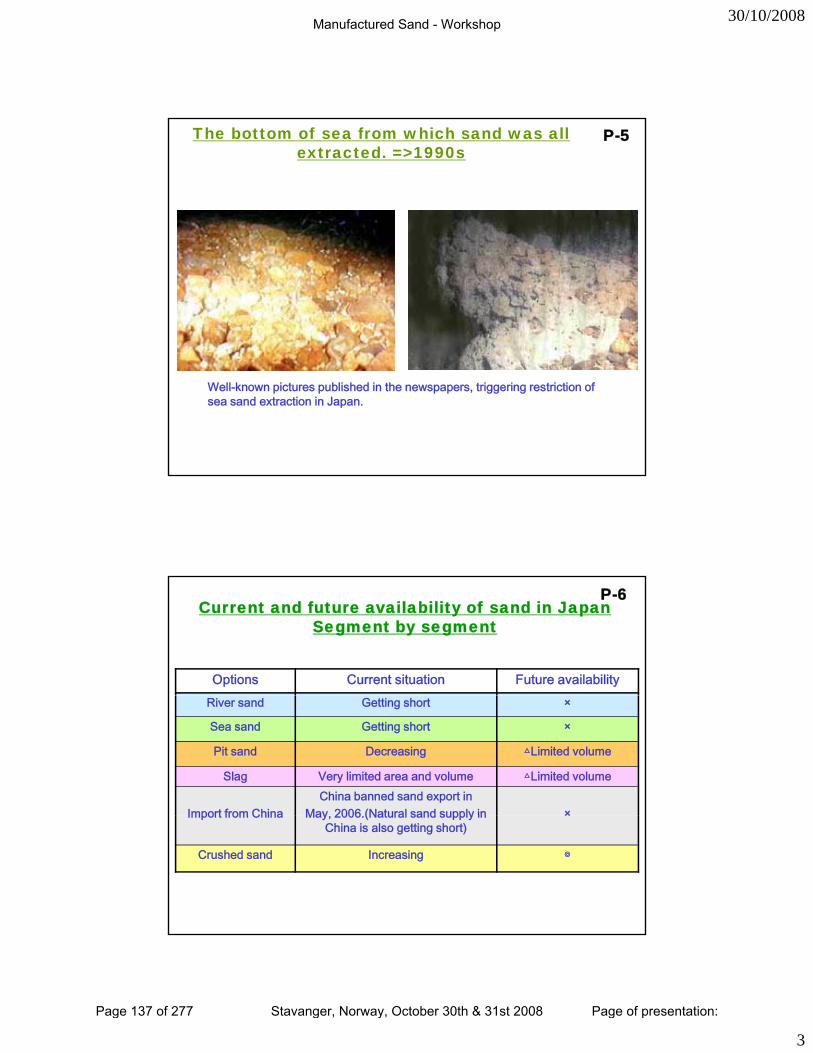
30/10/2008
3
P-5The bottom of sea from which sand was all extracted. =>1990s
Well-known pictures published in the newspapers, triggering restriction of sea sand extraction in Japan.
Current and future availability of sand in JapanSegment by segment
P-6
Options Current situation Future availabilityRiver sand Getting short ×
Sea sand Getting short ×
Pit sand Decreasing △Limited volume
Slag Very limited area and volume △Limited volume
Import from ChinaChina banned sand export in
May 2006 (Natural sand supply in ×Import from China May, 2006.(Natural sand supply in China is also getting short)
×
Crushed sand Increasing ◎
Manufactured Sand - Workshop
Page 137 of 277 Stavanger, Norway, October 30th & 31st 2008 Page of presentation:
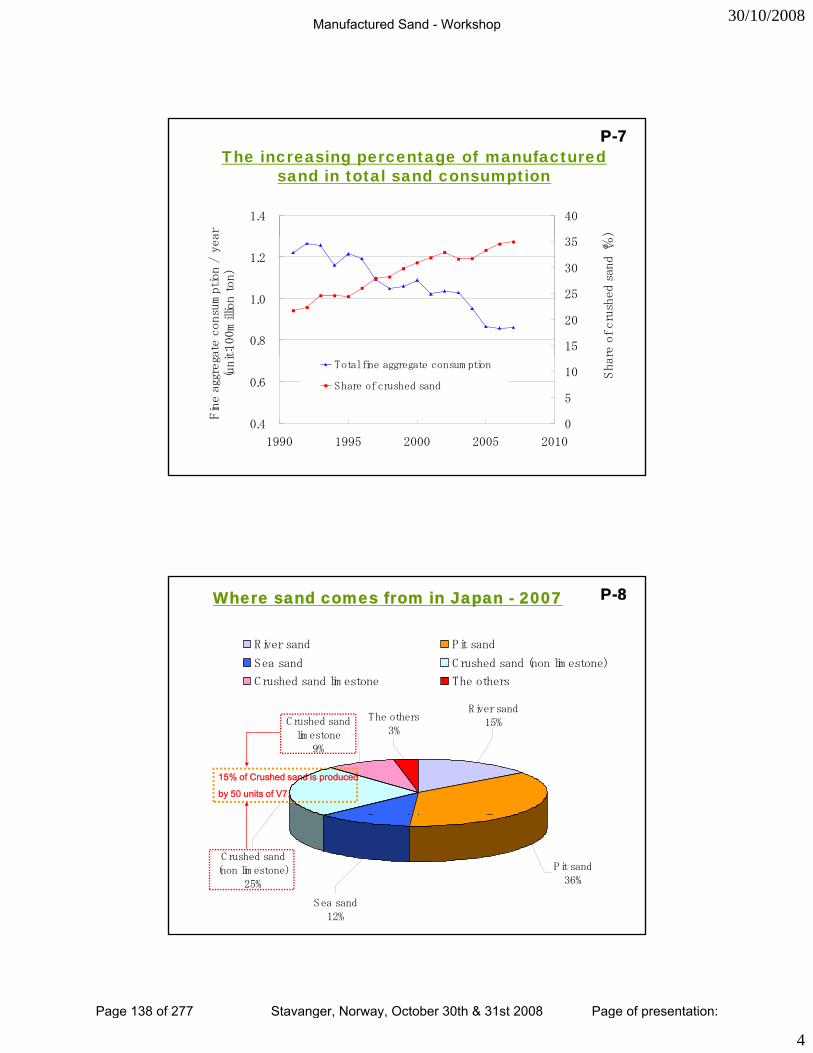
30/10/2008
4
1.4ar
40
)
The increasing percentage of manufactured sand in total sand consumption
P-7
0.8
1.0
1.2
ate consumption / yea
it:100million ton)
15
20
25
30
35
re of crushed sand(
%
0.4
0.6
1990 1995 2000 2005 2010
Fine aggreg
(unit
0
5
10 SharTotal fine aggregate consum ption
Share of crushed sand
R iver sand Pit sand
Sea sand Crushed sand (non lim estone)
Crushed sand lim estone The others
P-8Where sand comes from in Japan - 2007
C rushed sandlim estone
9%
The others3%
River sand15%
15% of Crushed sand is produced
by 50 units of V7.
Pit sand36%
Sea sand12%
C rushed sand(non lim estone)
25%
Manufactured Sand - Workshop
Page 138 of 277 Stavanger, Norway, October 30th & 31st 2008 Page of presentation:

30/10/2008
5
P-9Kemco presentation
HOW CRUSHED SAND WAS DEVELOPED IN JAPAN
AND WHAT ARE WE DOING NOW - 5 MAIN POINTS:
1. History of the use of fine aggregate and the current situation in Japan.
2. The current situation of crushed sand making machines in Japan.
3 Technical and commercial explanation of V7 dry sand 3.Technical and commercial explanation of V7 dry sand making system.
4.The filler problem.
5.What is commercially most preferable sand?
Dry system vs. wet system P-10
Dry Type (V7) Wet Type (Ball Mill)
Sand making system US$1,000,000 US$1,000,000 Sand making system-power
arrangement 190,000 160,000arrangementSand making system-
foundation 80,000 150,000
Wastewater disposal system 0 800,000
Wastewater disposal system-foundation 0 200,000
Cake disposal system 0 500 000
2 times
4 times
2 times
Cake disposal system 0 500,000Total US$1,270,000 US$2,810,000
Running cost 5 (US$/t) 10 (US$/t)
Required space 700m2
(20m×35m)3200m2
(40m×80m)
2 times
2 times
4 times
Manufactured Sand - Workshop
Page 139 of 277 Stavanger, Norway, October 30th & 31st 2008 Page of presentation:
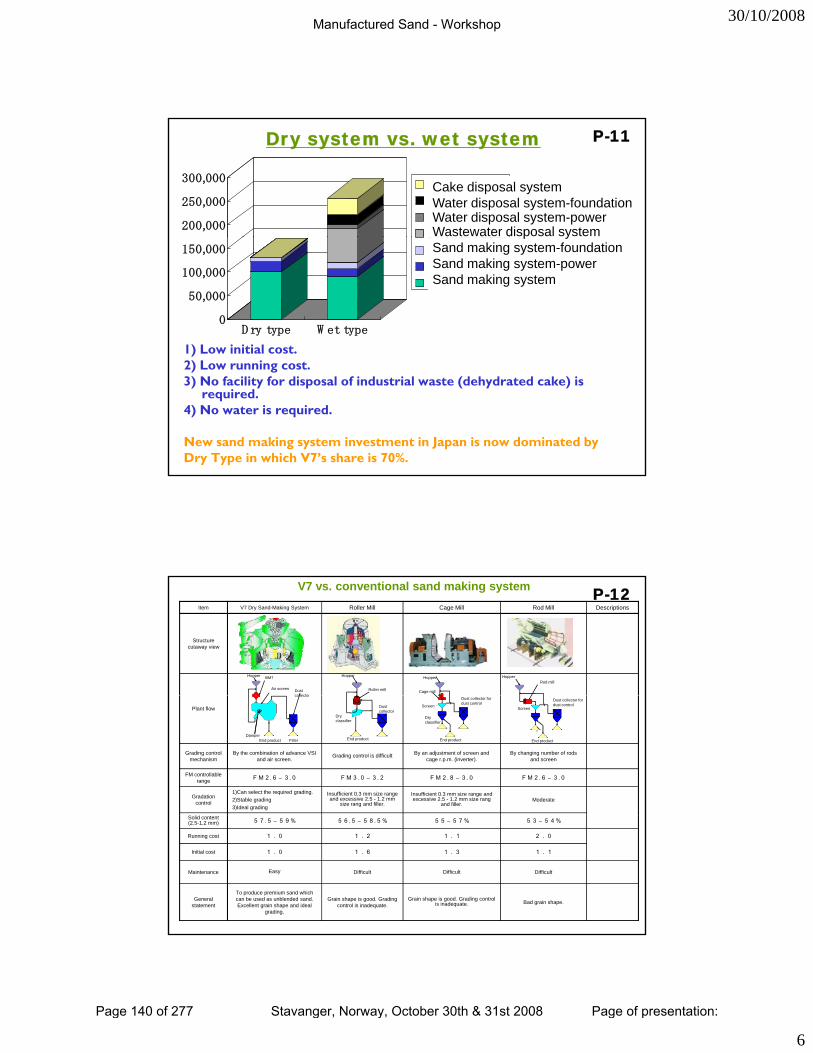
30/10/2008
6
200,000
250,000
300,000 C ake disposal
汚水処理基礎
汚水処理電気
汚水処理設備
Cake disposal systemWater disposal system-foundationWater disposal system-powerWastewater disposal system
Dry system vs. wet system P-11
0
50,000
100,000
150,000
D ry type W et type
汚水処理設備
Foundation
電気
Facilities
p ySand making system-foundationSand making system-powerSand making system
1) Low initial cost.2) Low running cost.3) No facility for disposal of industrial waste (dehydrated cake) is
required.4) No water is required.
New sand making system investment in Japan is now dominated by Dry Type in which V7’s share is 70%.
V7 vs. conventional sand making system
Hopper BM7
Air screen Dustcollector
Hopper
Roller mill
HopperRod mill
Hopper
Cage mill
P-12Item V7 Dry Sand-Making System Roller Mill Cage Mill Rod Mill Descriptions
Structure cutaway view
Damper
collector
End product Filler
Dustcollector
Dryclassifier
End product End product
Dust collector for dust control
Screen
Dust collector for dust control
End product
Dryclassifier
ScreenPlant flow
Grading control mechanism
By the combination of advance VSI and air screen.
Grading control is difficult By an adjustment of screen and cage r.p.m. (inverter).
By changing number of rods and screen
FM controllable range FM2.6 – 3.0 FM3.0 – 3.2 FM2.8 – 3.0 FM2.6 – 3.0
Gradation control
1)Can select the required grading.2)Stable grading3)Ideal grading
Insufficient 0.3 mm size range and excessive 2.5 - 1.2 mm
size rang and filler.
Insufficient 0.3 mm size range and excessive 2.5 - 1.2 mm size rang
and filler.Moderate
Solid content (2.5-1.2 mm) 57.5 – 59% 56.5 – 58.5% 55 – 57% 53 – 54%
Running cost 1.0 1.2 1.1 2.0
Initial cost 1.0 1.6 1.3 1.1
Maintenance Easy Difficult Difficult Difficult
General statement
To produce premium sand which can be used as unblended sand. Excellent grain shape and ideal
grading.
Grain shape is good. Grading control is inadequate.
Grain shape is good. Grading control is inadequate. Bad grain shape.
Manufactured Sand - Workshop
Page 140 of 277 Stavanger, Norway, October 30th & 31st 2008 Page of presentation:
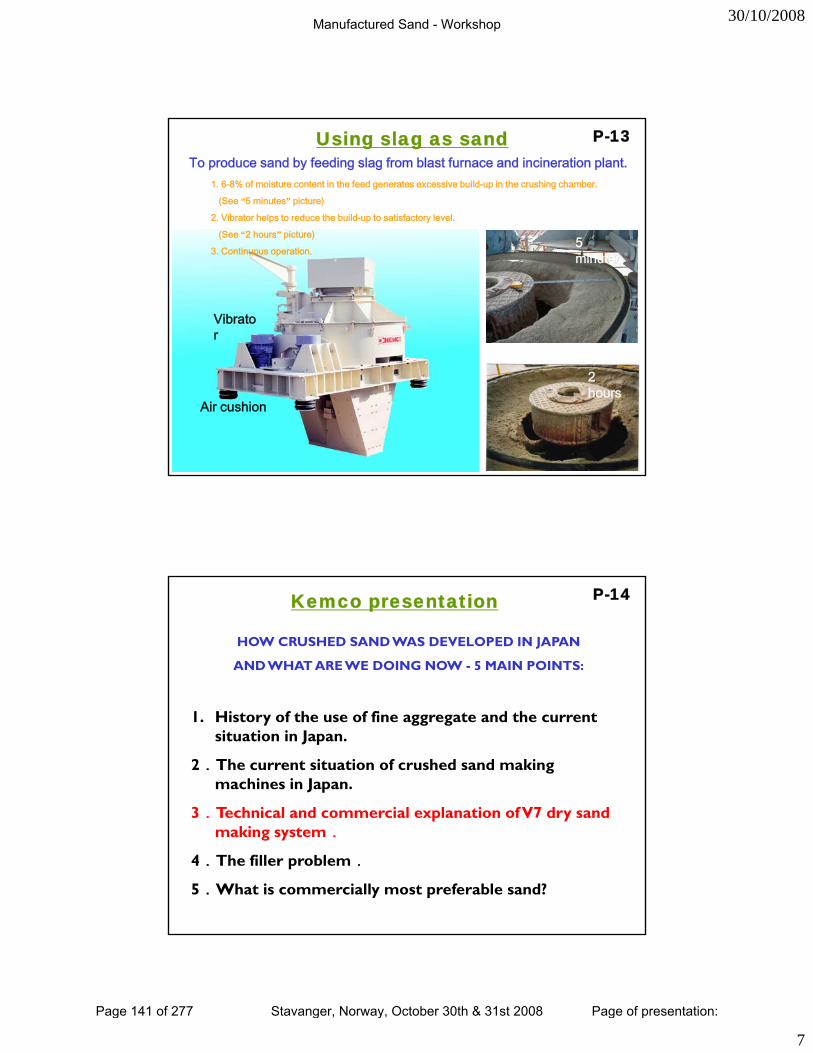
30/10/2008
7
To produce sand by feeding slag from blast furnace and incineration plant.
P-13Using slag as sand
1. 6-8% of moisture content in the feed generates excessive build-up in the crushing chamber.
(See “5 minutes” picture)
2. Vibrator helps to reduce the build-up to satisfactory level.
(See “2 hours” picture)5 minutes
Vibrator
(See 2 hours picture)
3. Continuous operation.
2 hours
Air cushion
P-14Kemco presentation
HOW CRUSHED SAND WAS DEVELOPED IN JAPAN
AND WHAT ARE WE DOING NOW - 5 MAIN POINTS:
1. History of the use of fine aggregate and the current situation in Japan.
2.The current situation of crushed sand making machines in Japan.
3 Technical and commercial explanation of V7 dry sand 3.Technical and commercial explanation of V7 dry sand making system.
4.The filler problem.
5.What is commercially most preferable sand?
Manufactured Sand - Workshop
Page 141 of 277 Stavanger, Norway, October 30th & 31st 2008 Page of presentation:
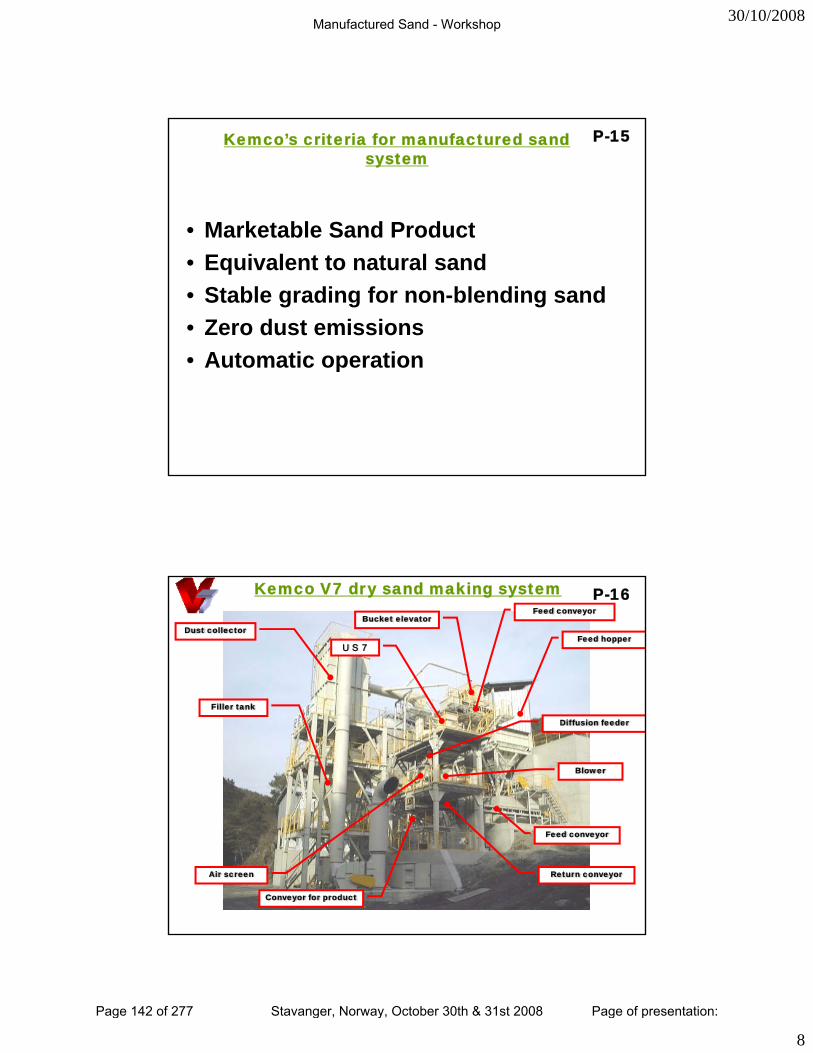
30/10/2008
8
P-15Kemco’s criteria for manufactured sand system
• Marketable Sand ProductMarketable Sand Product• Equivalent to natural sand• Stable grading for non-blending sand• Zero dust emissions• Automatic operation• Automatic operation
Feed conveyor
Feed hopper
Bucket elevatorDust collector
US7
Kemco V7 dry sand making system P-16
Diffusion feeder
Blower
Filler tank
Feed conveyor
Return conveyor
Conveyor for product
Air screen
Manufactured Sand - Workshop
Page 142 of 277 Stavanger, Norway, October 30th & 31st 2008 Page of presentation:
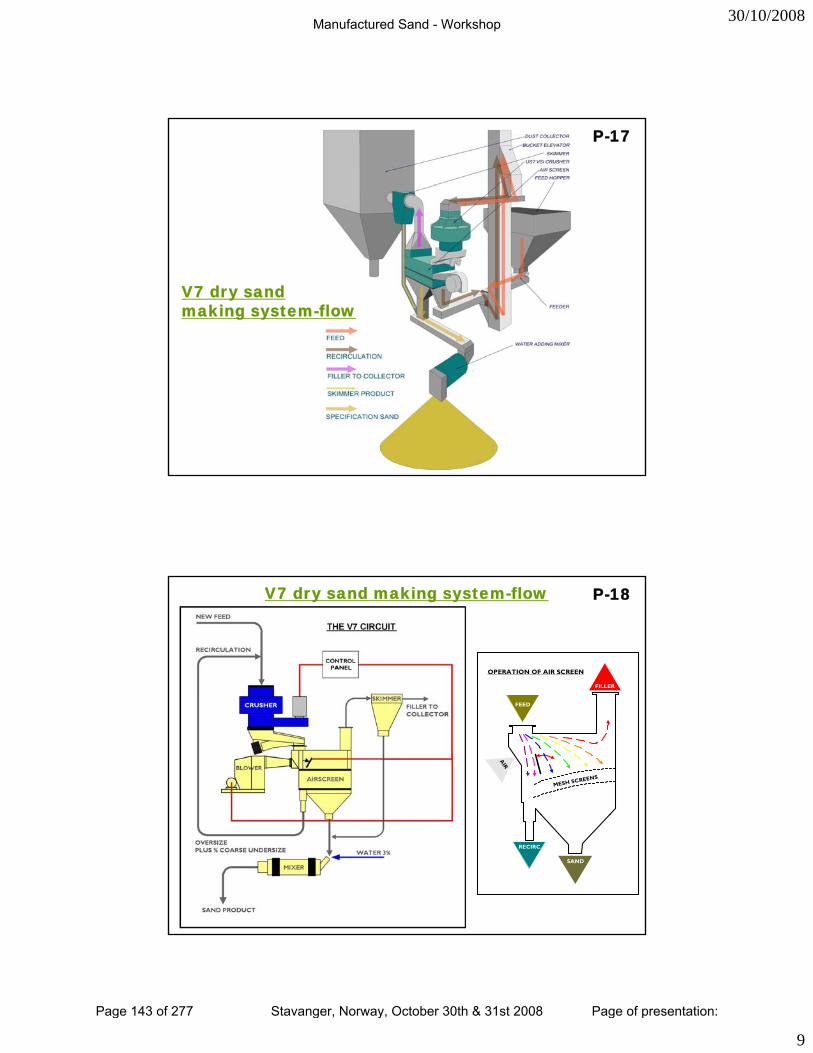
30/10/2008
9
P-17
V7 dry sand making system-flow
Dust collector
V7 dry sand making system-flow P-18
FILLER
OPERATION OF AIR SCREEN
Air screen
Cut screen
AIR
FEED
MESH SCREENS
Dumper
Sand
RECIRC.
SAND
Manufactured Sand - Workshop
Page 143 of 277 Stavanger, Norway, October 30th & 31st 2008 Page of presentation:

30/10/2008
10
P-193 sets of V7-100 on a common platform for the biggest cement manufacturer in Japan
粒形改善砕砂30%:山砂70%7 days 28 days
1 68 8 10.0 4.8 - G ood 16.8 26.2
Specified m ix.
18
Sam ple N o.Specifiedstrength
W /C(%)
Slum p(cm )
C om pressive
strength (N /m m 2)
Property of concrete
Slum p(cm )
Entrappedair(%)
Flow value(cm )
W orkability
Case 1=> V7 sand:30%/Natural sand:70%
P-20V7 sand trial mix data
2 68 15 16.5 5.2 26.5 X 26.0 G ood 18.1 27.03 57 8 9.5 4.6 - G ood 26.3 35.04 57 18 19.5 5.1 33.5 X 34.0 G ood 25.8 34.35 49 15 16.5 4.6 25.5 X 27.0 G ood 30.6 41.26 49 18 20.0 4.8 34.0 X 25.0 G ood 31.1 40.6
24
30
18
Property of concrete
Slum p( )
Entrappedair
Flow value( )
W orkabilityC om pressive
strength (N /m m 2)Sam ple N o.Specified
hW /C(%)
Slum p( )
Specified m ix.
Case 2=> V7 sand:70% / Natural sand:30%
7 days 28 days1 68 8 9.5 4.4 - G ood 17.1 27.22 68 15 16.0 5.5 26.5 X 26.5 G ood 17.8 28.13 57 8 10.0 4.2 - G ood 27.3 34.34 57 18 19.5 4.9 32.0 X 34.0 G ood 26.5 34.95 49 15 16.5 4.6 27.0 X 27.0 G ood 31.0 40.36 49 18 19.5 4.8 34.0 X 33.0 G ood 32.1 41.2
18
24
30
(cm )air(%)
(cm )W orkability strength (N /m m )Sam ple N o.
strength (%) (cm )
Specified mix remains unchanged!
Manufactured Sand - Workshop
Page 144 of 277 Stavanger, Norway, October 30th & 31st 2008 Page of presentation:

30/10/2008
11
0 0
1.0
2.0プ
差(c
m)
Slump
Deviation : Case 2 from Case 1 P-21
Increase of blending ratio of V7 sand using the
same specified mix does not affect slump air
-2.0
-1.0
0.0
0 1 2 3 4 5 6
試験No.
スラ
ンプ
1.0 2.0
Air Compressive strength(28 days)
Sample No.
same specified mix does not affect slump, air
entrainment or compressive strength!
-1.0
-0.5
0.0
0.5
0 1 2 3 4 5 6
試験No.
空気
量差
(%)
-2.0
-1.0
0.0
1.0
0 1 2 3 4 5 6
試験No.
強度
差(N
/㎟
)
Sample No. Sample No.
Actual cases in Japan. P-22
Case 1: A ready-mixed concrete plant “H” From 100% of sea sand to 50% of V7 sand: => Reduction of unit water content by 7 – 9 kg Reduction of unit water content by 7 9 kg
Case 2: A ready-mixed concrete plant “S”
From 100% of sea sand to 100% of V7 sand:
=> Improvement of the workability of concrete.
Case 3: A ready-mixed concrete plant “T”=> Achieved saving of 11kgs of unit water content and
15-20kgs of unit cement content.
Manufactured Sand - Workshop
Page 145 of 277 Stavanger, Norway, October 30th & 31st 2008 Page of presentation:
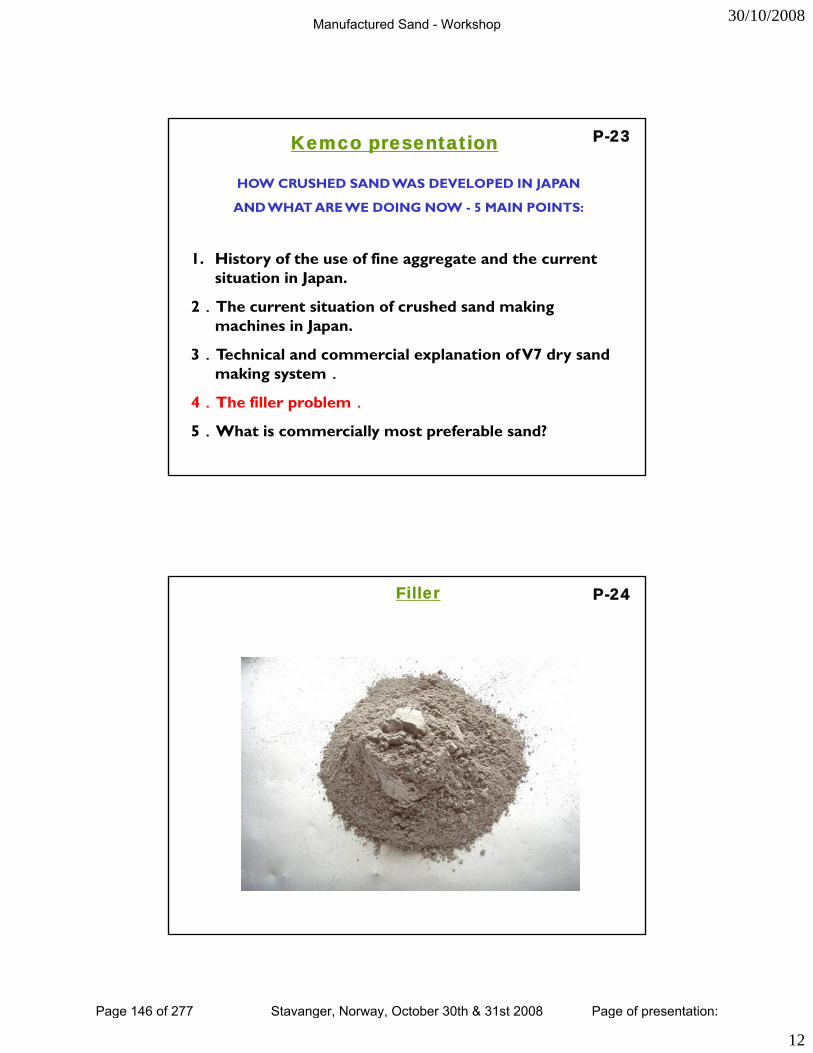
30/10/2008
12
P-23Kemco presentation
HOW CRUSHED SAND WAS DEVELOPED IN JAPAN
AND WHAT ARE WE DOING NOW - 5 MAIN POINTS:
1. History of the use of fine aggregate and the current situation in Japan.
2.The current situation of crushed sand making machines in Japan.
3 Technical and commercial explanation of V7 dry sand 3.Technical and commercial explanation of V7 dry sand making system.
4.The filler problem.
5.What is commercially most preferable sand?
Filler P-24
Manufactured Sand - Workshop
Page 146 of 277 Stavanger, Norway, October 30th & 31st 2008 Page of presentation:
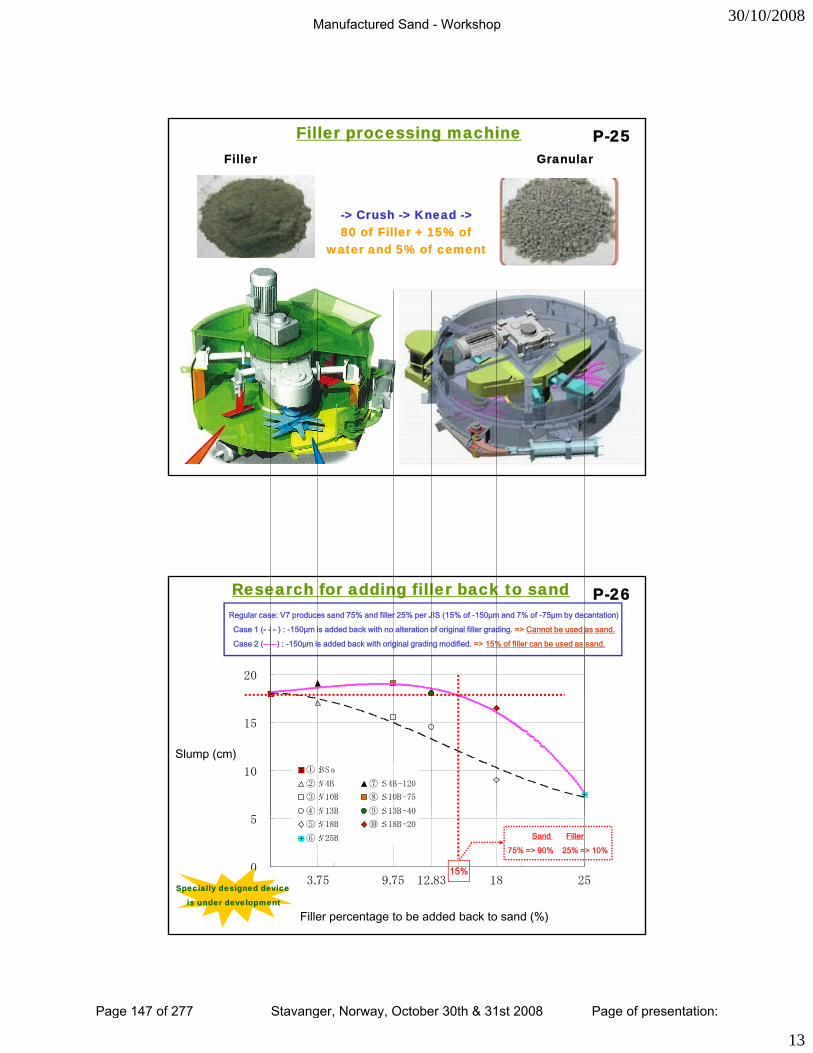
30/10/2008
13
-> Crush -> Knead ->80 of Filler + 15% of
Filler processing machineFiller Granular
P-25
water and 5% of cement
20
25
P-26Research for adding filler back to sand Regular case: V7 produces sand 75% and filler 25% per JIS (15% of -150μm and 7% of -75μm by decantation)
Case 1 (- - - ) : -150μm is added back with no alteration of original filler grading. => Cannot be used as sand.
Case 2 (-----) : -150μm is added back with original grading modified. => 15% of filler can be used as sand.
5
10
15
スランプ(cm)
①:BSa
②:V4B ⑦:S4B-120
③:V10B ⑧:S10B-75
④:V13B ⑨:S13B-40
Slump (cm)
3.75 9.75 12.83 18 250
5
微石粉混入率(%)
⑤:V18B ⑩:S18B-20
⑥:V25B
15%
Filler percentage to be added back to sand (%)
Sand Filler
75% => 90% 25% => 10%
Specially designed device
is under development
Manufactured Sand - Workshop
Page 147 of 277 Stavanger, Norway, October 30th & 31st 2008 Page of presentation:
30/10/2008
14
P-27Kemco presentation
HOW CRUSHED SAND WAS DEVELOPED IN JAPAN
AND WHAT ARE WE DOING NOW - 5 MAIN POINTS:
1. History of the use of fine aggregate and the current situation in Japan.
2.The current situation of crushed sand making machines in Japan.
3 Technical and commercial explanation of V7 dry sand 3.Technical and commercial explanation of V7 dry sand making system.
4.The filler problem.
5.What is commercially most preferable sand?
Natural sand and manufactured sand& what Kemco can do. Quality
P-28
Natural sand (Environmental issue & Less reservation)
<34%>
<63%>
2008
2008
Manufactured sand (Wet => Dry & Technical Innovation)
Volume
( )
① Market is selective:
=> Supplying the products with high performance. For last 10 years, wet system with less cost performance
disappeared and V7 got 90% of market share in Japan..② Iinnovation:
=> V7 sand is also used for dam and nuclear power plant construction where it was thought dry manufactured sand
could not be used. ③ Close but often ineffective relationship:
=> The relationship between concrete and aggregate producers is both close and distant :
Several hundreds of test data for sand sample and concrete trial mix in “KEMCO Archive”.
Kemco wants to be a bridge between the two branches of the industry.
Manufactured Sand - Workshop
Page 148 of 277 Stavanger, Norway, October 30th & 31st 2008 Page of presentation:
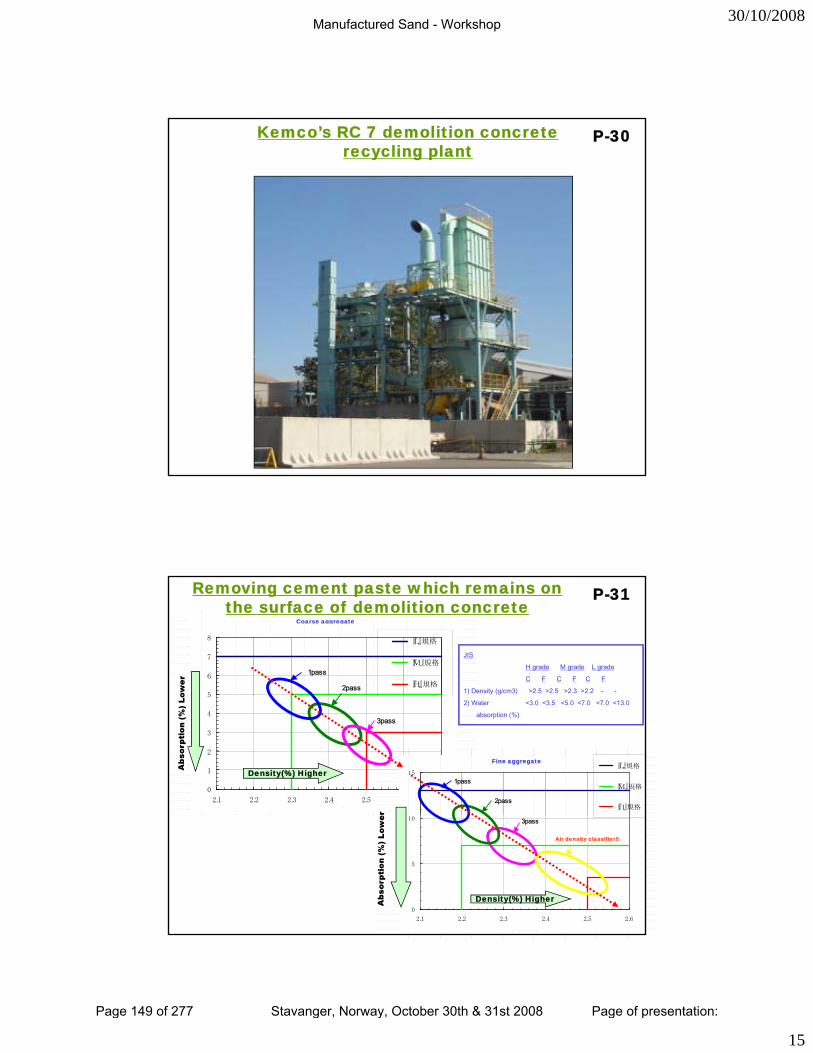
30/10/2008
15
Kemco’s RC 7 demolition concrete recycling plant
P-30
再生粗骨材の密度と吸水率イメージ図
5
6
7
8
)
『L』規格
『M』規格
『H』規格
1pass
2pass
Coarse aggregate
Removing cement paste which remains on the surface of demolition concrete
P-31
JIS
H grade M grade L grade
C F C F C F
1) Density (g/cm3) >2.5 >2.5 >2.3 >2.2 - -
0
1
2
3
4
5
2.1 2.2 2.3 2.4 2.5 2.6 2.7絶乾密度
吸水
率(%)
3pass
再生細骨材の密度と吸水率イメージ図
15『L』規格
『M』規格
『H』規格
1pass
2pass
Fine aggregate
Density(%) Higher
2) Water <3.0 <3.5 <5.0 <7.0 <7.0 <13.0
absorption (%)
0
5
10
2.1 2.2 2.3 2.4 2.5 2.6
絶乾密度
吸水
率(%
) 3pass
軽比重分離品
Density(%) Higher
Air density classifier!!
Manufactured Sand - Workshop
Page 149 of 277 Stavanger, Norway, October 30th & 31st 2008 Page of presentation:
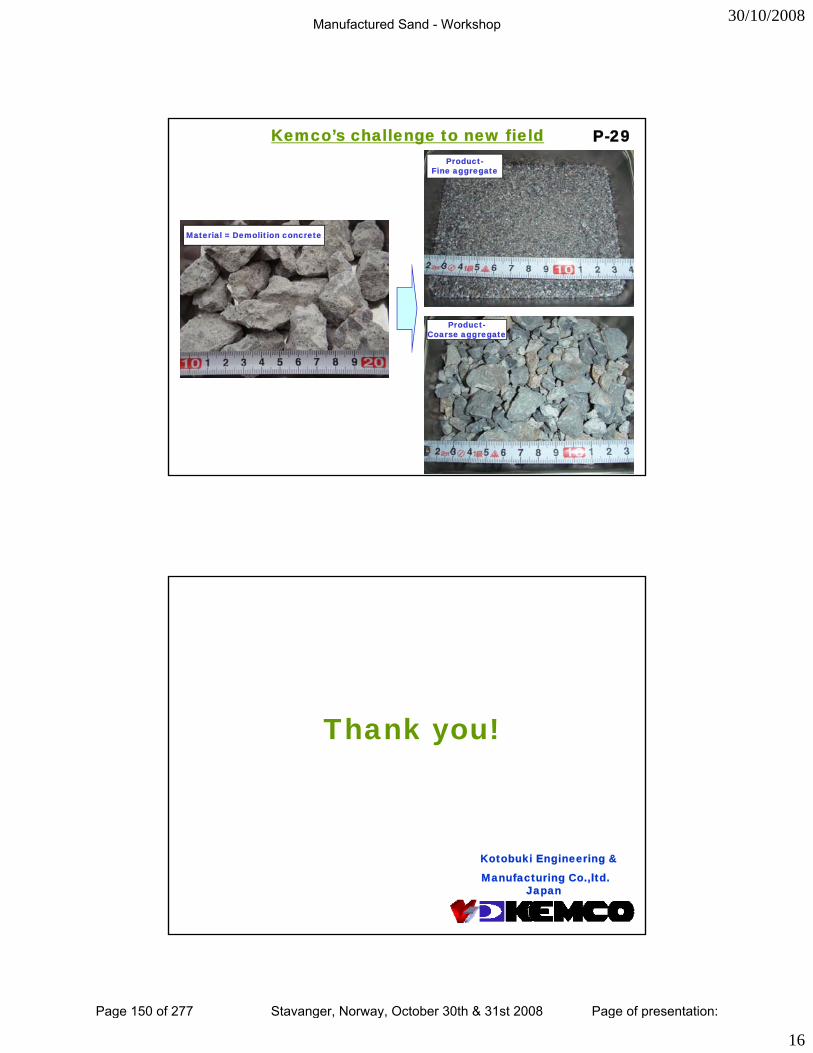
30/10/2008
16
Kemco’s challenge to new field P-29
Material = Demolition concrete
Product-Fine aggregate
Material Demolition concrete
Product-Coarse aggregate
Thank you!
Kotobuki Engineering &
Manufacturing Co.,ltd. Japan
Manufactured Sand - Workshop
Page 150 of 277 Stavanger, Norway, October 30th & 31st 2008 Page of presentation:
31/10/2008
1
Chalmers University of Technology
Development of Crushing Technology for
Manufactured SandManufactured Sand
Sida 1Magnus Evertsson, CRPR, PPU08-11-03
Chalmers Rock Processing Researchwww.crpr.se
Chalmers University of Technology
• Crushing technology for manufactured sand• Crushing technology for manufactured sand
• Real-time optimisation and statistical process control
Sida 2Magnus Evertsson, CRPR, PPU08-11-03
Manufactured Sand - Workshop
Page 151 of 277 Stavanger, Norway, October 30th & 31st 2008 Page of presentation:
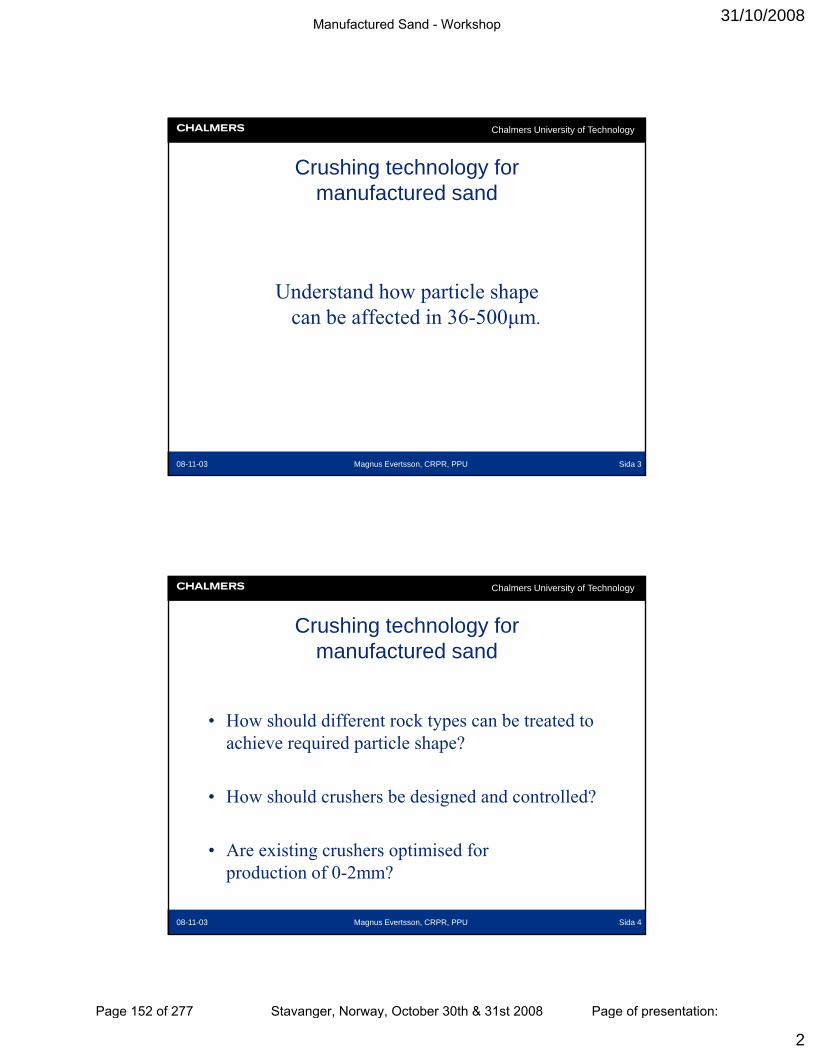
31/10/2008
2
Chalmers University of Technology
Crushing technology for manufactured sand
Understand how particle shape can be affected in 36-500μm.
Sida 3Magnus Evertsson, CRPR, PPU08-11-03
Chalmers University of Technology
Crushing technology for manufactured sand
• How should different rock types can be treated to achieve required particle shape?
• How should crushers be designed and controlled?
Sida 4Magnus Evertsson, CRPR, PPU08-11-03
• Are existing crushers optimised for production of 0-2mm?
Manufactured Sand - Workshop
Page 152 of 277 Stavanger, Norway, October 30th & 31st 2008 Page of presentation:
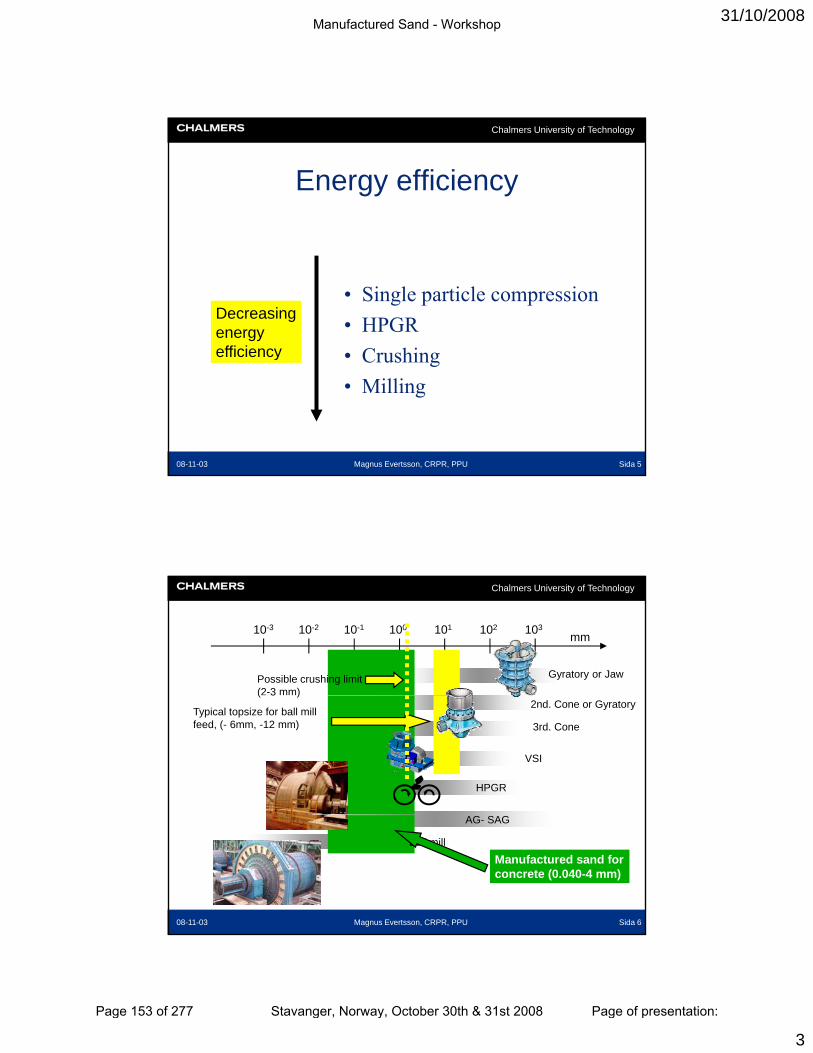
31/10/2008
3
Chalmers University of Technology
Energy efficiency
• Single particle compression• HPGR• Crushing
Decreasingenergy efficiency
Sida 5Magnus Evertsson, CRPR, PPU08-11-03
• Crushing• Milling
efficiency
Chalmers University of Technology
10310210110010-110-210-3mm
Gyratory or JawPossible crushing limit (2-3 mm)
2nd. Cone or Gyratory
3rd. Cone
VSI
HPGR
Typical topsize for ball mill feed, (- 6mm, -12 mm)
( 3 )
Sida 6Magnus Evertsson, CRPR, PPU08-11-03
AG- SAG
Ball mill
Manufactured sand for concrete (0.040-4 mm)
Manufactured Sand - Workshop
Page 153 of 277 Stavanger, Norway, October 30th & 31st 2008 Page of presentation:
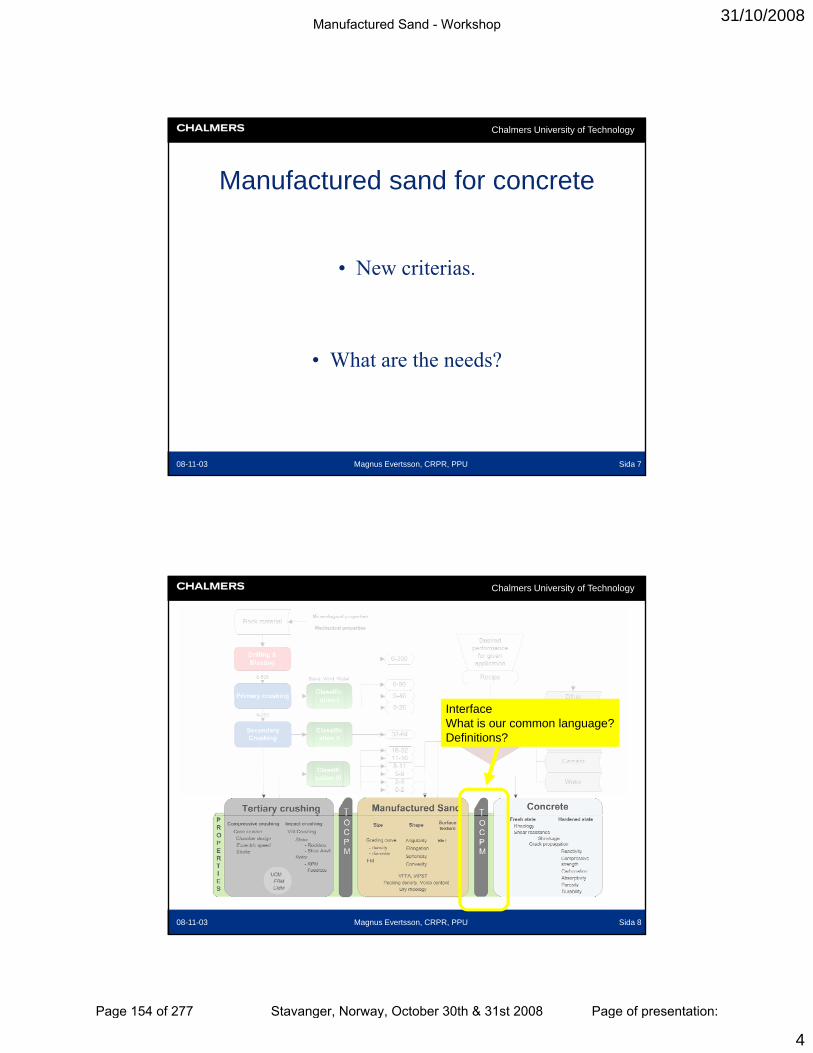
31/10/2008
4
Chalmers University of Technology
Manufactured sand for concrete
• New criterias.
Wh t e the eed ?
Sida 7Magnus Evertsson, CRPR, PPU08-11-03
• What are the needs?
Chalmers University of Technology
InterfaceWhat is our common language?Definitions?
Sida 8Magnus Evertsson, CRPR, PPU08-11-03
Manufactured Sand - Workshop
Page 154 of 277 Stavanger, Norway, October 30th & 31st 2008 Page of presentation:
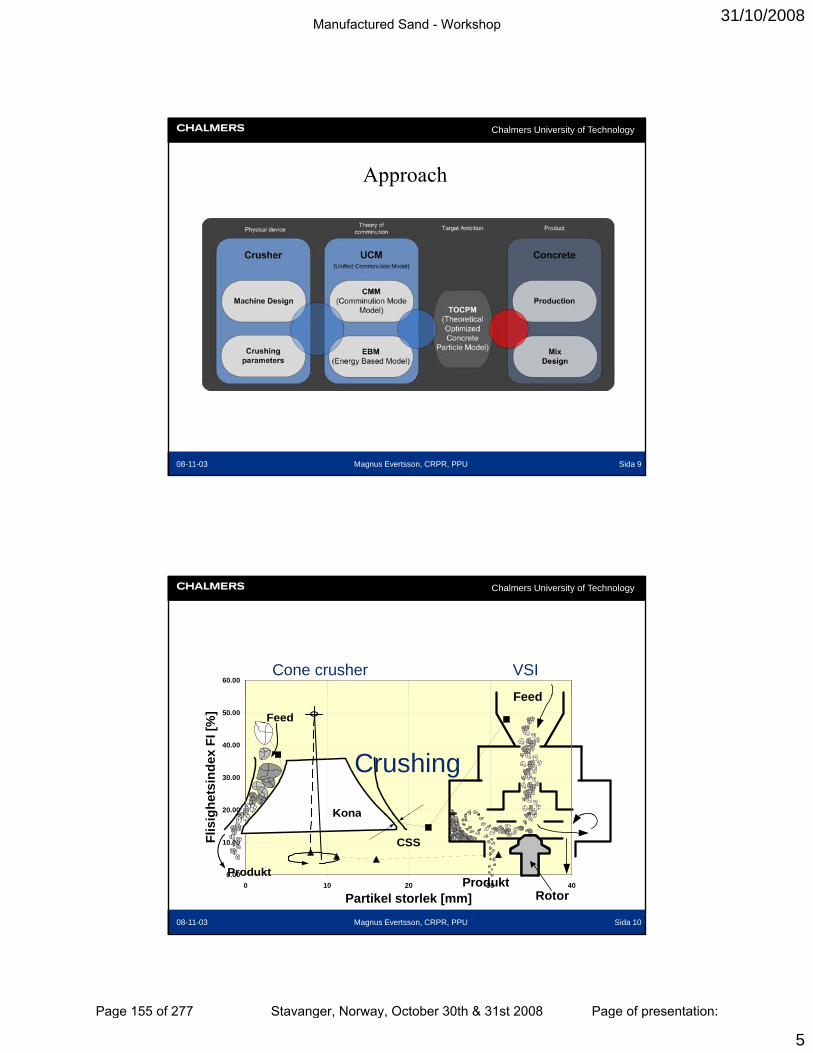
31/10/2008
5
Chalmers University of Technology
Approach
Sida 9Magnus Evertsson, CRPR, PPU08-11-03
Chalmers University of Technology
60.00Cone crusher VSI
Feed
20.00
30.00
40.00
50.00
ghet
sind
ex F
I [%
] Feed
Kona
Feed
Crushing
Sida 10Magnus Evertsson, CRPR, PPU08-11-03
0.00
10.00
0 10 20 30 40
Partikel storlek [mm]
Flis
ig
Produkt
Kona
CSS
ProduktRotor
Manufactured Sand - Workshop
Page 155 of 277 Stavanger, Norway, October 30th & 31st 2008 Page of presentation:
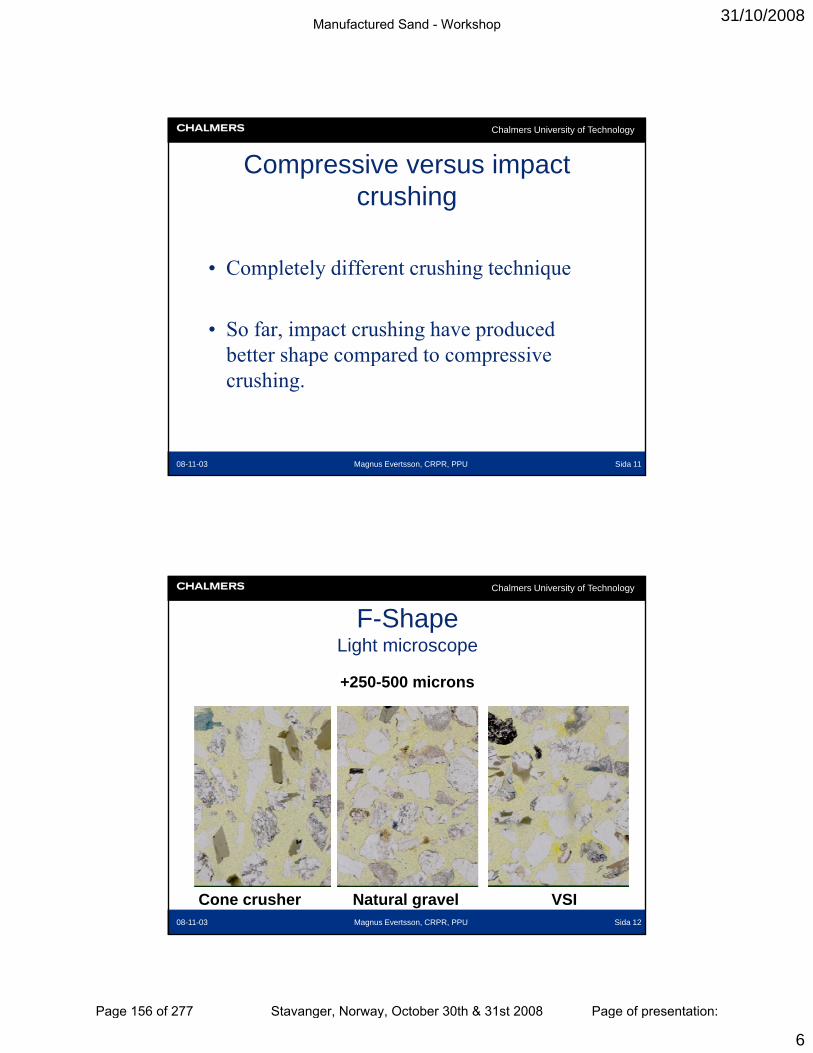
31/10/2008
6
Chalmers University of Technology
Compressive versus impact crushing
• Completely different crushing technique
• So far, impact crushing have produced better shape compared to compressive
Sida 11Magnus Evertsson, CRPR, PPU08-11-03
better shape compared to compressive crushing.
Chalmers University of Technology
F-Shape Light microscope
+250-500 microns
Sida 12Magnus Evertsson, CRPR, PPU08-11-03
Cone crusher Natural gravel VSI
Manufactured Sand - Workshop
Page 156 of 277 Stavanger, Norway, October 30th & 31st 2008 Page of presentation:
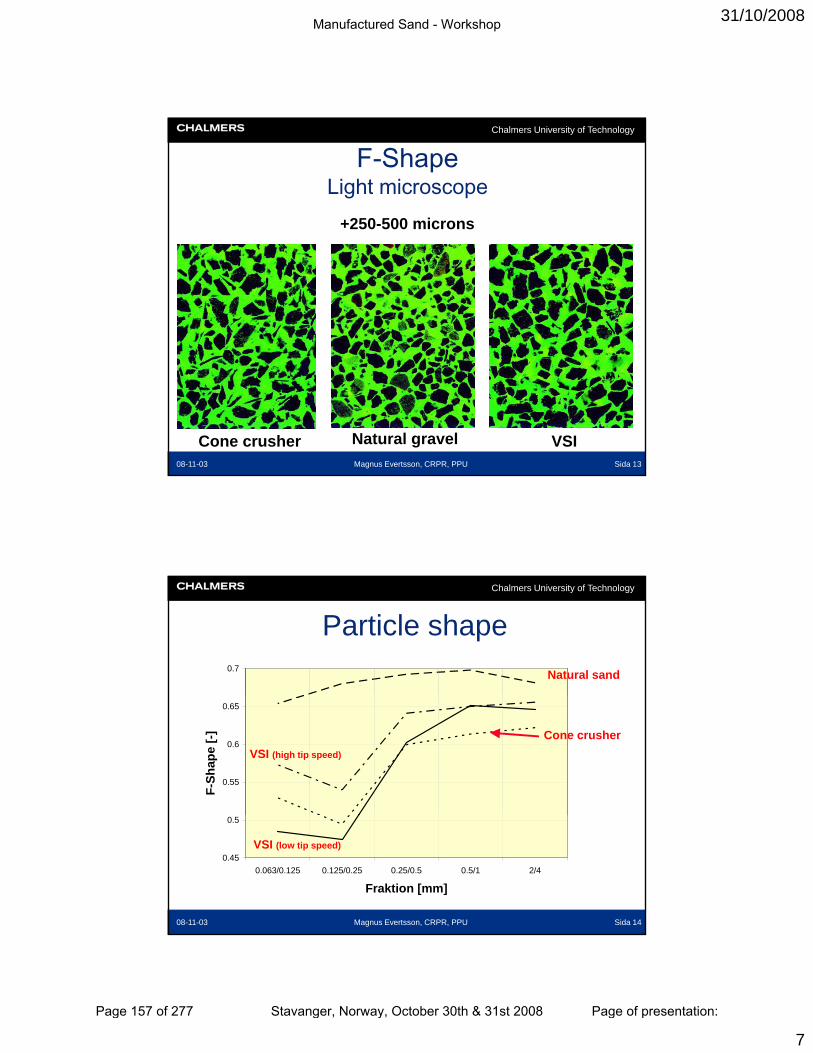
31/10/2008
7
Chalmers University of Technology
+250-500 microns
F-Shape Light microscope
Sida 13Magnus Evertsson, CRPR, PPU08-11-03
Cone crusher Natural gravel VSI
Chalmers University of Technology
0.7 Natural sand
Particle shape
0.55
0.6
0.65
F-Sh
ape
[-]
VSI (high tip speed)
Cone crusher
Sida 14Magnus Evertsson, CRPR, PPU08-11-03
0.45
0.5
2/40.5/10.25/0.50.125/0.250.063/0.125
Fraktion [mm]
VSI (low tip speed)
Manufactured Sand - Workshop
Page 157 of 277 Stavanger, Norway, October 30th & 31st 2008 Page of presentation:
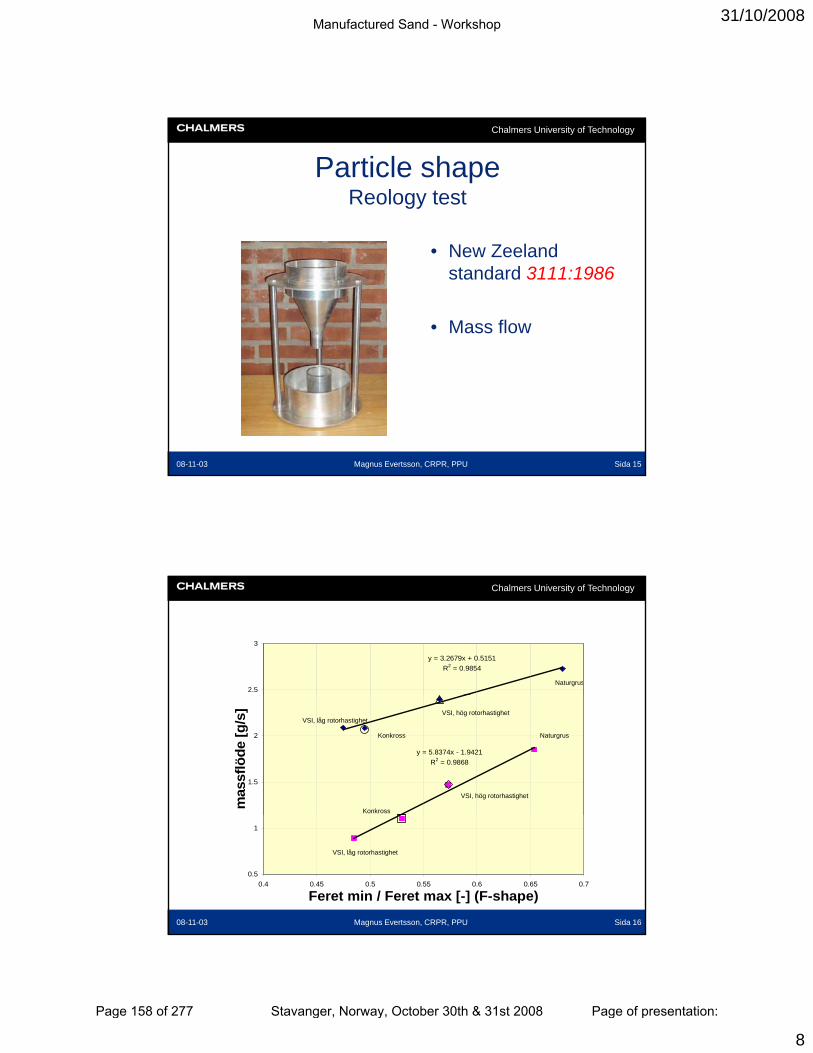
31/10/2008
8
Chalmers University of Technology
Particle shapeReology test
• New Zeeland standard 3111:1986
• Mass flow
Sida 15Magnus Evertsson, CRPR, PPU08-11-03
Chalmers University of Technology
y = 3.2679x + 0.5151R2 = 0.9854
2.5
3
Naturgrus
y = 5.8374x - 1.9421R2 = 0.9868
1.5
2
mas
sflö
de [g
/s]
VSI, låg rotorhastighet
VSI, hög rotorhastighet
VSI, hög rotorhastighet
Konkross
Konkross Naturgrus
Sida 16Magnus Evertsson, CRPR, PPU08-11-03
0.5
1
0.4 0.45 0.5 0.55 0.6 0.65 0.7
Feret min / Feret max [-] (F-shape)
VSI, låg rotorhastighet
Manufactured Sand - Workshop
Page 158 of 277 Stavanger, Norway, October 30th & 31st 2008 Page of presentation:
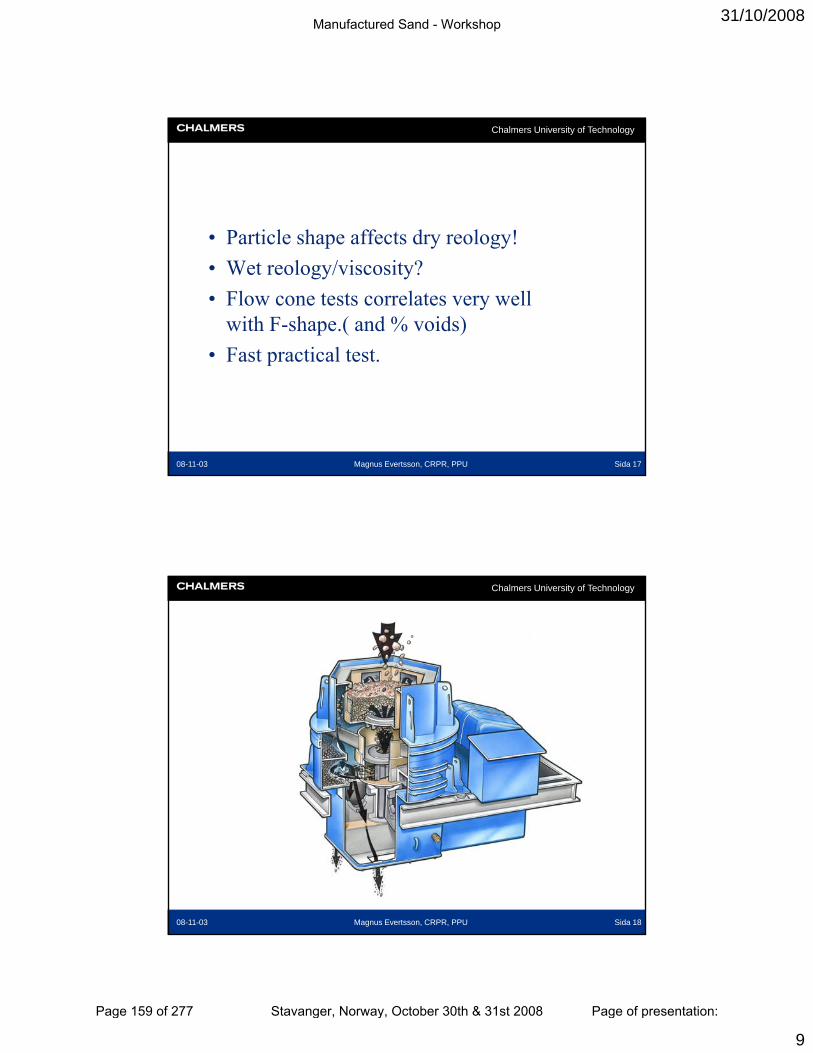
31/10/2008
9
Chalmers University of Technology
• Particle shape affects dry reology!• Particle shape affects dry reology! • Wet reology/viscosity?• Flow cone tests correlates very well
with F-shape.( and % voids)• Fast practical test
Sida 17Magnus Evertsson, CRPR, PPU08-11-03
• Fast practical test.
Chalmers University of Technology
Sida 18Magnus Evertsson, CRPR, PPU08-11-03
Manufactured Sand - Workshop
Page 159 of 277 Stavanger, Norway, October 30th & 31st 2008 Page of presentation:
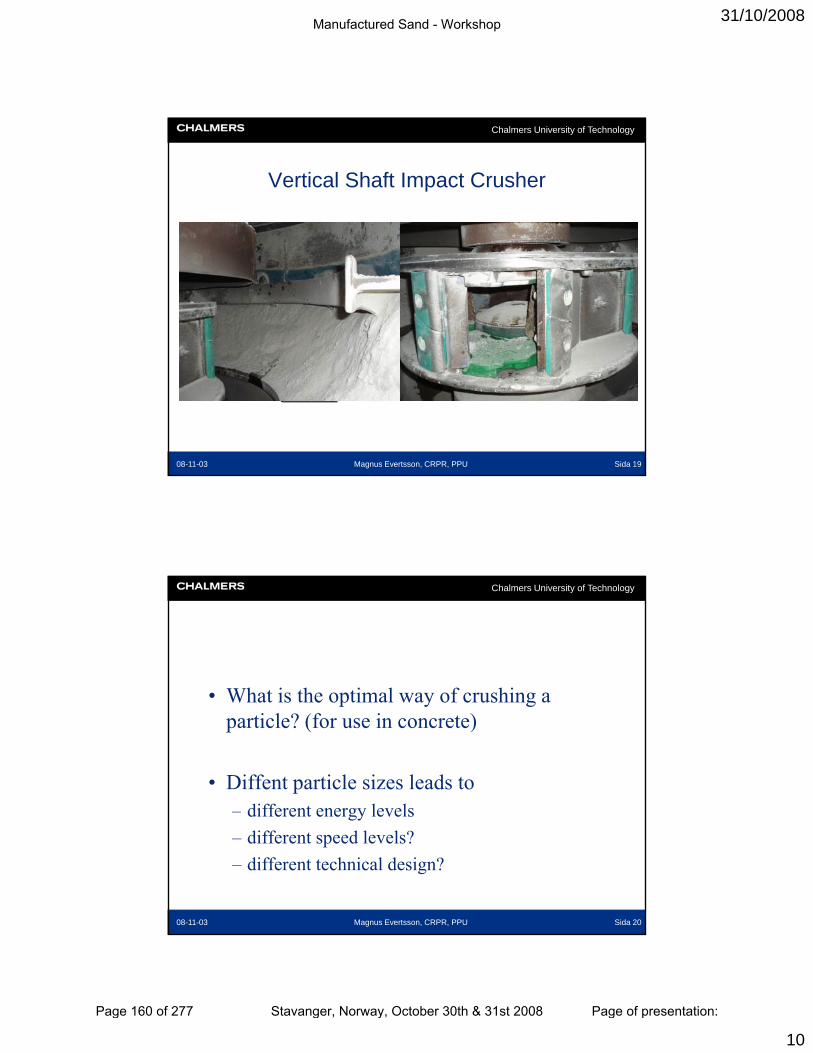
31/10/2008
10
Chalmers University of Technology
Vertical Shaft Impact Crusher
Sida 19Magnus Evertsson, CRPR, PPU08-11-03
Chalmers University of Technology
• What is the optimal way of crushing a• What is the optimal way of crushing a particle? (for use in concrete)
• Diffent particle sizes leads to – different energy levels
Sida 20Magnus Evertsson, CRPR, PPU08-11-03
different energy levels– different speed levels?– different technical design?
Manufactured Sand - Workshop
Page 160 of 277 Stavanger, Norway, October 30th & 31st 2008 Page of presentation:
31/10/2008
11
Chalmers University of Technology
UCM Unified Comminution Model
Comminution M d M d l
Energy Based Model
Mode Model
Crushing modes– Impact cleavage– Abrasive chipping– Abrasion
Sida 21Magnus Evertsson, CRPR, PPU08-11-03
Abrasion
Chalmers University of Technology
TOCPM- Theoretical Optimized Concrete Particle Model
• Interface between aggregates production and concrete
• Common language?
• Definitions?
Sida 22Magnus Evertsson, CRPR, PPU08-11-03
• Need for communication and knowledge exchange.
Manufactured Sand - Workshop
Page 161 of 277 Stavanger, Norway, October 30th & 31st 2008 Page of presentation:
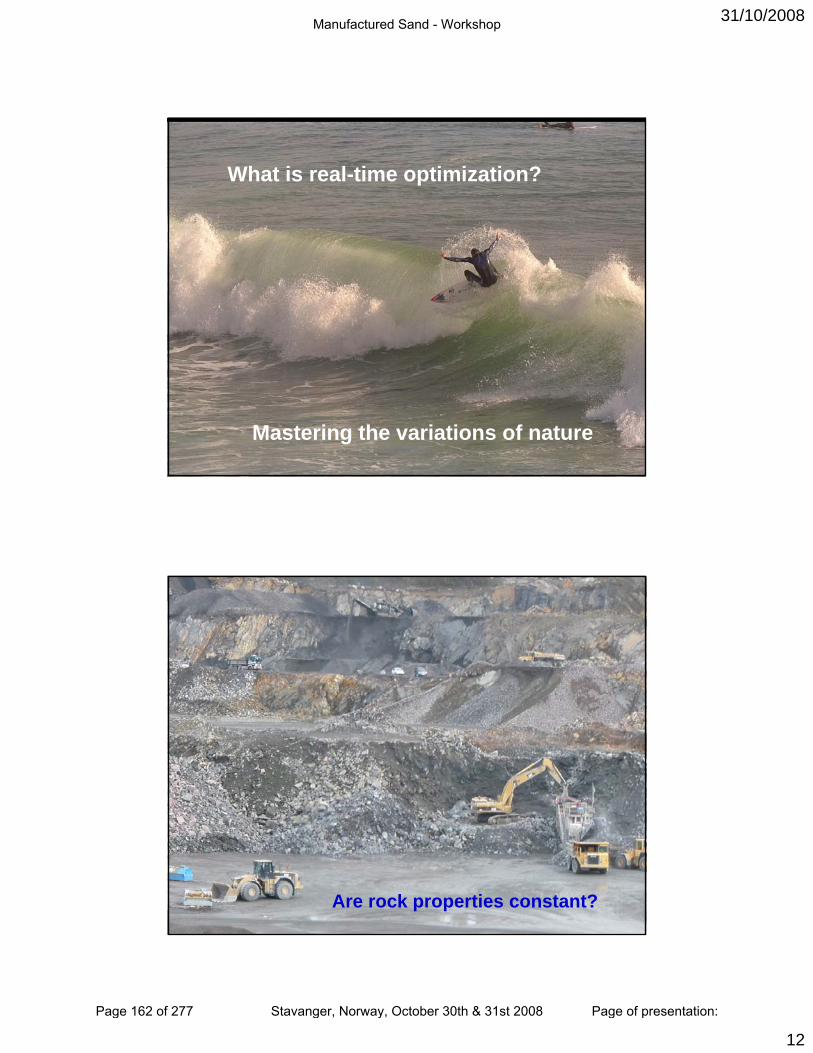
31/10/2008
12
Chalmers University of Technology
Real-time optimisationWhat is real-time optimization?
Sida 23Magnus Evertsson, CRPR, PPU08-11-03
Mastering the variations of nature
Chalmers University of Technology
Sida 24Magnus Evertsson, CRPR, PPU08-11-03
Are rock properties constant?
Manufactured Sand - Workshop
Page 162 of 277 Stavanger, Norway, October 30th & 31st 2008 Page of presentation:

31/10/2008
13
Chalmers University of Technology
Real-time optimisation
• Rock properties vary with time• Rock properties vary with time• Wear affects performance and output• Fixed values of any parameter
can not be optimal
Sida 25Magnus Evertsson, CRPR, PPU08-11-03
• Desirable to compensate for these effects
Chalmers University of Technology
Real-time optimisation
• More and better sensor techniques needed• More and better sensor techniques needed• Additional control parameters must be
identified
Sida 26Magnus Evertsson, CRPR, PPU08-11-03
• Control theories and algorithms
Manufactured Sand - Workshop
Page 163 of 277 Stavanger, Norway, October 30th & 31st 2008 Page of presentation:
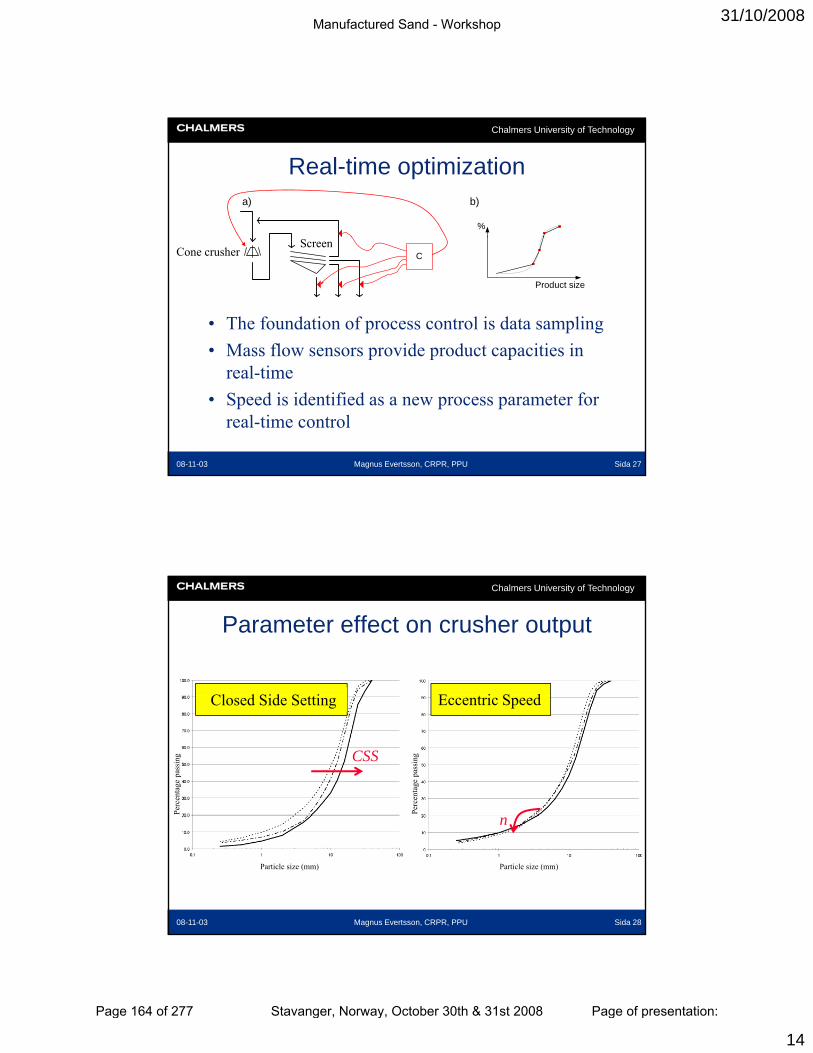
31/10/2008
14
Chalmers University of Technology
Real-time optimization
%
a) b)
• The foundation of process control is data sampling• Mass flow sensors provide product capacities in
Product size
CCone crusherScreen
Sida 27Magnus Evertsson, CRPR, PPU08-11-03
p p preal-time
• Speed is identified as a new process parameter for real-time control
Chalmers University of Technology
Parameter effect on crusher output
Cl d Sid S i E i S dClosed Side Setting
Perc
enta
ge p
assi
ng CSS
Eccentric Speed
Perc
enta
ge p
assi
ng
Sida 28Magnus Evertsson, CRPR, PPU08-11-03
Particle size (mm) Particle size (mm)
n
Manufactured Sand - Workshop
Page 164 of 277 Stavanger, Norway, October 30th & 31st 2008 Page of presentation:
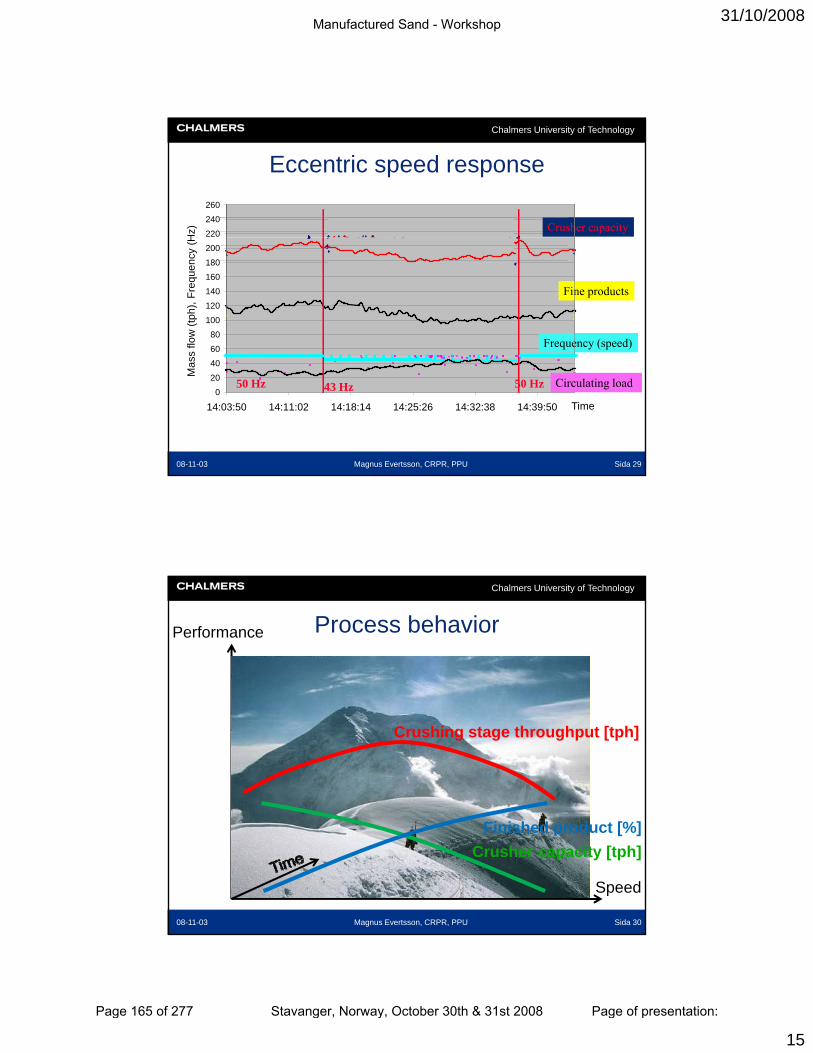
31/10/2008
15
Chalmers University of Technology
Eccentric speed response
220240260
z)
Crusher capacity
Hz)
6080
100120140160180200
ssflö
de (t
ph),
Frek
vens
(Hz
Fine products
Frequency (speed)
s flo
w (t
ph),
Freq
uenc
y (H
Sida 29Magnus Evertsson, CRPR, PPU08-11-03
02040
14:03:50 14:11:02 14:18:14 14:25:26 14:32:38 14:39:50 Tid
mas
Circulating load50 Hz 43 Hz 50 Hz
Time
Mas
Chalmers University of Technology
Process behaviorPerformance
Crushing stage throughput [tph]
Sida 30Magnus Evertsson, CRPR, PPU08-11-03
Speed
Crusher capacity [tph]Finished product [%]
Manufactured Sand - Workshop
Page 165 of 277 Stavanger, Norway, October 30th & 31st 2008 Page of presentation:
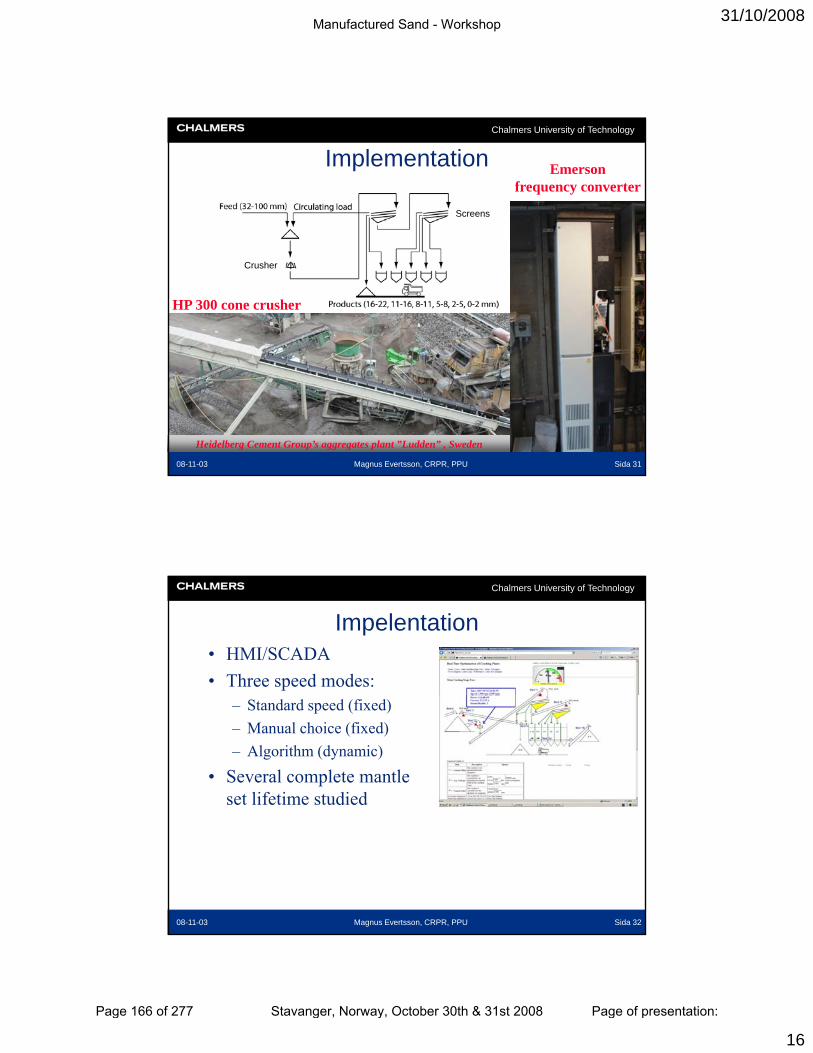
31/10/2008
16
Chalmers University of Technology
Emersonfrequency converter
Implementation
Screens
HP 300 cone crusher
Crusher
Sida 31Magnus Evertsson, CRPR, PPU08-11-03
Heidelberg Cement Group’s aggregates plant ”Ludden” , Sweden
Chalmers University of Technology
Impelentation• HMI/SCADA• Three speed modes:
– Standard speed (fixed)– Manual choice (fixed)– Algorithm (dynamic)
• Several complete mantle set lifetime studied
Sida 32Magnus Evertsson, CRPR, PPU08-11-03
Manufactured Sand - Workshop
Page 166 of 277 Stavanger, Norway, October 30th & 31st 2008 Page of presentation:
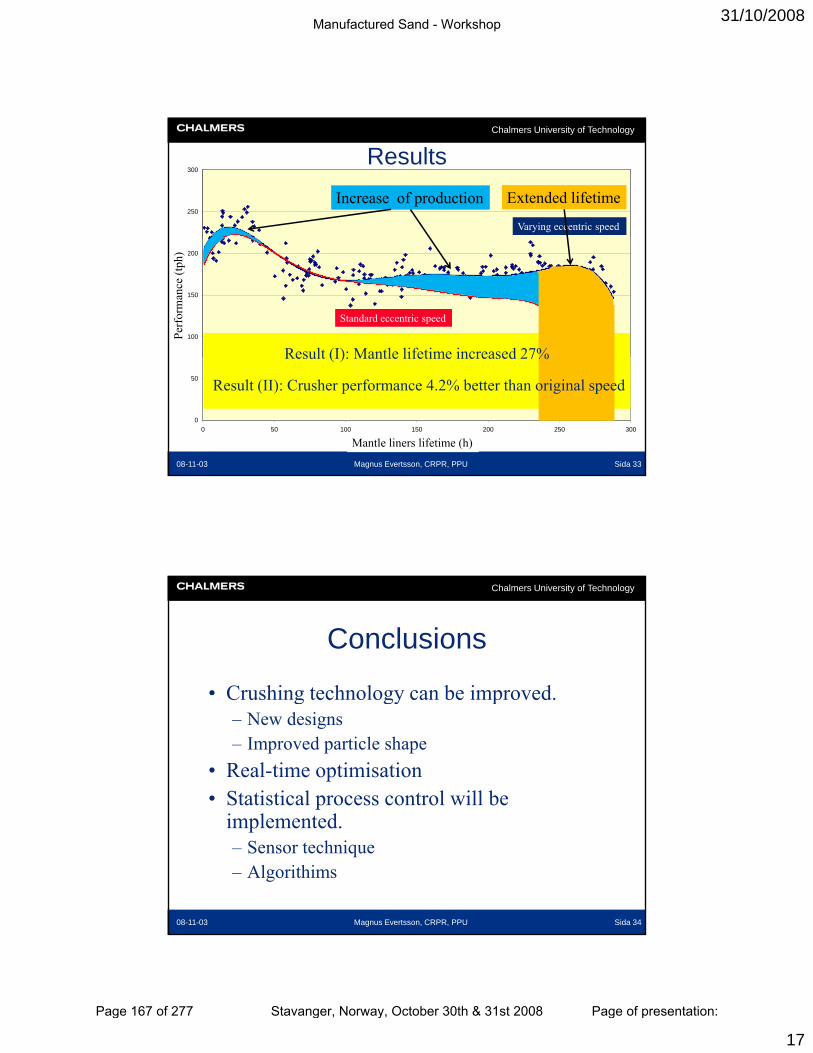
31/10/2008
17
Chalmers University of Technology
250
300Results
Varying eccentric speed
Increase of production Extended lifetime
100
150
200
Pres
tand
a (tp
h)Pe
rfor
man
ce (t
ph)
Standard eccentric speed
Result (I): Mantle lifetime increased 27%
Sida 33Magnus Evertsson, CRPR, PPU08-11-03
0
50
0 50 100 150 200 250 300
Mantellivslängd (h)Mantle liners lifetime (h)
Result (I): Mantle lifetime increased 27%
Result (II): Crusher performance 4.2% better than original speed
Chalmers University of Technology
Conclusions
• Crushing technology can be improvedCrushing technology can be improved.– New designs– Improved particle shape
• Real-time optimisation• Statistical process control will be
i l d
Sida 34Magnus Evertsson, CRPR, PPU08-11-03
implemented.– Sensor technique – Algorithims
Manufactured Sand - Workshop
Page 167 of 277 Stavanger, Norway, October 30th & 31st 2008 Page of presentation:

Manufactured Sand - Workshop
Page 168 of 277 Stavanger, Norway, October 30th & 31st 2008 Page of presentation:
31/10/2008
1
A li i t d f t d d i tA preliminary study on manufactured sand in concrete
- Effect of grading and fines content
COIN workshop on manufactured sand in Stavanger, October 2008
Bård PedersenNorStone AS
Case: NorStone Tau hard rock quarry
Slide 2 - 31.10.2008
Manufactured Sand - Workshop
Page 169 of 277 Stavanger, Norway, October 30th & 31st 2008 Page of presentation:
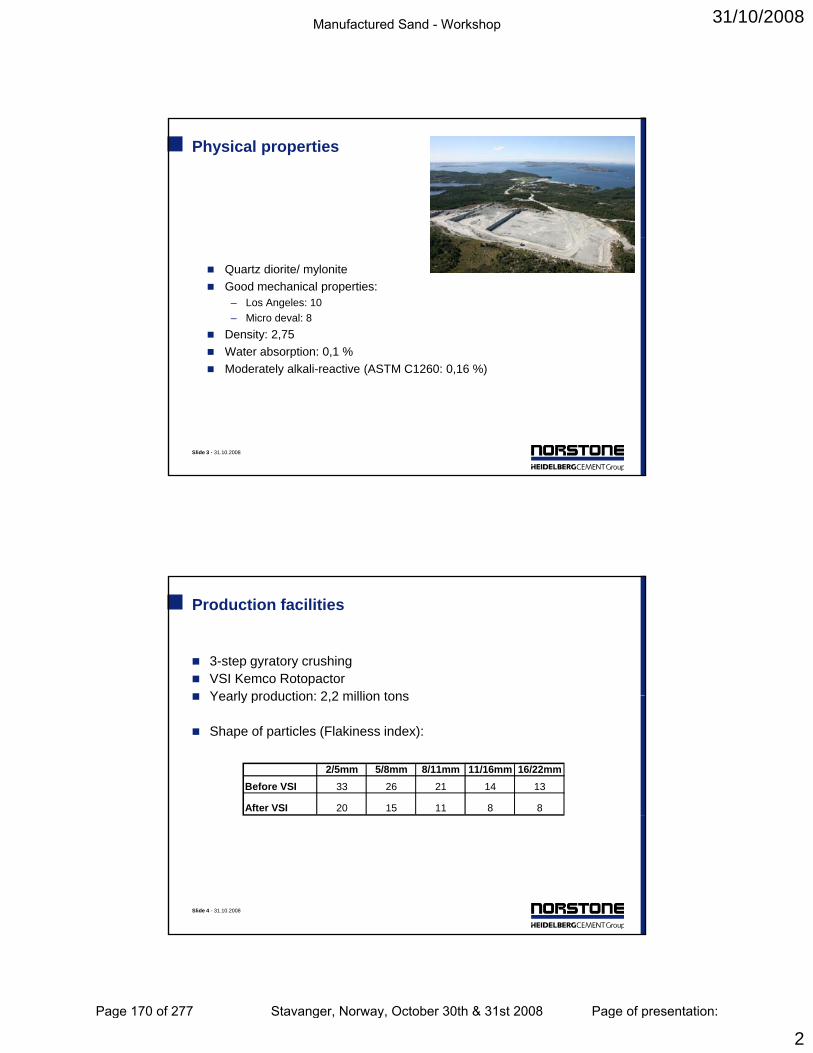
31/10/2008
2
Physical properties
Quartz diorite/ myloniteGood mechanical properties:
– Los Angeles: 10– Micro deval: 8
Density: 2,75 Water absorption: 0,1 %
Slide 3 - 31.10.2008
p ,Moderately alkali-reactive (ASTM C1260: 0,16 %)
Production facilities
3-step gyratory crushingVSI Kemco RotopactorYearly production: 2 2 million tonsYearly production: 2,2 million tons
Shape of particles (Flakiness index):
2/5mm 5/8mm 8/11mm 11/16mm 16/22mmBefore VSI 33 26 21 14 13
After VSI 20 15 11 8 8
Slide 4 - 31.10.2008
Manufactured Sand - Workshop
Page 170 of 277 Stavanger, Norway, October 30th & 31st 2008 Page of presentation:
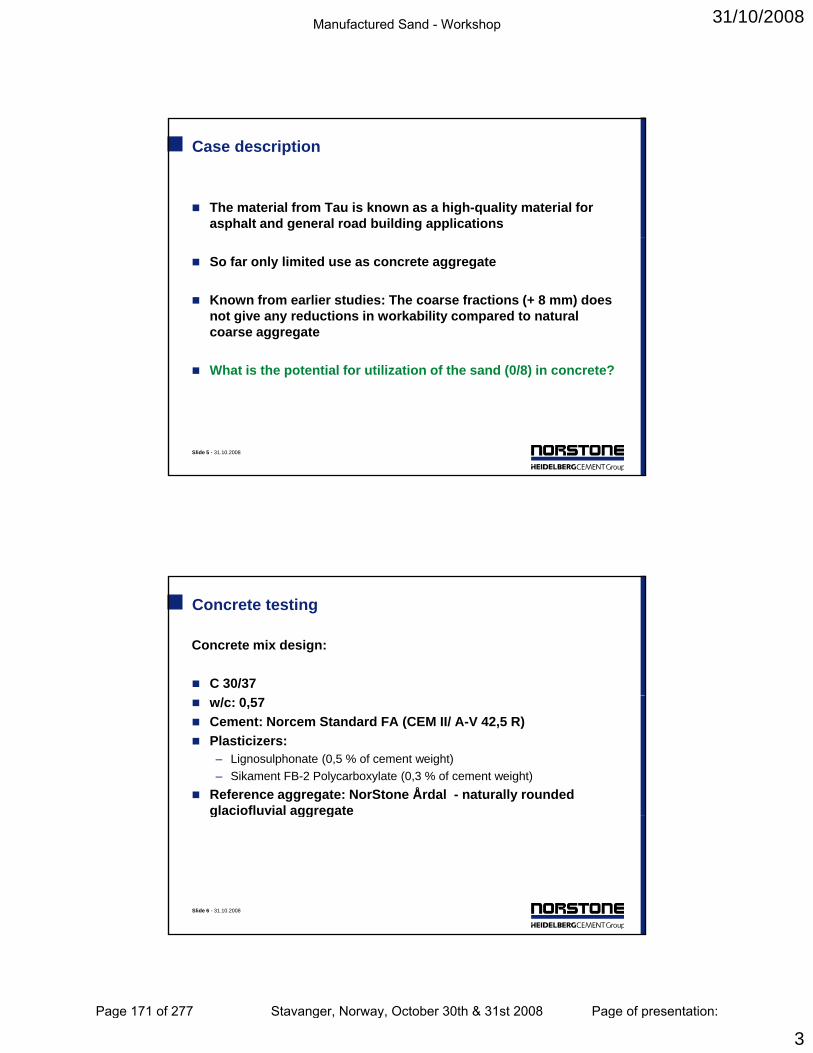
31/10/2008
3
Case description
The material from Tau is known as a high-quality material for asphalt and general road building applications
So far only limited use as concrete aggregate
Known from earlier studies: The coarse fractions (+ 8 mm) does not give any reductions in workability compared to natural coarse aggregate
Slide 5 - 31.10.2008
What is the potential for utilization of the sand (0/8) in concrete?
Concrete testing
Concrete mix design:
C 30/37w/c: 0,57Cement: Norcem Standard FA (CEM II/ A-V 42,5 R)Plasticizers: – Lignosulphonate (0,5 % of cement weight)– Sikament FB-2 Polycarboxylate (0,3 % of cement weight)
Reference aggregate: NorStone Årdal - naturally rounded glaciofluvial aggregate
Slide 6 - 31.10.2008
g gg g
Manufactured Sand - Workshop
Page 171 of 277 Stavanger, Norway, October 30th & 31st 2008 Page of presentation:
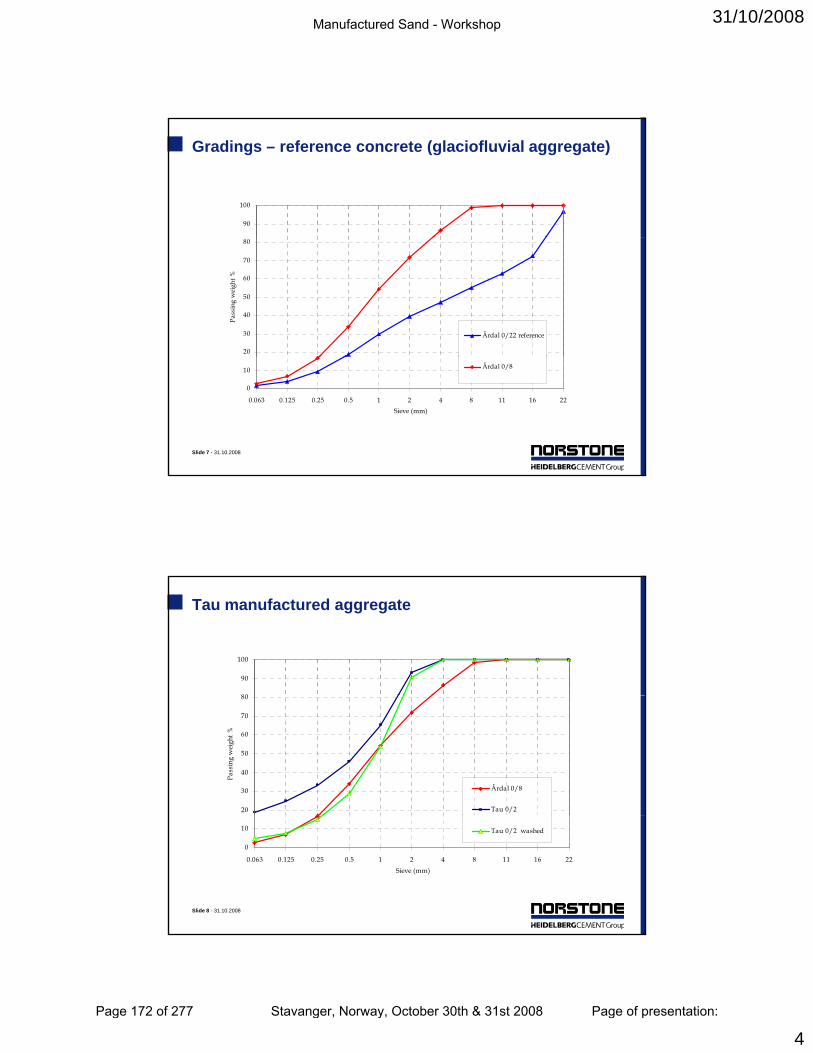
31/10/2008
4
Gradings – reference concrete (glaciofluvial aggregate)
90
100
20
30
40
50
60
70
80Pa
ssin
g w
eigh
t %
Årdal 0/22 reference
Slide 7 - 31.10.2008
0
10
22161184210.50.250.1250.063Sieve (mm)
Årdal 0/8
Tau manufactured aggregate
80
90
100
20
30
40
50
60
70
80
Pass
ing
wei
ght %
Årdal 0/8
Tau 0/2
Slide 8 - 31.10.2008
0
10
22161184210.50.250.1250.063Sieve (mm)
Tau 0/2 washed
Manufactured Sand - Workshop
Page 172 of 277 Stavanger, Norway, October 30th & 31st 2008 Page of presentation:
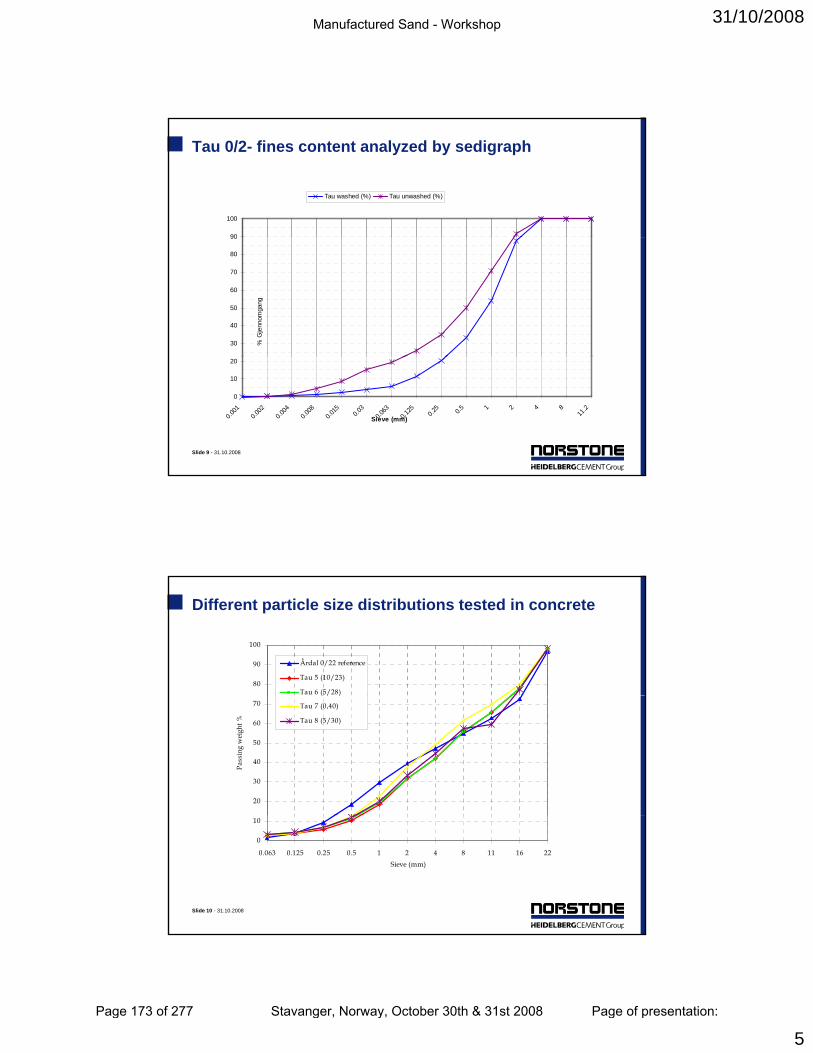
31/10/2008
5
Tau 0/2- fines content analyzed by sedigraph
90
100
Tau washed (%) Tau unwashed (%)
30
40
50
60
70
80
90
% G
jenn
omga
ng
Slide 9 - 31.10.2008
0
10
20
11.284210.50.2
50.1
250.0
630.03
0.015
0.008
0.004
0.002
0.001
Sieve (mm)
Different particle size distributions tested in concrete
80
90
100
Årdal 0/22 reference
Tau 5 (10/23)
Tau 6 (5/28)
20
30
40
50
60
70
Pass
ing
wei
ght %
( / )
Tau 7 (0,40)
Tau 8 (5/30)
Slide 10 - 31.10.2008
0
10
22161184210.50.250.1250.063Sieve (mm)
Manufactured Sand - Workshop
Page 173 of 277 Stavanger, Norway, October 30th & 31st 2008 Page of presentation:
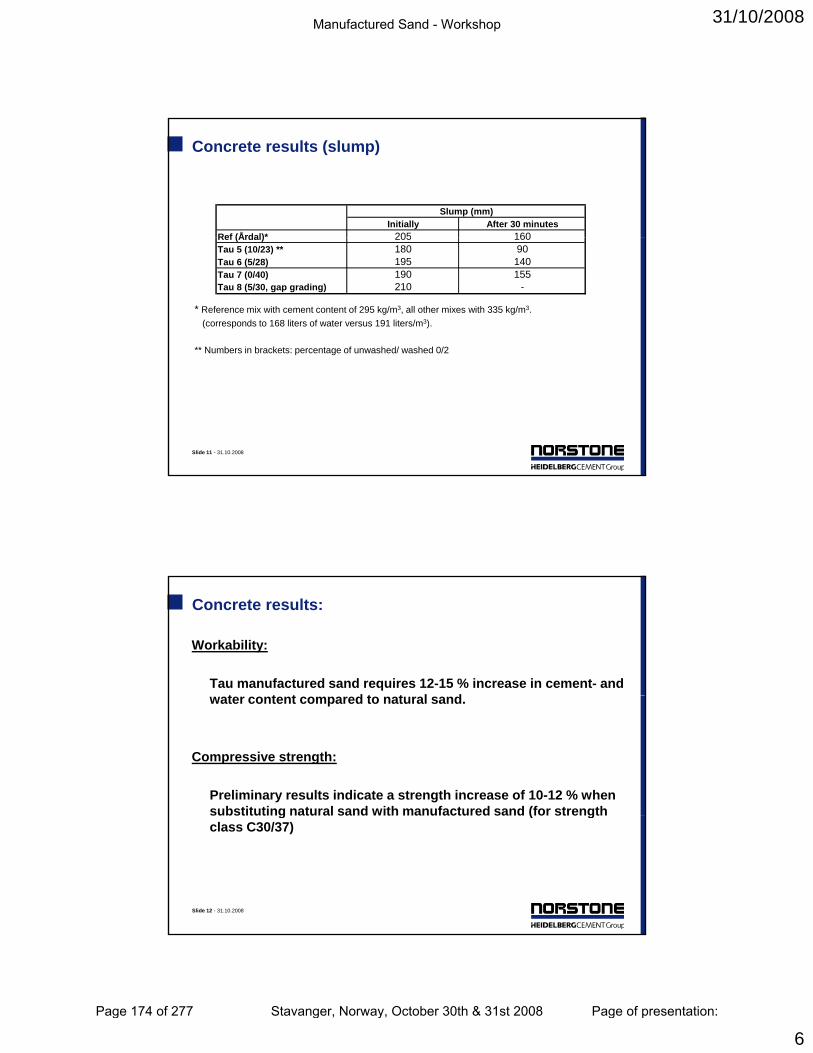
31/10/2008
6
Concrete results (slump)
Initially After 30 minutesRef (Årdal)* 205 160
Slump (mm)
* Reference mix with cement content of 295 kg/m3, all other mixes with 335 kg/m3. (corresponds to 168 liters of water versus 191 liters/m3).
** Numbers in brackets: percentage of unwashed/ washed 0/2
Ref (Årdal) 205 160Tau 5 (10/23) ** 180 90Tau 6 (5/28) 195 140Tau 7 (0/40) 190 155Tau 8 (5/30, gap grading) 210 -
Slide 11 - 31.10.2008
Concrete results:
Workability:
Tau manufactured sand requires 12-15 % increase in cement- and t t t d t t l dwater content compared to natural sand.
Compressive strength:
Preliminary results indicate a strength increase of 10-12 % when substituting natural sand with manufactured sand (for strength
Slide 12 - 31.10.2008
substituting natural sand with manufactured sand (for strength class C30/37)
Manufactured Sand - Workshop
Page 174 of 277 Stavanger, Norway, October 30th & 31st 2008 Page of presentation:

31/10/2008
7
Conclusions and need for further work
The potential to develop a manufactured sand suitable for concrete is obvious
One challenge is to establish a classification process, either wet or dry which gives suitable and stable products
The ASR has to be dealt with separately
Slide 13 - 31.10.2008
Manufactured Sand - Workshop
Page 175 of 277 Stavanger, Norway, October 30th & 31st 2008 Page of presentation:

Manufactured Sand - Workshop
Page 176 of 277 Stavanger, Norway, October 30th & 31st 2008 Page of presentation:

31/10/2008
1
Comparison of rheological
Grace Performance Chemicals
p gand mechanical properties of mortars prepared with manufactured and natural fine aggregates
Manufactured sand – workshop
Stavanger, October 31st
Aggregate ClassificationSand and Gravel Crushed Stone
Fine: natural sandCoarse: gravel
Fine: manufactured sandCoarse: crushed stone
Unconsolidated sedimentary materials transported by water ice or wind
Blasted from hard rock deposits, then crushed screened and washed
2 Manufactured Sand Workshop - Stavanger, October '08
transported by water, ice, or wind
Dug or dredged from deposits (glacial, river, lake, marine), then screened and washed (sized)
May be crushed to reduce size
Generally smooth texture, rounded shape (increased workability, reduced strength)
crushed, screened, and washed
Crushing creates large quantities of fines up to 20 – 30% of <75 µm (smaller size = lower value)
Generally rough texture, angular shape (reduced workability, increased strength)
Manufactured Sand - Workshop
Page 177 of 277 Stavanger, Norway, October 30th & 31st 2008 Page of presentation:
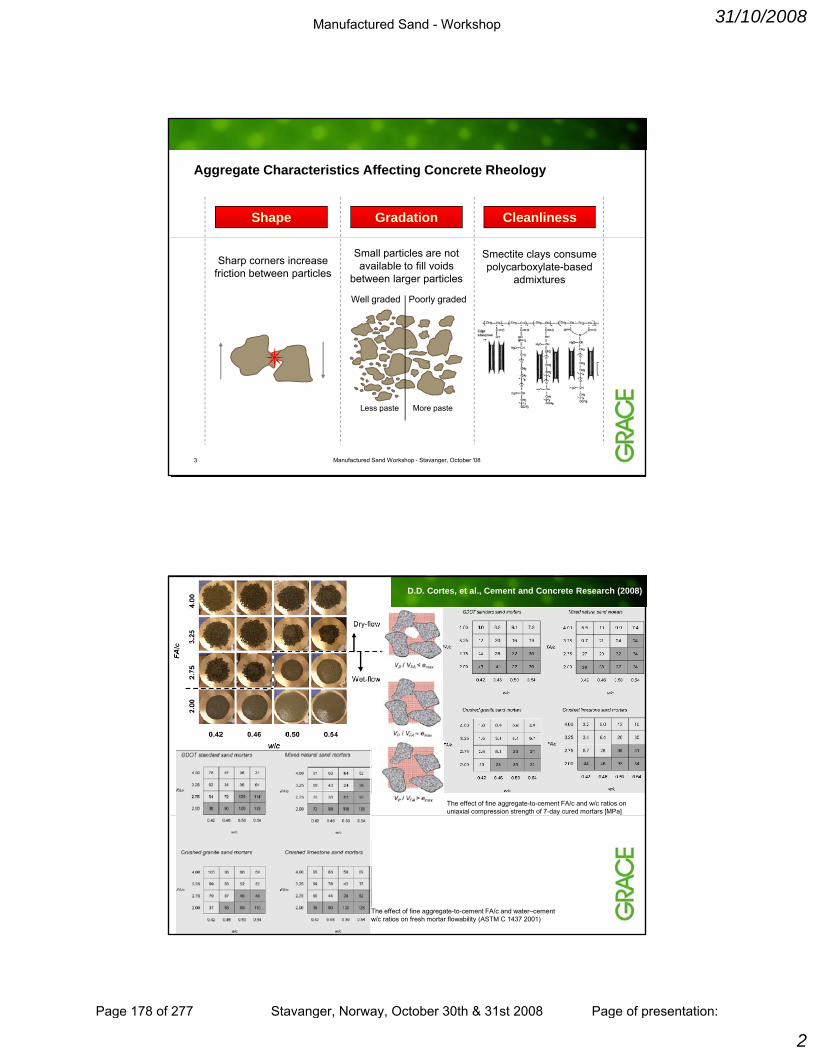
31/10/2008
2
Aggregate Characteristics Affecting Concrete Rheology
Shape Gradation Cleanliness
Sharp corners increase friction between particles
Small particles are not available to fill voids
between larger particles
Smectite clays consume polycarboxylate-based
admixtures
Well graded Poorly graded
3 Manufactured Sand Workshop - Stavanger, October '08
Less paste More paste
D.D. Cortes, et al., Cement and Concrete Research (2008)
The effect of fine aggregate-to-cement FA/c and w/c ratios on uniaxial compression strength of 7-day cured mortars [MPa]
4 Manufactured Sand Workshop - Stavanger, October '08The effect of fine aggregate-to-cement FA/c and water–cement w/c ratios on fresh mortar flowability (ASTM C 1437 2001)
Manufactured Sand - Workshop
Page 178 of 277 Stavanger, Norway, October 30th & 31st 2008 Page of presentation:
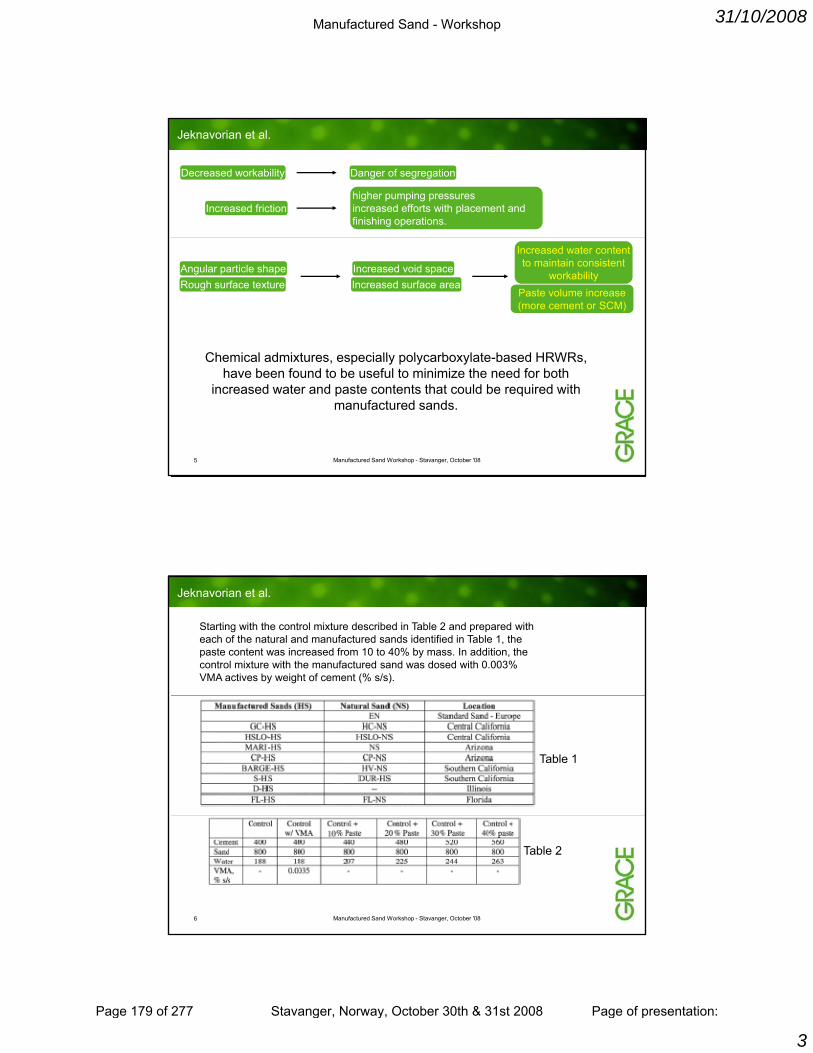
31/10/2008
3
Decreased workability
Increased friction
Danger of segregation
higher pumping pressuresincreased efforts with placement and finishing operations.
Jeknavorian et al.
Rough surface textureAngular particle shape
Increased surface areaIncreased void space
Increased water content to maintain consistent
workability
Chemical admixtures especially polycarboxylate based HRWRs
Paste volume increase (more cement or SCM)
5 Manufactured Sand Workshop - Stavanger, October '08
Chemical admixtures, especially polycarboxylate-based HRWRs, have been found to be useful to minimize the need for both
increased water and paste contents that could be required with manufactured sands.
Jeknavorian et al.
Starting with the control mixture described in Table 2 and prepared with each of the natural and manufactured sands identified in Table 1, the paste content was increased from 10 to 40% by mass. In addition, the control mixture with the manufactured sand was dosed with 0.003% VMA actives by weight of cement (% s/s).
Table 1
6 Manufactured Sand Workshop - Stavanger, October '08
Table 2
Manufactured Sand - Workshop
Page 179 of 277 Stavanger, Norway, October 30th & 31st 2008 Page of presentation:
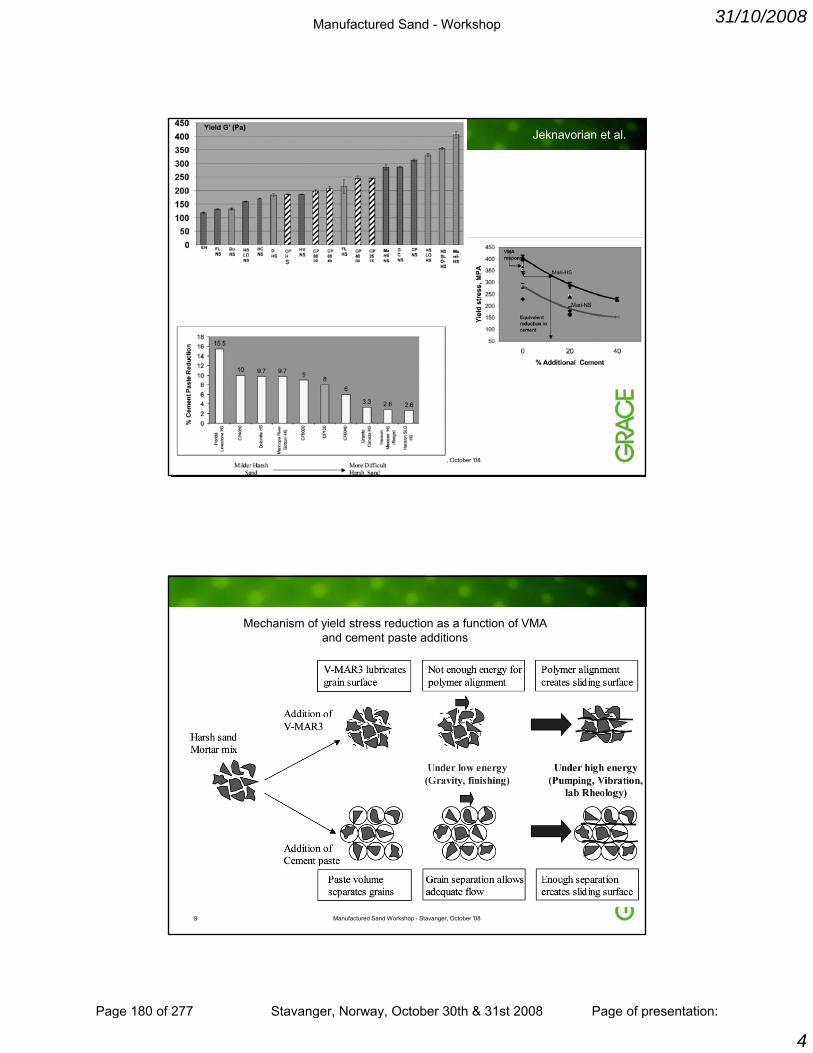
31/10/2008
4
Jeknavorian et al.
7 Manufactured Sand Workshop - Stavanger, October '08
Mechanism of yield stress reduction as a function of VMA and cement paste additions
8 Manufactured Sand Workshop - Stavanger, October '08
Manufactured Sand - Workshop
Page 180 of 277 Stavanger, Norway, October 30th & 31st 2008 Page of presentation:

31/10/2008
5
What is Clay?
Size Definition (e.g. AASHTO, USDA, USCS)*• Gravel: >2 mm• Sand: 75 μm to 2 mm• Silt: <75 μm
For concrete,we care about
i lSilt: 75 μm• Clay: <2 μm
*Each organization uses slightly different sizes to distinguish categories.
Mineralogy (Composition) DefinitionHydrous aluminum-phyllosilicates with certainlayered structures (tetrahedral and octahedralsheets and exchangeable cations) and exhibitingplasticity in presence of water• Kaolinite
mineralogy.Clay (particularly smectite)can be very detrimental toconcrete and asphalt. Non-clay fines may be beneficial
for concrete. Becauseaggregate processing is
based on size separation,most microfines are often
removed even if they do not
Often flocculated (appear as larger sizes)
9 Manufactured Sand Workshop - Stavanger, October '08
• Montmorillonite/Smectite• Illite• Chlorite
removed even if they do not contain clay.
Clay in Aggregates
The <75 µm fraction of an aggregate is composed of a variety of minerals, including both CLAY and NON-CLAY minerals.
Although particles are of similar SIZE, different mineralogy results in different CONCRETE PERFORMANCE.
Clay Minerals Non-Clay MineralsConsume and retain significant quantities of water and HRWR =reduced workability, reduced strength, increased shrinkage
Do not absorb appreciable quantities of water or HRWR, may enhance overall gradation = improved workability*
Examples*: smectite/montmorillonite, kaolinite illite chlorite
Examples: quartz, feldspar, calcite, dolomite mica
10 Manufactured Sand Workshop - Stavanger, October '08
kaolinite, illite, chlorite dolomite, mica
<75 μm = clayDo not assume that all material finer than a certain size is clay. Size and shape alone do not fully determine performance.
*smectite most severe, chlorite not always classified as clay. *depends on mixture proportions.
Manufactured Sand - Workshop
Page 181 of 277 Stavanger, Norway, October 30th & 31st 2008 Page of presentation:
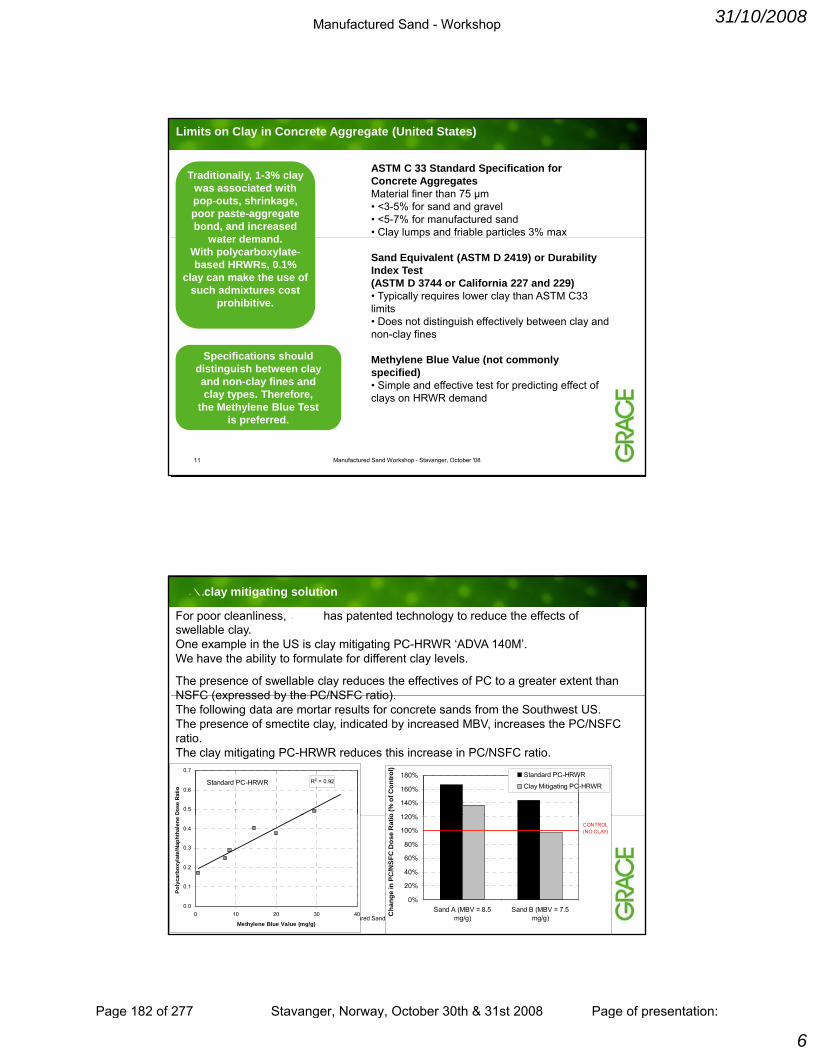
31/10/2008
6
ASTM C 33 Standard Specification for Concrete AggregatesMaterial finer than 75 μm• <3-5% for sand and gravel• <5-7% for manufactured sand• Clay lumps and friable particles 3% max
Traditionally, 1-3% claywas associated withpop-outs, shrinkage,poor paste-aggregatebond, and increased
water demand
Limits on Clay in Concrete Aggregate (United States)
y p p
Sand Equivalent (ASTM D 2419) or Durability Index Test(ASTM D 3744 or California 227 and 229)• Typically requires lower clay than ASTM C33 limits• Does not distinguish effectively between clay and non-clay fines
M th l Bl V l ( t l
water demand.With polycarboxylate-based HRWRs, 0.1%
clay can make the use of such admixtures cost
prohibitive.
Specifications should
11 Manufactured Sand Workshop - Stavanger, October '08
Methylene Blue Value (not commonly specified)• Simple and effective test for predicting effect of clays on HRWR demand
Specifications shoulddistinguish between clayand non-clay fines andclay types. Therefore,
the Methylene Blue Testis preferred.
GRACE clay mitigating solution
For poor cleanliness, G���� has patented technology to reduce the effects of swellable clay.One example in the US is clay mitigating PC-HRWR ‘ADVA 140M’.We have the ability to formulate for different clay levels.
The presence of swellable clay reduces the effectives of PC to a greater extent than NSFC (expressed by the PC/NSFC ratio)NSFC (expressed by the PC/NSFC ratio).The following data are mortar results for concrete sands from the Southwest US.The presence of smectite clay, indicated by increased MBV, increases the PC/NSFC ratio.The clay mitigating PC-HRWR reduces this increase in PC/NSFC ratio.
R2 = 0.92
0.5
0.6
0.7
Dose
Rat
io
Standard PC-HRWR
120%
140%
160%
180%
o (%
of C
ontro
l)
Standard PC-HRWR
Clay Mitigating PC-HRWR
12 Manufactured Sand Workshop - Stavanger, October '08
0.0
0.1
0.2
0.3
0.4
0 10 20 30 40
Methylene Blue Value (mg/g)
Poly
carb
oxyl
ate/
Naph
thal
ene
0%
20%
40%
60%
80%
100%
120%
Sand A (MBV = 8.5mg/g)
Sand B (MBV = 7.5mg/g)C
hang
e in
PC
/NS
FC D
ose
Rat
io
CONTROL(NO CLAY)
Manufactured Sand - Workshop
Page 182 of 277 Stavanger, Norway, October 30th & 31st 2008 Page of presentation:
31710/2008
1
CASTING OF CONCRETE MADE BY CRUSHED AGREGATEBY CRUSHED AGREGATE
CONTIGA AB Contiga AB
R M i AS
1
Rescon Mapei ASSINTEF
Dan Arve Juvik, Rescon Mapei AS
2
International R&D- centreRescon Mapei AS - Sagstua, Nord-Odal
Manufactured Sand - Workshop
Page 183 of 277 Stavanger, Norway, October 30th & 31st 2008 Page of presentation:
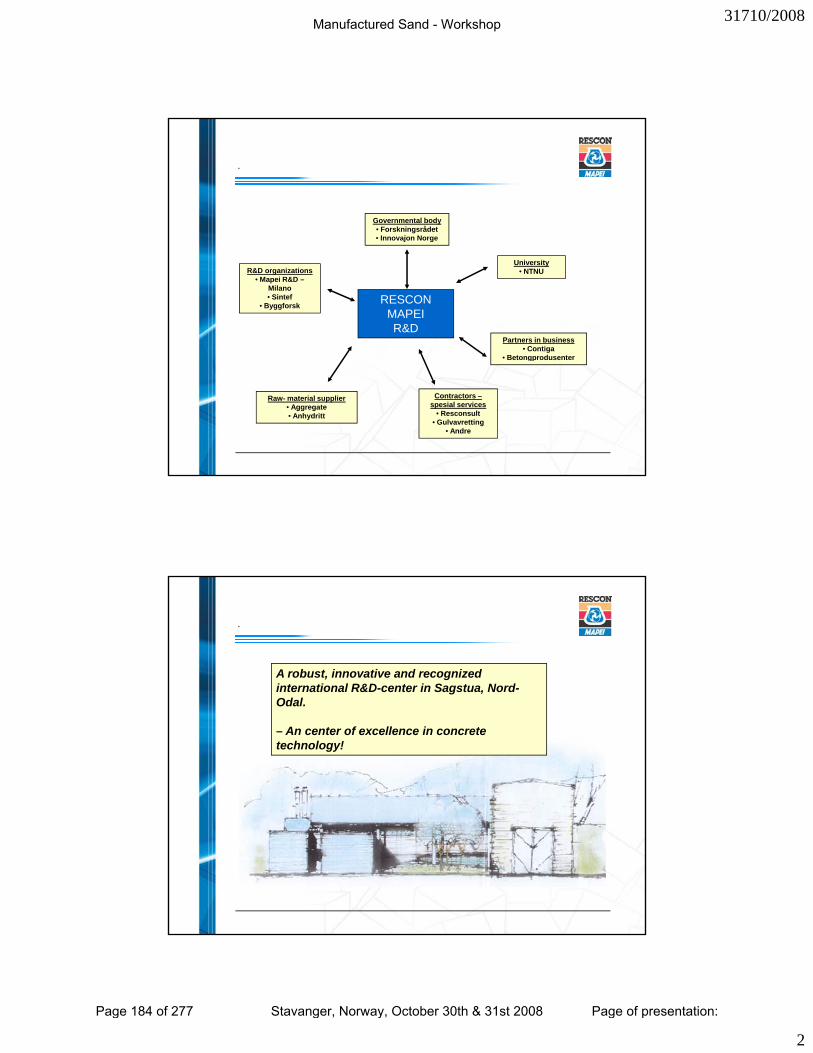
31710/2008
2
T��������� �������
Governmental body• Forskningsrådet• Innovajon Norge
RESCON MAPEIR&D
R&D organizations• Mapei R&D –
Milano• Sintef
• Byggforsk
University• NTNU
Partners in business• Contiga
• Betongprodusenter
• Innovajon Norge
3
• Betongprodusenter
Contractors –spesial services
• Resconsult• Gulvavretting
• Andre
Raw- material supplier• Aggregate• Anhydritt
V�����
A robust, innovative and recognized international R&D-center in Sagstua, Nord-Odal.
– An center of excellence in concrete technology!
4
Manufactured Sand - Workshop
Page 184 of 277 Stavanger, Norway, October 30th & 31st 2008 Page of presentation:
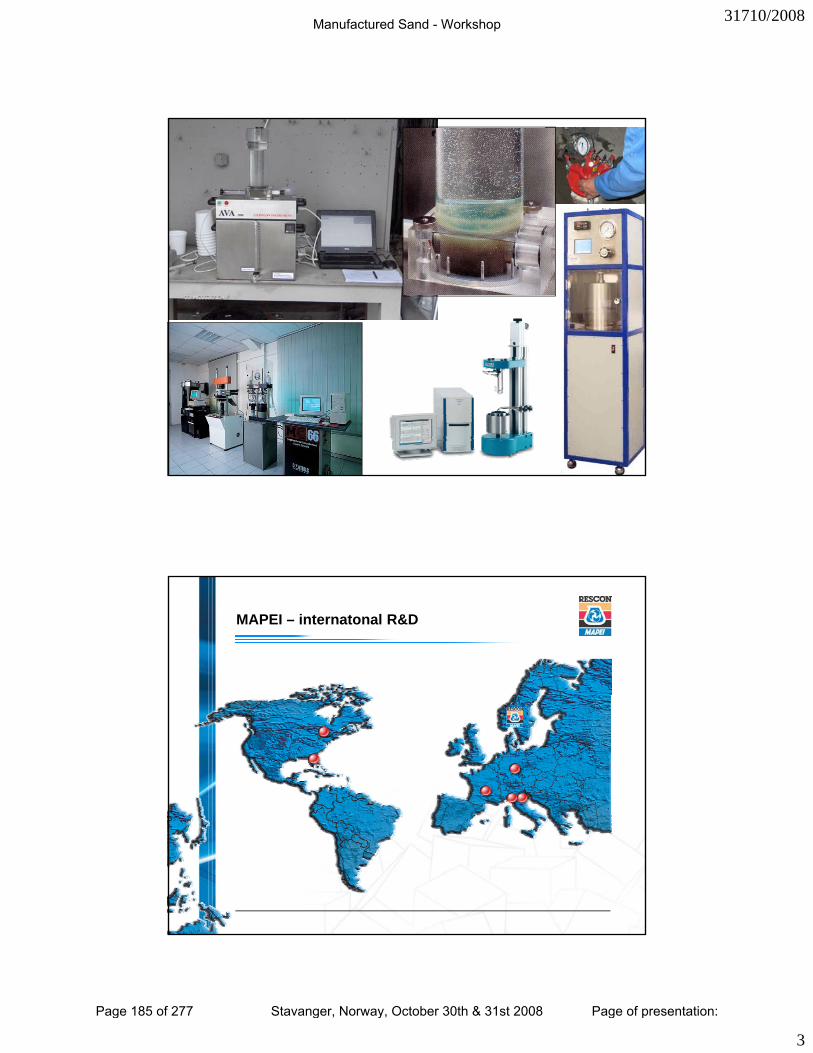
31710/2008
3
5
MAPEI – internatonal R&D
6
Manufactured Sand - Workshop
Page 185 of 277 Stavanger, Norway, October 30th & 31st 2008 Page of presentation:
31710/2008
4
The project
• Testing in laboratory and fulllaboratory, and full scale casting of wall element.
• Contiga AB, Norrtälje
i
7
• Contiga, Rescon Mapei AS, SINTEF
Sieve analysis
8
Manufactured Sand - Workshop
Page 186 of 277 Stavanger, Norway, October 30th & 31st 2008 Page of presentation:
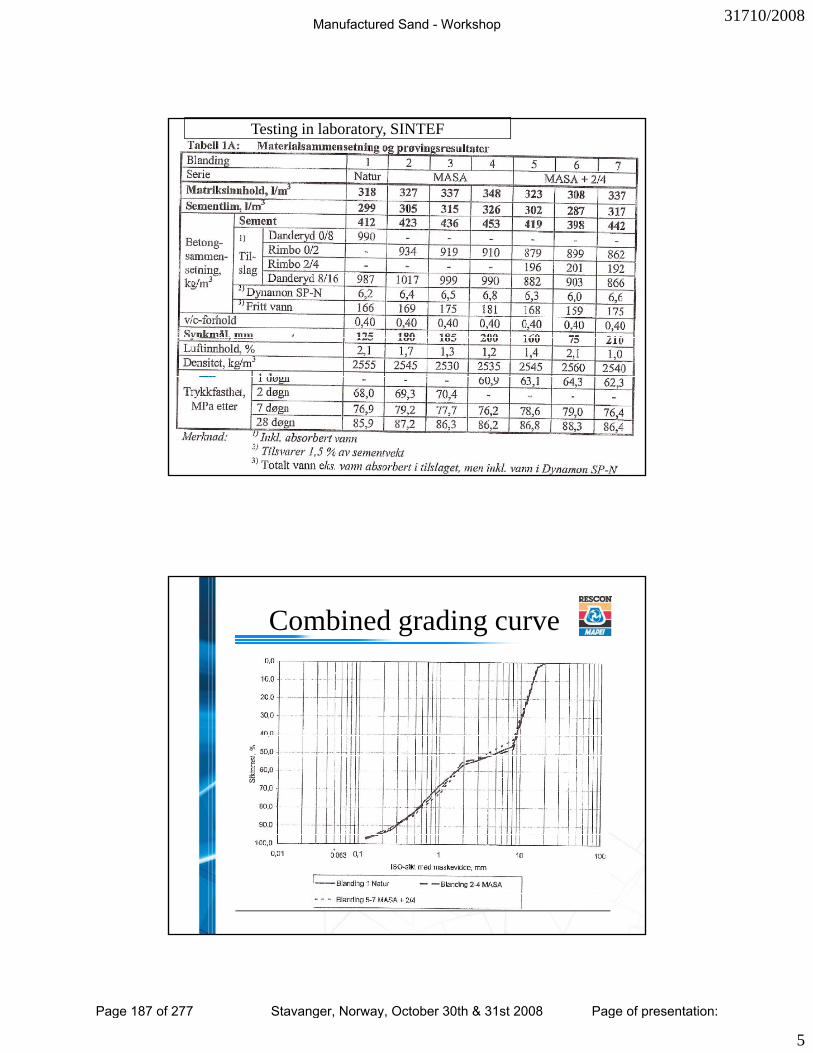
31710/2008
5
KornfordelingTesting in laboratory, SINTEF
9
Combined grading curve
10
Manufactured Sand - Workshop
Page 187 of 277 Stavanger, Norway, October 30th & 31st 2008 Page of presentation:

31710/2008
6
Slump
11Cement
KornfordelingDays Hours Compressive strength
12
Manufactured Sand - Workshop
Page 188 of 277 Stavanger, Norway, October 30th & 31st 2008 Page of presentation:
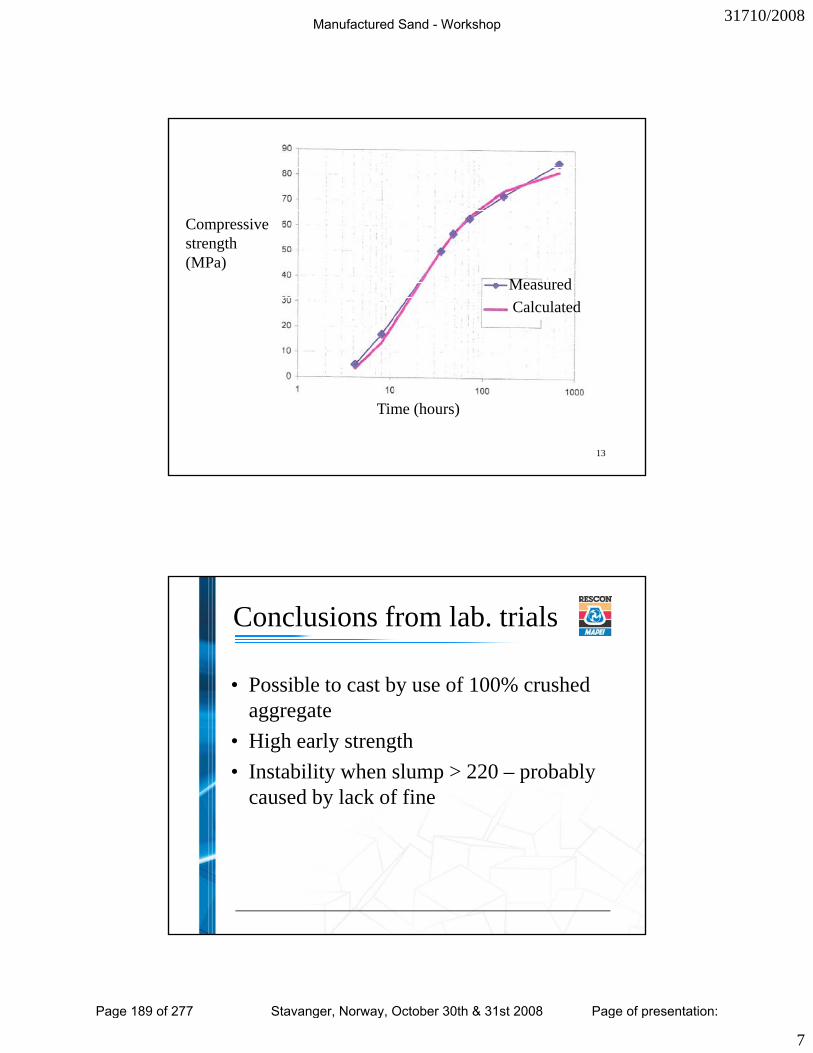
31710/2008
7
Compressive
MeasuredCalculated
strength (MPa)
13
Time (hours)
Conclusions from lab. trials
• Possible to cast by use of 100% crushed yaggregate
• High early strength• Instability when slump > 220 – probably
caused by lack of fine
14
Manufactured Sand - Workshop
Page 189 of 277 Stavanger, Norway, October 30th & 31st 2008 Page of presentation:
31710/2008
8
Full scale casting of concrete element
• Mix containing 100% crushed aggregate g gg g(mix nr. 3 from lab. Trials)
15
Testing of strength development
• Temperature was continuously logged in air and• Temperature was continuously logged in air, and in concrete element ( bottom, mid- and in top reinforcement).
• Temperature log vas used to calculate compressive strength
• 3 cylinders was drilled out to test the compressive
16
y pstrength after 5 (normal time for lifting) and 14 hour
Manufactured Sand - Workshop
Page 190 of 277 Stavanger, Norway, October 30th & 31st 2008 Page of presentation:
31710/2008
9
High early strenght!
• Strength after 5 ours 18 MPa and after 14 gours 50 MPa ! (correlating to the good result from laboratory tests made by SINTEF)
• The demand for compressive strength by lifting time is 16 MPa
17
lifting time is - 16 MPa
Casting
• Use of vibration in casting (table)• The concrete flow and the responding on vibration
vas different from the normal – but still OK• The slump retention vas tested by pouring
concrete in 4 buckets and test the slum after 5, 10, 15 and 20 minutes – the slump retention was OK
18
• The surface of the element was as normal
Manufactured Sand - Workshop
Page 191 of 277 Stavanger, Norway, October 30th & 31st 2008 Page of presentation:
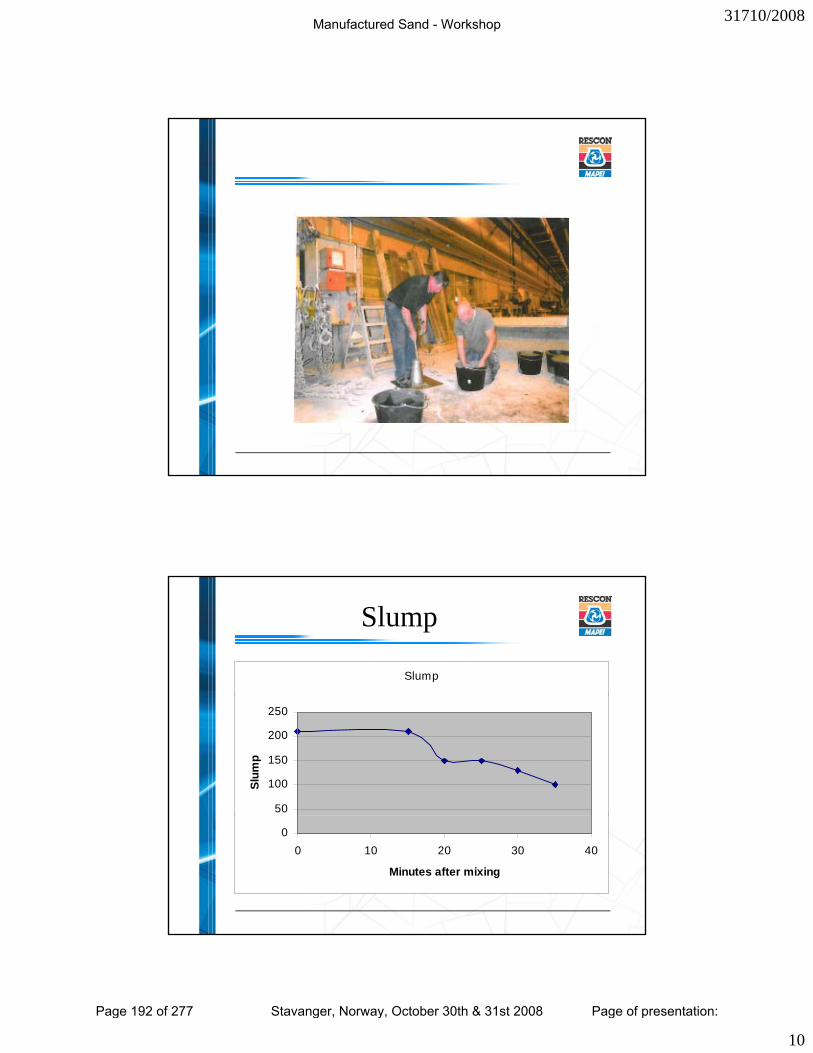
31710/2008
10
19
Slump
Slump
50
100
150
200
250
Slum
p
20
00 10 20 30 40
Minutes after mixing
Manufactured Sand - Workshop
Page 192 of 277 Stavanger, Norway, October 30th & 31st 2008 Page of presentation:
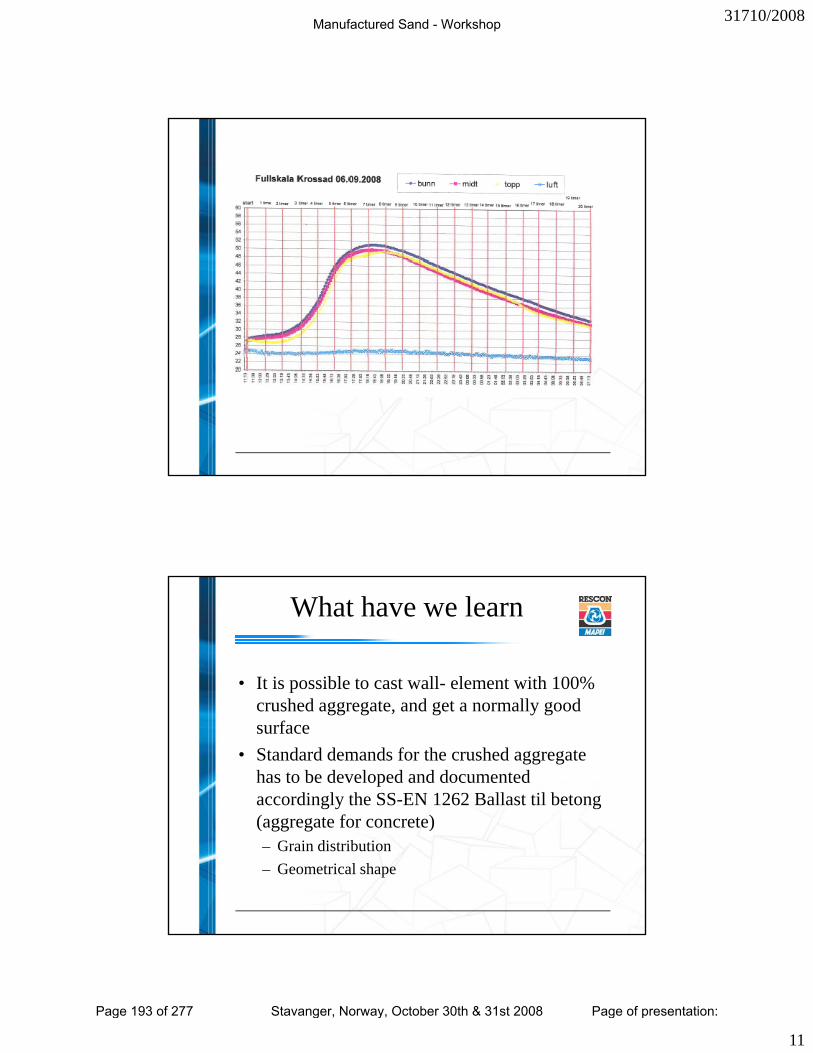
31710/2008
11
21
What have we learn
• It is possible to cast wall- element with 100% crushed aggregate, and get a normally good surface
• Standard demands for the crushed aggregate has to be developed and documented accordingly the SS-EN 1262 Ballast til betong ( f )
22
(aggregate for concrete)– Grain distribution– Geometrical shape
Manufactured Sand - Workshop
Page 193 of 277 Stavanger, Norway, October 30th & 31st 2008 Page of presentation:
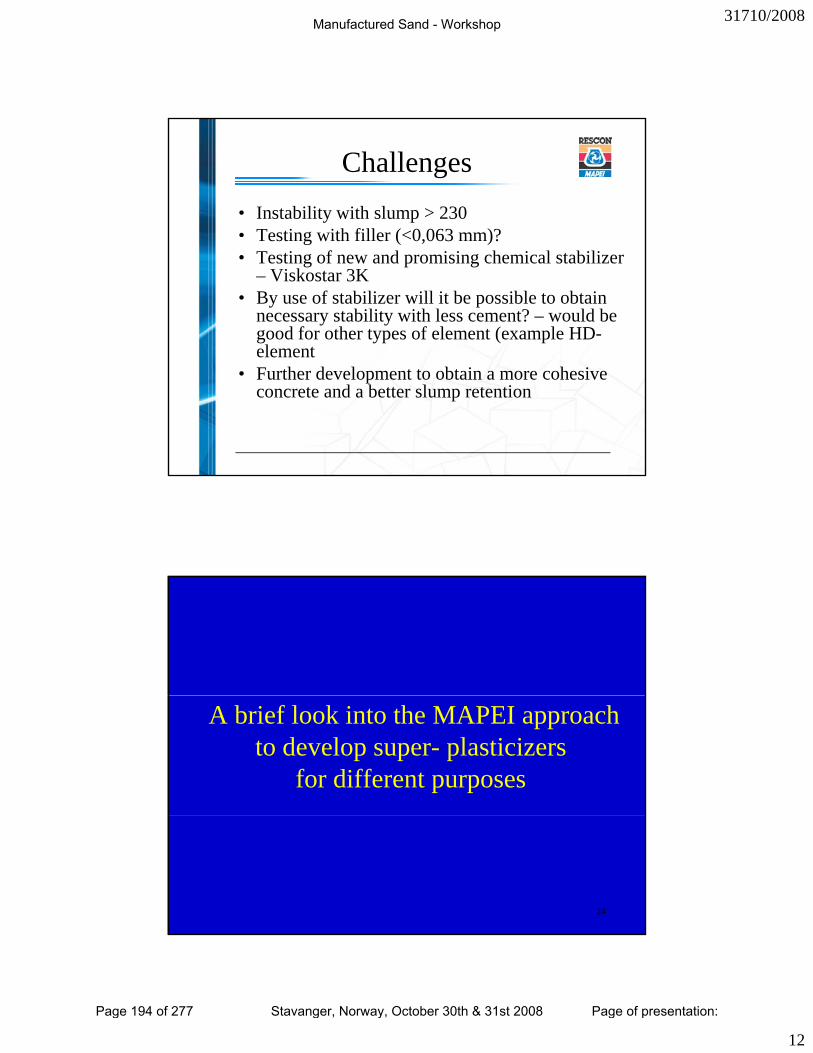
31710/2008
12
• Instability with slump > 230• Testing with filler (<0 063 mm)?
Challenges
Testing with filler (<0,063 mm)?• Testing of new and promising chemical stabilizer
– Viskostar 3K• By use of stabilizer will it be possible to obtain
necessary stability with less cement? – would be good for other types of element (example HD-element
23
element• Further development to obtain a more cohesive
concrete and a better slump retention
A brief look into the MAPEI approach to develop super- plasticizers
for different purposes
24
Manufactured Sand - Workshop
Page 194 of 277 Stavanger, Norway, October 30th & 31st 2008 Page of presentation:
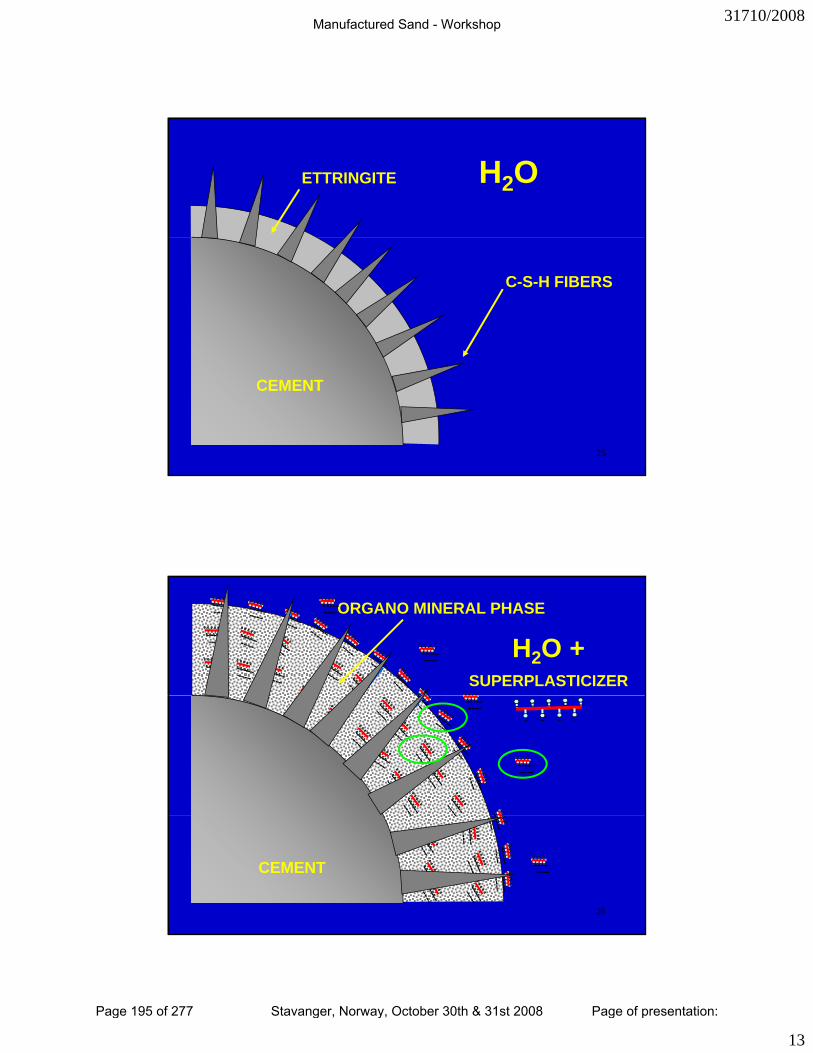
31710/2008
13
ETTRINGITE H2O
C-S-H FIBERS
25
CEMENT
ORGANO MINERAL PHASE
H2O +SUPERPLASTICIZER
26
CEMENT
Manufactured Sand - Workshop
Page 195 of 277 Stavanger, Norway, October 30th & 31st 2008 Page of presentation:
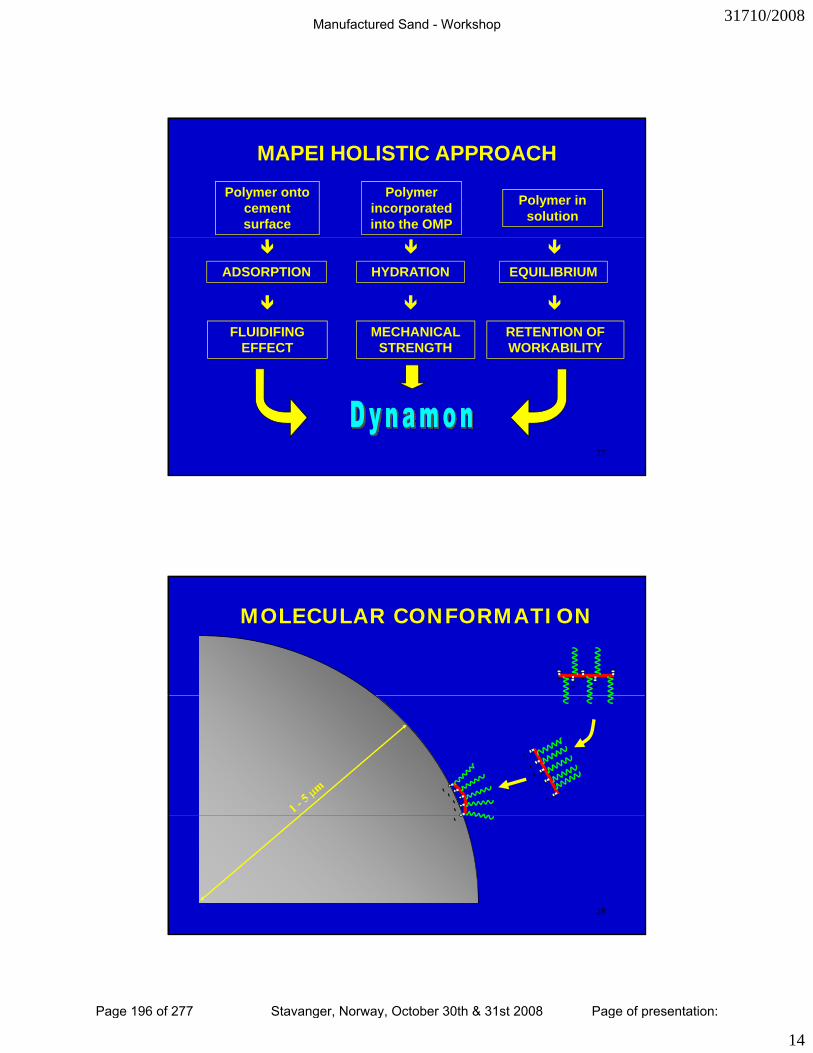
31710/2008
14
MAPEI HOLISTIC APPROACHPolymer onto
cement surface
Polymer incorporated into the OMP
Polymer in solution
ADSORPTION HYDRATION
FLUIDIFING EFFECT
MECHANICAL STRENGTH
EQUILIBRIUM
RETENTION OF WORKABILITY
27
MOLECULAR CONFORMATION
--
- --
28
Manufactured Sand - Workshop
Page 196 of 277 Stavanger, Norway, October 30th & 31st 2008 Page of presentation:
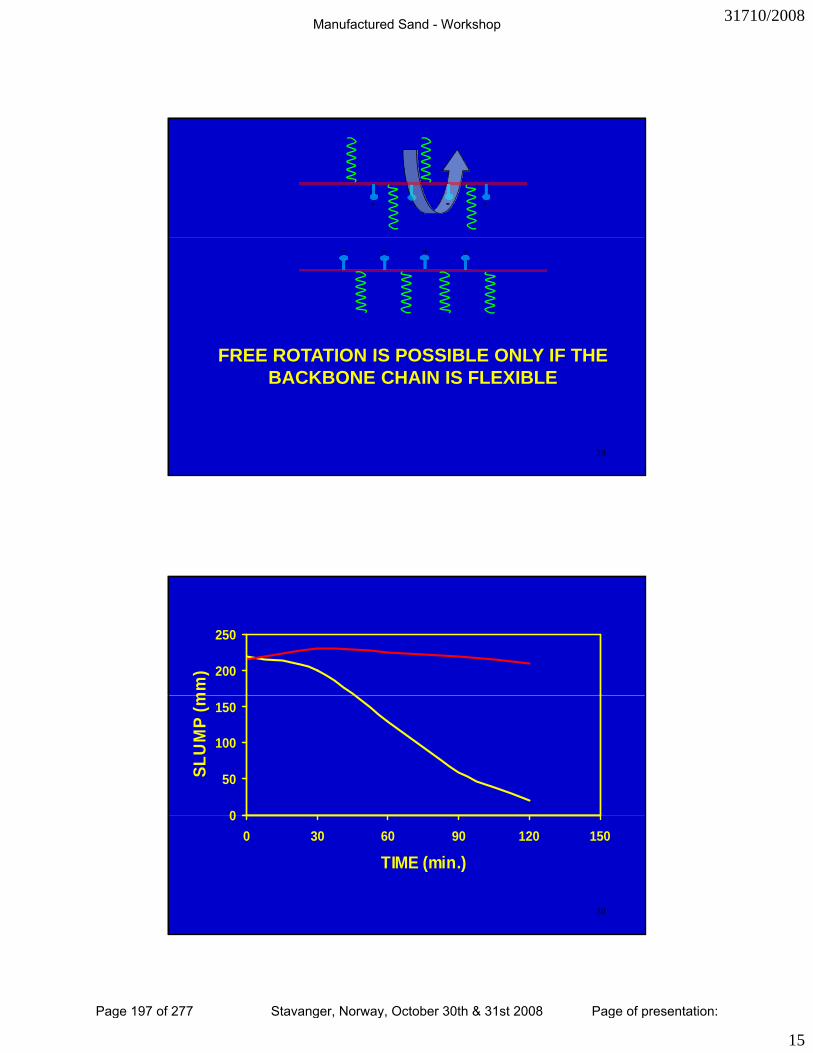
31710/2008
15
-- - -
FREE ROTATION IS POSSIBLE ONLY IF THE
29
FREE ROTATION IS POSSIBLE ONLY IF THE BACKBONE CHAIN IS FLEXIBLE
200
250
mm
)
0
50
100
150
SLU
MP
(m
30
00 30 60 90 120 150
TIME (min.)
Manufactured Sand - Workshop
Page 197 of 277 Stavanger, Norway, October 30th & 31st 2008 Page of presentation:
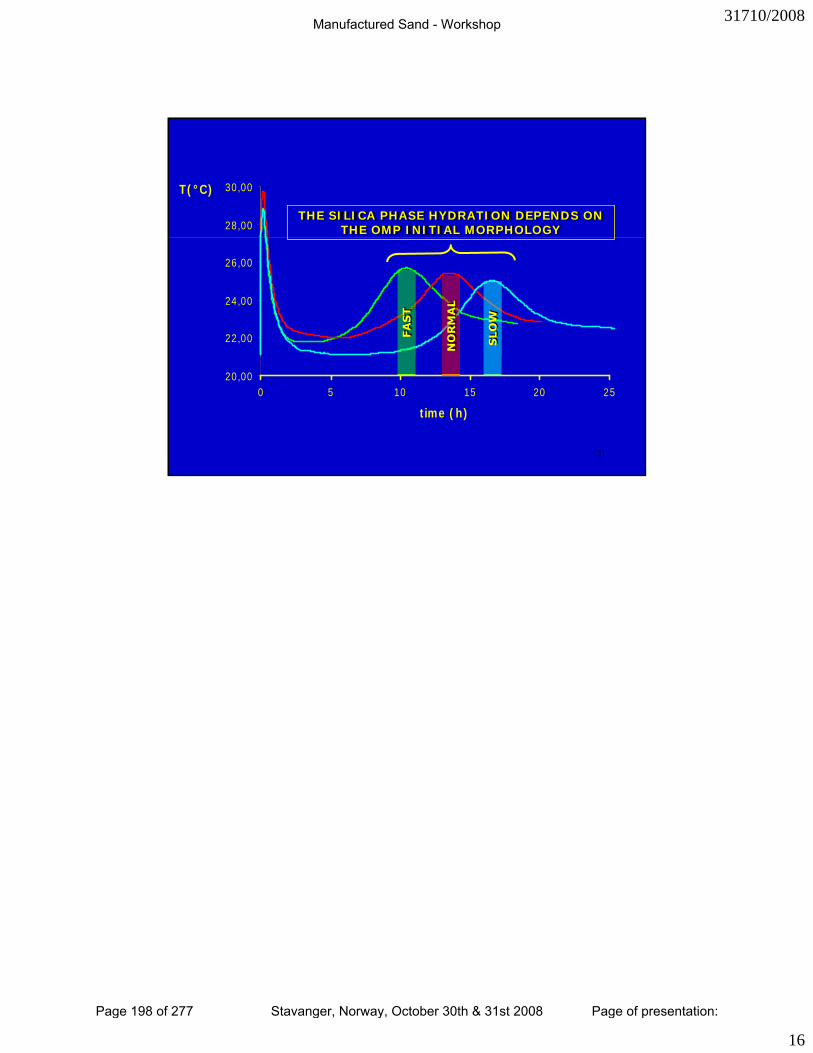
31710/2008
16
28,00
30,00T(°C)
THE SILICA PHASE HYDRATION DEPENDS ON THE OMP INITIAL MORPHOLOGY
22,00
24,00
26,00
31
20,000 5 10 15 20 25
time (h)
Manufactured Sand - Workshop
Page 198 of 277 Stavanger, Norway, October 30th & 31st 2008 Page of presentation:

Example of how to evaluateExample of how to evaluateshape of fine aggregate
Sand flow cone NZS 3111:1986Sa d o co e S 3 986
Stavanger Sand Meeting October 2008
Importance of measurement
������������ ���� ����������������
� ����������������������������
��������������������������� �
���� �����������;�but�when�you�cannot�express�it�in�numbers,�your�knowledge�is�of�a�meagre�and unsatisfactory kind ”and�unsatisfactory�kind.
William Thomson, 1st Baron Kelvin (1824-1907)
© Metso Date Author Title2
Source:
http://en.wikipedia.org/wiki/William_Thomson,_1st_Baron_Kelvin
http://www.webperformancematters.com/journal/2007/5/7/the-importance-of-measurements.html
Manufactured Sand - Workshop
Page 199 of 277 Stavanger, Norway, October 30th & 31st 2008 Page of presentation:
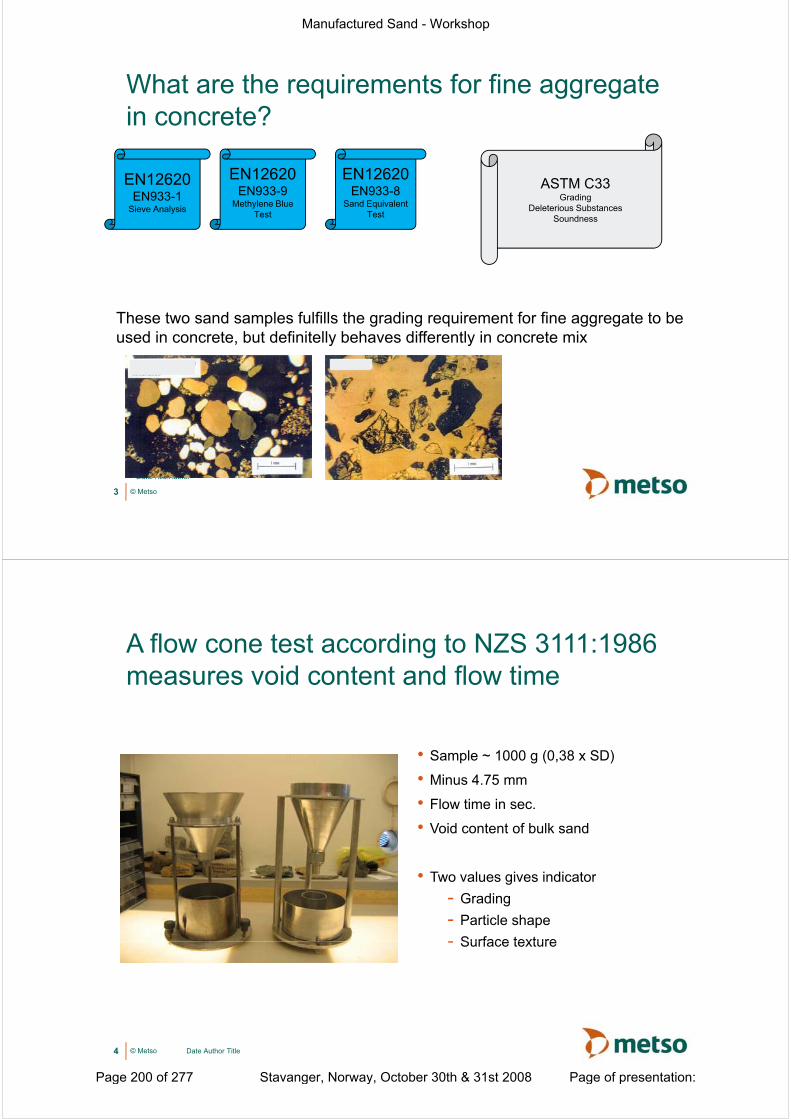
What are the requirements for fine aggregate i t ?in concrete?
EN12620 EN12620EN12620EN12620EN933-1
Sieve Analysis
EN12620EN933-8
Sand Equivalent Test
EN12620EN933-9
Methylene Blue Test
ASTM C33Grading
Deleterious SubstancesSoundness
Th t d l f lfill th di i t f fi t t bThese two sand samples fulfills the grading requirement for fine aggregate to beused in concrete, but definitelly behaves differently in concrete mix
© Metso3
Date/Title/Author
A flow cone test according to NZS 3111:1986 id t t d fl timeasures void content and flow time
• Sample ~ 1000 g (0,38 x SD)
• Minus 4.75 mm
• Flow time in sec• Flow time in sec.
• Void content of bulk sand
T l i i di t• Two values gives indicator- Grading- Particle shape- Surface texture- Surface texture
© Metso Date Author Title4
Manufactured Sand - Workshop
Page 200 of 277 Stavanger, Norway, October 30th & 31st 2008 Page of presentation:
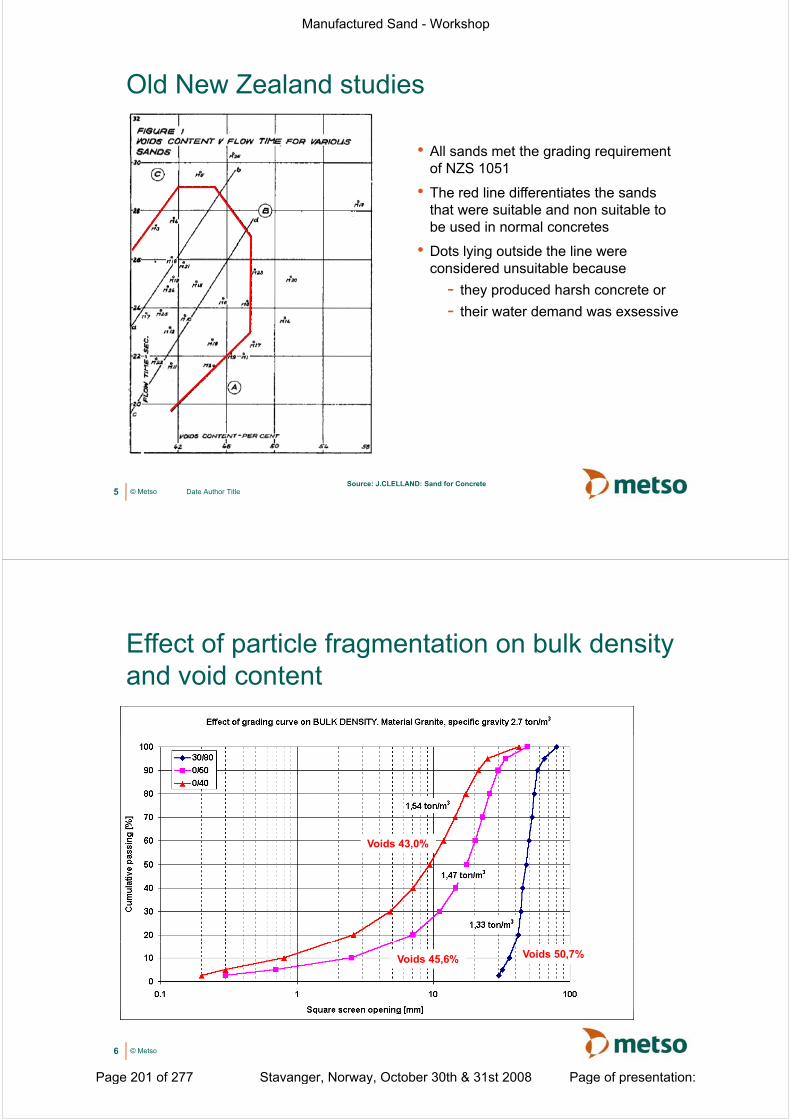
Old New Zealand studies
• All sands met the grading requirement of NZS 1051
• The red line differentiates the sands that were suitable and non suitable to be used in normal concretes
• Dots lying outside the line were considered unsuitable because
- they produced harsh concrete or- their water demand was exsessivetheir water demand was exsessive
© Metso Date Author Title5Source: J.CLELLAND: Sand for Concrete
Effect of particle fragmentation on bulk densityd id t tand void content
Voids 43,0%
Voids 45,6% Voids 50,7%
© Metso6
Manufactured Sand - Workshop
Page 201 of 277 Stavanger, Norway, October 30th & 31st 2008 Page of presentation:
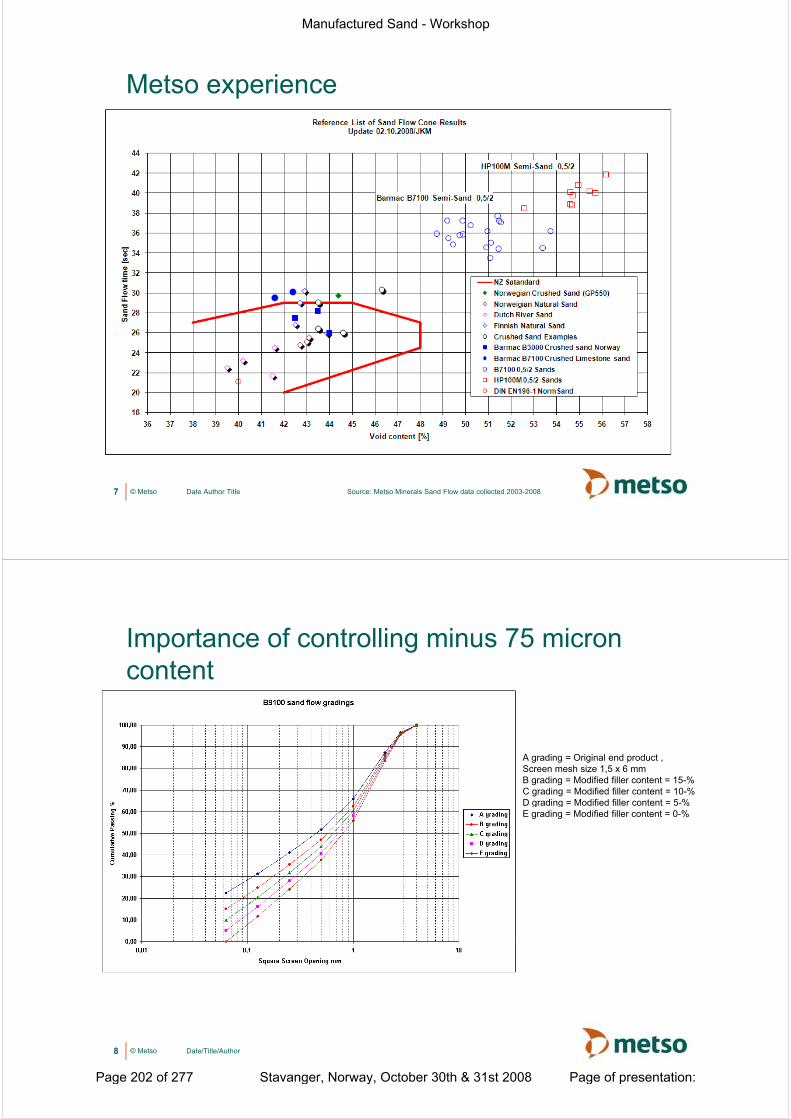
Metso experience
© Metso Date Author Title7 Source: Metso Minerals Sand Flow data collected 2003-2008
Importance of controlling minus 75 micron contentcontent
A grading = Original end product , Screen mesh size 1,5 x 6 mmB grading = Modified filler content = 15-%C grading = Modified filler content = 10-%D grading = Modified filler content = 5-%D grading Modified filler content 5 %E grading = Modified filler content = 0-%
© Metso8 Date/Title/Author
Manufactured Sand - Workshop
Page 202 of 277 Stavanger, Norway, October 30th & 31st 2008 Page of presentation:
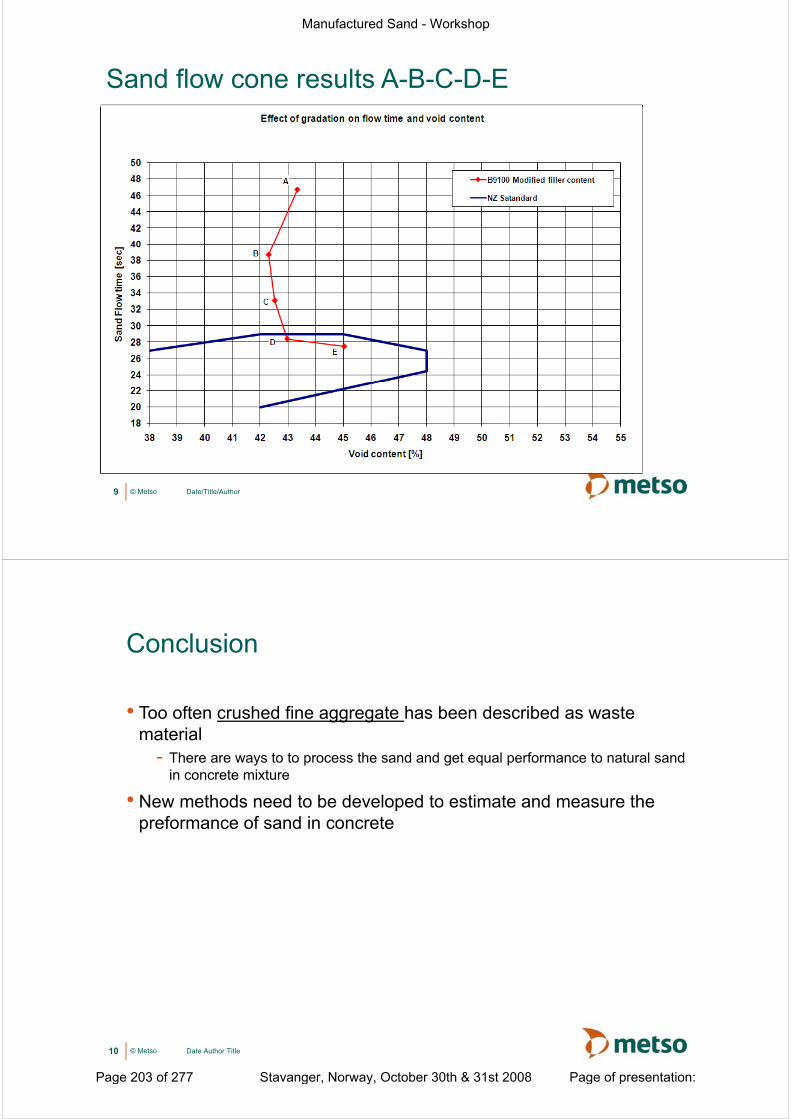
Sand flow cone results A-B-C-D-E
© Metso9 Date/Title/Author
Conclusion
• Too often crushed fine aggregate has been described as waste materialmaterial
- There are ways to to process the sand and get equal performance to natural sand in concrete mixture
• New methods need to be developed to estimate and measure theNew methods need to be developed to estimate and measure thepreformance of sand in concrete
© Metso Date Author Title10
Manufactured Sand - Workshop
Page 203 of 277 Stavanger, Norway, October 30th & 31st 2008 Page of presentation:

Manufactured Sand - Workshop
Page 204 of 277 Stavanger, Norway, October 30th & 31st 2008 Page of presentation:
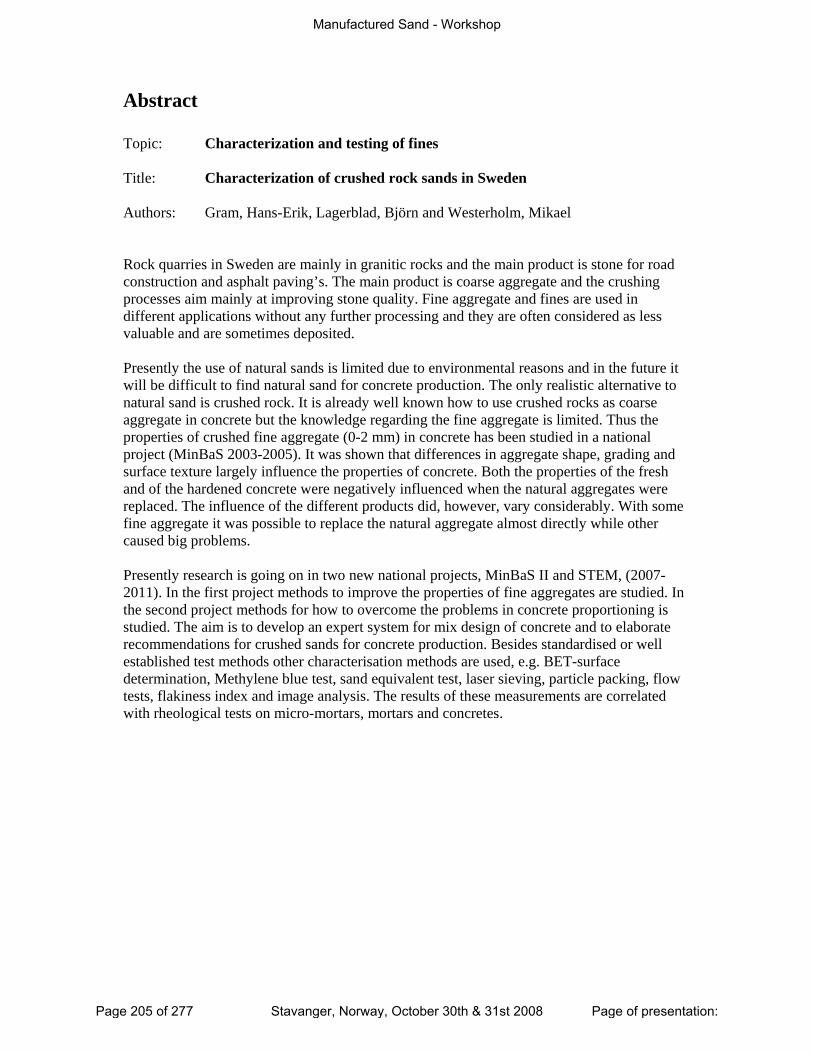
Abstract Topic: Characterization and testing of fines Title: Characterization of crushed rock sands in Sweden Authors: Gram, Hans-Erik, Lagerblad, Björn and Westerholm, Mikael Rock quarries in Sweden are mainly in granitic rocks and the main product is stone for road construction and asphalt paving’s. The main product is coarse aggregate and the crushing processes aim mainly at improving stone quality. Fine aggregate and fines are used in different applications without any further processing and they are often considered as less valuable and are sometimes deposited. Presently the use of natural sands is limited due to environmental reasons and in the future it will be difficult to find natural sand for concrete production. The only realistic alternative to natural sand is crushed rock. It is already well known how to use crushed rocks as coarse aggregate in concrete but the knowledge regarding the fine aggregate is limited. Thus the properties of crushed fine aggregate (0-2 mm) in concrete has been studied in a national project (MinBaS 2003-2005). It was shown that differences in aggregate shape, grading and surface texture largely influence the properties of concrete. Both the properties of the fresh and of the hardened concrete were negatively influenced when the natural aggregates were replaced. The influence of the different products did, however, vary considerably. With some fine aggregate it was possible to replace the natural aggregate almost directly while other caused big problems. Presently research is going on in two new national projects, MinBaS II and STEM, (2007-2011). In the first project methods to improve the properties of fine aggregates are studied. In the second project methods for how to overcome the problems in concrete proportioning is studied. The aim is to develop an expert system for mix design of concrete and to elaborate recommendations for crushed sands for concrete production. Besides standardised or well established test methods other characterisation methods are used, e.g. BET-surface determination, Methylene blue test, sand equivalent test, laser sieving, particle packing, flow tests, flakiness index and image analysis. The results of these measurements are correlated with rheological tests on micro-mortars, mortars and concretes.
Manufactured Sand - Workshop
Page 205 of 277 Stavanger, Norway, October 30th & 31st 2008 Page of presentation:
31/10/2008
1
Ch t i ti f h d R k d iCharacterization of crushed Rock sands in Sweden
Hans-Erik Gram CementaBjörn Lagerblad CBI BetonginstitutetMikael Westerholm CBI BetonginstitutetMikael Westerholm CBI Betonginstitutet
DISPOSITION
Introduction – BackgroundFiFinesSandsConclusions
Gram, Lagerblad, Westerholm – Stavanger October 2008
Manufactured Sand - Workshop
Page 206 of 277 Stavanger, Norway, October 30th & 31st 2008 Page of presentation:
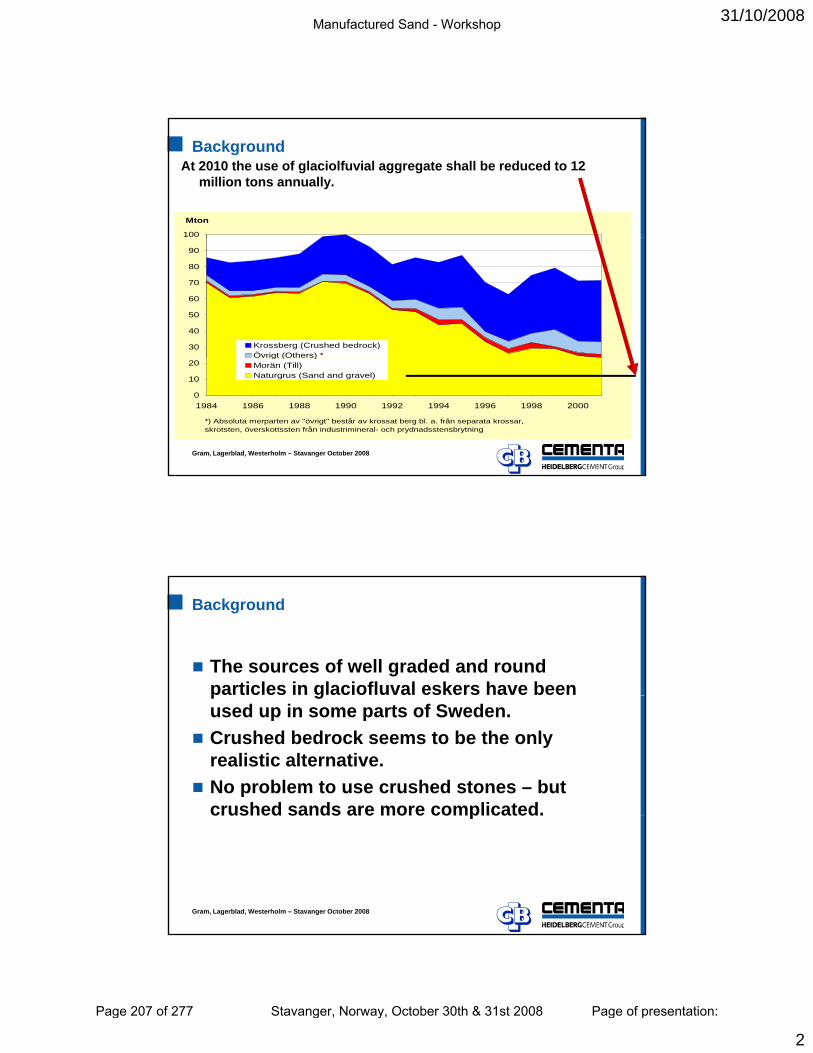
31/10/2008
2
BackgroundAt 2010 the use of glaciolfuvial aggregate shall be reduced to 12
million tons annually.
100
Mton
30
40
50
60
70
80
90
Krossberg (Crushed bedrock)Övrigt (Others) *
Gram, Lagerblad, Westerholm – Stavanger October 2008
0
10
20
1984 1986 1988 1990 1992 1994 1996 1998 2000
Övrigt (Others) Morän (Till)Naturgrus (Sand and gravel)
*) Absoluta merparten av "övrigt" består av krossat berg bl. a. från separata krossar,skrotsten, överskottssten från industrimineral- och prydnadsstensbrytning
Background
The sources of well graded and round particles in glaciofluval eskers have been p gused up in some parts of Sweden.Crushed bedrock seems to be the only realistic alternative.No problem to use crushed stones – but crushed sands are more complicated.
Gram, Lagerblad, Westerholm – Stavanger October 2008
crushed sands are more complicated.
Manufactured Sand - Workshop
Page 207 of 277 Stavanger, Norway, October 30th & 31st 2008 Page of presentation:
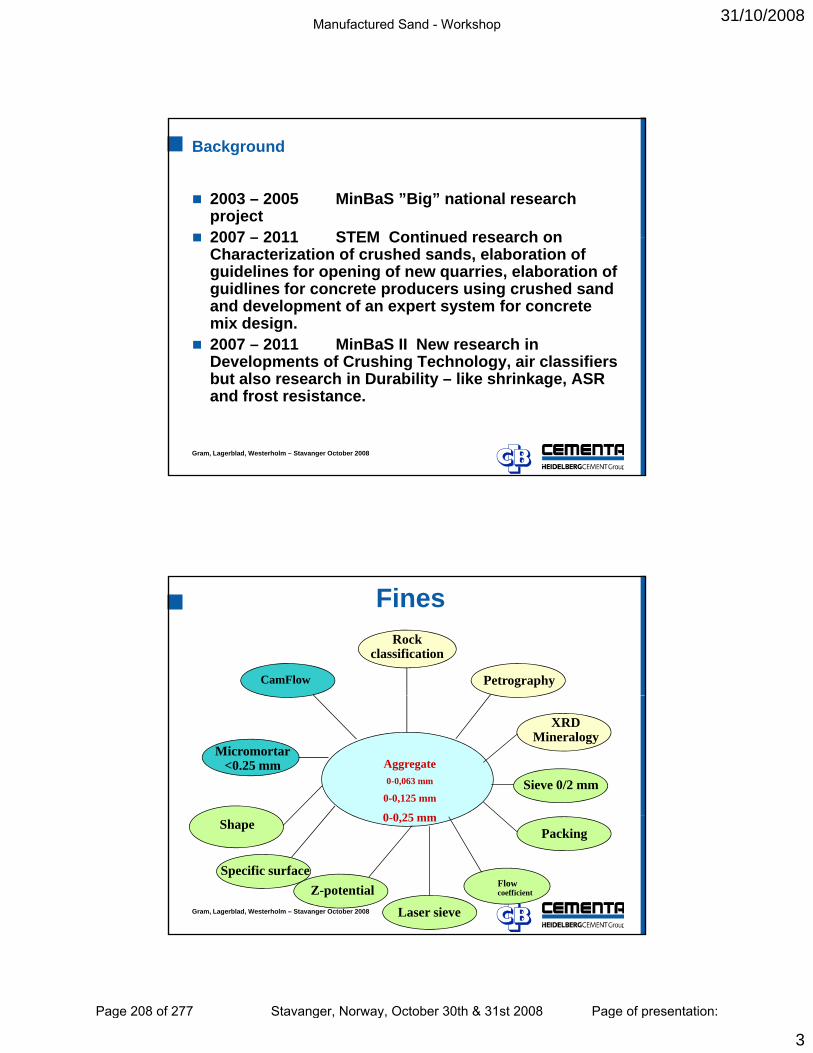
31/10/2008
3
Background
2003 – 2005 MinBaS ”Big” national research project2007 2011 STEM Continued research on2007 – 2011 STEM Continued research on Characterization of crushed sands, elaboration of guidelines for opening of new quarries, elaboration of guidlines for concrete producers using crushed sand and development of an expert system for concrete mix design.2007 – 2011 MinBaS II New research in D l t f C hi T h l i l ifi
Gram, Lagerblad, Westerholm – Stavanger October 2008
Developments of Crushing Technology, air classifiers but also research in Durability – like shrinkage, ASR and frost resistance.
FinesRock
classification
PetrographyCamFlow
Aggregate 0-0,063 mm
0-0,125 mm
0 0 25
XRDMineralogy
Sieve 0/2 mm
Micromortar<0.25 mm
Gram, Lagerblad, Westerholm – Stavanger October 2008
0-0,25 mmPacking
Flow coefficient
Laser sieve
Specific surface
Shape
Z-potential
Manufactured Sand - Workshop
Page 208 of 277 Stavanger, Norway, October 30th & 31st 2008 Page of presentation:
31/10/2008
4
Important properties of the fines
Particle size distribution
Shape Surface
Gram, Lagerblad, Westerholm – Stavanger October 2008
Granite is by definition rich in free Quartz. But it also contains various other minerals. Particle shape, size distribution and texture depends
on variations in the Granite Family.
Kvarts 100 %
The Granite family
Kvartsrik granit
Syenit
Kvartssyenit Granit Granodiorit
Kvartsdiorit
Diorit Kvartsmonsonit
Gram, Lagerblad, Westerholm – Stavanger October 2008
Alkalifältspat 100 % Plagioklas 100 % Kvarts 0 %
Classicfication after mineral content
Different Granites produce different particle properties!
Manufactured Sand - Workshop
Page 209 of 277 Stavanger, Norway, October 30th & 31st 2008 Page of presentation:
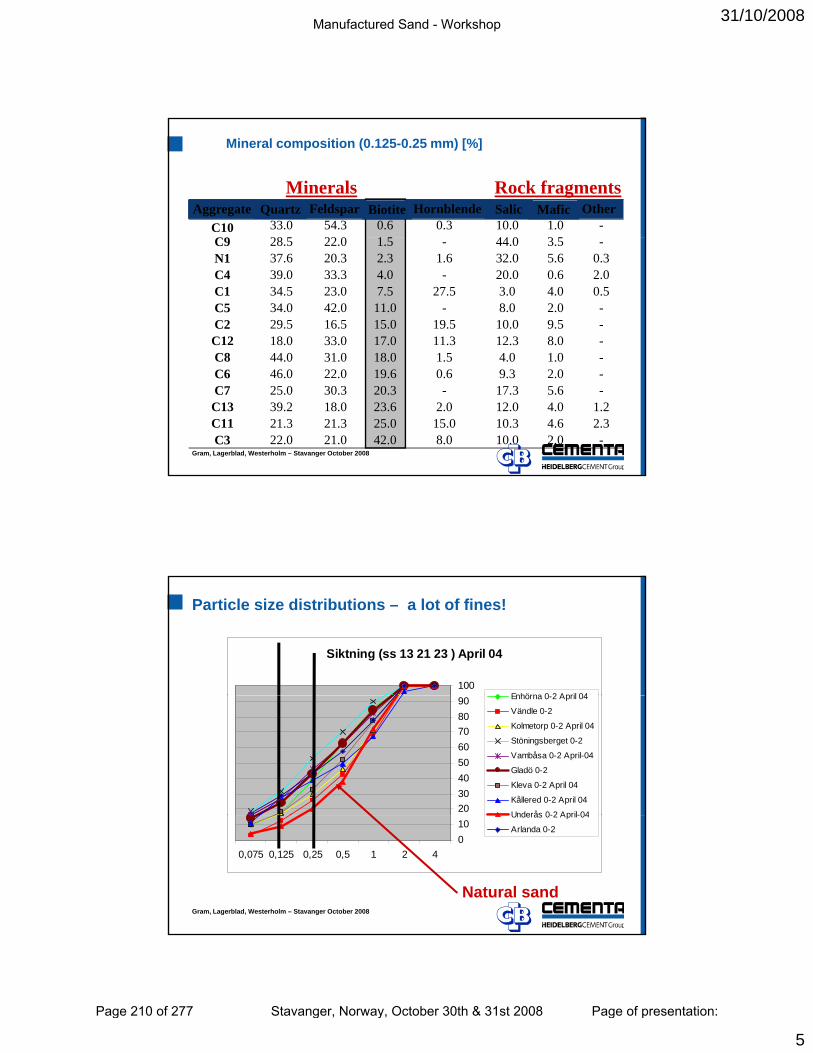
31/10/2008
5
Mineral composition (0.125-0.25 mm) [%]
Finballast Kvarts Fältspat Biotit Hornblände Salisk Mafisk ÖvrigtC10 33.0 54.3 0.6 0.3 10.0 1.0 -C9 28 22 0 1 44 0 3
Minerals Rock fragmentsAggregate Hornblende Salic Mafic OtherFeldsparQuartz Biotite
C9 28.5 22.0 1.5 - 44.0 3.5 -N1 37.6 20.3 2.3 1.6 32.0 5.6 0.3C4 39.0 33.3 4.0 - 20.0 0.6 2.0C1 34.5 23.0 7.5 27.5 3.0 4.0 0.5C5 34.0 42.0 11.0 - 8.0 2.0 -C2 29.5 16.5 15.0 19.5 10.0 9.5 -C12 18.0 33.0 17.0 11.3 12.3 8.0 -C8 44 0 31 0 18 0 1 5 4 0 1 0
Gram, Lagerblad, Westerholm – Stavanger October 2008
C8 44.0 31.0 18.0 1.5 4.0 1.0 -C6 46.0 22.0 19.6 0.6 9.3 2.0 -C7 25.0 30.3 20.3 - 17.3 5.6 -C13 39.2 18.0 23.6 2.0 12.0 4.0 1.2C11 21.3 21.3 25.0 15.0 10.3 4.6 2.3C3 22.0 21.0 42.0 8.0 10.0 2.0 -
Particle size distributions – a lot of fines!
Siktning (ss 13 21 23 ) April 04
100Enhörna 0 2 April 04
2030405060708090 Enhörna 0-2 April 04
Vändle 0-2
Kolmetorp 0-2 April 04
Stöningsberget 0-2
Vambåsa 0-2 April-04
Gladö 0-2
Kleva 0-2 April 04
Kållered 0-2 April 04
Underås 0-2 April-04
Gram, Lagerblad, Westerholm – Stavanger October 2008
010
4210,50,250,1250,075
Underås 0-2 April-04
Arlanda 0-2
Natural sand
Manufactured Sand - Workshop
Page 210 of 277 Stavanger, Norway, October 30th & 31st 2008 Page of presentation:
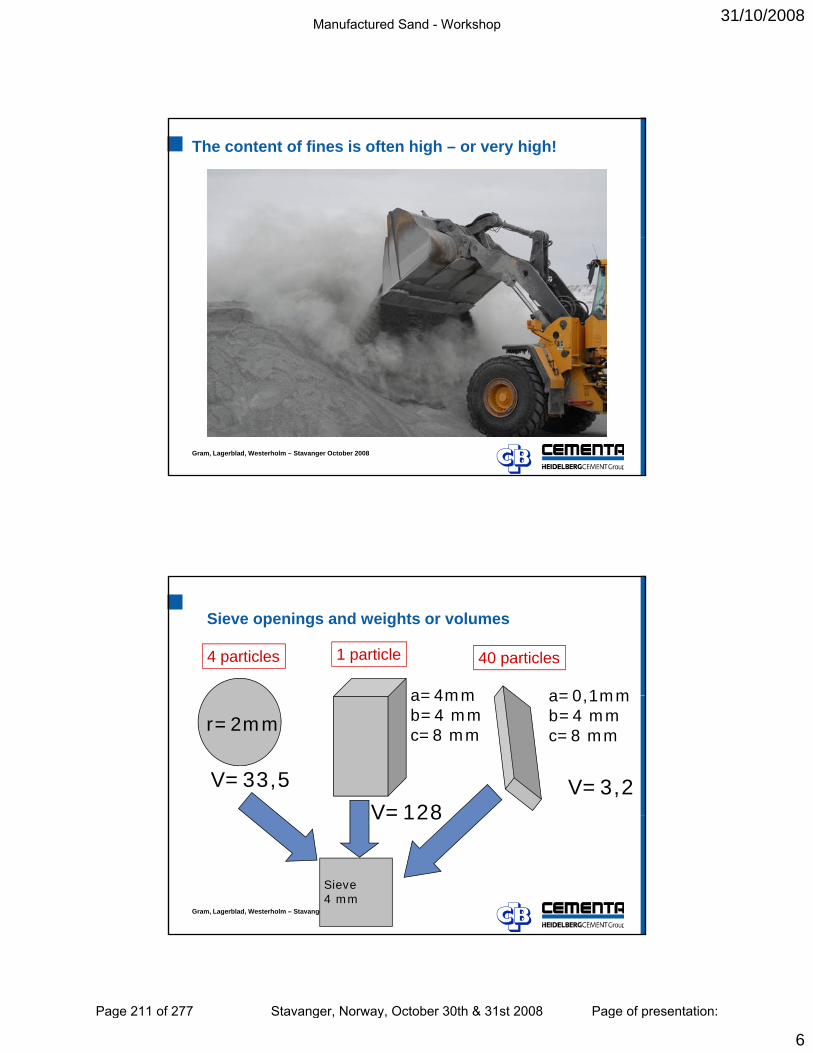
31/10/2008
6
The content of fines is often high – or very high!
Gram, Lagerblad, Westerholm – Stavanger October 2008
Sieve openings and weights or volumes
a=4mm a=0 1mm
4 particles 1 particle 40 particles
a=4mmb=4 mmc=8 mm
r=2mm
V=33,5
V=128
a=0,1mmb=4 mmc=8 mm
V=3,2
Gram, Lagerblad, Westerholm – Stavanger October 2008
Sieve4 mm
V=128
Manufactured Sand - Workshop
Page 211 of 277 Stavanger, Norway, October 30th & 31st 2008 Page of presentation:
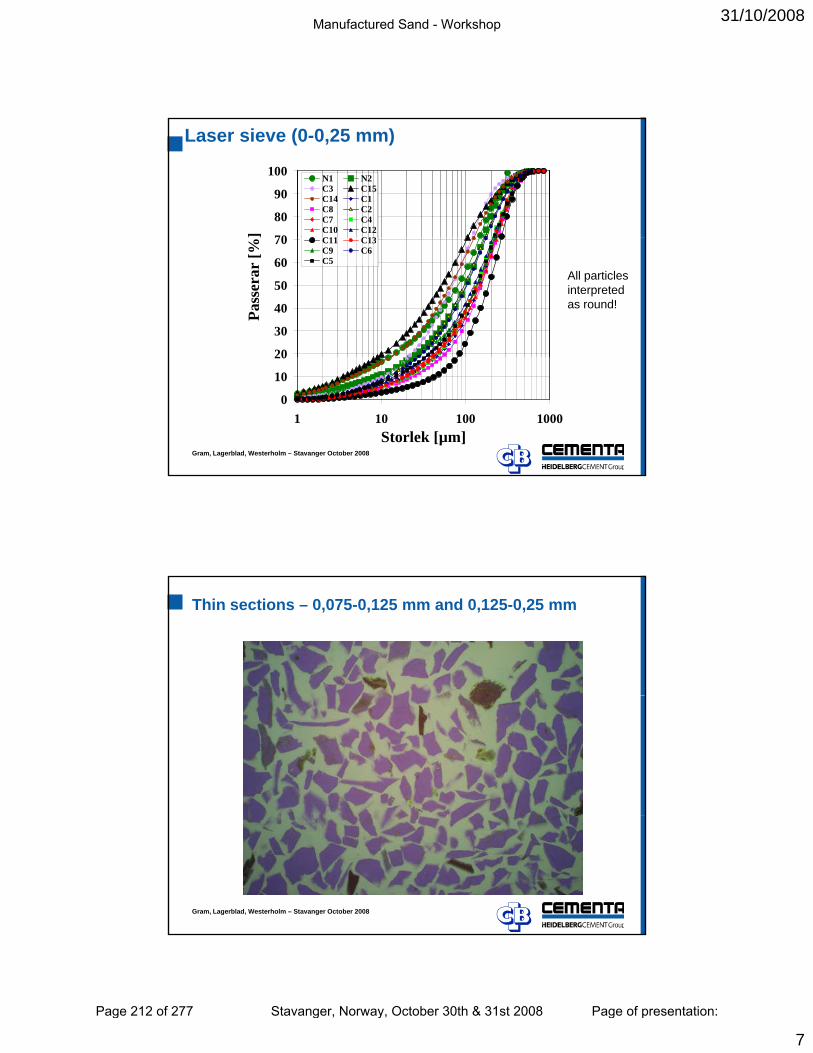
31/10/2008
7
70
80
90
100
]
N1 N2C3 C15C14 C1C8 C2C7 C4C10 C12C11 C13
Laser sieve (0-0,25 mm)
20
30
40
50
60
70Pa
sser
ar [%
] C11 C13C9 C6C5
All particlesinterpretedas round!
Gram, Lagerblad, Westerholm – Stavanger October 2008
0
10
20
1 10 100 1000Storlek [µm]
Thin sections – 0,075-0,125 mm and 0,125-0,25 mm
Gram, Lagerblad, Westerholm – Stavanger October 2008
Manufactured Sand - Workshop
Page 212 of 277 Stavanger, Norway, October 30th & 31st 2008 Page of presentation:
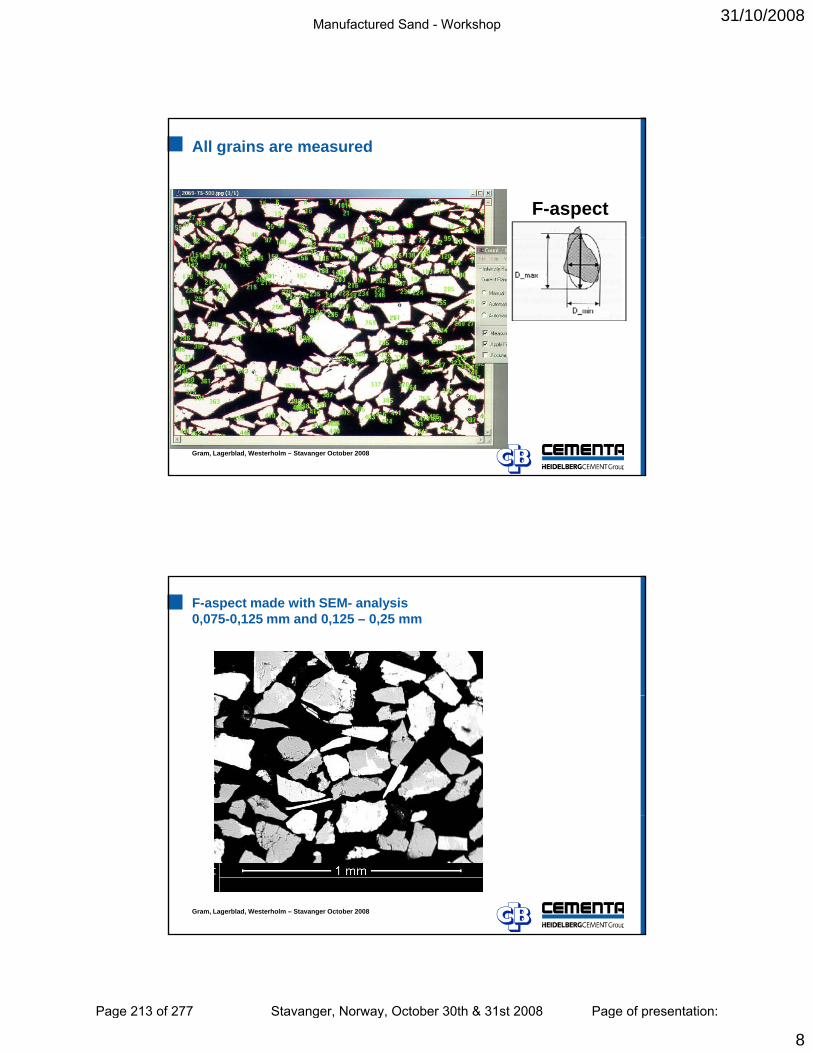
31/10/2008
8
All grains are measured
F-aspect
Gram, Lagerblad, Westerholm – Stavanger October 2008
F-aspect made with SEM- analysis 0,075-0,125 mm and 0,125 – 0,25 mm
Gram, Lagerblad, Westerholm – Stavanger October 2008
Manufactured Sand - Workshop
Page 213 of 277 Stavanger, Norway, October 30th & 31st 2008 Page of presentation:
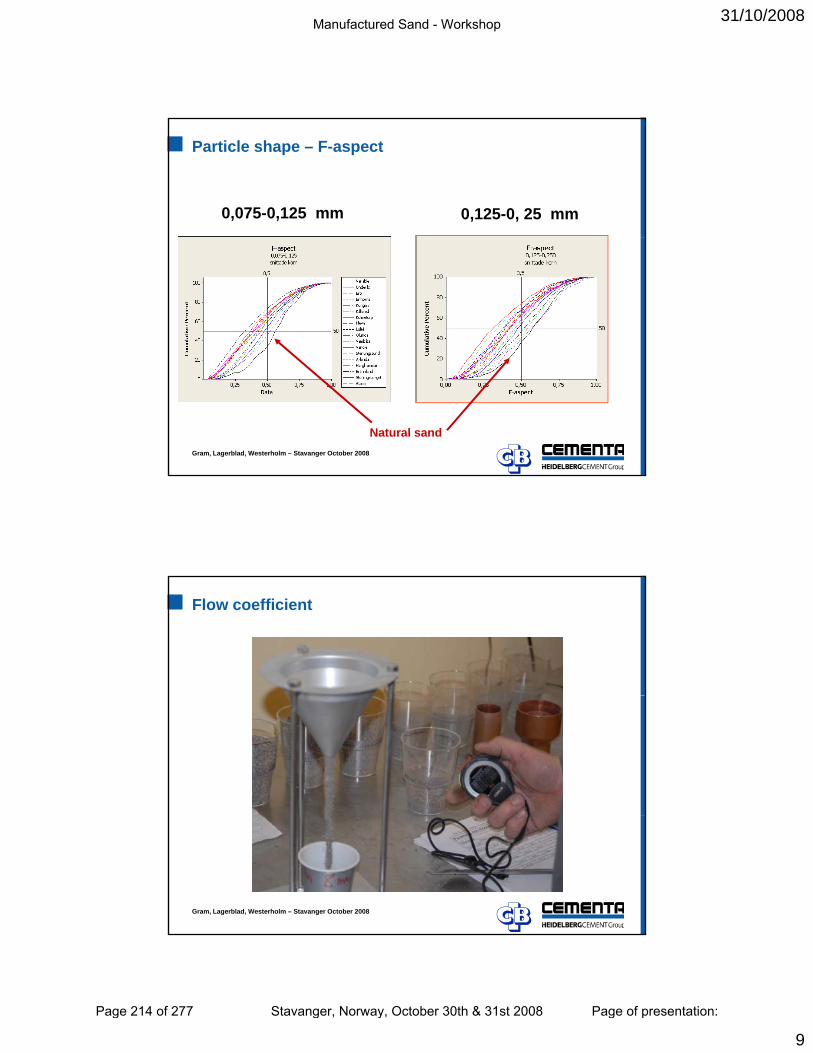
31/10/2008
9
Particle shape – F-aspect
0,075-0,125 mm 0,125-0, 25 mm
Gram, Lagerblad, Westerholm – Stavanger October 2008
Natural sand
Flow coefficient
Gram, Lagerblad, Westerholm – Stavanger October 2008
Manufactured Sand - Workshop
Page 214 of 277 Stavanger, Norway, October 30th & 31st 2008 Page of presentation:

31/10/2008
10
Determination of loose bulk density and voids0,063-0,125 mm and 0,125-0,25 mm
Gram, Lagerblad, Westerholm – Stavanger October 2008
Bulk density and Flow coefficient – 0,063-0,125 mm
A 35,4 stuckB 38,8 5,50
Loose packing Flow time
C 38,9 stuckC - VSI 40,5 4,36
D 44,7 4,03Natural sand 42,4 4,33
Gram, Lagerblad, Westerholm – Stavanger October 2008
Manufactured Sand - Workshop
Page 215 of 277 Stavanger, Norway, October 30th & 31st 2008 Page of presentation:
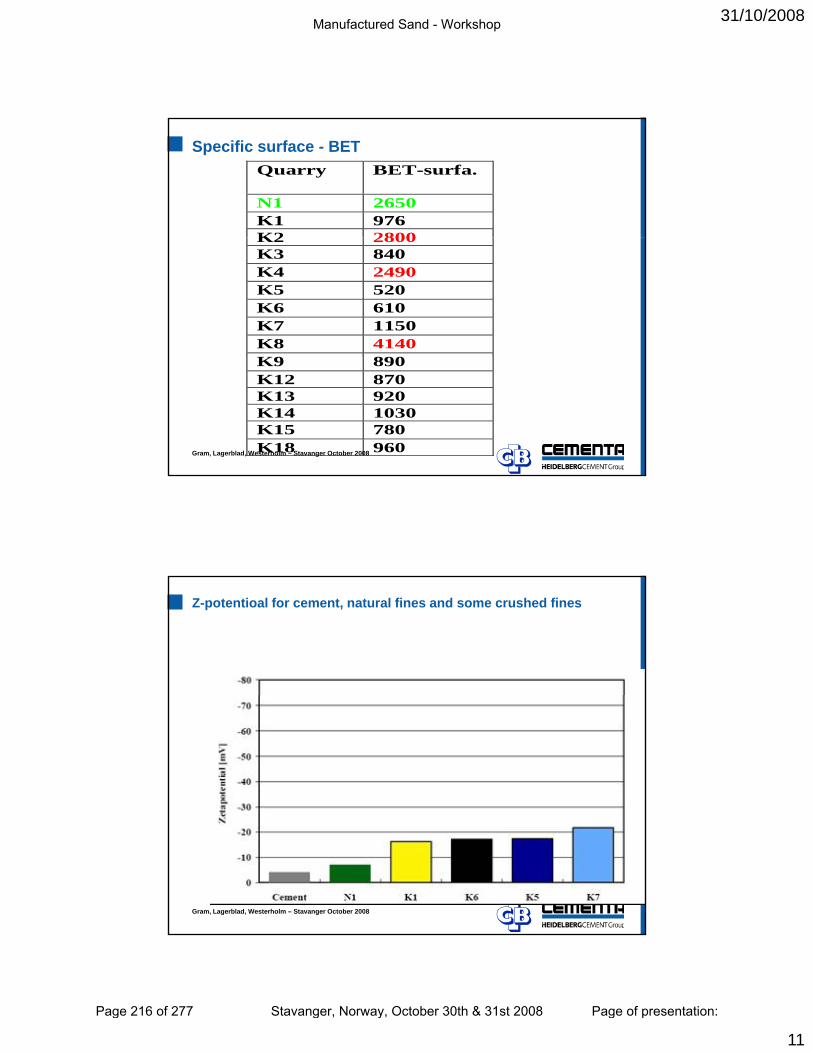
31/10/2008
11
Specific surface - BET Quarry BET-surfa.
N1 2650 K1 976 K2 2800K2 2800K3 840 K4 2490 K5 520 K6 610 K7 1150 K8 4140 K9 890
Gram, Lagerblad, Westerholm – Stavanger October 2008
K9 890K12 870 K13 920 K14 1030 K15 780 K18 960
Z-potentioal for cement, natural fines and some crushed fines
Gram, Lagerblad, Westerholm – Stavanger October 2008
Manufactured Sand - Workshop
Page 216 of 277 Stavanger, Norway, October 30th & 31st 2008 Page of presentation:
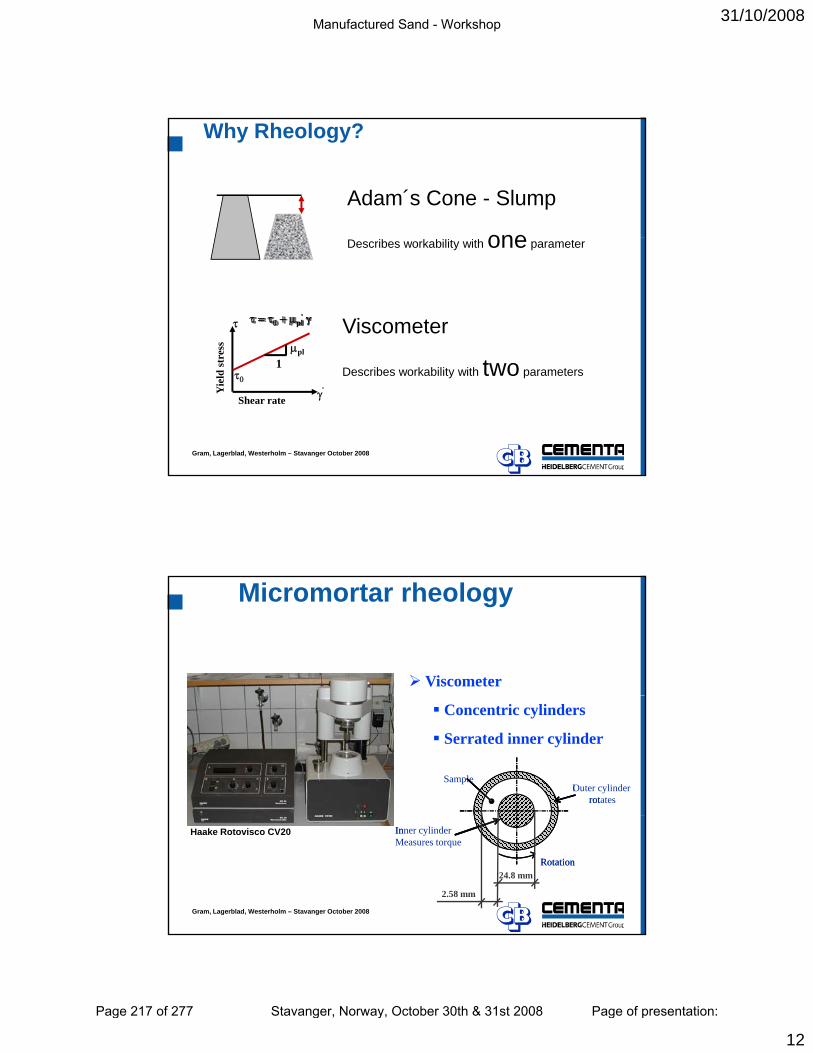
31/10/2008
12
Why Rheology?
Adam´s Cone - Slump
onere
ss
τ
μpl
τ = τ0 + μpl γ
Describes workability with one parameter
Viscometer
Gram, Lagerblad, Westerholm – Stavanger October 2008
Shear rate γYie
ld st
r
τ0
1Describes workability with two parameters
Micromortar rheology
Viscometer
Concentric cylinders
Serrated inner cylinder
Outer cylinderrot
lrotates
Sample
Gram, Lagerblad, Westerholm – Stavanger October 2008
Haake Rotovisco CV20
Rotation
In
Rotation
Inner cylinderMeasures torque
24.8 mm
2.58 mm
Manufactured Sand - Workshop
Page 217 of 277 Stavanger, Norway, October 30th & 31st 2008 Page of presentation:
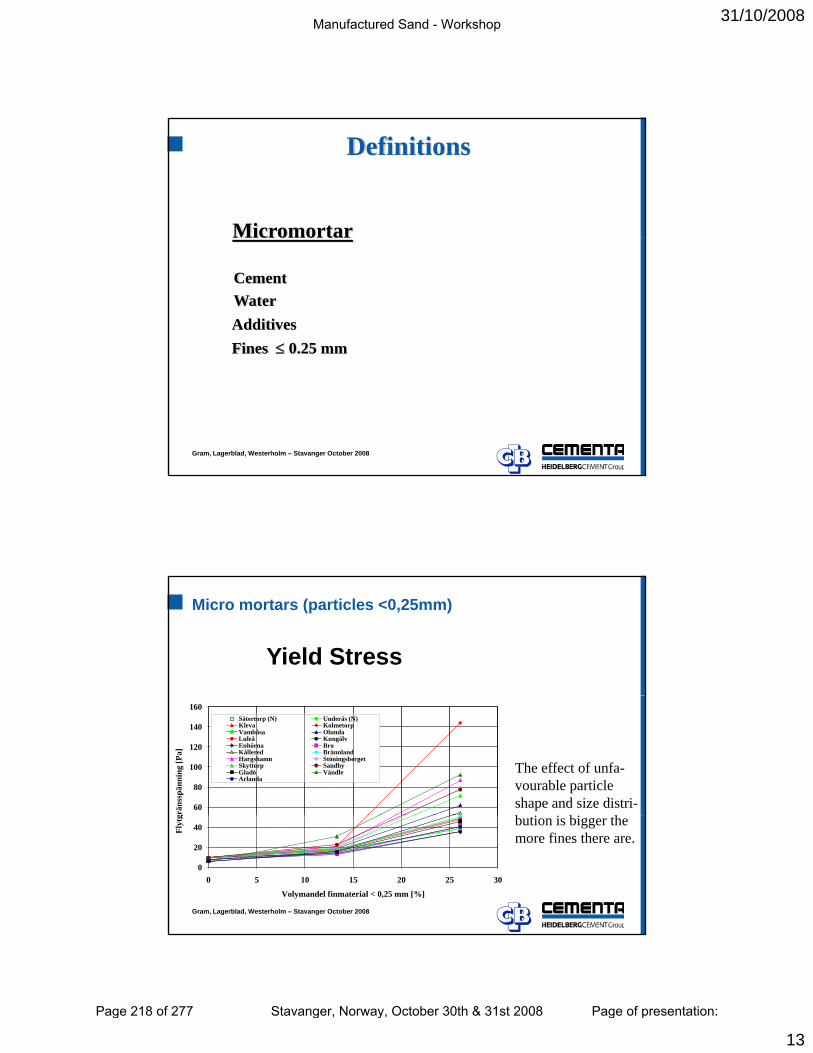
31/10/2008
13
Definitions
MicromortarMicromortar
Cement
Fines ≤ 0.25 mmAdditivesWater
Gram, Lagerblad, Westerholm – Stavanger October 2008
Micro mortars (particles <0,25mm)
Yield Stress
60
80
100
120
140
160
grän
sspä
nnin
g [P
a]
Sätertorp (N) Underås (N)Kleva KolmetorpVambåsa OlundaLuleå KungälvEnhörna BroKållered BrännlandHargshamn StöningsbergetSkyttorp SandbyGladö VändleArlanda
The effect of unfa-vourable particle shape and size distri-b i i bi h
Gram, Lagerblad, Westerholm – Stavanger October 2008
0
20
40
0 5 10 15 20 25 30
Volymandel finmaterial < 0,25 mm [%]
Flyt
g bution is bigger the more fines there are.
Manufactured Sand - Workshop
Page 218 of 277 Stavanger, Norway, October 30th & 31st 2008 Page of presentation:
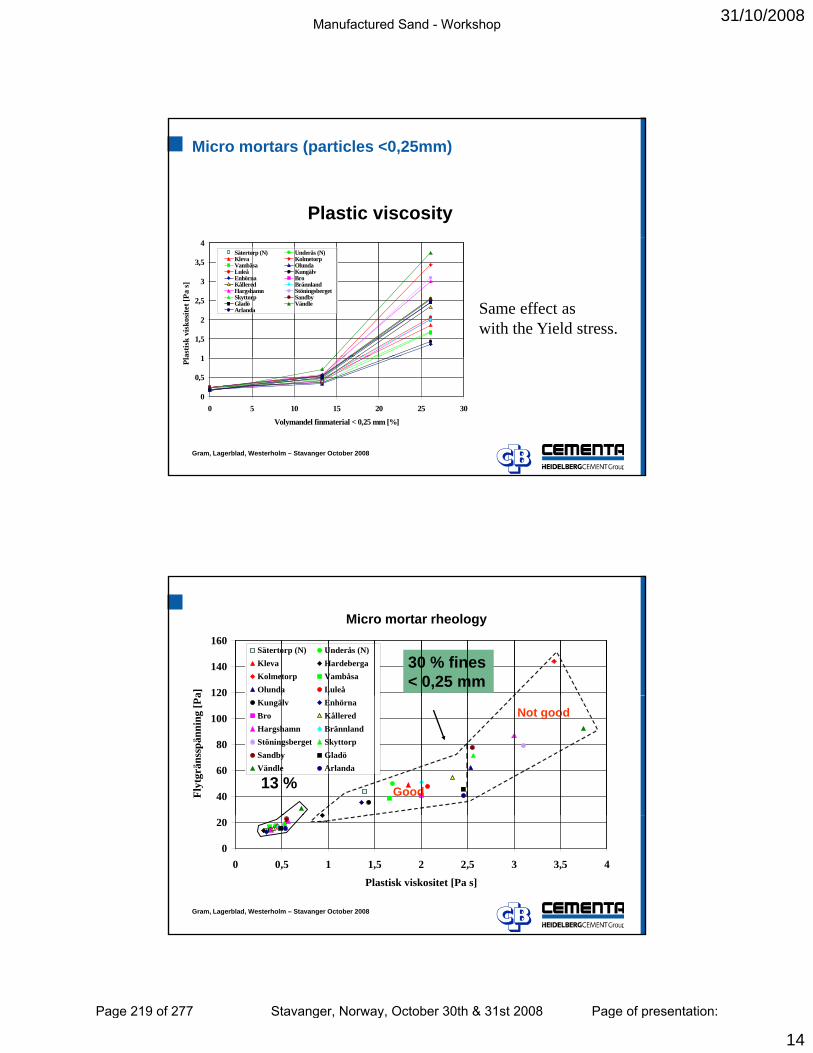
31/10/2008
14
Micro mortars (particles <0,25mm)
Plastic viscosity
1
1,5
2
2,5
3
3,5
4
astis
k vi
skos
itet [
Pa s]
Sätertorp (N) Underås (N)Kleva KolmetorpVambåsa OlundaLuleå KungälvEnhörna BroKållered BrännlandHargshamn StöningsbergetSkyttorp SandbyGladö VändleArlanda Same effect as
with the Yield stress.
Gram, Lagerblad, Westerholm – Stavanger October 2008
0
0,5
1
0 5 10 15 20 25 30
Volymandel finmaterial < 0,25 mm [%]
Pla
120
140
160
a]
Sätertorp (N) Underås (N)Kleva HardebergaKolmetorp VambåsaOlunda Luleå
Micro mortar rheology
30 % fines < 0,25 mm
40
60
80
100
120
Flyt
grän
sspä
nnin
g [P
a
Kungälv EnhörnaBro KålleredHargshamn BrännlandStöningsberget SkyttorpSandby GladöVändle Arlanda
Not good
Good13 %
Gram, Lagerblad, Westerholm – Stavanger October 2008
0
20
0 0,5 1 1,5 2 2,5 3 3,5 4
Plastisk viskositet [Pa s]
Manufactured Sand - Workshop
Page 219 of 277 Stavanger, Norway, October 30th & 31st 2008 Page of presentation:
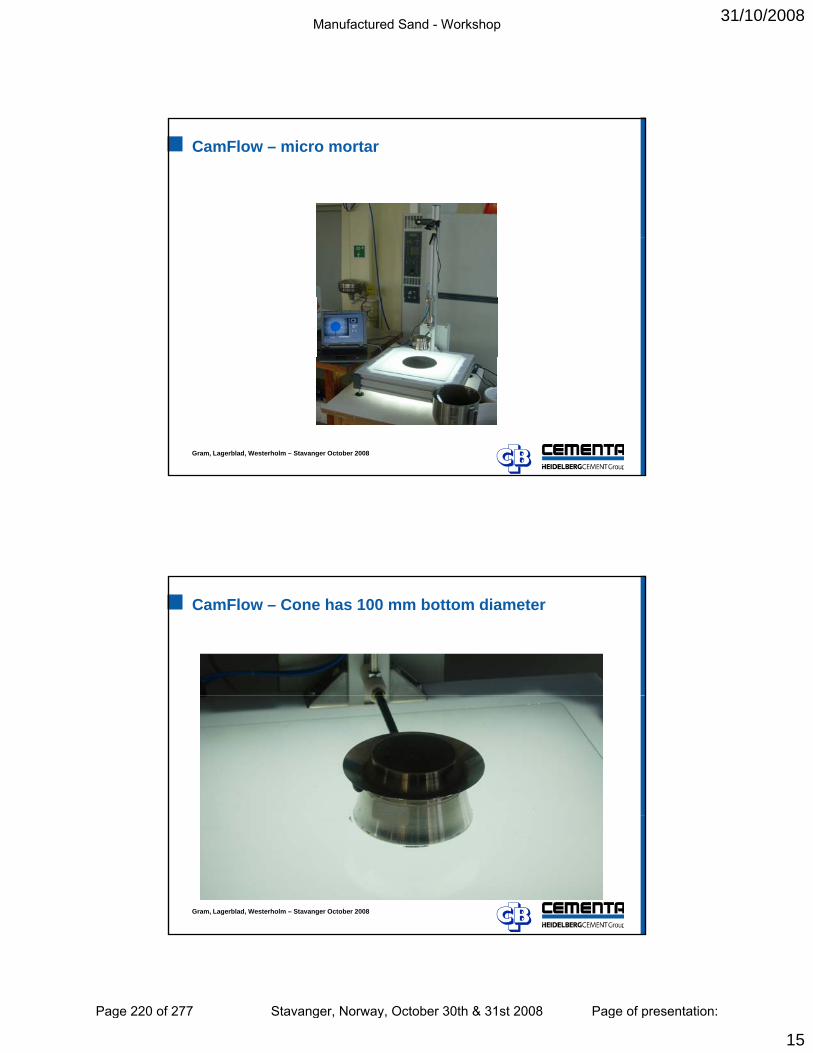
31/10/2008
15
CamFlow – micro mortar
Gram, Lagerblad, Westerholm – Stavanger October 2008
CamFlow – Cone has 100 mm bottom diameter
Gram, Lagerblad, Westerholm – Stavanger October 2008
Manufactured Sand - Workshop
Page 220 of 277 Stavanger, Norway, October 30th & 31st 2008 Page of presentation:
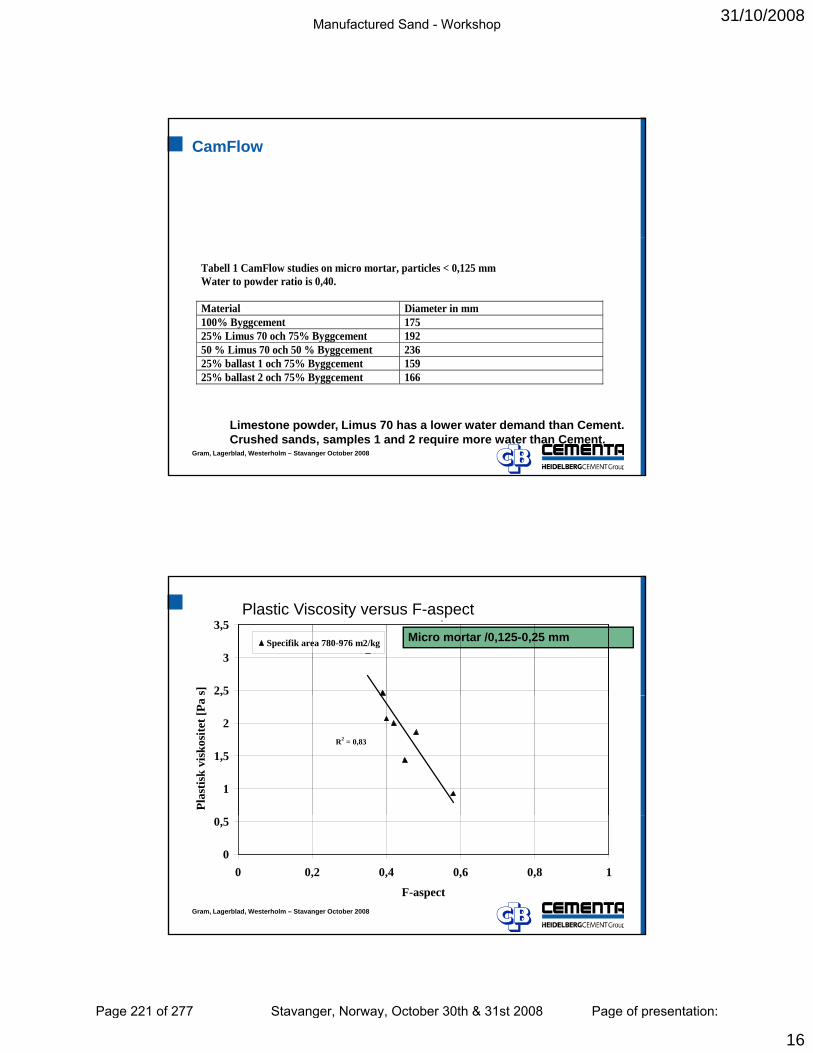
31/10/2008
16
CamFlow
Tabell 1 CamFlow studies on micro mortar, particles < 0,125 mm Water to powder ratio is 0,40. Material Diameter in mm 100% Byggcement 175 25% Limus 70 och 75% Byggcement 192 50 % Limus 70 och 50 % Byggcement 236
Gram, Lagerblad, Westerholm – Stavanger October 2008
25% ballast 1 och 75% Byggcement 15925% ballast 2 och 75% Byggcement 166
Limestone powder, Limus 70 has a lower water demand than Cement. Crushed sands, samples 1 and 2 require more water than Cement.
Plastisk viskositet vs F-aspect
2,5
3
3,5
s]
Specifik area 780-976 m2/kg Micro mortar /0,125-0,25 mm
Plastic Viscosity versus F-aspect
R2 = 0,83
1
1,5
2
,
Pla
stis
k vi
skos
itet [
Pa
Gram, Lagerblad, Westerholm – Stavanger October 2008
0
0,5
0 0,2 0,4 0,6 0,8 1
F-aspect
Manufactured Sand - Workshop
Page 221 of 277 Stavanger, Norway, October 30th & 31st 2008 Page of presentation:
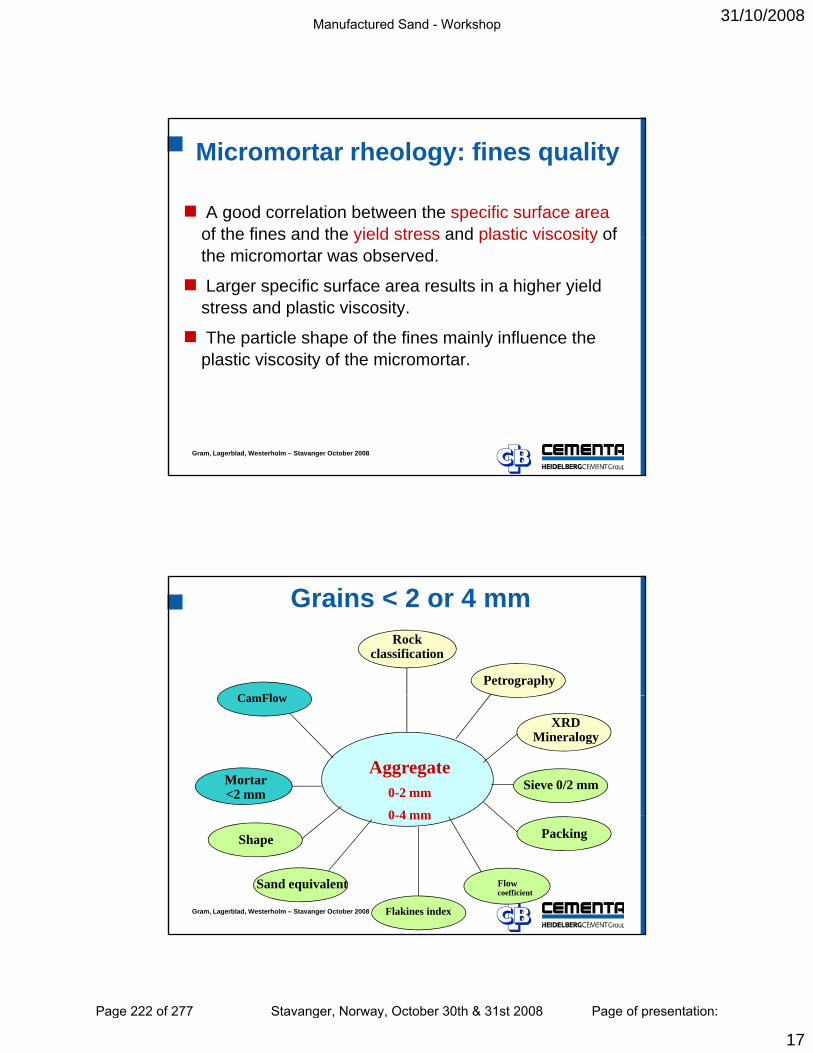
31/10/2008
17
A good correlation between the specific surface areaof the fines and the yield stress and plastic viscosity of
Micromortar rheology: fines quality
of the fines and the yield stress and plastic viscosity of the micromortar was observed.
Larger specific surface area results in a higher yield stress and plastic viscosity.
The particle shape of the fines mainly influence the plastic viscosity of the micromortar
Gram, Lagerblad, Westerholm – Stavanger October 2008
plastic viscosity of the micromortar.
Grains < 2 or 4 mmRock
classification
PetrographyC Fl
Aggregate 0-2 mm
0 4 mm
XRDMineralogy
Sieve 0/2 mm
CamFlow
Mortar<2 mm
Gram, Lagerblad, Westerholm – Stavanger October 2008
0-4 mmPacking
Flow coefficient
Flakines index
Sand equivalent
Shape
Manufactured Sand - Workshop
Page 222 of 277 Stavanger, Norway, October 30th & 31st 2008 Page of presentation:
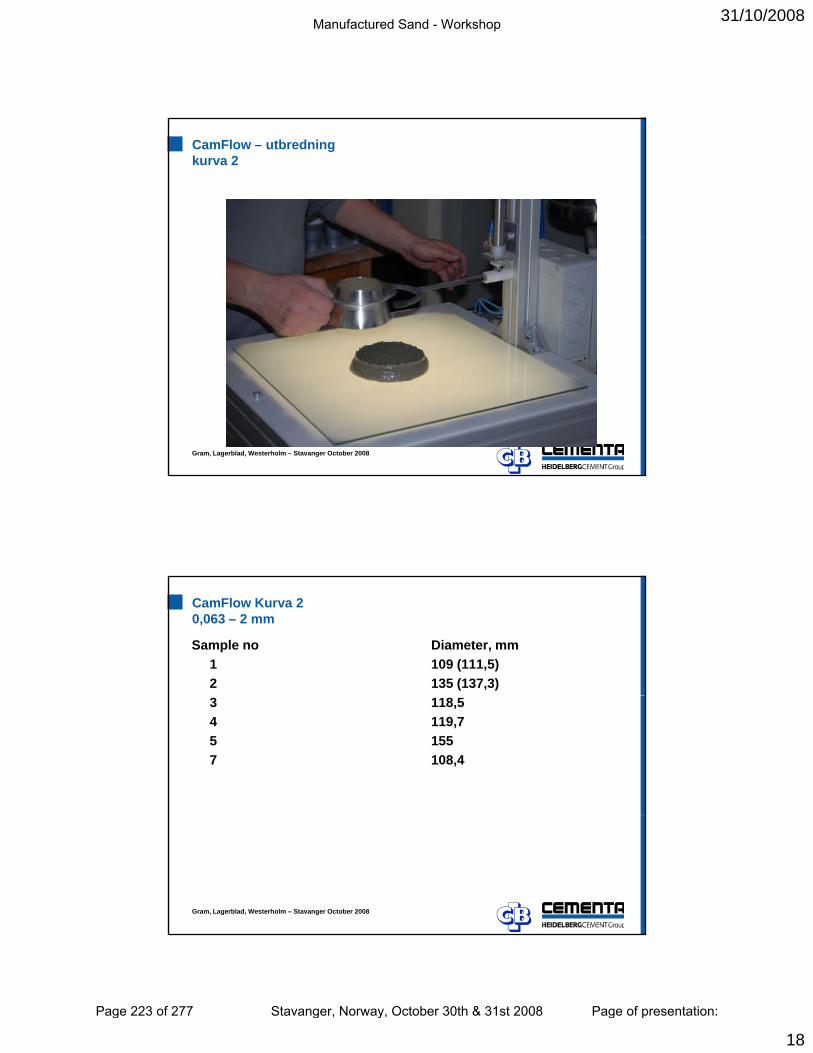
31/10/2008
18
CamFlow – utbredningkurva 2
Gram, Lagerblad, Westerholm – Stavanger October 2008
CamFlow Kurva 20,063 – 2 mm
Sample no Diameter, mm1 109 (111,5)2 135 (137,3)3 118,54 119,75 1557 108,4
Gram, Lagerblad, Westerholm – Stavanger October 2008
Manufactured Sand - Workshop
Page 223 of 277 Stavanger, Norway, October 30th & 31st 2008 Page of presentation:
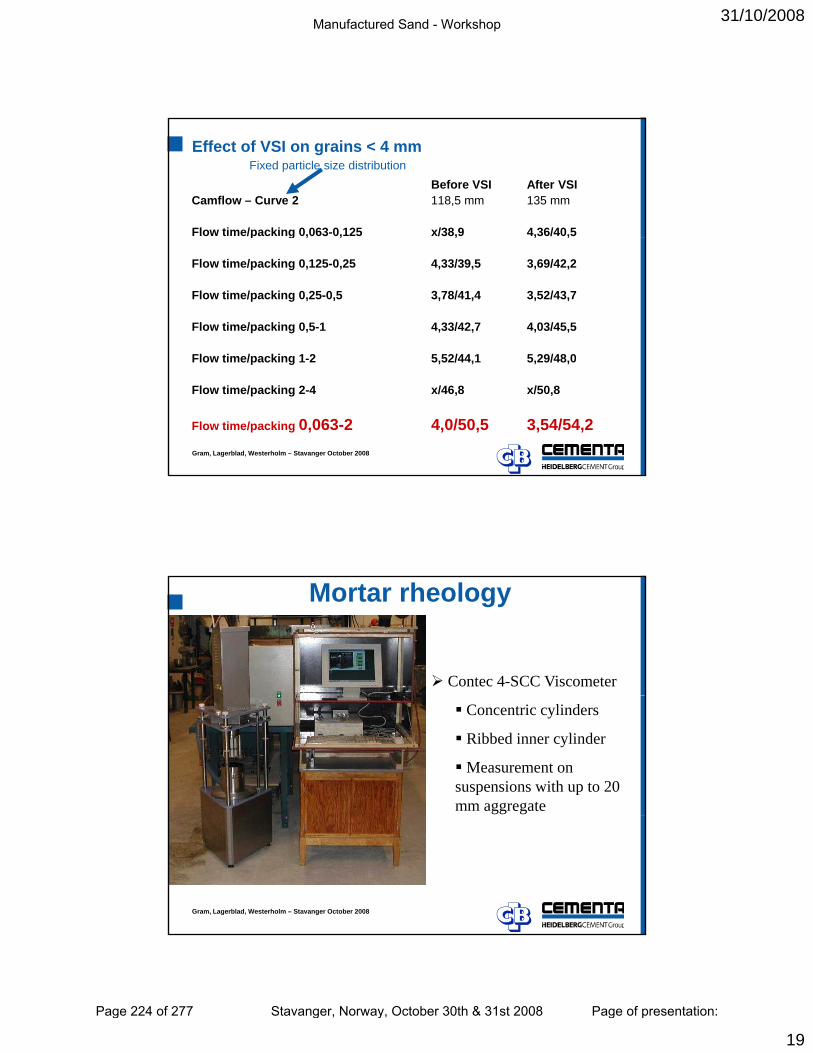
31/10/2008
19
Effect of VSI on grains < 4 mm
Before VSI After VSICamflow – Curve 2 118,5 mm 135 mm
Flow time/packing 0,063-0,125 x/38,9 4,36/40,5
Fixed particle size distribution
p g , , , , ,
Flow time/packing 0,125-0,25 4,33/39,5 3,69/42,2
Flow time/packing 0,25-0,5 3,78/41,4 3,52/43,7
Flow time/packing 0,5-1 4,33/42,7 4,03/45,5
Flow time/packing 1 2 5 52/44 1 5 29/48 0
Gram, Lagerblad, Westerholm – Stavanger October 2008
Flow time/packing 1-2 5,52/44,1 5,29/48,0
Flow time/packing 2-4 x/46,8 x/50,8
Flow time/packing 0,063-2 4,0/50,5 3,54/54,2
Mortar rheology
Contec 4-SCC Viscometer
Concentric cylinders
Ribbed inner cylinder
Measurement on suspensions with up to 20 mm aggregate
Gram, Lagerblad, Westerholm – Stavanger October 2008
Manufactured Sand - Workshop
Page 224 of 277 Stavanger, Norway, October 30th & 31st 2008 Page of presentation:
31/10/2008
20
Mortar: Influence of aggregate grading on the yield stress
Increasing amounts of 200
250N1C1C2C3
gfines result in a larger surface with higher water demand.
50
100
150
Yie
ld st
ress
[Pa] C3
C4C8
Gram, Lagerblad, Westerholm – Stavanger October 2008
00 10 20 30 40
Amount of fines < 0.25 mm [%]
250
300
Mortar: Influence of the aggregate shape on mortar rheology
Same grading but
N1
C1S
C2S
C3S
C4SC8S
50
100
150
200
Yie
ld st
ress
[Pa] Particle shape effect
different shapes.
The aggregate shape mainly influence the plastic viscosity of the mortar.
Gram, Lagerblad, Westerholm – Stavanger October 2008
00,0 0,5 1,0 1,5 2,0 2,5 3,0 3,5 4,0 4,5 5,0
Plastic viscosity [Pa s]
Particle interference / friction.
Manufactured Sand - Workshop
Page 225 of 277 Stavanger, Norway, October 30th & 31st 2008 Page of presentation:
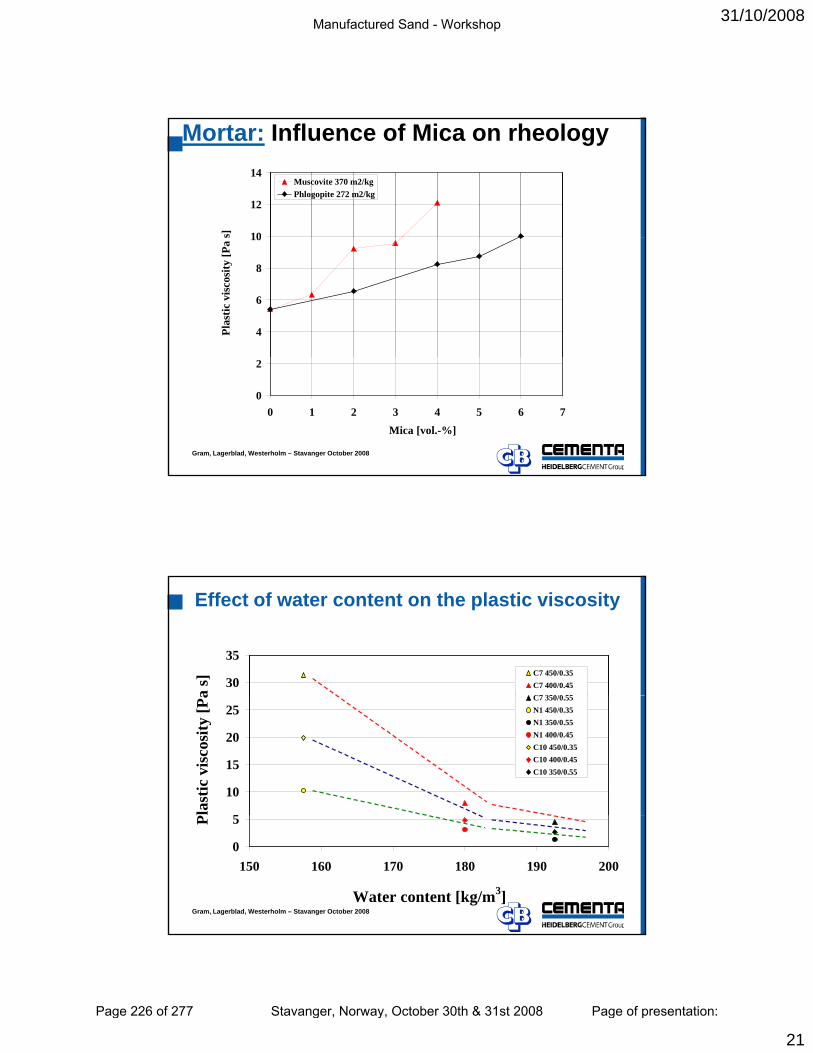
31/10/2008
21
Mortar: Influence of Mica on rheology
10
12
14
s]
Muscovite 370 m2/kgPhlogopite 272 m2/kg
4
6
8
10Pl
astic
vis
cosi
ty [P
a s
Gram, Lagerblad, Westerholm – Stavanger October 2008
0
2
0 1 2 3 4 5 6 7Mica [vol.-%]
54 % paste volume. Constant yield stress
30
35
a s]
C7 450/0.35C7 400/0.45C7 350/0 55
Effect of water content on the plastic viscosity
5
10
15
20
25
last
ic v
isco
sity
[Pa C7 350/0.55
N1 450/0.35N1 350/0.55N1 400/0.45C10 450/0.35C10 400/0.45C10 350/0.55
Gram, Lagerblad, Westerholm – Stavanger October 2008
0
5
150 160 170 180 190 200
Water content [kg/m3]
P
Manufactured Sand - Workshop
Page 226 of 277 Stavanger, Norway, October 30th & 31st 2008 Page of presentation:
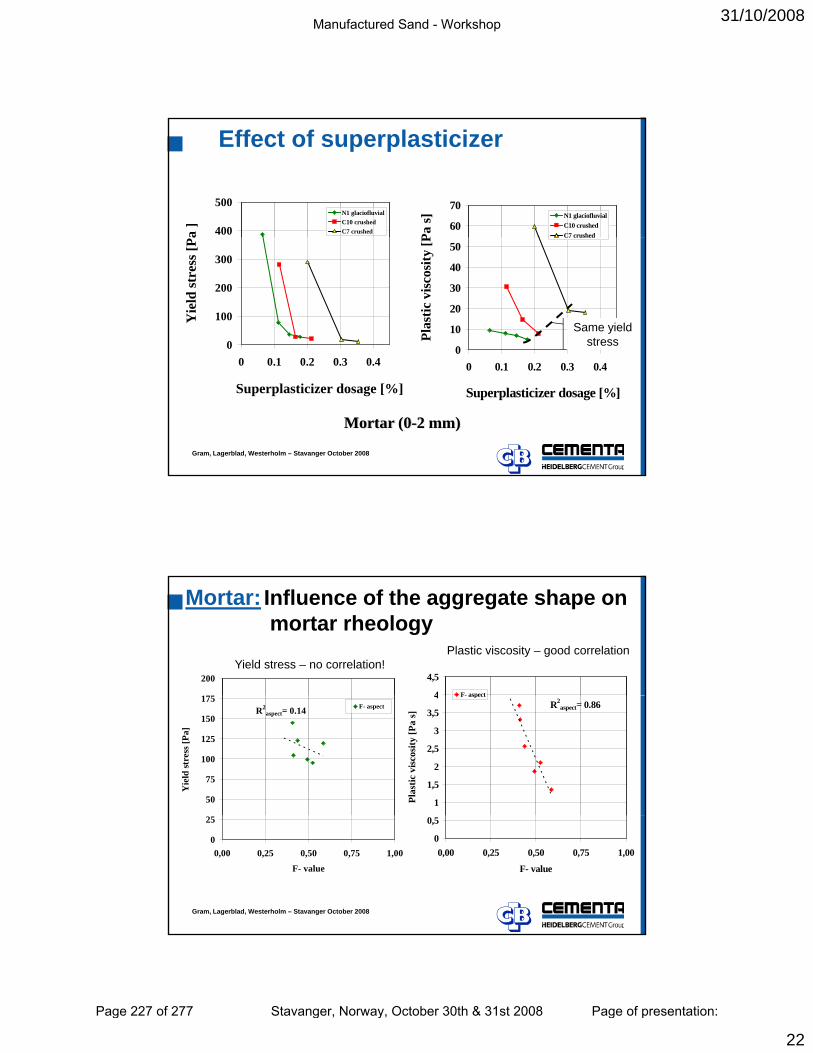
31/10/2008
22
Effect of superplasticizer
60
70
Pa s]
N1 glaciofluvialC10 crushedC7 crushed400
500a
]N1 glaciofluvialC10 crushedC7 crushed
0
10
20
30
40
50
Plas
tic v
isco
sity
[P
C7 crushed
0
100
200
300
Yie
ld st
ress
[Pa
Same yield stress
Gram, Lagerblad, Westerholm – Stavanger October 2008
0 0.1 0.2 0.3 0.4
Superplasticizer dosage [%]
0 0.1 0.2 0.3 0.4
Superplasticizer dosage [%]
Mortar (0-2 mm)
Mortar: Influence of the aggregate shape on mortar rheology
4
4,5
F- aspect
200Yield stress – no correlation!
Plastic viscosity – good correlation
R2aspect= 0.86
1
1,5
2
2,5
3
3,5
4
Plas
tic v
isco
sity
[Pa
s]
F- aspect
R2aspect= 0.14
50
75
100
125
150
175
Yie
ld st
ress
[Pa]
F- aspect
Gram, Lagerblad, Westerholm – Stavanger October 2008
0
0,5
0,00 0,25 0,50 0,75 1,00
F- value
0
25
0,00 0,25 0,50 0,75 1,00
F- value
Manufactured Sand - Workshop
Page 227 of 277 Stavanger, Norway, October 30th & 31st 2008 Page of presentation:
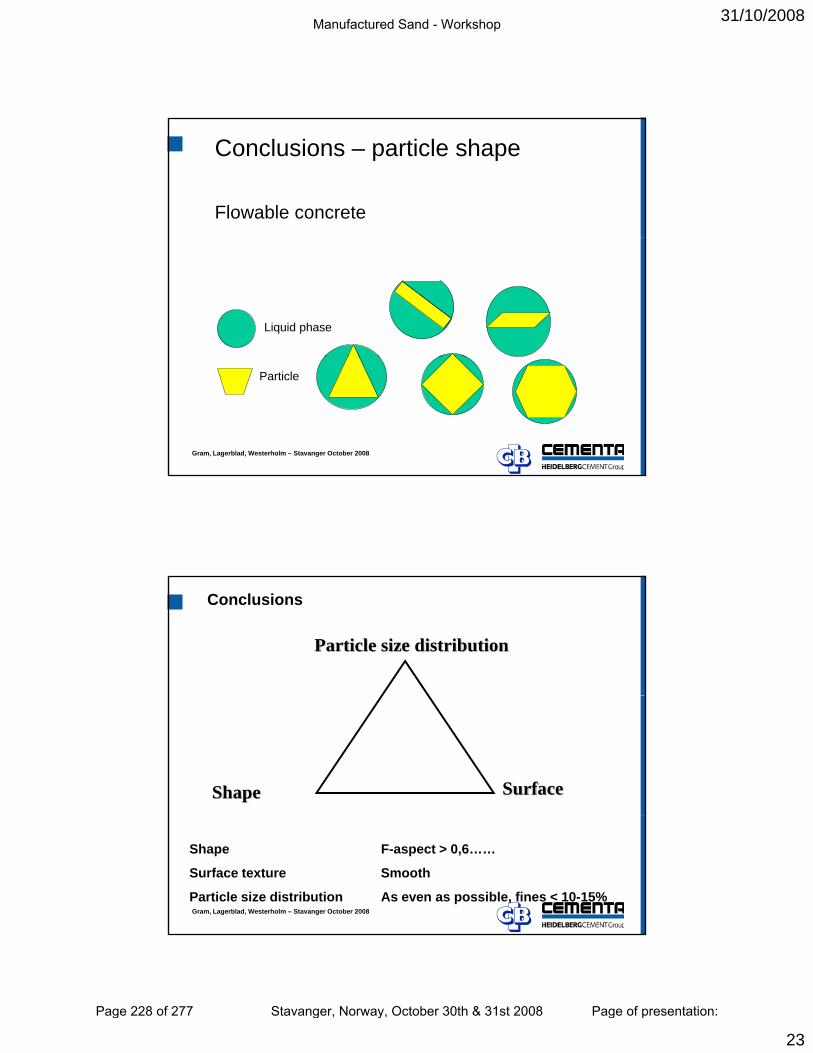
31/10/2008
23
Conclusions – particle shape
Flowable concrete
Fluid fas att röra sig iLiquid phase
Gram, Lagerblad, Westerholm – Stavanger October 2008
PartikelParticle
Conclusions
Particle size distribution
Shape Surface
Gram, Lagerblad, Westerholm – Stavanger October 2008
Shape F-aspect > 0,6……
Surface texture Smooth
Particle size distribution As even as possible, fines < 10-15%
Manufactured Sand - Workshop
Page 228 of 277 Stavanger, Norway, October 30th & 31st 2008 Page of presentation:
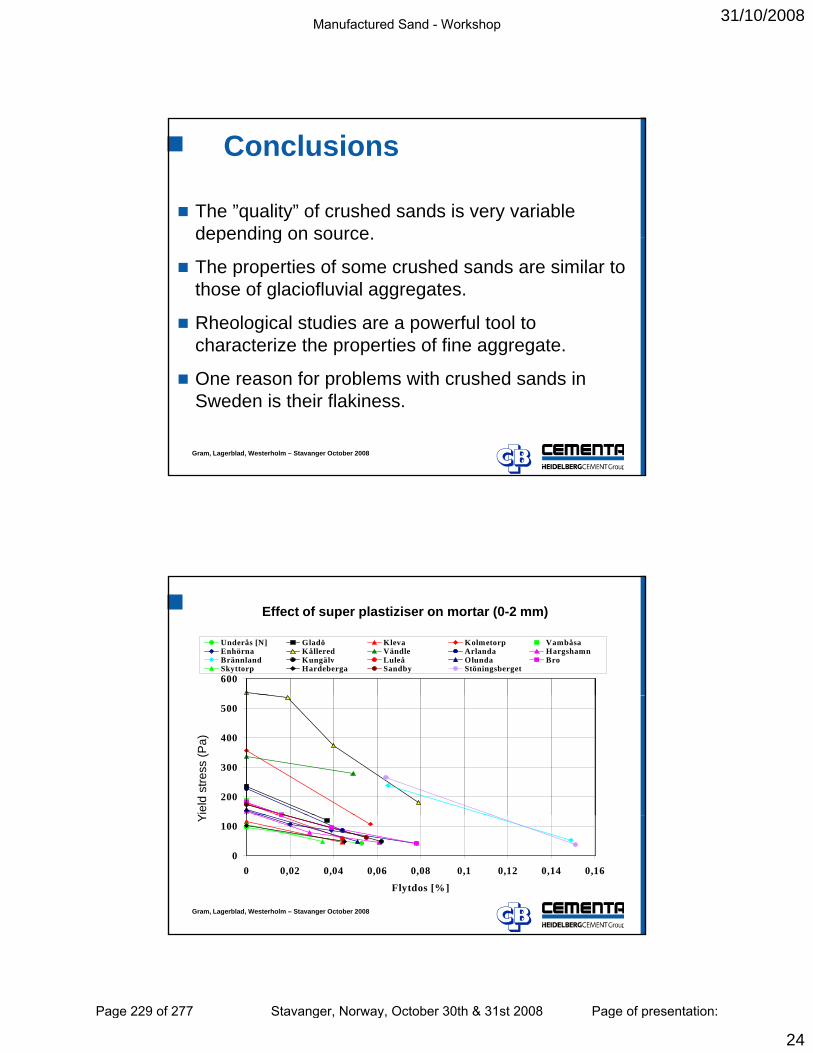
31/10/2008
24
Conclusions
The ”quality” of crushed sands is very variable depending on sourcedepending on source.
The properties of some crushed sands are similar to those of glaciofluvial aggregates.
Rheological studies are a powerful tool to characterize the properties of fine aggregate.
Gram, Lagerblad, Westerholm – Stavanger October 2008
One reason for problems with crushed sands in Sweden is their flakiness.
600
Underås [N] Gladö Kleva Kolmetorp VambåsaEnhörna Kållered Vändle Arlanda HargshamnBrännland Kungälv Luleå Olunda BroSkyttorp Hardeberga Sandby Stöningsberget
Effect of super plastiziser on mortar (0-2 mm)
200
300
400
500
Flyt
grän
sspä
nnin
g [P
a]Yi
eld
stre
ss (P
a)
Gram, Lagerblad, Westerholm – Stavanger October 2008
0
100
0 0,02 0,04 0,06 0,08 0,1 0,12 0,14 0,16
Flytdos [%]
FY
Manufactured Sand - Workshop
Page 229 of 277 Stavanger, Norway, October 30th & 31st 2008 Page of presentation:

Manufactured Sand - Workshop
Page 230 of 277 Stavanger, Norway, October 30th & 31st 2008 Page of presentation:
A FLAKINESS TEST FOR FINE AGGREGATE Chris Rogers Post Office Box 185, 161 Centre Street, Beeton, Ontario, Canada, L0G 1A0 E-mail [email protected] Phone 905-729-4768 Bob Gorman Soils and Aggregates Section, Materials Engineering and Research Office Ministry of Transportation, Downsview, Ontario, Canada, M3M 1J8 E-mail [email protected]
ABSTRACT
The presence of excessive amounts of flakey particles in the coarser fractions of fine
aggregate are thought to be the cause of two cases of ‘Uncompactable Hot Mix Asphalt’ that
have occurred in Canada. This paper describes the development of a test for measuring the
amount of flakey particles in fine aggregate. Commercially available slotted sieves for testing
grain or seeds are used. Material in the pass 4.75 mm to 2.36 mm fraction is tested on a 1.8 mm
slotted sieve and material in the pass 2.36 mm to 1.18 mm fraction is tested on a 1.0 mm slotted
sieve. The equipment is inexpensive and the test is easily done and fast.
High amounts of flakey particles in a fine aggregate may warn of difficulty in compacting
asphalt mixtures in which the material is used by itself as the fine aggregate. Caution should be
exercised with fine aggregates that contain amounts of flakey particles (as defined by the test
method) in excess of 30% in the 1.18 mm fraction and in excess of 25% in the 2.36 mm fraction.
This only applies when such aggregates are the sole fine aggregate in the mixture.
The measurement of flakey particles may also be used to compare the effect of different
crushers and crusher systems on creation of flakey particles in fine aggregate. It may also be
used to identify and compare suitable concrete making sands.
Keywords: aggregate, concrete, crusher screenings, flakey particles, grading, hot mix asphalt,
manufactured sand, particle shape, sand, slotted sieves, testing,
Manufactured Sand - Workshop
Page 231 of 277 Stavanger, Norway, October 30th & 31st 2008 Page of presentation:

31/10/2008
1
A FLAKINESS TEST FOR FINE AGGREGATEAGGREGATE
Chris Rogers and Bob Gorman fMinistry of Transportation Ontario,
Canada
City of Ottawa, Ontario, Canada
Manufactured Sand - Workshop
Page 232 of 277 Stavanger, Norway, October 30th & 31st 2008 Page of presentation:
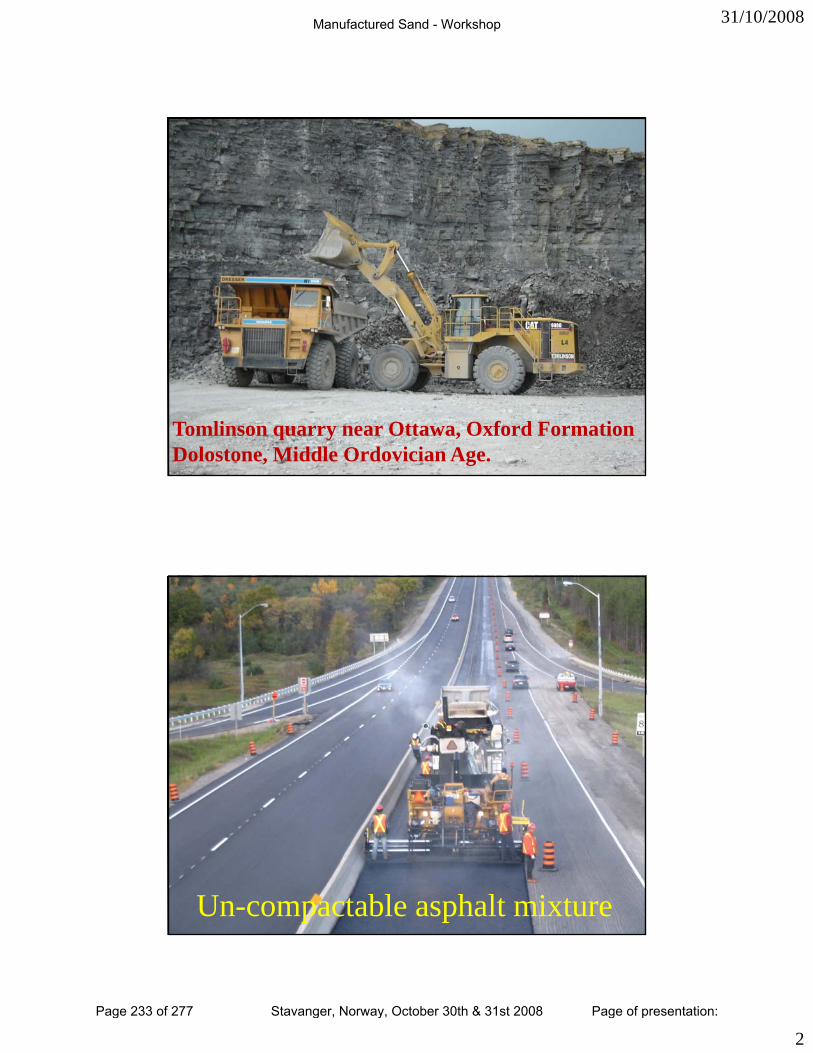
31/10/2008
2
Tomlinson quarry near Ottawa, Oxford Formation Dolostone, Middle Ordovician Age.
Un-compactable asphalt mixture
Manufactured Sand - Workshop
Page 233 of 277 Stavanger, Norway, October 30th & 31st 2008 Page of presentation:
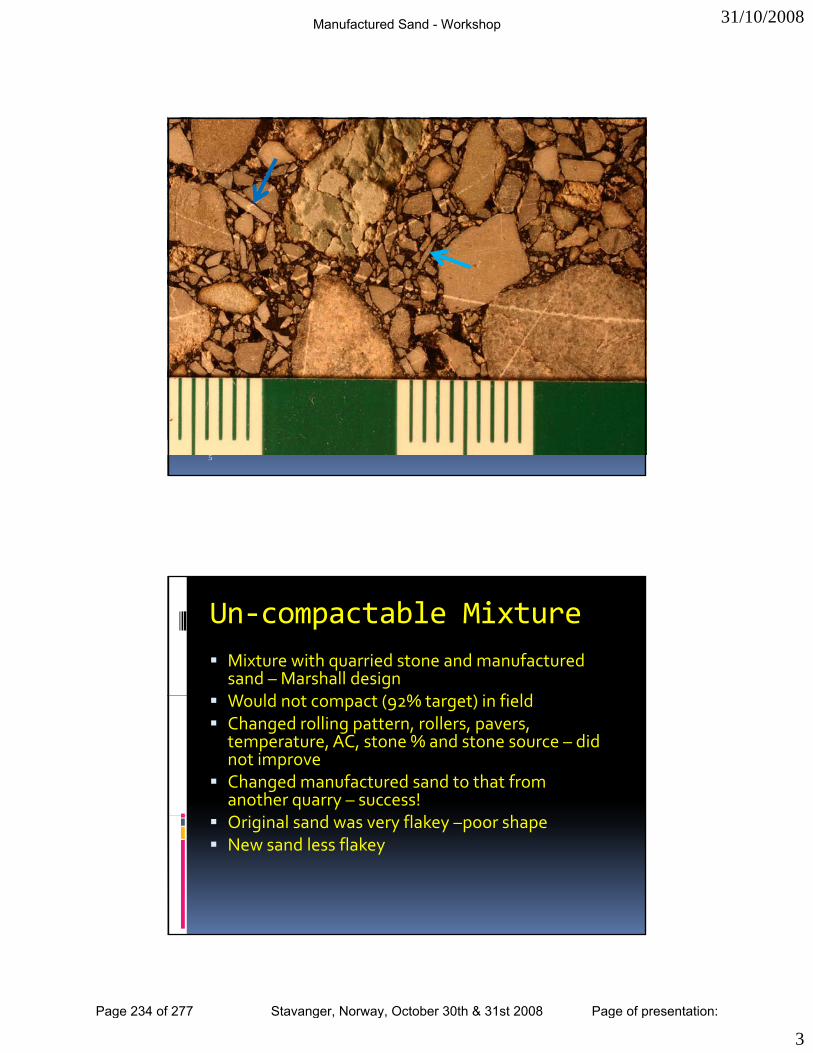
31/10/2008
3
5
Un‐compactable MixtureMixture with quarried stone and manufactured sand – Marshall designW ld ( % ) i fi ldWould not compact (92% target) in fieldChanged rolling pattern, rollers, pavers, temperature, AC, stone % and stone source – did not improveChanged manufactured sand to that from another quarry – success!
l d fl k hOriginal sand was very flakey –poor shape New sand less flakey
Manufactured Sand - Workshop
Page 234 of 277 Stavanger, Norway, October 30th & 31st 2008 Page of presentation:
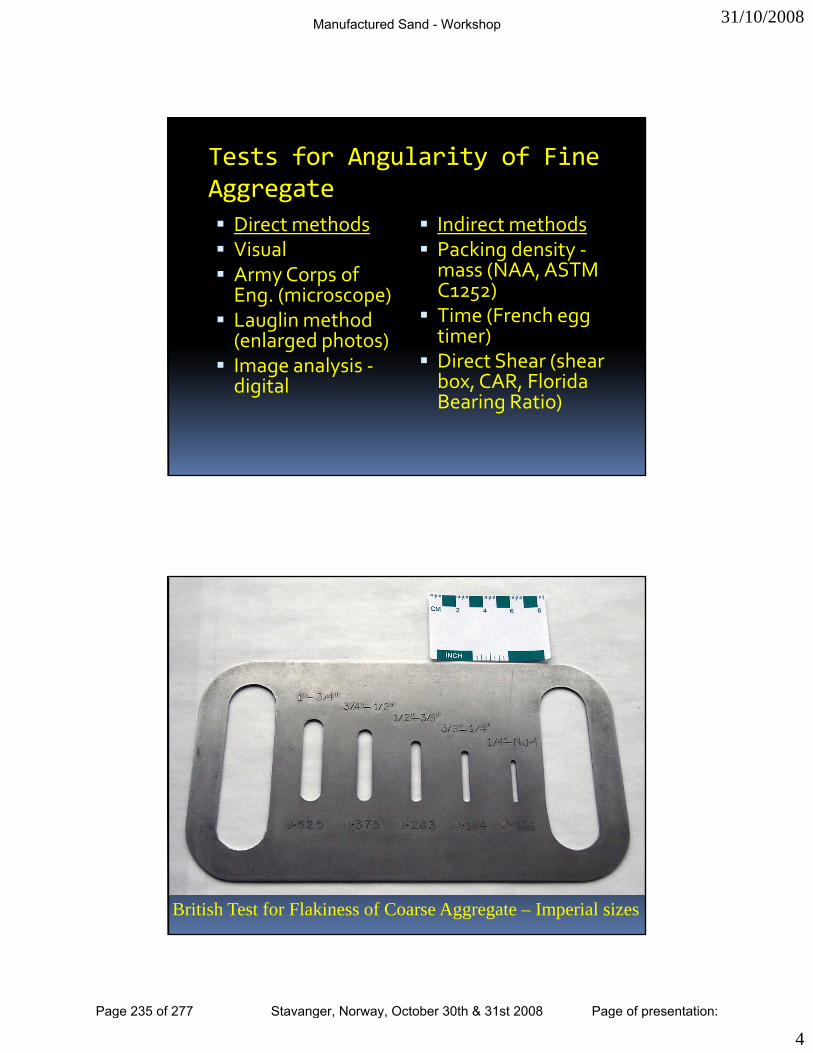
31/10/2008
4
Tests for Angularity of Fine Aggregate
Direct methods Indirect methodsVisualArmy Corps of Eng. (microscope)Lauglin method (enlarged photos)
Packing density ‐mass (NAA, ASTM C1252)Time (French egg timer)Di t Sh ( h Image analysis ‐
digitalDirect Shear (shear box, CAR, Florida Bearing Ratio)
British Test for Flakiness of Coarse Aggregate – Imperial sizes
Manufactured Sand - Workshop
Page 235 of 277 Stavanger, Norway, October 30th & 31st 2008 Page of presentation:
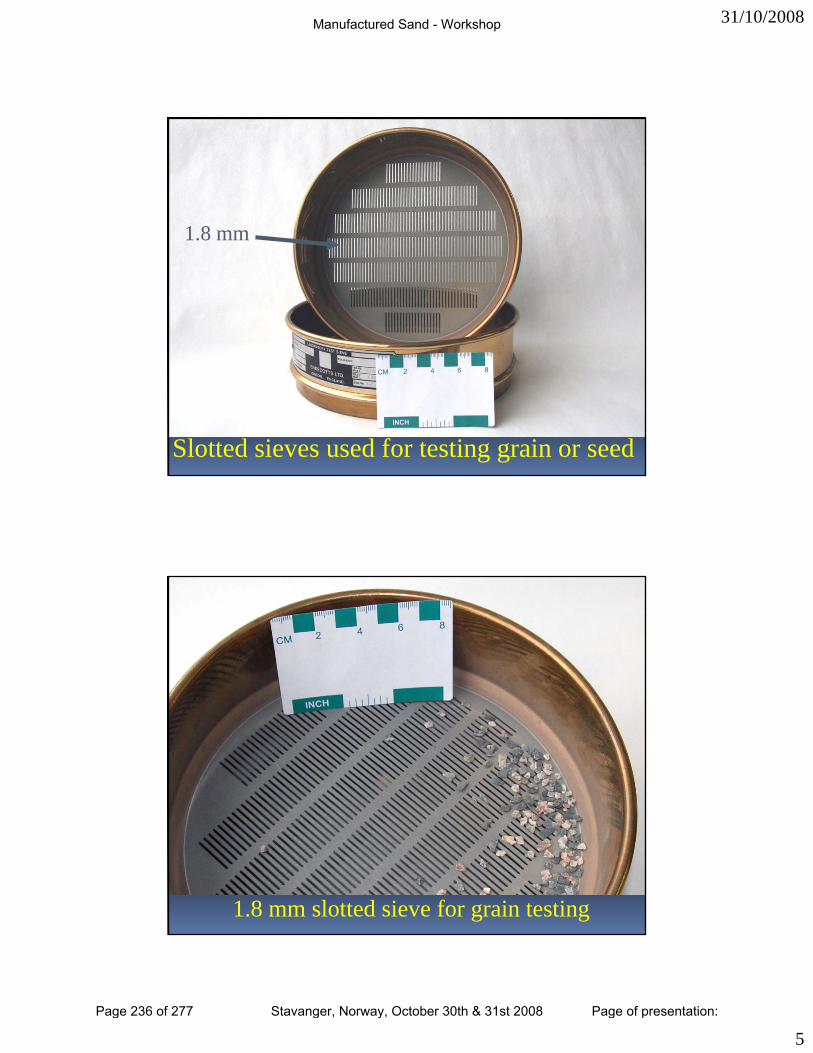
31/10/2008
5
1 8 mm1.8 mm
Slotted sieves used for testing grain or seed
1.8 mm slotted sieve for grain testing
Manufactured Sand - Workshop
Page 236 of 277 Stavanger, Norway, October 30th & 31st 2008 Page of presentation:
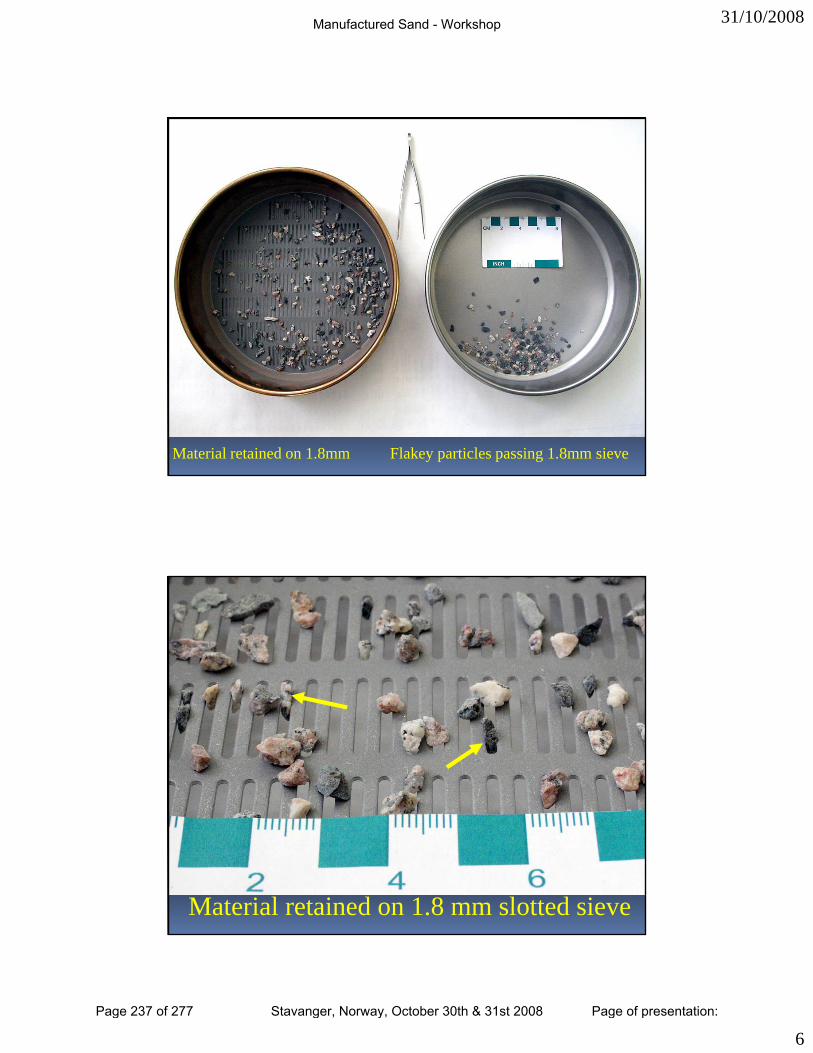
31/10/2008
6
Material retained on 1.8mm Flakey particles passing 1.8mm sieve
Material retained on 1.8 mm slotted sieve
Manufactured Sand - Workshop
Page 237 of 277 Stavanger, Norway, October 30th & 31st 2008 Page of presentation:

31/10/2008
7
Material passing through the 1.8 mm slot
25
30
35Flakiness of 4.75-2.36 mm fraction
Limestone, Bobcaygeon FormationDolostone, Oxford FormationMetavolcanic, mine wasteDolostone, Amabel Formation
s S
ieve
Poor compaction hi t
10
15
20
Dol. sandstone, March FormationSand with screenings
Per
cen
t Pas
sing
Fla
kine
ss history
Good compaction history
Chose to
0
5
0.8 1 1.2 1.4 1.6 1.8 2
Size of Flakiness Sieve in mm
C ose touse the 1.8 mmslotted sieve
Manufactured Sand - Workshop
Page 238 of 277 Stavanger, Norway, October 30th & 31st 2008 Page of presentation:
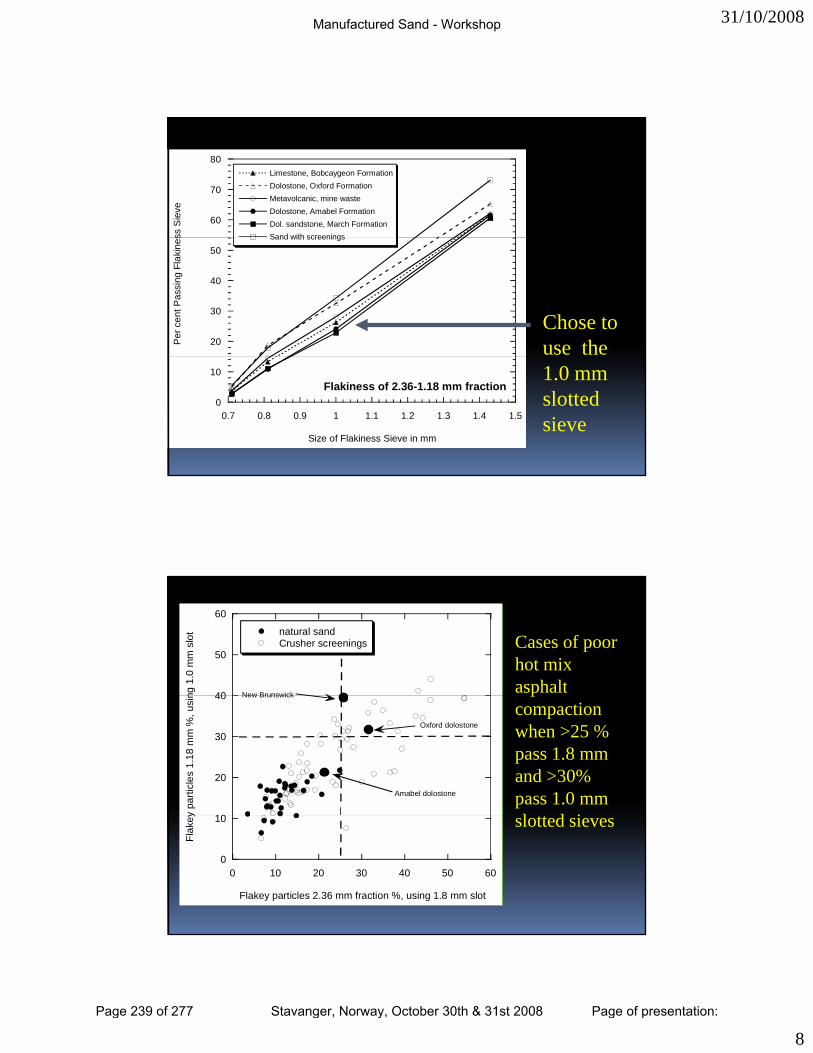
31/10/2008
8
60
70
80Limestone, Bobcaygeon FormationDolostone, Oxford FormationMetavolcanic, mine wasteDolostone, Amabel FormationDol. sandstone, March FormationSand with screeningsss
Sie
ve
20
30
40
50Sand with screenings
Per
cen
t Pas
sing
Fla
kine
s
Chose to use the
0
10
0.7 0.8 0.9 1 1.1 1.2 1.3 1.4 1.5
Flakiness of 2.36-1.18 mm fraction
Size of Flakiness Sieve in mm
1.0 mm slotted sieve
40
50
60
natural sandCrusher screenings
ng 1
.0 m
m s
lot
New Brunswick
Cases of poor hot mixasphalt
10
20
30
40
y pa
rticl
es 1
.18
mm
%, u
sin
Amabel dolostone
Oxford dolostone
New Brunswick pcompactionwhen >25 % pass 1.8 mm and >30%pass 1.0 mm l d i
0
10
0 10 20 30 40 50 60
Flak
ey
Flakey particles 2.36 mm fraction %, using 1.8 mm slot
slotted sieves
Manufactured Sand - Workshop
Page 239 of 277 Stavanger, Norway, October 30th & 31st 2008 Page of presentation:
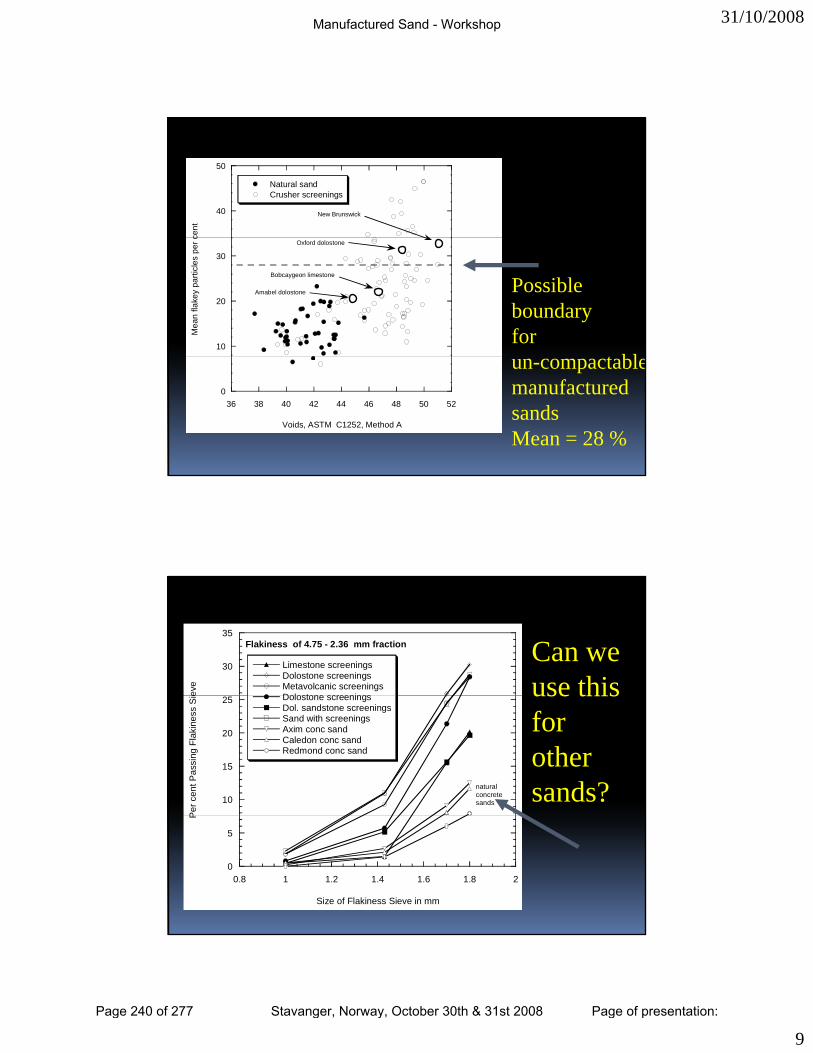
31/10/2008
9
40
50
Natural sandCrusher screenings
cent
New Brunswick
10
20
30
Mea
n fla
key
parti
cles
per
c Oxford dolostone
Bobcaygeon limestone
Amabel dolostone Possible boundary for
t bl0
36 38 40 42 44 46 48 50 52
Voids, ASTM C1252, Method A
un-compactablemanufactured sandsMean = 28 %
30
35Flakiness of 4.75 - 2.36 mm fraction
Limestone screeningsDolostone screeningsMetavolcanic screeningsDolostone screeningsev
e
Can we use this
10
15
20
25 Dolostone screeningsDol. sandstone screeningsSand with screeningsAxim conc sandCaledon conc sandRedmond conc sand
Per
cen
t Pas
sing
Fla
kine
ss S
ie
naturalconcretesands
use thisfor other sands?
0
5
0.8 1 1.2 1.4 1.6 1.8 2
P
Size of Flakiness Sieve in mm
Manufactured Sand - Workshop
Page 240 of 277 Stavanger, Norway, October 30th & 31st 2008 Page of presentation:
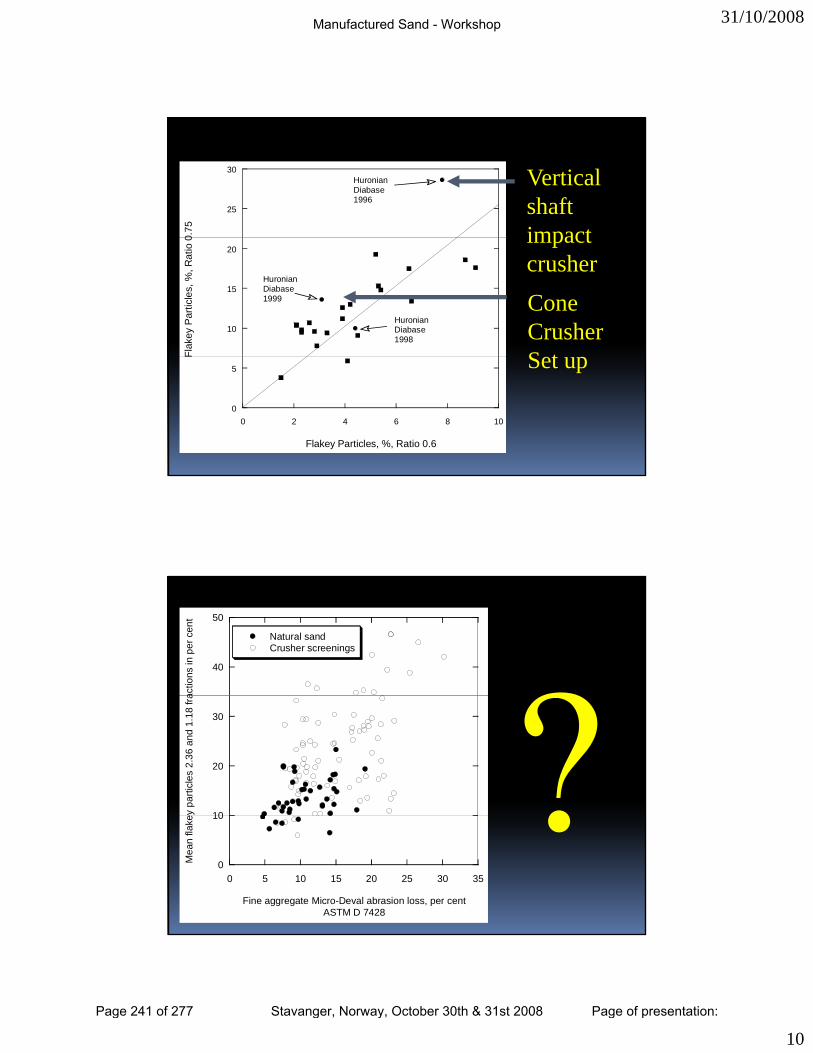
31/10/2008
10
25
30
0.75
HuronianDiabase 1996
Vertical shaftimpact
10
15
20
Flak
ey P
artic
les,
%, R
atio
0
HuronianDiabase1999
HuronianDiabase 1998
impact crusherConeCrusherS t
0
5
0 2 4 6 8 10
Flakey Particles, %, Ratio 0.6
Set up
40
50
Natural sandCrusher screenings
actio
ns in
per
cen
t
10
20
30
y pa
rticl
es 2
.36
and
1.18
fra
0
10
0 5 10 15 20 25 30 35
Mea
n fla
ke
Fine aggregate Micro-Deval abrasion loss, per centASTM D 7428
Manufactured Sand - Workshop
Page 241 of 277 Stavanger, Norway, October 30th & 31st 2008 Page of presentation:
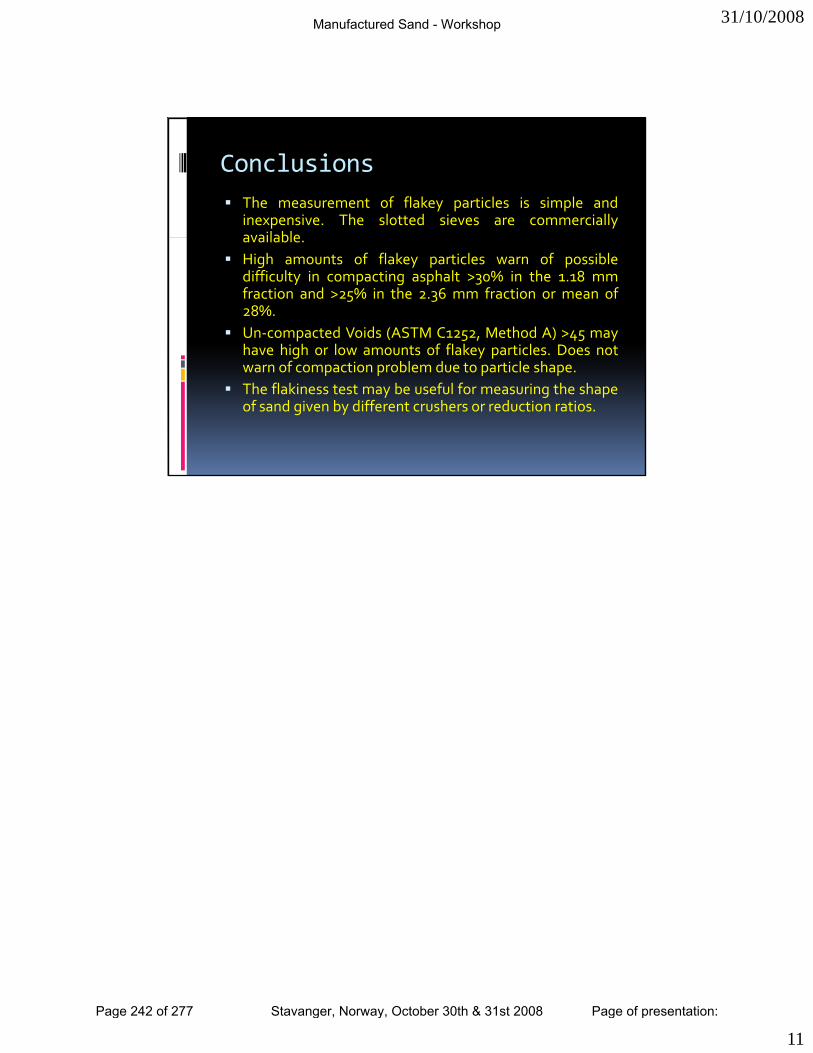
31/10/2008
11
ConclusionsThe measurement of flakey particles is simple andinexpensive. The slotted sieves are commerciallyavailableavailable.High amounts of flakey particles warn of possibledifficulty in compacting asphalt >30% in the 1.18 mmfraction and >25% in the 2.36 mm fraction or mean of28%.Un‐compacted Voids (ASTM C1252, Method A) >45 mayhave high or low amounts of flakey particles. Does notg y pwarn of compaction problem due to particle shape.The flakiness test may be useful for measuring the shapeof sand given by different crushers or reduction ratios.
Manufactured Sand - Workshop
Page 242 of 277 Stavanger, Norway, October 30th & 31st 2008 Page of presentation:
A FLAKINESS TEST FOR FINE AGGREGATE Chris Rogers Post Office Box 185, 161 Centre Street, Beeton, Ontario, Canada, L0G 1A0 E-mail [email protected] Bob Gorman Soils and Aggregates Section, Materials Engineering and Research Office Ministry of Transportation, Downsview, Ontario, Canada, M3M 1J8 E-mail [email protected]
ABSTRACT
The presence of excessive amounts of flakey particles in the coarser fractions of
fine aggregate are thought to be the cause of two cases of ‘Uncompactable Hot Mix
Asphalt’ that have occurred in Canada. This paper describes the development of a test for
measuring the amount of flakey particles in fine aggregate. Commercially available
slotted sieves for testing grain or seeds are used. Material in the pass 4.75 mm to 2.36
mm fraction is tested on a 1.8 mm slotted sieve and material in the pass 2.36 mm to 1.18
mm fraction is tested on a 1.0 mm slotted sieve. The equipment is inexpensive and the
test is not excessively time consuming.
High amounts of flakey particles in a fine aggregate may warn of difficulty in
compacting asphalt mixtures in which the material is used by itself as the fine aggregate.
Caution should be exercised with fine aggregates that contain amounts of flakey particles
(as defined by the test method) in excess of 30% in the 1.18 mm fraction and in excess of
25% in the 2.36 mm fraction. This only applies when such aggregates are the sole fine
aggregate in the mixture.
The measurement of flakey particles may also be used to compare the effect of
different crushers and crusher systems on creation of flakey particles in fine aggregate.
Keywords: aggregate, crusher screenings, flakey particles, grading, hot mix asphalt,
manufactured sand, particle shape, sand, slotted sieves, testing,
Manufactured Sand - Workshop
Page 243 of 277 Stavanger, Norway, October 30th & 31st 2008 Page of presentation:
Introduction
In 1996, a hot mix asphalt-paving contractor working near Ottawa, Ontario
encountered something that he described as an “uncompactable mix”. The mix had been
designed using the Marshall Mixture Design process and was what is called, in Ontario, a
Heavy Duty Binder Mix. This is an asphalt base course mix made with 100% crushed
aggregates, both coarse and fine. The aggregates are manufactured from quarried bedrock
sources. This mixture is commonly used in Ontario and was developed to resist rutting on
freeway pavements where there was very heavy truck use that would otherwise cause
wheel path rutting. In this case, the contractor had designed the mixture in his own
laboratory, which was well equipped and had extensive asphalt mixture design
experience.
The mixture consisted of about 50% by mass coarse aggregate (> 4.75 mm) of
quarried dolostone of the Oxford Formation with the fine aggregate consisting of
manufactured sand from the same source. The materials met and exceeded all relevant
material specifications. The experienced paving crew were unable to obtain the required
compaction in the field. A variety of solutions were sought. Various combinations of
paving and compaction equipment and rolling patterns were tried to no avail. Changes in
layer thickness or temperature did not work. The coarse aggregate was substituted for
another with no success. The ultimate solution was found to be to substitute the dolostone
fine aggregate with manufactured sand from a limestone quarry. After a redesign of the
mixture, paving took place with no problems and adequate compaction was achieved.
We were asked to look at the dolostone fine aggregate to see if there was any
characteristic that might indicate the cause of the problem. An examination under the
microscope showed that the particles retained on the 1.18 and 2.36 mm sieves contained
large amounts of flakey particles. The number of flakey particles in the limestone sand
was less and the particles were not so obviously flakey or sharp.
At this point, we started to look for a cheap, easy, and practical test that might be
used as a tool in the normal commercial mix design laboratory to warn of, or indicate,
manufactured sands that were extremely flakey and might contribute to or cause lay
down or compaction problems. More recently, the focus of researchers has been on image
analysis techniques (Masad et al 2007). The sophistication of the equipment is such that
Manufactured Sand - Workshop
Page 244 of 277 Stavanger, Norway, October 30th & 31st 2008 Page of presentation:

it can rarely be justified in a commercial asphalt mixture design laboratory and is not
commonly available.
Test Method Development
The first test that was looked at was the test for flat and elongated particles. In
Ontario, a hand-held set of proportional callipers set in ratio of 4:1 is used. Unlike the
conventional “Army Corps of Engineers” callipers used in ASTM D4791, the hand-held
callipers are capable of being used to fairly easily measure proportions of particles
retained on the 2.36 mm sieve. However, the quality of manufacture is such that a great
deal of operator experience is needed and there are variations in the accuracy of different
callipers. It was known that the coarse aggregate version of the method had extremely
poor multi-laboratory variation. It was desired to devise a piece of test equipment that
would be accurate, reduce the effect of operator influence, and give reproducible results
in different laboratories. For this reason, this test was not pursued further.
We also examined the uncompacted voids test (ASTM C1252). This test has
lower limits for acceptable asphalt paving aggregates but no upper limits. No suitable
upper value could be easily identified that would not result in possible rejection of
materials which might perform satisfactorily while rejecting those which gave a mixture
with poor compaction characteristics.
In the United Kingdom, there is a flakiness test used on coarse aggregate (Photo
1) and special slotted sieves that are commercially available which are used to determine
if particles are deemed by the test method definition to be flakey. In the British Standard
(BS 812), they define the slot dimensions through which flakey particles will pass as 0.6
of the mean size between two consecutive sieves. For instance, for a sieve fraction of
pass 6.3 mm and retained on 4.75 mm, the mean size is 5.53 mm. 5.53 x 0.6 = 3.3 mm.
Coarse aggregate is first sieved to refusal on a square opening sieve of 4.75 mm and then
the material retained on that sieve is re-sieved on the flakiness sieve of the appropriate
slot size (3.3 mm in this case). In actual practice, manipulation or examination of each
particle takes place to determine if it can be fitted through the slot. Material which passes
the slot is defined as a flakey particle and the proportion of these are expressed as a per
cent by mass of the original material retained on the square opening sieve. There are no
Manufactured Sand - Workshop
Page 245 of 277 Stavanger, Norway, October 30th & 31st 2008 Page of presentation:
known slotted flakiness sieves for fine aggregates and, indeed, the British Standard says
that this test is not applicable to material passing a 6.30 mm sieve.
We had a machine shop make slotted sieves in a variety of sizes. This was done
by taking a solid billet of steel approximately 100 mm square and 30 mm deep. Using an
extremely accurate computer controlled wire cutter, slots were cut in the solid steel to the
required size. To create a suitable hollow to contain and hold particles, the steel billet was
then milled out, leaving a thin base of about 2 mm thickness and solid steel sides. Each
sieve made in this way cost about $500. It was also not a process that would be easily
amenable to mass production.
Early investigations were conducted on sieves made in this way. One of the
problems that immediately became apparent was the need to obtain representative
specimens from bulk samples. It was found that, after sieving by hand on the slotted
sieves, there was still a need to inspect and sometimes manipulate each particle with a
pair of tweezers to see if it would fit through the slot. Flakey particles lie flat on the sieve
surface and do not easily present their edges to the slots. Many flakey particles will fall
through during hand sieving, but not all. The consequence is that, if the sample is large,
the number of particles that have to be individually examined becomes very large and the
task is tedious. In an effort to reduce the burden of testing, a spinning riffler was
purchased so that small representative test samples could be accurately made.
In a spinning riffler system, materials are fed from a hopper in a narrow stream
onto a slow-moving vibrating feeder. The feeder discharges into identical sample
containers or test tubes placed on a spinning turntable. It takes approximately 30 passes
under the stream of aggregate from the feeder to fill each test tube to capacity. The
number of passes depends on feeder speed, turntable speed, and desired sample size. One
or more of the filled test tubes can be further subdivided using the same technique. This
results in a more representative sample than could be obtained using any other technique.
Spinning rifflers are capable of removing the effects of segregation in a material stream
by the use of multiple passes to acquire the sample. The process will work best if the
turntable turns relatively quickly and the flow of material is relatively slow so as to
maximize the number of passes needed to acquire a sample.
Manufactured Sand - Workshop
Page 246 of 277 Stavanger, Norway, October 30th & 31st 2008 Page of presentation:

Following the British Standard definition for the fraction from 4.75 to 2.36: The
mean size is 3.55 mm. 3.55 mm x 0.6 = 2.13 mm. This size seemed too pass too much
material and, as a result, a variety of smaller slotted sieves were tested to understand
more fully some of the relationships. A ratio of 0.75 of the retaining sieve was finally
chosen, which is 2.36 mm x 0.75 = 1.77 (or 1.80 mm). We also evaluated a size of 1.42
mm that was developed from 2.36 mm x 0.60 = 1.42 mm slot size. The 1.0 mm and 1.70
mm sieves were also used because they were available. The results of testing a variety of
fine aggregates are shown in Table 1. Figure 1 shows graphically how the amount of
flakey particles varies as a function of slot or flakey sieve opening for material passing
the 4.75 mm sieve and retained on the 2.36 mm sieve.
Table 1 also shows the same relationship for material pass the 2.36 mm sieve and
sieved to refusal on a 1.18 mm sieve and then sieved over slotted sieves of various sizes.
For the 2.36 to 1.18 mm fraction, the mean size is 1.77 mm. 1.77 mm x 0.6 = 1.06 mm
that is the size needed if the British definition of a 0.6 ratio of the mean opening size is
used. For the same fraction, but calculating the slot size using the ratio of size of the
retaining sieve of would give 1.18 x 0.6 = 0.71 mm. If the same rationale as used for the
2.36 mm fraction were used for the 1.18 mm fraction, a flakiness sieve of 1.18 x 0.75 =
0.89 mm would be needed. In Figure 2, a graph of flakey particles as a function of slot
opening is shown for the 1.18 mm fraction. A flakiness sieve (1.42 mm) developed for
testing the 2.36 mm fraction was also used since it was available. As was expected, very
large amounts of material passed this sieve and the majority could not properly be
defined as flakey particles since they were often smaller non-flakey, or roughly
equidimensional, particles found in the sieve fraction.
In both graphs, it is noteworthy that there is an apparent straight-line relationship
between size of the slot and amount passing. The exception is in Figure 1 for the 1 mm
slot for the retained 2.36 mm fraction where very few particles passed the slot.
After this development work was carried out, we became aware that slotted sieves
used for testing seeds and grain were commercially available at a reasonable cost (Photo
2). These were made from punched plate and were available from 1 mm upwards in
0.1 mm increments. A decision was made at this point to arbitrarily focus on one slot size
for each fraction. For the 2.36 mm fraction, the 1.80 mm size was chosen (Photos 3 and
Manufactured Sand - Workshop
Page 247 of 277 Stavanger, Norway, October 30th & 31st 2008 Page of presentation:
4) and for the 1.18 fraction the 1.00 mm slot size sieve was chosen. When the 1.80 mm
size is chosen, it is a ratio of 0.75 of the retaining sieve (2.36 mm). A similar sieve would
have been chosen for the 1.18 mm fraction that is 0.89 mm. However, the lack of
commercial availability of that size swayed the decision to use the smallest commercially
available slotted sieve of 1.0 mm. It is realized that this choice was arbitrary, but the
search was for a practical and low cost test that would warn asphalt mix designers of
potential problems.
Figure 3 shows the relationship with the percent flakey particles in the 2.36 mm
fraction with the per cent flakey particles when the 1.0 mm and 0.89 mm slotted sieves
are used for testing the 1.18 mm fraction. Significantly, there is a better correlation with
flakey particles in the 2.36 mm fraction (using the 1.8 mm slot) when the 1.0 mm slotted
sieve is used, further justifying the choice of the commercially available 1.0 mm slotted
sieve for that fraction rather than the 0.89 mm sieve.
Sample Collection
We collected about 120 samples of aggregates used in concrete and asphalt from
across Ontario. This included natural glacio-fluvial sands composed substantially of
rounded and sub-angular particles; mixtures of natural sands and crusher screenings, and
samples composed exclusively of crusher screenings or manufactured sands. Most of
these had a history of being used in either asphalt or concrete or both. The composition of
the fine aggregates varied from those composed of 100% siliceous rock types from the
central and northern parts of the province, to those of 100% carbonate rock from the
south, as well as of mixtures of both carbonate and siliceous rock types in natural sands.
The sample collection was broad enough that samples of most of the fine aggregates
likely to be encountered in Ontario were represented. A variety of crusher types and
crushing set ups were also represented.
Testing Program
The sands were tested in a variety of tests:
1. The fine aggregate micro-Deval test now published by ASTM as D7428 – 08,
2. Bulk density and water absorption following ASTM C128,
Manufactured Sand - Workshop
Page 248 of 277 Stavanger, Norway, October 30th & 31st 2008 Page of presentation:
3. Aggregate uncompacted voids using method A and B following ASTM C1252,
4. Flakey particles (in per cent) using the test described in this paper and described
in detail in Appendix 1.
5. Compacted Aggregate Resistance Test (CAR) following the proposal of D. Jahn
following a simplified method (2004) described in Appendix 2.
Results and Discussion
Figure 4 shows a plot of flakey particles in the 1.18 mm fraction compared with
flakey particles in the 2.36 mm fraction. As might be expected, fine aggregates that have
a lot of flakey particles in one fraction tend to have a lot in the other fraction. However,
regression coefficients are not strong and have been omitted from this plot for clarity. As
might be expected, natural sands tend to have a lot less flakey particles than crusher
screenings. There are some crusher screenings that plot in the field of the natural sands
and is suspected that these may be mixtures of natural sand and crusher screenings.
Further microscopic study is needed. It is noteworthy that no natural sands have large
numbers of flakey particles (> 25%). Also plotted on this graph is the screenings sample
labelled as ‘Oxford dolostone’, which first raised the issue of uncompactable mixtures. It
can be seen that this material contained over 30% flakey particles in both sieve fractions.
Also plotted is a material labelled as ‘Amabel dolostone’. This material is of Silurian age
from the Niagara Escarpment and is a high purity reefal dolostone. This material has a
long history of use in ‘Heavy Duty Binder Mixes’, where 100% crushed coarse and fine
aggregate is used in asphalt base course. This material had flakey particles of about 20%
in both fractions and has given good performance. In about 2002, we became aware of
another case of a suspected uncompactable mix. This occurred in the province of New
Brunswick, and some of the physical characteristics of the rhyolitic fine aggregate are
summarized in Table 2, together with those for the Amabel dolostone. This data is shown
graphically in Figure 4. It is noteworthy that this material had a very high amount of
flakey particles and reportedly gave problems with compaction similar to those described
in the introduction that occurred in Ontario.
Tentative limits are drawn on the graph of 30% for the 1.18 mm fraction and 25%
for the 2.36 mm fraction. We speculate that, when crusher screenings are found with
Manufactured Sand - Workshop
Page 249 of 277 Stavanger, Norway, October 30th & 31st 2008 Page of presentation:
values in excess of both of these values AND the materials are used by themselves in a
100% crushed aggregate asphalt mixture, there is an increased likelihood that compaction
issues may arise. This warning does not necessarily apply if the crusher screenings/
manufactured sand is blended with either natural rounded sand or manufactured sand
with a low amount of flakey particles.
To obtain further information about this issue and the possible limits that may act
as a warning, further experiences with uncompactable or hard to compact mixtures will
have to be gained. These are apparently rare and the likely cause may be overlooked.
Figure 5 shows a plot similar to that of Figure 1 but, in this case, three concrete
sands have been plotted. Two of these sands (Caledon and Redmond) have a long history
of extensive satisfactory use in hydraulic cement concrete. It is noteworthy, but not
unexpected, that they have low amounts of flakey particles compared to the crusher
screenings/manufactured sands. If they did have a very flakey nature, the negative effect
on water demand would probably be such that they would not be economically used in
their respective market areas. The third sand ‘Axim” is a standard concrete sand used by
a chemical supply company for testing admixtures.
Figure 6 shows the mean amount of flakey particles (50% of each fraction used in
the calculation) plotted against the Uncompacted Voids Content of ASTM C1252,
Method A. Generally, using the Superpave mixture design process, it is desirable to use
fine aggregates that have a voids content of greater than 45 or 43 (in some cases) for high
ESAL asphalt pavements. It can be seen that, generally, natural sands gave values less
than about 44 and the crusher screenings/manufactured sands values in excess of this. It
is notable that there is not a strong relationship between voids value and amount of flakey
particles. Crusher screenings with voids value in the 48 range can have flakey particle
contents that range from about 11% to 40%. If the voids value predicts stability of asphalt
mixtures, it certainly will not warn of the presence of high amounts of flakey particles.
The two tests are measuring different properties and both should be considered when
evaluating a crusher screenings for use in asphaltic concrete.
The Uncompacted Voids Content test was originally developed by the National
Crushed Stone Association (Gray and Bell, 1964) for predicting finishability of concrete
sand. As there is increasing use of manufactured sands in this application, it may well be
Manufactured Sand - Workshop
Page 250 of 277 Stavanger, Norway, October 30th & 31st 2008 Page of presentation:
useful to also look at the amount of flakey particles present in the manufactured sand as
Figure 6 clearly shows that Voids by itself does not reliably predict flakey particle
content.
With more equidimensional (less flakey) aggregate, the optimum asphalt content
will normally be reduced due to a better packing density and lower internal surface area.
Therefore, it would be useful to measure the amount of flakey particles of crusher
screenings to choose those sources of supply that contain the least amount, other things
being equal. This would be beneficial when high amounts of crusher screenings or
manufactured sands are being used in an asphalt mixture.
Figure 7 shows the results of testing three samples of crusher screenings from the
same quarry over four years. The material was a hard diabase of Precambrian age
(Huronian). In 1996, the quarry operators were using a different crusher than was used in
1998 and 1999. The production of crusher screenings from 1996 had significantly more
flakey particles than that produced with the different crushers in 1998 and 1999. The
crusher used in 1996 was a vertical shaft impact crusher that had been brought in to
improve shape of the coarse aggregate. The crushers used in later years were a more
conventional series of cone crushers. The flakiness test may be useful for evaluating
shape of fine aggregate produced by different types of crusher and by different reduction
ratios. Further study is needed.
Figures 8 and 9 show relationships of water absorption and flakey particles as a
function of fine aggregate Micro-Deval loss. No obvious relationships can be observed
which is not unexpected. However, flakiness of fine aggregate from a single aggregate
source may influence Micro-Deval loss. For instance, flakey particles may be more easily
abraded in the rotating drum than cubical particles from the same source.
Figure 10 shows the relationship between flakey particles and the Compacted
Aggregate Resistance test (Jahn, 2004). The CAR test is done by measuring the
resistance to embedment of a metal cylinder on aggregate compacted in a Marshall mold
normally used for asphalt mixture design purposes (see Appendix 2). The values obtained
are thought to be related to shear resistance of the compacted sand. Low CAR values
indicate relatively low shear resistance; high values indicate relatively high shear
resistance. This figure shows that shear resistance is apparently unrelated to the amount
Manufactured Sand - Workshop
Page 251 of 277 Stavanger, Norway, October 30th & 31st 2008 Page of presentation:
of flakey particles. Other properties such as surface texture and roundness must be more
important. As expected, the natural sands that generally have a rounded and polished
texture all gave relatively low CAR stability (lower shear strength). Conversely, not all
crusher screenings gave high CAR values.
Figure 11 shows the relationship between Uncompacted Voids and the CAR test
values. It is noteworthy that there were no sands or screenings with low Voids values
(< 45) that gave high CAR values. Whether or not the CAR test can be used in place of
Uncompacted Voids Test as suggested by Jahn (2004) is unknown, but there does appear
to be a relationship between the two different tests.
Conclusions
The measurement of the amount of flakey particles in the coarse fractions of fine
aggregate is simple and inexpensive. The slotted sieves necessary to do this are
commercially available.
High amounts of flakey particles in a fine aggregate may warn of difficulty in
compacting asphalt mixtures in which the material is used by itself as the fine aggregate.
Two known cases of such mixes have been briefly documented and the responsible fine
aggregates had amounts of flakey particles (as defined by the test method) in excess of
30% in the 1.18 mm fraction and in excess of 25% in the 2.36 mm fraction.
Materials that have Uncompacted Voids (ASTM C1252, Method A) contents in
excess of 45 may have either high or low amounts of flakey particles. Thus, the ASTM
test does necessarily warn of a potential compaction problem due to particle shape.
The flakiness test may be useful for comparing the shape of crusher screenings
produced using different crusher types or using different reduction ratios.
The Compacted Aggregate Resistance Test is not related to the proportion of
flakey particles in a fine aggregate, and cannot be used to predict problems caused by the
presence of excessive amounts of flakey particles.
There is a relationship between the ASTM Uncompacted Voids value and the
CAR test.
Manufactured Sand - Workshop
Page 252 of 277 Stavanger, Norway, October 30th & 31st 2008 Page of presentation:

Further Development Needed
There is a need to gain experience with this test in a variety of laboratories and
applications. It is thought that this test would never be suitable in a material specification.
It might be used by people selecting sources of material, as a screening test, to indicate
potential problems related to excessive amounts of flakey particles. It can also be used to
compare the effect of different crushers and crusher systems on generation of flakey
particles in fine aggregate. The authors welcome feedback on the utility of the test.
ACKNOWLEDGEMENTS
We wish to acknowledge the assistance of Bert Hendricks of Tomlinson
Construction of Ottawa, Ontario, who first investigated the problem with an
uncompactable asphalt mix and recognized the probable contribution of the flakiness of
the manufactured sand to his problem. Mike MacKay, of JEGEL in Toronto, gave
information on the case in New Brunswick. Everton Arnold and Mark Vasavithasan
provided help with issues associated with conducting and interpreting the results from the
CAR test. Steve Senior took the photographs. We also wish to acknowledge the hard
work of the staff of the Soils and Aggregates Section of the Ministry of Transportation
who conducted the testing and other staff of the Ministry Aggregate Units who collected
the samples throughout Ontario.
REFERENCES
1. Masad, E., T. Al-Rousan, J. Button, D. Little, E Tutumluer, Test Methods for
Characterizing Aggregate Shape, Texture and Angularity, NCHRP Report 555,
Transportation Research Board, Washington, D.C., 94p., 2007.
2. British Standard 812, Flakiness Index, British Standards Institution, London, UK,
Section 105.1, 4p., 1985.
3. Gray, J.E., and Bell, J.E., Stone Sand, Engineering Bulletin No. 13, National Crushed
Stone Association, 1964.
4. Jahn, D., The Compacted Aggregate Resistance Test: Replacement for FAA?,
International Center for Aggregates Research, Annual Symposium, University of
Texas, Austin, Texas, 2004.
Manufactured Sand - Workshop
Page 253 of 277 Stavanger, Norway, October 30th & 31st 2008 Page of presentation:
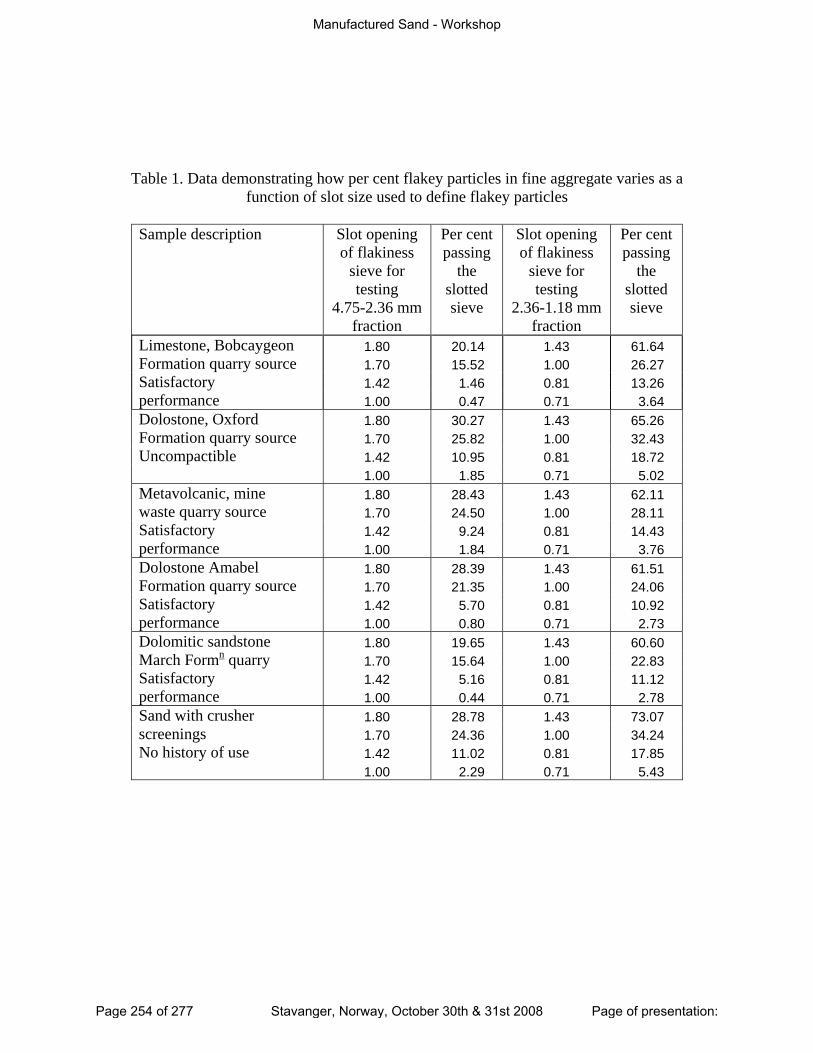
Table 1. Data demonstrating how per cent flakey particles in fine aggregate varies as a function of slot size used to define flakey particles
Sample description Slot opening
of flakiness sieve for testing
4.75-2.36 mm fraction
Per cent passing
the slotted sieve
Slot opening of flakiness
sieve for testing
2.36-1.18 mm fraction
Per cent passing
the slotted sieve
Limestone, Bobcaygeon 1.80 20.14 1.43 61.64 Formation quarry source 1.70 15.52 1.00 26.27 Satisfactory 1.42 1.46 0.81 13.26 performance 1.00 0.47 0.71 3.64 Dolostone, Oxford 1.80 30.27 1.43 65.26 Formation quarry source 1.70 25.82 1.00 32.43 Uncompactible 1.42 10.95 0.81 18.72 1.00 1.85 0.71 5.02 Metavolcanic, mine 1.80 28.43 1.43 62.11 waste quarry source 1.70 24.50 1.00 28.11 Satisfactory 1.42 9.24 0.81 14.43 performance 1.00 1.84 0.71 3.76 Dolostone Amabel 1.80 28.39 1.43 61.51 Formation quarry source 1.70 21.35 1.00 24.06 Satisfactory 1.42 5.70 0.81 10.92 performance 1.00 0.80 0.71 2.73 Dolomitic sandstone 1.80 19.65 1.43 60.60 March Formn quarry 1.70 15.64 1.00 22.83 Satisfactory 1.42 5.16 0.81 11.12 performance 1.00 0.44 0.71 2.78 Sand with crusher 1.80 28.78 1.43 73.07 screenings 1.70 24.36 1.00 34.24 No history of use 1.42 11.02 0.81 17.85 1.00 2.29 0.71 5.43
Manufactured Sand - Workshop
Page 254 of 277 Stavanger, Norway, October 30th & 31st 2008 Page of presentation:
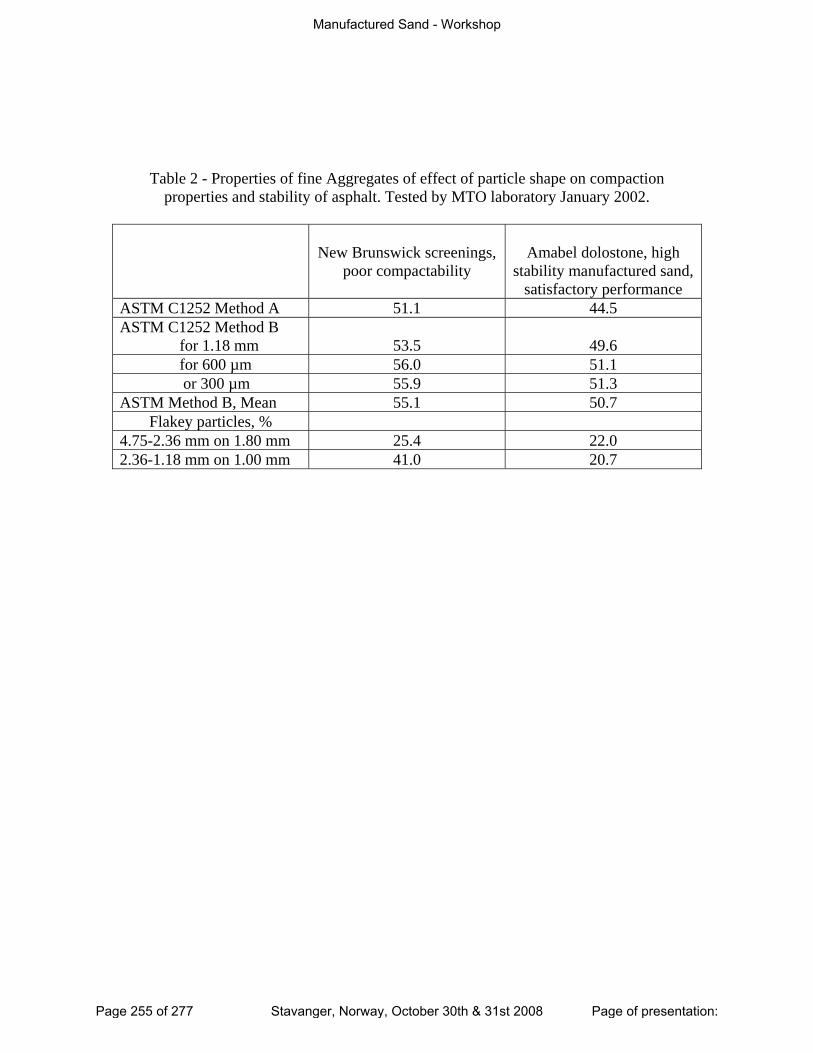
Table 2 - Properties of fine Aggregates of effect of particle shape on compaction properties and stability of asphalt. Tested by MTO laboratory January 2002.
New Brunswick screenings, poor compactability
Amabel dolostone, high
stability manufactured sand, satisfactory performance
ASTM C1252 Method A 51.1 44.5 ASTM C1252 Method B
for 1.18 mm
53.5
49.6 for 600 µm 56.0 51.1
or 300 µm 55.9 51.3 ASTM Method B, Mean 55.1 50.7
Flakey particles, % 4.75-2.36 mm on 1.80 mm 25.4 22.0 2.36-1.18 mm on 1.00 mm 41.0 20.7
Manufactured Sand - Workshop
Page 255 of 277 Stavanger, Norway, October 30th & 31st 2008 Page of presentation:
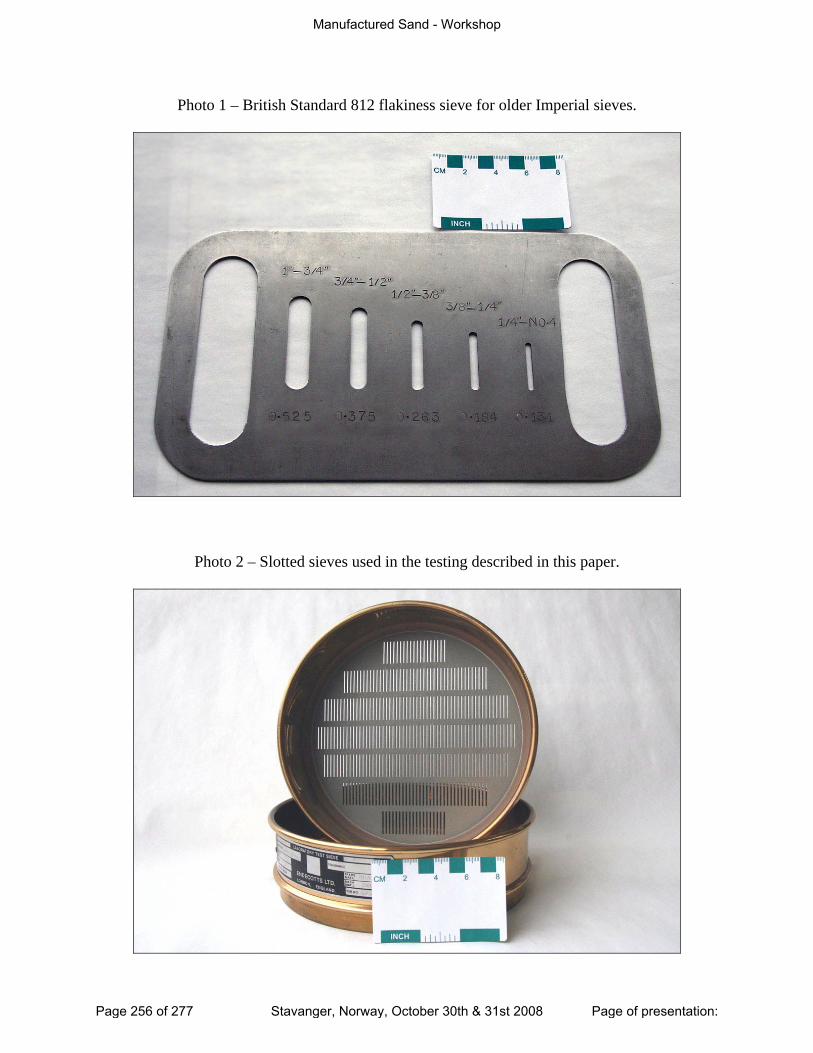
Photo 1 – British Standard 812 flakiness sieve for older Imperial sieves.
Photo 2 – Slotted sieves used in the testing described in this paper.
Manufactured Sand - Workshop
Page 256 of 277 Stavanger, Norway, October 30th & 31st 2008 Page of presentation:
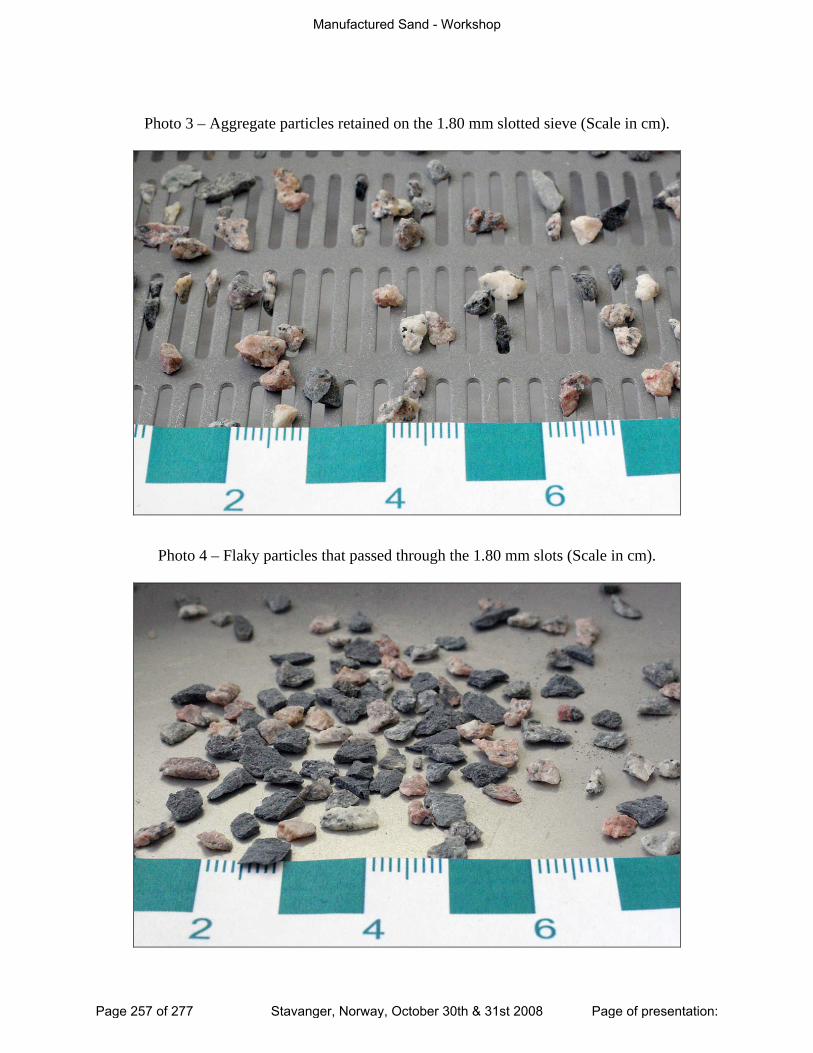
Photo 3 – Aggregate particles retained on the 1.80 mm slotted sieve (Scale in cm).
Photo 4 – Flaky particles that passed through the 1.80 mm slots (Scale in cm).
Manufactured Sand - Workshop
Page 257 of 277 Stavanger, Norway, October 30th & 31st 2008 Page of presentation:
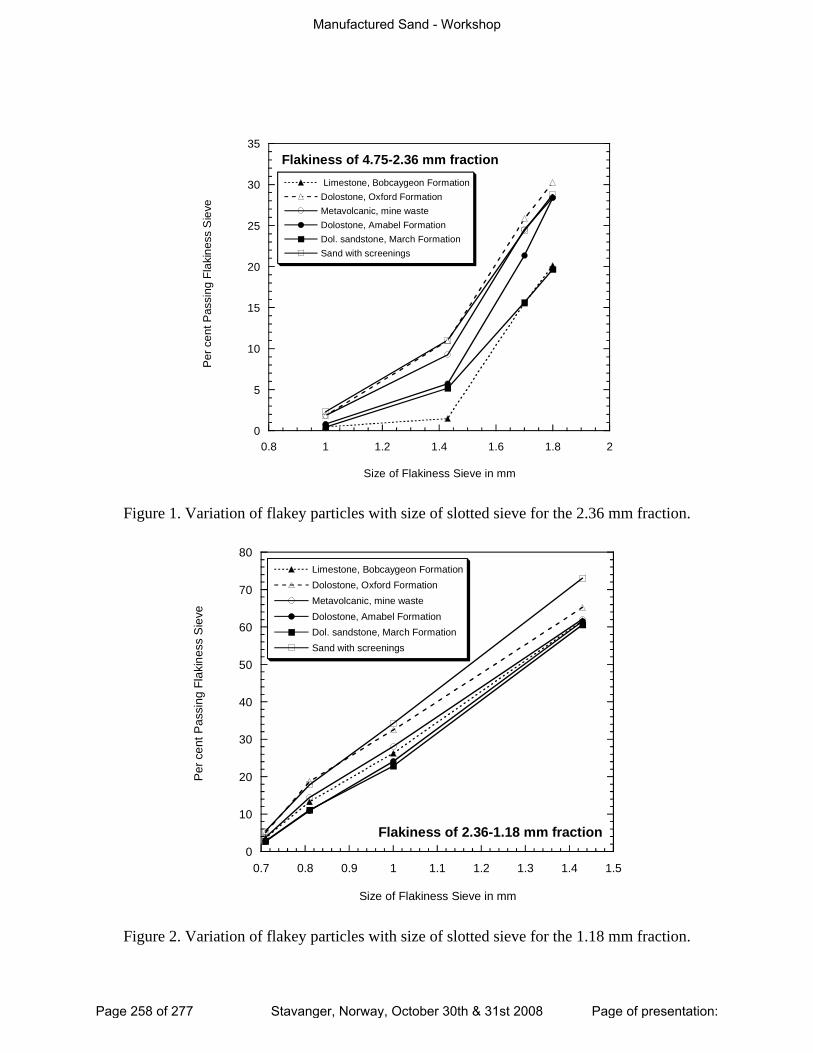
0
5
10
15
20
25
30
35
0.8 1 1.2 1.4 1.6 1.8 2
Flakiness of 4.75-2.36 mm fraction Limestone, Bobcaygeon FormationDolostone, Oxford FormationMetavolcanic, mine wasteDolostone, Amabel FormationDol. sandstone, March FormationSand with screenings
Per
cen
t Pas
sing
Fla
kine
ss S
ieve
Size of Flakiness Sieve in mm Figure 1. Variation of flakey particles with size of slotted sieve for the 2.36 mm fraction.
0
10
20
30
40
50
60
70
80
0.7 0.8 0.9 1 1.1 1.2 1.3 1.4 1.5
Flakiness of 2.36-1.18 mm fraction
Limestone, Bobcaygeon FormationDolostone, Oxford FormationMetavolcanic, mine wasteDolostone, Amabel FormationDol. sandstone, March FormationSand with screenings
Per
cen
t Pas
sing
Fla
kine
ss S
ieve
Size of Flakiness Sieve in mm Figure 2. Variation of flakey particles with size of slotted sieve for the 1.18 mm fraction.
Manufactured Sand - Workshop
Page 258 of 277 Stavanger, Norway, October 30th & 31st 2008 Page of presentation:
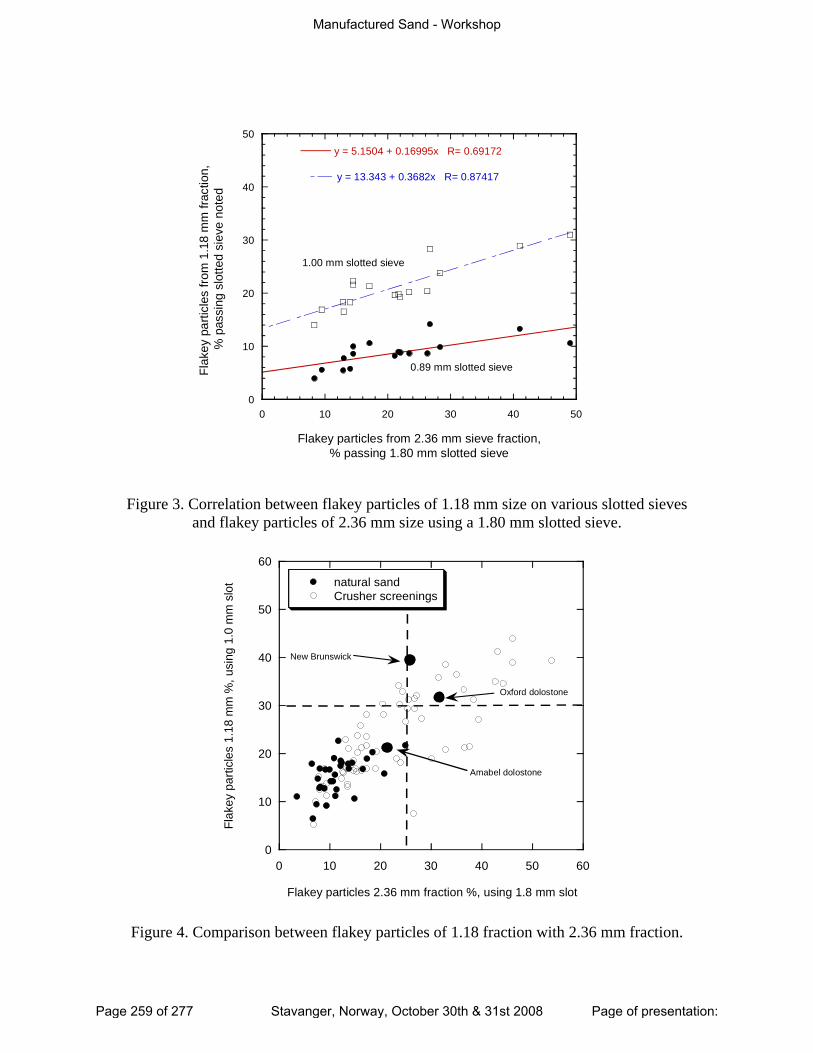
0
10
20
30
40
50
0 10 20 30 40 50
y = 5.1504 + 0.16995x R= 0.69172
y = 13.343 + 0.3682x R= 0.87417
Flak
ey p
artic
les
from
1.1
8 m
m fr
actio
n,
% p
assi
ng s
lotte
d si
eve
note
d
Flakey particles from 2.36 mm sieve fraction,% passing 1.80 mm slotted sieve
0.89 mm slotted sieve
1.00 mm slotted sieve
Figure 3. Correlation between flakey particles of 1.18 mm size on various slotted sieves
and flakey particles of 2.36 mm size using a 1.80 mm slotted sieve.
0
10
20
30
40
50
60
0 10 20 30 40 50 60
natural sandCrusher screenings
Flak
ey p
artic
les
1.18
mm
%, u
sing
1.0
mm
slo
t
Flakey particles 2.36 mm fraction %, using 1.8 mm slot
Amabel dolostone
Oxford dolostone
New Brunswick
Figure 4. Comparison between flakey particles of 1.18 fraction with 2.36 mm fraction.
Manufactured Sand - Workshop
Page 259 of 277 Stavanger, Norway, October 30th & 31st 2008 Page of presentation:

0
5
10
15
20
25
30
35
0.8 1 1.2 1.4 1.6 1.8 2
Flakiness of 4.75 - 2.36 mm fraction
Limestone screeningsDolostone screeningsMetavolcanic screeningsDolostone screeningsDol. sandstone screeningsSand with screeningsAxim conc sandCaledon conc sandRedmond conc sand
Per
cen
t Pas
sing
Fla
kine
ss S
ieve
Size of Flakiness Sieve in mm
naturalconcretesands
Figure 5. Comparison of flakey particles in sand and crusher screenings.
0
10
20
30
40
50
36 38 40 42 44 46 48 50 52
Natural sandCrusher screenings
Mea
n fla
key
parti
cles
per
cen
t
Voids, ASTM C1252, Method A
New Brunswick
Oxford dolostone
Bobcaygeon limestone
Amabel dolostone
Figure 6. Mean flakey particles compared to uncompacted voids.
Manufactured Sand - Workshop
Page 260 of 277 Stavanger, Norway, October 30th & 31st 2008 Page of presentation:
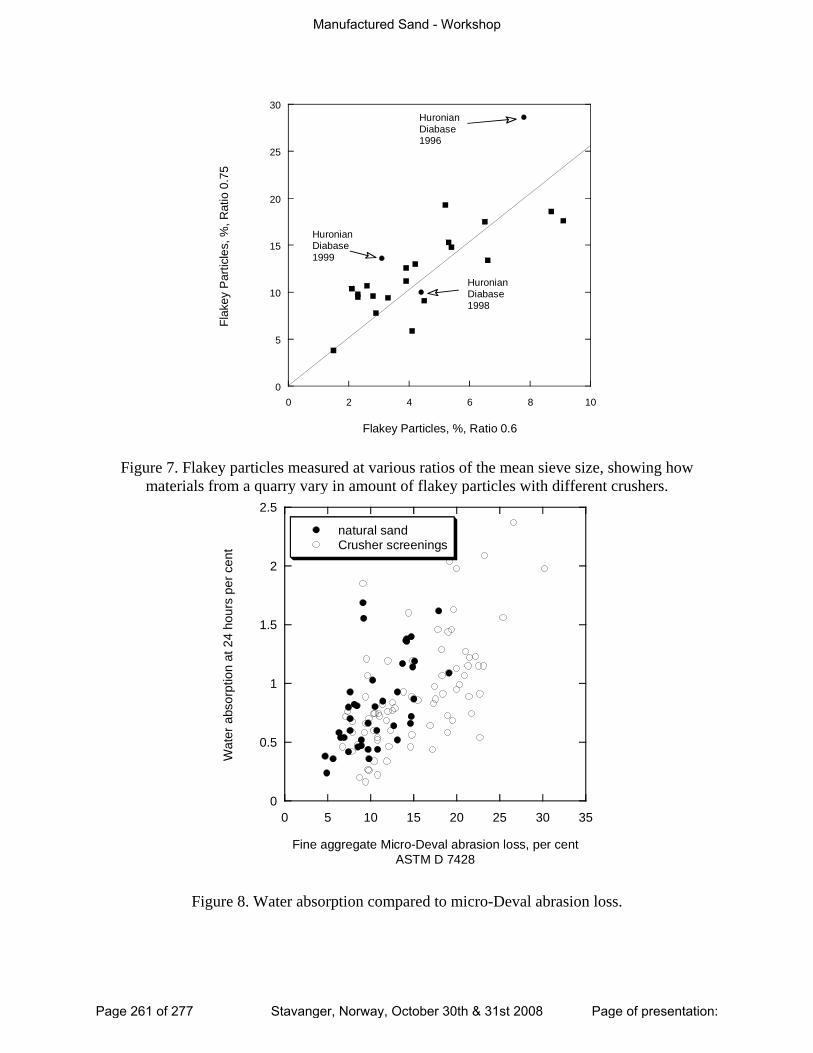
0
5
10
15
20
25
30
0 2 4 6 8
Flak
ey P
artic
les,
%, R
atio
0.7
5
Flakey Particles, %, Ratio 0.6
HuronianDiabase 1996
HuronianDiabase1999
HuronianDiabase 1998
10
Figure 7. Flakey particles measured at various ratios of the mean sieve size, showing how materials from a quarry vary in amount of flakey particles with different crushers.
0
0.5
1
1.5
2
2.5
0 5 10 15 20 25 30 35
natural sandCrusher screenings
Wat
er a
bsor
ptio
n at
24
hour
s pe
r cen
t
Fine aggregate Micro-Deval abrasion loss, per centASTM D 7428
Figure 8. Water absorption compared to micro-Deval abrasion loss.
Manufactured Sand - Workshop
Page 261 of 277 Stavanger, Norway, October 30th & 31st 2008 Page of presentation:
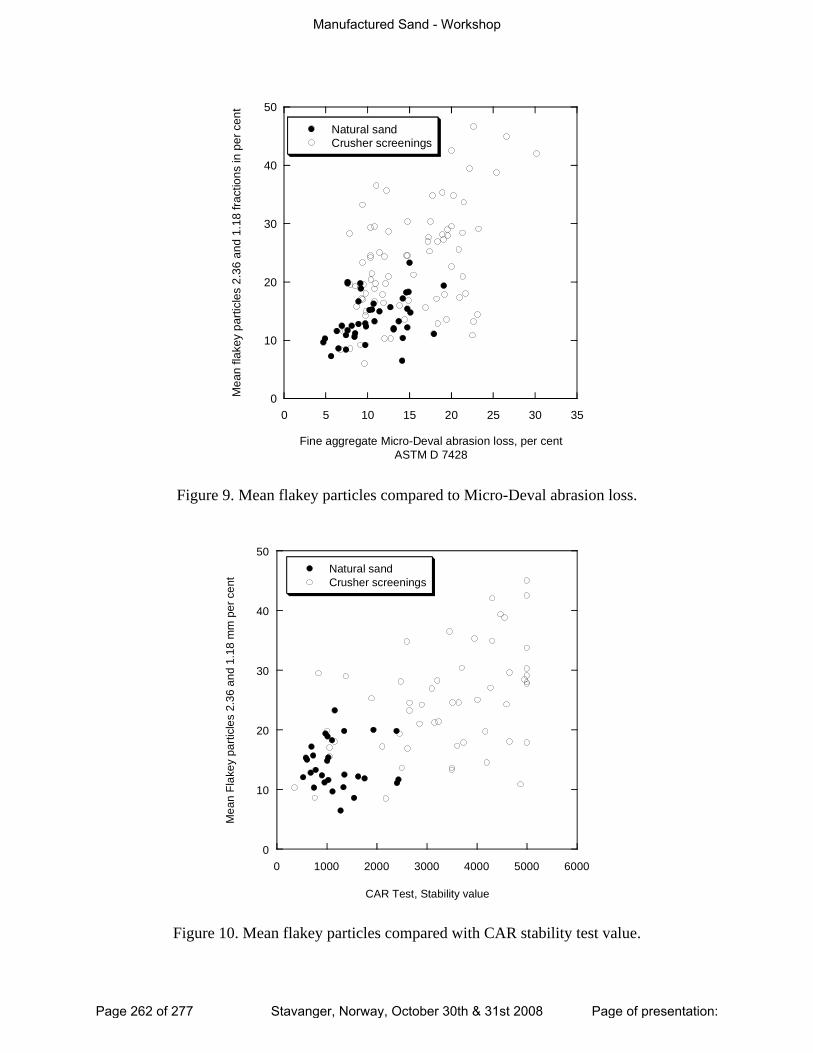
0
10
20
30
40
50
0 5 10 15 20 25 30 35
Natural sandCrusher screenings
Mea
n fla
key
parti
cles
2.3
6 an
d 1.
18 fr
actio
ns in
per
cen
t
Fine aggregate Micro-Deval abrasion loss, per centASTM D 7428
Figure 9. Mean flakey particles compared to Micro-Deval abrasion loss.
0
10
20
30
40
50
0 1000 2000 3000 4000 5000 6000
Natural sandCrusher screenings
Mea
n Fl
akey
par
ticle
s 2.
36 a
nd 1
.18
mm
per
cen
t
CAR Test, Stability value
Figure 10. Mean flakey particles compared with CAR stability test value.
Manufactured Sand - Workshop
Page 262 of 277 Stavanger, Norway, October 30th & 31st 2008 Page of presentation:
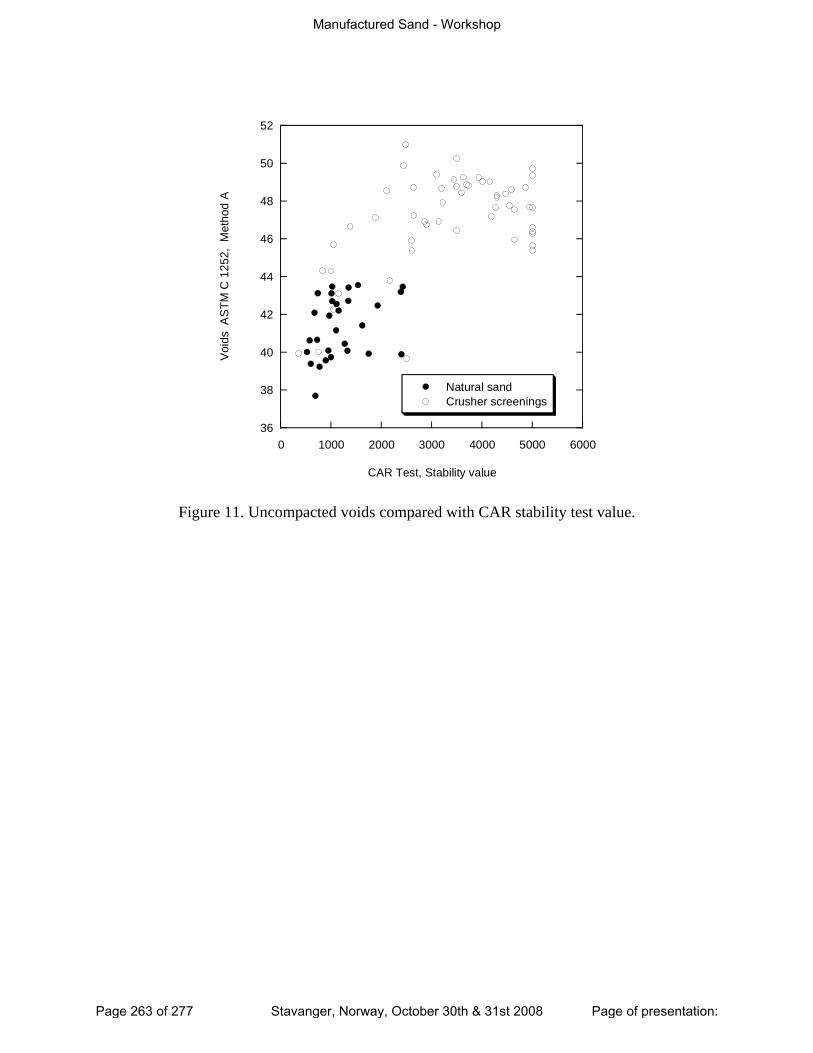
36
38
40
42
44
46
48
50
52
0 1000 2000 3000 4000 5000 6000
Natural sandCrusher screenings
Voi
ds A
STM
C 1
252,
Met
hod
A
CAR Test, Stability value
Figure 11. Uncompacted voids compared with CAR stability test value.
Manufactured Sand - Workshop
Page 263 of 277 Stavanger, Norway, October 30th & 31st 2008 Page of presentation:
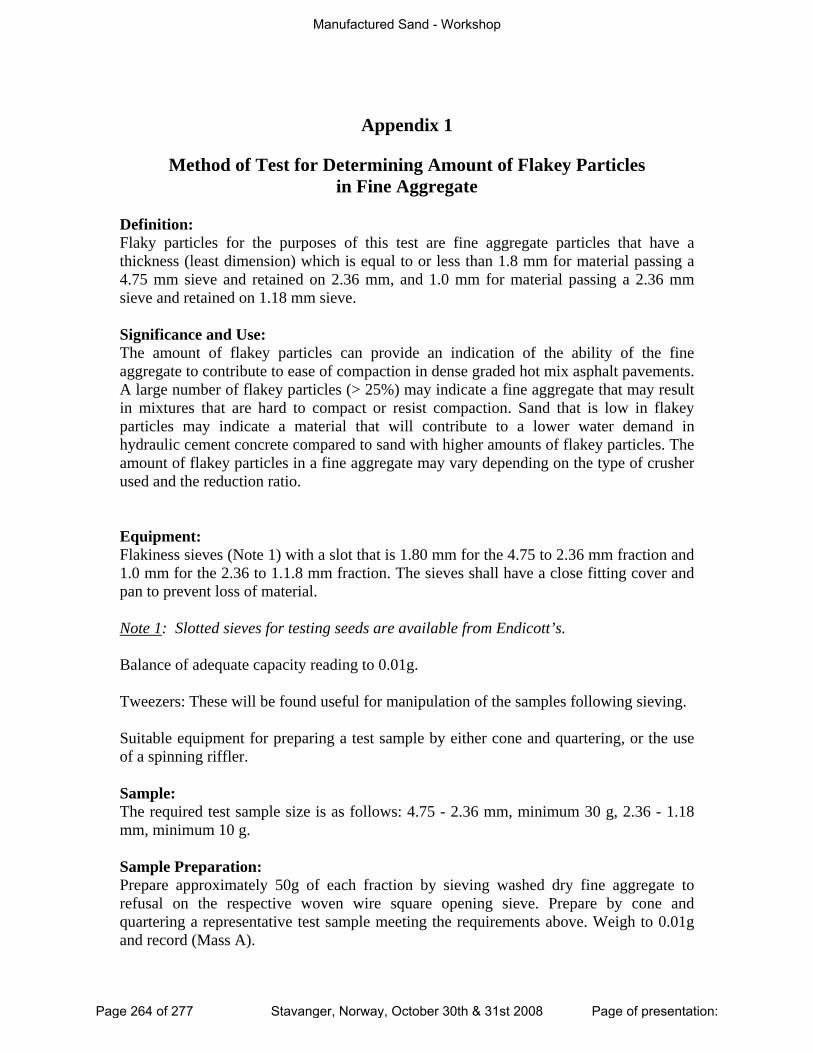
Appendix 1
Method of Test for Determining Amount of Flakey Particles
in Fine Aggregate Definition: Flaky particles for the purposes of this test are fine aggregate particles that have a thickness (least dimension) which is equal to or less than 1.8 mm for material passing a 4.75 mm sieve and retained on 2.36 mm, and 1.0 mm for material passing a 2.36 mm sieve and retained on 1.18 mm sieve. Significance and Use: The amount of flakey particles can provide an indication of the ability of the fine aggregate to contribute to ease of compaction in dense graded hot mix asphalt pavements. A large number of flakey particles (> 25%) may indicate a fine aggregate that may result in mixtures that are hard to compact or resist compaction. Sand that is low in flakey particles may indicate a material that will contribute to a lower water demand in hydraulic cement concrete compared to sand with higher amounts of flakey particles. The amount of flakey particles in a fine aggregate may vary depending on the type of crusher used and the reduction ratio. Equipment: Flakiness sieves (Note 1) with a slot that is 1.80 mm for the 4.75 to 2.36 mm fraction and 1.0 mm for the 2.36 to 1.1.8 mm fraction. The sieves shall have a close fitting cover and pan to prevent loss of material. Note 1: Slotted sieves for testing seeds are available from Endicott’s. Balance of adequate capacity reading to 0.01g. Tweezers: These will be found useful for manipulation of the samples following sieving. Suitable equipment for preparing a test sample by either cone and quartering, or the use of a spinning riffler. Sample: The required test sample size is as follows: 4.75 - 2.36 mm, minimum 30 g, 2.36 - 1.18 mm, minimum 10 g. Sample Preparation: Prepare approximately 50g of each fraction by sieving washed dry fine aggregate to refusal on the respective woven wire square opening sieve. Prepare by cone and quartering a representative test sample meeting the requirements above. Weigh to 0.01g and record (Mass A).
Manufactured Sand - Workshop
Page 264 of 277 Stavanger, Norway, October 30th & 31st 2008 Page of presentation:
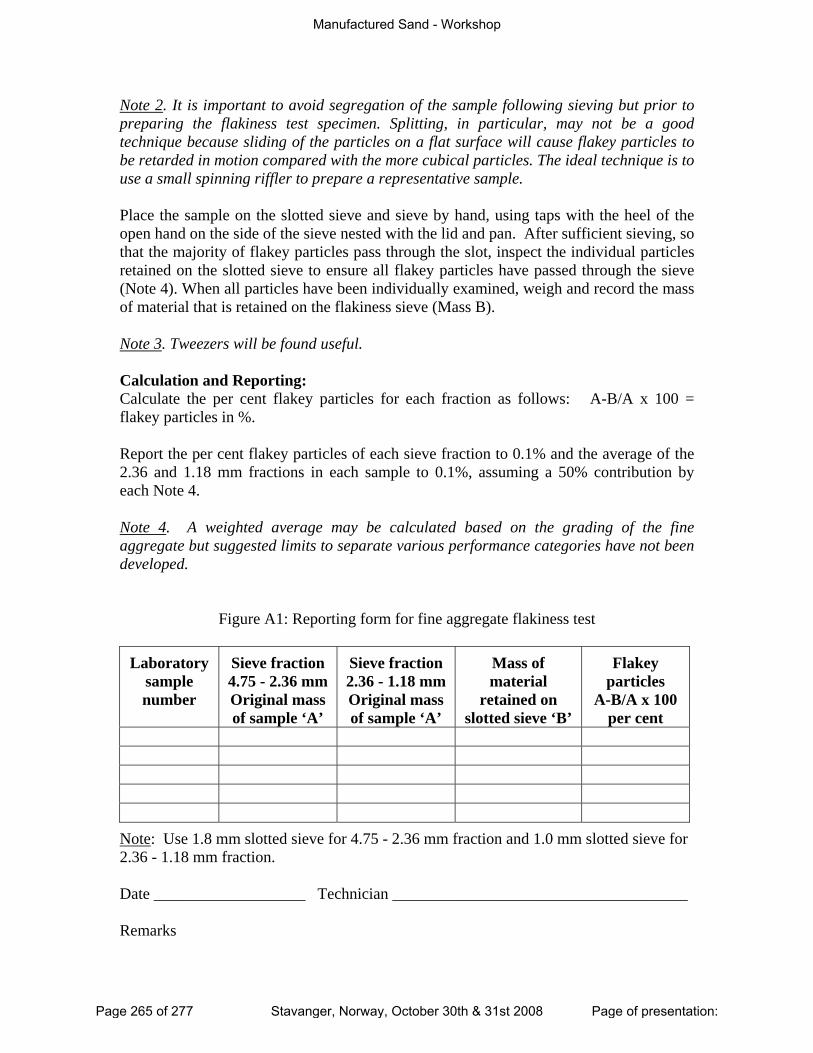
Note 2. It is important to avoid segregation of the sample following sieving but prior to preparing the flakiness test specimen. Splitting, in particular, may not be a good technique because sliding of the particles on a flat surface will cause flakey particles to be retarded in motion compared with the more cubical particles. The ideal technique is to use a small spinning riffler to prepare a representative sample. Place the sample on the slotted sieve and sieve by hand, using taps with the heel of the open hand on the side of the sieve nested with the lid and pan. After sufficient sieving, so that the majority of flakey particles pass through the slot, inspect the individual particles retained on the slotted sieve to ensure all flakey particles have passed through the sieve (Note 4). When all particles have been individually examined, weigh and record the mass of material that is retained on the flakiness sieve (Mass B). Note 3. Tweezers will be found useful. Calculation and Reporting: Calculate the per cent flakey particles for each fraction as follows: A-B/A x 100 = flakey particles in %. Report the per cent flakey particles of each sieve fraction to 0.1% and the average of the 2.36 and 1.18 mm fractions in each sample to 0.1%, assuming a 50% contribution by each Note 4. Note 4. A weighted average may be calculated based on the grading of the fine aggregate but suggested limits to separate various performance categories have not been developed.
Figure A1: Reporting form for fine aggregate flakiness test
Laboratory sample number
Sieve fraction 4.75 - 2.36 mm Original mass of sample ‘A’
Sieve fraction 2.36 - 1.18 mm Original mass of sample ‘A’
Mass of material
retained on slotted sieve ‘B’
Flakey particles
A-B/A x 100 per cent
Note: Use 1.8 mm slotted sieve for 4.75 - 2.36 mm fraction and 1.0 mm slotted sieve for 2.36 - 1.18 mm fraction. Date ___________________ Technician _____________________________________ Remarks
Manufactured Sand - Workshop
Page 265 of 277 Stavanger, Norway, October 30th & 31st 2008 Page of presentation:

Appendix 2
Abbreviated Test Procedure for the
Compacted Aggregate Resistance (CAR) Test (2003) The CAR test evaluates the shear resistance of the blend of fine aggregate materials for HMA, using as received gradations. Useful information can also be obtained by testing individual components. 1. Mixture preparation: 1.1 Oven dry each fine aggregate material, allow to cool to room temperature, and separate into #4 x #8 and #8 x 0 components. 1.2 Combine components of each fine aggregate material, based on the intended combination of fine aggregates, sufficient to produce a compacted specimen 2.5 in. high in a 4-inch Marshall mold (approx. 1000 g). 1.3 Mix the dry materials in a mixing bowl, crater the mixture, and then add 3.5% moisture. Immediately mix until particles are uniformly coated (about 30 seconds). 2. Mixture Compaction: 2.1 Place entire coated mixture in a room temperature 4” Marshall mold with base plate and collar. Spade 20 times over the mixture with a spatula, trowel, or spoon. Round off the top of the mixture with a spatula, and place two pieces of non-absorbent paper cut to fit on top of the mix. 2.2 Place the mold onto the compaction hammer pedestal, and insert the compaction hammer. Seat the compaction foot on top of the loose mix by raising the sliding weight approximately ½-inch and tap the compaction foot three times. 2.3 Compact the sample using 50 blows, one side only, with a Marshall hammer. An automatic hammer has been used to develop this procedure. 3. Shear Resistance Determination: 3.1 Remove the collar, but leave the base plate underneath the compacted sample. Transfer the mold, compacted sample, and base plate, keeping the compacted side up, to the breaking head (modified 6-inch Lottman breaking head). Centre the plunger (1 ½-inch by 1 ½-inch cylinder) on top of the compacted specimen, and shear the flat end of the plunger into the compacted specimen using the Marshall Stability and Flow machine. 3.2 Terminate testing when a penetration of 0.25 inches (flow of 25) has been reached, or 10% of the sample height.
Manufactured Sand - Workshop
Page 266 of 277 Stavanger, Norway, October 30th & 31st 2008 Page of presentation:

3.3 Record the peak shear resistance (CAR value) in pounds. For many 100% crushed fine aggregates, this will be the value at the time of termination (penetration of 0.25 in.). Notes: 1. The influence of moisture absorption in this test procedure is mitigated if the components are mixed as soon as the 3.5% moisture has been added and then compacted immediately after mixing. 2. Using two pieces of non-absorptive specimen protection paper has been found to prevent the paper from sticking to the bottom of the compaction foot. 3. When compaction of the loose sample first occurs, collapse of air voids in the loose mix causes fine particles to be vented along with air from the collapsing air voids. The fine particles tend to adhere to a lubricated hammer shaft, and will cause drag on the sliding weight, which affects compactive effort. Tapping the sliding hammer on top of the compaction foot helps to collapse some of the air voids without forcefully ejecting aggregate particles. It is recommended that the hammer shaft be cleaned and lubricated often. Fines escaping from the edge of the specimen protection paper will adhere to the bottom of the compaction foot but are easily removed. Check the bottom of the compaction foot after each test specimen has been prepared. 4. When removing the protection paper, pry up one edge and slowly peel the paper backwards to prevent disturbing the compacted surface of the fine aggregate. 5. Use of a recording chart is recommended. The 5,000 lb setting works well for all
materials. Some cubical limestone fine aggregates will exceed 5,000 lbs before reaching a penetration of 0.25 in. In these cases, record the CAR value as 5,000.
Manufactured Sand - Workshop
Page 267 of 277 Stavanger, Norway, October 30th & 31st 2008 Page of presentation:
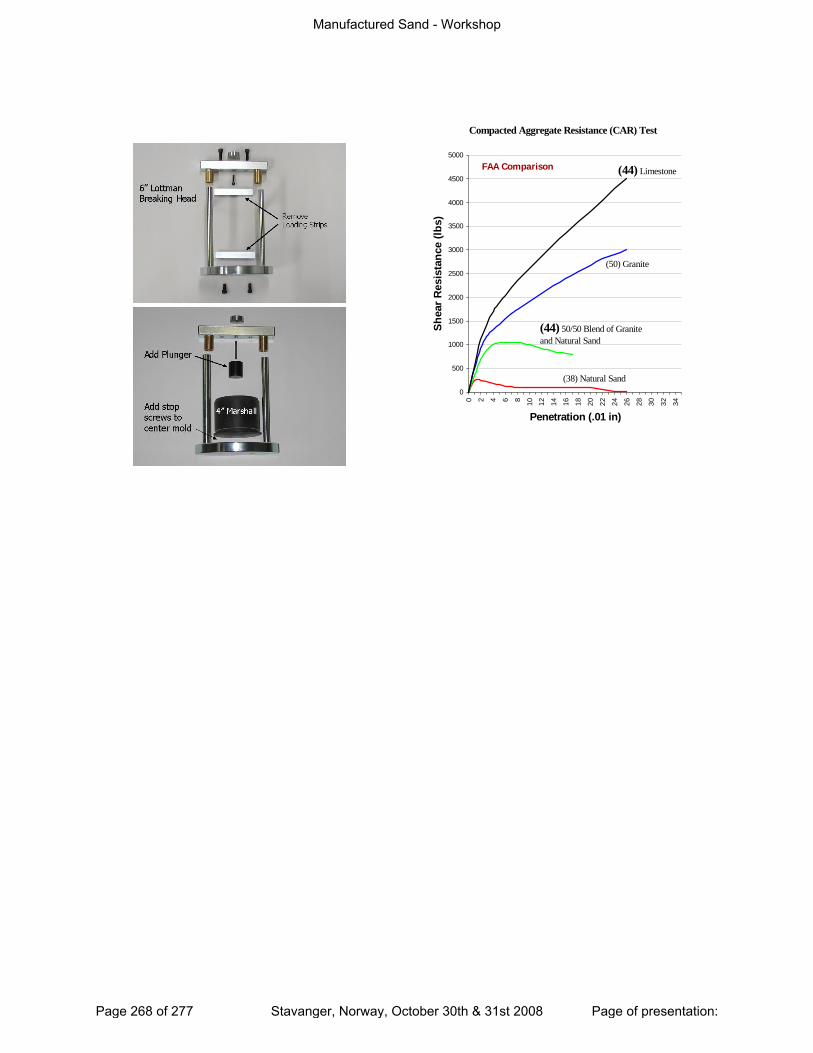
Compacted Aggregate Resistance (CAR) Test
0
500
1000
1500
2000
2500
3000
3500
4000
4500
5000
0 2 4 6 8 10 12 14 16 18 20 22 24 26 28 30 32 34
Penetration (.01 in)
Shea
r Res
ista
nce
(lbs)
(44) 50/50 Blend of Graniteand Natural Sand
(50) Granite
(38) Natural Sand
(44) LimestoneFAA Comparison
Manufactured Sand - Workshop
Page 268 of 277 Stavanger, Norway, October 30th & 31st 2008 Page of presentation:
Limitation of the fine particles content in the aggregates for concrete
Girbes Clari, I., Marti Marti, P., Cuevas Castell, J.M., López Buendía, A.M.
AIDICO, Construction Technology Institute, Valencia Spain
Abstract The goal of this study is the evaluation of the differential treatment imposed by the Standard EHE99 (Structural Concrete Instruction) regarding to the limitation of fine particles added by the fine fraction of the aggregates and fine particles added by the others concrete components. It is well known that the crushing processes to obtain sand particles with a certain grain size, implies an addition of considerable amount of fine particles. Moreover, the increasing of aggregate production and the environmental restriction to their exploitations make this study necessary in order to assure the demand of good quality aggregates. Those fine particles may produce a conflict with the EHE standard which regulates the maximum fine particle content added by the incorporation of the aggregates for the concrete, independently of the mechanical properties of the concrete and the composition of the fine particles. It does not consider the additions in cement. Furthermore, the general followed objectives for the fabrication of concrete are their performance for elaboration (workability), at short time behaviour (resistance) and long time (durability), as well as cost. From the point of view of aggregates, the alternative of a most economic concrete with good mechanical properties is the main goal. For those arguments, it has been considered in this study to estimate the real influence of the fine particles added by the aggregates on the mechanical properties of the concrete when the other components are maintained constant. The study was carried out in different phases in order to evaluate, firstly, the influence of different fillers supplied by the fine fraction of the aggregates, and secondly, the influence of the quality and properties of each filler on the mechanical properties of the concretes. Finally, another interesting point for revision is the standard specifications regarding to the quality of the fillers due to this parameter play a determinant role on the mechanical properties and durability of the concretes. Moreover, according to the specification of the EHE standard, when the filler content not agree any of the requirements additional tests are required in order to corroborate the quality of the concrete. The obtained results demonstrate that the influence of the fine particles introduced in the aggregates depend on the mineralogical composition of the fillers more than in the total amount. The resistance of the concretes is not compromised by the amount of fillers when the mineralogy assures a good adhesion to the cementing components. For this reasons the limitations of the standard should be revised in order to specify the quality of the fillers more than the quantity considering, at the same time, the amount of fillers supplied by the other components of the concrete. Finally, the results of the study have contributed to the actualization of the recent normative by been included into the new draft of the EHE07.
Manufactured Sand - Workshop
Page 269 of 277 Stavanger, Norway, October 30th & 31st 2008 Page of presentation:
31/10/2008
1
Limitation of the fine particles content in the aggregates for concrete
Manufactured Aggregates WORKSHOPSTAVANGER 30 and 31 October 2008
Girbes Clari, I., Marti Marti, P., Cuevas Castell, J.M., López Buendía, A.M.AIDICO, Construction Technology Institute, Valencia Spain
Limitation of the fine particles content in the aggregates for concrete
Chapter 6, article 28: “ The nature and preparation of aggregates willallow assuring the suitable resistance and durability of the concrete,as well as the other characteristics which are demanded to the
Introduction to the problem of the fine particles in aggregates
What are the main specifications for our study?:
as well as the other characteristics, which are demanded to theconcrete in the particular technical specifications.
According to the normative, the aggregates supplier mustguarantee with documents the fulfill of the technicalspecifications indicated in the section 28.3, “prescriptions andtests”, until the reception of the aggregates. At this moment theconcrete manufacturer is obliged to use the aggregateswhich are in compliance with the specifications. Additional testscould be demanded in case that the results are closed to thespecifications.
Section 28.3.3. “ Granulometry and shape of the aggregates”, page 86: “It isrecommended that the resultant quantity of the particles from the fineaggregate which are able to pass the Sieve UNE 0.063 and the limestonecomponent of the concrete was smaller than 175 kg/m3.”
Manufactured Sand - Workshop
Page 270 of 277 Stavanger, Norway, October 30th & 31st 2008 Page of presentation:
31/10/2008
2
Limitation of the fine particles content in the aggregates for concrete
Maximum fine particle content in
sand is10%
TABLE 28.3.3Situation in Valencian Region
sand is10%
Maximum fine particle content in course aggregate is 2%
1%
4%
limestonedolostone
86%
3%
0%2%
4%
quarzt sandporfidsofitesandstonequarzsite
Enterprises Quarries Gravel pit TotalAlicante 20 20 10 30Castellón 15 15 10 25Valencia 60 45 20 65Totals 95 80 40 120
• Table 4.1.1. “Usual Concretes”: The percentage ofmain and minority components is defined for eachclass and type of concrete. It is observed that everyt f t d it t 5 % f i it
Limitation of the fine particles content in the aggregates for concrete
And some more technical specification of the Normative…
type of concrete admit up to 5 % of minoritycomponents, in most of the cases they are limeadditions. Furthermore, the CEM II concretes admitin their compositions percentages of lime fillersbetween 6 % and 35 %.
Resuming:
There is not differences between the fine particles from the sandfraction and from the cements in the influence that both couldplay on the final product (concrete). This represent a incongruencewith specifications marked by the EHE about the maximumadmissible fine content in the sand fraction of the aggregate ( 10% inthis case).
Manufactured Sand - Workshop
Page 271 of 277 Stavanger, Norway, October 30th & 31st 2008 Page of presentation:
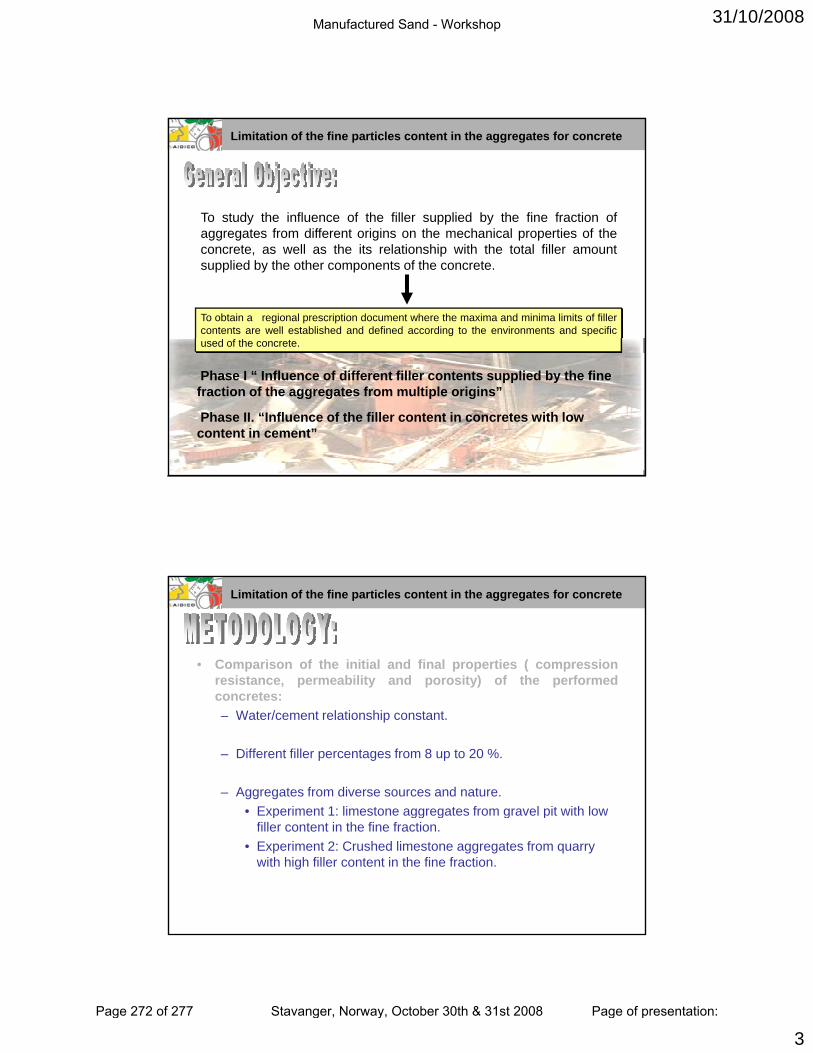
31/10/2008
3
Limitation of the fine particles content in the aggregates for concrete
To study the influence of the filler supplied by the fine fraction ofaggregates from different origins on the mechanical properties of the
To obtain a regional prescription document where the maxima and minima limits of fillercontents are well established and defined according to the environments and specificused of the concrete.
aggregates from different origins on the mechanical properties of theconcrete, as well as the its relationship with the total filler amountsupplied by the other components of the concrete.
Phase I “ Influence of different filler contents supplied by the fine fraction of the aggregates from multiple origins”
Phase II. “Influence of the filler content in concretes with low content in cement”
• Comparison of the initial and final properties ( compressionresistance, permeability and porosity) of the performedconcretes:
Limitation of the fine particles content in the aggregates for concrete
concretes:– Water/cement relationship constant.
– Different filler percentages from 8 up to 20 %.
– Aggregates from diverse sources and nature.• Experiment 1: limestone aggregates from gravel pit with lowExperiment 1: limestone aggregates from gravel pit with low
filler content in the fine fraction.• Experiment 2: Crushed limestone aggregates from quarry
with high filler content in the fine fraction.
Manufactured Sand - Workshop
Page 272 of 277 Stavanger, Norway, October 30th & 31st 2008 Page of presentation:
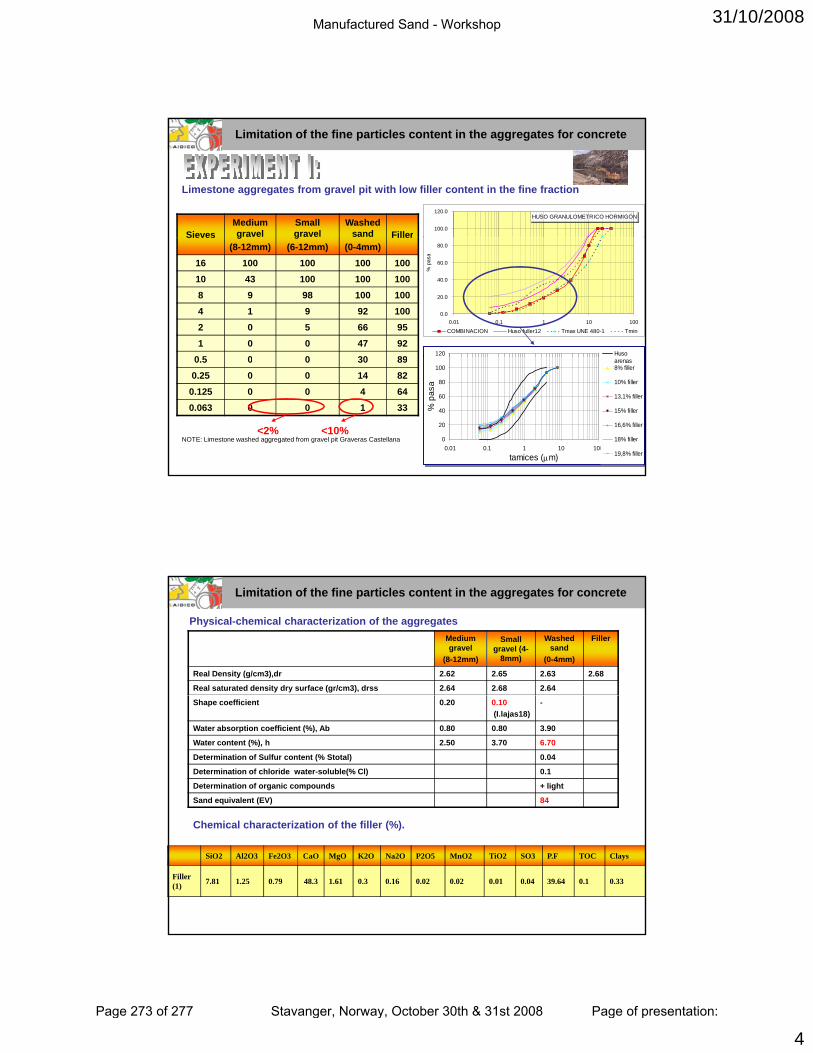
31/10/2008
4
Limitation of the fine particles content in the aggregates for concrete
Limestone aggregates from gravel pit with low filler content in the fine fraction
SievesMedium gravel
Small gravel
Washed sand Filler
HUSO GRANULOMETRICO HORMIGÓN
100.0
120.0
Sieves g(8-12mm)
g(6-12mm) (0-4mm)
Filler
16 100 100 100 10010 43 100 100 1008 9 98 100 1004 1 9 92 1002 0 5 66 951 0 0 47 92
0 5 0 0 30 89
0.0
20.0
40.0
60.0
80.0
0.01 0.1 1 10 100
% p
asa
COMBINACION Huso fuller12 Tmax UNE 480-1 Tmin
120 Huso0.5 0 0 30 890.25 0 0 14 82
0.125 0 0 4 640.063 0 0 1 33
NOTE: Limestone washed aggregated from gravel pit Graveras Castellana <2% <10%
0
20
40
60
80
100
0.01 0.1 1 10 100tamices (μm)
% p
asa
arenas8% filler
10% filler
13,1% filler
15% filler
16,6% filler
18% filler
19,8% filler
Physical-chemical characterization of the aggregates
Limitation of the fine particles content in the aggregates for concrete
Medium gravel
(8-12mm)
Small gravel (4-
8mm)
Washed sand
(0-4mm)
Filler
Real Density (g/cm3),dr 2.62 2.65 2.63 2.68
Real saturated density dry surface (gr/cm3), drss 2.64 2.68 2.64
Shape coefficient 0.20 0.10(I.lajas18)
-
Water absorption coefficient (%), Ab 0.80 0.80 3.90
Water content (%), h 2.50 3.70 6.70
Determination of Sulfur content (% Stotal) 0.04
Determination of chloride water-soluble(% Cl) 0.1
Determination of organic compounds + light
Sand equivalent (EV) 84
Chemical characterization of the filler (%).
SiO2 Al2O3 Fe2O3 CaO MgO K2O Na2O P2O5 MnO2 TiO2 SO3 P.F TOC Clays
Filler (1) 7.81 1.25 0.79 48.3 1.61 0.3 0.16 0.02 0.02 0.01 0.04 39.64 0.1 0.33
Manufactured Sand - Workshop
Page 273 of 277 Stavanger, Norway, October 30th & 31st 2008 Page of presentation:
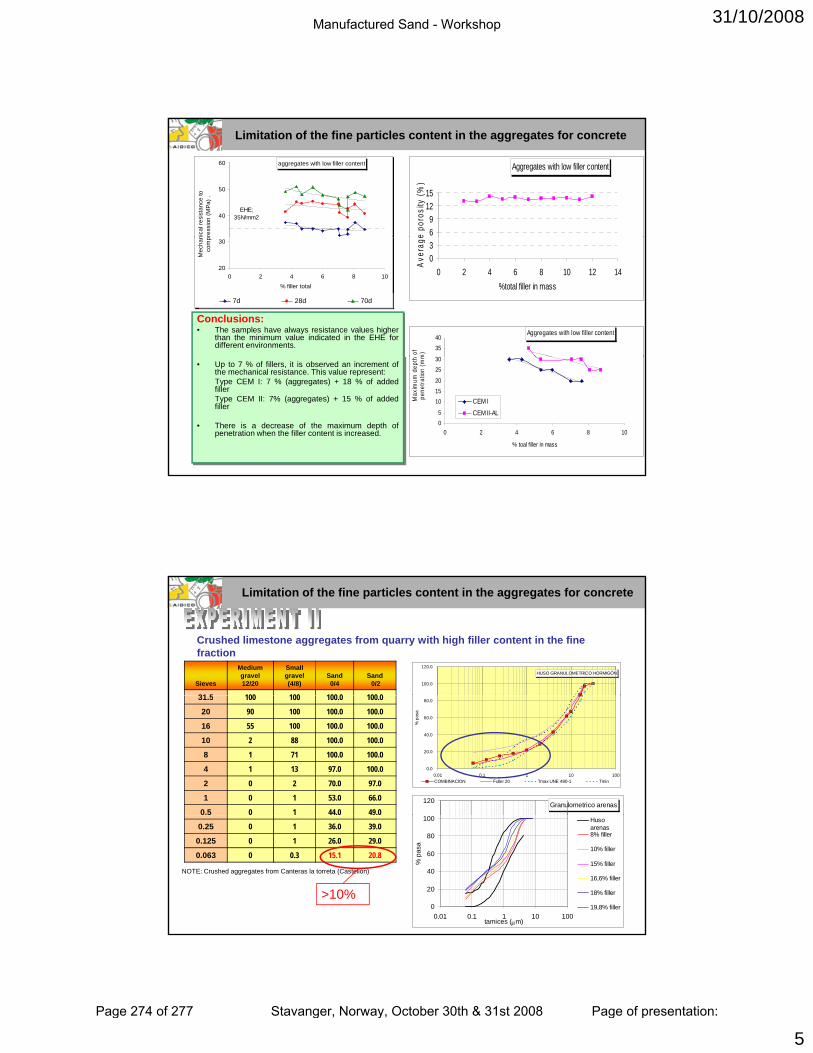
31/10/2008
5
Limitation of the fine particles content in the aggregates for concrete
Aggregates with low filler content
69
1215
e po
rosi
ty (%
)
aggregates with low filler content
EHE; 35N/mm240
50
60
nica
l res
ista
nce
to
ress
ion
(MPa
) .
03
0 2 4 6 8 10 12 14%total filler in mass
Ave
rage
20
30
0 2 4 6 8 10% filler total
Mec
han
com
p
7d 28d 70d
Conclusions:• The samples have always resistance values higher
than the minimum value indicated in the EHE fordifferent environments.
Aggregates with low filler content
30
3540
of
m)
• Up to 7 % of fillers, it is observed an increment ofthe mechanical resistance. This value represent:Type CEM I: 7 % (aggregates) + 18 % of addedfillerType CEM II: 7% (aggregates) + 15 % of addedfiller
• There is a decrease of the maximum depth ofpenetration when the filler content is increased.
05
101520
2530
0 2 4 6 8 10
% toal f iller in mass
Max
imum
dep
thpe
netra
tion
(mm
CEM I
CEM II-AL
Crushed limestone aggregates from quarry with high filler content in the fine fraction
HUSO GRANULOMETRICO HORMIGÓN
100.0
120.0
Sieves
Medium gravel 12/20
Small gravel (4/8)
Sand0/4
Sand0/2
31 5 100 100 100 0 100 0
Limitation of the fine particles content in the aggregates for concrete
0.0
20.0
40.0
60.0
80.0
0.01 0.1 1 10 100
% p
asa
COMBINACION Fuller 20 Tmax UNE 480-1 Tmin
31.5 100 100 100.0 100.0
20 90 100 100.0 100.0
16 55 100 100.0 100.0
10 2 88 100.0 100.0
8 1 71 100.0 100.0
4 1 13 97.0 100.0
2 0 2 70.0 97.0
1 0 1 53.0 66.0
0.5 0 1 44.0 49.0 Granulometrico arenas120
0.25 0 1 36.0 39.0
0.125 0 1 26.0 29.0
0.063 0 0.3 15.1 20.8
0
20
40
60
80
100
0.01 0.1 1 10 100tamices (μm)
% p
asa
Husoarenas8% filler
10% filler
15% filler
16,6% filler
18% filler
19,8% filler
NOTE: Crushed aggregates from Canteras la torreta (Castellón)
>10%
Manufactured Sand - Workshop
Page 274 of 277 Stavanger, Norway, October 30th & 31st 2008 Page of presentation:
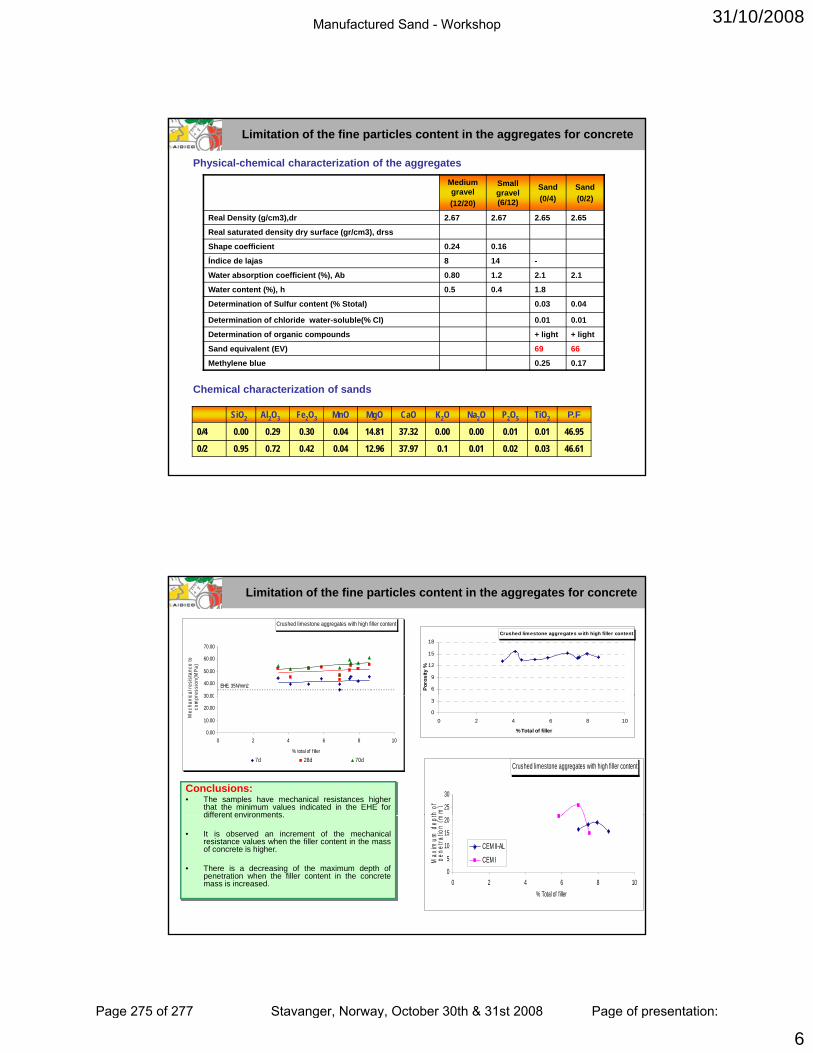
31/10/2008
6
Physical-chemical characterization of the aggregates
Medium gravel(12/20)
Small gravel (6/12)
Sand (0/4)
Sand(0/2)
Real Density (g/cm3),dr 2.67 2.67 2.65 2.65
Real saturated density dry surface (gr/cm3), drss
Limitation of the fine particles content in the aggregates for concrete
Shape coefficient 0.24 0.16
Índice de lajas 8 14 -
Water absorption coefficient (%), Ab 0.80 1.2 2.1 2.1
Water content (%), h 0.5 0.4 1.8
Determination of Sulfur content (% Stotal) 0.03 0.04
Determination of chloride water-soluble(% Cl) 0.01 0.01
Determination of organic compounds + light + light
Sand equivalent (EV) 69 66
Chemical characterization of sands
SiO2 Al2O3 Fe2O3 MnO MgO CaO K2O Na2O P2O5 TiO2 P.F
0/4 0.00 0.29 0.30 0.04 14.81 37.32 0.00 0.00 0.01 0.01 46.95
0/2 0.95 0.72 0.42 0.04 12.96 37.97 0.1 0.01 0.02 0.03 46.61
Methylene blue 0.25 0.17
Crushed limestone aggregates w ith high filler content
6
9
12
15
18
Poro
sity
%
Limitation of the fine particles content in the aggregates for concrete
Crushed limestone aggregates with high filler content
EHE, 35N/mm2
30 00
40.00
50.00
60.00
70.00
cal r
esis
tanc
e to
re
ssio
n(M
Pa)
0
3
0 2 4 6 8 10
% Total of filler
Crushed limestone aggregates with high filler content
25
30
h of m)
Conclusions:• The samples have mechanical resistances higher
that the minimum values indicated in the EHE fordifferent environments
0.00
10.00
20.00
30.00
0 2 4 6 8 10
% total of f iller
Mec
hani
cco
mpr
7d 28d 70d
0
5
10
15
20
0 2 4 6 8 10% Total of f iller
Max
imum
dep
tpe
netra
tion
(m
CEM II-AL
CEM I
different environments.
• It is observed an increment of the mechanicalresistance values when the filler content in the massof concrete is higher.
• There is a decreasing of the maximum depth ofpenetration when the filler content in the concretemass is increased.
Manufactured Sand - Workshop
Page 275 of 277 Stavanger, Norway, October 30th & 31st 2008 Page of presentation:

31/10/2008
7
Limitation of the fine particles content in the aggregates for concrete
Conclusions and open questions for future works…
•The influence of the fine particles introduced in the aggregates depend onthe mineralogical composition of the fillers more than in the total amount.
•The mechanical resistance of the concretes is not compromised by theamount of fillers when the mineralogy assures a good adhesion to thecementing components.
•For this reasons the limitations of the standard should be revised in orderto specify the quality of the fillers more than the quantity considering, at thep y q y q y g,same time, the amount of fillers supplied by the other components of theconcrete.
Limitation of the fine particles content in the aggregates for concrete
Conclusions and open questions for future works…
Open questions:
What happens when the fillers are mainly clays? What is up whenWhat happens when the fillers are mainly clays? What is up when the mineralogy of the fillers differs of the mineralogy of the aggregates? What is the behavior when the cement ratios are different?...
Future tasks:
• Perform a new experiment with a limestone aggregate with high content of clays as filler fraction.
• Analyze the filler of the aggregates to identify the different mineralogy and determinate the influence of the mineralogy of filler in the mechanical properties of the concretes.
• Evaluate the influence of fillers in concrete with low cement ratios
Manufactured Sand - Workshop
Page 276 of 277 Stavanger, Norway, October 30th & 31st 2008 Page of presentation: