laboratory investigation of sand-geosynthetic interface
TRANSCRIPT

Fibers 2022, 10, 84. https://doi.org/10.3390/fib10100084 www.mdpi.com/journal/fibers
Article
Laboratory Investigation of Sand‐Geosynthetic
Interface Friction Parameters Using Cost‐Effective
Vertical Pullout Apparatus
Malik Rizwan 1, Hassan Mujtaba 1, Khalid Farooq 1, Zia Ur Rehman 2, Syed Zishan Ashiq 1,
Syed Minhaj Saleem Kazmi 3,* and Muhammad Junaid Munir 3,*
1 Department of Civil Engineering, University of Engineering and Technology, Lahore 54600, Pakistan 2 Department of Civil Engineering, University of Engineering and Technology, Taxila 47040, Pakistan 3 School of Engineering, RMIT University, Melbourne, VIC 3001, Australia
* Correspondence: [email protected] (S.M.S.K.); [email protected] (M.J.M.)
Abstract: The current research has been carried out to investigate the interactive behaviour of soil‐
geosynthetic interfaces. A cost‐effective vertical pullout test (VPT) apparatus was designed for this
purpose. A series of laboratory direct shear tests (DSTs) and vertical pullout tests (VPT) were carried
out using three types of sands and four different types of geosynthetics. All three sandy samples
used in this research were classified as poorly graded sand (SP) as per the Unified Soil Classification
System (USCS) with median grain size ranging between 0.39~0.2 mm. The geosynthetics used were
three woven and one non‐woven with a tensile force of 3.3 kN/m~103.8 kN/m. The direct shear test
revealed that geometric properties of geosynthetics have an influence on interface shear resistance.
Interface friction angle varies between 29.2~38.3. Vertical pullout (VPT) test results show that the
pullout force is in the range of 23.9~31.4. The interface friction angle by both direct and vertical
pullout tests is more for coarse‐grained soils than for fine‐grained soils. Interface friction angles
from pullout tests were around 19% smaller than direct shear tests. The interface efficiency ranged
from 0.69 to 0.97 for all soils; meanwhile, for non‐woven geotextiles, the efficiency values are up to
22% higher as compared to woven geotextiles due to theirtexture. The present research indicates
that interface friction parameters can be efficiently determined through the interface of a cost‐effec‐
tive VPT which is also comparable with DST. The reliable values of interface efficiency can be ob‐
tained for soil‐geosynthetic interfaces which can optimize the design and omits the need foras‐
sumed conservative values of friction parameters.
Keywords: geosynthetic; vertical pull out; interface efficiency; interface friction angle
1. Introduction
The inclusion of geosynthetic reinforcement in a soil mass increases the bearing ca‐
pacity and ability to sustain extra surcharge and overburden [1]. Geosynthetics are uti‐
lized to enhance the performance of foundations and fills [2]. Its main application areas
include mechanically stabilized earth walls [3], reinforced soil slopes, embankments, ge‐
osynthetic landfill liner systems and other geosynthetic reinforced structures. Several
studies investigated soil‐geosynthetic interface shear strength using direct shear tests for
sandy soils [4]. The inclusion of geosynthetic reinforcement in a soil mass increases the
bearing capacity and ability to sustain extra surcharge and overburden [1].Geosynthetics
are utilized to enhance the performance of foundations and fill [5]. Investigation of the
interaction behavior and mechanism of soil reinforcement is inevitable for the design and
stability analysis of geosynthetic reinforced soil structures. Assessment of soil‐reinforce‐
ment interaction will indicate how the composite structure will perform under different
Citation: Rizwan, M.; Mujtaba, H.;
Farooq, K.; Rehman, Z.U.; Ashiq,
S.Z.; Kazmi, S.M.S.; Munir, M.J. La‐
boratory Investigation of Sand‐Geo‐
synthetic Interface Friction Parame‐
ters Using Cost‐Effective
Vertical Pullout Apparatus. Fibers
2022, 10, 84. https://doi.org/10.3390/
fib10100084
Academic Editors: Radu Dorin An‐
drei and Akanshu Sharma
Received: 14 August 2022
Accepted: 26 September 2022
Published: 30 September 2022
Publisher’s Note: MDPI stays neu‐
tral with regard to jurisdictional
claims in published maps and institu‐
tional affiliations.
Copyright: © 2022 by the authors. Li‐
censee MDPI, Basel, Switzerland.
This article is an open access article
distributed under the terms and con‐
ditions of the Creative Commons At‐
tribution (CC BY) license (https://cre‐
ativecommons.org/licenses/by/4.0/).
Fibers 2022, 10, 84 2 of 14
loading conditions depending upon both the type of soil and the reinforcement material
and its properties. Several studies investigated soil‐geosynthetic interface shear strength
using direct shear tests, triaxial compression tests, and numerical modeling for sandy soils
[6–10]. The use of geosynthetics in soils presents potential planes of weakness due to par‐
tial loss of particle‐to‐particle frictional interlock and resistance at the interface of soil re‐
inforcement; therefore, it becomes necessary to evaluate the interface friction parameters
for the safe design of geosynthetic reinforced soil (GRS) structures [11–13]. When a geo‐
synthetic is used as soil reinforcement, the bond strength between the soil and the rein‐
forcement should be sufficient to prevent the sliding of the soil mass against the reinforce‐
ment fibers and should prevent the pulling out of reinforcement when the tensile stresses
are developed in geosynthetics [5]. The efficiency of anchorage between the soil and rein‐
forcement depends upon the contact surfaces of both elements. Anubhav and Bashudar
[14] investigated the soil/geotextile shear interface mechanism. They concluded that peak
and residual coefficient friction for sands with angular particles werehigher than for sands
with rounded particles. The friction coefficients were significantly higher for sands with
sub‐angular gains as compared to rounded grains [15]. Tuna and Altun [16] studied the
effect of size of equipment, confining pressure, geosynthetic properties, and relative den‐
sity. They concluded that the size of the equipment did not cause any prominent change
in the interface behavior of reinforced soil. Abdi and Goband [17] revealed that interaction
coefficients, which arethe ratio of roughened geotextile shear strength to sand‐geotextile
interface shear strength, ranged from 1.02 to 1.23 and 1.03 to 1.31 for coarse and fine sand,
respectively.
Pullout resistance is determined by using laboratory pullout tests and depends on
soil parameters, in‐situ dry density and length, and type of geosynthetic [18]. Different
research works suggest the utilization of medium to large‐sized shear boxes (100~300 mm)
to carefully simulate the field conditions and large interface monitoring. However, geo‐
synthetic‐soil interface shear strength can also be studied using the small shear box (60
mm × 60 mm) and the results are comparable. Several shear apparatuses have been devel‐
oped for the evaluation of geosynthetic‐soil shear strength. However, most of these
pullout test setups are of specialized and expensive nature. For developing countries,
where such laboratory facilities are scarce, there is a need to propose low‐cost simplified
testing apparatus to evaluate the strength of the geosynthetic‐soil interface. This study is
aimed to propose a simplified test apparatus to carry out a pullout resistance test on the
geosynthetic‐soil interface with reasonable accuracy and propose interface friction angles
for different types of sandy soils and geosynthetics.
2. Materials and Methods
Three different types of locally available sands, namely Ravi, Chenab, and Lawren‐
cepur, were used as backfill materials for this study. All three types of soils were clean
sands classified as poorly graded (SP) as per the Unified soil classification system (USCS)
classification system. For the present research, Ravi sand, Chenab sand, and Lawrencepur
sand are designated as Soil1, Soil2, and Soil3, respectively. The physical properties of all
three types of sands are determined in the laboratory. Sands selected varied in their me‐
dian particle size (D50) as 0.19 mm, 0.26 mm, and 0.75 mm for Soil1, Soil2, and Soil3, re‐
spectively. Tests revealed that Soil3 has no fine contents and Soil1 and Soil2 had 4% and
0.4% fines, respectively. Based on gradation analysis, the coefficient of uniformity (Cu)
varies between 2.94~1.75 while the coefficient of curvature (Cc) ranged from 0.98~1.36.
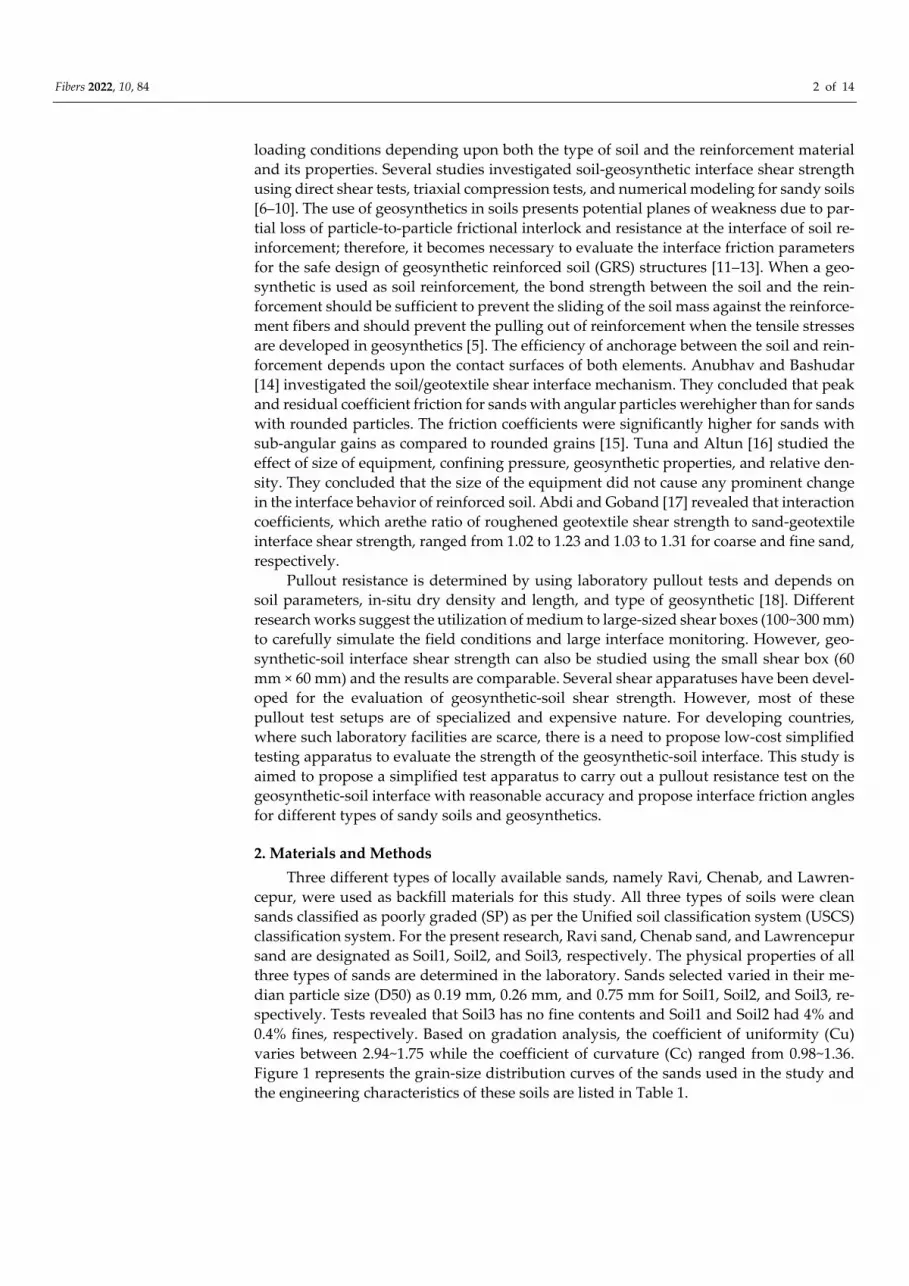
Figure 1 represents the grain‐size distribution curves of the sands used in the study and
the engineering characteristics of these soils are listed in Table 1.
Fibers 2022, 10, 84 3 of 14
Figure 1. Particle size distribution of various sands used in the study.
Table 1.Properties of soils used in this study.
Property Type/Value
Soil1 Soil2 Soil3
Effective Size, D10 (mm) 0.09 0.16 0.17
D50(mm) 0.19 0.26 0.75
D85 (mm) 0.33 0.40 1.24
Coefficient of uniformity, Cu 2.67 1.75 2.94
Coefficient of Curvature, Cc 1.04 0.98 1.36
Friction angle,ϕ (deg) 34.4 37.2 42.9
Specific Gravity, Gs 2.67 2.67 2.66
Maximum index density, 𝛾dmax (kN/m3) 15.95 16.03 17.69
emin 0.63 0.64 0.47
emax 0.96 0.93 0.73
Soil classification (USCS) *SP *SP *SP
*SP—Poorly graded sand.
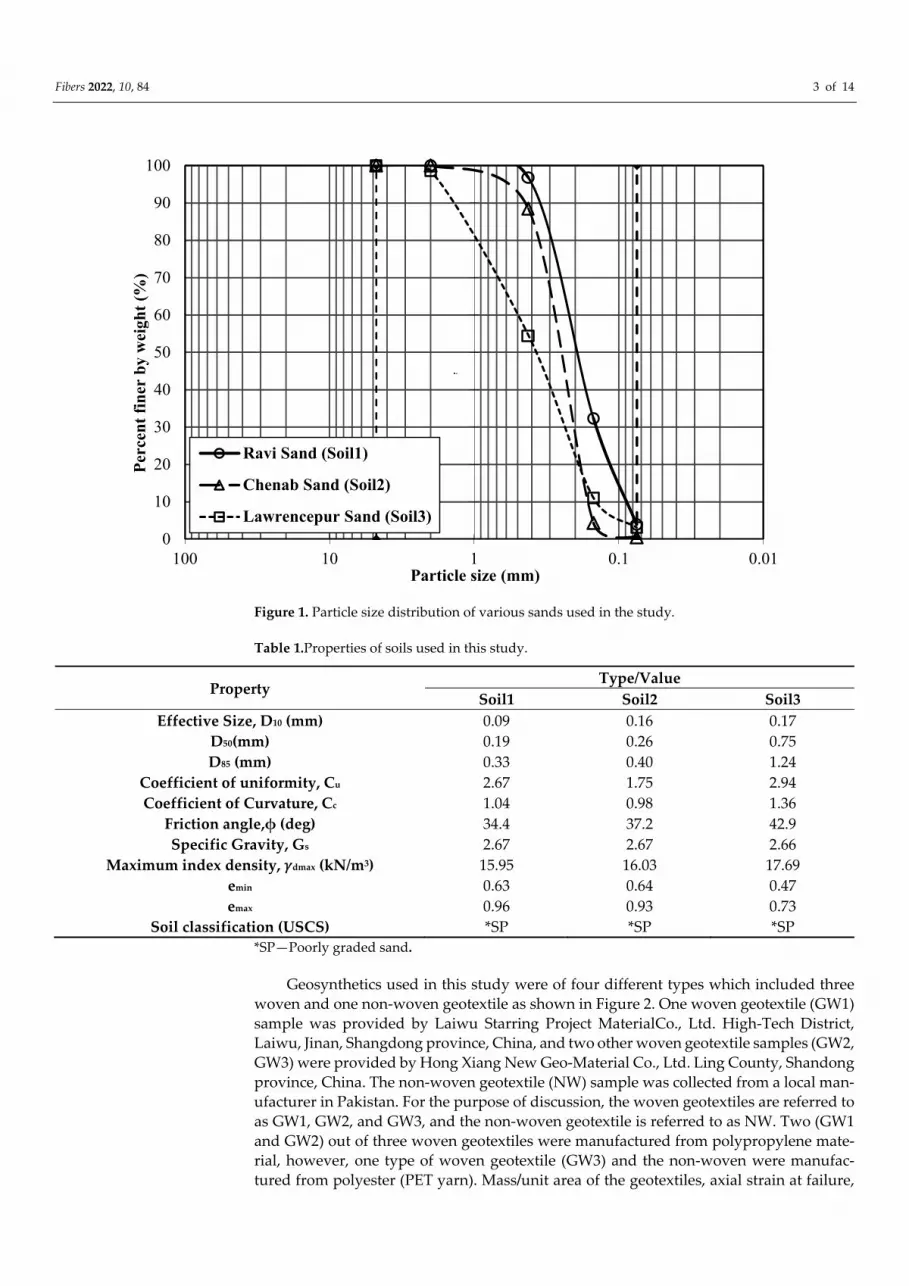
Geosynthetics used in this study were of four different types which included three
woven and one non‐woven geotextile as shown in Figure 2. One woven geotextile (GW1)
sample was provided by Laiwu Starring Project MaterialCo., Ltd. High‐Tech District,
Laiwu, Jinan, Shangdong province, China, and two other woven geotextile samples (GW2,
GW3) were provided by Hong Xiang New Geo‐Material Co., Ltd. Ling County, Shandong
province, China. The non‐woven geotextile (NW) sample was collected from a local man‐
ufacturer in Pakistan. For the purpose of discussion, the woven geotextiles are referred to
as GW1, GW2, and GW3, and the non‐woven geotextile is referred to as NW. Two (GW1
and GW2) out of three woven geotextiles were manufactured from polypropylene mate‐
rial, however, one type of woven geotextile (GW3) and the non‐woven were manufac‐
tured from polyester (PET yarn). Mass/unit area of the geotextiles, axial strain at failure,
0
10
20
30
40
50
60
70
80
90
100
0.010.1110100
Per
cen
t fi
ner
by
wei
ght
(%)
Particle size (mm)
Ravi Sand (Soil1)
Chenab Sand (Soil2)
Lawrencepur Sand (Soil3)
.....
Fibers 2022, 10, 84 4 of 14
and thickness were measured following the relevant ASTM standards [19,20,21]. The re‐
ported values of mass/unit area, thickness, and effective opening size were provided by
the relevant manufacturers while the wide‐width strip tensile test is performed at the Ma‐
terial Testing Laboratory, Polymer and Process Engineering Department, University of
Engineering & Technology, Lahore. The physical properties of the geosynthetics are sum‐
marized in Table 2.
Figure 2. Four different types of geotextiles, three woven; (a) GW1, (b) GW2, and (c) GW3, and
one non‐woven (d) (NW) used in this study. Particle size distribution for different sands used in
this study.
Table 2. Properties of geotextiles used in this study.
Material Polymer Mass/Unit Area Thickness Effective
Opening Size
Ultimate
Tensile
Strength
Axial Strain at
Failure
g/m
2 mm mm KN/m %
GW1 PP 310 0.425 76.2 8.0
GW2 PP 190 0.20 24.0 6.8
GW3 PET 295 1.2 0.45 103.8 15.7
NW PET 150 0.4 ‐‐ 3.3 42.5
GW1: Woven Geotextile (PP), GW2: Split Yarn Woven Geotextile (PP),GW3: Woven Geotextile
(PET), NW: Non‐woven Geotextile (PET), PP: Polypropylene, PET: Polyester Yarn.
Fibers 2022, 10, 84 5 of 14
The tensile strength of a geosynthetic is defined as the peak load applied per unit
width of the geosynthetic. The tensile strength of geosynthetics is commonly determined
by the wide‐width strip tensile test [20]. A tensile load was applied at a rate of 1 mm/min
on a 200 mm wide geosynthetic strip clamped between the jaws of UTM with a gauge
length of 100 mm. Thewide‐width strip test closely simulates the deformations experi‐
enced by the geosynthetics in the soil. This test provides various parameters such as max‐
imum tensile strength, extension, and tensile modulus. The measured strength and the
strain at failure depend on several variables such as the applied preload (if any), temper‐
ature, strain rate, sample geometry, gripping method, and any normal confinement ap‐
plied to the geosynthetic. To minimize the influence of the geometry of geosynthetics on
test results, it is suggested that the width‐gauge length ratio of the geosynthetic should
not be less than 2 [22]. The tensile strength of geosynthetics has a close relation with mass
per unit area.
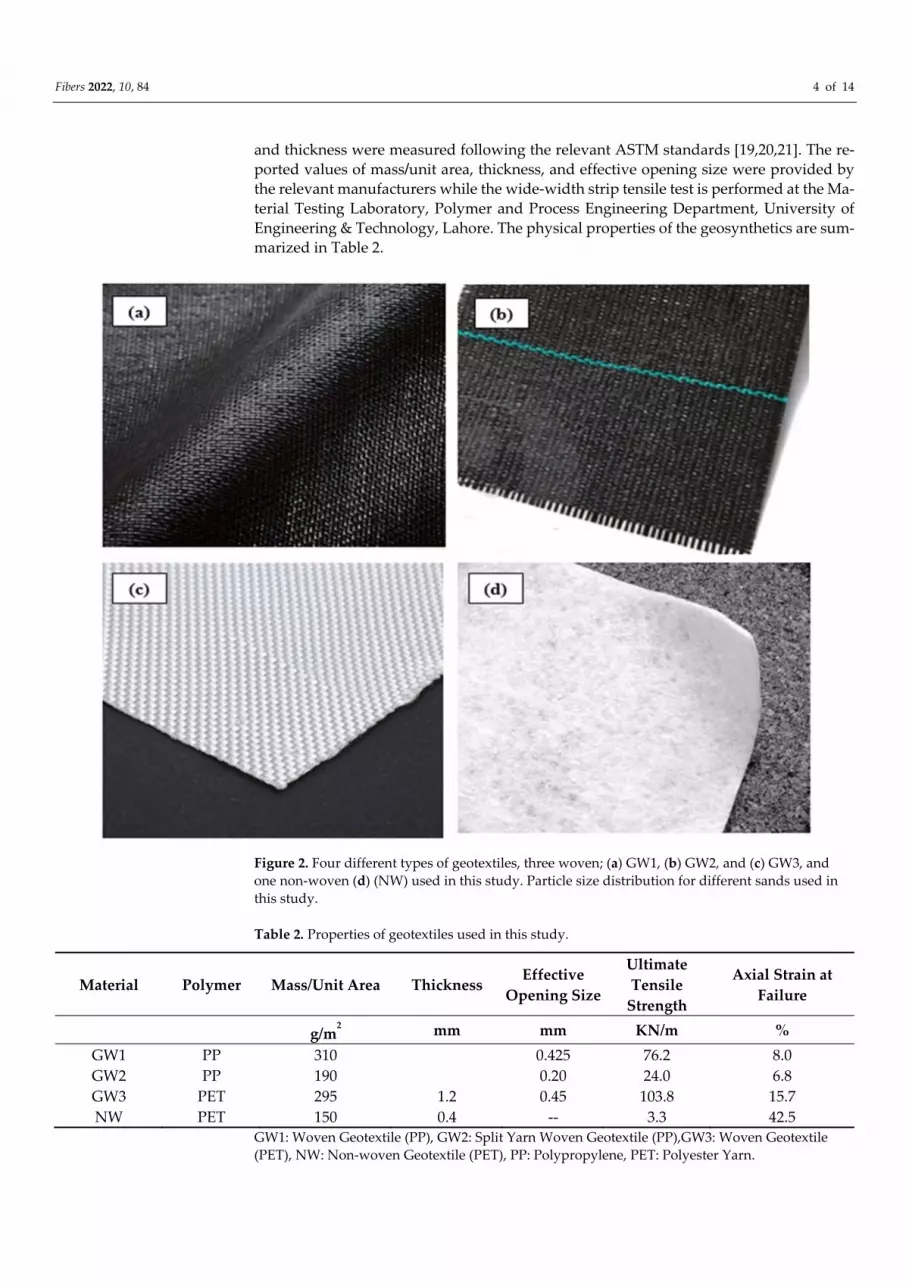
Results of tensile strength tests are presented in Figure 3.The tensile strength of GW3
is 103.8 kN/m at a strain of 15.7% which is 34.5 times more than the NW sample. The
probable reason for the high tensile strength of GW3 is its woven nature as compared to
the non‐woven sample. The tensile strength of GW3 is 1.36~4.13 times more than GW1
and GW2, respectively.
Figure 3.Wide‐width strip test on geosynthetics used in the current research.
2.1. Vertical Pullout Test Apparatus
A vertical pullout test (VPT) apparatus is designed in this study as shown in Figure
4. A wooden box was prepared to constrain the soil sample. A clamp and hanger were‐
fabricated to hold embedded geotextile in a soil sample within a wooden box. A load
measuring device having an accuracy of 0.01 N and a peak hold feature was used to record
the peak pullout force. Bricks of standard weight wereused to apply surcharge load on
the soil‐geotextile interface. In order to make this apparatus cost‐effective local material
was used for fabrication.
0
20
40
60
80
100
120
0 20 40 60 80 100 120
Ten
sile
For
ce (k
N/m
)
Elongation (%/)
GW1
GW2
GW3
NW
76.2 kN/m
103.8 kN/m
24.0 kN/m
3.3 kN/m
Material Tensile Strength kN/m
Axial Strain at Failure
(%) GW1 76.2 8.0 GW2 24.0 6.8 GW3 103.8 15.7 NW 3.3 42.5

Fibers 2022, 10, 84 6 of 14
(a) (b)
(c)
Figure 4.Assembled VPT setup (a) without surcharge and (b) with surcharge. (c) Clamp and
hanger fabricated for holding the reinforcement and digital scale in VPT.
2.2.Pullout Test Philosophy
VPT is a relatively simple technique for the evaluation of interface friction parameters
in the laboratory. It requires relatively inexpensive equipment that can be easily adapted
by laboratories and for field experimentation. In VPT,a geosynthetic product (geotextile
or geomembrane) is vertically embedded in the soil mass. The soil mass surrounding the
geosynthetic provides the lateral earth pressure that is utilized as the normal force to gen‐
erate normal stresses. In order to increase the normal stress, a surcharge is symmetrically
placed around the geosynthetic on top of the soil mass.The shearing force is applied by
vertically pulling out the geosynthetic to mobilize the friction around both faces of the
reinforcement. The peak or maximum value of the pullout force is recorded.
The lateral earth pressures are determined by assuming at rest condition of the soil
mass by using the angle of internal friction of soil that is estimated or already calculated
through direct shear tests of soil. For the present study, the soil used is in the dry state and
the lateral earth pressures acting on two faces of the geotextile were calculated using Bous‐
sinesq’s method. However, in the presence of moisture in the soil, effective stresses should
be considered. The shear strength parameters and peak interface friction angle (δ) be‐
tween soil and the geotextile reinforcement were determined by performing a series of
tests with different levels of normal stresses generated by applying different surcharge
loads and measuring the shear/pullout stresses by vertically pulling out the geotextile.
Figure 5 shows the stresses used to analyze the results of VPT.

Fibers 2022, 10, 84 7 of 14
Figure 5. Surcharge load application philosophy.
A sample of the desired dimension of geotextile was cut and fixed in the holding
clamps. The size of the geotextile sample selected to embed in the soil is 100 mm × 150 mm
and an additional 50 mm in height is taken for mounting the sample in the clamps and to
allow clearance above the soil. The geotextile sample was placed in clamps and held ver‐
tically in the middle of the container. The soil is filled around the geosynthetic sample
while carefully maintaining the vertical alignment of the reinforcement. The sand was
poured into a container in three layers to achieve the desired embedment height of the
geotextile. Each sand layer was compacted with equal compacting energy using the tam‐
per to achieve the final relative density of 50%. The length of geotextile above the soil
surface was noted after adding the soil to record the exact embedment length of the sam‐
ple.
Surcharge load is applied using bricks placed symmetrically on both sides of the re‐
inforcement to achieve different levels of normal stress. The clamps holding the digital
scale with an accuracy of 0. 0.01 N and the peak hold feature were used to record the peak
pullout force. The clamp holding the digital scale was held vertically and pulled out at a
predetermined uniform pace such that the complete reinforcement was pulled out of the
soil in 60 s. Figure 4 shows the photographs of the experimental procedure of VPT. The
reading on the digital scale increases until the interface friction on both faces of the geo‐
textile is fully mobilized and the peak value is recorded as the peak pullout force. After
the reading on the digital scale reaches its peak, it starts dropping rapidly and the rein‐
forcement gets pulled out. Tests were repeated for four different levels of normal stress.
Initially, no surcharge was applied and the normal stress was generated by the soil lateral
earth pressure, then for an increase in normal stress, bricks were added symmetrically on
both sides of the reinforcement. To avoid obstruction during pulling out,a surcharge was
placed about 20 mm from the clamp. Normal stress was calculated by summing up the
lateral earth pressure of the soil mass and pressure due to surcharge load. The normal
stress at different points was determined at equal intervals of embedment height of geo‐
textile and then the average of the stresses was taken as normal stress due to surface sur‐
charge (Figure 5).
𝐴𝑣𝑒𝑟𝑎𝑔𝑒𝑛𝑜𝑟𝑚𝑎𝑙𝑠𝑡𝑟𝑒𝑠𝑠 𝝈𝒛 𝒂𝒗𝒈 𝜎 𝜎 𝜎 𝜎
4 (1)
where
Fibers 2022, 10, 84 8 of 14
σ1, σ2, σ3, and σ4= normal stresses at height “z” of the embedded geotextile
and 𝜎 =the average normal stress at one face of embedded geotextile.
Normal stress and shear stress arecalculated using Equations (2) and (3), respectively:
𝜎 𝑁
𝐵 𝐿 (2)
𝜏 𝐹
2 𝐵 𝐿 (3)
where
Fvp= peak vertical pullout force,
B = width of the geotextile sample, and
Le= length of the geotextile embedded in soil.
2.3.Direct Shear Test
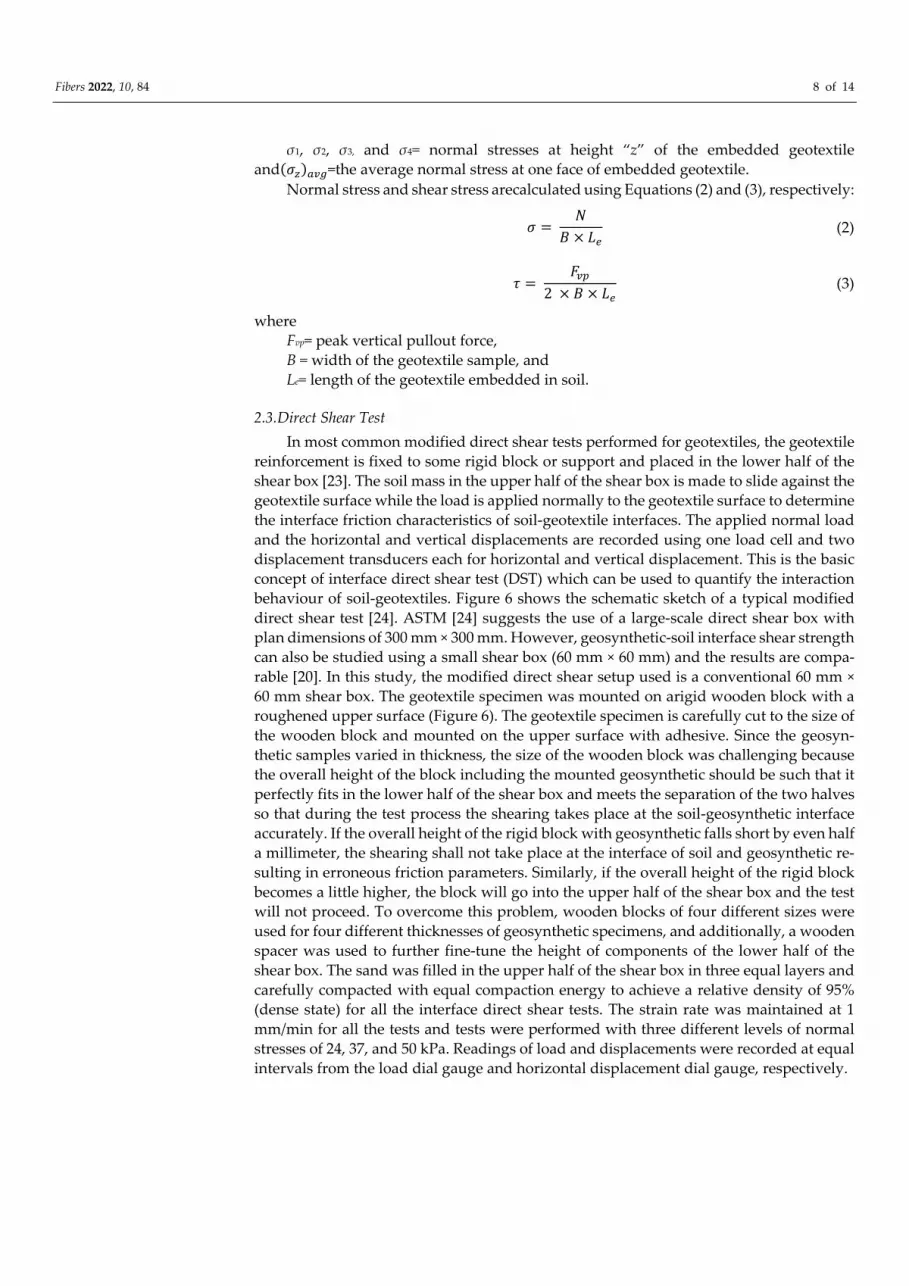
In most common modified direct shear tests performed for geotextiles, the geotextile
reinforcement is fixed to some rigid block or support and placed in the lower half of the
shear box [23]. The soil mass in the upper half of the shear box is made to slide against the
geotextile surface while the load is applied normally to the geotextile surface to determine
the interface friction characteristics of soil‐geotextile interfaces. The applied normal load
and the horizontal and vertical displacements are recorded using one load cell and two
displacement transducers each for horizontal and vertical displacement. This is the basic
concept of interface direct shear test (DST) which can be used to quantify the interaction
behaviour of soil‐geotextiles. Figure 6 shows the schematic sketch of a typical modified
direct shear test [24]. ASTM [24] suggests the use of a large‐scale direct shear box with
plan dimensions of 300 mm × 300 mm. However, geosynthetic‐soil interface shear strength
can also be studied using a small shear box (60 mm × 60 mm) and the results are compa‐
rable [20]. In this study, the modified direct shear setup used is a conventional 60 mm ×
60 mm shear box. The geotextile specimen was mounted on arigid wooden block with a
roughened upper surface (Figure 6). The geotextile specimen is carefully cut to the size of
the wooden block and mounted on the upper surface with adhesive. Since the geosyn‐
thetic samples varied in thickness, the size of the wooden block was challenging because
the overall height of the block including the mounted geosynthetic should be such that it
perfectly fits in the lower half of the shear box and meets the separation of the two halves
so that during the test process the shearing takes place at the soil‐geosynthetic interface
accurately. If the overall height of the rigid block with geosynthetic falls short by even half
a millimeter, the shearing shall not take place at the interface of soil and geosynthetic re‐
sulting in erroneous friction parameters. Similarly, if the overall height of the rigid block
becomes a little higher, the block will go into the upper half of the shear box and the test
will not proceed. To overcome this problem, wooden blocks of four different sizes were
used for four different thicknesses of geosynthetic specimens, and additionally, a wooden
spacer was used to further fine‐tune the height of components of the lower half of the
shear box. The sand was filled in the upper half of the shear box in three equal layers and
carefully compacted with equal compaction energy to achieve a relative density of 95%
(dense state) for all the interface direct shear tests. The strain rate was maintained at 1
mm/min for all the tests and tests were performed with three different levels of normal
stresses of 24, 37, and 50 kPa. Readings of load and displacements were recorded at equal
intervals from the load dial gauge and horizontal displacement dial gauge, respectively.
Fibers 2022, 10, 84 9 of 14
(a) (b)
(c)
Figure 6. (a) Wooden blocks of different heights fabricated to place in the lower half of the shear
box, (b) geosynthetic reinforcement mounted on top of the wooden block for interface shear
tests,(c) direct shear test philosophy.
3. Results
VPT Results
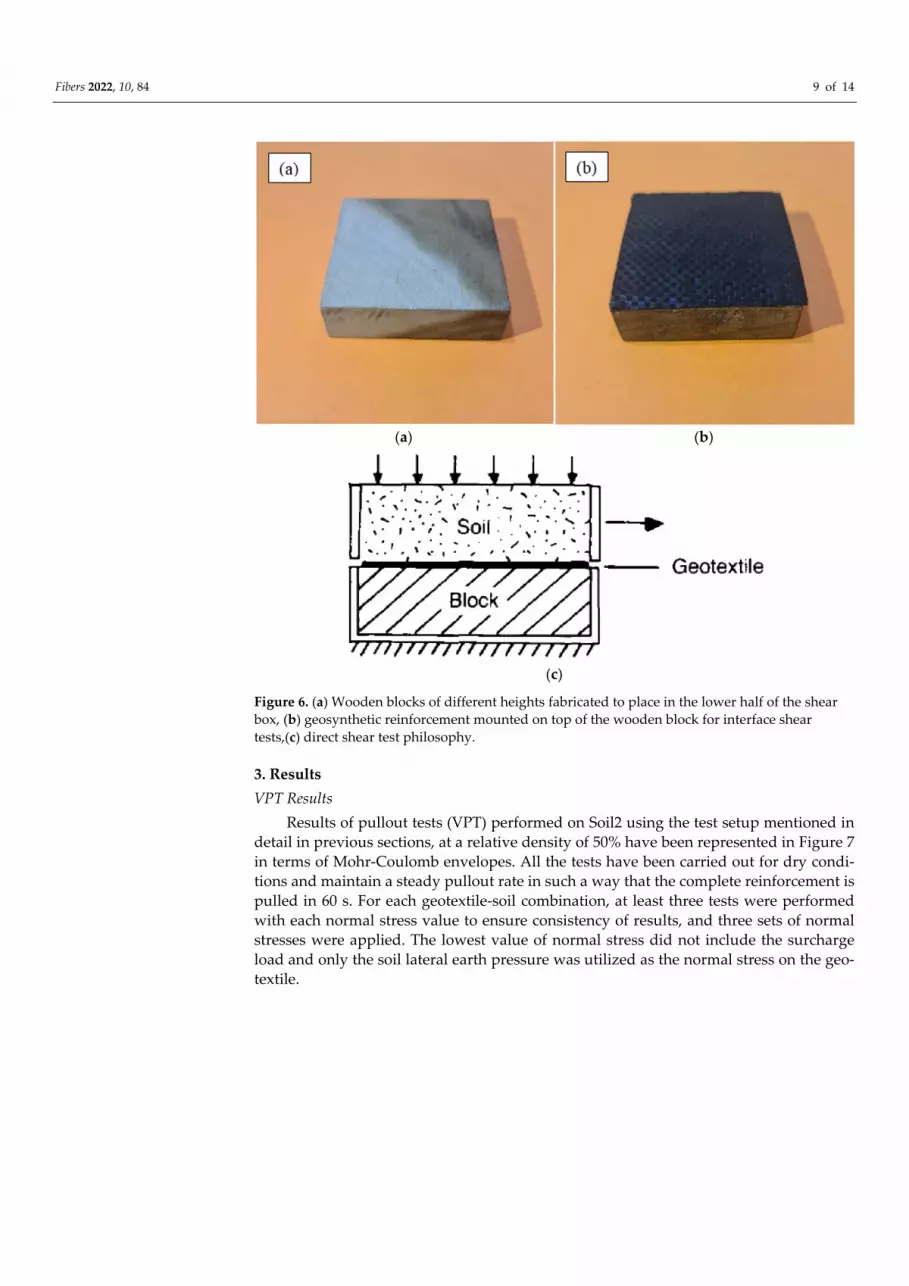
Results of pullout tests (VPT) performed on Soil2 using the test setup mentioned in
detail in previous sections, at a relative density of 50% have been represented in Figure 7
in terms of Mohr‐Coulomb envelopes. All the tests have been carried out for dry condi‐
tions and maintain a steady pullout rate in such a way that the complete reinforcement is
pulled in 60 s. For each geotextile‐soil combination, at least three tests were performed
with each normal stress value to ensure consistency of results, and three sets of normal
stresses were applied. The lowest value of normal stress did not include the surcharge
load and only the soil lateral earth pressure was utilized as the normal stress on the geo‐
textile.
Fibers 2022, 10, 84 10 of 14
(a) (b)
(c)
Figure 7.Interface friction angles obtained through vertical pullout with different geosynthetics.(a)
Geosynthetics~Soil1,(b) Geosynthetics~Soil2,(c) Geosynthetics~Soil3.
Figure 7 shows the results for Soil1, Soil2, and Soil3. The measured interface friction
angle for GW2 for all soil sample is minimum (23.9° ~ 26.6°) i.e 76% ~ 91% of that interface
friction angle for the NW specimen. All four geotextiles (GW1, GW2, GW3, and NW) were
tested with three Soils (Soil1, Soil2, and Soil3) using a vertical pullout test (VPT). Since all
three soils used in this study were cohesionless therefore the adhesion values for all inter‐
faces were negligible.
4. Discussion
The discussion regarding the test results is as follows.
4.1.Comparison of VPT and Direct Shear Test
A comparison of the results obtained from DST and VPT is summarized in Figure 7.
The results indicate that the values from DST are higher as compared to the pullout test
and the values of interface friction angles are up to 19% smaller than that of DST, due to
dissimilar boundary conditions in direct shear and pullout tests. Secondly, the normal
stresses applied in pullout tests were comparatively smaller than that of direct shear tests.
Also in pullout mode, the reinforcement undergoes large deformations which result
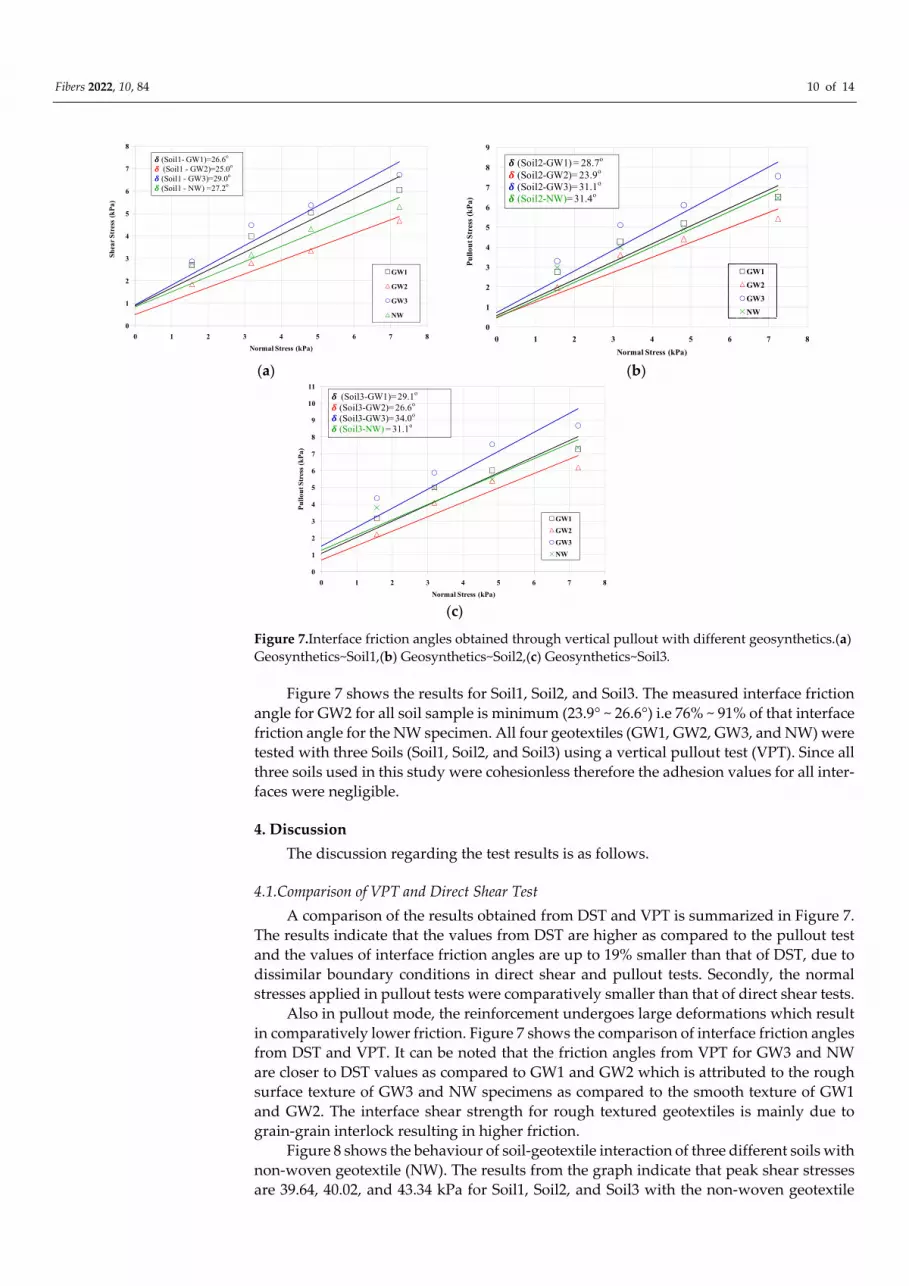
in comparatively lower friction. Figure 7 shows the comparison of interface friction angles
from DST and VPT. It can be noted that the friction angles from VPT for GW3 and NW
are closer to DST values as compared to GW1 and GW2 which is attributed to the rough
surface texture of GW3 and NW specimens as compared to the smooth texture of GW1
and GW2. The interface shear strength for rough textured geotextiles is mainly due to
grain‐grain interlock resulting in higher friction.
Figure 8 shows the behaviour of soil‐geotextile interaction of three different soils with
non‐woven geotextile (NW). The results from the graph indicate that peak shear stresses
are 39.64, 40.02, and 43.34 kPa for Soil1, Soil2, and Soil3 with the non‐woven geotextile
0
1
2
3
4
5
6
7
8
0 1 2 3 4 5 6 7 8
Sh
ear
Str
ess
(kP
a)
Normal Stress (kPa)
GW1
GW2
GW3
NW
𝜹 (Soil1- GW1)=26.6o
𝜹 (Soil1 - GW2)=25.0o
𝜹 (Soil1 - GW3)=29.0o
𝜹 (Soil1 - NW) =27.2o
0
1
2
3
4
5
6
7
8
9
0 1 2 3 4 5 6 7 8
Pu
llou
t Str
ess
(kP
a)
Normal Stress (kPa)
GW1
GW2
GW3
NW
𝜹 (Soil2-GW1) = 28.7o
𝜹 (Soil2-GW2)= 23.9o
𝜹 (Soil2-GW3)= 31.1o
𝜹 (Soil2-NW)= 31.4o
0
1
2
3
4
5
6
7
8
9
10
11
0 1 2 3 4 5 6 7 8
Pu
llou
t Str
ess
(kP
a)
Normal Stress (kPa)
GW1
GW2
GW3
NW
𝜹 (Soil3-GW1)= 29.1o
𝜹 (Soil3-GW2)= 26.6o
𝜹 (Soil3-GW3)= 34.0o
𝜹 (Soil3-NW) = 31.1o
Fibers 2022, 10, 84 11 of 14
(NW), respectively. These peak shear stress values are higher than that of woven geotex‐
tile (GW1). This suggests that non‐woven geotextile developed better interactions with
the neighboring soil which may be attributed to its relatively rough surface texture. The
rough texture of non‐woven geotextile (NW) allowed the soil particles to stick to its sur‐
face and coarser particles were also able to penetrate the surface. Further, VPT shows con‐
servative interface strength owing to the fact actual stiffness of geotextiles is being incor‐
porated in VPT (Figure 8); meanwhile in DST, the stiffness of geotextile increases due to
mounting it on a wooden box. Therefore, VPT presents a more realistic approach to eval‐
uating the interfacial strength of the geotextile‐soil reinforcement.
Figure 8. Comparison of interface friction angles obtained from modified direct shear tests and
vertical pullout tests for various soil‐geotextile interfaces.
4.2.Interface Efficiency
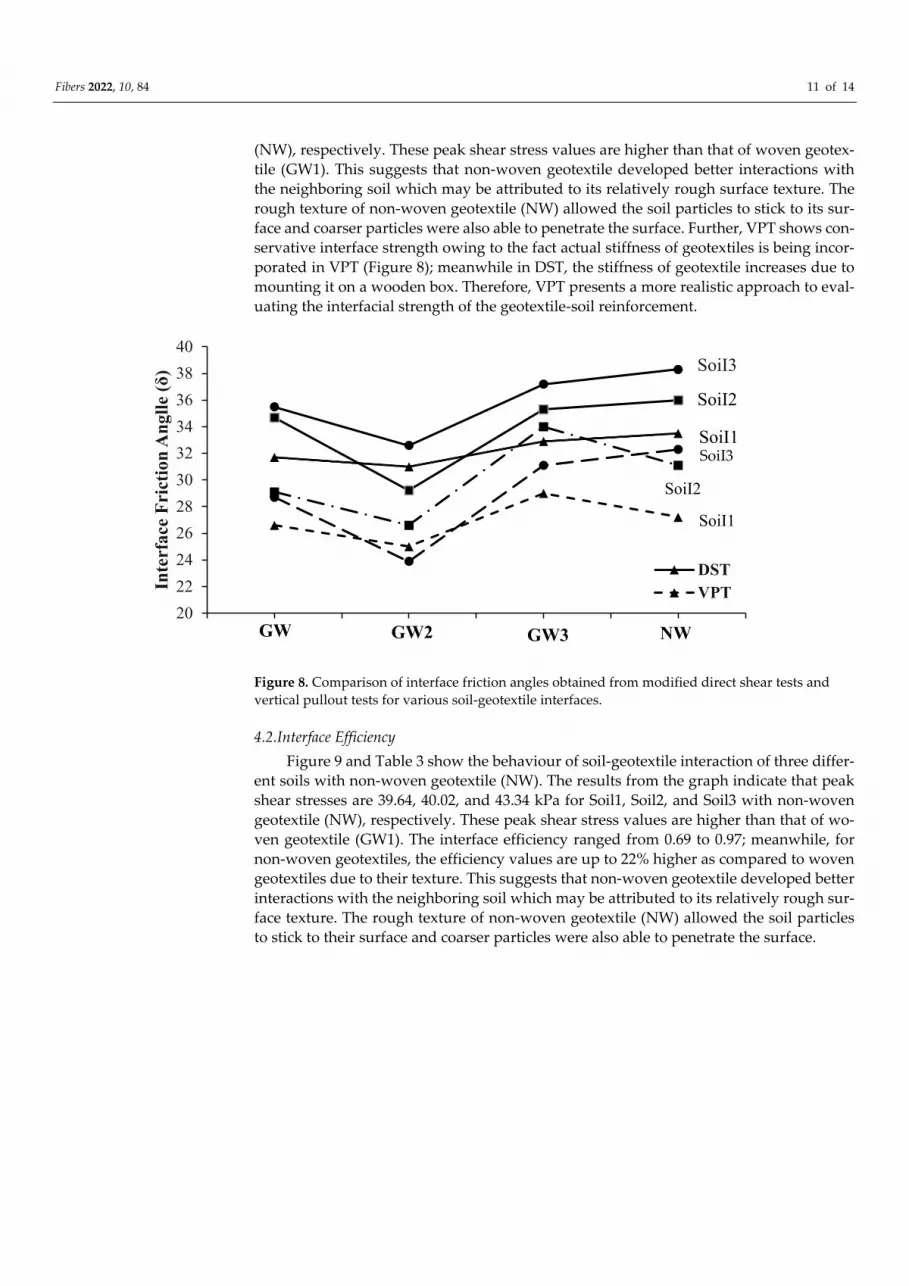
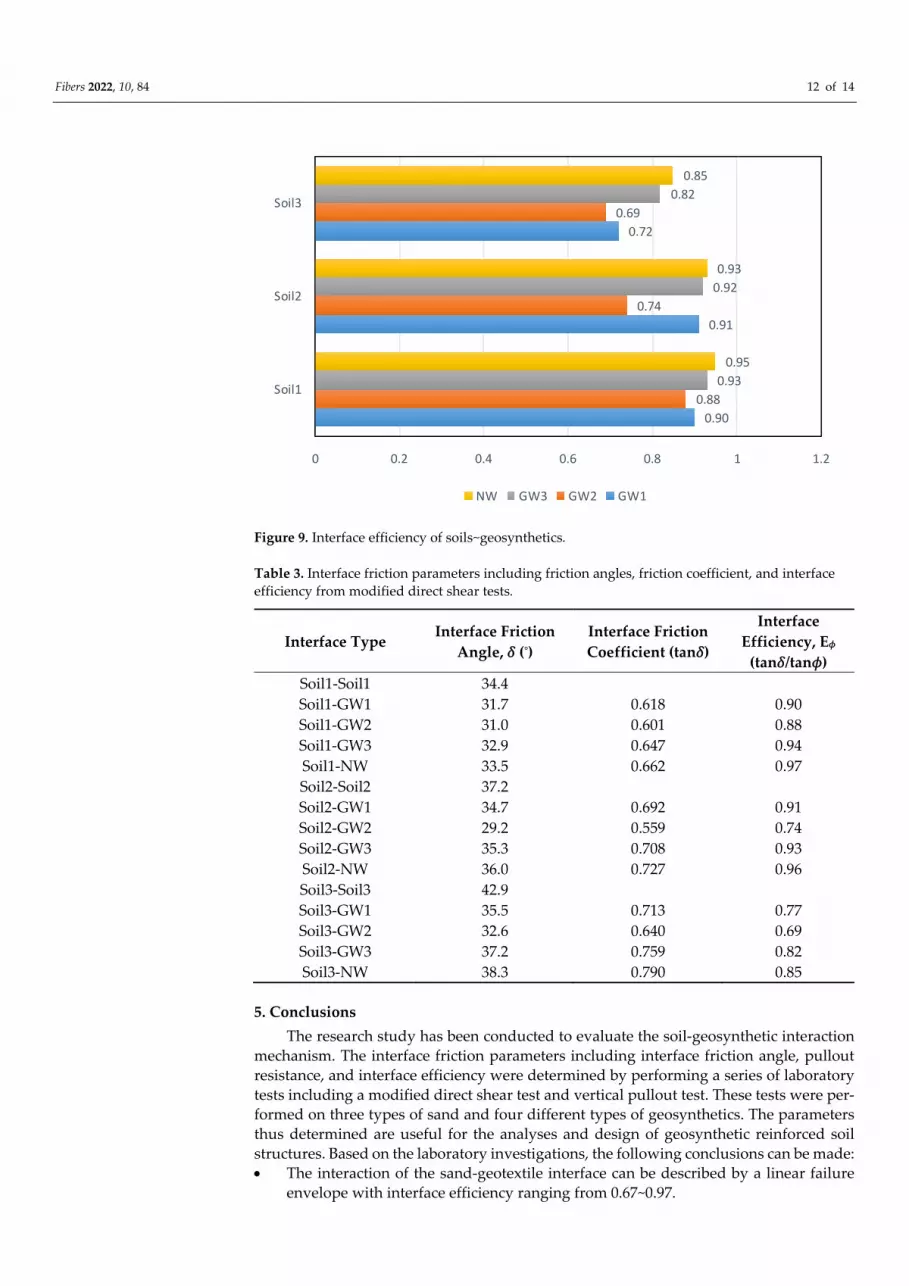
Figure 9 and Table 3 show the behaviour of soil‐geotextile interaction of three differ‐
ent soils with non‐woven geotextile (NW). The results from the graph indicate that peak
shear stresses are 39.64, 40.02, and 43.34 kPa for Soil1, Soil2, and Soil3 with non‐woven
geotextile (NW), respectively. These peak shear stress values are higher than that of wo‐
ven geotextile (GW1). The interface efficiency ranged from 0.69 to 0.97; meanwhile, for
non‐woven geotextiles, the efficiency values are up to 22% higher as compared to woven
geotextiles due to their texture. This suggests that non‐woven geotextile developed better
interactions with the neighboring soil which may be attributed to its relatively rough sur‐
face texture. The rough texture of non‐woven geotextile (NW) allowed the soil particles
to stick to their surface and coarser particles were also able to penetrate the surface.
20
22
24
26
28
30
32
34
36
38
40
0.5 1 1.5 2 2.5 3 3.5 4 4.5
Inte
rfac
e F
rict
ion
An
glle
(δ)
DSTVPT
SoiI3
SoiI2
SoiI1
GW GW2 GW3 NW
SoiI1
SoiI2
SoiI3
Fibers 2022, 10, 84 12 of 14
Figure 9. Interface efficiency of soils~geosynthetics.
Table 3. Interface friction parameters including friction angles, friction coefficient, and interface
efficiency from modified direct shear tests.
Interface Type Interface Friction
Angle, 𝛿 (°) Interface Friction
Coefficient (tan𝛿)
Interface
Efficiency, E𝜙
(tan𝛿/tan𝜙) Soil1‐Soil1 34.4
Soil1‐GW1 31.7 0.618 0.90
Soil1‐GW2 31.0 0.601 0.88
Soil1‐GW3 32.9 0.647 0.94
Soil1‐NW 33.5 0.662 0.97
Soil2‐Soil2 37.2
Soil2‐GW1 34.7 0.692 0.91
Soil2‐GW2 29.2 0.559 0.74
Soil2‐GW3 35.3 0.708 0.93
Soil2‐NW 36.0 0.727 0.96
Soil3‐Soil3 42.9
Soil3‐GW1 35.5 0.713 0.77
Soil3‐GW2 32.6 0.640 0.69
Soil3‐GW3 37.2 0.759 0.82
Soil3‐NW 38.3 0.790 0.85
5. Conclusions
The research study has been conducted to evaluate the soil‐geosynthetic interaction
mechanism. The interface friction parameters including interface friction angle, pullout
resistance, and interface efficiency were determined by performing a series of laboratory
tests including a modified direct shear test and vertical pullout test. These tests were per‐
formed on three types of sand and four different types of geosynthetics. The parameters
thus determined are useful for the analyses and design of geosynthetic reinforced soil
structures. Based on the laboratory investigations, the following conclusions can be made:
The interaction of the sand‐geotextile interface can be described by a linear failure
envelope with interface efficiency ranging from 0.67~0.97.
0.90
0.91
0.72
0.88
0.74
0.69
0.93
0.92
0.82
0.95
0.93
0.85
0 0.2 0.4 0.6 0.8 1 1.2
Soil1
Soil2
Soil3
NW GW3 GW2 GW1
Fibers 2022, 10, 84 13 of 14
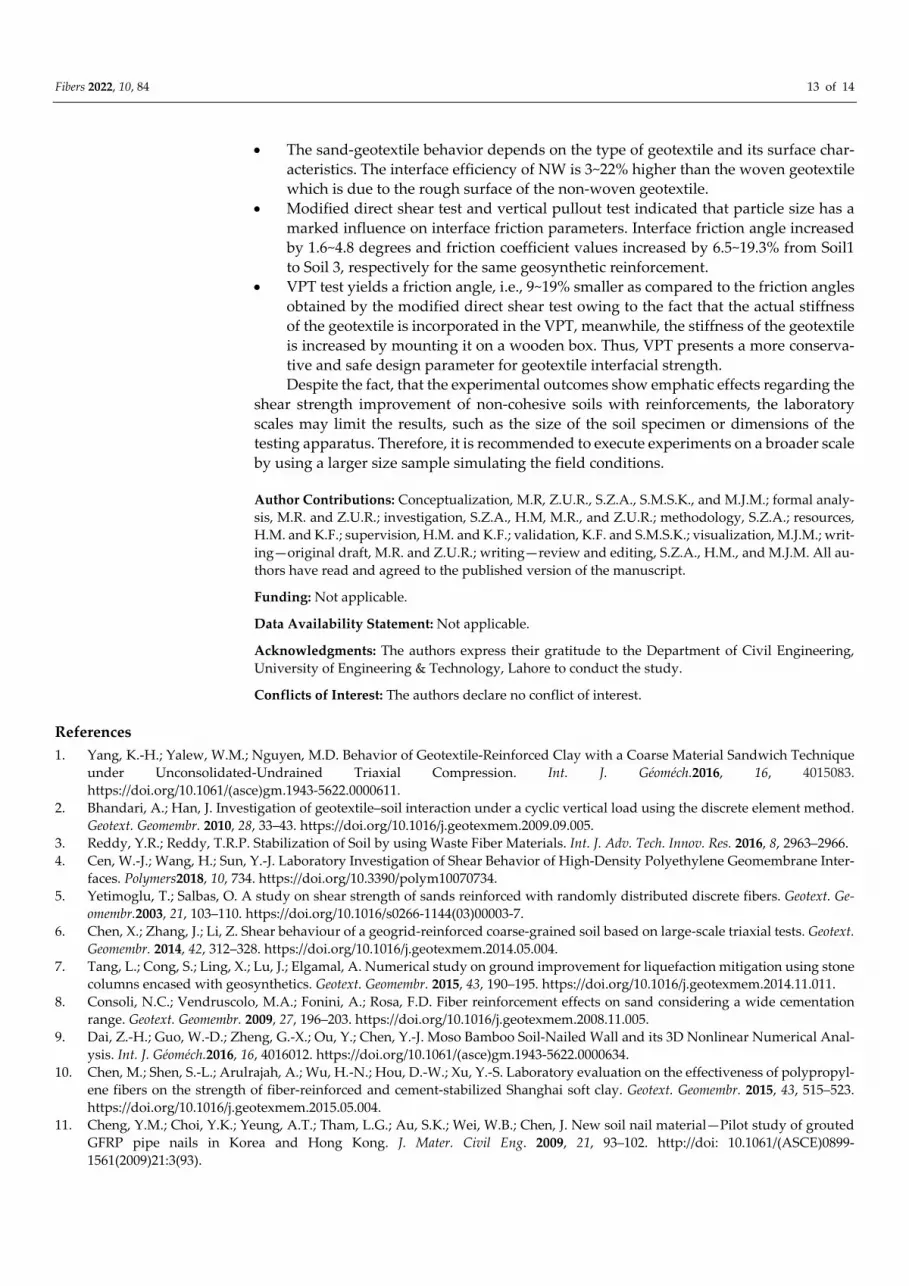
The sand‐geotextile behavior depends on the type of geotextile and its surface char‐
acteristics. The interface efficiency of NW is 3~22% higher than the woven geotextile
which is due to the rough surface of the non‐woven geotextile.
Modified direct shear test and vertical pullout test indicated that particle size has a
marked influence on interface friction parameters. Interface friction angle increased
by 1.6~4.8 degrees and friction coefficient values increased by 6.5~19.3% from Soil1
to Soil 3, respectively for the same geosynthetic reinforcement.
VPT test yields a friction angle, i.e., 9~19% smaller as compared to the friction angles
obtained by the modified direct shear test owing to the fact that the actual stiffness
of the geotextile is incorporated in the VPT, meanwhile, the stiffness of the geotextile
is increased by mounting it on a wooden box. Thus, VPT presents a more conserva‐
tive and safe design parameter for geotextile interfacial strength.
Despite the fact, that the experimental outcomes show emphatic effects regarding the
shear strength improvement of non‐cohesive soils with reinforcements, the laboratory
scales may limit the results, such as the size of the soil specimen or dimensions of the
testing apparatus. Therefore, it is recommended to execute experiments on a broader scale
by using a larger size sample simulating the field conditions.
Author Contributions: Conceptualization, M.R, Z.U.R., S.Z.A., S.M.S.K., and M.J.M.; formal analy‐
sis, M.R. and Z.U.R.; investigation, S.Z.A., H.M, M.R., and Z.U.R.; methodology, S.Z.A.; resources,
H.M. and K.F.; supervision, H.M. and K.F.; validation, K.F. and S.M.S.K.; visualization, M.J.M.; writ‐
ing—original draft, M.R. and Z.U.R.; writing—review and editing, S.Z.A., H.M., and M.J.M. All au‐
thors have read and agreed to the published version of the manuscript.
Funding: Not applicable.
Data Availability Statement: Not applicable.
Acknowledgments: The authors express their gratitude to the Department of Civil Engineering,
University of Engineering & Technology, Lahore to conduct the study.
Conflicts of Interest: The authors declare no conflict of interest.
References
1. Yang, K.‐H.; Yalew, W.M.; Nguyen, M.D. Behavior of Geotextile‐Reinforced Clay with a Coarse Material Sandwich Technique
under Unconsolidated‐Undrained Triaxial Compression. Int. J. Géoméch.2016, 16, 4015083.
https://doi.org/10.1061/(asce)gm.1943‐5622.0000611.
2. Bhandari, A.; Han, J. Investigation of geotextile–soil interaction under a cyclic vertical load using the discrete element method.
Geotext. Geomembr. 2010, 28, 33–43. https://doi.org/10.1016/j.geotexmem.2009.09.005.
3. Reddy, Y.R.; Reddy, T.R.P. Stabilization of Soil by using Waste Fiber Materials. Int. J. Adv. Tech. Innov. Res. 2016, 8, 2963–2966.
4. Cen, W.‐J.; Wang, H.; Sun, Y.‐J. Laboratory Investigation of Shear Behavior of High‐Density Polyethylene Geomembrane Inter‐
faces. Polymers2018, 10, 734. https://doi.org/10.3390/polym10070734.
5. Yetimoglu, T.; Salbas, O. A study on shear strength of sands reinforced with randomly distributed discrete fibers. Geotext. Ge‐
omembr.2003, 21, 103–110. https://doi.org/10.1016/s0266‐1144(03)00003‐7.
6. Chen, X.; Zhang, J.; Li, Z. Shear behaviour of a geogrid‐reinforced coarse‐grained soil based on large‐scale triaxial tests. Geotext.
Geomembr. 2014, 42, 312–328. https://doi.org/10.1016/j.geotexmem.2014.05.004.
7. Tang, L.; Cong, S.; Ling, X.; Lu, J.; Elgamal, A. Numerical study on ground improvement for liquefaction mitigation using stone
columns encased with geosynthetics. Geotext. Geomembr. 2015, 43, 190–195. https://doi.org/10.1016/j.geotexmem.2014.11.011.
8. Consoli, N.C.; Vendruscolo, M.A.; Fonini, A.; Rosa, F.D. Fiber reinforcement effects on sand considering a wide cementation
range. Geotext. Geomembr. 2009, 27, 196–203. https://doi.org/10.1016/j.geotexmem.2008.11.005.
9. Dai, Z.‐H.; Guo, W.‐D.; Zheng, G.‐X.; Ou, Y.; Chen, Y.‐J. Moso Bamboo Soil‐Nailed Wall and its 3D Nonlinear Numerical Anal‐
ysis. Int. J. Géoméch.2016, 16, 4016012. https://doi.org/10.1061/(asce)gm.1943‐5622.0000634.
10. Chen, M.; Shen, S.‐L.; Arulrajah, A.; Wu, H.‐N.; Hou, D.‐W.; Xu, Y.‐S. Laboratory evaluation on the effectiveness of polypropyl‐
ene fibers on the strength of fiber‐reinforced and cement‐stabilized Shanghai soft clay. Geotext. Geomembr. 2015, 43, 515–523.
https://doi.org/10.1016/j.geotexmem.2015.05.004.
11. Cheng, Y.M.; Choi, Y.K.; Yeung, A.T.; Tham, L.G.; Au, S.K.; Wei, W.B.; Chen, J. New soil nail material—Pilot study of grouted
GFRP pipe nails in Korea and Hong Kong. J. Mater. Civil Eng. 2009, 21, 93–102. http://doi: 10.1061/(ASCE)0899‐
1561(2009)21:3(93).
Fibers 2022, 10, 84 14 of 14
12. Cheng, Y.; Au, S.; Pearson, A.; Li, N. An innovative Geonail system for soft ground stabilization. Soils Found.2013, 53, 282–298.
https://doi.org/10.1016/j.sandf.2013.02.009.
13. Cheng, Y.; Au, S.; Yeung, A.T. Laboratory and field evaluation of several types of soil nails for different geological conditions.
Can. Geotech. J.2015, 53, 634–645. https://doi.org/10.1139/cgj‐2015‐0267.
14. Anubhav; Basudhar, P.K. Interface Behavior of Woven Geotextile with Rounded and Angular Particle Sand. J. Mater. Civ.
Eng.2013, 25, 1970–1974. https://doi.org/10.1061/(asce)mt.1943‐5533.0000774.
15. Markou, I.N. Direct Shear Testing of Sand—Geotextile Interfaces. In Advances in Reinforced Soil Structures, GeoMEast, 2017. Sus‐
tainable Civil Infrastructures; Shukla, S., Guler, E., Eds.; Springer: Cham, Switzerland, 2018. https://doi.org/10.1007/978‐3‐319‐
63570‐5_1.
16. Tuna, S.; Altun, S. Mechanical behavior of sand‐geotextile interface. Sci. Iran. 2012, 19, 1044–1051.
17. Abdi, M.R.; Gonbad, M.S.S. Studying the effect of roughness on soil‐geotextile interaction in direct shear test. J. Eng. Geol.2018,
12,1–30.
18. Hsieh, C.W.; Chen, G.H.; Wu, J.H. The shear behavior obtained from the direct shear and pullout tests for different poor graded
soil‐geosynthetic systems. J. GeoEng. 2011, 6, 15–26.
19. ASTM D5261‐10; Standard Test Method for Measuring Mass per Unit Area of Geotextiles. ASTM International: West Con‐
shohocken, PA, USA, 2018. Available online: www.astm.org (accessed on 23 April 2020).
20. ASTM D4595‐17; Standard Test Method for Tensile Properties of Geotextiles by the Wide‐Width Strip Method. ASTM Interna‐
tional, West Conshohocken, PA, USA, 2017. Available online: www.astm.org (accessed on 30 June 2020).
21. ASTM D5199‐12; Standard Test Method for Measuring the Nominal Thickness of Geosynthetics. ASTM International, West
Conshohocken, PA, USA, 2019. Available online: www.astm.org (accessed on 15 April 2020).
22. Shukla, R.P.; Parihar, N.S.; Gupta, A.K. The effect of geotextile on low plastic sandy clay. In Proceedings of the 6th Asian Re‐
gional Conference on Geosynthetics—Geosynthetics for Infrastructure Development, New Delhi, India, 8–11 November 2016;
pp. 251–259.
23. Rehman, Z.U.; Zhang, G. Shear coupling effect of monotonic and cyclic behavior of the interface between steel and gravel. Can.
Geotech. J. 2019, 56, 876–884.
24. ASTM D 5321‐12; Standard Test Method for Determining the Shear Strength of Soil‐Geosynthetic and Geosynthetic‐Geosyn‐
thetic Interfaces by Direct Shear. ASTM International, West Conshohocken, PA, USA, 2017. Available online: www.astm.org
(accessed on 15 May 2020).