psychological bulletin
TRANSCRIPT

Psychological Bulletin
Manuscript version of
Improving Neurocognitive Testing Using Computational Psychiatry—A Systematic Review for ADHD
Nadja R. Ging-Jehli, Roger Ratcliff, L. Eugene Arnold
Funded by: • National Institute on Aging
© 2020, American Psychological Association. This manuscript is not the copy of record and may not exactly replicate the final, authoritative version of the article. Please do not copy or cite without authors’ permission. The final version of record is available via its DOI: https://dx.doi.org/10.1037/bul0000319
This article is intended solely for the personal use of the individual user and is not to be disseminated broadly.
Improving Neurocognitive Testing using Computational Psychiatry – A Systematic Review
for ADHD
Nadja R. Ging-Jehli1, Roger Ratcliff
1, L. Eugene Arnold
2,3
1Department of Psychology, The Ohio State University
2Department of Psychiatry & Behavioral Health, The Ohio State University
3Nisonger Center UCEDD, The Ohio State University
Author Note
Nadja R. Ging-Jehli, Department of Psychology, The Ohio State University; Roger
Ratcliff, Department of Psychology, The Ohio State University. L. Eugene Arnold, Department
of Psychiatry & Behavioral Health and Nisonger Center UCEDD, The Ohio State University.
Mrs. Ging-Jehli and Dr. Ratcliff have no conflicts of interest to disclose. Dr. Arnold has
received research funding from Curemark, Forest, Lilly, Neuropharm, Novartis, Noven, Shire,
Supernus, Roche, and YoungLiving (as well as NIH and Autism Speaks), has consulted with
Gowlings, Neuropharm, Organon, Pfizer, Sigma Tau, Shire, Tris Pharma, and Waypoint, and
been on advisory boards for Arbor, Ironshore, Novartis, Noven, Otsuka, Pfizer, Roche, Seaside
Therapeutics, Sigma Tau, Shire. No other publication has been submitted for this research, and
the results were not presented in any form. Nadja R. Ging-Jehli is a Graduate Student and thanks
the Swiss National Science Foundation (SNSF) for their support of her graduate studies.
Preparation of this article was supported by NIA grants R01-AG041176 and R01-AG057841
awarded to Roger Ratcliff. Special thanks to Russ Childers and Deniz Ecemis Özbilen for
inspiring discussions and suggestions to the content of this manuscript.
Correspondence concerning this article should be addressed to Nadja R. Ging-Jehli,
Department of Psychology, The Ohio State University, 1835 Neil Avenue Mall, Columbus, OH
43210, United States. E-mails: [email protected] or [email protected]. Phone: +1 (614)
736-7755
Review of cognitive tests for ADHD 2
Abstract
Computational models, in conjunction with (neuro)cognitive tests, are increasingly used to
understand the cognitive characteristics of participants with attention-deficit hyperactivity
disorder (ADHD). We reviewed 50 studies from a broad range of cognitive tests for ADHD to
synthesize findings and to summarize the new insights provided by three commonly applied
computational models (i.e., diffusion decision models, absolute accumulator models, ex-
Gaussian distribution models). Four areas are discussed to improve the utility of (neuro)cognitive
testing for ADHD: 1. the requirements for appropriate application of the computational models;
2. the consideration of sample characteristics and neurophysiological measures; 3. the integration
of findings from cognitive psychology into the literature of cognitive testing to reconcile mixed
evidence; and 4. future directions for the study of ADHD endophenotypes. We illustrate how
computational models refine our understanding of cognitive concepts (slow processing speed,
inhibition failures) presumed to characterize ADHD. We also show that considering sample
characteristics and integrating findings from computational models and neurophysiological
measures provide evidence for ADHD endophenotype-specific cognitive characteristics.
However, studying the cognitive characteristics of ADHD endophenotypes often lies beyond the
scope of existing research due to three reasons: some cognitive tests lack sensitivity to detect
clinical characteristics; analysis methods do not allow the study of subtle cognitive differences;
and the pre-categorization of participants restricts the study of symptom severity on a continuous
spectrum. We provide recommendations for cognitive testing, computational modeling and
integrating electrophysiological measures to produce more valuable tools in research and clinical
practice (above and beyond the research domain of ADHD).
Review of cognitive tests for ADHD 3
Keywords: computational psychiatry, ADHD endophenotypes, cognitive tests, neurocognitive
testing, computational decision models
Public Significance Statement: Neurocognitive testing lacks evidence-based standards on
tasks and methods used. This review of research on attention-deficit hyperactivity disorder
(ADHD) shows that studies are often not comparable because of differences in tasks, participant
groups, and provided performance measures. We suggest that sequential sampling models are
promising tools to advance research in this domain, but common tests need adaptations to
improve our understanding of differences and similarities between various ADHD
endophenotypes and frequently co-occurring diagnoses.
Introduction
Attention-deficit hyperactivity disorder (ADHD) is a widespread disorder that includes
symptoms of inattention, impulsivity, and hyperactivity. The current Diagnostic and Statistical
Manual of Mental Disorders (DSM-V; [APA], 2013) distinguishes among three ADHD
presentations, namely the predominantly inattentive-type (ADHD-I); the predominantly
hyperactive presentation (ADHD-H); and the combined presentation (ADHD-C), which shares
characteristics of the other two (i.e., ADHD-I, ADHD-H). We subsequently refer to these three
presentations as subtypes.
There is a common acknowledgment that most participants with ADHD experience a
diverse range of symptoms with disparate severity (Kofler et al., 2019; Mostert et al., 2015;
Sjowall & Thorell, 2019; Wahlstedt, Thorell & Bohlin, 2009; Willoughby, Wylie, & Blair,
2019). A growing body of research also suggests that comorbidities frequently accompany
ADHD, such as anxiety, depression, bipolar disorder, autism spectrum disorder, obsessive-
compulsive disorder, and oppositional defiant disorders (Avila et al., 2004; Birmaher et al., 2006;
Review of cognitive tests for ADHD 4
DelBello, Kowatch, & Strakowski, 2006; Kessler et al., 2006; Nikolas, Marshall, & Hoelzle,
2019; Singh, Nigg, 2001; Spencer, Biederman, & Wilens, 1999). These comorbidities
themselves potentially have unique cognitive characteristics that may interact with or mask
characteristics specific to ADHD. Therefore, researchers and clinicians are searching for features
that characterize ADHD, and for procedures to diagnose different ADHD endophenotypes1 (e.g.,
Coghill et al., 2005; Killeen, 2019; Nigg, 2001; 2005; Vaurio, Simmonds & Mostofsky, 2009).
Identifying the cognitive characteristics of ADHD endophenotypes may help in the
selection of effective treatments by tailoring them to the specific demands of the different
endophenotypes (Kofler et al., 2017; Kofler et al., 2013; Nigg, Willcutt, Doyle, & Sonuga-Barke,
2005). Given that approximately one-third of participants with ADHD do not sufficiently
respond to medical treatments, finding and tailoring effective treatments is important (Adler et
al., 2006; Bhandary et al., 1997; Levy, 2009;). Moreover, some studies have shown that certain
endophenotypes (e.g., ADHD with co-morbid anxiety) respond differently to medical
interventions than do others (Jensen et al, 2001; MTA Cooperative Group, 1999; Pliszka, 1989).
The diagnosis of ADHD requires the exclusion of other disorders as the best explanation of
the symptoms. Diagnosis is often based on multiple measures such as participant clinical
interviews and behavioral questionnaires (e.g., The Conners-3 Parent and Teacher scales,
Conners, 2008; The Wender Utah Rating Scale, Ward, Wender, & Reimherr, 1993). Also,
1 In this review, the term “ADHD endophenotypes” is used as an umbrella term to refer to unspecified
subtypes and to account for the fact that a diagnosis of ADHD is frequently accompanied by various co-
morbid diagnoses.

Review of cognitive tests for ADHD 5
attempts have been made to complement these diagnostic measures with (neuro)cognitive
testing2 (Doyle, Biederman, Seidman, Weber, & Faraone, 2000; Nigg, 2001).
The Importance of Understanding Cognitive Characteristics of ADHD Endophenotypes
We discuss three reasons why a better understanding of particular cognitive
characteristics of ADHD endophenotypes using model-based analyses is important:
Reason 1: ADHD Endophenotypes may have Unique Signatures in Distinct Components of
the Decision Process
ADHD endophenotypes may express unique characteristics in distinct components of
their decision process, which can be studied in cognitive tasks. By so doing, researchers can
examine how participants trade-off between making accurate versus fast decisions, the extent to
which they rely on a priori beliefs rather than presented information (e.g., beliefs about what type
of stimulus is presented next), or the quality of information integration on which they base their
decisions. Applying sequential sampling models (described in the Method section) to data from
cognitive tasks allows the decomposition of the test performance (which are a result of latent
decision processes) into distinct cognitive components that can be separately examined. These
distinct cognitive components do not have a 1:1 correspondence with either reaction time (RT) or
accuracy, but they transform these data into the components. Moreover, sequential sampling
models may serve as an instrument to characterize and study different ADHD endophenotypes.
For instance, White, Ratcliff, Vasey, & McKoon (2010b) applied a model analysis to the data
from a recognition memory task. They found that participants with high-trait anxiety scores had
slower responses than participants with low-trait anxiety scores not because of slow processing
2 Some tasks integrate neurophysiological measures and are often also referred to as neurocognitive tests.
However, many tasks, referred to as neurocognitive tests, do not involve any neurophysiological
measures. Henceforth, we refer to the term “cognitive tasks” and include those with and without
neurophysiological measures.

Review of cognitive tests for ADHD 6
speed, but because the participants with high-trait anxiety scores required more information to
make a response (i.e., more cautious response strategy) than did participants with low-trait
anxiety scores (i.e., less cautious response strategy). A pronounced cautiousness in response
strategy may also be a characteristic of participants with ADHD and co-morbid anxiety.
Reason 2: Cognitive Components may be Informative beyond Cognitive Tests
Identifying the cognitive components that are characteristic for ADHD may improve the
understanding of the emotional and social aspects of the disorder (Alloway et al., 2005; Hilton,
Jarret, McDonald, & Ollendick, 2017; Huang-Pollock, Mikami, Pfiffner, & McBurnett, 2009;
Kofler et al., 2018; Kofler et al., 2017; Moffitt et al., 2011; Thorell, 2007; Tseng & Gau, 2013).
For instance, research has shown that the severity of cognitive deficits (e.g., impairment in
working memory; deficits in conflict resolution) modulates the frequency of problems in social
interactions and overall ADHD symptom-severity (Alloway et al., 2005; Forns, et al., 2014;
Hilton, Jarret, McDonald, & Ollendick, 2017; Huang-Pollock, Mikami, Pfiffner, & McBurnett,
2009; Kofler et al., 2018; Kofler et al., 2017; Thorell, 2007; Tseng & Gau, 2013). Associations
between cognitive components (derived from cognitive tests) and behavior (observed in other
contexts) seem plausible given that cognitive components characterize a participant’s general
decision process. For example, studies in aging research have found high correlations between
drift rates of different tasks (Ratcliff, Thapar, & McKoon, 2006; 2007). They also found
associations between drift rates and other measures such as IQ and reading scores (Ratcliff,
Schmiedek, & McKoon, 2008; Ratcliff, Thapar, & McKoon, 2010; 2011; Schmiedek et al.,
2007).
Reason 3: Different ADHD Endophenotypes may have Deficits that affect their Decision
Process at different Time Points

Review of cognitive tests for ADHD 7
Characterizing ADHD endophenotypes by biological markers alone has had only
moderate success (Coghill et al., 2005; Killeen, 2019; Nigg, 2005). Computational psychiatry
may help to link advances in epidemiology, genetics, and basic neuroscience with cognition and
behavior. For instance, sequential sampling models not only allow for the study of separate
cognitive components, but they also allow for the examination of how these components change
as a function of neural activity. One can link model parameters with neurophysiological
measures to obtain a meaningful psychological interpretation of the neural activity (Forstmann,
Ratcliff, & Wagenmakers, 2016; Ratcliff, Sederberg, Smith & Childers, 2016; Ratcliff, Smith,
Brown, & McKoon, 2016; Turner et al., 2017; Palestro et al., 2018). The association of
neurophysiological measures with specific cognitive components is, by itself, an interesting
domain of study. However, for this article, the important fact is that associations between neural
activity and model parameters might allow the study of individual differences and the estimation
of symptom severity. We will elaborate more on this in the Discussion section: Suggestions for
Integrating Neural Measures.
Current Limitations in Cognitive Testing for ADHD
The limited understanding of ADHD has increasingly encouraged the assessment of
ADHD by administering cognitive tests such as the Continuous Performance Test (CPT; see
Moreno-García, Delgado-Pardo, & Roldán-Blasco, 2015). The underlying assumption of
cognitive testing is that the study of speeded decision-making processes in such clinical settings
reveal clinically significant cognitive deficits. To sufficiently account for different ADHD
endophenotypes, a combination of multiple cognitive tests is required (Nikolas, Marshall, &
Hoelzle, 2019). However, current review articles are predominantly focused on one test domain
(e.g., CPT: Huang-Pollock et al., 2012); or the study of one cognitive concept (e.g., inhibitory
control: Nichols & Waschbusch, 2004; Nigg, 2001); or the inclusion of specific groups of
Review of cognitive tests for ADHD 8
participants with ADHD (e.g., children with ADHD: Epstein et al., 2011; adults with ADHD:
Nikolas, Hoelzle, & Marshall, 2019; Woods, Lovejoy, & Ball 2002). To date, findings from
studies that evaluated performance differences between participants with and without ADHD, for
different types of ADHD groups, and across a wide range of cognitive tests, have not been
synthesized. Additionally, studies that used computational model analyses to investigate group
differences, as well as individual differences, have not been critically reviewed. There are some
meta-analyses with the diffusion decision model (for specific test domains) that we integrated
into this review (Huang-Pollock et al., 2012; Mowinckel et al., 2015).
Objectives of this Article
The objectives of this review are four-folded: First, the review of a range of cognitive
tests to identify test procedures (e.g., type of tasks; task specifics; conditions) that are sensitive
for measuring ADHD characteristics. Second, the synthesis of sample characteristics (e.g.,
gender, age, subtypes, comorbid diagnoses) to provide an overview of the heterogeneity of
participants with ADHD. Third, the reconciliation of the mixed evidence by incorporating
findings from cognitive psychology about the specific effects of different test procedures (e.g.,
stimulus types, interstimulus intervals). Fourth, the examination of three classes of computational
models to summarize new findings and to identify important factors for the proper application of
such models. By pursuing the four objectives, this article produces an overview of the field of
cognitive testing for ADHD. Moreover, we integrate findings from cognitive psychology into the
literature of cognitive testing because cognitive research after 1970 has had relatively little
impact on the domain of cognitive testing. We will show (e.g., the section on the test domain:
Cognitive flexibility) that contradictory findings between studies can be reconciled when
considering differences in test design, such as with cue-stimulus intervals (CSI). Moreover, we

Review of cognitive tests for ADHD 9
provide recommendations for computational model applications to guide the increasing use of
this approach in the field of cognitive testing.
Method
We first describe the search procedure as well as the inclusion and exclusion criteria for
the research reviewed. We then explain how we organized the included studies to synthesis their
findings.
Literature Search
We searched four academic databases for published studies: namely, PsycINFO,
PubMed, ProQuest, and EBSCO and we also searched Google Scholar. The search strategy for
all five sources used the following keywords “ADHD” AND “cognition,” OR “cognitive
characteristics,” OR “cognitive deficits,” OR “cognitive flexibility,” OR “conflicting
information,” OR “continuous performance,” OR “comorbidities,” OR “computational,” OR
“distractibility,” OR “cognitive tests,” OR “task switching,” OR “subtypes,” OR “slow cognitive
tempo.” In addition, we examined the reference list of each paper for further studies and
screened the google scholar profiles of several researchers in the field.
Inclusion/Exclusion Criteria
We centered this review on studies that employed cognitive tests, and that either
examined group differences between participants with and without ADHD, or between
participants with different ADHD endophenotypes. Studies were included if they provided
performance measures of both accuracy values and RTs. We focus on these two measures
because these are the conventional metrics for measuring performance in cognitive tasks and
these measures serve also as input data for the computational models commonly applied in the
field of cognitive testing. However, we also included studies that focused on either accuracy

Review of cognitive tests for ADHD 10
values or RTs if their findings suggested differences between ADHD endophenotypes. We did so
because research on ADHD endophenotypes in the domain of cognitive tests is relatively sparse.
Moreover, we did not exclude any studies based on perceived methodological weaknesses (e.g.,
characteristics of the cognitive task, sample size, or diagnostic criteria). However, studies were
excluded when their main purpose was the examination of treatment outcomes (e.g., medication,
behavioral, or neural interventions). We did not include brain imaging studies, although
references to such studies are provided when they are relevant to the discussion. The literature
search yielded 50 studies that met the above criteria.
System of Study Classification
Reviewing a large range of cognitive tests for ADHD hints at six test domains, which
seem to identify the cognitive concepts sensitive to ADHD characteristics. Table 1 provides an
overview of these domains with the second column describing the cognitive concepts intended to
be studied, and the third column lists the most commonly used tasks for each test domain.
We grouped the 50 reviewed studies based on their test domain. This approach allowed
us to cluster and to discuss research that attempted to examine the same cognitive concepts.
However, Table 1 illustrates that some tasks are used to examine multiple test domains (by
sometimes changing the details of the test procedures). Moreover, it seems that several tasks
likely assess multiple cognitive concepts. It is possible to argue that these test domains are
defined mainly (or historically) by the tasks that are used and not by the processes that might be
involved in performing the tasks. Therefore, they have not been conceptually organized by the
cognitive components that are most sensitive to the detection and study of ADHD.
We emphasize that Table 1 is not an exhaustive list of test domains (or task types) in
cognitive testing for ADHD. For instance, research (Castellanos et al., 2005; Douglas, 1999;

Review of cognitive tests for ADHD 11
Goth-Owens, Martinez-Torteya, Martel, & Nigg, 2010; Hervey et al., 2006; Karalunas, Huang-
Pollock, & Nigg, 2012; Kuntsi & Stevenson, 2001; Leth-Steensen, Elbaz, & Douglas, 2000;
Weigard & Huang-Pollock, 2017) suggests slow processing speed to be another prominent
characteristic of ADHD. Most studies in this domain utilized RTs as a proxy for processing
speed (Forns et al., 2014; Togo, Lange, Natelson, & Quigley, 2015). However, research that
utilized computational models illustrates that RTs are a product of multiple processes (e.g.,
Ratcliff & McKoon, 2008; Ratcliff, Love, Thompson, & Opfer, 2012). Therefore, processing
speed was not used as a major concept in this review; it is nevertheless implicitly represented in
this review because of the focus on research that measured RTs.
<< insert Table 1 here >>
Frequently Used Cognitive Tests
Some reviewed studies employed the same class of cognitive tests. Therefore, Table 2
provides descriptions of the standard format and the general findings for these tasks. A more
comprehensive overview and description of these and other cognitive tests can be found in
Spreen and Strauss (1998).
<< insert Table 2 here >>
Frequently Applied Computational Models
The following three classes of computational models have been most commonly applied
to cognitive tests (Figure 1): diffusion decision models (DDM; Ratcliff, 1978), absolute
accumulator models (AAM; Smith & Vickers, 1988), and ex-Gaussian distribution models
(EGDM; Hohle, 1965; Ratcliff, 1979).
<< insert Figure 1 here >>
Review of cognitive tests for ADHD 12
Table 3 provides descriptions for the three classes of computational models. Most
importantly, the DDM and the AAM both belong to the class of sequential sampling models that
were developed in the 1960’s and 1970’s and that are based on the most dominant theory of how
people make speeded. These sequential sampling models are particular appealing because they
allow the decomposition of performance (i.e., RTs and accuracy) from laboratory tasks into
underlying cognitive components that can be separately studied (see for a review: Forstmann et
al., 2016; Ratcliff & Smith, 2004). Moreover, sequential sampling models account for both
correct and error RT distributions (and corresponding accuracy rates) and allow researchers to
derive parameters that are psychologically interpretable. In contrast, the EGDM does not account
for error responses and accuracy rates, only correct responses, and the derived model parameters
do not have a straightforward psychological interpretation (Matzke & Wagenmakers, 2009) but
rather provide a compact description of RT distributions (Ratcliff, 1979).
<< insert Table 3 here >>
Findings Across Six Test Domains
The six test domains (i.e., cognitive flexibility, selective attention, working memory, time
perception, sustained attention, inhibitory control) are discussed in separate subsections below.
Each subsection is divided into four parts. After an introduction to the test domain, the second
part synthesizes findings from studies that used summary statistics. The third part discusses
findings from studies that applied computational models. The fourth part summarizes findings
from neurophysiological measures collected during cognitive testing. Tables 4 to 9 list the main
findings for each study. Table A1 in the appendix includes more information about study-
Review of cognitive tests for ADHD 13
specific tasks. Tables A2 to A7 in the appendix provide sample characteristics and summary
statistics and/or model parameter values to assess effect sizes for each study.
Cognitive flexibility
Cognitive flexibility is commonly studied using paradigms in which participants have to
switch back and forth between either different features of the same stimulus (e.g., global vs. local
features as in Navon tasks; Table 2) or between different tasks (e.g., task-switch paradigms; see
for review: Gajewski, Ferdinand, Kray, & Falkenstein, 2018). Research from cognitive
psychology suggests that switching between tasks and/or stimulus features involves a
coordinated interplay between activation and inhibition of various executive control processes3
(Cepeda, Kramer, & Gonzalez de Sather, 2001; Hasher, Lustig, & Zacks, 2007; Hasher, Zacks,
& May, 1999; White & Shah, 2006). Specifically, when switching from task (or stimulus feature)
A to task (or stimulus feature) B, the cognitive processes which are configured to the specifics of
A, need to be inhibited. Next, the cognitive processes need to be reconfigured to the specific
requirements of B (e.g., Cepeda et al., 2000; Rubinstein, Meyer, & Evans, 2001). Paradigms
generally involve pure blocks (i.e., pure trials) in which participants need to focus on one task (or
stimulus feature) and mixed blocks (i.e., no-switch and switch trials) in which participants need
to switch between tasks (or stimulus feature) on some trials. Performance is typically slower and
more error-prone when participants switch between multiple tasks (or stimulus features) than
when they focus on the same task (or stimulus feature) (e.g., Rogers & Monsell, 1995;
Rubinstein et al., 2001; Schmitz & Voss, 2012). Global switch costs refer to the performance
3 The concept of “executive control processes” (also referred to as “executive functioning”) is often not
well defined. There exist diverse descriptions (Pennington, 1997; Morgan & Lilienfeld, 2000). In this
article, we follow a neurocognitive framework to define this concept. Specifically, “executive control
processes” (or “executive functioning”) refers to context-specific regulations of responses to perform a
neurocognitive test (Pennington & Ozonoff, 1996).
Review of cognitive tests for ADHD 14
difference between pure and no-switch trials, whereas local switch costs refer to the performance
difference between no-switch and switch trials.
Findings from summary statistics
In Hung et al.’s (2016) study, boys with and without ADHD performed a task-switch
paradigm that involved two numeracy judgment tasks. They found larger global switch costs (but
similar local switch costs) for boys with ADHD as compared to those without ADHD (Table 4).
Similar results were also obtained in other research that involved adults (McLean et al., 2004;
White & Shah, 2006). This contrasts with most research in cognitive psychology, which also
found local switch costs in terms of both accuracy and mean reaction times RTs (Ging-Jehli &
Ratcliff, 2020; Rogers & Monsell, 1995; Rubinstein et al., 2001; Schmitz & Voss, 2012). The
absence of local switch costs in Hung et al.’s study could indicate that task-switching in their
paradigm was undemanding because the two tasks used in their task-switch paradigm were
similar (Table A1). Research in cognitive psychology suggests large local switch costs
particularly in task-switch paradigms that involve unrelated tasks. Hence, task-switch paradigms
composed of tasks that tap into different cognitive domains may be more sensitive to study
clinical characteristics in terms of switch costs.
While Hung et al. (2016) examined ADHD-related differences in global and local switch
costs, Cepeda et al. (2000) focused only on local switch costs but as a function of response
congruency. In their study, children with and without ADHD performed a task-switch paradigm
that involved two number discrimination tasks (each task consisted of congruent and incongruent
trials). Cepeda et al.’s findings (Table 4) suggest that task-switch paradigms composed of related
tasks can be sensitive to clinical characteristics (i.e., produce significant group differences), if
“congruency” of responses to the tasks is manipulated.
Review of cognitive tests for ADHD 15
Based on the findings discussed so far, the detection of clinical characteristics in task-
switch paradigms seem to depend highly on the specifics of the paradigms (i.e., types of tasks,
congruency of stimuli). This view is further supported by Oades and Christiansen (2008), who
used the same paradigm as Cepeda et al. (2000), but with some modifications (i.e., a longer CSI
and with task switches occurring randomly rather than predictably). While Cepeda et al. found
group-specific differences in local switch costs in terms of only mean RTs, Oades and
Christiansen found group-specific differences in local switch costs in terms of only accuracy.
These different results regarding the types of local switch costs can be explained by findings
from cognitive psychology (Rogers & Monsell, 1995; Rubinstein et al., 2001; Schmitz & Voss,
2012; Vandierendonck, Liefooghe, & Verbruggen, 2010). Random task switching usually results
in larger switch costs compared to those from predictable task switching (Schmitz & Voss,
2012). However, increases in CSI usually results in much smaller switch costs. Therefore,
increasing CSI in Oades and Christiansen’s study may have given participants enough time for
switching between tasks without time costs, even though task-switches occurred randomly.
These findings could further suggest that ADHD is characterized by deficient control processes
associated with task switching and allowing for enough time to prepare switches between tasks
may compensate for these deficits.
Multiple explanations exist for ADHD-specific deficits in task switching. For instance,
Luna-Rodriguez et al. (2018) hypothesized that ADHD-specific increases in local switch costs4
would be due to deficits in switching attention to different perceptual attributes of a stimulus. In
their study, adults with and without ADHD performed a task-switch paradigm (composed of a
letter and a number discrimination task). Accuracy values were high for all adults and all
4 It was not specified whether switch costs were measured in terms of RTs or accuracy.
Review of cognitive tests for ADHD 16
conditions (Table A2), which suggests that the task-switch paradigm was undemanding and
probably not sensitive enough to produce group-specific differences. Song and Hakoda (2012)
refined Luna-Rodriguez et al.’s hypothesis proposing that the deficits in switching attention to
different perceptual attributes of a stimulus is a characteristic particularly of ADHD-I. In a
modified Navon task (involving large letters [global condition] composed of smaller letters [local
condition]; Table A1), children with ADHD-I experienced greater interference from the local
stimulus features when asked to process the global stimulus features. Other studies (Chun &
Potter, 1995; Duncan, Ward, & Shapiro, 1994; Hommel et al., 2006) support the findings of
Song and Hakoda and Luna-Rodriguez et al. Synthesizing the findings across studies discussed
thus far suggests that ADHD-specific local switch costs arise from deficits in switching attention
to different stimulus features and that these deficits are a characteristic of ADHD-I.
Given that the children in Song and Hakoda (2012)’s study were only required to switch
between stimulus features but not between tasks, it may seem surprising that Luna-Rodriguez et
al. (2018) did not find any group differences in accuracy (Table 4). One difference between the
two studies is that the participants in Luna-Rodriguez et al.’s study were adults, whereas
participants in Song and Hakoda’s study were children (Table A2). There is also an important
methodological difference between the two studies: in Luna-Rodriguez et al.’s study, trials
started with a blank screen, followed by the cue and then the stimulus. In contrast, Song and
Hakoda administered the task with paper and pencil (Table A1). Hence, it can be argued that in
Luna-Rodriguez et al.’s study, the sequential presentation of cues and stimuli, one at a time,
helped particularly participants with ADHD (maybe by structuring the task for them). This
conclusion is consistent with the findings of Oades and Christiansen (2008) and Cepeda et al.
Review of cognitive tests for ADHD 17
(2000), previously discussed, and suggests that deficits in ADHD are more prominent when the
time to restructure thoughts is short rather than long.
The results from studies initially discussed suggested subtype-specific differences in
switch costs. Baytunca et al. (2018) examined this further by sub-grouping children with ADHD
into either ADHD-only or ADHD+SCT based on parent- and teacher-rated scores on the slow
cognitive tempo scale (McBurnett, Pfiffner, & Frick, 2001). Children then performed a task-
switch paradigm (classifying geometric figures either based on their color or shape). Instead of
reporting switch costs in terms of mean RTs and accuracy, Baytunca et al. reported cognitive
flexibility scores which were derived from several tasks.5 Their results (Table 4) support the
view that impairments in cognitive flexibility are what characterize ADHD and that ADHD co-
morbid SCT show pronounced impairments. Considering that clinical research found positive
associations between SCT and ADHD-I (e.g., McBurnett, Pfiffner, and Frick, 2001) further
suggests that ADHD-I is not only characterized by greater interference of a stimulus’ local
features (as previously shown by Song & Hakoda, 2012), but also by an inflexibility to switch
between different features of a stimulus (as shown by Baytunca et al.).
The findings discussed so far provide few insights into the differentiating characteristics
between ADHD subgroups. Carr et al. (2010) showed in two experiments that differences in
early-stage and late-stage attentional filtering processes are what differentiate ADHD-C from
ADHD-I. Children with ADHD were sub-grouped into either ADHD-C, ADHD-I, or ADD
(Table A2). In the first experiment, children with and without ADHD performed an Attentional
5 Baytunca et al. (2018) administered a battery of cognitive tests including a Flanker task (i.e., SAT) and the Stroop
task (Table 2; see also Gualtieri & Johnson, 2006). The cognitive flexibility scores discussed in this section were
calculated by subtracting the number of error responses (i.e., total errors from the Flanker task plus the commission
errors from the Stroop task) from the number of correct responses from the Flanker (higher scores are better).
Review of cognitive tests for ADHD 18
blink task (Table A1) used to study early-stage attentional filtering processes6. Table 4 shows
that children with ADD exhibited sensitive early-stage attentional filtering processes (i.e.,
attentional gating of information at an early-stage; for details see Adams, Derefinko, Milich, &
Fillmore, 2008). Considering the findings previously discussed (e.g., Song & Hakoda, 2012;
Luna-Rodriguez et al., 2018), Carr et al.’s results refines the current view by suggesting that
ADHD-I is characterized by greater stimulus interference due to sensitive early-stage control
processes involved in gating attention to specific stimulus features.
In Carr et al. (2010)’s second experiment, children with and without ADHD performed
an Anti-saccade task (Table A1) used to study late-stage attentional filtering processes. Children
with ADHD-C exhibited deficient late-stage attentional filtering processes (Table 4). This
conclusion is supported by the findings of O’Driscoll et al. (2005), who administered the same
task to three groups of boys (ADHD-C, ADHD-I, non-ADHD). Note that the error rates in
O’Driscoll et al.’s study seemed much larger than the error rates found in Carr et al.’s study
(Table A2). Synthesizing the different findings discussed so far suggests that a high severity in
inattention but not in hyperactivity/impulsivity (e.g., ADHD-I, ADD) is manifested in deficient
early-stage information filtering. Additional high severity in hyperactivity/impulsivity (e.g.,
ADHD-C) is manifested in deficient late-stage control processes.
Findings from computational model applications
6 The efficacy of early-stage attentional filtering processes was estimated from the accuracy of probe detection in the
single and dual condition. Such an analysis is motivated by research (Chun & Potter, 1995; Duncan, Ward, &
Shapiro, 1994; Hommel et al., 2006) which showed that the detection of the probe letter is usually high when the
probe letter follows immediately (i.e., 90ms to 200ms) after the target letter. In contrast, the detection of the probe
letter is usually low when the probe letter follows 200ms to 500ms after the target letter (referred to as “attentional
blink window”). This is because in this window the target letter is processed which takes away resources needed for
the detection of the probe letter.

Review of cognitive tests for ADHD 19
Metin et al. (2013) administered the same Anti-saccade task as Carr et al. (2010) to
children with ADHD-C and without ADHD and compared their performance with a DDM
analysis. Their results (Table 4) support the view that ADHD-C is characterized by deficits in
late-stage control processes involved in integrating presented information (indexed by drift rates)
but intact early-stage control processes involved in perceptual encoding (indexed by nondecision
time components)7.
Salum et al. (2014) used the same paradigm as Metin et al. (2013) and found similar
findings. An interesting aspect of Salum et al.’s study is their group categorization of children
based on their symptom severity of hyperactivity and inattention (Table A2). This grouping
allowed Salum et al. to study whether the magnitude of differences in the DDM parameters
would linearly increase with symptom severity. Table 4 illustrates that Salum et al. found
significant differences in DDM parameters not only between the asymptomatic non-ADHD
group and the clinical ADHD group. Notably, the more severe the ADHD symptoms, the larger
the estimated differences in model parameters. The paradigm used by Salum et al. and Metin et
al. comprised a low number of trials (i.e., 25 incongruent trials, 75 congruent trials) which makes
it difficult to estimate model parameters with any degree of accuracy. Hence, their results need to
be interpreted with caution.
Findings from neurophysiological measures
Hung et al. (2016), whose behavioral results were discussed earlier, used EEG to collect
event-related potentials (EEG-ERPs) during a task-switch paradigm. The ADHD group had
smaller amplitudes and longer latencies in the P3 component than the non-ADHD group (for
7 Ging-Jehli and Ratcliff (2020) provide evidence and explanation for the mapping of control processes to diffusion
model parameters in the context of a task-switch paradigm. See also the Summary of this test domain in the
Discussion section.
Review of cognitive tests for ADHD 20
pure and mixed blocks). Hung et al. did not find any association between switch costs and P3
component (neither in amplitude nor in latency). Other studies support Hung et al.’s findings and
suggest further that ADHD-specific deficits in cognitive flexibility arise from insufficient frontal
and parietal lobe activation when switching between tasks (Lou et al., 1989; Sieg et al., 1995;
Smith, Taylor, Brammer, Toone, & Rubia, 2006).
<< insert Table 4 here >>
Selective attention
Selective attention refers to the ability to maintain focus on a stimulus in the presence of
other stimuli that serve as distractors (Sohlberg & Mateer, 1989). Therefore, it is presumed that
participants who have a better selective attention are also less distractible. Two frequently
applied tasks in this test domain are Perceptual discrimination tasks and Flanker tasks (Table 2).
The main difference between these two tasks lies in the characteristics of the stimuli. Perceptual
discrimination tasks usually involve degraded (i.e., noisy) stimuli. In contrast, Flanker tasks
usually involve pure (i.e., clearly identifiable) stimuli. We show that distinguishing between
these two task types is important for clinical research because pure and degraded stimuli seem to
evoke different magnitudes of distractibility. We first discuss studies that used Perceptual
discrimination tasks, followed by a discussion of studies that used Flanker tasks.
Perceptual Discrimination Tasks
Findings from summary statistics. In Friedman-Hill et al.’s (2010) study, children with
and without ADHD performed a Picture discrimination task composed of conditions with
varying levels of discrimination difficulty (degradation of target pictures) and distractor saliency
(degradation of non-target pictures surrounding target pictures). Friedman-Hill et al.
hypothesized that the efficiency of processes involved in controlling sensory information can be
Review of cognitive tests for ADHD 21
indexed by the performance change across conditions with varying distractor saliency; whereas
the efficiency of processes involved in controlling attention can be indexed by the performance
change across conditions with varying difficulty level. Table A3 shows that neither accuracy nor
mean RTs varied as a function of distractor saliency (neither for the children without ADHD nor
for the children with ADHD). Based on these results, Friedman-Hill et al. concluded efficient
early-stage control processes for ADHD and non-ADHD. However, it could also be that the
processes involved in controlling sensory information were not at all affected by the
manipulation of distractor saliency.
The combination of error rate and mean RTs summarized in Table 5 suggests that
children with ADHD preferred being accurate over being fast, whereas the children without
ADHD preferred being fast over being accurate. This seems an unusual result given that research
suggests that children with ADHD usually prefer being fast over being accurate (see for a
review: Ziegler, Pedersen, Mowinckel, & Biele, 2016).
Based on how performance changed between conditions of varying difficulty levels
(Table 5), Friedman-Hill et al. concluded that distractibility in ADHD arises from insufficient
attentional control. However, children with ADHD showed a large heterogeneity in their
performance (Table A3), which may be due to the fact that the ADHD group consisted of an
equal number of ADHD-C and ADHD-I. Based on the findings from the test domain “cognitive
flexibility,” and other research (e.g., Ben Shalom et al., 2017; Goth-Owens, Martinez-Torteya,
Martel, & Nigg, 2010; Song & Hakoda, 2012), one may expect that participants with ADHD-I,
in particular, are most susceptible to distractors. However, the authors did not provide subtype-
specific analyses to test this hypothesis.

Review of cognitive tests for ADHD 22
In the study by Schneidt, Jusyte, Rauss, and Schönenberg (2018), adults with and without
ADHD performed a Perceptual orientation task (Table A1). Schneidt et al.’s result (Table 5) is
consistent with Friedman-Hill et al. (2010)’s findings discussed above and suggest that ADHD is
characterized by slow processing speed. However, slower mean RTs for ADHD could imply that
ADHD is characterized by a cautious response strategy, but it could also imply that ADHD is
characterized by deficits in processing speed. In the next section, we illustrate how
computational models can help to differentiate between different sources.
Findings from computational model applications. Mulder et al. (2010) conducted a
DDM analysis to compare the performance of children with and without ADHD in a random-
dots motion paradigm with accuracy- and speed-emphasized conditions. The results (Table 5)
suggest that children with ADHD (and particularly those with high hyperactivity symptoms) had
difficulties adapting a more cautious response strategy in response to changes in instructions
(emphasizing accurate versus fast responding). Moreover, Mulder et al.’s results imply for the
findings discussed in the previous paragraphs (e.g., Friedmann-Hill et al.; Schneidt et al.) that
ADHD-specific slower mean RTs arise from more cautious response strategies rather than from
slow processing speed. Particularly, deficits in processing speed would be manifested in longer
nondecision time components and/or lower drift rates for ADHD which was not present in
Mulder et al.’s study (Table 5).
The studies discussed in the previous section suggested that ADHD is characterized by a
pronounced sensitivity towards distractors; a finding that is further supported by Mulder et al.’s
(2010) results. Specifically, children with ADHD needed a higher proportion of coherently
moving dots to achieve the same accuracy level as children without ADHD. Moreover, the drift
rates of children with ADHD degraded more when difficulty level increased as compared to

Review of cognitive tests for ADHD 23
those of children without ADHD. These results corroborate the previous findings in this section
supporting the view that ADHD is characterized by distractibility.
Findings from neurophysiological measures. Schneidt et al. (2018), whose behavioral
results were discussed earlier, collected EEG-ERPs during a Perceptual orientation task to
compare the amplitudes of two components (i.e., EPN: early posterior negativity, and LPP: late
positive potential)8 between adults with and without ADHD. For the high-difficulty condition,
adults with ADHD had increased amplitudes in the EPN component compared to those of adults
without ADHD. Based on this result, the authors concluded that adults with ADHD could not
effectively recruit early-stage attentional filtering processes. This finding is consistent with other
studies, suggesting that ADHD is characterized by an inability to recruit prefrontal-parietal
networks to resolve conflicting sensory inputs (Cornoldi et al. 2001; Crone, Richard Jennings, &
Van der Molen, 2003; Desimone & Duncan, 1995; Forster et al. 2014; Kastner & Ungerleider,
2001).
For the low-difficulty condition, in Schneidt et al. (2018) found that adults with ADHD
had increased amplitudes in the LPP component compared to those of adults without ADHD.
Based on this result, the authors concluded that adults with ADHD could not effectively recruit
late-stage attentional filtering processes. This result is consistent with the behavioral findings of
Friedman-Hill et al. (2010) (discussed earlier), suggesting that ADHD is characterized by deficits
in late-stage control processes when task difficulty was low. It remains unclear how the findings
from Schneidt et al.’s EEG analyses relate to the findings from behavioral outcome measures.
Flanker Tasks
8 Research suggests that EPN and LPP both serve as indices for distractibility (Hajcak, Weinberg, MacNamara, &
Foti, 2012; Schupp, Flaisch, Stockburger, & Junghofer, 2006; Milanesi et al., 2007).
Review of cognitive tests for ADHD 24
Findings from summary statistics. In the study by Johnson et al. (2008), boys with and
without ADHD performed a Flanker task (with target arrows pointing in one direction and
distractor arrows pointing in the other direction). Johnson et al.’s result (Table 5) is consistent
with the discussed findings of Friedman-Hill et al. (2010; previous section) and Cepeda et al.
(2000; test domain: Cognitive flexibility) and support the view that ADHD is characterized by
distractibility. Epstein et al. (2011) used the same Flanker task as Johnson et al. (2008) and found
differences between children with ADHD-I, ADHD-C, and without ADHD (including boys and
girls). As for the test domain Cognitive flexibility, there seem to exist subtype-specific
differences in this test domain (Table 5).
Tegelbeckers et al. (2016), Gohil et al. (2017), and Banich (2009) added additional
distractors into their Flanker tasks (with target arrows pointing in one direction and distractor
arrows pointing in the other direction). Results from these studies suggest that children with
ADHD are more sensitive to distractors than children without ADHD (Table 5). This view is
consistent with the findings of Johnson et al. (2008) and Epstein et al. (2011) that used standard
Flanker tasks without additional distractors (discussed earlier).
The studies discussed to this point examined results from children. Hasler et al. (2016)
administered a Flanker task (with target arrows pointing in one direction and distractor arrows
pointing in the other direction) to groups of adults with and without ADHD. Strikingly, all adults
(with and without ADHD) had similar mean RTs for both incongruent and congruent trials. This
result is inconsistent with those of most other studies and could suggest that the manipulation of
stimulus congruency was not strong enough. In the study by Merkt et al. (2013), female college
students with and without ADHD performed a Flanker task (with even/odd target numbers and
congruent/incongruent distractor numbers). Their results (Table 5) contrast with the initially
Review of cognitive tests for ADHD 25
discussed findings of Johnson et al. (2008). However, Merkt et al.’s results are hard to compare
with those of Johnson et al. as many aspects differ between the two studies (e.g., gender and age
of participants, target stimuli of the Flanker tasks). Synthesizing the different results suggests
that Flanker tasks are not suitable (i.e., produce inconsistently group differences) for the study of
ADHD characteristics among adolescents and adults.
Findings from computational model applications. Epstein et al. (2011), whose findings
were presented earlier, used an EGDM analysis to examine group differences between three
groups of children (ADHD-C, ADHD-I, non-ADHD). The ADHD-C group had significantly
larger tau values than the non-ADHD and ADHD-I group. This result indicates that the slower
mean RTs for ADHD-C (compared to ADHD-I and non-ADHD; see initial discussion at the
beginning of this test domain), was primarily due to the larger spread in the tails of their RT
distribution. However, the EGDM analysis does not allow for conclusions of potential sources
that caused the larger spread in the tails of the RT distribution. In contrast, the DDM analysis by
Merkt et al. (2013), whose summary statistics were discussed earlier and who also found slower
mean RTs for ADHD, suggest that the students with ADHD were characterized by a cautious
response strategy (indexed by boundary separation). This in addition to a poor information
integration (indexed by drift rate) and a longer time for perceptual encoding and response
execution (indexed by nondecision time component).
Merkt et al. (2013) further found that students with higher scores on a hostility scale had
shorter nondecision time components. This result complements the findings of Mulder et al.
(2010; section: Perceptual Discrimination Tasks) and suggests that symptoms of hyperactivity
and hostility manifest themselves in a short nondecision time component. Interestingly, Merkt et
al. (2013) also found that students with higher scores on an anxiety scale had larger boundary
Review of cognitive tests for ADHD 26
separation. This result is consistent with other studies (e.g., White et al., 2010b; see Introduction
section) and suggests that anxiety symptoms manifest in a large boundary separation.
The studies discussed so far used Flanker tasks with distractors and targets occurring
always in the same locations on the computer screen. Weigard and Huang-Pollock (2014)
applied a DDM analysis to the performance of children with and without ADHD from a Flanker-
like search paradigm (Table A1). Their results (Table 5) suggest that ADHD is characterized by
poor information integration and a less cautious response strategy; a finding that is inconsistent
with Merkt et al. (2013)’s results as well as with the conclusion derived from studies that used
Perceptual discrimination tasks. Specifically, those studies (e.g., Mulder et al., 2010) suggest that
ADHD-specific slower mean RTs arise from more cautious response strategies.
Weigard and Huang-Pollock (2014) further found that children without ADHD
experienced greater learning effects (i.e., as represented by increases in boundary separation for
NC relative to RC trials) than children with ADHD. This result is consistent with Mulder et al.
(2010)’s DDM analysis, previously discussed, who showed that children with ADHD had
difficulties adapting a more cautious response strategy in response to changes in instructions.
Combining the results above suggest that ADHD is characterized by an inflexibility to adjust
response strategies when needed (i.e., to speed up learning or to follow changing instructions).
Findings from neurophysiological measures. Gohil et al. (2017), whose behavioral
findings were presented earlier, collected EEG-ERPs during a Flanker task that involved
subliminal primes. They assessed group-specific differences in four EEG-ERP components (P1,
Review of cognitive tests for ADHD 27
P3, N1, N2) meant to index early- and late-stage control processes9. Children with and without
ADHD had similar early-stage components (P1, N1). Hence, the behavioral difference in
accuracy between children with and without ADHD seems not to map to a neural difference in
the components supposed to index early-stage control processes. Moreover, children with ADHD
had significantly larger amplitudes in late-stage components (N2, P3) for incongruent compared
to congruent trials. In contrast, children without ADHD had significantly larger amplitudes in
late-stage components for congruent compared to incongruent trials10
. Gohil et al. concluded that
children with ADHD had difficulties to recruit late-stage control processes when needed; a
finding consistent with previously discussed research that employed Perceptual discrimination
tasks (e.g., Schneidt et al., 2018; Friedman-Hill et al., 2010). Like Schneidt et al., Gohil et al. did
not find any associations between behavioral measures and neurophysiological measures. Hasler
et al. (2016), whose behavioral results were introduced earlier, also collected EEG-ERPs during
a Flanker task. Adults with ADHD had significantly lower amplitudes in the P3 component11
than adults without ADHD (for congruent and incongruent trials). This result, combined with the
findings of Gohil et al. (2017) discussed above (see also footnote 13), suggests that ADHD is
characterized by an insufficient modulation of late-stage control processes (involved in conflict
resolution) as a function incongruency.
In Hasler et al. (2016)’s study, adults with ADHD also had significantly lower power in
the alpha and beta frequency bands, presumed to index under-activation particularly in the
9 Research has shown that the P1 and N1 components are associated with perceptual gating and processes
responsible for selective attention (e.g. Herrmann & Knight, 2001). The N2 component is associated with
distractibility and its amplitude is enlarged when interference between stimuli is high (Larson, Clayson, & Clawson,
2014; Folstein & Van Petten, 2008). The P3 component is associated with stimulus evaluation and its amplitude is
enlarged when the evaluation process is cognitively less demanding (i.e., low level of conflicting information)
(Verleger, Jaśkowski, & Wascher, 2005; Twomey, Murphy, Kelly, & O’Connell 2015). 10
Moreover, the amplitude of the P3 component was modulated by the prime type (correct vs. incorrect) in children
without ADHD. In contrast, the P3 component in children with ADHD did not vary as a function of prime type. 11
Assumed to measure information integration after stimulus onset; Polich, 2007.

Review of cognitive tests for ADHD 28
preparatory stages of the decision process (Engel & Fries, 2010; Tan et al., 2013), than adults
without ADHD (for congruent and incongruent trials). Hasler et al.’s results are consistent with
the theory of the default-mode network12
, suggesting that ADHD is characterized by insufficient
suppression and activation of control processes (i.e., Barkley, 1998; Woods, Lovejoy, & Ball,
2002). Interestingly, Hasler et al. found a significant positive correlation between RTs and the
power in alpha and beta frequency bands but only for adults without ADHD (for adults with
ADHD, there was no association between RTs and the power in any frequency band.) The
findings of Hasler et al. and Gohil et al. both suggest that a mapping between behavioral
performance measures and neurophysiological measures is not straightforward. We will address
potential issues in the Discussion section: Suggestions for Integrating Neural Measures.
<< insert Table 5 here >>
Working memory
Most studies define working memory (WM) as a set of cognitive processes that allows an
individual to temporarily hold information ready for use in subsequent processing (Baddeley,
2012; Miyake & Shah, 1999; Oberauer et al., 2012; 2018; Unsworth & Engle, 2007). The N-back
task and the Sternberg task (Table 2) are tasks that are frequently used for this test domain. In
addition to these tasks, manipulations, such as increases in cue-stimulus interval (CSI) (or inter-
stimulus interval; ISI), allow researchers to increase the demand on WM in many different
cognitive tasks. This is because participants are required to hold information for a greater amount
of time when CSI (or ISI) is long rather than short.
Findings from summary statistics
12
The default-mode network refers to specific brain regions whose activities are low during cognitive performance,
but high otherwise (e.g., default-mode; Sonuga-Barke & Castellanos, 2007).

Review of cognitive tests for ADHD 29
Epstein et al. (2011) administered a 1-back task (with letters as target stimuli) to three
groups of children (ADHD-C, ADHD-I, and non-ADHD). Their results (Table 6) are
complemented with the findings of Stroux et al. (2016), who administered a 1- and 2-back task
(with letters as target stimuli) to adults with and without ADHD. Interestingly, children without
ADHD in Epstein et al.’s study were almost as accurate as the adults without ADHD in Stroux et
al.’s study (Table A4). In contrast, the children with ADHD in Epstein et al.’s study were much
less accurate than the adults with ADHD in Stroux et al.’s study. Hence, ADHD-specific deficits
in WM may improve with age.
Kawabe et al. (2018) employed a 1-back task (with playing cards as target stimuli) to
boys with ADHD and autism spectrum disorder (ASD) and those without ADHD and ASD.
Contrary to the results by Epstein et al. (2011) and Stroux et al. (2016), Kawabe et al. did not
find any group differences; neither in mean RTs nor in accuracy. However, Kawabe et al.’s
results should be interpreted with caution because the ADHD+ASD group was small (Table A4).
The findings from the N-back studies discussed so far did not suggest subtype-specific
differences in this test domain. Moreover, the studies only found significant group differences in
accuracy but not in mean RTs. In Lenartowicz et al. (2014)’s study, children with and without
ADHD performed a Sternberg task (with sequentially illuminating dots in different locations of
the computer screen). Because Lenartowicz et al. found significant group differences in accuracy
and RTs (Table 6), the Sternberg tasks may be better suited to study ADHD-specific deficits in
WM than N-back tasks.
Findings from computational model applications
In Weigard and Huang-Pollock’s (2017) study, children with and without ADHD
performed a modified Sternberg task (Table 6). Their results suggest that ADHD is characterized
Review of cognitive tests for ADHD 30
by a smaller WM capacity that can be modulated by the degree of cognitive load during the
maintenance phase. Moreover, based on the DDM results by Merkt et al. (2013; test domain:
Selective attention) discussed earlier, the difference in nondecision time components between
children with and without ADHD (Table 6) may have been driven by children with ADHD-C.
Findings from neurophysiological measures
Stroux et al. (2016), whose behavioral findings were presented earlier, collected EEG-
ERPs during 1- and 2-back tasks. Adults with ADHD had significantly lower mean amplitudes in
the late-stage component (N212
) than adults without ADHD. Most importantly, adults with
ADHD had a significantly smaller difference in mean amplitudes between targets and non-
targets than adults without ADHD. Stroux et al. concluded that adults with ADHD had
difficulties in discriminating between targets and non-targets in an early encoding phase. The
findings discussed for the test domain “cognitive flexibility” suggest that participants with
ADHD-I are particularly susceptible to distractors in early-stage encoding phases. Moreover,
Stroux et al.’s result is consistent with the findings from neurophysiological measures discussed
for the test domain Selective attention (Gohil et al., 2017; Hasler et al., 2016). Synthesizing these
findings supports the view that ADHD is characterized by an insufficient modulation of control
processes in response to their demands (e.g., degree of interference, incongruency).
Stroux et al. (2016) found a significant positive association between the N2 amplitudes
for non-targets and accuracy rates for non-targets in correlational analyses. These results contrast
with the results from previously discussed studies that did not find any association between
neural and behavioral measures (e.g., Hung et al., 2016 for the domain: Cognitive flexibility;
Gohil et al., 2017 for the domain: Selective attention). We will elaborate more on these mixed
results in the Discussion section: Suggestions for Integrating Neural Measures.
Review of cognitive tests for ADHD 31
Lenartowicz et al. (2014), whose behavioral findings were presented earlier, examined
EEG frequency bands collected during a Sternberg task to distinguish between deficits occurring
at different time points of the task (i.e., encoding, maintenance, probe). Midoccipital alpha
frequency band (8-12Hz) indexed the efficiency of processing for the encoding stage. Frontal
midline theta frequency band (4-7Hz) indexed the efficiency of processing for the maintenance
stage. Across all participants, the higher the alpha band power during the encoding phase, the
lower the accuracy and the slower the mean RTs. Moreover, children with ADHD had increased
alpha band power compared to those of children without ADHD. These results suggest that
children with ADHD had less efficient processes during the encoding stage; a finding that is
consistent with earlier discussions (i.e., Stroux et al., 2016, Gohil et al., 2017; Hasler et al., 2016)
and that supports the view that ADHD is characterized by less efficient early-stage control
processes.
Lenartowicz et al. (2014) further found that children with ADHD had increased theta
band power compared to those of children without ADHD13
. These group differences were more
pronounced in the low- than in the high-difficulty condition, which suggests that subjects with
ADHD had problems to engage WM when the task was cognitively less demanding. This finding
is consistent with the default mode network theory (introduced earlier, see also footnote 15),
Friedman-Hill et al. (2010)’s results (see test domain: Selective attention), and supports the view
that ADHD is characterized by problems staying engaged during less demanding tasks.
<< insert Table 6 here >>
13
Children with ADHD had also decreased alpha-band event-related desynchronization compared to children
without ADHD.

Review of cognitive tests for ADHD 32
Time perception
An accurate perception of time plays an important role for many cognitive processes
(e.g., motor timing of responses, perceptual timing, temporal judgment, temporal foresight,
temporal discounting). Deficits in timing processes are therefore implicitly measured in many
different cognitive tasks such as delay discounting tasks, motor timing tasks and coordination
tasks (e.g., Barkley, 1997a; Marx et al., 2017; Nigg & Casey, 2005). The focus for this test
domain lies on perceptual timing tasks (i.e., Time reproduction tasks and Time differentiation
tasks; Table 2) that provide an explicit measure of participants’ ability to reproduce and to
discriminate between different amounts of time.
Findings from summary statistics
Marx et al. (2017) found that boys with ADHD had poorer performance than boys
without ADHD in a variety of perceptual timing tasks (Table 7). These results are complemented
with the findings of Valko et al. (2010) who administered a Time reproduction task and a Time
differentiation task (Table A1) to adults and children with and without ADHD. Their findings
(Table 7) suggest that ADHD is characterized by abnormal time processing and ADHD-specific
age-related shifts in accuracy-speed tradeoffs. In particular, age-related increases in accuracy
(accompanied by decreases in mean RTs) were larger in the non-ADHD group than in the
ADHD group. Hence, ADHD-specific deficits in time perception may improve with age.
Findings from computational model applications
Shapiro and Huang-Pollock (2019) compared performance of children with and without
ADHD in a Time differentiation task with a modified AAM analysis (i.e., time-adaptive,
opponent poisson model). Their results are consistent with Valko et al. (2010)’s findings and
suggest that children with ADHD had more difficulties discriminating between short and long
durations than children without ADHD. Shapiro and Huang-Pollock also found that children

Review of cognitive tests for ADHD 33
with and without ADHD did not significantly differ in their estimated bisection point14
, but
children with ADHD exhibited a starting point bias for assigning tones into the “short duration”
category. It seems unclear how the group difference in the starting point should be interpreted
given that there was no group difference in the bisection point. Intuitively, a bias for assigning
tones into the “short duration” category should be reflected in a lower bisection point given that
the drift criterion15
remained constant.
Findings from neurophysiological measures
None of the studies discussed in this section collected neuronal measures during the task.
However, the study by Marx et al. (2017), discussed earlier, suggests that ADHD-specific timing
deficits arise from multiple components, namely perceptual stimulus encoding and reproducing
of the stimulus duration. This hypothesis is testable with the joint application of sequential
sampling models and the collection of EEG measures (see Discussion section: Suggestions for
Integrating Neural Measures).
<< insert Table 7 here >>
Sustained attention
Sustained attention describes the ability to maintain attention over an extended period of
time (Huang-Pollock, Karalunas, Tam, & Moore, 2012). One of the most applied tasks in this
test domain is the CPT (Table 2). In the CPT, participants are instructed to detect rare target
stimuli (10-25%) in a series of rapidly presented nontarget stimuli (90-75%). Measures of
omission and commission errors, as well as mean RTs are presumed to index the ability to
sustain attention (e.g., Nichols & Waschbusch, 2004). There are several review articles that have
14
The bisection point represents the duration of a tone at which a participant’s accuracy for assigning a stimulus into
either the “short” or “long duration” category is at chance (Church & Deluty, 1977). 15
The drift criterion is the dividing point between the mean drift rate towards the “short duration” response category
and the mean drift rate towards “long duration” response category.
Review of cognitive tests for ADHD 34
synthesized a large number of studies in this test domain (Boonstra, Oosterlaan, Sergeant,
Buitelaar, 2005; Hasson & Fine, 2012; Huang-Pollock et al., 2012; Losier, McGrath, & Klein,
1996; Nichols & Waschbusch, 2004). Therefore, we focus on studies that included analyses of
ADHD subgroup-specific differences or DDM analyses.
Findings from summary statistics
In a study by Collings (2003), boys with and without ADHD performed a CPT. Baytunca
et al. (2018) also applied a CPT and their results extend Collings’ findings with the examination
of ADHD subgroups different from the subtypes (ADHD-C, ADHD-I). Specifically, Baytunca et
al. divided children with ADHD into subgroups, either ADHD-only or ADHD+SCT based on
parent- and teacher-rated scores on the slow cognitive tempo scale (McBurnett, Pfiffner, & Frick,
2001). While Collings found group-specific differences in omission errors, Baytunca et al. found
group-specific differences in commission errors and mean RTs (Table 8). However, Baytunca et
al.’s and Collings’ results are hard to compare because of differences in gender and subgrouping
(Table A6). Nevertheless, both studies provide evidence for ADHD endophenotype-specific
differences in this test domain.
Findings from computational model applications
Huang-Pollock et al. (2012) performed a meta-analysis with the DDM including 12
clinical studies that administered CPTs (with visual stimuli only) and that reported accuracy,
mean RTs, and RT variances. Children with ADHD had significantly lower drift rates (but
similar boundary separation and nondecision time components) than children without ADHD.
The starting point was fixed symmetrically between the boundaries. Recent DDM analyses of
CPTs (and CCPTs) have shown biases in starting points and in drift rates (Huang-Pollock et al.,
2017; Ratcliff et al., 2018). Therefore, the meta-analysis by Huang-Pollock et al. needs to be
updated. Moreover, the result that children with ADHD were characterized by low drift rates is
Review of cognitive tests for ADHD 35
only partially consistent with DDM applications discussed in other test domains (i.e., Cognitive
flexibility, Selective attention, Working memory). For instance, findings suggest that ADHD-C
(and ADHD with co-morbid externalizing symptoms) are characterized by shorter nondecision
time components and a rigid response strategy (e.g., Merkt et al., 2013; Metin et al., 2013;
Mulder et al., 2010; Salum et al., 2014; Weigard & Huang-Pollock, 2017).
If ADHD is characterized by an inability to sustain attention, one would expect
performance of participants with ADHD to decline more over time as compared to that of
participants without ADHD. To test this hypothesis, one would need to divide trials into different
time blocks (e.g., for a task with 40 trials: one block containing the first 20 trials, and one block
containing the last 20 trials), estimate separate model parameters for the different time blocks,
and compare them with each other (e.g., Huang-Pollock et al., 2020: Table 8). However, Huang-
Pollock et al. (2012) reported that most studies did not provide measures of mean RTs or
accuracy as a function of blocks in the task. Hence, this test domain seems difficult to explore
with computational models applied to existing datasets (see also Discussion section: Suggestions
for Applying Computational Models).
Findings from neurophysiological measures
Loo et al. (2009) administered a CPT, in conjunction with EEG, to groups of adults with
and without ADHD (Table 8). Loo et al. divided the CPT into a first, middle and last block to
test for group-specific differences in alpha and beta band power in each of these blocks. The
ADHD and non-ADHD groups had similar values in alpha band power for the first block. For
the last relative to the first block though, the ADHD group had a significantly smaller decrease in
alpha band power as compared to the non-ADHD group. These results suggest that adults with
ADHD had more difficulties to maintain attention over time (because a larger decrease in alpha
Review of cognitive tests for ADHD 36
band power is associated with a larger increase in cortical activity associated with cognitive
processing). This finding is consistent with the default mode network theory (introduced earlier)
and is also supported by the similar results discussed previously for the test domains Selective
attention and Working memory (e.g., Friedman-Hill et al., 2010; Hasler et al., 2016; Lenartowicz
et al., 2014).
<< insert Table 8 here >>
Inhibitory control
Inhibitory control is often operationalized as the efficiency of cognitive control processes
to withhold ongoing actions in the presence of new information (Logan, Cowan, & Davis, 1984;
Raiker, Rapport, Kofler, & Sarver, 2012). CCPTs and Stop-signal tasks are frequently used for
this test domain (Table 2). The Stop-signal task is considered to measure “response inhibition”
because participants are required to stop their ongoing responses on trials that introduce a signal
after stimulus onset. The standard CCPT (also known as the go/no-go task) includes more go
trials (75-90%) than no-go trials (10-25%). Conversely, the CPT includes more no-go than go
trials (see previous section: Sustained attention). Therefore, participants need to frequently
respond, but then to inhibit this response pattern on the rare no-go trials. In what follows, we first
discuss studies that used CCPTs and then studies that employed stop-signal tasks.
Conners’ Continuous Performance Tasks (CCPTs)
Findings from summary statistics. Results remain mixed whether CCPTs elicit
differences between participants with and without ADHD (Halperin et al., 1992; Klee &
Garfinkel, 1983; Koelega, 1995; Rovet & Hepworth, 2001; Shapiro & Garfinkel, 1986; Zahn,
Kruesi, & Rapoport, 1991). Likewise, many studies that administered CCPTs did not find
evidence for subtype-specific differences, but evidence remains mixed (Baytunca et al., 2018;
Edwards et al., 2007; Egeland, & Kowalik-Gran, 2008; Epstein et al., 2011; Scheres, Oosterlaan,
Review of cognitive tests for ADHD 37
& Sergeant, 2001). For instance, Epstein et al. (2011) administered a CCPT to three groups of
children (non-ADHD, ADHD-C, ADHD-I). In contrast, Baytunca et al. (2018) administered a
CCPT to children with and without ADHD. Children with ADHD were sub-grouped into either
ADHD-only or ADHD+SCT based on parent- and teacher-rated scores on the slow cognitive
tempo scale (McBurnett, Pfiffner, & Frick, 2001). Similar to Epstein et al.’s result, both ADHD
groups made significantly more errors than the non-ADHD group (Table 9). However, Epstein et
al. found also significant group differences in accuracy while Baytunca et al. did not. The studies
by Epstein et al. and Baytunca et al. illustrate that comparisons across study results are difficult.
First, the studies used different criteria to define ADHD subtypes although both studies subtyped
ADHD for their primary analyses. Hence, divergent results could be due to differences in sample
characteristics. Second, the studies used different versions of the CCPT (e.g., different types of
stimuli, Table A1). Hence, divergent results could also be due to dissimilarities in task specifics.
To produce failures in response inhibition, ISI is sometimes varied across conditions. By
doing so, it is reasoned that a short ISI produces more commission errors and faster RTs when
attention is “on task,” but produces more omission errors and slower RTs when attention is “off
task” (Chee et al., 1989; Davis, 1957; Kantowitz, 1974; McGrath, Harabedian, & Bruckner,
1968). For this reason, the CCPT was thought to hold promise not only in the diagnosis of
ADHD, but also in the distinction between different subtypes of ADHD (Edwards et al., 2007;
Scheres, Oosterlaan, & Sergeant, 2001). Specifically, in conditions with short relative to long
ISIs, participants with ADHD-C (or ADHD-H) were expected to produce faster RTs and more
commission errors than participants with ADHD-I; who were expected to produce slower RTs
and more omission errors. The studies discussed thus far did not examine subtype-specific
differences as a function of ISI. In contrast, Wiersema et al. (2006) did examine performance in a

Review of cognitive tests for ADHD 38
CCPT that involved blocks with short and long ISIs. Consistent with the hypothesis above,
children with ADHD and pronounced hyperactivity-impulsivity symptoms are characterized by
faster RTs and more commission errors in blocks with short ISI (Table 9). It remains to be
determined whether participants with ADHD-I are characterized by slower RTs and more
omission errors in blocks with long ISI’s.
Findings from computational model applications. Mowinckel et al. (2015) conducted a
DDM meta-analysis of 9 studies that administered a CCPT to adults with and without ADHD.
Mowinckel et al.’s results (Table 9) are consistent with the results by Huang-Pollock et al.
(2012)’s meta-analysis described in the test domain Sustained attention. However, DDM
applications that we discussed in other test domains (e.g., Cognitive flexibility, Selective
attention, Working memory) suggested that different ADHD endophenotypes expressed
characteristics in distinct model parameters (e.g., Merkt et al., 2013; Metin et al., 2013; Mulder
et al., 2010; Salum et al., 2014; Weigard & Huang-Pollock, 2017).
Lee et al. (2015) hypothesized that the ADHD-specific increases in tau values found in
CCPTs (e.g., Epstein et al., 2011) indicate failures in inhibitory control processes. They
administered a modified CCPT (composed of blocks with either constant ISI or jittered ISI) to
children with and without ADHD and then applied an EGDM analysis. Their results (Table 9)
are consistent with their hypothesis above. However, the explanation provided by Lee et al. rests
on the concept of “sustained attention.” Specifically, in order to explain ADHD-specific larger
tau values for blocks with constant ISI, Lee et al. argued that jittering ISI helped children with
ADHD to maintain their attention (which otherwise decayed faster as evident by the larger tau
values in the blocks with constant ISI). This explanation rests on the definition of “inhibitory
Review of cognitive tests for ADHD 39
control” as maintaining attention (i.e., withholding the influence of potential distractors on
ongoing actions).
The hypothesis usually examined with CCPTs (i.e., participants with ADHD produce
particularly more commission errors when ISI is short rather than long) could not be tested by
Lee et al. (2015), because the different block types involved ISIs of similar lengths (Table A1).
A paradigm related to Lee et al. (2015)’s study design but used to test the hypothesis associated
with the test domain “inhibitory control,” was introduced by Huang-Pollock et al. (2017).
Children with and without ADHD performed a modified CCPT (with conditions that varied in
ISI length and difficulty level) and their performance was analyzed with a DDM application.
Huang-Pollock et al.’s findings (Table 9) question whether ADHD is characterized by failures in
“inhibitory control.” This is because failures in “inhibitory control” would not be expected to
result in larger biases towards no-go responses.
The results by Huang-Pollock et al. (2017) differ from the findings of Lee et al. (2015).
Specifically, while performance of the ADHD group did not vary as a function of ISI in Lee et
al.’s study, performance of the ADHD group did vary as a function of ISI in Huang-Pollock et
al.’s study (Table 9). Importantly, only the performance of children with ADHD varied with ISI
(the performance of children without ADHD was similar across ISI conditions). This result is
consistent with findings discussed previously (test domains: Selective attention, Sustained
attention), suggesting that ADHD-specific characteristics can be found when one focuses on how
performance changes across multiple conditions.
Applying an AAM analysis (using the linear ballistic accumulator model, LBA, Brown &
Heathcote, 2008) to the data from children with and without ADHD from a similar numerosity
discrimination task used by Huang-Pollock et al. (2017), Weigard, Huang-Pollock, Brown, and
Review of cognitive tests for ADHD 40
Heathcote (2018) found additional support for the conclusion above (Table 9). Moreover,
Weigard et al.’s results, combined with the findings of Friedman-Hill et al. (2010; see test
domain: Selective attention), suggest that manipulating difficulty levels across conditions
represent a sensitive alternative to manipulations of ISIs to study clinical characteristics of
ADHD.
Findings from neurophysiological measures. Kingery (2017) compared EEG–ERP
components (P3, Pz, P4) in an auditory CCPT between children with and without ADHD with an
EGDM analysis (Table 9). Each child’s RT distribution for correct responses was subdivided
into terciles for fast, medium, and slow RTs16
. Slow RT terciles were associated with decreased
peak amplitudes (which could be due to averaging over a longer time interval) and lower AUC,
but these changes in EEG activity (i.e., peak amplitude, latency and AUC) were similar for
children with and without ADHD. Wiersema et al. (2006), whose behavioral results were
presented earlier, also found a significant association between RTs and P3 amplitudes (for all
participants). Specifically, the difference in mean RTs between blocks with short and long ISIs
was significantly associated with the difference in P3 amplitudes between those two block types.
These results suggest that P3 components are associated with RTs but not with accuracy.
Wiersema et al. (2006) also found that the frequent commission errors of children with ADHD
(particularly those with ADHD comorbid oppositional defiant/conduct disorder) were
significantly associated with smaller amplitudes in the N2 components. This result is consistent
with the finding of Stroux et al. (2016; test domain: Working memory), who used N-back tasks
and who found a significant positive association between the N2 amplitudes and accuracy rates
16
For each tercile, EEG-ERPs (P3, P4) were averaged across all epochs between stimulus onset and the following
900ms to identify peak amplitude and latency. Linear mixed models were estimated with tercile RTs as independent
variables for amplitude, latency, and area under the curve (AUC).
Review of cognitive tests for ADHD 41
for non-targets (but not for targets). Synthesizing all results suggest that N2 components are
associated with accuracy but not with RTs.
The above findings suggest that earlier EEG-ERP components covary with accuracy,
whereas later EEG-ERP components covary with RTs. However, there seem to exist other latent
variables that affect these associations because some of the previously discussed studies did not
find any association between neural and behavioral measures (e.g., Hung et al., 2016 for the
domain: Cognitive flexibility; Gohil et al., 2017 for the domain: Selective attention), whereas
other studies found that other neural components also affect performance (Durston et al., 2003;
Groom et al., 2010; Kingery, 2017; Van De Voorde et al., 2010; Wiersema et al., 2005; 2006;
Zhang et al., 2009). For instance, Durston et al. (2003) found that children with ADHD had
decreased activation of frontostriatal regions and increased activation of more diffuse network
regions for go trials that followed no-go trials.
Stop-Signal Task
Findings from summary statistics. Numerous studies found that participants with
ADHD had slower RTs for go trials with intermittent Stop-signals as compared to participants
without ADHD (Alderson, Rapport, Sarver & Kofler, 2007; Lipszyc & Schachar, 2010; Martel,
Nikolas, & Nigg, 2007; Nigg, 1999; Senderecka et al., 2012; Willcutt et al., 2005). Despite the
above findings, multiple other studies suggest that slow RTs in Stop-signal tasks are not specific
to ADHD, but rather characterize a broader set of clinical disorders (Arabzadeh et al., 2014;
Hughes, Fulham, Johnston, & Michie, 2012; Lipszyc & Schachar, 2010). For instances, Kofler et
al. (2018) and Fosco et al. (2018) both studied differences between children with and without
ADHD in a Stop-signal task and they did not find any differences in mean RTs for go trials.
However, the groups without ADHD included not only neurotypical children but also children

Review of cognitive tests for ADHD 42
with psychiatric disorders other than ADHD. Hence, children with ADHD and those with other
disorders seem to share clinical, ADHD-unrelated, characteristics that result in similar behavioral
differences.
Findings from computational model applications. ADHD-specific slow RTs in Stop-
signal tasks can have different reasons. For instance, participants may adapt a cautious response
strategy in the presence of stop-signals. Alternatively, participants may process information at a
slow rate due to the increased cognitive demand. Fosco et al. (2018), whose summary statistics
were discussed above, showed that a DDM analysis can help to disentangle the extent to which
slow RTs are attributable to response cautiousness, deficits in information processing and/or
latency of perceptual encoding and motor execution. Their results (Table 9) question whether the
Stop-signal task measures inhibition control. Rather, their findings suggest that changes in
response strategies could account for slower RTs in the presence of stop-signals. It would have
been interesting to examine in Fosco et al.’s study whether measures on anxiety were associated
with larger boundary separation as found by Merkt et al. (2013; test domain: Selective attention).
Another explanation on the constructs measured in Stop-signal tasks is provided by
Weigard, Heathcote, Matzke, and Huang-Pollock (2019). They argued that slower RTs in the
presence of stop-signals could also stem from inhibitory control processes that were not activated
at all. To test this hypothesis, Weigard et al. administered a Stop-signal task to children with and
without ADHD. They then applied a modified EGDM analysis, which provided the common
EGDM parameters (mu, sigma, tau) for the RT distributions of correct responses (go responses
to go trials; mugo-match, sigmago-match), for those of commission errors (go responses to no-go trials;
Review of cognitive tests for ADHD 43
mugo-mismatch, sigmago-mismatch)17
, and additional estimates for the probability that the stop-signal
did not trigger an inhibition process (PTF; commission errors), and the probability that the go
stimulus did not trigger a go response (PGF; omission errors). ADHD-specific RT distributions
were characterized by a faster rise in the leading edge (indexed by sigma) and a larger spread in
the tails (indexed by tau) relative to non-ADHD.
One may wonder whether ADHD endophenotype-specific differences can be found in
this test domain. Epstein et al. (2011) administered a Stop-signal task to three group of children
(non-ADHD, ADHD-C, ADHD-I) and applied an EGDM analysis to test for subtype-specific
differences in the Stop-signal task. There were no significant group differences in EGDM
parameters, which contrasts with the above findings of Weigard et al. (2019). Tye et al. (2016)
examined whether a modified Stop-signal task, in conjunction with an EGDM analysis, can be
used to discriminate between ADHD and autism spectrum disorder (ASD). The Stop-signal task
was employed to a group of boys with ASD, a group of boys with ADHD only, a group of boys
with ADHD and ASD (ADHD+ASD), and a group of boys without ADHD (non-ADHD group).
Tye et al.’s results (Table 9) suggest that Stop-signal tasks can be used to distinguish between
different ADHD endophenotype-specific characteristics. Moreover, the finding (Table A7) that
tau values were similar between ADHD and control groups but substantially larger when ISI was
long is consistent with the findings by Lee et al. (2015). However, as explained in the previous
section “sustained attention,” tau values seem to index a measure more related to “sustained
attention” than “inhibitory control.”
Findings from neurophysiological measures. Senderecka et al. (2012), whose
behavioral findings were presented earlier, collected EEG-ERPs during a Stop-signal task.
17
Tau (τ) was kept constant across the two RT distributions.
Review of cognitive tests for ADHD 44
Relative to children without ADHD, children with ADHD showed smaller differences between
correct and error responses on the stop-signal trials in the amplitudes of the P3 component
(meant to index successful response inhibition). Similar results were found in other studies
(Johnstone, Barry, & Clarke, 2007; Overtoom et al., 2003; Wessel & Aaron, 2015). For instance,
a study by Wessel and Aaron (2015) suggested that the latency of the P3 component indexed the
temporal onset of response inhibition processes and that the P3 latency onset was highly
correlated with stop-signal reaction times. These results are consistent with the findings from
EEG studies discussed previously and that suggested associations between P3 components and
RTs (e.g., Hung et al., 2016 for the domain: Cognitive flexibility; Gohil et al., 2017 for the
domain: Selective attention; Wiersema et al., 2006 for CCPTs). Senderecka et al. (2012) also
found that, relative to children without ADHD, children with ADHD showed a larger amplitude
and a longer latency in the N2 component for correct responses and smaller ERN-Pe complexes
(associated with the detection of error responses). Similar results were found in EEG studies
discussed previously (test domain Working memory: Stroux et al., 2016; test domain CCPTs:
Wiersema et al., 2006). The above results suggest the existence of ADHD-specific neural
differences. However, the neural characteristics of ADHD remain unclear as studies propose
multiple components and concepts to find ADHD-specific characteristics.
<< insert Table 9 here >>
Discussion
In the next subsection, we summarize the findings for each test domain. We then provide
suggestions for: the improvement of cognitive testing (subsection 2), the consideration of critical
aspects when applying computational models (subsection 3), the integration of
Review of cognitive tests for ADHD 45
neurophysiological measures (subsection 4) and sample characteristics (subsection 5) into
cognitive testing for ADHD. In the final subsection, we provide concluding remarks (e.g.,
limitations of this review). Table 10 lists the most important messages of this article (i.e.,
recommendations for cognitive testing, computational modeling, and integrating
neurophysiological measures) which are general applicable.
Summary of Findings Across Test Domains
Cognitive flexibility
Paradigms reviewed for this test domain required participants to switch between different
features of the same stimulus (i.e., feature-switch paradigms) or between different tasks (i.e.,
task-switch paradigms). Studies that utilized task-switch paradigms consistently found large
group differences in switch costs between children with ADHD (mostly with ADHD-C) and
those without ADHD. The type of switch costs (i.e., global or local switch costs in terms of
accuracy, mean RTs, or both) and the size of effect varied across studies. We showed that mixed
evidence can be reconciled when considering differences in the specifics of task-switch
paradigms across studies (e.g., cue-stimulus intervals, predictability of task-switches, similarity
of tasks involved in the task-switch paradigm). Studies that utilized feature-switch paradigms
found differences between DSM-defined ADHD subtypes (i.e., ADHD-C and ADHD-I). ADHD-
C was characterized by a slow processing speed, whereas ADHD-I was characterized by a
pronounced local-oriented encoding style (i.e., in Navon tasks: ADHD-I showed greater
interference from local stimuli when asked to process at a global level as compared to non-
ADHD; in Attentional blink tasks: ADHD-I were better able to detect probe letters than ADHD-
C and non-ADHD).
DDM analyses suggested ADHD to be characterized by lower drift rates and longer
nondecision time components (compared to non-ADHD). These results suggest impairments in
Review of cognitive tests for ADHD 46
information integration and in the activation of early- and late- stage control processes. Ging-
Jehli and Ratcliff (2020) recently illustrated with a DDM application to a task-switch paradigm
that DDM parameters can be used to index distinct control processes. They showed that the
nondecision time component can index early-stage control processes (involved in reconfiguring
the cognitive system for task switches) while the drift rate can index late-stage control processes
(involved in resolving any interference that arises from performing multiple tasks). Hence, task-
switch paradigms in conjunction with computational modeling seems promising for the study of
ADHD characteristics. Moreover, studies indicated that the higher the severity of ADHD
symptoms, the lower the drift rates and the longer the nondecision time components. This
suggests that model parameters could be used to approximate a spectrum of ADHD, considering
it a dimensional disorder rather than a categorical disorder. This notion is supported by findings
from neuroimaging, behavioral genetics and taxonomic studies (Carson, 1991; Clark, Watson, &
Reynolds 1995; Coghill & Sonuga-Barke, 2012; Larsson et al., 2012; Marcus, Norris, &
Coccaro, 2012). Acknowledging ADHD as a dimensional disorder implies that participants with
a clinical diagnosis of ADHD differ from those with moderate or mild ADHD symptoms in the
degree of severity on a continuous spectrum of severity. In contrast, regarding ADHD as a
categorical disorder implies that participants with a clinical diagnosis of ADHD differ not only
quantitatively from normality, but they also lie outside any variation in the normal range. The
results from sequential sampling models point toward a spectrum of ADHD, illustrating specific
biases in the decision processes of participants with ADHD that can lie in the variation of the
normal range. Hence, sequential sampling models such as the DDM represent an alternative
approach to discover dysfunctionalities, can account for individual differences and heterogeneity
in ADHD, and can refine the cognitive characteristics of ADHD endophenotypes. However,

Review of cognitive tests for ADHD 47
upon review of the DDM analyses of some clinical studies, the findings should be interpreted
with caution (e.g., unsuccessful manipulations of difficulty levels; a very low number of trials
which compromises parameter estimation).
Brain imaging studies (Fink et al., 1996; Song & Hakoda, 2012; Yeo et al., 2003) relate
biases in local information processing in ADHD-I to dysfunctions (i.e., reduced cortical and
subcortical volumes) in the right hemisphere. Further evidence from neurophysiological
measures suggested differences between participants with and without ADHD for multiple EEG-
ERP components. Sequential sampling models could be used to link neuronal measures to
specific cognitive components, assigning a psychological interpretation to the different ERP
components (Turner et al., 2017).
Selective attention
Studies were organized based on whether they employed Perceptual discrimination tasks
(involving degraded stimuli) or Flanker tasks (involving undegraded stimuli). Research that
employed Perceptual discrimination tasks found that participants with ADHD (children and
adults) were more distractible than participants without ADHD. We discussed examples of
mixed findings and highlighted that significant heterogeneity exists in performance among
participants with ADHD. However, most studies did not account for ADHD subtypes or any
comorbidities. We showed that some of the mixed evidence could be reconciled when
considering characteristics such as gender, ADHD subgroups, and comorbidities. For instance,
numerous studies suggest that ADHD-I seems to be characterized by impairments in processes
involved in filtering relevant from irrelevant information (e.g., Carlson, Lahey, & Neeper 1986;
Goth-Owens et al., 2010; Song & Hakoda, 2012; Weiler, Bernstein, Bellinger, & Waber 2002).
Studies that employed Flanker tasks showed that participants with ADHD were more sensitive to
Review of cognitive tests for ADHD 48
distractors (irrespective of whether distractors were relevant, irrelevant, subliminal, or salient)
than participants without ADHD. Moreover, results from studies that used Flanker tasks seemed
first to contradict the results from studies that used Perceptual discrimination tasks. However,
these contradictory results can be reconciled when considering that Flanker tasks imposed less
difficulty (as shown by accuracy above 95%) than Perceptual Discrimination tasks (as shown by
accuracy between 65% and 90%). It further implies that the stimulus degradation (pure vs.
degraded stimuli) may be an important distinction for clinical research, because pure and
degraded stimuli seem to evoke different magnitudes of distractibility. Moreover, evidence
suggests that participants with ADHD were less distractible when task difficulty was high rather
than low; or when the interstimulus interval (ISI) was short rather than long.
DDM applications to Perceptual discrimination tasks showed that particularly individuals
with ADHD and a high degree in hyperactivity have deficits in adjusting their response strategy
when asked to make accurate rather than fast responses (i.e., as indexed by the model parameter
boundary separation). DDM applications to Flanker tasks found a positive association between
anxiety and boundary separation (i.e., indexing cautiousness of response strategy); and a
negative association between hostility and nondecision time component (indexing the time for
perceptually encoding and response execution) for all participants (with and without ADHD).
Moreover, ADHD was characterized by lower drift rates (compared to non-ADHD). Like for the
test domain “Cognitive flexibility,” ADHD-related deficits in drift rates were linearly related to
symptom severity. EGDM analyses of Flanker tasks found that children with ADHD-C had
significantly larger tau values (indicating a higher proportion of slow responses) than children
with ADHD-I or those without ADHD. To date, the psychological interpretation of EGDM

Review of cognitive tests for ADHD 49
parameters such as tau (e.g., index for lapses of inattention, slowed processing, deficits in motor
output) remain unclear (Table 3).
Studies that examined neurophysiological measures support the view that ADHD is
characterized by a pronounced degree of distractibility (Libera & Chelazzi, 2006; Mason,
Humphreys, & Kent, 2003; Tegelbeckers et al., 2015; Weissman, Mangun, & Woldorff, 2002).
For instances, studies that utilized functional brain imaging (fMRI) showed that boys with
ADHD had enhanced neural activity when presented with unexpected, irrelevant stimuli as
compared to boys without ADHD (Banich et al., 2009; Tegelbeckers et al., 2015). Studies that
utilized EEG-ERPs showed that participants with ADHD processed and filtered sensory inputs
differently than participants without ADHD (Gohil et al., 2017; Hasler et al., 2016; Schneidt et
al., 2018). There are several hypotheses for this test domain about the psychological meaning of
EEG-ERP components such as EPN and LPP. With sequential sampling models, one could link
these neuronal measures to specific cognitive components, assigning a psychological
interpretation to those neural constructs (e.g., Palestro et al., 2018; Philiastides et al., 2006;
Ratcliff, Sederberg et al., 2016; Schubert, Nunez, Hagemann, & Vandekerckhove, 2018; Van
Vugt et al., 2012). For instance, in the framework of sequential sampling models, EPN may be
associated with nondecision time components, whereas LPP may be associated with drift rates.
This represents an alternative approach to discover dysfunctionality. The aim would be to
account for individual differences and heterogeneity in ADHD and refine the cognitive
characteristics of ADHD endophenotypes. In particular, the joint modeling of behavioral and
neural data may help to determine whether distractibility is caused by increased interference in
sensory processing, decreased capability to activate executive control processes, or impaired

Review of cognitive tests for ADHD 50
feedback loops between executive control processes and networks that process sensory inputs
(see for a discussion of these latest approaches: Turner et al., 2017).
Working memory
N-back tasks and Sternberg tasks were paradigms frequently used in this test domain.
Studies that employed N-back tasks showed that participants with ADHD (children and adults)
had poorer performance (as evidenced by lower accuracy values, but similar mean RTs) than
participants without ADHD (e.g., Epstein et al., 2011; Stroux et al., 2016). However, a study that
focused on boys without any mental health disorders and those with ADHD and autism spectrum
disorder (ASD) did not find any group-specific differences, neither in accuracy values nor in
mean RTs (Kawabe et al., 2018). A study that employed modified Sternberg tasks by introducing
a second distractor task during the maintenance phase of the Sternberg task found that children
with ADHD were slower, less accurate, and exhibited a higher RT variability than children
without ADHD. Modified Sternberg tasks seem particularly suited to study WM deficits because
it can be used to address whether participants with ADHD had poorer performance in WM tasks
because of deficits in the perceptual encoding of stimuli (encoding phase), or because of deficits
in maintaining the information in WM (maintenance phase).
In the framework of sequential sampling models, deficits during the encoding phase of a WM
task would lead to longer nondecision time components for ADHD. In contrast, deficits during
the maintenance phase of a WM task would lead to lower drift rates for ADHD. DDM
applications to modified Sternberg tasks suggested ADHD to be characterized by deficits in both,
perceptual encoding (as evidenced by longer nondecision time components) and information
maintaining (as evidenced by lower drift rates). Past EGDM applications to 1-back tasks
Review of cognitive tests for ADHD 51
suggested ADHD (i.e., both ADHD-C and ADHD-I) to be characterized by large tau values (i.e.,
higher proportion of slow responses).
Research proposes that deficits in WM are a characteristic for ADHD (Buzy, Medoff, &
Schweitzer 2009; Lenartowicz et al., 2014; Weigard & Huang-Pollock, 2017; Willcutt et al.,
2005). The underlying neurophysiological components that lead to WM deficits remain a topic of
debate. Some studies suggest that WM deficits are a consequence of limited prefrontal capacities
(e.g., Friedman-Hill, 2010; Lavie & De Fockert, 2003). Other studies suggest that WM deficits
are due to impairments in controlling attention (e.g., Friedman-Hill et al., 2010; Huang-Pollock,
Nigg & Halperin, 2006); or due to biased processing of information (e.g., Lenartowicz et al.,
2014). Studies (Stroux et al., 2016; Lenartowicz et al., 2014) that collected EEG measures during
task performance suggested that ADHD is characterized by deficits in perceptual encoding only.
This finding could result from an insufficient deactivation of the default mode network resulting
in a delayed start of stimulus encoding and a lower refreshing rate of items in WM. This
hypothesis could be tested in a paradigm with a joint modeling approach of neural and
behavioral responses (Palestro et al., 2018; Ratcliff, Sederberg et al., 2016; Turner et al., 2017;
Van Vugt et al., 2012).
Time perception
We focused on Time discriminations tasks such as Time reproduction tasks and Time
differentiation tasks. For both task types, ADHD children and adults displayed abnormal
temporal processing (i.e., systematically overpredicting elapsed time intervals). These results are
consistent with the findings from studies in related test domains (Barkley, Koplowitz, Anderson,
& McMurray, 1997; McInerney & Kerns, 2003; Smith, Taylor, Brammer, Halari, & Rubia,
2008). For instance, participants with ADHD showed greater temporal discounting than
participants without ADHD in different delay discounting tasks (Barkley, Edwards, Laneri,
Review of cognitive tests for ADHD 52
Fletcher, & Metevia, 2001; Bitsakou, Psychogiou, Thompson, & Sonuga-Barke, 2009). Future
research is needed to examine to what extent abnormal temporal processing influences
performance in these other tasks. To date, studies have not investigated any subtype-specific
differences in this domain.
Different theoretical explanations have been proposed to account for the abnormal time
processing observed in ADHD; some of which could be tested with the application of sequential
sampling models. For instance, the executive function deficits hypothesis (e.g., Barkley et al.,
1997a) suggests that impaired time processing is a result of dysfunctional response inhibition and
deficits in executive functioning. This would lead to a systematic underestimation of elapsed
time intervals that can be observed in perceptual timing tasks. The cognitive energetic theory
(e.g., Sergeant, 2000; van der Meere, 2005; van der Meere, Shalev, Borger, & Wiersema, 2009)
proposes that abnormal time processing results from dysfunctional state regulations (e.g.,
mismatch between a participant’s state of arousal and the stimulation provided by the task).
More motivation-based theories (e.g., Sonuga-Barke, 2002; Sonuga-Barke, Saxton, & Hall,
1998) propose that participants with ADHD possess an internal clock, which runs faster than
those of participants without ADHD. This would lead to a delay aversion and to
underestimations of particularly long time intervals. An AAM analysis applied to a Duration
discrimination task showed that the internal clock of participants with ADHD (children and
adults) ran faster than that of participants without ADHD (Shapiro & Huang-Pollock, 2019).
None of the reviewed studies collected neuronal measures during task performance.
However, brain imaging studies found that temporal processing is based on the communication
in dopamine-rich pathways between frontal and limbic regions (De La Fuente, Xia, Branch, &
Li, 2013; Konrad & Eickhoff, 2010), which are areas presumed to be associated with ADHD.

Review of cognitive tests for ADHD 53
For instance, dopaminergic stimulants have been shown to improve behavioral performance on
time perception tasks (Rubia, Halari, Christakou, & Taylor, 2009). Therefore, tasks from this test
domain may be particularly suitable for the study of ADHD-specific characteristics.
Sustained attention
CPTs were commonly applied in this test domain. Evidence suggested ADHD is
characterized by difficulties in maintaining attention. There was also preliminary evidence for
differences between ADHD endophenotypes that warrants further study. Reviewing findings for
this test domain confronted us with many challenges. First, many studies did not examine
changes in performance measures over the course of a task. Instead, they focused on changes in
performance measures between conditions with short versus long interstimulus intervals (ISIs).
Nevertheless, changes in performance over time may serve as a good proxy for one’s ability to
maintain attention over an extended period of time. Specifically, if ADHD is characterized by
deficits in sustaining attention, one would expect that the performance of participants with
ADHD declines more over time as compared to that of participants without ADHD. Second,
many studies did not report mean RTs and/or accuracy, but reported measures derived from
experimental data that were provided by test makers (e.g., Leppma, Long, Smith, & Lassiter,
2017; Moreno-García, Delgado-Pardo, & Roldán-Blasco, 2015; Tinius, 2003). This made it
impossible for us to determine how the results from these studies relate to the findings from other
studies. Third, some studies employed inhibitory control paradigms (e.g., CCPTs which are
CPTs with presentations of frequent rather than rare target stimuli) to study “sustained attention,”
which produced results that were neither consistent with other results in the domain “sustained
attention,” nor were they consistent with other results in the domain “inhibitory control” we
showed.
Review of cognitive tests for ADHD 54
EGDM analyses found that participants with ADHD had larger increases in tau values
when ISI increased as compared to participants without ADHD. The cognitive-energetic model
(Sergeant, 2005) and the default-mode network model (Sonuga-Barke & Castellanos, 2007)
propose that larger increases in tau values (as a result of increased ISI) are due to difficulties of
participants with ADHD to remain in an active mode. A meta-analysis with the DDM suggested
that children with ADHD had lower drift rates than children without ADHD (Huang-Pollock et
al., 2012). However, the meta-analysis with the DDM needs to be updated because it makes an
assumption about the starting point of the process that is not supported by recent analyses
(Huang-Pollock et al., 2017; Ratcliff et al., 2018).
Studies that utilized frequency-based analyses of EEG power bands found that ADHD
adults required a higher level of neural activation (as evidenced by attenuated alpha power) to
sustain attention towards the end of the task as compared to adults without ADHD. Decreased
alpha power in ADHD has been observed across a range of tasks (Loo et al., 2009; Klimesch,
Sauseng, & Hanslmayr, 2007). For instance, Loo et al. found that a decreased power in alpha
band indexes increased cortical effort in adults with ADHD to perform the task. Other studies
(Bresnahan et al., 1999; Bresnahan & Barry, 2002) found that ADHD is characterized by
increased power in theta band. Further research is needed to determine whether different ADHD
subgroups exhibit specific characteristics in different power bands.
Inhibitory control
CCPTs and Stop-signal tasks were frequently used in this test domain. Results remain
mixed whether these tasks are able to discriminate between participants with and without ADHD
(Halperin et al., 1992; Klee & Garfinkel, 1983; Koelega, 1995; Rovet & Hepworth, 2001;
Shapiro & Garfinkel, 1986; Zahn, Kruesi, & Rapoport, 1991). In fact, multiple studies that used
Review of cognitive tests for ADHD 55
CCPTs and Stop-signal tasks found that participants with other clinical disorders (e.g.,
schizophrenia, psychosis) showed deficits similar to those of participants with ADHD
(Arabzadeh et al., 2014; Hughes, Fulham, Johnston, & Michie, 2012; Lipszyc & Schachar,
2010). Moreover, many of the reviewed studies suggest subtype-specific differences in this test
domain. This stands in contrast with other studies that did not find subtype-specific differences
(e.g., Edwards et al., 2007; Egeland, & Kowalik-Gran, 2008; Scheres, Oosterlaan, & Sergeant,
2001). Reviewing this test domain revealed multiple difficulties in comparing results across
studies. First, some studies did not test the hypothesis whether participants with ADHD produce
more commission errors than participants without ADHD (in particular without examining the
effects of ISI). Instead, they focused on the finding that participants with ADHD showed a large
proportion of very slow RTs particularly for long ISI as compared to short ISI – a finding that
seems more related to the concept of “sustained attention.” Studying different cognitive concepts
with the same type of task makes it difficult to compare results across studies and to disentangle
the cognitive aspects that characterize ADHD. Second, evidence remained mixed on whether
behavioral measures from the CCPT relate to symptoms assessed with parent or teacher ratings
(Epstein et al., 2003). Based on the difficulties in this test domain, it is not surprising that the
CCPT showed poor sensitivity to correctly identify participants with ADHD (Epstein, Conners,
Sitarenios, & Erhardt, 1998; McGee, Clark, & Symons, 2000).
Multiple applications of sequential sampling models raised uncertainty about what
cognitive concepts CCPTs and Stop-signal tasks measured. For instance, the AAM application
by Huang-Pollock et al. (2018) and the EGDM application by Weigard et al. (2019) suggested
that error responses in the CCPT and the Stop-signal task do not solely index failures in
inhibitory control processes. Rather, behavioral measures were confounded by biases in the
Review of cognitive tests for ADHD 56
decision process (i.e., biases in starting points, which index a participant’s preference to rely on
prior expectations rather than presented information to reach a decision). To date, researchers
debate whether CCPTs and Stop-signal tasks do indeed measure deficits in inhibitory control
(Alderson, Rapport, & Kofler, 2007; Barkley, 1997b; Lipszyc & Schachar 2010; Nigg, 2001;
Nikolas et al., 2019). For instance, dysfunctional regulations of arousal, attention, integration of
information, or expectations could be the actual underlying cognitive processes that are
dysfunctional and that cause deficits in inhibitory control (Milich, Hartung, Martin, & Haigler,
1994; Nigg, 2001; Sergeant et al., 1999).
Studies that additionally collected neurophysiological measures during CCPTs and Stop-
signal tasks found that participants with ADHD showed significant differences to participants
without ADHD in areas involved in error processing. Moreover, multiple studies suggest that the
detection of clinical characteristics in neurophysiological measures heavily depend on the
specifics of the task (e.g., task difficulty, ISIs, frequency of target stimuli). Ultimately, the
characteristics of ADHD remain unclear as studies propose multiple neural components and
concepts to find ADHD-specific characteristics in this test domain.
Suggestions for Improving Cognitive Testing
Reviewing studies across a range of test domains shows one of the biggest challenges that
needs to be overcome: designing studies so that they can be directly compared. Currently,
problems arise because tasks differ, participant groups differ, and the degree to which data to all
these aspects are available differs. Even when multiple studies use the same tasks, details in the
procedures of these tasks differ to such a degree that often they cannot be directly compared
unambiguously. This means that contradictory results can occur because of differences between
participant groups; differences between task specifics (e.g., cue-stimulus interval, presentation

Review of cognitive tests for ADHD 57
time of stimuli, digits presented in singles or triples versus presented sequentially); and/or
differences between tasks. To address this challenge, we might aim for standards that define the
requirements on tasks and methods used to characterize mental health disorders such as ADHD.
Perhaps one partial solution might be to include some standard conditions across studies so that
there is some basis for comparison. Most importantly, we may want to suggest how much and
what kind of data needs to be collected and to be made available to allow test results to be
compared (e.g., sample characteristics of co-morbid diagnoses, raw cognitive data from test
providers, not just their commercialized “cognitive” scores).
The discussion so far also raises questions as to whether commonly used tasks validly
assess their target cognitive concept(s). Terms such as “inhibition,” “selective attention,”
“inhibitory control” are useful for talking about the possible locus of deficits. Sometimes one
task is assumed to measure several of these concepts and so it is difficult to relate tasks to
concepts. Thus, the concepts are not particularly useful for specifying tests that measure these
concepts and within these tests, they do not specify which measures correspond to these concepts
(as noted in the Method section: System of Study Classification). It is difficult to see what to
replace these concepts with, but we may want to re-evaluate the validity and reliability of
measures (e.g., scores of cognitive flexibility, indices of sustained attention) provided by
commonly used tasks and to be on the watch for more direct relationships between disorders and
measures and/or model-based constructs.
We emphasize that the computational modeling applications that were discussed made us
question whether the CCPT does indeed measure inhibitory control (see summary of test domain
Inhibitory control in previous subsection). Moreover, we showed that sequential sampling
models can help to test different cognitive concepts hypothesized to be deficient in ADHD. For
Review of cognitive tests for ADHD 58
instance, multiple studies (Senderecka et al., 2012 for the test domain: Inhibitory control; Merkt
et al., 2013 for the test domain: Selective attention) concluded that ADHD is characterized by
slowed processing speed (due to slower mean RTs for participants with ADHD compared to
those without ADHD). We illustrated that ADHD-specific slower mean RTs sometimes stemmed
from deficits in cognitive processing (e.g., deficits in information integration, perceptual
processing), but they also sometimes stemmed from the accommodation of a cautious response
strategy. Hence, the findings from a range of cognitive tasks suggests that the notion of ADHD
being characterized by slow processing speed seems not to represent a universal characteristic
(e.g., Friedmann-Hill et al., 2010 for the test domain: Cognitive flexibility; Fosco et al., 2018 for
the test domain: Inhibitory control; Mulder et al., 2010 for the test domain: Selective attention).
Cognitive tasks need to be evaluated with respect to their internal and external validity to
increase the possibility to measure cognitive characteristics that are generalizable to contexts
outside of the laboratory test setting. We argue that cognitive components can be informative
beyond cognitive tests, particularly when administering a set of cognitive tests rather than one
single test. The utility of cognitive testing is further increased if each test is dedicated to the
study of a specific characteristic of ADHD, including cognitive and social aspects. We
hypothesize that stronger associations between decisions across contexts could be made when
cognitive testing also involves the study of intra-individual differences across multiple
conditions of the same test. For instance, asking questions such as: which components of the
decision process change if the frequency of a stimulus type is changed or if the participant is told
to focus on being fast rather than accurate?; will the participant use the new information to
modify processing?; how much will they rely on their a priori expectation? Answers to questions
like those presented above may eventually guide the characterization of ADHD endophenotypes.
Review of cognitive tests for ADHD 59
Evidence from cognitive psychology should have more impact in the design of cognitive
tests. For instances, future research may consider the following findings from cognitive
psychology when designing task-switch paradigms (Madden et al., 2009; Rogers & Monsell,
1995; Rubinstein, et al., 2001; Schmitz & Voss, 2012; Schneider & Logan, 2005). First, the
longer the CSI, the more likely are participants able to compensate for their deficits in cognitive
flexibility. Second, the more related the tasks that compose the task-switch paradigm, the less
demanding task switching, unless response congruency (or stimulus congruency) is varied across
tasks to produce conflicts between tasks. Moreover, varying interstimulus interval (ISI) could be
used to study the concept of sustained attention in a range of tasks.
Suggestions for Applying Computational Models
Most studies that used summary statistics either focused on accuracy or mean correct RT.
The advantage of sequential sampling models is the possibility to consider simultaneously entire
RT distribution shapes for correct and error responses (and corresponding accuracy values).
These models allow not only for predictions of choice probabilities and mean RTs, but also for
identification of the sources of behavioral choices (e.g., response bias, perceptual bias, failures in
inhibition control). These sources may be more sensitive for distinguishing between clinical and
non-clinical participants, between different ADHD subtypes, or between various severities of
ADHD symptoms. We emphasize that the interpretation of model parameters depends on the
task and interpretations should not be separated from the task in which they are estimated.
Unlike most other analysis methods, applications of sequential sampling models have
multiple hurdles to overcome. First, the models have to adequately fit the experimental data
(accuracy and correct and error RT distributions) before it can be legitimately used to interpret
the experimental data. This means that applications should have plots of fits to data (cf, Ging-

Review of cognitive tests for ADHD 60
Jehli & Ratcliff, 2020; Ratcliff & Childers, 2015) presented in the text, and appendix, or at least
a supplement. Second, the models need to be adequately parametrized. This means considering
which model parameters to keep constant across conditions based on a priori hypotheses or
theories. Keeping constant some of the model parameters yield to a constrained model that is
more highly falsifiable than fits to a single condition. Third, correlational analyses between
model parameters should be performed to check to what extent model parameters trade-off
against each other (and therefore question the degree to which model parameters index distinct
components). For instance, Ging-Jehli and Ratcliff (2020) found that nondecision time and drift
rate did not correlate with each other and indexed different cognitive components of task-
switching. However, this may not be the case for simpler tasks such as CPTs and CCPTs.
Multiple studies found that, although parameters trade-off, that this effect is much smaller
than the individual differences in model parameters (e.g., Ratcliff, Thapar, & McKoon, 2006;
2010; 2011). It has been shown that tradeoffs in parameter values are usually 3 to 5 times smaller
than individual differences. Because variances add, this produces very small effects (5%) on
individual differences. In Ratcliff, Thapar, & McKoon (2010, 2011), boundary separation,
nondecision time, and drift rate parameters correlate 0.4 to 0.6 across tasks and drift rates
correlate with IQ in the 0.5 range. These are strong individual differences that are captured in
the modeling.
The application of many computational models often requires adjustments of the
cognitive test. For instance, to estimate consistent parameters, the task needs to have enough
trials. A rule of thumb is a bare minimum of 50 or more trials per condition with several
conditions, the more data, the better the parameter estimates (Ratcliff & Childers, 2015; Ratcliff
et al. 2018). This means that the design of a task used for model-based analysis should not be an
Review of cognitive tests for ADHD 61
add-on to a larger battery with say 10 minutes of testing (it may take 5 minutes for the participant
to be instructed, work out how to perform the task, and settle in to performing the task in a stable
manner). The experiment needs to be designed so that the model-based analysis have enough
power to allow conclusions to be drawn from it. If the experiment can be designed for modeling,
then 500 to 1000 observations in total should be collected, which may require 30-45 minutes of
testing. However, the number of observations depend on the number of conditions in a task.
Moreover, the difficulty level of the task needs to be adjusted so that there is a sufficiently high
error rate in some conditions (i.e., rule of thumb: larger than 10% per task, Ratcliff, 2014).
Ideally, the task should involve multiple conditions with a range of accuracy rates between 70%
and 90%. Estimating model parameters based on a low number of observations or a few error
responses can result in biased or inconsistent estimates (or both) and this limits the potential
effects that can be detected with model-based analyses. If a task does not produce enough error
responses, the benefits of the computational models cannot be fully utilized.
Sequential sampling models should be simultaneously fit to accuracy and RT
distributions of correct and error responses for all conditions. This will lead to a highly
constrained model, one that will be falsifiable in many cases (see also: Van Zandt, Colonius, &
Proctor, 2000). We suggest checking goodness of fit not only with the use of critical values such
as G-square or Chi-square values. Rather, deriving model predictions and plotting those
predictions against data for accuracy and different quantile RTs (e.g., .1, .5, and .9 quantile RTs)
for each condition and for each participant, will transparently show how well the model fits the
data (e.g., Ging-Jehli & Ratcliff, 2020).
Computational models sometimes also require adjustments in their specifications. For
instance, previous DDM analyses of flanker tasks showed that the standard DDM does not apply
Review of cognitive tests for ADHD 62
and that modifications are needed. Such models include the spotlight model (White, Ratcliff, &
Starns, 2011), the dual stage model (Hübner, Steinhauser, & Lehle, 2010), or the race diffusion
model (Tillman, Van Zandt, & Logan, 2020).
Studies (Ratcliff, Van Zandt, & McKoon, 1999; Smith & Ratcliff, 2015) have shown that
the introduction of variability parameters (i.e., variabilities in nondecision time component,
starting points, or across-trial variability in drift rates) allow for accounting specific accuracy-
response time patterns (i.e., faster error responses than correct responses as a result of variation
in starting points). However, research have shown that such variability parameters are difficult to
recover (Ratcliff & Tuerlinckx, 2002) without sufficient numbers of observations. Therefore,
group-specific analyses in variability parameters are less robust than group-specific analyses in
main model parameters.
Suggestions for Integrating Neural Measures
Multiple limitations occur when examining results from neurophysiological measures.
For example, a single EEG-ERP component (e.g., P3) has been associated with many different
cognitive processes. Therefore, finding differences in a single component might not map into the
construct being examined. Furthermore, due to the large number of EEG-ERP components that
can be examined, it seems tempting to focus on significant results and report those results with
post hoc explanation of why that particular component (which might be amplitude, frequency
band, or onset time) relates to the process or participant difference being studied. The problem is
that the collection of EEG measures without a theoretical foundation biases the investigator to
focus on significant results only. A remedy to this problem is the use of single-trial measures
integrated into model-based analyses (Ratcliff et al., 2016) or other joint modeling approaches
discussed earlier (see also: Turner et al., 2017).

Review of cognitive tests for ADHD 63
Most of the studies focused on latency and peak amplitude when characterizing EEG-
ERPs. However, studies have shown that it can be beneficial to measure the onset or offset of a
component rather than the peak. Other measures such as the fractional area latency are
particularly suitable for making comparisons with RTs (e.g., Luck, 2014; Zoumpoulaki et al.,
2015).
Another limitation occurs in the use of activity-based measures and neural theories based
on resting state analyses. These theories do not allow deriving testable, quantitative predictions
because they do not map into behavioral measures in any agreed-upon way. Therefore, in the
worst case, these theories might be able to explain any possible pattern of results, making them
unfalsifiable. A long-term aim of theory is to form a consistent picture of the different theories,
find specific ways of relating these neurophysiological measures and analyses to behavior and
individuals, and to provide testable predictions.
Different ADHD phenotypes may have deficits that affect their decision process at
different time points. For instance, participants with ADHD who start their decision process late
(due to a slow perceptual encoding phase or a slow accessibility to stored memory, henceforth
“late starter”) may show pronounced hypoactivation in brain areas associated with the default-
mode network. In this case, the neural activity would be associated with the nondecision time
component of the DDM. In contrast, participants with ADHD who tend to have lapses of
attention (due to an abnormal propensity for daydreaming, henceforth “daydreamer”), may also
show pronounced hypoactivation in brain areas associated with the default-mode network similar
to late starters. The neural activity in this case would be associated with the drift rate because the
onset of the decision process is not what is deficient. Rather, a daydreamer may lose their train of
thought during the decision process, leading to poorer information integration. Hence, both
Review of cognitive tests for ADHD 64
prospective ADHD endophenotypes (i.e., a late starter, daydreamer) may exhibit the same neural
activity (i.e., hypoactivation in the default-mode network). However, the time dynamics of the
neural pattern become quantifiable and psychologically interpretable with the conjoint
application of computational modeling and neurophysiological measures such as
electroencephalography (EEG).
Suggestions for Integrating Sample Characteristics
Synthesizing findings across the different test domains indicate a high heterogeneity in
test performance among participants with ADHD. Many studies centered their investigation
around specific ADHD groups (e.g. boys aged between 7 and 14 years and diagnosed with
ADHD-C or ADHD-H). However, summarizing the findings across test domains illustrated the
importance to account for subgroup-specific differences in ADHD. For instance, a subgroup of
ADHD (i.e., individuals with ADHD-I) seems to be more sensitive to perceptual noise than
another subgroup of ADHD (i.e., individuals with ADHD-C) (see section on the test domain:
Cognitive flexibility). Other studies also found subtype-specific differences in
neurophysiological measures (Clarke, Barry, McCarthy, & Selikowitz, 2001; Fair et al., 2013;
Loo et al., 2003). For instance, Fair et al. (2013) found ADHD-C to be characterized by atypical
connectivity in the insular cortex, as well as in the midline default network components, whereas
ADHD-I to be characterized by atypical connectivity in the cerebellum and in the dorsolateral
prefrontal cortex.
Studies that accounted for subtype differences in their primary analysis often used
different criteria for subclassifying participants with ADHD (Epstein et al., 2011; Pritchard,
Neumann, & Rucklidge, 2008; Solanto et al., 2009). This can make comparisons across studies
difficult. For instance, the study by Carr et al. (2010) assigned participants with ADHD-I, but

Review of cognitive tests for ADHD 65
with teacher’ and parents’ ratings of hyperactivity and restlessness below the mean to a group
referred to as “ADD.” It sometimes remained unclear to what extent the different results are due
to differences in the subclassification of participants with ADHD or due to differences in the task
specifics.
Future studies should consider which cognitive characteristics best distinguish ADHD
from frequently co-occurring comorbid diagnoses such as autism spectrum disorder (ASD). For
instance, the studies we reviewed that used the Navon task or the Attentional blink task
suggested that individuals with ADHD-I are characterized by a detail-oriented, local processing
mode (Fink et al., 1996; Song & Hakoda, 2012; Yeo et al., 2003). On the other hand, ASD is
defined by restricted and repetitive behavior which also includes a detail-oriented processing
mode, among other modes (APA, 2013; Levy, Mandell, & Schultz, 2009). This raises the
question as to where to place individuals with ADHD-I on the broad spectrum of ASD. To date,
it is unclear what the determining difference is between individuals with ADHD-I, high-
functioning ASD, or both. In contrast, an ADHD group characterized by high severity of
hyperactivity and distractibility may accommodate a more global-oriented processing mode. For
that ADHD group it may be that the level of processing mode (local vs. global) is what
distinguishes them from ADHD-I and/or ASD. To account for the heterogeneity in ADHD, a set
of multiple cognitive tasks seems most promising.
Conclusion
Sequential sampling models are promising tools to characterize ADHD endophenotypes.
However, it will be necessary for the field to show that the results of modeling provide insights
beyond those provided by purely experimental approaches. Further research is needed to show
that a set of sequential sampling model parameters (e.g., drift rates, nondecision time

Review of cognitive tests for ADHD 66
components) can serve as an endophenotype, allowing identification of homogenous subtypes of
ADHD.
We focused on three frequently applied computational models (DDM, AAM, EGDM)
across six test domains of clinical cognitive testing. There are other test domains that we did not
discuss such as reinforcement learning for which also other computational models have been
used. Moreover, our qualitative meta-analysis focused on studies that investigated differences
between participants with and without ADHD, or between participants with different ADHD
endophenotypes. However, for the design of effective treatments for different ADHD
endophenotypes (i.e., drug interventions, cognitive-behavioral therapies), it will also be
important to understand how such clinical interventions affect different cognitive components
(e.g., treatment interventions that used computational models).
Our review is specific to (neuro)cognitive testing for ADHD. However, many issues that
we have raised (see the summary in Table 10) generalize to neuropsychological testing and
model-based approaches in psychiatry. For instance, studies dedicated to measure a single
construct (e.g., deficits in working memory) differ in many ways (e.g., the task used, task
manipulations, participant groups) so that they cannot be directly compared. Perhaps some
standard conditions could be included to allow comparisons across tasks. Another issue
concerns the extent to which tasks indeed measure targeted cognitive concepts such as
"inhibition failures" or "processing speed." Importantly, there are usually no hypotheses about
how processing in a task connects to the concept being measured. For example, there is no one to
one correspondence between tasks and concepts because a single task is often used to measure
different cognitive concepts. This is also a problem for neurophysiological analyses. For
instance, rarely are theoretical, quantifiable reasons (beyond a simple verbal plausibility
Review of cognitive tests for ADHD 67
argument) provided that explain why cognitive concepts such as sustained attention could be
indexed by measures such as a frequency band or an ERP component.
Ultimately, even computational modeling, as it is currently used, has limitations. To use
these models (i.e., interpret their results), they need to fit the data. This is even more important
considering that for some tasks (e.g., conflict tasks), standard models have been shown to fail
and new models have been developed (so applications of standard models are invalid).
Moreover, enough data has to be collected in a task to allow measurement of the processing
components (parameters) to the degree needed for the analysis. These criticisms suggest
significant weaknesses in the neuropsychological approach to clinical issues. However, we view
these weaknesses as opportunities that will spur new high-quality research that will advance the
field.
<< insert Table 10 here >>
Review of cognitive tests for ADHD 68
References
Adams, Z. W., Derefinko, K. J., Milich, R., & Fillmore, M. T. (2008). Inhibitory functioning
across ADHD subtypes: recent findings, clinical implications, and future directions.
Developmental Disabilities Research Reviews, 14(4), 268-275.
https://doi.org/10.1002/ddrr.37
Adler, L. A., Reingold, L. S., Morrill, M. S., & Wilens, T. E. (2006). Combination
pharmacotherapy for adult ADHD. Current psychiatry reports, 8(5), 409-415.
https://doi.org/10.1007/s11920-006-0044-9
Alderson, R. M., Rapport, M. D., & Kofler, M. J. (2007). ADHD and behavioral inhibition: A
meta-analytic review of the stop-signal paradigm. Journal of Abnormal Child
Psychology, 35, 745–758. https://doi.org/10.1007/s10802-007-9131-6
Alloway, T. P., Gathercole, S. E., Adams, A. M., Willis, C., Eaglen, R., & Lamont, E. (2005).
Working memory and phonological awareness as predictors of progress towards early
learning goals at school entry. British Journal of Developmental Psychology, 23(3), 417-
426. https://doi.org/10.1348/026151005x26804
American Psychiatric Association. (2013). Diagnostic and statistical manual of mental disorders
(5th ed.). Arlington, VA: Author.
Arabzadeh, S., Amini, H., Tehrani-Doost, M., Sharifi, V., Noroozian, M., & Rahiminejad, F.
(2014). Correlation of neurological soft signs and neurocognitive performance in first
episode psychosis. Psychiatry Research, 220(1-2), 81–88.
doi:10.1016/j.psychres.2014.07.044
Avila, C., Cuenca, I., Félix, V., Parcet, M., & Miranda, A. (2004). Measuring impulsivity in
school-aged boys and examining its relationship with ADHD and ODD ratings. Journal
of Abnormal Child Psychology, 32, 295 –304. doi:10.1023/B:
JACP.0000026143.70832.4b.
Baddeley, A. (2012). Working memory: theories, models, and controversies. Annual review of
psychology, 63, 1-29. https://doi.org/10.1146/annurev-psych-120710-100422
Banich, M. T., Burgess, G. C., Depue, B. E., Ruzic, L., Bidwell, L. C., Hitt-Laustsen, S., ... &
Willcutt, E. G. (2009). The neural basis of sustained and transient attentional control in
young adults with ADHD. Neuropsychologia, 47(14), 3095-3104.
https://doi.org/10.1016/j.neuropsychologia.2009.07.005
Barkley, R. A. (1997a). Behavioral inhibition, sustained attention, and executive function:
Constructing a unified theory of ADHD. Psychological Bulletin, 121, 65-94.
https://doi.org/10.1037/0033-2909.121.1.65
Barkley, R. A. (1997b). ADHD and the nature of self-control. Guilford Press.
Barkley, R. A. (1998). Attention Deficit Hyperactivity Disorder. New York: The Guilford Press.
Barkley, R. A. (2013). A plea to rename sluggish cognitive tempo (SCT) as concentration deficit
disorder (CDD). The ADHD Report, 21(7), 1-4. https://doi.org/10.1521/adhd.2013.21.7.1
Review of cognitive tests for ADHD 69
Barkley, R. A. (2018). Barkley Sluggish Cognitive Tempo Scale--Children and Adolescents
(BSCTS-CA). Guilford Publications.
Barkley, R. A., Edwards, G., Laneri, M., Fletcher, K., & Metevia, L. (2001). Executive
functioning, temporal discounting, and sense of time in adolescents with attention deficit
hyperactivity disorder (ADHD) and oppositional defiant disorder (ODD). Journal of
Abnormal Child Psychology, 29, 541-556. doi:10.1023/a:1012233310098
Barkley, R. A., Koplowitz, S., Anderson, T., & McMurray, M. B. (1997). Sense of time in
children with ADHD: Effects of duration, distraction, and stimulant medication. Journal
of the International Neuropsychological Society, 3(4), 359-369.
https://doi.org/10.1017/s1355617797003597
Baytunca, M. B., Inci, S. B., Ipci, M., Kardas, B., Bolat, G. U., & Ercan, E. S. (2018). The
neurocognitive nature of children with ADHD comorbid sluggish cognitive tempo: Might
SCT be a disorder of vigilance?. Psychiatry research, 270, 967-973.
https://doi.org/10.1016/j.psychres.2018.03.038
Becker, S. P., Langberg, J. M., Evans, S. W., Girio-Herrera, E., & Vaughn, A. J. (2015).
Differentiating anxiety and depression in relation to the social functioning of young
adolescents with ADHD. Journal of Clinical Child & Adolescent Psychology, 44(6),
1015-1029. https://doi.org/10.1080/15374416.2014.930689
Becker, S. P., & Willcutt, E. G. (2018). Advancing the study of sluggish cognitive tempo via
DSM, RDoC, and hierarchical models of psychopathology. European Child &
Adolescent Psychiatry, 28(5), 603-613. https://doi.org/10.1007/s00787-018-1136-x
Ben Shalom, D., Ronel, Z., Faran, Y., Meiri, G., Gabis, L., & Kerns, K. A. (2017). A double
dissociation between inattentive and impulsive traits, on tasks of visual processing and
emotion regulation. Journal of attention disorders, 21(7), 543-553.
https://doi.org/10.1177/1087054713510351
Bhandary, A. N., Fernandez, F., Gregory, R. J., Tucker, P., & Masand, P. (1997).
Pharmacotherapy in adults with ADHD. Psychiatric Annals, 27(8), 545-555.
https://doi.org/10.3928/0048-5713-19970801-07
Birmaher, B., Axelson, D., Strober, M., Gill, M. K., Valeri, S., Chiappetta, L., ... & Keller, M.
(2006). Clinical course of children and adolescents with bipolar spectrum disorders.
Archives of general psychiatry, 63(2), 175-183. https://doi.org/10.1001/archpsyc.63.2.175
Bitsakou, P., Psychogiou, L., Thompson, M., & Sonuga-Barke, E. J. S. (2009). Delay Aversion
in Attention Deficit/Hyperactivity Disorder: An empirical investigation of the broader
phenotype. Neuropsychologia, 47(2), 446-456. doi:10.1016/j.neuropsychologia.
2008.09.015
Boonstra, A. M., Oosterlaan, J., Sergeant, J. A., & Buitelaar, J. K. (2005). Executive functioning
in adult ADHD: a meta-analytic review. Psychological medicine, 35(8), 1097-1108.
https://doi.org/10.1017/s003329170500499x
Booth, J., Carlson, C., & Tucker, D. (2007). Performance on a neurocognitive measure of
alerting differentiates ADHD combined and inattentive subtypes: A preliminary report.
Archives of Clinical Neuropsychology, 22(4), 423–432.
https://doi.org/10.1016/j.acn.2007.01.017
Review of cognitive tests for ADHD 70
Bresnahan, S. M., Anderson, J. W., & Barry, R. J. (1999). Age-related changes in quantitative
EEG in attention- deficit/hyperactivity disorder. Biological Psychiatry, 46(12), 1690–
1697. doi:10.1016/s0006-3223(99)00042-6
Bresnahan, S. M., & Barry, R. J. (2002). Specificity of quantitative EEG analysis in adults with
attention deficit hyperactivity disorder. Psychiatry Research, 112(2), 133–144.
doi:10.1016/s0165-1781(02)00190-7
Brown, S. D., & Heathcote, A. (2008). The simplest complete model of choice reaction time:
Linear ballistic accumulation. Cognitive Psychology, 57, 153–178.
doi:10.1016/j.cogpsych.2007.12.002
Buzy, W. M., Medoff, D. R., & Schweitzer, J. B. (2009). Intra-individual variability among
children with ADHD on a working memory task: an ex-Gaussian approach. Child
Neuropsychology, 15(5), 441-459. https://doi.org/10.1080/09297040802646991
Carr, L., Henderson, J., & Nigg, J. T. (2010). Cognitive control and attentional selection in
adolescents with ADHD versus ADD. Journal of Clinical Child & Adolescent
Psychology, 39(6), 726-740. https://doi.org/10.1080/15374416.2010.517168
Carlson, C. L., Lahey, B. B. & Neeper, R. (1986). Direct assessment of the cognitive correlates
of attention deficit disorders with and without hyperactivity. Journal of Psychopathology
and Behavioral Assessment, 8(1), 69-86. https://doi.org/10.1007/bf00960874
Carlson, C. L., & Mann, M. (2002). Sluggish cognitive tempo predicts a different pattern of
impairment in the attention deficit hyperactivity disorder, predominantly inattentive type.
Journal of Clinical Child and Adolescent Psychology, 31(1), 123-129.
https://doi.org/10.1207/s15374424jccp3101_14
Carson RC (1991). Dilemmas in the pathway of the DSM-IV. Journal of Abnormal Psychology
100(3), 302–307. https://doi.org/10.1037/0021-843x.100.3.302
Castellanos, F. X., Sonuga-Barke, E. J. S., Scheres, A., Di Martino, A., Hyde, C., & Walters, J.
R. (2005). Varieties of attention-deficit/hyperactivity disorder-related intra-individual
variability. Biological Psychiatry, 57(11), 1416–1423.
https://doi.org/10.1016/j.biopsych.2004.12.005
Caulfield, M. D., & Myers, C. E. (2018). Post-traumatic stress symptoms are associated with
better performance on a delayed match-to-position task. PeerJ, 6, e4701.
https://doi.org/10.7717/peerj.4701
Cepeda, N. J., Cepeda, M. L., & Kramer, A. F. (2000). Task switching and attention deficit
hyperactivity disorder. Journal of Abnormal Child Psychology, 28(3), 213–226.
https://doi.org/10.1023/a:1005143419092
Cepeda, N. J., Kramer, A. F., & Gonzalez de Sather, J. C. M. (2001). Changes in executive
control across the lifespan: Examination of task-switching performance. Developmental
Psychology, 37(5), 715–730. https://doi.org/10.1037/0012-1649.37.5.715
Chee, P., Logan, G., Schachar, R., Lindsay, P., & Wachsmuth, R. (1989). Effects of event rate
and display time on sustained attention in hyperactive, normal, and control children.
Journal of Abnormal Child Psychology, 17(4), 371–391. doi:10.1007/bf00915033

Review of cognitive tests for ADHD 71
Chun, M. M., & Potter, M. C. (1995). A two-stage model for multiple target detection in rapid
serial visual presentation. Journal of Experimental psychology: Human perception and
performance, 21(1), 109. https://doi.org/10.1037/0096-1523.21.1.109
Church, R. M., & Deluty, M. Z. (1977). Bisection of temporal intervals. Journal of Experimental
Psychology: Animal Behavior Processes, 3, 216–228. http://dx.doi.org/10.1037/0097-
7403.3.3.216
Clark LA, Watson D, Reynolds S (1995). Diagnosis and classification of psychopathology:
challenges to the current system and future directions. Annual Review of Psychology,
46(1), 121–153. https://doi.org/10.1146/annurev.ps.46.020195.001005
Clarke, A. R., Barry, R. J., McCarthy, R., & Selikowitz, M. (2001). EEG-defined subtypes of
children with attention-deficit/hyperactivity disorder. Clinical Neurophysiology,
112(11), 2098–2105. doi:10.1016/s1388-2457(01)00668-x
Coghill, D., Nigg, J., Rothenberger, A., Sonuga‐ Barke, E., & Tannock, R. (2005). Whither
causal models in the neuroscience of ADHD?. Developmental Science, 8(2), 105-114.
https://doi.org/10.1111/j.1467-7687.2005.00397.x
Coghill D, Sonuga-Barke EJ (2012). Annual research review: categories versus dimensions in
the classification and conceptualisation of child and adolescent mental disorders –
implications of recent empirical study. Journal of Child Psychology and Psychiatry, and
Allied Disciplines, 53(5), 469–489. https://doi.org/10.1111/j.1469-7610.2011.02511.x
Cohen, M. R., & Kohn, A. (2011). Measuring and interpreting neuronal correlations. Nature
neuroscience, 14(7), 811-819. https://doi.org/10.1038/nn.2842
Cohen, J. D., Perlstein, W. M., Braver, T. S., Nystrom, L. E., Noll, D. C., Jonides, J., & Smith, E.
E. (1997). Temporal dynamics of brain activation during a working memory task. Nature,
386(6625), 604–608. doi:10.1038/386604a0
Collings, R. D. (2003). Differences between ADHD inattentive and combined types on the CPT.
Journal of Psychopathology and Behavioral Assessment, 25(3), 177-189.
https://doi.org/10.1023/a:1023525007441
Conners, C. K. (1994). The Conners’ Continuous Performance Test. Multi-Health Systems. Inc.,
Toronto, Canada.
Conners, C. K. (2002). Conners’ continuous performance test (CPTII). Technical guide and
software manual. North Tonawanda, NY: Multi Health Systems.
Conners, K. C. (2008). Conners 3rd edition manual. New York: Multi-Health Systems, Inc.
Corkum, P. V., & Siegel, L. S. (1993). Is the continuous performance task a valuable research
tool for use with children with attention-deficit hyperactivity disorder? Journal of Child
Psychology and Psychiatry, 34(7), 1217–1239. https://doi.org/10.1111/j.1469-
7610.1993.tb01784.x
Cornoldi, C., Marzocchi, G. M., Belotti, M., Caroli, M. G., Meo, T., & Braga, C. (2001).
Working memory interference control deficit in children referred by teachers for ADHD
symptoms. Child Neuropsychology, 7(4), 230-240.
https://doi.org/10.1076/chin.7.4.230.8735
Review of cognitive tests for ADHD 72
Crone, E. A., Richard Jennings, J., & Van Der Molen, M. W. (2003). Sensitivity to interference
and response contingencies in attention‐ deficit/hyperactivity disorder. Journal of Child
Psychology and Psychiatry, 44(2), 214-226. https://doi.org/10.1111/1469-7610.00115
Crosbie, J., Arnold, P., Paterson, A., Swanson, J., Dupuis, A., Li, X., . . . Strug, L. (2013).
Response inhibition and ADHD traits: Correlates and heritability in a community sample.
Journal of Abnormal Child Psychology, 41(3), 497–507. https://doi.org/10.1007/s10802-
012-9693-9
Davis, R. (1957). The Human Operator as a Single Channel Information System. Quarterly
Journal of Experimental Psychology, 9(3), 119–129. doi:10.1080/17470215708416232
De La Fuente, A., Xia, S., Branch, C., & Li, X. (2013). A review of attention-deficit/
hyperactivity disorder from the perspective of brain networks. Frontiers in Human
Neuroscience, 7, 192. http://dx.doi.org/10.3389/fnhum.2013.00192
Desimone, R., & Duncan, J. (1995). Neural mechanisms of selective visual attention. Annual
review of neuroscience, 18(1), 193-222. https://doi.org/10.1146/annurev.ne.
18.030195.001205
Douglas, V. I. (1999). Cognitive control processes in attention-deficit/hyperactivity disorder. In
H. C. Quay & A. E. Hogan (Eds.), Handbook of disruptive behavior disorders (Vol. xiii,
pp. 105–138). Dordrecht, Netherlands: Kluwer Academic Publishers.
https://doi.org/10.1007/978-1-4615-4881-2_5
Donkin, C., & Brown, S. D. (2018). Response times and decision making. In T. Wixted &
E.-J. Wagenmakers (Eds.), The stevens’ handbook of experimental psychology and
cognitive neuroscience (4th ed., Vol. 5). New York: John Wiley & Sons, Inc.
Donkin, C., Brown, S., Heathcote, A., & Wagenmakers, E.-J. (2010). Diffusion versus linear
ballistic accumulation: different models but the same conclusions about psychological
processes? Psychonomic Bulletin & Review, 18(1), 61–69. doi:10.3758/s13423-010-
0022-4
Doyle, A. E., Biederman, J., Seidman, L. J., Weber, W., & Faraone, S. V. (2000). Diagnostic
efficiency of neuropsychological test scores for discriminating boys with and without
attention deficit-hyperactivity disorder. Journal of Consulting and Clinical Psychology,
68, 477–488. http://dx.doi.org/10.1037/0022-006X.68.3.477
Duncan, J., Ward, R., & Shapiro, K. (1994). Direct measurement of attentional dwell time in
human vision. Nature, 369(6478), 313-315. https://doi.org/10.1038/369313a0
Durston, S., Tottenham, N. T., Thomas, K. M., Davidson, M. C., Eigsti, I. M., Yang, Y., ... &
Casey, B. J. (2003). Differential patterns of striatal activation in young children with and
without ADHD. Biological psychiatry, 53(10), 871-878. https://doi.org/10.1016/s0006-
3223(02)01904-2
Edwards, M. C., Gardner, E. S., Chelonis, J. J., Schulz, E. G., Flake, R. A., & Diaz, P. F. (2007).
Estimates of the Validity and Utility of the Conners’ Continuous Performance Test in the
Assessment of Inattentive and/or Hyperactive-Impulsive Behaviors in Children. Journal
of Abnormal Child Psychology, 35(3), 393–404. doi:10.1007/s10802-007-9098-3
Review of cognitive tests for ADHD 73
Egeland, J. & Kowalik‐ Gran, I. (2008). Measuring several aspects of attention in one test: The
factorstructure of Conners’ CPT. Journal of Attention Disorders. doi:
1087054708323019v1.
Engel, A.K., Fries, P., 2010. Beta-band oscillations – signalling the status quo? Current Opinion
Neurobiology, 20(2), 156-165. https://doi.org/10.1016/j.conb.2010.02.015
Epstein, J. N., Conners, C. K., Sitarenios, G., & Erhardt, D. (1998). Continuous Performance
Test Results of Adults with Attention Deficit Hyperactivity Disorder. The Clinical
Neuropsychologist, 12(2), 155–168. doi:10.1076/clin.12.2.155.2000
Epstein, J. N., Erkanli, A., Conners, C. K., Klaric, J., Costello, J. E., & Angold, A. (2003).
Relations between continuous performance test performance measures and ADHD
behaviors. Journal of Abnormal Child Psychology, 31(5), 543–554.
doi:10.1023/a:1025405216339
Epstein, J. N., Langberg, J. M., Rosen, P. J., Graham, A., Narad, M. E., Antonini, T. N., ... &
Altaye, M. (2011). Evidence for higher reaction time variability for children with ADHD
on a range of cognitive tasks including reward and event rate manipulations.
Neuropsychology, 25(4), 427-441. https://doi.org/10.1037/a0022155
Eriksen, B. A., & Eriksen, C. W. (1974). Effects of noise letters upon the identification of a
target letter in a nonsearch task. Perception & psychophysics, 16(1), 143-149.
https://doi.org/10.3758/bf03203267
Fair, D., Nigg, J. T., Iyer, S., Bathula, D., Mills, K. L., Dosenbach, N. U., ... & Buitelaar, J. K.
(2013). Distinct neural signatures detected for ADHD subtypes after controlling for
micro-movements in resting state functional connectivity MRI data. Frontiers in systems
neuroscience, 6, 80. https://doi.org/10.3389/fnsys.2012.00080
Fan, J., McCandliss, B.D., Fossella, J., Flombaum, J.I., & Posner, M.I. (2005). The activation of
attentional networks. Neuroimage, 26(2), 471–479.
https://doi.org/10.1016/j.neuroimage.2005.02.004
Fan, J., McCandliss, B.D., Sommer, T., Raz, A., & Posner, M.I. (2002). Testing the efficiency
and independence of attentional networks. Journal of Cognitive Neuroscience, 14(3),
340–347. https://doi.org/10.1162/089892902317361886
Fink, G. R., Halligan, P. W., Marshall, J. C., Frith, C. D., Frackowiak, R. S. J., & Dolan, R. J.
(1996). Where in the brain does visual attention select the forest and the trees?. Nature,
382(6592), 626-628. https://doi.org/10.1038/382626a0
Folstein, J. R., & Van Petten, C. (2008). Influence of cognitive control and mismatch on the N2
component of the ERP: a review. Psychophysiology, 45(1), 152-170.
https://doi.org/10.1111/j.1469-8986.2007.00602.x
Forns, J., Esnaola, M., López-Vicente, M., Suades-González, E., Alvarez-Pedrerol, M., Julvez,
J., ... & Sunyer, J. (2014). The n-back Test and the Attentional Network Task as measures
of child neuropsychological development in epidemiological studies. Neuropsychology,
28(4), 519-529. https://doi.org/10.1037/neu0000085
Fosco, W. D., Kofler, M. J., Alderson, R. M., Tarle, S. J., Raiker, J. S., & Sarver, D. E. (2018).
Inhibitory Control and Information Processing in ADHD: Comparing the Dual Task and
Review of cognitive tests for ADHD 74
Performance Adjustment Hypotheses. Journal of abnormal child psychology, 1-14.
https://doi.org/10.1007/s10802-018-0504-9
Forster, S., Robertson, D. J., Jennings, A., Asherson, P., & Lavie, N. (2014). Plugging the
attention deficit: Perceptual load counters increased distraction in ADHD.
Neuropsychology, 28(1), 91-97. https://doi.org/10.1037/neu0000020
Forstmann, B. U., Ratcliff, R., & Wagenmakers, E. J. (2016). Sequential sampling models in
cognitive neuroscience: Advantages, applications, and extensions. Annual review of
psychology, 67(1), 641-666. https://doi.org/10.1146/annurev-psych-122414-033645
Friedman-Hill, S. R., Wagman, M. R., Gex, S. E., Pine, D. S., Leibenluft, E., & Ungerleider, L.
G. (2010). What does distractibility in ADHD reveal about mechanisms for top-down
attentional control?. Cognition, 115(1), 93-103. https://doi.org/10.1016/j.cognition.2009
.11.013
Gajewski, P. D., Ferdinand, N. K., Kray, J., & Falkenstein, M. (2018). Understanding sources of
adult age differences in task switching: Evidence from behavioral and ERP studies.
Neuroscience & Biobehavioral Reviews, 92, 255-275.
https://doi.org/10.1016/j.neubiorev.2018.05.029
Garner, A. A., Marceaux, J. C., Mrug, S., Patterson, C., & Hodgens, B. (2010). Dimensions and
correlates of attention deficit/hyperactivity disorder and sluggish cognitive tempo.
Journal of Abnormal Child Psychology, 38(8), 1097-1107.
https://doi.org/10.1007/s10802-010-9436-8
Gerlach, C., & Poirel, N. (2018). Navon’s classical paradigm concerning local and global
processing relates systematically to visual object classification performance. Scientific
reports, 8(1), 324. https://doi.org/10.1038/s41598-017-18664-5
Gilliam, J.E.(1995). Attention-Deficit Hyperactivity Disorder Test: A Method for
Identifying Individuals with ADHD: Examiner’s Manual. Austin, TX: Pro-Ed.
Ging-Jehli, N. R., & Ratcliff, R (2020). Effects of aging in a task-switch paradigm with the
diffusion decision model. Psychology and aging. https://doi.org/10.1037/pag0000562
Gohil, K., Bluschke, A., Roessner, V., Stock, A. K., & Beste, C. (2017). ADHD patients fail to
maintain task goals in face of subliminally and consciously induced cognitive
conflicts. Psychological medicine, 47(10), 1771-1783.
https://doi.org/10.1017/s0033291717000216
Gold, J. I., & Shadlen, M. N. (2007). The neural basis of decision making. Annu. Rev. Neurosci.,
30(1), 535-574. https://doi.org/10.1146/annurev.neuro.29.051605.113038
Gold, J. I., & Shadlen, M. N. (2001). Neural computations that underlie decisions about sensory
stimuli. Trends in cognitive sciences, 5(1), 10-16. https://doi.org/10.1016/s1364-
6613(00)01567-9
Goldstein, F. C. & Green, R. C. (1995). Assessment of Problem Solving and Executive
Functions. Clinical Neuropsychological Assessment, 49-81. https://doi.org/10.1007/978-
1-4757-9709-1_3

Review of cognitive tests for ADHD 75
Gomez, P., Ratcliff, R., & Perea, M. (2007). A model of the go/no-go task. Journal of
Experimental Psychology: General, 136(3), 389-413. https://doi.org/10.1037/0096-
3445.136.3.389
Gordon, M. (1986). Instruction manual for the Gordon diagnostic system. DeWitt, NY: Gordon
Diagnostic Systems.
Goth-Owens, T. L., Martinez-Torteya, C., Martel, M. M., & Nigg, J. T. (2010). Processing speed
weakness in children and adolescents with non-hyperactive but inattentive ADHD
(ADD). Child Neuropsychology, 16(6), 577-591.
https://doi.org/10.1080/09297049.2010.485126
Green, L., & Myerson, J. (2004). A Discounting Framework for Choice With Delayed and
Probabilistic Rewards. Psychological Bulletin, 130(5), 769–792.
http://doi.org/10.1037/0033-2909.130.5.769
Greenberg, L. M. (1987). An objective measure of methylphenidate response: clinical use of the
MCA. Psychopharmacology Bulletin, 23(2), 279.
Greenberg, L. M., & Waldmant, I. D. (1993). Developmental normative data on the Test of
Variables of Attention (TOVA™). Journal of Child Psychology and Psychiatry, 34(6),
1019-1030. https://doi.org/10.1111/j.1469-7610.1993.tb01105.x
Groom, M. J., Scerif, G., Liddle, P. F., Batty, M. J., Liddle, E. B., Roberts, K. L., … Hollis, C.
(2010). Effects of Motivation and Medication on Electrophysiological Markers of
Response Inhibition in Children with Attention-Deficit/Hyperactivity Disorder.
Biological Psychiatry, 67(7), 624–631. doi:10.1016/j.biopsych.2009.09.029
Gualtieri, C. T., & Johnson, L. G. (2008). A Computerized Test Battery Sensitive to Mild and
Severe Brain Injury. Medscape J Med, 10(4), 90.
Gualtieri, C. T., & Johnson, L. G. (2006). Reliability and validity of a computerized
neurocognitive test battery, CNS Vital Signs. Archives of Clinical Neuropsychology,
21(7), 623-643. https://doi.org/10.1016/j.acn.2006.05.007
Hajcak, G., Weinberg, A., MacNamara, A., & Foti, D. (2012). ERPs and the study of emotion. In
S. J. Luck, & E. S. Kappenman (Eds.), Oxford handbook of event-related potential
components (pp. 441e472). New York: Oxford University Press, Inc.
Halperin, J. M., Matier, K., Bedi, G., Sharma, V., & Newcorn, J. H. (1992). Specificity of
Inattention, Impulsivity, and Hyperactivity to the Diagnosis of Attention-deficit
Hyperactivity Disorder. Journal of the American Academy of Child & Adolescent
Psychiatry, 31(2), 190–196. doi:10.1097/00004583-199203000-00002
Hanes, D. P., & Schall, J. D. (1996). Neural control of voluntary movement initiation. Science,
274(5286), 427-430. https://doi.org/10.1126/science.274.5286.427
Harvey, P.-O., Fossati, P., Pochon, J.-B., Levy, R., LeBastard, G., Lehéricy, S., … Dubois, B.
(2005). Cognitive control and brain resources in major depression: An fMRI study using
the n-back task. NeuroImage, 26(3), 860–869. doi:10.1016/j.neuroimage.2005.02.048
Hasson, R., & Fine, J. G. (2012). Gender differences among children with ADHD on continuous
performance tests: a meta-analytic review. Journal of attention disorders, 16(3), 190-198.
https://doi.org/10.1177/1087054711427398
Review of cognitive tests for ADHD 76
Happé, F., & Frith, U. (2006). The weak coherence account: detail-focused cognitive style in
autism spectrum disorders. Journal of autism and developmental disorders, 36(1), 5-25.
https://doi.org/10.1007/s10803-005-0039-0
Hasher, L., Lustig, C., and Zacks, R. (2007). “Inhibitory mechanisms and the control of
attention,” in Variation in Working Memory, eds A. Conway, C. Jarrold, M. Kane, A.
Miyake, and J. Towse (NewYork, NY: Oxford University Press),227–249.
https://doi.org/10.1093/acprof:oso/9780195168648.003.0009
Hasher, L., Zacks, R.T., and May, C.P. (1999). “Inhibitory control, circadian arousal, and age,”
in Attention and Performance XVII. Cognitive Regulation of Performance: Interaction of
Theory and Application, eds D. Gopher and A. Koriat (Cambridge, MA: MITPress), 653–
675.
Hasler, R., Perroud, N., Meziane, H. B., Herrmann, F., Prada, P., Giannakopoulos, P., & Deiber,
M. P. (2016). Attention-related EEG markers in adult ADHD. Neuropsychologia, 87,
120-133. https://doi.org/10.1016/j.neuropsychologia.2016.05.008
Heathcoate, A., Popiel, S. J., & Mewhort, D. J. K. (1991). Analysis of response time
distributions: An example using the Stroop task. Psychological Bulletin, 109(2), 340-347.
https://doi.org/10.1037/0033-2909.109.2.340
Heil, M., Osman, A., Wiegelmann, J., Rolke, B., & Hennighausen, E. (2000). N200 in the
Eriksen-task: Inhibitory executive process?. Journal of Psychophysiology, 14(4), 218-
225. https://doi.org/10.1027//0269-8803.14.4.218
Helton, W. S. (2009). Impulsive responding and the sustained attention to response task. Journal
of Clinical and Experimental Neuropsychology, 31(1), 39-47.
https://doi.org/10.1080/13803390801978856
Henríquez-Henríquez, M. P., Billeke, P., Henríquez, H., Zamorano, F. J., Rothhammer, F., &
Aboitiz, F. (2015). Intra-individual response variability assessed by ex-Gaussian analysis
may be a new endophenotype for attention-deficit/hyperactivity disorder. Frontiers in
psychiatry, 5, 197. https://doi.org/10.3389/fpsyt.2014.00197
Herrmann, C. S., & Knight, R. T. (2001). Mechanisms of human attention: event-related
potentials and oscillations. Neuroscience & Biobehavioral Reviews, 25(6), 465-476.
https://doi.org/10.1016/s0149-7634(01)00027-6
Hervey, A. S., Epstein, J. N., Curry, J. F., Tonev, S., Eugene Arnold, L., Keith Conners, C., ... &
Hechtman, L. (2006). Reaction time distribution analysis of neuropsychological
performance in an ADHD sample. Child Neuropsychology, 12(2), 125-140.
https://doi.org/10.1080/09297040500499081
Hilton, D. C., Jarrett, M. A., McDonald, K. L., & Ollendick, T. H. (2017). Attention problems as
a mediator of the relation between executive function and social problems in a child and
adolescent outpatient sample. Journal of Abnormal Child Psychology, 45, 777–788.
http://dx.doi.org/10.1007/s10802-016-0200-6.
Hockley, W. E. (1982). Retrieval processes in continuous recognition. Journal of Experimental
Psychology: Learning, Memory, and Cognition, 8(6), 497-512.
https://doi.org/10.1037/0278-7393.8.6.497

Review of cognitive tests for ADHD 77
Hockley, W. E. (1984). Analysis of response time distributions in the study of cognitive
processes. Journal of Experimental Psychology: Learning, Memory, and Cognition,
10(4), 598-615. https://doi.org/10.1037/0278-7393.10.4.598
Hohle, R. H. (1965). Inferred components of reaction times as a function of foreperiod duration.
Journal of Experimental Psychology, 69(4), 382-386. https://doi.org/10.1037/h0021740
Hommel, B., Kessler, K., Schmitz, F., Gross, J., Akyürek, E., Shapiro, K., & Schnitzler, A.
(2006). How the brain blinks: Towards a neurocognitive model of the attentional blink.
Psychological research, 70(6), 425-435. https://doi.org/10.1007/s00426-005-0009-3
Huang-Pollock, C. L., Karalunas, S. L., Tam, H., & Moore, A. N. (2012). Evaluating vigilance
deficits in ADHD: A meta-analysis of CPT performance. Journal of abnormal
psychology, 121(2), 360-371. https://doi.org/10.1037/a0027205
Huang-Pollock, C. L., Mikami, A. Y., Pfiffner, L., & McBurnett, K. (2009). Can executive
functions explain relation between ADHD and social adjustment? Journal of Abnormal
Child Psychology, 37, 679–691. http://dx.doi.org/10.1007/s10802-009-9302-8
Huang-Pollock, C. L., Nigg, J. T., & Halperin, J. M. (2006). Single dissociation findings of
ADHD deficits in vigilance but not anterior or posterior attention systems.
Neuropsychology, 20(4), 420-429. https://doi.org/10.1037/0894-4105.20.4.420
Huang-Pollock, C., Ratcliff, R., McKoon, G., Roule, A., Warner, T., Feldman, J., & Wise, S.
(2020). A diffusion model analysis of sustained attention in children with attention deficit
hyperactivity disorder. Neuropsychology. doi:10.1037/neu0000636
Huang-Pollock, C., Ratcliff, R., McKoon, G., Shapiro, Z., Weigard, A., & Galloway-Long, H.
(2017). Using the diffusion model to explain cognitive deficits in attention deficit
hyperactivity disorder. Journal of abnormal child psychology, 45(1), 57-68.
https://doi.org/10.1007/s10802-016-0151-y
Huang-Pollock, C., Shapiro, Z., Galloway-Long, H., & Weigard, A. (2017). Is poor working
memory a transdiagnostic risk factor for psychopathology?. Journal of abnormal child
psychology, 45(8), 1477-1490. https://doi.org/10.1007/s10802-016-0219-8
Hughes, M. E., Fulham, W. R., Johnston, P. J., & Michie, P. T. (2012). Stop-signal response
inhibition in schizophrenia: Behavioural, event-related potential and functional
neuroimaging data. Biological Psychology, 89(1), 220–231.
doi:10.1016/j.biopsycho.2011.10.013
Hübner, R., Steinhauser, M., & Lehle, C. (2010). A dual-stage two-phase model of selective
attention. Psychological Review, 117(3), 759–784. doi:10.1037/a0019471
Hung, C. L., Huang, C. J., Tsai, Y. J., Chang, Y. K., & Hung, T. M. (2016). Neuroelectric and
behavioral effects of acute exercise on task switching in children with attention-
deficit/hyperactivity disorder. Frontiers in psychology, 7, 1589.
https://doi.org/10.3389/fpsyg.2016.01589
Hwang-Gu, S. L., Chen, Y. C., Liang, S. H. Y., Ni, H. C., Lin, H. Y., Lin, C. F., & Gau, S. S. F.
(2019). Exploring the Variability in Reaction Times of Preschoolers at Risk of Attention-
Deficit/Hyperactivity Disorder: an ex-Gaussian Analysis. Journal of abnormal child
psychology, 1-12. https://doi.org/10.1007/s10802-018-00508-z

Review of cognitive tests for ADHD 78
Irlbacher, K., Kraft, A., Kehrer, S. & Brandt, S. A. (2014). Mechanisms and neuronal networks
involved in reactive and proactive cognitive control of interference in working memory.
Neuroscience & Biobehavioral Reviews, 46(1), 58-70.
https://doi.org/10.1016/j.neubiorev.2014.06.014
Jaeggi, S. M., Buschkuehl, M., Perrig, W. J. & Meier, B. (2010). The concurrent validity of the
N-back task as a working memory measure. Memory, 18(4), 394-412.
https://doi.org/10.1080/09658211003702171
Jensen, P. S., Hinshaw, S. P., Kraemer, H. C., Lenora, N., Newcorn, J. H., Abikoff, H. B., ... &
Elliott, G. R. (2001). ADHD comorbidity findings from the MTA study: comparing
comorbid subgroups. Journal of the American Academy of Child & Adolescent Psychiatry,
40(2), 147-158. doi:10.1097/00004583-200102000-00009
Johnson, K. A., Robertson, I. H., Barry, E., Mulligan, A., Dáibhis, A., Daly, M., ... & Bellgrove,
M. A. (2008). Impaired conflict resolution and alerting in children with ADHD: evidence
from the Attention Network Task (ANT). Journal of Child Psychology and Psychiatry,
49(12), 1339-1347. https://doi.org/10.1111/j.1469-7610.2008.01936.x
Johnstone, S. J., Barry, R. J., & Clarke, A. R. (2007). Behavioural and ERP indices of response
inhibition during a Stop-signal task in children with two subtypes of Attention-Deficit
Hyperactivity Disorder. International Journal of Psychophysiology, 66(1), 37–47.
doi:10.1016/j.ijpsycho.2007.05.011
Jonkman, L., Kemmer, C, Verbaten, M., Van Engeland, H., Kenemans, J., Camfferman, G.,
Buitelaar, J., & Koelga, H. (1999). Perceptual and response interference in children with
attention-deficit hyperactivity disorder and the effects of methylphenidate.
Psychophysiology, 36(4), 419-429. https://doi.org/10.1111/1469-8986.3640419
Kalanthroff, E., Naparstek, S., & Henik, A. (2013). Spatial processing in adults with attention
deficit hyperactivity disorder. Neuropsychology, 27(5), 546-555.
https://doi.org/10.1037/a0033655
Kantowitz, B. H. (1974). Double stimulation. In B. H. Kantowitz (Ed.), Human information
processing: Tutorials in performance and cognition (pp. 83-131). Hillsdale, N J: Erlbaum.
Karalunas, S. L., Huang-Pollock, C. L., & Nigg, J. T. (2012). Decomposing attention-
deficit/hyperactivity disorder (ADHD)-related effects in response speed and variability.
Neuropsychology, 26(6), 684-694. https://doi.org/10.1037/a0029936
Kastner, S., & Ungerleider, L. G. (2001). The neural basis of biased competition in human visual
cortex. Neuropsychologia, 39(12), 1263-1276. https://doi.org/10.1016/s0028-
3932(01)00116-6
Kawabe, K., Horiuchi, F., Kondo, S., Matsumoto, M., Seo, K., Oka, Y., & Ueno, S. I. (2018).
Neurocognitive assessment of children with neurodevelopmental disorders: Preliminary
findings. Pediatrics International, 60(9), 820-827. https://doi.org/10.1111/ped.13662
Killeen, P. R. (2019). Models of Attention-Deficit Hyperactivity Disorder. Behavioural
processes, 162, 205-214. https://doi.org/10.1016/j.beproc.2019.01.001
Kimchi, R. (1992). Primacy of wholistic processing and global/local paradigm: a critical review.
Psychological bulletin, 112(1), 24-38. https://doi.org/10.1037/0033-2909.112.1.24
Review of cognitive tests for ADHD 79
Kingery, K. M. (2013). Investigating Neuropsychological, Academic, and Behavioral Correlates
of Sluggish Cognitive Tempo in ADHD (Doctoral dissertation, University of Cincinnati).
Kingery, K. M. (2017). Brain Activity During Periods of Longer Reaction Times: Event-Related
Potential Comparisons of Children With and Without ADHD (Doctoral dissertation,
University of Cincinnati).
Klee, S. H., & Garfinkel, B. D. (1983). The computerized continuous performance task: A new
measure of inattention. Journal of Abnormal Child Psychology, 11(4), 487–495.
doi:10.1007/bf00917077
Klein, C., Wendling, K., Huettner, P., Ruder, H., & Peper, M. (2006). Intra-participant variability
in attention-deficit hyperactivity disorder. Biological Psychiatry, 60(10), 1088–1097.
https://doi.org/10.1016/j.biopsych.2006.04.003
Klimesch, W., Sauseng, P., & Hanslmayr, S. (2007). EEG alpha oscillations: The inhibition–
timing hypothesis. Brain Research Reviews, 53(1), 63–88.
doi:10.1016/j.brainresrev.2006.06.003
Koelega, H. S. (1995). Is the Continuous Performance Task Useful in Research with ADHD
Children? Comments on a Review. Journal of Child Psychology and Psychiatry, 36(8),
1477–1485. doi:10.1111/j.1469-7610.1995.tb01677.x
Kofler, M. J., Harmon, S. L., Aduen, P. A., Day, T. N., Austin, K. E., Spiegel, J. A., ... & Sarver,
D. E. (2018). Neurocognitive and behavioral predictors of social problems in ADHD: A
Bayesian framework. Neuropsychology, 32(3), 344-355.
https://doi.org/10.1037/neu0000416
Kofler, M. J., Irwin, L. N., Soto, E. F., Groves, N. B., Harmon, S. L., & Sarver, D. E. (2019).
Executive functioning heterogeneity in pediatric ADHD. Journal of Abnormal Child
Psychology, 47(2), 273–286. https://doi.org/10.1007/s10802-018-0438-2.
Kofler, M.J., Rapport, M.D., Sarver, D.E., Raiker, J.S., Orban, S.A., Friedman, L.M. &
Kolomeyer, E.G. (2013). Reaction time variability in ADHD: A meta-analytic review of
319 studies. Clinical Psychology Review, 33(6),795-811.
https://doi.org/10.1016/j.cpr.2013.06.001
Kofler, M. J., Sarver, D. E., Spiegel, J. A., Day, T. N., Harmon, S. L., & Wells, E. L. (2017).
Heterogeneity in ADHD: Neurocognitive predictors of peer, family, and academic
functioning. Child Neuropsychology, 23(6), 733-759.
https://doi.org/10.1080/09297049.2016.1205010
Konrad, K., & Eickhoff, S. B. (2010). Is the ADHD brain wired differently? A review on
structural and functional connectivity in attention deficit hyperactivity disorder. Human
Brain Mapping, 31, 904–916. http://dx.doi.org/10.1002/hbm.21058
Konrad, K., Neufang, S., Hanisch, C., Fink, G. R., & Herpertz-Dahlmann, B. (2006).
Dysfunctional attentional networks in children with attention deficit/hyperactivity
disorder: evidence from an event-related functional magnetic resonance imaging study.
Biological psychiatry, 59(7), 643-651. https://doi.org/10.1016/j.biopsych.2005.08.013
Review of cognitive tests for ADHD 80
Kopp, B., Mattler, U., & Rist, F. (1994). Selective attention and response competition in
schizophrenic patients. Psychiatry research, 53(2), 129-139.
https://doi.org/10.1016/0165-1781(94)90104-x
Kopp, B., Rist, F., &Mattler, U. (1996). N200 in the flanker task as a neurobehavioral tool for
investigating executive control. Psychophysiology, 33(3), 282–294.
https://doi.org/10.1111/j.1469-8986.1996.tb00425.x
Kramer, A. F., Cepeda, N. J., & Cepeda, M. L. (2001). Methylphenidate effects on task-
switching performance in attention-deficit/hyperactivity disorder. Journal of the
American Academy of Child & Adolescent Psychiatry, 40(11), 1277-1284.
https://doi.org/10.1097/00004583-200111000-00007
Kuntsi, J. & Stevenson, J. (2001). Psychological Mechanisms in Hyperactivity: II The Role of
Genetic Factors. The Journal of Child Psychology and Psychiatry, 42(2), 211-219.
https://doi.org/10.1111/1469-7610.00712
Larsson H, Anckarsater H, Rastam M, Chang Z, Lichtenstein P (2012). Childhood attention-
deficit hyperactivity disorder as an extreme of a continuous trait: a quantitative genetic
study of 8,500 twin pairs. Journal of Child Psychology and Psychiatry, and Allied
Disciplines, 53(1), 73–80. https://doi.org/10.1111/j.1469-7610.2011.02467.x
Larson, M. J., Clayson, P. E., & Clawson, A. (2014). Making sense of all the conflict: a
theoretical review and critique of conflict-related ERPs. International Journal of
Psychophysiology, 93(3), 283-297. https://doi.org/10.1016/j.ijpsycho.2014.06.007
Lavie, N., & De Fockert, J. W. (2003). Contrasting effects of sensory limits and capacity limits
in visual selective attention. Perception & Psychophysics, 65(2), 202-212.
https://doi.org/10.3758/bf03194795
Lee, R. W., Jacobson, L. A., Pritchard, A. E., Ryan, M. S., Yu, Q., Denckla, M. B., ... &
Mahone, E. M. (2015). Jitter reduces response-time variability in ADHD: An ex-
Gaussian analysis. Journal of attention disorders, 19(9), 794-804.
https://doi.org/10.1177/1087054712464269
Lenartowicz, A., Delorme, A., Walshaw, P. D., Cho, A. L., Bilder, R. M., McGough, J. J., ... &
Loo, S. K. (2014). Electroencephalography correlates of spatial working memory deficits
in attention-deficit/hyperactivity disorder: vigilance, encoding, and maintenance. Journal
of Neuroscience, 34(4), 1171-1182. https://doi.org/10.1523/jneurosci.1765-13.2014
Leppma, M., Long, D., Smith, M., & Lassiter, C. (2017). Detecting Symptom Exaggeration in
College Students Seeking ADHD Treatment: Performance Validity Assessment Using
the NV-MSVT and IVA-Plus. Applied Neuropsychology: Adult, 25(3), 210–218.
doi:10.1080/23279095.2016.1277723
Leth-Steensen, C., Elbaz, Z. K., & Douglas, V. I. (2000). Mean response times, variability and
skew in the responding of ADHD children: A response time distributional approach. Acta
Psychologica, 104, 167–190. https://doi.org/10.1016/S0001-6918(00)00019-6
Levy, F. (2009). Dopamine vs noradrenaline: inverted-U effects and ADHD theories. Australian
and New Zealand Journal of Psychiatry, 43(2), 101-108.
https://doi.org/10.1080/00048670802607238
Review of cognitive tests for ADHD 81
Levy, S. E., Mandell, D. S., & Schultz, R. T. (2009). Autism. The Lancet, 374(9701), 1627–
1638. doi:10.1016/s0140-6736(09)61376-3
Libera, C. D., & Chelazzi, L. (2006). Visual selective attention and the effects of monetary
rewards. Psychological science, 17(3), 222-227. https://doi.org/10.1111/j.1467-
9280.2006.01689.x
Lipszyc, J., & Schachar, R. (2010). Inhibitory control and psychopathology: A meta-analysis of
studies using the stop signal task. Journal of the International Neuropsychological
Society, 16(6), 1064–1076. https://doi.org/10.1017/s1355617710000895
Logan, G. D., Cowan, W. B., & Davis, K. A. (1984). On the ability to inhibit simple and choice
reaction time responses: A model and a method. Journal of Experimental Psychology:
Human Perception and Performance, 10(2), 276–291. https://doi.org/10.1037/0096-
1523.10.2.276
Logan, G. D., Van Zandt, T., Verbruggen, F., & Wagenmakers, E.-J. (2014). On the ability to
inhibit thought and action: General and special theories of an act of control.
Psychological Review, 121(1), 66–95. https://doi.org/10.1037/a0035230
Loo, S. K., Hale, T. S., Macion, J., Hanada, G., McGough, J. J., McCracken, J. T., & Smalley, S.
L. (2009). Cortical activity patterns in ADHD during arousal, activation and sustained
attention. Neuropsychologia, 47(10), 2114–2119.
doi:10.1016/j.neuropsychologia.2009.04.013
Loo, S. K., Specter, E., Smolen, A., Hopfer, C., Teale, P. D., & Reite, M. L. (2003). Functional
Effects of the DAT1 Polymorphism on EEG Measures in ADHD. Journal of the
American Academy of Child & Adolescent Psychiatry, 42(8), 986–993.
doi:10.1097/01.chi.0000046890.27264.88
Losier, B. J., McGrath, P. J., & Klein, R. M. (1996). Error patterns on the continuous
performance test in non-medicated and medicated samples of children with and without
ADHD: A meta-analytic review. Journal of Child Psychology and Psychiatry, 37(8),
971–987. https://doi.org/10.1111/j.1469-7610.1996.tb01494.x
Lou, H. C., Henriksen, L., Bruhn, P., Børner, H., & Nielsen, J. B. (1989). Striatal dysfunction in
attention deficit and hyperkinetic disorder. Archives of Neurology, 46(1), 48-52.
https://doi.org/10.1001/archneur.1989.00520370050018
Luce, R. D. (1986). Response times. New York: Oxford University Press.
Luck, S. J. (2014). An introduction to the event-related potential technique. Cambridge, Mass:
MIT Press.
Luna-Rodriguez, A., Wendt, M., auch Koerner, J. K., Gawrilow, C., & Jacobsen, T. (2018).
Selective impairment of attentional set shifting in adults with ADHD. Behavioral and
Brain Functions, 14(1), 18. https://doi.org/10.1186/s12993-018-0150-y
Madden, D. J., Spaniol, J., Costello, M. C., Bucur, B., White, L. E., Cabeza, R., . . . Huettel, S.
A. (2009). Cerebral white matter integrity mediates adult age differences in cognitive
performance. Journal of Cognitive Neuroscience, 21(2), 289–302.
https://doi.org/10.1162/jocn.2009.21047
Review of cognitive tests for ADHD 82
Marcus, D. K., Norris, A. L. & Coccaro, E. F. (2012). The latent structure of attention
deficit/hyperactivity disorder in an adult sample. Journal of Psychiatric Research, 46(6),
782–789. https://doi.org/10.1016/j.jpsychires.2012.03.010
Martel, M., Nikolas, M., & Nigg, J. T. (2007). Executive function in adolescents with ADHD.
Journal of the American Academy of Child & Adolescent Psychiatry, 46(11), 1437–1444.
https://doi.org/10.1097/chi.0b013e31814cf953
Marx, I., Weirich, S., Berger, C., Herpertz, S. C., Cohrs, S., Wandschneider, R., . . . Häßler, F.
(2017). Living in the fast lane: Evidence for a global perceptual timing deficit in
childhood ADHD caused by distinct but partially overlapping task-dependent cognitive
mechanisms. Frontiers in Human Neuroscience, 11, 122.
http://dx.doi.org/10.3389/fnhum.2017.00122
Mason, D. J., Humphreys, G. W., & Kent, L. S. (2003). Exploring selective attention in ADHD:
visual search through space and time. Journal of Child Psychology and Psychiatry, 44(8),
1158-1176. https://doi.org/10.1111/1469-7610.00204
Matzke, D., Curley, S., Gong, C., & Heathcote, A. (2019). Inhibiting responses to difficult
choices. Journal of Experimental Psychology: General, 148, 124–142.
https://doi.org/10.1037/xge0000525
Matzke, D., & Wagenmakers, E. J. (2009). Psychological interpretation of the ex-Gaussian and
shifted Wald parameters: A diffusion model analysis. Psychonomic bulletin & review,
16(5), 798-817. https://doi.org/10.3758/pbr.16.5.798
McBurnett, K., Pfiffner, L. J., & Frick, P. J. (2001). Symptom properties as a function of ADHD
type: An argument for continued study of sluggish cognitive tempo. Journal of abnormal
child psychology, 29(3), 207-213. https://doi.org/10.1023/a:1010377530749
McGee, R. A., Clark, S. E., & Symons, D.K. (2000). Does the Conners’ continuous performance
test aid in ADHD diagnosis? Journal of Abnormal Child Psychology, 28(5), 415–424.
doi:10.1023/a:1005127504982
McGrath, J. J., Harabedian, A., & Bruckner, D. N. (1968). Review and critique of the litera- ture
on vigilance performance. In Studies of human vigilance: A n omnibus of technical
reports. Goleta, CA: Human Factors Research.
McInerney, R. J., & Kerns, K. A. (2003). Time reproduction in children with ADHD: motivation
matters. Child Neuropsychology, 9(2), 91-108. https://doi.org/10.1076/chin.9.2.91.14506
McLean, A., Dowson, J., Toone, B., Bazanis, E., Robbins, T. W., & Sahakian, B. J.(2004).
Characteristic neurocognitive profile associated with adult attention-deficit/hyperactivity
disorder. Psychological Medicine, 34(4), 681-692. doi:10.1017/s0033291703001296
McVay, J. C., & Kane, M. J. (2012). Drifting from slow to “d’Oh!”: Working memory capacity
and mind wandering predict extreme reaction times and executive control errors. Journal
of Experimental Psychology: Learning, Memory, and Cognition, 38(3), 525-549.
https://doi.org/10.1037/a0025896
Merkt, J., Singmann, H., Bodenburg, S., Goossens-Merkt, H., Kappes, A., Wendt, M., &
Gawrilow, C. (2013). Flanker performance in female college students with ADHD: a
Review of cognitive tests for ADHD 83
diffusion model analysis. ADHD Attention Deficit and Hyperactivity Disorders, 5(4),
321-341. https://doi.org/10.1007/s12402-013-0110-1
Metin, B., Roeyers, H., Wiersema, J. R., van der Meere, J. J., Thompson, M., & Sonuga-Barke,
E. (2013). ADHD performance reflects inefficient but not impulsive information
processing: A diffusion model analysis. Neuropsychology, 27(2), 193-200.
https://doi.org/10.1037/a0031533
Metin, B., Wiersema, J. R., Verguts, T., Gasthuys, R., van Der Meere, J. J., Roeyers, H., &
Sonuga-Barke, E. (2016). Event rate and reaction time performance in ADHD: testing
predictions from the state regulation deficit hypothesis using an ex-Gaussian model.
Child Neuropsychology, 22(1), 99-109. https://doi.org/10.1080/09297049.2014.986082
Milanesi, M., James, C. J., Gemignani, A., Menicucci, D., Ghelarducci, B., & Landini, L. (2007,
August). Residual dependeny estimation of independent components applied to EEG
event related potentials associated with emotional processing. In 2007 29th Annual
International Conference of the IEEE Engineering in Medicine and Biology Society (pp.
3860-3863). IEEE. https://doi.org/10.1109/iembs.2007.4353175
Milich, R., Hartung, C. M., Martin, C. A., & Haigler, E. D. (1994). Behavioral disinhibition and
underlying processes in adolescents with disruptive behavior disorders. In D. K. Routh
(Ed.), Disruptive behavior disorders in childhood (pp. 109-138). New York: Plenum.
https://doi.org/10.1007/978-1-4899-1501-6_5
Miller, K. M., Price, C. C., Okun, M. S., Montijo, H., & Bowers, D. (2009). Is the N-Back Task
a Valid Neuropsychological Measure for Assessing Working Memory? Archives of
Clinical Neuropsychology, 24(7), 711–717. doi:10.1093/arclin/acp063
Miyake,A.,Friedman,N.P.,Emerson,M.J.,Witzki,A.H.,Howerter,A.,and Wager,T.D. (2000). The
unity and diversity of executive functions and their contributions to complex
“frontallobe” tasks: a latent variable analysis. Cogn. Psychol. 41, 49–100.
https://doi.org/10.1006/cogp.1999.0734
Miyake, A., & Shah, P. (Eds.). (1999). Models of working memory: Mechanisms of active
maintenance and executive control. Cambridge University Press.
https://doi.org/10.1017/cbo9781139174909
MTA Co-operative Group. (1999). A 14-month randomized clinical trial of treatment of attention
deficit hyperactivity disorder (ADHD). Archives of General Psychiatry, 56, 1073-1086.
doi:10.1001/archpsyc.56.12.1073
Moffitt, T. E., Arseneault, L., Belsky, D., Dickson, N., Hancox, R. J., Harrington, H., et al.
(2011). A gradient of childhood self-control predicts health, wealth, and public safety.
Proceedings of the National Academy of Sciences, 108, 2693 –2698.
https://doi.org/10.1073/ pnas.1010076108.
Moreno-García, I., Delgado-Pardo, G., & Roldán-Blasco, C. (2015). Attention and Response
Control in ADHD. Evaluation through Integrated Visual and Auditory Continuous
Performance Test. The Spanish Journal of Psychology, 18. doi:10.1017/sjp.2015.2
Morgan, A. B., & Lilienfeld, S. O. (2000). A meta-analytic review of the relation between
antisocial behavior and neuropsychological measures of executive function. Clinical
Psychology Review, 20(1), 113–136. https://doi.org/10.1016/s0272-7358(98)00096-8
Review of cognitive tests for ADHD 84
Mostert, J. C., Onnink, A. M. H., Klein, M., Dammers, J., Harneit, A., Schulten, T., et al. (2015).
Cognitive heterogeneity in adult attention deficit/hyperactivity disorder: A systematic
analysis of neuropsychological measurements. European Neuropsychopharmacology,
25(11), 2062–2074. https://doi.org/10.1016/j.euroneuro.2015.08.010.
Moustafa, A. A., Kéri, S., Somlai, Z., Balsdon, T., Frydecka, D., Misiak, B., & White, C. (2015).
Drift diffusion model of reward and punishment learning in schizophrenia: Modeling and
experimental data. Behavioural Brain Research, 291, 147-154.
https://doi.org/10.1016/j.bbr.2015.05.024
Mowinckel, A. M., Pedersen, M. L., Eilertsen, E., & Biele, G. (2015). A meta-analysis of
decision-making and attention in adults with ADHD. Journal of attention disorders,
19(5), 355-367. https://doi.org/10.1177/1087054714558872
Mulder, M. J., Bos, D., Weusten, J. M., van Belle, J., van Dijk, S. C., Simen, P., ... & Durston, S.
(2010). Basic impairments in regulating the speed-accuracy tradeoff predict symptoms of
attention-deficit/hyperactivity disorder. Biological psychiatry, 68(12), 1114-1119.
https://doi.org/10.1016/j.biopsych.2010.07.031
Navon, D. (2003). What does a compound letter tell the psychologist’s mind?. Acta
psychologica, 114(3), 273-309. https://doi.org/10.1016/j.actpsy.2003.06.002
Navon, D. (1977). Forest before trees: The precedence of global features in visual perception.
Cognitive psychology, 9(3), 353-383. https://doi.org/10.1016/0010-0285(77)90012-3
Nichols, S. L., & Waschbusch, D. A. (2004). A review of the validity of laboratory cognitive
tasks used to assess symptoms of ADHD. Child Psychiatry and Human Development,
34(4), 297-315. https://doi.org/10.1023/b:chud.0000020681.06865.97
Nigg, J. T. (2005). Neuropsychologic theory and findings in attention-deficit/hyperactivity
disorder: the state of the field and salient challenges for the coming decade. Biological
psychiatry, 57(11), 1424-1435. https://doi.org/10.1016/j.biopsych.2004.11.011
Nigg, J. T. (2001). Is ADHD a disinhibitory disorder?. Psychological bulletin, 127(5), 571-598.
https://doi.org/10.1037/0033-2909.127.5.571
Nigg, J. T. (1999). The ADHD response-inhibition deficit as measured by the stop task:
Replication with DSM–IV combined type, extension, and qualification. Journal of
Abnormal Child Psychology, 27(5), 393–402. https://doi.org/10.1023/a:1021980002473
Nigg, J. T., & Casey, B. J. (2005). An integrative theory of attention deficit/hyperactivity
disorder based on the cognitive and affective neurosciences. Development and
Psychopathology, 17, 785–806. http://dx.doi.org/10.1017/S0954579405050376
Nigg, J. T., Willcutt, E. G., Doyle, A. E., & Sonuga-Barke, E. J. (2005). Causal heterogeneity in
attention-deficit/hyperactivity disorder: do we need neuropsychologically impaired
subtypes?. Biological psychiatry, 57(11), 1224-1230.
https://doi.org/10.1016/j.biopsych.2004.08.025
Nikolas, M. A., Marshall, P., & Hoelzle, J. B. (2019). The role of neurocognitive tests in the
assessment of adult attention-deficit/hyperactivity disorder. Psychological assessment,
31(5), 685-698. https://doi.org/10.1037/pas0000688

Review of cognitive tests for ADHD 85
Oberauer, K., Lewandowsky, S., Awh, E., Brown, G. D. A., Conway, A., Cowan, N., ... Ward,
G. (2018). Benchmarks for models of short-term and working memory. Psychological
Bulletin, 144(9), 885-958. https://doi.org/10.1037/bul0000153
Oberauer, K., Lewandowsky, S., Farrell, S., Jarrold, C., & Greaves, M. (2012). Modeling
working memory: An interference model of complex span. Psychonomic bulletin &
review, 19(5), 779-819. https://doi.org/10.3758/s13423-012-0272-4
Oberlin, B.G., Alford, J.L., & Marrocco, R.T. (2005). Normal attention orienting but abnormal
stimulus alerting and conflict effect in combined subtype of ADHD. Behavioural Brain
Research, 165(1), 1–11. https://doi.org/10.1016/j.bbr.2005.06.041
Oades, R. D., & Christiansen, H. (2008). Cognitive switching processes in young people with
attention-deficit/hyperactivity disorder. Archives of Clinical Neuropsychology, 23(1), 21-
32. https://doi.org/10.1016/j.acn.2007.09.002
O’Driscoll, G. A., Dépatie, L., Holahan, A. L. V., Savion-Lemieux, T., Barr, R. G., Jolicoeur, C.,
& Douglas, V. I. (2005). Executive functions and methylphenidate response in subtypes
of attention-deficit/hyperactivity disorder. Biological psychiatry, 57(11), 1452-1460.
https://doi.org/10.1016/j.biopsych.2005.02.029
Overtoom, C. C. ., Verbaten, M. ., Kemner, C., Kenemans, J. ., Engeland, H. va., Buitelaar, J. .,
… Koelega, H. . (2003). Effects of methylphenidate, desipramine, and l-dopa on attention
and inhibition in children with Attention Deficit Hyperactivity Disorder. Behavioural
Brain Research, 145(1-2), 7–15. doi:10.1016/s0166-4328(03)00097-4
Palestro, J. J., Bahg, G., Sederberg, P. B., Lu, Z. L., Steyvers, M., & Turner, B. M. (2018). A
tutorial on joint models of neural and behavioral measures of cognition. Journal of
Mathematical Psychology, 84, 20-48. https://doi.org/10.1016/j.jmp.2018.03.003
Parsons, T. D., Duffield, T., & Asbee, J. (2019). A Comparison of Virtual Reality Classroom
Continuous Performance Tests to Traditional Continuous Performance Tests in
Delineating ADHD: a Meta-Analysis. Neuropsychology review, 1-19.
https://doi.org/10.1007/s11065-019-09407-6
Pe, M. L., Vandekerckhove, J., & Kuppens, P. (2013). A diffusion model account of the
relationship between the emotional flanker task and rumination and depression. Emotion,
13(4), 739-747. https://doi.org/10.1037/a0031628
Pennington, B. F. (1997). Dimensions of executive functions in normal and abnormal
development. In N. A. Krasnegor, G. R. Lyon, & P. S. Goldman-Rakic (Eds.),
Development of the prefrontal cortex: Evolution, neurobiology, and behavior (pp. 265 –
281). Baltimore: Paul H. Brooks.
Pennington, B. F., & Ozonoff, S. (1996). Executive functions and developmental
psychopathology. Journal of Child Psychology and Psychiatry, 37(1), 51 – 87.
https://doi.org/10.1111/j.1469-7610.1996.tb01380.x
Perlstein, W. M., Cole, M. A., Larson, M., Kelly, K., Seignourel, P., & Keil, A. (2003). Steady-
state visual evoked potentials reveal frontally-mediated working memory activity in
humans. Neuroscience Letters, 342(3), 191–195. doi:10.1016/s0304-3940(03)00226-x

Review of cognitive tests for ADHD 86
Perugini, A., Ditterich, J., & Basso, M. A. (2016). Patients with Parkinson’s disease show
impaired use of priors in conditions of sensory uncertainty. Current Biology, 26(14),
1902-1910. https://doi.org/10.1016/j.cub.2016.05.039
Philiastides, M. g., Ratcliff, R., & Sajda, P. (2006). Neural representation of task difficulty and
decision making during perceptual categorization: a timing diagram. Journal of
Neuroscience, 26(35), 8965-8975. https://doi.org/10.1523/jneurosci.1655-06.2006
Pirrone, A., Johnson, I., Stafford, T., & Milne, E. (2018). A diffusion model decomposition of
orientation discrimination in children with Autism Spectrum Disorder (ASD). European
Journal of Developmental Psychology, 1-18.
https://doi.org/10.1080/17405629.2018.1561364
Pliszka, S. R. (1989). Effect of anxiety on cognition, behavior, and stimulant response in ADHD.
Journal of the American Academy of Child and Adolescent Psychiatry, 28(6), 882-887.
https://doi.org/10.1097/00004583-198911000-00012
Polich, J., 2007. Updating P300: an integrative theory of P3a and P3b. Clinical Neurophysiology,
118(10), 2128-2148. https://doi.org/10.1016/j.clinph.2007.04.019
Portrat, S., Camos, V., & Barrouillet, P. (2009). Working memory in children: A time-
constrained functioning similar to adults. Journal of Experimental Child Psychology,
102(3), 368-374. https://doi.org/10.1016/j.jecp.2008.05.005
Posner, M. I., & Petersen, S. E. (1990). The attention system of the human brain. Annual review
of neuroscience, 13(1), 25-42. https://doi.org/10.1146/annurev.ne.13.030190.000325
Pritchard, V. E., Neumann, E., & Rucklidge, J. J. (2008). Selective attention and inhibitory
deficits in ADHD: Does subtype or comorbidity modulate negative priming effects?.
Brain and Cognition, 67(3), 324-339. https://doi.org/10.1016/j.bandc.2008.02.002
Raiker, J. S., Rapport, M. D., Kofler, M. J., & Sarver, D. E. (2012). Objectively-measured
impulsivity and attention-deficit/hyperactivity disorder (ADHD): testing competing
predictions from the working memory and behavioral inhibition models of ADHD.
Journal of abnormal child psychology, 40(5), 699-713. https://doi.org/10.1007/s10802-
011-9607-2
Ratcliff, R. (1978). A theory of memory retrieval. Psychological review, 85(2), 59-108.
https://doi.org/10.1037/0033-295x.85.2.59
Ratcliff, R. (1979). Group reaction time distributions and an analysis of distribution statistics.
Psychological Bulletin, 86(3), 446-461. https://doi.org/10.1037/0033-2909.86.3.446
Ratcliff, R. (1985). Theoretical interpretations of the speed and accuracy of positive and negative
responses. Psychological Review. 92(2), 212-225. https://doi.org/10.1037/0033-
295x.92.2.212
Ratcliff, R. (1987). More on the speed and accuracy of positive and negative responses.
Psychological Review, 94(2), 277-280. https://doi.org/10.1037/0033-295x.94.2.277
Ratcliff, R. (1993). Methods for dealing with reaction time outliers. Psychological bulletin,
114(3), 510-532. https://doi.org/10.1037/0033-2909.114.3.510
Review of cognitive tests for ADHD 87
Ratcliff, R. (2008). The EZ diffusion method: Too EZ? Psychonomic Bulletin & Review, 15(6),
1218–1228. doi:10.3758/pbr.15.6.1218
Ratcliff, R. (2014). Measuring psychometric functions with the diffusion model. Journal of
Experimental Psychology: Human Perception and Performance, 40(2), 870-888.
https://doi.org/10.1037/a0034954
Ratcliff, R., Cherian, A., & Segraves, M. (2003). A comparison of macaque behavior and
superior colliculus neuronal activity to predictions from models of two-choice decisions.
Journal of neurophysiology, 90(3), 1392-1407. https://doi.org/10.1152/jn.01049.2002
Ratcliff, R., & Childers, R. (2015). Individual differences and fitting methods for the two-choice
diffusion model of decision making. Decision, 2(4), 237-279.
https://doi.org/10.1037/dec0000030
Ratcliff, R., Hasegawa, Y. T., Hasegawa, R. P., Smith, P. L., & Segraves, M. A. (2007). Dual
diffusion model for single-cell recording data from the superior colliculus in a brightness-
discrimination task. Journal of neurophysiology, 97(2), 1756-1774.
https://doi.org/10.1152/jn.00393.2006
Ratcliff, R., Huang-Pollock, C., & McKoon, G. (2018). Modeling individual differences in the
go/no-go task with a diffusion model. Decision, 5(1), 42-62.
https://doi.org/10.1037/dec0000065
Ratcliff, R., Love, J., Thompson, C. A., & Opfer, J. E. (2012). Children are not like older adults:
A diffusion model analysis of developmental changes in speeded responses. Child
development, 83(1), 367-381. https://doi.org/10.1111/j.1467-8624.2011.01683.x
Ratcliff, R., & McKoon, G. (2008). The diffusion decision model: theory and data for two-choice
decision tasks. Neural computation, 20(4), 873-922.
https://doi.org/10.1162/neco.2008.12-06-420
Ratcliff, R., & Murdock, B. B., Jr. (1976). Retrieval processes in recognition memory.
Psychological Review, 83(3), 190-214. https://doi.org/10.1037/0033-295x.83.3.190
Ratcliff, R., Perea, M., Colangelo, A., & Buchanan, L. (2004). A diffusion model account of
normal and impaired readers. Brain and Cognition, 55(2), 374-382.
https://doi.org/10.1016/j.bandc.2004.02.051
Ratcliff, R., & Rouder, J. N. (1998). Modeling response times for two-choice decisions.
Psychological science, 9(5), 347-356. https://doi.org/10.1111/1467-9280.00067
Ratcliff, R., Schmiedek, F., & McKoon, G. (2008). A diffusion model explanation of the worst
performance rule for reaction time and IQ. Intelligence, 36(1), 10-17.
https://doi.org/10.1016/j.intell.2006.12.002
Ratcliff, R., Sederberg, P. B., Smith, T. A., & Childers, R. (2016). A single trial analysis of EEG
in recognition memory: Tracking the neural correlates of memory strength.
Neuropsychologia, 93, 128-141. https://doi.org/10.1016/j.neuropsychologia.2016.09.026
Ratcliff, R., & Smith, P. L. (2004). A Comparison of Sequential Sampling Models for Two-
Choice Reaction Time. Psychological Review, 111(2), 333–367. doi:10.1037/0033-
295x.111.2.333
Review of cognitive tests for ADHD 88
Ratcliff, R., Smith, P. L., Brown, S. D., & McKoon, G. (2016). Diffusion decision model:
Current issues and history. Trends in cognitive sciences, 20(4), 260-281.
https://doi.org/10.1016/j.tics.2016.01.007
Ratcliff, R., Thapar, A., & McKoon, G. (2006). Aging and individual differences in rapid two-
choice decisions. Psychonomic Bulletin & Review, 13(4), 626–635.
https://doi.org/10.3758/bf03193973
Ratcliff, R., Thapar, A., & McKoon, G. (2007). Application of the diffusion model to two-choice
tasks for adults 75-90 years old. Psychology and aging, 22(1), 56-66.
https://doi.org/10.1037/0882-7974.22.1.56
Ratcliff, R., Thapar, A., & McKoon, G. (2010). Individual differences, aging, and IQ in two-
choice tasks. Cognitive psychology, 60(3), 127-157.
https://doi.org/10.1016/j.cogpsych.2009.09.001
Ratcliff, R., Thapar, A., & McKoon, G. (2011). Effects of aging and IQ on item and associative
memory. Journal of Experimental Psychology: General, 140(3), 464-487.
https://doi.org/10.1037/a0023810
Ratcliff, R., & Tuerlinckx, F. (2002). Estimating parameters of the diffusion model: Approaches
to dealing with contaminant reaction times and parameter variability. Psychonomic
Bulletin & Review, 9(3), 438–481. doi:10.3758/bf03196302
Ratcliff, R., Van Zandt, T., & McKoon, G. (1999). Connectionist and diffusion models of
reaction time. Psychological review, 106(2), 261-300. https://doi.org/10.1037/0033-
295x.106.2.261
Ridderinkhof, K. R., Band, G. P., & Logan, G. D. (1999). A study of adaptive behavior: Effects
of age and irrelevant information on the ability to inhibit one's actions. Acta
psychologica, 101(2-3), 315-337. https://doi.org/10.1016/s0001-6918(99)00010-4
Robertson, I. H., Manly, T., Andrade, J., Baddeley, B. T., & Yiend, J. (1997). “Oops!”:
Performance correlates of everyday attentional failures in traumatic brain injured and
normal participants. Neuropsychologia, 35(6), 747–758. https://doi.org/10.1016/s0028-
3932(97)00015-8
Robinson, L. J., Kester, D. B., Saykin, A. J., Kaplan, E. F., & Gur, R. C. (1991). Comparison of
two short forms of the Wisconsin Card Sorting Test. Archives of Clinical
Neuropsychology, 6(1-2), 27-33. https://doi.org/10.1093/arclin/6.1.27
Rogers, R. D., & Monsell, S. (1995). Costs of a predictable switch between simple cognitive
tasks. Journal of experimental psychology: General, 124(2), 207-231.
https://doi.org/10.1037/0096-3445.124.2.207
Romine, C. B., Lee, D., Wolfe, M. E., Homack, S., George, C., & Riccio, C. A. (2004).
Wisconsin Card Sorting Test with children: a meta-analytic study of sensitivity and
specificity. Archives of Clinical Neuropsychology, 19(8), 1027-1041.
https://doi.org/10.1016/j.acn.2003.12.009
Rovet, J. F., & Hepworth, S. L. (2001). Dissociating Attention Deficits in Children with ADHD
and Congenital Hypothyroidism using Multiple CPTs. Journal of Child Psychology and
Psychiatry, 42(8), 1049–1056. doi:10.1111/1469-7610.00804
Review of cognitive tests for ADHD 89
Rubia, K., Halari, R., Christakou, A., & Taylor, E. (2009). Impulsiveness as a timing
disturbance: Neurocognitive abnormalities in attention deficit hyperactivity disorder
during temporal processes and normalization with methylphenidate. Philosophical
Transactions of the Royal Society of London Series B, Biological Sciences, 364, 1919–
1931. http://dx.doi.org/10.1098/rstb.2009.0014
Rubinstein, J. S., Meyer, D. E., & Evans, J. E. (2001). Executive control of cognitive processes
in task switching. Journal of experimental psychology: human perception and
performance, 27(4), 763-797. https://doi.org/10.1037/0096-1523.27.4.763
Rueda, M. R., Fan, J., McCandliss, B. D., Halparin, J. D., Gruber, D. B., Lercari, L. P., &
Posner, M. I. (2004). Development of attentional networks in childhood.
Neuropsychologia, 42(8), 1029–1040.
https://doi.org/10.1016/j.neuropsychologia.2003.12.012
Salum, G. A., Sonuga-Barke, E., Sergeant, J., Vandekerckhove, J., Gadelha, A., Moriyama, T.
S., ... & Rohde, L. A. P. (2014). Mechanisms underpinning inattention and hyperactivity:
neurocognitive support for ADHD dimensionality. Psychological medicine, 44(15),
3189-3201. https://doi.org/10.1017/s0033291714000919
Scheres, A., Oosterlaan, J., & Sergeant, J. A. (2001). Response Execution and Inhibition in
Children with AD/HD and Other Disruptive Disorders: The Role of Behavioural
Activation. Journal of Child Psychology and Psychiatry, 42(3), 347–357.
doi:10.1111/1469-7610.00728
Schmiedek, F., Oberauer, K., Wilhelm, O., Süß, H. M., & Wittmann, W. W. (2007). Individual
differences in components of reaction time distributions and their relations to working
memory and intelligence. Journal of Experimental Psychology: General, 136(3), 414.
Schmitz, F., & Voss, A. (2012). Decomposing task-switching costs with the diffusion model.
Journal of Experimental Psychology: Human Perception and Performance, 38(1), 222-
250. https://doi.org/10.1037/a0026003
Schneider, D. W., & Logan, G. D. (2005). Modeling task switching without switching tasks: A
short-term priming account of explicitly cued performance. Journal of Experimental
Psychology: General, 134(3), 343–367. https://doi.org/10.1037/0096-3445.134.3.343
Schneidt, A., Jusyte, A., Rauss, K., & Schönenberg, M. (2018). Distraction by salient stimuli in
adults with attention-deficit/hyperactivity disorder: Evidence for the role of task difficulty
in bottom-up and top-down processing. Cortex, 101, 206-220.
https://doi.org/10.1016/j.cortex.2018.01.021
Schubert, A.-L., Nunez, M. D., Hagemann, D., & Vandekerckhove, J. (2018). Individual
Differences in Cortical Processing Speed Predict Cognitive Abilities: a Model-Based
Cognitive Neuroscience Account. Computational Brain & Behavior, 2(2), 64–84.
doi:10.1007/s42113-018-0021-5
Schupp, H. T., Flaisch, T., Stockburger, J., & Junghöfer, M. (2006). Emotion and attention:
event-related brain potential studies. Progress in brain research. 156, 31-51.
https://doi.org/10.1016/s0079-6123(06)56002-9
Senderecka, M., Grabowska, A., Szewczyk, J., Gerc, K., & Chmylak, R. (2012). Response
inhibition of children with ADHD in the stop-signal task: An event-related potential
Review of cognitive tests for ADHD 90
study. International Journal of Psychophysiology, 85(1), 93–105.
doi:10.1016/j.ijpsycho.2011.05.007
Sergeant, J. (2000). The cognitive-energetic model: an empirical approach to attention-deficit
hyperactivity disorder. Neuroscience & Biobehavioral Reviews, 24(1), 7-12.
https://doi.org/10.1016/s0149-7634(99)00060-3
Sergeant, J. A. (2005). Modeling Attention-Deficit/Hyperactivity Disorder: A Critical Appraisal
of the Cognitive-Energetic Model. Biological Psychiatry, 57(11), 1248–1255.
doi:10.1016/j.biopsych.2004.09.010
Sergeant, J. A., Oosterlaan, J., & van der Meere, J. (1999). Information processing and energetic
factors in attention-deficit/hyperactivity disorder. In H. C. Quay & A. E. Hogan (Eds.),
Handbook of disruptive behavior disorders (pp. 1975–104). Dordrecht, Netherlands:
Kluwer Academic Publishers. https://doi.org/10.1007/978-1-4615-4881-2_4
Servera, M., Sáez, B., Burns, G. L., & Becker, S. P. (2018). Clinical differentiation of sluggish
cognitive tempo and attention-deficit/hyperactivity disorder in children. Journal of
abnormal psychology, 127(8), 818-829. https://doi.org/10.1037/abn0000375
Shahar, N., Teodorescu, A. R., Karmon-Presser, A., Anholt, G. E., & Meiran, N. (2016).
Memory for action rules and reaction time variability in attention-deficit/hyperactivity
disorder. Biological Psychiatry: Cognitive Neuroscience and Neuroimaging, 1(2), 132-
140. https://doi.org/10.1016/j.bpsc.2016.01.003
Shapiro, S. K., & Garfinkel, B. D. (1986). The Occurrence of Behavior Disorders in Children:
The Interdependence of Attention Deficit Disorder and Conduct Disorder. Journal of the
American Academy of Child Psychiatry, 25(6), 809–819. doi:10.1016/s0002-
7138(09)60200-4
Shapiro, Z., & Huang-Pollock, C. (2019). A diffusion-model analysis of timing deficits among
children with ADHD. Neuropsychology, 33(6), 883-896.
https://doi.org/10.1037/neu0000562
Sieg, K. G., Gaffney, G. R., Preston, D. F., & Hellings, J. A. (1995). SPECT brain imaging
abnormalities in attention deficit hyperactivity disorder. Clinical nuclear medicine, 20(1),
55-60. https://doi.org/10.1097/00003072-199501000-00014
Singh, M. K., DelBello, M. P., Kowatch, R. A., & Strakowski, S. M. (2006). Co‐ occurrence of
bipolar and attention‐ deficit hyperactivity disorders in children. Bipolar disorders, 8(6),
710-720. https://doi.org/10.1111/j.1399-5618.2006.00391.x
Sjowall, D., & Thorell, L. B. (2019). A critical appraisal of the role of neuropsychological
deficits in preschool ADHD. Child Neuropsychology, 25(1), 60–80.
https://doi.org/10.1080/09297049. 2018.1447096.
Smith, P. L., & Ratcliff, R. (2015). An Introduction to the Diffusion Model of Decision Making.
An Introduction to Model-Based Cognitive Neuroscience, 49–70. doi:10.1007/978-1-
4939-2236-9_3
Smith, A. B., Taylor, E., Brammer, M., Halari, R., & Rubia, K. (2008). Reduced activation in
right lateral prefrontal cortex and anterior cingulate gyrus in medication‐ naïve
adolescents with attention deficit hyperactivity disorder during time discrimination.
Review of cognitive tests for ADHD 91
Journal of Child Psychology and Psychiatry, 49(9), 977-985.
https://doi.org/10.1111/j.1469-7610.2008.01870.x
Smith, A. B., Taylor, E., Brammer, M., Toone, B., & Rubia, K. (2006). Task-specific
hypoactivation in prefrontal and temporoparietal brain regions during motor inhibition
and task switching in medication-naive children and adolescents with attention deficit
hyperactivity disorder. American Journal of Psychiatry, 163(6), 1044-1051.
https://doi.org/10.1176/ajp.2006.163.6.1044
Smith-Seemiller, L., Franzen, M. D., & Bowers, D. (1997). Use of Wisconsin Card Sorting Test
short forms in clinical samples. The Clinical Neuropsychologist, 11(4), 421-427.
https://doi.org/10.1080/13854049708400472
Smith, P. L., & Vickers, D. (1988). The accumulator model of two-choice discrimination.
Journal of Mathematical Psychology, 32(2), 135–168. doi:10.1016/0022-2496(88)90043-
0
Sohlberg MM, Mateer CA (1989). Introduction to cognitive rehabilitation: theory and practice.
New York: Guilford Press.
Solanto, M. V., Schulz, K. P., Fan, J., Tang, C. Y., & Newcorn, J. H. (2009). Event‐ related
FMRI of inhibitory control in the predominantly inattentive and combined subtypes of
ADHD. Journal of Neuroimaging, 19(3), 205-212. https://doi.org/10.1111/j.1552-
6569.2008.00289.x
Song, Y., & Hakoda, Y. (2012). The interference of local over global information processing in
children with attention deficit hyperactivity disorder of the inattentive type. Brain and
Development, 34(4), 308-317. https://doi.org/10.1016/j.braindev.2011.07.010
Sonuga-Barke, E. J. (2002). Psychological heterogeneity in AD/HD—a dual pathway model of
behaviour and cognition. Behavioural brain research, 130(1-2), 29-36.
https://doi.org/10.1016/s0166-4328(01)00432-6
Sonuga-Barke, E. J., & Castellanos, F. X. (2007). Spontaneous attentional fluctuations in
impaired states and pathological conditions: a neurobiological hypothesis. Neuroscience
& Biobehavioral Reviews, 31(7), 977-986.
https://doi.org/10.1016/j.neubiorev.2007.02.005
Sonuga-Barke, E. J., Saxton, T., & Hall, M. (1998). The role of interval underestimation in
hyperactive children's failure to suppress responses over time. Behavioural Brain
Research, 94(1), 45-50. https://doi.org/10.1016/s0166-4328(97)00168-x
Sonuga-Barke, E. J., Sergeant, J. A., Nigg, J., & Willcutt, E. (2008). Executive dysfunction and
delay aversion in attention deficit hyperactivity disorder: Nosologic and diagnostic
implications. Child and Adolescent Psychiatric Clinics of North America, 17(2), 367–
384. https://doi.org/10.1016/j.chc.2007.11.008
Soveri, A., Antfolk, J., Karlsson, L., Salo, B. & Laine, M. (2017). Working memory training
revisited: A multi-level meta-analysis of n-back training studies. Psychonomic Bulletin &
Review, 24(4), 1077-1096. https://doi.org/10.3758/s13423-016-1217-0
Review of cognitive tests for ADHD 92
Spencer, T., Biederman, J., & Wilens, T. (1999). Attention-deficit/hyperactivity disorder and
comorbidity. Pediatric Clinics of North America, 46(5), 915-927.
https://doi.org/10.1016/s0031-3955(05)70163-2
Spreen, O., & Strauss, E. (1998). A compendium of neuropsychological tests: Administration,
norms and commentary (2nd ed.). New York: Oxford University Press.
Sternberg, S. (1966). High-speed scanning in human memory. Science, 153(3736), 652-654.
https://doi.org/10.1126/science.153.3736.652
Sternberg, S. (1967). Two operations in character recognition: Some evidence from reaction-time
measurements. Perception & Psychophysics, 2(2), 45–53. doi:10.3758/bf03212460
Stroop, J. R. (1935). Studies of interference in serial verbal reactions. Journal of experimental
psychology, 18(6), 643-662. https://doi.org/10.1037/h0054651
Stroux, D., Shushakova, A., Geburek-Höfer, A. J., Ohrmann, P., Rist, F., & Pedersen, A. (2016).
Deficient interference control during working memory updating in adults with ADHD: an
event-related potential study. Clinical Neurophysiology, 127(1), 452-463.
https://doi.org/10.1016/j.clinph.2015.05.021
Szmalec, A., Verbruggen, F., Vandierendonck, A., & Kemps, E. (2011). Control of interference
during working memory updating. Journal of Experimental Psychology: Human
Perception and Performance, 37(1), 137–151. https://doi.org/10.1037/a0020365
Tannock, R., Schachar, R. J., & Logan, G. D. (1995). Methylphenidate and cognitive flexibility:
Dissociated dose effects in hyperactive children. Journal of Abnormal Child Psychology,
23(2), 235–266. https://doi.org/10.1007/bf01447091
Tarantino, V., Cutini, S., Mogentale, C., & Bisiacchi, P. S. (2013). Time-on-task in children with
ADHD: an ex-Gaussian analysis. Journal of the International Neuropsychological
Society, 19(7), 820-828. https://doi.org/10.1017/s1355617713000623
Tegelbeckers, J., Bunzeck, N., Duzel, E., Bonath, B., Flechtner, H. H., & Krauel, K. (2015).
Altered salience processing in attention deficit hyperactivity disorder. Human brain
mapping, 36(6), 2049-2060. https://doi.org/10.1002/hbm.22755
Tegelbeckers, J., Schares, L., Lederer, A., Bonath, B., Flechtner, H. H., & Krauel, K. (2016).
Task-irrelevant novel sounds improve attentional performance in children with and
without ADHD. Frontiers in Psychology, 6, 1970.
https://doi.org/10.3389/fpsyg.2015.01970
Thorell LB (2007). Do delay aversion and executive function deficits make distinct contributions
to the functional impact of ADHD symptoms? Journal of Child Psychology and
Psychiatry, 48(11), 1061–1070. https://doi.org/10.1111/j.1469-7610.2007.01777.x
Tillman, G., Van Zandt, T., & Logan, G. D. (2020). Sequential sampling models without random
between-trial variability: the racing diffusion model of speeded decision making.
Psychonomic Bulletin & Review. doi:10.3758/s13423-020-01719-6
Tinius, T. (2003). The Integrated Visual and Auditory Continuous Performance Test as a
neuropsychological measure. Archives of Clinical Neuropsychology, 18(5), 439–454.
doi:10.1016/s0887-6177(02)00144-0

Review of cognitive tests for ADHD 93
Togo, F., Lange, G., Natelson, B. H., & Quigley, K. S. (2015). Attention network test:
assessment of cognitive function in chronic fatigue syndrome. Journal of
neuropsychology, 9(1), 1-9. https://doi.org/10.1111/jnp.12030
Tseng, W. L., & Gau, S. S. F. (2013). Executive function as a mediator in the link between
ADHD and social problems. Journal of Child Psychology and Psychiatry, and Allied
Disciplines, 54(9), 996–1004. https://doi.org/10.1111/jcpp.12072
Turner, B. M., Forstmann, B. U., Love, B. C., Palmeri, T. J., & Van Maanen, L. (2017).
Approaches to analysis in model-based cognitive neuroscience. Journal of Mathematical
Psychology, 76, 65–79. doi:10.1016/j.jmp.2016.01.001
Twomey, D. M., Murphy, P. R., Kelly, S. P., & O'connell, R. G. (2015). The classic P300
encodes a build‐ to‐ threshold decision variable. European Journal of Neuroscience,
42(1), 1636-1643. https://doi.org/10.1111/ejn.12936
Tye, C., Johnson, K. A., Kelly, S. P., Asherson, P., Kuntsi, J., Ashwood, K. L., ... &
McLoughlin, G. (2016). Response time variability under slow and fast‐ incentive
conditions in children with ASD, ADHD and ASD+ ADHD. Journal of Child
Psychology and Psychiatry, 57(12), 1414-1423. https://doi.org/10.1111/jcpp.12608
Unsworth, N., & Engle, R. W. (2007). The nature of individual differences in working memory
capacity: active maintenance in primary memory and controlled search from secondary
memory. Psychological review, 114(1), 104-132. https://doi.org/10.1037/0033-
295x.114.1.104
Usher, M., & McClelland, J. L. (2001). The time course of perceptual choice: The leaky,
competing accumulator model. Psychological Review, 108(3), 550–592.
doi:10.1037/0033-295x.108.3.550
Van De Voorde, S., Roeyers, H., & Wiersema, J. R. (2010). Error monitoring in children with
ADHD or reading disorder: An event-related potential study. Biological Psychology,
84(2), 176–185. doi:10.1016/j.biopsycho.2010.01.011
Vandekerckhove, J., Tuerlinckx, F., & Lee, M. D. (2011). Hierarchical diffusion models for two-
choice response times. Psychological Methods, 16(1), 44–62. doi:10.1037/a0021765
Van der Meere, J. (2005). State regulation and attention deficit hyperactivity disorder. In
Attention deficit hyperactivity disorder (pp. 413-433). Humana Press.
https://doi.org/10.1385/1-59259-891-9:413
Van der Meere, J. J., Shalev, R. S., Borger, N., & Wiersema, J. R. (2009). Methylphenidate,
interstimulus interval, and reaction time performance of children with attention
deficit/hyperactivity disorder: a pilot study. Child neuropsychology, 15(6), 554-566.
https://doi.org/10.1080/09297040902758803
Vandierendonck, A., Liefooghe, B., & Verbruggen, F. (2010). Task switching: interplay of
reconfiguration and interference control. Psychological bulletin, 136(4), 601-626.
https://doi.org/10.1037/a0019791
van Vugt, M. K., Simen, P., Nystrom, L. E., Holmes, P., & Cohen, J. D. (2012). EEG oscillations
reveal neural correlates of evidence accumulation. Frontiers in neuroscience, 6, 106.
https://doi.org/10.3389/fnins.2012.00106
Review of cognitive tests for ADHD 94
Van Zandt, T., Colonius, H., & Proctor, R. W. (2000). A comparison of two response time
models applied to perceptual matching. Psychonomic Bulletin & Review, 7(2), 208–256.
doi:10.3758/bf03212980
Valko, L., Schneider, G., Doehnert, M., Müller, U., Brandeis, D., Steinhausen, H. C., &
Drechsler, R. (2010). Time processing in children and adults with ADHD. Journal of
neural transmission, 117(10), 1213-1228. https://doi.org/10.1007/s00702-010-0473-9
Vaurio, R. G., Simmonds, D. J., & Mostofsky, S. H. (2009). Increased intra-individual reaction
time variability in attention-deficit/hyperactivity disorder across response inhibition tasks
with different cognitive demands. Neuropsychologia, 47(12), 2389-2396.
https://doi.org/10.1016/j.neuropsychologia.2009.01.022
Verleger, R., Jaśkowski, P., & Wascher, E. (2005). Evidence for an integrative role of P3b in
linking reaction to perception. Journal of Psychophysiology, 19(3), 165-181.
https://doi.org/10.1027/0269-8803.19.3.165
Volberg, G. & Hübner, R. (2004). On the role of response conflicts and stimulus position for
hemispheric differences in global/local processing: an ERP study. Neuropsychologia,
42(13), 1805-1813. https://doi.org/10.1016/j.neuropsychologia.2004.04.017
Voss, A., Rothermund, K., & Voss, J. (2004). Interpreting the parameters of the diffusion model:
An empirical validation. Memory & cognition, 32(7), 1206-1220.
https://doi.org/10.3758/bf03196893
Voss, A., & Voss, J. (2007). Fast-dm: A free program for efficient diffusion model analysis.
Behavior Research Methods, 39, 767–775. doi: 10.3758/BF03192967
Wagenmakers, E.-J., Van Der Maas, H. L. J., & Grasman, R. P. P. P. (2007). An EZ-diffusion
model for response time and accuracy. Psychonomic Bulletin & Review, 14(1), 3–22.
doi:10.3758/bf03194023
Wahlstedt, C., Thorell, L. B., & Bohlin, G. (2009). Heterogeneity in ADHD: Neuropsychological
pathways, comorbidity and symptom domains. Journal of Abnormal Child Psychology,
37(4), 551–564. https://doi.org/10.1007/s10802-008-9286-9
Ward MF, Wender PH, Reimherr FW. (1993) The Wender Utah Ating Scale: an aid in the
retrospective diagnosis of childhood attention deficit hyeractivity disorder. The American
Journal of Psychiatry, 150(6), 885–890. https://doi.org/10.1176/ajp.150.6.885
Weigard, A., Heathcote, A., Matzke, D., & Huang-Pollock, C. (2019). Cognitive Modeling
Suggests That Attentional Failures Drive Longer Stop-Signal Reaction Time Estimates in
Attention Deficit/Hyperactivity Disorder. Clinical Psychological Science, 7(4), 856-872.
https://doi.org/10.1177/2167702619838466
Weigard, A., & Huang-Pollock, C. (2017). The role of speed in ADHD-related working memory
deficits: A time-based resource-sharing and diffusion model account. Clinical
Psychological Science, 5(2), 195-211. https://doi.org/10.1177/2167702616668320
Weigard, A., & Huang‐ Pollock, C. (2014). A diffusion modeling approach to understanding
contextual cueing effects in children with ADHD. Journal of Child Psychology and
Psychiatry, 55(12), 1336-1344. https://doi.org/10.1111/jcpp.12250
Review of cognitive tests for ADHD 95
Weigard, A., Huang-Pollock, C., Brown, S., & Heathcote, A. (2018). Testing formal predictions
of neuroscientific theories of ADHD with a cognitive model–based approach. Journal of
abnormal psychology, 127(5), 529-539. https://doi.org/10.1037/abn0000357
Weiler, M. D., Bernstein, J. H., Bellinger, D. & Waber, D. P. (2002). Information Processing
Deficits in Children with Attention-Deficit/Hyperactivity Disorder, Inattentive Type, and
Children with Reading Disability. Journal of Learning Disabilities, 35(5), 449-462.
https://doi.org/10.1177/00222194020350050501
Weissman, D. H., Mangun, G. R., & Woldorff, M. G. (2002). A role for top-down attentional
orienting during interference between global and local aspects of hierarchical stimuli.
NeuroImage, 17(3), 1266-1276. https://doi.org/10.1006/nimg.2002.1284
Wessel, J. R., & Aron, A. R. (2015). It's not too late: The onset of the frontocentral P 3 indexes
successful response inhibition in the stop‐ signal paradigm. Psychophysiology, 52(4),
472-480. doi: 10.1111/psyp.12374
White, C. N., Ratcliff, R., & Starns, J. J. (2011). Diffusion models of the flanker task: Discrete
versus gradual attentional selection. Cognitive Psychology, 63(4), 210–238.
doi:10.1016/j.cogpsych.2011.08.001
White, C. N., Ratcliff, R., Vasey, M. W., & McKoon, G. (2010a). Using diffusion models to
understand clinical disorders. Journal of Mathematical Psychology, 54(1), 39-52.
https://doi.org/10.1016/j.jmp.2010.01.004
White, C. N., Ratcliff, R., Vasey, M. W., & McKoon, G. (2010b). Anxiety enhances threat
processing without competition among multiple inputs: A diffusion model analysis.
Emotion, 10(5), 662-677. https://doi.org/10.1037/a0019474
White, H. A., & Shah, P. (2006). Training Attention-Switching Ability in Adults With ADHD.
Journal of Attention Disorders, 10(1), 44–53. doi:10.1177/1087054705286063
Wiecki, T. V., Poland, J., & Frank, M. J. (2015). Model-based cognitive neuroscience
approaches to computational psychiatry: clustering and classification. Clinical
Psychological Science, 3(3), 378-399. https://doi.org/10.1177/2167702614565359
Wiersema, J. R., van der Meere, J. J., & Roeyers, H. (2005). ERP correlates of impaired error
monitoring in children with ADHD. Journal of Neural Transmission, 112(10), 1417–
1430. doi:10.1007/s00702-005-0276-6
Wiersema, R., Van Der Meere, J., Roeyers, H., Van Coster, R., & Baeyens, D. (2006). Event rate
and event-related potentials in ADHD. Journal of Child Psychology and Psychiatry,
47(6), 560–567. doi:10.1111/j.1469-7610.2005.01592.x
Willcutt, E. G., Doyle, A. E., Nigg, J. T., Faraone, S. V., & Pennington, B. F. (2005). Validity of
the executive function theory of attention-deficit/hyperactivity disorder: a meta-analytic
review. Biological psychiatry, 57(11), 1336-1346.
https://doi.org/10.1016/j.biopsych.2005.02.006
Willoughby, M. T., Wylie, A. C., & Blair, C. B. (2019). Using Repeated-Measures Data to Make
Stronger Tests of the Association between Executive Function Skills and Attention
Deficit/Hyperactivity Disorder Symptomatology in Early Childhood. Journal of
Review of cognitive tests for ADHD 96
abnormal child psychology, 47(11), 1759-1770. https://doi.org/10.1007/s10802-019-
00559-w
Wong, K. F., Huk, A. C., Shadlen, M. N., & Wang, X. J. (2007). Neural circuit dynamics
underlying accumulation of time-varying evidence during perceptual decision making.
Frontiers in Computational Neuroscience, 1, 6.
https://doi.org/10.3389/neuro.10.006.2007
Woods, S. P., Lovejoy, D. W., & Ball, J. D. (2002). Neuropsychological characteristics of adults
with ADHD: a comprehensive review of initial studies. The Clinical Neuropsychologist,
16(1), 12-34. https://doi.org/10.1076/clin.16.1.12.8336
Yeo, R. A., Hill, D. E., Campbell, R. A., Vigil, J., Petropoulos, H., Hart, B., ... & Brooks, W. M.
(2003). Proton magnetic resonance spectroscopy investigation of the right frontal lobe in
children with attention-deficit/hyperactivity disorder. Journal of the American Academy
of Child & Adolescent Psychiatry, 42(3), 303-310. https://doi.org/10.1097/00004583-
200303000-00010
Yovel, G., Yovel, I., & Levy, J. (2001). Hemispheric asymmetries for global and local visual
perception: effects of stimulus and task factors. Journal of Experimental Psychology:
Human Perception and Performance, 27(6), 1369-1385. https://doi.org/10.1037/0096-
1523.27.6.1369
Zahn, T. P., Kruesi, M. J. P., & Rapoport, J. L. (1991). Reaction time indices of attention deficits
in boys with disruptive behavior disorders. Journal of Abnormal Child Psychology, 19(2),
233–252. doi:10.1007/bf00909980
Zeguers, M. H., Snellings, P., Tijms, J., Weeda, W. D., Tamboer, P., Bexkens, A., & Huizenga,
H. M. (2011). Specifying theories of developmental dyslexia: a diffusion model analysis
of word recognition. Developmental Science, 14(6), 1340-1354.
https://doi.org/10.1111/j.1467-7687.2011.01091.x
Zhang, J.-S., Wang, Y., Cai, R.-G., & Yan, C.-H. (2009). The brain regulation mechanism of
error monitoring in impulsive children with ADHD—An analysis of error related
potentials. Neuroscience Letters, 460(1), 11–15. doi:10.1016/j.neulet.2009.05.027
Ziegler, S., Pedersen, M. L., Mowinckel, A. M., & Biele, G. (2016). Modelling ADHD: a review
of ADHD theories through their predictions for computational models of decision-
making and reinforcement learning. Neuroscience & Biobehavioral Reviews, 71, 633-
656. https://doi.org/10.1016/j.neubiorev.2016.09.002
Zoumpoulaki, A., Alsufyani, A., Filetti, M., Brammer, M., & Bowman, H. (2015). Latency as a
region contrast: Measuring ERP latency differences with Dynamic Time Warping.
Psychophysiology, 52(12), 1559–1576. doi:10.1111/psyp.12521

Review of cognitive tests for ADHD 97
Figures
Figure 1. Overview of the Computational Models included in this review.

Review of cognitive tests for ADHD 98
Tables
Table 1. Six test domains to classify studies discussed in this Review
Test domain Cognitive concepts Common tasks Reviewed
studies
Cognitive
flexibility
Coordinated interplay between the
activation and the inhibition of
multiple control processes.
Task-switch paradigms;
Stroop tasks; Navon tasks;
Flanker tasks; Anti-saccade
tasks
11
Selective
attention
Ability to maintain focus on a
stimulus in the presence of
distractors.
Stroop tasks; Perceptual
discrimination tasks;
Attentional network tasks;
Flanker tasks; Contextual
cueing paradigms; Navon
tasks; Attentional blink tasks;
Anti-saccade tasks
11
Working
memory
Cognitive processes that allows an
individual to temporarily hold
information readily for a prompt
usage in a subsequent decision.
N-back tasks; Sternberg tasks
5
Time
perception
Judgments about the duration of
processes or how much time has
passed.
Duration differentiation
tasks; Time reproduction
tasks
4
Sustained
attention
Ability to maintain attention over an
extended period of time.
Continuous performance
tasks; Navon tasks 5
Inhibitory
control
Withholding ongoing actions
in the presence of new information.
Stop-signal tasks; Stroop
tasks; Continuous
performance tasks
14

REVIEW OF COGNITIVE TESTS FOR ADHD 99
Table 2. Description of common cognitive tasks
Task Description of task paradigm
Continuous
Performance
Task
The Continuous Performance Task (CPT) is one of the most commonly administered tests. It is designed to assess
cognitive concepts such as “inhibitory control,” “vigilance,” and “sustained attention” (Huang-Pollock et al., 2012;
Spreen & Strauss, 1998). Within the framework of cognitive psychology, the CPT belongs to the class of go/no-go
tasks (Gomez, Ratcliff, & Perea, 2007; Ratcliff, Huang-Pollock, & McKoon, 2018). In a go/no-go task, a series of
stimuli (e.g., letters, words, nonwords, or symbols) are presented. Usually, one stimulus type represents go trials, while
another type represents no-go trials. Participants are asked to press a response key for go trials while refraining from
pressing any response key for no-go trials. For clinical use, there are currently three versions of the CPT on the market,
which differ in the relative proportion of go/no-go trials and which we will introduce in the following (Edwards et al.,
2007).
To assess cognitive concepts such as “vigilance” and “sustained attention,” go trials are rare (usually 10%), while no-go
trials are frequent (usually 90%). This version of the CPT is often referred to as “Sustained Attention to Response
Task” (SART, Robertson et al., 1997); or “Gordon Diagnostic System Vigilance Task” (GDS, Gordon, 1986).
Experimental evidence (Huang-Pollock, Nigg, & Halperin, 2006; Sergeant et al., 1999) suggests that participants with
ADHD exhibit increased errors to no-go trials, slower mean RTs, and greater variability in RTs as compared to
participants without ADHD. We subsequently refer to this class of CPTs as “CPTs.”
To assess cognitive concepts such as “inhibitory control” and “impulsivity,” go trials are frequent (usually between
75% and 90%), while no-go trials are rare (usually 10%). To this version of the CPT is often referred to as “Conners’
Continuous Performance Task” (CCPT, Conners, 1994; 2002). Therefore, the main difference between CPTs and
CCPTs are the relative proportion of go and no-go trials. Experimental evidence (see for a review: Parsons, Duffield, &
Asbee, 2019) suggests that participants with ADHD commit more errors than participants without ADHD. However,
results are inconclusive in that some studies found large differences between participants with and without ADHD,
while other studies found small or no differences (Corkum & Siegel, 1993; Huang-Pollock et al., 2012; Losier,
McGrath, & Klein, 1996; Nigg, 2005; Sonuga-Barke, Sergeant, Nigg, & Willcutt, 2008; Willcutt, Doyle, Nigg,
Faraone, & Pennington, 2005). We subsequently refer to this class of CPTs as “CCPTs.” Note that the “Test of
Variables of Attention” (TOVATM, Greenberg, 1987; Greenberg & Waldmant, 1993) includes a CPT and a CCPT
because it has blocks of frequent “go trials” (77.5% go trials vs. 22.5% no-go trials) and blocks of rare “go trials”
(22.5% go trials vs. 77.5% no-go trials).
Flanker Task
Different versions of the Flanker task (Eriksen & Eriksen, 1974) have been used for clinical assessments (e.g., Fan et
al., 2002; Johnson et al., 2008; Posner & Petersen, 1990; 2005). This task is also often also referred to as Attentional
Network Task (ANT). Flanker tasks involve neutral, congruent, and incongruent trials. On each trial, a target stimulus
(e.g., right – or left – pointed arrow) is presented, accompanied by surrounding stimuli (e.g., arrows) referred to as
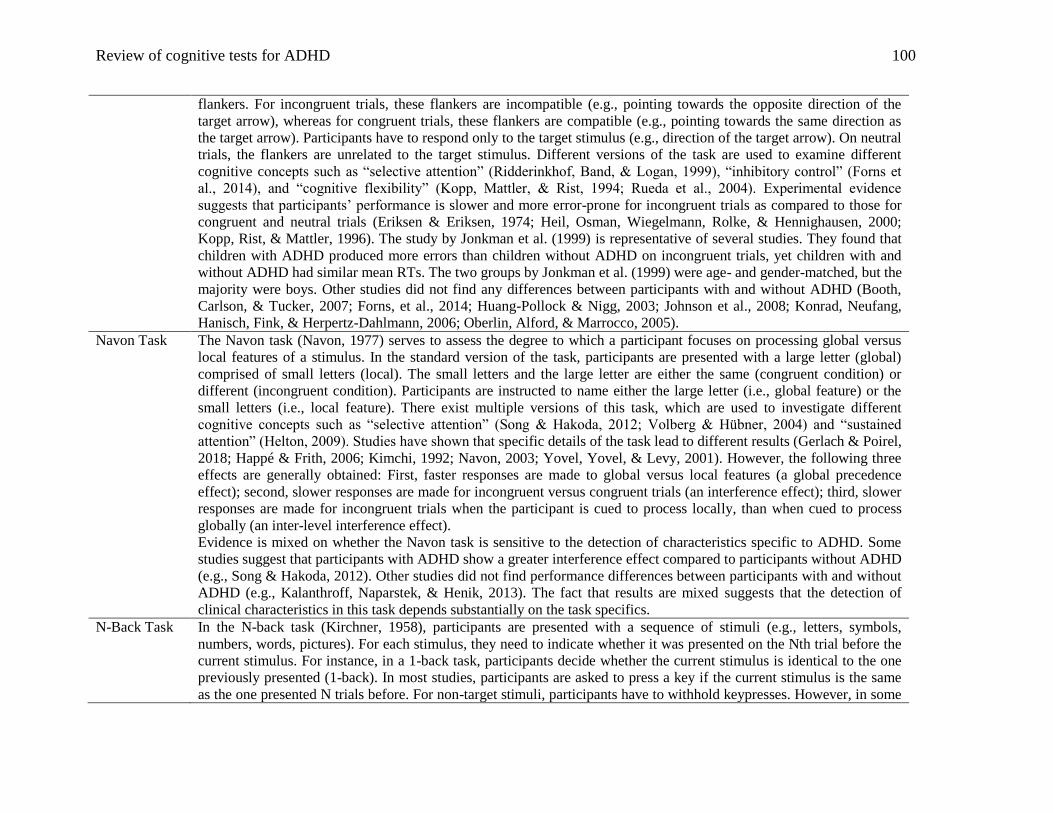
Review of cognitive tests for ADHD 100
flankers. For incongruent trials, these flankers are incompatible (e.g., pointing towards the opposite direction of the
target arrow), whereas for congruent trials, these flankers are compatible (e.g., pointing towards the same direction as
the target arrow). Participants have to respond only to the target stimulus (e.g., direction of the target arrow). On neutral
trials, the flankers are unrelated to the target stimulus. Different versions of the task are used to examine different
cognitive concepts such as “selective attention” (Ridderinkhof, Band, & Logan, 1999), “inhibitory control” (Forns et
al., 2014), and “cognitive flexibility” (Kopp, Mattler, & Rist, 1994; Rueda et al., 2004). Experimental evidence
suggests that participants’ performance is slower and more error-prone for incongruent trials as compared to those for
congruent and neutral trials (Eriksen & Eriksen, 1974; Heil, Osman, Wiegelmann, Rolke, & Hennighausen, 2000;
Kopp, Rist, & Mattler, 1996). The study by Jonkman et al. (1999) is representative of several studies. They found that
children with ADHD produced more errors than children without ADHD on incongruent trials, yet children with and
without ADHD had similar mean RTs. The two groups by Jonkman et al. (1999) were age- and gender-matched, but the
majority were boys. Other studies did not find any differences between participants with and without ADHD (Booth,
Carlson, & Tucker, 2007; Forns, et al., 2014; Huang-Pollock & Nigg, 2003; Johnson et al., 2008; Konrad, Neufang,
Hanisch, Fink, & Herpertz-Dahlmann, 2006; Oberlin, Alford, & Marrocco, 2005).
Navon Task
The Navon task (Navon, 1977) serves to assess the degree to which a participant focuses on processing global versus
local features of a stimulus. In the standard version of the task, participants are presented with a large letter (global)
comprised of small letters (local). The small letters and the large letter are either the same (congruent condition) or
different (incongruent condition). Participants are instructed to name either the large letter (i.e., global feature) or the
small letters (i.e., local feature). There exist multiple versions of this task, which are used to investigate different
cognitive concepts such as “selective attention” (Song & Hakoda, 2012; Volberg & Hübner, 2004) and “sustained
attention” (Helton, 2009). Studies have shown that specific details of the task lead to different results (Gerlach & Poirel,
2018; Happé & Frith, 2006; Kimchi, 1992; Navon, 2003; Yovel, Yovel, & Levy, 2001). However, the following three
effects are generally obtained: First, faster responses are made to global versus local features (a global precedence
effect); second, slower responses are made for incongruent versus congruent trials (an interference effect); third, slower
responses are made for incongruent trials when the participant is cued to process locally, than when cued to process
globally (an inter-level interference effect).
Evidence is mixed on whether the Navon task is sensitive to the detection of characteristics specific to ADHD. Some
studies suggest that participants with ADHD show a greater interference effect compared to participants without ADHD
(e.g., Song & Hakoda, 2012). Other studies did not find performance differences between participants with and without
ADHD (e.g., Kalanthroff, Naparstek, & Henik, 2013). The fact that results are mixed suggests that the detection of
clinical characteristics in this task depends substantially on the task specifics.
N-Back Task
In the N-back task (Kirchner, 1958), participants are presented with a sequence of stimuli (e.g., letters, symbols,
numbers, words, pictures). For each stimulus, they need to indicate whether it was presented on the Nth trial before the
current stimulus. For instance, in a 1-back task, participants decide whether the current stimulus is identical to the one
previously presented (1-back). In most studies, participants are asked to press a key if the current stimulus is the same
as the one presented N trials before. For non-target stimuli, participants have to withhold keypresses. However, in some
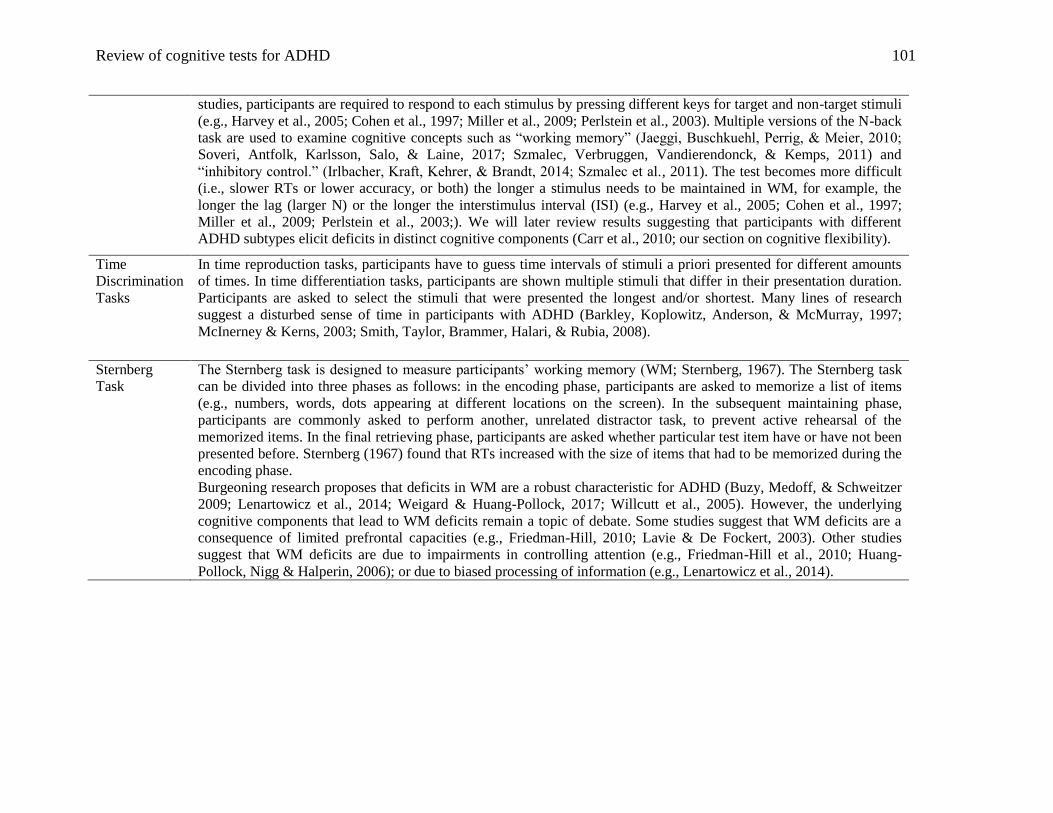
Review of cognitive tests for ADHD 101
studies, participants are required to respond to each stimulus by pressing different keys for target and non-target stimuli
(e.g., Harvey et al., 2005; Cohen et al., 1997; Miller et al., 2009; Perlstein et al., 2003). Multiple versions of the N-back
task are used to examine cognitive concepts such as “working memory” (Jaeggi, Buschkuehl, Perrig, & Meier, 2010;
Soveri, Antfolk, Karlsson, Salo, & Laine, 2017; Szmalec, Verbruggen, Vandierendonck, & Kemps, 2011) and
“inhibitory control.” (Irlbacher, Kraft, Kehrer, & Brandt, 2014; Szmalec et al., 2011). The test becomes more difficult
(i.e., slower RTs or lower accuracy, or both) the longer a stimulus needs to be maintained in WM, for example, the
longer the lag (larger N) or the longer the interstimulus interval (ISI) (e.g., Harvey et al., 2005; Cohen et al., 1997;
Miller et al., 2009; Perlstein et al., 2003;). We will later review results suggesting that participants with different
ADHD subtypes elicit deficits in distinct cognitive components (Carr et al., 2010; our section on cognitive flexibility).
Time
Discrimination
Tasks
In time reproduction tasks, participants have to guess time intervals of stimuli a priori presented for different amounts
of times. In time differentiation tasks, participants are shown multiple stimuli that differ in their presentation duration.
Participants are asked to select the stimuli that were presented the longest and/or shortest. Many lines of research
suggest a disturbed sense of time in participants with ADHD (Barkley, Koplowitz, Anderson, & McMurray, 1997;
McInerney & Kerns, 2003; Smith, Taylor, Brammer, Halari, & Rubia, 2008).
Sternberg
Task
The Sternberg task is designed to measure participants’ working memory (WM; Sternberg, 1967). The Sternberg task
can be divided into three phases as follows: in the encoding phase, participants are asked to memorize a list of items
(e.g., numbers, words, dots appearing at different locations on the screen). In the subsequent maintaining phase,
participants are commonly asked to perform another, unrelated distractor task, to prevent active rehearsal of the
memorized items. In the final retrieving phase, participants are asked whether particular test item have or have not been
presented before. Sternberg (1967) found that RTs increased with the size of items that had to be memorized during the
encoding phase.
Burgeoning research proposes that deficits in WM are a robust characteristic for ADHD (Buzy, Medoff, & Schweitzer
2009; Lenartowicz et al., 2014; Weigard & Huang-Pollock, 2017; Willcutt et al., 2005). However, the underlying
cognitive components that lead to WM deficits remain a topic of debate. Some studies suggest that WM deficits are a
consequence of limited prefrontal capacities (e.g., Friedman-Hill, 2010; Lavie & De Fockert, 2003). Other studies
suggest that WM deficits are due to impairments in controlling attention (e.g., Friedman-Hill et al., 2010; Huang-
Pollock, Nigg & Halperin, 2006); or due to biased processing of information (e.g., Lenartowicz et al., 2014).

Review of cognitive tests for ADHD 102
Stop-Signal
Task
The Stop-Signal task is designed to measure inhibitory control processes (Crosbie et al., 2013; Logan et al., 1984;
Logan, Van Zandt, Verbruggen, & Wagenmakers, 2014; Nigg, 1999; Willcutt et al., 2005), and is conceptualized as a
go/no-go task. As in the CPT, participants need to respond quickly to go trials. In contrast to the CPT, some of the go
trials are followed by a signal (e.g., typically an auditory tone), which requires participants to stop their ongoing
response. It is hypothesized that the mean stop-signal reaction time (SSRT), which represents the difference between go
stimulus onset and stop-signal onset, indexes the efficiency of cognitive control processes. Research has found that
children with ADHD exhibit significantly slower RTs compared to children without ADHD for go trials in blocks with
intermittent stop signals compared to controls (with medium effect sizes, see Alderson, Rapport, Sarver & Kofler, 2007;
Lipszyc & Schachar, 2010; Martel, Nikolas, & Nigg, 2007; Nigg, 1999; Willcutt et al., 2005). However, current
research questions whether the SSRT indeed indexes efficiency of cognitive control processes and whether cognitive
control processes are indeed the characterizing feature of ADHD (Nikolas, Marshall, & Hoelzle, 2019; Weigard,
Heathcote, Matzke, & Huang-Pollock, 2019).
Stroop Task
In the Stroop task (Stroop, 1935), participants are presented with words of colors and are required to either read the
color word or to name the color of the word. The task is composed of incongruent and congruent trials. On congruent
trials, the ink color of the word matches the color word. On incongruent trials, the ink color is dissimilar to the color
word. The Stroop task measures cognitive concepts such as “cognitive flexibility” (Spreen & Strauss, 1998) and
“selective attention” (Spreen & Strauss, 1998). Experimental evidence (Spreen & Strauss, 1998; Stroop, 1935)
consistently showed that participants’ performance is slower and more error-prone for incongruent trials as compared to
congruent trials. Some reviews suggest that children with ADHD show poorer performance than children without
ADHD for incongruent trials. They conclude that one characteristic of ADHD is a deficit in the resolution of
interference (Barkley, 1997a; Pennington & Ozonoff, 1996).
Wisconsin
Card Sorting
Task
The Wisconsin Card Sorting Task (WCST) is a task-switch paradigm frequently used to study cognitive characteristics
such as “cognitive flexibility” and “efficiency of executive control processes” in participants with ADHD (Goldstein &
Green, 1995; Romine, Lee, Wolfe, Homack, George, & Riccio, 2004). In the standard version of this test, participants
are asked to sort cards based on their color, shape, or number. The participant has to learn the rule (i.e., which card
feature to sort the card: color, shape, or number) based on feedback messages (i.e., correct/incorrect). The rule usually
changes every eleventh trial and so the WCST measures not only cognitive flexibility but also a participant’s ability to
learn the rule. Accuracy values index the performance on the WCST. Conducting a meta-analysis, Romine et al. (2004)
found that participants with ADHD had poorer performance (i.e., a higher error rate) on the WCST as compared to
participants without ADHD. The test can be difficult to administer, because it requires participants to tolerate
frustration as newly learned rules must be updated unexpectedly and multiple times during the test (Robinson, Kester,
Saykin, Kaplan, & Gur, 1991; Smith-Seemiller, Franzen, & Bowers, 1997).

Review of cognitive tests for ADHD 103
Table 3. Description of computational models covered in this study
Model Description of model
Absolute
Accumulator
Models
(AAMs)
Absolute accumulator models (AAMs), alternatives to DDMs (explained below), belong to the class of sequential sampling
models (for comparisons among the models see Ratcliff & Smith, 2004; Forstmann et al., 2016). The underlying
assumption of sequential sampling models is that evidence for one (or more) response alternatives are accumulated over
time until a particular decision criterion (i.e., threshold of evidence) is reached (Forstmann et al., 2016; Van Zandt,
Colonius and Proctor, 2000).
AAMs introduce a separate decision process (i.e., accumulator) for each response alternative. Hence, it is assumed that
evidence is accumulated for each possible response independently and separately. The rate of evidence accumulation for
each counter is referred to as drift rate. In contrast, the DDM introduces one decision process for all response alternative so
that the rate of evidence accumulation (i.e., drift rate) represents the net evidence for a particular response. There are
multiple versions of AAMs that vary in their underlying assumption about whether evidence accumulation processes are
noisy and/or vary across trials (e.g., Racing Diffusion Model; Van Zandt et al., 2000; Linear Ballistic Accumulator Model;
Brown and Heathcote, 2008; accumulator and counter models, Ratcliff & Smith, 2004; Leaky competing accumulator
model, Usher & McClelland, 2001).
EAMs typically decompose the task performance into components that closely resemble the DDM’s main model parameters
(i.e., drift rate, nondecision time component, boundary separation, and starting point; see for a review: Donkin, Brown,
Heathcote, and Wagenmakers, 2010).
Diffusion
Decision Models
(DDMs)
The diffusion decision model (DDM, Ratcliff, 1978) utilizes accuracy and RT data to decompose the task performance into
separable cognitive components, namely: the quality of information driving the decision process (drift rate, v), the amount
of evidence used to reach a decision (boundary separation, a), the duration of perceptual encoding and response execution
(nondecision time component, Ter), and a priori expectations (starting point, z) (Forstmann et al., 2016; Ratcliff, 1978;
1985; 1987; Ratcliff & McKoon, 2008). The model is also appealing because the assumption about decision processes
closely resembles our understanding of brain functioning and dynamics. For instance, multiple studies provide neuronal
evidence for the existence and dynamics of the cognitive components suggested above. Specifically, they demonstrate that
distinct brain areas are active during different stages of the decision process (Cohen & Kohn, 2011; Gold & Shadlen, 2001;
Gold & Shadlen, 2007; Hanes & Schall, 1996; Philiastides, Ratcliff, & Sajda, 2006; Ratcliff, Cherian, & Segraves, 2003;
Ratcliff et al., 2007; Wong, Huk, Shadlen, & Wang, 2007).
The diffusion model has been used in a range of research fields. Its parameters have validated cognitive interpretations
(Ratcliff & McKoon 2008; Ratcliff & Rouder, 1998; Ratcliff, Smith, Brown & McKoon, 2016; Ratcliff, Van Zandt, &
McKoon, 1999; Voss, Rothermund, & Voss, 2004). Moreover, the diffusion model has successfully accounted for the
cognitive task data from a wide range of clinical participant populations such as ADHD, autism, depression, anxiety,
aphasia, and dyslexia, among others (Caulfield & Myers, 2018; Johnson, Stafford, & Milne, 2018; Pe, Vandekerckhove, &
Kuppens, 2013; Perugini, Ditterich, & Basso, 2016; Pirrone, Moustafa et al., 2015; Ratcliff, Perea, Colangelo, & Buchanan,
2004; White, Ratcliff, Vasey & McKoon, 2010a, 2010b; Zeguers et al., 2011).
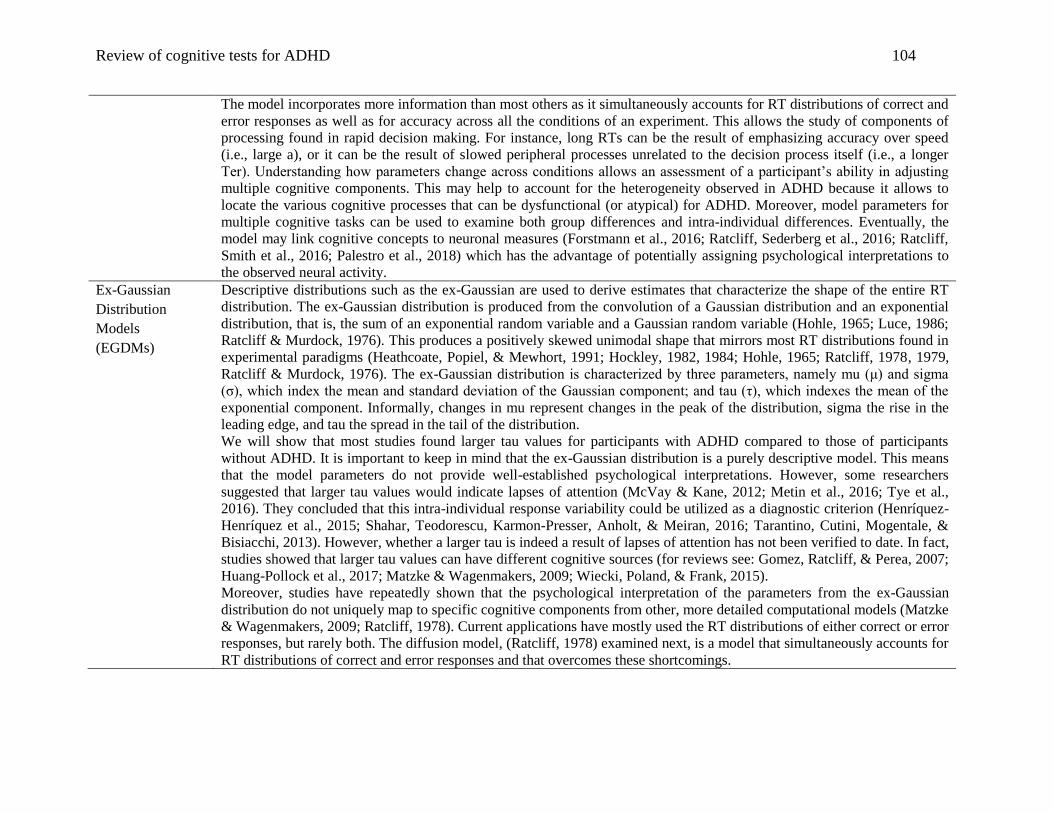
Review of cognitive tests for ADHD 104
The model incorporates more information than most others as it simultaneously accounts for RT distributions of correct and
error responses as well as for accuracy across all the conditions of an experiment. This allows the study of components of
processing found in rapid decision making. For instance, long RTs can be the result of emphasizing accuracy over speed
(i.e., large a), or it can be the result of slowed peripheral processes unrelated to the decision process itself (i.e., a longer
Ter). Understanding how parameters change across conditions allows an assessment of a participant’s ability in adjusting
multiple cognitive components. This may help to account for the heterogeneity observed in ADHD because it allows to
locate the various cognitive processes that can be dysfunctional (or atypical) for ADHD. Moreover, model parameters for
multiple cognitive tasks can be used to examine both group differences and intra-individual differences. Eventually, the
model may link cognitive concepts to neuronal measures (Forstmann et al., 2016; Ratcliff, Sederberg et al., 2016; Ratcliff,
Smith et al., 2016; Palestro et al., 2018) which has the advantage of potentially assigning psychological interpretations to
the observed neural activity.
Ex-Gaussian
Distribution
Models
(EGDMs)
Descriptive distributions such as the ex-Gaussian are used to derive estimates that characterize the shape of the entire RT
distribution. The ex-Gaussian distribution is produced from the convolution of a Gaussian distribution and an exponential
distribution, that is, the sum of an exponential random variable and a Gaussian random variable (Hohle, 1965; Luce, 1986;
Ratcliff & Murdock, 1976). This produces a positively skewed unimodal shape that mirrors most RT distributions found in
experimental paradigms (Heathcoate, Popiel, & Mewhort, 1991; Hockley, 1982, 1984; Hohle, 1965; Ratcliff, 1978, 1979,
Ratcliff & Murdock, 1976). The ex-Gaussian distribution is characterized by three parameters, namely mu (μ) and sigma
(σ), which index the mean and standard deviation of the Gaussian component; and tau (τ), which indexes the mean of the
exponential component. Informally, changes in mu represent changes in the peak of the distribution, sigma the rise in the
leading edge, and tau the spread in the tail of the distribution.
We will show that most studies found larger tau values for participants with ADHD compared to those of participants
without ADHD. It is important to keep in mind that the ex-Gaussian distribution is a purely descriptive model. This means
that the model parameters do not provide well-established psychological interpretations. However, some researchers
suggested that larger tau values would indicate lapses of attention (McVay & Kane, 2012; Metin et al., 2016; Tye et al.,
2016). They concluded that this intra-individual response variability could be utilized as a diagnostic criterion (Henríquez-
Henríquez et al., 2015; Shahar, Teodorescu, Karmon-Presser, Anholt, & Meiran, 2016; Tarantino, Cutini, Mogentale, &
Bisiacchi, 2013). However, whether a larger tau is indeed a result of lapses of attention has not been verified to date. In fact,
studies showed that larger tau values can have different cognitive sources (for reviews see: Gomez, Ratcliff, & Perea, 2007;
Huang-Pollock et al., 2017; Matzke & Wagenmakers, 2009; Wiecki, Poland, & Frank, 2015).
Moreover, studies have repeatedly shown that the psychological interpretation of the parameters from the ex-Gaussian
distribution do not uniquely map to specific cognitive components from other, more detailed computational models (Matzke
& Wagenmakers, 2009; Ratcliff, 1978). Current applications have mostly used the RT distributions of either correct or error
responses, but rarely both. The diffusion model, (Ratcliff, 1978) examined next, is a model that simultaneously accounts for
RT distributions of correct and error responses and that overcomes these shortcomings.

Review of cognitive tests for ADHD 105
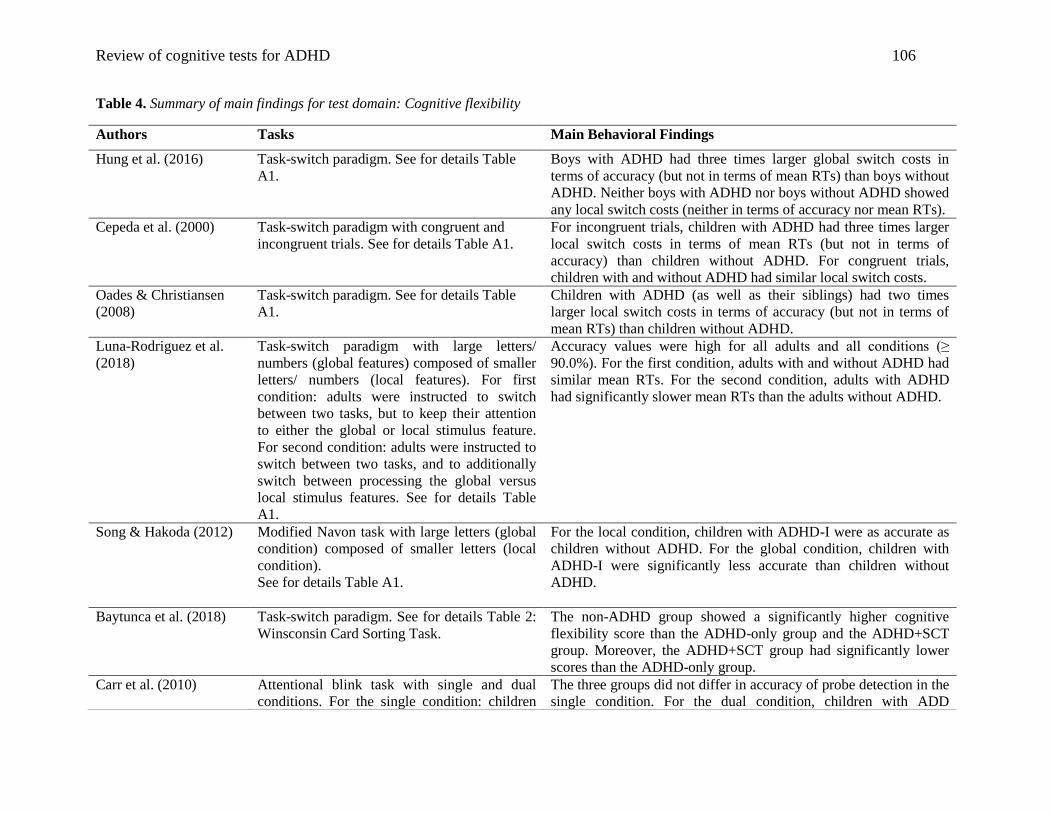
Review of cognitive tests for ADHD 106
Table 4. Summary of main findings for test domain: Cognitive flexibility
Authors Tasks Main Behavioral Findings
Hung et al. (2016) Task-switch paradigm. See for details Table
A1.
Boys with ADHD had three times larger global switch costs in
terms of accuracy (but not in terms of mean RTs) than boys without
ADHD. Neither boys with ADHD nor boys without ADHD showed
any local switch costs (neither in terms of accuracy nor mean RTs).
Cepeda et al. (2000) Task-switch paradigm with congruent and
incongruent trials. See for details Table A1.
For incongruent trials, children with ADHD had three times larger
local switch costs in terms of mean RTs (but not in terms of
accuracy) than children without ADHD. For congruent trials,
children with and without ADHD had similar local switch costs.
Oades & Christiansen
(2008)
Task-switch paradigm. See for details Table
A1.
Children with ADHD (as well as their siblings) had two times
larger local switch costs in terms of accuracy (but not in terms of
mean RTs) than children without ADHD.
Luna-Rodriguez et al.
(2018)
Task-switch paradigm with large letters/
numbers (global features) composed of smaller
letters/ numbers (local features). For first
condition: adults were instructed to switch
between two tasks, but to keep their attention
to either the global or local stimulus feature.
For second condition: adults were instructed to
switch between two tasks, and to additionally
switch between processing the global versus
local stimulus features. See for details Table
A1.
Accuracy values were high for all adults and all conditions (≥
90.0%). For the first condition, adults with and without ADHD had
similar mean RTs. For the second condition, adults with ADHD
had significantly slower mean RTs than the adults without ADHD.
Song & Hakoda (2012) Modified Navon task with large letters (global
condition) composed of smaller letters (local
condition).
See for details Table A1.
For the local condition, children with ADHD-I were as accurate as
children without ADHD. For the global condition, children with
ADHD-I were significantly less accurate than children without
ADHD.
Baytunca et al. (2018) Task-switch paradigm. See for details Table 2:
Winsconsin Card Sorting Task.
The non-ADHD group showed a significantly higher cognitive
flexibility score than the ADHD-only group and the ADHD+SCT
group. Moreover, the ADHD+SCT group had significantly lower
scores than the ADHD-only group.
Carr et al. (2010) Attentional blink task with single and dual
conditions. For the single condition: children
The three groups did not differ in accuracy of probe detection in the
single condition. For the dual condition, children with ADD
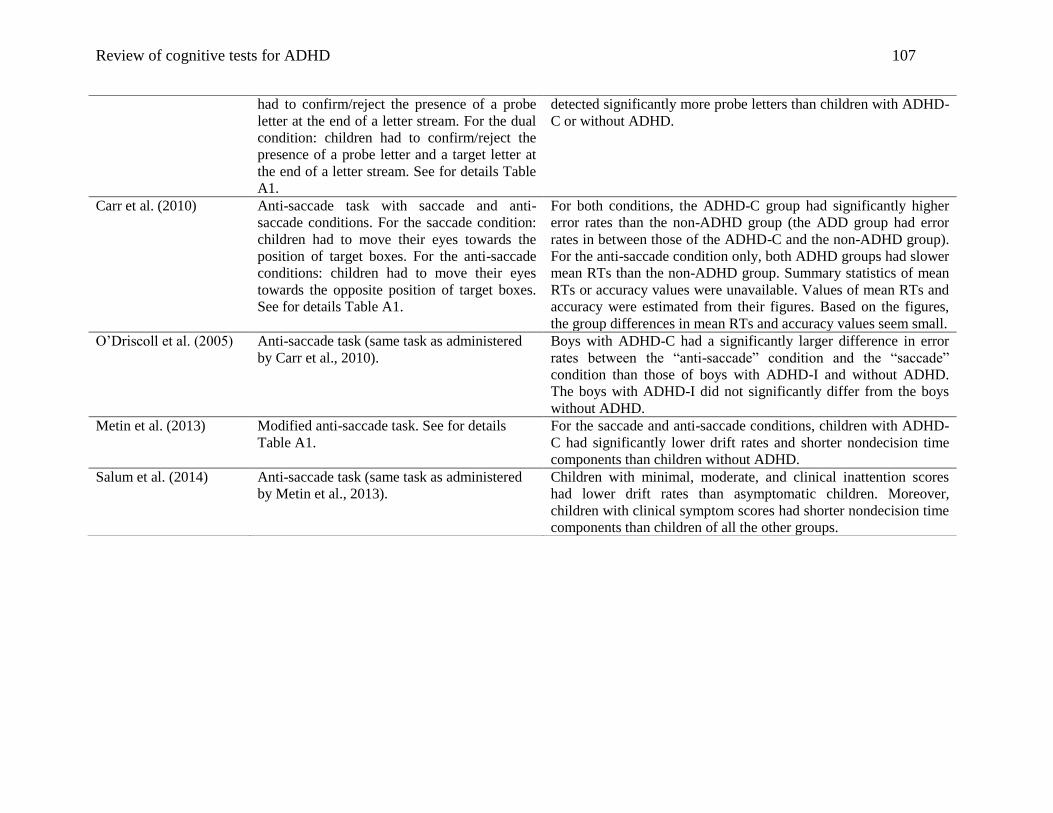
Review of cognitive tests for ADHD 107
had to confirm/reject the presence of a probe
letter at the end of a letter stream. For the dual
condition: children had to confirm/reject the
presence of a probe letter and a target letter at
the end of a letter stream. See for details Table
A1.
detected significantly more probe letters than children with ADHD-
C or without ADHD.
Carr et al. (2010) Anti-saccade task with saccade and anti-
saccade conditions. For the saccade condition:
children had to move their eyes towards the
position of target boxes. For the anti-saccade
conditions: children had to move their eyes
towards the opposite position of target boxes.
See for details Table A1.
For both conditions, the ADHD-C group had significantly higher
error rates than the non-ADHD group (the ADD group had error
rates in between those of the ADHD-C and the non-ADHD group).
For the anti-saccade condition only, both ADHD groups had slower
mean RTs than the non-ADHD group. Summary statistics of mean
RTs or accuracy values were unavailable. Values of mean RTs and
accuracy were estimated from their figures. Based on the figures,
the group differences in mean RTs and accuracy values seem small.
O’Driscoll et al. (2005) Anti-saccade task (same task as administered
by Carr et al., 2010).
Boys with ADHD-C had a significantly larger difference in error
rates between the “anti-saccade” condition and the “saccade”
condition than those of boys with ADHD-I and without ADHD.
The boys with ADHD-I did not significantly differ from the boys
without ADHD.
Metin et al. (2013) Modified anti-saccade task. See for details
Table A1.
For the saccade and anti-saccade conditions, children with ADHD-
C had significantly lower drift rates and shorter nondecision time
components than children without ADHD.
Salum et al. (2014) Anti-saccade task (same task as administered
by Metin et al., 2013).
Children with minimal, moderate, and clinical inattention scores
had lower drift rates than asymptomatic children. Moreover,
children with clinical symptom scores had shorter nondecision time
components than children of all the other groups.
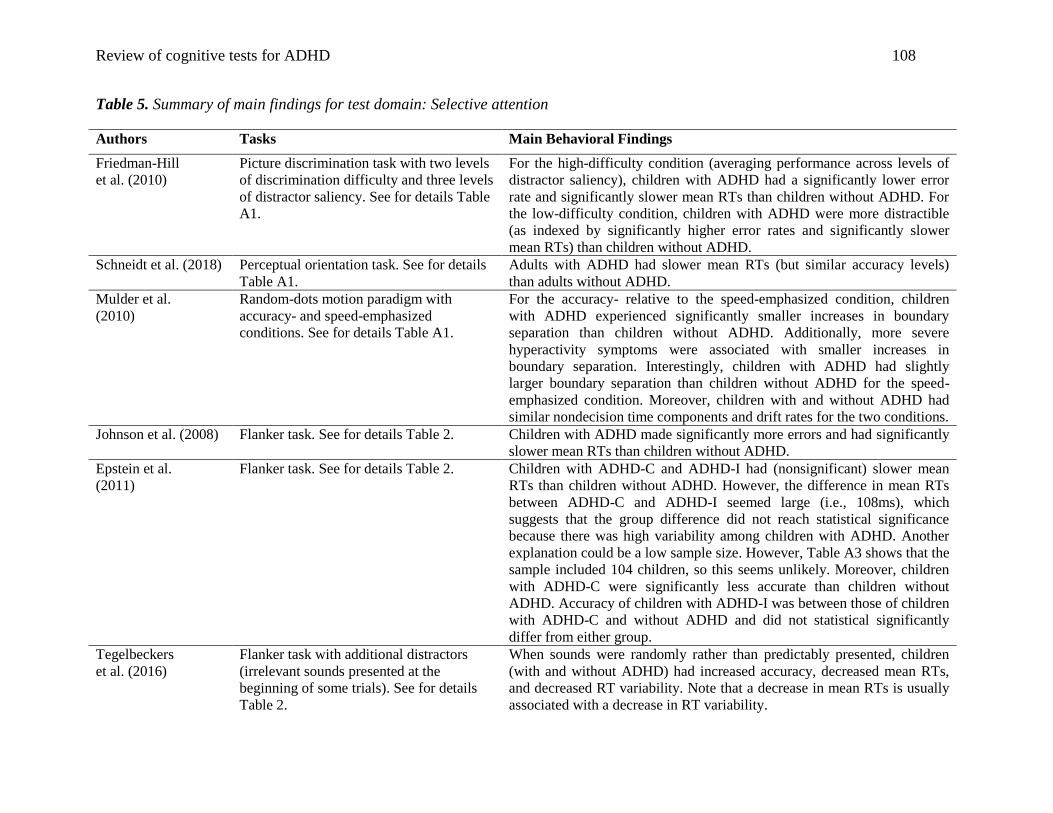
Review of cognitive tests for ADHD 108
Table 5. Summary of main findings for test domain: Selective attention
Authors Tasks Main Behavioral Findings
Friedman-Hill
et al. (2010)
Picture discrimination task with two levels
of discrimination difficulty and three levels
of distractor saliency. See for details Table
A1.
For the high-difficulty condition (averaging performance across levels of
distractor saliency), children with ADHD had a significantly lower error
rate and significantly slower mean RTs than children without ADHD. For
the low-difficulty condition, children with ADHD were more distractible
(as indexed by significantly higher error rates and significantly slower
mean RTs) than children without ADHD.
Schneidt et al. (2018) Perceptual orientation task. See for details
Table A1.
Adults with ADHD had slower mean RTs (but similar accuracy levels)
than adults without ADHD.
Mulder et al.
(2010)
Random-dots motion paradigm with
accuracy- and speed-emphasized
conditions. See for details Table A1.
For the accuracy- relative to the speed-emphasized condition, children
with ADHD experienced significantly smaller increases in boundary
separation than children without ADHD. Additionally, more severe
hyperactivity symptoms were associated with smaller increases in
boundary separation. Interestingly, children with ADHD had slightly
larger boundary separation than children without ADHD for the speed-
emphasized condition. Moreover, children with and without ADHD had
similar nondecision time components and drift rates for the two conditions.
Johnson et al. (2008) Flanker task. See for details Table 2. Children with ADHD made significantly more errors and had significantly
slower mean RTs than children without ADHD.
Epstein et al.
(2011)
Flanker task. See for details Table 2. Children with ADHD-C and ADHD-I had (nonsignificant) slower mean
RTs than children without ADHD. However, the difference in mean RTs
between ADHD-C and ADHD-I seemed large (i.e., 108ms), which
suggests that the group difference did not reach statistical significance
because there was high variability among children with ADHD. Another
explanation could be a low sample size. However, Table A3 shows that the
sample included 104 children, so this seems unlikely. Moreover, children
with ADHD-C were significantly less accurate than children without
ADHD. Accuracy of children with ADHD-I was between those of children
with ADHD-C and without ADHD and did not statistical significantly
differ from either group.
Tegelbeckers
et al. (2016)
Flanker task with additional distractors
(irrelevant sounds presented at the
beginning of some trials). See for details
Table 2.
When sounds were randomly rather than predictably presented, children
(with and without ADHD) had increased accuracy, decreased mean RTs,
and decreased RT variability. Note that a decrease in mean RTs is usually
associated with a decrease in RT variability.
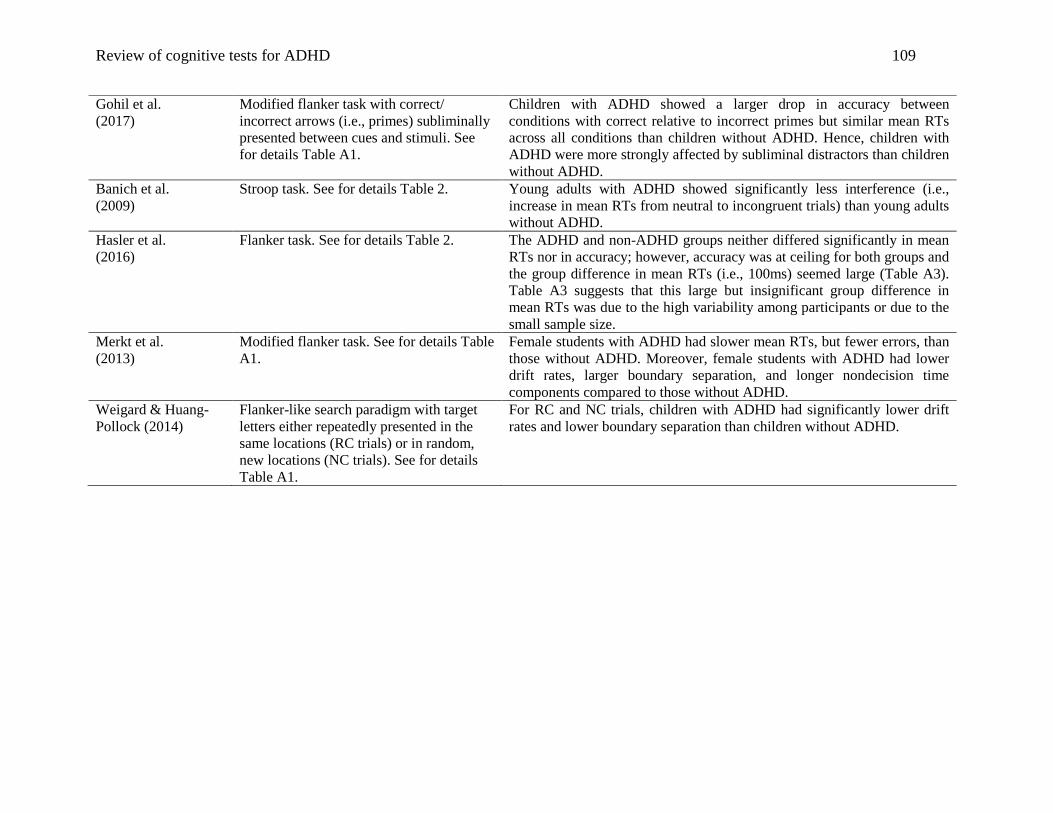
Review of cognitive tests for ADHD 109
Gohil et al.
(2017)
Modified flanker task with correct/
incorrect arrows (i.e., primes) subliminally
presented between cues and stimuli. See
for details Table A1.
Children with ADHD showed a larger drop in accuracy between
conditions with correct relative to incorrect primes but similar mean RTs
across all conditions than children without ADHD. Hence, children with
ADHD were more strongly affected by subliminal distractors than children
without ADHD.
Banich et al.
(2009)
Stroop task. See for details Table 2. Young adults with ADHD showed significantly less interference (i.e.,
increase in mean RTs from neutral to incongruent trials) than young adults
without ADHD.
Hasler et al.
(2016)
Flanker task. See for details Table 2. The ADHD and non-ADHD groups neither differed significantly in mean
RTs nor in accuracy; however, accuracy was at ceiling for both groups and
the group difference in mean RTs (i.e., 100ms) seemed large (Table A3).
Table A3 suggests that this large but insignificant group difference in
mean RTs was due to the high variability among participants or due to the
small sample size.
Merkt et al.
(2013)
Modified flanker task. See for details Table
A1.
Female students with ADHD had slower mean RTs, but fewer errors, than
those without ADHD. Moreover, female students with ADHD had lower
drift rates, larger boundary separation, and longer nondecision time
components compared to those without ADHD.
Weigard & Huang-
Pollock (2014)
Flanker-like search paradigm with target
letters either repeatedly presented in the
same locations (RC trials) or in random,
new locations (NC trials). See for details
Table A1.
For RC and NC trials, children with ADHD had significantly lower drift
rates and lower boundary separation than children without ADHD.
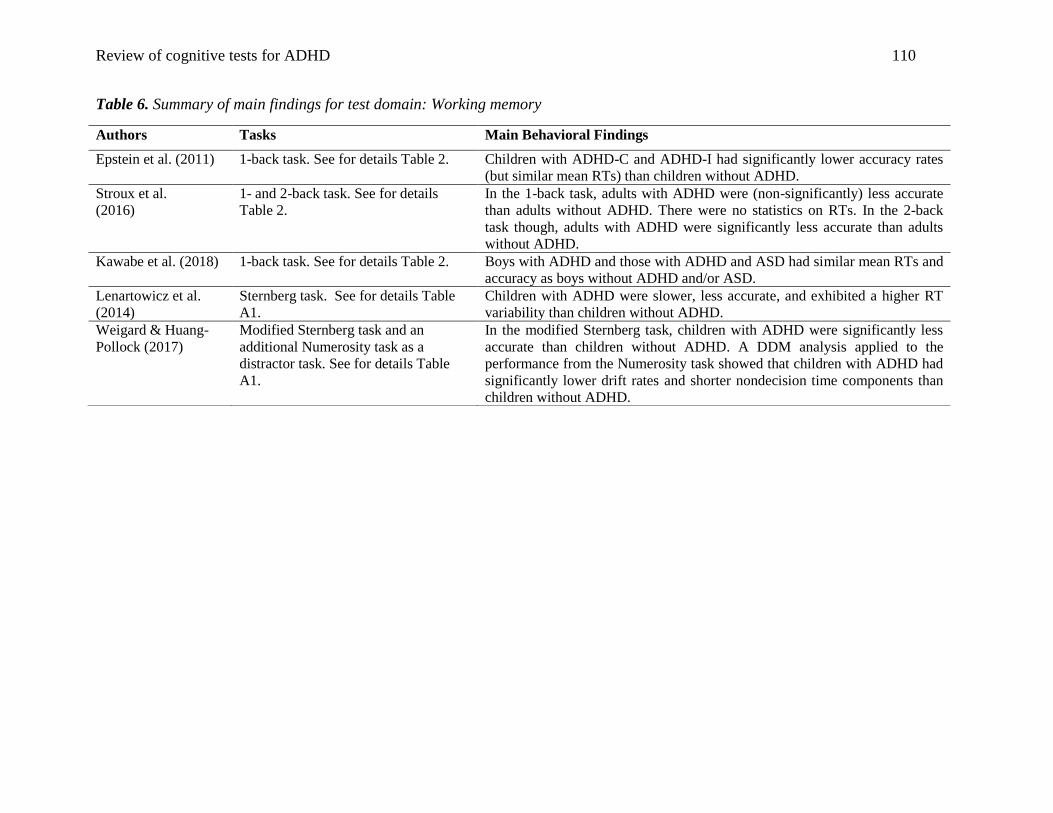
Review of cognitive tests for ADHD 110
Table 6. Summary of main findings for test domain: Working memory
Authors Tasks Main Behavioral Findings
Epstein et al. (2011) 1-back task. See for details Table 2. Children with ADHD-C and ADHD-I had significantly lower accuracy rates
(but similar mean RTs) than children without ADHD.
Stroux et al.
(2016)
1- and 2-back task. See for details
Table 2.
In the 1-back task, adults with ADHD were (non-significantly) less accurate
than adults without ADHD. There were no statistics on RTs. In the 2-back
task though, adults with ADHD were significantly less accurate than adults
without ADHD.
Kawabe et al. (2018) 1-back task. See for details Table 2. Boys with ADHD and those with ADHD and ASD had similar mean RTs and
accuracy as boys without ADHD and/or ASD.
Lenartowicz et al.
(2014)
Sternberg task. See for details Table
A1.
Children with ADHD were slower, less accurate, and exhibited a higher RT
variability than children without ADHD.
Weigard & Huang-
Pollock (2017)
Modified Sternberg task and an
additional Numerosity task as a
distractor task. See for details Table
A1.
In the modified Sternberg task, children with ADHD were significantly less
accurate than children without ADHD. A DDM analysis applied to the
performance from the Numerosity task showed that children with ADHD had
significantly lower drift rates and shorter nondecision time components than
children without ADHD.
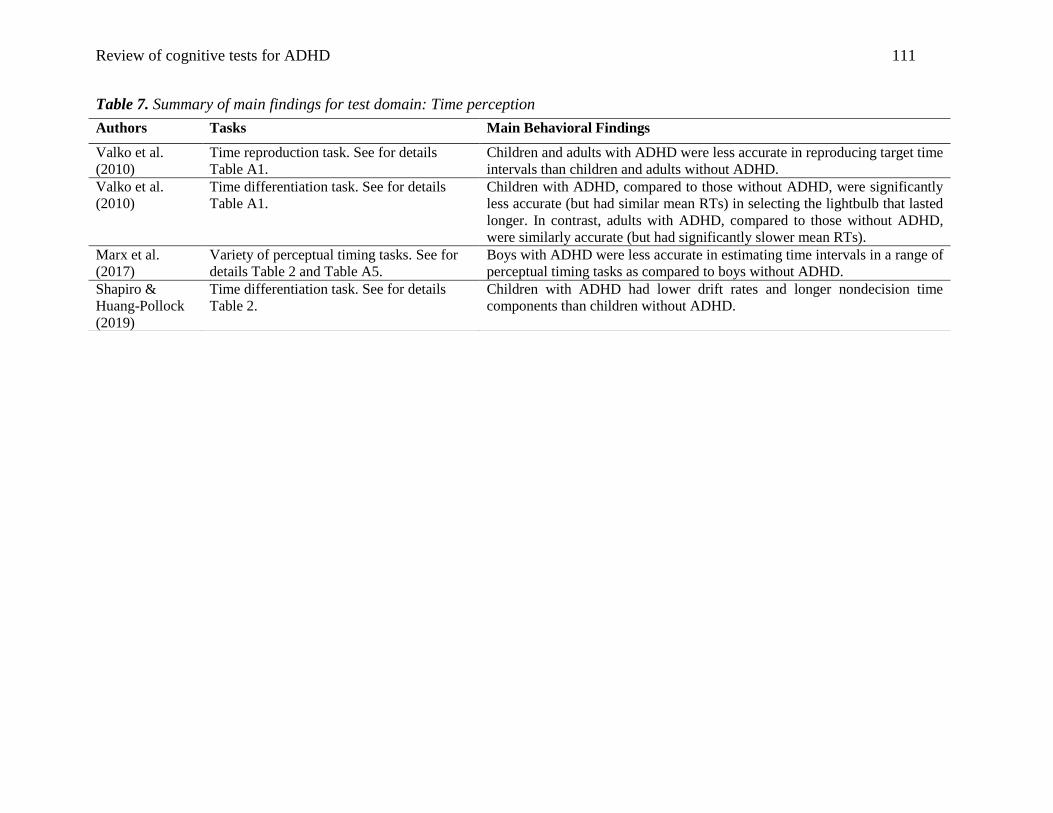
Review of cognitive tests for ADHD 111
Table 7. Summary of main findings for test domain: Time perception
Authors Tasks Main Behavioral Findings
Valko et al.
(2010)
Time reproduction task. See for details
Table A1.
Children and adults with ADHD were less accurate in reproducing target time
intervals than children and adults without ADHD.
Valko et al.
(2010)
Time differentiation task. See for details
Table A1.
Children with ADHD, compared to those without ADHD, were significantly
less accurate (but had similar mean RTs) in selecting the lightbulb that lasted
longer. In contrast, adults with ADHD, compared to those without ADHD,
were similarly accurate (but had significantly slower mean RTs).
Marx et al.
(2017)
Variety of perceptual timing tasks. See for
details Table 2 and Table A5.
Boys with ADHD were less accurate in estimating time intervals in a range of
perceptual timing tasks as compared to boys without ADHD.
Shapiro &
Huang-Pollock
(2019)
Time differentiation task. See for details
Table 2.
Children with ADHD had lower drift rates and longer nondecision time
components than children without ADHD.

Review of cognitive tests for ADHD 112
Table 8. Summary of main findings for test domain: Sustained attention
Authors Tasks Main Behavioral Findings
Collings
(2003)
Continuous performance task (CPT).
See for details Table 2.
Boys with ADHD-C made significantly more omission errors than those
with ADHD-I or those without ADHD.
Baytunca
et al. (2018)
Modified continuous performance task
(CPT). See for details Table A1.
The ADHD-only group had similar mean RTs (for correct responses) as the
ADHD+SCT group. Both ADHD groups had significantly slower mean RTs
(for correct responses) and produced significantly more errors (commission
and omission) than the non-ADHD group. The ADHD+SCT group produced
significantly more commission errors (but not more omission errors) than
the ADHD-only group.
Huang-Pollock et
al. (2012)
Continuous performance task (CPT).
See for details Table 2.
Children with ADHD show significantly slower and less accurate responses
(i.e., lower drift rates) than children without ADHD.
Huang-Pollock et
al. (2020)
Continuous performance task (CPT).
See for details Table 2.
Comparing performance from first half of blocks of the task with the
performance from second half of blocks showed: Children with and without
ADHD both showed an increase in the bias towards no-go responses.
Compared to children without ADHD, children with ADHD showed
additional increases in drift rate for no-go responses over time.
Loo et al. (2009) Continuous performance task (CPT).
See for details Table 2.
The ADHD group and the non-ADHD group did not differ in any behavioral
measure (i.e., similar omission and commission errors as well as similar
mean RTs for correct responses).
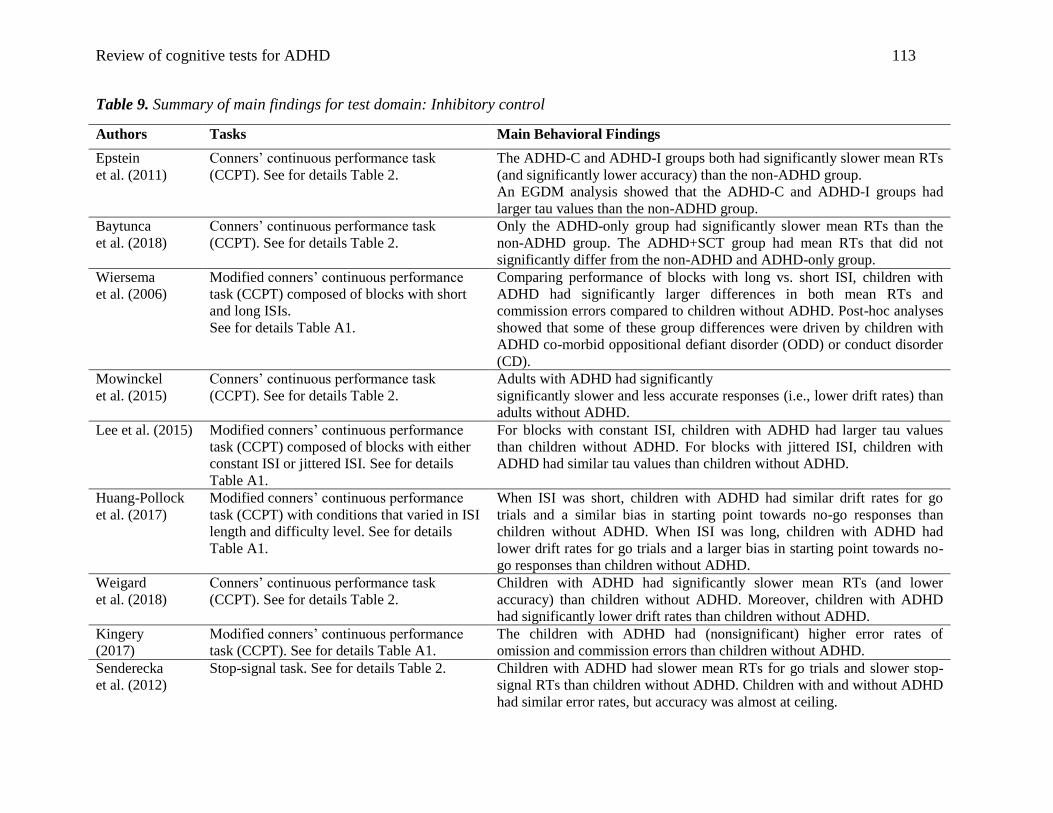
Review of cognitive tests for ADHD 113
Table 9. Summary of main findings for test domain: Inhibitory control
Authors Tasks Main Behavioral Findings
Epstein
et al. (2011)
Conners’ continuous performance task
(CCPT). See for details Table 2.
The ADHD-C and ADHD-I groups both had significantly slower mean RTs
(and significantly lower accuracy) than the non-ADHD group.
An EGDM analysis showed that the ADHD-C and ADHD-I groups had
larger tau values than the non-ADHD group.
Baytunca
et al. (2018)
Conners’ continuous performance task
(CCPT). See for details Table 2.
Only the ADHD-only group had significantly slower mean RTs than the
non-ADHD group. The ADHD+SCT group had mean RTs that did not
significantly differ from the non-ADHD and ADHD-only group.
Wiersema
et al. (2006)
Modified conners’ continuous performance
task (CCPT) composed of blocks with short
and long ISIs.
See for details Table A1.
Comparing performance of blocks with long vs. short ISI, children with
ADHD had significantly larger differences in both mean RTs and
commission errors compared to children without ADHD. Post-hoc analyses
showed that some of these group differences were driven by children with
ADHD co-morbid oppositional defiant disorder (ODD) or conduct disorder
(CD).
Mowinckel
et al. (2015)
Conners’ continuous performance task
(CCPT). See for details Table 2.
Adults with ADHD had significantly
significantly slower and less accurate responses (i.e., lower drift rates) than
adults without ADHD.
Lee et al. (2015) Modified conners’ continuous performance
task (CCPT) composed of blocks with either
constant ISI or jittered ISI. See for details
Table A1.
For blocks with constant ISI, children with ADHD had larger tau values
than children without ADHD. For blocks with jittered ISI, children with
ADHD had similar tau values than children without ADHD.
Huang-Pollock
et al. (2017)
Modified conners’ continuous performance
task (CCPT) with conditions that varied in ISI
length and difficulty level. See for details
Table A1.
When ISI was short, children with ADHD had similar drift rates for go
trials and a similar bias in starting point towards no-go responses than
children without ADHD. When ISI was long, children with ADHD had
lower drift rates for go trials and a larger bias in starting point towards no-
go responses than children without ADHD.
Weigard
et al. (2018)
Conners’ continuous performance task
(CCPT). See for details Table 2.
Children with ADHD had significantly slower mean RTs (and lower
accuracy) than children without ADHD. Moreover, children with ADHD
had significantly lower drift rates than children without ADHD.
Kingery
(2017)
Modified conners’ continuous performance
task (CCPT). See for details Table A1.
The children with ADHD had (nonsignificant) higher error rates of
omission and commission errors than children without ADHD.
Senderecka
et al. (2012)
Stop-signal task. See for details Table 2. Children with ADHD had slower mean RTs for go trials and slower stop-
signal RTs than children without ADHD. Children with and without ADHD
had similar error rates, but accuracy was almost at ceiling.
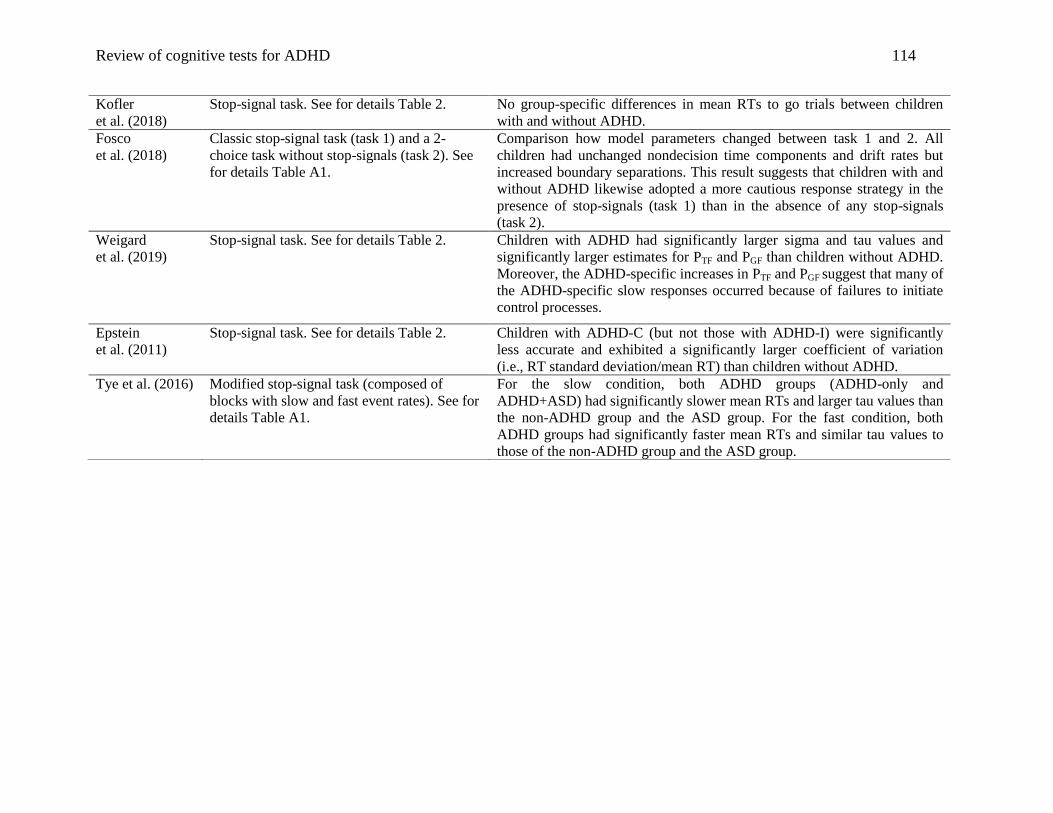
Review of cognitive tests for ADHD 114
Kofler
et al. (2018)
Stop-signal task. See for details Table 2. No group-specific differences in mean RTs to go trials between children
with and without ADHD.
Fosco
et al. (2018)
Classic stop-signal task (task 1) and a 2-
choice task without stop-signals (task 2). See
for details Table A1.
Comparison how model parameters changed between task 1 and 2. All
children had unchanged nondecision time components and drift rates but
increased boundary separations. This result suggests that children with and
without ADHD likewise adopted a more cautious response strategy in the
presence of stop-signals (task 1) than in the absence of any stop-signals
(task 2).
Weigard
et al. (2019)
Stop-signal task. See for details Table 2. Children with ADHD had significantly larger sigma and tau values and
significantly larger estimates for PTF and PGF than children without ADHD.
Moreover, the ADHD-specific increases in PTF and PGF suggest that many of
the ADHD-specific slow responses occurred because of failures to initiate
control processes.
Epstein
et al. (2011)
Stop-signal task. See for details Table 2. Children with ADHD-C (but not those with ADHD-I) were significantly
less accurate and exhibited a significantly larger coefficient of variation
(i.e., RT standard deviation/mean RT) than children without ADHD.
Tye et al. (2016) Modified stop-signal task (composed of
blocks with slow and fast event rates). See for
details Table A1.
For the slow condition, both ADHD groups (ADHD-only and
ADHD+ASD) had significantly slower mean RTs and larger tau values than
the non-ADHD group and the ASD group. For the fast condition, both
ADHD groups had significantly faster mean RTs and similar tau values to
those of the non-ADHD group and the ASD group.
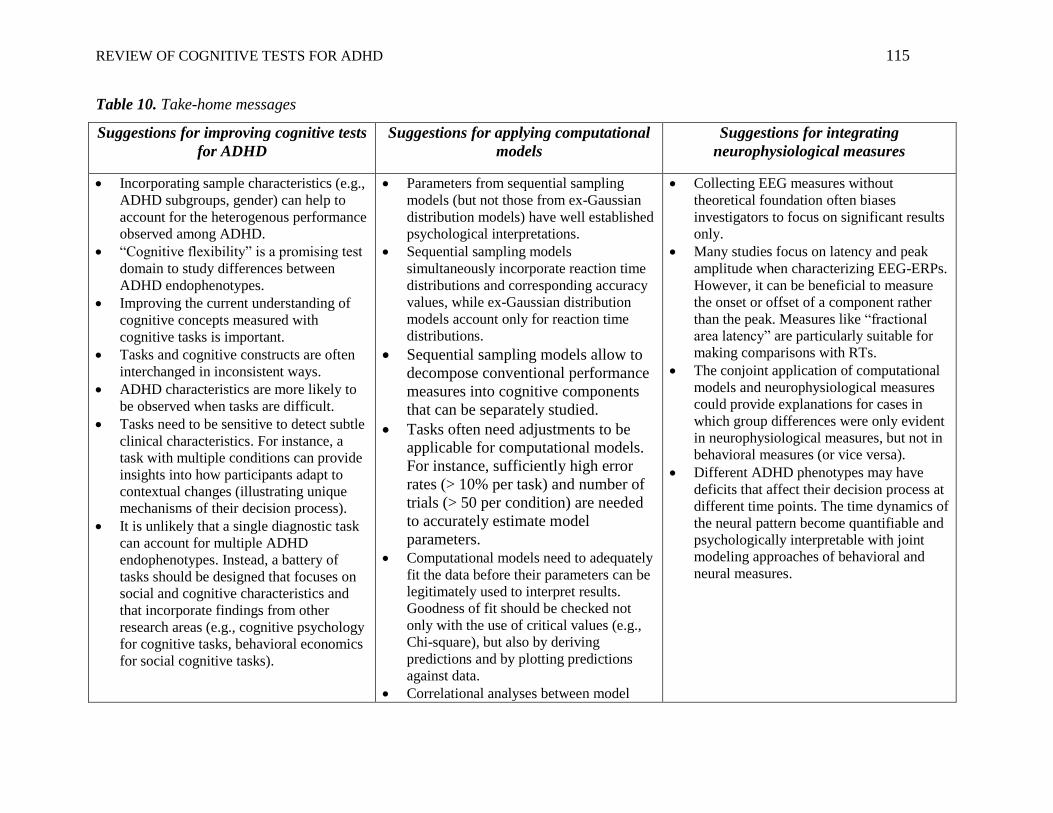
REVIEW OF COGNITIVE TESTS FOR ADHD 115
Table 10. Take-home messages
Suggestions for improving cognitive tests
for ADHD
Suggestions for applying computational
models
Suggestions for integrating
neurophysiological measures
Incorporating sample characteristics (e.g.,
ADHD subgroups, gender) can help to
account for the heterogenous performance
observed among ADHD.
“Cognitive flexibility” is a promising test
domain to study differences between
ADHD endophenotypes.
Improving the current understanding of
cognitive concepts measured with
cognitive tasks is important.
Tasks and cognitive constructs are often
interchanged in inconsistent ways.
ADHD characteristics are more likely to
be observed when tasks are difficult.
Tasks need to be sensitive to detect subtle
clinical characteristics. For instance, a
task with multiple conditions can provide
insights into how participants adapt to
contextual changes (illustrating unique
mechanisms of their decision process).
It is unlikely that a single diagnostic task
can account for multiple ADHD
endophenotypes. Instead, a battery of
tasks should be designed that focuses on
social and cognitive characteristics and
that incorporate findings from other
research areas (e.g., cognitive psychology
for cognitive tasks, behavioral economics
for social cognitive tasks).
Parameters from sequential sampling
models (but not those from ex-Gaussian
distribution models) have well established
psychological interpretations.
Sequential sampling models
simultaneously incorporate reaction time
distributions and corresponding accuracy
values, while ex-Gaussian distribution
models account only for reaction time
distributions.
Sequential sampling models allow to
decompose conventional performance
measures into cognitive components
that can be separately studied.
Tasks often need adjustments to be
applicable for computational models.
For instance, sufficiently high error
rates (> 10% per task) and number of
trials (> 50 per condition) are needed
to accurately estimate model
parameters.
Computational models need to adequately
fit the data before their parameters can be
legitimately used to interpret results.
Goodness of fit should be checked not
only with the use of critical values (e.g.,
Chi-square), but also by deriving
predictions and by plotting predictions
against data.
Correlational analyses between model
Collecting EEG measures without
theoretical foundation often biases
investigators to focus on significant results
only.
Many studies focus on latency and peak
amplitude when characterizing EEG-ERPs.
However, it can be beneficial to measure
the onset or offset of a component rather
than the peak. Measures like “fractional
area latency” are particularly suitable for
making comparisons with RTs.
The conjoint application of computational
models and neurophysiological measures
could provide explanations for cases in
which group differences were only evident
in neurophysiological measures, but not in
behavioral measures (or vice versa).
Different ADHD phenotypes may have
deficits that affect their decision process at
different time points. The time dynamics of
the neural pattern become quantifiable and
psychologically interpretable with joint
modeling approaches of behavioral and
neural measures.

Review of cognitive tests for ADHD 116
parameters allow to detect if model
parameters likely do not index different
components. This can be particularly the
case for very easy tasks with pure stimuli
(e.g., CCPTs) but is less likely for
difficult tasks (e.g., task-switch
paradigms)
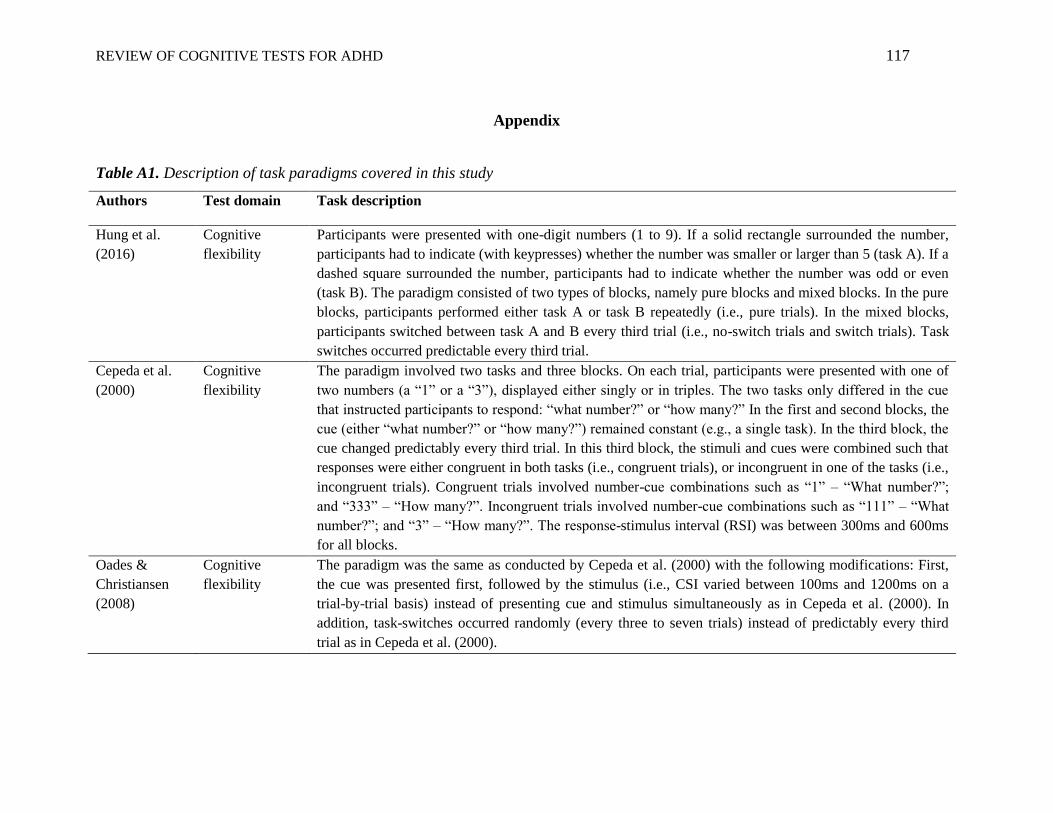
REVIEW OF COGNITIVE TESTS FOR ADHD 117
Appendix
Table A1. Description of task paradigms covered in this study
Authors Test domain Task description
Hung et al.
(2016)
Cognitive
flexibility
Participants were presented with one-digit numbers (1 to 9). If a solid rectangle surrounded the number,
participants had to indicate (with keypresses) whether the number was smaller or larger than 5 (task A). If a
dashed square surrounded the number, participants had to indicate whether the number was odd or even
(task B). The paradigm consisted of two types of blocks, namely pure blocks and mixed blocks. In the pure
blocks, participants performed either task A or task B repeatedly (i.e., pure trials). In the mixed blocks,
participants switched between task A and B every third trial (i.e., no-switch trials and switch trials). Task
switches occurred predictable every third trial.
Cepeda et al.
(2000)
Cognitive
flexibility
The paradigm involved two tasks and three blocks. On each trial, participants were presented with one of
two numbers (a “1” or a “3”), displayed either singly or in triples. The two tasks only differed in the cue
that instructed participants to respond: “what number?” or “how many?” In the first and second blocks, the
cue (either “what number?” or “how many?”) remained constant (e.g., a single task). In the third block, the
cue changed predictably every third trial. In this third block, the stimuli and cues were combined such that
responses were either congruent in both tasks (i.e., congruent trials), or incongruent in one of the tasks (i.e.,
incongruent trials). Congruent trials involved number-cue combinations such as “1” – “What number?”;
and “333” – “How many?”. Incongruent trials involved number-cue combinations such as “111” – “What
number?”; and “3” – “How many?”. The response-stimulus interval (RSI) was between 300ms and 600ms
for all blocks.
Oades &
Christiansen
(2008)
Cognitive
flexibility
The paradigm was the same as conducted by Cepeda et al. (2000) with the following modifications: First,
the cue was presented first, followed by the stimulus (i.e., CSI varied between 100ms and 1200ms on a
trial-by-trial basis) instead of presenting cue and stimulus simultaneously as in Cepeda et al. (2000). In
addition, task-switches occurred randomly (every three to seven trials) instead of predictably every third
trial as in Cepeda et al. (2000).
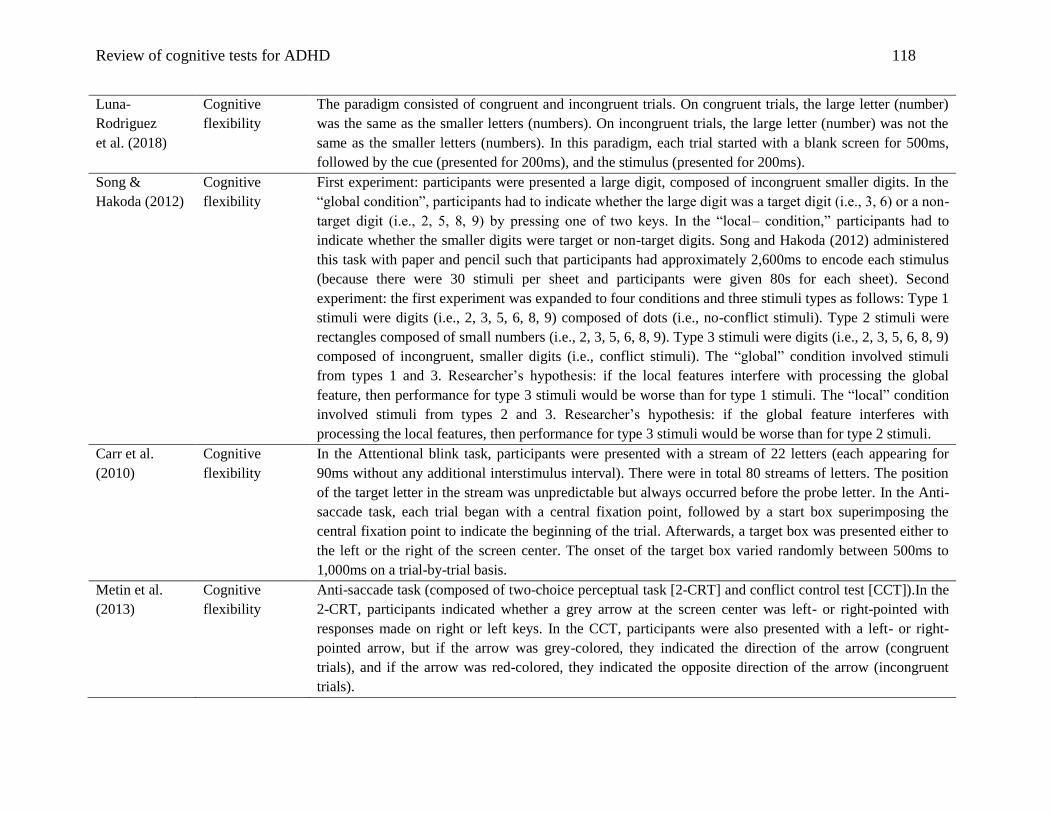
Review of cognitive tests for ADHD 118
Luna-
Rodriguez
et al. (2018)
Cognitive
flexibility
The paradigm consisted of congruent and incongruent trials. On congruent trials, the large letter (number)
was the same as the smaller letters (numbers). On incongruent trials, the large letter (number) was not the
same as the smaller letters (numbers). In this paradigm, each trial started with a blank screen for 500ms,
followed by the cue (presented for 200ms), and the stimulus (presented for 200ms).
Song &
Hakoda (2012)
Cognitive
flexibility
First experiment: participants were presented a large digit, composed of incongruent smaller digits. In the
“global condition”, participants had to indicate whether the large digit was a target digit (i.e., 3, 6) or a non-
target digit (i.e., 2, 5, 8, 9) by pressing one of two keys. In the “local– condition,” participants had to
indicate whether the smaller digits were target or non-target digits. Song and Hakoda (2012) administered
this task with paper and pencil such that participants had approximately 2,600ms to encode each stimulus
(because there were 30 stimuli per sheet and participants were given 80s for each sheet). Second
experiment: the first experiment was expanded to four conditions and three stimuli types as follows: Type 1
stimuli were digits (i.e., 2, 3, 5, 6, 8, 9) composed of dots (i.e., no-conflict stimuli). Type 2 stimuli were
rectangles composed of small numbers (i.e., 2, 3, 5, 6, 8, 9). Type 3 stimuli were digits (i.e., 2, 3, 5, 6, 8, 9)
composed of incongruent, smaller digits (i.e., conflict stimuli). The “global” condition involved stimuli
from types 1 and 3. Researcher’s hypothesis: if the local features interfere with processing the global
feature, then performance for type 3 stimuli would be worse than for type 1 stimuli. The “local” condition
involved stimuli from types 2 and 3. Researcher’s hypothesis: if the global feature interferes with
processing the local features, then performance for type 3 stimuli would be worse than for type 2 stimuli.
Carr et al.
(2010)
Cognitive
flexibility
In the Attentional blink task, participants were presented with a stream of 22 letters (each appearing for
90ms without any additional interstimulus interval). There were in total 80 streams of letters. The position
of the target letter in the stream was unpredictable but always occurred before the probe letter. In the Anti-
saccade task, each trial began with a central fixation point, followed by a start box superimposing the
central fixation point to indicate the beginning of the trial. Afterwards, a target box was presented either to
the left or the right of the screen center. The onset of the target box varied randomly between 500ms to
1,000ms on a trial-by-trial basis.
Metin et al.
(2013)
Cognitive
flexibility
Anti-saccade task (composed of two-choice perceptual task [2-CRT] and conflict control test [CCT]).In the
2-CRT, participants indicated whether a grey arrow at the screen center was left- or right-pointed with
responses made on right or left keys. In the CCT, participants were also presented with a left- or right-
pointed arrow, but if the arrow was grey-colored, they indicated the direction of the arrow (congruent
trials), and if the arrow was red-colored, they indicated the opposite direction of the arrow (incongruent
trials).

Review of cognitive tests for ADHD 119
Friedman-Hill
et al. (2010)
Selective
attention
In a Perceptual Discrimination task, they manipulated the difficulty level of discrimination (low, medium,
high), and the saliency of distractors (low, medium, high). Target images for this task were faces that were
created by morphing the image of a primate’s face and a woman’s face. Participants were asked whether
presented target images showed the original primate’s face or a morphed image. In the “low distraction”
condition, target images were surrounded by unrelated images (i.e., distractors) with lower resolution. In
the “high distraction” condition, target images were surrounded by unrelated images with the same
resolution as the target. In the “medium distraction” condition, the distractor images were presented with a
medium level of distractor salience and a medium level of spatial configuration relative to target images.
Schneidt et al.
(2018)
Selective
attention
Participants had to respond whether a rectangle was oriented horizontally or vertically. The level of task
difficulty was manipulated by making the rectangle more or less like a square. Irrelevant, emotionally
arousing images (displayed in the background during the task performance) served as distractors.
Mulder et al.
(2010)
Selective
attention
Participants had to indicate the direction of randomly moving dots with keypresses. The level of task
difficulty (low vs. high) varied on a trial-by-trial basis, while the type of instructions (speed vs. accuracy)
varied on a session-by-session basis.
Gohil et al.
(2017)
Selective
attention
Preceding (presented for 30ms at the beginning of each trial) distractors (right- or left-pointed arrows)
served as subliminal masked cues (e.g., primes). The task was therefore comprised of trials that were either
preceded with correct (C) or incorrect (I) primes; and which contained either congruent (C) or incongruent
(I) flankers. This resulted in four conditions, namely CC, IC, CI and II (with the first letter referring to
prime type, and the second to flanker type). The incorrect primes served to induce additional conflict on
trials with incongruent distractors. Comparing CC with IC conditions or CI with II conditions provided one
conflict effect (either incompatible or incongruent) on performance. In contrast, comparing CC with II
conditions illustrated the effect of two different kinds of conflict (incompatible and incongruent) on
performance.
Merkt et al.
(2013)
Selective
attention
The task was composed of two blocks (i.e., rare conflict vs. frequent conflict). Participants were presented
with a three-digit number and asked to indicate whether the middle digit was even or odd with keypresses.
The two digits, one on either side of the middle digit, had either the same parity (e.g., 646; congruent trial)
or a different parity (e.g., 343; incongruent trial). The “rare conflict” block was composed of 20%
incongruent trials, whereas the “frequent conflict” block was comprised of 80% incongruent trials.

Review of cognitive tests for ADHD 120
Weigard &
Huang-Pollock
(2014)
Selective
attention
Participants were presented with a target letter “T” (rotated 90 degrees to the right or left), accompanied by
letters “L” that served as distractors. Participants had to locate the target letter on the computer screen and
indicate its direction (right- or leftward pointed) with keypresses. On RC-trials: the target letter and the
distractors repeatedly occurred in the same locations. On NC-trials: the target letter and the distractors
occurred in random, new locations. Researcher’s hypothesis: participants would learn where to find the
target letter for RC-trials. This would lead to a shorter detection time for RC-trials as compared to NC-
trials. These learning effects were examined with a diffusion model analysis; the total number of trials (480
trials) was divided into three epochs, and model parameters estimated for each epoch separately.
Lenartowicz et
al. (2014)
Working
Memory
Participants were presented with sequentially illuminating dots for 2s (encoding phase), followed by a
fixation cross displayed for 2s (maintenance phase). In the subsequent probe phase, another dot was
presented for 3s. Participants had to indicate whether the location of that dot (in the probe phase) matched
the location of any of the dots presented during the encoding phase. The level of task difficulty was
manipulated by the number of dots presented during the encoding phase. In the “low-demand” condition,
either one or three dots were presented. In the “high-demand” condition, either five or seven dots were
presented.
Weigard &
Huang-Pollock
(2017)
Working
memory
The paradigm was composed of two tasks, namely the digit span task and the numerosity task. A trial
started with the digit span task for 1,800ms. Children had to memorize the order of squares (on a 4x4-grid)
that were randomly turned red (encoding phase). The number of squares to be remembered varied from two
to nine on a trial basis. Following the squares presentation but before recollection, children completed a
two-choice numerosity task in order to prevent active rehearsal (maintenance phase). In this task, children
indicated with keypresses whether the number of asterisks displayed in a box was high or low.
Subsequently, they had to recollect the order and position of the illuminated squares (probe phase).
Valko et al.
(2010)
Time perception For the time reproduction task: participants watched an animation of a beacon from a lighthouse that lasted
between one and eight seconds. Participants were then presented a second beacon for which they had to
guess the time interval of the first by pressing a button once the time had elapsed. For the time
differentiation task: participants were shown two consecutive stimuli that differed in their presentation
duration. They were then asked to indicate which stimulus lasted longer.

Review of cognitive tests for ADHD 121
Baytunca
et al. (2018)
Sustained
attention
The Stroop task involved two parts: In the first part, participants had to press a key if the word matched the
color of the word (i.e., congruent trials), but to withhold pressing any key if the word did not match the
color of the word (i.e., incongruent trials). In the second part, participants had to press a key for
incongruent trials, but to withhold pressing any key for congruent trials. The responses on the congruent
and incongruent trials were collapsed for the analysis.
Wiersema
et al. (2006)
Inhibitory
control
Children were presented with a letter randomly displayed at one of four locations on the screen for 300ms.
They had to press a key whenever the letter “K” was presented (75% of the trials), but to withhold any
keypresses whenever another letter than “K” was presented. ISI was either 1,700ms referred to as “fast
blocks” or 2,300ms referred to as “slow blocks”
Lee et al.
(2015)
Inhibitory
control
The task was composed of blocks with constant interstimulus interval (ISI) and blocks with jittered ISI
(Lee et al. call randomization of different ISIs ranging from 1,000ms to 2,000ms within a block “jitter”).
For the blocks with constant ISI, Lee et al. (2015) reported that the cue-stimulus interval was 1,500ms and
the presentation time of the cues was 300ms.
Huang-Pollock
et al.
(2017)
Inhibitory
control
In this CCPT, interstimulus interval (ISI) and the level of difficulty was manipulated. Children were
presented with a box containing either a few stars or many stars. They had to press a key whenever the box
contained a lot of stars (go trials), but to withhold any keypresses whenever the box contained a few stars
(no-go trials). Children were initially randomly assigned to either the “slow event rate” condition (i.e., long
ISI) or the “fast event rate” condition (i.e., fast ISI).
Kingery
(2017)
Inhibitory
control
In this CCPT, participants were presented with either high-pitched sounds (i.e., go trials with 2,000 Hz) or
low-pitched sounds (no-go trials with 1,000 Hz).
Fosco et al.
(2018)
Inhibitory
control
For a description of the classic version of the Stop-signal task (Table 2). The modified version of the Stop-
signal task (i.e., NSSCRTT) was a 2-choice task without any stop-signals. Therefore, the NSSCRTT was
identical to the CSST, except that all trials contained go stimuli without any stop-signals. An auditory tone
(i.e., stop-signal) was introduced randomly on 25% of the trials. As in most Stop-signal tasks, the latency
between the stop-signal and the onset of the go stimulus was dynamically adjusted throughout the task.
Tye et al.
(2016)
Inhibitory
control
Participants were presented with four empty circles. One of those circles was filled either after one second
(fast condition) or eight seconds (slow condition). Participants were instructed to press the response key
associated with the filled circle as fast as possible. They were additionally informed that they would earn a
small reward in the fast condition.
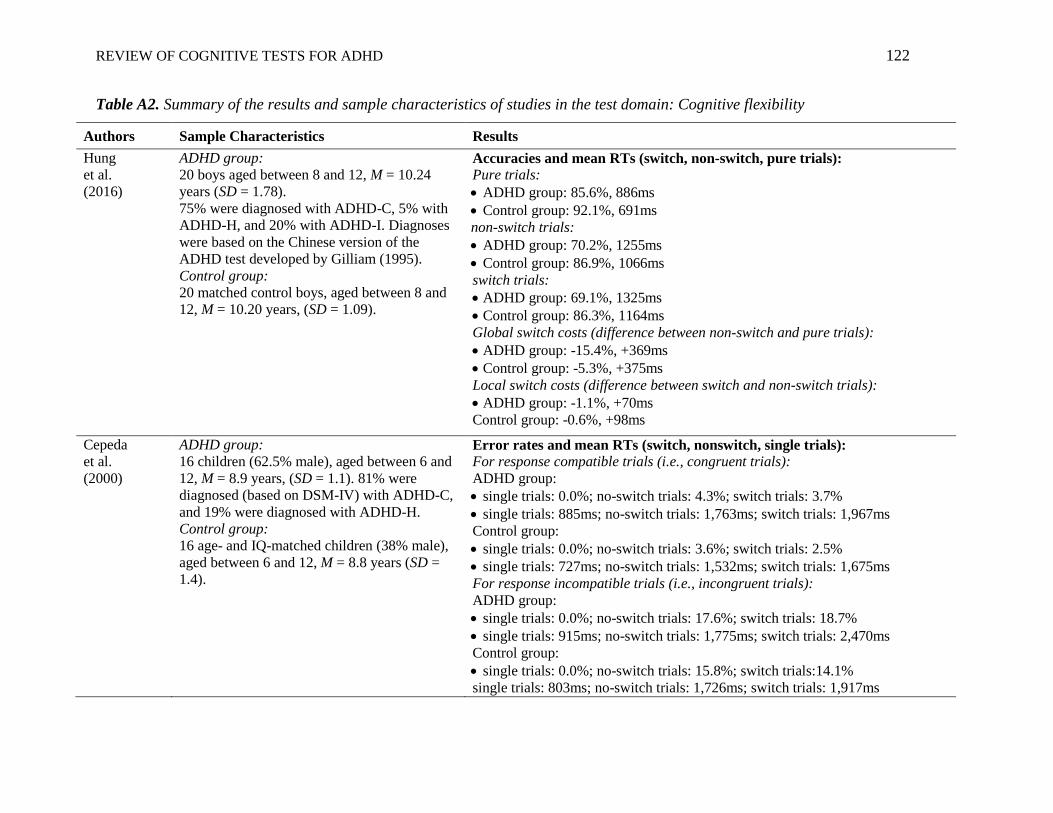
REVIEW OF COGNITIVE TESTS FOR ADHD 122
Table A2. Summary of the results and sample characteristics of studies in the test domain: Cognitive flexibility
Authors Sample Characteristics Results
Hung
et al.
(2016)
ADHD group:
20 boys aged between 8 and 12, M = 10.24
years (SD = 1.78).
75% were diagnosed with ADHD-C, 5% with
ADHD-H, and 20% with ADHD-I. Diagnoses
were based on the Chinese version of the
ADHD test developed by Gilliam (1995).
Control group:
20 matched control boys, aged between 8 and
12, M = 10.20 years, (SD = 1.09).
Accuracies and mean RTs (switch, non-switch, pure trials):
Pure trials:
ADHD group: 85.6%, 886ms
Control group: 92.1%, 691ms
non-switch trials:
ADHD group: 70.2%, 1255ms
Control group: 86.9%, 1066ms
switch trials:
ADHD group: 69.1%, 1325ms
Control group: 86.3%, 1164ms
Global switch costs (difference between non-switch and pure trials):
ADHD group: -15.4%, +369ms
Control group: -5.3%, +375ms
Local switch costs (difference between switch and non-switch trials):
ADHD group: -1.1%, +70ms
Control group: -0.6%, +98ms
Cepeda
et al.
(2000)
ADHD group:
16 children (62.5% male), aged between 6 and
12, M = 8.9 years, (SD = 1.1). 81% were
diagnosed (based on DSM-IV) with ADHD-C,
and 19% were diagnosed with ADHD-H.
Control group:
16 age- and IQ-matched children (38% male),
aged between 6 and 12, M = 8.8 years (SD =
1.4).
Error rates and mean RTs (switch, nonswitch, single trials):
For response compatible trials (i.e., congruent trials):
ADHD group:
single trials: 0.0%; no-switch trials: 4.3%; switch trials: 3.7%
single trials: 885ms; no-switch trials: 1,763ms; switch trials: 1,967ms
Control group:
single trials: 0.0%; no-switch trials: 3.6%; switch trials: 2.5%
single trials: 727ms; no-switch trials: 1,532ms; switch trials: 1,675ms
For response incompatible trials (i.e., incongruent trials):
ADHD group:
single trials: 0.0%; no-switch trials: 17.6%; switch trials: 18.7%
single trials: 915ms; no-switch trials: 1,775ms; switch trials: 2,470ms
Control group:
single trials: 0.0%; no-switch trials: 15.8%; switch trials:14.1%
single trials: 803ms; no-switch trials: 1,726ms; switch trials: 1,917ms
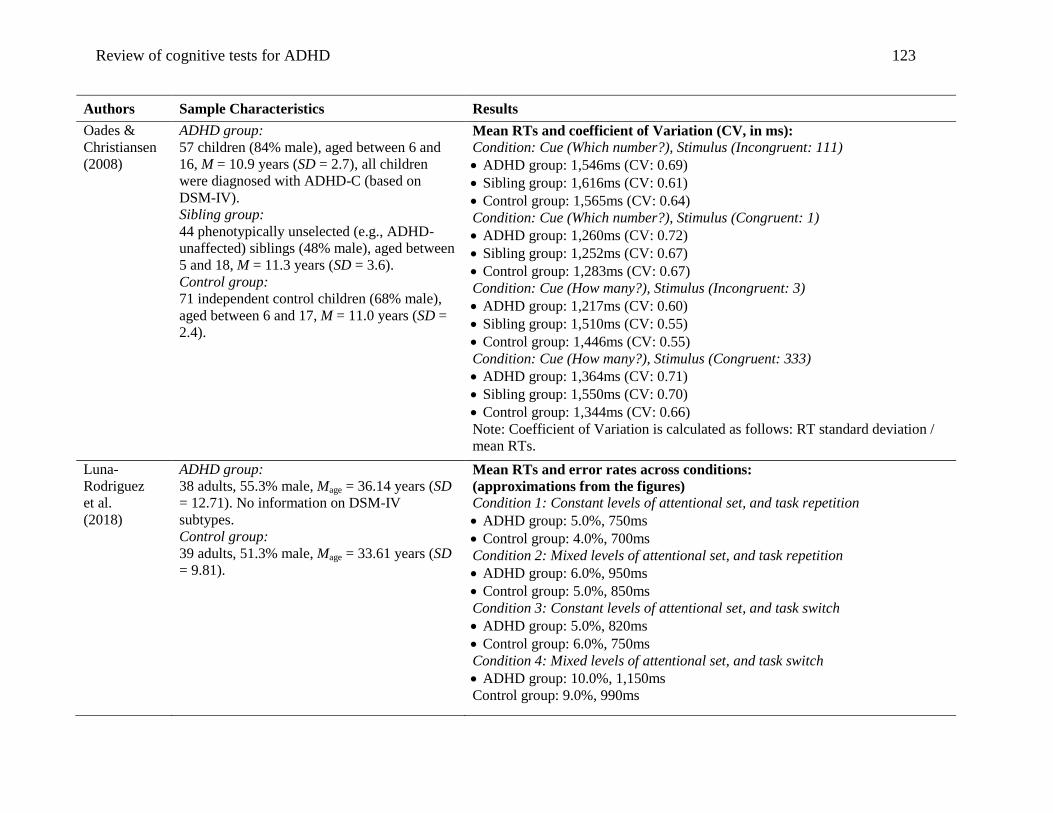
Review of cognitive tests for ADHD 123
Authors Sample Characteristics Results
Oades &
Christiansen
(2008)
ADHD group:
57 children (84% male), aged between 6 and
16, M = 10.9 years (SD = 2.7), all children
were diagnosed with ADHD-C (based on
DSM-IV).
Sibling group:
44 phenotypically unselected (e.g., ADHD-
unaffected) siblings (48% male), aged between
5 and 18, M = 11.3 years (SD = 3.6).
Control group:
71 independent control children (68% male),
aged between 6 and 17, M = 11.0 years (SD =
2.4).
Mean RTs and coefficient of Variation (CV, in ms):
Condition: Cue (Which number?), Stimulus (Incongruent: 111)
ADHD group: 1,546ms (CV: 0.69)
Sibling group: 1,616ms (CV: 0.61)
Control group: 1,565ms (CV: 0.64)
Condition: Cue (Which number?), Stimulus (Congruent: 1)
ADHD group: 1,260ms (CV: 0.72)
Sibling group: 1,252ms (CV: 0.67)
Control group: 1,283ms (CV: 0.67)
Condition: Cue (How many?), Stimulus (Incongruent: 3)
ADHD group: 1,217ms (CV: 0.60)
Sibling group: 1,510ms (CV: 0.55)
Control group: 1,446ms (CV: 0.55)
Condition: Cue (How many?), Stimulus (Congruent: 333)
ADHD group: 1,364ms (CV: 0.71)
Sibling group: 1,550ms (CV: 0.70)
Control group: 1,344ms (CV: 0.66)
Note: Coefficient of Variation is calculated as follows: RT standard deviation /
mean RTs.
Luna-
Rodriguez
et al.
(2018)
ADHD group:
38 adults, 55.3% male, Mage = 36.14 years (SD
= 12.71). No information on DSM-IV
subtypes.
Control group:
39 adults, 51.3% male, Mage = 33.61 years (SD
= 9.81).
Mean RTs and error rates across conditions:
(approximations from the figures)
Condition 1: Constant levels of attentional set, and task repetition
ADHD group: 5.0%, 750ms
Control group: 4.0%, 700ms
Condition 2: Mixed levels of attentional set, and task repetition
ADHD group: 6.0%, 950ms
Control group: 5.0%, 850ms
Condition 3: Constant levels of attentional set, and task switch
ADHD group: 5.0%, 820ms
Control group: 6.0%, 750ms
Condition 4: Mixed levels of attentional set, and task switch
ADHD group: 10.0%, 1,150ms
Control group: 9.0%, 990ms
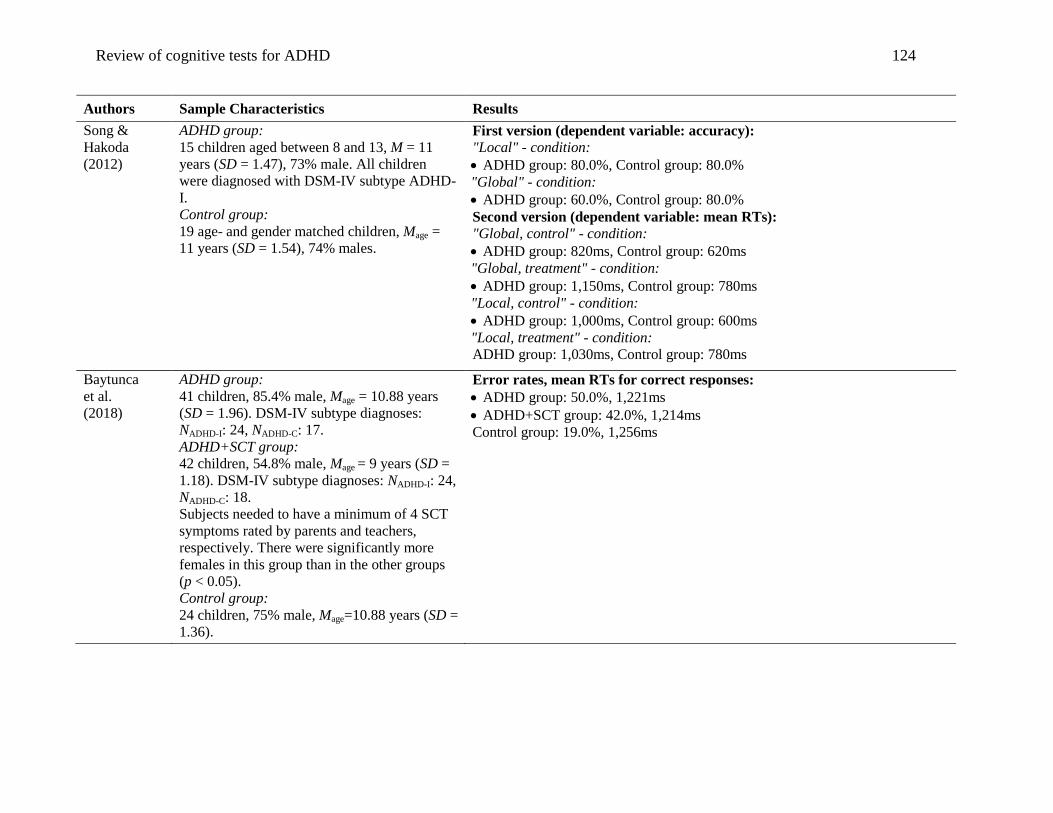
Review of cognitive tests for ADHD 124
Authors Sample Characteristics Results
Song &
Hakoda
(2012)
ADHD group:
15 children aged between 8 and 13, M = 11
years (SD = 1.47), 73% male. All children
were diagnosed with DSM-IV subtype ADHD-
I.
Control group:
19 age- and gender matched children, Mage =
11 years (SD = 1.54), 74% males.
First version (dependent variable: accuracy):
"Local" - condition:
ADHD group: 80.0%, Control group: 80.0%
"Global" - condition:
ADHD group: 60.0%, Control group: 80.0%
Second version (dependent variable: mean RTs):
"Global, control" - condition:
ADHD group: 820ms, Control group: 620ms
"Global, treatment" - condition:
ADHD group: 1,150ms, Control group: 780ms
"Local, control" - condition:
ADHD group: 1,000ms, Control group: 600ms
"Local, treatment" - condition:
ADHD group: 1,030ms, Control group: 780ms
Baytunca
et al.
(2018)
ADHD group:
41 children, 85.4% male, Mage = 10.88 years
(SD = 1.96). DSM-IV subtype diagnoses:
NADHD-I: 24, NADHD-C: 17.
ADHD+SCT group:
42 children, 54.8% male, Mage = 9 years (SD =
1.18). DSM-IV subtype diagnoses: NADHD-I: 24,
NADHD-C: 18.
Subjects needed to have a minimum of 4 SCT
symptoms rated by parents and teachers,
respectively. There were significantly more
females in this group than in the other groups
(p < 0.05).
Control group:
24 children, 75% male, Mage=10.88 years (SD =
1.36).
Error rates, mean RTs for correct responses:
ADHD group: 50.0%, 1,221ms
ADHD+SCT group: 42.0%, 1,214ms
Control group: 19.0%, 1,256ms

Review of cognitive tests for ADHD 125
Authors Sample Characteristics Results
Carr et al.
(2010)
ADHD group:
86 children aged between 13 and 17. DSM-IV
subtype diagnoses. Sample characteristics by
subtype:
ADHD-C:
N = 37, 76% male, Mage = 15 years (SD = 1.1).
Comorbidities included: 13 subjects with
Oppositional Defiant Disorder (ODD), 2
subjects with Conduct Disorder (CD), 1 subject
with Anxiety Disorder.
ADHD-I:
N = 34, 62% male, Mage = 15.3 years (SD =
1.2). Comorbidities included: 3 subjects with
ODD.
ADD group:
post hoc sub-selection of subjects diagnosed
with ADHD-I and ratings of hyperactivity/
restlessness below the mean score (based on
Conners' teacher's and parents' ratings). N = 15,
47% male, Mage = 15.1 years (SD = 1.1).
Control group:
71 children aged between 13 and 17, M = 15.5
years (SD = 1.0), 54.1% male, 1 subject with
diagnosis of ODD.
Attentional Blink task:
Probe detection accuracies across conditions:
(approximation from the figures)
Control group:
single task: lag(1) = 90.0%, lag(3) = 90.0%, lag(5) = 90.0%
dual task: lag(1) = 68.0%, lag(3) = 52.0%, lag(5) = 60.0%
ADHD-C group:
single task: lag(1) = 90.0%, lag(3) = 90.0%, lag(5) = 90.0%
dual task: lag(1) = 60.0%, lag(3) = 54.0%, lag(5) = 50.0%
ADD group:
single task: lag(1) = 90.0%, lag(3) = 90.0%, lag(5) = 90.0%
dual task: lag(1) = 71.0%, lag(3) = 70.0%, lag(5) = 71.0%
Anti-Saccade task:
Directional error rates and mean RTs across conditions:
(approximation from the figures)
Prosaccade condition:
Control group: 0.0%, 200ms
ADHD-C group: 0.1%, 210ms
ADD group: 0.0%, 200ms
Anti-saccade condition:
Control group: 0.1%, 275ms
ADHD-C group: 0.3%, 290ms
ADD group: 0.2%, 310ms
O'Driscoll
et al. (2005)
ADHD group:
22 boys aged between 11 and 14. Subtype
diagnosis based on DSM-IV: ADHD-C: N =
10, Mage = 12.38 years (SD = 0.57). 1 boy with
comorbid Anxiety Disorder.
ADHD-I: N = 12, Mage = 12.74 years (SD =
0.60). 1 boy with comorbid Anxiety Disorder.
Control group:
10 boys, aged between 11 and 14, Mage = 12.66
years (SD = 0.58).
Error rates:
Control group:
no-switch trials: 7.0%
switch trials: 11.0%
ADHD-I group:
no-switch trials: 12.0%
switch trials: 16.0%
ADHD-C group:
no-switch trials: 13.0%
switch trials: 20.0%
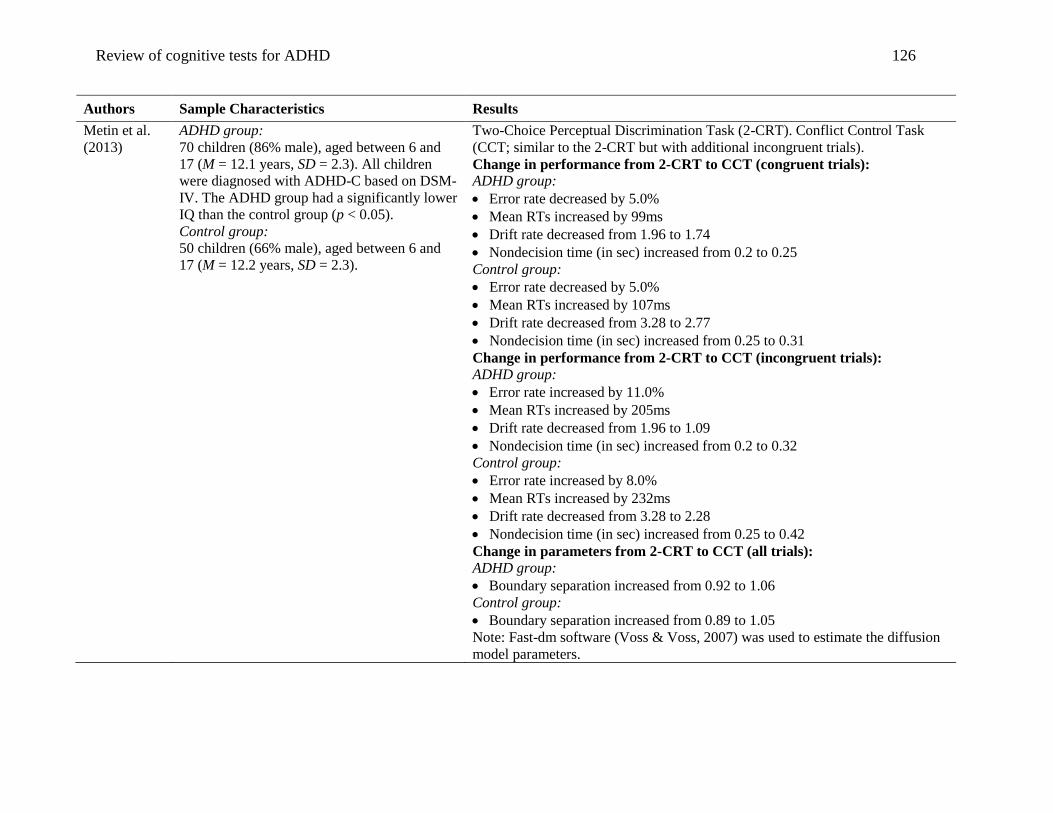
Review of cognitive tests for ADHD 126
Authors Sample Characteristics Results
Metin et al.
(2013)
ADHD group:
70 children (86% male), aged between 6 and
17 (M = 12.1 years, SD = 2.3). All children
were diagnosed with ADHD-C based on DSM-
IV. The ADHD group had a significantly lower
IQ than the control group (p < 0.05).
Control group:
50 children (66% male), aged between 6 and
17 (M = 12.2 years, SD = 2.3).
Two-Choice Perceptual Discrimination Task (2-CRT). Conflict Control Task
(CCT; similar to the 2-CRT but with additional incongruent trials).
Change in performance from 2-CRT to CCT (congruent trials):
ADHD group:
Error rate decreased by 5.0%
Mean RTs increased by 99ms
Drift rate decreased from 1.96 to 1.74
Nondecision time (in sec) increased from 0.2 to 0.25
Control group:
Error rate decreased by 5.0%
Mean RTs increased by 107ms
Drift rate decreased from 3.28 to 2.77
Nondecision time (in sec) increased from 0.25 to 0.31
Change in performance from 2-CRT to CCT (incongruent trials):
ADHD group:
Error rate increased by 11.0%
Mean RTs increased by 205ms
Drift rate decreased from 1.96 to 1.09
Nondecision time (in sec) increased from 0.2 to 0.32
Control group:
Error rate increased by 8.0%
Mean RTs increased by 232ms
Drift rate decreased from 3.28 to 2.28
Nondecision time (in sec) increased from 0.25 to 0.42
Change in parameters from 2-CRT to CCT (all trials): ADHD group:
Boundary separation increased from 0.92 to 1.06
Control group:
Boundary separation increased from 0.89 to 1.05
Note: Fast-dm software (Voss & Voss, 2007) was used to estimate the diffusion
model parameters.

Review of cognitive tests for ADHD 127
Authors Sample Characteristics Results
Salum et al.
(2014)
Classification of children (aged between 6 and
12) into groups based on severity of inattention
(groups a) and hyperactivity (groups b)
(Development and Well-Being Assessment
Scale):
1) clinical ADHD groups:
Group 1.a: ADHD diagnoses (based on DSM-
IV).
Sample characteristics: N = 53 (NADHD-I = 36,
NADHD-C = 17), Mage = 9.5 years (SD = 1.8),
57% males.
Group 1.b: ADHD diagnoses (based on DSM-
IV).
Sample characteristics: N = 32 (NADHD-C = 15,
NADHD-H = 17), Mage = 9.8 years (SD = 1.9),
53% males.
2) subthreshold moderate groups:
Group 2.a: inattentive score between 6 and 11,
and a maximum of five full ADHD symptoms.
Sample characteristics: N = 312, Mage = 9.9
years (SD = 2.0), 53% male.
Group 2.b: hyperactive/impulsive score
between 6 and 11, and a maximum of five full
ADHD symptoms.
Sample characteristics: N = 225, Mage = 9.4
years (SD=1.9), 56% males.
3) subthreshold minimal groups:
Group 3.a: inattentive score between 1 and 5,
and a maximum of two full ADHD symptoms.
Sample characteristics: N = 590, Mage = 9.9
years (SD = 2.0), 51% males.
Group 3.b: hyperactive/impulsive score
between 1 and 5, and a maximum of two full
ADHD symptoms. Sample characteristics: N =
658, Mage = 9.9 years (SD = 2.0), 50% males.
Two-Choice Perceptual Discrimination Task (2-CRT). Conflict Control Task
(CCT; similar to the 2-CRT but with additional incongruent trials).
2-CRT (%correct, %outlier, mean RTs, RT standard deviation):
Group 1.a: 71.4%, 4.3%, 504ms, 228ms
Group 1.b: 69.7%, 4.2%, 503ms, 231ms
Group 2.a: 77.7%, 2.8%, 501ms, 188ms
Group 2.b: 76.5%, 3.0%, 498ms, 192ms
Group 3.a: 79.1%, 2.6%, 486ms, 179ms
Group 3.b: 79.5%, 2.5%, 491ms, 179ms
Group 4.a: 82.3%, 2.3%, 478ms, 162ms
Group 4.b: 81.8%, 2.3%, 481ms, 166ms
CCT Congruent (%correct, %outlier, mean RTs, SD RTs):
Group 1.a: 63.4%, 1.7%, 561ms, 204ms
Group 1.b: 67.1%, 1.4%, 571ms, 205ms
Group 2.a: 71.5%, 2.4%, 573ms, 182ms
Group 2.b: 70.6%, 2.0%, 568ms, 181ms
Group 3.a: 73.2%, 2.0%, 556ms, 173ms
Group 3.b: 73.8%, 2.2%, 563ms, 176ms
Group 4.a: 78.4%, 1.9%, 558ms, 163ms
Group 4.b: 77.1%, 1.9%, 560ms, 165ms
CCT Incongruent (%correct, %outlier, mean RTs, SD RTs):
Group 1.a: 55.8%, 1.5%, 676ms, 233ms
Group 1.b: 59.5%, 0.8%, 687ms, 222ms
Group 2.a: 57.9%, 0.6%, 695ms, 201ms
Group 2.b: 56.8%, 0.8%, 700ms, 196ms
Group 3.a: 59.8%, 0.8%, 677ms, 190ms
Group 3.b: 60.2%, 0.8%, 684ms, 192ms
Group 4.a: 65.7%, 0.6%, 685ms, 168ms
Group 4.b: 64.1%, 0.7%, 683ms, 172ms
Mean diffusion model parameters
(variability in nondecision time, nondecision time (in sec), boundary
separation, across-trial variability in drift rate, drift rate):
CRT task:
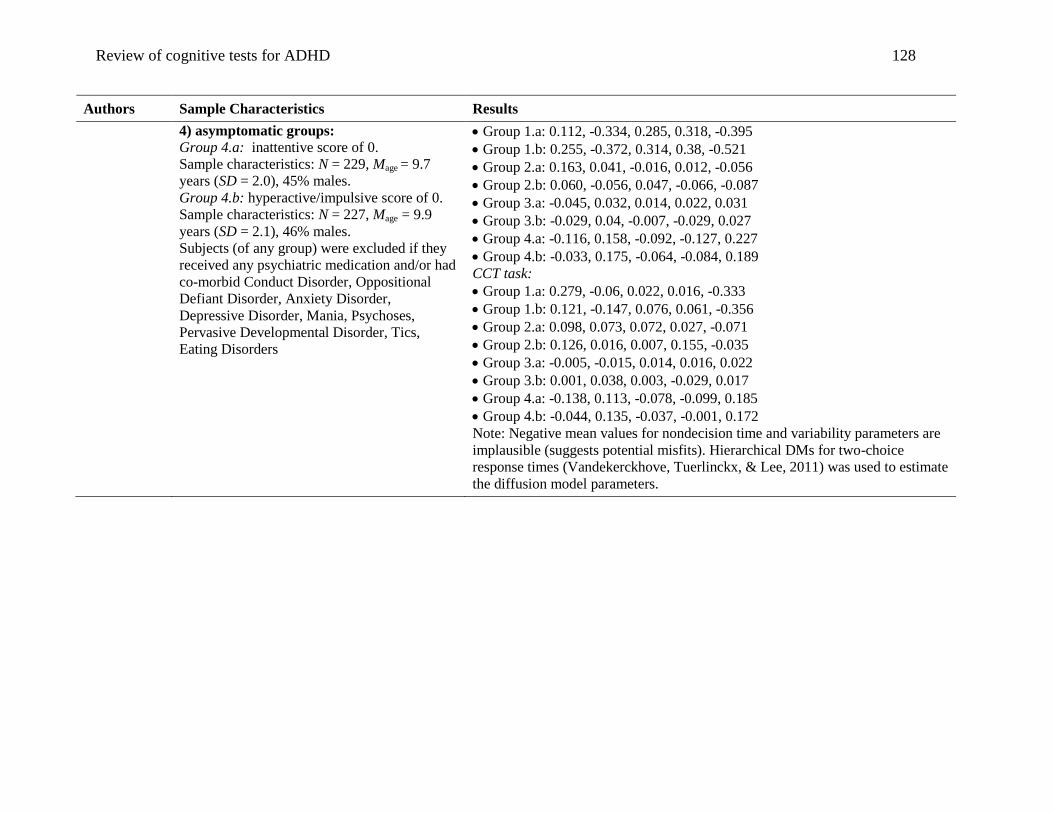
Review of cognitive tests for ADHD 128
Authors Sample Characteristics Results
4) asymptomatic groups:
Group 4.a: inattentive score of 0.
Sample characteristics: N = 229, Mage = 9.7
years (SD = 2.0), 45% males.
Group 4.b: hyperactive/impulsive score of 0.
Sample characteristics: N = 227, Mage = 9.9
years (SD = 2.1), 46% males.
Subjects (of any group) were excluded if they
received any psychiatric medication and/or had
co-morbid Conduct Disorder, Oppositional
Defiant Disorder, Anxiety Disorder,
Depressive Disorder, Mania, Psychoses,
Pervasive Developmental Disorder, Tics,
Eating Disorders
Group 1.a: 0.112, -0.334, 0.285, 0.318, -0.395
Group 1.b: 0.255, -0.372, 0.314, 0.38, -0.521
Group 2.a: 0.163, 0.041, -0.016, 0.012, -0.056
Group 2.b: 0.060, -0.056, 0.047, -0.066, -0.087
Group 3.a: -0.045, 0.032, 0.014, 0.022, 0.031
Group 3.b: -0.029, 0.04, -0.007, -0.029, 0.027
Group 4.a: -0.116, 0.158, -0.092, -0.127, 0.227
Group 4.b: -0.033, 0.175, -0.064, -0.084, 0.189
CCT task:
Group 1.a: 0.279, -0.06, 0.022, 0.016, -0.333
Group 1.b: 0.121, -0.147, 0.076, 0.061, -0.356
Group 2.a: 0.098, 0.073, 0.072, 0.027, -0.071
Group 2.b: 0.126, 0.016, 0.007, 0.155, -0.035
Group 3.a: -0.005, -0.015, 0.014, 0.016, 0.022
Group 3.b: 0.001, 0.038, 0.003, -0.029, 0.017
Group 4.a: -0.138, 0.113, -0.078, -0.099, 0.185
Group 4.b: -0.044, 0.135, -0.037, -0.001, 0.172
Note: Negative mean values for nondecision time and variability parameters are
implausible (suggests potential misfits). Hierarchical DMs for two-choice
response times (Vandekerckhove, Tuerlinckx, & Lee, 2011) was used to estimate
the diffusion model parameters.
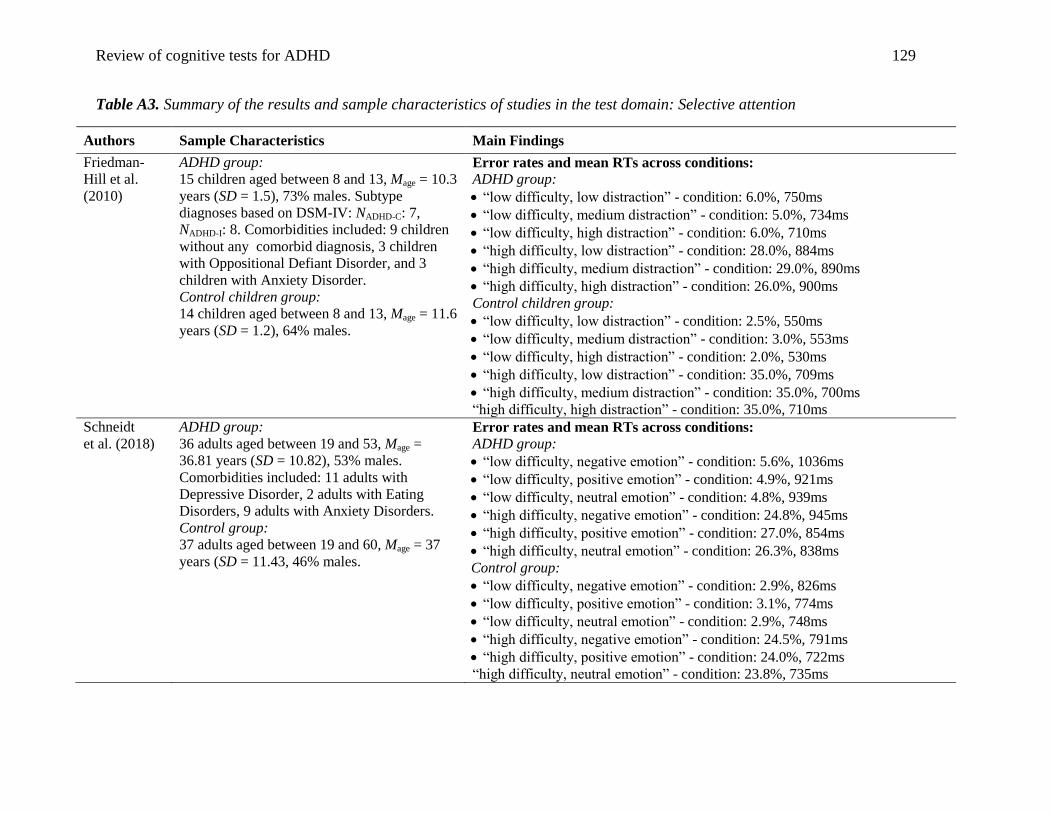
Review of cognitive tests for ADHD 129
Table A3. Summary of the results and sample characteristics of studies in the test domain: Selective attention
Authors Sample Characteristics Main Findings
Friedman-
Hill et al.
(2010)
ADHD group:
15 children aged between 8 and 13, Mage = 10.3
years (SD = 1.5), 73% males. Subtype
diagnoses based on DSM-IV: NADHD-C: 7,
NADHD-I: 8. Comorbidities included: 9 children
without any comorbid diagnosis, 3 children
with Oppositional Defiant Disorder, and 3
children with Anxiety Disorder.
Control children group:
14 children aged between 8 and 13, Mage = 11.6
years (SD = 1.2), 64% males.
Error rates and mean RTs across conditions:
ADHD group:
“low difficulty, low distraction” - condition: 6.0%, 750ms
“low difficulty, medium distraction” - condition: 5.0%, 734ms
“low difficulty, high distraction” - condition: 6.0%, 710ms
“high difficulty, low distraction” - condition: 28.0%, 884ms
“high difficulty, medium distraction” - condition: 29.0%, 890ms
“high difficulty, high distraction” - condition: 26.0%, 900ms
Control children group:
“low difficulty, low distraction” - condition: 2.5%, 550ms
“low difficulty, medium distraction” - condition: 3.0%, 553ms
“low difficulty, high distraction” - condition: 2.0%, 530ms
“high difficulty, low distraction” - condition: 35.0%, 709ms
“high difficulty, medium distraction” - condition: 35.0%, 700ms
“high difficulty, high distraction” - condition: 35.0%, 710ms
Schneidt
et al. (2018)
ADHD group:
36 adults aged between 19 and 53, Mage =
36.81 years (SD = 10.82), 53% males.
Comorbidities included: 11 adults with
Depressive Disorder, 2 adults with Eating
Disorders, 9 adults with Anxiety Disorders.
Control group:
37 adults aged between 19 and 60, Mage = 37
years (SD = 11.43, 46% males.
Error rates and mean RTs across conditions:
ADHD group:
“low difficulty, negative emotion” - condition: 5.6%, 1036ms
“low difficulty, positive emotion” - condition: 4.9%, 921ms
“low difficulty, neutral emotion” - condition: 4.8%, 939ms
“high difficulty, negative emotion” - condition: 24.8%, 945ms
“high difficulty, positive emotion” - condition: 27.0%, 854ms
“high difficulty, neutral emotion” - condition: 26.3%, 838ms
Control group:
“low difficulty, negative emotion” - condition: 2.9%, 826ms
“low difficulty, positive emotion” - condition: 3.1%, 774ms
“low difficulty, neutral emotion” - condition: 2.9%, 748ms
“high difficulty, negative emotion” - condition: 24.5%, 791ms
“high difficulty, positive emotion” - condition: 24.0%, 722ms
“high difficulty, neutral emotion” - condition: 23.8%, 735ms
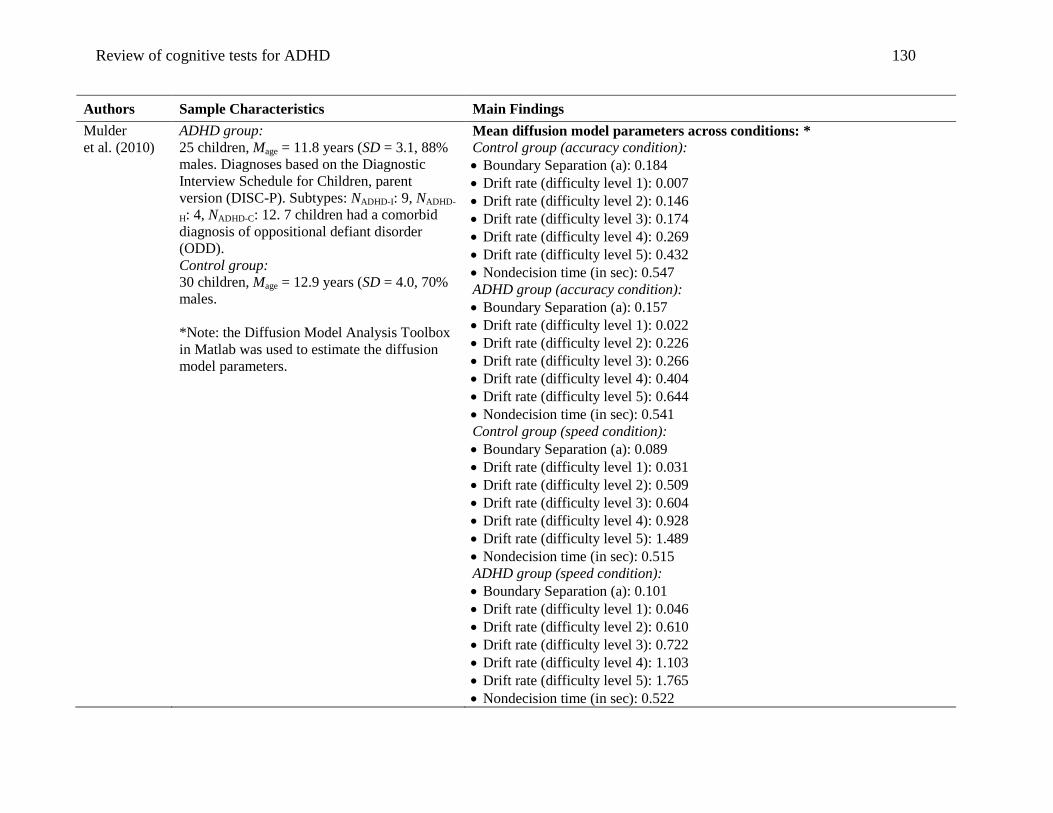
Review of cognitive tests for ADHD 130
Authors Sample Characteristics Main Findings
Mulder
et al. (2010)
ADHD group:
25 children, Mage = 11.8 years (SD = 3.1, 88%
males. Diagnoses based on the Diagnostic
Interview Schedule for Children, parent
version (DISC-P). Subtypes: NADHD-I: 9, NADHD-
H: 4, NADHD-C: 12. 7 children had a comorbid
diagnosis of oppositional defiant disorder
(ODD).
Control group:
30 children, Mage = 12.9 years (SD = 4.0, 70%
males.
*Note: the Diffusion Model Analysis Toolbox
in Matlab was used to estimate the diffusion
model parameters.
Mean diffusion model parameters across conditions: *
Control group (accuracy condition):
Boundary Separation (a): 0.184
Drift rate (difficulty level 1): 0.007
Drift rate (difficulty level 2): 0.146
Drift rate (difficulty level 3): 0.174
Drift rate (difficulty level 4): 0.269
Drift rate (difficulty level 5): 0.432
Nondecision time (in sec): 0.547
ADHD group (accuracy condition):
Boundary Separation (a): 0.157
Drift rate (difficulty level 1): 0.022
Drift rate (difficulty level 2): 0.226
Drift rate (difficulty level 3): 0.266
Drift rate (difficulty level 4): 0.404
Drift rate (difficulty level 5): 0.644
Nondecision time (in sec): 0.541
Control group (speed condition):
Boundary Separation (a): 0.089
Drift rate (difficulty level 1): 0.031
Drift rate (difficulty level 2): 0.509
Drift rate (difficulty level 3): 0.604
Drift rate (difficulty level 4): 0.928
Drift rate (difficulty level 5): 1.489
Nondecision time (in sec): 0.515
ADHD group (speed condition):
Boundary Separation (a): 0.101
Drift rate (difficulty level 1): 0.046
Drift rate (difficulty level 2): 0.610
Drift rate (difficulty level 3): 0.722
Drift rate (difficulty level 4): 1.103
Drift rate (difficulty level 5): 1.765
Nondecision time (in sec): 0.522
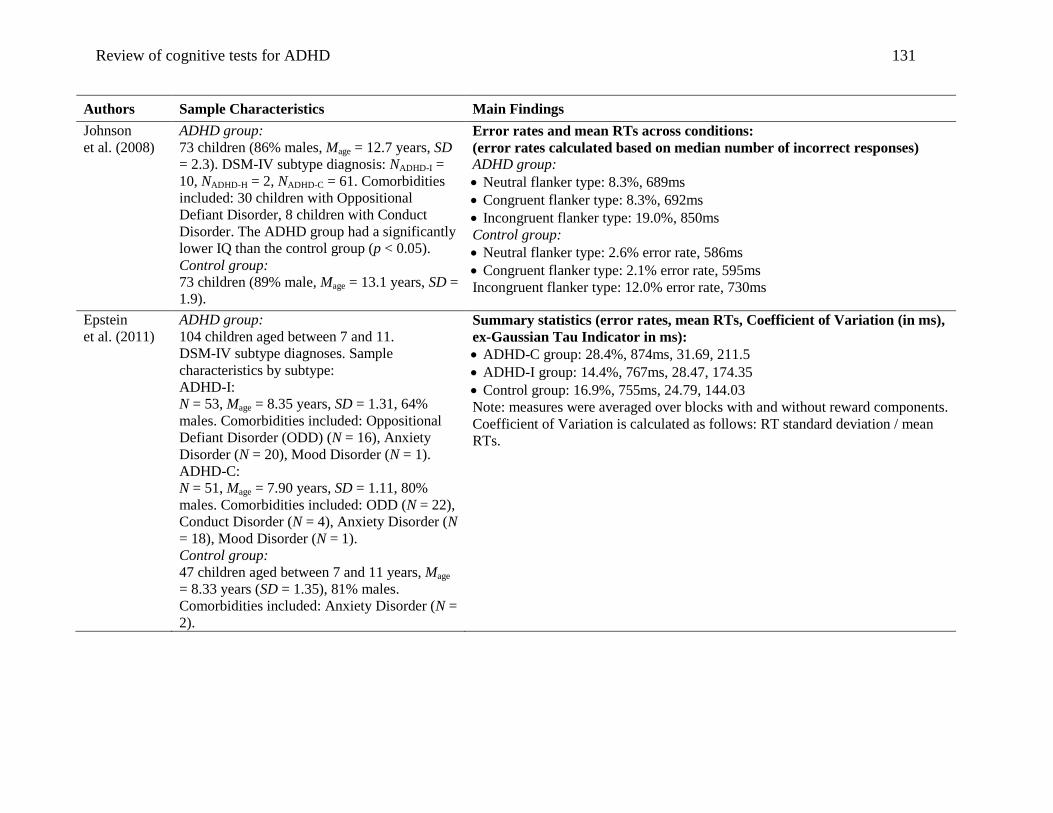
Review of cognitive tests for ADHD 131
Authors Sample Characteristics Main Findings
Johnson
et al. (2008)
ADHD group:
73 children (86% males, Mage = 12.7 years, SD
= 2.3). DSM-IV subtype diagnosis: NADHD-I =
10, NADHD-H = 2, NADHD-C = 61. Comorbidities
included: 30 children with Oppositional
Defiant Disorder, 8 children with Conduct
Disorder. The ADHD group had a significantly
lower IQ than the control group (p < 0.05).
Control group:
73 children (89% male, Mage = 13.1 years, SD =
1.9).
Error rates and mean RTs across conditions:
(error rates calculated based on median number of incorrect responses)
ADHD group:
Neutral flanker type: 8.3%, 689ms
Congruent flanker type: 8.3%, 692ms
Incongruent flanker type: 19.0%, 850ms
Control group:
Neutral flanker type: 2.6% error rate, 586ms
Congruent flanker type: 2.1% error rate, 595ms
Incongruent flanker type: 12.0% error rate, 730ms
Epstein
et al. (2011)
ADHD group:
104 children aged between 7 and 11.
DSM-IV subtype diagnoses. Sample
characteristics by subtype:
ADHD-I:
N = 53, Mage = 8.35 years, SD = 1.31, 64%
males. Comorbidities included: Oppositional
Defiant Disorder (ODD) (N = 16), Anxiety
Disorder (N = 20), Mood Disorder (N = 1).
ADHD-C:
N = 51, Mage = 7.90 years, SD = 1.11, 80%
males. Comorbidities included: ODD (N = 22),
Conduct Disorder (N = 4), Anxiety Disorder (N
= 18), Mood Disorder (N = 1).
Control group:
47 children aged between 7 and 11 years, Mage
= 8.33 years (SD = 1.35), 81% males.
Comorbidities included: Anxiety Disorder (N =
2).
Summary statistics (error rates, mean RTs, Coefficient of Variation (in ms),
ex-Gaussian Tau Indicator in ms):
ADHD-C group: 28.4%, 874ms, 31.69, 211.5
ADHD-I group: 14.4%, 767ms, 28.47, 174.35
Control group: 16.9%, 755ms, 24.79, 144.03
Note: measures were averaged over blocks with and without reward components.
Coefficient of Variation is calculated as follows: RT standard deviation / mean
RTs.
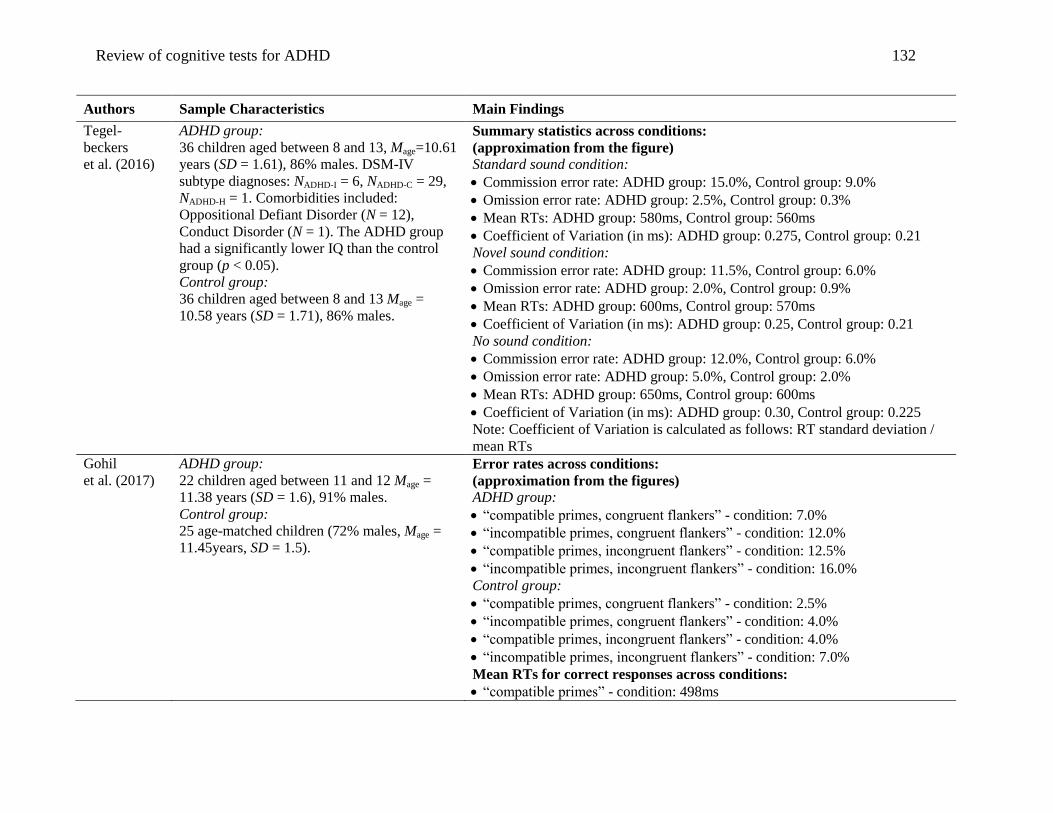
Review of cognitive tests for ADHD 132
Authors Sample Characteristics Main Findings
Tegel-
beckers
et al. (2016)
ADHD group:
36 children aged between 8 and 13, Mage=10.61
years (SD = 1.61), 86% males. DSM-IV
subtype diagnoses: NADHD-I = 6, NADHD-C = 29,
NADHD-H = 1. Comorbidities included:
Oppositional Defiant Disorder (N = 12),
Conduct Disorder (N = 1). The ADHD group
had a significantly lower IQ than the control
group (p < 0.05).
Control group:
36 children aged between 8 and 13 Mage =
10.58 years (SD = 1.71), 86% males.
Summary statistics across conditions:
(approximation from the figure)
Standard sound condition:
Commission error rate: ADHD group: 15.0%, Control group: 9.0%
Omission error rate: ADHD group: 2.5%, Control group: 0.3%
Mean RTs: ADHD group: 580ms, Control group: 560ms
Coefficient of Variation (in ms): ADHD group: 0.275, Control group: 0.21
Novel sound condition:
Commission error rate: ADHD group: 11.5%, Control group: 6.0%
Omission error rate: ADHD group: 2.0%, Control group: 0.9%
Mean RTs: ADHD group: 600ms, Control group: 570ms
Coefficient of Variation (in ms): ADHD group: 0.25, Control group: 0.21
No sound condition:
Commission error rate: ADHD group: 12.0%, Control group: 6.0%
Omission error rate: ADHD group: 5.0%, Control group: 2.0%
Mean RTs: ADHD group: 650ms, Control group: 600ms
Coefficient of Variation (in ms): ADHD group: 0.30, Control group: 0.225
Note: Coefficient of Variation is calculated as follows: RT standard deviation /
mean RTs
Gohil
et al. (2017)
ADHD group:
22 children aged between 11 and 12 Mage =
11.38 years (SD = 1.6), 91% males.
Control group:
25 age-matched children (72% males, Mage =
11.45years, SD = 1.5).
Error rates across conditions:
(approximation from the figures)
ADHD group:
“compatible primes, congruent flankers” - condition: 7.0%
“incompatible primes, congruent flankers” - condition: 12.0%
“compatible primes, incongruent flankers” - condition: 12.5%
“incompatible primes, incongruent flankers” - condition: 16.0%
Control group:
“compatible primes, congruent flankers” - condition: 2.5%
“incompatible primes, congruent flankers” - condition: 4.0%
“compatible primes, incongruent flankers” - condition: 4.0%
“incompatible primes, incongruent flankers” - condition: 7.0%
Mean RTs for correct responses across conditions:
“compatible primes” - condition: 498ms
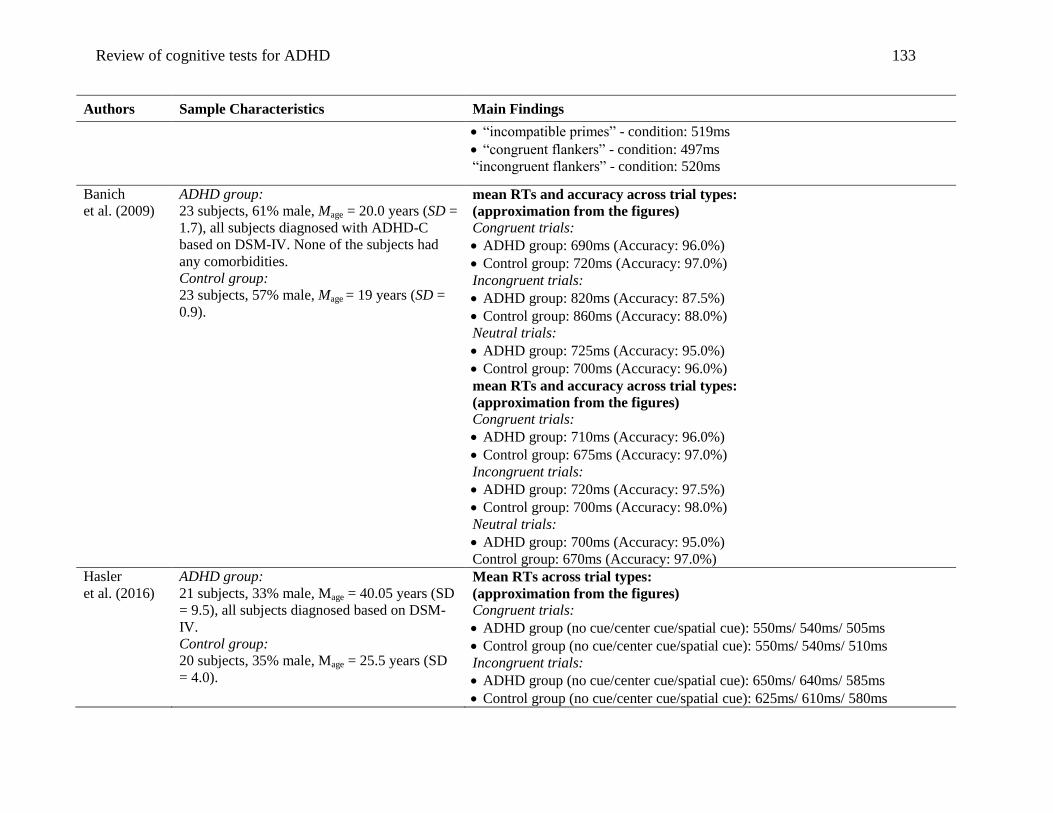
Review of cognitive tests for ADHD 133
Authors Sample Characteristics Main Findings
“incompatible primes” - condition: 519ms
“congruent flankers” - condition: 497ms
“incongruent flankers” - condition: 520ms
Banich
et al. (2009)
ADHD group:
23 subjects, 61% male, Mage = 20.0 years (SD =
1.7), all subjects diagnosed with ADHD-C
based on DSM-IV. None of the subjects had
any comorbidities.
Control group:
23 subjects, 57% male, Mage = 19 years (SD =
0.9).
mean RTs and accuracy across trial types:
(approximation from the figures)
Congruent trials:
ADHD group: 690ms (Accuracy: 96.0%)
Control group: 720ms (Accuracy: 97.0%)
Incongruent trials:
ADHD group: 820ms (Accuracy: 87.5%)
Control group: 860ms (Accuracy: 88.0%)
Neutral trials:
ADHD group: 725ms (Accuracy: 95.0%)
Control group: 700ms (Accuracy: 96.0%)
mean RTs and accuracy across trial types:
(approximation from the figures)
Congruent trials:
ADHD group: 710ms (Accuracy: 96.0%)
Control group: 675ms (Accuracy: 97.0%)
Incongruent trials:
ADHD group: 720ms (Accuracy: 97.5%)
Control group: 700ms (Accuracy: 98.0%)
Neutral trials:
ADHD group: 700ms (Accuracy: 95.0%)
Control group: 670ms (Accuracy: 97.0%)
Hasler
et al. (2016)
ADHD group:
21 subjects, 33% male, Mage = 40.05 years (SD
= 9.5), all subjects diagnosed based on DSM-
IV.
Control group:
20 subjects, 35% male, Mage = 25.5 years (SD
= 4.0).
Mean RTs across trial types:
(approximation from the figures)
Congruent trials:
ADHD group (no cue/center cue/spatial cue): 550ms/ 540ms/ 505ms
Control group (no cue/center cue/spatial cue): 550ms/ 540ms/ 510ms
Incongruent trials:
ADHD group (no cue/center cue/spatial cue): 650ms/ 640ms/ 585ms
Control group (no cue/center cue/spatial cue): 625ms/ 610ms/ 580ms
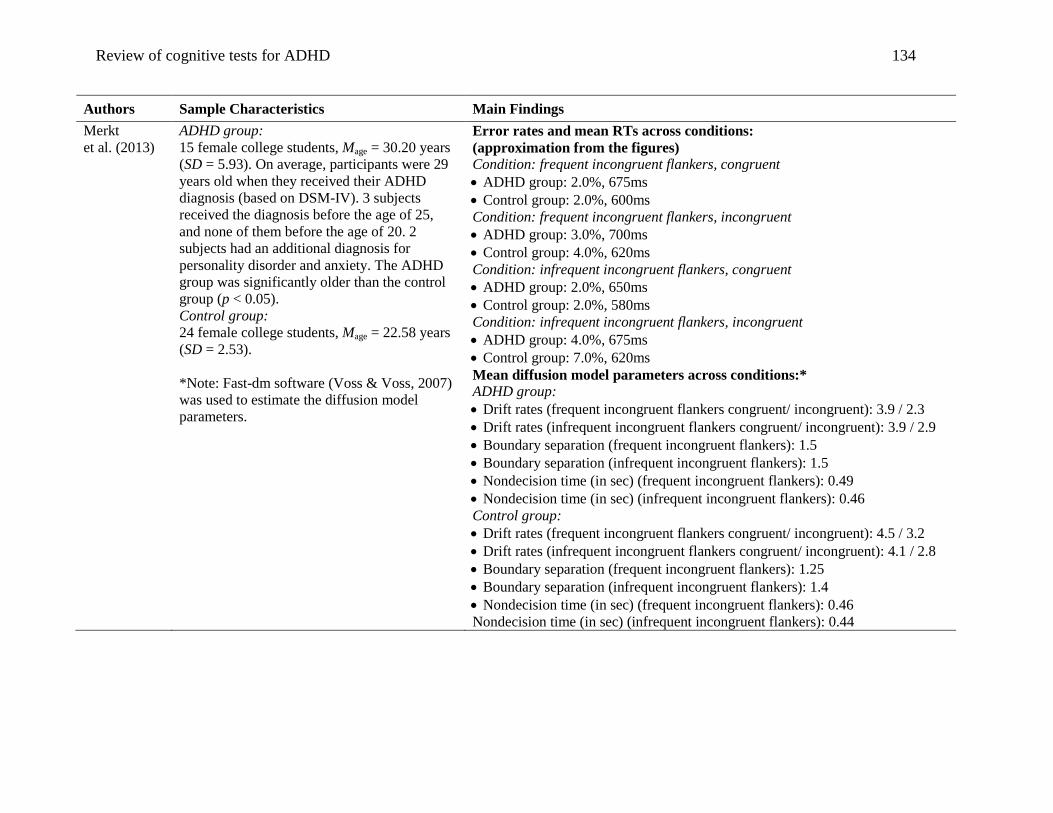
Review of cognitive tests for ADHD 134
Authors Sample Characteristics Main Findings
Merkt
et al. (2013)
ADHD group:
15 female college students, Mage = 30.20 years
(SD = 5.93). On average, participants were 29
years old when they received their ADHD
diagnosis (based on DSM-IV). 3 subjects
received the diagnosis before the age of 25,
and none of them before the age of 20. 2
subjects had an additional diagnosis for
personality disorder and anxiety. The ADHD
group was significantly older than the control
group (p < 0.05).
Control group:
24 female college students, Mage = 22.58 years
(SD = 2.53).
*Note: Fast-dm software (Voss & Voss, 2007)
was used to estimate the diffusion model
parameters.
Error rates and mean RTs across conditions:
(approximation from the figures)
Condition: frequent incongruent flankers, congruent
ADHD group: 2.0%, 675ms
Control group: 2.0%, 600ms
Condition: frequent incongruent flankers, incongruent
ADHD group: 3.0%, 700ms
Control group: 4.0%, 620ms
Condition: infrequent incongruent flankers, congruent
ADHD group: 2.0%, 650ms
Control group: 2.0%, 580ms
Condition: infrequent incongruent flankers, incongruent
ADHD group: 4.0%, 675ms
Control group: 7.0%, 620ms
Mean diffusion model parameters across conditions:*
ADHD group:
Drift rates (frequent incongruent flankers congruent/ incongruent): 3.9 / 2.3
Drift rates (infrequent incongruent flankers congruent/ incongruent): 3.9 / 2.9
Boundary separation (frequent incongruent flankers): 1.5
Boundary separation (infrequent incongruent flankers): 1.5
Nondecision time (in sec) (frequent incongruent flankers): 0.49
Nondecision time (in sec) (infrequent incongruent flankers): 0.46
Control group:
Drift rates (frequent incongruent flankers congruent/ incongruent): 4.5 / 3.2
Drift rates (infrequent incongruent flankers congruent/ incongruent): 4.1 / 2.8
Boundary separation (frequent incongruent flankers): 1.25
Boundary separation (infrequent incongruent flankers): 1.4
Nondecision time (in sec) (frequent incongruent flankers): 0.46
Nondecision time (in sec) (infrequent incongruent flankers): 0.44

Review of cognitive tests for ADHD 135
Authors Sample Characteristics Main Findings
Weigard &
Huang-
Pollock
(2014)
ADHD group:
72 children aged between 9 and 12, Mage =
10.17 years (SD=1.02), 54% males. DSM-IV
subtype diagnoses:
NADHD-I = 40, NADHD-C = 33, NADHD-H = 5.
Comorbidities included: Oppositional Defiant
Disorder (ODD) (N = 23), Conduct Disorder
(N = 6), Depressive Disorder (N = 6), Anxiety
Disorder (N = 10).
Control group:
36 children aged between 9 and 12, Mage =
10.50 years (SD = 1.16), 53% males.
Comorbidities included: ODD
(N = 1), Anxiety Disorder (N = 1).
Mean RTs (approximation from the figures)
Epoch 1 (novel configuration / repeated configuration - conditions):
ADHD: (1,510ms / 1,550ms), Control: (1,475ms / 1,475ms)
Epoch 2 (novel configuration / repeated configuration - conditions):
ADHD: (1,450ms / 1,450ms), Control: (1,350ms / 1,350ms)
Epoch 3 (novel configuration / repeated configuration - conditions):
ADHD: (1,360ms / 1,360ms), Control: (1,300ms / 1,250ms)
Accuracy for the three epochs (approximation from the figures)
Epoch 1 (novel configuration / repeated configuration - conditions):
ADHD: (95.1% / 94.8%), Control: (96.9% / 97.4%)
Epoch 2 (novel configuration / repeated configuration - conditions):
ADHD: (95.2% / 95.0%), Control: (97.2% / 97.2%)
Epoch 3 (novel configuration / repeated configuration - conditions):
ADHD: (95.0% / 95.0%), Control: (97.8% / 97.9%)
Mean diffusion model parameters across epochs and conditions:
Epoch 1 (novel configuration / repeated configuration - conditions):
nondecision time (in sec): ADHD: (0.750 / 0.785), Control: (0.725 / 0.725)
Drift rate: ADHD: (1.39 / 1.35), Control: (1.50 / 1.50)
Boundary separation: ADHD: (2.37 / 2.35), Control: (2.43 / 2.49)
Epoch 2 (novel configuration / repeated configuration - conditions):
nondecision time (in sec): ADHD: (0.700 / 0.725), Control: (0.650 / 0.650)
Drift rate: ADHD: (1.47 / 1.44), Control: (1.60 / 1.65)
Boundary separation: ADHD: (2.35 / 2.31), Control: (2.45 / 2.46)
Epoch 3 (novel configuration / repeated configuration - conditions):
nondecision time (in sec): ADHD: (0.640 / 0.650), Control: (0.600 / 0.615)
Drift rate: ADHD: (1.47 / 1.55), Control: (1.65 / 1.80)
Boundary separation: ADHD: (2.37 / 2.37), Control: (2.52 / 2.41)
Notes: Data was grouped into three epochs. Fast-dm software (Voss & Voss,
2007) was used to estimate the diffusion model parameters.
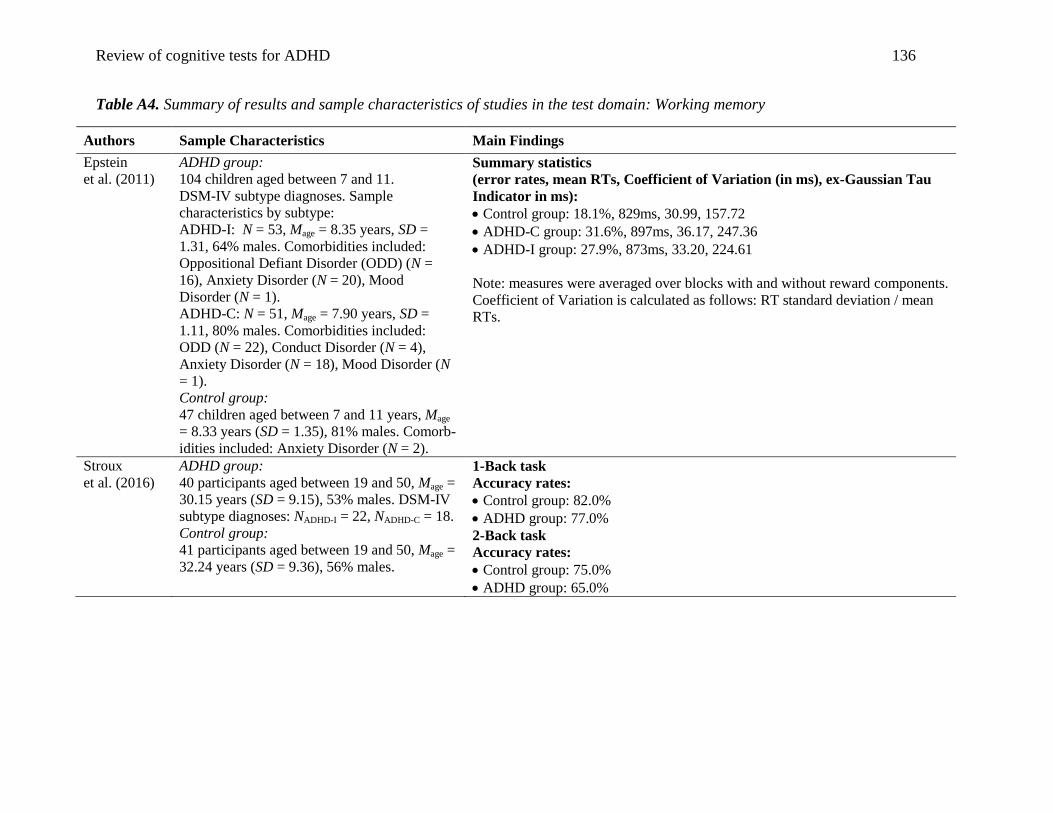
Review of cognitive tests for ADHD 136
Table A4. Summary of results and sample characteristics of studies in the test domain: Working memory
Authors Sample Characteristics Main Findings
Epstein
et al. (2011)
ADHD group:
104 children aged between 7 and 11.
DSM-IV subtype diagnoses. Sample
characteristics by subtype:
ADHD-I: N = 53, Mage = 8.35 years, SD =
1.31, 64% males. Comorbidities included:
Oppositional Defiant Disorder (ODD) (N =
16), Anxiety Disorder (N = 20), Mood
Disorder (N = 1).
ADHD-C: N = 51, Mage = 7.90 years, SD =
1.11, 80% males. Comorbidities included:
ODD (N = 22), Conduct Disorder (N = 4),
Anxiety Disorder (N = 18), Mood Disorder (N
= 1).
Control group:
47 children aged between 7 and 11 years, Mage
= 8.33 years (SD = 1.35), 81% males. Comorb-
idities included: Anxiety Disorder (N = 2).
Summary statistics
(error rates, mean RTs, Coefficient of Variation (in ms), ex-Gaussian Tau
Indicator in ms):
Control group: 18.1%, 829ms, 30.99, 157.72
ADHD-C group: 31.6%, 897ms, 36.17, 247.36
ADHD-I group: 27.9%, 873ms, 33.20, 224.61
Note: measures were averaged over blocks with and without reward components.
Coefficient of Variation is calculated as follows: RT standard deviation / mean
RTs.
Stroux
et al. (2016)
ADHD group:
40 participants aged between 19 and 50, Mage =
30.15 years (SD = 9.15), 53% males. DSM-IV
subtype diagnoses: NADHD-I = 22, NADHD-C = 18.
Control group:
41 participants aged between 19 and 50, Mage =
32.24 years (SD = 9.36), 56% males.
1-Back task
Accuracy rates:
Control group: 82.0%
ADHD group: 77.0%
2-Back task
Accuracy rates:
Control group: 75.0%
ADHD group: 65.0%
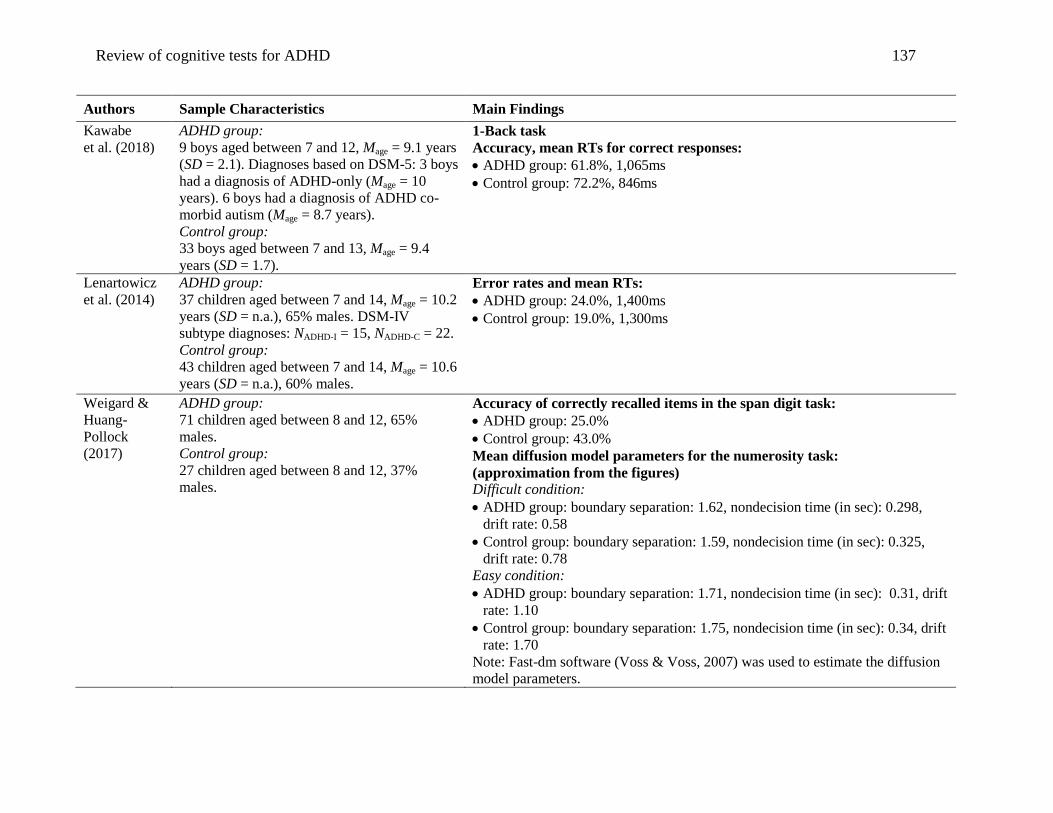
Review of cognitive tests for ADHD 137
Authors Sample Characteristics Main Findings
Kawabe
et al. (2018)
ADHD group:
9 boys aged between 7 and 12, Mage = 9.1 years
(SD = 2.1). Diagnoses based on DSM-5: 3 boys
had a diagnosis of ADHD-only (Mage = 10
years). 6 boys had a diagnosis of ADHD co-
morbid autism (Mage = 8.7 years).
Control group:
33 boys aged between 7 and 13, Mage = 9.4
years (SD = 1.7).
1-Back task
Accuracy, mean RTs for correct responses:
ADHD group: 61.8%, 1,065ms
Control group: 72.2%, 846ms
Lenartowicz
et al. (2014)
ADHD group:
37 children aged between 7 and 14, Mage = 10.2
years (SD = n.a.), 65% males. DSM-IV
subtype diagnoses: NADHD-I = 15, NADHD-C = 22.
Control group:
43 children aged between 7 and 14, Mage = 10.6
years (SD = n.a.), 60% males.
Error rates and mean RTs:
ADHD group: 24.0%, 1,400ms
Control group: 19.0%, 1,300ms
Weigard &
Huang-
Pollock
(2017)
ADHD group:
71 children aged between 8 and 12, 65%
males.
Control group:
27 children aged between 8 and 12, 37%
males.
Accuracy of correctly recalled items in the span digit task:
ADHD group: 25.0%
Control group: 43.0%
Mean diffusion model parameters for the numerosity task:
(approximation from the figures)
Difficult condition:
ADHD group: boundary separation: 1.62, nondecision time (in sec): 0.298,
drift rate: 0.58
Control group: boundary separation: 1.59, nondecision time (in sec): 0.325,
drift rate: 0.78
Easy condition:
ADHD group: boundary separation: 1.71, nondecision time (in sec): 0.31, drift
rate: 1.10
Control group: boundary separation: 1.75, nondecision time (in sec): 0.34, drift
rate: 1.70
Note: Fast-dm software (Voss & Voss, 2007) was used to estimate the diffusion
model parameters.

Review of cognitive tests for ADHD 138
Table A5. Summary of the results and sample characteristics of studies in the test domain: Time perception
Authors Sample Characteristics Main Findings
Valko
et al. (2010)
ADHD adult group:
22 adults aged between 32 and 52, Mage = 42.2
years (SD = 4.4), 50% males. 12 adults met
criteria for additional clinical
psychopathological symptoms.
ADHD children group:
33 children aged between 8 and 15, Mage = 11
years, (SD = 2.1), 61% males. All children
were diagnosed with ADHD-C based on DSM-
IV. Comorbidities included: Oppositional
Defiant Disorder (N = 11), Depressive
Disorder (N = 3), Anxiety Disorder (N = 2).
Control adult group:
22 adults aged between 32 and 52, Mage = 43.5
years (SD = 4.5), 50% males.
Control children group:
33 age- gender- and IQ matched children, Mage
= 11.0 years (SD = 2.1), 61% males.
Time Reproduction task:
absolute discrepancies between target intervals and mean reproduction time
ADHD children group:
2 sec-interval: 253ms, 4 sec-interval: 506ms
6 sec-interval: 713ms, 8 sec-interval: 968ms
ADHD adult group:
2 sec-interval: 226ms, 4 sec-interval: 427ms
6 sec-interval: 605ms, 8 sec-interval: 809ms
Control children group:
2 sec-interval: 196ms, 4 sec-interval: 270ms
6 sec-interval: 412ms, 8 sec-interval: 502ms
Control adult group:
2 sec-interval: 179ms, 4 sec-interval: 270ms
6 sec-interval: 409ms, 8 sec-interval: 504ms
Time Discrimination task:
Hits and mean RTs
Difference in stimuli duration smaller or equal than 100ms:
ADHD children group: 20.9, 1,322ms
ADHD adult group: 24.0, 1,281ms
Control children group: 22.2, 1,453ms
Control adult group: 26.0, 951ms
Difference in stimuli duration greater or equal than 200ms:
ADHD children group: 27.0, 1,105ms
ADHD adult group: 32.0, 906ms
Control children group: 30.2, 1,168ms
Control adult group: 33.6, 682ms
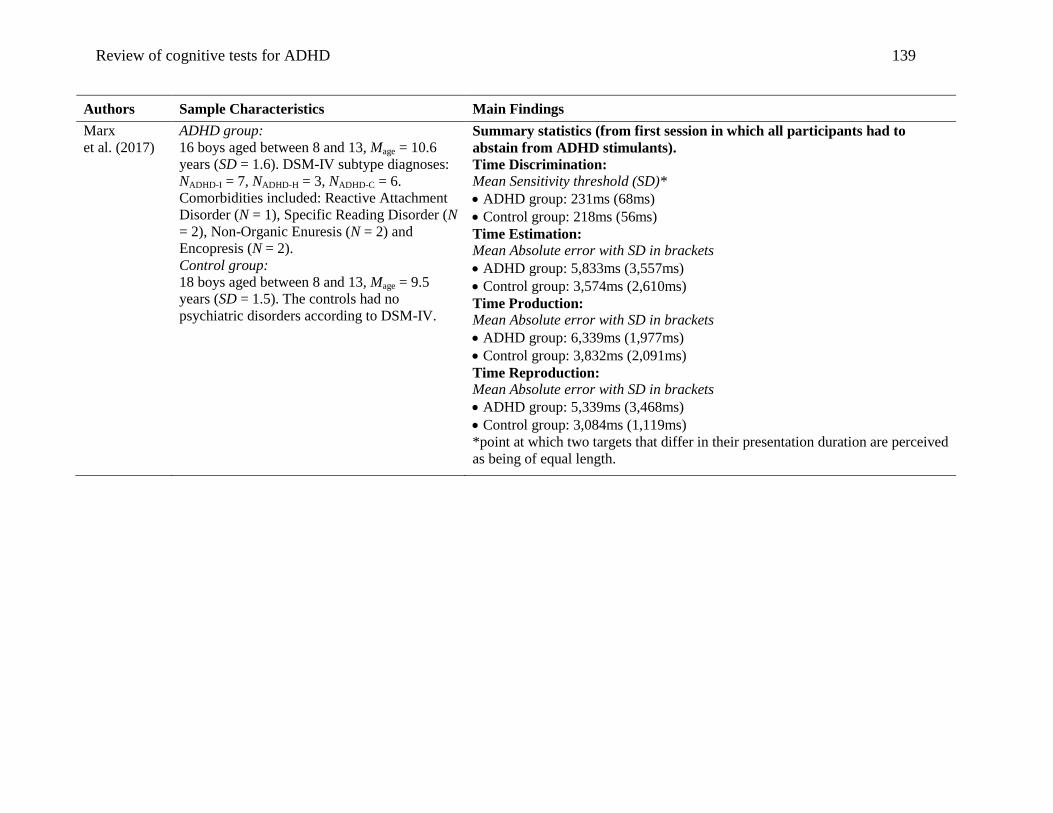
Review of cognitive tests for ADHD 139
Authors Sample Characteristics Main Findings
Marx
et al. (2017)
ADHD group:
16 boys aged between 8 and 13, Mage = 10.6
years (SD = 1.6). DSM-IV subtype diagnoses:
NADHD-I = 7, NADHD-H = 3, NADHD-C = 6.
Comorbidities included: Reactive Attachment
Disorder (N = 1), Specific Reading Disorder (N
= 2), Non-Organic Enuresis (N = 2) and
Encopresis (N = 2).
Control group:
18 boys aged between 8 and 13, Mage = 9.5
years (SD = 1.5). The controls had no
psychiatric disorders according to DSM-IV.
Summary statistics (from first session in which all participants had to
abstain from ADHD stimulants).
Time Discrimination:
Mean Sensitivity threshold (SD)*
ADHD group: 231ms (68ms)
Control group: 218ms (56ms)
Time Estimation:
Mean Absolute error with SD in brackets
ADHD group: 5,833ms (3,557ms)
Control group: 3,574ms (2,610ms)
Time Production:
Mean Absolute error with SD in brackets
ADHD group: 6,339ms (1,977ms)
Control group: 3,832ms (2,091ms)
Time Reproduction:
Mean Absolute error with SD in brackets
ADHD group: 5,339ms (3,468ms)
Control group: 3,084ms (1,119ms)
*point at which two targets that differ in their presentation duration are perceived
as being of equal length.
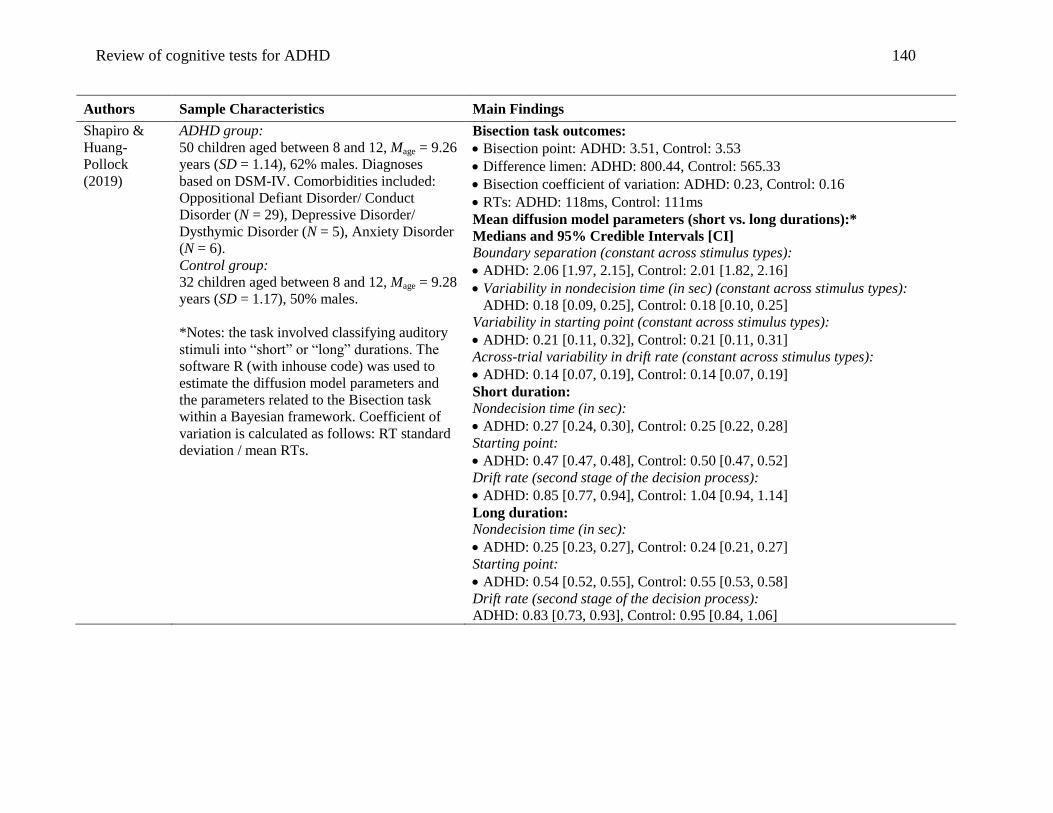
Review of cognitive tests for ADHD 140
Authors Sample Characteristics Main Findings
Shapiro &
Huang-
Pollock
(2019)
ADHD group:
50 children aged between 8 and 12, Mage = 9.26
years (SD = 1.14), 62% males. Diagnoses
based on DSM-IV. Comorbidities included:
Oppositional Defiant Disorder/ Conduct
Disorder (N = 29), Depressive Disorder/
Dysthymic Disorder (N = 5), Anxiety Disorder
(N = 6).
Control group:
32 children aged between 8 and 12, Mage = 9.28
years (SD = 1.17), 50% males.
*Notes: the task involved classifying auditory
stimuli into “short” or “long” durations. The
software R (with inhouse code) was used to
estimate the diffusion model parameters and
the parameters related to the Bisection task
within a Bayesian framework. Coefficient of
variation is calculated as follows: RT standard
deviation / mean RTs.
Bisection task outcomes:
Bisection point: ADHD: 3.51, Control: 3.53
Difference limen: ADHD: 800.44, Control: 565.33
Bisection coefficient of variation: ADHD: 0.23, Control: 0.16
RTs: ADHD: 118ms, Control: 111ms
Mean diffusion model parameters (short vs. long durations):*
Medians and 95% Credible Intervals [CI]
Boundary separation (constant across stimulus types):
ADHD: 2.06 [1.97, 2.15], Control: 2.01 [1.82, 2.16]
Variability in nondecision time (in sec) (constant across stimulus types):
ADHD: 0.18 [0.09, 0.25], Control: 0.18 [0.10, 0.25]
Variability in starting point (constant across stimulus types):
ADHD: 0.21 [0.11, 0.32], Control: 0.21 [0.11, 0.31]
Across-trial variability in drift rate (constant across stimulus types):
ADHD: 0.14 [0.07, 0.19], Control: 0.14 [0.07, 0.19]
Short duration:
Nondecision time (in sec):
ADHD: 0.27 [0.24, 0.30], Control: 0.25 [0.22, 0.28]
Starting point:
ADHD: 0.47 [0.47, 0.48], Control: 0.50 [0.47, 0.52]
Drift rate (second stage of the decision process):
ADHD: 0.85 [0.77, 0.94], Control: 1.04 [0.94, 1.14]
Long duration:
Nondecision time (in sec):
ADHD: 0.25 [0.23, 0.27], Control: 0.24 [0.21, 0.27]
Starting point:
ADHD: 0.54 [0.52, 0.55], Control: 0.55 [0.53, 0.58]
Drift rate (second stage of the decision process):
ADHD: 0.83 [0.73, 0.93], Control: 0.95 [0.84, 1.06]
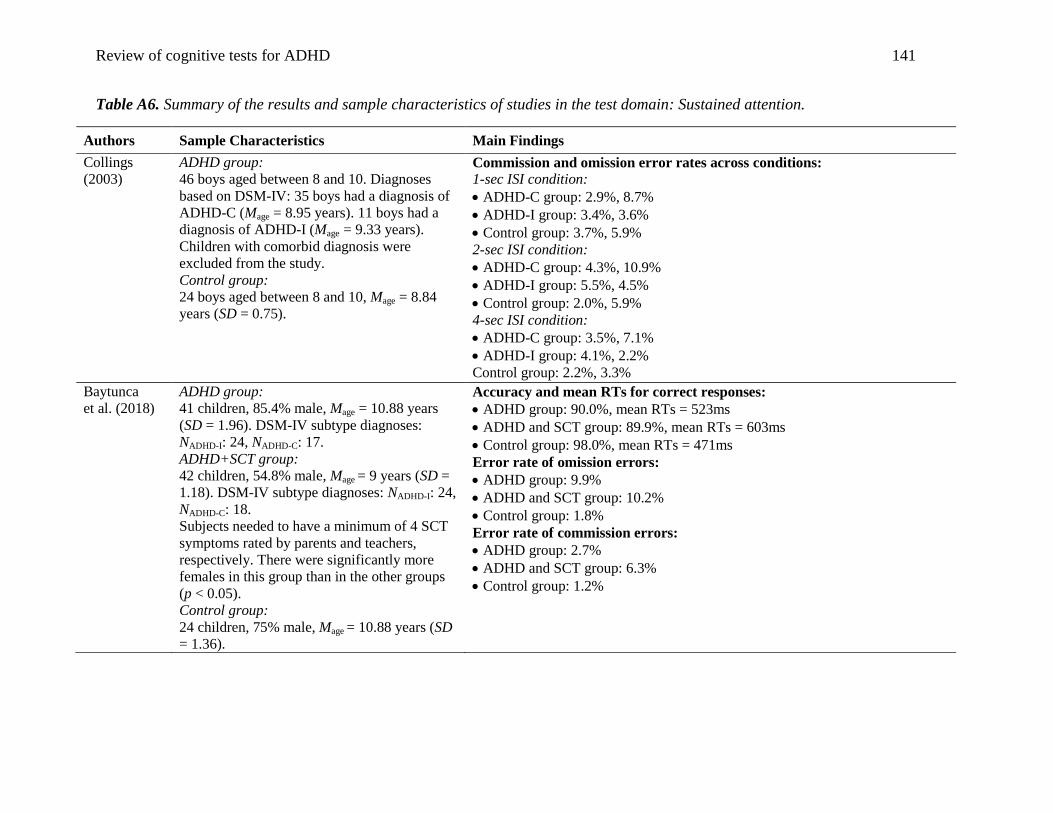
Review of cognitive tests for ADHD 141
Table A6. Summary of the results and sample characteristics of studies in the test domain: Sustained attention.
Authors Sample Characteristics Main Findings
Collings
(2003)
ADHD group:
46 boys aged between 8 and 10. Diagnoses
based on DSM-IV: 35 boys had a diagnosis of
ADHD-C (Mage = 8.95 years). 11 boys had a
diagnosis of ADHD-I (Mage = 9.33 years).
Children with comorbid diagnosis were
excluded from the study.
Control group:
24 boys aged between 8 and 10, Mage = 8.84
years (SD = 0.75).
Commission and omission error rates across conditions:
1-sec ISI condition:
ADHD-C group: 2.9%, 8.7%
ADHD-I group: 3.4%, 3.6%
Control group: 3.7%, 5.9%
2-sec ISI condition:
ADHD-C group: 4.3%, 10.9%
ADHD-I group: 5.5%, 4.5%
Control group: 2.0%, 5.9%
4-sec ISI condition:
ADHD-C group: 3.5%, 7.1%
ADHD-I group: 4.1%, 2.2%
Control group: 2.2%, 3.3%
Baytunca
et al. (2018)
ADHD group:
41 children, 85.4% male, Mage = 10.88 years
(SD = 1.96). DSM-IV subtype diagnoses:
NADHD-I: 24, NADHD-C: 17.
ADHD+SCT group:
42 children, 54.8% male, Mage = 9 years (SD =
1.18). DSM-IV subtype diagnoses: NADHD-I: 24,
NADHD-C: 18.
Subjects needed to have a minimum of 4 SCT
symptoms rated by parents and teachers,
respectively. There were significantly more
females in this group than in the other groups
(p < 0.05).
Control group:
24 children, 75% male, Mage = 10.88 years (SD
= 1.36).
Accuracy and mean RTs for correct responses:
ADHD group: 90.0%, mean RTs = 523ms
ADHD and SCT group: 89.9%, mean RTs = 603ms
Control group: 98.0%, mean RTs = 471ms
Error rate of omission errors:
ADHD group: 9.9%
ADHD and SCT group: 10.2%
Control group: 1.8%
Error rate of commission errors:
ADHD group: 2.7%
ADHD and SCT group: 6.3%
Control group: 1.2%
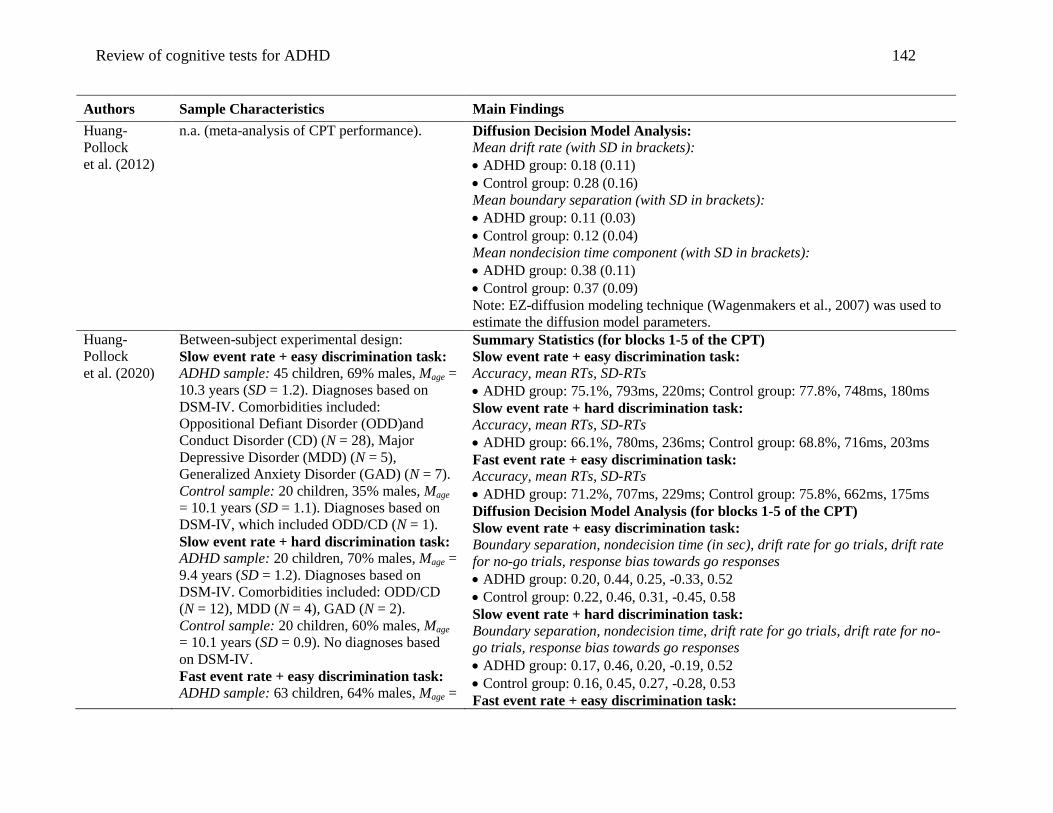
Review of cognitive tests for ADHD 142
Authors Sample Characteristics Main Findings
Huang-
Pollock
et al. (2012)
n.a. (meta-analysis of CPT performance). Diffusion Decision Model Analysis:
Mean drift rate (with SD in brackets):
ADHD group: 0.18 (0.11)
Control group: 0.28 (0.16)
Mean boundary separation (with SD in brackets):
ADHD group: 0.11 (0.03)
Control group: 0.12 (0.04)
Mean nondecision time component (with SD in brackets):
ADHD group: 0.38 (0.11)
Control group: 0.37 (0.09)
Note: EZ-diffusion modeling technique (Wagenmakers et al., 2007) was used to
estimate the diffusion model parameters.
Huang-
Pollock
et al. (2020)
Between-subject experimental design:
Slow event rate + easy discrimination task:
ADHD sample: 45 children, 69% males, Mage =
10.3 years (SD = 1.2). Diagnoses based on
DSM-IV. Comorbidities included:
Oppositional Defiant Disorder (ODD)and
Conduct Disorder (CD) (N = 28), Major
Depressive Disorder (MDD) (N = 5),
Generalized Anxiety Disorder (GAD) (N = 7).
Control sample: 20 children, 35% males, Mage
= 10.1 years (SD = 1.1). Diagnoses based on
DSM-IV, which included ODD/CD (N = 1).
Slow event rate + hard discrimination task:
ADHD sample: 20 children, 70% males, Mage =
9.4 years (SD = 1.2). Diagnoses based on
DSM-IV. Comorbidities included: ODD/CD
(N = 12), MDD (N = 4), GAD (N = 2).
Control sample: 20 children, 60% males, Mage
= 10.1 years (SD = 0.9). No diagnoses based
on DSM-IV.
Fast event rate + easy discrimination task:
ADHD sample: 63 children, 64% males, Mage =
Summary Statistics (for blocks 1-5 of the CPT)
Slow event rate + easy discrimination task:
Accuracy, mean RTs, SD-RTs
ADHD group: 75.1%, 793ms, 220ms; Control group: 77.8%, 748ms, 180ms
Slow event rate + hard discrimination task:
Accuracy, mean RTs, SD-RTs
ADHD group: 66.1%, 780ms, 236ms; Control group: 68.8%, 716ms, 203ms
Fast event rate + easy discrimination task:
Accuracy, mean RTs, SD-RTs
ADHD group: 71.2%, 707ms, 229ms; Control group: 75.8%, 662ms, 175ms
Diffusion Decision Model Analysis (for blocks 1-5 of the CPT)
Slow event rate + easy discrimination task:
Boundary separation, nondecision time (in sec), drift rate for go trials, drift rate
for no-go trials, response bias towards go responses
ADHD group: 0.20, 0.44, 0.25, -0.33, 0.52
Control group: 0.22, 0.46, 0.31, -0.45, 0.58
Slow event rate + hard discrimination task:
Boundary separation, nondecision time, drift rate for go trials, drift rate for no-
go trials, response bias towards go responses
ADHD group: 0.17, 0.46, 0.20, -0.19, 0.52
Control group: 0.16, 0.45, 0.27, -0.28, 0.53
Fast event rate + easy discrimination task:

Review of cognitive tests for ADHD 143
Authors Sample Characteristics Main Findings
10.0 years (SD = 1.3). Diagnoses based on
DSM-IV. Comorbidities included: ODD/CD
(N = 30), MDD (N = 5), GAD (N = 5).
Control sample: 19 children, 42% males, Mage
= 9.5 years (SD = 1.3). Diagnoses based on
DSM-IV, which included ODD/CD (N = 1).
Boundary separation, nondecision time, drift rate for go trials, drift rate for no-
go trials, response bias towards go responses
ADHD group: 0.19, 0.39, 0.24, -0.29, 0.54
Control group: 0.18, 0.42, 0.30, -0.36, 0.59
Summary Statistics (for blocks 6-10 of the CPT)
Slow event rate + easy discrimination task:
Accuracy, mean RTs, SD-RTs
ADHD group: 75.6%, 834ms, 217ms; Control group: 77.7%, 810ms, 185ms
Slow event rate + hard discrimination task:
Accuracy, mean RTs, SD-RTs
ADHD group: 68.5%, 792ms, 244ms; Control group: 72.8%, 753ms, 203ms
Fast event rate + easy discrimination task:
Accuracy, mean RTs, SD-RTs
ADHD group: 72.8%, 736ms, 232ms; Control group: 77.4%, 705ms, 172ms
Diffusion Decision Model Analysis (for blocks 6-10 of the CPT)
Slow event rate + easy discrimination task:
Boundary separation, nondecision time (in sec), drift rate for go trials, drift rate
for no-go trials, response bias towards go responses
ADHD group: 0.20, 0.46, 0.24, -0.36, 0.46
Control group: 0.19, 0.48, 0.31, -0.36, 0.46
Slow event rate + hard discrimination task:
Boundary separation, nondecision time, drift rate for go trials, drift rate for no-
go trials, response bias towards go responses
ADHD group: 0.17, 0.45, 0.18, -0.25, 0.48
Control group: 0.17, 0.46, 0.29, -0.33, 0.48
Fast event rate + easy discrimination task:
Boundary separation, nondecision time, drift rate for go trials, drift rate for no-
go trials, response bias towards go responses
ADHD group: 0.20, 0.41, 0.24, -0.34, 0.51
Control group: 0.19, 0.41, 0.35, -0.38, 0.49
Note: Fortran code (Inhouse code by Roger Ratcliff) was used to estimate the
diffusion model parameters.
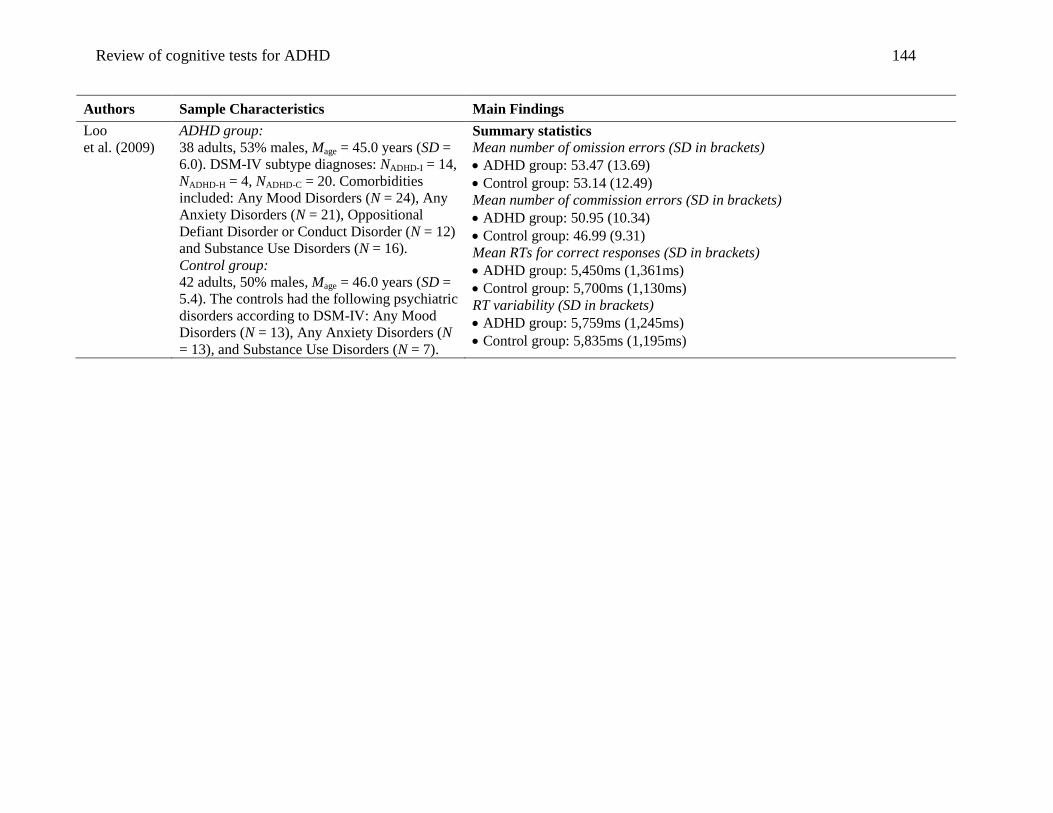
Review of cognitive tests for ADHD 144
Authors Sample Characteristics Main Findings
Loo
et al. (2009)
ADHD group:
38 adults, 53% males, Mage = 45.0 years (SD =
6.0). DSM-IV subtype diagnoses: NADHD-I = 14,
NADHD-H = 4, NADHD-C = 20. Comorbidities
included: Any Mood Disorders (N = 24), Any
Anxiety Disorders (N = 21), Oppositional
Defiant Disorder or Conduct Disorder (N = 12)
and Substance Use Disorders (N = 16).
Control group:
42 adults, 50% males, Mage = 46.0 years (SD =
5.4). The controls had the following psychiatric
disorders according to DSM-IV: Any Mood
Disorders (N = 13), Any Anxiety Disorders (N
= 13), and Substance Use Disorders (N = 7).
Summary statistics
Mean number of omission errors (SD in brackets)
ADHD group: 53.47 (13.69)
Control group: 53.14 (12.49)
Mean number of commission errors (SD in brackets)
ADHD group: 50.95 (10.34)
Control group: 46.99 (9.31)
Mean RTs for correct responses (SD in brackets)
ADHD group: 5,450ms (1,361ms)
Control group: 5,700ms (1,130ms)
RT variability (SD in brackets)
ADHD group: 5,759ms (1,245ms)
Control group: 5,835ms (1,195ms)
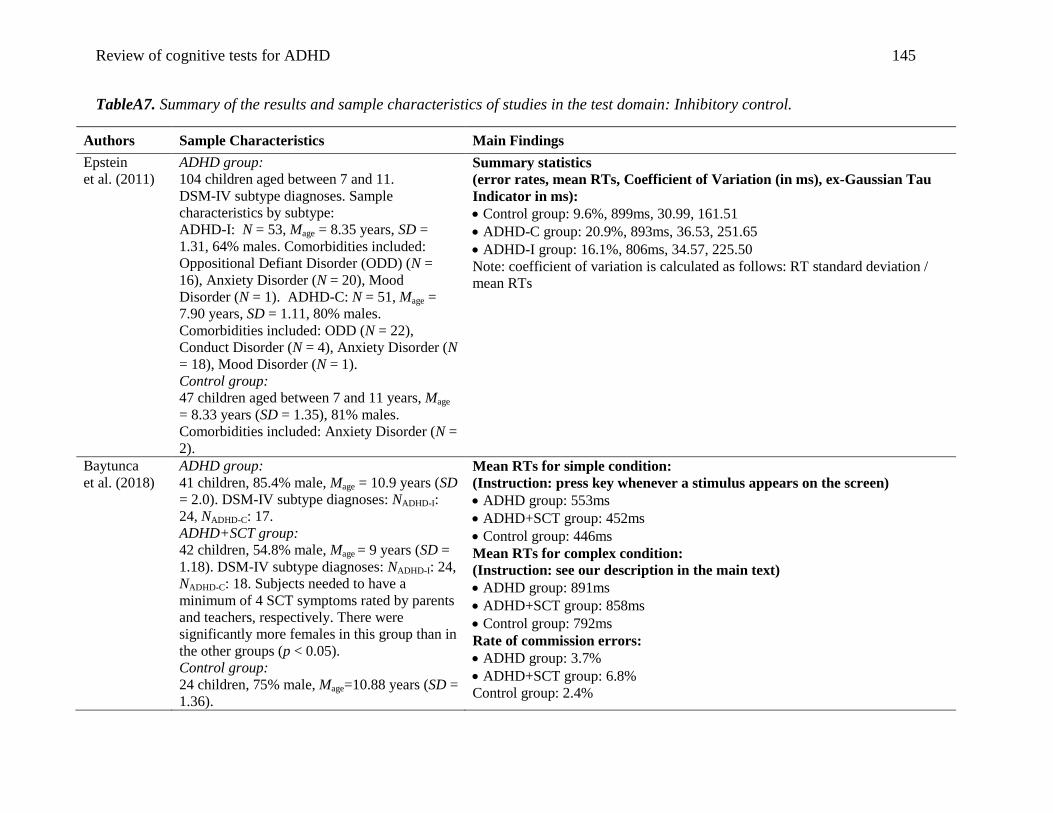
Review of cognitive tests for ADHD 145
TableA7. Summary of the results and sample characteristics of studies in the test domain: Inhibitory control.
Authors Sample Characteristics Main Findings
Epstein
et al. (2011)
ADHD group:
104 children aged between 7 and 11.
DSM-IV subtype diagnoses. Sample
characteristics by subtype:
ADHD-I: N = 53, Mage = 8.35 years, SD =
1.31, 64% males. Comorbidities included:
Oppositional Defiant Disorder (ODD) (N =
16), Anxiety Disorder (N = 20), Mood
Disorder (N = 1). ADHD-C: N = 51, Mage =
7.90 years, SD = 1.11, 80% males.
Comorbidities included: ODD (N = 22),
Conduct Disorder (N = 4), Anxiety Disorder (N
= 18), Mood Disorder (N = 1).
Control group:
47 children aged between 7 and 11 years, Mage
= 8.33 years (SD = 1.35), 81% males.
Comorbidities included: Anxiety Disorder (N =
2).
Summary statistics
(error rates, mean RTs, Coefficient of Variation (in ms), ex-Gaussian Tau
Indicator in ms):
Control group: 9.6%, 899ms, 30.99, 161.51
ADHD-C group: 20.9%, 893ms, 36.53, 251.65
ADHD-I group: 16.1%, 806ms, 34.57, 225.50
Note: coefficient of variation is calculated as follows: RT standard deviation /
mean RTs
Baytunca
et al. (2018)
ADHD group:
41 children, 85.4% male, Mage = 10.9 years (SD
= 2.0). DSM-IV subtype diagnoses: NADHD-I:
24, NADHD-C: 17.
ADHD+SCT group:
42 children, 54.8% male, Mage = 9 years (SD =
1.18). DSM-IV subtype diagnoses: NADHD-I: 24,
NADHD-C: 18. Subjects needed to have a
minimum of 4 SCT symptoms rated by parents
and teachers, respectively. There were
significantly more females in this group than in
the other groups (p < 0.05).
Control group:
24 children, 75% male, Mage=10.88 years (SD =
1.36).
Mean RTs for simple condition:
(Instruction: press key whenever a stimulus appears on the screen)
ADHD group: 553ms
ADHD+SCT group: 452ms
Control group: 446ms
Mean RTs for complex condition:
(Instruction: see our description in the main text)
ADHD group: 891ms
ADHD+SCT group: 858ms
Control group: 792ms
Rate of commission errors:
ADHD group: 3.7%
ADHD+SCT group: 6.8%
Control group: 2.4%
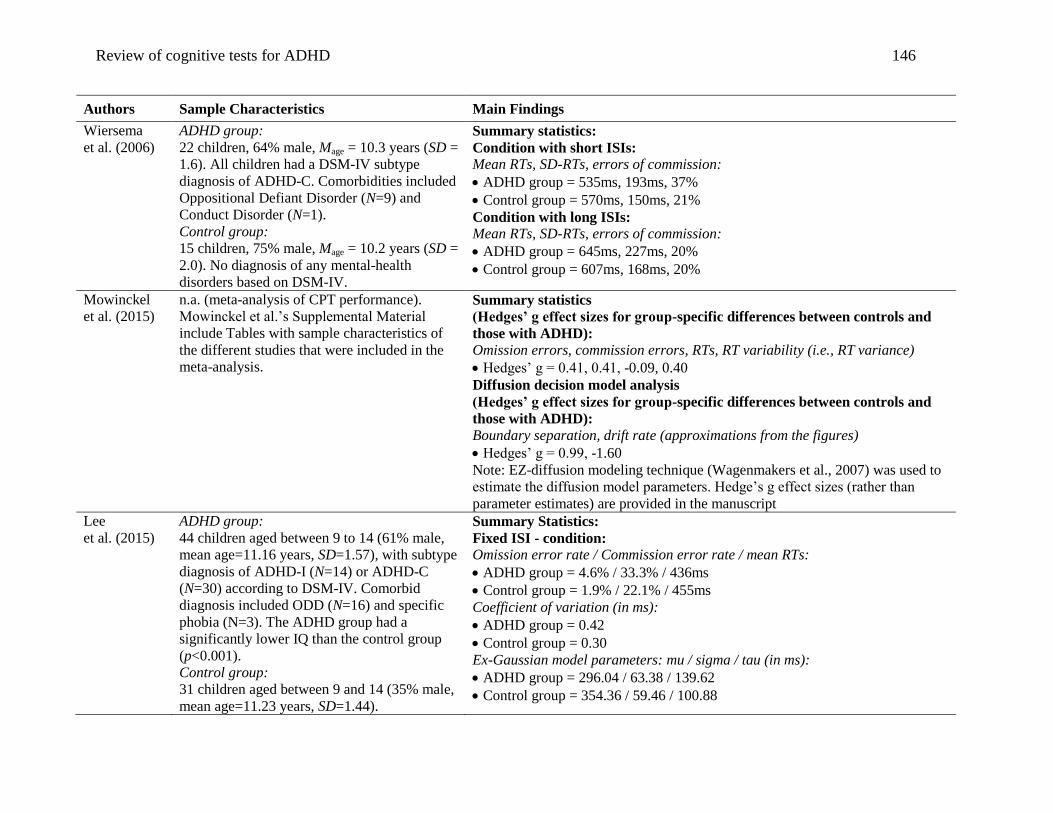
Review of cognitive tests for ADHD 146
Authors Sample Characteristics Main Findings
Wiersema
et al. (2006)
ADHD group:
22 children, 64% male, Mage = 10.3 years (SD =
1.6). All children had a DSM-IV subtype
diagnosis of ADHD-C. Comorbidities included
Oppositional Defiant Disorder (N=9) and
Conduct Disorder (N=1).
Control group:
15 children, 75% male, Mage = 10.2 years (SD =
2.0). No diagnosis of any mental-health
disorders based on DSM-IV.
Summary statistics:
Condition with short ISIs:
Mean RTs, SD-RTs, errors of commission:
ADHD group = 535ms, 193ms, 37%
Control group = 570ms, 150ms, 21%
Condition with long ISIs:
Mean RTs, SD-RTs, errors of commission:
ADHD group = 645ms, 227ms, 20%
Control group = 607ms, 168ms, 20%
Mowinckel
et al. (2015)
n.a. (meta-analysis of CPT performance).
Mowinckel et al.’s Supplemental Material
include Tables with sample characteristics of
the different studies that were included in the
meta-analysis.
Summary statistics
(Hedges’ g effect sizes for group-specific differences between controls and
those with ADHD):
Omission errors, commission errors, RTs, RT variability (i.e., RT variance)
Hedges’ g = 0.41, 0.41, -0.09, 0.40
Diffusion decision model analysis
(Hedges’ g effect sizes for group-specific differences between controls and
those with ADHD):
Boundary separation, drift rate (approximations from the figures)
Hedges’ g = 0.99, -1.60
Note: EZ-diffusion modeling technique (Wagenmakers et al., 2007) was used to
estimate the diffusion model parameters. Hedge’s g effect sizes (rather than
parameter estimates) are provided in the manuscript
Lee
et al. (2015)
ADHD group:
44 children aged between 9 to 14 (61% male,
mean age=11.16 years, SD=1.57), with subtype
diagnosis of ADHD-I (N=14) or ADHD-C
(N=30) according to DSM-IV. Comorbid
diagnosis included ODD (N=16) and specific
phobia (N=3). The ADHD group had a
significantly lower IQ than the control group
(p<0.001).
Control group:
31 children aged between 9 and 14 (35% male,
mean age=11.23 years, SD=1.44).
Summary Statistics:
Fixed ISI - condition:
Omission error rate / Commission error rate / mean RTs:
ADHD group = 4.6% / 33.3% / 436ms
Control group = 1.9% / 22.1% / 455ms
Coefficient of variation (in ms):
ADHD group = 0.42
Control group = 0.30
Ex-Gaussian model parameters: mu / sigma / tau (in ms):
ADHD group = 296.04 / 63.38 / 139.62
Control group = 354.36 / 59.46 / 100.88
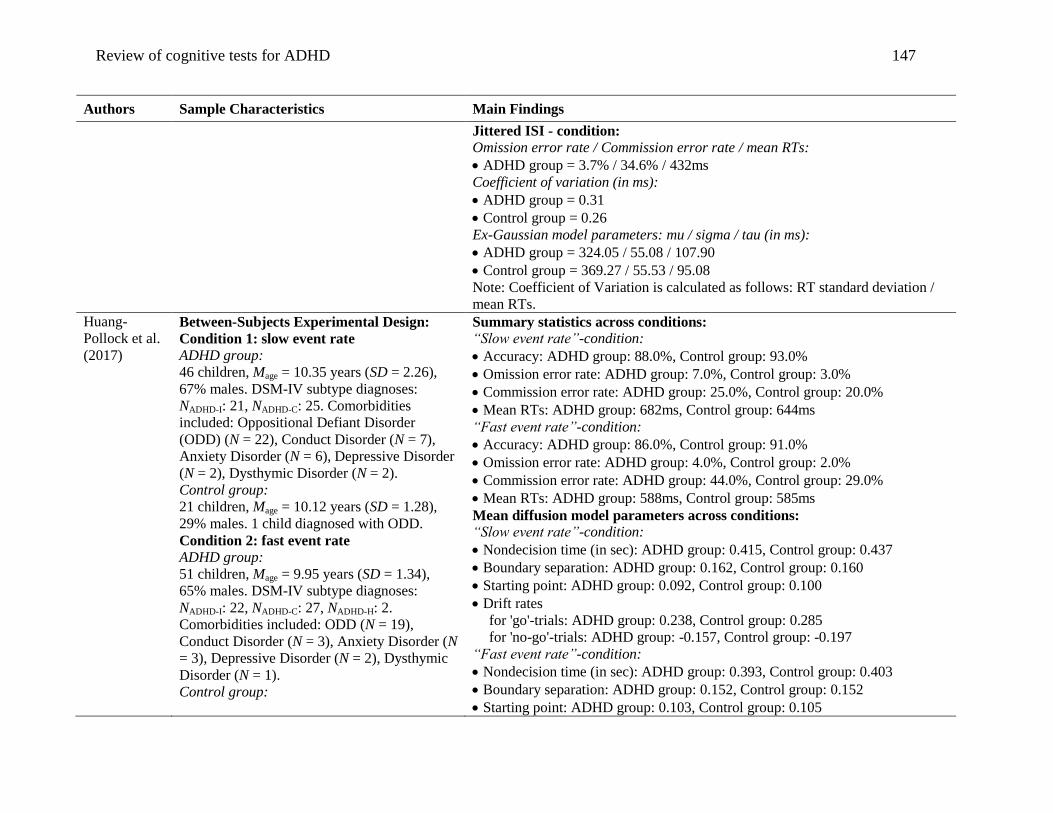
Review of cognitive tests for ADHD 147
Authors Sample Characteristics Main Findings
Jittered ISI - condition:
Omission error rate / Commission error rate / mean RTs:
ADHD group = 3.7% / 34.6% / 432ms
Coefficient of variation (in ms):
ADHD group = 0.31
Control group = 0.26
Ex-Gaussian model parameters: mu / sigma / tau (in ms):
ADHD group = 324.05 / 55.08 / 107.90
Control group = 369.27 / 55.53 / 95.08
Note: Coefficient of Variation is calculated as follows: RT standard deviation /
mean RTs.
Huang-
Pollock et al.
(2017)
Between-Subjects Experimental Design:
Condition 1: slow event rate
ADHD group:
46 children, Mage = 10.35 years (SD = 2.26),
67% males. DSM-IV subtype diagnoses:
NADHD-I: 21, NADHD-C: 25. Comorbidities
included: Oppositional Defiant Disorder
(ODD) (N = 22), Conduct Disorder (N = 7),
Anxiety Disorder (N = 6), Depressive Disorder
(N = 2), Dysthymic Disorder (N = 2).
Control group:
21 children, Mage = 10.12 years (SD = 1.28),
29% males. 1 child diagnosed with ODD.
Condition 2: fast event rate
ADHD group:
51 children, Mage = 9.95 years (SD = 1.34),
65% males. DSM-IV subtype diagnoses:
NADHD-I: 22, NADHD-C: 27, NADHD-H: 2.
Comorbidities included: ODD (N = 19),
Conduct Disorder (N = 3), Anxiety Disorder (N
= 3), Depressive Disorder (N = 2), Dysthymic
Disorder (N = 1).
Control group:
Summary statistics across conditions:
“Slow event rate”-condition:
Accuracy: ADHD group: 88.0%, Control group: 93.0%
Omission error rate: ADHD group: 7.0%, Control group: 3.0%
Commission error rate: ADHD group: 25.0%, Control group: 20.0%
Mean RTs: ADHD group: 682ms, Control group: 644ms
“Fast event rate”-condition:
Accuracy: ADHD group: 86.0%, Control group: 91.0%
Omission error rate: ADHD group: 4.0%, Control group: 2.0%
Commission error rate: ADHD group: 44.0%, Control group: 29.0%
Mean RTs: ADHD group: 588ms, Control group: 585ms
Mean diffusion model parameters across conditions:
“Slow event rate”-condition:
Nondecision time (in sec): ADHD group: 0.415, Control group: 0.437
Boundary separation: ADHD group: 0.162, Control group: 0.160
Starting point: ADHD group: 0.092, Control group: 0.100
Drift rates
for 'go'-trials: ADHD group: 0.238, Control group: 0.285
for 'no-go'-trials: ADHD group: -0.157, Control group: -0.197
“Fast event rate”-condition:
Nondecision time (in sec): ADHD group: 0.393, Control group: 0.403
Boundary separation: ADHD group: 0.152, Control group: 0.152
Starting point: ADHD group: 0.103, Control group: 0.105
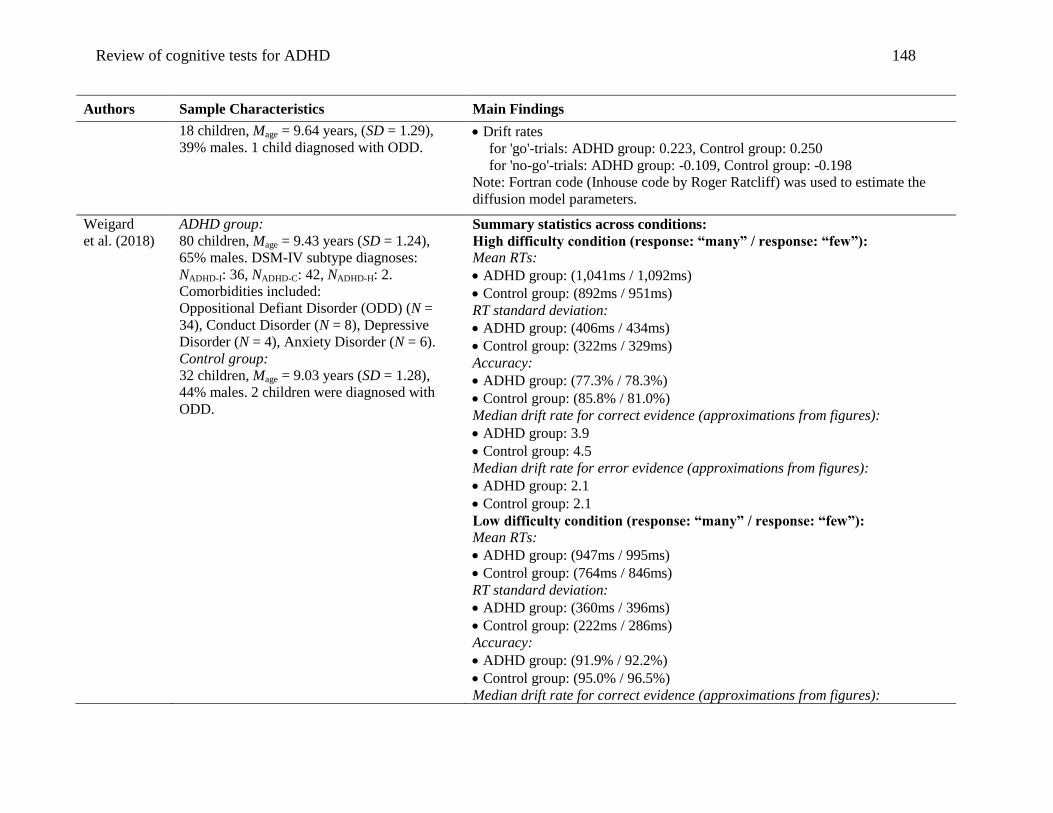
Review of cognitive tests for ADHD 148
Authors Sample Characteristics Main Findings
18 children, Mage = 9.64 years, (SD = 1.29),
39% males. 1 child diagnosed with ODD. Drift rates
for 'go'-trials: ADHD group: 0.223, Control group: 0.250
for 'no-go'-trials: ADHD group: -0.109, Control group: -0.198
Note: Fortran code (Inhouse code by Roger Ratcliff) was used to estimate the
diffusion model parameters.
Weigard
et al. (2018)
ADHD group:
80 children, Mage = 9.43 years (SD = 1.24),
65% males. DSM-IV subtype diagnoses:
NADHD-I: 36, NADHD-C: 42, NADHD-H: 2.
Comorbidities included:
Oppositional Defiant Disorder (ODD) (N =
34), Conduct Disorder (N = 8), Depressive
Disorder (N = 4), Anxiety Disorder (N = 6).
Control group:
32 children, Mage = 9.03 years (SD = 1.28),
44% males. 2 children were diagnosed with
ODD.
Summary statistics across conditions:
High difficulty condition (response: “many” / response: “few”):
Mean RTs:
ADHD group: (1,041ms / 1,092ms)
Control group: (892ms / 951ms)
RT standard deviation:
ADHD group: (406ms / 434ms)
Control group: (322ms / 329ms)
Accuracy:
ADHD group: (77.3% / 78.3%)
Control group: (85.8% / 81.0%)
Median drift rate for correct evidence (approximations from figures):
ADHD group: 3.9
Control group: 4.5
Median drift rate for error evidence (approximations from figures):
ADHD group: 2.1
Control group: 2.1
Low difficulty condition (response: “many” / response: “few”):
Mean RTs:
ADHD group: (947ms / 995ms)
Control group: (764ms / 846ms)
RT standard deviation:
ADHD group: (360ms / 396ms)
Control group: (222ms / 286ms)
Accuracy:
ADHD group: (91.9% / 92.2%)
Control group: (95.0% / 96.5%)
Median drift rate for correct evidence (approximations from figures):
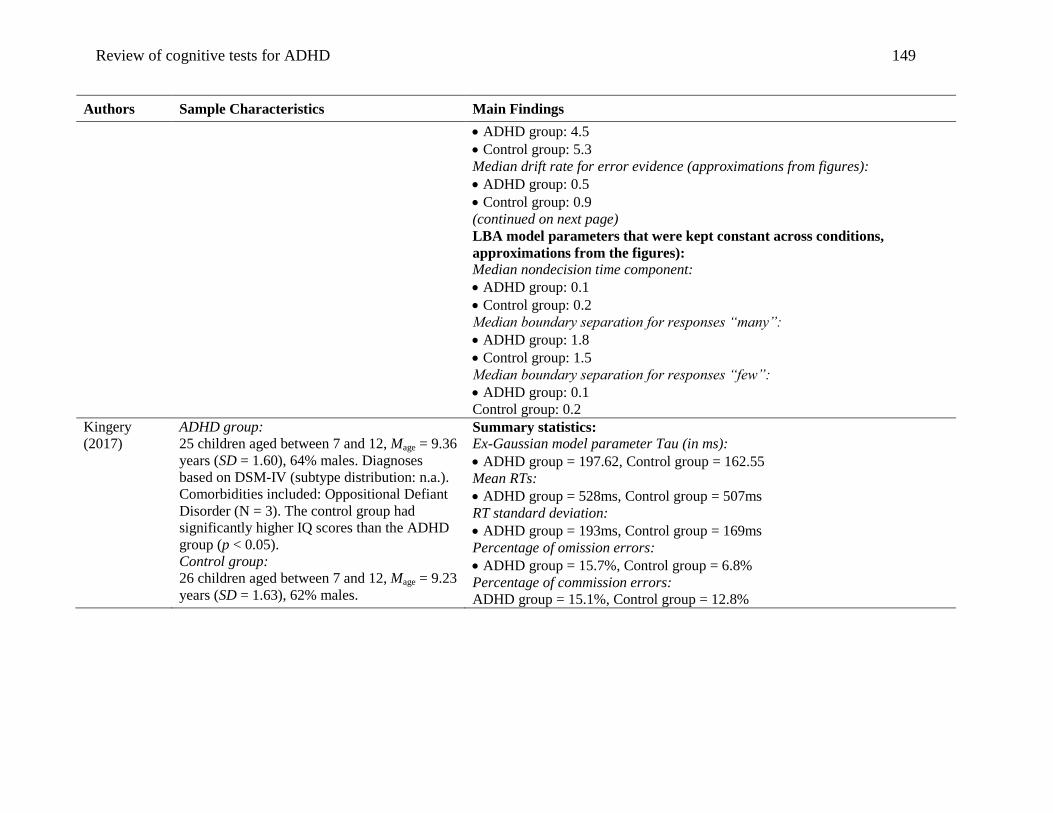
Review of cognitive tests for ADHD 149
Authors Sample Characteristics Main Findings
ADHD group: 4.5
Control group: 5.3
Median drift rate for error evidence (approximations from figures):
ADHD group: 0.5
Control group: 0.9
(continued on next page)
LBA model parameters that were kept constant across conditions,
approximations from the figures):
Median nondecision time component:
ADHD group: 0.1
Control group: 0.2
Median boundary separation for responses “many”:
ADHD group: 1.8
Control group: 1.5
Median boundary separation for responses “few”:
ADHD group: 0.1
Control group: 0.2
Kingery
(2017)
ADHD group:
25 children aged between 7 and 12, Mage = 9.36
years (SD = 1.60), 64% males. Diagnoses
based on DSM-IV (subtype distribution: n.a.).
Comorbidities included: Oppositional Defiant
Disorder (N = 3). The control group had
significantly higher IQ scores than the ADHD
group (p < 0.05).
Control group:
26 children aged between 7 and 12, Mage = 9.23
years (SD = 1.63), 62% males.
Summary statistics:
Ex-Gaussian model parameter Tau (in ms):
ADHD group = 197.62, Control group = 162.55
Mean RTs:
ADHD group = 528ms, Control group = 507ms
RT standard deviation:
ADHD group = 193ms, Control group = 169ms
Percentage of omission errors:
ADHD group = 15.7%, Control group = 6.8%
Percentage of commission errors:
ADHD group = 15.1%, Control group = 12.8%
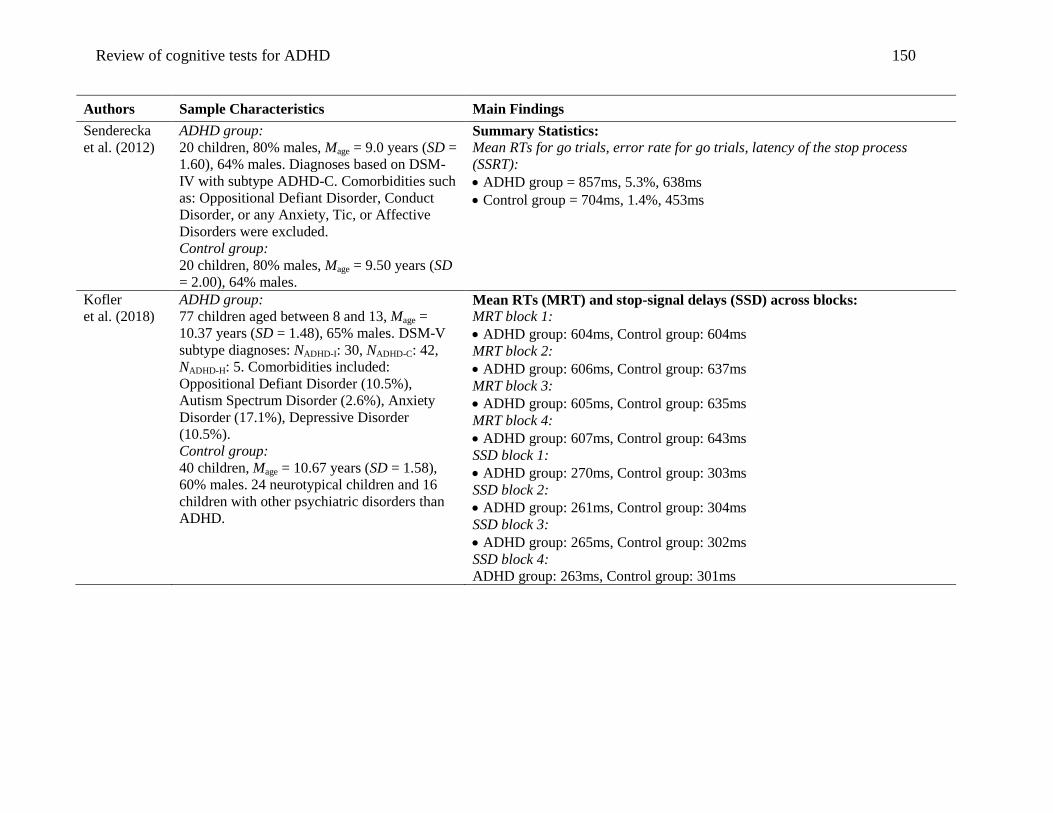
Review of cognitive tests for ADHD 150
Authors Sample Characteristics Main Findings
Senderecka
et al. (2012)
ADHD group:
20 children, 80% males, Mage = 9.0 years (SD =
1.60), 64% males. Diagnoses based on DSM-
IV with subtype ADHD-C. Comorbidities such
as: Oppositional Defiant Disorder, Conduct
Disorder, or any Anxiety, Tic, or Affective
Disorders were excluded.
Control group:
20 children, 80% males, Mage = 9.50 years (SD
= 2.00), 64% males.
Summary Statistics:
Mean RTs for go trials, error rate for go trials, latency of the stop process
(SSRT):
ADHD group = 857ms, 5.3%, 638ms
Control group = 704ms, 1.4%, 453ms
Kofler
et al. (2018)
ADHD group:
77 children aged between 8 and 13, Mage =
10.37 years (SD = 1.48), 65% males. DSM-V
subtype diagnoses: NADHD-I: 30, NADHD-C: 42,
NADHD-H: 5. Comorbidities included:
Oppositional Defiant Disorder (10.5%),
Autism Spectrum Disorder (2.6%), Anxiety
Disorder (17.1%), Depressive Disorder
(10.5%).
Control group:
40 children, Mage = 10.67 years (SD = 1.58),
60% males. 24 neurotypical children and 16
children with other psychiatric disorders than
ADHD.
Mean RTs (MRT) and stop-signal delays (SSD) across blocks:
MRT block 1:
ADHD group: 604ms, Control group: 604ms
MRT block 2:
ADHD group: 606ms, Control group: 637ms
MRT block 3:
ADHD group: 605ms, Control group: 635ms
MRT block 4:
ADHD group: 607ms, Control group: 643ms
SSD block 1:
ADHD group: 270ms, Control group: 303ms
SSD block 2:
ADHD group: 261ms, Control group: 304ms
SSD block 3:
ADHD group: 265ms, Control group: 302ms
SSD block 4:
ADHD group: 263ms, Control group: 301ms
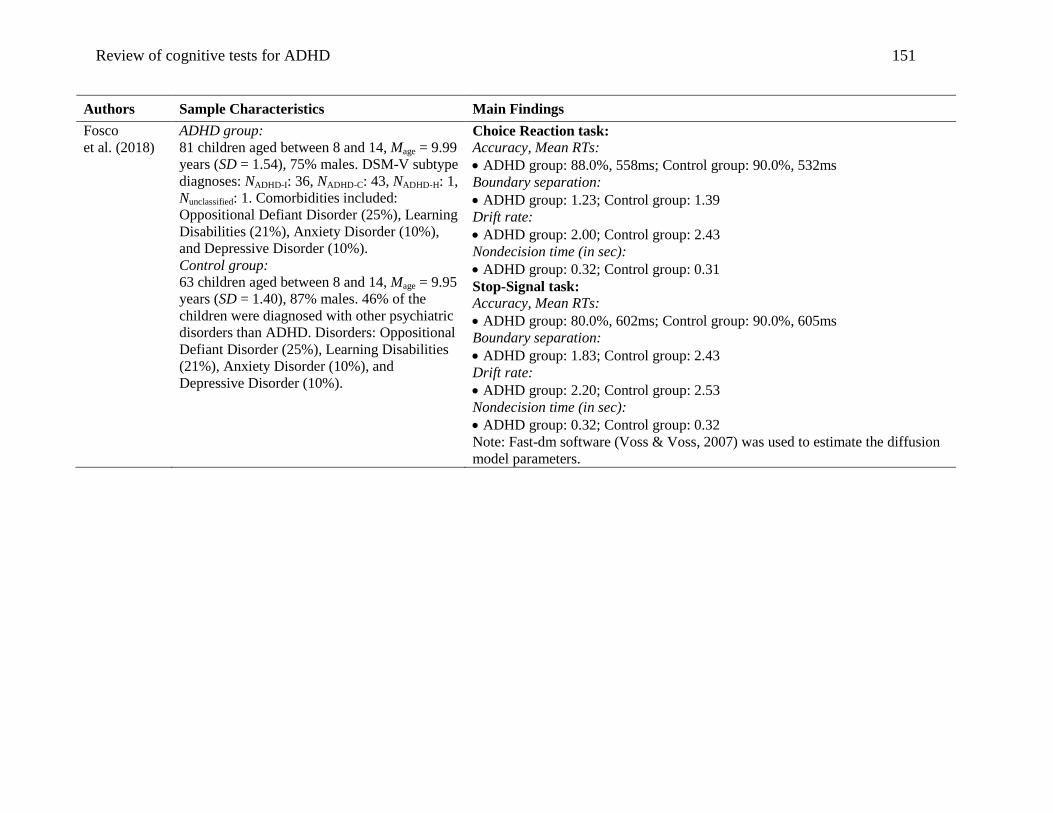
Review of cognitive tests for ADHD 151
Authors Sample Characteristics Main Findings
Fosco
et al. (2018)
ADHD group:
81 children aged between 8 and 14, Mage = 9.99
years (SD = 1.54), 75% males. DSM-V subtype
diagnoses: NADHD-I: 36, NADHD-C: 43, NADHD-H: 1,
Nunclassified: 1. Comorbidities included:
Oppositional Defiant Disorder (25%), Learning
Disabilities (21%), Anxiety Disorder (10%),
and Depressive Disorder (10%).
Control group:
63 children aged between 8 and 14, Mage = 9.95
years (SD = 1.40), 87% males. 46% of the
children were diagnosed with other psychiatric
disorders than ADHD. Disorders: Oppositional
Defiant Disorder (25%), Learning Disabilities
(21%), Anxiety Disorder (10%), and
Depressive Disorder (10%).
Choice Reaction task:
Accuracy, Mean RTs:
ADHD group: 88.0%, 558ms; Control group: 90.0%, 532ms
Boundary separation:
ADHD group: 1.23; Control group: 1.39
Drift rate:
ADHD group: 2.00; Control group: 2.43
Nondecision time (in sec):
ADHD group: 0.32; Control group: 0.31
Stop-Signal task:
Accuracy, Mean RTs:
ADHD group: 80.0%, 602ms; Control group: 90.0%, 605ms
Boundary separation:
ADHD group: 1.83; Control group: 2.43
Drift rate:
ADHD group: 2.20; Control group: 2.53
Nondecision time (in sec):
ADHD group: 0.32; Control group: 0.32
Note: Fast-dm software (Voss & Voss, 2007) was used to estimate the diffusion
model parameters.
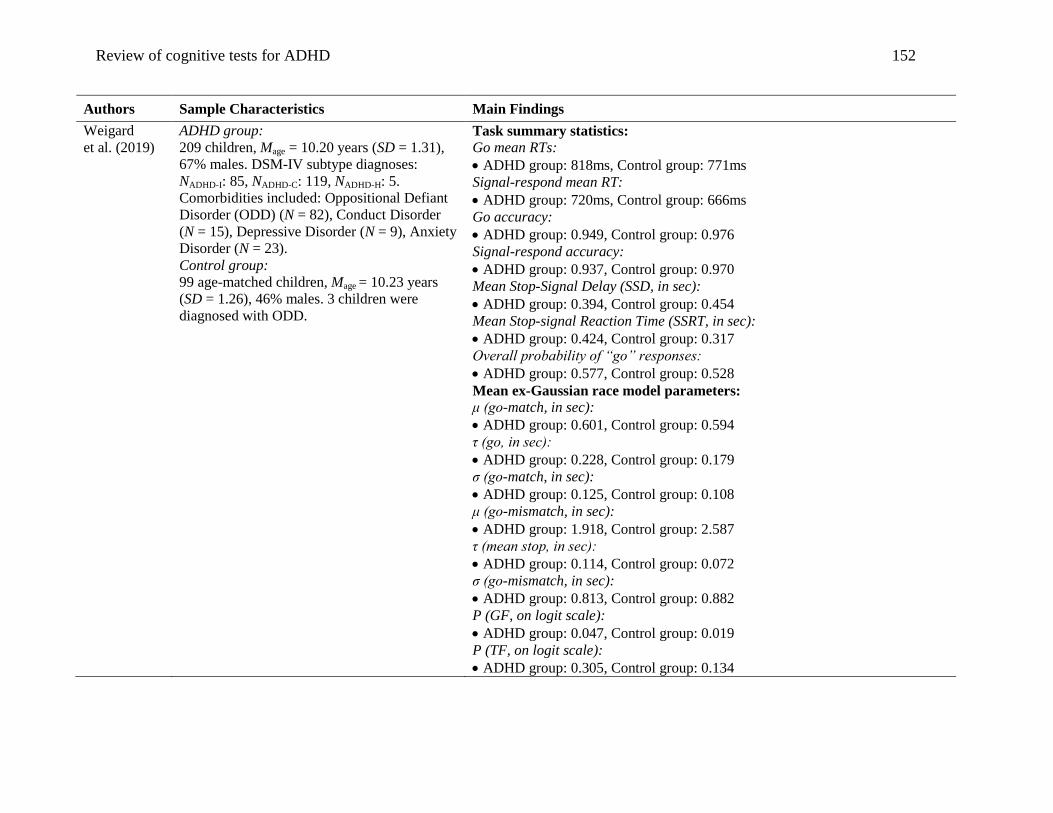
Review of cognitive tests for ADHD 152
Authors Sample Characteristics Main Findings
Weigard
et al. (2019)
ADHD group:
209 children, Mage = 10.20 years (SD = 1.31),
67% males. DSM-IV subtype diagnoses:
NADHD-I: 85, NADHD-C: 119, NADHD-H: 5.
Comorbidities included: Oppositional Defiant
Disorder (ODD) (N = 82), Conduct Disorder
(N = 15), Depressive Disorder (N = 9), Anxiety
Disorder (N = 23).
Control group:
99 age-matched children, Mage = 10.23 years
(SD = 1.26), 46% males. 3 children were
diagnosed with ODD.
Task summary statistics:
Go mean RTs:
ADHD group: 818ms, Control group: 771ms
Signal-respond mean RT:
ADHD group: 720ms, Control group: 666ms
Go accuracy:
ADHD group: 0.949, Control group: 0.976
Signal-respond accuracy:
ADHD group: 0.937, Control group: 0.970
Mean Stop-Signal Delay (SSD, in sec):
ADHD group: 0.394, Control group: 0.454
Mean Stop-signal Reaction Time (SSRT, in sec):
ADHD group: 0.424, Control group: 0.317
Overall probability of “go” responses:
ADHD group: 0.577, Control group: 0.528
Mean ex-Gaussian race model parameters:
μ (go-match, in sec):
ADHD group: 0.601, Control group: 0.594
τ (go, in sec):
ADHD group: 0.228, Control group: 0.179
σ (go-match, in sec):
ADHD group: 0.125, Control group: 0.108
μ (go-mismatch, in sec):
ADHD group: 1.918, Control group: 2.587
τ (mean stop, in sec):
ADHD group: 0.114, Control group: 0.072
σ (go-mismatch, in sec):
ADHD group: 0.813, Control group: 0.882
P (GF, on logit scale):
ADHD group: 0.047, Control group: 0.019
P (TF, on logit scale):
ADHD group: 0.305, Control group: 0.134
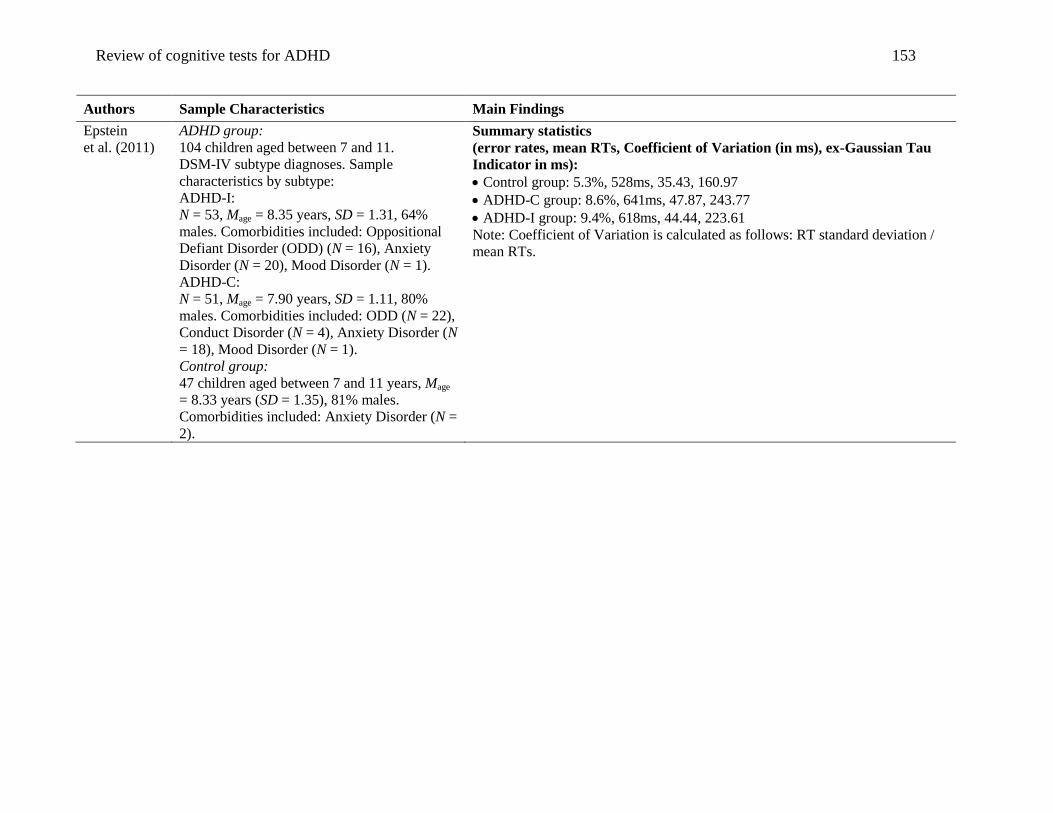
Review of cognitive tests for ADHD 153
Authors Sample Characteristics Main Findings
Epstein
et al. (2011)
ADHD group:
104 children aged between 7 and 11.
DSM-IV subtype diagnoses. Sample
characteristics by subtype:
ADHD-I:
N = 53, Mage = 8.35 years, SD = 1.31, 64%
males. Comorbidities included: Oppositional
Defiant Disorder (ODD) (N = 16), Anxiety
Disorder (N = 20), Mood Disorder (N = 1).
ADHD-C:
N = 51, Mage = 7.90 years, SD = 1.11, 80%
males. Comorbidities included: ODD (N = 22),
Conduct Disorder (N = 4), Anxiety Disorder (N
= 18), Mood Disorder (N = 1).
Control group:
47 children aged between 7 and 11 years, Mage
= 8.33 years (SD = 1.35), 81% males.
Comorbidities included: Anxiety Disorder (N =
2).
Summary statistics
(error rates, mean RTs, Coefficient of Variation (in ms), ex-Gaussian Tau
Indicator in ms):
Control group: 5.3%, 528ms, 35.43, 160.97
ADHD-C group: 8.6%, 641ms, 47.87, 243.77
ADHD-I group: 9.4%, 618ms, 44.44, 223.61
Note: Coefficient of Variation is calculated as follows: RT standard deviation /
mean RTs.
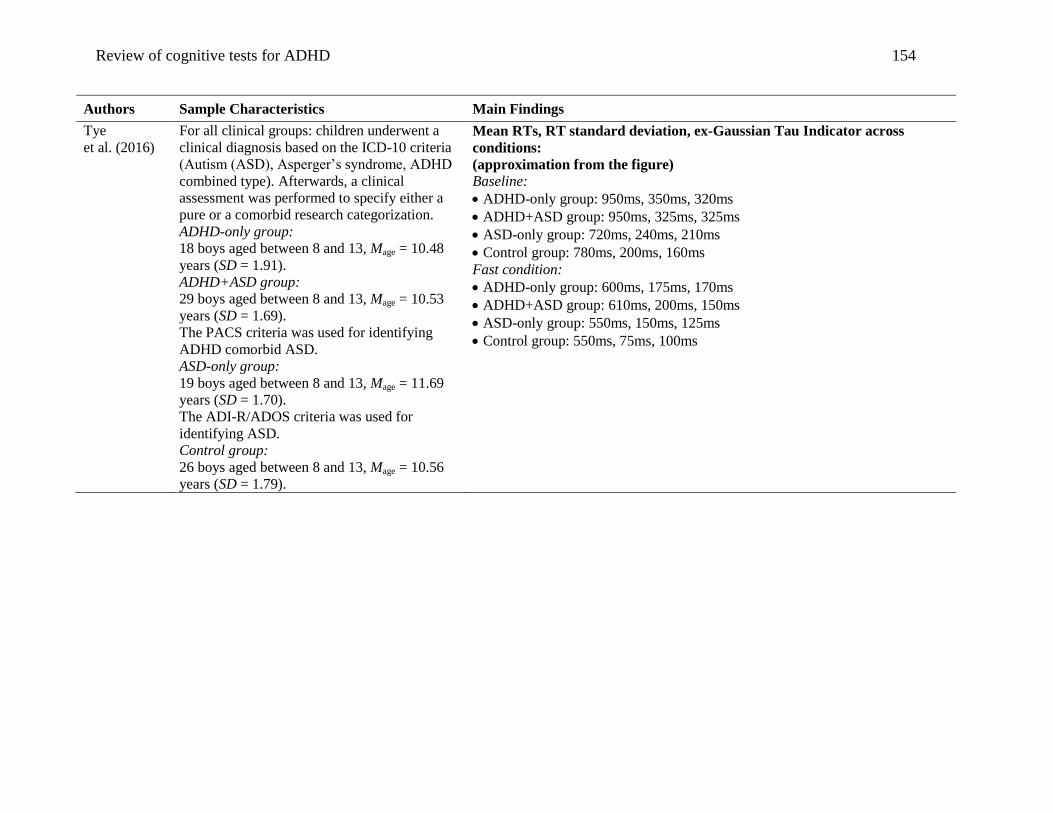
Review of cognitive tests for ADHD 154
Authors Sample Characteristics Main Findings
Tye
et al. (2016)
For all clinical groups: children underwent a
clinical diagnosis based on the ICD-10 criteria
(Autism (ASD), Asperger’s syndrome, ADHD
combined type). Afterwards, a clinical
assessment was performed to specify either a
pure or a comorbid research categorization.
ADHD-only group:
18 boys aged between 8 and 13, Mage = 10.48
years (SD = 1.91).
ADHD+ASD group:
29 boys aged between 8 and 13, Mage = 10.53
years (SD = 1.69).
The PACS criteria was used for identifying
ADHD comorbid ASD.
ASD-only group:
19 boys aged between 8 and 13, Mage = 11.69
years (SD = 1.70).
The ADI-R/ADOS criteria was used for
identifying ASD.
Control group:
26 boys aged between 8 and 13, Mage = 10.56
years (SD = 1.79).
Mean RTs, RT standard deviation, ex-Gaussian Tau Indicator across
conditions:
(approximation from the figure)
Baseline:
ADHD-only group: 950ms, 350ms, 320ms
ADHD+ASD group: 950ms, 325ms, 325ms
ASD-only group: 720ms, 240ms, 210ms
Control group: 780ms, 200ms, 160ms
Fast condition:
ADHD-only group: 600ms, 175ms, 170ms
ADHD+ASD group: 610ms, 200ms, 150ms
ASD-only group: 550ms, 150ms, 125ms
Control group: 550ms, 75ms, 100ms