bulletin - sebi
TRANSCRIPT

DECEMBER 2006 VOL. 4 NUMBER 12
Hkkjrh; izfrHkwfr vkSj fofue; cksMZ
������������
Securities and Exchange Board of India
SEBI BULLETIN
DECEMBER SEBI BULLETIN 2006
D:\BULLET26\DEC-2006\INI-DEC.PM5 Tan-14 MK O.P> 26-12-2006\Mg 28-12-2006 2
EDITORIAL COMMITTEE EDITOR
� Mr. Radhakrishnan Nair � Dr. Sarat Malik
� Prof. G. Sethu
� Dr. B.K. Bhoi
� Dr. Sanjeevan Kapshe
� Dr. Anil Kumar Sharma
� Mr. Sandeep Deore
The Securities and Exchange Board of India Bulletin is issued by the Depart-ment of Research, Securities and Exchange Board of India, under the directionof the Editorial Committee. The SEBI is not responsible for accuracy of data/information/interpretations and opinions expressed in the case of signedarticles, as it is the responsibility of the author. This monthly Bulletin is normallypublished in the third week of the succeeding month. Non-receipt of Bulletinmust be communicated within 60 days of the due date. SEBI has no objectionto the material published herein being reproduced, provided an acknowledgementof the same is made.
Annual subscription for 2006 issues in India is Rs. 1,750 (inclusive of postage)and abroad, US $ 72 (Air Mail). The price of any single issue in India is Rs. 125and abroad, US $ 6. Concessional subscription rate for public libraries andeducational institutions in India is Rs. 1,500. The concessional rate is alsoavailable to whole-time teachers and research students in Economics, Com-merce, Statistics and Business Management in Universities and Colleges inIndia, provided the request to that effect is forwarded through the head ofthe respective institution. Cheques/drafts should be drawn in favour ofM/s. Taxmann Allied Services Pvt. Ltd. payable at New Delhi.
Subscription correspondence must be addressed to :
Taxmann Allied Services (P.) Ltd.59/32, New Rohtak RoadNew Delhi - 110005Phone : 91-11-28714449Fax : 91-11-28715041/25220777Email: [email protected]
A readable version of SEBI Bulletin is available at http://www.sebi.gov.in
Printed and published by Mr. Amit Bhargava on behalf of Taxmann AlliedServices Pvt. Ltd. and printed at Tan Prints (India) Pvt. Ltd., 44KM. Mile Stone,National Highway, Rohtak Road, Village Rohad, Dist. Jhajjar Haryana andpublished at 59/32, New Rohtak Road, New Delhi-110 005.
Any comments and suggestions on any of the features/sections may be sentto [email protected]
[TOTAL PAGES INCLUDING COVER ??]
SEBI BULLETIN
DECEMBER SEBI BULLETIN 2006
D:\BULLET26\DEC-2006\INI-DEC.PM5 Tan-14 MK O.P> 26-12-2006\Mg 28-12-2006 3
CONTENTS
PAGE
SPEECH
� Indian Capital Market - Foreign Investment Options 5
CAPITAL MARKET REVIEW 9
PRESS RELEASES
� Registration of M/s. P.K.Khanna & Co.,Member of Ludhiana Stock Exchange,suspended 23
� SEBI offices shift to new office building in Bandra Kurla Complex 23
� Order in the matter of M/s. Baroda Agro Industries Ltd. 23
� Order against M/s. Binani Cements Ltd. 23
� Order against Jhaveri Securities Pvt. Ltd. in the matter of IPO Investigations 23
� Acquisition of shareholding of M/s. Falcon Tyres Ltd. and M/s. Dunlop India Ltd. byM/s. Wealth Sea Pte. Ltd. 24
� Order in the matter of M/s. Natural Expo Agro Industries Ltd. 24
� Order issued in the matter of dealing in shares by Shri Mathew Easow and his associateentities 24
� Order against Meghraj SP Corporate Finance (Private) Ltd. (formerly known as MeghrajFinancial Services (India) Pvt. Ltd.) 24
� Order in the matter of Global Trust Bank in respect of M/s. Niskalp Investments &Trading Co. Ltd. 24
� Orders against (1) M/s. Arcadia Share and Stock Brokers Pvt. Ltd. and (2) M/s. KaushikShah Shares and Securities Pvt. Ltd. 24
� Order against M/s. Nirjay Securities Pvt. Ltd. and Shri Jatin A. Khandwala 25
� Order in the matter of M/s. Abhipra Capital Ltd., Member, NSE 25
� Order in the matter of Shri S.K.Jain, Member, CSE 25
� Registration of M/s. Mitra Options and Share Brokers Ltd.,Member, NSE, suspended 25
� Order against Shri Chandravadan J.Dalal, Member, BSE 25
� Order in the matter of M/s. Home Trade Ltd. 25
� Securities Contracts (Regulation) (Manner of Increasing and MaintainingPublic Shareholding in Recognised Stock Exchanges) Regulations, 2006 25
� Registration of M/s. Akriti Securities Pvt. Ltd., suspended 26
� SEBI passes disgorgement order in “IPO Manipulation” case 26
� Prohibition on opening of fresh demat accounts by HDFC Bank Ltd., lifted 26

SEBI BULLETIN
DECEMBER SEBI BULLETIN 2006
D:\BULLET26\DEC-2006\INI-DEC.PM5 Tan-14 MK O.P> 26-12-2006\Mg 28-12-2006 4
PAGE
4
� SEBI invites public comments on the draft SEBI (Delisting of Securities) Regulations,2006 27
� SEBI restrains M/s. Cyberspace Ltd., for two years 27
� Order against M/s. Marlecha Securities Pvt. Ltd. and M/s. Uday Stocks & Securities Pvt.Ltd. in the matter of M/s. Home Trade Ltd. 27
� Order in the matter of M/s. India Bulls Securities Ltd. in the case of IPOs 27
� Order against M/s. Credit Suisse First Boston (India) Securities Pvt. Ltd., Member, BSE& NSE Ltd. in the matter of M/s. DSQ Biotech Ltd. 27
� Order against Ms. Aditi Dalal, in the matter of M/s. Roofit Industries Ltd. 28
CIRCULARS
� Establishment of Connectivity with both NSDL and CDSL - Shifting from Trade for TradeSegment (TFTS) to Rolling Segment 29
� Dispatch of account statement 29
LEGAL ROUND UP 31
ANNEXURES AND STATISTICAL TABLES 38
DOs AND DON’Ts FOR INVESTORS 82
PUBLICATIONS 89
D:\BULLET26\DEC-2006\SB-DEC-1 Tan-14 MK O.P> 26-12-2006\Mg 28-12-2006 5
DECEMBER SEBI BULLETIN 2006
5
INDIAN CAPITAL MARKET - FOREIGN INVESTMENT OPTIONST.C. Nair*
*Speech delivered by Dr.T.C. Nair, Whole Time Member, SEBI on November 30, 2006 at US-India Summit, Mumbai. He would liketo thank Dr. B.K. Bhoi, Chief General Manager, SEBI for his valuable support. Usual disclaimer applies.
1. Inflows by way of Foreign Direct Investment(FDI) have been on the rise so far as India isconcerned, especially during the recent past. In fact,aggregate inflows have already crossed US $ 10billion by middle of the current fiscal while the amountstood at US $ 5.5 billion for the fiscal year as a wholein 2005-06. A wide range of sectors attracted suchinvestments and they came from a variety of sources.Country-wise, Mauritius and the US remained themajor FDI investors in India, followed by the UK andSingapore during 2005-06. FDI flows continued tobe impressive in manufacturing industries andservices sector.
2. Foreign investment can be made in India withspecific prior approval in sectors other than thoseprohibited. For the purpose, a three tier system ofapproval for foreign investment has been put inplace viz. (i) Reserve Bank of India (ii) Secretariat ofIndustrial Assistance (SIA); and (iii) ForeignInvestment Promotion Board (FIPB).
3. Existing companies or new companies inIndia with foreign equity participation wishing toincrease their stake to the sectoral cap are grantedautomatic approvals provided the expansionprogramme is in the high priority industries listed inAnnex. III of the Industrial Policy Statement 1991.The proposals within the general policy framework,but outside the powers delegated to the RBI arebeing considered by the SIA. FIPB was specificallycreated to invite, negotiate and facilitate substantiallylarge investment by international companies. Thehighlights of the foreign investment policy whichhave a bearing on the capital market are as follows :
� Foreign investment is now freely allowed in allsectors, including the services sector subject tospecified sectoral ceilings. However, a fewareas such as defence, atomic minerals, printmedia, broadcasting, postal services etc. arestill excluded for foreign investment as they arestrategically sensitive;
� FDI up to 100 per cent through the RBI’sautomatic route was permitted in respect of anumber of new sectors in 2005-06. These sec-tors include green field airport projects, layingof pipelines, export trading etc. FDI caps underthe automatic route were enhanced to 100 percent for coal and lignite mining for captiveconsumption and setting up infrastructure re-lating to marketing in petroleum and naturalgas. FDI up to 100 per cent under the automaticroute is also now permitted for development oftownship, housing, infrastructure and construc-tion development projects;
� General permission is granted to the Indiancompanies for issuing rights/bonus shares tothe existing non-resident shareholders subjectto adherence to sectoral caps;
� Indian companies can issue shares underEmployees’ Stock Option Scheme to their em-ployees who are resident outside;
� An Indian company can raise foreign currencyresources overseas through ADRs or GDRs;
� Foreign Institutional Investors (FIIs) can investin India under the Foreign Institutional Invest-ment Scheme. They are allowed to invest inpublic issuances and through secondary mar-ket in the equity segment. So also, they caninvestment in Government and corporate debtmarket within specified limits fixed from time totime;
� Portfolio investment limits in individual compa-nies can be raised by Board resolution keepingthe overall sectoral cap in view;
� Qualified institutional investors are allowed toinvest in Indian Depository Receipts (IDRs)floated by foreign companies. FIIs and NRIscan also invest in IDRs after obtaining permis-sion from RBI;
D:\BULLET26\DEC-2006\SB-DEC-1 Tan-14 MK O.P> 26-12-2006\Mg 28-12-2006 6
DECEMBER SEBI BULLETIN 2006
6SECURITIES & EXCHANGE BOARD OF INDIA
� The other avenues for making investmentsinclude those companies which take venturecapital and private equity routes.
4. Between FDI and Portfolio Investment (PI), itis the portfolio flows which fall under the domain ofSEBI activities. Although major policy decisions aretaken in this regard by the Government, SEBI isdirectly involved in the process of policy formulationand exercising statutory powers on portfolioinvestment by the FIIs.
5. Since 1992, FIIs were allowed to invest inIndia under the portfolio investment scheme. Theirnet investment has been positive every year since1992 except in 1998-99. The average portfolioinvestment by FIIs was above US $ 10 billion peryear during the last three years. Strong macro-economic fundamentals, encouraging corporateresults, relatively low level of inflation, and largeforeign exchange reserves attract FIIs to invest inIndia. In fact, the FIIs consider India as a preferredinvestment destination. As at end October 2006, 973FIIs had registered with SEBI from various parts ofthe world. Their cumulative investment at theacquisition cost exceeded US $ 48 billion as on thesame date. At the current prices, their investmentwould be over US $ 106 billion, roughly equivalent to15 per cent of the total market capitalisation.
6. FIIs need to be registered with SEBI for theiractivities in capital market in India. Established andincorporated abroad, the entities that are eligible tobe registered as FIIs in India are: (a) Pension Funds;(b) Mutual Funds; (c) Investment Trusts; (d) AssetManagement Companies (e) Nominee Companies(f) Banks; (g) Institutional Portfolio Managers; (h)Power of Attorney Holders ; and (j) University funds,endowments, foundations or charitable trusts orCharitable Societies. The FIIs can also invest onbehalf of their customers through sub-accounts. Theentities that are eligible to be registered as sub-accounts are: (i) an institution or fund or portfolioestablished or incorporated outside India; (ii) a foreigncorporate or a foreign individual. A regular FII isrequired to invest not less than 70 per cent of itsinvestments in equity related instruments and up to30 per cent in non-equity instruments. The FII can be
a 100 per cent debt-fund where it is permitted toinvest only in debt instruments.
7. Restrictions on FII investment have beenprogressively reduced over a period of time. Initially,FIIs were not allowed to invest in Treasury Bills.Since May 1998, this restriction is withdrawn. Theaggregate limits for FII investment in Governmentsecurities and corporate debt have been increasedto US $ 2 billion and US $ 1.5 billion, respectively for2006-07. The limit for investment in Governmentsecurities has been further raised to US $ 3.6 billionas announced in its October 2006 Policy Measuresby the Reserve Bank. Since 1998, individual FIIinvestment limit on equity has also been enhancedfrom 5 per cent to 10 per cent of the total paid-upcapital or 10 per cent of the paid-up value of eachseries of convertible debentures. The aggregate FIIportfolio investment ceiling, which was initially fixedat 24 per cent of the paid-up capital, could also beenhanced subject to approval of the Board ofDirectors. The aggregate FII investment ceiling underthe special procedure was raised up to the sectoralcap in September 2001. FIIs are not allowed to shortsell and they would need to take delivery of securitiespurchased and give delivery of securities sold.
8. SEBI registered FIIs are allowed to trade inall exchange traded derivative contracts on the stockexchanges in India subject to the position limits asprescribed by SEBI from time to time. Further,separate accounts for the purpose of derivativetrading are to be maintained by the FIIs.
9. Subject to Know-Your-Customer (KYC)norms, foreign corporates and foreign individualsare allowed to invest in Indian capital market throughsub-accounts. Moreover, Mutual Funds, as registeredFIIs, can pool the resources from their clients abroad.In addition, FIIs are allowed to issue derivativeproducts such as participatory notes to entities thatare registered in the country of origin. In fact, thecapital account is virtually open for all non-residentsexcept hedge funds and for entities of doubtfulintegrity.
10. Non-resident Indians (NRIs) can also investin India under the portfolio investment scheme (PIS).It should be ensured that the paid-up value of shares/debentures purchased by an NRI under PIS should
D:\BULLET26\DEC-2006\SB-DEC-1 Tan-14 MK O.P> 26-12-2006\Mg 28-12-2006 7
DECEMBER SEBI BULLETIN 2006
7
not exceed 5 per cent value of the paid-up capital/paid-up value of each series of debentures. So alsothe aggregate paid-up value of shares/convertibledebentures purchased by all NRIs should not exceed10 per cent of the paid-up capital of the company/paid-up value of each series of debenture of thecompany. The aggregate ceiling of 10 per cent canbe raised to 24 per cent if the General Body of theIndian company passes a special resolution to thateffect. The NRI investor should take delivery ofshares purchased and give delivery of shares soldas in the case of FIIs. Payment for purchase ofshares/debentures on repatriation basis is made byinward remittance in foreign exchange through normalbanking channels or out of funds held in NRE/FCNRaccounts maintained in India by the NRIs.
11. There are variety of factors which makeIndian Capital Market most attractive to the rest ofthe world for investments. These factors include thefollowing :
� India is one of the fast growing economies inthe region after China with over 8 per centgrowth of real GDP per annum;
� India’s household investment in shares anddebentures as a percentage of financial sav-ings is still low at 4.9 per cent of GDP and hencethere is a great potential for further growthduring the years to come;
� Indian equity market has been growing fast andits market capitalisation to GDP ratio has al-ready crossed 100 per cent apart from the factthat India is the world’s 12th largest in themarket capitalisation.
� Indian capital market has been providing morethan reasonable return during the last threeyears.
� India has well developed facilities in place so faras the capital market infrastructure is con-cerned and its two large stock exchanges viz.,Bombay Stock Exchange and National StockExchange account for 99 per cent of the trade.In fact, it is NSE which is the third largest stockexchange in the world in terms of number oftrades undertaken after NYSE and NASDAQ.
� Indian capital market has more than 7000 listedcompanies on stock exchanges and it is thelargest in the world.
� Indian capital market has a network of 9040brokers in the cash segment and 1064 in de-rivatives segment of the market with a set up oflarge number of sub-brokers. The network alsoincludes 122 investment bankers, 58 under-writers to support primary issues, 34 foreignventure capital funds, 120 portfolio managers,4 credit rating agencies, 11 custodian banksand 2 large depositories with over 9 millionbeneficiary owner accounts and 39 mutual fundsas on date.
� India’s stock exchanges provide T+2 rollingsettlement as against T+3 available with NYSE.In India the transactions undertaken in theequity segment are fully electronic and India isone of the few countries of the world which hasintroduced straight through processing.
� Indian capital market has in place a soundregulatory framework. It has disclosure basedregime or regulation and its disclosure andinvestor protection guidelines are reviewed onan ongoing basis.
� Its accounting standards are closer to interna-tional standards.
� India unlike most other developing countrieshas a sound legal framework to support itsfinancial system.
� SEBI has put in place a sound risk manage-ment system both for cash and derivative seg-ments of the stock market which inter alia,include margin requirements, stock based cir-cuit filter and index based (market wide) circuitfilter apart from capital adequacy, trading andexposure limits etc.
� SEBI has an integrated market surveillancesystem that captures market signals on a realtime basis. Derivatives transactions are subjectto client/broker-wise limits as well as market-wide position limits keeping in view the orderlygrowth of the market and interests of the inves-tors.
INDIAN CAPITAL MARKET - FOREIGN INVESTMENT OPTIONS
D:\BULLET26\DEC-2006\SB-DEC-1 Tan-14 MK O.P> 26-12-2006\Mg 28-12-2006 8
DECEMBER SEBI BULLETIN 2006
8SECURITIES & EXCHANGE BOARD OF INDIA
� The Unique Identification Number (UIN) sys-tem under MAPIN Regulations, which was sus-pended for sometime, is being revived in aphased manner with biometric impression forhigh value transactions. This will provide ad-equate safeguard against market abuse.
12. The focus on the ongoing reforms in thefinancial market in general and the capital market inparticular, apart from the initiation by the Governmentto develop a corporate debt market, coupled withopening up the economy for further investments,could make Indian capital market a preferreddestination for investments during the days to come.
D:\BULLET26\DEC-2006\SB-DEC-1 Tan-14 MK O.P> 26-12-2006\Mg 28-12-2006 9
DECEMBER SEBI BULLETIN 2006
9
CAPITAL MARKET REVIEW
The stock market continued to remain distinctlybuoyant in November, 2006. A firm trend wasalso witnessed in the international markets
including Asian markets on account of decline incrude oil prices during the month under review. InIndia, the benchmark indices continued the upwardjourney with BSE Sensex crossing the 13000 level.Sound corporate results and a substantial rise in theforeign institutional investment in equities sustainedthe rally. The cumulative FII investment in Indiacrossed US $ 50 billion at the end of November 2006.During the financial year so far, the total resourcemobilisation from the primary market by thecorporates increased considerably. In addition, themutual funds have also raised substantial amount offunds.
1. TRENDS IN THE PRIMARY MARKET
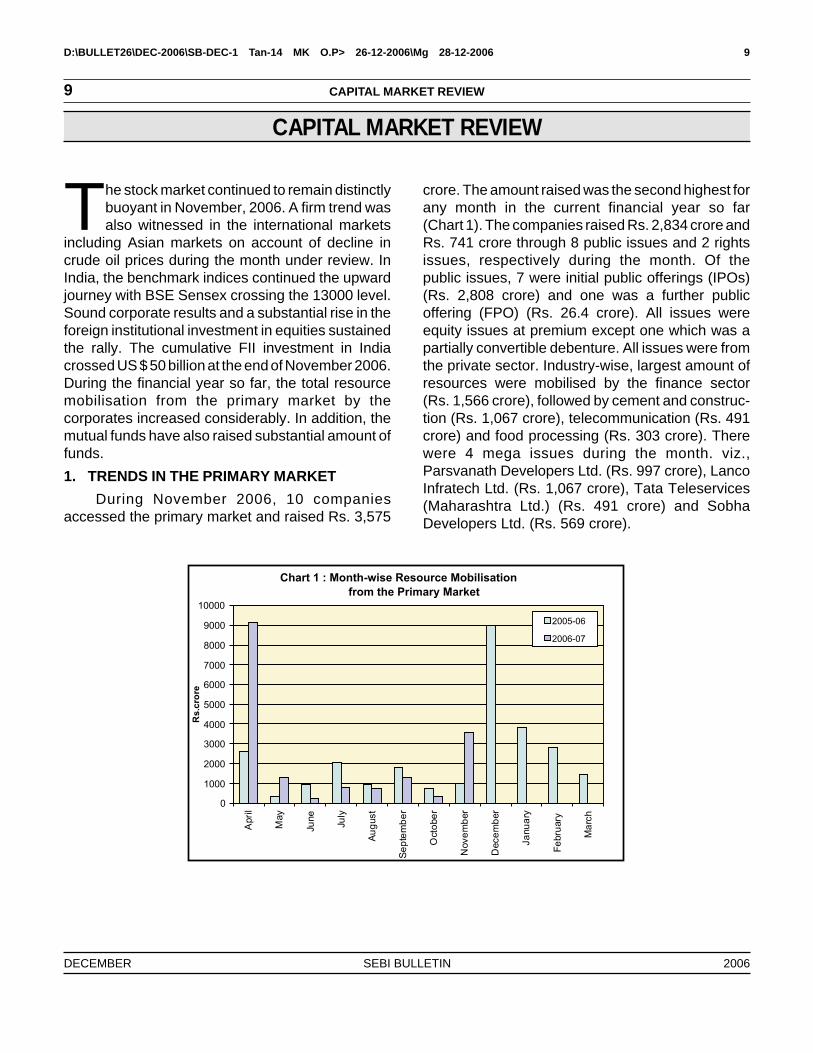
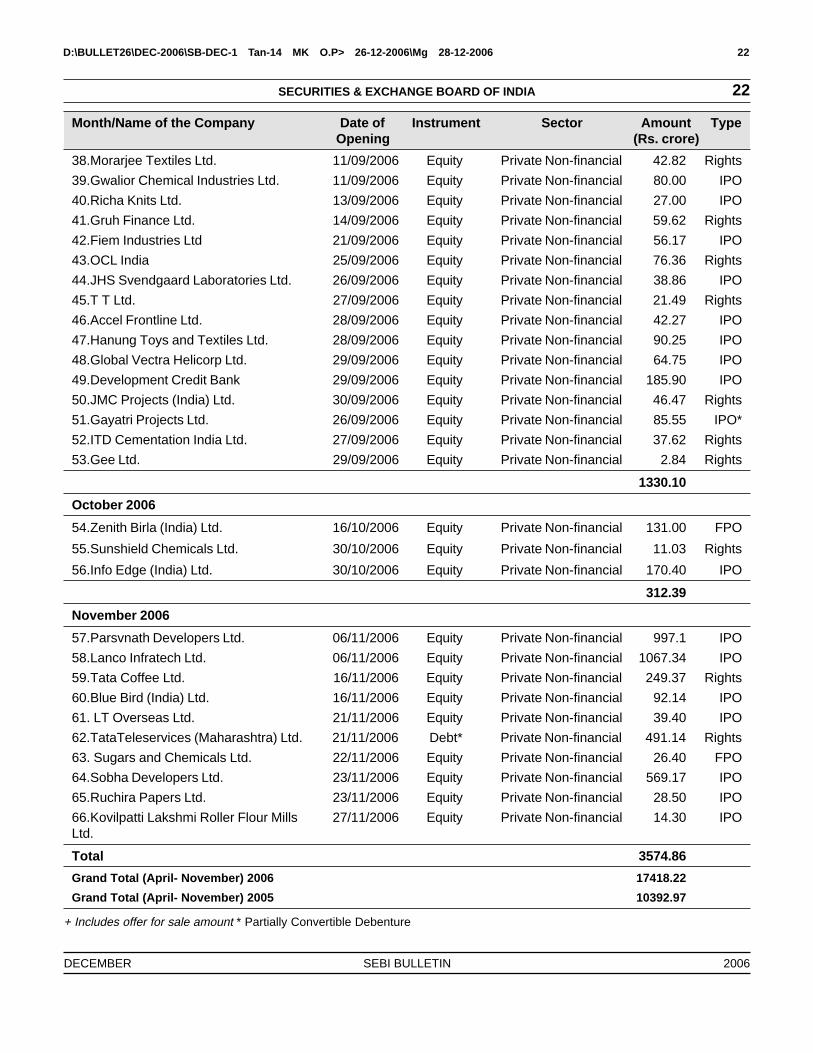
During November 2006, 10 companiesaccessed the primary market and raised Rs. 3,575
crore. The amount raised was the second highest forany month in the current financial year so far(Chart 1). The companies raised Rs. 2,834 crore andRs. 741 crore through 8 public issues and 2 rightsissues, respectively during the month. Of thepublic issues, 7 were initial public offerings (IPOs)(Rs. 2,808 crore) and one was a further publicoffering (FPO) (Rs. 26.4 crore). All issues wereequity issues at premium except one which was apartially convertible debenture. All issues were fromthe private sector. Industry-wise, largest amount ofresources were mobilised by the finance sector(Rs. 1,566 crore), followed by cement and construc-tion (Rs. 1,067 crore), telecommunication (Rs. 491crore) and food processing (Rs. 303 crore). Therewere 4 mega issues during the month. viz.,Parsvanath Developers Ltd. (Rs. 997 crore), LancoInfratech Ltd. (Rs. 1,067 crore), Tata Teleservices(Maharashtra Ltd.) (Rs. 491 crore) and SobhaDevelopers Ltd. (Rs. 569 crore).
CAPITAL MARKET REVIEW
D:\BULLET26\DEC-2006\SB-DEC-1 Tan-14 MK O.P> 26-12-2006\Mg 28-12-2006 10
DECEMBER SEBI BULLETIN 2006
10SECURITIES & EXCHANGE BOARD OF INDIA
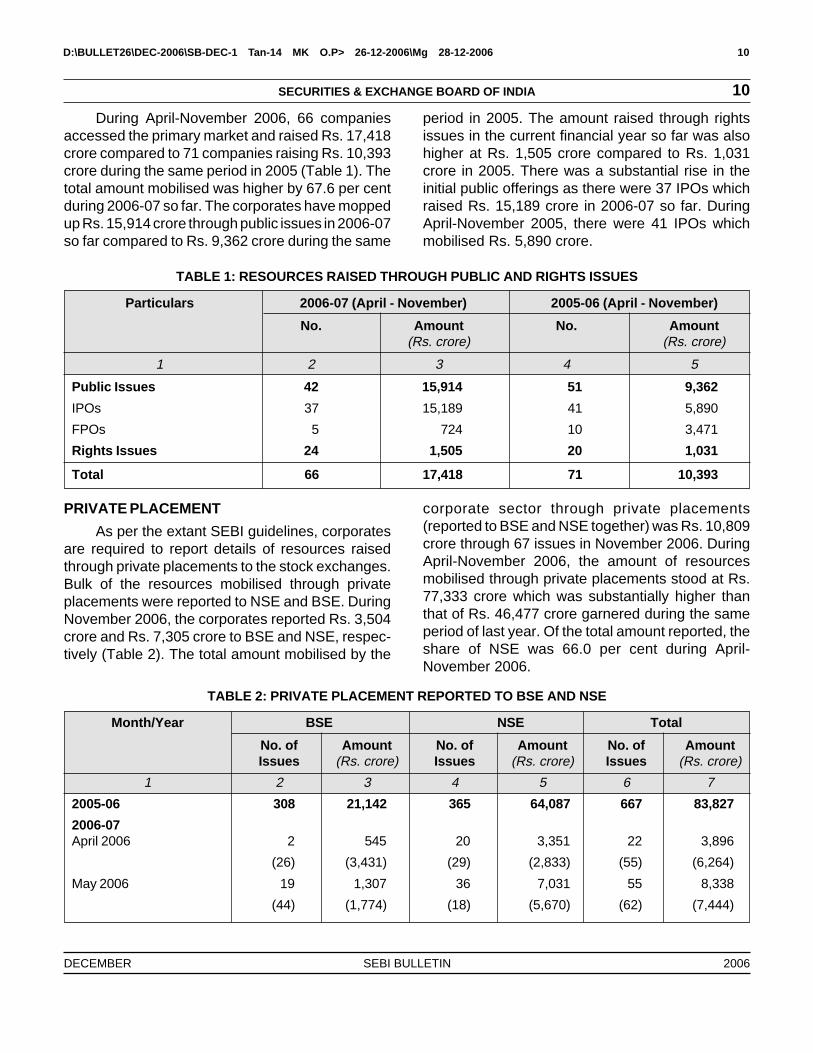
During April-November 2006, 66 companiesaccessed the primary market and raised Rs. 17,418crore compared to 71 companies raising Rs. 10,393crore during the same period in 2005 (Table 1). Thetotal amount mobilised was higher by 67.6 per centduring 2006-07 so far. The corporates have moppedup Rs. 15,914 crore through public issues in 2006-07so far compared to Rs. 9,362 crore during the same
period in 2005. The amount raised through rightsissues in the current financial year so far was alsohigher at Rs. 1,505 crore compared to Rs. 1,031crore in 2005. There was a substantial rise in theinitial public offerings as there were 37 IPOs whichraised Rs. 15,189 crore in 2006-07 so far. DuringApril-November 2005, there were 41 IPOs whichmobilised Rs. 5,890 crore.
TABLE 1: RESOURCES RAISED THROUGH PUBLIC AND RIGHTS ISSUES
Particulars 2006-07 (April - November) 2005-06 (April - November)
No. Amount No. Amount(Rs. crore) (Rs. crore)
1 2 3 4 5
Public Issues 42 15,914 51 9,362
IPOs 37 15,189 41 5,890
FPOs 5 724 10 3,471
Rights Issues 24 1,505 20 1,031
Total 66 17,418 71 10,393
PRIVATE PLACEMENT
As per the extant SEBI guidelines, corporatesare required to report details of resources raisedthrough private placements to the stock exchanges.Bulk of the resources mobilised through privateplacements were reported to NSE and BSE. DuringNovember 2006, the corporates reported Rs. 3,504crore and Rs. 7,305 crore to BSE and NSE, respec-tively (Table 2). The total amount mobilised by the
corporate sector through private placements(reported to BSE and NSE together) was Rs. 10,809crore through 67 issues in November 2006. DuringApril-November 2006, the amount of resourcesmobilised through private placements stood at Rs.77,333 crore which was substantially higher thanthat of Rs. 46,477 crore garnered during the sameperiod of last year. Of the total amount reported, theshare of NSE was 66.0 per cent during April-November 2006.
TABLE 2: PRIVATE PLACEMENT REPORTED TO BSE AND NSE
Month/Year BSE NSE Total
No. of Amount No. of Amount No. of AmountIssues (Rs. crore) Issues (Rs. crore) Issues (Rs. crore)
1 2 3 4 5 6 7
2005-06 308 21,142 365 64,087 667 83,827
2006-07April 2006 2 545 20 3,351 22 3,896
(26) (3,431) (29) (2,833) (55) (6,264)
May 2006 19 1,307 36 7,031 55 8,338
(44) (1,774) (18) (5,670) (62) (7,444)
D:\BULLET26\DEC-2006\SB-DEC-1 Tan-14 MK O.P> 26-12-2006\Mg 28-12-2006 11
DECEMBER SEBI BULLETIN 2006
11
June 2006 27 5,743 11 4,426 38 10,169
(41) (1,873) (31) (4,872) (72) (6,745)
July 2006 12 1,243 36 4,301 47* 5,244*
(13) (1,549) (58) (5,502) (71) (7,051)
August 2006 17 3,149 18 5,863 35 9,012
(18) (724) (22) (3,111) (40) (3,835)
September 2006 9 7,276 51 13,537 60 20,813
(27) (1,710) (25) (3,081) (52) (4,791)
October 2006 13 3,868 24 5,184 37 9,052
(27) (2,021) (26) (3,922) (53) (5,943)
November 2006 10 3504 57 7,305 67 10,809
(19) (666) (31) (3,738) (50) (4,404)
April - November 2006 109 26,635 253 50,998 361 77,333
(215) (13,748) (240) (32,749) (455) (46,477)
*Data adjusted as one issue of HDFC Bank of Rs. 300 crore was reported to both BSE and NSE in July 2006.
Note: Figures in parentheses relate to 2005-06.
Source: NSE and BSE
Month/Year BSE NSE Total
No. of Amount No. of Amount No. of AmountIssues (Rs. crore) Issues (Rs. crore) Issues (Rs. crore)
1 2 3 4 5 6 7
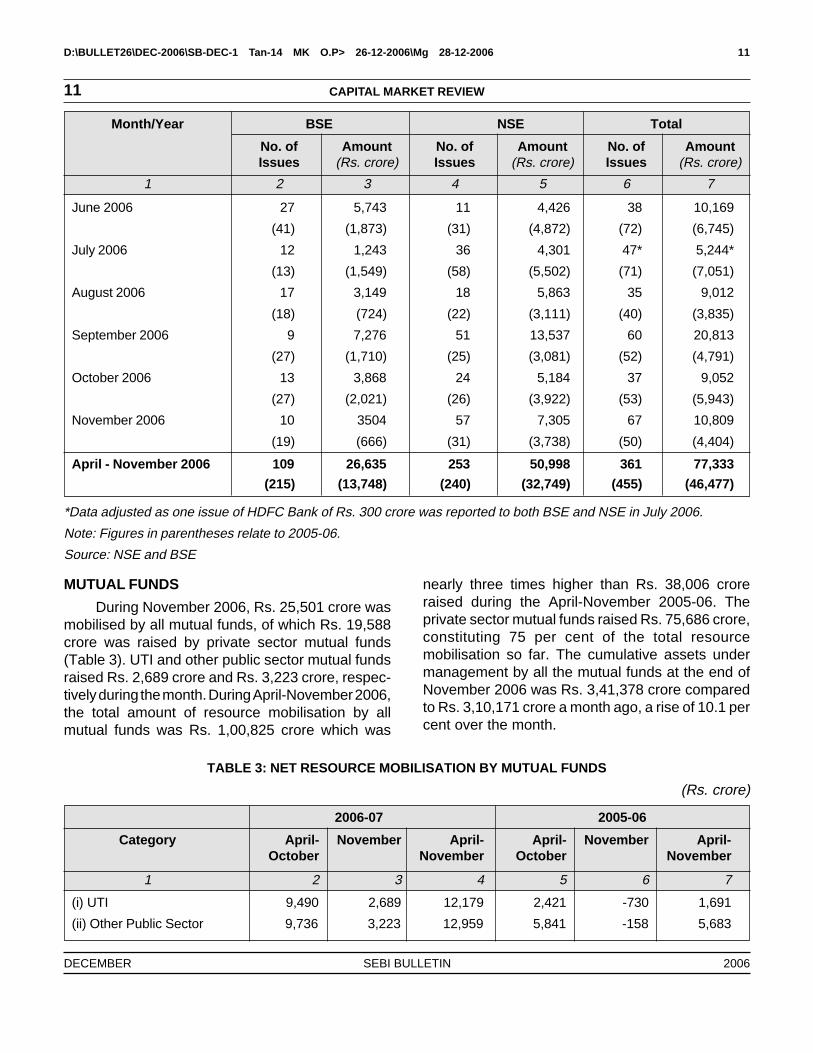
MUTUAL FUNDS
During November 2006, Rs. 25,501 crore wasmobilised by all mutual funds, of which Rs. 19,588crore was raised by private sector mutual funds(Table 3). UTI and other public sector mutual fundsraised Rs. 2,689 crore and Rs. 3,223 crore, respec-tively during the month. During April-November 2006,the total amount of resource mobilisation by allmutual funds was Rs. 1,00,825 crore which was
nearly three times higher than Rs. 38,006 croreraised during the April-November 2005-06. Theprivate sector mutual funds raised Rs. 75,686 crore,constituting 75 per cent of the total resourcemobilisation so far. The cumulative assets undermanagement by all the mutual funds at the end ofNovember 2006 was Rs. 3,41,378 crore comparedto Rs. 3,10,171 crore a month ago, a rise of 10.1 percent over the month.
TABLE 3: NET RESOURCE MOBILISATION BY MUTUAL FUNDS
(Rs. crore)
2006-07 2005-06
Category April- November April- April- November April-October November October November
1 2 3 4 5 6 7
(i) UTI 9,490 2,689 12,179 2,421 -730 1,691
(ii) Other Public Sector 9,736 3,223 12,959 5,841 -158 5,683
CAPITAL MARKET REVIEW
D:\BULLET26\DEC-2006\SB-DEC-1 Tan-14 MK O.P> 26-12-2006\Mg 28-12-2006 12
DECEMBER SEBI BULLETIN 2006
12SECURITIES & EXCHANGE BOARD OF INDIA
2006-07 2005-06
Category April- November April- April- November April-October November October November
1 2 3 4 5 6 7
(iii) Private Sector 56,098 19,588 75,686 32,757 -2,125 30,632
Total (i + ii + iii) 75,324 25,501 1,00,825 41,019 -3,013 38,006
Cumulative Assets
Under Management 3,10,171 3,41,378 2,00,209 2,04,519
II. TRENDS IN THE SECONDARY MARKET
A. Cash Segment
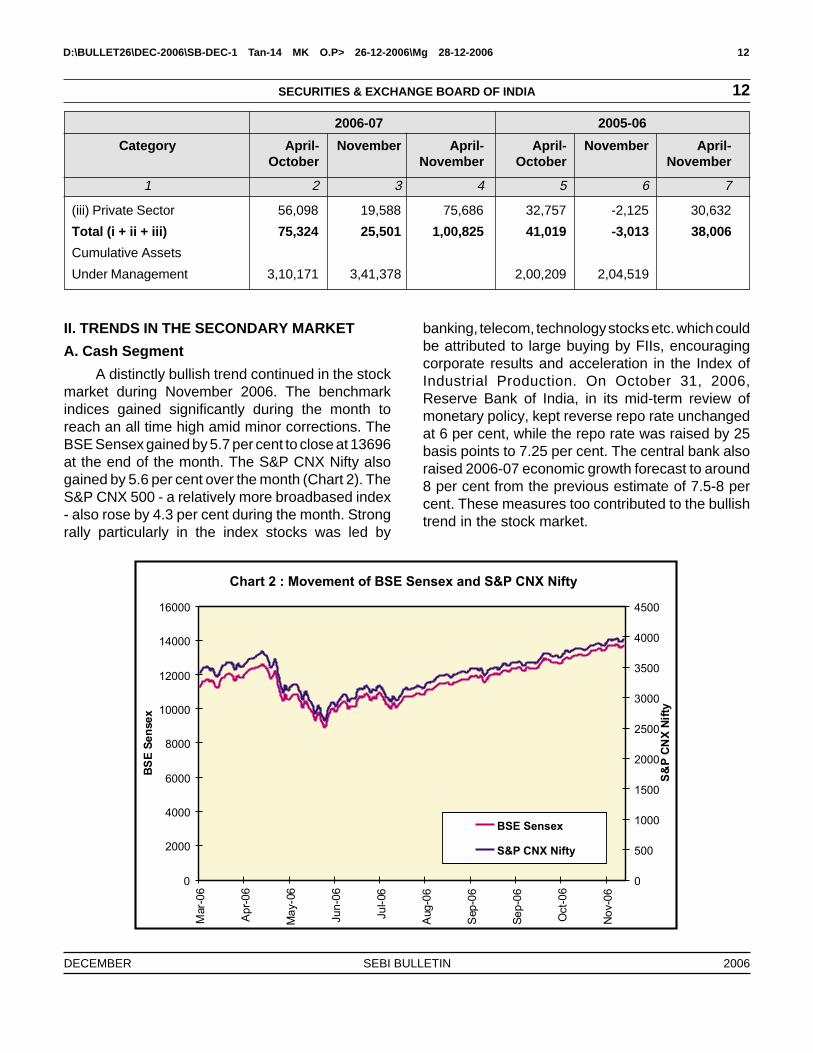
A distinctly bullish trend continued in the stockmarket during November 2006. The benchmarkindices gained significantly during the month toreach an all time high amid minor corrections. TheBSE Sensex gained by 5.7 per cent to close at 13696at the end of the month. The S&P CNX Nifty alsogained by 5.6 per cent over the month (Chart 2). TheS&P CNX 500 - a relatively more broadbased index- also rose by 4.3 per cent during the month. Strongrally particularly in the index stocks was led by
banking, telecom, technology stocks etc. which couldbe attributed to large buying by FIIs, encouragingcorporate results and acceleration in the Index ofIndustrial Production. On October 31, 2006,Reserve Bank of India, in its mid-term review ofmonetary policy, kept reverse repo rate unchangedat 6 per cent, while the repo rate was raised by 25basis points to 7.25 per cent. The central bank alsoraised 2006-07 economic growth forecast to around8 per cent from the previous estimate of 7.5-8 percent. These measures too contributed to the bullishtrend in the stock market.
D:\BULLET26\DEC-2006\SB-DEC-1 Tan-14 MK O.P> 26-12-2006\Mg 28-12-2006 13
DECEMBER SEBI BULLETIN 2006
13
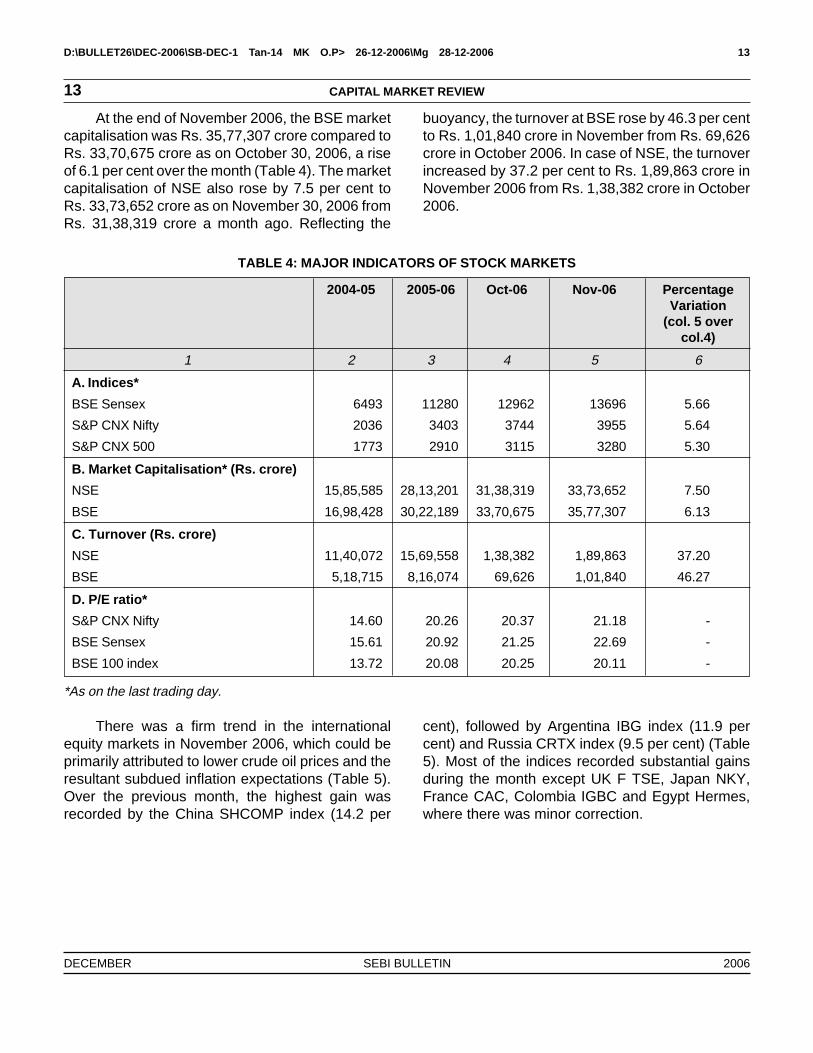
At the end of November 2006, the BSE marketcapitalisation was Rs. 35,77,307 crore compared toRs. 33,70,675 crore as on October 30, 2006, a riseof 6.1 per cent over the month (Table 4). The marketcapitalisation of NSE also rose by 7.5 per cent toRs. 33,73,652 crore as on November 30, 2006 fromRs. 31,38,319 crore a month ago. Reflecting the
buoyancy, the turnover at BSE rose by 46.3 per centto Rs. 1,01,840 crore in November from Rs. 69,626crore in October 2006. In case of NSE, the turnoverincreased by 37.2 per cent to Rs. 1,89,863 crore inNovember 2006 from Rs. 1,38,382 crore in October2006.
TABLE 4: MAJOR INDICATORS OF STOCK MARKETS
2004-05 2005-06 Oct-06 Nov-06 PercentageVariation
(col. 5 overcol.4)
1 2 3 4 5 6
A. Indices*
BSE Sensex 6493 11280 12962 13696 5.66
S&P CNX Nifty 2036 3403 3744 3955 5.64
S&P CNX 500 1773 2910 3115 3280 5.30
B. Market Capitalisation* (Rs. crore)
NSE 15,85,585 28,13,201 31,38,319 33,73,652 7.50
BSE 16,98,428 30,22,189 33,70,675 35,77,307 6.13
C. Turnover (Rs. crore)
NSE 11,40,072 15,69,558 1,38,382 1,89,863 37.20
BSE 5,18,715 8,16,074 69,626 1,01,840 46.27
D. P/E ratio*
S&P CNX Nifty 14.60 20.26 20.37 21.18 -
BSE Sensex 15.61 20.92 21.25 22.69 -
BSE 100 index 13.72 20.08 20.25 20.11 -
*As on the last trading day.
There was a firm trend in the internationalequity markets in November 2006, which could beprimarily attributed to lower crude oil prices and theresultant subdued inflation expectations (Table 5).Over the previous month, the highest gain wasrecorded by the China SHCOMP index (14.2 per
cent), followed by Argentina IBG index (11.9 percent) and Russia CRTX index (9.5 per cent) (Table5). Most of the indices recorded substantial gainsduring the month except UK F TSE, Japan NKY,France CAC, Colombia IGBC and Egypt Hermes,where there was minor correction.
CAPITAL MARKET REVIEW

D:\BULLET26\DEC-2006\SB-DEC-1 Tan-14 MK O.P> 26-12-2006\Mg 28-12-2006 14
DECEMBER SEBI BULLETIN 2006
14SECURITIES & EXCHANGE BOARD OF INDIA
TABLE 5: VARIATION IN INTERNATIONAL INDICES
Index As on As on November Variation over theOctober 30, 2006 previous month31, 2006 (Per cent)
1 2 3 4
USA Dow Jones 12081 12222 1.17
USA NASDAQ Composite 2367 2432 2.75
UK F TSE 100 6129 6049 -1.31
Hong Kong HSI 18324 18961 3.48
Japan NKY 16400 16274 -0.77
Singapore STI 2702 2839 5.07
France CAC 5349 5328 -0.39
Germany DAX 6269 6309 0.64
Australia AS 30 5353 5462 2.04
Malaysia KLCI 988 1081 9.41
S. Korea KOSPI 1365 1432 4.91
Thailand SET 722 739 2.35
Indonesia JCI 1583 1719 8.59
Taiwan TWSE 7021 7568 7.79
Russia CRTX 2482 2718 9.51
China SHCOMP 1838 2099 14.20
South Africa JALSH 23338 23950 2.62
Colombia IGBC 10285 10253 -0.31
Hungary BUX 22391 22881 2.19
Argentina IBG 87048 97394 11.89
Mexico INMEX 1355 1466 8.19
Chile IPSA 2380 2560 7.56
Brazil IBOV 39263 41932 6.80
Egypt HERMES 58832 57974 -1.46
Source: Bloomberg Financial Services
In the developed markets, the P/E ratio was thehighest for NASDAQ Composite (39.7), followed byJapan NKY (34.92) and USA Dow Jones (21.0)(Table 6). Among the emerging market indices, thehighest P/E ratio was recorded by China SHCOMP
(32.0), followed by JCI index of Indonesia (24.9),Taiwan TWSE (20.4) and Chile IPSA (18.6). TheP/E ratios of Indian indices- BSE Sensex (22.69) andS&P CNX Nifty (21.18) - were higher than most of theemerging markets.

D:\BULLET26\DEC-2006\SB-DEC-1 Tan-14 MK O.P> 26-12-2006\Mg 28-12-2006 15
DECEMBER SEBI BULLETIN 2006
15
TABLE 6: P/E RATIOS IN THE INTERNATIONAL MARKETS
Index Apr-06 May-06 Jun-06 Jul-06 Aug-06 Sep-06 Oct-06 Nov-06
1 2 3 4 5 6 7 8 9
USA Dow Jones 21.73 20.86 20.78 21.31 21.74 22.31 21.33 21.04
USA NASDAQ Comp. 45.94 44.90 46.52 47.59 48.80 59.68 42.08 39.73
Japan NKY 43.28 36.61 36.67 36.75 38.45 39.97 37.24 34.98
UK FTSE 100 15.19 16.63 16.61 16.22 15.64 15.65 16.28 17.51
Hong Kong HSI 12.88 12.30 12.59 12.88 12.45 12.74 13.30 13.82
Australia AS 30 18.79 18.01 18.26 18.05 16.11 15.50 16.70 17.46
Germany DAX 15.59 13.51 13.44 13.02 12.82 13.08 13.77 13.85
France CAC 14.64 13.39 13.89 14.21 13.79 13.70 13.98 14.04
Singapore STI 14.36 12.78 13.02 12.71 12.03 12.34 12.92 13.70
S. Korea KOSPI 11.40 11.30 11.01 11.22 11.65 11.87 11.82 12.50
Malaysia KLCI 15.55 16.21 15.89 16.26 16.42 16.56 16.50 17.14
Thailand SET 10.50 9.53 10.04 9.25 9.03 8.98 9.66 10.25
Indonesia JCI 21.40 17.76 16.57 17.21 17.61 19.60 24.40 24.95
Taiwan T WSE 17.91 18.32 18.14 17.32 17.94 18.66 18.80 20.42
Russia CRTX 17.57 14.06 13.09 13.50 13.61 11.47 12.40 13.33
China SHCOMP 21.02 24.71 25.37 24.16 24.34 25.70 31.42 31.96
South Africa JALSH 11.57 10.32 10.39 10.90 9.90 9.64 9.83 9.88
Colombia IGBC 23.27 18.33 15.50 16.26 17.22 16.68 14.15 14.10
Hungary BUX 12.95 10.90 10.85 11.28 10.10 9.92 10.07 9.09
Argentina IBG 12.52 10.49 11.02 10.15 9.84 9.87 10.61 11.20
Mexico INMEX 14.14 11.66 11.96 13.06 13.76 14.60 13.78 15.68
Chile IPSA 18.57 18.12 16.78 15.94 16.57 17.58 17.19 18.60
Brazil IBOV 11.06 10.59 10.60 10.72 10.43 10.68 11.47 11.77
Egypt HERMES 19.16 14.55 13.05 14.79 17.89 19.15 19.95 18.10
Source: Bloomberg Financial Services
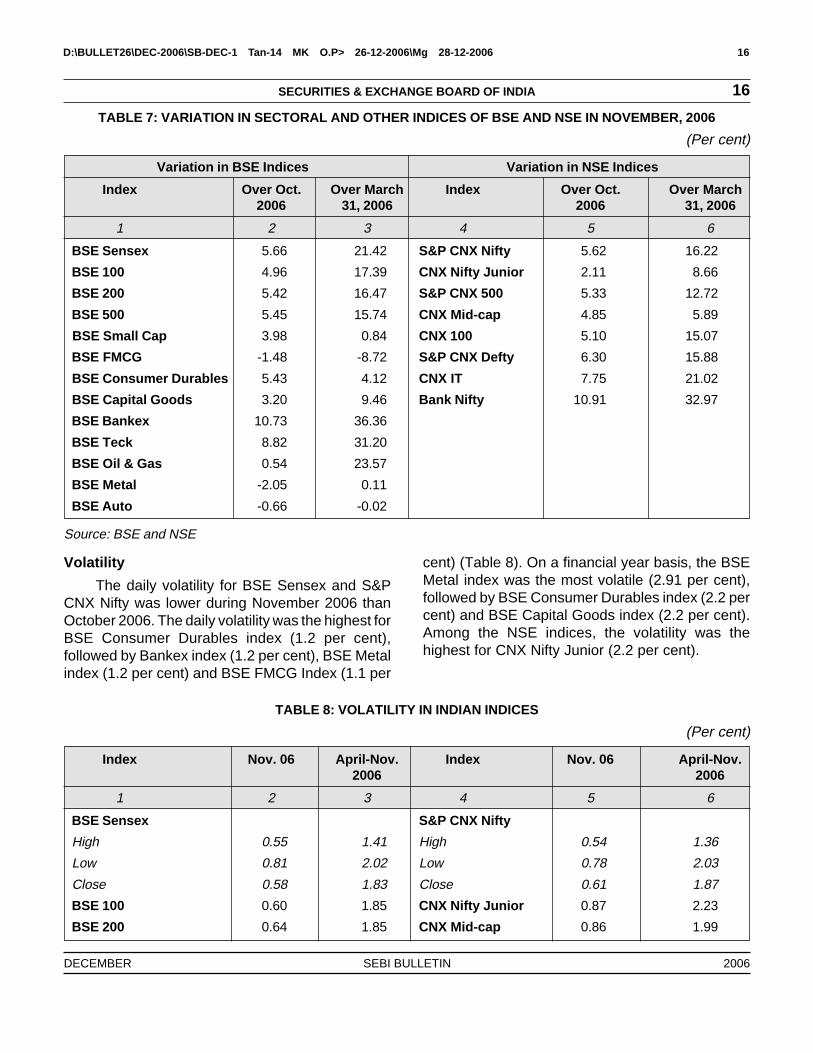
Sectoral Indices
Among the sectoral indices, the highest returnduring November 2006 was recorded by Bank Niftyindex (10.9 per cent) and BSE Bankex index (10.7per cent), followed by BSE teck index (8.8 per cent)and CNX IT index (7.7 per cent), (Table 7). On afinancial year basis, the highest gain was recordedby BSE Bankex index (36.3 per cent), followed by
BSE Teck index (31.2 per cent) and BSE oil and gasindex (23.6 per cent). Among the NSE indices, thehighest gain was recorded by bank Nifty index (33.0per cent), followed by CNX IT index (21.0 per cent)and S&P CNX Defty index (15.9 per cent). Thesectors which posted negative trend were BSE FMCG(-8.7 per cent) and BSE Auto (-0.02 per cent).
CAPITAL MARKET REVIEW
D:\BULLET26\DEC-2006\SB-DEC-1 Tan-14 MK O.P> 26-12-2006\Mg 28-12-2006 16
DECEMBER SEBI BULLETIN 2006
16SECURITIES & EXCHANGE BOARD OF INDIA
TABLE 7: VARIATION IN SECTORAL AND OTHER INDICES OF BSE AND NSE IN NOVEMBER, 2006
(Per cent)
Variation in BSE Indices Variation in NSE Indices
Index Over Oct. Over March Index Over Oct. Over March2006 31, 2006 2006 31, 2006
1 2 3 4 5 6
BSE Sensex 5.66 21.42 S&P CNX Nifty 5.62 16.22
BSE 100 4.96 17.39 CNX Nifty Junior 2.11 8.66
BSE 200 5.42 16.47 S&P CNX 500 5.33 12.72
BSE 500 5.45 15.74 CNX Mid-cap 4.85 5.89
BSE Small Cap 3.98 0.84 CNX 100 5.10 15.07
BSE FMCG -1.48 -8.72 S&P CNX Defty 6.30 15.88
BSE Consumer Durables 5.43 4.12 CNX IT 7.75 21.02
BSE Capital Goods 3.20 9.46 Bank Nifty 10.91 32.97
BSE Bankex 10.73 36.36
BSE Teck 8.82 31.20
BSE Oil & Gas 0.54 23.57
BSE Metal -2.05 0.11
BSE Auto -0.66 -0.02
Source: BSE and NSE
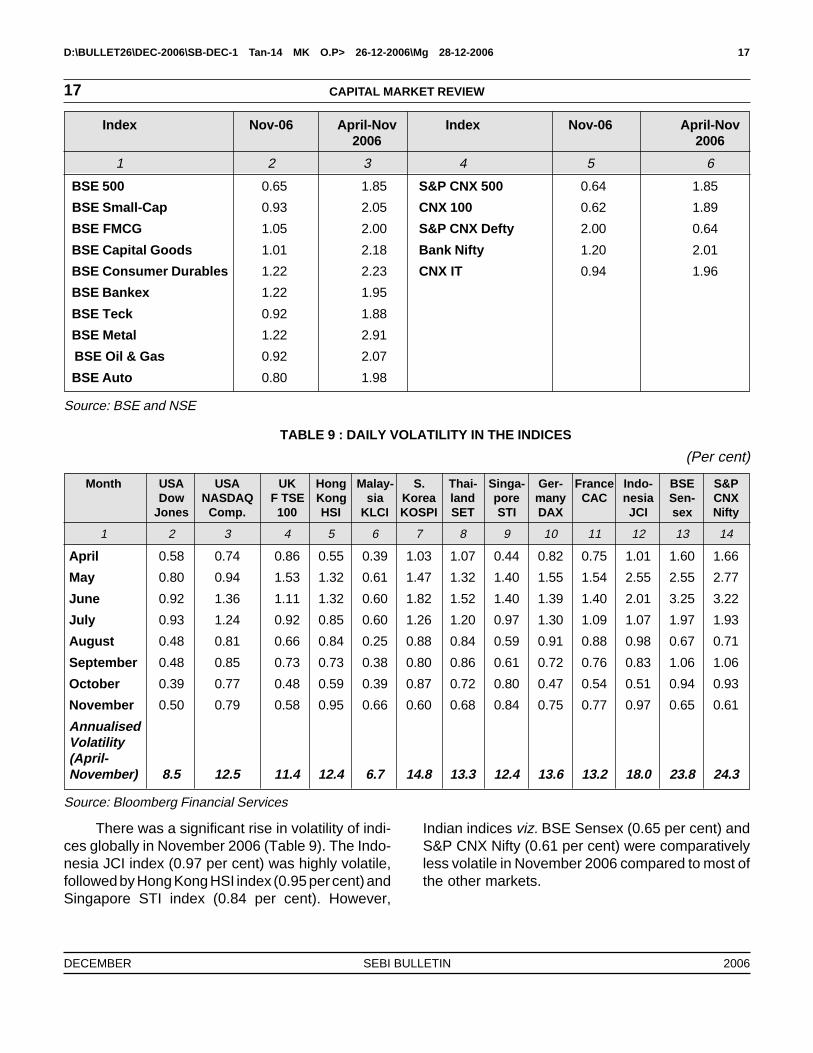
Volatility
The daily volatility for BSE Sensex and S&PCNX Nifty was lower during November 2006 thanOctober 2006. The daily volatility was the highest forBSE Consumer Durables index (1.2 per cent),followed by Bankex index (1.2 per cent), BSE Metalindex (1.2 per cent) and BSE FMCG Index (1.1 per
cent) (Table 8). On a financial year basis, the BSEMetal index was the most volatile (2.91 per cent),followed by BSE Consumer Durables index (2.2 percent) and BSE Capital Goods index (2.2 per cent).Among the NSE indices, the volatility was thehighest for CNX Nifty Junior (2.2 per cent).
TABLE 8: VOLATILITY IN INDIAN INDICES
(Per cent)
Index Nov. 06 April-Nov. Index Nov. 06 April-Nov.2006 2006
1 2 3 4 5 6
BSE Sensex S&P CNX Nifty
High 0.55 1.41 High 0.54 1.36
Low 0.81 2.02 Low 0.78 2.03
Close 0.58 1.83 Close 0.61 1.87
BSE 100 0.60 1.85 CNX Nifty Junior 0.87 2.23
BSE 200 0.64 1.85 CNX Mid-cap 0.86 1.99
D:\BULLET26\DEC-2006\SB-DEC-1 Tan-14 MK O.P> 26-12-2006\Mg 28-12-2006 17
DECEMBER SEBI BULLETIN 2006
17
BSE 500 0.65 1.85 S&P CNX 500 0.64 1.85
BSE Small-Cap 0.93 2.05 CNX 100 0.62 1.89
BSE FMCG 1.05 2.00 S&P CNX Defty 2.00 0.64
BSE Capital Goods 1.01 2.18 Bank Nifty 1.20 2.01
BSE Consumer Durables 1.22 2.23 CNX IT 0.94 1.96
BSE Bankex 1.22 1.95
BSE Teck 0.92 1.88
BSE Metal 1.22 2.91
BSE Oil & Gas 0.92 2.07
BSE Auto 0.80 1.98
Source: BSE and NSE
TABLE 9 : DAILY VOLATILITY IN THE INDICES
(Per cent)
Month USA USA UK Hong Malay- S. Thai- Singa- Ger- France Indo- BSE S&PDow NASDAQ F TSE Kong sia Korea land pore many CAC nesia Sen- CNX
Jones Comp. 100 HSI KLCI KOSPI SET STI DAX JCI sex Nifty
1 2 3 4 5 6 7 8 9 10 11 12 13 14
April 0.58 0.74 0.86 0.55 0.39 1.03 1.07 0.44 0.82 0.75 1.01 1.60 1.66
May 0.80 0.94 1.53 1.32 0.61 1.47 1.32 1.40 1.55 1.54 2.55 2.55 2.77
June 0.92 1.36 1.11 1.32 0.60 1.82 1.52 1.40 1.39 1.40 2.01 3.25 3.22
July 0.93 1.24 0.92 0.85 0.60 1.26 1.20 0.97 1.30 1.09 1.07 1.97 1.93
August 0.48 0.81 0.66 0.84 0.25 0.88 0.84 0.59 0.91 0.88 0.98 0.67 0.71
September 0.48 0.85 0.73 0.73 0.38 0.80 0.86 0.61 0.72 0.76 0.83 1.06 1.06
October 0.39 0.77 0.48 0.59 0.39 0.87 0.72 0.80 0.47 0.54 0.51 0.94 0.93
November 0.50 0.79 0.58 0.95 0.66 0.60 0.68 0.84 0.75 0.77 0.97 0.65 0.61
AnnualisedVolatility(April-November) 8.5 12.5 11.4 12.4 6.7 14.8 13.3 12.4 13.6 13.2 18.0 23.8 24.3
Source: Bloomberg Financial Services
Index Nov-06 April-Nov Index Nov-06 April-Nov2006 2006
1 2 3 4 5 6
There was a significant rise in volatility of indi-ces globally in November 2006 (Table 9). The Indo-nesia JCI index (0.97 per cent) was highly volatile,followed by Hong Kong HSI index (0.95 per cent) andSingapore STI index (0.84 per cent). However,
Indian indices viz. BSE Sensex (0.65 per cent) andS&P CNX Nifty (0.61 per cent) were comparativelyless volatile in November 2006 compared to most ofthe other markets.
CAPITAL MARKET REVIEW
D:\BULLET26\DEC-2006\SB-DEC-1 Tan-14 MK O.P> 26-12-2006\Mg 28-12-2006 18
DECEMBER SEBI BULLETIN 2006
18SECURITIES & EXCHANGE BOARD OF INDIA
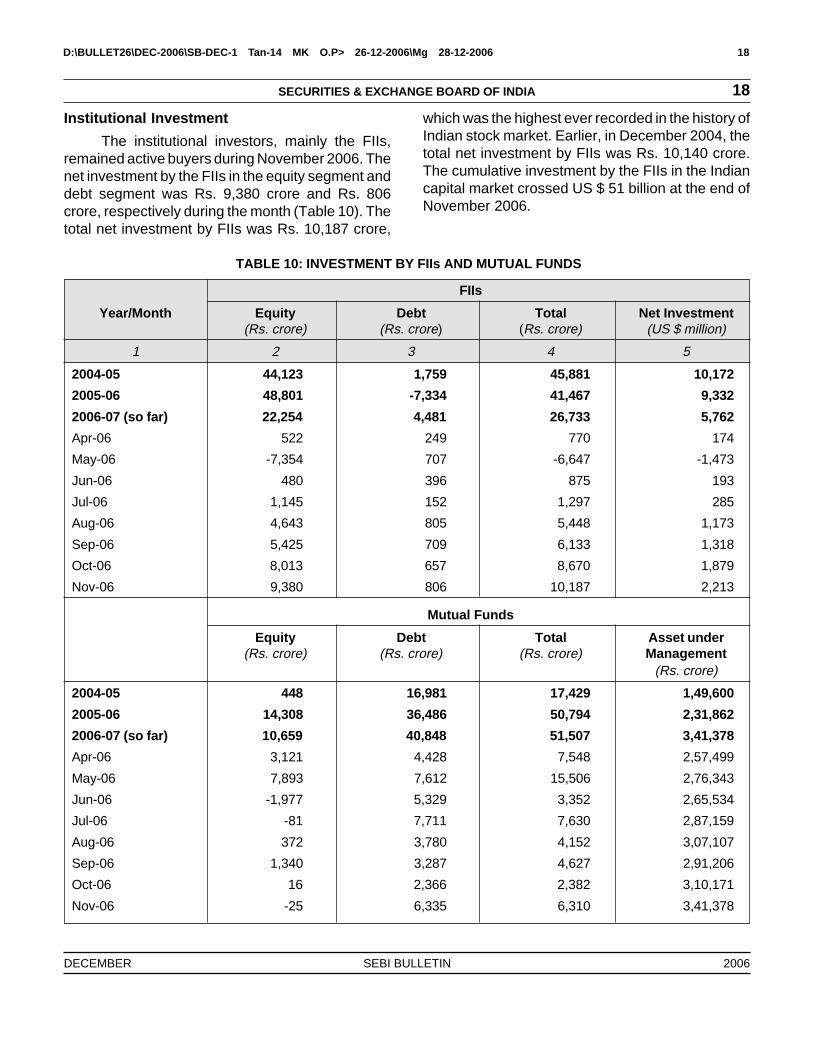
Institutional Investment
The institutional investors, mainly the FIIs,remained active buyers during November 2006. Thenet investment by the FIIs in the equity segment anddebt segment was Rs. 9,380 crore and Rs. 806crore, respectively during the month (Table 10). Thetotal net investment by FIIs was Rs. 10,187 crore,
which was the highest ever recorded in the history ofIndian stock market. Earlier, in December 2004, thetotal net investment by FIIs was Rs. 10,140 crore.The cumulative investment by the FIIs in the Indiancapital market crossed US $ 51 billion at the end ofNovember 2006.
TABLE 10: INVESTMENT BY FIIs AND MUTUAL FUNDS
FIIs
Year/Month Equity Debt Total Net Investment(Rs. crore) (Rs. crore) (Rs. crore) (US $ million)
1 2 3 4 5
2004-05 44,123 1,759 45,881 10,172
2005-06 48,801 -7,334 41,467 9,332
2006-07 (so far) 22,254 4,481 26,733 5,762
Apr-06 522 249 770 174
May-06 -7,354 707 -6,647 -1,473
Jun-06 480 396 875 193
Jul-06 1,145 152 1,297 285
Aug-06 4,643 805 5,448 1,173
Sep-06 5,425 709 6,133 1,318
Oct-06 8,013 657 8,670 1,879
Nov-06 9,380 806 10,187 2,213
Mutual Funds
Equity Debt Total Asset under(Rs. crore) (Rs. crore) (Rs. crore) Management
(Rs. crore)
2004-05 448 16,981 17,429 1,49,600
2005-06 14,308 36,486 50,794 2,31,862
2006-07 (so far) 10,659 40,848 51,507 3,41,378
Apr-06 3,121 4,428 7,548 2,57,499
May-06 7,893 7,612 15,506 2,76,343
Jun-06 -1,977 5,329 3,352 2,65,534
Jul-06 -81 7,711 7,630 2,87,159
Aug-06 372 3,780 4,152 3,07,107
Sep-06 1,340 3,287 4,627 2,91,206
Oct-06 16 2,366 2,382 3,10,171
Nov-06 -25 6,335 6,310 3,41,378

D:\BULLET26\DEC-2006\SB-DEC-1 Tan-14 MK O.P> 26-12-2006\Mg 28-12-2006 19
DECEMBER SEBI BULLETIN 2006
19
TABLE 11: TRENDS IN DERIVATIVES MARKET AT NSE
Item 2005-06 Aug-06 Oct-06 Nov-06 Variation (%)Col. 4 over
Col. 3
1 2 3 4 5 6
A. Turnover (Rs. crore)(i) Index Futures 15,13,791 1,73,334 1,66,974 1,80,781 8.27(ii) Stock Futures 27,91,721 2,29,182 2,72,516 3,88,800 42.67(iii) Stock Options
Put 36,518 2,772 2,553 3,343 30.94Call 1,43,752 11,273 13,873 16,886 21.72
(iv) Index OptionsPut 1,69,837 25,830 26,549 32,450 22.23Call 1,68,632 27,276 23,195 27,568 18.85
TOTAL 48,24,250 4,69,666 5,05,658 6,49,829 28.51
B. No. of Contracts
(i) Index Futures 5,85,37,886 52,50,973 45,56,984 46,44,632 1.92
(ii) Stock Futures 7,95,86,852 75,30,310 79,29,018 1,05,39,507 32.92
(iii) Stock Options
Put 10,74,780 87,767 74,318 90,369 21.60
Call 41,65,996 3,58,753 4,00,618 4,63,369 15.66
(iv) Index Options
Put 65,21,649 7,89,241 7,29,855 8,45,270 15.81
Call 64,13,467 8,07,014 6,22,933 7,01,372 12.59
TOTAL 15,76,19,271 1,48,24,058 1,43,13,726 1,72,84,519 20.75
C. Open Interest
No. of Contracts 10,28,003 12,85,783 11,27,466 17,51,644 55.36
Notional Turnover(Rs. crore) 38,469 41,048 39,644 65,069 64.13
Source: NSE
The net investment by mutual funds in debt wasRs. 6,335 crore in November 2006. During 2006-07so far, the net investment by mutual funds in equityand debt was Rs. 10,659 crore and Rs. 40,848 crore,respectively.
B. Derivatives Market
During November 2006, there was an acrossthe board upward trend in both number of contractstraded and turnover in the derivatives segment(Table 11). The total turnover in the derivativesegment increased substantially by 28.5 per centto Rs. 6,49,829 crore during November 2006 from
Rs. 5,05,658 crore in the previous month. Stockfutures were the most dominant product with a shareof 59.9 per cent in the total derivatives turnover andit rose significantly by 42.7 per cent to Rs. 3,88,800crore in November 2006 from Rs. 2,72,516 crore inthe previous month. The turnover in stock options -both put and call-also increased considerably by30.9 per cent and 21.7 per cent, respectively duringthe month. The value of open interest in the deriva-tives segment rose substantially by 64.1 per cent toRs. 65,069 crore at the end of October 2006 fromRs. 39,644 crore a month ago.
CAPITAL MARKET REVIEW
D:\BULLET26\DEC-2006\SB-DEC-1 Tan-14 MK O.P> 26-12-2006\Mg 28-12-2006 20
DECEMBER SEBI BULLETIN 2006
20SECURITIES & EXCHANGE BOARD OF INDIA
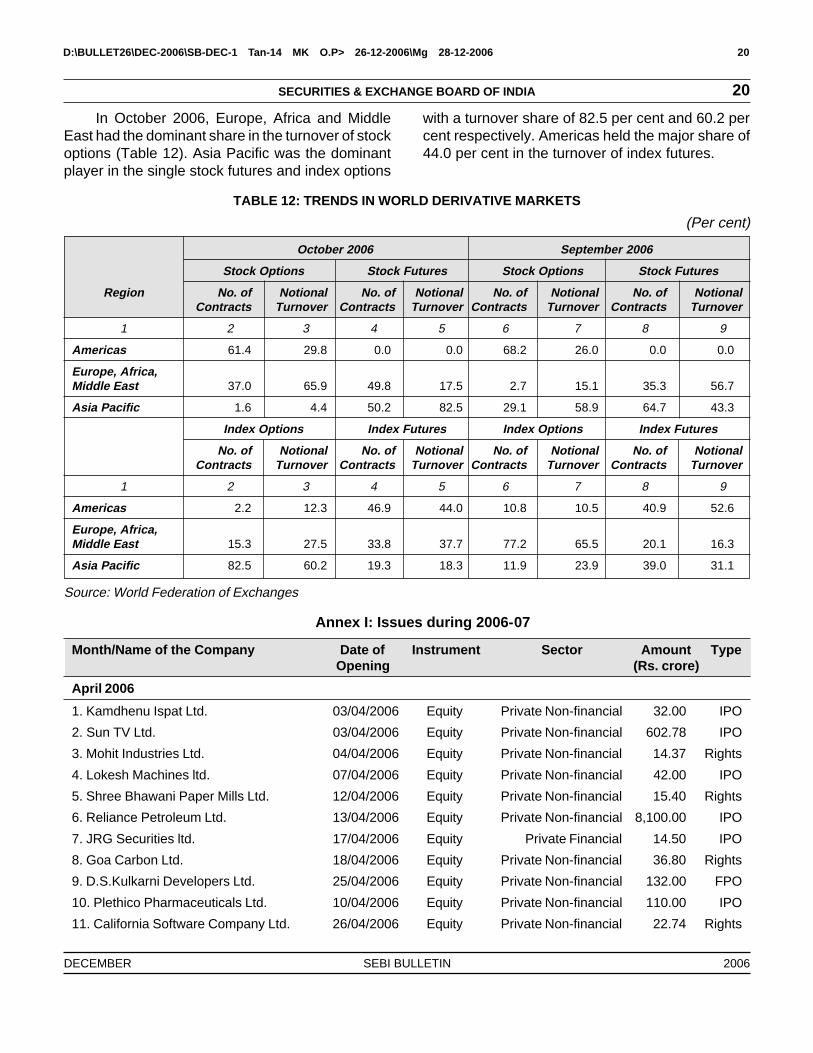
TABLE 12: TRENDS IN WORLD DERIVATIVE MARKETS
(Per cent)
October 2006 September 2006
Stock Options Stock Futures Stock Options Stock Futures
Region No. of Notional No. of Notional No. of Notional No. of NotionalContracts Turnover Contracts Turnover Contracts Turnover Contracts Turnover
1 2 3 4 5 6 7 8 9
Americas 61.4 29.8 0.0 0.0 68.2 26.0 0.0 0.0
Europe, Africa,Middle East 37.0 65.9 49.8 17.5 2.7 15.1 35.3 56.7
Asia Pacific 1.6 4.4 50.2 82.5 29.1 58.9 64.7 43.3
Index Options Index Futures Index Options Index Futures
No. of Notional No. of Notional No. of Notional No. of NotionalContracts Turnover Contracts Turnover Contracts Turnover Contracts Turnover
1 2 3 4 5 6 7 8 9
Americas 2.2 12.3 46.9 44.0 10.8 10.5 40.9 52.6
Europe, Africa,Middle East 15.3 27.5 33.8 37.7 77.2 65.5 20.1 16.3
Asia Pacific 82.5 60.2 19.3 18.3 11.9 23.9 39.0 31.1
Source: World Federation of Exchanges
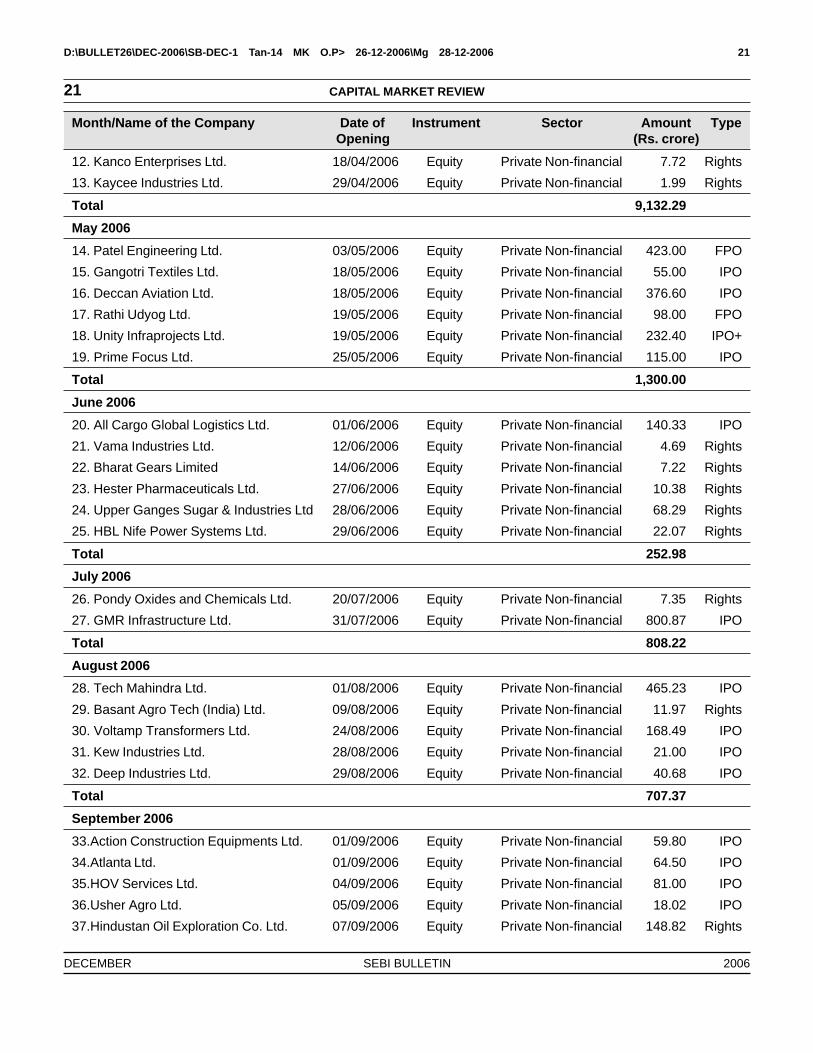
Annex I: Issues during 2006-07
Month/Name of the Company Date of Instrument Sector Amount TypeOpening (Rs. crore)
April 2006
1. Kamdhenu Ispat Ltd. 03/04/2006 Equity Private Non-financial 32.00 IPO
2. Sun TV Ltd. 03/04/2006 Equity Private Non-financial 602.78 IPO
3. Mohit Industries Ltd. 04/04/2006 Equity Private Non-financial 14.37 Rights
4. Lokesh Machines ltd. 07/04/2006 Equity Private Non-financial 42.00 IPO
5. Shree Bhawani Paper Mills Ltd. 12/04/2006 Equity Private Non-financial 15.40 Rights
6. Reliance Petroleum Ltd. 13/04/2006 Equity Private Non-financial 8,100.00 IPO
7. JRG Securities ltd. 17/04/2006 Equity Private Financial 14.50 IPO
8. Goa Carbon Ltd. 18/04/2006 Equity Private Non-financial 36.80 Rights
9. D.S.Kulkarni Developers Ltd. 25/04/2006 Equity Private Non-financial 132.00 FPO
10. Plethico Pharmaceuticals Ltd. 10/04/2006 Equity Private Non-financial 110.00 IPO
11. California Software Company Ltd. 26/04/2006 Equity Private Non-financial 22.74 Rights
In October 2006, Europe, Africa and MiddleEast had the dominant share in the turnover of stockoptions (Table 12). Asia Pacific was the dominantplayer in the single stock futures and index options
with a turnover share of 82.5 per cent and 60.2 percent respectively. Americas held the major share of44.0 per cent in the turnover of index futures.
D:\BULLET26\DEC-2006\SB-DEC-1 Tan-14 MK O.P> 26-12-2006\Mg 28-12-2006 21
DECEMBER SEBI BULLETIN 2006
21
12. Kanco Enterprises Ltd. 18/04/2006 Equity Private Non-financial 7.72 Rights
13. Kaycee Industries Ltd. 29/04/2006 Equity Private Non-financial 1.99 Rights
Total 9,132.29
May 2006
14. Patel Engineering Ltd. 03/05/2006 Equity Private Non-financial 423.00 FPO
15. Gangotri Textiles Ltd. 18/05/2006 Equity Private Non-financial 55.00 IPO
16. Deccan Aviation Ltd. 18/05/2006 Equity Private Non-financial 376.60 IPO
17. Rathi Udyog Ltd. 19/05/2006 Equity Private Non-financial 98.00 FPO
18. Unity Infraprojects Ltd. 19/05/2006 Equity Private Non-financial 232.40 IPO+
19. Prime Focus Ltd. 25/05/2006 Equity Private Non-financial 115.00 IPO
Total 1,300.00
June 2006
20. All Cargo Global Logistics Ltd. 01/06/2006 Equity Private Non-financial 140.33 IPO
21. Vama Industries Ltd. 12/06/2006 Equity Private Non-financial 4.69 Rights
22. Bharat Gears Limited 14/06/2006 Equity Private Non-financial 7.22 Rights
23. Hester Pharmaceuticals Ltd. 27/06/2006 Equity Private Non-financial 10.38 Rights
24. Upper Ganges Sugar & Industries Ltd 28/06/2006 Equity Private Non-financial 68.29 Rights
25. HBL Nife Power Systems Ltd. 29/06/2006 Equity Private Non-financial 22.07 Rights
Total 252.98
July 2006
26. Pondy Oxides and Chemicals Ltd. 20/07/2006 Equity Private Non-financial 7.35 Rights
27. GMR Infrastructure Ltd. 31/07/2006 Equity Private Non-financial 800.87 IPO
Total 808.22
August 2006
28. Tech Mahindra Ltd. 01/08/2006 Equity Private Non-financial 465.23 IPO
29. Basant Agro Tech (India) Ltd. 09/08/2006 Equity Private Non-financial 11.97 Rights
30. Voltamp Transformers Ltd. 24/08/2006 Equity Private Non-financial 168.49 IPO
31. Kew Industries Ltd. 28/08/2006 Equity Private Non-financial 21.00 IPO
32. Deep Industries Ltd. 29/08/2006 Equity Private Non-financial 40.68 IPO
Total 707.37
September 2006
33.Action Construction Equipments Ltd. 01/09/2006 Equity Private Non-financial 59.80 IPO
34.Atlanta Ltd. 01/09/2006 Equity Private Non-financial 64.50 IPO
35.HOV Services Ltd. 04/09/2006 Equity Private Non-financial 81.00 IPO
36.Usher Agro Ltd. 05/09/2006 Equity Private Non-financial 18.02 IPO
37.Hindustan Oil Exploration Co. Ltd. 07/09/2006 Equity Private Non-financial 148.82 Rights
Month/Name of the Company Date of Instrument Sector Amount TypeOpening (Rs. crore)
CAPITAL MARKET REVIEW
D:\BULLET26\DEC-2006\SB-DEC-1 Tan-14 MK O.P> 26-12-2006\Mg 28-12-2006 22
DECEMBER SEBI BULLETIN 2006
22SECURITIES & EXCHANGE BOARD OF INDIA
38.Morarjee Textiles Ltd. 11/09/2006 Equity Private Non-financial 42.82 Rights
39.Gwalior Chemical Industries Ltd. 11/09/2006 Equity Private Non-financial 80.00 IPO
40.Richa Knits Ltd. 13/09/2006 Equity Private Non-financial 27.00 IPO
41.Gruh Finance Ltd. 14/09/2006 Equity Private Non-financial 59.62 Rights
42.Fiem Industries Ltd 21/09/2006 Equity Private Non-financial 56.17 IPO
43.OCL India 25/09/2006 Equity Private Non-financial 76.36 Rights
44.JHS Svendgaard Laboratories Ltd. 26/09/2006 Equity Private Non-financial 38.86 IPO
45.T T Ltd. 27/09/2006 Equity Private Non-financial 21.49 Rights
46.Accel Frontline Ltd. 28/09/2006 Equity Private Non-financial 42.27 IPO
47.Hanung Toys and Textiles Ltd. 28/09/2006 Equity Private Non-financial 90.25 IPO
48.Global Vectra Helicorp Ltd. 29/09/2006 Equity Private Non-financial 64.75 IPO
49.Development Credit Bank 29/09/2006 Equity Private Non-financial 185.90 IPO
50.JMC Projects (India) Ltd. 30/09/2006 Equity Private Non-financial 46.47 Rights
51.Gayatri Projects Ltd. 26/09/2006 Equity Private Non-financial 85.55 IPO*
52.ITD Cementation India Ltd. 27/09/2006 Equity Private Non-financial 37.62 Rights
53.Gee Ltd. 29/09/2006 Equity Private Non-financial 2.84 Rights
1330.10
October 2006
54.Zenith Birla (India) Ltd. 16/10/2006 Equity Private Non-financial 131.00 FPO
55.Sunshield Chemicals Ltd. 30/10/2006 Equity Private Non-financial 11.03 Rights
56.Info Edge (India) Ltd. 30/10/2006 Equity Private Non-financial 170.40 IPO
312.39
November 2006
57.Parsvnath Developers Ltd. 06/11/2006 Equity Private Non-financial 997.1 IPO
58.Lanco Infratech Ltd. 06/11/2006 Equity Private Non-financial 1067.34 IPO
59.Tata Coffee Ltd. 16/11/2006 Equity Private Non-financial 249.37 Rights
60.Blue Bird (India) Ltd. 16/11/2006 Equity Private Non-financial 92.14 IPO
61. LT Overseas Ltd. 21/11/2006 Equity Private Non-financial 39.40 IPO
62.TataTeleservices (Maharashtra) Ltd. 21/11/2006 Debt* Private Non-financial 491.14 Rights
63. Sugars and Chemicals Ltd. 22/11/2006 Equity Private Non-financial 26.40 FPO
64.Sobha Developers Ltd. 23/11/2006 Equity Private Non-financial 569.17 IPO
65.Ruchira Papers Ltd. 23/11/2006 Equity Private Non-financial 28.50 IPO
66.Kovilpatti Lakshmi Roller Flour Mills 27/11/2006 Equity Private Non-financial 14.30 IPOLtd.
Total 3574.86
Grand Total (April- November) 2006 17418.22
Grand Total (April- November) 2005 10392.97
+ Includes offer for sale amount * Partially Convertible Debenture
Month/Name of the Company Date of Instrument Sector Amount TypeOpening (Rs. crore)
D:\BULLET26\DEC-2006\SB-DEC-1 Tan-14 MK O.P> 26-12-2006\Mg 28-12-2006 23
DECEMBER SEBI BULLETIN 2006
23
I. REGISTRATION OF M/S. P.K.KHANNA & CO.,MEMBER OF LUDHIANA STOCK EXCHANGE,SUSPENDED.
Dr. T.C.Nair, Whole Time Member, SEBI, haspassed an order dated October 23, 2006, suspend-ing the certificate of registration of M/s. P. K. Khanna& Co. (SEBI Reg. No. INB120592219), member ofthe Ludhiana Stock Exchange for a period of three(3) months with effect from November 13, 2006.
M/s. P.K. Khanna & Co. will not be entitled tocarry on the business as a broker with effect fromNovember 13, 2006 to February 12, 2007.
Ref: PR No.238/2006 dated November 02, 2006
II. SEBI OFFICES SHIFT TO NEW OFFICE BUILD-ING IN BANDRA KURLA COMPLEX.
Securities and Exchange Board of India hasshifted its offices in Mumbai to their new head officebuilding “SEBI Bhavan”.
The address of SEBI Bhavan is Plot No. C-4A,G Block, Bandra-Kurla Complex, Bandra (East),Mumbai- 400 051.
The telephone number of the new office is26449000. The telephone numbers of the Office ofInvestor Assistance and Education, dealing withinvestor grievances and guidance, are 26449188/26449199.
SEBI Bhavan was inaugurated by HonourablePrime Minister of India, Dr. Manmohan Singh onOctober 6, 2006.
Ref: PR-239/2006 dated November 02, 2006
III. ORDER IN THE MATTER OF M/S. BARODAAGRO INDUSTRIES LTD.
Dr. T.C Nair, Whole Time Member, SEBI, haspassed an order dated November 2, 2006 in thematter of M/s. Baroda Agro Industries Ltd. debarringM/s World Link Finance Ltd. from dealing in securi-ties or associating with any of the activities in thecapital market for a period of three years. The ordershall come into force with immediate effect.
Ref: PR No.240/2006 dated November 03, 2006
IV. ORDER AGAINST M/S. BINANI CEMENTSLIMITED.
Dr.T.C. Nair, Whole Time Member, SEBI videhis order dated November 2, 2006 passed in thematter of M/s. Munga Holdings Ltd. has directedM/s. Binani Cements Limited to be careful in ensur-ing timely compliance of the listing requirements andother ancillary filing requirements. This order comesinto force with immediate effect.
Ref: PR No.241/2006 dated November 3, 2006
V. ORDER AGAINST JHAVERI SECURITIES PVT.LIMITED IN THE MATTER OF IPO INVESTI-GATIONS.
Shri G. Anantharaman, Whole Time Member,SEBI has passed final order on November 3, 2006against M/s Jhaveri Securities Pvt. Ltd. (JSPL) in thematter of IPO Investigations directing “JSPL, de-pository participant of NSDL, not to open freshdemat accounts for a period of nine months. Theperiod of prohibition already undergone by JSPLvide SEBI order dated April 27, 2006 would be set offagainst the said period of nine months.”
JSPL failed to exercise due diligence and careas required of a SEBI registered intermediary in thematter of opening of 534 demat accounts. The said534 demat accounts held with JSPL were afferentaccounts of one of the key operators, Shri BirenKantilal Shah which had been used by him forcornering shares of various IPOs/Public issues tothe detriment of genuine retail investors. The veryfact that these accounts have turned out to besuspect on enquiry and also duly buttressed by theadmission of JSPL in its reply dated October 27,2006 is clearly demonstrative of a signal failure onthe part of JSPL. What really heightened the gravityof the matter was that the key operator was allowedby JSPL to continue the said abhorrent practiceswith impunity even after SEBI’s directions containedin the interim order dated January 12, 2006 restrain-ing Shri Biren Kantilal Shah, without exercising nec-essary precautions and due diligence.
Ref: PR-242/2006 dated November 3, 2006
PRESS RELEASES
PRESS RELEASES

D:\BULLET26\DEC-2006\SB-DEC-1 Tan-14 MK O.P> 26-12-2006\Mg 28-12-2006 24
DECEMBER SEBI BULLETIN 2006
24SECURITIES & EXCHANGE BOARD OF INDIA
VI. ACQUISITION OF SHAREHOLDING OF M/S.FALCON TYRES LTD. AND M/S. DUNLOPINDIA LTD. BY M/S. WEALTH SEA PTE. LTD.
Dr. T.C.Nair, Whole Time Member, SEBI, haspassed an order dated November 01, 2006 directingM/s. Wealth Sea Pte. Ltd. (“the Acquirer”) to make apublic offer to the shareholders of M/s. Falcon TyresLtd. and M/s. Dunlop India Ltd. within a period of 45days from the date of order under the SEBI (Sub-stantial Acquisition of Shares and Takeovers) Regu-lations, 1997.
As per the aforesaid Order, the acquirer ac-quired entire share capital of M/s. Dil Rim andWheels Corporation Ltd. (DRW) from M/s. JumboWorld Holdings Ltd. through a share purchase agree-ment. DRW was having 74.50 per cent of the equityshares of M/s. Dunlop India Ltd. and 68.98 per centof the equity shares of M/s. Falcon Tyres Ltd. Thesaid acquisition mandated the acquirer to makeopen offer to the shareholders of M/s. Falcon TyresLtd. and M/s. Dunlop India Ltd. in terms of theTakeover Regulations. The acquirer failed to complywith the said mandatory requirement.
Ref: PR-243/2006 dated November 06, 2006
VII.ORDER IN THE MATTER OF M/S. NATURALEXPO AGRO INDUSTRIES LTD.
Dr. T.C.Nair, Whole Time Member, SEBI haspassed an order dated November 03, 2006 directingno action to be taken against Shri Keyoor M. Bakshi,Director, M/s. Vrushti Financial Services Pvt. Ltd. inthe matter of M/s. Natural Expo Agro Industries Ltd.
Ref: PR No.244/2006 dated November 08, 2006
VIII. ORDER ISSUED IN THE MATTER OF DEAL-ING IN SHARES BY SHRI MATHEW EASOWAND HIS ASSOCIATE ENTITIES.
Whole Time Member, SEBI has issued orderNo. WTM/GA/98/ISD/11/06 dated November 08,2006 in the matter of dealing in shares by ShriMathew Easow and his associate entities.
Ref: PR No.245/2006 dated November 8, 2006
IX. ORDER AGAINST MEGHRAJ SP CORPO-RATE FINANCE (PRIVATE) LIMITED (FOR-
MERLY KNOWN AS MEGHRAJ FINANCIALSERVICES (INDIA) PVT. LTD.)
Whole Time Member, SEBI has passed anorder dated November 08, 2006, imposing a minorpenalty of censure against Meghraj SP CorporateFinance (Private) Limited (formerly known as MeghrajFinancial Services (India) Pvt. Ltd.), Merchant Bankerwith registration number INM 000001220, for itsfailure to exercise due diligence in the matter ofacquisition of shares of SRP Tools Ltd. pursuant toan open offer by the acquirers.
Ref: PR-246/2006 dated November 8, 2006
X. ORDER IN THE MATTER OF GLOBAL TRUSTBANK IN RESPECT OF M/S. NISKALP IN-VESTMENTS & TRADING CO. LTD.
SEBI has passed an order on November 07,2006 disposing off the show cause notice issued toM/s. Niskalp Investments & Trading Co. Ltd., in thematter of Global Trust Bank.
The Show Cause Notice is disposed off on thegrounds that there is absence of sufficient evidencewith respect to M/s. Niskalp Investments & TradingCo. Ltd. alleged role in the price manipulation in theshares of Global Trust Bank.
Ref: PR No.247/2006 dated November 09, 2006
XI. ORDERS AGAINST (1) M/S. ARCADIA SHAREAND STOCK BROKERS PVT. LTD. AND (2)M/S. KAUSHIK SHAH SHARES AND SECURI-TIES PVT. LTD.
Certificates of registration of two brokers M/s.Arcadia Share and Stock Brokers Pvt. Ltd. Member- NSE Ltd. (Regn. No. INB 230778238) and M/s.Kaushik Shah Shares and Securities Pvt. Ltd., Mem-ber - BSE Ltd.(Regn. No. INB 010939732) havebeen suspended for a period of seven days. Thebrokers have been found guilty of violating theprovisions of SEBI (Prohibition of Fraudulent andUnfair Trade practices Relating to Securities Mar-ket), Regulations, 1995 and provisions of the Codeof Conduct as specified in SEBI (Stock Brokers andSub-Brokers) Regulations, 1992, while dealing inthe shares of Orient Information Technology Ltd.
D:\BULLET26\DEC-2006\SB-DEC-1 Tan-14 MK O.P> 26-12-2006\Mg 28-12-2006 25
DECEMBER SEBI BULLETIN 2006
25
The orders have been passed by Dr. T.C. Nair,Whole Time Member, SEBI on November 01, 2006and shall come into force after the expiry of 21 daysfrom the date of orders.
Ref: PR No.248/2006 dated November 09, 2006
XII.ORDER AGAINST M/S. NIRJAY SECURITIESPVT. LTD. AND SHRI JATIN A. KHANDWALA.
M/s. Nirjay Securities Pvt. Ltd. and its Director,Shri Jatin A. Khandwala have been restrained frombuying, selling or dealing in securities for a period ofsix months for violations of the provisions of SEBI(Prohibition of Fraudulent and Unfair Trade Prac-tices relating to Securities Market), Regulations,1995 while dealing in the shares of M/s. OrientInformation Technology Ltd.
The order passed by Dr. T.C. Nair, Whole TimeMember, SEBI on November 01, 2006 came intoforce with immediate effect.
Ref: PR No.249/2006 dated November 09, 2006
XIII. ORDER IN THE MATTER OF M/S. ABHIPRACAPITAL LTD., MEMBER, NSE.
Dr. T.C.Nair, Whole Time Member, SEBI, haspassed an order dated November 02, 2006 warningM/s. Abhipra Capital Ltd., Member, National StockExchange (NSE) to be more cautious in its dealingswith securities and adhere to the provisions of SEBIAct and the Regulations.
Ref: PR No.250/2006 dated November 09, 2006
XIV. ORDER IN THE MATTER OF SHRI S.K.JAIN,MEMBER, CSE.
Dr. T.C.Nair, Whole Time Member, SEBI, haspassed an order dated November 03, 2006 dispos-ing off the proceedings against Shri S.K.Jain (SEBIRegn No.INB030951610), member of Calcutta StockExchange (CSE).
Ref: PR No.251/2006 dated November 09, 2006
XV. REGISTRATION OF M/S. MITRA OPTIONSAND SHARE BROKERS LTD., MEMBER,NSE, SUSPENDED.
Dr. T.C.Nair, Whole Time Member, SEBI, haspassed an order dated November 02, 2006, sus-pending the certificate of registration of M/s. MitraOptions and Share Brokers Ltd. having SEBI Regis-
tration No. INB230950637, member of the NationalStock Exchange (NSE) for a period of 3 (three)months with effect from November 23, 2006.
M/s. Mitra Options and Share Brokers Ltd. willnot be entitled to carry on the business as a brokerwith effect from November 23, 2006 to February 22,2007.
Ref: PR No.252/2006 dated November 09, 2006
XVI. ORDER AGAINST SHRI CHANDRAVADANJ.DALAL, MEMBER, BSE.
Enquiry proceedings initiated by SEBI againstShri Chandravadan J.Dalal, Member of the BombayStock Exchange Ltd. (BSE) for trading in the scrip ofM/s. Padmalaya Telefilms Ltd. have been abated onaccount of the death of Shri Chandravadan J.Dalal,the sole proprietor of the firm.
The order has been passed by Dr. T.C.Nair,Whole Time Member, SEBI on November 02, 2006.
Ref: PR No.254/2006 dated November 14, 2006
XVII. ORDER IN THE MATTER OF M/S. HOMETRADE LTD.
SEBI has passed an order on November 14,2006 suspending certificate of registration of M/s.Hexagon Capital Markets Limited, Member, Banga-lore Stock Exchange Ltd. (BgSE), SEBI RegistrationNo. INB081008934, for a period of fifteen days in thematter of M/s. Home Trade Ltd.
The penalty is imposed on the broker for notcomplying with the Code of Conduct norms andguidelines relating to Know Your Client norms. Thecertificate of registration of M/s. Hexagon CapitalMarkets Limited will be suspended from December05, 2006 till December 19, 2006.
Ref: PR-256/2006 dated November 14, 2006
XVIII. SECURITIES CONTRACTS (REGULATION)(MANNER OF INCREASING AND MAIN-TAINING PUBLIC SHAREHOLDING INRECOGNISED STOCK EXCHANGES)REGULATIONS, 2006.
SEBI has notified the Securities Contracts(Regulation) (Manner of Increasing and MaintainingPublic Shareholding in Recognised Stock Ex-changes) Regulations, 2006. The Regulations are
PRESS RELEASES
D:\BULLET26\DEC-2006\SB-DEC-1 Tan-14 MK O.P> 26-12-2006\Mg 28-12-2006 26
DECEMBER SEBI BULLETIN 2006
26SECURITIES & EXCHANGE BOARD OF INDIA
notified under section 4B (8) of the Securities Con-tracts (Regulation) Act, 1956.
The Regulations shall be applicable to allrecognised stock exchanges in respect of which thescheme for corporatisation and/or demutualisationhas been approved by SEBI. These Regulationsspecify that the public shareholding in recognisedstock exchanges may be increased in the followingmanner:
(a) offer for sale, by issue of prospectus, of sharesheld by shareholders having trading rightstherein; or
(b) placement of shares held by shareholders hav-ing trading rights to such persons or institutionsas may be shortlisted by the recognised stockexchange with the approval of SEBI; or
(c) issue of equity shares on private placementbasis by the recognised stock exchange to anyperson or group of persons not being share-holders having trading rights or their associatessubject to the approval of SEBI; or
(d) any combination of the above.
The above are in addition to the mode permit-ted by Securities Contracts (Regulation) Act itself,i.e. by fresh issue of equity shares to the public.
The Regulations further specify that no personshall, directly or indirectly, acquire or hold more thanfive per cent in the paid-up equity capital of arecognised stock exchange. Further, no person shall,either individually or together with persons acting inconcert with him, acquire and/or hold more than oneper cent of the paid up equity capital of a recognisedstock exchange, unless he is a fit and proper personand has taken prior approval of SEBI for doing so.
Presently, SEBI has approved and notified thecorporatisation and/or demutualisation schemes ofnineteen stock exchanges.
Ref: PR No.257/2006 dated November 16, 2006
XIX. REGISTRATION OF M/S. AKRITI SECURI-TIES PVT. LTD., SUSPENDED.
Shri V.K.Chopra, Whole Time Member, SEBI,has passed an order dated November 08, 2006,suspending the certificate of registration of
M/s. Akriti Securities Pvt. Ltd. (SEBI Reg. No.INS010751134), a sub-broker affiliated to UPSESecurities Ltd., Member of the Bombay Stock Ex-change Ltd. for a period of (15) fifteen days witheffect from November 29, 2006.
M/s. Akriti Securities Pvt. Ltd. will not be entitledto carry on the business as a sub-broker with effectfrom November 29, 2006 to December 13, 2006.
Ref: PR No.258/2006 dated November 16, 2006
XX. SEBI PASSES DISGORGEMENT ORDER IN“IPO MANIPULATION” CASE.
In continuation of the interim order dated April27, 2006 relating to “IPO Manipulation”, Shri G.Anantharaman, Whole Time Member, SEBI haspassed an interim order dated November 21, 2006ordering both the depositories viz. National Securi-ties Depository Ltd. (NSDL) and Central DepositoryServices (India) Ltd. (CDSL) and eight (8) Deposi-tory Participants namely Karvy Stock Broking Ltd.,HDFC Bank Ltd., Khandwala Integrated FinancialServices Pvt. Ltd., IDBI Bank Ltd., Jhaveri SecuritiesPvt. Ltd., ING Vysya Bank Ltd., Pravin Ratilal Share& Stock Broking Ltd. and Pratik Stock Vision Pvt.Ltd. to jointly and severally disgorge an amount ofRs. 115.81 crore within a period of six (6) monthsfrom the date of passing of the order. The orderfurther states that “all parties are at liberty to seekcontribution/indemnity from any party which theybelieve is liable to a greater extent than quantifiedhere as also from individuals and companies whichwere involved in the IPO cornering/fraud but are notnamed, not being intermediaries under section 12 ofthe SEBI Act, 1992.”
Ref: PR-259/2006 dated November 21, 2006
XXI. PROHIBITION ON OPENING OF FRESHDEMAT ACCOUNTS BY HDFC BANK LTD.,LIFTED.
Dr. T.C.Nair, Whole Time Member, SEBI hasvide his post hearing order passed on November 23,2006 in the matter of Initial Public Offering (IPO)Investigations directed that, pending enquiry, theprohibition on opening fresh demat accounts by theHDFC Bank Ltd., a Depository Participant belifted. The order further states that all issues and
D:\BULLET26\DEC-2006\SB-DEC-1 Tan-14 MK O.P> 26-12-2006\Mg 28-12-2006 27
DECEMBER SEBI BULLETIN 2006
27
contentions are left open to be considered by theEnquiry Officer appointed by SEBI and to be decidedin subsequent proceedings pursuant to his report.
Ref: PR-260/2006 dated November 23, 2006
XXII. SEBI INVITES PUBLIC COMMENTS ONTHE DRAFT SEBI (DELISTING OF SECURI-TIES) REGULATIONS, 2006.
SEBI has invited public comments on the draftSEBI (Delisting of Securities) Regulations, 2006.The draft Regulations have been prepared in con-sultation with various market participants. The fulltext of the draft Regulations along with the rationalebehind the proposed amendments is available onthe website: www.sebi.gov.in.
Interested persons and entities may send theircomments by email to [email protected] [email protected] and by post to the AssistantGeneral Manager, Division of Corporate Restructur-ing, Securities and Exchange Board of India, SEBIBhavan, 3rd Floor, C4-A, G-Block, Bandra KurlaComplex, Bandra (East), Mumbai - 400 051, so as toreach on or before December 14, 2006.
Ref: PR-261/2006 dated November 23, 2006
XXIII. SEBI RESTRAINS M/S. CYBERSPACELTD., FOR TWO YEARS.
Shri V.K.Chopra, Whole Time Member, SEBIvide order dated November 23, 2006 has restrainedthe company M/s. Cyberspace Ltd. from buying,selling and dealing or accessing the securities mar-ket in any manner for a period of two years from thedate of the order, for its role in the dealings in thescrip of the Company.
The order shall come into force with immediateeffect.
Ref: PR-262/2006 dated November 24, 2006
XXIV. ORDER AGAINST M/S. MARLECHASECURITIES PVT. LTD. AND M/S. UDAYSTOCKS & SECURITIES PVT. LTD. IN THEMATTER OF M/S. HOME TRADE LTD.
Shri G. Anantharaman, Whole Time Member,SEBI has passed the following orders on November24, 2006 against the following two brokers ofBangalore Stock Exchange (BgSE) in the matter ofM/s. Home Trade Ltd.:
1. Minor penalty of Censure on M/s. MarlechaSecurities Pvt. Ltd., SEBI Reg. No INB081009639, member, Bangalore Stock Ex-change (BgSE). The penalty is imposed forfailure to exercise due care, skill and diligencewhile dealing in the scrip of Home Trade Ltd.
2. Minor penalty of Censure on M/s. Uday Stocks& Securities Pvt. Ltd., SEBI Reg. No INB081033837, member, Bangalore Stock Ex-change (BgSE). The penalty is imposed forfailure to exercise due care, skill and diligencewhile dealing in the scrip of M/s. Home TradeLtd.
Ref: PR-265/2006 dated November 28, 2006
XXV. ORDER IN THE MATTER OF M/S. INDIABULLS SECURITIES LTD. IN THE CASEOF IPOs.
Shri G.Anantharaman, Whole Time Member,SEBI vide order dated November 28, 2006 directedthat the interim order dated April 27, 2006 passedagainst M/s. India Bulls Securities Ltd. in the case ofInitial Public Offerings (IPOs) would stand finallydisposed off without any further directions afterhaving regard to the findings of the inspection re-ports of depositories, Stock Exchanges and SEBIthat none of the multiple accounts pertaining to thesaid entity have been identified as afferent accounts.
The order shall come into force with immediateeffect.
Ref: PR No.263/2006 dated November 29, 2006
XXVI. ORDER AGAINST M/S. CREDIT SUISSEFIRST BOSTON (INDIA) SECURITIES PVT.LTD., MEMBER, BSE & NSE LTD. IN THEMATTER OF M/S. DSQ BIOTECH LTD.
Shri G. Anantharaman, Whole Time Member,SEBI has passed an order dated November 27,2006 imposing no further penalty against M/s. CreditSuisse First Boston (India) Securities Pvt. Ltd. in thematter of M/s. DSQ Biotech Ltd. However,M/s. Credit Suisse First Boston (India) SecuritiesPvt. Ltd. have been advised to be careful in future.
Ref: PR-264/2006 dated November 29, 2006
PRESS RELEASES
D:\BULLET26\DEC-2006\SB-DEC-1 Tan-14 MK O.P> 26-12-2006\Mg 28-12-2006 28
DECEMBER SEBI BULLETIN 2006
28SECURITIES & EXCHANGE BOARD OF INDIA
XXVII. ORDER AGAINST MS. ADITI DALAL, INTHE MATTER OF M/S. ROOFIT INDUS-TRIES LTD.
Shri V.K.Chopra, Whole Time Member, SEBIvide order dated November 29, 2006 in the case ofM/s. Roofit Industries Ltd. has restrained, Ms. Aditi
Dalal from buying, selling and dealing or accessingthe securities market in any manner for a period ofsix months from the date of the order.
Ref: PR-266/2006 dated November 30, 2006
(For further details, log on to www.sebi.gov.in)
D:\BULLET26\DEC-2006\SB-DEC-1 Tan-14 MK O.P> 26-12-2006\Mg 28-12-2006 29
DECEMBER SEBI BULLETIN 2006
29
I. ESTABLISHMENT OF CONNECTIVITY WITHBOTH NSDL AND CDSL: SHIFTING FROMTRADE FOR TRADE SEGMENT (TFTS) TOROLLING SEGMENT.
1. It is observed from the information provided bythe depositories that the companies listed inAnnexure ‘A’ have established connectivity withboth the depositories on or before 30-09-2006.
2. The stock exchanges may consider shifting thetrading in these securities to rolling settlementsubject to the following:
(a) At least 50 per cent of non-promoter hold-ings as per clause 35 of Listing Agreementare in demat mode before shifting thetrading in the securities of the companyfrom TFTS to Rolling settlement. For this
purpose, the listed companies shall obtaina certificate from its Registrar and Trans-fer Agent (RTA) and submit the same tothe stock exchange/s. However, if an is-suer-company does not have a separateRTA, it may obtain a certificate in thisregard from a practicing Company Secre-tary/Chartered Accountant and submit thesame to the stock exchange/s.
(b) There are no other grounds/reasons forcontinuation of the trading in TFTS.
3. The Stock Exchanges are advised to report toSEBI, the action taken in this regard in sectionII, item No. 13 of the Monthly/Quarterly Devel-opment Report.
CIRCULARS
ANNEXURE A
S.NO NAME OF THE COMPANY ISIN
1. ESSAR TELEHOLDINGS LIMITED INE317C01016
2. FRONTIER LEASING & FINANCE LIMITED INE977E01013
3. G. S. AUTO INTERNATIONAL LIMITED INE736H01016
4. JAIPRAKASH ENTERPRISES LIMITED INE782H01010
5. NAGARJUNA AGRI TECH LIMITED INE793H01017
6. SHAKTI MET-DOR LIMITED INE614D01014
7. SUBWAY FINANCE & INVESTMENT COMPANY LIMITED INE033F01012
Ref: MRD/DoP/SE/Cir- 18/06 dated November 13, 2006
II. DISPATCH OF ACCOUNT STATEMENT.
Please refer to Para 1 of SEBI circular No.MFD/CIR/9/120/2000 dated November 24, 2000,regarding dispatch of account statement to the unitholders.
1. Mutual Funds, at present, dispatch theaccount statements to the unit holders under Sys-tematic Investment Plan (SIP)/Systematic TransferPlan (STP)/Systematic Withdrawal Plan (SWP) onmonthly/quarterly/half-yearly basis, as may be appli-cable.
AMFI has represented to SEBI that with theincrease in the number of investors opting for SIP/STP/SWP, the statement of accounts that eachMutual Fund has to send every month has increased.
The proposal of AMFI has been examined.Mutual Funds may, henceforth, dispatch the state-ment of accounts to the unit holders under SIP/STP/SWP once every quarter ending March, June, Sep-tember and December within 10 working days of theend of the respective quarter. However, the firstaccount statement under SIP/STP/SWP shall be
CIRCULARS
D:\BULLET26\DEC-2006\SB-DEC-1 Tan-14 MK O.P> 26-12-2006\Mg 28-12-2006 30
DECEMBER SEBI BULLETIN 2006
30SECURITIES & EXCHANGE BOARD OF INDIA
issued within 10 working days of the initial invest-ment.
In case of specific request received from inves-tors, Mutual Funds shall provide the account state-ment to the investors within 5 working days from thereceipt of such request without any charges. Fur-ther, soft copy of the account statement shall bemailed to the investors under SIP/STP/SWP to theire-mail address on a monthly basis, if so mandated.
2. At present the account statements are sentto unit holders only in case of a transaction in the unitholder’s account. In the interest of investors, theMutual Funds shall provide the account statementsto the unit holders who have not transacted duringthe last six months prior to the date of generation ofaccount statements. The account statements insuch cases may be generated and issued along withthe Portfolio Statement or Annual Report of the
scheme. The account statement should reflect thelatest closing balance and value of the units prior tothe date of generation of the account statement.Further, soft copy of the account statements shall bemailed to the investors’ e-mail address, instead ofphysical statement, if so mandated.
This circular is issued in exercise of powersconferred under section 11 (1) of the Securities andExchange Board of India Act, 1992, read with theprovisions of Regulation 77 of SEBI (Mutual Funds)Regulations, 1996, to protect the interests of inves-tors in securities and to promote the development of,and to regulate the securities market.
Ref: IMD/CIR/12/80083/2006 dated November 20,2006
(For further details, log on to www.sebi.gov.in)
D:\BULLET26\DEC-2006\SB-DEC-1 Tan-14 MK O.P> 26-12-2006\Mg 28-12-2006 31
DECEMBER SEBI BULLETIN 2006
31
A. SECURITIES APPELLATE TRIBUNAL (SAT)ORDERS
(1) Appeal No. 158/2004- Mangalore Stock Ex-change Vs. SEBI
The appeal was filed by Mangalore StockExchange(MgSE) against the Order dated August31, 2004 passed by SEBI under 4(4) of the Securi-ties Contract Regulation Act, 1956 (SCRA), refusingto grant renewal of recognition of MgSE.
Vide order dated October 4, 2006, SAT dis-missed the appeal in toto while finding no reason tointerfere with the impugned order. While dismissingthe appeal, SAT has discussed in detail the eventsthat took place since the filing of the appeal till itsdisposal, which are as under:
MgSE is a company limited by guarantee andwas granted recognition as a Stock Exchange in1985 and its recognition was renewed from time totime till 2003. On finding a number of shortcomingsin its working, SEBI, while granting renewal of recog-nition in 2002, forwarded its Inspection Report toMgSE pointing out the shortcomings and advised itto take corrective measures within 2 months fromthe date of notification of the renewal. MgSE failed torectify the shortcomings which ultimately culminatedin the passing of the order dated August 31, 2004refusing to grant the renewal of recognition.
The appeal was admitted by the Tribunal onNovember 22, 2004. At the time of admission, SEBIraised the question of maintainability of the appeal.Subsequently, the Tribunal vide its order datedJanuary 20, 2005 directed SEBI to consider theapplication for corporatisation and demutulisationsubmitted by the MgSE in accordance with law dehors the impugned order. SEBI filed Civil AppealNo.1685 of 2005 in the Hon’ble Supreme Courtagainst the said order of SAT. Supreme Court in turnstayed the said interim order until SAT decides theissue of maintainability
When the matter came up for hearing of themain appeal, SEBI filed an application seeking clari-fication of the interim order dated January 20, 2005
and submitted that vide impugned order datedOctober 31, 2004, SEBI had already derecognisedMgSE and therefore the exchange could not file thescheme of corporatisation and demutualisation forSEBI’s approval as the said scheme could be filedonly by a recognised stock exchange. Upon hearingthe parties, SAT directed SEBI to conduct anotherinspection of the stock exchange and to report toSAT by August 2006 to enable it to find out thecompliance of the shortcomings as pointed out bySEBI earlier. SEBI accordingly conducted the in-spection and submitted its report to SAT submittingthat the conditions which were mandatory have notyet been complied with by the exchange.
While dismissing the appeal, SAT opined thatthe Board had de-recognised MgSE due to nonrectification of irregularities mentioned in the inspec-tion report of 2002-03 and the current inspection bythe Board confirms the persistence of quite a fewserious irregularities. SAT has further made it clearthat the appellant is free to apply afresh for therecognition of the stock exchange after fulfilling allthe requirements.
(2) Appeal No. 148/2005- Dr.Anjali Beke Vs. SEBI
The appeal was filed by the appellant (Dr. AnjaliBeke) against the order dated 8-8-2005 passed bythe Adjudicating Officer imposing a penalty of Rs. 5lakh on the appellant and Anjudi Properties andInvestments Pvt. Ltd (APIL) for its trades in theshares of Tata Finance Ltd. (TFL).
The main allegation against the appellant wasthat the appellant had sold 2.5 lakh shares of TFL onreceipt of some unpublished price sensitive informa-tion from one Shri Dilip Pendse, relating to the lossof Rs. 79.37 crores by Nishkalp Investments andTrading Company Ltd. (NITC) which was whollyowned by TFL.
The backbone of contention of the appellantwas that Shri Dilip Pendse was a family friend of theappellant for the last 15 years and Shri Dilip Pendsewanted to form a private limited company himselfand requested the appellant and her husband to
LEGAL ROUND UP
LEGAL ROUND UP
D:\BULLET26\DEC-2006\SB-DEC-1 Tan-14 MK O.P> 26-12-2006\Mg 28-12-2006 32
DECEMBER SEBI BULLETIN 2006
32SECURITIES & EXCHANGE BOARD OF INDIA
become directors of APIL. The learned Sr. Counselcontended on behalf of the appellant that the sub-scribed capital of APIL was only 20,000 and inter-company deposits could not have been given to thecompany without the active involvement of Shri DilipPendse. He further contended that the appellantbeing a qualified doctor who was practicing for morethan 20 years, could not have got any time tomanage the voluminous trading in the shares trans-acted in the name of APIL and the appellant signedblank cheque books and handed them over to ShriPendse because of the long standing relationshipwith him. The Sr. Counsel further contended thatShri Dilip Pendse was doing Benami transactions inthe name of the appellant.
Shri Kumar Desai, the counsel appeared forSEBI, strenuously argued that the instant case wasclearly a case of Insider Trading in terms of Regula-tion 2(e) of the Insider Trading Regulations. Whilearguing at length the definition of ‘Insider’ and ‘PriceSensitive Information’, he referred to the variousstatements made by the appellant before the Boardon different dates to convince that the appellant hadbeen carrying on the business herself and that itcould not be said that Shri Dilip Pendse was carryingon the business in her name. He vehemently con-tented that the appellant was having the unpublishedprice sensitive information and therefore was anInsider and since she traded in the shares of TFL, thecharge against her is fully established.
After hearing both the sides SAT was pleasedto dismiss the appeal in toto on merits. While dis-missing the appeal SAT opined the following:
“From the answers to the various queries whichshe has voluntarily given on oath to the Board, itbecomes abundantly clear to us that not onlywas she herself dealing in the shares and ex-ecuting the transactions through select brokersbut she was quite knowledgeable about themarket and its functioning. She also seems to bein complete control of the operations of thecompany registered in her name and also thetransactions done by her. It could not, therefore,be accepted that she was totally novice about themarket and its functioning and share transac-tions. Her own recorded statements confirm that
she was taking keen interest in the affairs of thecompany. She uses familiar market terminologyand even abbreviations which go to show thatshe had acquired sufficient operational knowl-edge of the share market. Her later statementsin which she has totally denied having any thingto do with the trading of shares or with the affairsof API could not be relied upon. It could be hersecond thought to wriggle out of this tangledsituation which impelled her to change the earlierstatements. Admittedly, she had close proximitywith Shri Dilip Pendse and it is also a fact thatShri Pendse had access to unpublished pricesensitive information and the appellant also sold2.5 lac TFL shares in the month of March beforethe results were declared in April 2001. Theappellant therefore made huge profits from thistransaction. There are a number of loan transac-tions between API and the companies of ShriPendse. It is quite understandable that ShriPendse would have helped her to get the loansarranged for API but this did not imply that theappellant had nothing to do with the affairs of thecompany of which she and her husband were thedirectors”.
3. Appeal No. 66 of 2003 - Milan Mahindra Secu-rities Pvt Limited Vs. SEBI - Appeal before SAT -Order of SAT dismissing the Appeal.
The captioned appeal was filed against theOrder dated 22-04-2004 passed by the AdjudicatingOfficer whereby a monetary penalty of Rs. 1, 50,000was imposed on the appellant for violating Regula-tion 7(1) and (2) of Takeover Regulations.
The Appellant, a stock broker, acquired 10 lakhshares of Shonk Technologies International Limited(Target Company) on 29-10-2000 from SaimangalInvestrade Ltd and this acquisition of shares consti-tuted 5.72 per cent of the paid up capital of the targetcompany. Further, on 13-03-2001 the appellant ac-quired 10 lakh more shares of the Target Companyfrom Classic Credit Limited which also exceeded thelimit of 5 per cent as per the Takeover Regulations.The appellant had failed to report to the targetcompany regarding the acquisition of these sharesand thereby violated the Takeover Regulations.

D:\BULLET26\DEC-2006\SB-DEC-1 Tan-14 MK O.P> 26-12-2006\Mg 28-12-2006 33
DECEMBER SEBI BULLETIN 2006
33
The appeal came up for the final hearing on15.11.2006, when SAT, after hearing both of theparties, dismissed the appeal in toto.
During hearing the counsel for the appellantvehemently argued that the shares in question wereacquired by the appellant by way of security foradvances given to the clients and the same cannotbe termed as acquisition within the meaning ofTakeover Regulations and the violation if any, wasonly technical in nature and the same be condoned.
After hearing both sides, SAT was prima facieof the view that the submissions made by the appel-lant are not acceptable. SAT further opined thatsince these shares were transferred to the propri-etary account of the appellant it has to be held thatthe appellant had acquired these shares within themeaning of the Regulation. Since the shares werenot transferred to the pool account the appellantbecame the beneficial owner of those shares. Fur-ther, SAT referred to section 2(1)(a) of DepositoryAct, 1996 and section 41 of Companies Act, 1956 toelaborate the definition of the term beneficial owner.
With regard to the argument of the appellantthat the violation in the instant case was technicalonly and deserves to be condoned, SAT opined thefollowing:
“The Regulations were framed on the basis ofthe input provided by a Committee headed byJustice P.N. Bhagwati which had recommendedthat substantial acquisition of shares and take-overs should operate principally to ensure fairand equal treatment to all shareholders in rela-tion to substantial acquisition of shares andtakeovers. The object of the Regulation is to giveequal treatment and opportunity to all sharehold-ers and protect their interest. To translate theseprinciples into reality measures have to be takenby the Board to bring about transparency intransactions and it is for this purpose that dis-semination of full information is required. It iswith this end in view that the Regulations requirethe making of disclosures on pre acquisition andpost acquisition stages and the requirement inRegulation 7 at post acquisition stage is oneamong them. As observed, the purpose of thesedisclosures is to bring about transparency in the
transactions and assist the Regulator to effec-tively monitor the transactions in the market. Wecannot therefore subscribe to view that the vio-lation was technical in nature”.
SAT has also directed the appellant to pay thepenalty amount within 45 days from the date ofhearing.
4. Appeal No. 137/2003 in the matter ofParasrampuria Plantations Ltd. Vs. SEBI.
M/s Parasrampuria Plantations Ltd preferredan appeal before Hon’ble SAT against the order ofthe Chairman, SEBI, dated October 8, 2003 passedunder section 11B of the SEBI Act, 1992 read withRegulations 65 and 73 of SEBI (Collective Invest-ment Scheme) Regulations, 1999 to refund themoney collected under its Collective InvestmentSchemes with returns due to the investors as per theterms of the offer within a period of one month fromthe date of the said order.
SAT heard the appeal and vide order datedJanuary 12, 2004 passed an interim order andstayed the impugned order of October 8, 2003 till thedisposal of appeal.
SAT passed an interim order dated April 28,2004 and stated that “in facts and circumstances ofthe case the interim order passed by the tribunal ismodified to the extent that the appellant shall deposita sum of Rs 10,00,000 (Rupees Ten Lakh Only) permonth till the matter is disposed off finally with therespondent. The first payment made shall be madeon or before the 10th of that current month. If thesepayments are not made, the interim order shallautomatically vacate. This deposit is made withoutprejudice to the contentions of both parties.”
Appellant in compliance with the SAT ordermade first payment. Subsequently, appellant failedto make the payments. The appellant made anapplication dated June 9, 2004 to SAT to suspendthe payment of deposit until final disposal of appeal.
The matter again came up for hearing beforetribunal. The Hon’ble SAT in its order dated Septem-ber 28, 2006 stated that “the learned counsel for theappellant at the outset submits that without goinginto the merits of the order the appellant be allowedsome reasonable time to refund the amounts due to
LEGAL ROUND UP
D:\BULLET26\DEC-2006\SB-DEC-1 Tan-14 MK O.P> 26-12-2006\Mg 28-12-2006 34
DECEMBER SEBI BULLETIN 2006
34SECURITIES & EXCHANGE BOARD OF INDIA
the investors. He has informed us that a sum ofRs. 24.16 crore is due to different investors. Herequests for time upto the end of August 2007 andundertakes that by that time all the investors wouldbe refunded the amounts due to them. Keeping inview the large amounts due to the investors we grantextension of time. Another reason that weighs withus is that if the appellant is not granted time and theBoard is allowed to carry on further proceedingsincluding prosecution of Directors of the appellantcompany, the investors may not get their moneyback. Since sufficient time is being allowed forrepayment of the amounts, we make it clear that nofurther extension shall be granted and in case theappellant fails to satisfy each and every investor bythe aforesaid date, the Board shall take steps inaccordance with law and proceed against the appel-lant. The impugned order is modified accordinglyand the appeal stands disposed off as above with noorder as to costs.”
5. Panther Fincap and Management ServicesLtd. Vs. Adjudication Officer (Appeal No. 3 of2003) Classic Credit Ltd. Vs. Adjudication Of-ficer (Appeal No. 4 of 2003)
These two appeals were disposed off by way ofcommon order as the question of law and facts weresame. Appellants in both of these appeals whileacting in concert had acquired 25 per cent each ofthe share holding of DSQ Industries Ltd. (targetcompany) without disclosing the aggregate of theirholding. These shares were transferred to theirrespective demat accounts on March 1, 2001. Thefact of acquisition was not disclosed to the targetcompany and the appellants also did not make thepublic announcement and thereby violated Regula-tions 7 and 10 of SEBI SAST Regulations, 1997. AnAdjudication Officer was appointed by SEBI. Adjudi-cation Officer after finding the appellants guilty of thecharge imposed a penalty of Rs. 1,50,000 underSection 15A(b) of the SEBI Act and Rs. 5 lakh undersection 15H(ii) of SEBI Act.
Aggrieved by this order appellants approachedHon’ble SAT. Appellants contented that they did notacquire shares as alleged. Shares were received byway of loan from M/s Greenfield Investments Ltd.The appellants also contented that Section 15H
cannot be invoked by the Adjudication Officer sincethe section was not made a subject matter of thecharge in the show-cause notice.
Hon’ble SAT set aside the argument of theappellants on the ground that once the shares aretransferred to demat accounts, they will be consid-ered to be beneficial owners. The said loan transac-tions are not in conformity with the Securities Lend-ing Scheme, 1997. SAT refused to accept the con-tention that appellants were not acting in concert onthe ground that letter dated February 27, 2001 itselfproves that the alleged transaction of loan wasgranted only when Ketan Parekh acted on behalf ofthe appellants and M/s. Greenfield Investments Ltd.Hon’ble Tribunal found that SEBI vide its order dated12-12-2003 held that the appellants were controlledby Ketan Parekh and the same was confirmed bySAT in Appeal No. 4 of 2004 vide its order dated July14, 2006. Further Hon’ble SAT came to the conclu-sion that Section 15(H)(ii) and 15 A(b) deal withdifferent situations and Adjudication Officer wasjustified in levying penalties under both the provi-sions.
In view of above, the aforesaid appeals weredismissed by SAT and the appellants were directedto pay the penalty.
6. Bank of Rajasthan Ltd. Vs. SEBI and another-Appeal No. 96/2006 - Before Hon’ble SecuritiesAppellate Tribunal
The above appeal was filed by Bank ofRajasthan challenging the letter dated June 22,2006 issued by SEBI to BSE.
Brief facts of the case:
The appellant had come up with rights issue inrespect of 4,48,55,480 equity shares with one de-tachable warrant attached to each such share. Lateron the appellant opened the issue for conversion ofthe warrants into shares. The option for conversionof warrants into shares were exercised by 3,58,04,902warrant holders and 90,21,153 warrants remainedunsubscribed. Thereafter, the appellant allotted90,00,000 equity shares in pursuance to Board ofDirectors resolution dated 29-03-2001.
Subsequent to the allotment of the 90 lakhequity shares, the appellant forwarded an applica-
D:\BULLET26\DEC-2006\SB-DEC-1 Tan-14 MK O.P> 26-12-2006\Mg 28-12-2006 35
DECEMBER SEBI BULLETIN 2006
35
tion for listing of the aforesaid 90 lakhs shares in theBombay Stock Exchange. The Bombay Stock Ex-change asked the appellant to obtain a no-objectioncertificate from SEBI and thus the appellant re-quested SEBI to grant them the no objection certifi-cate as required by the Bombay Stock Exchange.
Vide letter dated 22-06-2006, SEBI informedthe Bombay Stock Exchange that upon examina-tion, it has been noted that allotment of shares by theappellant against warrants, conversion of which hasnot been exercised and which have consequentlylapsed would amount to fresh issuance of sharesand hence would amount to preferential allotment ofshares. SEBI had also informed that the price inrespect of such shares would be required to bedetermined as per the pricing provisions containedin SEBI’s Preferential Offer Guidelines. SEBI ad-vised the Exchange to take an appropriate decisionregarding the listing of the shares in accordance withthe bye-laws of the Exchange and other statutoryrequirements and principles of natural justice ensur-ing the satisfaction of certain conditions. The saidletter was under challenge in the captioned appeal.
The appellant had, inter alia, sought for a reliefto quash/set aside the letter dated 22-06-2006 is-sued by SEBI to Bombay Stock Exchange and adirection by SEBI to grant no objection to BombayStock Exchange for listing of the 90,00,000 equityshares without imposing any pre-condition.
Issues framed:
Whether the allotment of 90 lakh shares by theAppellant to its promoters was under sub-section (1)or sub-section (1A) of Section 81 of the CompaniesAct.
As the Guidelines for Preferential Issues speci-fied under Chapter XIII of the SEBI (Disclosure &Investor Protection) Guidelines, 2000 is applicableto an allotment made under Section 81(1A) of theCompanies Act and not for the one made underSection 81(1)(d) of the Companies Act, the directiongiven by SEBI to BSE will hold good only if theallotment is made by the company under section81(1A). Hence, the only issue before the Tribunalwas whether the allotment was under section 81(1)(d)or 81(1A).
The Tribunal held that Section 81 of the Com-panies Act applies only to allotment of shares andnot to allotment of warrants or any other marketablesecurity.
It was also held that the offer to subscribe towarrants which could be converted into equity sharesin future were not shares per se and were thus, notgoverned by section 81 of the Companies Act anddid not carry with them the right of renunciation.When the warrant holders did not exercise theiroption to convert the warrants into shares, theunsubscribed warrants lapsed and theseunsubscribed portions could not be renounced infavour of others. Thus, when the Board of Directorsconverted these warrants into equity shares theyissued fresh capital.
The warrant became shares only on conver-sion and it was thereafter their allotment came to begoverned by section 81 of the Companies Act i.e.,these shares came into existence only in the year2001 and were then allotted to the promoters onMarch 29, 2001. The allotment of these shares topromoters were in pursuance to the passing ofSpecial Resolution in the meeting held on 22-09-1995. Thus the allotment of the 90 lakh shares washeld to be fresh allotment and one made underSection 81(1A). As the shares were allotted underSection 81(1A), the price of the shares should havebeen as per the (DIP) Guidelines on preferentialissue of shares. In result, the appeal was dismissed.
HIGH COURT ORDERS
1. W.P. No. 15065/2006- M/s Integral Finvest (P.)Ltd.- Before the Delhi High Court
The captioned writ petition was filed by M/sIntegral Finvest (P) Ltd against SEBI and 4 others.SEBI was arrayed as the 1st respondent.
Brief facts of the case:
The petitioner had entered into a Memorandumof Understanding with the 4th respondent, the Chair-man cum Managing Director of the 3rd respondentCompany (M/s Indo Gulf Industries Ltd.) in further-ance of the agreement to purchase the share hold-ing offered by Respondent No. 4 and to take over thecontrol and management of the 3rd respondent
LEGAL ROUND UP

D:\BULLET26\DEC-2006\SB-DEC-1 Tan-14 MK O.P> 26-12-2006\Mg 28-12-2006 36
DECEMBER SEBI BULLETIN 2006
36SECURITIES & EXCHANGE BOARD OF INDIA
Company. In this respect the petitioner had alsoissued a cheque dated 14-11-2005 for a sum ofRs. 25 lakhs. When the petitioner came to knowabout the intention of the 4th respondent to divestthe entire share holding of Respondent No. 3 infavour of M/s Balrampur Chini Mills Ltd., the peti-tioner preferred Original Miscellaneous Petition 417/2006 before the Delhi High Court under Section 9 ofthe Arbitration and Conciliation Act for restrainingrespondent No. 3 from selling/entering into/imple-menting any agreement pertaining to the sale ofequity shares, for executing any share transfer ofequity shares and registering transfer of shares. TheHon’ble Court vide its order dated 06-09-2006, di-rected respondents 3 and 4 to maintain status quowith respect to the share holdings of respondent 4and his relatives or group companies till 29-09-2006.However, on 13-09-2006, the petitioner came toknow of the public announcement of respondentNo.3 in respect of which there was an order of statusquo and vide letter dated 14-09-2006 the petitionerrequested SEBI and other respondents to withdrawthe public announcement from its official websitewithin 48 hours of receipt of notice. However, re-spondent Nos. 1 and 2 continued the publication ofthe said public announcement. Aggrieved by theabove the petitioner approached the Delhi HighCourt.
Holding of the Court:
The petitioner has not taken any step as con-templated in the Memorandum of Understandingexecuted on 14-08-2005 providing for the executionof another agreement for the purpose of acquisitionof shares and control and management of 3rd re-spondent company.
The Hon’ble Court further held that the peti-tioner should approach the appropriate Court seek-ing remedy if it is felt that respondents 1 and 2 havenot complied with/implemented the Order dated 06-09-2006 and not invoke the jurisdiction of High Courtunder Article 226 of the Constitution of India. It wasalso held that there is no illegality, arbitrarinessor procedural unreasonableness in the actionsof respondents no. 1 & 2.
LEGISLATIVE DEVELOPMENTS
1. Securities and Exchange Board of India (Om-budsman) (Amendment) Regulations, 2006
The Securities and Exchange Board of India(Ombudsman) Regulations, 2003 were furtheramended by the captioned Amendment Regulationson November 09, 2006 vide S.O. No.1935(E). Theprincipal regulations provide for a cooling period ofthree years as one of the qualifications for appoint-ment of a person as an Ombudsman if he was aWhole Time Director of an intermediary or a listedcompany. The present amendment removes thedisqualification in case of a Whole Time Director ofa public sector bank or a public sector undertaking.
2. Securities Contracts (Regulation) (Manner ofIncreasing and Maintaining Public Shareholdingin Recognised Stock Exchanges) Regulations,2006
The Securities Contracts (Regulation) (Mannerof Increasing and Maintaining Public Shareholdingin Recognised Stock Exchanges) Regulations, 2006were notified on November 13, 2006 vide S.O.No.1950(E). The Regulations were notified undersection 4B(8) of the Securities Contracts (Regula-tion) Act, 1956.
The Regulations shall be applicable to allrecognised stock exchanges in respect of which thescheme for corporatisation and/or demutualisationhas been approved by SEBI. These Regulationsspecify that the public shareholding in recognisedstock exchanges may be increased to at least 51 percent in the following manner for the purpose ofdemutualisation of the stock exchanges:
(a) offer for sale, by issue of prospectus, of sharesheld by shareholders having trading rightstherein; or
(b) placement of shares held by shareholders hav-ing trading rights to such persons or institutionsas may be shortlisted by the recognised stockexchange with the approval of SEBI; or
(c) issue of equity shares on private placementbasis by the recognised stock exchange to anyperson or group of persons not being share-
D:\BULLET26\DEC-2006\SB-DEC-1 Tan-14 MK O.P> 26-12-2006\Mg 28-12-2006 37
DECEMBER SEBI BULLETIN 2006
37
holders having trading rights or their associatessubject to the approval of SEBI; or
(d) any combination of the above.
The above are in addition to the mode permit-ted by Securities Contracts (Regulation) Act itself,i.e. by fresh issue of equity shares to the public.When SEBI is satisfied that the provisions of section4B(8) of the Act [increasing public shareholding to51 per cent within specified time in the prescribedmanner] have been complied in respect of anyrecognised stock exchange, it shall issue an intima-tion to that exchange to that effect.
The Regulations further provide as follows:
(a) No person shall, directly or indirectly, acquire orhold more than five per cent in the paid upequity capital of a recognised stock exchange.
(b) No person shall, either individually or togetherwith persons acting in concert with him, acquireand/or hold more than one per cent of the paidup equity capital of a recognised stock ex-change, unless he is a fit and proper person andhas taken prior approval of SEBI for doing so.A provision elaborating who is a fit and properperson has also been included.
(c) Recognised stock exchanges covered underthe regulations have to enter into agreementswith depositories for dematerialisation of theirshares.
(d) All recognised stock exchanges to which theregulations are applicable are required to moni-tor and ensure compliance with the same. Theyshall report on a quarterly basis confirmingcompliance to SEBI.
3. Securities and Exchange Board of India (Port-folio Managers) (Third Amendment) Regulations,2006
The Securities and Exchange Board of India (Port-folio Managers) Regulations, 1993 were furtheramended by the captioned Amendment Regulationson November 30, 2006 vide S.O. No. 2053(E). Thesalient features of the amendment are as follows:
(a) Provision relating to deemed FIIs availing ser-vices of portfolio managers is deleted.
(b) A clarificatory provision has been introduced tothe effect that SEBI registered FIIs and sub-accounts may avail services of portfolio man-agers.
LEGAL ROUND UP
D:\BULLET26\DEC-2006\SB-DEC-1 Tan-14 MK O.P> 26-12-2006\Mg 28-12-2006 38
DECEMBER SEBI BULLETIN 2006
38SECURITIES & EXCHANGE BOARD OF INDIA
Annexures
1A. Draft Offer Documents Received during No-vember 2006
1B. Observations Issued during November 2006
1C: Company-wise Capital Raised
2A. Open Offers under SEBI Takeover Code dur-ing November 2006
2B. Buyback Documents Filed with SEBI duringNovember 2006
Statistical Tables
1. SEBI Registered Market Intermediaries
2. Offer Documents Received and ObservationsIssued by SEBI
3. Capital Raised
4. Industry-wise Classification of Capital Raised
5. Sector-wise and Region-wise Distribution ofCapital Mobilised
6. Size-wise Classification of Capital Raised
7. Distribution of Turnover on Cash Segments ofExchanges
8. Cash Segment of BSE
9. Cash Segment of NSE
10. Trends in Cash Segment of BSE, November2006
11. Trends in Cash Segment of NSE, November2006
12. Turnover and Market Capitalisation at BSE andNSE, November 2006
13. Movement of Indices at BSE and NSE, Novem-ber 2006
14. Component Stocks: BSE Sensex, November2006
15. Component Stocks: S&P CNX Nifty, November2006
16. Volatility of Major Indices
ANNEXURES AND STATISTICAL TABLES
17. City-wise Distribution of Turnover on Cash Seg-ments of BSE and NSE
18. Advances/Declines in Cash Segment of BSEand NSE (No. of Securities)
19. Trading Frequency in Cash Segment of BSEand NSE
20. Percentage Share of Top ‘N’ Securities/Mem-bers in Turnover of Cash Segment
21. Settlement Statistics for Cash Segment of BSE
22. Settlement Statistics for Cash Segment of NSE
23. Derivatives Segment at BSE
24. Derivatives Segment at NSE
25. Derivatives Trading at NSE, November 2006
26. Settlement Statistics in Derivatives Segment atBSE and NSE
27. Trends in FII Investment
28. Daily Trends in FII Investment, November 2006
29. Trends in Mutual Funds Resource Mobilisation
30A.Type-wise Resource Mobilisation by MutualFunds: Open-ended and Close-ended
30B.Scheme-wise Resource Mobilisation by MutualFunds
31. Trends in Transactions on Stock Exchanges byMutual Funds
32. Substantial Acquisition of Shares and Take-overs
33. Progress of Dematerialisation at NSDL andCDSL
34. Assets under the Custody of Custodians
35. Ratings Assigned for Long-term Corporate DebtSecurities (Maturity > 1 year)
36. Review of Accepted Ratings of Corporate DebtSecurities (Maturity > 1 year)
37. Macro-economic Indicators
38. Daily Return and Volatility: Select World StockIndices
D:\BULLET26\DEC-2006\SB-DEC-1 Tan-14 MK O.P> 26-12-2006\Mg 28-12-2006 39
DECEMBER SEBI BULLETIN 2006
39
N.B.:
1. NA = Not Applicable/Available.
2. 1 crore = 10 million = 100 lakh.
3. The total provided in the Annexures and Statis-tical Tables may not always match with the sum
total of the break-ups due to decimal differ-ences.
4. The data for the current month is provisional.
ANNEXURES AND STATISTICAL TABLES
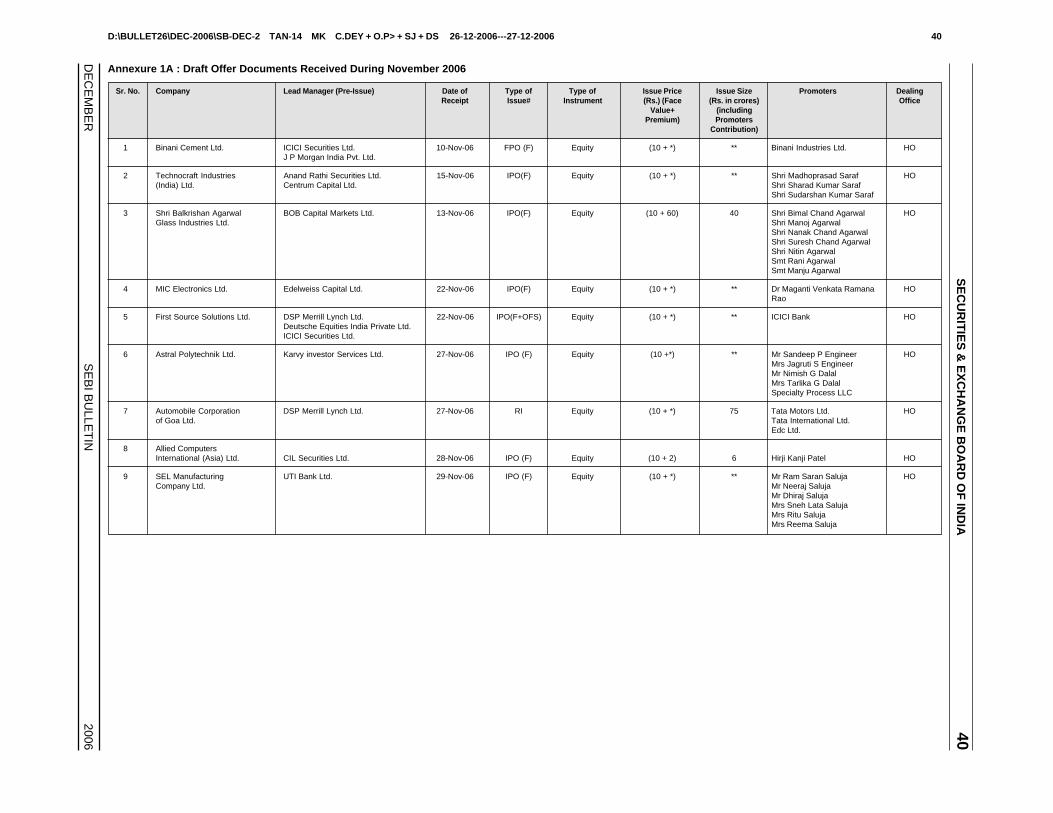
D:\BULLET26\DEC-2006\SB-DEC-2 TAN-14 MK C.DEY + O.P> + SJ + DS 26-12-2006---27-12-2006 40
DE
CE
MB
ER
SE
BI B
ULLE
TIN
2006
SE
CU
RIT
IES
& E
XC
HA
NG
E B
OA
RD
OF
IND
IA40
Annexure 1A : Draft Offer Documents Received During November 2006
Sr. No. Company Lead Manager (Pre-Issue) Date of Type of Type of Issue Price Issue Size Promoters DealingReceipt Issue# Instrument (Rs.) (Face (Rs. in crores) Office
Value+ (includingPremium) Promoters
Contribution)
1 Binani Cement Ltd. ICICI Securities Ltd. 10-Nov-06 FPO (F) Equity (10 + *) ** Binani Industries Ltd. HOJ P Morgan India Pvt. Ltd.
2 Technocraft Industries Anand Rathi Securities Ltd. 15-Nov-06 IPO(F) Equity (10 + *) ** Shri Madhoprasad Saraf HO(India) Ltd. Centrum Capital Ltd. Shri Sharad Kumar Saraf
Shri Sudarshan Kumar Saraf
3 Shri Balkrishan Agarwal BOB Capital Markets Ltd. 13-Nov-06 IPO(F) Equity (10 + 60) 40 Shri Bimal Chand Agarwal HOGlass Industries Ltd. Shri Manoj Agarwal
Shri Nanak Chand AgarwalShri Suresh Chand AgarwalShri Nitin AgarwalSmt Rani AgarwalSmt Manju Agarwal
4 MIC Electronics Ltd. Edelweiss Capital Ltd. 22-Nov-06 IPO(F) Equity (10 + *) ** Dr Maganti Venkata Ramana HORao
5 First Source Solutions Ltd. DSP Merrill Lynch Ltd. 22-Nov-06 IPO(F+OFS) Equity (10 + *) ** ICICI Bank HODeutsche Equities India Private Ltd.ICICI Securities Ltd.
6 Astral Polytechnik Ltd. Karvy investor Services Ltd. 27-Nov-06 IPO (F) Equity (10 +*) ** Mr Sandeep P Engineer HOMrs Jagruti S EngineerMr Nimish G DalalMrs Tarlika G DalalSpecialty Process LLC
7 Automobile Corporation DSP Merrill Lynch Ltd. 27-Nov-06 RI Equity (10 + *) 75 Tata Motors Ltd. HOof Goa Ltd. Tata International Ltd.
Edc Ltd.
8 Allied ComputersInternational (Asia) Ltd. CIL Securities Ltd. 28-Nov-06 IPO (F) Equity (10 + 2) 6 Hirji Kanji Patel HO
9 SEL Manufacturing UTI Bank Ltd. 29-Nov-06 IPO (F) Equity (10 + *) ** Mr Ram Saran Saluja HOCompany Ltd. Mr Neeraj Saluja
Mr Dhiraj SalujaMrs Sneh Lata SalujaMrs Ritu SalujaMrs Reema Saluja
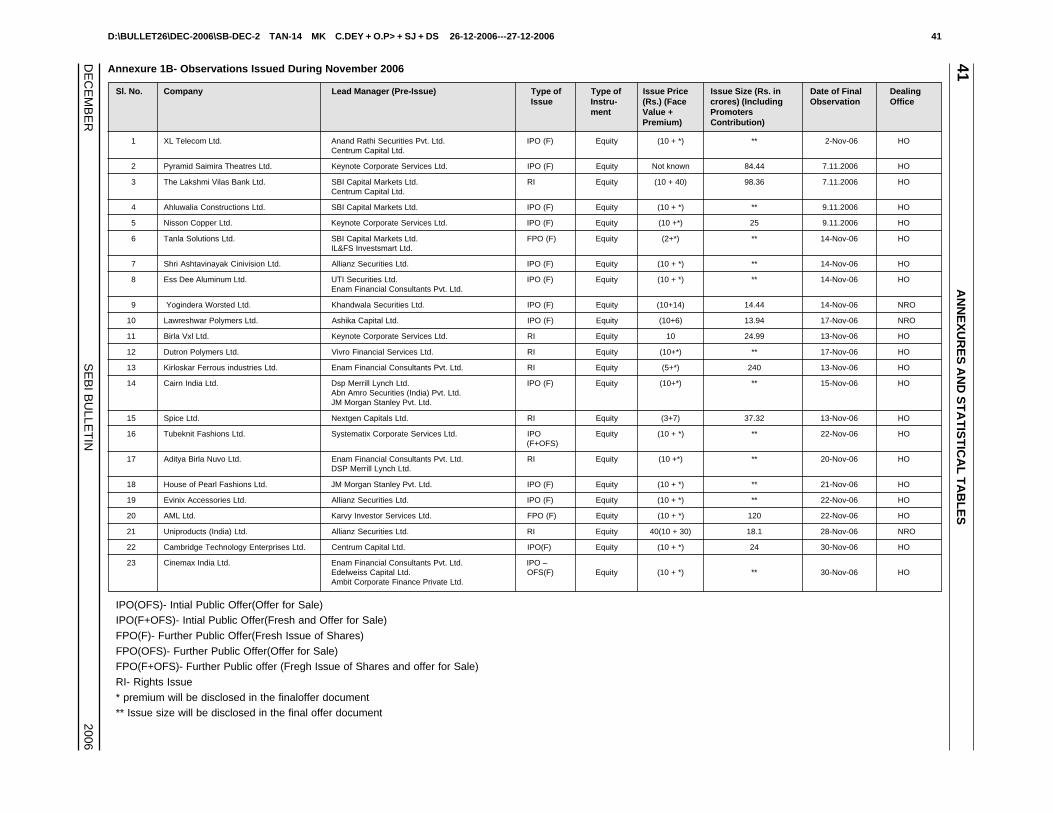
D:\BULLET26\DEC-2006\SB-DEC-2 TAN-14 MK C.DEY + O.P> + SJ + DS 26-12-2006---27-12-2006 41
DE
CE
MB
ER
SE
BI B
ULLE
TIN
2006
41A
NN
EX
UR
ES
AN
D S
TA
TIS
TIC
AL
TA
BL
ES
Annexure 1B- Observations Issued During November 2006
Sl. No. Company Lead Manager (Pre-Issue) Type of Type of Issue Price Issue Size (Rs. in Date of Final DealingIssue Instru- (Rs.) (Face crores) (Including Observation Office
ment Value + PromotersPremium) Contribution)
1 XL Telecom Ltd. Anand Rathi Securities Pvt. Ltd. IPO (F) Equity (10 + *) ** 2-Nov-06 HOCentrum Capital Ltd.
2 Pyramid Saimira Theatres Ltd. Keynote Corporate Services Ltd. IPO (F) Equity Not known 84.44 7.11.2006 HO
3 The Lakshmi Vilas Bank Ltd. SBI Capital Markets Ltd. RI Equity (10 + 40) 98.36 7.11.2006 HOCentrum Capital Ltd.
4 Ahluwalia Constructions Ltd. SBI Capital Markets Ltd. IPO (F) Equity (10 + *) ** 9.11.2006 HO
5 Nisson Copper Ltd. Keynote Corporate Services Ltd. IPO (F) Equity (10 +*) 25 9.11.2006 HO
6 Tanla Solutions Ltd. SBI Capital Markets Ltd. FPO (F) Equity (2+*) ** 14-Nov-06 HOIL&FS Investsmart Ltd.
7 Shri Ashtavinayak Cinivision Ltd. Allianz Securities Ltd. IPO (F) Equity (10 + *) ** 14-Nov-06 HO
8 Ess Dee Aluminum Ltd. UTI Securities Ltd. IPO (F) Equity (10 + *) ** 14-Nov-06 HOEnam Financial Consultants Pvt. Ltd.
9 Yogindera Worsted Ltd. Khandwala Securities Ltd. IPO (F) Equity (10+14) 14.44 14-Nov-06 NRO
10 Lawreshwar Polymers Ltd. Ashika Capital Ltd. IPO (F) Equity (10+6) 13.94 17-Nov-06 NRO
11 Birla Vxl Ltd. Keynote Corporate Services Ltd. RI Equity 10 24.99 13-Nov-06 HO
12 Dutron Polymers Ltd. Vivro Financial Services Ltd. RI Equity (10+*) ** 17-Nov-06 HO
13 Kirloskar Ferrous industries Ltd. Enam Financial Consultants Pvt. Ltd. RI Equity (5+*) 240 13-Nov-06 HO
14 Cairn India Ltd. Dsp Merrill Lynch Ltd. IPO (F) Equity (10+*) ** 15-Nov-06 HOAbn Amro Securities (India) Pvt. Ltd.JM Morgan Stanley Pvt. Ltd.
15 Spice Ltd. Nextgen Capitals Ltd. RI Equity (3+7) 37.32 13-Nov-06 HO
16 Tubeknit Fashions Ltd. Systematix Corporate Services Ltd. IPO Equity (10 + *) ** 22-Nov-06 HO(F+OFS)
17 Aditya Birla Nuvo Ltd. Enam Financial Consultants Pvt. Ltd. RI Equity (10 +*) ** 20-Nov-06 HODSP Merrill Lynch Ltd.
18 House of Pearl Fashions Ltd. JM Morgan Stanley Pvt. Ltd. IPO (F) Equity (10 + *) ** 21-Nov-06 HO
19 Evinix Accessories Ltd. Allianz Securities Ltd. IPO (F) Equity (10 + *) ** 22-Nov-06 HO
20 AML Ltd. Karvy Investor Services Ltd. FPO (F) Equity (10 + *) 120 22-Nov-06 HO
21 Uniproducts (India) Ltd. Allianz Securities Ltd. RI Equity 40(10 + 30) 18.1 28-Nov-06 NRO
22 Cambridge Technology Enterprises Ltd. Centrum Capital Ltd. IPO(F) Equity (10 + *) 24 30-Nov-06 HO
23 Cinemax India Ltd. Enam Financial Consultants Pvt. Ltd. IPO –Edelweiss Capital Ltd. OFS(F) Equity (10 + *) ** 30-Nov-06 HOAmbit Corporate Finance Private Ltd.
IPO(OFS)- Intial Public Offer(Offer for Sale)IPO(F+OFS)- Intial Public Offer(Fresh and Offer for Sale)
FPO(F)- Further Public Offer(Fresh Issue of Shares)
FPO(OFS)- Further Public Offer(Offer for Sale)FPO(F+OFS)- Further Public offer (Fregh Issue of Shares and offer for Sale)
RI- Rights Issue
* premium will be disclosed in the finaloffer document** Issue size will be disclosed in the final offer document
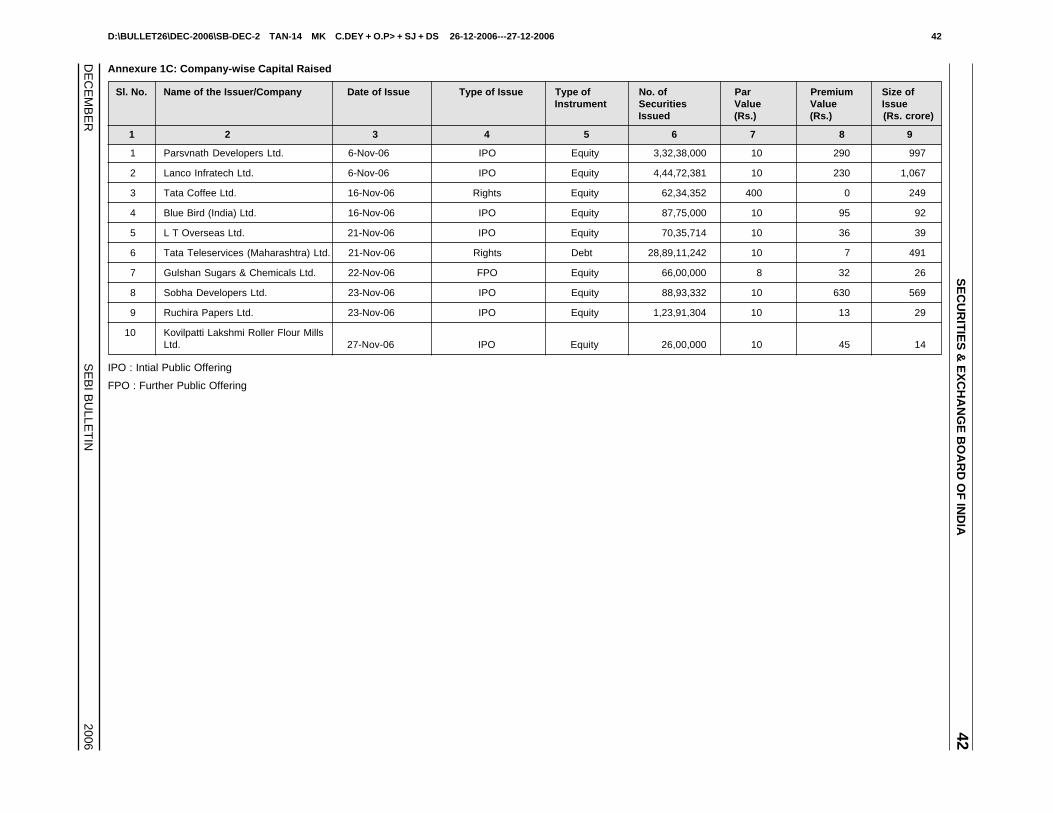
D:\BULLET26\DEC-2006\SB-DEC-2 TAN-14 MK C.DEY + O.P> + SJ + DS 26-12-2006---27-12-2006 42
DE
CE
MB
ER
SE
BI B
ULLE
TIN
2006
SE
CU
RIT
IES
& E
XC
HA
NG
E B
OA
RD
OF
IND
IA42
Annexure 1C: Company-wise Capital Raised
Sl. No. Name of the Issuer/Company Date of Issue Type of Issue Type of No. of Par Premium Size ofInstrument Securities Value Value Issue
Issued (Rs.) (Rs.) (Rs. crore)
1 2 3 4 5 6 7 8 9
1 Parsvnath Developers Ltd. 6-Nov-06 IPO Equity 3,32,38,000 10 290 997
2 Lanco Infratech Ltd. 6-Nov-06 IPO Equity 4,44,72,381 10 230 1,067
3 Tata Coffee Ltd. 16-Nov-06 Rights Equity 62,34,352 400 0 249
4 Blue Bird (India) Ltd. 16-Nov-06 IPO Equity 87,75,000 10 95 92
5 L T Overseas Ltd. 21-Nov-06 IPO Equity 70,35,714 10 36 39
6 Tata Teleservices (Maharashtra) Ltd. 21-Nov-06 Rights Debt 28,89,11,242 10 7 491
7 Gulshan Sugars & Chemicals Ltd. 22-Nov-06 FPO Equity 66,00,000 8 32 26
8 Sobha Developers Ltd. 23-Nov-06 IPO Equity 88,93,332 10 630 569
9 Ruchira Papers Ltd. 23-Nov-06 IPO Equity 1,23,91,304 10 13 29
10 Kovilpatti Lakshmi Roller Flour MillsLtd. 27-Nov-06 IPO Equity 26,00,000 10 45 14
IPO : Intial Public Offering
FPO : Further Public Offering
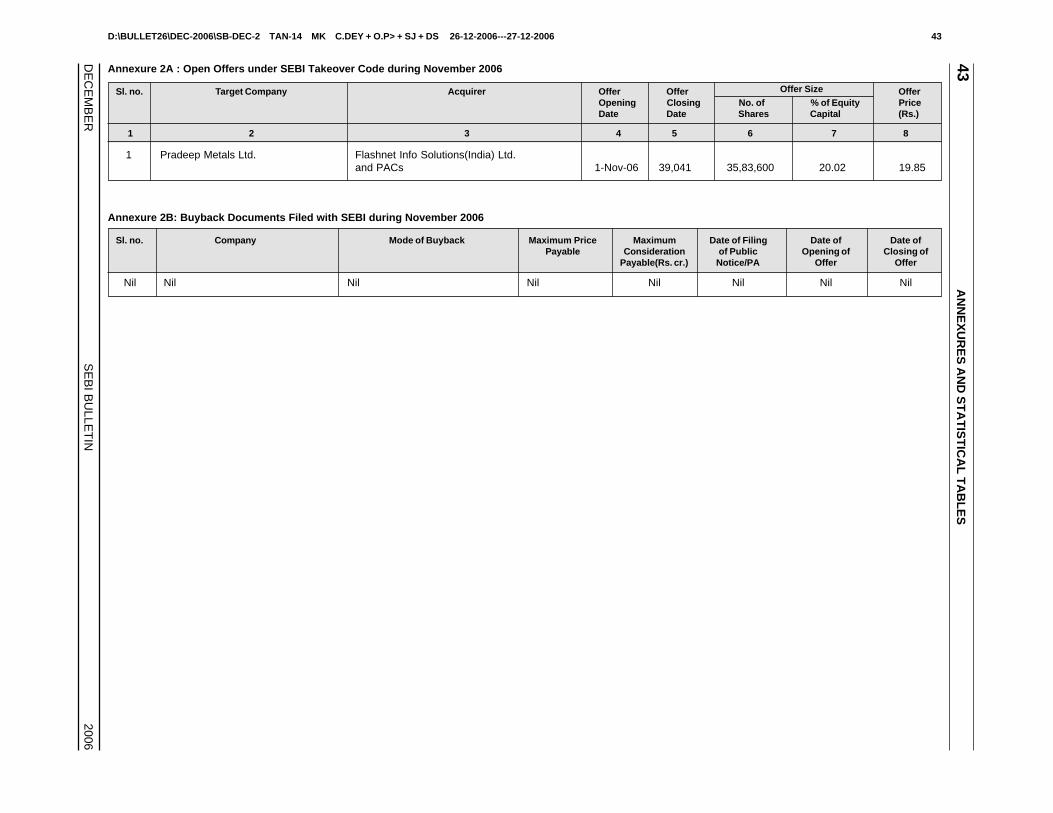
D:\BULLET26\DEC-2006\SB-DEC-2 TAN-14 MK C.DEY + O.P> + SJ + DS 26-12-2006---27-12-2006 43
DE
CE
MB
ER
SE
BI B
ULLE
TIN
2006
43A
NN
EX
UR
ES
AN
D S
TA
TIS
TIC
AL
TA
BL
ES
Annexure 2A : Open Offers under SEBI Takeover Code during November 2006
Sl. no. Target Company Acquirer Offer Offer Offer Size OfferOpening Closing No. of % of Equity PriceDate Date Shares Capital (Rs.)
1 2 3 4 5 6 7 8
1 Pradeep Metals Ltd. Flashnet Info Solutions(India) Ltd.and PACs 1-Nov-06 39,041 35,83,600 20.02 19.85
Annexure 2B: Buyback Documents Filed with SEBI during November 2006
Sl. no. Company Mode of Buyback Maximum Price Maximum Date of Filing Date of Date ofPayable Consideration of Public Opening of Closing of
Payable(Rs. cr.) Notice/PA Offer Offer
Nil Nil Nil Nil Nil Nil Nil Nil
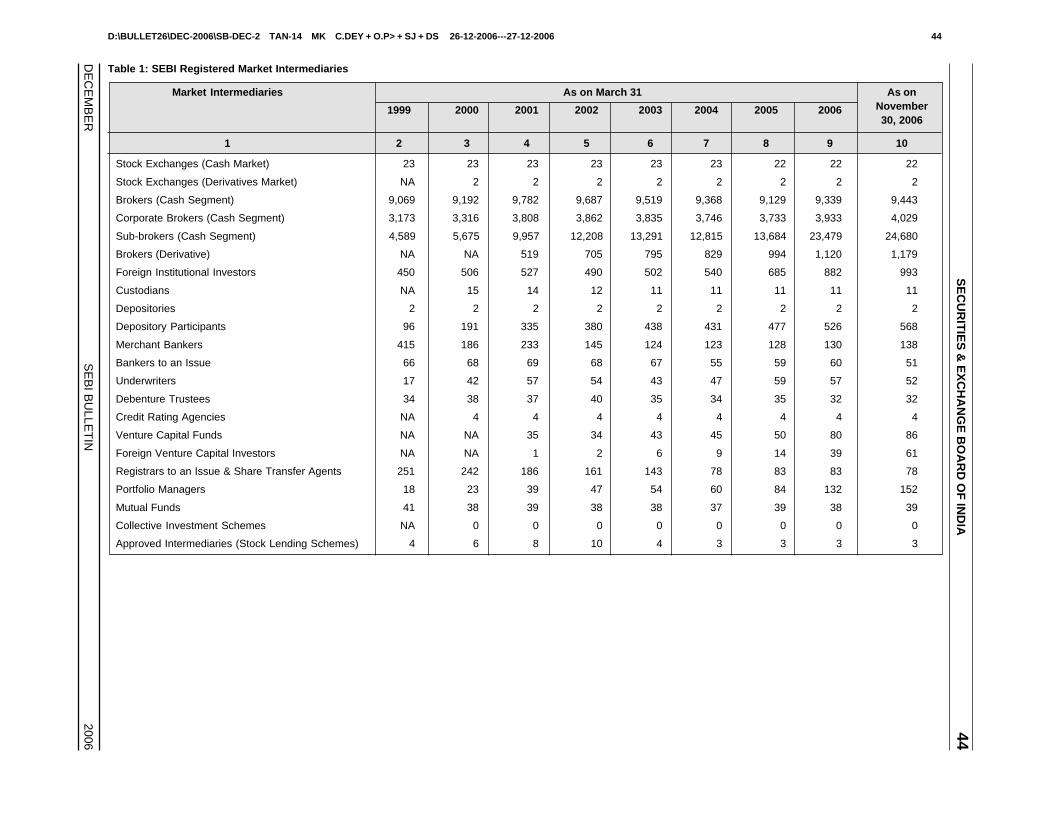
D:\BULLET26\DEC-2006\SB-DEC-2 TAN-14 MK C.DEY + O.P> + SJ + DS 26-12-2006---27-12-2006 44
DE
CE
MB
ER
SE
BI B
ULLE
TIN
2006
SE
CU
RIT
IES
& E
XC
HA
NG
E B
OA
RD
OF
IND
IA44
Table 1: SEBI Registered Market Intermediaries
Market Intermediaries As on March 31 As on
1999 2000 2001 2002 2003 2004 2005 2006 November30, 2006
1 2 3 4 5 6 7 8 9 10
Stock Exchanges (Cash Market) 23 23 23 23 23 23 22 22 22
Stock Exchanges (Derivatives Market) NA 2 2 2 2 2 2 2 2
Brokers (Cash Segment) 9,069 9,192 9,782 9,687 9,519 9,368 9,129 9,339 9,443
Corporate Brokers (Cash Segment) 3,173 3,316 3,808 3,862 3,835 3,746 3,733 3,933 4,029
Sub-brokers (Cash Segment) 4,589 5,675 9,957 12,208 13,291 12,815 13,684 23,479 24,680
Brokers (Derivative) NA NA 519 705 795 829 994 1,120 1,179
Foreign Institutional Investors 450 506 527 490 502 540 685 882 993
Custodians NA 15 14 12 11 11 11 11 11
Depositories 2 2 2 2 2 2 2 2 2
Depository Participants 96 191 335 380 438 431 477 526 568
Merchant Bankers 415 186 233 145 124 123 128 130 138
Bankers to an Issue 66 68 69 68 67 55 59 60 51
Underwriters 17 42 57 54 43 47 59 57 52
Debenture Trustees 34 38 37 40 35 34 35 32 32
Credit Rating Agencies NA 4 4 4 4 4 4 4 4
Venture Capital Funds NA NA 35 34 43 45 50 80 86
Foreign Venture Capital Investors NA NA 1 2 6 9 14 39 61
Registrars to an Issue & Share Transfer Agents 251 242 186 161 143 78 83 83 78
Portfolio Managers 18 23 39 47 54 60 84 132 152
Mutual Funds 41 38 39 38 38 37 39 38 39
Collective Investment Schemes NA 0 0 0 0 0 0 0 0
Approved Intermediaries (Stock Lending Schemes) 4 6 8 10 4 3 3 3 3

D:\BULLET26\DEC-2006\SB-DEC-2 TAN-14 MK C.DEY + O.P> + SJ + DS 26-12-2006---27-12-2006 45
DE
CE
MB
ER
SE
BI B
ULLE
TIN
2006
45A
NN
EX
UR
ES
AN
D S
TA
TIS
TIC
AL
TA
BL
ES
Tab
le 2: Offer D
ocu
men
ts Received
and
Ob
servation
s Issued
by S
EB
I *
(Rs. crore)
Year/M
on
thD
ocu
men
ts Received
Ob
servation
s Issued
No
.A
mo
un
tN
o.
Am
ou
nt
12
34
5
1999-00165
8,967125
12,026
2000-01197
13,176181
11,160
2001-0234
9,37828
9,228
2002-0328
7,09223
4,982
2003-0498
7,46558
17,873
2004-0588
11,48459
12,559
2005-06198
3,608139
5,944
Apr-05
10111
8281
May-05
10160
14171
Jun-059
18412
272
Jul-055
1393
54
Aug-05
17674
9182
Sep-05
1789
6283
Oct-05
19496
16205
Nov-05
21442
11181
Dec-05
18310
14349
Jan-0622
12410
158
Feb-06
21537
223,485
Mar-06
29341
14324
2006-07 (so far)
Apr-06
768
634
May-06
21206
15423
Jun-0620
19611
296
Jul-0611
6,6499
78
Aug-06
19810
6289
Sep-06
241,632
736
Oct-06
1234
116,812
Nov-06
740
22682
* 1. As regards data starting from
January 2004, the issue size is calculated by multiplying num
ber of securities offered by issue price. Issue sizecontained in this table does not include book built issues, as the issue price is neither fixed at the tim
e of filing of documents nor issuance of
observations.
2. The no. of issues opened for a period m
ight not tally with the no. of observations issued in the sam
e time period due to various reasons like tim
elag in opening an issue after S
EB
I observations, decision of issuers not to go ahead with the issue etc.
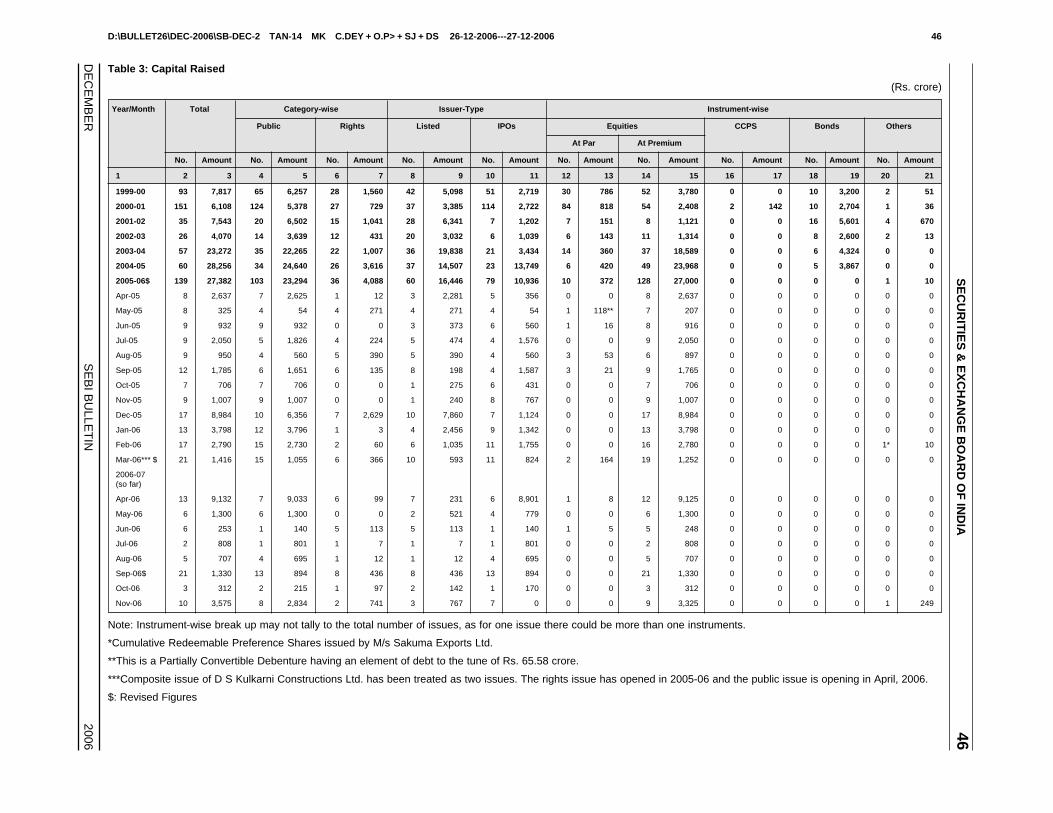
D:\BULLET26\DEC-2006\SB-DEC-2 TAN-14 MK C.DEY + O.P> + SJ + DS 26-12-2006---27-12-2006 46
DE
CE
MB
ER
SE
BI B
ULLE
TIN
2006
SE
CU
RIT
IES
& E
XC
HA
NG
E B
OA
RD
OF
IND
IA46
Table 3: Capital Raised
(Rs. crore)
Year/Month Total Category-wise Issuer-Type Instrument-wise
Public Rights Listed IPOs Equities CCPS Bonds Others
At Par At Premium
No. Amount No. Amount No. Amount No. Amount No. Amount No. Amount No. Amount No. Amount No. Amount No. Amount
1 2 3 4 5 6 7 8 9 10 11 12 13 14 15 16 17 18 19 20 21
1999-00 93 7,817 65 6,257 28 1,560 42 5,098 51 2,719 30 786 52 3,780 0 0 10 3,200 2 51
2000-01 151 6,108 124 5,378 27 729 37 3,385 114 2,722 84 818 54 2,408 2 142 10 2,704 1 36
2001-02 35 7,543 20 6,502 15 1,041 28 6,341 7 1,202 7 151 8 1,121 0 0 16 5,601 4 670
2002-03 26 4,070 14 3,639 12 431 20 3,032 6 1,039 6 143 11 1,314 0 0 8 2,600 2 13
2003-04 57 23,272 35 22,265 22 1,007 36 19,838 21 3,434 14 360 37 18,589 0 0 6 4,324 0 0
2004-05 60 28,256 34 24,640 26 3,616 37 14,507 23 13,749 6 420 49 23,968 0 0 5 3,867 0 0
2005-06$ 139 27,382 103 23,294 36 4,088 60 16,446 79 10,936 10 372 128 27,000 0 0 0 0 1 10
Apr-05 8 2,637 7 2,625 1 12 3 2,281 5 356 0 0 8 2,637 0 0 0 0 0 0
May-05 8 325 4 54 4 271 4 271 4 54 1 118** 7 207 0 0 0 0 0 0
Jun-05 9 932 9 932 0 0 3 373 6 560 1 16 8 916 0 0 0 0 0 0
Jul-05 9 2,050 5 1,826 4 224 5 474 4 1,576 0 0 9 2,050 0 0 0 0 0 0
Aug-05 9 950 4 560 5 390 5 390 4 560 3 53 6 897 0 0 0 0 0 0
Sep-05 12 1,785 6 1,651 6 135 8 198 4 1,587 3 21 9 1,765 0 0 0 0 0 0
Oct-05 7 706 7 706 0 0 1 275 6 431 0 0 7 706 0 0 0 0 0 0
Nov-05 9 1,007 9 1,007 0 0 1 240 8 767 0 0 9 1,007 0 0 0 0 0 0
Dec-05 17 8,984 10 6,356 7 2,629 10 7,860 7 1,124 0 0 17 8,984 0 0 0 0 0 0
Jan-06 13 3,798 12 3,796 1 3 4 2,456 9 1,342 0 0 13 3,798 0 0 0 0 0 0
Feb-06 17 2,790 15 2,730 2 60 6 1,035 11 1,755 0 0 16 2,780 0 0 0 0 1* 10
Mar-06*** $ 21 1,416 15 1,055 6 366 10 593 11 824 2 164 19 1,252 0 0 0 0 0 0
2006-07(so far)
Apr-06 13 9,132 7 9,033 6 99 7 231 6 8,901 1 8 12 9,125 0 0 0 0 0 0
May-06 6 1,300 6 1,300 0 0 2 521 4 779 0 0 6 1,300 0 0 0 0 0 0
Jun-06 6 253 1 140 5 113 5 113 1 140 1 5 5 248 0 0 0 0 0 0
Jul-06 2 808 1 801 1 7 1 7 1 801 0 0 2 808 0 0 0 0 0 0
Aug-06 5 707 4 695 1 12 1 12 4 695 0 0 5 707 0 0 0 0 0 0
Sep-06$ 21 1,330 13 894 8 436 8 436 13 894 0 0 21 1,330 0 0 0 0 0 0
Oct-06 3 312 2 215 1 97 2 142 1 170 0 0 3 312 0 0 0 0 0 0
Nov-06 10 3,575 8 2,834 2 741 3 767 7 0 0 0 9 3,325 0 0 0 0 1 249
Note: Instrument-wise break up may not tally to the total number of issues, as for one issue there could be more than one instruments.
*Cumulative Redeemable Preference Shares issued by M/s Sakuma Exports Ltd.
**This is a Partially Convertible Debenture having an element of debt to the tune of Rs. 65.58 crore.
***Composite issue of D S Kulkarni Constructions Ltd. has been treated as two issues. The rights issue has opened in 2005-06 and the public issue is opening in April, 2006.
$: Revised Figures

D:\BULLET26\DEC-2006\SB-DEC-2 TAN-14 MK C.DEY + O.P> + SJ + DS 26-12-2006---27-12-2006 47
DE
CE
MB
ER
SE
BI B
ULLE
TIN
2006
47A
NN
EX
UR
ES
AN
D S
TA
TIS
TIC
AL
TA
BL
ES
Table 4: Industry-wise Classification of Capital Raised
(Rs. crore)
Industry 2004-05 2005-06* Nov. 06 Nov. 05
No. Amount No. Amount No. Amount No. Amount
1 2 3 4 5 6 7 8 9
Banking/FIs 12 11,311 12 12,439 0 0 0 0
Cement & Construction 2 169 11 1,020 1 1,067 0 0
Chemical 4 128 2 128 1 26 0 0
Electronics 2 61 2 54 0 0 0 0
Engineering 3 133 6 1,124 0 0 2 388
Entertainment 3 154 7 710 0 0 0 0
Finance 3 116 7 824 2 1,566 0 0
Food Processing 6 317 9 427 3 303 0 0
Health Care 2 109 10 651 0 0 0 0
Information Technology 5 5,095 15 902 0 0 2 126
Paper & Pulp 1 60 4 182 0 0 0 0
Plastic 0 0 0 0 0 0 0 0
Power 2 5,854 6 2,164 0 0 0 0
Printing 1 130 1 43 2 121 1 43
Telecommunication 2 25 0 0 1 491 0 0
Textile 0 0 13 771 0 0 1 94
Others 12 4,595 34 5,944 0 0 3 355
Total 60 28,256 139 27,382 10 3,575 9 1,007
* Revised Figures
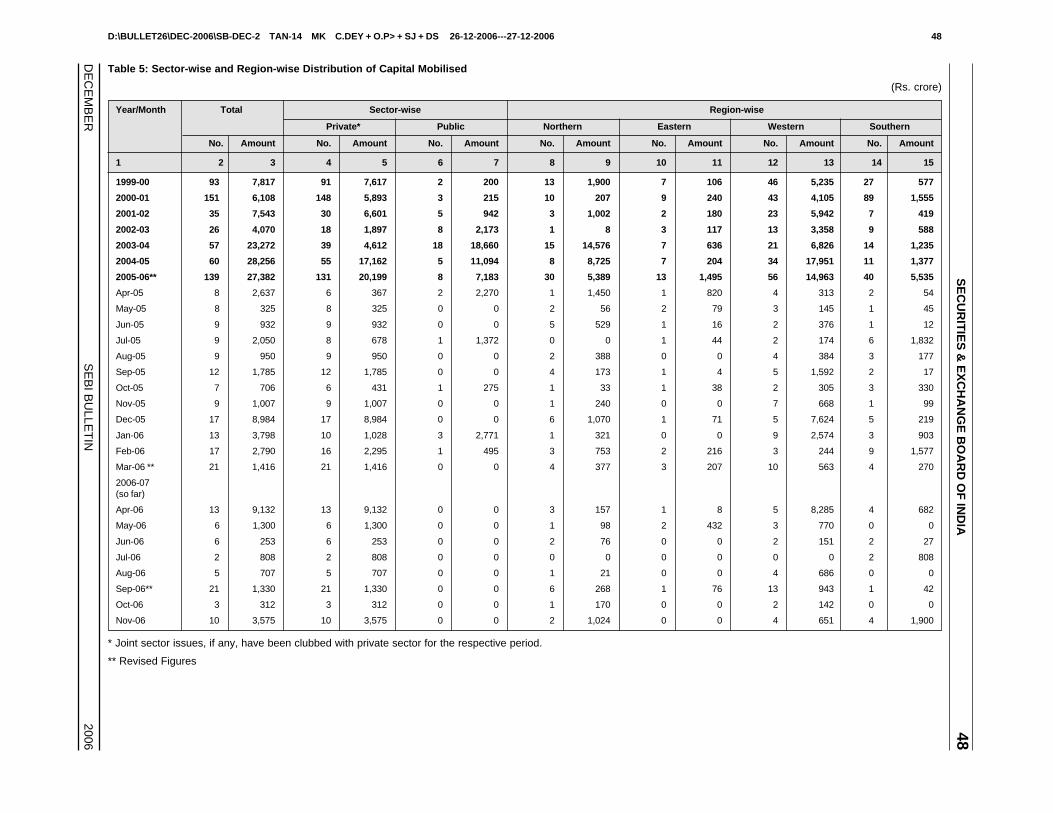
D:\BULLET26\DEC-2006\SB-DEC-2 TAN-14 MK C.DEY + O.P> + SJ + DS 26-12-2006---27-12-2006 48
DE
CE
MB
ER
SE
BI B
ULLE
TIN
2006
SE
CU
RIT
IES
& E
XC
HA
NG
E B
OA
RD
OF
IND
IA48
Table 5: Sector-wise and Region-wise Distribution of Capital Mobilised
(Rs. crore)
Year/Month Total Sector-wise Region-wise
Private* Public Northern Eastern Western Southern
No. Amount No. Amount No. Amount No. Amount No. Amount No. Amount No. Amount
1 2 3 4 5 6 7 8 9 10 11 12 13 14 15
1999-00 93 7,817 91 7,617 2 200 13 1,900 7 106 46 5,235 27 577
2000-01 151 6,108 148 5,893 3 215 10 207 9 240 43 4,105 89 1,555
2001-02 35 7,543 30 6,601 5 942 3 1,002 2 180 23 5,942 7 419
2002-03 26 4,070 18 1,897 8 2,173 1 8 3 117 13 3,358 9 588
2003-04 57 23,272 39 4,612 18 18,660 15 14,576 7 636 21 6,826 14 1,235
2004-05 60 28,256 55 17,162 5 11,094 8 8,725 7 204 34 17,951 11 1,377
2005-06** 139 27,382 131 20,199 8 7,183 30 5,389 13 1,495 56 14,963 40 5,535
Apr-05 8 2,637 6 367 2 2,270 1 1,450 1 820 4 313 2 54
May-05 8 325 8 325 0 0 2 56 2 79 3 145 1 45
Jun-05 9 932 9 932 0 0 5 529 1 16 2 376 1 12
Jul-05 9 2,050 8 678 1 1,372 0 0 1 44 2 174 6 1,832
Aug-05 9 950 9 950 0 0 2 388 0 0 4 384 3 177
Sep-05 12 1,785 12 1,785 0 0 4 173 1 4 5 1,592 2 17
Oct-05 7 706 6 431 1 275 1 33 1 38 2 305 3 330
Nov-05 9 1,007 9 1,007 0 0 1 240 0 0 7 668 1 99
Dec-05 17 8,984 17 8,984 0 0 6 1,070 1 71 5 7,624 5 219
Jan-06 13 3,798 10 1,028 3 2,771 1 321 0 0 9 2,574 3 903
Feb-06 17 2,790 16 2,295 1 495 3 753 2 216 3 244 9 1,577
Mar-06 ** 21 1,416 21 1,416 0 0 4 377 3 207 10 563 4 270
2006-07(so far)
Apr-06 13 9,132 13 9,132 0 0 3 157 1 8 5 8,285 4 682
May-06 6 1,300 6 1,300 0 0 1 98 2 432 3 770 0 0
Jun-06 6 253 6 253 0 0 2 76 0 0 2 151 2 27
Jul-06 2 808 2 808 0 0 0 0 0 0 0 0 2 808
Aug-06 5 707 5 707 0 0 1 21 0 0 4 686 0 0
Sep-06** 21 1,330 21 1,330 0 0 6 268 1 76 13 943 1 42
Oct-06 3 312 3 312 0 0 1 170 0 0 2 142 0 0
Nov-06 10 3,575 10 3,575 0 0 2 1,024 0 0 4 651 4 1,900
* Joint sector issues, if any, have been clubbed with private sector for the respective period.
** Revised Figures
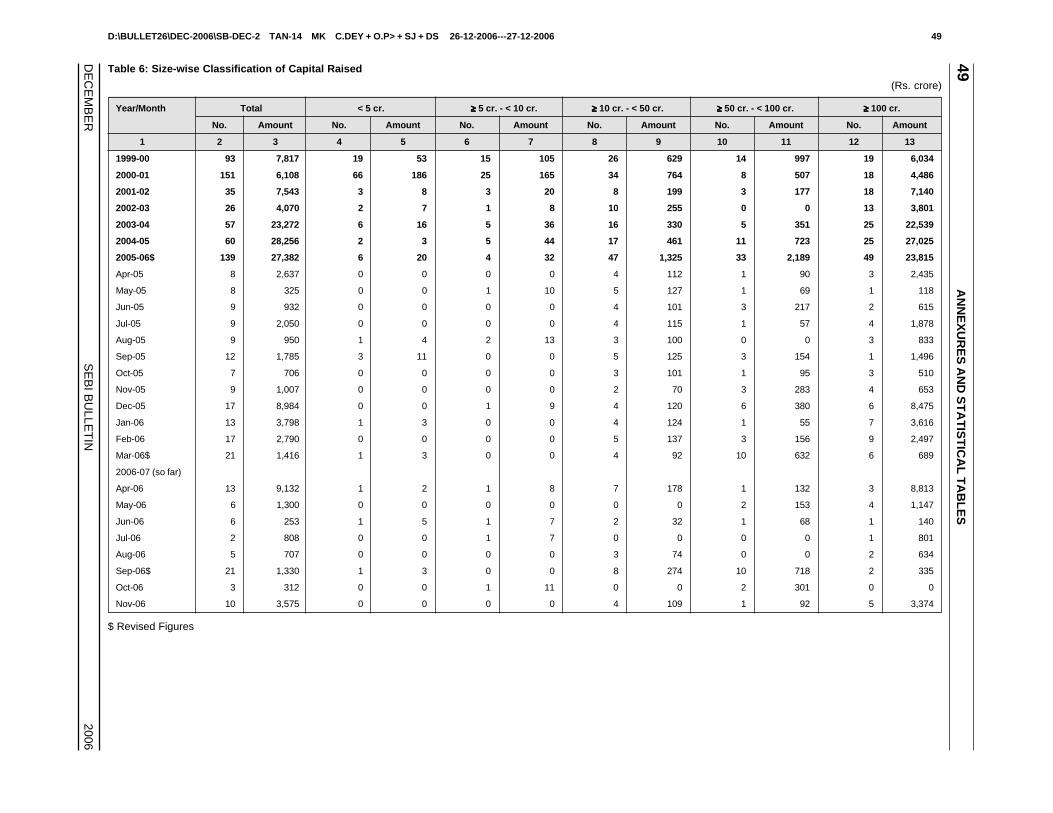
D:\BULLET26\DEC-2006\SB-DEC-2 TAN-14 MK C.DEY + O.P> + SJ + DS 26-12-2006---27-12-2006 49
DE
CE
MB
ER
SE
BI B
ULLE
TIN
2006
49A
NN
EX
UR
ES
AN
D S
TA
TIS
TIC
AL
TA
BL
ES
Table 6: Size-wise Classification of Capital Raised
(Rs. crore)
Year/Month Total < 5 cr. ≥≥≥≥≥ 5 cr. - < 10 cr. ≥≥≥≥≥ 10 cr. - < 50 cr. ≥≥≥≥≥ 50 cr. - < 100 cr. ≥≥≥≥≥ 100 cr.
No. Amount No. Amount No. Amount No. Amount No. Amount No. Amount
1 2 3 4 5 6 7 8 9 10 11 12 13
1999-00 93 7,817 19 53 15 105 26 629 14 997 19 6,034
2000-01 151 6,108 66 186 25 165 34 764 8 507 18 4,486
2001-02 35 7,543 3 8 3 20 8 199 3 177 18 7,140
2002-03 26 4,070 2 7 1 8 10 255 0 0 13 3,801
2003-04 57 23,272 6 16 5 36 16 330 5 351 25 22,539
2004-05 60 28,256 2 3 5 44 17 461 11 723 25 27,025
2005-06$ 139 27,382 6 20 4 32 47 1,325 33 2,189 49 23,815
Apr-05 8 2,637 0 0 0 0 4 112 1 90 3 2,435
May-05 8 325 0 0 1 10 5 127 1 69 1 118
Jun-05 9 932 0 0 0 0 4 101 3 217 2 615
Jul-05 9 2,050 0 0 0 0 4 115 1 57 4 1,878
Aug-05 9 950 1 4 2 13 3 100 0 0 3 833
Sep-05 12 1,785 3 11 0 0 5 125 3 154 1 1,496
Oct-05 7 706 0 0 0 0 3 101 1 95 3 510
Nov-05 9 1,007 0 0 0 0 2 70 3 283 4 653
Dec-05 17 8,984 0 0 1 9 4 120 6 380 6 8,475
Jan-06 13 3,798 1 3 0 0 4 124 1 55 7 3,616
Feb-06 17 2,790 0 0 0 0 5 137 3 156 9 2,497
Mar-06$ 21 1,416 1 3 0 0 4 92 10 632 6 689
2006-07 (so far)
Apr-06 13 9,132 1 2 1 8 7 178 1 132 3 8,813
May-06 6 1,300 0 0 0 0 0 0 2 153 4 1,147
Jun-06 6 253 1 5 1 7 2 32 1 68 1 140
Jul-06 2 808 0 0 1 7 0 0 0 0 1 801
Aug-06 5 707 0 0 0 0 3 74 0 0 2 634
Sep-06$ 21 1,330 1 3 0 0 8 274 10 718 2 335
Oct-06 3 312 0 0 1 11 0 0 2 301 0 0
Nov-06 10 3,575 0 0 0 0 4 109 1 92 5 3,374
$ Revised Figures
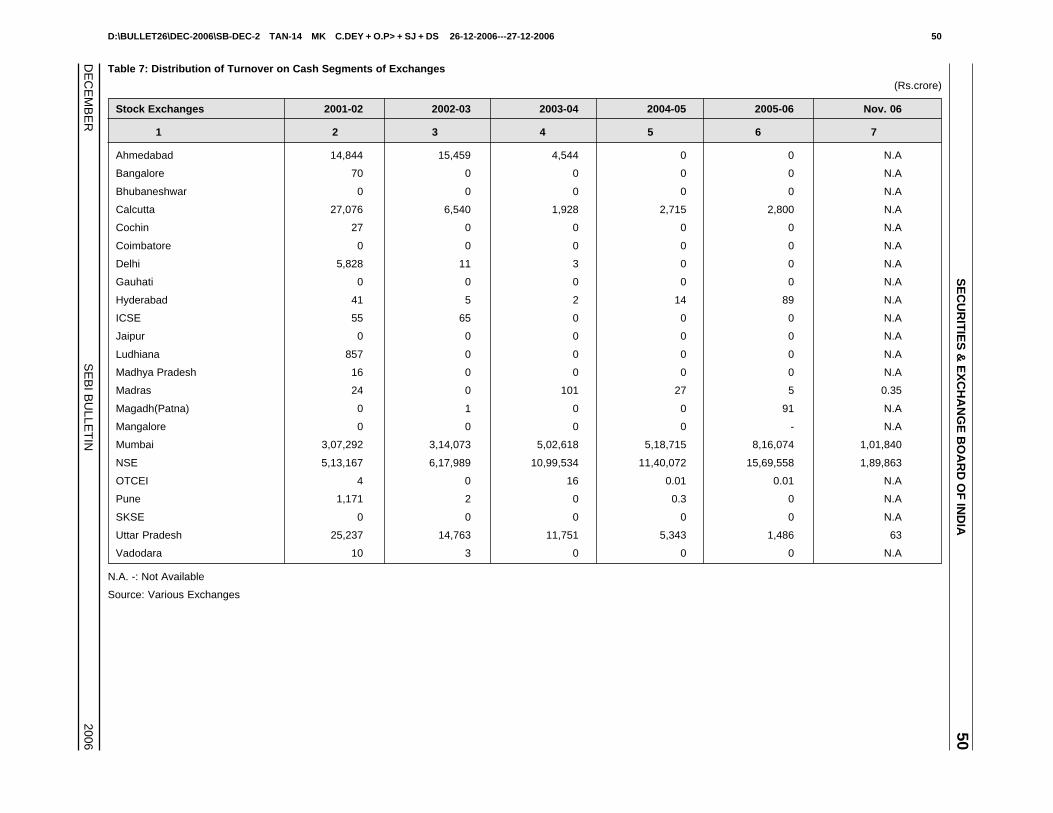
D:\BULLET26\DEC-2006\SB-DEC-2 TAN-14 MK C.DEY + O.P> + SJ + DS 26-12-2006---27-12-2006 50
DE
CE
MB
ER
SE
BI B
ULLE
TIN
2006
SE
CU
RIT
IES
& E
XC
HA
NG
E B
OA
RD
OF
IND
IA50
Table 7: Distribution of Turnover on Cash Segments of Exchanges
(Rs.crore)
Stock Exchanges 2001-02 2002-03 2003-04 2004-05 2005-06 Nov. 06
1 2 3 4 5 6 7
Ahmedabad 14,844 15,459 4,544 0 0 N.A
Bangalore 70 0 0 0 0 N.A
Bhubaneshwar 0 0 0 0 0 N.A
Calcutta 27,076 6,540 1,928 2,715 2,800 N.A
Cochin 27 0 0 0 0 N.A
Coimbatore 0 0 0 0 0 N.A
Delhi 5,828 11 3 0 0 N.A
Gauhati 0 0 0 0 0 N.A
Hyderabad 41 5 2 14 89 N.A
ICSE 55 65 0 0 0 N.A
Jaipur 0 0 0 0 0 N.A
Ludhiana 857 0 0 0 0 N.A
Madhya Pradesh 16 0 0 0 0 N.A
Madras 24 0 101 27 5 0.35
Magadh(Patna) 0 1 0 0 91 N.A
Mangalore 0 0 0 0 - N.A
Mumbai 3,07,292 3,14,073 5,02,618 5,18,715 8,16,074 1,01,840
NSE 5,13,167 6,17,989 10,99,534 11,40,072 15,69,558 1,89,863
OTCEI 4 0 16 0.01 0.01 N.A
Pune 1,171 2 0 0.3 0 N.A
SKSE 0 0 0 0 0 N.A
Uttar Pradesh 25,237 14,763 11,751 5,343 1,486 63
Vadodara 10 3 0 0 0 N.A
N.A. -: Not Available
Source: Various Exchanges
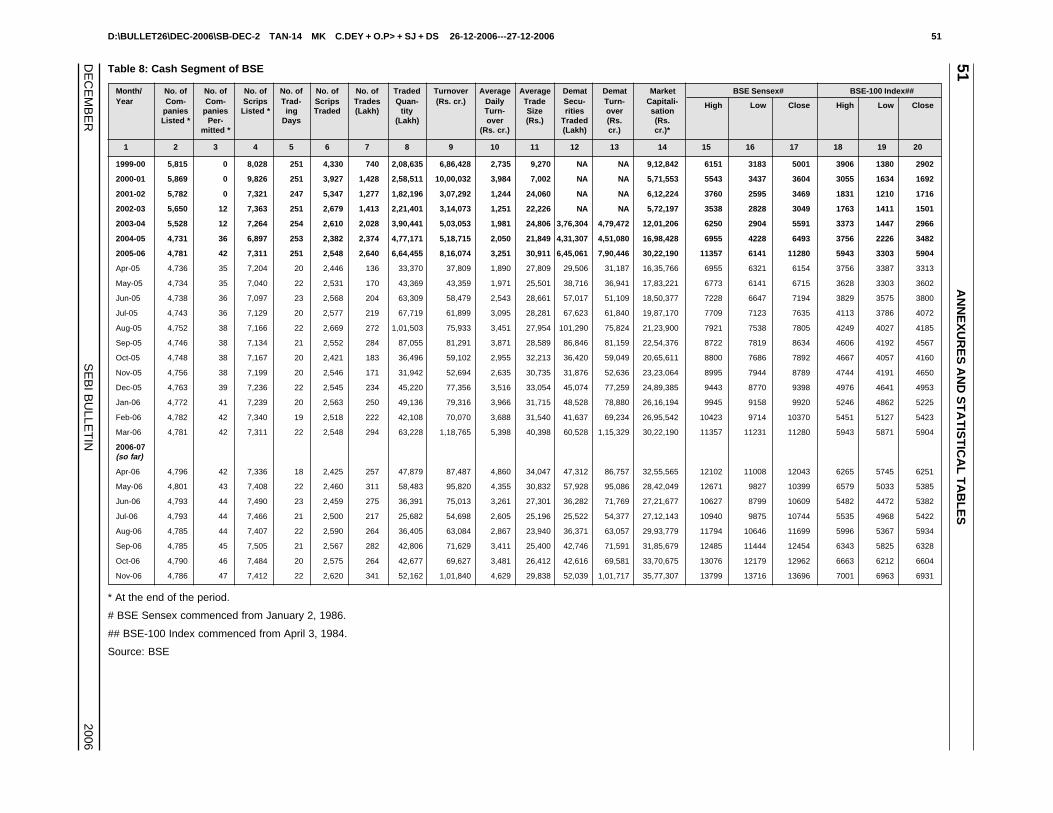
D:\BULLET26\DEC-2006\SB-DEC-2 TAN-14 MK C.DEY + O.P> + SJ + DS 26-12-2006---27-12-2006 51
DE
CE
MB
ER
SE
BI B
ULLE
TIN
2006
51A
NN
EX
UR
ES
AN
D S
TA
TIS
TIC
AL
TA
BL
ES
Table 8: Cash Segment of BSE
Month/ No. of No. of No. of No. of No. of No. of Traded Turnover Average Average Demat Demat Market BSE Sensex# BSE-100 Index##Year Com- Com- Scrips Trad- Scrips Trades Quan- (Rs. cr.) Daily Trade Secu- Turn- Capitali- High Low Close High Low Close
panies panies Listed * ing Traded (Lakh) tity Turn- Size rities over sationListed * Per- Days (Lakh) over (Rs.) Traded (Rs. (Rs.
mitted * (Rs. cr.) (Lakh) cr.) cr.)*
1 2 3 4 5 6 7 8 9 10 11 12 13 14 15 16 17 18 19 20
1999-00 5,815 0 8,028 251 4,330 740 2,08,635 6,86,428 2,735 9,270 NA NA 9,12,842 6151 3183 5001 3906 1380 2902
2000-01 5,869 0 9,826 251 3,927 1,428 2,58,511 10,00,032 3,984 7,002 NA NA 5,71,553 5543 3437 3604 3055 1634 1692
2001-02 5,782 0 7,321 247 5,347 1,277 1,82,196 3,07,292 1,244 24,060 NA NA 6,12,224 3760 2595 3469 1831 1210 1716
2002-03 5,650 12 7,363 251 2,679 1,413 2,21,401 3,14,073 1,251 22,226 NA NA 5,72,197 3538 2828 3049 1763 1411 1501
2003-04 5,528 12 7,264 254 2,610 2,028 3,90,441 5,03,053 1,981 24,806 3,76,304 4,79,472 12,01,206 6250 2904 5591 3373 1447 2966
2004-05 4,731 36 6,897 253 2,382 2,374 4,77,171 5,18,715 2,050 21,849 4,31,307 4,51,080 16,98,428 6955 4228 6493 3756 2226 3482
2005-06 4,781 42 7,311 251 2,548 2,640 6,64,455 8,16,074 3,251 30,911 6,45,061 7,90,446 30,22,190 11357 6141 11280 5943 3303 5904
Apr-05 4,736 35 7,204 20 2,446 136 33,370 37,809 1,890 27,809 29,506 31,187 16,35,766 6955 6321 6154 3756 3387 3313
May-05 4,734 35 7,040 22 2,531 170 43,369 43,359 1,971 25,501 38,716 36,941 17,83,221 6773 6141 6715 3628 3303 3602
Jun-05 4,738 36 7,097 23 2,568 204 63,309 58,479 2,543 28,661 57,017 51,109 18,50,377 7228 6647 7194 3829 3575 3800
Jul-05 4,743 36 7,129 20 2,577 219 67,719 61,899 3,095 28,281 67,623 61,840 19,87,170 7709 7123 7635 4113 3786 4072
Aug-05 4,752 38 7,166 22 2,669 272 1,01,503 75,933 3,451 27,954 101,290 75,824 21,23,900 7921 7538 7805 4249 4027 4185
Sep-05 4,746 38 7,134 21 2,552 284 87,055 81,291 3,871 28,589 86,846 81,159 22,54,376 8722 7819 8634 4606 4192 4567
Oct-05 4,748 38 7,167 20 2,421 183 36,496 59,102 2,955 32,213 36,420 59,049 20,65,611 8800 7686 7892 4667 4057 4160
Nov-05 4,756 38 7,199 20 2,546 171 31,942 52,694 2,635 30,735 31,876 52,636 23,23,064 8995 7944 8789 4744 4191 4650
Dec-05 4,763 39 7,236 22 2,545 234 45,220 77,356 3,516 33,054 45,074 77,259 24,89,385 9443 8770 9398 4976 4641 4953
Jan-06 4,772 41 7,239 20 2,563 250 49,136 79,316 3,966 31,715 48,528 78,880 26,16,194 9945 9158 9920 5246 4862 5225
Feb-06 4,782 42 7,340 19 2,518 222 42,108 70,070 3,688 31,540 41,637 69,234 26,95,542 10423 9714 10370 5451 5127 5423
Mar-06 4,781 42 7,311 22 2,548 294 63,228 1,18,765 5,398 40,398 60,528 1,15,329 30,22,190 11357 11231 11280 5943 5871 5904
2006-07(so far)
Apr-06 4,796 42 7,336 18 2,425 257 47,879 87,487 4,860 34,047 47,312 86,757 32,55,565 12102 11008 12043 6265 5745 6251
May-06 4,801 43 7,408 22 2,460 311 58,483 95,820 4,355 30,832 57,928 95,086 28,42,049 12671 9827 10399 6579 5033 5385
Jun-06 4,793 44 7,490 23 2,459 275 36,391 75,013 3,261 27,301 36,282 71,769 27,21,677 10627 8799 10609 5482 4472 5382
Jul-06 4,793 44 7,466 21 2,500 217 25,682 54,698 2,605 25,196 25,522 54,377 27,12,143 10940 9875 10744 5535 4968 5422
Aug-06 4,785 44 7,407 22 2,590 264 36,405 63,084 2,867 23,940 36,371 63,057 29,93,779 11794 10646 11699 5996 5367 5934
Sep-06 4,785 45 7,505 21 2,567 282 42,806 71,629 3,411 25,400 42,746 71,591 31,85,679 12485 11444 12454 6343 5825 6328
Oct-06 4,790 46 7,484 20 2,575 264 42,677 69,627 3,481 26,412 42,616 69,581 33,70,675 13076 12179 12962 6663 6212 6604
Nov-06 4,786 47 7,412 22 2,620 341 52,162 1,01,840 4,629 29,838 52,039 1,01,717 35,77,307 13799 13716 13696 7001 6963 6931
* At the end of the period.
# BSE Sensex commenced from January 2, 1986.
## BSE-100 Index commenced from April 3, 1984.
Source: BSE
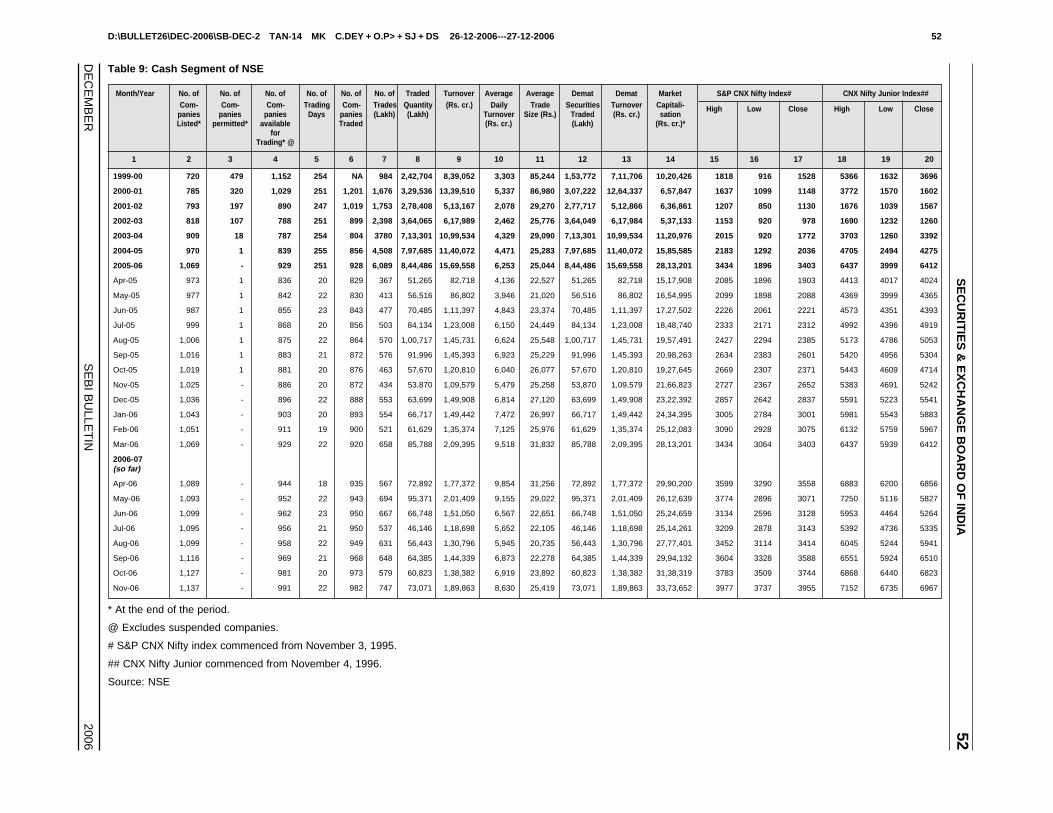
D:\BULLET26\DEC-2006\SB-DEC-2 TAN-14 MK C.DEY + O.P> + SJ + DS 26-12-2006---27-12-2006 52
DE
CE
MB
ER
SE
BI B
ULLE
TIN
2006
SE
CU
RIT
IES
& E
XC
HA
NG
E B
OA
RD
OF
IND
IA52
Table 9: Cash Segment of NSE
Month/Year No. of No. of No. of No. of No. of No. of Traded Turnover Average Average Demat Demat Market S&P CNX Nifty Index# CNX Nifty Junior Index##Com- Com- Com- Trading Com- Trades Quantity (Rs. cr.) Daily Trade Securities Turnover Capitali- High Low Close High Low Close
panies panies panies Days panies (Lakh) (Lakh) Turnover Size (Rs.) Traded (Rs. cr.) sationListed* permitted* available Traded (Rs. cr.) (Lakh) (Rs. cr.)*
forTrading* @
1 2 3 4 5 6 7 8 9 10 11 12 13 14 15 16 17 18 19 20
1999-00 720 479 1,152 254 NA 984 2,42,704 8,39,052 3,303 85,244 1,53,772 7,11,706 10,20,426 1818 916 1528 5366 1632 3696
2000-01 785 320 1,029 251 1,201 1,676 3,29,536 13,39,510 5,337 86,980 3,07,222 12,64,337 6,57,847 1637 1099 1148 3772 1570 1602
2001-02 793 197 890 247 1,019 1,753 2,78,408 5,13,167 2,078 29,270 2,77,717 5,12,866 6,36,861 1207 850 1130 1676 1039 1567
2002-03 818 107 788 251 899 2,398 3,64,065 6,17,989 2,462 25,776 3,64,049 6,17,984 5,37,133 1153 920 978 1690 1232 1260
2003-04 909 18 787 254 804 3780 7,13,301 10,99,534 4,329 29,090 7,13,301 10,99,534 11,20,976 2015 920 1772 3703 1260 3392
2004-05 970 1 839 255 856 4,508 7,97,685 11,40,072 4,471 25,283 7,97,685 11,40,072 15,85,585 2183 1292 2036 4705 2494 4275
2005-06 1,069 - 929 251 928 6,089 8,44,486 15,69,558 6,253 25,044 8,44,486 15,69,558 28,13,201 3434 1896 3403 6437 3999 6412
Apr-05 973 1 836 20 829 367 51,265 82,718 4,136 22,527 51,265 82,718 15,17,908 2085 1896 1903 4413 4017 4024
May-05 977 1 842 22 830 413 56,516 86,802 3,946 21,020 56,516 86,802 16,54,995 2099 1898 2088 4369 3999 4365
Jun-05 987 1 855 23 843 477 70,485 1,11,397 4,843 23,374 70,485 1,11,397 17,27,502 2226 2061 2221 4573 4351 4393
Jul-05 999 1 868 20 856 503 84,134 1,23,008 6,150 24,449 84,134 1,23,008 18,48,740 2333 2171 2312 4992 4396 4919
Aug-05 1,006 1 875 22 864 570 1,00,717 1,45,731 6,624 25,548 1,00,717 1,45,731 19,57,491 2427 2294 2385 5173 4786 5053
Sep-05 1,016 1 883 21 872 576 91,996 1,45,393 6,923 25,229 91,996 1,45,393 20,98,263 2634 2383 2601 5420 4956 5304
Oct-05 1,019 1 881 20 876 463 57,670 1,20,810 6,040 26,077 57,670 1,20,810 19,27,645 2669 2307 2371 5443 4609 4714
Nov-05 1,025 - 886 20 872 434 53,870 1,09,579 5,479 25,258 53,870 1,09,579 21,66,823 2727 2367 2652 5383 4691 5242
Dec-05 1,036 - 896 22 888 553 63,699 1,49,908 6,814 27,120 63,699 1,49,908 23,22,392 2857 2642 2837 5591 5223 5541
Jan-06 1,043 - 903 20 893 554 66,717 1,49,442 7,472 26,997 66,717 1,49,442 24,34,395 3005 2784 3001 5981 5543 5883
Feb-06 1,051 - 911 19 900 521 61,629 1,35,374 7,125 25,976 61,629 1,35,374 25,12,083 3090 2928 3075 6132 5759 5967
Mar-06 1,069 - 929 22 920 658 85,788 2,09,395 9,518 31,832 85,788 2,09,395 28,13,201 3434 3064 3403 6437 5939 6412
2006-07(so far)
Apr-06 1,089 - 944 18 935 567 72,892 1,77,372 9,854 31,256 72,892 1,77,372 29,90,200 3599 3290 3558 6883 6200 6856
May-06 1,093 - 952 22 943 694 95,371 2,01,409 9,155 29,022 95,371 2,01,409 26,12,639 3774 2896 3071 7250 5116 5827
Jun-06 1,099 - 962 23 950 667 66,748 1,51,050 6,567 22,651 66,748 1,51,050 25,24,659 3134 2596 3128 5953 4464 5264
Jul-06 1,095 - 956 21 950 537 46,146 1,18,698 5,652 22,105 46,146 1,18,698 25,14,261 3209 2878 3143 5392 4736 5335
Aug-06 1,099 - 958 22 949 631 56,443 1,30,796 5,945 20,735 56,443 1,30,796 27,77,401 3452 3114 3414 6045 5244 5941
Sep-06 1,116 - 969 21 968 648 64,385 1,44,339 6,873 22,278 64,385 1,44,339 29,94,132 3604 3328 3588 6551 5924 6510
Oct-06 1,127 - 981 20 973 579 60,823 1,38,382 6,919 23,892 60,823 1,38,382 31,38,319 3783 3509 3744 6868 6440 6823
Nov-06 1,137 - 991 22 982 747 73,071 1,89,863 8,630 25,419 73,071 1,89,863 33,73,652 3977 3737 3955 7152 6735 6967
* At the end of the period.
@ Excludes suspended companies.
# S&P CNX Nifty index commenced from November 3, 1995.
## CNX Nifty Junior commenced from November 4, 1996.
Source: NSE
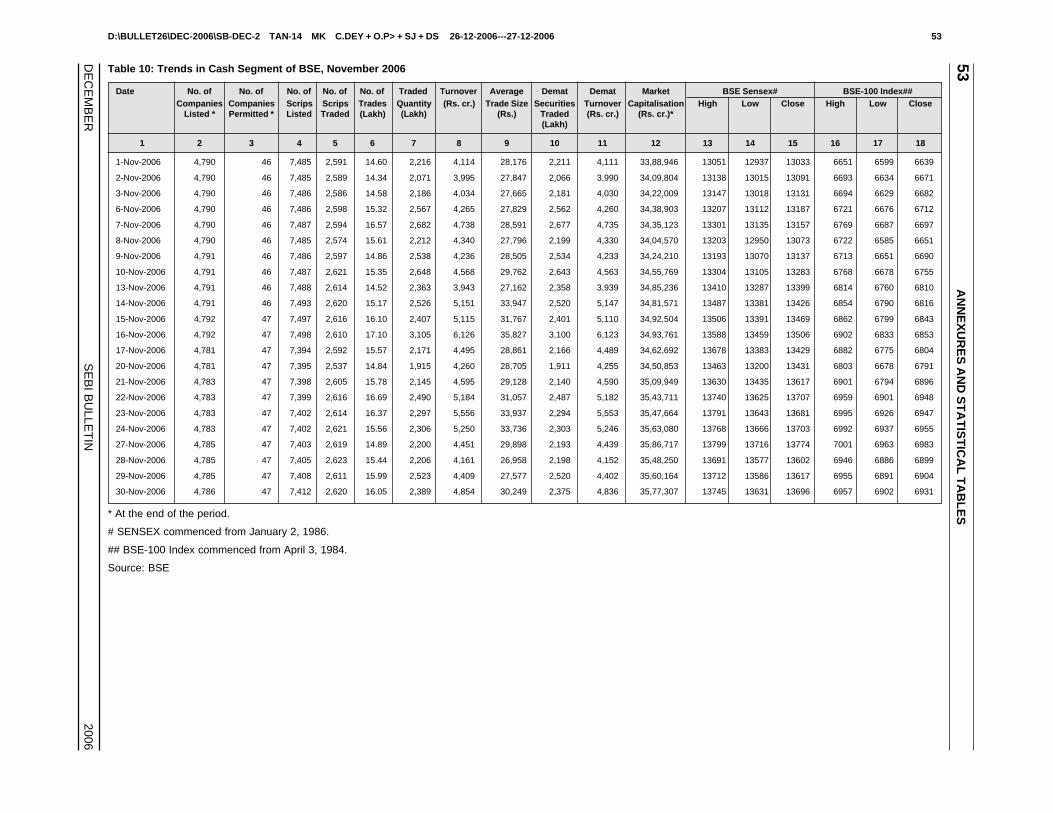
D:\BULLET26\DEC-2006\SB-DEC-2 TAN-14 MK C.DEY + O.P> + SJ + DS 26-12-2006---27-12-2006 53
DE
CE
MB
ER
SE
BI B
ULLE
TIN
2006
53A
NN
EX
UR
ES
AN
D S
TA
TIS
TIC
AL
TA
BL
ES
Table 10: Trends in Cash Segment of BSE, November 2006
Date No. of No. of No. of No. of No. of Traded Turnover Average Demat Demat Market BSE Sensex# BSE-100 Index##Companies Companies Scrips Scrips Trades Quantity (Rs. cr.) Trade Size Securities Turnover Capitalisation High Low Close High Low Close
Listed * Permitted * Listed Traded (Lakh) (Lakh) (Rs.) Traded (Rs. cr.) (Rs. cr.)*(Lakh)
1 2 3 4 5 6 7 8 9 10 11 12 13 14 15 16 17 18
1-Nov-2006 4,790 46 7,485 2,591 14.60 2,216 4,114 28,176 2,211 4,111 33,88,946 13051 12937 13033 6651 6599 6639
2-Nov-2006 4,790 46 7,485 2,589 14.34 2,071 3,995 27,847 2,066 3,990 34,09,804 13138 13015 13091 6693 6634 6671
3-Nov-2006 4,790 46 7,486 2,586 14.58 2,186 4,034 27,665 2,181 4,030 34,22,009 13147 13018 13131 6694 6629 6682
6-Nov-2006 4,790 46 7,486 2,598 15.32 2,567 4,265 27,829 2,562 4,260 34,38,903 13207 13112 13187 6721 6676 6712
7-Nov-2006 4,790 46 7,487 2,594 16.57 2,682 4,738 28,591 2,677 4,735 34,35,123 13301 13135 13157 6769 6687 6697
8-Nov-2006 4,790 46 7,485 2,574 15.61 2,212 4,340 27,796 2,199 4,330 34,04,570 13203 12950 13073 6722 6585 6651
9-Nov-2006 4,791 46 7,486 2,597 14.86 2,538 4,236 28,505 2,534 4,233 34,24,210 13193 13070 13137 6713 6651 6690
10-Nov-2006 4,791 46 7,487 2,621 15.35 2,648 4,568 29,762 2,643 4,563 34,55,769 13304 13105 13283 6768 6678 6755
13-Nov-2006 4,791 46 7,488 2,614 14.52 2,363 3,943 27,162 2,358 3,939 34,85,236 13410 13287 13399 6814 6760 6810
14-Nov-2006 4,791 46 7,493 2,620 15.17 2,526 5,151 33,947 2,520 5,147 34,81,571 13487 13381 13426 6854 6790 6816
15-Nov-2006 4,792 47 7,497 2,616 16.10 2,407 5,115 31,767 2,401 5,110 34,92,504 13506 13391 13469 6862 6799 6843
16-Nov-2006 4,792 47 7,498 2,610 17.10 3,105 6,126 35,827 3,100 6,123 34,93,761 13588 13459 13506 6902 6833 6853
17-Nov-2006 4,781 47 7,394 2,592 15.57 2,171 4,495 28,861 2,166 4,489 34,62,692 13678 13383 13429 6882 6775 6804
20-Nov-2006 4,781 47 7,395 2,537 14.84 1,915 4,260 28,705 1,911 4,255 34,50,853 13463 13200 13431 6803 6678 6791
21-Nov-2006 4,783 47 7,398 2,605 15.78 2,145 4,595 29,128 2,140 4,590 35,09,949 13630 13435 13617 6901 6794 6896
22-Nov-2006 4,783 47 7,399 2,616 16.69 2,490 5,184 31,057 2,487 5,182 35,43,711 13740 13625 13707 6959 6901 6948
23-Nov-2006 4,783 47 7,402 2,614 16.37 2,297 5,556 33,937 2,294 5,553 35,47,664 13791 13643 13681 6995 6926 6947
24-Nov-2006 4,783 47 7,402 2,621 15.56 2,306 5,250 33,736 2,303 5,246 35,63,080 13768 13666 13703 6992 6937 6955
27-Nov-2006 4,785 47 7,403 2,619 14.89 2,200 4,451 29,898 2,193 4,439 35,86,717 13799 13716 13774 7001 6963 6983
28-Nov-2006 4,785 47 7,405 2,623 15.44 2,206 4,161 26,958 2,198 4,152 35,48,250 13691 13577 13602 6946 6886 6899
29-Nov-2006 4,785 47 7,408 2,611 15.99 2,523 4,409 27,577 2,520 4,402 35,60,164 13712 13586 13617 6955 6891 6904
30-Nov-2006 4,786 47 7,412 2,620 16.05 2,389 4,854 30,249 2,375 4,836 35,77,307 13745 13631 13696 6957 6902 6931
* At the end of the period.
# SENSEX commenced from January 2, 1986.
## BSE-100 Index commenced from April 3, 1984.
Source: BSE

D:\BULLET26\DEC-2006\SB-DEC-2 TAN-14 MK C.DEY + O.P> + SJ + DS 26-12-2006---27-12-2006 54
DE
CE
MB
ER
SE
BI B
ULLE
TIN
2006
SE
CU
RIT
IES
& E
XC
HA
NG
E B
OA
RD
OF
IND
IA54
Table 11: Trends in Cash Segment of NSE, November 2006
Month/Year No. of No. of Traded Turnover Average Demat Demat Market S&P CNX Nifty Index# CNX Nifty Junior Index##Securities Trades Quantity (Rs. cr.) Trade Companies Turnover Capitalisa-
Traded (Lakh) (Lakh) Size (Rs.) Traded (Rs. cr.) tion High Low Close High Low Close(Lakh) (Rs. cr.)*
1 2 3 4 5 6 7 8 9 10 11 12 13 14 15
01-Nov-2006 968 32.36 3,161 7,754 23,962 3,161 7,754 31,55,702 3778 3737 3767 6862 6807 6821
02-Nov-2006 968 31.07 2,799 7,364 23,701 2,799 7,364 31,75,741 3806 3762 3791 6868 6805 6862
03-Nov-2006 970 31.52 3,224 7,347 23,306 3,224 7,347 31,87,045 3810 3771 3805 6915 6845 6883
06-Nov-2006 966 33.57 3,667 7,753 23,096 3,667 7,753 32,00,355 3822 3798 3809 6934 6878 6924
07-Nov-2006 965 35.85 4,010 9,067 25,294 4,010 9,067 31,94,822 3840 3789 3799 6994 6918 6924
08-Nov-2006 963 34.70 3,471 8,573 24,707 3,471 8,573 31,62,341 3810 3737 3777 6957 6789 6879
09-Nov-2006 967 33.55 3,648 7,837 23,359 3,648 7,837 31,79,557 3808 3770 3796 6937 6876 6886
10-Nov-2006 964 33.29 3,287 8,232 24,727 3,287 8,232 32,09,964 3842 3785 3835 6975 6899 6951
13-Nov-2006 966 31.46 3,019 6,744 21,440 3,019 6,744 32,39,461 3862 3834 3859 7006 6956 6998
14-Nov-2006 965 33.25 3,238 8,072 24,274 3,238 8,072 32,39,733 3883 3851 3866 7040 6950 6996
15-Nov-2006 971 35.00 3,197 8,769 25,056 3,197 8,769 32,51,450 3889 3838 3876 7076 6980 7063
16-Nov-2006 969 37.43 3,561 10,321 27,572 3,561 10,321 32,54,288 3900 3864 3877 7152 7072 7097
17-Nov-2006 963 35.10 3,075 8,720 24,843 3,075 8,720 32,24,404 3892 3836 3853 7118 6897 6942
20-Nov-2006 962 36.31 3,242 9,629 26,519 3,242 9,629 32,14,817 3867 3794 3856 6881 6735 6860
21-Nov-2006 964 34.50 3,117 9,099 26,372 3,117 9,099 33,08,231 3922 3857 3918 6993 6893 6987
22-Nov-2006 968 35.99 3,515 10,464 29,072 3,515 10,464 33,38,592 3960 3910 3955 7054 7001 7031
23-Nov-2006 970 35.60 3,190 8,885 24,958 3,190 8,885 33,41,494 3977 3934 3945 7077 6999 7039
24-Nov-2006 967 33.57 3,208 8,195 24,408 3,208 8,195 33,55,742 3966 3935 3951 7105 7035 7071
27-Nov-2006 974 31.05 2,925 7,973 25,681 2,925 7,973 33,83,540 3975 3949 3969 7127 7084 7102
28-Nov-2006 971 32.83 3,159 8,258 25,157 3,159 8,258 33,45,952 3966 3912 3922 7080 6981 7018
29-Nov-2006 973 33.10 3,139 8,084 24,421 3,139 8,084 33,57,112 3952 3920 3928 7084 7002 7017
30-Nov-2006 978 35.83 4,217 12,725 35,515 4,217 12,725 33,73,652 3973 3929 3955 7065 6958 6967
Note : Data has been compiled for all markets excpet auction and retail debt market.
* At the end of the period.
@ Excludes suspended companies.
# S&P CNX Nifty Index commenced from November 3, 1995.
## CNX Nifty Junior commenced from November 4, 1996.
Source: NSE
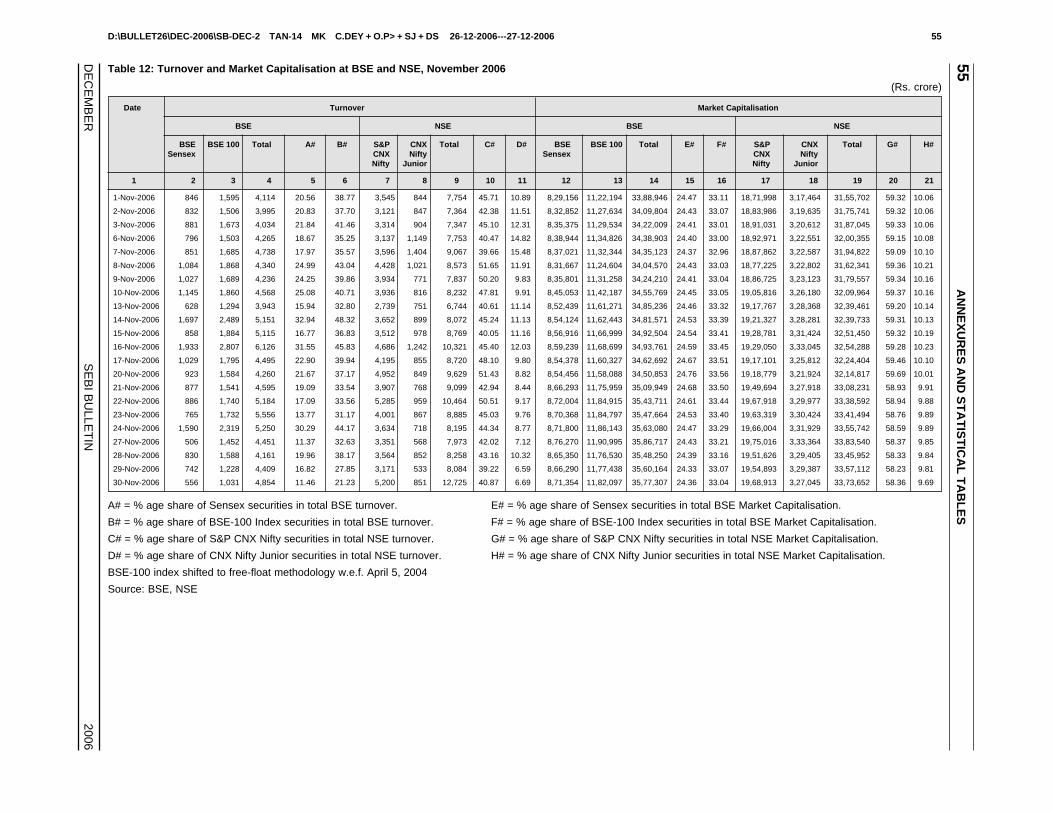
D:\BULLET26\DEC-2006\SB-DEC-2 TAN-14 MK C.DEY + O.P> + SJ + DS 26-12-2006---27-12-2006 55
DE
CE
MB
ER
SE
BI B
ULLE
TIN
2006
55A
NN
EX
UR
ES
AN
D S
TA
TIS
TIC
AL
TA
BL
ES
Table 12: Turnover and Market Capitalisation at BSE and NSE, November 2006
(Rs. crore)
Date Turnover Market Capitalisation
BSE NSE BSE NSE
BSE BSE 100 Total A# B# S&P CNX Total C# D# BSE BSE 100 Total E# F# S&P CNX Total G# H#Sensex CNX Nifty Sensex CNX Nifty
Nifty Junior Nifty Junior
1 2 3 4 5 6 7 8 9 10 11 12 13 14 15 16 17 18 19 20 21
1-Nov-2006 846 1,595 4,114 20.56 38.77 3,545 844 7,754 45.71 10.89 8,29,156 11,22,194 33,88,946 24.47 33.11 18,71,998 3,17,464 31,55,702 59.32 10.06
2-Nov-2006 832 1,506 3,995 20.83 37.70 3,121 847 7,364 42.38 11.51 8,32,852 11,27,634 34,09,804 24.43 33.07 18,83,986 3,19,635 31,75,741 59.32 10.06
3-Nov-2006 881 1,673 4,034 21.84 41.46 3,314 904 7,347 45.10 12.31 8,35,375 11,29,534 34,22,009 24.41 33.01 18,91,031 3,20,612 31,87,045 59.33 10.06
6-Nov-2006 796 1,503 4,265 18.67 35.25 3,137 1,149 7,753 40.47 14.82 8,38,944 11,34,826 34,38,903 24.40 33.00 18,92,971 3,22,551 32,00,355 59.15 10.08
7-Nov-2006 851 1,685 4,738 17.97 35.57 3,596 1,404 9,067 39.66 15.48 8,37,021 11,32,344 34,35,123 24.37 32.96 18,87,862 3,22,587 31,94,822 59.09 10.10
8-Nov-2006 1,084 1,868 4,340 24.99 43.04 4,428 1,021 8,573 51.65 11.91 8,31,667 11,24,604 34,04,570 24.43 33.03 18,77,225 3,22,802 31,62,341 59.36 10.21
9-Nov-2006 1,027 1,689 4,236 24.25 39.86 3,934 771 7,837 50.20 9.83 8,35,801 11,31,258 34,24,210 24.41 33.04 18,86,725 3,23,123 31,79,557 59.34 10.16
10-Nov-2006 1,145 1,860 4,568 25.08 40.71 3,936 816 8,232 47.81 9.91 8,45,053 11,42,187 34,55,769 24.45 33.05 19,05,816 3,26,180 32,09,964 59.37 10.16
13-Nov-2006 628 1,294 3,943 15.94 32.80 2,739 751 6,744 40.61 11.14 8,52,439 11,61,271 34,85,236 24.46 33.32 19,17,767 3,28,368 32,39,461 59.20 10.14
14-Nov-2006 1,697 2,489 5,151 32.94 48.32 3,652 899 8,072 45.24 11.13 8,54,124 11,62,443 34,81,571 24.53 33.39 19,21,327 3,28,281 32,39,733 59.31 10.13
15-Nov-2006 858 1,884 5,115 16.77 36.83 3,512 978 8,769 40.05 11.16 8,56,916 11,66,999 34,92,504 24.54 33.41 19,28,781 3,31,424 32,51,450 59.32 10.19
16-Nov-2006 1,933 2,807 6,126 31.55 45.83 4,686 1,242 10,321 45.40 12.03 8,59,239 11,68,699 34,93,761 24.59 33.45 19,29,050 3,33,045 32,54,288 59.28 10.23
17-Nov-2006 1,029 1,795 4,495 22.90 39.94 4,195 855 8,720 48.10 9.80 8,54,378 11,60,327 34,62,692 24.67 33.51 19,17,101 3,25,812 32,24,404 59.46 10.10
20-Nov-2006 923 1,584 4,260 21.67 37.17 4,952 849 9,629 51.43 8.82 8,54,456 11,58,088 34,50,853 24.76 33.56 19,18,779 3,21,924 32,14,817 59.69 10.01
21-Nov-2006 877 1,541 4,595 19.09 33.54 3,907 768 9,099 42.94 8.44 8,66,293 11,75,959 35,09,949 24.68 33.50 19,49,694 3,27,918 33,08,231 58.93 9.91
22-Nov-2006 886 1,740 5,184 17.09 33.56 5,285 959 10,464 50.51 9.17 8,72,004 11,84,915 35,43,711 24.61 33.44 19,67,918 3,29,977 33,38,592 58.94 9.88
23-Nov-2006 765 1,732 5,556 13.77 31.17 4,001 867 8,885 45.03 9.76 8,70,368 11,84,797 35,47,664 24.53 33.40 19,63,319 3,30,424 33,41,494 58.76 9.89
24-Nov-2006 1,590 2,319 5,250 30.29 44.17 3,634 718 8,195 44.34 8.77 8,71,800 11,86,143 35,63,080 24.47 33.29 19,66,004 3,31,929 33,55,742 58.59 9.89
27-Nov-2006 506 1,452 4,451 11.37 32.63 3,351 568 7,973 42.02 7.12 8,76,270 11,90,995 35,86,717 24.43 33.21 19,75,016 3,33,364 33,83,540 58.37 9.85
28-Nov-2006 830 1,588 4,161 19.96 38.17 3,564 852 8,258 43.16 10.32 8,65,350 11,76,530 35,48,250 24.39 33.16 19,51,626 3,29,405 33,45,952 58.33 9.84
29-Nov-2006 742 1,228 4,409 16.82 27.85 3,171 533 8,084 39.22 6.59 8,66,290 11,77,438 35,60,164 24.33 33.07 19,54,893 3,29,387 33,57,112 58.23 9.81
30-Nov-2006 556 1,031 4,854 11.46 21.23 5,200 851 12,725 40.87 6.69 8,71,354 11,82,097 35,77,307 24.36 33.04 19,68,913 3,27,045 33,73,652 58.36 9.69
A# = % age share of Sensex securities in total BSE turnover. E# = % age share of Sensex securities in total BSE Market Capitalisation.
B# = % age share of BSE-100 Index securities in total BSE turnover. F# = % age share of BSE-100 Index securities in total BSE Market Capitalisation.
C# = % age share of S&P CNX Nifty securities in total NSE turnover. G# = % age share of S&P CNX Nifty securities in total NSE Market Capitalisation.
D# = % age share of CNX Nifty Junior securities in total NSE turnover. H# = % age share of CNX Nifty Junior securities in total NSE Market Capitalisation.
BSE-100 index shifted to free-float methodology w.e.f. April 5, 2004
Source: BSE, NSE
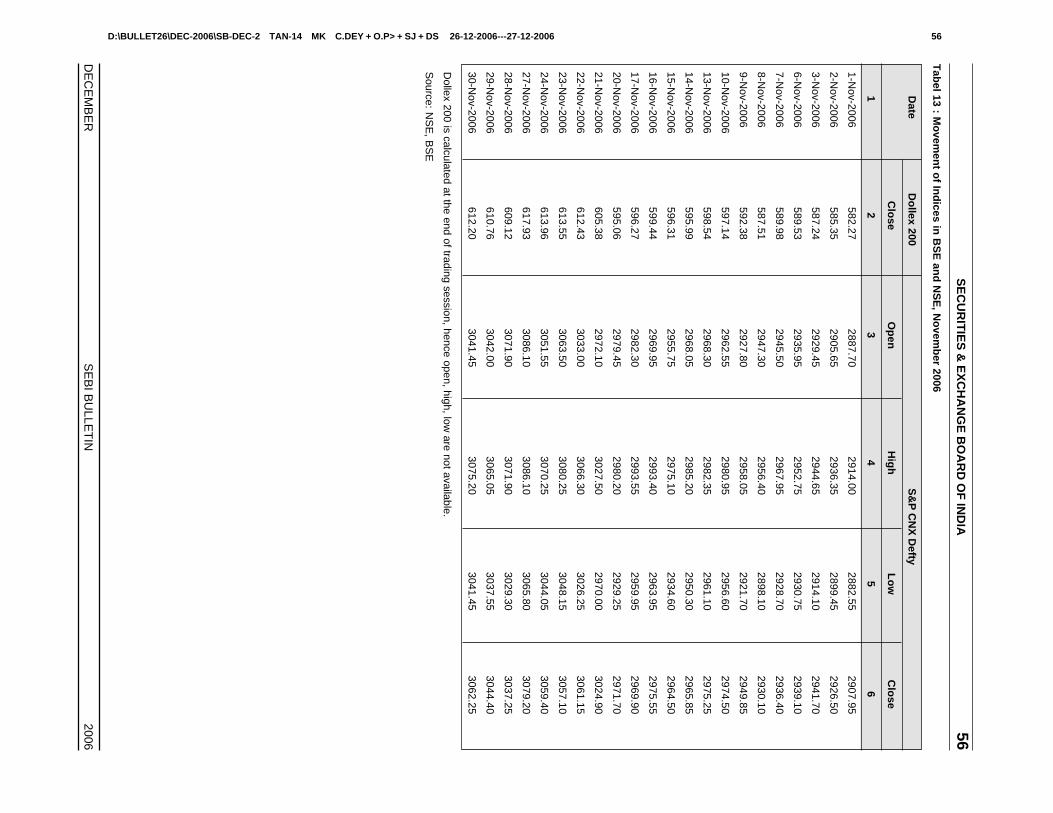
D:\BULLET26\DEC-2006\SB-DEC-2 TAN-14 MK C.DEY + O.P> + SJ + DS 26-12-2006---27-12-2006 56
DE
CE
MB
ER
SE
BI B
ULLE
TIN
2006
SE
CU
RIT
IES
& E
XC
HA
NG
E B
OA
RD
OF
IND
IA56
Tab
el 13 : Mo
vemen
t of In
dices in
BS
E an
d N
SE
, No
vemb
er 2006
Date
Do
llex 200S
&P
CN
X D
efty
Clo
seO
pen
Hig
hL
ow
Clo
se
12
34
56
1-Nov-2006
582.272887.70
2914.002882.55
2907.95
2-Nov-2006
585.352905.65
2936.352899.45
2926.50
3-Nov-2006
587.242929.45
2944.652914.10
2941.70
6-Nov-2006
589.532935.95
2952.752930.75
2939.10
7-Nov-2006
589.982945.50
2967.952928.70
2936.40
8-Nov-2006
587.512947.30
2956.402898.10
2930.10
9-Nov-2006
592.382927.80
2958.052921.70
2949.85
10-Nov-2006
597.142962.55
2980.952956.60
2974.50
13-Nov-2006
598.542968.30
2982.352961.10
2975.25
14-Nov-2006
595.992968.05
2985.202950.30
2965.85
15-Nov-2006
596.312955.75
2975.102934.60
2964.50
16-Nov-2006
599.442969.95
2993.402963.95
2975.55
17-Nov-2006
596.272982.30
2993.552959.95
2969.90
20-Nov-2006
595.062979.45
2980.202929.25
2971.70
21-Nov-2006
605.382972.10
3027.502970.00
3024.90
22-Nov-2006
612.433033.00
3066.303026.25
3061.15
23-Nov-2006
613.553063.50
3080.253048.15
3057.10
24-Nov-2006
613.963051.55
3070.253044.05
3059.40
27-Nov-2006
617.933086.10
3086.103065.80
3079.20
28-Nov-2006
609.123071.90
3071.903029.30
3037.25
29-Nov-2006
610.763042.00
3065.053037.55
3044.40
30-Nov-2006
612.203041.45
3075.203041.45
3062.25
Dollex 200 is calculated at the end of trading session, hence open, high, low
are not available.
Source: N
SE
, BS
E
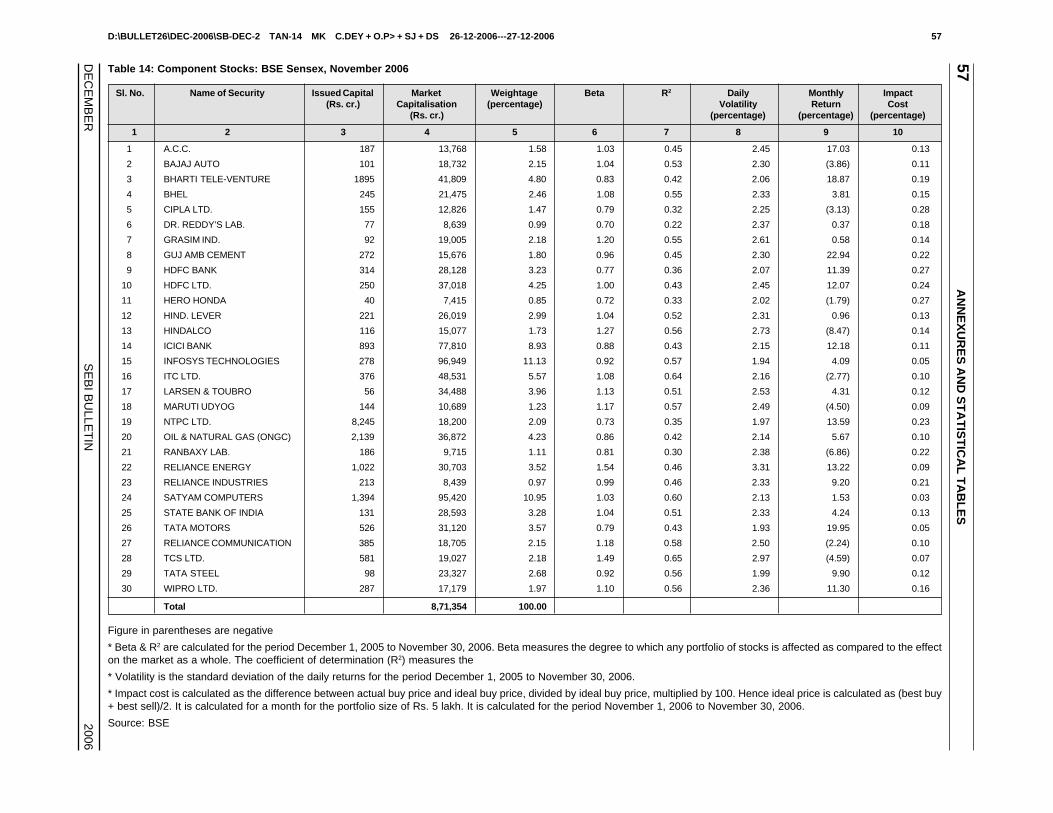
D:\BULLET26\DEC-2006\SB-DEC-2 TAN-14 MK C.DEY + O.P> + SJ + DS 26-12-2006---27-12-2006 57
DE
CE
MB
ER
SE
BI B
ULLE
TIN
2006
57A
NN
EX
UR
ES
AN
D S
TA
TIS
TIC
AL
TA
BL
ES
Table 14: Component Stocks: BSE Sensex, November 2006
Sl. No. Name of Security Issued Capital Market Weightage Beta R2 Daily Monthly Impact(Rs. cr.) Capitalisation (percentage) Volatility Return Cost
(Rs. cr.) (percentage) (percentage) (percentage)
1 2 3 4 5 6 7 8 9 10
1 A.C.C. 187 13,768 1.58 1.03 0.45 2.45 17.03 0.13
2 BAJAJ AUTO 101 18,732 2.15 1.04 0.53 2.30 (3.86) 0.11
3 BHARTI TELE-VENTURE 1895 41,809 4.80 0.83 0.42 2.06 18.87 0.19
4 BHEL 245 21,475 2.46 1.08 0.55 2.33 3.81 0.15
5 CIPLA LTD. 155 12,826 1.47 0.79 0.32 2.25 (3.13) 0.28
6 DR. REDDY’S LAB. 77 8,639 0.99 0.70 0.22 2.37 0.37 0.18
7 GRASIM IND. 92 19,005 2.18 1.20 0.55 2.61 0.58 0.14
8 GUJ AMB CEMENT 272 15,676 1.80 0.96 0.45 2.30 22.94 0.22
9 HDFC BANK 314 28,128 3.23 0.77 0.36 2.07 11.39 0.27
10 HDFC LTD. 250 37,018 4.25 1.00 0.43 2.45 12.07 0.24
11 HERO HONDA 40 7,415 0.85 0.72 0.33 2.02 (1.79) 0.27
12 HIND. LEVER 221 26,019 2.99 1.04 0.52 2.31 0.96 0.13
13 HINDALCO 116 15,077 1.73 1.27 0.56 2.73 (8.47) 0.14
14 ICICI BANK 893 77,810 8.93 0.88 0.43 2.15 12.18 0.11
15 INFOSYS TECHNOLOGIES 278 96,949 11.13 0.92 0.57 1.94 4.09 0.05
16 ITC LTD. 376 48,531 5.57 1.08 0.64 2.16 (2.77) 0.10
17 LARSEN & TOUBRO 56 34,488 3.96 1.13 0.51 2.53 4.31 0.12
18 MARUTI UDYOG 144 10,689 1.23 1.17 0.57 2.49 (4.50) 0.09
19 NTPC LTD. 8,245 18,200 2.09 0.73 0.35 1.97 13.59 0.23
20 OIL & NATURAL GAS (ONGC) 2,139 36,872 4.23 0.86 0.42 2.14 5.67 0.10
21 RANBAXY LAB. 186 9,715 1.11 0.81 0.30 2.38 (6.86) 0.22
22 RELIANCE ENERGY 1,022 30,703 3.52 1.54 0.46 3.31 13.22 0.09
23 RELIANCE INDUSTRIES 213 8,439 0.97 0.99 0.46 2.33 9.20 0.21
24 SATYAM COMPUTERS 1,394 95,420 10.95 1.03 0.60 2.13 1.53 0.03
25 STATE BANK OF INDIA 131 28,593 3.28 1.04 0.51 2.33 4.24 0.13
26 TATA MOTORS 526 31,120 3.57 0.79 0.43 1.93 19.95 0.05
27 RELIANCE COMMUNICATION 385 18,705 2.15 1.18 0.58 2.50 (2.24) 0.10
28 TCS LTD. 581 19,027 2.18 1.49 0.65 2.97 (4.59) 0.07
29 TATA STEEL 98 23,327 2.68 0.92 0.56 1.99 9.90 0.12
30 WIPRO LTD. 287 17,179 1.97 1.10 0.56 2.36 11.30 0.16
Total 8,71,354 100.00
Figure in parentheses are negative
* Beta & R2 are calculated for the period December 1, 2005 to November 30, 2006. Beta measures the degree to which any portfolio of stocks is affected as compared to the effecton the market as a whole. The coefficient of determination (R2) measures the
* Volatility is the standard deviation of the daily returns for the period December 1, 2005 to November 30, 2006.
* Impact cost is calculated as the difference between actual buy price and ideal buy price, divided by ideal buy price, multiplied by 100. Hence ideal price is calculated as (best buy+ best sell)/2. It is calculated for a month for the portfolio size of Rs. 5 lakh. It is calculated for the period November 1, 2006 to November 30, 2006.
Source: BSE
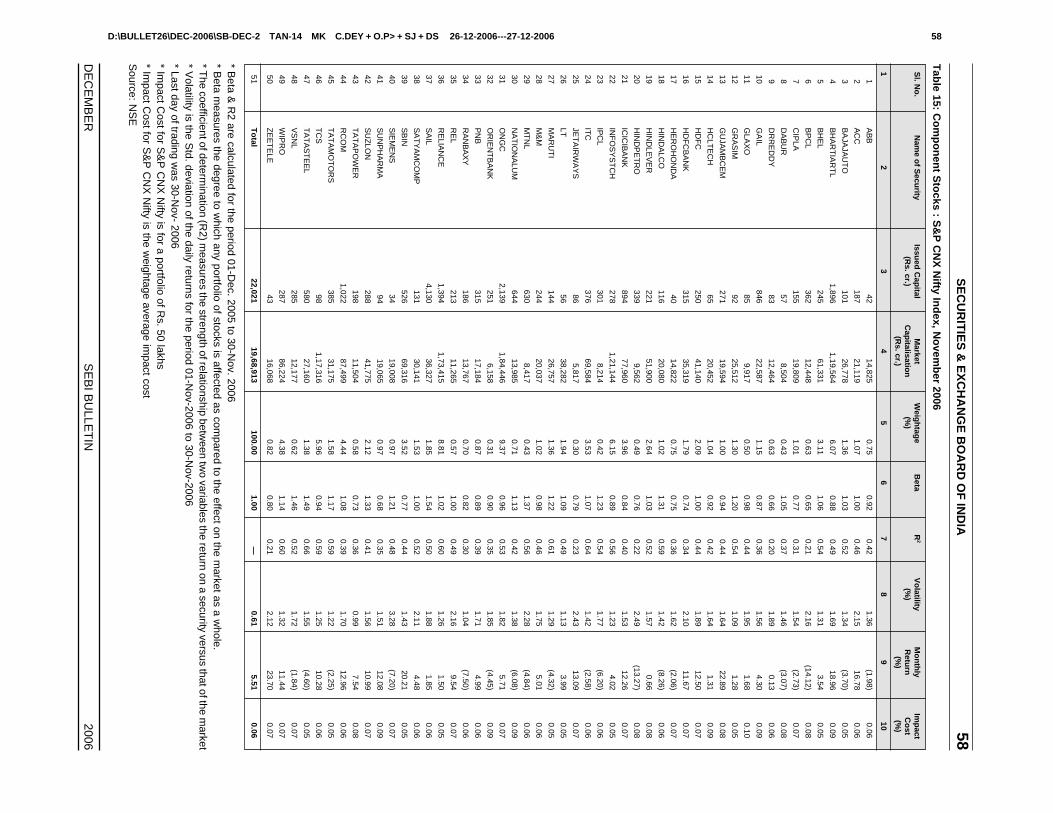
D:\BULLET26\DEC-2006\SB-DEC-2 TAN-14 MK C.DEY + O.P> + SJ + DS 26-12-2006---27-12-2006 58
DE
CE
MB
ER
SE
BI B
ULLE
TIN
2006
SE
CU
RIT
IES
& E
XC
HA
NG
E B
OA
RD
OF
IND
IA58
Tab
le 15: Co
mp
on
ent S
tocks : S
&P
CN
X N
ifty Ind
ex, No
vemb
er 2006
Sl. N
o.
Nam
e of S
ecurity
Issued
Cap
italM
arketW
eigh
tage
Beta
R2
Vo
latilityM
on
thly
Imp
act(R
s. cr.)C
apitalisatio
n(%
)(%
)R
eturn
Co
st(R
s. cr.)(%
)(%
)
12
34
56
78
910
1A
BB
42 14,825
0.750.92
0.421.36
(1.98)0.06
2A
CC
187 21,119
1.071.00
0.462.15
16.780.06
3B
AJA
JAU
TO
101 26,778
1.361.03
0.521.34
(3.70)0.05
4B
HA
RT
IAR
TL
1,896 1,19,564
6.070.88
0.491.69
18.960.09
5B
HE
L245
61,3313.11
1.060.54
1.31 3.54
0.05
6B
PC
L362
12,4480.63
0.650.21
2.16 (14.12)
0.08
7C
IPLA
155 19,809
1.010.77
0.311.54
(2.73)0.07
8D
AB
UR
57 8,504
0.431.05
0.371.46
(3.07)0.08
9D
RR
ED
DY
83 12,464
0.630.66
0.201.89
0.130.06
10G
AIL
846 22,587
1.150.87
0.361.56
4.300.09
11G
LAX
O85
9,9170.50
0.980.44
1.95 1.68
0.10
12G
RA
SIM
92 25,512
1.301.20
0.541.09
1.280.05
13G
UJA
MB
CE
M271
19,5941.00
0.940.44
1.64 22.89
0.08
14H
CLT
EC
H65
20,4521.04
0.920.42
1.64 1.31
0.09
15H
DF
C250
41,1402.09
1.000.44
1.89 12.50
0.07
16H
DF
CB
AN
K315
35,3191.79
0.740.34
2.10 11.67
0.07
17H
ER
OH
ON
DA
40 14,822
0.750.75
0.361.62
(2.06)0.07
18H
IND
ALC
O116
20,0801.02
1.310.59
1.42 (8.26)
0.06
19H
IND
LEV
ER
221 51,900
2.641.03
0.521.57
0.660.08
20H
IND
PE
TR
O339
9,5620.49
0.760.22
2.49 (13.27)
0.08
21IC
ICIB
AN
K894
77,9603.96
0.840.40
1.53 12.26
0.07
22IN
FO
SY
ST
CH
278 1,21,144
6.150.89
0.561.23
4.020.05
23IP
CL
301 8,214
0.421.23
0.541.77
(6.20)0.06
24IT
C376
69,5843.53
1.070.64
1.42 (2.58)
0.06
25JE
TA
IRW
AY
S86
5,8170.30
0.790.23
2.43 13.09
0.07
26LT
56 38,282
1.941.09
0.491.13
3.990.05
27M
AR
UT
I144
26,7571.36
1.220.61
1.29 (4.32)
0.05
28M
&M
244 20,037
1.020.98
0.461.75
5.010.06
29M
TN
L630
8,4170.43
1.370.56
2.28 (4.84)
0.06
30N
AT
ION
ALU
M644
13,9850.71
1.130.42
1.38 (6.08)
0.09
31O
NG
C2,139
1,84,4469.37
0.960.53
1.82 5.71
0.07
32O
RIE
NT
BA
NK
251 6,158
0.310.90
0.351.85
(4.45)0.09
33P
NB
315 17,184
0.870.89
0.391.71
4.990.06
34R
AN
BA
XY
186 13,767
0.700.82
0.301.04
(7.50)0.06
35R
EL
213 11,265
0.571.00
0.492.16
9.540.07
36R
ELIA
NC
E1,394
1,73,4158.81
1.020.60
1.26 1.50
0.05
37S
AIL
4,130 36,327
1.851.54
0.501.88
1.850.06
38S
AT
YA
MC
OM
P131
30,1411.53
1.000.52
2.11 4.48
0.06
39S
BIN
526 69,316
3.520.77
0.441.43
20.210.05
40S
IEM
EN
S34
19,0080.97
1.210.48
3.28 (7.20)
0.07
41S
UN
PH
AR
MA
94 19,065
0.970.68
0.351.51
12.080.09
42S
UZ
LON
288 41,775
2.121.33
0.411.56
10.990.07
43T
AT
AP
OW
ER
198 11,504
0.580.73
0.360.99
7.540.08
44R
CO
M1,022
87,4994.44
1.080.39
1.70 12.96
0.06
45T
AT
AM
OT
OR
S385
31,1751.58
1.170.59
1.22 (2.25)
0.05
46T
CS
98 1,17,316
5.960.94
0.591.25
10.280.06
47T
AT
AS
TE
EL
580 27,160
1.381.49
0.661.55
(4.60)0.05
48V
SN
L285
12,1770.62
1.460.52
1.72 (1.84)
0.07
49W
IPR
O287
86,2244.38
1.140.60
1.32 11.44
0.07
50Z
EE
TE
LE43
16,0680.82
0.800.21
2.12 23.70
0.07
51T
otal
22,02119,68,913
100.001.00
—0.61
5.510.06
* Beta &
R2 are calculated for the period 01-D
ec. 2005 to 30-Nov. 2006
* Beta m
easures the degree to which any portfolio of stocks is affected as com
pared to the effect on the market as a w
hole.* T
he coefficient of determination (R
2) measures the strength of relationship betw
een two variables the return on a security versus that of the m
arket* V
olatility is the Std. deviation of the daily returns for the period 01-N
ov-2006 to 30-Nov-2006
* Last day of trading was 30-N
ov- 2006* Im
pact Cost for S
&P
CN
X N
ifty is for a portfolio of Rs. 50 lakhs
* Impact C
ost for S&
P C
NX
Nifty is the w
eightage average impact cost
Source: N
SE

D:\BULLET26\DEC-2006\SB-DEC-2 TAN-14 MK C.DEY + O.P> + SJ + DS 26-12-2006---27-12-2006 59
DE
CE
MB
ER
SE
BI B
ULLE
TIN
2006
59A
NN
EX
UR
ES
AN
D S
TA
TIS
TIC
AL
TA
BL
ES
Table 16: Volatility* of Major Indices
(per cent)
Month/Year BSE Sensex BSE-100 Dollex-200 S&P CNX CNX Nifty S&P CNXIndex Nifty Junior Defty
1 2 3 4 5 6 7
2001-02 1.50 1.60 1.62 1.40 1.58 1.42
2002-03 1.01 0.99 0.98 0.99 1.23 0.99
2003-04 1.35 1.51 1.52 1.43 1.57 1.46
2004-05 1.48 1.50 1.73 1.61 1.83 1.70
2005-06 1.03 0.98 0.99 1.04 1.13 1.44
Apr-05 1.29 1.19 1.14 1.23 1.17 1.26
May-05 0.63 0.59 0.61 0.66 0.84 0.73
Jun-05 0.76 0.67 0.68 0.73 0.77 0.75
Jul-05 0.91 0.86 0.88 0.94 1.01 0.98
Aug-05 0.95 0.96 0.94 0.98 1.15 0.98
Sep-05 1.10 1.14 1.18 1.19 1.56 1.19
Oct-05 1.39 1.37 1.41 1.51 1.37 1.50
Nov-05 0.98 0.90 0.81 0.95 0.88 0.94
Dec-05 1.09 1.08 1.06 1.09 1.24 1.08
Jan-06 1.01 0.95 0.96 0.93 1.18 0.98
Feb-06 0.90 0.80 0.82 0.81 1.03 0.84
Mar-06 0.88 0.83 0.88 0.93 0.95 3.49
2006-07 (so far)
Apr-06 1.64 1.58 1.59 1.67 1.59 1.76
May-06 2.55 2.72 2.95 2.73 3.26 3.02
Jun-06 3.25 3.34 3.50 3.23 4.15 3.38
Jul-06 1.97 1.88 1.96 1.93 1.78 2.05
Aug-06 0.67 0.69 0.70 0.72 1.01 0.70
Sep-06 1.04 1.06 1.16 1.06 1.31 1.14
Oct-06 0.94 0.86 0.90 0.93 0.88 1.00
Nov-06 0.58 0.60 0.66 0.61 0.87 0.64
* Volatility is calculated as the standard deviation of the natural log of returns in indices for the respective period.
Source: BSE, NSE.
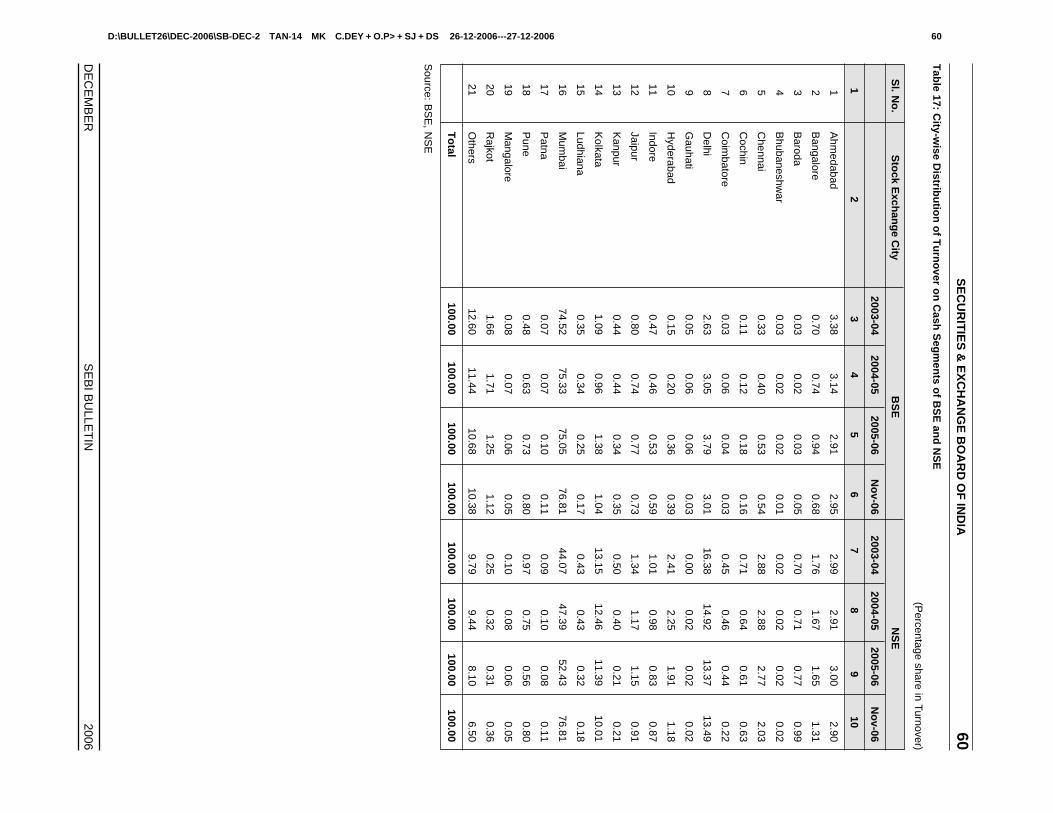
D:\BULLET26\DEC-2006\SB-DEC-2 TAN-14 MK C.DEY + O.P> + SJ + DS 26-12-2006---27-12-2006 60
DE
CE
MB
ER
SE
BI B
ULLE
TIN
2006
SE
CU
RIT
IES
& E
XC
HA
NG
E B
OA
RD
OF
IND
IA60
Tab
le 17: City-w
ise Distrib
utio
n o
f Tu
rno
ver on
Cash
Seg
men
ts of B
SE
and
NS
E
(Percentage share in T
urnover)
Sl. N
o.
Sto
ck Exch
ang
e City
BS
EN
SE
2003-042004-05
2005-06N
ov-06
2003-042004-05
2005-06N
ov-06
12
34
56
78
910
1A
hmedabad
3.383.14
2.912.95
2.992.91
3.002.90
2B
angalore0.70
0.740.94
0.681.76
1.671.65
1.31
3B
aroda0.03
0.020.03
0.050.70
0.710.77
0.99
4B
hubaneshwar
0.030.02
0.020.01
0.020.02
0.020.02
5C
hennai0.33
0.400.53
0.542.88
2.882.77
2.03
6C
ochin0.11
0.120.18
0.160.71
0.640.61
0.63
7C
oimbatore
0.030.06
0.040.03
0.450.46
0.440.22
8D
elhi2.63
3.053.79
3.0116.38
14.9213.37
13.49
9G
auhati0.05
0.060.06
0.030.00
0.020.02
0.02
10H
yderabad0.15
0.200.36
0.392.41
2.251.91
1.18
11Indore
0.470.46
0.530.59
1.010.98
0.830.87
12Jaipur
0.800.74
0.770.73
1.341.17
1.150.91
13K
anpur0.44
0.440.34
0.350.50
0.400.21
0.21
14K
olkata1.09
0.961.38
1.0413.15
12.4611.39
10.01
15Ludhiana
0.350.34
0.250.17
0.430.43
0.320.18
16M
umbai
74.5275.33
75.0576.81
44.0747.39
52.4376.81
17P
atna0.07
0.070.10
0.110.09
0.100.08
0.11
18P
une0.48
0.630.73
0.800.97
0.750.56
0.80
19M
angalore0.08
0.070.06
0.050.10
0.080.06
0.05
20R
ajkot1.66
1.711.25
1.120.25
0.320.31
0.36
21O
thers12.60
11.4410.68
10.389.79
9.448.10
6.50
To
tal100.00
100.00100.00
100.00100.00
100.00100.00
100.00
Source: B
SE
, NS
E
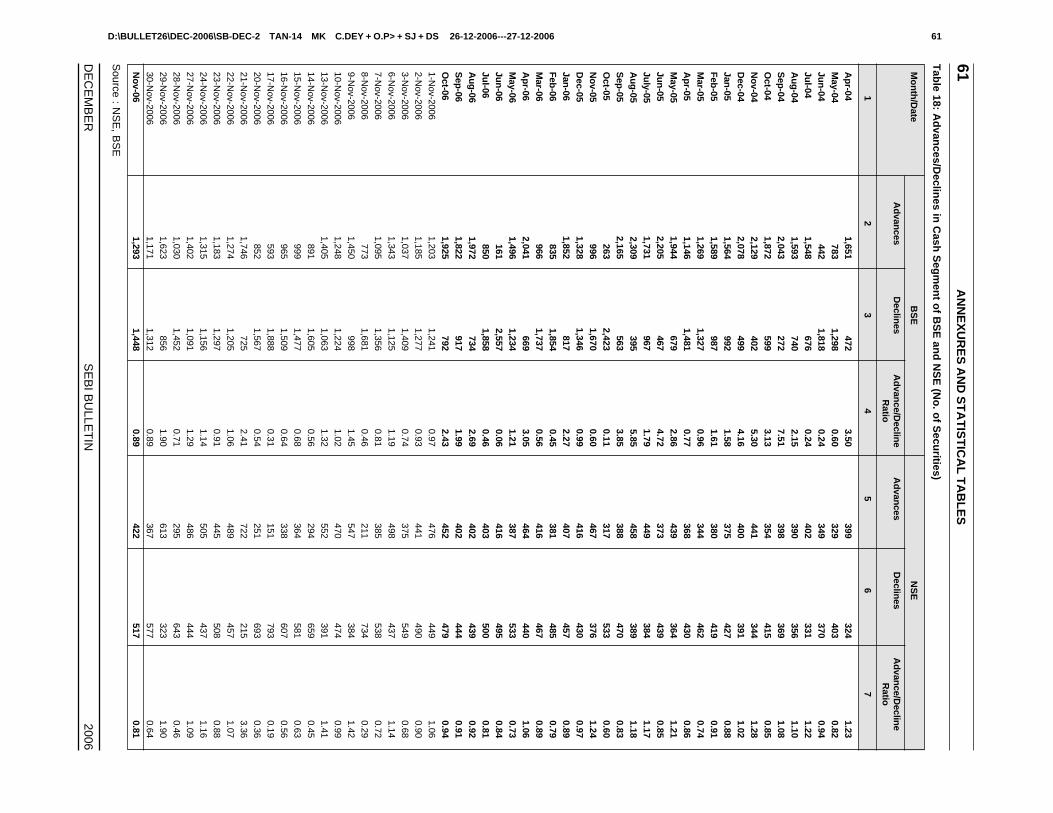
D:\BULLET26\DEC-2006\SB-DEC-2 TAN-14 MK C.DEY + O.P> + SJ + DS 26-12-2006---27-12-2006 61
DE
CE
MB
ER
SE
BI B
ULLE
TIN
2006
61A
NN
EX
UR
ES
AN
D S
TA
TIS
TIC
AL
TA
BL
ES
Tab
le 18: Ad
vances/D
eclines in
Cash
Seg
men
t of B
SE
and
NS
E (N
o. o
f Secu
rities)
Mo
nth
/Date
BS
EN
SE
Ad
vances
Declin
esA
dvan
ce/Declin
eA
dvan
cesD
eclines
Ad
vance/D
ecline
Ratio
Ratio
12
34
56
7
Ap
r-041,651
4723.50
399324
1.23M
ay-04783
1,2980.60
329403
0.82Ju
n-04
4421,818
0.24349
3700.94
Jul-04
1,548676
0.24402
3311.22
Au
g-04
1,593740
2.15390
3561.10
Sep
-042,043
2727.51
398369
1.08O
ct-041,872
5993.13
354415
0.85N
ov-04
2,129402
5.30441
3441.28
Dec-04
2,078499
4.16400
3911.02
Jan-05
1,564992
1.58375
4270.88
Feb
-051,589
9871.61
380419
0.91M
ar-051,269
1,3270.96
344462
0.74A
pr-05
1,1461,481
0.77368
4300.86
May-05
1,944679
2.86439
3641.21
Jun
-05 2,205
4674.72
373439
0.85Ju
ly-05 1,731
9671.79
449384
1.17A
ug
-052,309
3955.85
458389
1.18S
ep-05
2,165563
3.85388
4700.83
Oct-05
263 2,423
0.11317
5330.60
No
v-05 996
1,6700.60
467376
1.24D
ec-05 1,328
1,3460.99
416430
0.97Jan
-06 1,852
8172.27
407457
0.89F
eb-06
8351,854
0.45381
4850.79
Mar-06
9661,737
0.56416
4670.89
Ap
r-062,041
6693.05
464440
1.06M
ay-061,496
1,2341.21
387533
0.73Ju
n-06
1612,557
0.06416
4950.84
Jul-06
8501,858
0.46403
5000.81
Au
g-06
1,972734
2.69402
4390.92
Sep
-061,822
9171.99
402444
0.91O
ct-061,925
7922.43
452479
0.941-N
ov-20061,203
1,2410.97
476449
1.062-N
ov-20061,185
1,2770.93
441490
0.903-N
ov-20061,037
1,4090.74
375549
0.686-N
ov-20061,343
1,1251.19
498437
1.14
7-Nov-2006
1,0951,356
0.81385
5380.72
8-Nov-2006
7731,681
0.46211
7340.29
9-Nov-2006
1,450998
1.45547
3841.42
10-Nov-2006
1,2481,224
1.02470
4740.99
13-Nov-2006
1,4051,063
1.32552
3911.41
14-Nov-2006
8911,605
0.56294
6590.45
15-Nov-2006
9991,477
0.68364
5810.63
16-Nov-2006
9651,509
0.64338
6070.56
17-Nov-2006
5931,888
0.31151
7930.19
20-Nov-2006
8521,567
0.54251
6930.36
21-Nov-2006
1,746725
2.41722
2153.36
22-Nov-2006
1,2741,205
1.06489
4571.07
23-Nov-2006
1,1831,297
0.91445
5080.88
24-Nov-2006
1,3151,156
1.14505
4371.16
27-Nov-2006
1,4021,091
1.29486
4441.09
28-Nov-2006
1,0301,452
0.71295
6430.46
29-Nov-2006
1,623856
1.90613
3231.90
30-Nov-2006
1,1711,312
0.89367
5770.64
No
v-061,293
1,4480.89
422517
0.81
Source : N
SE
, BS
E
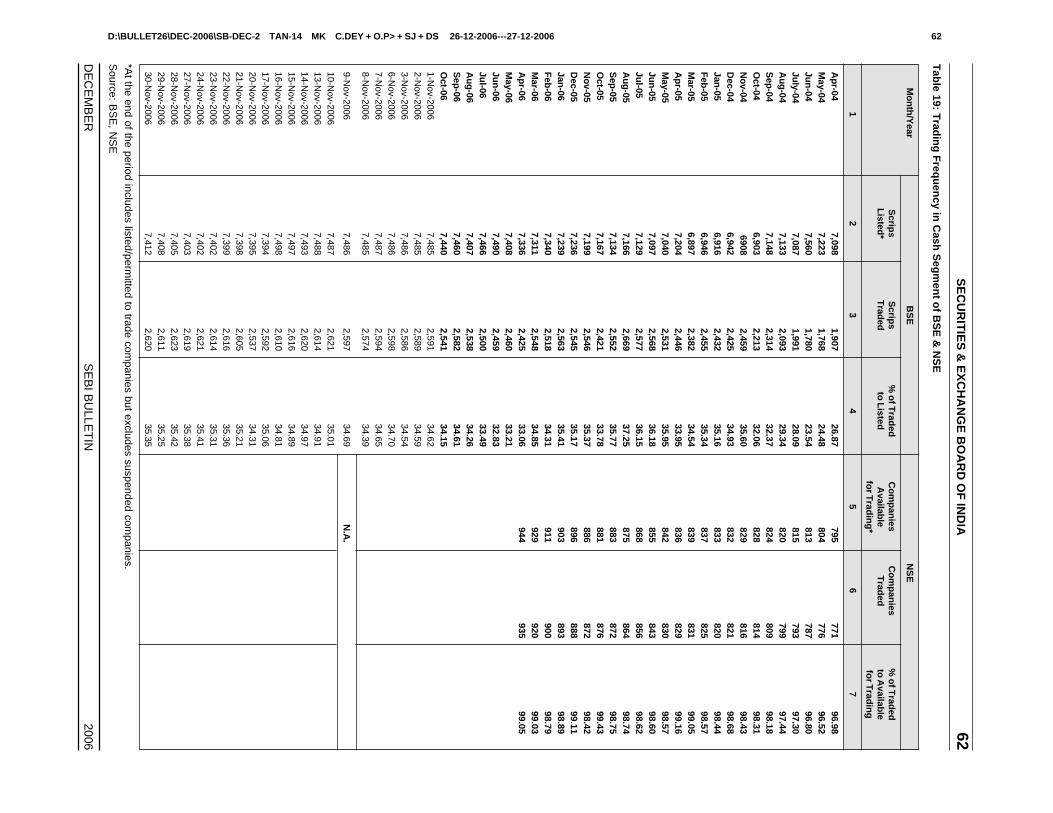
D:\BULLET26\DEC-2006\SB-DEC-2 TAN-14 MK C.DEY + O.P> + SJ + DS 26-12-2006---27-12-2006 62
DE
CE
MB
ER
SE
BI B
ULLE
TIN
2006
SE
CU
RIT
IES
& E
XC
HA
NG
E B
OA
RD
OF
IND
IA62
Tab
le 19: Trad
ing
Freq
uen
cy in C
ash S
egm
ent o
f BS
E &
NS
E
Mo
nth
/Year
BS
EN
SE
Scrip
sS
crips
% o
f Trad
edC
om
pan
iesC
om
pan
ies%
of T
raded
Listed
*T
raded
to L
istedA
vailable
Trad
edto
Availab
lefo
r Trad
ing
*fo
r Trad
ing
12
34
56
7
Ap
r-047,098
1,90726.87
795771
96.98M
ay-047,223
1,76824.48
804776
96.52Ju
n-04
7,5601,780
23.54813
78796.80
July-04
7,0871,991
28.09815
79397.30
Au
g-04
7,1332,093
29.34820
79997.44
Sep
-047,148
2,31432.37
824809
98.18O
ct-046,903
2,21332.06
828814
98.31N
ov-04
69082,459
35.60829
81698.43
Dec-04
6,9422,425
34.93832
82198.68
Jan-05
6,9162,432
35.16833
82098.44
Feb
-056,946
2,45535.34
837825
98.57M
ar-056,897
2,38234.54
839831
99.05A
pr-05
7,2042,446
33.95836
82999.16
May-05
7,0402,531
35.95842
83098.57
Jun
-057,097
2,56836.18
855843
98.60Ju
l-057,129
2,57736.15
868856
98.62A
ug
-057,166
2,66937.25
875864
98.74S
ep-05
7,1342,552
35.77883
87298.75
Oct-05
7,1672,421
33.78881
87699.43
No
v-057,199
2,54635.37
886872
98.42D
ec-057,236
2,54535.17
896888
99.11Jan
-067,239
2,56335.41
903893
98.89F
eb-06
7,3402,518
34.31911
90098.79
Mar-06
7,3112,548
34.85929
92099.03
Ap
r-067,336
2,42533.06
944935
99.05M
ay-067,408
2,46033.21
Jun
-067,490
2,45932.83
Jul-06
7,4662,500
33.49A
ug
-067,407
2,53834.26
Sep
-067,460
2,58234.61
Oct-06
7,4402,541
34.151-N
ov-20067,485
2,59134.62
2-Nov-2006
7,4852,589
34.593-N
ov-20067,486
2,58634.54
6-Nov-2006
7,4862,598
34.707-N
ov-20067,487
2,59434.65
8-Nov-2006
7,4852,574
34.39
9-Nov-2006
7,4862,597
34.69N
.A.
10-Nov-2006
7,4872,621
35.0113-N
ov-20067,488
2,61434.91
14-Nov-2006
7,4932,620
34.9715-N
ov-20067,497
2,61634.89
16-Nov-2006
7,4982,610
34.8117-N
ov-20067,394
2,59235.06
20-Nov-2006
7,3952,537
34.3121-N
ov-20067,398
2,60535.21
22-Nov-2006
7,3992,616
35.3623-N
ov-20067,402
2,61435.31
24-Nov-2006
7,4022,621
35.4127-N
ov-20067,403
2,61935.38
28-Nov-2006
7,4052,623
35.4229-N
ov-20067,408
2,61135.25
30-Nov-2006
7,4122,620
35.35
*At the end of the period includes listed/perm
itted to trade companies but excludes suspended com
panies.
Source: B
SE
, NS
E
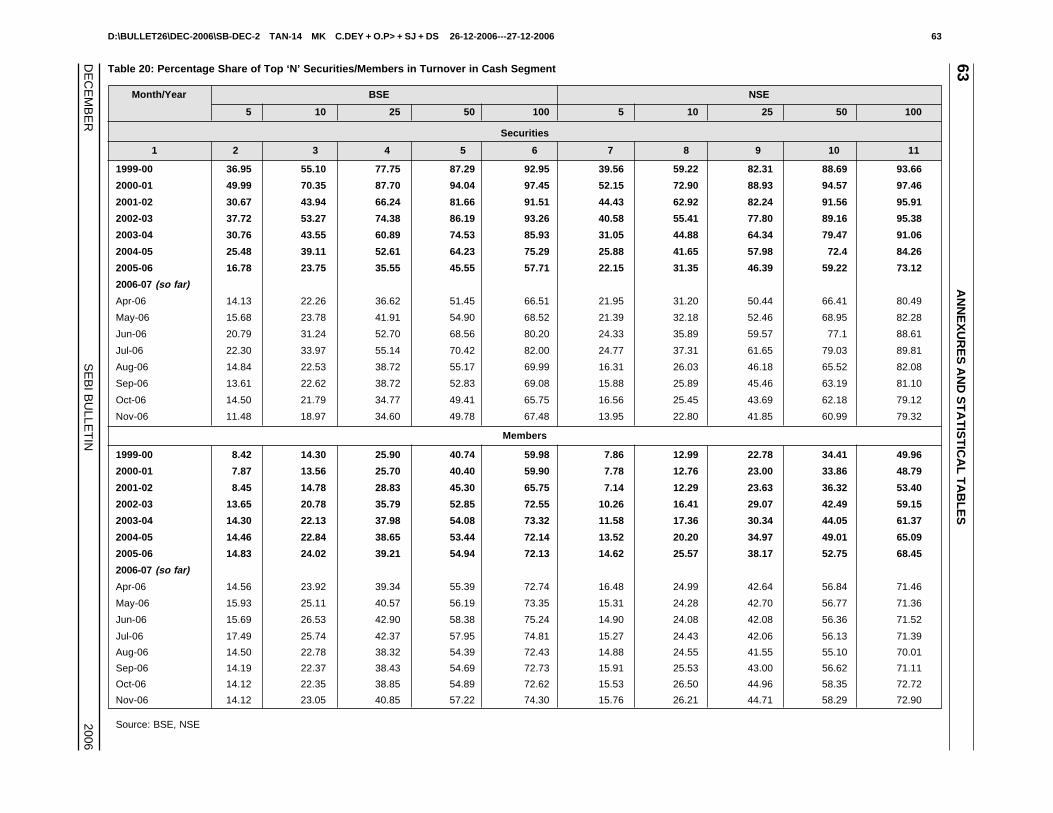
D:\BULLET26\DEC-2006\SB-DEC-2 TAN-14 MK C.DEY + O.P> + SJ + DS 26-12-2006---27-12-2006 63
DE
CE
MB
ER
SE
BI B
ULLE
TIN
2006
63A
NN
EX
UR
ES
AN
D S
TA
TIS
TIC
AL
TA
BL
ES
Table 20: Percentage Share of Top ‘N’ Securities/Members in Turnover in Cash Segment
Month/Year BSE NSE
5 10 25 50 100 5 10 25 50 100
Securities
1 2 3 4 5 6 7 8 9 10 11
1999-00 36.95 55.10 77.75 87.29 92.95 39.56 59.22 82.31 88.69 93.66
2000-01 49.99 70.35 87.70 94.04 97.45 52.15 72.90 88.93 94.57 97.46
2001-02 30.67 43.94 66.24 81.66 91.51 44.43 62.92 82.24 91.56 95.91
2002-03 37.72 53.27 74.38 86.19 93.26 40.58 55.41 77.80 89.16 95.38
2003-04 30.76 43.55 60.89 74.53 85.93 31.05 44.88 64.34 79.47 91.06
2004-05 25.48 39.11 52.61 64.23 75.29 25.88 41.65 57.98 72.4 84.26
2005-06 16.78 23.75 35.55 45.55 57.71 22.15 31.35 46.39 59.22 73.12
2006-07 (so far)
Apr-06 14.13 22.26 36.62 51.45 66.51 21.95 31.20 50.44 66.41 80.49
May-06 15.68 23.78 41.91 54.90 68.52 21.39 32.18 52.46 68.95 82.28
Jun-06 20.79 31.24 52.70 68.56 80.20 24.33 35.89 59.57 77.1 88.61
Jul-06 22.30 33.97 55.14 70.42 82.00 24.77 37.31 61.65 79.03 89.81
Aug-06 14.84 22.53 38.72 55.17 69.99 16.31 26.03 46.18 65.52 82.08
Sep-06 13.61 22.62 38.72 52.83 69.08 15.88 25.89 45.46 63.19 81.10
Oct-06 14.50 21.79 34.77 49.41 65.75 16.56 25.45 43.69 62.18 79.12
Nov-06 11.48 18.97 34.60 49.78 67.48 13.95 22.80 41.85 60.99 79.32
Members
1999-00 8.42 14.30 25.90 40.74 59.98 7.86 12.99 22.78 34.41 49.96
2000-01 7.87 13.56 25.70 40.40 59.90 7.78 12.76 23.00 33.86 48.79
2001-02 8.45 14.78 28.83 45.30 65.75 7.14 12.29 23.63 36.32 53.40
2002-03 13.65 20.78 35.79 52.85 72.55 10.26 16.41 29.07 42.49 59.15
2003-04 14.30 22.13 37.98 54.08 73.32 11.58 17.36 30.34 44.05 61.37
2004-05 14.46 22.84 38.65 53.44 72.14 13.52 20.20 34.97 49.01 65.09
2005-06 14.83 24.02 39.21 54.94 72.13 14.62 25.57 38.17 52.75 68.45
2006-07 (so far)
Apr-06 14.56 23.92 39.34 55.39 72.74 16.48 24.99 42.64 56.84 71.46
May-06 15.93 25.11 40.57 56.19 73.35 15.31 24.28 42.70 56.77 71.36
Jun-06 15.69 26.53 42.90 58.38 75.24 14.90 24.08 42.08 56.36 71.52
Jul-06 17.49 25.74 42.37 57.95 74.81 15.27 24.43 42.06 56.13 71.39
Aug-06 14.50 22.78 38.32 54.39 72.43 14.88 24.55 41.55 55.10 70.01
Sep-06 14.19 22.37 38.43 54.69 72.73 15.91 25.53 43.00 56.62 71.11
Oct-06 14.12 22.35 38.85 54.89 72.62 15.53 26.50 44.96 58.35 72.72
Nov-06 14.12 23.05 40.85 57.22 74.30 15.76 26.21 44.71 58.29 72.90
Source: BSE, NSE
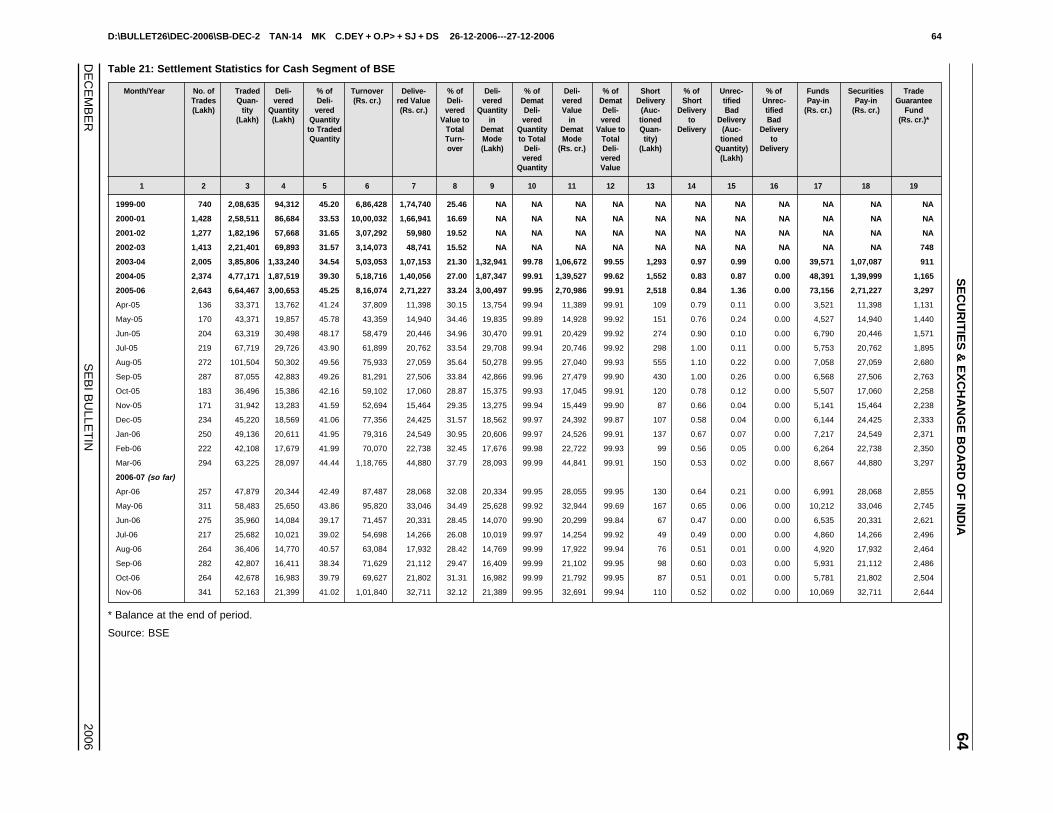
D:\BULLET26\DEC-2006\SB-DEC-2 TAN-14 MK C.DEY + O.P> + SJ + DS 26-12-2006---27-12-2006 64
DE
CE
MB
ER
SE
BI B
ULLE
TIN
2006
SE
CU
RIT
IES
& E
XC
HA
NG
E B
OA
RD
OF
IND
IA64
Table 21: Settlement Statistics for Cash Segment of BSE
Month/Year No. of Traded Deli- % of Turnover Delive- % of Deli- % of Deli- % of Short % of Unrec- % of Funds Securities TradeTrades Quan- vered Deli- (Rs. cr.) red Value Deli- vered Demat vered Demat Delivery Short tified Unrec- Pay-in Pay-in Guarantee(Lakh) tity Quantity vered (Rs. cr.) vered Quantity Deli- Value Deli- (Auc- Delivery Bad tified (Rs. cr.) (Rs. cr.) Fund
(Lakh) (Lakh) Quantity Value to in vered in vered tioned to Delivery Bad (Rs. cr.)*to Traded Total Demat Quantity Demat Value to Quan- Delivery (Auc- DeliveryQuantity Turn- Mode to Total Mode Total tity) tioned to
over (Lakh) Deli- (Rs. cr.) Deli- (Lakh) Quantity) Deliveryvered vered (Lakh)
Quantity Value
1 2 3 4 5 6 7 8 9 10 11 12 13 14 15 16 17 18 19
1999-00 740 2,08,635 94,312 45.20 6,86,428 1,74,740 25.46 NA NA NA NA NA NA NA NA NA NA NA
2000-01 1,428 2,58,511 86,684 33.53 10,00,032 1,66,941 16.69 NA NA NA NA NA NA NA NA NA NA NA
2001-02 1,277 1,82,196 57,668 31.65 3,07,292 59,980 19.52 NA NA NA NA NA NA NA NA NA NA NA
2002-03 1,413 2,21,401 69,893 31.57 3,14,073 48,741 15.52 NA NA NA NA NA NA NA NA NA NA 748
2003-04 2,005 3,85,806 1,33,240 34.54 5,03,053 1,07,153 21.30 1,32,941 99.78 1,06,672 99.55 1,293 0.97 0.99 0.00 39,571 1,07,087 911
2004-05 2,374 4,77,171 1,87,519 39.30 5,18,716 1,40,056 27.00 1,87,347 99.91 1,39,527 99.62 1,552 0.83 0.87 0.00 48,391 1,39,999 1,165
2005-06 2,643 6,64,467 3,00,653 45.25 8,16,074 2,71,227 33.24 3,00,497 99.95 2,70,986 99.91 2,518 0.84 1.36 0.00 73,156 2,71,227 3,297
Apr-05 136 33,371 13,762 41.24 37,809 11,398 30.15 13,754 99.94 11,389 99.91 109 0.79 0.11 0.00 3,521 11,398 1,131
May-05 170 43,371 19,857 45.78 43,359 14,940 34.46 19,835 99.89 14,928 99.92 151 0.76 0.24 0.00 4,527 14,940 1,440
Jun-05 204 63,319 30,498 48.17 58,479 20,446 34.96 30,470 99.91 20,429 99.92 274 0.90 0.10 0.00 6,790 20,446 1,571
Jul-05 219 67,719 29,726 43.90 61,899 20,762 33.54 29,708 99.94 20,746 99.92 298 1.00 0.11 0.00 5,753 20,762 1,895
Aug-05 272 101,504 50,302 49.56 75,933 27,059 35.64 50,278 99.95 27,040 99.93 555 1.10 0.22 0.00 7,058 27,059 2,680
Sep-05 287 87,055 42,883 49.26 81,291 27,506 33.84 42,866 99.96 27,479 99.90 430 1.00 0.26 0.00 6,568 27,506 2,763
Oct-05 183 36,496 15,386 42.16 59,102 17,060 28.87 15,375 99.93 17,045 99.91 120 0.78 0.12 0.00 5,507 17,060 2,258
Nov-05 171 31,942 13,283 41.59 52,694 15,464 29.35 13,275 99.94 15,449 99.90 87 0.66 0.04 0.00 5,141 15,464 2,238
Dec-05 234 45,220 18,569 41.06 77,356 24,425 31.57 18,562 99.97 24,392 99.87 107 0.58 0.04 0.00 6,144 24,425 2,333
Jan-06 250 49,136 20,611 41.95 79,316 24,549 30.95 20,606 99.97 24,526 99.91 137 0.67 0.07 0.00 7,217 24,549 2,371
Feb-06 222 42,108 17,679 41.99 70,070 22,738 32.45 17,676 99.98 22,722 99.93 99 0.56 0.05 0.00 6,264 22,738 2,350
Mar-06 294 63,225 28,097 44.44 1,18,765 44,880 37.79 28,093 99.99 44,841 99.91 150 0.53 0.02 0.00 8,667 44,880 3,297
2006-07 (so far)
Apr-06 257 47,879 20,344 42.49 87,487 28,068 32.08 20,334 99.95 28,055 99.95 130 0.64 0.21 0.00 6,991 28,068 2,855
May-06 311 58,483 25,650 43.86 95,820 33,046 34.49 25,628 99.92 32,944 99.69 167 0.65 0.06 0.00 10,212 33,046 2,745
Jun-06 275 35,960 14,084 39.17 71,457 20,331 28.45 14,070 99.90 20,299 99.84 67 0.47 0.00 0.00 6,535 20,331 2,621
Jul-06 217 25,682 10,021 39.02 54,698 14,266 26.08 10,019 99.97 14,254 99.92 49 0.49 0.00 0.00 4,860 14,266 2,496
Aug-06 264 36,406 14,770 40.57 63,084 17,932 28.42 14,769 99.99 17,922 99.94 76 0.51 0.01 0.00 4,920 17,932 2,464
Sep-06 282 42,807 16,411 38.34 71,629 21,112 29.47 16,409 99.99 21,102 99.95 98 0.60 0.03 0.00 5,931 21,112 2,486
Oct-06 264 42,678 16,983 39.79 69,627 21,802 31.31 16,982 99.99 21,792 99.95 87 0.51 0.01 0.00 5,781 21,802 2,504
Nov-06 341 52,163 21,399 41.02 1,01,840 32,711 32.12 21,389 99.95 32,691 99.94 110 0.52 0.02 0.00 10,069 32,711 2,644
* Balance at the end of period.
Source: BSE
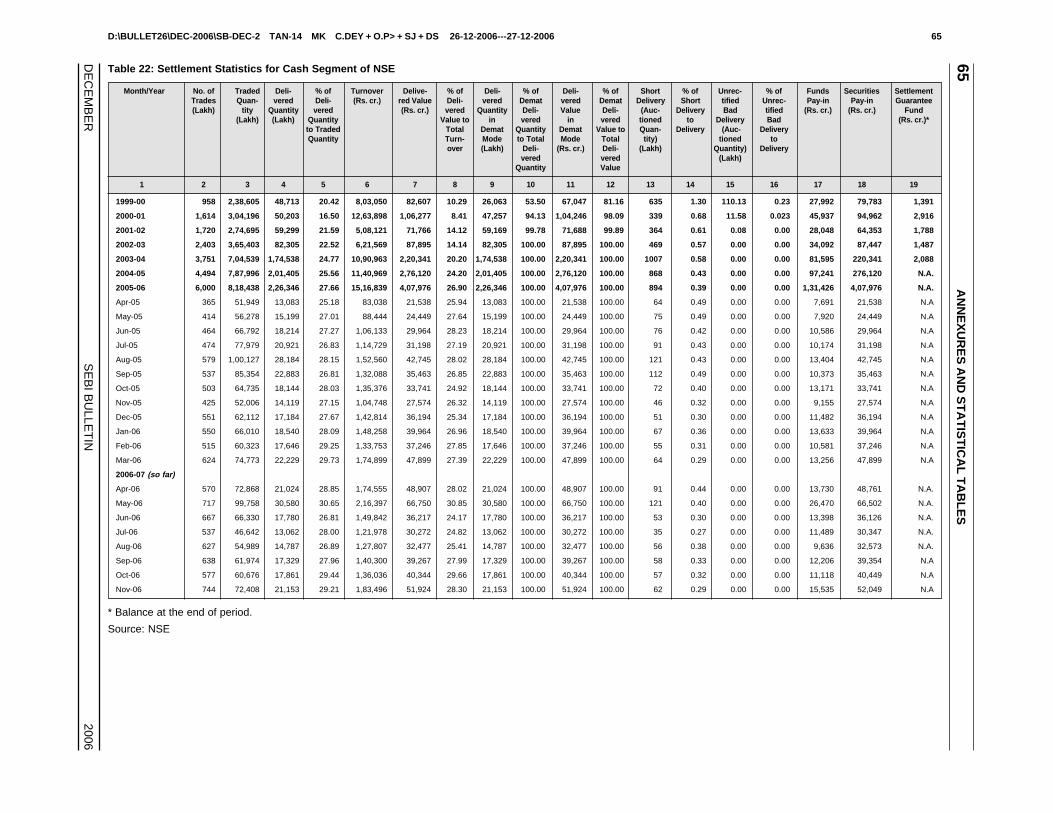
D:\BULLET26\DEC-2006\SB-DEC-2 TAN-14 MK C.DEY + O.P> + SJ + DS 26-12-2006---27-12-2006 65
DE
CE
MB
ER
SE
BI B
ULLE
TIN
2006
65A
NN
EX
UR
ES
AN
D S
TA
TIS
TIC
AL
TA
BL
ES
Table 22: Settlement Statistics for Cash Segment of NSE
Month/Year No. of Traded Deli- % of Turnover Delive- % of Deli- % of Deli- % of Short % of Unrec- % of Funds Securities SettlementTrades Quan- vered Deli- (Rs. cr.) red Value Deli- vered Demat vered Demat Delivery Short tified Unrec- Pay-in Pay-in Guarantee(Lakh) tity Quantity vered (Rs. cr.) vered Quantity Deli- Value Deli- (Auc- Delivery Bad tified (Rs. cr.) (Rs. cr.) Fund
(Lakh) (Lakh) Quantity Value to in vered in vered tioned to Delivery Bad (Rs. cr.)*to Traded Total Demat Quantity Demat Value to Quan- Delivery (Auc- DeliveryQuantity Turn- Mode to Total Mode Total tity) tioned to
over (Lakh) Deli- (Rs. cr.) Deli- (Lakh) Quantity) Deliveryvered vered (Lakh)
Quantity Value
1 2 3 4 5 6 7 8 9 10 11 12 13 14 15 16 17 18 19
1999-00 958 2,38,605 48,713 20.42 8,03,050 82,607 10.29 26,063 53.50 67,047 81.16 635 1.30 110.13 0.23 27,992 79,783 1,391
2000-01 1,614 3,04,196 50,203 16.50 12,63,898 1,06,277 8.41 47,257 94.13 1,04,246 98.09 339 0.68 11.58 0.023 45,937 94,962 2,916
2001-02 1,720 2,74,695 59,299 21.59 5,08,121 71,766 14.12 59,169 99.78 71,688 99.89 364 0.61 0.08 0.00 28,048 64,353 1,788
2002-03 2,403 3,65,403 82,305 22.52 6,21,569 87,895 14.14 82,305 100.00 87,895 100.00 469 0.57 0.00 0.00 34,092 87,447 1,487
2003-04 3,751 7,04,539 1,74,538 24.77 10,90,963 2,20,341 20.20 1,74,538 100.00 2,20,341 100.00 1007 0.58 0.00 0.00 81,595 220,341 2,088
2004-05 4,494 7,87,996 2,01,405 25.56 11,40,969 2,76,120 24.20 2,01,405 100.00 2,76,120 100.00 868 0.43 0.00 0.00 97,241 276,120 N.A.
2005-06 6,000 8,18,438 2,26,346 27.66 15,16,839 4,07,976 26.90 2,26,346 100.00 4,07,976 100.00 894 0.39 0.00 0.00 1,31,426 4,07,976 N.A.
Apr-05 365 51,949 13,083 25.18 83,038 21,538 25.94 13,083 100.00 21,538 100.00 64 0.49 0.00 0.00 7,691 21,538 N.A
May-05 414 56,278 15,199 27.01 88,444 24,449 27.64 15,199 100.00 24,449 100.00 75 0.49 0.00 0.00 7,920 24,449 N.A
Jun-05 464 66,792 18,214 27.27 1,06,133 29,964 28.23 18,214 100.00 29,964 100.00 76 0.42 0.00 0.00 10,586 29,964 N.A
Jul-05 474 77,979 20,921 26.83 1,14,729 31,198 27.19 20,921 100.00 31,198 100.00 91 0.43 0.00 0.00 10,174 31,198 N.A
Aug-05 579 1,00,127 28,184 28.15 1,52,560 42,745 28.02 28,184 100.00 42,745 100.00 121 0.43 0.00 0.00 13,404 42,745 N.A
Sep-05 537 85,354 22,883 26.81 1,32,088 35,463 26.85 22,883 100.00 35,463 100.00 112 0.49 0.00 0.00 10,373 35,463 N.A
Oct-05 503 64,735 18,144 28.03 1,35,376 33,741 24.92 18,144 100.00 33,741 100.00 72 0.40 0.00 0.00 13,171 33,741 N.A
Nov-05 425 52,006 14,119 27.15 1,04,748 27,574 26.32 14,119 100.00 27,574 100.00 46 0.32 0.00 0.00 9,155 27,574 N.A
Dec-05 551 62,112 17,184 27.67 1,42,814 36,194 25.34 17,184 100.00 36,194 100.00 51 0.30 0.00 0.00 11,482 36,194 N.A
Jan-06 550 66,010 18,540 28.09 1,48,258 39,964 26.96 18,540 100.00 39,964 100.00 67 0.36 0.00 0.00 13,633 39,964 N.A
Feb-06 515 60,323 17,646 29.25 1,33,753 37,246 27.85 17,646 100.00 37,246 100.00 55 0.31 0.00 0.00 10,581 37,246 N.A
Mar-06 624 74,773 22,229 29.73 1,74,899 47,899 27.39 22,229 100.00 47,899 100.00 64 0.29 0.00 0.00 13,256 47,899 N.A
2006-07 (so far)
Apr-06 570 72,868 21,024 28.85 1,74,555 48,907 28.02 21,024 100.00 48,907 100.00 91 0.44 0.00 0.00 13,730 48,761 N.A.
May-06 717 99,758 30,580 30.65 2,16,397 66,750 30.85 30,580 100.00 66,750 100.00 121 0.40 0.00 0.00 26,470 66,502 N.A.
Jun-06 667 66,330 17,780 26.81 1,49,842 36,217 24.17 17,780 100.00 36,217 100.00 53 0.30 0.00 0.00 13,398 36,126 N.A.
Jul-06 537 46,642 13,062 28.00 1,21,978 30,272 24.82 13,062 100.00 30,272 100.00 35 0.27 0.00 0.00 11,489 30,347 N.A.
Aug-06 627 54,989 14,787 26.89 1,27,807 32,477 25.41 14,787 100.00 32,477 100.00 56 0.38 0.00 0.00 9,636 32,573 N.A.
Sep-06 638 61,974 17,329 27.96 1,40,300 39,267 27.99 17,329 100.00 39,267 100.00 58 0.33 0.00 0.00 12,206 39,354 N.A
Oct-06 577 60,676 17,861 29.44 1,36,036 40,344 29.66 17,861 100.00 40,344 100.00 57 0.32 0.00 0.00 11,118 40,449 N.A
Nov-06 744 72,408 21,153 29.21 1,83,496 51,924 28.30 21,153 100.00 51,924 100.00 62 0.29 0.00 0.00 15,535 52,049 N.A
* Balance at the end of period.
Source: NSE

D:\BULLET26\DEC-2006\SB-DEC-2 TAN-14 MK C.DEY + O.P> + SJ + DS 26-12-2006---27-12-2006 66
DE
CE
MB
ER
SE
BI B
ULLE
TIN
2006
SE
CU
RIT
IES
& E
XC
HA
NG
E B
OA
RD
OF
IND
IA66
Table 23: Derivatives Segment at BSE
Month/ No. of Index Futures Stock Futures Index Options Stock Options Total Open Interest atYear Trading
Call Put Call Putthe end of
Days
No. of Turnover No. of Turnover No. of Notional No. of Notional No. of Notional No. of Notional No. of Turnover No. of TurnoverContracts (Rs. Cr.) Contracts (Rs. Cr.) Contracts Turnover Contracts Turnover Contracts Turnover Contracts Turnover Contracts (Rs. Cr.) Contracts (Rs. Cr.)
(Rs. Cr.) (Rs. Cr.) (Rs. Cr.) (Rs. Cr.)
1 2 3 4 5 6 7 8 9 10 11 12 13 14 15 16 17 18
Jun-00 toMar-01 207 77,743 1,673 NA NA NA NA NA NA NA NA NA NA 77,743 1,673 NA NA
2001-02 247 79,552 1,276 17,951 452 1,139 39 1,276 45 3,605 79 1,500 35 1,05,527 1,922 NA NA
2002-03 251 1,11,324 1,811 25,842 644 41 1 2 0.1 783 21 19 0.4 1,38,037 2,478 375 7
2003-04 254 2,46,443 6,572 1,28,193 5,171 1 0.0 0 0.0 4,391 174 3,230 157 3,82,258 12,452 35 1
2004-05 253 4,49,630 13,600 6,725 213 48,065 1,471 27,210 827 72 2.1 17 0.50 5,31,719 16,112 0 0.0
2005-06 251 89 5 12 0.5 100 3 0 0 2 0.1 0 0.0 203 9 0 0.0
Apr-05 20 0 0.0 0 0.0 100 3 0 0.0 0 0.0 0 0.0 100 3 0 0.0
May-05 22 0 0.0 0 0.0 0 0.0 0 0.0 0 0.0 0 0.0 0 0.0 0 0.0
Jun-05 23 0 0.0 0 0.0 0 0.0 0 0.0 0 0.0 0 0.0 0 0.0 0 0.0
Jul-05 20 0 0.0 0 0.0 0 0.0 0 0.0 0 0.0 0 0.0 0 0.0 0 0.0
Aug-05 22 0 0.0 0 0.0 0 0.0 0 0.0 0 0.0 0 0.0 0 0.0 0 0.0
Sep-05 21 0 0.0 0 0.0 0 0.0 0 0.0 0 0.0 0 0.0 0 0.0 0 0.0
Oct-05 20 0 0.0 0 0.0 0 0.0 0 0.0 0 0.0 0 0.0 0 0.0 0 0.0
Nov-05 20 0 0.0 0 0.0 0 0.0 0 0.0 0 0.0 0 0.0 0 0.0 0 0.0
Dec-05 22 0 0.0 0 0.0 0 0.0 0 0.0 0 0.0 0 0.0 0 0.0 0 0.0
Jan-06 20 0 0.0 0 0.0 0 0.0 0 0.0 0 0.0 0 0.0 0 0.0 0 0.0
Feb-06 19 1 0.1 1 0.0 0 0.0 0 0.0 0 0.0 0 0.0 2 0.1 0 0.0
Mar-06 22 88 5.0 11 0.4 0 0.0 0 0.0 2 0.1 0 0.0 101 5.5 0 0.0
2006-07(so far)
Apr-06 18 24 1.4 0 0.0 0 0.0 0 0.0 0 0.0 0 0.0 24 1.4 0 0.0
May-06 22 0 0.0 0 0.0 0 0.0 0 0.0 0 0.0 0 0.0 0 0.0 0 0.0
Jun-06 23 346 17.6 0 0 0 0.0 0 0.0 0 0.0 0 0.0 346 17.6 0 0.0
Jul-06 23 979 25.8 9 0 2 0.1 0 0.0 5 0.2 1 0.0 996 26.3 1 0.0
Aug-06 21 2,357 68.4 5 0.1 0 0 0 0 0 0 0 0 2,362 68.5 17 0.5
Sep-06 21 8,902 265.0 0 0 0 0 0 0 0 0 0 0 8,902 265.0 32 1.0
Oct-06 20 6,166 196.1 4.00 0.1 0 0 0 0 0 0 0 0 6,170 196.2 88 2.8
Nov-06 22 2,36,049 7985.7 2.00 0.1 0 0 0 0 0 0 0 0 2,36,051 7,985.8 540 18.5
Note: 1. Notional Turnover = (Strike Price + Premium) * Quantity.
2. Index Futures, Index Options, Stock Options and Stock Futures were introduced in June 2000, June 2001, July 2001 and November 2001, respectively.
Source: BSE
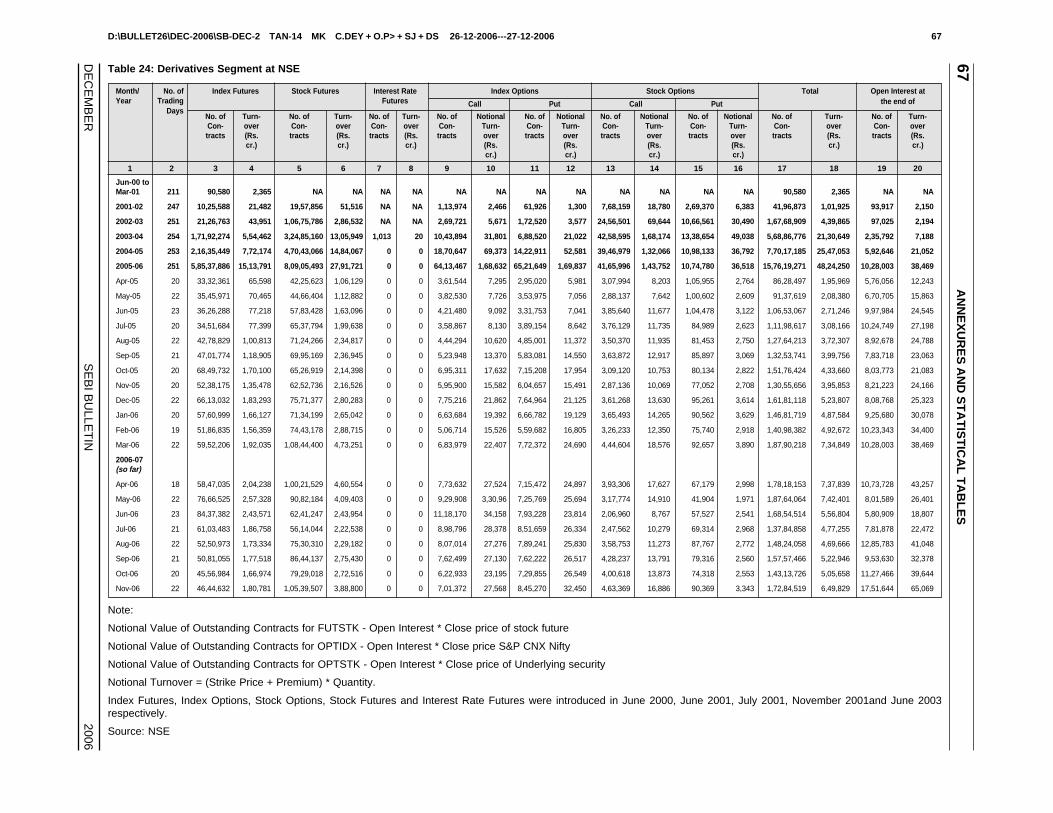
D:\BULLET26\DEC-2006\SB-DEC-2 TAN-14 MK C.DEY + O.P> + SJ + DS 26-12-2006---27-12-2006 67
DE
CE
MB
ER
SE
BI B
ULLE
TIN
2006
67A
NN
EX
UR
ES
AN
D S
TA
TIS
TIC
AL
TA
BL
ES
Table 24: Derivatives Segment at NSE
Month/ No. of Index Futures Stock Futures Interest Rate Index Options Stock Options Total Open Interest atYear Trading Futures Call Put Call Put the end of
DaysNo. of Turn- No. of Turn- No. of Turn- No. of Notional No. of Notional No. of Notional No. of Notional No. of Turn- No. of Turn-Con- over Con- over Con- over Con- Turn- Con- Turn- Con- Turn- Con- Turn- Con- over Con- overtracts (Rs. tracts (Rs. tracts (Rs. tracts over tracts over tracts over tracts over tracts (Rs. tracts (Rs.
cr.) cr.) cr.) (Rs. (Rs. (Rs. (Rs. cr.) cr.)cr.) cr.) cr.) cr.)
1 2 3 4 5 6 7 8 9 10 11 12 13 14 15 16 17 18 19 20
Jun-00 toMar-01 211 90,580 2,365 NA NA NA NA NA NA NA NA NA NA NA NA 90,580 2,365 NA NA
2001-02 247 10,25,588 21,482 19,57,856 51,516 NA NA 1,13,974 2,466 61,926 1,300 7,68,159 18,780 2,69,370 6,383 41,96,873 1,01,925 93,917 2,150
2002-03 251 21,26,763 43,951 1,06,75,786 2,86,532 NA NA 2,69,721 5,671 1,72,520 3,577 24,56,501 69,644 10,66,561 30,490 1,67,68,909 4,39,865 97,025 2,194
2003-04 254 1,71,92,274 5,54,462 3,24,85,160 13,05,949 1,013 20 10,43,894 31,801 6,88,520 21,022 42,58,595 1,68,174 13,38,654 49,038 5,68,86,776 21,30,649 2,35,792 7,188
2004-05 253 2,16,35,449 7,72,174 4,70,43,066 14,84,067 0 0 18,70,647 69,373 14,22,911 52,581 39,46,979 1,32,066 10,98,133 36,792 7,70,17,185 25,47,053 5,92,646 21,052
2005-06 251 5,85,37,886 15,13,791 8,09,05,493 27,91,721 0 0 64,13,467 1,68,632 65,21,649 1,69,837 41,65,996 1,43,752 10,74,780 36,518 15,76,19,271 48,24,250 10,28,003 38,469
Apr-05 20 33,32,361 65,598 42,25,623 1,06,129 0 0 3,61,544 7,295 2,95,020 5,981 3,07,994 8,203 1,05,955 2,764 86,28,497 1,95,969 5,76,056 12,243
May-05 22 35,45,971 70,465 44,66,404 1,12,882 0 0 3,82,530 7,726 3,53,975 7,056 2,88,137 7,642 1,00,602 2,609 91,37,619 2,08,380 6,70,705 15,863
Jun-05 23 36,26,288 77,218 57,83,428 1,63,096 0 0 4,21,480 9,092 3,31,753 7,041 3,85,640 11,677 1,04,478 3,122 1,06,53,067 2,71,246 9,97,984 24,545
Jul-05 20 34,51,684 77,399 65,37,794 1,99,638 0 0 3,58,867 8,130 3,89,154 8,642 3,76,129 11,735 84,989 2,623 1,11,98,617 3,08,166 10,24,749 27,198
Aug-05 22 42,78,829 1,00,813 71,24,266 2,34,817 0 0 4,44,294 10,620 4,85,001 11,372 3,50,370 11,935 81,453 2,750 1,27,64,213 3,72,307 8,92,678 24,788
Sep-05 21 47,01,774 1,18,905 69,95,169 2,36,945 0 0 5,23,948 13,370 5,83,081 14,550 3,63,872 12,917 85,897 3,069 1,32,53,741 3,99,756 7,83,718 23,063
Oct-05 20 68,49,732 1,70,100 65,26,919 2,14,398 0 0 6,95,311 17,632 7,15,208 17,954 3,09,120 10,753 80,134 2,822 1,51,76,424 4,33,660 8,03,773 21,083
Nov-05 20 52,38,175 1,35,478 62,52,736 2,16,526 0 0 5,95,900 15,582 6,04,657 15,491 2,87,136 10,069 77,052 2,708 1,30,55,656 3,95,853 8,21,223 24,166
Dec-05 22 66,13,032 1,83,293 75,71,377 2,80,283 0 0 7,75,216 21,862 7,64,964 21,125 3,61,268 13,630 95,261 3,614 1,61,81,118 5,23,807 8,08,768 25,323
Jan-06 20 57,60,999 1,66,127 71,34,199 2,65,042 0 0 6,63,684 19,392 6,66,782 19,129 3,65,493 14,265 90,562 3,629 1,46,81,719 4,87,584 9,25,680 30,078
Feb-06 19 51,86,835 1,56,359 74,43,178 2,88,715 0 0 5,06,714 15,526 5,59,682 16,805 3,26,233 12,350 75,740 2,918 1,40,98,382 4,92,672 10,23,343 34,400
Mar-06 22 59,52,206 1,92,035 1,08,44,400 4,73,251 0 0 6,83,979 22,407 7,72,372 24,690 4,44,604 18,576 92,657 3,890 1,87,90,218 7,34,849 10,28,003 38,469
2006-07(so far)
Apr-06 18 58,47,035 2,04,238 1,00,21,529 4,60,554 0 0 7,73,632 27,524 7,15,472 24,897 3,93,306 17,627 67,179 2,998 1,78,18,153 7,37,839 10,73,728 43,257
May-06 22 76,66,525 2,57,328 90,82,184 4,09,403 0 0 9,29,908 3,30,96 7,25,769 25,694 3,17,774 14,910 41,904 1,971 1,87,64,064 7,42,401 8,01,589 26,401
Jun-06 23 84,37,382 2,43,571 62,41,247 2,43,954 0 0 11,18,170 34,158 7,93,228 23,814 2,06,960 8,767 57,527 2,541 1,68,54,514 5,56,804 5,80,909 18,807
Jul-06 21 61,03,483 1,86,758 56,14,044 2,22,538 0 0 8,98,796 28,378 8,51,659 26,334 2,47,562 10,279 69,314 2,968 1,37,84,858 4,77,255 7,81,878 22,472
Aug-06 22 52,50,973 1,73,334 75,30,310 2,29,182 0 0 8,07,014 27,276 7,89,241 25,830 3,58,753 11,273 87,767 2,772 1,48,24,058 4,69,666 12,85,783 41,048
Sep-06 21 50,81,055 1,77,518 86,44,137 2,75,430 0 0 7,62,499 27,130 7,62,222 26,517 4,28,237 13,791 79,316 2,560 1,57,57,466 5,22,946 9,53,630 32,378
Oct-06 20 45,56,984 1,66,974 79,29,018 2,72,516 0 0 6,22,933 23,195 7,29,855 26,549 4,00,618 13,873 74,318 2,553 1,43,13,726 5,05,658 11,27,466 39,644
Nov-06 22 46,44,632 1,80,781 1,05,39,507 3,88,800 0 0 7,01,372 27,568 8,45,270 32,450 4,63,369 16,886 90,369 3,343 1,72,84,519 6,49,829 17,51,644 65,069
Note:
Notional Value of Outstanding Contracts for FUTSTK - Open Interest * Close price of stock future
Notional Value of Outstanding Contracts for OPTIDX - Open Interest * Close price S&P CNX Nifty
Notional Value of Outstanding Contracts for OPTSTK - Open Interest * Close price of Underlying security
Notional Turnover = (Strike Price + Premium) * Quantity.
Index Futures, Index Options, Stock Options, Stock Futures and Interest Rate Futures were introduced in June 2000, June 2001, July 2001, November 2001and June 2003respectively.
Source: NSE
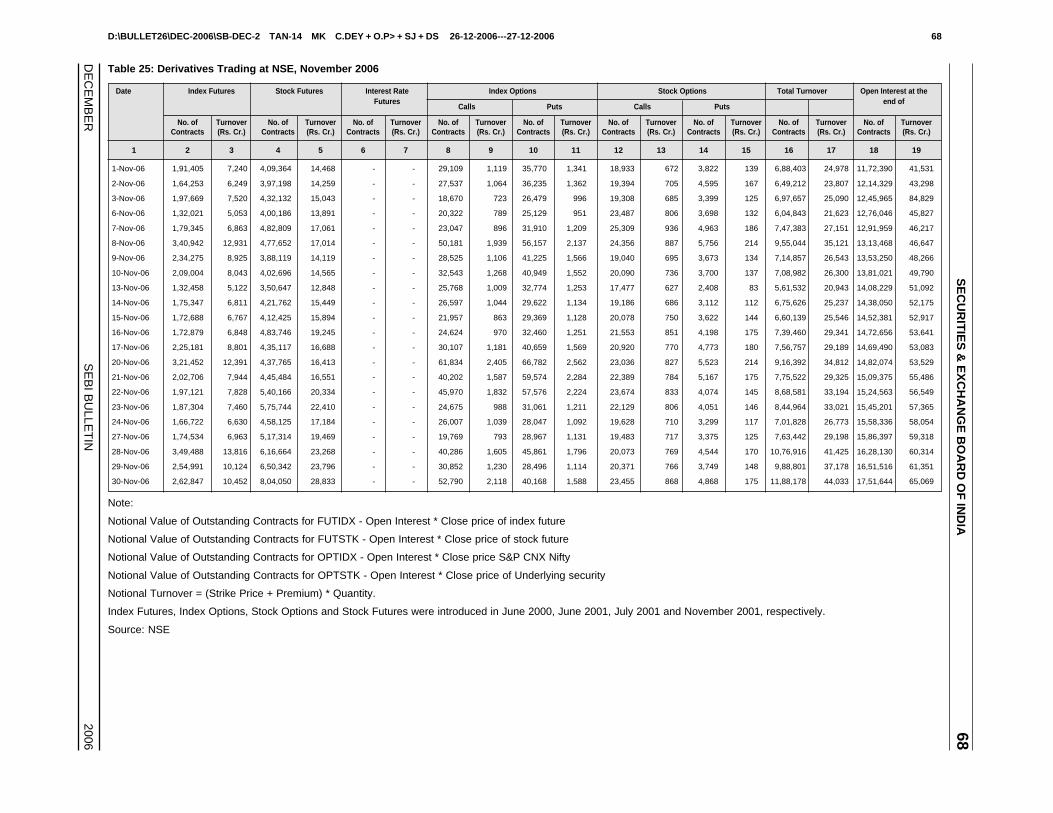
D:\BULLET26\DEC-2006\SB-DEC-2 TAN-14 MK C.DEY + O.P> + SJ + DS 26-12-2006---27-12-2006 68
DE
CE
MB
ER
SE
BI B
ULLE
TIN
2006
SE
CU
RIT
IES
& E
XC
HA
NG
E B
OA
RD
OF
IND
IA68
Table 25: Derivatives Trading at NSE, November 2006
Date Index Futures Stock Futures Interest Rate Index Options Stock Options Total Turnover Open Interest at theFutures
Calls Puts Calls Putsend of
No. of Turnover No. of Turnover No. of Turnover No. of Turnover No. of Turnover No. of Turnover No. of Turnover No. of Turnover No. of TurnoverContracts (Rs. Cr.) Contracts (Rs. Cr.) Contracts (Rs. Cr.) Contracts (Rs. Cr.) Contracts (Rs. Cr.) Contracts (Rs. Cr.) Contracts (Rs. Cr.) Contracts (Rs. Cr.) Contracts (Rs. Cr.)
1 2 3 4 5 6 7 8 9 10 11 12 13 14 15 16 17 18 19
1-Nov-06 1,91,405 7,240 4,09,364 14,468 - - 29,109 1,119 35,770 1,341 18,933 672 3,822 139 6,88,403 24,978 11,72,390 41,531
2-Nov-06 1,64,253 6,249 3,97,198 14,259 - - 27,537 1,064 36,235 1,362 19,394 705 4,595 167 6,49,212 23,807 12,14,329 43,298
3-Nov-06 1,97,669 7,520 4,32,132 15,043 - - 18,670 723 26,479 996 19,308 685 3,399 125 6,97,657 25,090 12,45,965 84,829
6-Nov-06 1,32,021 5,053 4,00,186 13,891 - - 20,322 789 25,129 951 23,487 806 3,698 132 6,04,843 21,623 12,76,046 45,827
7-Nov-06 1,79,345 6,863 4,82,809 17,061 - - 23,047 896 31,910 1,209 25,309 936 4,963 186 7,47,383 27,151 12,91,959 46,217
8-Nov-06 3,40,942 12,931 4,77,652 17,014 - - 50,181 1,939 56,157 2,137 24,356 887 5,756 214 9,55,044 35,121 13,13,468 46,647
9-Nov-06 2,34,275 8,925 3,88,119 14,119 - - 28,525 1,106 41,225 1,566 19,040 695 3,673 134 7,14,857 26,543 13,53,250 48,266
10-Nov-06 2,09,004 8,043 4,02,696 14,565 - - 32,543 1,268 40,949 1,552 20,090 736 3,700 137 7,08,982 26,300 13,81,021 49,790
13-Nov-06 1,32,458 5,122 3,50,647 12,848 - - 25,768 1,009 32,774 1,253 17,477 627 2,408 83 5,61,532 20,943 14,08,229 51,092
14-Nov-06 1,75,347 6,811 4,21,762 15,449 - - 26,597 1,044 29,622 1,134 19,186 686 3,112 112 6,75,626 25,237 14,38,050 52,175
15-Nov-06 1,72,688 6,767 4,12,425 15,894 - - 21,957 863 29,369 1,128 20,078 750 3,622 144 6,60,139 25,546 14,52,381 52,917
16-Nov-06 1,72,879 6,848 4,83,746 19,245 - - 24,624 970 32,460 1,251 21,553 851 4,198 175 7,39,460 29,341 14,72,656 53,641
17-Nov-06 2,25,181 8,801 4,35,117 16,688 - - 30,107 1,181 40,659 1,569 20,920 770 4,773 180 7,56,757 29,189 14,69,490 53,083
20-Nov-06 3,21,452 12,391 4,37,765 16,413 - - 61,834 2,405 66,782 2,562 23,036 827 5,523 214 9,16,392 34,812 14,82,074 53,529
21-Nov-06 2,02,706 7,944 4,45,484 16,551 - - 40,202 1,587 59,574 2,284 22,389 784 5,167 175 7,75,522 29,325 15,09,375 55,486
22-Nov-06 1,97,121 7,828 5,40,166 20,334 - - 45,970 1,832 57,576 2,224 23,674 833 4,074 145 8,68,581 33,194 15,24,563 56,549
23-Nov-06 1,87,304 7,460 5,75,744 22,410 - - 24,675 988 31,061 1,211 22,129 806 4,051 146 8,44,964 33,021 15,45,201 57,365
24-Nov-06 1,66,722 6,630 4,58,125 17,184 - - 26,007 1,039 28,047 1,092 19,628 710 3,299 117 7,01,828 26,773 15,58,336 58,054
27-Nov-06 1,74,534 6,963 5,17,314 19,469 - - 19,769 793 28,967 1,131 19,483 717 3,375 125 7,63,442 29,198 15,86,397 59,318
28-Nov-06 3,49,488 13,816 6,16,664 23,268 - - 40,286 1,605 45,861 1,796 20,073 769 4,544 170 10,76,916 41,425 16,28,130 60,314
29-Nov-06 2,54,991 10,124 6,50,342 23,796 - - 30,852 1,230 28,496 1,114 20,371 766 3,749 148 9,88,801 37,178 16,51,516 61,351
30-Nov-06 2,62,847 10,452 8,04,050 28,833 - - 52,790 2,118 40,168 1,588 23,455 868 4,868 175 11,88,178 44,033 17,51,644 65,069
Note:
Notional Value of Outstanding Contracts for FUTIDX - Open Interest * Close price of index future
Notional Value of Outstanding Contracts for FUTSTK - Open Interest * Close price of stock future
Notional Value of Outstanding Contracts for OPTIDX - Open Interest * Close price S&P CNX Nifty
Notional Value of Outstanding Contracts for OPTSTK - Open Interest * Close price of Underlying security
Notional Turnover = (Strike Price + Premium) * Quantity.
Index Futures, Index Options, Stock Options and Stock Futures were introduced in June 2000, June 2001, July 2001 and November 2001, respectively.
Source: NSE

D:\BULLET26\DEC-2006\SB-DEC-2 TAN-14 MK C.DEY + O.P> + SJ + DS 26-12-2006---27-12-2006 69
DE
CE
MB
ER
SE
BI B
ULLE
TIN
2006
69A
NN
EX
UR
ES
AN
D S
TA
TIS
TIC
AL
TA
BL
ES
Table 26: Settlement Statistics in Derivatives Segment at BSE and NSE
(Rs.crore)
Month/Year BSE NSE
Index/Stock Futures Index/Stock Options Total Settlement Index/Stock Futures Index/Stock Options Total SettlementMTM Final Premium Exercise Guarantee MTM Final Premium Exercise Guarantee
Settlement Settlement Settlement Settlement Fund* Settlement Settlement Settlement Settlement Fund*
1 2 3 4 5 6 7 8 9 10 11 12 13
Jun-00 to Mar-01 50.5 1.1 NA NA 52 66 84 2 NA NA 86 NA
2001-02 25.8 1.5 5.1 2.6 35 49 505 22 165 94 786 648
2002-03 12.2 0.6 0.3 0.0 13 49 1,738 46 331 196 2,311 1,300
2003-04 53.3 1.0 8.2 0.2 63 53 10,822 139 859 476 12,296 4,424
2004-05 19 0.9 147 2.7 169 51 13,024 228 941 456 14,649 N.A.
2005-06 0.003 0.002 0.001 0.002 0.008 44 25,586 598 1,521 818 28,522 N.A.
Apr-05 0.0 0.0 0.0 0.0 0.0 48 1,737 31 83 30 1,881 N.A.
May-05 0.0 0.0 0.0 0.0 0.0 48 944 42 73 45 1,103 N.A.
Jun-05 0.0 0.0 0.0 0.0 0.0 47 1,096 35 93 71 1,295 N.A.
Jul-05 0.0 0.0 0.0 0.0 0.0 46 1,568 38 93 59 1,758 N.A.
Aug-05 0.0 0.0 0.0 0.0 0.0 45 2,545 37 119 27 2,727 N.A.
Sep-05 0.0 0.0 0.0 0.0 0.0 45 2,367 17 136 96 2,616 N.A.
Oct-05 0.0 0.0 0.0 0.0 0.0 45 3,479 120 144 79 3,823 N.A.
Nov-05 0.0 0.0 0.0 0.0 0.0 46 1,831 32 123 76 2,062 N.A.
Dec-05 0.0 0.0 0.0 0.0 0.0 46 2,488 23 140 67 2,717 N.A.
Jan-06 0.0 0.0 0.0 0.0 0.0 46 2,035 107 140 52 2,333 N.A.
Feb-06 0.0 0.0 0.0 0.0 46 1,887 44 147 57 2,135 N.A.
Mar-06 0.003 0.002 0.001 0.002 0.008 44 3,611 70 232 159 4,072 N.A.
2006-07 (so far)
Apr-06 0.81 0.03 0.00 0.00 0.8 43 7,414 97 237 104 7,852 N.A.
May-06 0.00 0.00 0.00 0.00 0.00 43 13,594 135 326 124 14,179 N.A.
Jun-06 0.04 0.00 - - 0.04 42 6,854 50 265 97 7,267 N.A.
Jul-06 0.06 0.00 0.00 0.01 0.07 44 2,810 56 197 74 3,137 N.A.
Aug-06 0.07 0.00 0.00 0.00 0.00 42 1,558 39 193 115 1,904 N.A.
Sep-06 0.46 0.00 0.00 0.00 0.00 65 2,827 27 192 73 3,119 N.A.
Oct-06 0.62 0.02 0.00 0.00 0.00 46 2,218 28 223 64 2,533 N.A.
Nov-06 4.28 0.14 0.00 0.00 0.00 80 2,412 57 212 133 2,815 N.A.
* Balance at the end of the period
* includes members collateral and SGF
Source: BSE, NSE
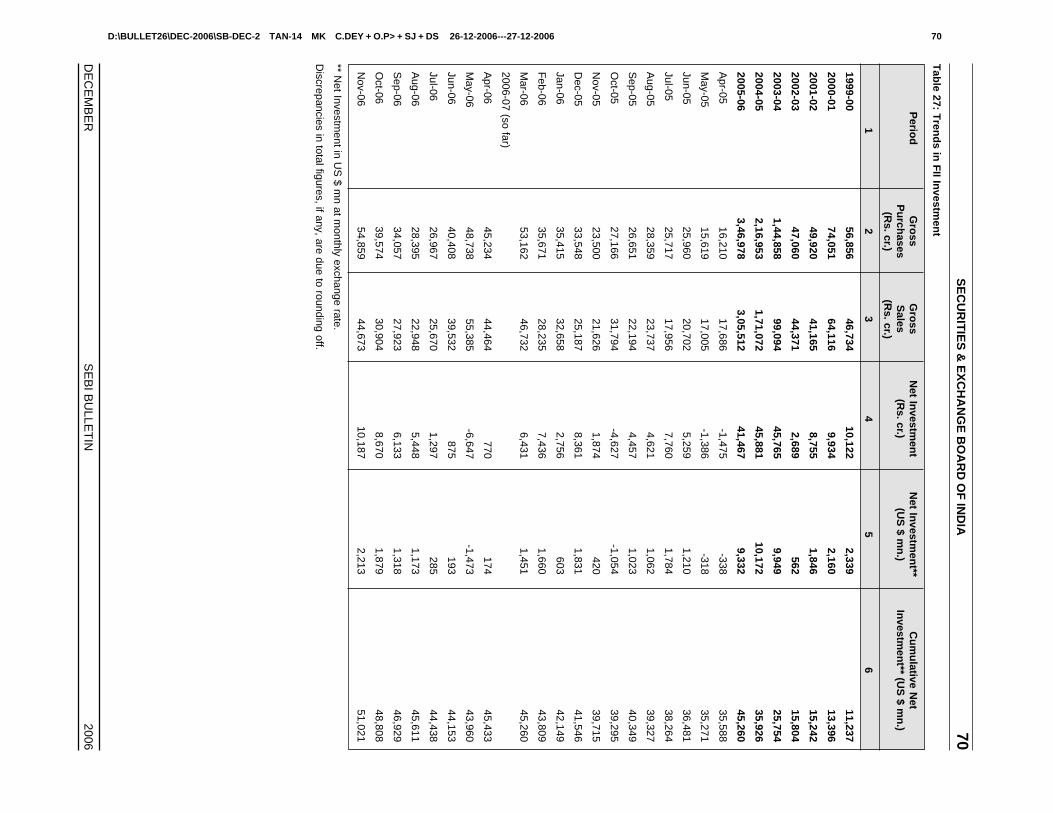
D:\BULLET26\DEC-2006\SB-DEC-2 TAN-14 MK C.DEY + O.P> + SJ + DS 26-12-2006---27-12-2006 70
DE
CE
MB
ER
SE
BI B
ULLE
TIN
2006
SE
CU
RIT
IES
& E
XC
HA
NG
E B
OA
RD
OF
IND
IA70
Tab
le 27: Tren
ds in
FII In
vestmen
t
Perio
dG
ross
Gro
ssN
et Investm
ent
Net In
vestmen
t**C
um
ulative N
etP
urch
asesS
ales(R
s. cr.)(U
S $ m
n.)
Investm
ent** (U
S $ m
n.)
(Rs. cr.)
(Rs. cr.)
12
34
56
1999-0056,856
46,73410,122
2,33911,237
2000-0174,051
64,1169,934
2,16013,396
2001-0249,920
41,1658,755
1,84615,242
2002-0347,060
44,3712,689
56215,804
2003-041,44,858
99,09445,765
9,94925,754
2004-052,16,953
1,71,07245,881
10,17235,926
2005-063,46,978
3,05,51241,467
9,33245,260
Apr-05
16,21017,686
-1,475-338
35,588
May-05
15,61917,005
-1,386-318
35,271
Jun-0525,960
20,7025,259
1,21036,481
Jul-0525,717
17,9567,760
1,78438,264
Aug-05
28,35923,737
4,6211,062
39,327
Sep-05
26,65122,194
4,4571,023
40,349
Oct-05
27,16631,794
-4,627-1,054
39,295
Nov-05
23,50021,626
1,874420
39,715
Dec-05
33,54825,187
8,3611,831
41,546
Jan-0635,415
32,6582,756
60342,149
Feb-06
35,67128,235
7,4361,660
43,809
Mar-06
53,16246,732
6,4311,451
45,260
2006-07 (so far)
Apr-06
45,23444,464
770174
45,433
May-06
48,73855,385
-6,647-1,473
43,960
Jun-0640,408
39,532875
19344,153
Jul-0626,967
25,6701,297
28544,438
Aug-06
28,39522,948
5,4481,173
45,611
Sep-06
34,05727,923
6,1331,318
46,929
Oct-06
39,57430,904
8,6701,879
48,808
Nov-06
54,85944,673
10,1872,213
51,021
** Net Investm
ent in US
$ mn at m
onthly exchange rate.
Discrepancies in total figures, if any, are due to rounding off.
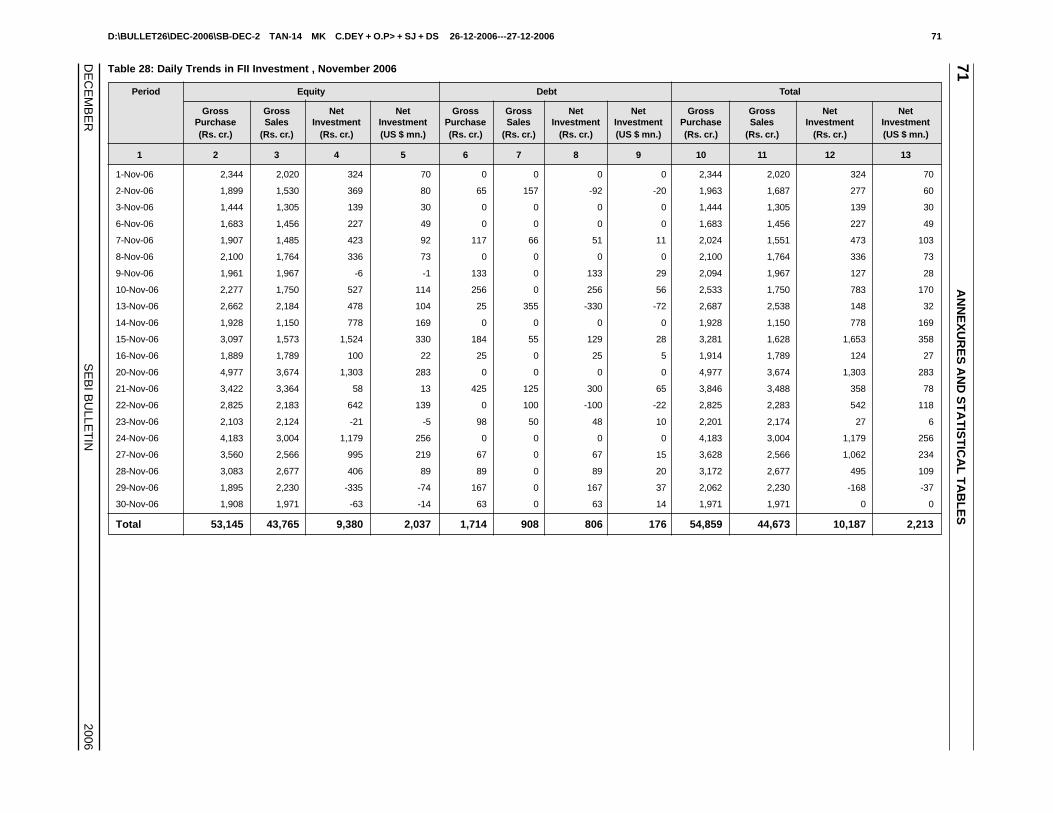
D:\BULLET26\DEC-2006\SB-DEC-2 TAN-14 MK C.DEY + O.P> + SJ + DS 26-12-2006---27-12-2006 71
DE
CE
MB
ER
SE
BI B
ULLE
TIN
2006
71A
NN
EX
UR
ES
AN
D S
TA
TIS
TIC
AL
TA
BL
ES
Table 28: Daily Trends in FII Investment , November 2006
Period Equity Debt Total
Gross Gross Net Net Gross Gross Net Net Gross Gross Net NetPurchase Sales Investment Investment Purchase Sales Investment Investment Purchase Sales Investment Investment(Rs. cr.) (Rs. cr.) (Rs. cr.) (US $ mn.) (Rs. cr.) (Rs. cr.) (Rs. cr.) (US $ mn.) (Rs. cr.) (Rs. cr.) (Rs. cr.) (US $ mn.)
1 2 3 4 5 6 7 8 9 10 11 12 13
1-Nov-06 2,344 2,020 324 70 0 0 0 0 2,344 2,020 324 70
2-Nov-06 1,899 1,530 369 80 65 157 -92 -20 1,963 1,687 277 60
3-Nov-06 1,444 1,305 139 30 0 0 0 0 1,444 1,305 139 30
6-Nov-06 1,683 1,456 227 49 0 0 0 0 1,683 1,456 227 49
7-Nov-06 1,907 1,485 423 92 117 66 51 11 2,024 1,551 473 103
8-Nov-06 2,100 1,764 336 73 0 0 0 0 2,100 1,764 336 73
9-Nov-06 1,961 1,967 -6 -1 133 0 133 29 2,094 1,967 127 28
10-Nov-06 2,277 1,750 527 114 256 0 256 56 2,533 1,750 783 170
13-Nov-06 2,662 2,184 478 104 25 355 -330 -72 2,687 2,538 148 32
14-Nov-06 1,928 1,150 778 169 0 0 0 0 1,928 1,150 778 169
15-Nov-06 3,097 1,573 1,524 330 184 55 129 28 3,281 1,628 1,653 358
16-Nov-06 1,889 1,789 100 22 25 0 25 5 1,914 1,789 124 27
20-Nov-06 4,977 3,674 1,303 283 0 0 0 0 4,977 3,674 1,303 283
21-Nov-06 3,422 3,364 58 13 425 125 300 65 3,846 3,488 358 78
22-Nov-06 2,825 2,183 642 139 0 100 -100 -22 2,825 2,283 542 118
23-Nov-06 2,103 2,124 -21 -5 98 50 48 10 2,201 2,174 27 6
24-Nov-06 4,183 3,004 1,179 256 0 0 0 0 4,183 3,004 1,179 256
27-Nov-06 3,560 2,566 995 219 67 0 67 15 3,628 2,566 1,062 234
28-Nov-06 3,083 2,677 406 89 89 0 89 20 3,172 2,677 495 109
29-Nov-06 1,895 2,230 -335 -74 167 0 167 37 2,062 2,230 -168 -37
30-Nov-06 1,908 1,971 -63 -14 63 0 63 14 1,971 1,971 0 0
Total 53,145 43,765 9,380 2,037 1,714 908 806 176 54,859 44,673 10,187 2,213
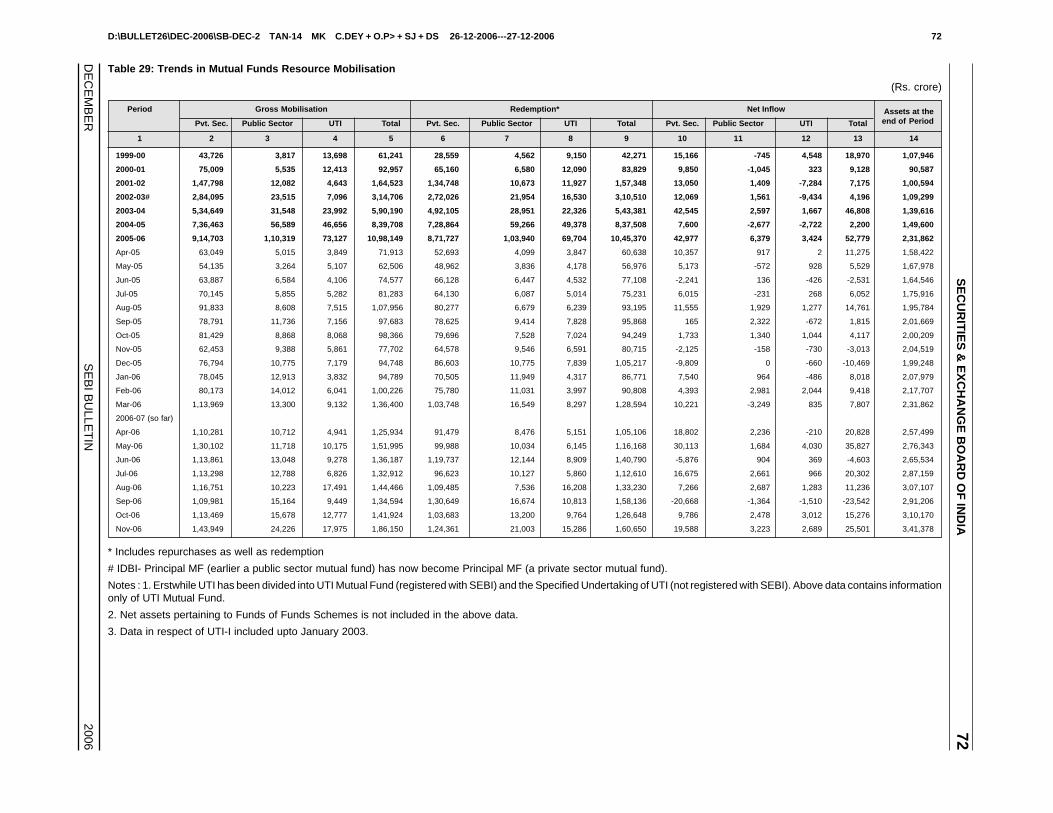
D:\BULLET26\DEC-2006\SB-DEC-2 TAN-14 MK C.DEY + O.P> + SJ + DS 26-12-2006---27-12-2006 72
DE
CE
MB
ER
SE
BI B
ULLE
TIN
2006
SE
CU
RIT
IES
& E
XC
HA
NG
E B
OA
RD
OF
IND
IA72
Table 29: Trends in Mutual Funds Resource Mobilisation
(Rs. crore)
Period Gross Mobilisation Redemption* Net Inflow Assets at the
Pvt. Sec. Public Sector UTI Total Pvt. Sec. Public Sector UTI Total Pvt. Sec. Public Sector UTI Total end of Period
1 2 3 4 5 6 7 8 9 10 11 12 13 14
1999-00 43,726 3,817 13,698 61,241 28,559 4,562 9,150 42,271 15,166 -745 4,548 18,970 1,07,946
2000-01 75,009 5,535 12,413 92,957 65,160 6,580 12,090 83,829 9,850 -1,045 323 9,128 90,587
2001-02 1,47,798 12,082 4,643 1,64,523 1,34,748 10,673 11,927 1,57,348 13,050 1,409 -7,284 7,175 1,00,594
2002-03# 2,84,095 23,515 7,096 3,14,706 2,72,026 21,954 16,530 3,10,510 12,069 1,561 -9,434 4,196 1,09,299
2003-04 5,34,649 31,548 23,992 5,90,190 4,92,105 28,951 22,326 5,43,381 42,545 2,597 1,667 46,808 1,39,616
2004-05 7,36,463 56,589 46,656 8,39,708 7,28,864 59,266 49,378 8,37,508 7,600 -2,677 -2,722 2,200 1,49,600
2005-06 9,14,703 1,10,319 73,127 10,98,149 8,71,727 1,03,940 69,704 10,45,370 42,977 6,379 3,424 52,779 2,31,862
Apr-05 63,049 5,015 3,849 71,913 52,693 4,099 3,847 60,638 10,357 917 2 11,275 1,58,422
May-05 54,135 3,264 5,107 62,506 48,962 3,836 4,178 56,976 5,173 -572 928 5,529 1,67,978
Jun-05 63,887 6,584 4,106 74,577 66,128 6,447 4,532 77,108 -2,241 136 -426 -2,531 1,64,546
Jul-05 70,145 5,855 5,282 81,283 64,130 6,087 5,014 75,231 6,015 -231 268 6,052 1,75,916
Aug-05 91,833 8,608 7,515 1,07,956 80,277 6,679 6,239 93,195 11,555 1,929 1,277 14,761 1,95,784
Sep-05 78,791 11,736 7,156 97,683 78,625 9,414 7,828 95,868 165 2,322 -672 1,815 2,01,669
Oct-05 81,429 8,868 8,068 98,366 79,696 7,528 7,024 94,249 1,733 1,340 1,044 4,117 2,00,209
Nov-05 62,453 9,388 5,861 77,702 64,578 9,546 6,591 80,715 -2,125 -158 -730 -3,013 2,04,519
Dec-05 76,794 10,775 7,179 94,748 86,603 10,775 7,839 1,05,217 -9,809 0 -660 -10,469 1,99,248
Jan-06 78,045 12,913 3,832 94,789 70,505 11,949 4,317 86,771 7,540 964 -486 8,018 2,07,979
Feb-06 80,173 14,012 6,041 1,00,226 75,780 11,031 3,997 90,808 4,393 2,981 2,044 9,418 2,17,707
Mar-06 1,13,969 13,300 9,132 1,36,400 1,03,748 16,549 8,297 1,28,594 10,221 -3,249 835 7,807 2,31,862
2006-07 (so far)
Apr-06 1,10,281 10,712 4,941 1,25,934 91,479 8,476 5,151 1,05,106 18,802 2,236 -210 20,828 2,57,499
May-06 1,30,102 11,718 10,175 1,51,995 99,988 10,034 6,145 1,16,168 30,113 1,684 4,030 35,827 2,76,343
Jun-06 1,13,861 13,048 9,278 1,36,187 1,19,737 12,144 8,909 1,40,790 -5,876 904 369 -4,603 2,65,534
Jul-06 1,13,298 12,788 6,826 1,32,912 96,623 10,127 5,860 1,12,610 16,675 2,661 966 20,302 2,87,159
Aug-06 1,16,751 10,223 17,491 1,44,466 1,09,485 7,536 16,208 1,33,230 7,266 2,687 1,283 11,236 3,07,107
Sep-06 1,09,981 15,164 9,449 1,34,594 1,30,649 16,674 10,813 1,58,136 -20,668 -1,364 -1,510 -23,542 2,91,206
Oct-06 1,13,469 15,678 12,777 1,41,924 1,03,683 13,200 9,764 1,26,648 9,786 2,478 3,012 15,276 3,10,170
Nov-06 1,43,949 24,226 17,975 1,86,150 1,24,361 21,003 15,286 1,60,650 19,588 3,223 2,689 25,501 3,41,378
* Includes repurchases as well as redemption
# IDBI- Principal MF (earlier a public sector mutual fund) has now become Principal MF (a private sector mutual fund).
Notes : 1. Erstwhile UTI has been divided into UTI Mutual Fund (registered with SEBI) and the Specified Undertaking of UTI (not registered with SEBI). Above data contains informationonly of UTI Mutual Fund.
2. Net assets pertaining to Funds of Funds Schemes is not included in the above data.
3. Data in respect of UTI-I included upto January 2003.

D:\BULLET26\DEC-2006\SB-DEC-2 TAN-14 MK C.DEY + O.P> + SJ + DS 26-12-2006---27-12-2006 73
DE
CE
MB
ER
SE
BI B
ULLE
TIN
2006
73A
NN
EX
UR
ES
AN
D S
TA
TIS
TIC
AL
TA
BL
ES
Table 30A: Type-wise Resource Mobilisation by Mutual Funds(Rs. crore)
Scheme 2004-05 2005-06 Nov-06 Net Assets ason November
Sale Purchase Net Sale Purchase Net Sale Purchase Net 30, 2006
1 2 3 4 5 6 7 8 9 10 11
Open-ended 8,22,004 8,25,977 -3,972 10,57,118 1,031,334 25,783 1,76,545 1,54,680 21,865 2,81,805
Close-ended 17,704 11,531 6,173 41,032 14,036 26,996 9,605 5,969 3,636 59,572
Total 8,39,708 8,37,508 2,200 10,98,149 10,98,149 52,779 1,86,150 1,60,650 25,501 3,41,378
Table 30 B: Scheme-wise Resource Mobilisation by Mutual Funds
(Rs. crore)
Scheme 2004-05 2005-06 Nov-06
Sale Purchase Net Sale Purchase Net Sale Purchase Net
1 2 3 4 5 6 7 8 9 10
A. Income/Debt Oriented Schemes (i+ii+iii+iv) 7,98,674 8,03,918 -5,244 10,08,129 9,91,508 16,621 1,76,850 1,53,496 23,354
i. Liquid/Money Market 6,38,594 6,28,246 10,348 8,36,859 8,32,654 4,205 1,55,108 1,38,663 16,445
ii. Gilt 4,361 5,706 -1,345 2,479 4,040 -1,560 143 210 -67
iii. Debt (other than assured return) 1,55,719 1,69,966 -14,247 1,68,791 1,54,814 13,977 21,599 14,622 6,977
iv. Debt (assured return) 0 0 0 0 0 0 0 0 0
B. Growth/Equity Oriented Schemes (i+ii) 37,280 30,180 7,100 86,014 50,783 35,231 9,060 6,835 2,226
i. ELSS 155 349 -194 3,935 343 3,592 197 24 173
ii. Others 37,126 29,832 7,294 82,079 50,440 31,639 8,864 6,811 2,053
C. Balanced Schemes 3,755 3,410 345 4,006 3,079 927 240 319 -79
Total (A+B+C) 8,39,708 8,37,508 2,200 10,98,149 10,45,370 52,779 1,86,150 1,60,650 25,501
Notes: 1. Erstwhile UTI has been divided into UTI Mutual Fund (registered with SEBI) and the Specified Undertaking of UTI (not registered with SEBI).
Above data contains information only of UTI Mutual Fund.
2. Net assets pertaining to Funds of Funds Schemes for Apr’ 04 is not included in the above data.
3. Net assets of pertaining to Funds of Funds Schemes (for Apr - Jul’ 04) is not included in the above data.
4. Data in respect of UTI-I included upto January 2003.
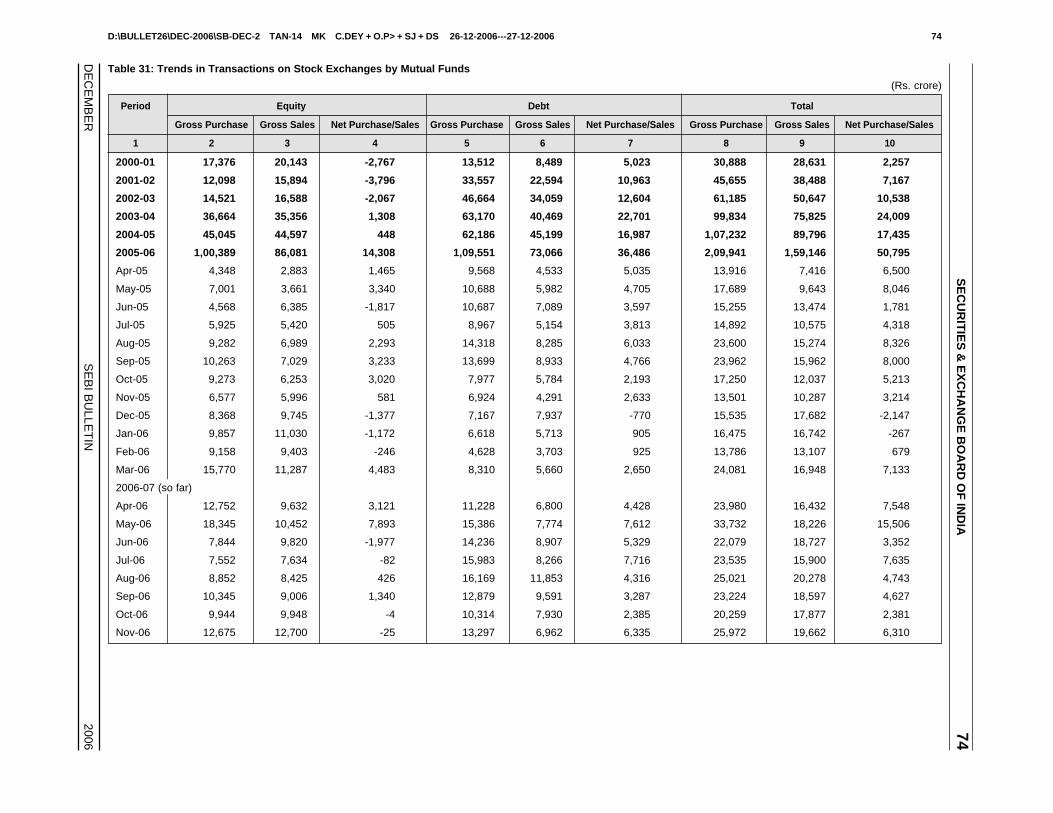
D:\BULLET26\DEC-2006\SB-DEC-2 TAN-14 MK C.DEY + O.P> + SJ + DS 26-12-2006---27-12-2006 74
DE
CE
MB
ER
SE
BI B
ULLE
TIN
2006
SE
CU
RIT
IES
& E
XC
HA
NG
E B
OA
RD
OF
IND
IA74
Table 31: Trends in Transactions on Stock Exchanges by Mutual Funds
(Rs. crore)
Period Equity Debt Total
Gross Purchase Gross Sales Net Purchase/Sales Gross Purchase Gross Sales Net Purchase/Sales Gross Purchase Gross Sales Net Purchase/Sales
1 2 3 4 5 6 7 8 9 10
2000-01 17,376 20,143 -2,767 13,512 8,489 5,023 30,888 28,631 2,257
2001-02 12,098 15,894 -3,796 33,557 22,594 10,963 45,655 38,488 7,167
2002-03 14,521 16,588 -2,067 46,664 34,059 12,604 61,185 50,647 10,538
2003-04 36,664 35,356 1,308 63,170 40,469 22,701 99,834 75,825 24,009
2004-05 45,045 44,597 448 62,186 45,199 16,987 1,07,232 89,796 17,435
2005-06 1,00,389 86,081 14,308 1,09,551 73,066 36,486 2,09,941 1,59,146 50,795
Apr-05 4,348 2,883 1,465 9,568 4,533 5,035 13,916 7,416 6,500
May-05 7,001 3,661 3,340 10,688 5,982 4,705 17,689 9,643 8,046
Jun-05 4,568 6,385 -1,817 10,687 7,089 3,597 15,255 13,474 1,781
Jul-05 5,925 5,420 505 8,967 5,154 3,813 14,892 10,575 4,318
Aug-05 9,282 6,989 2,293 14,318 8,285 6,033 23,600 15,274 8,326
Sep-05 10,263 7,029 3,233 13,699 8,933 4,766 23,962 15,962 8,000
Oct-05 9,273 6,253 3,020 7,977 5,784 2,193 17,250 12,037 5,213
Nov-05 6,577 5,996 581 6,924 4,291 2,633 13,501 10,287 3,214
Dec-05 8,368 9,745 -1,377 7,167 7,937 -770 15,535 17,682 -2,147
Jan-06 9,857 11,030 -1,172 6,618 5,713 905 16,475 16,742 -267
Feb-06 9,158 9,403 -246 4,628 3,703 925 13,786 13,107 679
Mar-06 15,770 11,287 4,483 8,310 5,660 2,650 24,081 16,948 7,133
2006-07 (so far)
Apr-06 12,752 9,632 3,121 11,228 6,800 4,428 23,980 16,432 7,548
May-06 18,345 10,452 7,893 15,386 7,774 7,612 33,732 18,226 15,506
Jun-06 7,844 9,820 -1,977 14,236 8,907 5,329 22,079 18,727 3,352
Jul-06 7,552 7,634 -82 15,983 8,266 7,716 23,535 15,900 7,635
Aug-06 8,852 8,425 426 16,169 11,853 4,316 25,021 20,278 4,743
Sep-06 10,345 9,006 1,340 12,879 9,591 3,287 23,224 18,597 4,627
Oct-06 9,944 9,948 -4 10,314 7,930 2,385 20,259 17,877 2,381
Nov-06 12,675 12,700 -25 13,297 6,962 6,335 25,972 19,662 6,310
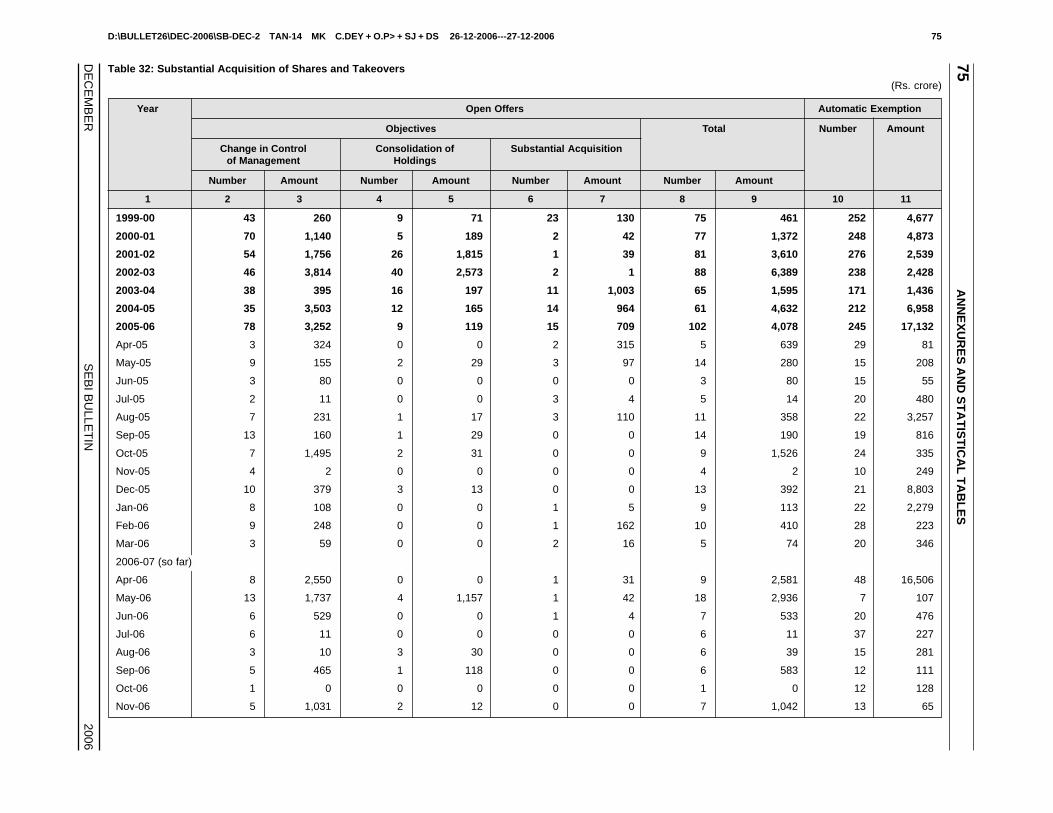
D:\BULLET26\DEC-2006\SB-DEC-2 TAN-14 MK C.DEY + O.P> + SJ + DS 26-12-2006---27-12-2006 75
DE
CE
MB
ER
SE
BI B
ULLE
TIN
2006
75A
NN
EX
UR
ES
AN
D S
TA
TIS
TIC
AL
TA
BL
ES
Table 32: Substantial Acquisition of Shares and Takeovers
(Rs. crore)
Year Open Offers Automatic Exemption
Objectives Total Number Amount
Change in Control Consolidation of Substantial Acquisitionof Management Holdings
Number Amount Number Amount Number Amount Number Amount
1 2 3 4 5 6 7 8 9 10 11
1999-00 43 260 9 71 23 130 75 461 252 4,677
2000-01 70 1,140 5 189 2 42 77 1,372 248 4,873
2001-02 54 1,756 26 1,815 1 39 81 3,610 276 2,539
2002-03 46 3,814 40 2,573 2 1 88 6,389 238 2,428
2003-04 38 395 16 197 11 1,003 65 1,595 171 1,436
2004-05 35 3,503 12 165 14 964 61 4,632 212 6,958
2005-06 78 3,252 9 119 15 709 102 4,078 245 17,132
Apr-05 3 324 0 0 2 315 5 639 29 81
May-05 9 155 2 29 3 97 14 280 15 208
Jun-05 3 80 0 0 0 0 3 80 15 55
Jul-05 2 11 0 0 3 4 5 14 20 480
Aug-05 7 231 1 17 3 110 11 358 22 3,257
Sep-05 13 160 1 29 0 0 14 190 19 816
Oct-05 7 1,495 2 31 0 0 9 1,526 24 335
Nov-05 4 2 0 0 0 0 4 2 10 249
Dec-05 10 379 3 13 0 0 13 392 21 8,803
Jan-06 8 108 0 0 1 5 9 113 22 2,279
Feb-06 9 248 0 0 1 162 10 410 28 223
Mar-06 3 59 0 0 2 16 5 74 20 346
2006-07 (so far)
Apr-06 8 2,550 0 0 1 31 9 2,581 48 16,506
May-06 13 1,737 4 1,157 1 42 18 2,936 7 107
Jun-06 6 529 0 0 1 4 7 533 20 476
Jul-06 6 11 0 0 0 0 6 11 37 227
Aug-06 3 10 3 30 0 0 6 39 15 281
Sep-06 5 465 1 118 0 0 6 583 12 111
Oct-06 1 0 0 0 0 0 1 0 12 128
Nov-06 5 1,031 2 12 0 0 7 1,042 13 65

D:\BULLET26\DEC-2006\SB-DEC-2 TAN-14 MK C.DEY + O.P> + SJ + DS 26-12-2006---27-12-2006 76
DE
CE
MB
ER
SE
BI B
ULLE
TIN
2006
SE
CU
RIT
IES
& E
XC
HA
NG
E B
OA
RD
OF
IND
IA76
Table 33: Progress of Dematerialisation at NSDL and CDSL
At the end of NSDL CDSLthe period Cos- Cos-Live DPs-Live DPs- Mkt. Cap. Demat Cos- Cos-Live DPs-Live** DPs-Loca- Mkt. Cap. Demat
Agreement Locations (Rs. cr.)* Quantity Agreement tions*** (Rs. cr.)# QuantitySigned (million Signed (million
shares) shares)
1 2 3 4 5 6 7 8 9 10 11 12 13
1999-00 918 821 124 1,425 7,65,875 15,501 541 541 NA NA NA NA
2000-01 2,821 2,786 186 1,896 5,55,376 37,208 2,723 2,703 137 132 10,906 1,920
2001-02 4,210 4,172 212 1,648 6,15,001 51,673 4,293 4,284 148 181 24,337 4,820
2002-03 4,803 4,761 213 1,718 6,00,539 68,757 4,628 4,628 177 212 36,164 8,210
2003-04 5,216 5,212 214 1,719 11,07,084 83,694 4,810 4,810 200 219 1,06,443 14,010
2004-05 5,536 5,536 216 2,819 16,38,300 1,28,663 5,068 5,068 532 1,530 1,67,226 19,080
2005-06 6,022 6,022 223 3,017 30,05,100 1,74,722 5,479 5,479 582 2,577 2,35,829 27,220
Apr-05 5,582 5,582 218 2,819 15,78,500 1,30,451 5,094 5,094 537 1,560 1,22,694 19,440
May-05 5,619 5,619 218 2,820 17,21,100 1,32,750 5,155 5,155 538 1,586 1,28,737 20,190
Jun-05 5,663 5,663 218 2,855 17,94,900 1,36,672 5,186 5,186 541 1,590 1,55,040 22,100
Jul-05 5,682 5,682 217 2,863 19,20,000 1,40,593 5,210 5,210 537 1,590 1,64,003 22,560
Aug-05 5,722 5,722 217 2,870 20,34,400 1,47,081 5,236 5,236 542 1,683 1,78,290 23,440
Sep-05 5,756 5,756 217 2,898 21,64,800 1,51,833 5,261 5,261 548 1,692 1,90,559 23,930
Oct-05 5,787 5,787 219 2,912 21,26,900 1,55,654 5,289 5,289 553 1,698 1,72,781 24,510
Nov-05 5,822 5,822 219 2,944 23,66,200 1,58,876 5,320 5,320 552 1,750 1,89,805 24,980
Dec-05 5,856 5,856 221 2,947 25,33,100 1,61,086 5,352 5,352 559 1,826 1,97,890 25,570
Jan-06 5,895 5,895 222 2,954 26,42,500 1,67,454 5,388 5,388 568 2,553 2,03,297 26,570
Feb-06 5,938 5,938 222 2,964 27,25,200 1,70,206 5,429 5,429 570 2,555 2,04,464 26,710
Mar-06 6,022 6,022 223 3,017 30,05,100 1,74,722 5,479 5,479 582 2,577 2,35,829 27,220
2006-07 (so far)
Apr-06 6,052 6,052 225 3,029 32,63,100 1,81,587 5,514 5,514 586 2,583 2,60,463 27,440
May-06 6,116 6,116 227 3,034 28,57,800 1,84,255 5,561 5,561 592 2,611 2,18,906 27,980
Jun-06 6,148 6,148 231 3,063 27,26,150 1,86,857 5,368 5,368 588 2,608 2,04,805 28,730
Jul-06 6,193 6,193 231 3,101 27,08,600 1,92,203 5,395 5,395 595 2,725 2,08,310 29,870
Aug-06 6,248 6,248 232 3,153 30,29,100 1,90,398 5,418 5,418 599 2,823 2,28,521 29,530
Sep-06 6,277 6,277 232 3,211 32,36,700 1,86,422 5,441 5,441 605 2,828 2,42,926 30,030
Oct-06 6,301 6,301 233 3,212 33,54,900 1,88,839 5,461 5,461 609 2,838 2,61,352 29,460
Nov-06 6,334 6,334 234 3,219 36,20,300 1,91,467 5,481 5,481 611 3,619 2,80,202 29,460
*Market capitalisation of companies that have joined NSDL (inclusive of both physical and dematerialised shares)
#Market capitalisation of securities in CDSL **Count includes main DPs as well as Branch DPs since April 2004.
***‘DPs Locations’ represents the total live (main DPs and branch DPs as well as non-live (back office connected collection centres) from April 2004 onwards
Source : NSDL and CDSL
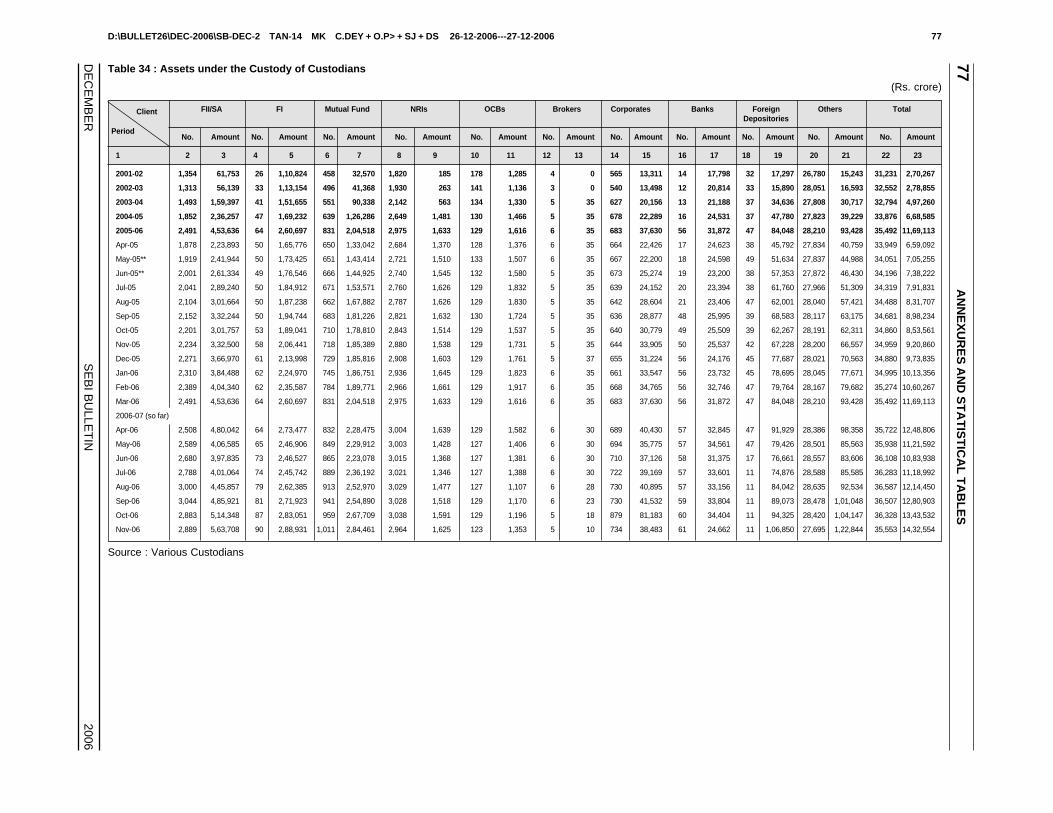
D:\BULLET26\DEC-2006\SB-DEC-2 TAN-14 MK C.DEY + O.P> + SJ + DS 26-12-2006---27-12-2006 77
DE
CE
MB
ER
SE
BI B
ULLE
TIN
2006
77A
NN
EX
UR
ES
AN
D S
TA
TIS
TIC
AL
TA
BL
ES
Table 34 : Assets under the Custody of Custodians
(Rs. crore)
FII/SA FI Mutual Fund NRIs OCBs Brokers Corporates Banks Foreign Others TotalDepositories
No. Amount No. Amount No. Amount No. Amount No. Amount No. Amount No. Amount No. Amount No. Amount No. Amount No. Amount
1 2 3 4 5 6 7 8 9 10 11 12 13 14 15 16 17 18 19 20 21 22 23
2001-02 1,354 61,753 26 1,10,824 458 32,570 1,820 185 178 1,285 4 0 565 13,311 14 17,798 32 17,297 26,780 15,243 31,231 2,70,267
2002-03 1,313 56,139 33 1,13,154 496 41,368 1,930 263 141 1,136 3 0 540 13,498 12 20,814 33 15,890 28,051 16,593 32,552 2,78,855
2003-04 1,493 1,59,397 41 1,51,655 551 90,338 2,142 563 134 1,330 5 35 627 20,156 13 21,188 37 34,636 27,808 30,717 32,794 4,97,260
2004-05 1,852 2,36,257 47 1,69,232 639 1,26,286 2,649 1,481 130 1,466 5 35 678 22,289 16 24,531 37 47,780 27,823 39,229 33,876 6,68,585
2005-06 2,491 4,53,636 64 2,60,697 831 2,04,518 2,975 1,633 129 1,616 6 35 683 37,630 56 31,872 47 84,048 28,210 93,428 35,492 11,69,113
Apr-05 1,878 2,23,893 50 1,65,776 650 1,33,042 2,684 1,370 128 1,376 6 35 664 22,426 17 24,623 38 45,792 27,834 40,759 33,949 6,59,092
May-05** 1,919 2,41,944 50 1,73,425 651 1,43,414 2,721 1,510 133 1,507 6 35 667 22,200 18 24,598 49 51,634 27,837 44,988 34,051 7,05,255
Jun-05** 2,001 2,61,334 49 1,76,546 666 1,44,925 2,740 1,545 132 1,580 5 35 673 25,274 19 23,200 38 57,353 27,872 46,430 34,196 7,38,222
Jul-05 2,041 2,89,240 50 1,84,912 671 1,53,571 2,760 1,626 129 1,832 5 35 639 24,152 20 23,394 38 61,760 27,966 51,309 34,319 7,91,831
Aug-05 2,104 3,01,664 50 1,87,238 662 1,67,882 2,787 1,626 129 1,830 5 35 642 28,604 21 23,406 47 62,001 28,040 57,421 34,488 8,31,707
Sep-05 2,152 3,32,244 50 1,94,744 683 1,81,226 2,821 1,632 130 1,724 5 35 636 28,877 48 25,995 39 68,583 28,117 63,175 34,681 8,98,234
Oct-05 2,201 3,01,757 53 1,89,041 710 1,78,810 2,843 1,514 129 1,537 5 35 640 30,779 49 25,509 39 62,267 28,191 62,311 34,860 8,53,561
Nov-05 2,234 3,32,500 58 2,06,441 718 1,85,389 2,880 1,538 129 1,731 5 35 644 33,905 50 25,537 42 67,228 28,200 66,557 34,959 9,20,860
Dec-05 2,271 3,66,970 61 2,13,998 729 1,85,816 2,908 1,603 129 1,761 5 37 655 31,224 56 24,176 45 77,687 28,021 70,563 34,880 9,73,835
Jan-06 2,310 3,84,488 62 2,24,970 745 1,86,751 2,936 1,645 129 1,823 6 35 661 33,547 56 23,732 45 78,695 28,045 77,671 34,995 10,13,356
Feb-06 2,389 4,04,340 62 2,35,587 784 1,89,771 2,966 1,661 129 1,917 6 35 668 34,765 56 32,746 47 79,764 28,167 79,682 35,274 10,60,267
Mar-06 2,491 4,53,636 64 2,60,697 831 2,04,518 2,975 1,633 129 1,616 6 35 683 37,630 56 31,872 47 84,048 28,210 93,428 35,492 11,69,113
2006-07 (so far)
Apr-06 2,508 4,80,042 64 2,73,477 832 2,28,475 3,004 1,639 129 1,582 6 30 689 40,430 57 32,845 47 91,929 28,386 98,358 35,722 12,48,806
May-06 2,589 4,06,585 65 2,46,906 849 2,29,912 3,003 1,428 127 1,406 6 30 694 35,775 57 34,561 47 79,426 28,501 85,563 35,938 11,21,592
Jun-06 2,680 3,97,835 73 2,46,527 865 2,23,078 3,015 1,368 127 1,381 6 30 710 37,126 58 31,375 17 76,661 28,557 83,606 36,108 10,83,938
Jul-06 2,788 4,01,064 74 2,45,742 889 2,36,192 3,021 1,346 127 1,388 6 30 722 39,169 57 33,601 11 74,876 28,588 85,585 36,283 11,18,992
Aug-06 3,000 4,45,857 79 2,62,385 913 2,52,970 3,029 1,477 127 1,107 6 28 730 40,895 57 33,156 11 84,042 28,635 92,534 36,587 12,14,450
Sep-06 3,044 4,85,921 81 2,71,923 941 2,54,890 3,028 1,518 129 1,170 6 23 730 41,532 59 33,804 11 89,073 28,478 1,01,048 36,507 12,80,903
Oct-06 2,883 5,14,348 87 2,83,051 959 2,67,709 3,038 1,591 129 1,196 5 18 879 81,183 60 34,404 11 94,325 28,420 1,04,147 36,328 13,43,532
Nov-06 2,889 5,63,708 90 2,88,931 1,011 2,84,461 2,964 1,625 123 1,353 5 10 734 38,483 61 24,662 11 1,06,850 27,695 1,22,844 35,553 14,32,554
Source : Various Custodians
Period
Client
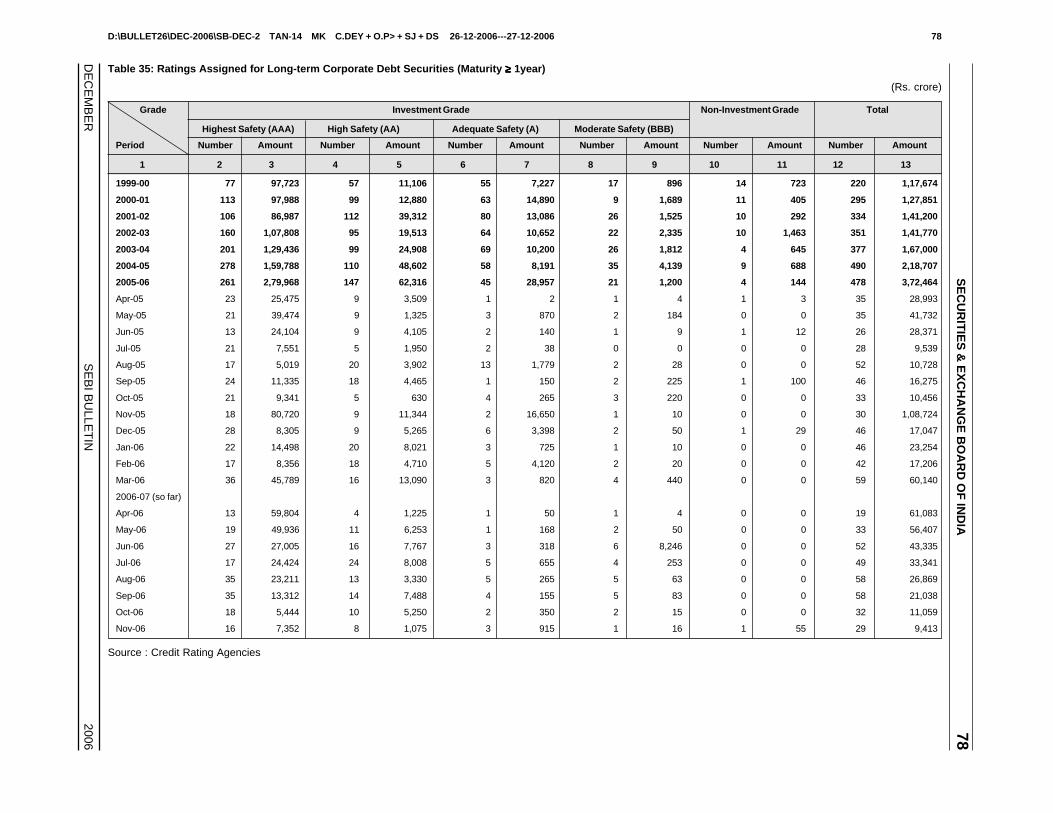
D:\BULLET26\DEC-2006\SB-DEC-2 TAN-14 MK C.DEY + O.P> + SJ + DS 26-12-2006---27-12-2006 78
DE
CE
MB
ER
SE
BI B
ULLE
TIN
2006
SE
CU
RIT
IES
& E
XC
HA
NG
E B
OA
RD
OF
IND
IA78
Table 35: Ratings Assigned for Long-term Corporate Debt Securities (Maturity ≥≥≥≥≥ 1year)
(Rs. crore)
Grade Investment Grade Non-Investment Grade Total
Highest Safety (AAA) High Safety (AA) Adequate Safety (A) Moderate Safety (BBB)
Period Number Amount Number Amount Number Amount Number Amount Number Amount Number Amount
1 2 3 4 5 6 7 8 9 10 11 12 13
1999-00 77 97,723 57 11,106 55 7,227 17 896 14 723 220 1,17,674
2000-01 113 97,988 99 12,880 63 14,890 9 1,689 11 405 295 1,27,851
2001-02 106 86,987 112 39,312 80 13,086 26 1,525 10 292 334 1,41,200
2002-03 160 1,07,808 95 19,513 64 10,652 22 2,335 10 1,463 351 1,41,770
2003-04 201 1,29,436 99 24,908 69 10,200 26 1,812 4 645 377 1,67,000
2004-05 278 1,59,788 110 48,602 58 8,191 35 4,139 9 688 490 2,18,707
2005-06 261 2,79,968 147 62,316 45 28,957 21 1,200 4 144 478 3,72,464
Apr-05 23 25,475 9 3,509 1 2 1 4 1 3 35 28,993
May-05 21 39,474 9 1,325 3 870 2 184 0 0 35 41,732
Jun-05 13 24,104 9 4,105 2 140 1 9 1 12 26 28,371
Jul-05 21 7,551 5 1,950 2 38 0 0 0 0 28 9,539
Aug-05 17 5,019 20 3,902 13 1,779 2 28 0 0 52 10,728
Sep-05 24 11,335 18 4,465 1 150 2 225 1 100 46 16,275
Oct-05 21 9,341 5 630 4 265 3 220 0 0 33 10,456
Nov-05 18 80,720 9 11,344 2 16,650 1 10 0 0 30 1,08,724
Dec-05 28 8,305 9 5,265 6 3,398 2 50 1 29 46 17,047
Jan-06 22 14,498 20 8,021 3 725 1 10 0 0 46 23,254
Feb-06 17 8,356 18 4,710 5 4,120 2 20 0 0 42 17,206
Mar-06 36 45,789 16 13,090 3 820 4 440 0 0 59 60,140
2006-07 (so far)
Apr-06 13 59,804 4 1,225 1 50 1 4 0 0 19 61,083
May-06 19 49,936 11 6,253 1 168 2 50 0 0 33 56,407
Jun-06 27 27,005 16 7,767 3 318 6 8,246 0 0 52 43,335
Jul-06 17 24,424 24 8,008 5 655 4 253 0 0 49 33,341
Aug-06 35 23,211 13 3,330 5 265 5 63 0 0 58 26,869
Sep-06 35 13,312 14 7,488 4 155 5 83 0 0 58 21,038
Oct-06 18 5,444 10 5,250 2 350 2 15 0 0 32 11,059
Nov-06 16 7,352 8 1,075 3 915 1 16 1 55 29 9,413
Source : Credit Rating Agencies
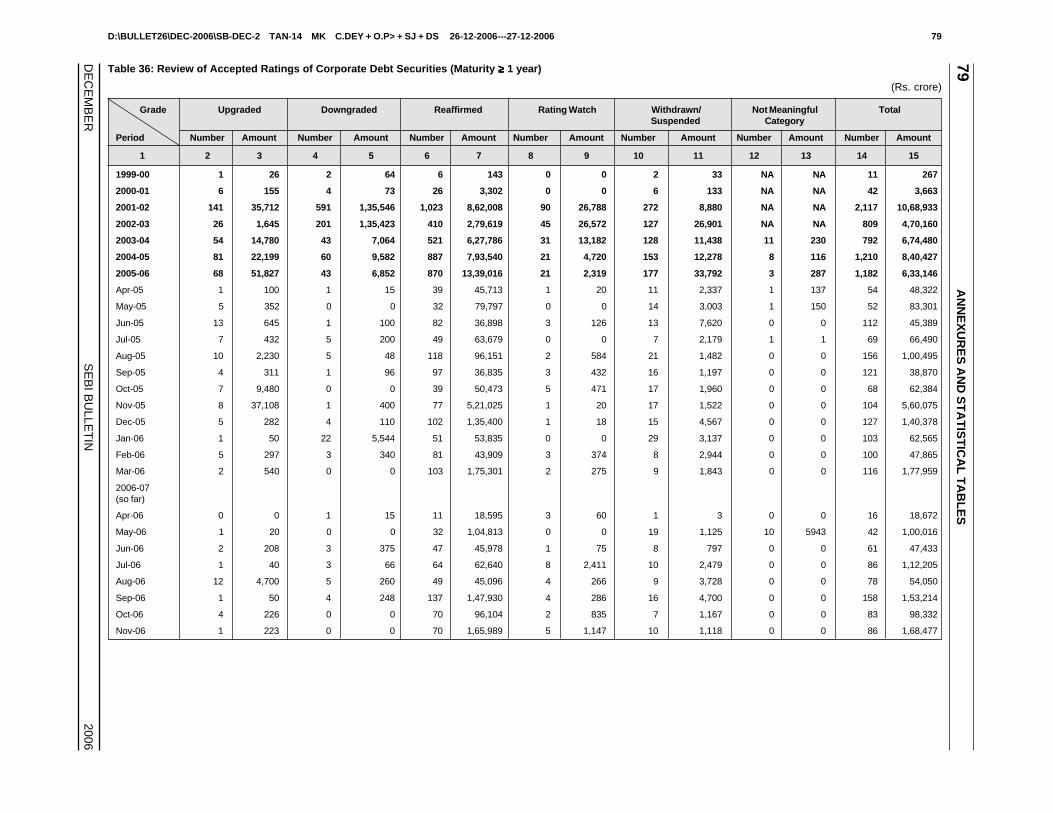
D:\BULLET26\DEC-2006\SB-DEC-2 TAN-14 MK C.DEY + O.P> + SJ + DS 26-12-2006---27-12-2006 79
DE
CE
MB
ER
SE
BI B
ULLE
TIN
2006
79A
NN
EX
UR
ES
AN
D S
TA
TIS
TIC
AL
TA
BL
ES
Table 36: Review of Accepted Ratings of Corporate Debt Securities (Maturity ≥≥≥≥≥ 1 year)
(Rs. crore)
Grade Upgraded Downgraded Reaffirmed Rating Watch Withdrawn/ Not Meaningful TotalSuspended Category
Period Number Amount Number Amount Number Amount Number Amount Number Amount Number Amount Number Amount
1 2 3 4 5 6 7 8 9 10 11 12 13 14 15
1999-00 1 26 2 64 6 143 0 0 2 33 NA NA 11 267
2000-01 6 155 4 73 26 3,302 0 0 6 133 NA NA 42 3,663
2001-02 141 35,712 591 1,35,546 1,023 8,62,008 90 26,788 272 8,880 NA NA 2,117 10,68,933
2002-03 26 1,645 201 1,35,423 410 2,79,619 45 26,572 127 26,901 NA NA 809 4,70,160
2003-04 54 14,780 43 7,064 521 6,27,786 31 13,182 128 11,438 11 230 792 6,74,480
2004-05 81 22,199 60 9,582 887 7,93,540 21 4,720 153 12,278 8 116 1,210 8,40,427
2005-06 68 51,827 43 6,852 870 13,39,016 21 2,319 177 33,792 3 287 1,182 6,33,146
Apr-05 1 100 1 15 39 45,713 1 20 11 2,337 1 137 54 48,322
May-05 5 352 0 0 32 79,797 0 0 14 3,003 1 150 52 83,301
Jun-05 13 645 1 100 82 36,898 3 126 13 7,620 0 0 112 45,389
Jul-05 7 432 5 200 49 63,679 0 0 7 2,179 1 1 69 66,490
Aug-05 10 2,230 5 48 118 96,151 2 584 21 1,482 0 0 156 1,00,495
Sep-05 4 311 1 96 97 36,835 3 432 16 1,197 0 0 121 38,870
Oct-05 7 9,480 0 0 39 50,473 5 471 17 1,960 0 0 68 62,384
Nov-05 8 37,108 1 400 77 5,21,025 1 20 17 1,522 0 0 104 5,60,075
Dec-05 5 282 4 110 102 1,35,400 1 18 15 4,567 0 0 127 1,40,378
Jan-06 1 50 22 5,544 51 53,835 0 0 29 3,137 0 0 103 62,565
Feb-06 5 297 3 340 81 43,909 3 374 8 2,944 0 0 100 47,865
Mar-06 2 540 0 0 103 1,75,301 2 275 9 1,843 0 0 116 1,77,959
2006-07(so far)
Apr-06 0 0 1 15 11 18,595 3 60 1 3 0 0 16 18,672
May-06 1 20 0 0 32 1,04,813 0 0 19 1,125 10 5943 42 1,00,016
Jun-06 2 208 3 375 47 45,978 1 75 8 797 0 0 61 47,433
Jul-06 1 40 3 66 64 62,640 8 2,411 10 2,479 0 0 86 1,12,205
Aug-06 12 4,700 5 260 49 45,096 4 266 9 3,728 0 0 78 54,050
Sep-06 1 50 4 248 137 1,47,930 4 286 16 4,700 0 0 158 1,53,214
Oct-06 4 226 0 0 70 96,104 2 835 7 1,167 0 0 83 98,332
Nov-06 1 223 0 0 70 1,65,989 5 1,147 10 1,118 0 0 86 1,68,477
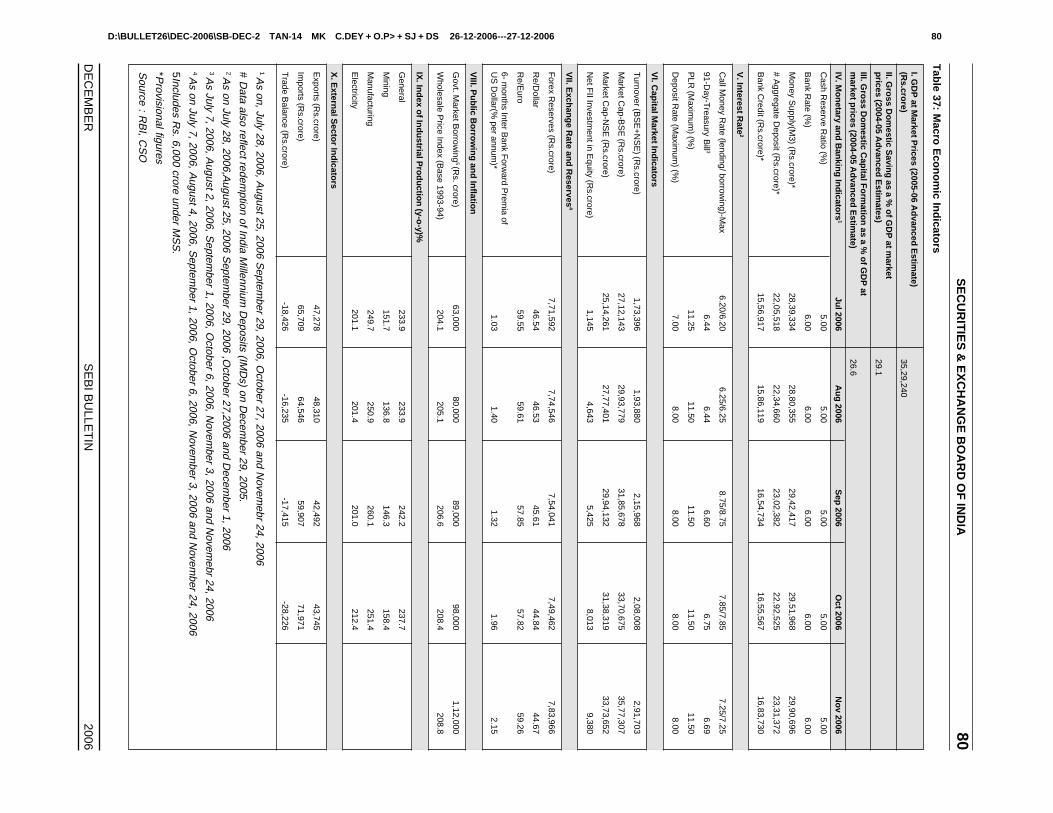
D:\BULLET26\DEC-2006\SB-DEC-2 TAN-14 MK C.DEY + O.P> + SJ + DS 26-12-2006---27-12-2006 80
DE
CE
MB
ER
SE
BI B
ULLE
TIN
2006
SE
CU
RIT
IES
& E
XC
HA
NG
E B
OA
RD
OF
IND
IA80
Tab
le 37: Macro
Eco
no
mic In
dicato
rs
I. GD
P at M
arket Prices (2005-06 A
dvan
ced E
stimate)
(Rs.cro
re)35,29,240
II. Gro
ss Do
mestic S
aving
as a % o
f GD
P at m
arketp
rices (2004-05 Ad
vanced
Estim
ates)29.1
III. Gro
ss Do
mestic C
apital F
orm
ation
as a % o
f GD
P at
market p
rices (2004-05 Ad
vanced
Estim
ate)26.6
IV. M
on
etary and
Ban
king
Ind
icators
1Ju
l 2006A
ug
2006S
ep 2006
Oct 2006
No
v 2006
Cash R
eserve Ratio (%
)5.00
5.005.00
5.005.00
Bank R
ate (%)
6.006.00
6.006.00
6.00
Money S
upply(M3) (R
s.crore)*28,39,334
28,80,35529,42,417
29,51,96829,90,696
# Aggregate D
eposit (Rs.crore)*
22,05,51822,34,660
23,02,38222,92,525
23,31,372
Bank C
redit (Rs.crore)*
15,56,91715,86,119
16,54,73416,55,567
16,83,730
V. In
terest Rate
2
Call M
oney Rate (lending/ borrow
ing)-Max
6.20/6.206.25/6.25
8.75/8.757.85/7.85
7.25/7.25
91-Day-T
reasury Bill 3
6.446.44
6.606.75
6.69
PLR
(Maxim
um) (%
)11.25
11.5011.50
11.5011.50
Deposit R
ate (Maxim
um) (%
)7.00
8.008.00
8.008.00
VI. C
apital M
arket Ind
icators
Turnover (B
SE
+N
SE
) (Rs.crore)
1,73,3961,93,880
2,15,9682,08,008
2,91,703
Market C
ap-BS
E (R
s.crore)27,12,143
29,93,77931,85,678
33,70,67535,77,307
Market C
ap-NS
E (R
s.crore)25,14,261
27,77,40129,94,132
31,38,31933,73,652
Net F
II Investment in E
quity (Rs.crore)
1,1454,643
5,4258,013
9,380
VII. E
xchan
ge R
ate and
Reserves
4
Forex R
eserves (Rs.crore)
7,71,5927,74,546
7,54,0417,49,462
7,83,966
Re/D
ollar46.54
46.5345.61
44.8444.67
Re/E
uro59.55
59.6157.85
57.8259.26
6- months Inter B
ank Forw
ard Prem
ia ofU
S D
ollar(% per annum
)*1.03
1.401.32
1.962.15
VIII. P
ub
lic Bo
rrow
ing
and
Inflatio
n
Govt. M
arket Borrow
ing5 (R
s. crore)63,000
80,00089,000
98,0001,12,000
Wholesale P
rice Index (Base 1993-94)
204.1205.1
206.6208.4
208.8
IX. In
dex o
f Ind
ustrial P
rod
uctio
n (y-o
-y)%
General
233.9233.9
242.2237.7
Mining
151.7136.8
146.3158.4
Manufacturing
249.7250.9
260.1251.4
Electricity
201.1201.4
201.0212.4
X. E
xternal S
ector In
dicato
rs
Exports (R
s.crore)47,278
48,31042,492
43,745
Imports (R
s.crore)65,709
64,54659,907
71,971
Trade B
alance (Rs.crore)
-18,426-16,235
-17,415-28,226
1 As on, July 28, 2006, A
ugust 25, 2006 Septem
ber 29, 2006, October 27, 2006 and N
ovemebr 24, 2006
# Data also reflect redem
ption of India Millennium
Deposits (IM
Ds) on D
ecember 29, 2005.
2 As on July 28, 2006,A
ugust 25, 2006 Septem
ber 29, 2006 ,October 27,2006 and D
ecember 1, 2006
3 As July 7, 2006, A
ugust 2, 2006, Septem
ber 1, 2006, October 6, 2006, N
ovember 3, 2006 and N
ovemebr 24, 2006
4 As on July 7, 2006, A
ugust 4, 2006, Septem
ber 1, 2006, October 6, 2006, N
ovember 3, 2006 and N
ovember 24, 2006
5Includes Rs. 6,000 crore under M
SS
.
*Provisional figures
Source : R
BI, C
SO
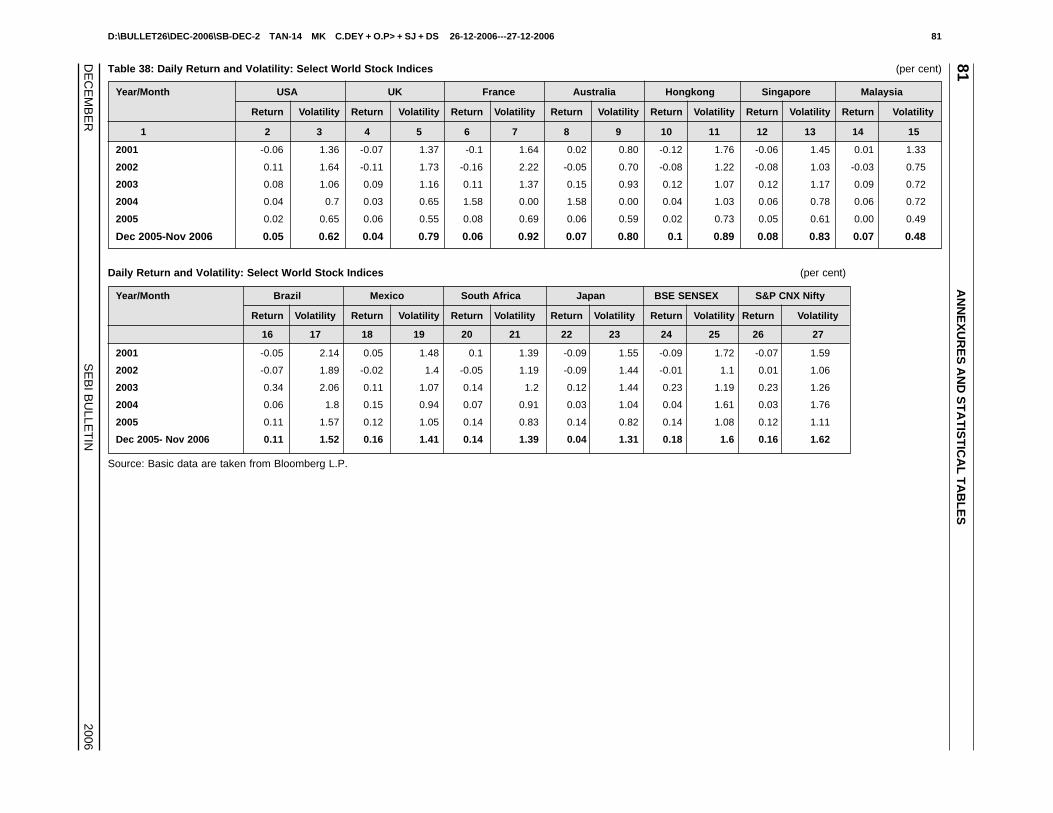
D:\BULLET26\DEC-2006\SB-DEC-2 TAN-14 MK C.DEY + O.P> + SJ + DS 26-12-2006---27-12-2006 81
DE
CE
MB
ER
SE
BI B
ULLE
TIN
2006
81A
NN
EX
UR
ES
AN
D S
TA
TIS
TIC
AL
TA
BL
ES
Table 38: Daily Return and Volatility: Select World Stock Indices (per cent)
Year/Month USA UK France Australia Hongkong Singapore Malaysia
Return Volatility Return Volatility Return Volatility Return Volatility Return Volatility Return Volatility Return Volatility
1 2 3 4 5 6 7 8 9 10 11 12 13 14 15
2001 -0.06 1.36 -0.07 1.37 -0.1 1.64 0.02 0.80 -0.12 1.76 -0.06 1.45 0.01 1.33
2002 0.11 1.64 -0.11 1.73 -0.16 2.22 -0.05 0.70 -0.08 1.22 -0.08 1.03 -0.03 0.75
2003 0.08 1.06 0.09 1.16 0.11 1.37 0.15 0.93 0.12 1.07 0.12 1.17 0.09 0.72
2004 0.04 0.7 0.03 0.65 1.58 0.00 1.58 0.00 0.04 1.03 0.06 0.78 0.06 0.72
2005 0.02 0.65 0.06 0.55 0.08 0.69 0.06 0.59 0.02 0.73 0.05 0.61 0.00 0.49
Dec 2005-Nov 2006 0.05 0.62 0.04 0.79 0.06 0.92 0.07 0.80 0.1 0.89 0.08 0.83 0.07 0.48
Daily Return and Volatility: Select World Stock Indices (per cent)
Year/Month Brazil Mexico South Africa Japan BSE SENSEX S&P CNX Nifty
Return Volatility Return Volatility Return Volatility Return Volatility Return Volatility Return Volatility
16 17 18 19 20 21 22 23 24 25 26 27
2001 -0.05 2.14 0.05 1.48 0.1 1.39 -0.09 1.55 -0.09 1.72 -0.07 1.59
2002 -0.07 1.89 -0.02 1.4 -0.05 1.19 -0.09 1.44 -0.01 1.1 0.01 1.06
2003 0.34 2.06 0.11 1.07 0.14 1.2 0.12 1.44 0.23 1.19 0.23 1.26
2004 0.06 1.8 0.15 0.94 0.07 0.91 0.03 1.04 0.04 1.61 0.03 1.76
2005 0.11 1.57 0.12 1.05 0.14 0.83 0.14 0.82 0.14 1.08 0.12 1.11
Dec 2005- Nov 2006 0.11 1.52 0.16 1.41 0.14 1.39 0.04 1.31 0.18 1.6 0.16 1.62
Source: Basic data are taken from Bloomberg L.P.
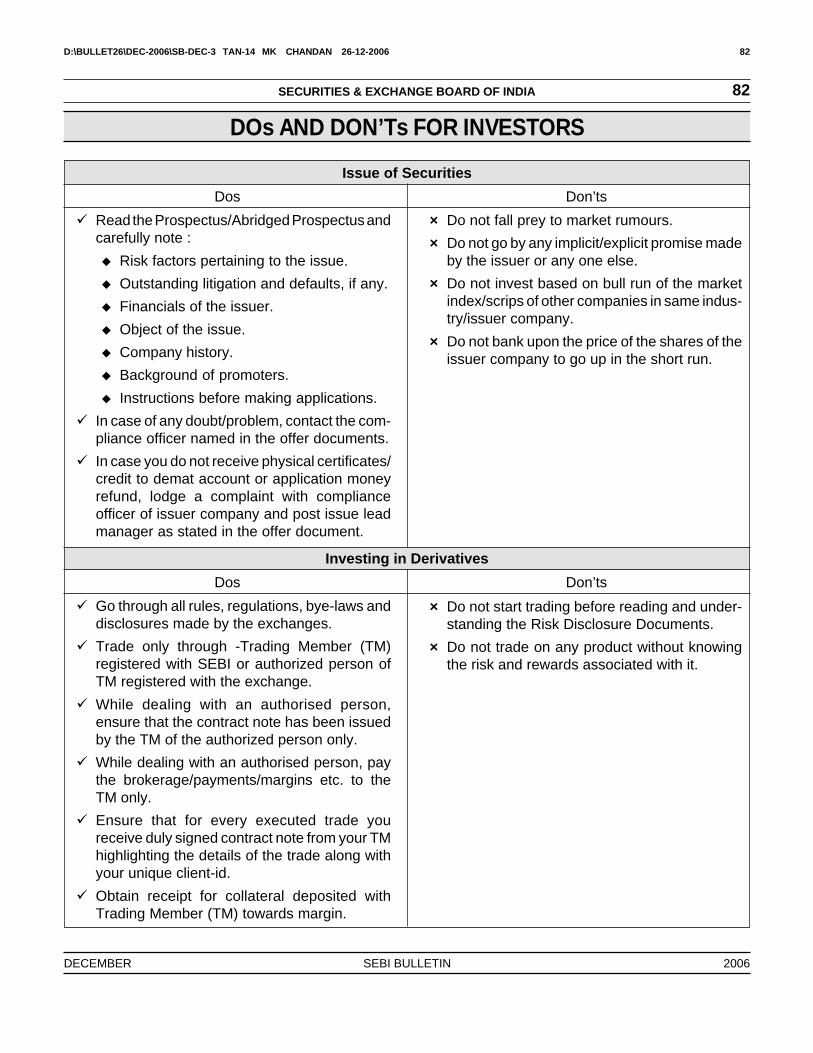
DECEMBER SEBI BULLETIN 2006
D:\BULLET26\DEC-2006\SB-DEC-3 TAN-14 MK CHANDAN 26-12-2006 82
SECURITIES & EXCHANGE BOARD OF INDIA 82
DOs AND DON’Ts FOR INVESTORS
Issue of Securities
Dos Don’ts
� Read the Prospectus/Abridged Prospectus andcarefully note :
� Risk factors pertaining to the issue.
� Outstanding litigation and defaults, if any.
� Financials of the issuer.
� Object of the issue.
� Company history.
� Background of promoters.
� Instructions before making applications.
� In case of any doubt/problem, contact the com-pliance officer named in the offer documents.
� In case you do not receive physical certificates/credit to demat account or application moneyrefund, lodge a complaint with complianceofficer of issuer company and post issue leadmanager as stated in the offer document.
Investing in Derivatives
Dos Don’ts
� Go through all rules, regulations, bye-laws anddisclosures made by the exchanges.
� Trade only through -Trading Member (TM)registered with SEBI or authorized person ofTM registered with the exchange.
� While dealing with an authorised person,ensure that the contract note has been issuedby the TM of the authorized person only.
� While dealing with an authorised person, paythe brokerage/payments/margins etc. to theTM only.
� Ensure that for every executed trade youreceive duly signed contract note from your TMhighlighting the details of the trade along withyour unique client-id.
� Obtain receipt for collateral deposited withTrading Member (TM) towards margin.
× Do not fall prey to market rumours.
× Do not go by any implicit/explicit promise madeby the issuer or any one else.
× Do not invest based on bull run of the marketindex/scrips of other companies in same indus-try/issuer company.
× Do not bank upon the price of the shares of theissuer company to go up in the short run.
× Do not start trading before reading and under-standing the Risk Disclosure Documents.
× Do not trade on any product without knowingthe risk and rewards associated with it.
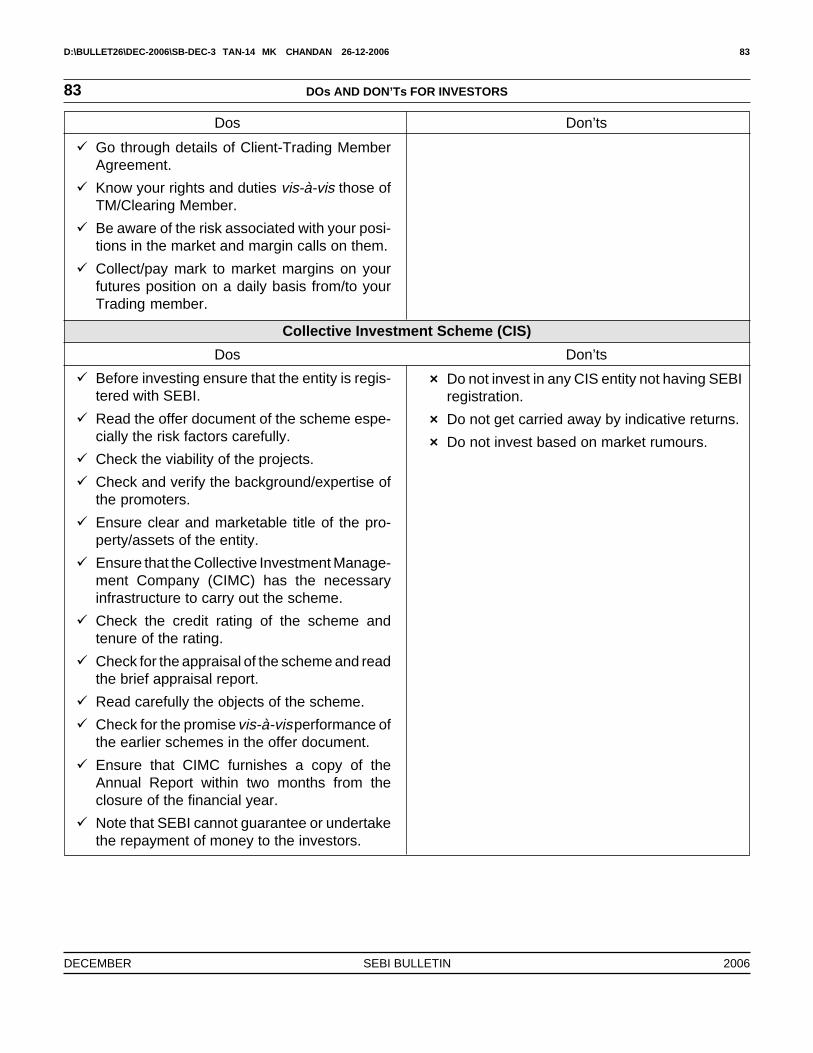
D:\BULLET26\DEC-2006\SB-DEC-3 TAN-14 MK CHANDAN 26-12-2006 83
DECEMBER SEBI BULLETIN 2006
83
� Go through details of Client-Trading MemberAgreement.
� Know your rights and duties vis-à-vis those ofTM/Clearing Member.
� Be aware of the risk associated with your posi-tions in the market and margin calls on them.
� Collect/pay mark to market margins on yourfutures position on a daily basis from/to yourTrading member.
Collective Investment Scheme (CIS)
Dos Don’ts
� Before investing ensure that the entity is regis-tered with SEBI.
� Read the offer document of the scheme espe-cially the risk factors carefully.
� Check the viability of the projects.
� Check and verify the background/expertise ofthe promoters.
� Ensure clear and marketable title of the pro-perty/assets of the entity.
� Ensure that the Collective Investment Manage-ment Company (CIMC) has the necessaryinfrastructure to carry out the scheme.
� Check the credit rating of the scheme andtenure of the rating.
� Check for the appraisal of the scheme and readthe brief appraisal report.
� Read carefully the objects of the scheme.
� Check for the promise vis-à-vis performance ofthe earlier schemes in the offer document.
� Ensure that CIMC furnishes a copy of theAnnual Report within two months from theclosure of the financial year.
� Note that SEBI cannot guarantee or undertakethe repayment of money to the investors.
Dos Don’ts
× Do not invest in any CIS entity not having SEBIregistration.
× Do not get carried away by indicative returns.
× Do not invest based on market rumours.
DOs AND DON’Ts FOR INVESTORS

DECEMBER SEBI BULLETIN 2006
D:\BULLET26\DEC-2006\SB-DEC-3 TAN-14 MK CHANDAN 26-12-2006 84
SECURITIES & EXCHANGE BOARD OF INDIA 84
Dealing with Brokers & Sub-brokers
Dos Don’ts
� Deal only with SEBI registered intermediaries.
� Ensure that the intermediary has a valid regis-tration certificate.
� Ensure that the intermediary is permitted totransact in the market.
� State clearly who will be placing orders on yourbehalf.
� Insist on client registration form to be signed bythe intermediary before commencing opera-tions.
� Enter into an agreement with your broker orsub-broker setting out terms and conditionsclearly.
� Insist on contract note/confirmation memo fortrades done each day.
� Insist on bill for every settlement.
� Ensure that broker’s name, trade time andnumber, transaction price and brokerage areshown distinctly on the contract note.
� Insist on periodical statement of accounts.
� Issue cheques/drafts in trade name of the inter-mediary only.
� Ensure receipt of payment/deliveries within 48hours of payout.
� In case of disputes, file written complaint tointermediary/Stock Exchange/SEBI within a rea-sonable time.
� In case of sub-broker disputes, inform the mainbroker about the dispute within 6 months.
� Familiarize yourself with the rules, regulationsand circulars issued by stock exchanges/SEBIbefore carrying out any transaction.
Investing in Mutual Funds
Dos Don’ts
� Read the offer document carefully beforeinvesting.
� Note that investments in Mutual Funds may berisky.
× Do not deal with unregistered intermediaries.
× Do not pay more than the approved brokerageto the intermediary.
× Do not undertake deals for others.
× Do not neglect to set out in writing, orders forhigher value given over phone.
× Do not sign blank delivery instruction slip(s)while meeting security payin obligation.
× Don’t accept contract note/confirmation memosigned by any unauthorized person.
× Don’t delay payment/deliveries of securities tobroker/sub-broker.
× Don’t get carried away by luring advertise-ments, if any.
× Don’t be led by market rumours or get intoshady transactions.
× Do not invest in a scheme just because some-body is offering you a commission or otherincentive, gifts etc.
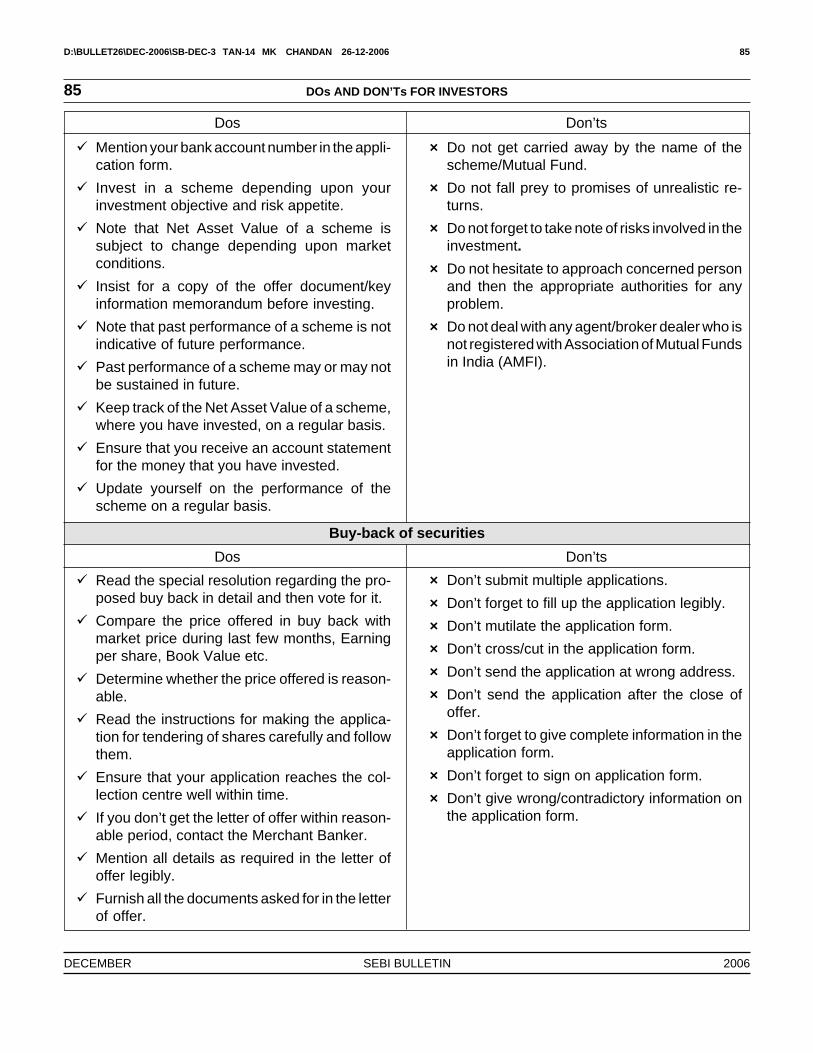
D:\BULLET26\DEC-2006\SB-DEC-3 TAN-14 MK CHANDAN 26-12-2006 85
DECEMBER SEBI BULLETIN 2006
85
� Mention your bank account number in the appli-cation form.
� Invest in a scheme depending upon yourinvestment objective and risk appetite.
� Note that Net Asset Value of a scheme issubject to change depending upon marketconditions.
� Insist for a copy of the offer document/keyinformation memorandum before investing.
� Note that past performance of a scheme is notindicative of future performance.
� Past performance of a scheme may or may notbe sustained in future.
� Keep track of the Net Asset Value of a scheme,where you have invested, on a regular basis.
� Ensure that you receive an account statementfor the money that you have invested.
� Update yourself on the performance of thescheme on a regular basis.
Buy-back of securities
Dos Don’ts
� Read the special resolution regarding the pro-posed buy back in detail and then vote for it.
� Compare the price offered in buy back withmarket price during last few months, Earningper share, Book Value etc.
� Determine whether the price offered is reason-able.
� Read the instructions for making the applica-tion for tendering of shares carefully and followthem.
� Ensure that your application reaches the col-lection centre well within time.
� If you don’t get the letter of offer within reason-able period, contact the Merchant Banker.
� Mention all details as required in the letter ofoffer legibly.
� Furnish all the documents asked for in the letterof offer.
Dos Don’ts
× Do not get carried away by the name of thescheme/Mutual Fund.
× Do not fall prey to promises of unrealistic re-turns.
× Do not forget to take note of risks involved in theinvestment.
× Do not hesitate to approach concerned personand then the appropriate authorities for anyproblem.
× Do not deal with any agent/broker dealer who isnot registered with Association of Mutual Fundsin India (AMFI).
× Don’t submit multiple applications.
× Don’t forget to fill up the application legibly.
× Don’t mutilate the application form.
× Don’t cross/cut in the application form.
× Don’t send the application at wrong address.
× Don’t send the application after the close ofoffer.
× Don’t forget to give complete information in theapplication form.
× Don’t forget to sign on application form.
× Don’t give wrong/contradictory information onthe application form.
DOs AND DON’Ts FOR INVESTORS
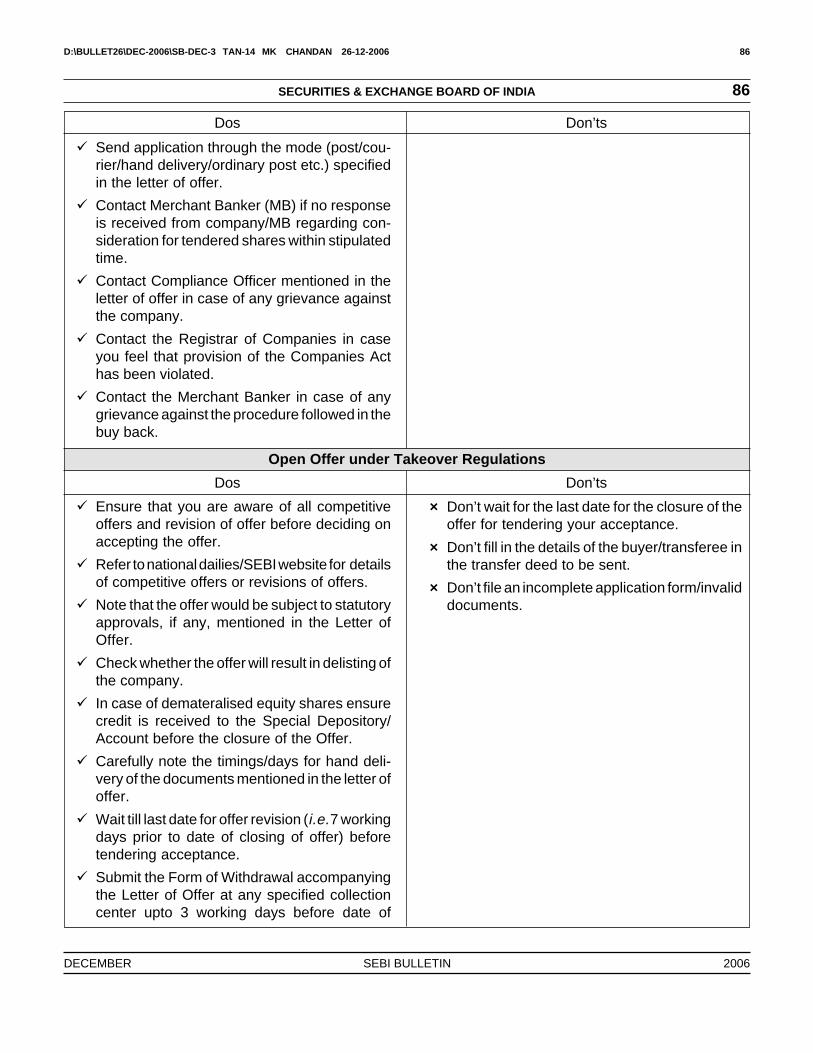
DECEMBER SEBI BULLETIN 2006
D:\BULLET26\DEC-2006\SB-DEC-3 TAN-14 MK CHANDAN 26-12-2006 86
SECURITIES & EXCHANGE BOARD OF INDIA 86
Dos Don’ts
� Send application through the mode (post/cou-rier/hand delivery/ordinary post etc.) specifiedin the letter of offer.
� Contact Merchant Banker (MB) if no responseis received from company/MB regarding con-sideration for tendered shares within stipulatedtime.
� Contact Compliance Officer mentioned in theletter of offer in case of any grievance againstthe company.
� Contact the Registrar of Companies in caseyou feel that provision of the Companies Acthas been violated.
� Contact the Merchant Banker in case of anygrievance against the procedure followed in thebuy back.
Open Offer under Takeover Regulations
Dos Don’ts
� Ensure that you are aware of all competitiveoffers and revision of offer before deciding onaccepting the offer.
� Refer to national dailies/SEBI website for detailsof competitive offers or revisions of offers.
� Note that the offer would be subject to statutoryapprovals, if any, mentioned in the Letter ofOffer.
� Check whether the offer will result in delisting ofthe company.
� In case of demateralised equity shares ensurecredit is received to the Special Depository/Account before the closure of the Offer.
� Carefully note the timings/days for hand deli-very of the documents mentioned in the letter ofoffer.
� Wait till last date for offer revision (i.e. 7 workingdays prior to date of closing of offer) beforetendering acceptance.
� Submit the Form of Withdrawal accompanyingthe Letter of Offer at any specified collectioncenter upto 3 working days before date of
× Don’t wait for the last date for the closure of theoffer for tendering your acceptance.
× Don’t fill in the details of the buyer/transferee inthe transfer deed to be sent.
× Don’t file an incomplete application form/invaliddocuments.
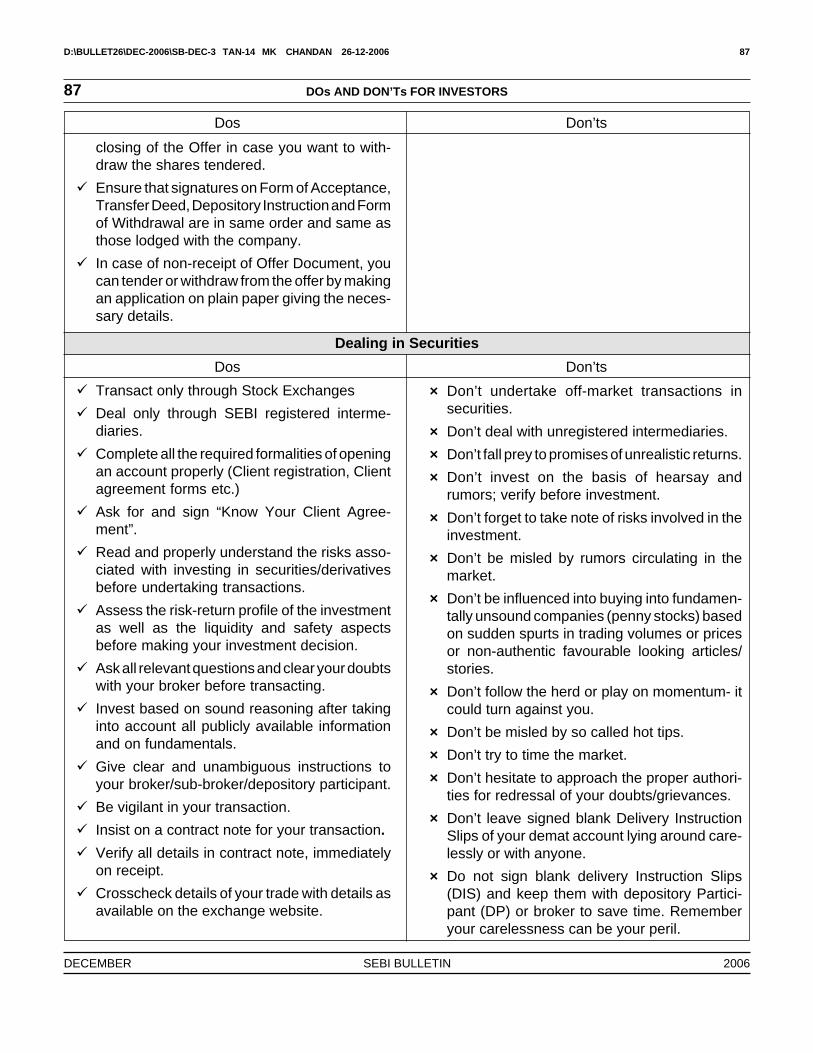
D:\BULLET26\DEC-2006\SB-DEC-3 TAN-14 MK CHANDAN 26-12-2006 87
DECEMBER SEBI BULLETIN 2006
87
closing of the Offer in case you want to with-draw the shares tendered.
� Ensure that signatures on Form of Acceptance,Transfer Deed, Depository Instruction and Formof Withdrawal are in same order and same asthose lodged with the company.
� In case of non-receipt of Offer Document, youcan tender or withdraw from the offer by makingan application on plain paper giving the neces-sary details.
Dealing in Securities
Dos Don’ts
� Transact only through Stock Exchanges
� Deal only through SEBI registered interme-diaries.
� Complete all the required formalities of openingan account properly (Client registration, Clientagreement forms etc.)
� Ask for and sign “Know Your Client Agree-ment”.
� Read and properly understand the risks asso-ciated with investing in securities/derivativesbefore undertaking transactions.
� Assess the risk-return profile of the investmentas well as the liquidity and safety aspectsbefore making your investment decision.
� Ask all relevant questions and clear your doubtswith your broker before transacting.
� Invest based on sound reasoning after takinginto account all publicly available informationand on fundamentals.
� Give clear and unambiguous instructions toyour broker/sub-broker/depository participant.
� Be vigilant in your transaction.
� Insist on a contract note for your transaction.
� Verify all details in contract note, immediatelyon receipt.
� Crosscheck details of your trade with details asavailable on the exchange website.
Dos Don’ts
× Don’t undertake off-market transactions insecurities.
× Don’t deal with unregistered intermediaries.
× Don’t fall prey to promises of unrealistic returns.
× Don’t invest on the basis of hearsay andrumors; verify before investment.
× Don’t forget to take note of risks involved in theinvestment.
× Don’t be misled by rumors circulating in themarket.
× Don’t be influenced into buying into fundamen-tally unsound companies (penny stocks) basedon sudden spurts in trading volumes or pricesor non-authentic favourable looking articles/stories.
× Don’t follow the herd or play on momentum- itcould turn against you.
× Don’t be misled by so called hot tips.
× Don’t try to time the market.
× Don’t hesitate to approach the proper authori-ties for redressal of your doubts/grievances.
× Don’t leave signed blank Delivery InstructionSlips of your demat account lying around care-lessly or with anyone.
× Do not sign blank delivery Instruction Slips(DIS) and keep them with depository Partici-pant (DP) or broker to save time. Rememberyour carelessness can be your peril.
DOs AND DON’Ts FOR INVESTORS
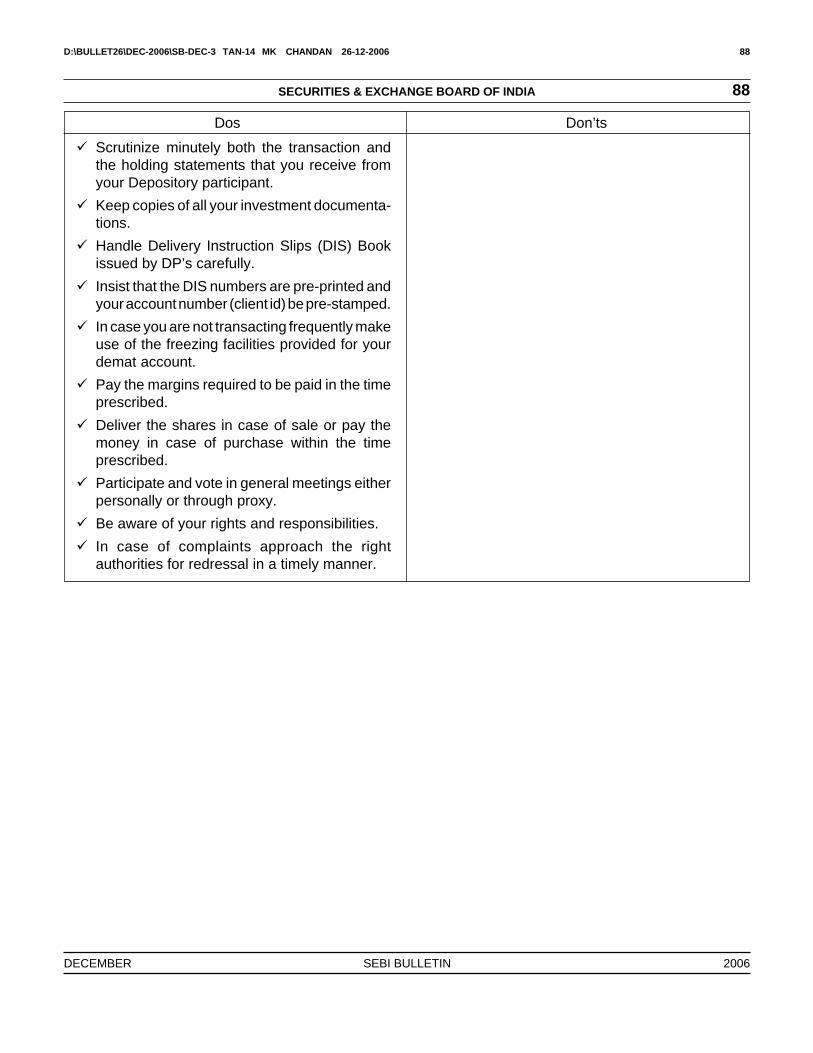
DECEMBER SEBI BULLETIN 2006
D:\BULLET26\DEC-2006\SB-DEC-3 TAN-14 MK CHANDAN 26-12-2006 88
SECURITIES & EXCHANGE BOARD OF INDIA 88
Dos Don’ts
� Scrutinize minutely both the transaction andthe holding statements that you receive fromyour Depository participant.
� Keep copies of all your investment documenta-tions.
� Handle Delivery Instruction Slips (DIS) Bookissued by DP’s carefully.
� Insist that the DIS numbers are pre-printed andyour account number (client id) be pre-stamped.
� In case you are not transacting frequently makeuse of the freezing facilities provided for yourdemat account.
� Pay the margins required to be paid in the timeprescribed.
� Deliver the shares in case of sale or pay themoney in case of purchase within the timeprescribed.
� Participate and vote in general meetings eitherpersonally or through proxy.
� Be aware of your rights and responsibilities.
� In case of complaints approach the rightauthorities for redressal in a timely manner.
D:\BULLET26\DEC-2006\SB-DEC-3 TAN-14 MK CHANDAN 26-12-2006 89
DECEMBER SEBI BULLETIN 2006
89
PUBLICATIONSPUBLICATIONS
1. Annual Reports: 2005-06, 2004-05, 2003-04.
2. Handbook of Statistics on Indian Securities Market, 2005.
Interested persons may contact the Research Department of SEBI to obtain a copy of Annual Report/Handbook of Statistics at the following address:
Research DepartmentSecurities and Exchange Board of IndiaPlot No. C 4-A, ‘G’ Block, Bandra Kurla Complex,Bandra (E).Mumbai - 400051
Tel No. +91-22-26449000, 26449280
Fax No. +91-22-26449013, 40459013
PUBLICATIONS