varun beverages limited - sebi
TRANSCRIPT
RED HERRING PROSPECTUS
Dated October 18, 2016
Please read Section 32 of the Companies Act, 2013
Book Built Offer
(a PepsiCo franchisee)
VARUN BEVERAGES LIMITED Our Company was incorporated as Varun Beverages Limited on June 16, 1995 as a public limited company under the Companies Act, 1956, with the Registrar of Companies, NCT of Delhi and Haryana. Our
Company obtained a certificate for commencement of business on July 4, 1995. For further details of change in registered office of our Company, see “History and Certain Corporate Matters” on page 162.
Registered Office: F-2/7, Okhla Industrial Area, Phase I, New Delhi 110 020; Tel: +91 11 41706720
Corporate Office: Plot No. 31, Institutional Area, Sector – 44, Gurgaon 122 002; Tel: +91 124 4643100, Fax: +91 124 4643303
Contact Person: Mahavir Prasad Garg, Company Secretary and Compliance Officer; Tel: +91 124 4643100; Fax: +91 124 4643303
E-mail: [email protected]; Website: www.varunpepsi.com
Corporate Identity Number: U74899DL1995PLC069839
OUR PROMOTERS: RJ CORP LIMITED, RAVI KANT JAIPURIA, VARUN JAIPURIA AND RAVI KANT JAIPURIA & SONS (HUF)
PUBLIC OFFER OF UP TO 25,000,000 EQUITY SHARES OF FACE VALUE OF ₹ 10 EACH (“EQUITY SHARES”) OF VARUN BEVERAGES LIMITED (“OUR COMPANY” OR THE
“ISSUER”) FOR CASH AT A PRICE OF ₹ [●] PER EQUITY SHARE (INCLUDING A SHARE PREMIUM OF ₹ [●] PER EQUITY SHARE) AGGREGATING UP TO ₹ [●] MILLION (THE
“OFFER”) CONSISTING OF A FRESH ISSUE OF UP TO 15,000,000 EQUITY SHARES AGGREGATING UP TO ₹ [●] MILLION (THE “FRESH ISSUE”) AND AN OFFER FOR SALE OF UP
TO 5,000,000 EQUITY SHARES BY VARUN JAIPURIA (PROMOTER) AGGREGATING UP TO ₹ [●] MILLION AND UP TO 5,000,000 EQUITY SHARES BY RAVI KANT JAIPURIA &
SONS (HUF) (PROMOTER) AGGREGATING UP TO ₹ [●] MILLION (“OFFER FOR SALE”, AND VARUN JAIPURIA AND RAVI KANT JAIPURIA & SONS (HUF) COLLECTIVELY,
“THE SELLING SHAREHOLDERS”). THE OFFER COMPRISES A NET OFFER TO THE PUBLIC OF UP TO 24,500,000 EQUITY SHARES (THE “NET OFFER”) AND A RESERVATION
OF 500,000 EQUITY SHARES AGGREGATING UP TO ₹ [●] MILLION FOR SUBSCRIPTION BY ELIGIBLE EMPLOYEES (AS DEFINED HEREIN), NOT EXCEEDING 5% OF OUR POST
OFFER PAID UP EQUITY SHARE CAPITAL (THE “EMPLOYEE RESERVATION PORTION”). THE OFFER WILL CONSTITUTE 13.74 % OF OUR POST OFFER PAID-UP EQUITY
SHARE CAPITAL AND THE NET OFFER WILL CONSTITUTE 13.47 % OF OUR POST OFFER PAID-UP EQUITY SHARE CAPITAL.
THE FACE VALUE OF EQUITY SHARES IS ₹ 10 EACH. THE PRICE BAND AND THE MINIMUM BID LOT WILL BE DECIDED BY OUR COMPANY IN CONSULTATION WITH THE
SELLING SHAREHOLDERS, THE GCBRLMS AND THE BRLM AND WILL BE ADVERTISED IN FINANCIAL EXPRESS (A WIDELY CIRCULATED ENGLISH NATIONAL DAILY
NEWSPAPER) AND JANSATTA (A WIDELY CIRCULATED HINDI NATIONAL DAILY NEWSPAPER WITH WIDE CIRCULATION IN NEW DELHI) AT LEAST FIVE WORKING DAYS
PRIOR TO THE BID/OFFER OPENING DATE AND SHALL BE MADE AVAILABLE TO THE BSE LIMITED (“BSE”) AND THE NATIONAL STOCK EXCHANGE LIMITED (“NSE”, AND
TOGETHER WITH BSE, THE “STOCK EXCHANGES”) FOR UPLOADING ON THEIR RESPECTIVE WEBSITES.
In case of any revision to the Price Band, the Bid/Offer Period will be extended by three additional Working Days after such revision of the Price Band, subject to the total Bid/Offer Period not exceeding 10
Working Days. Any revision in the Price Band and the revised Bid/Offer Period, if applicable, will be widely disseminated by notification to the Stock Exchanges, by issuing a press release, and also by
indicating the change on the website of the Book Running Lead Managers and at the terminals of the other members of the Syndicate.
In terms of Rule 19(2)(b)(iii) of the Securities Contracts (Regulation) Rules, 1957, as amended (“SCRR”), this is an Offer for at least 10% of the post-Offer paid-up Equity Share capital of our Company. In
accordance with Regulation 26(1) of the Securities and Exchange Board of India (Issue of Capital and Disclosure Requirements) Regulations, 2009, as amended (the “SEBI ICDR Regulations”), the Offer is
being made through the Book Building Process wherein not more than 50% of the Net Offer shall be available for allocation on a proportionate basis to Qualified Institutional Buyers (“QIBs”) (the “QIB
Portion”), provided that our Company, in consultation with the Selling Shareholders, the GCBRLMs and the BRLM, may allocate up to 60% of the QIB Portion to Anchor Investors on a discretionary basis.
One-third of the Anchor Investor Portion shall be reserved for domestic Mutual Funds, subject to valid Bids being received from domestic Mutual Funds at or above the Anchor Investor Allocation Price. 5% of
the QIB Portion (excluding the Anchor Investor Portion) shall be available for allocation on a proportionate basis to Mutual Funds only, and the remainder of the QIB Portion shall be available for allocation on
a proportionate basis to all QIB Bidders (other than Anchor Investors), including Mutual Funds, subject to valid Bids being received at or above the Offer Price. Further, not less than 15% of the Net Offer shall
be available for allocation on a proportionate basis to Non-Institutional Bidders and not less than 35% of the Net Offer shall be available for allocation to Retail Individual Bidders in accordance with the SEBI
ICDR Regulations, subject to valid Bids being received at or above the Offer Price. All potential Bidders, other than Anchor Investors, shall mandatorily participate in the Offer through an Application
Supported by Blocked Amount (“ASBA”) process by providing details of their respective bank account which will be blocked by the Self Certified Syndicate Banks (“SCSBs”). Anchor Investors are not
permitted to participate in the Anchor Investor Portion through ASBA process. For details, please see “Offer Procedure” on page 491.
RISKS IN RELATION TO THE FIRST OFFER
This being the first public issue of our Company, there has been no formal market for the Equity Shares of our Company. The face value of the Equity Shares is ₹ 10 and the Floor Price is [●] times the face
value and the Cap Price is [●] times the face value. The Offer Price (determined and justified by our Company in consultation with the Selling Shareholders, the GCBRLMs and the BRLM as stated under the
section “Basis for Offer Price” on page 110) should not be taken to be indicative of the market price of the Equity Shares after the Equity Shares are listed. No assurance can be given regarding an active or
sustained trading in the Equity Shares or regarding the price at which the Equity Shares will be traded after listing.
GENERAL RISKS
Investments in equity and equity-related securities involve a degree of risk and investors should not invest any funds in the Offer unless they can afford to take the risk of losing their entire investment. Investors
are advised to read the risk factors carefully before taking an investment decision in the Offer. For taking an investment decision, investors must rely on their own examination of our Company and the Offer,
including the risks involved. The Equity Shares in the Offer have not been recommended or approved by the Securities and Exchange Board of India (“SEBI”), nor does SEBI guarantee the accuracy or
adequacy of the contents of this Red Herring Prospectus. Specific attention of the investors is invited to the section “Risk Factors” on page 22.
ISSUER’S AND SELLING SHAREHOLDERS’ ABSOLUTE RESPONSIBILITY
Our Company, having made all reasonable inquiries, accepts responsibility for and confirms that this Red Herring Prospectus contains all information with regard to our Company and the Offer, which is
material in the context of the Offer, that the information contained in this Red Herring Prospectus is true and correct in all material aspects and is not misleading in any material respect, that the opinions and
intentions expressed herein are honestly held and that there are no other facts, the omission of which makes the Red Herring Prospectus as a whole or any of such information or the expression of any such
opinions or intentions misleading in any material respect. Further, the Selling Shareholders severally accept responsibility that this Red Herring Prospectus contains all information about themselves as the
Selling Shareholders in context of the Offer for Sale and severally accept responsibility for statements in relation to themselves included in this Red Herring Prospectus.
LISTING
The Equity Shares offered through this Red Herring Prospectus are proposed to be listed on the BSE and the NSE. Our Company has received an ‘in-principle’ approval from the BSE and the NSE for the listing
of the Equity Shares pursuant to letters dated June 29, 2016 and July 5, 2016 respectively. For the purposes of the Offer, the Designated Stock Exchange shall be NSE. A copy of this Red Herring Prospectus has
been delivered for registration to the RoC and a copy of the Prospectus shall be delivered for registration to the RoC in accordance with Section 26(4) of the Companies Act, 2013. For details of the material
contracts and documents available for inspection from the date of the Red Herring Prospectus up to the Bid/Offer Closing Date, see “Material Contracts and Documents for Inspection” on page 543.
GLOBAL COORDINATORS AND BOOK RUNNING LEAD MANAGERS BOOK RUNNING LEAD
MANAGER
REGISTRAR TO THE OFFER
Kotak Mahindra Capital Company
Limited
1st Floor, 27 BKC, Plot No. 27
“G” Block, Bandra Kurla Complex
Bandra (East)
Mumbai 400 051
Tel: +91 22 4336 0000
Fax: +91 22 6713 2447
E-mail: [email protected]
Investor grievance E-mail:
Website:
www.investmentbank.kotak.com
Contact Person: Ganesh Rane
SEBI Registration No.: INM000008704
Axis Capital Limited
1st Floor, Axis House
C-2, Wadia International Centre
P.B. Marg, Worli
Mumbai 400 025
Tel: + 91 22 4325 2183
Fax : +91 22 4325 3000
E-mail: [email protected]
Investor grievance E-mail:
Website: www.axiscapital.co.in
Contact person: Lohit Sharma
SEBI Registration No.: INM000012029
CLSA India Private Limited
(formerly CLSA India Limited)
8/F, Dalamal House
Nariman Point
Mumbai 400 021
Tel: +91 22 6650 5050
Fax: +91 22 2284 0271
E-mail: [email protected]
Investor grievance E-mail:
Website: www.india.clsa.com
Contact person: Sarfaraz Agboatwala
SEBI Registration No: INM000010619
YES Securities (India) Limited
IFC 1 & 2, Unit no. 602 A
6th Floor, Senapati Bapat Marg
Elphinstone (W)
Mumbai 400 013
Telephone: +91 22 3347 9688
Fax: +91 22 2421 4511
E-mail: [email protected]
Investor Grievance E-mail:
Website: www.yesinvest.in
Contact Person: Aditya Vora
SEBI Registration No:
INM000012227
Karvy Computershare Private
Limited
Karvy Selenium Tower B
Plot 31 and 32, Gachibowli
Financial District, Nanakramguda
Hyderabad 500 032
Tel: +91 40 6716 2222
Fax: +91 40 2343 1551
Email:[email protected]
Investor Grievance e-mail: varun-
Website: www.karisma.karvy.com
Contact Person: M Murali Krishna
SEBI Registration No. INR000000221
BID/OFFER PROGRAMME
BID/OFFER OPENS ON OCTOBER 26, 2016 (Wednesday) (1)
BID/OFFER CLOSES ON OCTOBER 28, 2016 (Friday) (1) Our Company may, in consultation with the Selling Shareholders, the GCBRLMs and the BRLM, consider participation by Anchor Investors in accordance with the SEBI ICDR Regulations. The Anchor
Investor Bid/Offer Period shall be one Working Day prior to the Bid/Offer Opening Date.
(i)
TABLE OF CONTENTS
SECTION I: GENERAL ........................................................................................................................................................ 1 DEFINITIONS AND ABBREVIATIONS ............................................................................................................................. 1 PRESENTATION OF FINANCIAL, INDUSTRY AND MARKET DATA ........................................................................ 17 FORWARD-LOOKING STATEMENTS ............................................................................................................................ 20
SECTION: II RISK FACTORS .......................................................................................................................................... 22
SECTION III: INTRODUCTION ....................................................................................................................................... 53 SUMMARY OF INDUSTRY ............................................................................................................................................... 53 SUMMARY OF BUSINESS ................................................................................................................................................ 57 SUMMARY FINANCIAL INFORMATION ....................................................................................................................... 64 THE OFFER ......................................................................................................................................................................... 73 GENERAL INFORMATION ............................................................................................................................................... 74 CAPITAL STRUCTURE...................................................................................................................................................... 83 OBJECTS OF THE OFFER ................................................................................................................................................ 101 BASIS FOR OFFER PRICE ............................................................................................................................................... 110 STATEMENT OF TAX BENEFITS................................................................................................................................... 114
SECTION IV: ABOUT THE COMPANY ....................................................................................................................... 116 INDUSTRY OVERVIEW .................................................................................................................................................. 116 OUR BUSINESS ................................................................................................................................................................ 130 REGULATIONS AND POLICIES ..................................................................................................................................... 157 HISTORY AND CERTAIN CORPORATE MATTERS .................................................................................................... 162 OUR SUBSIDIARIES ........................................................................................................................................................ 170 OUR MANAGEMENT ...................................................................................................................................................... 174 OUR PROMOTERS AND PROMOTER GROUP ............................................................................................................. 189 OUR GROUP COMPANIES .............................................................................................................................................. 194 RELATED PARTY TRANSACTIONS ............................................................................................................................. 208 DIVIDEND POLICY .......................................................................................................................................................... 209
SECTION V: FINANCIAL INFORMATION ................................................................................................................. 210 RESTATED CONSOLIDATED FINANCIAL STATEMENTS ........................................................................................ 210 RESTATED STANDALONE FINANCIAL STATEMENTS ............................................................................................ 310 FINANCIAL INDEBTEDNESS......................................................................................................................................... 404 SUMMARY OF SIGNIFICANT DIFFERENCES BETWEEN INDIAN GAAP AND IND AS ........................................ 406 MANAGEMENT’S DISCUSSION AND ANALYSIS OF FINANCIAL CONDITION AND RESULTS OF
OPERATIONS.................................................................................................................................................................... 413
SECTION VI: LEGAL AND OTHER INFORMATION ............................................................................................... 457 OUTSTANDING LITIGATION AND OTHER MATERIAL DEVELOPMENTS ........................................................... 457 GOVERNMENT AND OTHER APPROVALS ................................................................................................................. 467 OTHER REGULATORY AND STATUTORY DISCLOSURES ...................................................................................... 471
SECTION VII: OFFER INFORMATION ....................................................................................................................... 485 TERMS OF THE OFFER ................................................................................................................................................... 485 OFFER STRUCTURE ........................................................................................................................................................ 489 OFFER PROCEDURE ....................................................................................................................................................... 491 RESTRICTIONS ON FOREIGN OWNERSHIP OF INDIAN SECURITIES .................................................................... 531
SECTION VIII: MAIN PROVISIONS OF ARTICLES OF ASSOCIATION .............................................................. 532
SECTION IX: OTHER INFORMATION ........................................................................................................................ 543 MATERIAL CONTRACTS AND DOCUMENTS FOR INSPECTION ............................................................................ 543 DECLARATION ................................................................................................................................................................ 545
1
SECTION I: GENERAL
DEFINITIONS AND ABBREVIATIONS
This Red Herring Prospectus uses certain definitions and abbreviations which, unless the context otherwise indicates or
implies, shall have the meaning as provided below. References to any legislation, act, regulation, rule, guideline or policy
shall be to such legislation, act, regulation, rule, guideline or policy, as amended, supplemented or re-enacted from time to
time.
The words and expressions used in this Red Herring Prospectus but not defined herein, shall have, to the extent applicable,
the meaning ascribed to such terms under the Companies Act, the SEBI ICDR Regulations, the SCRA, the Depositories Act or
the rules and regulations made there under.
Notwithstanding the foregoing, terms used in of the sections “Statement of Tax Benefits”, “Restated Consolidated Financial
Statements”, “Restated Standalone Financial Statements” and “Main Provisions of Articles of Association” on pages 114,
210, 310 and 532, respectively, shall have the meaning ascribed to such terms in such sections.
General Terms
Term Description
“our Company”, the “Company”,
or the “Issuer”
Varun Beverages Limited, a company incorporated under the Companies Act, 1956,
having its registered office at F-2/7, Okhla Industrial Area, Phase I, New Delhi 110 020
we/us/our Unless the context otherwise indicates or implies, our Company, its Subsidiaries and its
associate, on a consolidated basis
Company Related Terms
Term Description
2015 Existing India Sub-Territories Delhi, Rajasthan, West Bengal, Goa, Arunachal Pradesh, Assam, Meghalaya, Manipur,
Mizoram, Nagaland, Tripura as well as certain designated parts of the following sub-
territories: Madhya Pradesh, Uttar Pradesh, Uttarakhand, Haryana and Maharashtra.
2015 New India Sub-Territories Punjab, Himachal Pradesh, Chandigarh UT, as well as the remaining parts of the
following sub-territories: Haryana, Uttarakhand and Uttar Pradesh.
ADBL Aradhana Drinks and Beverages Private Limited
AION AION Investments II Singapore Pte. Ltd.
AION Investment Agreement Securities purchase cum investment agreement dated September 18, 2015 between our
Company, AION Investments II Singapore Pte. Ltd. and Standard Chartered Private
Equity Mauritius II Limited
Articles of Association/AoA The articles of association of our Company, as amended
Audit Committee The audit committee of the Board of Director described in the section “Our
Management” on page 174
Board/Board of Directors The board of directors of our Company or a duly constituted committee thereof
Compulsorily Convertible
Debentures or CCDs
Compulsorily convertible debentures issued by our Company of face value of ₹ 1,000
each
CMCI Concentrate Manufacturing Company of Ireland
Compulsorily Convertible
Preference Shares or CCPSs
Compulsorily convertible preference shares of our Company of a face value of ₹ 100
each
Corporate Office Plot No. 31, Institutional Area, Sector – 44, Gurgaon 122 002
DBL Devyani Beverages Limited
2
Term Description
DASMPL Devyani Airport Services (Mumbai) Private Limited
DEPL Devyani Enterprises Private Limited
DexPL Devyani Exim Private Limited (formerly Rajputana Stores (Jaipur) Private Limited)
DHRPL Devyani Hotels and Resorts Private Limited
DIL Devyani International Limited
DHRPL CCPSs 25,000,000 CCPSs issued to DHRPL at par pursuant to the DHRPL Investment
Agreement and converted into 5,681,818 Equity Shares on October 7, 2016
DHRPL Investment Agreement Investment agreement dated February 16, 2015 between our Company and DHRPL
Director(s) The director(s) of our Company
Equity Shares The equity shares of our Company of face value of ₹ 10 each
ESOS 2013 Employee Stock Option Scheme 2013
ESOS 2016 Employee Stock Option Scheme 2016
Group Companies Companies which are covered under the applicable accounting standards and other
companies as considered material by our Board. For details, please see “Our Group
Companies” on page 194
Investment Agreement Investment agreement dated July 18, 2011 between VBIL, SCPE, RJ Corp, Ravi Kant
Jaipuria & Sons (HUF) and Varun Jaipuria as amended by an amendment and
supplemental agreement dated September 29, 2012 and an amendment agreement dated
June 13, 2016
Key Management Personnel Key management personnel of our Company in terms of section 2(51) the Companies
Act, 2013, the SEBI ICDR Regulations and as disclosed in the section “Our
Management” on page 174
Memorandum of Association/MoA The memorandum of association of our Company, as amended
Non-Convertible Debentures or
NCDs
Unsecured redeemable non-convertible debentures of our Company (denominated in
rupees) of a face value of ₹ 10,000,000 listed on the wholesale debt market segment of
NSE
OSBPL Ole Spring Bottlers (Private) Limited
PepsiCo Refers to PepsiCo Inc., PepsiCo India, Seven-Up International, a division of CMCI,
Tropicana Products Inc. and/ or their affiliates, as applicable
PepsiCo India PepsiCo India Holding Private Limited (formerly known as PepsiCo India Holding
Limited)
PepsiCo India Agreements Refers collectively to the four bottling appointment and trademark license agreements,
two dated October 3, 2012 executed between our Company and PepsiCo Inc., one dated
October 3, 2012 between our Company and PepsiCo India and another effective from
June 13, 2016 between Tropicana Products Inc. and our Company, as amended from
time to time, as applicable
PepsiCo International Agreements Refers collectively, to the 12 bottling agreements entered into by our Company in
relation to our international operations and specifically, the (i) exclusive bottling
appointment agreement dated November 7, 2013 between PepsiCo Inc. and VBL
Lanka; (ii) exclusive bottling appointment agreement dated August 1, 2011 between
PepsiCo Inc. and VBL Lanka; (iii) exclusive bottling appointment agreement dated
August 1, 2011 between Seven-Up International, a division of CMCI and VBL Lanka;
(iv) bottling appointment and trademark license agreement dated October 30, 2013
3
Term Description
between Tropicana Products Inc and VBL Lanka; (v) exclusive bottling appointment
agreement dated December 1, 2011 between PepsiCo Inc. and VBNPL, (vi) exclusive
bottling appointment agreement dated December 1, 2011 between Seven-Up
International, a division of CMCI and VBNPL; (vii) exclusive bottling appointment
agreement dated September 1, 2010 between Seven-Up International, a division of
CMCI and VBZL; (viii) exclusive bottling appointment agreement dated September 1,
2010 between PepsiCo Inc. and VBZL; (ix) exclusive bottling appointment agreement
dated February 1, 2011 between PepsiCo Inc. and VBM; (x) exclusive bottling
appointment agreement dated February 1, 2011 between Seven-Up International, a
division of CMCI and VBM; (xi) exclusive bottling appointment agreement dated
December 18, 2008 between PepsiCo Inc. and VBML effective from January 25, 2009;
and (xii) exclusive bottling appointment agreement dated December 18, 2008 between
Seven-Up International, a division of CMCI and VBML effective from January 25,
2009, as amended from time to time, as applicable
PepsiCo International Entities Refers to PepsiCo Inc., Seven-Up International, a division of CMCI, Tropicana
Products Inc. and/ or their affiliates, as applicable, with whom our Company through its
Subsidiaries has entered into the PepsiCo International Agreements
Promoter Group Persons and entities constituting the promoter group of our Company in terms of
Regulation 2(1)(zb) of the SEBI ICDR Regulations, but excluding any persons and
entities apart from the following: (i) Accor Developers (Private) Limited, (ii) Accor
Industries (Private) Limited, (iii) Accor Solar Energy Private Limited, (iv) Africare
Limited, (v) Agarwal Cold Drinks Private Limited, (vi) Alisha Retail Private Limited,
(vii) Angelica Technologies Private Limited, (viii) Anuj Traders Private Limited, (ix)
Arctic International Private Limited, (x) Arctic Overseas Pte. Limited, (xi) Capital
Infracon Private Limited, (xii) Capital Towers Private Limited, (xiii) Cryoviva
International Pte. Ltd., (xiv) Cryoviva Singapore Pte. Ltd., (xv) D.J. Agri Industries
Private Limited, (xvi) Devyani Enterprises Private Limited, (xvii) Devyani Food
Industries Limited, (xviii) Devyani Hotels & Resorts Private Limited, (xix) Devyani
International Limited, (xx) Devyani Overseas Private Limited, (xxi) Diagno Labs
Private Limited, (xxii) Empire Stocks Private Limited, (xxiii) Farm2Plate Dairy
Produce Private Limited (formerly known as ABInbev India Private Limited), (xxiv)
Lineage Healthcare Limited, (xxv) Lunarmech Technologies Private Limited, (xxvi)
Modern Montessori International (India) Private Limited, (xxvii) Mumbai Rockets
Sports Private Limited, (xxviii) Parkview City Limited, (xxix) Pinnacle Constructions
Private Limited, (xxx) Pinnacle Infracon Limited, (xxxi) Pinnacle Town Planners
Private Limited, (xxxii) Pinnacle Township Private Limited, (xxxiii) Rajasthan
Beverages Private Limited, (xxxiv) Ratnaker Foods & Beverages Private Limited,
(xxxv) S V S India Private Limited, (xxxvi) Sellwell Foods and Beverages Private
Limited, (xxxvii) Shabnam Properties Private Limited, (xxxviii)Universal Dairy
Products Private Limited, (xil) Wellness Holdings Limited, (xl) Mr. Ravi Kant Jaipuria,
(xli) Ms. Dhara Jaipuria, (xlii) Mr. Varun Jaipuria, (xliii) Ms. Devyani Jaipuria, (xliv)
RJ Corp Limited, (xlv) Ravi Kant Jaipuria & Sons (HUF), (xlvi) Mr. Vivek Gupta,
(xlvii) Ms. Bela Jyoti Kumar Saha, (xlviii) Ms. Madhu Rajendra Prasad Jindal, (xlix)
Alaknanda Traders Private Limited, (l) Avni Securities Private Limited, (li) Chanda
Exports Private Limited, (lii) Gee Kay Builder & Development Services Private
Limited, (liii) Manog Securities Private Limited, (liv) Ragini Advisors Private Limited,
(lv) Stallion Advisors Private Limited, (lvi) Geld Consultancy Services Private Limited,
(lvii) Saha Sprague Limited, (lviii) Sara Ferrous Private Limited, (lix) SFT Syscon
Private Limited, (lx) SFT Technologies Private Limited, (lxi) Sankalp Lifespaces
Private Limited, (lxii) Dr. Naresh Trehan and Associates Health Services Private
Limited; and (lxiii) Lemon Tree Hotels Limited. For details, please see “Our Promoters
and Promoter Group” on page 189
Promoters The promoters of our Company namely, RJ Corp Limited, Ravi Kant Jaipuria, Varun
Jaipuria and Ravi Kant Jaipuria & Sons (HUF). For details, please see “Our Promoters
and Promoter Group” on page 189
Registered Office F-2/7, Okhla Industrial Area, Phase I, New Delhi 110 020
4
Term Description
Restated Consolidated Financial
Statements
The consolidated financial statements of our Company’s assets and liabilities as at June
30, 2016, June 30, 2015, December 31, 2015, 2014, 2013 and 2012 and the consolidated
statements of profit and loss and cash flows for the six months periods ended June 30,
2016 and June 30, 2015 and for the years ended December 31, 2015, 2014, 2013 and
2012 of our Company prepared in accordance with Indian GAAP and the Companies
Act and restated in accordance with the SEBI ICDR Regulations and the Revised
Guidance Note on Reports in Company Prospectuses (Revised) issued by the ICAI,
together with the schedules, notes and annexures thereto
Restated Financial Statements Collectively, the Restated Consolidated Financial Statements and the Restated
Standalone Financial Statements
Restated Standalone Financial
Statements
The standalone financial statements of our Company’s assets and liabilities as at June
30, 2016 and June 30, 2015, December 31, 2015, 2014, 2013, 2012 and 2011 and the
standalone statements of profit and loss and cash flows for the six months periods ended
June 30, 2016 and June 30, 2015 and for the years ended December 31, 2015, 2014,
2013, 2012 and 2011 of our Company prepared in accordance with Indian GAAP and
the Companies Act and restated in accordance with the SEBI ICDR Regulations and the
Revised Guidance Note on Reports in Company Prospectuses (Revised) issued by the
ICAI, together with the schedules, notes and annexures thereto
RJCL CCPSs 20,000,000 CCPSs issued to RJCL at par pursuant to the RJCL Investment Agreement
and converted into 4,545,455 Equity Shares on October 7, 2016
RJCL Investment Agreement Investment agreement dated October 20, 2014 between our Company and RJ Corp
RJ Corp RJ Corp Limited (formerly Arctic Drinks Private Limited)
RoC Registrar of Companies, NCT of Delhi and Haryana at 4th
Floor, IFCI Tower; 61, Nehru
Place, New Delhi 110 019
Sales Volume(s) Represents sales volume (in million litres and / or million unit cases) of our PepsiCo
products to our customers but does not include any sales to PepsiCo and/or any other
franchisees of PepsiCo.
SCPE Standard Chartered Private Equity (Mauritius) II Limited
Shareholders Shareholders of our Company
Statutory Auditors The statutory auditors of our Company, Walker Chandiok & Associates and O.P. Bagla
& Co.
Subsidiaries Subsidiaries of our Company (including any step-down subsidiary) set out in the section
“Our Subsidiaries” on page 170
VBIL Varun Beverages (International) Limited
VBL Lanka Varun Beverages Lanka (Private) Limited
VBM Varun Beverages Morocco SA
VBML Varun Beverages Mozambique, Limitada
VBNPL Varun Beverages (Nepal) Pvt. Ltd.
VBZL Varun Beverages (Zambia) Limited
VBZPL Varun Beverages (Zimbabwe) (Private) Limited
5
Offer Related Terms
Term Description
Acknowledgement Slip The slip or document issued by the Designated Intermediary to a Bidder as proof of
registration of the Bid cum Application Form
Allot/Allotment/Allotted Unless the context otherwise requires, allotment of the Equity Shares pursuant to the
Fresh Issue and transfer of Equity Shares offered by the Selling Shareholders pursuant
to the Offer for Sale, to the successful Bidders
Allottee A successful Bidder to whom the Equity Shares are Allotted
Allotment Advice Note, advice or intimation of Allotment sent to the Bidders who have been or are to be
Allotted the Equity Shares after the Basis of Allotment has been approved by the
Designated Stock Exchange
Anchor Investor A Qualified Institutional Buyer, applying under the Anchor Investor Portion in
accordance with the requirements specified in the SEBI ICDR Regulations and the Red
Herring Prospectus
Anchor Investor Allocation Price The price at which the Equity Shares will be allocated to Anchor Investors in terms of
the Red Herring Prospectus and the Prospectus which will be decided by our Company
in consultation with the Selling Shareholders, the GCBRLMs and the BRLM
Anchor Investor Application Form The form used by an Anchor Investor to make a Bid in the Anchor Investor Portion and
which will be considered as an application for Allotment in terms of the Red Herring
Prospectus and Prospectus
Anchor Investor Bid/Offer Period The day which is one Working Day prior to the Bid/Offer Opening Date, on which Bids
by Anchor Investors shall be submitted and allocation to the Anchor Investors shall be
completed
Anchor Investor Offer Price Final price at which the Equity Shares will be Allotted to Anchor Investors in terms of
the Red Herring Prospectus and the Prospectus, which price will be equal to or higher
than the Offer Price but not higher than the Cap Price
The Anchor Investor Offer Price will be decided by our Company in consultation with
the Selling Shareholders, the GCBRLMs and the BRLM
Anchor Investor Portion Up to 60% of the QIB Portion consisting of up to 7,350,000 Equity Shares which may
be allocated by our Company in consultation with the Selling Shareholders, the
GCBRLMs and the BRLM to Anchor Investors on a discretionary basis
One-third of the Anchor Investor Portion shall be reserved for Mutual Funds, subject to
valid Bids being received from Mutual Funds at or above the Anchor Investors
Allocation Price
Application Supported by Blocked
Amount or ASBA
An application, whether physical or electronic, used by an ASBA Bidder, to make a Bid
and authorize a SCSB to block the Bid Amount in the ASBA Account
ASBA Account A bank account maintained with a SCSB and specified in the ASBA Form submitted by
Bidders for blocking the Bid Amount mentioned in the ASBA Form
ASBA Bid A Bid made by an ASBA Bidder including all revisions and modifications thereto as
permitted under the SEBI ICDR Regulations
ASBA Bidder All Bidders other than Anchor Investors
ASBA Forms An application form, whether physical or electronic, used by an ASBA Bidder and
which will be considered as an application for Allotment in terms of the Red Herring
Prospectus and the Prospectus
Axis Capital Axis Capital Limited
6
Term Description
Banker to the Offer/Escrow
Collection Bank
Bank which is a clearing member and registered with SEBI as banker to an issue and
with whom the Escrow Account will be opened, in this case being HDFC Bank Limited
Basis of Allotment The basis on which the Equity Shares will be Allotted to successful Bidders under the
Offer and which is described in the section “Offer Procedure” on page 491
Bid An indication to make an offer during the Bid/Offer Period by an ASBA Bidder
pursuant to submission of the ASBA Form, or during the Anchor Investor Bid/Offer
Period by the Anchor Investors pursuant to submission of Anchor Investor Application
Form, to subscribe to or purchase the Equity Shares of our Company at a price within
the Price Band, including all revisions and modifications thereto as permitted under the
SEBI ICDR Regulations
The term Bidding shall be construed accordingly
Bid Amount The highest value of optional Bids indicated in the Bid cum Application Form and
payable by the Bidder or as blocked in the ASBA Account of the Bidder, as the case
may be, upon submission of the Bid
Bid cum Application Form The Anchor Investor Application Form or ASBA Form, as the context requires
Bid/Offer Closing Date Except in relation to any Bids received from the Anchor Investors, the date after which
the Designated Intermediaries will not accept any Bids, which shall be published in all
editions of Financial Express (a widely circulated English national daily newspaper) and
all editions of Jansatta (a widely circulated Hindi national daily newspaper with wide
circulation in Delhi)
Our Company may, in consultation with the Selling Shareholders, the GCBRLMs and
the BRLM, consider closing the Bid/Offer Period for QIBs one Working Day prior to
the Bid/Offer Closing Date in accordance with the SEBI ICDR Regulations
Bid/Offer Opening Date Except in relation to any Bids received from the Anchor Investors, the date on which the
Designated Intermediaries shall start accepting Bids, which shall be published in all
editions of Financial Express (a widely circulated English national daily newspaper) and
all editions of Jansatta (a widely circulated Hindi national daily newspaper with wide
circulation in Delhi)
Bid/Offer Period Except in relation to Anchor Investors, the period between the Bid/Offer Opening Date
and the Bid/Offer Closing Date, inclusive of both days, during which prospective
Bidders can submit their Bids, including any revisions thereof
Bid Lot [●] Equity Shares
Bidder Any prospective investor who makes a Bid pursuant to the terms of the Red Herring
Prospectus and the Bid cum Application Form and unless otherwise stated or implied,
includes an Anchor Investor
Bidding Centers Centers at which the Designated Intermediaries shall accept the Bid cum Application
Forms, i.e, Designated SCSB Branch for SCSBs, Specified Locations for Syndicate,
Broker Centres for Registered Brokers, Designated RTA Locations for RTAs and
Designated CDP Locations for CDPs
Book Building Process Book building process, as provided in Schedule XI of the SEBI ICDR Regulations, in
terms of which the Offer is being made
Broker Centres Broker centres notified by the Stock Exchanges where Bidders can submit the ASBA
Forms to a Registered Broker
The details of such Broker Centres, along with the names and contact details of the
Registered Brokers are available on the respective websites of the Stock Exchanges
(www.bseindia.com and www.nseindia.com)
7
Term Description
BRLM/Book Running Lead
Manager
YES Securities (India) Limited
CAN/Confirmation of Allocation
Note
Notice or intimation of allocation of the Equity Shares sent to Anchor Investors, who
have been allocated the Equity Shares, after the Anchor Investor Bid/Offer Period
Cap Price The higher end of the Price Band, above which the Offer Price and the Anchor Investor
Offer Price will not be finalised and above which no Bids will be accepted
Client ID Client identification number maintained with one of the Depositories in relation to the
demat account
CLSA CLSA India Private Limited
Collecting Depository Participant
or CDP
A depository participant as defined under the Depositories Act, 1996, registered with
SEBI and who is eligible to procure Bids at the Designated CDP Locations in terms of
circular no. CIR/CFD/POLICYCELL/11/2015 dated November 10, 2015 issued by
SEBI
Cut-off Price Offer Price, finalised by our Company in consultation with the Selling Shareholders, the
GCBRLMs and the BRLM, which shall be any price within the Price Band
Only Retail Individual Bidders and the Eligible Employees Bidding in the Employee
Reservation Portion are entitled to Bid at the Cut-off Price. QIBs and Non-Institutional
Bidders are not entitled to Bid at the Cut-off Price
Demographic Details Details of the Bidders including the Bidder’s address, name of the Bidder’s
father/husband, investor status, occupation and bank account details
Designated CDP Locations Such locations of the CDPs where Bidders can submit the ASBA Forms to Collecting
Depository Participants
The details of such Designated CDP Locations, along with names and contact details of
the Collecting Depository Participants eligible to accept Bid cum Application Forms are
available on the respective websites of the Stock Exchanges (www.bseindia.com and
www.nseindia.com)
Designated Intermediaries/
Collecting Agent
Syndicate Member, sub-syndicate/agents, SCSBs, Registered Brokers, Brokers, the
CDPs and RTAs, who are authorized to collect Bid cum Application Forms from the
Bidders, in relation to the Offer
Designated SCSB Branches Such branches of the SCSBs which shall collect the ASBA Forms, a list of which is
available on the website of SEBI at http://www.sebi.gov.in/sebiweb/home
/list/5/33/0/0/Recognised-Intermediaries or at such other website as may be prescribed
by SEBI from time to time
Designated Date The date on which funds are transferred by the Escrow Collection Bank from the
Escrow Accounts and the amounts blocked by the SCSBs are transferred from the
ASBA Accounts, as the case may be, to the Public Issue Account or the Refund
Account, as appropriate, after filing of the Prospectus with the RoC, following which
the Board of Directors may Allot Equity Shares to successful Bidders in the Offer
Designated RTA Locations Such locations of the RTAs where Bidders can submit the ASBA Forms to RTAs
The details of such Designated RTA Locations, along with names and contact details of
the RTAs eligible to accept ASBA Forms are available on the respective websites of the
Stock Exchanges (www.bseindia.com and www.nseindia.com).
Designated Stock Exchange NSE
Draft Red Herring Prospectus or
DRHP
The draft red herring prospectus dated June 21, 2016, issued in accordance with the
SEBI ICDR Regulations, which does not contain complete particulars of the price at
8
Term Description
which the Equity Shares will be Allotted and the size of the Offer
EBITDA Earnings before interest, taxes, depreciation, and amortisation
Eligible Employee All or any of the following:
(a) a permanent and full time employee of our Company (excluding such
employees who are not eligible to invest in the Offer under applicable laws and
our Promoters and their immediate relatives) or any of our Subsidiaries as of
the date of filing of the Red Herring Prospectus with the RoC and who
continues to be an employee of our Company or any of our Subsidiaries, until
the submission of the Bid cum Application Form; and
(b) a Director of our Company (excluding Promoters who are Directors of our
Company) who is eligible to apply under the Employee Reservation Portion
under applicable law and is resident in India
The maximum Bid Amount under the Employee Reservation Portion by an Eligible
Employee shall not exceed ₹ 200,000
Eligible NRI(s) NRI(s) from jurisdictions outside India where it is not unlawful to make an offer or
invitation under the Offer and in relation to whom the Bid cum Application Form and
the Red Herring Prospectus will constitute an invitation to subscribe or to purchase the
Equity Shares
Employee Reservation Portion The portion of the Offer being 500,000 Equity Shares aggregating up to ₹ [●] million
available for allocation to Eligible Employees, on a proportionate basis
Escrow Account An account opened with the Escrow Collection Bank and in whose favour the Anchor
Investors will transfer money through direct credit/NEFT/RTGS in respect of the Bid
Amount when submitting a Bid
Escrow Agreement The agreement dated October 13, 2016 entered into between our Company, the Selling
Shareholders, the Registrar to the Offer, the GCBRLMs, the BRLM, the Escrow
Collection Bank, the public issue account bank (being HDFC Bank Limited) and the
Refund Bank for collection of the Bid Amounts from Anchor Investors transfer of funds
to Public Issue Account and where applicable, refunds of the amounts collected from
Anchor Investors, on the terms and conditions thereof
First Bidder Bidder whose name shall be mentioned in the Bid cum Application Form or the
Revision Form and in case of joint Bids, whose name shall also appear as the first
holder of the beneficiary account held in joint names
Floor Price The lower end of the Price Band, subject to any revision thereto, at or above which the
Offer Price and the Anchor Investor Offer Price will be finalised and below which no
Bids will be accepted
Fresh Issue The fresh issue of up to 15,000,000 Equity Shares of face value of ₹ 10 each for cash at
a price of ₹ [●] each, aggregating up to ₹ [●] million by our Company
General Information
Document/GID
The General Information Document prepared and issued in accordance with the circular
(CIR/CFD/DIL/12/2013) dated October 23, 2013 notified by SEBI and updated
pursuant to the circulars (CIR/CFD/POLICYCELL/III/2015) dated November 10, 2015
and (SEBI/HO/CFD/DIL/CIR/P/2016/26) dated January 21, 2016, suitably modified and
included in “Offer Procedure” on page 491
Global Coordinators and Book
Running Lead Managers or
GCBRLMs
Kotak Mahindra Capital Company Limited, Axis Capital Limited, and CLSA India
Private Limited
Kotak Kotak Mahindra Capital Company Limited
9
Term Description
Maximum RIB Allottees The maximum number of Retail Individual Bidders who can be allotted the minimum
Bid Lot. This is computed by dividing the total number of Equity Shares available for
Allotment to Retail Individual Bidders by the minimum Bid Lot
Mutual Fund Portion 5% of the QIB Portion (excluding the Anchor Investor Portion), or 245,000 Equity
Shares which shall be available for allocation to Mutual Funds only
Mutual Funds Mutual funds registered with SEBI under the Securities and Exchange Board of India
(Mutual Funds) Regulations, 1996
Net Offer The Offer less the Employee Reservation Portion, being up to 24,500,000 Equity Shares
aggregating up to ₹ [●] million
Net Proceeds Proceeds of the Fresh Issue less our Company’s share of the Offer expenses. For further
information about use of the Offer Proceeds and the Offer expenses, please see “Objects
of the Offer” on page 101
Non-Institutional Bidders All Bidders that are not QIBs or Retail Individual Bidders or Eligible Employees
Bidding in the Employee Reservation Portion and who have Bid for the Equity Shares
for an amount more than ₹ 200,000 (but not including NRIs other than Eligible NRIs)
Non-Institutional Portion The portion of the Offer being not less than 15% of the Net Offer comprising of
3,675,000 Equity Shares which shall be available for allocation on a proportionate basis
to Non-Institutional Bidders, subject to valid Bids being received at or above the Offer
Price
Non-Resident A person resident outside India as defined under FEMA and includes a Non Resident
Indian, FVCIs, FIIs and FPIs
Offer The public issue of up to 25,000,000 Equity Shares of face value of ₹ 10 each for cash at
a price of ₹ [●] each, aggregating up to ₹ [●] million comprising the Fresh Issue and the
Offer for Sale. The Offer comprises of Net Offer and Employee Reservation Portion.
Offer Agreement The agreement dated June 21, 2016 entered into between our Company, the Selling
Shareholders, the GCBRLMs and the BRLM, pursuant to which certain arrangements
are agreed to in relation to the Offer
Offer for Sale Offer for sale of up to 10,000,000 Equity Shares by the Selling Shareholders at the Offer
Price aggregating up to ₹ [●] million comprising up to 5,000,000 Equity Shares by
Varun Jaipuria (Promoter) aggregating up to ₹ [●] million and up to 5,000,000 Equity
Shares by Ravi Kant Jaipuria & Sons (HUF) (Promoter) aggregating up to ₹ [●] million
Offer Price The final price at which the Equity Shares will be Allotted to Bidders other than Anchor
Investors. Equity Shares will be Allotted to Anchor Investors at the Anchor Investor
Offer Price in terms of the Red Herring Prospectus
The Offer Price will be decided by our Company in consultation with the Selling
Shareholders, the GCBRLMs and the BRLM on the Pricing Date
Offer Proceeds The proceeds of the Fresh Issue and the Offer for Sale that are available to our Company
and the Selling Shareholders, respectively
Price Band Price band of a minimum price of ₹ [●] per Equity Share (Floor Price) and the maximum
price of ₹ [●] per Equity Share (Cap Price) including any revisions thereof
The Price Band and the minimum Bid Lot size for the Offer will be decided by our
Company in consultation with the Selling Shareholders, the GCBRLMs and the BRLM
and will be advertised, at least five Working Days prior to the Bid/Offer Opening Date,
in all editions of Financial Express (a widely circulated English national daily
newspaper) and all editions of Jansatta (a widely circulated Hindi national daily
newspaper with wide circulation in Delhi)
10
Term Description
Pricing Date The date on which our Company in consultation with the Selling Shareholders, the
GCBRLMs and the BRLM, will finalise the Offer Price
Prospectus The Prospectus to be filed with the RoC after the Pricing Date in accordance with
Section 26 of the Companies Act, 2013, and the provisions of the SEBI ICDR
Regulations containing, inter alia, the Offer Price that is determined at the end of the
Book Building Process, the size of the Offer and certain other information including any
addenda or corrigenda thereto
Public Issue Account A bank account opened with the Bankers to the Offer by our Company under Section
40(3) of the Companies Act, 2013 to receive monies from the Escrow Account(s) and
from the ASBA Accounts on the Designated Date
QIB Category/QIB Portion The portion of the Net Offer (including the Anchor Investor Portion) being not more
than 50% of the Net Offer comprising of 12,250,000 Equity Shares which shall be
Allotted to QIBs including Anchor Investors
Qualified Institutional Buyers or
QIBs or QIB Bidders
Qualified institutional buyers as defined under Regulation 2(1)(zd) of the SEBI ICDR
Regulations
Red Herring Prospectus or RHP This red herring prospectus dated October 18, 2016 issued in accordance with Section
32 of the Companies Act, 2013 and the provisions of the SEBI ICDR Regulations,
which will not have complete particulars of the price at which the Equity Shares will be
offered and the size of the Offer, including any addenda or corrigenda thereto
This Red Herring Prospectus has been registered with the ROC at least three Working
Days before Bid Offer Opening Date and will become the Prospectus upon filing with
the RoC after the Pricing Date
Refund Account The account opened with the Refund Bank, from which refunds, if any, of the whole or
part of the Bid Amount to Anchor Investors shall be made
Refund Bank HDFC Bank Limited
Registered Brokers Stock brokers registered with the stock exchanges having nationwide terminals, other
than the Members of the Syndicate, eligible to procure Bids in terms of circular no.
CIR/CFD/14/2012 dated October 4, 2012 issued by SEBI
Registrar to the Offer or Registrar Karvy Computershare Private Limited
Registrar and Share Transfer
Agents or RTAs
Registrar and share transfer agents registered with SEBI and eligible to procure Bids at
the Designated RTA Locations in terms of circular no.
CIR/CFD/POLICYCELL/11/2015 dated November 10, 2015 issued by SEBI
Registrar Agreement The agreement dated May 31, 2016 entered into between our Company, the Selling
Shareholders and the Registrar to the Offer in relation to the responsibilities and
obligations of the Registrar to the Offer pertaining to the Offer
Retail Individual Bidder(s)/RIB(s) Individual Bidders, other than Eligible Employees Bidding in the Employee Reservation
Portion who have Bid for the Equity Shares for an amount not more than ₹ 200,000 in
any of the bidding options in the Net Offer (including HUFs applying through their
Karta and Eligible NRIs)
Retail Portion The portion of the Net Offer being not less than 35% of the Net Offer consisting of
8,575,000 Equity Shares which shall be available for allocation to Retail Individual
Bidder(s) in accordance with the SEBI ICDR Regulations subject to valid Bids being
received at or above the Offer Price
Revision Form Form used by the Bidders to modify the quantity of the Equity Shares or the Bid
Amount in any of their ASBA Forms or any previous Revision form(s).
QIB Bidders and Non-Institutional Bidders are not allowed to withdraw or lower their
Bids (in terms of quantity and of Equity Shares or the Bid Amount) at any stage. Retail
11
Term Description
Individual Bidders cannot revise their Bids after the Bid/Offer Closing Date
Self Certified Syndicate Bank(s) or
SCSB(s)
Banks registered with SEBI, offering services in relation to ASBA, a list of which is
available on the website of SEBI at
http://www.sebi.gov.in/sebiweb/home/list/5/33/0/0/Recognised-Intermediaries and
updated from time to time
Selling Shareholders Varun Jaipuria and Ravi Kant Jaipuria & Sons (HUF)
Share Escrow Agent Share escrow agent appointed pursuant to the Share Escrow Agreement namely Karvy
Computershare Private Limited
Share Escrow Agreement The agreement dated October 13, 2016 entered into between the Selling Shareholders,
our Company and the Share Escrow Agent in connection with the transfer of the
respective portion of Offered Shares by each of the Selling Shareholders and credit of
such Equity Shares to the demat account of the Allottees
Specified Locations Bidding centres where the Syndicate shall accept ASBA Forms, a list of which is
available on the website of SEBI at
www.sebi.gov.in/sebiweb/home/list/5/33/0/0/Recognised-Intermediaries and updated
from time to time
Stock Exchanges BSE Limited and the National Stock Exchange of India Limited
Syndicate Agreement The agreement dated October 13, 2016 entered into between, the GCBRLMs, the
BRLM, the Syndicate Member, our Company, the Selling Shareholders and Registrar to
the Offer in relation to the collection of Bid cum Application Forms by the Syndicate
Member
Syndicate Member Intermediary registered with SEBI who is permitted to carry out activities as an
underwriter, in this case, Kotak Securities Limited
Syndicate or Members of the
Syndicate
The GCBRLMs, the BRLM and the Syndicate Member
Underwriters [●]
Underwriting Agreement The agreement dated [●] to be entered into among the Underwriters, our Company and
the Selling Shareholders on or after the Pricing Date
Working Day “Working Day”, with reference to (a) announcement of Price Band; and (b) Bid/Offer
Period, shall mean all days, excluding Saturdays, Sundays and public holidays, on
which commercial banks in Mumbai are open for business; and (c) the time period
between the Bid/Offer Closing Date and the listing of the Equity Shares on the Stock
Exchanges, shall mean all trading days of Stock Exchanges, excluding Sundays and
bank holidays, as per the SEBI Circular SEBI/HO/CFD/DIL/CIR/P/2016/26 dated
January 21, 2016
YES Securities YES Securities (India) Limited
Technical/Industry Related Terms/Abbreviations
Term Description
CSD Carbonated Soft Drinks
CSO Central Statistics Office
CSR Corporate and social responsibility
F&B Food and Beverages
12
Term Description
GBO Global Brand Owner
GPRS General Packet Radio Services
IMF International Monetary Fund
LBN Local Brand Network
NBO National Brand Owner
NCB Non-Carbonated Beverages
Off-trade sales Sales that take place at retail outlets such as grocery stores, hypermarkets, super markets
etc.
On-trade sales Sales through consumer foodservice outlets that serve the general public in a non-
captive environment.
PET Polyethylene terephthalate
RGB Returnable Glass Bottles
RTD Ready-to-drink
SAMNA Sales Automation Management for the New Age
SKU Stock Keeping Unit
Conventional and General Terms or Abbreviations
Term Description
₹/Rs./Rupees/INR Indian Rupees
AGM Annual General Meeting
AIF Alternative Investment Fund as defined in and registered with SEBI under the Securities
and Exchange Board of India (Alternative Investments Funds) Regulations, 2012
AS/Accounting Standards Accounting Standards issued by the Institute of Chartered Accountants of India
BIS Act The Bureau of Indian Standards Act, 2016
Bn/bn Billion
Boilers Act Indian Boilers Act, 1923
BSE BSE Limited
C.P.C Civil Procedure Code, 1908
CAGR Compounded Annual Growth Rate
Category I Foreign Portfolio
Investors
FPIs who are registered with SEBI as “Category I foreign portfolio investors” under the
SEBI FPI Regulations
Category II Foreign Portfolio
Investors
FPIs who are registered with SEBI as “Category II foreign portfolio investors” under the
SEBI FPI Regulations
Category III Foreign Portfolio
Investors
FPIs who are registered with SEBI as “Category III foreign portfolio investors” under the
SEBI FPI Regulations
13
Term Description
CCI Competition Commission of India
CDSL Central Depository Services (India) Limited
CENVAT Central Value Added Tax
CESTAT Customs, Excise and Service Tax Appellate Tribunal
CGWA Central Ground Water Authority
CIN Corporate Identity Number
CIT Commissioner of Income Tax
Client ID Client identification number of the Bidders beneficiary account
CLRA Contract Labour (Regulation and Abolition) Act,1979
Companies Act Companies Act, 1956 and/or the Companies Act, 2013, as applicable
Companies Act, 1956 Companies Act, 1956, as amended (without reference to the provisions thereof that have
ceased to have effect upon the notification of the Notified Sections)
Companies Act, 2013 The Companies Act, 2013, to the extent in force pursuant to the notification of the
Notified Sections
COPRA Consumer Protection Act, 1986
Cr.P.C Criminal Procedure Code, 1973
Depositories NSDL and CDSL
Depositories Act The Depositories Act, 1996
DIN Director Identification Number
DIPP Department of Industrial Policy and Promotion, Ministry of Commerce and Industry,
Government of India
DP ID Depository Participant’s Identification
DP/Depository Participant A depository participant as defined under the Depositories Act
DTC Direct Taxes Code
EC Act Essential Commodities Act, 1955
ECB External commercial borrowing
EGM Extraordinary General Meeting
Environment Act Environment Protection Act, 1986
EPS Earnings Per Share
Equity Listing Agreement Listing Agreement to be entered into with the Stock Exchanges on which the Equity
Shares of our Company are to be listed
ESI Act Employees State Insurance Act, 1948
FCNR Foreign Currency Non-Resident
FDI Foreign Direct Investment
14
Term Description
FDI Policy Consolidated Foreign Direct Investment Policy notified by DIPP by notification D/o IPP
F. No. 5(1)/2016-FC-1 dated June 7, 2016 effective from June 7, 2016
FEMA Foreign Exchange Management Act, 1999, read with rules and regulations thereunder
FEMA Regulations Foreign Exchange Management (Transfer or Issue of Security by a Person Resident
Outside India) Regulations, 2000, as amended
FII(s) Foreign Institutional Investors as defined under the SEBI FPI Regulations
Financial Year/FY/Fiscal Unless stated otherwise, the period of 12 months ending December 31 of that particular
year
FIPB Foreign Investment Promotion Board
FIR First Information Report
FPI(s) A foreign portfolio investor as defined under the SEBI FPI Regulations
FSSA Food Safety and Standards Act, 2006
FSSAI Food Safety and Standards Authority of India
FSSR Food Safety and Standards Rules, 2011
FVCI Foreign venture capital investors as defined and registered under the SEBI FVCI
Regulations
GAAR General Anti Avoidance Rules
GDP Gross Domestic Product
GIR General Index Register
GoI or Government Government of India
GST Goods and services tax
HUF Hindu Undivided Family
ICAI The Institute of Chartered Accountants of India
ICDS Income Computation and Disclosure Standards
IFRS International Financial Reporting Standards
Income Tax Act The Income Tax Act, 1961
Ind AS Indian Accounting Standards
Ind AS Rules Companies (Indian Accounting Standards) Rules, 2015
India Republic of India
Indian GAAP Generally Accepted Accounting Principles in India
IPC Indian Penal Code, 1860
IPO Initial Public Offering
IRDAI Insurance Regulatory and Development Authority of India
IST Indian Standard Time
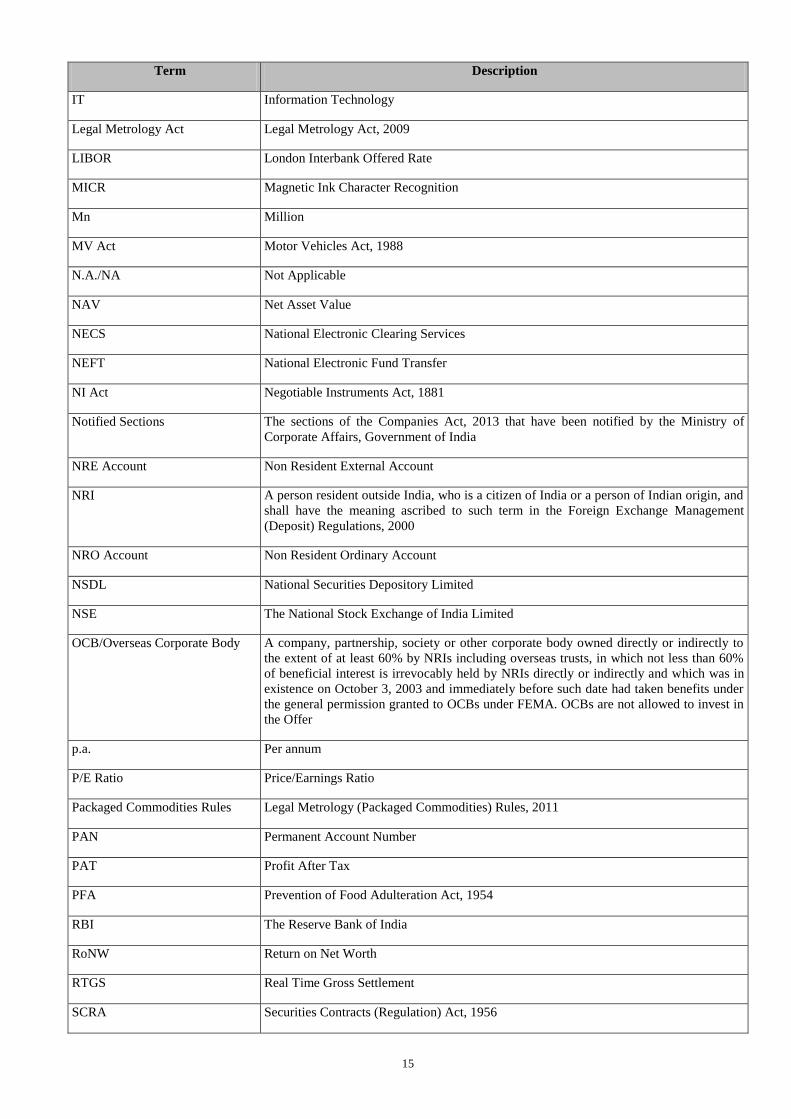
15
Term Description
IT Information Technology
Legal Metrology Act Legal Metrology Act, 2009
LIBOR London Interbank Offered Rate
MICR Magnetic Ink Character Recognition
Mn Million
MV Act Motor Vehicles Act, 1988
N.A./NA Not Applicable
NAV Net Asset Value
NECS National Electronic Clearing Services
NEFT National Electronic Fund Transfer
NI Act Negotiable Instruments Act, 1881
Notified Sections The sections of the Companies Act, 2013 that have been notified by the Ministry of
Corporate Affairs, Government of India
NRE Account Non Resident External Account
NRI A person resident outside India, who is a citizen of India or a person of Indian origin, and
shall have the meaning ascribed to such term in the Foreign Exchange Management
(Deposit) Regulations, 2000
NRO Account Non Resident Ordinary Account
NSDL National Securities Depository Limited
NSE The National Stock Exchange of India Limited
OCB/Overseas Corporate Body A company, partnership, society or other corporate body owned directly or indirectly to
the extent of at least 60% by NRIs including overseas trusts, in which not less than 60%
of beneficial interest is irrevocably held by NRIs directly or indirectly and which was in
existence on October 3, 2003 and immediately before such date had taken benefits under
the general permission granted to OCBs under FEMA. OCBs are not allowed to invest in
the Offer
p.a. Per annum
P/E Ratio Price/Earnings Ratio
Packaged Commodities Rules Legal Metrology (Packaged Commodities) Rules, 2011
PAN Permanent Account Number
PAT Profit After Tax
PFA Prevention of Food Adulteration Act, 1954
RBI The Reserve Bank of India
RoNW Return on Net Worth
RTGS Real Time Gross Settlement
SCRA Securities Contracts (Regulation) Act, 1956
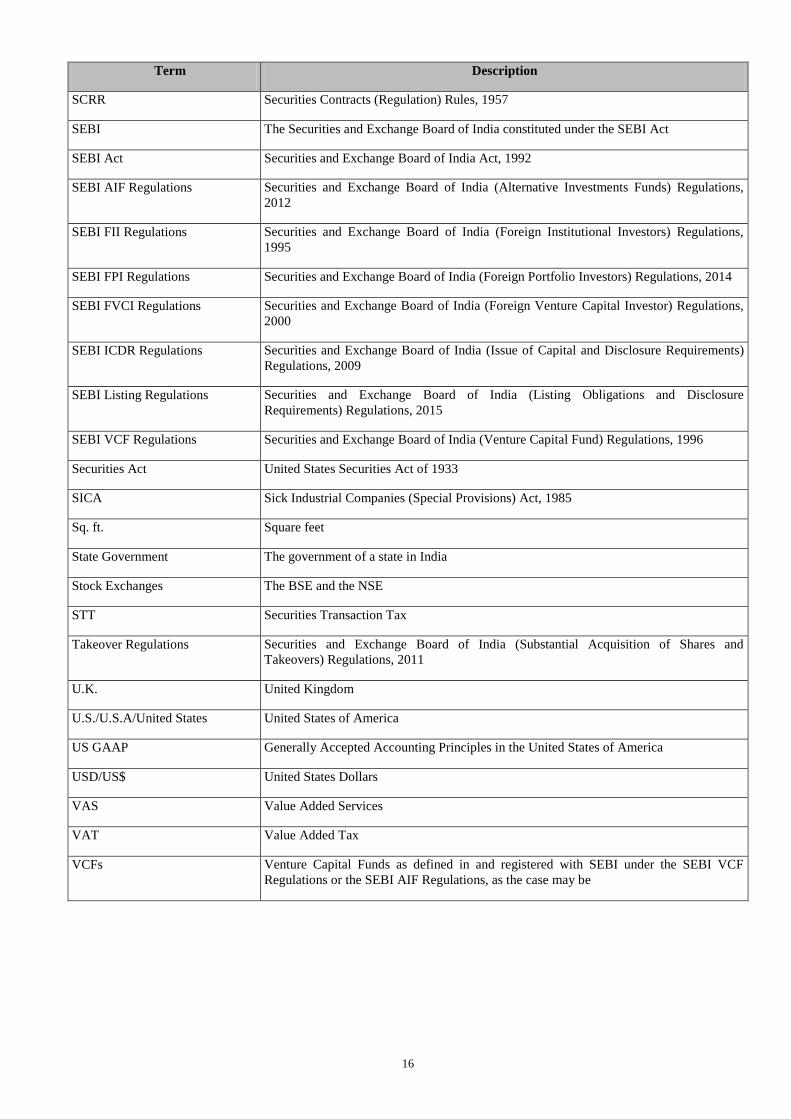
16
Term Description
SCRR Securities Contracts (Regulation) Rules, 1957
SEBI The Securities and Exchange Board of India constituted under the SEBI Act
SEBI Act Securities and Exchange Board of India Act, 1992
SEBI AIF Regulations Securities and Exchange Board of India (Alternative Investments Funds) Regulations,
2012
SEBI FII Regulations Securities and Exchange Board of India (Foreign Institutional Investors) Regulations,
1995
SEBI FPI Regulations Securities and Exchange Board of India (Foreign Portfolio Investors) Regulations, 2014
SEBI FVCI Regulations Securities and Exchange Board of India (Foreign Venture Capital Investor) Regulations,
2000
SEBI ICDR Regulations Securities and Exchange Board of India (Issue of Capital and Disclosure Requirements)
Regulations, 2009
SEBI Listing Regulations Securities and Exchange Board of India (Listing Obligations and Disclosure
Requirements) Regulations, 2015
SEBI VCF Regulations Securities and Exchange Board of India (Venture Capital Fund) Regulations, 1996
Securities Act United States Securities Act of 1933
SICA Sick Industrial Companies (Special Provisions) Act, 1985
Sq. ft. Square feet
State Government The government of a state in India
Stock Exchanges The BSE and the NSE
STT Securities Transaction Tax
Takeover Regulations Securities and Exchange Board of India (Substantial Acquisition of Shares and
Takeovers) Regulations, 2011
U.K. United Kingdom
U.S./U.S.A/United States United States of America
US GAAP Generally Accepted Accounting Principles in the United States of America
USD/US$ United States Dollars
VAS Value Added Services
VAT Value Added Tax
VCFs Venture Capital Funds as defined in and registered with SEBI under the SEBI VCF
Regulations or the SEBI AIF Regulations, as the case may be
17
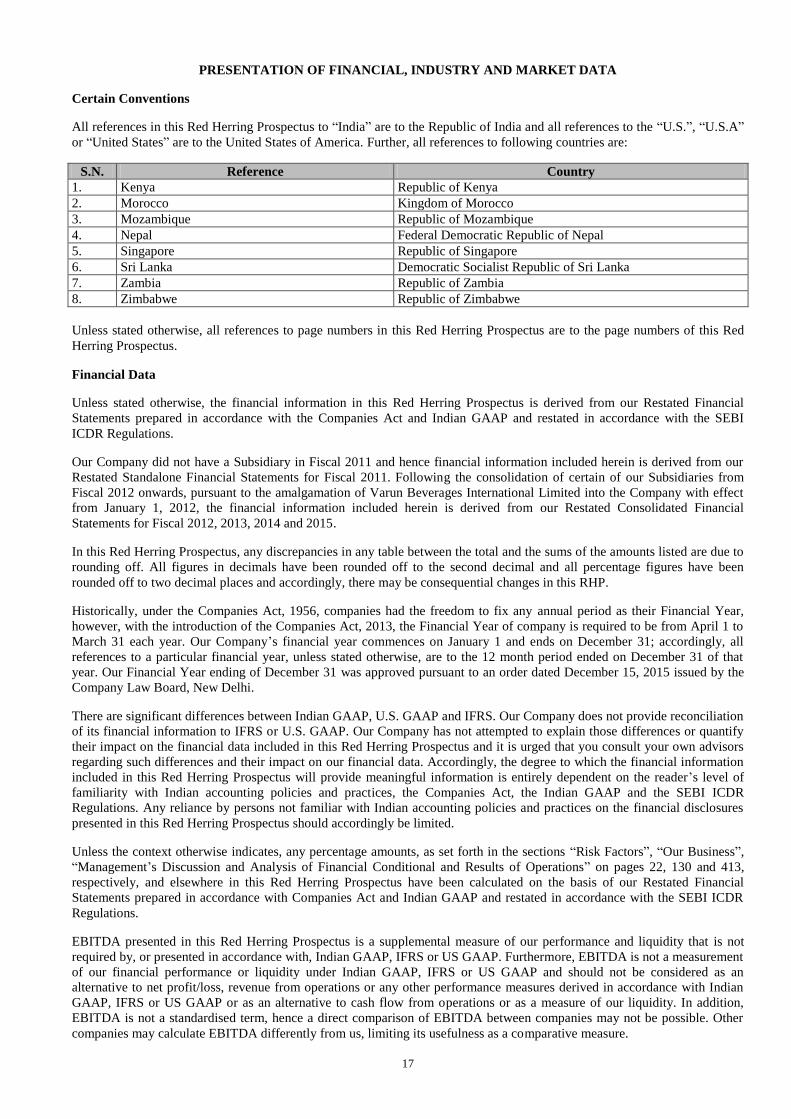
PRESENTATION OF FINANCIAL, INDUSTRY AND MARKET DATA
Certain Conventions
All references in this Red Herring Prospectus to “India” are to the Republic of India and all references to the “U.S.”, “U.S.A”
or “United States” are to the United States of America. Further, all references to following countries are:
S.N. Reference Country
1. Kenya Republic of Kenya
2. Morocco Kingdom of Morocco
3. Mozambique Republic of Mozambique
4. Nepal Federal Democratic Republic of Nepal
5. Singapore Republic of Singapore
6. Sri Lanka Democratic Socialist Republic of Sri Lanka
7. Zambia Republic of Zambia
8. Zimbabwe Republic of Zimbabwe
Unless stated otherwise, all references to page numbers in this Red Herring Prospectus are to the page numbers of this Red
Herring Prospectus.
Financial Data
Unless stated otherwise, the financial information in this Red Herring Prospectus is derived from our Restated Financial
Statements prepared in accordance with the Companies Act and Indian GAAP and restated in accordance with the SEBI
ICDR Regulations.
Our Company did not have a Subsidiary in Fiscal 2011 and hence financial information included herein is derived from our
Restated Standalone Financial Statements for Fiscal 2011. Following the consolidation of certain of our Subsidiaries from
Fiscal 2012 onwards, pursuant to the amalgamation of Varun Beverages International Limited into the Company with effect
from January 1, 2012, the financial information included herein is derived from our Restated Consolidated Financial
Statements for Fiscal 2012, 2013, 2014 and 2015.
In this Red Herring Prospectus, any discrepancies in any table between the total and the sums of the amounts listed are due to
rounding off. All figures in decimals have been rounded off to the second decimal and all percentage figures have been
rounded off to two decimal places and accordingly, there may be consequential changes in this RHP.
Historically, under the Companies Act, 1956, companies had the freedom to fix any annual period as their Financial Year,
however, with the introduction of the Companies Act, 2013, the Financial Year of company is required to be from April 1 to
March 31 each year. Our Company’s financial year commences on January 1 and ends on December 31; accordingly, all
references to a particular financial year, unless stated otherwise, are to the 12 month period ended on December 31 of that
year. Our Financial Year ending of December 31 was approved pursuant to an order dated December 15, 2015 issued by the
Company Law Board, New Delhi.
There are significant differences between Indian GAAP, U.S. GAAP and IFRS. Our Company does not provide reconciliation
of its financial information to IFRS or U.S. GAAP. Our Company has not attempted to explain those differences or quantify
their impact on the financial data included in this Red Herring Prospectus and it is urged that you consult your own advisors
regarding such differences and their impact on our financial data. Accordingly, the degree to which the financial information
included in this Red Herring Prospectus will provide meaningful information is entirely dependent on the reader’s level of
familiarity with Indian accounting policies and practices, the Companies Act, the Indian GAAP and the SEBI ICDR
Regulations. Any reliance by persons not familiar with Indian accounting policies and practices on the financial disclosures
presented in this Red Herring Prospectus should accordingly be limited.
Unless the context otherwise indicates, any percentage amounts, as set forth in the sections “Risk Factors”, “Our Business”,
“Management’s Discussion and Analysis of Financial Conditional and Results of Operations” on pages 22, 130 and 413,
respectively, and elsewhere in this Red Herring Prospectus have been calculated on the basis of our Restated Financial
Statements prepared in accordance with Companies Act and Indian GAAP and restated in accordance with the SEBI ICDR
Regulations.
EBITDA presented in this Red Herring Prospectus is a supplemental measure of our performance and liquidity that is not
required by, or presented in accordance with, Indian GAAP, IFRS or US GAAP. Furthermore, EBITDA is not a measurement
of our financial performance or liquidity under Indian GAAP, IFRS or US GAAP and should not be considered as an
alternative to net profit/loss, revenue from operations or any other performance measures derived in accordance with Indian
GAAP, IFRS or US GAAP or as an alternative to cash flow from operations or as a measure of our liquidity. In addition,
EBITDA is not a standardised term, hence a direct comparison of EBITDA between companies may not be possible. Other
companies may calculate EBITDA differently from us, limiting its usefulness as a comparative measure.
18
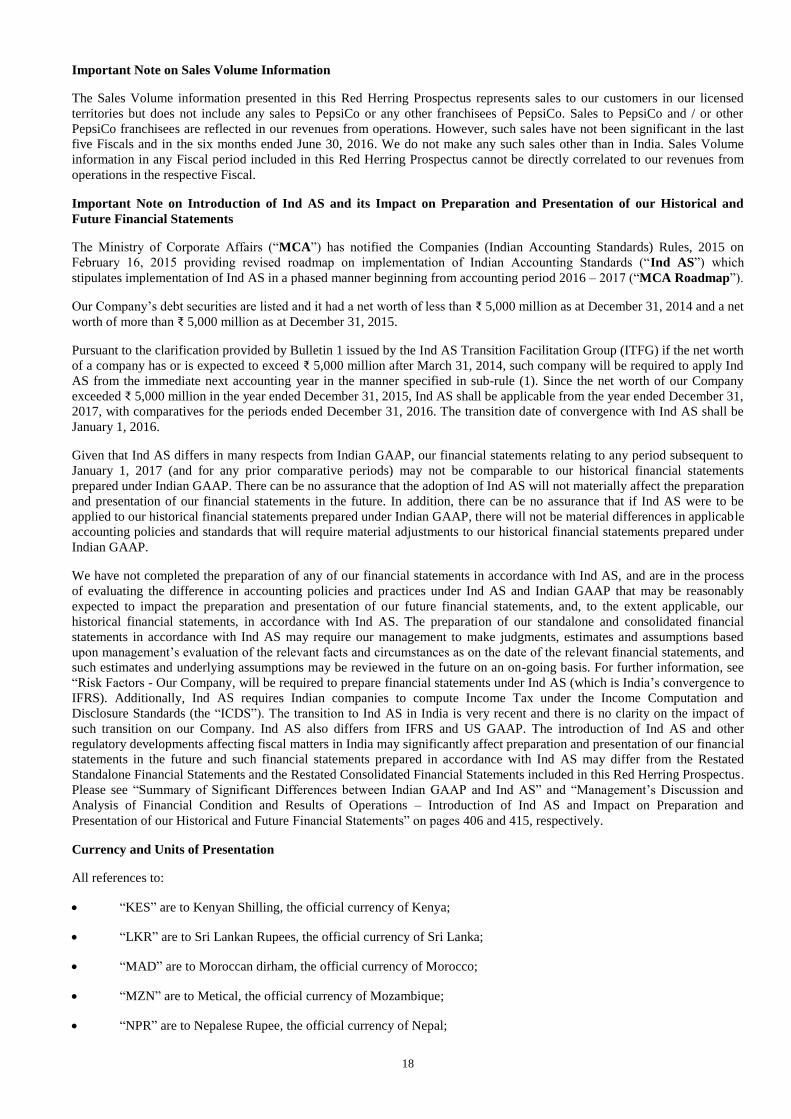
Important Note on Sales Volume Information
The Sales Volume information presented in this Red Herring Prospectus represents sales to our customers in our licensed
territories but does not include any sales to PepsiCo or any other franchisees of PepsiCo. Sales to PepsiCo and / or other
PepsiCo franchisees are reflected in our revenues from operations. However, such sales have not been significant in the last
five Fiscals and in the six months ended June 30, 2016. We do not make any such sales other than in India. Sales Volume
information in any Fiscal period included in this Red Herring Prospectus cannot be directly correlated to our revenues from
operations in the respective Fiscal.
Important Note on Introduction of Ind AS and its Impact on Preparation and Presentation of our Historical and
Future Financial Statements
The Ministry of Corporate Affairs (“MCA”) has notified the Companies (Indian Accounting Standards) Rules, 2015 on
February 16, 2015 providing revised roadmap on implementation of Indian Accounting Standards (“Ind AS”) which
stipulates implementation of Ind AS in a phased manner beginning from accounting period 2016 – 2017 (“MCA Roadmap”).
Our Company’s debt securities are listed and it had a net worth of less than ₹ 5,000 million as at December 31, 2014 and a net
worth of more than ₹ 5,000 million as at December 31, 2015.
Pursuant to the clarification provided by Bulletin 1 issued by the Ind AS Transition Facilitation Group (ITFG) if the net worth
of a company has or is expected to exceed ₹ 5,000 million after March 31, 2014, such company will be required to apply Ind
AS from the immediate next accounting year in the manner specified in sub-rule (1). Since the net worth of our Company
exceeded ₹ 5,000 million in the year ended December 31, 2015, Ind AS shall be applicable from the year ended December 31,
2017, with comparatives for the periods ended December 31, 2016. The transition date of convergence with Ind AS shall be
January 1, 2016.
Given that Ind AS differs in many respects from Indian GAAP, our financial statements relating to any period subsequent to
January 1, 2017 (and for any prior comparative periods) may not be comparable to our historical financial statements
prepared under Indian GAAP. There can be no assurance that the adoption of Ind AS will not materially affect the preparation
and presentation of our financial statements in the future. In addition, there can be no assurance that if Ind AS were to be
applied to our historical financial statements prepared under Indian GAAP, there will not be material differences in applicable
accounting policies and standards that will require material adjustments to our historical financial statements prepared under
Indian GAAP.
We have not completed the preparation of any of our financial statements in accordance with Ind AS, and are in the process
of evaluating the difference in accounting policies and practices under Ind AS and Indian GAAP that may be reasonably
expected to impact the preparation and presentation of our future financial statements, and, to the extent applicable, our
historical financial statements, in accordance with Ind AS. The preparation of our standalone and consolidated financial
statements in accordance with Ind AS may require our management to make judgments, estimates and assumptions based
upon management’s evaluation of the relevant facts and circumstances as on the date of the relevant financial statements, and
such estimates and underlying assumptions may be reviewed in the future on an on-going basis. For further information, see
“Risk Factors - Our Company, will be required to prepare financial statements under Ind AS (which is India’s convergence to
IFRS). Additionally, Ind AS requires Indian companies to compute Income Tax under the Income Computation and
Disclosure Standards (the “ICDS”). The transition to Ind AS in India is very recent and there is no clarity on the impact of
such transition on our Company. Ind AS also differs from IFRS and US GAAP. The introduction of Ind AS and other
regulatory developments affecting fiscal matters in India may significantly affect preparation and presentation of our financial
statements in the future and such financial statements prepared in accordance with Ind AS may differ from the Restated
Standalone Financial Statements and the Restated Consolidated Financial Statements included in this Red Herring Prospectus.
Please see “Summary of Significant Differences between Indian GAAP and Ind AS” and “Management’s Discussion and
Analysis of Financial Condition and Results of Operations – Introduction of Ind AS and Impact on Preparation and
Presentation of our Historical and Future Financial Statements” on pages 406 and 415, respectively.
Currency and Units of Presentation
All references to:
“KES” are to Kenyan Shilling, the official currency of Kenya;
“LKR” are to Sri Lankan Rupees, the official currency of Sri Lanka;
“MAD” are to Moroccan dirham, the official currency of Morocco;
“MZN” are to Metical, the official currency of Mozambique;
“NPR” are to Nepalese Rupee, the official currency of Nepal;
19
“Rupees” or “₹” or “INR” or “Rs.” are to Indian Rupee, the official currency of the Republic of India;
“SGD” are to Singapore Dollar, the official currency of Singapore;
“USD” or “US$” are to United States Dollar, the official currency of the United States; and
“ZMK/ZMW” are to Zambian kwacha, the official currency of Zambia.
Our Company has presented certain numerical information in this Red Herring Prospectus in “million” units. One million
represents 1,000,000 and one billion represents 1,000,000,000.
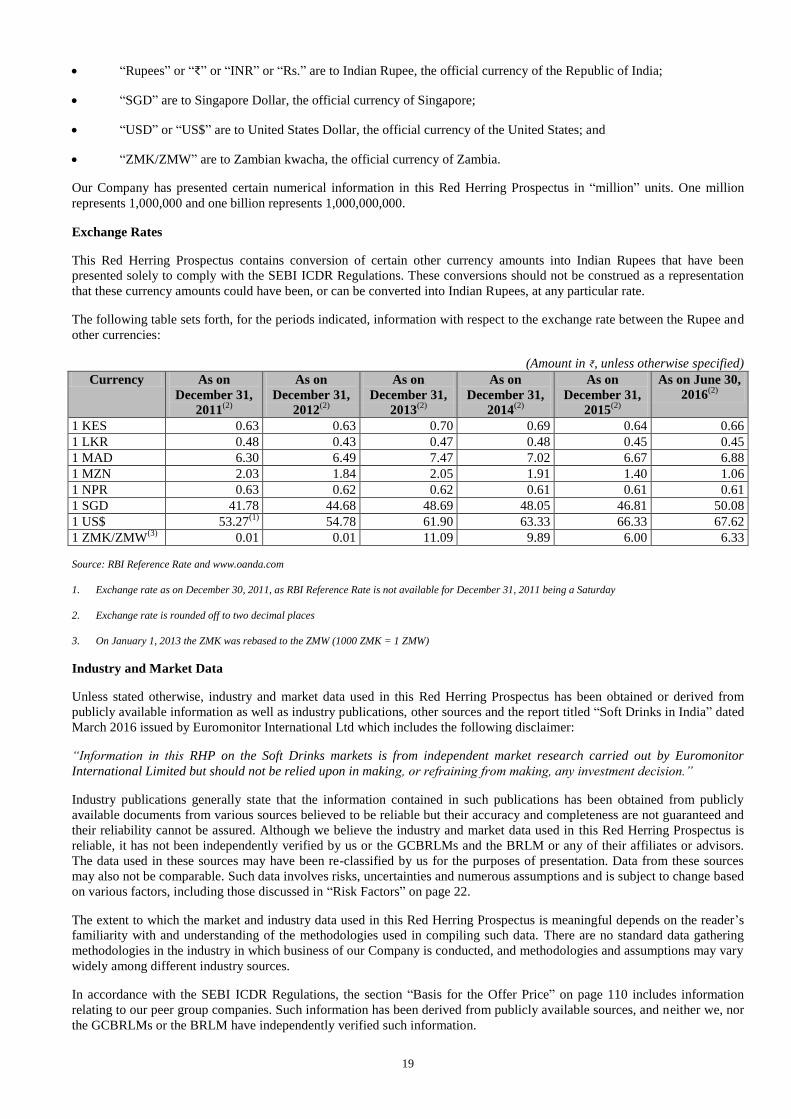
Exchange Rates
This Red Herring Prospectus contains conversion of certain other currency amounts into Indian Rupees that have been
presented solely to comply with the SEBI ICDR Regulations. These conversions should not be construed as a representation
that these currency amounts could have been, or can be converted into Indian Rupees, at any particular rate.
The following table sets forth, for the periods indicated, information with respect to the exchange rate between the Rupee and
other currencies:
(Amount in ₹, unless otherwise specified)
Currency As on
December 31,
2011(2)
As on
December 31,
2012(2)
As on
December 31,
2013(2)
As on
December 31,
2014(2)
As on
December 31,
2015(2)
As on June 30,
2016(2)
1 KES 0.63 0.63 0.70 0.69 0.64 0.66
1 LKR 0.48 0.43 0.47 0.48 0.45 0.45
1 MAD 6.30 6.49 7.47 7.02 6.67 6.88
1 MZN 2.03 1.84 2.05 1.91 1.40 1.06
1 NPR 0.63 0.62 0.62 0.61 0.61 0.61
1 SGD 41.78 44.68 48.69 48.05 46.81 50.08
1 US$ 53.27(1)
54.78 61.90 63.33 66.33 67.62
1 ZMK/ZMW(3)
0.01 0.01 11.09 9.89 6.00 6.33
Source: RBI Reference Rate and www.oanda.com
1. Exchange rate as on December 30, 2011, as RBI Reference Rate is not available for December 31, 2011 being a Saturday
2. Exchange rate is rounded off to two decimal places
3. On January 1, 2013 the ZMK was rebased to the ZMW (1000 ZMK = 1 ZMW)
Industry and Market Data
Unless stated otherwise, industry and market data used in this Red Herring Prospectus has been obtained or derived from
publicly available information as well as industry publications, other sources and the report titled “Soft Drinks in India” dated
March 2016 issued by Euromonitor International Ltd which includes the following disclaimer:
“Information in this RHP on the Soft Drinks markets is from independent market research carried out by Euromonitor
International Limited but should not be relied upon in making, or refraining from making, any investment decision.”
Industry publications generally state that the information contained in such publications has been obtained from publicly
available documents from various sources believed to be reliable but their accuracy and completeness are not guaranteed and
their reliability cannot be assured. Although we believe the industry and market data used in this Red Herring Prospectus is
reliable, it has not been independently verified by us or the GCBRLMs and the BRLM or any of their affiliates or advisors.
The data used in these sources may have been re-classified by us for the purposes of presentation. Data from these sources
may also not be comparable. Such data involves risks, uncertainties and numerous assumptions and is subject to change based
on various factors, including those discussed in “Risk Factors” on page 22.
The extent to which the market and industry data used in this Red Herring Prospectus is meaningful depends on the reader’s
familiarity with and understanding of the methodologies used in compiling such data. There are no standard data gathering
methodologies in the industry in which business of our Company is conducted, and methodologies and assumptions may vary
widely among different industry sources.
In accordance with the SEBI ICDR Regulations, the section “Basis for the Offer Price” on page 110 includes information
relating to our peer group companies. Such information has been derived from publicly available sources, and neither we, nor
the GCBRLMs or the BRLM have independently verified such information.
20
FORWARD-LOOKING STATEMENTS
This Red Herring Prospectus contains certain “forward-looking statements”. These forward-looking statements generally can
be identified by words or phrases such as “aim”, “anticipate”, “believe”, “expect”, “estimate”, “intend”, “objective”, “plan”,
“project”, “will”, “will continue”, “will pursue” or other words or phrases of similar import. Similarly, statements that
describe our strategies, objectives, plans, prospects or goals are also forward-looking statements. All forward-looking
statements are subject to risks, uncertainties and assumptions about us that could cause actual results to differ materially from
those contemplated by the relevant forward-looking statement.
Actual results may differ materially from those suggested by the forward-looking statements due to risks or uncertainties
associated with the expectations with respect to, but not limited to, regulatory changes pertaining to the industries in India in
which our Company operates and our ability to respond to them, our ability to successfully implement our strategy, our
growth and expansion, technological changes, our exposure to market risks, general economic and political conditions in
India which have an impact on its business activities or investments, the monetary and fiscal policies of India, inflation,
deflation, unanticipated turbulence in interest rates, foreign exchange rates, equity prices or other rates or prices, the
performance of the financial markets in India and globally, changes in domestic laws, regulations and taxes and changes in
competition in the industries in which we operate. Important factors that could cause actual results to differ materially from
our Company’s expectations include, but are not limited to, the following:
Termination or non-renewal of the our agreements with PepsiCo;
Inability to maintain our competitive position in India and in our other markets;
Failure to integrate businesses we have acquired with our existing operations;
Interruption in the supply or significant increase in the price of raw materials or packaging materials;
Adverse weather conditions during peak sales seasons;
Changes in consumer preferences leading to reduction in demand of our products;
Contamination or deterioration of our beverages resulting in legal liability;
Significant interruption in production at our production facilities;
An inability to repay our substantial indebtedness in a timely manner or comply with various financial and other
covenants;
Scarcity or non-availability of quality water;
Any withdrawal, or termination of, or unavailability of tax benefits we currently avail;
Failure to maintain sufficient insurance coverage to cover all possible losses and liabilities associated with our
business; and
General economic and business conditions in India and other countries.
For further discussion of factors that could cause the actual results to differ from the expectations, please see “Risk Factors”,
“Our Business” and “Management’s Discussion and Analysis of Financial Condition and Results of Operations” on pages 22,
130 and 414, respectively. By their nature, certain market risk disclosures are only estimates and could be materially different
from what actually occurs in the future. As a result, actual gains or losses could materially differ from those that have been
estimated.
We cannot assure Bidders that the expectations reflected in these forward-looking statements will prove to be correct. Given
these uncertainties, Bidders are cautioned not to place undue reliance on such forward-looking statements and not to regard
such statements as a guarantee of future performance.
Forward-looking statements reflect the current views of our Company as of the date of this Red Herring Prospectus and are
not a guarantee of future performance. These statements are based on the management’s beliefs and assumptions, which in
turn are based on currently available information. Although we believe the assumptions upon which these forward-looking
statements are based are reasonable, any of these assumptions could prove to be inaccurate, and the forward-looking
statements based on these assumptions could be incorrect. Neither our Company, our Directors, the GCBRLMs, the BRLM
nor any of their respective affiliates have any obligation to update or otherwise revise any statements reflecting circumstances
arising after the date hereof or to reflect the occurrence of underlying events, even if the underlying assumptions do not come
to fruition. In accordance with SEBI requirements, our Company, the GCBRLMs and BRLM will ensure that the Bidders in
21
India are informed of material developments until the time of the grant of listing and trading permission by the Stock
Exchanges.
The Selling Shareholders will ensure that investors are informed of material developments in relation to statements and
undertakings made by the Selling Shareholders in this Red Herring Prospectus, the Red Herring Prospectus and the
Prospectus until the time of the grant of listing and trading permission by the Stock Exchanges. Further, in accordance with
Regulation 51A of the SEBI ICDR Regulations, our Company may be required to undertake an annual updation of the
disclosures made in this Red Herring Prospectus and make it publicly available in the manner specified by SEBI.
22
SECTION: II RISK FACTORS
An investment in Equity Shares involves a high degree of risk. Investors should carefully consider all the information in this
Red Herring Prospectus, including the risks and uncertainties described below, before making an investment in our Equity
Shares. The risks described below are not the only ones relevant to us or our Equity Shares, but also to the industry in which
we operate or to India and other jurisdictions we operate in. Additional risks and uncertainties, not currently known to us or
that we currently do not deem material may also adversely affect our business, results of operations and financial condition.
If any of the following risks, or other risks that are not currently known or are not currently deemed material, actually occur,
our business, results of operations and financial condition could be adversely affected, the price of our Equity Shares could
decline, and investors may lose all or part of their investment. In order to obtain a complete understanding of our Company
and our business, prospective investors should read this section in conjunction with “Our Business” and “Management’s
Discussions and Analysis of Financial Condition and Results of Operations” on pages 130 and 413, respectively, as well as
the other financial and statistical information contained in this Red Herring Prospectus. In making an investment decision,
prospective investors must rely on their own examination of us and our business and the terms of the Offer including the
merits and risks involved. Unless specified or quantified in the relevant risk factors below, we are unable to quantify the
financial or other impact of any of the risks described in this section.
This Red Herring Prospectus also contains forward-looking statements that involve risks, assumptions, estimates and
uncertainties. Our actual results could differ from those anticipated in these forward-looking statements as a result of certain
factors, including the considerations described below and elsewhere in this Red Herring Prospectus. See “Forward-Looking
Statements” on page 20.
Unless the context otherwise requires, in this section, references to “we”, “us” or “our” refers to Varun Beverages Limited
and its subsidiaries on a consolidated basis, and includes references to entities that have merged with, or that have been
acquired by, our Company, including Devyani Beverages Limited, Varun Beverages (Nepal) Private Limited, North East
Pure Drinks Private Limited, Varun Beverages (International) Limited, Varun Beverages (Zambia) Limited, Varun Beverages
Mozambique, Limitada and Varun Beverages (Zimbabwe) (Private) Limited. Unless the context otherwise requires,
references to our “Company” refers to Varun Beverages Limited on a standalone basis. Unless the context otherwise
requires, any financial information included herein have been derived from our Restated Standalone Financial Statements for
Fiscal 2011 and from our Restated Consolidated Financial Statements for Fiscal 2012, 2013, 2014, 2015, the six months
ended June 30, 2015 and the six months ended June 30, 2016.
The Sales Volume information presented in this section represents sales to our customers in our licensed territories but does
not include any sales to PepsiCo or any other franchisees of PepsiCo. Sales to PepsiCo and / or other PepsiCo franchisees
are reflected in our revenues from operations. However, such sales have not been significant in the last five Fiscals and the
six months ended June 30, 2016. We do not make any such sales other than in India. Sales Volume information in any Fiscal
or period included in this section cannot be directly correlated to our revenues from operations in the respective Fiscal or
period.
Internal Risk Factors
1. Termination or non-renewal of the PepsiCo India Agreements or the PepsiCo International Agreements by
PepsiCo India / PepsiCo Inc. or PepsiCo International Entities or any material modification to the existing terms
under such agreements adverse to our interest will materially and adversely affect our ability to continue our
business and operations and our future financial performance.
Pursuant to our franchise arrangements with PepsiCo under the PepsiCo India Agreements and the PepsiCo
International Agreements, we have been granted the franchise for PepsiCo products in certain specified sub-
territories in India and certain international jurisdictions. Under the PepsiCo India Agreements, we have been
granted the franchise for various licensed territories across 17 States and two Union Territories in India. The PepsiCo
India Agreements are valid for a period of ten years until October 2, 2022 and may be renewed, at the discretion of
PepsiCo India / PepsiCo Inc., for successive terms of five years. Similarly, pursuant to the PepsiCo International
Agreements, we have been granted the franchise for PepsiCo products in Morocco for five years until January 31,
2021, in Nepal for 10 years until November 30, 2021, in Zambia for five years until August 31, 2020, and in
Mozambique for five years until January 24, 2019. In Sri Lanka, we have been granted the franchise for Aquafina
and Tropicana products until July 31, 2021, and certain other PepsiCo products for 10 years until July 31, 2021.
Under the PepsiCo India Agreements, PepsiCo India / PepsiCo Inc. are entitled to unilaterally terminate such
agreements by providing written notice of 12 months. Additionally, under certain of the PepsiCo International
Agreements, certain of the PepsiCo International Entities also have the right to unilaterally terminate such PepsiCo
International Agreements. Additionally, PepsiCo India / PepsiCo Inc. and the PepsiCo International Entities are also
entitled to terminate, with immediate effect, the PepsiCo India Agreements and the PepsiCo International
Agreements in the event of, among others, any one and/or more of the following circumstances:
23
If we fail to perform or comply with the terms and conditions of the PepsiCo India Agreements and the
PepsiCo International Agreements;
If the entities controlled by Mr. Ravi Kant Jaipuria, RJ Corp Limited, Ravi Kant Jaipuria & Sons (HUF),
Devyani Enterprises Private Limited, Devyani Overseas Private Limited, the lineal descendants of Mr. Ravi
Kant Jaipuria and their respective spouses and relatives of Ravi Kant Jaipuria and companies controlled by
such relatives of Ravi Kant Jaipuria cease to be in control of our Company;
In the event any competitor of PepsiCo (i) acquires any shareholding or voting rights in any entity
comprising the entities controlled by Mr. Ravi Kant Jaipuria, RJ Corp Limited, Ravi Kant Jaipuria & Sons
(HUF), Devyani Enterprises Private Limited, Devyani Overseas Private Limited, the lineal descendants of
Mr. Ravi Kant Jaipuria and their respective spouses and relatives of Ravi Kant Jaipuria and companies
controlled by such relatives of Ravi Kant Jaipuria, whether during or subsequent to our initial public
offering; or (ii) acquires directly or indirectly any shareholding or voting rights in our Company equal to or
in excess of 15.0% of our total outstanding shares, whether during or subsequent to our initial public
offering;
If we discontinue the production of the PepsiCo beverages for a period of 30 consecutive days other than on
account of annual maintenance or any other reason subject to the prior approval of PepsiCo;
In the event of insolvency or bankruptcy or other such events affecting our Company;
In the event of the debt to equity ratio for our Company on a standalone basis exceeds 2:1 or such other
ratio as agreed with PepsiCo India;
In the event our management or control of our business changes pursuant to any law, decree, order, rule,
regulation, ordinance or any other similar cause; and
In the event of any sale, transfer or other disposition which results, at any time prior to any initial public
offering of the securities of our Company, whether by itself or taken together with any previous transaction
which has not been approved by PepsiCo, directly or indirectly, in the change of more than 10% of voting
rights or ownership of the Company or of any entity which directly or indirectly, owns or controls our
Company.
For further information on other similar conditions applicable under the PepsiCo India Agreements and the PepsiCo
International Agreements, see “Our Business – Relationship with PepsiCo” on page 136.
We require the consent of PepsiCo to undertake the Offer and we have obtained such consent from PepsiCo in
connection with the Offer.
In the event that PepsiCo India / PepsiCo Inc. and /or the PepsiCo International Entities exercises their right to
terminate these agreements whether on the occurrence of any such aforesaid events or otherwise, or, on expiry of the
term of such agreements, or in the event PepsiCo India / PepsiCo Inc. and/or the PepsiCo International Entities are
unwilling to renew such agreements or imposes terms less favourable to us than existing terms, it may materially and
adversely affect our ability to carry on our business operations and our future financial performance.
In addition, our franchises are on a non-exclusive basis and PepsiCo is entitled to undertake the production,
distribution or sale of the PepsiCo products and brands either themselves or appoint other third-party franchisees for
these territories and sub-territories licensed to us. Although PepsiCo has in the past renewed such franchise
agreements in our favour, and also granted franchises for additional territories and sub-territories to us, there can be
no assurance that in the future PepsiCo will not terminate or discontinue our franchise arrangements for cause,
including any failure by us to meet performance standards or any breach by us of applicable terms and conditions
under such agreements, or without cause, and undertake production and distribution activities directly or through
other franchisees in our licensed territories and sub-territories.
2. PepsiCo India / PepsiCo Inc. and the PepsiCo International Entities are entitled to various rights under the
PepsiCo India Agreements and the PepsiCo International Agreements, including the right to unilaterally
determine the price of the PepsiCo beverage concentrates we purchase. In the event any such right is exercised by
PepsiCo India / PepsiCo Inc. and / or the PepsiCo International Entities in a manner adverse to our business
interest, our business prospects and future financial performance will be materially and adversely affected.
The cost of concentrate purchased from PepsiCo India or other relevant PepsiCo entities or their authorized suppliers
constitutes our most significant raw material expense.
24
Our franchisee arrangements with PepsiCo India / PepsiCo Inc. and the PepsiCo International Entities stipulate that
PepsiCo India / PepsiCo Inc. and the PepsiCo International Entities will be entitled to set terms and conditions
related to our purchase of concentrates from PepsiCo India and the relevant PepsiCo International Entities or their
authorised suppliers including the price of such concentrates. Historically, the concentrate price has been determined
by PepsiCo India / PepsiCo Inc. and the PepsiCo International Entities in discussions with us, after taking into
account the selling price, input price and other relevant market conditions. However, there can be no assurance that
such practice will continue in the future or that we will be able to pass on any increase in concentrate costs to our
customers or end customers.
In addition, for the license to use the trademark “LEHAR” in conjunction with Aquafina and Evervess we are
currently required to pay certain royalty to PepsiCo India. In the six months ended June 30, 2016, Fiscal 2015, Fiscal
2014, Fiscal 2013, the Company has paid royalty of ₹ 131.53 million, ₹ 188.51 million, ₹ 94.91 million, and ₹ 90.52
million, respectively, to PepsiCo India. PepsiCo India is entitled to revise the royalty rates from time to time.
Although we are not currently required to pay any royalty for the use of any other PepsiCo trademarks or brands as
the licenses for the other products are governed under the terms of the respective PepsiCo International Agreements
and PepsiCo India Agreements under which the concentrate is supplied by PepsiCo for the other products, there can
be no assurance that PepsiCo India / PepsiCo Inc. and / or the PepsiCo International Entities will not in the future
amend current terms and require us to pay royalty also for other PepsiCo trademarks and brands. There can also be
no assurance that such royalty payments will not be materially increased or that we will be able to pass on any such
increase in royalty expenses to our customers or ultimate consumers.
In addition, the maximum retail price for the relevant PepsiCo products is fixed in consultation with PepsiCo. The
maximum retail price is influenced by market dynamics and various factors including the pricing pattern followed by
PepsiCo competitors. Under the PepsiCo India Agreements, we are also required to submit our annual marketing,
advertising, management and financial plans for review and approval of PepsiCo India, and also meet certain
performance parameters set by PepsiCo India relating to the volume, market share, cooling equipment penetration
level and quality of products. Other notable arrangements with PepsiCo India / PepsiCo Inc. and the PepsiCo
International Entities include purchases of raw materials, cooling equipment, strategic marketing initiatives, supply
chain operations, information services and sales organization. In the event of an inability on our part to implement
business strategies, PepsiCo India / PepsiCo Inc. and the PepsiCo International Entities may terminate the relevant
PepsiCo India Agreements or PepsiCo International Agreements. Although our agreements with PepsiCo India have
not been terminated in the past and no notice of default of the terms of the agreements has been issued to the
Company by PepsiCo India, in the event of an inability on our part to meet the stipulated performance parameters
under the PepsiCo India Agreements, PepsiCo India may terminate the relevant PepsiCo India Agreements. These
agreements also contemplate other rights that may be exercised by PepsiCo in a manner that may adversely affect
our business prospects and financial performance. For further information, see “Our Business – Relationship with
PepsiCo” on page 136.
3. Our growth plans and expansion strategies are subject to prior approval of PepsiCo, and an inability to secure
such approval may adversely affect our business prospects and future financial performance.
In addition to increasing our Sales Volumes, we continue to evaluate acquisition of additional production facilities as
well as franchises for additional licensed territories and sub-territories, in particular sub-territories in India that are
contiguous to our existing licensed sub-territories. We also intend to obtain franchises for other existing or newly
introduced beverage products of PepsiCo. Under the PepsiCo India Agreements and the PepsiCo International
Agreements, any such acquisition will require prior approval from PepsiCo India / PepsiCo Inc. and the PepsiCo
International Entities. While historically, PepsiCo has granted franchises for additional licensed territories and sub-
territories to us from time to time, including territories that were earlier operated directly by PepsiCo or by other
franchisees, there can be no assurance that PepsiCo will grant us franchises for additional territories or sub-territories
or provide approval for the acquisition of additional production facilities in the future. In addition, if PepsiCo were to
grant other franchisees, the franchise rights to territories and sub-territories currently licensed to us, it may materially
and adversely affect our business operations and future financial performance. Our growth plans and expansion
strategies are therefore subject to the approval of PepsiCo and if PepsiCo were to deny such approval for any reason,
it could adversely affect our business, prospects, results of operations and financial condition.
4. There are certain criminal and other outstanding legal proceedings against the Company, certain of its Directors
and Promoters, Subsidiaries and Group Companies which may adversely affect our business, financial condition
and results of operations.
There are certain criminal proceedings pending against us initiated under the Motor Vehicles Act, 1988 in relation to
accidents caused by drivers employed by our Company, one criminal proceeding initiated under section 133 of the
Code of Criminal Procedure, 1973 in relation to alleged public nuisance caused by our operations, and certain
criminal proceedings initiated under the Prevention of Food Adulteration Act, 1954 or the Food Safety and
Standards Act, 2006 as the case may be, in relation to alleged adulteration, misbranding or presence of foreign
25
substance in products manufactured by our Company. Additionally, four of our Directors and Devyani International
Limited and Devyani Food Industries Limited, our Group Companies, have been named as respondents in certain
criminal proceedings initiated under the Indian Penal Code, 1860 that are pending at different levels of adjudication
before various courts. For further details, see “Outstanding Litigation and Material Developments” on page 457. Any
adverse rulings in these proceedings or consequent levy of, penalties by statutory authorities or other action against
our Director or our Group Entity for the offences alleged by the complainants may potentially cause negative
publicity thereby affecting our reputation, business, and financial condition.
There are outstanding legal proceedings against us that are incidental to our business and operations, including
certain civil and tax proceedings against our Company and certain of our Directors, Promoters, Subsidiaries and
Group Companies. These proceedings are pending at different levels of adjudication before various courts, tribunals,
enquiry officers and appellate tribunals. Such proceedings could divert management time and attention, and consume
financial resources in their defence. Further, if there were to be an adverse judgment in some of these proceedings
could have an adverse impact on our business, financial condition and results of operations. For details in relation to
certain material litigation, see “Outstanding Litigation and Other Material Developments” on page 457.
A summary of the outstanding criminal, tax and material civil legal proceedings, as determined by our Board in its
meeting held on March 28, 2016 for identification of material legal proceedings against our Company, our Directors,
Promoters, Subsidiaries and Group Companies as disclosed in this Red Herring Prospectus, to the extent
quantifiable, have been set out below:
Litigation against our Company
S.
No.
Nature of Case Number of Outstanding Cases Amount involved (In ₹ Million)
1. Criminal Proceedings 83 58.87
2. Civil Proceedings(1)
Nil -
3. Tax Proceedings
Direct Tax
- Disallowances 20 845.83
- Penalties 1 39.00
- Demand amounts 10 10.62
Indirect Tax 94 171.81
Litigation against the Promoters
S.
No.
Nature of Case Number of Outstanding Cases Amount involved (In ₹ Million)
Ravi Kant Jaipuria
1. Criminal Proceedings 3 0.03
2. Civil Proceedings(1)
Nil -
3. Tax Proceedings 2 8.25
Varun Jaipuria
1. Tax Proceedings 1 0.21
RJ Corp Limited
1. Criminal Proceedings 31 Nil
2. Tax Proceedings
Direct Tax
- Disallowances 11 773.44
- Penalties 1 10.00
Litigation against the Directors
S.
No.
Nature of Case Number of Outstanding Cases Amount involved (In ₹ Million)
Ravi Kant Jaipuria
1. Criminal Proceedings 3 0.03
2. Civil Proceedings(1)
Nil -
3. Tax Proceedings 2 8.25
Raj Pal Gandhi
1. Tax Proceedings 1 0.21
Kamlesh Kumar Jain
1. Criminal Proceedings 1 Nil
26
S.
No.
Nature of Case Number of Outstanding Cases Amount involved (In ₹ Million)
2. Tax Proceedings 1 0.21
Varun Jaipuria
1. Tax Proceedings 1 0.21
Litigation against the Subsidiaries
S.
No.
Nature of Case Number of Outstanding Cases Amount involved (In Million)
Ole Springs Bottlers (Private) Limited
1. Criminal Proceedings 3 LKR 0.09
2. Civil Proceedings(1)
Nil -
3. Tax Proceedings 2 LKR 17.63
Varun Beverages Morocco SA
1. Civil Proceedings(1)
1 INR 162.04
Varun Beverages (Lanka) Private Limited
1. Tax Proceedings 3 LKR 660.82
Varun Beverages (Nepal) Pvt. Ltd.
1. Tax Proceedings 3 NPR 440.30
Varun Beverages (Zambia) Limited
1. Criminal Proceedings 1 -
2. Civil Proceedings Nil -
Litigation against the Group Companies
S.
No.
Nature of Case Number of Outstanding Cases Amount involved (In ₹ Million)
Devyani International Limited
1. Criminal Proceedings 9 Nil
2. Direct Tax Proceedings
(Disallowances)
10 200.42
3. Civil Proceedings 1 20.00
Devyani Food Industries Limited
1. Criminal Proceedings 15 Nil
2. Tax Proceedings
Direct Tax
- Disallowances 5 351.11
- Penalties 1 5.00
Lineage Healthcare Limited
1. Civil Proceedings 1 104.28
2. Direct Tax Proceedings
(Disallowances)
1 -
Cryoviva Biotech Private Limited
1. Direct Tax Proceedings
(Disallowances)
4 22.90
Devyani Airport Services Mumbai Private Limited
1. Direct Tax Proceedings
(Disallowances)
2 -
(1) Based on the policy adopted by the Board on March 28, 2016, our Board has considered as material, each legal proceeding where the
aggregate amount involved exceeds one percent of the profit after tax of our Company as per the Restated Standalone Financial Statements
for Financial Year 2015, or any outstanding litigation wherein monetary liability is not quantifiable and whose outcome would have a
bearing on the operations or performance of our Company.
5. We have, in the past, revalued certain of our assets. There can be no assurance that the value of our assets and
accordingly our net worth will not undergo any further change based on any future revaluation.
In Fiscal 2012, our Company revalued certain land parcels at various plant locations of our Company. This
revaluation was conducted based on valuation reports of independent valuers at manufacturing facilities of the
Company situated at Kosi, Greater Noida, Alwar, Jodhpur, Nuh, Jaipur, Kolkata and Bhiwadi. Prior to such
revaluation the value of all such land parcels aggregated to ₹ 494.97 million. In furtherance to the VBIL Scheme, the
value of all such land parcels was revalued by ₹ 2,157.65 million which increased the net worth of the Company.
27
Further, the goodwill on amalgamation amounting to ₹ 1,258.95 million and certain unrealised assets of our
Company amounting to ₹ 710.77 million aggregating to ₹ 1,969.72 million was reduced from the net worth of our
Company. Accordingly, the net impact on net worth of our Company was ₹ 187.93 million. For further details
relating to the revaluation of assets, see “History and Other Corporate Matter – Revaluation of Assets” and “Restated
Consolidated Financial Statements – Annexure 5” on pages 169 and 228, respectively. There can be no assurance
that our assets will not be revalued in the future and that the value of our assets and accordingly our net worth will
not undergo any further change based on any future revaluation. If any such revaluation were to occur in the future,
it may materially and adversely affect the value of our assets, our net worth and impact our results of operations.
6. An inability to integrate the operations of, or leverage potential operating and cost efficiencies from, the recently
acquired 2015 New India Sub-Territories or additional acquired territories or sub-territories in the future may
adversely affect our business and future financial performance.
We have over the years been granted franchises to additional sub-territories in India by PepsiCo India / PepsiCo Inc.
In addition to franchises for territories and sub-territories acquired prior to Fiscal 2011, part of the Delhi sub-territory
was acquired with effect from January 31, 2013. We were also granted, with effect from February 28, 2015,
franchises for the 2015 New India Sub-Territories. In addition, we are in the process of setting up a greenfield
facility in Zimbabwe in anticipation of franchise rights being granted by PepsiCo Inc. for such territory. These
acquisitions have resulted in, and any future acquisitions will result in, significant growth in our operations, in terms
of geographic spread as well as the penetration of our distribution network. For further information relating to our
acquisition strategy, see “Our Business — Our Strategy — continue to acquire and integrate additional franchisee
rights” on page 134.
We will continue to invest significant management time and financial resources to integrate and manage such
acquired operations, overcome local market challenges that we may be unfamiliar with, including potential cultural
and language barriers, and assimilate business practices from the recently acquired 2015 New India Sub-Territories
or additionally acquired territories or sub-territories in the future. Although, our business operations in each market
is similar, each territory and sub-territory presents specific operational challenges, which can vary depending on
whether the relevant market is urban, semi-urban or rural, the degree of penetration of CSD and NCB beverages and
packaged drinking water in such markets, the competition, access to uninterrupted electricity supply and
refrigeration and cooling equipment, logistics infrastructure as well as the demographic profile and general socio-
economic conditions in the relevant market. Our ability to successfully extend our existing operational, technological
or distribution logistics infrastructure to these territories and sub-territories will be affected by these factors.
Although we continue to evaluate strategic acquisition opportunities, either production facilities or additional
licensed territories and sub-territories that are with other operators, such potential acquisition may raise a number of
challenges beyond our control including unforeseen expenses, complications or delays in connection with the
expansion of our operations through these acquisitions. In addition, we may be required to incur additional debt or
issue equity to pay for future acquisitions. We may also face challenges from PepsiCo competitors or other PepsiCo
franchisees in completing such acquisitions and implementing our business strategy, developing relationships with
distributors and dealers in these new markets, and integrating these territories and sub-territories in our existing
operations. If we are unable to successfully acquire, manage or integrate such acquisitions as planned, or at all, or if
we are unable to achieve operating and financial synergies or economies of scale that we expect from such
acquisitions, as a result of any of the foregoing or other risks or challenges, or for any other reason, it may have a
material and adverse effect on our business, prospects, results of operations and financial condition.
7. An inability to manage our growth effectively could adversely affect our business and future financial
performance.
We have experienced significant growth over the last few years as we have expanded our operations in India and
internationally. Our revenue from operations (net) increased at a CAGR of 31.15% from ₹ 11,472.54 million in
Fiscal 2011 to ₹ 33,941.49 million in Fiscal 2015. We continue to evaluate organic and inorganic expansion plans to
pursue growth opportunities. In order to expand our business operations, we must acquire franchises for additional
territories and sub-territories, and license to a broader range of PepsiCo products, increase our production capacity,
strengthen our distribution network and increase market penetration in our licensed territories and sub-territories.
Our ability to further grow our business will depend on various factors, many of which are beyond our control.
These factors include, but are not limited to: customer loyalty to PepsiCo’s existing and future beverage products;
evolving consumer preferences and our ability to adapt our business and operations; recruiting and training qualified
personnel; further strengthening PepsiCo brands in new markets; competition in our markets; availability of
financing at suitable terms and conditions; and sourcing and managing the cost of our expansion and identifying
suitable supply and delivery resources. In addition, further expansion of our operations and growth into additional
territories and sub-territories and franchises for new products will result in increase in demand on management
resources, financial controls as well as operating and information systems. In order to effectively manage our
28
growth, we will need to further strengthen our operating systems, procedures and internal controls systems, and a
failure to do so on a timely basis, or any weakness in our internal controls, may result in inconsistent or flawed
operating procedures. The development of future business may also be affected by external factors, including general
political and economic conditions in India and our international markets, government policies or strategies,
particularly with respect to excise duty and sales tax applicable to our products and operations, as well as prevailing
interest rates and currency exchange rates. Moreover, our ability to sustain our growth depends on our ability to
attract and retain key management personnel, maintain effective risk management policies and address adverse
market or business developments.
If we are unable to achieve our business strategy of organic and inorganic growth and if our existing and future
management resources, operational and financial systems, and operating procedures and control measures are not
adequate to support the growth in our future operations, it may adversely affect our business prospects and future
financial performance.
8. An inability to maintain our competitive position in India and in our other markets may adversely affect our
business, prospects and future financial performance.
The carbonated and non-carbonated beverage markets are highly competitive in India and the international markets
we operate in. We compete with, among others, bottlers of other global, regional and local brands of carbonated and
non-carbonated beverages. If the number of competitors or level of marketing or investments undertaken by such
competitors were to increase, it may result in a reduction in the consumption of our products and may reduce our
market share, or we may be required to incur increased marketing and distribution related expenses in order to
remain competitive. In addition, the success of our business depends on consumer behaviour and preferences and
their affinity and loyalty to PepsiCo beverages and brands, and there can be no assurance of market acceptance and
consumer preference for new PepsiCo beverages or that there will be an increase in market share of PepsiCo
products.
In addition, we compete with aggressive marketing and promotional activities by other global, regional or local CSD
and NCB beverage producers as well as packaged drinking water producers on price and promotional discounts
announced from time to time. Other global and regional beverage producers in our markets typically match the
pricing of our products. However, if the competition alters their pricing model, and we are unable to change our
product prices in response to such competitive measures, our results of operations and profitability may be materially
and adversely affected.
9. An interruption in the supply or significant increase in the price of raw materials or packaging materials may
adversely affect our business, prospects, results of operations and financial condition.
Our inability to maintain efficient inventory management and stock of raw materials at optimum levels may affect
our operations. The availability and price of raw materials, particularly beverage concentrate we purchase from
PepsiCo India other relevant PepsiCo entities or their authorized suppliers, sugar, mango pulp and carbon dioxide, as
well as the availability and price of packaging materials, in particular PET resin, aluminium, glass, tetra-pack
cartons, plastic closures, crowns and labels, may also impact our operations. The price of such raw materials and
packaging materials may be affected by changes in global supply and demand, weather conditions, governmental
policies, exchange rates and other macroeconomic factors. A prolonged interruption in the supply of raw materials or
packaging materials may require us to identify alternative suppliers that are acceptable to PepsiCo India / PepsiCo
Inc. and / or the PepsiCo International Entities, which could require us to pay significantly higher prices for such raw
materials and packaging materials. In the event of a significant increase in the price of such raw materials and
packaging materials, it will increase our cost of production and other operating costs and decrease our profitability in
the event we are unable to pass on such price increases to the dealers, and ultimately the consumers, by increasing
the price of our beverages.
In addition to the beverage concentrates that we purchase from PepsiCo India other relevant PepsiCo entities or their
authorized suppliers, our largest raw materials expenditure relates to purchase of sugar, which represented 27.95%,
27.04%, 26.53% and 33.65% of our cost of materials consumed in Fiscal 2013, 2014, 2015, and in the six months
ended June 30, 2016, respectively. We also purchase packaging materials such as labels from various local and
regional label producers and procure fuel for our delivery trucks. We typically do not enter into long term supply
contracts with any of the raw material and packaging material suppliers, but typically place orders in advance of our
anticipated requirements at agreed prices. In the absence of long term supply contracts, we are susceptible to a
sudden and significant increase in prices of raw materials and packaging materials. In addition, we are susceptible to
the risk that one or more of our existing raw material or packaging materials suppliers may discontinue supplies to
us, and unless we are able to enter into alternative arrangements in a timely manner on terms favourable to us, our
business operations and financial performance may be materially and adversely affected. Certain of our critical raw
materials such as sugar, mango pulp may also be subject to seasonal fluctuations in price.
29
We are required to procure raw materials and packaging materials supplies only from suppliers that meet the
standards specified by PepsiCo India / PepsiCo Inc. and / or the PepsiCo International Entities. From time to time,
we recommend additional suppliers that meet applicable quality standards for PepsiCo India / PepsiCo Inc. and / or
the PepsiCo International Entities’ approval, and while historically such recommendations have generally been
approved by PepsiCo India / PepsiCo Inc. and / or the PepsiCo International Entities, there can be no assurance that
in the future PepsiCo India / PepsiCo Inc. and / or the PepsiCo International Entities will approve such
recommendations. We may not be in a position to select or obtain supply of raw material and packaging materials
from the most cost effective suppliers unless they are pre-approved by PepsiCo India / PepsiCo Inc. and / or the
PepsiCo International Entities. We do not currently obtain any hedge protection against changes in raw material
prices. While historically we have not experienced a shortfall or limited availability of raw materials or packaging
materials that has affected our operations, there can be no assurance that there will not be any seasonal factors, or a
significant and prolonged interruption or a shortage in the supply of our critical raw materials and packaging
materials. Such interruptions or shortages in supply of requisite standard raw materials and packaging materials may
prevent us from operating our production facilities at optimal capacity, and if such shortage is severe, may lead to
the suspension of production. In particular, a significant majority of our production activities takes place during the
pre-summer and summer months when sales of our PepsiCo products are maximum, and any shortage of raw
materials or packaging materials during such periods may materially and adversely affect our production, sales and
results of operations in such year.
10. A significant majority of our production and sales take place during the summer months, and any adverse
weather conditions during such peak sales seasons may materially and adversely affect our sales, results of
operations and financial condition.
Sales of our PepsiCo beverages are generally significantly higher in the summer months of April through June, due
to the heat and warm weather, and considerably lower during the winter months of December through February. The
Sales Volumes during second quarter of April to June accounted for 47.25% of total Sales Volume of our India
territory in Fiscal 2015. Bad weather conditions, including disturbed summers or untimely rains during the peak
sales season of summer, may adversely affect our Sales Volumes, results of operations and financial condition, and
could therefore have a disproportionate impact on our results of operations in the relevant year. For example, in
Fiscal 2013 and Fiscal 2015, we faced significant adverse weather conditions in the form of heavy rains during the
peak summer months, which adversely affected our peak season sales in these fiscal years. In addition, the
seasonality of our results of operations may be affected by unforeseen circumstances that affect production during
such peak periods, such as any downtime to production due to breakdown of equipment, shortage of raw materials,
inadequate inventory planning and other interruptions to timely production and delivery of our products to the
market. Because of the significant fluctuations in demand for CSDs and NCBs during various seasons of the year,
any comparison of the sales recorded and our results of operations between different periods within a year is not
meaningful and should not be relied on as an indicator of our future business prospects or financial performance.
11. Any contamination or deterioration of our beverages could result in legal liability, damage our reputation and
adversely affect our business prospects and financial performance.
The actual or alleged contamination or deterioration of our PepsiCo beverages could result in legal liability, damage
our reputation and adversely affect our business prospects and consequently our financial performance. The risk of
contamination or deterioration exists at each stage of the production cycle, including during the production and
delivery of raw materials, the bottling, storage and delivery to our customers and the storage and shelving of our
products by our distributor and customers until final consumption by consumers. While we follow stringent quality
control processes and quality standards specified by PepsiCo India / PepsiCo Inc. and / or the PepsiCo International
Entities and our production facilities and operations are regularly monitored by PepsiCo India / PepsiCo Inc. and / or
the PepsiCo International Entities, there can be no assurance that our products will not be contaminated or suffer
deterioration. If any of our products is found to have been contaminated or to have deteriorated, we could be
required to recall large quantities of our beverages, and we could incur criminal or civil liability for any adverse
medical condition or other damage resulting from consumption of such products. In addition, any actual or alleged
contamination or deterioration of our products or products manufactured by other PepsiCo bottlers may damage the
reputation of PepsiCo brands, which may materially and adversely affect our business operations, prospects, and
financial performance. Although historically we have not experienced any significant product liability claims or
similar allegations against us or our products, there can be no assurance that there will not be any such claims or
allegations in the future which could materially and adversely affect our business and financial performance or lead
to significant civil and criminal liability or other penalties. In addition, we have historically not obtained product
liability insurance cover; even if we were to obtain such insurance in the future, there can be no assurance that in the
case of any such claim or allegation, such insurance will be adequate to cover any losses. In addition, if PepsiCo
India / PepsiCo Inc. and / or the PepsiCo International Entities determine that our products do not meet their
standards, they may require us to suspend production at the relevant production facilities until appropriate remedial
action is undertaken or it may even terminate our franchise arrangements under the PepsiCo India Agreements and
the PepsiCo International Agreements.
30
12. Demand for our products may be adversely affected by changes in consumer preferences and any significant
reduction in demand could adversely affect our business, prospects, results of operations and financial condition.
We operate in the highly competitive CSD, NCB and packaged drinking water segments and rely on the continued
demand for PepsiCo beverages in our licensed territories and sub-territories in India and internationally. In order to
maintain and increase revenues and profitability, we are required to continuously address market trends and
consumer preferences and produce and sell beverages that appeal to our customers and ultimate consumers. In the
event of a significant change in consumer preferences or in the event of an inability on our part to anticipate or react
to such changes, it could result in reduced demand for our beverages and erosion of our competitive position and
goodwill and could adversely affect our business, prospects, results of operations and financial condition.
Our success depends on our ability to anticipate and effectively respond to shifts in consumer trends, including
convenience and availability of the beverages consumed, the quality of our beverages, ability to improve production
and packaging of our beverages, and our ability to respond to competitive pricing pressures. Consumer preferences
may evolve due to a variety of factors, including the aging of the general population; consumer concerns or
perceptions relating to the nutrition profile of our products, including their calorie content or perceptions (whether or
not valid) regarding the health effects of ingredients or substances present in our products; the packaging materials
we use, or changes in packaging or consumption size; any change in consumption patterns, or social trends that
impact travel, vacation or leisure activity patterns; any changes in weather patterns or seasonal consumption cycles;
any negative publicity resulting from regulatory action, litigation against us or other companies in our industry or
negative or inaccurate posts or comments in the media, including social media, about us, our beverages or
advertising campaigns and marketing programs; consumer perception of social media posts or other information
disseminated by us or our employees, agents, customers, suppliers, bottlers, distributors, or other third parties; any
downturn in economic conditions; and taxes or other restrictions imposed on our products. We continue to balance
sales of established brands such as Pepsi and Mountain Dew with an increased focus on marketing and distribution
activities for relatively newer brands such as Seven-Up Nimbooz Masala Soda and Seven-Up Revive, and continue
to focus on growing NCB brands such as Tropicana Slice, Tropicana Frutz and Aquafina sales as the packaged water
segment in India is highly fragmented and provides significant growth opportunities. We continue to evaluate, in
consonance with PepsiCo’s product development strategy, growth opportunities in fruit juice based carbonated
beverages. In recent years, we have experienced slower growth rates for cola based drinks such as Pepsi compared to
non-cola based CSDs such as Mountain Dew and fruit juiced based CSDs such as Seven-Up Nimbooz Masala Soda.
Changes in consumer preferences may reduce consumers’ willingness to purchase certain of our products and
adversely affect our business, prospects, results of operations and financial condition.
13. If we are unable to service our debt obligations in a timely manner or to comply with various financial and other
covenants and other terms and conditions of our financing agreements, it may adversely affect our business,
prospects, results of operations and financial condition
As of June 30, 2016, our Company had total indebtedness on a standalone basis of ₹ 15,754.82 million, which
represented a debt to equity ratio of 1.03:1. For further information, see “Financial Information – Restated
Standalone Financial Statements – Annexure 37” on page 399. As of June 30, 2016, on a consolidated basis, our
total indebtedness was ₹ 20,461.55 million which represented a debt to equity ratio of 1.54:1. For further
information, see “Financial Information – Restated Consolidated Financial Statements – Annexure 37” on page 307.
For further information regarding our indebtedness, see “Management’s Discussion and Analysis of Financial
Condition and Results of Operations — Indebtedness and Other Arrangements” and “Financial Indebtedness”
beginning on pages 453 and 404, respectively.
Under the PepsiCo India Agreements, we are required to maintain the financial capacity reasonably necessary to
ensure the performance of our obligations to PepsiCo India/ PepsiCo Inc. Under the PepsiCo India Agreements we
are required to ensure that the debt to equity ratio for our Company on a standalone basis does not exceed 2:1, unless
otherwise agreed with PepsiCo India. Our business has witnessed significant growth during the last decade, requiring
capital infusion which has been met by raising of funds through loans and our borrowings may have significant
consequences to our shareholders and future financial results and business prospects, including increasing our
vulnerability to a downturn in business; limiting our ability to pursue our growth plans; requiring us to dedicate a
substantial portion of our cash flow from operations to service debt; and limiting our ability to raise additional funds
or refinance existing indebtedness. While historically we have been able to generate sufficient cash flow from
operations to service our debt obligations on a timely basis, in the event that we are unable to do so in the future our
business operations and financial performance may be adversely affected.
Many of our financing agreements include conditions and restrictive covenants that require us to obtain consent from
the respective lenders prior to carrying out certain activities and entering into certain transactions. We are required to
obtain an approval from our lenders for, among other matters: (i) effecting any change in the capital structure; (ii)
undertaking any merger, de-merger, amalgamation, consolidation or corporate reconstruction; (iii) change the nature
of the business of our relevant borrowing company; (iii) prepaying loans; (iv) declaring dividends; (v) changing the
31
ownership pattern or management structure of our Company; and (vi) making amendments to the Memorandum and
Articles of Association. For more details and conditions specified in our financing agreements, see “Management’s
Discussion and Analysis of Financial Condition and Results of Operations — Indebtedness and Other
Arrangements” on page 453. Under these agreements, we require lender consent for any initial public offering of
securities of our Company and we have obtained such consent from the lenders. Further Axis Trustee Services
Limited acting on behalf of AION pursuant to the debenture trust deed cum facility agreement dated September 17,
2015 among Axis Trustee Services Limited and the Company has a right to nominate a nominee director on the
Board. In addition, certain of our financing arrangements contain cross default provisions which could automatically
be triggered by defaults under other financing arrangements.
Our future borrowings may also contain similar or additional restrictive provisions. In the event of a breach of
relevant terms of our financing arrangements, we may be required to seek waivers of such breaches, including cross
defaults arising from the breach of relevant covenants. We cannot assure you that we will be able to obtain such
amendments or waivers on satisfactory terms, or at all, and the relevant lenders could, inter-alia, impose penal and
default interests, accelerate the maturity of our obligations and declare all amounts payable in respect of the facility
to be due and payable immediately or otherwise on demand. In the event of any such acceleration, we may have to
dedicate a substantial portion of our cash flow from operations to make payments under such financing documents,
thereby reducing the availability of cash for our working capital requirements and other general corporate purposes,
or if required, sale of our assets. Further, during any period in which we are in default, we may be unable to obtain
further financing or any refinancing of our debt could be at higher rates with more onerous covenants. In addition,
lenders may be able to sell our assets charged under such financing arrangements to enforce their claims.
Our operations involve a significant amount of working capital, principally to fund our raw material procurement.
While we typically do not extend credit beyond three to 15 days to our distributors, depending on the track record of
certain distributors servicing the modern trade channels we selectively extend credit up to 60 days. In addition, our
obligations to PepsiCo India / PepsiCo Inc. and / or the PepsiCo International Entities arise on receipt of the
beverage concentrates at our production facilities. We fund a significant part of our working capital requirements
through borrowings. In the event we are unable to generate sufficient cash from our sales, suffer decreasing sales as
a result of inability to extend competitive credit terms or otherwise, experience a reduction in credit terms from
PepsiCo India / PepsiCo Inc. and / or the PepsiCo International Entities, or experience difficulties in collecting our
accounts receivables, we may not have sufficient cash flows to service our indebtedness or adequately fund our
working capital requirements. In such event, our business operations could be adversely affected. See
“Management’s Discussion and Analysis of Financial Condition and Results of Operations — Indebtedness and
Other Arrangements” on page 453.
Any of these circumstances or other consequences could adversely affect our business, credit rating, prospects,
financial condition and results of operations. Moreover, any such action initiated by our lenders could adversely
affect the price of the Equity Shares.
14. We are dependent on PepsiCo for brand promotion and the protection of the PepsiCo trademarks and brands. An
inability by PepsiCo to adequately promote its brands and/ or adequately protect its trademarks and brands may
result in loss of goodwill and business and adversely affect our business prospects, results of operations and
financial condition.
As a franchisee, we have been granted licenses by PepsiCo to use certain trademarks and brands owned by PepsiCo
for certain PepsiCo products that we produce, sell and distribute. See “Our Business – Relationship with PepsiCo”
on page 136. PepsiCo is primarily responsible for the protection of its trademarks and brands. We have been licensed
franchise rights for certain sub-territories in India as well as certain international jurisdictions. All trademarks and
brands owned by PepsiCo and used by us are either registered with the respective trademark offices of the relevant
countries, or are the subject of a pending application in the name of PepsiCo. See “Our Business – Intellectual
Property” on page 154. While PepsiCo undertakes appropriate measures to protect its trademarks and brands against
infringement or counterfeiting, in the event of a failure on part of PepsiCo to effectively do so in the future, it could
adversely affect the competitive position of the PepsiCo brands which could result in a decrease in the volume of
products we sell, which in turn may materially and adversely affect our business, prospects, results of operations and
financial condition.
In addition, as the owner of the PepsiCo beverage trademarks, PepsiCo has the primary responsibility for consumer
marketing and brand promotion. The continued growth of the PepsiCo beverages which we are licensed to sell will
depend on the consumer marketing activities of PepsiCo. Currently while we make no contribution to the brand
marketing costs in India, we could be asked in future by PepsiCo to share such expenses. PepsiCo is under no
obligation to make such contribution or maintain historical levels of funding in the future, and our ability to expand
our product range would depend on PepsiCo’s product expansion strategy and its ability to respond to competitive
pressure from competition. A decrease in marketing efforts and expenditure by PepsiCo, in its contribution to our
marketing plan or in its commitment to the development and introduction of new products could lead to decreased
32
consumption of PepsiCo beverages and we may not be able to compete with PepsiCo competitors in the markets in
which we operate, which could have a material adverse effect on our business, results of operations and financial
condition.
15. The Objects of our Offer include repayment of outstanding loans including loans to Axis Bank Limited, a holding
company of one of our GCBRLMs, Axis Capital Limited.
Our Company has availed loans facilities in connection with our business and operations under financing
arrangements from various lenders. As on August 31, 2016, the top 10 lenders of the Company were Standard
Chartered Bank Plc, IDBI Bank Limited, Axis Bank Limited, HDFC Bank Limited, HDFC Limited, Kotak Mahindra
Bank Limited, IndusInd Bank Limited, YES Bank Limited, DBS Bank Limited and RBL Bank Limited. For further
information on the outstanding indebtedness of our Company, see “Financial Indebtedness” on page 404. Our
Company has entered into various financing arrangements with Axis Bank Limited in Fiscal 2011, Fiscal 2012 and
Fiscal 2016. The total amount outstanding to Axis Bank Limited as on August 31, 2016 was ₹ 1,059.61 million out
of which our Company proposes to repay such amount which is proportionate to the total principal amount
outstanding under all the loans proposed to be repaid or prepaid by the Company from the Net Proceeds as set out in
the section “Objects of the Offer” on page 101. For further information in relation to the loans that the Company
proposes to repay from the Net Proceeds, see “Objects of the Offer” on page 102. Axis Bank Limited is also the
holding company of Axis Capital Limited, one of our GCBRLMs. There may be a conflict of interest in such
proposed Objects of our Offer and the relationship between Axis Bank Limited and Axis Capital Limited, one of our
GCBRLMs.
16. Our Company, will be required to prepare financial statements under Ind AS (which is India’s convergence to
IFRS). The transition to Ind AS in India is very recent and there is no clarity on the impact of such transition on
our Company. Ind AS also differs from IFRS and US GAAP. The introduction of Ind AS and other regulatory
developments affecting fiscal matters in India may significantly affect preparation and presentation of our
financial statements in the future and such financial statements prepared in accordance with Ind AS may differ
from the Restated Standalone Financial Statements and the Restated Consolidated Financial Statements included
in this Red Herring Prospectus.
The Ministry of Corporate Affairs (“MCA”) has notified the Companies (Indian Accounting Standards) Rules, 2015
on February 16, 2015 providing revised roadmap on implementation of Indian Accounting Standards (“Ind AS”)
which stipulates implementation of Ind AS in a phased manner beginning from accounting period 2016 – 2017
(“MCA Roadmap”). Pursuant to the clarification provided by Bulletin 1 issued by the Ind AS Transition
Facilitation Group (ITFG) if the net worth of a company has or is expected to exceed ₹ 5,000 million after March 31,
2014, such company will be required to apply Ind AS from the immediate next accounting year in the manner
specified in sub-rule (1). Since the net worth of our Company exceeded ₹ 5,000 million in the year ended December
31, 2015, Ind AS shall be applicable from the year ended December 31, 2017, with comparatives for the periods
ended December 31, 2016. The transition date of convergence with Ind AS shall be January 1, 2016.
Given that Ind AS differs in many respects from Indian GAAP, our financial statements relating to any period
subsequent to January 1, 2017 (and for any prior comparative periods) may not be comparable to our historical
financial statements prepared under Indian GAAP. There can be no assurance that the adoption of Ind-AS will not
materially affect the preparation and presentation of our financial statements in the future. In addition, there can be
no assurance that if Ind AS were to be applied to our historical financial statements prepared under Indian GAAP,
there will not be material differences in applicable accounting policies and standards that will require material
adjustments to our historical financial statements prepared under Indian GAAP.
Certain matters related to our financial information that could result in differences between our financial statements
prepared in accordance with Indian GAAP and those prepared in accordance with Ind AS include accounting
policies related to the non-convertible debentures, foreign currency loans, deferred value added tax, actuarial gain/
losses in employee benefit expenses, loans to subsidiaries, leasehold land and intangible assets. While we have
conducted a preliminary evaluation of the differences between Indian GAAP and Ind AS that may be applicable to
our Company, we however, have not undertaken a detailed assessment of the possible impact to our financial
statements on the transition to Ind AS and we do not provide reconciliation of our Indian GAAP financial statements
included in this Red Herring Prospectus to Ind AS. See “Summary of Significant Differences between Indian GAAP
and Ind AS” and “Management’s Discussion and Analysis of Financial Condition and Results of Operation –
Introduction of Ind AS and Impact on Preparation and Presentation of our Historical and Future Financial
Statements” on pages 406 and 413. The preparation of our standalone and consolidated financial statements in
accordance with Ind AS will require our management to make judgments, estimates and certain assumptions. The
estimates and assumptions used in the preparation of such financial statements in accordance with Ind AS will be
based upon management’s evaluation of the relevant facts and circumstances as on the date of the relevant financial
statements, and such estimates and underlying assumptions may be reviewed in the future on an on-going basis.
33
Accordingly, any financial information based on Ind AS may not be comparable to the Restated Standalone
Financial Information and Restated Consolidated Financial Information included herein. For any investment
decision, you should rely solely on our restated audited financial statements prepared under Indian GAAP included
in this Red Herring Prospectus.
Any failure to successfully adopt Ind AS may have an adverse effect on the trading price of the Equity Shares and/or
may lead to regulatory action and other legal consequences. In addition, our management may be required to divert
its time and other resources for the successful and timely implementation of Ind AS. Moreover, our transition to Ind
AS reporting may be hampered by increasing competition and increased costs for the relatively small number of Ind
AS-experienced accounting personnel available as more Indian companies begin to prepare Ind AS financial
statements. There is not yet a significant body of established practice from which to draw references/judgments
regarding the implementation and application of Ind AS.
Further, we have not attempted to quantify the impact of IFRS or US GAAP on the financial information included in
this Red Herring Prospectus, nor do we provide a reconciliation of our financial statements to those of IFRS or US
GAAP. IFRS and US GAAP differ in significant respects from Indian GAAP. Accordingly, the degree to which the
Indian GAAP financial statements included in this Red Herring Prospectus will provide meaningful information is
entirely dependent on the reader's level of familiarity with Indian accounting practices.
17. Any loss of business or potential adverse publicity resulting from spurious or imitation beverages, including in
our licensed territories or sub-territories, could result in loss of goodwill for PepsiCo products leading to loss of
sales and adversely affect our business, prospects, results of operations and financial condition.
We are exposed to the risk that entities in India and elsewhere could pass off their products as PepsiCo products,
including spurious or imitation products. For example, products imitating the PepsiCo brands and packaging material
selling spurious beverages may adversely affect sale of genuine PepsiCo products, resulting in a decrease in market
share resulting from a decrease in demand for PepsiCo products. Such imitation or spurious products may not only
result in loss of sales but also adversely affect the reputation of PepsiCo beverages we produce and sell and
consequently our future sales and results of operations. The proliferation of spurious and imitation beverages in our
territories and sub-territories, and the time and resources in taking action against such spurious products, defending
claims and complaints regarding these spurious products, and in assisting PepsiCo taking appropriate legal
proceedings against offenders who infringe PepsiCo’s intellectual property rights, could result in lower sales, and
adversely affect our results of operations and may have a material and adverse effect on our reputation, business,
prospects, results of operations and financial condition.
18. Information relating to the estimated manufacturing capacities of our production facilities included in this Red
Herring Prospectus is based on various assumptions and estimates. Actual production rate may vary from such
estimated manufacturing capacity information and historical capacity utilization rates.
The information relating to the estimated manufacturing capacities of our manufacturing facilities included in this
Red Herring Prospectus are based on various assumptions and estimates of our management, including proposed
operations, assumptions relating to availability and quality of raw materials and assumptions relating to potential
facility capacity, facility operating shifts, and potential operational efficiencies. Capacity additions to our production
facilities have been made on an incremental basis, including through expansion of our production facilities,
improving material handling and other operational efficiencies in the production process and addition of equipment
or production lines from time to time. Actual production levels and future capacity utilization rates may vary
significantly from the estimated manufacturing capacities of our manufacturing facilities and historical capacity
utilization rates. In addition, capacity utilization is calculated differently in different countries, industries and for the
different kinds of products we manufacture.
In relation to our manufacturing capacity, the following assumptions have been made in the calculation of the
estimated annual installed capacities of our production facilities included in this RHP (as certified by an independent
certified engineer): (a) a PET line (CSD/NCB/Packaged Drinking Water) is assumed to run on one pack size on a
dedicated basis; and (b) A line is assumed to run for 20 hours in a day, 28 days in a month and 9 months in a year for
capacity calculation; Actual production levels and utilization may however vary due to seasonality in demand from
the computed installed capacities of our production facilities. Undue reliance should therefore not be placed on the
manufacturing capacity information for our existing manufacturing facilities and any additional capacity information
proposed or the historical capacity utilization rate information included in this Red Herring Prospectus. For more
details, see “Our Business – Production Process – Production Facilities” and “Management’s Discussion and
Analysis of Financial Condition and Results of Operations — Significant Factors Affecting Our Results of
Operations and Financial Condition – Production capacities, backward integration and operating efficiencies” on
pages 148 and 424, respectively.
34
19. We are dependent on the continuing operation of our production facilities. Any significant interruption in
production at our facilities could have a material adverse effect on our business, results of operations and
financial condition.
We manufacture substantially all of the products that we sell at our production facilities in India and international
production facilities. These plants are subject to the normal risks of industrial production, including equipment
breakdowns, labour stoppages, natural disasters, directives from government agencies, water shortages and power
interruptions. Under the PepsiCo India Agreements and the PepsiCo International Agreements, if there is
discontinuation of our production process of the bottling of the beverages for a period of 30 consecutive days other
than on account of annual maintenance or any other reason subject to the approval of PepsiCo India / PepsiCo Inc.
and / or the PepsiCo International Entities, PepsiCo India / PepsiCo Inc. and / or the PepsiCo International Entities
may exercise their right to terminate the said agreements. Particularly, all of these production facilities require a
significant amount and continuous supply of electricity and water and any shortage or non-availability of electricity
and water may adversely affect our operations. The production process of our products, as well as the storage of
products at particular temperatures requires significant electricity. We are also required to store our raw materials in
a temperature-controlled environment. We currently source our water requirements from bore wells and also depend
on the municipal supply of water. We also depend on state electricity supply for our energy requirements. For further
information, see “Government and Other Approvals” on page 467. Although we have adequate diesel generators to
meet exigencies at our facilities, our operations at our facilities may be adversely affected during power failures.
Any failure on our part to obtain alternate sources of electricity or water, in a timely fashion, and at an acceptable
cost, may have an adverse effect on our business, results of operations and financial condition.
20. Scarcity of water or non-availability of quality water could negatively impact our costs and production capacity.
Water is one of the primary raw materials used in the production of all our products, and our business operations are
vastly dependent on our ability to procure sufficient amounts of quality water at commercially viable prices. Supply
of water is an indispensable requirement for our manufacturing process as we require water to mix the base
concentrates of our beverages with sugar. Moreover, it is also vital to the production of the agricultural ingredients
on which our business relies. Water is a limited resource, facing unprecedented challenges from overexploitation,
increasing demand for food and other consumer and industrial products whose manufacturing processes require
water, increasing pollution and poor management. Further, supply of water can also be significantly influenced by
changing environmental conditions leading to drying water resources and receding ground water levels. Water
scarcity and deterioration in the quality of available water sources in our territories, or our supply chain, even if
temporary, may result in increased production costs or capacity constraints, which could adversely affect our ability
to produce, sell and distribute our products and increase our costs.
21. Our inability to expand or effectively manage our growing dealer and distribution network or any disruptions in
our supply or distribution infrastructure may have an adverse effect on our business, results of operations and
financial condition.
As of June 30, 2016, we had 562 primary distributors (i.e., distributors that recorded sales in excess of 0.5 million
litres of our PepsiCo beverages in the 12 months ended June 30, 2016) in India and 415 distributors in our
international operations. The 562 primary distributors in India accounted for 74.36% of our aggregate Sales Volumes
in India in the 12 months ended June 30, 2016. In order to sell products to our end consumers, we use modern trade
channels which include super-markets and hyper-markets and general trade channels that include smaller retail
stores. Our ability to expand and grow our product reach significantly depends on the reach and effective
management of our distribution network. We continuously seek to increase the penetration of our products by
appointing new dealers and distributors targeted at different customer groups and regions. If we are unable to
identify or appoint distributors, it may affect our distribution capabilities. If the terms offered to such distributors by
our competitors are more favourable than those offered by us, distributors may decline to distribute our products and
terminate their arrangements with us. We may be unable to appoint replacement distributors in a timely fashion, or at
all, which may reduce our Sales Volumes and adversely affect our business, results of operations and financial
condition. Further, our competitors may have exclusive arrangements with distributors who may be unable to stock
and distribute our products, which may limit our ability to expand our distribution network. While we offer our
distributors certain incentive schemes to distribute our products, we may not be able to effectively implement them
across our distribution network. If our distributors fail to distribute our products in a timely manner, or adhere to the
terms of the distribution agreement, or if our distribution agreements are terminated, our business and results of
operations may be adversely affected.
We take delivery of many of our raw materials requirements at respective production facilities and typically the
transportation and delivery of raw materials are undertaken by third party contractors. Interruptions in the
transportation of raw materials or delivery of finished products, and poor handling of materials or products in transit
could interrupt our business, cause us losses, damage our reputation, and adversely affect our results of operations
and financial condition. We may also face disruptions in the delivery of our products for various reasons beyond our
35
control, including poor handling by distributors of our products, transportation bottlenecks, natural disasters and
labour issues, breakdown of equipment, accidents, fire, loss of water or power supply, terrorism, political instability,
military conflict, pandemic, strikes, the financial and/or operational instability of key suppliers, distributors,
warehouses and transportation providers or brokers, or other reasons, which could impair our ability to sell our
products, and lead to delayed or lost deliveries. To the extent that we are unable to effectively manage such events if
they occur, or cannot financially mitigate the likelihood or potential impact of such events, there could be a material
adverse effect on our business and results of operations.
22. An inability to plan our infrastructure investments and arrange for adequate and timely funding of such
investments may adversely affect our business, prospects and financial performance.
We have made significant investments in our production facilities as well as our sales and distribution infrastructure,
including in connection with the acquisition of the 2015 New India Sub-Territories. As part of the acquisition of the
2015 New India Sub-Territories, we also acquired four production facilities at Jainpur and Satharia in Uttar Pradesh,
Bazpur in Uttarakhand and Panipat in Haryana which further added to our production capacities. Between Fiscal
2013 and in the six months ended June 30, 2016, we invested in the aggregate ₹ 24,591.43 million in connection
with the expansion and modernization of our production capacities and increase penetration of chilling equipment
such as visi-coolers for our distribution infrastructure. As of December 31, 2015, we operated 13 production
facilities at different locations across India. In Fiscal 2016, we acquired two additional production facilities and
installed a PET line at our production facility in Goa. As of June 30, 2016, we had an estimated aggregate annual
production capacity of 3,438.38 million litres (equivalent to 605.56 million unit cases) in India, and 991.57 million
litres (equivalent to 174.63 million unit cases) in our international production facilities. Our projected requirements
for infrastructure investments may vary from actual levels if anticipated Sales Volume growth does not materialize
or varies significantly from our projections. Such investments are generally long-term in nature and it is possible that
investments may not generate the expected returns due to changes in the marketplace. Significant changes from our
expected returns on production facility equipment, fleet of vehicles, technology support systems and supply chain
infrastructure investments could adversely affect our results of operations and financial condition.
23. We are subject to extensive government regulation and our inability to obtain, maintain or renew requisite
statutory and regulatory permits and approvals for our business operations could materially and adversely affect
our business, prospects, results of operations and financial condition.
The food and beverage segment is subject to extensive government regulation and in respect of our existing
operations we are required to obtain and maintain various statutory and regulatory permits, certificates and approvals
including approvals under the Food Safety and Standards Act, 2006, Water (Prevention and Control of Pollution)
Act, 1974, environmental approvals, factories licenses, labour related and tax related approvals.
Further, approvals applicable to our Company include the registration of our suppliers and distributors under the
Food Safety Standards Act, 2006 which is obtained by the respective vendors, distributors, approvals for operating
diesel generator sets and transformers, approvals from the utilities’ companies/authorities for water and electricity
connection, periodic inspection and periodic verification of the weights and measures, and packaging used by our
Company, periodic inspection and certification of the engineering construction in our manufacturing facilities, and
permission for self-sealing of export goods. Our Company has made applications for various approvals including
approvals under environmental laws and the Factories Act, 1948. We are also required to obtain permission from
Ground Water Authority for abstraction of ground water for each production facility, some of which are yet to be
received. For details of our approvals, see “Government and Other Approvals” on page 467. There can be no
assurance that the relevant authorities will issue or renew any expired permits or approvals in time or at all. Failure
or delay in obtaining approvals or failure by us to obtain, maintain or renew the required permits or approvals within
applicable time, may result in interruption of our operations. Furthermore, under such circumstances, the relevant
authorities may initiate penal action against us, restrain our operations, impose fines/penalties or initiate legal
proceedings for our inability to renew/obtain approvals in a timely manner or at all.
Although we endeavour to obtain and maintain relevant regulatory approvals applicable to our operations, such
approvals are subject to various conditions and in the event of an inability to comply with such conditions, the
relevant regulatory authorities may suspend or revoke such approvals. In addition, the regulations governing our
operations may be amended and impose more onerous obligations on us which may result in increased costs, be
subject to penalties, or suffer disruption in our activities, any of which could adversely affect our business.
Our operations are subject to stringent health and safety laws as our products are for human consumption and are
therefore subject to various industry specific regulations. While we believe that our production facilities are in
compliance with applicable food safety, and other applicable laws and regulations, we may be subject to additional
regulatory requirements due to changes in governmental policies. Further we may also incur additional costs and
liabilities related to compliance with these laws and regulations that are an inherent part of our business. We are
subject to various central, state and local food safety, consumer goods, health and safety and other laws and
36
regulations. These relate to various issues, including food safety, food ingredients, and food packaging requirements,
and the investigation and remediation of contamination.
These laws and regulations governing the food and beverage industry are increasingly becoming stringent and may
in the future create substantial compliance or remediation liabilities and costs. Other laws may require us to
investigate and remediate contamination at our facilities and production processes. While we endeavour to comply
with applicable regulatory requirements, it is possible that such compliance measures may restrict our business and
operations, result in increased cost and onerous compliance measures, and an inability to comply with such
regulatory requirements may attract penalty. For details see, “Government and Other Approvals” on page 467.
24. Failure to comply with environmental laws and regulations could lead to unforeseen environmental litigation
which could impact our business and our future net earnings.
We are subject to various international, national, state, municipal and local laws and regulations concerning
environmental protection in India and in our international licensed territories, including laws addressing the
discharge of pollutants into the air and water, the management and disposal of any hazardous substances, and wastes
and the clean-up of contaminated sites. Environmental laws and regulations and their enforcement in India and our
international licensed territories are becoming more stringent, and the scope and extent of new environmental
regulations, including their effect on our operations, cannot be pre-empted with any certainty. In case of any change
in environmental or pollution regulations, we may be required to invest in, among other things, environmental
monitoring, pollution control equipment and emissions management. Further, any violation of the environmental
laws and regulations may result in fines, criminal sanctions, and revocation of operating permits or shutdown of our
facilities. Although there has been no failure to comply with environment laws in the past five years which adversely
affected our operations there have been instances where we have received notices from regulatory authorities with
respect to non-compliance with environmental laws. For instance, on May 7, 2015 we received a notice from the
Rajasthan Pollution Control Board alleging effluent discharge from our plant in Bhiwadi inconsistent with the
consent to operate. After providing the said clarifications on May 11, 2015, the Rajasthan Pollution Control Board
granted the necessary consent to operate by its letter dated May 3, 2016 which is valid till April 30, 2019. Further
with respect to our plant in Phillaur, Punjab, we received a notice dated June 21, 2016 from the Punjab Pollution
Control Board seeking technical clarifications. The said clarifications were provided on July 5, 2016. Subsequently
the Punjab Pollution Control Board has granted consent to operate by its letter dated August 16, 2016 which is valid
till March 31, 2021.
As a consequence of unanticipated regulatory or other developments, future environmental and regulatory related
expenditures may vary substantially from those currently anticipated and may adversely affect our business, results
of operations or financial condition. In the event our products are found to be non-compliant, our products could be
restricted from entering certain markets, and we could face other sanctions, if we were to violate or become liable
under environmental laws. In the event we are found to be non-compliant, the potential exposure could include fines
and civil or criminal sanctions, third-party property damage or personal injury claims and clean-up costs. Further,
liability under some environmental laws relating to contamination of sites can be imposed retroactively. The amount
and timing of costs under environmental laws are difficult to predict.
25. Our international operations subject us to risks associated with the legislative, judicial, regulatory, political and
economic risks and conditions specific to the countries or regions in which we operate, which could adversely
affect our business or financial performance.
We manufacture, sell and distribute PepsiCo beverages in Nepal, Sri Lanka, Mozambique, Zambia and Morocco.
Further, our Company is trading in the territory of Zimbabwe through our subsidiary, Varun Beverages (Zimbabwe)
(Private) Limited with effect from April 5, 2016. In addition, we are in the process of setting up a greenfield facility
in Zimbabwe in anticipation of franchise rights being granted by PepsiCo Inc. for such territory. Our prospective
financial performance in international markets may be adversely affected by various factors many of which are
beyond our control. These factors include political instability, local and global economic conditions, legal and
regulatory constraints, tax regulations, local labour laws, anti-money laundering laws and regulations, trade policies,
currency regulations, and other matters in any of the countries or regions in which we operate, currently or in the
future.
Moreover, the economies of Zambia, Mozambique and Zimbabwe have recently suffered from high rates of inflation
and currency devaluations, which, if they were to occur again, could adversely affect our financial performance. If
currency devaluations were to reoccur in the future, it may have an adverse effect on our business, financial
condition, and results of operations or liquidity. Our business in these territories may be significantly affected by the
general condition of Zambia, Mozambique and Zimbabwe economies and exchange rates for the Zambian kwacha,
the Mozambique metical and the Zimbabwean dollar. Decrease in the growth rate of economy, periods of negative
growth and/or increase in inflation or interest rates may result in lower demand for our products, lower real pricing
of our products or a shift to lower margin products and consequently our profit margins may suffer.
37
Other factors which may impact our international operations include foreign trade, monetary and fiscal policies both
of India and of other countries, laws, regulations and other activities of foreign governments, agencies and similar
organizations, and risks associated with having a number of production facilities located in countries which have
historically experienced political turbulence. Additional risks inherent in our international operations generally
include, among others, the costs and difficulties of managing international operations, adverse tax consequences. The
various risks inherent in doing business generally also exist when doing business outside of India, and may be more
onerous given the difficulty of doing business due to differences in language, culture, as well as local commercial
practice and custom.
The United States, through sanctions overseen primarily by the U.S. Treasury Department’s Office of Foreign Assets
Control and the U.S. State Department, and the European Union and its Member States have laws that regulate,
restrict or prohibit certain business activities in sanctioned countries or dealing with certain individuals or entities
within such countries or with significant ties to such countries. The United States government has imposed limited
economic sanctions against Zimbabwe. The sanctions are however, applicable to certain specially designated
nationals of Zimbabwe and do not prohibit all trade or transactions with companies in Zimbabwe. Any failure to
comply with these laws and regulations may expose our Company to risk of adverse and material financial,
operational, or other impacts.
Further, the regulatory regime in some of our international licensed territories continue to evolve at a rapid pace and
may be unclear or inconsistent or open to conflicting interpretation. Additionally, the accounting standards, tax laws
and other fiscal regulations in these jurisdictions are subject to differing interpretations. Differing interpretations of
tax and other fiscal laws and regulations may exist within several governmental ministries, including tax
administrations and appellate authorities, thus creating uncertainty and potentially unexpected results. The
applicability of the different accounting and taxation standards are subject to complex interpretation and as a result
we may be exposed to risks or face allegations of non-compliance with such standards. The degree of uncertainty in
tax laws and regulations, combined with significant penalties for default and a risk of aggressive action by
government or tax authorities, may result in our tax risks being significantly higher than expected. If we do not
effectively manage our international operations, our profitability from such operations may be affected, which in
turn may adversely affect our business, results of operations and financial condition.
26. Failure to realize anticipated benefits from various initiatives introduced to enhance productivity and improve
operating efficiencies may adversely affect our business, results of operations and financial condition.
Our future success and profitability depend in part on our ability to reduce costs and improve efficiencies. Our
productivity initiatives help fund our growth initiatives and contribute to our results of operations. We continue to
implement strategic plans that we believe will position our business for future success and long-term growth by
enabling us to achieve a lower cost structure and operate more efficiently in the highly competitive soft drink
industry. In order to capitalize on our cost reduction efforts, it will be necessary to make certain investments in our
business, which may be constrained by the amount of capital investments required. In addition, it is critical that we
have the appropriate personnel in place to continue to lead and execute our growth strategy. If we are unable to
successfully implement our productivity initiatives, fail to implement these initiatives on a timely basis, do not
achieve expected savings as a result of these initiatives or incur higher than expected or unanticipated costs in
implementing these initiatives, or fail to identify and implement additional productivity enhancement initiatives in
the future, our business, results of operations and financial condition may be adversely impacted.
27. We may be unable to grow our business in semi-urban and rural markets, which may adversely affect our
business prospects and results of operations.
We continue to target growth opportunities and believe that the relatively low level of penetration of soft drink
beverages in semi urban and rural areas provide significant growth opportunities. We intend to expand our
distribution network and appoint additional distributors to increase market penetration in tier 2 and tier 3 cities,
smaller towns and rural areas in India and make available a wider range of our PepsiCo products in these markets.
However, if our strategic plans do not deliver the desired results, then the expansion, distribution and penetration of
our distribution network and products in these markets may be hampered. Further, retail consumers in these regions
are typically price conscious and we may be unable to compete effectively with the products of certain competitors,
particularly smaller, regional or local beverage companies. In addition, general disposable income levels of
consumers in these markets may not continue to rise as anticipated by us, which may result in actual sales in such
markets varying significantly from anticipated business projections from these markets and areas. If we are unable to
grow our business in semi urban and rural markets effectively, our business prospects, results of operations and
financial condition may be adversely affected.
38
28. We generate a significant proportion of our total Sales Volume from our operations in Uttar Pradesh and any
adverse developments affecting our operations in this State could adversely affect our business operations and
financial performance.
Our operations in Uttar Pradesh contribute a significant share of our total Sales Volume. Our operations in Uttar
Pradesh contributed 29.56% and 32.19% of our total Sales Volume in India in Fiscal 2015 and in the six months
ended June 30, 2016, respectively. The other states where we operate that contribute significantly to our Sales
Volume are Rajasthan, Delhi, Haryana and West Bengal and these states collectively with Uttar Pradesh contributed
79.58% and 80.72% of our total Sales Volume in India in Fiscal 2015 and in the six months ended June 30, 2016,
respectively. Furthermore, four of our production facilities are located in Uttar Pradesh. The concentration of our
operations and sales in this region increases our exposure to competition, as well as economic, climatic,
demographic and other challenges in such sub-territory, which may adversely affect our business prospects, financial
conditions and results of operations. Any adverse development that affects the economic performance of this region
could have a material adverse effect on our results of operations.
29. We are dependent on a number of key personnel, including our senior management, and the loss of or our
inability to attract or retain such persons could adversely affect our business, results of operations and financial
condition.
We are highly dependent on our directors, senior management and other key personnel for setting our strategic
business direction and managing our business. We currently do not have any non-compete agreements with our
directors, senior management or other key personnel and have not obtained any key man insurance with respect to
such individuals. Our ability to meet continued success and future business challenges depends on our ability to
attract, recruit and retain experienced, talented and skilled professionals. Due to the current limited pool of skilled
personnel, competition for senior management, commercial and finance professionals in our industry is intense. In
the event of the loss of services of our directors, senior management or other key personnel or our inability to recruit
or train a sufficient number of experienced personnel or our inability to manage the attrition levels in different
employee categories may have an adverse effect on the Company’s financial results and business prospects.
30. The increase in concentration of retailers and independent wholesalers, on which we depend to distribute
products in certain countries, could lower our profitability and harm our ability to compete.
We derive a large and increasing proportion of our revenues from sales of our products either directly to large
retailers, including supermarkets and hypermarkets, or to wholesalers for resale to smaller retail outlets. We expect
such sales to continue to represent a significant portion of our revenues. We have in recent years experienced a
significant increase in concentration in the retail and wholesale sectors, either because large retailers and wholesalers
are expanding their share in the relevant market, or as a result of increased consolidation among large retailers and
wholesalers.
Such rise in concentration increases the bargaining power of larger retailers and wholesalers. Our products compete
with other non-alcoholic ready-to-drink beverage brands for shelf space in retail stores and with other fast-moving
consumer goods for preferential in-store placement. Our large retail and independent wholesaler customers also offer
other products, sometimes including their own brands that compete directly with our products. These large retailers
and wholesalers could use their increasing market power in a way that could lower our profitability and adversely
affect our ability to compete.
Our revenue is impacted by the manner in which large retailers, such as supermarkets, hypermarket chains and
independent wholesalers, market or promote PepsiCo products. Our revenues may, for example, be negatively
impacted by unfavourable product placement at points of sale or less aggressive price promotions by large retailers
or independent wholesalers, particularly in future consumption channels. Brand image may be negatively affected by
aggressive price positioning close to that of non-premium products and private labels. Although we seek to engage
our large retail and independent wholesale customers to achieve favourable product placement and in the
development and implementation of marketing and promotional programs, our Sales Volumes, revenues and
profitability may be adversely impacted by the manner in which large retailers or independent wholesalers engage in
the marketing or promotion of its products. In addition, such large retail and independent wholesale customers, who
often also sell non-PepsiCo products, may give PepsiCo’s competitors, or their products, higher priority, thereby
affecting their efforts to sell PepsiCo’s products.
31. We incurred losses in Fiscal 2013 and Fiscal 2014 and some of our subsidiaries have incurred losses in the past,
and we may incur losses in the future.
We incurred losses of ₹ 395.30 million and ₹ 201.56 million in Fiscal 2013 and Fiscal 2014, respectively. In
addition, some of our subsidiaries have incurred losses in the past. Any such losses that we may incur in the future
will adversely affect our results of operations and financial condition.
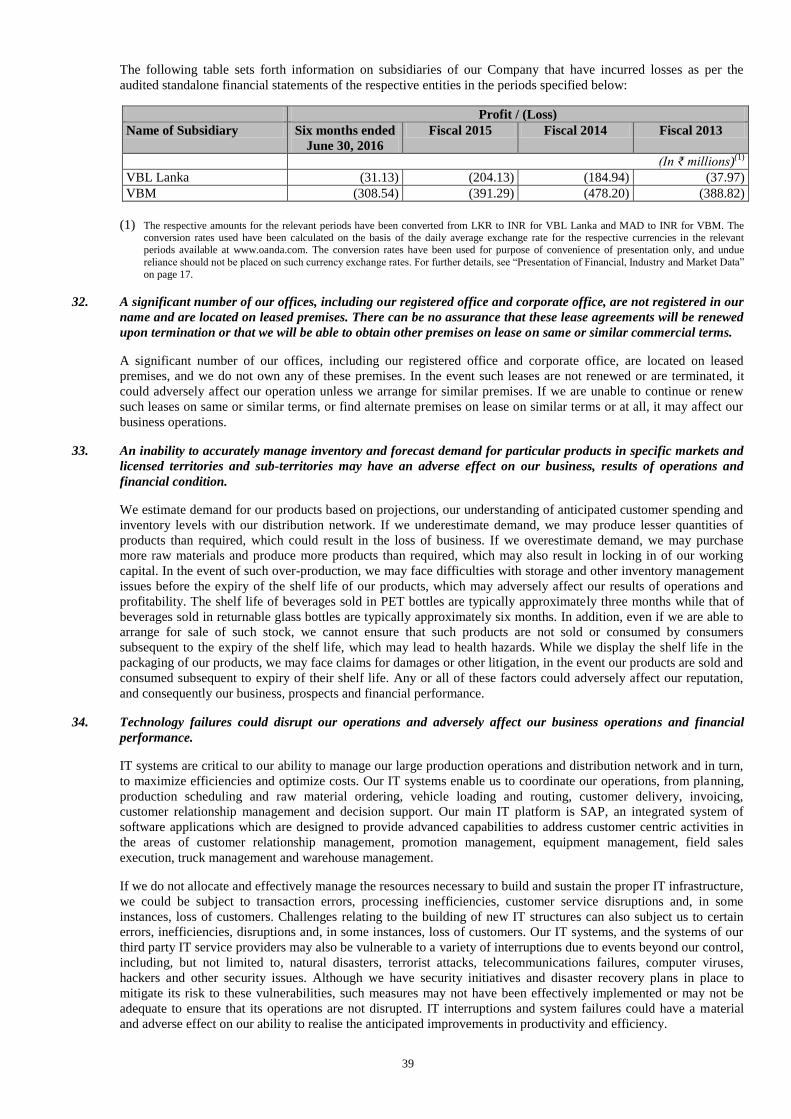
39
The following table sets forth information on subsidiaries of our Company that have incurred losses as per the
audited standalone financial statements of the respective entities in the periods specified below:
Profit / (Loss)
Name of Subsidiary Six months ended
June 30, 2016
Fiscal 2015 Fiscal 2014 Fiscal 2013
(In ₹ millions)(1)
VBL Lanka (31.13) (204.13) (184.94) (37.97)
VBM (308.54) (391.29) (478.20) (388.82)
(1) The respective amounts for the relevant periods have been converted from LKR to INR for VBL Lanka and MAD to INR for VBM. The conversion rates used have been calculated on the basis of the daily average exchange rate for the respective currencies in the relevant periods available at www.oanda.com. The conversion rates have been used for purpose of convenience of presentation only, and undue
reliance should not be placed on such currency exchange rates. For further details, see “Presentation of Financial, Industry and Market Data”
on page 17.
32. A significant number of our offices, including our registered office and corporate office, are not registered in our
name and are located on leased premises. There can be no assurance that these lease agreements will be renewed
upon termination or that we will be able to obtain other premises on lease on same or similar commercial terms.
A significant number of our offices, including our registered office and corporate office, are located on leased
premises, and we do not own any of these premises. In the event such leases are not renewed or are terminated, it
could adversely affect our operation unless we arrange for similar premises. If we are unable to continue or renew
such leases on same or similar terms, or find alternate premises on lease on similar terms or at all, it may affect our
business operations.
33. An inability to accurately manage inventory and forecast demand for particular products in specific markets and
licensed territories and sub-territories may have an adverse effect on our business, results of operations and
financial condition.
We estimate demand for our products based on projections, our understanding of anticipated customer spending and
inventory levels with our distribution network. If we underestimate demand, we may produce lesser quantities of
products than required, which could result in the loss of business. If we overestimate demand, we may purchase
more raw materials and produce more products than required, which may also result in locking in of our working
capital. In the event of such over-production, we may face difficulties with storage and other inventory management
issues before the expiry of the shelf life of our products, which may adversely affect our results of operations and
profitability. The shelf life of beverages sold in PET bottles are typically approximately three months while that of
beverages sold in returnable glass bottles are typically approximately six months. In addition, even if we are able to
arrange for sale of such stock, we cannot ensure that such products are not sold or consumed by consumers
subsequent to the expiry of the shelf life, which may lead to health hazards. While we display the shelf life in the
packaging of our products, we may face claims for damages or other litigation, in the event our products are sold and
consumed subsequent to expiry of their shelf life. Any or all of these factors could adversely affect our reputation,
and consequently our business, prospects and financial performance.
34. Technology failures could disrupt our operations and adversely affect our business operations and financial
performance.
IT systems are critical to our ability to manage our large production operations and distribution network and in turn,
to maximize efficiencies and optimize costs. Our IT systems enable us to coordinate our operations, from planning,
production scheduling and raw material ordering, vehicle loading and routing, customer delivery, invoicing,
customer relationship management and decision support. Our main IT platform is SAP, an integrated system of
software applications which are designed to provide advanced capabilities to address customer centric activities in
the areas of customer relationship management, promotion management, equipment management, field sales
execution, truck management and warehouse management.
If we do not allocate and effectively manage the resources necessary to build and sustain the proper IT infrastructure,
we could be subject to transaction errors, processing inefficiencies, customer service disruptions and, in some
instances, loss of customers. Challenges relating to the building of new IT structures can also subject us to certain
errors, inefficiencies, disruptions and, in some instances, loss of customers. Our IT systems, and the systems of our
third party IT service providers may also be vulnerable to a variety of interruptions due to events beyond our control,
including, but not limited to, natural disasters, terrorist attacks, telecommunications failures, computer viruses,
hackers and other security issues. Although we have security initiatives and disaster recovery plans in place to
mitigate its risk to these vulnerabilities, such measures may not have been effectively implemented or may not be
adequate to ensure that its operations are not disrupted. IT interruptions and system failures could have a material
and adverse effect on our ability to realise the anticipated improvements in productivity and efficiency.
40
35. Obesity or nutritional concerns may reduce demand for some of our products.
There is growing concern among consumers, public health professionals and government agencies about the health
problems associated with obesity. In addition, some researchers, health advocates and dietary guidelines are
suggesting that consumption of sugar-sweetened beverages is a primary cause of increased obesity rates and are
encouraging consumers to reduce or eliminate consumption of such products. Increasing public concern about
obesity; additional governmental regulations concerning the marketing, labelling, packaging or sale of our sugar-
sweetened beverages; and negative publicity resulting from actual or threatened legal actions against us or other
companies in our industry relating to the marketing, labelling or sale of sugar-sweetened beverages may reduce
demand for sugar-sweetened beverages, which could adversely affect our profitability.
36. An increase in the cost of or shortage or disruption in supply of electricity and fuel may adversely affect our
results of operations and profitability.
An increase in the price, disruption of supply or shortage of fuel and other energy sources in the countries in which
we operate, that may be caused by increasing demand or by events such as natural disasters, power outages, or the
like could increase our operating costs and negatively impact our profitability.
37. Our business does not involve long term purchase arrangements and we rely on purchase orders from distributors
that determine the terms of sales of our products. As a result, our sales may fluctuate significantly as a result of
changes in our dealers’ and distributors’ preferences.
Our business does not involve long-term agreements and we rely on purchase orders from distributors that determine
the terms of sales of our products. However, if purchase orders get amended or cancelled prior to finalization, and in
such event, an amendment or cancellation may take place, and we may be unable to seek compensation for any
surplus products that we produce. Additionally, any failure to meet our dealers’ and distributors’ expectation could
result in the cancellation or non-renewal of purchase orders. In addition, in cases where we have entered into
agreements with dealers and distributors, such contracts do not bind them to provide us with a specific volume of
business and can be terminated by them for cause. Consequently, there is no firm commitment on part of our dealers
or distributors to continue to pass on new purchase orders to us and as a result, our sales may fluctuate significantly
as a result of changes in our dealers’ and distributors’ preferences.
38. The grant of options under the Employee Stock Option Scheme 2013 and the Employee Stock Option Scheme
2016 will result in a charge to our profit and loss account and may adversely impact our net income.
Our senior executives are rewarded with stock options. The quantum of stock options awarded is determined based
on recommendations of the Nominations and Remuneration Committee of the Board of Directors. Employee stock
compensation cost for stock options is recognised in accordance with the Guidance Note on Accounting for
Employee Share-based Payments, issued by the Institute of Chartered Accountants of India.
Our Company follows the intrinsic value method for the accounting of employee compensation cost on options
granted, pursuant to which, if the exercise price of any options granted is lower than the market price at the time of
grant, it will result in a charge to our profit and loss account equal to the product of the number of Equity Shares
granted and the difference between the exercise price and the market price at the time of grant.
We established the ESOS 2013 on May 13, 2013 pursuant to our Board and Shareholders’ resolutions dated May 13,
2013. Pursuant to the ESOS 2013, all eligible employees of our Company (including Directors), and our Subsidiaries
will be entitled to purchase Equity Share at a stipulated exercise price, subject to compliance with vesting conditions.
As per the ESOS 2013, holders of the vested options are entitled to purchase one Equity Share for every one option
at an exercise price of ₹ 149.51. As of June 30, 2016, we had granted 2,675,400 options of which 2,675,400 options
have vested as at June 30, 2016 and 1,903,700 options have been exercised.
We established the ESOS 2016 on April 27, 2016 pursuant to our Board and Shareholders’ resolutions dated April
27, 2016. Pursuant to the ESOS 2016, all eligible employees of our Company (including directors), and our
subsidiaries will be entitled to purchase Equity Share at a stipulated exercise price, subject to compliance with
vesting condition. As a result of future grants of options under ESOS 2016, we will have to charge the difference
between exercise price and the market price at the time of grant to our profit and our loss statement, which may have
an adverse impact on our net income.
We may continue to introduce such employee stock option schemes in the future, where we issue options to our
employees at substantial discount to the market price of the Equity Shares, which may result in a charge to our profit
and loss account and may have an impact on our results of operations and financial condition. The holders of the
Equity Shares may experience dilution of their shareholding to the extent that we issue any Equity Shares pursuant to
any options issued under the ESOS Scheme.
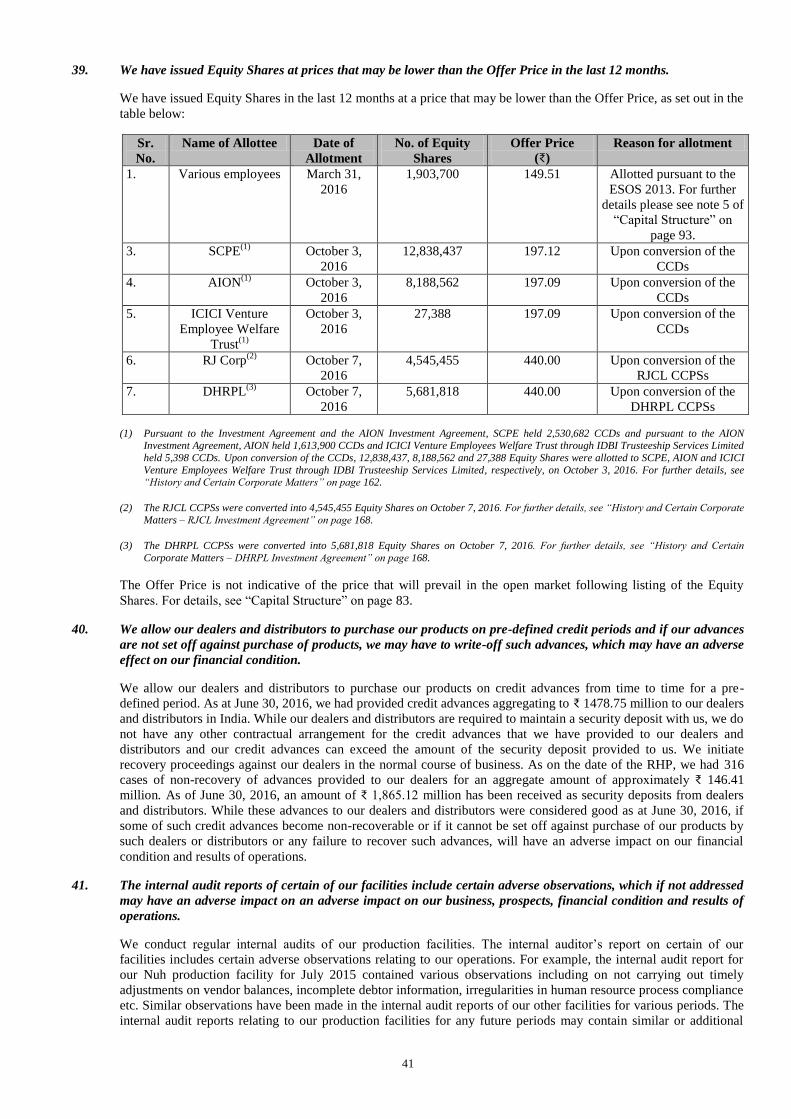
41
39. We have issued Equity Shares at prices that may be lower than the Offer Price in the last 12 months.
We have issued Equity Shares in the last 12 months at a price that may be lower than the Offer Price, as set out in the
table below:
Sr.
No.
Name of Allottee Date of
Allotment
No. of Equity
Shares
Offer Price
(₹)
Reason for allotment
1. Various employees March 31,
2016
1,903,700 149.51 Allotted pursuant to the
ESOS 2013. For further
details please see note 5 of
“Capital Structure” on
page 93.
3. SCPE(1)
October 3,
2016
12,838,437 197.12 Upon conversion of the
CCDs
4. AION(1)
October 3,
2016
8,188,562 197.09 Upon conversion of the
CCDs
5. ICICI Venture
Employee Welfare
Trust(1)
October 3,
2016
27,388 197.09 Upon conversion of the
CCDs
6. RJ Corp(2)
October 7,
2016
4,545,455 440.00 Upon conversion of the
RJCL CCPSs
7. DHRPL(3)
October 7,
2016
5,681,818 440.00 Upon conversion of the
DHRPL CCPSs
(1) Pursuant to the Investment Agreement and the AION Investment Agreement, SCPE held 2,530,682 CCDs and pursuant to the AION Investment Agreement, AION held 1,613,900 CCDs and ICICI Venture Employees Welfare Trust through IDBI Trusteeship Services Limited
held 5,398 CCDs. Upon conversion of the CCDs, 12,838,437, 8,188,562 and 27,388 Equity Shares were allotted to SCPE, AION and ICICI
Venture Employees Welfare Trust through IDBI Trusteeship Services Limited, respectively, on October 3, 2016. For further details, see “History and Certain Corporate Matters” on page 162.
(2) The RJCL CCPSs were converted into 4,545,455 Equity Shares on October 7, 2016. For further details, see “History and Certain Corporate
Matters – RJCL Investment Agreement” on page 168.
(3) The DHRPL CCPSs were converted into 5,681,818 Equity Shares on October 7, 2016. For further details, see “History and Certain
Corporate Matters – DHRPL Investment Agreement” on page 168.
The Offer Price is not indicative of the price that will prevail in the open market following listing of the Equity
Shares. For details, see “Capital Structure” on page 83.
40. We allow our dealers and distributors to purchase our products on pre-defined credit periods and if our advances
are not set off against purchase of products, we may have to write-off such advances, which may have an adverse
effect on our financial condition.
We allow our dealers and distributors to purchase our products on credit advances from time to time for a pre-
defined period. As at June 30, 2016, we had provided credit advances aggregating to ₹ 1478.75 million to our dealers
and distributors in India. While our dealers and distributors are required to maintain a security deposit with us, we do
not have any other contractual arrangement for the credit advances that we have provided to our dealers and
distributors and our credit advances can exceed the amount of the security deposit provided to us. We initiate
recovery proceedings against our dealers in the normal course of business. As on the date of the RHP, we had 316
cases of non-recovery of advances provided to our dealers for an aggregate amount of approximately ₹ 146.41
million. As of June 30, 2016, an amount of ₹ 1,865.12 million has been received as security deposits from dealers
and distributors. While these advances to our dealers and distributors were considered good as at June 30, 2016, if
some of such credit advances become non-recoverable or if it cannot be set off against purchase of our products by
such dealers or distributors or any failure to recover such advances, will have an adverse impact on our financial
condition and results of operations.
41. The internal audit reports of certain of our facilities include certain adverse observations, which if not addressed
may have an adverse impact on an adverse impact on our business, prospects, financial condition and results of
operations.
We conduct regular internal audits of our production facilities. The internal auditor’s report on certain of our
facilities includes certain adverse observations relating to our operations. For example, the internal audit report for
our Nuh production facility for July 2015 contained various observations including on not carrying out timely
adjustments on vendor balances, incomplete debtor information, irregularities in human resource process compliance
etc. Similar observations have been made in the internal audit reports of our other facilities for various periods. The
internal audit reports relating to our production facilities for any future periods may contain similar or additional
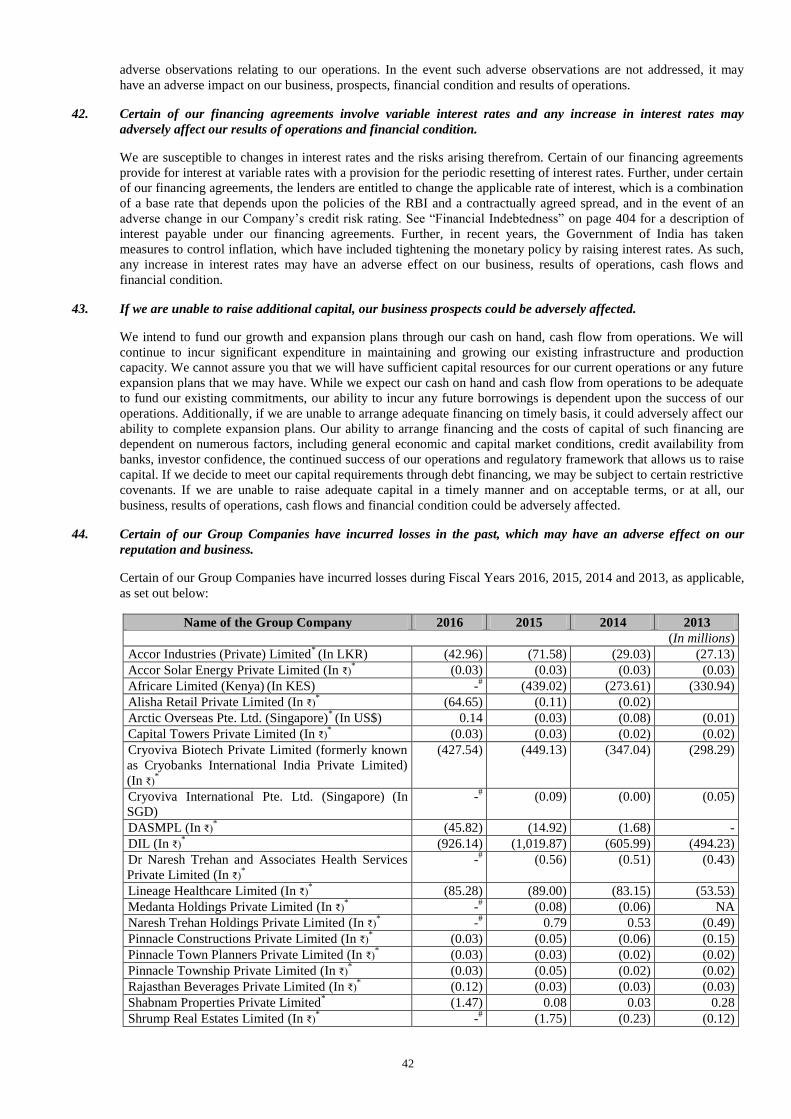
42
adverse observations relating to our operations. In the event such adverse observations are not addressed, it may
have an adverse impact on our business, prospects, financial condition and results of operations.
42. Certain of our financing agreements involve variable interest rates and any increase in interest rates may
adversely affect our results of operations and financial condition.
We are susceptible to changes in interest rates and the risks arising therefrom. Certain of our financing agreements
provide for interest at variable rates with a provision for the periodic resetting of interest rates. Further, under certain
of our financing agreements, the lenders are entitled to change the applicable rate of interest, which is a combination
of a base rate that depends upon the policies of the RBI and a contractually agreed spread, and in the event of an
adverse change in our Company’s credit risk rating. See “Financial Indebtedness” on page 404 for a description of
interest payable under our financing agreements. Further, in recent years, the Government of India has taken
measures to control inflation, which have included tightening the monetary policy by raising interest rates. As such,
any increase in interest rates may have an adverse effect on our business, results of operations, cash flows and
financial condition.
43. If we are unable to raise additional capital, our business prospects could be adversely affected.
We intend to fund our growth and expansion plans through our cash on hand, cash flow from operations. We will
continue to incur significant expenditure in maintaining and growing our existing infrastructure and production
capacity. We cannot assure you that we will have sufficient capital resources for our current operations or any future
expansion plans that we may have. While we expect our cash on hand and cash flow from operations to be adequate
to fund our existing commitments, our ability to incur any future borrowings is dependent upon the success of our
operations. Additionally, if we are unable to arrange adequate financing on timely basis, it could adversely affect our
ability to complete expansion plans. Our ability to arrange financing and the costs of capital of such financing are
dependent on numerous factors, including general economic and capital market conditions, credit availability from
banks, investor confidence, the continued success of our operations and regulatory framework that allows us to raise
capital. If we decide to meet our capital requirements through debt financing, we may be subject to certain restrictive
covenants. If we are unable to raise adequate capital in a timely manner and on acceptable terms, or at all, our
business, results of operations, cash flows and financial condition could be adversely affected.
44. Certain of our Group Companies have incurred losses in the past, which may have an adverse effect on our
reputation and business.
Certain of our Group Companies have incurred losses during Fiscal Years 2016, 2015, 2014 and 2013, as applicable,
as set out below:
Name of the Group Company 2016 2015 2014 2013
(In millions)
Accor Industries (Private) Limited* (In LKR) (42.96) (71.58) (29.03) (27.13)
Accor Solar Energy Private Limited (In ₹)* (0.03) (0.03) (0.03) (0.03)
Africare Limited (Kenya) (In KES) -
# (439.02) (273.61) (330.94)
Alisha Retail Private Limited (In ₹)* (64.65) (0.11) (0.02)
Arctic Overseas Pte. Ltd. (Singapore)* (In US$) 0.14 (0.03) (0.08) (0.01)
Capital Towers Private Limited (In ₹)* (0.03) (0.03) (0.02) (0.02)
Cryoviva Biotech Private Limited (formerly known
as Cryobanks International India Private Limited)
(In ₹)*
(427.54) (449.13) (347.04) (298.29)
Cryoviva International Pte. Ltd. (Singapore)
(In
SGD)
-# (0.09) (0.00) (0.05)
DASMPL (In ₹)* (45.82) (14.92) (1.68) -
DIL (In ₹)* (926.14) (1,019.87) (605.99) (494.23)
Dr Naresh Trehan and Associates Health Services
Private Limited (In ₹)*
-# (0.56) (0.51) (0.43)
Lineage Healthcare Limited (In ₹)* (85.28) (89.00) (83.15) (53.53)
Medanta Holdings Private Limited (In ₹)* -
# (0.08) (0.06) NA
Naresh Trehan Holdings Private Limited (In ₹)* -
# 0.79 0.53 (0.49)
Pinnacle Constructions Private Limited (In ₹)* (0.03) (0.05) (0.06) (0.15)
Pinnacle Town Planners Private Limited (In ₹)* (0.03) (0.03) (0.02) (0.02)
Pinnacle Township Private Limited (In ₹)* (0.03) (0.05) (0.02) (0.02)
Rajasthan Beverages Private Limited (In ₹)* (0.12) (0.03) (0.03) (0.03)
Shabnam Properties Private Limited* (1.47) 0.08 0.03 0.28
Shrump Real Estates Limited (In ₹)* -
# (1.75) (0.23) (0.12)
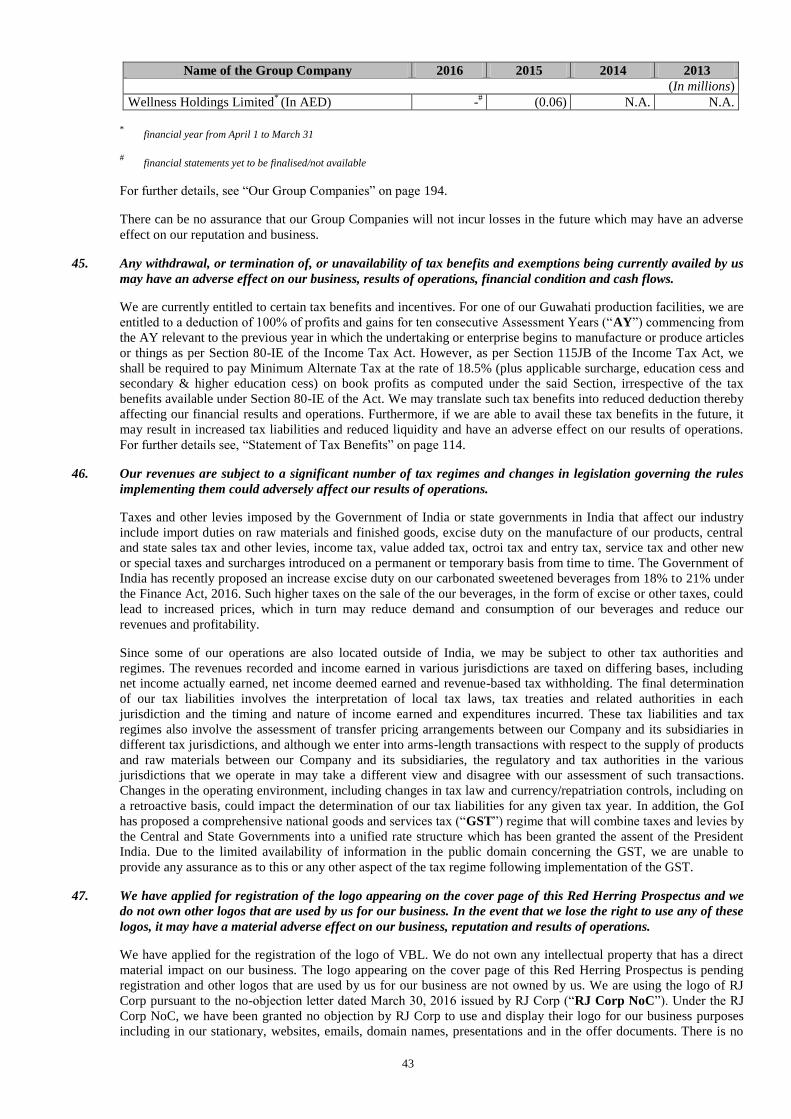
43
Name of the Group Company 2016 2015 2014 2013
(In millions)
Wellness Holdings Limited* (In AED) -
# (0.06) N.A. N.A.
* financial year from April 1 to March 31
# financial statements yet to be finalised/not available
For further details, see “Our Group Companies” on page 194.
There can be no assurance that our Group Companies will not incur losses in the future which may have an adverse
effect on our reputation and business.
45. Any withdrawal, or termination of, or unavailability of tax benefits and exemptions being currently availed by us
may have an adverse effect on our business, results of operations, financial condition and cash flows.
We are currently entitled to certain tax benefits and incentives. For one of our Guwahati production facilities, we are
entitled to a deduction of 100% of profits and gains for ten consecutive Assessment Years (“AY”) commencing from
the AY relevant to the previous year in which the undertaking or enterprise begins to manufacture or produce articles
or things as per Section 80-IE of the Income Tax Act. However, as per Section 115JB of the Income Tax Act, we
shall be required to pay Minimum Alternate Tax at the rate of 18.5% (plus applicable surcharge, education cess and
secondary & higher education cess) on book profits as computed under the said Section, irrespective of the tax
benefits available under Section 80-IE of the Act. We may translate such tax benefits into reduced deduction thereby
affecting our financial results and operations. Furthermore, if we are able to avail these tax benefits in the future, it
may result in increased tax liabilities and reduced liquidity and have an adverse effect on our results of operations.
For further details see, “Statement of Tax Benefits” on page 114.
46. Our revenues are subject to a significant number of tax regimes and changes in legislation governing the rules
implementing them could adversely affect our results of operations.
Taxes and other levies imposed by the Government of India or state governments in India that affect our industry
include import duties on raw materials and finished goods, excise duty on the manufacture of our products, central
and state sales tax and other levies, income tax, value added tax, octroi tax and entry tax, service tax and other new
or special taxes and surcharges introduced on a permanent or temporary basis from time to time. The Government of
India has recently proposed an increase excise duty on our carbonated sweetened beverages from 18% to 21% under
the Finance Act, 2016. Such higher taxes on the sale of the our beverages, in the form of excise or other taxes, could
lead to increased prices, which in turn may reduce demand and consumption of our beverages and reduce our
revenues and profitability.
Since some of our operations are also located outside of India, we may be subject to other tax authorities and
regimes. The revenues recorded and income earned in various jurisdictions are taxed on differing bases, including
net income actually earned, net income deemed earned and revenue-based tax withholding. The final determination
of our tax liabilities involves the interpretation of local tax laws, tax treaties and related authorities in each
jurisdiction and the timing and nature of income earned and expenditures incurred. These tax liabilities and tax
regimes also involve the assessment of transfer pricing arrangements between our Company and its subsidiaries in
different tax jurisdictions, and although we enter into arms-length transactions with respect to the supply of products
and raw materials between our Company and its subsidiaries, the regulatory and tax authorities in the various
jurisdictions that we operate in may take a different view and disagree with our assessment of such transactions.
Changes in the operating environment, including changes in tax law and currency/repatriation controls, including on
a retroactive basis, could impact the determination of our tax liabilities for any given tax year. In addition, the GoI
has proposed a comprehensive national goods and services tax (“GST”) regime that will combine taxes and levies by
the Central and State Governments into a unified rate structure which has been granted the assent of the President
India. Due to the limited availability of information in the public domain concerning the GST, we are unable to
provide any assurance as to this or any other aspect of the tax regime following implementation of the GST.
47. We have applied for registration of the logo appearing on the cover page of this Red Herring Prospectus and we
do not own other logos that are used by us for our business. In the event that we lose the right to use any of these
logos, it may have a material adverse effect on our business, reputation and results of operations.
We have applied for the registration of the logo of VBL. We do not own any intellectual property that has a direct
material impact on our business. The logo appearing on the cover page of this Red Herring Prospectus is pending
registration and other logos that are used by us for our business are not owned by us. We are using the logo of RJ
Corp pursuant to the no-objection letter dated March 30, 2016 issued by RJ Corp (“RJ Corp NoC”). Under the RJ
Corp NoC, we have been granted no objection by RJ Corp to use and display their logo for our business purposes
including in our stationary, websites, emails, domain names, presentations and in the offer documents. There is no
44
consideration payable by us for use of the logo of RJ Corp. The RJ Corp NoC is subject to RJ Corp maintaining the
status of our promoter and the logo of RJ Corp not being misused by any of our group companies. We are using the
logo of PepsiCo pursuant to the consent letter dated June 20, 2016 issued by PepsiCo India / PepsiCo Inc.
48. The objects of the Offer for which the funds are being raised have not been appraised by any bank or financial
institutions. Any variation in the utilization of our Net Proceeds as disclosed in this Red Herring Prospectus
would be subject to certain compliance requirements, including prior shareholders’ approval.
The objects of the Offer have not been appraised by any bank or financial institution. Though these estimates have
been taken recently, they are subject to change and may result in cost escalation. Any variation in the Objects of the
Offer would require shareholders’ approval and may involve considerable time or may not be forthcoming and in
such an eventuality it may adversely affect our business or operations.
Further, our Promoter or controlling shareholders would be required to provide an exit opportunity to the
shareholders who do not agree with our proposal to change the objects of the Offer, at a price and manner as
specified in Chapter VI-A of the SEBI ICDR Regulations pursuant to the SEBI ICDR (Second Amendment)
Regulations, 2016 dated February 17, 2016. Additionally, the requirement on Promoter or controlling shareholders to
provide an exit opportunity to such dissenting shareholders may deter the Promoter or controlling shareholders from
agreeing to the variation of the proposed utilisation of our Net Proceeds, even if such variation is in our interest.
Further, we cannot assure you that our Promoter or the controlling shareholders will have adequate resources at their
disposal at all times to enable them to provide an exit opportunity at the price which may be prescribed by SEBI.
In light of these factors, we may not be able to undertake any variation in Objects of the Offer to use any unutilized
proceeds of the Offer even if such variation is in our interest. This may restrict our ability to respond to any change
in our business or financial condition by re-deploying the unutilised portion of our Net Proceeds, if any, which may
adversely affect our business and results of operations.
We propose to utilize a portion of the Net Proceeds to repay or pre-pay, in full or in part, certain of the term loans
availed by us, and accordingly, the utilization of that portion of the Net Proceeds will not result in creation of any
tangible assets. The details of the loans identified to be repaid or prepaid using the Net Proceeds have been disclosed
in “Objects of the Offer” on page 101. However, the repayment or prepayment of the term loans are subject to
various factors including, in certain cases, pre-payment penalties. While we believe that utilization of Net Proceeds
for repayment of loans would help us to reduce our cost of debt and enable the utilization of our funds for further
investment in business growth and expansion, the repayment or pre-payment of certain of our term loans, as the case
may be, will not result in the creation of any tangible assets for our Company.
49. Our insurance coverage may not adequately protect us against all material hazards, which may adversely affect
our business, results of operations and financial condition.
We believe we are adequately insured against all losses and risks involving property and third party liability. For our
Indian operations, we have obtained insurance cover for standard fire and special perils, cash in transit, group
personal accidental companies. Our operations outside of India generally have insurance policies covering standard
fire and special perils insurance, group personal accidental policy and group medi-claim insurance policies from
local insurers. While the gross block of our assets such as buildings, plant and machinery and stocks as of June 30,
2016 in India was ₹ 4,304.78 million, ₹ 14,283.38 million and ₹ 4,373.70 million, respectively, our sum assured
under our insurance policies was ₹ 4,096 million, ₹ 17,239 million and ₹ 6,557 million, respectively.
Notwithstanding the insurance coverage that we carry, we may not be fully insured against some business risks and
the occurrence of an event that causes losses in excess of limits specified under the relevant policy, or losses arising
from events not covered by insurance policies, could adversely affect our business, results of operations and
financial condition. If we are subject to litigation or claims or our operations are interrupted for a sustained period,
the insurance policies may not be found to be adequate to cover the losses that may be incurred as a result of such
interruption. If we suffer large uninsured losses or if any insured losses suffered by us significantly exceed our
insurance coverage or our insurance claim is rejected, it may adversely affect our business, results of operations and
financial condition. See “Our Business – Insurance” on page 153.
50. Our operations could be adversely affected by strikes, work stoppages or increased wage demands by our
employees or any other kind of disputes with our employees.
As of June 30, 2016, we employed 4,413 full time employees in India, and 1,739 full time employees in our
international operations and some of our employees are represented by labour or workers’ unions in the various
jurisdictions. Although our relations with our employees are good and we have not experienced any major work
stoppages due to labour disputes or cessation of work in the recent past, we cannot assure you that we will not
experience disruptions in work due to disputes or other problems with our work force, which may adversely affect
our ability to continue our business operations. Any labour unrest directed against us, could directly or indirectly
prevent or hinder our normal operating activities, and, if not resolved in a timely manner, could lead to disruptions in
45
our operations. These actions are improbable for us to forecast or control and any such event could adversely affect
our business, results of operations and financial condition.
51. We appoint contract labour for carrying out certain of our operations and we may be held responsible for paying
the wages of such workers, if the independent contractors through whom such workers are hired default on their
obligations, and such obligations could have an adverse effect on our results of operations and financial
condition.
In order to maintain operational efficiencies, we appoint independent contractors who in turn engage on-site contract
labour for performance of certain of our operations. Under the Contract Labour (Regulation and Abolition) Act,
1970, as amended, in the event that the contractor fails to pay wages to its employees, we as a principal employer of
such contract labour may be held responsible for any wage payments to be made to such labourers in the event of
default by such independent contractor. Any requirement to fund their wage requirements may have an adverse
impact on our results of operations and financial condition. In addition, under the Contract Labour (Regulation and
Abolition) Act, 1970, as amended, we may be required to absorb a number of such contract labourers as permanent
employees in specified situations. Thus, any such order from a regulatory body or court may have an adverse effect
on our business, results of operations and financial condition.
52. Any negative cash flows in the future would adversely affect our cash flow requirements, which may adversely
affect our ability to operate our business and implement our growth plans, thereby affecting our financial
condition.
The following table sets forth certain information relating to our cash flows on a consolidated basis for the periods
indicated. We may in the future experience negative operating cash flows as well.
(₹ in millions)
Particulars Fiscal Six months ended June 30,
2012 2013 2014 2015 2015 2016
Net cash generated from/
(used in) operating activities
2,804.27 2,970.70 4,308.55 5,597.96 6,392.26 7,329.46
Net cash generated from/
(used in) investing activities
(5,065.82) (5,735.75) (4,999.58) (2,916.35) (1,607.88) (8,215.04)
Net cash generated from/
(used in) the financing
activities
2,292.06 2,743.18 577.33 (2,490.43) (4,120.09) 1,466.47
Net increase/(decrease) in
cash and cash equivalents
30.51 (21.87) (113.70) 191.18 664.29 580.89
Negative cash flows over extended periods, or significant negative cash flows in the short term, could materially
impact our ability to operate our business and implement our growth plans. This situation may have an adverse effect
on our cash flows, business, future financial performance and results of operations. For further details, see
“Management's Discussion and Analysis of Financial Condition and Results of Operations” on page 413.
53. Certain Promoters, Promoter Group and Directors hold Equity Shares in our Company and are therefore
interested in the Company's performance in addition to their remuneration and reimbursement of expenses.
Certain of our Directors (including our Promoters and Promoter Group) are interested in our Company, in addition to
regular remuneration or benefits and reimbursement of expenses, to the extent of their shareholding in our Company.
Our Promoters will continue to exercise significant control over us, including being able to control the composition
of our Board of Directors and determine decisions requiring simple or special majority voting of shareholders, and
our other shareholders may not be able to affect the outcome of such voting. Our Promoters may take or block
actions with respect to our business which may conflict with the best interests of the Company or that of minority
shareholders. For details on the interest of our Promoters and Directors of our Company, other than reimbursement
of expenses incurred or normal remuneration or benefits, see “Our Management – Interest of Directors” and “Our
Promoters and Promoter Group – Interests of Promoters” on pages 182 and 191, respectively.
54. We have in the past entered into related party transactions and may continue to do so in the future, which may
potentially involve conflicts of interest with the equity shareholders.
We have in the past entered into transactions with certain of our Promoters, relatives of our Promoters, Directors,
and enterprises over which our Directors have a significant influence. While we believe that all such transactions
have been conducted on an arm’s length basis, we cannot assure you that we might have obtained more favourable
terms had such transactions been entered into with unrelated parties. Further, it is likely that we may enter into
related party transactions in the future.
46
For details on our related party transactions, see “Related Party Transactions” on page 208. We cannot assure you
that such transactions, individually or in the aggregate, will always be in the best interests of our minority
shareholders and will not have an adverse effect on our business, results of operations, cash flows and financial
condition.
55. We have certain contingent liabilities that may adversely affect our financial condition.
Our contingent liabilities as of June 30, 2016 were as follows:
(₹ in millions)
Particulars Amount (₹ in million)
Guarantees issued on behalf of other companies# 410.83
Counter guarantees given in respect of guarantees issued by the Company's bankers**. 149.33
Claims against the Company not acknowledged as debts (being contested):-
-For excise and service tax 87.46
-For sales tax / entry tax 52.27
- For income tax 34.90
-Others* 171.73 * excludes pending cases where amount of liability is not ascertainable.
** excluding NIL (previous period/years ₹ 5.40 million already considered as contingent liability for claims against the Company not
acknowledged as debt).
# includes guarantees for loans given on behalf of Lunarmech Technologies Private Limited for business purposes for the years ended 31
December 2015, 2014, 2013 and 2012.
If a significant portion of these liabilities materialize, it could have an adverse effect on our business, financial
condition and results of operations. For details, see “Financial Statements – Annexure 5” on page 228.
56. We, our Promoters and Group Companies have obtained, or may obtain in future, unsecured loans, which may be
recalled at any time. Any recall of the unsecured loans obtained by our Company may have an adverse effect on
our business, prospects, financial condition and results of operations.
We, our Promoters and Group Companies have obtained, or may obtain in future, unsecured loans, some of which
may be recalled at any time at the option of the lender. As on August 31, 2016, our Company has outstanding
unsecured loans of ₹ 3, 000 million. If the unsecured loans obtained by our Company are recalled at any time, the
financial condition of our Company may be adversely affected. For details of our unsecured loans, see “Financial
Indebtedness” on page 404.
57. Our statutory auditors have drawn attention to certain statements/ comments in our Restated Consolidated
Financial Statements.
Our statutory auditors have drawn attention to certain statements/comments included in Companies (Auditor’s
Report) Order (“CARO Report”) of the Company, which do not require any adjustments in the Restated
Consolidated Financial Statements. There is no assurance that our CARO Reports for any future fiscal periods will
not contain such comments or any other qualifications for such future fiscal periods or otherwise affect our results of
operations in such future fiscal periods. Also, see “Financial Statements” on page 210, respectively.
58. Our ability to pay dividends in the future will depend on our earnings, financial condition, working capital
requirements, capital expenditures and restrictive covenants of our financing arrangements.
Our ability to pay dividends in the future will depend on our earnings, financial condition, cash flow, working capital
requirements, capital expenditure and restrictive covenants of our financing arrangements. In the past, we have not
made dividend payments to the Shareholders of our Company. The Company may decide to retain all future
earnings, if any, for use in the operations and expansion of the business. In such situation, the Company may not
declare dividends in the foreseeable future. Any future determination as to the declaration and payment of dividends
will be at the discretion of our Board and will depend on factors that our Board deems relevant, including among
others, our future earnings, financial condition, cash requirements, business prospects and any other financing
arrangements. We cannot state with any certainty whether we will be able to pay dividends in the future.
Accordingly, realization of a gain on Shareholders’ investments will depend on the appreciation of the price of the
Equity Shares. There is no guarantee that our Equity Shares will appreciate in value. For details of dividend paid by
our Company in the past, see “Dividend Policy” on page 209.
47
59. We are subject to risks resulting from foreign exchange rate fluctuations, which could adversely affect our results
of operations as our export sales and sales outside India and a portion of our expenditures are denominated in
foreign currencies. Further, a decline in India’s foreign exchange reserves and higher interest rates in the Indian
economy could also adversely affect us.
Changes in currency exchange rate influence our results of operations. Some of our expenses, particularly operating
expenses in connection with our operations outside India, are denominated in currencies other than Indian Rupees.
In addition, depreciation of the Indian Rupee against the U.S. Dollar and other foreign currencies may adversely
affect our results of operations by increasing the cost of financing any debt denominated in foreign currency that we
may enter into or proposed capital expenditure, if any, in foreign currencies. Furthermore, the financial reporting
currency of our Company and our operations in India is in Indian Rupees, while the financial reporting currency of
our international subsidiaries is in the relevant foreign currency. We incur currency transaction risks whenever one
of our foreign subsidiaries enters into either a purchase or sale transaction using a currency other than its functional
currency. In particular, the purchases of raw materials which are priced predominantly in Indian Rupees, while we
currently sells our products in countries other than India, in local currencies. Our foreign currency exchange risks
therefore arise from the mismatch between our financial reporting currencies, currency of a substantial majority of
our revenue and the currency of a portion of our expenses and our indebtedness, as well as timing differences
between receipts and payments which could result in an increase of any such mismatch. Although we may, in the
future, enter into hedging transactions to minimize our currency exchange risks, there can be no assurance that such
measures will enable us to avoid the effect of any adverse fluctuations in the value of the Indian Rupee against the
relevant foreign currencies.
A decline in India’s foreign exchange reserves could impact the valuation of the Rupee and could result in reduced
liquidity and higher interest rates which could adversely affect our financial condition. A future material decline in
these reserves could result in reduced liquidity and higher interest rates in the Indian economy which in turn, could
adversely affect our business and future financial performance.
External Risk Factors
60. General economic conditions in India and globally could adversely affect our business and results of operation.
Our results of operations and financial condition may also be impacted by global economic conditions and the health
of the Indian economy. Various factors may lead to a slowdown in the Indian or world economy which in turn may
adversely impact our business, financial performance and operations.
We mainly derive revenue from our operations in India and the performance and growth of our business is impacted
by the performance of the Indian economy. In the past, the Indian economy has been affected by global economic
uncertainties, liquidity crisis, domestic policies, global political environment, volatility in interest rates, currency
exchange rates, commodity and electricity prices, volatility in inflation rates and various other factors. Accordingly,
high rates of inflation in India could increase our employee costs and raw material costs and decrease our operating
margins, which could have an adverse effect on our results of operations. In the year ended March 31, 2016, the
GDP of India grew by 7.6% (Source: IMF World Economic Outlook Update for July 2016. Available at
https://www.imf.org/external/pubs/ft/weo/2016/update/02/). Accordingly, high rates of inflation in India could
increase our employee costs and decrease our operating margins, which could have an adverse effect on our results
of operations.
Risk management initiatives undertaken by financial institutions in order to remedy the global economic slowdown
could affect the availability of funds in the future or cause the withdrawal of our existing credit facilities. Further the
Indian economy is undergoing many changes and it is difficult to predict the impact of certain fundamental
economic changes on our business. Conditions outside India, such as a slowdown or recession in the economic
growth of other major countries, especially the United States, also have an impact on the growth of the Indian
economy. Additionally, an increase in trade deficit, a downgrading in India’s sovereign debt rating or a decline in
India’s foreign exchange reserves could negatively affect interest rates and liquidity, which could adversely affect
the Indian economy and our business. Any downturn in the macroeconomic environment in India could also
adversely affect our business, results of operations, financial condition and the trading price of the Equity Shares.
India’s economy could be adversely affected by a general rise in interest rates, adverse weather conditions affecting
agriculture, commodity and energy prices as well as various other factors. A slowdown in the Indian economy could
adversely affect the policy of the GoI towards our industry, which may in turn adversely affect our financial
performance and our ability to implement our business strategy.
The Indian economy is also influenced by economic and market conditions in other countries, particularly emerging
market conditions in Asia. A decline in India’s foreign exchange reserves may also affect liquidity and interest rates
in the Indian economy, which could adversely impact our financial condition. A loss of investor confidence in other
48
emerging market economies or any worldwide financial instability may adversely affect the Indian economy, which
could materially and adversely affect our business and results of operations and the market price of the Equity
Shares.
61. Any downgrading of India’s debt rating by a domestic or international rating agency could adversely affect our
business.
India’s sovereign debt rating could be downgraded due to various factors, including changes in tax or fiscal policy or
a decline in India’s foreign exchange reserves, which are outside our control. Any adverse revisions to India’s credit
ratings for domestic and international debt by domestic or international rating agencies may adversely impact our
ability to raise additional financing, and the interest rates and other commercial terms at which such additional
financing is available. This could have an adverse effect on our business and financial performance, ability to obtain
financing for capital expenditures and the price of the Equity Shares.
62. Changing laws, rules and regulations and legal uncertainties, including adverse application of corporate and tax
laws, may adversely affect our business, results of operations, financial condition and prospects.
The regulatory and policy environment in which we operate is evolving and may continue to evolve. Our business is
subject to a significant number of state tax regimes and changes in legislation governing the rules implementing
them or the regulator enforcing them in any one of those jurisdictions could adversely affect our results of
operations. The applicable categories of taxes and tax rates also vary significantly from state to state, which may be
amended from time to time. The final determination of our tax liabilities involves the interpretation of local tax laws
and related regulations in each jurisdiction as well as the significant use of estimates and assumptions regarding the
scope of future operations and results achieved and the timing and nature of income earned and expenditures
incurred. Changes in the operating environment, including changes in tax law, could impact the determination of our
tax liabilities for any given tax year. Taxes and other levies imposed by the Government or State Governments that
affect our industry include excise duties, income tax and other taxes, duties or surcharges introduced from time to
time. The tax scheme in India is extensive and subject to change from time to time and any adverse changes in any
of the taxes levied by the Government or State Governments could adversely affect our competitive position and
profitability. Such changes, including the instances mentioned below, may adversely affect our business, results of
operations, financial condition and prospects, to the extent that we are unable to suitably respond to and comply with
any such changes in applicable law and policy.
The GoI proposed to revamp the implementation of direct taxes by way of the introduction of the Direct
Taxes Code (“DTC”). The DTC proposes to consolidate and amend laws relating to income tax and wealth
tax. The Government has indicated in the Union Budget for the financial year from April 1, 2016 to March
31, 2017, that the DTC shall not be pursued further.
The GoI has proposed a comprehensive national GST regime that will combine taxes and levies by the
Central and State Governments into a unified rate structure which has been granted the assent of the
President of India. While the GoI and other state governments have announced that all committed
incentives will be protected following the implementation of the GST, given the limited availability of
information in the public domain concerning the GST, we are unable to provide any assurance as to this or
any other aspect of the tax regime following implementation of the GST. The implementation of this
rationalized tax structure may be affected by any disagreement between certain state governments, which
may create uncertainty. Any such future increases or amendments may affect the overall tax efficiency of
companies operating in India and may result in significant additional taxes becoming payable.
Further, the General Anti Avoidance Rules (“GAAR”) are proposed to be effective from April 1, 2017. The
tax consequences of the GAAR provisions being applied to an arrangement could result in denial of tax
benefit amongst other consequences. In the absence of any precedents on the subject, the application of
these provisions is uncertain. If the GAAR provisions are made applicable to our Company, it may have an
adverse tax impact on us.
We have not determined the impact of these proposed legislations on our business. Uncertainty in the applicability,
interpretation or implementation of any amendment to, or change in, governing law, regulation or policy in the
jurisdictions in which we operate, including by reason of an absence, or a limited body, of administrative or judicial
precedent may be time consuming as well as costly for us to resolve and may impact the viability of our current
business or restrict our ability to grow our business in the future.
63. Financial instability, economic developments and volatility in securities markets in other countries may also
cause the price of the Equity Shares to decline.
The Indian market and the Indian economy are influenced by economic and market conditions in other countries,
particularly emerging market countries in Asia. Financial turmoil in Europe and elsewhere in the world in recent
49
years has affected the Indian economy. Although economic conditions are different in each country, investors’
reactions to developments in one country can have adverse effects on the securities of companies in other countries,
including India. Recently, the currencies of a few Asian countries including India suffered depreciation against the
US Dollar owing to amongst other, the announcement by the US government that it may consider reducing its
quantitative easing measures. A loss of investor confidence in the financial systems of other emerging markets may
cause increased volatility in Indian financial markets and, indirectly, in the Indian economy in general. Any
worldwide financial instability could also have a negative impact on the Indian economy. Financial disruptions may
occur again and could harm our business, future financial performance and the prices of the Equity Shares.
The global credit and equity markets have experienced substantial dislocations, liquidity disruptions and market
corrections in recent years. Since September 2008, liquidity and credit concerns and volatility in the global credit
and financial markets increased significantly with the bankruptcy or acquisition of, and government assistance
extended to, several major US and European financial institutions. These and other related events, such as the
European sovereign debt crisis, have had a significant impact on the global credit and financial markets as a whole,
including reduced liquidity, greater volatility, widening of credit spreads and a lack of price transparency in global
credit and financial markets. In response to such developments, legislators and financial regulators in the United
States and other jurisdictions, including India, have implemented a number of policy measures designed to add
stability to the financial markets.
However, the overall impact of these and other legislative and regulatory efforts on the global financial markets is
uncertain, and they may not have the intended stabilizing effects. In the event that the current difficult conditions in
the global credit markets continue or if there is any significant financial disruption, such conditions could have an
adverse effect on our business, future financial performance and the trading price of the Equity Shares.
64. We may be affected by competition law in India and any adverse application or interpretation of the Competition
Act could adversely affect our business.
The Competition Act, 2002, as amended (the “Competition Act”), regulates practices having an appreciable adverse
effect on competition in the relevant market in India. Under the Competition Act, any formal or informal
arrangement, understanding or action in concert, which causes or is likely to cause an appreciable adverse effect on
competition is considered void and may result in the imposition of substantial monetary penalties. Further, any
agreement among competitors which directly or indirectly involves the determination of purchase or sale prices,
limits or controls production, supply, markets, technical development, investment or provision of services in any
manner, shares the market or source of production or provision of services by way of allocation of geographical area,
type of goods or services or number of customers in the relevant market or in any other similar way, or directly or
indirectly results in bid-rigging or collusive bidding is presumed to have an appreciable adverse effect on
competition. The Competition Act also prohibits abuse of a dominant position by any enterprise. If it is proved that
the contravention committed by a company took place with the consent or connivance of or is attributable to any
neglect on the part of, any director, manager, secretary or other officer of such company, that person shall be guilty
of the contravention and may be liable to punishment.
On March 4, 2011, the Government issued and brought into force the Competition Commission of India (Procedure
in regard to the transaction of business relating to combinations) Regulations, 2011 under the Competition Act with
effect from June 1, 2011 which sets out the mechanism for implementation of the merger control regime in India.
These provisions require acquisitions of shares, voting rights, assets or control or mergers or amalgamations that
cross the prescribed asset and turnover based thresholds to be mandatorily notified to and pre-approved by the
Competition Commission of India (the “CCI”). The Competition Act aims to, among others, prohibit all agreements
and transactions which may have an appreciable adverse effect on competition in India. Further, the CCI has extra-
territorial powers and can investigate any agreements, abusive conduct or combination occurring outside India if
such agreement, conduct or combination has an appreciable adverse effect on competition in India. However, we
cannot predict the impact of the provisions of the Competition Act on the agreements entered into by us at this stage.
We are not currently party to any outstanding proceedings, nor have we received notice in relation to non-
compliance with the Competition Act or the agreements entered into by us. However, if we are affected, directly or
indirectly, by the application or interpretation of any provision of the Competition Act, or any enforcement
proceedings initiated by the CCI, or any adverse publicity that may be generated due to scrutiny or prosecution by
the CCI or if any prohibition or substantial penalties are levied under the Competition Act, it would adversely affect
our business, results of operation and prospects.
The applicability or interpretation of the Competition Act to any merger, amalgamation or acquisition proposed or
undertaken by us, or any enforcement proceedings initiated by CCI for alleged violation of provisions of the
Competition Act may adversely affect our business, financial condition or results of operation.
65. Investors may not be able to enforce a judgment of a foreign court against us.
50
We are incorporated under the laws of India and other than Mr. Ravi Kant Jaipuria, who is a non-resident, all of our
Directors, key management personnel and senior management personnel reside in India. Majority of our assets, and
the assets of certain of our Directors, key management personnel and other senior management, are also located in
India. Where investors wish to enforce foreign judgments in India, they may face difficulties in enforcing such
judgments. India is not a party to any international treaty in relation to the recognition or enforcement of foreign
judgments. India exercises reciprocal recognition and enforcement of judgments in civil and commercial matters
with a limited number of jurisdictions. In order to be enforceable, a judgment obtained in a jurisdiction which India
recognises as a reciprocating territory must meet certain requirements of the Civil Procedure Code, 1908 (the
“CPC”). Further, the CPC only permits enforcement of monetary decrees not being in the nature of any amounts
payable in respect of taxes or, other charges of a like nature or in respect of a fine or other penalty and does not
provide for the enforcement of arbitration awards. Judgments or decrees from jurisdictions not recognised as a
reciprocating territory by India, cannot be enforced or executed in India. Even if a party were to obtain a judgment in
such a jurisdiction, it would be required to institute a fresh suit upon the judgment and would not be able to enforce
such judgment by proceedings in execution. Further, the party which has obtained such judgment must institute the
new proceedings within three years of obtaining the judgment.
As a result, you may be unable to: (i) effect service of process outside of India upon us and such other persons or
entities; or (ii) enforce in courts outside of India judgments obtained in such courts against us and such other persons
or entities. It is unlikely that a court in India would award damages on the same basis as a foreign court if an action
is brought in India. Furthermore, it is unlikely that an Indian court would enforce foreign judgments if it viewed the
amount of damages awarded as excessive or inconsistent with Indian practice. A party seeking to enforce a foreign
judgment in India is required to obtain prior approval from the RBI to repatriate any amount recovered pursuant to
the execution of such foreign judgment, and any such amount may be subject to income tax in accordance with
applicable laws. In addition, the regulatory regime of our various international territories may have similar
restrictions on enforcement of foreign judgments.
66. Investors may be restricted in their ability to exercise pre-emptive rights under Indian law and thereby may suffer
future dilution of their ownership position.
Under the Companies Act, a company having share capital and incorporated in India must offer its holders of equity
shares pre-emptive rights to subscribe and pay for a proportionate number of shares to maintain their existing
ownership percentages before the issuance of any new equity shares, unless the pre-emptive rights have been waived
by adoption of a special resolution by the company. However, if the law of the jurisdiction the investors are subject
to, does not permit them to exercise their pre-emptive rights without our Company filing an offering document or
registration statement with the applicable authority in such jurisdiction, the investors will be unable to exercise their
pre-emptive rights unless our Company makes such a filing. If we elect not to file a registration statement, the new
securities may be issued to a custodian, who may sell the securities for the investor’s benefit. The value such
custodian receives on the sale of such securities and the related transaction costs cannot be predicted. In addition, to
the extent that the investors are unable to exercise pre-emptive rights granted in respect of the Equity Shares held by
them, their proportional interest in the Company would be reduced.
67. Under Indian law, foreign investors are subject to investment restrictions that limit our ability to attract foreign
investors, which may adversely affect the trading price of the Equity Shares.
Under foreign exchange regulations currently in force in India, transfer of shares between non-residents and
residents are freely permitted (subject to certain exceptions), if they comply with the valuation and reporting
requirements specified by the RBI. If a transfer of shares is not in compliance with such requirements and does not
fall under any of the exceptions specified by the RBI, then the RBI’s prior approval is required. Additionally,
shareholders who seek to convert Rupee proceeds from a sale of shares in India into foreign currency and repatriate
that foreign currency from India require a no-objection or a tax clearance certificate from the Indian income tax
authorities. We cannot assure you that any required approval from the RBI or any other governmental agency can be
obtained on any particular terms or at all.
68. You may be subject to Indian taxes arising out of capital gains on the sale of the Equity Shares.
Under current Indian tax laws, unless specifically exempted, capital gains arising from the sale of Equity Shares in
an Indian company are generally taxable in India. Any gain realized on the sale of listed equity shares on a stock
exchange held for more than 12 months will not be subject to capital gains tax in India if Securities Transaction Tax
(“STT”) has been paid on the transaction. STT will be levied on and collected by a domestic stock exchange on
which the Equity Shares are sold. Any gain realized on the sale of equity shares held for more than 12 months, which
are sold other than on a recognized stock exchange and on which no STT has been paid to an Indian resident, will be
subject to long term capital gains tax in India.
Further, any gain realized on the sale of listed equity shares held for a period of 12 months or less will be subject to
short term capital gains tax in India. Capital gains arising from the sale of the Equity Shares will be exempt from
51
taxation in India in cases where the exemption from taxation in India is provided under a treaty between India and
the country of which the seller is resident. Generally, Indian tax treaties do not limit India’s ability to impose tax on
capital gains. As a result, residents of other countries may be liable for tax in India as well as in their own
jurisdiction on a gain upon the sale of the Equity Shares.
69. The occurrence of natural or man-made disasters could adversely affect our results of operations and financial
condition.
The occurrence of natural disasters, including tsunami, cyclones, storms, floods, earthquakes, tornadoes, fires,
explosions, pandemic disease and man-made disasters, including acts of terrorism and military actions, could
adversely affect our results of operations or financial condition, including in the following respects:
A natural or man-made disaster could result in damage to our assets or losses in our projects, or the failure
of our counterparties to perform, or cause significant volatility in global financial markets.
Pandemic disease, caused by a virus such as H5N1, the “avian flu” virus, the Ebola virus, or H1N1, the
“swine flu” virus, could have a severe adverse effect on our business. Also as an agricultural based
business, we could be adversely affected by a serious outbreak of disease in cows (for example, foot and
mouth disease).
Political tension, civil unrest, riots, acts of violence, situations of war or terrorist activities may result in
disruption of services and may potentially lead to an economic recession and/or impact investor confidence.
Risks related to the Offer
70. The Equity Shares have never been publicly traded, and, after the Offer, the Equity Shares may experience price
and volume fluctuations, and an active trading market for the Equity Shares may not develop. Further, the price
of the Equity Shares may be volatile, and you may be unable to resell the Equity Shares at or above the Offer
Price, or at all.
Prior to the Offer, there has been no public market for the Equity Shares, and an active trading market on the Stock
Exchanges may not develop or be sustained after the Offer. Listing and quotation does not guarantee that a market
for the Equity Shares will develop, or if developed, the liquidity of such market for the Equity Shares. The Offer
Price of the Equity Shares is proposed to be determined through a book-building process and may not be indicative
of the market price of the Equity Shares at the time of commencement of trading of the Equity Shares or at any time
thereafter. The market price of the Equity Shares may be subject to significant fluctuations in response to, among
other factors, variations in our operating results of our Company, market conditions specific to the industry we
operate in, developments relating to India, volatility in the securities markets in India and other jurisdictions,
variations in the growth rate of financial indicators, variations in revenue or earnings estimates by research
publications, and changes in economic, legal and other regulatory factors.
71. The Offer Price of the Equity Shares may not be indicative of the market price of the Equity Shares after the
Offer.
The Offer Price of the Equity Shares will be determined by our Company in consultation with the Selling
Shareholders and the BRLMs through the Book Building Process. This price will be based on numerous factors, as
described under “Basis for Offer Price” on page 110 and may not be indicative of the market price for the Equity
Shares after the Offer. The market price of the Equity Shares could be subject to significant fluctuations after the
Offer, and may decline below the Offer Price. We cannot assure you that the investor will be able to resell their
Equity Shares at or above the Offer Price.
72. Any future issuance of Equity Shares, or convertible securities or other equity linked securities by us and any sale
of Equity Shares by our Promoters or significant shareholders may dilute your shareholding and adversely affect
the trading price of the Equity Shares.
After the completion of the Offer, our Promoters and significant shareholders will own, directly and indirectly,
approximately 85.19% of our outstanding Equity Shares. Any future issuance of the Equity Shares, convertible
securities or securities linked to the Equity Shares by us may dilute your shareholding in the Company, adversely
affect the trading price of the Equity Shares and our ability to raise capital through an issue of our securities. In
addition, any perception by investors that such issuances or sales might occur could also affect the trading price of
the Equity Shares. No assurance may be given that we will not issue additional Equity Shares. The disposal of
Equity Shares by any of our significant shareholders, or the perception that such sales may occur may significantly
affect the trading price of the Equity Shares. Except as disclosed in “Capital Structure” on page 83, no assurance
may be given that our significant shareholders will not dispose of, pledge or encumber their Equity Shares in the
future.
52
Prominent Notes
1. Public Offer of up to 25,000,000 Equity Shares for cash at price of ₹ [●] (including a premium of ₹ [●]) aggregating
to ₹ [●] comprising of Fresh Issue of up to 15,000,000 Equity Shares aggregating up to ₹ [●] million by our
Company and an Offer of Sale of up to 10,000,000 Equity Shares aggregating up to ₹ [●] by the Selling
Shareholders. The Offer comprises a Net Offer to the public of up to 24,500,000 Equity Shares and a reservation of
500,000 Equity Shares for subscription by Eligible Employees, not exceeding 5% of our post Offer paid up Equity
Share capital. The Offer will constitute 13.74% of the post-Offer paid-up Equity Share capital of our Company and
the Net Offer will constitute 13.47% of the post-Offer paid-up Equity Share capital of our Company.
2. As of June 30, 2016, the Company’s net worth was ₹ 13,264.80 million as per the Company’s Restated Consolidated
Financial Statements and ₹ 15,330.62 million as per the Restated Standalone Financial Statements.
3. As of June 30, 2016, the net asset value per Equity Share was ₹ 97.77 as per the Company’s Restated Consolidated
Financial Statements and ₹ 113.00 as per the Restated Standalone Financial Statements.
4. As of June 30, 2016, the net asset value per Equity Share (post conversion)* was ₹79.45 on a restated consolidated
basis and ₹91.83 on a restated standalone basis.
*The accounting ratios have been calculated considering the impact of the abovementioned changes (Note I) in the capital
structure subsequent to June 30, 2016. The date of issuance of Equity Shares has been assumed to be same as the date on which
the underlying instrument was issued.
5. The average cost of acquisition of Equity Shares currently held by each of our Promoters is as follows:
S. N. Name of Promoter Average cost of acquisition (in ₹)
1. RJ Corp 43.32
2. Ravi Kant Jaipuria Not applicable
3. Varun Jaipuria 5.66*
4. Ravi Kant Jaipuria & Sons (HUF) 5.66*
* The average cost of acquisition per Equity Share currently held by our Promoters has been calculated by taking the average
of the amounts paid in cash by each of our Promoters to acquire the Equity Shares and where such Equity Shares were
allotted/transferred pursuant to any merger schemes, (i) the cost incurred in acquiring the equity shares of such merged
entities; or (ii) the cost incurred by such merged entity in acquiring the Equity Shares, as the case may be. For details in
relation to build-up of shareholding of our Promoters in our Company, see “Capital Structure” on page 83.
6. Our Company was incorporated as Varun Beverages Limited on June 16, 1995 at New Delhi as a public limited
company under the Companies Act, 1956. For more details, see “History and Certain Corporate Matters” on page
162.
7. For details of related party transactions entered into by the Company with our Promoters, Group Companies and
Subsidiaries in the last financial year, including nature and cumulative value of the transactions, see “Restated
Consolidated Financial Statements – Related Party Transactions” on page 303.
8. Except as disclosed in “Our Group Companies” and “Restated Consolidated Financial Statements – Related Party
Transactions” on pages 194 and 303, respectively, none of our Group Companies have business interest or other
interests in our Company.
9. There have been no financing arrangements whereby our Promoter Group, directors of RJ Corp, our Directors and
their relatives have financed the purchase by any other person of securities of the Company other than in normal
course of the business of the financing entity during the period of six months immediately preceding the date of the
Draft Red Herring till the date of the Red Herring Prospectus.
10. For any complaints, information or clarifications pertaining to the Offer, investors may contact the GCBRLMs and
the BRLM who have submitted the due diligence certificate to the SEBI.
53
SECTION III: INTRODUCTION
SUMMARY OF INDUSTRY
The information in this section includes extracts from publicly available information, data and statistics and has been derived
from various government publications and industry sources, including reports that have been published by Euromonitor
International Limited titled “Soft Drinks in India” dated March 2016 and certain other industry global data relating to the
soft drinks industry provided by Euromonitor International Limited in conjunction with the foregoing report (collectively
referred to herein as,”Euromonitor Report”). The information has not been independently verified by us, the Book Running
Lead Managers, or any of our or their respective affiliates or advisors. The information may not be consistent with other
information compiled by third parties within or outside India. The data may have been re-classified by us for the purposes of
presentation. Industry sources and publications generally state that the information contained therein has been obtained from
sources generally believed to be reliable, but that their accuracy, completeness and underlying assumptions are not
guaranteed and their reliability cannot be assured. Industry sources and publications are also prepared based on information
as of specific dates and may no longer be current or reflect current trends. Industry sources and publications may also base
their information on estimates, projections, forecasts and assumptions that may prove to be incorrect. Accordingly, investors
should not place undue reliance on, or base their investment decision on this information.
Unless stated otherwise, all the industry and market data in this section have been obtained or derived from Euromonitor
Report as defined above. Information in this RHP on the Soft Drinks markets is from independent market research carried out
by Euromonitor International Limited but should not be relied upon in making, or refraining from making, any investment
decision.
Indian Economy
The International Monetary Fund places India’s growth at 7.6% in the year ended March 31, 2016 and estimates a growth of
7.4% for 2016 and 2017. (Source: World Economic Outlook Update for July 2016. Available at
https://www.imf.org/external/pubs/ft/weo/2016/update/02/). As per IMF’s estimates in April 2016, there is a gradual increase
in the global weight of fast growing countries such as India and China which plays a role in boosting global growth. It is
estimated that the growth of Indian economy will continue to be driven by private consumption, which has benefited from
lower energy prices and higher real incomes. With the revival of sentiment and pickup in industrial activity, a recovery of
private investment is expected to further strengthen growth. (Source: World Economic Outlook Update for April 2016.
Available at http://www.imf.org/external/pubs/ft/weo/2016/01/)
World soft drinks market
The soft drink market majorly comprises of bottled water, carbonates, packaged juices, ready to drink tea and coffee. The
world soft drink market grew from 564,993 million litres in 2010 to 667,963 million litres in 2015, at a CAGR of 3.4% by
volume. In terms of value, the soft drink market grew from US$ 732,766 million in 2010 to US$ 782,224 million in 2015, at a
CAGR of 1.3%. In 2015, the per capita consumption of global soft drink market was 91.9 litres. It is expected to reach 103.0
litres in 2020. (Source: Euromonitor Report)
In terms of per capita consumption of soft drinks, Asian and African economies are well behind mature markets like US and
Germany. India, Sri Lanka, Zambia, Morocco, Mozambique and Nepal are forecasted to grow at a much faster rate than the
world average of 2.3%, with markets like India and Nepal forecasted to grow in high double digits. (Source: Euromonitor
Report)
Soft Drinks in India – Industry Overview
The soft drinks market in India is underdeveloped in terms of total per capita consumption of 9.4 litres in 2015, compared to
the more mature markets such as U.S. and Germany, with per capita consumption of 347.3 litres and 291.9 litres, respectively,
in such period. It is expected to almost double and reach 18.4 litres in 2020. In 2015, the total off-trade and on-trade sales of
soft drinks in India was 12,081 million litres. During the period of 2010-2015, the total off-trade and on-trade sales by volume
grew at a CAGR of 17.9% and by value grew at a CAGR of 18.7%. As a trend, the sale of soft drinks is higher during the
summer months of April to June. According to Euromonitor International, with the end of winter and the resultant rising
temperatures during summer months, soft drinks manufacturers, especially carbonates players, record strong sales. The
Euromonitor Report, while noting that the growth in 2015 was slightly slower than 2014 due to untimely monsoons, estimates
that the soft drinks industry in India will witness further growth in the next few years. (Source: Euromonitor Report)
HISTORICAL TRENDS
The overall soft drinks market in India saw aggregate sales of 12,081 million litres, worth ₹ 524.3 billion in the year 2015.
The main segments constituting the soft drinks market in India are carbonates, juices and bottled water, which together
accounted for over 99% of the total volumes sold in 2015. The remaining is divided among products such as ready-to-drink
coffee and tea, concentrates and sports and energy drinks. (Source: Euromonitor Report)
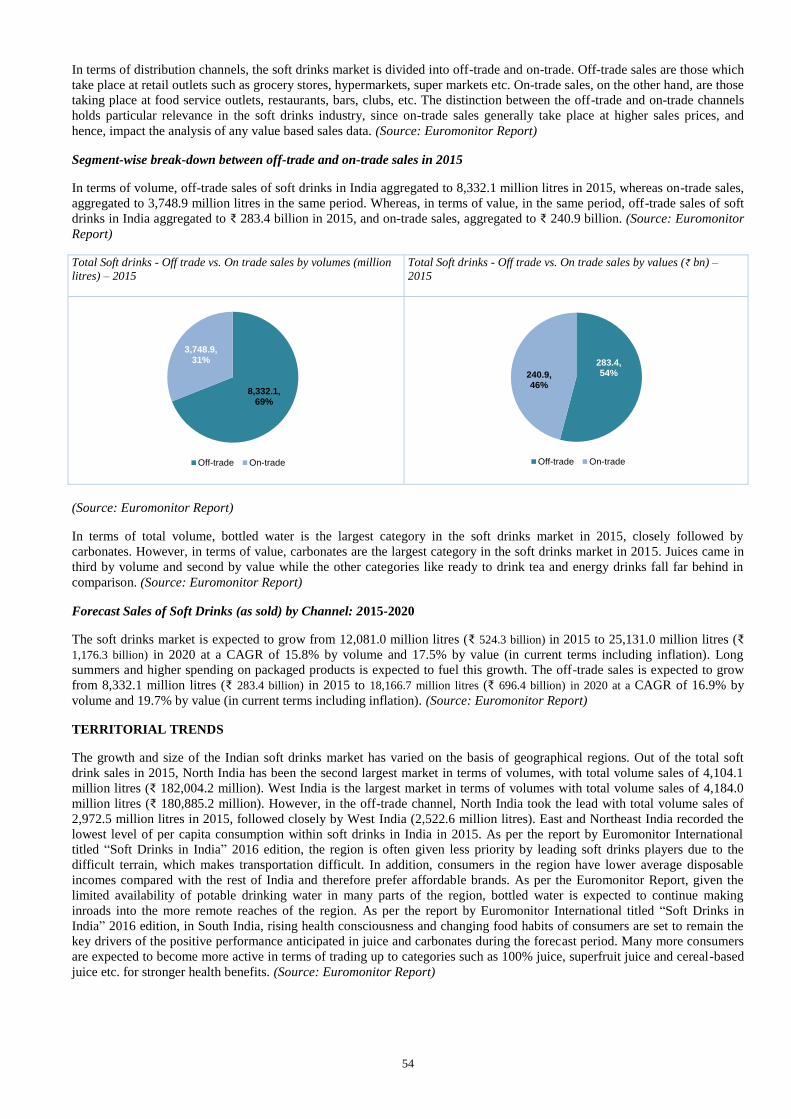
54
In terms of distribution channels, the soft drinks market is divided into off-trade and on-trade. Off-trade sales are those which
take place at retail outlets such as grocery stores, hypermarkets, super markets etc. On-trade sales, on the other hand, are those
taking place at food service outlets, restaurants, bars, clubs, etc. The distinction between the off-trade and on-trade channels
holds particular relevance in the soft drinks industry, since on-trade sales generally take place at higher sales prices, and
hence, impact the analysis of any value based sales data. (Source: Euromonitor Report)
Segment-wise break-down between off-trade and on-trade sales in 2015
In terms of volume, off-trade sales of soft drinks in India aggregated to 8,332.1 million litres in 2015, whereas on-trade sales,
aggregated to 3,748.9 million litres in the same period. Whereas, in terms of value, in the same period, off-trade sales of soft
drinks in India aggregated to ₹ 283.4 billion in 2015, and on-trade sales, aggregated to ₹ 240.9 billion. (Source: Euromonitor
Report)
Total Soft drinks - Off trade vs. On trade sales by volumes (million
litres) – 2015
Total Soft drinks - Off trade vs. On trade sales by values (₹ bn) –
2015
(Source: Euromonitor Report)
In terms of total volume, bottled water is the largest category in the soft drinks market in 2015, closely followed by
carbonates. However, in terms of value, carbonates are the largest category in the soft drinks market in 2015. Juices came in
third by volume and second by value while the other categories like ready to drink tea and energy drinks fall far behind in
comparison. (Source: Euromonitor Report)
Forecast Sales of Soft Drinks (as sold) by Channel: 2015-2020
The soft drinks market is expected to grow from 12,081.0 million litres (₹ 524.3 billion) in 2015 to 25,131.0 million litres (₹
1,176.3 billion) in 2020 at a CAGR of 15.8% by volume and 17.5% by value (in current terms including inflation). Long
summers and higher spending on packaged products is expected to fuel this growth. The off-trade sales is expected to grow
from 8,332.1 million litres (₹ 283.4 billion) in 2015 to 18,166.7 million litres (₹ 696.4 billion) in 2020 at a CAGR of 16.9% by
volume and 19.7% by value (in current terms including inflation). (Source: Euromonitor Report)
TERRITORIAL TRENDS
The growth and size of the Indian soft drinks market has varied on the basis of geographical regions. Out of the total soft
drink sales in 2015, North India has been the second largest market in terms of volumes, with total volume sales of 4,104.1
million litres (₹ 182,004.2 million). West India is the largest market in terms of volumes with total volume sales of 4,184.0
million litres (₹ 180,885.2 million). However, in the off-trade channel, North India took the lead with total volume sales of
2,972.5 million litres in 2015, followed closely by West India (2,522.6 million litres). East and Northeast India recorded the
lowest level of per capita consumption within soft drinks in India in 2015. As per the report by Euromonitor International
titled “Soft Drinks in India” 2016 edition, the region is often given less priority by leading soft drinks players due to the
difficult terrain, which makes transportation difficult. In addition, consumers in the region have lower average disposable
incomes compared with the rest of India and therefore prefer affordable brands. As per the Euromonitor Report, given the
limited availability of potable drinking water in many parts of the region, bottled water is expected to continue making
inroads into the more remote reaches of the region. As per the report by Euromonitor International titled “Soft Drinks in
India” 2016 edition, in South India, rising health consciousness and changing food habits of consumers are set to remain the
key drivers of the positive performance anticipated in juice and carbonates during the forecast period. Many more consumers
are expected to become more active in terms of trading up to categories such as 100% juice, superfruit juice and cereal-based
juice etc. for stronger health benefits. (Source: Euromonitor Report)
8,332.1, 69%
3,748.9, 31%
Off-trade On-trade
283.4, 54%240.9,
46%
Off-trade On-trade
55
RURAL VERSUS URBAN TRENDS
As per the report by Euromonitor International titled “Soft Drinks in India” 2016 edition, in rural areas most of the soft
drinks, especially carbonates and concentrates are growing well, despite higher price sensitivity and greater preference for
conventional beverages versus their urban counterparts. Consumers in rural areas continued to become more aware of the
brands or became brand loyal in soft drinks. Consumption growth in rural areas increased at a faster pace compared to urban
locations. For many categories in soft drinks, manufacturers started to target rural consumers in order to increase sales
volumes. However, electricity and refrigeration are the primary hurdles for selling soft drinks in villages. These issues have
been tackled to a large extent by soft drinks companies like Coca-Cola and PepsiCo by providing coolers to stock their
products. In 2015, rural areas constituted about 24.3% and urban areas constituted about 75.7% of the total off-trade volume
sales of soft drinks in India. (Source: Euromonitor Report)
The gap between rural and urban consumers continued to shrink day by day with manufacturers’ increased interest in rural
markets and the readiness of consumers to spend on these soft drink options. This has increased the penetration of urban-
based popular soft drinks products in rural markets as well. (Source: Euromonitor Report)
PRODUCT WISE TRENDS
Carbonates
The total sale of carbonates in India in 2015 aggregated to 4,577.7 million litres worth ₹ 251.1 billion, recording a growth of
8.6% and 10.9% by volume and value respectively in the year. (Source: Euromonitor Report). Out of this, the off-trade
channel contributed to about 60.5% by volume but only about 41.5% by value. Further, cola carbonates held about 40.5% of
the off-trade volume sales of carbonates, in 2015. Among non-cola carbonates, lemonade/lime carbonates held close to 36.5%
of the off-trade volume sales of carbonates, in 2015. Within the carbonates category, other non-cola carbonates registered the
maximum growth at a CAGR of 16.1% by volume during the 2010-15 period and lemonade/lime based drinks grew at a
CAGR of 15.4% by volume during the same period. (Source: Euromonitor Report)
Outlook
The total carbonates segment grew at a CAGR of 10.7% by volume in the five year period between 2010 and 2015. However,
it is likely to grow at a CAGR of 7.8% by volume over the period 2015 to 2020. Lemonade/lime based carbonates are poised
to grow at a projected CAGR of 10.7% by volume in the period 2015 to 2020, with other non-cola carbonates poised to grow
at a projected CAGR of 11.7% by volume in this period. Cola based carbonates, on the other hand, are likely to grow at a
CAGR of 6.1% in this period. (Source: Euromonitor Report). North India is expected to deliver highest volume and value (at
current prices including inflation) growth of 8.6% and 10.9% for the period between 2015 and 2020. (Source: Euromonitor
Report)
Bottled Water
The total off-trade sale of bottled water in India in 2015 aggregated to 3,905.8 million litres worth ₹ 60.8 billion. On-trade
sales of bottled water in India in 2015 aggregated to 1,700.7 million litres worth ₹ 60.5 billion. The total sales of bottled water
grew at a CAGR of 25.4% by volume and 31.2% by value during the period of 2010-15. The key drivers to the growth of
bottled water were increasing awareness and rising consciousness among consumers about water borne diseases. A large
number of consumers in the urban areas without water purifiers at home bought bulk water bottles of 20 litres on a more
frequent basis in 2015. Companies preferred bottled water over installing water purifiers due to absence of any maintenance
required. (Source: Euromonitor Report).
Outlook
In the bottled water segment, off-trade sales is likely to grow at a CAGR of 20.2% by volume and 22.2% by value (in current
terms including inflation) over the period between 2015 and 2020 to reach 9,794.5 million litres (worth ₹ 165.6 billion in
current terms including inflation) in 2020. On-trade sales are likely to grow at a CAGR of 17.3% and 19.8% by volume and
value (at current prices, including inflation) respectively, during the 2015-20 period. On-trade volume growth of 21.2%
slightly trails the 23.8% off-trade volume increase in 2015. (Source: Euromonitor Report)
Juice segment
The total sale of juice in India in 2015 aggregated to 1,801.6 million litres worth ₹ 131,538.6 million. The juice segment of
the soft drinks market in India is divided into three main categories: 100% juice, nectars and juice drinks. Of these, juice
drinks aggregated up to 1,478.8 million litres worth ₹ 95,363.7 million in 2015, constituting 82.1% and 72.5% of the total
juice market in India in terms of volume and value, respectively. Juice drinks have grown at a CAGR of 21.9% by volume in
the period 2010-2015, marginally above the overall juice segment CAGR of 21.6% in the same period. However, 100% juice
emerged as the fastest growing in the period 2010-2015, with a retail growth of 25.1% by volume. (Source: Euromonitor
Report)
56
Outlook
According to the Euromonitor Report, the Indian juice industry is likely to grow at CAGR of 21.5% and 26.0%, by total
volume and value (at current prices including inflation) respectively, over the five year period from 2015 to 2020. The
following is the break-down of the growth in various categories of the juice market over this period: (Source: Euromonitor
Report)
MARKET OUTLOOK
The growing focus on rural and semi-urban markets from all major players has helped improve product penetration. This has
also led to customisation of products. Soft drinks manufacturers are likely to introduce the customisation of soft drinks based
on the specific requirements of rural consumers. For example, manufacturers would launch smaller pack sizes and soft drinks
in glass bottles to make the products available at lower price points. (Source: Euromonitor Report). The Indian soft drinks
industry is likely to reach 25,131.0 million litres (worth ₹ 11,76,321.2 million) by 2020. This implies a growth with CAGR of
15.8% and 17.5% by volume and value (at current prices including inflation) respectively, over the five year period from
2015 to 2020.
Competition in the soft drinks market in India
Multinational companies Coca-Cola and PepsiCo have occupied the first and second positions respectively in the off-trade
soft drinks market in India in the period between 2011 and 2015, with a market share of 34.6% and 21.1% respectively, in
2015. The third place has been held by Parle Bisleri, with an off-trade market share of 10.8% by volume in 2015, all of which
can be attributed to its mineral water brand Bisleri. (Source: Euromonitor Report)
57
SUMMARY OF BUSINESS
Some of the information in the following discussion, including information with respect to our plans and strategies, contain
forward-looking statements that involve risks and uncertainties. You should read the section “Forward-Looking Statements”
on page 20 for a discussion of the risks and uncertainties related to those statements and also the section “Risk Factors”
beginning on page 22 for a discussion of certain factors that may affect our business, financial condition or results of
operations. Our actual results may differ materially from those expressed in or implied by these forward-looking statements.
Our fiscal year ends on December 31 of each year, and references to a particular Fiscal are to the twelve-month period
ended December 31 of that year.
Unless the context otherwise requires, in this section, references to “we”, “us” or “our” refers to Varun Beverages Limited
and its subsidiaries on a consolidated basis, and includes references to entities that have merged with, or that have been
acquired by, our Company, including Devyani Beverages Limited, Varun Beverages (Nepal) Private Limited, North East
Pure Drinks Private Limited, Varun Beverages (International) Limited, Varun Beverages Mozambique, Limitada, Varun
Beverages (Zambia) Limited and Varun Beverages (Zimbabwe) (Private) Limited. Unless the context otherwise requires,
references to our “Company” refers to Varun Beverages Limited on a standalone basis. Unless otherwise indicated, all
financial information included herein are based on our Restated Consolidated Financial Statements included in this Red
Herring Prospectus beginning on page 210. Unless the context otherwise requires, any financial information included herein
have been derived from our Restated Standalone Financial Statements for Fiscal 2011 and from our Restated Consolidated
Financial Statements for Fiscal 2012, 2013, 2014, 2015, the six months ended June 30, 2015 and the six months ended June
30, 2016.
The Sales Volume information presented in this section represents sales to our customers in our licensed territories but does
not include any sales to PepsiCo or any other franchisees of PepsiCo. Sales to PepsiCo and / or other PepsiCo franchisees
are reflected in our revenues from operations. However, such sales have not been significant in the last five Fiscals and in the
six months ended June 30, 2016. We do not make any such sales other than in India. Sales Volume information in any Fiscal
period included in this section cannot be directly correlated to our revenues from operations in the respective Fiscal.
Overview
We are one of the largest franchisee in the world (outside USA) of carbonated soft drinks (“CSDs”) and non-carbonated
beverages (“NCBs”) sold under trademarks owned by PepsiCo. We produce and distribute a wide range of CSDs, as well as a
large selection of NCBs, including packaged drinking water. PepsiCo CSD brands produced and sold by us include Pepsi,
Diet Pepsi, Seven-Up, Mirinda Orange, Mirinda Lemon, Mountain Dew, Mountain Dew Game Fuel, Seven-Up Nimbooz
Masala Soda, Seven-Up Revive and Evervess. PepsiCo NCB brands produced and sold by us include Tropicana Slice,
Tropicana Frutz (Lychee, Apple and Mango), Nimbooz as well as packaged drinking water under the brand Aquafina. In
addition, we have also been granted the franchise for Ole brand of PepsiCo products in Sri Lanka.
We have been associated with PepsiCo since the 1990s and have over two and half decades consolidated our business
association with PepsiCo, increasing the number of licensed territories and sub-territories covered by us, producing and
distributing a wider range of PepsiCo beverages, introducing various SKUs in our portfolio, and expanding our distribution
network. As of June 30, 2016, we have been granted franchises for various PepsiCo products across 17 States and two Union
Territories in India. India is our largest market and contributed 82.48%, 80.67%, 84.38% and 83.46% of our revenues from
operations (net) in Fiscal 2013, Fiscal 2014, Fiscal 2015, and in the six months ended June 30, 2016, respectively. We have
also been granted the franchise for various PepsiCo products for the territories of Nepal, Sri Lanka, Morocco, Mozambique
and Zambia. In addition, we are in the process of setting up a greenfield facility in Zimbabwe in anticipation of franchise
rights being granted by PepsiCo Inc. for such territory. For further information on our franchise arrangements with PepsiCo
India / PepsiCo Inc. and / or the PepsiCo International Entities, see “Our Business – Relationship with PepsiCo” on page 136.
According to the Euromonitor Report, the beverage markets in India, Nepal, Morocco and Sri Lanka are some of the fastest
growing beverage markets in the world. (Source: Euromonitor Report). Our demonstrated ability to grow PepsiCo product
sales in our territories and sub-territories has led to PepsiCo India / PepsiCo Inc. and / or the PepsiCo International Entities
licensing additional franchises to us, including sub-territories in India that were earlier directly operated by PepsiCo or by
third-party bottlers. PepsiCo soft drinks total volume sales (based on sales to end consumers) in India was 1,654.9 million
litres in Fiscal 2011 and 2,688.1 million litres in Fiscal 2015. (Source: Euromonitor Report). Our Sales Volumes in our sub-
territories in India were 437.90 million litres (equivalent to 77.12 million unit cases) in Fiscal 2011 and 1,186.04 million litres
(equivalent to 208.88 million unit cases) in Fiscal 2015. Based on the Sales Volume of our products in our sub-territories in
India in Fiscal 2011 and Fiscal 2015 and Euromonitor Report data on PepsiCo soft drinks total volume sales (based on sales
to end consumers) in India in these years, our share of PepsiCo soft drinks total volume sales in India increased from 26.46%
in Fiscal 2011 to 44.12% in Fiscal 2015. Until February 2015, our licensed sub-territories in India included Delhi, Rajasthan,
West Bengal, Goa, Arunachal Pradesh, Assam, Meghalaya, Manipur, Mizoram, Nagaland, Tripura as well as certain
designated parts of the following sub-territories: Madhya Pradesh, Uttar Pradesh, Uttarakhand, Haryana and Maharashtra
(collectively, the “2015 Existing India Sub-Territories”). As part of PepsiCo's strategy of consolidating certain PepsiCo-
operated sub-territories in India under long-term bottling partners, pursuant to a business transfer agreement entered into with
58
PepsiCo India in November 2014, we were granted, with effect from February 28, 2015, franchises for the following
additional sub-territories in India: Punjab, Himachal Pradesh, Chandigarh UT, as well as the remaining parts of the following
sub-territories: Haryana, Uttarakhand and Uttar Pradesh (collectively, the “2015 New India Sub-Territories”). We believe
that our operational experience, widespread integrated distribution network and market knowledge adds significant value to
the distribution and sale of PepsiCo products in India, and we continue to leverage our long association with PepsiCo to
evaluate new beverages, packaging, SKUs and markets as consumer preferences evolve.
As of June 30, 2016, we operated 16 production facilities across India and five production facilities in our international
licensed territories. As of June 30, 2016, we had an estimated aggregate annual production capacity of 3,438.38 million litres
(equivalent to 605.56 million unit cases) in India and an estimated aggregate annual production capacity of 991.57 million
litres (equivalent to 174.63 million unit cases) in our international production facilities. In addition, we have set up backward
integration facilities for production of preforms, crowns, corrugated boxes and pads, plastic crates and shrink-wrap films in
certain of our production facilities to ensure operational efficiencies and quality standards. Additionally, we have two
facilities dedicated to backward integration located at Jaipur and Alwar which manufacture crowns, plastic shells, corrugated
boxes and pads and shrink wrap film. We have over the years developed a wide-spread, integrated distribution network across
our licensed territories and sub-territories. As of June 30, 2016 our distribution network in India included 60 depots and 1,438
delivery vehicles. Our distribution network covers urban, semi-urban and rural markets, targeting a wide range of consumers.
We have also developed an extensive distribution network in our international markets which as of June 30, 2016 included 20
depots and 518 delivery vehicles. As of June 30, 2016, we had 562 primary distributors (i.e., distributors that recorded sales in
excess of 0.5 million litres of our PepsiCo beverages in the 12 months ended June 30, 2016) in India and 415 distributors in
our international operations. The 562 primary distributors in India accounted for 74.36% of our aggregate Sales Volumes in
India in the 12 months ended June 30, 2016.
In Fiscal 2013, Fiscal 2014, Fiscal 2015, and in the six months ended June 30, 2016, CSD Sales Volumes were 724.30 million
litres (equivalent to 127.56 million unit cases), 805.48 million litres (equivalent to 141.85 million unit cases), 1,111.50
million litres (equivalent to 195.76 million unit cases), and 857.90 million litres (equivalent to 151.08 million unit cases),
respectively, NCB Sales Volumes were 63.91 million litres (equivalent to 11.26 million unit cases), 71.60 million litres
(equivalent to 12.61 million unit cases), 82.11 million litres (equivalent to 14.46 million unit cases), and 63.70 million litres
(equivalent to 11.22 million unit cases), respectively, while packaged drinking water Sales Volumes were 83.23 million litres
(equivalent to 14.66 million unit cases), 87.04 million litres (equivalent to 15.33 million unit cases), 167.51 million litres
(equivalent to 29.50 million unit cases), and 122.44 million litres (equivalent to 21.56 million unit cases), respectively.
We are part of the RJ Corp group, a diversified business conglomerate with interests in beverages, quick-service restaurants,
dairy and healthcare. Our Promoter and Chairman, Mr. Ravi Kant Jaipuria has an established reputation as an entrepreneur
and business leader and is the only Indian company’s promoter to receive PepsiCo's International Bottler of the Year award,
which was awarded in 1997.
In Fiscal 2013, Fiscal 2014, Fiscal 2015, and in the six months ended June 30, 2016, we had revenues from operations (net) of
₹ 21,151.49 million, ₹ 25,024.07 million, ₹ 33,941.49 million and ₹ 25,296.58 million, respectively. In the period Fiscal 2011
to Fiscal 2015, revenues from operations (net) increased at a CAGR of 31.15%. In Fiscal 2013, Fiscal 2014, Fiscal 2015, and
in the six months ended June 30, 2016, EBITDA was ₹ 3,093.18 million, ₹ 4,001.06 million, ₹ 6,498.59 million and ₹
6,101.96 million, respectively. While we incurred a loss after tax in Fiscal 2013 and 2014 of ₹ 395.30 million and ₹ 201.56
million, respectively, we recorded a net profit of ₹ 870.38 million in Fiscal 2015 and a profit of ₹ 2,097.45 million in the six
months ended June 30, 2016.
Our Strengths
Demonstrated ability to grow Sales Volumes
We have been associated with PepsiCo since the 1990s and have over two and half decades consolidated our business
association with PepsiCo, increasing the number of licensed territories and sub-territories covered by us, producing and
distributing a wider range of PepsiCo beverages, introducing various SKUs in our portfolio, and expanding our distribution
network. As of June 30, 2016, we have been granted franchises for various PepsiCo products across 17 States and two Union
Territories. We have also successfully leveraged our association with PepsiCo to expand our operations internationally and
have been granted franchises for PepsiCo products in Nepal, Sri Lanka, Morocco, Zambia and Mozambique. In addition, we
are in the process of setting up a greenfield facility in Zimbabwe in anticipation of franchise rights being granted by PepsiCo
Inc. for such territory. Our total Sales Volumes have grown at a CAGR of 32.78% from 437.90 million litres (equivalent to
77.12 million unit cases) in Fiscal 2011 to 1,361.12 million litres (equivalent to 239.72 million unit cases) in Fiscal 2015. The
Sales Volumes in our 2015 Existing India Sub-Territories grew by volume from 437.90 million litres (equivalent to 77.12
million unit cases) in Fiscal 2011 to 759.46 million litres (equivalent to 133.76 million unit cases) in Fiscal 2015. 2015
Existing India Sub-Territories includes the sub-territories in India that were granted to us prior to Fiscal 2011, the Goa and
North East sub-territories which were merged into our Company pursuant to the amalgamation of VBIL into the Company
with effect from January 1, 2012 and part of the Delhi sub-territory which was acquired with effect from January 31, 2013.
59
We work closely with PepsiCo to implement operational best practices, garner supply chain efficiencies from our large
production capacities and distribution network, and implement dynamic "push" marketing strategies taking PepsiCo products
directly to customers through retailers and point-of-sale displays, and "pull" marketing initiatives through advertisement and
promotional offers. According to Euromonitor Report, the soft drinks markets in India, Nepal, Morocco and Sri Lanka are
some of the fastest growing beverage markets in the world. (Source: Euromonitor Report). Our demonstrated ability to grow
PepsiCo product sales has led to PepsiCo India / PepsiCo Inc. and / or the PepsiCo International Entities licensing additional
territories to us, including those that were earlier directly operated by PepsiCo or by third-party bottlers. In particular, as part
of PepsiCo strategy of consolidating certain PepsiCo-operated sub-territories in India under long-term bottling partners, we
entered into a business transfer agreement with PepsiCo India in November 2014 pursuant to which we were granted the
franchise for the 2015 New India Sub-Territories. As these 2015 New India Sub-Territories are geographically contiguous
with the 2015 Existing India Sub-territories, we are able to benefit from cost and operational efficiencies as well as benefits of
economies of scale. We are able to optimize the freight, transportation and distribution costs over a larger territory base which
helps increase our margins. The increase in scale of our operations provides us with better bargaining power with our
suppliers and ensures better working capital management. As an added advantage, we are able to get benefits of operating
leverage through improved asset-utilization and are able to amortize head office expenses on a wider base.
Strategically located large and technologically advanced production capabilities
As of June 30, 2016, we operated 16 production facilities across India and five production facilities in our international
licensed territories. As of June 30, 2016, we had an estimated aggregate annual production capacity of 3,438.38 million litres
(equivalent to 605.56 million unit cases) in India and an estimated aggregate annual production capacity of 991.57 million
litres (equivalent to 174.63 million unit cases) in our international production facilities. These 16 production facilities also
include the Satharia – 2 production facility which we recently acquired from our co-packer in September 2016. As a result of
this acquisition, we have been able to improve our control on the quality of products and it has also enabled us to reduce
conversion charges of buying from a co-packer. We use advanced machinery and production techniques in our manufacturing
process for water treatment, packing etc. in certain of our production facilities. These techniques enable us to improve
production efficiencies and reduce personnel costs. In Fiscal 2013, 2014, 2015, and in the six months ended June 30, 2016,
we incurred capital expenditure of ₹ 6,415.92 million, ₹ 2,161.76 million, ₹ 15,324.85 million and ₹ 5,671.71 million,
respectively, primarily in connection with property, plant and equipment, in order to increase production capacities and
modernise our production facilities, as well as on visi-coolers and other chilling equipment placed with retailers and other
points of sale.
Our production facilities across India are strategically located in geographical proximity to various target markets, which
results in lower transportation and distribution expenses and enable us to leverage economies of scale. In addition, we have
set up backward integration facilities in certain of our production facilities for preforms, crowns, corrugated boxes, corrugated
pads, plastic crates and shrink wrap films to ensure operational efficiencies and quality standards. Additionally, we have two
facilities dedicated to backward integration located at Jaipur and Alwar which manufacture crowns, plastic shells, corrugated
boxes and pads and shrink wrap film. Our large and technologically advanced production capabilities provide cost and
operational efficiencies, and we comply with quality standards consistent with PepsiCo’s global production standards and
regulatory compliance policies. Our large scale of operations offers significant synergies including market knowledge
operational best practices, economies of scale, optimal investment planning and capital expenditure.
Wide spread and integrated sales and distribution network that ensures effective market penetration
Our wide spread and integrated sales and distribution network enables us to reach a wide range of consumers and ensure
effective market penetration. Points of sale for our products include traditional retail points, such as grocery stores, as well as
modern retail outlets including e-commerce, supermarkets, hypermarkets, convenience stores, bars and restaurants. As of
June 30, 2016, our distribution network in India included 60 depots and 1,438 delivery vehicles. As of June 30, 2016, we had
562 primary distributors (i.e., distributors that recorded sales in excess of 0.5 million litres of our PepsiCo beverages in the 12
months ended June 30, 2016) in India and 415 distributors in our international operations. The 562 primary distributors in
India accounted for 74.36% of our aggregate Sales Volumes in India in the 12 months ended June 30, 2016. Our distribution
network covers urban, semi-urban and rural markets, targeting a wide range of consumers. We have also developed an
extensive distribution network in our international markets which as of June 30, 2016 included 20 depots and 518 delivery
vehicles. Our distribution network is strategically located to maximize market penetration across our licensed sub-territories
in India, with an increased focus on higher growth markets such as semi-urban and rural sub-territories. We have over the
years successfully managed our large distribution network and developed strong supply and distribution chain relationships
across our licensed sub-territories in India.
Our production capabilities and distribution network enables us to effectively respond to competitive pressures, market
demand and evolving consumer preferences in our territories. Our supply chain management systems enable us to efficiently
and cost effectively manage our distribution network and allows us to introduce additional products in our markets and
implement marketing campaigns initiated by PepsiCo. We believe that our large production capacities and distribution
infrastructure will enable us to address volume growth at a relatively low incremental capital cost.

60
Significant markets with high growth potential
The soft drinks market in India is underdeveloped in terms of per capita consumption of 9.4 litres in 2015, especially when
compared to the world average of 91.9 litres and the more mature U.S. market, with a per capita consumption of 347.3 litres
in such period. (Source: Euromonitor Report). We believe there is significant growth potential for PepsiCo’s beverages in our
licensed territories in India. In North India, sales of soft drinks grew at a CAGR of 18.2% by total volume from 2010 – 2015.
(Source: Euromonitor Report). PepsiCo beverages remained among the top brands in the soft drinks market in both CSDs and
NCB segment in North India. (Source: Euromonitor Report). In East and North-east India, sales of soft drinks grew at a
CAGR of 16.1% by total volume from 2010 – 2015. (Source: Euromonitor Report). PepsiCo beverages commanded strong
market positions in 2015 as Pepsi remained amongst the most visible carbonates brands in terms of off-trade value sales and
Tropicana Slice was among the leading beverages in the NCB segment in this region. (Source: Euromonitor Report). The
total sales of bottled water in India grew at a CAGR of 25.4% by volume and 31.2% by value during the period of 2010-15.
(Source: Euromonitor Report). The key driver to the growth of bottled water was rising awareness among consumers about
water borne diseases. Many areas of the North-east India are not well equipped to provide hygienic drinking water for the
population, thus also elevating the market for bottled water. (Source: Euromonitor Report). We expect this trend to continue
as consumer disposable income increases further.
During the period of 2015-20, per capita consumption in litres of the beverage markets in India, Nepal, Sri Lanka, Morocco,
Zambia, Mozambique and Zimbabwe are expected to grow at a rate much higher than the world average of 2.3%. (Source:
Euromonitor Report). The forecasted per capita volume consumption CAGR for the period of 2015-2020 in India (14.4%),
Sri Lanka (10.8%), Morocco (11.8%), Nepal (16.1%), Mozambique (4.4%) and Zambia (4.5%), surpasses the projections of
some of the other global markets. (Source: Euromonitor Report). The Zimbabwe market, where we anticipate commencing
operations is also expected to grow at a CAGR of 4.3% in terms of per capita consumption during the 2015-2020 period.
(Source: Euromonitor Report). Within the India territory, in North India, sales of soft drinks are expected to grow at a CAGR
of 16.4% by total volume from 2015 – 2020. (Source: Euromonitor Report). In East and North-east India, it is expected to
grow at a CAGR of 14.7% total by volume from 2015 – 2020. (Source: Euromonitor Report). In India, the annual disposable
income is expected to increase by 11.5% over 2016 – 2020. (Source: Euromonitor Report). In India, the gap between rural
and urban consumers continues to diminish with manufacturers increased interest in rural markets and the readiness of
consumers to spend on these soft drink options. In 2015, the consumption growth of soft drinks in rural areas grew at a faster
pace compared to that in urban locations. (Source: Euromonitor Report). We expect such trend to continue as rural and semi-
urban consumers become aware of PepsiCo brands. This is expected to result in increased consumption of PepsiCo’s
beverages and we believe that we are well positioned to capitalize on such market growth.
Creating value through alignment with PepsiCo
PepsiCo is one of the leading international food and beverage companies with a global presence. (Source: Euromonitor
Report). PepsiCo owns some of the most visible soft drink brands in India (Source: Euromonitor Report). PepsiCo CSD
brands produced and sold by us include Pepsi, Diet Pepsi, Seven-Up, Mirinda Orange, Mirinda Lemon, Mountain Dew,
Mountain Dew Game Fuel, Seven-Up Nimbooz Masala Soda, Seven-Up Revive, and Evervess. PepsiCo NCB brands
produced and sold by us include Tropicana Slice, Tropicana Frutz (Lychee, Apple and Mango), Nimbooz as well as packaged
drinking water under the brand Aquafina.
We have been associated with PepsiCo since the 1990s and believe that our strong relationship with PepsiCo is one of our key
strengths. Our operations benefit from our long association with PepsiCo, including access to modern technology, marketing
leverage, operational know-how, industry best practices, access to raw materials and equipment at competitive prices as well
as access to experienced personnel. We have developed a strategic and operational alignment with PepsiCo across all our
functions and organization levels. In Fiscal 2015, PepsiCo’s aggregate sales volume in the carbonates, juice and bottled water
categories were 1,523.1 million litres, 498.3 million litres and 650.6 million litres. (Source: Euromonitor Report) In Fiscal
2015, our Sales Volume for CSDs, NCBs and packaged drinking water in our sub-territories in India were 955.45 million
litres (equivalent to 168.27 million unit cases), 77.62 million litres (equivalent to 13.67 million unit cases) and 152.97 million
litres (equivalent to 26.94 million unit cases), respectively (reflecting sales for the 2015 New India Sub-Territories only from
date of acquisition, i.e. for the ten month period between February 28, 2015 and December 31, 2015).
We have developed strong sales teams that work closely with PepsiCo to develop and implement local advertising and
marketing strategies and special sales schemes. PepsiCo also has an active product development team that we work with to
strategize new product launches in India. We believe that our wide consumer base and strong distribution chain relationships
enable us to contribute effectively to PepsiCo’s marketing strategy and implement these initiatives at the local distribution
and consumer level. In addition, we work closely with PepsiCo on production techniques, quality control, environmental
matters as well as new packaging and product development initiatives. We source high quality raw materials from reputed
suppliers that are pre-approved by PepsiCo India / PepsiCo Inc. and / or PepsiCo International Entities. Our key employees
also attend management and staff development programs organized by PepsiCo. For further information relating to our
relationship with PepsiCo, see “Our Business – Relationship with PepsiCo” on page 136.
61
We support PepsiCo’s initiative of “Positive Water Balance” and “Giving Back MORE WATER Than We Take”. As
confirmed by an independent audit, through rainwater harvesting, community watersheds and water conservation in
agriculture, PepsiCo saved 13.5 billion litres more water than what PepsiCo consumed, since 2009.
Experienced management team
We have a qualified and professional management team with significant experience in all operational aspects of our business.
We believe that the industry experience of our management team and their ability to deliver consistent sales growth are our
significant strengths. Our senior management team has extensive experience in the food and beverage industry in India. Our
Promoter and Chairman, Mr. Ravi Kant Jaipuria, has an established reputation as an entrepreneur and business leader and is
the only Indian company’s promoter to receive PepsiCo’s International Bottler of the Year award, in 1997. Mr. Jaipuria
provides strategic leadership to our Company and is also closely involved in our operations. We believe that our management
team’s in-depth understanding of target markets and consumer demand and preferences has enabled us to continue to grow
our business and expand our operations internationally. This experience has also enabled us to develop a business model that
incorporates aspects of both multinational as well as local beverage company operating structures.
Our Strategy
Grow our business by capitalizing on brand strength and diversifying our product portfolio
According to Euromonitor Report, Slice and Pepsi brands by PepsiCo are amongst the leading beverage brands in India.
(Source: Euromonitor Report). We will continue to leverage PepsiCo’s brand portfolio to increase market penetration in our
licensed territories. Aquafina and Pepsi were among the top six largest selling beverage brands in India in 2012, 2013, 2014
and 2015. (Source: Euromonitor Report). Mountain Dew was the fastest growing CSD brand by off-trade value in India from
2011-15 with a CAGR of 19.2%. (Source: Euromonitor Report). In Fiscal 2014 and Fiscal 2015 Mountain Dew was our
largest selling CSD beverage brand by volume and value. We believe that the relative under-penetration of Mountain Dew in
certain markets and distribution channels presents significant growth opportunities. There is a large segment of customers
switching from regular cola-carbonates to non-cola carbonates. (Source: Euromonitor Report) We intend to capitalize on this
changing market sentiment by focusing on improving the market share of Seven-Up Nimbooz Masala Soda, which was
initially launched in India in 2013, by expanding our distribution network and increasing production volumes.
We continue to leverage our ability to implement new brand and product launches for PepsiCo, particularly in the fast-
growing NCB space, to further grow our business. As consumer preferences evolve, we continue to work closely with
PepsiCo to launch new products and diversify our product portfolio. We have introduced several NCB brands in India over
the years, including Tropicana Slice, Tropicana Frutz (Lychee, Apple and Mango) and Nimbooz and have launched a range of
new flavors, packages and SKUs. Slice has been rebranded as Tropicana Slice to take advantage of the Tropicana brand with
wider recognition and stronger brand value in the NCB segment. We also continue to focus on growing Aquafina sales as the
packaged drinking water segment in India is highly fragmented and provides significant growth opportunities. In addition,
consistent with PepsiCo’s marketing and product strategy, we intend to launch certain of our products and brands in smaller
packages to target the semi-urban and rural markets in India. We aim to balance the growth of sales in large brands such as
Pepsi with an increased focus on marketing and distribution activities for relatively newer brands such as Seven-Up Nimbooz
Masala Soda, Mountain Dew and Seven-Up Revive, which provide significant growth opportunities. We continue to evaluate,
in alignment with PepsiCo’s product development strategy, growth opportunities in fruit juice based carbonated beverages.
We continue to leverage our in-depth understanding of local markets and produce and distribute beverages that address
clearly identified market opportunities.
We continue to, by expanding our product portfolio and distribution reach, focus on increasing consumption volumes,
particularly in markets and demographic segments with relatively low per capita consumption, as well as address changing
consumer preferences. We believe that our increased focus on semi-urban and rural markets, and ability to understand
consumer preferences in such markets, will enable us to further increase market penetration in these markets and segments,
resulting in organic growth.
Continue to acquire and integrate additional franchisee rights
We continue to play a significant role in the consolidation of PepsiCo’s production and distribution operations in South Asia
and Africa. We evaluate strategic acquisition opportunities for production facilities and licensing of franchisee rights for
additional territories and sub-territories in India, including for territories that were franchised to other bottlers of PepsiCo or
operated by PepsiCo directly. We entered into a business transfer agreement with PepsiCo India in November 2014 pursuant
to which we were granted the franchise for the 2015 New India Sub-Territories. We strategically target territories that either
have significant growth opportunities for PepsiCo products or are located contiguous or in close proximity to our existing
licensed territories and sub-territories such that we can benefit from operating and freight, transportation and distribution cost
efficiencies. We continue to work closely with PepsiCo to identify such strategic consolidation opportunities. We may also
consider acquisition of other third-party bottlers of PepsiCo which will require PepsiCo’s prior consent. We also continue to
explore expansion opportunities into new geographical markets, licensed territories and jurisdictions, where we can leverage
our operational experience or where low per capita consumption levels for beverages present opportunities for volume
62
growth. We believe that strategic acquisitions are effective catalysts for business growth, and take into account strategic
considerations to make investments that are complementary to our existing operations, focused on expanding our reach in
India and internationally in South Asia and Africa.
In recent years, we have expanded our operations in India through the acquisition of additional territories, with PepsiCo
granting license for additional territories to us, including territories operated directly by PepsiCo as well as third-party
bottlers. The 2015 Existing India Sub-Territories include the sub-territories in India that were granted prior to Fiscal 2011 and
the Goa and North-east sub-territories that were merged into our Company with effect from January 1, 2012. The subsidiaries
that held the franchises for the Nepal, Sri Lanka and Morocco territories were consolidated with our Company pursuant to the
amalgamation of VBIL into our Company with effect from January 1, 2012. In addition, part of the Delhi sub-territory was
acquired with effect from January 31, 2013. We have successfully integrated these territories and sub-territories into our
existing operations. As part of PepsiCo strategy of consolidating certain PepsiCo-operated territories in India under long-term
bottling partners, we entered into a business transfer agreement with PepsiCo India pursuant to which we were granted the
franchise for the 2015 New India Sub-Territories. The 2015 New India Sub-Territories are in most part geographically
contiguous with the 2015 Existing India Sub-Territories. Due to this contiguity, we are able to ensure cost and operational
efficiencies as well as economies of scale. The acquisition of franchisees for these 2015 New India Sub-Territories has
resulted in significant increase in Sales Volumes, resulting in an increase in revenues and profitability. We will continue to
focus on the integration of operations in these New India Sub-territories and any licensed territories or sub-territories we
acquire in the future with our existing production and distribution operations to benefit from operational efficiencies and
derive business synergies. We have also successfully leveraged our association with PepsiCo to expand our operations
internationally and have been granted franchisees for PepsiCo beverages in Nepal, Sri Lanka, Morocco, Zambia and
Mozambique.
Expand our distribution network and optimise distribution operations
We continue to focus on increasing Sales Volumes in our licensed territories and sub-territories by expanding our distribution
network, optimizing our distribution operations and increasing product supply to under-penetrated markets, particularly to
semi-urban and rural areas. We focus on optimal utilization of our existing distribution infrastructure by implementing
effective brand and product promotion strategies through intensive interaction with distributors, effective involvement of our
sales team at points of sale, and expanding the range of product offerings in certain markets and areas to specifically cater to
regional and local consumer preferences. As of June 30, 2016, we had 562 primary distributors (i.e., distributors that recorded
sales in excess of 0.5 million litres of our PepsiCo beverages in the 12 months ended June 30, 2016) in India and 415
distributors in our international operations. The 562 primary distributors in India accounted for 74.36% of our aggregate Sales
Volumes in India in the 12 months ended June 30, 2016. We intend to further expand our distribution network by setting up
additional distribution centers, consolidating existing distributors and increasing the number of distributors in under-
penetrated markets. We believe that these measures will enable us to increase the availability of our beverages across our
licensed territories and sub-territories which will in turn increase brand awareness and sales of PepsiCo beverages. We seek to
develop long-term relationships with our distributors by supporting the growth of their businesses, focusing on exclusive
distributor relationships and providing support services for their business such as visi-coolers, delivery vehicles and
marketing material.
We continue to focus on increasing retail presence of our licensed PepsiCo products, through increased brand promotion
activities, increased in-store product inventory as well as price competitiveness. We continue to evaluate strategic placement
of vending machines and visi-coolers at high density consumer areas such as malls, super-markets and large stores,
multiplexes and airports. The market for beverages sold from vending machines and visi-coolers for immediate consumption
is a fast growing segment, resulting from an emerging on-the-go lifestyle and consumer convenience. Single-serve sales
channels typically involve higher margins compared to sales of multi-serve SKUs. Sales in this segment depend on strategic
inventory management, rapid inventory deployment, and effective availability and placement of relevant chilling equipment
such as vending machines, visi-coolers and fountain dispensers in close proximity to high density consumer areas. We
continuously focus on placement of chilling equipment, and make significant investment annually on chilling equipment to be
placed in the market, and intend to continue to make significant investments on such equipment as we expand into new
markets and consolidate our position in existing licensed territories and sub-territories.
Continue to focus on cost efficiencies and invest in technology to improve operational efficiency
As an integral part of our continuing efforts targeted at ensuring cost efficiencies, we have undertaken a number of initiatives
aimed at reduction of cost of goods sold, effective management of operating expenses and improvement in cash flows. These
initiatives include backward integration of production facilities and having a centralised procurement team. We continue to
focus on consolidation of our production activities to ensure all components of our products are supplied internally. We have
introduced lower weight plastic bottles and decreased size of bottle caps, which has enabled us to reduce polyethylene
terephthalate (“PET”) costs. We also target increased margins through a reduction in freight and distribution costs, for
example, through introduction of a newly installed PET line at our Goa production facility. We believe this will enable us to
increase production volumes and improve operating margins. We have also acquired co-packing production facilities at
63
Phillaur in Punjab and Satharia in Uttar Pradesh. These acquisitions are expected to result in further cost savings and efficient
operations.
We continue to plan our capital expenditure carefully by focusing our investments on more profitable areas of our business,
such as chilled equipment for use in immediate-consumption channels. Through strategic capital investments for efficient
deployment of assets such as chilled equipment and distribution infrastructure, we intend to optimize the utilization of our
capital.
In addition, we continue to introduce advanced technologies in order to improve operational efficiencies and work processes
in our operations. We have introduced GPRS-enabled handheld devices and systems called SAMNA (Sales Automation
Management for the New Age) in certain of our operations to automate field work processes and enable access to real-time
sales information from production facilities, warehouses and distribution centers across India, thereby ensuring integrated
operational data from manufacturing, planned procurement and superior tracking of transportation of products from
distributors to final delivery to the retail point-of-sale. We continue to evaluate similar technologies targeted at improving
operating and cost efficiencies.
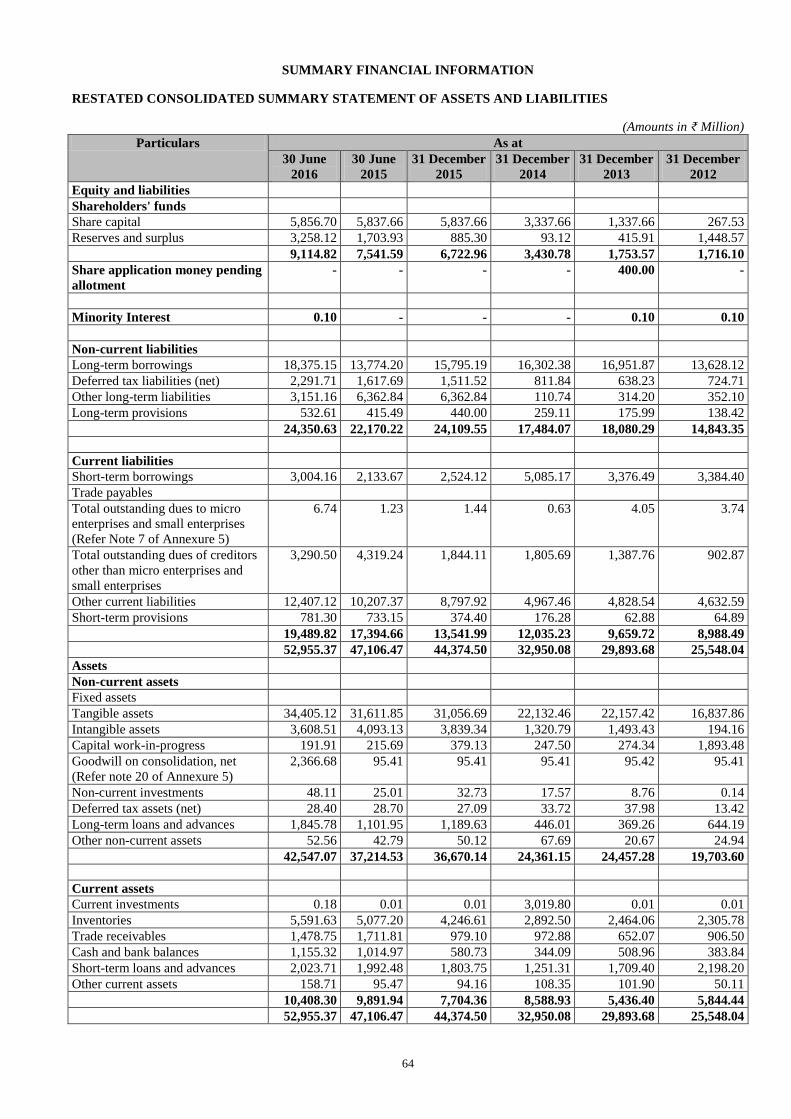
64
SUMMARY FINANCIAL INFORMATION
RESTATED CONSOLIDATED SUMMARY STATEMENT OF ASSETS AND LIABILITIES
(Amounts in ₹ Million)
Particulars As at
30 June
2016
30 June
2015
31 December
2015
31 December
2014
31 December
2013
31 December
2012
Equity and liabilities
Shareholders' funds
Share capital 5,856.70 5,837.66 5,837.66 3,337.66 1,337.66 267.53
Reserves and surplus 3,258.12 1,703.93 885.30 93.12 415.91 1,448.57
9,114.82 7,541.59 6,722.96 3,430.78 1,753.57 1,716.10
Share application money pending
allotment
- - - - 400.00 -
Minority Interest 0.10 - - - 0.10 0.10
Non-current liabilities
Long-term borrowings 18,375.15 13,774.20 15,795.19 16,302.38 16,951.87 13,628.12
Deferred tax liabilities (net) 2,291.71 1,617.69 1,511.52 811.84 638.23 724.71
Other long-term liabilities 3,151.16 6,362.84 6,362.84 110.74 314.20 352.10
Long-term provisions 532.61 415.49 440.00 259.11 175.99 138.42
24,350.63 22,170.22 24,109.55 17,484.07 18,080.29 14,843.35
Current liabilities
Short-term borrowings 3,004.16 2,133.67 2,524.12 5,085.17 3,376.49 3,384.40
Trade payables
Total outstanding dues to micro
enterprises and small enterprises
(Refer Note 7 of Annexure 5)
6.74 1.23 1.44 0.63 4.05 3.74
Total outstanding dues of creditors
other than micro enterprises and
small enterprises
3,290.50 4,319.24 1,844.11 1,805.69 1,387.76 902.87
Other current liabilities 12,407.12 10,207.37 8,797.92 4,967.46 4,828.54 4,632.59
Short-term provisions 781.30 733.15 374.40 176.28 62.88 64.89
19,489.82 17,394.66 13,541.99 12,035.23 9,659.72 8,988.49
52,955.37 47,106.47 44,374.50 32,950.08 29,893.68 25,548.04
Assets
Non-current assets
Fixed assets
Tangible assets 34,405.12 31,611.85 31,056.69 22,132.46 22,157.42 16,837.86
Intangible assets 3,608.51 4,093.13 3,839.34 1,320.79 1,493.43 194.16
Capital work-in-progress 191.91 215.69 379.13 247.50 274.34 1,893.48
Goodwill on consolidation, net
(Refer note 20 of Annexure 5)
2,366.68 95.41 95.41 95.41 95.42 95.41
Non-current investments 48.11 25.01 32.73 17.57 8.76 0.14
Deferred tax assets (net) 28.40 28.70 27.09 33.72 37.98 13.42
Long-term loans and advances 1,845.78 1,101.95 1,189.63 446.01 369.26 644.19
Other non-current assets 52.56 42.79 50.12 67.69 20.67 24.94
42,547.07 37,214.53 36,670.14 24,361.15 24,457.28 19,703.60
Current assets
Current investments 0.18 0.01 0.01 3,019.80 0.01 0.01
Inventories 5,591.63 5,077.20 4,246.61 2,892.50 2,464.06 2,305.78
Trade receivables 1,478.75 1,711.81 979.10 972.88 652.07 906.50
Cash and bank balances 1,155.32 1,014.97 580.73 344.09 508.96 383.84
Short-term loans and advances 2,023.71 1,992.48 1,803.75 1,251.31 1,709.40 2,198.20
Other current assets 158.71 95.47 94.16 108.35 101.90 50.11
10,408.30 9,891.94 7,704.36 8,588.93 5,436.40 5,844.44
52,955.37 47,106.47 44,374.50 32,950.08 29,893.68 25,548.04

65
Note: The above Statement should be read with the Restated Consolidated Summary Statement of Significant Accounting
Policies in Annexure 4, Restated Consolidated Summary Statement of Notes to Restated Summary Statements in Annexure 5
and the Restated Consolidated Summary Statement of Reconciliation of Restated Profit/ (Loss) to Profit/ (Loss) as per
Audited Financial Statements in Annexure 6.
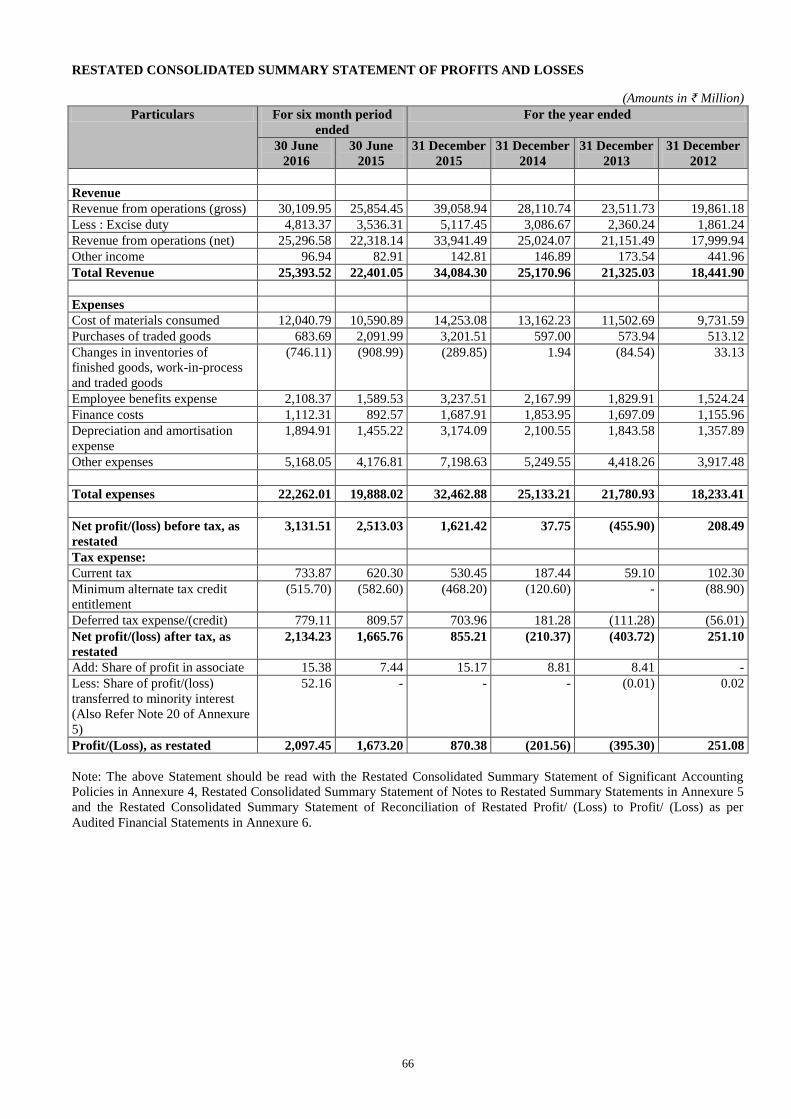
66
RESTATED CONSOLIDATED SUMMARY STATEMENT OF PROFITS AND LOSSES
(Amounts in ₹ Million)
Particulars For six month period
ended
For the year ended
30 June
2016
30 June
2015
31 December
2015
31 December
2014
31 December
2013
31 December
2012
Revenue
Revenue from operations (gross) 30,109.95 25,854.45 39,058.94 28,110.74 23,511.73 19,861.18
Less : Excise duty 4,813.37 3,536.31 5,117.45 3,086.67 2,360.24 1,861.24
Revenue from operations (net) 25,296.58 22,318.14 33,941.49 25,024.07 21,151.49 17,999.94
Other income 96.94 82.91 142.81 146.89 173.54 441.96
Total Revenue 25,393.52 22,401.05 34,084.30 25,170.96 21,325.03 18,441.90
Expenses
Cost of materials consumed 12,040.79 10,590.89 14,253.08 13,162.23 11,502.69 9,731.59
Purchases of traded goods 683.69 2,091.99 3,201.51 597.00 573.94 513.12
Changes in inventories of
finished goods, work-in-process
and traded goods
(746.11) (908.99) (289.85) 1.94 (84.54) 33.13
Employee benefits expense 2,108.37 1,589.53 3,237.51 2,167.99 1,829.91 1,524.24
Finance costs 1,112.31 892.57 1,687.91 1,853.95 1,697.09 1,155.96
Depreciation and amortisation
expense
1,894.91 1,455.22 3,174.09 2,100.55 1,843.58 1,357.89
Other expenses 5,168.05 4,176.81 7,198.63 5,249.55 4,418.26 3,917.48
Total expenses 22,262.01 19,888.02 32,462.88 25,133.21 21,780.93 18,233.41
Net profit/(loss) before tax, as
restated
3,131.51 2,513.03 1,621.42 37.75 (455.90) 208.49
Tax expense:
Current tax 733.87 620.30 530.45 187.44 59.10 102.30
Minimum alternate tax credit
entitlement
(515.70) (582.60) (468.20) (120.60) - (88.90)
Deferred tax expense/(credit) 779.11 809.57 703.96 181.28 (111.28) (56.01)
Net profit/(loss) after tax, as
restated
2,134.23 1,665.76 855.21 (210.37) (403.72) 251.10
Add: Share of profit in associate 15.38 7.44 15.17 8.81 8.41 -
Less: Share of profit/(loss)
transferred to minority interest
(Also Refer Note 20 of Annexure
5)
52.16 - - - (0.01) 0.02
Profit/(Loss), as restated 2,097.45 1,673.20 870.38 (201.56) (395.30) 251.08
Note: The above Statement should be read with the Restated Consolidated Summary Statement of Significant Accounting
Policies in Annexure 4, Restated Consolidated Summary Statement of Notes to Restated Summary Statements in Annexure 5
and the Restated Consolidated Summary Statement of Reconciliation of Restated Profit/ (Loss) to Profit/ (Loss) as per
Audited Financial Statements in Annexure 6.
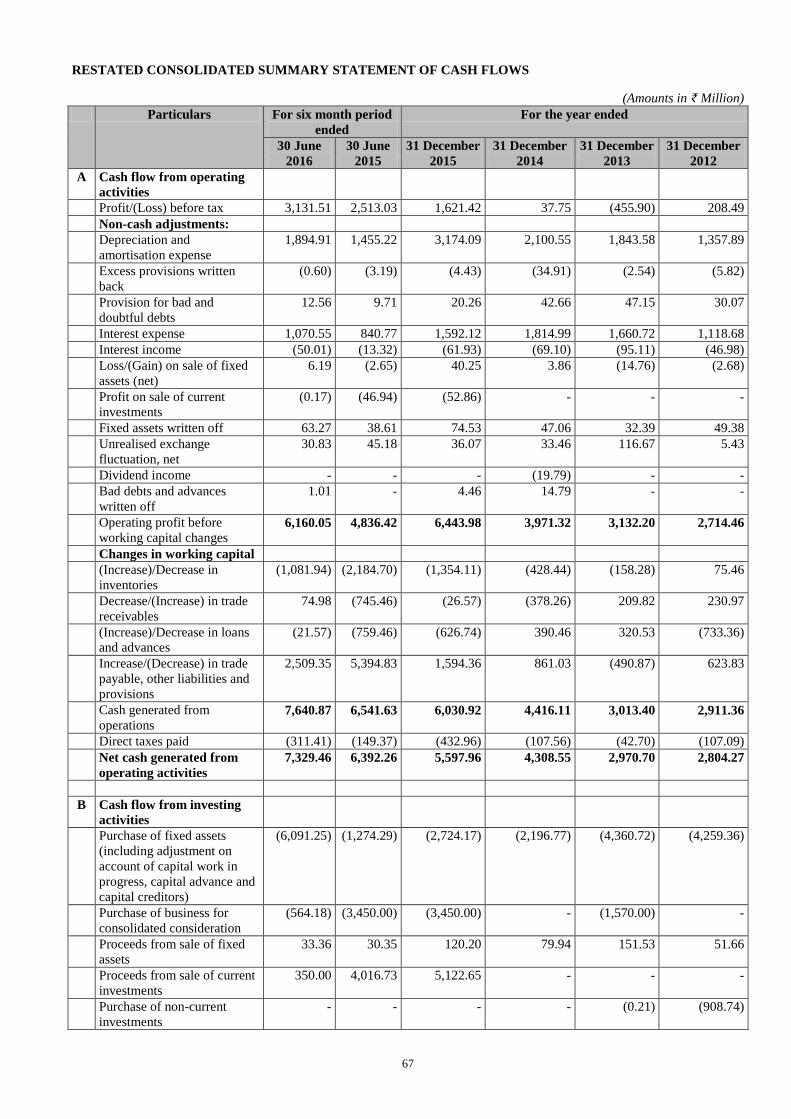
67
RESTATED CONSOLIDATED SUMMARY STATEMENT OF CASH FLOWS
(Amounts in ₹ Million)
Particulars For six month period
ended
For the year ended
30 June
2016
30 June
2015
31 December
2015
31 December
2014
31 December
2013
31 December
2012
A Cash flow from operating
activities
Profit/(Loss) before tax 3,131.51 2,513.03 1,621.42 37.75 (455.90) 208.49
Non-cash adjustments:
Depreciation and
amortisation expense
1,894.91 1,455.22 3,174.09 2,100.55 1,843.58 1,357.89
Excess provisions written
back
(0.60) (3.19) (4.43) (34.91) (2.54) (5.82)
Provision for bad and
doubtful debts
12.56 9.71 20.26 42.66 47.15 30.07
Interest expense 1,070.55 840.77 1,592.12 1,814.99 1,660.72 1,118.68
Interest income (50.01) (13.32) (61.93) (69.10) (95.11) (46.98)
Loss/(Gain) on sale of fixed
assets (net)
6.19 (2.65) 40.25 3.86 (14.76) (2.68)
Profit on sale of current
investments
(0.17) (46.94) (52.86) - - -
Fixed assets written off 63.27 38.61 74.53 47.06 32.39 49.38
Unrealised exchange
fluctuation, net
30.83 45.18 36.07 33.46 116.67 5.43
Dividend income - - - (19.79) - -
Bad debts and advances
written off
1.01 - 4.46 14.79 - -
Operating profit before
working capital changes 6,160.05 4,836.42 6,443.98 3,971.32 3,132.20 2,714.46
Changes in working capital
(Increase)/Decrease in
inventories
(1,081.94) (2,184.70) (1,354.11) (428.44) (158.28) 75.46
Decrease/(Increase) in trade
receivables
74.98 (745.46) (26.57) (378.26) 209.82 230.97
(Increase)/Decrease in loans
and advances
(21.57) (759.46) (626.74) 390.46 320.53 (733.36)
Increase/(Decrease) in trade
payable, other liabilities and
provisions
2,509.35 5,394.83 1,594.36 861.03 (490.87) 623.83
Cash generated from
operations 7,640.87 6,541.63 6,030.92 4,416.11 3,013.40 2,911.36
Direct taxes paid (311.41) (149.37) (432.96) (107.56) (42.70) (107.09)
Net cash generated from
operating activities
7,329.46 6,392.26 5,597.96 4,308.55 2,970.70 2,804.27
B Cash flow from investing
activities
Purchase of fixed assets
(including adjustment on
account of capital work in
progress, capital advance and
capital creditors)
(6,091.25) (1,274.29) (2,724.17) (2,196.77) (4,360.72) (4,259.36)
Purchase of business for
consolidated consideration
(564.18) (3,450.00) (3,450.00) - (1,570.00) -
Proceeds from sale of fixed
assets
33.36 30.35 120.20 79.94 151.53 51.66
Proceeds from sale of current
investments
350.00 4,016.73 5,122.65 - - -
Purchase of non-current
investments
- - - - (0.21) (908.74)
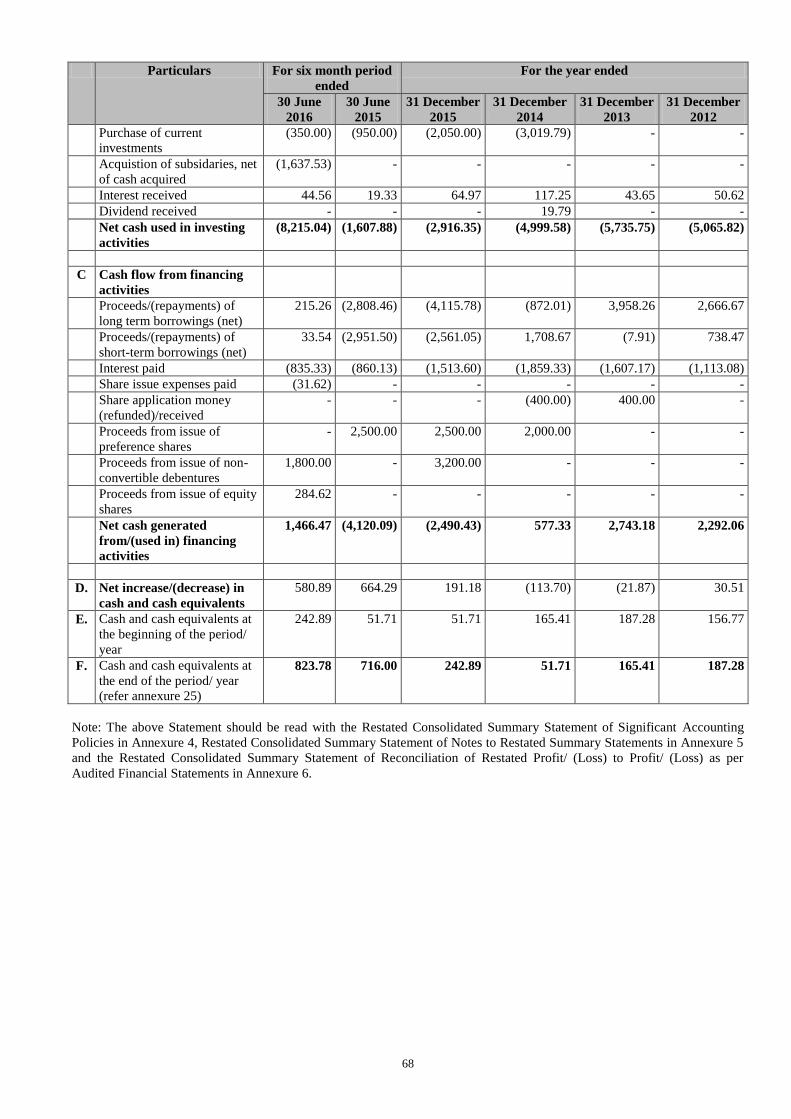
68
Particulars For six month period
ended
For the year ended
30 June
2016
30 June
2015
31 December
2015
31 December
2014
31 December
2013
31 December
2012
Purchase of current
investments
(350.00) (950.00) (2,050.00) (3,019.79) - -
Acquistion of subsidaries, net
of cash acquired
(1,637.53) - - - - -
Interest received 44.56 19.33 64.97 117.25 43.65 50.62
Dividend received - - - 19.79 - -
Net cash used in investing
activities
(8,215.04) (1,607.88) (2,916.35) (4,999.58) (5,735.75) (5,065.82)
C Cash flow from financing
activities
Proceeds/(repayments) of
long term borrowings (net)
215.26 (2,808.46) (4,115.78) (872.01) 3,958.26 2,666.67
Proceeds/(repayments) of
short-term borrowings (net)
33.54 (2,951.50) (2,561.05) 1,708.67 (7.91) 738.47
Interest paid (835.33) (860.13) (1,513.60) (1,859.33) (1,607.17) (1,113.08)
Share issue expenses paid (31.62) - - - - -
Share application money
(refunded)/received
- - - (400.00) 400.00 -
Proceeds from issue of
preference shares
- 2,500.00 2,500.00 2,000.00 - -
Proceeds from issue of non-
convertible debentures
1,800.00 - 3,200.00 - - -
Proceeds from issue of equity
shares
284.62 - - - - -
Net cash generated
from/(used in) financing
activities
1,466.47 (4,120.09) (2,490.43) 577.33 2,743.18 2,292.06
D. Net increase/(decrease) in
cash and cash equivalents
580.89 664.29 191.18 (113.70) (21.87) 30.51
E. Cash and cash equivalents at
the beginning of the period/
year
242.89 51.71 51.71 165.41 187.28 156.77
F. Cash and cash equivalents at
the end of the period/ year
(refer annexure 25)
823.78 716.00 242.89 51.71 165.41 187.28
Note: The above Statement should be read with the Restated Consolidated Summary Statement of Significant Accounting
Policies in Annexure 4, Restated Consolidated Summary Statement of Notes to Restated Summary Statements in Annexure 5
and the Restated Consolidated Summary Statement of Reconciliation of Restated Profit/ (Loss) to Profit/ (Loss) as per
Audited Financial Statements in Annexure 6.
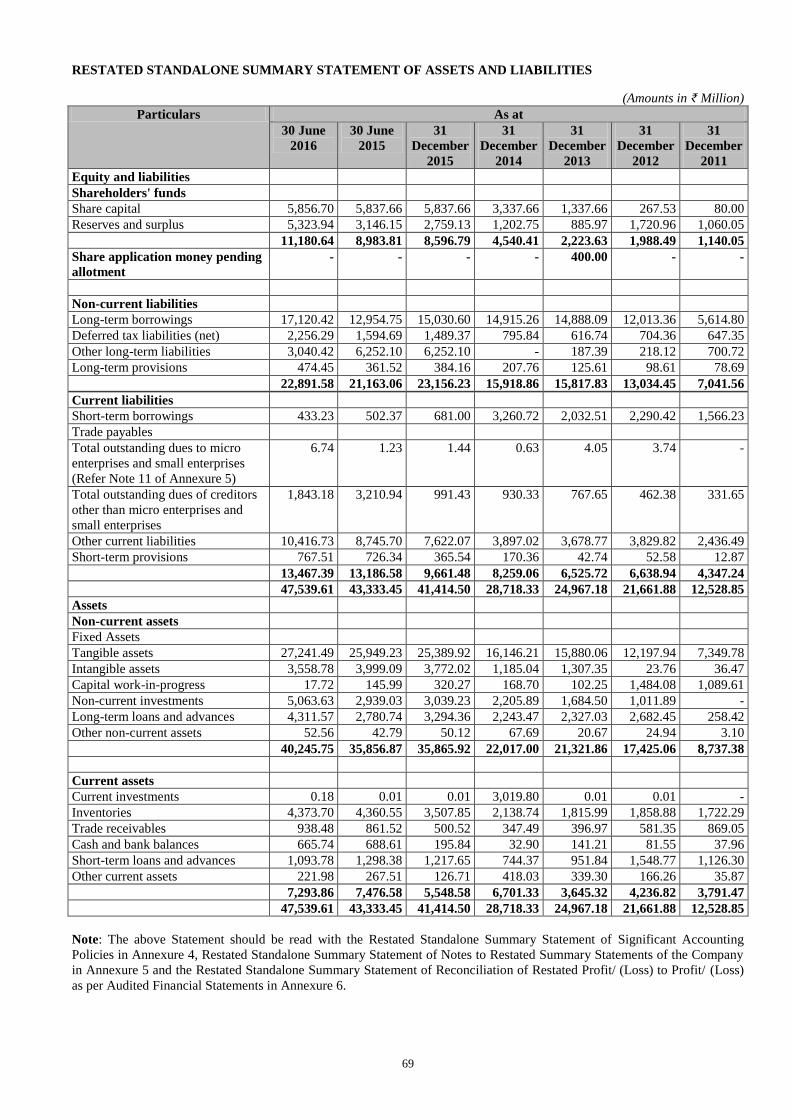
69
RESTATED STANDALONE SUMMARY STATEMENT OF ASSETS AND LIABILITIES
(Amounts in ₹ Million)
Particulars As at
30 June
2016
30 June
2015
31
December
2015
31
December
2014
31
December
2013
31
December
2012
31
December
2011
Equity and liabilities
Shareholders' funds
Share capital 5,856.70 5,837.66 5,837.66 3,337.66 1,337.66 267.53 80.00
Reserves and surplus 5,323.94 3,146.15 2,759.13 1,202.75 885.97 1,720.96 1,060.05
11,180.64 8,983.81 8,596.79 4,540.41 2,223.63 1,988.49 1,140.05
Share application money pending
allotment
- - - - 400.00 - -
Non-current liabilities
Long-term borrowings 17,120.42 12,954.75 15,030.60 14,915.26 14,888.09 12,013.36 5,614.80
Deferred tax liabilities (net) 2,256.29 1,594.69 1,489.37 795.84 616.74 704.36 647.35
Other long-term liabilities 3,040.42 6,252.10 6,252.10 - 187.39 218.12 700.72
Long-term provisions 474.45 361.52 384.16 207.76 125.61 98.61 78.69
22,891.58 21,163.06 23,156.23 15,918.86 15,817.83 13,034.45 7,041.56
Current liabilities
Short-term borrowings 433.23 502.37 681.00 3,260.72 2,032.51 2,290.42 1,566.23
Trade payables
Total outstanding dues to micro
enterprises and small enterprises
(Refer Note 11 of Annexure 5)
6.74 1.23 1.44 0.63 4.05 3.74 -
Total outstanding dues of creditors
other than micro enterprises and
small enterprises
1,843.18 3,210.94 991.43 930.33 767.65 462.38 331.65
Other current liabilities 10,416.73 8,745.70 7,622.07 3,897.02 3,678.77 3,829.82 2,436.49
Short-term provisions 767.51 726.34 365.54 170.36 42.74 52.58 12.87
13,467.39 13,186.58 9,661.48 8,259.06 6,525.72 6,638.94 4,347.24
47,539.61 43,333.45 41,414.50 28,718.33 24,967.18 21,661.88 12,528.85
Assets
Non-current assets
Fixed Assets
Tangible assets 27,241.49 25,949.23 25,389.92 16,146.21 15,880.06 12,197.94 7,349.78
Intangible assets 3,558.78 3,999.09 3,772.02 1,185.04 1,307.35 23.76 36.47
Capital work-in-progress 17.72 145.99 320.27 168.70 102.25 1,484.08 1,089.61
Non-current investments 5,063.63 2,939.03 3,039.23 2,205.89 1,684.50 1,011.89 -
Long-term loans and advances 4,311.57 2,780.74 3,294.36 2,243.47 2,327.03 2,682.45 258.42
Other non-current assets 52.56 42.79 50.12 67.69 20.67 24.94 3.10
40,245.75 35,856.87 35,865.92 22,017.00 21,321.86 17,425.06 8,737.38
Current assets
Current investments 0.18 0.01 0.01 3,019.80 0.01 0.01 -
Inventories 4,373.70 4,360.55 3,507.85 2,138.74 1,815.99 1,858.88 1,722.29
Trade receivables 938.48 861.52 500.52 347.49 396.97 581.35 869.05
Cash and bank balances 665.74 688.61 195.84 32.90 141.21 81.55 37.96
Short-term loans and advances 1,093.78 1,298.38 1,217.65 744.37 951.84 1,548.77 1,126.30
Other current assets 221.98 267.51 126.71 418.03 339.30 166.26 35.87
7,293.86 7,476.58 5,548.58 6,701.33 3,645.32 4,236.82 3,791.47
47,539.61 43,333.45 41,414.50 28,718.33 24,967.18 21,661.88 12,528.85
Note: The above Statement should be read with the Restated Standalone Summary Statement of Significant Accounting
Policies in Annexure 4, Restated Standalone Summary Statement of Notes to Restated Summary Statements of the Company
in Annexure 5 and the Restated Standalone Summary Statement of Reconciliation of Restated Profit/ (Loss) to Profit/ (Loss)
as per Audited Financial Statements in Annexure 6.
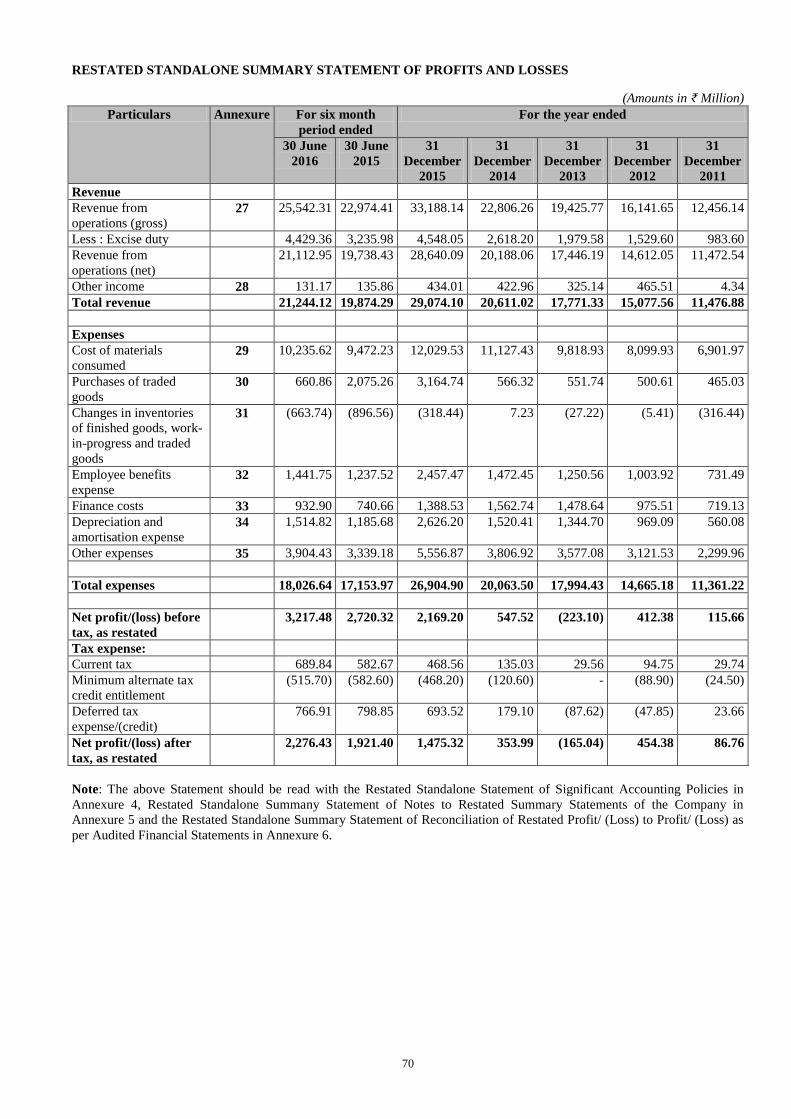
70
RESTATED STANDALONE SUMMARY STATEMENT OF PROFITS AND LOSSES
(Amounts in ₹ Million)
Particulars Annexure For six month
period ended
For the year ended
30 June
2016
30 June
2015
31
December
2015
31
December
2014
31
December
2013
31
December
2012
31
December
2011
Revenue
Revenue from
operations (gross) 27 25,542.31 22,974.41 33,188.14 22,806.26 19,425.77 16,141.65 12,456.14
Less : Excise duty 4,429.36 3,235.98 4,548.05 2,618.20 1,979.58 1,529.60 983.60
Revenue from
operations (net)
21,112.95 19,738.43 28,640.09 20,188.06 17,446.19 14,612.05 11,472.54
Other income 28 131.17 135.86 434.01 422.96 325.14 465.51 4.34
Total revenue 21,244.12 19,874.29 29,074.10 20,611.02 17,771.33 15,077.56 11,476.88
Expenses
Cost of materials
consumed 29 10,235.62 9,472.23 12,029.53 11,127.43 9,818.93 8,099.93 6,901.97
Purchases of traded
goods 30 660.86 2,075.26 3,164.74 566.32 551.74 500.61 465.03
Changes in inventories
of finished goods, work-
in-progress and traded
goods
31 (663.74) (896.56) (318.44) 7.23 (27.22) (5.41) (316.44)
Employee benefits
expense 32 1,441.75 1,237.52 2,457.47 1,472.45 1,250.56 1,003.92 731.49
Finance costs 33 932.90 740.66 1,388.53 1,562.74 1,478.64 975.51 719.13
Depreciation and
amortisation expense 34 1,514.82 1,185.68 2,626.20 1,520.41 1,344.70 969.09 560.08
Other expenses 35 3,904.43 3,339.18 5,556.87 3,806.92 3,577.08 3,121.53 2,299.96
Total expenses 18,026.64 17,153.97 26,904.90 20,063.50 17,994.43 14,665.18 11,361.22
Net profit/(loss) before
tax, as restated
3,217.48 2,720.32 2,169.20 547.52 (223.10) 412.38 115.66
Tax expense:
Current tax 689.84 582.67 468.56 135.03 29.56 94.75 29.74
Minimum alternate tax
credit entitlement
(515.70) (582.60) (468.20) (120.60) - (88.90) (24.50)
Deferred tax
expense/(credit)
766.91 798.85 693.52 179.10 (87.62) (47.85) 23.66
Net profit/(loss) after
tax, as restated
2,276.43 1,921.40 1,475.32 353.99 (165.04) 454.38 86.76
Note: The above Statement should be read with the Restated Standalone Statement of Significant Accounting Policies in
Annexure 4, Restated Standalone Summany Statement of Notes to Restated Summary Statements of the Company in
Annexure 5 and the Restated Standalone Summary Statement of Reconciliation of Restated Profit/ (Loss) to Profit/ (Loss) as
per Audited Financial Statements in Annexure 6.
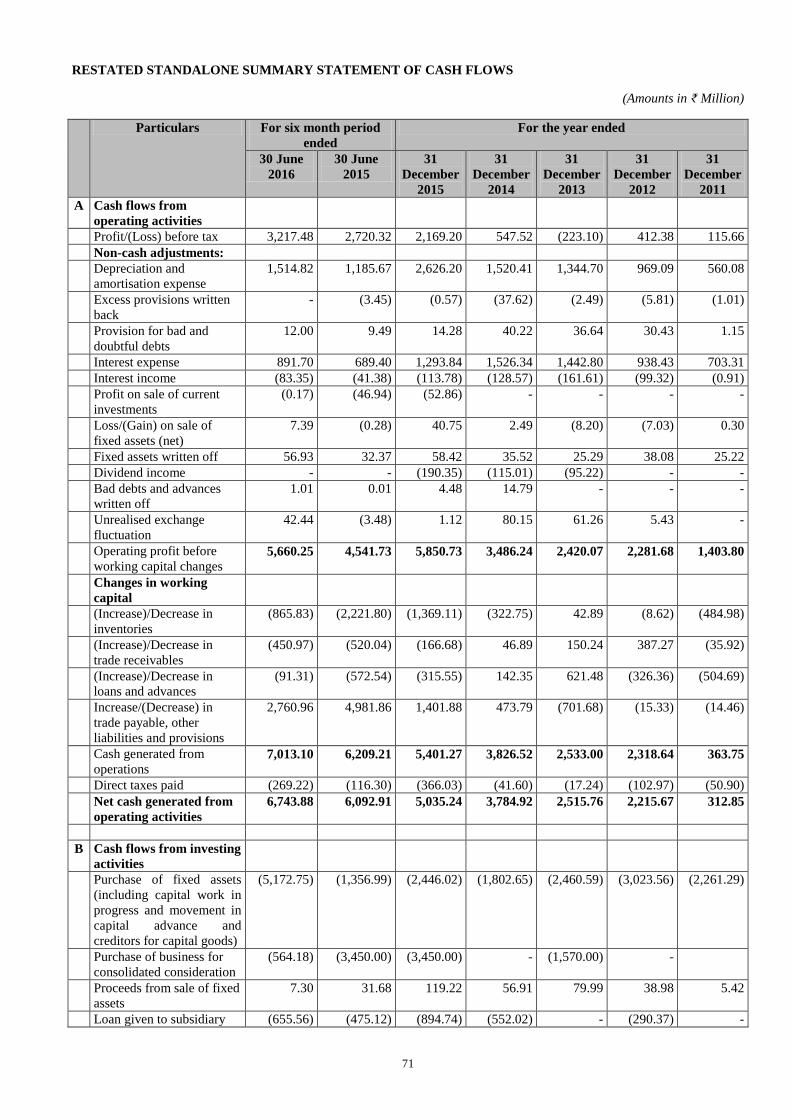
71
RESTATED STANDALONE SUMMARY STATEMENT OF CASH FLOWS
(Amounts in ₹ Million)
Particulars For six month period
ended
For the year ended
30 June
2016
30 June
2015
31
December
2015
31
December
2014
31
December
2013
31
December
2012
31
December
2011
A Cash flows from
operating activities
Profit/(Loss) before tax 3,217.48 2,720.32 2,169.20 547.52 (223.10) 412.38 115.66
Non-cash adjustments:
Depreciation and
amortisation expense
1,514.82 1,185.67 2,626.20 1,520.41 1,344.70 969.09 560.08
Excess provisions written
back
- (3.45) (0.57) (37.62) (2.49) (5.81) (1.01)
Provision for bad and
doubtful debts
12.00 9.49 14.28 40.22 36.64 30.43 1.15
Interest expense 891.70 689.40 1,293.84 1,526.34 1,442.80 938.43 703.31
Interest income (83.35) (41.38) (113.78) (128.57) (161.61) (99.32) (0.91)
Profit on sale of current
investments
(0.17) (46.94) (52.86) - - - -
Loss/(Gain) on sale of
fixed assets (net)
7.39 (0.28) 40.75 2.49 (8.20) (7.03) 0.30
Fixed assets written off 56.93 32.37 58.42 35.52 25.29 38.08 25.22
Dividend income - - (190.35) (115.01) (95.22) - -
Bad debts and advances
written off
1.01 0.01 4.48 14.79 - - -
Unrealised exchange
fluctuation
42.44 (3.48) 1.12 80.15 61.26 5.43 -
Operating profit before
working capital changes 5,660.25 4,541.73 5,850.73 3,486.24 2,420.07 2,281.68 1,403.80
Changes in working
capital
(Increase)/Decrease in
inventories
(865.83) (2,221.80) (1,369.11) (322.75) 42.89 (8.62) (484.98)
(Increase)/Decrease in
trade receivables
(450.97) (520.04) (166.68) 46.89 150.24 387.27 (35.92)
(Increase)/Decrease in
loans and advances
(91.31) (572.54) (315.55) 142.35 621.48 (326.36) (504.69)
Increase/(Decrease) in
trade payable, other
liabilities and provisions
2,760.96 4,981.86 1,401.88 473.79 (701.68) (15.33) (14.46)
Cash generated from
operations 7,013.10 6,209.21 5,401.27 3,826.52 2,533.00 2,318.64 363.75
Direct taxes paid (269.22) (116.30) (366.03) (41.60) (17.24) (102.97) (50.90)
Net cash generated from
operating activities
6,743.88 6,092.91 5,035.24 3,784.92 2,515.76 2,215.67 312.85
B Cash flows from investing
activities
Purchase of fixed assets
(including capital work in
progress and movement in
capital advance and
creditors for capital goods)
(5,172.75) (1,356.99) (2,446.02) (1,802.65) (2,460.59) (3,023.56) (2,261.29)
Purchase of business for
consolidated consideration
(564.18) (3,450.00) (3,450.00) - (1,570.00) -
Proceeds from sale of fixed
assets
7.30 31.68 119.22 56.91 79.99 38.98 5.42
Loan given to subsidiary (655.56) (475.12) (894.74) (552.02) - (290.37) -

72
Particulars For six month period
ended
For the year ended
30 June
2016
30 June
2015
31
December
2015
31
December
2014
31
December
2013
31
December
2012
31
December
2011
Recovery of loan given - - - - 178.53 - -
Proceeds from sale of
current investments
350.00 4,016.73 5,122.65 - - - -
Proceeds from redemption
of non-current investments
- 94.05 94.05 - - - -
Purchase of non-current
investments
(2,024.41) (256.41) (356.61) - (672.62) (903.74) -
Purchase of current
investments
(350.00) (950.00) (2,050.00) (3,019.79) - - -
Interest received 37.74 183.99 390.78 103.08 (8.19) (34.69) 0.91
Dividend received 180.92 - - 210.24 - - -
Cash received on merger - - - - - 93.79 -
Net cash used in investing
activities
(8,190.94) (2,162.07) (3,470.67) (5,004.23) (4,452.88) (4,119.59) (2,254.96)
C Cash flows from
financing activities
Proceeds of long-term
borrowings
1,868.29 2,422.46 3,255.59 3,501.73 6,954.39 5,132.16 3,882.52
Repayments of long-term
borrowings
(1,068.06) (4,732.88) (6,566.16) (3,632.22) (3,731.01) (3,493.77) (1,587.55)
Proceeds/(repayments) of
short-term borrowings (net)
(247.77) (2,758.34) (2,579.73) 1,228.22 (257.92) 1,233.80 1,044.56
Interest paid (682.18) (712.95) (1,217.43) (1,535.53) (1,418.98) (925.96) (691.04)
Share application money
(refunded)/received
- - - (400.00) 400.00 - -
Share issue expenses paid (31.62) - - - - - -
Redemption of preference
shares
- - - - - - (773.76)
Proceeds from issue of
preference shares
- 2,500.00 2,500.00 2,000.00 - - -
Proceeds from issue of
equity shares
284.62 - - - - - -
Proceeds from issue of non
convertible debentures
1,800.00 - 3,200.00 - - - -
Preference dividend paid - - - - - - (68.18)
Taxes on dividend paid - - - - - - (11.32)
Net cash generated/(used
in) financing activities
1,923.28 (3,281.71) (1,407.73) 1,162.20 1,946.48 1,946.23 1,795.23
D Net increase/(decrease) in
cash and cash equivalents
476.22 649.13 156.84 (57.11) 9.36 42.31 (146.88)
E Cash and cash equivalents
at the beginning of the
reporting period/ year
189.26 32.42 32.42 89.53 80.17 37.86 184.74
F Cash and cash equivalents
at the end of the reporting
period/ year (refer
annexure 25)
665.48 681.55 189.26 32.42 89.53 80.17 37.86
Note: The above Statement should be read with the Restated Standalone Summary Statement of Significant Accounting
Policies in Annexure 4, Restated Standalone Summary Statement of Notes to Restated Standalone Summary Statements of
the Company in Annexure 5 and the Restated Standalone Summary Statement of Reconciliation of Restated Profit/ (Loss) to
Profit/ (Loss) as per Audited Standalone Financial Statements in Annexure 6.
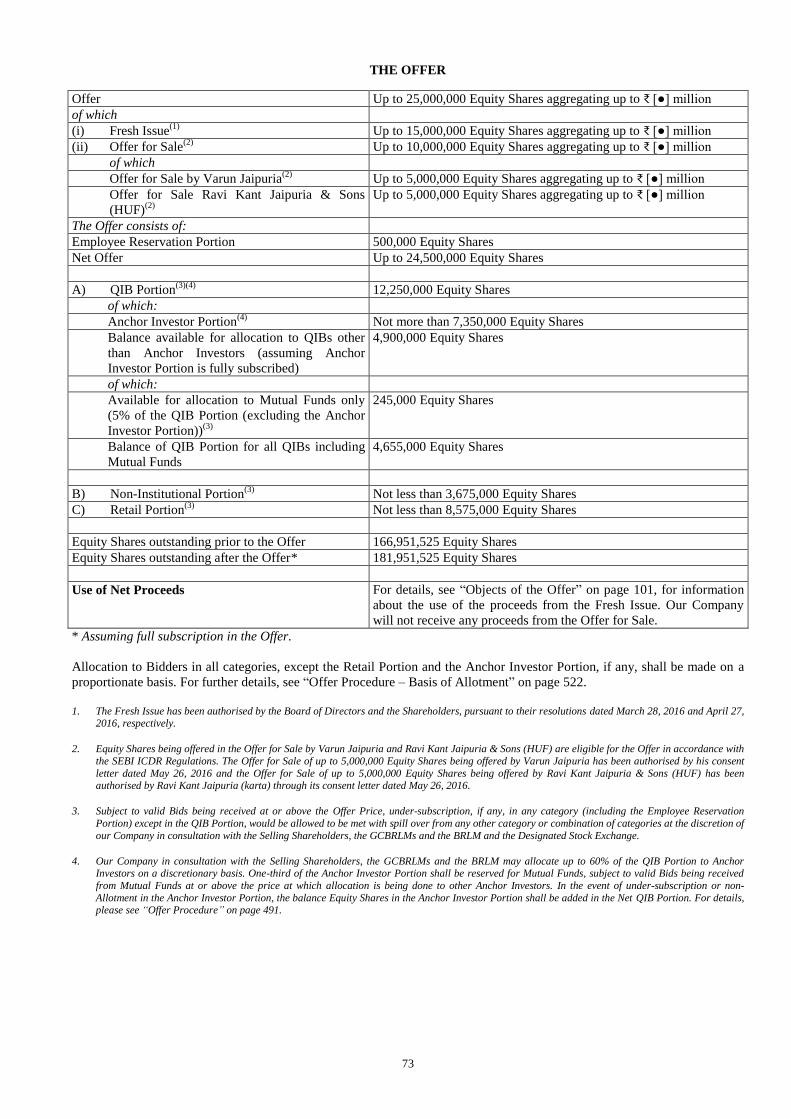
73
THE OFFER
Offer Up to 25,000,000 Equity Shares aggregating up to ₹ [●] million
of which
(i) Fresh Issue(1)
Up to 15,000,000 Equity Shares aggregating up to ₹ [●] million
(ii) Offer for Sale(2)
Up to 10,000,000 Equity Shares aggregating up to ₹ [●] million
of which
Offer for Sale by Varun Jaipuria(2)
Up to 5,000,000 Equity Shares aggregating up to ₹ [●] million
Offer for Sale Ravi Kant Jaipuria & Sons
(HUF)(2)
Up to 5,000,000 Equity Shares aggregating up to ₹ [●] million
The Offer consists of:
Employee Reservation Portion 500,000 Equity Shares
Net Offer Up to 24,500,000 Equity Shares
A) QIB Portion(3)(4)
12,250,000 Equity Shares
of which:
Anchor Investor Portion(4)
Not more than 7,350,000 Equity Shares
Balance available for allocation to QIBs other
than Anchor Investors (assuming Anchor
Investor Portion is fully subscribed)
4,900,000 Equity Shares
of which:
Available for allocation to Mutual Funds only
(5% of the QIB Portion (excluding the Anchor
Investor Portion))(3)
245,000 Equity Shares
Balance of QIB Portion for all QIBs including
Mutual Funds
4,655,000 Equity Shares
B) Non-Institutional Portion(3)
Not less than 3,675,000 Equity Shares
C) Retail Portion(3)
Not less than 8,575,000 Equity Shares
Equity Shares outstanding prior to the Offer 166,951,525 Equity Shares
Equity Shares outstanding after the Offer* 181,951,525 Equity Shares
Use of Net Proceeds For details, see “Objects of the Offer” on page 101, for information
about the use of the proceeds from the Fresh Issue. Our Company
will not receive any proceeds from the Offer for Sale.
* Assuming full subscription in the Offer.
Allocation to Bidders in all categories, except the Retail Portion and the Anchor Investor Portion, if any, shall be made on a
proportionate basis. For further details, see “Offer Procedure – Basis of Allotment” on page 522.
1. The Fresh Issue has been authorised by the Board of Directors and the Shareholders, pursuant to their resolutions dated March 28, 2016 and April 27,
2016, respectively.
2. Equity Shares being offered in the Offer for Sale by Varun Jaipuria and Ravi Kant Jaipuria & Sons (HUF) are eligible for the Offer in accordance with
the SEBI ICDR Regulations. The Offer for Sale of up to 5,000,000 Equity Shares being offered by Varun Jaipuria has been authorised by his consent
letter dated May 26, 2016 and the Offer for Sale of up to 5,000,000 Equity Shares being offered by Ravi Kant Jaipuria & Sons (HUF) has been authorised by Ravi Kant Jaipuria (karta) through its consent letter dated May 26, 2016.
3. Subject to valid Bids being received at or above the Offer Price, under-subscription, if any, in any category (including the Employee Reservation
Portion) except in the QIB Portion, would be allowed to be met with spill over from any other category or combination of categories at the discretion of
our Company in consultation with the Selling Shareholders, the GCBRLMs and the BRLM and the Designated Stock Exchange.
4. Our Company in consultation with the Selling Shareholders, the GCBRLMs and the BRLM may allocate up to 60% of the QIB Portion to Anchor Investors on a discretionary basis. One-third of the Anchor Investor Portion shall be reserved for Mutual Funds, subject to valid Bids being received
from Mutual Funds at or above the price at which allocation is being done to other Anchor Investors. In the event of under-subscription or non-
Allotment in the Anchor Investor Portion, the balance Equity Shares in the Anchor Investor Portion shall be added in the Net QIB Portion. For details, please see “Offer Procedure” on page 491.
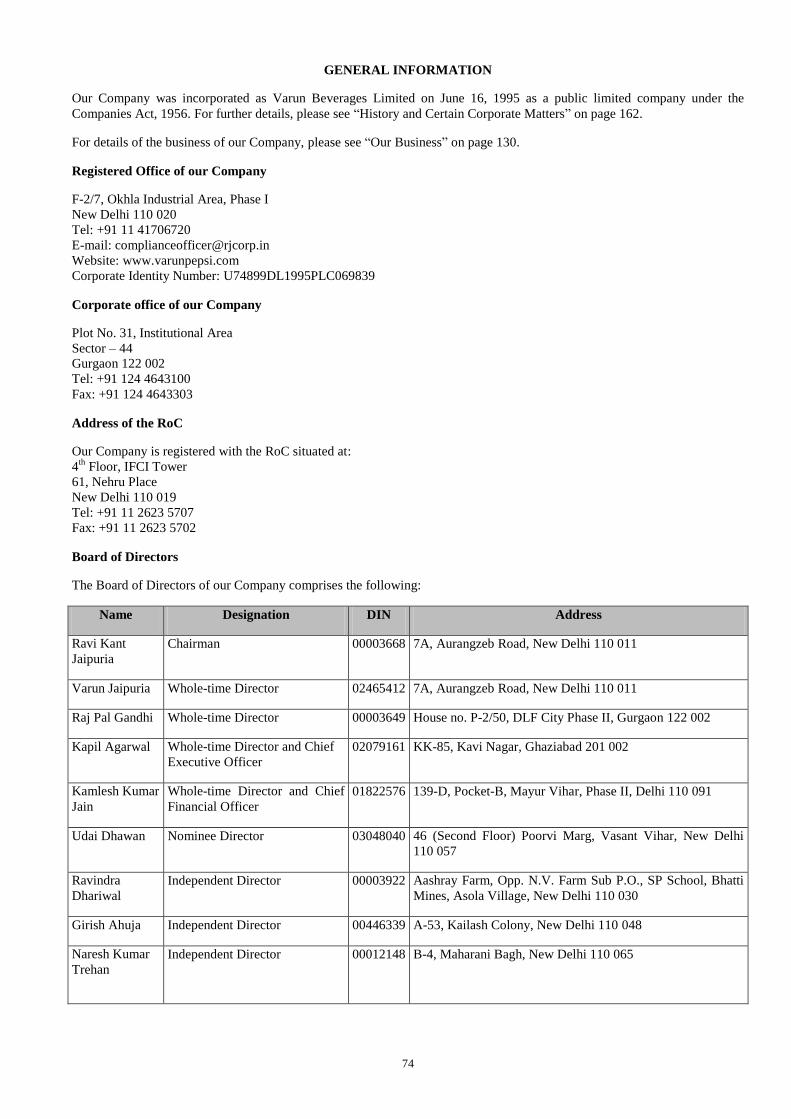
74
GENERAL INFORMATION
Our Company was incorporated as Varun Beverages Limited on June 16, 1995 as a public limited company under the
Companies Act, 1956. For further details, please see “History and Certain Corporate Matters” on page 162.
For details of the business of our Company, please see “Our Business” on page 130.
Registered Office of our Company
F-2/7, Okhla Industrial Area, Phase I
New Delhi 110 020
Tel: +91 11 41706720
E-mail: [email protected]
Website: www.varunpepsi.com
Corporate Identity Number: U74899DL1995PLC069839
Corporate office of our Company
Plot No. 31, Institutional Area
Sector – 44
Gurgaon 122 002
Tel: +91 124 4643100
Fax: +91 124 4643303
Address of the RoC
Our Company is registered with the RoC situated at:
4th
Floor, IFCI Tower
61, Nehru Place
New Delhi 110 019
Tel: +91 11 2623 5707
Fax: +91 11 2623 5702
Board of Directors
The Board of Directors of our Company comprises the following:
Name Designation DIN Address
Ravi Kant
Jaipuria
Chairman 00003668 7A, Aurangzeb Road, New Delhi 110 011
Varun Jaipuria Whole-time Director 02465412 7A, Aurangzeb Road, New Delhi 110 011
Raj Pal Gandhi Whole-time Director 00003649 House no. P-2/50, DLF City Phase II, Gurgaon 122 002
Kapil Agarwal Whole-time Director and Chief
Executive Officer
02079161 KK-85, Kavi Nagar, Ghaziabad 201 002
Kamlesh Kumar
Jain
Whole-time Director and Chief
Financial Officer
01822576 139-D, Pocket-B, Mayur Vihar, Phase II, Delhi 110 091
Udai Dhawan Nominee Director 03048040 46 (Second Floor) Poorvi Marg, Vasant Vihar, New Delhi
110 057
Ravindra
Dhariwal
Independent Director 00003922 Aashray Farm, Opp. N.V. Farm Sub P.O., SP School, Bhatti
Mines, Asola Village, New Delhi 110 030
Girish Ahuja Independent Director 00446339 A-53, Kailash Colony, New Delhi 110 048
Naresh Kumar
Trehan
Independent Director 00012148 B-4, Maharani Bagh, New Delhi 110 065
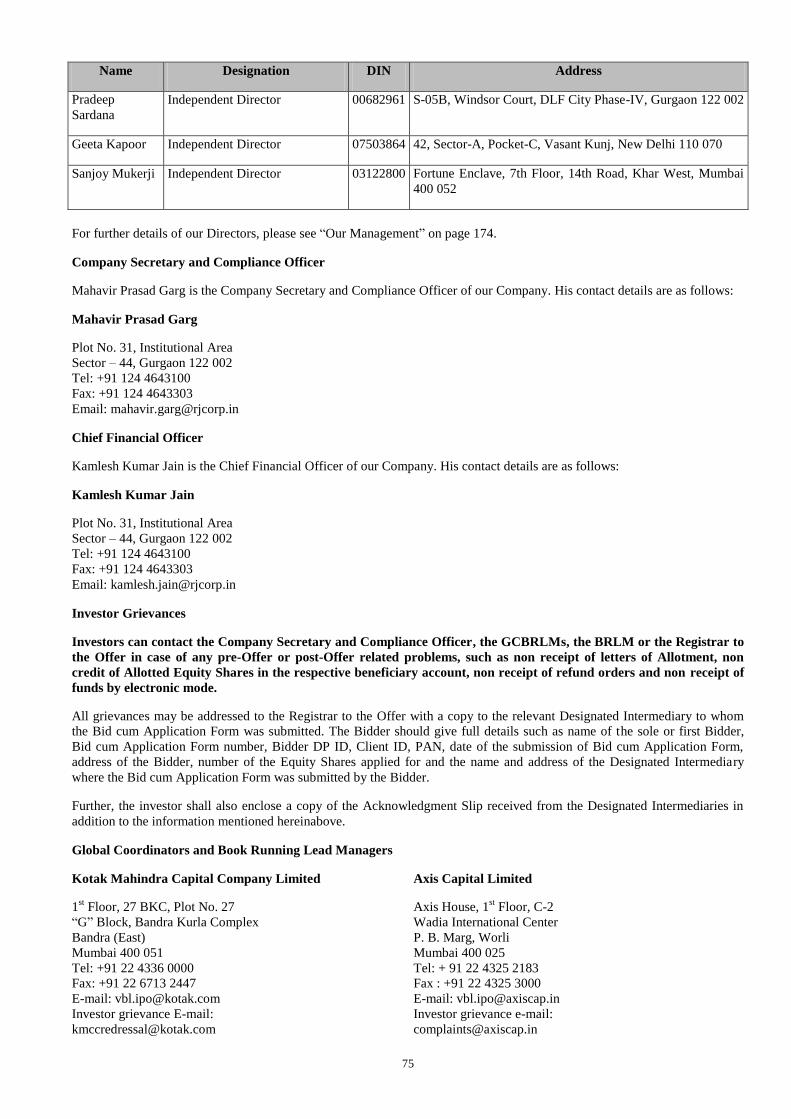
75
Name Designation DIN Address
Pradeep
Sardana
Independent Director 00682961 S-05B, Windsor Court, DLF City Phase-IV, Gurgaon 122 002
Geeta Kapoor Independent Director 07503864 42, Sector-A, Pocket-C, Vasant Kunj, New Delhi 110 070
Sanjoy Mukerji Independent Director 03122800 Fortune Enclave, 7th Floor, 14th Road, Khar West, Mumbai
400 052
For further details of our Directors, please see “Our Management” on page 174.
Company Secretary and Compliance Officer
Mahavir Prasad Garg is the Company Secretary and Compliance Officer of our Company. His contact details are as follows:
Mahavir Prasad Garg
Plot No. 31, Institutional Area
Sector – 44, Gurgaon 122 002
Tel: +91 124 4643100
Fax: +91 124 4643303
Email: [email protected]
Chief Financial Officer
Kamlesh Kumar Jain is the Chief Financial Officer of our Company. His contact details are as follows:
Kamlesh Kumar Jain
Plot No. 31, Institutional Area
Sector – 44, Gurgaon 122 002
Tel: +91 124 4643100
Fax: +91 124 4643303
Email: [email protected]
Investor Grievances
Investors can contact the Company Secretary and Compliance Officer, the GCBRLMs, the BRLM or the Registrar to
the Offer in case of any pre-Offer or post-Offer related problems, such as non receipt of letters of Allotment, non
credit of Allotted Equity Shares in the respective beneficiary account, non receipt of refund orders and non receipt of
funds by electronic mode.
All grievances may be addressed to the Registrar to the Offer with a copy to the relevant Designated Intermediary to whom
the Bid cum Application Form was submitted. The Bidder should give full details such as name of the sole or first Bidder,
Bid cum Application Form number, Bidder DP ID, Client ID, PAN, date of the submission of Bid cum Application Form,
address of the Bidder, number of the Equity Shares applied for and the name and address of the Designated Intermediary
where the Bid cum Application Form was submitted by the Bidder.
Further, the investor shall also enclose a copy of the Acknowledgment Slip received from the Designated Intermediaries in
addition to the information mentioned hereinabove.
Global Coordinators and Book Running Lead Managers
Kotak Mahindra Capital Company Limited
1st Floor, 27 BKC, Plot No. 27
“G” Block, Bandra Kurla Complex
Bandra (East)
Mumbai 400 051
Tel: +91 22 4336 0000
Fax: +91 22 6713 2447
E-mail: [email protected]
Investor grievance E-mail:
Axis Capital Limited
Axis House, 1st Floor, C-2
Wadia International Center
P. B. Marg, Worli
Mumbai 400 025
Tel: + 91 22 4325 2183
Fax : +91 22 4325 3000
E-mail: [email protected]
Investor grievance e-mail:
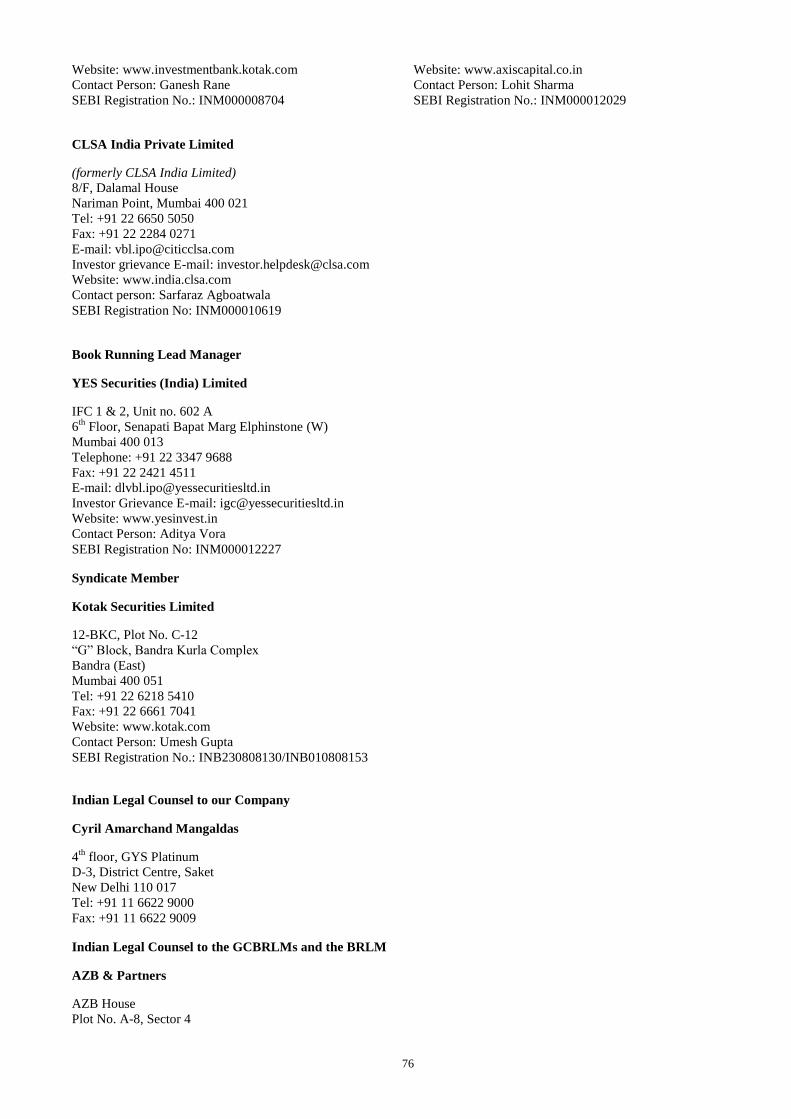
76
Website: www.investmentbank.kotak.com
Contact Person: Ganesh Rane
SEBI Registration No.: INM000008704
Website: www.axiscapital.co.in
Contact Person: Lohit Sharma
SEBI Registration No.: INM000012029
CLSA India Private Limited
(formerly CLSA India Limited)
8/F, Dalamal House
Nariman Point, Mumbai 400 021
Tel: +91 22 6650 5050
Fax: +91 22 2284 0271
E-mail: [email protected]
Investor grievance E-mail: [email protected]
Website: www.india.clsa.com
Contact person: Sarfaraz Agboatwala
SEBI Registration No: INM000010619
Book Running Lead Manager
YES Securities (India) Limited
IFC 1 & 2, Unit no. 602 A
6th
Floor, Senapati Bapat Marg Elphinstone (W)
Mumbai 400 013
Telephone: +91 22 3347 9688
Fax: +91 22 2421 4511
E-mail: [email protected]
Investor Grievance E-mail: [email protected]
Website: www.yesinvest.in
Contact Person: Aditya Vora
SEBI Registration No: INM000012227
Syndicate Member
Kotak Securities Limited
12-BKC, Plot No. C-12
“G” Block, Bandra Kurla Complex
Bandra (East)
Mumbai 400 051
Tel: +91 22 6218 5410
Fax: +91 22 6661 7041
Website: www.kotak.com
Contact Person: Umesh Gupta
SEBI Registration No.: INB230808130/INB010808153
Indian Legal Counsel to our Company
Cyril Amarchand Mangaldas
4th
floor, GYS Platinum
D-3, District Centre, Saket
New Delhi 110 017
Tel: +91 11 6622 9000
Fax: +91 11 6622 9009
Indian Legal Counsel to the GCBRLMs and the BRLM
AZB & Partners
AZB House
Plot No. A-8, Sector 4
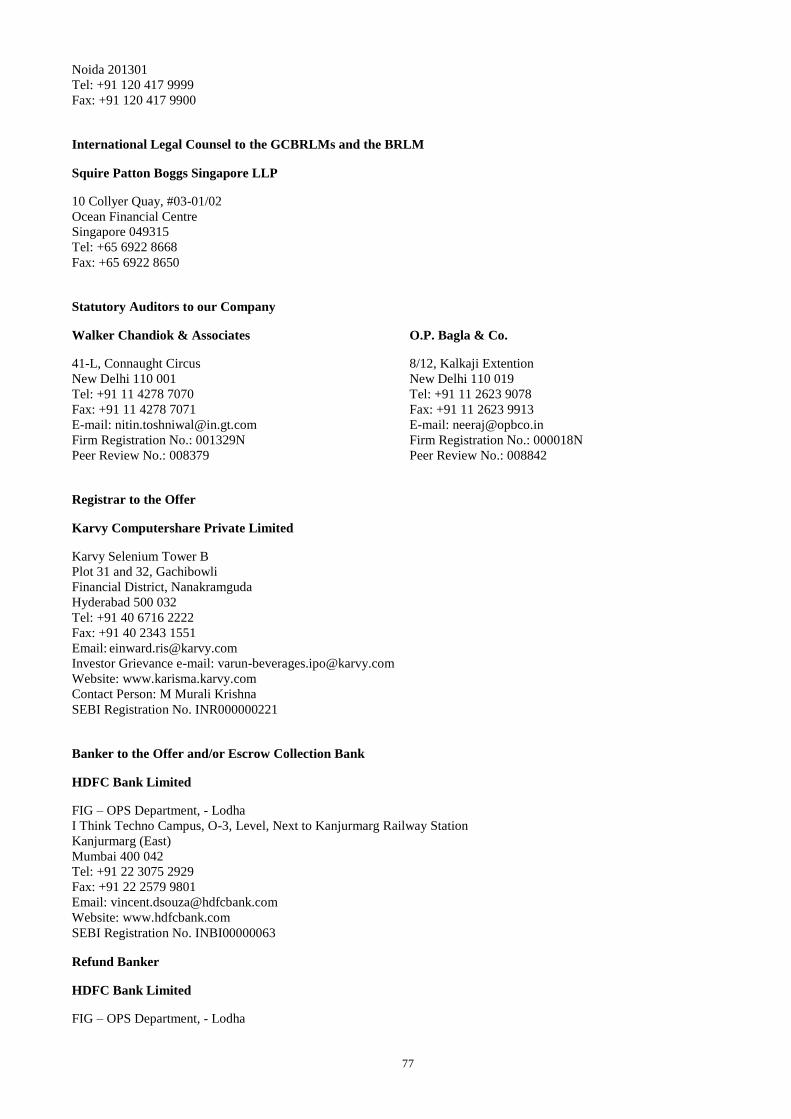
77
Noida 201301
Tel: +91 120 417 9999
Fax: +91 120 417 9900
International Legal Counsel to the GCBRLMs and the BRLM
Squire Patton Boggs Singapore LLP
10 Collyer Quay, #03-01/02
Ocean Financial Centre
Singapore 049315
Tel: +65 6922 8668
Fax: +65 6922 8650
Statutory Auditors to our Company
Walker Chandiok & Associates
41-L, Connaught Circus
New Delhi 110 001
Tel: +91 11 4278 7070
Fax: +91 11 4278 7071
E-mail: [email protected]
Firm Registration No.: 001329N
Peer Review No.: 008379
O.P. Bagla & Co.
8/12, Kalkaji Extention
New Delhi 110 019
Tel: +91 11 2623 9078
Fax: +91 11 2623 9913
E-mail: [email protected]
Firm Registration No.: 000018N
Peer Review No.: 008842
Registrar to the Offer
Karvy Computershare Private Limited
Karvy Selenium Tower B
Plot 31 and 32, Gachibowli
Financial District, Nanakramguda
Hyderabad 500 032
Tel: +91 40 6716 2222
Fax: +91 40 2343 1551
Email: [email protected]
Investor Grievance e-mail: [email protected]
Website: www.karisma.karvy.com
Contact Person: M Murali Krishna
SEBI Registration No. INR000000221
Banker to the Offer and/or Escrow Collection Bank
HDFC Bank Limited
FIG – OPS Department, - Lodha
I Think Techno Campus, O-3, Level, Next to Kanjurmarg Railway Station
Kanjurmarg (East)
Mumbai 400 042
Tel: +91 22 3075 2929
Fax: +91 22 2579 9801
Email: [email protected]
Website: www.hdfcbank.com
SEBI Registration No. INBI00000063
Refund Banker
HDFC Bank Limited
FIG – OPS Department, - Lodha
78
I Think Techno Campus, O-3, Level, Next to Kanjurmarg Railway Station
Kanjurmarg (East)
Mumbai 400 042
Tel: +91 22 3075 2929
Fax: +91 22 2579 9801
Email: [email protected]
Website: www.hdfcbank.com
SEBI Registration No. INBI00000063
Bankers to our Company
Axis Bank Limited
2nd
Floor, Redfort Capital Tower
Gole Market
New Delhi 110 001
Tel: +91 981 853 3501
E-mail: [email protected]
Contact Person: Amit Mathur
DBS Bank Limited
DLF Capitol Point, Baba Kharak Singh Marg
Connaught Place
New Delhi 110 001
Tel: +91 6621 1801
Fax: +91 11 3041 8899
E-mail: [email protected]
Website: www.dbs.com
Contact Person: Sandeep Kumar
HDFC Bank Limited
HDFC Bank House
2nd
Floor, Vatika Atrium
Block A, Sector 53
Gurgaon 122 002
Tel: +91 124 4664 391
Fax: +91 124 4289 819
E-mail: [email protected]
Website: www.hdfcbank.com
Contact Person: Pranav Priyadarshi
Housing Development Finance Corporation Limited
The Capitol Court, Outer Ring Road
OLOF Palme Marg, Munirka
New Delhi 110 067
Tel: +91 11 4159 6524
Fax: +91 11 2619 4617
E-mail: [email protected]
Website: www.hdfc.com
Contact Person: Ankur Gupta
ICICI Bank Limited
NBCC Place, Bhisma Pitamah Marg
Pragati Vihar
New Delhi 110 003
Tel: +91 11 4221 8433
Fax: +91 11 2439 00700
E-mail: [email protected]
Website: www.icicibank.com
Contact Person: Anshul Kumar
IDBI Bank Limited
3rd
Floor, Red Cross Building
1 Red Cross Road
New Delhi 110 001
Tel: +91 11 6628 1019
Fax: +91 11 2375 2730
E-mail: [email protected]/[email protected]
Website: www.idbi.com
Contact Persons: Amit Kumar/Shipra Tiwari
IndusInd Bank Limited
Building No. 10 B, 3rd
Floor
DLF Cyber City
Gurgaon 122 001
Tel: +91 989 976 6369
Fax: +91 124 4749 597
E-mail: [email protected]
Website: www.indusind.com
Contact Person: Roopak Jain
Kotak Mahindra Bank Limited
Kotak Aerocity Asset Area 9
2nd
Floor, Ibis Commercial Block
Hospitality District, IGI Airport
New Delhi 110 037
Tel: +91 116617 6255
Fax: +91 11 6608 4533
E-mail: [email protected]
Website: www.kotak.com
Contact Person: Amit Singh
RBL Bank Limited
28, Gopal Das Bhawan
Barakhamba Road, Connaught Place
New Delhi 110 001
Tel: +91 4936 5515
Standard Chartered Bank Limited
Crescenzo, C/38-39
G-Block, Bandra Kurla Complex
Bandra (East)
Mumbai 400 0051
79
Fax: +91 11 4936 5526
E-mail: [email protected]
Website: www.rblbank.com
Contact Person: Parminder Singh
Tel: +91 22 6115 7224
Fax: +91 22 6115 7132, 6115 7226
E-mail: [email protected]/[email protected]/
Website: www.standardchartered.com
Contact Persons: Kaushik Godbole/Priscilla Dsilva/
Karthikeyan Venkatraman
YES Bank Limited
D-12, First Floor
South Extension, Part II
New Delhi 110 049
Tel: +91 981 150 4345
Fax: +91 11 2625 4000
E-mail: [email protected]
Website: www.yesbank.com
Contact Person: Vinay Gupta
Self Certified Syndicate Banks
The list of banks that have been notified by SEBI to act as the SCSBs for the ASBA process is provided on the website of
SEBI at http://www.sebi.gov.in/sebiweb/home/list/5/33/0/0/Recognised-Intermediaries. For a list of branches of SCSBs
named by the respective SCSBs to receive ASBA Forms from the Designated Intermediaries, please refer to the above-
mentioned link.
Registered Brokers
The list of the Registered Brokers, including details such as postal address, telephone number and e-mail address, is provided
on the websites of the BSE and the NSE at www.bseindia.com and www.nseindia.com, respectively, as updated from time to
time.
Registrar and Share Transfer Agents
The list of the RTAs eligible to accept ASBA Forms at the Designated RTA Locations, including details such as address,
telephone number and e-mail address, is provided on the websites of Stock Exchanges at www.bseindia.com and
www.nseindia.com, respectively, as updated from time to time.
Collecting Depository Participants
The list of the CDPs eligible to accept ASBA Forms at the Designated CDP Locations, including details such as name and
contact details, is provided on the websites of BSE at
http://www.bseindia.com/Static/Markets/PublicIssues/RtaDp.aspx?expandable=6 and on the website of NSE at
http://www.nseindia.com/products/content/equities/ipos/asba_procedures.htm, as updated from time to time.
Experts
Except as stated below, our Company has not obtained any expert opinions:
Our Company has received written consent from the Statutory Auditors namely, Walker Chandiok & Associates and O.P.
Bagla & Co., each holding a valid peer review certificate from ICAI, to include their names as expert under Section 26 of the
Companies Act, 2013 in this Red Herring Prospectus in relation to the reports dated September 22, 2016 on the Restated
Financial Statements of our Company and the statement of tax benefits dated June 1, 2016, included in this Red Herring
Prospectus and such consent has not been withdrawn up to the time of delivery of this Red Herring Prospectus.
Our Company has received written consent from Euromonitor International Ltd dated September 21, 2016, to include its
name as expert under Section 26 of the Companies Act, 2013 in this Red Herring Prospectus in relation to the report titled
“Soft Drinks in India” dated 2016.
Monitoring Agency
Our Company has appointed Yes Bank Limited as the monitoring agency in accordance with Regulation 16 of SEBI ICDR
Regulations.
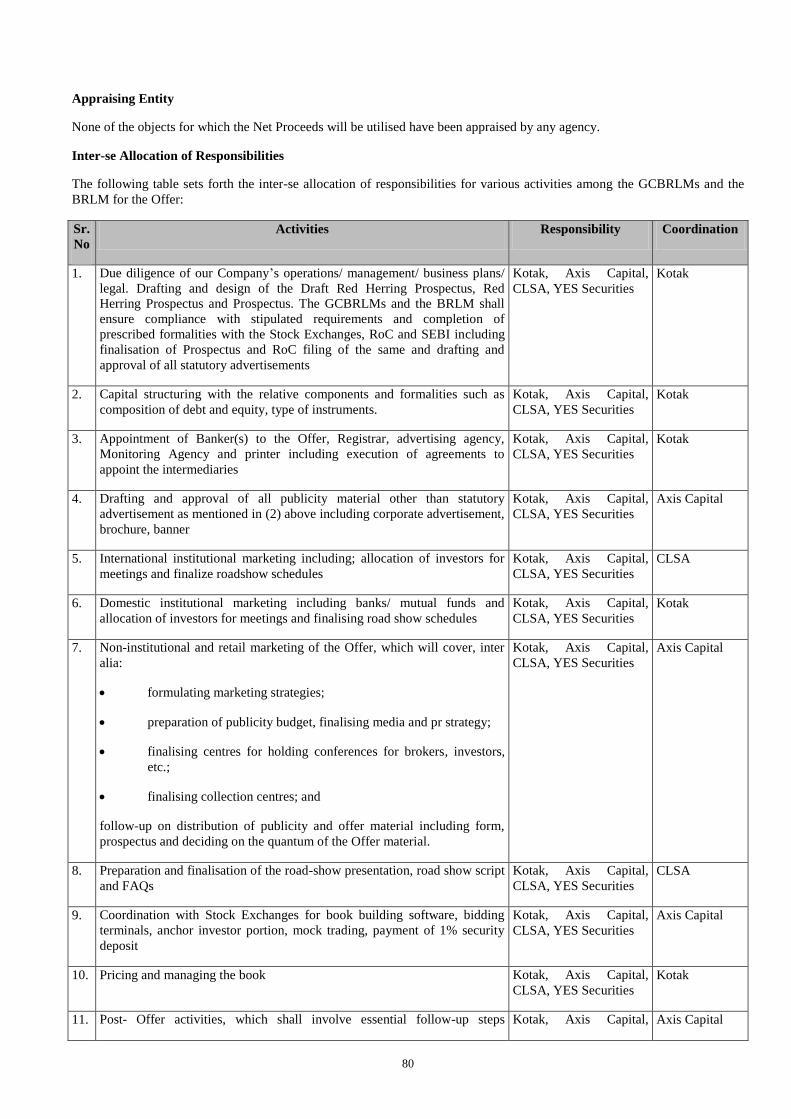
80
Appraising Entity
None of the objects for which the Net Proceeds will be utilised have been appraised by any agency.
Inter-se Allocation of Responsibilities
The following table sets forth the inter-se allocation of responsibilities for various activities among the GCBRLMs and the
BRLM for the Offer:
Sr.
No
Activities Responsibility Coordination
1. Due diligence of our Company’s operations/ management/ business plans/
legal. Drafting and design of the Draft Red Herring Prospectus, Red
Herring Prospectus and Prospectus. The GCBRLMs and the BRLM shall
ensure compliance with stipulated requirements and completion of
prescribed formalities with the Stock Exchanges, RoC and SEBI including
finalisation of Prospectus and RoC filing of the same and drafting and
approval of all statutory advertisements
Kotak, Axis Capital,
CLSA, YES Securities
Kotak
2. Capital structuring with the relative components and formalities such as
composition of debt and equity, type of instruments.
Kotak, Axis Capital,
CLSA, YES Securities
Kotak
3. Appointment of Banker(s) to the Offer, Registrar, advertising agency,
Monitoring Agency and printer including execution of agreements to
appoint the intermediaries
Kotak, Axis Capital,
CLSA, YES Securities
Kotak
4. Drafting and approval of all publicity material other than statutory
advertisement as mentioned in (2) above including corporate advertisement,
brochure, banner
Kotak, Axis Capital,
CLSA, YES Securities
Axis Capital
5. International institutional marketing including; allocation of investors for
meetings and finalize roadshow schedules
Kotak, Axis Capital,
CLSA, YES Securities
CLSA
6. Domestic institutional marketing including banks/ mutual funds and
allocation of investors for meetings and finalising road show schedules
Kotak, Axis Capital,
CLSA, YES Securities
Kotak
7. Non-institutional and retail marketing of the Offer, which will cover, inter
alia:
formulating marketing strategies;
preparation of publicity budget, finalising media and pr strategy;
finalising centres for holding conferences for brokers, investors,
etc.;
finalising collection centres; and
follow-up on distribution of publicity and offer material including form,
prospectus and deciding on the quantum of the Offer material.
Kotak, Axis Capital,
CLSA, YES Securities
Axis Capital
8. Preparation and finalisation of the road-show presentation, road show script
and FAQs
Kotak, Axis Capital,
CLSA, YES Securities
CLSA
9. Coordination with Stock Exchanges for book building software, bidding
terminals, anchor investor portion, mock trading, payment of 1% security
deposit
Kotak, Axis Capital,
CLSA, YES Securities
Axis Capital
10. Pricing and managing the book Kotak, Axis Capital,
CLSA, YES Securities
Kotak
11. Post- Offer activities, which shall involve essential follow-up steps Kotak, Axis Capital, Axis Capital
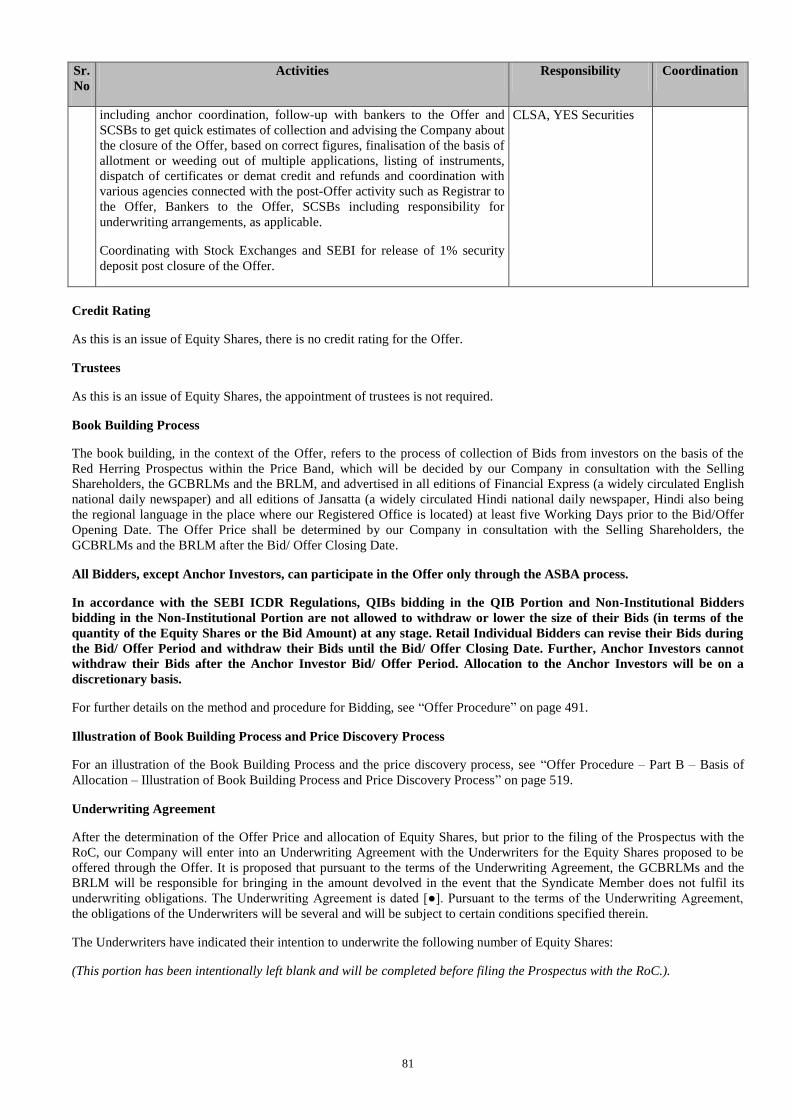
81
Sr.
No
Activities Responsibility Coordination
including anchor coordination, follow-up with bankers to the Offer and
SCSBs to get quick estimates of collection and advising the Company about
the closure of the Offer, based on correct figures, finalisation of the basis of
allotment or weeding out of multiple applications, listing of instruments,
dispatch of certificates or demat credit and refunds and coordination with
various agencies connected with the post-Offer activity such as Registrar to
the Offer, Bankers to the Offer, SCSBs including responsibility for
underwriting arrangements, as applicable.
Coordinating with Stock Exchanges and SEBI for release of 1% security
deposit post closure of the Offer.
CLSA, YES Securities
Credit Rating
As this is an issue of Equity Shares, there is no credit rating for the Offer.
Trustees
As this is an issue of Equity Shares, the appointment of trustees is not required.
Book Building Process
The book building, in the context of the Offer, refers to the process of collection of Bids from investors on the basis of the
Red Herring Prospectus within the Price Band, which will be decided by our Company in consultation with the Selling
Shareholders, the GCBRLMs and the BRLM, and advertised in all editions of Financial Express (a widely circulated English
national daily newspaper) and all editions of Jansatta (a widely circulated Hindi national daily newspaper, Hindi also being
the regional language in the place where our Registered Office is located) at least five Working Days prior to the Bid/Offer
Opening Date. The Offer Price shall be determined by our Company in consultation with the Selling Shareholders, the
GCBRLMs and the BRLM after the Bid/ Offer Closing Date.
All Bidders, except Anchor Investors, can participate in the Offer only through the ASBA process.
In accordance with the SEBI ICDR Regulations, QIBs bidding in the QIB Portion and Non-Institutional Bidders
bidding in the Non-Institutional Portion are not allowed to withdraw or lower the size of their Bids (in terms of the
quantity of the Equity Shares or the Bid Amount) at any stage. Retail Individual Bidders can revise their Bids during
the Bid/ Offer Period and withdraw their Bids until the Bid/ Offer Closing Date. Further, Anchor Investors cannot
withdraw their Bids after the Anchor Investor Bid/ Offer Period. Allocation to the Anchor Investors will be on a
discretionary basis.
For further details on the method and procedure for Bidding, see “Offer Procedure” on page 491.
Illustration of Book Building Process and Price Discovery Process
For an illustration of the Book Building Process and the price discovery process, see “Offer Procedure – Part B – Basis of
Allocation – Illustration of Book Building Process and Price Discovery Process” on page 519.
Underwriting Agreement
After the determination of the Offer Price and allocation of Equity Shares, but prior to the filing of the Prospectus with the
RoC, our Company will enter into an Underwriting Agreement with the Underwriters for the Equity Shares proposed to be
offered through the Offer. It is proposed that pursuant to the terms of the Underwriting Agreement, the GCBRLMs and the
BRLM will be responsible for bringing in the amount devolved in the event that the Syndicate Member does not fulfil its
underwriting obligations. The Underwriting Agreement is dated [●]. Pursuant to the terms of the Underwriting Agreement,
the obligations of the Underwriters will be several and will be subject to certain conditions specified therein.
The Underwriters have indicated their intention to underwrite the following number of Equity Shares:
(This portion has been intentionally left blank and will be completed before filing the Prospectus with the RoC.).
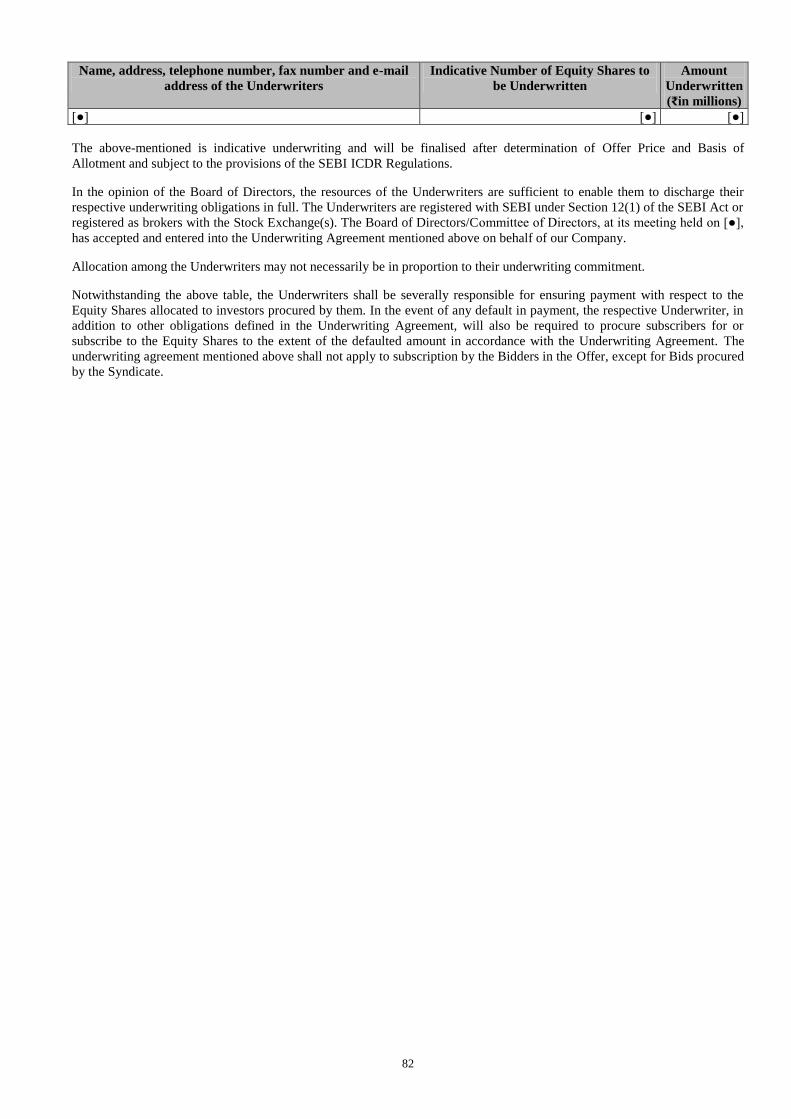
82
Name, address, telephone number, fax number and e-mail
address of the Underwriters
Indicative Number of Equity Shares to
be Underwritten
Amount
Underwritten
(₹in millions)
[●] [●] [●]
The above-mentioned is indicative underwriting and will be finalised after determination of Offer Price and Basis of
Allotment and subject to the provisions of the SEBI ICDR Regulations.
In the opinion of the Board of Directors, the resources of the Underwriters are sufficient to enable them to discharge their
respective underwriting obligations in full. The Underwriters are registered with SEBI under Section 12(1) of the SEBI Act or
registered as brokers with the Stock Exchange(s). The Board of Directors/Committee of Directors, at its meeting held on [●],
has accepted and entered into the Underwriting Agreement mentioned above on behalf of our Company.
Allocation among the Underwriters may not necessarily be in proportion to their underwriting commitment.
Notwithstanding the above table, the Underwriters shall be severally responsible for ensuring payment with respect to the
Equity Shares allocated to investors procured by them. In the event of any default in payment, the respective Underwriter, in
addition to other obligations defined in the Underwriting Agreement, will also be required to procure subscribers for or
subscribe to the Equity Shares to the extent of the defaulted amount in accordance with the Underwriting Agreement. The
underwriting agreement mentioned above shall not apply to subscription by the Bidders in the Offer, except for Bids procured
by the Syndicate.
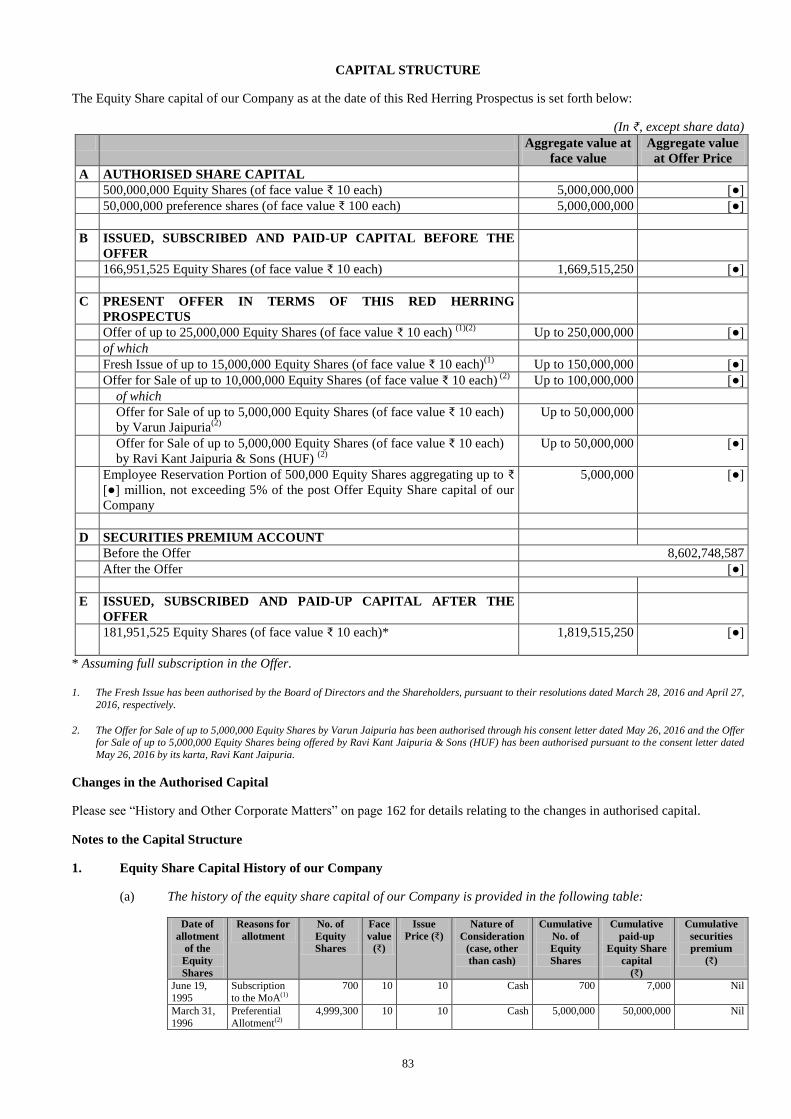
83
CAPITAL STRUCTURE
The Equity Share capital of our Company as at the date of this Red Herring Prospectus is set forth below:
(In ₹, except share data)
Aggregate value at
face value
Aggregate value
at Offer Price
A AUTHORISED SHARE CAPITAL
500,000,000 Equity Shares (of face value ₹ 10 each) 5,000,000,000 [●]
50,000,000 preference shares (of face value ₹ 100 each) 5,000,000,000 [●]
B ISSUED, SUBSCRIBED AND PAID-UP CAPITAL BEFORE THE
OFFER
166,951,525 Equity Shares (of face value ₹ 10 each) 1,669,515,250 [●]
C PRESENT OFFER IN TERMS OF THIS RED HERRING
PROSPECTUS
Offer of up to 25,000,000 Equity Shares (of face value ₹ 10 each) (1)(2)
Up to 250,000,000 [●]
of which
Fresh Issue of up to 15,000,000 Equity Shares (of face value ₹ 10 each)(1)
Up to 150,000,000 [●]
Offer for Sale of up to 10,000,000 Equity Shares (of face value ₹ 10 each) (2)
Up to 100,000,000 [●]
of which
Offer for Sale of up to 5,000,000 Equity Shares (of face value ₹ 10 each)
by Varun Jaipuria(2)
Up to 50,000,000
Offer for Sale of up to 5,000,000 Equity Shares (of face value ₹ 10 each)
by Ravi Kant Jaipuria & Sons (HUF) (2)
Up to 50,000,000 [●]
Employee Reservation Portion of 500,000 Equity Shares aggregating up to ₹
[●] million, not exceeding 5% of the post Offer Equity Share capital of our
Company
5,000,000 [●]
D SECURITIES PREMIUM ACCOUNT
Before the Offer 8,602,748,587
After the Offer [●]
E ISSUED, SUBSCRIBED AND PAID-UP CAPITAL AFTER THE
OFFER
181,951,525 Equity Shares (of face value ₹ 10 each)*
1,819,515,250 [●]
* Assuming full subscription in the Offer.
1. The Fresh Issue has been authorised by the Board of Directors and the Shareholders, pursuant to their resolutions dated March 28, 2016 and April 27,
2016, respectively.
2. The Offer for Sale of up to 5,000,000 Equity Shares by Varun Jaipuria has been authorised through his consent letter dated May 26, 2016 and the Offer for Sale of up to 5,000,000 Equity Shares being offered by Ravi Kant Jaipuria & Sons (HUF) has been authorised pursuant to the consent letter dated
May 26, 2016 by its karta, Ravi Kant Jaipuria.
Changes in the Authorised Capital
Please see “History and Other Corporate Matters” on page 162 for details relating to the changes in authorised capital.
Notes to the Capital Structure
1. Equity Share Capital History of our Company
(a) The history of the equity share capital of our Company is provided in the following table:
Date of
allotment
of the
Equity
Shares
Reasons for
allotment
No. of
Equity
Shares
Face
value
(₹)
Issue
Price (₹)
Nature of
Consideration
(case, other
than cash)
Cumulative
No. of
Equity
Shares
Cumulative
paid-up
Equity Share
capital
(₹)
Cumulative
securities
premium
(₹)
June 19,
1995
Subscription
to the MoA(1)
700 10 10 Cash 700 7,000 Nil
March 31,
1996
Preferential
Allotment(2)
4,999,300 10 10 Cash 5,000,000 50,000,000 Nil
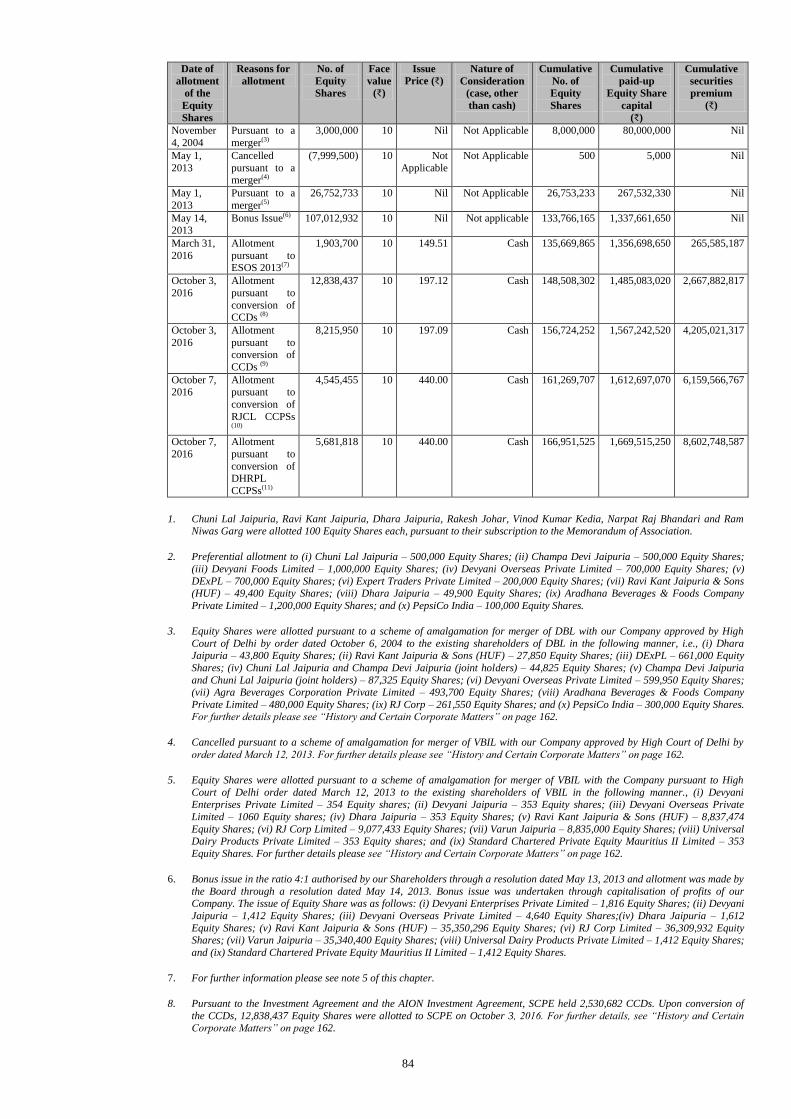
84
Date of
allotment
of the
Equity
Shares
Reasons for
allotment
No. of
Equity
Shares
Face
value
(₹)
Issue
Price (₹)
Nature of
Consideration
(case, other
than cash)
Cumulative
No. of
Equity
Shares
Cumulative
paid-up
Equity Share
capital
(₹)
Cumulative
securities
premium
(₹)
November
4, 2004
Pursuant to a
merger(3)
3,000,000 10 Nil Not Applicable 8,000,000 80,000,000 Nil
May 1,
2013
Cancelled
pursuant to a merger(4)
(7,999,500) 10 Not
Applicable
Not Applicable 500 5,000 Nil
May 1,
2013
Pursuant to a
merger(5)
26,752,733 10 Nil Not Applicable 26,753,233 267,532,330 Nil
May 14, 2013
Bonus Issue(6) 107,012,932 10 Nil Not applicable 133,766,165 1,337,661,650 Nil
March 31,
2016
Allotment
pursuant to ESOS 2013(7)
1,903,700 10 149.51 Cash 135,669,865 1,356,698,650 265,585,187
October 3,
2016
Allotment
pursuant to
conversion of CCDs (8)
12,838,437 10 197.12 Cash 148,508,302 1,485,083,020 2,667,882,817
October 3,
2016
Allotment
pursuant to conversion of
CCDs (9)
8,215,950 10 197.09 Cash 156,724,252 1,567,242,520 4,205,021,317
October 7, 2016
Allotment pursuant to
conversion of
RJCL CCPSs
(10)
4,545,455 10 440.00 Cash 161,269,707 1,612,697,070 6,159,566,767
October 7,
2016
Allotment
pursuant to
conversion of DHRPL
CCPSs(11)
5,681,818 10 440.00 Cash 166,951,525 1,669,515,250 8,602,748,587
1. Chuni Lal Jaipuria, Ravi Kant Jaipuria, Dhara Jaipuria, Rakesh Johar, Vinod Kumar Kedia, Narpat Raj Bhandari and Ram
Niwas Garg were allotted 100 Equity Shares each, pursuant to their subscription to the Memorandum of Association.
2. Preferential allotment to (i) Chuni Lal Jaipuria – 500,000 Equity Shares; (ii) Champa Devi Jaipuria – 500,000 Equity Shares;
(iii) Devyani Foods Limited – 1,000,000 Equity Shares; (iv) Devyani Overseas Private Limited – 700,000 Equity Shares; (v)
DExPL – 700,000 Equity Shares; (vi) Expert Traders Private Limited – 200,000 Equity Shares; (vii) Ravi Kant Jaipuria & Sons (HUF) – 49,400 Equity Shares; (viii) Dhara Jaipuria – 49,900 Equity Shares; (ix) Aradhana Beverages & Foods Company
Private Limited – 1,200,000 Equity Shares; and (x) PepsiCo India – 100,000 Equity Shares.
3. Equity Shares were allotted pursuant to a scheme of amalgamation for merger of DBL with our Company approved by High
Court of Delhi by order dated October 6, 2004 to the existing shareholders of DBL in the following manner, i.e., (i) Dhara Jaipuria – 43,800 Equity Shares; (ii) Ravi Kant Jaipuria & Sons (HUF) – 27,850 Equity Shares; (iii) DExPL – 661,000 Equity
Shares; (iv) Chuni Lal Jaipuria and Champa Devi Jaipuria (joint holders) – 44,825 Equity Shares; (v) Champa Devi Jaipuria
and Chuni Lal Jaipuria (joint holders) – 87,325 Equity Shares; (vi) Devyani Overseas Private Limited – 599,950 Equity Shares; (vii) Agra Beverages Corporation Private Limited – 493,700 Equity Shares; (viii) Aradhana Beverages & Foods Company
Private Limited – 480,000 Equity Shares; (ix) RJ Corp – 261,550 Equity Shares; and (x) PepsiCo India – 300,000 Equity Shares. For further details please see “History and Certain Corporate Matters” on page 162.
4. Cancelled pursuant to a scheme of amalgamation for merger of VBIL with our Company approved by High Court of Delhi by
order dated March 12, 2013. For further details please see “History and Certain Corporate Matters” on page 162.
5. Equity Shares were allotted pursuant to a scheme of amalgamation for merger of VBIL with the Company pursuant to High
Court of Delhi order dated March 12, 2013 to the existing shareholders of VBIL in the following manner., (i) Devyani
Enterprises Private Limited – 354 Equity shares; (ii) Devyani Jaipuria – 353 Equity shares; (iii) Devyani Overseas Private
Limited – 1060 Equity shares; (iv) Dhara Jaipuria – 353 Equity Shares; (v) Ravi Kant Jaipuria & Sons (HUF) – 8,837,474
Equity Shares; (vi) RJ Corp Limited – 9,077,433 Equity Shares; (vii) Varun Jaipuria – 8,835,000 Equity Shares; (viii) Universal Dairy Products Private Limited – 353 Equity shares; and (ix) Standard Chartered Private Equity Mauritius II Limited – 353
Equity Shares. For further details please see “History and Certain Corporate Matters” on page 162.
6. Bonus issue in the ratio 4:1 authorised by our Shareholders through a resolution dated May 13, 2013 and allotment was made by
the Board through a resolution dated May 14, 2013. Bonus issue was undertaken through capitalisation of profits of our Company. The issue of Equity Share was as follows: (i) Devyani Enterprises Private Limited – 1,816 Equity Shares; (ii) Devyani
Jaipuria – 1,412 Equity Shares; (iii) Devyani Overseas Private Limited – 4,640 Equity Shares;(iv) Dhara Jaipuria – 1,612
Equity Shares; (v) Ravi Kant Jaipuria & Sons (HUF) – 35,350,296 Equity Shares; (vi) RJ Corp Limited – 36,309,932 Equity Shares; (vii) Varun Jaipuria – 35,340,400 Equity Shares; (viii) Universal Dairy Products Private Limited – 1,412 Equity Shares;
and (ix) Standard Chartered Private Equity Mauritius II Limited – 1,412 Equity Shares.
7. For further information please see note 5 of this chapter.
8. Pursuant to the Investment Agreement and the AION Investment Agreement, SCPE held 2,530,682 CCDs. Upon conversion of
the CCDs, 12,838,437 Equity Shares were allotted to SCPE on October 3, 2016. For further details, see “History and Certain Corporate Matters” on page 162.
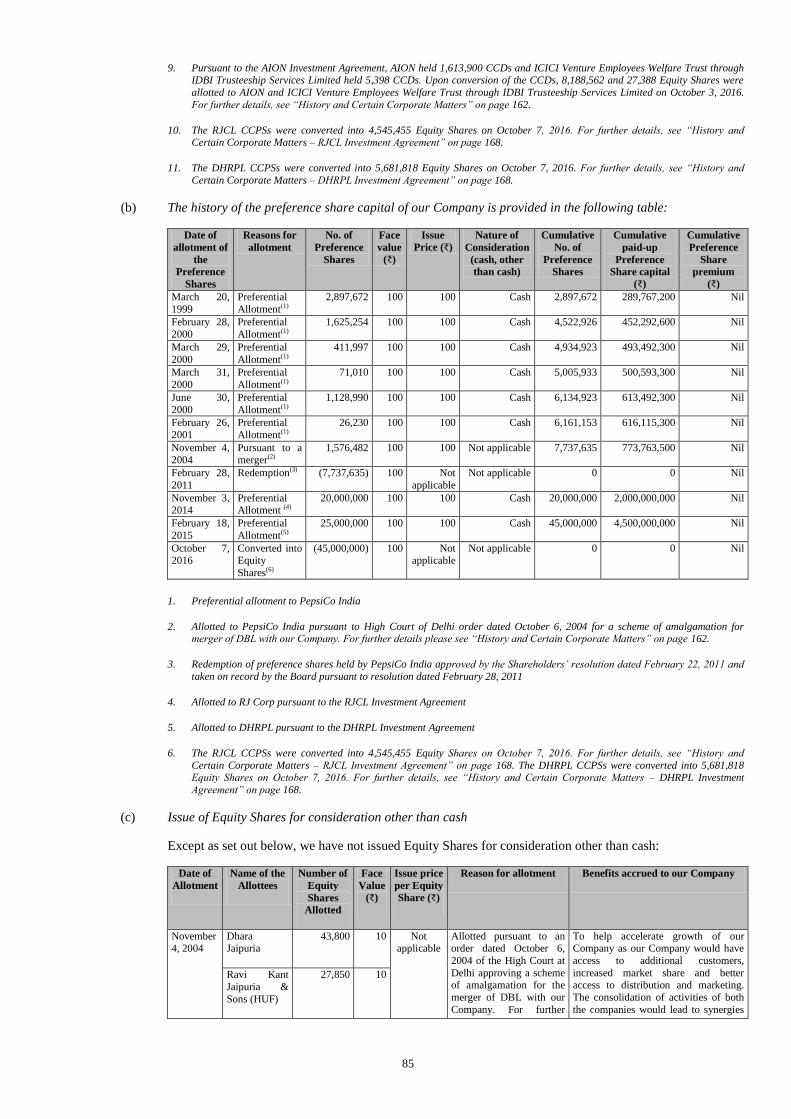
85
9. Pursuant to the AION Investment Agreement, AION held 1,613,900 CCDs and ICICI Venture Employees Welfare Trust through IDBI Trusteeship Services Limited held 5,398 CCDs. Upon conversion of the CCDs, 8,188,562 and 27,388 Equity Shares were
allotted to AION and ICICI Venture Employees Welfare Trust through IDBI Trusteeship Services Limited on October 3, 2016.
For further details, see “History and Certain Corporate Matters” on page 162.
10. The RJCL CCPSs were converted into 4,545,455 Equity Shares on October 7, 2016. For further details, see “History and Certain Corporate Matters – RJCL Investment Agreement” on page 168.
11. The DHRPL CCPSs were converted into 5,681,818 Equity Shares on October 7, 2016. For further details, see “History and
Certain Corporate Matters – DHRPL Investment Agreement” on page 168.
(b) The history of the preference share capital of our Company is provided in the following table:
Date of
allotment of
the
Preference
Shares
Reasons for
allotment
No. of
Preference
Shares
Face
value
(₹)
Issue
Price (₹)
Nature of
Consideration
(cash, other
than cash)
Cumulative
No. of
Preference
Shares
Cumulative
paid-up
Preference
Share capital
(₹)
Cumulative
Preference
Share
premium
(₹)
March 20,
1999
Preferential
Allotment(1)
2,897,672 100 100 Cash 2,897,672 289,767,200 Nil
February 28,
2000
Preferential
Allotment(1)
1,625,254 100 100 Cash 4,522,926 452,292,600 Nil
March 29,
2000
Preferential
Allotment(1)
411,997 100 100 Cash 4,934,923 493,492,300 Nil
March 31,
2000
Preferential
Allotment(1)
71,010 100 100 Cash 5,005,933 500,593,300 Nil
June 30,
2000
Preferential
Allotment(1)
1,128,990 100 100 Cash 6,134,923 613,492,300 Nil
February 26,
2001
Preferential
Allotment(1)
26,230 100 100 Cash 6,161,153 616,115,300 Nil
November 4, 2004
Pursuant to a merger(2)
1,576,482 100 100 Not applicable 7,737,635 773,763,500 Nil
February 28,
2011
Redemption(3) (7,737,635) 100 Not
applicable
Not applicable 0 0 Nil
November 3, 2014
Preferential Allotment (4)
20,000,000 100 100 Cash 20,000,000 2,000,000,000 Nil
February 18,
2015
Preferential
Allotment(5)
25,000,000 100 100 Cash 45,000,000 4,500,000,000 Nil
October 7, 2016
Converted into Equity
Shares(6)
(45,000,000) 100 Not applicable
Not applicable 0 0 Nil
1. Preferential allotment to PepsiCo India
2. Allotted to PepsiCo India pursuant to High Court of Delhi order dated October 6, 2004 for a scheme of amalgamation for merger of DBL with our Company. For further details please see “History and Certain Corporate Matters” on page 162.
3. Redemption of preference shares held by PepsiCo India approved by the Shareholders’ resolution dated February 22, 2011 and
taken on record by the Board pursuant to resolution dated February 28, 2011
4. Allotted to RJ Corp pursuant to the RJCL Investment Agreement
5. Allotted to DHRPL pursuant to the DHRPL Investment Agreement
6. The RJCL CCPSs were converted into 4,545,455 Equity Shares on October 7, 2016. For further details, see “History and
Certain Corporate Matters – RJCL Investment Agreement” on page 168. The DHRPL CCPSs were converted into 5,681,818 Equity Shares on October 7, 2016. For further details, see “History and Certain Corporate Matters – DHRPL Investment
Agreement” on page 168.
(c) Issue of Equity Shares for consideration other than cash
Except as set out below, we have not issued Equity Shares for consideration other than cash:
Date of
Allotment
Name of the
Allottees
Number of
Equity
Shares
Allotted
Face
Value
(₹)
Issue price
per Equity
Share (₹)
Reason for allotment Benefits accrued to our Company
November 4, 2004
Dhara Jaipuria
43,800 10 Not applicable
Allotted pursuant to an order dated October 6,
2004 of the High Court at
Delhi approving a scheme of amalgamation for the
merger of DBL with our
Company. For further
To help accelerate growth of our Company as our Company would have
access to additional customers,
increased market share and better access to distribution and marketing.
The consolidation of activities of both
the companies would lead to synergies
Ravi Kant
Jaipuria &
Sons (HUF)
27,850 10
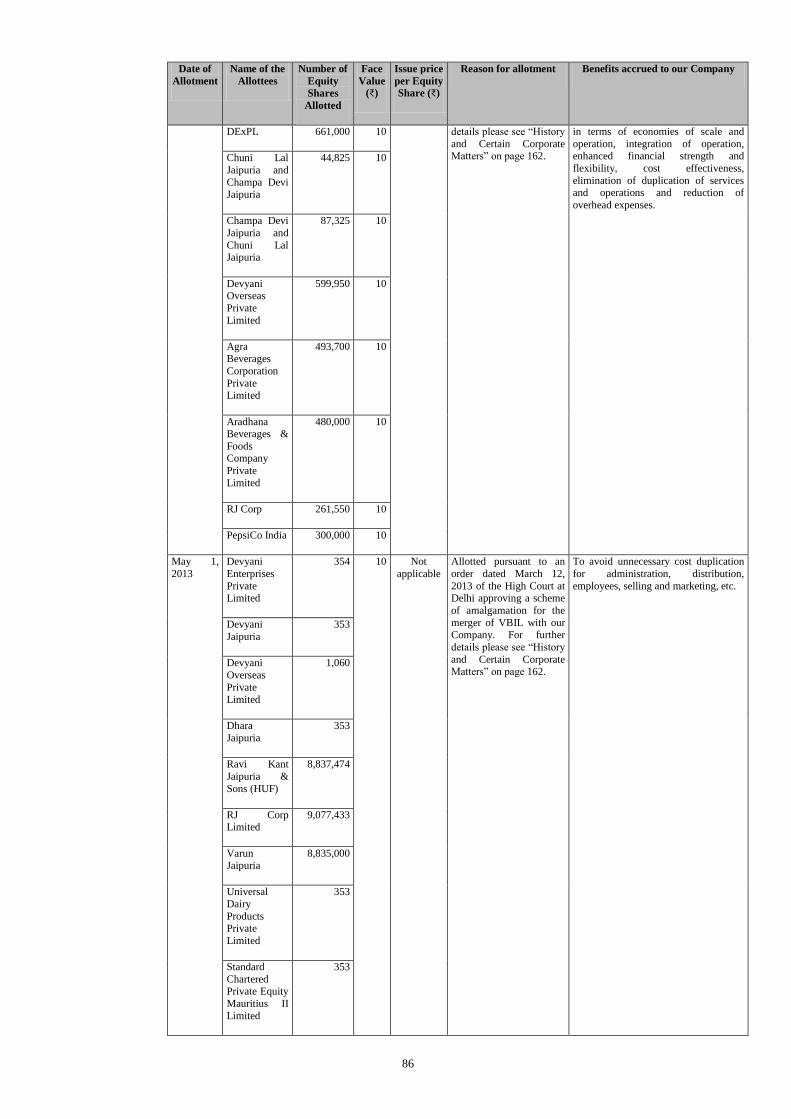
86
Date of
Allotment
Name of the
Allottees
Number of
Equity
Shares
Allotted
Face
Value
(₹)
Issue price
per Equity
Share (₹)
Reason for allotment Benefits accrued to our Company
DExPL 661,000 10 details please see “History
and Certain Corporate Matters” on page 162.
in terms of economies of scale and
operation, integration of operation, enhanced financial strength and
flexibility, cost effectiveness,
elimination of duplication of services and operations and reduction of
overhead expenses.
Chuni Lal
Jaipuria and
Champa Devi Jaipuria
44,825 10
Champa Devi
Jaipuria and
Chuni Lal Jaipuria
87,325 10
Devyani Overseas
Private
Limited
599,950 10
Agra Beverages
Corporation
Private Limited
493,700 10
Aradhana Beverages &
Foods Company
Private
Limited
480,000 10
RJ Corp 261,550 10
PepsiCo India 300,000 10
May 1,
2013
Devyani
Enterprises
Private Limited
354 10 Not
applicable
Allotted pursuant to an
order dated March 12,
2013 of the High Court at Delhi approving a scheme
of amalgamation for the
merger of VBIL with our Company. For further
details please see “History
and Certain Corporate Matters” on page 162.
To avoid unnecessary cost duplication
for administration, distribution,
employees, selling and marketing, etc.
Devyani
Jaipuria
353
Devyani
Overseas
Private Limited
1,060
Dhara
Jaipuria
353
Ravi Kant
Jaipuria &
Sons (HUF)
8,837,474
RJ Corp Limited
9,077,433
Varun Jaipuria
8,835,000
Universal
Dairy
Products Private
Limited
353
Standard
Chartered Private Equity
Mauritius II
Limited
353
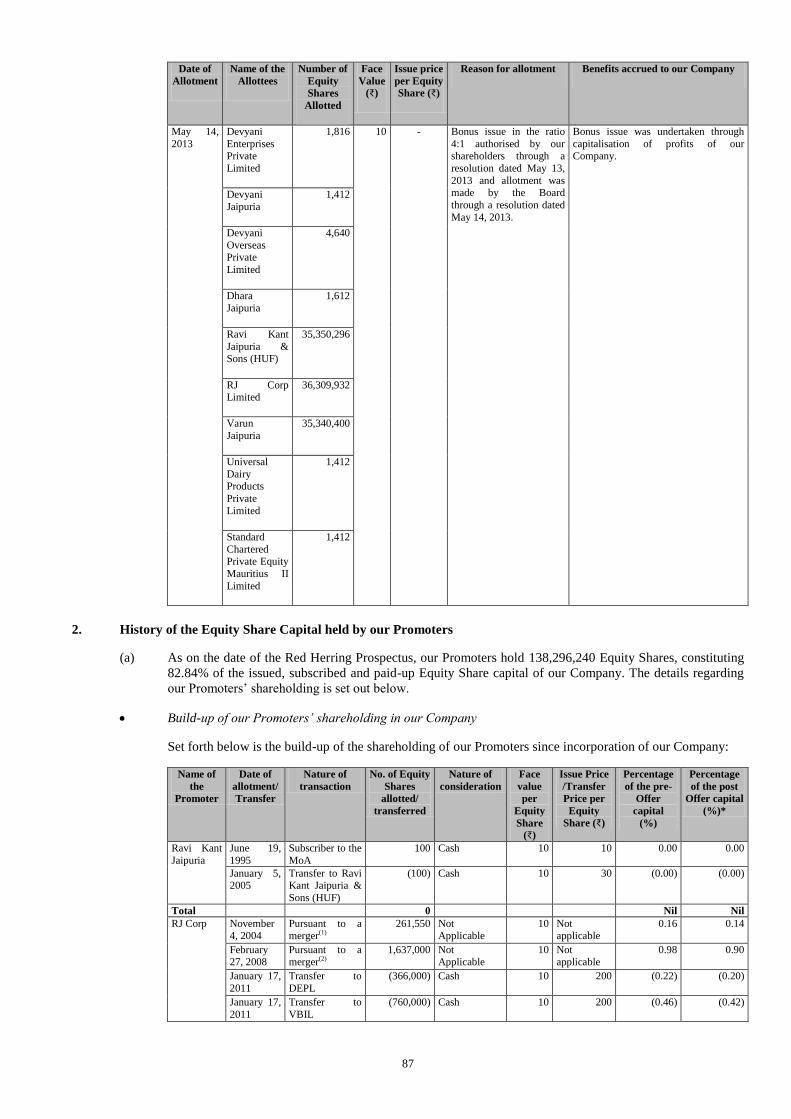
87
Date of
Allotment
Name of the
Allottees
Number of
Equity
Shares
Allotted
Face
Value
(₹)
Issue price
per Equity
Share (₹)
Reason for allotment Benefits accrued to our Company
May 14,
2013
Devyani
Enterprises Private
Limited
1,816 10 - Bonus issue in the ratio
4:1 authorised by our shareholders through a
resolution dated May 13,
2013 and allotment was made by the Board
through a resolution dated
May 14, 2013.
Bonus issue was undertaken through
capitalisation of profits of our Company.
Devyani
Jaipuria
1,412
Devyani
Overseas Private
Limited
4,640
Dhara
Jaipuria
1,612
Ravi Kant
Jaipuria & Sons (HUF)
35,350,296
RJ Corp Limited
36,309,932
Varun
Jaipuria
35,340,400
Universal
Dairy Products
Private
Limited
1,412
Standard
Chartered Private Equity
Mauritius II
Limited
1,412
2. History of the Equity Share Capital held by our Promoters
(a) As on the date of the Red Herring Prospectus, our Promoters hold 138,296,240 Equity Shares, constituting
82.84% of the issued, subscribed and paid-up Equity Share capital of our Company. The details regarding
our Promoters’ shareholding is set out below.
Build-up of our Promoters’ shareholding in our Company
Set forth below is the build-up of the shareholding of our Promoters since incorporation of our Company:
Name of
the
Promoter
Date of
allotment/
Transfer
Nature of
transaction
No. of Equity
Shares
allotted/
transferred
Nature of
consideration
Face
value
per
Equity
Share
(₹)
Issue Price
/Transfer
Price per
Equity
Share (₹)
Percentage
of the pre-
Offer
capital
(%)
Percentage
of the post
Offer capital
(%)*
Ravi Kant
Jaipuria
June 19,
1995
Subscriber to the
MoA
100 Cash 10 10 0.00 0.00
January 5, 2005
Transfer to Ravi Kant Jaipuria &
Sons (HUF)
(100) Cash 10 30 (0.00) (0.00)
Total 0 Nil Nil
RJ Corp November 4, 2004
Pursuant to a merger(1)
261,550 Not Applicable
10 Not applicable
0.16 0.14
February 27, 2008
Pursuant to a merger(2)
1,637,000 Not Applicable
10 Not applicable
0.98 0.90
January 17,
2011
Transfer to
DEPL
(366,000) Cash 10 200 (0.22) (0.20)
January 17,
2011
Transfer to
VBIL
(760,000) Cash 10 200 (0.46) (0.42)
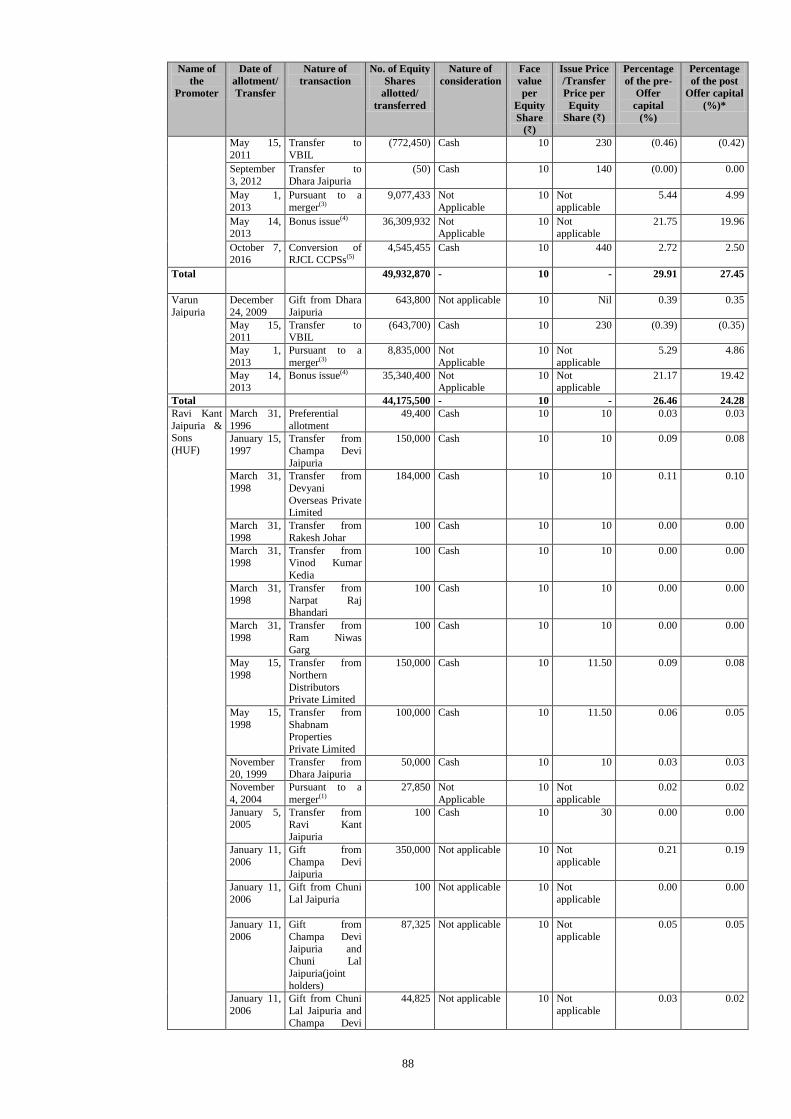
88
Name of
the
Promoter
Date of
allotment/
Transfer
Nature of
transaction
No. of Equity
Shares
allotted/
transferred
Nature of
consideration
Face
value
per
Equity
Share
(₹)
Issue Price
/Transfer
Price per
Equity
Share (₹)
Percentage
of the pre-
Offer
capital
(%)
Percentage
of the post
Offer capital
(%)*
May 15,
2011
Transfer to
VBIL
(772,450) Cash 10 230 (0.46) (0.42)
September
3, 2012
Transfer to
Dhara Jaipuria
(50) Cash 10 140 (0.00) 0.00
May 1,
2013
Pursuant to a
merger(3)
9,077,433 Not
Applicable
10 Not
applicable
5.44 4.99
May 14, 2013
Bonus issue(4) 36,309,932 Not Applicable
10 Not applicable
21.75 19.96
October 7, 2016
Conversion of RJCL CCPSs(5)
4,545,455 Cash 10 440 2.72 2.50
Total 49,932,870 - 10 - 29.91 27.45
Varun
Jaipuria
December
24, 2009
Gift from Dhara
Jaipuria
643,800 Not applicable 10 Nil 0.39 0.35
May 15, 2011
Transfer to VBIL
(643,700) Cash 10 230 (0.39) (0.35)
May 1,
2013
Pursuant to a
merger(3)
8,835,000 Not
Applicable
10 Not
applicable
5.29 4.86
May 14, 2013
Bonus issue(4) 35,340,400 Not Applicable
10 Not applicable
21.17 19.42
Total 44,175,500 - 10 - 26.46 24.28
Ravi Kant
Jaipuria & Sons
(HUF)
March 31,
1996
Preferential
allotment
49,400 Cash 10 10 0.03 0.03
January 15,
1997
Transfer from
Champa Devi
Jaipuria
150,000 Cash 10 10 0.09 0.08
March 31,
1998
Transfer from
Devyani
Overseas Private Limited
184,000 Cash 10 10 0.11 0.10
March 31,
1998
Transfer from
Rakesh Johar
100 Cash 10 10 0.00 0.00
March 31, 1998
Transfer from Vinod Kumar
Kedia
100 Cash 10 10 0.00 0.00
March 31,
1998
Transfer from
Narpat Raj Bhandari
100 Cash 10 10 0.00 0.00
March 31,
1998
Transfer from
Ram Niwas Garg
100 Cash 10 10 0.00 0.00
May 15,
1998
Transfer from
Northern
Distributors Private Limited
150,000 Cash 10 11.50 0.09 0.08
May 15,
1998
Transfer from
Shabnam Properties
Private Limited
100,000 Cash 10 11.50 0.06 0.05
November 20, 1999
Transfer from Dhara Jaipuria
50,000 Cash 10 10 0.03 0.03
November
4, 2004
Pursuant to a
merger(1)
27,850 Not
Applicable
10 Not
applicable
0.02 0.02
January 5, 2005
Transfer from Ravi Kant
Jaipuria
100 Cash 10 30 0.00 0.00
January 11,
2006
Gift from
Champa Devi Jaipuria
350,000 Not applicable 10 Not
applicable
0.21 0.19
January 11,
2006
Gift from Chuni
Lal Jaipuria
100 Not applicable 10 Not
applicable
0.00 0.00
January 11,
2006
Gift from
Champa Devi
Jaipuria and Chuni Lal
Jaipuria(joint
holders)
87,325 Not applicable 10 Not
applicable
0.05 0.05
January 11,
2006
Gift from Chuni
Lal Jaipuria and
Champa Devi
44,825 Not applicable 10 Not
applicable
0.03 0.02
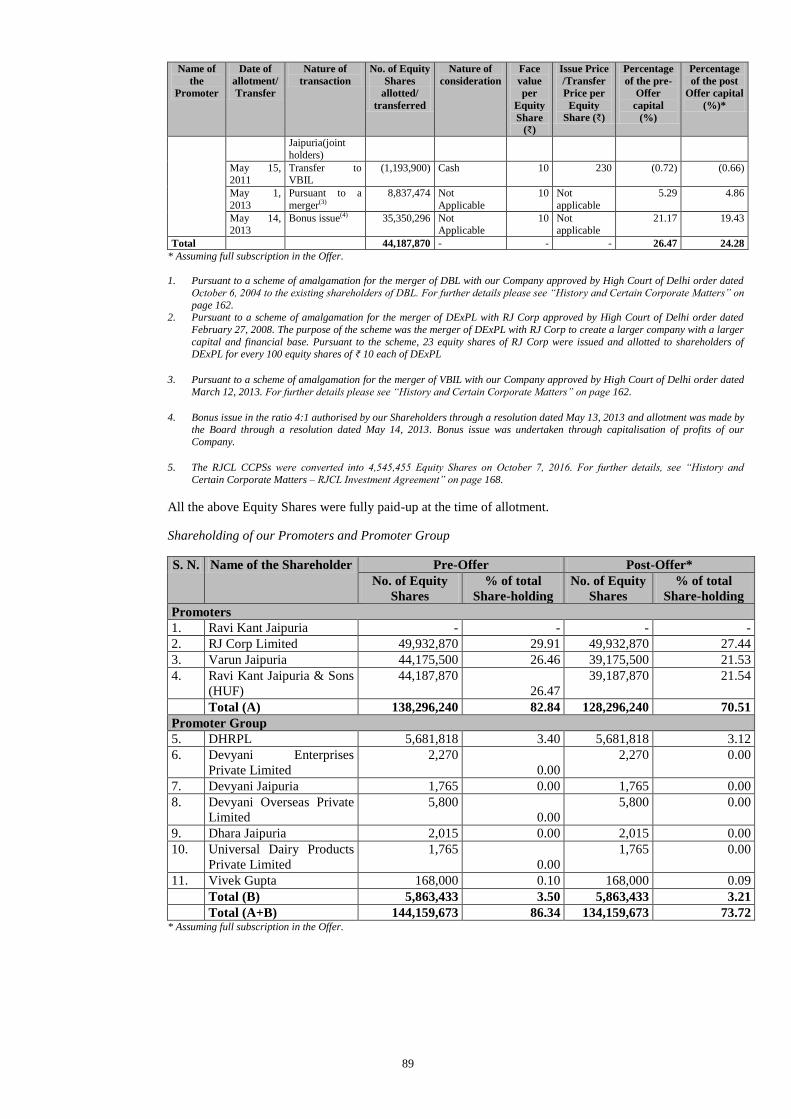
89
Name of
the
Promoter
Date of
allotment/
Transfer
Nature of
transaction
No. of Equity
Shares
allotted/
transferred
Nature of
consideration
Face
value
per
Equity
Share
(₹)
Issue Price
/Transfer
Price per
Equity
Share (₹)
Percentage
of the pre-
Offer
capital
(%)
Percentage
of the post
Offer capital
(%)*
Jaipuria(joint
holders)
May 15, 2011
Transfer to VBIL
(1,193,900) Cash 10 230 (0.72) (0.66)
May 1,
2013
Pursuant to a
merger(3)
8,837,474 Not
Applicable
10 Not
applicable
5.29 4.86
May 14, 2013
Bonus issue(4) 35,350,296 Not Applicable
10 Not applicable
21.17 19.43
Total 44,187,870 - - - 26.47 24.28
* Assuming full subscription in the Offer.
1. Pursuant to a scheme of amalgamation for the merger of DBL with our Company approved by High Court of Delhi order dated
October 6, 2004 to the existing shareholders of DBL. For further details please see “History and Certain Corporate Matters” on
page 162. 2. Pursuant to a scheme of amalgamation for the merger of DExPL with RJ Corp approved by High Court of Delhi order dated
February 27, 2008. The purpose of the scheme was the merger of DExPL with RJ Corp to create a larger company with a larger
capital and financial base. Pursuant to the scheme, 23 equity shares of RJ Corp were issued and allotted to shareholders of DExPL for every 100 equity shares of ₹ 10 each of DExPL
3. Pursuant to a scheme of amalgamation for the merger of VBIL with our Company approved by High Court of Delhi order dated
March 12, 2013. For further details please see “History and Certain Corporate Matters” on page 162.
4. Bonus issue in the ratio 4:1 authorised by our Shareholders through a resolution dated May 13, 2013 and allotment was made by the Board through a resolution dated May 14, 2013. Bonus issue was undertaken through capitalisation of profits of our
Company.
5. The RJCL CCPSs were converted into 4,545,455 Equity Shares on October 7, 2016. For further details, see “History and
Certain Corporate Matters – RJCL Investment Agreement” on page 168.
All the above Equity Shares were fully paid-up at the time of allotment.
Shareholding of our Promoters and Promoter Group
S. N. Name of the Shareholder Pre-Offer Post-Offer*
No. of Equity
Shares
% of total
Share-holding
No. of Equity
Shares
% of total
Share-holding
Promoters
1. Ravi Kant Jaipuria - - - -
2. RJ Corp Limited 49,932,870 29.91 49,932,870 27.44
3. Varun Jaipuria 44,175,500 26.46 39,175,500 21.53
4. Ravi Kant Jaipuria & Sons
(HUF)
44,187,870
26.47
39,187,870 21.54
Total (A) 138,296,240 82.84 128,296,240 70.51
Promoter Group
5. DHRPL 5,681,818 3.40 5,681,818 3.12
6. Devyani Enterprises
Private Limited
2,270
0.00
2,270 0.00
7. Devyani Jaipuria 1,765 0.00 1,765 0.00
8. Devyani Overseas Private
Limited
5,800
0.00
5,800 0.00
9. Dhara Jaipuria 2,015 0.00 2,015 0.00
10. Universal Dairy Products
Private Limited
1,765
0.00
1,765 0.00
11. Vivek Gupta 168,000 0.10 168,000 0.09
Total (B) 5,863,433 3.50 5,863,433 3.21
Total (A+B) 144,159,673 86.34 134,159,673 73.72 * Assuming full subscription in the Offer.
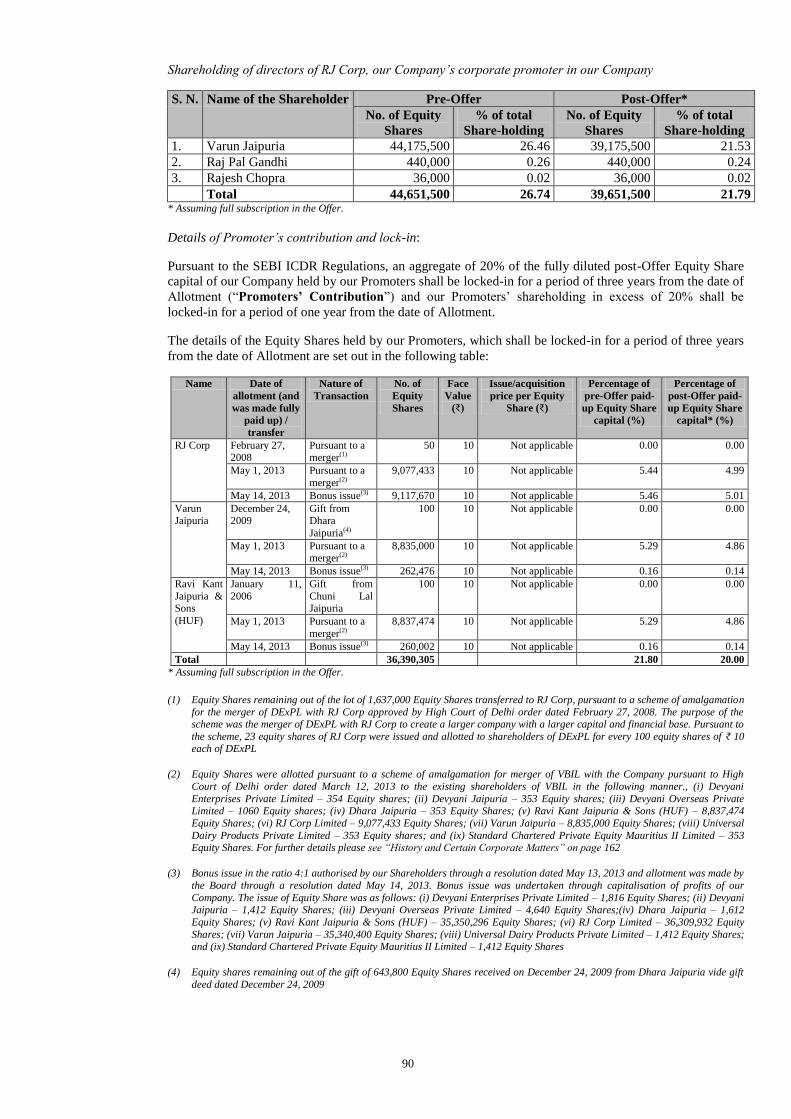
90
Shareholding of directors of RJ Corp, our Company’s corporate promoter in our Company
S. N. Name of the Shareholder Pre-Offer Post-Offer*
No. of Equity
Shares
% of total
Share-holding
No. of Equity
Shares
% of total
Share-holding
1. Varun Jaipuria 44,175,500 26.46 39,175,500 21.53
2. Raj Pal Gandhi 440,000 0.26 440,000 0.24
3. Rajesh Chopra 36,000 0.02 36,000 0.02
Total 44,651,500 26.74 39,651,500 21.79 * Assuming full subscription in the Offer.
Details of Promoter’s contribution and lock-in:
Pursuant to the SEBI ICDR Regulations, an aggregate of 20% of the fully diluted post-Offer Equity Share
capital of our Company held by our Promoters shall be locked-in for a period of three years from the date of
Allotment (“Promoters’ Contribution”) and our Promoters’ shareholding in excess of 20% shall be
locked-in for a period of one year from the date of Allotment.
The details of the Equity Shares held by our Promoters, which shall be locked-in for a period of three years
from the date of Allotment are set out in the following table:
Name Date of
allotment (and
was made fully
paid up) /
transfer
Nature of
Transaction
No. of
Equity
Shares
Face
Value
(₹)
Issue/acquisition
price per Equity
Share (₹)
Percentage of
pre-Offer paid-
up Equity Share
capital (%)
Percentage of
post-Offer paid-
up Equity Share
capital* (%)
RJ Corp February 27, 2008
Pursuant to a merger(1)
50 10 Not applicable 0.00 0.00
May 1, 2013 Pursuant to a
merger(2)
9,077,433 10 Not applicable 5.44 4.99
May 14, 2013 Bonus issue(3) 9,117,670 10 Not applicable 5.46 5.01
Varun Jaipuria
December 24, 2009
Gift from Dhara
Jaipuria(4)
100 10 Not applicable 0.00 0.00
May 1, 2013 Pursuant to a merger(2)
8,835,000 10 Not applicable 5.29 4.86
May 14, 2013 Bonus issue(3) 262,476 10 Not applicable 0.16 0.14
Ravi Kant
Jaipuria & Sons
(HUF)
January 11,
2006
Gift from
Chuni Lal Jaipuria
100 10 Not applicable 0.00 0.00
May 1, 2013 Pursuant to a
merger(2)
8,837,474 10 Not applicable 5.29 4.86
May 14, 2013 Bonus issue(3) 260,002 10 Not applicable 0.16 0.14
Total 36,390,305 21.80 20.00
* Assuming full subscription in the Offer.
(1) Equity Shares remaining out of the lot of 1,637,000 Equity Shares transferred to RJ Corp, pursuant to a scheme of amalgamation
for the merger of DExPL with RJ Corp approved by High Court of Delhi order dated February 27, 2008. The purpose of the scheme was the merger of DExPL with RJ Corp to create a larger company with a larger capital and financial base. Pursuant to
the scheme, 23 equity shares of RJ Corp were issued and allotted to shareholders of DExPL for every 100 equity shares of ₹ 10 each of DExPL
(2) Equity Shares were allotted pursuant to a scheme of amalgamation for merger of VBIL with the Company pursuant to High
Court of Delhi order dated March 12, 2013 to the existing shareholders of VBIL in the following manner., (i) Devyani
Enterprises Private Limited – 354 Equity shares; (ii) Devyani Jaipuria – 353 Equity shares; (iii) Devyani Overseas Private Limited – 1060 Equity shares; (iv) Dhara Jaipuria – 353 Equity Shares; (v) Ravi Kant Jaipuria & Sons (HUF) – 8,837,474
Equity Shares; (vi) RJ Corp Limited – 9,077,433 Equity Shares; (vii) Varun Jaipuria – 8,835,000 Equity Shares; (viii) Universal
Dairy Products Private Limited – 353 Equity shares; and (ix) Standard Chartered Private Equity Mauritius II Limited – 353 Equity Shares. For further details please see “History and Certain Corporate Matters” on page 162
(3) Bonus issue in the ratio 4:1 authorised by our Shareholders through a resolution dated May 13, 2013 and allotment was made by
the Board through a resolution dated May 14, 2013. Bonus issue was undertaken through capitalisation of profits of our
Company. The issue of Equity Share was as follows: (i) Devyani Enterprises Private Limited – 1,816 Equity Shares; (ii) Devyani Jaipuria – 1,412 Equity Shares; (iii) Devyani Overseas Private Limited – 4,640 Equity Shares;(iv) Dhara Jaipuria – 1,612
Equity Shares; (v) Ravi Kant Jaipuria & Sons (HUF) – 35,350,296 Equity Shares; (vi) RJ Corp Limited – 36,309,932 Equity
Shares; (vii) Varun Jaipuria – 35,340,400 Equity Shares; (viii) Universal Dairy Products Private Limited – 1,412 Equity Shares; and (ix) Standard Chartered Private Equity Mauritius II Limited – 1,412 Equity Shares
(4) Equity shares remaining out of the gift of 643,800 Equity Shares received on December 24, 2009 from Dhara Jaipuria vide gift
deed dated December 24, 2009
91
The Promoters have confirmed that the Promoters’ Contribution has been financed from their internal
accruals and no loans or financial assistance from any bank or financial institutions has been availed by
them for this purpose.
The Promoters’ Contribution has been brought in to the extent of not less than the specified minimum lot
and from the persons defined as ‘promoter’ under the SEBI ICDR Regulations. Our Company undertakes
that the Equity Shares that are being locked-in are not ineligible for computation of Promoters’
Contribution in terms of Regulation 33 of the SEBI ICDR Regulations. In this connection, we confirm the
following:
(i) The Equity Shares offered for Promoters’ Contribution have not been acquired in the last three
years for consideration other than cash and revaluation of assets or capitalisation of intangible
assets; or resulting from bonus issue by utilisation of revaluation reserves or unrealised profits of
our Company or bonus issue against Equity Shares which are otherwise ineligible for computation
of Promoters’ Contribution;
(ii) The Promoters’ Contribution does not include any Equity Shares acquired during the preceding
one year and at a price lower than the price at which the Equity Shares are being offered to the
public in the Offer;
(iii) The Company has not been formed by the conversion of a partnership firm into a company;
(iv) The Equity Shares held by the Promoters and offered for Promoters’ Contribution are not subject
to any pledge; and
(v) All the Equity Shares of our Company held by the Promoters are held in dematerialised form.
Other requirements in respect of lock-in:
In addition to 20% of the fully diluted post-Offer shareholding of our Company held by our Promoters and
locked-in for three years as specified above, the entire pre-Offer Equity Share capital of our Company and
any unsubscribed portion of the Offer for Sale by the Selling Shareholders will be locked-in for a period of
one year from the date of Allotment, except for the Equity Shares allotted to the employees under ESOS
2013 and the Equity Shares proposed to be allotted under ESOS 2013 and ESOS 2016.
The Equity Shares held by our Promoters which are locked-in for a period of one year from the date of
Allotment may be pledged only with scheduled commercial banks or public financial institutions as
collateral security for loans granted by such banks or public financial institutions, provided that such pledge
of the Equity Shares is one of the terms of the sanction of such loans.
The Equity Shares held by our Promoters which are locked-in may be transferred to and amongst the
Promoters, or the Promoter Group entities or to any new promoter or persons in control of our Company,
subject to continuation of the lock-in in the hands of the transferees for the remaining period and
compliance with the Takeover Regulations, as applicable.
The Equity Shares held by persons other than our Promoters and locked-in for a period of one year from the
date of Allotment in the Offer may be transferred to any other person holding the Equity Shares which are
locked-in, subject to the continuation of the lock-in in the hands of transferees for the remaining period and
compliance with the Takeover Regulations. However, under Regulation 37(b) of the SEBI ICDR
Regulations, the Equity Shares held by SCPE which is a SEBI registered foreign venture capital investor
will not be subject to lock-in.
Lock-in of the Equity Shares to be Allotted, if any, to the Anchor Investors
Any Equity Shares allotted to Anchor Investors in the Anchor Investor Portion shall be locked-in for a
period of 30 days from the date of Allotment.
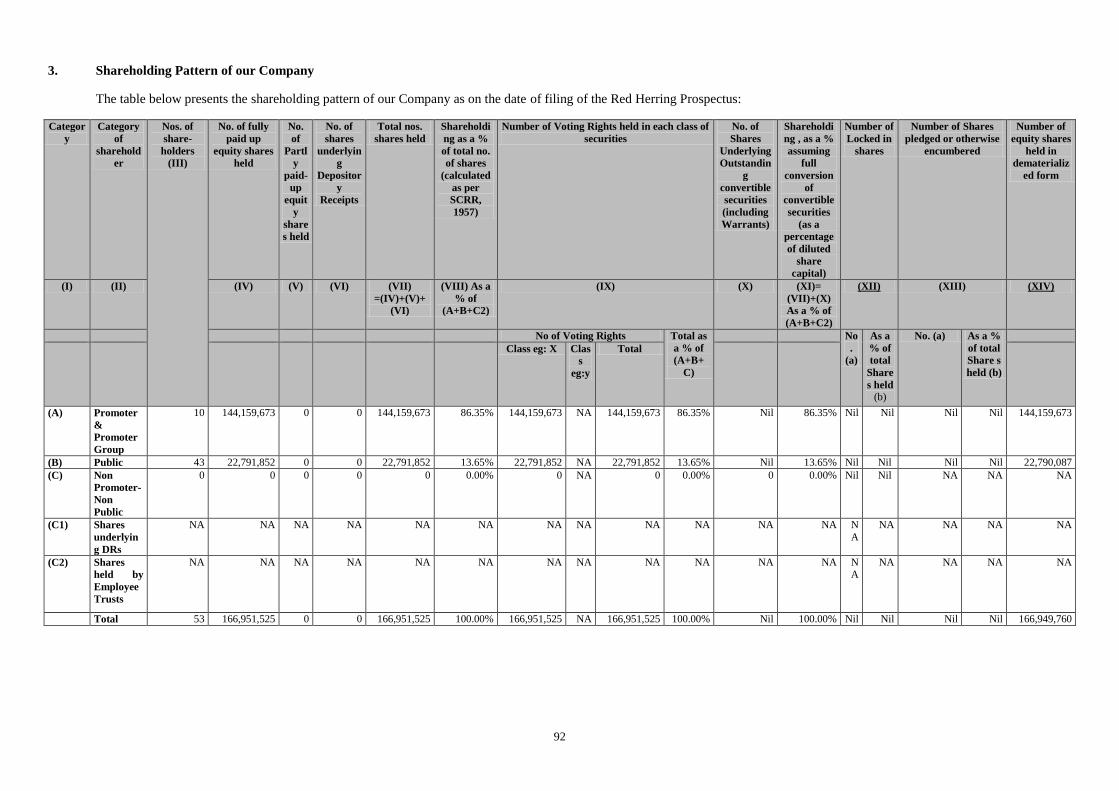
92
3. Shareholding Pattern of our Company
The table below presents the shareholding pattern of our Company as on the date of filing of the Red Herring Prospectus:
Categor
y
Category
of
sharehold
er
Nos. of
share-
holders
(III)
No. of fully
paid up
equity shares
held
No.
of
Partl
y
paid-
up
equit
y
share
s held
No. of
shares
underlyin
g
Depositor
y
Receipts
Total nos.
shares held
Shareholdi
ng as a %
of total no.
of shares
(calculated
as per
SCRR,
1957)
Number of Voting Rights held in each class of
securities
No. of
Shares
Underlying
Outstandin
g
convertible
securities
(including
Warrants)
Shareholdi
ng , as a %
assuming
full
conversion
of
convertible
securities
(as a
percentage
of diluted
share
capital)
Number of
Locked in
shares
Number of Shares
pledged or otherwise
encumbered
Number of
equity shares
held in
dematerializ
ed form
(I) (II) (IV) (V) (VI) (VII)
=(IV)+(V)+
(VI)
(VIII) As a
% of
(A+B+C2)
(IX) (X) (XI)=
(VII)+(X)
As a % of
(A+B+C2)
(XII) (XIII) (XIV)
No of Voting Rights Total as
a % of
(A+B+
C)
No
.
(a)
As a
% of
total
Share
s held
(b)
No. (a) As a %
of total
Share s
held (b)
Class eg: X Clas
s
eg:y
Total
(A) Promoter
&
Promoter
Group
10 144,159,673 0 0 144,159,673 86.35% 144,159,673 NA 144,159,673 86.35% Nil 86.35% Nil Nil Nil Nil 144,159,673
(B) Public 43 22,791,852 0 0 22,791,852 13.65% 22,791,852 NA 22,791,852 13.65% Nil 13.65% Nil Nil Nil Nil 22,790,087
(C) Non
Promoter-
Non
Public
0 0 0 0 0 0.00% 0 NA 0 0.00% 0 0.00% Nil Nil NA NA NA
(C1) Shares
underlyin
g DRs
NA NA NA NA NA NA NA NA NA NA NA NA N
A
NA NA NA NA
(C2) Shares
held by
Employee
Trusts
NA NA NA NA NA NA NA NA NA NA NA NA NA
NA NA NA NA
Total 53 166,951,525 0 0 166,951,525 100.00% 166,951,525 NA 166,951,525 100.00% Nil 100.00% Nil Nil Nil Nil 166,949,760
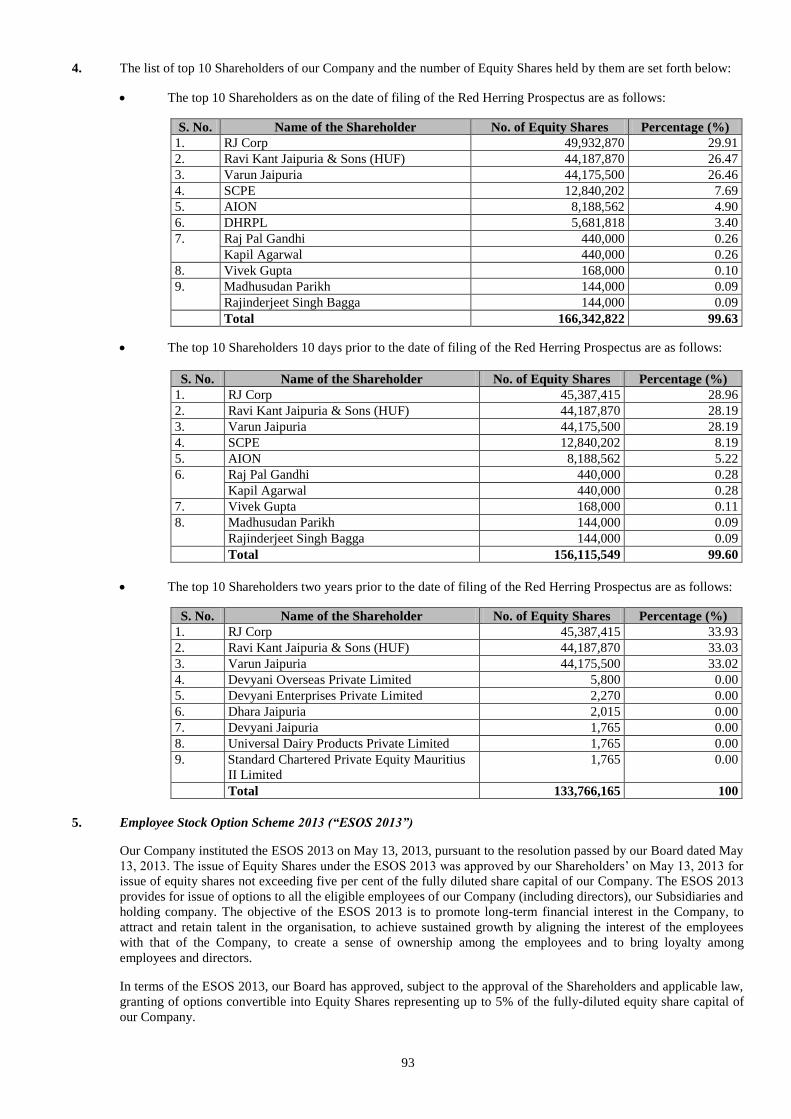
93
4. The list of top 10 Shareholders of our Company and the number of Equity Shares held by them are set forth below:
The top 10 Shareholders as on the date of filing of the Red Herring Prospectus are as follows:
S. No. Name of the Shareholder No. of Equity Shares Percentage (%)
1. RJ Corp 49,932,870 29.91
2. Ravi Kant Jaipuria & Sons (HUF) 44,187,870 26.47
3. Varun Jaipuria 44,175,500 26.46
4. SCPE 12,840,202 7.69
5. AION 8,188,562 4.90
6. DHRPL 5,681,818 3.40
7. Raj Pal Gandhi 440,000 0.26
Kapil Agarwal 440,000 0.26
8. Vivek Gupta 168,000 0.10
9. Madhusudan Parikh 144,000 0.09
Rajinderjeet Singh Bagga 144,000 0.09
Total 166,342,822 99.63
The top 10 Shareholders 10 days prior to the date of filing of the Red Herring Prospectus are as follows:
S. No. Name of the Shareholder No. of Equity Shares Percentage (%)
1. RJ Corp 45,387,415 28.96
2. Ravi Kant Jaipuria & Sons (HUF) 44,187,870 28.19
3. Varun Jaipuria 44,175,500 28.19
4. SCPE 12,840,202 8.19
5. AION 8,188,562 5.22
6. Raj Pal Gandhi 440,000 0.28
Kapil Agarwal 440,000 0.28
7. Vivek Gupta 168,000 0.11
8. Madhusudan Parikh 144,000 0.09
Rajinderjeet Singh Bagga 144,000 0.09
Total 156,115,549 99.60
The top 10 Shareholders two years prior to the date of filing of the Red Herring Prospectus are as follows:
S. No. Name of the Shareholder No. of Equity Shares Percentage (%)
1. RJ Corp 45,387,415 33.93
2. Ravi Kant Jaipuria & Sons (HUF) 44,187,870 33.03
3. Varun Jaipuria 44,175,500 33.02
4. Devyani Overseas Private Limited 5,800 0.00
5. Devyani Enterprises Private Limited 2,270 0.00
6. Dhara Jaipuria 2,015 0.00
7. Devyani Jaipuria 1,765 0.00
8. Universal Dairy Products Private Limited 1,765 0.00
9. Standard Chartered Private Equity Mauritius
II Limited
1,765 0.00
Total 133,766,165 100
5. Employee Stock Option Scheme 2013 (“ESOS 2013”)
Our Company instituted the ESOS 2013 on May 13, 2013, pursuant to the resolution passed by our Board dated May
13, 2013. The issue of Equity Shares under the ESOS 2013 was approved by our Shareholders’ on May 13, 2013 for
issue of equity shares not exceeding five per cent of the fully diluted share capital of our Company. The ESOS 2013
provides for issue of options to all the eligible employees of our Company (including directors), our Subsidiaries and
holding company. The objective of the ESOS 2013 is to promote long-term financial interest in the Company, to
attract and retain talent in the organisation, to achieve sustained growth by aligning the interest of the employees
with that of the Company, to create a sense of ownership among the employees and to bring loyalty among
employees and directors.
In terms of the ESOS 2013, our Board has approved, subject to the approval of the Shareholders and applicable law,
granting of options convertible into Equity Shares representing up to 5% of the fully-diluted equity share capital of
our Company.
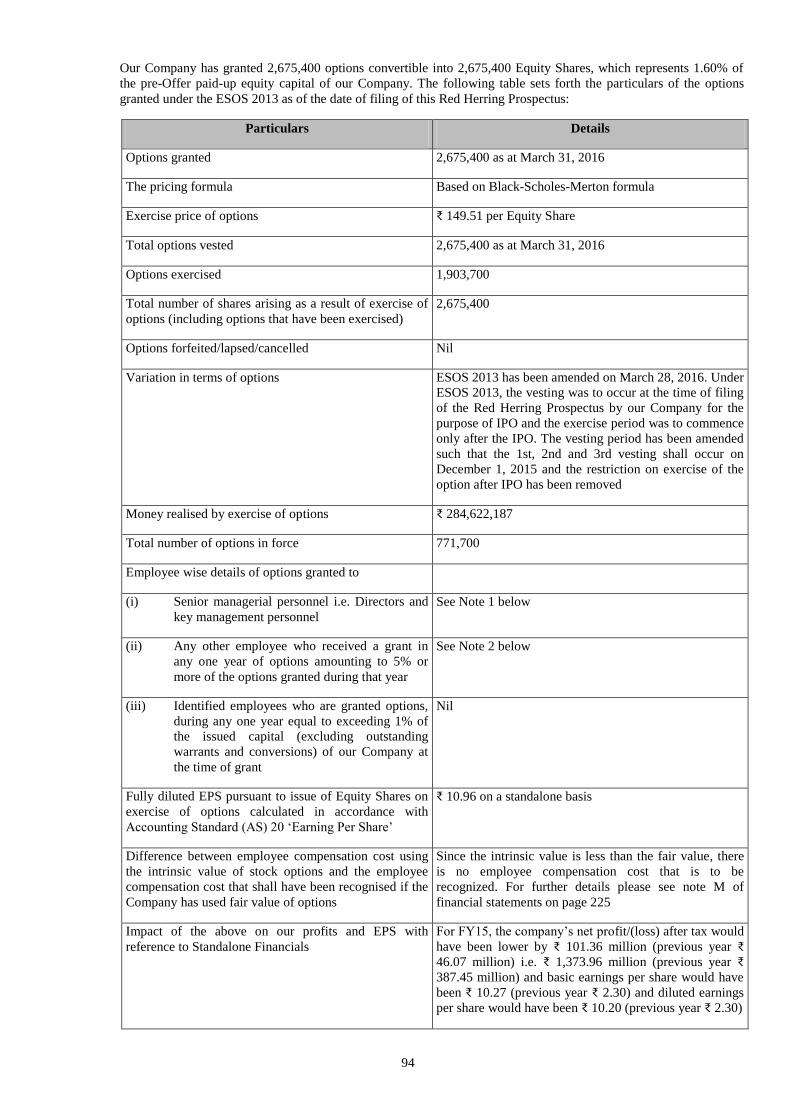
94
Our Company has granted 2,675,400 options convertible into 2,675,400 Equity Shares, which represents 1.60% of
the pre-Offer paid-up equity capital of our Company. The following table sets forth the particulars of the options
granted under the ESOS 2013 as of the date of filing of this Red Herring Prospectus:
Particulars Details
Options granted 2,675,400 as at March 31, 2016
The pricing formula Based on Black-Scholes-Merton formula
Exercise price of options ₹ 149.51 per Equity Share
Total options vested 2,675,400 as at March 31, 2016
Options exercised 1,903,700
Total number of shares arising as a result of exercise of
options (including options that have been exercised)
2,675,400
Options forfeited/lapsed/cancelled Nil
Variation in terms of options ESOS 2013 has been amended on March 28, 2016. Under
ESOS 2013, the vesting was to occur at the time of filing
of the Red Herring Prospectus by our Company for the
purpose of IPO and the exercise period was to commence
only after the IPO. The vesting period has been amended
such that the 1st, 2nd and 3rd vesting shall occur on
December 1, 2015 and the restriction on exercise of the
option after IPO has been removed
Money realised by exercise of options ₹ 284,622,187
Total number of options in force 771,700
Employee wise details of options granted to
(i) Senior managerial personnel i.e. Directors and
key management personnel
See Note 1 below
(ii) Any other employee who received a grant in
any one year of options amounting to 5% or
more of the options granted during that year
See Note 2 below
(iii) Identified employees who are granted options,
during any one year equal to exceeding 1% of
the issued capital (excluding outstanding
warrants and conversions) of our Company at
the time of grant
Nil
Fully diluted EPS pursuant to issue of Equity Shares on
exercise of options calculated in accordance with
Accounting Standard (AS) 20 ‘Earning Per Share’
₹ 10.96 on a standalone basis
Difference between employee compensation cost using
the intrinsic value of stock options and the employee
compensation cost that shall have been recognised if the
Company has used fair value of options
Since the intrinsic value is less than the fair value, there
is no employee compensation cost that is to be
recognized. For further details please see note M of
financial statements on page 225
Impact of the above on our profits and EPS with
reference to Standalone Financials
For FY15, the company’s net profit/(loss) after tax would
have been lower by ₹ 101.36 million (previous year ₹
46.07 million) i.e. ₹ 1,373.96 million (previous year ₹
387.45 million) and basic earnings per share would have
been ₹ 10.27 (previous year ₹ 2.30) and diluted earnings
per share would have been ₹ 10.20 (previous year ₹ 2.30)
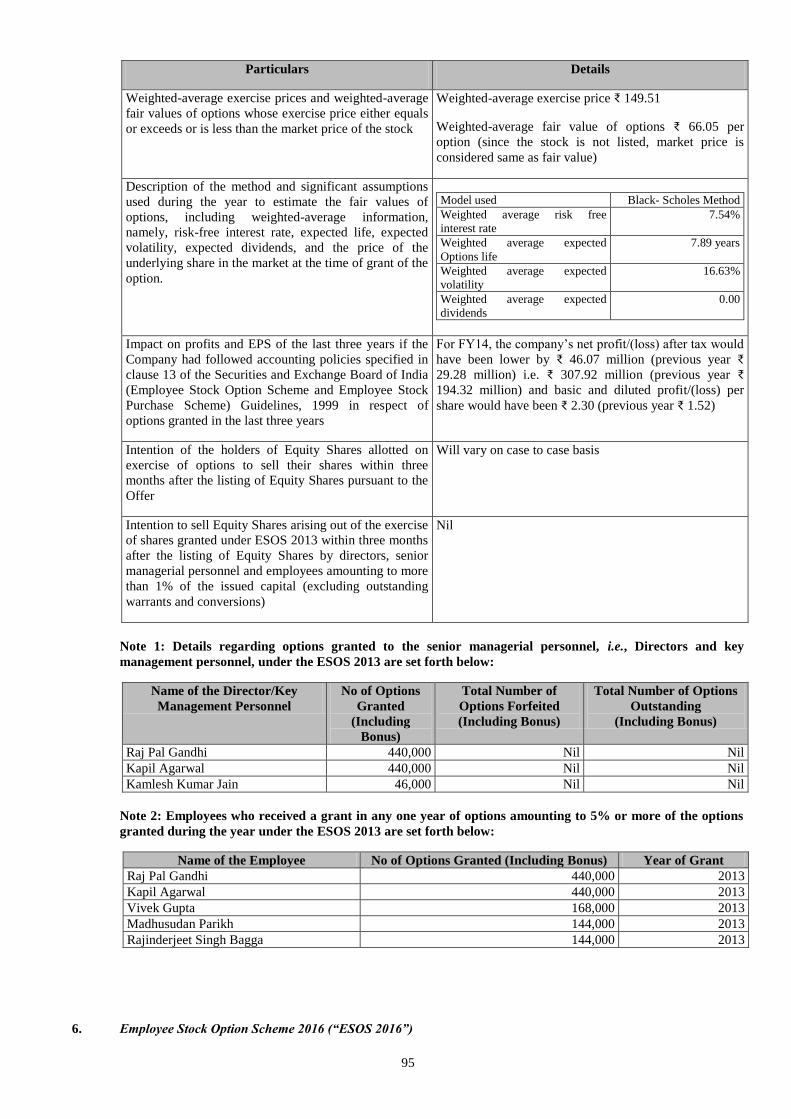
95
Particulars Details
Weighted-average exercise prices and weighted-average
fair values of options whose exercise price either equals
or exceeds or is less than the market price of the stock
Weighted-average exercise price ₹ 149.51
Weighted-average fair value of options ₹ 66.05 per
option (since the stock is not listed, market price is
considered same as fair value)
Description of the method and significant assumptions
used during the year to estimate the fair values of
options, including weighted-average information,
namely, risk-free interest rate, expected life, expected
volatility, expected dividends, and the price of the
underlying share in the market at the time of grant of the
option.
Model used Black- Scholes Method
Weighted average risk free
interest rate
7.54%
Weighted average expected
Options life
7.89 years
Weighted average expected
volatility
16.63%
Weighted average expected
dividends
0.00
Impact on profits and EPS of the last three years if the
Company had followed accounting policies specified in
clause 13 of the Securities and Exchange Board of India
(Employee Stock Option Scheme and Employee Stock
Purchase Scheme) Guidelines, 1999 in respect of
options granted in the last three years
For FY14, the company’s net profit/(loss) after tax would
have been lower by ₹ 46.07 million (previous year ₹
29.28 million) i.e. ₹ 307.92 million (previous year ₹
194.32 million) and basic and diluted profit/(loss) per
share would have been ₹ 2.30 (previous year ₹ 1.52)
Intention of the holders of Equity Shares allotted on
exercise of options to sell their shares within three
months after the listing of Equity Shares pursuant to the
Offer
Will vary on case to case basis
Intention to sell Equity Shares arising out of the exercise
of shares granted under ESOS 2013 within three months
after the listing of Equity Shares by directors, senior
managerial personnel and employees amounting to more
than 1% of the issued capital (excluding outstanding
warrants and conversions)
Nil
Note 1: Details regarding options granted to the senior managerial personnel, i.e., Directors and key
management personnel, under the ESOS 2013 are set forth below:
Name of the Director/Key
Management Personnel
No of Options
Granted
(Including
Bonus)
Total Number of
Options Forfeited
(Including Bonus)
Total Number of Options
Outstanding
(Including Bonus)
Raj Pal Gandhi 440,000 Nil Nil
Kapil Agarwal 440,000 Nil Nil
Kamlesh Kumar Jain 46,000 Nil Nil
Note 2: Employees who received a grant in any one year of options amounting to 5% or more of the options
granted during the year under the ESOS 2013 are set forth below:
Name of the Employee No of Options Granted (Including Bonus) Year of Grant
Raj Pal Gandhi 440,000 2013
Kapil Agarwal 440,000 2013
Vivek Gupta 168,000 2013
Madhusudan Parikh 144,000 2013
Rajinderjeet Singh Bagga 144,000 2013
6. Employee Stock Option Scheme 2016 (“ESOS 2016”)
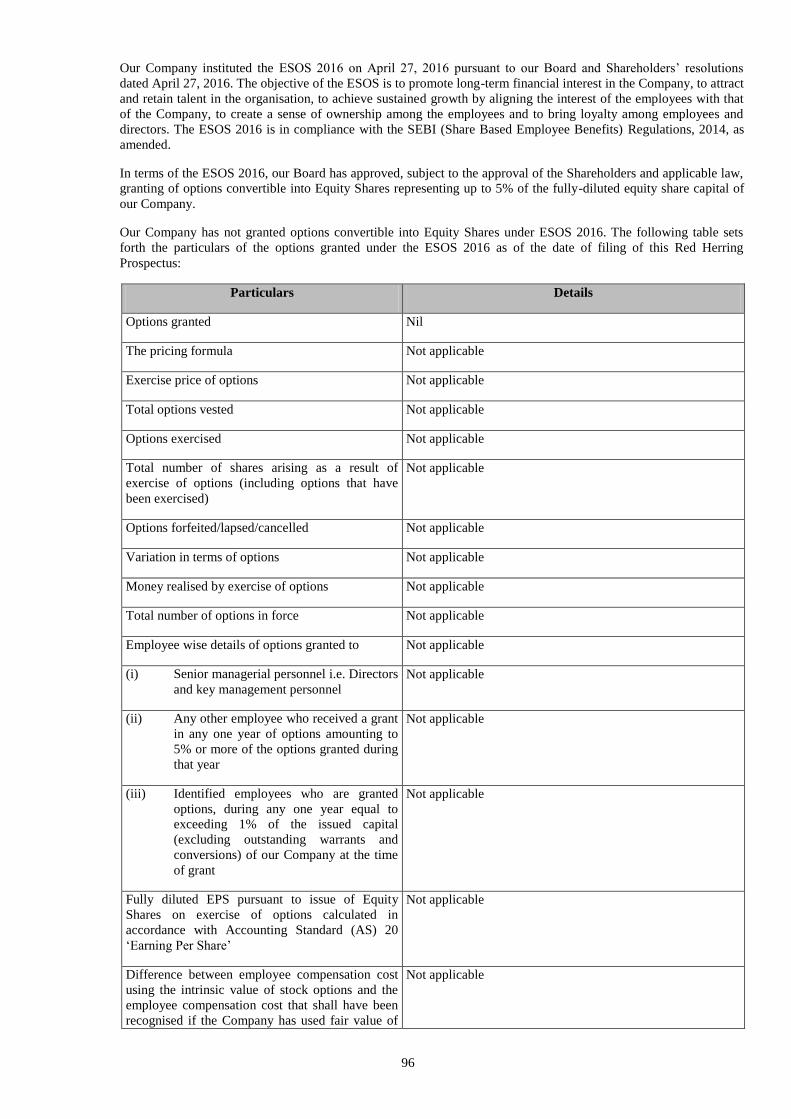
96
Our Company instituted the ESOS 2016 on April 27, 2016 pursuant to our Board and Shareholders’ resolutions
dated April 27, 2016. The objective of the ESOS is to promote long-term financial interest in the Company, to attract
and retain talent in the organisation, to achieve sustained growth by aligning the interest of the employees with that
of the Company, to create a sense of ownership among the employees and to bring loyalty among employees and
directors. The ESOS 2016 is in compliance with the SEBI (Share Based Employee Benefits) Regulations, 2014, as
amended.
In terms of the ESOS 2016, our Board has approved, subject to the approval of the Shareholders and applicable law,
granting of options convertible into Equity Shares representing up to 5% of the fully-diluted equity share capital of
our Company.
Our Company has not granted options convertible into Equity Shares under ESOS 2016. The following table sets
forth the particulars of the options granted under the ESOS 2016 as of the date of filing of this Red Herring
Prospectus:
Particulars Details
Options granted Nil
The pricing formula Not applicable
Exercise price of options Not applicable
Total options vested Not applicable
Options exercised Not applicable
Total number of shares arising as a result of
exercise of options (including options that have
been exercised)
Not applicable
Options forfeited/lapsed/cancelled Not applicable
Variation in terms of options Not applicable
Money realised by exercise of options Not applicable
Total number of options in force Not applicable
Employee wise details of options granted to Not applicable
(i) Senior managerial personnel i.e. Directors
and key management personnel
Not applicable
(ii) Any other employee who received a grant
in any one year of options amounting to
5% or more of the options granted during
that year
Not applicable
(iii) Identified employees who are granted
options, during any one year equal to
exceeding 1% of the issued capital
(excluding outstanding warrants and
conversions) of our Company at the time
of grant
Not applicable
Fully diluted EPS pursuant to issue of Equity
Shares on exercise of options calculated in
accordance with Accounting Standard (AS) 20
‘Earning Per Share’
Not applicable
Difference between employee compensation cost
using the intrinsic value of stock options and the
employee compensation cost that shall have been
recognised if the Company has used fair value of
Not applicable
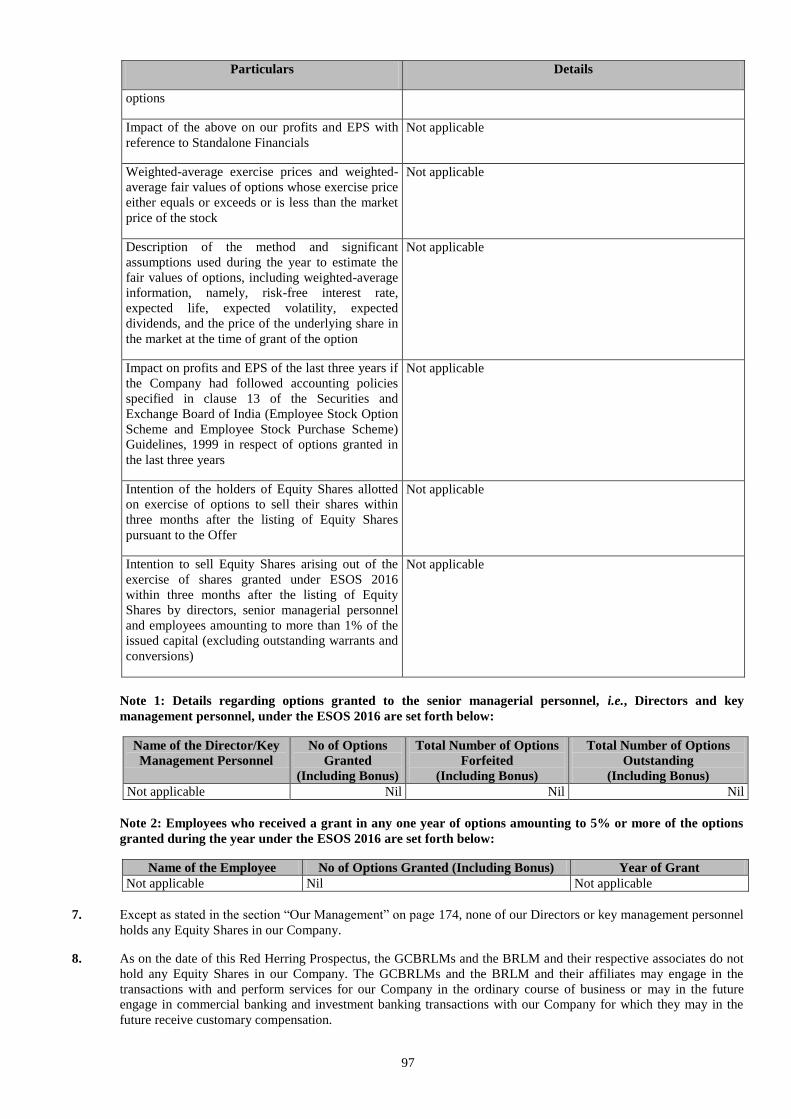
97
Particulars Details
options
Impact of the above on our profits and EPS with
reference to Standalone Financials
Not applicable
Weighted-average exercise prices and weighted-
average fair values of options whose exercise price
either equals or exceeds or is less than the market
price of the stock
Not applicable
Description of the method and significant
assumptions used during the year to estimate the
fair values of options, including weighted-average
information, namely, risk-free interest rate,
expected life, expected volatility, expected
dividends, and the price of the underlying share in
the market at the time of grant of the option
Not applicable
Impact on profits and EPS of the last three years if
the Company had followed accounting policies
specified in clause 13 of the Securities and
Exchange Board of India (Employee Stock Option
Scheme and Employee Stock Purchase Scheme)
Guidelines, 1999 in respect of options granted in
the last three years
Not applicable
Intention of the holders of Equity Shares allotted
on exercise of options to sell their shares within
three months after the listing of Equity Shares
pursuant to the Offer
Not applicable
Intention to sell Equity Shares arising out of the
exercise of shares granted under ESOS 2016
within three months after the listing of Equity
Shares by directors, senior managerial personnel
and employees amounting to more than 1% of the
issued capital (excluding outstanding warrants and
conversions)
Not applicable
Note 1: Details regarding options granted to the senior managerial personnel, i.e., Directors and key
management personnel, under the ESOS 2016 are set forth below:
Name of the Director/Key
Management Personnel
No of Options
Granted
(Including Bonus)
Total Number of Options
Forfeited
(Including Bonus)
Total Number of Options
Outstanding
(Including Bonus)
Not applicable Nil Nil Nil
Note 2: Employees who received a grant in any one year of options amounting to 5% or more of the options
granted during the year under the ESOS 2016 are set forth below:
Name of the Employee No of Options Granted (Including Bonus) Year of Grant
Not applicable Nil Not applicable
7. Except as stated in the section “Our Management” on page 174, none of our Directors or key management personnel
holds any Equity Shares in our Company.
8. As on the date of this Red Herring Prospectus, the GCBRLMs and the BRLM and their respective associates do not
hold any Equity Shares in our Company. The GCBRLMs and the BRLM and their affiliates may engage in the
transactions with and perform services for our Company in the ordinary course of business or may in the future
engage in commercial banking and investment banking transactions with our Company for which they may in the
future receive customary compensation.
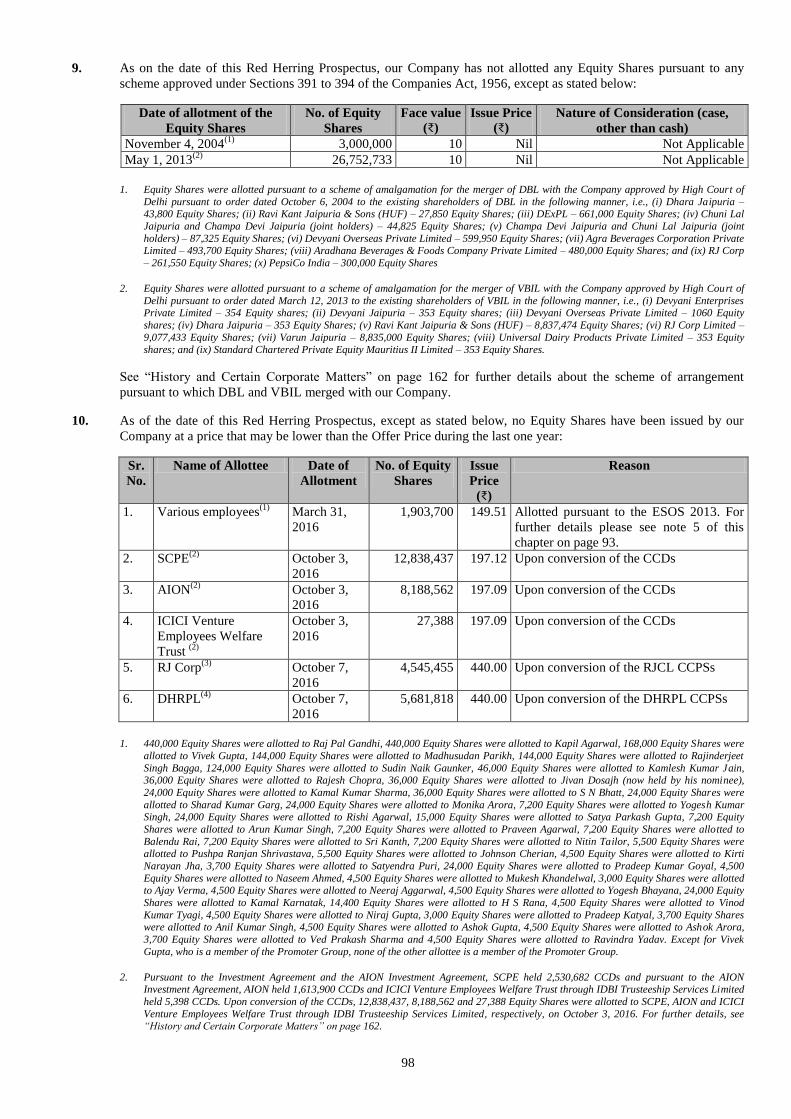
98
9. As on the date of this Red Herring Prospectus, our Company has not allotted any Equity Shares pursuant to any
scheme approved under Sections 391 to 394 of the Companies Act, 1956, except as stated below:
Date of allotment of the
Equity Shares
No. of Equity
Shares
Face value
(₹)
Issue Price
(₹)
Nature of Consideration (case,
other than cash)
November 4, 2004(1)
3,000,000 10 Nil Not Applicable
May 1, 2013(2)
26,752,733 10 Nil Not Applicable
1. Equity Shares were allotted pursuant to a scheme of amalgamation for the merger of DBL with the Company approved by High Court of
Delhi pursuant to order dated October 6, 2004 to the existing shareholders of DBL in the following manner, i.e., (i) Dhara Jaipuria – 43,800 Equity Shares; (ii) Ravi Kant Jaipuria & Sons (HUF) – 27,850 Equity Shares; (iii) DExPL – 661,000 Equity Shares; (iv) Chuni Lal
Jaipuria and Champa Devi Jaipuria (joint holders) – 44,825 Equity Shares; (v) Champa Devi Jaipuria and Chuni Lal Jaipuria (joint
holders) – 87,325 Equity Shares; (vi) Devyani Overseas Private Limited – 599,950 Equity Shares; (vii) Agra Beverages Corporation Private Limited – 493,700 Equity Shares; (viii) Aradhana Beverages & Foods Company Private Limited – 480,000 Equity Shares; and (ix) RJ Corp
– 261,550 Equity Shares; (x) PepsiCo India – 300,000 Equity Shares
2. Equity Shares were allotted pursuant to a scheme of amalgamation for the merger of VBIL with the Company approved by High Court of
Delhi pursuant to order dated March 12, 2013 to the existing shareholders of VBIL in the following manner, i.e., (i) Devyani Enterprises Private Limited – 354 Equity shares; (ii) Devyani Jaipuria – 353 Equity shares; (iii) Devyani Overseas Private Limited – 1060 Equity
shares; (iv) Dhara Jaipuria – 353 Equity Shares; (v) Ravi Kant Jaipuria & Sons (HUF) – 8,837,474 Equity Shares; (vi) RJ Corp Limited –
9,077,433 Equity Shares; (vii) Varun Jaipuria – 8,835,000 Equity Shares; (viii) Universal Dairy Products Private Limited – 353 Equity
shares; and (ix) Standard Chartered Private Equity Mauritius II Limited – 353 Equity Shares.
See “History and Certain Corporate Matters” on page 162 for further details about the scheme of arrangement
pursuant to which DBL and VBIL merged with our Company.
10. As of the date of this Red Herring Prospectus, except as stated below, no Equity Shares have been issued by our
Company at a price that may be lower than the Offer Price during the last one year:
Sr.
No.
Name of Allottee Date of
Allotment
No. of Equity
Shares
Issue
Price
(₹)
Reason
1. Various employees(1)
March 31,
2016
1,903,700 149.51 Allotted pursuant to the ESOS 2013. For
further details please see note 5 of this
chapter on page 93.
2. SCPE(2)
October 3,
2016
12,838,437 197.12 Upon conversion of the CCDs
3. AION(2)
October 3,
2016
8,188,562 197.09 Upon conversion of the CCDs
4. ICICI Venture
Employees Welfare
Trust (2)
October 3,
2016
27,388 197.09 Upon conversion of the CCDs
5. RJ Corp(3)
October 7,
2016
4,545,455 440.00 Upon conversion of the RJCL CCPSs
6. DHRPL(4)
October 7,
2016
5,681,818 440.00 Upon conversion of the DHRPL CCPSs
1. 440,000 Equity Shares were allotted to Raj Pal Gandhi, 440,000 Equity Shares were allotted to Kapil Agarwal, 168,000 Equity Shares were
allotted to Vivek Gupta, 144,000 Equity Shares were allotted to Madhusudan Parikh, 144,000 Equity Shares were allotted to Rajinderjeet
Singh Bagga, 124,000 Equity Shares were allotted to Sudin Naik Gaunker, 46,000 Equity Shares were allotted to Kamlesh Kumar Jain, 36,000 Equity Shares were allotted to Rajesh Chopra, 36,000 Equity Shares were allotted to Jivan Dosajh (now held by his nominee),
24,000 Equity Shares were allotted to Kamal Kumar Sharma, 36,000 Equity Shares were allotted to S N Bhatt, 24,000 Equity Shares were
allotted to Sharad Kumar Garg, 24,000 Equity Shares were allotted to Monika Arora, 7,200 Equity Shares were allotted to Yogesh Kumar Singh, 24,000 Equity Shares were allotted to Rishi Agarwal, 15,000 Equity Shares were allotted to Satya Parkash Gupta, 7,200 Equity
Shares were allotted to Arun Kumar Singh, 7,200 Equity Shares were allotted to Praveen Agarwal, 7,200 Equity Shares were allotted to
Balendu Rai, 7,200 Equity Shares were allotted to Sri Kanth, 7,200 Equity Shares were allotted to Nitin Tailor, 5,500 Equity Shares were allotted to Pushpa Ranjan Shrivastava, 5,500 Equity Shares were allotted to Johnson Cherian, 4,500 Equity Shares were allotted to Kirti
Narayan Jha, 3,700 Equity Shares were allotted to Satyendra Puri, 24,000 Equity Shares were allotted to Pradeep Kumar Goyal, 4,500
Equity Shares were allotted to Naseem Ahmed, 4,500 Equity Shares were allotted to Mukesh Khandelwal, 3,000 Equity Shares were allotted to Ajay Verma, 4,500 Equity Shares were allotted to Neeraj Aggarwal, 4,500 Equity Shares were allotted to Yogesh Bhayana, 24,000 Equity
Shares were allotted to Kamal Karnatak, 14,400 Equity Shares were allotted to H S Rana, 4,500 Equity Shares were allotted to Vinod
Kumar Tyagi, 4,500 Equity Shares were allotted to Niraj Gupta, 3,000 Equity Shares were allotted to Pradeep Katyal, 3,700 Equity Shares were allotted to Anil Kumar Singh, 4,500 Equity Shares were allotted to Ashok Gupta, 4,500 Equity Shares were allotted to Ashok Arora,
3,700 Equity Shares were allotted to Ved Prakash Sharma and 4,500 Equity Shares were allotted to Ravindra Yadav. Except for Vivek
Gupta, who is a member of the Promoter Group, none of the other allottee is a member of the Promoter Group.
2. Pursuant to the Investment Agreement and the AION Investment Agreement, SCPE held 2,530,682 CCDs and pursuant to the AION Investment Agreement, AION held 1,613,900 CCDs and ICICI Venture Employees Welfare Trust through IDBI Trusteeship Services Limited
held 5,398 CCDs. Upon conversion of the CCDs, 12,838,437, 8,188,562 and 27,388 Equity Shares were allotted to SCPE, AION and ICICI
Venture Employees Welfare Trust through IDBI Trusteeship Services Limited, respectively, on October 3, 2016. For further details, see “History and Certain Corporate Matters” on page 162.
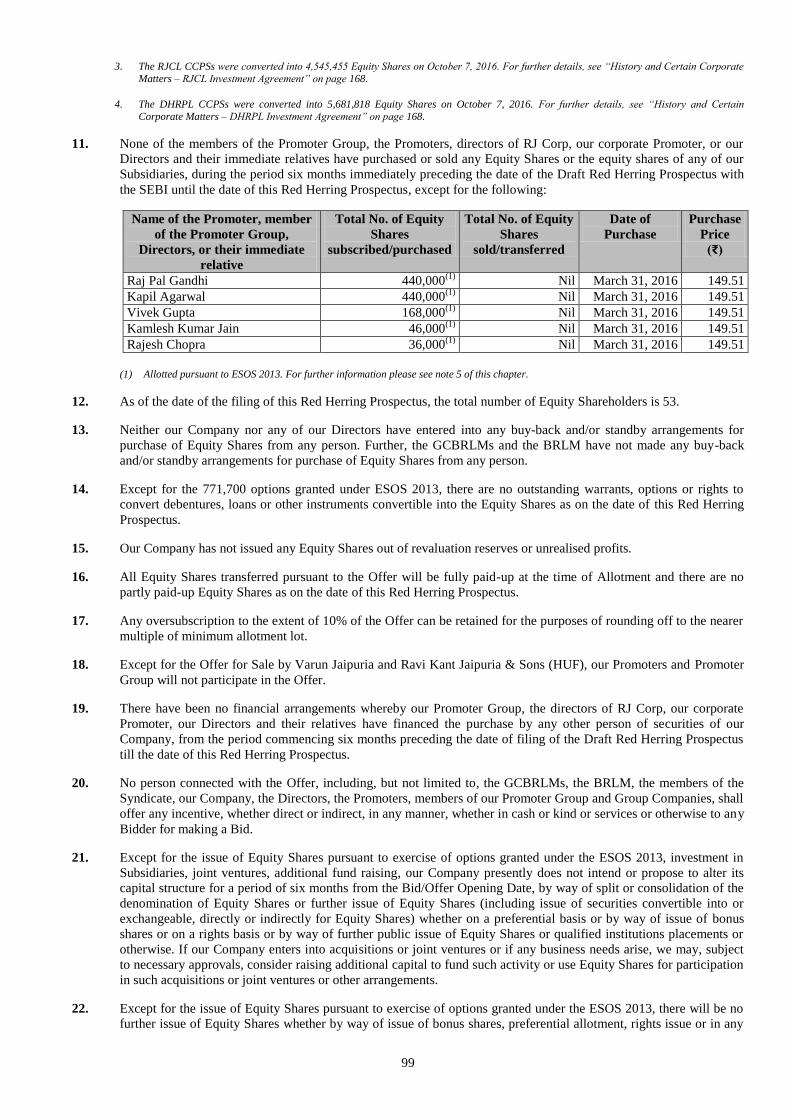
99
3. The RJCL CCPSs were converted into 4,545,455 Equity Shares on October 7, 2016. For further details, see “History and Certain Corporate
Matters – RJCL Investment Agreement” on page 168.
4. The DHRPL CCPSs were converted into 5,681,818 Equity Shares on October 7, 2016. For further details, see “History and Certain
Corporate Matters – DHRPL Investment Agreement” on page 168.
11. None of the members of the Promoter Group, the Promoters, directors of RJ Corp, our corporate Promoter, or our
Directors and their immediate relatives have purchased or sold any Equity Shares or the equity shares of any of our
Subsidiaries, during the period six months immediately preceding the date of the Draft Red Herring Prospectus with
the SEBI until the date of this Red Herring Prospectus, except for the following:
Name of the Promoter, member
of the Promoter Group,
Directors, or their immediate
relative
Total No. of Equity
Shares
subscribed/purchased
Total No. of Equity
Shares
sold/transferred
Date of
Purchase
Purchase
Price
(₹)
Raj Pal Gandhi 440,000(1)
Nil March 31, 2016 149.51
Kapil Agarwal 440,000(1)
Nil March 31, 2016 149.51
Vivek Gupta 168,000(1)
Nil March 31, 2016 149.51
Kamlesh Kumar Jain 46,000(1)
Nil March 31, 2016 149.51
Rajesh Chopra 36,000(1)
Nil March 31, 2016 149.51
(1) Allotted pursuant to ESOS 2013. For further information please see note 5 of this chapter.
12. As of the date of the filing of this Red Herring Prospectus, the total number of Equity Shareholders is 53.
13. Neither our Company nor any of our Directors have entered into any buy-back and/or standby arrangements for
purchase of Equity Shares from any person. Further, the GCBRLMs and the BRLM have not made any buy-back
and/or standby arrangements for purchase of Equity Shares from any person.
14. Except for the 771,700 options granted under ESOS 2013, there are no outstanding warrants, options or rights to
convert debentures, loans or other instruments convertible into the Equity Shares as on the date of this Red Herring
Prospectus.
15. Our Company has not issued any Equity Shares out of revaluation reserves or unrealised profits.
16. All Equity Shares transferred pursuant to the Offer will be fully paid-up at the time of Allotment and there are no
partly paid-up Equity Shares as on the date of this Red Herring Prospectus.
17. Any oversubscription to the extent of 10% of the Offer can be retained for the purposes of rounding off to the nearer
multiple of minimum allotment lot.
18. Except for the Offer for Sale by Varun Jaipuria and Ravi Kant Jaipuria & Sons (HUF), our Promoters and Promoter
Group will not participate in the Offer.
19. There have been no financial arrangements whereby our Promoter Group, the directors of RJ Corp, our corporate
Promoter, our Directors and their relatives have financed the purchase by any other person of securities of our
Company, from the period commencing six months preceding the date of filing of the Draft Red Herring Prospectus
till the date of this Red Herring Prospectus.
20. No person connected with the Offer, including, but not limited to, the GCBRLMs, the BRLM, the members of the
Syndicate, our Company, the Directors, the Promoters, members of our Promoter Group and Group Companies, shall
offer any incentive, whether direct or indirect, in any manner, whether in cash or kind or services or otherwise to any
Bidder for making a Bid.
21. Except for the issue of Equity Shares pursuant to exercise of options granted under the ESOS 2013, investment in
Subsidiaries, joint ventures, additional fund raising, our Company presently does not intend or propose to alter its
capital structure for a period of six months from the Bid/Offer Opening Date, by way of split or consolidation of the
denomination of Equity Shares or further issue of Equity Shares (including issue of securities convertible into or
exchangeable, directly or indirectly for Equity Shares) whether on a preferential basis or by way of issue of bonus
shares or on a rights basis or by way of further public issue of Equity Shares or qualified institutions placements or
otherwise. If our Company enters into acquisitions or joint ventures or if any business needs arise, we may, subject
to necessary approvals, consider raising additional capital to fund such activity or use Equity Shares for participation
in such acquisitions or joint ventures or other arrangements.
22. Except for the issue of Equity Shares pursuant to exercise of options granted under the ESOS 2013, there will be no
further issue of Equity Shares whether by way of issue of bonus shares, preferential allotment, rights issue or in any
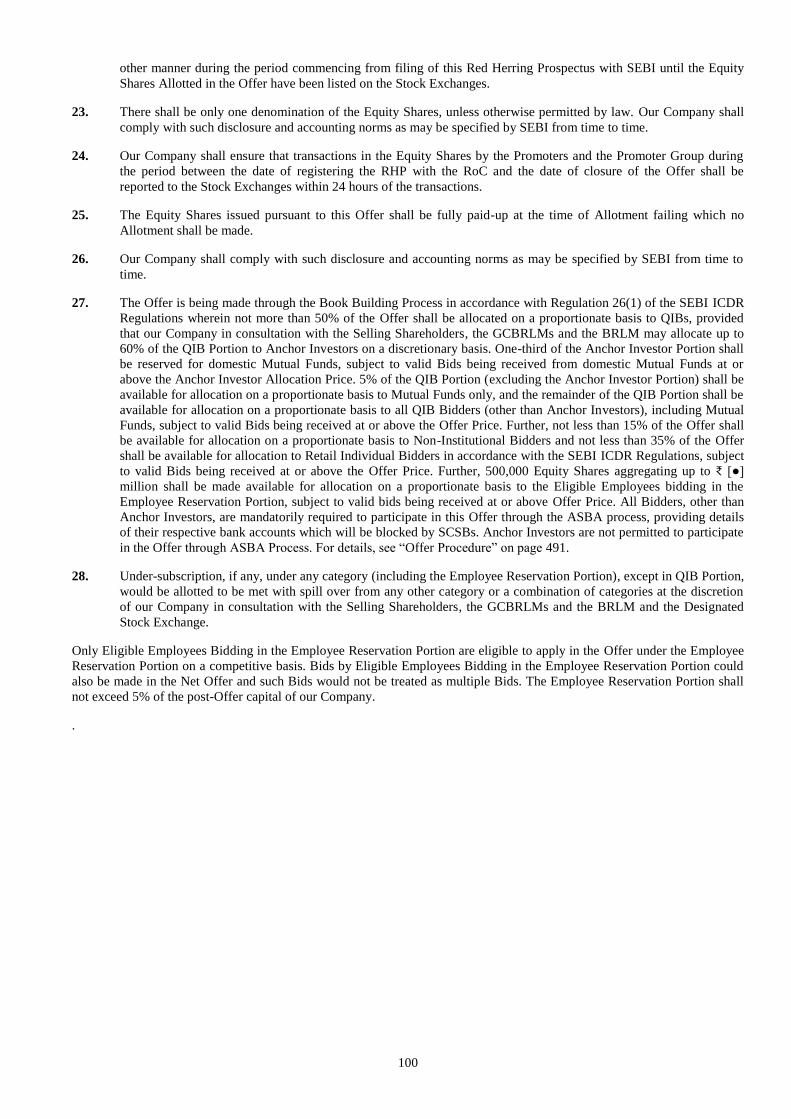
100
other manner during the period commencing from filing of this Red Herring Prospectus with SEBI until the Equity
Shares Allotted in the Offer have been listed on the Stock Exchanges.
23. There shall be only one denomination of the Equity Shares, unless otherwise permitted by law. Our Company shall
comply with such disclosure and accounting norms as may be specified by SEBI from time to time.
24. Our Company shall ensure that transactions in the Equity Shares by the Promoters and the Promoter Group during
the period between the date of registering the RHP with the RoC and the date of closure of the Offer shall be
reported to the Stock Exchanges within 24 hours of the transactions.
25. The Equity Shares issued pursuant to this Offer shall be fully paid-up at the time of Allotment failing which no
Allotment shall be made.
26. Our Company shall comply with such disclosure and accounting norms as may be specified by SEBI from time to
time.
27. The Offer is being made through the Book Building Process in accordance with Regulation 26(1) of the SEBI ICDR
Regulations wherein not more than 50% of the Offer shall be allocated on a proportionate basis to QIBs, provided
that our Company in consultation with the Selling Shareholders, the GCBRLMs and the BRLM may allocate up to
60% of the QIB Portion to Anchor Investors on a discretionary basis. One-third of the Anchor Investor Portion shall
be reserved for domestic Mutual Funds, subject to valid Bids being received from domestic Mutual Funds at or
above the Anchor Investor Allocation Price. 5% of the QIB Portion (excluding the Anchor Investor Portion) shall be
available for allocation on a proportionate basis to Mutual Funds only, and the remainder of the QIB Portion shall be
available for allocation on a proportionate basis to all QIB Bidders (other than Anchor Investors), including Mutual
Funds, subject to valid Bids being received at or above the Offer Price. Further, not less than 15% of the Offer shall
be available for allocation on a proportionate basis to Non-Institutional Bidders and not less than 35% of the Offer
shall be available for allocation to Retail Individual Bidders in accordance with the SEBI ICDR Regulations, subject
to valid Bids being received at or above the Offer Price. Further, 500,000 Equity Shares aggregating up to ₹ [●]
million shall be made available for allocation on a proportionate basis to the Eligible Employees bidding in the
Employee Reservation Portion, subject to valid bids being received at or above Offer Price. All Bidders, other than
Anchor Investors, are mandatorily required to participate in this Offer through the ASBA process, providing details
of their respective bank accounts which will be blocked by SCSBs. Anchor Investors are not permitted to participate
in the Offer through ASBA Process. For details, see “Offer Procedure” on page 491.
28. Under-subscription, if any, under any category (including the Employee Reservation Portion), except in QIB Portion,
would be allotted to be met with spill over from any other category or a combination of categories at the discretion
of our Company in consultation with the Selling Shareholders, the GCBRLMs and the BRLM and the Designated
Stock Exchange.
Only Eligible Employees Bidding in the Employee Reservation Portion are eligible to apply in the Offer under the Employee
Reservation Portion on a competitive basis. Bids by Eligible Employees Bidding in the Employee Reservation Portion could
also be made in the Net Offer and such Bids would not be treated as multiple Bids. The Employee Reservation Portion shall
not exceed 5% of the post-Offer capital of our Company.
.
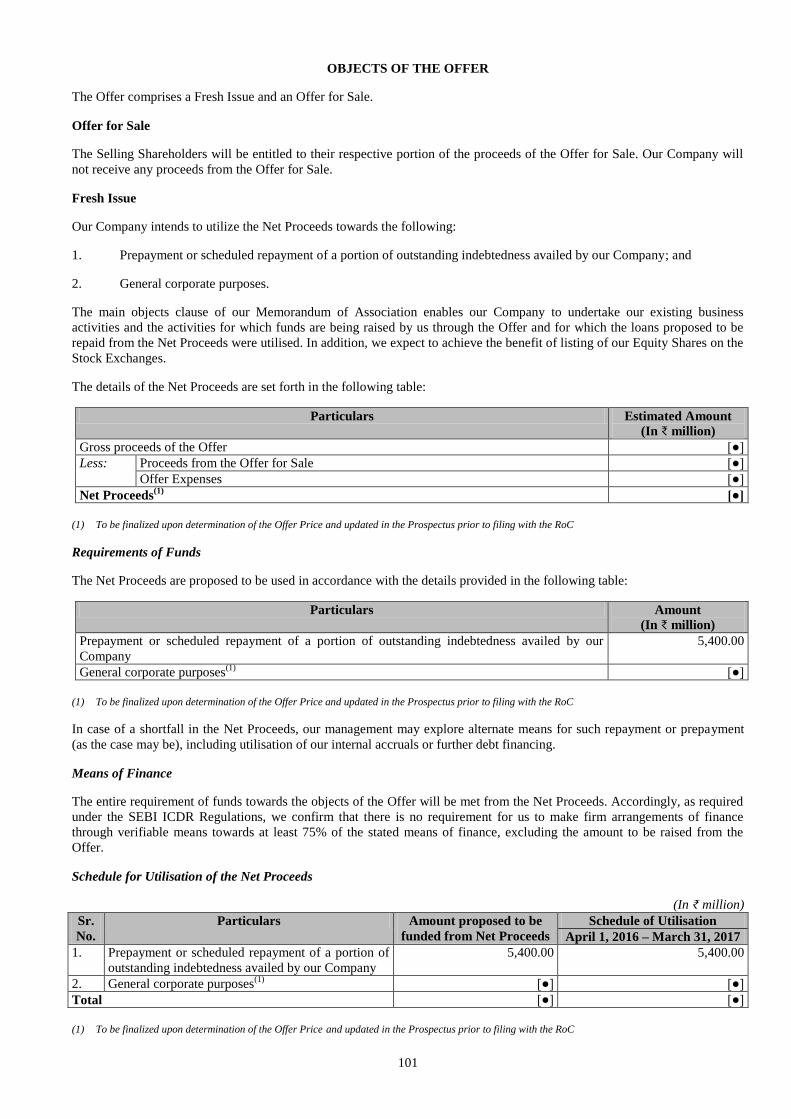
101
OBJECTS OF THE OFFER
The Offer comprises a Fresh Issue and an Offer for Sale.
Offer for Sale
The Selling Shareholders will be entitled to their respective portion of the proceeds of the Offer for Sale. Our Company will
not receive any proceeds from the Offer for Sale.
Fresh Issue
Our Company intends to utilize the Net Proceeds towards the following:
1. Prepayment or scheduled repayment of a portion of outstanding indebtedness availed by our Company; and
2. General corporate purposes.
The main objects clause of our Memorandum of Association enables our Company to undertake our existing business
activities and the activities for which funds are being raised by us through the Offer and for which the loans proposed to be
repaid from the Net Proceeds were utilised. In addition, we expect to achieve the benefit of listing of our Equity Shares on the
Stock Exchanges.
The details of the Net Proceeds are set forth in the following table:
Particulars Estimated Amount
(In ₹ million)
Gross proceeds of the Offer [●]
Less: Proceeds from the Offer for Sale [●]
Offer Expenses [●]
Net Proceeds(1)
[●]
(1) To be finalized upon determination of the Offer Price and updated in the Prospectus prior to filing with the RoC
Requirements of Funds
The Net Proceeds are proposed to be used in accordance with the details provided in the following table:
Particulars Amount
(In ₹ million)
Prepayment or scheduled repayment of a portion of outstanding indebtedness availed by our
Company
5,400.00
General corporate purposes(1)
[●]
(1) To be finalized upon determination of the Offer Price and updated in the Prospectus prior to filing with the RoC
In case of a shortfall in the Net Proceeds, our management may explore alternate means for such repayment or prepayment
(as the case may be), including utilisation of our internal accruals or further debt financing.
Means of Finance
The entire requirement of funds towards the objects of the Offer will be met from the Net Proceeds. Accordingly, as required
under the SEBI ICDR Regulations, we confirm that there is no requirement for us to make firm arrangements of finance
through verifiable means towards at least 75% of the stated means of finance, excluding the amount to be raised from the
Offer.
Schedule for Utilisation of the Net Proceeds
(In ₹ million)
Sr.
No.
Particulars Amount proposed to be
funded from Net Proceeds
Schedule of Utilisation
April 1, 2016 – March 31, 2017
1. Prepayment or scheduled repayment of a portion of
outstanding indebtedness availed by our Company
5,400.00 5,400.00
2. General corporate purposes(1)
[●] [●]
Total [●] [●]
(1) To be finalized upon determination of the Offer Price and updated in the Prospectus prior to filing with the RoC
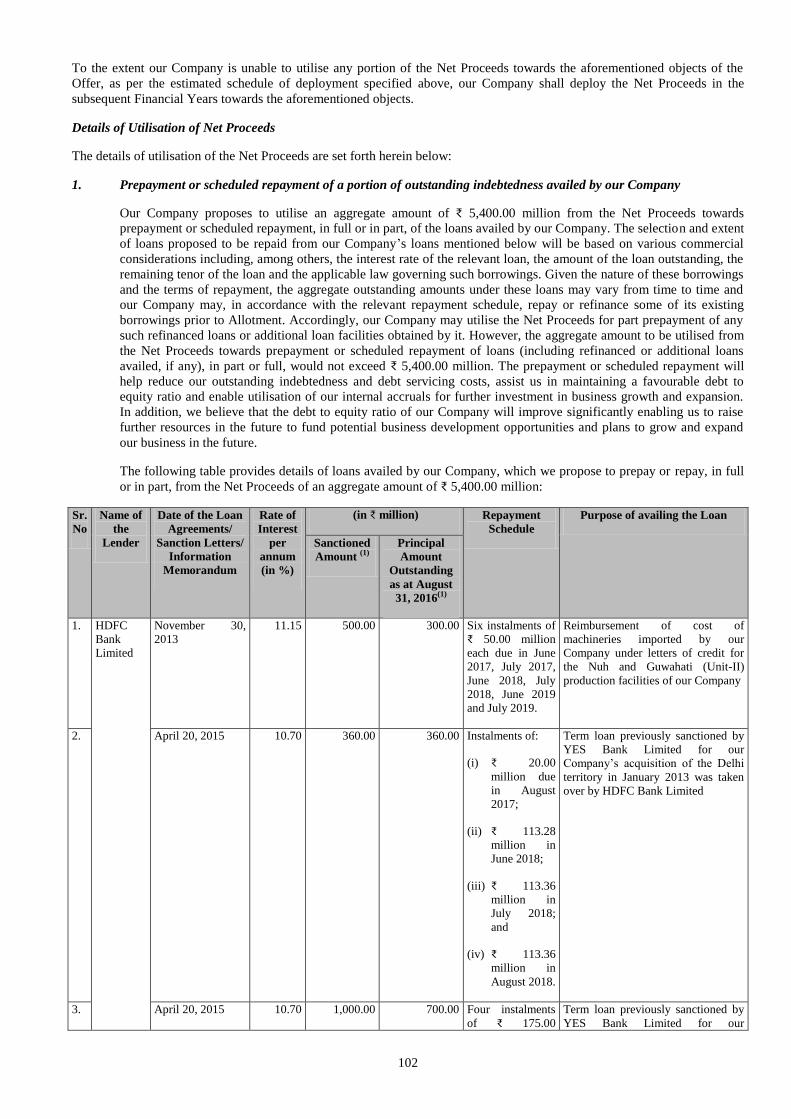
102
To the extent our Company is unable to utilise any portion of the Net Proceeds towards the aforementioned objects of the
Offer, as per the estimated schedule of deployment specified above, our Company shall deploy the Net Proceeds in the
subsequent Financial Years towards the aforementioned objects.
Details of Utilisation of Net Proceeds
The details of utilisation of the Net Proceeds are set forth herein below:
1. Prepayment or scheduled repayment of a portion of outstanding indebtedness availed by our Company
Our Company proposes to utilise an aggregate amount of ₹ 5,400.00 million from the Net Proceeds towards
prepayment or scheduled repayment, in full or in part, of the loans availed by our Company. The selection and extent
of loans proposed to be repaid from our Company’s loans mentioned below will be based on various commercial
considerations including, among others, the interest rate of the relevant loan, the amount of the loan outstanding, the
remaining tenor of the loan and the applicable law governing such borrowings. Given the nature of these borrowings
and the terms of repayment, the aggregate outstanding amounts under these loans may vary from time to time and
our Company may, in accordance with the relevant repayment schedule, repay or refinance some of its existing
borrowings prior to Allotment. Accordingly, our Company may utilise the Net Proceeds for part prepayment of any
such refinanced loans or additional loan facilities obtained by it. However, the aggregate amount to be utilised from
the Net Proceeds towards prepayment or scheduled repayment of loans (including refinanced or additional loans
availed, if any), in part or full, would not exceed ₹ 5,400.00 million. The prepayment or scheduled repayment will
help reduce our outstanding indebtedness and debt servicing costs, assist us in maintaining a favourable debt to
equity ratio and enable utilisation of our internal accruals for further investment in business growth and expansion.
In addition, we believe that the debt to equity ratio of our Company will improve significantly enabling us to raise
further resources in the future to fund potential business development opportunities and plans to grow and expand
our business in the future.
The following table provides details of loans availed by our Company, which we propose to prepay or repay, in full
or in part, from the Net Proceeds of an aggregate amount of ₹ 5,400.00 million:
Sr.
No
Name of
the
Lender
Date of the Loan
Agreements/
Sanction Letters/
Information
Memorandum
Rate of
Interest
per
annum
(in %)
(in ₹ million) Repayment
Schedule
Purpose of availing the Loan
Sanctioned
Amount (1)
Principal
Amount
Outstanding
as at August
31, 2016(1)
1. HDFC
Bank
Limited
November 30,
2013
11.15 500.00 300.00 Six instalments of
₹ 50.00 million
each due in June
2017, July 2017,
June 2018, July
2018, June 2019
and July 2019.
Reimbursement of cost of
machineries imported by our
Company under letters of credit for
the Nuh and Guwahati (Unit-II)
production facilities of our Company
2. April 20, 2015 10.70 360.00 360.00 Instalments of:
(i) ₹ 20.00
million due
in August
2017;
(ii) ₹ 113.28
million in
June 2018;
(iii) ₹ 113.36
million in
July 2018;
and
(iv) ₹ 113.36
million in
August 2018.
Term loan previously sanctioned by
YES Bank Limited for our
Company’s acquisition of the Delhi
territory in January 2013 was taken
over by HDFC Bank Limited
3. April 20, 2015 10.70 1,000.00 700.00 Four instalments
of ₹ 175.00
Term loan previously sanctioned by
YES Bank Limited for our
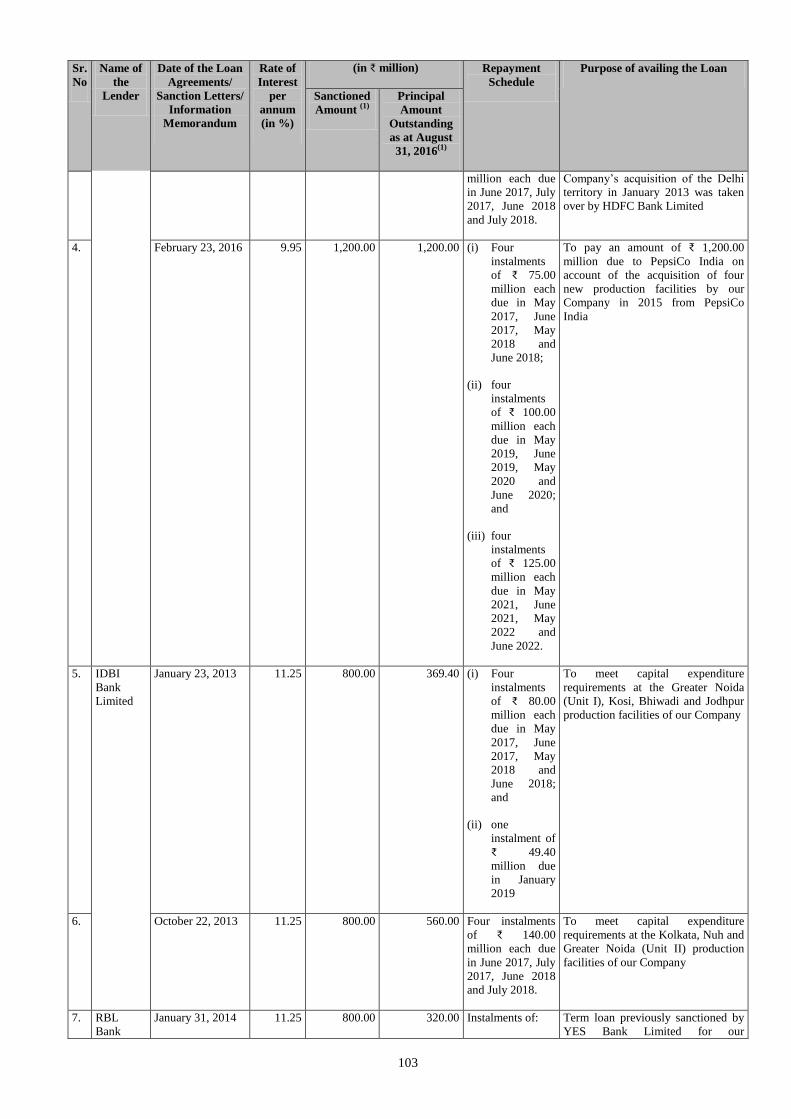
103
Sr.
No
Name of
the
Lender
Date of the Loan
Agreements/
Sanction Letters/
Information
Memorandum
Rate of
Interest
per
annum
(in %)
(in ₹ million) Repayment
Schedule
Purpose of availing the Loan
Sanctioned
Amount (1)
Principal
Amount
Outstanding
as at August
31, 2016(1)
million each due
in June 2017, July
2017, June 2018
and July 2018.
Company’s acquisition of the Delhi
territory in January 2013 was taken
over by HDFC Bank Limited
4. February 23, 2016 9.95 1,200.00 1,200.00 (i) Four
instalments
of ₹ 75.00
million each
due in May
2017, June
2017, May
2018 and
June 2018;
(ii) four
instalments
of ₹ 100.00
million each
due in May
2019, June
2019, May
2020 and
June 2020;
and
(iii) four
instalments
of ₹ 125.00
million each
due in May
2021, June
2021, May
2022 and
June 2022.
To pay an amount of ₹ 1,200.00
million due to PepsiCo India on
account of the acquisition of four
new production facilities by our
Company in 2015 from PepsiCo
India
5. IDBI
Bank
Limited
January 23, 2013 11.25 800.00 369.40 (i) Four
instalments
of ₹ 80.00
million each
due in May
2017, June
2017, May
2018 and
June 2018;
and
(ii) one
instalment of
₹ 49.40
million due
in January
2019
To meet capital expenditure
requirements at the Greater Noida
(Unit I), Kosi, Bhiwadi and Jodhpur
production facilities of our Company
6. October 22, 2013 11.25 800.00 560.00 Four instalments
of ₹ 140.00
million each due
in June 2017, July
2017, June 2018
and July 2018.
To meet capital expenditure
requirements at the Kolkata, Nuh and
Greater Noida (Unit II) production
facilities of our Company
7. RBL
Bank
January 31, 2014 11.25 800.00 320.00 Instalments of: Term loan previously sanctioned by
YES Bank Limited for our
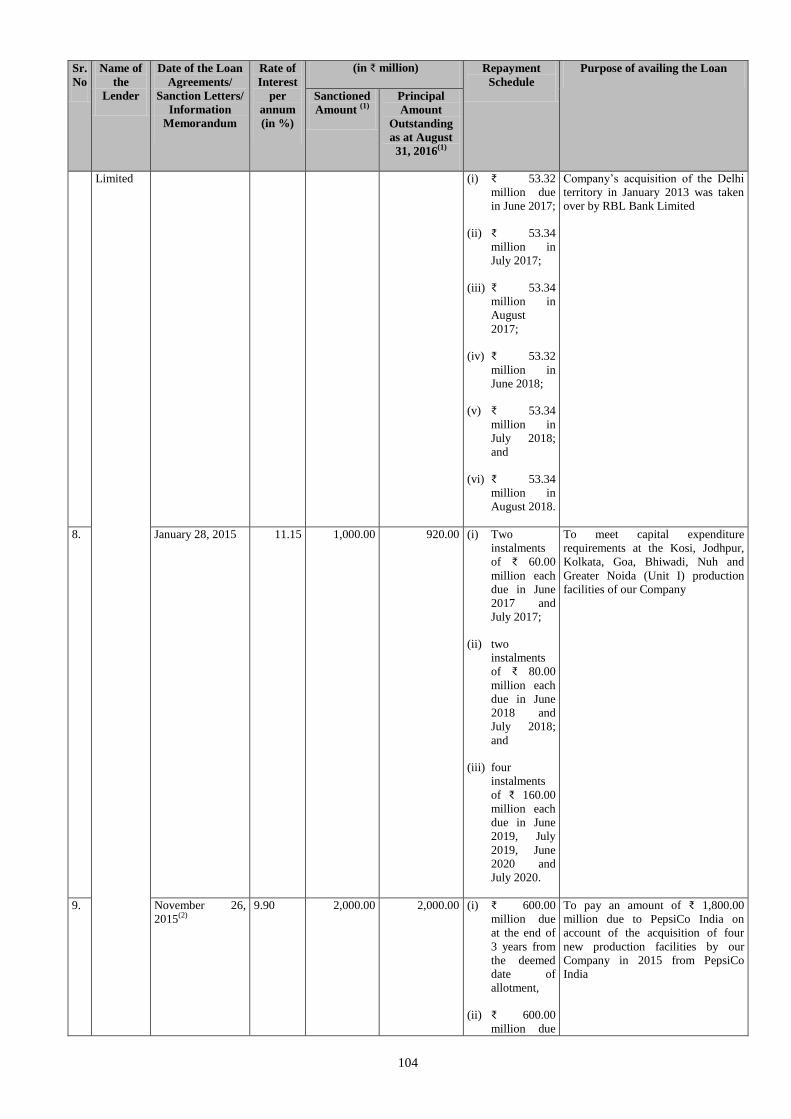
104
Sr.
No
Name of
the
Lender
Date of the Loan
Agreements/
Sanction Letters/
Information
Memorandum
Rate of
Interest
per
annum
(in %)
(in ₹ million) Repayment
Schedule
Purpose of availing the Loan
Sanctioned
Amount (1)
Principal
Amount
Outstanding
as at August
31, 2016(1)
Limited (i) ₹ 53.32
million due
in June 2017;
(ii) ₹ 53.34
million in
July 2017;
(iii) ₹ 53.34
million in
August
2017;
(iv) ₹ 53.32
million in
June 2018;
(v) ₹ 53.34
million in
July 2018;
and
(vi) ₹ 53.34
million in
August 2018.
Company’s acquisition of the Delhi
territory in January 2013 was taken
over by RBL Bank Limited
8. January 28, 2015 11.15 1,000.00 920.00 (i) Two
instalments
of ₹ 60.00
million each
due in June
2017 and
July 2017;
(ii) two
instalments
of ₹ 80.00
million each
due in June
2018 and
July 2018;
and
(iii) four
instalments
of ₹ 160.00
million each
due in June
2019, July
2019, June
2020 and
July 2020.
To meet capital expenditure
requirements at the Kosi, Jodhpur,
Kolkata, Goa, Bhiwadi, Nuh and
Greater Noida (Unit I) production
facilities of our Company
9. November 26,
2015(2)
9.90 2,000.00 2,000.00 (i) ₹ 600.00
million due
at the end of
3 years from
the deemed
date of
allotment,
(ii) ₹ 600.00
million due
To pay an amount of ₹ 1,800.00
million due to PepsiCo India on
account of the acquisition of four
new production facilities by our
Company in 2015 from PepsiCo
India
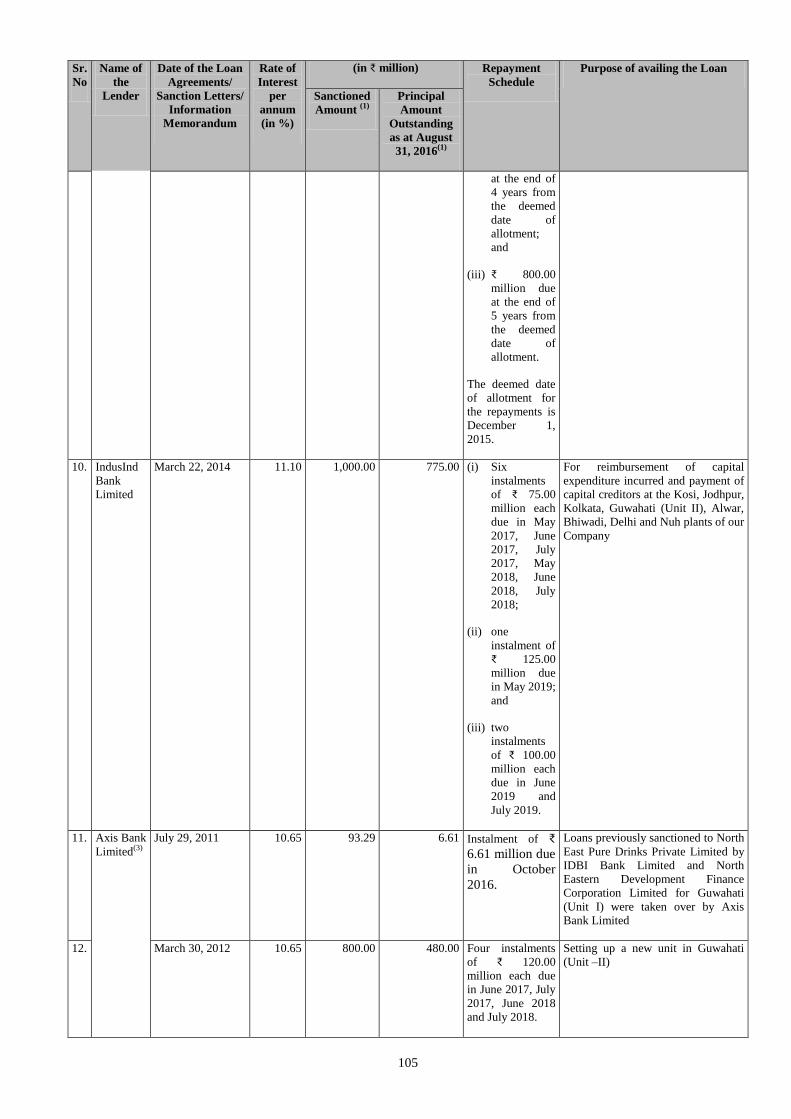
105
Sr.
No
Name of
the
Lender
Date of the Loan
Agreements/
Sanction Letters/
Information
Memorandum
Rate of
Interest
per
annum
(in %)
(in ₹ million) Repayment
Schedule
Purpose of availing the Loan
Sanctioned
Amount (1)
Principal
Amount
Outstanding
as at August
31, 2016(1)
at the end of
4 years from
the deemed
date of
allotment;
and
(iii) ₹ 800.00
million due
at the end of
5 years from
the deemed
date of
allotment.
The deemed date
of allotment for
the repayments is
December 1,
2015.
10. IndusInd
Bank
Limited
March 22, 2014
11.10 1,000.00 775.00 (i) Six
instalments
of ₹ 75.00
million each
due in May
2017, June
2017, July
2017, May
2018, June
2018, July
2018;
(ii) one
instalment of
₹ 125.00
million due
in May 2019;
and
(iii) two
instalments
of ₹ 100.00
million each
due in June
2019 and
July 2019.
For reimbursement of capital
expenditure incurred and payment of
capital creditors at the Kosi, Jodhpur,
Kolkata, Guwahati (Unit II), Alwar,
Bhiwadi, Delhi and Nuh plants of our
Company
11. Axis Bank
Limited(3)
July 29, 2011 10.65 93.29 6.61 Instalment of ₹
6.61 million due
in October
2016.
Loans previously sanctioned to North
East Pure Drinks Private Limited by
IDBI Bank Limited and North
Eastern Development Finance
Corporation Limited for Guwahati
(Unit I) were taken over by Axis
Bank Limited
12. March 30, 2012 10.65 800.00 480.00 Four instalments
of ₹ 120.00
million each due
in June 2017, July
2017, June 2018
and July 2018.
Setting up a new unit in Guwahati
(Unit –II)
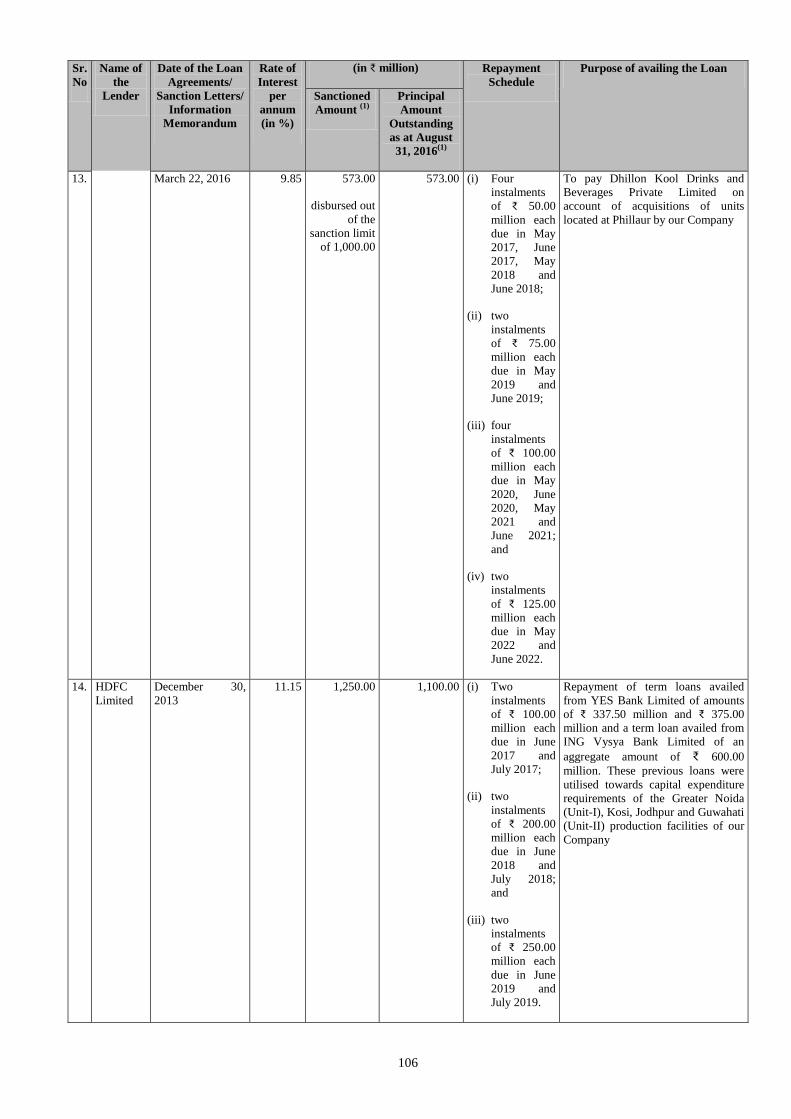
106
Sr.
No
Name of
the
Lender
Date of the Loan
Agreements/
Sanction Letters/
Information
Memorandum
Rate of
Interest
per
annum
(in %)
(in ₹ million) Repayment
Schedule
Purpose of availing the Loan
Sanctioned
Amount (1)
Principal
Amount
Outstanding
as at August
31, 2016(1)
13. March 22, 2016 9.85 573.00
disbursed out
of the
sanction limit
of 1,000.00
573.00 (i) Four
instalments
of ₹ 50.00
million each
due in May
2017, June
2017, May
2018 and
June 2018;
(ii) two
instalments
of ₹ 75.00
million each
due in May
2019 and
June 2019;
(iii) four
instalments
of ₹ 100.00
million each
due in May
2020, June
2020, May
2021 and
June 2021;
and
(iv) two
instalments
of ₹ 125.00
million each
due in May
2022 and
June 2022.
To pay Dhillon Kool Drinks and
Beverages Private Limited on
account of acquisitions of units
located at Phillaur by our Company
14. HDFC
Limited
December 30,
2013
11.15 1,250.00 1,100.00 (i) Two
instalments
of ₹ 100.00
million each
due in June
2017 and
July 2017;
(ii) two
instalments
of ₹ 200.00
million each
due in June
2018 and
July 2018;
and
(iii) two
instalments
of ₹ 250.00
million each
due in June
2019 and
July 2019.
Repayment of term loans availed
from YES Bank Limited of amounts
of ₹ 337.50 million and ₹ 375.00
million and a term loan availed from
ING Vysya Bank Limited of an
aggregate amount of ₹ 600.00
million. These previous loans were
utilised towards capital expenditure
requirements of the Greater Noida
(Unit-I), Kosi, Jodhpur and Guwahati
(Unit-II) production facilities of our
Company
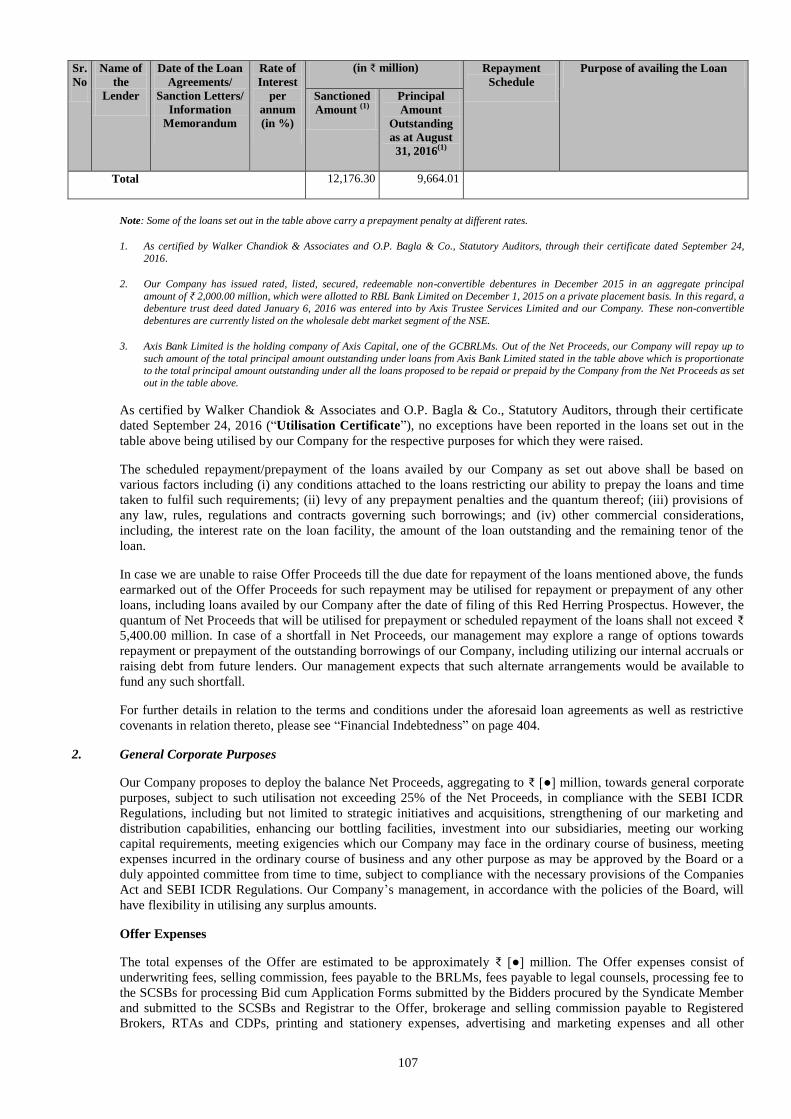
107
Sr.
No
Name of
the
Lender
Date of the Loan
Agreements/
Sanction Letters/
Information
Memorandum
Rate of
Interest
per
annum
(in %)
(in ₹ million) Repayment
Schedule
Purpose of availing the Loan
Sanctioned
Amount (1)
Principal
Amount
Outstanding
as at August
31, 2016(1)
Total 12,176.30 9,664.01
Note: Some of the loans set out in the table above carry a prepayment penalty at different rates.
1. As certified by Walker Chandiok & Associates and O.P. Bagla & Co., Statutory Auditors, through their certificate dated September 24,
2016.
2. Our Company has issued rated, listed, secured, redeemable non-convertible debentures in December 2015 in an aggregate principal
amount of ₹ 2,000.00 million, which were allotted to RBL Bank Limited on December 1, 2015 on a private placement basis. In this regard, a debenture trust deed dated January 6, 2016 was entered into by Axis Trustee Services Limited and our Company. These non-convertible
debentures are currently listed on the wholesale debt market segment of the NSE.
3. Axis Bank Limited is the holding company of Axis Capital, one of the GCBRLMs. Out of the Net Proceeds, our Company will repay up to
such amount of the total principal amount outstanding under loans from Axis Bank Limited stated in the table above which is proportionate to the total principal amount outstanding under all the loans proposed to be repaid or prepaid by the Company from the Net Proceeds as set
out in the table above.
As certified by Walker Chandiok & Associates and O.P. Bagla & Co., Statutory Auditors, through their certificate
dated September 24, 2016 (“Utilisation Certificate”), no exceptions have been reported in the loans set out in the
table above being utilised by our Company for the respective purposes for which they were raised.
The scheduled repayment/prepayment of the loans availed by our Company as set out above shall be based on
various factors including (i) any conditions attached to the loans restricting our ability to prepay the loans and time
taken to fulfil such requirements; (ii) levy of any prepayment penalties and the quantum thereof; (iii) provisions of
any law, rules, regulations and contracts governing such borrowings; and (iv) other commercial considerations,
including, the interest rate on the loan facility, the amount of the loan outstanding and the remaining tenor of the
loan.
In case we are unable to raise Offer Proceeds till the due date for repayment of the loans mentioned above, the funds
earmarked out of the Offer Proceeds for such repayment may be utilised for repayment or prepayment of any other
loans, including loans availed by our Company after the date of filing of this Red Herring Prospectus. However, the
quantum of Net Proceeds that will be utilised for prepayment or scheduled repayment of the loans shall not exceed ₹
5,400.00 million. In case of a shortfall in Net Proceeds, our management may explore a range of options towards
repayment or prepayment of the outstanding borrowings of our Company, including utilizing our internal accruals or
raising debt from future lenders. Our management expects that such alternate arrangements would be available to
fund any such shortfall.
For further details in relation to the terms and conditions under the aforesaid loan agreements as well as restrictive
covenants in relation thereto, please see “Financial Indebtedness” on page 404.
2. General Corporate Purposes
Our Company proposes to deploy the balance Net Proceeds, aggregating to ₹ [●] million, towards general corporate
purposes, subject to such utilisation not exceeding 25% of the Net Proceeds, in compliance with the SEBI ICDR
Regulations, including but not limited to strategic initiatives and acquisitions, strengthening of our marketing and
distribution capabilities, enhancing our bottling facilities, investment into our subsidiaries, meeting our working
capital requirements, meeting exigencies which our Company may face in the ordinary course of business, meeting
expenses incurred in the ordinary course of business and any other purpose as may be approved by the Board or a
duly appointed committee from time to time, subject to compliance with the necessary provisions of the Companies
Act and SEBI ICDR Regulations. Our Company’s management, in accordance with the policies of the Board, will
have flexibility in utilising any surplus amounts.
Offer Expenses
The total expenses of the Offer are estimated to be approximately ₹ [●] million. The Offer expenses consist of
underwriting fees, selling commission, fees payable to the BRLMs, fees payable to legal counsels, processing fee to
the SCSBs for processing Bid cum Application Forms submitted by the Bidders procured by the Syndicate Member
and submitted to the SCSBs and Registrar to the Offer, brokerage and selling commission payable to Registered
Brokers, RTAs and CDPs, printing and stationery expenses, advertising and marketing expenses and all other
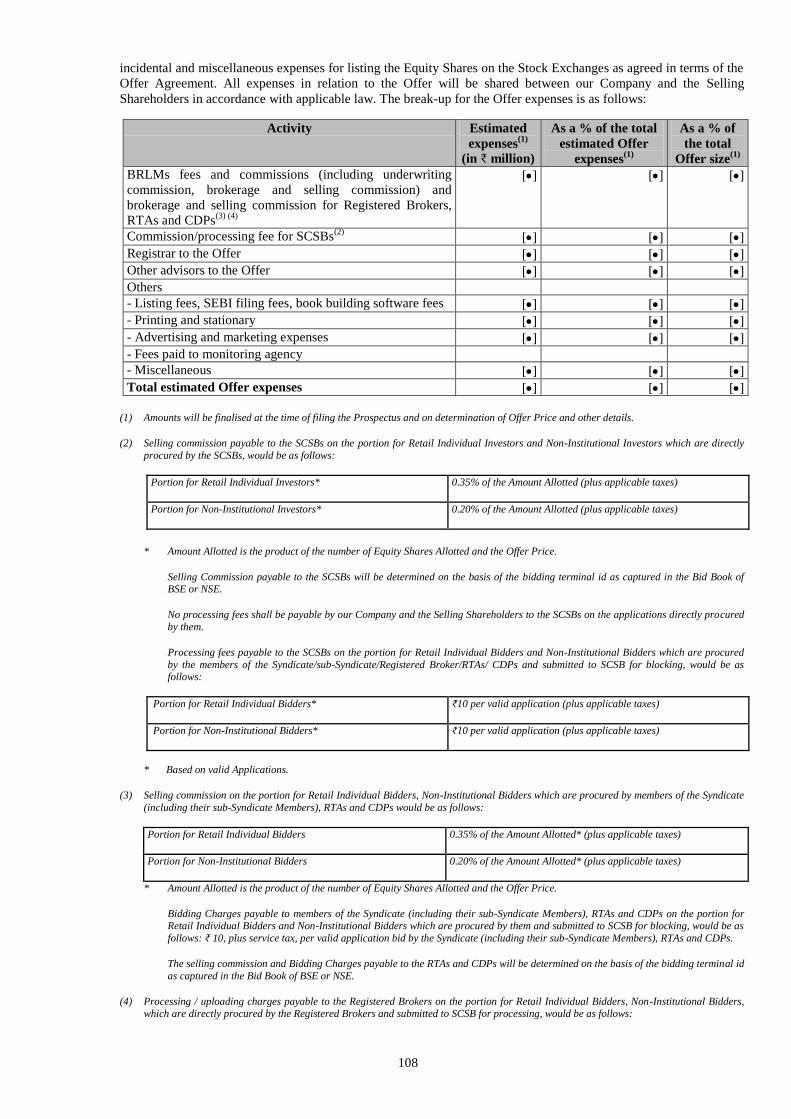
108
incidental and miscellaneous expenses for listing the Equity Shares on the Stock Exchanges as agreed in terms of the
Offer Agreement. All expenses in relation to the Offer will be shared between our Company and the Selling
Shareholders in accordance with applicable law. The break-up for the Offer expenses is as follows:
Activity Estimated
expenses(1)
(in ₹ million)
As a % of the total
estimated Offer
expenses(1)
As a % of
the total
Offer size(1)
BRLMs fees and commissions (including underwriting
commission, brokerage and selling commission) and
brokerage and selling commission for Registered Brokers,
RTAs and CDPs(3) (4)
[] [] []
Commission/processing fee for SCSBs(2)
[] [] []
Registrar to the Offer [] [] []
Other advisors to the Offer [] [] []
Others
- Listing fees, SEBI filing fees, book building software fees [] [] []
- Printing and stationary [] [] []
- Advertising and marketing expenses [] [] []
- Fees paid to monitoring agency
- Miscellaneous [] [] []
Total estimated Offer expenses [] [] []
(1) Amounts will be finalised at the time of filing the Prospectus and on determination of Offer Price and other details.
(2) Selling commission payable to the SCSBs on the portion for Retail Individual Investors and Non-Institutional Investors which are directly
procured by the SCSBs, would be as follows:
Portion for Retail Individual Investors* 0.35% of the Amount Allotted (plus applicable taxes)
Portion for Non-Institutional Investors* 0.20% of the Amount Allotted (plus applicable taxes)
* Amount Allotted is the product of the number of Equity Shares Allotted and the Offer Price.
Selling Commission payable to the SCSBs will be determined on the basis of the bidding terminal id as captured in the Bid Book of BSE or NSE.
No processing fees shall be payable by our Company and the Selling Shareholders to the SCSBs on the applications directly procured
by them.
Processing fees payable to the SCSBs on the portion for Retail Individual Bidders and Non-Institutional Bidders which are procured
by the members of the Syndicate/sub-Syndicate/Registered Broker/RTAs/ CDPs and submitted to SCSB for blocking, would be as follows:
Portion for Retail Individual Bidders* ₹10 per valid application (plus applicable taxes)
Portion for Non-Institutional Bidders* ₹10 per valid application (plus applicable taxes)
* Based on valid Applications.
(3) Selling commission on the portion for Retail Individual Bidders, Non-Institutional Bidders which are procured by members of the Syndicate
(including their sub-Syndicate Members), RTAs and CDPs would be as follows:
Portion for Retail Individual Bidders 0.35% of the Amount Allotted* (plus applicable taxes)
Portion for Non-Institutional Bidders 0.20% of the Amount Allotted* (plus applicable taxes)
* Amount Allotted is the product of the number of Equity Shares Allotted and the Offer Price.
Bidding Charges payable to members of the Syndicate (including their sub-Syndicate Members), RTAs and CDPs on the portion for Retail Individual Bidders and Non-Institutional Bidders which are procured by them and submitted to SCSB for blocking, would be as
follows: ₹ 10, plus service tax, per valid application bid by the Syndicate (including their sub-Syndicate Members), RTAs and CDPs.
The selling commission and Bidding Charges payable to the RTAs and CDPs will be determined on the basis of the bidding terminal id
as captured in the Bid Book of BSE or NSE.
(4) Processing / uploading charges payable to the Registered Brokers on the portion for Retail Individual Bidders, Non-Institutional Bidders, which are directly procured by the Registered Brokers and submitted to SCSB for processing, would be as follows:
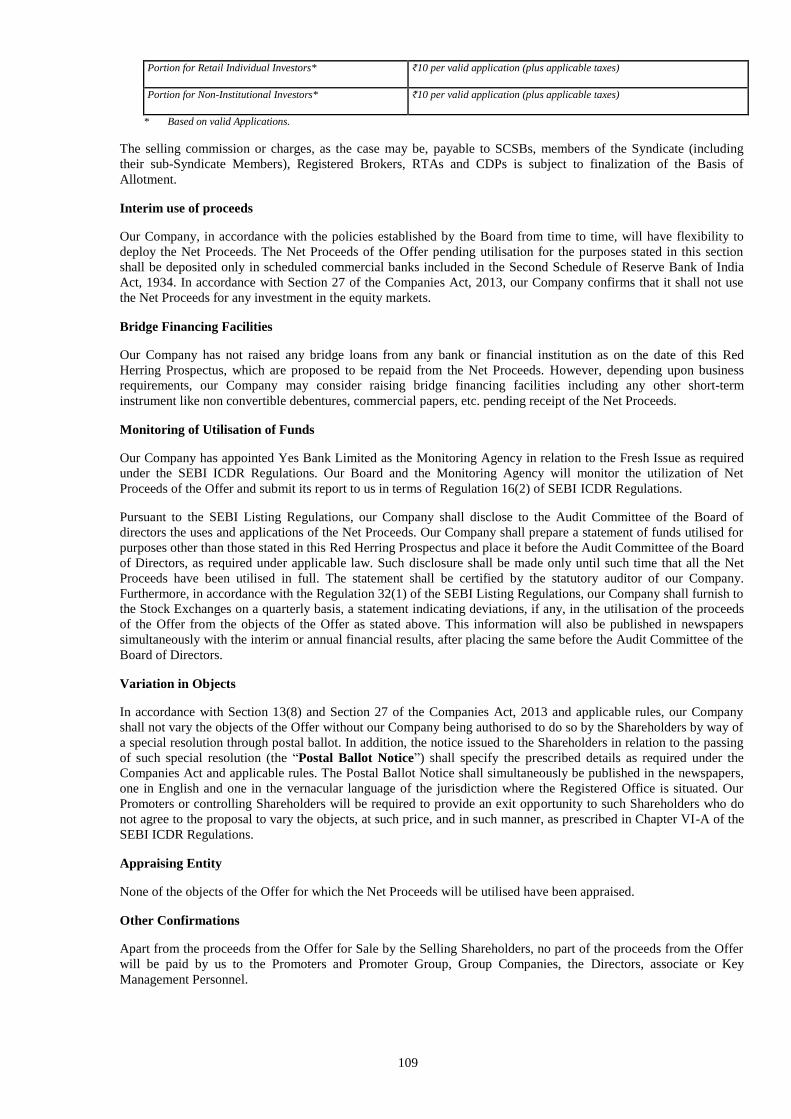
109
Portion for Retail Individual Investors* ₹10 per valid application (plus applicable taxes)
Portion for Non-Institutional Investors* ₹10 per valid application (plus applicable taxes)
* Based on valid Applications.
The selling commission or charges, as the case may be, payable to SCSBs, members of the Syndicate (including
their sub-Syndicate Members), Registered Brokers, RTAs and CDPs is subject to finalization of the Basis of
Allotment.
Interim use of proceeds
Our Company, in accordance with the policies established by the Board from time to time, will have flexibility to
deploy the Net Proceeds. The Net Proceeds of the Offer pending utilisation for the purposes stated in this section
shall be deposited only in scheduled commercial banks included in the Second Schedule of Reserve Bank of India
Act, 1934. In accordance with Section 27 of the Companies Act, 2013, our Company confirms that it shall not use
the Net Proceeds for any investment in the equity markets.
Bridge Financing Facilities
Our Company has not raised any bridge loans from any bank or financial institution as on the date of this Red
Herring Prospectus, which are proposed to be repaid from the Net Proceeds. However, depending upon business
requirements, our Company may consider raising bridge financing facilities including any other short-term
instrument like non convertible debentures, commercial papers, etc. pending receipt of the Net Proceeds.
Monitoring of Utilisation of Funds
Our Company has appointed Yes Bank Limited as the Monitoring Agency in relation to the Fresh Issue as required
under the SEBI ICDR Regulations. Our Board and the Monitoring Agency will monitor the utilization of Net
Proceeds of the Offer and submit its report to us in terms of Regulation 16(2) of SEBI ICDR Regulations.
Pursuant to the SEBI Listing Regulations, our Company shall disclose to the Audit Committee of the Board of
directors the uses and applications of the Net Proceeds. Our Company shall prepare a statement of funds utilised for
purposes other than those stated in this Red Herring Prospectus and place it before the Audit Committee of the Board
of Directors, as required under applicable law. Such disclosure shall be made only until such time that all the Net
Proceeds have been utilised in full. The statement shall be certified by the statutory auditor of our Company.
Furthermore, in accordance with the Regulation 32(1) of the SEBI Listing Regulations, our Company shall furnish to
the Stock Exchanges on a quarterly basis, a statement indicating deviations, if any, in the utilisation of the proceeds
of the Offer from the objects of the Offer as stated above. This information will also be published in newspapers
simultaneously with the interim or annual financial results, after placing the same before the Audit Committee of the
Board of Directors.
Variation in Objects
In accordance with Section 13(8) and Section 27 of the Companies Act, 2013 and applicable rules, our Company
shall not vary the objects of the Offer without our Company being authorised to do so by the Shareholders by way of
a special resolution through postal ballot. In addition, the notice issued to the Shareholders in relation to the passing
of such special resolution (the “Postal Ballot Notice”) shall specify the prescribed details as required under the
Companies Act and applicable rules. The Postal Ballot Notice shall simultaneously be published in the newspapers,
one in English and one in the vernacular language of the jurisdiction where the Registered Office is situated. Our
Promoters or controlling Shareholders will be required to provide an exit opportunity to such Shareholders who do
not agree to the proposal to vary the objects, at such price, and in such manner, as prescribed in Chapter VI-A of the
SEBI ICDR Regulations.
Appraising Entity
None of the objects of the Offer for which the Net Proceeds will be utilised have been appraised.
Other Confirmations
Apart from the proceeds from the Offer for Sale by the Selling Shareholders, no part of the proceeds from the Offer
will be paid by us to the Promoters and Promoter Group, Group Companies, the Directors, associate or Key
Management Personnel.
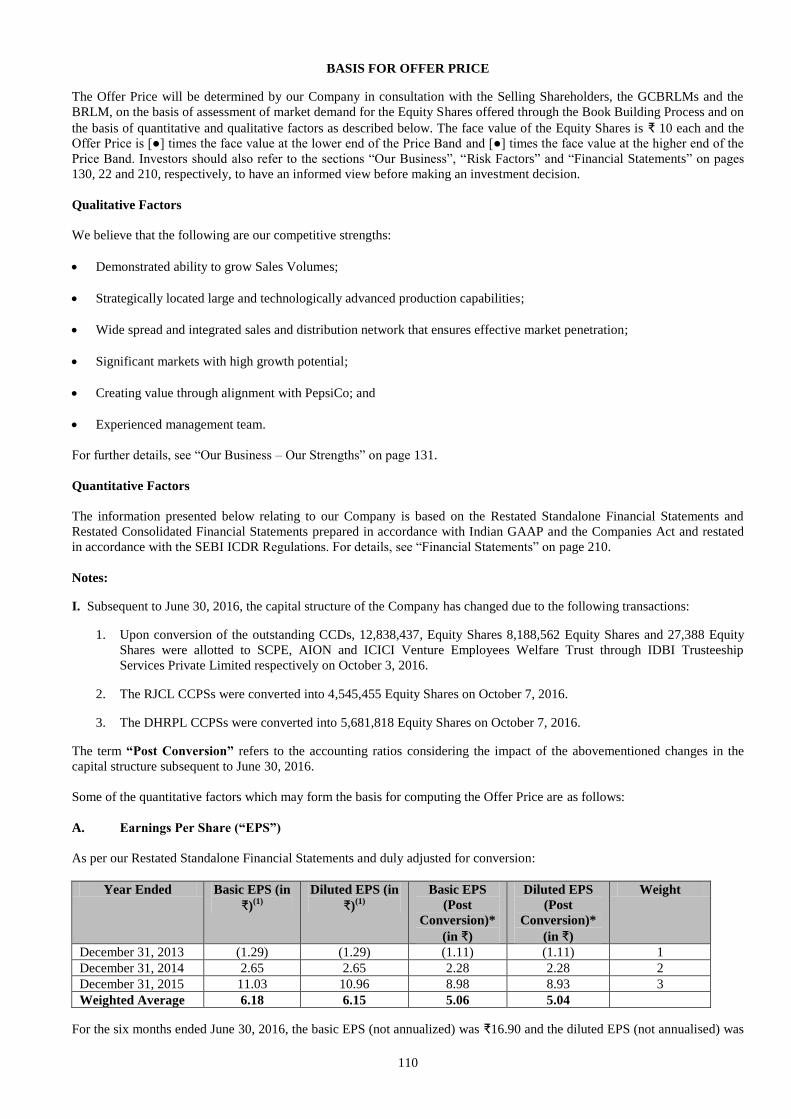
110
BASIS FOR OFFER PRICE
The Offer Price will be determined by our Company in consultation with the Selling Shareholders, the GCBRLMs and the
BRLM, on the basis of assessment of market demand for the Equity Shares offered through the Book Building Process and on
the basis of quantitative and qualitative factors as described below. The face value of the Equity Shares is ₹ 10 each and the
Offer Price is [●] times the face value at the lower end of the Price Band and [●] times the face value at the higher end of the
Price Band. Investors should also refer to the sections “Our Business”, “Risk Factors” and “Financial Statements” on pages
130, 22 and 210, respectively, to have an informed view before making an investment decision.
Qualitative Factors
We believe that the following are our competitive strengths:
Demonstrated ability to grow Sales Volumes;
Strategically located large and technologically advanced production capabilities;
Wide spread and integrated sales and distribution network that ensures effective market penetration;
Significant markets with high growth potential;
Creating value through alignment with PepsiCo; and
Experienced management team.
For further details, see “Our Business – Our Strengths” on page 131.
Quantitative Factors
The information presented below relating to our Company is based on the Restated Standalone Financial Statements and
Restated Consolidated Financial Statements prepared in accordance with Indian GAAP and the Companies Act and restated
in accordance with the SEBI ICDR Regulations. For details, see “Financial Statements” on page 210.
Notes:
I. Subsequent to June 30, 2016, the capital structure of the Company has changed due to the following transactions:
1. Upon conversion of the outstanding CCDs, 12,838,437, Equity Shares 8,188,562 Equity Shares and 27,388 Equity
Shares were allotted to SCPE, AION and ICICI Venture Employees Welfare Trust through IDBI Trusteeship
Services Private Limited respectively on October 3, 2016.
2. The RJCL CCPSs were converted into 4,545,455 Equity Shares on October 7, 2016.
3. The DHRPL CCPSs were converted into 5,681,818 Equity Shares on October 7, 2016.
The term “Post Conversion” refers to the accounting ratios considering the impact of the abovementioned changes in the
capital structure subsequent to June 30, 2016.
Some of the quantitative factors which may form the basis for computing the Offer Price are as follows:
A. Earnings Per Share (“EPS”)
As per our Restated Standalone Financial Statements and duly adjusted for conversion:
Year Ended Basic EPS (in
₹)(1)
Diluted EPS (in
₹)(1)
Basic EPS
(Post
Conversion)*
(in ₹)
Diluted EPS
(Post
Conversion)*
(in ₹)
Weight
December 31, 2013 (1.29) (1.29) (1.11) (1.11) 1
December 31, 2014 2.65 2.65 2.28 2.28 2
December 31, 2015 11.03 10.96 8.98 8.93 3
Weighted Average 6.18 6.15 5.06 5.04
For the six months ended June 30, 2016, the basic EPS (not annualized) was ₹16.90 and the diluted EPS (not annualised) was
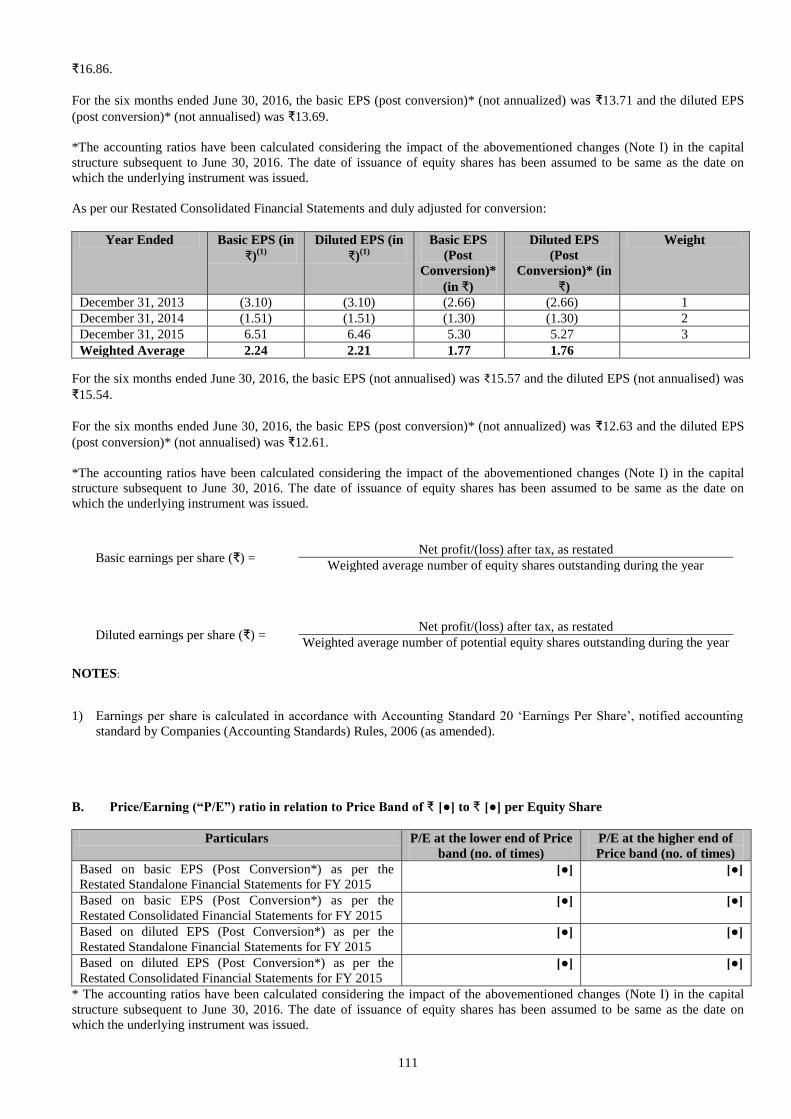
111
₹16.86.
For the six months ended June 30, 2016, the basic EPS (post conversion)* (not annualized) was ₹13.71 and the diluted EPS
(post conversion)* (not annualised) was ₹13.69.
*The accounting ratios have been calculated considering the impact of the abovementioned changes (Note I) in the capital
structure subsequent to June 30, 2016. The date of issuance of equity shares has been assumed to be same as the date on
which the underlying instrument was issued.
As per our Restated Consolidated Financial Statements and duly adjusted for conversion:
Year Ended Basic EPS (in
₹)(1)
Diluted EPS (in
₹)(1)
Basic EPS
(Post
Conversion)*
(in ₹)
Diluted EPS
(Post
Conversion)* (in
₹)
Weight
December 31, 2013 (3.10) (3.10) (2.66) (2.66) 1
December 31, 2014 (1.51) (1.51) (1.30) (1.30) 2
December 31, 2015 6.51 6.46 5.30 5.27 3
Weighted Average 2.24 2.21 1.77 1.76
For the six months ended June 30, 2016, the basic EPS (not annualised) was ₹15.57 and the diluted EPS (not annualised) was
₹15.54.
For the six months ended June 30, 2016, the basic EPS (post conversion)* (not annualized) was ₹12.63 and the diluted EPS
(post conversion)* (not annualised) was ₹12.61.
*The accounting ratios have been calculated considering the impact of the abovementioned changes (Note I) in the capital
structure subsequent to June 30, 2016. The date of issuance of equity shares has been assumed to be same as the date on
which the underlying instrument was issued.
Basic earnings per share (₹) = Net profit/(loss) after tax, as restated
Weighted average number of equity shares outstanding during the year
Diluted earnings per share (₹) = Net profit/(loss) after tax, as restated
Weighted average number of potential equity shares outstanding during the year
NOTES:
1) Earnings per share is calculated in accordance with Accounting Standard 20 ‘Earnings Per Share’, notified accounting
standard by Companies (Accounting Standards) Rules, 2006 (as amended).
B. Price/Earning (“P/E”) ratio in relation to Price Band of ₹ [●] to ₹ [●] per Equity Share
Particulars P/E at the lower end of Price
band (no. of times)
P/E at the higher end of
Price band (no. of times)
Based on basic EPS (Post Conversion*) as per the
Restated Standalone Financial Statements for FY 2015 [●] [●]
Based on basic EPS (Post Conversion*) as per the
Restated Consolidated Financial Statements for FY 2015 [●] [●]
Based on diluted EPS (Post Conversion*) as per the
Restated Standalone Financial Statements for FY 2015 [●] [●]
Based on diluted EPS (Post Conversion*) as per the
Restated Consolidated Financial Statements for FY 2015 [●] [●]
* The accounting ratios have been calculated considering the impact of the abovementioned changes (Note I) in the capital
structure subsequent to June 30, 2016. The date of issuance of equity shares has been assumed to be same as the date on
which the underlying instrument was issued.
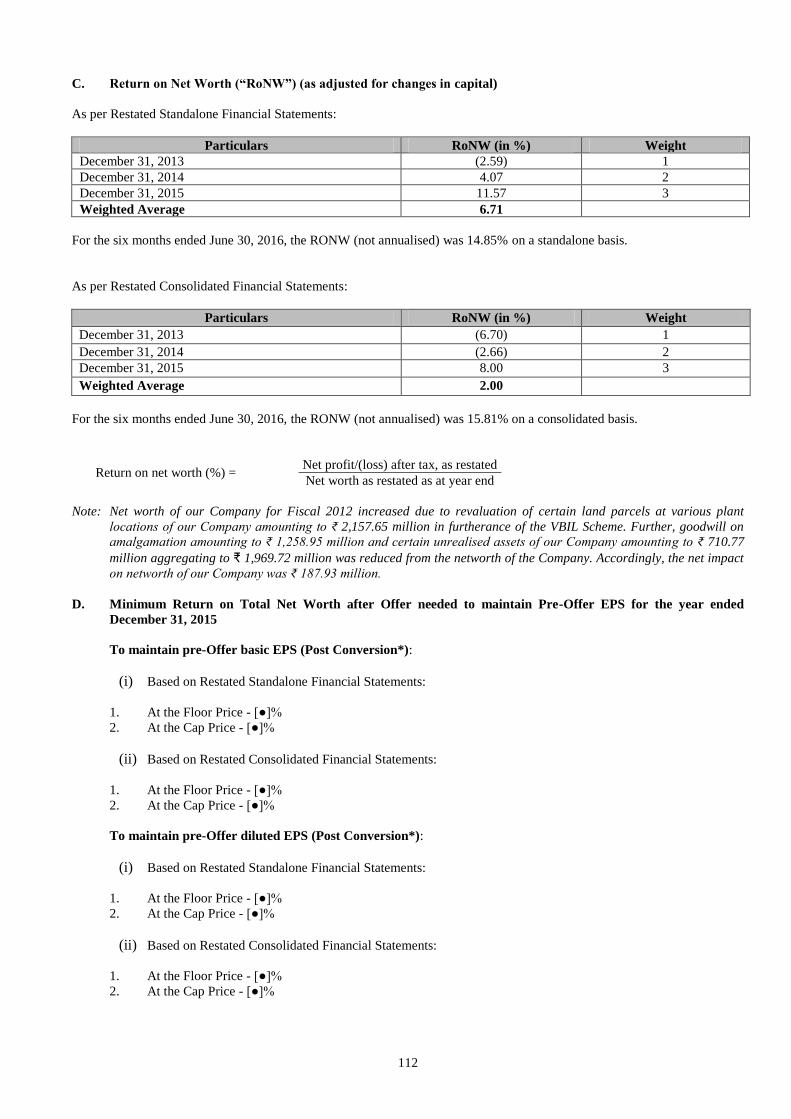
112
C. Return on Net Worth (“RoNW”) (as adjusted for changes in capital)
As per Restated Standalone Financial Statements:
Particulars RoNW (in %) Weight
December 31, 2013 (2.59) 1
December 31, 2014 4.07 2
December 31, 2015 11.57 3
Weighted Average 6.71
For the six months ended June 30, 2016, the RONW (not annualised) was 14.85% on a standalone basis.
As per Restated Consolidated Financial Statements:
Particulars RoNW (in %) Weight
December 31, 2013 (6.70) 1
December 31, 2014 (2.66) 2
December 31, 2015 8.00 3
Weighted Average 2.00
For the six months ended June 30, 2016, the RONW (not annualised) was 15.81% on a consolidated basis.
Return on net worth (%) = Net profit/(loss) after tax, as restated
Net worth as restated as at year end
Note: Net worth of our Company for Fiscal 2012 increased due to revaluation of certain land parcels at various plant
locations of our Company amounting to ₹ 2,157.65 million in furtherance of the VBIL Scheme. Further, goodwill on
amalgamation amounting to ₹ 1,258.95 million and certain unrealised assets of our Company amounting to ₹ 710.77
million aggregating to ₹ 1,969.72 million was reduced from the networth of the Company. Accordingly, the net impact
on networth of our Company was ₹ 187.93 million.
D. Minimum Return on Total Net Worth after Offer needed to maintain Pre-Offer EPS for the year ended
December 31, 2015
To maintain pre-Offer basic EPS (Post Conversion*):
(i) Based on Restated Standalone Financial Statements:
1. At the Floor Price - [●]%
2. At the Cap Price - [●]%
(ii) Based on Restated Consolidated Financial Statements:
1. At the Floor Price - [●]%
2. At the Cap Price - [●]%
To maintain pre-Offer diluted EPS (Post Conversion*):
(i) Based on Restated Standalone Financial Statements:
1. At the Floor Price - [●]%
2. At the Cap Price - [●]%
(ii) Based on Restated Consolidated Financial Statements:
1. At the Floor Price - [●]%
2. At the Cap Price - [●]%
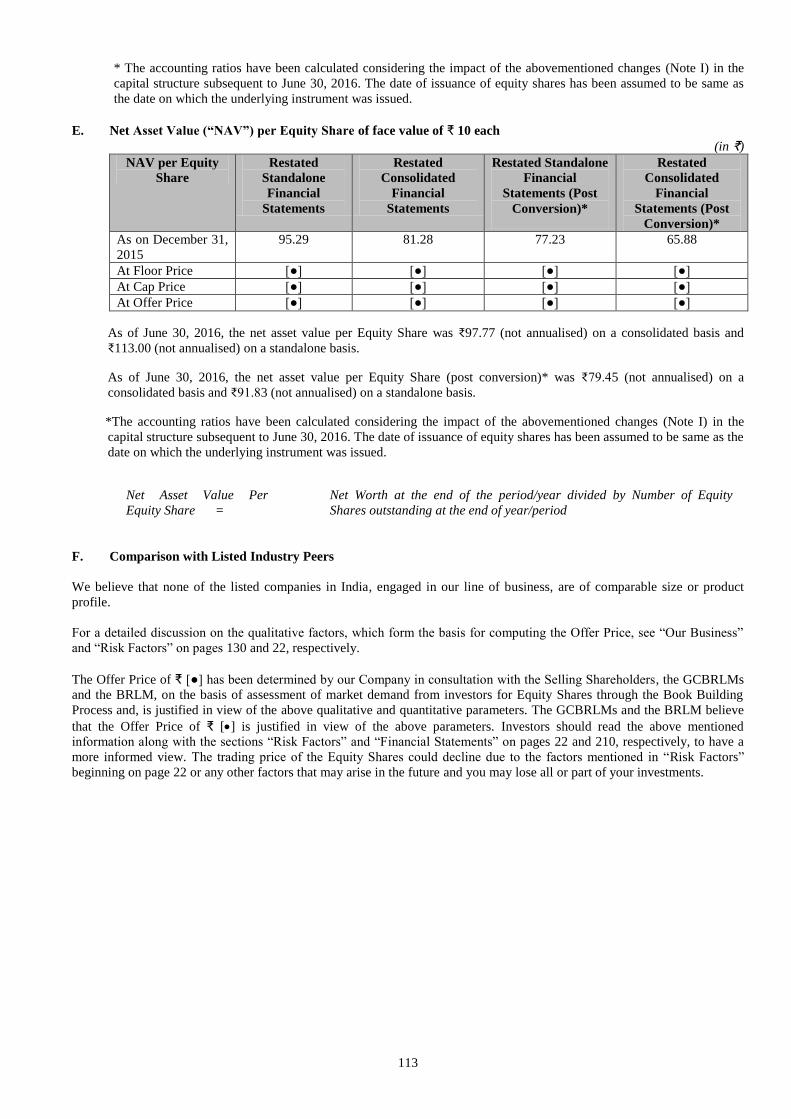
113
* The accounting ratios have been calculated considering the impact of the abovementioned changes (Note I) in the
capital structure subsequent to June 30, 2016. The date of issuance of equity shares has been assumed to be same as
the date on which the underlying instrument was issued.
E. Net Asset Value (“NAV”) per Equity Share of face value of ₹ 10 each
(in ₹)
NAV per Equity
Share
Restated
Standalone
Financial
Statements
Restated
Consolidated
Financial
Statements
Restated Standalone
Financial
Statements (Post
Conversion)*
Restated
Consolidated
Financial
Statements (Post
Conversion)*
As on December 31,
2015
95.29 81.28 77.23 65.88
At Floor Price [●] [●] [●] [●]
At Cap Price [●] [●] [●] [●]
At Offer Price [●] [●] [●] [●]
As of June 30, 2016, the net asset value per Equity Share was ₹97.77 (not annualised) on a consolidated basis and
₹113.00 (not annualised) on a standalone basis.
As of June 30, 2016, the net asset value per Equity Share (post conversion)* was ₹79.45 (not annualised) on a
consolidated basis and ₹91.83 (not annualised) on a standalone basis.
*The accounting ratios have been calculated considering the impact of the abovementioned changes (Note I) in the
capital structure subsequent to June 30, 2016. The date of issuance of equity shares has been assumed to be same as the
date on which the underlying instrument was issued.
Net Asset Value Per
Equity Share =
Net Worth at the end of the period/year divided by Number of Equity
Shares outstanding at the end of year/period
F. Comparison with Listed Industry Peers
We believe that none of the listed companies in India, engaged in our line of business, are of comparable size or product
profile.
For a detailed discussion on the qualitative factors, which form the basis for computing the Offer Price, see “Our Business”
and “Risk Factors” on pages 130 and 22, respectively.
The Offer Price of ₹ [●] has been determined by our Company in consultation with the Selling Shareholders, the GCBRLMs
and the BRLM, on the basis of assessment of market demand from investors for Equity Shares through the Book Building
Process and, is justified in view of the above qualitative and quantitative parameters. The GCBRLMs and the BRLM believe
that the Offer Price of ₹ [] is justified in view of the above parameters. Investors should read the above mentioned
information along with the sections “Risk Factors” and “Financial Statements” on pages 22 and 210, respectively, to have a
more informed view. The trading price of the Equity Shares could decline due to the factors mentioned in “Risk Factors”
beginning on page 22 or any other factors that may arise in the future and you may lose all or part of your investments.
114
STATEMENT OF TAX BENEFITS
To,
The Board of Directors
Varun Beverages Limited
F-2/7, Okhla Industrial Area,
Phase-I,
Delhi - 110020
Dear Sirs,
Subject: Statement of Possible Tax Benefits
The enclosed annexure states the possible tax benefits available to Varun Beverages Limited(“the Company”) and to the
shareholders of the Company under the provisions of the Income-tax Act, 1961 (referred to as “Tax Laws”), presently in force
in India1 for the Financial Year (“FY”) 2015-16 – Assessment year (AY) 2016-17. Several of these benefits are dependent on
the Company or its shareholders fulfilling the conditions prescribed under the relevant Tax Laws. Hence, the ability of the
Company or its shareholders to derive tax benefits is dependent upon fulfilling such conditions, which based on business
imperatives the Company faces in the future, the Company may or may not choose to fulfil.
The enclosed statement discusses key tax benefits including potential benefits. This statement is only intended to provide
general information to the investors and is neither designed nor intended to be a substitute for a professional tax advice. A
shareholder is advised to consult his/ her/ their own tax consultant with respect to the tax implications arising out of their
participation in the proposed issue of equity shares of the Company particularly in view of ever changing Tax Laws in India.
We do not express any opinion or provide any assurance as to whether:
The Company or its shareholders will continue to obtain these benefits in future; or
The conditions prescribed for availing the benefits have been / would be met.
The contents of this annexure are based on information, explanations and representations obtained from the Company and on
the basis of our understanding of the business activities and operations of the Company and the provisions of the Tax Laws.
The same shall be subject to notes to this annexure.
This report is intended solely for your information and for the inclusion in the Offer Document in connection with the
proposed pubic issue of the Company and is not to be used, referred to or distributed for any other purpose without our prior
written consent.
For Walker Chandiok & Associates For O.P. Bagla & Co.
Chartered Accountants Chartered Accountants
Firm Registration No: 001329N
Firm Registration No: 000018N
Per Nitin Toshniwal Per Neeraj Kumar Agarwal
Partner Partner
Membership No. 507568 Membership No. 094155
Place: New Delhi Place: New Delhi
Date: June 1, 2016 Date: June 1, 2016
1 Based on rules and regulations as per Finance Act, 2015
115
ANNEXURE: 1
NOTE ON POSSIBLE TAX BENEFITS AVAILABLE TO VARUN BEVERAGES LIMITED AND ITS
SHAREHOLDERS
UNDER THE TAX LAWS
Varun Beverages Limited is an Indian Company, subject to tax in India. The company is taxed on its profits. Profits are
computed after allowing all reasonable business expenditure, laid out wholly and exclusively for the purposes of the business,
including depreciation.
Considering the activities and the business of the company, the following benefits may be available to them.
I. SPECIAL TAX BENEFITS AVAILABLE TO THE COMPANY
1. Section 80-IE of the Act - In accordance with and subject to the conditions specified under Section 80-IE of the
Act, an enterprise or undertaking which has begun or begins to manufacture or produce any article or thing (being an
article or thing specified in this respect), on or after 1 April 2007 but before 1 April 2017, is entitled to a deduction
of 100% of profits and gains for ten consecutive Assessment Years (“AY”) commencing from the AY relevant to the
previous year in which the undertaking or enterprise begins to manufacture or produce articles or things. The
deduction is available to an enterprise or undertaking which is in any of the North Eastern States including Assam.
The deduction is available subject to fulfilment of conditions prescribed under the said Section.
The Company has a unit set up in 2013 in Guwahati, Assam which, as informed to us, is eligible for deduction under
Section 80-IE of the Act.
However, as per Section 115JB of the Act, the Company shall be required to pay Minimum Alternate Tax (“MAT”)
at the rate of 18.5% (plus applicable surcharge, education cess and secondary & higher education cess) on book
profits as computed under the said Section, irrespective of the tax benefits available under Section 80-IE of the Act.
II. SPECIAL TAX BENEFITS AVAILABLE TO THE SHAREHOLDERS
There are no special tax benefits available to the shareholders under the provisions of the Tax Laws.
Notes:
1) The above Statement of Possible Direct Tax Benefits sets out the provisions of law in a summary manner only and is not a complete analysis or listing of all potential tax consequences of the purchase, ownership and disposal of equity shares;
2) The above Statement of Possible Direct Tax Benefits sets out the possible tax benefits available to the Company and its shareholders under
the current Tax Laws presently in force in India. Several of these benefits are dependent on the Company or its shareholders fulfilling the
conditions prescribed under the relevant Tax Laws;
3) This Statement is only intended to provide general information to the investors and is neither designed nor intended to be a substitute for professional tax advice. In view of the individual nature of the tax consequences, the changing Tax Laws, each investor is advised to consult
his or her own tax consultant with respect to the specific tax implications arising out of their participation in the issue;
4) The stated benefits will be available only to the sole/first named holder in case the shares are held by joint shareholders.
For Walker Chandiok & Associates For O.P. Bagla & Co.
Chartered Accountants Chartered Accountants
Firm Registration No: 001329N
Firm Registration No: 000018N
Per Nitin Toshniwal Per Neeraj Kumar Agarwal
Partner Partner
Membership No. 507568 Membership No. 094155
Place : New Delhi Place : New Delhi
Date : June 1, 2016 Date : June 1, 2016
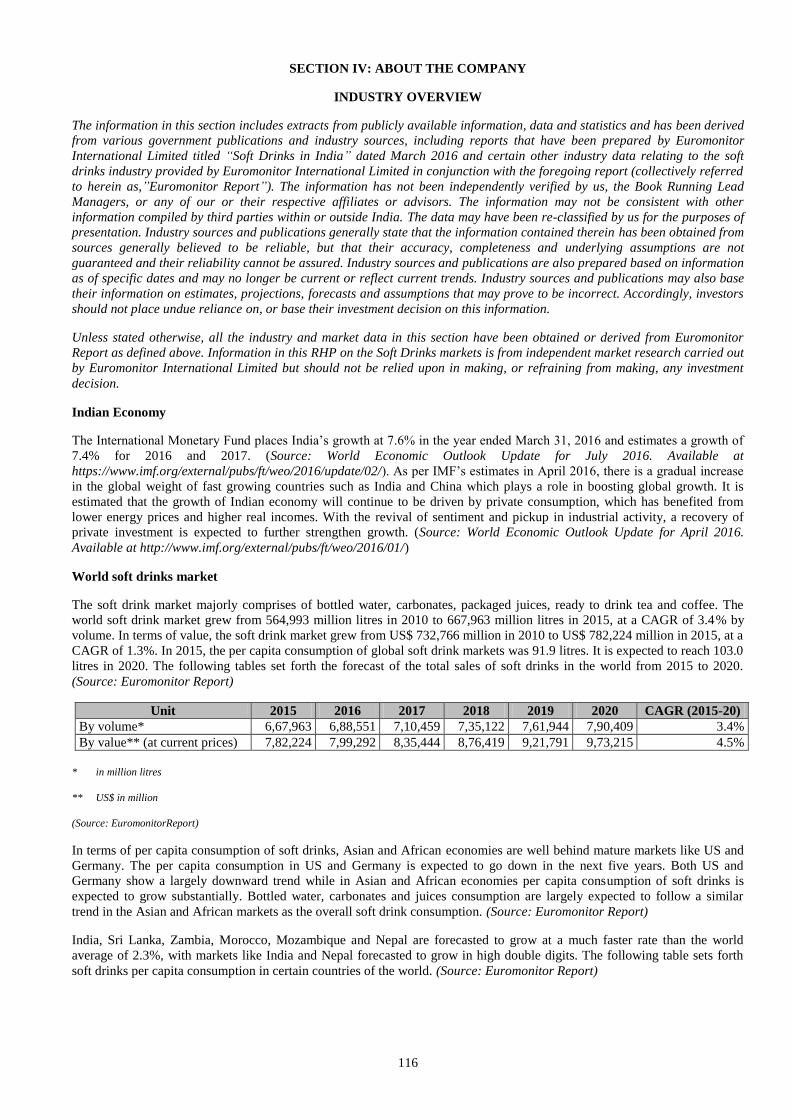
116
SECTION IV: ABOUT THE COMPANY
INDUSTRY OVERVIEW
The information in this section includes extracts from publicly available information, data and statistics and has been derived
from various government publications and industry sources, including reports that have been prepared by Euromonitor
International Limited titled “Soft Drinks in India” dated March 2016 and certain other industry data relating to the soft
drinks industry provided by Euromonitor International Limited in conjunction with the foregoing report (collectively referred
to herein as,”Euromonitor Report”). The information has not been independently verified by us, the Book Running Lead
Managers, or any of our or their respective affiliates or advisors. The information may not be consistent with other
information compiled by third parties within or outside India. The data may have been re-classified by us for the purposes of
presentation. Industry sources and publications generally state that the information contained therein has been obtained from
sources generally believed to be reliable, but that their accuracy, completeness and underlying assumptions are not
guaranteed and their reliability cannot be assured. Industry sources and publications are also prepared based on information
as of specific dates and may no longer be current or reflect current trends. Industry sources and publications may also base
their information on estimates, projections, forecasts and assumptions that may prove to be incorrect. Accordingly, investors
should not place undue reliance on, or base their investment decision on this information.
Unless stated otherwise, all the industry and market data in this section have been obtained or derived from Euromonitor
Report as defined above. Information in this RHP on the Soft Drinks markets is from independent market research carried out
by Euromonitor International Limited but should not be relied upon in making, or refraining from making, any investment
decision.
Indian Economy
The International Monetary Fund places India’s growth at 7.6% in the year ended March 31, 2016 and estimates a growth of
7.4% for 2016 and 2017. (Source: World Economic Outlook Update for July 2016. Available at
https://www.imf.org/external/pubs/ft/weo/2016/update/02/). As per IMF’s estimates in April 2016, there is a gradual increase
in the global weight of fast growing countries such as India and China which plays a role in boosting global growth. It is
estimated that the growth of Indian economy will continue to be driven by private consumption, which has benefited from
lower energy prices and higher real incomes. With the revival of sentiment and pickup in industrial activity, a recovery of
private investment is expected to further strengthen growth. (Source: World Economic Outlook Update for April 2016.
Available at http://www.imf.org/external/pubs/ft/weo/2016/01/)
World soft drinks market
The soft drink market majorly comprises of bottled water, carbonates, packaged juices, ready to drink tea and coffee. The
world soft drink market grew from 564,993 million litres in 2010 to 667,963 million litres in 2015, at a CAGR of 3.4% by
volume. In terms of value, the soft drink market grew from US$ 732,766 million in 2010 to US$ 782,224 million in 2015, at a
CAGR of 1.3%. In 2015, the per capita consumption of global soft drink markets was 91.9 litres. It is expected to reach 103.0
litres in 2020. The following tables set forth the forecast of the total sales of soft drinks in the world from 2015 to 2020.
(Source: Euromonitor Report)
Unit 2015 2016 2017 2018 2019 2020 CAGR (2015-20)
By volume* 6,67,963 6,88,551 7,10,459 7,35,122 7,61,944 7,90,409 3.4%
By value** (at current prices) 7,82,224 7,99,292 8,35,444 8,76,419 9,21,791 9,73,215 4.5%
* in million litres
** US$ in million
(Source: EuromonitorReport)
In terms of per capita consumption of soft drinks, Asian and African economies are well behind mature markets like US and
Germany. The per capita consumption in US and Germany is expected to go down in the next five years. Both US and
Germany show a largely downward trend while in Asian and African economies per capita consumption of soft drinks is
expected to grow substantially. Bottled water, carbonates and juices consumption are largely expected to follow a similar
trend in the Asian and African markets as the overall soft drink consumption. (Source: Euromonitor Report)
India, Sri Lanka, Zambia, Morocco, Mozambique and Nepal are forecasted to grow at a much faster rate than the world
average of 2.3%, with markets like India and Nepal forecasted to grow in high double digits. The following table sets forth
soft drinks per capita consumption in certain countries of the world. (Source: Euromonitor Report)
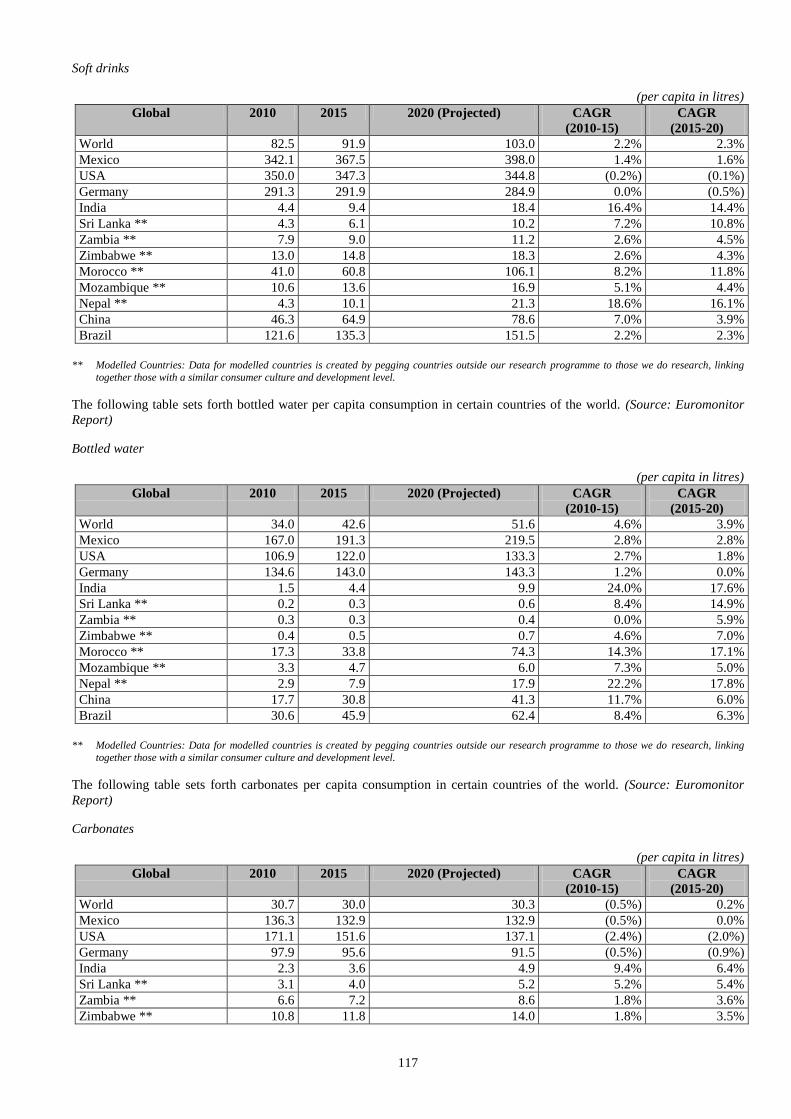
117
Soft drinks
(per capita in litres)
Global 2010 2015 2020 (Projected) CAGR
(2010-15)
CAGR
(2015-20)
World 82.5 91.9 103.0 2.2% 2.3%
Mexico 342.1 367.5 398.0 1.4% 1.6%
USA 350.0 347.3 344.8 (0.2%) (0.1%)
Germany 291.3 291.9 284.9 0.0% (0.5%)
India 4.4 9.4 18.4 16.4% 14.4%
Sri Lanka ** 4.3 6.1 10.2 7.2% 10.8%
Zambia ** 7.9 9.0 11.2 2.6% 4.5%
Zimbabwe ** 13.0 14.8 18.3 2.6% 4.3%
Morocco ** 41.0 60.8 106.1 8.2% 11.8%
Mozambique ** 10.6 13.6 16.9 5.1% 4.4%
Nepal ** 4.3 10.1 21.3 18.6% 16.1%
China 46.3 64.9 78.6 7.0% 3.9%
Brazil 121.6 135.3 151.5 2.2% 2.3%
** Modelled Countries: Data for modelled countries is created by pegging countries outside our research programme to those we do research, linking
together those with a similar consumer culture and development level.
The following table sets forth bottled water per capita consumption in certain countries of the world. (Source: Euromonitor
Report)
Bottled water
(per capita in litres)
Global 2010 2015 2020 (Projected) CAGR
(2010-15)
CAGR
(2015-20)
World 34.0 42.6 51.6 4.6% 3.9%
Mexico 167.0 191.3 219.5 2.8% 2.8%
USA 106.9 122.0 133.3 2.7% 1.8%
Germany 134.6 143.0 143.3 1.2% 0.0%
India 1.5 4.4 9.9 24.0% 17.6%
Sri Lanka ** 0.2 0.3 0.6 8.4% 14.9%
Zambia ** 0.3 0.3 0.4 0.0% 5.9%
Zimbabwe ** 0.4 0.5 0.7 4.6% 7.0%
Morocco ** 17.3 33.8 74.3 14.3% 17.1%
Mozambique ** 3.3 4.7 6.0 7.3% 5.0%
Nepal ** 2.9 7.9 17.9 22.2% 17.8%
China 17.7 30.8 41.3 11.7% 6.0%
Brazil 30.6 45.9 62.4 8.4% 6.3%
** Modelled Countries: Data for modelled countries is created by pegging countries outside our research programme to those we do research, linking
together those with a similar consumer culture and development level.
The following table sets forth carbonates per capita consumption in certain countries of the world. (Source: Euromonitor
Report)
Carbonates
(per capita in litres)
Global 2010 2015 2020 (Projected) CAGR
(2010-15)
CAGR
(2015-20)
World 30.7 30.0 30.3 (0.5%) 0.2%
Mexico 136.3 132.9 132.9 (0.5%) 0.0%
USA 171.1 151.6 137.1 (2.4%) (2.0%)
Germany 97.9 95.6 91.5 (0.5%) (0.9%)
India 2.3 3.6 4.9 9.4% 6.4%
Sri Lanka ** 3.1 4.0 5.2 5.2% 5.4%
Zambia ** 6.6 7.2 8.6 1.8% 3.6%
Zimbabwe ** 10.8 11.8 14.0 1.8% 3.5%
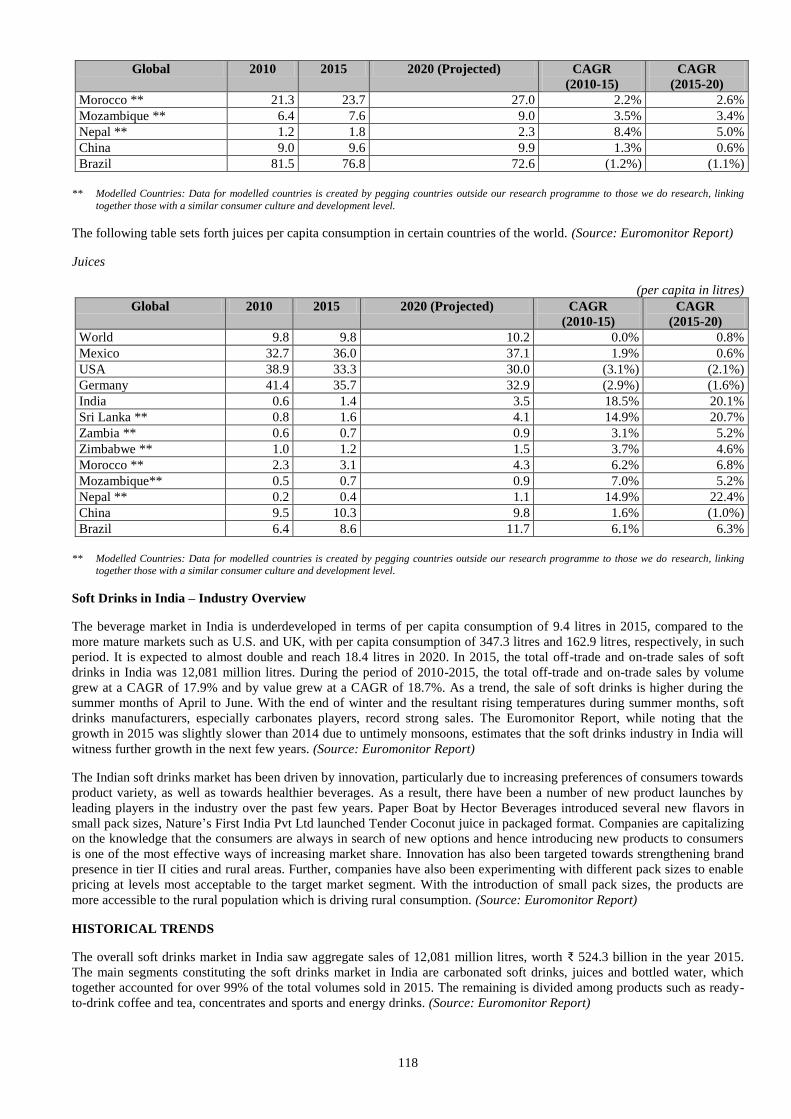
118
Global 2010 2015 2020 (Projected) CAGR
(2010-15)
CAGR
(2015-20)
Morocco ** 21.3 23.7 27.0 2.2% 2.6%
Mozambique ** 6.4 7.6 9.0 3.5% 3.4%
Nepal ** 1.2 1.8 2.3 8.4% 5.0%
China 9.0 9.6 9.9 1.3% 0.6%
Brazil 81.5 76.8 72.6 (1.2%) (1.1%)
** Modelled Countries: Data for modelled countries is created by pegging countries outside our research programme to those we do research, linking
together those with a similar consumer culture and development level.
The following table sets forth juices per capita consumption in certain countries of the world. (Source: Euromonitor Report)
Juices
(per capita in litres)
Global 2010 2015 2020 (Projected) CAGR
(2010-15)
CAGR
(2015-20)
World 9.8 9.8 10.2 0.0% 0.8%
Mexico 32.7 36.0 37.1 1.9% 0.6%
USA 38.9 33.3 30.0 (3.1%) (2.1%)
Germany 41.4 35.7 32.9 (2.9%) (1.6%)
India 0.6 1.4 3.5 18.5% 20.1%
Sri Lanka ** 0.8 1.6 4.1 14.9% 20.7%
Zambia ** 0.6 0.7 0.9 3.1% 5.2%
Zimbabwe ** 1.0 1.2 1.5 3.7% 4.6%
Morocco ** 2.3 3.1 4.3 6.2% 6.8%
Mozambique** 0.5 0.7 0.9 7.0% 5.2%
Nepal ** 0.2 0.4 1.1 14.9% 22.4%
China 9.5 10.3 9.8 1.6% (1.0%)
Brazil 6.4 8.6 11.7 6.1% 6.3%
** Modelled Countries: Data for modelled countries is created by pegging countries outside our research programme to those we do research, linking
together those with a similar consumer culture and development level.
Soft Drinks in India – Industry Overview
The beverage market in India is underdeveloped in terms of per capita consumption of 9.4 litres in 2015, compared to the
more mature markets such as U.S. and UK, with per capita consumption of 347.3 litres and 162.9 litres, respectively, in such
period. It is expected to almost double and reach 18.4 litres in 2020. In 2015, the total off-trade and on-trade sales of soft
drinks in India was 12,081 million litres. During the period of 2010-2015, the total off-trade and on-trade sales by volume
grew at a CAGR of 17.9% and by value grew at a CAGR of 18.7%. As a trend, the sale of soft drinks is higher during the
summer months of April to June. With the end of winter and the resultant rising temperatures during summer months, soft
drinks manufacturers, especially carbonates players, record strong sales. The Euromonitor Report, while noting that the
growth in 2015 was slightly slower than 2014 due to untimely monsoons, estimates that the soft drinks industry in India will
witness further growth in the next few years. (Source: Euromonitor Report)
The Indian soft drinks market has been driven by innovation, particularly due to increasing preferences of consumers towards
product variety, as well as towards healthier beverages. As a result, there have been a number of new product launches by
leading players in the industry over the past few years. Paper Boat by Hector Beverages introduced several new flavors in
small pack sizes, Nature’s First India Pvt Ltd launched Tender Coconut juice in packaged format. Companies are capitalizing
on the knowledge that the consumers are always in search of new options and hence introducing new products to consumers
is one of the most effective ways of increasing market share. Innovation has also been targeted towards strengthening brand
presence in tier II cities and rural areas. Further, companies have also been experimenting with different pack sizes to enable
pricing at levels most acceptable to the target market segment. With the introduction of small pack sizes, the products are
more accessible to the rural population which is driving rural consumption. (Source: Euromonitor Report)
HISTORICAL TRENDS
The overall soft drinks market in India saw aggregate sales of 12,081 million litres, worth ₹ 524.3 billion in the year 2015.
The main segments constituting the soft drinks market in India are carbonated soft drinks, juices and bottled water, which
together accounted for over 99% of the total volumes sold in 2015. The remaining is divided among products such as ready-
to-drink coffee and tea, concentrates and sports and energy drinks. (Source: Euromonitor Report)
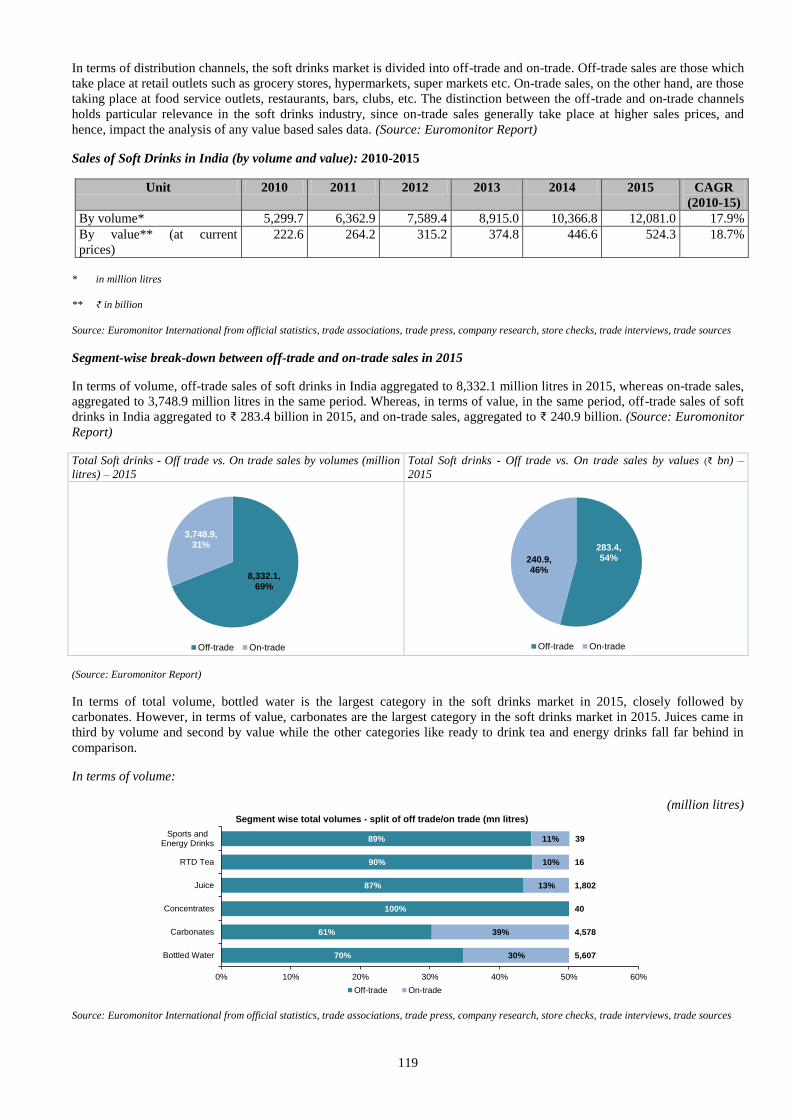
119
In terms of distribution channels, the soft drinks market is divided into off-trade and on-trade. Off-trade sales are those which
take place at retail outlets such as grocery stores, hypermarkets, super markets etc. On-trade sales, on the other hand, are those
taking place at food service outlets, restaurants, bars, clubs, etc. The distinction between the off-trade and on-trade channels
holds particular relevance in the soft drinks industry, since on-trade sales generally take place at higher sales prices, and
hence, impact the analysis of any value based sales data. (Source: Euromonitor Report)
Sales of Soft Drinks in India (by volume and value): 2010-2015
Unit 2010 2011 2012 2013 2014 2015 CAGR
(2010-15)
By volume* 5,299.7 6,362.9 7,589.4 8,915.0 10,366.8 12,081.0 17.9%
By value** (at current
prices)
222.6 264.2 315.2 374.8 446.6 524.3 18.7%
* in million litres
** ₹ in billion
Source: Euromonitor International from official statistics, trade associations, trade press, company research, store checks, trade interviews, trade sources
Segment-wise break-down between off-trade and on-trade sales in 2015
In terms of volume, off-trade sales of soft drinks in India aggregated to 8,332.1 million litres in 2015, whereas on-trade sales,
aggregated to 3,748.9 million litres in the same period. Whereas, in terms of value, in the same period, off-trade sales of soft
drinks in India aggregated to ₹ 283.4 billion in 2015, and on-trade sales, aggregated to ₹ 240.9 billion. (Source: Euromonitor
Report)
Total Soft drinks - Off trade vs. On trade sales by volumes (million
litres) – 2015
Total Soft drinks - Off trade vs. On trade sales by values (₹ bn) –
2015
(Source: Euromonitor Report)
In terms of total volume, bottled water is the largest category in the soft drinks market in 2015, closely followed by
carbonates. However, in terms of value, carbonates are the largest category in the soft drinks market in 2015. Juices came in
third by volume and second by value while the other categories like ready to drink tea and energy drinks fall far behind in
comparison.
In terms of volume:
(million litres)
Source: Euromonitor International from official statistics, trade associations, trade press, company research, store checks, trade interviews, trade sources
8,332.1, 69%
3,748.9, 31%
Off-trade On-trade
283.4, 54%240.9,
46%
Off-trade On-trade
70%
61%
100%
87%
90%
89%
30%
39%
13%
10%
11%
5,607
4,578
40
1,802
16
39
0% 10% 20% 30% 40% 50% 60%
Bottled Water
Carbonates
Concentrates
Juice
RTD Tea
Sports andEnergy Drinks
Segment wise total volumes - split of off trade/on trade (mn litres)
Off-trade On-trade
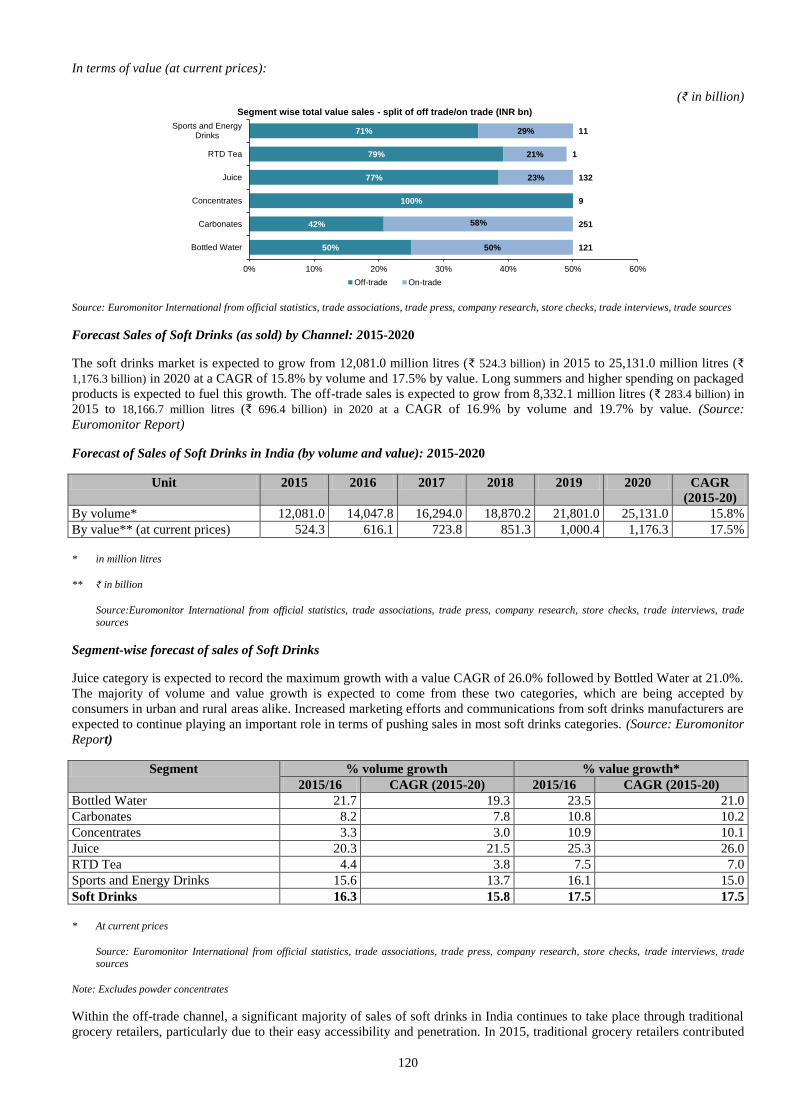
120
In terms of value (at current prices):
(₹ in billion)
Source: Euromonitor International from official statistics, trade associations, trade press, company research, store checks, trade interviews, trade sources
Forecast Sales of Soft Drinks (as sold) by Channel: 2015-2020
The soft drinks market is expected to grow from 12,081.0 million litres (₹ 524.3 billion) in 2015 to 25,131.0 million litres (₹
1,176.3 billion) in 2020 at a CAGR of 15.8% by volume and 17.5% by value. Long summers and higher spending on packaged
products is expected to fuel this growth. The off-trade sales is expected to grow from 8,332.1 million litres (₹ 283.4 billion) in
2015 to 18,166.7 million litres (₹ 696.4 billion) in 2020 at a CAGR of 16.9% by volume and 19.7% by value. (Source:
Euromonitor Report)
Forecast of Sales of Soft Drinks in India (by volume and value): 2015-2020
Unit 2015 2016 2017 2018 2019 2020 CAGR
(2015-20)
By volume* 12,081.0 14,047.8 16,294.0 18,870.2 21,801.0 25,131.0 15.8%
By value** (at current prices) 524.3 616.1 723.8 851.3 1,000.4 1,176.3 17.5%
* in million litres
** ₹ in billion
Source:Euromonitor International from official statistics, trade associations, trade press, company research, store checks, trade interviews, trade
sources
Segment-wise forecast of sales of Soft Drinks
Juice category is expected to record the maximum growth with a value CAGR of 26.0% followed by Bottled Water at 21.0%.
The majority of volume and value growth is expected to come from these two categories, which are being accepted by
consumers in urban and rural areas alike. Increased marketing efforts and communications from soft drinks manufacturers are
expected to continue playing an important role in terms of pushing sales in most soft drinks categories. (Source: Euromonitor
Report)
Segment % volume growth % value growth*
2015/16 CAGR (2015-20) 2015/16 CAGR (2015-20)
Bottled Water 21.7 19.3 23.5 21.0
Carbonates 8.2 7.8 10.8 10.2
Concentrates 3.3 3.0 10.9 10.1
Juice 20.3 21.5 25.3 26.0
RTD Tea 4.4 3.8 7.5 7.0
Sports and Energy Drinks 15.6 13.7 16.1 15.0
Soft Drinks 16.3 15.8 17.5 17.5
* At current prices
Source: Euromonitor International from official statistics, trade associations, trade press, company research, store checks, trade interviews, trade sources
Note: Excludes powder concentrates
Within the off-trade channel, a significant majority of sales of soft drinks in India continues to take place through traditional
grocery retailers, particularly due to their easy accessibility and penetration. In 2015, traditional grocery retailers contributed
50%
42%
100%
77%
79%
71%
50%
58%
23%
21%
29%
121
251
9
132
1
11
0% 10% 20% 30% 40% 50% 60%
Bottled Water
Carbonates
Concentrates
Juice
RTD Tea
Sports and EnergyDrinks
Segment wise total value sales - split of off trade/on trade (INR bn)
Off-trade On-trade
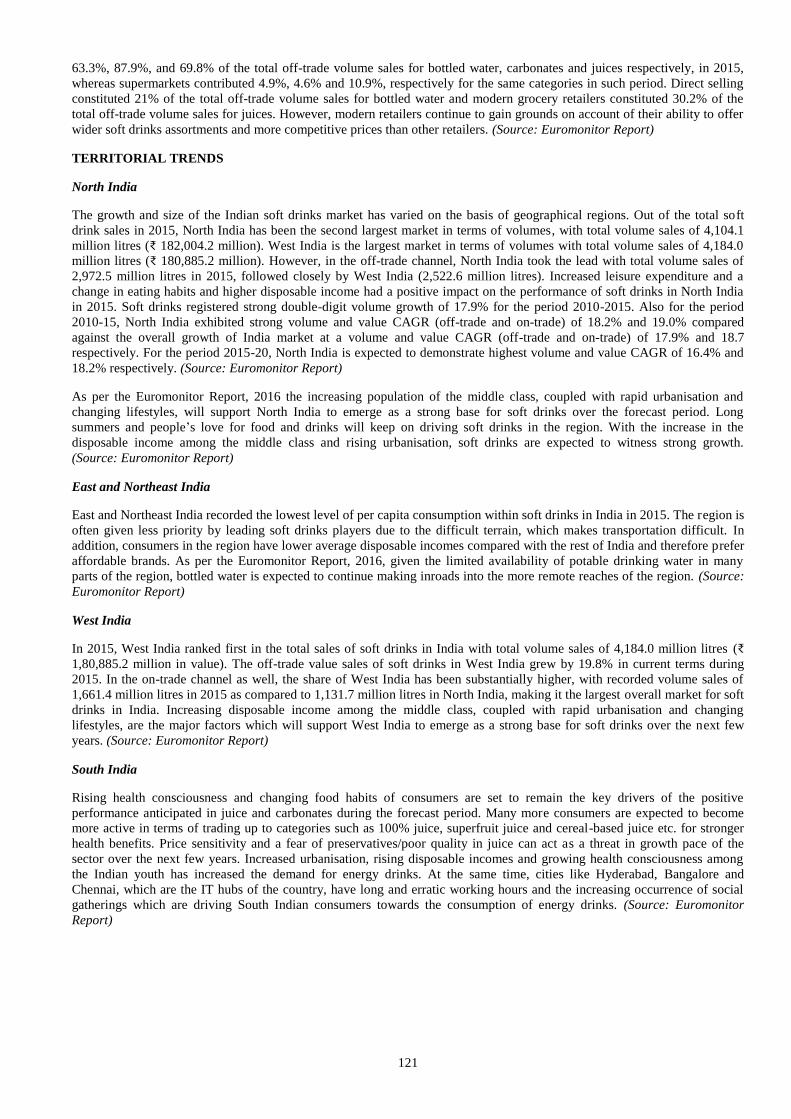
121
63.3%, 87.9%, and 69.8% of the total off-trade volume sales for bottled water, carbonates and juices respectively, in 2015,
whereas supermarkets contributed 4.9%, 4.6% and 10.9%, respectively for the same categories in such period. Direct selling
constituted 21% of the total off-trade volume sales for bottled water and modern grocery retailers constituted 30.2% of the
total off-trade volume sales for juices. However, modern retailers continue to gain grounds on account of their ability to offer
wider soft drinks assortments and more competitive prices than other retailers. (Source: Euromonitor Report)
TERRITORIAL TRENDS
North India
The growth and size of the Indian soft drinks market has varied on the basis of geographical regions. Out of the total soft
drink sales in 2015, North India has been the second largest market in terms of volumes, with total volume sales of 4,104.1
million litres (₹ 182,004.2 million). West India is the largest market in terms of volumes with total volume sales of 4,184.0
million litres (₹ 180,885.2 million). However, in the off-trade channel, North India took the lead with total volume sales of
2,972.5 million litres in 2015, followed closely by West India (2,522.6 million litres). Increased leisure expenditure and a
change in eating habits and higher disposable income had a positive impact on the performance of soft drinks in North India
in 2015. Soft drinks registered strong double-digit volume growth of 17.9% for the period 2010-2015. Also for the period
2010-15, North India exhibited strong volume and value CAGR (off-trade and on-trade) of 18.2% and 19.0% compared
against the overall growth of India market at a volume and value CAGR (off-trade and on-trade) of 17.9% and 18.7
respectively. For the period 2015-20, North India is expected to demonstrate highest volume and value CAGR of 16.4% and
18.2% respectively. (Source: Euromonitor Report)
As per the Euromonitor Report, 2016 the increasing population of the middle class, coupled with rapid urbanisation and
changing lifestyles, will support North India to emerge as a strong base for soft drinks over the forecast period. Long
summers and people’s love for food and drinks will keep on driving soft drinks in the region. With the increase in the
disposable income among the middle class and rising urbanisation, soft drinks are expected to witness strong growth.
(Source: Euromonitor Report)
East and Northeast India
East and Northeast India recorded the lowest level of per capita consumption within soft drinks in India in 2015. The region is
often given less priority by leading soft drinks players due to the difficult terrain, which makes transportation difficult. In
addition, consumers in the region have lower average disposable incomes compared with the rest of India and therefore prefer
affordable brands. As per the Euromonitor Report, 2016, given the limited availability of potable drinking water in many
parts of the region, bottled water is expected to continue making inroads into the more remote reaches of the region. (Source:
Euromonitor Report)
West India
In 2015, West India ranked first in the total sales of soft drinks in India with total volume sales of 4,184.0 million litres (₹
1,80,885.2 million in value). The off-trade value sales of soft drinks in West India grew by 19.8% in current terms during
2015. In the on-trade channel as well, the share of West India has been substantially higher, with recorded volume sales of
1,661.4 million litres in 2015 as compared to 1,131.7 million litres in North India, making it the largest overall market for soft
drinks in India. Increasing disposable income among the middle class, coupled with rapid urbanisation and changing
lifestyles, are the major factors which will support West India to emerge as a strong base for soft drinks over the next few
years. (Source: Euromonitor Report)
South India
Rising health consciousness and changing food habits of consumers are set to remain the key drivers of the positive
performance anticipated in juice and carbonates during the forecast period. Many more consumers are expected to become
more active in terms of trading up to categories such as 100% juice, superfruit juice and cereal-based juice etc. for stronger
health benefits. Price sensitivity and a fear of preservatives/poor quality in juice can act as a threat in growth pace of the
sector over the next few years. Increased urbanisation, rising disposable incomes and growing health consciousness among
the Indian youth has increased the demand for energy drinks. At the same time, cities like Hyderabad, Bangalore and
Chennai, which are the IT hubs of the country, have long and erratic working hours and the increasing occurrence of social
gatherings which are driving South Indian consumers towards the consumption of energy drinks. (Source: Euromonitor
Report)
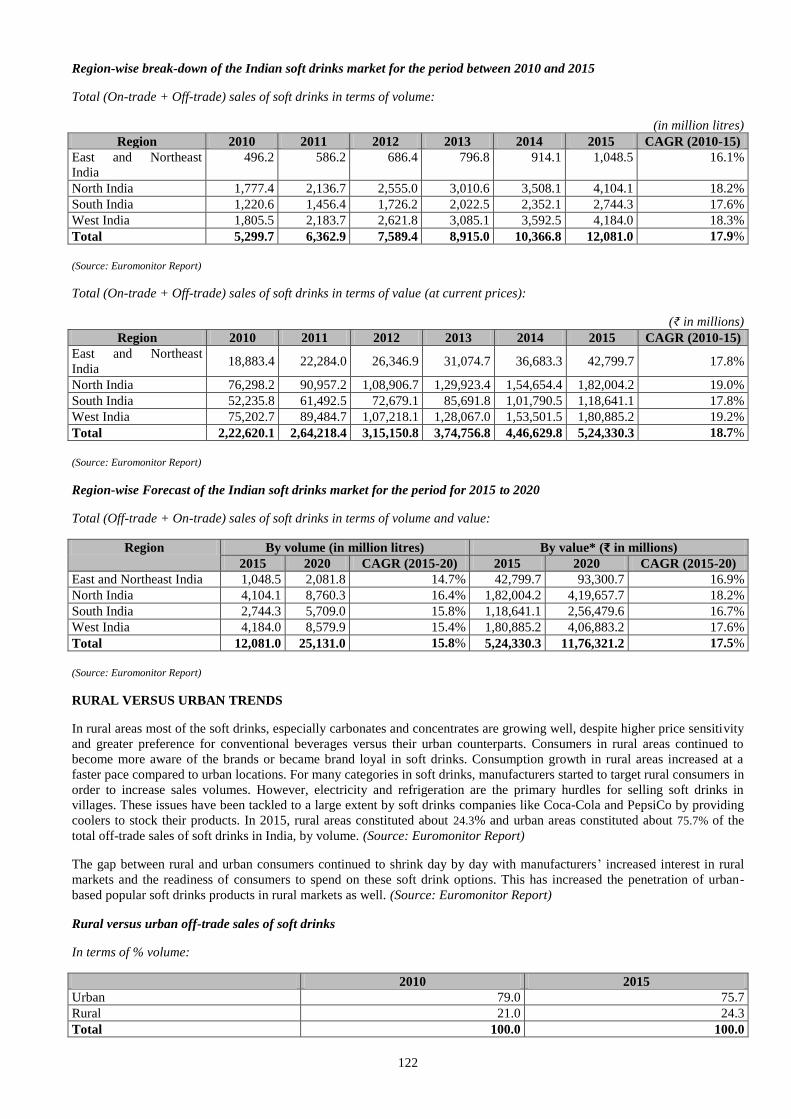
122
Region-wise break-down of the Indian soft drinks market for the period between 2010 and 2015
Total (On-trade + Off-trade) sales of soft drinks in terms of volume:
(in million litres)
Region 2010 2011 2012 2013 2014 2015 CAGR (2010-15)
East and Northeast
India
496.2 586.2 686.4 796.8 914.1 1,048.5 16.1%
North India 1,777.4 2,136.7 2,555.0 3,010.6 3,508.1 4,104.1 18.2%
South India 1,220.6 1,456.4 1,726.2 2,022.5 2,352.1 2,744.3 17.6%
West India 1,805.5 2,183.7 2,621.8 3,085.1 3,592.5 4,184.0 18.3%
Total 5,299.7 6,362.9 7,589.4 8,915.0 10,366.8 12,081.0 17.9%
(Source: Euromonitor Report)
Total (On-trade + Off-trade) sales of soft drinks in terms of value (at current prices):
(₹ in millions)
Region 2010 2011 2012 2013 2014 2015 CAGR (2010-15)
East and Northeast
India 18,883.4 22,284.0 26,346.9 31,074.7 36,683.3 42,799.7 17.8%
North India 76,298.2 90,957.2 1,08,906.7 1,29,923.4 1,54,654.4 1,82,004.2 19.0%
South India 52,235.8 61,492.5 72,679.1 85,691.8 1,01,790.5 1,18,641.1 17.8%
West India 75,202.7 89,484.7 1,07,218.1 1,28,067.0 1,53,501.5 1,80,885.2 19.2%
Total 2,22,620.1 2,64,218.4 3,15,150.8 3,74,756.8 4,46,629.8 5,24,330.3 18.7%
(Source: Euromonitor Report)
Region-wise Forecast of the Indian soft drinks market for the period for 2015 to 2020
Total (Off-trade + On-trade) sales of soft drinks in terms of volume and value:
Region By volume (in million litres) By value* (₹ in millions)
2015 2020 CAGR (2015-20) 2015 2020 CAGR (2015-20)
East and Northeast India 1,048.5 2,081.8 14.7% 42,799.7 93,300.7 16.9%
North India 4,104.1 8,760.3 16.4% 1,82,004.2 4,19,657.7 18.2%
South India 2,744.3 5,709.0 15.8% 1,18,641.1 2,56,479.6 16.7%
West India 4,184.0 8,579.9 15.4% 1,80,885.2 4,06,883.2 17.6%
Total 12,081.0 25,131.0 15.8% 5,24,330.3 11,76,321.2 17.5%
(Source: Euromonitor Report)
RURAL VERSUS URBAN TRENDS
In rural areas most of the soft drinks, especially carbonates and concentrates are growing well, despite higher price sensitivity
and greater preference for conventional beverages versus their urban counterparts. Consumers in rural areas continued to
become more aware of the brands or became brand loyal in soft drinks. Consumption growth in rural areas increased at a
faster pace compared to urban locations. For many categories in soft drinks, manufacturers started to target rural consumers in
order to increase sales volumes. However, electricity and refrigeration are the primary hurdles for selling soft drinks in
villages. These issues have been tackled to a large extent by soft drinks companies like Coca-Cola and PepsiCo by providing
coolers to stock their products. In 2015, rural areas constituted about 24.3% and urban areas constituted about 75.7% of the
total off-trade sales of soft drinks in India, by volume. (Source: Euromonitor Report)
The gap between rural and urban consumers continued to shrink day by day with manufacturers’ increased interest in rural
markets and the readiness of consumers to spend on these soft drink options. This has increased the penetration of urban-
based popular soft drinks products in rural markets as well. (Source: Euromonitor Report)
Rural versus urban off-trade sales of soft drinks
In terms of % volume:
2010 2015
Urban 79.0 75.7
Rural 21.0 24.3
Total 100.0 100.0
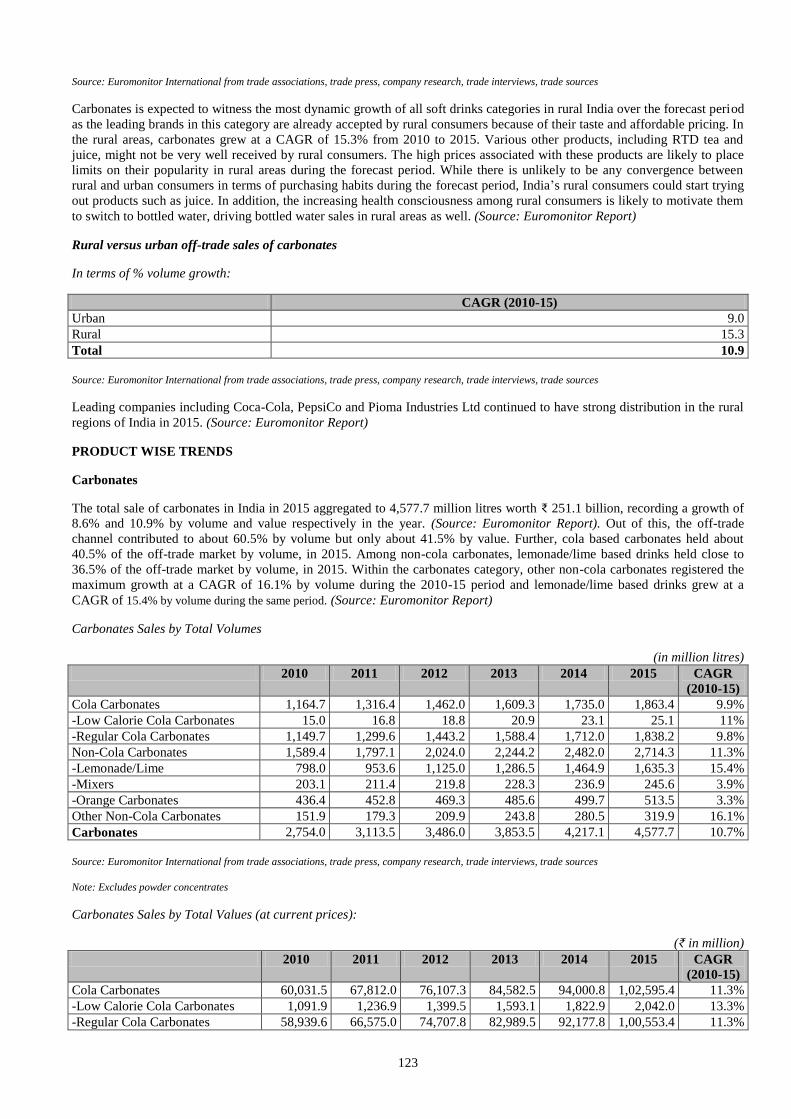
123
Source: Euromonitor International from trade associations, trade press, company research, trade interviews, trade sources
Carbonates is expected to witness the most dynamic growth of all soft drinks categories in rural India over the forecast period
as the leading brands in this category are already accepted by rural consumers because of their taste and affordable pricing. In
the rural areas, carbonates grew at a CAGR of 15.3% from 2010 to 2015. Various other products, including RTD tea and
juice, might not be very well received by rural consumers. The high prices associated with these products are likely to place
limits on their popularity in rural areas during the forecast period. While there is unlikely to be any convergence between
rural and urban consumers in terms of purchasing habits during the forecast period, India’s rural consumers could start trying
out products such as juice. In addition, the increasing health consciousness among rural consumers is likely to motivate them
to switch to bottled water, driving bottled water sales in rural areas as well. (Source: Euromonitor Report)
Rural versus urban off-trade sales of carbonates
In terms of % volume growth:
CAGR (2010-15)
Urban 9.0
Rural 15.3
Total 10.9
Source: Euromonitor International from trade associations, trade press, company research, trade interviews, trade sources
Leading companies including Coca-Cola, PepsiCo and Pioma Industries Ltd continued to have strong distribution in the rural
regions of India in 2015. (Source: Euromonitor Report)
PRODUCT WISE TRENDS
Carbonates
The total sale of carbonates in India in 2015 aggregated to 4,577.7 million litres worth ₹ 251.1 billion, recording a growth of
8.6% and 10.9% by volume and value respectively in the year. (Source: Euromonitor Report). Out of this, the off-trade
channel contributed to about 60.5% by volume but only about 41.5% by value. Further, cola based carbonates held about
40.5% of the off-trade market by volume, in 2015. Among non-cola carbonates, lemonade/lime based drinks held close to
36.5% of the off-trade market by volume, in 2015. Within the carbonates category, other non-cola carbonates registered the
maximum growth at a CAGR of 16.1% by volume during the 2010-15 period and lemonade/lime based drinks grew at a
CAGR of 15.4% by volume during the same period. (Source: Euromonitor Report)
Carbonates Sales by Total Volumes
(in million litres)
2010 2011 2012 2013 2014 2015 CAGR
(2010-15)
Cola Carbonates 1,164.7 1,316.4 1,462.0 1,609.3 1,735.0 1,863.4 9.9%
-Low Calorie Cola Carbonates 15.0 16.8 18.8 20.9 23.1 25.1 11%
-Regular Cola Carbonates 1,149.7 1,299.6 1,443.2 1,588.4 1,712.0 1,838.2 9.8%
Non-Cola Carbonates 1,589.4 1,797.1 2,024.0 2,244.2 2,482.0 2,714.3 11.3%
-Lemonade/Lime 798.0 953.6 1,125.0 1,286.5 1,464.9 1,635.3 15.4%
-Mixers 203.1 211.4 219.8 228.3 236.9 245.6 3.9%
-Orange Carbonates 436.4 452.8 469.3 485.6 499.7 513.5 3.3%
Other Non-Cola Carbonates 151.9 179.3 209.9 243.8 280.5 319.9 16.1%
Carbonates 2,754.0 3,113.5 3,486.0 3,853.5 4,217.1 4,577.7 10.7%
Source: Euromonitor International from trade associations, trade press, company research, trade interviews, trade sources
Note: Excludes powder concentrates
Carbonates Sales by Total Values (at current prices):
(₹ in million)
2010 2011 2012 2013 2014 2015 CAGR
(2010-15)
Cola Carbonates 60,031.5 67,812.0 76,107.3 84,582.5 94,000.8 1,02,595.4 11.3%
-Low Calorie Cola Carbonates 1,091.9 1,236.9 1,399.5 1,593.1 1,822.9 2,042.0 13.3%
-Regular Cola Carbonates 58,939.6 66,575.0 74,707.8 82,989.5 92,177.8 1,00,553.4 11.3%
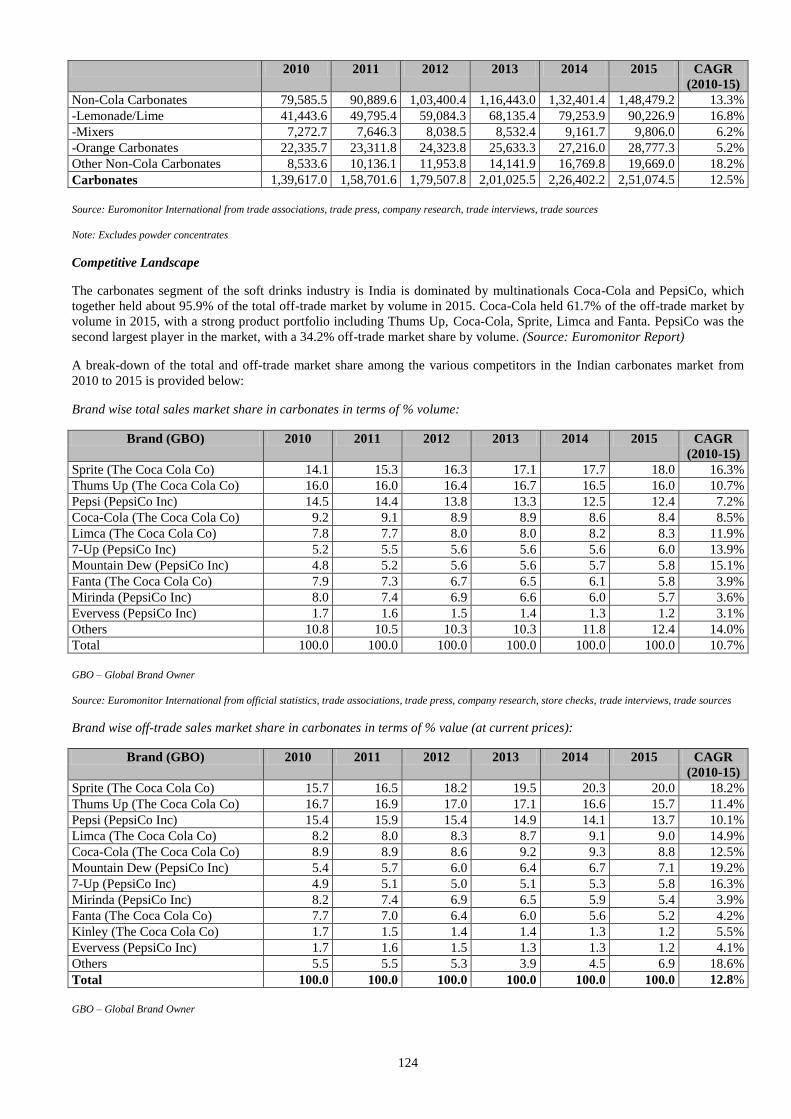
124
2010 2011 2012 2013 2014 2015 CAGR
(2010-15)
Non-Cola Carbonates 79,585.5 90,889.6 1,03,400.4 1,16,443.0 1,32,401.4 1,48,479.2 13.3%
-Lemonade/Lime 41,443.6 49,795.4 59,084.3 68,135.4 79,253.9 90,226.9 16.8%
-Mixers 7,272.7 7,646.3 8,038.5 8,532.4 9,161.7 9,806.0 6.2%
-Orange Carbonates 22,335.7 23,311.8 24,323.8 25,633.3 27,216.0 28,777.3 5.2%
Other Non-Cola Carbonates 8,533.6 10,136.1 11,953.8 14,141.9 16,769.8 19,669.0 18.2%
Carbonates 1,39,617.0 1,58,701.6 1,79,507.8 2,01,025.5 2,26,402.2 2,51,074.5 12.5%
Source: Euromonitor International from trade associations, trade press, company research, trade interviews, trade sources
Note: Excludes powder concentrates
Competitive Landscape
The carbonates segment of the soft drinks industry is India is dominated by multinationals Coca-Cola and PepsiCo, which
together held about 95.9% of the total off-trade market by volume in 2015. Coca-Cola held 61.7% of the off-trade market by
volume in 2015, with a strong product portfolio including Thums Up, Coca-Cola, Sprite, Limca and Fanta. PepsiCo was the
second largest player in the market, with a 34.2% off-trade market share by volume. (Source: Euromonitor Report)
A break-down of the total and off-trade market share among the various competitors in the Indian carbonates market from
2010 to 2015 is provided below:
Brand wise total sales market share in carbonates in terms of % volume:
Brand (GBO) 2010 2011 2012 2013 2014 2015 CAGR
(2010-15)
Sprite (The Coca Cola Co) 14.1 15.3 16.3 17.1 17.7 18.0 16.3%
Thums Up (The Coca Cola Co) 16.0 16.0 16.4 16.7 16.5 16.0 10.7%
Pepsi (PepsiCo Inc) 14.5 14.4 13.8 13.3 12.5 12.4 7.2%
Coca-Cola (The Coca Cola Co) 9.2 9.1 8.9 8.9 8.6 8.4 8.5%
Limca (The Coca Cola Co) 7.8 7.7 8.0 8.0 8.2 8.3 11.9%
7-Up (PepsiCo Inc) 5.2 5.5 5.6 5.6 5.6 6.0 13.9%
Mountain Dew (PepsiCo Inc) 4.8 5.2 5.6 5.6 5.7 5.8 15.1%
Fanta (The Coca Cola Co) 7.9 7.3 6.7 6.5 6.1 5.8 3.9%
Mirinda (PepsiCo Inc) 8.0 7.4 6.9 6.6 6.0 5.7 3.6%
Evervess (PepsiCo Inc) 1.7 1.6 1.5 1.4 1.3 1.2 3.1%
Others 10.8 10.5 10.3 10.3 11.8 12.4 14.0%
Total 100.0 100.0 100.0 100.0 100.0 100.0 10.7%
GBO – Global Brand Owner
Source: Euromonitor International from official statistics, trade associations, trade press, company research, store checks, trade interviews, trade sources
Brand wise off-trade sales market share in carbonates in terms of % value (at current prices):
Brand (GBO) 2010 2011 2012 2013 2014 2015 CAGR
(2010-15)
Sprite (The Coca Cola Co) 15.7 16.5 18.2 19.5 20.3 20.0 18.2%
Thums Up (The Coca Cola Co) 16.7 16.9 17.0 17.1 16.6 15.7 11.4%
Pepsi (PepsiCo Inc) 15.4 15.9 15.4 14.9 14.1 13.7 10.1%
Limca (The Coca Cola Co) 8.2 8.0 8.3 8.7 9.1 9.0 14.9%
Coca-Cola (The Coca Cola Co) 8.9 8.9 8.6 9.2 9.3 8.8 12.5%
Mountain Dew (PepsiCo Inc) 5.4 5.7 6.0 6.4 6.7 7.1 19.2%
7-Up (PepsiCo Inc) 4.9 5.1 5.0 5.1 5.3 5.8 16.3%
Mirinda (PepsiCo Inc) 8.2 7.4 6.9 6.5 5.9 5.4 3.9%
Fanta (The Coca Cola Co) 7.7 7.0 6.4 6.0 5.6 5.2 4.2%
Kinley (The Coca Cola Co) 1.7 1.5 1.4 1.4 1.3 1.2 5.5%
Evervess (PepsiCo Inc) 1.7 1.6 1.5 1.3 1.3 1.2 4.1%
Others 5.5 5.5 5.3 3.9 4.5 6.9 18.6%
Total 100.0 100.0 100.0 100.0 100.0 100.0 12.8%
GBO – Global Brand Owner
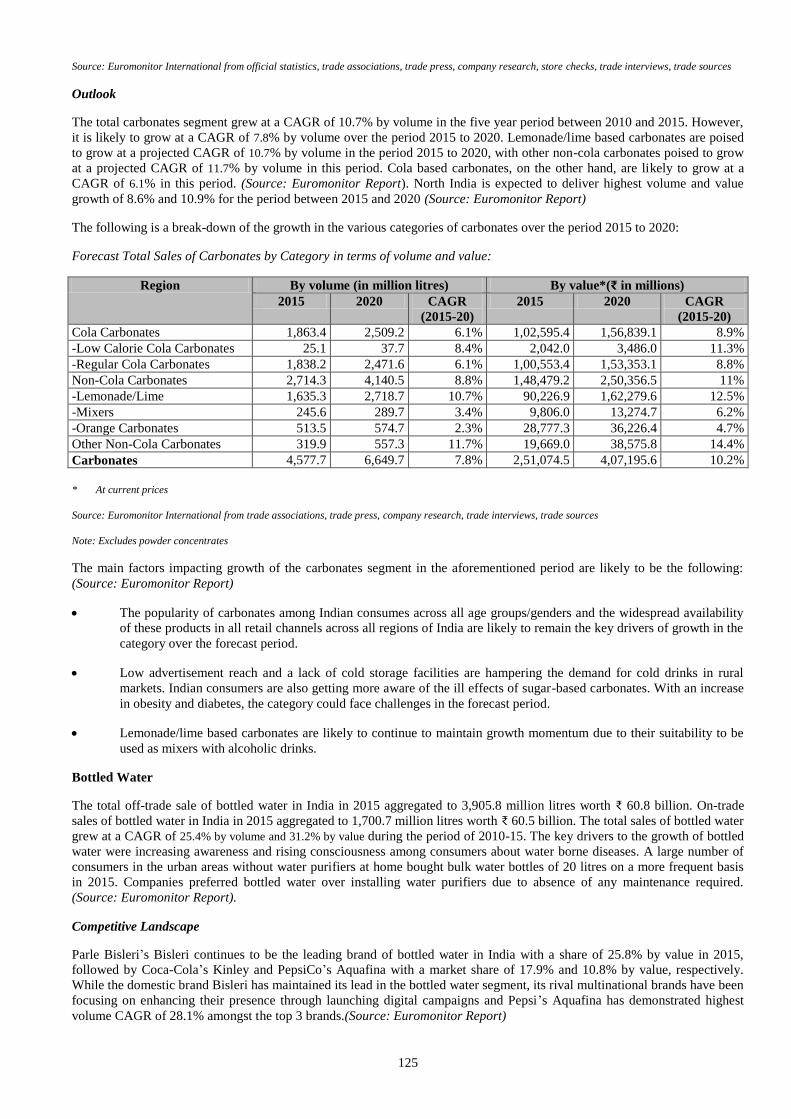
125
Source: Euromonitor International from official statistics, trade associations, trade press, company research, store checks, trade interviews, trade sources
Outlook
The total carbonates segment grew at a CAGR of 10.7% by volume in the five year period between 2010 and 2015. However,
it is likely to grow at a CAGR of 7.8% by volume over the period 2015 to 2020. Lemonade/lime based carbonates are poised
to grow at a projected CAGR of 10.7% by volume in the period 2015 to 2020, with other non-cola carbonates poised to grow
at a projected CAGR of 11.7% by volume in this period. Cola based carbonates, on the other hand, are likely to grow at a
CAGR of 6.1% in this period. (Source: Euromonitor Report). North India is expected to deliver highest volume and value
growth of 8.6% and 10.9% for the period between 2015 and 2020 (Source: Euromonitor Report)
The following is a break-down of the growth in the various categories of carbonates over the period 2015 to 2020:
Forecast Total Sales of Carbonates by Category in terms of volume and value:
Region By volume (in million litres) By value*(₹ in millions)
2015 2020 CAGR
(2015-20)
2015 2020 CAGR
(2015-20)
Cola Carbonates 1,863.4 2,509.2 6.1% 1,02,595.4 1,56,839.1 8.9%
-Low Calorie Cola Carbonates 25.1 37.7 8.4% 2,042.0 3,486.0 11.3%
-Regular Cola Carbonates 1,838.2 2,471.6 6.1% 1,00,553.4 1,53,353.1 8.8%
Non-Cola Carbonates 2,714.3 4,140.5 8.8% 1,48,479.2 2,50,356.5 11%
-Lemonade/Lime 1,635.3 2,718.7 10.7% 90,226.9 1,62,279.6 12.5%
-Mixers 245.6 289.7 3.4% 9,806.0 13,274.7 6.2%
-Orange Carbonates 513.5 574.7 2.3% 28,777.3 36,226.4 4.7%
Other Non-Cola Carbonates 319.9 557.3 11.7% 19,669.0 38,575.8 14.4%
Carbonates 4,577.7 6,649.7 7.8% 2,51,074.5 4,07,195.6 10.2%
* At current prices
Source: Euromonitor International from trade associations, trade press, company research, trade interviews, trade sources
Note: Excludes powder concentrates
The main factors impacting growth of the carbonates segment in the aforementioned period are likely to be the following:
(Source: Euromonitor Report)
The popularity of carbonates among Indian consumes across all age groups/genders and the widespread availability
of these products in all retail channels across all regions of India are likely to remain the key drivers of growth in the
category over the forecast period.
Low advertisement reach and a lack of cold storage facilities are hampering the demand for cold drinks in rural
markets. Indian consumers are also getting more aware of the ill effects of sugar-based carbonates. With an increase
in obesity and diabetes, the category could face challenges in the forecast period.
Lemonade/lime based carbonates are likely to continue to maintain growth momentum due to their suitability to be
used as mixers with alcoholic drinks.
Bottled Water
The total off-trade sale of bottled water in India in 2015 aggregated to 3,905.8 million litres worth ₹ 60.8 billion. On-trade
sales of bottled water in India in 2015 aggregated to 1,700.7 million litres worth ₹ 60.5 billion. The total sales of bottled water
grew at a CAGR of 25.4% by volume and 31.2% by value during the period of 2010-15. The key drivers to the growth of bottled
water were increasing awareness and rising consciousness among consumers about water borne diseases. A large number of
consumers in the urban areas without water purifiers at home bought bulk water bottles of 20 litres on a more frequent basis
in 2015. Companies preferred bottled water over installing water purifiers due to absence of any maintenance required.
(Source: Euromonitor Report).
Competitive Landscape
Parle Bisleri’s Bisleri continues to be the leading brand of bottled water in India with a share of 25.8% by value in 2015,
followed by Coca-Cola’s Kinley and PepsiCo’s Aquafina with a market share of 17.9% and 10.8% by value, respectively.
While the domestic brand Bisleri has maintained its lead in the bottled water segment, its rival multinational brands have been
focusing on enhancing their presence through launching digital campaigns and Pepsi’s Aquafina has demonstrated highest
volume CAGR of 28.1% amongst the top 3 brands.(Source: Euromonitor Report)
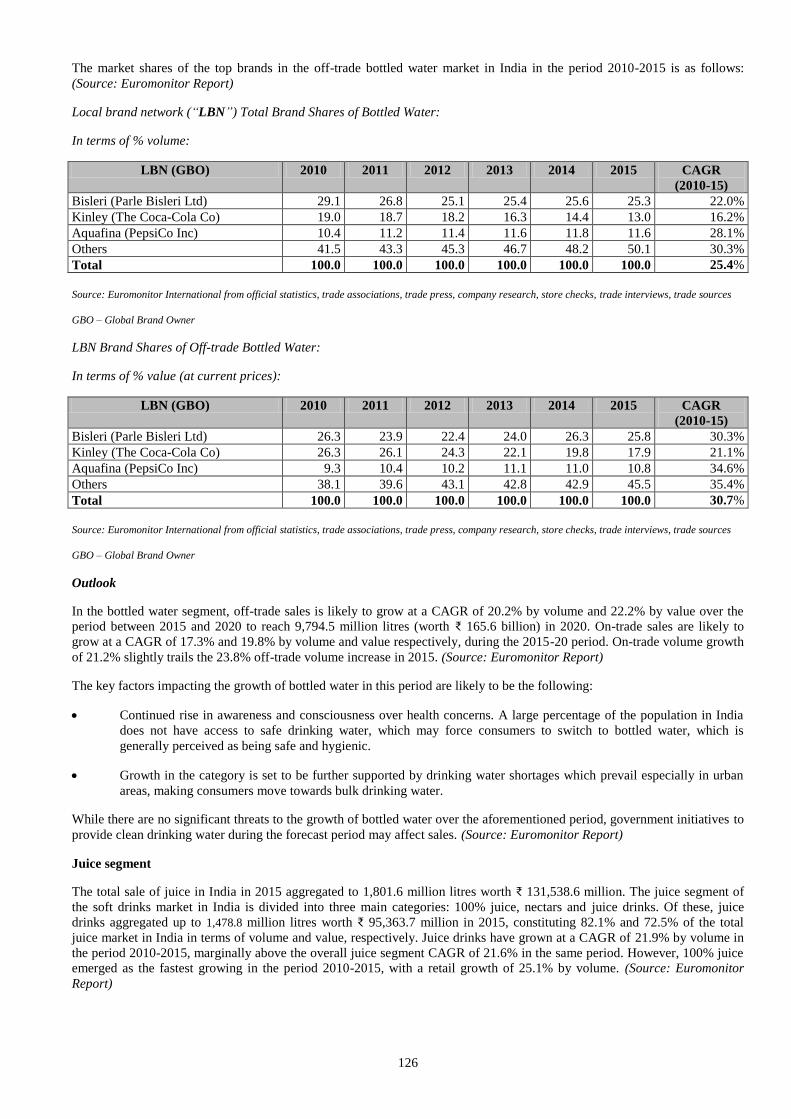
126
The market shares of the top brands in the off-trade bottled water market in India in the period 2010-2015 is as follows:
(Source: Euromonitor Report)
Local brand network (“LBN”) Total Brand Shares of Bottled Water:
In terms of % volume:
LBN (GBO) 2010 2011 2012 2013 2014 2015 CAGR
(2010-15)
Bisleri (Parle Bisleri Ltd) 29.1 26.8 25.1 25.4 25.6 25.3 22.0%
Kinley (The Coca-Cola Co) 19.0 18.7 18.2 16.3 14.4 13.0 16.2%
Aquafina (PepsiCo Inc) 10.4 11.2 11.4 11.6 11.8 11.6 28.1%
Others 41.5 43.3 45.3 46.7 48.2 50.1 30.3%
Total 100.0 100.0 100.0 100.0 100.0 100.0 25.4%
Source: Euromonitor International from official statistics, trade associations, trade press, company research, store checks, trade interviews, trade sources
GBO – Global Brand Owner
LBN Brand Shares of Off-trade Bottled Water:
In terms of % value (at current prices):
LBN (GBO) 2010 2011 2012 2013 2014 2015 CAGR
(2010-15)
Bisleri (Parle Bisleri Ltd) 26.3 23.9 22.4 24.0 26.3 25.8 30.3%
Kinley (The Coca-Cola Co) 26.3 26.1 24.3 22.1 19.8 17.9 21.1%
Aquafina (PepsiCo Inc) 9.3 10.4 10.2 11.1 11.0 10.8 34.6%
Others 38.1 39.6 43.1 42.8 42.9 45.5 35.4%
Total 100.0 100.0 100.0 100.0 100.0 100.0 30.7%
Source: Euromonitor International from official statistics, trade associations, trade press, company research, store checks, trade interviews, trade sources
GBO – Global Brand Owner
Outlook
In the bottled water segment, off-trade sales is likely to grow at a CAGR of 20.2% by volume and 22.2% by value over the
period between 2015 and 2020 to reach 9,794.5 million litres (worth ₹ 165.6 billion) in 2020. On-trade sales are likely to
grow at a CAGR of 17.3% and 19.8% by volume and value respectively, during the 2015-20 period. On-trade volume growth
of 21.2% slightly trails the 23.8% off-trade volume increase in 2015. (Source: Euromonitor Report)
The key factors impacting the growth of bottled water in this period are likely to be the following:
Continued rise in awareness and consciousness over health concerns. A large percentage of the population in India
does not have access to safe drinking water, which may force consumers to switch to bottled water, which is
generally perceived as being safe and hygienic.
Growth in the category is set to be further supported by drinking water shortages which prevail especially in urban
areas, making consumers move towards bulk drinking water.
While there are no significant threats to the growth of bottled water over the aforementioned period, government initiatives to
provide clean drinking water during the forecast period may affect sales. (Source: Euromonitor Report)
Juice segment
The total sale of juice in India in 2015 aggregated to 1,801.6 million litres worth ₹ 131,538.6 million. The juice segment of
the soft drinks market in India is divided into three main categories: 100% juice, nectars and juice drinks. Of these, juice
drinks aggregated up to 1,478.8 million litres worth ₹ 95,363.7 million in 2015, constituting 82.1% and 72.5% of the total
juice market in India in terms of volume and value, respectively. Juice drinks have grown at a CAGR of 21.9% by volume in
the period 2010-2015, marginally above the overall juice segment CAGR of 21.6% in the same period. However, 100% juice
emerged as the fastest growing in the period 2010-2015, with a retail growth of 25.1% by volume. (Source: Euromonitor
Report)
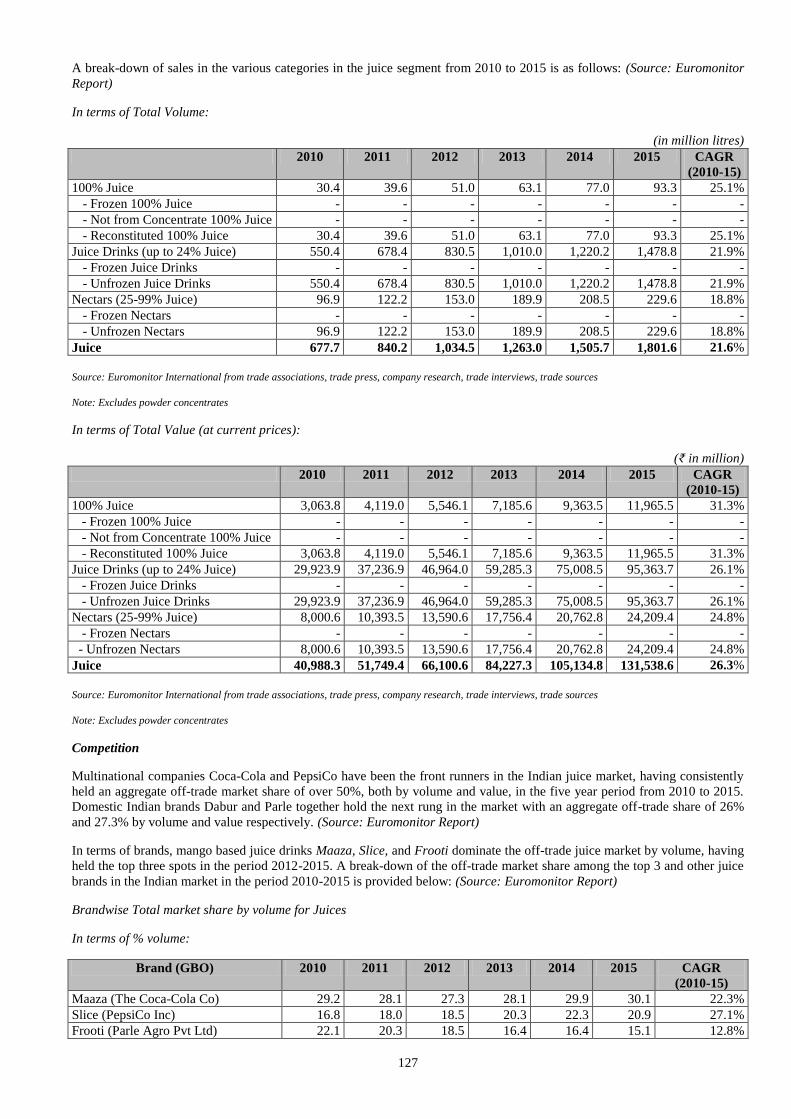
127
A break-down of sales in the various categories in the juice segment from 2010 to 2015 is as follows: (Source: Euromonitor
Report)
In terms of Total Volume:
(in million litres)
2010 2011 2012 2013 2014 2015 CAGR
(2010-15)
100% Juice 30.4 39.6 51.0 63.1 77.0 93.3 25.1%
- Frozen 100% Juice - - - - - - -
- Not from Concentrate 100% Juice - - - - - - -
- Reconstituted 100% Juice 30.4 39.6 51.0 63.1 77.0 93.3 25.1%
Juice Drinks (up to 24% Juice) 550.4 678.4 830.5 1,010.0 1,220.2 1,478.8 21.9%
- Frozen Juice Drinks - - - - - - -
- Unfrozen Juice Drinks 550.4 678.4 830.5 1,010.0 1,220.2 1,478.8 21.9%
Nectars (25-99% Juice) 96.9 122.2 153.0 189.9 208.5 229.6 18.8%
- Frozen Nectars - - - - - - -
- Unfrozen Nectars 96.9 122.2 153.0 189.9 208.5 229.6 18.8%
Juice 677.7 840.2 1,034.5 1,263.0 1,505.7 1,801.6 21.6%
Source: Euromonitor International from trade associations, trade press, company research, trade interviews, trade sources
Note: Excludes powder concentrates
In terms of Total Value (at current prices):
(₹ in million)
2010 2011 2012 2013 2014 2015 CAGR
(2010-15)
100% Juice 3,063.8 4,119.0 5,546.1 7,185.6 9,363.5 11,965.5 31.3%
- Frozen 100% Juice - - - - - - -
- Not from Concentrate 100% Juice - - - - - - -
- Reconstituted 100% Juice 3,063.8 4,119.0 5,546.1 7,185.6 9,363.5 11,965.5 31.3%
Juice Drinks (up to 24% Juice) 29,923.9 37,236.9 46,964.0 59,285.3 75,008.5 95,363.7 26.1%
- Frozen Juice Drinks - - - - - - -
- Unfrozen Juice Drinks 29,923.9 37,236.9 46,964.0 59,285.3 75,008.5 95,363.7 26.1%
Nectars (25-99% Juice) 8,000.6 10,393.5 13,590.6 17,756.4 20,762.8 24,209.4 24.8%
- Frozen Nectars - - - - - - -
- Unfrozen Nectars 8,000.6 10,393.5 13,590.6 17,756.4 20,762.8 24,209.4 24.8%
Juice 40,988.3 51,749.4 66,100.6 84,227.3 105,134.8 131,538.6 26.3%
Source: Euromonitor International from trade associations, trade press, company research, trade interviews, trade sources
Note: Excludes powder concentrates
Competition
Multinational companies Coca-Cola and PepsiCo have been the front runners in the Indian juice market, having consistently
held an aggregate off-trade market share of over 50%, both by volume and value, in the five year period from 2010 to 2015.
Domestic Indian brands Dabur and Parle together hold the next rung in the market with an aggregate off-trade share of 26%
and 27.3% by volume and value respectively. (Source: Euromonitor Report)
In terms of brands, mango based juice drinks Maaza, Slice, and Frooti dominate the off-trade juice market by volume, having
held the top three spots in the period 2012-2015. A break-down of the off-trade market share among the top 3 and other juice
brands in the Indian market in the period 2010-2015 is provided below: (Source: Euromonitor Report)
Brandwise Total market share by volume for Juices
In terms of % volume:
Brand (GBO) 2010 2011 2012 2013 2014 2015 CAGR
(2010-15)
Maaza (The Coca-Cola Co) 29.2 28.1 27.3 28.1 29.9 30.1 22.3%
Slice (PepsiCo Inc) 16.8 18.0 18.5 20.3 22.3 20.9 27.1%
Frooti (Parle Agro Pvt Ltd) 22.1 20.3 18.5 16.4 16.4 15.1 12.8%
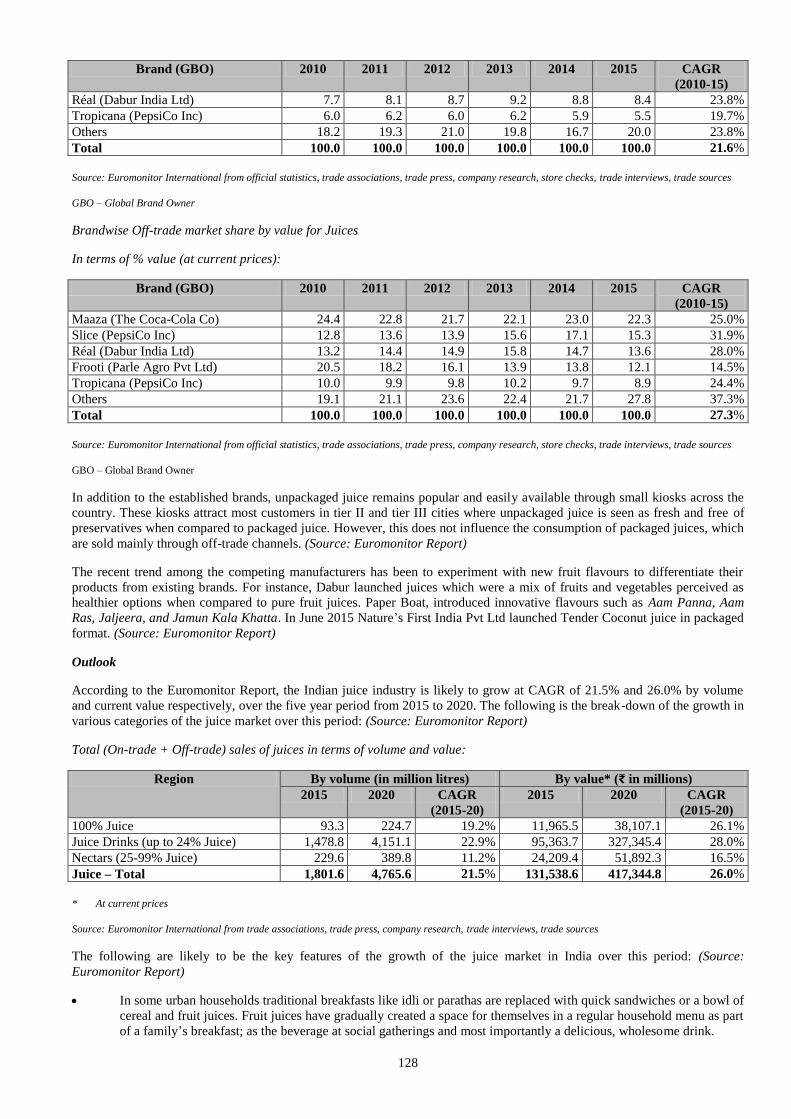
128
Brand (GBO) 2010 2011 2012 2013 2014 2015 CAGR
(2010-15)
Réal (Dabur India Ltd) 7.7 8.1 8.7 9.2 8.8 8.4 23.8%
Tropicana (PepsiCo Inc) 6.0 6.2 6.0 6.2 5.9 5.5 19.7%
Others 18.2 19.3 21.0 19.8 16.7 20.0 23.8%
Total 100.0 100.0 100.0 100.0 100.0 100.0 21.6%
Source: Euromonitor International from official statistics, trade associations, trade press, company research, store checks, trade interviews, trade sources
GBO – Global Brand Owner
Brandwise Off-trade market share by value for Juices
In terms of % value (at current prices):
Brand (GBO) 2010 2011 2012 2013 2014 2015 CAGR
(2010-15)
Maaza (The Coca-Cola Co) 24.4 22.8 21.7 22.1 23.0 22.3 25.0%
Slice (PepsiCo Inc) 12.8 13.6 13.9 15.6 17.1 15.3 31.9%
Réal (Dabur India Ltd) 13.2 14.4 14.9 15.8 14.7 13.6 28.0%
Frooti (Parle Agro Pvt Ltd) 20.5 18.2 16.1 13.9 13.8 12.1 14.5%
Tropicana (PepsiCo Inc) 10.0 9.9 9.8 10.2 9.7 8.9 24.4%
Others 19.1 21.1 23.6 22.4 21.7 27.8 37.3%
Total 100.0 100.0 100.0 100.0 100.0 100.0 27.3%
Source: Euromonitor International from official statistics, trade associations, trade press, company research, store checks, trade interviews, trade sources
GBO – Global Brand Owner
In addition to the established brands, unpackaged juice remains popular and easily available through small kiosks across the
country. These kiosks attract most customers in tier II and tier III cities where unpackaged juice is seen as fresh and free of
preservatives when compared to packaged juice. However, this does not influence the consumption of packaged juices, which
are sold mainly through off-trade channels. (Source: Euromonitor Report)
The recent trend among the competing manufacturers has been to experiment with new fruit flavours to differentiate their
products from existing brands. For instance, Dabur launched juices which were a mix of fruits and vegetables perceived as
healthier options when compared to pure fruit juices. Paper Boat, introduced innovative flavours such as Aam Panna, Aam
Ras, Jaljeera, and Jamun Kala Khatta. In June 2015 Nature’s First India Pvt Ltd launched Tender Coconut juice in packaged
format. (Source: Euromonitor Report)
Outlook
According to the Euromonitor Report, the Indian juice industry is likely to grow at CAGR of 21.5% and 26.0% by volume
and current value respectively, over the five year period from 2015 to 2020. The following is the break-down of the growth in
various categories of the juice market over this period: (Source: Euromonitor Report)
Total (On-trade + Off-trade) sales of juices in terms of volume and value:
Region By volume (in million litres) By value* (₹ in millions)
2015 2020 CAGR
(2015-20)
2015 2020 CAGR
(2015-20)
100% Juice 93.3 224.7 19.2% 11,965.5 38,107.1 26.1%
Juice Drinks (up to 24% Juice) 1,478.8 4,151.1 22.9% 95,363.7 327,345.4 28.0%
Nectars (25-99% Juice) 229.6 389.8 11.2% 24,209.4 51,892.3 16.5%
Juice – Total 1,801.6 4,765.6 21.5% 131,538.6 417,344.8 26.0%
* At current prices
Source: Euromonitor International from trade associations, trade press, company research, trade interviews, trade sources
The following are likely to be the key features of the growth of the juice market in India over this period: (Source:
Euromonitor Report)
In some urban households traditional breakfasts like idli or parathas are replaced with quick sandwiches or a bowl of
cereal and fruit juices. Fruit juices have gradually created a space for themselves in a regular household menu as part
of a family’s breakfast; as the beverage at social gatherings and most importantly a delicious, wholesome drink.
129
Moreover, conscientious mothers have taken to stocking juices in a bid to discourage children from colas and other
fizzy drinks. These are expected to drive the category.
Rising health consciousness and changing food habits of consumers, as a result of which consumers are likely to
move from carbonated to juice-based drinks.
Availability of fresh juice through small kiosks in local neighbourhoods, as a result of which consumers may be
restricted from moving to branded juice. Fresh juice is perceived as healthier due to lack of preservatives and more
affordable, a factor especially impacting the tier II and tier III cities.
MARKET OUTLOOK
The growing focus on rural and semi-urban markets from all major players has helped improve product penetration. This has
also led to customisation of products. Soft drinks manufacturers are likely to introduce the customisation of soft drinks based
on the specific requirements of rural consumers. For example, manufacturers would launch smaller pack sizes and soft drinks
in glass bottles to make the products available at lower price points. (Source: Euromonitor Report)
It is estimated that long summers and higher spend on packaged products will fuel the growth. Increased marketing efforts
and communications from soft drinks manufacturers are expected to continue playing an important role in terms of pushing
sales in most soft drinks categories. The bottled water and juice segments are also expected to exhibit strong growth, as they
are being embraced by consumers in urban and rural areas alike. The Indian soft drinks industry is likely to reach 25,131.0
million litres (worth ₹ 11,76,321.2 million) by 2020. This implies a growth with CAGR of 15.8% and 17.5% by volume and
value respectively, over the five year period from 2015 to 2020. The majority of volume and value growth is likely to come
from bottled water and juice, which are being embraced by consumers in urban and rural areas alike. Increased marketing
efforts and communications from soft drinks manufacturers are expected to continue playing an important role in terms of
pushing sales in most soft drinks categories. With several new brand launches and the expansion of comparatively new
players such as Hector Beverages, the competition in soft drinks became even more intense during 2015. (Source:
Euromonitor Report)
Competition in the soft drinks market in India
Multinational companies Coca-Cola and PepsiCo have occupied the first and second positions respectively in the off-trade
soft drinks market in India in the period between 2011 and 2015, with a market share of 34.6% and 21.1% respectively, in
2015. The third place has been held by Parle Bisleri, with an off-trade market share of 10.8% by volume in 2015, all of which
can be attributed to its mineral water brand Bisleri. (Source: Euromonitor Report)
Overall, the top 10 players in the market have generally held about 75% of the off-trade market by volume in the last five
years (being 84% in 2011 and 75% in 2015). Manufacturers have undertaken a variety of steps to compete in the market
including undertaking marketing and promotional activities, especially in North and West India. This includes marketing
through signing up of popular film celebrities. Sports also was used as a platform by PepsiCo to reach a wider audience.
(Source: Euromonitor Report)
130
OUR BUSINESS
Some of the information in the following discussion, including information with respect to our plans and strategies, contain
forward-looking statements that involve risks and uncertainties. You should read the section “Forward-Looking Statements”
on page 20 for a discussion of the risks and uncertainties related to those statements and also the section “Risk Factors”
beginning on page 22 for a discussion of certain factors that may affect our business, financial condition or results of
operations. Our actual results may differ materially from those expressed in or implied by these forward-looking statements.
Our fiscal year ends on December 31 of each year, and references to a particular Fiscal are to the twelve-month period
ended December 31 of that year.
Unless the context otherwise requires, in this section, references to “we”, “us” or “our” refers to Varun Beverages Limited
and its subsidiaries on a consolidated basis, and includes references to entities that have merged with, or that have been
acquired by, our Company, including Devyani Beverages Limited, Varun Beverages (Nepal) Private Limited, North East
Pure Drinks Private Limited, Varun Beverages (International) Limited, Varun Beverages Mozambique, Limitada, Varun
Beverages (Zambia) Limited and Varun Beverages (Zimbabwe) (Private) Limited. Unless the context otherwise requires,
references to our “Company” refers to Varun Beverages Limited on a standalone basis. Unless otherwise indicated, all
financial information included herein are based on our Restated Consolidated Financial Statements included in this Red
Herring Prospectus beginning on page 210. Unless the context otherwise requires, any financial information included herein
have been derived from our Restated Standalone Financial Statements for Fiscal 2011 and from our Restated Consolidated
Financial Statements for Fiscal 2012, 2013, 2014, 2015, the six months ended June 30, 2015 and the six months ended June
30, 2016.
The Sales Volume information presented in this section represents sales to our customers in our licensed territories but does
not include any sales to PepsiCo or any other franchisees of PepsiCo. Sales to PepsiCo and / or other PepsiCo franchisees
are reflected in our revenues from operations. However, such sales have not been significant in the last five Fiscals and in the
six months ended June 30, 2016. We do not make any such sales other than in India. Sales Volume information in any Fiscal
period included in this section cannot be directly correlated to our revenues from operations in the respective Fiscal.
Overview
We are one of the largest franchisee in the world (outside USA) of carbonated soft drinks (“CSDs”) and non-carbonated
beverages (“NCBs”) sold under trademarks owned by PepsiCo. We produce and distribute a wide range of CSDs, as well as a
large selection of NCBs, including packaged drinking water. PepsiCo CSD brands produced and sold by us include Pepsi,
Diet Pepsi, Seven-Up, Mirinda Orange, Mirinda Lemon, Mountain Dew, Mountain Dew Game Fuel, Seven-Up Nimbooz
Masala Soda, Seven-Up Revive and Evervess. PepsiCo NCB brands produced and sold by us include Tropicana Slice,
Tropicana Frutz (Lychee, Apple and Mango), Nimbooz as well as packaged drinking water under the brand Aquafina. In
addition, we have also been granted the franchise for Ole brand of PepsiCo products in Sri Lanka.
We have been associated with PepsiCo since the 1990s and have over two and half decades consolidated our business
association with PepsiCo, increasing the number of licensed territories and sub-territories covered by us, producing and
distributing a wider range of PepsiCo beverages, introducing various SKUs in our portfolio, and expanding our distribution
network. As of June 30, 2016, we have been granted franchises for various PepsiCo products across 17 States and two Union
Territories in India. India is our largest market and contributed 82.48%, 80.67%, 84.38% and 83.46% of our revenues from
operations (net) in Fiscal 2013, Fiscal 2014, Fiscal 2015, and in the six months ended June 30, 2016, respectively. We have
also been granted the franchise for various PepsiCo products for the territories of Nepal, Sri Lanka, Morocco, Mozambique
and Zambia. In addition, we are in the process of setting up a greenfield facility in Zimbabwe in anticipation of franchise
rights being granted by PepsiCo Inc. for such territory. For further information on our franchise arrangements with PepsiCo
India / PepsiCo Inc. and / or the PepsiCo International Entities, see “Our Business – Relationship with PepsiCo” on page 136.
According to the Euromonitor Report, the beverage markets in India, Nepal, Morocco and Sri Lanka are some of the fastest
growing beverage markets in the world. (Source: Euromonitor Report). Our demonstrated ability to grow PepsiCo product
sales in our territories and sub-territories has led to PepsiCo India / PepsiCo Inc. and / or the PepsiCo International Entities
licensing additional franchises to us, including sub-territories in India that were earlier directly operated by PepsiCo or by
third-party bottlers. PepsiCo soft drinks total volume sales (based on sales to end consumers) in India was 1,654.9 million
litres in Fiscal 2011 and 2,688.1 million litres in Fiscal 2015. (Source: Euromonitor Report). Our Sales Volumes in our sub-
territories in India were 437.90 million litres (equivalent to 77.12 million unit cases) in Fiscal 2011 and 1,186.04 million litres
(equivalent to 208.88 million unit cases) in Fiscal 2015. Based on the Sales Volume of our products in our sub-territories in
India in Fiscal 2011 and Fiscal 2015 and Euromonitor Report data on PepsiCo soft drinks total volume sales (based on sales
to end consumers) in India in these years, our share of PepsiCo soft drinks total volume sales in India increased from 26.46%
in Fiscal 2011 to 44.12% in Fiscal 2015. Until February 2015, our licensed sub-territories in India included Delhi, Rajasthan,
West Bengal, Goa, Arunachal Pradesh, Assam, Meghalaya, Manipur, Mizoram, Nagaland, Tripura as well as certain
designated parts of the following sub-territories: Madhya Pradesh, Uttar Pradesh, Uttarakhand, Haryana and Maharashtra
(collectively, the “2015 Existing India Sub-Territories”). As part of PepsiCo's strategy of consolidating certain PepsiCo-
operated sub-territories in India under long-term bottling partners, pursuant to a business transfer agreement entered into with
131
PepsiCo India in November 2014, we were granted, with effect from February 28, 2015, franchises for the following
additional sub-territories in India: Punjab, Himachal Pradesh, Chandigarh UT, as well as the remaining parts of the following
sub-territories: Haryana, Uttarakhand and Uttar Pradesh (collectively, the “2015 New India Sub-Territories”). We believe
that our operational experience, widespread integrated distribution network and market knowledge adds significant value to
the distribution and sale of PepsiCo products in India, and we continue to leverage our long association with PepsiCo to
evaluate new beverages, packaging, SKUs and markets as consumer preferences evolve.
As of June 30, 2016, we operated 16 production facilities across India and five production facilities in our international
licensed territories. These 16 production facilities also include the Satharia – 2 production facility which we recently acquired
from our co-packer in September 2016. As of June 30, 2016, we had an estimated aggregate annual production capacity of
3,438.38 million litres (equivalent to 605.56 million unit cases) in India and an estimated aggregate annual production
capacity of 991.57 million litres (equivalent to 174.63 million unit cases) in our international production facilities. In addition,
we have set up backward integration facilities for production of preforms, crowns, corrugated boxes and pads, plastic crates
and shrink-wrap films in certain of our production facilities to ensure operational efficiencies and quality standards.
Additionally, we have two facilities dedicated to backward integration located at Jaipur and Alwar which manufacture
crowns, plastic shells, corrugated boxes and pads and shrink wrap film. We have over the years developed a wide-spread,
integrated distribution network across our licensed territories and sub-territories. As of June 30, 2016 our distribution network
in India included 60 depots and 1,438 delivery vehicles. Our distribution network covers urban, semi-urban and rural markets,
targeting a wide range of consumers. We have also developed an extensive distribution network in our international markets
which as of June 30, 2016 included 20 depots and 518 delivery vehicles. As of June 30, 2016, we had 562 primary
distributors (i.e., distributors that recorded sales in excess of 0.5 million litres of our PepsiCo beverages in the 12 months
ended June 30, 2016) in India and 415 distributors in our international operations. The 562 primary distributors in India
accounted for 74.36% of our aggregate Sales Volumes in India in the 12 months ended June 30, 2016.
In Fiscal 2013, Fiscal 2014, Fiscal 2015, and in the six months ended June 30, 2016, CSD Sales Volumes were 724.30 million
litres (equivalent to 127.56 million unit cases), 805.48 million litres (equivalent to 141.85 million unit cases), 1,111.50
million litres (equivalent to 195.76 million unit cases), and 857.90 million litres (equivalent to 151.08 million unit cases),
respectively, NCB Sales Volumes were 63.91 million litres (equivalent to 11.26 million unit cases), 71.60 million litres
(equivalent to 12.61 million unit cases), 82.11 million litres (equivalent to 14.46 million unit cases), and 63.70 million litres
(equivalent to 11.22 million unit cases), respectively, while packaged drinking water Sales Volumes were 83.23 million litres
(equivalent to 14.66 million unit cases), 87.04 million litres (equivalent to 15.33 million unit cases), 167.51 million litres
(equivalent to 29.50 million unit cases), and 122.44 million litres (equivalent to 21.56 million unit cases), respectively.
We are part of the RJ Corp group, a diversified business conglomerate with interests in beverages, quick-service restaurants,
dairy and healthcare. Our Promoter and Chairman, Mr. Ravi Kant Jaipuria has an established reputation as an entrepreneur
and business leader and is the only Indian company’s promoter to receive PepsiCo's International Bottler of the Year award,
which was awarded in 1997.
In Fiscal 2013, Fiscal 2014, Fiscal 2015, and in the six months ended June 30, 2016, we had revenues from operations (net) of
₹ 21,151.49 million, ₹ 25,024.07 million, ₹ 33,941.49 million and ₹ 25,296.58 million, respectively. In the period Fiscal 2011
to Fiscal 2015, revenues from operations (net) increased at a CAGR of 31.15%. In Fiscal 2013, Fiscal 2014, Fiscal 2015, and
in the six months ended June 30, 2016, EBITDA was ₹ 3,093.18 million, ₹ 4,001.06 million, ₹ 6,498.59 million and ₹
6,101.96 million, respectively. While we incurred a loss after tax in Fiscal 2013 and 2014 of ₹ 395.30 million and ₹ 201.56
million, respectively, we recorded a net profit of ₹ 870.38 million in Fiscal 2015 and a profit of ₹ 2,097.45 million in the six
months ended June 30, 2016.
Our Strengths
Demonstrated ability to grow Sales Volumes
We have been associated with PepsiCo since the 1990s and have over two and half decades consolidated our business
association with PepsiCo, increasing the number of licensed territories and sub-territories covered by us, producing and
distributing a wider range of PepsiCo beverages, introducing various SKUs in our portfolio, and expanding our distribution
network. As of June 30, 2016, we have been granted franchises for various PepsiCo products across 17 States and two Union
Territories. We have also successfully leveraged our association with PepsiCo to expand our operations internationally and
have been granted franchises for PepsiCo products in Nepal, Sri Lanka, Morocco, Zambia and Mozambique. In addition, we
are in the process of setting up a greenfield facility in Zimbabwe in anticipation of franchise rights being granted by PepsiCo
Inc. for such territory. Our total Sales Volumes have grown at a CAGR of 32.78% from 437.90 million litres (equivalent to
77.12 million unit cases) in Fiscal 2011 to 1,361.12 million litres (equivalent to 239.72 million unit cases) in Fiscal 2015. The
Sales Volumes in our 2015 Existing India Sub-Territories grew by volume from 437.90 million litres (equivalent to 77.12
million unit cases) in Fiscal 2011 to 759.46 million litres (equivalent to 133.76 million unit cases) in Fiscal 2015. 2015
Existing India Sub-Territories includes the sub-territories in India that were granted to us prior to Fiscal 2011, the Goa and
North East sub-territories which were merged into our Company pursuant to the amalgamation of VBIL into the Company
with effect from January 1, 2012 and part of the Delhi sub-territory which was acquired with effect from January 31, 2013.

132
We work closely with PepsiCo to implement operational best practices, garner supply chain efficiencies from our large
production capacities and distribution network, and implement dynamic "push" marketing strategies taking PepsiCo products
directly to customers through retailers and point-of-sale displays, and "pull" marketing initiatives through advertisement and
promotional offers. According to Euromonitor Report, the soft drinks markets in India, Nepal, Morocco and Sri Lanka are
some of the fastest growing beverage markets in the world. (Source: Euromonitor Report). Our demonstrated ability to grow
PepsiCo product sales has led to PepsiCo India / PepsiCo Inc. and / or the PepsiCo International Entities licensing additional
territories to us, including those that were earlier directly operated by PepsiCo or by third-party bottlers. In particular, as part
of PepsiCo strategy of consolidating certain PepsiCo-operated sub-territories in India under long-term bottling partners, we
entered into a business transfer agreement with PepsiCo India in November 2014 pursuant to which we were granted the
franchise for the 2015 New India Sub-Territories. As these 2015 New India Sub-Territories are geographically contiguous
with the 2015 Existing India Sub-territories, we are able to benefit from cost and operational efficiencies as well as benefits of
economies of scale. We are able to optimize the freight, transportation and distribution costs over a larger territory base which
helps increase our margins. The increase in scale of our operations provides us with better bargaining power with our
suppliers and ensures better working capital management. As an added advantage, we are able to get benefits of operating
leverage through improved asset-utilization and are able to amortize head office expenses on a wider base.
Strategically located large and technologically advanced production capabilities
As of June 30, 2016, we operated 16 production facilities across India and five production facilities in our international
licensed territories. As of June 30, 2016, we had an estimated aggregate annual production capacity of 3,438.38 million litres
(equivalent to 605.56 million unit cases) in India and an estimated aggregate annual production capacity of 991.57 million
litres (equivalent to 174.63 million unit cases) in our international production facilities. These 16 production facilities also
include the Satharia – 2 production facility which we recently acquired from our co-packer in September 2016. As a result of
this acquisition, we have been able to improve our control on the quality of products and it has also enabled us to reduce
conversion charges of buying from a co-packer. We use advanced machinery and production techniques in our manufacturing
process for water treatment, packing etc. in certain of our production facilities. These techniques enable us to improve
production efficiencies and reduce personnel costs. In Fiscal 2013, 2014, 2015, and in the six months ended June 30, 2016,
we incurred capital expenditure of ₹ 6,415.92 million, ₹ 2,161.76 million, ₹ 15,324.85 million and ₹ 5,671.71 million,
respectively, primarily in connection with property, plant and equipment, in order to increase production capacities and
modernise our production facilities, as well as on visi-coolers and other chilling equipment placed with retailers and other
points of sale.
Our production facilities across India are strategically located in geographical proximity to various target markets, which
results in lower transportation and distribution expenses and enable us to leverage economies of scale. In addition, we have
set up backward integration facilities in certain of our production facilities for preforms, crowns, corrugated boxes, corrugated
pads, plastic crates and shrink wrap films to ensure operational efficiencies and quality standards. Additionally, we have two
facilities dedicated to backward integration located at Jaipur and Alwar which manufacture crowns, plastic shells, corrugated
boxes and pads and shrink wrap film. Our large and technologically advanced production capabilities provide cost and
operational efficiencies, and we comply with quality standards consistent with PepsiCo’s global production standards and
regulatory compliance policies. Our large scale of operations offers significant synergies including market knowledge
operational best practices, economies of scale, optimal investment planning and capital expenditure.
Wide spread and integrated sales and distribution network that ensures effective market penetration
Our wide spread and integrated sales and distribution network enables us to reach a wide range of consumers and ensure
effective market penetration. Points of sale for our products include traditional retail points, such as grocery stores, as well as
modern retail outlets including e-commerce, supermarkets, hypermarkets, convenience stores, bars and restaurants. As of
June 30, 2016, our distribution network in India included 60 depots and 1,438 delivery vehicles. As of June 30, 2016, we had
562 primary distributors (i.e., distributors that recorded sales in excess of 0.5 million litres of our PepsiCo beverages in the 12
months ended June 30, 2016) in India and 415 distributors in our international operations. The 562 primary distributors in
India accounted for 74.36% of our aggregate Sales Volumes in India in the 12 months ended June 30, 2016. Our distribution
network covers urban, semi-urban and rural markets, targeting a wide range of consumers. We have also developed an
extensive distribution network in our international markets which as of June 30, 2016 included 20 depots and 518 delivery
vehicles. Our distribution network is strategically located to maximize market penetration across our licensed sub-territories
in India, with an increased focus on higher growth markets such as semi-urban and rural sub-territories. We have over the
years successfully managed our large distribution network and developed strong supply and distribution chain relationships
across our licensed sub-territories in India.
Our production capabilities and distribution network enables us to effectively respond to competitive pressures, market
demand and evolving consumer preferences in our territories. Our supply chain management systems enable us to efficiently
and cost effectively manage our distribution network and allows us to introduce additional products in our markets and
implement marketing campaigns initiated by PepsiCo. We believe that our large production capacities and distribution
infrastructure will enable us to address volume growth at a relatively low incremental capital cost.
133
Significant markets with high growth potential
The soft drinks market in India is underdeveloped in terms of per capita consumption of 9.4 litres in 2015, especially when
compared to the world average of 91.9 litres and the more mature U.S. market, with a per capita consumption of 347.3 litres
in such period. (Source: Euromonitor Report). We believe there is significant growth potential for PepsiCo’s beverages in our
licensed territories in India. In North India, sales of soft drinks grew at a CAGR of 18.2% by total volume from 2010 – 2015.
(Source: Euromonitor Report). PepsiCo beverages remained among the top brands in the soft drinks market in both CSDs and
NCB segment in North India. (Source: Euromonitor Report). In East and North-east India, sales of soft drinks grew at a
CAGR of 16.1% by total volume from 2010 – 2015. (Source: Euromonitor Report). PepsiCo beverages commanded strong
market positions in 2015 as Pepsi remained amongst the most visible carbonates brands in terms of off-trade value sales and
Tropicana Slice was among the leading beverages in the NCB segment in this region. (Source: Euromonitor Report). The
total sales of bottled water in India grew at a CAGR of 25.4% by volume and 31.2% by value during the period of 2010-15.
(Source: Euromonitor Report). The key driver to the growth of bottled water was rising awareness among consumers about
water borne diseases. Many areas of the North-east India are not well equipped to provide hygienic drinking water for the
population, thus also elevating the market for bottled water. (Source: Euromonitor Report). We expect this trend to continue
as consumer disposable income increases further.
During the period of 2015-20, per capita consumption in litres of the beverage markets in India, Nepal, Sri Lanka, Morocco,
Zambia, Mozambique and Zimbabwe are expected to grow at a rate much higher than the world average of 2.3%. (Source:
Euromonitor Report). The forecasted per capita volume consumption CAGR for the period of 2015-2020 in India (14.4%),
Sri Lanka (10.8%), Morocco (11.8%), Nepal (16.1%), Mozambique (4.4%) and Zambia (4.5%), surpasses the projections of
some of the other global markets. (Source: Euromonitor Report). The Zimbabwe market, where we anticipate commencing
operations is also expected to grow at a CAGR of 4.3% in terms of per capita consumption during the 2015-2020 period.
(Source: Euromonitor Report). Within the India territory, in North India, sales of soft drinks are expected to grow at a CAGR
of 16.4% by total volume from 2015 – 2020. (Source: Euromonitor Report). In East and North-east India, it is expected to
grow at a CAGR of 14.7% total by volume from 2015 – 2020. (Source: Euromonitor Report). In India, the annual disposable
income is expected to increase by 11.5% over 2016 – 2020. (Source: Euromonitor Report). In India, the gap between rural
and urban consumers continues to diminish with manufacturers increased interest in rural markets and the readiness of
consumers to spend on these soft drink options. In 2015, the consumption growth of soft drinks in rural areas grew at a faster
pace compared to that in urban locations. (Source: Euromonitor Report). We expect such trend to continue as rural and semi-
urban consumers become aware of PepsiCo brands. This is expected to result in increased consumption of PepsiCo’s
beverages and we believe that we are well positioned to capitalize on such market growth.
Creating value through alignment with PepsiCo
PepsiCo is one of the leading international food and beverage companies with a global presence. (Source: Euromonitor
Report). PepsiCo owns some of the most visible soft drink brands in India (Source: Euromonitor Report). PepsiCo CSD
brands produced and sold by us include Pepsi, Diet Pepsi, Seven-Up, Mirinda Orange, Mirinda Lemon, Mountain Dew,
Mountain Dew Game Fuel, Seven-Up Nimbooz Masala Soda, Seven-Up Revive, and Evervess. PepsiCo NCB brands
produced and sold by us include Tropicana Slice, Tropicana Frutz (Lychee, Apple and Mango), Nimbooz as well as packaged
drinking water under the brand Aquafina.
We have been associated with PepsiCo since the 1990s and believe that our strong relationship with PepsiCo is one of our key
strengths. Our operations benefit from our long association with PepsiCo, including access to modern technology, marketing
leverage, operational know-how, industry best practices, access to raw materials and equipment at competitive prices as well
as access to experienced personnel. We have developed a strategic and operational alignment with PepsiCo across all our
functions and organization levels. In Fiscal 2015, PepsiCo’s aggregate sales volume in the carbonates, juice and bottled water
categories were 1,523.1 million litres, 498.3 million litres and 650.6 million litres. (Source: Euromonitor Report) In Fiscal
2015, our Sales Volume for CSDs, NCBs and packaged drinking water in our sub-territories in India were 955.45 million
litres (equivalent to 168.27 million unit cases), 77.62 million litres (equivalent to 13.67 million unit cases) and 152.97 million
litres (equivalent to 26.94 million unit cases), respectively (reflecting sales for the 2015 New India Sub-Territories only from
date of acquisition, i.e. for the ten month period between February 28, 2015 and December 31, 2015).
We have developed strong sales teams that work closely with PepsiCo to develop and implement local advertising and
marketing strategies and special sales schemes. PepsiCo also has an active product development team that we work with to
strategize new product launches in India. We believe that our wide consumer base and strong distribution chain relationships
enable us to contribute effectively to PepsiCo’s marketing strategy and implement these initiatives at the local distribution
and consumer level. In addition, we work closely with PepsiCo on production techniques, quality control, environmental
matters as well as new packaging and product development initiatives. We source high quality raw materials from reputed
suppliers that are pre-approved by PepsiCo India / PepsiCo Inc. and / or PepsiCo International Entities. Our key employees
also attend management and staff development programs organized by PepsiCo. For further information relating to our
relationship with PepsiCo, see “Our Business – Relationship with PepsiCo” on page 136.
134
We support PepsiCo’s initiative of “Positive Water Balance” and “Giving Back MORE WATER Than We Take”. As
confirmed by an independent audit, through rainwater harvesting, community watersheds and water conservation in
agriculture, PepsiCo saved 13.5 billion litres more water than what PepsiCo consumed, since 2009.
Experienced management team
We have a qualified and professional management team with significant experience in all operational aspects of our business.
We believe that the industry experience of our management team and their ability to deliver consistent sales growth are our
significant strengths. Our senior management team has extensive experience in the food and beverage industry in India. Our
Promoter and Chairman, Mr. Ravi Kant Jaipuria, has an established reputation as an entrepreneur and business leader and is
the only Indian company’s promoter to receive PepsiCo’s International Bottler of the Year award, in 1997. Mr. Jaipuria
provides strategic leadership to our Company and is also closely involved in our operations. We believe that our management
team’s in-depth understanding of target markets and consumer demand and preferences has enabled us to continue to grow
our business and expand our operations internationally. This experience has also enabled us to develop a business model that
incorporates aspects of both multinational as well as local beverage company operating structures.
Our Strategy
Grow our business by capitalizing on brand strength and diversifying our product portfolio
According to Euromonitor Report, Slice and Pepsi brands by PepsiCo are amongst the leading beverage brands in India.
(Source: Euromonitor Report). We will continue to leverage PepsiCo’s brand portfolio to increase market penetration in our
licensed territories. Aquafina and Pepsi were among the top six largest selling beverage brands in India in 2012, 2013, 2014
and 2015. (Source: Euromonitor Report). Mountain Dew was the fastest growing CSD brand by off-trade value in India from
2011-15 with a CAGR of 19.2%. (Source: Euromonitor Report). In Fiscal 2014 and Fiscal 2015 Mountain Dew was our
largest selling CSD beverage brand by volume and value. We believe that the relative under-penetration of Mountain Dew in
certain markets and distribution channels presents significant growth opportunities. There is a large segment of customers
switching from regular cola-carbonates to non-cola carbonates. (Source: Euromonitor Report) We intend to capitalize on this
changing market sentiment by focusing on improving the market share of Seven-Up Nimbooz Masala Soda, which was
initially launched in India in 2013, by expanding our distribution network and increasing production volumes.
We continue to leverage our ability to implement new brand and product launches for PepsiCo, particularly in the fast-
growing NCB space, to further grow our business. As consumer preferences evolve, we continue to work closely with
PepsiCo to launch new products and diversify our product portfolio. We have introduced several NCB brands in India over
the years, including Tropicana Slice, Tropicana Frutz (Lychee, Apple and Mango) and Nimbooz and have launched a range of
new flavors, packages and SKUs. Slice has been rebranded as Tropicana Slice to take advantage of the Tropicana brand with
wider recognition and stronger brand value in the NCB segment. We also continue to focus on growing Aquafina sales as the
packaged drinking water segment in India is highly fragmented and provides significant growth opportunities. In addition,
consistent with PepsiCo’s marketing and product strategy, we intend to launch certain of our products and brands in smaller
packages to target the semi-urban and rural markets in India. We aim to balance the growth of sales in large brands such as
Pepsi with an increased focus on marketing and distribution activities for relatively newer brands such as Seven-Up Nimbooz
Masala Soda, Mountain Dew and Seven-Up Revive, which provide significant growth opportunities. We continue to evaluate,
in alignment with PepsiCo’s product development strategy, growth opportunities in fruit juice based carbonated beverages.
We continue to leverage our in-depth understanding of local markets and produce and distribute beverages that address
clearly identified market opportunities.
We continue to, by expanding our product portfolio and distribution reach, focus on increasing consumption volumes,
particularly in markets and demographic segments with relatively low per capita consumption, as well as address changing
consumer preferences. We believe that our increased focus on semi-urban and rural markets, and ability to understand
consumer preferences in such markets, will enable us to further increase market penetration in these markets and segments,
resulting in organic growth.
Continue to acquire and integrate additional franchisee rights
We continue to play a significant role in the consolidation of PepsiCo’s production and distribution operations in South Asia
and Africa. We evaluate strategic acquisition opportunities for production facilities and licensing of franchisee rights for
additional territories and sub-territories in India, including for territories that were franchised to other bottlers of PepsiCo or
operated by PepsiCo directly. We entered into a business transfer agreement with PepsiCo India in November 2014 pursuant
to which we were granted the franchise for the 2015 New India Sub-Territories. We strategically target territories that either
have significant growth opportunities for PepsiCo products or are located contiguous or in close proximity to our existing
licensed territories and sub-territories such that we can benefit from operating and freight, transportation and distribution cost
efficiencies. We continue to work closely with PepsiCo to identify such strategic consolidation opportunities. We may also
consider acquisition of other third-party bottlers of PepsiCo which will require PepsiCo’s prior consent. We also continue to
explore expansion opportunities into new geographical markets, licensed territories and jurisdictions, where we can leverage
our operational experience or where low per capita consumption levels for beverages present opportunities for volume
135
growth. We believe that strategic acquisitions are effective catalysts for business growth, and take into account strategic
considerations to make investments that are complementary to our existing operations, focused on expanding our reach in
India and internationally in South Asia and Africa.
In recent years, we have expanded our operations in India through the acquisition of additional territories, with PepsiCo
granting license for additional territories to us, including territories operated directly by PepsiCo as well as third-party
bottlers. The 2015 Existing India Sub-Territories include the sub-territories in India that were granted prior to Fiscal 2011 and
the Goa and North-east sub-territories that were merged into our Company with effect from January 1, 2012. The subsidiaries
that held the franchises for the Nepal, Sri Lanka and Morocco territories were consolidated with our Company pursuant to the
amalgamation of VBIL into our Company with effect from January 1, 2012. In addition, part of the Delhi sub-territory was
acquired with effect from January 31, 2013. We have successfully integrated these territories and sub-territories into our
existing operations. As part of PepsiCo strategy of consolidating certain PepsiCo-operated territories in India under long-term
bottling partners, we entered into a business transfer agreement with PepsiCo India pursuant to which we were granted the
franchise for the 2015 New India Sub-Territories. The 2015 New India Sub-Territories are in most part geographically
contiguous with the 2015 Existing India Sub-Territories. Due to this contiguity, we are able to ensure cost and operational
efficiencies as well as economies of scale. The acquisition of franchisees for these 2015 New India Sub-Territories has
resulted in significant increase in Sales Volumes, resulting in an increase in revenues and profitability. We will continue to
focus on the integration of operations in these New India Sub-territories and any licensed territories or sub-territories we
acquire in the future with our existing production and distribution operations to benefit from operational efficiencies and
derive business synergies. We have also successfully leveraged our association with PepsiCo to expand our operations
internationally and have been granted franchisees for PepsiCo beverages in Nepal, Sri Lanka, Morocco, Zambia and
Mozambique.
Expand our distribution network and optimise distribution operations
We continue to focus on increasing Sales Volumes in our licensed territories and sub-territories by expanding our distribution
network, optimizing our distribution operations and increasing product supply to under-penetrated markets, particularly to
semi-urban and rural areas. We focus on optimal utilization of our existing distribution infrastructure by implementing
effective brand and product promotion strategies through intensive interaction with distributors, effective involvement of our
sales team at points of sale, and expanding the range of product offerings in certain markets and areas to specifically cater to
regional and local consumer preferences. As of June 30, 2016, we had 562 primary distributors (i.e., distributors that recorded
sales in excess of 0.5 million litres of our PepsiCo beverages in the 12 months ended June 30, 2016) in India and 415
distributors in our international operations. The 562 primary distributors in India accounted for 74.36% of our aggregate Sales
Volumes in India in the 12 months ended June 30, 2016. We intend to further expand our distribution network by setting up
additional distribution centers, consolidating existing distributors and increasing the number of distributors in under-
penetrated markets. We believe that these measures will enable us to increase the availability of our beverages across our
licensed territories and sub-territories which will in turn increase brand awareness and sales of PepsiCo beverages. We seek to
develop long-term relationships with our distributors by supporting the growth of their businesses, focusing on exclusive
distributor relationships and providing support services for their business such as visi-coolers, delivery vehicles and
marketing material.
We continue to focus on increasing retail presence of our licensed PepsiCo products, through increased brand promotion
activities, increased in-store product inventory as well as price competitiveness. We continue to evaluate strategic placement
of vending machines and visi-coolers at high density consumer areas such as malls, super-markets and large stores,
multiplexes and airports. The market for beverages sold from vending machines and visi-coolers for immediate consumption
is a fast growing segment, resulting from an emerging on-the-go lifestyle and consumer convenience. Single-serve sales
channels typically involve higher margins compared to sales of multi-serve SKUs. Sales in this segment depend on strategic
inventory management, rapid inventory deployment, and effective availability and placement of relevant chilling equipment
such as vending machines, visi-coolers and fountain dispensers in close proximity to high density consumer areas. We
continuously focus on placement of chilling equipment, and make significant investment annually on chilling equipment to be
placed in the market, and intend to continue to make significant investments on such equipment as we expand into new
markets and consolidate our position in existing licensed territories and sub-territories.
Continue to focus on cost efficiencies and invest in technology to improve operational efficiency
As an integral part of our continuing efforts targeted at ensuring cost efficiencies, we have undertaken a number of initiatives
aimed at reduction of cost of goods sold, effective management of operating expenses and improvement in cash flows. These
initiatives include backward integration of production facilities and having a centralised procurement team. We continue to
focus on consolidation of our production activities to ensure all components of our products are supplied internally. We have
introduced lower weight plastic bottles and decreased size of bottle caps, which has enabled us to reduce polyethylene
terephthalate (“PET”) costs. We also target increased margins through a reduction in freight and distribution costs, for
example, through introduction of a newly installed PET line at our Goa production facility. We believe this will enable us to
increase production volumes and improve operating margins. We have also acquired co-packing production facilities at
136
Phillaur in Punjab and Satharia in Uttar Pradesh. These acquisitions are expected to result in further cost savings and efficient
operations.
We continue to plan our capital expenditure carefully by focusing our investments on more profitable areas of our business,
such as chilled equipment for use in immediate-consumption channels. Through strategic capital investments for efficient
deployment of assets such as chilled equipment and distribution infrastructure, we intend to optimize the utilization of our
capital.
In addition, we continue to introduce advanced technologies in order to improve operational efficiencies and work processes
in our operations. We have introduced GPRS-enabled handheld devices and systems called SAMNA (Sales Automation
Management for the New Age) in certain of our operations to automate field work processes and enable access to real-time
sales information from production facilities, warehouses and distribution centers across India, thereby ensuring integrated
operational data from manufacturing, planned procurement and superior tracking of transportation of products from
distributors to final delivery to the retail point-of-sale. We continue to evaluate similar technologies targeted at improving
operating and cost efficiencies.
Relationship with PepsiCo
We are a strategic franchisee partner for PepsiCo in India and have over the years developed a significant and mutually
beneficial business association with ongoing operational synergies. Our association with PepsiCo has developed over the
years and this strong relationship is reflected in the large number of franchisee territories and sub-territories granted/
transferred to us and in particular the additional licenses to the 2015 New India Sub-Territories granted in our favour by
PepsiCo India with effect from February 28, 2015.
We manufacture, package, sell, and distribute beverage products under trademarks owned by PepsiCo. PepsiCo controls the
global marketing of PepsiCo’s brands and supplies us with relevant concentrates for the production of its CSD and NCB
products in our licensed territories and sub-territories. As a franchisee of PepsiCo products, we produce, package and sell the
beverage products of PepsiCo; engage in local marketing and promotional activities customized to specific markets; develop
business relationships with local customers and develop local distribution channels, e.g. through investment in chilling
equipment such as visi-coolers, ice chests, bottle coolers, delivery vehicles etc.; and distribute PepsiCo products to retailers,
which include traditional and modern retail outlets, either directly or indirectly, through distributors and wholesalers.
Our franchisee arrangements with PepsiCo for India are granted under four bottling appointment and trademark license
agreements, two dated October 3, 2012 executed with PepsiCo Inc, another dated October 3, 2012 with PepsiCo India and the
one effective from June 13, 2016 executed with Tropicana Products Inc., as amended from time to time (collectively, the
PepsiCo India Agreements) for the various licensed sub-territories in India. For our international operations, we have been
granted franchisee arrangements under 12 country specific bottling agreements, viz-a viz, (i) exclusive bottling appointment
agreement dated November 7, 2013 between PepsiCo Inc. and VBL Lanka; (ii) exclusive bottling appointment agreement
dated August 1, 2011 between PepsiCo Inc. and VBL Lanka; (iii) exclusive bottling appointment agreement dated August 1,
2011 between Seven-Up International, a division of CMCI and VBL Lanka; (iv) bottling appointment and trademark license
agreement dated October 30, 2013 between Tropicana Products Inc and VBL Lanka; (v) exclusive bottling appointment
agreement dated December 1, 2011 between PepsiCo Inc. and VBNPL, (vi) exclusive bottling appointment agreement dated
December 1, 2011 between Seven-Up International, a division of CMCI and VBNPL; (vii) exclusive bottling appointment
agreement dated September 1, 2010 between Seven-Up International, a division of CMCI and VBZL; (viii) exclusive bottling
appointment agreement dated September 1, 2010 between PepsiCo Inc. and VBZL; (ix) exclusive bottling appointment
agreement dated February 1, 2011 between PepsiCo Inc. and VBM; (x) exclusive bottling appointment agreement dated
February 1, 2011 between Seven-Up International, a division of CMCI and VBM; (xi) exclusive bottling appointment
agreement dated December 18, 2008 between PepsiCo Inc. and VBML effective from January 25, 2009; and (xii) exclusive
bottling appointment agreement dated December 18, 2008 between Seven-Up International, a division of CMCI and VBML
effective from January 25, 2009 (collectively, the “PepsiCo International Agreements”) with PepsiCo entities in the
respective jurisdictions; Our PepsiCo International Agreements relate to our franchise operations in Nepal, Sri Lanka,
Morocco, Zambia and Mozambique. In addition, we are in the process of setting up a greenfield facility in Zimbabwe in
anticipation of franchise rights being granted by PepsiCo Inc. for such territory. Further, our Company is trading in the
territory of Zimbabwe through our subsidiary Varun Beverages (Zimbabwe) (Private) Limited with effect from April 5, 2016.
Pursuant to the PepsiCo India Agreements applicable to the sub-territories in India and the PepsiCo International Agreements
for the territories of Nepal, Sri Lanka, Morocco, Zambia and Mozambique, we are licensed by PepsiCo (the relevant PepsiCo
entity in the respective jurisdiction) to use PepsiCo’s trademarks and brands in the relevant licensed territories and sub-
territories. These agreements enable us to use only those trademarks and brands that have been specifically licensed by
PepsiCo India / PepsiCo Inc. and / or the PepsiCo International Entities to us with respect to the relevant licensed territory or
sub-territory.
With respect to our licensed territories and sub-territories, PepsiCo India / PepsiCo Inc. and / or the PepsiCo International
Entities reserves the right for themselves and authorised third parties to undertake the production, sale and distribution of
beverage products for the relevant territories and sub-territories. However, historically, we have been the sole franchisee and
137
licensee with respect to our licensed territories and sub-territories. Our business operations are therefore entirely dependent on
the continuation of the relevant franchise arrangement and license to use PepsiCo trademarks and brands granted by PepsiCo
India / PepsiCo Inc. and / or the PepsiCo International Entities in our favour with respect to a specific territory or sub-
territory. See “Risk Factors — Termination or non-renewal of the PepsiCo India Agreements or the PepsiCo International
Agreements by PepsiCo India / PepsiCo Inc. or PepsiCo International Entities or any material modification to the existing
terms under such agreements adverse to our interest will materially and adversely affect our ability to continue our business
and operations and our future financial performance.” on page 22.
Our franchisee arrangements with PepsiCo India / PepsiCo Inc. and / or the PepsiCo International Entities stipulate that
PepsiCo India / PepsiCo Inc. and / or the PepsiCo International Entities will be entitled to set terms and conditions related to
our purchase of concentrates from PepsiCo India and relevant PepsiCo entities and their authorised suppliers including the
price of such concentrates. However, in practice, the concentrate price is determined by PepsiCo India / PepsiCo Inc. and / or
the PepsiCo International Entities in discussions with us, after taking into account the selling price, taxation, input cost and
market and other conditions. In the last five years the variance in the concentrate price purchased by us has been lower than
the increase in India’s consumer price index (CPI). CPI measures changes in the prices paid by consumers for a basket of
goods and services where such yearly (or monthly) growth rates represent the inflation rate in such period. See “Risk factors
— PepsiCo India / PepsiCo Inc. and / or the PepsiCo International Entities are entitled to various rights under the PepsiCo
India Agreements and the PepsiCo International Agreements, including the right to unilaterally determine the price of
PepsiCo beverage concentrates we purchase. In the event any such right is exercised by PepsiCo in a manner adverse to our
business interest, our business prospects and future financial performance will be materially and adversely affected.” on page
23.
Other notable arrangements with PepsiCo India / PepsiCo Inc. and / or the PepsiCo International Entities include purchases of
raw materials, cooling equipment and strategic marketing initiatives. We and PepsiCo review various aspects of our
operations. This includes review by PepsiCo of our supply chain operations, information services and sales organizations. In
addition, our objective is to further strengthen our relationship with PepsiCo and better align our economic interests and to
drive growth.
Research and Development
We also get the benefit of PepsiCo’s various research and development initiatives and its continued investment into research
and development. PepsiCo’s research and development activities principally involve: development of new ingredients and
products; reformulation and improvement in the quality and appeal of existing products; improvement and modernization of
manufacturing processes; improvements in product quality, safety and integrity; development of, and improvements in,
dispensing equipment, packaging technology, package design and portion sizes; and efforts focused on identifying
opportunities to transform, grow and broaden its product portfolio, including by developing products with improved nutrition
profiles that reduce sodium, saturated fat or added sugars, including through the use of sweetener alternatives and flavor
modifiers and innovation in existing sweeteners, and by offering more options with whole grains, fruits and vegetables. We
are also able to draw such research and development benefits from their various research centers including the one in India.
Franchise Arrangements for India Sub-Territories
Pursuant to the PepsiCo India Agreements, we have been granted the license to manufacture, sell and distribute
PepsiCo products under trademarks and brands owned by PepsiCo in certain specified sub-territories within the
territory of India. The PepsiCo India Agreements are valid for a period of ten years until October 2, 2022, and
PepsiCo India / PepsiCo Inc. may renew such agreements for an additional five years. The PepsiCo India
Agreements specify the PepsiCo brands licensed to us for the specific sub-territories in India, and applicable royalty
fee, if any, payable by us to PepsiCo India in this connection. The PepsiCo India Agreements also stipulate certain
performance parameters required to be maintained by us with respect to the relevant licensed sub-territories,
including certain quality and market share parameters. The PepsiCo India Agreements are non-exclusive franchisees
granted in our favour by PepsiCo India / PepsiCo Inc., and PepsiCo India / PepsiCo Inc. have under such
arrangements reserved the right to, without our consent, undertake production and distribution activities within our
licensed sub-territories in India either directly themselves or through third party bottlers.
Key terms of the PepsiCo India Agreements include the following:
Purchase of Concentrate. Concentrate cost represents our most significant raw material expenditure, and
under the PepsiCo India Agreements we are required to purchase the relevant concentrate for all PepsiCo
products produced by us exclusively either from PepsiCo or PepsiCo approved manufacturers at a price and
at terms and conditions determined from time to time by PepsiCo or such other approved manufacturer.
However, in practice, the concentrate price is determined by PepsiCo in discussions with us, after taking
into account the selling price, taxation, input cost and market and other relevant conditions. In order to
encourage promotion of new products and penetration into new markets, PepsiCo India allows concentrate
138
discounts from time to time, the quantum of which may vary from territory to territory and from period to
period.
Production Facilities and Quality Control. We are required to install and maintain adequate production
and distribution capacity to ensure that we are able to match the demand of PepsiCo products at any time.
We are required to establish, maintain and operate in our licensed territories, one or more production
facilities, adequately equipped and staffed for production of PepsiCo products. Such agreements also
stipulate that in preparing, packaging and distributing PepsiCo brand products, we will conform to the
production standards specified by PepsiCo and that PepsiCo representatives will be entitled to inspect our
production facilities at any time. We are required to use a particular water filtration process as specified by
PepsiCo, and PepsiCo is entitled to regularly test our products and inspect our production facilities to
ensure compliance with PepsiCo product quality standards. PepsiCo is also entitled to require us to rectify
any deficiency in our production process, or cease production of PepsiCo products at non-compliant
facilities, until such deficiencies in such production processes have been rectified.
Intellectual Property and Royalty. Under the franchise granted by PepsiCo, we have been licensed certain
PepsiCo owned trademarks, including Pepsi, Diet Pepsi, Seven-Up, Mirinda Orange, Mirinda Lemon,
Mountain Dew, Seven-Up Nimbooz Masala Soda, Seven-Up Revive, Evervess, Tropicana Slice, Nimbooz,
and Aquafina. We are required to pay a royalty to PepsiCo India for use of the trademark “LEHAR” in
conjunction with Aquafina and Evervess. PepsiCo India is entitled to revise the royalty rates from time to
time. In July 2013, we were also granted the license to use Teem by PepsiCo, without paying any royalty to
PepsiCo. We are currently not required to pay royalty for the use of any other PepsiCo trademarks, except,
“LEHAR” in conjunction with Aquafina and Evervess, as the licenses for the other products are governed
under the terms of the PepsiCo International Agreements with PepsiCo Inc. under which the concentrate is
supplied by PepsiCo for the other products.
Promotional and Marketing Support. PepsiCo continues to provide extensive advertising and marketing
support through ongoing brand promotion campaigns pan India. Our business benefits from the various
marketing campaigns implemented by PepsiCo. In the event we undertake any localized marketing
initiative, all advertisement and promotional materials relating to PepsiCo products and trademarks are
required to be approved in advance by PepsiCo in order to ensure consistency of trademarks and product
images. For promoting sale of goods in local areas and increasing the brand footprint, we also undertake
joint promotion campaigns with PepsiCo. In relation to the above we may be required to provide logistics
support and storage materials for such marketing and brand promotional initiatives. We are required to
ensure that an adequate number of visi-coolers have been placed within each licensed sub-territory in India.
In addition, we are required to ensure that all delivery vehicles, including the delivery vehicles of our
distributors, use colors and signage specified by PepsiCo. We endeavor to maximize visibility of PepsiCo
trademarks and brands in order to maximize sales of PepsiCo beverages in our licensed sub-territories.
Annual Operating Plan. We discuss and exchange business information with PepsiCo on a regular basis,
including with respect to production, marketing and distribution, and PepsiCo provides us significant
support including market strategies and best practices. We discuss with PepsiCo on an annual operating
plan relating to the Sales Volume targets for the relevant fiscal year, based on which we determine proposed
capital expenditure, volume capacity, distribution capacity and other operational resources. PepsiCo
continues to undertake extensive product development activities, and we are able to access new products
that PepsiCo develops. In addition, we are required to report to PepsiCo from time to time the sales
information of each of the PepsiCo products sold by us in the form requested by PepsiCo.
Performance Parameters. We are required to achieve and/or maintain certain performance parameters
stipulated for each calendar year agreed between us and PepsiCo India. These parameters relate to the Sales
Volumes, market share, cooling equipment penetration levels as well as quality standards for PepsiCo
products produced by us. Any non-compliance with these performance parameters beyond the stipulated
period results in a default of the terms of the PepsiCo India Agreements and provides PepsiCo India the
option to terminate the PepsiCo India Agreements.
Financial Covenants. We are required to maintain a minimum financial capability that is reasonably
required to ensure the performance of our obligations to PepsiCo under the franchise arrangements. We are
required to ensure that the debt to equity ratio for our Company (on a standalone basis) does not exceed 2:1,
as well as other financial parameters stipulated by PepsiCo India, failing which PepsiCo India is entitled to
terminate the PepsiCo India Agreements.
Packaging and Trademarks. We are required to distribute all PepsiCo products we produce in SKUs that
are designed in accordance with specifications stipulated by PepsiCo. PepsiCo must approve all packaging
and SKUs for PepsiCo beverages, including the size, shape, design and other attributes, and we are
139
restricted from producing other products or packages that imitate, infringe on, or may cause confusion with,
PepsiCo products, containers, trademarks or brands.
Non-Compete. We are prohibited from manufacturing, distributing or selling any non-PepsiCo products
that are an imitation of the PepsiCo products or could compete with PepsiCo products licensed/ franchised
to us.
Termination. PepsiCo may terminate the PepsiCo India Agreements prior to the expiry of the specified
term in the event of certain conditions, including, among others, insolvency, bankruptcy, change of
ownership, control or management of our Company. PepsiCo may terminate PepsiCo India Agreements in
the event that the terms and conditions of such arrangements, including the financial covenants provided in
such agreements are breached by us or in the event that operations are discontinued for more than 30 days
without the approval of PepsiCo. The PepsiCo India Agreements may also be terminated by PepsiCo in the
event of a default that is not remedied within the default cure period specified under the relevant bottling
agreement.
The PepsiCo India Agreements may also be terminated, among other grounds, if any competitor of PepsiCo (i)
acquires any shareholding or voting rights in any entity comprising our Promoter group, whether during or
subsequent to our initial public offering, (ii) if the acquirer gains indirect ownership or voting rights in our Company
in excess of 15.0% of our total outstanding shares; or (ii) acquires directly or indirectly any shareholding or voting
rights in our Company equal to or in excess of 15.0% of our total outstanding shares, whether during or subsequent
to our initial public offering. These agreements may also be terminated if similar agreements with PepsiCo are
terminated. PepsiCo India / PepsiCo Inc. is entitled to terminate the agreements without cause by providing 12
months' notice to us. On the termination of the agreements, PepsiCo is entitled to acquire all the shares of our
Company held by our Promoter Group at a price arrived at in accordance with the provisions of the PepsiCo India
Agreements as determined by an independent valuation expert. In the PepsiCo Agreements, ‘Promoter Group’
comprises of entities controlled by Mr. Ravi Kant Jaipuria, RJ Corp, Ravi Kant Jaipuria & Sons (HUF), Devyani
Enterprises Private Limited, Devyani Overseas Private Limited, the lineal descendants of Mr. Ravi Kant Jaipuria and
their respective spouses and relatives of Mr. Ravi Kant Jaipuria and companies controlled by such relatives of Mr.
Ravi Kant Jaipuria.
Franchisee Arrangements for International Territories
Through our subsidiaries, we have entered into PepsiCo International Agreements with the PepsiCo International
Entities in Sri Lanka, Morocco, Nepal, Zambia and Mozambique. The PepsiCo International Agreements for each of
our international licensed territories include terms and conditions similar to those in the PepsiCo India Agreements.
Under the PepsiCo International Agreements, PepsiCo International Entities retain the right to undertake the
production and distribution of PepsiCo products either directly or through other third party bottlers. These
agreements do not grant the franchise for all PepsiCo products for all the licensed territories, but for specific PepsiCo
products for specified licensed territories.
We have been granted the franchise for certain PepsiCo products in Morocco for five years until January 31, 2021, in
Nepal for ten years until November 30, 2021, in Zambia for five years until August 31, 2020, in Mozambique for
five years until January 24, 2019. In Sri Lanka we have been granted the franchise for Aquafina and Tropicana
products until July 31, 2021, and certain other PepsiCo products for 10 years until July 31, 2021. The PepsiCo
International Agreements do not contemplate franchisee rights of all PepsiCo products for all the licensed territories.
The franchises are granted for certain identified PepsiCo products in these particular territories. The PepsiCo
International Agreements are automatically renewed for successive five year terms if neither party provides notice of
termination.
In each of these international territories, we are obliged to purchase all required concentrate from PepsiCo
International Entities or authorized suppliers at specified terms and conditions. An indicative annual operating plan
is agreed upon for each licensed territory. The marketing and sales promotion activities in these territories are
executed by PepsiCo. However, in certain of these territories, we share the marketing and advertising expenditure
incurred. PepsiCo International Entities may terminate the PepsiCo International Agreements prior to the expiry of
the specified term in the event of certain conditions similar to those set out in the PepsiCo India Agreements.
We believe that we have at all times complied with the PepsiCo India Agreements and the PepsiCo International
Agreements. We have not received any intimation to the contrary from PepsiCo India / PepsiCo Inc. and / or the
PepsiCo International Entities.
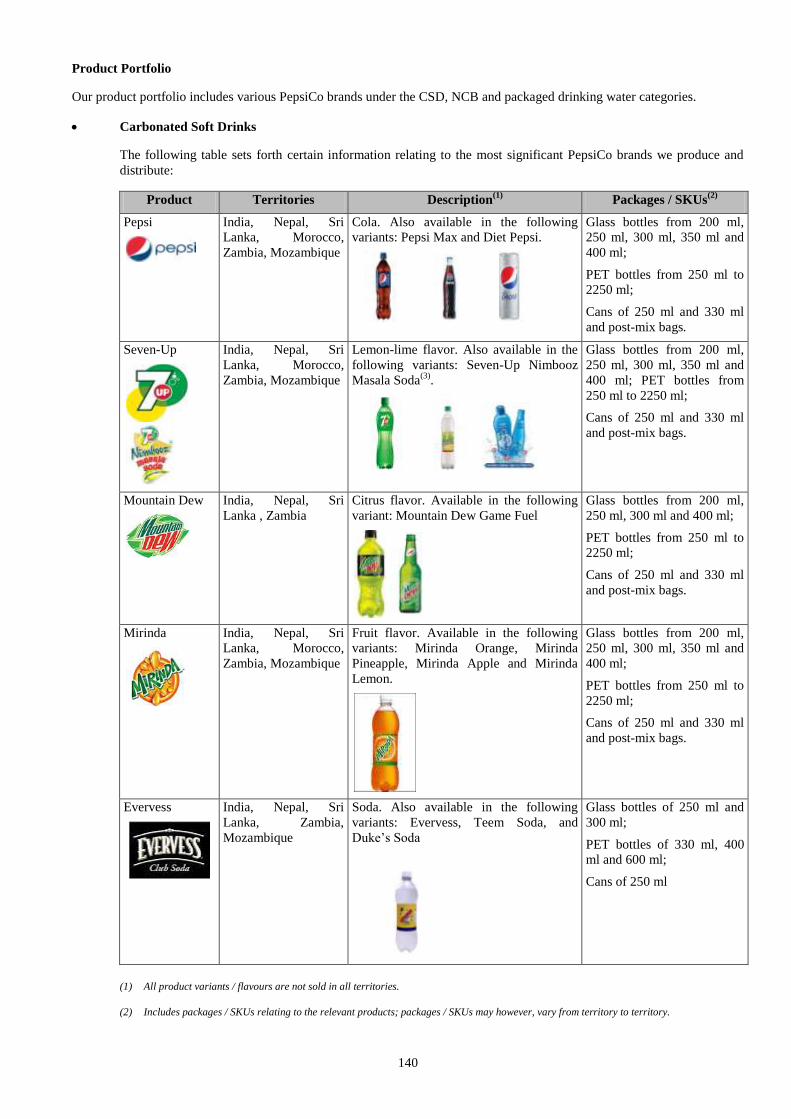
140
Product Portfolio
Our product portfolio includes various PepsiCo brands under the CSD, NCB and packaged drinking water categories.
Carbonated Soft Drinks
The following table sets forth certain information relating to the most significant PepsiCo brands we produce and
distribute:
Product Territories Description(1)
Packages / SKUs(2)
Pepsi
India, Nepal, Sri
Lanka, Morocco,
Zambia, Mozambique
Cola. Also available in the following
variants: Pepsi Max and Diet Pepsi.
Glass bottles from 200 ml,
250 ml, 300 ml, 350 ml and
400 ml;
PET bottles from 250 ml to
2250 ml;
Cans of 250 ml and 330 ml
and post-mix bags.
Seven-Up
India, Nepal, Sri
Lanka, Morocco,
Zambia, Mozambique
Lemon-lime flavor. Also available in the
following variants: Seven-Up Nimbooz
Masala Soda(3)
.
Glass bottles from 200 ml,
250 ml, 300 ml, 350 ml and
400 ml; PET bottles from
250 ml to 2250 ml;
Cans of 250 ml and 330 ml
and post-mix bags.
Mountain Dew
India, Nepal, Sri
Lanka , Zambia
Citrus flavor. Available in the following
variant: Mountain Dew Game Fuel
Glass bottles from 200 ml,
250 ml, 300 ml and 400 ml;
PET bottles from 250 ml to
2250 ml;
Cans of 250 ml and 330 ml
and post-mix bags.
Mirinda
India, Nepal, Sri
Lanka, Morocco,
Zambia, Mozambique
Fruit flavor. Available in the following
variants: Mirinda Orange, Mirinda
Pineapple, Mirinda Apple and Mirinda
Lemon.
Glass bottles from 200 ml,
250 ml, 300 ml, 350 ml and
400 ml;
PET bottles from 250 ml to
2250 ml;
Cans of 250 ml and 330 ml
and post-mix bags.
Evervess
India, Nepal, Sri
Lanka, Zambia,
Mozambique
Soda. Also available in the following
variants: Evervess, Teem Soda, and
Duke’s Soda
Glass bottles of 250 ml and
300 ml;
PET bottles of 330 ml, 400
ml and 600 ml;
Cans of 250 ml
(1) All product variants / flavours are not sold in all territories.
(2) Includes packages / SKUs relating to the relevant products; packages / SKUs may however, vary from territory to territory.
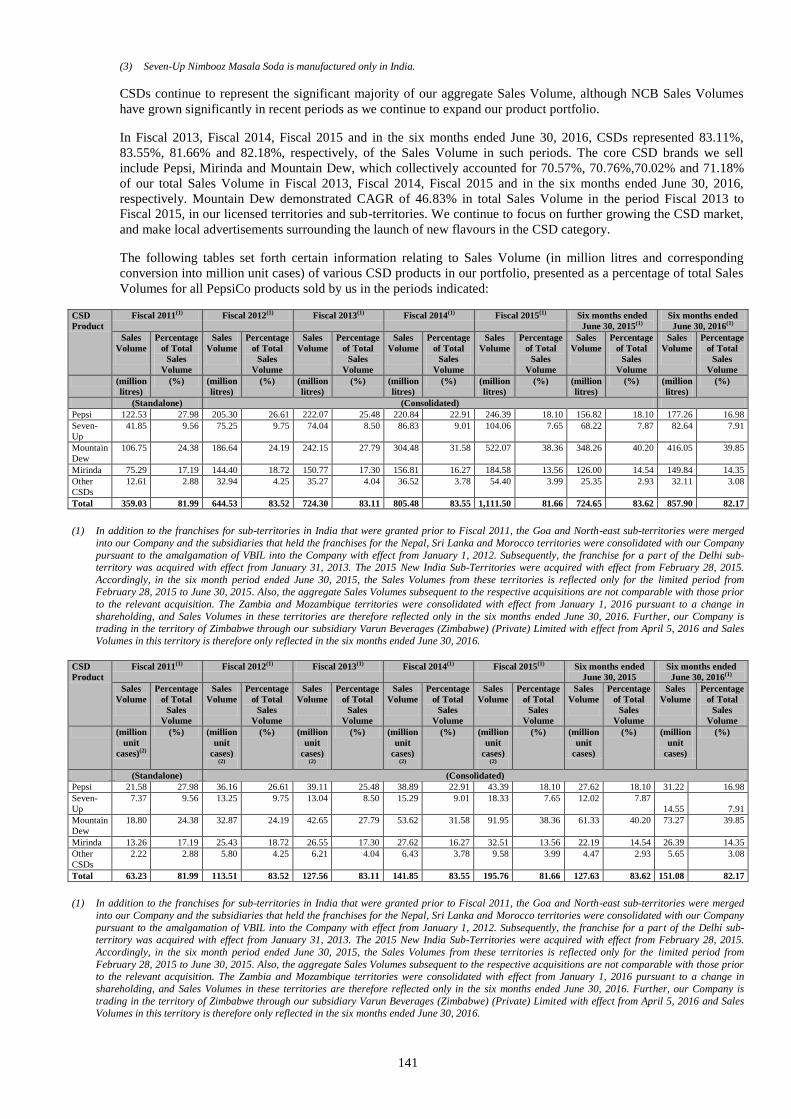
141
(3) Seven-Up Nimbooz Masala Soda is manufactured only in India.
CSDs continue to represent the significant majority of our aggregate Sales Volume, although NCB Sales Volumes
have grown significantly in recent periods as we continue to expand our product portfolio.
In Fiscal 2013, Fiscal 2014, Fiscal 2015 and in the six months ended June 30, 2016, CSDs represented 83.11%,
83.55%, 81.66% and 82.18%, respectively, of the Sales Volume in such periods. The core CSD brands we sell
include Pepsi, Mirinda and Mountain Dew, which collectively accounted for 70.57%, 70.76%,70.02% and 71.18%
of our total Sales Volume in Fiscal 2013, Fiscal 2014, Fiscal 2015 and in the six months ended June 30, 2016,
respectively. Mountain Dew demonstrated CAGR of 46.83% in total Sales Volume in the period Fiscal 2013 to
Fiscal 2015, in our licensed territories and sub-territories. We continue to focus on further growing the CSD market,
and make local advertisements surrounding the launch of new flavours in the CSD category.
The following tables set forth certain information relating to Sales Volume (in million litres and corresponding
conversion into million unit cases) of various CSD products in our portfolio, presented as a percentage of total Sales
Volumes for all PepsiCo products sold by us in the periods indicated:
CSD
Product
Fiscal 2011(1) Fiscal 2012(1) Fiscal 2013(1) Fiscal 2014(1) Fiscal 2015(1) Six months ended
June 30, 2015(1)
Six months ended
June 30, 2016(1)
Sales
Volume
Percentage
of Total
Sales
Volume
Sales
Volume
Percentage
of Total
Sales
Volume
Sales
Volume
Percentage
of Total
Sales
Volume
Sales
Volume
Percentage
of Total
Sales
Volume
Sales
Volume
Percentage
of Total
Sales
Volume
Sales
Volume
Percentage
of Total
Sales
Volume
Sales
Volume
Percentage
of Total
Sales
Volume
(million
litres)
(%) (million
litres)
(%) (million
litres)
(%) (million
litres)
(%) (million
litres)
(%) (million
litres)
(%) (million
litres)
(%)
(Standalone) (Consolidated)
Pepsi 122.53 27.98 205.30 26.61 222.07 25.48 220.84 22.91 246.39 18.10 156.82 18.10 177.26 16.98
Seven-
Up
41.85 9.56 75.25 9.75 74.04 8.50 86.83 9.01 104.06 7.65 68.22 7.87 82.64 7.91
Mountain
Dew
106.75 24.38 186.64 24.19 242.15 27.79 304.48 31.58 522.07 38.36 348.26 40.20 416.05 39.85
Mirinda 75.29 17.19 144.40 18.72 150.77 17.30 156.81 16.27 184.58 13.56 126.00 14.54 149.84 14.35
Other
CSDs
12.61 2.88 32.94 4.25 35.27 4.04 36.52 3.78 54.40 3.99 25.35 2.93 32.11 3.08
Total 359.03 81.99 644.53 83.52 724.30 83.11 805.48 83.55 1,111.50 81.66 724.65 83.62 857.90 82.17
(1) In addition to the franchises for sub-territories in India that were granted prior to Fiscal 2011, the Goa and North-east sub-territories were merged
into our Company and the subsidiaries that held the franchises for the Nepal, Sri Lanka and Morocco territories were consolidated with our Company
pursuant to the amalgamation of VBIL into the Company with effect from January 1, 2012. Subsequently, the franchise for a part of the Delhi sub-territory was acquired with effect from January 31, 2013. The 2015 New India Sub-Territories were acquired with effect from February 28, 2015.
Accordingly, in the six month period ended June 30, 2015, the Sales Volumes from these territories is reflected only for the limited period from February 28, 2015 to June 30, 2015. Also, the aggregate Sales Volumes subsequent to the respective acquisitions are not comparable with those prior
to the relevant acquisition. The Zambia and Mozambique territories were consolidated with effect from January 1, 2016 pursuant to a change in
shareholding, and Sales Volumes in these territories are therefore reflected only in the six months ended June 30, 2016. Further, our Company is trading in the territory of Zimbabwe through our subsidiary Varun Beverages (Zimbabwe) (Private) Limited with effect from April 5, 2016 and Sales
Volumes in this territory is therefore only reflected in the six months ended June 30, 2016.
CSD
Product
Fiscal 2011(1) Fiscal 2012(1) Fiscal 2013(1) Fiscal 2014(1) Fiscal 2015(1) Six months ended
June 30, 2015
Six months ended
June 30, 2016(1)
Sales
Volume
Percentage
of Total
Sales
Volume
Sales
Volume
Percentage
of Total
Sales
Volume
Sales
Volume
Percentage
of Total
Sales
Volume
Sales
Volume
Percentage
of Total
Sales
Volume
Sales
Volume
Percentage
of Total
Sales
Volume
Sales
Volume
Percentage
of Total
Sales
Volume
Sales
Volume
Percentage
of Total
Sales
Volume
(million
unit
cases)(2)
(%) (million
unit
cases)
(2)
(%) (million
unit
cases)
(2)
(%) (million
unit
cases)
(2)
(%) (million
unit
cases)
(2)
(%) (million
unit
cases)
(%) (million
unit
cases)
(%)
(Standalone) (Consolidated)
Pepsi 21.58 27.98 36.16 26.61 39.11 25.48 38.89 22.91 43.39 18.10 27.62 18.10 31.22 16.98
Seven-
Up
7.37 9.56 13.25 9.75 13.04 8.50 15.29 9.01 18.33 7.65 12.02 7.87
14.55 7.91
Mountain
Dew
18.80 24.38 32.87 24.19 42.65 27.79 53.62 31.58 91.95 38.36 61.33 40.20 73.27 39.85
Mirinda 13.26 17.19 25.43 18.72 26.55 17.30 27.62 16.27 32.51 13.56 22.19 14.54 26.39 14.35
Other
CSDs 2.22 2.88 5.80 4.25 6.21 4.04 6.43 3.78 9.58 3.99 4.47 2.93 5.65 3.08
Total 63.23 81.99 113.51 83.52 127.56 83.11 141.85 83.55 195.76 81.66 127.63 83.62 151.08 82.17
(1) In addition to the franchises for sub-territories in India that were granted prior to Fiscal 2011, the Goa and North-east sub-territories were merged
into our Company and the subsidiaries that held the franchises for the Nepal, Sri Lanka and Morocco territories were consolidated with our Company
pursuant to the amalgamation of VBIL into the Company with effect from January 1, 2012. Subsequently, the franchise for a part of the Delhi sub-territory was acquired with effect from January 31, 2013. The 2015 New India Sub-Territories were acquired with effect from February 28, 2015.
Accordingly, in the six month period ended June 30, 2015, the Sales Volumes from these territories is reflected only for the limited period from
February 28, 2015 to June 30, 2015. Also, the aggregate Sales Volumes subsequent to the respective acquisitions are not comparable with those prior to the relevant acquisition. The Zambia and Mozambique territories were consolidated with effect from January 1, 2016 pursuant to a change in
shareholding, and Sales Volumes in these territories are therefore reflected only in the six months ended June 30, 2016. Further, our Company is
trading in the territory of Zimbabwe through our subsidiary Varun Beverages (Zimbabwe) (Private) Limited with effect from April 5, 2016 and Sales Volumes in this territory is therefore only reflected in the six months ended June 30, 2016.
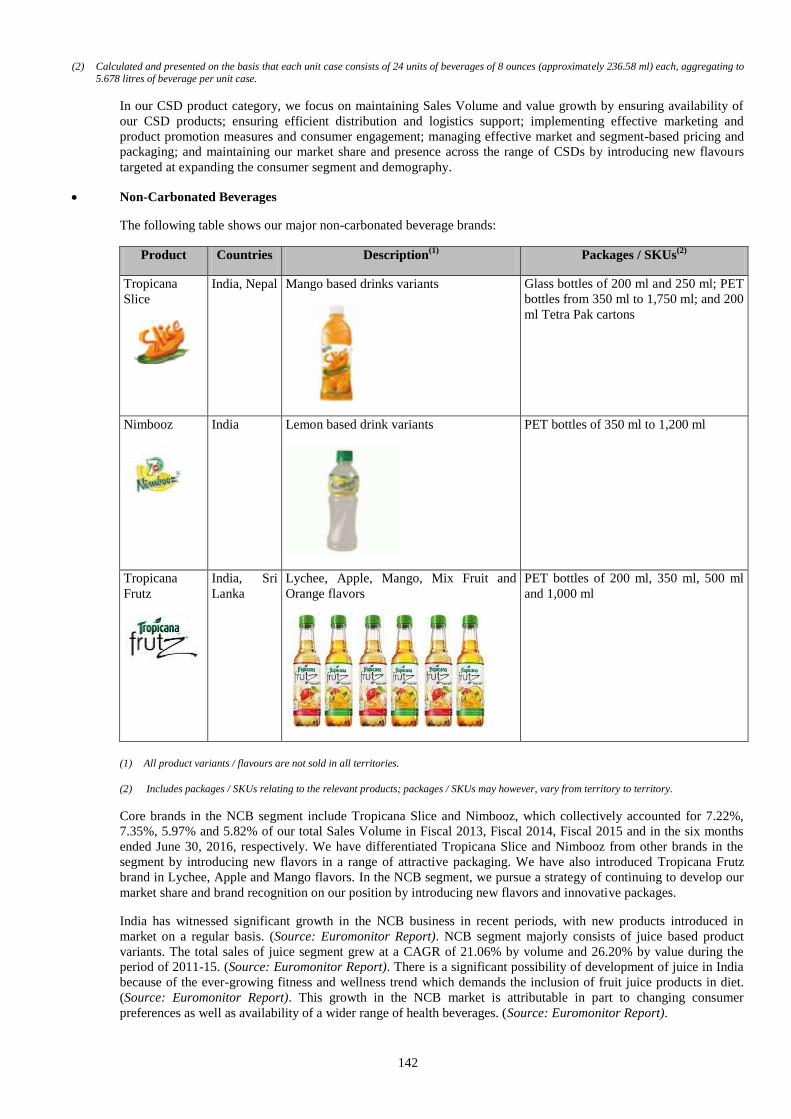
142
(2) Calculated and presented on the basis that each unit case consists of 24 units of beverages of 8 ounces (approximately 236.58 ml) each, aggregating to
5.678 litres of beverage per unit case.
In our CSD product category, we focus on maintaining Sales Volume and value growth by ensuring availability of
our CSD products; ensuring efficient distribution and logistics support; implementing effective marketing and
product promotion measures and consumer engagement; managing effective market and segment-based pricing and
packaging; and maintaining our market share and presence across the range of CSDs by introducing new flavours
targeted at expanding the consumer segment and demography.
Non-Carbonated Beverages
The following table shows our major non-carbonated beverage brands:
Product Countries Description(1)
Packages / SKUs(2)
Tropicana
Slice
India, Nepal Mango based drinks variants
Glass bottles of 200 ml and 250 ml; PET
bottles from 350 ml to 1,750 ml; and 200
ml Tetra Pak cartons
Nimbooz
India Lemon based drink variants
PET bottles of 350 ml to 1,200 ml
Tropicana
Frutz
India, Sri
Lanka
Lychee, Apple, Mango, Mix Fruit and
Orange flavors
PET bottles of 200 ml, 350 ml, 500 ml
and 1,000 ml
(1) All product variants / flavours are not sold in all territories.
(2) Includes packages / SKUs relating to the relevant products; packages / SKUs may however, vary from territory to territory.
Core brands in the NCB segment include Tropicana Slice and Nimbooz, which collectively accounted for 7.22%,
7.35%, 5.97% and 5.82% of our total Sales Volume in Fiscal 2013, Fiscal 2014, Fiscal 2015 and in the six months
ended June 30, 2016, respectively. We have differentiated Tropicana Slice and Nimbooz from other brands in the
segment by introducing new flavors in a range of attractive packaging. We have also introduced Tropicana Frutz
brand in Lychee, Apple and Mango flavors. In the NCB segment, we pursue a strategy of continuing to develop our
market share and brand recognition on our position by introducing new flavors and innovative packages.
India has witnessed significant growth in the NCB business in recent periods, with new products introduced in
market on a regular basis. (Source: Euromonitor Report). NCB segment majorly consists of juice based product
variants. The total sales of juice segment grew at a CAGR of 21.06% by volume and 26.20% by value during the
period of 2011-15. (Source: Euromonitor Report). There is a significant possibility of development of juice in India
because of the ever-growing fitness and wellness trend which demands the inclusion of fruit juice products in diet.
(Source: Euromonitor Report). This growth in the NCB market is attributable in part to changing consumer
preferences as well as availability of a wider range of health beverages. (Source: Euromonitor Report).
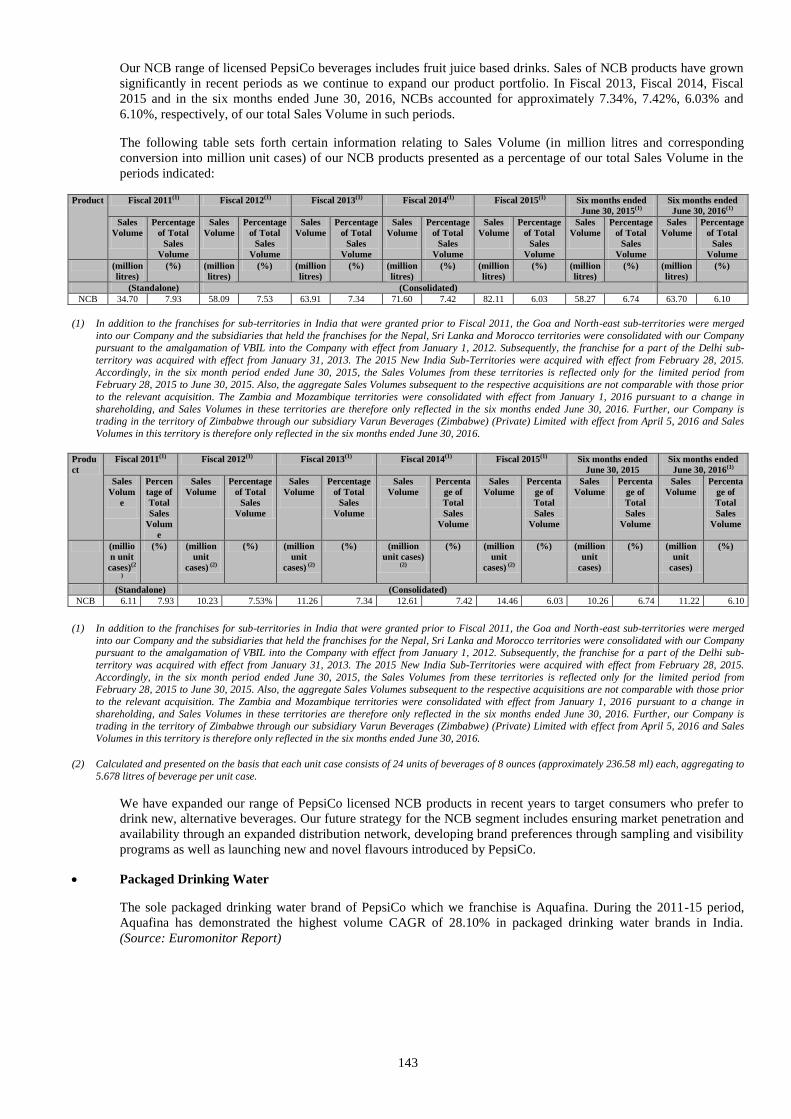
143
Our NCB range of licensed PepsiCo beverages includes fruit juice based drinks. Sales of NCB products have grown
significantly in recent periods as we continue to expand our product portfolio. In Fiscal 2013, Fiscal 2014, Fiscal
2015 and in the six months ended June 30, 2016, NCBs accounted for approximately 7.34%, 7.42%, 6.03% and
6.10%, respectively, of our total Sales Volume in such periods.
The following table sets forth certain information relating to Sales Volume (in million litres and corresponding
conversion into million unit cases) of our NCB products presented as a percentage of our total Sales Volume in the
periods indicated:
Product Fiscal 2011(1) Fiscal 2012(1) Fiscal 2013(1) Fiscal 2014(1) Fiscal 2015(1) Six months ended
June 30, 2015(1)
Six months ended
June 30, 2016(1)
Sales
Volume
Percentage
of Total
Sales
Volume
Sales
Volume
Percentage
of Total
Sales
Volume
Sales
Volume
Percentage
of Total
Sales
Volume
Sales
Volume
Percentage
of Total
Sales
Volume
Sales
Volume
Percentage
of Total
Sales
Volume
Sales
Volume
Percentage
of Total
Sales
Volume
Sales
Volume
Percentage
of Total
Sales
Volume
(million
litres)
(%) (million
litres)
(%) (million
litres)
(%) (million
litres)
(%) (million
litres)
(%) (million
litres)
(%) (million
litres)
(%)
(Standalone) (Consolidated)
NCB 34.70 7.93 58.09 7.53 63.91 7.34 71.60 7.42 82.11 6.03 58.27 6.74 63.70 6.10
(1) In addition to the franchises for sub-territories in India that were granted prior to Fiscal 2011, the Goa and North-east sub-territories were merged
into our Company and the subsidiaries that held the franchises for the Nepal, Sri Lanka and Morocco territories were consolidated with our Company
pursuant to the amalgamation of VBIL into the Company with effect from January 1, 2012. Subsequently, the franchise for a part of the Delhi sub-
territory was acquired with effect from January 31, 2013. The 2015 New India Sub-Territories were acquired with effect from February 28, 2015.
Accordingly, in the six month period ended June 30, 2015, the Sales Volumes from these territories is reflected only for the limited period from February 28, 2015 to June 30, 2015. Also, the aggregate Sales Volumes subsequent to the respective acquisitions are not comparable with those prior
to the relevant acquisition. The Zambia and Mozambique territories were consolidated with effect from January 1, 2016 pursuant to a change in
shareholding, and Sales Volumes in these territories are therefore only reflected in the six months ended June 30, 2016. Further, our Company is trading in the territory of Zimbabwe through our subsidiary Varun Beverages (Zimbabwe) (Private) Limited with effect from April 5, 2016 and Sales
Volumes in this territory is therefore only reflected in the six months ended June 30, 2016.
Produ
ct
Fiscal 2011(1) Fiscal 2012(1) Fiscal 2013(1) Fiscal 2014(1) Fiscal 2015(1) Six months ended
June 30, 2015
Six months ended
June 30, 2016(1)
Sales
Volum
e
Percen
tage of
Total
Sales
Volum
e
Sales
Volume
Percentage
of Total
Sales
Volume
Sales
Volume
Percentage
of Total
Sales
Volume
Sales
Volume
Percenta
ge of
Total
Sales
Volume
Sales
Volume
Percenta
ge of
Total
Sales
Volume
Sales
Volume
Percenta
ge of
Total
Sales
Volume
Sales
Volume
Percenta
ge of
Total
Sales
Volume
(millio
n unit
cases)(2
)
(%) (million
unit
cases) (2)
(%) (million
unit
cases) (2)
(%) (million
unit cases)
(2)
(%) (million
unit
cases) (2)
(%) (million
unit
cases)
(%) (million
unit
cases)
(%)
(Standalone) (Consolidated)
NCB 6.11 7.93 10.23 7.53% 11.26 7.34 12.61 7.42 14.46 6.03 10.26 6.74 11.22 6.10
(1) In addition to the franchises for sub-territories in India that were granted prior to Fiscal 2011, the Goa and North-east sub-territories were merged
into our Company and the subsidiaries that held the franchises for the Nepal, Sri Lanka and Morocco territories were consolidated with our Company pursuant to the amalgamation of VBIL into the Company with effect from January 1, 2012. Subsequently, the franchise for a part of the Delhi sub-
territory was acquired with effect from January 31, 2013. The 2015 New India Sub-Territories were acquired with effect from February 28, 2015.
Accordingly, in the six month period ended June 30, 2015, the Sales Volumes from these territories is reflected only for the limited period from February 28, 2015 to June 30, 2015. Also, the aggregate Sales Volumes subsequent to the respective acquisitions are not comparable with those prior
to the relevant acquisition. The Zambia and Mozambique territories were consolidated with effect from January 1, 2016 pursuant to a change in
shareholding, and Sales Volumes in these territories are therefore only reflected in the six months ended June 30, 2016. Further, our Company is trading in the territory of Zimbabwe through our subsidiary Varun Beverages (Zimbabwe) (Private) Limited with effect from April 5, 2016 and Sales
Volumes in this territory is therefore only reflected in the six months ended June 30, 2016.
(2) Calculated and presented on the basis that each unit case consists of 24 units of beverages of 8 ounces (approximately 236.58 ml) each, aggregating to
5.678 litres of beverage per unit case.
We have expanded our range of PepsiCo licensed NCB products in recent years to target consumers who prefer to
drink new, alternative beverages. Our future strategy for the NCB segment includes ensuring market penetration and
availability through an expanded distribution network, developing brand preferences through sampling and visibility
programs as well as launching new and novel flavours introduced by PepsiCo.
Packaged Drinking Water
The sole packaged drinking water brand of PepsiCo which we franchise is Aquafina. During the 2011-15 period,
Aquafina has demonstrated the highest volume CAGR of 28.10% in packaged drinking water brands in India.
(Source: Euromonitor Report)
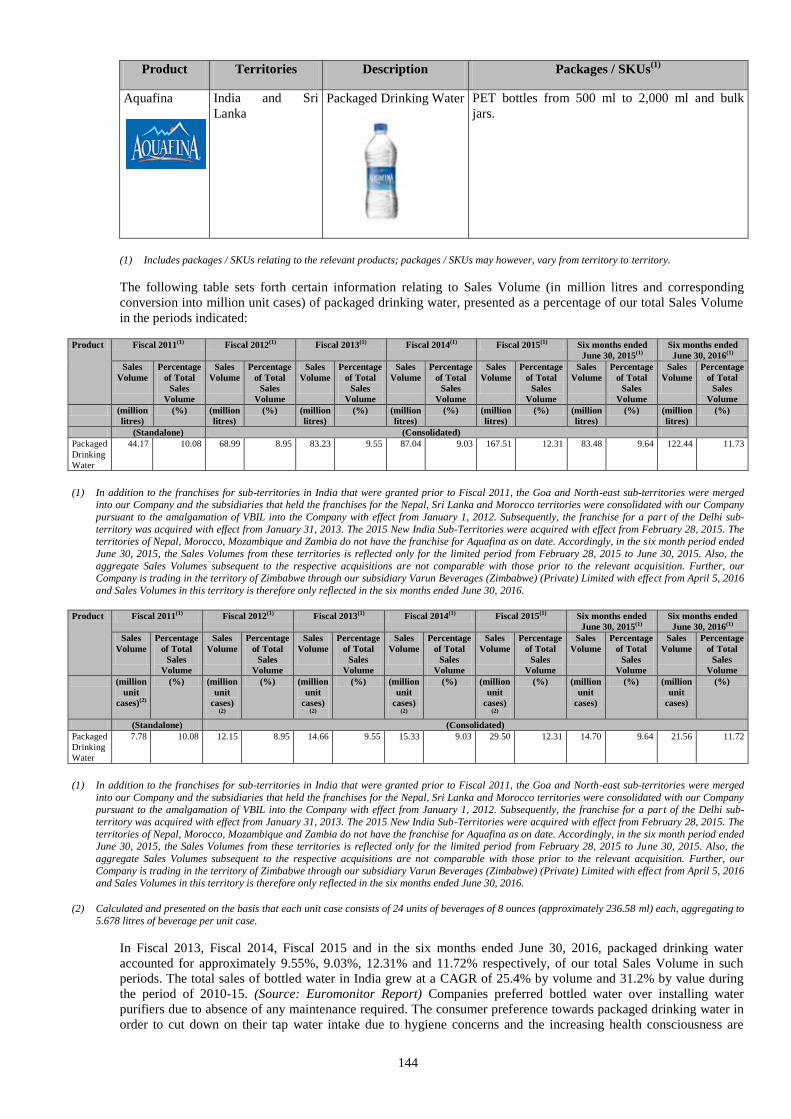
144
Product Territories Description Packages / SKUs(1)
Aquafina
India and Sri
Lanka
Packaged Drinking Water
PET bottles from 500 ml to 2,000 ml and bulk
jars.
(1) Includes packages / SKUs relating to the relevant products; packages / SKUs may however, vary from territory to territory.
The following table sets forth certain information relating to Sales Volume (in million litres and corresponding
conversion into million unit cases) of packaged drinking water, presented as a percentage of our total Sales Volume
in the periods indicated:
Product Fiscal 2011(1) Fiscal 2012(1) Fiscal 2013(1) Fiscal 2014(1) Fiscal 2015(1) Six months ended
June 30, 2015(1)
Six months ended
June 30, 2016(1)
Sales
Volume
Percentage
of Total
Sales
Volume
Sales
Volume
Percentage
of Total
Sales
Volume
Sales
Volume
Percentage
of Total
Sales
Volume
Sales
Volume
Percentage
of Total
Sales
Volume
Sales
Volume
Percentage
of Total
Sales
Volume
Sales
Volume
Percentage
of Total
Sales
Volume
Sales
Volume
Percentage
of Total
Sales
Volume
(million
litres)
(%) (million
litres)
(%) (million
litres)
(%) (million
litres)
(%) (million
litres)
(%) (million
litres)
(%) (million
litres)
(%)
(Standalone) (Consolidated)
Packaged
Drinking
Water
44.17 10.08 68.99 8.95 83.23 9.55 87.04 9.03 167.51 12.31 83.48 9.64 122.44 11.73
(1) In addition to the franchises for sub-territories in India that were granted prior to Fiscal 2011, the Goa and North-east sub-territories were merged
into our Company and the subsidiaries that held the franchises for the Nepal, Sri Lanka and Morocco territories were consolidated with our Company
pursuant to the amalgamation of VBIL into the Company with effect from January 1, 2012. Subsequently, the franchise for a part of the Delhi sub-
territory was acquired with effect from January 31, 2013. The 2015 New India Sub-Territories were acquired with effect from February 28, 2015. The territories of Nepal, Morocco, Mozambique and Zambia do not have the franchise for Aquafina as on date. Accordingly, in the six month period ended
June 30, 2015, the Sales Volumes from these territories is reflected only for the limited period from February 28, 2015 to June 30, 2015. Also, the
aggregate Sales Volumes subsequent to the respective acquisitions are not comparable with those prior to the relevant acquisition. Further, our Company is trading in the territory of Zimbabwe through our subsidiary Varun Beverages (Zimbabwe) (Private) Limited with effect from April 5, 2016
and Sales Volumes in this territory is therefore only reflected in the six months ended June 30, 2016.
Product Fiscal 2011(1) Fiscal 2012(1) Fiscal 2013(1) Fiscal 2014(1) Fiscal 2015(1) Six months ended
June 30, 2015(1)
Six months ended
June 30, 2016(1)
Sales
Volume
Percentage
of Total
Sales
Volume
Sales
Volume
Percentage
of Total
Sales
Volume
Sales
Volume
Percentage
of Total
Sales
Volume
Sales
Volume
Percentage
of Total
Sales
Volume
Sales
Volume
Percentage
of Total
Sales
Volume
Sales
Volume
Percentage
of Total
Sales
Volume
Sales
Volume
Percentage
of Total
Sales
Volume
(million
unit
cases)(2)
(%) (million
unit
cases)
(2)
(%) (million
unit
cases)
(2)
(%) (million
unit
cases)
(2)
(%) (million
unit
cases)
(2)
(%) (million
unit
cases)
(%) (million
unit
cases)
(%)
(Standalone) (Consolidated)
Packaged
Drinking
Water
7.78 10.08 12.15 8.95 14.66 9.55 15.33 9.03 29.50 12.31 14.70 9.64 21.56 11.72
(1) In addition to the franchises for sub-territories in India that were granted prior to Fiscal 2011, the Goa and North-east sub-territories were merged
into our Company and the subsidiaries that held the franchises for the Nepal, Sri Lanka and Morocco territories were consolidated with our Company pursuant to the amalgamation of VBIL into the Company with effect from January 1, 2012. Subsequently, the franchise for a part of the Delhi sub-
territory was acquired with effect from January 31, 2013. The 2015 New India Sub-Territories were acquired with effect from February 28, 2015. The
territories of Nepal, Morocco, Mozambique and Zambia do not have the franchise for Aquafina as on date. Accordingly, in the six month period ended June 30, 2015, the Sales Volumes from these territories is reflected only for the limited period from February 28, 2015 to June 30, 2015. Also, the
aggregate Sales Volumes subsequent to the respective acquisitions are not comparable with those prior to the relevant acquisition. Further, our
Company is trading in the territory of Zimbabwe through our subsidiary Varun Beverages (Zimbabwe) (Private) Limited with effect from April 5, 2016 and Sales Volumes in this territory is therefore only reflected in the six months ended June 30, 2016.
(2) Calculated and presented on the basis that each unit case consists of 24 units of beverages of 8 ounces (approximately 236.58 ml) each, aggregating to
5.678 litres of beverage per unit case.
In Fiscal 2013, Fiscal 2014, Fiscal 2015 and in the six months ended June 30, 2016, packaged drinking water
accounted for approximately 9.55%, 9.03%, 12.31% and 11.72% respectively, of our total Sales Volume in such
periods. The total sales of bottled water in India grew at a CAGR of 25.4% by volume and 31.2% by value during
the period of 2010-15. (Source: Euromonitor Report) Companies preferred bottled water over installing water
purifiers due to absence of any maintenance required. The consumer preference towards packaged drinking water in
order to cut down on their tap water intake due to hygiene concerns and the increasing health consciousness are
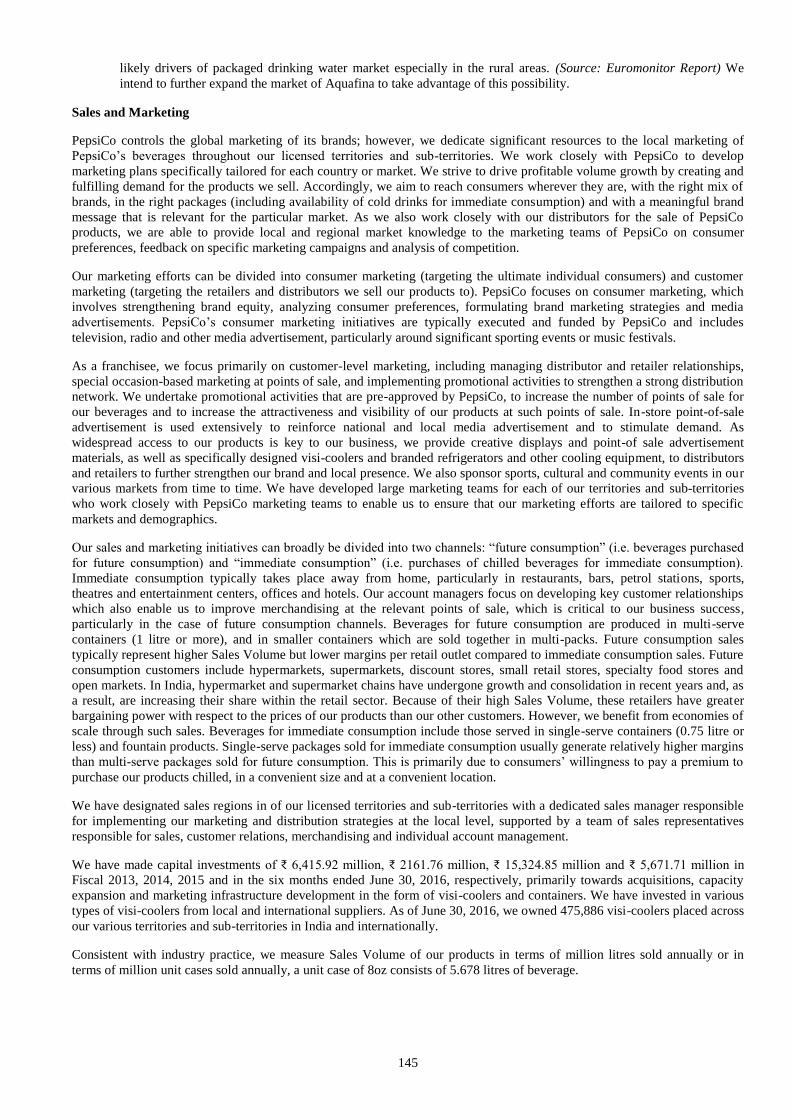
145
likely drivers of packaged drinking water market especially in the rural areas. (Source: Euromonitor Report) We
intend to further expand the market of Aquafina to take advantage of this possibility.
Sales and Marketing
PepsiCo controls the global marketing of its brands; however, we dedicate significant resources to the local marketing of
PepsiCo’s beverages throughout our licensed territories and sub-territories. We work closely with PepsiCo to develop
marketing plans specifically tailored for each country or market. We strive to drive profitable volume growth by creating and
fulfilling demand for the products we sell. Accordingly, we aim to reach consumers wherever they are, with the right mix of
brands, in the right packages (including availability of cold drinks for immediate consumption) and with a meaningful brand
message that is relevant for the particular market. As we also work closely with our distributors for the sale of PepsiCo
products, we are able to provide local and regional market knowledge to the marketing teams of PepsiCo on consumer
preferences, feedback on specific marketing campaigns and analysis of competition.
Our marketing efforts can be divided into consumer marketing (targeting the ultimate individual consumers) and customer
marketing (targeting the retailers and distributors we sell our products to). PepsiCo focuses on consumer marketing, which
involves strengthening brand equity, analyzing consumer preferences, formulating brand marketing strategies and media
advertisements. PepsiCo’s consumer marketing initiatives are typically executed and funded by PepsiCo and includes
television, radio and other media advertisement, particularly around significant sporting events or music festivals.
As a franchisee, we focus primarily on customer-level marketing, including managing distributor and retailer relationships,
special occasion-based marketing at points of sale, and implementing promotional activities to strengthen a strong distribution
network. We undertake promotional activities that are pre-approved by PepsiCo, to increase the number of points of sale for
our beverages and to increase the attractiveness and visibility of our products at such points of sale. In-store point-of-sale
advertisement is used extensively to reinforce national and local media advertisement and to stimulate demand. As
widespread access to our products is key to our business, we provide creative displays and point-of sale advertisement
materials, as well as specifically designed visi-coolers and branded refrigerators and other cooling equipment, to distributors
and retailers to further strengthen our brand and local presence. We also sponsor sports, cultural and community events in our
various markets from time to time. We have developed large marketing teams for each of our territories and sub-territories
who work closely with PepsiCo marketing teams to enable us to ensure that our marketing efforts are tailored to specific
markets and demographics.
Our sales and marketing initiatives can broadly be divided into two channels: “future consumption” (i.e. beverages purchased
for future consumption) and “immediate consumption” (i.e. purchases of chilled beverages for immediate consumption).
Immediate consumption typically takes place away from home, particularly in restaurants, bars, petrol stations, sports,
theatres and entertainment centers, offices and hotels. Our account managers focus on developing key customer relationships
which also enable us to improve merchandising at the relevant points of sale, which is critical to our business success,
particularly in the case of future consumption channels. Beverages for future consumption are produced in multi-serve
containers (1 litre or more), and in smaller containers which are sold together in multi-packs. Future consumption sales
typically represent higher Sales Volume but lower margins per retail outlet compared to immediate consumption sales. Future
consumption customers include hypermarkets, supermarkets, discount stores, small retail stores, specialty food stores and
open markets. In India, hypermarket and supermarket chains have undergone growth and consolidation in recent years and, as
a result, are increasing their share within the retail sector. Because of their high Sales Volume, these retailers have greater
bargaining power with respect to the prices of our products than our other customers. However, we benefit from economies of
scale through such sales. Beverages for immediate consumption include those served in single-serve containers (0.75 litre or
less) and fountain products. Single-serve packages sold for immediate consumption usually generate relatively higher margins
than multi-serve packages sold for future consumption. This is primarily due to consumers’ willingness to pay a premium to
purchase our products chilled, in a convenient size and at a convenient location.
We have designated sales regions in of our licensed territories and sub-territories with a dedicated sales manager responsible
for implementing our marketing and distribution strategies at the local level, supported by a team of sales representatives
responsible for sales, customer relations, merchandising and individual account management.
We have made capital investments of ₹ 6,415.92 million, ₹ 2161.76 million, ₹ 15,324.85 million and ₹ 5,671.71 million in
Fiscal 2013, 2014, 2015 and in the six months ended June 30, 2016, respectively, primarily towards acquisitions, capacity
expansion and marketing infrastructure development in the form of visi-coolers and containers. We have invested in various
types of visi-coolers from local and international suppliers. As of June 30, 2016, we owned 475,886 visi-coolers placed across
our various territories and sub-territories in India and internationally.
Consistent with industry practice, we measure Sales Volume of our products in terms of million litres sold annually or in
terms of million unit cases sold annually, a unit case of 8oz consists of 5.678 litres of beverage.
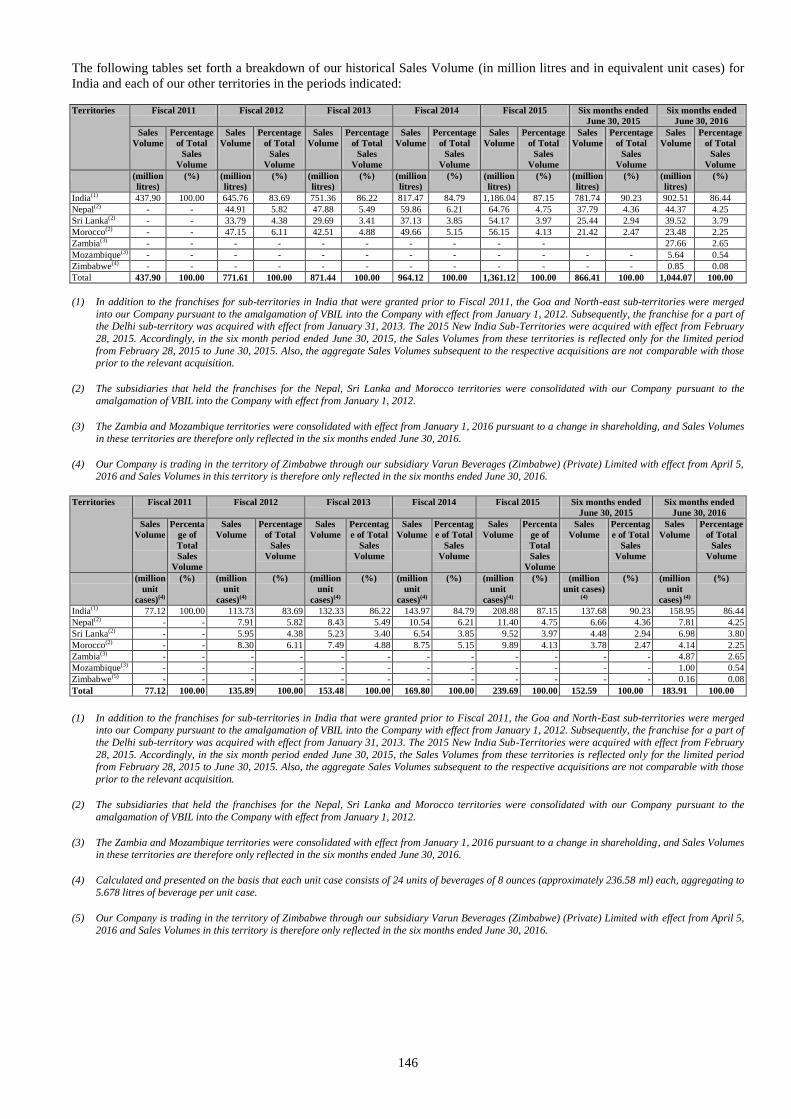
146
The following tables set forth a breakdown of our historical Sales Volume (in million litres and in equivalent unit cases) for
India and each of our other territories in the periods indicated:
Territories Fiscal 2011 Fiscal 2012 Fiscal 2013 Fiscal 2014 Fiscal 2015 Six months ended
June 30, 2015
Six months ended
June 30, 2016
Sales
Volume
Percentage
of Total
Sales
Volume
Sales
Volume
Percentage
of Total
Sales
Volume
Sales
Volume
Percentage
of Total
Sales
Volume
Sales
Volume
Percentage
of Total
Sales
Volume
Sales
Volume
Percentage
of Total
Sales
Volume
Sales
Volume
Percentage
of Total
Sales
Volume
Sales
Volume
Percentage
of Total
Sales
Volume
(million
litres)
(%) (million
litres)
(%) (million
litres)
(%) (million
litres)
(%) (million
litres)
(%) (million
litres)
(%) (million
litres)
(%)
India(1) 437.90 100.00 645.76 83.69 751.36 86.22 817.47 84.79 1,186.04 87.15 781.74 90.23 902.51 86.44
Nepal(2) - - 44.91 5.82 47.88 5.49 59.86 6.21 64.76 4.75 37.79 4.36 44.37 4.25
Sri Lanka(2) - - 33.79 4.38 29.69 3.41 37.13 3.85 54.17 3.97 25.44 2.94 39.52 3.79
Morocco(2) - - 47.15 6.11 42.51 4.88 49.66 5.15 56.15 4.13 21.42 2.47 23.48 2.25
Zambia(3) - - - - - - - - - - 27.66 2.65
Mozambique(3) - - - - - - - - - - - - 5.64 0.54
Zimbabwe(4) - - - - - - - - - - - - 0.85 0.08
Total 437.90 100.00 771.61 100.00 871.44 100.00 964.12 100.00 1,361.12 100.00 866.41 100.00 1,044.07 100.00
(1) In addition to the franchises for sub-territories in India that were granted prior to Fiscal 2011, the Goa and North-east sub-territories were merged
into our Company pursuant to the amalgamation of VBIL into the Company with effect from January 1, 2012. Subsequently, the franchise for a part of the Delhi sub-territory was acquired with effect from January 31, 2013. The 2015 New India Sub-Territories were acquired with effect from February
28, 2015. Accordingly, in the six month period ended June 30, 2015, the Sales Volumes from these territories is reflected only for the limited period
from February 28, 2015 to June 30, 2015. Also, the aggregate Sales Volumes subsequent to the respective acquisitions are not comparable with those prior to the relevant acquisition.
(2) The subsidiaries that held the franchises for the Nepal, Sri Lanka and Morocco territories were consolidated with our Company pursuant to the
amalgamation of VBIL into the Company with effect from January 1, 2012.
(3) The Zambia and Mozambique territories were consolidated with effect from January 1, 2016 pursuant to a change in shareholding, and Sales Volumes
in these territories are therefore only reflected in the six months ended June 30, 2016.
(4) Our Company is trading in the territory of Zimbabwe through our subsidiary Varun Beverages (Zimbabwe) (Private) Limited with effect from April 5, 2016 and Sales Volumes in this territory is therefore only reflected in the six months ended June 30, 2016.
Territories Fiscal 2011 Fiscal 2012 Fiscal 2013 Fiscal 2014 Fiscal 2015 Six months ended
June 30, 2015
Six months ended
June 30, 2016
Sales
Volume
Percenta
ge of
Total
Sales
Volume
Sales
Volume
Percentage
of Total
Sales
Volume
Sales
Volume
Percentag
e of Total
Sales
Volume
Sales
Volume
Percentag
e of Total
Sales
Volume
Sales
Volume
Percenta
ge of
Total
Sales
Volume
Sales
Volume
Percentag
e of Total
Sales
Volume
Sales
Volume
Percentage
of Total
Sales
Volume
(million
unit
cases)(4)
(%) (million
unit
cases)(4)
(%) (million
unit
cases)(4)
(%) (million
unit
cases)(4)
(%) (million
unit
cases)(4)
(%) (million
unit cases)
(4)
(%) (million
unit
cases) (4)
(%)
India(1) 77.12 100.00 113.73 83.69 132.33 86.22 143.97 84.79 208.88 87.15 137.68 90.23 158.95 86.44
Nepal(2) - - 7.91 5.82 8.43 5.49 10.54 6.21 11.40 4.75 6.66 4.36 7.81 4.25
Sri Lanka(2) - - 5.95 4.38 5.23 3.40 6.54 3.85 9.52 3.97 4.48 2.94 6.98 3.80
Morocco(2) - - 8.30 6.11 7.49 4.88 8.75 5.15 9.89 4.13 3.78 2.47 4.14 2.25
Zambia(3) - - - - - - - - - - - - 4.87 2.65
Mozambique(3) - - - - - - - - - - - - 1.00 0.54
Zimbabwe(5) - - - - - - - - - - - - 0.16 0.08
Total 77.12 100.00 135.89 100.00 153.48 100.00 169.80 100.00 239.69 100.00 152.59 100.00 183.91 100.00
(1) In addition to the franchises for sub-territories in India that were granted prior to Fiscal 2011, the Goa and North-East sub-territories were merged
into our Company pursuant to the amalgamation of VBIL into the Company with effect from January 1, 2012. Subsequently, the franchise for a part of
the Delhi sub-territory was acquired with effect from January 31, 2013. The 2015 New India Sub-Territories were acquired with effect from February
28, 2015. Accordingly, in the six month period ended June 30, 2015, the Sales Volumes from these territories is reflected only for the limited period from February 28, 2015 to June 30, 2015. Also, the aggregate Sales Volumes subsequent to the respective acquisitions are not comparable with those
prior to the relevant acquisition.
(2) The subsidiaries that held the franchises for the Nepal, Sri Lanka and Morocco territories were consolidated with our Company pursuant to the
amalgamation of VBIL into the Company with effect from January 1, 2012.
(3) The Zambia and Mozambique territories were consolidated with effect from January 1, 2016 pursuant to a change in shareholding, and Sales Volumes in these territories are therefore only reflected in the six months ended June 30, 2016.
(4) Calculated and presented on the basis that each unit case consists of 24 units of beverages of 8 ounces (approximately 236.58 ml) each, aggregating to
5.678 litres of beverage per unit case.
(5) Our Company is trading in the territory of Zimbabwe through our subsidiary Varun Beverages (Zimbabwe) (Private) Limited with effect from April 5,
2016 and Sales Volumes in this territory is therefore only reflected in the six months ended June 30, 2016.
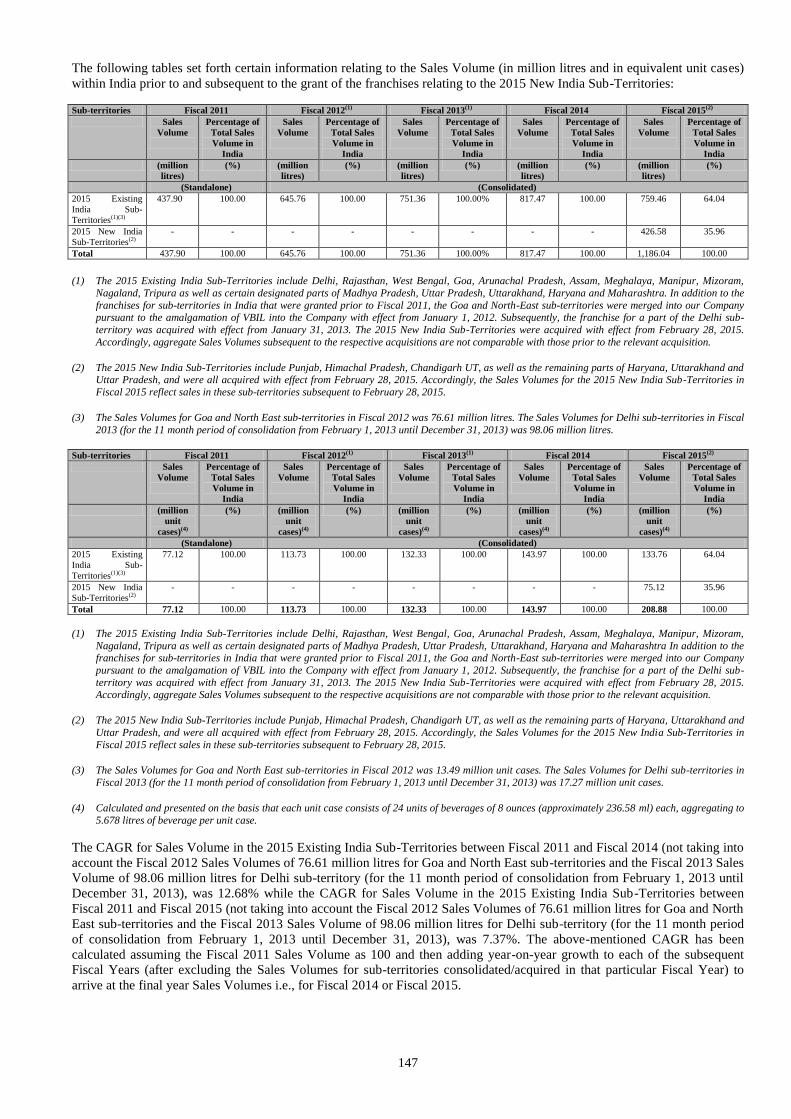
147
The following tables set forth certain information relating to the Sales Volume (in million litres and in equivalent unit cases)
within India prior to and subsequent to the grant of the franchises relating to the 2015 New India Sub-Territories:
Sub-territories Fiscal 2011 Fiscal 2012(1) Fiscal 2013(1) Fiscal 2014 Fiscal 2015(2)
Sales
Volume
Percentage of
Total Sales
Volume in
India
Sales
Volume
Percentage of
Total Sales
Volume in
India
Sales
Volume
Percentage of
Total Sales
Volume in
India
Sales
Volume
Percentage of
Total Sales
Volume in
India
Sales
Volume
Percentage of
Total Sales
Volume in
India
(million
litres) (%) (million
litres)
(%) (million
litres)
(%) (million
litres)
(%) (million
litres)
(%)
(Standalone) (Consolidated)
2015 Existing
India Sub-
Territories(1)(3)
437.90 100.00 645.76 100.00 751.36 100.00% 817.47 100.00 759.46 64.04
2015 New India
Sub-Territories(2)
- - - - - - - - 426.58 35.96
Total 437.90 100.00 645.76 100.00 751.36 100.00% 817.47 100.00 1,186.04 100.00
(1) The 2015 Existing India Sub-Territories include Delhi, Rajasthan, West Bengal, Goa, Arunachal Pradesh, Assam, Meghalaya, Manipur, Mizoram,
Nagaland, Tripura as well as certain designated parts of Madhya Pradesh, Uttar Pradesh, Uttarakhand, Haryana and Maharashtra. In addition to the
franchises for sub-territories in India that were granted prior to Fiscal 2011, the Goa and North-East sub-territories were merged into our Company pursuant to the amalgamation of VBIL into the Company with effect from January 1, 2012. Subsequently, the franchise for a part of the Delhi sub-
territory was acquired with effect from January 31, 2013. The 2015 New India Sub-Territories were acquired with effect from February 28, 2015.
Accordingly, aggregate Sales Volumes subsequent to the respective acquisitions are not comparable with those prior to the relevant acquisition.
(2) The 2015 New India Sub-Territories include Punjab, Himachal Pradesh, Chandigarh UT, as well as the remaining parts of Haryana, Uttarakhand and Uttar Pradesh, and were all acquired with effect from February 28, 2015. Accordingly, the Sales Volumes for the 2015 New India Sub-Territories in
Fiscal 2015 reflect sales in these sub-territories subsequent to February 28, 2015.
(3) The Sales Volumes for Goa and North East sub-territories in Fiscal 2012 was 76.61 million litres. The Sales Volumes for Delhi sub-territories in Fiscal
2013 (for the 11 month period of consolidation from February 1, 2013 until December 31, 2013) was 98.06 million litres.
Sub-territories Fiscal 2011 Fiscal 2012(1) Fiscal 2013(1) Fiscal 2014 Fiscal 2015(2)
Sales
Volume
Percentage of
Total Sales
Volume in
India
Sales
Volume
Percentage of
Total Sales
Volume in
India
Sales
Volume
Percentage of
Total Sales
Volume in
India
Sales
Volume
Percentage of
Total Sales
Volume in
India
Sales
Volume
Percentage of
Total Sales
Volume in
India
(million
unit
cases)(4)
(%) (million
unit
cases)(4)
(%) (million
unit
cases)(4)
(%) (million
unit
cases)(4)
(%) (million
unit
cases)(4)
(%)
(Standalone) (Consolidated)
2015 Existing
India Sub-
Territories(1)(3)
77.12 100.00 113.73 100.00 132.33 100.00 143.97 100.00 133.76 64.04
2015 New India
Sub-Territories(2)
- - - - - - - - 75.12 35.96
Total 77.12 100.00 113.73 100.00 132.33 100.00 143.97 100.00 208.88 100.00
(1) The 2015 Existing India Sub-Territories include Delhi, Rajasthan, West Bengal, Goa, Arunachal Pradesh, Assam, Meghalaya, Manipur, Mizoram,
Nagaland, Tripura as well as certain designated parts of Madhya Pradesh, Uttar Pradesh, Uttarakhand, Haryana and Maharashtra In addition to the franchises for sub-territories in India that were granted prior to Fiscal 2011, the Goa and North-East sub-territories were merged into our Company
pursuant to the amalgamation of VBIL into the Company with effect from January 1, 2012. Subsequently, the franchise for a part of the Delhi sub-
territory was acquired with effect from January 31, 2013. The 2015 New India Sub-Territories were acquired with effect from February 28, 2015. Accordingly, aggregate Sales Volumes subsequent to the respective acquisitions are not comparable with those prior to the relevant acquisition.
(2) The 2015 New India Sub-Territories include Punjab, Himachal Pradesh, Chandigarh UT, as well as the remaining parts of Haryana, Uttarakhand and
Uttar Pradesh, and were all acquired with effect from February 28, 2015. Accordingly, the Sales Volumes for the 2015 New India Sub-Territories in
Fiscal 2015 reflect sales in these sub-territories subsequent to February 28, 2015.
(3) The Sales Volumes for Goa and North East sub-territories in Fiscal 2012 was 13.49 million unit cases. The Sales Volumes for Delhi sub-territories in
Fiscal 2013 (for the 11 month period of consolidation from February 1, 2013 until December 31, 2013) was 17.27 million unit cases.
(4) Calculated and presented on the basis that each unit case consists of 24 units of beverages of 8 ounces (approximately 236.58 ml) each, aggregating to
5.678 litres of beverage per unit case.
The CAGR for Sales Volume in the 2015 Existing India Sub-Territories between Fiscal 2011 and Fiscal 2014 (not taking into
account the Fiscal 2012 Sales Volumes of 76.61 million litres for Goa and North East sub-territories and the Fiscal 2013 Sales
Volume of 98.06 million litres for Delhi sub-territory (for the 11 month period of consolidation from February 1, 2013 until
December 31, 2013), was 12.68% while the CAGR for Sales Volume in the 2015 Existing India Sub-Territories between
Fiscal 2011 and Fiscal 2015 (not taking into account the Fiscal 2012 Sales Volumes of 76.61 million litres for Goa and North
East sub-territories and the Fiscal 2013 Sales Volume of 98.06 million litres for Delhi sub-territory (for the 11 month period
of consolidation from February 1, 2013 until December 31, 2013), was 7.37%. The above-mentioned CAGR has been
calculated assuming the Fiscal 2011 Sales Volume as 100 and then adding year-on-year growth to each of the subsequent
Fiscal Years (after excluding the Sales Volumes for sub-territories consolidated/acquired in that particular Fiscal Year) to
arrive at the final year Sales Volumes i.e., for Fiscal 2014 or Fiscal 2015.
148
Production Process
Beverage Production
The production process of our CSDs involves mixing concentrate, sugar and treated water. The mixture is
carbonated and filled in containers such as bottles (PET and glass) or cans on automated filling lines. The production
process for NCB products involves a similar process, except that the beverage is pasteurized. Aquafina is packaged
drinking water processed using the water filtration process specified by PepsiCo. Similarly, the processed water is
carbonated to produce Evervess.
Container Production
In order to manufacture PET bottles, injection moulding machines are used to melt PET resin and form “preforms”
through injection moulding. Preforms are hollow PET tubes. In blow moulding machines, hot preforms are blown
with air flow in two stages, low pressure and high pressure, while preforms are stretched with stretch rod, converting
them into hollow PET bottles inside a fixed mould in the shape of the desired bottle design and size. This process
makes it possible to manufacture PET bottles of high quality surface finish, with uniformity in thickness and
consistent dimension. Our production facility in Kosi, Guwahati and that in Sri Lanka produces preform for use in
our operations in India and in our international licensed territories. In all of our production facilities that include PET
filling lines, preforms are blown into PET bottles.
Labelling and Packaging
Sealed cans, corked glass bottles and capped PET bottles are labelled with the relevant brand and PepsiCo logo.
After labelling, the containers are imprinted with date codes in our production facilities that enable us to monitor and
ensure smooth supply of inventory. Following labelling and imprinting, these containers are wrapped in shrink wrap
or cardboard cartons on automated packaging lines. This final stage in the production process may involve
packaging into packs of 24, 12, 9, 8, 6 or 4 units.
Production Facilities
As of June 30, 2016, we operated 16 production facilities across India. These 16 production facilities also include the
Satharia – 2 production facility which we recently acquired from our co-packer in September 2016. Additionally, we
have two facilities dedicated to backward integration located at Jaipur and Alwar which manufacture crowns, plastic
shells, corrugated boxes and pads and shrink wrap film. The map below shows our India Sub-territories and our
production facilities located across India as of June 30, 2016:
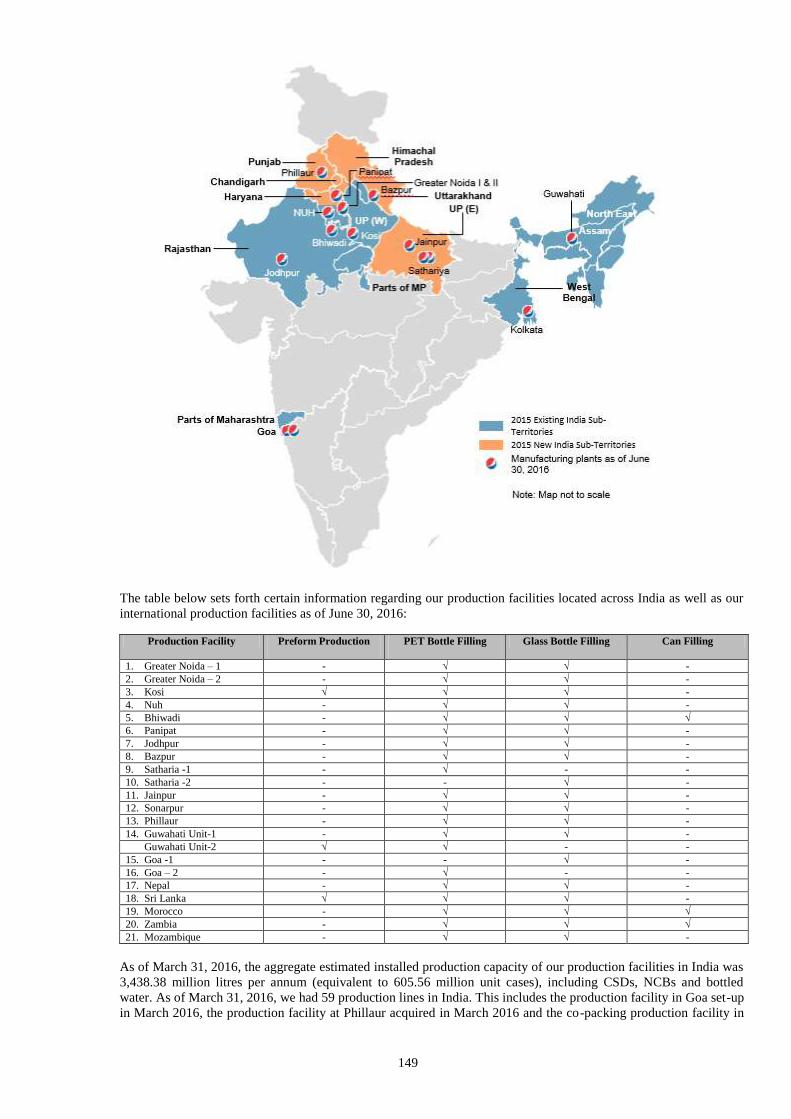
149
The table below sets forth certain information regarding our production facilities located across India as well as our
international production facilities as of June 30, 2016:
Production Facility Preform Production
PET Bottle Filling
Glass Bottle Filling Can Filling
1. Greater Noida – 1 - √ √ - 2. Greater Noida – 2 - √ √ - 3. Kosi √ √ √ - 4. Nuh - √ √ - 5. Bhiwadi - √ √ √
6. Panipat - √ √ - 7. Jodhpur - √ √ - 8. Bazpur - √ √ - 9. Satharia -1 - √ - - 10. Satharia -2 - - √ -
11. Jainpur - √ √ - 12. Sonarpur - √ √ - 13. Phillaur - √ √ -
14. Guwahati Unit-1 - √ √ - Guwahati Unit-2 √ √ - -
15. Goa -1 - - √ - 16. Goa – 2 - √ - -
17. Nepal - √ √ - 18. Sri Lanka √ √ √ -
19. Morocco - √ √ √ 20. Zambia - √ √ √ 21. Mozambique - √ √ -
As of March 31, 2016, the aggregate estimated installed production capacity of our production facilities in India was
3,438.38 million litres per annum (equivalent to 605.56 million unit cases), including CSDs, NCBs and bottled
water. As of March 31, 2016, we had 59 production lines in India. This includes the production facility in Goa set-up
in March 2016, the production facility at Phillaur acquired in March 2016 and the co-packing production facility in
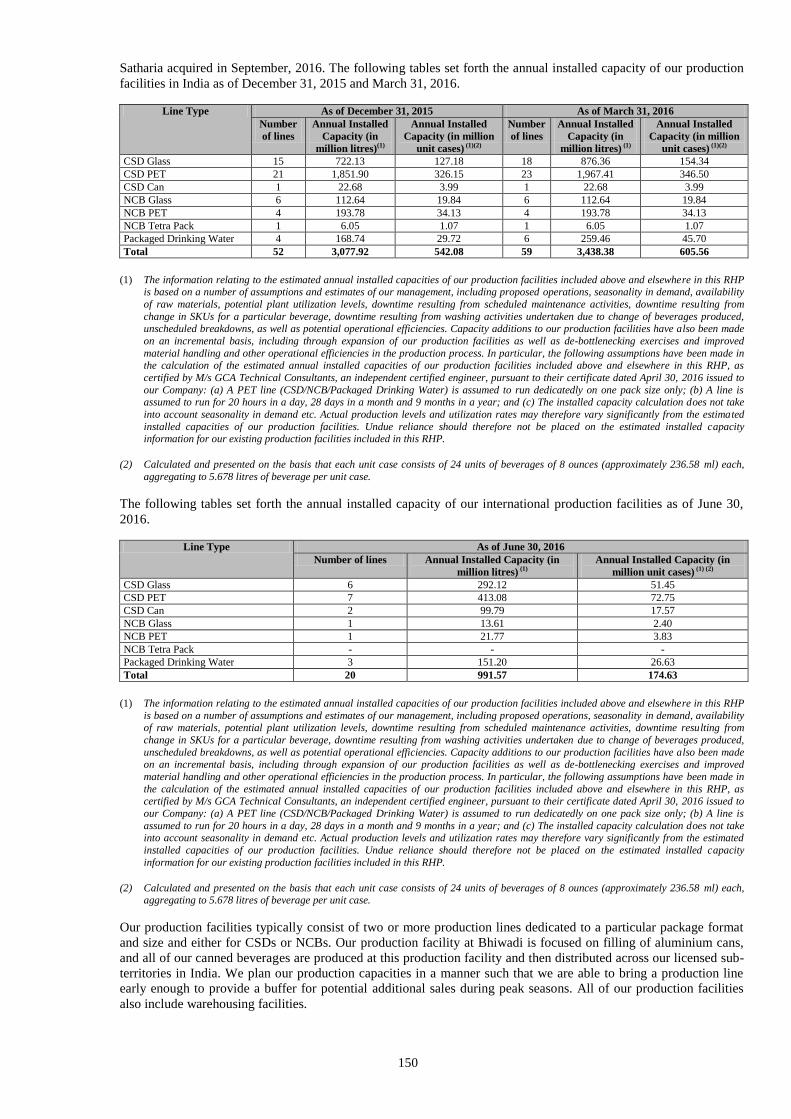
150
Satharia acquired in September, 2016. The following tables set forth the annual installed capacity of our production
facilities in India as of December 31, 2015 and March 31, 2016.
Line Type As of December 31, 2015 As of March 31, 2016
Number
of lines
Annual Installed
Capacity (in
million litres)(1)
Annual Installed
Capacity (in million
unit cases) (1)(2)
Number
of lines
Annual Installed
Capacity (in
million litres) (1)
Annual Installed
Capacity (in million
unit cases) (1)(2)
CSD Glass 15 722.13 127.18 18 876.36 154.34
CSD PET 21 1,851.90 326.15 23 1,967.41 346.50
CSD Can 1 22.68 3.99 1 22.68 3.99
NCB Glass 6 112.64 19.84 6 112.64 19.84
NCB PET 4 193.78 34.13 4 193.78 34.13
NCB Tetra Pack 1 6.05 1.07 1 6.05 1.07
Packaged Drinking Water 4 168.74 29.72 6 259.46 45.70
Total 52 3,077.92 542.08 59 3,438.38 605.56
(1) The information relating to the estimated annual installed capacities of our production facilities included above and elsewhere in this RHP
is based on a number of assumptions and estimates of our management, including proposed operations, seasonality in demand, availability
of raw materials, potential plant utilization levels, downtime resulting from scheduled maintenance activities, downtime resulting from
change in SKUs for a particular beverage, downtime resulting from washing activities undertaken due to change of beverages produced, unscheduled breakdowns, as well as potential operational efficiencies. Capacity additions to our production facilities have also been made
on an incremental basis, including through expansion of our production facilities as well as de-bottlenecking exercises and improved
material handling and other operational efficiencies in the production process. In particular, the following assumptions have been made in the calculation of the estimated annual installed capacities of our production facilities included above and elsewhere in this RHP, as
certified by M/s GCA Technical Consultants, an independent certified engineer, pursuant to their certificate dated April 30, 2016 issued to
our Company: (a) A PET line (CSD/NCB/Packaged Drinking Water) is assumed to run dedicatedly on one pack size only; (b) A line is assumed to run for 20 hours in a day, 28 days in a month and 9 months in a year; and (c) The installed capacity calculation does not take
into account seasonality in demand etc. Actual production levels and utilization rates may therefore vary significantly from the estimated
installed capacities of our production facilities. Undue reliance should therefore not be placed on the estimated installed capacity information for our existing production facilities included in this RHP.
(2) Calculated and presented on the basis that each unit case consists of 24 units of beverages of 8 ounces (approximately 236.58 ml) each,
aggregating to 5.678 litres of beverage per unit case.
The following tables set forth the annual installed capacity of our international production facilities as of June 30,
2016.
Line Type As of June 30, 2016
Number of lines Annual Installed Capacity (in
million litres) (1)
Annual Installed Capacity (in
million unit cases) (1) (2)
CSD Glass 6 292.12 51.45
CSD PET 7 413.08 72.75
CSD Can 2 99.79 17.57
NCB Glass 1 13.61 2.40
NCB PET 1 21.77 3.83
NCB Tetra Pack - - -
Packaged Drinking Water 3 151.20 26.63
Total 20 991.57 174.63
(1) The information relating to the estimated annual installed capacities of our production facilities included above and elsewhere in this RHP
is based on a number of assumptions and estimates of our management, including proposed operations, seasonality in demand, availability of raw materials, potential plant utilization levels, downtime resulting from scheduled maintenance activities, downtime resulting from
change in SKUs for a particular beverage, downtime resulting from washing activities undertaken due to change of beverages produced,
unscheduled breakdowns, as well as potential operational efficiencies. Capacity additions to our production facilities have also been made on an incremental basis, including through expansion of our production facilities as well as de-bottlenecking exercises and improved
material handling and other operational efficiencies in the production process. In particular, the following assumptions have been made in
the calculation of the estimated annual installed capacities of our production facilities included above and elsewhere in this RHP, as
certified by M/s GCA Technical Consultants, an independent certified engineer, pursuant to their certificate dated April 30, 2016 issued to
our Company: (a) A PET line (CSD/NCB/Packaged Drinking Water) is assumed to run dedicatedly on one pack size only; (b) A line is
assumed to run for 20 hours in a day, 28 days in a month and 9 months in a year; and (c) The installed capacity calculation does not take into account seasonality in demand etc. Actual production levels and utilization rates may therefore vary significantly from the estimated
installed capacities of our production facilities. Undue reliance should therefore not be placed on the estimated installed capacity
information for our existing production facilities included in this RHP.
(2) Calculated and presented on the basis that each unit case consists of 24 units of beverages of 8 ounces (approximately 236.58 ml) each, aggregating to 5.678 litres of beverage per unit case.
Our production facilities typically consist of two or more production lines dedicated to a particular package format
and size and either for CSDs or NCBs. Our production facility at Bhiwadi is focused on filling of aluminium cans,
and all of our canned beverages are produced at this production facility and then distributed across our licensed sub-
territories in India. We plan our production capacities in a manner such that we are able to bring a production line
early enough to provide a buffer for potential additional sales during peak seasons. All of our production facilities
also include warehousing facilities.
151
Our international production facilities had an aggregate estimated installed production capacity of 991.57 million
litres (equivalent to 174.63 million unit cases) as of June 30, 2016, including CSDs, NCBs and packaged drinking
water. Our largest production facility outside India is located in Morocco. In addition to our existing production
facilities in Nepal, Sri Lanka, Zambia, Morocco and Mozambique, we are in the process of setting up a greenfield
facility in Zimbabwe in anticipation of franchise rights being granted by PepsiCo Inc. for such territory.
Distribution Network and Infrastructure
As at June 30, 2016, our distribution network in India included 60 depots and 1,438 delivery vehicles. As at June 30, 2016,
we employed more than 1,300 sales and distribution personnel, including personnel involved in the logistics management
activities at our depots and in the supply chain management team. Our sales and distribution network is spread strategically
across different parts within our licensed sub-territories in India, and we continue to strengthen our distribution network semi-
urban and rural areas and markets. Our expansive distribution network enables us to reach a wide range of consumer
segments and ensures effective market penetration. In addition, we have over the years significantly expanded our distribution
network and infrastructure internationally, and as of June 30, 2016, we had 20 distribution centers in our international
territories.
We deliver our products from our manufacturing facilities to our distribution depots, from where our distributors pick up
consignments of stock and deliver it to sales outlets in our licensed territories and sub-territories. The depots and distributors
in a sub-territory serve sales outlets in such sub-territory and as a result transportation distances, and consequently
transportation costs, are reduced.
Points of sale for our products include traditional retail points, such as grocery stores, and modern retail outlets including e-
commerce, supermarkets, hypermarkets, convenience stores, bars and restaurants. For our returnable glass bottle products, our
distributors pick up empty glass bottles when delivering fresh stock, returning the bottles to our distribution depots, from
where they are then returned to our manufacturing facilities.
We place significant importance on quality control, which is in line with the specifications laid down by PepsiCo. Our
comprehensive quality standards cover the entire value chain, from the purification of water to the production of the finished
product, up to and including the point where the product ultimately reaches the consumer. We believe that the quality of the
products manufactured by us is critical to our success, and are committed to maintaining quality standards with respect to the
purity of our water and the quality of the raw materials we use. Our production facilities are all equipped with quality control
laboratories for testing raw materials, packaging and finished products.
Our PepsiCo India Agreements and PepsiCo International Agreements stipulate stringent quality standards with respect to the
entire production process as well as the sales and distribution process. In addition, we are required to obtain our concentrates,
raw materials, including packaging, only from suppliers that have been pre-approved by PepsiCo India / PepsiCo Inc. and / or
PepsiCo International Entities. We follow specific water filtration processes as prescribed by PepsiCo to ensure quality
control. In addition, we furnish samples of water and beverages every month to PepsiCo for their inspection. PepsiCo
regularly undertakes quality checks of our distribution channels to monitor compliance with packaging and product standards.
In these checks, random samples of PepsiCo beverages produced by us from the various channels are taken and tested in
PepsiCo’s laboratories. PepsiCo provides us with monthly reports with our product and packaging quality scores.
We continue to closely monitor our compliance with quality control standards. As at June 30, 2016, we had more than 250
full-time quality control personnel. We have sophisticated control equipment to monitor the key areas of the production
process in our production facilities and as well as testing laboratories within our production facilities. We monitor the
functioning of these control systems on a regular basis. Both PepsiCo and as well as local regulatory authorities in each of our
licensed territories and sub-territories in which we operate also check our facilities and production and distribution processes
to ensure that independent validation of key control points. In certain instances, our control systems conduct monitoring on a
continuous basis while the beverages are being manufactured. We also use a sampling procedure for certain tests. The
objective of our production quality monitoring is to ensure that any beverage that does not conform to our exact specifications
is removed prior to being placed in the market.
Procurement and Raw Materials
In the production of PepsiCo products, we use raw materials and ingredients that have been reviewed and pre-approved by
PepsiCo India / PepsiCo Inc. and / or PepsiCo International Entities, and relevant regulatory agencies responsible for food
safety. Our raw material requirements include ingredients required for production of beverages, as well as processing aid
materials and packaging and labelling materials. The key ingredients and raw materials required for the production of our
PepsiCo beverages include concentrate, sweeteners, purified water and carbon dioxide. Processing aid materials are used in
syrup preparation, glass bottle washing, cleaning-in-place, conveyor lubrication. Processing aid materials are indirect
materials but are required to complete processing cycle. Packaging materials include preform, cans, can ends, returnable glass
bottles, PET resin, labels, plastic caps, crowns, cardboard and plastic film.
152
Other than Aquafina, Evervess and Teem Soda, our other CSD and NCB products requires flavour concentrates, which is
diluted with water and, in the case of non-low-calorie beverages, sweetened with sugar. PepsiCo’s ‘diet’ beverage flavour
concentrates already contain artificial sweeteners and therefore do not require additional sweetening. For our carbonated
beverages, we inject carbon dioxide during blending.
Our principal raw materials include the following:
Concentrate. Concentrate costs represent our most significant raw materials expense, and such cost of concentrate
was between 28% to 34% of our total cost of raw materials consumed in Fiscal 2013, Fiscal 2014, Fiscal 2015 and in
the six months ended June 30, 2016, respectively. Pursuant to the terms of our PepsiCo India Agreements and
PepsiCo International Agreements, concentrate is supplied directly by PepsiCo India or other relevant PepsiCo
entities or their approved manufacturers at a specified price. For India, we typically purchase our concentrates
requirements from PepsiCo India’s concentrate manufacturing facility in Patiala, Punjab. Although the concentrate
price could be set by PepsiCo India / PepsiCo Inc. and / or PepsiCo International Entities at their discretion, in
practice, the concentrate price is determined by PepsiCo India / PepsiCo Inc. and / or PepsiCo International Entities
in discussions with us, after taking into account the selling price, taxation, input cost and market and other relevant
conditions. In the last five years the variance in the concentrate price purchased by us has been lower than the
increase in India’s CPI. CPI measures changes in the prices paid by consumers for a basket of goods and services
where such yearly (or monthly) growth rates represent the inflation rate in such period.
In our international operations, we import the concentrate required for our operations in Sri Lanka and Nepal from
India, whereas for Zambia, Morocco and Mozambique, we import concentrate from PepsiCo facilities in Ireland. For
our international operations, PepsiCo International Entities specify a fixed price denominated in United States
Dollars for concentrate, except for Nepal which is denominated in Indian Rupees. These specified prices are
typically fixed for a period of one year, and such prices are subject to annual review by PepsiCo International
Entities.
Sugar. In India we procure sugar from various sugar mills and wholesale distributors, primarily from the States of
Uttar Pradesh and Maharashtra. Sugar prices tend to be volatile, and we do not enter into any long-term supply
contracts in place. We place orders depending on our production requirements at negotiated prices, and typically
procure sugar from a few key suppliers in India. For our international operations, we procure sugar from various
local suppliers through short term or spot purchase agreements. In Fiscal 2013, Fiscal 2014, Fiscal 2015, and in the
six months ended June 30, 2016, cost of sugar represented 27.95%, 27.04%, 26.53%, and 33.65%, respectively, of
our cost of materials consumed. As a result of the significant increase in our operations, we benefited from
economies of scale by negotiating favourable prices from our suppliers.
Packaging Material. The principal packaging materials used by us include preforms for PET bottles, cans, shrink-
wrap films, crowns, plastic closures, labels and corrugated boxes. Our production facilities in Kosi and Guwahati in
India, and our production facility in Sri Lanka manufactures preforms, our production facility in Jaipur manufactures
crowns and our production facility in Alwar manufacture shrink-wrap films, plastic shells and corrugated boxes and
pads. Preforms, crowns, corrugated boxes and shrink-wrap films from these facilities are then transported to, and
used in production in, our other production facilities in India. Accordingly, a majority of our packaging requirements
are produced internally. For labels, we source our requirements from local suppliers with whom we have developed
long-term relationships, to ensure quality and uninterrupted supply. We typically order the materials required by us
on negotiated terms and prices that are fixed between our head office and the suppliers, in advance of our production
requirements. A drop in PET chips prices, which is a key raw material for our packaging material has led to a
decrease in our cost towards the packaging material over the past three fiscals. In Fiscal 2013, Fiscal 2014, Fiscal
2015, and in the six months ended June 30, 2016, the cost of PET chips represented 13.26%, 11.84%, 9.01% and
7.44%, of our cost of materials consumed.
A majority of our products are packaged in a mixture of PET bottles and returnable glass bottles (“RGBs”) in both
single-serve and multi-serve sizes and single-serve aluminium cans. We also sell Tropicana Slice in tetrapak cartons.
We sell post-mix syrup to restaurants, bars and convenience stores in “bag in a box” format. We print each packaged
container with information relating to the manufacturer, expiry date and bar codes for identification in accordance
with various regulatory requirements.
Competition
The market for CSDs and NCBs beverages is highly competitive in India. (Source: Euromonitor Report). In practice, the
franchise rights are granted for a particular sub-territory on an exclusive basis by PepsiCo subject to PepsiCo’s right to
unilaterally suspend or terminate the arrangement. This ensures that there is no competition among other PepsiCo’s
franchisees. However, we compete with other globally recognized brands in the CSDs and NCBs industry with an established
brand and extensive market presence in India. Similarly, in our international markets, we have entered into distribution
arrangements with PepsiCo in connection with our licensed territories. In our international markets, we compete with various
153
global brands in the beverage industry as well as several regional competitors in the CSD or NCB industries. As a significant
portion of marketing activity for the PepsiCo beverages we sell is undertaken by PepsiCo India directly, we have only a
limited ability to affect the competitive position of such products and enhance brand recognition. We believe that brand
recognition is a primary factor affecting our competitive position. If the reputation of the PepsiCo brands were to be damaged,
it could significantly reduce our competitiveness.
Certain significant competitive factors that impact our business operations and prospects include the scale of our distribution
network, distribution chain management ensuring timely supply and availability of our PepsiCo products, as well as
advertising and marketing, brand image, product offerings that meet consumer preferences and trends, new product and
package innovations, pricing, and cost inputs. Other competitive factors include supply chain (procurement, manufacturing,
and distribution) and sales methods, customer service, and the management of sales and promotional activities. Management
of chilled drink equipment, including visi-coolers and vending machines, is also a competitive factor. We believe our most
favourable competitive factor is the consumer and customer goodwill associated with the PepsiCo brand portfolio.
In addition, we compete with a number of smaller manufacturers, including regional competitors that compete principally on
price. In particular, we face price competition from local non-premium brand producers and distributors, which typically
produce, market and sell CSDs and NCBs at prices lower than ours, especially during the summer months. However, we
believe that the substantial investment in multiple production facilities, distribution infrastructure and systems is required to
operate a nation-wide beverage production and distribution business represents significant entry barriers to potential
competitors.
Health and Safety
We are subject to applicable environmental and other regulatory restrictions in each of the jurisdictions in which we operate.
In addition, in all our facilities we have adopted PepsiCo’s stringent environmental standards and implemented its stringent
control procedures.
We continue to ensure compliance with applicable health and safety regulations and other requirements in our operations and
maintain adequate workmen’s compensation policies for our licensed sub-territories in India. In India, some of our production
facilities have received quality certifications, confirmed through annual audits by independent consultants. We have to also
ensure waste minimization with respect to our usage of raw materials, consumption of energy and discharge of water.
We believe the environmental and associated regulatory climate in all our markets will become increasingly stringent. We
believe that we have complied, and will continue to comply, with all applicable environmental and associated laws, rules and
regulations. We have obtained, or are in the process of obtaining or renewing, all material environmental consents and
licenses from the relevant governmental agencies that are necessary for us to carry on our business. Our activities are subject
to various environmental laws and regulations applicable to our licensed territories and sub-territories, which govern, among
other matters, air emissions, waste water discharges, the handling, storage and disposal of hazardous substances and wastes,
the remediation of contaminated sites, natural resource damages, and employee health and employee safety.
Insurance
We believe we are adequately insured against all losses and risks involving property and third party liability. For our
operations in India, we have obtained insurance coverage for standard cash in transit, group personal accidental policy, group
medi-claim insurance policies, foreign travel policy as well as fleet insurance, from various reputed insurance companies. We
also maintain standard insurance policies for burglary insurance, money insurance and a standard fire and special perils
insurance. For our international operations, we generally maintain appropriate insurance policies for our operations consistent
with general industry practice and taking into account cost of relevant insurance. We have established risk control guidelines,
which are applied and audited at all of our production facilities.
Human Resources
As of June 30, 2016, we employed more than 4,000 full time employees in India, and more than 1,600 full time employees in
our international operations. In addition, we contract with third party manpower and services firms for the supply of contract
labour. The number of contract labourers varies seasonally, with generally higher numbers during our peak summer months.
Our employees are represented by labour or workers’ unions in the various jurisdictions. We believe that our relations with
our employees are good. We have not experienced any major work stoppages due to labour disputes or cessation of work in
the recent past.
We place significant emphasis on training our personnel and increasing their skill levels, and fostering ongoing employee
engagement in our Company. We organize in-house training for our employees through skill building programs and
professional development programs at all levels and across all functions. Our key employees also attend management and
staff development programs organized by PepsiCo.
154
Intellectual Property
We do not own any other intellectual property that has a direct material impact on our business. We have applied for the
registration of the logo of VBL. As a franchisee of PepsiCo, we have been awarded the franchise to certain licensed brands of
PepsiCo in 17 States and two Union Territories in India. We have also been granted the franchise rights for the production
and distribution of certain licensed brands of PepsiCo in Nepal, Sri Lanka, Zambia, Morocco and Mozambique.
PepsiCo owns or licenses all the trademarks and brands for products that we produce, sell and distribute, and it has the
responsibility for protecting its trademarks in India, Nepal, Sri Lanka, Zambia, Morocco and Mozambique. Trademarks in
India are protected by PepsiCo India. Trademarks in the other jurisdictions are protected by similar national laws and
international treaties. All the trademarks owned and licensed by PepsiCo are registered with the national trademark registry
offices, or are subject of a pending application, in the name of PepsiCo. Historically, PepsiCo has borne all the legal costs of
initiating proceedings against infringement of PepsiCo trademarks.
Accordingly, our business and operations are significantly dependent on the intellectual property rights, particularly
PepsiCo’s CSD and NCB brands, and the nature of our agreements with PepsiCo with respect to such rights. See
“Relationship with PepsiCo” on page 136 and “Risk Factors — We are dependent on PepsiCo for brand promotion and the
protection of the PepsiCo trademarks and brands. An inability by PepsiCo to adequately promote its brands and/ or
adequately protect its trademarks and brands may result in loss of goodwill and business and adversely affect our business
prospects, results of operations and financial condition.” on page 31.
Information Technology
Information technology systems are crucial in the management of our business. We use advanced information technology
systems to schedule production, procure raw materials, route delivery vehicles and invoice customers. We have introduced
GPRS-enabled handheld devices and systems called SAMNA (Sales Automation Management for the New Age) in certain of
our operations to automate field work processes and enable access to real-time sales information from production facilities,
warehouses and distribution centers across India, thereby ensuring integrated operational data from manufacturing, planned
procurement and superior tracking of transportation of products from distributors to final delivery to the retail point-of-sale.
We also invest in information systems across India in order to ensure that detailed, useful information on sales, customer
performance and consumer preferences and behavior is regularly available. We use this information to perform a
comprehensive and detailed analysis of the purchasing patterns and preferences of various groups of soft drink consumers in
each of the types of channels where they might potentially purchase our beverages. Based on this analysis, we tailor our
product, pricing, packaging and distribution strategies to maximize the growth potential of each distribution channel. Our use
of information technology allows us to react quickly and effectively to consumer trends, which may differ in each channel.
Corporate Social Responsibility
We have set up a corporate and social responsibility (“CSR”) committee of our Board of Directors (the “CSR Committee”)
comprising of Mr. Ravi Kant Jaipuria, Mr. Ravindra Dhariwal, Mr. Raj Pal Gandhi and Mr. Udai Dhawan, and have adopted
and implemented a CSR policy pursuant to which we undertake our CSR activities. These activities may include, amongst
others, the promotion of healthcare and sanitation, the promotion of education, promotion of gender equality and
empowerment of women, promotion of sports, measures for the benefit of the armed forces.
Property
Our registered office is situated at F-2/7, Okhla Industrial Area Phase – I, New Delhi and our corporate office is situated at
Plot number 31, Institutional Area, Sector 4, Gurgaon, Haryana, both of which have been taken on lease by our Company for
a period of three and five years respectively, beginning from February 1, 2015 and April 1, 2013, respectively. The following
table provides details of our other properties in India as at June 30, 2016:
Item Location Address Use Leasehold /
Freehold
Term of lease
1. Greater
Noida – 1
Plot No. 2, Surajpur Byepass, Greater Noida (U.P.) Manufacturing
Facility
Leasehold Long-term
lease for 90
years
2. Greater
Noida – 2
Plot No. 2E, Udyog Kendra, Ecotech – III, Greater
Noida (U.P.)
Manufacturing
Facility
Leasehold Long-term
lease for 90
years
3. Kosi Plot No. 477 to 479, Village Dautana, Near Kosi
kalan, Distt. Mathura (U.P.)
Manufacturing
Facility
Freehold Owned
Property
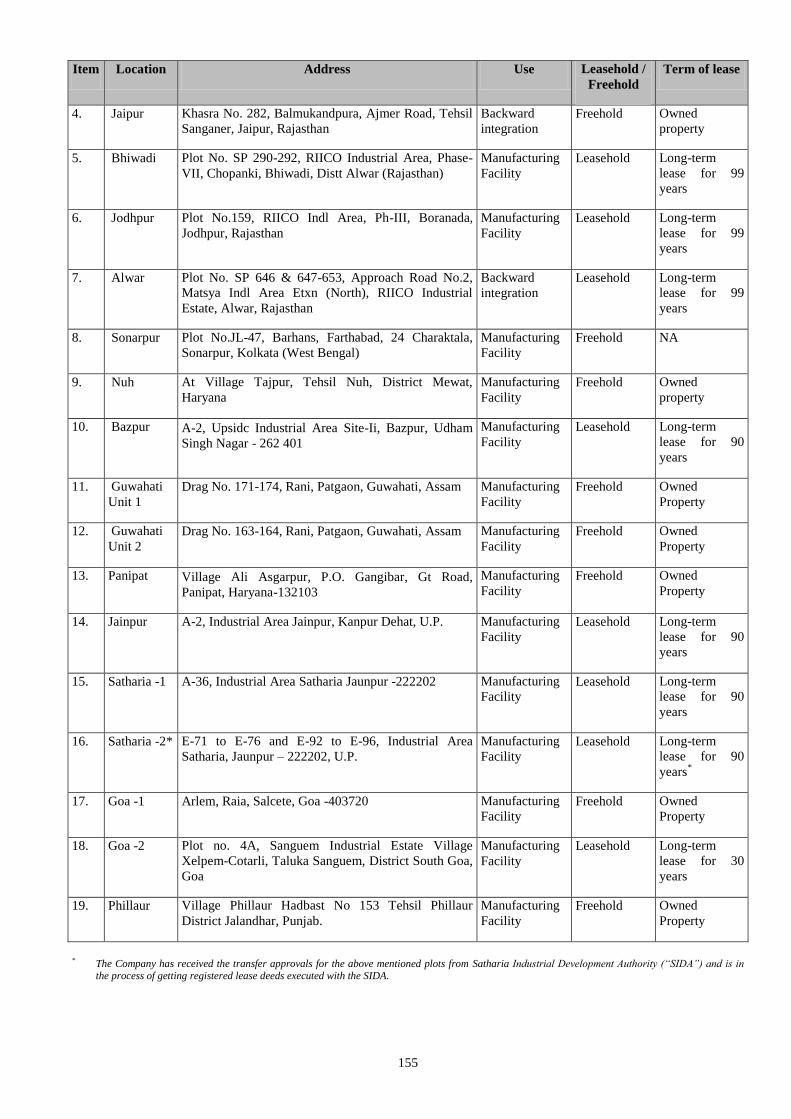
155
Item Location Address Use Leasehold /
Freehold
Term of lease
4. Jaipur Khasra No. 282, Balmukandpura, Ajmer Road, Tehsil
Sanganer, Jaipur, Rajasthan
Backward
integration
Freehold Owned
property
5. Bhiwadi Plot No. SP 290-292, RIICO Industrial Area, Phase-
VII, Chopanki, Bhiwadi, Distt Alwar (Rajasthan)
Manufacturing
Facility
Leasehold Long-term
lease for 99
years
6. Jodhpur Plot No.159, RIICO Indl Area, Ph-III, Boranada,
Jodhpur, Rajasthan
Manufacturing
Facility
Leasehold Long-term
lease for 99
years
7. Alwar Plot No. SP 646 & 647-653, Approach Road No.2,
Matsya Indl Area Etxn (North), RIICO Industrial
Estate, Alwar, Rajasthan
Backward
integration
Leasehold Long-term
lease for 99
years
8. Sonarpur Plot No.JL-47, Barhans, Farthabad, 24 Charaktala,
Sonarpur, Kolkata (West Bengal)
Manufacturing
Facility
Freehold NA
9. Nuh At Village Tajpur, Tehsil Nuh, District Mewat,
Haryana
Manufacturing
Facility
Freehold Owned
property
10. Bazpur A-2, Upsidc Industrial Area Site-Ii, Bazpur, Udham
Singh Nagar - 262 401
Manufacturing
Facility
Leasehold Long-term
lease for 90
years
11. Guwahati
Unit 1
Drag No. 171-174, Rani, Patgaon, Guwahati, Assam Manufacturing
Facility
Freehold Owned
Property
12. Guwahati
Unit 2
Drag No. 163-164, Rani, Patgaon, Guwahati, Assam Manufacturing
Facility
Freehold Owned
Property
13. Panipat Village Ali Asgarpur, P.O. Gangibar, Gt Road,
Panipat, Haryana-132103
Manufacturing
Facility
Freehold Owned
Property
14. Jainpur A-2, Industrial Area Jainpur, Kanpur Dehat, U.P. Manufacturing
Facility
Leasehold Long-term
lease for 90
years
15. Satharia -1 A-36, Industrial Area Satharia Jaunpur -222202 Manufacturing
Facility
Leasehold Long-term
lease for 90
years
16. Satharia -2* E-71 to E-76 and E-92 to E-96, Industrial Area
Satharia, Jaunpur – 222202, U.P.
Manufacturing
Facility
Leasehold Long-term
lease for 90
years*
17. Goa -1 Arlem, Raia, Salcete, Goa -403720 Manufacturing
Facility
Freehold Owned
Property
18. Goa -2 Plot no. 4A, Sanguem Industrial Estate Village
Xelpem-Cotarli, Taluka Sanguem, District South Goa,
Goa
Manufacturing
Facility
Leasehold Long-term
lease for 30
years
19. Phillaur Village Phillaur Hadbast No 153 Tehsil Phillaur
District Jalandhar, Punjab.
Manufacturing
Facility
Freehold Owned
Property
* The Company has received the transfer approvals for the above mentioned plots from Satharia Industrial Development Authority (“SIDA”) and is in the process of getting registered lease deeds executed with the SIDA.
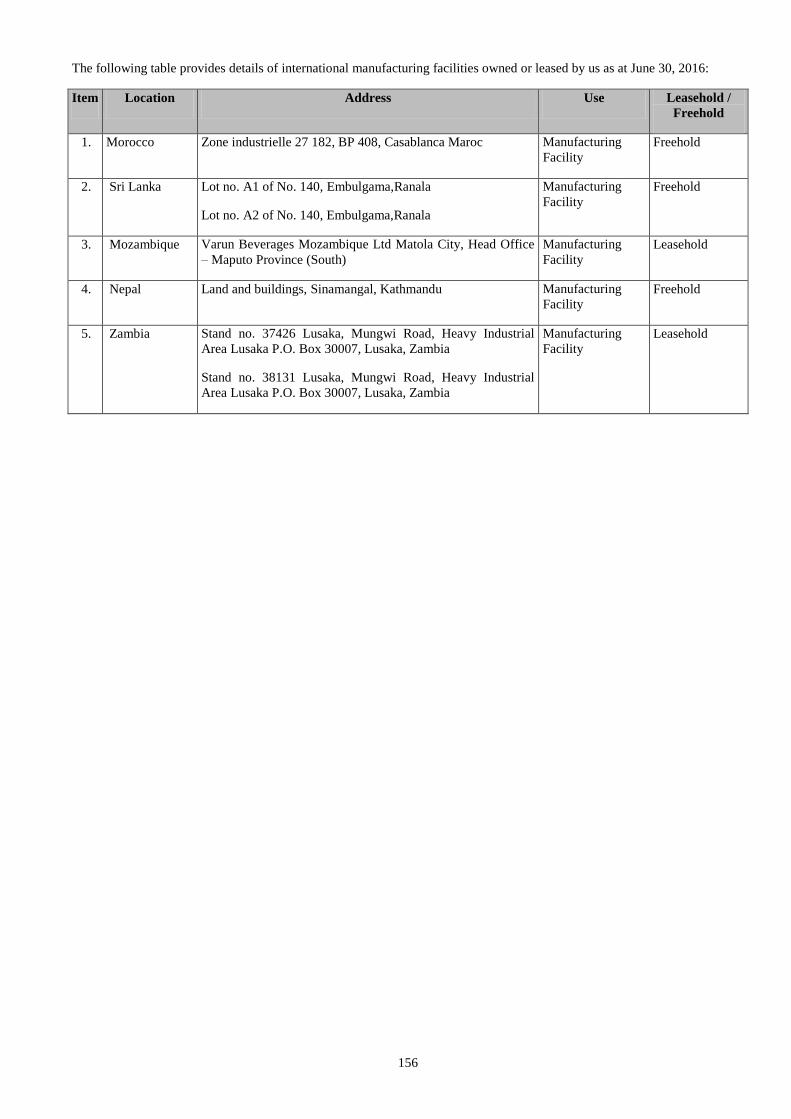
156
The following table provides details of international manufacturing facilities owned or leased by us as at June 30, 2016:
Item Location Address Use Leasehold /
Freehold
1. Morocco Zone industrielle 27 182, BP 408, Casablanca Maroc Manufacturing
Facility
Freehold
2. Sri Lanka Lot no. A1 of No. 140, Embulgama,Ranala
Lot no. A2 of No. 140, Embulgama,Ranala
Manufacturing
Facility
Freehold
3. Mozambique Varun Beverages Mozambique Ltd Matola City, Head Office
– Maputo Province (South)
Manufacturing
Facility
Leasehold
4. Nepal Land and buildings, Sinamangal, Kathmandu Manufacturing
Facility
Freehold
5. Zambia Stand no. 37426 Lusaka, Mungwi Road, Heavy Industrial
Area Lusaka P.O. Box 30007, Lusaka, Zambia
Stand no. 38131 Lusaka, Mungwi Road, Heavy Industrial
Area Lusaka P.O. Box 30007, Lusaka, Zambia
Manufacturing
Facility
Leasehold
157
REGULATIONS AND POLICIES
The following description is a summary of certain sector specific laws and regulations as prescribed by the Government of
India or state governments which are applicable to our Company and its subsidiaries. The information detailed in this
chapter has been obtained from publications available in the public domain. The regulations set out below are not
exhaustive, and are only intended to provide general information to the investors and is neither designed nor intended to be a
substitute for professional legal advice. The statements below are based on the current provisions of Indian law, and the
judicial and administrative interpretations thereof, which are subject to change or modifications by subsequent legislative,
regulatory, administrative or judicial decisions.
Regulations applicable to the Food Industry
Food Safety and Standards Act, 2006
The FSSA, enacted on August 23, 2006, seeks to consolidate the laws relating to food and establish the FSSAI for setting out
scientific standards for articles of food and to regulate their manufacture, storage, distribution, sale and import to ensure
availability of safe and wholesome food for human consumption. The standards prescribed by the FSSAI include
specifications for ingredients, contaminants, pesticide residue, biological hazards and labels.
The FSSA defines ‘food’ as any substance, whether processed, partially processed or unprocessed, which is intended for
human consumption which includes beverages. Under section 31 of the FSSA, no person shall carry on any food business
except under a license granted by the FSSAI. The FSSA sets forth the requirements for licensing and registering food
businesses in addition to laying down the general principles for safety, responsibilities and liabilities of food business
operators. The enforcement of the FSSA is generally facilitated by ‘state commissioners of food safety’ and other officials at
a local level.
Under section 51 of the FSSA, any person who manufactures sub-standard food for human consumption is liable to pay a
penalty which may extend up to ₹ 5.00 lakh, FSSA has defined sub-standard as, an article of food which does not meet the
specified standards but not so as to render the article of food unsafe.
The provisions of the FSSA require every distributor to be able to identify any food article by its manufacturer, and every
seller by its distributor that should be registered under the FSSA and every entity in the sector is bound to initiate recall
procedures if it finds that the food marketed has violated specified standards. Food business operators are required to ensure
that persons in their employment do not suffer from infectious or contagious diseases. The FSSA also imposes liabilities upon
manufacturers, packers, wholesalers, distributors and sellers requiring them to ensure that inter alia unsafe and misbranded
products are not sold or supplied in the market.
In order to address certain specific aspects of the FSSA, the FSSAI has framed several regulations such as the following:
(a) Food Safety and Standards (Contaminants, Toxins and Residues) Regulations, 2011;
(b) Food Safety and Standards (Food Products Standards and Food Additives) Regulations, 2011;
(c) Food Safety and Standards (Licensing and Registration of Food Businesses) Regulation, 2011;
(d) Food Safety and Standards (Packaging and Labelling) Regulations, 2011; and
(e) Food Safety and Standards (Prohibition and Restrictions on Sales) Regulations, 2011.
The FSSAI has also framed the FSSR which have been operative since August 5, 2011. The FSSR provides the procedure for
registration and licensing process for food business and lays down detailed standards for various food products. The FSSR
also sets out the enforcement structure of ‘commissioner of food safety’, ‘the food safety officer’ and ‘the food analyst’ and
procedures of taking extracts, seizure, sampling and analysis.
The Bureau of Indian Standards Act, 2016
The BIS Act provides for the establishment of bureau for the standardization, marking and quality certification of goods.
Functions of the bureau include, inter-alia, (a) recognizing as an Indian standard, any standard established for any article or
process by any other institution in India or elsewhere; (b) specifying a standard mark which shall be of such design and
contain such particulars as may be prescribed to represent a particular Indian standard; and (c) conducting such inspection and
taking such samples of any material or substance as may be necessary to see whether any article or process in relation to
which the standard mark has been used conforms to the Indian Standard or whether the standard mark has been improperly
used in relation to any article or process with or without a license.
158
Legal Metrology Act, 2009
Legal Metrology Act replaced the Standards of Weights and Measures Act, 1976 and the Standards of Weights and Measures
(Enforcement) Act, 1985. The Legal Metrology Act and the Legal Metrology (Packaged Commodities) Rules, 2011seek to
establish and enforce standards of weights and measures, regulate trade and commerce in weights, measures and other goods
which are sold or distributed by weight, measure or number and for matters connected therewith or incidental thereto. Further,
the Legal Metrology Act lays down penalties for various offences.
The key features of the Legal Metrology Act are:
Appointment of government approved test centres for verification of weights and measures;
Allowing the companies to nominate a person who will be held responsible for breach of provisions of the Act; and
Simplified definition of packaged commodity and more stringent punishment for violation of provisions.
Legal Metrology (Packaged Commodities) Rules, 2011
The Packaged Commodities Rules were framed under section 52(2) (j) and (q) of the Legal Metrology Act and lays down
specific provisions applicable to packages intended for retail sale, whole sale and for export and import. A “pre-packaged
commodity” means a commodity which without the purchaser being present is placed in a package of a pre-determined
quantity.
The key provisions of the Packaged Commodities Rules are:
It is illegal to manufacture, pack, sell, import, distribute, deliver, offer, expose or possess for sale any pre-packaged
commodity unless the package is in such standard quantities or number and bears thereon such declarations and
particulars as prescribed.
All pre-packaged commodities must conform to the declarations provided thereon as per the requirement of section
18(1) of the Legal Metrology Act.
No pre-packaged commodity shall be packed with error in net quantity beyond the limit prescribed in the first
schedule of the Packaged Commodity Rules.
Indian Boilers Act, 1923
Boilers Act was enacted with the objective of ensuring the safety of public life and property by administering and enforcing
the provisions of the Boilers Act with respect to steam boilers and steam pipes, which produce steam, which is used for re-
distillation of alcohol and liquor. As per the provisions of the Boilers Act, the Chief Inspector of Boilers or an Inspector
appointed under the Boilers Act periodically reviews the administration of the regulations by: (a) approval of manufacturers;
(b) inspection of designs relating to boilers and inspection of the manufacturing of boiler and boiler components; (c) approval
of boiler repairers and boiler erectors; (d) authorisation and inspection of boiler repairs; and (e) certification of boiler
operating engineers, boiler operators and welders.
Essential Commodities Act, 1955
EC Act gives powers to control production, supply, distribution of essential commodities for maintaining or increasing
supplies and for securing their equitable distribution and availability at fair price. The EC Act is being implemented by the
State Governments by availing of the delegated powers under the EC Act. The State Governments have issued various control
orders to regulate various aspects of trading in essential commodities such as food grains, edible oils, pulses, sugar etc. If any
company found to be in contravention of such orders, every person responsible for the conduct of the business of the
Company shall be deemed to be in contravention of such order and shall be punished accordingly.
Consumer Protection Act, 1986
COPRA aims at providing better protection to the interests of consumers and for that purpose makes provisions for the
establishment of authorities for the settlement of consumer disputes. The COPRA provides a mechanism for the consumer to
file a complaint against a trader or service provider in cases of unfair trade practices, restrictive trade practices, defects in
goods, deficiency in services, price charged being unlawful and goods being hazardous to life and safety when used. The
COPRA provides for a three tier consumer grievance redressal mechanism at the national, state and district levels. Non
compliance of the orders of these authorities attracts criminal penalties.
159
Environmental Laws
The major statutes in India which seek to regulate and protect the environment against pollution related activities in India
include the Water (Prevention and Control of Pollution) Act, 1974, the Air (Prevention and Control of Pollution) Act, 1981
and the Environment Protection Act, 1986. The basic purpose of these statutes is to control, abate and prevent pollution. In
order to achieve these objectives, Pollution Control Boards (the “PCBs”), which are vested with diverse powers to deal with
water and air pollution, have been set up in each State. The PCBs are responsible for setting the standards for maintenance of
clean air and water, directing the installation of pollution control devices in industries and undertaking inspection to ensure
that industries are functioning in compliance with the standards prescribed. These authorities also have the power to carry out
search, seizure and investigation if the authorities are aware of or suspect pollution that is not in accordance with such
regulations. All industries and factories are required to obtain consent orders from the PCBs, which are indicative of the fact
that the factory or industry in question is functioning in compliance with the pollution control norms. These consent orders
are required to be renewed annually.
Environment Act has been enacted for the protection and improvement of the environment. The Environment Act empowers
the Government of India to take measures to protect and improve the environment such as by laying down standards for
emission or discharge of pollutants, providing for restrictions regarding areas where industries may operate. No construction
work, preliminary or other, relating to the setting up of a project can be undertaken until such clearance from ministry of
environment and forests is obtained. The Government of India may make rules for regulating environmental pollution, such
as Hazardous and Other Wastes (Management and Transboundary Movement) Rules, 2016 which monitors and regulates the
disposal of hazardous wastes from the factories.
CGWA has been constituted under section 3(3) of the Environment Act to regulate the consumption and prevent over
exploitation of the ground water. CGWA had issued a policy guidelines for clearance of ground water abstraction for various
uses pursuant to letter number 21-4/Guidelines/CGWA/2009-832 dated October 14, 2009. Under these guidelines all
industries have to obtain a no objection certificate (“NOC”) from CGWA for using ground water. It requires that all
industries which are drawing ground water have to undertake artificial recharge measures.
Laws relating to employment
The Factories Act, 1948 (“Factories Act”) defines a “factory” to cover any premises which employs ten or more workers and
in which manufacturing process is carried on with the aid of power and any premises where there are at least twenty workers
even though there is or no electrically aided manufacturing process being carried on. Each State Government has rules in
respect of the prior submission of plans and their approval for the establishment of factories and registration and licensing of
factories. The Factories Act provides that an occupier of a factory i.e. the person who has ultimate control over the affairs of
the factory and in the case of a company, any one of the directors, must ensure the health, safety and welfare of all workers.
There is a prohibition on employing children below the age of fourteen years in a factory. The occupier and the manager of a
factory may be punished with imprisonment for a term up to two years or with a fine up to ₹ 100,000 or with both in case of
contravention of any provisions of the Factories Act or rules framed there under and in case of a contravention continuing
after conviction, with a fine of up to ₹ 1,000 per day of contravention. In addition to the Factories Act, the employment of
workers, depending on the nature of activity, is regulated by a wide variety of generally applicable labour laws. The following
is an indicative list of labour laws applicable to the business and operations of Indian companies engaged in manufacturing
activities:
Contract Labour (Regulation and Abolition) Act, 1970;
Employees’ Provident Funds and Miscellaneous Provisions Act, 1952;
Employees’ State Insurance Act, 1948;
Inter-State Migrant Workmen (Regulation of Employment and Conditions of Service) Act, 1979;
Minimum Wages Act, 1948;
Payment of Bonus Act, 1965;
Payment of Gratuity Act, 1972;
Payment of Wages Act, 1936;
Maternity Benefit Act, 1961;
Industrial Disputes Act, 1947; and
Employees Compensation Act, 1923.
160
Intellectual Property Laws
Certain laws relating to intellectual property rights such as patent protection under the Patents Act, 1970, copyright protection
under the Copyright Act, 1957 trademark protection under the Trade Marks Act, 1999, and design protection under the
Designs Act, 2000 are also applicable to us.
The Copyright Act, 1957 (the “Copyright Act”) governs copyright protection in India. Even while copyright registration is
not a prerequisite for acquiring or enforcing a copyright in an otherwise copyrightable work, registration under the Copyright
Act acts as a prima facie evidence of the particulars entered therein and helps expedite infringement proceedings and reduce
delay caused due to evidentiary considerations.
The Trademarks Act, 1999 (the “Trademarks Act”) provides for the process for making an application and obtaining
registration of trademarks in India. The purpose of the Trademarks Act is to grant exclusive rights to marks such as a brand,
label, and heading and to obtain relief in case of infringement for commercial purposes as a trade description. The
Trademarks Act prohibits registration of deceptively similar trademarks and provides for penalties for infringement, falsifying
and falsely applying trademarks.
Under statute, India provides for the patent protection under the Patents Act, 1970 (the “Patents Act”). The Patents Act
governs the patent regime in India and recognises process patents as well as product patents. Patents obtained in India are
valid for a period of 20 years from the date of filing the application. The Patents Act also provides for grant of compulsory
license on patents after expiry of three years of its grant in certain circumstances such as reasonable requirements of the
public, non-availability of patented invention to public at affordable price or failure to work the patented invention.
The Designs Act, 2000, (the “Designs Act”) protects any visual design of objects that are not purely utilitarian. An industrial
design consists of the creation of a shape, configuration or composition of pattern or colour, or combination of pattern and
colour in three-dimensional form containing aesthetic value. It provides an exclusive right to apply a design to any article in
any class in which the design is registered.
Other regulations
Foreign Investment
The DIPP has issued the Consolidated Foreign Direct Investment Policy with effect from June 7, 2016 (the “FDI Policy”).
The FDI Policy consolidates and subsumes all the press notes, press releases, and clarifications on FDI issued by DIPP which
were in force on June 7, 2016. FDI in activities pertaining to beverage industry is permitted up to 100% on the automatic
route.
Competition Act, 2002
The Competition Act 2002 (the “Competition Act”) has been enacted to prevent anti-competitive practices, promote and
sustain competition, protect the interests of consumers and ensure freedom of trade in markets in India. As per Section 3 of
the Competition Act, entering into agreements between enterprises which, inter alia, affect the prices, supply, distribution or
other such collusive arrangements are anti-competitive in nature and are prohibited. Section 4 of the Competition Act,
prohibits an enterprise that is in a dominant position from abusing its dominant position. Further, Section 5 of the
Competition Act provides that assets/turnover thresholds applicable to acquisitions, merger and amalgamations in order to
determine whether the transaction would be regarded as a combination for the purposes of the Competition Act. Section 6 (1)
of the Competition Act provides that no person or enterprise shall enter into a combination which causes or is likely to cause
an appreciable adverse effect on competition within the relevant market in India and such a combination shall be void.
Municipality Laws
Pursuant to the Seventy Fourth Amendment Act, 1992, the respective state legislatures in India have the power to endow the
municipalities (as defined under Article 243Q of the Constitution of India) with the power to implement schemes and perform
functions in relation to matters listed in the twelfth schedule to the Constitution of India which includes regulation of public
health. The respective states of India have enacted laws empowering the municipalities to regulate public health including the
issuance of a health trade license and implementation of regulations relating to such license along with prescribing penalties
for non compliance.
Shops and Establishments legislations in various states
The provisions of various shops and establishments legislations, as applicable, regulate the conditions of work and
employment in shops and commercial establishments and generally prescribe obligations in respect of inter-alia registration,
opening and closing hours, daily and weekly working hours, holidays, leave, health, termination of services and safety
measures and wages for overtime work.
161
Indian Electricity Rules, 1956
Indian Electricity Act, 2003 has repealed Indian Electricity Act, 1910. Indian Electricity Rules, 2005 were framed by Central
Government pursuant to the power granted under section 176 of Electricity Act, 2003. These rules states that periodic
inspection and testing of consumer’s installation must be done at intervals not exceeding five years either by an Inspector or
any officer appointed to assist the Inspector or by the supplier as directed by the Central Government.
Laws applicable for operations outside India
Our Company operates in various jurisdictions, including Sri Lanka, Nepal, Morocco, Zambia, Mozambique, and Zimbabwe,
through our Subsidiaries. The relevant laws in these jurisdictions are applicable to our Subsidiaries, which relate to
incorporation or registration as applicable, labour, immigration, intellectual property, data protection, taxation, and other
business related laws.
162
HISTORY AND CERTAIN CORPORATE MATTERS
Brief history of our Company
Our Company was incorporated as Varun Beverages Limited on June 16, 1995 at New Delhi as a public limited company
under the Companies Act, 1956. Our Company obtained a certificate of commencement of business on July 4, 1995. We have
been associated with PepsiCo since the 1990s and have over two and half decades consolidated our business association with
PepsiCo, increasing the number of licensed territories and sub-territories covered by us, producing and distributing a wider
range of PepsiCo beverages, introducing various SKUs in our portfolio, and expanding our distribution network.
As of the date of this Red Herring Prospectus, our Company has 53 Equity Shareholders.
For information on our Company’s profile, activities, services, market, growth, technology, managerial competence, standing
with reference to prominent competitors, major vendors and suppliers, see “Our Management”, “Our Business”, “Industry
Overview”, “Management’s Discussion and Analysis of Financial Condition and Results of Operations” and “Financial
Statements” on pages 174, 130, 116, 413 and 210, respectively.
Changes in Registered Office
The details of changes in the registered office of our Company since incorporation are set forth below:
Date of
change
Details of the address of Registered Office Reason for Change
June 28, 1995 Registered office of the Company was changed from F-2/7,
Okhla Industrial Area, Phase I, New Delhi 110 020 to 8,
Prithviraj Road, New Delhi 110 011
Convenience for the Board to meet as
majority of the directors were residing at the
same address
November
25, 1996
Registered office of the Company was changed from 8,
Prithviraj Road, New Delhi 110 011 to F-2/7, Okhla Industrial
Area, Phase I, New Delhi 110 020
To ensure greater operational efficiency and
to meet growing business requirements
Main Objects of our Company
The main objects contained in the MOA of our Company are as follows:
“1. To carry on the business of manufacturing, producing, selling, distributing and bottling of beverages, aerated
waters, soft drinks, concentrate and fruit juices.
2. To manufacture, bottle, produce, process, prepare, improve, create, buy, sell, distribute, import, export and deal in
all kinds of foods, food products, cereals, spices, sugar, rice, wheat, flour, sugar cane, sugar products, jams, jellys,
pickles, chutneys, marmalades, vinegars, sausages, ketchups, essences, ghee, butter, cheese, malted foods, garden
products preserved, canned and tinned fruits and vegetables, biscuits, ice creams, creams, dairy products, milk
products and condensed milk, cakes, chocolates, potato wafers, potato products, snack foods, vegetable products,
preserved provisions and food and food products.”
The main objects as contained in the MOA enable our Company to carry on the business presently being carried out.
Amendments to our Memorandum of Association
Set out below are the amendments to our Memorandum of Association since the incorporation of our Company:
Date of Shareholders’ Resolution Particulars
September 30, 1996 Clause V of the MOA was amended to reflect the increase in authorised capital from ₹
50,000,000 divided into 5,000,000 Equity Shares of ₹ 10 each to ₹ 60,000,000 divided
into 6,000,000 Equity Shares of ₹ 10 each
May 25, 1998 Clause V of the MOA was amended to reflect the increase in authorised capital from ₹
60,000,000 divided into 6,000,000 Equity Shares of ₹ 10 each to ₹ 200,000,000
divided into 6,000,000 Equity Shares of ₹ 10 each and 1,400,000 Preference Shares of
₹ 100 each
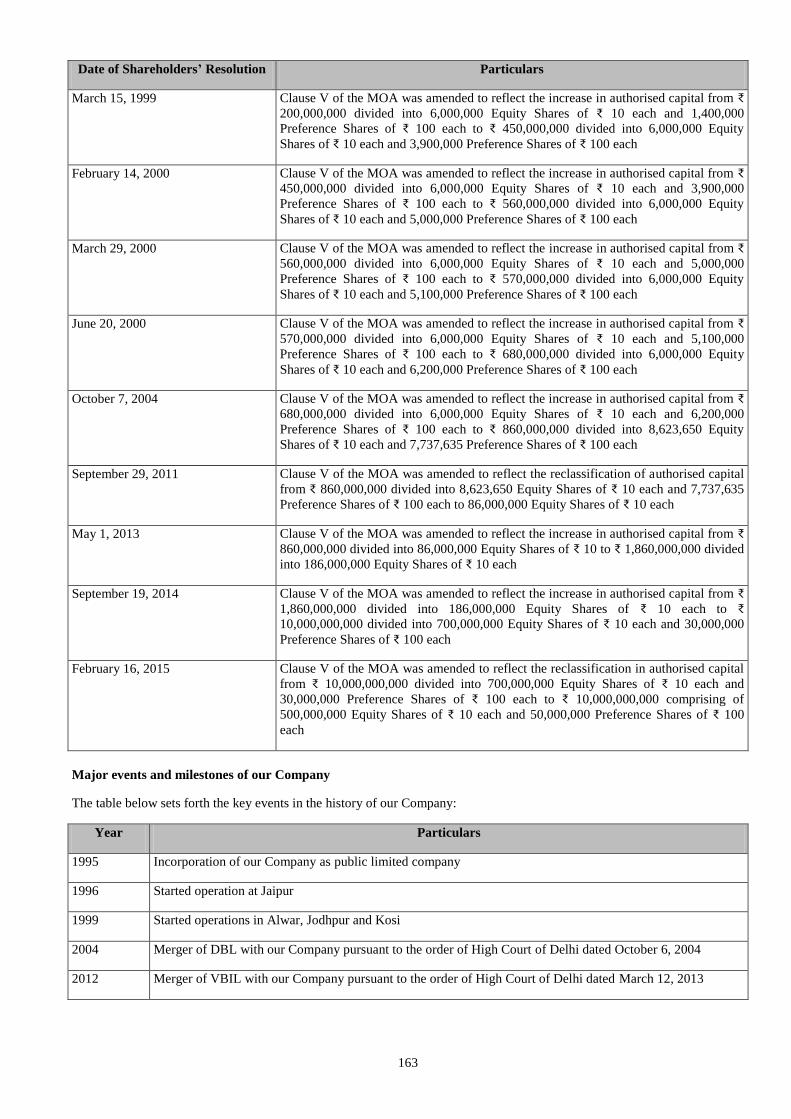
163
Date of Shareholders’ Resolution Particulars
March 15, 1999 Clause V of the MOA was amended to reflect the increase in authorised capital from ₹
200,000,000 divided into 6,000,000 Equity Shares of ₹ 10 each and 1,400,000
Preference Shares of ₹ 100 each to ₹ 450,000,000 divided into 6,000,000 Equity
Shares of ₹ 10 each and 3,900,000 Preference Shares of ₹ 100 each
February 14, 2000 Clause V of the MOA was amended to reflect the increase in authorised capital from ₹
450,000,000 divided into 6,000,000 Equity Shares of ₹ 10 each and 3,900,000
Preference Shares of ₹ 100 each to ₹ 560,000,000 divided into 6,000,000 Equity
Shares of ₹ 10 each and 5,000,000 Preference Shares of ₹ 100 each
March 29, 2000 Clause V of the MOA was amended to reflect the increase in authorised capital from ₹
560,000,000 divided into 6,000,000 Equity Shares of ₹ 10 each and 5,000,000
Preference Shares of ₹ 100 each to ₹ 570,000,000 divided into 6,000,000 Equity
Shares of ₹ 10 each and 5,100,000 Preference Shares of ₹ 100 each
June 20, 2000 Clause V of the MOA was amended to reflect the increase in authorised capital from ₹
570,000,000 divided into 6,000,000 Equity Shares of ₹ 10 each and 5,100,000
Preference Shares of ₹ 100 each to ₹ 680,000,000 divided into 6,000,000 Equity
Shares of ₹ 10 each and 6,200,000 Preference Shares of ₹ 100 each
October 7, 2004 Clause V of the MOA was amended to reflect the increase in authorised capital from ₹
680,000,000 divided into 6,000,000 Equity Shares of ₹ 10 each and 6,200,000
Preference Shares of ₹ 100 each to ₹ 860,000,000 divided into 8,623,650 Equity
Shares of ₹ 10 each and 7,737,635 Preference Shares of ₹ 100 each
September 29, 2011 Clause V of the MOA was amended to reflect the reclassification of authorised capital
from ₹ 860,000,000 divided into 8,623,650 Equity Shares of ₹ 10 each and 7,737,635
Preference Shares of ₹ 100 each to 86,000,000 Equity Shares of ₹ 10 each
May 1, 2013 Clause V of the MOA was amended to reflect the increase in authorised capital from ₹
860,000,000 divided into 86,000,000 Equity Shares of ₹ 10 to ₹ 1,860,000,000 divided
into 186,000,000 Equity Shares of ₹ 10 each
September 19, 2014 Clause V of the MOA was amended to reflect the increase in authorised capital from ₹
1,860,000,000 divided into 186,000,000 Equity Shares of ₹ 10 each to ₹
10,000,000,000 divided into 700,000,000 Equity Shares of ₹ 10 each and 30,000,000
Preference Shares of ₹ 100 each
February 16, 2015 Clause V of the MOA was amended to reflect the reclassification in authorised capital
from ₹ 10,000,000,000 divided into 700,000,000 Equity Shares of ₹ 10 each and
30,000,000 Preference Shares of ₹ 100 each to ₹ 10,000,000,000 comprising of
500,000,000 Equity Shares of ₹ 10 each and 50,000,000 Preference Shares of ₹ 100
each
Major events and milestones of our Company
The table below sets forth the key events in the history of our Company:
Year Particulars
1995 Incorporation of our Company as public limited company
1996 Started operation at Jaipur
1999 Started operations in Alwar, Jodhpur and Kosi
2004 Merger of DBL with our Company pursuant to the order of High Court of Delhi dated October 6, 2004
2012 Merger of VBIL with our Company pursuant to the order of High Court of Delhi dated March 12, 2013
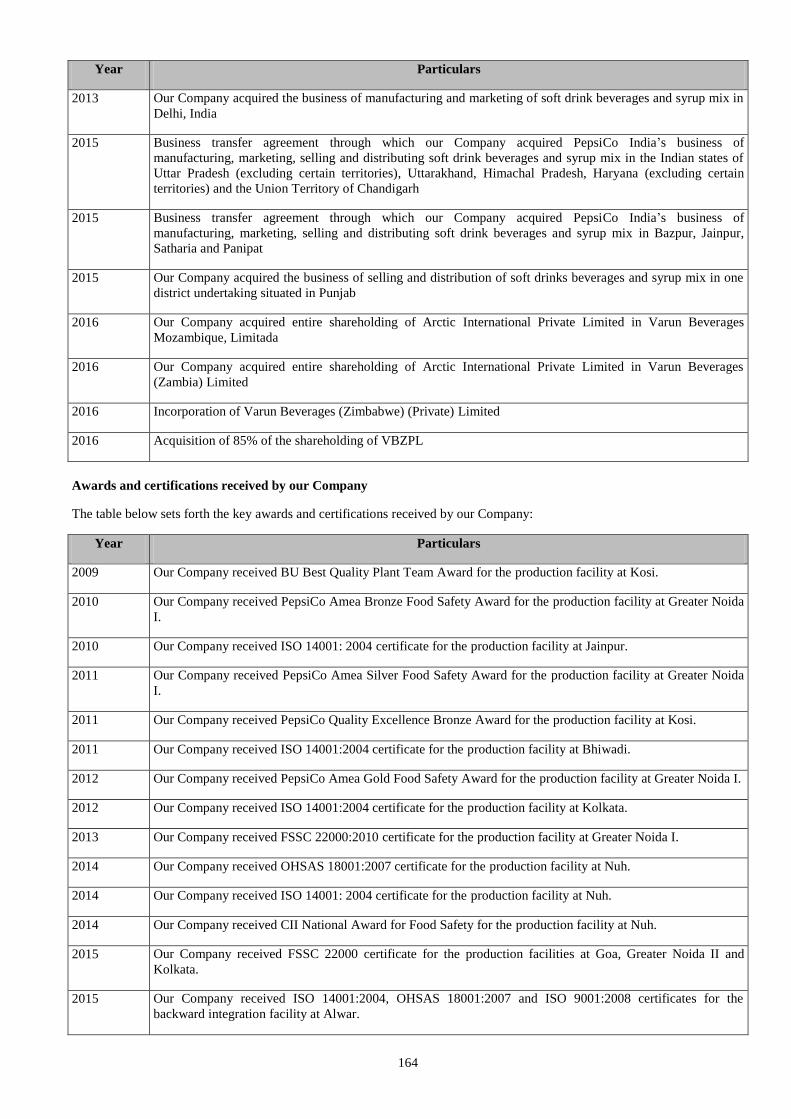
164
Year Particulars
2013 Our Company acquired the business of manufacturing and marketing of soft drink beverages and syrup mix in
Delhi, India
2015 Business transfer agreement through which our Company acquired PepsiCo India’s business of
manufacturing, marketing, selling and distributing soft drink beverages and syrup mix in the Indian states of
Uttar Pradesh (excluding certain territories), Uttarakhand, Himachal Pradesh, Haryana (excluding certain
territories) and the Union Territory of Chandigarh
2015 Business transfer agreement through which our Company acquired PepsiCo India’s business of
manufacturing, marketing, selling and distributing soft drink beverages and syrup mix in Bazpur, Jainpur,
Satharia and Panipat
2015 Our Company acquired the business of selling and distribution of soft drinks beverages and syrup mix in one
district undertaking situated in Punjab
2016 Our Company acquired entire shareholding of Arctic International Private Limited in Varun Beverages
Mozambique, Limitada
2016 Our Company acquired entire shareholding of Arctic International Private Limited in Varun Beverages
(Zambia) Limited
2016 Incorporation of Varun Beverages (Zimbabwe) (Private) Limited
2016 Acquisition of 85% of the shareholding of VBZPL
Awards and certifications received by our Company
The table below sets forth the key awards and certifications received by our Company:
Year Particulars
2009 Our Company received BU Best Quality Plant Team Award for the production facility at Kosi.
2010 Our Company received PepsiCo Amea Bronze Food Safety Award for the production facility at Greater Noida
I.
2010 Our Company received ISO 14001: 2004 certificate for the production facility at Jainpur.
2011 Our Company received PepsiCo Amea Silver Food Safety Award for the production facility at Greater Noida
I.
2011 Our Company received PepsiCo Quality Excellence Bronze Award for the production facility at Kosi.
2011 Our Company received ISO 14001:2004 certificate for the production facility at Bhiwadi.
2012 Our Company received PepsiCo Amea Gold Food Safety Award for the production facility at Greater Noida I.
2012 Our Company received ISO 14001:2004 certificate for the production facility at Kolkata.
2013 Our Company received FSSC 22000:2010 certificate for the production facility at Greater Noida I.
2014 Our Company received OHSAS 18001:2007 certificate for the production facility at Nuh.
2014 Our Company received ISO 14001: 2004 certificate for the production facility at Nuh.
2014 Our Company received CII National Award for Food Safety for the production facility at Nuh.
2015 Our Company received FSSC 22000 certificate for the production facilities at Goa, Greater Noida II and
Kolkata.
2015 Our Company received ISO 14001:2004, OHSAS 18001:2007 and ISO 9001:2008 certificates for the
backward integration facility at Alwar.
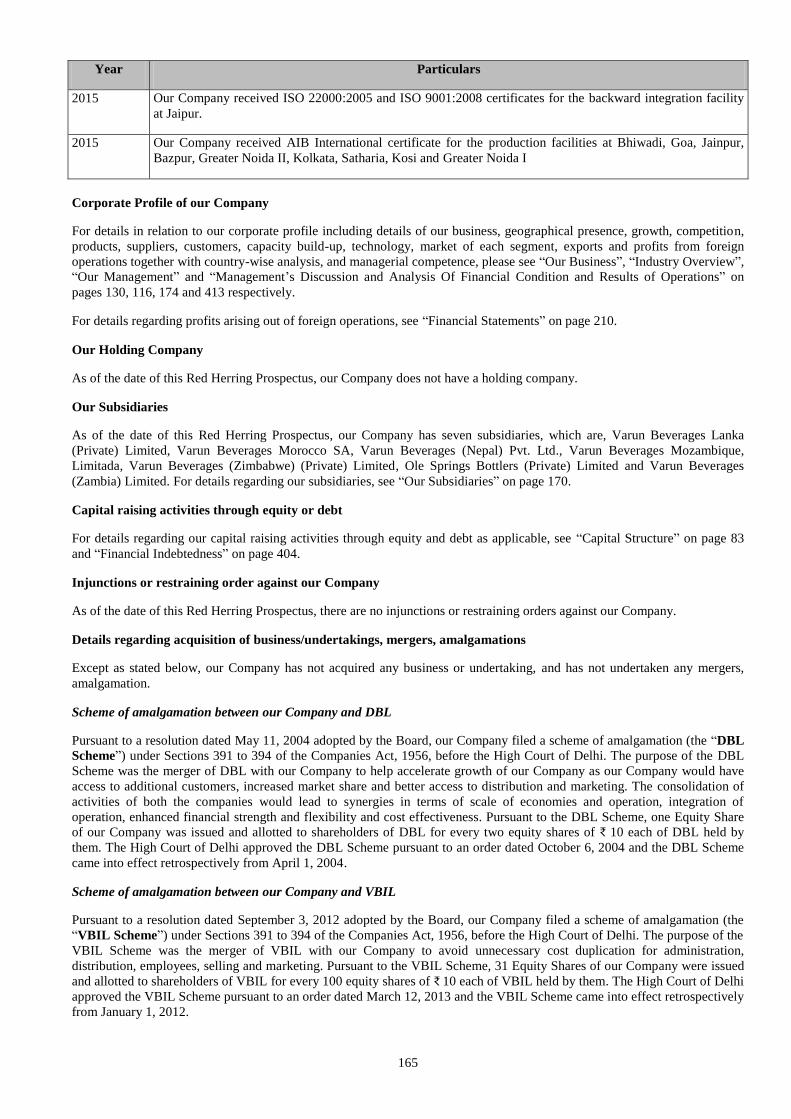
165
Year Particulars
2015 Our Company received ISO 22000:2005 and ISO 9001:2008 certificates for the backward integration facility
at Jaipur.
2015 Our Company received AIB International certificate for the production facilities at Bhiwadi, Goa, Jainpur,
Bazpur, Greater Noida II, Kolkata, Satharia, Kosi and Greater Noida I
Corporate Profile of our Company
For details in relation to our corporate profile including details of our business, geographical presence, growth, competition,
products, suppliers, customers, capacity build-up, technology, market of each segment, exports and profits from foreign
operations together with country-wise analysis, and managerial competence, please see “Our Business”, “Industry Overview”,
“Our Management” and “Management’s Discussion and Analysis Of Financial Condition and Results of Operations” on
pages 130, 116, 174 and 413 respectively.
For details regarding profits arising out of foreign operations, see “Financial Statements” on page 210.
Our Holding Company
As of the date of this Red Herring Prospectus, our Company does not have a holding company.
Our Subsidiaries
As of the date of this Red Herring Prospectus, our Company has seven subsidiaries, which are, Varun Beverages Lanka
(Private) Limited, Varun Beverages Morocco SA, Varun Beverages (Nepal) Pvt. Ltd., Varun Beverages Mozambique,
Limitada, Varun Beverages (Zimbabwe) (Private) Limited, Ole Springs Bottlers (Private) Limited and Varun Beverages
(Zambia) Limited. For details regarding our subsidiaries, see “Our Subsidiaries” on page 170.
Capital raising activities through equity or debt
For details regarding our capital raising activities through equity and debt as applicable, see “Capital Structure” on page 83
and “Financial Indebtedness” on page 404.
Injunctions or restraining order against our Company
As of the date of this Red Herring Prospectus, there are no injunctions or restraining orders against our Company.
Details regarding acquisition of business/undertakings, mergers, amalgamations
Except as stated below, our Company has not acquired any business or undertaking, and has not undertaken any mergers,
amalgamation.
Scheme of amalgamation between our Company and DBL
Pursuant to a resolution dated May 11, 2004 adopted by the Board, our Company filed a scheme of amalgamation (the “DBL
Scheme”) under Sections 391 to 394 of the Companies Act, 1956, before the High Court of Delhi. The purpose of the DBL
Scheme was the merger of DBL with our Company to help accelerate growth of our Company as our Company would have
access to additional customers, increased market share and better access to distribution and marketing. The consolidation of
activities of both the companies would lead to synergies in terms of scale of economies and operation, integration of
operation, enhanced financial strength and flexibility and cost effectiveness. Pursuant to the DBL Scheme, one Equity Share
of our Company was issued and allotted to shareholders of DBL for every two equity shares of ₹ 10 each of DBL held by
them. The High Court of Delhi approved the DBL Scheme pursuant to an order dated October 6, 2004 and the DBL Scheme
came into effect retrospectively from April 1, 2004.
Scheme of amalgamation between our Company and VBIL
Pursuant to a resolution dated September 3, 2012 adopted by the Board, our Company filed a scheme of amalgamation (the
“VBIL Scheme”) under Sections 391 to 394 of the Companies Act, 1956, before the High Court of Delhi. The purpose of the
VBIL Scheme was the merger of VBIL with our Company to avoid unnecessary cost duplication for administration,
distribution, employees, selling and marketing. Pursuant to the VBIL Scheme, 31 Equity Shares of our Company were issued
and allotted to shareholders of VBIL for every 100 equity shares of ₹ 10 each of VBIL held by them. The High Court of Delhi
approved the VBIL Scheme pursuant to an order dated March 12, 2013 and the VBIL Scheme came into effect retrospectively
from January 1, 2012.
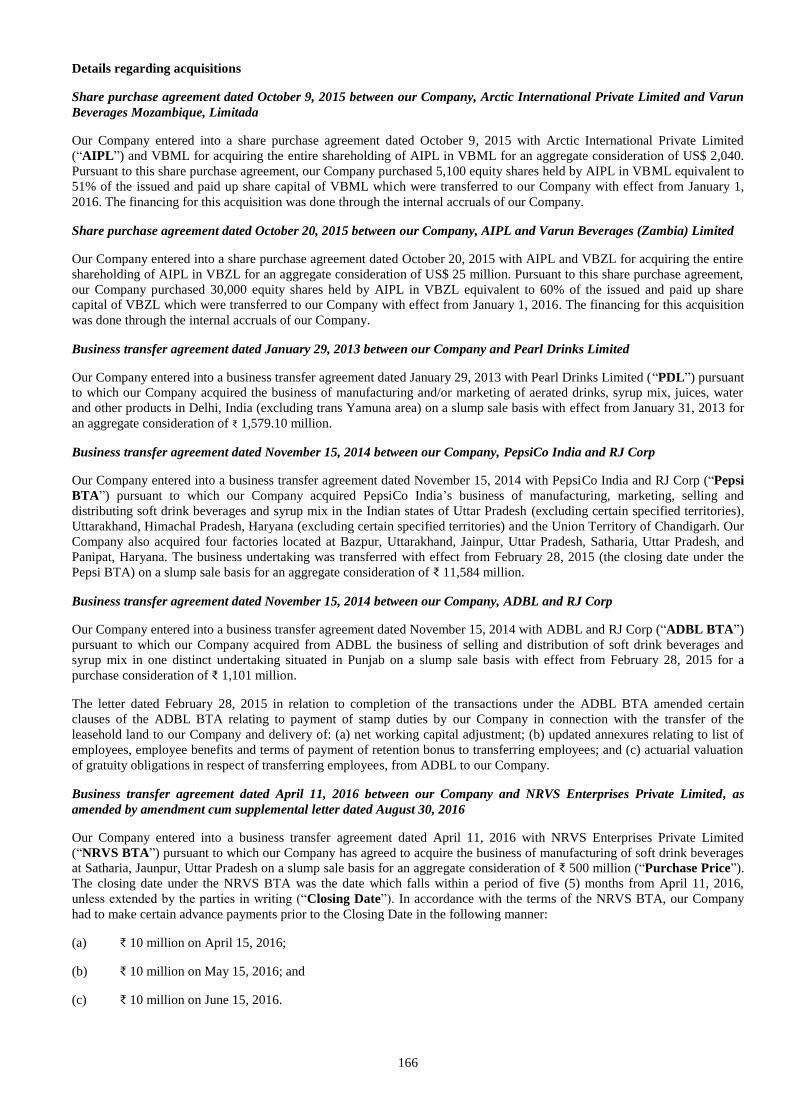
166
Details regarding acquisitions
Share purchase agreement dated October 9, 2015 between our Company, Arctic International Private Limited and Varun
Beverages Mozambique, Limitada
Our Company entered into a share purchase agreement dated October 9, 2015 with Arctic International Private Limited
(“AIPL”) and VBML for acquiring the entire shareholding of AIPL in VBML for an aggregate consideration of US$ 2,040.
Pursuant to this share purchase agreement, our Company purchased 5,100 equity shares held by AIPL in VBML equivalent to
51% of the issued and paid up share capital of VBML which were transferred to our Company with effect from January 1,
2016. The financing for this acquisition was done through the internal accruals of our Company.
Share purchase agreement dated October 20, 2015 between our Company, AIPL and Varun Beverages (Zambia) Limited
Our Company entered into a share purchase agreement dated October 20, 2015 with AIPL and VBZL for acquiring the entire
shareholding of AIPL in VBZL for an aggregate consideration of US$ 25 million. Pursuant to this share purchase agreement,
our Company purchased 30,000 equity shares held by AIPL in VBZL equivalent to 60% of the issued and paid up share
capital of VBZL which were transferred to our Company with effect from January 1, 2016. The financing for this acquisition
was done through the internal accruals of our Company.
Business transfer agreement dated January 29, 2013 between our Company and Pearl Drinks Limited
Our Company entered into a business transfer agreement dated January 29, 2013 with Pearl Drinks Limited (“PDL”) pursuant
to which our Company acquired the business of manufacturing and/or marketing of aerated drinks, syrup mix, juices, water
and other products in Delhi, India (excluding trans Yamuna area) on a slump sale basis with effect from January 31, 2013 for
an aggregate consideration of ₹ 1,579.10 million.
Business transfer agreement dated November 15, 2014 between our Company, PepsiCo India and RJ Corp
Our Company entered into a business transfer agreement dated November 15, 2014 with PepsiCo India and RJ Corp (“Pepsi
BTA”) pursuant to which our Company acquired PepsiCo India’s business of manufacturing, marketing, selling and
distributing soft drink beverages and syrup mix in the Indian states of Uttar Pradesh (excluding certain specified territories),
Uttarakhand, Himachal Pradesh, Haryana (excluding certain specified territories) and the Union Territory of Chandigarh. Our
Company also acquired four factories located at Bazpur, Uttarakhand, Jainpur, Uttar Pradesh, Satharia, Uttar Pradesh, and
Panipat, Haryana. The business undertaking was transferred with effect from February 28, 2015 (the closing date under the
Pepsi BTA) on a slump sale basis for an aggregate consideration of ₹ 11,584 million.
Business transfer agreement dated November 15, 2014 between our Company, ADBL and RJ Corp
Our Company entered into a business transfer agreement dated November 15, 2014 with ADBL and RJ Corp (“ADBL BTA”)
pursuant to which our Company acquired from ADBL the business of selling and distribution of soft drink beverages and
syrup mix in one distinct undertaking situated in Punjab on a slump sale basis with effect from February 28, 2015 for a
purchase consideration of ₹ 1,101 million.
The letter dated February 28, 2015 in relation to completion of the transactions under the ADBL BTA amended certain
clauses of the ADBL BTA relating to payment of stamp duties by our Company in connection with the transfer of the
leasehold land to our Company and delivery of: (a) net working capital adjustment; (b) updated annexures relating to list of
employees, employee benefits and terms of payment of retention bonus to transferring employees; and (c) actuarial valuation
of gratuity obligations in respect of transferring employees, from ADBL to our Company.
Business transfer agreement dated April 11, 2016 between our Company and NRVS Enterprises Private Limited, as
amended by amendment cum supplemental letter dated August 30, 2016
Our Company entered into a business transfer agreement dated April 11, 2016 with NRVS Enterprises Private Limited
(“NRVS BTA”) pursuant to which our Company has agreed to acquire the business of manufacturing of soft drink beverages
at Satharia, Jaunpur, Uttar Pradesh on a slump sale basis for an aggregate consideration of ₹ 500 million (“Purchase Price”).
The closing date under the NRVS BTA was the date which falls within a period of five (5) months from April 11, 2016,
unless extended by the parties in writing (“Closing Date”). In accordance with the terms of the NRVS BTA, our Company
had to make certain advance payments prior to the Closing Date in the following manner:
(a) ₹ 10 million on April 15, 2016;
(b) ₹ 10 million on May 15, 2016; and
(c) ₹ 10 million on June 15, 2016.
167
The above mentioned advance payments were deducted from the Purchase Price at the time of closing under the NRVS BTA.
Our Company has made all the advance payments. The closing under the NRVS BTA was achieved on September 3, 2016
and our Company acquired the business of manufacturing soft drink beverages at Satharia, Jaunpur, Uttar Pradesh. Under the
NRVS BTA, our Company was also required to provide a bank guarantee of ₹ 460 million as security towards payment of the
Purchase Price in favour of NRVS. IDFC Bank Limited had issued such bank guarantee on April 18, 2016 on our behalf in
favour of NRVS. This bank guarantee was placed with PepsiCo India in its capacity as the escrow agent and has now expired.
Our Company has received the transfer approval for the transfer of the manufacturing facility located at Plot Nos. E 71 to E
76 and E 92 to E 96 Satharia, Jaunpur, Uttar Pradesh from the Satharia Industrial Development Authority and is in the process
of getting the registered long term lease deeds executed with the Satharia Industrial Development Authority.
Business transfer agreement dated March 28, 2016 between our Company and Dhillon Kool Drinks and Beverages Private
Limited as amended by letter dated March 28, 2016 from our Company to Dhillon Kool Drinks and Beverages Private
Limited
Our Company has entered into a business transfer agreement dated March 28, 2016 with Dhillion Kool Drinks and Beverages
Private Limited (“Dhillon Kool Drinks BTA”) pursuant to which our Company acquired the business of manufacturing of
soft drinks beverages at Phillaur, Punjab on a slump sale basis with effect from March 28, 2016 for an aggregate
consideration of ₹ 574 million.
Shareholders’ Agreement dated February 8, 2016 between our Company and Glaciem (Private) Limited
Our Company and Glaciem (Private) Limited (“GPL”) entered into a shareholders’ agreement dated February 8, 2016
(“Zimbabwe SHA”) pursuant to which our Company subscribed to 850 shares constituting 85% of the shareholding of
VBZPL and GPL subscribed to 150 shares constituting 15% of the shareholding of VBZPL with effect from April 5, 2016 as
per the terms and conditions contained in the SHA. The financing for this acquisition was done through the internal accruals
of our Company. The Zimbabwe SHA confers certain rights and obligations upon our Company including, inter alia, drag
along rights and consent rights with respect to reserved matters. Our Company is required to appoint the managing director of
VBZPL and when required, provide loans to VBZPL in proportion of its shareholding.
Summary of Key Agreements
Investment Agreements
Investment agreement dated July 18, 2011 between VBIL, SCPE, RJ Corp, Ravi Kant Jaipuria & Sons (HUF) and Varun
Jaipuria as amended by an amendment and supplemental agreement dated September 29, 2012 and an amendment
agreement dated June 13, 2016. (the “Investment Agreement”)
VBIL, RJ Corp, Ravi Kant Jaipuria & Sons (HUF), Varun Jaipuria and SCPE had entered into an investment agreement dated
July 18, 2011 pursuant to which SCPE subscribed to 100 equity shares in VBIL at an aggregate consideration of ₹ 20,000 and
4,149,980 CCDs in three tranches at an aggregate consideration of ₹ 4,149.98 million. Subscription of CCDs includes
issuance of: (a) 1,249,980 CCDs for an aggregate consideration of ₹ 1,249.98 million (“Tranche 1 CCDs”); (b) 1,250,000
CCDs for an aggregate consideration of ₹ 1,250 million (“Tranche 2 CCDs”); and (c) 1,650,000 CCDs for an aggregate
consideration of ₹ 1,650 million (“Tranche 3 CCDs”). Under the amendment and supplemental agreement dated September
29, 2012, VBIL agreed to purchase 2,080,000 Equity Shares constituting 26% of the equity share capital of our Company
held by PepsiCo India.
Pursuant to the VBIL Scheme, the CCDs issued by VBIL to SCPE were deemed to be issued by our Company at the same
face value and on the same terms and conditions under the Investment Agreement.
The Investment Agreement confers certain rights and obligations upon SCPE, including, inter alia, the right to appoint a
nominee director, consent rights with respect to reserved matters, tag-along right, veto rights, pre-emptive right, and certain
exit rights. For details in relation to such special rights, please see “Main Provisions of Articles of Associations – Chapter II”
on page 540. The Investment Agreement terminates with respect to all parties upon listing of the equity shares of our
Company, however, certain clauses, including indemnities, confidentiality and publicity related matters survive the
termination of the Investment Agreement.
Under the Investment Agreement, our Company shall not dilute its shareholding in any of its subsidiaries, including without
limitation by way of raising equity or equity linked capital, provided that our Company shall be entitled to swap the
shareholding of our Company in its subsidiaries with any other company, so long as such swap of shareholding is conducted
in consultation with SCPE and is on an arm’s length basis.
The Investment Agreement shall be terminated on the earlier of (a) listing of Equity Shares of our Company on the stock
exchanges; and (b) our Company, RJ Corp, Ravi Kant Jaipuria & Sons (HUF), and Varun Jaipuria fulfilling their obligation
to provide SCPE the agreed return in accordance with the terms of the Investment Agreement.
168
Securities purchase cum investment agreement dated September 18, 2015 between our Company, AION Investments II
Singapore Pte. Ltd. and Standard Chartered Private Equity Mauritius II Limited (the “AION Investment Agreement”)
Our Company entered into the AION Investment Agreement for recording the terms and conditions regulating the
relationship and their respective rights and obligations in relation to purchase of CCDs from SCPE and other incidental
matters.
Pursuant to the AION Investment Agreement, AION purchased 1,619,298 CCDs from SCPE for an aggregate consideration
of ₹ 3,000 million as detailed below:
(a) 487,740 Tranche 1 CCDs;
(b) 487,740 Tranche 2 CCDs; and
(c) 643,818 Series B CCDs.
Pursuant to the Investment Agreement and the AION Investment Agreement, SCPE held 2,530,682 CCDs and pursuant to the
AION Investment Agreement, AION held 1,613,900 CCDs and ICICI Venture Employees Welfare Trust through IDBI
Trusteeship Services Limited held 5,398 CCDs. Upon conversion of the CCDs, 12,838,437, 8,188,562 and 27,388 Equity
Shares were allotted to SCPE, AION and ICICI Venture Employees Welfare Trust through IDBI Trusteeship Services
Limited, respectively, on October 3, 2016.
Deed of adherence dated September 18, 2015 between our Company, AION, SCPE, RJ Corp, Ravi Kant Jaipuria & Sons
(HUF) and Varun Jaipuria (“Deed of Adherence”)
Our Company has entered into a Deed of Adherence dated September 18, 2015 with AION, SCPE, RJ Corp, Ravi Kant
Jaipuria & Sons (HUF) and Varun Jaipuria in order to comply with and amend certain provisions of the Investment
Agreement.
Under the Deed of Adherence, certain rights and benefits available to SCPE under the Investment Agreement have been
assigned to AION. These rights include rights relating to dealing in equity shares, exit provisions, transfer of shares and non-
compete. However, the rights relating to appointment of nominee director and reserved matters available to SCPE under the
Investment Agreement were not assigned to AION.
Investment agreement dated October 20, 2014 between our Company and RJ Corp (“RJCL Investment Agreement”)
Our Company has entered into the RJCL Investment Agreement pursuant to which RJ Corp has purchased 20,000,000 CCPSs
for an aggregate consideration of ₹ 2,000 million. RJCL CCPSs were issued on November 3, 2014.
Under the RJCL Investment Agreement, our Company has agreed that the investment amount shall only be used by our
Company for further acquisition of beverage business from PepsiCo India and/or its affiliates for the growth and expansion of
its business.
The CCPSs shall not carry any dividend during the first three years. Each CCPSs holder shall be entitled to receive dividend
at the rate of 10% in the fourth year and at the rate of 20% in the fifth year. The CCPSs shall, unless converted earlier in terms
of the RJCL Investment Agreement, be compulsorily convertible into Equity Shares upon the expiry of five years from the
closing date at a price which shall be calculated at the valuation of our Company computed by an independent valuer or at a
price not lower than break up value, whichever is higher. The CCPSs will be mandatorily converted into Equity Shares prior
to: (a) filing of the red herring prospectus at the IPO price; or (b) a third party private equity investor investing in our
Company, at a price at which the said private equity investor is investing into our Company; or (c) the conversion of CCDs
held by SCPE in accordance with the terms of the Investment Agreement, at the same price at which the said CCDs are
converted. The RJCL CCPSs were converted into 4,545,455 Equity Shares on October 7, 2016.
The RJCL Investment Agreement terminates with respect to all parties upon listing of the Equity Shares, however, certain
clauses, including indemnities and confidentiality survive its termination. The RJCL Investment Agreement shall terminate on
the earlier of (a) listing of the Equity Shares on the stock exchanges; and (b) the investment by a third party private equity
investor into our Company.
Investment agreement dated February 16, 2015 between our Company and DHRPL (“DHRPL Investment Agreement”)
Our Company has entered into an investment agreement dated February 16, 2015 with DHRPL pursuant to which DHRPL
has purchased 25,000,000 CCPSs for an aggregate consideration of ₹ 2,500 million. DHRPL CCPSs were issued on February
18, 2015. The investment amount under the DHRPL Investment Agreement shall only be used by our Company for further
acquisition of beverage business from PepsiCo India and/or its affiliates for the growth and expansion of its business.
169
The CCPSs shall not carry any dividend during the first three years. Each CCPSs holder shall be entitled to receive dividend
at the rate of 10% in the fourth year and at the rate of 20% in the fifth year. The CCPSs shall, unless converted earlier in terms
of the DHRPL Investment Agreement, be compulsorily convertible into Equity Shares upon the expiry of five years from the
closing date at a price which shall be calculated at the valuation of the Company computed by an independent valuer or at a
price not lower than break up value, whichever is higher. The CCPSs will be mandatorily converted into Equity Shares prior
to: (a) filing of the red herring prospectus at the IPO price; or (b) a third party private equity investor investing in the
Company, at a price at which the said private equity investor is investing into the Company; or (c) the conversion of CCDs
held by SCPE in accordance with the terms of the Investment Agreement, at the same price at which the said CCDs are
converted. The DHRPL CCPSs were converted into 5,681,818 Equity Shares on October 7, 2016.
The DHRPL Investment Agreement terminates with respect to all parties upon listing of the Equity Shares, however, certain
clauses, including indemnities and confidentiality survive its termination. The DHRPL Investment Agreement shall terminate
on the earlier of (a) listing of the Equity Shares on the stock exchanges; and (b) the investment by a third party private equity
investor into our Company.
Guarantees issued by Ravi Kant Jaipuria in favour of lenders of certain of our Subsidiaries
In accordance with the provisions of the loan agreements entered into by certain of our Subsidiaries and various lenders, Ravi
Kant Jaipuria, one of our Promoters, has issued guarantees in favour of such lenders. For details in relation to the guarantees
issued by Ravi Kant Jaipuria, please see “Restated Consolidated Financial Statements – Restated Consolidated Summary
Statement of Long Term Borrowings” and “Restated Consolidated Financial Statements – Restated Consolidated Summary
Statement of Short Term Borrowings” on pages 247 and 265, respectively.
Financial and Strategic Partners
Our Company does not have any financial and strategic partners as of the date of filing this Red Herring Prospectus.
Lock-outs and strikes, injunctions or restraining orders
There have been no lock-outs or strikes at any time in our Company and our Company is not operating under any injunction
or restraining order.
Time and cost overruns
Our Company has not experienced any time or cost overruns in relation any projects implemented by it.
Changes in the activities of our Company during the last five years
There have been no changes in the activities of our Company during the last five years which may have had a material
adverse effect on the profits and loss account of our Company, including discontinuance of lines of business, loss of agencies
or markets and similar factors.
Revaluation of Assets
Pursuant to the VBIL Scheme, our Company re-valued certain land parcels at various plant locations of our Company situated
at Kosi, Greater Noida, Alwar, Jodhpur, Nuh, Jaipur, Kolkata and Bhiwadi amounting to ₹ 2,157.65 million. Prior to such
revaluation the value of all such land parcels aggregated to ₹ 494.97 million. The revaluation amount was credited to the
capital reserve account of the Company and the resultant amount has been utilised as per the VBIL Scheme. For details
relating to the VBIL Scheme, please see “– Scheme of amalgamation between our Company and VBIL” on page 165 and see
“Risk Factors - We have, in the past, revalued certain of our assets. There can be no assurance that the value of our assets and
accordingly our net worth will not undergo any further change based on any future revaluation.” on page 26.
170
OUR SUBSIDIARIES
Our Company has seven subsidiaries, which are, Varun Beverages Lanka (Private) Limited, Varun Beverages Morocco SA;
Varun Beverages (Nepal) Pvt. Ltd., Varun Beverages Mozambique, Limitada, Varun Beverages (Zimbabwe) (Private)
Limited, Ole Springs Bottlers (Pvt.) Ltd and Varun Beverages (Zambia) Limited (together, our “Subsidiaries”).
Details of our Subsidiaries
1. Varun Beverages Lanka (Private) Limited (“VBL Lanka”)
Corporate Information:
VBL Lanka was incorporated on February 19, 2010 under the (Sri Lankan) Companies Act No. 7 of 2007 and has its
registered office at No. 140, Low Level Road, Embulgama, Ranala, Sri Lanka.
VBL Lanka is involved in the business of manufacturing, bottling, marketing and distribution of PepsiCo beverages
in Sri Lanka.
Capital Structure
No. of shares
Authorised capital N.A.
Issued, subscribed and paid-up capital of Ordinary Shares of LKR 10 each 56,775,000
Redeemable Preference Shares of LKR 100 each 20,116,526
Shareholding Pattern
The shareholding pattern of VBL Lanka is as follows:
Sr.
No.
Name of the shareholder No. of shares Percentage of shareholding
Ordinary Shares of LKR 10 each
1. Varun Beverages Limited 56,775,000 100
Total 56,775,000 100
Redeemable Preference Shares of LKR 100 each
2. Varun Beverages Limited 20,116,526 100
Total 20,116,526 100
There are no accumulated profits or losses of VBL Lanka not accounted for by our Company.
2. Varun Beverages Morocco SA (“VBM”)
Corporate Information:
VBM was incorporated on December 29, 2010 under Dahir n° 1-96-124 of Rabii II 1417 (August 30, 1996)
promulgating law n°17-95 and Dahir n° 1-08-18 of 17 Jaournada 1 1429 (May 23, 2008) promulgating 20-05 at
Casablanca and has its registered office at Zone Industrielle Bouskoura Province De Nouacer, Morocco.
VBM is involved in the business of bottling, production and distribution of PepsiCo beverages in Morocco.
Capital Structure
No. of shares of MAD 50 each
Authorised capital N.A.
Issued, subscribed and paid-up capital 7,480,000
Shareholding Pattern
The shareholding pattern of VBM is as follows:
Sr. No. Name of the shareholder No. of equity shares of
MAD 50 each
Percentage of total equity
holding (%)
1. Varun Beverages Limited 7,479,996 99.99
2. Ravi Kant Jaipuria* 1 0.00
3. Madhu Sudan Parikh* 1 0.00
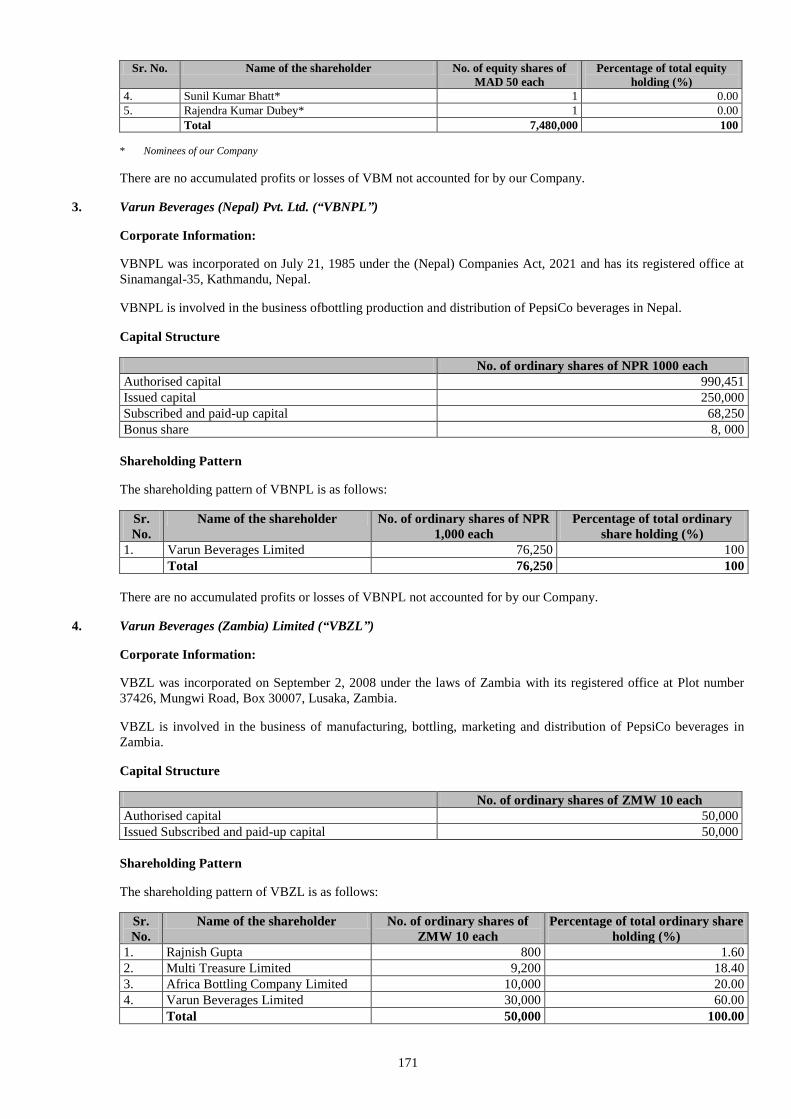
171
Sr. No. Name of the shareholder No. of equity shares of
MAD 50 each
Percentage of total equity
holding (%)
4. Sunil Kumar Bhatt* 1 0.00
5. Rajendra Kumar Dubey* 1 0.00
Total 7,480,000 100
* Nominees of our Company
There are no accumulated profits or losses of VBM not accounted for by our Company.
3. Varun Beverages (Nepal) Pvt. Ltd. (“VBNPL”)
Corporate Information:
VBNPL was incorporated on July 21, 1985 under the (Nepal) Companies Act, 2021 and has its registered office at
Sinamangal-35, Kathmandu, Nepal.
VBNPL is involved in the business ofbottling production and distribution of PepsiCo beverages in Nepal.
Capital Structure
No. of ordinary shares of NPR 1000 each
Authorised capital 990,451
Issued capital 250,000
Subscribed and paid-up capital 68,250
Bonus share 8, 000
Shareholding Pattern
The shareholding pattern of VBNPL is as follows:
Sr.
No.
Name of the shareholder No. of ordinary shares of NPR
1,000 each
Percentage of total ordinary
share holding (%)
1. Varun Beverages Limited 76,250 100
Total 76,250 100
There are no accumulated profits or losses of VBNPL not accounted for by our Company.
4. Varun Beverages (Zambia) Limited (“VBZL”)
Corporate Information:
VBZL was incorporated on September 2, 2008 under the laws of Zambia with its registered office at Plot number
37426, Mungwi Road, Box 30007, Lusaka, Zambia.
VBZL is involved in the business of manufacturing, bottling, marketing and distribution of PepsiCo beverages in
Zambia.
Capital Structure
No. of ordinary shares of ZMW 10 each
Authorised capital 50,000
Issued Subscribed and paid-up capital 50,000
Shareholding Pattern
The shareholding pattern of VBZL is as follows:
Sr.
No.
Name of the shareholder No. of ordinary shares of
ZMW 10 each
Percentage of total ordinary share
holding (%)
1. Rajnish Gupta 800 1.60
2. Multi Treasure Limited 9,200 18.40
3. Africa Bottling Company Limited 10,000 20.00
4. Varun Beverages Limited 30,000 60.00
Total 50,000 100.00
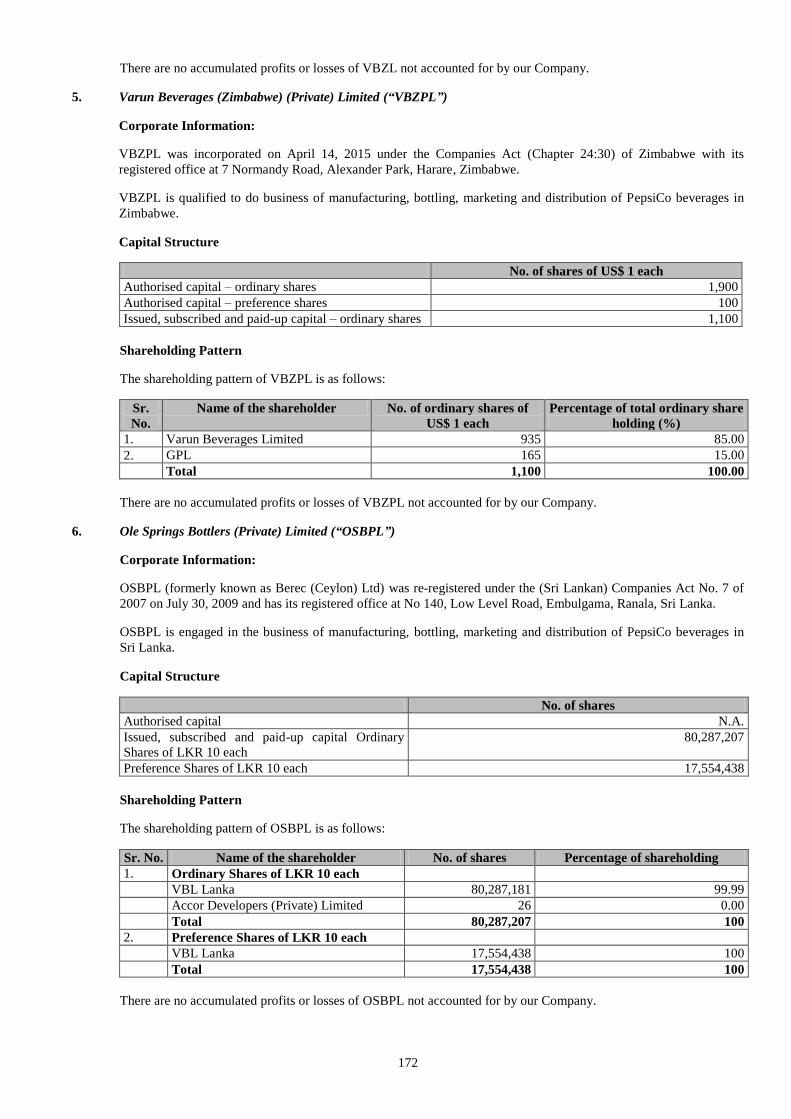
172
There are no accumulated profits or losses of VBZL not accounted for by our Company.
5. Varun Beverages (Zimbabwe) (Private) Limited (“VBZPL”)
Corporate Information:
VBZPL was incorporated on April 14, 2015 under the Companies Act (Chapter 24:30) of Zimbabwe with its
registered office at 7 Normandy Road, Alexander Park, Harare, Zimbabwe.
VBZPL is qualified to do business of manufacturing, bottling, marketing and distribution of PepsiCo beverages in
Zimbabwe.
Capital Structure
No. of shares of US$ 1 each
Authorised capital – ordinary shares 1,900
Authorised capital – preference shares 100
Issued, subscribed and paid-up capital – ordinary shares 1,100
Shareholding Pattern
The shareholding pattern of VBZPL is as follows:
Sr.
No.
Name of the shareholder No. of ordinary shares of
US$ 1 each
Percentage of total ordinary share
holding (%)
1. Varun Beverages Limited 935 85.00
2. GPL 165 15.00
Total 1,100 100.00
There are no accumulated profits or losses of VBZPL not accounted for by our Company.
6. Ole Springs Bottlers (Private) Limited (“OSBPL”)
Corporate Information:
OSBPL (formerly known as Berec (Ceylon) Ltd) was re-registered under the (Sri Lankan) Companies Act No. 7 of
2007 on July 30, 2009 and has its registered office at No 140, Low Level Road, Embulgama, Ranala, Sri Lanka.
OSBPL is engaged in the business of manufacturing, bottling, marketing and distribution of PepsiCo beverages in
Sri Lanka.
Capital Structure
No. of shares
Authorised capital N.A.
Issued, subscribed and paid-up capital Ordinary
Shares of LKR 10 each
80,287,207
Preference Shares of LKR 10 each 17,554,438
Shareholding Pattern
The shareholding pattern of OSBPL is as follows:
Sr. No. Name of the shareholder No. of shares Percentage of shareholding
1. Ordinary Shares of LKR 10 each
VBL Lanka 80,287,181 99.99
Accor Developers (Private) Limited 26 0.00
Total 80,287,207 100
2. Preference Shares of LKR 10 each
VBL Lanka 17,554,438 100
Total 17,554,438 100
There are no accumulated profits or losses of OSBPL not accounted for by our Company.
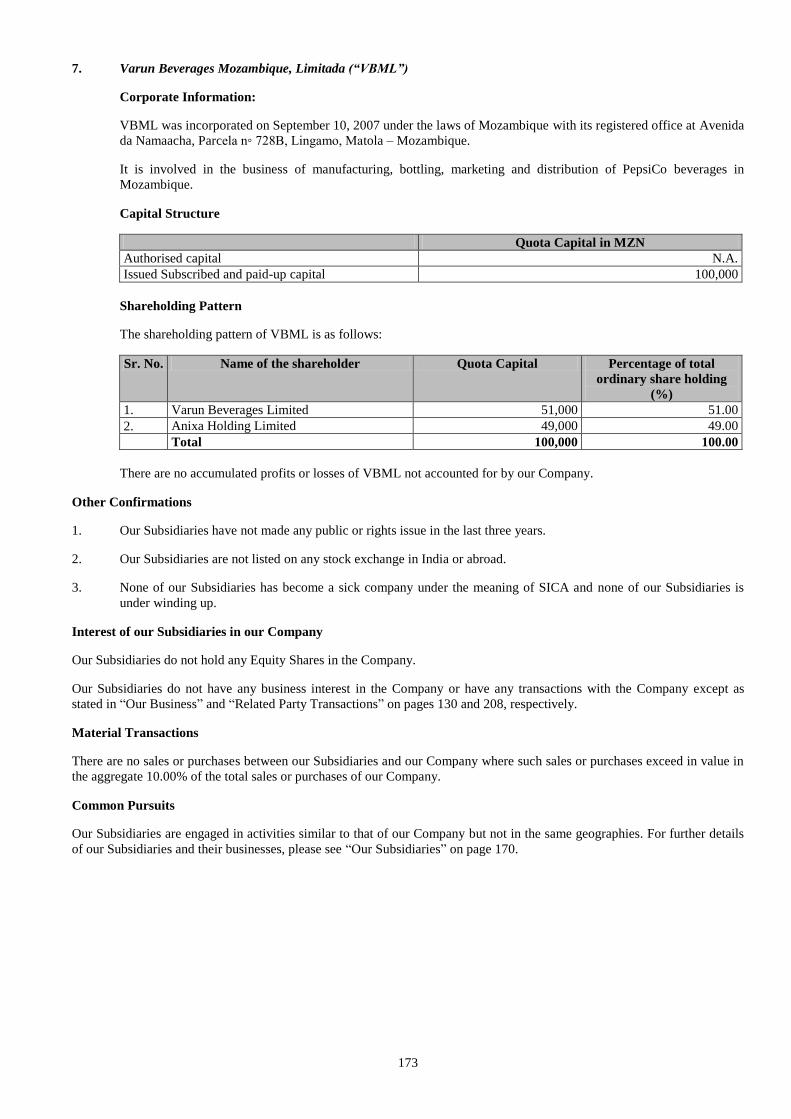
173
7. Varun Beverages Mozambique, Limitada (“VBML”)
Corporate Information:
VBML was incorporated on September 10, 2007 under the laws of Mozambique with its registered office at Avenida
da Namaacha, Parcela n◦ 728B, Lingamo, Matola – Mozambique.
It is involved in the business of manufacturing, bottling, marketing and distribution of PepsiCo beverages in
Mozambique.
Capital Structure
Quota Capital in MZN
Authorised capital N.A.
Issued Subscribed and paid-up capital 100,000
Shareholding Pattern
The shareholding pattern of VBML is as follows:
Sr. No. Name of the shareholder Quota Capital Percentage of total
ordinary share holding
(%)
1. Varun Beverages Limited 51,000 51.00
2. Anixa Holding Limited 49,000 49.00
Total 100,000 100.00
There are no accumulated profits or losses of VBML not accounted for by our Company.
Other Confirmations
1. Our Subsidiaries have not made any public or rights issue in the last three years.
2. Our Subsidiaries are not listed on any stock exchange in India or abroad.
3. None of our Subsidiaries has become a sick company under the meaning of SICA and none of our Subsidiaries is
under winding up.
Interest of our Subsidiaries in our Company
Our Subsidiaries do not hold any Equity Shares in the Company.
Our Subsidiaries do not have any business interest in the Company or have any transactions with the Company except as
stated in “Our Business” and “Related Party Transactions” on pages 130 and 208, respectively.
Material Transactions
There are no sales or purchases between our Subsidiaries and our Company where such sales or purchases exceed in value in
the aggregate 10.00% of the total sales or purchases of our Company.
Common Pursuits
Our Subsidiaries are engaged in activities similar to that of our Company but not in the same geographies. For further details
of our Subsidiaries and their businesses, please see “Our Subsidiaries” on page 170.
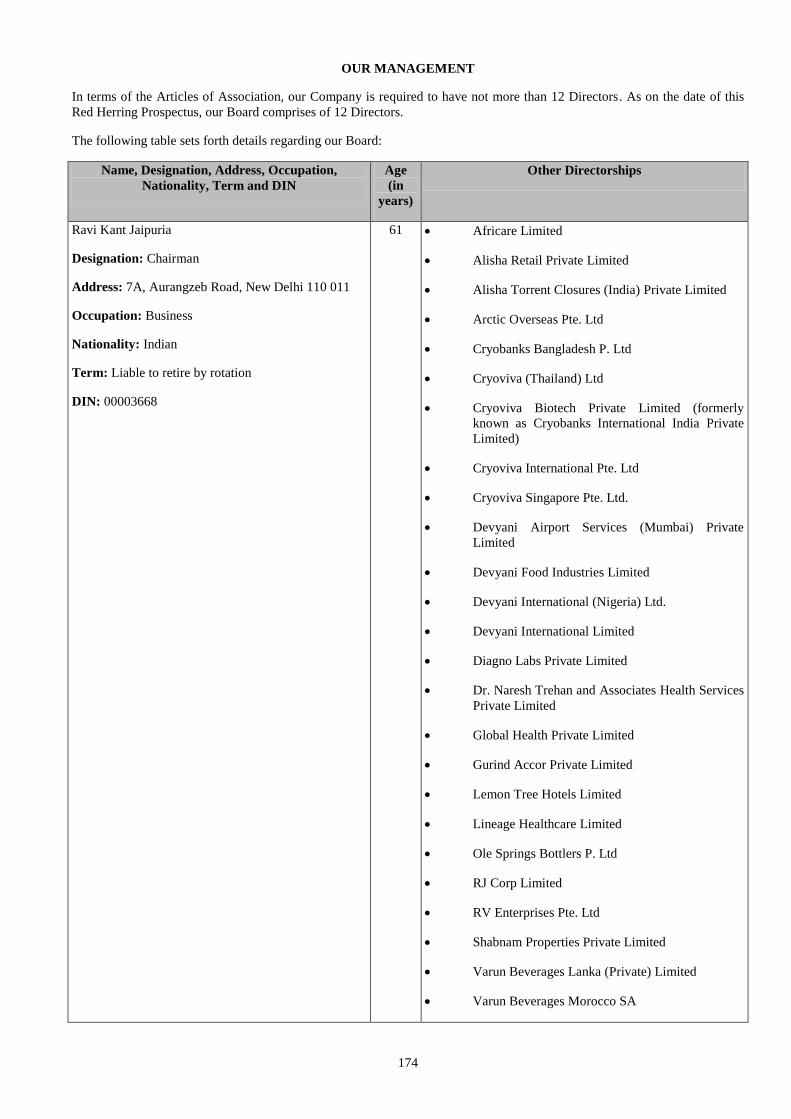
174
OUR MANAGEMENT
In terms of the Articles of Association, our Company is required to have not more than 12 Directors. As on the date of this
Red Herring Prospectus, our Board comprises of 12 Directors.
The following table sets forth details regarding our Board:
Name, Designation, Address, Occupation,
Nationality, Term and DIN
Age
(in
years)
Other Directorships
Ravi Kant Jaipuria
Designation: Chairman
Address: 7A, Aurangzeb Road, New Delhi 110 011
Occupation: Business
Nationality: Indian
Term: Liable to retire by rotation
DIN: 00003668
61
Africare Limited
Alisha Retail Private Limited
Alisha Torrent Closures (India) Private Limited
Arctic Overseas Pte. Ltd
Cryobanks Bangladesh P. Ltd
Cryoviva (Thailand) Ltd
Cryoviva Biotech Private Limited (formerly
known as Cryobanks International India Private
Limited)
Cryoviva International Pte. Ltd
Cryoviva Singapore Pte. Ltd.
Devyani Airport Services (Mumbai) Private
Limited
Devyani Food Industries Limited
Devyani International (Nigeria) Ltd.
Devyani International Limited
Diagno Labs Private Limited
Dr. Naresh Trehan and Associates Health Services
Private Limited
Global Health Private Limited
Gurind Accor Private Limited
Lemon Tree Hotels Limited
Lineage Healthcare Limited
Ole Springs Bottlers P. Ltd
RJ Corp Limited
RV Enterprises Pte. Ltd
Shabnam Properties Private Limited
Varun Beverages Lanka (Private) Limited
Varun Beverages Morocco SA
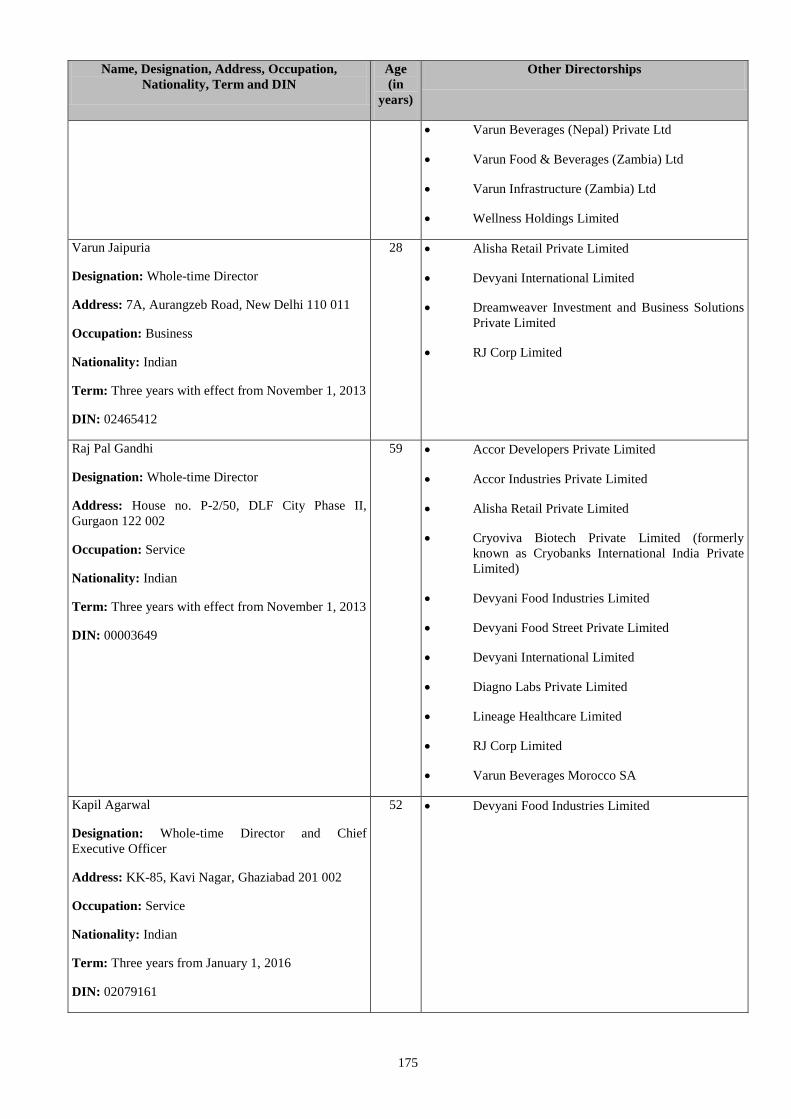
175
Name, Designation, Address, Occupation,
Nationality, Term and DIN
Age
(in
years)
Other Directorships
Varun Beverages (Nepal) Private Ltd
Varun Food & Beverages (Zambia) Ltd
Varun Infrastructure (Zambia) Ltd
Wellness Holdings Limited
Varun Jaipuria
Designation: Whole-time Director
Address: 7A, Aurangzeb Road, New Delhi 110 011
Occupation: Business
Nationality: Indian
Term: Three years with effect from November 1, 2013
DIN: 02465412
28 Alisha Retail Private Limited
Devyani International Limited
Dreamweaver Investment and Business Solutions
Private Limited
RJ Corp Limited
Raj Pal Gandhi
Designation: Whole-time Director
Address: House no. P-2/50, DLF City Phase II,
Gurgaon 122 002
Occupation: Service
Nationality: Indian
Term: Three years with effect from November 1, 2013
DIN: 00003649
59 Accor Developers Private Limited
Accor Industries Private Limited
Alisha Retail Private Limited
Cryoviva Biotech Private Limited (formerly
known as Cryobanks International India Private
Limited)
Devyani Food Industries Limited
Devyani Food Street Private Limited
Devyani International Limited
Diagno Labs Private Limited
Lineage Healthcare Limited
RJ Corp Limited
Varun Beverages Morocco SA
Kapil Agarwal
Designation: Whole-time Director and Chief
Executive Officer
Address: KK-85, Kavi Nagar, Ghaziabad 201 002
Occupation: Service
Nationality: Indian
Term: Three years from January 1, 2016
DIN: 02079161
52 Devyani Food Industries Limited
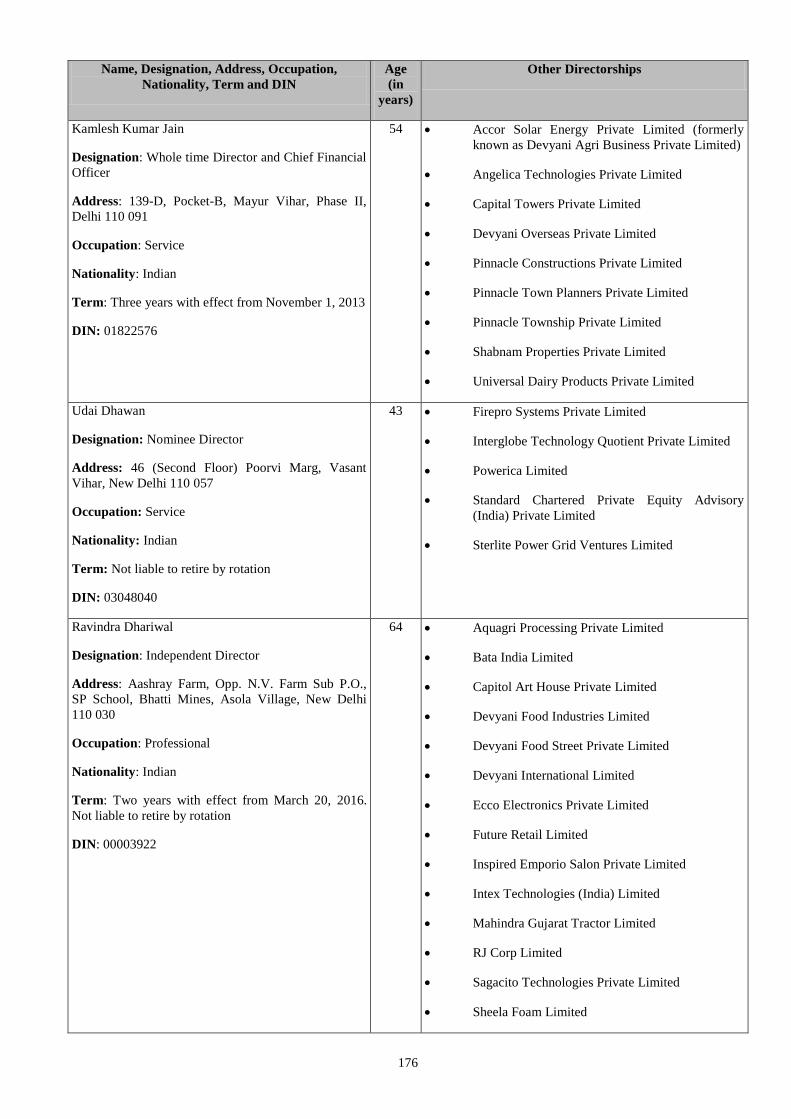
176
Name, Designation, Address, Occupation,
Nationality, Term and DIN
Age
(in
years)
Other Directorships
Kamlesh Kumar Jain
Designation: Whole time Director and Chief Financial
Officer
Address: 139-D, Pocket-B, Mayur Vihar, Phase II,
Delhi 110 091
Occupation: Service
Nationality: Indian
Term: Three years with effect from November 1, 2013
DIN: 01822576
54 Accor Solar Energy Private Limited (formerly
known as Devyani Agri Business Private Limited)
Angelica Technologies Private Limited
Capital Towers Private Limited
Devyani Overseas Private Limited
Pinnacle Constructions Private Limited
Pinnacle Town Planners Private Limited
Pinnacle Township Private Limited
Shabnam Properties Private Limited
Universal Dairy Products Private Limited
Udai Dhawan
Designation: Nominee Director
Address: 46 (Second Floor) Poorvi Marg, Vasant
Vihar, New Delhi 110 057
Occupation: Service
Nationality: Indian
Term: Not liable to retire by rotation
DIN: 03048040
43 Firepro Systems Private Limited
Interglobe Technology Quotient Private Limited
Powerica Limited
Standard Chartered Private Equity Advisory
(India) Private Limited
Sterlite Power Grid Ventures Limited
Ravindra Dhariwal
Designation: Independent Director
Address: Aashray Farm, Opp. N.V. Farm Sub P.O.,
SP School, Bhatti Mines, Asola Village, New Delhi
110 030
Occupation: Professional
Nationality: Indian
Term: Two years with effect from March 20, 2016.
Not liable to retire by rotation
DIN: 00003922
64 Aquagri Processing Private Limited
Bata India Limited
Capitol Art House Private Limited
Devyani Food Industries Limited
Devyani Food Street Private Limited
Devyani International Limited
Ecco Electronics Private Limited
Future Retail Limited
Inspired Emporio Salon Private Limited
Intex Technologies (India) Limited
Mahindra Gujarat Tractor Limited
RJ Corp Limited
Sagacito Technologies Private Limited
Sheela Foam Limited
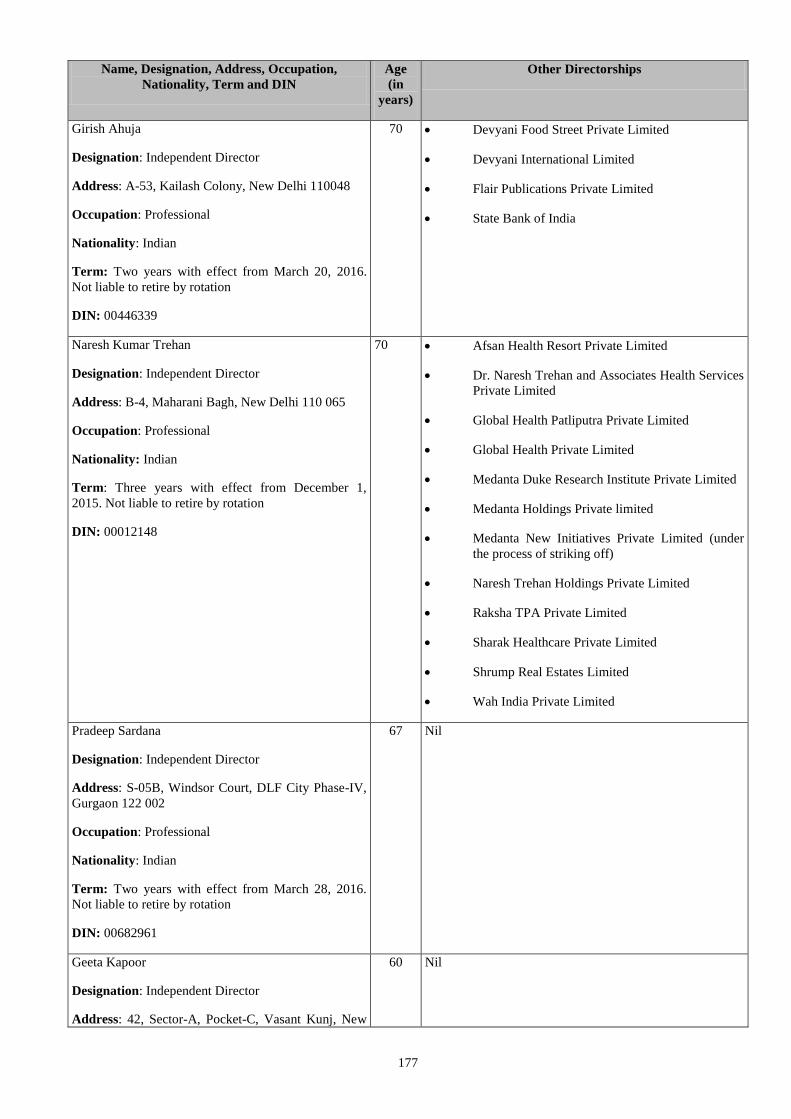
177
Name, Designation, Address, Occupation,
Nationality, Term and DIN
Age
(in
years)
Other Directorships
Girish Ahuja
Designation: Independent Director
Address: A-53, Kailash Colony, New Delhi 110048
Occupation: Professional
Nationality: Indian
Term: Two years with effect from March 20, 2016.
Not liable to retire by rotation
DIN: 00446339
70 Devyani Food Street Private Limited
Devyani International Limited
Flair Publications Private Limited
State Bank of India
Naresh Kumar Trehan
Designation: Independent Director
Address: B-4, Maharani Bagh, New Delhi 110 065
Occupation: Professional
Nationality: Indian
Term: Three years with effect from December 1,
2015. Not liable to retire by rotation
DIN: 00012148
70 Afsan Health Resort Private Limited
Dr. Naresh Trehan and Associates Health Services
Private Limited
Global Health Patliputra Private Limited
Global Health Private Limited
Medanta Duke Research Institute Private Limited
Medanta Holdings Private limited
Medanta New Initiatives Private Limited (under
the process of striking off)
Naresh Trehan Holdings Private Limited
Raksha TPA Private Limited
Sharak Healthcare Private Limited
Shrump Real Estates Limited
Wah India Private Limited
Pradeep Sardana
Designation: Independent Director
Address: S-05B, Windsor Court, DLF City Phase-IV,
Gurgaon 122 002
Occupation: Professional
Nationality: Indian
Term: Two years with effect from March 28, 2016.
Not liable to retire by rotation
DIN: 00682961
67 Nil
Geeta Kapoor
Designation: Independent Director
Address: 42, Sector-A, Pocket-C, Vasant Kunj, New
60 Nil
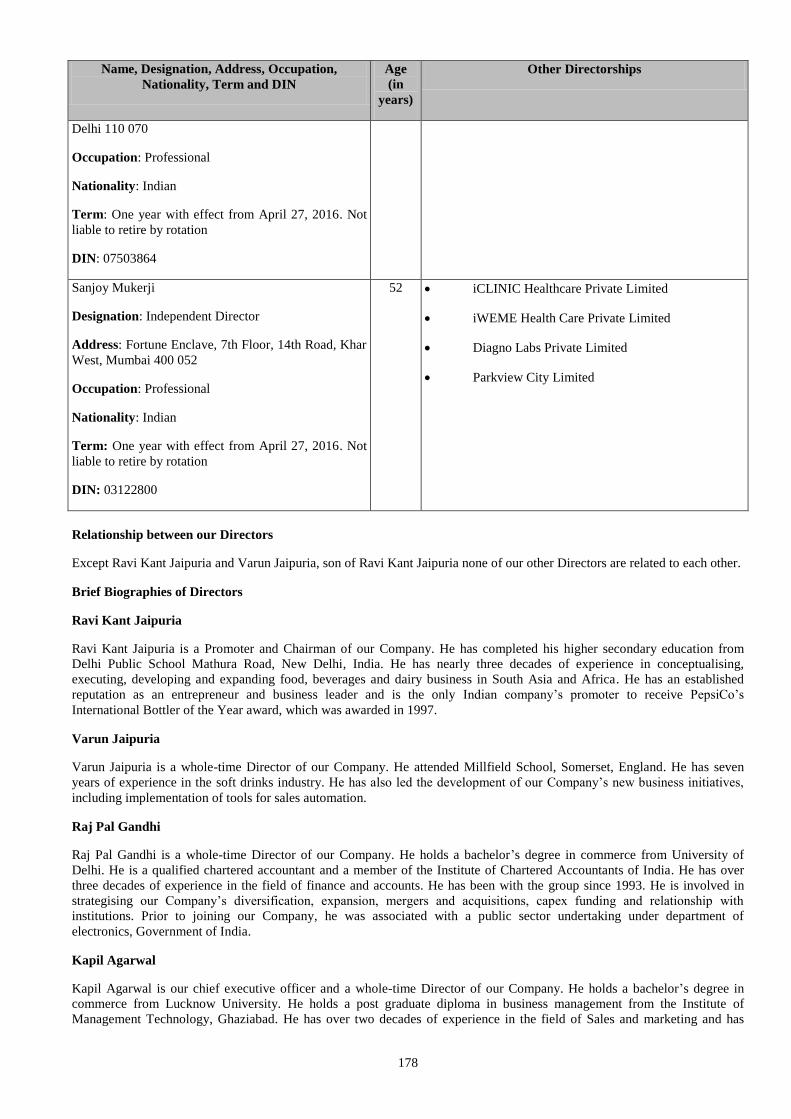
178
Name, Designation, Address, Occupation,
Nationality, Term and DIN
Age
(in
years)
Other Directorships
Delhi 110 070
Occupation: Professional
Nationality: Indian
Term: One year with effect from April 27, 2016. Not
liable to retire by rotation
DIN: 07503864
Sanjoy Mukerji
Designation: Independent Director
Address: Fortune Enclave, 7th Floor, 14th Road, Khar
West, Mumbai 400 052
Occupation: Professional
Nationality: Indian
Term: One year with effect from April 27, 2016. Not
liable to retire by rotation
DIN: 03122800
52 iCLINIC Healthcare Private Limited
iWEME Health Care Private Limited
Diagno Labs Private Limited
Parkview City Limited
Relationship between our Directors
Except Ravi Kant Jaipuria and Varun Jaipuria, son of Ravi Kant Jaipuria none of our other Directors are related to each other.
Brief Biographies of Directors
Ravi Kant Jaipuria
Ravi Kant Jaipuria is a Promoter and Chairman of our Company. He has completed his higher secondary education from
Delhi Public School Mathura Road, New Delhi, India. He has nearly three decades of experience in conceptualising,
executing, developing and expanding food, beverages and dairy business in South Asia and Africa. He has an established
reputation as an entrepreneur and business leader and is the only Indian company’s promoter to receive PepsiCo’s
International Bottler of the Year award, which was awarded in 1997.
Varun Jaipuria
Varun Jaipuria is a whole-time Director of our Company. He attended Millfield School, Somerset, England. He has seven
years of experience in the soft drinks industry. He has also led the development of our Company’s new business initiatives,
including implementation of tools for sales automation.
Raj Pal Gandhi
Raj Pal Gandhi is a whole-time Director of our Company. He holds a bachelor’s degree in commerce from University of
Delhi. He is a qualified chartered accountant and a member of the Institute of Chartered Accountants of India. He has over
three decades of experience in the field of finance and accounts. He has been with the group since 1993. He is involved in
strategising our Company’s diversification, expansion, mergers and acquisitions, capex funding and relationship with
institutions. Prior to joining our Company, he was associated with a public sector undertaking under department of
electronics, Government of India.
Kapil Agarwal
Kapil Agarwal is our chief executive officer and a whole-time Director of our Company. He holds a bachelor’s degree in
commerce from Lucknow University. He holds a post graduate diploma in business management from the Institute of
Management Technology, Ghaziabad. He has over two decades of experience in the field of Sales and marketing and has
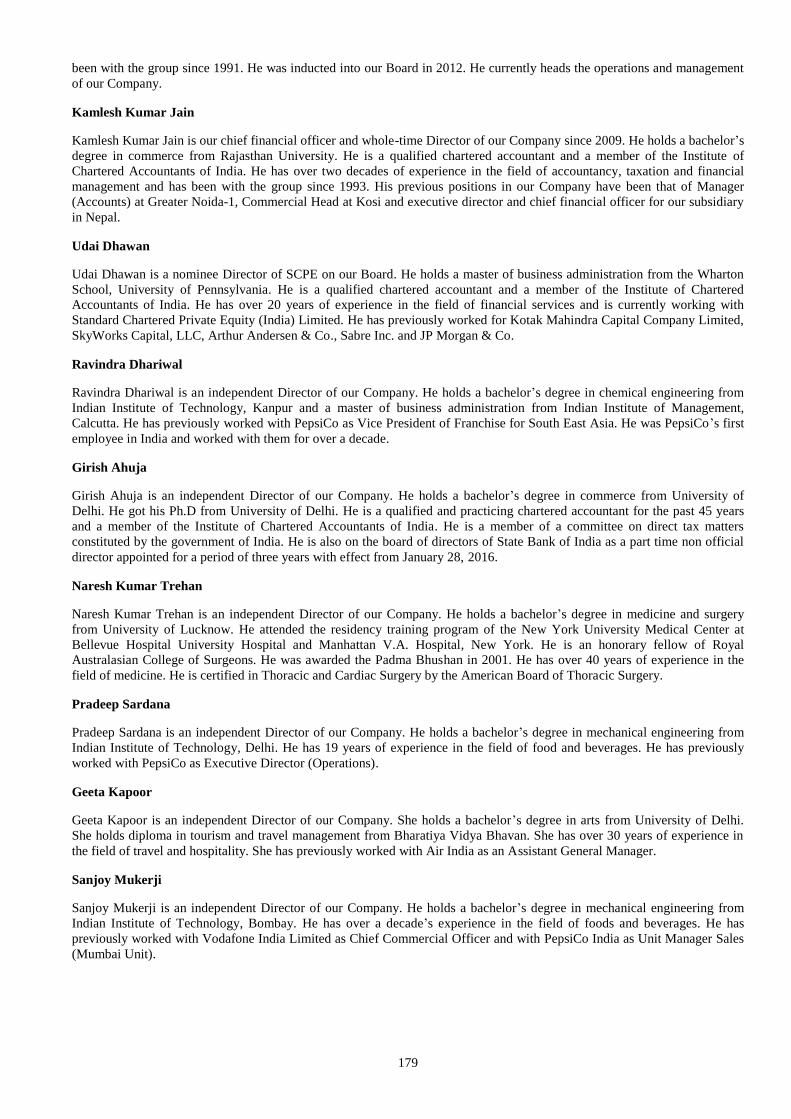
179
been with the group since 1991. He was inducted into our Board in 2012. He currently heads the operations and management
of our Company.
Kamlesh Kumar Jain
Kamlesh Kumar Jain is our chief financial officer and whole-time Director of our Company since 2009. He holds a bachelor’s
degree in commerce from Rajasthan University. He is a qualified chartered accountant and a member of the Institute of
Chartered Accountants of India. He has over two decades of experience in the field of accountancy, taxation and financial
management and has been with the group since 1993. His previous positions in our Company have been that of Manager
(Accounts) at Greater Noida-1, Commercial Head at Kosi and executive director and chief financial officer for our subsidiary
in Nepal.
Udai Dhawan
Udai Dhawan is a nominee Director of SCPE on our Board. He holds a master of business administration from the Wharton
School, University of Pennsylvania. He is a qualified chartered accountant and a member of the Institute of Chartered
Accountants of India. He has over 20 years of experience in the field of financial services and is currently working with
Standard Chartered Private Equity (India) Limited. He has previously worked for Kotak Mahindra Capital Company Limited,
SkyWorks Capital, LLC, Arthur Andersen & Co., Sabre Inc. and JP Morgan & Co.
Ravindra Dhariwal
Ravindra Dhariwal is an independent Director of our Company. He holds a bachelor’s degree in chemical engineering from
Indian Institute of Technology, Kanpur and a master of business administration from Indian Institute of Management,
Calcutta. He has previously worked with PepsiCo as Vice President of Franchise for South East Asia. He was PepsiCo’s first
employee in India and worked with them for over a decade.
Girish Ahuja
Girish Ahuja is an independent Director of our Company. He holds a bachelor’s degree in commerce from University of
Delhi. He got his Ph.D from University of Delhi. He is a qualified and practicing chartered accountant for the past 45 years
and a member of the Institute of Chartered Accountants of India. He is a member of a committee on direct tax matters
constituted by the government of India. He is also on the board of directors of State Bank of India as a part time non official
director appointed for a period of three years with effect from January 28, 2016.
Naresh Kumar Trehan
Naresh Kumar Trehan is an independent Director of our Company. He holds a bachelor’s degree in medicine and surgery
from University of Lucknow. He attended the residency training program of the New York University Medical Center at
Bellevue Hospital University Hospital and Manhattan V.A. Hospital, New York. He is an honorary fellow of Royal
Australasian College of Surgeons. He was awarded the Padma Bhushan in 2001. He has over 40 years of experience in the
field of medicine. He is certified in Thoracic and Cardiac Surgery by the American Board of Thoracic Surgery.
Pradeep Sardana
Pradeep Sardana is an independent Director of our Company. He holds a bachelor’s degree in mechanical engineering from
Indian Institute of Technology, Delhi. He has 19 years of experience in the field of food and beverages. He has previously
worked with PepsiCo as Executive Director (Operations).
Geeta Kapoor
Geeta Kapoor is an independent Director of our Company. She holds a bachelor’s degree in arts from University of Delhi.
She holds diploma in tourism and travel management from Bharatiya Vidya Bhavan. She has over 30 years of experience in
the field of travel and hospitality. She has previously worked with Air India as an Assistant General Manager.
Sanjoy Mukerji
Sanjoy Mukerji is an independent Director of our Company. He holds a bachelor’s degree in mechanical engineering from
Indian Institute of Technology, Bombay. He has over a decade’s experience in the field of foods and beverages. He has
previously worked with Vodafone India Limited as Chief Commercial Officer and with PepsiCo India as Unit Manager Sales
(Mumbai Unit).
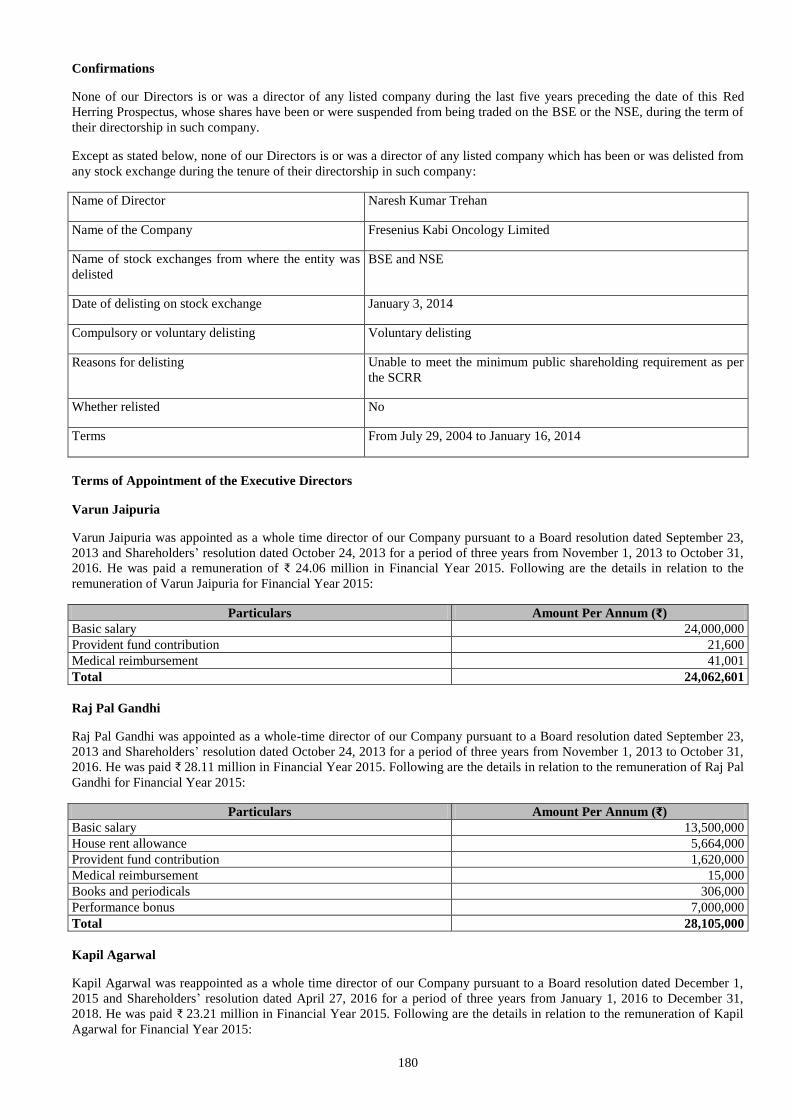
180
Confirmations
None of our Directors is or was a director of any listed company during the last five years preceding the date of this Red
Herring Prospectus, whose shares have been or were suspended from being traded on the BSE or the NSE, during the term of
their directorship in such company.
Except as stated below, none of our Directors is or was a director of any listed company which has been or was delisted from
any stock exchange during the tenure of their directorship in such company:
Name of Director Naresh Kumar Trehan
Name of the Company Fresenius Kabi Oncology Limited
Name of stock exchanges from where the entity was
delisted
BSE and NSE
Date of delisting on stock exchange January 3, 2014
Compulsory or voluntary delisting Voluntary delisting
Reasons for delisting Unable to meet the minimum public shareholding requirement as per
the SCRR
Whether relisted No
Terms From July 29, 2004 to January 16, 2014
Terms of Appointment of the Executive Directors
Varun Jaipuria
Varun Jaipuria was appointed as a whole time director of our Company pursuant to a Board resolution dated September 23,
2013 and Shareholders’ resolution dated October 24, 2013 for a period of three years from November 1, 2013 to October 31,
2016. He was paid a remuneration of ₹ 24.06 million in Financial Year 2015. Following are the details in relation to the
remuneration of Varun Jaipuria for Financial Year 2015:
Particulars Amount Per Annum (₹)
Basic salary 24,000,000
Provident fund contribution 21,600
Medical reimbursement 41,001
Total 24,062,601
Raj Pal Gandhi
Raj Pal Gandhi was appointed as a whole-time director of our Company pursuant to a Board resolution dated September 23,
2013 and Shareholders’ resolution dated October 24, 2013 for a period of three years from November 1, 2013 to October 31,
2016. He was paid ₹ 28.11 million in Financial Year 2015. Following are the details in relation to the remuneration of Raj Pal
Gandhi for Financial Year 2015:
Particulars Amount Per Annum (₹)
Basic salary 13,500,000
House rent allowance 5,664,000
Provident fund contribution 1,620,000
Medical reimbursement 15,000
Books and periodicals 306,000
Performance bonus 7,000,000
Total 28,105,000
Kapil Agarwal
Kapil Agarwal was reappointed as a whole time director of our Company pursuant to a Board resolution dated December 1,
2015 and Shareholders’ resolution dated April 27, 2016 for a period of three years from January 1, 2016 to December 31,
2018. He was paid ₹ 23.21 million in Financial Year 2015. Following are the details in relation to the remuneration of Kapil
Agarwal for Financial Year 2015:
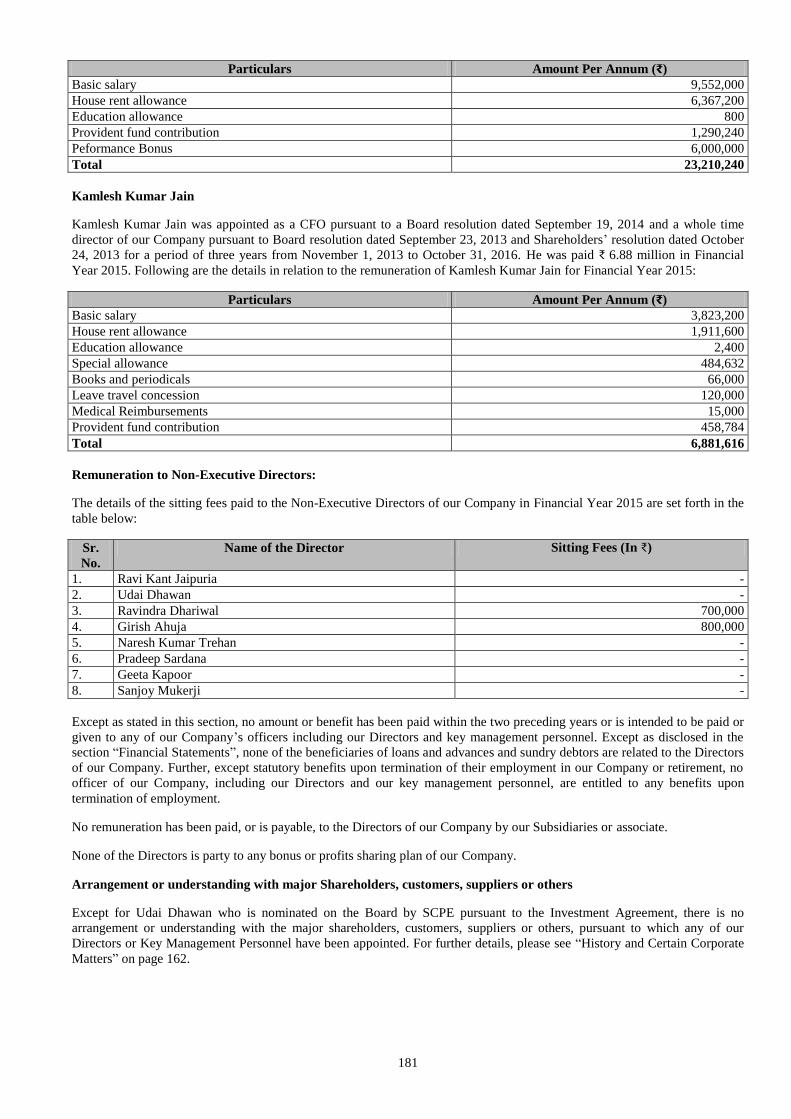
181
Particulars Amount Per Annum (₹)
Basic salary 9,552,000
House rent allowance 6,367,200
Education allowance 800
Provident fund contribution 1,290,240
Peformance Bonus 6,000,000
Total 23,210,240
Kamlesh Kumar Jain
Kamlesh Kumar Jain was appointed as a CFO pursuant to a Board resolution dated September 19, 2014 and a whole time
director of our Company pursuant to Board resolution dated September 23, 2013 and Shareholders’ resolution dated October
24, 2013 for a period of three years from November 1, 2013 to October 31, 2016. He was paid ₹ 6.88 million in Financial
Year 2015. Following are the details in relation to the remuneration of Kamlesh Kumar Jain for Financial Year 2015:
Particulars Amount Per Annum (₹)
Basic salary 3,823,200
House rent allowance 1,911,600
Education allowance 2,400
Special allowance 484,632
Books and periodicals 66,000
Leave travel concession 120,000
Medical Reimbursements 15,000
Provident fund contribution 458,784
Total 6,881,616
Remuneration to Non-Executive Directors:
The details of the sitting fees paid to the Non-Executive Directors of our Company in Financial Year 2015 are set forth in the
table below:
Sr.
No.
Name of the Director Sitting Fees (In ₹)
1. Ravi Kant Jaipuria -
2. Udai Dhawan -
3. Ravindra Dhariwal 700,000
4. Girish Ahuja 800,000
5. Naresh Kumar Trehan -
6. Pradeep Sardana -
7. Geeta Kapoor -
8. Sanjoy Mukerji -
Except as stated in this section, no amount or benefit has been paid within the two preceding years or is intended to be paid or
given to any of our Company’s officers including our Directors and key management personnel. Except as disclosed in the
section “Financial Statements”, none of the beneficiaries of loans and advances and sundry debtors are related to the Directors
of our Company. Further, except statutory benefits upon termination of their employment in our Company or retirement, no
officer of our Company, including our Directors and our key management personnel, are entitled to any benefits upon
termination of employment.
No remuneration has been paid, or is payable, to the Directors of our Company by our Subsidiaries or associate.
None of the Directors is party to any bonus or profits sharing plan of our Company.
Arrangement or understanding with major Shareholders, customers, suppliers or others
Except for Udai Dhawan who is nominated on the Board by SCPE pursuant to the Investment Agreement, there is no
arrangement or understanding with the major shareholders, customers, suppliers or others, pursuant to which any of our
Directors or Key Management Personnel have been appointed. For further details, please see “History and Certain Corporate
Matters” on page 162.
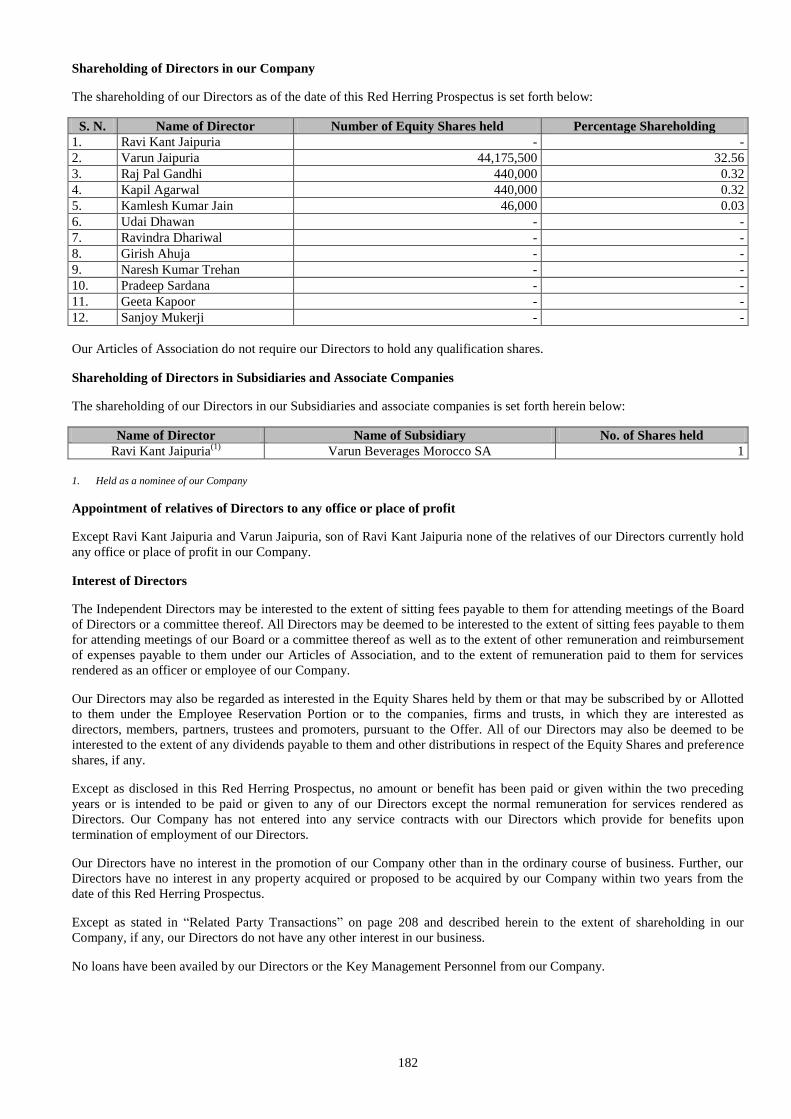
182
Shareholding of Directors in our Company
The shareholding of our Directors as of the date of this Red Herring Prospectus is set forth below:
S. N. Name of Director Number of Equity Shares held Percentage Shareholding
1. Ravi Kant Jaipuria - -
2. Varun Jaipuria 44,175,500 32.56
3. Raj Pal Gandhi 440,000 0.32
4. Kapil Agarwal 440,000 0.32
5. Kamlesh Kumar Jain 46,000 0.03
6. Udai Dhawan - -
7. Ravindra Dhariwal - -
8. Girish Ahuja - -
9. Naresh Kumar Trehan - -
10. Pradeep Sardana - -
11. Geeta Kapoor - -
12. Sanjoy Mukerji - -
Our Articles of Association do not require our Directors to hold any qualification shares.
Shareholding of Directors in Subsidiaries and Associate Companies
The shareholding of our Directors in our Subsidiaries and associate companies is set forth herein below:
Name of Director Name of Subsidiary No. of Shares held
Ravi Kant Jaipuria(1)
Varun Beverages Morocco SA 1
1. Held as a nominee of our Company
Appointment of relatives of Directors to any office or place of profit
Except Ravi Kant Jaipuria and Varun Jaipuria, son of Ravi Kant Jaipuria none of the relatives of our Directors currently hold
any office or place of profit in our Company.
Interest of Directors
The Independent Directors may be interested to the extent of sitting fees payable to them for attending meetings of the Board
of Directors or a committee thereof. All Directors may be deemed to be interested to the extent of sitting fees payable to them
for attending meetings of our Board or a committee thereof as well as to the extent of other remuneration and reimbursement
of expenses payable to them under our Articles of Association, and to the extent of remuneration paid to them for services
rendered as an officer or employee of our Company.
Our Directors may also be regarded as interested in the Equity Shares held by them or that may be subscribed by or Allotted
to them under the Employee Reservation Portion or to the companies, firms and trusts, in which they are interested as
directors, members, partners, trustees and promoters, pursuant to the Offer. All of our Directors may also be deemed to be
interested to the extent of any dividends payable to them and other distributions in respect of the Equity Shares and preference
shares, if any.
Except as disclosed in this Red Herring Prospectus, no amount or benefit has been paid or given within the two preceding
years or is intended to be paid or given to any of our Directors except the normal remuneration for services rendered as
Directors. Our Company has not entered into any service contracts with our Directors which provide for benefits upon
termination of employment of our Directors.
Our Directors have no interest in the promotion of our Company other than in the ordinary course of business. Further, our
Directors have no interest in any property acquired or proposed to be acquired by our Company within two years from the
date of this Red Herring Prospectus.
Except as stated in “Related Party Transactions” on page 208 and described herein to the extent of shareholding in our
Company, if any, our Directors do not have any other interest in our business.
No loans have been availed by our Directors or the Key Management Personnel from our Company.
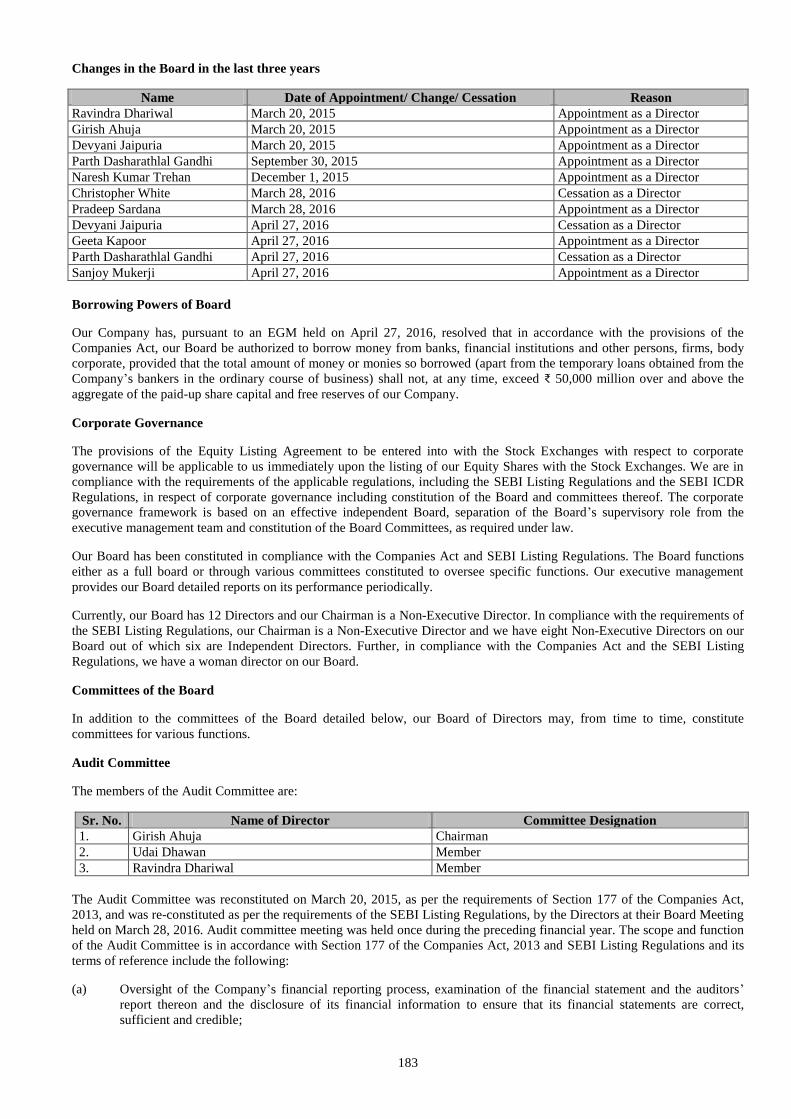
183
Changes in the Board in the last three years
Name Date of Appointment/ Change/ Cessation Reason
Ravindra Dhariwal March 20, 2015 Appointment as a Director
Girish Ahuja March 20, 2015 Appointment as a Director
Devyani Jaipuria March 20, 2015 Appointment as a Director
Parth Dasharathlal Gandhi September 30, 2015 Appointment as a Director
Naresh Kumar Trehan December 1, 2015 Appointment as a Director
Christopher White March 28, 2016 Cessation as a Director
Pradeep Sardana March 28, 2016 Appointment as a Director
Devyani Jaipuria April 27, 2016 Cessation as a Director
Geeta Kapoor April 27, 2016 Appointment as a Director
Parth Dasharathlal Gandhi April 27, 2016 Cessation as a Director
Sanjoy Mukerji April 27, 2016 Appointment as a Director
Borrowing Powers of Board
Our Company has, pursuant to an EGM held on April 27, 2016, resolved that in accordance with the provisions of the
Companies Act, our Board be authorized to borrow money from banks, financial institutions and other persons, firms, body
corporate, provided that the total amount of money or monies so borrowed (apart from the temporary loans obtained from the
Company’s bankers in the ordinary course of business) shall not, at any time, exceed ₹ 50,000 million over and above the
aggregate of the paid-up share capital and free reserves of our Company.
Corporate Governance
The provisions of the Equity Listing Agreement to be entered into with the Stock Exchanges with respect to corporate
governance will be applicable to us immediately upon the listing of our Equity Shares with the Stock Exchanges. We are in
compliance with the requirements of the applicable regulations, including the SEBI Listing Regulations and the SEBI ICDR
Regulations, in respect of corporate governance including constitution of the Board and committees thereof. The corporate
governance framework is based on an effective independent Board, separation of the Board’s supervisory role from the
executive management team and constitution of the Board Committees, as required under law.
Our Board has been constituted in compliance with the Companies Act and SEBI Listing Regulations. The Board functions
either as a full board or through various committees constituted to oversee specific functions. Our executive management
provides our Board detailed reports on its performance periodically.
Currently, our Board has 12 Directors and our Chairman is a Non-Executive Director. In compliance with the requirements of
the SEBI Listing Regulations, our Chairman is a Non-Executive Director and we have eight Non-Executive Directors on our
Board out of which six are Independent Directors. Further, in compliance with the Companies Act and the SEBI Listing
Regulations, we have a woman director on our Board.
Committees of the Board
In addition to the committees of the Board detailed below, our Board of Directors may, from time to time, constitute
committees for various functions.
Audit Committee
The members of the Audit Committee are:
Sr. No. Name of Director Committee Designation
1. Girish Ahuja Chairman
2. Udai Dhawan Member
3. Ravindra Dhariwal Member
The Audit Committee was reconstituted on March 20, 2015, as per the requirements of Section 177 of the Companies Act,
2013, and was re-constituted as per the requirements of the SEBI Listing Regulations, by the Directors at their Board Meeting
held on March 28, 2016. Audit committee meeting was held once during the preceding financial year. The scope and function
of the Audit Committee is in accordance with Section 177 of the Companies Act, 2013 and SEBI Listing Regulations and its
terms of reference include the following:
(a) Oversight of the Company’s financial reporting process, examination of the financial statement and the auditors’
report thereon and the disclosure of its financial information to ensure that its financial statements are correct,
sufficient and credible;
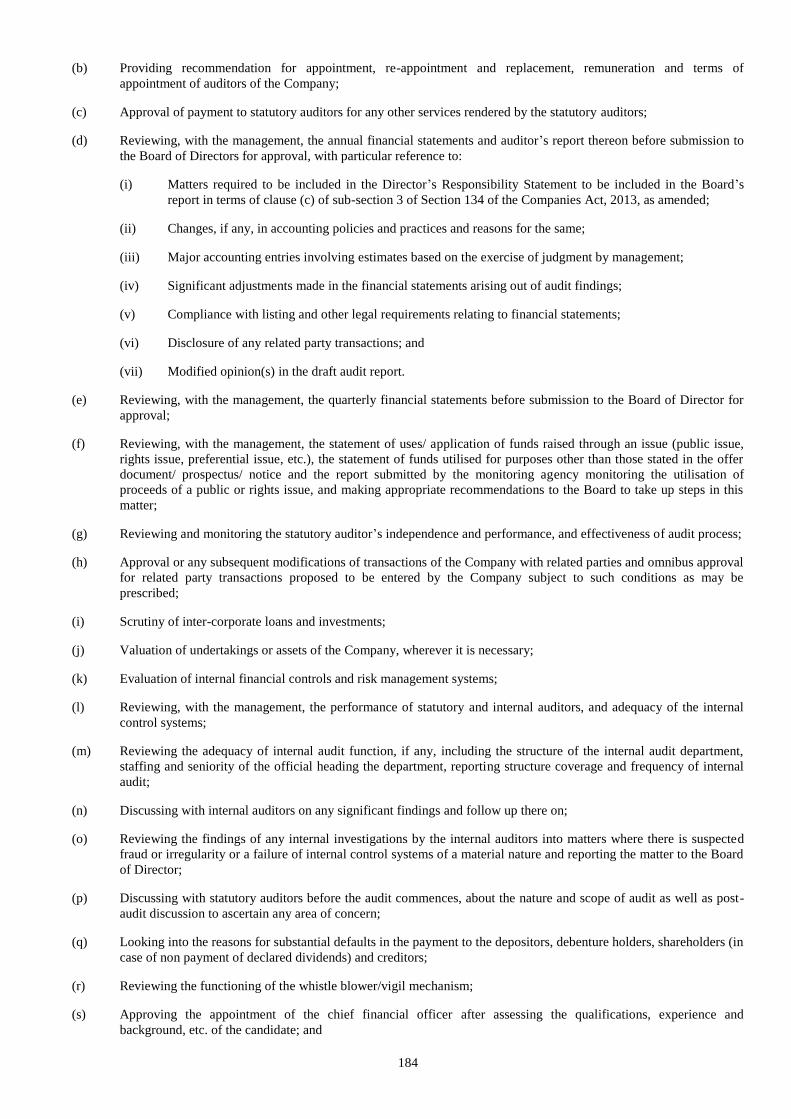
184
(b) Providing recommendation for appointment, re-appointment and replacement, remuneration and terms of
appointment of auditors of the Company;
(c) Approval of payment to statutory auditors for any other services rendered by the statutory auditors;
(d) Reviewing, with the management, the annual financial statements and auditor’s report thereon before submission to
the Board of Directors for approval, with particular reference to:
(i) Matters required to be included in the Director’s Responsibility Statement to be included in the Board’s
report in terms of clause (c) of sub-section 3 of Section 134 of the Companies Act, 2013, as amended;
(ii) Changes, if any, in accounting policies and practices and reasons for the same;
(iii) Major accounting entries involving estimates based on the exercise of judgment by management;
(iv) Significant adjustments made in the financial statements arising out of audit findings;
(v) Compliance with listing and other legal requirements relating to financial statements;
(vi) Disclosure of any related party transactions; and
(vii) Modified opinion(s) in the draft audit report.
(e) Reviewing, with the management, the quarterly financial statements before submission to the Board of Director for
approval;
(f) Reviewing, with the management, the statement of uses/ application of funds raised through an issue (public issue,
rights issue, preferential issue, etc.), the statement of funds utilised for purposes other than those stated in the offer
document/ prospectus/ notice and the report submitted by the monitoring agency monitoring the utilisation of
proceeds of a public or rights issue, and making appropriate recommendations to the Board to take up steps in this
matter;
(g) Reviewing and monitoring the statutory auditor’s independence and performance, and effectiveness of audit process;
(h) Approval or any subsequent modifications of transactions of the Company with related parties and omnibus approval
for related party transactions proposed to be entered by the Company subject to such conditions as may be
prescribed;
(i) Scrutiny of inter-corporate loans and investments;
(j) Valuation of undertakings or assets of the Company, wherever it is necessary;
(k) Evaluation of internal financial controls and risk management systems;
(l) Reviewing, with the management, the performance of statutory and internal auditors, and adequacy of the internal
control systems;
(m) Reviewing the adequacy of internal audit function, if any, including the structure of the internal audit department,
staffing and seniority of the official heading the department, reporting structure coverage and frequency of internal
audit;
(n) Discussing with internal auditors on any significant findings and follow up there on;
(o) Reviewing the findings of any internal investigations by the internal auditors into matters where there is suspected
fraud or irregularity or a failure of internal control systems of a material nature and reporting the matter to the Board
of Director;
(p) Discussing with statutory auditors before the audit commences, about the nature and scope of audit as well as post-
audit discussion to ascertain any area of concern;
(q) Looking into the reasons for substantial defaults in the payment to the depositors, debenture holders, shareholders (in
case of non payment of declared dividends) and creditors;
(r) Reviewing the functioning of the whistle blower/vigil mechanism;
(s) Approving the appointment of the chief financial officer after assessing the qualifications, experience and
background, etc. of the candidate; and
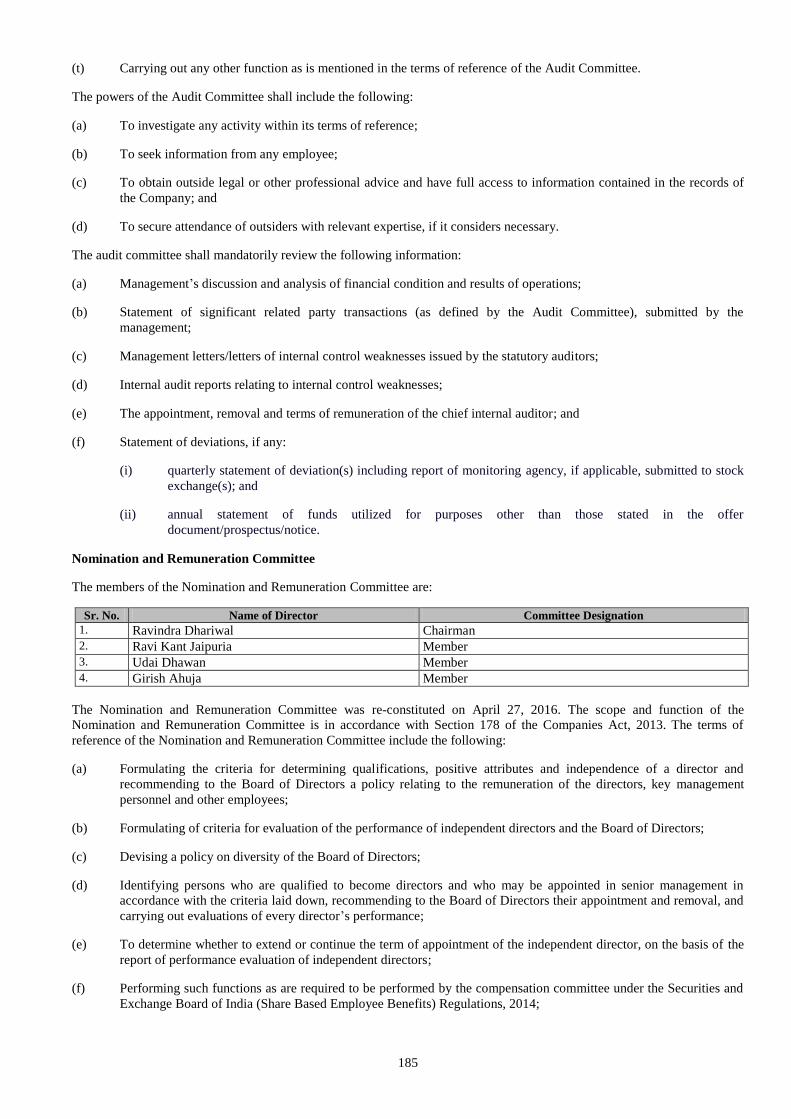
185
(t) Carrying out any other function as is mentioned in the terms of reference of the Audit Committee.
The powers of the Audit Committee shall include the following:
(a) To investigate any activity within its terms of reference;
(b) To seek information from any employee;
(c) To obtain outside legal or other professional advice and have full access to information contained in the records of
the Company; and
(d) To secure attendance of outsiders with relevant expertise, if it considers necessary.
The audit committee shall mandatorily review the following information:
(a) Management’s discussion and analysis of financial condition and results of operations;
(b) Statement of significant related party transactions (as defined by the Audit Committee), submitted by the
management;
(c) Management letters/letters of internal control weaknesses issued by the statutory auditors;
(d) Internal audit reports relating to internal control weaknesses;
(e) The appointment, removal and terms of remuneration of the chief internal auditor; and
(f) Statement of deviations, if any:
(i) quarterly statement of deviation(s) including report of monitoring agency, if applicable, submitted to stock
exchange(s); and
(ii) annual statement of funds utilized for purposes other than those stated in the offer
document/prospectus/notice.
Nomination and Remuneration Committee
The members of the Nomination and Remuneration Committee are:
Sr. No. Name of Director Committee Designation
1. Ravindra Dhariwal Chairman
2. Ravi Kant Jaipuria Member 3. Udai Dhawan Member 4. Girish Ahuja Member
The Nomination and Remuneration Committee was re-constituted on April 27, 2016. The scope and function of the
Nomination and Remuneration Committee is in accordance with Section 178 of the Companies Act, 2013. The terms of
reference of the Nomination and Remuneration Committee include the following:
(a) Formulating the criteria for determining qualifications, positive attributes and independence of a director and
recommending to the Board of Directors a policy relating to the remuneration of the directors, key management
personnel and other employees;
(b) Formulating of criteria for evaluation of the performance of independent directors and the Board of Directors;
(c) Devising a policy on diversity of the Board of Directors;
(d) Identifying persons who are qualified to become directors and who may be appointed in senior management in
accordance with the criteria laid down, recommending to the Board of Directors their appointment and removal, and
carrying out evaluations of every director’s performance;
(e) To determine whether to extend or continue the term of appointment of the independent director, on the basis of the
report of performance evaluation of independent directors;
(f) Performing such functions as are required to be performed by the compensation committee under the Securities and
Exchange Board of India (Share Based Employee Benefits) Regulations, 2014;
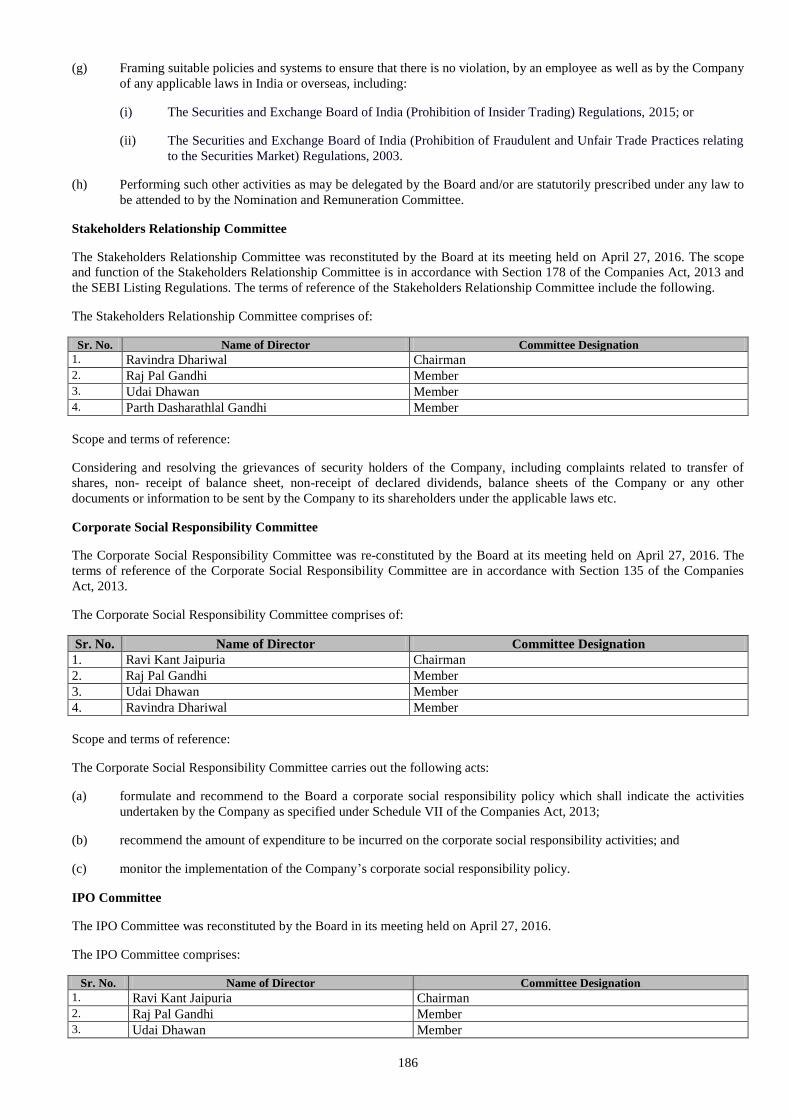
186
(g) Framing suitable policies and systems to ensure that there is no violation, by an employee as well as by the Company
of any applicable laws in India or overseas, including:
(i) The Securities and Exchange Board of India (Prohibition of Insider Trading) Regulations, 2015; or
(ii) The Securities and Exchange Board of India (Prohibition of Fraudulent and Unfair Trade Practices relating
to the Securities Market) Regulations, 2003.
(h) Performing such other activities as may be delegated by the Board and/or are statutorily prescribed under any law to
be attended to by the Nomination and Remuneration Committee.
Stakeholders Relationship Committee
The Stakeholders Relationship Committee was reconstituted by the Board at its meeting held on April 27, 2016. The scope
and function of the Stakeholders Relationship Committee is in accordance with Section 178 of the Companies Act, 2013 and
the SEBI Listing Regulations. The terms of reference of the Stakeholders Relationship Committee include the following.
The Stakeholders Relationship Committee comprises of:
Sr. No. Name of Director Committee Designation
1. Ravindra Dhariwal Chairman 2. Raj Pal Gandhi Member 3. Udai Dhawan Member 4. Parth Dasharathlal Gandhi Member
Scope and terms of reference:
Considering and resolving the grievances of security holders of the Company, including complaints related to transfer of
shares, non- receipt of balance sheet, non-receipt of declared dividends, balance sheets of the Company or any other
documents or information to be sent by the Company to its shareholders under the applicable laws etc.
Corporate Social Responsibility Committee
The Corporate Social Responsibility Committee was re-constituted by the Board at its meeting held on April 27, 2016. The
terms of reference of the Corporate Social Responsibility Committee are in accordance with Section 135 of the Companies
Act, 2013.
The Corporate Social Responsibility Committee comprises of:
Sr. No. Name of Director Committee Designation
1. Ravi Kant Jaipuria Chairman
2. Raj Pal Gandhi Member
3. Udai Dhawan Member
4. Ravindra Dhariwal Member
Scope and terms of reference:
The Corporate Social Responsibility Committee carries out the following acts:
(a) formulate and recommend to the Board a corporate social responsibility policy which shall indicate the activities
undertaken by the Company as specified under Schedule VII of the Companies Act, 2013;
(b) recommend the amount of expenditure to be incurred on the corporate social responsibility activities; and
(c) monitor the implementation of the Company’s corporate social responsibility policy.
IPO Committee
The IPO Committee was reconstituted by the Board in its meeting held on April 27, 2016.
The IPO Committee comprises:
Sr. No. Name of Director Committee Designation
1. Ravi Kant Jaipuria Chairman
2. Raj Pal Gandhi Member 3. Udai Dhawan Member
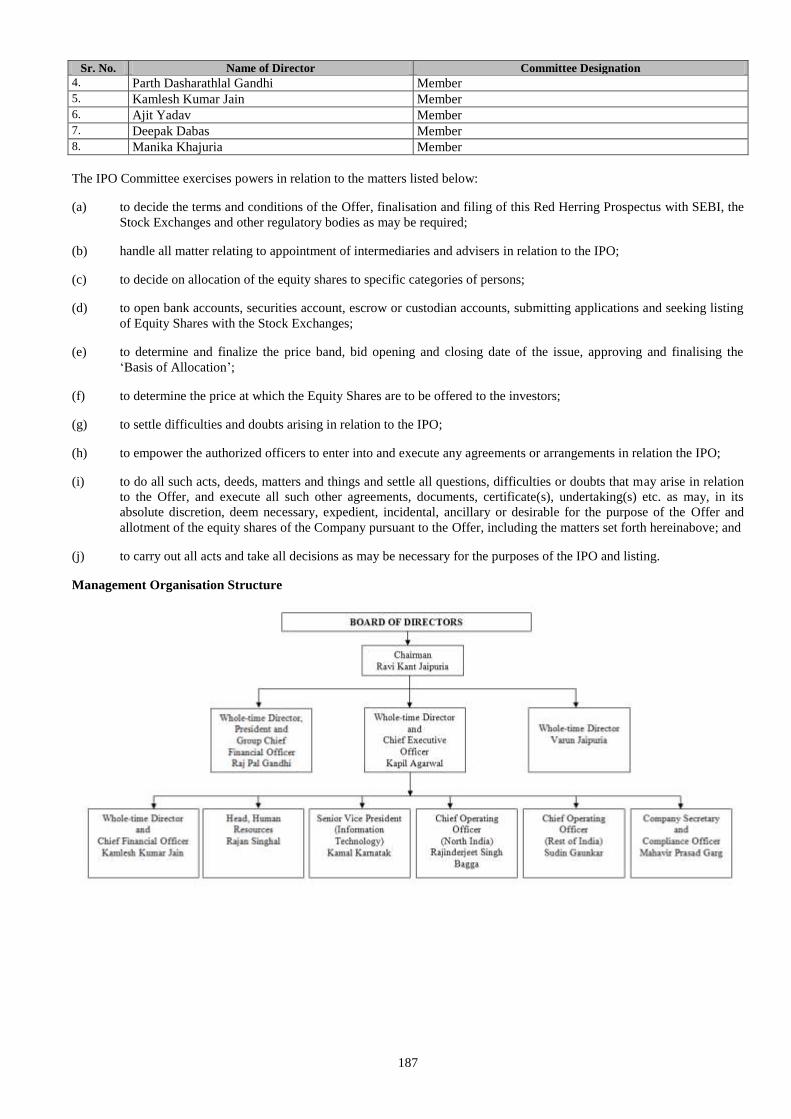
187
Sr. No. Name of Director Committee Designation
4. Parth Dasharathlal Gandhi Member 5. Kamlesh Kumar Jain Member 6. Ajit Yadav Member 7. Deepak Dabas Member 8. Manika Khajuria Member
The IPO Committee exercises powers in relation to the matters listed below:
(a) to decide the terms and conditions of the Offer, finalisation and filing of this Red Herring Prospectus with SEBI, the
Stock Exchanges and other regulatory bodies as may be required;
(b) handle all matter relating to appointment of intermediaries and advisers in relation to the IPO;
(c) to decide on allocation of the equity shares to specific categories of persons;
(d) to open bank accounts, securities account, escrow or custodian accounts, submitting applications and seeking listing
of Equity Shares with the Stock Exchanges;
(e) to determine and finalize the price band, bid opening and closing date of the issue, approving and finalising the
‘Basis of Allocation’;
(f) to determine the price at which the Equity Shares are to be offered to the investors;
(g) to settle difficulties and doubts arising in relation to the IPO;
(h) to empower the authorized officers to enter into and execute any agreements or arrangements in relation the IPO;
(i) to do all such acts, deeds, matters and things and settle all questions, difficulties or doubts that may arise in relation
to the Offer, and execute all such other agreements, documents, certificate(s), undertaking(s) etc. as may, in its
absolute discretion, deem necessary, expedient, incidental, ancillary or desirable for the purpose of the Offer and
allotment of the equity shares of the Company pursuant to the Offer, including the matters set forth hereinabove; and
(j) to carry out all acts and take all decisions as may be necessary for the purposes of the IPO and listing.
Management Organisation Structure
188
Key Management Personnel
Brief biographies of Key Management Personnel
The details of the Key Management Personnel other than our Executive Directors, as on the date of this Red Herring
Prospectus, are set out below.
Mahavir Prasad Garg
Mahavir Prasad Garg is the company secretary of our Company. He holds a degree in law from Chaudhary Charan Singh
University, Meerut. He is a member of the Institute of Company Secretaries of India. He has over 22 years of experience as a
Company Secretary. He joined our Company on December 16, 2013 and will serve until his retirement as per our Company’s
policy. Prior to joining our Company he was associated with Bharat Rasayan Limited, Oceanic Magnetics Limited, Kandy
Finlease Limited, Shree Krishna Paper Mills & Industries Limited and BPTP Limited. During the financial year 2015 he was
paid a gross annual compensation of ₹ 2.24 million.
Family relationship of Directors with Key Management Personnel
None of our key management personnel as disclosed above are related to the Directors of our Company.
Shareholding of Key Management Personnel
The shareholding of our executive directors is as disclosed in “- Shareholding of our Directors in our Company” on page 182,
as on the date of this Red Herring Prospectus, the shareholding of our key management personnel in our Company is as
follows:
Sr. No. Name of KMP Number of Equity Shares
1. Mahavir Prasad Garg Nil
Bonus or profit sharing plan of the Key Management Personnel
None of our Key Management Personnel are a party to any bonus or profit sharing plan.
Interests of Key Management Personnel
Except as stated below, the Key Management Personnel of our Company, other than our Executive Directors, do not have any
interest in our Company other than to the extent of the remuneration or benefits to which they are entitled to as per their terms
of appointment and the reimbursement of expenses incurred by them during the ordinary course of business and Equity
Shares or employee stock options, held by them, if any. The Key Management Personnel may be regarded as interested in the
Equity Shares that may be subscribed by or Allotted to them under the Employee Reservation Portion. All the Key
Management Personnel may also be deemed to be interested to the extent of any dividend payable to them and other
distributions in respect of such Equity Shares, if any.
Changes in the Key Management Personnel
Name Date of Appointment Date of Cessation Reason
Sandeep Chandana April 5, 2013 October 18, 2013 Resignation
Mahavir Prasad Garg December 16, 2013 - Appointment
Payment or benefit to officers of the Company
Except the normal remuneration/ commission for services rendered as our Directors, officers or employees, no amount or
benefit has been paid or given within the two preceding years or is intended to be paid or given to any of the officers.
None of our Directors or Key Management Personnel has entered into service contracts with our Company or the Subsidiaries
providing for benefits or payments upon termination of employment.
Employee Stock Option Schemes
For details in relation to the ESOS 2013 and ESOS 2016 schemes, see “Capital Structure” on page 83.
189
OUR PROMOTERS AND PROMOTER GROUP
Our Company has the following Promoters:
1. RJ Corp Limited;
2. Ravi Kant Jaipuria;
3. Varun Jaipuria; and
4. Ravi Kant Jaipuria & Sons (HUF)
Details in relation to our Promoters are as follows:
1. RJ Corp Limited
Corporate Information
RJ Corp was incorporated on March 1, 1980 as Cheers Beverages Private Limited, a private limited company under
the Companies Act, 1956 with the Registrar of Companies, Delhi and Haryana. Its name changed from Cheers
Beverages Private Limited to Arctic Drinks Private Limited pursuant to a fresh certificate of incorporation dated
January 31, 1985. Arctic Drinks Private Limited converted into a public limited company with effect from May 13,
2005. Arctic Drinks Limited’s name changed to RJ Corp Limited pursuant to a fresh certificate of incorporation
dated May 29, 2008. The CIN of RJ Corp is U62200DL1980PLC010262. The registered office of RJ Corp is
situated at F-2/7, Okhla Industrial Area, Phase-I, New Delhi 110 020.
RJ Corp is currently in the business of trading in shares, securities, debentures and operating franchises for leading
shoes and apparel brands.
Board of directors
The board of directors of RJ Corp comprises:
1. Ravi Kant Jaipuria;
2. Raj Pal Gandhi;
3. Varun Jaipuria;
4. Satya Vir Singh;
5. Prashant Purker;
6. Ravindra Dhariwal;
7. Raman Monga;
8. Rajesh Chopra; and
9. Parth Dasharathlal Gandhi
RJ Corp holds 45,387,415 Equity Shares in our Company.
Shareholding pattern
The authorised share capital of RJ Corp is ₹ 1,895 million divided into 9,500,000 equity shares of ₹ 10 each and
18,000,000 Preference Shares of ₹ 100 each.
The shareholding pattern of RJ Corp is as follows:
S. No. Name of Shareholders No. of shares Percentage
Equity shares of ₹ 10 each
1. Varun Jaipuria 8,509 0.15
2. Ravi Kant Jaipuria & Sons (HUF) 115,434 2.02
3. Devyani Overseas Private Limited 2,845,788 49.86
4. Devyani Enterprises Private Limited 2,738,244 47.97
5. Anuj Traders Private Limited 10 Negligible
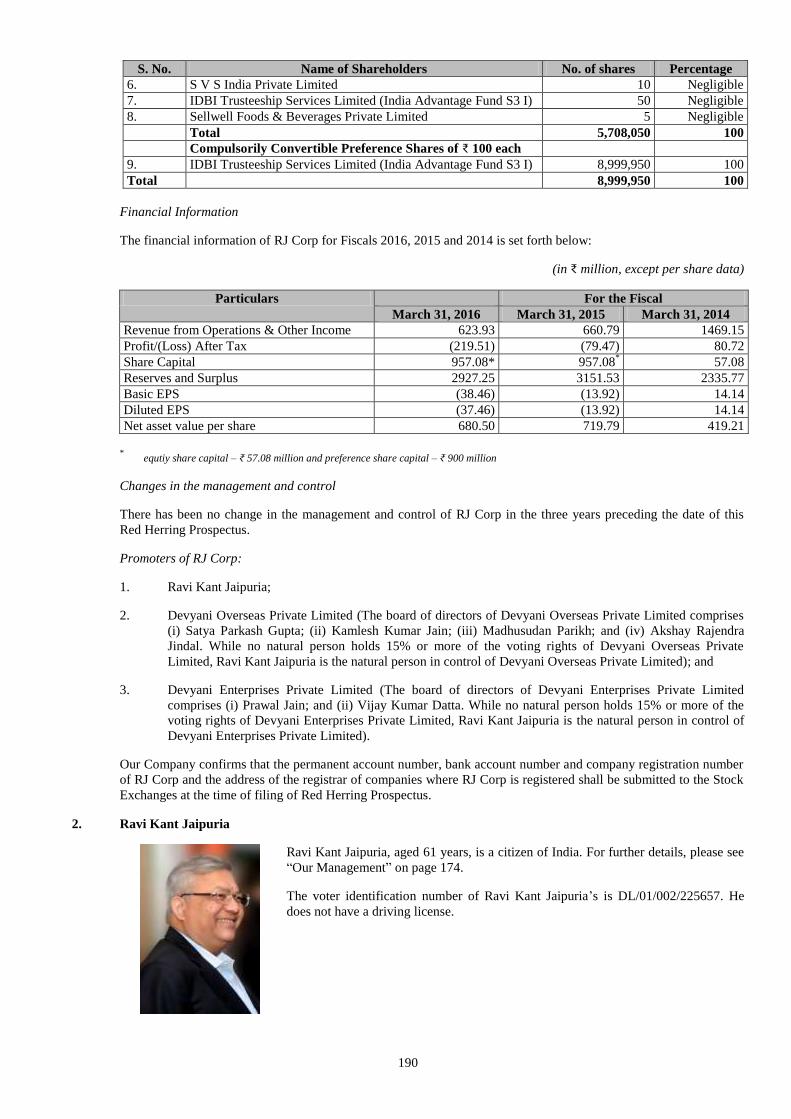
190
S. No. Name of Shareholders No. of shares Percentage
6. S V S India Private Limited 10 Negligible
7. IDBI Trusteeship Services Limited (India Advantage Fund S3 I) 50 Negligible
8. Sellwell Foods & Beverages Private Limited 5 Negligible
Total 5,708,050 100
Compulsorily Convertible Preference Shares of ₹ 100 each
9. IDBI Trusteeship Services Limited (India Advantage Fund S3 I) 8,999,950 100
Total 8,999,950 100
Financial Information
The financial information of RJ Corp for Fiscals 2016, 2015 and 2014 is set forth below:
(in ₹ million, except per share data)
Particulars For the Fiscal
March 31, 2016 March 31, 2015 March 31, 2014
Revenue from Operations & Other Income 623.93 660.79 1469.15
Profit/(Loss) After Tax (219.51) (79.47) 80.72
Share Capital 957.08* 957.08* 57.08
Reserves and Surplus 2927.25 3151.53 2335.77
Basic EPS (38.46) (13.92) 14.14
Diluted EPS (37.46) (13.92) 14.14
Net asset value per share 680.50 719.79 419.21
* equtiy share capital – ₹ 57.08 million and preference share capital – ₹ 900 million
Changes in the management and control
There has been no change in the management and control of RJ Corp in the three years preceding the date of this
Red Herring Prospectus.
Promoters of RJ Corp:
1. Ravi Kant Jaipuria;
2. Devyani Overseas Private Limited (The board of directors of Devyani Overseas Private Limited comprises
(i) Satya Parkash Gupta; (ii) Kamlesh Kumar Jain; (iii) Madhusudan Parikh; and (iv) Akshay Rajendra
Jindal. While no natural person holds 15% or more of the voting rights of Devyani Overseas Private
Limited, Ravi Kant Jaipuria is the natural person in control of Devyani Overseas Private Limited); and
3. Devyani Enterprises Private Limited (The board of directors of Devyani Enterprises Private Limited
comprises (i) Prawal Jain; and (ii) Vijay Kumar Datta. While no natural person holds 15% or more of the
voting rights of Devyani Enterprises Private Limited, Ravi Kant Jaipuria is the natural person in control of
Devyani Enterprises Private Limited).
Our Company confirms that the permanent account number, bank account number and company registration number
of RJ Corp and the address of the registrar of companies where RJ Corp is registered shall be submitted to the Stock
Exchanges at the time of filing of Red Herring Prospectus.
2. Ravi Kant Jaipuria
Ravi Kant Jaipuria, aged 61 years, is a citizen of India. For further details, please see
“Our Management” on page 174.
The voter identification number of Ravi Kant Jaipuria’s is DL/01/002/225657. He
does not have a driving license.
191
3. Varun Jaipuria
Varun Jaipuria, aged 28 years, is a resident of India. For further details, please see
“Our Management” on page 174.
The voter identification number of Varun Jaipuria is SJE1957652 and his driving
license number is P02022006138727.
4. Ravi Kant Jaipuria & Sons (HUF)
Ravi Kant Jaipuria & Sons (HUF) came into existence on March 31, 1979 and its members are Ravi Kant Jaipuria,
Dhara Jaipuria and Varun Jaipuria. Ravi Kant Jaipuria is the karta of Ravi Kant Jaipuria & Sons (HUF). Ravi Kant
Jaipuria & Sons (HUF) holds 44,187,870 Equity Shares in our Company.
Our Company confirms that the permanent account number, bank account numbers and passport numbers of Ravi
Kant Jaipuria and Varun Jaipuria shall be submitted to the Stock Exchanges at the time of filing this Red Herring
Prospectus. Our Company further confirms that the permanent account number and bank account numbers of Ravi
Kant Jaipuria & Sons (HUF) shall be submitted to the Stock Exchanges at the time of filing this Red Herring
Prospectus.
Interests of Promoters
Our Promoters are interested in our Company to the extent that they have promoted our Company and to the extent
of their respective shareholding in our Company and the dividends payable, if any, and any other distributions in
respect of the Equity Shares held by them. For details on the shareholding of our Promoters in our Company, please
see “Capital Structure” on page 83.
Our Promoters are not interested in the properties acquired or proposed to be acquired by our Company in the two
years preceding the filing of this Red Herring Prospectus with SEBI.
Except as stated below, our Company has not entered into any contract, agreements or arrangements during the
preceding two years from the date of this Red Herring Prospectus or proposes to enter into any such contract in
which our Promoters are directly or indirectly interested and no payments have been made to them in respect of the
contracts, agreements or arrangements which are proposed to be made with them.
(i) Our Company has entered into a lease agreement dated February 1, 2013 and amended pursuant to
amendment agreement dated November 1, 2013 with RJ Corp, one of our Promoters. The lease is for our
corporate office building. The lease has a term of five years from April 1, 2013 to March 31, 2018 and it is
deemed to be renewed for a further period of three years on the same terms and conditions upon expiry. In
terms of the said lease agreement, the amendment agreement and letter issued by RJ Corp dated April 1,
2015, our Company was required to pay rent of ₹ 5.66 million per month and the rent is subject to increase
only after mutual consent of the parties to the lease agreement (and is currently ₹ 6.23 million per month).
(ii) Our Company has entered into a lease agreement dated June 1, 2013 with Dhara Jaipuria, wife of Ravi Kant
Jaipuria, one of the Promoters (“Delhi Lease Agreement”). The lease is for a guest house situated at 1st
floor, B-26, Block B, Kailash Colony, New Delhi 110 048 (“B Block Kailash Colony”). The lease has a
term of five years from April 1, 2013 to March 31, 2018 and it is deemed to be renewed for a further period
of three years on the same terms and conditions upon expiry. In terms of the said lease agreement, our
Company is required to pay rent of ₹ 0.15 million per month and the rent is subject to increase by 10%
every three years for the remaining term of the lease agreement. Our Company has entered into a fresh lease
agreement for B Block Kailash Colony dated April 1, 2016 which superseded the Delhi Lease Agreement.
This lease has a term of nine years from April 1, 2016 to March 31, 2025 and it is deemed to be renewed for
a further period of three years on the same terms and conditions upon expiry. In terms of the said lease
agreement, our Company is required to pay rent of ₹ 0.16 million per month and the rent is subject to
increase by 10% every year for the remaining term of the lease agreement.
(iii) Our Company had entered into a lease agreement dated June 1, 2013 with Ravi Kant Jaipuria & Sons
(HUF), our Promoter. The lease was for a property situated at Betalbatim Village of Salcete Taluka, District
of South Goa (“Goa Lease Agreement”). The lease had a term of five years from April 1, 2013 to March
192
31, 2018 and it was deemed to be renewed for a further period of three years on the same terms and
conditions upon expiry. In terms of the said lease agreement, our Company was required to pay rent of ₹
0.50 million per month and the rent was subject to increase by 10% every three years for the remaining term
of the lease agreement. Thereafter, our Company entered into a new lease agreement dated April 1, 2016
with Ravi Kant Jaipuria & Sons (HUF), one of our Promoters, which superseded the Goa Lease Agreement.
This lease has a term of nine years from April 1, 2016 to March 31, 2025 and it is deemed to be renewed for
a further period of three years on the same terms and conditions upon expiry. In terms of the said lease
agreement, our Company is required to pay rent of ₹ 0.53 million per month and the rent is subject to
increase by five percent every year for the remaining term of the lease agreement.
(iv) Our Company has contributed ₹ 0.92 million as part of contribution to corporate social responsibility
activities to Champa Devi Jaipuria Charitable Trust whose trustee include Ravi Kant Jaipuria and Varun
Jaipuria, our Promoters, Dhara Jaipuria, wife of Ravi Kant Jaipuria and Devyani Jaipuria, daughter of Ravi
Kant Jaipuria.
(v) Our Company had entered into a lease agreement dated February 1, 2015 with SVS India Private Limited
(“Registered Office Lease”), a company in which RJ Corp, our Promoter, holds 38.80% of its total issued
and paid up equity share capital. The lease was for our registered office building. The lease has a term of
three years from February 1, 2015 to January 31, 2018. Our Company was required to pay rent of ₹ 12,000
per year. Thereafter, our Company entered into a fresh lease agreement dated April 1, 2016 with SVS India
Private Limited which superseded the Registered Office Lease. This lease has a term of 60 months from
April 1, 2016 to March 31, 2021 and our Company is required to pay a rent of ₹ 3,000 per month.
For further details of related party transactions, as per Accounting Standard 18, please see “Related Party
Transactions” on page 208.
Other than our Subsidiaries and Group Companies, our Promoters do not have any interest in any venture that is
involved in any activities similar to those conducted by our Company.
Our Promoters are not related to any sundry debtors of our Company.
Except as disclosed in this Red Herring Prospectus, our Promoters are not interested as a member of a firm or
company, and no sum has been paid or agreed to be paid to our Promoters or to such firm or company in cash or
shares or otherwise by any person for services rendered by him or by such firm or company in connection with the
promotion or formation of our Company.
Payment or Benefits to Promoters
Except as stated otherwise in the section “Related Party Transactions” on page 208 about the related party
transactions entered into during the last five Financial Years as per Accounting Standard 18 and in the section “Our
Promoters and Promoter Group – Interests of Promoters” on page 191, there has been no payment or benefit to our
Promoters or Promoter Group during the two years prior to the filing of this Red Herring Prospectus nor is there any
intention to pay or give any benefit to our Promoters or Promoter Group as on the date of this Red Herring
Prospectus.
Companies with which our Promoters have disassociated in the last three years
Except as provided below, our Promoters have not disassociated themselves from any other companies during the
preceding three years:
Name of Promoter Name of the entity Nature of
change
Date of
disassociation
Reasons
Ravi Kant Jaipuria
& Sons (HUF)
Devyani Airport Services
(Mumbai) Private Limited
Disassociation Financial Year
2013-14
Sale of shareholding
Pinnacle Infracon Private
Limited
Disassociation Financial Year
2013-14
Sale of shareholding
Varun Beverages
(International) Limited
Disassociation Financial Year
2013-14
Merger of VBIL with VBL
Pinnacle Propmart Private
Limited
Disassociation Financial Year
2014-15
Sale of shareholding
RJ Corp Limited Sellwell Foods & Beverages Disassociation Financial Year Sale of shareholding
193
Name of Promoter Name of the entity Nature of
change
Date of
disassociation
Reasons
Private Limited 2013-14
Spank Hotels Private Limited Disassociation Financial Year
2013-14
Merger of Spank Hotels Private
Limited with Lemon Tree Hotels
Limited
Varun Beverages
(International) Limited
Disassociation Financial Year
2013-14
Merger of VBIL with VBL
Varun Beverages Lanka
(Pvt.) Ltd.
Disassociation Financial Year
2014-15
Sale of shareholding
South Yarra Land Holdings
Pvt. Ltd.
Disassociation Financial Year
2015-16
Sale of shareholding
Universal Airways Private
Limited
Disassociation Financial Year
2016-17
Sale of shareholding
Varun Jaipuria Diagno Labs Private Limited Disassociation Financial Year
2013-14
Sale of shareholding
Varun Beverages
(International) Limited
Disassociation Financial Year
2013-14
Merger of VBIL with VBL
Change in the management and control of our Company
Our Promoters are the original promoters of our Company and there has not been any change in the management or control of
our Company.
Guarantees
Except as stated in the section “History and Certain Corporate Matters” on page 162, our Promoters have not given any
guarantee to a third party as of the date of this Red Herring Prospectus.
Confirmations
Our Promoters and members of the Promoter Group have not been declared as wilful defaulters by any bank or financial
institution or consortium thereof, in accordance with the guidelines on wilful defaulters issued by the RBI or any other
government authority. Further, there are no violations of securities laws committed by our Promoters and members of the
Promoter Group in the past and no proceedings for violation of securities laws are pending against them.
Our Promoters and members of the Promoter Group have not been prohibited from accessing or operating in capital markets
under any order or direction passed by SEBI or any other regulatory or governmental authority.
Our Promoters and members of the Promoter Group are not and have never been promoters, directors or person in control of
any other company which is prohibited from accessing or operating in capital markets under any order or direction passed by
SEBI or any other regulatory or governmental authority.
Except as disclosed in this Red Herring Prospectus, our Promoters are not interested in any entity which holds any intellectual
property rights that are used by our Company.
Our Promoters have not taken any unsecured loans which may be recalled by the lenders at any time.
194
OUR GROUP COMPANIES
Under the SEBI ICDR Regulations, Group Companies of the Company includes such companies which are covered under
applicable accounting standards (Accounting Standard 18 issued by ICAI) and such other companies as are considered
material by the Board. Further, pursuant to a resolution of our Board dated March 28, 2016, for the purpose of disclosure in
offer documents for the Offer, a company shall be considered material and disclosed as a ‘Group Company’ if (i) the
company is included in the list of related parties in accordance with Accounting Standard 18 provided that, this list shall
exclude (a) the companies that are consolidated with the Company in its consolidated financial statements under Accounting
Standard 21 and; (b) the Company’s corporate Promoter, Subsidiaries and associate; and (ii) it is a company (a) in which
any of the Company or its promoters hold not less than 20% of such company’s equity share capital; and (b) with whom the
Company’s transactions during the most recent completed financial year exceed 10% of the Company’s standalone revenue
for that financial year.
Based on the above, the following are our Group Companies:
1. Accor Industries (Private) Limited;
2. Accor Solar Energy Private Limited;
3. Africare Limited;
4. Alisha Retail Private Limited;
5. Arctic Overseas Pte. Ltd.;
6. Capital Towers Private Limited;
7. Cryoviva Biotech Private Limited;
8. Cryoviva International Pte. Ltd.;
9. Devyani Airport Services (Mumbai) Private Limited;
10. Devyani Food Industries Limited;
11. Devyani International Limited;
12. Dr. Naresh Trehan And Associates Health Services Private Limited;
13. Lineage Healthcare Limited;
14. Medanta Holdings Private Limited;
15. Naresh Trehan Holdings Private Limited;
16. Pinnacle Constructions Private Limited;
17. Pinnacle Town Planners Private Limited;
18. Pinnacle Township Private Limited;
19. Rajasthan Beverages Private Limited;
20. S V S India Private Limited;
21. Shabnam Properties Private Limited;
22. Shrump Real Estates Limited;
23. Wah India Private Limited; and
24. Wellness Holdings Limited.
A. Details of the five largest Group Companies (based on turnover)
The details of our five largest Group Companies (based on turnover) based on financial results for the last three
Fiscals, as applicable, are provided below:
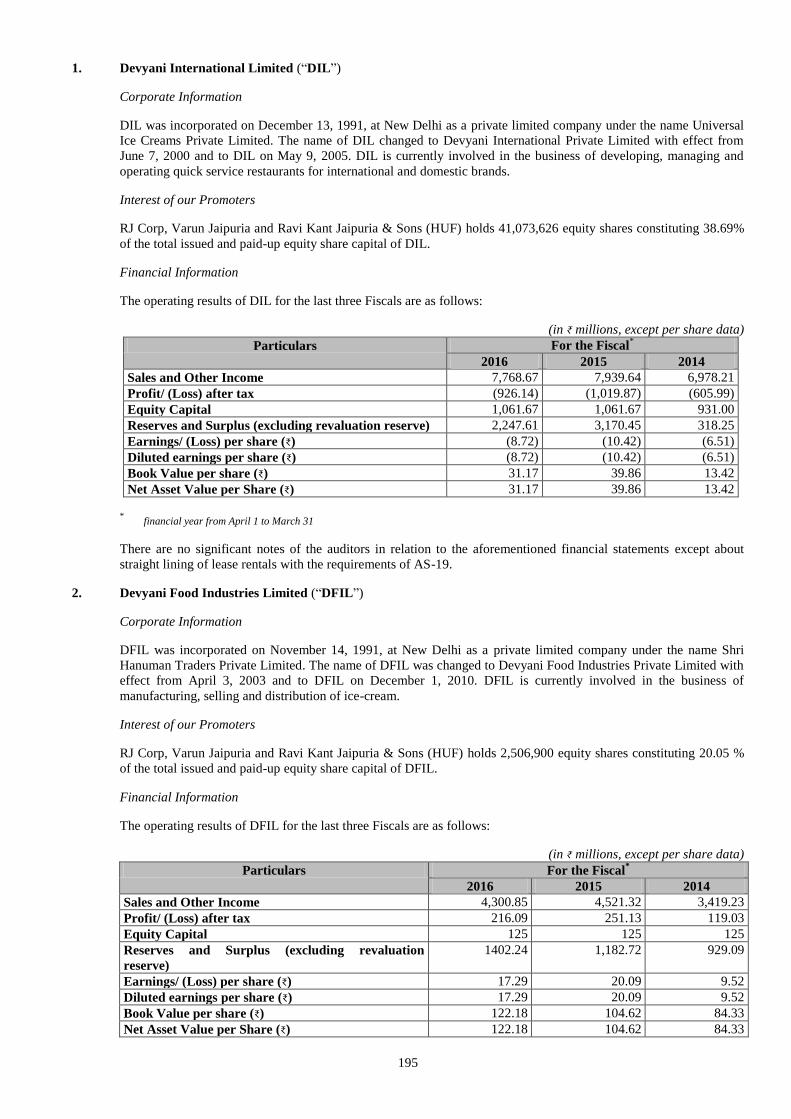
195
1. Devyani International Limited (“DIL”)
Corporate Information
DIL was incorporated on December 13, 1991, at New Delhi as a private limited company under the name Universal
Ice Creams Private Limited. The name of DIL changed to Devyani International Private Limited with effect from
June 7, 2000 and to DIL on May 9, 2005. DIL is currently involved in the business of developing, managing and
operating quick service restaurants for international and domestic brands.
Interest of our Promoters
RJ Corp, Varun Jaipuria and Ravi Kant Jaipuria & Sons (HUF) holds 41,073,626 equity shares constituting 38.69%
of the total issued and paid-up equity share capital of DIL.
Financial Information
The operating results of DIL for the last three Fiscals are as follows:
(in ₹ millions, except per share data)
Particulars For the Fiscal*
2016 2015 2014
Sales and Other Income 7,768.67 7,939.64 6,978.21
Profit/ (Loss) after tax (926.14) (1,019.87) (605.99)
Equity Capital 1,061.67 1,061.67 931.00
Reserves and Surplus (excluding revaluation reserve) 2,247.61 3,170.45 318.25
Earnings/ (Loss) per share (₹) (8.72) (10.42) (6.51)
Diluted earnings per share (₹) (8.72) (10.42) (6.51)
Book Value per share (₹) 31.17 39.86 13.42
Net Asset Value per Share (₹) 31.17 39.86 13.42
* financial year from April 1 to March 31
There are no significant notes of the auditors in relation to the aforementioned financial statements except about
straight lining of lease rentals with the requirements of AS-19.
2. Devyani Food Industries Limited (“DFIL”)
Corporate Information
DFIL was incorporated on November 14, 1991, at New Delhi as a private limited company under the name Shri
Hanuman Traders Private Limited. The name of DFIL was changed to Devyani Food Industries Private Limited with
effect from April 3, 2003 and to DFIL on December 1, 2010. DFIL is currently involved in the business of
manufacturing, selling and distribution of ice-cream.
Interest of our Promoters
RJ Corp, Varun Jaipuria and Ravi Kant Jaipuria & Sons (HUF) holds 2,506,900 equity shares constituting 20.05 %
of the total issued and paid-up equity share capital of DFIL.
Financial Information
The operating results of DFIL for the last three Fiscals are as follows:
(in ₹ millions, except per share data)
Particulars For the Fiscal*
2016 2015 2014
Sales and Other Income 4,300.85 4,521.32 3,419.23
Profit/ (Loss) after tax 216.09 251.13 119.03
Equity Capital 125 125 125
Reserves and Surplus (excluding revaluation
reserve)
1402.24 1,182.72 929.09
Earnings/ (Loss) per share (₹) 17.29 20.09 9.52
Diluted earnings per share (₹) 17.29 20.09 9.52
Book Value per share (₹) 122.18 104.62 84.33
Net Asset Value per Share (₹) 122.18 104.62 84.33
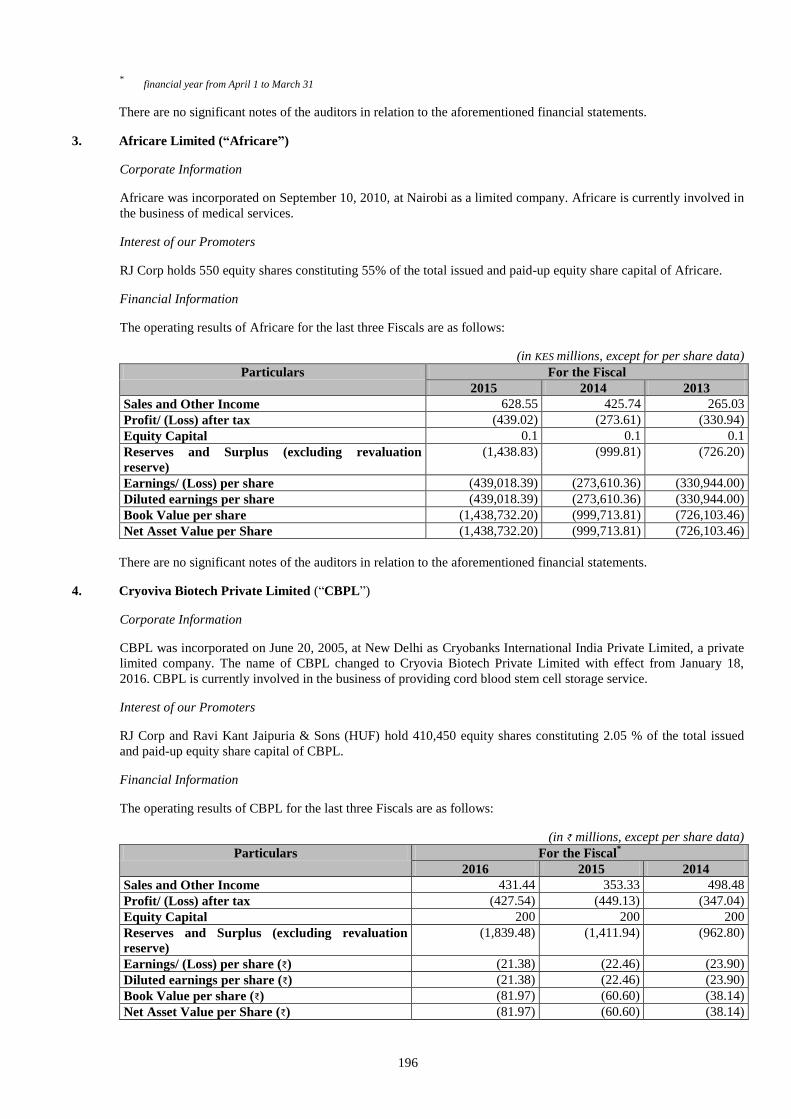
196
* financial year from April 1 to March 31
There are no significant notes of the auditors in relation to the aforementioned financial statements.
3. Africare Limited (“Africare”)
Corporate Information
Africare was incorporated on September 10, 2010, at Nairobi as a limited company. Africare is currently involved in
the business of medical services.
Interest of our Promoters
RJ Corp holds 550 equity shares constituting 55% of the total issued and paid-up equity share capital of Africare.
Financial Information
The operating results of Africare for the last three Fiscals are as follows:
(in KES millions, except for per share data)
Particulars For the Fiscal
2015 2014 2013
Sales and Other Income 628.55 425.74 265.03
Profit/ (Loss) after tax (439.02) (273.61) (330.94)
Equity Capital 0.1 0.1 0.1
Reserves and Surplus (excluding revaluation
reserve)
(1,438.83) (999.81) (726.20)
Earnings/ (Loss) per share (439,018.39) (273,610.36) (330,944.00)
Diluted earnings per share (439,018.39) (273,610.36) (330,944.00)
Book Value per share (1,438,732.20) (999,713.81) (726,103.46)
Net Asset Value per Share (1,438,732.20) (999,713.81) (726,103.46)
There are no significant notes of the auditors in relation to the aforementioned financial statements.
4. Cryoviva Biotech Private Limited (“CBPL”)
Corporate Information
CBPL was incorporated on June 20, 2005, at New Delhi as Cryobanks International India Private Limited, a private
limited company. The name of CBPL changed to Cryovia Biotech Private Limited with effect from January 18,
2016. CBPL is currently involved in the business of providing cord blood stem cell storage service.
Interest of our Promoters
RJ Corp and Ravi Kant Jaipuria & Sons (HUF) hold 410,450 equity shares constituting 2.05 % of the total issued
and paid-up equity share capital of CBPL.
Financial Information
The operating results of CBPL for the last three Fiscals are as follows:
(in ₹ millions, except per share data)
Particulars For the Fiscal*
2016 2015 2014
Sales and Other Income 431.44 353.33 498.48
Profit/ (Loss) after tax (427.54) (449.13) (347.04)
Equity Capital 200 200 200
Reserves and Surplus (excluding revaluation
reserve)
(1,839.48) (1,411.94) (962.80)
Earnings/ (Loss) per share (₹) (21.38) (22.46) (23.90)
Diluted earnings per share (₹) (21.38) (22.46) (23.90)
Book Value per share (₹) (81.97) (60.60) (38.14)
Net Asset Value per Share (₹) (81.97) (60.60) (38.14)
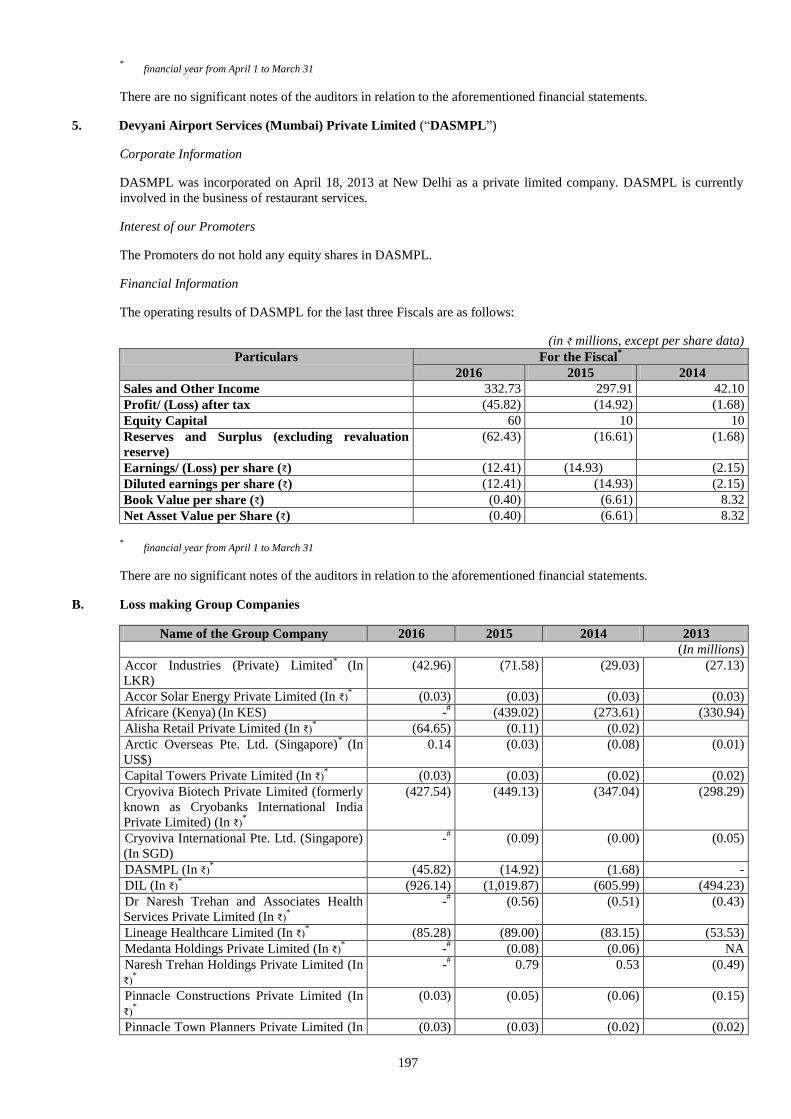
197
* financial year from April 1 to March 31
There are no significant notes of the auditors in relation to the aforementioned financial statements.
5. Devyani Airport Services (Mumbai) Private Limited (“DASMPL”)
Corporate Information
DASMPL was incorporated on April 18, 2013 at New Delhi as a private limited company. DASMPL is currently
involved in the business of restaurant services.
Interest of our Promoters
The Promoters do not hold any equity shares in DASMPL.
Financial Information
The operating results of DASMPL for the last three Fiscals are as follows:
(in ₹ millions, except per share data)
Particulars For the Fiscal*
2016 2015 2014
Sales and Other Income 332.73 297.91 42.10
Profit/ (Loss) after tax (45.82) (14.92) (1.68)
Equity Capital 60 10 10
Reserves and Surplus (excluding revaluation
reserve)
(62.43) (16.61) (1.68)
Earnings/ (Loss) per share (₹) (12.41) (14.93) (2.15)
Diluted earnings per share (₹) (12.41) (14.93) (2.15)
Book Value per share (₹) (0.40) (6.61) 8.32
Net Asset Value per Share (₹) (0.40) (6.61) 8.32
* financial year from April 1 to March 31
There are no significant notes of the auditors in relation to the aforementioned financial statements.
B. Loss making Group Companies
Name of the Group Company 2016 2015 2014 2013
(In millions)
Accor Industries (Private) Limited*
(In
LKR)
(42.96) (71.58) (29.03) (27.13)
Accor Solar Energy Private Limited (In ₹)* (0.03) (0.03) (0.03) (0.03)
Africare (Kenya) (In KES) -
# (439.02) (273.61) (330.94)
Alisha Retail Private Limited (In ₹)* (64.65) (0.11) (0.02)
Arctic Overseas Pte. Ltd. (Singapore)*
(In
US$)
0.14 (0.03) (0.08) (0.01)
Capital Towers Private Limited (In ₹)* (0.03) (0.03) (0.02) (0.02)
Cryoviva Biotech Private Limited (formerly
known as Cryobanks International India
Private Limited) (In ₹)*
(427.54) (449.13) (347.04) (298.29)
Cryoviva International Pte. Ltd. (Singapore)
(In SGD)
-# (0.09) (0.00) (0.05)
DASMPL (In ₹)* (45.82) (14.92) (1.68) -
DIL (In ₹)* (926.14) (1,019.87) (605.99) (494.23)
Dr Naresh Trehan and Associates Health
Services Private Limited (In ₹)*
-# (0.56) (0.51) (0.43)
Lineage Healthcare Limited (In ₹)* (85.28) (89.00) (83.15) (53.53)
Medanta Holdings Private Limited (In ₹)* -
# (0.08) (0.06) NA
Naresh Trehan Holdings Private Limited (In
₹)*
-# 0.79 0.53 (0.49)
Pinnacle Constructions Private Limited (In
₹)*
(0.03) (0.05) (0.06) (0.15)
Pinnacle Town Planners Private Limited (In (0.03) (0.03) (0.02) (0.02)
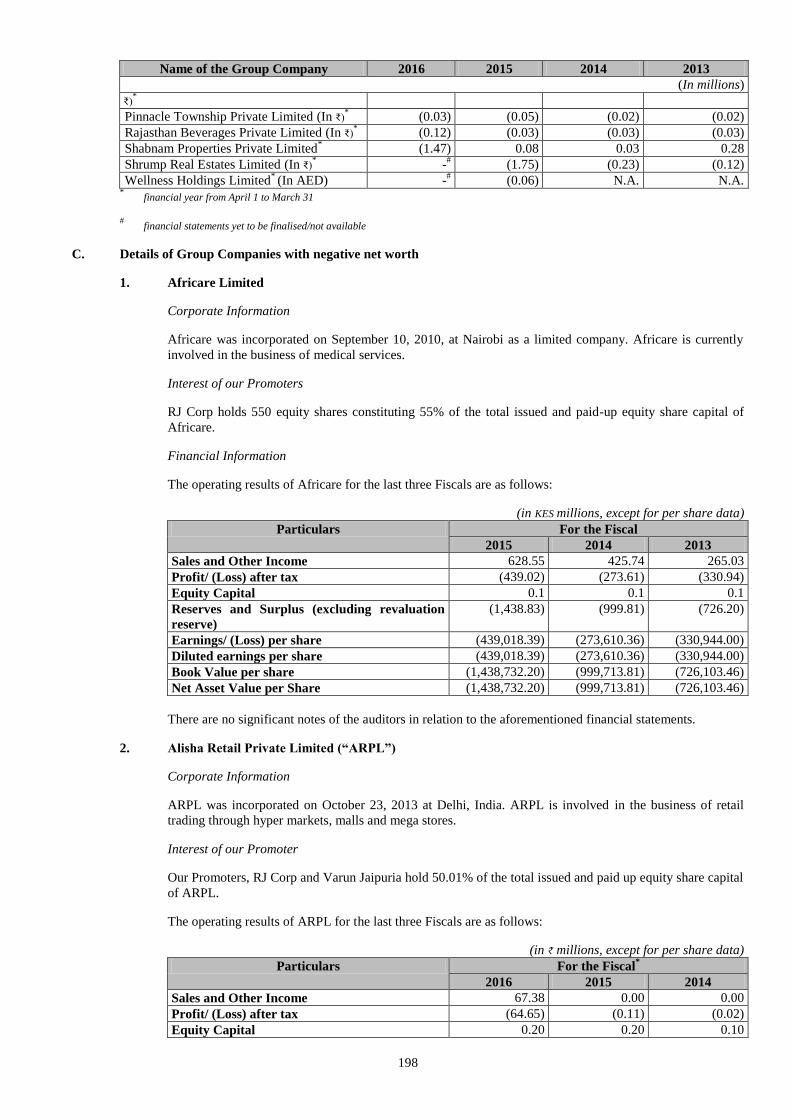
198
Name of the Group Company 2016 2015 2014 2013
(In millions)
₹)*
Pinnacle Township Private Limited (In ₹)* (0.03) (0.05) (0.02) (0.02)
Rajasthan Beverages Private Limited (In ₹)* (0.12) (0.03) (0.03) (0.03)
Shabnam Properties Private Limited* (1.47) 0.08 0.03 0.28
Shrump Real Estates Limited (In ₹)* -
# (1.75) (0.23) (0.12)
Wellness Holdings Limited* (In AED) -
# (0.06) N.A. N.A.
* financial year from April 1 to March 31
# financial statements yet to be finalised/not available
C. Details of Group Companies with negative net worth
1. Africare Limited
Corporate Information
Africare was incorporated on September 10, 2010, at Nairobi as a limited company. Africare is currently
involved in the business of medical services.
Interest of our Promoters
RJ Corp holds 550 equity shares constituting 55% of the total issued and paid-up equity share capital of
Africare.
Financial Information
The operating results of Africare for the last three Fiscals are as follows:
(in KES millions, except for per share data)
Particulars For the Fiscal
2015 2014 2013
Sales and Other Income 628.55 425.74 265.03
Profit/ (Loss) after tax (439.02) (273.61) (330.94)
Equity Capital 0.1 0.1 0.1
Reserves and Surplus (excluding revaluation
reserve)
(1,438.83) (999.81) (726.20)
Earnings/ (Loss) per share (439,018.39) (273,610.36) (330,944.00)
Diluted earnings per share (439,018.39) (273,610.36) (330,944.00)
Book Value per share (1,438,732.20) (999,713.81) (726,103.46)
Net Asset Value per Share (1,438,732.20) (999,713.81) (726,103.46)
There are no significant notes of the auditors in relation to the aforementioned financial statements.
2. Alisha Retail Private Limited (“ARPL”)
Corporate Information
ARPL was incorporated on October 23, 2013 at Delhi, India. ARPL is involved in the business of retail
trading through hyper markets, malls and mega stores.
Interest of our Promoter
Our Promoters, RJ Corp and Varun Jaipuria hold 50.01% of the total issued and paid up equity share capital
of ARPL.
The operating results of ARPL for the last three Fiscals are as follows:
(in ₹ millions, except for per share data)
Particulars For the Fiscal*
2016 2015 2014
Sales and Other Income 67.38 0.00 0.00
Profit/ (Loss) after tax (64.65) (0.11) (0.02)
Equity Capital 0.20 0.20 0.10
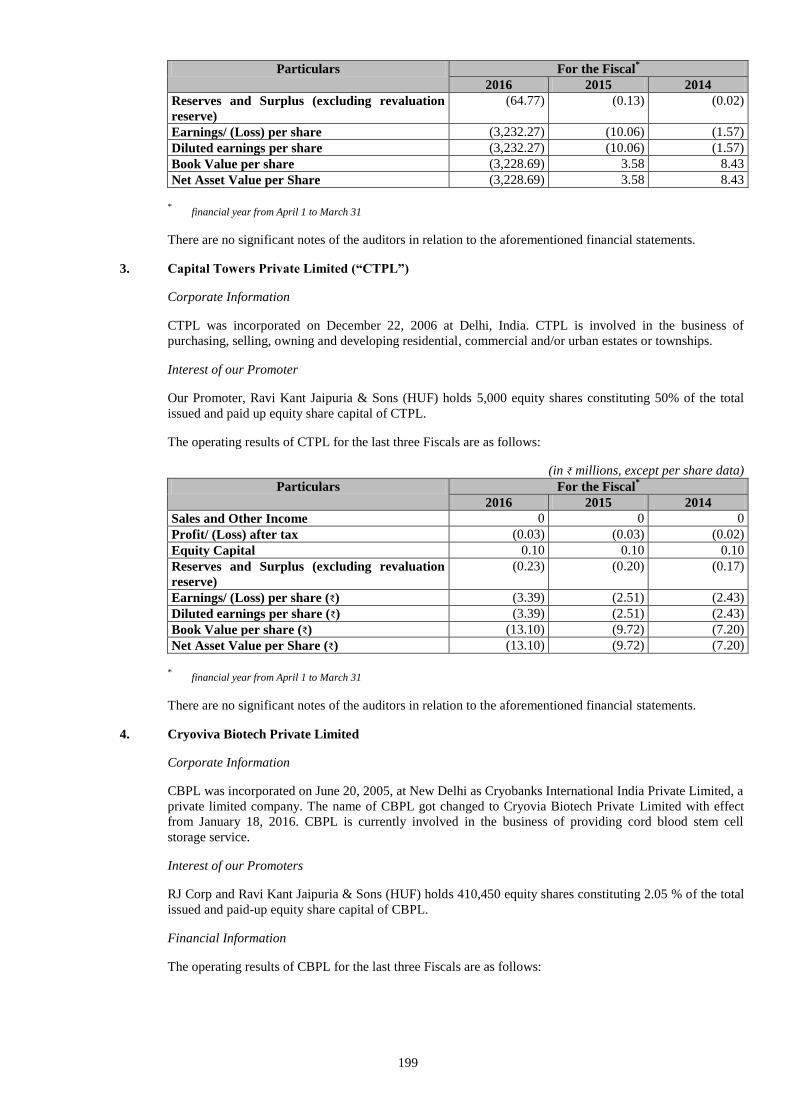
199
Particulars For the Fiscal*
2016 2015 2014
Reserves and Surplus (excluding revaluation
reserve)
(64.77) (0.13) (0.02)
Earnings/ (Loss) per share (3,232.27) (10.06) (1.57)
Diluted earnings per share (3,232.27) (10.06) (1.57)
Book Value per share (3,228.69) 3.58 8.43
Net Asset Value per Share (3,228.69) 3.58 8.43
* financial year from April 1 to March 31
There are no significant notes of the auditors in relation to the aforementioned financial statements.
3. Capital Towers Private Limited (“CTPL”)
Corporate Information
CTPL was incorporated on December 22, 2006 at Delhi, India. CTPL is involved in the business of
purchasing, selling, owning and developing residential, commercial and/or urban estates or townships.
Interest of our Promoter
Our Promoter, Ravi Kant Jaipuria & Sons (HUF) holds 5,000 equity shares constituting 50% of the total
issued and paid up equity share capital of CTPL.
The operating results of CTPL for the last three Fiscals are as follows:
(in ₹ millions, except per share data)
Particulars For the Fiscal*
2016 2015 2014
Sales and Other Income 0 0 0
Profit/ (Loss) after tax (0.03) (0.03) (0.02)
Equity Capital 0.10 0.10 0.10
Reserves and Surplus (excluding revaluation
reserve)
(0.23) (0.20) (0.17)
Earnings/ (Loss) per share (₹) (3.39) (2.51) (2.43)
Diluted earnings per share (₹) (3.39) (2.51) (2.43)
Book Value per share (₹) (13.10) (9.72) (7.20)
Net Asset Value per Share (₹) (13.10) (9.72) (7.20)
* financial year from April 1 to March 31
There are no significant notes of the auditors in relation to the aforementioned financial statements.
4. Cryoviva Biotech Private Limited
Corporate Information
CBPL was incorporated on June 20, 2005, at New Delhi as Cryobanks International India Private Limited, a
private limited company. The name of CBPL got changed to Cryovia Biotech Private Limited with effect
from January 18, 2016. CBPL is currently involved in the business of providing cord blood stem cell
storage service.
Interest of our Promoters
RJ Corp and Ravi Kant Jaipuria & Sons (HUF) holds 410,450 equity shares constituting 2.05 % of the total
issued and paid-up equity share capital of CBPL.
Financial Information
The operating results of CBPL for the last three Fiscals are as follows:
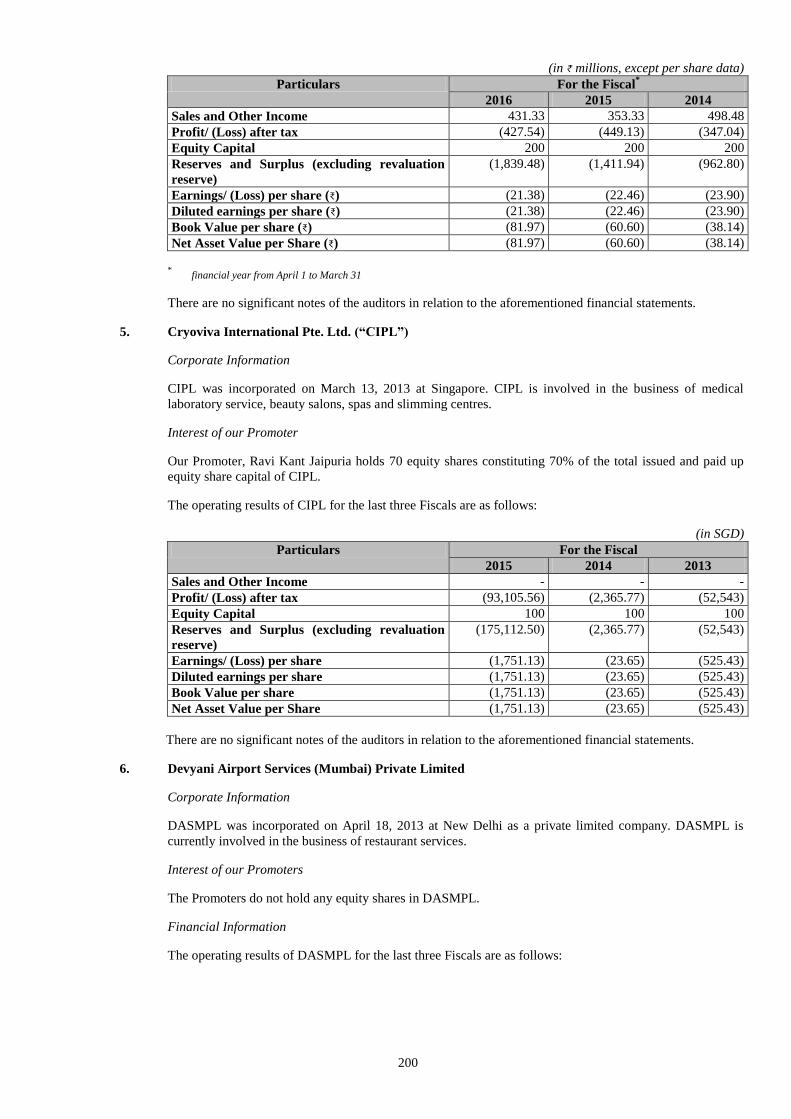
200
(in ₹ millions, except per share data)
Particulars For the Fiscal*
2016 2015 2014
Sales and Other Income 431.33 353.33 498.48
Profit/ (Loss) after tax (427.54) (449.13) (347.04)
Equity Capital 200 200 200
Reserves and Surplus (excluding revaluation
reserve)
(1,839.48) (1,411.94) (962.80)
Earnings/ (Loss) per share (₹) (21.38) (22.46) (23.90)
Diluted earnings per share (₹) (21.38) (22.46) (23.90)
Book Value per share (₹) (81.97) (60.60) (38.14)
Net Asset Value per Share (₹) (81.97) (60.60) (38.14)
* financial year from April 1 to March 31
There are no significant notes of the auditors in relation to the aforementioned financial statements.
5. Cryoviva International Pte. Ltd. (“CIPL”)
Corporate Information
CIPL was incorporated on March 13, 2013 at Singapore. CIPL is involved in the business of medical
laboratory service, beauty salons, spas and slimming centres.
Interest of our Promoter
Our Promoter, Ravi Kant Jaipuria holds 70 equity shares constituting 70% of the total issued and paid up
equity share capital of CIPL.
The operating results of CIPL for the last three Fiscals are as follows:
(in SGD)
Particulars For the Fiscal
2015 2014 2013
Sales and Other Income - - -
Profit/ (Loss) after tax (93,105.56) (2,365.77) (52,543)
Equity Capital 100 100 100
Reserves and Surplus (excluding revaluation
reserve)
(175,112.50) (2,365.77) (52,543)
Earnings/ (Loss) per share (1,751.13) (23.65) (525.43)
Diluted earnings per share (1,751.13) (23.65) (525.43)
Book Value per share (1,751.13) (23.65) (525.43)
Net Asset Value per Share (1,751.13) (23.65) (525.43)
There are no significant notes of the auditors in relation to the aforementioned financial statements.
6. Devyani Airport Services (Mumbai) Private Limited
Corporate Information
DASMPL was incorporated on April 18, 2013 at New Delhi as a private limited company. DASMPL is
currently involved in the business of restaurant services.
Interest of our Promoters
The Promoters do not hold any equity shares in DASMPL.
Financial Information
The operating results of DASMPL for the last three Fiscals are as follows:
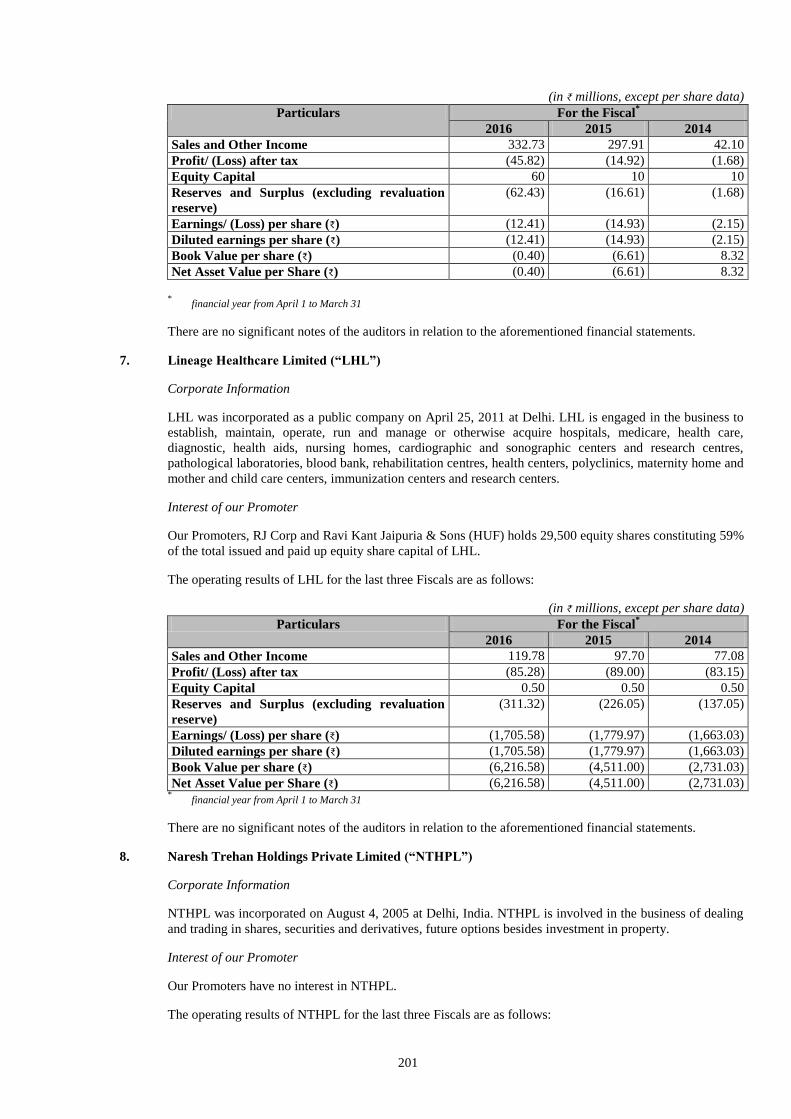
201
(in ₹ millions, except per share data)
Particulars For the Fiscal*
2016 2015 2014
Sales and Other Income 332.73 297.91 42.10
Profit/ (Loss) after tax (45.82) (14.92) (1.68)
Equity Capital 60 10 10
Reserves and Surplus (excluding revaluation
reserve)
(62.43) (16.61) (1.68)
Earnings/ (Loss) per share (₹) (12.41) (14.93) (2.15)
Diluted earnings per share (₹) (12.41) (14.93) (2.15)
Book Value per share (₹) (0.40) (6.61) 8.32
Net Asset Value per Share (₹) (0.40) (6.61) 8.32
* financial year from April 1 to March 31
There are no significant notes of the auditors in relation to the aforementioned financial statements.
7. Lineage Healthcare Limited (“LHL”)
Corporate Information
LHL was incorporated as a public company on April 25, 2011 at Delhi. LHL is engaged in the business to
establish, maintain, operate, run and manage or otherwise acquire hospitals, medicare, health care,
diagnostic, health aids, nursing homes, cardiographic and sonographic centers and research centres,
pathological laboratories, blood bank, rehabilitation centres, health centers, polyclinics, maternity home and
mother and child care centers, immunization centers and research centers.
Interest of our Promoter
Our Promoters, RJ Corp and Ravi Kant Jaipuria & Sons (HUF) holds 29,500 equity shares constituting 59%
of the total issued and paid up equity share capital of LHL.
The operating results of LHL for the last three Fiscals are as follows:
(in ₹ millions, except per share data)
Particulars For the Fiscal*
2016 2015 2014
Sales and Other Income 119.78 97.70 77.08
Profit/ (Loss) after tax (85.28) (89.00) (83.15)
Equity Capital 0.50 0.50 0.50
Reserves and Surplus (excluding revaluation
reserve)
(311.32) (226.05) (137.05)
Earnings/ (Loss) per share (₹) (1,705.58) (1,779.97) (1,663.03)
Diluted earnings per share (₹) (1,705.58) (1,779.97) (1,663.03)
Book Value per share (₹) (6,216.58) (4,511.00) (2,731.03)
Net Asset Value per Share (₹) (6,216.58) (4,511.00) (2,731.03) *
financial year from April 1 to March 31
There are no significant notes of the auditors in relation to the aforementioned financial statements.
8. Naresh Trehan Holdings Private Limited (“NTHPL”)
Corporate Information
NTHPL was incorporated on August 4, 2005 at Delhi, India. NTHPL is involved in the business of dealing
and trading in shares, securities and derivatives, future options besides investment in property.
Interest of our Promoter
Our Promoters have no interest in NTHPL.
The operating results of NTHPL for the last three Fiscals are as follows:
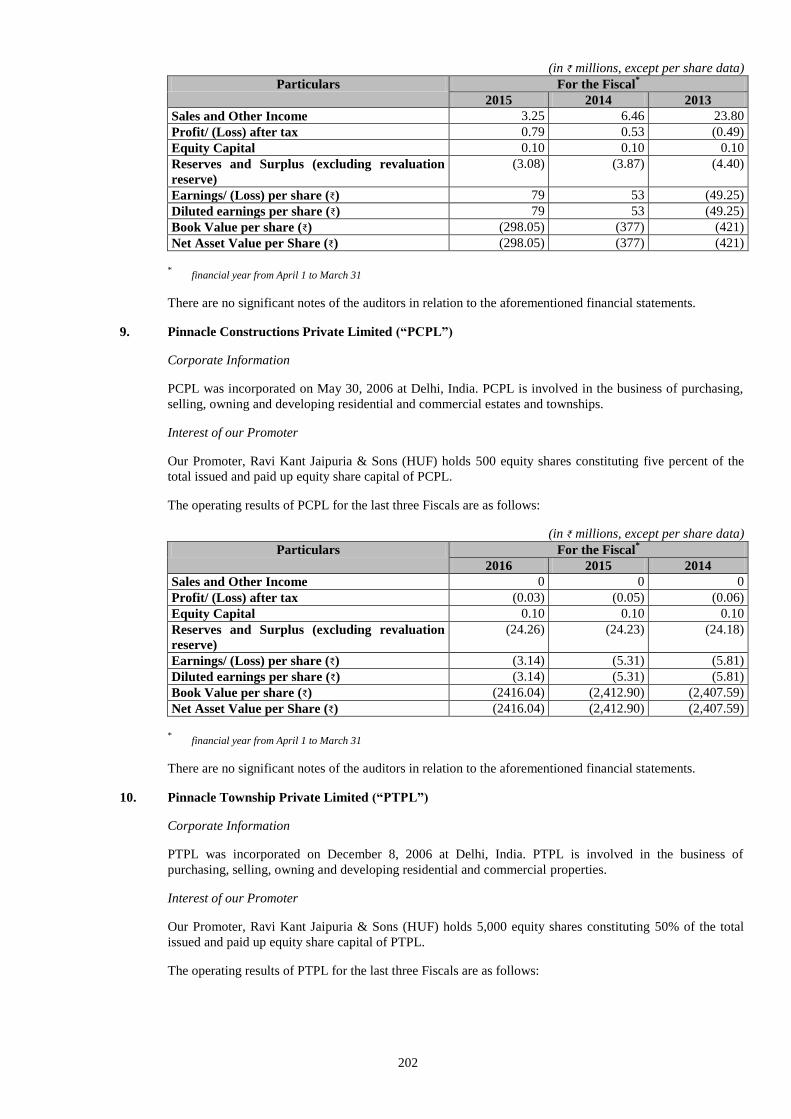
202
(in ₹ millions, except per share data)
Particulars For the Fiscal*
2015 2014 2013
Sales and Other Income 3.25 6.46 23.80
Profit/ (Loss) after tax 0.79 0.53 (0.49)
Equity Capital 0.10 0.10 0.10
Reserves and Surplus (excluding revaluation
reserve)
(3.08) (3.87) (4.40)
Earnings/ (Loss) per share (₹) 79 53 (49.25)
Diluted earnings per share (₹) 79 53 (49.25)
Book Value per share (₹) (298.05) (377) (421)
Net Asset Value per Share (₹) (298.05) (377) (421)
* financial year from April 1 to March 31
There are no significant notes of the auditors in relation to the aforementioned financial statements.
9. Pinnacle Constructions Private Limited (“PCPL”)
Corporate Information
PCPL was incorporated on May 30, 2006 at Delhi, India. PCPL is involved in the business of purchasing,
selling, owning and developing residential and commercial estates and townships.
Interest of our Promoter
Our Promoter, Ravi Kant Jaipuria & Sons (HUF) holds 500 equity shares constituting five percent of the
total issued and paid up equity share capital of PCPL.
The operating results of PCPL for the last three Fiscals are as follows:
(in ₹ millions, except per share data)
Particulars For the Fiscal*
2016 2015 2014
Sales and Other Income 0 0 0
Profit/ (Loss) after tax (0.03) (0.05) (0.06)
Equity Capital 0.10 0.10 0.10
Reserves and Surplus (excluding revaluation
reserve)
(24.26) (24.23) (24.18)
Earnings/ (Loss) per share (₹) (3.14) (5.31) (5.81)
Diluted earnings per share (₹) (3.14) (5.31) (5.81)
Book Value per share (₹) (2416.04) (2,412.90) (2,407.59)
Net Asset Value per Share (₹) (2416.04) (2,412.90) (2,407.59)
* financial year from April 1 to March 31
There are no significant notes of the auditors in relation to the aforementioned financial statements.
10. Pinnacle Township Private Limited (“PTPL”)
Corporate Information
PTPL was incorporated on December 8, 2006 at Delhi, India. PTPL is involved in the business of
purchasing, selling, owning and developing residential and commercial properties.
Interest of our Promoter
Our Promoter, Ravi Kant Jaipuria & Sons (HUF) holds 5,000 equity shares constituting 50% of the total
issued and paid up equity share capital of PTPL.
The operating results of PTPL for the last three Fiscals are as follows:
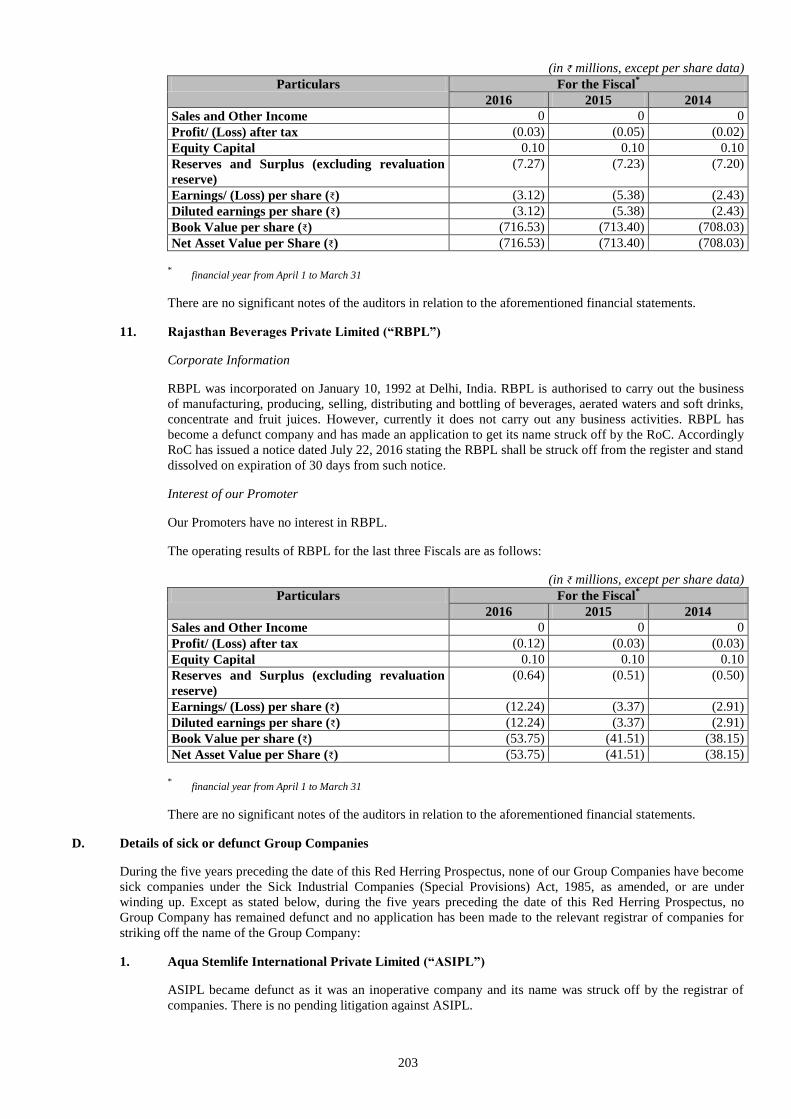
203
(in ₹ millions, except per share data)
Particulars For the Fiscal*
2016 2015 2014
Sales and Other Income 0 0 0
Profit/ (Loss) after tax (0.03) (0.05) (0.02)
Equity Capital 0.10 0.10 0.10
Reserves and Surplus (excluding revaluation
reserve)
(7.27) (7.23) (7.20)
Earnings/ (Loss) per share (₹) (3.12) (5.38) (2.43)
Diluted earnings per share (₹) (3.12) (5.38) (2.43)
Book Value per share (₹) (716.53) (713.40) (708.03)
Net Asset Value per Share (₹) (716.53) (713.40) (708.03)
* financial year from April 1 to March 31
There are no significant notes of the auditors in relation to the aforementioned financial statements.
11. Rajasthan Beverages Private Limited (“RBPL”)
Corporate Information
RBPL was incorporated on January 10, 1992 at Delhi, India. RBPL is authorised to carry out the business
of manufacturing, producing, selling, distributing and bottling of beverages, aerated waters and soft drinks,
concentrate and fruit juices. However, currently it does not carry out any business activities. RBPL has
become a defunct company and has made an application to get its name struck off by the RoC. Accordingly
RoC has issued a notice dated July 22, 2016 stating the RBPL shall be struck off from the register and stand
dissolved on expiration of 30 days from such notice.
Interest of our Promoter
Our Promoters have no interest in RBPL.
The operating results of RBPL for the last three Fiscals are as follows:
(in ₹ millions, except per share data)
Particulars For the Fiscal*
2016 2015 2014
Sales and Other Income 0 0 0
Profit/ (Loss) after tax (0.12) (0.03) (0.03)
Equity Capital 0.10 0.10 0.10
Reserves and Surplus (excluding revaluation
reserve)
(0.64) (0.51) (0.50)
Earnings/ (Loss) per share (₹) (12.24) (3.37) (2.91)
Diluted earnings per share (₹) (12.24) (3.37) (2.91)
Book Value per share (₹) (53.75) (41.51) (38.15)
Net Asset Value per Share (₹) (53.75) (41.51) (38.15)
* financial year from April 1 to March 31
There are no significant notes of the auditors in relation to the aforementioned financial statements.
D. Details of sick or defunct Group Companies
During the five years preceding the date of this Red Herring Prospectus, none of our Group Companies have become
sick companies under the Sick Industrial Companies (Special Provisions) Act, 1985, as amended, or are under
winding up. Except as stated below, during the five years preceding the date of this Red Herring Prospectus, no
Group Company has remained defunct and no application has been made to the relevant registrar of companies for
striking off the name of the Group Company:
1. Aqua Stemlife International Private Limited (“ASIPL”)
ASIPL became defunct as it was an inoperative company and its name was struck off by the registrar of
companies. There is no pending litigation against ASIPL.
204
2. Devyani International (Chennai) Private Limited (“DICPL”)
DICPL became defunct as it was an inoperative company and its name was struck off by the registrar of
companies. There is no pending litigation against DICPL.
3. Devyani International (Kolkata) Private Limited (“DIKPL”)
DIKPL became defunct as it was an inoperative company and its name was struck off by the registrar of
companies. There is no pending litigation against DIKPL.
4. Devyani International Costa Private Limited (“DICL”)
DICL became defunct as it was an inoperative company and its name was struck off by the registrar of
companies. There is no pending litigation against DICL.
5. Varun Residential Projects Private Limited (“VRPPL”)
VRPPL became defunct as it was an inoperative company and its name was struck off by the registrar of
companies. There is no pending litigation against VRPPL.
6. Devyani Education Foundation Private Limited (“DEFPL”)
DEFPL became defunct as it was an inoperative company and its name was struck off by the registrar of
companies. There is no pending litigation against DEFPL.
7. Rajasthan Beverages Private Limited (“RBPL”)
RBPL has become a defunct company and has made an application to get its name struck off by the RoC
and the RoC has issued a notice dated July 22, 2016 stating the RBPL shall be struck off from the register
and stand dissolved on expiration of 30 days from such notice. There is no pending litigation against RBPL.
E. Details of other Group Companies
1. Accor Industries (Private) Limited (“AIPL”)
Corporate Information
AIPL was incorporated on July 22, 2004 at Wattala, Sri Lanka. AIPL is involved in the business of
manufacturing hydrogenated vegetable oil for exports.
Interest of our Promoter
Our Promoter, Ravi Kant Jaipuria holds 85.06% of the total issued and paid up equity share capital of
AIPL.
2. Accor Solar Energy Private Limited (“ASEPL”)
Corporate Information
ASEPL was incorporated on October 30, 2006 at Delhi, India. ASEPL is involved in the business of
transmitting, manufacturing, supplying, generating, distributing and dealing in electricity and all forms of
energy and power generated by alternate sources.
Interest of our Promoter
Our Promoter, Ravi Kant Jaipuria & Sons (HUF) holds 5% of the total issued and paid up equity share
capital of ASEPL.
3. Arctic Overseas Pte. Limited (“AOPL”)
Corporate Information
AOPL was incorporated on September 26, 2012 in Singapore. AOPL is involved in the business of
investment company.
Interest of our Promoter
205
Our Promoter, Ravi Kant Jaipuria holds 100% of the total issued and paid up equity share capital of AOPL.
4. Dr. Naresh Trehan And Associates Health Services Private Limited (“DNTAHS”)
Corporate Information
DNTAHS was incorporated on September 21, 2005 at Delhi, India. DNTAHS is involved in the business of
providing healthcare services.
Interest of our Promoter
Our Promoters, RJ Corp holds 15% of the total issued and paid up equity share capital of DNTAHS.
5. Medanta Holdings Private Limited (“MHPL”)
Corporate Information
MHPL was incorporated on April 10, 2013 at Delhi, India. MHPL is involved in the business of consulting,
establishing, owning and management of healthcare services and healthcare ventures.
Interest of our Promoter
Our Promoters have no interest in MHPL.
6. Pinnacle Town Planners Private Limited (“PTPPL”)
Corporate Information
PTPPL was incorporated on December 18, 2006 at Delhi, India. PTPPL is involved in the business of
purchasing, selling, owning and developing residential and commercial properties.
Interest of our Promoter
Our Promoter, Ravi Kant Jaipuria & Sons (HUF) holds 50% of the total issued and paid up equity share
capital of PTPPL.
7. S V S India Private Limited (“SVS”)
Corporate Information
SVS was incorporated on November 15, 1985 at Delhi, India. SVS is involved in the business of
organizing, installing and carrying on the business of mechanical engineering consultants, etc.
Interest of our Promoter
Our Promoter, RJ Corp, holds 38.8% of the total issued and paid up equity share capital of SVS.
8. Shabnam Properties Private Limited (“SPPL”)
Corporate Information
SPPL was incorporated on February 16, 1987 at Delhi, India. SPPL is involved in the business of acquiring
land, construction and sale of flats and to act as estate agents.
Interest of our Promoter
Our Promoters, RJ Corp and Varun Jaipuria, hold 100% of the total issued and paid up equity share capital
of SPPL.
9. Shrump Real Estates Limited (“SREL”)
Corporate Information
SREL was incorporated on November 26, 1986 at Delhi, India. SREL is involved in the business of real
estate.
Interest of our Promoter
206
Our Promoters have no interest in SREL.
10. Wah India Private Limited (“WIPL”)
Corporate Information
WIPL was incorporated on January 11, 2001 at Delhi, India. WIPL is engaged in the business of trading,
printing material, publishing, selling, distribution and printed books and materials.
Interest of our Promoter
Our Promoters have no interest in WIPL.
11. Wellness Holdings Limited (“WHL”)
Corporate Information
WHL was incorporated on October 29, 2014 at Dubai, United Arab Emirates. WHL is involved in the
business of purchasing, leasing, maintenance, chartering of scheduled, non-scheduled chartered aircrafts,
investment in limited liability companies and general trading.
Interest of our Promoter
Our Promoter, RJ Corp, holds 100% of the total issued and paid up equity share capital of WHL.
Nature and Extent of Interest of Group Companies
(a) In the promotion of Our Company
Except as disclosed in “Restated Consolidated Financial Statements – Annexure 36” on page 303, none of our Group
Companies have any interest in the promotion or any business interest or other interests in our Company.
(b) In the properties acquired or proposed to be acquired by our Company in the past two years before filing this
Red Herring Prospectus with SEBI
None of our Group Companies are interested in the properties acquired or proposed to be acquired by our Company
in the two years preceding the filing of this Red Herring Prospectus.
(c) In transactions for acquisitions of land, construction of building and supply of machinery
None of our Group Companies is interested in any transactions for the acquisition of land, construction of building
or supply of machinery.
Common Pursuits amongst the Group Companies with our Company
There are no common pursuits between any of our Group Companies and our Company.
Related Business Transactions within the Group Companies and significance on the financial performance of our
Company
For more information, see “Related Party Transactions” on page 208.
Significant Sale/Purchase between Group Companies and our Company
None of our Group Companies is involved in any sales or purchase with our Company where such sales or purchases exceed
in value in the aggregate of 10% of the total sales or purchases of our Company.
Other Confirmations
None of the Group Companies are listed on any stock exchange or have made any public or rights issue of securities in
preceding three years.
None of the Group Companies have been debarred from accessing the capital market for any reasons by the SEBI or any
other authorities.
None of the Group Companies have been identified as wilful defaulters by any bank or financial institution or consortium
thereof, in accordance with the guidelines on wilful defaulters issued by the RBI or other authorities.

207
[PAGE INTENTIONALLY LEFT BLANK]
208
RELATED PARTY TRANSACTIONS
For details of the related party transactions during the last five Fiscal Years, pursuant to the requirements under Accounting
Standard 18 “Related Party Disclosures”, issued by the Institute of Chartered Accountants of India, please see “Restated
Consolidated Financial Statements – Annexure 36 – Restated Statement of Related Party Transactions” and” “Restated
Standalone Financial Statements – Annexure 36 – Restated Statement of Related Party Transactions” on page 303 and page
391, respectively.
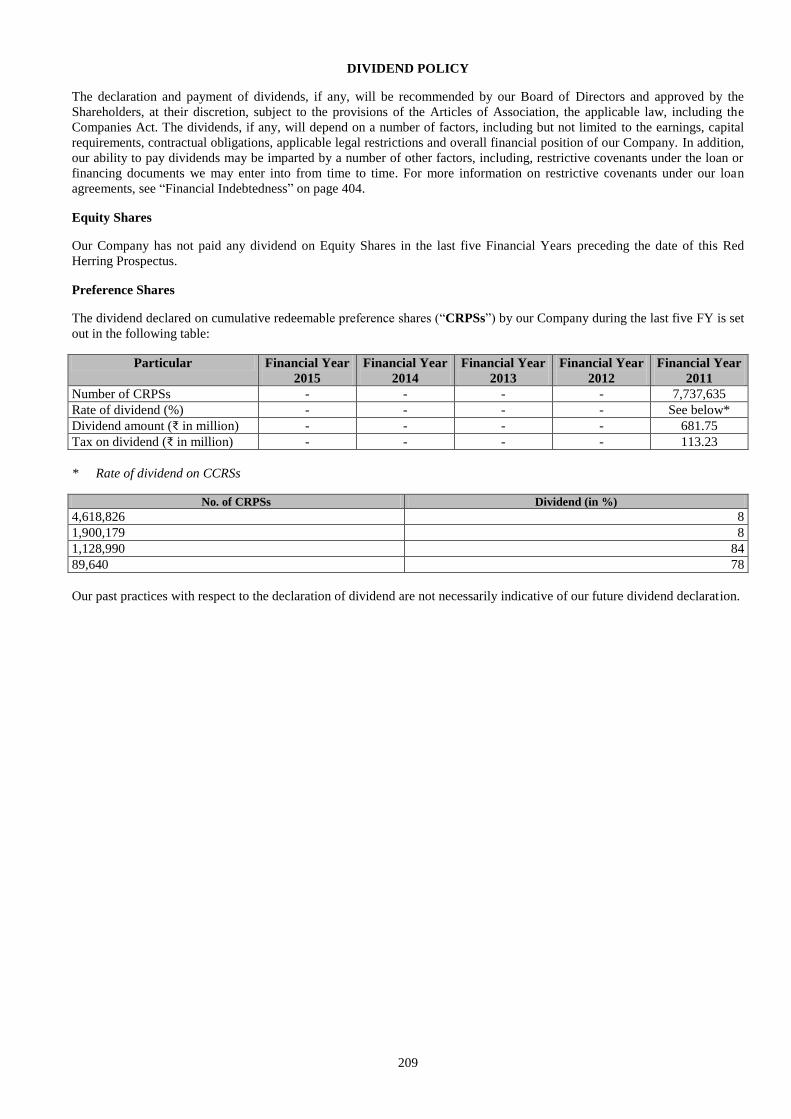
209
DIVIDEND POLICY
The declaration and payment of dividends, if any, will be recommended by our Board of Directors and approved by the
Shareholders, at their discretion, subject to the provisions of the Articles of Association, the applicable law, including the
Companies Act. The dividends, if any, will depend on a number of factors, including but not limited to the earnings, capital
requirements, contractual obligations, applicable legal restrictions and overall financial position of our Company. In addition,
our ability to pay dividends may be imparted by a number of other factors, including, restrictive covenants under the loan or
financing documents we may enter into from time to time. For more information on restrictive covenants under our loan
agreements, see “Financial Indebtedness” on page 404.
Equity Shares
Our Company has not paid any dividend on Equity Shares in the last five Financial Years preceding the date of this Red
Herring Prospectus.
Preference Shares
The dividend declared on cumulative redeemable preference shares (“CRPSs”) by our Company during the last five FY is set
out in the following table:
Particular Financial Year
2015
Financial Year
2014
Financial Year
2013
Financial Year
2012
Financial Year
2011
Number of CRPSs - - - - 7,737,635
Rate of dividend (%) - - - - See below*
Dividend amount (₹ in million) - - - - 681.75
Tax on dividend (₹ in million) - - - - 113.23
* Rate of dividend on CCRSs
No. of CRPSs Dividend (in %)
4,618,826 8
1,900,179 8
1,128,990 84
89,640 78
Our past practices with respect to the declaration of dividend are not necessarily indicative of our future dividend declaration.
210
SECTION V: FINANCIAL INFORMATION
RESTATED CONSOLIDATED FINANCIAL STATEMENTS
To
The Board of Directors,
Varun Beverages Limited
RJ Corp House, Plot No. 31,
Institutional Area, Sector – 44,
Gurgaon – 122022, Haryana
Auditors’ Report on Consolidated Financial Information in connection with the proposed issue of equity shares of
Varun Beverages Limited
Dear Sirs,
1. We have examined the attached Consolidated Financial Information comprising Restated Consolidated Summary
Statement of Assets and Liabilities as at 30 June 2016, 2015, 31 December 2015, 2014, 2013 and 2012, Restated
Consolidated Summary Statement of Profits and Losses, Restated Consolidated Summary Statement of Cash Flows
(collectively referred as “Consolidated Financial Information”) and consolidated other financial information (as
described more in detail in paragraph 4 (e) below, referred as “consolidated other financial information”) for the six
month periods ended 30 June 2016, 2015 and years ended 31 December 2015, 2014, 2013 and 2012 of Varun
Beverages Limited, its subsidiaries and associates (collectively, the “Company”), as approved by the Board of
Directors of the Company, prepared by Company’s management in terms of the requirements of Section 26(1)(b) of
the Companies Act, 2013 (“the Act”), read with rules 4 to 6 of the Companies (Prospectus and Allotment of
Securities) Rules, 2014 and Part (B) of Item (IX) of Schedule VIII of the Securities and Exchange Board of India
(Issue of Capital and Disclosure Requirements) Regulations, 2009 as amended to date (“SEBI Regulations”) and in
terms of our engagement agreed upon with you in accordance with our engagement letter dated 04 December 2015,
for the purpose of inclusion in the Draft Red Herring Prospectus, Red Herring Prospectus and Prospectus
(collectively, ‘Offer Document”), in connection with the proposed issue of equity shares of the Company.
2. These information have been prepared by the Company’s management from the Audited Consolidated Financial
Statements of the Company for the six month periods ended 30 June 2016, 2015 and years ended 31 December 2015,
2014, 2013 and 2012. The audits for the financial years ended 31 December 2013 and 2012 was conducted by O.P.
Bagla & Co. and reliance has been placed on the Consolidated Financial Statements audited by them for the said
years. Accordingly, our examination of the Consolidated Financial Information and consolidated other financial
information of the Company for the financial years December 2013 and 2012 is based solely on the Consolidated
Financial Statements audited by them and audit reports issued by them.
Walker Chandiok & Associates and O.P. Bagla & Co. did not audit the financial statements of the subsidiaries,
neither jointly nor individually, for the six month periods ended 30 June 2016, 2015 and years ended 31 December
2015, 2014, 2013 and 2012, whose financial statements reflect total assets of Rs 13,599.94 million, Rs 8,750.73
million, Rs. 8,597.39 million, Rs. 8,256.67 million, Rs. 6,325.96 million and Rs. 4,749.53 million respectively, total
revenues of Rs 4,554.07 million, Rs 2690.03 million, Rs. 5,528.49 million, 4,979.63 million, Rs. 3,666.71 million
and Rs. 3,572.78 million respectively and net cashflows aggregating to Rs 104.67 million, Rs 15.13 million, Rs.
34.34 million, Rs 56.58 million, Rs. 31.23 million and Rs. 11.98 million respectively. These financial statements
have been audited by other auditors, whose reports have been furnished to us by you and our opinion in so far as it
relates to the amounts included in these Consolidated Financial Information are based solely on the report of other
auditors.
Walker Chandiok & Associates did not audit the Consolidated Financial Statements of an associate for the six month
period ended 30 June 2016, 2015 and years ended 31 December 2015, 2014 and 2013, whose financial statements
reflect the Company’s share of net profit of Rs. 15.39 million, Rs 5.18 million, Rs. 12.90 million, 19.48 million, and
Rs. Nil for the six month period ended 30 June 2016, 2015 and years ended 31 December 2015, 2014 and 2013
respectively. These Consolidated Financial Statements have been audited by O.P. Bagla & Co., whose audit reports
have been furnished to Walker Chandiok & Associates by you and our opinion in so far as it relates to the amounts
included in these Consolidated Financial Information are based solely on the audit reports of O.P. Bagla & Co.
Auditors’ Report on Consolidated Financial Information in connection with the proposed issue of equity
shares of the Varun Beverages Limited (Cont’d)
These other auditors of the Company’s subsidiaries and associate have confirmed that the Consolidated Financial
Information and consolidated other financial information:
211
i. Have been prepared after incorporating adjustments for the changes, if any, in accounting policies
retrospectively in respective financial years to reflect the same accounting treatment as per changed
accounting policy for all the reporting periods;
ii. Have been prepared after incorporating adjustments for the material amounts in the respective financial
years to which they relate;
iii. And do not contain extra-ordinary items other than those disclosed separately and do not contain
qualification requiring adjustments.
3. We have not examined any consolidated financial statements of the Company as of any date or for any period
subsequent to 30 June 2016. Accordingly, we do not express any opinion on the consolidated financial position,
results of operations or cash flows as of any date or for any period subsequent to 30 June 2016.
4. In accordance with the requirements of Section 26(1)(b) of the Act, the SEBI Regulations and the terms of our
engagement agreed with you, we further report that:
a. The Restated Consolidated Summary Statement of Assets and Liabilities of the Company examined by us,
as set out in Annexure 1 to this report, are after making adjustments and regrouping as in our opinion were
appropriate and more fully described in Restated Consolidated Summary Statement of Significant
Accounting Policies, Restated Consolidated Summary Statement of Notes to Restated Consolidated
Summary Statements and Restated Consolidated Summary Statement of Reconciliation of Restated Profit/
(Loss) to Profit/ (Loss) as per Audited Consolidated Financial Statements of the Company in Annexures 4,
5 and 6 respectively. For the years ended 31 December 2013 and 2012, Walker Chandiok & Associates has
relied on the Consolidated Financial Statements audited by O.P. Bagla & Co. for the said years.
b. The Restated Consolidated Summary Statement of Profit and Loss of the Company examined by us, as set
out in Annexure 2 to this report, are after making adjustments and regrouping as in our opinion were
appropriate and more fully described in Restated Consolidated Summary Statement of Significant
Accounting Policies, Restated Consolidated Summary Statement of Notes to the Restated Consolidated
Summary Statements and Restated Consolidated Summary Statement of Reconciliation of Restated Profit/
(Loss) to Profit/ (Loss) as per Audited Consolidated Financial Statements of the Company in Annexures 4,
5 and 6 respectively. For the years ended 31 December 2013 and 2012, Walker Chandiok & Associates has
relied on the Consolidated Financial Statements audited by O.P. Bagla & Co. for the said years.
c. The Restated Consolidated Summary Statement of Cash Flows of the Company examined by us, as set out
in Annexure 3 to this report, are after making adjustments and regrouping as in our opinion were
appropriate and more fully described in Restated Consolidated Summary Statement of Significant
Accounting Policies, Restated Consolidated Summary Statement of Notes to the Restated Consolidated
Summary Statements and Restated Consolidated Summary Statement of Reconciliation of Restated Profit/
(Loss) to Profit/ (Loss) as per Audited Consolidated Financial Statements of the Company in Annexures 4,
5 and 6 respectively. For the years ended 31 December 2013 and 2012, Walker Chandiok & Associates has
relied on the Consolidated Financial Statements audited by O.P. Bagla & Co. for the said years.
Auditors’ Report on Consolidated Financial Information in connection with the proposed issue of equity
shares of the Varun Beverages Limited (Cont’d)
d. Based on the above and also as per reliance placed by on the financial statements audited by the other
auditors of the Company, its subsidiaries and associate for the respective years, we are of the opinion that
the Consolidated Financial Information:
i. Has been made after incorporating adjustments for the changes, if any, in accounting policies
retrospectively in respective financial years to reflect the same accounting treatment as per
changed accounting policy, if any, for all the reporting periods;
ii. Has been made after incorporating adjustments for the material amounts in the respective financial
years to which they relate;
iii. And does not contain extra-ordinary items other than disclosed separately and does not contain
qualification requiring adjustments.
e. We have also examined the following “consolidated other financial information” set out in Annexures
prepared by the Company’s management and approved by the Board of Directors, relating to the Company,
for the six month periods ended 30 June 2016, 2015 and years ended 31 December 2015, 2014, 2013 and
2012. In respect of the years ended 31 December 2013 and 2012, these information have been included
212
based upon the audit reports submitted by O.P. Bagla & Co. to you and relied upon by Walker Chandiok &
Associates.
i Restated Consolidated Summary Statement of Related Party Transactions and Balances, Annexure
36
ii Restated Consolidated Summary of Capitalisation Statement, Annexure 37
iii Restated Consolidated Summary Statement of Accounting Ratios, Annexure 38
In our opinion the Consolidated Financial Information and consolidated other financial information contained in
Annexures 1 to 38 of this report read along with the Restated Consolidated Summary Statement of Significant
Accounting Policies and Restated Consolidated Summary Statement of Notes to the Restated Consolidated Summary
Statements and Restated Consolidated Summary Statement of Reconciliation of Restated Profit/ (Loss) to Profit/
(Loss) as per Audited Consolidated Financial Statements of the Company in Annexures 4, 5 and 6 respectively,
prepared after making adjustments and regrouping as considered appropriate have been prepared in accordance with
Section 26(1)(b) of the Act and SEBI Regulations.
5. This report should not be in any way construed as a re-issuance or re-dating of any of the previous audit reports
issued by other auditors or by us nor should it be construed as a new opinion on any of the consolidated financial
statements referred to therein.
6. We have no responsibility to update our report for events and circumstances occurring after the date of the report.
7. Our report is intended solely for use of the management in connection with the proposed issue of equity shares of the
Company. Our report should not be used for any other purpose except with our consent in writing.
For Walker Chandiok & Associates For O.P. Bagla & Co.
Chartered Accountants Chartered Accountants
Firm Registration No: 001329N Firm Registration No: 000018N
Nitin Toshniwal Neeraj Kumar Agarwal Partner Partner
Membership No. 507568 Membership No 094155
Place: Gurugram
Date: 22 September 2016
L-41 Connaught Place, 8/12, Kalkaji Extension,
New Delhi 110 001 New Delhi 110 019
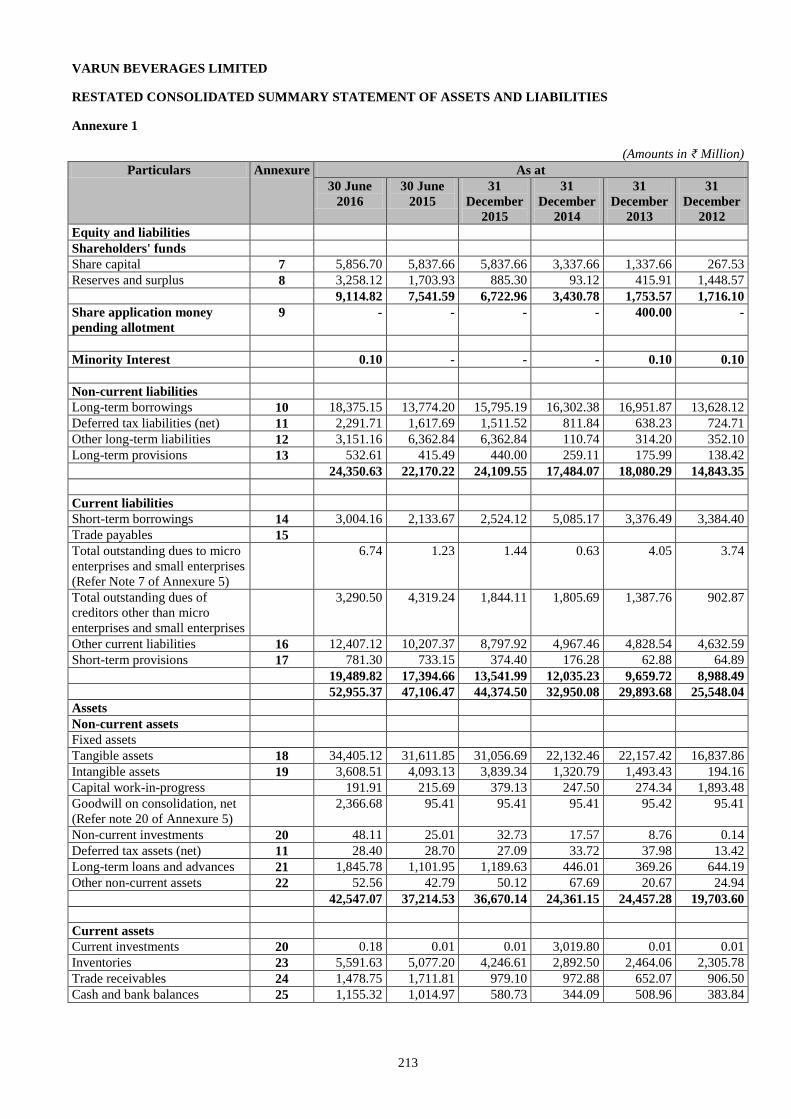
213
VARUN BEVERAGES LIMITED
RESTATED CONSOLIDATED SUMMARY STATEMENT OF ASSETS AND LIABILITIES
Annexure 1
(Amounts in ₹ Million)
Particulars Annexure As at
30 June
2016
30 June
2015
31
December
2015
31
December
2014
31
December
2013
31
December
2012
Equity and liabilities
Shareholders' funds
Share capital 7 5,856.70 5,837.66 5,837.66 3,337.66 1,337.66 267.53
Reserves and surplus 8 3,258.12 1,703.93 885.30 93.12 415.91 1,448.57
9,114.82 7,541.59 6,722.96 3,430.78 1,753.57 1,716.10
Share application money
pending allotment
9 - - - - 400.00 -
Minority Interest 0.10 - - - 0.10 0.10
Non-current liabilities
Long-term borrowings 10 18,375.15 13,774.20 15,795.19 16,302.38 16,951.87 13,628.12
Deferred tax liabilities (net) 11 2,291.71 1,617.69 1,511.52 811.84 638.23 724.71
Other long-term liabilities 12 3,151.16 6,362.84 6,362.84 110.74 314.20 352.10
Long-term provisions 13 532.61 415.49 440.00 259.11 175.99 138.42
24,350.63 22,170.22 24,109.55 17,484.07 18,080.29 14,843.35
Current liabilities
Short-term borrowings 14 3,004.16 2,133.67 2,524.12 5,085.17 3,376.49 3,384.40
Trade payables 15
Total outstanding dues to micro
enterprises and small enterprises
(Refer Note 7 of Annexure 5)
6.74 1.23 1.44 0.63 4.05 3.74
Total outstanding dues of
creditors other than micro
enterprises and small enterprises
3,290.50 4,319.24 1,844.11 1,805.69 1,387.76 902.87
Other current liabilities 16 12,407.12 10,207.37 8,797.92 4,967.46 4,828.54 4,632.59
Short-term provisions 17 781.30 733.15 374.40 176.28 62.88 64.89
19,489.82 17,394.66 13,541.99 12,035.23 9,659.72 8,988.49
52,955.37 47,106.47 44,374.50 32,950.08 29,893.68 25,548.04
Assets
Non-current assets
Fixed assets
Tangible assets 18 34,405.12 31,611.85 31,056.69 22,132.46 22,157.42 16,837.86
Intangible assets 19 3,608.51 4,093.13 3,839.34 1,320.79 1,493.43 194.16
Capital work-in-progress 191.91 215.69 379.13 247.50 274.34 1,893.48
Goodwill on consolidation, net
(Refer note 20 of Annexure 5) 2,366.68 95.41 95.41 95.41 95.42 95.41
Non-current investments 20 48.11 25.01 32.73 17.57 8.76 0.14
Deferred tax assets (net) 11 28.40 28.70 27.09 33.72 37.98 13.42
Long-term loans and advances 21 1,845.78 1,101.95 1,189.63 446.01 369.26 644.19
Other non-current assets 22 52.56 42.79 50.12 67.69 20.67 24.94
42,547.07 37,214.53 36,670.14 24,361.15 24,457.28 19,703.60
Current assets
Current investments 20 0.18 0.01 0.01 3,019.80 0.01 0.01
Inventories 23 5,591.63 5,077.20 4,246.61 2,892.50 2,464.06 2,305.78
Trade receivables 24 1,478.75 1,711.81 979.10 972.88 652.07 906.50
Cash and bank balances 25 1,155.32 1,014.97 580.73 344.09 508.96 383.84
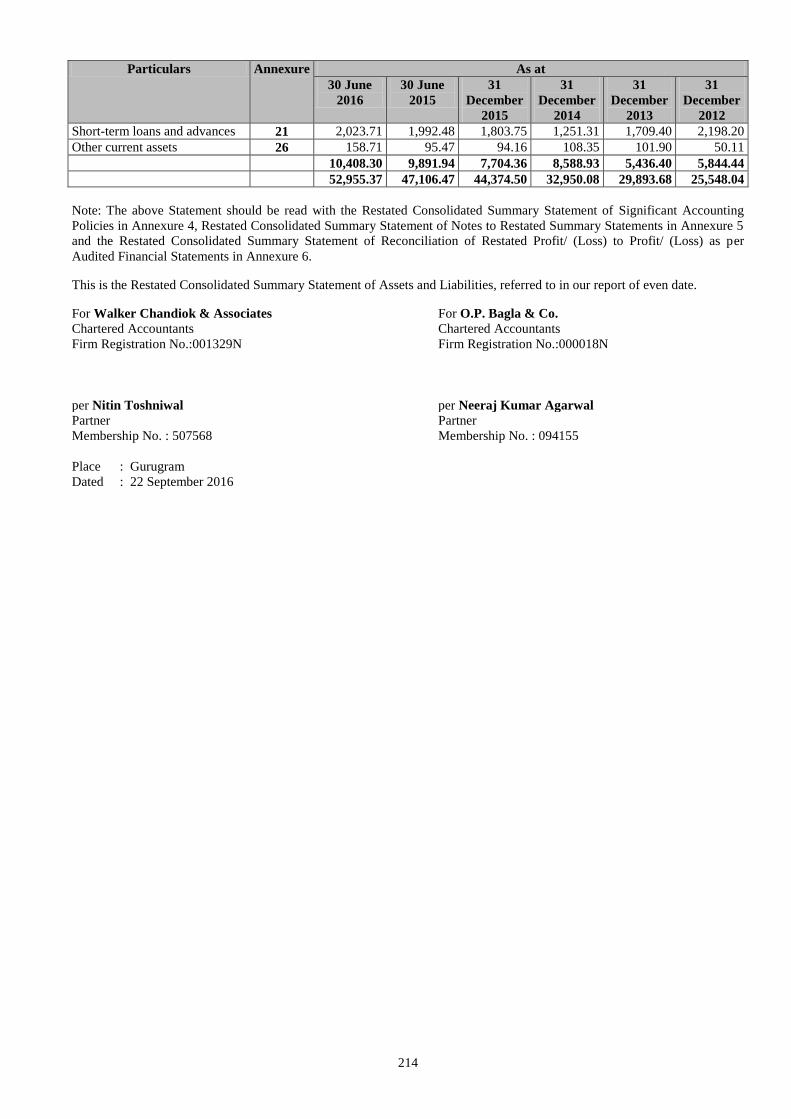
214
Particulars Annexure As at
30 June
2016
30 June
2015
31
December
2015
31
December
2014
31
December
2013
31
December
2012
Short-term loans and advances 21 2,023.71 1,992.48 1,803.75 1,251.31 1,709.40 2,198.20
Other current assets 26 158.71 95.47 94.16 108.35 101.90 50.11
10,408.30 9,891.94 7,704.36 8,588.93 5,436.40 5,844.44
52,955.37 47,106.47 44,374.50 32,950.08 29,893.68 25,548.04
Note: The above Statement should be read with the Restated Consolidated Summary Statement of Significant Accounting
Policies in Annexure 4, Restated Consolidated Summary Statement of Notes to Restated Summary Statements in Annexure 5
and the Restated Consolidated Summary Statement of Reconciliation of Restated Profit/ (Loss) to Profit/ (Loss) as per
Audited Financial Statements in Annexure 6.
This is the Restated Consolidated Summary Statement of Assets and Liabilities, referred to in our report of even date.
For Walker Chandiok & Associates For O.P. Bagla & Co.
Chartered Accountants Chartered Accountants
Firm Registration No.:001329N Firm Registration No.:000018N
per Nitin Toshniwal per Neeraj Kumar Agarwal
Partner Partner
Membership No. : 507568 Membership No. : 094155
Place : Gurugram
Dated : 22 September 2016
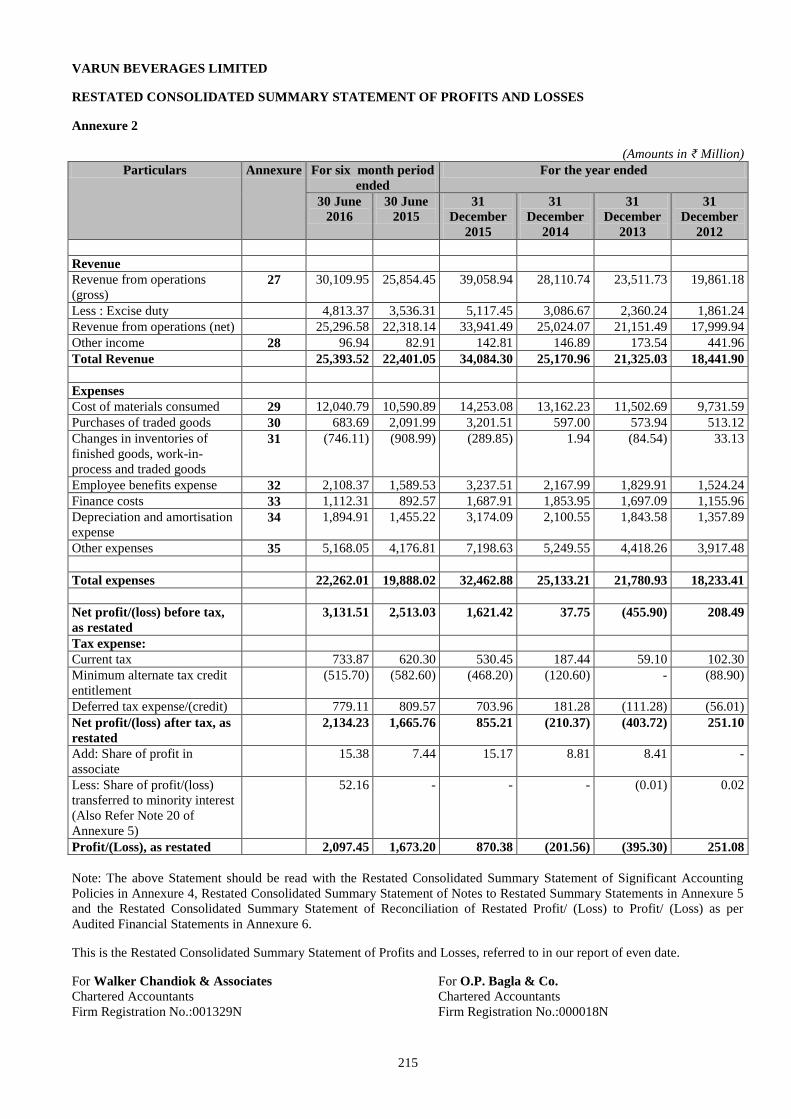
215
VARUN BEVERAGES LIMITED
RESTATED CONSOLIDATED SUMMARY STATEMENT OF PROFITS AND LOSSES
Annexure 2
(Amounts in ₹ Million)
Particulars Annexure For six month period
ended
For the year ended
30 June
2016
30 June
2015
31
December
2015
31
December
2014
31
December
2013
31
December
2012
Revenue
Revenue from operations
(gross) 27 30,109.95 25,854.45 39,058.94 28,110.74 23,511.73 19,861.18
Less : Excise duty 4,813.37 3,536.31 5,117.45 3,086.67 2,360.24 1,861.24
Revenue from operations (net) 25,296.58 22,318.14 33,941.49 25,024.07 21,151.49 17,999.94
Other income 28 96.94 82.91 142.81 146.89 173.54 441.96
Total Revenue 25,393.52 22,401.05 34,084.30 25,170.96 21,325.03 18,441.90
Expenses
Cost of materials consumed 29 12,040.79 10,590.89 14,253.08 13,162.23 11,502.69 9,731.59
Purchases of traded goods 30 683.69 2,091.99 3,201.51 597.00 573.94 513.12
Changes in inventories of
finished goods, work-in-
process and traded goods
31 (746.11) (908.99) (289.85) 1.94 (84.54) 33.13
Employee benefits expense 32 2,108.37 1,589.53 3,237.51 2,167.99 1,829.91 1,524.24
Finance costs 33 1,112.31 892.57 1,687.91 1,853.95 1,697.09 1,155.96
Depreciation and amortisation
expense 34 1,894.91 1,455.22 3,174.09 2,100.55 1,843.58 1,357.89
Other expenses 35 5,168.05 4,176.81 7,198.63 5,249.55 4,418.26 3,917.48
Total expenses 22,262.01 19,888.02 32,462.88 25,133.21 21,780.93 18,233.41
Net profit/(loss) before tax,
as restated
3,131.51 2,513.03 1,621.42 37.75 (455.90) 208.49
Tax expense:
Current tax 733.87 620.30 530.45 187.44 59.10 102.30
Minimum alternate tax credit
entitlement
(515.70) (582.60) (468.20) (120.60) - (88.90)
Deferred tax expense/(credit) 779.11 809.57 703.96 181.28 (111.28) (56.01)
Net profit/(loss) after tax, as
restated
2,134.23 1,665.76 855.21 (210.37) (403.72) 251.10
Add: Share of profit in
associate
15.38 7.44 15.17 8.81 8.41 -
Less: Share of profit/(loss)
transferred to minority interest
(Also Refer Note 20 of
Annexure 5)
52.16 - - - (0.01) 0.02
Profit/(Loss), as restated 2,097.45 1,673.20 870.38 (201.56) (395.30) 251.08
Note: The above Statement should be read with the Restated Consolidated Summary Statement of Significant Accounting
Policies in Annexure 4, Restated Consolidated Summary Statement of Notes to Restated Summary Statements in Annexure 5
and the Restated Consolidated Summary Statement of Reconciliation of Restated Profit/ (Loss) to Profit/ (Loss) as per
Audited Financial Statements in Annexure 6.
This is the Restated Consolidated Summary Statement of Profits and Losses, referred to in our report of even date.
For Walker Chandiok & Associates For O.P. Bagla & Co.
Chartered Accountants Chartered Accountants
Firm Registration No.:001329N Firm Registration No.:000018N
216
per Nitin Toshniwal per Neeraj Kumar Agarwal
Partner Partner
Membership No. : 507568 Membership No. : 094155
Place : Gurugram
Dated : 22 September 2016
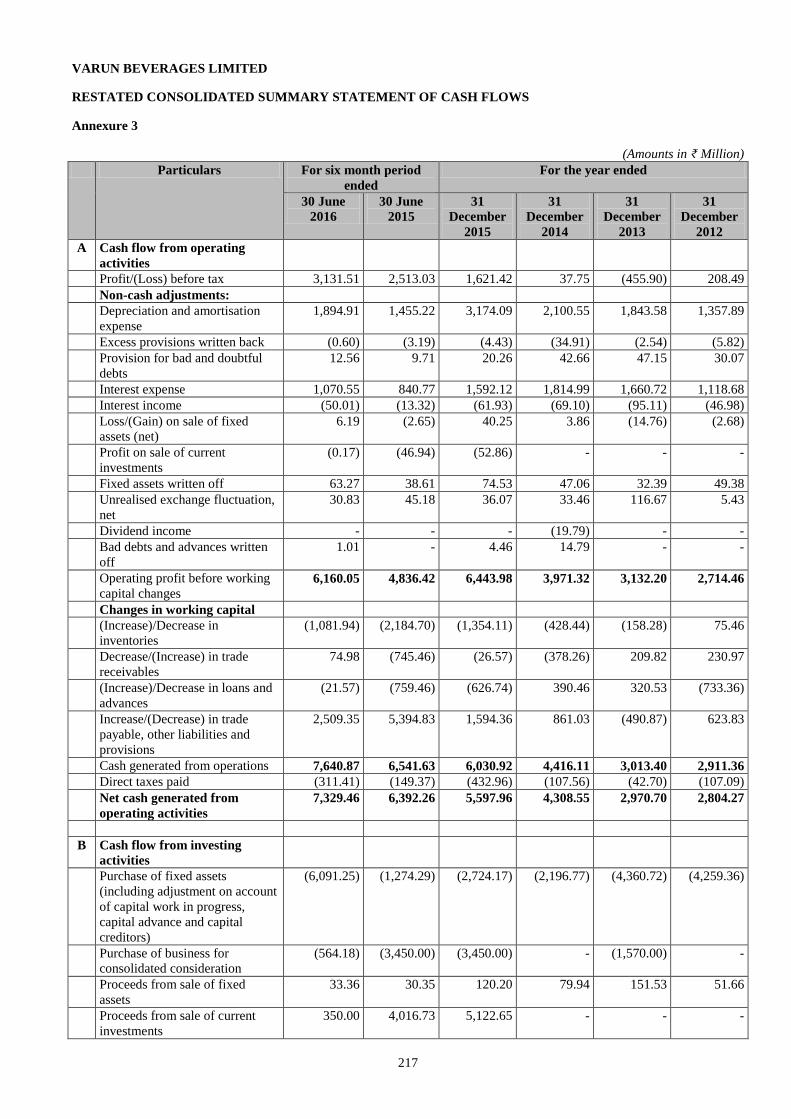
217
VARUN BEVERAGES LIMITED
RESTATED CONSOLIDATED SUMMARY STATEMENT OF CASH FLOWS
Annexure 3
(Amounts in ₹ Million)
Particulars For six month period
ended
For the year ended
30 June
2016
30 June
2015
31
December
2015
31
December
2014
31
December
2013
31
December
2012
A Cash flow from operating
activities
Profit/(Loss) before tax 3,131.51 2,513.03 1,621.42 37.75 (455.90) 208.49
Non-cash adjustments:
Depreciation and amortisation
expense
1,894.91 1,455.22 3,174.09 2,100.55 1,843.58 1,357.89
Excess provisions written back (0.60) (3.19) (4.43) (34.91) (2.54) (5.82)
Provision for bad and doubtful
debts
12.56 9.71 20.26 42.66 47.15 30.07
Interest expense 1,070.55 840.77 1,592.12 1,814.99 1,660.72 1,118.68
Interest income (50.01) (13.32) (61.93) (69.10) (95.11) (46.98)
Loss/(Gain) on sale of fixed
assets (net)
6.19 (2.65) 40.25 3.86 (14.76) (2.68)
Profit on sale of current
investments
(0.17) (46.94) (52.86) - - -
Fixed assets written off 63.27 38.61 74.53 47.06 32.39 49.38
Unrealised exchange fluctuation,
net
30.83 45.18 36.07 33.46 116.67 5.43
Dividend income - - - (19.79) - -
Bad debts and advances written
off
1.01 - 4.46 14.79 - -
Operating profit before working
capital changes 6,160.05 4,836.42 6,443.98 3,971.32 3,132.20 2,714.46
Changes in working capital
(Increase)/Decrease in
inventories
(1,081.94) (2,184.70) (1,354.11) (428.44) (158.28) 75.46
Decrease/(Increase) in trade
receivables
74.98 (745.46) (26.57) (378.26) 209.82 230.97
(Increase)/Decrease in loans and
advances
(21.57) (759.46) (626.74) 390.46 320.53 (733.36)
Increase/(Decrease) in trade
payable, other liabilities and
provisions
2,509.35 5,394.83 1,594.36 861.03 (490.87) 623.83
Cash generated from operations 7,640.87 6,541.63 6,030.92 4,416.11 3,013.40 2,911.36
Direct taxes paid (311.41) (149.37) (432.96) (107.56) (42.70) (107.09)
Net cash generated from
operating activities
7,329.46 6,392.26 5,597.96 4,308.55 2,970.70 2,804.27
B Cash flow from investing
activities
Purchase of fixed assets
(including adjustment on account
of capital work in progress,
capital advance and capital
creditors)
(6,091.25) (1,274.29) (2,724.17) (2,196.77) (4,360.72) (4,259.36)
Purchase of business for
consolidated consideration
(564.18) (3,450.00) (3,450.00) - (1,570.00) -
Proceeds from sale of fixed
assets
33.36 30.35 120.20 79.94 151.53 51.66
Proceeds from sale of current
investments
350.00 4,016.73 5,122.65 - - -
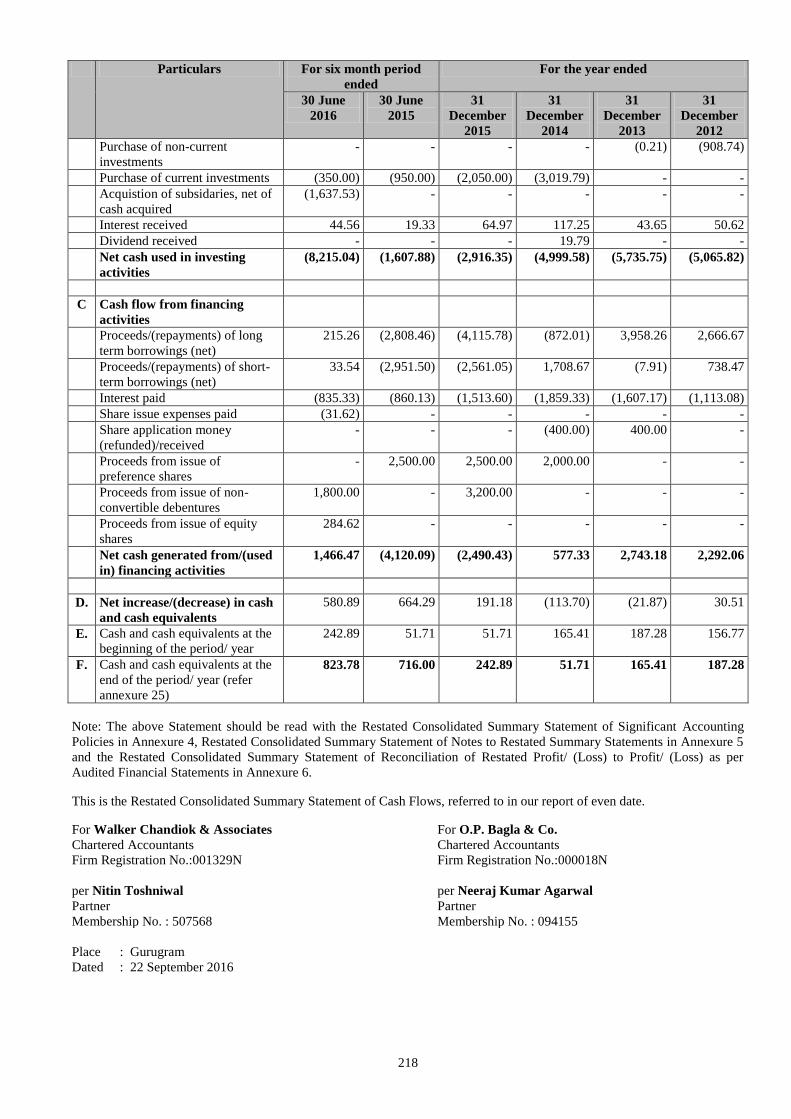
218
Particulars For six month period
ended
For the year ended
30 June
2016
30 June
2015
31
December
2015
31
December
2014
31
December
2013
31
December
2012
Purchase of non-current
investments
- - - - (0.21) (908.74)
Purchase of current investments (350.00) (950.00) (2,050.00) (3,019.79) - -
Acquistion of subsidaries, net of
cash acquired
(1,637.53) - - - - -
Interest received 44.56 19.33 64.97 117.25 43.65 50.62
Dividend received - - - 19.79 - -
Net cash used in investing
activities
(8,215.04) (1,607.88) (2,916.35) (4,999.58) (5,735.75) (5,065.82)
C Cash flow from financing
activities
Proceeds/(repayments) of long
term borrowings (net)
215.26 (2,808.46) (4,115.78) (872.01) 3,958.26 2,666.67
Proceeds/(repayments) of short-
term borrowings (net)
33.54 (2,951.50) (2,561.05) 1,708.67 (7.91) 738.47
Interest paid (835.33) (860.13) (1,513.60) (1,859.33) (1,607.17) (1,113.08)
Share issue expenses paid (31.62) - - - - -
Share application money
(refunded)/received
- - - (400.00) 400.00 -
Proceeds from issue of
preference shares
- 2,500.00 2,500.00 2,000.00 - -
Proceeds from issue of non-
convertible debentures
1,800.00 - 3,200.00 - - -
Proceeds from issue of equity
shares
284.62 - - - - -
Net cash generated from/(used
in) financing activities
1,466.47 (4,120.09) (2,490.43) 577.33 2,743.18 2,292.06
D. Net increase/(decrease) in cash
and cash equivalents
580.89 664.29 191.18 (113.70) (21.87) 30.51
E. Cash and cash equivalents at the
beginning of the period/ year
242.89 51.71 51.71 165.41 187.28 156.77
F. Cash and cash equivalents at the
end of the period/ year (refer
annexure 25)
823.78 716.00 242.89 51.71 165.41 187.28
Note: The above Statement should be read with the Restated Consolidated Summary Statement of Significant Accounting
Policies in Annexure 4, Restated Consolidated Summary Statement of Notes to Restated Summary Statements in Annexure 5
and the Restated Consolidated Summary Statement of Reconciliation of Restated Profit/ (Loss) to Profit/ (Loss) as per
Audited Financial Statements in Annexure 6.
This is the Restated Consolidated Summary Statement of Cash Flows, referred to in our report of even date.
For Walker Chandiok & Associates For O.P. Bagla & Co.
Chartered Accountants Chartered Accountants
Firm Registration No.:001329N
Firm Registration No.:000018N
per Nitin Toshniwal per Neeraj Kumar Agarwal
Partner Partner
Membership No. : 507568 Membership No. : 094155
Place : Gurugram
Dated : 22 September 2016
219
VARUN BEVERAGES LIMITED
RESTATED CONSOLIDATED SUMMARY STATEMENT OF SIGNIFICANT ACCOUNTING POLICIES
Annexure 4
1 Corporate information
Varun Beverages Limited was incorporated on 16 June 1995 and is engaged in manufacturing, selling, bottling and
distribution of beverages of Pepsi brand in geographically pre-defined territories as per franchisee agreement with
PepsiCo India Holdings Private Limited.
2.1 Basis of preparation of financial statements
The Restated Consolidated Summary Statement of the Assets and Liabilities, of the Company, its subsidiaries and
associated(the “Group”) as at 30 June 2016, 30 June 2015, 31 December 2015, 2014, 2013, 2012 and 2011, the
Restated Standalone Summary Statement of Profits and Losses and the Restated Standalone Summary Statement of
Cash Flows, for the reporting period/ years ended 30 June 2016, 30 June 2015, 31 December 2015, 2014, 2013,
2012 and 2011 (collectively referred to as ‘Restated Standalone Summary Statements’) have been compiled by the
management of the Group from the audited standalone financial statements of the Company for the period/years
ended 30 June 2016, 30 June 2015, 31 December 2015, 2014, 2013, 2012 and 2011 and have been prepared
specifically for the purpose of inclusion in the offer document to be filed by the Company with the Securities and
Exchange Board of India (‘SEBI’) in connection with the proposed Initial Public Offering (hereinafter referred to as
‘IPO’).
The audited consolidated financial statements were prepared in accordance with the accounting principles generally
accepted in India, including the Accounting Standards as specified under Section 133 of the Act, read with Rule 7
of the Companies (Accounts) Rules, 2014 (as amended). The audited consolidated financial statements were
prepared on a going concern basis under the historical cost convention on accrual basis. The accounting policies
were consistently applied by the Group unless otherwise stated.
Effective 01 April 2014, Schedule III notified under the Companies Act, 2013 was applicable to the Group for
preparation and presentation of its financial statements. The adoption of Schedule III of the Companies Act, 2013
did not impact recognition and measurement principles followed for preparation of financial statements. However,
it had significant impact on presentation and disclosures made in the audited consolidated financial statements for
the year ended 31 December 2011.
The Restated Consolidated Summary Statement of the Assets and Liabilities, profits and losses and cash flows have
been prepared to comply in all material respects with the requirement of Section 26(1)(b) of the Companies Act,
2013, read with rules 4 to 6 of the Companies (Prospectus and Allotment of Securities) Rules, 2014, and the
Securities and Exchange Board of India (Issue of Capital and Disclosure Requirements) Regulations, 2009 (as
amended from time to time).
2.2 Principles of consolidation
The Restated Consolidated Summary Statements include the financial statements of the Company, its subsidiaries
and associates.
The Restated Consolidated Summary Statements have been prepared in accordance with Accounting Standard (AS
21) ‘Consolidated Financial Statements’ and AS 23 ‘Accounting for Investments in Associates in Consolidated
Financial Statements’. The Restated Consolidated Summary Statements are prepared on the following basis:
i) Restated Consolidated Summary Statements include Restated Consolidated Summary Statement of Assets
and Liabilities, Restated Consolidated Summary Statement of Profits and Losses, Restated Consolidated
Summary Statement of Cash Flows and Restated Consolidated Summary Statement of Notes. The Restated
Consolidated Summary Statements are presented, to the extent possible, in the same format as that adopted
by the Parent Company for Restated Standalone Summary Statements.
ii) The Restated Consolidated Summary Statements include the restated financial statements of the Company
and all its subsidiaries, which are more than 50 per cent owned or whose composition of Board of Directors
is controlled by the Company. Investments in entities that were not more than 50 per cent owned or
controlled during the year have been accounted for in accordance with the provisions of Accounting
Standard 13 ‘Accounting for Investments’, or Accounting Standard 23 ‘Accounting for Investments in
Associates in Consolidated Financial Statements’, (as applicable).
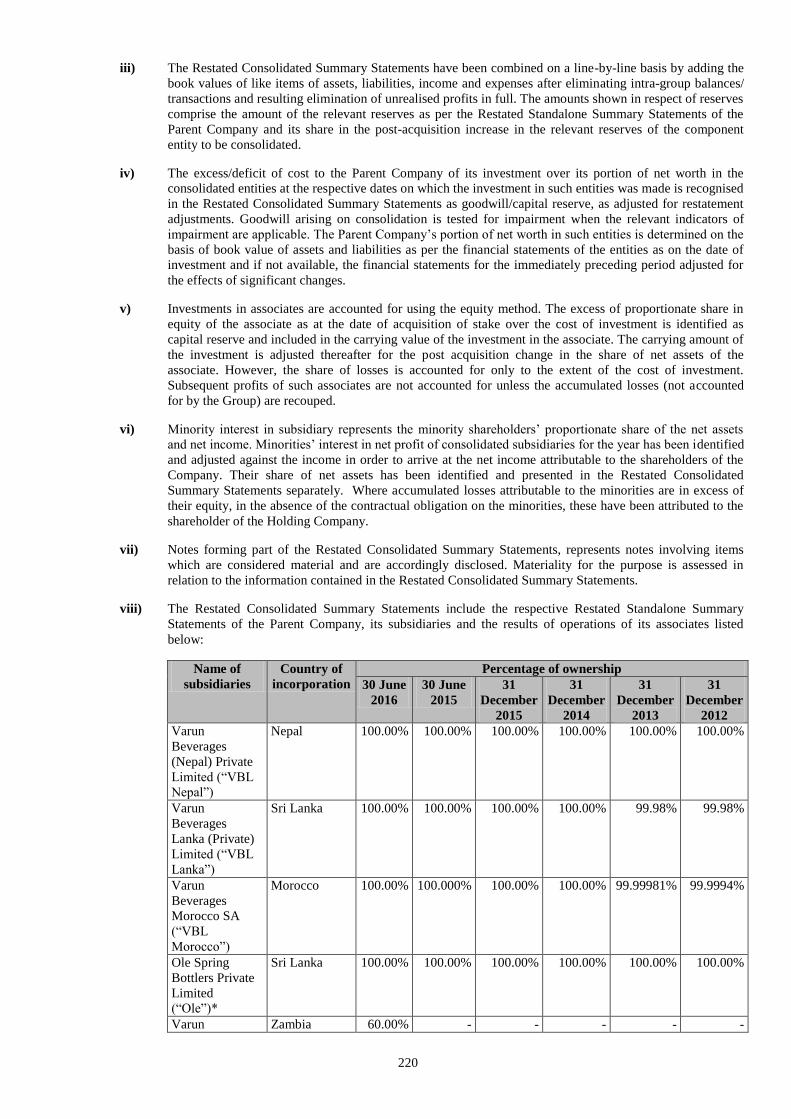
220
iii) The Restated Consolidated Summary Statements have been combined on a line-by-line basis by adding the
book values of like items of assets, liabilities, income and expenses after eliminating intra-group balances/
transactions and resulting elimination of unrealised profits in full. The amounts shown in respect of reserves
comprise the amount of the relevant reserves as per the Restated Standalone Summary Statements of the
Parent Company and its share in the post-acquisition increase in the relevant reserves of the component
entity to be consolidated.
iv) The excess/deficit of cost to the Parent Company of its investment over its portion of net worth in the
consolidated entities at the respective dates on which the investment in such entities was made is recognised
in the Restated Consolidated Summary Statements as goodwill/capital reserve, as adjusted for restatement
adjustments. Goodwill arising on consolidation is tested for impairment when the relevant indicators of
impairment are applicable. The Parent Company’s portion of net worth in such entities is determined on the
basis of book value of assets and liabilities as per the financial statements of the entities as on the date of
investment and if not available, the financial statements for the immediately preceding period adjusted for
the effects of significant changes.
v) Investments in associates are accounted for using the equity method. The excess of proportionate share in
equity of the associate as at the date of acquisition of stake over the cost of investment is identified as
capital reserve and included in the carrying value of the investment in the associate. The carrying amount of
the investment is adjusted thereafter for the post acquisition change in the share of net assets of the
associate. However, the share of losses is accounted for only to the extent of the cost of investment.
Subsequent profits of such associates are not accounted for unless the accumulated losses (not accounted
for by the Group) are recouped.
vi) Minority interest in subsidiary represents the minority shareholders’ proportionate share of the net assets
and net income. Minorities’ interest in net profit of consolidated subsidiaries for the year has been identified
and adjusted against the income in order to arrive at the net income attributable to the shareholders of the
Company. Their share of net assets has been identified and presented in the Restated Consolidated
Summary Statements separately. Where accumulated losses attributable to the minorities are in excess of
their equity, in the absence of the contractual obligation on the minorities, these have been attributed to the
shareholder of the Holding Company.
vii) Notes forming part of the Restated Consolidated Summary Statements, represents notes involving items
which are considered material and are accordingly disclosed. Materiality for the purpose is assessed in
relation to the information contained in the Restated Consolidated Summary Statements.
viii) The Restated Consolidated Summary Statements include the respective Restated Standalone Summary
Statements of the Parent Company, its subsidiaries and the results of operations of its associates listed
below:
Name of
subsidiaries
Country of
incorporation
Percentage of ownership
30 June
2016
30 June
2015
31
December
2015
31
December
2014
31
December
2013
31
December
2012
Varun
Beverages
(Nepal) Private
Limited (“VBL
Nepal”)
Nepal 100.00% 100.00% 100.00% 100.00% 100.00% 100.00%
Varun
Beverages
Lanka (Private)
Limited (“VBL
Lanka”)
Sri Lanka 100.00% 100.00% 100.00% 100.00% 99.98% 99.98%
Varun
Beverages
Morocco SA
(“VBL
Morocco”)
Morocco 100.00% 100.000% 100.00% 100.00% 99.99981% 99.9994%
Ole Spring
Bottlers Private
Limited
(“Ole”)*
Sri Lanka 100.00% 100.00% 100.00% 100.00% 100.00% 100.00%
Varun Zambia 60.00% - - - - -
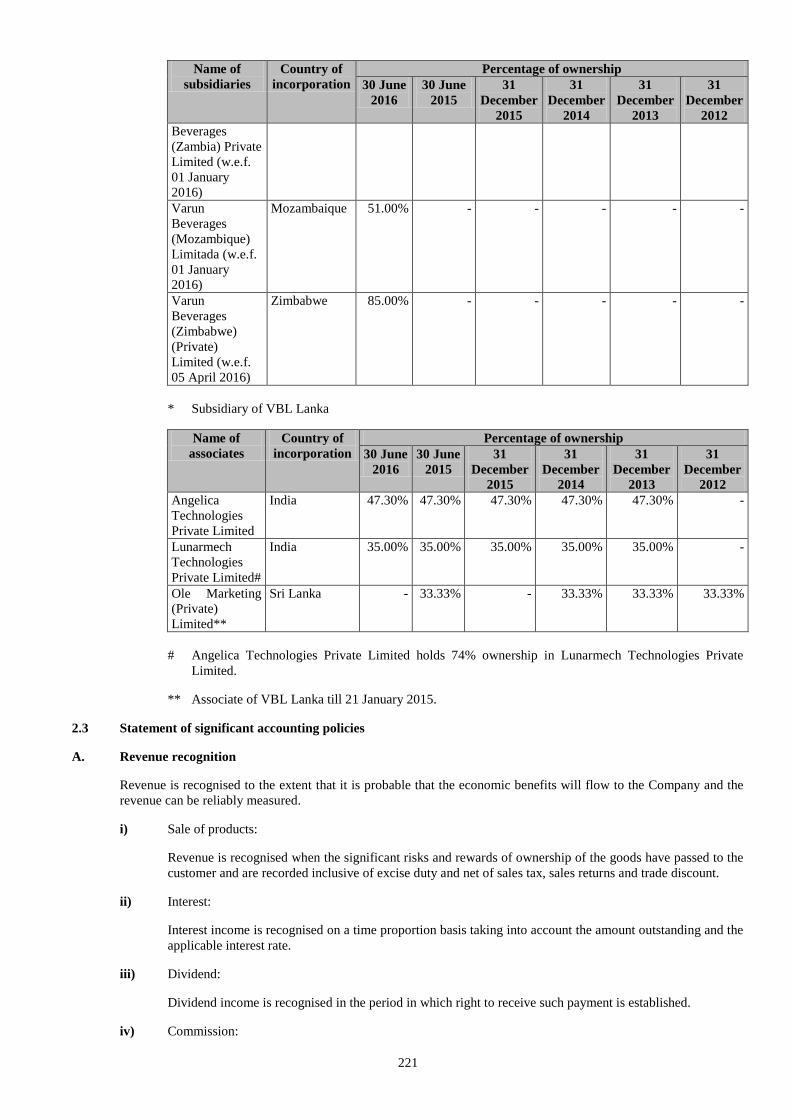
221
Name of
subsidiaries
Country of
incorporation
Percentage of ownership
30 June
2016
30 June
2015
31
December
2015
31
December
2014
31
December
2013
31
December
2012
Beverages
(Zambia) Private
Limited (w.e.f.
01 January
2016)
Varun
Beverages
(Mozambique)
Limitada (w.e.f.
01 January
2016)
Mozambaique 51.00% - - - - -
Varun
Beverages
(Zimbabwe)
(Private)
Limited (w.e.f.
05 April 2016)
Zimbabwe 85.00% - - - - -
* Subsidiary of VBL Lanka
Name of
associates
Country of
incorporation
Percentage of ownership
30 June
2016
30 June
2015
31
December
2015
31
December
2014
31
December
2013
31
December
2012
Angelica
Technologies
Private Limited
India 47.30% 47.30% 47.30% 47.30% 47.30% -
Lunarmech
Technologies
Private Limited#
India 35.00% 35.00% 35.00% 35.00% 35.00% -
Ole Marketing
(Private)
Limited**
Sri Lanka - 33.33% - 33.33% 33.33% 33.33%
# Angelica Technologies Private Limited holds 74% ownership in Lunarmech Technologies Private
Limited.
** Associate of VBL Lanka till 21 January 2015.
2.3 Statement of significant accounting policies
A. Revenue recognition
Revenue is recognised to the extent that it is probable that the economic benefits will flow to the Company and the
revenue can be reliably measured.
i) Sale of products:
Revenue is recognised when the significant risks and rewards of ownership of the goods have passed to the
customer and are recorded inclusive of excise duty and net of sales tax, sales returns and trade discount.
ii) Interest:
Interest income is recognised on a time proportion basis taking into account the amount outstanding and the
applicable interest rate.
iii) Dividend:
Dividend income is recognised in the period in which right to receive such payment is established.
iv) Commission:
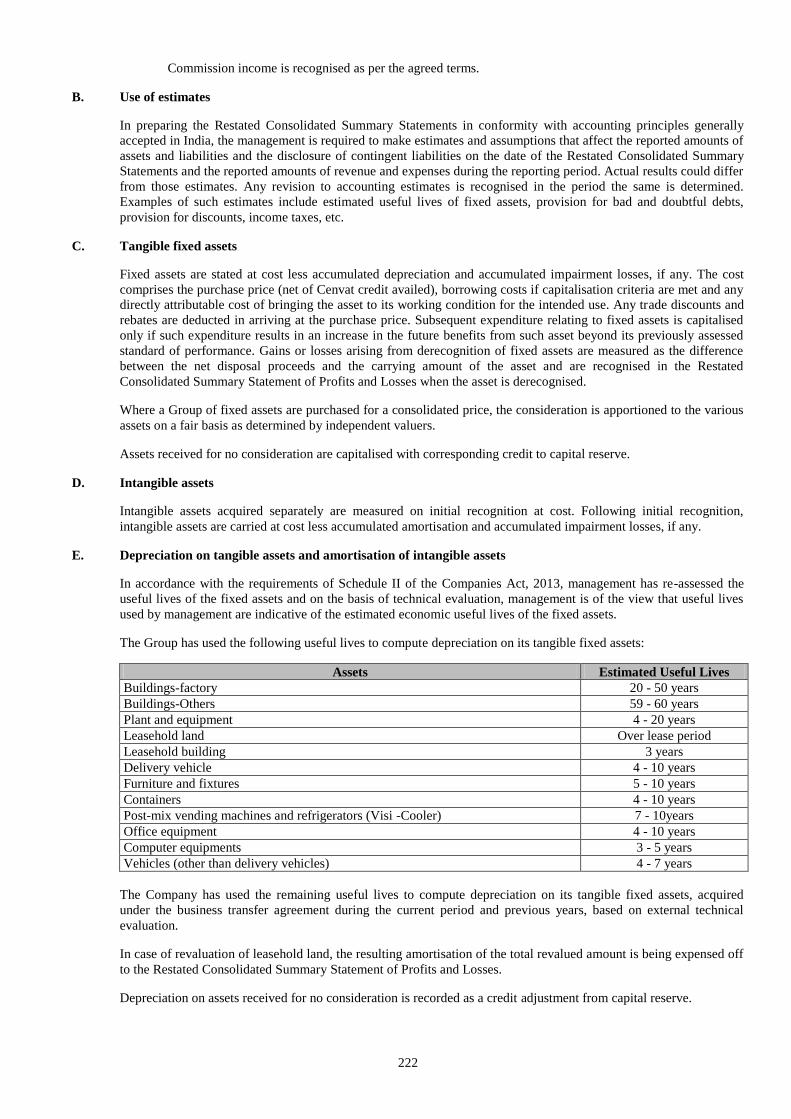
222
Commission income is recognised as per the agreed terms.
B. Use of estimates
In preparing the Restated Consolidated Summary Statements in conformity with accounting principles generally
accepted in India, the management is required to make estimates and assumptions that affect the reported amounts of
assets and liabilities and the disclosure of contingent liabilities on the date of the Restated Consolidated Summary
Statements and the reported amounts of revenue and expenses during the reporting period. Actual results could differ
from those estimates. Any revision to accounting estimates is recognised in the period the same is determined.
Examples of such estimates include estimated useful lives of fixed assets, provision for bad and doubtful debts,
provision for discounts, income taxes, etc.
C. Tangible fixed assets
Fixed assets are stated at cost less accumulated depreciation and accumulated impairment losses, if any. The cost
comprises the purchase price (net of Cenvat credit availed), borrowing costs if capitalisation criteria are met and any
directly attributable cost of bringing the asset to its working condition for the intended use. Any trade discounts and
rebates are deducted in arriving at the purchase price. Subsequent expenditure relating to fixed assets is capitalised
only if such expenditure results in an increase in the future benefits from such asset beyond its previously assessed
standard of performance. Gains or losses arising from derecognition of fixed assets are measured as the difference
between the net disposal proceeds and the carrying amount of the asset and are recognised in the Restated
Consolidated Summary Statement of Profits and Losses when the asset is derecognised.
Where a Group of fixed assets are purchased for a consolidated price, the consideration is apportioned to the various
assets on a fair basis as determined by independent valuers.
Assets received for no consideration are capitalised with corresponding credit to capital reserve.
D. Intangible assets
Intangible assets acquired separately are measured on initial recognition at cost. Following initial recognition,
intangible assets are carried at cost less accumulated amortisation and accumulated impairment losses, if any.
E. Depreciation on tangible assets and amortisation of intangible assets
In accordance with the requirements of Schedule II of the Companies Act, 2013, management has re-assessed the
useful lives of the fixed assets and on the basis of technical evaluation, management is of the view that useful lives
used by management are indicative of the estimated economic useful lives of the fixed assets.
The Group has used the following useful lives to compute depreciation on its tangible fixed assets:
Assets Estimated Useful Lives
Buildings-factory 20 - 50 years
Buildings-Others 59 - 60 years
Plant and equipment 4 - 20 years
Leasehold land Over lease period
Leasehold building 3 years
Delivery vehicle 4 - 10 years
Furniture and fixtures 5 - 10 years
Containers 4 - 10 years
Post-mix vending machines and refrigerators (Visi -Cooler) 7 - 10years
Office equipment 4 - 10 years
Computer equipments 3 - 5 years
Vehicles (other than delivery vehicles) 4 - 7 years
The Company has used the remaining useful lives to compute depreciation on its tangible fixed assets, acquired
under the business transfer agreement during the current period and previous years, based on external technical
evaluation.
In case of revaluation of leasehold land, the resulting amortisation of the total revalued amount is being expensed off
to the Restated Consolidated Summary Statement of Profits and Losses.
Depreciation on assets received for no consideration is recorded as a credit adjustment from capital reserve.
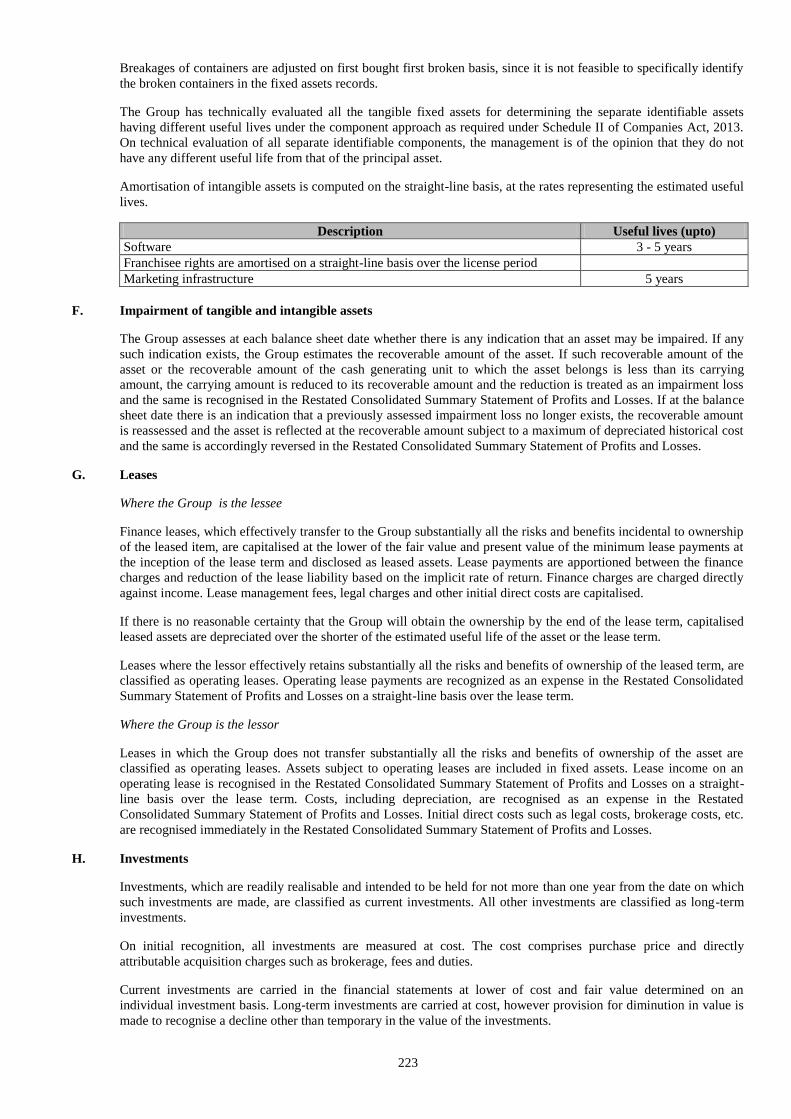
223
Breakages of containers are adjusted on first bought first broken basis, since it is not feasible to specifically identify
the broken containers in the fixed assets records.
The Group has technically evaluated all the tangible fixed assets for determining the separate identifiable assets
having different useful lives under the component approach as required under Schedule II of Companies Act, 2013.
On technical evaluation of all separate identifiable components, the management is of the opinion that they do not
have any different useful life from that of the principal asset.
Amortisation of intangible assets is computed on the straight-line basis, at the rates representing the estimated useful
lives.
Description Useful lives (upto)
Software 3 - 5 years
Franchisee rights are amortised on a straight-line basis over the license period
Marketing infrastructure 5 years
F. Impairment of tangible and intangible assets
The Group assesses at each balance sheet date whether there is any indication that an asset may be impaired. If any
such indication exists, the Group estimates the recoverable amount of the asset. If such recoverable amount of the
asset or the recoverable amount of the cash generating unit to which the asset belongs is less than its carrying
amount, the carrying amount is reduced to its recoverable amount and the reduction is treated as an impairment loss
and the same is recognised in the Restated Consolidated Summary Statement of Profits and Losses. If at the balance
sheet date there is an indication that a previously assessed impairment loss no longer exists, the recoverable amount
is reassessed and the asset is reflected at the recoverable amount subject to a maximum of depreciated historical cost
and the same is accordingly reversed in the Restated Consolidated Summary Statement of Profits and Losses.
G. Leases
Where the Group is the lessee
Finance leases, which effectively transfer to the Group substantially all the risks and benefits incidental to ownership
of the leased item, are capitalised at the lower of the fair value and present value of the minimum lease payments at
the inception of the lease term and disclosed as leased assets. Lease payments are apportioned between the finance
charges and reduction of the lease liability based on the implicit rate of return. Finance charges are charged directly
against income. Lease management fees, legal charges and other initial direct costs are capitalised.
If there is no reasonable certainty that the Group will obtain the ownership by the end of the lease term, capitalised
leased assets are depreciated over the shorter of the estimated useful life of the asset or the lease term.
Leases where the lessor effectively retains substantially all the risks and benefits of ownership of the leased term, are
classified as operating leases. Operating lease payments are recognized as an expense in the Restated Consolidated
Summary Statement of Profits and Losses on a straight-line basis over the lease term.
Where the Group is the lessor
Leases in which the Group does not transfer substantially all the risks and benefits of ownership of the asset are
classified as operating leases. Assets subject to operating leases are included in fixed assets. Lease income on an
operating lease is recognised in the Restated Consolidated Summary Statement of Profits and Losses on a straight-
line basis over the lease term. Costs, including depreciation, are recognised as an expense in the Restated
Consolidated Summary Statement of Profits and Losses. Initial direct costs such as legal costs, brokerage costs, etc.
are recognised immediately in the Restated Consolidated Summary Statement of Profits and Losses.
H. Investments
Investments, which are readily realisable and intended to be held for not more than one year from the date on which
such investments are made, are classified as current investments. All other investments are classified as long-term
investments.
On initial recognition, all investments are measured at cost. The cost comprises purchase price and directly
attributable acquisition charges such as brokerage, fees and duties.
Current investments are carried in the financial statements at lower of cost and fair value determined on an
individual investment basis. Long-term investments are carried at cost, however provision for diminution in value is
made to recognise a decline other than temporary in the value of the investments.
224
On disposal of an investment, the difference between its carrying amount and net disposal proceeds is charged or
credited to the Restated Consolidated Summary Statement of Profits and Losses.
I. Inventories
Inventories are valued as follows:
i) Raw materials, components and stores and spares : At lower of cost and net realisable value. Cost
represents purchase price and other direct costs and is determined on a moving weighted average cost basis.
However, materials and other items held for use in the production of inventories are not written down below
cost if the finished products in which they will be incorporated are expected to be sold at or above cost.
ii) Work-in-progress : At lower of cost and net realisable value. Cost for this purpose includes material,
labour and appropriate allocation of overheads including depreciation. Cost is determined on a moving
weighted average basis.
iii) Finished goods:
a) Manufactured - At lower of cost and net realisable value. Cost for this purpose includes material,
labour and appropriate allocation of overheads. Excise duty on inventory lying with Group is
added to the cost of the finished goods inventory (where applicable). Cost is determined on a
moving weighted average basis.
b) Traded - At lower of cost and net realisable value. Cost represents purchase price and other
direct costs and is determined on a moving weighted average cost basis.
Net realisable value is the estimated selling price in the ordinary course of business, less estimated costs of
completion and estimated costs necessary to make the sale. Provision for obsolescence is determined based on
management’s assessment and is charged to the Restated Consolidated Summary Statement of Profits and Losses.
J. Borrowing costs
Borrowing cost includes interest, amortisation of ancillary costs incurred in connection with the arrangement of
borrowings and exchange differences arising from foreign currency borrowings to the extent they are regarded as an
adjustment to the interest cost.
Borrowing costs directly attributable to the acquisition, construction or production of an asset that necessarily takes a
substantial period of time to get ready for its intended use or sale are capitalised as part of the cost of the respective
asset. All other borrowing costs are expensed in the period they occur.
K. Foreign currency transactions
Relating to overseas entities
Indian Rupee is the reporting currency for the Group. However, reporting currencies of certain non-integral overseas
subsidiaries are different from the reporting currency of the Group. The translation of local currencies into Indian
Rupee is performed for assets and liabilities (excluding share capital and opening reserves and surplus), using the
exchange rate as at the balance sheet date.
Revenues, costs and expenses are translated using weighted average exchange rate during the reporting period. The
resultant currency translation exchange gain/ loss is carried as foreign currency translation reserve under Restated
Consolidated Summary Statement of Reserves and Surplus. Investments in foreign entities are recorded at the
exchange rate prevailing on the date of making the investment.
Exchange differences arising on a monetary item that, in substance, forms part of the Company’s net investment in a
non-integral foreign operation is accumulated in the foreign operation is accumulated in the foreign currency
translation reserve until the disposal of the net investment. On the disposal of such net investment, the cumulative
amount of the exchange differences which have been deferred and which relate to that investment is recognised as
income or as expenses in the same period in which the gain or loss on disposal is recognised.
Relating to Indian entity
i) Initial recognition
Foreign currency transactions are recorded in the reporting currency, by applying to the foreign currency
amount the exchange rate between the reporting currency and the foreign currency at the date of the
225
transaction.
ii) Conversion
Foreign currency monetary items are reported using the closing rate. Non-monetary items which are carried
in terms of historical cost denominated in a foreign currency are reported using the exchange rate at the date
of the transaction.
iii) Exchange differences
Exchange differences arising on the settlement of monetary items or on reporting Group's monetary items at
rates different from those at which they were initially recorded during the period, or reported in previous
financial statements, are recognised as income or as expenses in the year in which they arise.
As per the amendment of the Companies (Accounting Standard) Rules, 2006-‘AS 11’ relating to ‘The
Effects of Changes in Foreign Exchange Rates’, exchange difference arising on conversion of long term
foreign currency monetary items used for acquisition of depreciable fixed assets are added to the cost of
fixed assets and is depreciated over the remaining life of the respective asset and in other cases, is recorded
under the head ‘Foreign Currency Monetary Item Translation Difference Account’ and is amortised over
period not extending beyond, earlier of 31 March 2020 or maturity date of underlying long term foreign
currency monetary items.
(iv) Derivative instruments and hedge accounting
Outstanding contracts as at the reporting date are restated at the exchange rate prevailing on that date. In
respect of contracts entered into to hedge foreign currency and interest rate risk, gain/losses on settlement
and losses on restatement (by marking them to market) at the Balance Sheet date are recognised in the
Restated Consolidated Summary Statement of Profits and Losses or in case of hedge contracts for long term
foreign currency monetary items relating to acquistion of depreciable capital asset in which case they are
adjusted to the carrying cost of such assets.
L. Retirement and other employee benefits
i) Contributions to the provident fund, a defined contribution scheme, are charged to the Restated
Consolidated Summary Statement of Profits and Losses for the year when the contributions are due.
ii) Gratuity liability is accrued on the basis of an actuarial valuation made at the end of reporting period. The
actuarial valuation is performed by an independent actuary as per projected unit credit method, except for
the subsidiary companies namely, Varun Beverages (Nepal) Private Limited, Varun Beverages (Zambia)
Private Limited where gratuity liability is provided on full cost basis.
iii) Accumulated leave, which is expected to be utilised within next twelve months, is treated as short term
employee benefit. The Group measures the expected cost of such absences as the additional amount that it
expects to pay as a result of the unused entitlement that has accumulated at the reporting date.
The Group treats accumulated leave expected to be carried forward beyond twelve months, as long-term
employee benefit for measurement purposes. Such long-term compensated absences are computed based on
the actuarial valuation performed by an independent actuary using the projected unit credit method at the
reporting period end except for the subsidiary companies namely, Varun Beverages (Nepal) Private
Limited, Varun Beverages (Zambia) Private Limited and Varun Beverages Mozambique Limitada where
accumulated leave liability is provided on full cost basis.
iv) Actuarial gains/losses are immediately taken to the Restated Consolidated Summary Statement of Profits
and Losses.
M. Employee stock options
Accounting value of stock options is determined on the basis of ‘Intrinsic Value’ representing the excess of the fair
market value of Company's equity share on the date of grant over the exercise price of the options granted under the
"Employees Stock Option Scheme" of the Company, and is being amortised as "Employee Compensation Expense"
on a straight-line basis over the vesting period in accordance with the Guidance Note 18 "Share Based Payments"
issued by the Institute of Chartered Accountants of India.
226
N. Earnings/(loss) per share
Basic earnings/ (loss) per share are calculated by dividing the net profit or loss for the period attributable to equity
shareholders by the weighted average number of equity shares outstanding during the period. The weighted average
number of equity shares outstanding during the period is adjusted for events of bonus issue; bonus element in a
rights issue to existing shareholders; share split; and reverse share split (consolidation of shares).
For the purpose of calculating diluted earnings/(loss) per share, the net profit or loss for the period attributable to
equity shareholders and the weighted average number of shares outstanding during the period are adjusted for the
effects of all dilutive potential equity shares.
O. Provisions, contingent liabilities and contingent assets
A provision is recognised when an enterprise has a present obligation as a result of past event and it is probable that
an outflow of resources will be required to settle the obligation, in respect of which a reliable estimate can be made.
Provisions are not discounted to present value and are determined based on best estimate required to settle the
obligation at the balance sheet date. These are reviewed at each balance sheet date and adjusted to reflect the current
best estimates.
A contingent liability is a possible obligation that arises from past events whose existence will be confirmed by the
occurrence or non-occurrence of one or more uncertain future events beyond the control of the Group or a present
obligation that is not recognised because it is not probable that an outflow of resources will be required to settle the
obligation. A contingent liability also arises in extremely rare cases where there is a liability that cannot be
recognised because it cannot be measured reliably.
Contingent assets are not recognised in the Restated Consolidated Summary Statements.
P. Cash and cash equivalents
Cash and cash equivalents for Restated Consolidated Summary Statement of Cash Flows comprises cash at bank and
in hand and short-term investments with an original maturity of three months or less.
Q. Government grants
Grants from the government are recognised when there is reasonable assurance that the grant will be received and all
underlying conditions will be complied with.
Where the grants are in the nature of promoter’s contribution and no repayment is expected, then they are treated as
capital reserve. Grants that are determined to be of revenue nature are deducted from the related expenses.
R. Income taxes
Relating to Indian entity
Tax expense comprises current and deferred tax. Current income tax is measured at the amount expected to be paid
to the tax authorities in accordance with the Income-tax Act, 1961 enacted in India. Deferred income taxes reflects
the impact of current year timing differences between taxable income and accounting income for the year and
reversal of timing differences of earlier years.
Minimum Alternate Tax (“MAT”) credit is recognised as an asset only when and to the extent there is convincing
evidence that the entity will pay normal income tax during the specified period. In the year in which the MAT credit
becomes eligible to be recognised as an asset in accordance with the recommendations contained in the Guidance
Note issued by the Institute of Chartered Accountants of India, the said asset is created by way of a credit to the
Restated Consolidated Summary Statement of Profits and Losses and is disclosed as MAT credit entitlement. The
entity reviews this balance at each balance sheet date and writes down the carrying amount to the extent there is no
longer convincing evidence that the entity will pay normal income tax during the specified period.
Relating to overseas entity
Tax provisions for overseas subsidiaries/ associates are determined in accordance with the tax laws of their
respective country of incorporation.
For a period of six years reckoned from the year of assessment as may be determined by the Board of Investment of
Sri Lanka (BOI) (“tax exception period”) the provisions of the Inland Revenue Act No. 10 of 2006 relating to the
imposition, payment and recovery of income tax in respect of the profits and income of the Enterprise, i.e., Varun
Beverages Lanka (Private) Limited shall not apply to the profit and income of the Enterprise.
227
For the above purpose the year of assessment shall be reckoned from the year in which the Enterprise commences to
make profits or any year of assessment not later than two years reckoned from the date of commencement of
commercial operations, whichever year is earlier, as specified in a certificate issued by the Board of Investment of
Sri Lanka (BOI).
After the aforesaid tax exemption period referred to above, the profits and income of the Enterprise shall be charged
at the rate of fifteen percent.
Deferred taxes
Deferred tax is measured based on the tax rates and the tax laws enacted or substantively enacted at the balance sheet
date. Deferred tax assets and deferred tax liabilities are offset, if a legally enforceable right exists to set off current
tax assets against current tax liabilities and the deferred tax assets and deferred tax liabilities relate to the taxes on
income levied by same governing taxation laws. Deferred tax assets are recognised only to the extent that there is
reasonable certainty that sufficient future taxable income will be available against which such deferred tax assets can
be realised. In situations where the entity has unabsorbed depreciation or carry forward tax losses, all deferred tax
assets are recognised only if there is virtual certainty supported by convincing evidence that they can be realised
against future taxable profits.
At each balance sheet date the entity re-assesses unrecognised deferred tax assets. It recognises unrecognised
deferred tax assets to the extent that it has become reasonably certain or virtually certain, as the case may be that
sufficient future taxable income will be available against which such deferred tax assets can be realised.
The carrying amount of deferred tax assets are reviewed at each balance sheet date. The entity writes-down the
carrying amount of a deferred tax asset to the extent that it is no longer reasonably certain or virtually certain, as the
case may be, that sufficient future taxable income will be available against which deferred tax asset can be realised.
Any such write-down is reversed to the extent that it becomes reasonably certain or virtually certain, as the case may
be, that sufficient future taxable income will be available.
Note: The above Statement should be read with the Restated Consolidated Summary Statement of Notes to Restated
Summary Statements in Annexure 5 and the Restated Consolidated Summary Statement of Reconciliation of
Restated Profit/ (Loss) to Profit/ (Loss) as per Audited Financial Statements in Annexure 6.
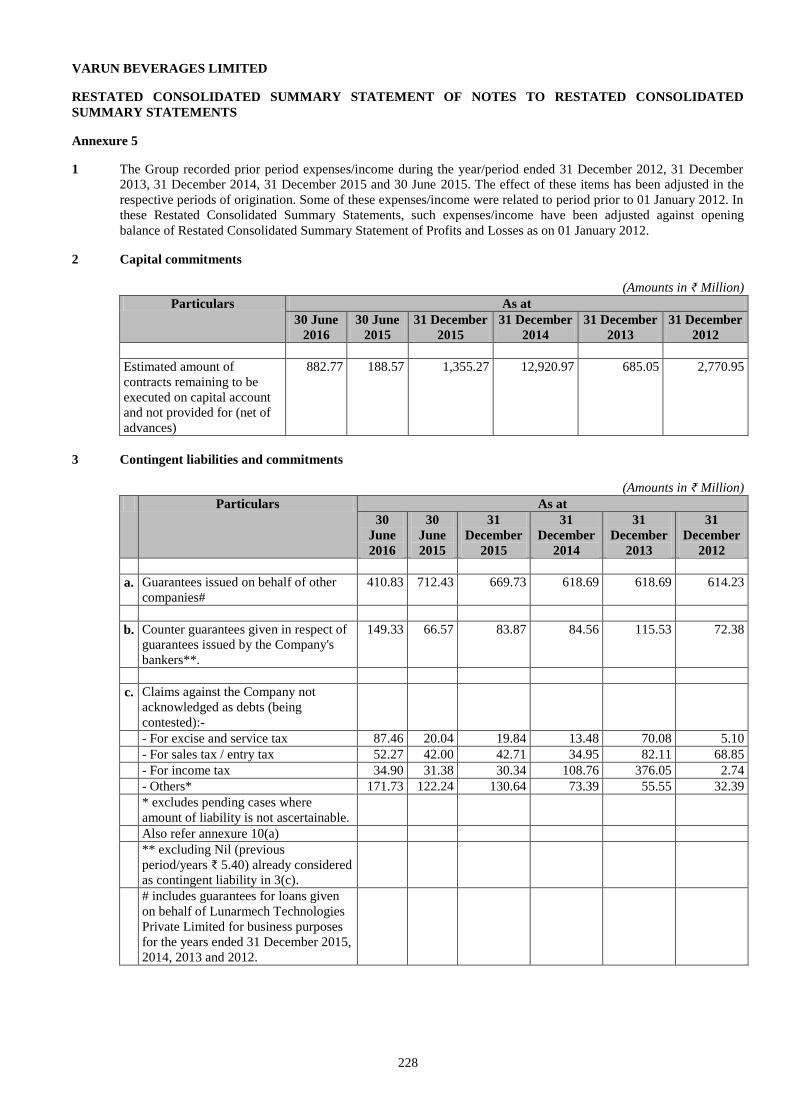
228
VARUN BEVERAGES LIMITED
RESTATED CONSOLIDATED SUMMARY STATEMENT OF NOTES TO RESTATED CONSOLIDATED
SUMMARY STATEMENTS
Annexure 5
1 The Group recorded prior period expenses/income during the year/period ended 31 December 2012, 31 December
2013, 31 December 2014, 31 December 2015 and 30 June 2015. The effect of these items has been adjusted in the
respective periods of origination. Some of these expenses/income were related to period prior to 01 January 2012. In
these Restated Consolidated Summary Statements, such expenses/income have been adjusted against opening
balance of Restated Consolidated Summary Statement of Profits and Losses as on 01 January 2012.
2 Capital commitments
(Amounts in ₹ Million)
Particulars As at
30 June
2016
30 June
2015
31 December
2015
31 December
2014
31 December
2013
31 December
2012
Estimated amount of
contracts remaining to be
executed on capital account
and not provided for (net of
advances)
882.77 188.57 1,355.27 12,920.97 685.05 2,770.95
3 Contingent liabilities and commitments
(Amounts in ₹ Million)
Particulars As at
30
June
2016
30
June
2015
31
December
2015
31
December
2014
31
December
2013
31
December
2012
a. Guarantees issued on behalf of other
companies#
410.83 712.43 669.73 618.69 618.69 614.23
b. Counter guarantees given in respect of
guarantees issued by the Company's
bankers**.
149.33 66.57 83.87 84.56 115.53 72.38
c. Claims against the Company not
acknowledged as debts (being
contested):-
- For excise and service tax 87.46 20.04 19.84 13.48 70.08 5.10
- For sales tax / entry tax 52.27 42.00 42.71 34.95 82.11 68.85
- For income tax 34.90 31.38 30.34 108.76 376.05 2.74
- Others* 171.73 122.24 130.64 73.39 55.55 32.39
* excludes pending cases where
amount of liability is not ascertainable.
Also refer annexure 10(a)
** excluding Nil (previous
period/years ₹ 5.40) already considered
as contingent liability in 3(c).
# includes guarantees for loans given
on behalf of Lunarmech Technologies
Private Limited for business purposes
for the years ended 31 December 2015,
2014, 2013 and 2012.
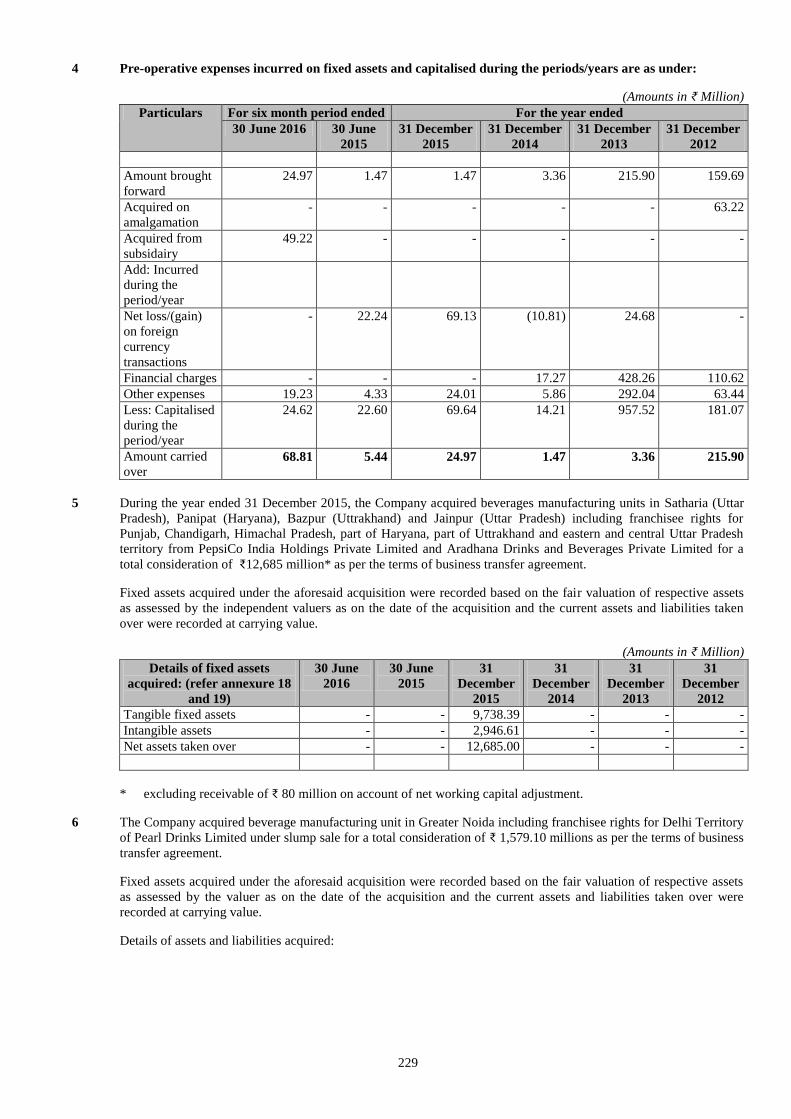
229
4 Pre-operative expenses incurred on fixed assets and capitalised during the periods/years are as under:
(Amounts in ₹ Million)
Particulars For six month period ended For the year ended
30 June 2016 30 June
2015
31 December
2015
31 December
2014
31 December
2013
31 December
2012
Amount brought
forward
24.97 1.47 1.47 3.36 215.90 159.69
Acquired on
amalgamation
- - - - - 63.22
Acquired from
subsidairy
49.22 - - - - -
Add: Incurred
during the
period/year
Net loss/(gain)
on foreign
currency
transactions
- 22.24 69.13 (10.81) 24.68 -
Financial charges - - - 17.27 428.26 110.62
Other expenses 19.23 4.33 24.01 5.86 292.04 63.44
Less: Capitalised
during the
period/year
24.62 22.60 69.64 14.21 957.52 181.07
Amount carried
over 68.81 5.44 24.97 1.47 3.36 215.90
5 During the year ended 31 December 2015, the Company acquired beverages manufacturing units in Satharia (Uttar
Pradesh), Panipat (Haryana), Bazpur (Uttrakhand) and Jainpur (Uttar Pradesh) including franchisee rights for
Punjab, Chandigarh, Himachal Pradesh, part of Haryana, part of Uttrakhand and eastern and central Uttar Pradesh
territory from PepsiCo India Holdings Private Limited and Aradhana Drinks and Beverages Private Limited for a
total consideration of ₹12,685 million* as per the terms of business transfer agreement.
Fixed assets acquired under the aforesaid acquisition were recorded based on the fair valuation of respective assets
as assessed by the independent valuers as on the date of the acquisition and the current assets and liabilities taken
over were recorded at carrying value.
(Amounts in ₹ Million)
Details of fixed assets
acquired: (refer annexure 18
and 19)
30 June
2016
30 June
2015
31
December
2015
31
December
2014
31
December
2013
31
December
2012
Tangible fixed assets - - 9,738.39 - - -
Intangible assets - - 2,946.61 - - -
Net assets taken over - - 12,685.00 - - -
* excluding receivable of ₹ 80 million on account of net working capital adjustment.
6 The Company acquired beverage manufacturing unit in Greater Noida including franchisee rights for Delhi Territory
of Pearl Drinks Limited under slump sale for a total consideration of ₹ 1,579.10 millions as per the terms of business
transfer agreement.
Fixed assets acquired under the aforesaid acquisition were recorded based on the fair valuation of respective assets
as assessed by the valuer as on the date of the acquisition and the current assets and liabilities taken over were
recorded at carrying value.
Details of assets and liabilities acquired:
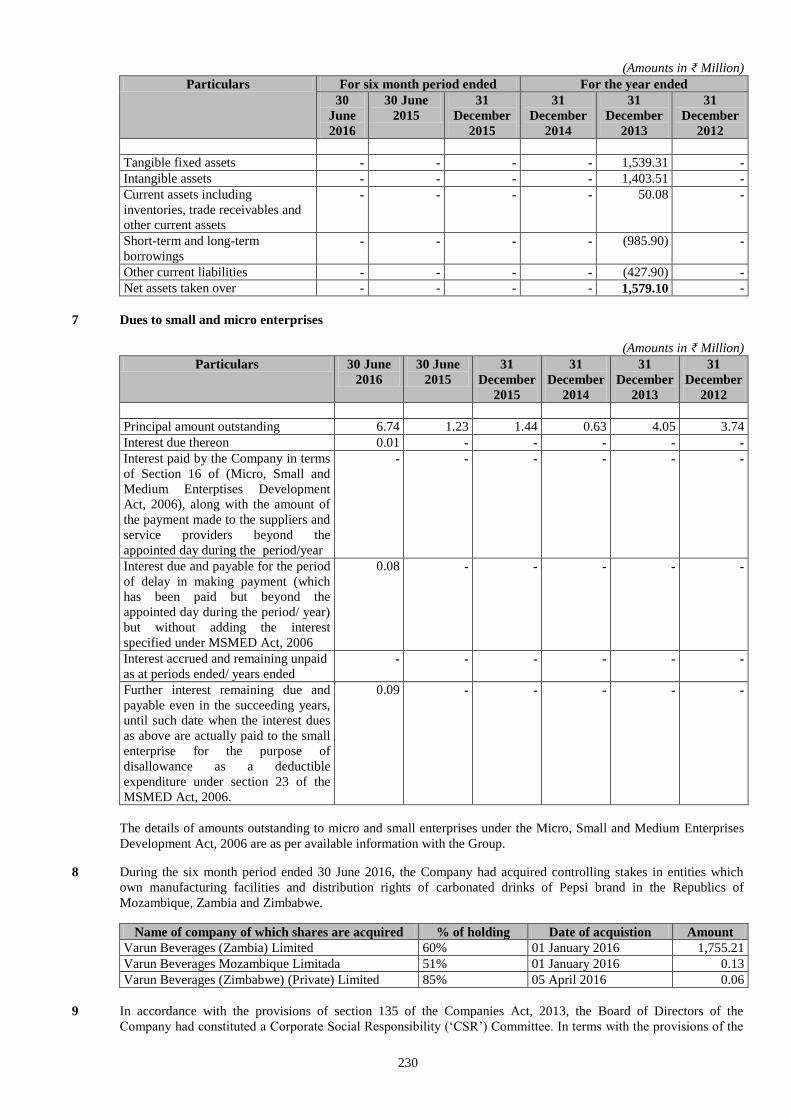
230
(Amounts in ₹ Million)
Particulars For six month period ended For the year ended
30
June
2016
30 June
2015
31
December
2015
31
December
2014
31
December
2013
31
December
2012
Tangible fixed assets - - - - 1,539.31 -
Intangible assets - - - - 1,403.51 -
Current assets including
inventories, trade receivables and
other current assets
- - - - 50.08 -
Short-term and long-term
borrowings - - - - (985.90) -
Other current liabilities - - - - (427.90) -
Net assets taken over - - - - 1,579.10 -
7 Dues to small and micro enterprises
(Amounts in ₹ Million)
Particulars 30 June
2016
30 June
2015
31
December
2015
31
December
2014
31
December
2013
31
December
2012
Principal amount outstanding 6.74 1.23 1.44 0.63 4.05 3.74
Interest due thereon 0.01 - - - - -
Interest paid by the Company in terms
of Section 16 of (Micro, Small and
Medium Enterptises Development
Act, 2006), along with the amount of
the payment made to the suppliers and
service providers beyond the
appointed day during the period/year
- - - - - -
Interest due and payable for the period
of delay in making payment (which
has been paid but beyond the
appointed day during the period/ year)
but without adding the interest
specified under MSMED Act, 2006
0.08 - - - - -
Interest accrued and remaining unpaid
as at periods ended/ years ended - - - - - -
Further interest remaining due and
payable even in the succeeding years,
until such date when the interest dues
as above are actually paid to the small
enterprise for the purpose of
disallowance as a deductible
expenditure under section 23 of the
MSMED Act, 2006.
0.09 - - - - -
The details of amounts outstanding to micro and small enterprises under the Micro, Small and Medium Enterprises
Development Act, 2006 are as per available information with the Group.
8 During the six month period ended 30 June 2016, the Company had acquired controlling stakes in entities which
own manufacturing facilities and distribution rights of carbonated drinks of Pepsi brand in the Republics of
Mozambique, Zambia and Zimbabwe.
Name of company of which shares are acquired % of holding Date of acquistion Amount
Varun Beverages (Zambia) Limited 60% 01 January 2016 1,755.21
Varun Beverages Mozambique Limitada 51% 01 January 2016 0.13
Varun Beverages (Zimbabwe) (Private) Limited 85% 05 April 2016 0.06
9 In accordance with the provisions of section 135 of the Companies Act, 2013, the Board of Directors of the
Company had constituted a Corporate Social Responsibility (‘CSR’) Committee. In terms with the provisions of the
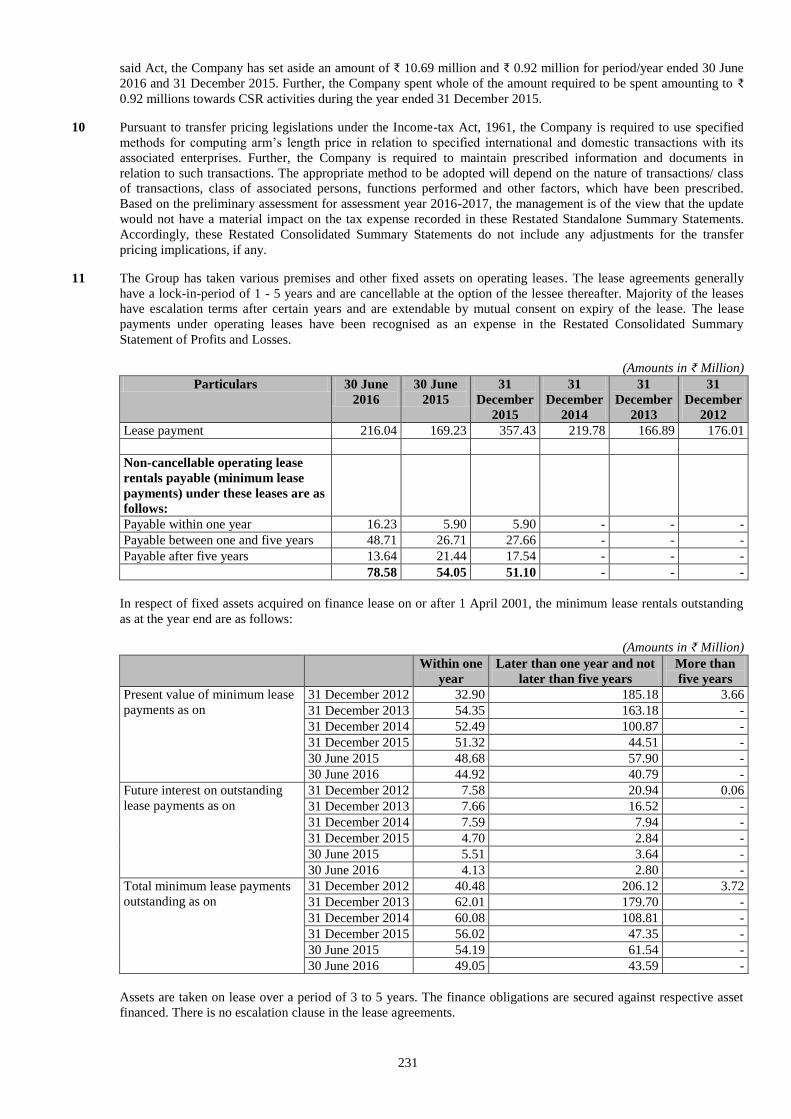
231
said Act, the Company has set aside an amount of ₹ 10.69 million and ₹ 0.92 million for period/year ended 30 June
2016 and 31 December 2015. Further, the Company spent whole of the amount required to be spent amounting to ₹
0.92 millions towards CSR activities during the year ended 31 December 2015.
10 Pursuant to transfer pricing legislations under the Income-tax Act, 1961, the Company is required to use specified
methods for computing arm’s length price in relation to specified international and domestic transactions with its
associated enterprises. Further, the Company is required to maintain prescribed information and documents in
relation to such transactions. The appropriate method to be adopted will depend on the nature of transactions/ class
of transactions, class of associated persons, functions performed and other factors, which have been prescribed.
Based on the preliminary assessment for assessment year 2016-2017, the management is of the view that the update
would not have a material impact on the tax expense recorded in these Restated Standalone Summary Statements.
Accordingly, these Restated Consolidated Summary Statements do not include any adjustments for the transfer
pricing implications, if any.
11 The Group has taken various premises and other fixed assets on operating leases. The lease agreements generally
have a lock-in-period of 1 - 5 years and are cancellable at the option of the lessee thereafter. Majority of the leases
have escalation terms after certain years and are extendable by mutual consent on expiry of the lease. The lease
payments under operating leases have been recognised as an expense in the Restated Consolidated Summary
Statement of Profits and Losses.
(Amounts in ₹ Million)
Particulars 30 June
2016
30 June
2015
31
December
2015
31
December
2014
31
December
2013
31
December
2012
Lease payment 216.04 169.23 357.43 219.78 166.89 176.01
Non-cancellable operating lease
rentals payable (minimum lease
payments) under these leases are as
follows:
Payable within one year 16.23 5.90 5.90 - - -
Payable between one and five years 48.71 26.71 27.66 - - -
Payable after five years 13.64 21.44 17.54 - - -
78.58 54.05 51.10 - - -
In respect of fixed assets acquired on finance lease on or after 1 April 2001, the minimum lease rentals outstanding
as at the year end are as follows:
(Amounts in ₹ Million)
Within one
year
Later than one year and not
later than five years
More than
five years
Present value of minimum lease
payments as on
31 December 2012 32.90 185.18 3.66
31 December 2013 54.35 163.18 -
31 December 2014 52.49 100.87 -
31 December 2015 51.32 44.51 -
30 June 2015 48.68 57.90 -
30 June 2016 44.92 40.79 -
Future interest on outstanding
lease payments as on
31 December 2012 7.58 20.94 0.06
31 December 2013 7.66 16.52 -
31 December 2014 7.59 7.94 -
31 December 2015 4.70 2.84 -
30 June 2015 5.51 3.64 -
30 June 2016 4.13 2.80 -
Total minimum lease payments
outstanding as on
31 December 2012 40.48 206.12 3.72
31 December 2013 62.01 179.70 -
31 December 2014 60.08 108.81 -
31 December 2015 56.02 47.35 -
30 June 2015 54.19 61.54 -
30 June 2016 49.05 43.59 -
Assets are taken on lease over a period of 3 to 5 years. The finance obligations are secured against respective asset
financed. There is no escalation clause in the lease agreements.
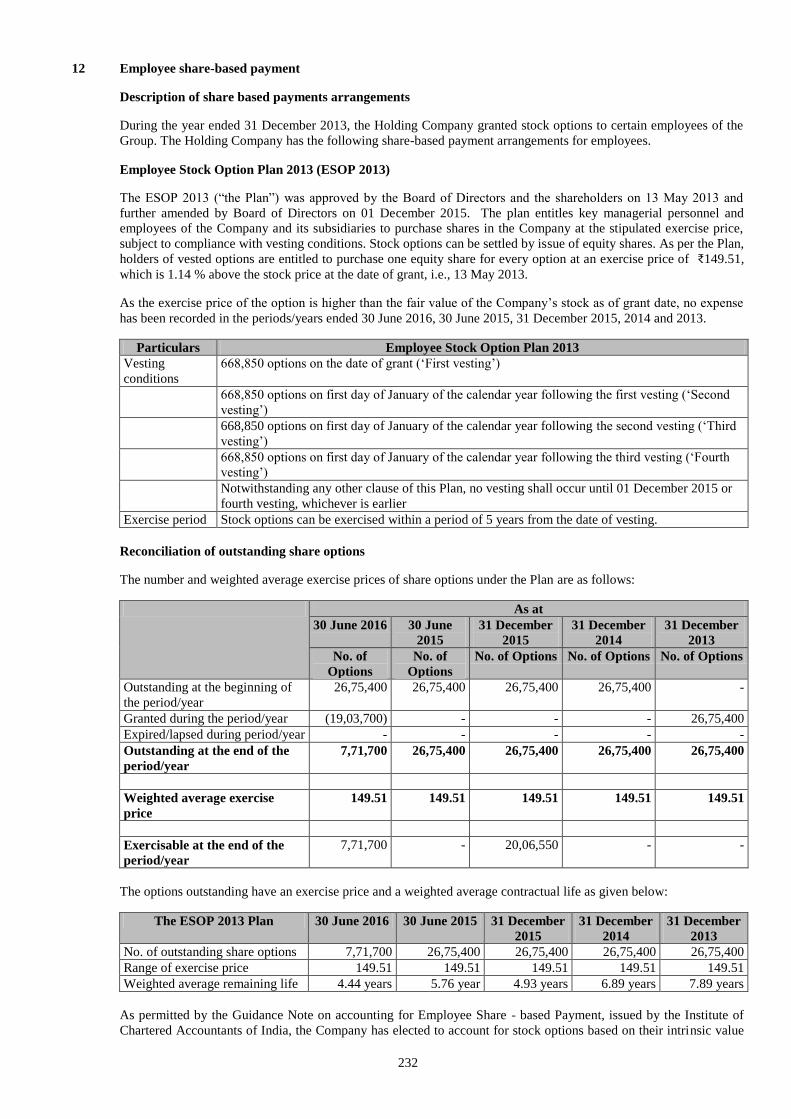
232
12 Employee share-based payment
Description of share based payments arrangements
During the year ended 31 December 2013, the Holding Company granted stock options to certain employees of the
Group. The Holding Company has the following share-based payment arrangements for employees.
Employee Stock Option Plan 2013 (ESOP 2013)
The ESOP 2013 (“the Plan”) was approved by the Board of Directors and the shareholders on 13 May 2013 and
further amended by Board of Directors on 01 December 2015. The plan entitles key managerial personnel and
employees of the Company and its subsidiaries to purchase shares in the Company at the stipulated exercise price,
subject to compliance with vesting conditions. Stock options can be settled by issue of equity shares. As per the Plan,
holders of vested options are entitled to purchase one equity share for every option at an exercise price of ₹149.51,
which is 1.14 % above the stock price at the date of grant, i.e., 13 May 2013.
As the exercise price of the option is higher than the fair value of the Company’s stock as of grant date, no expense
has been recorded in the periods/years ended 30 June 2016, 30 June 2015, 31 December 2015, 2014 and 2013.
Particulars Employee Stock Option Plan 2013
Vesting
conditions
668,850 options on the date of grant (‘First vesting’)
668,850 options on first day of January of the calendar year following the first vesting (‘Second
vesting’)
668,850 options on first day of January of the calendar year following the second vesting (‘Third
vesting’)
668,850 options on first day of January of the calendar year following the third vesting (‘Fourth
vesting’)
Notwithstanding any other clause of this Plan, no vesting shall occur until 01 December 2015 or
fourth vesting, whichever is earlier
Exercise period Stock options can be exercised within a period of 5 years from the date of vesting.
Reconciliation of outstanding share options
The number and weighted average exercise prices of share options under the Plan are as follows:
As at
30 June 2016 30 June
2015
31 December
2015
31 December
2014
31 December
2013
No. of
Options
No. of
Options
No. of Options No. of Options No. of Options
Outstanding at the beginning of
the period/year
26,75,400 26,75,400 26,75,400 26,75,400 -
Granted during the period/year (19,03,700) - - - 26,75,400
Expired/lapsed during period/year - - - - -
Outstanding at the end of the
period/year
7,71,700 26,75,400 26,75,400 26,75,400 26,75,400
Weighted average exercise
price
149.51 149.51 149.51 149.51 149.51
Exercisable at the end of the
period/year
7,71,700 - 20,06,550 - -
The options outstanding have an exercise price and a weighted average contractual life as given below:
The ESOP 2013 Plan 30 June 2016 30 June 2015 31 December
2015
31 December
2014
31 December
2013
No. of outstanding share options 7,71,700 26,75,400 26,75,400 26,75,400 26,75,400
Range of exercise price 149.51 149.51 149.51 149.51 149.51
Weighted average remaining life 4.44 years 5.76 year 4.93 years 6.89 years 7.89 years
As permitted by the Guidance Note on accounting for Employee Share - based Payment, issued by the Institute of
Chartered Accountants of India, the Company has elected to account for stock options based on their intrinsic value
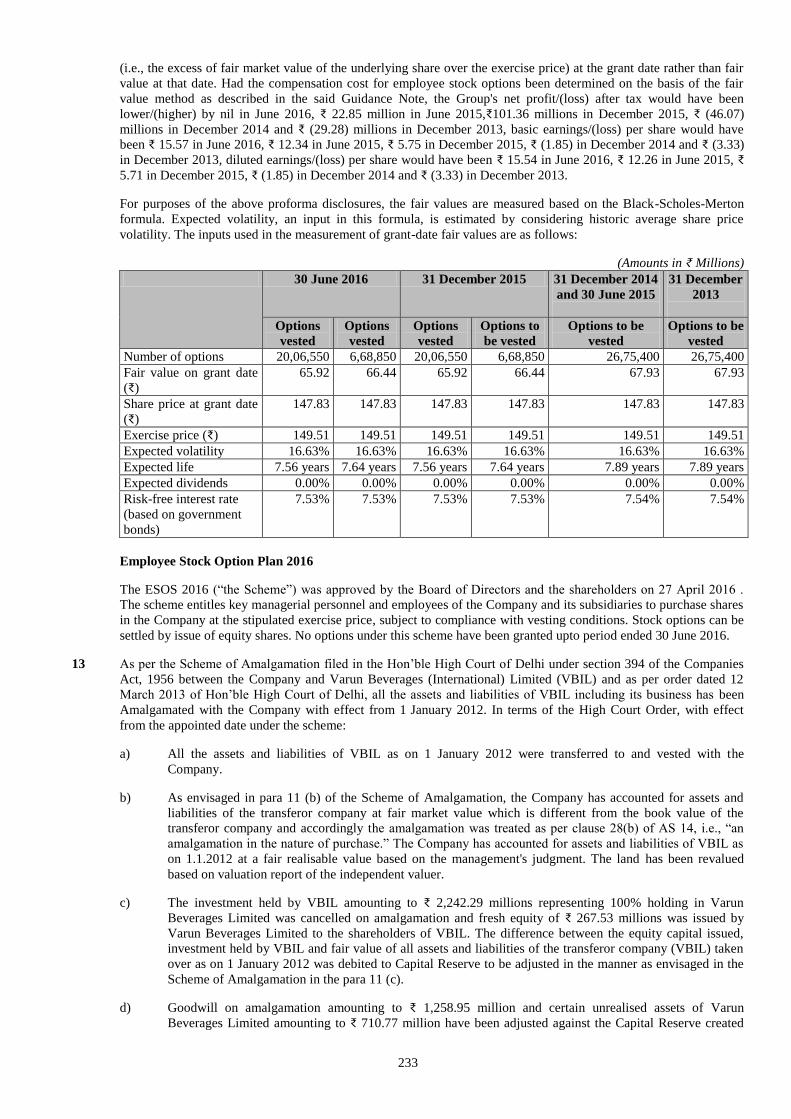
233
(i.e., the excess of fair market value of the underlying share over the exercise price) at the grant date rather than fair
value at that date. Had the compensation cost for employee stock options been determined on the basis of the fair
value method as described in the said Guidance Note, the Group's net profit/(loss) after tax would have been
lower/(higher) by nil in June 2016, ₹ 22.85 million in June 2015,₹101.36 millions in December 2015, ₹ (46.07)
millions in December 2014 and ₹ (29.28) millions in December 2013, basic earnings/(loss) per share would have
been ₹ 15.57 in June 2016, ₹ 12.34 in June 2015, ₹ 5.75 in December 2015, ₹ (1.85) in December 2014 and ₹ (3.33)
in December 2013, diluted earnings/(loss) per share would have been ₹ 15.54 in June 2016, ₹ 12.26 in June 2015, ₹
5.71 in December 2015, ₹ (1.85) in December 2014 and ₹ (3.33) in December 2013.
For purposes of the above proforma disclosures, the fair values are measured based on the Black-Scholes-Merton
formula. Expected volatility, an input in this formula, is estimated by considering historic average share price
volatility. The inputs used in the measurement of grant-date fair values are as follows:
(Amounts in ₹ Millions)
30 June 2016 31 December 2015 31 December 2014
and 30 June 2015
31 December
2013
Options
vested
Options
vested
Options
vested
Options to
be vested
Options to be
vested
Options to be
vested
Number of options 20,06,550 6,68,850 20,06,550 6,68,850 26,75,400 26,75,400
Fair value on grant date
(₹)
65.92 66.44 65.92 66.44 67.93 67.93
Share price at grant date
(₹)
147.83 147.83 147.83 147.83 147.83 147.83
Exercise price (₹) 149.51 149.51 149.51 149.51 149.51 149.51
Expected volatility 16.63% 16.63% 16.63% 16.63% 16.63% 16.63%
Expected life 7.56 years 7.64 years 7.56 years 7.64 years 7.89 years 7.89 years
Expected dividends 0.00% 0.00% 0.00% 0.00% 0.00% 0.00%
Risk-free interest rate
(based on government
bonds)
7.53% 7.53% 7.53% 7.53% 7.54% 7.54%
Employee Stock Option Plan 2016
The ESOS 2016 (“the Scheme”) was approved by the Board of Directors and the shareholders on 27 April 2016 .
The scheme entitles key managerial personnel and employees of the Company and its subsidiaries to purchase shares
in the Company at the stipulated exercise price, subject to compliance with vesting conditions. Stock options can be
settled by issue of equity shares. No options under this scheme have been granted upto period ended 30 June 2016.
13 As per the Scheme of Amalgamation filed in the Hon’ble High Court of Delhi under section 394 of the Companies
Act, 1956 between the Company and Varun Beverages (International) Limited (VBIL) and as per order dated 12
March 2013 of Hon’ble High Court of Delhi, all the assets and liabilities of VBIL including its business has been
Amalgamated with the Company with effect from 1 January 2012. In terms of the High Court Order, with effect
from the appointed date under the scheme:
a) All the assets and liabilities of VBIL as on 1 January 2012 were transferred to and vested with the
Company.
b) As envisaged in para 11 (b) of the Scheme of Amalgamation, the Company has accounted for assets and
liabilities of the transferor company at fair market value which is different from the book value of the
transferor company and accordingly the amalgamation was treated as per clause 28(b) of AS 14, i.e., “an
amalgamation in the nature of purchase.” The Company has accounted for assets and liabilities of VBIL as
on 1.1.2012 at a fair realisable value based on the management's judgment. The land has been revalued
based on valuation report of the independent valuer.
c) The investment held by VBIL amounting to ₹ 2,242.29 millions representing 100% holding in Varun
Beverages Limited was cancelled on amalgamation and fresh equity of ₹ 267.53 millions was issued by
Varun Beverages Limited to the shareholders of VBIL. The difference between the equity capital issued,
investment held by VBIL and fair value of all assets and liabilities of the transferor company (VBIL) taken
over as on 1 January 2012 was debited to Capital Reserve to be adjusted in the manner as envisaged in the
Scheme of Amalgamation in the para 11 (c).
d) Goodwill on amalgamation amounting to ₹ 1,258.95 million and certain unrealised assets of Varun
Beverages Limited amounting to ₹ 710.77 million have been adjusted against the Capital Reserve created
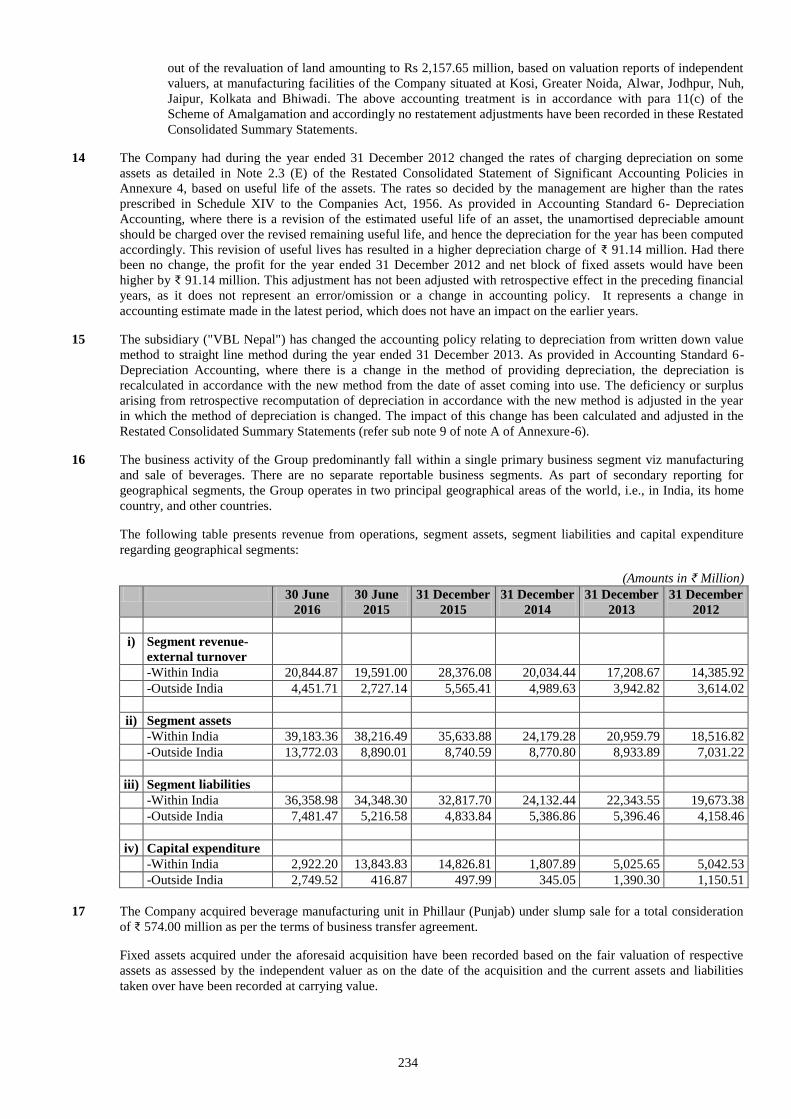
234
out of the revaluation of land amounting to Rs 2,157.65 million, based on valuation reports of independent
valuers, at manufacturing facilities of the Company situated at Kosi, Greater Noida, Alwar, Jodhpur, Nuh,
Jaipur, Kolkata and Bhiwadi. The above accounting treatment is in accordance with para 11(c) of the
Scheme of Amalgamation and accordingly no restatement adjustments have been recorded in these Restated
Consolidated Summary Statements.
14 The Company had during the year ended 31 December 2012 changed the rates of charging depreciation on some
assets as detailed in Note 2.3 (E) of the Restated Consolidated Statement of Significant Accounting Policies in
Annexure 4, based on useful life of the assets. The rates so decided by the management are higher than the rates
prescribed in Schedule XIV to the Companies Act, 1956. As provided in Accounting Standard 6- Depreciation
Accounting, where there is a revision of the estimated useful life of an asset, the unamortised depreciable amount
should be charged over the revised remaining useful life, and hence the depreciation for the year has been computed
accordingly. This revision of useful lives has resulted in a higher depreciation charge of ₹ 91.14 million. Had there
been no change, the profit for the year ended 31 December 2012 and net block of fixed assets would have been
higher by ₹ 91.14 million. This adjustment has not been adjusted with retrospective effect in the preceding financial
years, as it does not represent an error/omission or a change in accounting policy. It represents a change in
accounting estimate made in the latest period, which does not have an impact on the earlier years.
15 The subsidiary ("VBL Nepal") has changed the accounting policy relating to depreciation from written down value
method to straight line method during the year ended 31 December 2013. As provided in Accounting Standard 6-
Depreciation Accounting, where there is a change in the method of providing depreciation, the depreciation is
recalculated in accordance with the new method from the date of asset coming into use. The deficiency or surplus
arising from retrospective recomputation of depreciation in accordance with the new method is adjusted in the year
in which the method of depreciation is changed. The impact of this change has been calculated and adjusted in the
Restated Consolidated Summary Statements (refer sub note 9 of note A of Annexure-6).
16 The business activity of the Group predominantly fall within a single primary business segment viz manufacturing
and sale of beverages. There are no separate reportable business segments. As part of secondary reporting for
geographical segments, the Group operates in two principal geographical areas of the world, i.e., in India, its home
country, and other countries.
The following table presents revenue from operations, segment assets, segment liabilities and capital expenditure
regarding geographical segments:
(Amounts in ₹ Million)
30 June
2016
30 June
2015
31 December
2015
31 December
2014
31 December
2013
31 December
2012
i) Segment revenue-
external turnover
-Within India 20,844.87 19,591.00 28,376.08 20,034.44 17,208.67 14,385.92
-Outside India 4,451.71 2,727.14 5,565.41 4,989.63 3,942.82 3,614.02
ii) Segment assets
-Within India 39,183.36 38,216.49 35,633.88 24,179.28 20,959.79 18,516.82
-Outside India 13,772.03 8,890.01 8,740.59 8,770.80 8,933.89 7,031.22
iii) Segment liabilities
-Within India 36,358.98 34,348.30 32,817.70 24,132.44 22,343.55 19,673.38
-Outside India 7,481.47 5,216.58 4,833.84 5,386.86 5,396.46 4,158.46
iv) Capital expenditure
-Within India 2,922.20 13,843.83 14,826.81 1,807.89 5,025.65 5,042.53
-Outside India 2,749.52 416.87 497.99 345.05 1,390.30 1,150.51
17 The Company acquired beverage manufacturing unit in Phillaur (Punjab) under slump sale for a total consideration
of ₹ 574.00 million as per the terms of business transfer agreement.
Fixed assets acquired under the aforesaid acquisition have been recorded based on the fair valuation of respective
assets as assessed by the independent valuer as on the date of the acquisition and the current assets and liabilities
taken over have been recorded at carrying value.
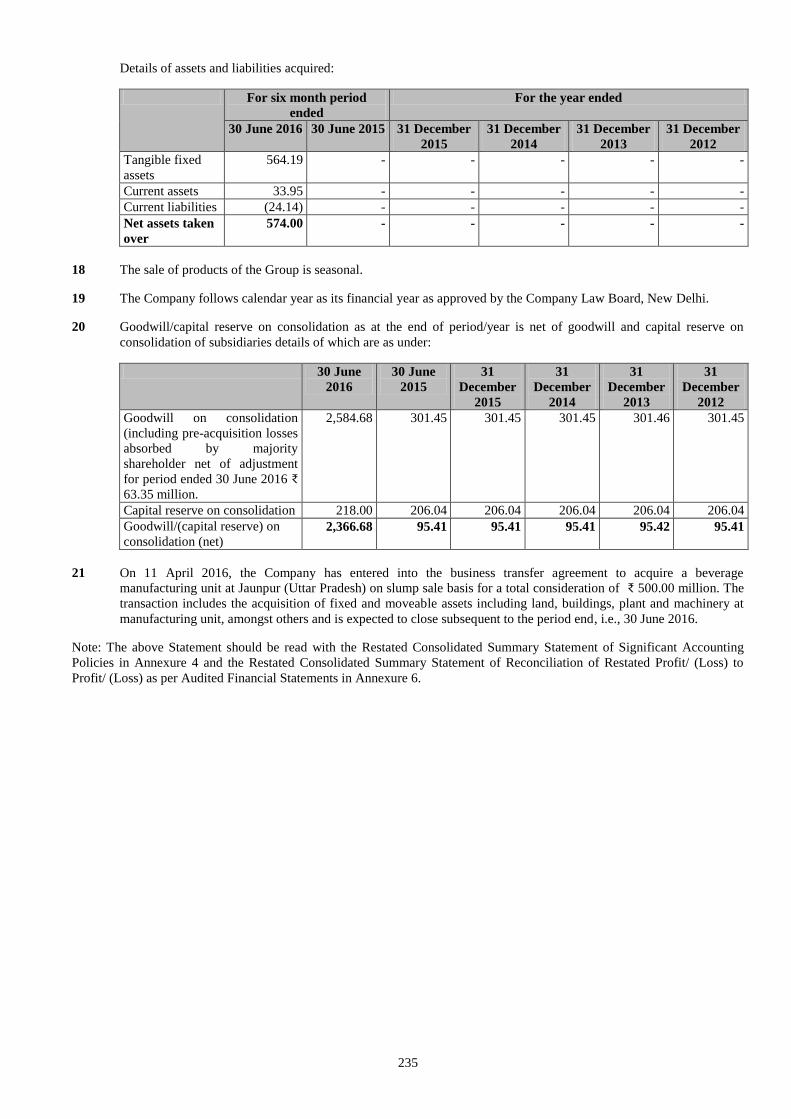
235
Details of assets and liabilities acquired:
For six month period
ended
For the year ended
30 June 2016 30 June 2015 31 December
2015
31 December
2014
31 December
2013
31 December
2012
Tangible fixed
assets
564.19 - - - - -
Current assets 33.95 - - - - -
Current liabilities (24.14) - - - - -
Net assets taken
over
574.00 - - - - -
18 The sale of products of the Group is seasonal.
19 The Company follows calendar year as its financial year as approved by the Company Law Board, New Delhi.
20 Goodwill/capital reserve on consolidation as at the end of period/year is net of goodwill and capital reserve on
consolidation of subsidiaries details of which are as under:
30 June
2016
30 June
2015
31
December
2015
31
December
2014
31
December
2013
31
December
2012
Goodwill on consolidation
(including pre-acquisition losses
absorbed by majority
shareholder net of adjustment
for period ended 30 June 2016 ₹
63.35 million.
2,584.68 301.45 301.45 301.45 301.46 301.45
Capital reserve on consolidation 218.00 206.04 206.04 206.04 206.04 206.04
Goodwill/(capital reserve) on
consolidation (net) 2,366.68 95.41 95.41 95.41 95.42 95.41
21 On 11 April 2016, the Company has entered into the business transfer agreement to acquire a beverage
manufacturing unit at Jaunpur (Uttar Pradesh) on slump sale basis for a total consideration of ₹ 500.00 million. The
transaction includes the acquisition of fixed and moveable assets including land, buildings, plant and machinery at
manufacturing unit, amongst others and is expected to close subsequent to the period end, i.e., 30 June 2016.
Note: The above Statement should be read with the Restated Consolidated Summary Statement of Significant Accounting
Policies in Annexure 4 and the Restated Consolidated Summary Statement of Reconciliation of Restated Profit/ (Loss) to
Profit/ (Loss) as per Audited Financial Statements in Annexure 6.
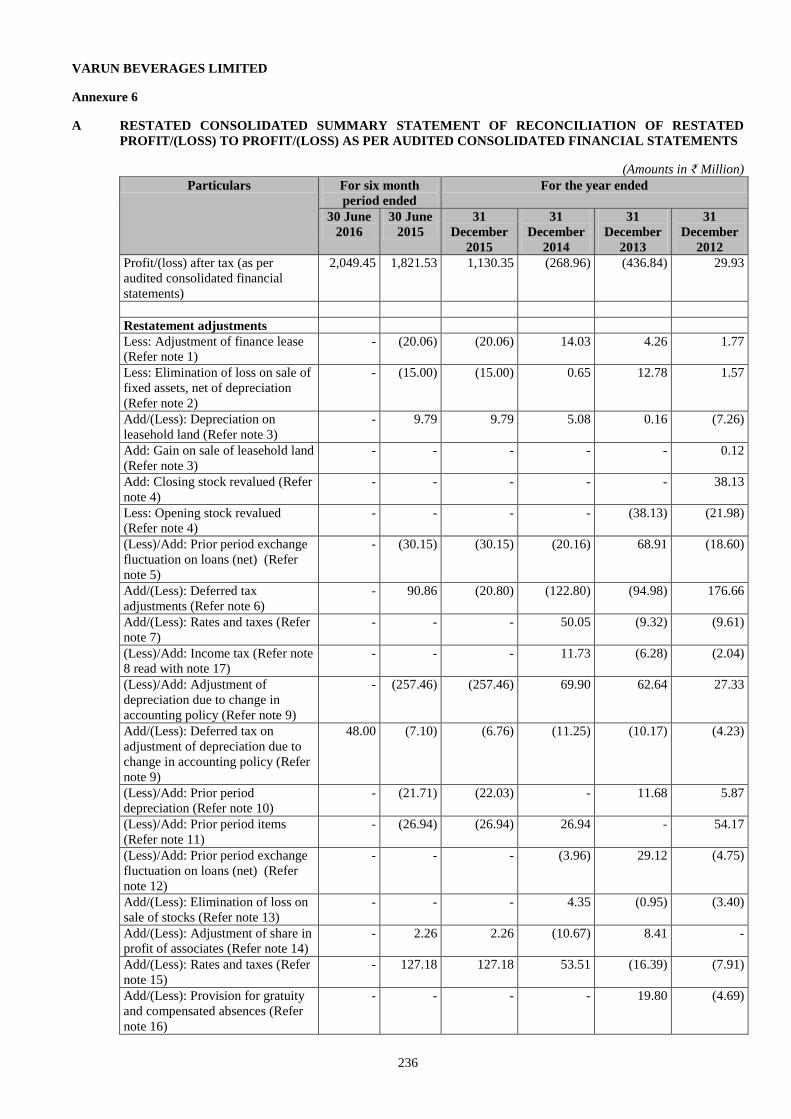
236
VARUN BEVERAGES LIMITED
Annexure 6
A RESTATED CONSOLIDATED SUMMARY STATEMENT OF RECONCILIATION OF RESTATED
PROFIT/(LOSS) TO PROFIT/(LOSS) AS PER AUDITED CONSOLIDATED FINANCIAL STATEMENTS
(Amounts in ₹ Million)
Particulars For six month
period ended
For the year ended
30 June
2016
30 June
2015
31
December
2015
31
December
2014
31
December
2013
31
December
2012
Profit/(loss) after tax (as per
audited consolidated financial
statements)
2,049.45 1,821.53 1,130.35 (268.96) (436.84) 29.93
Restatement adjustments
Less: Adjustment of finance lease
(Refer note 1)
- (20.06) (20.06) 14.03 4.26 1.77
Less: Elimination of loss on sale of
fixed assets, net of depreciation
(Refer note 2)
- (15.00) (15.00) 0.65 12.78 1.57
Add/(Less): Depreciation on
leasehold land (Refer note 3)
- 9.79 9.79 5.08 0.16 (7.26)
Add: Gain on sale of leasehold land
(Refer note 3)
- - - - - 0.12
Add: Closing stock revalued (Refer
note 4)
- - - - - 38.13
Less: Opening stock revalued
(Refer note 4)
- - - - (38.13) (21.98)
(Less)/Add: Prior period exchange
fluctuation on loans (net) (Refer
note 5)
- (30.15) (30.15) (20.16) 68.91 (18.60)
Add/(Less): Deferred tax
adjustments (Refer note 6)
- 90.86 (20.80) (122.80) (94.98) 176.66
Add/(Less): Rates and taxes (Refer
note 7)
- - - 50.05 (9.32) (9.61)
(Less)/Add: Income tax (Refer note
8 read with note 17)
- - - 11.73 (6.28) (2.04)
(Less)/Add: Adjustment of
depreciation due to change in
accounting policy (Refer note 9)
- (257.46) (257.46) 69.90 62.64 27.33
Add/(Less): Deferred tax on
adjustment of depreciation due to
change in accounting policy (Refer
note 9)
48.00 (7.10) (6.76) (11.25) (10.17) (4.23)
(Less)/Add: Prior period
depreciation (Refer note 10)
- (21.71) (22.03) - 11.68 5.87
(Less)/Add: Prior period items
(Refer note 11)
- (26.94) (26.94) 26.94 - 54.17
(Less)/Add: Prior period exchange
fluctuation on loans (net) (Refer
note 12)
- - - (3.96) 29.12 (4.75)
Add/(Less): Elimination of loss on
sale of stocks (Refer note 13)
- - - 4.35 (0.95) (3.40)
Add/(Less): Adjustment of share in
profit of associates (Refer note 14)
- 2.26 2.26 (10.67) 8.41 -
Add/(Less): Rates and taxes (Refer
note 15)
- 127.18 127.18 53.51 (16.39) (7.91)
Add/(Less): Provision for gratuity
and compensated absences (Refer
note 16)
- - - - 19.80 (4.69)
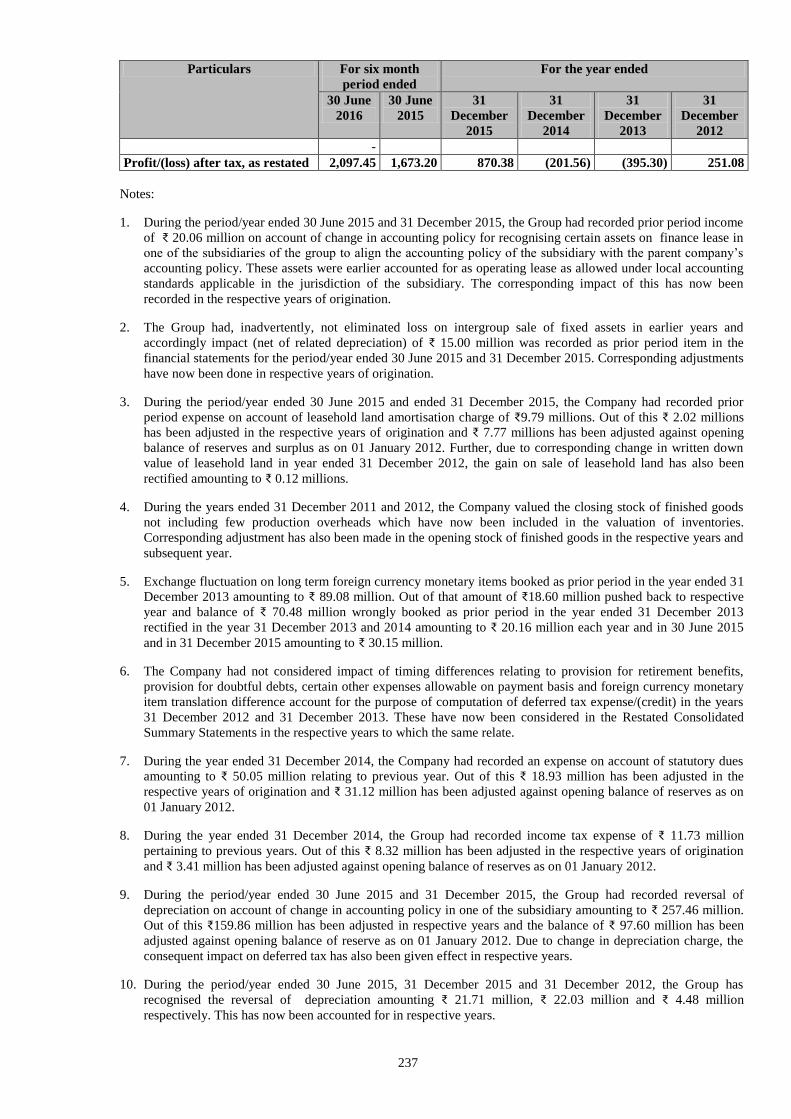
237
Particulars For six month
period ended
For the year ended
30 June
2016
30 June
2015
31
December
2015
31
December
2014
31
December
2013
31
December
2012
-
Profit/(loss) after tax, as restated 2,097.45 1,673.20 870.38 (201.56) (395.30) 251.08
Notes:
1. During the period/year ended 30 June 2015 and 31 December 2015, the Group had recorded prior period income
of ₹ 20.06 million on account of change in accounting policy for recognising certain assets on finance lease in
one of the subsidiaries of the group to align the accounting policy of the subsidiary with the parent company’s
accounting policy. These assets were earlier accounted for as operating lease as allowed under local accounting
standards applicable in the jurisdiction of the subsidiary. The corresponding impact of this has now been
recorded in the respective years of origination.
2. The Group had, inadvertently, not eliminated loss on intergroup sale of fixed assets in earlier years and
accordingly impact (net of related depreciation) of ₹ 15.00 million was recorded as prior period item in the
financial statements for the period/year ended 30 June 2015 and 31 December 2015. Corresponding adjustments
have now been done in respective years of origination.
3. During the period/year ended 30 June 2015 and ended 31 December 2015, the Company had recorded prior
period expense on account of leasehold land amortisation charge of ₹9.79 millions. Out of this ₹ 2.02 millions
has been adjusted in the respective years of origination and ₹ 7.77 millions has been adjusted against opening
balance of reserves and surplus as on 01 January 2012. Further, due to corresponding change in written down
value of leasehold land in year ended 31 December 2012, the gain on sale of leasehold land has also been
rectified amounting to ₹ 0.12 millions.
4. During the years ended 31 December 2011 and 2012, the Company valued the closing stock of finished goods
not including few production overheads which have now been included in the valuation of inventories.
Corresponding adjustment has also been made in the opening stock of finished goods in the respective years and
subsequent year.
5. Exchange fluctuation on long term foreign currency monetary items booked as prior period in the year ended 31
December 2013 amounting to ₹ 89.08 million. Out of that amount of ₹18.60 million pushed back to respective
year and balance of ₹ 70.48 million wrongly booked as prior period in the year ended 31 December 2013
rectified in the year 31 December 2013 and 2014 amounting to ₹ 20.16 million each year and in 30 June 2015
and in 31 December 2015 amounting to ₹ 30.15 million.
6. The Company had not considered impact of timing differences relating to provision for retirement benefits,
provision for doubtful debts, certain other expenses allowable on payment basis and foreign currency monetary
item translation difference account for the purpose of computation of deferred tax expense/(credit) in the years
31 December 2012 and 31 December 2013. These have now been considered in the Restated Consolidated
Summary Statements in the respective years to which the same relate.
7. During the year ended 31 December 2014, the Company had recorded an expense on account of statutory dues
amounting to ₹ 50.05 million relating to previous year. Out of this ₹ 18.93 million has been adjusted in the
respective years of origination and ₹ 31.12 million has been adjusted against opening balance of reserves as on
01 January 2012.
8. During the year ended 31 December 2014, the Group had recorded income tax expense of ₹ 11.73 million
pertaining to previous years. Out of this ₹ 8.32 million has been adjusted in the respective years of origination
and ₹ 3.41 million has been adjusted against opening balance of reserves as on 01 January 2012.
9. During the period/year ended 30 June 2015 and 31 December 2015, the Group had recorded reversal of
depreciation on account of change in accounting policy in one of the subsidiary amounting to ₹ 257.46 million.
Out of this ₹159.86 million has been adjusted in respective years and the balance of ₹ 97.60 million has been
adjusted against opening balance of reserve as on 01 January 2012. Due to change in depreciation charge, the
consequent impact on deferred tax has also been given effect in respective years.
10. During the period/year ended 30 June 2015, 31 December 2015 and 31 December 2012, the Group has
recognised the reversal of depreciation amounting ₹ 21.71 million, ₹ 22.03 million and ₹ 4.48 million
respectively. This has now been accounted for in respective years.
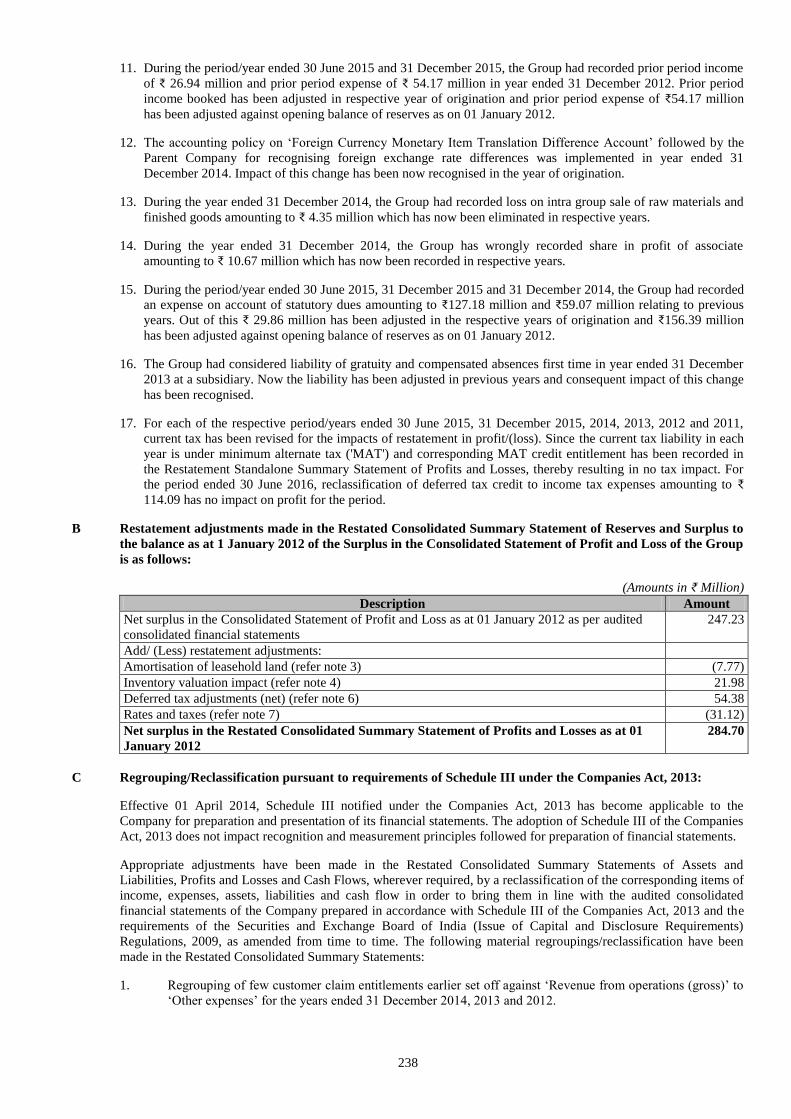
238
11. During the period/year ended 30 June 2015 and 31 December 2015, the Group had recorded prior period income
of ₹ 26.94 million and prior period expense of ₹ 54.17 million in year ended 31 December 2012. Prior period
income booked has been adjusted in respective year of origination and prior period expense of ₹54.17 million
has been adjusted against opening balance of reserves as on 01 January 2012.
12. The accounting policy on ‘Foreign Currency Monetary Item Translation Difference Account’ followed by the
Parent Company for recognising foreign exchange rate differences was implemented in year ended 31
December 2014. Impact of this change has been now recognised in the year of origination.
13. During the year ended 31 December 2014, the Group had recorded loss on intra group sale of raw materials and
finished goods amounting to ₹ 4.35 million which has now been eliminated in respective years.
14. During the year ended 31 December 2014, the Group has wrongly recorded share in profit of associate
amounting to ₹ 10.67 million which has now been recorded in respective years.
15. During the period/year ended 30 June 2015, 31 December 2015 and 31 December 2014, the Group had recorded
an expense on account of statutory dues amounting to ₹127.18 million and ₹59.07 million relating to previous
years. Out of this ₹ 29.86 million has been adjusted in the respective years of origination and ₹156.39 million
has been adjusted against opening balance of reserves as on 01 January 2012.
16. The Group had considered liability of gratuity and compensated absences first time in year ended 31 December
2013 at a subsidiary. Now the liability has been adjusted in previous years and consequent impact of this change
has been recognised.
17. For each of the respective period/years ended 30 June 2015, 31 December 2015, 2014, 2013, 2012 and 2011,
current tax has been revised for the impacts of restatement in profit/(loss). Since the current tax liability in each
year is under minimum alternate tax ('MAT') and corresponding MAT credit entitlement has been recorded in
the Restatement Standalone Summary Statement of Profits and Losses, thereby resulting in no tax impact. For
the period ended 30 June 2016, reclassification of deferred tax credit to income tax expenses amounting to ₹
114.09 has no impact on profit for the period.
B Restatement adjustments made in the Restated Consolidated Summary Statement of Reserves and Surplus to
the balance as at 1 January 2012 of the Surplus in the Consolidated Statement of Profit and Loss of the Group
is as follows:
(Amounts in ₹ Million)
Description Amount
Net surplus in the Consolidated Statement of Profit and Loss as at 01 January 2012 as per audited
consolidated financial statements
247.23
Add/ (Less) restatement adjustments:
Amortisation of leasehold land (refer note 3) (7.77)
Inventory valuation impact (refer note 4) 21.98
Deferred tax adjustments (net) (refer note 6) 54.38
Rates and taxes (refer note 7) (31.12)
Net surplus in the Restated Consolidated Summary Statement of Profits and Losses as at 01
January 2012
284.70
C Regrouping/Reclassification pursuant to requirements of Schedule III under the Companies Act, 2013:
Effective 01 April 2014, Schedule III notified under the Companies Act, 2013 has become applicable to the
Company for preparation and presentation of its financial statements. The adoption of Schedule III of the Companies
Act, 2013 does not impact recognition and measurement principles followed for preparation of financial statements.
Appropriate adjustments have been made in the Restated Consolidated Summary Statements of Assets and
Liabilities, Profits and Losses and Cash Flows, wherever required, by a reclassification of the corresponding items of
income, expenses, assets, liabilities and cash flow in order to bring them in line with the audited consolidated
financial statements of the Company prepared in accordance with Schedule III of the Companies Act, 2013 and the
requirements of the Securities and Exchange Board of India (Issue of Capital and Disclosure Requirements)
Regulations, 2009, as amended from time to time. The following material regroupings/reclassification have been
made in the Restated Consolidated Summary Statements:
1. Regrouping of few customer claim entitlements earlier set off against ‘Revenue from operations (gross)’ to
‘Other expenses’ for the years ended 31 December 2014, 2013 and 2012.
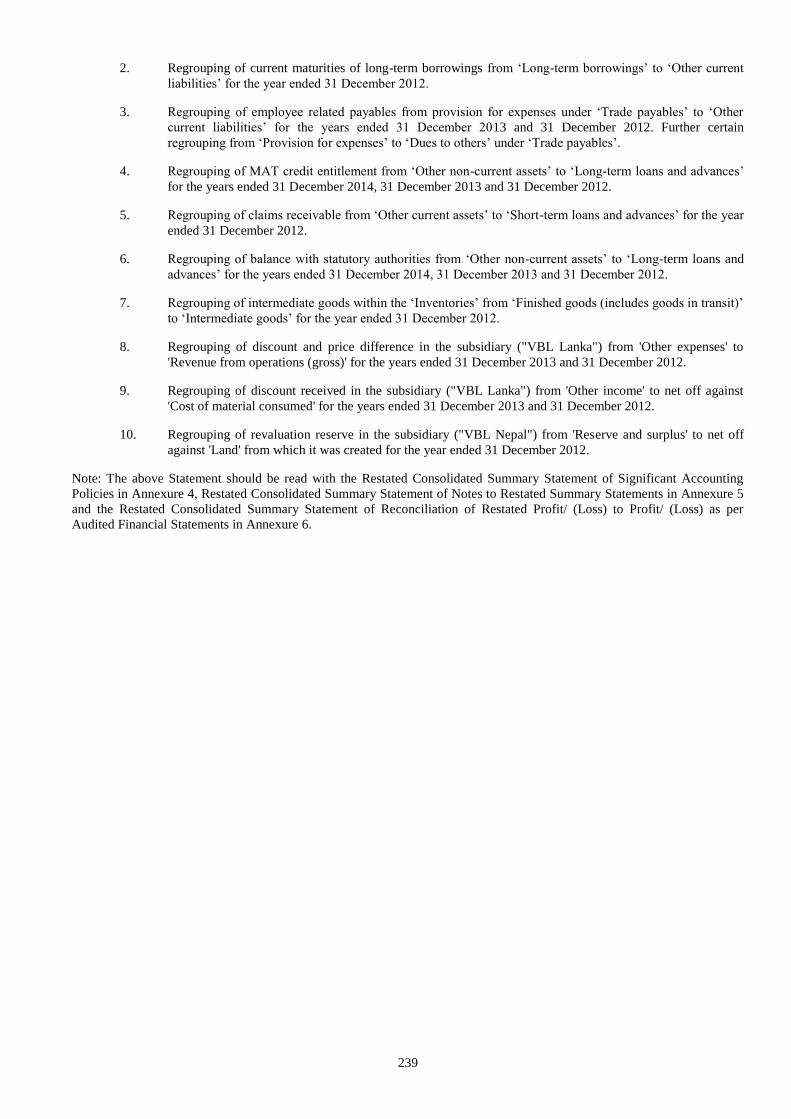
239
2. Regrouping of current maturities of long-term borrowings from ‘Long-term borrowings’ to ‘Other current
liabilities’ for the year ended 31 December 2012.
3. Regrouping of employee related payables from provision for expenses under ‘Trade payables’ to ‘Other
current liabilities’ for the years ended 31 December 2013 and 31 December 2012. Further certain
regrouping from ‘Provision for expenses’ to ‘Dues to others’ under ‘Trade payables’.
4. Regrouping of MAT credit entitlement from ‘Other non-current assets’ to ‘Long-term loans and advances’
for the years ended 31 December 2014, 31 December 2013 and 31 December 2012.
5. Regrouping of claims receivable from ‘Other current assets’ to ‘Short-term loans and advances’ for the year
ended 31 December 2012.
6. Regrouping of balance with statutory authorities from ‘Other non-current assets’ to ‘Long-term loans and
advances’ for the years ended 31 December 2014, 31 December 2013 and 31 December 2012.
7. Regrouping of intermediate goods within the ‘Inventories’ from ‘Finished goods (includes goods in transit)’
to ‘Intermediate goods’ for the year ended 31 December 2012.
8. Regrouping of discount and price difference in the subsidiary ("VBL Lanka") from 'Other expenses' to
'Revenue from operations (gross)' for the years ended 31 December 2013 and 31 December 2012.
9. Regrouping of discount received in the subsidiary ("VBL Lanka") from 'Other income' to net off against
'Cost of material consumed' for the years ended 31 December 2013 and 31 December 2012.
10. Regrouping of revaluation reserve in the subsidiary ("VBL Nepal") from 'Reserve and surplus' to net off
against 'Land' from which it was created for the year ended 31 December 2012.
Note: The above Statement should be read with the Restated Consolidated Summary Statement of Significant Accounting
Policies in Annexure 4, Restated Consolidated Summary Statement of Notes to Restated Summary Statements in Annexure 5
and the Restated Consolidated Summary Statement of Reconciliation of Restated Profit/ (Loss) to Profit/ (Loss) as per
Audited Financial Statements in Annexure 6.
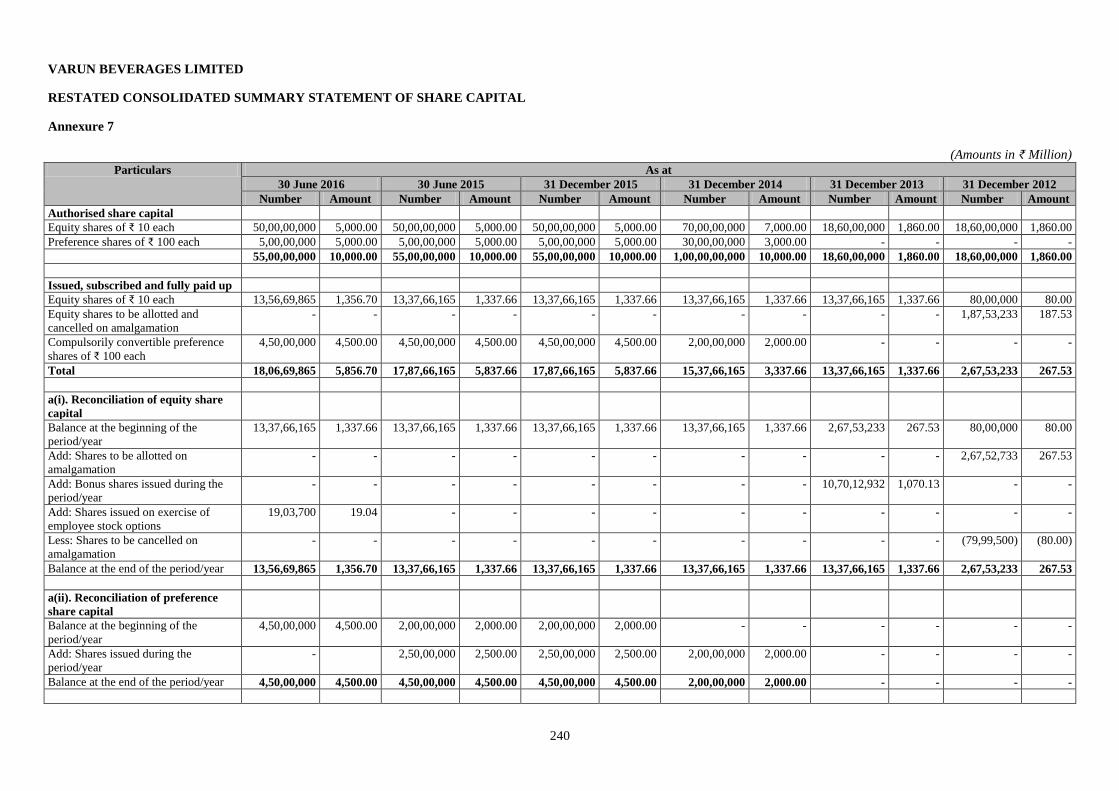
240
VARUN BEVERAGES LIMITED
RESTATED CONSOLIDATED SUMMARY STATEMENT OF SHARE CAPITAL
Annexure 7
(Amounts in ₹ Million)
Particulars As at
30 June 2016 30 June 2015 31 December 2015 31 December 2014 31 December 2013 31 December 2012
Number Amount Number Amount Number Amount Number Amount Number Amount Number Amount
Authorised share capital
Equity shares of ₹ 10 each 50,00,00,000 5,000.00 50,00,00,000 5,000.00 50,00,00,000 5,000.00 70,00,00,000 7,000.00 18,60,00,000 1,860.00 18,60,00,000 1,860.00
Preference shares of ₹ 100 each 5,00,00,000 5,000.00 5,00,00,000 5,000.00 5,00,00,000 5,000.00 30,00,00,000 3,000.00 - - - -
55,00,00,000 10,000.00 55,00,00,000 10,000.00 55,00,00,000 10,000.00 1,00,00,00,000 10,000.00 18,60,00,000 1,860.00 18,60,00,000 1,860.00
Issued, subscribed and fully paid up
Equity shares of ₹ 10 each 13,56,69,865 1,356.70 13,37,66,165 1,337.66 13,37,66,165 1,337.66 13,37,66,165 1,337.66 13,37,66,165 1,337.66 80,00,000 80.00
Equity shares to be allotted and
cancelled on amalgamation
- - - - - - - - - - 1,87,53,233 187.53
Compulsorily convertible preference
shares of ₹ 100 each
4,50,00,000 4,500.00 4,50,00,000 4,500.00 4,50,00,000 4,500.00 2,00,00,000 2,000.00 - - - -
Total 18,06,69,865 5,856.70 17,87,66,165 5,837.66 17,87,66,165 5,837.66 15,37,66,165 3,337.66 13,37,66,165 1,337.66 2,67,53,233 267.53
a(i). Reconciliation of equity share
capital
Balance at the beginning of the
period/year
13,37,66,165 1,337.66 13,37,66,165 1,337.66 13,37,66,165 1,337.66 13,37,66,165 1,337.66 2,67,53,233 267.53 80,00,000 80.00
Add: Shares to be allotted on
amalgamation
- - - - - - - - - - 2,67,52,733 267.53
Add: Bonus shares issued during the
period/year
- - - - - - - - 10,70,12,932 1,070.13 - -
Add: Shares issued on exercise of
employee stock options
19,03,700 19.04 - - - - - - - - - -
Less: Shares to be cancelled on
amalgamation
- - - - - - - - - - (79,99,500) (80.00)
Balance at the end of the period/year 13,56,69,865 1,356.70 13,37,66,165 1,337.66 13,37,66,165 1,337.66 13,37,66,165 1,337.66 13,37,66,165 1,337.66 2,67,53,233 267.53
a(ii). Reconciliation of preference
share capital
Balance at the beginning of the
period/year
4,50,00,000 4,500.00 2,00,00,000 2,000.00 2,00,00,000 2,000.00 - - - - - -
Add: Shares issued during the
period/year
- 2,50,00,000 2,500.00 2,50,00,000 2,500.00 2,00,00,000 2,000.00 - - - -
Balance at the end of the period/year 4,50,00,000 4,500.00 4,50,00,000 4,500.00 4,50,00,000 4,500.00 2,00,00,000 2,000.00 - - - -
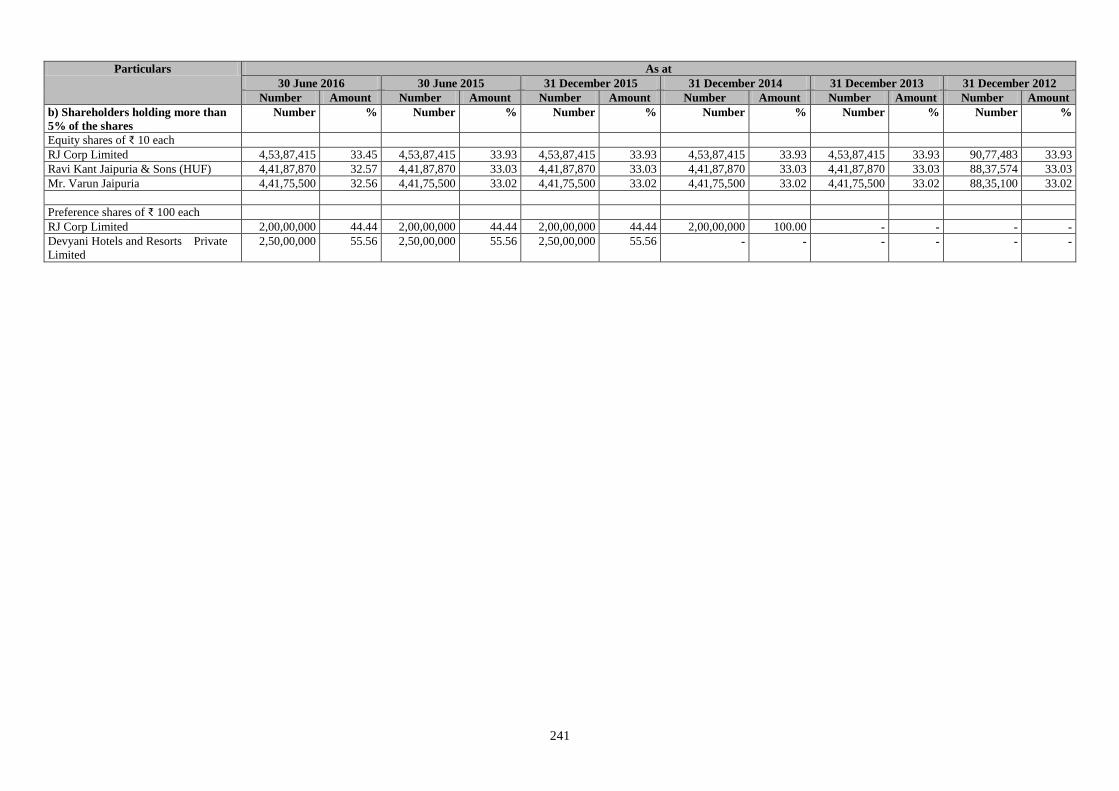
241
Particulars As at
30 June 2016 30 June 2015 31 December 2015 31 December 2014 31 December 2013 31 December 2012
Number Amount Number Amount Number Amount Number Amount Number Amount Number Amount
b) Shareholders holding more than
5% of the shares
Number % Number % Number % Number % Number % Number %
Equity shares of ₹ 10 each
RJ Corp Limited 4,53,87,415 33.45 4,53,87,415 33.93 4,53,87,415 33.93 4,53,87,415 33.93 4,53,87,415 33.93 90,77,483 33.93
Ravi Kant Jaipuria & Sons (HUF) 4,41,87,870 32.57 4,41,87,870 33.03 4,41,87,870 33.03 4,41,87,870 33.03 4,41,87,870 33.03 88,37,574 33.03
Mr. Varun Jaipuria 4,41,75,500 32.56 4,41,75,500 33.02 4,41,75,500 33.02 4,41,75,500 33.02 4,41,75,500 33.02 88,35,100 33.02
Preference shares of ₹ 100 each
RJ Corp Limited 2,00,00,000 44.44 2,00,00,000 44.44 2,00,00,000 44.44 2,00,00,000 100.00 - - - -
Devyani Hotels and Resorts Private
Limited
2,50,00,000 55.56 2,50,00,000 55.56 2,50,00,000 55.56 - - - - - -
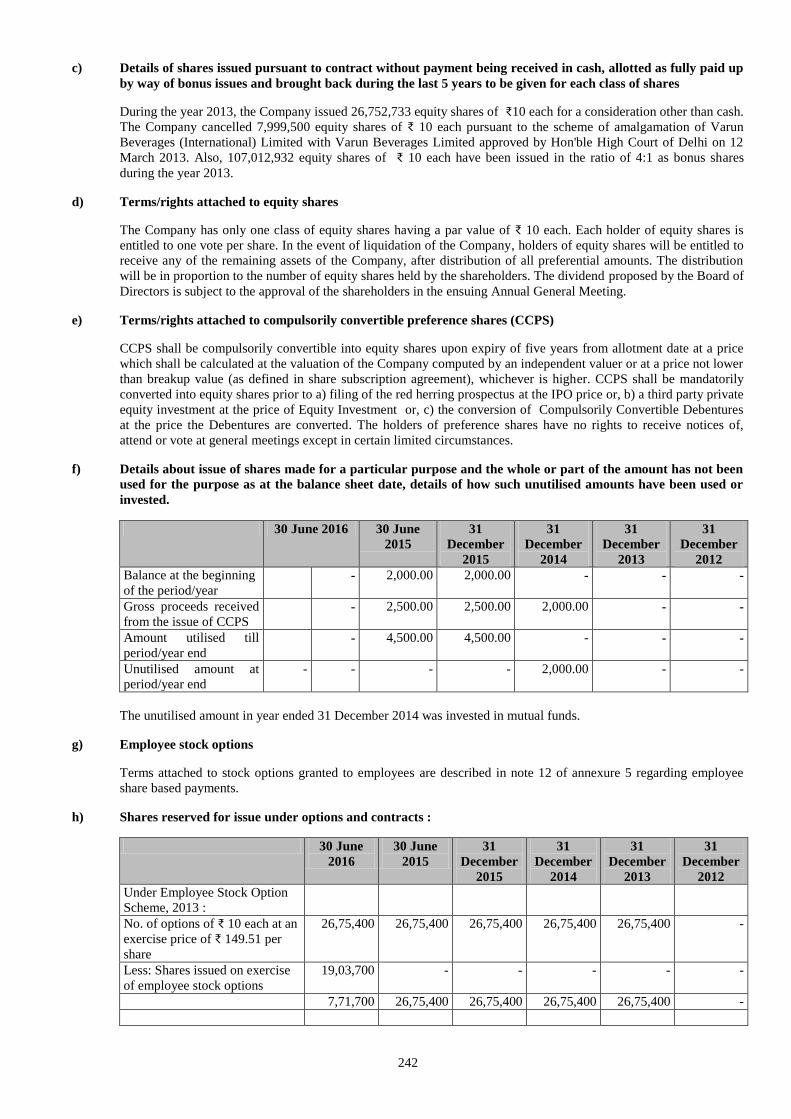
242
c) Details of shares issued pursuant to contract without payment being received in cash, allotted as fully paid up
by way of bonus issues and brought back during the last 5 years to be given for each class of shares
During the year 2013, the Company issued 26,752,733 equity shares of ₹10 each for a consideration other than cash.
The Company cancelled 7,999,500 equity shares of ₹ 10 each pursuant to the scheme of amalgamation of Varun
Beverages (International) Limited with Varun Beverages Limited approved by Hon'ble High Court of Delhi on 12
March 2013. Also, 107,012,932 equity shares of ₹ 10 each have been issued in the ratio of 4:1 as bonus shares
during the year 2013.
d) Terms/rights attached to equity shares
The Company has only one class of equity shares having a par value of ₹ 10 each. Each holder of equity shares is
entitled to one vote per share. In the event of liquidation of the Company, holders of equity shares will be entitled to
receive any of the remaining assets of the Company, after distribution of all preferential amounts. The distribution
will be in proportion to the number of equity shares held by the shareholders. The dividend proposed by the Board of
Directors is subject to the approval of the shareholders in the ensuing Annual General Meeting.
e) Terms/rights attached to compulsorily convertible preference shares (CCPS)
CCPS shall be compulsorily convertible into equity shares upon expiry of five years from allotment date at a price
which shall be calculated at the valuation of the Company computed by an independent valuer or at a price not lower
than breakup value (as defined in share subscription agreement), whichever is higher. CCPS shall be mandatorily
converted into equity shares prior to a) filing of the red herring prospectus at the IPO price or, b) a third party private
equity investment at the price of Equity Investment or, c) the conversion of Compulsorily Convertible Debentures
at the price the Debentures are converted. The holders of preference shares have no rights to receive notices of,
attend or vote at general meetings except in certain limited circumstances.
f) Details about issue of shares made for a particular purpose and the whole or part of the amount has not been
used for the purpose as at the balance sheet date, details of how such unutilised amounts have been used or
invested.
30 June 2016 30 June
2015
31
December
2015
31
December
2014
31
December
2013
31
December
2012
Balance at the beginning
of the period/year - 2,000.00 2,000.00 - - -
Gross proceeds received
from the issue of CCPS
- 2,500.00 2,500.00 2,000.00 - -
Amount utilised till
period/year end
- 4,500.00 4,500.00 - - -
Unutilised amount at
period/year end
- - - - 2,000.00 - -
The unutilised amount in year ended 31 December 2014 was invested in mutual funds.
g) Employee stock options
Terms attached to stock options granted to employees are described in note 12 of annexure 5 regarding employee
share based payments.
h) Shares reserved for issue under options and contracts :
30 June
2016
30 June
2015
31
December
2015
31
December
2014
31
December
2013
31
December
2012
Under Employee Stock Option
Scheme, 2013 :
No. of options of ₹ 10 each at an
exercise price of ₹ 149.51 per
share
26,75,400 26,75,400 26,75,400 26,75,400 26,75,400 -
Less: Shares issued on exercise
of employee stock options
19,03,700 - - - - -
7,71,700 26,75,400 26,75,400 26,75,400 26,75,400 -
243
Note: The above Statement should be read with the Restated Consolidated Summary Statement of Significant
Accounting Policies in Annexure 4, Restated Consolidated Summary Statement of Notes to Restated Consolidated
Summary Statements in Annexure 5 and the Restated Consolidated Summary Statement of Reconciliation of
Restated Profit/ (Loss) to Profit/ (Loss) as per Audited Consolidated Financial Statements in Annexure 6.
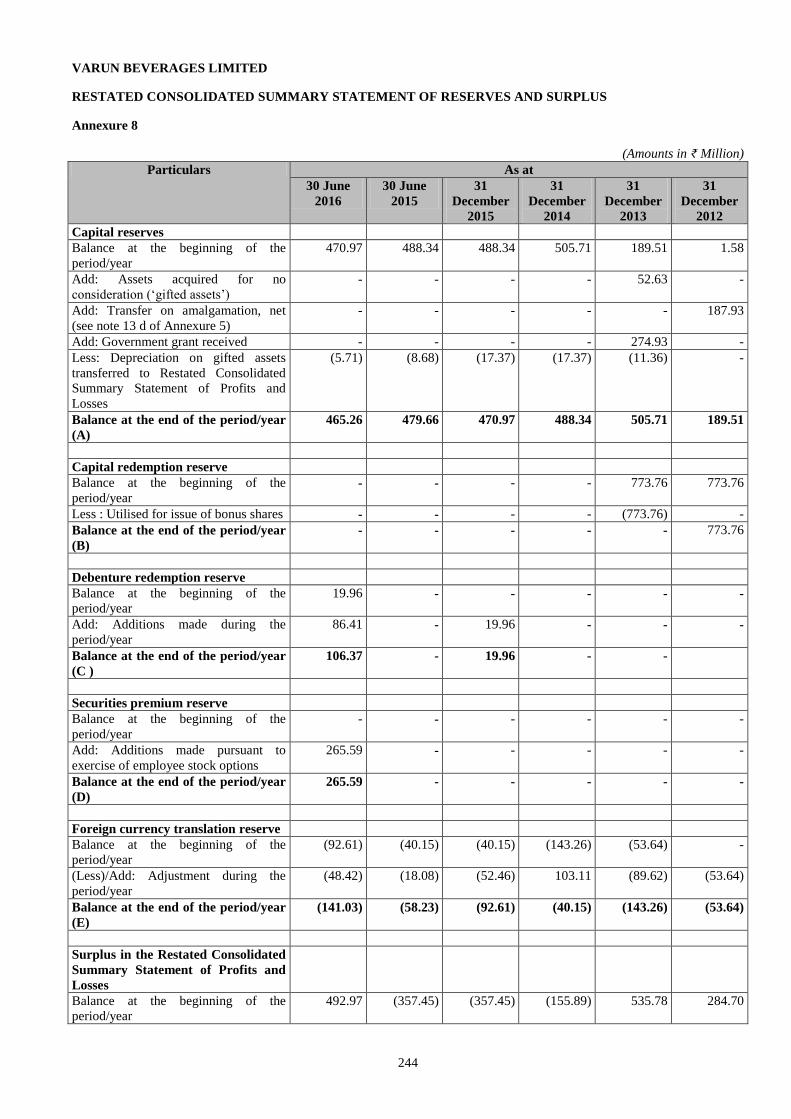
244
VARUN BEVERAGES LIMITED
RESTATED CONSOLIDATED SUMMARY STATEMENT OF RESERVES AND SURPLUS
Annexure 8
(Amounts in ₹ Million)
Particulars As at
30 June
2016
30 June
2015
31
December
2015
31
December
2014
31
December
2013
31
December
2012
Capital reserves
Balance at the beginning of the
period/year
470.97 488.34 488.34 505.71 189.51 1.58
Add: Assets acquired for no
consideration (‘gifted assets’)
- - - - 52.63 -
Add: Transfer on amalgamation, net
(see note 13 d of Annexure 5)
- - - - - 187.93
Add: Government grant received - - - - 274.93 -
Less: Depreciation on gifted assets
transferred to Restated Consolidated
Summary Statement of Profits and
Losses
(5.71) (8.68) (17.37) (17.37) (11.36) -
Balance at the end of the period/year
(A)
465.26 479.66 470.97 488.34 505.71 189.51
Capital redemption reserve
Balance at the beginning of the
period/year - - - - 773.76 773.76
Less : Utilised for issue of bonus shares - - - - (773.76) -
Balance at the end of the period/year
(B)
- - - - - 773.76
Debenture redemption reserve
Balance at the beginning of the
period/year
19.96 - - - - -
Add: Additions made during the
period/year
86.41 - 19.96 - - -
Balance at the end of the period/year
(C )
106.37 - 19.96 - -
Securities premium reserve
Balance at the beginning of the
period/year
- - - - - -
Add: Additions made pursuant to
exercise of employee stock options
265.59 - - - - -
Balance at the end of the period/year
(D)
265.59 - - - - -
Foreign currency translation reserve
Balance at the beginning of the
period/year
(92.61) (40.15) (40.15) (143.26) (53.64) -
(Less)/Add: Adjustment during the
period/year
(48.42) (18.08) (52.46) 103.11 (89.62) (53.64)
Balance at the end of the period/year
(E)
(141.03) (58.23) (92.61) (40.15) (143.26) (53.64)
Surplus in the Restated Consolidated
Summary Statement of Profits and
Losses
Balance at the beginning of the
period/year
492.97 (357.45) (357.45) (155.89) 535.78 284.70
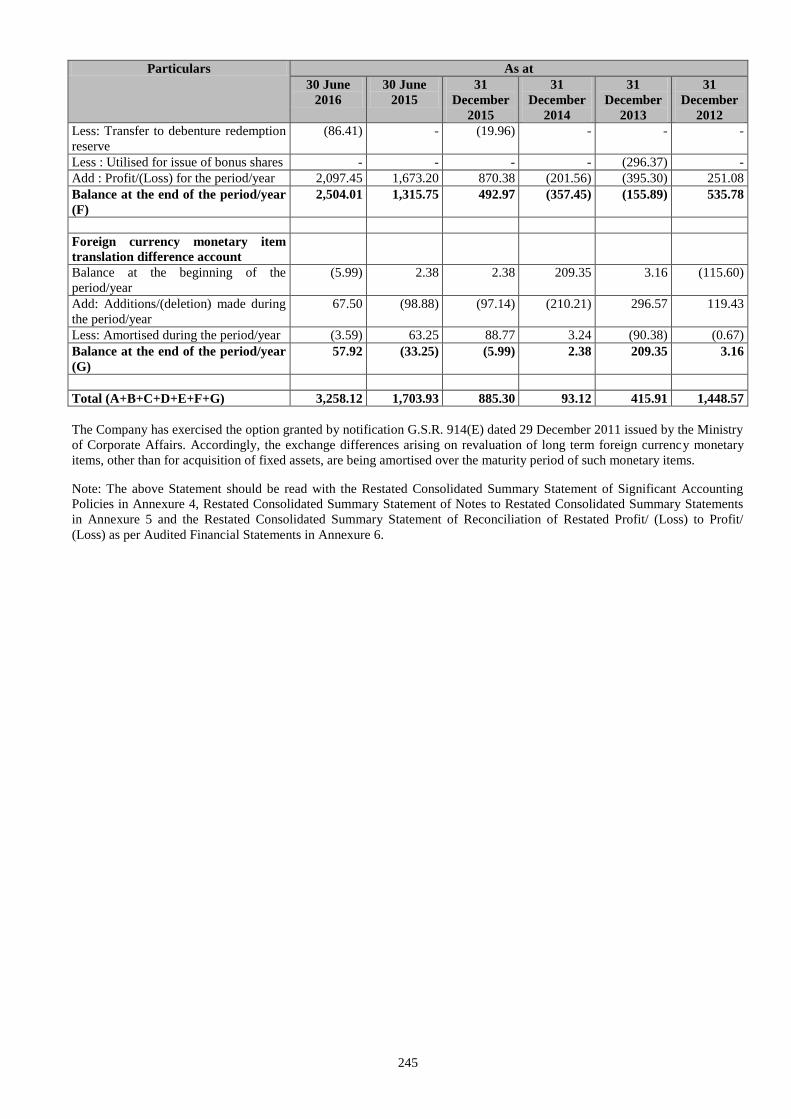
245
Particulars As at
30 June
2016
30 June
2015
31
December
2015
31
December
2014
31
December
2013
31
December
2012
Less: Transfer to debenture redemption
reserve
(86.41) - (19.96) - - -
Less : Utilised for issue of bonus shares - - - - (296.37) -
Add : Profit/(Loss) for the period/year 2,097.45 1,673.20 870.38 (201.56) (395.30) 251.08
Balance at the end of the period/year
(F)
2,504.01 1,315.75 492.97 (357.45) (155.89) 535.78
Foreign currency monetary item
translation difference account
Balance at the beginning of the
period/year
(5.99) 2.38 2.38 209.35 3.16 (115.60)
Add: Additions/(deletion) made during
the period/year
67.50 (98.88) (97.14) (210.21) 296.57 119.43
Less: Amortised during the period/year (3.59) 63.25 88.77 3.24 (90.38) (0.67)
Balance at the end of the period/year
(G)
57.92 (33.25) (5.99) 2.38 209.35 3.16
Total (A+B+C+D+E+F+G) 3,258.12 1,703.93 885.30 93.12 415.91 1,448.57
The Company has exercised the option granted by notification G.S.R. 914(E) dated 29 December 2011 issued by the Ministry
of Corporate Affairs. Accordingly, the exchange differences arising on revaluation of long term foreign currency monetary
items, other than for acquisition of fixed assets, are being amortised over the maturity period of such monetary items.
Note: The above Statement should be read with the Restated Consolidated Summary Statement of Significant Accounting
Policies in Annexure 4, Restated Consolidated Summary Statement of Notes to Restated Consolidated Summary Statements
in Annexure 5 and the Restated Consolidated Summary Statement of Reconciliation of Restated Profit/ (Loss) to Profit/
(Loss) as per Audited Financial Statements in Annexure 6.
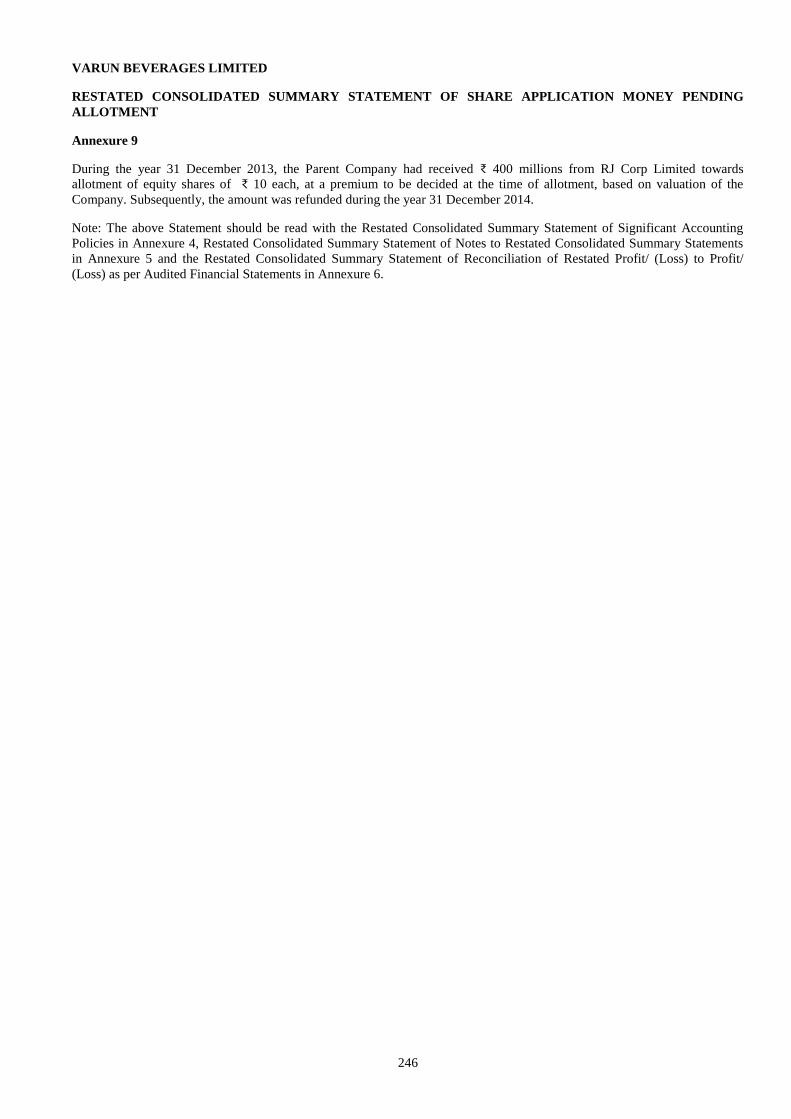
246
VARUN BEVERAGES LIMITED
RESTATED CONSOLIDATED SUMMARY STATEMENT OF SHARE APPLICATION MONEY PENDING
ALLOTMENT
Annexure 9
During the year 31 December 2013, the Parent Company had received ₹ 400 millions from RJ Corp Limited towards
allotment of equity shares of ₹ 10 each, at a premium to be decided at the time of allotment, based on valuation of the
Company. Subsequently, the amount was refunded during the year 31 December 2014.
Note: The above Statement should be read with the Restated Consolidated Summary Statement of Significant Accounting
Policies in Annexure 4, Restated Consolidated Summary Statement of Notes to Restated Consolidated Summary Statements
in Annexure 5 and the Restated Consolidated Summary Statement of Reconciliation of Restated Profit/ (Loss) to Profit/
(Loss) as per Audited Financial Statements in Annexure 6.
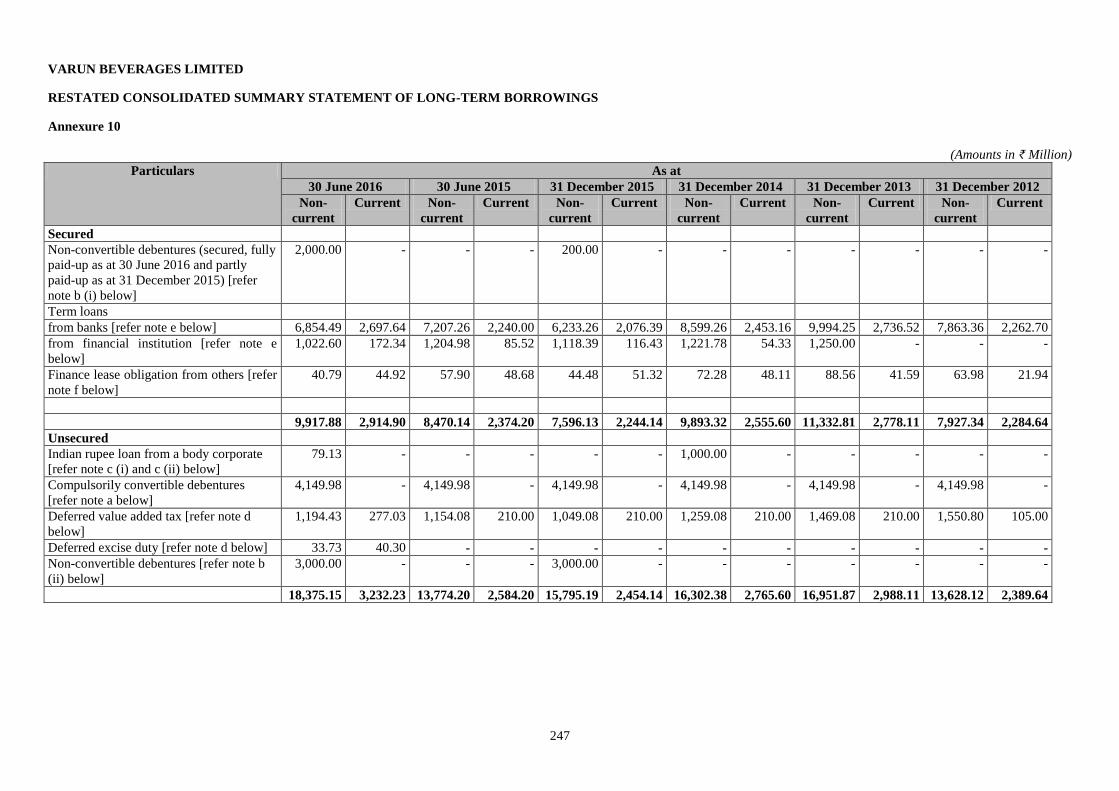
247
VARUN BEVERAGES LIMITED
RESTATED CONSOLIDATED SUMMARY STATEMENT OF LONG-TERM BORROWINGS
Annexure 10
(Amounts in ₹ Million)
Particulars As at
30 June 2016 30 June 2015 31 December 2015 31 December 2014 31 December 2013 31 December 2012
Non-
current
Current Non-
current
Current Non-
current
Current Non-
current
Current Non-
current
Current Non-
current
Current
Secured
Non-convertible debentures (secured, fully
paid-up as at 30 June 2016 and partly
paid-up as at 31 December 2015) [refer
note b (i) below]
2,000.00 - - - 200.00 - - - - - - -
Term loans
from banks [refer note e below] 6,854.49 2,697.64 7,207.26 2,240.00 6,233.26 2,076.39 8,599.26 2,453.16 9,994.25 2,736.52 7,863.36 2,262.70
from financial institution [refer note e
below]
1,022.60 172.34 1,204.98 85.52 1,118.39 116.43 1,221.78 54.33 1,250.00 - - -
Finance lease obligation from others [refer
note f below]
40.79 44.92 57.90 48.68 44.48 51.32 72.28 48.11 88.56 41.59 63.98 21.94
9,917.88 2,914.90 8,470.14 2,374.20 7,596.13 2,244.14 9,893.32 2,555.60 11,332.81 2,778.11 7,927.34 2,284.64
Unsecured
Indian rupee loan from a body corporate
[refer note c (i) and c (ii) below]
79.13 - - - - - 1,000.00 - - - - -
Compulsorily convertible debentures
[refer note a below]
4,149.98 - 4,149.98 - 4,149.98 - 4,149.98 - 4,149.98 - 4,149.98 -
Deferred value added tax [refer note d
below]
1,194.43 277.03 1,154.08 210.00 1,049.08 210.00 1,259.08 210.00 1,469.08 210.00 1,550.80 105.00
Deferred excise duty [refer note d below] 33.73 40.30 - - - - - - - - - -
Non-convertible debentures [refer note b
(ii) below]
3,000.00 - - - 3,000.00 - - - - - - -
18,375.15 3,232.23 13,774.20 2,584.20 15,795.19 2,454.14 16,302.38 2,765.60 16,951.87 2,988.11 13,628.12 2,389.64
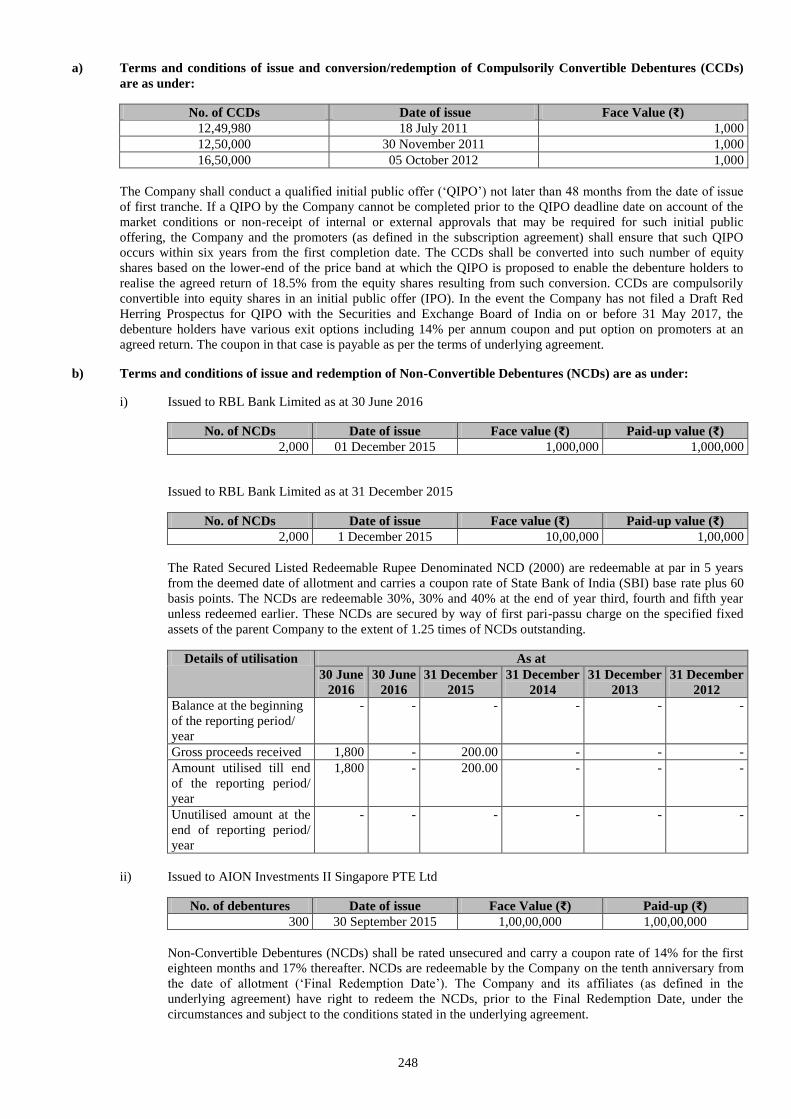
248
a) Terms and conditions of issue and conversion/redemption of Compulsorily Convertible Debentures (CCDs)
are as under:
No. of CCDs Date of issue Face Value (₹)
12,49,980 18 July 2011 1,000
12,50,000 30 November 2011 1,000
16,50,000 05 October 2012 1,000
The Company shall conduct a qualified initial public offer (‘QIPO’) not later than 48 months from the date of issue
of first tranche. If a QIPO by the Company cannot be completed prior to the QIPO deadline date on account of the
market conditions or non-receipt of internal or external approvals that may be required for such initial public
offering, the Company and the promoters (as defined in the subscription agreement) shall ensure that such QIPO
occurs within six years from the first completion date. The CCDs shall be converted into such number of equity
shares based on the lower-end of the price band at which the QIPO is proposed to enable the debenture holders to
realise the agreed return of 18.5% from the equity shares resulting from such conversion. CCDs are compulsorily
convertible into equity shares in an initial public offer (IPO). In the event the Company has not filed a Draft Red
Herring Prospectus for QIPO with the Securities and Exchange Board of India on or before 31 May 2017, the
debenture holders have various exit options including 14% per annum coupon and put option on promoters at an
agreed return. The coupon in that case is payable as per the terms of underlying agreement.
b) Terms and conditions of issue and redemption of Non-Convertible Debentures (NCDs) are as under:
i) Issued to RBL Bank Limited as at 30 June 2016
No. of NCDs Date of issue Face value (₹) Paid-up value (₹)
2,000 01 December 2015 1,000,000 1,000,000
Issued to RBL Bank Limited as at 31 December 2015
No. of NCDs Date of issue Face value (₹) Paid-up value (₹)
2,000 1 December 2015 10,00,000 1,00,000
The Rated Secured Listed Redeemable Rupee Denominated NCD (2000) are redeemable at par in 5 years
from the deemed date of allotment and carries a coupon rate of State Bank of India (SBI) base rate plus 60
basis points. The NCDs are redeemable 30%, 30% and 40% at the end of year third, fourth and fifth year
unless redeemed earlier. These NCDs are secured by way of first pari-passu charge on the specified fixed
assets of the parent Company to the extent of 1.25 times of NCDs outstanding.
Details of utilisation As at
30 June
2016
30 June
2016
31 December
2015
31 December
2014
31 December
2013
31 December
2012
Balance at the beginning
of the reporting period/
year
- - - - - -
Gross proceeds received 1,800 - 200.00 - - -
Amount utilised till end
of the reporting period/
year
1,800 - 200.00 - - -
Unutilised amount at the
end of reporting period/
year
- - - - - -
ii) Issued to AION Investments II Singapore PTE Ltd
No. of debentures Date of issue Face Value (₹) Paid-up (₹)
300 30 September 2015 1,00,00,000 1,00,00,000
Non-Convertible Debentures (NCDs) shall be rated unsecured and carry a coupon rate of 14% for the first
eighteen months and 17% thereafter. NCDs are redeemable by the Company on the tenth anniversary from
the date of allotment (‘Final Redemption Date’). The Company and its affiliates (as defined in the
underlying agreement) have right to redeem the NCDs, prior to the Final Redemption Date, under the
circumstances and subject to the conditions stated in the underlying agreement.
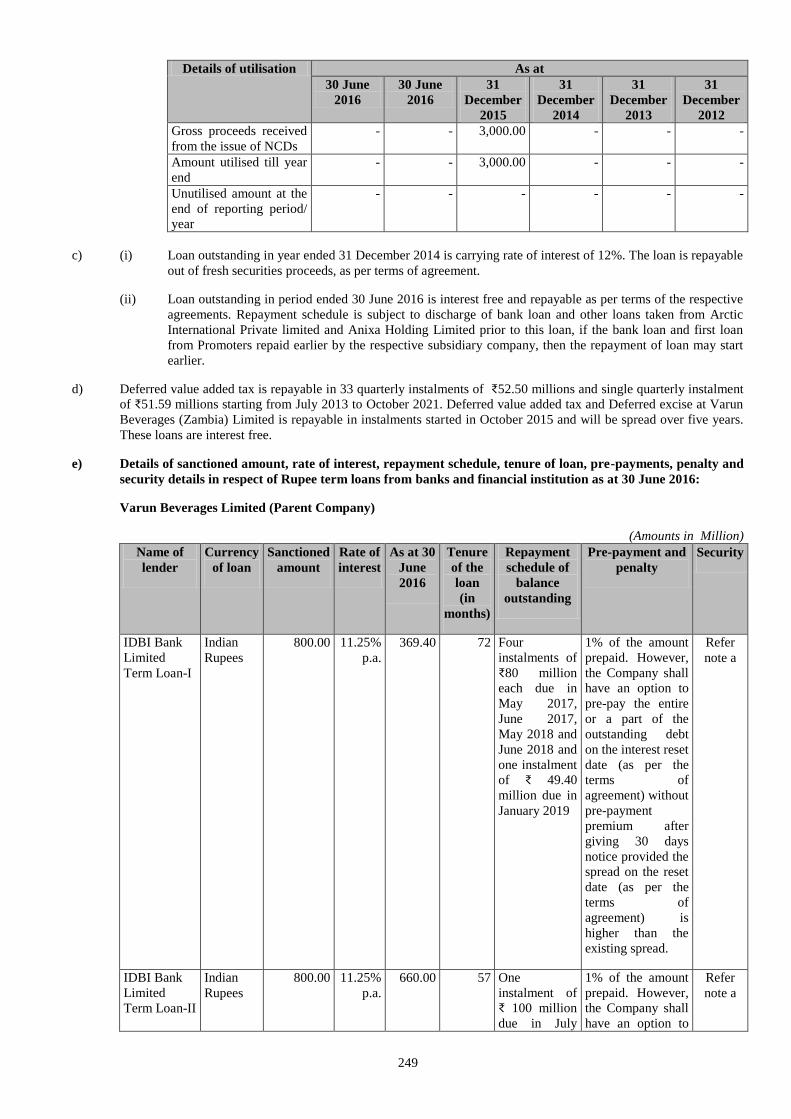
249
Details of utilisation As at
30 June
2016
30 June
2016
31
December
2015
31
December
2014
31
December
2013
31
December
2012
Gross proceeds received
from the issue of NCDs
- - 3,000.00 - - -
Amount utilised till year
end
- - 3,000.00 - - -
Unutilised amount at the
end of reporting period/
year
- - - - - -
c) (i) Loan outstanding in year ended 31 December 2014 is carrying rate of interest of 12%. The loan is repayable
out of fresh securities proceeds, as per terms of agreement.
(ii) Loan outstanding in period ended 30 June 2016 is interest free and repayable as per terms of the respective
agreements. Repayment schedule is subject to discharge of bank loan and other loans taken from Arctic
International Private limited and Anixa Holding Limited prior to this loan, if the bank loan and first loan
from Promoters repaid earlier by the respective subsidiary company, then the repayment of loan may start
earlier.
d) Deferred value added tax is repayable in 33 quarterly instalments of ₹52.50 millions and single quarterly instalment
of ₹51.59 millions starting from July 2013 to October 2021. Deferred value added tax and Deferred excise at Varun
Beverages (Zambia) Limited is repayable in instalments started in October 2015 and will be spread over five years.
These loans are interest free.
e) Details of sanctioned amount, rate of interest, repayment schedule, tenure of loan, pre-payments, penalty and
security details in respect of Rupee term loans from banks and financial institution as at 30 June 2016:
Varun Beverages Limited (Parent Company)
(Amounts in Million)
Name of
lender
Currency
of loan
Sanctioned
amount
Rate of
interest
As at 30
June
2016
Tenure
of the
loan
(in
months)
Repayment
schedule of
balance
outstanding
Pre-payment and
penalty
Security
IDBI Bank
Limited
Term Loan-I
Indian
Rupees
800.00 11.25%
p.a.
369.40 72 Four
instalments of
₹80 million
each due in
May 2017,
June 2017,
May 2018 and
June 2018 and
one instalment
of ₹ 49.40
million due in
January 2019
1% of the amount
prepaid. However,
the Company shall
have an option to
pre-pay the entire
or a part of the
outstanding debt
on the interest reset
date (as per the
terms of
agreement) without
pre-payment
premium after
giving 30 days
notice provided the
spread on the reset
date (as per the
terms of
agreement) is
higher than the
existing spread.
Refer
note a
IDBI Bank
Limited
Term Loan-II
Indian
Rupees
800.00 11.25%
p.a.
660.00 57 One
instalment of
₹ 100 million
due in July
1% of the amount
prepaid. However,
the Company shall
have an option to
Refer
note a
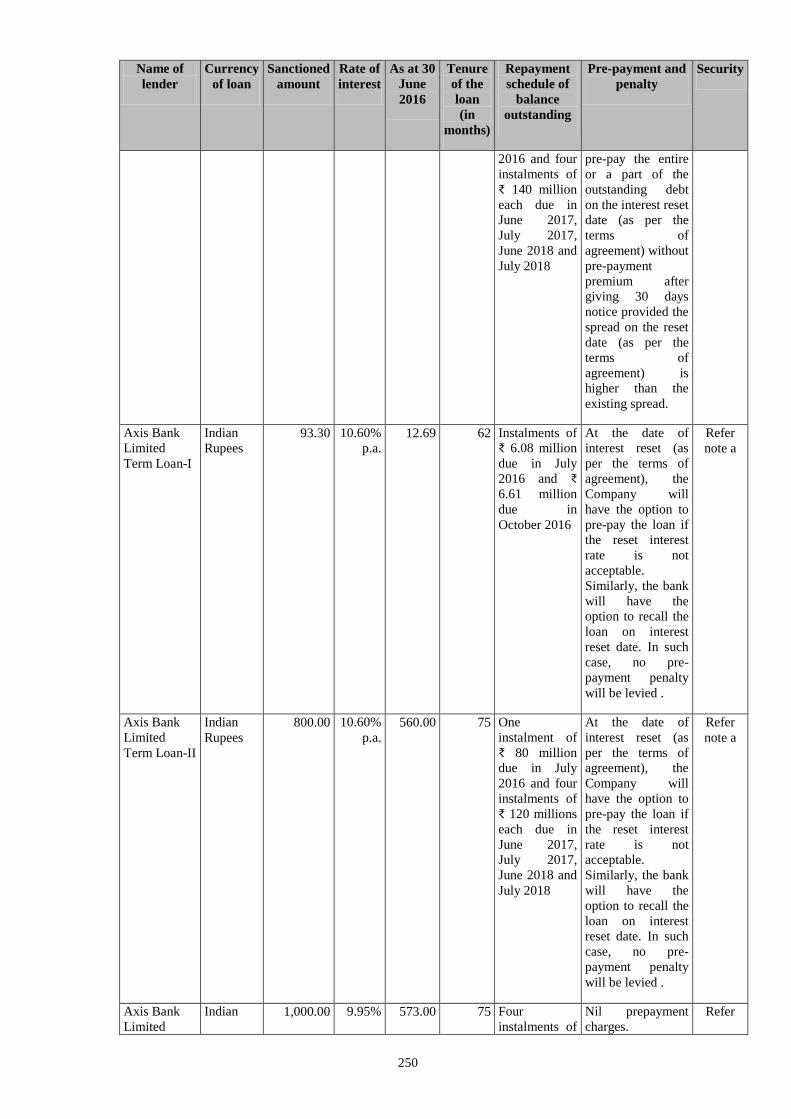
250
Name of
lender
Currency
of loan
Sanctioned
amount
Rate of
interest
As at 30
June
2016
Tenure
of the
loan
(in
months)
Repayment
schedule of
balance
outstanding
Pre-payment and
penalty
Security
2016 and four
instalments of
₹ 140 million
each due in
June 2017,
July 2017,
June 2018 and
July 2018
pre-pay the entire
or a part of the
outstanding debt
on the interest reset
date (as per the
terms of
agreement) without
pre-payment
premium after
giving 30 days
notice provided the
spread on the reset
date (as per the
terms of
agreement) is
higher than the
existing spread.
Axis Bank
Limited
Term Loan-I
Indian
Rupees
93.30 10.60%
p.a.
12.69 62 Instalments of
₹ 6.08 million
due in July
2016 and ₹
6.61 million
due in
October 2016
At the date of
interest reset (as
per the terms of
agreement), the
Company will
have the option to
pre-pay the loan if
the reset interest
rate is not
acceptable.
Similarly, the bank
will have the
option to recall the
loan on interest
reset date. In such
case, no pre-
payment penalty
will be levied .
Refer
note a
Axis Bank
Limited
Term Loan-II
Indian
Rupees
800.00 10.60%
p.a.
560.00 75 One
instalment of
₹ 80 million
due in July
2016 and four
instalments of
₹ 120 millions
each due in
June 2017,
July 2017,
June 2018 and
July 2018
At the date of
interest reset (as
per the terms of
agreement), the
Company will
have the option to
pre-pay the loan if
the reset interest
rate is not
acceptable.
Similarly, the bank
will have the
option to recall the
loan on interest
reset date. In such
case, no pre-
payment penalty
will be levied .
Refer
note a
Axis Bank
Limited
Indian 1,000.00 9.95% 573.00 75 Four
instalments of
Nil prepayment
charges.
Refer
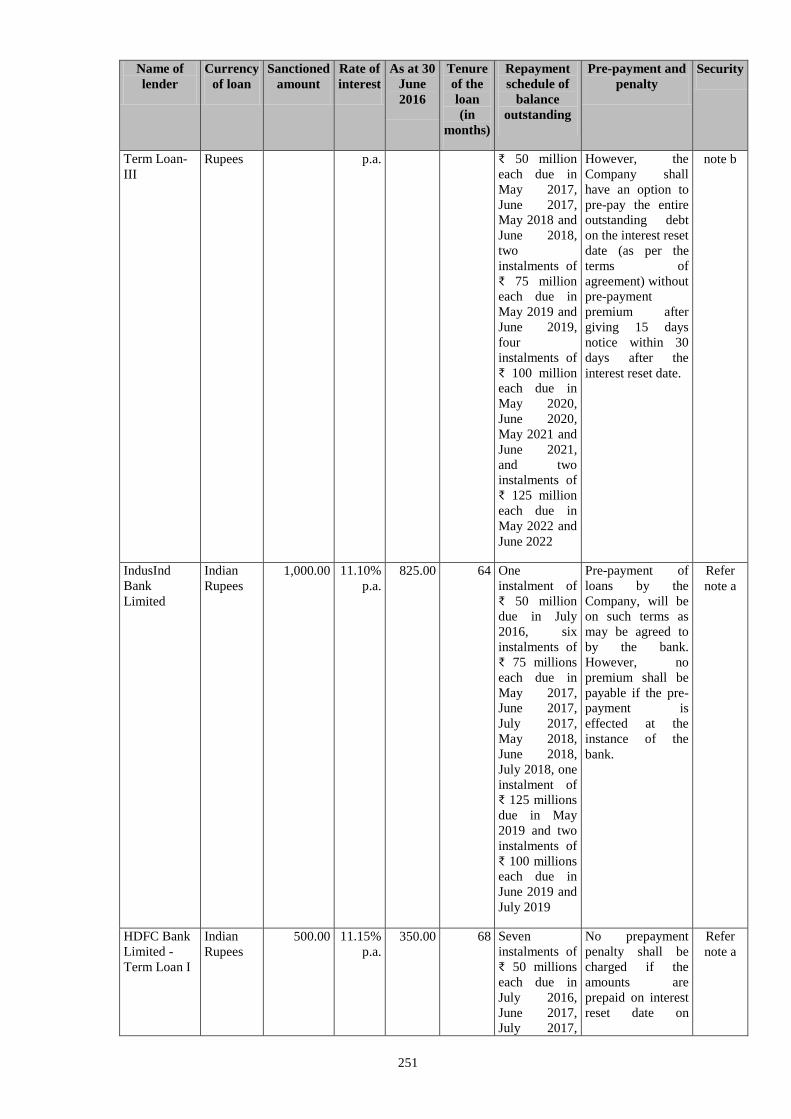
251
Name of
lender
Currency
of loan
Sanctioned
amount
Rate of
interest
As at 30
June
2016
Tenure
of the
loan
(in
months)
Repayment
schedule of
balance
outstanding
Pre-payment and
penalty
Security
Term Loan-
III
Rupees p.a. ₹ 50 million
each due in
May 2017,
June 2017,
May 2018 and
June 2018,
two
instalments of
₹ 75 million
each due in
May 2019 and
June 2019,
four
instalments of
₹ 100 million
each due in
May 2020,
June 2020,
May 2021 and
June 2021,
and two
instalments of
₹ 125 million
each due in
May 2022 and
June 2022
However, the
Company shall
have an option to
pre-pay the entire
outstanding debt
on the interest reset
date (as per the
terms of
agreement) without
pre-payment
premium after
giving 15 days
notice within 30
days after the
interest reset date.
note b
IndusInd
Bank
Limited
Indian
Rupees
1,000.00 11.10%
p.a.
825.00 64 One
instalment of
₹ 50 million
due in July
2016, six
instalments of
₹ 75 millions
each due in
May 2017,
June 2017,
July 2017,
May 2018,
June 2018,
July 2018, one
instalment of
₹ 125 millions
due in May
2019 and two
instalments of
₹ 100 millions
each due in
June 2019 and
July 2019
Pre-payment of
loans by the
Company, will be
on such terms as
may be agreed to
by the bank.
However, no
premium shall be
payable if the pre-
payment is
effected at the
instance of the
bank.
Refer
note a
HDFC Bank
Limited -
Term Loan I
Indian
Rupees
500.00 11.15%
p.a.
350.00 68 Seven
instalments of
₹ 50 millions
each due in
July 2016,
June 2017,
July 2017,
No prepayment
penalty shall be
charged if the
amounts are
prepaid on interest
reset date on
Refer
note a
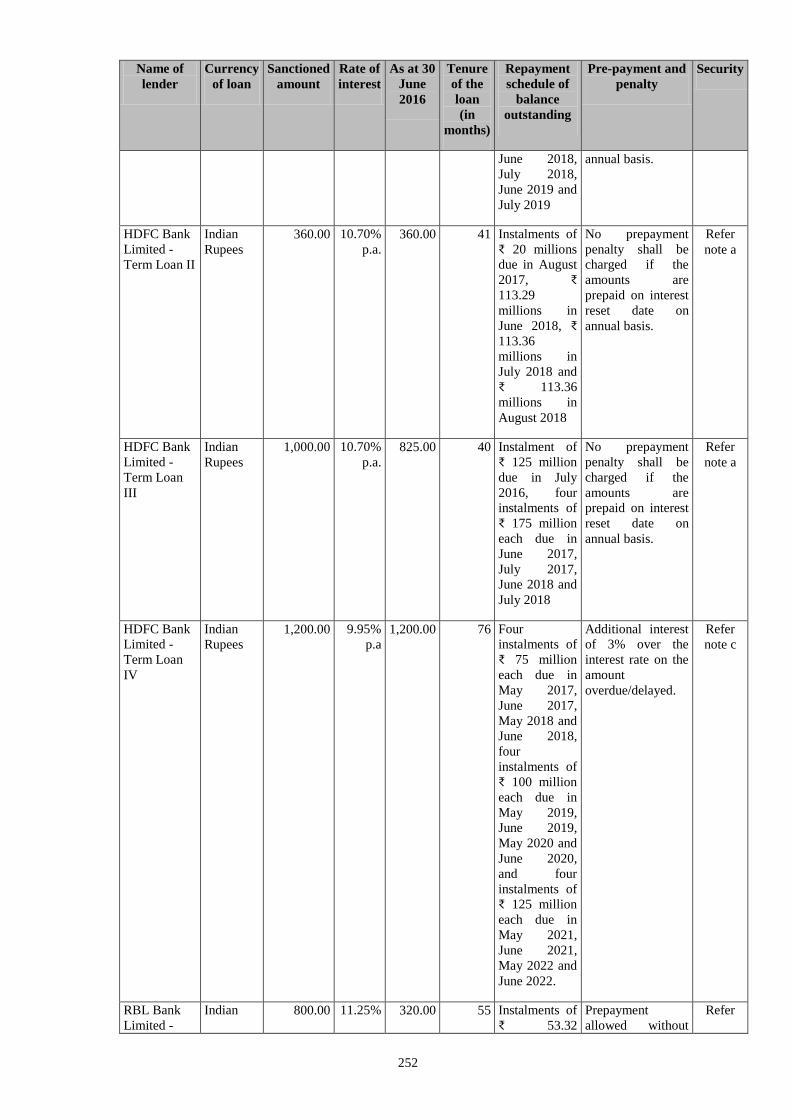
252
Name of
lender
Currency
of loan
Sanctioned
amount
Rate of
interest
As at 30
June
2016
Tenure
of the
loan
(in
months)
Repayment
schedule of
balance
outstanding
Pre-payment and
penalty
Security
June 2018,
July 2018,
June 2019 and
July 2019
annual basis.
HDFC Bank
Limited -
Term Loan II
Indian
Rupees
360.00 10.70%
p.a.
360.00 41 Instalments of
₹ 20 millions
due in August
2017, ₹
113.29
millions in
June 2018, ₹
113.36
millions in
July 2018 and
₹ 113.36
millions in
August 2018
No prepayment
penalty shall be
charged if the
amounts are
prepaid on interest
reset date on
annual basis.
Refer
note a
HDFC Bank
Limited -
Term Loan
III
Indian
Rupees
1,000.00 10.70%
p.a.
825.00 40 Instalment of
₹ 125 million
due in July
2016, four
instalments of
₹ 175 million
each due in
June 2017,
July 2017,
June 2018 and
July 2018
No prepayment
penalty shall be
charged if the
amounts are
prepaid on interest
reset date on
annual basis.
Refer
note a
HDFC Bank
Limited -
Term Loan
IV
Indian
Rupees
1,200.00 9.95%
p.a
1,200.00 76 Four
instalments of
₹ 75 million
each due in
May 2017,
June 2017,
May 2018 and
June 2018,
four
instalments of
₹ 100 million
each due in
May 2019,
June 2019,
May 2020 and
June 2020,
and four
instalments of
₹ 125 million
each due in
May 2021,
June 2021,
May 2022 and
June 2022.
Additional interest
of 3% over the
interest rate on the
amount
overdue/delayed.
Refer
note c
RBL Bank
Limited -
Indian 800.00 11.25% 320.00 55 Instalments of
₹ 53.32
Prepayment
allowed without
Refer
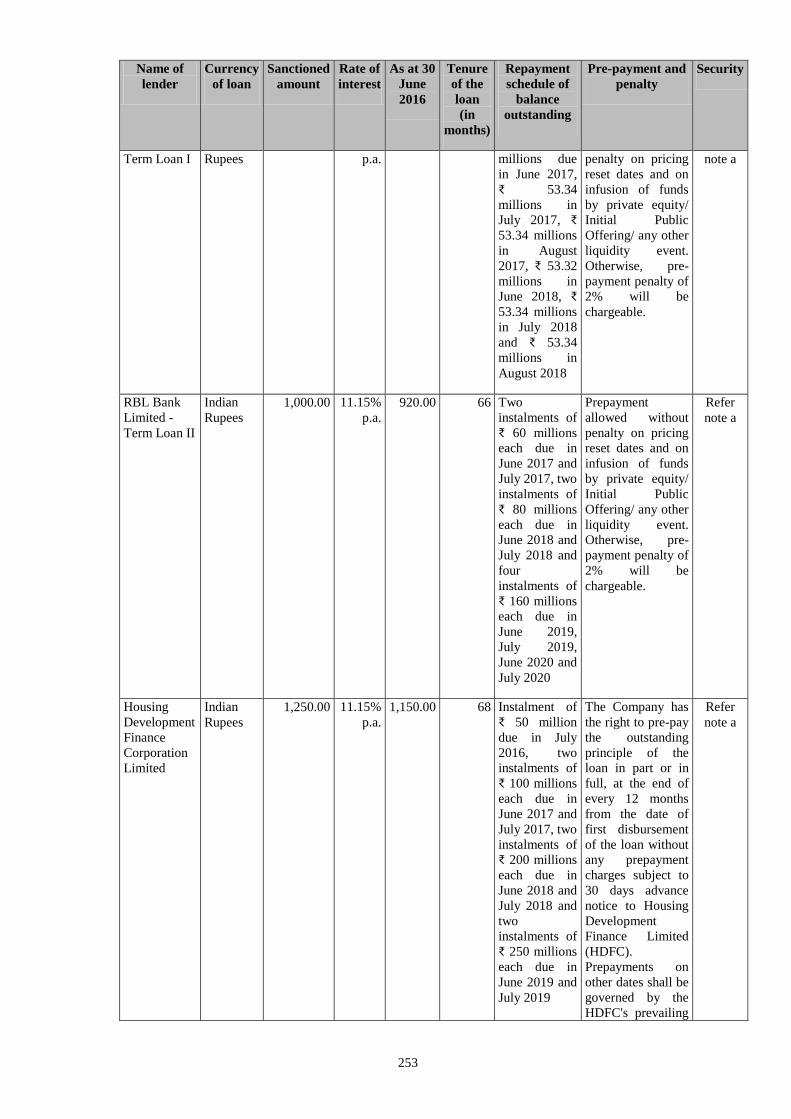
253
Name of
lender
Currency
of loan
Sanctioned
amount
Rate of
interest
As at 30
June
2016
Tenure
of the
loan
(in
months)
Repayment
schedule of
balance
outstanding
Pre-payment and
penalty
Security
Term Loan I Rupees p.a. millions due
in June 2017,
₹ 53.34
millions in
July 2017, ₹
53.34 millions
in August
2017, ₹ 53.32
millions in
June 2018, ₹
53.34 millions
in July 2018
and ₹ 53.34
millions in
August 2018
penalty on pricing
reset dates and on
infusion of funds
by private equity/
Initial Public
Offering/ any other
liquidity event.
Otherwise, pre-
payment penalty of
2% will be
chargeable.
note a
RBL Bank
Limited -
Term Loan II
Indian
Rupees
1,000.00 11.15%
p.a.
920.00 66 Two
instalments of
₹ 60 millions
each due in
June 2017 and
July 2017, two
instalments of
₹ 80 millions
each due in
June 2018 and
July 2018 and
four
instalments of
₹ 160 millions
each due in
June 2019,
July 2019,
June 2020 and
July 2020
Prepayment
allowed without
penalty on pricing
reset dates and on
infusion of funds
by private equity/
Initial Public
Offering/ any other
liquidity event.
Otherwise, pre-
payment penalty of
2% will be
chargeable.
Refer
note a
Housing
Development
Finance
Corporation
Limited
Indian
Rupees
1,250.00 11.15%
p.a.
1,150.00 68 Instalment of
₹ 50 million
due in July
2016, two
instalments of
₹ 100 millions
each due in
June 2017 and
July 2017, two
instalments of
₹ 200 millions
each due in
June 2018 and
July 2018 and
two
instalments of
₹ 250 millions
each due in
June 2019 and
July 2019
The Company has
the right to pre-pay
the outstanding
principle of the
loan in part or in
full, at the end of
every 12 months
from the date of
first disbursement
of the loan without
any prepayment
charges subject to
30 days advance
notice to Housing
Development
Finance Limited
(HDFC).
Prepayments on
other dates shall be
governed by the
HDFC's prevailing
Refer
note a
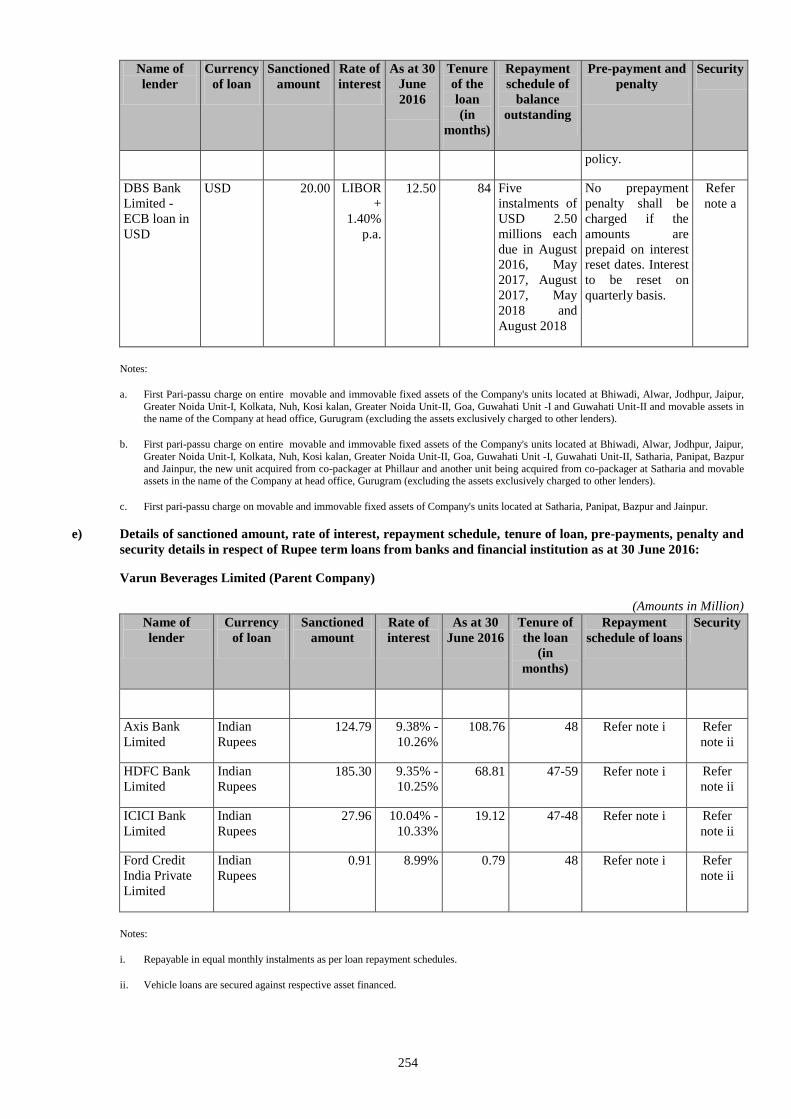
254
Name of
lender
Currency
of loan
Sanctioned
amount
Rate of
interest
As at 30
June
2016
Tenure
of the
loan
(in
months)
Repayment
schedule of
balance
outstanding
Pre-payment and
penalty
Security
policy.
DBS Bank
Limited -
ECB loan in
USD
USD 20.00 LIBOR
+
1.40%
p.a.
12.50 84 Five
instalments of
USD 2.50
millions each
due in August
2016, May
2017, August
2017, May
2018 and
August 2018
No prepayment
penalty shall be
charged if the
amounts are
prepaid on interest
reset dates. Interest
to be reset on
quarterly basis.
Refer
note a
Notes:
a. First Pari-passu charge on entire movable and immovable fixed assets of the Company's units located at Bhiwadi, Alwar, Jodhpur, Jaipur,
Greater Noida Unit-I, Kolkata, Nuh, Kosi kalan, Greater Noida Unit-II, Goa, Guwahati Unit -I and Guwahati Unit-II and movable assets in the name of the Company at head office, Gurugram (excluding the assets exclusively charged to other lenders).
b. First pari-passu charge on entire movable and immovable fixed assets of the Company's units located at Bhiwadi, Alwar, Jodhpur, Jaipur,
Greater Noida Unit-I, Kolkata, Nuh, Kosi kalan, Greater Noida Unit-II, Goa, Guwahati Unit -I, Guwahati Unit-II, Satharia, Panipat, Bazpur
and Jainpur, the new unit acquired from co-packager at Phillaur and another unit being acquired from co-packager at Satharia and movable assets in the name of the Company at head office, Gurugram (excluding the assets exclusively charged to other lenders).
c. First pari-passu charge on movable and immovable fixed assets of Company's units located at Satharia, Panipat, Bazpur and Jainpur.
e) Details of sanctioned amount, rate of interest, repayment schedule, tenure of loan, pre-payments, penalty and
security details in respect of Rupee term loans from banks and financial institution as at 30 June 2016:
Varun Beverages Limited (Parent Company)
(Amounts in Million)
Name of
lender
Currency
of loan
Sanctioned
amount
Rate of
interest
As at 30
June 2016
Tenure of
the loan
(in
months)
Repayment
schedule of loans
Security
Axis Bank
Limited
Indian
Rupees
124.79 9.38% -
10.26%
108.76 48 Refer note i Refer
note ii
HDFC Bank
Limited
Indian
Rupees
185.30 9.35% -
10.25%
68.81 47-59 Refer note i Refer
note ii
ICICI Bank
Limited
Indian
Rupees
27.96 10.04% -
10.33%
19.12 47-48 Refer note i Refer
note ii
Ford Credit
India Private
Limited
Indian
Rupees
0.91 8.99% 0.79 48 Refer note i Refer
note ii
Notes:
i. Repayable in equal monthly instalments as per loan repayment schedules.
ii. Vehicle loans are secured against respective asset financed.
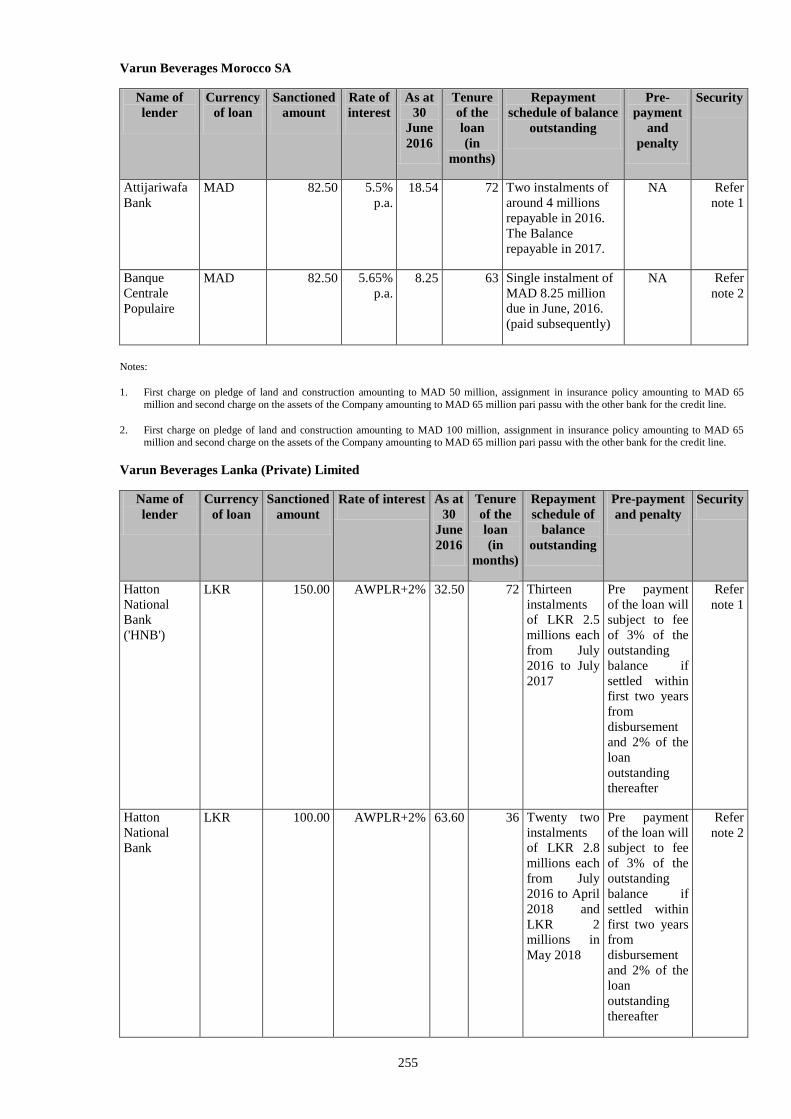
255
Varun Beverages Morocco SA
Name of
lender
Currency
of loan
Sanctioned
amount
Rate of
interest
As at
30
June
2016
Tenure
of the
loan
(in
months)
Repayment
schedule of balance
outstanding
Pre-
payment
and
penalty
Security
Attijariwafa
Bank
MAD 82.50 5.5%
p.a.
18.54 72 Two instalments of
around 4 millions
repayable in 2016.
The Balance
repayable in 2017.
NA Refer
note 1
Banque
Centrale
Populaire
MAD 82.50 5.65%
p.a.
8.25 63 Single instalment of
MAD 8.25 million
due in June, 2016.
(paid subsequently)
NA Refer
note 2
Notes:
1. First charge on pledge of land and construction amounting to MAD 50 million, assignment in insurance policy amounting to MAD 65
million and second charge on the assets of the Company amounting to MAD 65 million pari passu with the other bank for the credit line.
2. First charge on pledge of land and construction amounting to MAD 100 million, assignment in insurance policy amounting to MAD 65
million and second charge on the assets of the Company amounting to MAD 65 million pari passu with the other bank for the credit line.
Varun Beverages Lanka (Private) Limited
Name of
lender
Currency
of loan
Sanctioned
amount
Rate of interest As at
30
June
2016
Tenure
of the
loan
(in
months)
Repayment
schedule of
balance
outstanding
Pre-payment
and penalty
Security
Hatton
National
Bank
('HNB')
LKR 150.00 AWPLR+2% 32.50 72 Thirteen
instalments
of LKR 2.5
millions each
from July
2016 to July
2017
Pre payment
of the loan will
subject to fee
of 3% of the
outstanding
balance if
settled within
first two years
from
disbursement
and 2% of the
loan
outstanding
thereafter
Refer
note 1
Hatton
National
Bank
LKR 100.00 AWPLR+2% 63.60 36 Twenty two
instalments
of LKR 2.8
millions each
from July
2016 to April
2018 and
LKR 2
millions in
May 2018
Pre payment
of the loan will
subject to fee
of 3% of the
outstanding
balance if
settled within
first two years
from
disbursement
and 2% of the
loan
outstanding
thereafter
Refer
note 2
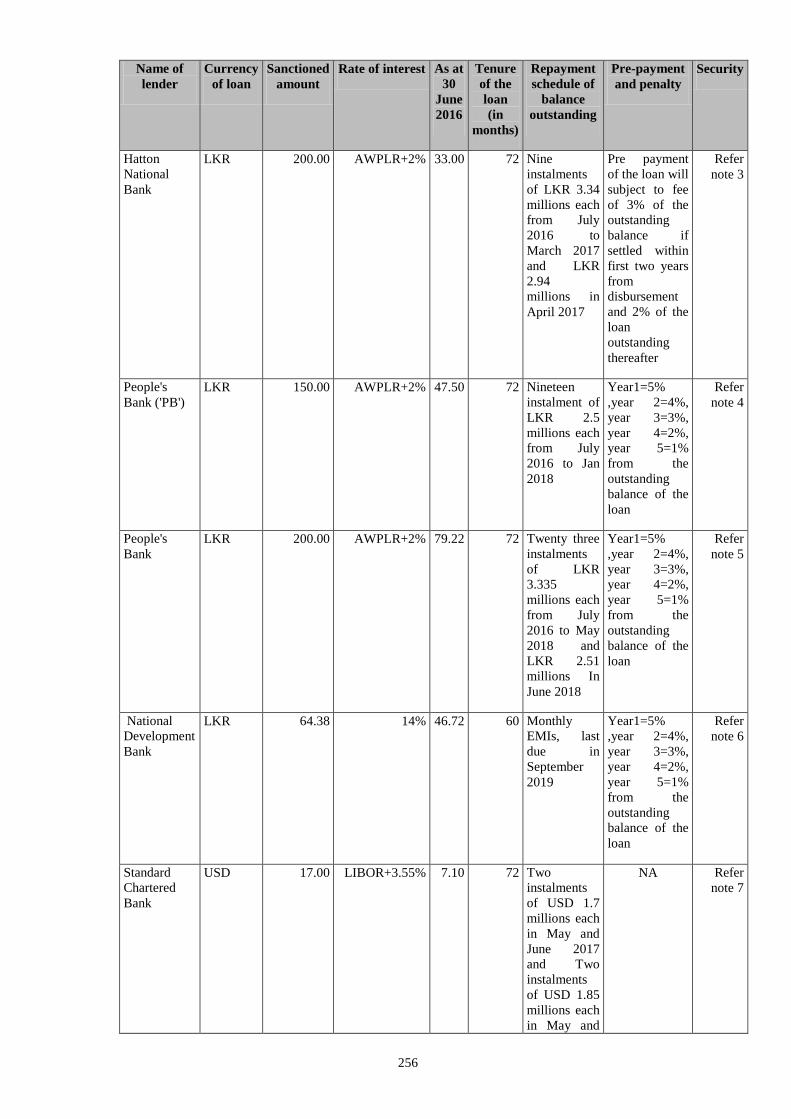
256
Name of
lender
Currency
of loan
Sanctioned
amount
Rate of interest As at
30
June
2016
Tenure
of the
loan
(in
months)
Repayment
schedule of
balance
outstanding
Pre-payment
and penalty
Security
Hatton
National
Bank
LKR 200.00 AWPLR+2% 33.00 72 Nine
instalments
of LKR 3.34
millions each
from July
2016 to
March 2017
and LKR
2.94
millions in
April 2017
Pre payment
of the loan will
subject to fee
of 3% of the
outstanding
balance if
settled within
first two years
from
disbursement
and 2% of the
loan
outstanding
thereafter
Refer
note 3
People's
Bank ('PB')
LKR 150.00 AWPLR+2% 47.50 72 Nineteen
instalment of
LKR 2.5
millions each
from July
2016 to Jan
2018
Year1=5%
,year 2=4%,
year 3=3%,
year 4=2%,
year 5=1%
from the
outstanding
balance of the
loan
Refer
note 4
People's
Bank
LKR 200.00 AWPLR+2% 79.22 72 Twenty three
instalments
of LKR
3.335
millions each
from July
2016 to May
2018 and
LKR 2.51
millions In
June 2018
Year1=5%
,year 2=4%,
year 3=3%,
year 4=2%,
year 5=1%
from the
outstanding
balance of the
loan
Refer
note 5
National
Development
Bank
LKR 64.38 14% 46.72 60 Monthly
EMIs, last
due in
September
2019
Year1=5%
,year 2=4%,
year 3=3%,
year 4=2%,
year 5=1%
from the
outstanding
balance of the
loan
Refer
note 6
Standard
Chartered
Bank
USD 17.00 LIBOR+3.55% 7.10 72 Two
instalments
of USD 1.7
millions each
in May and
June 2017
and Two
instalments
of USD 1.85
millions each
in May and
NA Refer
note 7
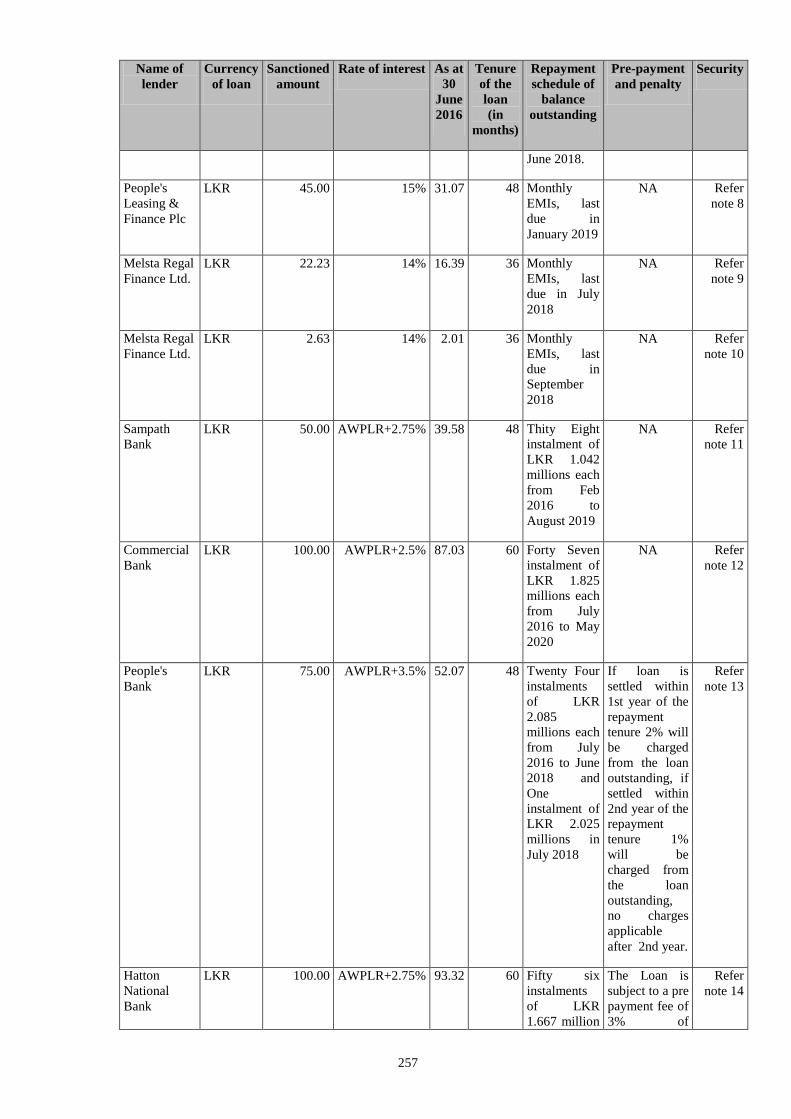
257
Name of
lender
Currency
of loan
Sanctioned
amount
Rate of interest As at
30
June
2016
Tenure
of the
loan
(in
months)
Repayment
schedule of
balance
outstanding
Pre-payment
and penalty
Security
June 2018.
People's
Leasing &
Finance Plc
LKR 45.00 15% 31.07 48 Monthly
EMIs, last
due in
January 2019
NA Refer
note 8
Melsta Regal
Finance Ltd.
LKR 22.23 14% 16.39 36 Monthly
EMIs, last
due in July
2018
NA Refer
note 9
Melsta Regal
Finance Ltd.
LKR 2.63 14% 2.01 36 Monthly
EMIs, last
due in
September
2018
NA Refer
note 10
Sampath
Bank
LKR 50.00 AWPLR+2.75% 39.58 48 Thity Eight
instalment of
LKR 1.042
millions each
from Feb
2016 to
August 2019
NA Refer
note 11
Commercial
Bank
LKR 100.00 AWPLR+2.5% 87.03 60 Forty Seven
instalment of
LKR 1.825
millions each
from July
2016 to May
2020
NA Refer
note 12
People's
Bank
LKR 75.00 AWPLR+3.5% 52.07 48 Twenty Four
instalments
of LKR
2.085
millions each
from July
2016 to June
2018 and
One
instalment of
LKR 2.025
millions in
July 2018
If loan is
settled within
1st year of the
repayment
tenure 2% will
be charged
from the loan
outstanding, if
settled within
2nd year of the
repayment
tenure 1%
will be
charged from
the loan
outstanding,
no charges
applicable
after 2nd year.
Refer
note 13
Hatton
National
Bank
LKR 100.00 AWPLR+2.75% 93.32 60 Fifty six
instalments
of LKR
1.667 million
The Loan is
subject to a pre
payment fee of
3% of
Refer
note 14
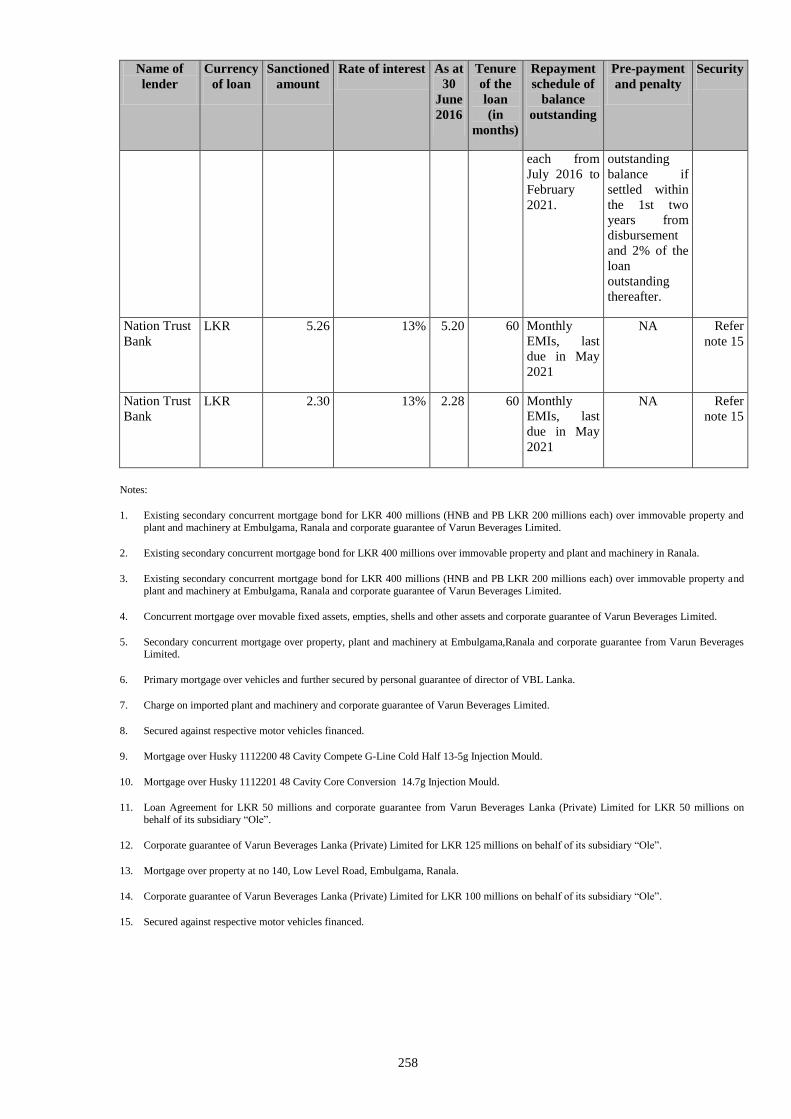
258
Name of
lender
Currency
of loan
Sanctioned
amount
Rate of interest As at
30
June
2016
Tenure
of the
loan
(in
months)
Repayment
schedule of
balance
outstanding
Pre-payment
and penalty
Security
each from
July 2016 to
February
2021.
outstanding
balance if
settled within
the 1st two
years from
disbursement
and 2% of the
loan
outstanding
thereafter.
Nation Trust
Bank
LKR 5.26 13% 5.20 60 Monthly
EMIs, last
due in May
2021
NA Refer
note 15
Nation Trust
Bank
LKR 2.30 13% 2.28 60 Monthly
EMIs, last
due in May
2021
NA Refer
note 15
Notes:
1. Existing secondary concurrent mortgage bond for LKR 400 millions (HNB and PB LKR 200 millions each) over immovable property and
plant and machinery at Embulgama, Ranala and corporate guarantee of Varun Beverages Limited.
2. Existing secondary concurrent mortgage bond for LKR 400 millions over immovable property and plant and machinery in Ranala.
3. Existing secondary concurrent mortgage bond for LKR 400 millions (HNB and PB LKR 200 millions each) over immovable property and
plant and machinery at Embulgama, Ranala and corporate guarantee of Varun Beverages Limited.
4. Concurrent mortgage over movable fixed assets, empties, shells and other assets and corporate guarantee of Varun Beverages Limited.
5. Secondary concurrent mortgage over property, plant and machinery at Embulgama,Ranala and corporate guarantee from Varun Beverages Limited.
6. Primary mortgage over vehicles and further secured by personal guarantee of director of VBL Lanka.
7. Charge on imported plant and machinery and corporate guarantee of Varun Beverages Limited.
8. Secured against respective motor vehicles financed.
9. Mortgage over Husky 1112200 48 Cavity Compete G-Line Cold Half 13-5g Injection Mould.
10. Mortgage over Husky 1112201 48 Cavity Core Conversion 14.7g Injection Mould.
11. Loan Agreement for LKR 50 millions and corporate guarantee from Varun Beverages Lanka (Private) Limited for LKR 50 millions on
behalf of its subsidiary “Ole”.
12. Corporate guarantee of Varun Beverages Lanka (Private) Limited for LKR 125 millions on behalf of its subsidiary “Ole”.
13. Mortgage over property at no 140, Low Level Road, Embulgama, Ranala.
14. Corporate guarantee of Varun Beverages Lanka (Private) Limited for LKR 100 millions on behalf of its subsidiary “Ole”.
15. Secured against respective motor vehicles financed.
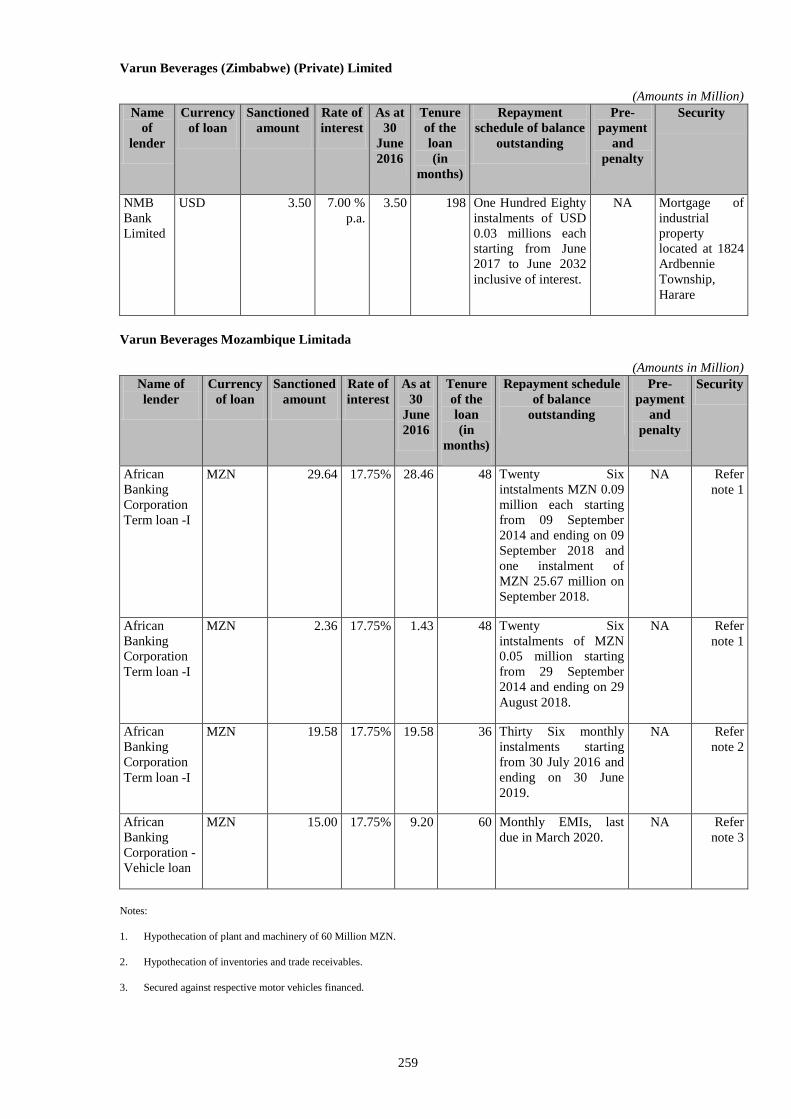
259
Varun Beverages (Zimbabwe) (Private) Limited
(Amounts in Million)
Name
of
lender
Currency
of loan
Sanctioned
amount
Rate of
interest
As at
30
June
2016
Tenure
of the
loan
(in
months)
Repayment
schedule of balance
outstanding
Pre-
payment
and
penalty
Security
NMB
Bank
Limited
USD 3.50 7.00 %
p.a.
3.50 198 One Hundred Eighty
instalments of USD
0.03 millions each
starting from June
2017 to June 2032
inclusive of interest.
NA Mortgage of
industrial
property
located at 1824
Ardbennie
Township,
Harare
Varun Beverages Mozambique Limitada
(Amounts in Million)
Name of
lender
Currency
of loan
Sanctioned
amount
Rate of
interest
As at
30
June
2016
Tenure
of the
loan
(in
months)
Repayment schedule
of balance
outstanding
Pre-
payment
and
penalty
Security
African
Banking
Corporation
Term loan -I
MZN 29.64 17.75% 28.46 48 Twenty Six
intstalments MZN 0.09
million each starting
from 09 September
2014 and ending on 09
September 2018 and
one instalment of
MZN 25.67 million on
September 2018.
NA Refer
note 1
African
Banking
Corporation
Term loan -I
MZN 2.36 17.75% 1.43 48 Twenty Six
intstalments of MZN
0.05 million starting
from 29 September
2014 and ending on 29
August 2018.
NA Refer
note 1
African
Banking
Corporation
Term loan -I
MZN 19.58 17.75% 19.58 36 Thirty Six monthly
instalments starting
from 30 July 2016 and
ending on 30 June
2019.
NA Refer
note 2
African
Banking
Corporation -
Vehicle loan
MZN 15.00 17.75% 9.20 60 Monthly EMIs, last
due in March 2020.
NA Refer
note 3
Notes:
1. Hypothecation of plant and machinery of 60 Million MZN.
2. Hypothecation of inventories and trade receivables.
3. Secured against respective motor vehicles financed.
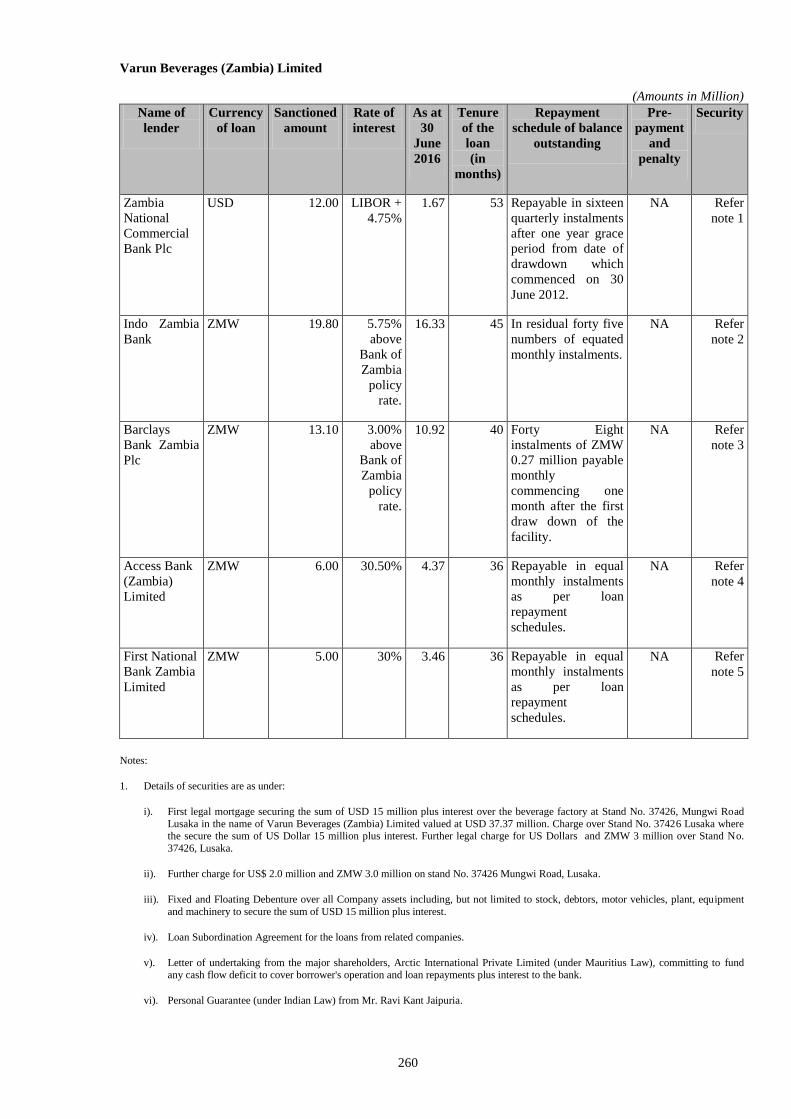
260
Varun Beverages (Zambia) Limited
(Amounts in Million)
Name of
lender
Currency
of loan
Sanctioned
amount
Rate of
interest
As at
30
June
2016
Tenure
of the
loan
(in
months)
Repayment
schedule of balance
outstanding
Pre-
payment
and
penalty
Security
Zambia
National
Commercial
Bank Plc
USD 12.00 LIBOR +
4.75%
1.67 53 Repayable in sixteen
quarterly instalments
after one year grace
period from date of
drawdown which
commenced on 30
June 2012.
NA Refer
note 1
Indo Zambia
Bank
ZMW 19.80 5.75%
above
Bank of
Zambia
policy
rate.
16.33 45 In residual forty five
numbers of equated
monthly instalments.
NA Refer
note 2
Barclays
Bank Zambia
Plc
ZMW 13.10 3.00%
above
Bank of
Zambia
policy
rate.
10.92 40 Forty Eight
instalments of ZMW
0.27 million payable
monthly
commencing one
month after the first
draw down of the
facility.
NA Refer
note 3
Access Bank
(Zambia)
Limited
ZMW 6.00 30.50% 4.37 36 Repayable in equal
monthly instalments
as per loan
repayment
schedules.
NA Refer
note 4
First National
Bank Zambia
Limited
ZMW 5.00 30% 3.46 36 Repayable in equal
monthly instalments
as per loan
repayment
schedules.
NA Refer
note 5
Notes:
1. Details of securities are as under:
i). First legal mortgage securing the sum of USD 15 million plus interest over the beverage factory at Stand No. 37426, Mungwi Road
Lusaka in the name of Varun Beverages (Zambia) Limited valued at USD 37.37 million. Charge over Stand No. 37426 Lusaka where the secure the sum of US Dollar 15 million plus interest. Further legal charge for US Dollars and ZMW 3 million over Stand No.
37426, Lusaka.
ii). Further charge for US$ 2.0 million and ZMW 3.0 million on stand No. 37426 Mungwi Road, Lusaka.
iii). Fixed and Floating Debenture over all Company assets including, but not limited to stock, debtors, motor vehicles, plant, equipment
and machinery to secure the sum of USD 15 million plus interest.
iv). Loan Subordination Agreement for the loans from related companies.
v). Letter of undertaking from the major shareholders, Arctic International Private Limited (under Mauritius Law), committing to fund any cash flow deficit to cover borrower's operation and loan repayments plus interest to the bank.
vi). Personal Guarantee (under Indian Law) from Mr. Ravi Kant Jaipuria.
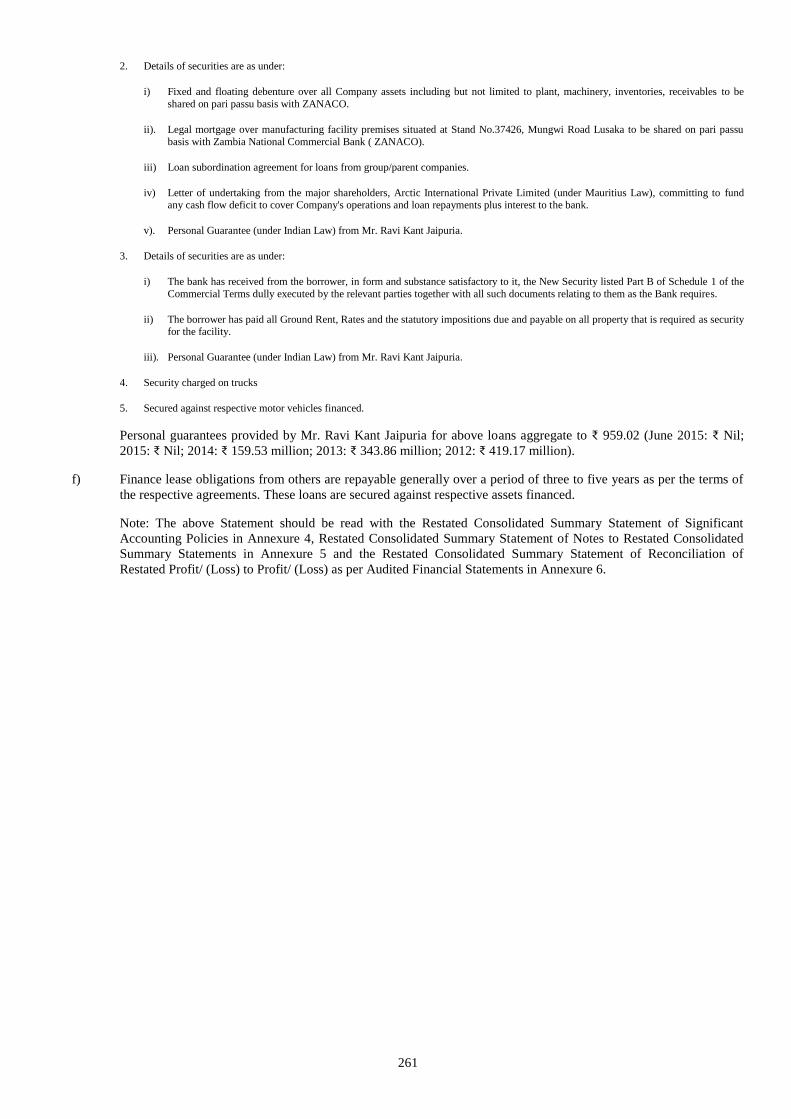
261
2. Details of securities are as under:
i) Fixed and floating debenture over all Company assets including but not limited to plant, machinery, inventories, receivables to be
shared on pari passu basis with ZANACO.
ii). Legal mortgage over manufacturing facility premises situated at Stand No.37426, Mungwi Road Lusaka to be shared on pari passu
basis with Zambia National Commercial Bank ( ZANACO).
iii) Loan subordination agreement for loans from group/parent companies.
iv) Letter of undertaking from the major shareholders, Arctic International Private Limited (under Mauritius Law), committing to fund any cash flow deficit to cover Company's operations and loan repayments plus interest to the bank.
v). Personal Guarantee (under Indian Law) from Mr. Ravi Kant Jaipuria.
3. Details of securities are as under:
i) The bank has received from the borrower, in form and substance satisfactory to it, the New Security listed Part B of Schedule 1 of the
Commercial Terms dully executed by the relevant parties together with all such documents relating to them as the Bank requires.
ii) The borrower has paid all Ground Rent, Rates and the statutory impositions due and payable on all property that is required as security for the facility.
iii). Personal Guarantee (under Indian Law) from Mr. Ravi Kant Jaipuria.
4. Security charged on trucks
5. Secured against respective motor vehicles financed.
Personal guarantees provided by Mr. Ravi Kant Jaipuria for above loans aggregate to ₹ 959.02 (June 2015: ₹ Nil;
2015: ₹ Nil; 2014: ₹ 159.53 million; 2013: ₹ 343.86 million; 2012: ₹ 419.17 million).
f) Finance lease obligations from others are repayable generally over a period of three to five years as per the terms of
the respective agreements. These loans are secured against respective assets financed.
Note: The above Statement should be read with the Restated Consolidated Summary Statement of Significant
Accounting Policies in Annexure 4, Restated Consolidated Summary Statement of Notes to Restated Consolidated
Summary Statements in Annexure 5 and the Restated Consolidated Summary Statement of Reconciliation of
Restated Profit/ (Loss) to Profit/ (Loss) as per Audited Financial Statements in Annexure 6.
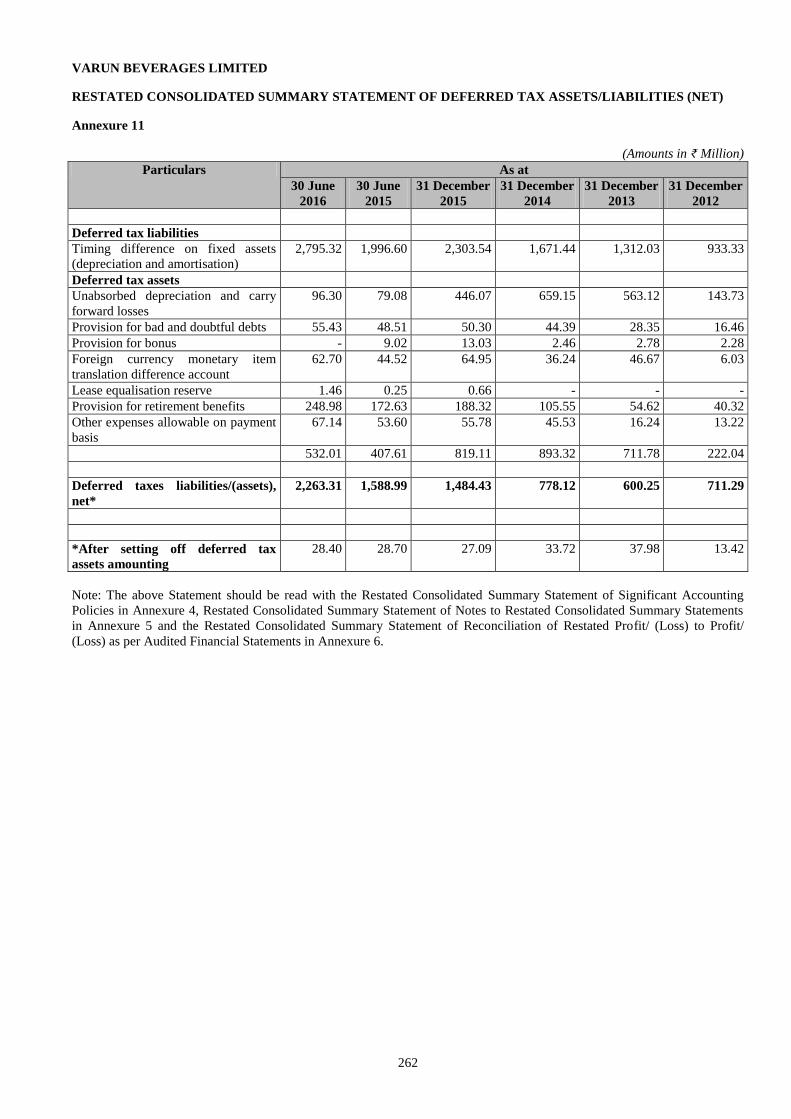
262
VARUN BEVERAGES LIMITED
RESTATED CONSOLIDATED SUMMARY STATEMENT OF DEFERRED TAX ASSETS/LIABILITIES (NET)
Annexure 11
(Amounts in ₹ Million)
Particulars As at
30 June
2016
30 June
2015
31 December
2015
31 December
2014
31 December
2013
31 December
2012
Deferred tax liabilities
Timing difference on fixed assets
(depreciation and amortisation)
2,795.32 1,996.60 2,303.54 1,671.44 1,312.03 933.33
Deferred tax assets
Unabsorbed depreciation and carry
forward losses
96.30 79.08 446.07 659.15 563.12 143.73
Provision for bad and doubtful debts 55.43 48.51 50.30 44.39 28.35 16.46
Provision for bonus - 9.02 13.03 2.46 2.78 2.28
Foreign currency monetary item
translation difference account
62.70 44.52 64.95 36.24 46.67 6.03
Lease equalisation reserve 1.46 0.25 0.66 - - -
Provision for retirement benefits 248.98 172.63 188.32 105.55 54.62 40.32
Other expenses allowable on payment
basis
67.14 53.60 55.78 45.53 16.24 13.22
532.01 407.61 819.11 893.32 711.78 222.04
Deferred taxes liabilities/(assets),
net*
2,263.31 1,588.99 1,484.43 778.12 600.25 711.29
*After setting off deferred tax
assets amounting
28.40 28.70 27.09 33.72 37.98 13.42
Note: The above Statement should be read with the Restated Consolidated Summary Statement of Significant Accounting
Policies in Annexure 4, Restated Consolidated Summary Statement of Notes to Restated Consolidated Summary Statements
in Annexure 5 and the Restated Consolidated Summary Statement of Reconciliation of Restated Profit/ (Loss) to Profit/
(Loss) as per Audited Financial Statements in Annexure 6.
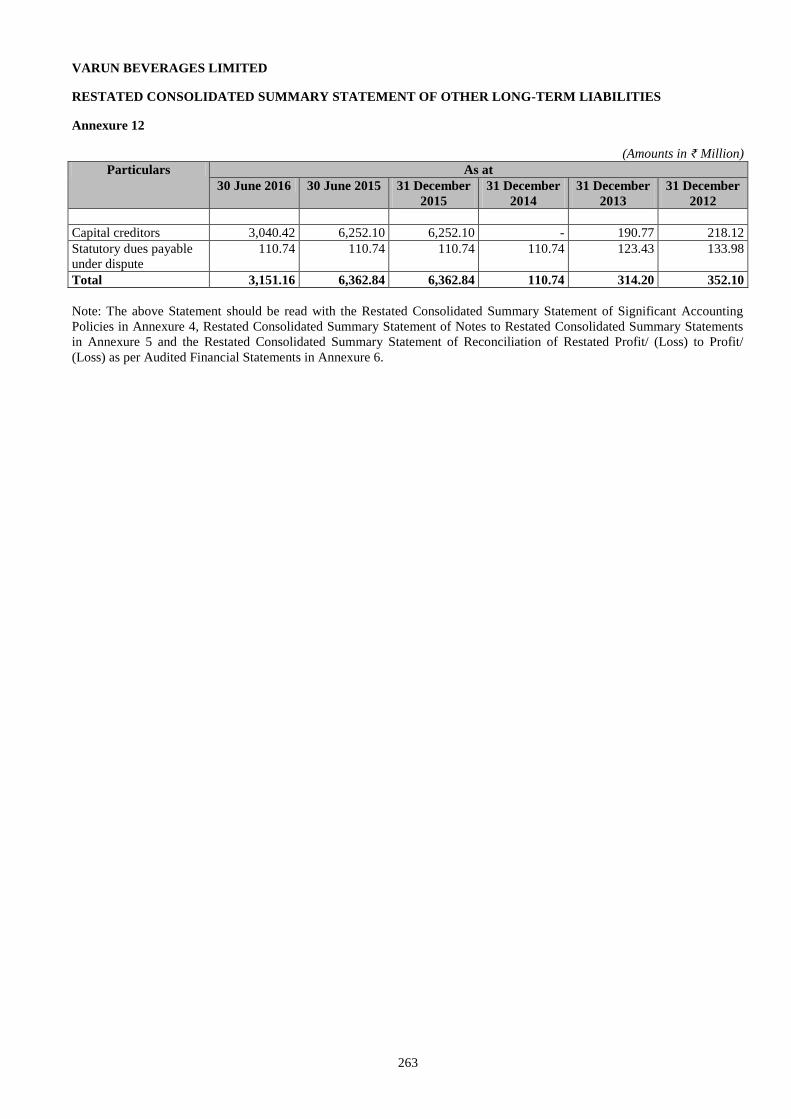
263
VARUN BEVERAGES LIMITED
RESTATED CONSOLIDATED SUMMARY STATEMENT OF OTHER LONG-TERM LIABILITIES
Annexure 12
(Amounts in ₹ Million)
Particulars As at
30 June 2016 30 June 2015 31 December
2015
31 December
2014
31 December
2013
31 December
2012
Capital creditors 3,040.42 6,252.10 6,252.10 - 190.77 218.12
Statutory dues payable
under dispute
110.74 110.74 110.74 110.74 123.43 133.98
Total 3,151.16 6,362.84 6,362.84 110.74 314.20 352.10
Note: The above Statement should be read with the Restated Consolidated Summary Statement of Significant Accounting
Policies in Annexure 4, Restated Consolidated Summary Statement of Notes to Restated Consolidated Summary Statements
in Annexure 5 and the Restated Consolidated Summary Statement of Reconciliation of Restated Profit/ (Loss) to Profit/
(Loss) as per Audited Financial Statements in Annexure 6.
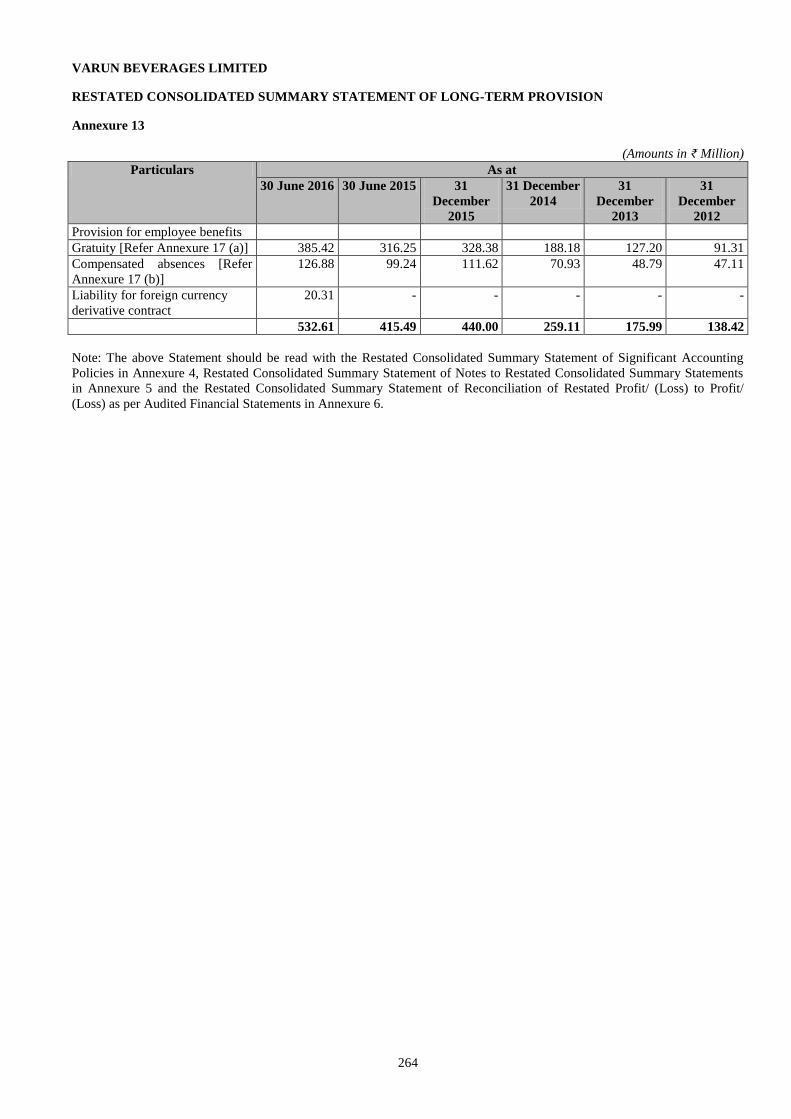
264
VARUN BEVERAGES LIMITED
RESTATED CONSOLIDATED SUMMARY STATEMENT OF LONG-TERM PROVISION
Annexure 13
(Amounts in ₹ Million)
Particulars As at
30 June 2016 30 June 2015 31
December
2015
31 December
2014
31
December
2013
31
December
2012
Provision for employee benefits
Gratuity [Refer Annexure 17 (a)] 385.42 316.25 328.38 188.18 127.20 91.31
Compensated absences [Refer
Annexure 17 (b)]
126.88 99.24 111.62 70.93 48.79 47.11
Liability for foreign currency
derivative contract
20.31 - - - - -
532.61 415.49 440.00 259.11 175.99 138.42
Note: The above Statement should be read with the Restated Consolidated Summary Statement of Significant Accounting
Policies in Annexure 4, Restated Consolidated Summary Statement of Notes to Restated Consolidated Summary Statements
in Annexure 5 and the Restated Consolidated Summary Statement of Reconciliation of Restated Profit/ (Loss) to Profit/
(Loss) as per Audited Financial Statements in Annexure 6.
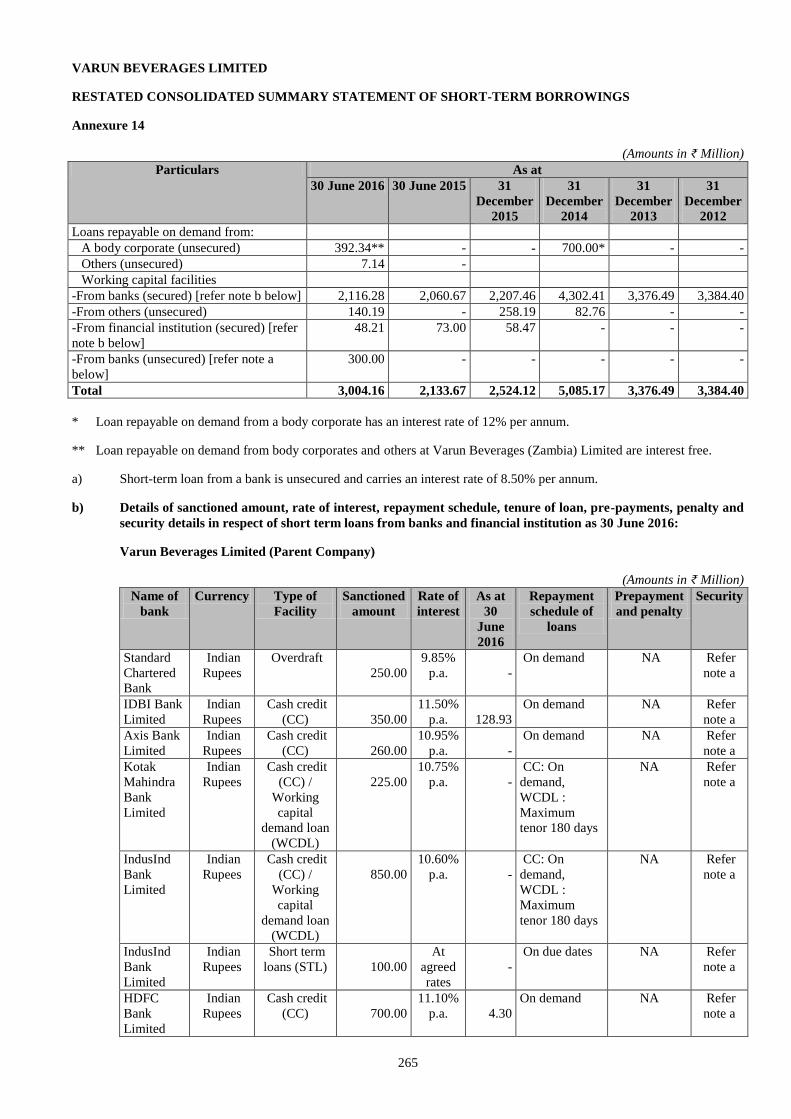
265
VARUN BEVERAGES LIMITED
RESTATED CONSOLIDATED SUMMARY STATEMENT OF SHORT-TERM BORROWINGS
Annexure 14
(Amounts in ₹ Million)
Particulars As at
30 June 2016 30 June 2015 31
December
2015
31
December
2014
31
December
2013
31
December
2012
Loans repayable on demand from:
A body corporate (unsecured) 392.34** - - 700.00* - -
Others (unsecured) 7.14 -
Working capital facilities
-From banks (secured) [refer note b below] 2,116.28 2,060.67 2,207.46 4,302.41 3,376.49 3,384.40
-From others (unsecured) 140.19 - 258.19 82.76 - -
-From financial institution (secured) [refer
note b below]
48.21 73.00 58.47 - - -
-From banks (unsecured) [refer note a
below]
300.00 - - - - -
Total 3,004.16 2,133.67 2,524.12 5,085.17 3,376.49 3,384.40
* Loan repayable on demand from a body corporate has an interest rate of 12% per annum.
** Loan repayable on demand from body corporates and others at Varun Beverages (Zambia) Limited are interest free.
a) Short-term loan from a bank is unsecured and carries an interest rate of 8.50% per annum.
b) Details of sanctioned amount, rate of interest, repayment schedule, tenure of loan, pre-payments, penalty and
security details in respect of short term loans from banks and financial institution as 30 June 2016:
Varun Beverages Limited (Parent Company)
(Amounts in ₹ Million)
Name of
bank
Currency Type of
Facility
Sanctioned
amount
Rate of
interest
As at
30
June
2016
Repayment
schedule of
loans
Prepayment
and penalty
Security
Standard
Chartered
Bank
Indian
Rupees
Overdraft
250.00
9.85%
p.a.
-
On demand NA Refer
note a
IDBI Bank
Limited
Indian
Rupees
Cash credit
(CC)
350.00
11.50%
p.a.
128.93
On demand NA Refer
note a
Axis Bank
Limited
Indian
Rupees
Cash credit
(CC)
260.00
10.95%
p.a.
-
On demand NA Refer
note a
Kotak
Mahindra
Bank
Limited
Indian
Rupees
Cash credit
(CC) /
Working
capital
demand loan
(WCDL)
225.00
10.75%
p.a.
-
CC: On
demand,
WCDL :
Maximum
tenor 180 days
NA Refer
note a
IndusInd
Bank
Limited
Indian
Rupees
Cash credit
(CC) /
Working
capital
demand loan
(WCDL)
850.00
10.60%
p.a.
-
CC: On
demand,
WCDL :
Maximum
tenor 180 days
NA Refer
note a
IndusInd
Bank
Limited
Indian
Rupees
Short term
loans (STL)
100.00
At
agreed
rates
-
On due dates NA Refer
note a
HDFC
Bank
Limited
Indian
Rupees
Cash credit
(CC)
700.00
11.10%
p.a.
4.30
On demand NA Refer
note a
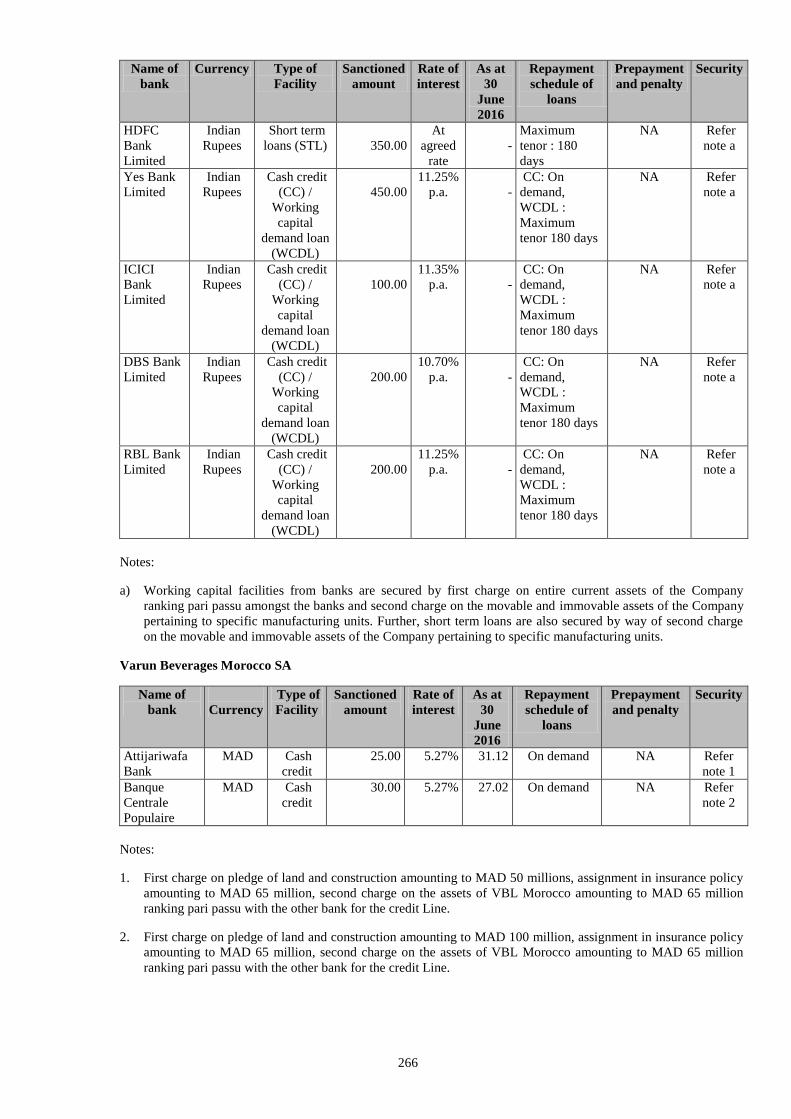
266
Name of
bank
Currency Type of
Facility
Sanctioned
amount
Rate of
interest
As at
30
June
2016
Repayment
schedule of
loans
Prepayment
and penalty
Security
HDFC
Bank
Limited
Indian
Rupees
Short term
loans (STL)
350.00
At
agreed
rate
-
Maximum
tenor : 180
days
NA Refer
note a
Yes Bank
Limited
Indian
Rupees
Cash credit
(CC) /
Working
capital
demand loan
(WCDL)
450.00
11.25%
p.a.
-
CC: On
demand,
WCDL :
Maximum
tenor 180 days
NA Refer
note a
ICICI
Bank
Limited
Indian
Rupees
Cash credit
(CC) /
Working
capital
demand loan
(WCDL)
100.00
11.35%
p.a.
-
CC: On
demand,
WCDL :
Maximum
tenor 180 days
NA Refer
note a
DBS Bank
Limited
Indian
Rupees
Cash credit
(CC) /
Working
capital
demand loan
(WCDL)
200.00
10.70%
p.a.
-
CC: On
demand,
WCDL :
Maximum
tenor 180 days
NA Refer
note a
RBL Bank
Limited
Indian
Rupees
Cash credit
(CC) /
Working
capital
demand loan
(WCDL)
200.00
11.25%
p.a.
-
CC: On
demand,
WCDL :
Maximum
tenor 180 days
NA Refer
note a
Notes:
a) Working capital facilities from banks are secured by first charge on entire current assets of the Company
ranking pari passu amongst the banks and second charge on the movable and immovable assets of the Company
pertaining to specific manufacturing units. Further, short term loans are also secured by way of second charge
on the movable and immovable assets of the Company pertaining to specific manufacturing units.
Varun Beverages Morocco SA
Name of
bank
Currency
Type of
Facility
Sanctioned
amount
Rate of
interest
As at
30
June
2016
Repayment
schedule of
loans
Prepayment
and penalty
Security
Attijariwafa
Bank
MAD Cash
credit
25.00 5.27% 31.12 On demand NA Refer
note 1
Banque
Centrale
Populaire
MAD Cash
credit
30.00 5.27% 27.02 On demand NA Refer
note 2
Notes:
1. First charge on pledge of land and construction amounting to MAD 50 millions, assignment in insurance policy
amounting to MAD 65 million, second charge on the assets of VBL Morocco amounting to MAD 65 million
ranking pari passu with the other bank for the credit Line.
2. First charge on pledge of land and construction amounting to MAD 100 million, assignment in insurance policy
amounting to MAD 65 million, second charge on the assets of VBL Morocco amounting to MAD 65 million
ranking pari passu with the other bank for the credit Line.
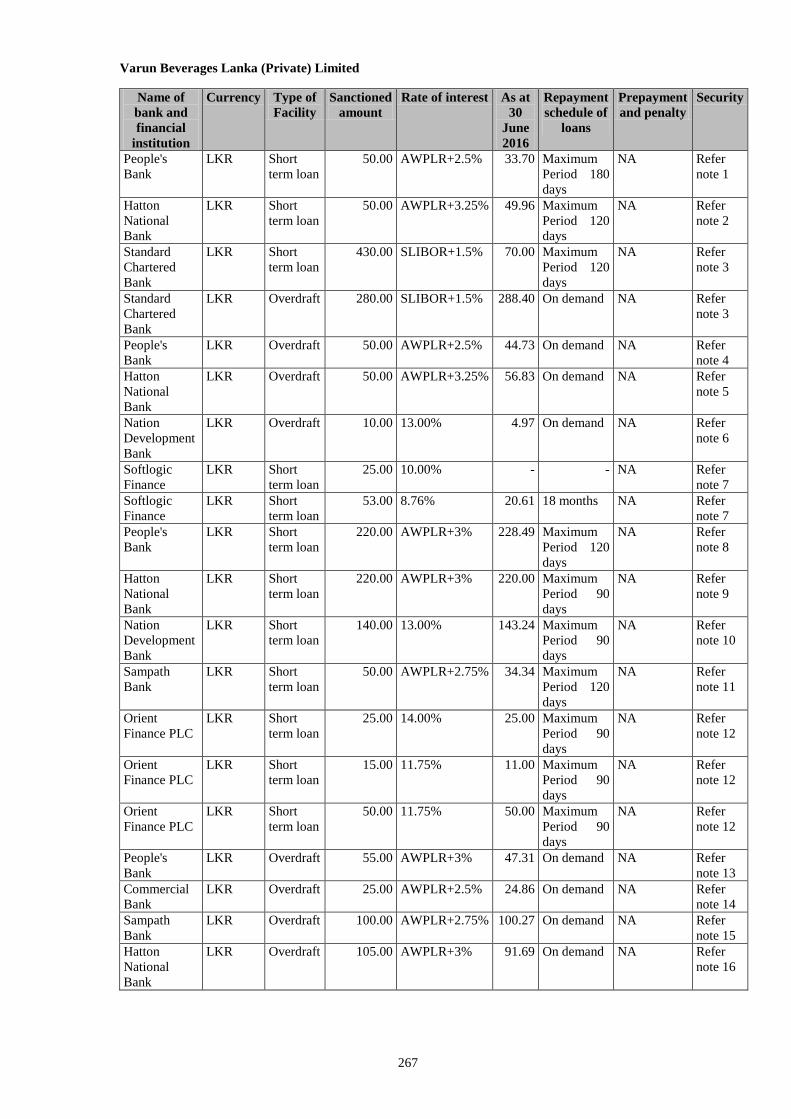
267
Varun Beverages Lanka (Private) Limited
Name of
bank and
financial
institution
Currency Type of
Facility
Sanctioned
amount
Rate of interest As at
30
June
2016
Repayment
schedule of
loans
Prepayment
and penalty
Security
People's
Bank
LKR Short
term loan
50.00 AWPLR+2.5% 33.70 Maximum
Period 180
days
NA Refer
note 1
Hatton
National
Bank
LKR Short
term loan
50.00 AWPLR+3.25% 49.96 Maximum
Period 120
days
NA Refer
note 2
Standard
Chartered
Bank
LKR Short
term loan
430.00 SLIBOR+1.5% 70.00 Maximum
Period 120
days
NA Refer
note 3
Standard
Chartered
Bank
LKR Overdraft 280.00 SLIBOR+1.5% 288.40 On demand NA Refer
note 3
People's
Bank
LKR Overdraft 50.00 AWPLR+2.5% 44.73 On demand NA Refer
note 4
Hatton
National
Bank
LKR Overdraft 50.00 AWPLR+3.25% 56.83 On demand NA Refer
note 5
Nation
Development
Bank
LKR Overdraft 10.00 13.00% 4.97 On demand NA Refer
note 6
Softlogic
Finance
LKR Short
term loan
25.00 10.00% - - NA Refer
note 7
Softlogic
Finance
LKR Short
term loan
53.00 8.76% 20.61 18 months NA Refer
note 7
People's
Bank
LKR Short
term loan
220.00 AWPLR+3% 228.49 Maximum
Period 120
days
NA Refer
note 8
Hatton
National
Bank
LKR Short
term loan
220.00 AWPLR+3% 220.00 Maximum
Period 90
days
NA Refer
note 9
Nation
Development
Bank
LKR Short
term loan
140.00 13.00% 143.24 Maximum
Period 90
days
NA Refer
note 10
Sampath
Bank
LKR Short
term loan
50.00 AWPLR+2.75% 34.34 Maximum
Period 120
days
NA Refer
note 11
Orient
Finance PLC
LKR Short
term loan
25.00 14.00% 25.00 Maximum
Period 90
days
NA Refer
note 12
Orient
Finance PLC
LKR Short
term loan
15.00 11.75% 11.00 Maximum
Period 90
days
NA Refer
note 12
Orient
Finance PLC
LKR Short
term loan
50.00 11.75% 50.00 Maximum
Period 90
days
NA Refer
note 12
People's
Bank
LKR Overdraft 55.00 AWPLR+3% 47.31 On demand NA Refer
note 13
Commercial
Bank
LKR Overdraft 25.00 AWPLR+2.5% 24.86 On demand NA Refer
note 14
Sampath
Bank
LKR Overdraft 100.00 AWPLR+2.75% 100.27 On demand NA Refer
note 15
Hatton
National
Bank
LKR Overdraft 105.00 AWPLR+3% 91.69 On demand NA Refer
note 16
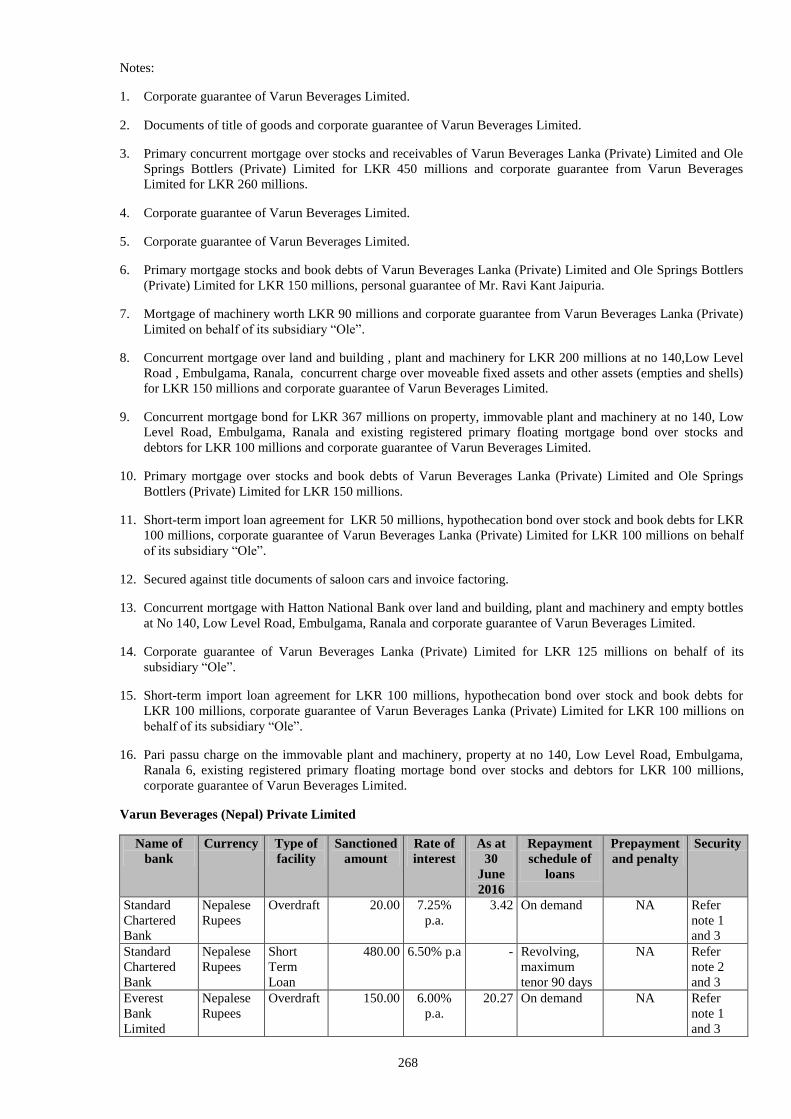
268
Notes:
1. Corporate guarantee of Varun Beverages Limited.
2. Documents of title of goods and corporate guarantee of Varun Beverages Limited.
3. Primary concurrent mortgage over stocks and receivables of Varun Beverages Lanka (Private) Limited and Ole
Springs Bottlers (Private) Limited for LKR 450 millions and corporate guarantee from Varun Beverages
Limited for LKR 260 millions.
4. Corporate guarantee of Varun Beverages Limited.
5. Corporate guarantee of Varun Beverages Limited.
6. Primary mortgage stocks and book debts of Varun Beverages Lanka (Private) Limited and Ole Springs Bottlers
(Private) Limited for LKR 150 millions, personal guarantee of Mr. Ravi Kant Jaipuria.
7. Mortgage of machinery worth LKR 90 millions and corporate guarantee from Varun Beverages Lanka (Private)
Limited on behalf of its subsidiary “Ole”.
8. Concurrent mortgage over land and building , plant and machinery for LKR 200 millions at no 140,Low Level
Road , Embulgama, Ranala, concurrent charge over moveable fixed assets and other assets (empties and shells)
for LKR 150 millions and corporate guarantee of Varun Beverages Limited.
9. Concurrent mortgage bond for LKR 367 millions on property, immovable plant and machinery at no 140, Low
Level Road, Embulgama, Ranala and existing registered primary floating mortgage bond over stocks and
debtors for LKR 100 millions and corporate guarantee of Varun Beverages Limited.
10. Primary mortgage over stocks and book debts of Varun Beverages Lanka (Private) Limited and Ole Springs
Bottlers (Private) Limited for LKR 150 millions.
11. Short-term import loan agreement for LKR 50 millions, hypothecation bond over stock and book debts for LKR
100 millions, corporate guarantee of Varun Beverages Lanka (Private) Limited for LKR 100 millions on behalf
of its subsidiary “Ole”.
12. Secured against title documents of saloon cars and invoice factoring.
13. Concurrent mortgage with Hatton National Bank over land and building, plant and machinery and empty bottles
at No 140, Low Level Road, Embulgama, Ranala and corporate guarantee of Varun Beverages Limited.
14. Corporate guarantee of Varun Beverages Lanka (Private) Limited for LKR 125 millions on behalf of its
subsidiary “Ole”.
15. Short-term import loan agreement for LKR 100 millions, hypothecation bond over stock and book debts for
LKR 100 millions, corporate guarantee of Varun Beverages Lanka (Private) Limited for LKR 100 millions on
behalf of its subsidiary “Ole”.
16. Pari passu charge on the immovable plant and machinery, property at no 140, Low Level Road, Embulgama,
Ranala 6, existing registered primary floating mortage bond over stocks and debtors for LKR 100 millions,
corporate guarantee of Varun Beverages Limited.
Varun Beverages (Nepal) Private Limited
Name of
bank
Currency Type of
facility
Sanctioned
amount
Rate of
interest
As at
30
June
2016
Repayment
schedule of
loans
Prepayment
and penalty
Security
Standard
Chartered
Bank
Nepalese
Rupees
Overdraft 20.00 7.25%
p.a.
3.42 On demand NA Refer
note 1
and 3
Standard
Chartered
Bank
Nepalese
Rupees
Short
Term
Loan
480.00 6.50% p.a - Revolving,
maximum
tenor 90 days
NA Refer
note 2
and 3
Everest
Bank
Limited
Nepalese
Rupees
Overdraft 150.00 6.00%
p.a.
20.27 On demand NA Refer
note 1
and 3
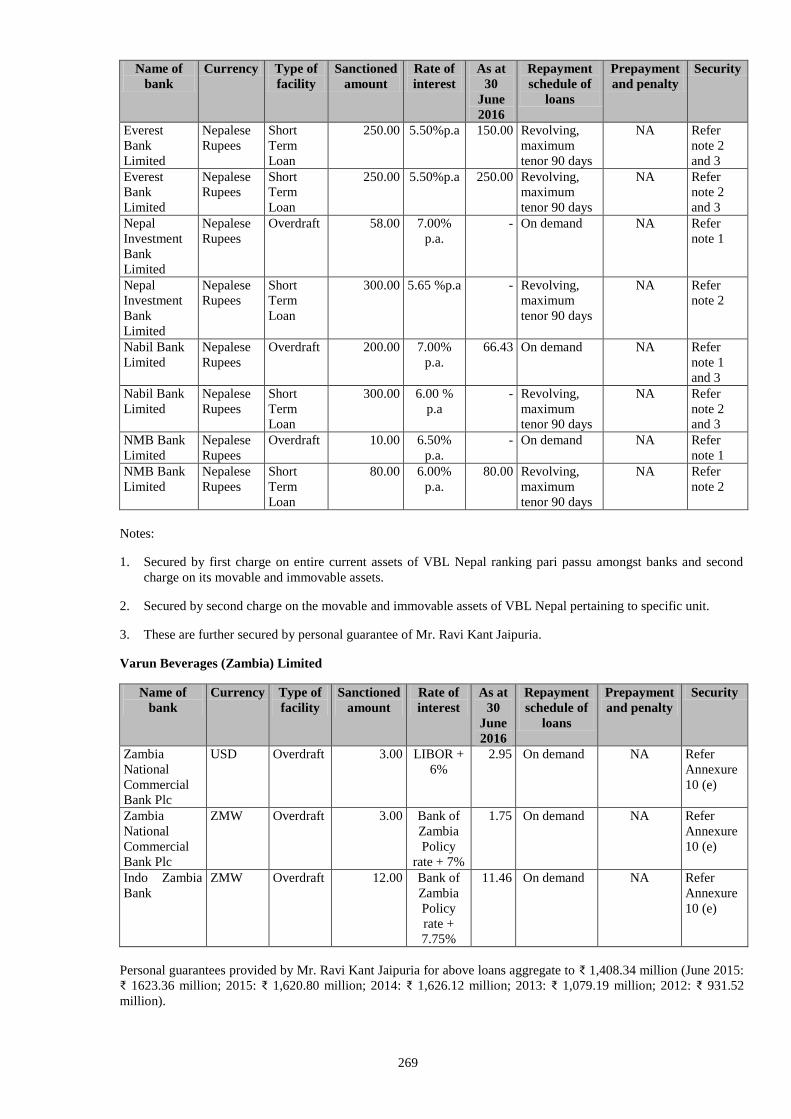
269
Name of
bank
Currency Type of
facility
Sanctioned
amount
Rate of
interest
As at
30
June
2016
Repayment
schedule of
loans
Prepayment
and penalty
Security
Everest
Bank
Limited
Nepalese
Rupees
Short
Term
Loan
250.00 5.50%p.a 150.00 Revolving,
maximum
tenor 90 days
NA Refer
note 2
and 3
Everest
Bank
Limited
Nepalese
Rupees
Short
Term
Loan
250.00 5.50%p.a 250.00 Revolving,
maximum
tenor 90 days
NA Refer
note 2
and 3
Nepal
Investment
Bank
Limited
Nepalese
Rupees
Overdraft 58.00 7.00%
p.a.
- On demand NA Refer
note 1
Nepal
Investment
Bank
Limited
Nepalese
Rupees
Short
Term
Loan
300.00 5.65 %p.a - Revolving,
maximum
tenor 90 days
NA Refer
note 2
Nabil Bank
Limited
Nepalese
Rupees
Overdraft 200.00 7.00%
p.a.
66.43 On demand NA Refer
note 1
and 3
Nabil Bank
Limited
Nepalese
Rupees
Short
Term
Loan
300.00 6.00 %
p.a
- Revolving,
maximum
tenor 90 days
NA Refer
note 2
and 3
NMB Bank
Limited
Nepalese
Rupees
Overdraft 10.00 6.50%
p.a.
- On demand NA Refer
note 1
NMB Bank
Limited
Nepalese
Rupees
Short
Term
Loan
80.00 6.00%
p.a.
80.00 Revolving,
maximum
tenor 90 days
NA Refer
note 2
Notes:
1. Secured by first charge on entire current assets of VBL Nepal ranking pari passu amongst banks and second
charge on its movable and immovable assets.
2. Secured by second charge on the movable and immovable assets of VBL Nepal pertaining to specific unit.
3. These are further secured by personal guarantee of Mr. Ravi Kant Jaipuria.
Varun Beverages (Zambia) Limited
Name of
bank
Currency Type of
facility
Sanctioned
amount
Rate of
interest
As at
30
June
2016
Repayment
schedule of
loans
Prepayment
and penalty
Security
Zambia
National
Commercial
Bank Plc
USD Overdraft 3.00 LIBOR +
6%
2.95 On demand NA Refer
Annexure
10 (e)
Zambia
National
Commercial
Bank Plc
ZMW Overdraft 3.00 Bank of
Zambia
Policy
rate + 7%
1.75 On demand NA Refer
Annexure
10 (e)
Indo Zambia
Bank
ZMW Overdraft 12.00 Bank of
Zambia
Policy
rate +
7.75%
11.46 On demand NA Refer
Annexure
10 (e)
Personal guarantees provided by Mr. Ravi Kant Jaipuria for above loans aggregate to ₹ 1,408.34 million (June 2015:
₹ 1623.36 million; 2015: ₹ 1,620.80 million; 2014: ₹ 1,626.12 million; 2013: ₹ 1,079.19 million; 2012: ₹ 931.52
million).
270
Note: The above Statement should be read with the Restated Consolidated Summary Statement of Significant Accounting
Policies in Annexure 4, Restated Consolidated Summary Statement of Notes to Restated Consolidated Summary Statements
in Annexure 5 and the Restated Consolidated Summary Statement of Reconciliation of Restated Profit/ (Loss) to Profit/
(Loss) as per Audited Financial Statements in Annexure 6.
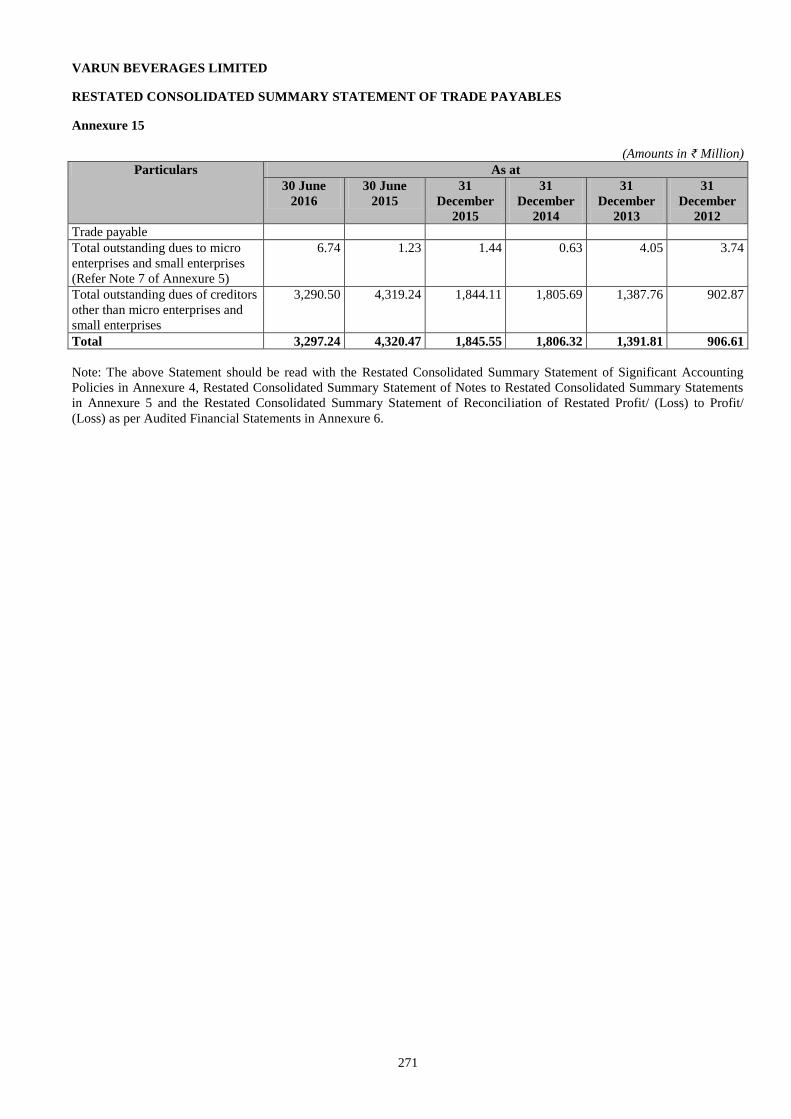
271
VARUN BEVERAGES LIMITED
RESTATED CONSOLIDATED SUMMARY STATEMENT OF TRADE PAYABLES
Annexure 15
(Amounts in ₹ Million)
Particulars As at
30 June
2016
30 June
2015
31
December
2015
31
December
2014
31
December
2013
31
December
2012
Trade payable
Total outstanding dues to micro
enterprises and small enterprises
(Refer Note 7 of Annexure 5)
6.74 1.23 1.44 0.63 4.05 3.74
Total outstanding dues of creditors
other than micro enterprises and
small enterprises
3,290.50 4,319.24 1,844.11 1,805.69 1,387.76 902.87
Total 3,297.24 4,320.47 1,845.55 1,806.32 1,391.81 906.61
Note: The above Statement should be read with the Restated Consolidated Summary Statement of Significant Accounting
Policies in Annexure 4, Restated Consolidated Summary Statement of Notes to Restated Consolidated Summary Statements
in Annexure 5 and the Restated Consolidated Summary Statement of Reconciliation of Restated Profit/ (Loss) to Profit/
(Loss) as per Audited Financial Statements in Annexure 6.
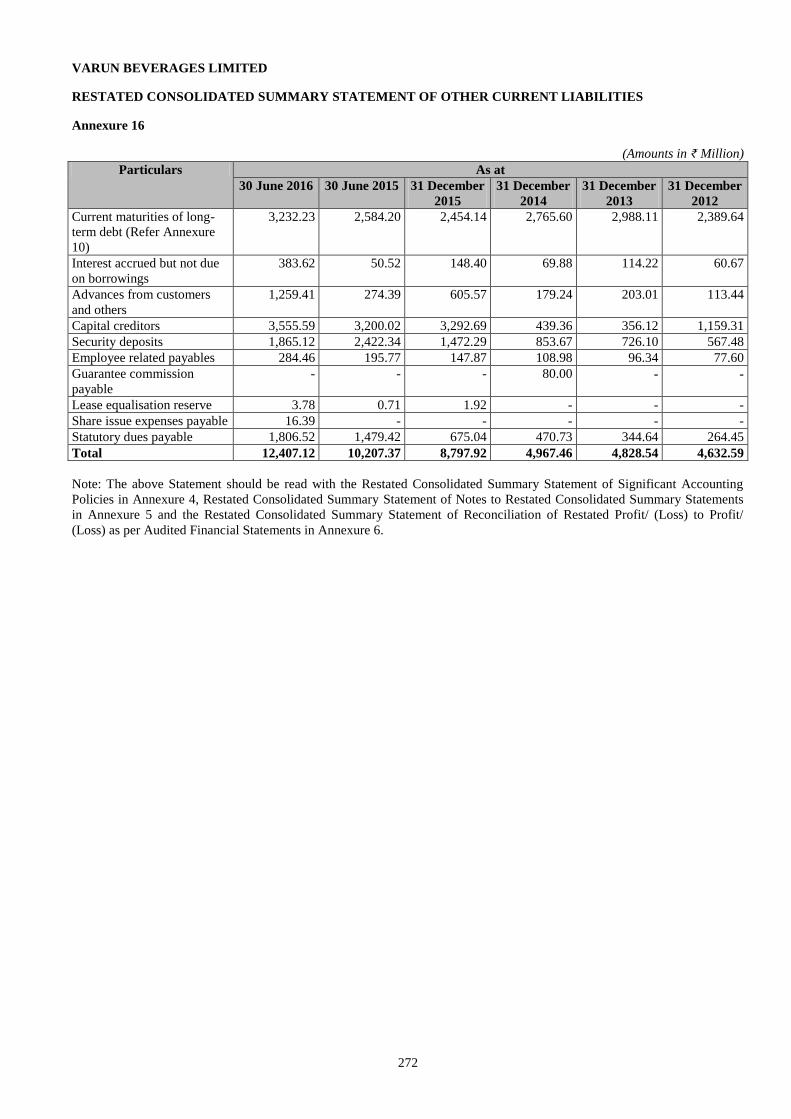
272
VARUN BEVERAGES LIMITED
RESTATED CONSOLIDATED SUMMARY STATEMENT OF OTHER CURRENT LIABILITIES
Annexure 16
(Amounts in ₹ Million)
Particulars As at
30 June 2016 30 June 2015 31 December
2015
31 December
2014
31 December
2013
31 December
2012
Current maturities of long-
term debt (Refer Annexure
10)
3,232.23 2,584.20 2,454.14 2,765.60 2,988.11 2,389.64
Interest accrued but not due
on borrowings
383.62 50.52 148.40 69.88 114.22 60.67
Advances from customers
and others
1,259.41 274.39 605.57 179.24 203.01 113.44
Capital creditors 3,555.59 3,200.02 3,292.69 439.36 356.12 1,159.31
Security deposits 1,865.12 2,422.34 1,472.29 853.67 726.10 567.48
Employee related payables 284.46 195.77 147.87 108.98 96.34 77.60
Guarantee commission
payable
- - - 80.00 - -
Lease equalisation reserve 3.78 0.71 1.92 - - -
Share issue expenses payable 16.39 - - - - -
Statutory dues payable 1,806.52 1,479.42 675.04 470.73 344.64 264.45
Total 12,407.12 10,207.37 8,797.92 4,967.46 4,828.54 4,632.59
Note: The above Statement should be read with the Restated Consolidated Summary Statement of Significant Accounting
Policies in Annexure 4, Restated Consolidated Summary Statement of Notes to Restated Consolidated Summary Statements
in Annexure 5 and the Restated Consolidated Summary Statement of Reconciliation of Restated Profit/ (Loss) to Profit/
(Loss) as per Audited Financial Statements in Annexure 6.
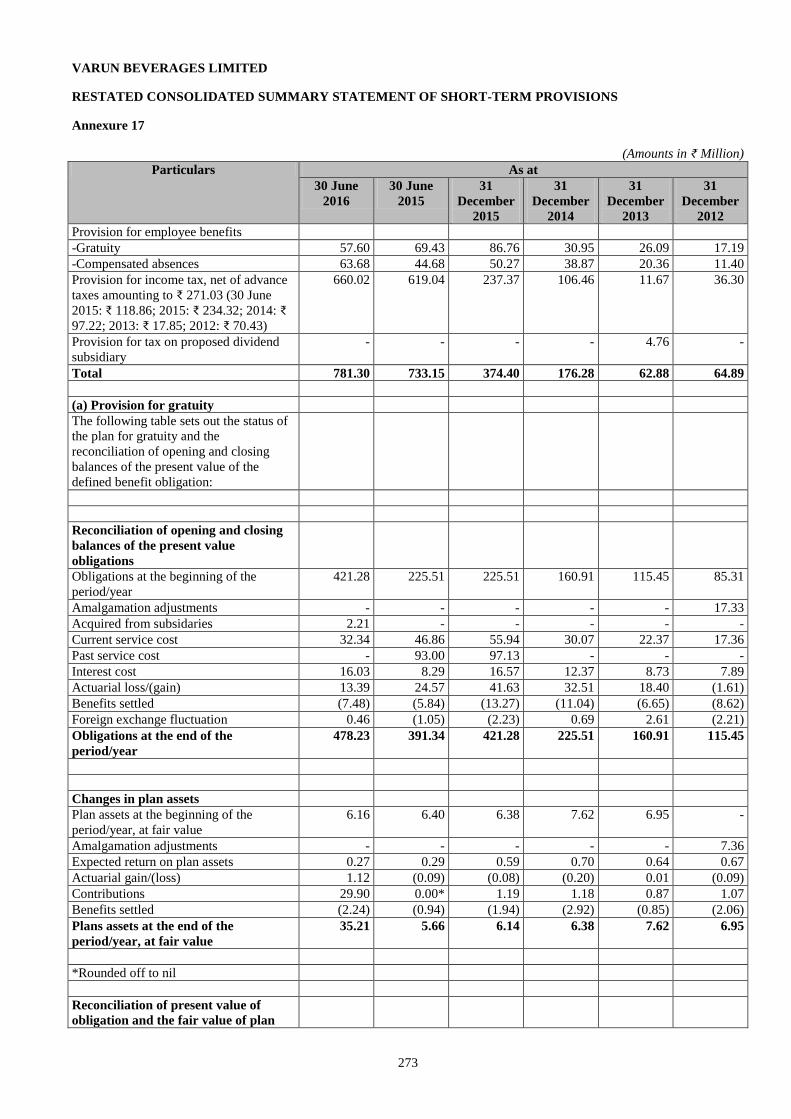
273
VARUN BEVERAGES LIMITED
RESTATED CONSOLIDATED SUMMARY STATEMENT OF SHORT-TERM PROVISIONS
Annexure 17
(Amounts in ₹ Million)
Particulars As at
30 June
2016
30 June
2015
31
December
2015
31
December
2014
31
December
2013
31
December
2012
Provision for employee benefits
-Gratuity 57.60 69.43 86.76 30.95 26.09 17.19
-Compensated absences 63.68 44.68 50.27 38.87 20.36 11.40
Provision for income tax, net of advance
taxes amounting to ₹ 271.03 (30 June
2015: ₹ 118.86; 2015: ₹ 234.32; 2014: ₹
97.22; 2013: ₹ 17.85; 2012: ₹ 70.43)
660.02 619.04 237.37 106.46 11.67 36.30
Provision for tax on proposed dividend
subsidiary
- - - - 4.76 -
Total 781.30 733.15 374.40 176.28 62.88 64.89
(a) Provision for gratuity
The following table sets out the status of
the plan for gratuity and the
reconciliation of opening and closing
balances of the present value of the
defined benefit obligation:
Reconciliation of opening and closing
balances of the present value
obligations
Obligations at the beginning of the
period/year
421.28 225.51 225.51 160.91 115.45 85.31
Amalgamation adjustments - - - - - 17.33
Acquired from subsidaries 2.21 - - - - -
Current service cost 32.34 46.86 55.94 30.07 22.37 17.36
Past service cost - 93.00 97.13 - - -
Interest cost 16.03 8.29 16.57 12.37 8.73 7.89
Actuarial loss/(gain) 13.39 24.57 41.63 32.51 18.40 (1.61)
Benefits settled (7.48) (5.84) (13.27) (11.04) (6.65) (8.62)
Foreign exchange fluctuation 0.46 (1.05) (2.23) 0.69 2.61 (2.21)
Obligations at the end of the
period/year
478.23 391.34 421.28 225.51 160.91 115.45
Changes in plan assets
Plan assets at the beginning of the
period/year, at fair value
6.16 6.40 6.38 7.62 6.95 -
Amalgamation adjustments - - - - - 7.36
Expected return on plan assets 0.27 0.29 0.59 0.70 0.64 0.67
Actuarial gain/(loss) 1.12 (0.09) (0.08) (0.20) 0.01 (0.09)
Contributions 29.90 0.00* 1.19 1.18 0.87 1.07
Benefits settled (2.24) (0.94) (1.94) (2.92) (0.85) (2.06)
Plans assets at the end of the
period/year, at fair value
35.21 5.66 6.14 6.38 7.62 6.95
*Rounded off to nil
Reconciliation of present value of
obligation and the fair value of plan
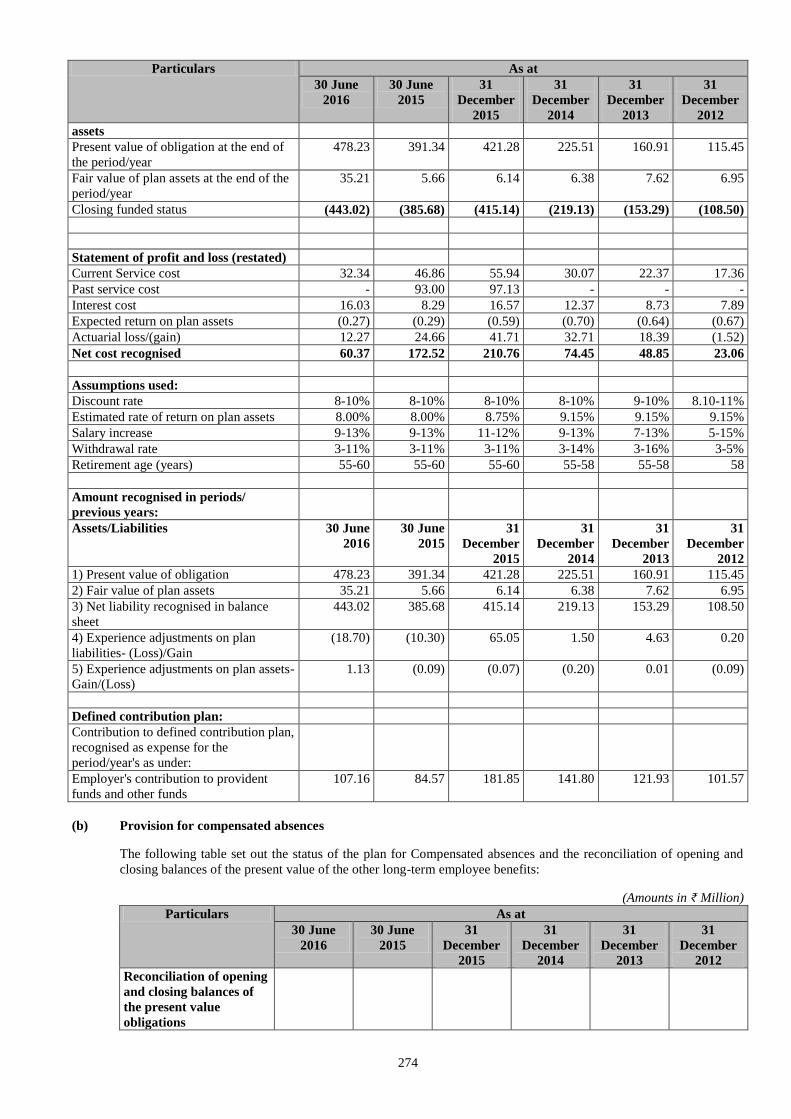
274
Particulars As at
30 June
2016
30 June
2015
31
December
2015
31
December
2014
31
December
2013
31
December
2012
assets
Present value of obligation at the end of
the period/year
478.23 391.34 421.28 225.51 160.91 115.45
Fair value of plan assets at the end of the
period/year
35.21 5.66 6.14 6.38 7.62 6.95
Closing funded status (443.02) (385.68) (415.14) (219.13) (153.29) (108.50)
Statement of profit and loss (restated)
Current Service cost 32.34 46.86 55.94 30.07 22.37 17.36
Past service cost - 93.00 97.13 - - -
Interest cost 16.03 8.29 16.57 12.37 8.73 7.89
Expected return on plan assets (0.27) (0.29) (0.59) (0.70) (0.64) (0.67)
Actuarial loss/(gain) 12.27 24.66 41.71 32.71 18.39 (1.52)
Net cost recognised 60.37 172.52 210.76 74.45 48.85 23.06
Assumptions used:
Discount rate 8-10% 8-10% 8-10% 8-10% 9-10% 8.10-11%
Estimated rate of return on plan assets 8.00% 8.00% 8.75% 9.15% 9.15% 9.15%
Salary increase 9-13% 9-13% 11-12% 9-13% 7-13% 5-15%
Withdrawal rate 3-11% 3-11% 3-11% 3-14% 3-16% 3-5%
Retirement age (years) 55-60 55-60 55-60 55-58 55-58 58
Amount recognised in periods/
previous years:
Assets/Liabilities 30 June
2016
30 June
2015
31
December
2015
31
December
2014
31
December
2013
31
December
2012
1) Present value of obligation 478.23 391.34 421.28 225.51 160.91 115.45
2) Fair value of plan assets 35.21 5.66 6.14 6.38 7.62 6.95
3) Net liability recognised in balance
sheet
443.02 385.68 415.14 219.13 153.29 108.50
4) Experience adjustments on plan
liabilities- (Loss)/Gain
(18.70) (10.30) 65.05 1.50 4.63 0.20
5) Experience adjustments on plan assets-
Gain/(Loss)
1.13 (0.09) (0.07) (0.20) 0.01 (0.09)
Defined contribution plan:
Contribution to defined contribution plan,
recognised as expense for the
period/year's as under:
Employer's contribution to provident
funds and other funds
107.16 84.57 181.85 141.80 121.93 101.57
(b) Provision for compensated absences
The following table set out the status of the plan for Compensated absences and the reconciliation of opening and
closing balances of the present value of the other long-term employee benefits:
(Amounts in ₹ Million)
Particulars As at
30 June
2016
30 June
2015
31
December
2015
31
December
2014
31
December
2013
31
December
2012
Reconciliation of opening
and closing balances of
the present value
obligations
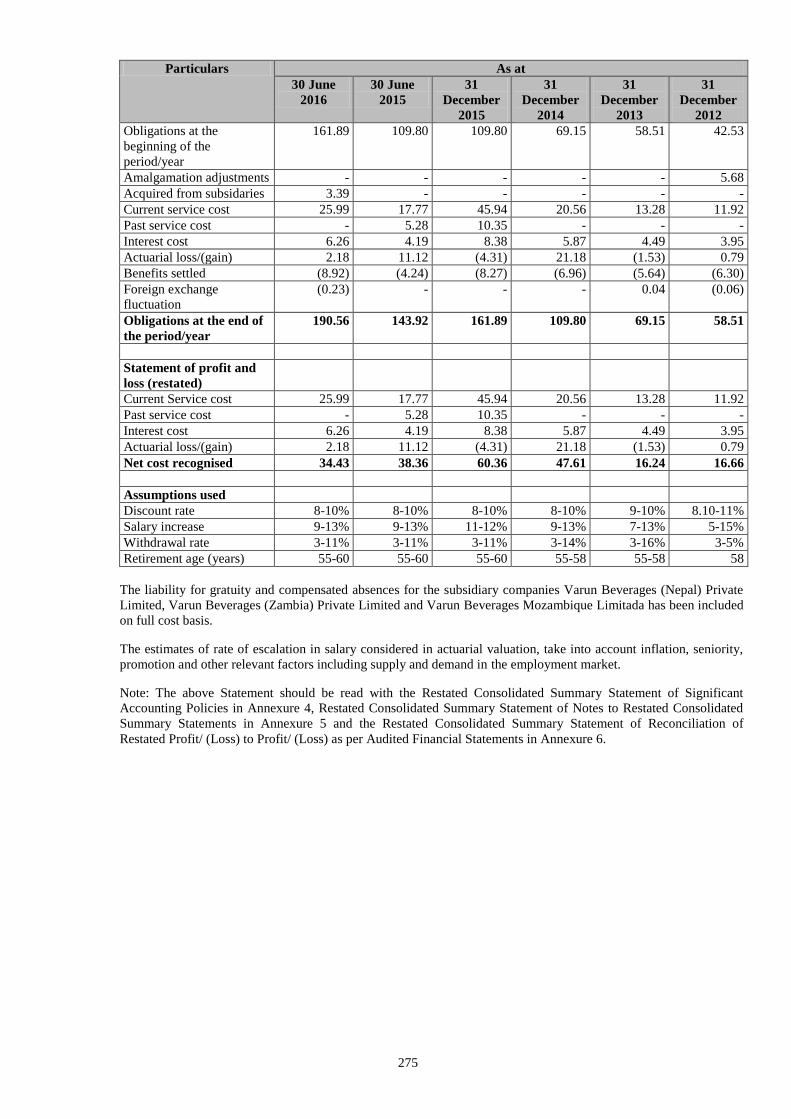
275
Particulars As at
30 June
2016
30 June
2015
31
December
2015
31
December
2014
31
December
2013
31
December
2012
Obligations at the
beginning of the
period/year
161.89 109.80 109.80 69.15 58.51 42.53
Amalgamation adjustments - - - - - 5.68
Acquired from subsidaries 3.39 - - - - -
Current service cost 25.99 17.77 45.94 20.56 13.28 11.92
Past service cost - 5.28 10.35 - - -
Interest cost 6.26 4.19 8.38 5.87 4.49 3.95
Actuarial loss/(gain) 2.18 11.12 (4.31) 21.18 (1.53) 0.79
Benefits settled (8.92) (4.24) (8.27) (6.96) (5.64) (6.30)
Foreign exchange
fluctuation
(0.23) - - - 0.04 (0.06)
Obligations at the end of
the period/year
190.56 143.92 161.89 109.80 69.15 58.51
Statement of profit and
loss (restated)
Current Service cost 25.99 17.77 45.94 20.56 13.28 11.92
Past service cost - 5.28 10.35 - - -
Interest cost 6.26 4.19 8.38 5.87 4.49 3.95
Actuarial loss/(gain) 2.18 11.12 (4.31) 21.18 (1.53) 0.79
Net cost recognised 34.43 38.36 60.36 47.61 16.24 16.66
Assumptions used
Discount rate 8-10% 8-10% 8-10% 8-10% 9-10% 8.10-11%
Salary increase 9-13% 9-13% 11-12% 9-13% 7-13% 5-15%
Withdrawal rate 3-11% 3-11% 3-11% 3-14% 3-16% 3-5%
Retirement age (years) 55-60 55-60 55-60 55-58 55-58 58
The liability for gratuity and compensated absences for the subsidiary companies Varun Beverages (Nepal) Private
Limited, Varun Beverages (Zambia) Private Limited and Varun Beverages Mozambique Limitada has been included
on full cost basis.
The estimates of rate of escalation in salary considered in actuarial valuation, take into account inflation, seniority,
promotion and other relevant factors including supply and demand in the employment market.
Note: The above Statement should be read with the Restated Consolidated Summary Statement of Significant
Accounting Policies in Annexure 4, Restated Consolidated Summary Statement of Notes to Restated Consolidated
Summary Statements in Annexure 5 and the Restated Consolidated Summary Statement of Reconciliation of
Restated Profit/ (Loss) to Profit/ (Loss) as per Audited Financial Statements in Annexure 6.
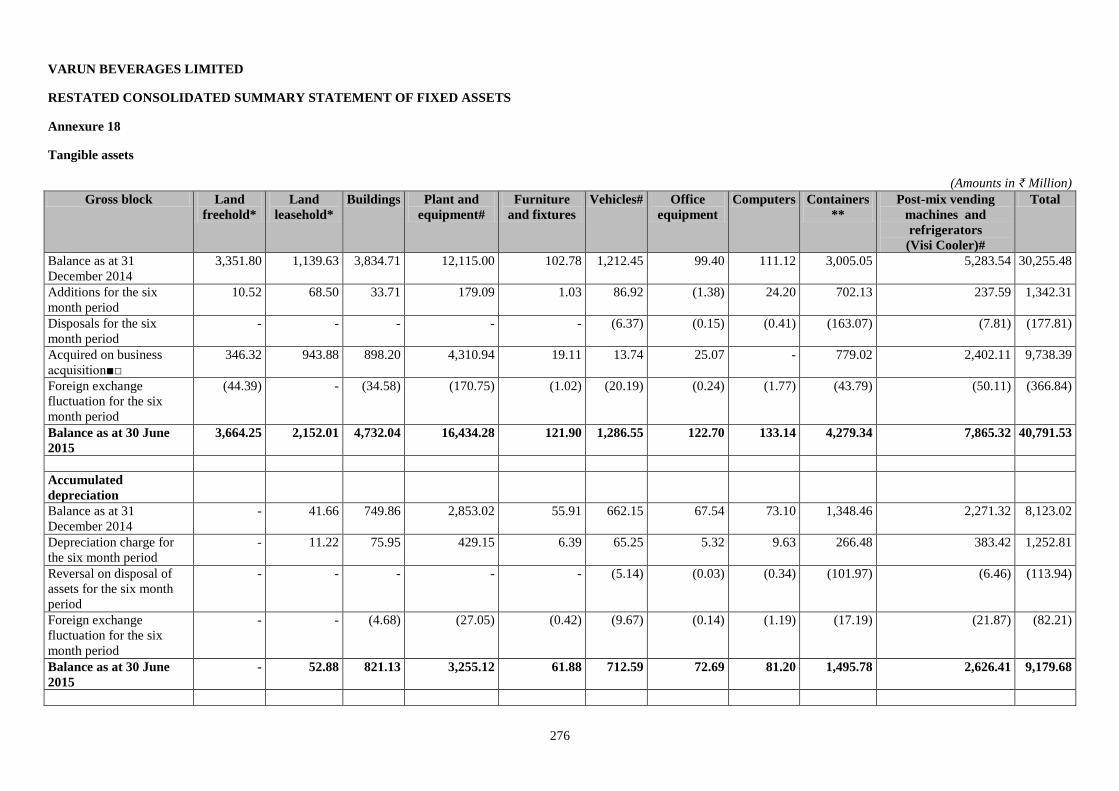
276
VARUN BEVERAGES LIMITED
RESTATED CONSOLIDATED SUMMARY STATEMENT OF FIXED ASSETS
Annexure 18
Tangible assets
(Amounts in ₹ Million)
Gross block Land
freehold*
Land
leasehold*
Buildings Plant and
equipment#
Furniture
and fixtures
Vehicles# Office
equipment
Computers Containers
**
Post-mix vending
machines and
refrigerators
(Visi Cooler)#
Total
Balance as at 31
December 2014
3,351.80 1,139.63 3,834.71 12,115.00 102.78 1,212.45 99.40 111.12 3,005.05 5,283.54 30,255.48
Additions for the six
month period
10.52 68.50 33.71 179.09 1.03 86.92 (1.38) 24.20 702.13 237.59 1,342.31
Disposals for the six
month period
- - - - - (6.37) (0.15) (0.41) (163.07) (7.81) (177.81)
Acquired on business
acquisition■□
346.32 943.88 898.20 4,310.94 19.11 13.74 25.07 - 779.02 2,402.11 9,738.39
Foreign exchange
fluctuation for the six
month period
(44.39) - (34.58) (170.75) (1.02) (20.19) (0.24) (1.77) (43.79) (50.11) (366.84)
Balance as at 30 June
2015
3,664.25 2,152.01 4,732.04 16,434.28 121.90 1,286.55 122.70 133.14 4,279.34 7,865.32 40,791.53
Accumulated
depreciation
Balance as at 31
December 2014
- 41.66 749.86 2,853.02 55.91 662.15 67.54 73.10 1,348.46 2,271.32 8,123.02
Depreciation charge for
the six month period
- 11.22 75.95 429.15 6.39 65.25 5.32 9.63 266.48 383.42 1,252.81
Reversal on disposal of
assets for the six month
period
- - - - - (5.14) (0.03) (0.34) (101.97) (6.46) (113.94)
Foreign exchange
fluctuation for the six
month period
- - (4.68) (27.05) (0.42) (9.67) (0.14) (1.19) (17.19) (21.87) (82.21)
Balance as at 30 June
2015
- 52.88 821.13 3,255.12 61.88 712.59 72.69 81.20 1,495.78 2,626.41 9,179.68
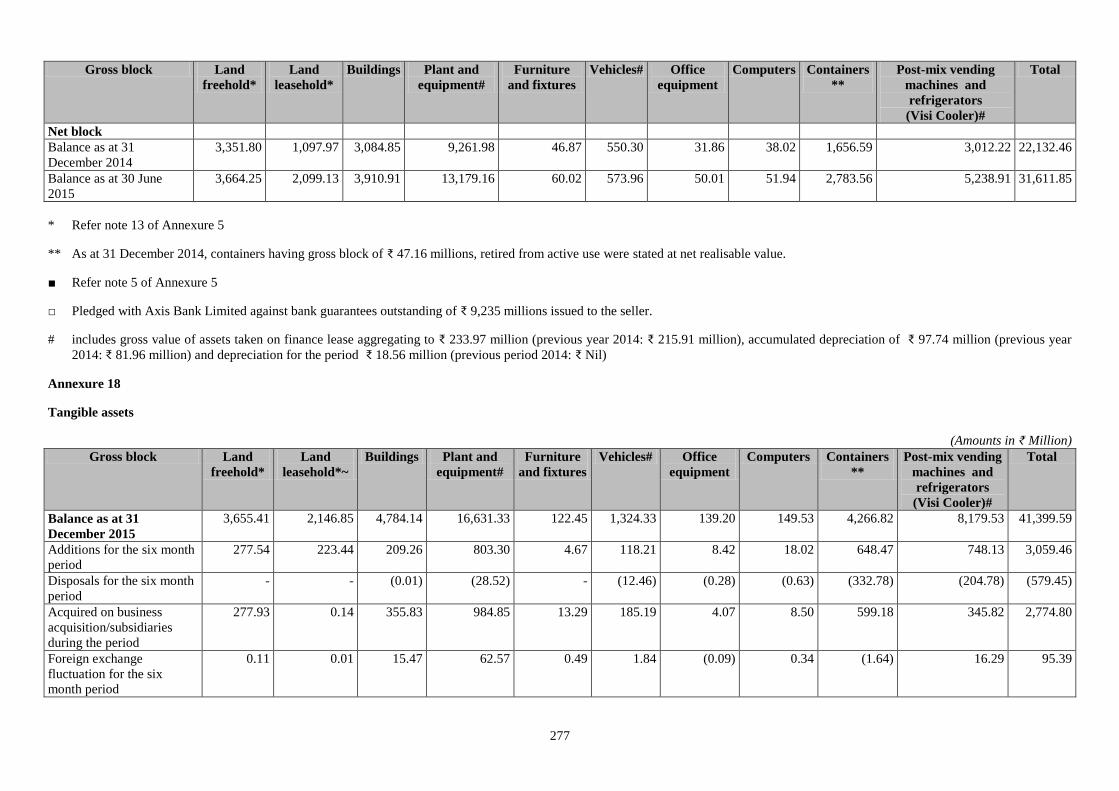
277
Gross block Land
freehold*
Land
leasehold*
Buildings Plant and
equipment#
Furniture
and fixtures
Vehicles# Office
equipment
Computers Containers
**
Post-mix vending
machines and
refrigerators
(Visi Cooler)#
Total
Net block
Balance as at 31
December 2014
3,351.80 1,097.97 3,084.85 9,261.98 46.87 550.30 31.86 38.02 1,656.59 3,012.22 22,132.46
Balance as at 30 June
2015
3,664.25 2,099.13 3,910.91 13,179.16 60.02 573.96 50.01 51.94 2,783.56 5,238.91 31,611.85
* Refer note 13 of Annexure 5
** As at 31 December 2014, containers having gross block of ₹ 47.16 millions, retired from active use were stated at net realisable value.
■ Refer note 5 of Annexure 5
□ Pledged with Axis Bank Limited against bank guarantees outstanding of ₹ 9,235 millions issued to the seller.
# includes gross value of assets taken on finance lease aggregating to ₹ 233.97 million (previous year 2014: ₹ 215.91 million), accumulated depreciation of ₹ 97.74 million (previous year
2014: ₹ 81.96 million) and depreciation for the period ₹ 18.56 million (previous period 2014: ₹ Nil)
Annexure 18
Tangible assets
(Amounts in ₹ Million)
Gross block Land
freehold*
Land
leasehold*~
Buildings Plant and
equipment#
Furniture
and fixtures
Vehicles# Office
equipment
Computers Containers
**
Post-mix vending
machines and
refrigerators
(Visi Cooler)#
Total
Balance as at 31
December 2015
3,655.41 2,146.85 4,784.14 16,631.33 122.45 1,324.33 139.20 149.53 4,266.82 8,179.53 41,399.59
Additions for the six month
period
277.54 223.44 209.26 803.30 4.67 118.21 8.42 18.02 648.47 748.13 3,059.46
Disposals for the six month
period
- - (0.01) (28.52) - (12.46) (0.28) (0.63) (332.78) (204.78) (579.45)
Acquired on business
acquisition/subsidiaries
during the period
277.93 0.14 355.83 984.85 13.29 185.19 4.07 8.50 599.18 345.82 2,774.80
Foreign exchange
fluctuation for the six
month period
0.11 0.01 15.47 62.57 0.49 1.84 (0.09) 0.34 (1.64) 16.29 95.39
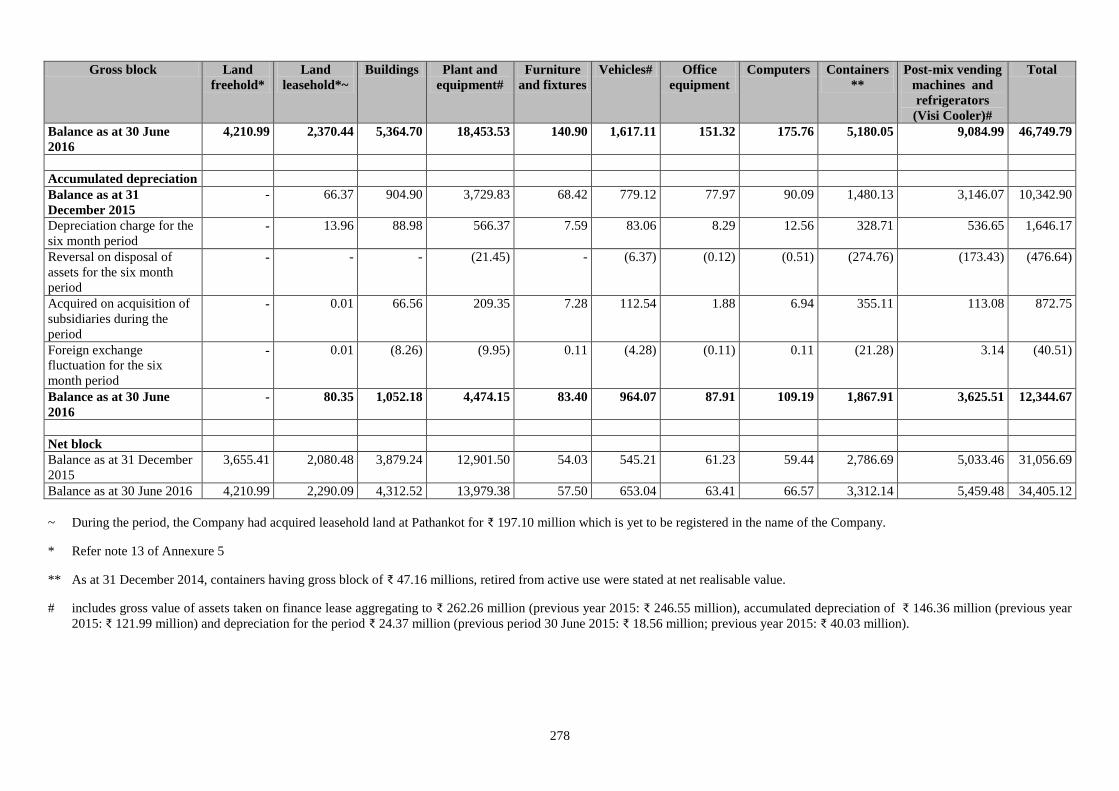
278
Gross block Land
freehold*
Land
leasehold*~
Buildings Plant and
equipment#
Furniture
and fixtures
Vehicles# Office
equipment
Computers Containers
**
Post-mix vending
machines and
refrigerators
(Visi Cooler)#
Total
Balance as at 30 June
2016
4,210.99 2,370.44 5,364.70 18,453.53 140.90 1,617.11 151.32 175.76 5,180.05 9,084.99 46,749.79
Accumulated depreciation
Balance as at 31
December 2015
- 66.37 904.90 3,729.83 68.42 779.12 77.97 90.09 1,480.13 3,146.07 10,342.90
Depreciation charge for the
six month period - 13.96 88.98 566.37 7.59 83.06 8.29 12.56 328.71 536.65 1,646.17
Reversal on disposal of
assets for the six month
period
- - - (21.45) - (6.37) (0.12) (0.51) (274.76) (173.43) (476.64)
Acquired on acquisition of
subsidiaries during the
period
- 0.01 66.56 209.35 7.28 112.54 1.88 6.94 355.11 113.08 872.75
Foreign exchange
fluctuation for the six
month period
- 0.01 (8.26) (9.95) 0.11 (4.28) (0.11) 0.11 (21.28) 3.14 (40.51)
Balance as at 30 June
2016
- 80.35 1,052.18 4,474.15 83.40 964.07 87.91 109.19 1,867.91 3,625.51 12,344.67
Net block
Balance as at 31 December
2015
3,655.41 2,080.48 3,879.24 12,901.50 54.03 545.21 61.23 59.44 2,786.69 5,033.46 31,056.69
Balance as at 30 June 2016 4,210.99 2,290.09 4,312.52 13,979.38 57.50 653.04 63.41 66.57 3,312.14 5,459.48 34,405.12
~ During the period, the Company had acquired leasehold land at Pathankot for ₹ 197.10 million which is yet to be registered in the name of the Company.
* Refer note 13 of Annexure 5
** As at 31 December 2014, containers having gross block of ₹ 47.16 millions, retired from active use were stated at net realisable value.
# includes gross value of assets taken on finance lease aggregating to ₹ 262.26 million (previous year 2015: ₹ 246.55 million), accumulated depreciation of ₹ 146.36 million (previous year
2015: ₹ 121.99 million) and depreciation for the period ₹ 24.37 million (previous period 30 June 2015: ₹ 18.56 million; previous year 2015: ₹ 40.03 million).
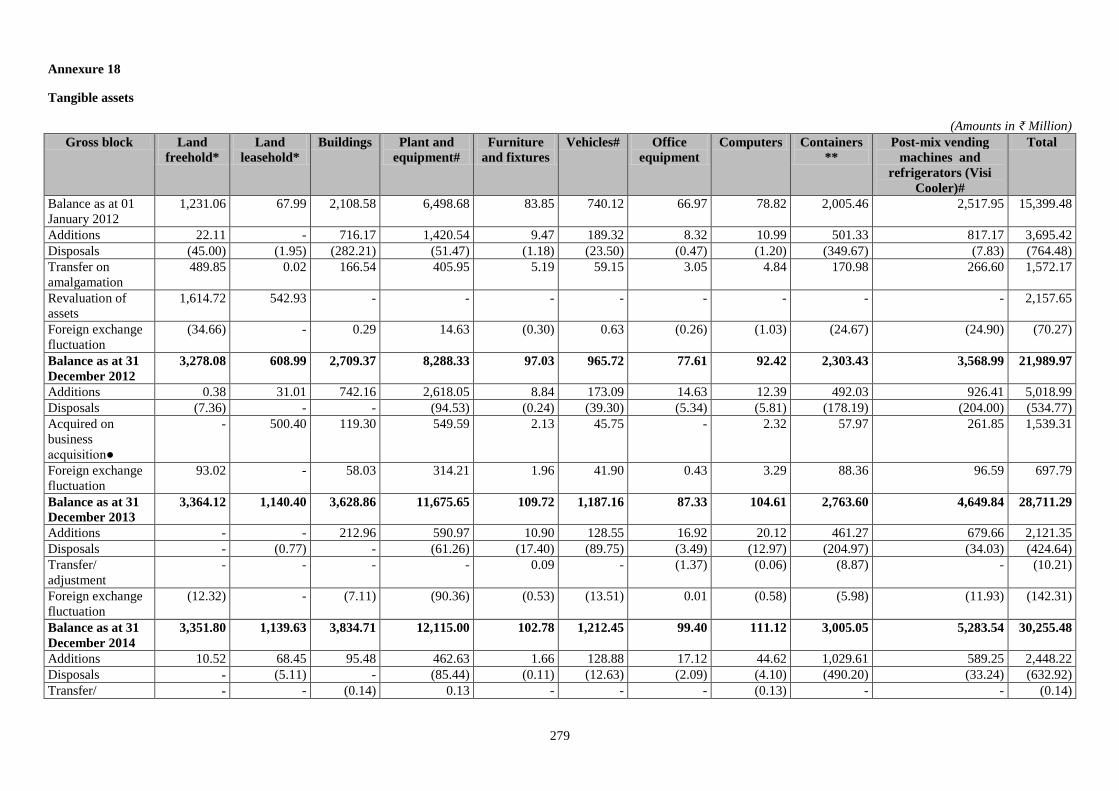
279
Annexure 18
Tangible assets
(Amounts in ₹ Million)
Gross block Land
freehold*
Land
leasehold*
Buildings Plant and
equipment#
Furniture
and fixtures
Vehicles# Office
equipment
Computers Containers
**
Post-mix vending
machines and
refrigerators (Visi
Cooler)#
Total
Balance as at 01
January 2012
1,231.06 67.99 2,108.58 6,498.68 83.85 740.12 66.97 78.82 2,005.46 2,517.95 15,399.48
Additions 22.11 - 716.17 1,420.54 9.47 189.32 8.32 10.99 501.33 817.17 3,695.42
Disposals (45.00) (1.95) (282.21) (51.47) (1.18) (23.50) (0.47) (1.20) (349.67) (7.83) (764.48)
Transfer on
amalgamation
489.85 0.02 166.54 405.95 5.19 59.15 3.05 4.84 170.98 266.60 1,572.17
Revaluation of
assets
1,614.72 542.93 - - - - - - - - 2,157.65
Foreign exchange
fluctuation
(34.66) - 0.29 14.63 (0.30) 0.63 (0.26) (1.03) (24.67) (24.90) (70.27)
Balance as at 31
December 2012
3,278.08 608.99 2,709.37 8,288.33 97.03 965.72 77.61 92.42 2,303.43 3,568.99 21,989.97
Additions 0.38 31.01 742.16 2,618.05 8.84 173.09 14.63 12.39 492.03 926.41 5,018.99
Disposals (7.36) - - (94.53) (0.24) (39.30) (5.34) (5.81) (178.19) (204.00) (534.77)
Acquired on
business
acquisition●
- 500.40 119.30 549.59 2.13 45.75 - 2.32 57.97 261.85 1,539.31
Foreign exchange
fluctuation
93.02 - 58.03 314.21 1.96 41.90 0.43 3.29 88.36 96.59 697.79
Balance as at 31
December 2013
3,364.12 1,140.40 3,628.86 11,675.65 109.72 1,187.16 87.33 104.61 2,763.60 4,649.84 28,711.29
Additions - - 212.96 590.97 10.90 128.55 16.92 20.12 461.27 679.66 2,121.35
Disposals - (0.77) - (61.26) (17.40) (89.75) (3.49) (12.97) (204.97) (34.03) (424.64)
Transfer/
adjustment
- - - - 0.09 - (1.37) (0.06) (8.87) - (10.21)
Foreign exchange
fluctuation
(12.32) - (7.11) (90.36) (0.53) (13.51) 0.01 (0.58) (5.98) (11.93) (142.31)
Balance as at 31
December 2014
3,351.80 1,139.63 3,834.71 12,115.00 102.78 1,212.45 99.40 111.12 3,005.05 5,283.54 30,255.48
Additions 10.52 68.45 95.48 462.63 1.66 128.88 17.12 44.62 1,029.61 589.25 2,448.22
Disposals - (5.11) - (85.44) (0.11) (12.63) (2.09) (4.10) (490.20) (33.24) (632.92)
Transfer/ - - (0.14) 0.13 - - - (0.13) - - (0.14)
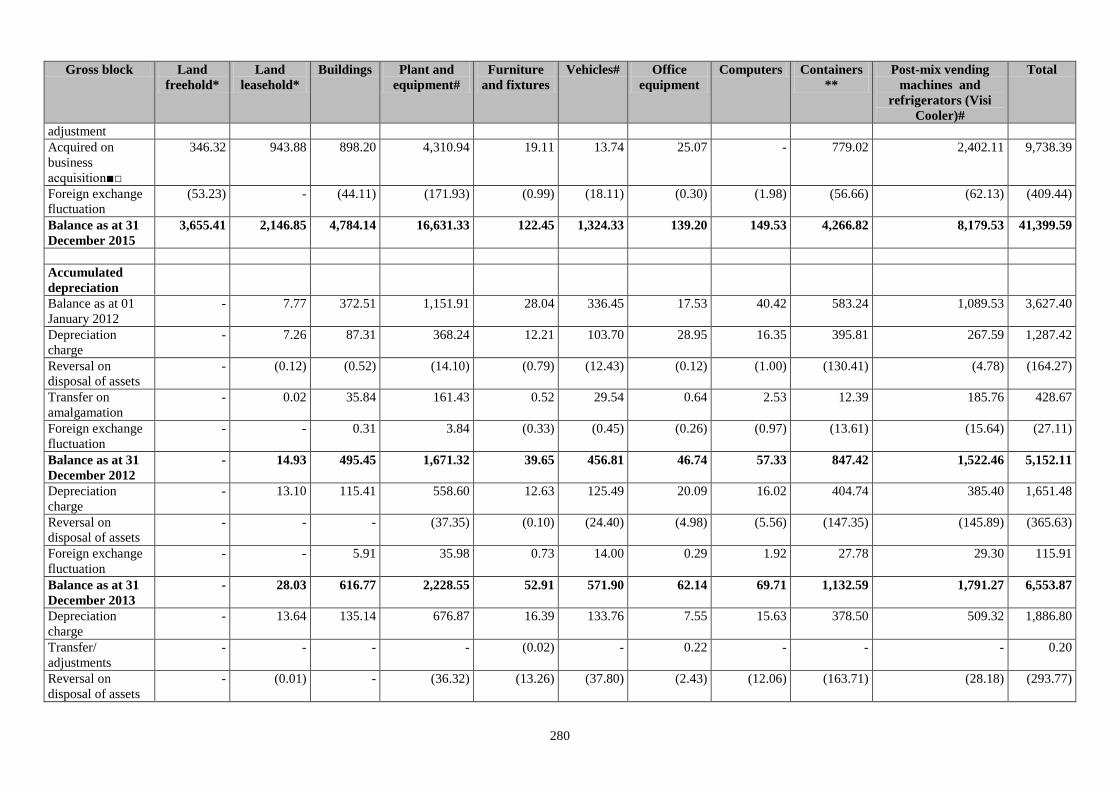
280
Gross block Land
freehold*
Land
leasehold*
Buildings Plant and
equipment#
Furniture
and fixtures
Vehicles# Office
equipment
Computers Containers
**
Post-mix vending
machines and
refrigerators (Visi
Cooler)#
Total
adjustment
Acquired on
business
acquisition■□
346.32 943.88 898.20 4,310.94 19.11 13.74 25.07 - 779.02 2,402.11 9,738.39
Foreign exchange
fluctuation
(53.23) - (44.11) (171.93) (0.99) (18.11) (0.30) (1.98) (56.66) (62.13) (409.44)
Balance as at 31
December 2015
3,655.41 2,146.85 4,784.14 16,631.33 122.45 1,324.33 139.20 149.53 4,266.82 8,179.53 41,399.59
Accumulated
depreciation
Balance as at 01
January 2012
- 7.77 372.51 1,151.91 28.04 336.45 17.53 40.42 583.24 1,089.53 3,627.40
Depreciation
charge
- 7.26 87.31 368.24 12.21 103.70 28.95 16.35 395.81 267.59 1,287.42
Reversal on
disposal of assets
- (0.12) (0.52) (14.10) (0.79) (12.43) (0.12) (1.00) (130.41) (4.78) (164.27)
Transfer on
amalgamation
- 0.02 35.84 161.43 0.52 29.54 0.64 2.53 12.39 185.76 428.67
Foreign exchange
fluctuation
- - 0.31 3.84 (0.33) (0.45) (0.26) (0.97) (13.61) (15.64) (27.11)
Balance as at 31
December 2012
- 14.93 495.45 1,671.32 39.65 456.81 46.74 57.33 847.42 1,522.46 5,152.11
Depreciation
charge
- 13.10 115.41 558.60 12.63 125.49 20.09 16.02 404.74 385.40 1,651.48
Reversal on
disposal of assets
- - - (37.35) (0.10) (24.40) (4.98) (5.56) (147.35) (145.89) (365.63)
Foreign exchange
fluctuation
- - 5.91 35.98 0.73 14.00 0.29 1.92 27.78 29.30 115.91
Balance as at 31
December 2013
- 28.03 616.77 2,228.55 52.91 571.90 62.14 69.71 1,132.59 1,791.27 6,553.87
Depreciation
charge
- 13.64 135.14 676.87 16.39 133.76 7.55 15.63 378.50 509.32 1,886.80
Transfer/
adjustments
- - - - (0.02) - 0.22 - - - 0.20
Reversal on
disposal of assets
- (0.01) - (36.32) (13.26) (37.80) (2.43) (12.06) (163.71) (28.18) (293.77)
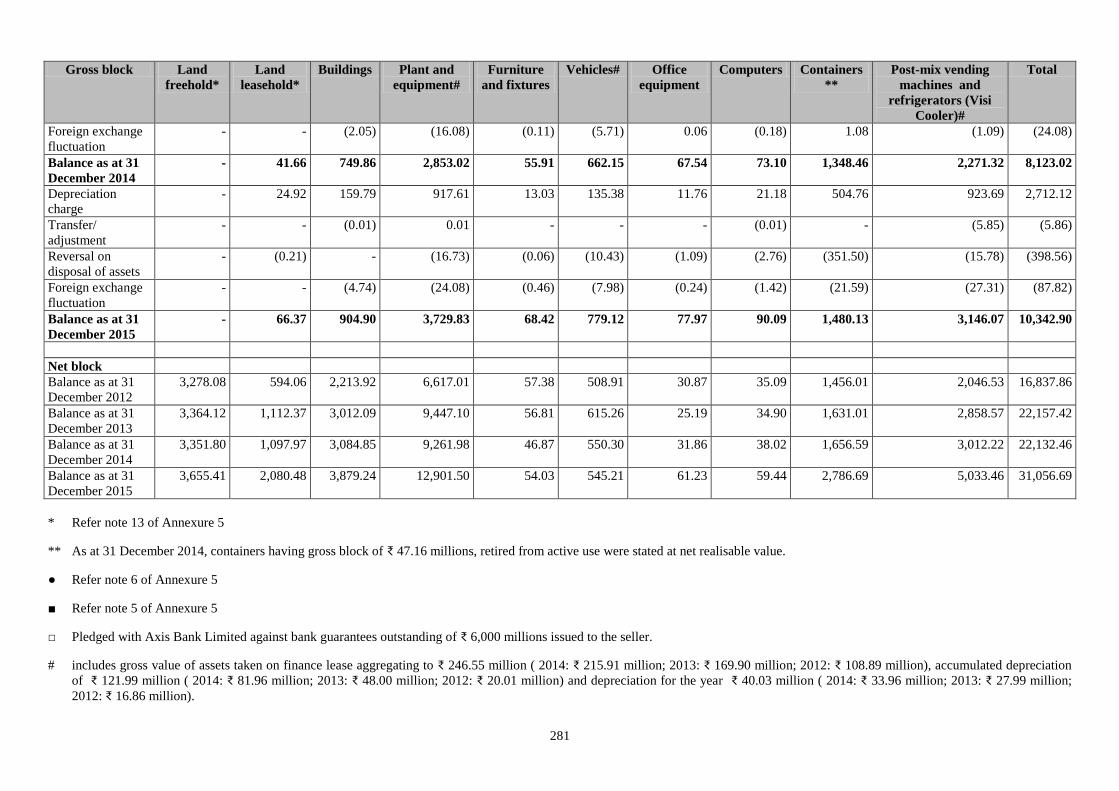
281
Gross block Land
freehold*
Land
leasehold*
Buildings Plant and
equipment#
Furniture
and fixtures
Vehicles# Office
equipment
Computers Containers
**
Post-mix vending
machines and
refrigerators (Visi
Cooler)#
Total
Foreign exchange
fluctuation
- - (2.05) (16.08) (0.11) (5.71) 0.06 (0.18) 1.08 (1.09) (24.08)
Balance as at 31
December 2014
- 41.66 749.86 2,853.02 55.91 662.15 67.54 73.10 1,348.46 2,271.32 8,123.02
Depreciation
charge
- 24.92 159.79 917.61 13.03 135.38 11.76 21.18 504.76 923.69 2,712.12
Transfer/
adjustment
- - (0.01) 0.01 - - - (0.01) - (5.85) (5.86)
Reversal on
disposal of assets
- (0.21) - (16.73) (0.06) (10.43) (1.09) (2.76) (351.50) (15.78) (398.56)
Foreign exchange
fluctuation
- - (4.74) (24.08) (0.46) (7.98) (0.24) (1.42) (21.59) (27.31) (87.82)
Balance as at 31
December 2015
- 66.37 904.90 3,729.83 68.42 779.12 77.97 90.09 1,480.13 3,146.07 10,342.90
Net block
Balance as at 31
December 2012
3,278.08 594.06 2,213.92 6,617.01 57.38 508.91 30.87 35.09 1,456.01 2,046.53 16,837.86
Balance as at 31
December 2013
3,364.12 1,112.37 3,012.09 9,447.10 56.81 615.26 25.19 34.90 1,631.01 2,858.57 22,157.42
Balance as at 31
December 2014
3,351.80 1,097.97 3,084.85 9,261.98 46.87 550.30 31.86 38.02 1,656.59 3,012.22 22,132.46
Balance as at 31
December 2015
3,655.41 2,080.48 3,879.24 12,901.50 54.03 545.21 61.23 59.44 2,786.69 5,033.46 31,056.69
* Refer note 13 of Annexure 5
** As at 31 December 2014, containers having gross block of ₹ 47.16 millions, retired from active use were stated at net realisable value.
● Refer note 6 of Annexure 5
■ Refer note 5 of Annexure 5
□ Pledged with Axis Bank Limited against bank guarantees outstanding of ₹ 6,000 millions issued to the seller.
# includes gross value of assets taken on finance lease aggregating to ₹ 246.55 million ( 2014: ₹ 215.91 million; 2013: ₹ 169.90 million; 2012: ₹ 108.89 million), accumulated depreciation
of ₹ 121.99 million ( 2014: ₹ 81.96 million; 2013: ₹ 48.00 million; 2012: ₹ 20.01 million) and depreciation for the year ₹ 40.03 million ( 2014: ₹ 33.96 million; 2013: ₹ 27.99 million;
2012: ₹ 16.86 million).
282
Note: The above Statement should be read with the Restated Consolidated Summary Statement of Significant Accounting Policies in Annexure 4, Restated Consolidated Summary Statement
of Notes to Restated Consolidated Summary Statements in Annexure 5 and the Restated Consolidated Summary Statement of Reconciliation of Restated Profit/ (Loss) to Profit/ (Loss) as per
Audited Financial Statements in Annexure 6.
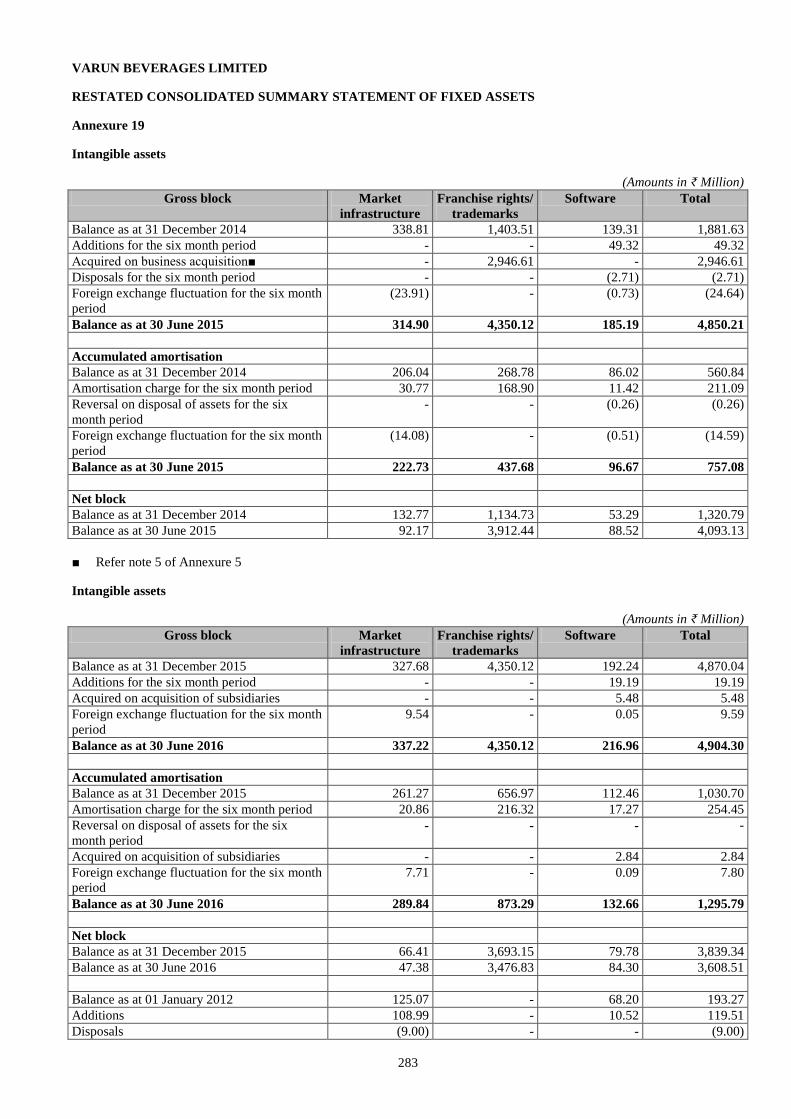
283
VARUN BEVERAGES LIMITED
RESTATED CONSOLIDATED SUMMARY STATEMENT OF FIXED ASSETS
Annexure 19
Intangible assets
(Amounts in ₹ Million)
Gross block Market
infrastructure
Franchise rights/
trademarks
Software Total
Balance as at 31 December 2014 338.81 1,403.51 139.31 1,881.63
Additions for the six month period - - 49.32 49.32
Acquired on business acquisition■ - 2,946.61 - 2,946.61
Disposals for the six month period - - (2.71) (2.71)
Foreign exchange fluctuation for the six month
period
(23.91) - (0.73) (24.64)
Balance as at 30 June 2015 314.90 4,350.12 185.19 4,850.21
Accumulated amortisation
Balance as at 31 December 2014 206.04 268.78 86.02 560.84
Amortisation charge for the six month period 30.77 168.90 11.42 211.09
Reversal on disposal of assets for the six
month period
- - (0.26) (0.26)
Foreign exchange fluctuation for the six month
period
(14.08) - (0.51) (14.59)
Balance as at 30 June 2015 222.73 437.68 96.67 757.08
Net block
Balance as at 31 December 2014 132.77 1,134.73 53.29 1,320.79
Balance as at 30 June 2015 92.17 3,912.44 88.52 4,093.13
■ Refer note 5 of Annexure 5
Intangible assets
(Amounts in ₹ Million)
Gross block Market
infrastructure
Franchise rights/
trademarks
Software Total
Balance as at 31 December 2015 327.68 4,350.12 192.24 4,870.04
Additions for the six month period - - 19.19 19.19
Acquired on acquisition of subsidiaries - - 5.48 5.48
Foreign exchange fluctuation for the six month
period
9.54 - 0.05 9.59
Balance as at 30 June 2016 337.22 4,350.12 216.96 4,904.30
Accumulated amortisation
Balance as at 31 December 2015 261.27 656.97 112.46 1,030.70
Amortisation charge for the six month period 20.86 216.32 17.27 254.45
Reversal on disposal of assets for the six
month period - - - -
Acquired on acquisition of subsidiaries - - 2.84 2.84
Foreign exchange fluctuation for the six month
period
7.71 - 0.09 7.80
Balance as at 30 June 2016 289.84 873.29 132.66 1,295.79
Net block
Balance as at 31 December 2015 66.41 3,693.15 79.78 3,839.34
Balance as at 30 June 2016 47.38 3,476.83 84.30 3,608.51
Balance as at 01 January 2012 125.07 - 68.20 193.27
Additions 108.99 - 10.52 119.51
Disposals (9.00) - - (9.00)
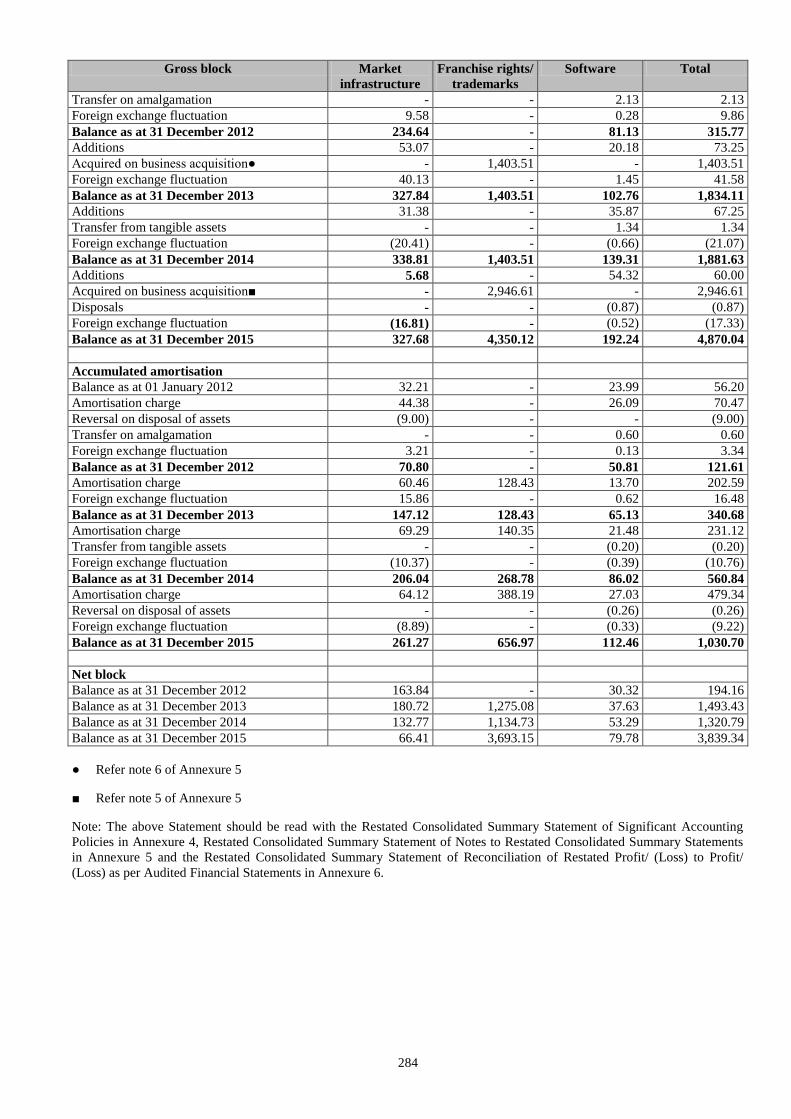
284
Gross block Market
infrastructure
Franchise rights/
trademarks
Software Total
Transfer on amalgamation - - 2.13 2.13
Foreign exchange fluctuation 9.58 - 0.28 9.86
Balance as at 31 December 2012 234.64 - 81.13 315.77
Additions 53.07 - 20.18 73.25
Acquired on business acquisition● - 1,403.51 - 1,403.51
Foreign exchange fluctuation 40.13 - 1.45 41.58
Balance as at 31 December 2013 327.84 1,403.51 102.76 1,834.11
Additions 31.38 - 35.87 67.25
Transfer from tangible assets - - 1.34 1.34
Foreign exchange fluctuation (20.41) - (0.66) (21.07)
Balance as at 31 December 2014 338.81 1,403.51 139.31 1,881.63
Additions 5.68 - 54.32 60.00
Acquired on business acquisition■ - 2,946.61 - 2,946.61
Disposals - - (0.87) (0.87)
Foreign exchange fluctuation (16.81) - (0.52) (17.33)
Balance as at 31 December 2015 327.68 4,350.12 192.24 4,870.04
Accumulated amortisation
Balance as at 01 January 2012 32.21 - 23.99 56.20
Amortisation charge 44.38 - 26.09 70.47
Reversal on disposal of assets (9.00) - - (9.00)
Transfer on amalgamation - - 0.60 0.60
Foreign exchange fluctuation 3.21 - 0.13 3.34
Balance as at 31 December 2012 70.80 - 50.81 121.61
Amortisation charge 60.46 128.43 13.70 202.59
Foreign exchange fluctuation 15.86 - 0.62 16.48
Balance as at 31 December 2013 147.12 128.43 65.13 340.68
Amortisation charge 69.29 140.35 21.48 231.12
Transfer from tangible assets - - (0.20) (0.20)
Foreign exchange fluctuation (10.37) - (0.39) (10.76)
Balance as at 31 December 2014 206.04 268.78 86.02 560.84
Amortisation charge 64.12 388.19 27.03 479.34
Reversal on disposal of assets - - (0.26) (0.26)
Foreign exchange fluctuation (8.89) - (0.33) (9.22)
Balance as at 31 December 2015 261.27 656.97 112.46 1,030.70
Net block
Balance as at 31 December 2012 163.84 - 30.32 194.16
Balance as at 31 December 2013 180.72 1,275.08 37.63 1,493.43
Balance as at 31 December 2014 132.77 1,134.73 53.29 1,320.79
Balance as at 31 December 2015 66.41 3,693.15 79.78 3,839.34
● Refer note 6 of Annexure 5
■ Refer note 5 of Annexure 5
Note: The above Statement should be read with the Restated Consolidated Summary Statement of Significant Accounting
Policies in Annexure 4, Restated Consolidated Summary Statement of Notes to Restated Consolidated Summary Statements
in Annexure 5 and the Restated Consolidated Summary Statement of Reconciliation of Restated Profit/ (Loss) to Profit/
(Loss) as per Audited Financial Statements in Annexure 6.
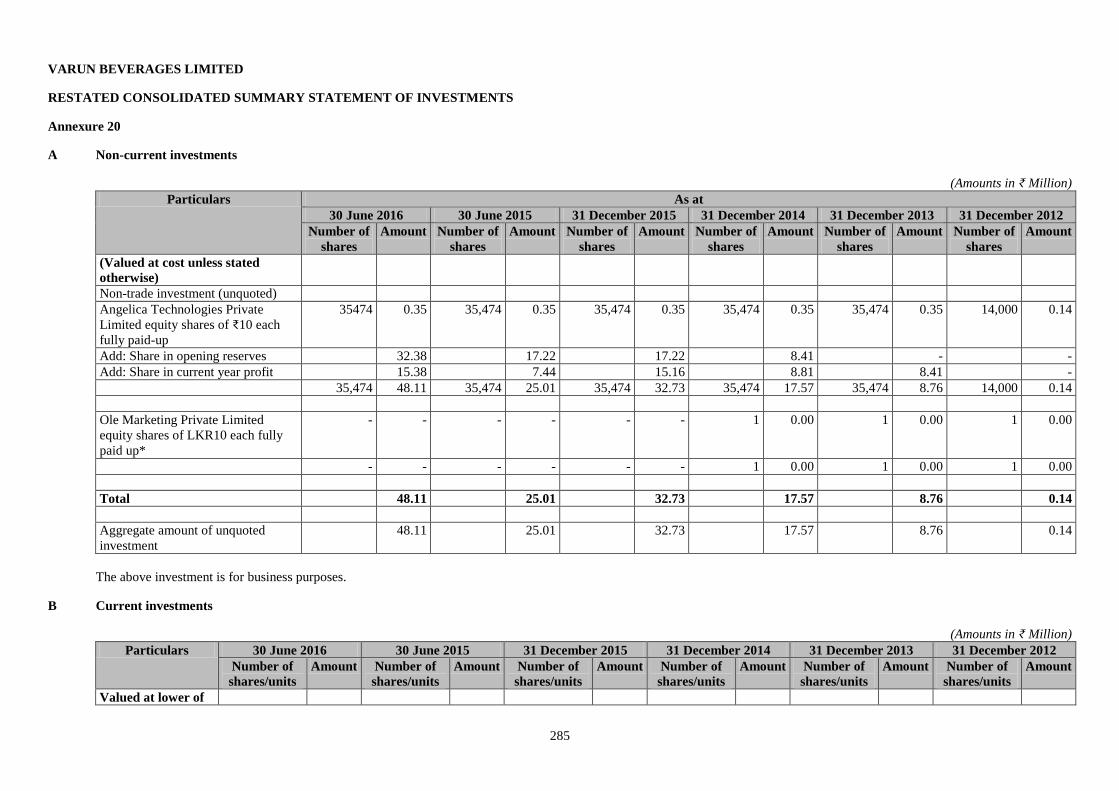
285
VARUN BEVERAGES LIMITED
RESTATED CONSOLIDATED SUMMARY STATEMENT OF INVESTMENTS
Annexure 20
A Non-current investments
(Amounts in ₹ Million)
Particulars As at
30 June 2016 30 June 2015 31 December 2015 31 December 2014 31 December 2013 31 December 2012
Number of
shares
Amount Number of
shares
Amount Number of
shares
Amount Number of
shares
Amount Number of
shares
Amount Number of
shares
Amount
(Valued at cost unless stated
otherwise)
Non-trade investment (unquoted)
Angelica Technologies Private
Limited equity shares of ₹10 each
fully paid-up
35474 0.35 35,474 0.35 35,474 0.35 35,474 0.35 35,474 0.35 14,000 0.14
Add: Share in opening reserves 32.38 17.22 17.22 8.41 - -
Add: Share in current year profit 15.38 7.44 15.16 8.81 8.41 -
35,474 48.11 35,474 25.01 35,474 32.73 35,474 17.57 35,474 8.76 14,000 0.14
Ole Marketing Private Limited
equity shares of LKR10 each fully
paid up*
- - - - - - 1 0.00 1 0.00 1 0.00
- - - - - - 1 0.00 1 0.00 1 0.00
Total 48.11 25.01 32.73 17.57 8.76 0.14
Aggregate amount of unquoted
investment
48.11 25.01 32.73 17.57 8.76 0.14
The above investment is for business purposes.
B Current investments
(Amounts in ₹ Million)
Particulars 30 June 2016 30 June 2015 31 December 2015 31 December 2014 31 December 2013 31 December 2012
Number of
shares/units
Amount Number of
shares/units
Amount Number of
shares/units
Amount Number of
shares/units
Amount Number of
shares/units
Amount Number of
shares/units
Amount
Valued at lower of
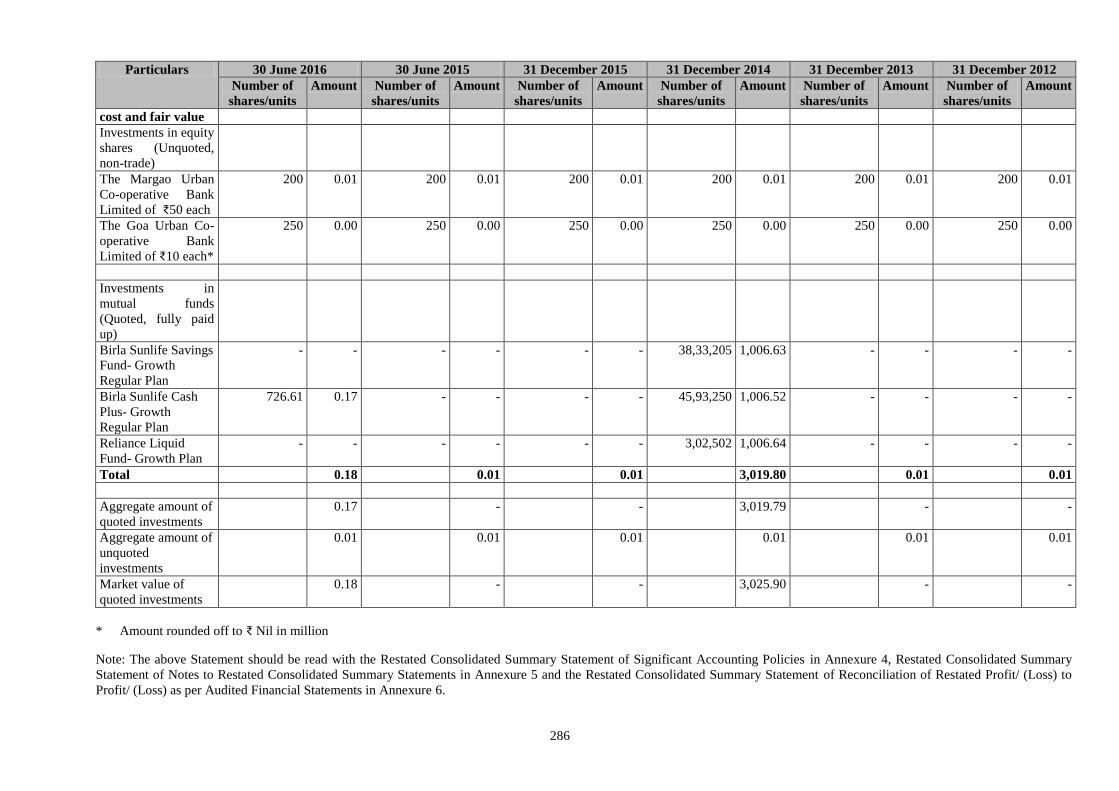
286
Particulars 30 June 2016 30 June 2015 31 December 2015 31 December 2014 31 December 2013 31 December 2012
Number of
shares/units
Amount Number of
shares/units
Amount Number of
shares/units
Amount Number of
shares/units
Amount Number of
shares/units
Amount Number of
shares/units
Amount
cost and fair value
Investments in equity
shares (Unquoted,
non-trade)
The Margao Urban
Co-operative Bank
Limited of ₹50 each
200 0.01 200 0.01 200 0.01 200 0.01 200 0.01 200 0.01
The Goa Urban Co-
operative Bank
Limited of ₹10 each*
250 0.00 250 0.00 250 0.00 250 0.00 250 0.00 250 0.00
Investments in
mutual funds
(Quoted, fully paid
up)
Birla Sunlife Savings
Fund- Growth
Regular Plan
- - - - - - 38,33,205 1,006.63 - - - -
Birla Sunlife Cash
Plus- Growth
Regular Plan
726.61 0.17 - - - - 45,93,250 1,006.52 - - - -
Reliance Liquid
Fund- Growth Plan
- - - - - - 3,02,502 1,006.64 - - - -
Total 0.18 0.01 0.01 3,019.80 0.01 0.01
Aggregate amount of
quoted investments
0.17 - - 3,019.79 - -
Aggregate amount of
unquoted
investments
0.01 0.01 0.01 0.01 0.01 0.01
Market value of
quoted investments
0.18 - - 3,025.90 - -
* Amount rounded off to ₹ Nil in million
Note: The above Statement should be read with the Restated Consolidated Summary Statement of Significant Accounting Policies in Annexure 4, Restated Consolidated Summary
Statement of Notes to Restated Consolidated Summary Statements in Annexure 5 and the Restated Consolidated Summary Statement of Reconciliation of Restated Profit/ (Loss) to
Profit/ (Loss) as per Audited Financial Statements in Annexure 6.
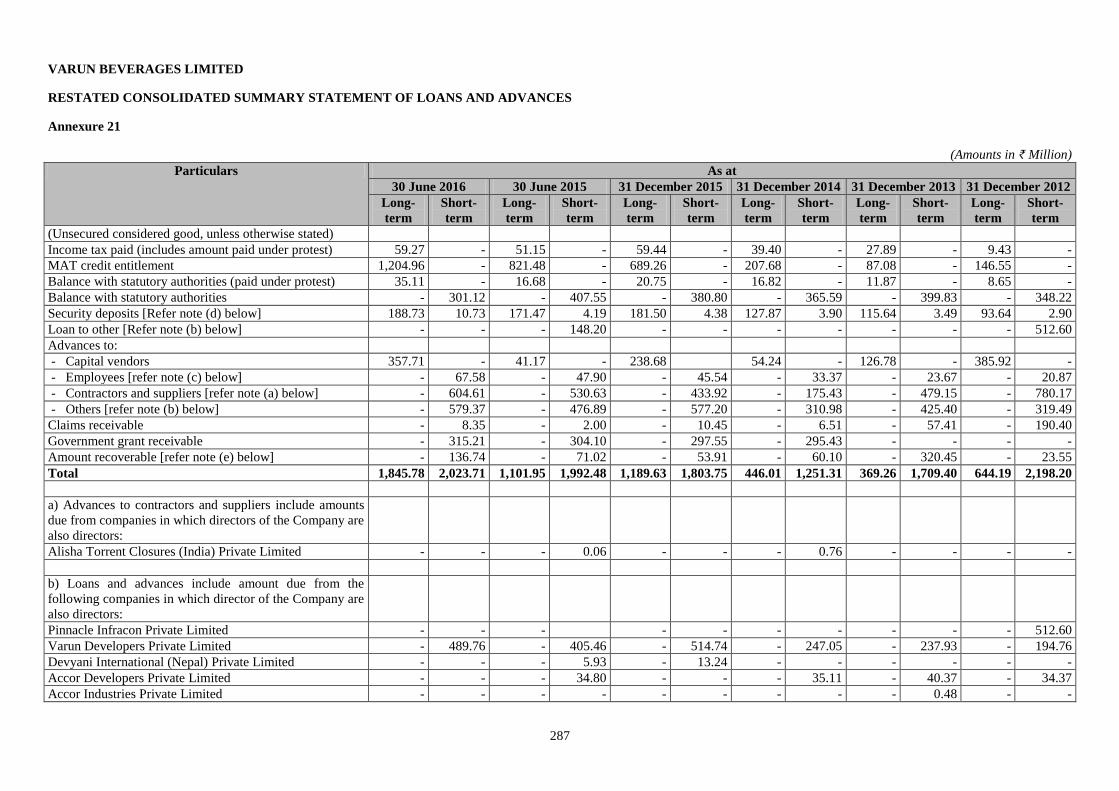
287
VARUN BEVERAGES LIMITED
RESTATED CONSOLIDATED SUMMARY STATEMENT OF LOANS AND ADVANCES
Annexure 21
(Amounts in ₹ Million)
Particulars As at
30 June 2016 30 June 2015 31 December 2015 31 December 2014 31 December 2013 31 December 2012
Long-
term
Short-
term
Long-
term
Short-
term
Long-
term
Short-
term
Long-
term
Short-
term
Long-
term
Short-
term
Long-
term
Short-
term
(Unsecured considered good, unless otherwise stated)
Income tax paid (includes amount paid under protest) 59.27 - 51.15 - 59.44 - 39.40 - 27.89 - 9.43 -
MAT credit entitlement 1,204.96 - 821.48 - 689.26 - 207.68 - 87.08 - 146.55 -
Balance with statutory authorities (paid under protest) 35.11 - 16.68 - 20.75 - 16.82 - 11.87 - 8.65 -
Balance with statutory authorities - 301.12 - 407.55 - 380.80 - 365.59 - 399.83 - 348.22
Security deposits [Refer note (d) below] 188.73 10.73 171.47 4.19 181.50 4.38 127.87 3.90 115.64 3.49 93.64 2.90
Loan to other [Refer note (b) below] - - - 148.20 - - - - - - - 512.60
Advances to:
- Capital vendors 357.71 - 41.17 - 238.68 54.24 - 126.78 - 385.92 -
- Employees [refer note (c) below] - 67.58 - 47.90 - 45.54 - 33.37 - 23.67 - 20.87
- Contractors and suppliers [refer note (a) below] - 604.61 - 530.63 - 433.92 - 175.43 - 479.15 - 780.17
- Others [refer note (b) below] - 579.37 - 476.89 - 577.20 - 310.98 - 425.40 - 319.49
Claims receivable - 8.35 - 2.00 - 10.45 - 6.51 - 57.41 - 190.40
Government grant receivable - 315.21 - 304.10 - 297.55 - 295.43 - - - -
Amount recoverable [refer note (e) below] - 136.74 - 71.02 - 53.91 - 60.10 - 320.45 - 23.55
Total 1,845.78 2,023.71 1,101.95 1,992.48 1,189.63 1,803.75 446.01 1,251.31 369.26 1,709.40 644.19 2,198.20
a) Advances to contractors and suppliers include amounts
due from companies in which directors of the Company are
also directors:
Alisha Torrent Closures (India) Private Limited - - - 0.06 - - - 0.76 - - - -
b) Loans and advances include amount due from the
following companies in which director of the Company are
also directors:
Pinnacle Infracon Private Limited - - - - - - - - - - 512.60
Varun Developers Private Limited - 489.76 - 405.46 - 514.74 - 247.05 - 237.93 - 194.76
Devyani International (Nepal) Private Limited - - - 5.93 - 13.24 - - - - - -
Accor Developers Private Limited - - - 34.80 - - - 35.11 - 40.37 - 34.37
Accor Industries Private Limited - - - - - - - - - 0.48 - -
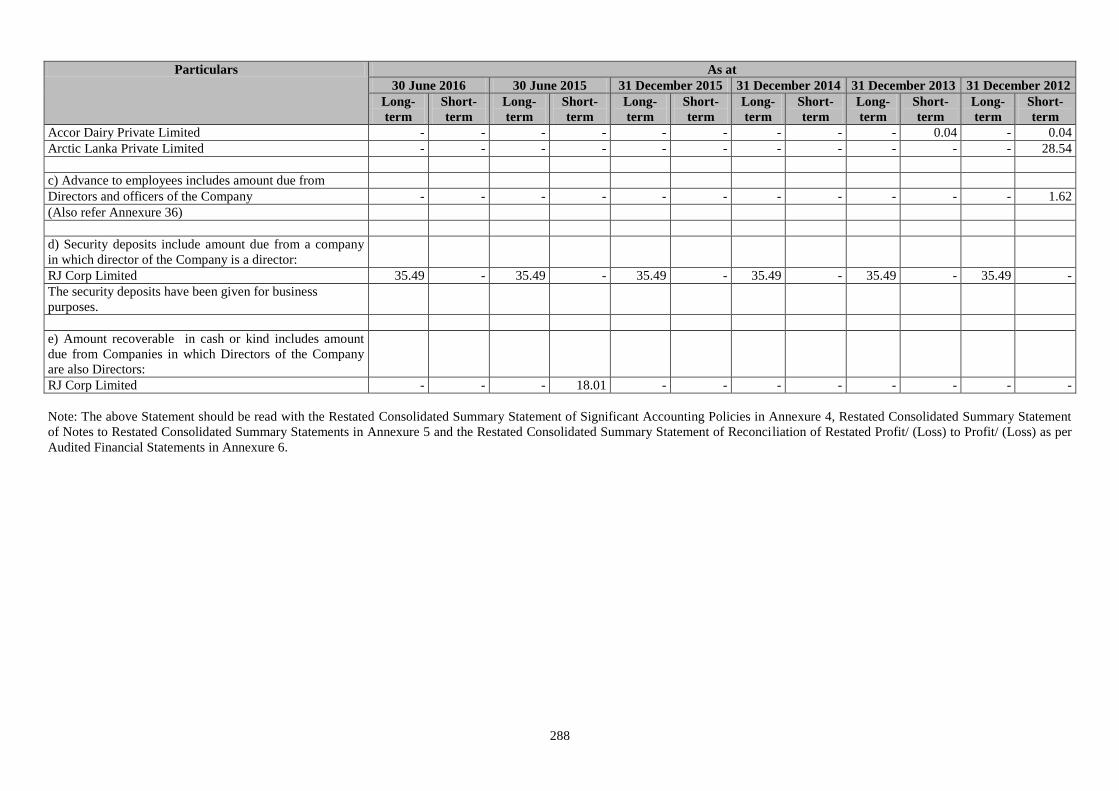
288
Particulars As at
30 June 2016 30 June 2015 31 December 2015 31 December 2014 31 December 2013 31 December 2012
Long-
term
Short-
term
Long-
term
Short-
term
Long-
term
Short-
term
Long-
term
Short-
term
Long-
term
Short-
term
Long-
term
Short-
term
Accor Dairy Private Limited - - - - - - - - - 0.04 - 0.04
Arctic Lanka Private Limited - - - - - - - - - - - 28.54
c) Advance to employees includes amount due from
Directors and officers of the Company - - - - - - - - - - - 1.62
(Also refer Annexure 36)
d) Security deposits include amount due from a company
in which director of the Company is a director:
RJ Corp Limited 35.49 - 35.49 - 35.49 - 35.49 - 35.49 - 35.49 -
The security deposits have been given for business
purposes.
e) Amount recoverable in cash or kind includes amount
due from Companies in which Directors of the Company
are also Directors:
RJ Corp Limited - - - 18.01 - - - - - - - -
Note: The above Statement should be read with the Restated Consolidated Summary Statement of Significant Accounting Policies in Annexure 4, Restated Consolidated Summary Statement
of Notes to Restated Consolidated Summary Statements in Annexure 5 and the Restated Consolidated Summary Statement of Reconciliation of Restated Profit/ (Loss) to Profit/ (Loss) as per
Audited Financial Statements in Annexure 6.
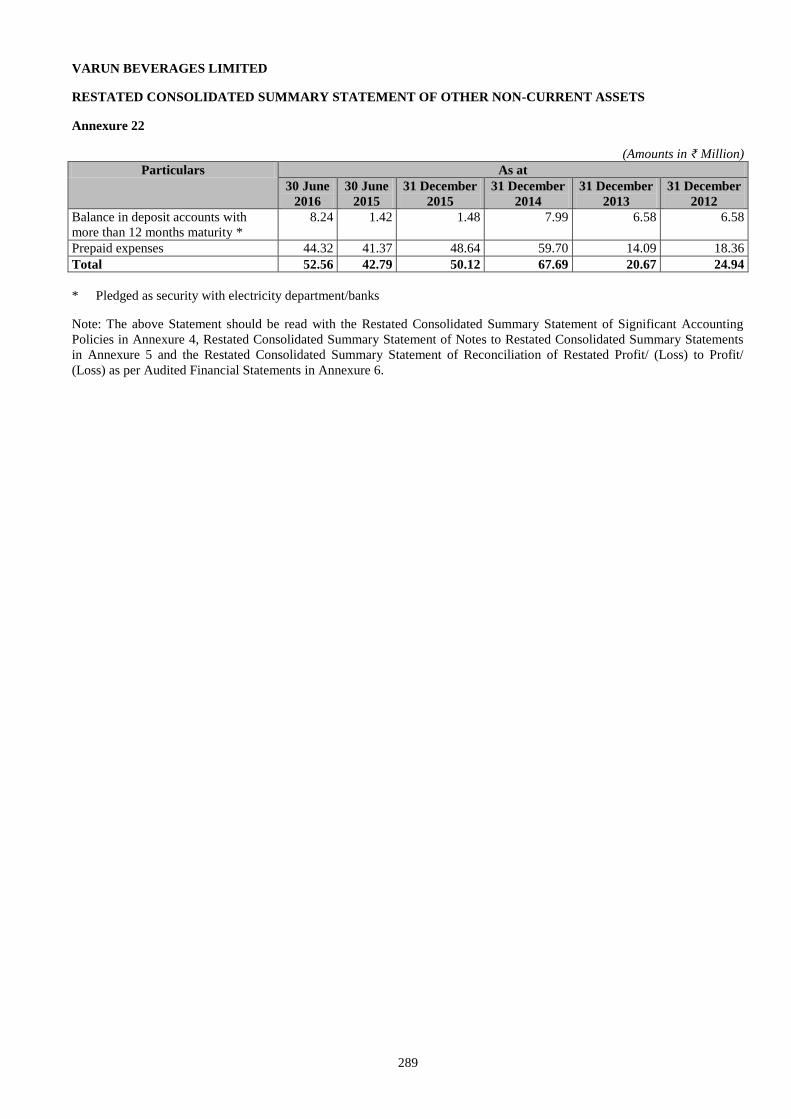
289
VARUN BEVERAGES LIMITED
RESTATED CONSOLIDATED SUMMARY STATEMENT OF OTHER NON-CURRENT ASSETS
Annexure 22
(Amounts in ₹ Million)
Particulars As at
30 June
2016
30 June
2015
31 December
2015
31 December
2014
31 December
2013
31 December
2012
Balance in deposit accounts with
more than 12 months maturity *
8.24 1.42 1.48 7.99 6.58 6.58
Prepaid expenses 44.32 41.37 48.64 59.70 14.09 18.36
Total 52.56 42.79 50.12 67.69 20.67 24.94
* Pledged as security with electricity department/banks
Note: The above Statement should be read with the Restated Consolidated Summary Statement of Significant Accounting
Policies in Annexure 4, Restated Consolidated Summary Statement of Notes to Restated Consolidated Summary Statements
in Annexure 5 and the Restated Consolidated Summary Statement of Reconciliation of Restated Profit/ (Loss) to Profit/
(Loss) as per Audited Financial Statements in Annexure 6.
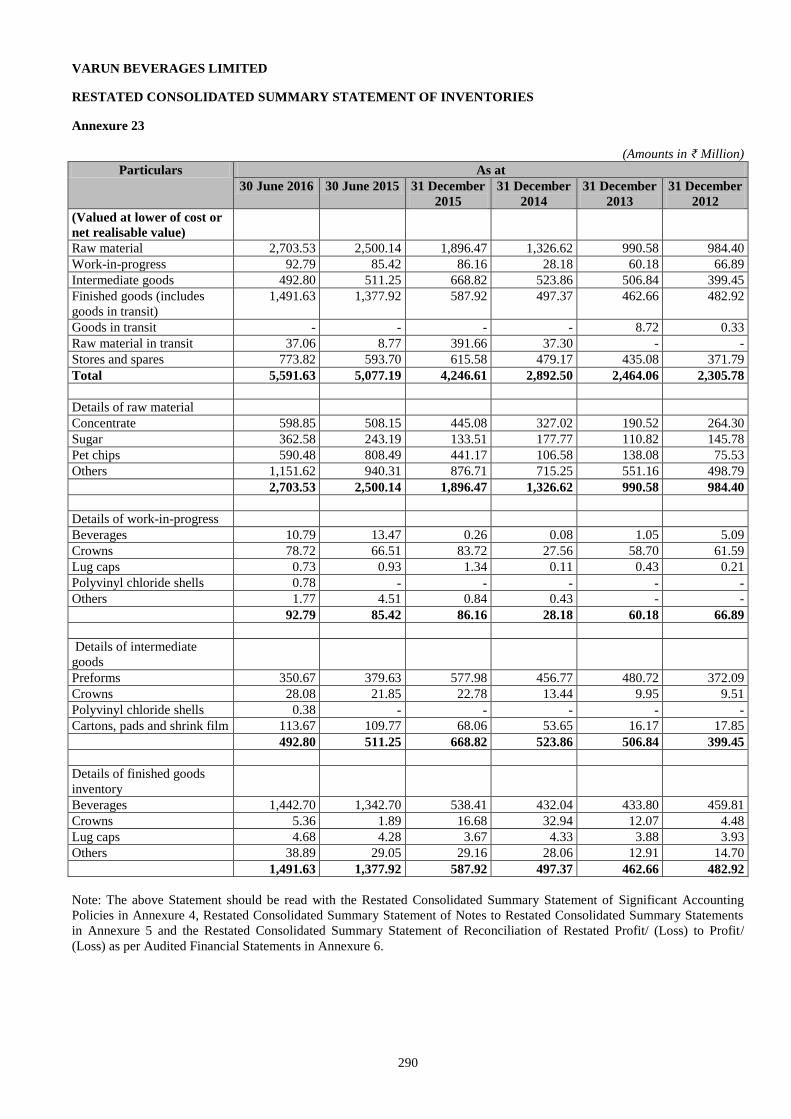
290
VARUN BEVERAGES LIMITED
RESTATED CONSOLIDATED SUMMARY STATEMENT OF INVENTORIES
Annexure 23
(Amounts in ₹ Million)
Particulars As at
30 June 2016 30 June 2015 31 December
2015
31 December
2014
31 December
2013
31 December
2012
(Valued at lower of cost or
net realisable value)
Raw material 2,703.53 2,500.14 1,896.47 1,326.62 990.58 984.40
Work-in-progress 92.79 85.42 86.16 28.18 60.18 66.89
Intermediate goods 492.80 511.25 668.82 523.86 506.84 399.45
Finished goods (includes
goods in transit)
1,491.63 1,377.92 587.92 497.37 462.66 482.92
Goods in transit - - - - 8.72 0.33
Raw material in transit 37.06 8.77 391.66 37.30 - -
Stores and spares 773.82 593.70 615.58 479.17 435.08 371.79
Total 5,591.63 5,077.19 4,246.61 2,892.50 2,464.06 2,305.78
Details of raw material
Concentrate 598.85 508.15 445.08 327.02 190.52 264.30
Sugar 362.58 243.19 133.51 177.77 110.82 145.78
Pet chips 590.48 808.49 441.17 106.58 138.08 75.53
Others 1,151.62 940.31 876.71 715.25 551.16 498.79
2,703.53 2,500.14 1,896.47 1,326.62 990.58 984.40
Details of work-in-progress
Beverages 10.79 13.47 0.26 0.08 1.05 5.09
Crowns 78.72 66.51 83.72 27.56 58.70 61.59
Lug caps 0.73 0.93 1.34 0.11 0.43 0.21
Polyvinyl chloride shells 0.78 - - - - -
Others 1.77 4.51 0.84 0.43 - -
92.79 85.42 86.16 28.18 60.18 66.89
Details of intermediate
goods
Preforms 350.67 379.63 577.98 456.77 480.72 372.09
Crowns 28.08 21.85 22.78 13.44 9.95 9.51
Polyvinyl chloride shells 0.38 - - - - -
Cartons, pads and shrink film 113.67 109.77 68.06 53.65 16.17 17.85
492.80 511.25 668.82 523.86 506.84 399.45
Details of finished goods
inventory
Beverages 1,442.70 1,342.70 538.41 432.04 433.80 459.81
Crowns 5.36 1.89 16.68 32.94 12.07 4.48
Lug caps 4.68 4.28 3.67 4.33 3.88 3.93
Others 38.89 29.05 29.16 28.06 12.91 14.70
1,491.63 1,377.92 587.92 497.37 462.66 482.92
Note: The above Statement should be read with the Restated Consolidated Summary Statement of Significant Accounting
Policies in Annexure 4, Restated Consolidated Summary Statement of Notes to Restated Consolidated Summary Statements
in Annexure 5 and the Restated Consolidated Summary Statement of Reconciliation of Restated Profit/ (Loss) to Profit/
(Loss) as per Audited Financial Statements in Annexure 6.
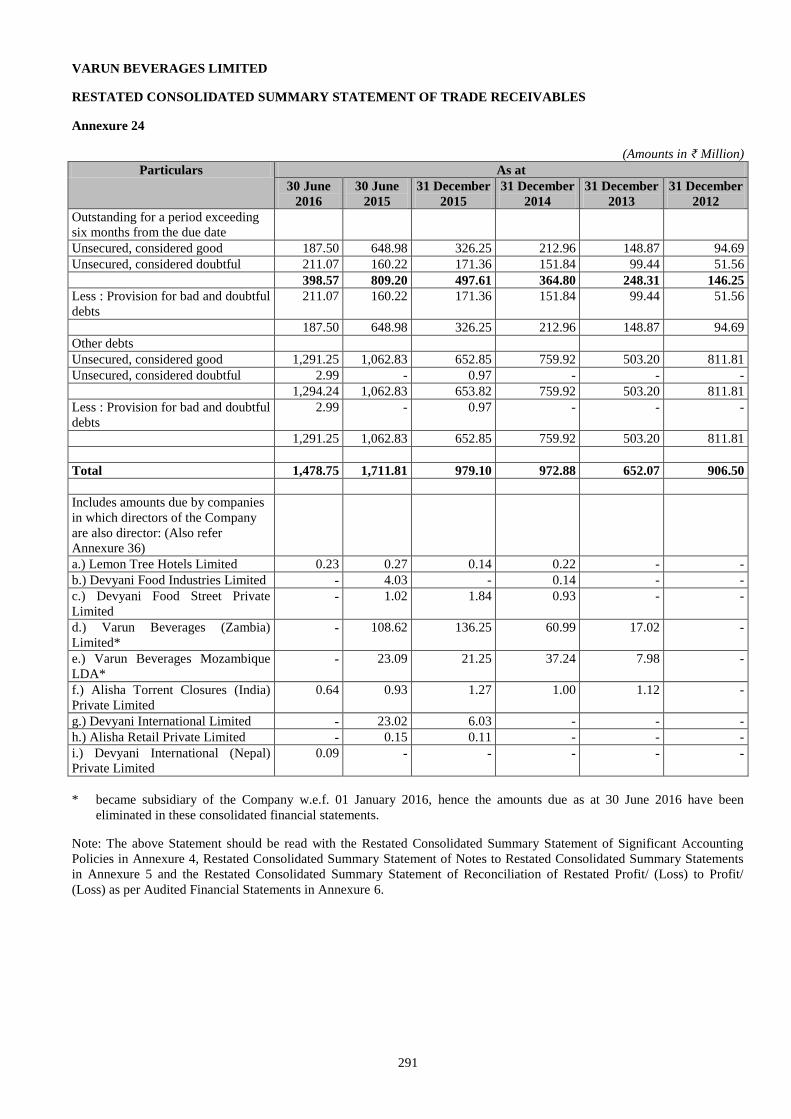
291
VARUN BEVERAGES LIMITED
RESTATED CONSOLIDATED SUMMARY STATEMENT OF TRADE RECEIVABLES
Annexure 24
(Amounts in ₹ Million)
Particulars As at
30 June
2016
30 June
2015
31 December
2015
31 December
2014
31 December
2013
31 December
2012
Outstanding for a period exceeding
six months from the due date
Unsecured, considered good 187.50 648.98 326.25 212.96 148.87 94.69
Unsecured, considered doubtful 211.07 160.22 171.36 151.84 99.44 51.56
398.57 809.20 497.61 364.80 248.31 146.25
Less : Provision for bad and doubtful
debts
211.07 160.22 171.36 151.84 99.44 51.56
187.50 648.98 326.25 212.96 148.87 94.69
Other debts
Unsecured, considered good 1,291.25 1,062.83 652.85 759.92 503.20 811.81
Unsecured, considered doubtful 2.99 - 0.97 - - -
1,294.24 1,062.83 653.82 759.92 503.20 811.81
Less : Provision for bad and doubtful
debts
2.99 - 0.97 - - -
1,291.25 1,062.83 652.85 759.92 503.20 811.81
Total 1,478.75 1,711.81 979.10 972.88 652.07 906.50
Includes amounts due by companies
in which directors of the Company
are also director: (Also refer
Annexure 36)
a.) Lemon Tree Hotels Limited 0.23 0.27 0.14 0.22 - -
b.) Devyani Food Industries Limited - 4.03 - 0.14 - -
c.) Devyani Food Street Private
Limited - 1.02 1.84 0.93 - -
d.) Varun Beverages (Zambia)
Limited* - 108.62 136.25 60.99 17.02 -
e.) Varun Beverages Mozambique
LDA* - 23.09 21.25 37.24 7.98 -
f.) Alisha Torrent Closures (India)
Private Limited
0.64 0.93 1.27 1.00 1.12 -
g.) Devyani International Limited - 23.02 6.03 - - -
h.) Alisha Retail Private Limited - 0.15 0.11 - - -
i.) Devyani International (Nepal)
Private Limited
0.09 - - - - -
* became subsidiary of the Company w.e.f. 01 January 2016, hence the amounts due as at 30 June 2016 have been
eliminated in these consolidated financial statements.
Note: The above Statement should be read with the Restated Consolidated Summary Statement of Significant Accounting
Policies in Annexure 4, Restated Consolidated Summary Statement of Notes to Restated Consolidated Summary Statements
in Annexure 5 and the Restated Consolidated Summary Statement of Reconciliation of Restated Profit/ (Loss) to Profit/
(Loss) as per Audited Financial Statements in Annexure 6.
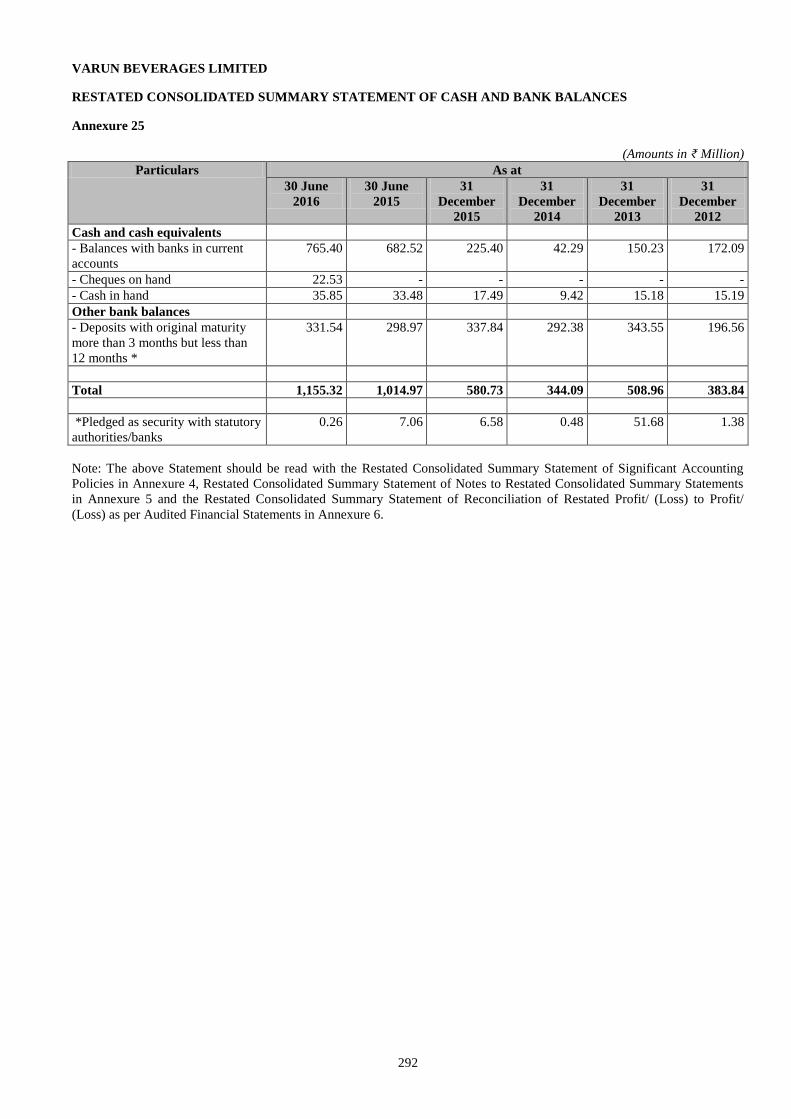
292
VARUN BEVERAGES LIMITED
RESTATED CONSOLIDATED SUMMARY STATEMENT OF CASH AND BANK BALANCES
Annexure 25
(Amounts in ₹ Million)
Particulars As at
30 June
2016
30 June
2015
31
December
2015
31
December
2014
31
December
2013
31
December
2012
Cash and cash equivalents
- Balances with banks in current
accounts
765.40 682.52 225.40 42.29 150.23 172.09
- Cheques on hand 22.53 - - - - -
- Cash in hand 35.85 33.48 17.49 9.42 15.18 15.19
Other bank balances
- Deposits with original maturity
more than 3 months but less than
12 months *
331.54 298.97 337.84 292.38 343.55 196.56
Total 1,155.32 1,014.97 580.73 344.09 508.96 383.84
*Pledged as security with statutory
authorities/banks
0.26 7.06 6.58 0.48 51.68 1.38
Note: The above Statement should be read with the Restated Consolidated Summary Statement of Significant Accounting
Policies in Annexure 4, Restated Consolidated Summary Statement of Notes to Restated Consolidated Summary Statements
in Annexure 5 and the Restated Consolidated Summary Statement of Reconciliation of Restated Profit/ (Loss) to Profit/
(Loss) as per Audited Financial Statements in Annexure 6.
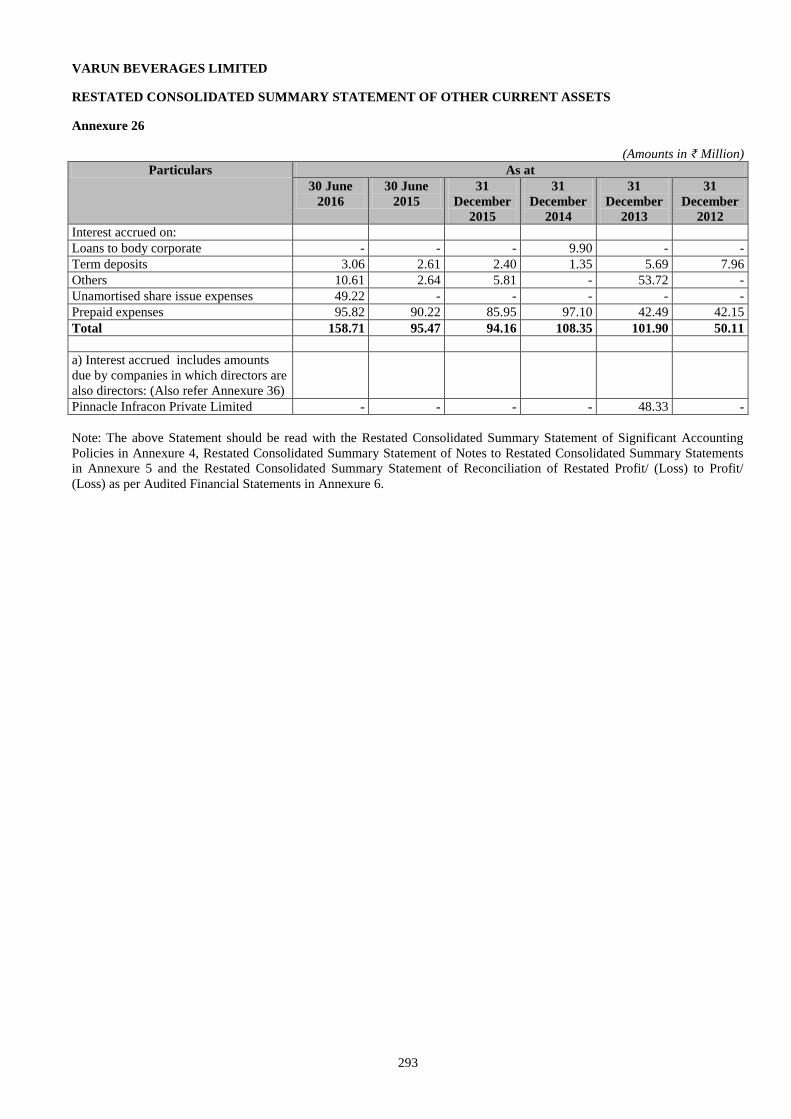
293
VARUN BEVERAGES LIMITED
RESTATED CONSOLIDATED SUMMARY STATEMENT OF OTHER CURRENT ASSETS
Annexure 26
(Amounts in ₹ Million)
Particulars As at
30 June
2016
30 June
2015
31
December
2015
31
December
2014
31
December
2013
31
December
2012
Interest accrued on:
Loans to body corporate - - - 9.90 - -
Term deposits 3.06 2.61 2.40 1.35 5.69 7.96
Others 10.61 2.64 5.81 - 53.72 -
Unamortised share issue expenses 49.22 - - - - -
Prepaid expenses 95.82 90.22 85.95 97.10 42.49 42.15
Total 158.71 95.47 94.16 108.35 101.90 50.11
a) Interest accrued includes amounts
due by companies in which directors are
also directors: (Also refer Annexure 36)
Pinnacle Infracon Private Limited - - - - 48.33 -
Note: The above Statement should be read with the Restated Consolidated Summary Statement of Significant Accounting
Policies in Annexure 4, Restated Consolidated Summary Statement of Notes to Restated Consolidated Summary Statements
in Annexure 5 and the Restated Consolidated Summary Statement of Reconciliation of Restated Profit/ (Loss) to Profit/
(Loss) as per Audited Financial Statements in Annexure 6.
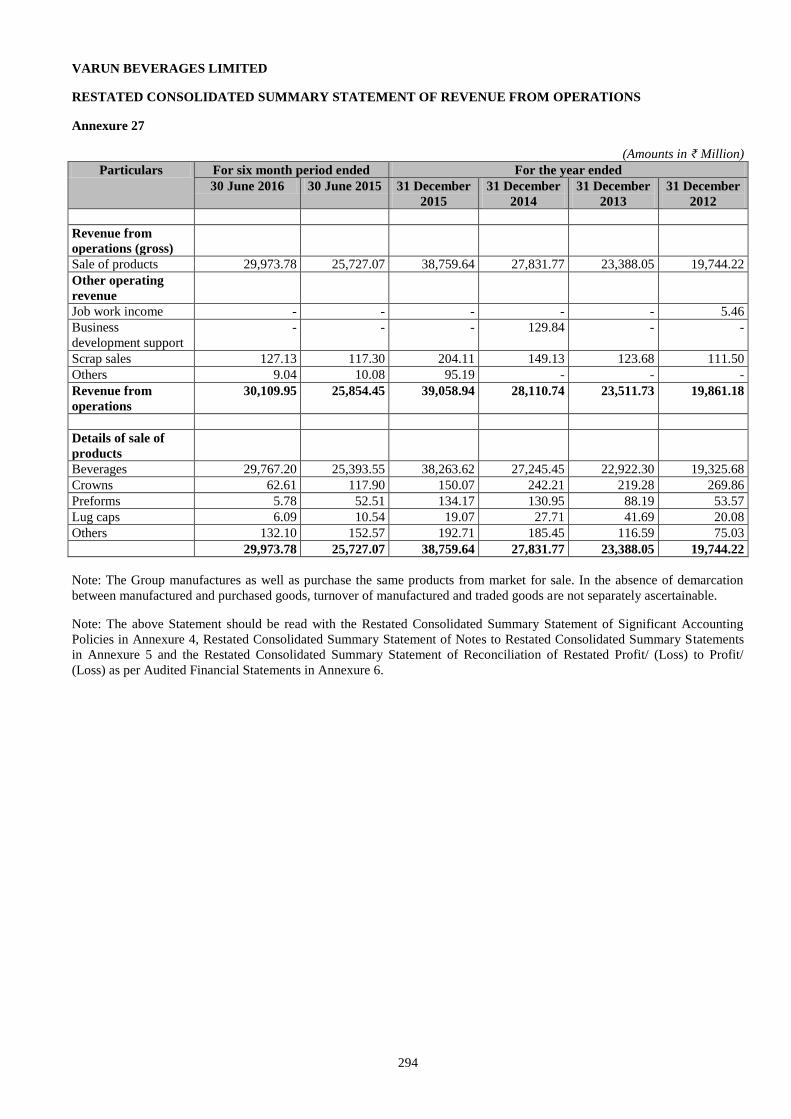
294
VARUN BEVERAGES LIMITED
RESTATED CONSOLIDATED SUMMARY STATEMENT OF REVENUE FROM OPERATIONS
Annexure 27
(Amounts in ₹ Million)
Particulars For six month period ended For the year ended
30 June 2016 30 June 2015 31 December
2015
31 December
2014
31 December
2013
31 December
2012
Revenue from
operations (gross)
Sale of products 29,973.78 25,727.07 38,759.64 27,831.77 23,388.05 19,744.22
Other operating
revenue
Job work income - - - - - 5.46
Business
development support
- - - 129.84 - -
Scrap sales 127.13 117.30 204.11 149.13 123.68 111.50
Others 9.04 10.08 95.19 - - -
Revenue from
operations
30,109.95 25,854.45 39,058.94 28,110.74 23,511.73 19,861.18
Details of sale of
products
Beverages 29,767.20 25,393.55 38,263.62 27,245.45 22,922.30 19,325.68
Crowns 62.61 117.90 150.07 242.21 219.28 269.86
Preforms 5.78 52.51 134.17 130.95 88.19 53.57
Lug caps 6.09 10.54 19.07 27.71 41.69 20.08
Others 132.10 152.57 192.71 185.45 116.59 75.03
29,973.78 25,727.07 38,759.64 27,831.77 23,388.05 19,744.22
Note: The Group manufactures as well as purchase the same products from market for sale. In the absence of demarcation
between manufactured and purchased goods, turnover of manufactured and traded goods are not separately ascertainable.
Note: The above Statement should be read with the Restated Consolidated Summary Statement of Significant Accounting
Policies in Annexure 4, Restated Consolidated Summary Statement of Notes to Restated Consolidated Summary Statements
in Annexure 5 and the Restated Consolidated Summary Statement of Reconciliation of Restated Profit/ (Loss) to Profit/
(Loss) as per Audited Financial Statements in Annexure 6.
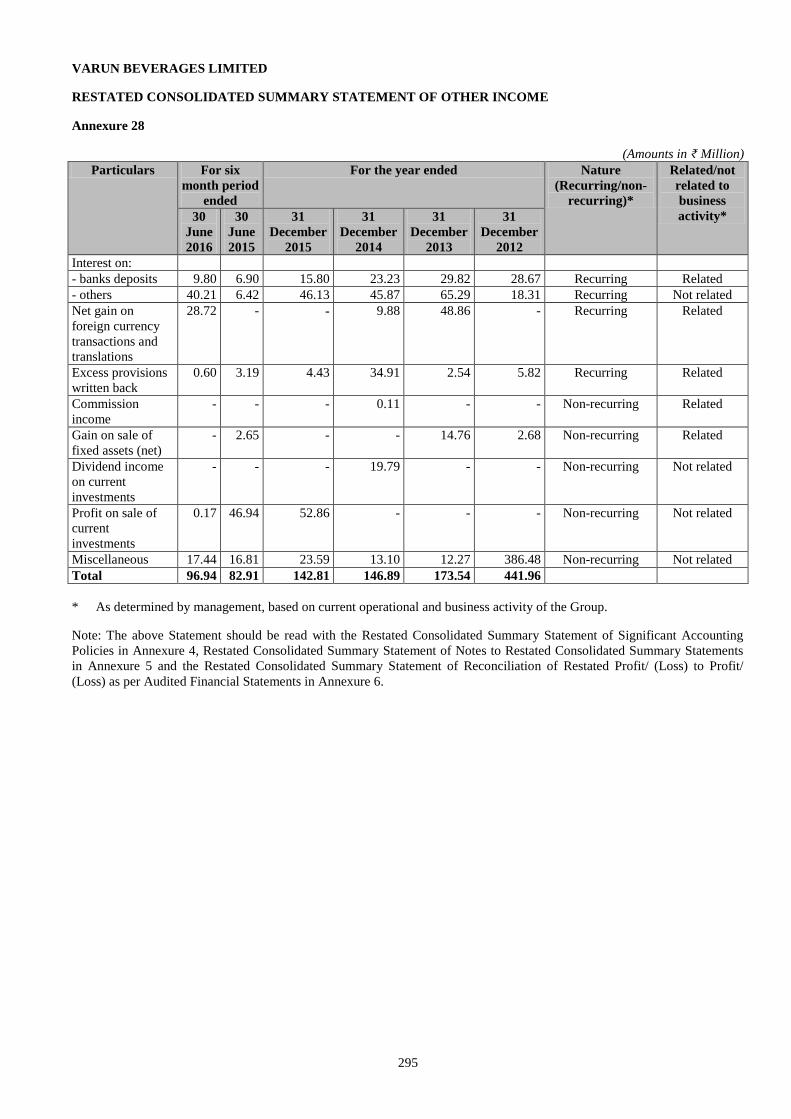
295
VARUN BEVERAGES LIMITED
RESTATED CONSOLIDATED SUMMARY STATEMENT OF OTHER INCOME
Annexure 28
(Amounts in ₹ Million)
Particulars For six
month period
ended
For the year ended Nature
(Recurring/non-
recurring)*
Related/not
related to
business
activity* 30
June
2016
30
June
2015
31
December
2015
31
December
2014
31
December
2013
31
December
2012
Interest on:
- banks deposits 9.80 6.90 15.80 23.23 29.82 28.67 Recurring Related
- others 40.21 6.42 46.13 45.87 65.29 18.31 Recurring Not related
Net gain on
foreign currency
transactions and
translations
28.72 - - 9.88 48.86 - Recurring Related
Excess provisions
written back
0.60 3.19 4.43 34.91 2.54 5.82 Recurring Related
Commission
income
- - - 0.11 - - Non-recurring Related
Gain on sale of
fixed assets (net)
- 2.65 - - 14.76 2.68 Non-recurring Related
Dividend income
on current
investments
- - - 19.79 - - Non-recurring Not related
Profit on sale of
current
investments
0.17 46.94 52.86 - - - Non-recurring Not related
Miscellaneous 17.44 16.81 23.59 13.10 12.27 386.48 Non-recurring Not related
Total 96.94 82.91 142.81 146.89 173.54 441.96
* As determined by management, based on current operational and business activity of the Group.
Note: The above Statement should be read with the Restated Consolidated Summary Statement of Significant Accounting
Policies in Annexure 4, Restated Consolidated Summary Statement of Notes to Restated Consolidated Summary Statements
in Annexure 5 and the Restated Consolidated Summary Statement of Reconciliation of Restated Profit/ (Loss) to Profit/
(Loss) as per Audited Financial Statements in Annexure 6.
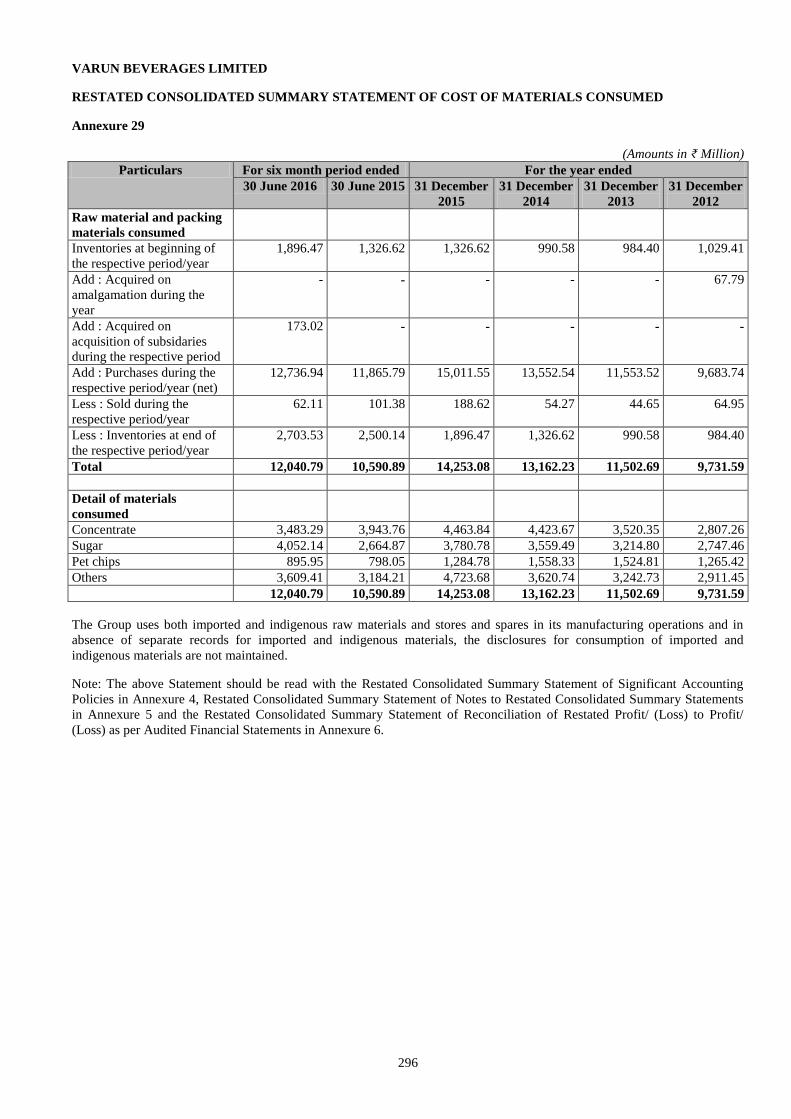
296
VARUN BEVERAGES LIMITED
RESTATED CONSOLIDATED SUMMARY STATEMENT OF COST OF MATERIALS CONSUMED
Annexure 29
(Amounts in ₹ Million)
Particulars For six month period ended For the year ended
30 June 2016 30 June 2015 31 December
2015
31 December
2014
31 December
2013
31 December
2012
Raw material and packing
materials consumed
Inventories at beginning of
the respective period/year
1,896.47 1,326.62 1,326.62 990.58 984.40 1,029.41
Add : Acquired on
amalgamation during the
year
- - - - - 67.79
Add : Acquired on
acquisition of subsidaries
during the respective period
173.02 - - - - -
Add : Purchases during the
respective period/year (net)
12,736.94 11,865.79 15,011.55 13,552.54 11,553.52 9,683.74
Less : Sold during the
respective period/year
62.11 101.38 188.62 54.27 44.65 64.95
Less : Inventories at end of
the respective period/year
2,703.53 2,500.14 1,896.47 1,326.62 990.58 984.40
Total 12,040.79 10,590.89 14,253.08 13,162.23 11,502.69 9,731.59
Detail of materials
consumed
Concentrate 3,483.29 3,943.76 4,463.84 4,423.67 3,520.35 2,807.26
Sugar 4,052.14 2,664.87 3,780.78 3,559.49 3,214.80 2,747.46
Pet chips 895.95 798.05 1,284.78 1,558.33 1,524.81 1,265.42
Others 3,609.41 3,184.21 4,723.68 3,620.74 3,242.73 2,911.45
12,040.79 10,590.89 14,253.08 13,162.23 11,502.69 9,731.59
The Group uses both imported and indigenous raw materials and stores and spares in its manufacturing operations and in
absence of separate records for imported and indigenous materials, the disclosures for consumption of imported and
indigenous materials are not maintained.
Note: The above Statement should be read with the Restated Consolidated Summary Statement of Significant Accounting
Policies in Annexure 4, Restated Consolidated Summary Statement of Notes to Restated Consolidated Summary Statements
in Annexure 5 and the Restated Consolidated Summary Statement of Reconciliation of Restated Profit/ (Loss) to Profit/
(Loss) as per Audited Financial Statements in Annexure 6.
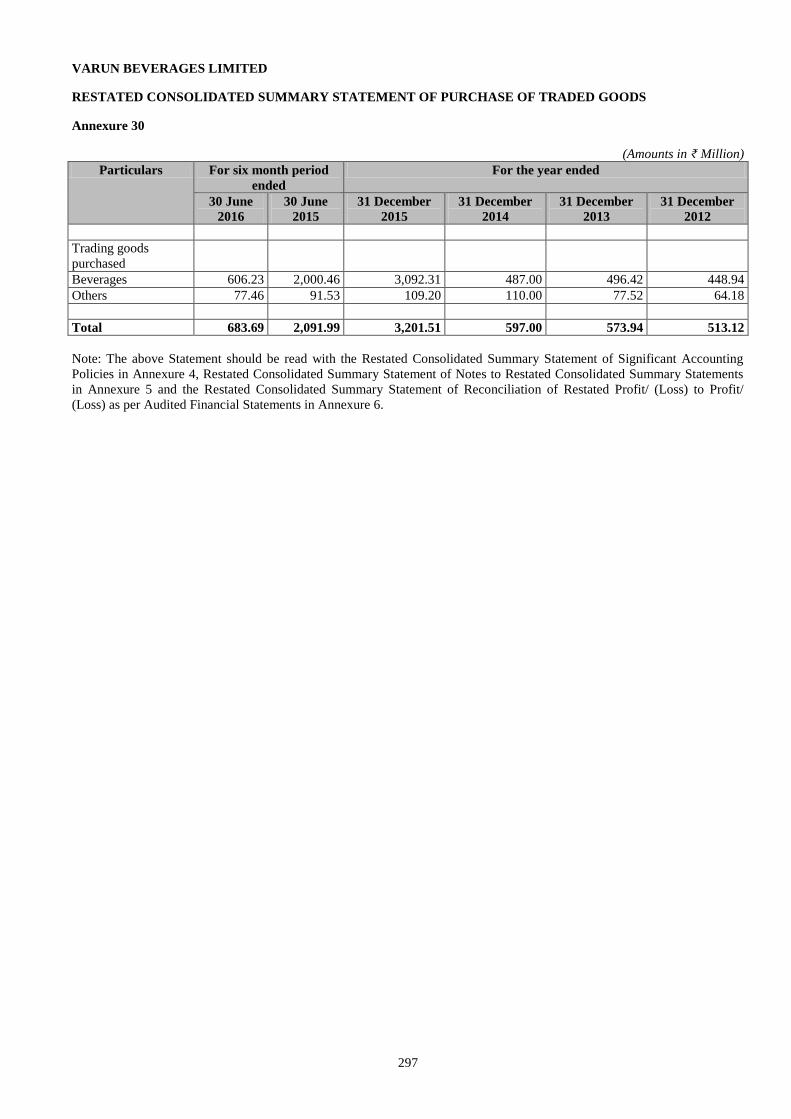
297
VARUN BEVERAGES LIMITED
RESTATED CONSOLIDATED SUMMARY STATEMENT OF PURCHASE OF TRADED GOODS
Annexure 30
(Amounts in ₹ Million)
Particulars For six month period
ended
For the year ended
30 June
2016
30 June
2015
31 December
2015
31 December
2014
31 December
2013
31 December
2012
Trading goods
purchased
Beverages 606.23 2,000.46 3,092.31 487.00 496.42 448.94
Others 77.46 91.53 109.20 110.00 77.52 64.18
Total 683.69 2,091.99 3,201.51 597.00 573.94 513.12
Note: The above Statement should be read with the Restated Consolidated Summary Statement of Significant Accounting
Policies in Annexure 4, Restated Consolidated Summary Statement of Notes to Restated Consolidated Summary Statements
in Annexure 5 and the Restated Consolidated Summary Statement of Reconciliation of Restated Profit/ (Loss) to Profit/
(Loss) as per Audited Financial Statements in Annexure 6.
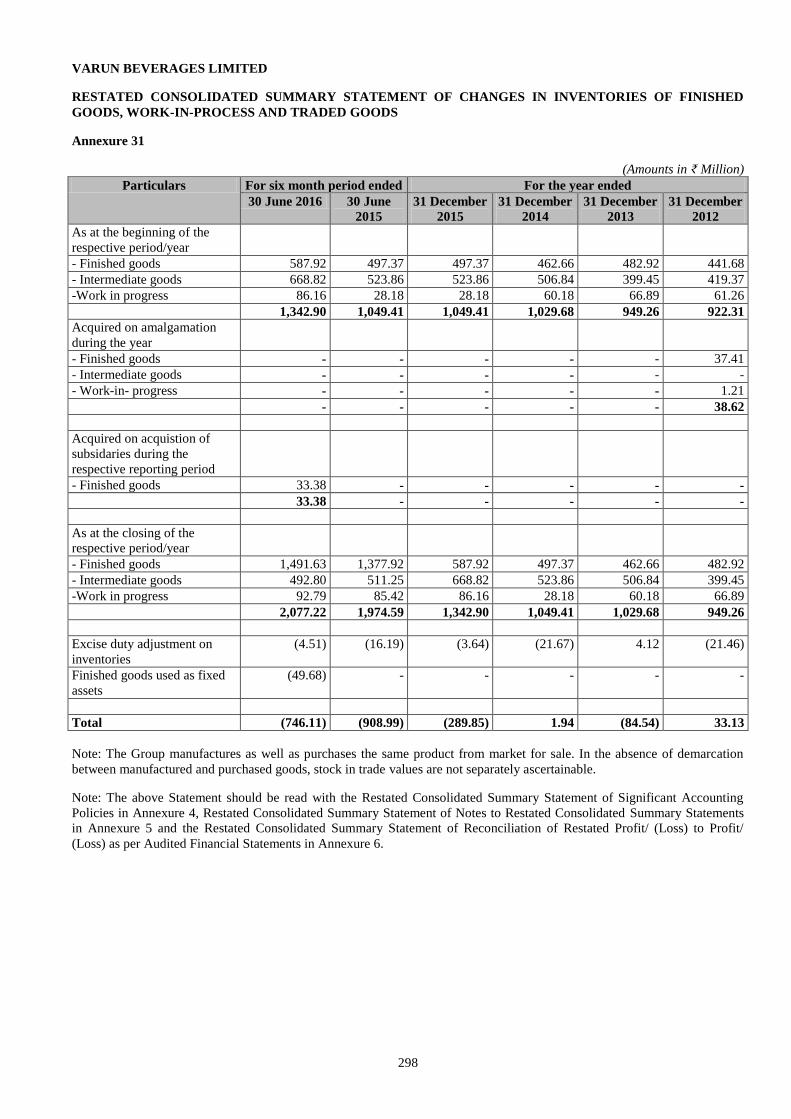
298
VARUN BEVERAGES LIMITED
RESTATED CONSOLIDATED SUMMARY STATEMENT OF CHANGES IN INVENTORIES OF FINISHED
GOODS, WORK-IN-PROCESS AND TRADED GOODS
Annexure 31
(Amounts in ₹ Million)
Particulars For six month period ended For the year ended
30 June 2016 30 June
2015
31 December
2015
31 December
2014
31 December
2013
31 December
2012
As at the beginning of the
respective period/year
- Finished goods 587.92 497.37 497.37 462.66 482.92 441.68
- Intermediate goods 668.82 523.86 523.86 506.84 399.45 419.37
-Work in progress 86.16 28.18 28.18 60.18 66.89 61.26
1,342.90 1,049.41 1,049.41 1,029.68 949.26 922.31
Acquired on amalgamation
during the year
- Finished goods - - - - - 37.41
- Intermediate goods - - - - - -
- Work-in- progress - - - - - 1.21
- - - - - 38.62
Acquired on acquistion of
subsidaries during the
respective reporting period
- Finished goods 33.38 - - - - -
33.38 - - - - -
As at the closing of the
respective period/year
- Finished goods 1,491.63 1,377.92 587.92 497.37 462.66 482.92
- Intermediate goods 492.80 511.25 668.82 523.86 506.84 399.45
-Work in progress 92.79 85.42 86.16 28.18 60.18 66.89
2,077.22 1,974.59 1,342.90 1,049.41 1,029.68 949.26
Excise duty adjustment on
inventories
(4.51) (16.19) (3.64) (21.67) 4.12 (21.46)
Finished goods used as fixed
assets
(49.68) - - - - -
Total (746.11) (908.99) (289.85) 1.94 (84.54) 33.13
Note: The Group manufactures as well as purchases the same product from market for sale. In the absence of demarcation
between manufactured and purchased goods, stock in trade values are not separately ascertainable.
Note: The above Statement should be read with the Restated Consolidated Summary Statement of Significant Accounting
Policies in Annexure 4, Restated Consolidated Summary Statement of Notes to Restated Consolidated Summary Statements
in Annexure 5 and the Restated Consolidated Summary Statement of Reconciliation of Restated Profit/ (Loss) to Profit/
(Loss) as per Audited Financial Statements in Annexure 6.

299
VARUN BEVERAGES LIMITED
RESTATED CONSOLIDATED SUMMARY STATEMENT OF EMPLOYEE BENEFITS EXPENSE
Annexure 32
(Amounts in ₹ Million)
Particulars For six month period ended For the year ended
30 June 2016 30 June 2015 31 December
2015
31 December
2014
31 December
2013
31 December
2012
Salaries, wages and
bonus
1,917.02 1,444.95 2,904.98 1,920.97 1,612.43 1,342.39
Contribution to
provident and other
funds
107.16 84.57 181.85 141.80 121.93 101.57
Staff welfare expenses 84.19 60.01 150.68 105.22 95.55 80.28
Total 2,108.37 1,589.53 3,237.51 2,167.99 1,829.91 1,524.24
Note: The above Statement should be read with the Restated Consolidated Summary Statement of Significant Accounting
Policies in Annexure 4, Restated Consolidated Summary Statement of Notes to Restated Consolidated Summary Statements
in Annexure 5 and the Restated Consolidated Summary Statement of Reconciliation of Restated Profit/ (Loss) to Profit/
(Loss) as per Audited Financial Statements in Annexure 6.
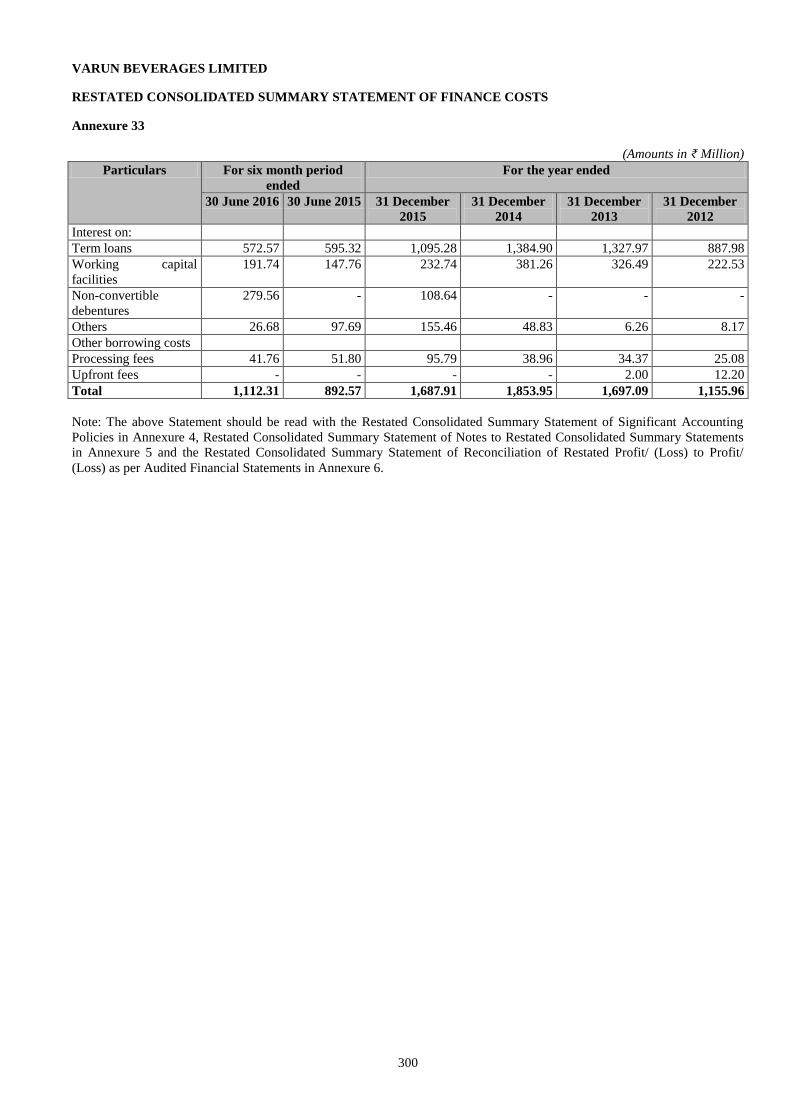
300
VARUN BEVERAGES LIMITED
RESTATED CONSOLIDATED SUMMARY STATEMENT OF FINANCE COSTS
Annexure 33
(Amounts in ₹ Million)
Particulars For six month period
ended
For the year ended
30 June 2016 30 June 2015 31 December
2015
31 December
2014
31 December
2013
31 December
2012
Interest on:
Term loans 572.57 595.32 1,095.28 1,384.90 1,327.97 887.98
Working capital
facilities
191.74 147.76 232.74 381.26 326.49 222.53
Non-convertible
debentures
279.56 - 108.64 - - -
Others 26.68 97.69 155.46 48.83 6.26 8.17
Other borrowing costs
Processing fees 41.76 51.80 95.79 38.96 34.37 25.08
Upfront fees - - - - 2.00 12.20
Total 1,112.31 892.57 1,687.91 1,853.95 1,697.09 1,155.96
Note: The above Statement should be read with the Restated Consolidated Summary Statement of Significant Accounting
Policies in Annexure 4, Restated Consolidated Summary Statement of Notes to Restated Consolidated Summary Statements
in Annexure 5 and the Restated Consolidated Summary Statement of Reconciliation of Restated Profit/ (Loss) to Profit/
(Loss) as per Audited Financial Statements in Annexure 6.
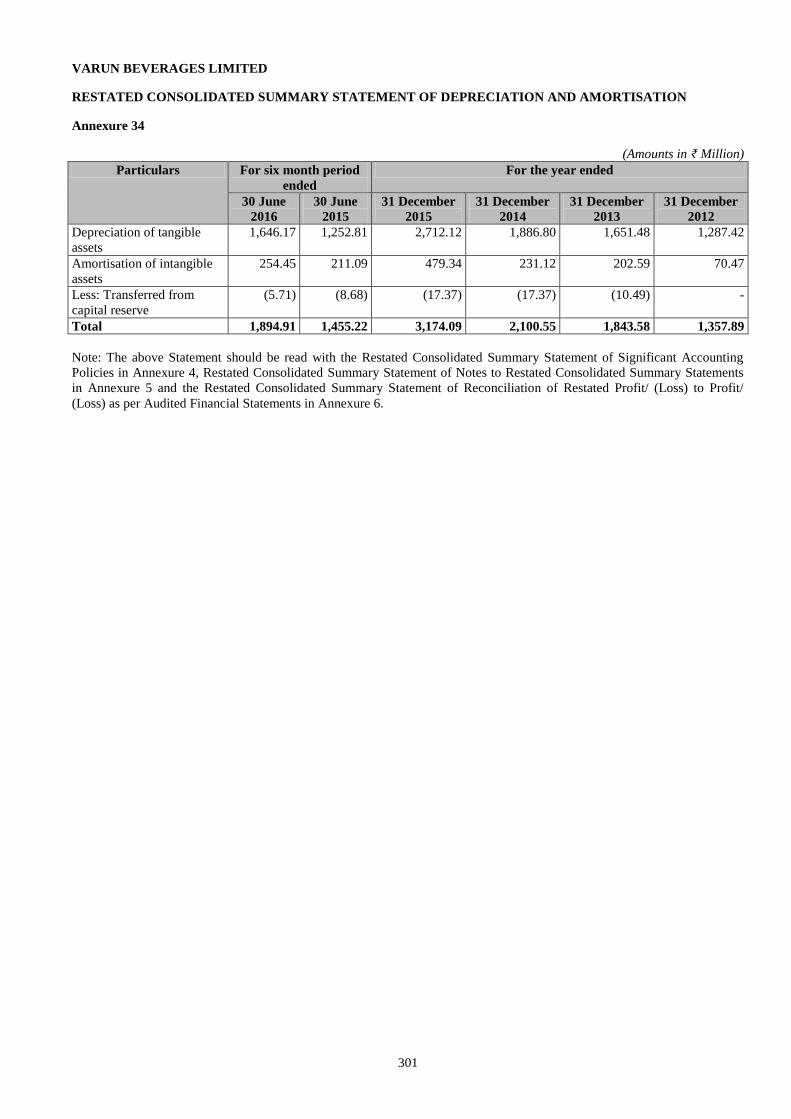
301
VARUN BEVERAGES LIMITED
RESTATED CONSOLIDATED SUMMARY STATEMENT OF DEPRECIATION AND AMORTISATION
Annexure 34
(Amounts in ₹ Million)
Particulars For six month period
ended
For the year ended
30 June
2016
30 June
2015
31 December
2015
31 December
2014
31 December
2013
31 December
2012
Depreciation of tangible
assets
1,646.17 1,252.81 2,712.12 1,886.80 1,651.48 1,287.42
Amortisation of intangible
assets
254.45 211.09 479.34 231.12 202.59 70.47
Less: Transferred from
capital reserve
(5.71) (8.68) (17.37) (17.37) (10.49) -
Total 1,894.91 1,455.22 3,174.09 2,100.55 1,843.58 1,357.89
Note: The above Statement should be read with the Restated Consolidated Summary Statement of Significant Accounting
Policies in Annexure 4, Restated Consolidated Summary Statement of Notes to Restated Consolidated Summary Statements
in Annexure 5 and the Restated Consolidated Summary Statement of Reconciliation of Restated Profit/ (Loss) to Profit/
(Loss) as per Audited Financial Statements in Annexure 6.
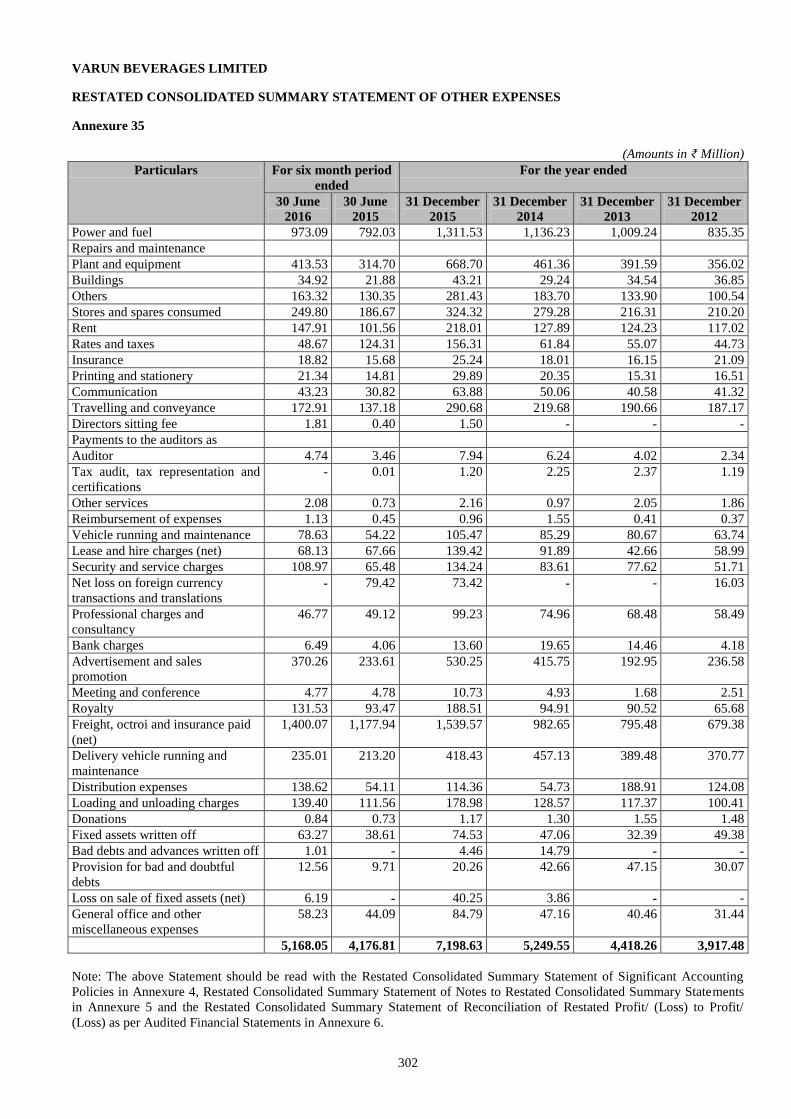
302
VARUN BEVERAGES LIMITED
RESTATED CONSOLIDATED SUMMARY STATEMENT OF OTHER EXPENSES
Annexure 35
(Amounts in ₹ Million)
Particulars For six month period
ended
For the year ended
30 June
2016
30 June
2015
31 December
2015
31 December
2014
31 December
2013
31 December
2012
Power and fuel 973.09 792.03 1,311.53 1,136.23 1,009.24 835.35
Repairs and maintenance
Plant and equipment 413.53 314.70 668.70 461.36 391.59 356.02
Buildings 34.92 21.88 43.21 29.24 34.54 36.85
Others 163.32 130.35 281.43 183.70 133.90 100.54
Stores and spares consumed 249.80 186.67 324.32 279.28 216.31 210.20
Rent 147.91 101.56 218.01 127.89 124.23 117.02
Rates and taxes 48.67 124.31 156.31 61.84 55.07 44.73
Insurance 18.82 15.68 25.24 18.01 16.15 21.09
Printing and stationery 21.34 14.81 29.89 20.35 15.31 16.51
Communication 43.23 30.82 63.88 50.06 40.58 41.32
Travelling and conveyance 172.91 137.18 290.68 219.68 190.66 187.17
Directors sitting fee 1.81 0.40 1.50 - - -
Payments to the auditors as
Auditor 4.74 3.46 7.94 6.24 4.02 2.34
Tax audit, tax representation and
certifications
- 0.01 1.20 2.25 2.37 1.19
Other services 2.08 0.73 2.16 0.97 2.05 1.86
Reimbursement of expenses 1.13 0.45 0.96 1.55 0.41 0.37
Vehicle running and maintenance 78.63 54.22 105.47 85.29 80.67 63.74
Lease and hire charges (net) 68.13 67.66 139.42 91.89 42.66 58.99
Security and service charges 108.97 65.48 134.24 83.61 77.62 51.71
Net loss on foreign currency
transactions and translations - 79.42 73.42 - - 16.03
Professional charges and
consultancy
46.77 49.12 99.23 74.96 68.48 58.49
Bank charges 6.49 4.06 13.60 19.65 14.46 4.18
Advertisement and sales
promotion
370.26 233.61 530.25 415.75 192.95 236.58
Meeting and conference 4.77 4.78 10.73 4.93 1.68 2.51
Royalty 131.53 93.47 188.51 94.91 90.52 65.68
Freight, octroi and insurance paid
(net)
1,400.07 1,177.94 1,539.57 982.65 795.48 679.38
Delivery vehicle running and
maintenance
235.01 213.20 418.43 457.13 389.48 370.77
Distribution expenses 138.62 54.11 114.36 54.73 188.91 124.08
Loading and unloading charges 139.40 111.56 178.98 128.57 117.37 100.41
Donations 0.84 0.73 1.17 1.30 1.55 1.48
Fixed assets written off 63.27 38.61 74.53 47.06 32.39 49.38
Bad debts and advances written off 1.01 - 4.46 14.79 - -
Provision for bad and doubtful
debts
12.56 9.71 20.26 42.66 47.15 30.07
Loss on sale of fixed assets (net) 6.19 - 40.25 3.86 - -
General office and other
miscellaneous expenses
58.23 44.09 84.79 47.16 40.46 31.44
5,168.05 4,176.81 7,198.63 5,249.55 4,418.26 3,917.48
Note: The above Statement should be read with the Restated Consolidated Summary Statement of Significant Accounting
Policies in Annexure 4, Restated Consolidated Summary Statement of Notes to Restated Consolidated Summary Statements
in Annexure 5 and the Restated Consolidated Summary Statement of Reconciliation of Restated Profit/ (Loss) to Profit/
(Loss) as per Audited Financial Statements in Annexure 6.
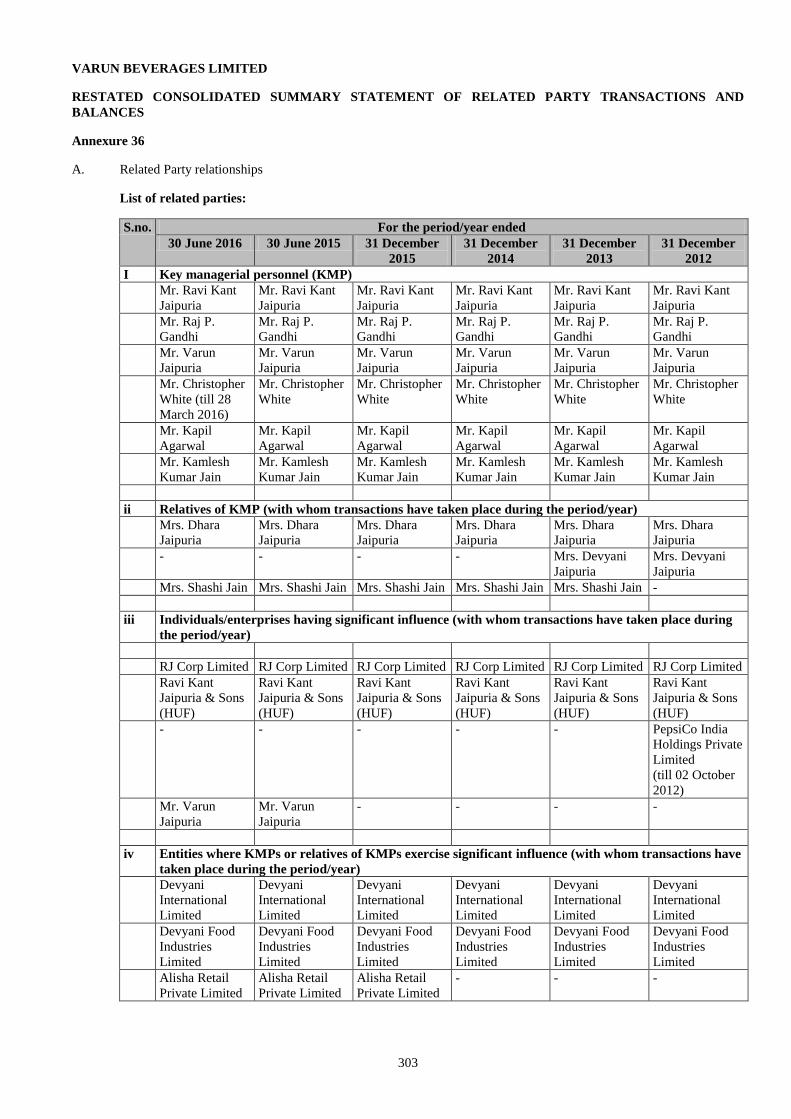
303
VARUN BEVERAGES LIMITED
RESTATED CONSOLIDATED SUMMARY STATEMENT OF RELATED PARTY TRANSACTIONS AND
BALANCES
Annexure 36
A. Related Party relationships
List of related parties:
S.no. For the period/year ended
30 June 2016 30 June 2015 31 December
2015
31 December
2014
31 December
2013
31 December
2012
I Key managerial personnel (KMP)
Mr. Ravi Kant
Jaipuria
Mr. Ravi Kant
Jaipuria
Mr. Ravi Kant
Jaipuria
Mr. Ravi Kant
Jaipuria
Mr. Ravi Kant
Jaipuria
Mr. Ravi Kant
Jaipuria
Mr. Raj P.
Gandhi
Mr. Raj P.
Gandhi
Mr. Raj P.
Gandhi
Mr. Raj P.
Gandhi
Mr. Raj P.
Gandhi
Mr. Raj P.
Gandhi
Mr. Varun
Jaipuria
Mr. Varun
Jaipuria
Mr. Varun
Jaipuria
Mr. Varun
Jaipuria
Mr. Varun
Jaipuria
Mr. Varun
Jaipuria
Mr. Christopher
White (till 28
March 2016)
Mr. Christopher
White
Mr. Christopher
White
Mr. Christopher
White
Mr. Christopher
White
Mr. Christopher
White
Mr. Kapil
Agarwal
Mr. Kapil
Agarwal
Mr. Kapil
Agarwal
Mr. Kapil
Agarwal
Mr. Kapil
Agarwal
Mr. Kapil
Agarwal
Mr. Kamlesh
Kumar Jain
Mr. Kamlesh
Kumar Jain
Mr. Kamlesh
Kumar Jain
Mr. Kamlesh
Kumar Jain
Mr. Kamlesh
Kumar Jain
Mr. Kamlesh
Kumar Jain
ii Relatives of KMP (with whom transactions have taken place during the period/year)
Mrs. Dhara
Jaipuria
Mrs. Dhara
Jaipuria
Mrs. Dhara
Jaipuria
Mrs. Dhara
Jaipuria
Mrs. Dhara
Jaipuria
Mrs. Dhara
Jaipuria
- - - - Mrs. Devyani
Jaipuria
Mrs. Devyani
Jaipuria
Mrs. Shashi Jain Mrs. Shashi Jain Mrs. Shashi Jain Mrs. Shashi Jain Mrs. Shashi Jain -
iii Individuals/enterprises having significant influence (with whom transactions have taken place during
the period/year)
RJ Corp Limited RJ Corp Limited RJ Corp Limited RJ Corp Limited RJ Corp Limited RJ Corp Limited
Ravi Kant
Jaipuria & Sons
(HUF)
Ravi Kant
Jaipuria & Sons
(HUF)
Ravi Kant
Jaipuria & Sons
(HUF)
Ravi Kant
Jaipuria & Sons
(HUF)
Ravi Kant
Jaipuria & Sons
(HUF)
Ravi Kant
Jaipuria & Sons
(HUF)
- - - - - PepsiCo India
Holdings Private
Limited
(till 02 October
2012)
Mr. Varun
Jaipuria
Mr. Varun
Jaipuria
- - - -
iv Entities where KMPs or relatives of KMPs exercise significant influence (with whom transactions have
taken place during the period/year)
Devyani
International
Limited
Devyani
International
Limited
Devyani
International
Limited
Devyani
International
Limited
Devyani
International
Limited
Devyani
International
Limited
Devyani Food
Industries
Limited
Devyani Food
Industries
Limited
Devyani Food
Industries
Limited
Devyani Food
Industries
Limited
Devyani Food
Industries
Limited
Devyani Food
Industries
Limited
Alisha Retail
Private Limited
Alisha Retail
Private Limited
Alisha Retail
Private Limited
- - -
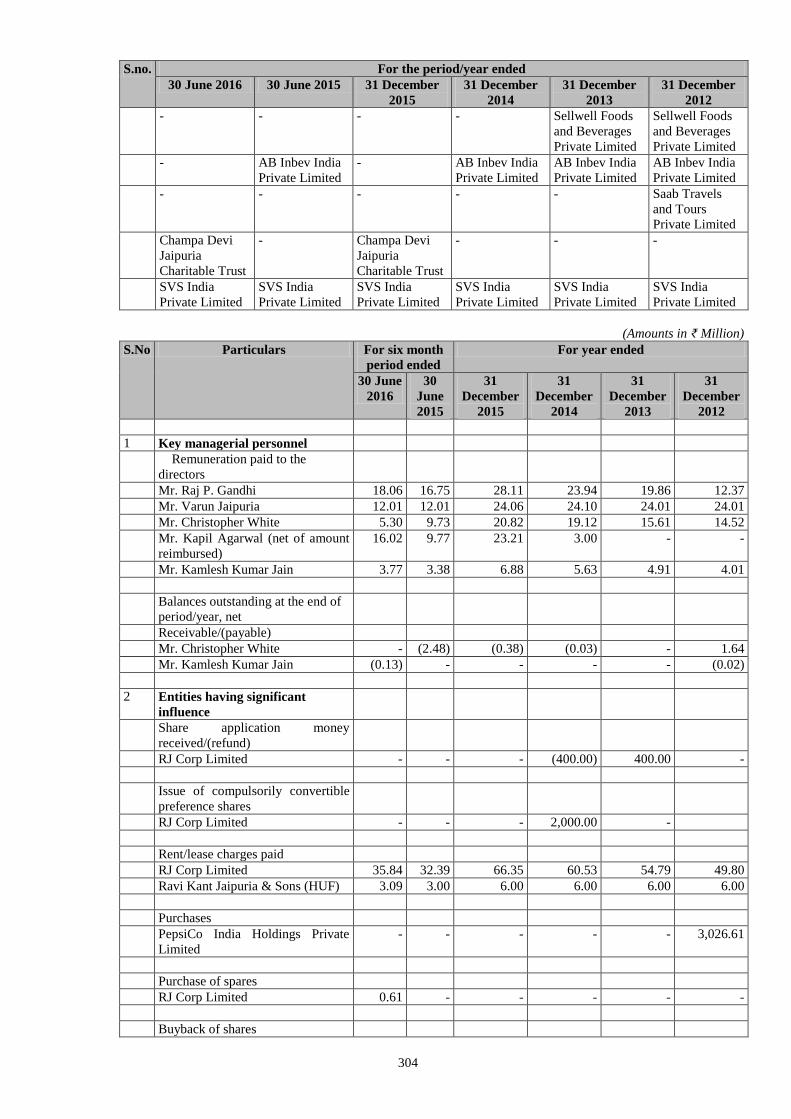
304
S.no. For the period/year ended
30 June 2016 30 June 2015 31 December
2015
31 December
2014
31 December
2013
31 December
2012
- - - - Sellwell Foods
and Beverages
Private Limited
Sellwell Foods
and Beverages
Private Limited
- AB Inbev India
Private Limited
- AB Inbev India
Private Limited
AB Inbev India
Private Limited
AB Inbev India
Private Limited
- - - - - Saab Travels
and Tours
Private Limited
Champa Devi
Jaipuria
Charitable Trust
- Champa Devi
Jaipuria
Charitable Trust
- - -
SVS India
Private Limited
SVS India
Private Limited
SVS India
Private Limited
SVS India
Private Limited
SVS India
Private Limited
SVS India
Private Limited
(Amounts in ₹ Million)
S.No Particulars For six month
period ended
For year ended
30 June
2016
30
June
2015
31
December
2015
31
December
2014
31
December
2013
31
December
2012
1 Key managerial personnel
Remuneration paid to the
directors
Mr. Raj P. Gandhi 18.06 16.75 28.11 23.94 19.86 12.37
Mr. Varun Jaipuria 12.01 12.01 24.06 24.10 24.01 24.01
Mr. Christopher White 5.30 9.73 20.82 19.12 15.61 14.52
Mr. Kapil Agarwal (net of amount
reimbursed)
16.02 9.77 23.21 3.00 - -
Mr. Kamlesh Kumar Jain 3.77 3.38 6.88 5.63 4.91 4.01
Balances outstanding at the end of
period/year, net
Receivable/(payable)
Mr. Christopher White - (2.48) (0.38) (0.03) - 1.64
Mr. Kamlesh Kumar Jain (0.13) - - - - (0.02)
2 Entities having significant
influence
Share application money
received/(refund)
RJ Corp Limited - - - (400.00) 400.00 -
Issue of compulsorily convertible
preference shares
RJ Corp Limited - - - 2,000.00 -
Rent/lease charges paid
RJ Corp Limited 35.84 32.39 66.35 60.53 54.79 49.80
Ravi Kant Jaipuria & Sons (HUF) 3.09 3.00 6.00 6.00 6.00 6.00
Purchases
PepsiCo India Holdings Private
Limited
- - - - - 3,026.61
Purchase of spares
RJ Corp Limited 0.61 - - - - -
Buyback of shares
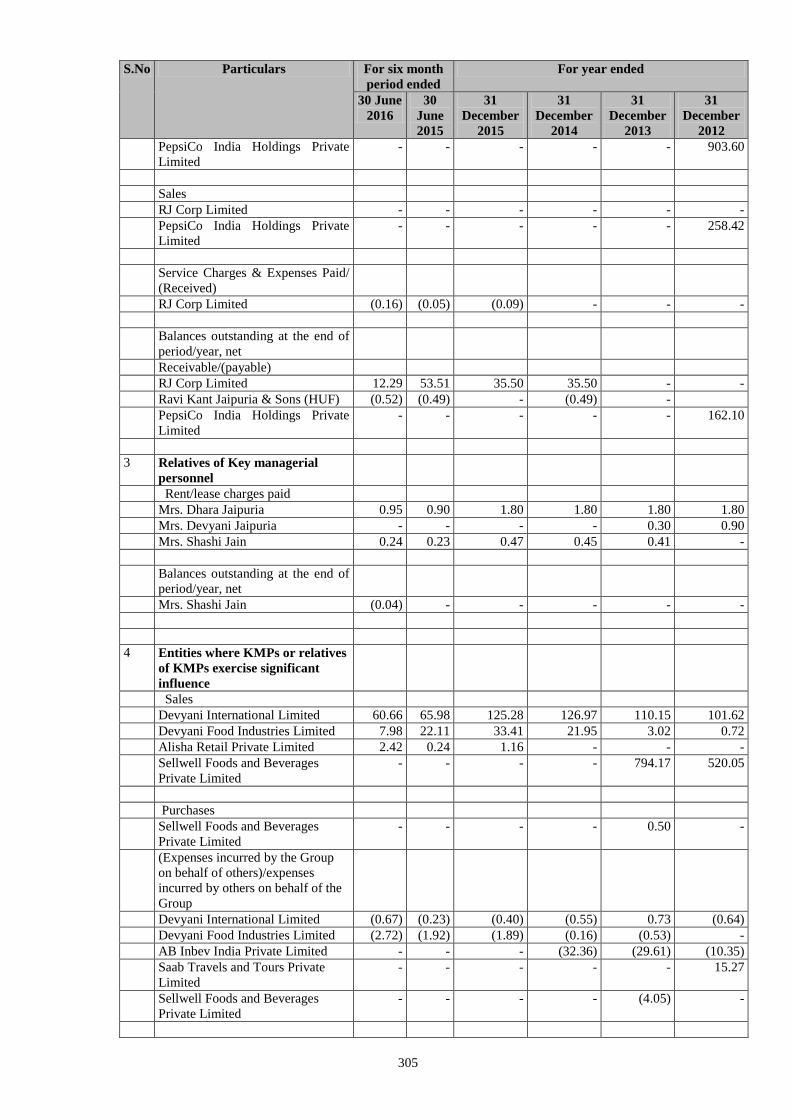
305
S.No Particulars For six month
period ended
For year ended
30 June
2016
30
June
2015
31
December
2015
31
December
2014
31
December
2013
31
December
2012
PepsiCo India Holdings Private
Limited
- - - - - 903.60
Sales
RJ Corp Limited - - - - - -
PepsiCo India Holdings Private
Limited
- - - - - 258.42
Service Charges & Expenses Paid/
(Received)
RJ Corp Limited (0.16) (0.05) (0.09) - - -
Balances outstanding at the end of
period/year, net
Receivable/(payable)
RJ Corp Limited 12.29 53.51 35.50 35.50 - -
Ravi Kant Jaipuria & Sons (HUF) (0.52) (0.49) - (0.49) -
PepsiCo India Holdings Private
Limited
- - - - - 162.10
3 Relatives of Key managerial
personnel
Rent/lease charges paid
Mrs. Dhara Jaipuria 0.95 0.90 1.80 1.80 1.80 1.80
Mrs. Devyani Jaipuria - - - - 0.30 0.90
Mrs. Shashi Jain 0.24 0.23 0.47 0.45 0.41 -
Balances outstanding at the end of
period/year, net
Mrs. Shashi Jain (0.04) - - - - -
4 Entities where KMPs or relatives
of KMPs exercise significant
influence
Sales
Devyani International Limited 60.66 65.98 125.28 126.97 110.15 101.62
Devyani Food Industries Limited 7.98 22.11 33.41 21.95 3.02 0.72
Alisha Retail Private Limited 2.42 0.24 1.16 - - -
Sellwell Foods and Beverages
Private Limited
- - - - 794.17 520.05
Purchases
Sellwell Foods and Beverages
Private Limited
- - - - 0.50 -
(Expenses incurred by the Group
on behalf of others)/expenses
incurred by others on behalf of the
Group
Devyani International Limited (0.67) (0.23) (0.40) (0.55) 0.73 (0.64)
Devyani Food Industries Limited (2.72) (1.92) (1.89) (0.16) (0.53) -
AB Inbev India Private Limited - - - (32.36) (29.61) (10.35)
Saab Travels and Tours Private
Limited
- - - - - 15.27
Sellwell Foods and Beverages
Private Limited
- - - - (4.05) -
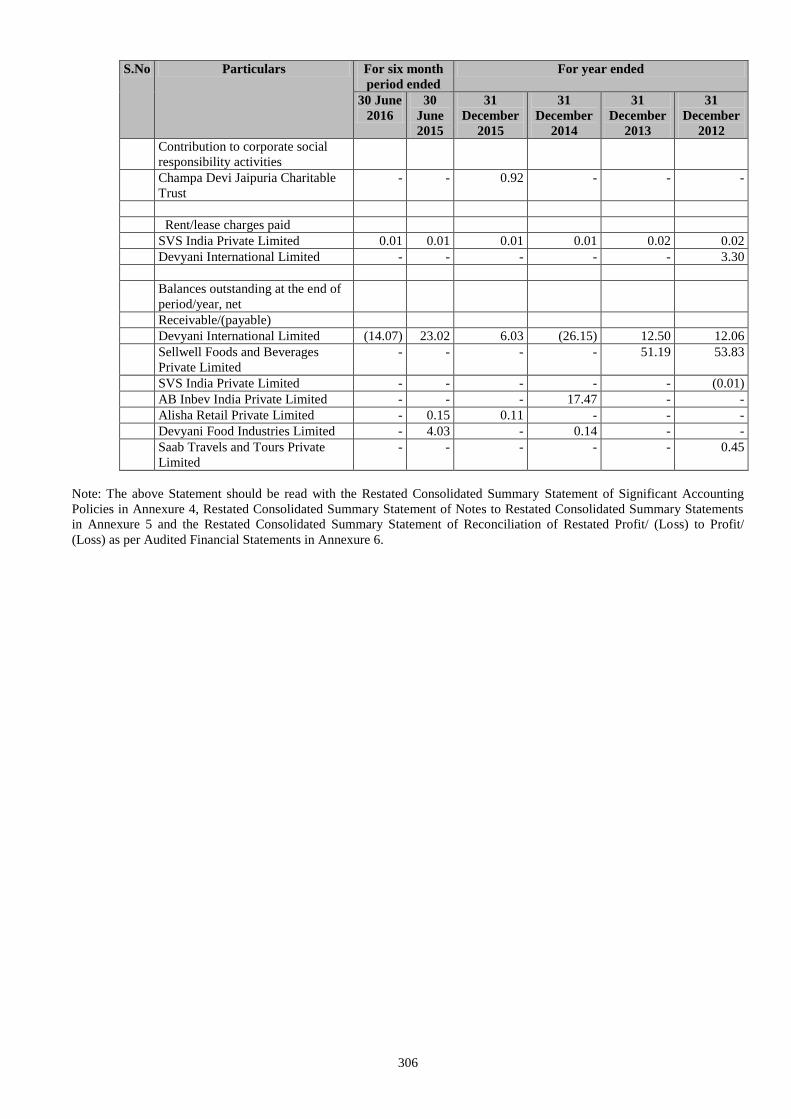
306
S.No Particulars For six month
period ended
For year ended
30 June
2016
30
June
2015
31
December
2015
31
December
2014
31
December
2013
31
December
2012
Contribution to corporate social
responsibility activities
Champa Devi Jaipuria Charitable
Trust
- - 0.92 - - -
Rent/lease charges paid
SVS India Private Limited 0.01 0.01 0.01 0.01 0.02 0.02
Devyani International Limited - - - - - 3.30
Balances outstanding at the end of
period/year, net
Receivable/(payable)
Devyani International Limited (14.07) 23.02 6.03 (26.15) 12.50 12.06
Sellwell Foods and Beverages
Private Limited
- - - - 51.19 53.83
SVS India Private Limited - - - - - (0.01)
AB Inbev India Private Limited - - - 17.47 - -
Alisha Retail Private Limited - 0.15 0.11 - - -
Devyani Food Industries Limited - 4.03 - 0.14 - -
Saab Travels and Tours Private
Limited
- - - - - 0.45
Note: The above Statement should be read with the Restated Consolidated Summary Statement of Significant Accounting
Policies in Annexure 4, Restated Consolidated Summary Statement of Notes to Restated Consolidated Summary Statements
in Annexure 5 and the Restated Consolidated Summary Statement of Reconciliation of Restated Profit/ (Loss) to Profit/
(Loss) as per Audited Financial Statements in Annexure 6.
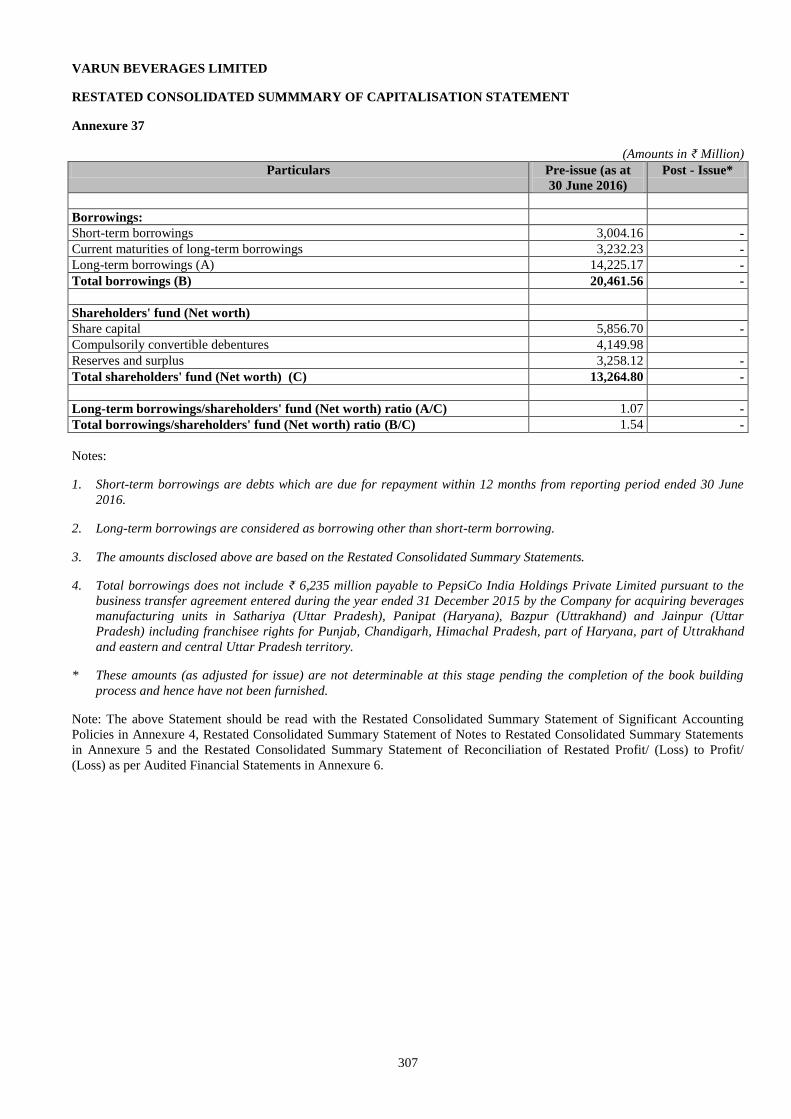
307
VARUN BEVERAGES LIMITED
RESTATED CONSOLIDATED SUMMMARY OF CAPITALISATION STATEMENT
Annexure 37
(Amounts in ₹ Million)
Particulars Pre-issue (as at
30 June 2016)
Post - Issue*
Borrowings:
Short-term borrowings 3,004.16 -
Current maturities of long-term borrowings 3,232.23 -
Long-term borrowings (A) 14,225.17 -
Total borrowings (B) 20,461.56 -
Shareholders' fund (Net worth)
Share capital 5,856.70 -
Compulsorily convertible debentures 4,149.98
Reserves and surplus 3,258.12 -
Total shareholders' fund (Net worth) (C) 13,264.80 -
Long-term borrowings/shareholders' fund (Net worth) ratio (A/C) 1.07 -
Total borrowings/shareholders' fund (Net worth) ratio (B/C) 1.54 -
Notes:
1. Short-term borrowings are debts which are due for repayment within 12 months from reporting period ended 30 June
2016.
2. Long-term borrowings are considered as borrowing other than short-term borrowing.
3. The amounts disclosed above are based on the Restated Consolidated Summary Statements.
4. Total borrowings does not include ₹ 6,235 million payable to PepsiCo India Holdings Private Limited pursuant to the
business transfer agreement entered during the year ended 31 December 2015 by the Company for acquiring beverages
manufacturing units in Sathariya (Uttar Pradesh), Panipat (Haryana), Bazpur (Uttrakhand) and Jainpur (Uttar
Pradesh) including franchisee rights for Punjab, Chandigarh, Himachal Pradesh, part of Haryana, part of Uttrakhand
and eastern and central Uttar Pradesh territory.
* These amounts (as adjusted for issue) are not determinable at this stage pending the completion of the book building
process and hence have not been furnished.
Note: The above Statement should be read with the Restated Consolidated Summary Statement of Significant Accounting
Policies in Annexure 4, Restated Consolidated Summary Statement of Notes to Restated Consolidated Summary Statements
in Annexure 5 and the Restated Consolidated Summary Statement of Reconciliation of Restated Profit/ (Loss) to Profit/
(Loss) as per Audited Financial Statements in Annexure 6.
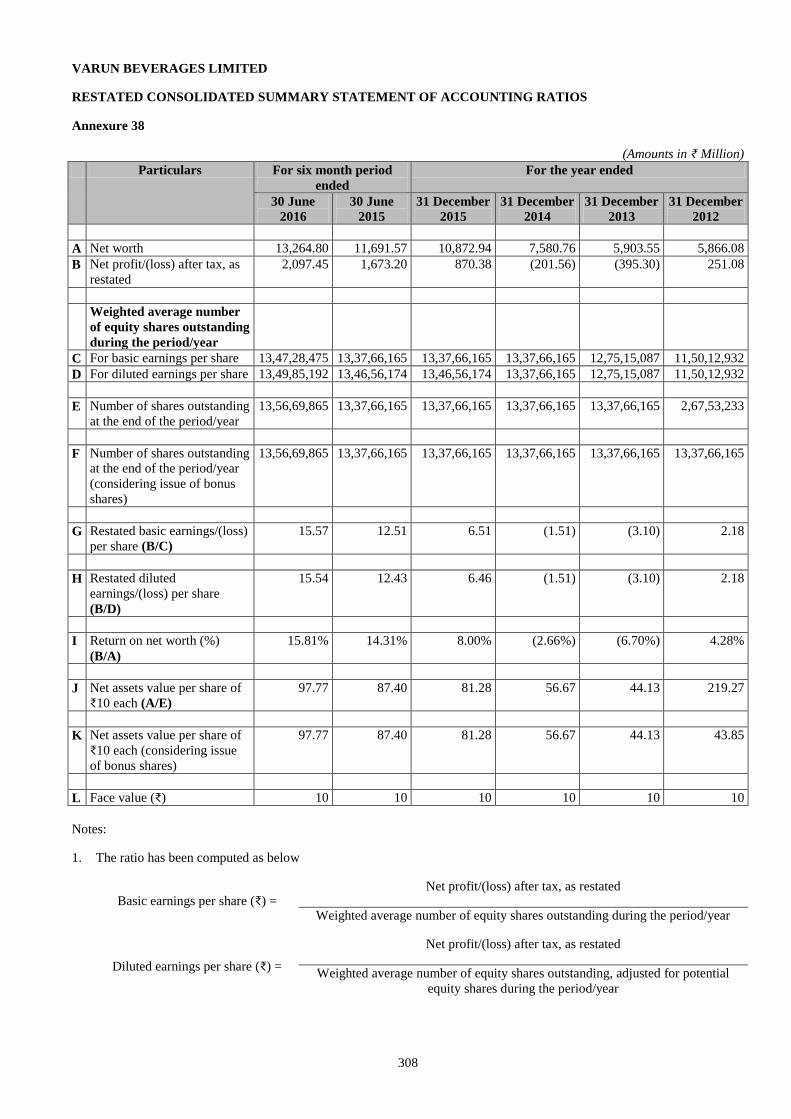
308
VARUN BEVERAGES LIMITED
RESTATED CONSOLIDATED SUMMARY STATEMENT OF ACCOUNTING RATIOS
Annexure 38
(Amounts in ₹ Million)
Particulars For six month period
ended
For the year ended
30 June
2016
30 June
2015
31 December
2015
31 December
2014
31 December
2013
31 December
2012
A Net worth 13,264.80 11,691.57 10,872.94 7,580.76 5,903.55 5,866.08
B Net profit/(loss) after tax, as
restated
2,097.45 1,673.20 870.38 (201.56) (395.30) 251.08
Weighted average number
of equity shares outstanding
during the period/year
C For basic earnings per share 13,47,28,475 13,37,66,165 13,37,66,165 13,37,66,165 12,75,15,087 11,50,12,932
D For diluted earnings per share 13,49,85,192 13,46,56,174 13,46,56,174 13,37,66,165 12,75,15,087 11,50,12,932
E Number of shares outstanding
at the end of the period/year
13,56,69,865 13,37,66,165 13,37,66,165 13,37,66,165 13,37,66,165 2,67,53,233
F Number of shares outstanding
at the end of the period/year
(considering issue of bonus
shares)
13,56,69,865 13,37,66,165 13,37,66,165 13,37,66,165 13,37,66,165 13,37,66,165
G Restated basic earnings/(loss)
per share (B/C)
15.57 12.51 6.51 (1.51) (3.10) 2.18
H Restated diluted
earnings/(loss) per share
(B/D)
15.54 12.43 6.46 (1.51) (3.10) 2.18
I Return on net worth (%)
(B/A)
15.81% 14.31% 8.00% (2.66%) (6.70%) 4.28%
J Net assets value per share of
₹10 each (A/E)
97.77 87.40 81.28 56.67 44.13 219.27
K Net assets value per share of
₹10 each (considering issue
of bonus shares)
97.77 87.40 81.28 56.67 44.13 43.85
L Face value (₹) 10 10 10 10 10 10
Notes:
1. The ratio has been computed as below
Basic earnings per share (₹) = Net profit/(loss) after tax, as restated
Weighted average number of equity shares outstanding during the period/year
Diluted earnings per share (₹) =
Net profit/(loss) after tax, as restated
Weighted average number of equity shares outstanding, adjusted for potential
equity shares during the period/year
309
Return on net worth (%) = Net profit/(loss) after tax, as restated
Net worth as restated as at period/year end
Net asset value per share (₹) = Net asset, as restated
Number of equity shares outstanding as at period/year end
Net asset value per share
(considering issue of bonus shares)
(₹) =
Net asset, as restated
Number of equity shares outstanding as at period/year end (considering issue of
bonus shares)
2. Earning per shares (EPS) calculation is in accordance with the notified Accounting Standard 20 'Earnings per share'
specified under Section 133 of the Companies Act, 2013, read with Rule 7 of the Companies (Accounts) Rules, 2014 (as
amended).
3. The diluted earnings per share do not include the potential impact of conversion of the compulsorily convertible
debentures and compulsorily convertible preference shares, since the conversion is dependent on future events which are
currently uncertain. Accordingly, the potential dilutive equity shares cannot be estimated reliably as at the end of the
period/year 30 June 2016 and 2015, 31 December 2015, 2014, 2013 and 2012.
4. The amounts disclosed above are based on the Restated Summary Statements of the Group.
5. Net worth for the year ended 31 December 2012 includes revalued amount of land of ₹ 187.93 millions (net of
adjustments) recorded in Capital Reserve as per the Scheme of Amalgamation of Varun Beverages (International)
Limited with Varun Beverages Limited as approved by the Honourable High Court of Delhi. Other than this, there has
been no revaluation in any of the years presented.
6. Number of shares outstanding as at the end of the year ended 31 December 2012 includes 18,753,233 equity shares of ₹
10 each pending allotment as fully paid up for consideration other than cash pursuant to Scheme of Amalgamation of
Varun Beverages (International) Limited with Varun Beverages Limited as approved by the Honourable High Court of
Delhi.
Note: The above Statement should be read with the Restated Consolidated Summary Statement of Significant Accounting
Policies in Annexure 4, Restated Consolidated Summary Statement of Notes to Restated Consolidated Summary Statements
in Annexure 5 and the Restated Consolidated Summary Statement of Reconciliation of Restated Profit/ (Loss) to Profit/
(Loss) as per Audited Financial Statements in Annexure 6.
310
RESTATED STANDALONE FINANCIAL STATEMENTS
To
The Board of Directors,
Varun Beverages Limited
RJ Corp House, Plot No. 31,
Institutional Area, Sector – 44,
Gurgaon – 122022, Haryana
Auditors’ Report on Standalone Financial Information in connection with the proposed issue of equity shares of
Varun Beverages Limited
Dear Sirs,
1. We have examined the attached Standalone Financial Information comprising Restated Standalone Summary
Statement of Assets and Liabilities as at 30 June 2016, 2015, 31 December 2015, 2014, 2013, 2012 and 2011,
Restated Standalone Summary Statement of Profits and Losses, Restated Standalone Summary Statement of Cash
Flows (collectively referred as “Financial Information”) and other financial information (as described more in detail
in paragraph 4 (e) below, referred as “other financial information”), for the six month periods ended 30 June 2016,
2015 and years ended 31 December 2015, 2014, 2013, 2012 and 2011 of Varun Beverages Limited (the ‘Company’),
as approved by the Board of Directors of the Company, prepared by Company’s management in terms of the
requirements of Section 26(1)(b) of the Companies Act, 2013 (“the Act”) read with rules 4 to 6 of the Companies
(Prospectus and Allotment of Securities) Rules, 2014 and Part (B) of Item (IX) of Schedule VIII of the Securities
and Exchange Board of India (Issue of Capital and Disclosure Requirements) Regulations, 2009 as amended to date
(“SEBI Regulations”) and in terms of our engagement agreed upon with you in accordance with our engagement
letter dated 04 December 2015, for the purpose of inclusion in the Draft Red Herring Prospectus, Red Herring
Prospectus and Prospectus (collectively, ‘Offer Document”), in connection with the proposed issue of equity shares
of the Company.
2. These information have been extracted by the Company’s management from the Audited Standalone Financial
Statements of the Company for the six month periods ended 30 June 2016, 2015 and years ended 31 December 2015,
2014, 2013, 2012 and 2011. The audits for the financial years ended 31 December 2012 and 2011 was conducted by
O.P. Bagla & Co. and reliance has been placed on the financial statements audited by them for the said years.
Accordingly, our examination of the Standalone Financial Information and other financial information of the
Company for financial years ended 31 December 2012 and 2011 is based solely on the financial statements audited
by them and the reports issued by them.
3. We have not examined any financial information of the Company as of any date or for any period subsequent to 30
June 2016. Accordingly, we do not express any opinion on the financial position, results of operations or cash flows
of the Company as of any date or for any period subsequent to 30 June 2016.
4. In accordance with the requirements of Section 26(1)(b) of the Act, the SEBI Regulations and the terms of our
engagement agreed with you, we further report that:
a. The Restated Standalone Summary Statement of Assets and Liabilities of the Company examined by us, as
set out in Annexure 1 to this report, are after making adjustments and regrouping as in our opinion were
appropriate and more fully described in Restated Standalone Summary Statement of Significant Accounting
Policies, Restated Standalone Summary Statement of Notes to the Restated Summary Statements of the
Company and Restated Standalone Summary Statement of Reconciliation of Restated Profit/ (Loss) to
Profit/ (Loss) as per Audited Standalone Financial Statements in Annexures 4, 5 and 6 respectively. For the
years ended 31 December 2012 and 2011, Walker Chandiok & Associates has relied on the financial
statements audited by O.P. Bagla & Co. for the said years.
Auditors’ Report on Standalone Financial Information in connection with the proposed issue of
equity shares of Varun Beverages Limited (Cont’d)
b. The Restated Standalone Summary Statement of Profits and Losses of the Company examined by us, as set
out in Annexure 2 to this report, are after making adjustments and regrouping as in our opinion were
appropriate and more fully described in Restated Standalone Summary Statement of Significant Accounting
Policies, Restated Standalone Summary Statement of Notes to the Restated Summary Statements of the
Company and Restated Standalone Summary Statement of Reconciliation of Restated Profit/ (Loss) to
Profit/ (Loss) as per Audited Standalone Financial Statements in Annexures 4, 5 and 6 respectively. For the
years ended 31 December 2012 and 2011, Walker Chandiok & Associates has relied on the financial
statements audited by O.P. Bagla & Co. for the said years.
311
c. The Restated Standalone Summary Statement of Cash Flows of the Company examined by us, as set out in
Annexure 3 to this report, are after making adjustments and regrouping as in our opinion were appropriate
and more fully described in Restated Standalone Summary Statement of Significant Accounting Policies,
Restated Standalone Summary Statement of Notes to the Restated Summary Statements of the Company
and Restated Standalone Summary Statement of Reconciliation of Restated Profit/ (Loss) to Profit/ (Loss)
as per Audited Standalone Financial Statements in Annexures 4, 5 and 6 respectively. For the years ended
31 December 2012 and 2011, Walker Chandiok & Associates has relied on the financial statements audited
by O.P. Bagla & Co. for the said years.
d. Based on the above and based on reliance placed by Walker Chandiok & Associates on the financial
statements audited by O.P. Bagla & Co. for the financial years ended 31 December 2012 and 2011, we are
of the opinion that the Financial Information:
i. Has been made after incorporating adjustments for the changes, if any, in accounting policies
retrospectively in respective financial years to reflect the same accounting treatment as per
changed accounting policy for all the reporting periods;
ii. Has been made after incorporating adjustments for the material amounts in the respective financial
years to which they relate;
iii. And does not contain any extra-ordinary items that need to be disclosed separately other than those
disclosed and does not contain any qualification requiring adjustments.
e. We have also examined the following “other financial information” set out in Annexures stated below,
prepared by the Company’s management and approved by the Board of Directors, relating to the Company
for the six month periods ended 30 June 2016, 2015 and years ended 31 December 2015, 2014, 2013, 2012
and 2011. In respect of the years ended 31 December 2012 and 2011, these information have been included
based upon the audit reports submitted by O.P. Bagla & Co. to you and relied upon by Walker Chandiok &
Associates.
i Restated Standalone Summary Statement of Related Party Transactions and Balances, Annexure
36
ii Restated Standalone Summary of Capitalisation Statement, Annexure 37
iii Restated Standalone Summary Statement of Tax Shelter, Annexure 38
iv Restated Standalone Summary Statement of Accounting Ratios, Annexure 39
In our opinion, the Standalone Financial Information and other financial information contained in Annexures 1 to 39
of this report read along with the Restated Standalone Summary Statement of Significant Accounting Policies and
Restated Standalone Summary Statement of Notes to the Restated Summary Statements and Restated Summary
Statement of Reconciliation of Restated Profit/ (Loss) to Profit/ (Loss) as per Audited Standalone Financial
Statements of the Company in Annexures 4, 5 and 6 respectively, prepared after making adjustments and regrouping
as considered appropriate have been prepared in accordance with Section 26(1)(b) of the Act and SEBI Regulations.
5. This report should not be in any way construed as a re-issuance or re-dating of any of the previous audit reports
issued by O.P. Bagla & Co. or by us nor should it be construed as a new opinion on any of the financial statements
referred to therein.
Auditors’ Report on Standalone Financial Information in connection with the proposed issue of equity shares
of Varun Beverages Limited (Cont’d)
6. We have no responsibility to update our report for events and circumstances occurring after the date of the report.
7. Our report is intended solely for use of the Company’s management in connection with the proposed issue of equity
shares of the Company. Our report should not be used for any other purpose except with our consent in writing.
For Walker Chandiok & Associates For O.P. Bagla & Co.
Chartered Accountants Chartered Accountants
Firm Registration No: 001329N Firm Registration No: 000018N
Nitin Toshniwal Neeraj Kumar Agarwal Partner Partner
312
Membership No. 507568 Membership No 094155
Place: Gurugram
Date: 22 September 2016
L-41 Connaught Place, 8/12, Kalkaji Extension,
New Delhi 110 001 New Delhi 110 019
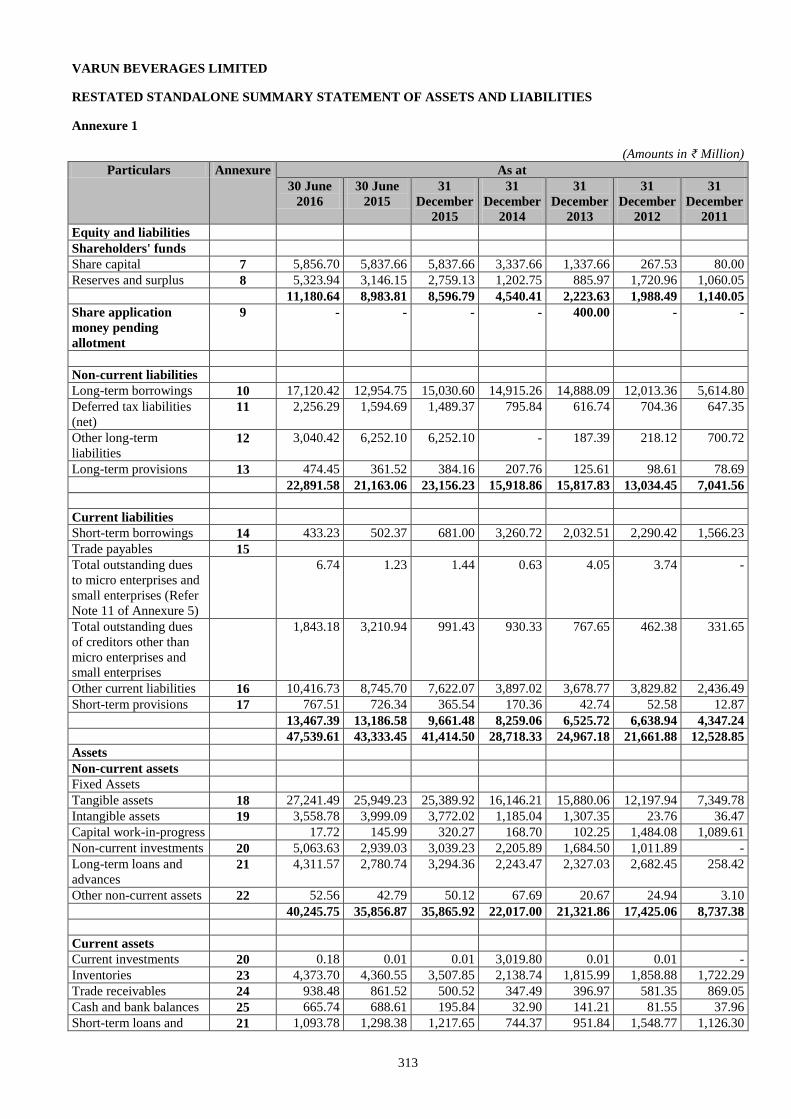
313
VARUN BEVERAGES LIMITED
RESTATED STANDALONE SUMMARY STATEMENT OF ASSETS AND LIABILITIES
Annexure 1
(Amounts in ₹ Million)
Particulars Annexure As at
30 June
2016
30 June
2015
31
December
2015
31
December
2014
31
December
2013
31
December
2012
31
December
2011
Equity and liabilities
Shareholders' funds
Share capital 7 5,856.70 5,837.66 5,837.66 3,337.66 1,337.66 267.53 80.00
Reserves and surplus 8 5,323.94 3,146.15 2,759.13 1,202.75 885.97 1,720.96 1,060.05
11,180.64 8,983.81 8,596.79 4,540.41 2,223.63 1,988.49 1,140.05
Share application
money pending
allotment
9 - - - - 400.00 - -
Non-current liabilities
Long-term borrowings 10 17,120.42 12,954.75 15,030.60 14,915.26 14,888.09 12,013.36 5,614.80
Deferred tax liabilities
(net) 11 2,256.29 1,594.69 1,489.37 795.84 616.74 704.36 647.35
Other long-term
liabilities 12 3,040.42 6,252.10 6,252.10 - 187.39 218.12 700.72
Long-term provisions 13 474.45 361.52 384.16 207.76 125.61 98.61 78.69
22,891.58 21,163.06 23,156.23 15,918.86 15,817.83 13,034.45 7,041.56
Current liabilities
Short-term borrowings 14 433.23 502.37 681.00 3,260.72 2,032.51 2,290.42 1,566.23
Trade payables 15
Total outstanding dues
to micro enterprises and
small enterprises (Refer
Note 11 of Annexure 5)
6.74 1.23 1.44 0.63 4.05 3.74 -
Total outstanding dues
of creditors other than
micro enterprises and
small enterprises
1,843.18 3,210.94 991.43 930.33 767.65 462.38 331.65
Other current liabilities 16 10,416.73 8,745.70 7,622.07 3,897.02 3,678.77 3,829.82 2,436.49
Short-term provisions 17 767.51 726.34 365.54 170.36 42.74 52.58 12.87
13,467.39 13,186.58 9,661.48 8,259.06 6,525.72 6,638.94 4,347.24
47,539.61 43,333.45 41,414.50 28,718.33 24,967.18 21,661.88 12,528.85
Assets
Non-current assets
Fixed Assets
Tangible assets 18 27,241.49 25,949.23 25,389.92 16,146.21 15,880.06 12,197.94 7,349.78
Intangible assets 19 3,558.78 3,999.09 3,772.02 1,185.04 1,307.35 23.76 36.47
Capital work-in-progress 17.72 145.99 320.27 168.70 102.25 1,484.08 1,089.61
Non-current investments 20 5,063.63 2,939.03 3,039.23 2,205.89 1,684.50 1,011.89 -
Long-term loans and
advances 21 4,311.57 2,780.74 3,294.36 2,243.47 2,327.03 2,682.45 258.42
Other non-current assets 22 52.56 42.79 50.12 67.69 20.67 24.94 3.10
40,245.75 35,856.87 35,865.92 22,017.00 21,321.86 17,425.06 8,737.38
Current assets
Current investments 20 0.18 0.01 0.01 3,019.80 0.01 0.01 -
Inventories 23 4,373.70 4,360.55 3,507.85 2,138.74 1,815.99 1,858.88 1,722.29
Trade receivables 24 938.48 861.52 500.52 347.49 396.97 581.35 869.05
Cash and bank balances 25 665.74 688.61 195.84 32.90 141.21 81.55 37.96
Short-term loans and 21 1,093.78 1,298.38 1,217.65 744.37 951.84 1,548.77 1,126.30
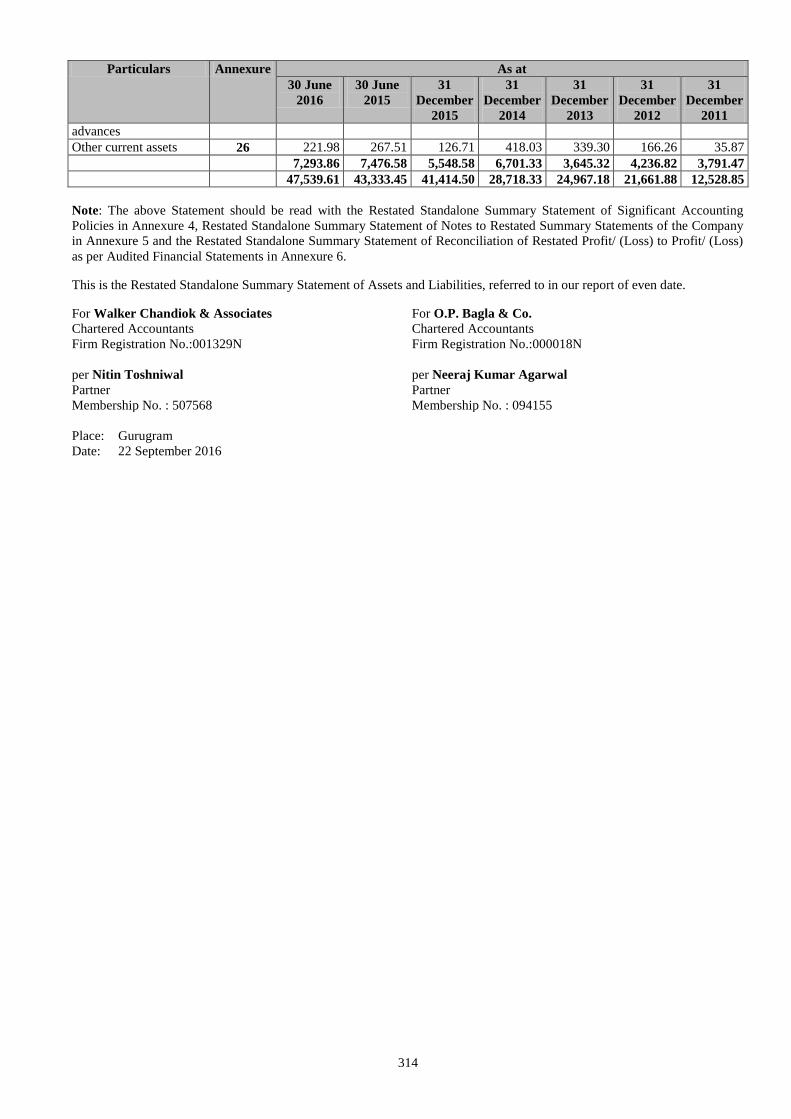
314
Particulars Annexure As at
30 June
2016
30 June
2015
31
December
2015
31
December
2014
31
December
2013
31
December
2012
31
December
2011
advances
Other current assets 26 221.98 267.51 126.71 418.03 339.30 166.26 35.87
7,293.86 7,476.58 5,548.58 6,701.33 3,645.32 4,236.82 3,791.47
47,539.61 43,333.45 41,414.50 28,718.33 24,967.18 21,661.88 12,528.85
Note: The above Statement should be read with the Restated Standalone Summary Statement of Significant Accounting
Policies in Annexure 4, Restated Standalone Summary Statement of Notes to Restated Summary Statements of the Company
in Annexure 5 and the Restated Standalone Summary Statement of Reconciliation of Restated Profit/ (Loss) to Profit/ (Loss)
as per Audited Financial Statements in Annexure 6.
This is the Restated Standalone Summary Statement of Assets and Liabilities, referred to in our report of even date.
For Walker Chandiok & Associates For O.P. Bagla & Co.
Chartered Accountants Chartered Accountants
Firm Registration No.:001329N Firm Registration No.:000018N
per Nitin Toshniwal per Neeraj Kumar Agarwal
Partner Partner
Membership No. : 507568 Membership No. : 094155
Place: Gurugram
Date: 22 September 2016
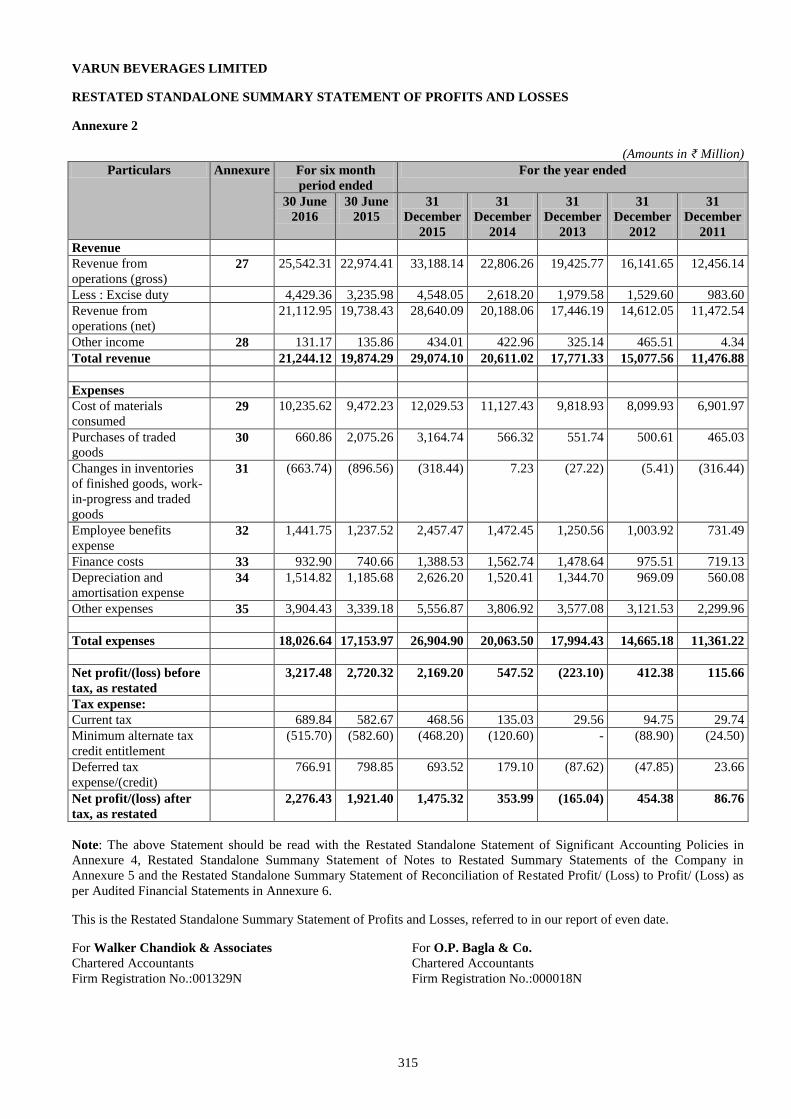
315
VARUN BEVERAGES LIMITED
RESTATED STANDALONE SUMMARY STATEMENT OF PROFITS AND LOSSES
Annexure 2
(Amounts in ₹ Million)
Particulars Annexure For six month
period ended
For the year ended
30 June
2016
30 June
2015
31
December
2015
31
December
2014
31
December
2013
31
December
2012
31
December
2011
Revenue
Revenue from
operations (gross) 27 25,542.31 22,974.41 33,188.14 22,806.26 19,425.77 16,141.65 12,456.14
Less : Excise duty 4,429.36 3,235.98 4,548.05 2,618.20 1,979.58 1,529.60 983.60
Revenue from
operations (net)
21,112.95 19,738.43 28,640.09 20,188.06 17,446.19 14,612.05 11,472.54
Other income 28 131.17 135.86 434.01 422.96 325.14 465.51 4.34
Total revenue 21,244.12 19,874.29 29,074.10 20,611.02 17,771.33 15,077.56 11,476.88
Expenses
Cost of materials
consumed 29 10,235.62 9,472.23 12,029.53 11,127.43 9,818.93 8,099.93 6,901.97
Purchases of traded
goods 30 660.86 2,075.26 3,164.74 566.32 551.74 500.61 465.03
Changes in inventories
of finished goods, work-
in-progress and traded
goods
31 (663.74) (896.56) (318.44) 7.23 (27.22) (5.41) (316.44)
Employee benefits
expense 32 1,441.75 1,237.52 2,457.47 1,472.45 1,250.56 1,003.92 731.49
Finance costs 33 932.90 740.66 1,388.53 1,562.74 1,478.64 975.51 719.13
Depreciation and
amortisation expense 34 1,514.82 1,185.68 2,626.20 1,520.41 1,344.70 969.09 560.08
Other expenses 35 3,904.43 3,339.18 5,556.87 3,806.92 3,577.08 3,121.53 2,299.96
Total expenses 18,026.64 17,153.97 26,904.90 20,063.50 17,994.43 14,665.18 11,361.22
Net profit/(loss) before
tax, as restated
3,217.48 2,720.32 2,169.20 547.52 (223.10) 412.38 115.66
Tax expense:
Current tax 689.84 582.67 468.56 135.03 29.56 94.75 29.74
Minimum alternate tax
credit entitlement
(515.70) (582.60) (468.20) (120.60) - (88.90) (24.50)
Deferred tax
expense/(credit)
766.91 798.85 693.52 179.10 (87.62) (47.85) 23.66
Net profit/(loss) after
tax, as restated
2,276.43 1,921.40 1,475.32 353.99 (165.04) 454.38 86.76
Note: The above Statement should be read with the Restated Standalone Statement of Significant Accounting Policies in
Annexure 4, Restated Standalone Summany Statement of Notes to Restated Summary Statements of the Company in
Annexure 5 and the Restated Standalone Summary Statement of Reconciliation of Restated Profit/ (Loss) to Profit/ (Loss) as
per Audited Financial Statements in Annexure 6.
This is the Restated Standalone Summary Statement of Profits and Losses, referred to in our report of even date.
For Walker Chandiok & Associates For O.P. Bagla & Co.
Chartered Accountants Chartered Accountants
Firm Registration No.:001329N Firm Registration No.:000018N
316
per Nitin Toshniwal per Neeraj Kumar Agarwal
Partner Partner
Membership No. : 507568 Membership No. : 094155
Place: Gurugram
Date: 22 September 2016
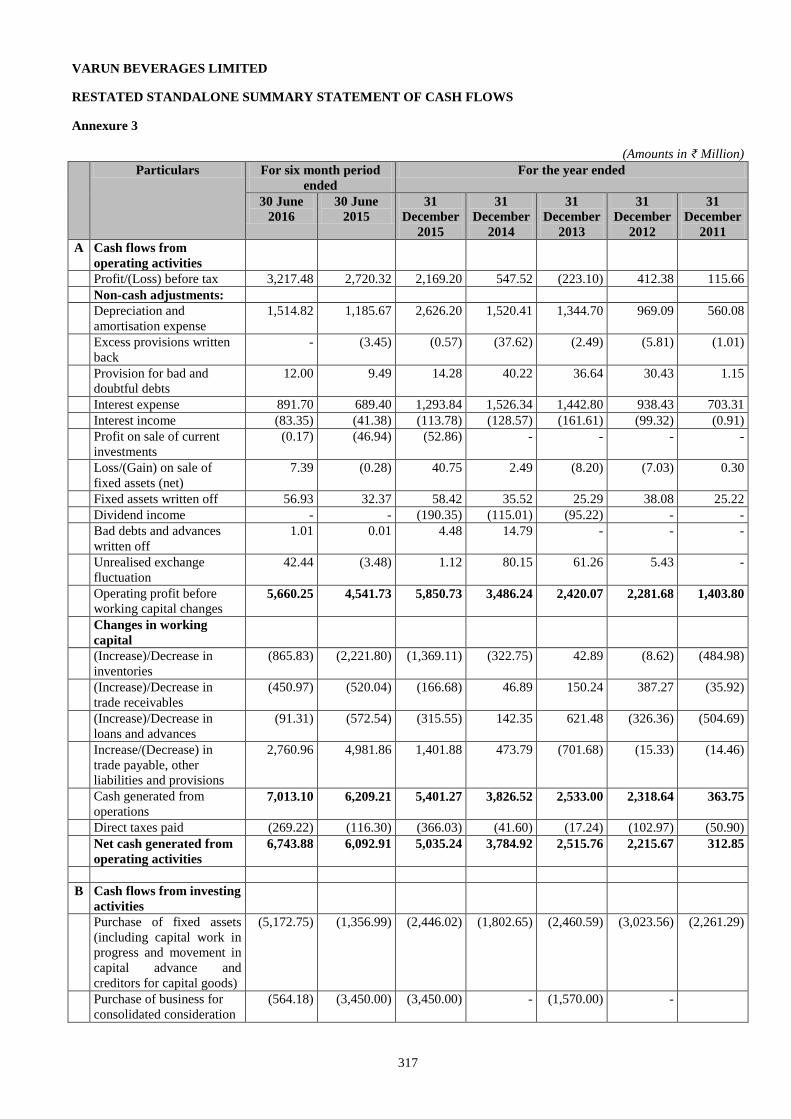
317
VARUN BEVERAGES LIMITED
RESTATED STANDALONE SUMMARY STATEMENT OF CASH FLOWS
Annexure 3
(Amounts in ₹ Million)
Particulars For six month period
ended
For the year ended
30 June
2016
30 June
2015
31
December
2015
31
December
2014
31
December
2013
31
December
2012
31
December
2011
A Cash flows from
operating activities
Profit/(Loss) before tax 3,217.48 2,720.32 2,169.20 547.52 (223.10) 412.38 115.66
Non-cash adjustments:
Depreciation and
amortisation expense
1,514.82 1,185.67 2,626.20 1,520.41 1,344.70 969.09 560.08
Excess provisions written
back
- (3.45) (0.57) (37.62) (2.49) (5.81) (1.01)
Provision for bad and
doubtful debts
12.00 9.49 14.28 40.22 36.64 30.43 1.15
Interest expense 891.70 689.40 1,293.84 1,526.34 1,442.80 938.43 703.31
Interest income (83.35) (41.38) (113.78) (128.57) (161.61) (99.32) (0.91)
Profit on sale of current
investments
(0.17) (46.94) (52.86) - - - -
Loss/(Gain) on sale of
fixed assets (net)
7.39 (0.28) 40.75 2.49 (8.20) (7.03) 0.30
Fixed assets written off 56.93 32.37 58.42 35.52 25.29 38.08 25.22
Dividend income - - (190.35) (115.01) (95.22) - -
Bad debts and advances
written off
1.01 0.01 4.48 14.79 - - -
Unrealised exchange
fluctuation
42.44 (3.48) 1.12 80.15 61.26 5.43 -
Operating profit before
working capital changes 5,660.25 4,541.73 5,850.73 3,486.24 2,420.07 2,281.68 1,403.80
Changes in working
capital
(Increase)/Decrease in
inventories
(865.83) (2,221.80) (1,369.11) (322.75) 42.89 (8.62) (484.98)
(Increase)/Decrease in
trade receivables
(450.97) (520.04) (166.68) 46.89 150.24 387.27 (35.92)
(Increase)/Decrease in
loans and advances
(91.31) (572.54) (315.55) 142.35 621.48 (326.36) (504.69)
Increase/(Decrease) in
trade payable, other
liabilities and provisions
2,760.96 4,981.86 1,401.88 473.79 (701.68) (15.33) (14.46)
Cash generated from
operations 7,013.10 6,209.21 5,401.27 3,826.52 2,533.00 2,318.64 363.75
Direct taxes paid (269.22) (116.30) (366.03) (41.60) (17.24) (102.97) (50.90)
Net cash generated from
operating activities
6,743.88 6,092.91 5,035.24 3,784.92 2,515.76 2,215.67 312.85
B Cash flows from investing
activities
Purchase of fixed assets
(including capital work in
progress and movement in
capital advance and
creditors for capital goods)
(5,172.75) (1,356.99) (2,446.02) (1,802.65) (2,460.59) (3,023.56) (2,261.29)
Purchase of business for
consolidated consideration
(564.18) (3,450.00) (3,450.00) - (1,570.00) -
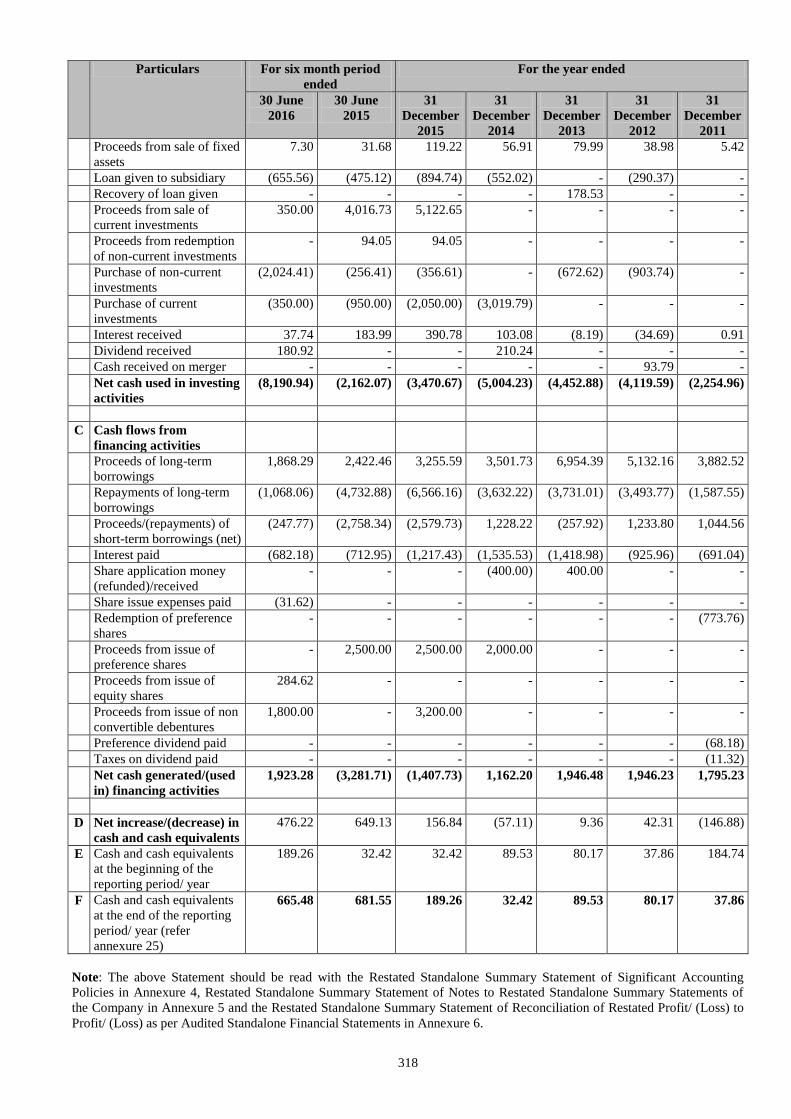
318
Particulars For six month period
ended
For the year ended
30 June
2016
30 June
2015
31
December
2015
31
December
2014
31
December
2013
31
December
2012
31
December
2011
Proceeds from sale of fixed
assets
7.30 31.68 119.22 56.91 79.99 38.98 5.42
Loan given to subsidiary (655.56) (475.12) (894.74) (552.02) - (290.37) -
Recovery of loan given - - - - 178.53 - -
Proceeds from sale of
current investments
350.00 4,016.73 5,122.65 - - - -
Proceeds from redemption
of non-current investments
- 94.05 94.05 - - - -
Purchase of non-current
investments
(2,024.41) (256.41) (356.61) - (672.62) (903.74) -
Purchase of current
investments
(350.00) (950.00) (2,050.00) (3,019.79) - - -
Interest received 37.74 183.99 390.78 103.08 (8.19) (34.69) 0.91
Dividend received 180.92 - - 210.24 - - -
Cash received on merger - - - - - 93.79 -
Net cash used in investing
activities
(8,190.94) (2,162.07) (3,470.67) (5,004.23) (4,452.88) (4,119.59) (2,254.96)
C Cash flows from
financing activities
Proceeds of long-term
borrowings
1,868.29 2,422.46 3,255.59 3,501.73 6,954.39 5,132.16 3,882.52
Repayments of long-term
borrowings
(1,068.06) (4,732.88) (6,566.16) (3,632.22) (3,731.01) (3,493.77) (1,587.55)
Proceeds/(repayments) of
short-term borrowings (net)
(247.77) (2,758.34) (2,579.73) 1,228.22 (257.92) 1,233.80 1,044.56
Interest paid (682.18) (712.95) (1,217.43) (1,535.53) (1,418.98) (925.96) (691.04)
Share application money
(refunded)/received
- - - (400.00) 400.00 - -
Share issue expenses paid (31.62) - - - - - -
Redemption of preference
shares
- - - - - - (773.76)
Proceeds from issue of
preference shares
- 2,500.00 2,500.00 2,000.00 - - -
Proceeds from issue of
equity shares
284.62 - - - - - -
Proceeds from issue of non
convertible debentures
1,800.00 - 3,200.00 - - - -
Preference dividend paid - - - - - - (68.18)
Taxes on dividend paid - - - - - - (11.32)
Net cash generated/(used
in) financing activities
1,923.28 (3,281.71) (1,407.73) 1,162.20 1,946.48 1,946.23 1,795.23
D Net increase/(decrease) in
cash and cash equivalents
476.22 649.13 156.84 (57.11) 9.36 42.31 (146.88)
E Cash and cash equivalents
at the beginning of the
reporting period/ year
189.26 32.42 32.42 89.53 80.17 37.86 184.74
F Cash and cash equivalents
at the end of the reporting
period/ year (refer
annexure 25)
665.48 681.55 189.26 32.42 89.53 80.17 37.86
Note: The above Statement should be read with the Restated Standalone Summary Statement of Significant Accounting
Policies in Annexure 4, Restated Standalone Summary Statement of Notes to Restated Standalone Summary Statements of
the Company in Annexure 5 and the Restated Standalone Summary Statement of Reconciliation of Restated Profit/ (Loss) to
Profit/ (Loss) as per Audited Standalone Financial Statements in Annexure 6.
319
This is the Restated Standalone Summary Statement of Cash Flows, referred to in our report of even date.
For Walker Chandiok & Associates For O.P. Bagla & Co.
Chartered Accountants Chartered Accountants
Firm Registration No.:001329N Firm Registration No.:000018N
per Nitin Toshniwal per Neeraj Kumar Agarwal
Partner Partner
Membership No. : 507568 Membership No. : 094155
Place: Gurugram
Date: 22 September 2016
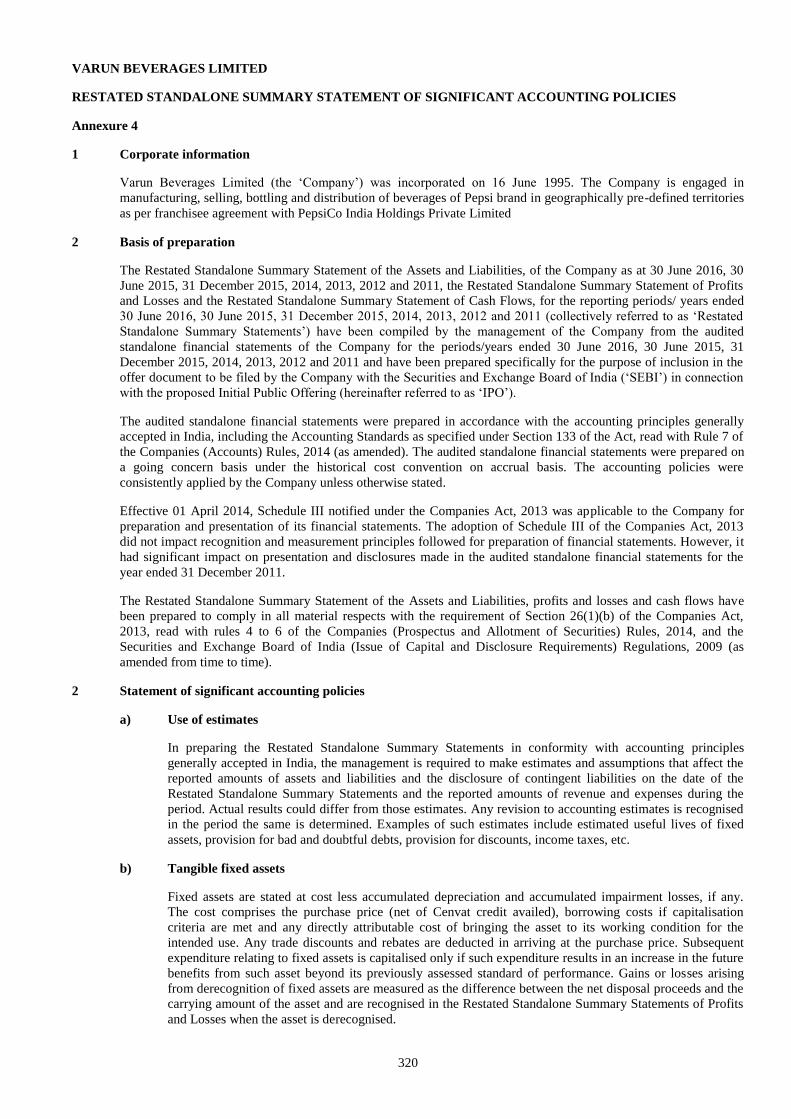
320
VARUN BEVERAGES LIMITED
RESTATED STANDALONE SUMMARY STATEMENT OF SIGNIFICANT ACCOUNTING POLICIES
Annexure 4
1 Corporate information
Varun Beverages Limited (the ‘Company’) was incorporated on 16 June 1995. The Company is engaged in
manufacturing, selling, bottling and distribution of beverages of Pepsi brand in geographically pre-defined territories
as per franchisee agreement with PepsiCo India Holdings Private Limited
2 Basis of preparation
The Restated Standalone Summary Statement of the Assets and Liabilities, of the Company as at 30 June 2016, 30
June 2015, 31 December 2015, 2014, 2013, 2012 and 2011, the Restated Standalone Summary Statement of Profits
and Losses and the Restated Standalone Summary Statement of Cash Flows, for the reporting periods/ years ended
30 June 2016, 30 June 2015, 31 December 2015, 2014, 2013, 2012 and 2011 (collectively referred to as ‘Restated
Standalone Summary Statements’) have been compiled by the management of the Company from the audited
standalone financial statements of the Company for the periods/years ended 30 June 2016, 30 June 2015, 31
December 2015, 2014, 2013, 2012 and 2011 and have been prepared specifically for the purpose of inclusion in the
offer document to be filed by the Company with the Securities and Exchange Board of India (‘SEBI’) in connection
with the proposed Initial Public Offering (hereinafter referred to as ‘IPO’).
The audited standalone financial statements were prepared in accordance with the accounting principles generally
accepted in India, including the Accounting Standards as specified under Section 133 of the Act, read with Rule 7 of
the Companies (Accounts) Rules, 2014 (as amended). The audited standalone financial statements were prepared on
a going concern basis under the historical cost convention on accrual basis. The accounting policies were
consistently applied by the Company unless otherwise stated.
Effective 01 April 2014, Schedule III notified under the Companies Act, 2013 was applicable to the Company for
preparation and presentation of its financial statements. The adoption of Schedule III of the Companies Act, 2013
did not impact recognition and measurement principles followed for preparation of financial statements. However, it
had significant impact on presentation and disclosures made in the audited standalone financial statements for the
year ended 31 December 2011.
The Restated Standalone Summary Statement of the Assets and Liabilities, profits and losses and cash flows have
been prepared to comply in all material respects with the requirement of Section 26(1)(b) of the Companies Act,
2013, read with rules 4 to 6 of the Companies (Prospectus and Allotment of Securities) Rules, 2014, and the
Securities and Exchange Board of India (Issue of Capital and Disclosure Requirements) Regulations, 2009 (as
amended from time to time).
2 Statement of significant accounting policies
a) Use of estimates
In preparing the Restated Standalone Summary Statements in conformity with accounting principles
generally accepted in India, the management is required to make estimates and assumptions that affect the
reported amounts of assets and liabilities and the disclosure of contingent liabilities on the date of the
Restated Standalone Summary Statements and the reported amounts of revenue and expenses during the
period. Actual results could differ from those estimates. Any revision to accounting estimates is recognised
in the period the same is determined. Examples of such estimates include estimated useful lives of fixed
assets, provision for bad and doubtful debts, provision for discounts, income taxes, etc.
b) Tangible fixed assets
Fixed assets are stated at cost less accumulated depreciation and accumulated impairment losses, if any.
The cost comprises the purchase price (net of Cenvat credit availed), borrowing costs if capitalisation
criteria are met and any directly attributable cost of bringing the asset to its working condition for the
intended use. Any trade discounts and rebates are deducted in arriving at the purchase price. Subsequent
expenditure relating to fixed assets is capitalised only if such expenditure results in an increase in the future
benefits from such asset beyond its previously assessed standard of performance. Gains or losses arising
from derecognition of fixed assets are measured as the difference between the net disposal proceeds and the
carrying amount of the asset and are recognised in the Restated Standalone Summary Statements of Profits
and Losses when the asset is derecognised.
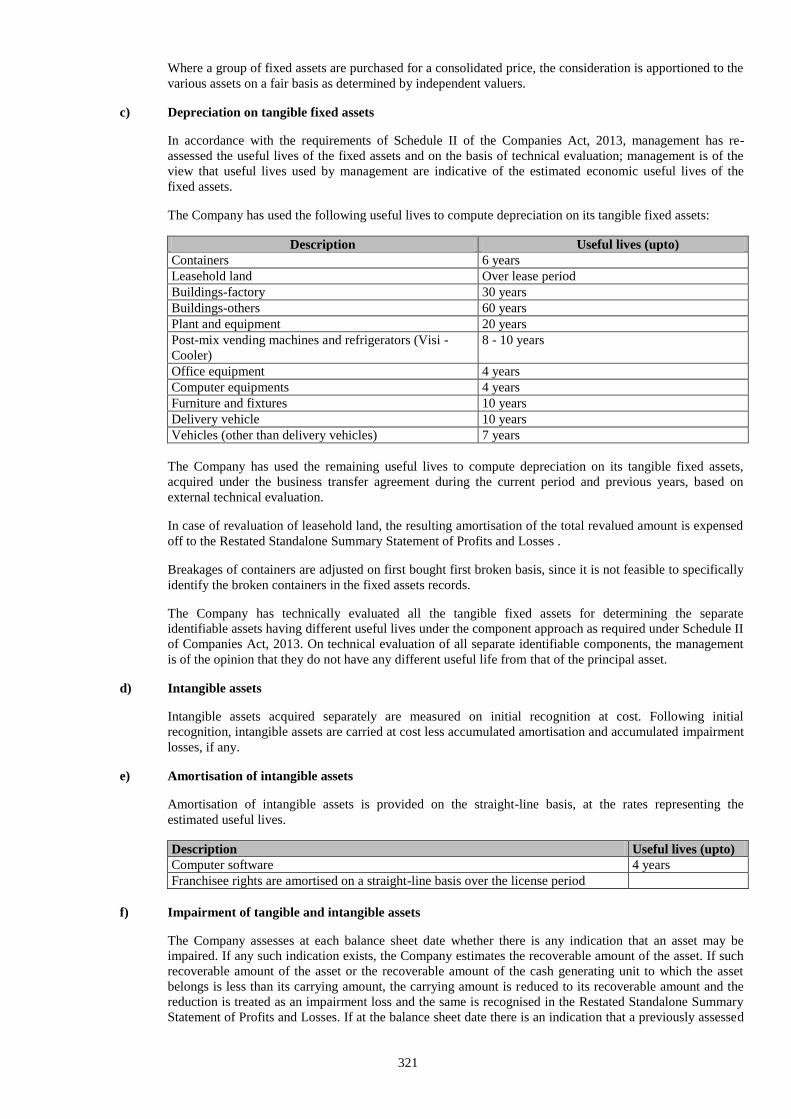
321
Where a group of fixed assets are purchased for a consolidated price, the consideration is apportioned to the
various assets on a fair basis as determined by independent valuers.
c) Depreciation on tangible fixed assets
In accordance with the requirements of Schedule II of the Companies Act, 2013, management has re-
assessed the useful lives of the fixed assets and on the basis of technical evaluation; management is of the
view that useful lives used by management are indicative of the estimated economic useful lives of the
fixed assets.
The Company has used the following useful lives to compute depreciation on its tangible fixed assets:
Description Useful lives (upto)
Containers 6 years
Leasehold land Over lease period
Buildings-factory 30 years
Buildings-others 60 years
Plant and equipment 20 years
Post-mix vending machines and refrigerators (Visi -
Cooler)
8 - 10 years
Office equipment 4 years
Computer equipments 4 years
Furniture and fixtures 10 years
Delivery vehicle 10 years
Vehicles (other than delivery vehicles) 7 years
The Company has used the remaining useful lives to compute depreciation on its tangible fixed assets,
acquired under the business transfer agreement during the current period and previous years, based on
external technical evaluation.
In case of revaluation of leasehold land, the resulting amortisation of the total revalued amount is expensed
off to the Restated Standalone Summary Statement of Profits and Losses .
Breakages of containers are adjusted on first bought first broken basis, since it is not feasible to specifically
identify the broken containers in the fixed assets records.
The Company has technically evaluated all the tangible fixed assets for determining the separate
identifiable assets having different useful lives under the component approach as required under Schedule II
of Companies Act, 2013. On technical evaluation of all separate identifiable components, the management
is of the opinion that they do not have any different useful life from that of the principal asset.
d) Intangible assets
Intangible assets acquired separately are measured on initial recognition at cost. Following initial
recognition, intangible assets are carried at cost less accumulated amortisation and accumulated impairment
losses, if any.
e) Amortisation of intangible assets
Amortisation of intangible assets is provided on the straight-line basis, at the rates representing the
estimated useful lives.
Description Useful lives (upto)
Computer software 4 years
Franchisee rights are amortised on a straight-line basis over the license period
f) Impairment of tangible and intangible assets
The Company assesses at each balance sheet date whether there is any indication that an asset may be
impaired. If any such indication exists, the Company estimates the recoverable amount of the asset. If such
recoverable amount of the asset or the recoverable amount of the cash generating unit to which the asset
belongs is less than its carrying amount, the carrying amount is reduced to its recoverable amount and the
reduction is treated as an impairment loss and the same is recognised in the Restated Standalone Summary
Statement of Profits and Losses. If at the balance sheet date there is an indication that a previously assessed
322
impairment loss no longer exists, the recoverable amount is reassessed and the asset is reflected at the
recoverable amount subject to a maximum of depreciated historical cost and the impairment is accordingly
reversed in the Restated Standalone Summary Statement of Profits and Losses.
g) Leases
Where the Company is the lessee
Finance leases, which effectively transfer to the Company substantially all the risks and benefits incidental
to ownership of the leased item, are capitalised at the lower of the fair value and present value of the
minimum lease payments at the inception of the lease term and disclosed as leased assets. Lease payments
are apportioned between the finance charges and reduction of the lease liability based on the implicit rate of
return. Finance charges are charged directly against income. Lease management fees, legal charges and
other initial direct costs are capitalised.
If there is no reasonable certainty that the Company will obtain the ownership by the end of the lease term,
capitalised leased assets are depreciated over the shorter of the estimated useful life of the asset or the lease
term.
Leases where the lessor effectively retains substantially all the risks and benefits of ownership of the leased
term, are classified as operating leases. Operating lease payments are recognised as an expense in the
Restated Standalone Summary Statement of Profits and Losses on a straight-line basis over the lease term.
Where the Company is the lessor
Leases in which the Company does not transfer substantially all the risks and benefits of ownership of the
asset are classified as operating leases. Assets subject to operating leases are included in fixed assets. Lease
income on an operating lease is recognised in the Restated Standalone Summary Statement of Profits and
Losses on a straight-line basis over the lease term. Costs, including depreciation, are recognised as an
expense in the Restated Standalone Summary Statement of Profits and Losses. Initial direct costs such as
legal costs, brokerage costs, etc. are recognised immediately in the Restated Standalone Summary
Statement of Profits and Losses.
h) Investments
Investments, which are readily realisable and intended to be held for not more than one year from the date
on which such investments are made, are classified as current investments. All other investments are
classified as long-term investments.
On initial recognition, all investments are measured at cost. The cost comprises purchase price and directly
attributable acquisition charges such as brokerage, fees and duties.
Current investments are carried in the Restated Standalone Summary Statements at lower of cost and fair
value determined on an individual investment basis. Long-term investments are carried at cost, however
provision for diminution in value is made to recognise a decline, other than temporary, in the value of the
investments.
On disposal of an investment, the difference between its carrying amount and net disposal proceeds is
charged or credited to the Restated Standalone Summary Statement of Profits and Losses.
i) Inventories
Inventories are valued as follows:
i) Raw materials, components and stores and spares: At lower of cost and net realisable value.
Cost represents purchase price and other direct costs and is determined on a moving weighted
average cost basis. However, materials and other items held for use in the production of
inventories are not written down below cost if the finished products in which they will be
incorporated are expected to be sold at or above cost.
ii) Work-in-progress: At lower of cost and net realisable value. Cost for this purpose includes
material, labour and appropriate allocation of overheads including depreciation. Cost is determined
on a moving weighted average basis.
323
iii) Finished goods:
a) Manufactured - At lower of cost and net realisable value. Cost for this purpose includes
material, labour and appropriate allocation of overheads. Excise duty on inventory lying
with the Company is added to the cost of the finished goods inventory. Cost is determined
on a moving weighted average basis.
b) Traded - At lower of cost and net realisable value. Cost represents purchase price and
other direct costs and is determined on a moving weighted average cost basis.
Net realisable value is the estimated selling price in the ordinary course of business, less estimated costs of
completion and estimated costs necessary to make the sale. Provision for obsolescence is determined based
on management’s assessment and is charged to the Restated Standalone Summary Statement of Profits and
Losses.
j) Revenue recognition
Revenue is recognised to the extent that it is probable that the economic benefits will flow to the Company
and the revenue can be reliably measured.
i) Sale of products:
Revenue is recognised when the significant risks and rewards of ownership of the goods have
passed to the customer and are recorded inclusive of excise duty and net of sales tax, sales returns
and trade discount.
ii) Interest:
Interest income is recognised on a time proportion basis taking into account the amount
outstanding and the applicable interest rate.
iii) Dividend:
Dividend income is recognised in the period in which right to receive such payment is established.
iv) Commission:
Commission income is recognised as per the agreed terms.
v) Management fees and technical know-how fees:
Management fees and technical know-how fees is recognised as per the agreed terms
k) Borrowing costs
Borrowing cost includes interest, amortisation of ancillary costs incurred in connection with the
arrangement of borrowings and exchange differences arising from foreign currency borrowings to the extent
they are regarded as an adjustment to the interest cost. Borrowing costs directly attributable to the
acquisition, construction or production of an asset that necessarily takes a substantial period of time to get
ready for its intended use or sale are capitalised as part of the cost of the respective asset. All other
borrowing costs are expensed in the period they occur.
l) Foreign currency transactions
i) Initial recognition
Foreign currency transactions are recorded in the reporting currency, by applying to the foreign
currency amount the exchange rate between the reporting currency and the foreign currency at the
date of the transaction.
ii) Conversion
Foreign currency monetary items are reported using the closing rate. Non-monetary items which
are carried in terms of historical cost denominated in a foreign currency are reported using the
exchange rate at the date of the transaction.
324
iii) Exchange differences
Exchange differences arising on the settlement of monetary items or on reporting Company's
monetary items at rates different from those at which they were initially recorded during the
period, or reported in previous Restated Standalone Summary Statements, are recognised as
income or as expenses in the year in which they arise.
iv) Derivative instruments and hedge accounting
Outstanding contracts as at the reporting date are restated at the exchange rate prevailing on that
date. In respect of contracts entered into to hedge foreign currency and interest rate risk,
gain/losses on settlement and losses on restatement (by marking them to market) at the Balance
Sheet date are recognised in the Restated Standalone Summary Statement of Profits and Losses or
in case of hedge contracts for long term foreign currency monetary items relating to acquistion of
depreciable capital asset in which case they are adjusted to the carrying cost of such assets.
As specified under Section 133 of the Companies Act, 2013, read with Rule 7 of the Companies
(Accounts) Rules, 2014 (as amended) - 'AS 11' relating to ‘The Effects of Changes in Foreign
Exchange Rates’, exchange differences arising on conversion of long-term foreign currency
monetary items used for acquisition of depreciable fixed assets are added to the cost of fixed assets
and is depreciated over the remaining life of the respective fixed asset and in other cases, is
recorded under the head ‘Foreign Currency Monetary Item Translation Difference Account’ and is
amortised over period not extending beyond, earlier of 31 March 2020 or maturity date of
underlying long-term foreign currency monetary items.
m) Retirement and other employee benefits
i) Contributions to the provident fund, a defined contribution scheme, are charged to the Restated
Standalone Summary Statement of Profits and Losses for the year when the contributions are due.
The Company has no other obligation, other than the contribution payable to the provident fund.
ii) Gratuity liability under the Payment of Gratuity Act, 1972 is accrued on the basis of an actuarial
valuation made at the end of each financial year. The actuarial valuation is performed by an
independent actuary as per projected unit credit method.
iii) Accumulated leave, which is expected to be utilised within next twelve months, is treated as short-
term employee benefit. The Company measures the expected cost of such absences as the
additional amount that it expects to pay as a result of the unused entitlement that has accumulated
at the reporting date.
The Company treats accumulated leave expected to be carried forward beyond twelve months, as
long-term employee benefit for measurement purposes. Such long-term compensated absences are
computed based on the actuarial valuation performed by an independent actuary using the
projected unit credit method at the year-end.
iv) Actuarial gains/losses are immediately taken to the Restated Standalone Summary Statement of
Profits and Losses.
n) Income taxes
Tax expense comprises current and deferred tax. Current income tax is measured at the amount expected to
be paid to the tax authorities in accordance with the Income-tax Act, 1961 enacted in India. Deferred
income taxes reflects the impact of current year timing differences between taxable income and accounting
income for the year and reversal of timing differences of earlier years.
Deferred tax is measured based on the tax rates and the tax laws enacted or substantively enacted at the
balance sheet date. Deferred tax assets and deferred tax liabilities are offset, if a legally enforceable right
exists to set off current tax assets against current tax liabilities and the deferred tax assets and deferred tax
liabilities relate to the taxes on income levied by same governing taxation laws. Deferred tax assets are
recognised only to the extent that there is reasonable certainty that sufficient future taxable income will be
available against which such deferred tax assets can be realised. In situations where the Company has
unabsorbed depreciation or carry forward tax losses, all deferred tax assets are recognised only if there is
virtual certainty supported by convincing evidence that they can be realised against future taxable profits.
325
At each balance sheet date the Company re-assesses unrecognised deferred tax assets. It recognises
unrecognised deferred tax assets to the extent that it has become reasonably certain or virtually certain, as
the case may be that sufficient future taxable income will be available against which such deferred tax
assets can be realised.
The carrying amount of deferred tax assets are reviewed at each balance sheet date. The Company writes-
down the carrying amount of a deferred tax asset to the extent that it is no longer reasonably certain or
virtually certain, as the case may be, that sufficient future taxable income will be available against which
deferred tax asset can be realised. Any such write-down is reversed to the extent that it becomes reasonably
certain or virtually certain, as the case may be, that sufficient future taxable income will be available.
Minimum Alternate Tax (‘MAT’) credit is recognised as an asset only when and to the extent there is
convincing evidence that the Company will pay normal income tax during the specified period. In the year
in which the MAT credit becomes eligible to be recognised as an asset in accordance with the
recommendations contained in the Guidance Note issued by the Institute of Chartered Accountants of India,
the said asset is created by way of a credit to the Restated Standalone Summary Statement of Profits and
Losses and is disclosed as MAT credit entitlement. The Company reviews this balance at each balance
sheet date and writes down the carrying amount to the extent there is no longer convincing evidence that the
Company will pay normal income tax during the specified period.
o) Employee stock options
Accounting value of stock options is determined on the basis of ‘Intrinsic Value’ representing the excess of
the fair market value of Company's equity share on the date of grant over the exercise price of the options
granted under the "Employees Stock Option Scheme" of the Company, and is being amortised as
"Employee Compensation Expense" on a straight-line basis over the vesting period in accordance with the
Guidance Note 18 "Share Based Payments" issued by the Institute of Chartered Accountants of India.
p) Earnings/(loss) per share
Basic earnings/(loss) per share are calculated by dividing the net profit or loss for the period attributable to
equity shareholders by the weighted average number of equity shares outstanding during the period. The
weighted average number of equity shares outstanding during the period is adjusted for events of bonus
issue; bonus element in a rights issue to existing shareholders; share split; and reverse share split
(consolidation of shares).
For the purpose of calculating diluted earnings/(loss) per share, the net profit or loss for the period
attributable to equity shareholders and the weighted average number of shares outstanding during the period
are adjusted for the effects of all dilutive potential equity shares.
q) Provisions, contingent liabilities and contingent assets
A provision is recognised when an enterprise has a present obligation as a result of past event and it is
probable that an outflow of resources will be required to settle the obligation, in respect of which a reliable
estimate can be made. Provisions are not discounted to present value and are determined based on best
estimate required to settle the obligation at the balance sheet date. These are reviewed at each balance sheet
date and adjusted to reflect the current best estimates.
A contingent liability is a possible obligation that arises from past events whose existence will be confirmed
by the occurrence or non-occurrence of one or more uncertain future events beyond the control of the
Company or a present obligation that is not recognised because it is not probable that an outflow of
resources will be required to settle the obligation. A contingent liability also arises in extremely rare cases
where there is a liability that cannot be recognised because it cannot be measured reliably.
Contingent assets are not recognised in the Restated Standalone Summary Statements.
r) Cash and cash equivalents
Cash and cash equivalents for Restated Standalone Summary Statement of Cash Flows comprises cash at
bank and in hand and short-term investments with an original maturity of three months or less.
Varun Beverages Limited
326
s) Government grants
Grants from the Government are recognised when there is reasonable assurance that the grant will be
received and all underlying conditions will be complied with.
Where the grants are in the nature of promoter’s contribution and no repayment is expected, then they are
treated as capital reserve. Grants that are determined to be of revenue nature are deducted from the related
expenses.
Note: The above Statement should be read with the Restated Standalone Summany Statement of Notes to
Restated Summary Statements of the Company in Annexure 5 and the Restated Standalone Summary
Statement of Reconciliation of Restated Profit/ (Loss) to Profit/ (Loss) as per Audited Financial Statements
in Annexure 6.
327
VARUN BEVERAGES LIMITED
RESTATED STANDALONE SUMMARY STATEMENT OF NOTES TO RESTATED STANDALONE SUMMARY
STATEMENTS
Annexure 5
1 The Company recorded prior period expenses/income during the year/period ended 31 December 2013, 31
December 2015 and 30 June 2015. The effect of these items has been adjusted in the respective periods of
origination. Some of these expenses/income were related to period prior to 01 January 2011. In these Restated
Standalone Summary Statements, such expenses/income have been adjusted against opening balance of Restated
Standalone Summary Statement of Profits and Losses as on 01 January 2011.
2 Capital commitments
(Amounts in ₹ Million)
Particulars As at
30 June
2016
30 June
2015
31
December
2015
31
December
2014
31
December
2013
31
December
2012
31
December
2011
Estimated amount of
contracts remaining to be
executed on capital account
and not provided for (net of
advances)
857.33 179.31 1,332.20 12,920.97 630.79 2,770.95 170.47
3 Contingent liabilities and commitments
(Amounts in ₹ Million)
Particulars As at
30 June
2016
30 June
2015
31
December
2015
31
December
2014
31
December
2013
31
December
2012
31
December
2011
a. Guarantees issued on
behalf of subsidiary
and other
companies#
1,236.49 1,745.44 1,727.62 1,790.04 1,891.81 1,837.69 900.53
b. Counter guarantees
given in respect of
guarantees issued by
the Company's
bankers**.
49.27 33.94 50.52 49.57 78.17 39.95 38.79
c. Claims against the
Company not
acknowledged as
debts (being
contested):-
i For excise and
service tax
57.95 14.57 14.57 7.80 70.08 5.10 4.53
ii For sales tax / entry
tax
52.27 42.00 42.71 34.95 82.11 68.85 53.82
iii For income tax 3.13 3.13 3.13 79.40 376.05 2.74 7.14
iv Others* 159.76 122.24 130.64 73.39 55.55 32.39 31.49
* excludes pending cases where amount of liability is not ascertainable.
Also refer annexure 10(a)
** excluding Nil (previous period/years ₹5.40) already considered as contingent liability in 3( c).
328
# includes guarantees for loans given on behalf of subsidiaries. Further, it includes guarantees for loans given on
behalf of Lunarmech Technologies Private Limited for business purposes for the years ended 31 December
2015, 2014, 2013 and 2012.
4 Value of imports on CIF basis:
(Amounts in ₹ Million)
Particulars For six month period
ended
For the year ended
30 June
2016
30 June
2015
31 December
2015
31 December
2014
31 December
2013
31 December
2012
31 December
2011
Capital goods 56.05 110.06 236.94 320.94 926.83 659.72 792.50
Stores, spares
and raw
material
862.79 1,771.92 1,977.28 1,139.87 1,357.25 537.65 409.53
5 Expenditure in foreign currency
(Amounts in ₹ Million)
Particulars For six month period
ended
For the year ended
30 June
2016
30 June
2015
31
December
2015
31
December
2014
31
December
2013
31
December
2012
31
December
2011
Travelling and others* 12.52 6.62 13.39 6.55 5.01 2.82 4.87
Finance costs 35.98 20.71 43.68 48.54 67.22 74.36 7.22
* includes share issue expenses of ₹ 8.67 in the period ended 30 June 2016 which has not been charged to
Restated Standalone Summary Statement of Profits and Losses.
6 Earnings in foreign currency
(Amounts in ₹ Million)
Particulars For six month period
ended
For the year ended
30 June
2016
30 June
2015
31
December
2015
31
December
2014
31
December
2013
31
December
2012
31
December
2011
FOB value of exports
(intermediate and
finished goods)
119.67 117.92 162.94 248.01 161.96 133.57 94.88
Interest 47.27 35.99 71.83 83.76 98.63 86.79 -
Guarantee commission 13.79 14.62 29.19 30.27 31.26 - -
7 Pre-operative expenses incurred on fixed assets and capitalised during the period/years are as under:
(Amounts in ₹ Million)
For six month period
ended
For the year ended
Particulars 30 June
2016
30 June
2015
31
December
2015
31
December
2014
31
December
2013
31
December
2012
31
December
2011
Amount brought forward 24.97 1.47 1.47 3.12 128.28 147.87 -
Acquired on
amalgamation
- - - - - 63.22 -
Add: Incurred during the
period/year
Net (gain)/ loss on
foreign currency
transactions
- - (0.15) (10.81) 24.68 - -
Financial charges - - - 17.27 296.34 70.63 108.19
Other expenses 0.80 4.33 24.01 5.86 62.85 27.63 39.68
Less: Capitalised during 24.62 0.36 0.36 13.97 509.03 181.07
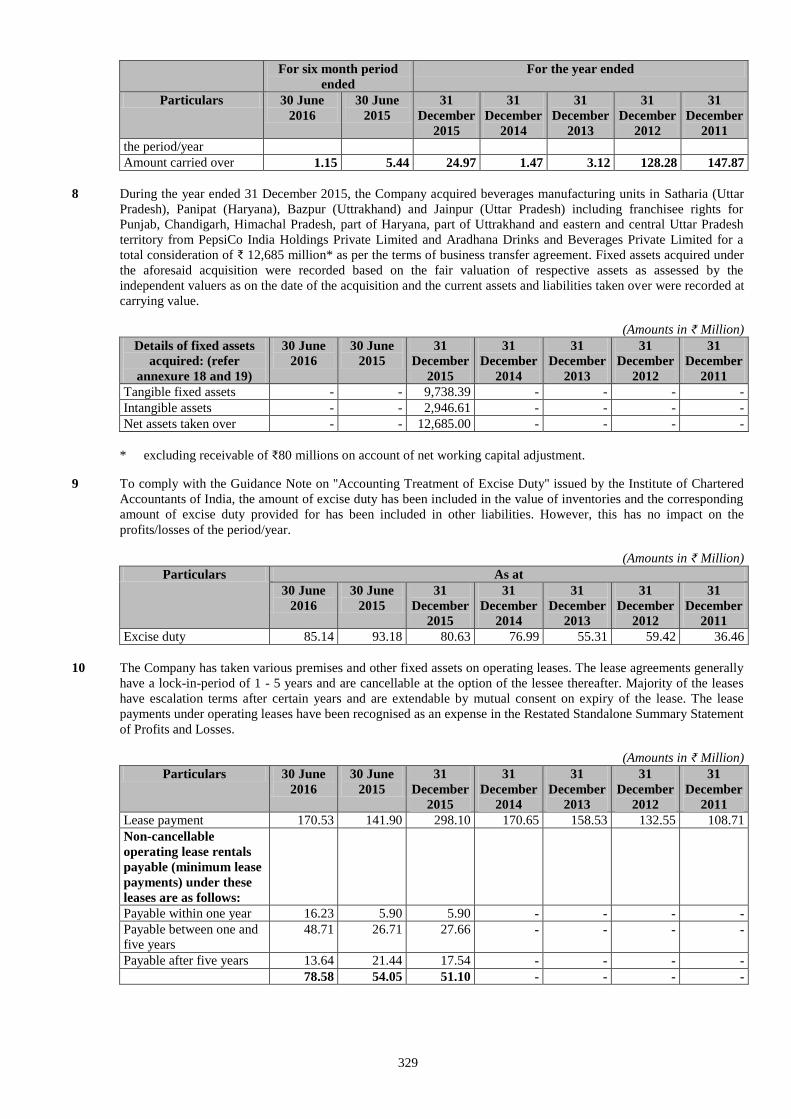
329
For six month period
ended
For the year ended
Particulars 30 June
2016
30 June
2015
31
December
2015
31
December
2014
31
December
2013
31
December
2012
31
December
2011
the period/year
Amount carried over 1.15 5.44 24.97 1.47 3.12 128.28 147.87
8 During the year ended 31 December 2015, the Company acquired beverages manufacturing units in Satharia (Uttar
Pradesh), Panipat (Haryana), Bazpur (Uttrakhand) and Jainpur (Uttar Pradesh) including franchisee rights for
Punjab, Chandigarh, Himachal Pradesh, part of Haryana, part of Uttrakhand and eastern and central Uttar Pradesh
territory from PepsiCo India Holdings Private Limited and Aradhana Drinks and Beverages Private Limited for a
total consideration of ₹ 12,685 million* as per the terms of business transfer agreement. Fixed assets acquired under
the aforesaid acquisition were recorded based on the fair valuation of respective assets as assessed by the
independent valuers as on the date of the acquisition and the current assets and liabilities taken over were recorded at
carrying value.
(Amounts in ₹ Million)
Details of fixed assets
acquired: (refer
annexure 18 and 19)
30 June
2016
30 June
2015
31
December
2015
31
December
2014
31
December
2013
31
December
2012
31
December
2011
Tangible fixed assets - - 9,738.39 - - - -
Intangible assets - - 2,946.61 - - - -
Net assets taken over - - 12,685.00 - - - -
* excluding receivable of ₹80 millions on account of net working capital adjustment.
9 To comply with the Guidance Note on ''Accounting Treatment of Excise Duty'' issued by the Institute of Chartered
Accountants of India, the amount of excise duty has been included in the value of inventories and the corresponding
amount of excise duty provided for has been included in other liabilities. However, this has no impact on the
profits/losses of the period/year.
(Amounts in ₹ Million)
Particulars As at
30 June
2016
30 June
2015
31
December
2015
31
December
2014
31
December
2013
31
December
2012
31
December
2011
Excise duty 85.14 93.18 80.63 76.99 55.31 59.42 36.46
10 The Company has taken various premises and other fixed assets on operating leases. The lease agreements generally
have a lock-in-period of 1 - 5 years and are cancellable at the option of the lessee thereafter. Majority of the leases
have escalation terms after certain years and are extendable by mutual consent on expiry of the lease. The lease
payments under operating leases have been recognised as an expense in the Restated Standalone Summary Statement
of Profits and Losses.
(Amounts in ₹ Million)
Particulars 30 June
2016
30 June
2015
31
December
2015
31
December
2014
31
December
2013
31
December
2012
31
December
2011
Lease payment 170.53 141.90 298.10 170.65 158.53 132.55 108.71
Non-cancellable
operating lease rentals
payable (minimum lease
payments) under these
leases are as follows:
Payable within one year 16.23 5.90 5.90 - - - -
Payable between one and
five years
48.71 26.71 27.66 - - - -
Payable after five years 13.64 21.44 17.54 - - - -
78.58 54.05 51.10 - - - -
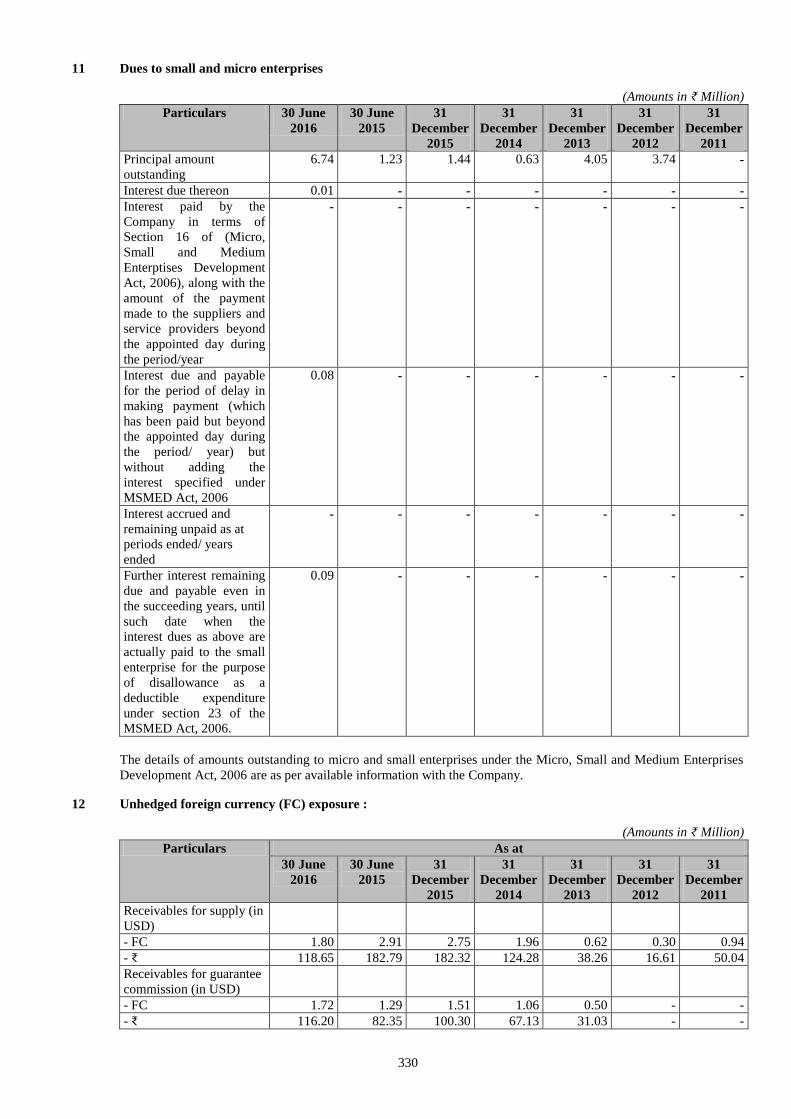
330
11 Dues to small and micro enterprises
(Amounts in ₹ Million)
Particulars 30 June
2016
30 June
2015
31
December
2015
31
December
2014
31
December
2013
31
December
2012
31
December
2011
Principal amount
outstanding
6.74 1.23 1.44 0.63 4.05 3.74 -
Interest due thereon 0.01 - - - - - -
Interest paid by the
Company in terms of
Section 16 of (Micro,
Small and Medium
Enterptises Development
Act, 2006), along with the
amount of the payment
made to the suppliers and
service providers beyond
the appointed day during
the period/year
- - - - - - -
Interest due and payable
for the period of delay in
making payment (which
has been paid but beyond
the appointed day during
the period/ year) but
without adding the
interest specified under
MSMED Act, 2006
0.08 - - - - - -
Interest accrued and
remaining unpaid as at
periods ended/ years
ended
- - - - - - -
Further interest remaining
due and payable even in
the succeeding years, until
such date when the
interest dues as above are
actually paid to the small
enterprise for the purpose
of disallowance as a
deductible expenditure
under section 23 of the
MSMED Act, 2006.
0.09 - - - - - -
The details of amounts outstanding to micro and small enterprises under the Micro, Small and Medium Enterprises
Development Act, 2006 are as per available information with the Company.
12 Unhedged foreign currency (FC) exposure :
(Amounts in ₹ Million)
Particulars As at
30 June
2016
30 June
2015
31
December
2015
31
December
2014
31
December
2013
31
December
2012
31
December
2011
Receivables for supply (in
USD)
- FC 1.80 2.91 2.75 1.96 0.62 0.30 0.94
- ₹ 118.65 182.79 182.32 124.28 38.26 16.61 50.04
Receivables for guarantee
commission (in USD)
- FC 1.72 1.29 1.51 1.06 0.50 - -
- ₹ 116.20 82.35 100.30 67.13 31.03 - -
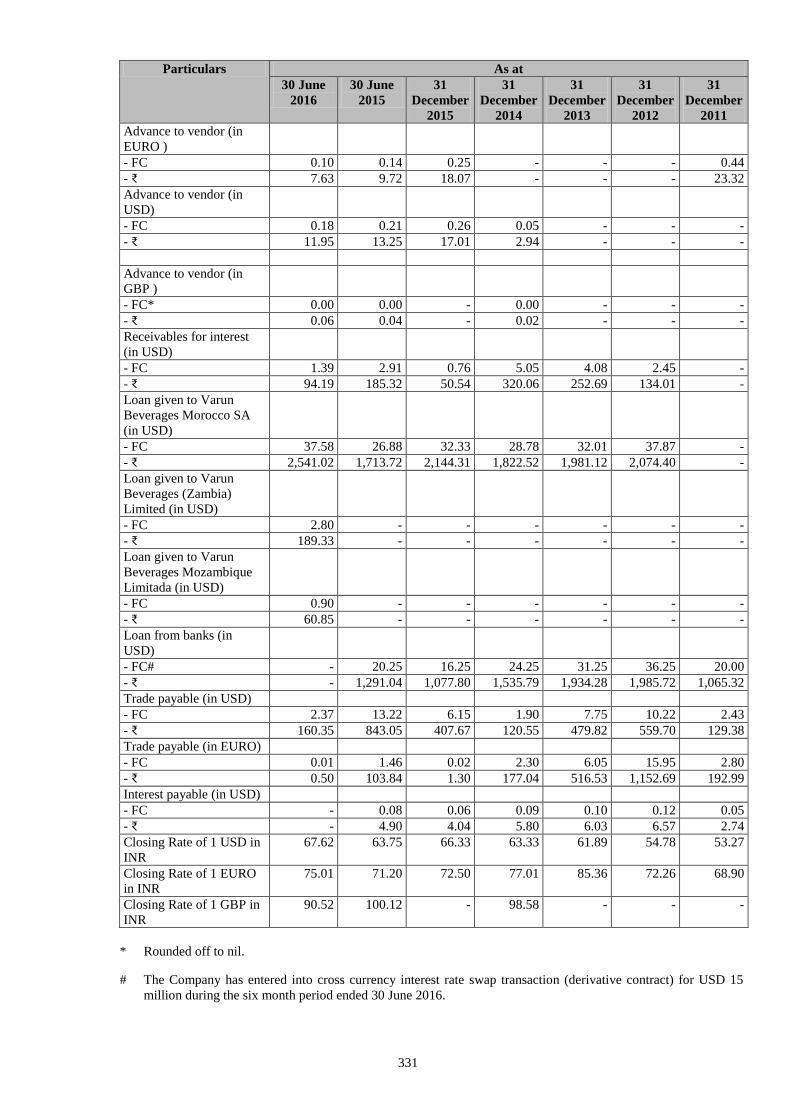
331
Particulars As at
30 June
2016
30 June
2015
31
December
2015
31
December
2014
31
December
2013
31
December
2012
31
December
2011
Advance to vendor (in
EURO )
- FC 0.10 0.14 0.25 - - - 0.44
- ₹ 7.63 9.72 18.07 - - - 23.32
Advance to vendor (in
USD)
- FC 0.18 0.21 0.26 0.05 - - -
- ₹ 11.95 13.25 17.01 2.94 - - -
Advance to vendor (in
GBP )
- FC* 0.00 0.00 - 0.00 - - -
- ₹ 0.06 0.04 - 0.02 - - -
Receivables for interest
(in USD)
- FC 1.39 2.91 0.76 5.05 4.08 2.45 -
- ₹ 94.19 185.32 50.54 320.06 252.69 134.01 -
Loan given to Varun
Beverages Morocco SA
(in USD)
- FC 37.58 26.88 32.33 28.78 32.01 37.87 -
- ₹ 2,541.02 1,713.72 2,144.31 1,822.52 1,981.12 2,074.40 -
Loan given to Varun
Beverages (Zambia)
Limited (in USD)
- FC 2.80 - - - - - -
- ₹ 189.33 - - - - - -
Loan given to Varun
Beverages Mozambique
Limitada (in USD)
- FC 0.90 - - - - - -
- ₹ 60.85 - - - - - -
Loan from banks (in
USD)
- FC# - 20.25 16.25 24.25 31.25 36.25 20.00
- ₹ - 1,291.04 1,077.80 1,535.79 1,934.28 1,985.72 1,065.32
Trade payable (in USD)
- FC 2.37 13.22 6.15 1.90 7.75 10.22 2.43
- ₹ 160.35 843.05 407.67 120.55 479.82 559.70 129.38
Trade payable (in EURO)
- FC 0.01 1.46 0.02 2.30 6.05 15.95 2.80
- ₹ 0.50 103.84 1.30 177.04 516.53 1,152.69 192.99
Interest payable (in USD)
- FC - 0.08 0.06 0.09 0.10 0.12 0.05
- ₹ - 4.90 4.04 5.80 6.03 6.57 2.74
Closing Rate of 1 USD in
INR
67.62 63.75 66.33 63.33 61.89 54.78 53.27
Closing Rate of 1 EURO
in INR
75.01 71.20 72.50 77.01 85.36 72.26 68.90
Closing Rate of 1 GBP in
INR
90.52 100.12 - 98.58 - - -
* Rounded off to nil.
# The Company has entered into cross currency interest rate swap transaction (derivative contract) for USD 15
million during the six month period ended 30 June 2016.
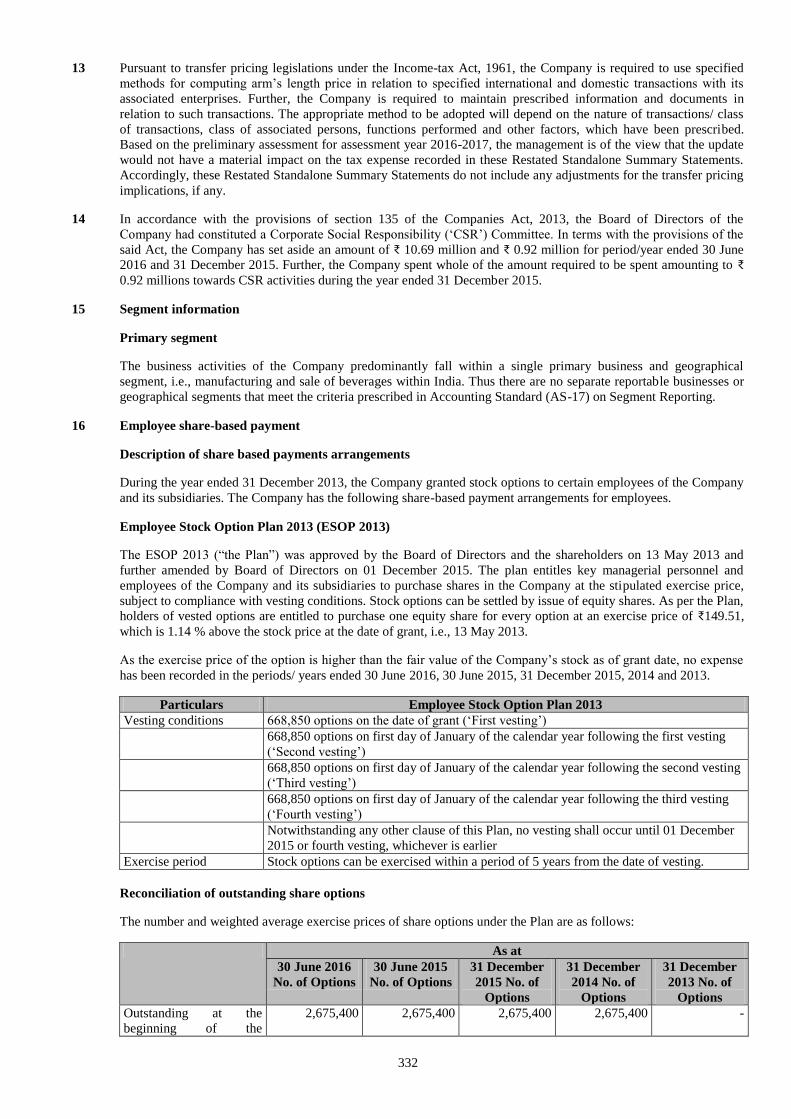
332
13 Pursuant to transfer pricing legislations under the Income-tax Act, 1961, the Company is required to use specified
methods for computing arm’s length price in relation to specified international and domestic transactions with its
associated enterprises. Further, the Company is required to maintain prescribed information and documents in
relation to such transactions. The appropriate method to be adopted will depend on the nature of transactions/ class
of transactions, class of associated persons, functions performed and other factors, which have been prescribed.
Based on the preliminary assessment for assessment year 2016-2017, the management is of the view that the update
would not have a material impact on the tax expense recorded in these Restated Standalone Summary Statements.
Accordingly, these Restated Standalone Summary Statements do not include any adjustments for the transfer pricing
implications, if any.
14 In accordance with the provisions of section 135 of the Companies Act, 2013, the Board of Directors of the
Company had constituted a Corporate Social Responsibility (‘CSR’) Committee. In terms with the provisions of the
said Act, the Company has set aside an amount of ₹ 10.69 million and ₹ 0.92 million for period/year ended 30 June
2016 and 31 December 2015. Further, the Company spent whole of the amount required to be spent amounting to ₹
0.92 millions towards CSR activities during the year ended 31 December 2015.
15 Segment information
Primary segment
The business activities of the Company predominantly fall within a single primary business and geographical
segment, i.e., manufacturing and sale of beverages within India. Thus there are no separate reportable businesses or
geographical segments that meet the criteria prescribed in Accounting Standard (AS-17) on Segment Reporting.
16 Employee share-based payment
Description of share based payments arrangements
During the year ended 31 December 2013, the Company granted stock options to certain employees of the Company
and its subsidiaries. The Company has the following share-based payment arrangements for employees.
Employee Stock Option Plan 2013 (ESOP 2013)
The ESOP 2013 (“the Plan”) was approved by the Board of Directors and the shareholders on 13 May 2013 and
further amended by Board of Directors on 01 December 2015. The plan entitles key managerial personnel and
employees of the Company and its subsidiaries to purchase shares in the Company at the stipulated exercise price,
subject to compliance with vesting conditions. Stock options can be settled by issue of equity shares. As per the Plan,
holders of vested options are entitled to purchase one equity share for every option at an exercise price of ₹149.51,
which is 1.14 % above the stock price at the date of grant, i.e., 13 May 2013.
As the exercise price of the option is higher than the fair value of the Company’s stock as of grant date, no expense
has been recorded in the periods/ years ended 30 June 2016, 30 June 2015, 31 December 2015, 2014 and 2013.
Particulars Employee Stock Option Plan 2013
Vesting conditions 668,850 options on the date of grant (‘First vesting’)
668,850 options on first day of January of the calendar year following the first vesting
(‘Second vesting’)
668,850 options on first day of January of the calendar year following the second vesting
(‘Third vesting’)
668,850 options on first day of January of the calendar year following the third vesting
(‘Fourth vesting’)
Notwithstanding any other clause of this Plan, no vesting shall occur until 01 December
2015 or fourth vesting, whichever is earlier
Exercise period Stock options can be exercised within a period of 5 years from the date of vesting.
Reconciliation of outstanding share options
The number and weighted average exercise prices of share options under the Plan are as follows:
As at
30 June 2016
No. of Options
30 June 2015
No. of Options
31 December
2015 No. of
Options
31 December
2014 No. of
Options
31 December
2013 No. of
Options
Outstanding at the
beginning of the
2,675,400 2,675,400 2,675,400 2,675,400 -
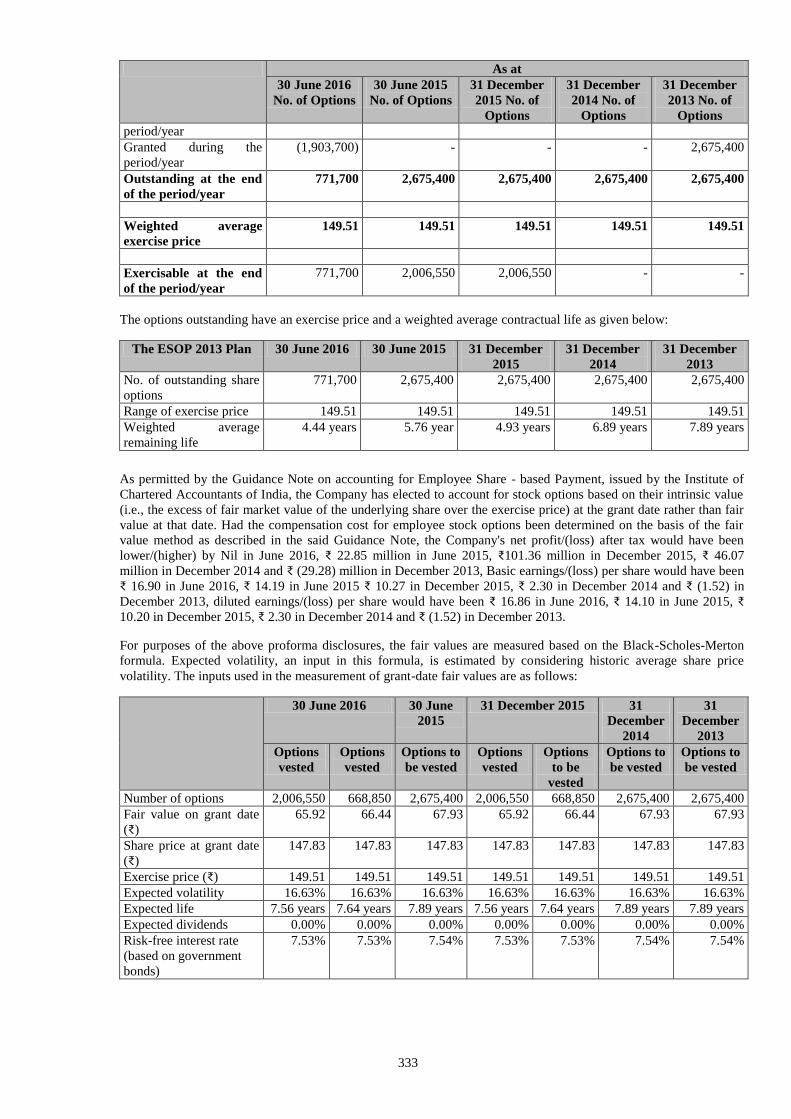
333
As at
30 June 2016
No. of Options
30 June 2015
No. of Options
31 December
2015 No. of
Options
31 December
2014 No. of
Options
31 December
2013 No. of
Options
period/year
Granted during the
period/year
(1,903,700) - - - 2,675,400
Outstanding at the end
of the period/year
771,700 2,675,400 2,675,400 2,675,400 2,675,400
Weighted average
exercise price
149.51 149.51 149.51 149.51 149.51
Exercisable at the end
of the period/year
771,700 2,006,550 2,006,550 - -
The options outstanding have an exercise price and a weighted average contractual life as given below:
The ESOP 2013 Plan 30 June 2016 30 June 2015 31 December
2015
31 December
2014
31 December
2013
No. of outstanding share
options
771,700 2,675,400 2,675,400 2,675,400 2,675,400
Range of exercise price 149.51 149.51 149.51 149.51 149.51
Weighted average
remaining life
4.44 years 5.76 year 4.93 years 6.89 years 7.89 years
As permitted by the Guidance Note on accounting for Employee Share - based Payment, issued by the Institute of
Chartered Accountants of India, the Company has elected to account for stock options based on their intrinsic value
(i.e., the excess of fair market value of the underlying share over the exercise price) at the grant date rather than fair
value at that date. Had the compensation cost for employee stock options been determined on the basis of the fair
value method as described in the said Guidance Note, the Company's net profit/(loss) after tax would have been
lower/(higher) by Nil in June 2016, ₹ 22.85 million in June 2015, ₹101.36 million in December 2015, ₹ 46.07
million in December 2014 and ₹ (29.28) million in December 2013, Basic earnings/(loss) per share would have been
₹ 16.90 in June 2016, ₹ 14.19 in June 2015 ₹ 10.27 in December 2015, ₹ 2.30 in December 2014 and ₹ (1.52) in
December 2013, diluted earnings/(loss) per share would have been ₹ 16.86 in June 2016, ₹ 14.10 in June 2015, ₹
10.20 in December 2015, ₹ 2.30 in December 2014 and ₹ (1.52) in December 2013.
For purposes of the above proforma disclosures, the fair values are measured based on the Black-Scholes-Merton
formula. Expected volatility, an input in this formula, is estimated by considering historic average share price
volatility. The inputs used in the measurement of grant-date fair values are as follows:
30 June 2016 30 June
2015
31 December 2015 31
December
2014
31
December
2013
Options
vested
Options
vested
Options to
be vested
Options
vested
Options
to be
vested
Options to
be vested
Options to
be vested
Number of options 2,006,550 668,850 2,675,400 2,006,550 668,850 2,675,400 2,675,400
Fair value on grant date
(₹)
65.92 66.44 67.93 65.92 66.44 67.93 67.93
Share price at grant date
(₹)
147.83 147.83 147.83 147.83 147.83 147.83 147.83
Exercise price (₹) 149.51 149.51 149.51 149.51 149.51 149.51 149.51
Expected volatility 16.63% 16.63% 16.63% 16.63% 16.63% 16.63% 16.63%
Expected life 7.56 years 7.64 years 7.89 years 7.56 years 7.64 years 7.89 years 7.89 years
Expected dividends 0.00% 0.00% 0.00% 0.00% 0.00% 0.00% 0.00%
Risk-free interest rate
(based on government
bonds)
7.53% 7.53% 7.54% 7.53% 7.53% 7.54% 7.54%
334
Employee Stock Option Plan 2016
The ESOS 2016 (“the Scheme”) was approved by the Board of Directors and the shareholders on 27 April 2016. The
scheme entitles key managerial personnel and employees of the Company and its subsidiaries to purchase shares in
the Company at the stipulated exercise price, subject to compliance with vesting conditions. Stock options can be
settled by issue of equity shares. No options under this scheme have been granted upto period ended 30 June 2016.
17 Statement of Dividend paid/proposed
During the year ended 31 December 2011, the Company had proposed dividend as per the terms of the agreement
amounting to ₹ 68.18 millions on cumulative redeemable preference shares which was paid in the subsequent year.
The cumulative redeemable preference shares were redeemded in the year ended 31 December 2011, hence no
dividend was proposed in the subsequent years.
18 The Company had during the year ended 31 December 2012 changed the rates of charging depreciation on some
assets as detailed in Note 2(c) of the Restated Standalone Statement of Significant Accounting Policies in Annexure
4, based on useful life of the assets. The rates so decided by the management are higher than the rates prescribed in
Schedule XIV to the Companies Act, 1956. As provided in Accounting Standard 6- Depreciation Accounting, where
there is a revision of the estimated useful life of an asset, the unamortised depreciable amount should be charged
over the revised remaining useful life, and hence the depreciation for the year has been computed accordingly. This
revision of useful lives has resulted in a higher depreciation charge of ₹ 91.14 million. Had there been no change, the
profit for the year ended 31 December 2012 and net block of fixed assets would have been higher by ₹ 91.14 million.
This adjustment has not been adjusted with retrospective effect in the preceding financial years, as it does not
represent an error/omission or a change in accounting policy. It represents a change in accounting estimate made in
the latest period, which does not have an impact on the earlier years.
19 As per the Scheme of Amalgamation filed in the Hon’ble High Court of Delhi under section 394 of the Companies
Act, 1956 between the Company and Varun Beverages (International) Limited (VBIL) and as per order dated 12
March 2013 of Hon’ble High Court of Delhi, all the assets and liabilities of VBIL including its business has been
Amalgamated with the Company with effect from 1 January 2012. In terms of the High Court Order, with effect
from the appointed date under the scheme:
a) All the assets and liabilities of VBIL as on 1 January 2012 were transferred to and vested with the
Company.
b) As envisaged in para 11 (b) of the Scheme of Amalgamation, the Company has accounted for assets and
liabilities of the transferor company at fair market value which is different from the book value of the
transferor company and accordingly the amalgamation was treated as per clause 28(b) of AS 14, i.e., “an
amalgamation in the nature of purchase.” The Company has accounted for assets and liabilities of VBIL as
on 1.1.2012 at a fair realisable value based on the management's judgment. The land has been revalued
based on valuation report of the independent valuer.
c) The investment held by VBIL amounting to ₹ 2,242.29 millions representing 100% holding in VBL was
cancelled on amalgamation and fresh equity of ₹ 267.53 millions was issued by VBL to the shareholders of
VBIL. The difference between the equity capital issued, investment held by VBIL and fair value of all
assets and liabilities of the transferor company (VBIL) taken over as on 1 January 2012 was debited to
Capital Reserve to be adjusted in the manner as envisaged in the Scheme of Amalgamation in the para 11
(c).
d) Goodwill on amalgamation amounting to ₹ 1,258.95 million and certain unrealised assets of VBL
amounting to ₹ 710.77 million have been adjusted against the Capital Reserve created out of the revaluation
of land amounting to Rs 2,157.65 million, based on valuation reports of independent valuers, at
manufacturing facilities of the Company situated at Kosi, Greater Noida, Alwar, Jodhpur, Nuh, Jaipur,
Kolkata and Bhiwadi. The above accounting treatment is in accordance with para 11(c) of the Scheme of
Amalgamation and accordingly no restatement adjustments have been recorded in these Restated
Standalone Summary Statements.
20 The Company acquired beverage manufacturing unit in Greater Noida including franchisee rights for Delhi Territory
of Pearl Drinks Limited under slump sale for a total consideration of ₹ 1,579.10 millions as per the terms of business
transfer agreement.
Fixed assets acquired under the aforesaid acquisition were recorded based on the fair valuation of respective assets
as assessed by the valuer as on the date of the acquisition and the current assets and liabilities taken over were
recorded at carrying value.
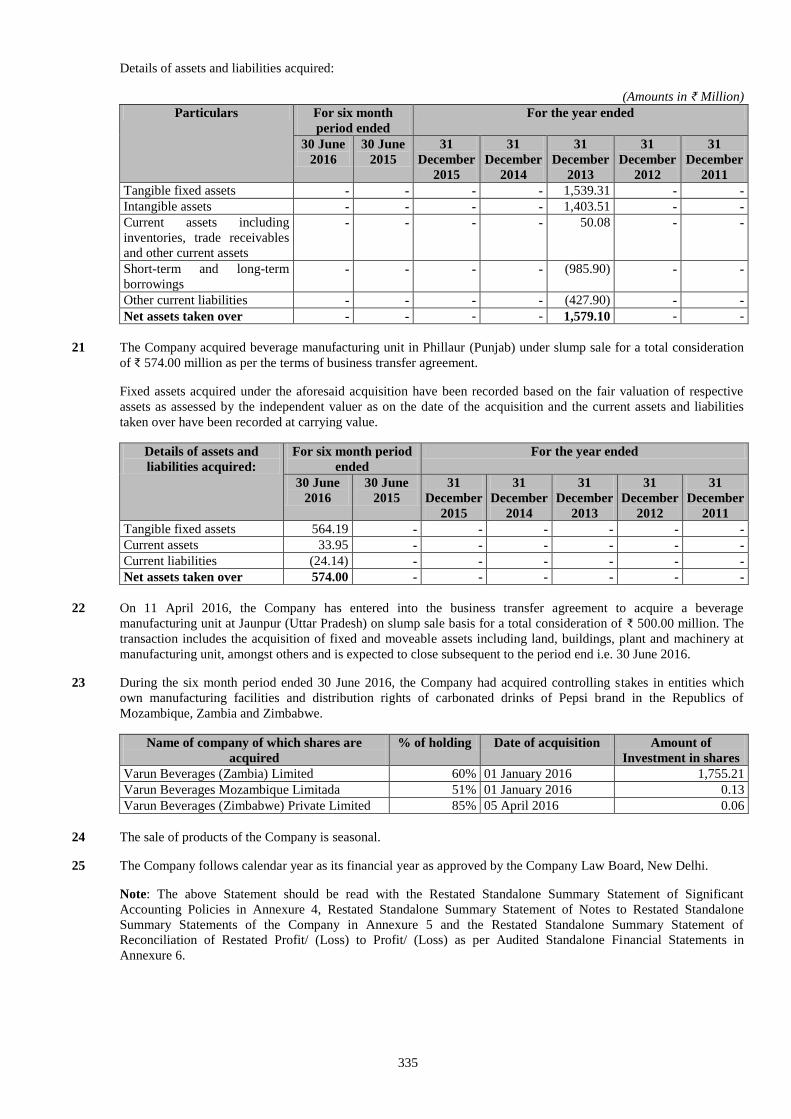
335
Details of assets and liabilities acquired:
(Amounts in ₹ Million)
Particulars For six month
period ended
For the year ended
30 June
2016
30 June
2015
31
December
2015
31
December
2014
31
December
2013
31
December
2012
31
December
2011
Tangible fixed assets - - - - 1,539.31 - -
Intangible assets - - - - 1,403.51 - -
Current assets including
inventories, trade receivables
and other current assets
- - - - 50.08 - -
Short-term and long-term
borrowings - - - - (985.90) - -
Other current liabilities - - - - (427.90) - -
Net assets taken over - - - - 1,579.10 - -
21 The Company acquired beverage manufacturing unit in Phillaur (Punjab) under slump sale for a total consideration
of ₹ 574.00 million as per the terms of business transfer agreement.
Fixed assets acquired under the aforesaid acquisition have been recorded based on the fair valuation of respective
assets as assessed by the independent valuer as on the date of the acquisition and the current assets and liabilities
taken over have been recorded at carrying value.
Details of assets and
liabilities acquired:
For six month period
ended
For the year ended
30 June
2016
30 June
2015
31
December
2015
31
December
2014
31
December
2013
31
December
2012
31
December
2011
Tangible fixed assets 564.19 - - - - - -
Current assets 33.95 - - - - - -
Current liabilities (24.14) - - - - - -
Net assets taken over 574.00 - - - - - -
22 On 11 April 2016, the Company has entered into the business transfer agreement to acquire a beverage
manufacturing unit at Jaunpur (Uttar Pradesh) on slump sale basis for a total consideration of ₹ 500.00 million. The
transaction includes the acquisition of fixed and moveable assets including land, buildings, plant and machinery at
manufacturing unit, amongst others and is expected to close subsequent to the period end i.e. 30 June 2016.
23 During the six month period ended 30 June 2016, the Company had acquired controlling stakes in entities which
own manufacturing facilities and distribution rights of carbonated drinks of Pepsi brand in the Republics of
Mozambique, Zambia and Zimbabwe.
Name of company of which shares are
acquired
% of holding Date of acquisition Amount of
Investment in shares
Varun Beverages (Zambia) Limited 60% 01 January 2016 1,755.21
Varun Beverages Mozambique Limitada 51% 01 January 2016 0.13
Varun Beverages (Zimbabwe) Private Limited 85% 05 April 2016 0.06
24 The sale of products of the Company is seasonal.
25 The Company follows calendar year as its financial year as approved by the Company Law Board, New Delhi.
Note: The above Statement should be read with the Restated Standalone Summary Statement of Significant
Accounting Policies in Annexure 4, Restated Standalone Summary Statement of Notes to Restated Standalone
Summary Statements of the Company in Annexure 5 and the Restated Standalone Summary Statement of
Reconciliation of Restated Profit/ (Loss) to Profit/ (Loss) as per Audited Standalone Financial Statements in
Annexure 6.
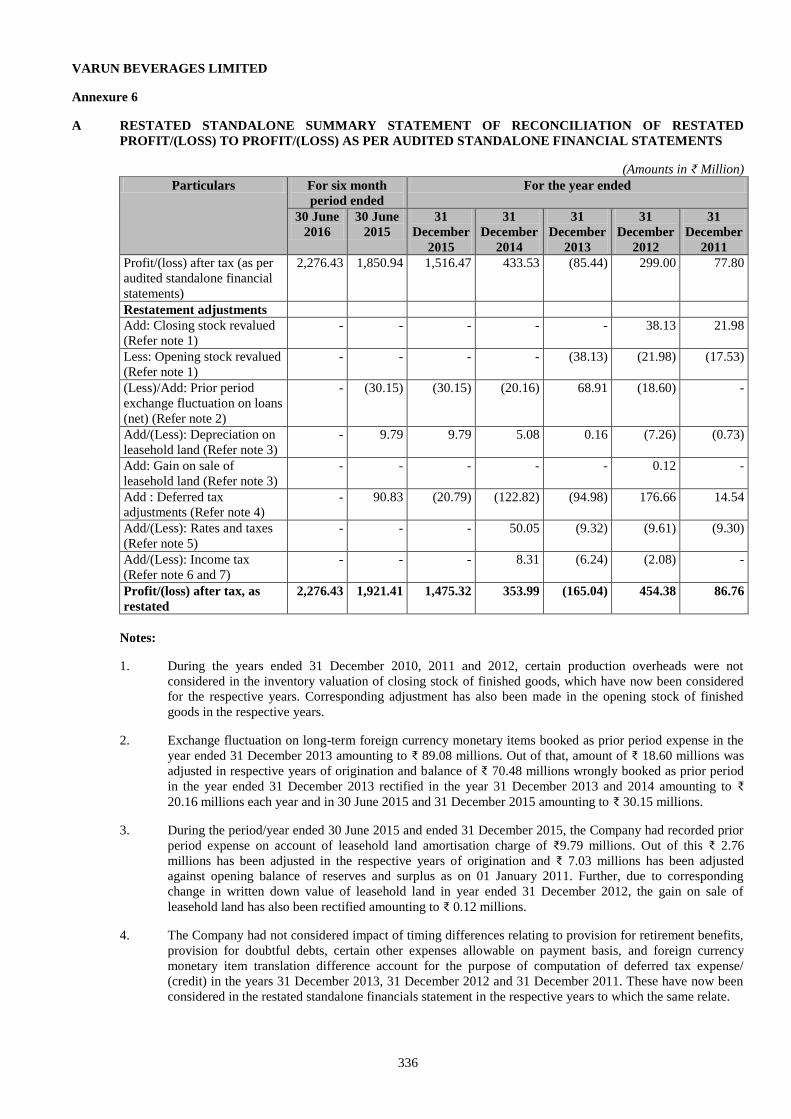
336
VARUN BEVERAGES LIMITED
Annexure 6
A RESTATED STANDALONE SUMMARY STATEMENT OF RECONCILIATION OF RESTATED
PROFIT/(LOSS) TO PROFIT/(LOSS) AS PER AUDITED STANDALONE FINANCIAL STATEMENTS
(Amounts in ₹ Million)
Particulars For six month
period ended
For the year ended
30 June
2016
30 June
2015
31
December
2015
31
December
2014
31
December
2013
31
December
2012
31
December
2011
Profit/(loss) after tax (as per
audited standalone financial
statements)
2,276.43 1,850.94 1,516.47 433.53 (85.44) 299.00 77.80
Restatement adjustments
Add: Closing stock revalued
(Refer note 1)
- - - - - 38.13 21.98
Less: Opening stock revalued
(Refer note 1)
- - - - (38.13) (21.98) (17.53)
(Less)/Add: Prior period
exchange fluctuation on loans
(net) (Refer note 2)
- (30.15) (30.15) (20.16) 68.91 (18.60) -
Add/(Less): Depreciation on
leasehold land (Refer note 3)
- 9.79 9.79 5.08 0.16 (7.26) (0.73)
Add: Gain on sale of
leasehold land (Refer note 3)
- - - - - 0.12 -
Add : Deferred tax
adjustments (Refer note 4)
- 90.83 (20.79) (122.82) (94.98) 176.66 14.54
Add/(Less): Rates and taxes
(Refer note 5)
- - - 50.05 (9.32) (9.61) (9.30)
Add/(Less): Income tax
(Refer note 6 and 7)
- - - 8.31 (6.24) (2.08) -
Profit/(loss) after tax, as
restated
2,276.43 1,921.41 1,475.32 353.99 (165.04) 454.38 86.76
Notes:
1. During the years ended 31 December 2010, 2011 and 2012, certain production overheads were not
considered in the inventory valuation of closing stock of finished goods, which have now been considered
for the respective years. Corresponding adjustment has also been made in the opening stock of finished
goods in the respective years.
2. Exchange fluctuation on long-term foreign currency monetary items booked as prior period expense in the
year ended 31 December 2013 amounting to ₹ 89.08 millions. Out of that, amount of ₹ 18.60 millions was
adjusted in respective years of origination and balance of ₹ 70.48 millions wrongly booked as prior period
in the year ended 31 December 2013 rectified in the year 31 December 2013 and 2014 amounting to ₹
20.16 millions each year and in 30 June 2015 and 31 December 2015 amounting to ₹ 30.15 millions.
3. During the period/year ended 30 June 2015 and ended 31 December 2015, the Company had recorded prior
period expense on account of leasehold land amortisation charge of ₹9.79 millions. Out of this ₹ 2.76
millions has been adjusted in the respective years of origination and ₹ 7.03 millions has been adjusted
against opening balance of reserves and surplus as on 01 January 2011. Further, due to corresponding
change in written down value of leasehold land in year ended 31 December 2012, the gain on sale of
leasehold land has also been rectified amounting to ₹ 0.12 millions.
4. The Company had not considered impact of timing differences relating to provision for retirement benefits,
provision for doubtful debts, certain other expenses allowable on payment basis, and foreign currency
monetary item translation difference account for the purpose of computation of deferred tax expense/
(credit) in the years 31 December 2013, 31 December 2012 and 31 December 2011. These have now been
considered in the restated standalone financials statement in the respective years to which the same relate.
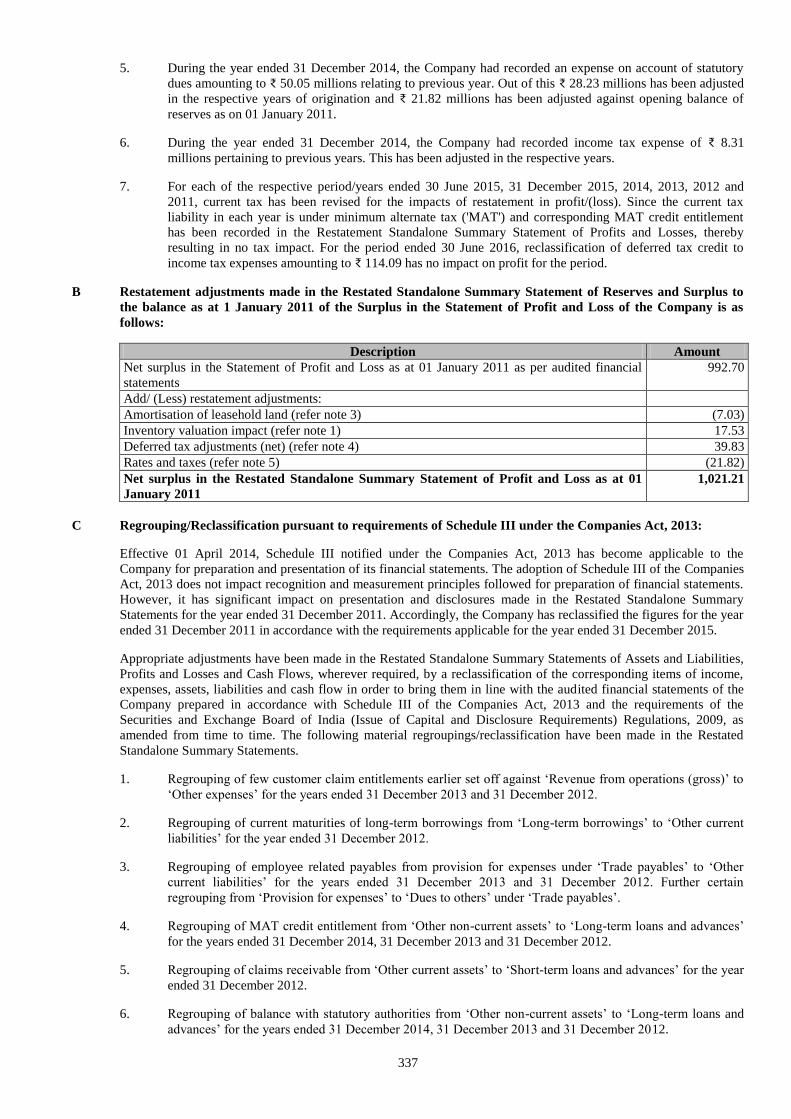
337
5. During the year ended 31 December 2014, the Company had recorded an expense on account of statutory
dues amounting to ₹ 50.05 millions relating to previous year. Out of this ₹ 28.23 millions has been adjusted
in the respective years of origination and ₹ 21.82 millions has been adjusted against opening balance of
reserves as on 01 January 2011.
6. During the year ended 31 December 2014, the Company had recorded income tax expense of ₹ 8.31
millions pertaining to previous years. This has been adjusted in the respective years.
7. For each of the respective period/years ended 30 June 2015, 31 December 2015, 2014, 2013, 2012 and
2011, current tax has been revised for the impacts of restatement in profit/(loss). Since the current tax
liability in each year is under minimum alternate tax ('MAT') and corresponding MAT credit entitlement
has been recorded in the Restatement Standalone Summary Statement of Profits and Losses, thereby
resulting in no tax impact. For the period ended 30 June 2016, reclassification of deferred tax credit to
income tax expenses amounting to ₹ 114.09 has no impact on profit for the period.
B Restatement adjustments made in the Restated Standalone Summary Statement of Reserves and Surplus to
the balance as at 1 January 2011 of the Surplus in the Statement of Profit and Loss of the Company is as
follows:
Description Amount
Net surplus in the Statement of Profit and Loss as at 01 January 2011 as per audited financial
statements
992.70
Add/ (Less) restatement adjustments:
Amortisation of leasehold land (refer note 3) (7.03)
Inventory valuation impact (refer note 1) 17.53
Deferred tax adjustments (net) (refer note 4) 39.83
Rates and taxes (refer note 5) (21.82)
Net surplus in the Restated Standalone Summary Statement of Profit and Loss as at 01
January 2011
1,021.21
C Regrouping/Reclassification pursuant to requirements of Schedule III under the Companies Act, 2013:
Effective 01 April 2014, Schedule III notified under the Companies Act, 2013 has become applicable to the
Company for preparation and presentation of its financial statements. The adoption of Schedule III of the Companies
Act, 2013 does not impact recognition and measurement principles followed for preparation of financial statements.
However, it has significant impact on presentation and disclosures made in the Restated Standalone Summary
Statements for the year ended 31 December 2011. Accordingly, the Company has reclassified the figures for the year
ended 31 December 2011 in accordance with the requirements applicable for the year ended 31 December 2015.
Appropriate adjustments have been made in the Restated Standalone Summary Statements of Assets and Liabilities,
Profits and Losses and Cash Flows, wherever required, by a reclassification of the corresponding items of income,
expenses, assets, liabilities and cash flow in order to bring them in line with the audited financial statements of the
Company prepared in accordance with Schedule III of the Companies Act, 2013 and the requirements of the
Securities and Exchange Board of India (Issue of Capital and Disclosure Requirements) Regulations, 2009, as
amended from time to time. The following material regroupings/reclassification have been made in the Restated
Standalone Summary Statements.
1. Regrouping of few customer claim entitlements earlier set off against ‘Revenue from operations (gross)’ to
‘Other expenses’ for the years ended 31 December 2013 and 31 December 2012.
2. Regrouping of current maturities of long-term borrowings from ‘Long-term borrowings’ to ‘Other current
liabilities’ for the year ended 31 December 2012.
3. Regrouping of employee related payables from provision for expenses under ‘Trade payables’ to ‘Other
current liabilities’ for the years ended 31 December 2013 and 31 December 2012. Further certain
regrouping from ‘Provision for expenses’ to ‘Dues to others’ under ‘Trade payables’.
4. Regrouping of MAT credit entitlement from ‘Other non-current assets’ to ‘Long-term loans and advances’
for the years ended 31 December 2014, 31 December 2013 and 31 December 2012.
5. Regrouping of claims receivable from ‘Other current assets’ to ‘Short-term loans and advances’ for the year
ended 31 December 2012.
6. Regrouping of balance with statutory authorities from ‘Other non-current assets’ to ‘Long-term loans and
advances’ for the years ended 31 December 2014, 31 December 2013 and 31 December 2012.
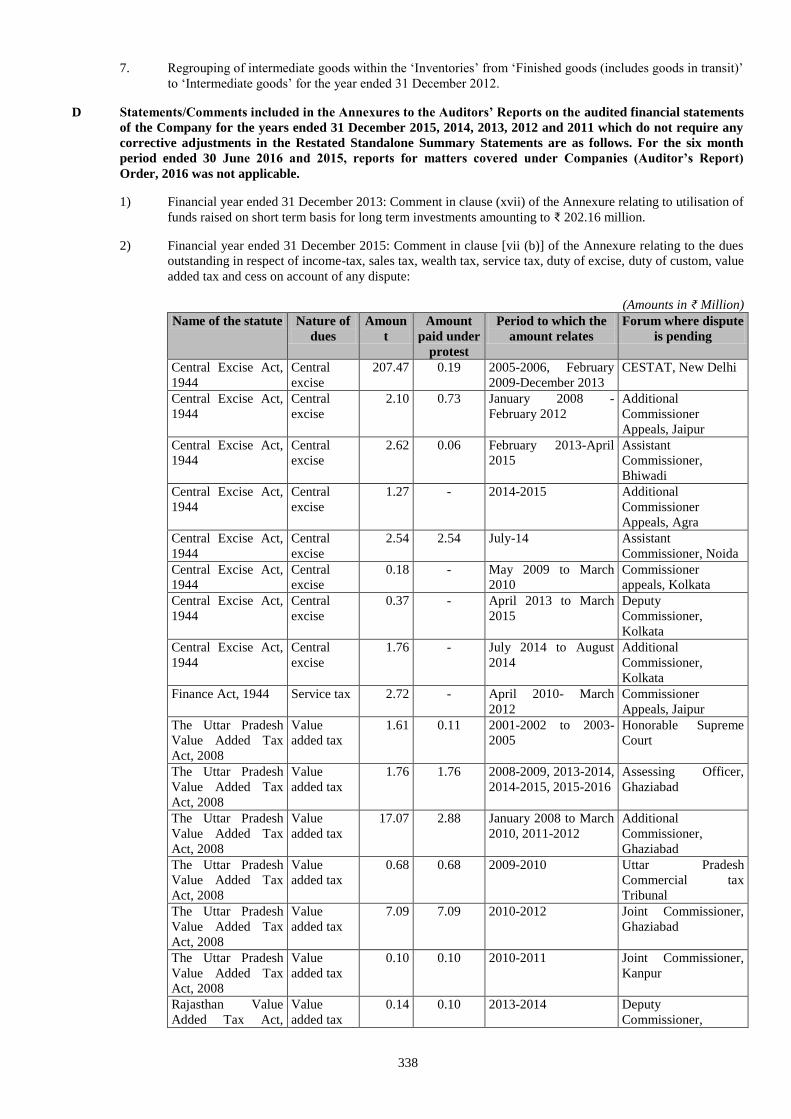
338
7. Regrouping of intermediate goods within the ‘Inventories’ from ‘Finished goods (includes goods in transit)’
to ‘Intermediate goods’ for the year ended 31 December 2012.
D Statements/Comments included in the Annexures to the Auditors’ Reports on the audited financial statements
of the Company for the years ended 31 December 2015, 2014, 2013, 2012 and 2011 which do not require any
corrective adjustments in the Restated Standalone Summary Statements are as follows. For the six month
period ended 30 June 2016 and 2015, reports for matters covered under Companies (Auditor’s Report)
Order, 2016 was not applicable.
1) Financial year ended 31 December 2013: Comment in clause (xvii) of the Annexure relating to utilisation of
funds raised on short term basis for long term investments amounting to ₹ 202.16 million.
2) Financial year ended 31 December 2015: Comment in clause [vii (b)] of the Annexure relating to the dues
outstanding in respect of income-tax, sales tax, wealth tax, service tax, duty of excise, duty of custom, value
added tax and cess on account of any dispute:
(Amounts in ₹ Million)
Name of the statute Nature of
dues
Amoun
t
Amount
paid under
protest
Period to which the
amount relates
Forum where dispute
is pending
Central Excise Act,
1944
Central
excise
207.47 0.19 2005-2006, February
2009-December 2013
CESTAT, New Delhi
Central Excise Act,
1944
Central
excise
2.10 0.73 January 2008 -
February 2012
Additional
Commissioner
Appeals, Jaipur
Central Excise Act,
1944
Central
excise
2.62 0.06 February 2013-April
2015
Assistant
Commissioner,
Bhiwadi
Central Excise Act,
1944
Central
excise
1.27 - 2014-2015 Additional
Commissioner
Appeals, Agra
Central Excise Act,
1944
Central
excise
2.54 2.54 July-14 Assistant
Commissioner, Noida
Central Excise Act,
1944
Central
excise
0.18 - May 2009 to March
2010
Commissioner
appeals, Kolkata
Central Excise Act,
1944
Central
excise
0.37 - April 2013 to March
2015
Deputy
Commissioner,
Kolkata
Central Excise Act,
1944
Central
excise
1.76 - July 2014 to August
2014
Additional
Commissioner,
Kolkata
Finance Act, 1944 Service tax 2.72 - April 2010- March
2012
Commissioner
Appeals, Jaipur
The Uttar Pradesh
Value Added Tax
Act, 2008
Value
added tax
1.61 0.11 2001-2002 to 2003-
2005
Honorable Supreme
Court
The Uttar Pradesh
Value Added Tax
Act, 2008
Value
added tax
1.76 1.76 2008-2009, 2013-2014,
2014-2015, 2015-2016
Assessing Officer,
Ghaziabad
The Uttar Pradesh
Value Added Tax
Act, 2008
Value
added tax
17.07 2.88 January 2008 to March
2010, 2011-2012
Additional
Commissioner,
Ghaziabad
The Uttar Pradesh
Value Added Tax
Act, 2008
Value
added tax
0.68 0.68 2009-2010 Uttar Pradesh
Commercial tax
Tribunal
The Uttar Pradesh
Value Added Tax
Act, 2008
Value
added tax
7.09 7.09 2010-2012 Joint Commissioner,
Ghaziabad
The Uttar Pradesh
Value Added Tax
Act, 2008
Value
added tax
0.10 0.10 2010-2011 Joint Commissioner,
Kanpur
Rajasthan Value
Added Tax Act,
Value
added tax
0.14 0.10 2013-2014 Deputy
Commissioner,
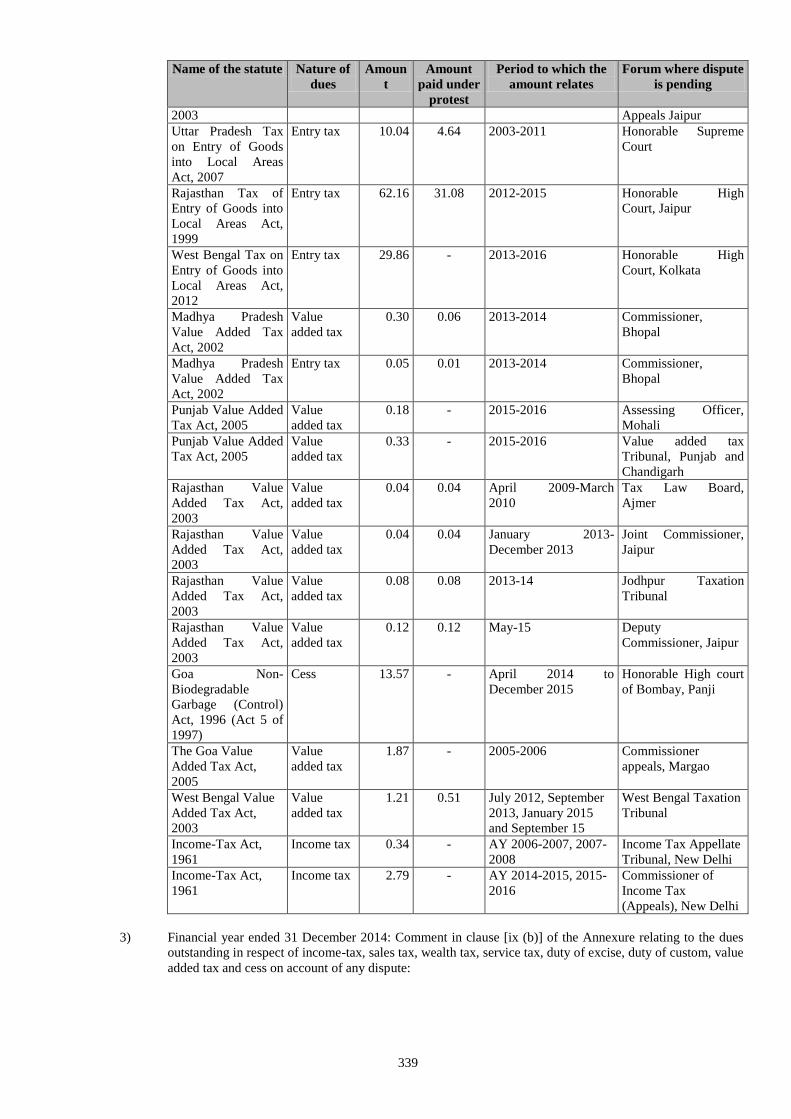
339
Name of the statute Nature of
dues
Amoun
t
Amount
paid under
protest
Period to which the
amount relates
Forum where dispute
is pending
2003 Appeals Jaipur
Uttar Pradesh Tax
on Entry of Goods
into Local Areas
Act, 2007
Entry tax 10.04 4.64 2003-2011 Honorable Supreme
Court
Rajasthan Tax of
Entry of Goods into
Local Areas Act,
1999
Entry tax 62.16 31.08 2012-2015 Honorable High
Court, Jaipur
West Bengal Tax on
Entry of Goods into
Local Areas Act,
2012
Entry tax 29.86 - 2013-2016 Honorable High
Court, Kolkata
Madhya Pradesh
Value Added Tax
Act, 2002
Value
added tax
0.30 0.06 2013-2014 Commissioner,
Bhopal
Madhya Pradesh
Value Added Tax
Act, 2002
Entry tax 0.05 0.01 2013-2014 Commissioner,
Bhopal
Punjab Value Added
Tax Act, 2005
Value
added tax
0.18 - 2015-2016 Assessing Officer,
Mohali
Punjab Value Added
Tax Act, 2005
Value
added tax
0.33 - 2015-2016 Value added tax
Tribunal, Punjab and
Chandigarh
Rajasthan Value
Added Tax Act,
2003
Value
added tax
0.04 0.04 April 2009-March
2010
Tax Law Board,
Ajmer
Rajasthan Value
Added Tax Act,
2003
Value
added tax
0.04 0.04 January 2013-
December 2013
Joint Commissioner,
Jaipur
Rajasthan Value
Added Tax Act,
2003
Value
added tax
0.08 0.08 2013-14 Jodhpur Taxation
Tribunal
Rajasthan Value
Added Tax Act,
2003
Value
added tax
0.12 0.12 May-15 Deputy
Commissioner, Jaipur
Goa Non-
Biodegradable
Garbage (Control)
Act, 1996 (Act 5 of
1997)
Cess 13.57 - April 2014 to
December 2015
Honorable High court
of Bombay, Panji
The Goa Value
Added Tax Act,
2005
Value
added tax
1.87 - 2005-2006 Commissioner
appeals, Margao
West Bengal Value
Added Tax Act,
2003
Value
added tax
1.21 0.51 July 2012, September
2013, January 2015
and September 15
West Bengal Taxation
Tribunal
Income-Tax Act,
1961
Income tax 0.34 - AY 2006-2007, 2007-
2008
Income Tax Appellate
Tribunal, New Delhi
Income-Tax Act,
1961
Income tax 2.79 - AY 2014-2015, 2015-
2016
Commissioner of
Income Tax
(Appeals), New Delhi
3) Financial year ended 31 December 2014: Comment in clause [ix (b)] of the Annexure relating to the dues
outstanding in respect of income-tax, sales tax, wealth tax, service tax, duty of excise, duty of custom, value
added tax and cess on account of any dispute:
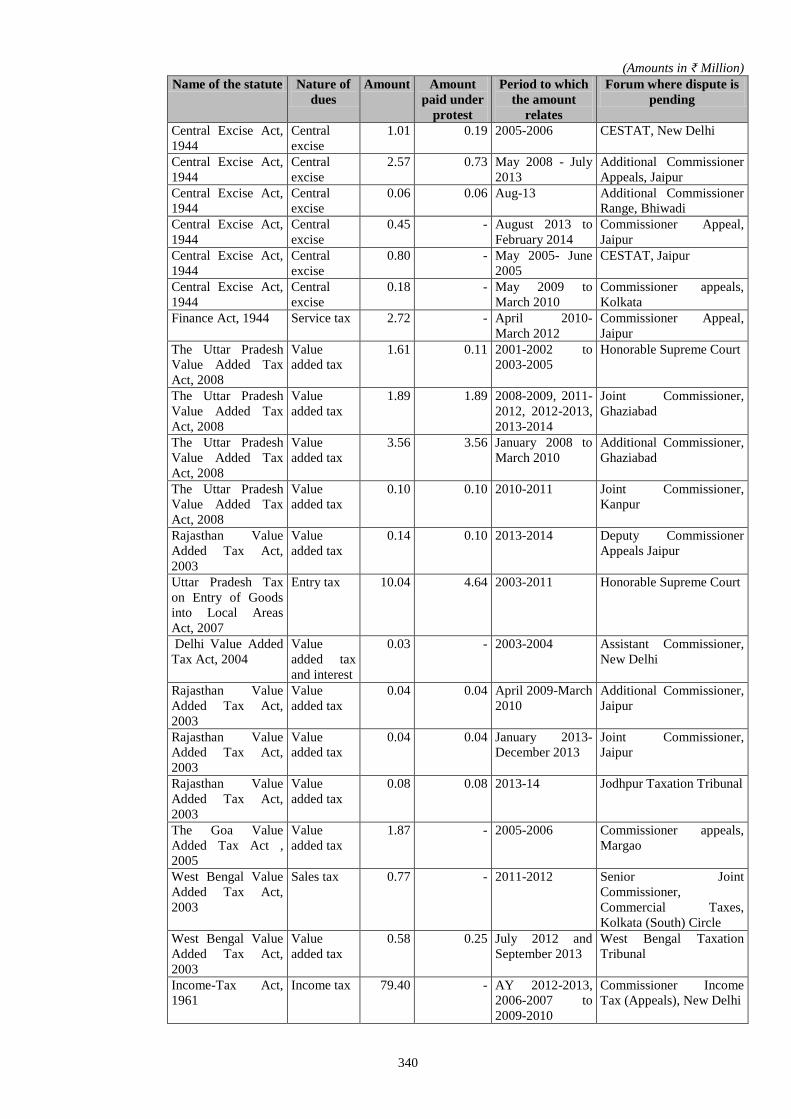
340
(Amounts in ₹ Million)
Name of the statute Nature of
dues
Amount Amount
paid under
protest
Period to which
the amount
relates
Forum where dispute is
pending
Central Excise Act,
1944
Central
excise
1.01 0.19 2005-2006 CESTAT, New Delhi
Central Excise Act,
1944
Central
excise
2.57 0.73 May 2008 - July
2013
Additional Commissioner
Appeals, Jaipur
Central Excise Act,
1944
Central
excise
0.06 0.06 Aug-13 Additional Commissioner
Range, Bhiwadi
Central Excise Act,
1944
Central
excise
0.45 - August 2013 to
February 2014
Commissioner Appeal,
Jaipur
Central Excise Act,
1944
Central
excise
0.80 - May 2005- June
2005
CESTAT, Jaipur
Central Excise Act,
1944
Central
excise
0.18 - May 2009 to
March 2010
Commissioner appeals,
Kolkata
Finance Act, 1944 Service tax 2.72 - April 2010-
March 2012
Commissioner Appeal,
Jaipur
The Uttar Pradesh
Value Added Tax
Act, 2008
Value
added tax
1.61 0.11 2001-2002 to
2003-2005
Honorable Supreme Court
The Uttar Pradesh
Value Added Tax
Act, 2008
Value
added tax
1.89 1.89 2008-2009, 2011-
2012, 2012-2013,
2013-2014
Joint Commissioner,
Ghaziabad
The Uttar Pradesh
Value Added Tax
Act, 2008
Value
added tax
3.56 3.56 January 2008 to
March 2010
Additional Commissioner,
Ghaziabad
The Uttar Pradesh
Value Added Tax
Act, 2008
Value
added tax
0.10 0.10 2010-2011 Joint Commissioner,
Kanpur
Rajasthan Value
Added Tax Act,
2003
Value
added tax
0.14 0.10 2013-2014 Deputy Commissioner
Appeals Jaipur
Uttar Pradesh Tax
on Entry of Goods
into Local Areas
Act, 2007
Entry tax 10.04 4.64 2003-2011 Honorable Supreme Court
Delhi Value Added
Tax Act, 2004
Value
added tax
and interest
0.03 - 2003-2004 Assistant Commissioner,
New Delhi
Rajasthan Value
Added Tax Act,
2003
Value
added tax
0.04 0.04 April 2009-March
2010
Additional Commissioner,
Jaipur
Rajasthan Value
Added Tax Act,
2003
Value
added tax
0.04 0.04 January 2013-
December 2013
Joint Commissioner,
Jaipur
Rajasthan Value
Added Tax Act,
2003
Value
added tax
0.08 0.08 2013-14 Jodhpur Taxation Tribunal
The Goa Value
Added Tax Act ,
2005
Value
added tax
1.87 - 2005-2006 Commissioner appeals,
Margao
West Bengal Value
Added Tax Act,
2003
Sales tax 0.77 - 2011-2012 Senior Joint
Commissioner,
Commercial Taxes,
Kolkata (South) Circle
West Bengal Value
Added Tax Act,
2003
Value
added tax
0.58 0.25 July 2012 and
September 2013
West Bengal Taxation
Tribunal
Income-Tax Act,
1961
Income tax 79.40 - AY 2012-2013,
2006-2007 to
2009-2010
Commissioner Income
Tax (Appeals), New Delhi
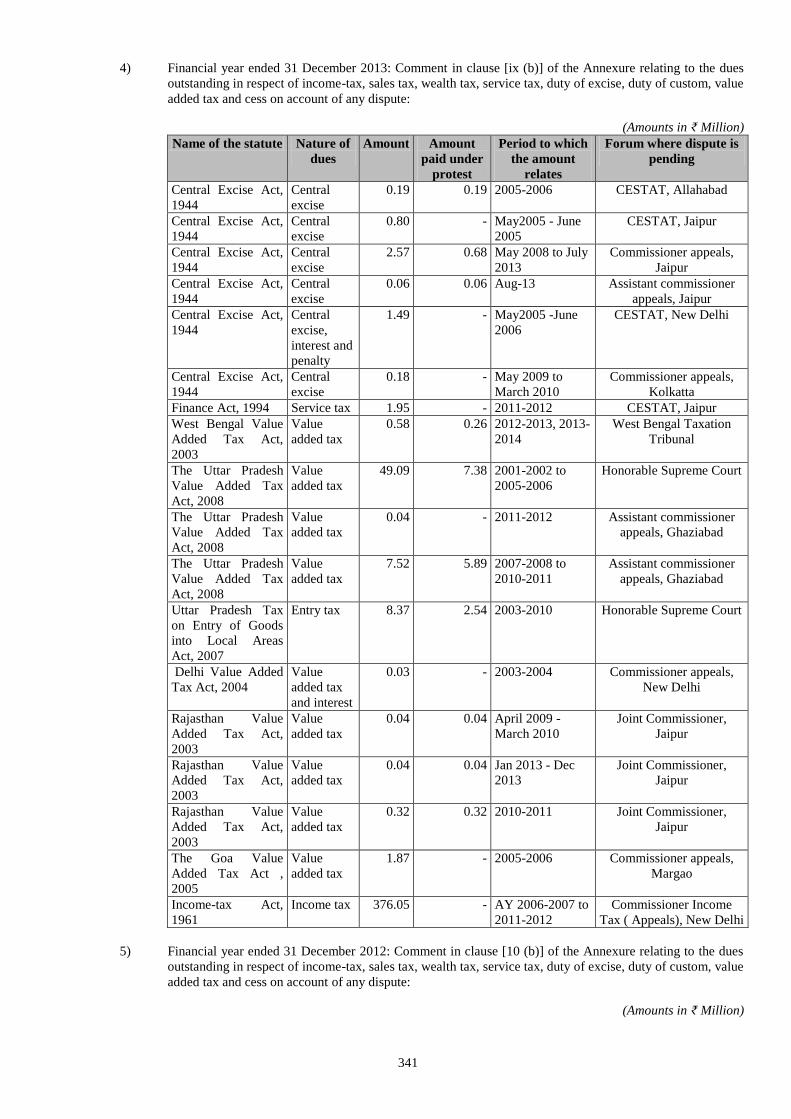
341
4) Financial year ended 31 December 2013: Comment in clause [ix (b)] of the Annexure relating to the dues
outstanding in respect of income-tax, sales tax, wealth tax, service tax, duty of excise, duty of custom, value
added tax and cess on account of any dispute:
(Amounts in ₹ Million)
Name of the statute Nature of
dues
Amount Amount
paid under
protest
Period to which
the amount
relates
Forum where dispute is
pending
Central Excise Act,
1944
Central
excise
0.19 0.19 2005-2006 CESTAT, Allahabad
Central Excise Act,
1944
Central
excise
0.80 - May2005 - June
2005
CESTAT, Jaipur
Central Excise Act,
1944
Central
excise
2.57 0.68 May 2008 to July
2013
Commissioner appeals,
Jaipur
Central Excise Act,
1944
Central
excise
0.06 0.06 Aug-13 Assistant commissioner
appeals, Jaipur
Central Excise Act,
1944
Central
excise,
interest and
penalty
1.49 - May2005 -June
2006
CESTAT, New Delhi
Central Excise Act,
1944
Central
excise
0.18 - May 2009 to
March 2010
Commissioner appeals,
Kolkatta
Finance Act, 1994 Service tax 1.95 - 2011-2012 CESTAT, Jaipur
West Bengal Value
Added Tax Act,
2003
Value
added tax
0.58 0.26 2012-2013, 2013-
2014
West Bengal Taxation
Tribunal
The Uttar Pradesh
Value Added Tax
Act, 2008
Value
added tax
49.09 7.38 2001-2002 to
2005-2006
Honorable Supreme Court
The Uttar Pradesh
Value Added Tax
Act, 2008
Value
added tax
0.04 - 2011-2012 Assistant commissioner
appeals, Ghaziabad
The Uttar Pradesh
Value Added Tax
Act, 2008
Value
added tax
7.52 5.89 2007-2008 to
2010-2011
Assistant commissioner
appeals, Ghaziabad
Uttar Pradesh Tax
on Entry of Goods
into Local Areas
Act, 2007
Entry tax 8.37 2.54 2003-2010 Honorable Supreme Court
Delhi Value Added
Tax Act, 2004
Value
added tax
and interest
0.03 - 2003-2004 Commissioner appeals,
New Delhi
Rajasthan Value
Added Tax Act,
2003
Value
added tax
0.04 0.04 April 2009 -
March 2010
Joint Commissioner,
Jaipur
Rajasthan Value
Added Tax Act,
2003
Value
added tax
0.04 0.04 Jan 2013 - Dec
2013
Joint Commissioner,
Jaipur
Rajasthan Value
Added Tax Act,
2003
Value
added tax
0.32 0.32 2010-2011 Joint Commissioner,
Jaipur
The Goa Value
Added Tax Act ,
2005
Value
added tax
1.87 - 2005-2006 Commissioner appeals,
Margao
Income-tax Act,
1961
Income tax 376.05 - AY 2006-2007 to
2011-2012
Commissioner Income
Tax ( Appeals), New Delhi
5) Financial year ended 31 December 2012: Comment in clause [10 (b)] of the Annexure relating to the dues
outstanding in respect of income-tax, sales tax, wealth tax, service tax, duty of excise, duty of custom, value
added tax and cess on account of any dispute:
(Amounts in ₹ Million)
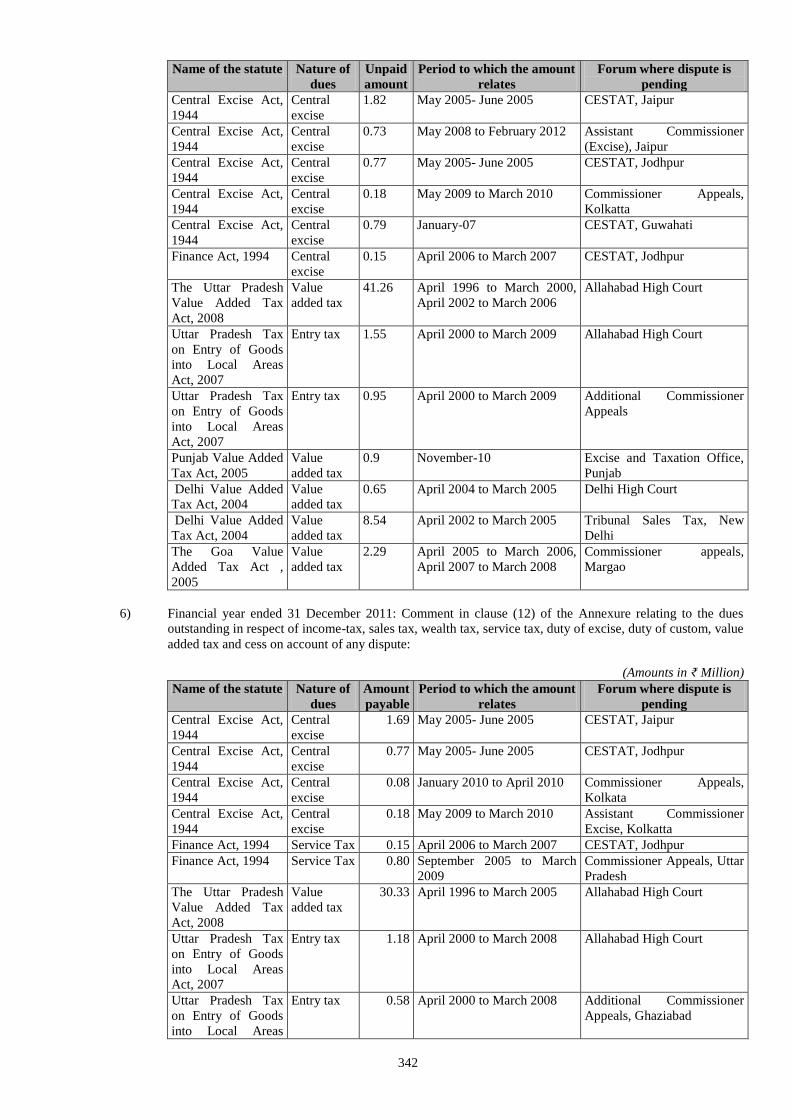
342
Name of the statute Nature of
dues
Unpaid
amount
Period to which the amount
relates
Forum where dispute is
pending
Central Excise Act,
1944
Central
excise
1.82 May 2005- June 2005 CESTAT, Jaipur
Central Excise Act,
1944
Central
excise
0.73 May 2008 to February 2012 Assistant Commissioner
(Excise), Jaipur
Central Excise Act,
1944
Central
excise
0.77 May 2005- June 2005 CESTAT, Jodhpur
Central Excise Act,
1944
Central
excise
0.18 May 2009 to March 2010 Commissioner Appeals,
Kolkatta
Central Excise Act,
1944
Central
excise
0.79 January-07 CESTAT, Guwahati
Finance Act, 1994 Central
excise
0.15 April 2006 to March 2007 CESTAT, Jodhpur
The Uttar Pradesh
Value Added Tax
Act, 2008
Value
added tax
41.26 April 1996 to March 2000,
April 2002 to March 2006
Allahabad High Court
Uttar Pradesh Tax
on Entry of Goods
into Local Areas
Act, 2007
Entry tax 1.55 April 2000 to March 2009 Allahabad High Court
Uttar Pradesh Tax
on Entry of Goods
into Local Areas
Act, 2007
Entry tax 0.95 April 2000 to March 2009 Additional Commissioner
Appeals
Punjab Value Added
Tax Act, 2005
Value
added tax
0.9 November-10 Excise and Taxation Office,
Punjab
Delhi Value Added
Tax Act, 2004
Value
added tax
0.65 April 2004 to March 2005 Delhi High Court
Delhi Value Added
Tax Act, 2004
Value
added tax
8.54 April 2002 to March 2005 Tribunal Sales Tax, New
Delhi
The Goa Value
Added Tax Act ,
2005
Value
added tax
2.29 April 2005 to March 2006,
April 2007 to March 2008
Commissioner appeals,
Margao
6) Financial year ended 31 December 2011: Comment in clause (12) of the Annexure relating to the dues
outstanding in respect of income-tax, sales tax, wealth tax, service tax, duty of excise, duty of custom, value
added tax and cess on account of any dispute:
(Amounts in ₹ Million)
Name of the statute Nature of
dues
Amount
payable
Period to which the amount
relates
Forum where dispute is
pending
Central Excise Act,
1944
Central
excise
1.69 May 2005- June 2005 CESTAT, Jaipur
Central Excise Act,
1944
Central
excise
0.77 May 2005- June 2005 CESTAT, Jodhpur
Central Excise Act,
1944
Central
excise
0.08 January 2010 to April 2010 Commissioner Appeals,
Kolkata
Central Excise Act,
1944
Central
excise
0.18 May 2009 to March 2010 Assistant Commissioner
Excise, Kolkatta
Finance Act, 1994 Service Tax 0.15 April 2006 to March 2007 CESTAT, Jodhpur
Finance Act, 1994 Service Tax 0.80 September 2005 to March
2009
Commissioner Appeals, Uttar
Pradesh
The Uttar Pradesh
Value Added Tax
Act, 2008
Value
added tax
30.33 April 1996 to March 2005 Allahabad High Court
Uttar Pradesh Tax
on Entry of Goods
into Local Areas
Act, 2007
Entry tax 1.18 April 2000 to March 2008 Allahabad High Court
Uttar Pradesh Tax
on Entry of Goods
into Local Areas
Entry tax 0.58 April 2000 to March 2008 Additional Commissioner
Appeals, Ghaziabad
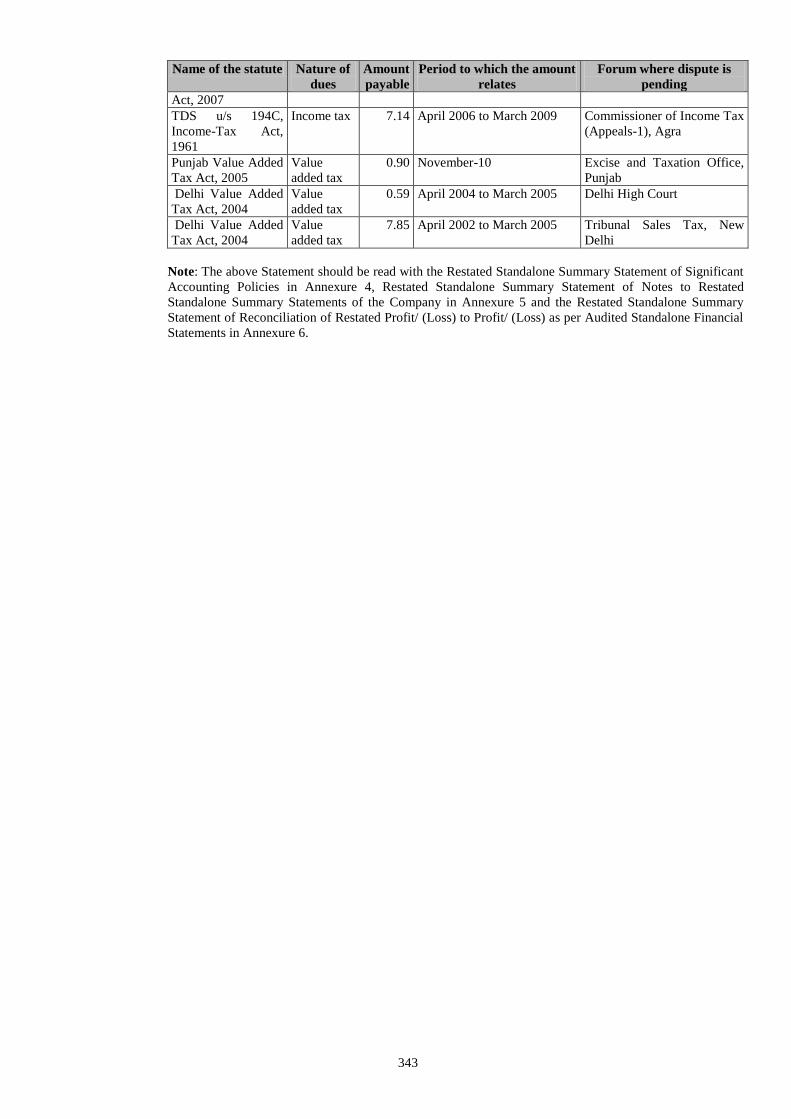
343
Name of the statute Nature of
dues
Amount
payable
Period to which the amount
relates
Forum where dispute is
pending
Act, 2007
TDS u/s 194C,
Income-Tax Act,
1961
Income tax 7.14 April 2006 to March 2009 Commissioner of Income Tax
(Appeals-1), Agra
Punjab Value Added
Tax Act, 2005
Value
added tax
0.90 November-10 Excise and Taxation Office,
Punjab
Delhi Value Added
Tax Act, 2004
Value
added tax
0.59 April 2004 to March 2005 Delhi High Court
Delhi Value Added
Tax Act, 2004
Value
added tax
7.85 April 2002 to March 2005 Tribunal Sales Tax, New
Delhi
Note: The above Statement should be read with the Restated Standalone Summary Statement of Significant
Accounting Policies in Annexure 4, Restated Standalone Summary Statement of Notes to Restated
Standalone Summary Statements of the Company in Annexure 5 and the Restated Standalone Summary
Statement of Reconciliation of Restated Profit/ (Loss) to Profit/ (Loss) as per Audited Standalone Financial
Statements in Annexure 6.
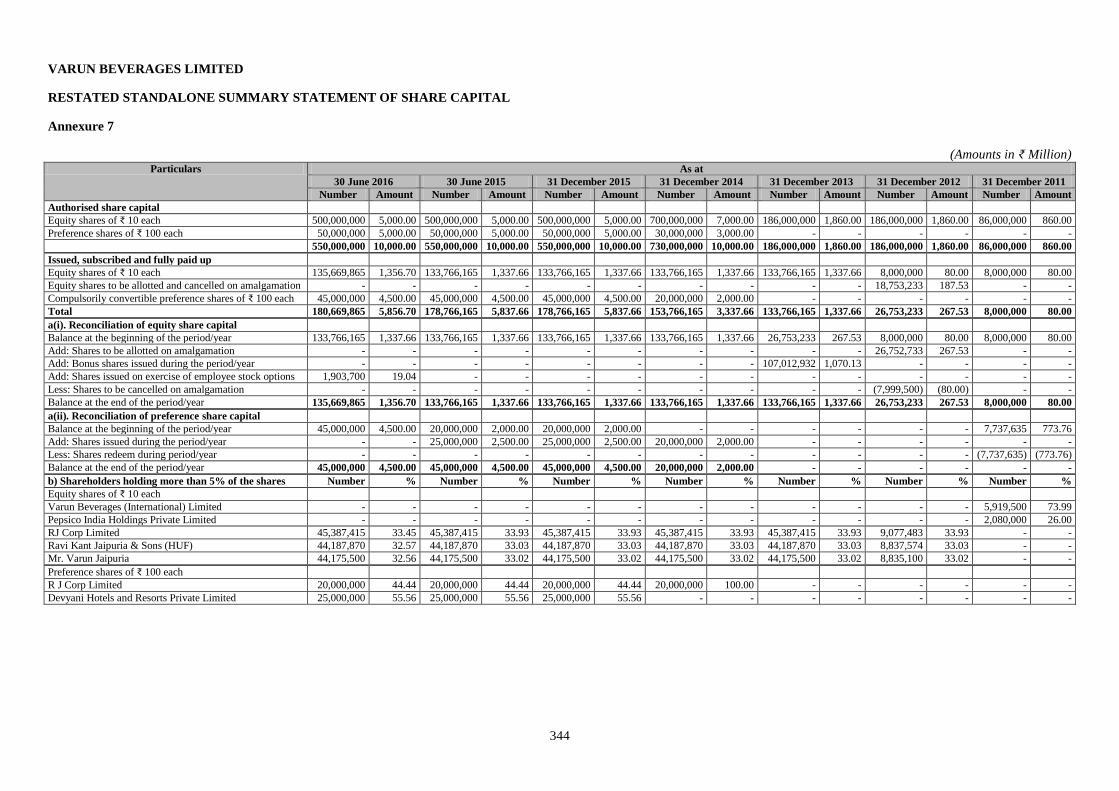
344
VARUN BEVERAGES LIMITED
RESTATED STANDALONE SUMMARY STATEMENT OF SHARE CAPITAL
Annexure 7
(Amounts in ₹ Million) Particulars As at
30 June 2016 30 June 2015 31 December 2015 31 December 2014 31 December 2013 31 December 2012 31 December 2011
Number Amount Number Amount Number Amount Number Amount Number Amount Number Amount Number Amount
Authorised share capital
Equity shares of ₹ 10 each 500,000,000 5,000.00 500,000,000 5,000.00 500,000,000 5,000.00 700,000,000 7,000.00 186,000,000 1,860.00 186,000,000 1,860.00 86,000,000 860.00
Preference shares of ₹ 100 each 50,000,000 5,000.00 50,000,000 5,000.00 50,000,000 5,000.00 30,000,000 3,000.00 - - - - - -
550,000,000 10,000.00 550,000,000 10,000.00 550,000,000 10,000.00 730,000,000 10,000.00 186,000,000 1,860.00 186,000,000 1,860.00 86,000,000 860.00
Issued, subscribed and fully paid up
Equity shares of ₹ 10 each 135,669,865 1,356.70 133,766,165 1,337.66 133,766,165 1,337.66 133,766,165 1,337.66 133,766,165 1,337.66 8,000,000 80.00 8,000,000 80.00
Equity shares to be allotted and cancelled on amalgamation - - - - - - - - - - 18,753,233 187.53 - -
Compulsorily convertible preference shares of ₹ 100 each 45,000,000 4,500.00 45,000,000 4,500.00 45,000,000 4,500.00 20,000,000 2,000.00 - - - - - -
Total 180,669,865 5,856.70 178,766,165 5,837.66 178,766,165 5,837.66 153,766,165 3,337.66 133,766,165 1,337.66 26,753,233 267.53 8,000,000 80.00
a(i). Reconciliation of equity share capital
Balance at the beginning of the period/year 133,766,165 1,337.66 133,766,165 1,337.66 133,766,165 1,337.66 133,766,165 1,337.66 26,753,233 267.53 8,000,000 80.00 8,000,000 80.00
Add: Shares to be allotted on amalgamation - - - - - - - - - - 26,752,733 267.53 - -
Add: Bonus shares issued during the period/year - - - - - - - - 107,012,932 1,070.13 - - - -
Add: Shares issued on exercise of employee stock options 1,903,700 19.04 - - - - - - - - - - - -
Less: Shares to be cancelled on amalgamation - - - - - - - - - - (7,999,500) (80.00) - -
Balance at the end of the period/year 135,669,865 1,356.70 133,766,165 1,337.66 133,766,165 1,337.66 133,766,165 1,337.66 133,766,165 1,337.66 26,753,233 267.53 8,000,000 80.00
a(ii). Reconciliation of preference share capital
Balance at the beginning of the period/year 45,000,000 4,500.00 20,000,000 2,000.00 20,000,000 2,000.00 - - - - - - 7,737,635 773.76
Add: Shares issued during the period/year - - 25,000,000 2,500.00 25,000,000 2,500.00 20,000,000 2,000.00 - - - - - -
Less: Shares redeem during period/year - - - - - - - - - - - - (7,737,635) (773.76)
Balance at the end of the period/year 45,000,000 4,500.00 45,000,000 4,500.00 45,000,000 4,500.00 20,000,000 2,000.00 - - - - - -
b) Shareholders holding more than 5% of the shares Number % Number % Number % Number % Number % Number % Number %
Equity shares of ₹ 10 each
Varun Beverages (International) Limited - - - - - - - - - - - - 5,919,500 73.99
Pepsico India Holdings Private Limited - - - - - - - - - - - - 2,080,000 26.00
RJ Corp Limited 45,387,415 33.45 45,387,415 33.93 45,387,415 33.93 45,387,415 33.93 45,387,415 33.93 9,077,483 33.93 - -
Ravi Kant Jaipuria & Sons (HUF) 44,187,870 32.57 44,187,870 33.03 44,187,870 33.03 44,187,870 33.03 44,187,870 33.03 8,837,574 33.03 - -
Mr. Varun Jaipuria 44,175,500 32.56 44,175,500 33.02 44,175,500 33.02 44,175,500 33.02 44,175,500 33.02 8,835,100 33.02 - -
Preference shares of ₹ 100 each
R J Corp Limited 20,000,000 44.44 20,000,000 44.44 20,000,000 44.44 20,000,000 100.00 - - - - - -
Devyani Hotels and Resorts Private Limited 25,000,000 55.56 25,000,000 55.56 25,000,000 55.56 - - - - - - - -
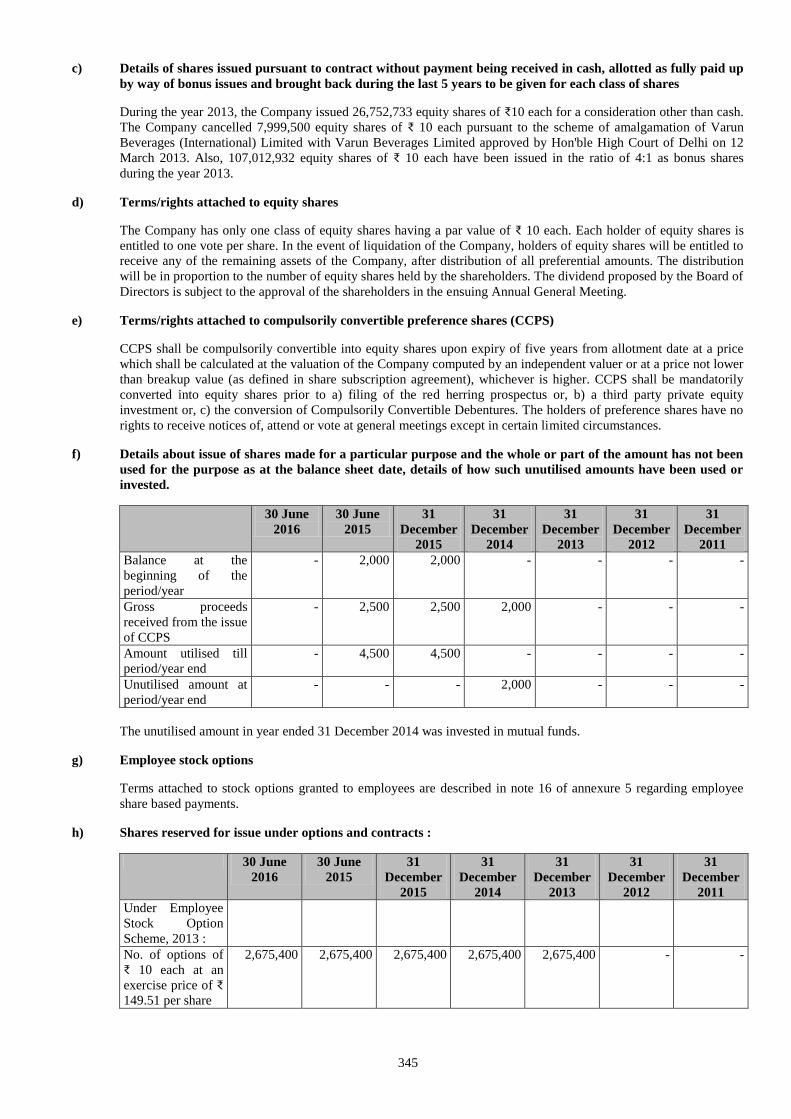
345
c) Details of shares issued pursuant to contract without payment being received in cash, allotted as fully paid up
by way of bonus issues and brought back during the last 5 years to be given for each class of shares
During the year 2013, the Company issued 26,752,733 equity shares of ₹10 each for a consideration other than cash.
The Company cancelled 7,999,500 equity shares of ₹ 10 each pursuant to the scheme of amalgamation of Varun
Beverages (International) Limited with Varun Beverages Limited approved by Hon'ble High Court of Delhi on 12
March 2013. Also, 107,012,932 equity shares of ₹ 10 each have been issued in the ratio of 4:1 as bonus shares
during the year 2013.
d) Terms/rights attached to equity shares
The Company has only one class of equity shares having a par value of ₹ 10 each. Each holder of equity shares is
entitled to one vote per share. In the event of liquidation of the Company, holders of equity shares will be entitled to
receive any of the remaining assets of the Company, after distribution of all preferential amounts. The distribution
will be in proportion to the number of equity shares held by the shareholders. The dividend proposed by the Board of
Directors is subject to the approval of the shareholders in the ensuing Annual General Meeting.
e) Terms/rights attached to compulsorily convertible preference shares (CCPS)
CCPS shall be compulsorily convertible into equity shares upon expiry of five years from allotment date at a price
which shall be calculated at the valuation of the Company computed by an independent valuer or at a price not lower
than breakup value (as defined in share subscription agreement), whichever is higher. CCPS shall be mandatorily
converted into equity shares prior to a) filing of the red herring prospectus or, b) a third party private equity
investment or, c) the conversion of Compulsorily Convertible Debentures. The holders of preference shares have no
rights to receive notices of, attend or vote at general meetings except in certain limited circumstances.
f) Details about issue of shares made for a particular purpose and the whole or part of the amount has not been
used for the purpose as at the balance sheet date, details of how such unutilised amounts have been used or
invested.
30 June
2016
30 June
2015
31
December
2015
31
December
2014
31
December
2013
31
December
2012
31
December
2011
Balance at the
beginning of the
period/year
- 2,000 2,000 - - - -
Gross proceeds
received from the issue
of CCPS
- 2,500 2,500 2,000 - - -
Amount utilised till
period/year end
- 4,500 4,500 - - - -
Unutilised amount at
period/year end
- - - 2,000 - - -
The unutilised amount in year ended 31 December 2014 was invested in mutual funds.
g) Employee stock options
Terms attached to stock options granted to employees are described in note 16 of annexure 5 regarding employee
share based payments.
h) Shares reserved for issue under options and contracts :
30 June
2016
30 June
2015
31
December
2015
31
December
2014
31
December
2013
31
December
2012
31
December
2011
Under Employee
Stock Option
Scheme, 2013 :
No. of options of
₹ 10 each at an
exercise price of ₹
149.51 per share
2,675,400 2,675,400 2,675,400 2,675,400 2,675,400 - -
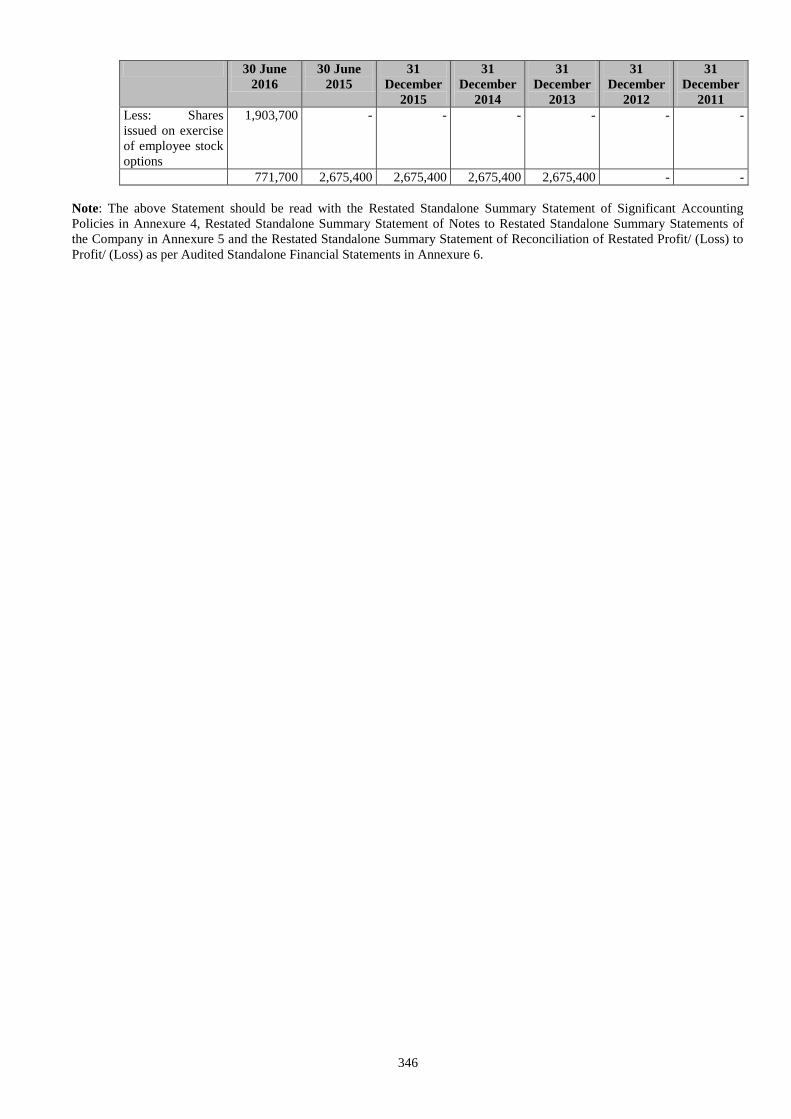
346
30 June
2016
30 June
2015
31
December
2015
31
December
2014
31
December
2013
31
December
2012
31
December
2011
Less: Shares
issued on exercise
of employee stock
options
1,903,700 - - - - - -
771,700 2,675,400 2,675,400 2,675,400 2,675,400 - -
Note: The above Statement should be read with the Restated Standalone Summary Statement of Significant Accounting
Policies in Annexure 4, Restated Standalone Summary Statement of Notes to Restated Standalone Summary Statements of
the Company in Annexure 5 and the Restated Standalone Summary Statement of Reconciliation of Restated Profit/ (Loss) to
Profit/ (Loss) as per Audited Standalone Financial Statements in Annexure 6.
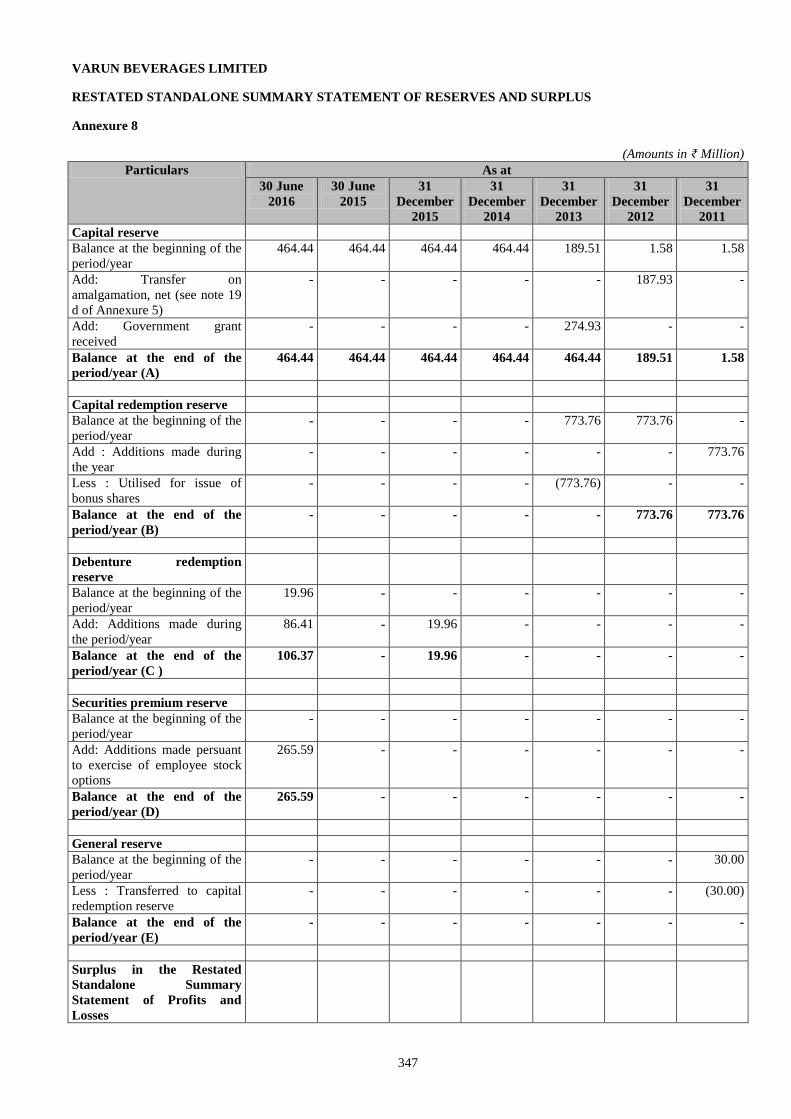
347
VARUN BEVERAGES LIMITED
RESTATED STANDALONE SUMMARY STATEMENT OF RESERVES AND SURPLUS
Annexure 8
(Amounts in ₹ Million)
Particulars As at
30 June
2016
30 June
2015
31
December
2015
31
December
2014
31
December
2013
31
December
2012
31
December
2011
Capital reserve
Balance at the beginning of the
period/year
464.44 464.44 464.44 464.44 189.51 1.58 1.58
Add: Transfer on
amalgamation, net (see note 19
d of Annexure 5)
- - - - - 187.93 -
Add: Government grant
received
- - - - 274.93 - -
Balance at the end of the
period/year (A)
464.44 464.44 464.44 464.44 464.44 189.51 1.58
Capital redemption reserve
Balance at the beginning of the
period/year - - - - 773.76 773.76 -
Add : Additions made during
the year
- - - - - - 773.76
Less : Utilised for issue of
bonus shares
- - - - (773.76) - -
Balance at the end of the
period/year (B)
- - - - - 773.76 773.76
Debenture redemption
reserve
Balance at the beginning of the
period/year
19.96 - - - - - -
Add: Additions made during
the period/year
86.41 - 19.96 - - - -
Balance at the end of the
period/year (C )
106.37 - 19.96 - - - -
Securities premium reserve
Balance at the beginning of the
period/year
- - - - - - -
Add: Additions made persuant
to exercise of employee stock
options
265.59 - - - - - -
Balance at the end of the
period/year (D)
265.59 - - - - - -
General reserve
Balance at the beginning of the
period/year
- - - - - - 30.00
Less : Transferred to capital
redemption reserve
- - - - - - (30.00)
Balance at the end of the
period/year (E)
- - - - - - -
Surplus in the Restated
Standalone Summary
Statement of Profits and
Losses
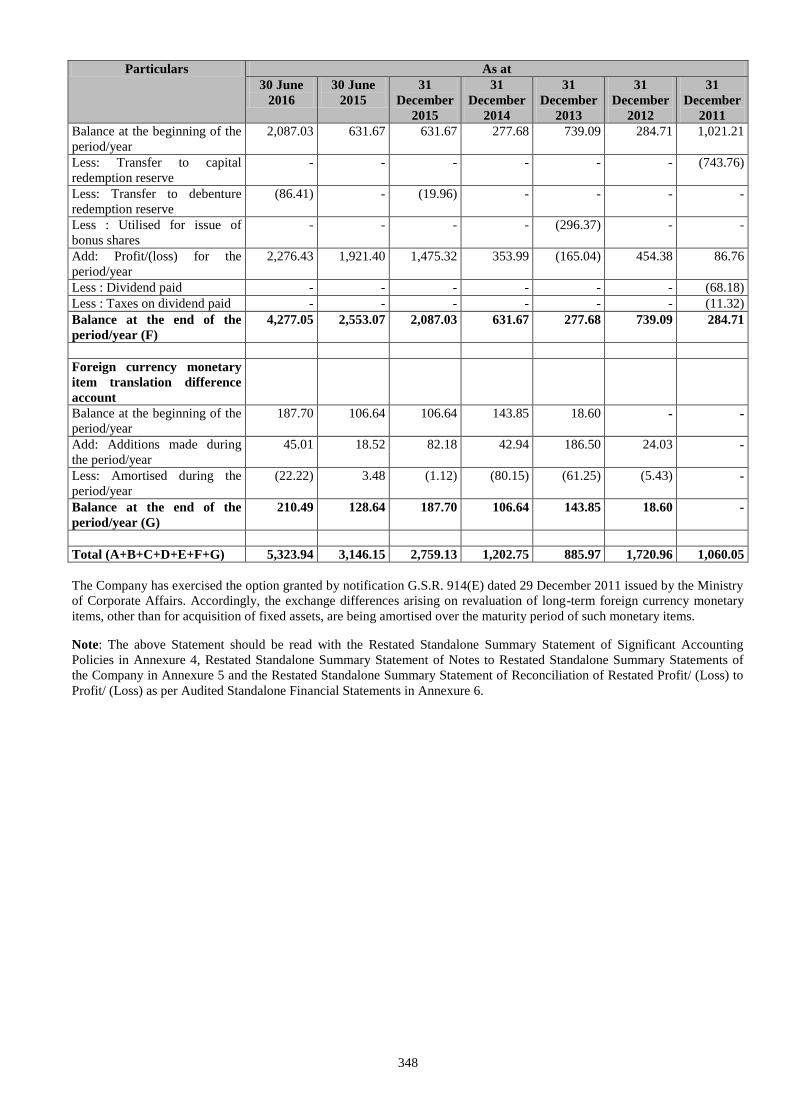
348
Particulars As at
30 June
2016
30 June
2015
31
December
2015
31
December
2014
31
December
2013
31
December
2012
31
December
2011
Balance at the beginning of the
period/year
2,087.03 631.67 631.67 277.68 739.09 284.71 1,021.21
Less: Transfer to capital
redemption reserve
- - - - - - (743.76)
Less: Transfer to debenture
redemption reserve
(86.41) - (19.96) - - - -
Less : Utilised for issue of
bonus shares
- - - - (296.37) - -
Add: Profit/(loss) for the
period/year
2,276.43 1,921.40 1,475.32 353.99 (165.04) 454.38 86.76
Less : Dividend paid - - - - - - (68.18)
Less : Taxes on dividend paid - - - - - - (11.32)
Balance at the end of the
period/year (F)
4,277.05 2,553.07 2,087.03 631.67 277.68 739.09 284.71
Foreign currency monetary
item translation difference
account
Balance at the beginning of the
period/year
187.70 106.64 106.64 143.85 18.60 - -
Add: Additions made during
the period/year
45.01 18.52 82.18 42.94 186.50 24.03 -
Less: Amortised during the
period/year
(22.22) 3.48 (1.12) (80.15) (61.25) (5.43) -
Balance at the end of the
period/year (G)
210.49 128.64 187.70 106.64 143.85 18.60 -
Total (A+B+C+D+E+F+G) 5,323.94 3,146.15 2,759.13 1,202.75 885.97 1,720.96 1,060.05
The Company has exercised the option granted by notification G.S.R. 914(E) dated 29 December 2011 issued by the Ministry
of Corporate Affairs. Accordingly, the exchange differences arising on revaluation of long-term foreign currency monetary
items, other than for acquisition of fixed assets, are being amortised over the maturity period of such monetary items.
Note: The above Statement should be read with the Restated Standalone Summary Statement of Significant Accounting
Policies in Annexure 4, Restated Standalone Summary Statement of Notes to Restated Standalone Summary Statements of
the Company in Annexure 5 and the Restated Standalone Summary Statement of Reconciliation of Restated Profit/ (Loss) to
Profit/ (Loss) as per Audited Standalone Financial Statements in Annexure 6.
349
VARUN BEVERAGES LIMITED
RESTATED STANDALONE SUMMARY STATEMENT OF SHARE APPLICATION MONEY PENDING
ALLOTMENT
Annexure 9
During the year 31 December 2013, the Company had received ₹ 400 million from RJ Corp Limited towards allotment of
equity shares of ₹ 10 each, at a premium to be decided at the time of allotment, based on valuation of the Company.
Subsequently, the amount was refunded during the year 31 December 2014.
Note: The above Statement should be read with the Restated Standalone Summary Statement of Significant Accounting
Policies in Annexure 4, Restated Standalone Summary Statement of Notes to Restated Standalone Summary Statements of
the Company in Annexure 5 and the Restated Standalone Summary Statement of Reconciliation of Restated Profit/ (Loss) to
Profit/ (Loss) as per Audited Standalone Financial Statements in Annexure 6.
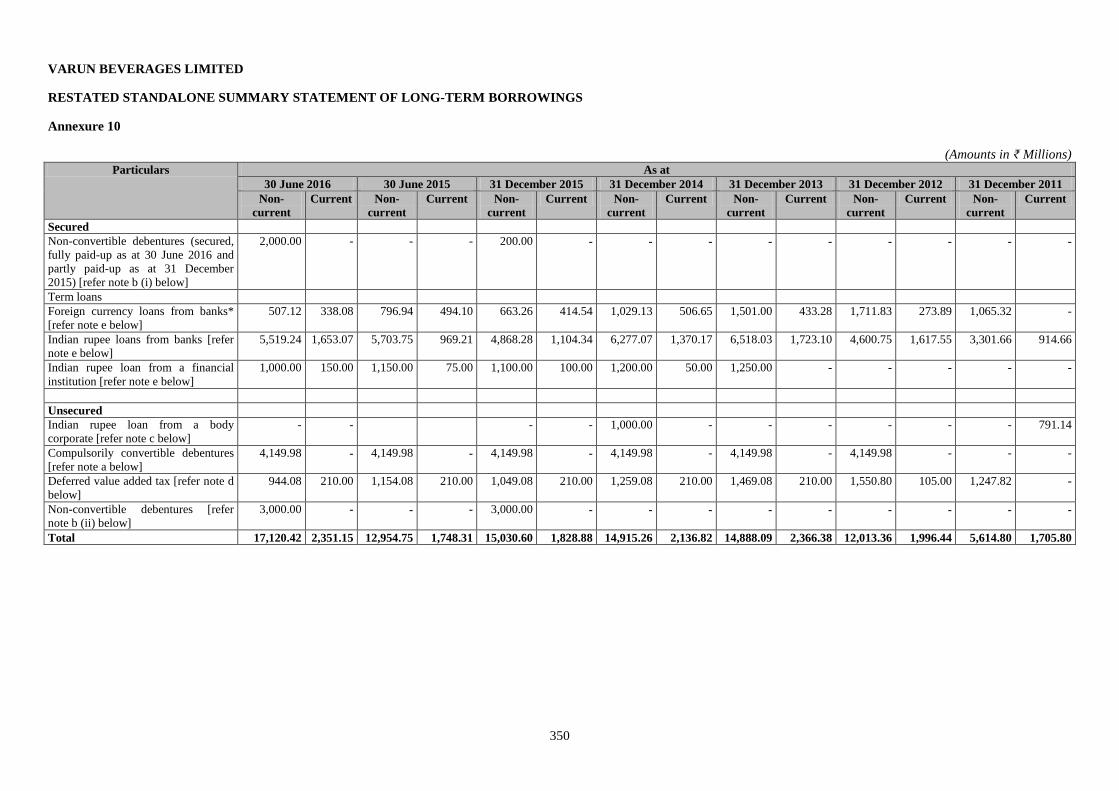
350
VARUN BEVERAGES LIMITED
RESTATED STANDALONE SUMMARY STATEMENT OF LONG-TERM BORROWINGS
Annexure 10
(Amounts in ₹ Millions)
Particulars As at
30 June 2016 30 June 2015 31 December 2015 31 December 2014 31 December 2013 31 December 2012 31 December 2011
Non-
current
Current Non-
current
Current Non-
current
Current Non-
current
Current Non-
current
Current Non-
current
Current Non-
current
Current
Secured
Non-convertible debentures (secured,
fully paid-up as at 30 June 2016 and
partly paid-up as at 31 December
2015) [refer note b (i) below]
2,000.00 - - - 200.00 - - - - - - - - -
Term loans
Foreign currency loans from banks*
[refer note e below]
507.12 338.08 796.94 494.10 663.26 414.54 1,029.13 506.65 1,501.00 433.28 1,711.83 273.89 1,065.32 -
Indian rupee loans from banks [refer
note e below]
5,519.24 1,653.07 5,703.75 969.21 4,868.28 1,104.34 6,277.07 1,370.17 6,518.03 1,723.10 4,600.75 1,617.55 3,301.66 914.66
Indian rupee loan from a financial
institution [refer note e below]
1,000.00 150.00 1,150.00 75.00 1,100.00 100.00 1,200.00 50.00 1,250.00 - - - - -
Unsecured
Indian rupee loan from a body
corporate [refer note c below]
- - - - 1,000.00 - - - - - - 791.14
Compulsorily convertible debentures
[refer note a below]
4,149.98 - 4,149.98 - 4,149.98 - 4,149.98 - 4,149.98 - 4,149.98 - - -
Deferred value added tax [refer note d
below]
944.08 210.00 1,154.08 210.00 1,049.08 210.00 1,259.08 210.00 1,469.08 210.00 1,550.80 105.00 1,247.82 -
Non-convertible debentures [refer
note b (ii) below]
3,000.00 - - - 3,000.00 - - - - - - - - -
Total 17,120.42 2,351.15 12,954.75 1,748.31 15,030.60 1,828.88 14,915.26 2,136.82 14,888.09 2,366.38 12,013.36 1,996.44 5,614.80 1,705.80
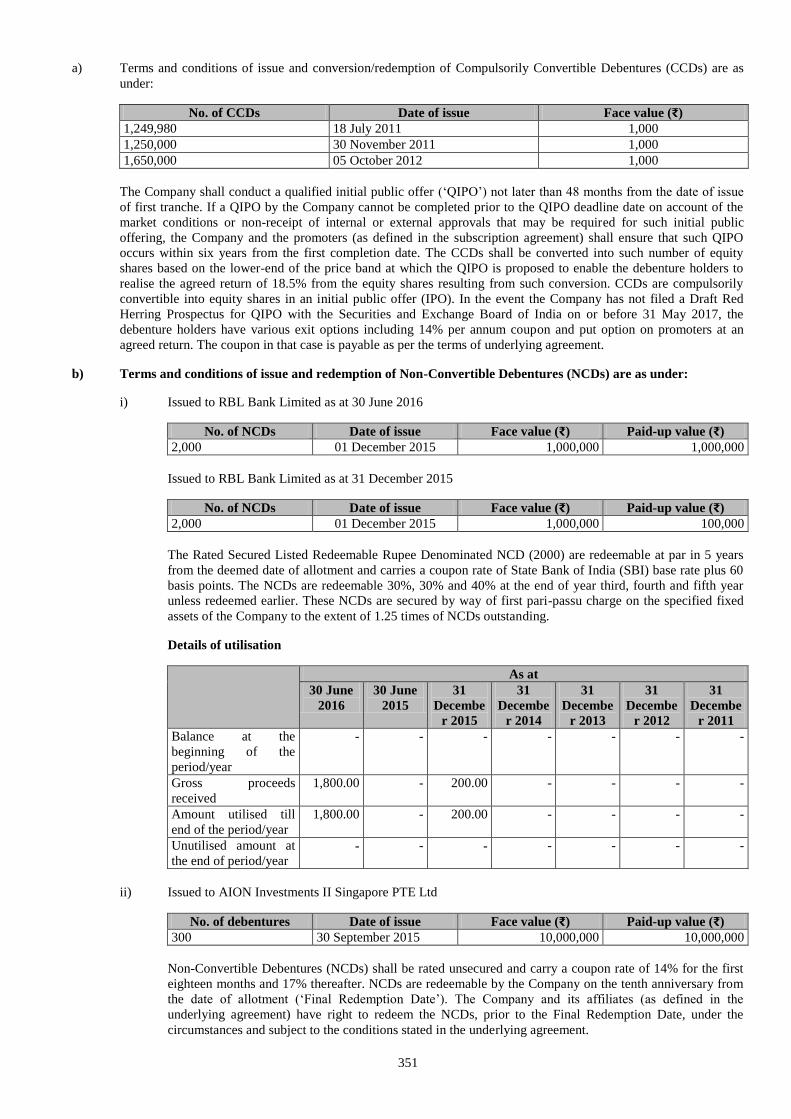
351
a) Terms and conditions of issue and conversion/redemption of Compulsorily Convertible Debentures (CCDs) are as
under:
No. of CCDs Date of issue Face value (₹)
1,249,980 18 July 2011 1,000
1,250,000 30 November 2011 1,000
1,650,000 05 October 2012 1,000
The Company shall conduct a qualified initial public offer (‘QIPO’) not later than 48 months from the date of issue
of first tranche. If a QIPO by the Company cannot be completed prior to the QIPO deadline date on account of the
market conditions or non-receipt of internal or external approvals that may be required for such initial public
offering, the Company and the promoters (as defined in the subscription agreement) shall ensure that such QIPO
occurs within six years from the first completion date. The CCDs shall be converted into such number of equity
shares based on the lower-end of the price band at which the QIPO is proposed to enable the debenture holders to
realise the agreed return of 18.5% from the equity shares resulting from such conversion. CCDs are compulsorily
convertible into equity shares in an initial public offer (IPO). In the event the Company has not filed a Draft Red
Herring Prospectus for QIPO with the Securities and Exchange Board of India on or before 31 May 2017, the
debenture holders have various exit options including 14% per annum coupon and put option on promoters at an
agreed return. The coupon in that case is payable as per the terms of underlying agreement.
b) Terms and conditions of issue and redemption of Non-Convertible Debentures (NCDs) are as under:
i) Issued to RBL Bank Limited as at 30 June 2016
No. of NCDs Date of issue Face value (₹) Paid-up value (₹)
2,000 01 December 2015 1,000,000 1,000,000
Issued to RBL Bank Limited as at 31 December 2015
No. of NCDs Date of issue Face value (₹) Paid-up value (₹)
2,000 01 December 2015 1,000,000 100,000
The Rated Secured Listed Redeemable Rupee Denominated NCD (2000) are redeemable at par in 5 years
from the deemed date of allotment and carries a coupon rate of State Bank of India (SBI) base rate plus 60
basis points. The NCDs are redeemable 30%, 30% and 40% at the end of year third, fourth and fifth year
unless redeemed earlier. These NCDs are secured by way of first pari-passu charge on the specified fixed
assets of the Company to the extent of 1.25 times of NCDs outstanding.
Details of utilisation
As at
30 June
2016
30 June
2015
31
Decembe
r 2015
31
Decembe
r 2014
31
Decembe
r 2013
31
Decembe
r 2012
31
Decembe
r 2011
Balance at the
beginning of the
period/year
- - - - - - -
Gross proceeds
received
1,800.00 - 200.00 - - - -
Amount utilised till
end of the period/year
1,800.00 - 200.00 - - - -
Unutilised amount at
the end of period/year - - - - - - -
ii) Issued to AION Investments II Singapore PTE Ltd
No. of debentures Date of issue Face value (₹) Paid-up value (₹)
300 30 September 2015 10,000,000 10,000,000
Non-Convertible Debentures (NCDs) shall be rated unsecured and carry a coupon rate of 14% for the first
eighteen months and 17% thereafter. NCDs are redeemable by the Company on the tenth anniversary from
the date of allotment (‘Final Redemption Date’). The Company and its affiliates (as defined in the
underlying agreement) have right to redeem the NCDs, prior to the Final Redemption Date, under the
circumstances and subject to the conditions stated in the underlying agreement.
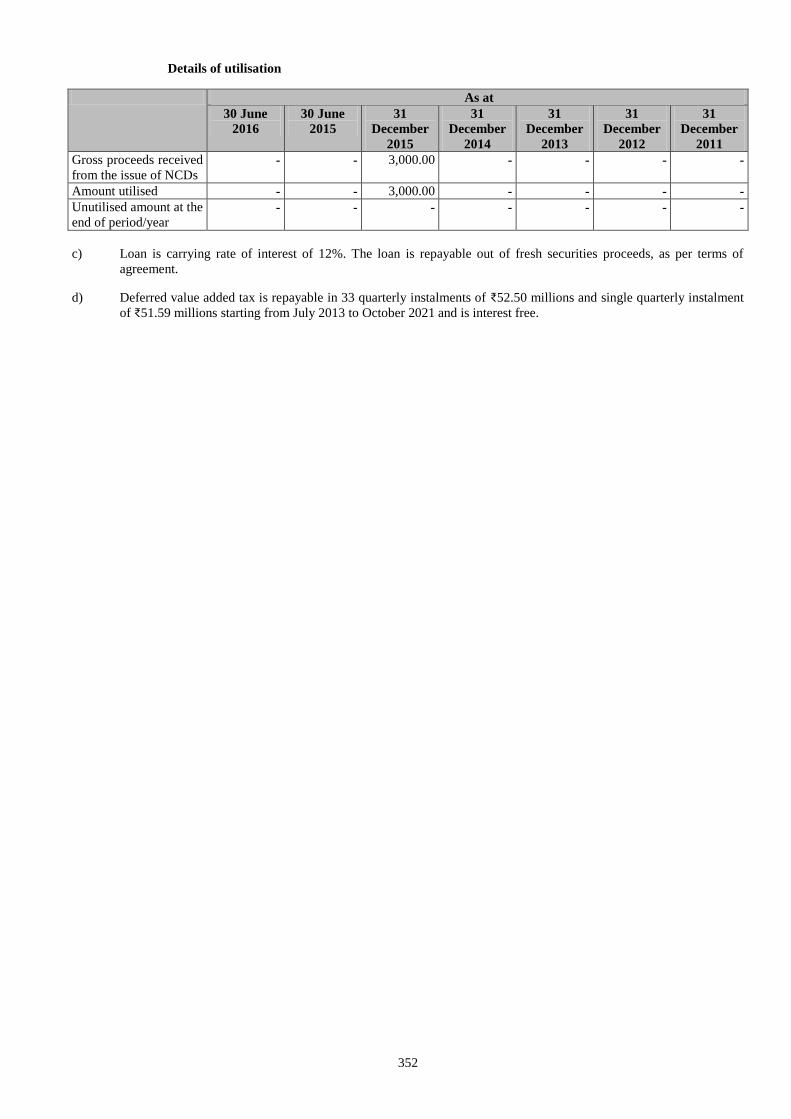
352
Details of utilisation
As at
30 June
2016
30 June
2015
31
December
2015
31
December
2014
31
December
2013
31
December
2012
31
December
2011
Gross proceeds received
from the issue of NCDs - - 3,000.00 - - - -
Amount utilised - - 3,000.00 - - - -
Unutilised amount at the
end of period/year - - - - - - -
c) Loan is carrying rate of interest of 12%. The loan is repayable out of fresh securities proceeds, as per terms of
agreement.
d) Deferred value added tax is repayable in 33 quarterly instalments of ₹52.50 millions and single quarterly instalment
of ₹51.59 millions starting from July 2013 to October 2021 and is interest free.
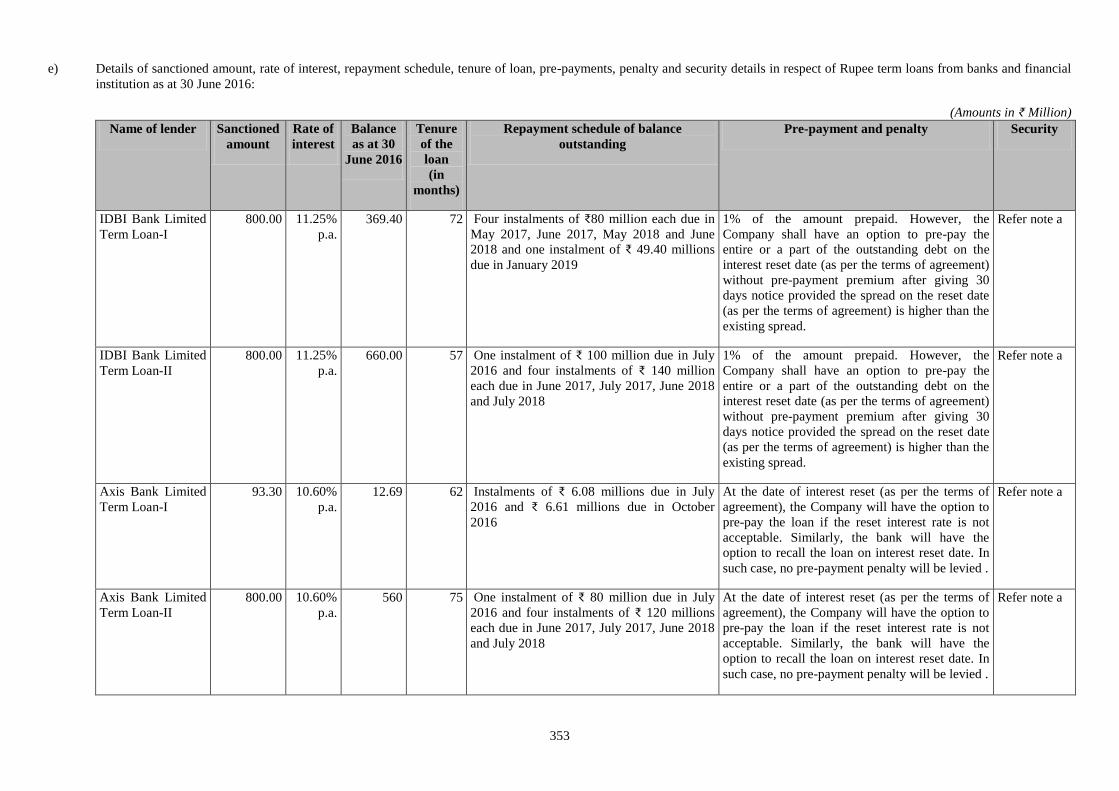
353
e) Details of sanctioned amount, rate of interest, repayment schedule, tenure of loan, pre-payments, penalty and security details in respect of Rupee term loans from banks and financial
institution as at 30 June 2016:
(Amounts in ₹ Million)
Name of lender Sanctioned
amount
Rate of
interest
Balance
as at 30
June 2016
Tenure
of the
loan
(in
months)
Repayment schedule of balance
outstanding
Pre-payment and penalty Security
IDBI Bank Limited
Term Loan-I
800.00 11.25%
p.a.
369.40 72 Four instalments of ₹80 million each due in
May 2017, June 2017, May 2018 and June
2018 and one instalment of ₹ 49.40 millions
due in January 2019
1% of the amount prepaid. However, the
Company shall have an option to pre-pay the
entire or a part of the outstanding debt on the
interest reset date (as per the terms of agreement)
without pre-payment premium after giving 30
days notice provided the spread on the reset date
(as per the terms of agreement) is higher than the
existing spread.
Refer note a
IDBI Bank Limited
Term Loan-II
800.00 11.25%
p.a.
660.00 57 One instalment of ₹ 100 million due in July
2016 and four instalments of ₹ 140 million
each due in June 2017, July 2017, June 2018
and July 2018
1% of the amount prepaid. However, the
Company shall have an option to pre-pay the
entire or a part of the outstanding debt on the
interest reset date (as per the terms of agreement)
without pre-payment premium after giving 30
days notice provided the spread on the reset date
(as per the terms of agreement) is higher than the
existing spread.
Refer note a
Axis Bank Limited
Term Loan-I
93.30 10.60%
p.a.
12.69 62 Instalments of ₹ 6.08 millions due in July
2016 and ₹ 6.61 millions due in October
2016
At the date of interest reset (as per the terms of
agreement), the Company will have the option to
pre-pay the loan if the reset interest rate is not
acceptable. Similarly, the bank will have the
option to recall the loan on interest reset date. In
such case, no pre-payment penalty will be levied .
Refer note a
Axis Bank Limited
Term Loan-II
800.00 10.60%
p.a.
560 75 One instalment of ₹ 80 million due in July
2016 and four instalments of ₹ 120 millions
each due in June 2017, July 2017, June 2018
and July 2018
At the date of interest reset (as per the terms of
agreement), the Company will have the option to
pre-pay the loan if the reset interest rate is not
acceptable. Similarly, the bank will have the
option to recall the loan on interest reset date. In
such case, no pre-payment penalty will be levied .
Refer note a
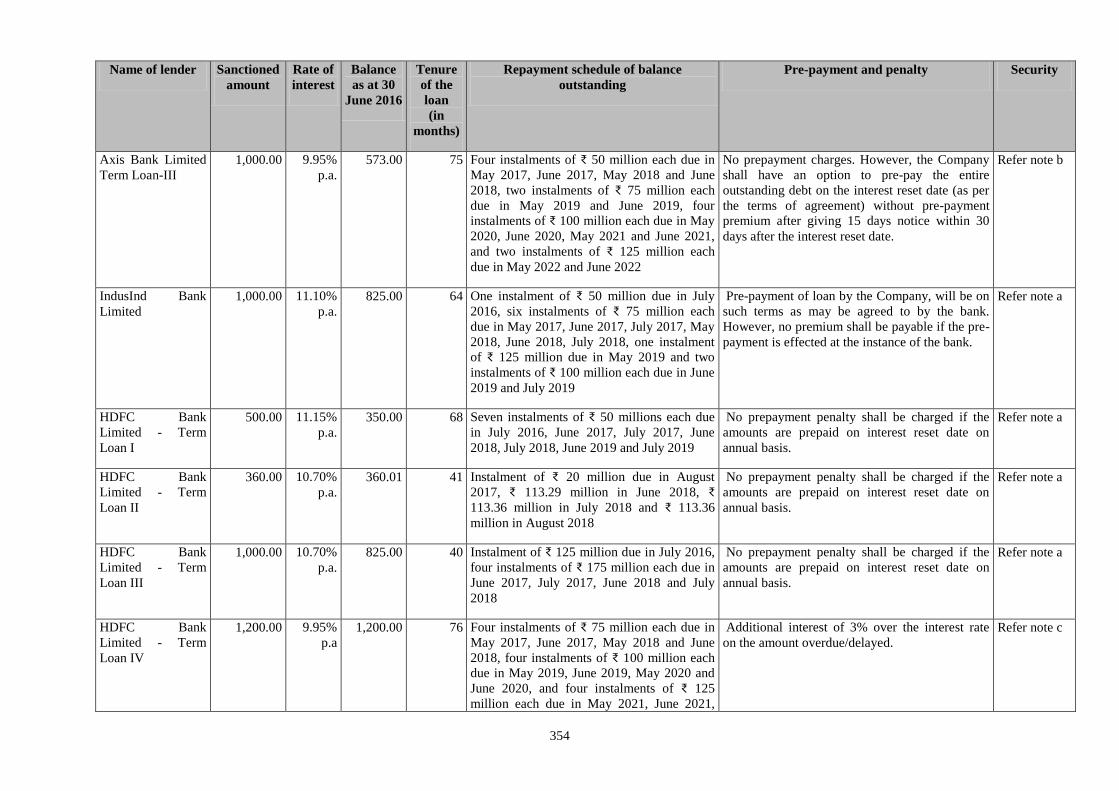
354
Name of lender Sanctioned
amount
Rate of
interest
Balance
as at 30
June 2016
Tenure
of the
loan
(in
months)
Repayment schedule of balance
outstanding
Pre-payment and penalty Security
Axis Bank Limited
Term Loan-III
1,000.00 9.95%
p.a.
573.00 75 Four instalments of ₹ 50 million each due in
May 2017, June 2017, May 2018 and June
2018, two instalments of ₹ 75 million each
due in May 2019 and June 2019, four
instalments of ₹ 100 million each due in May
2020, June 2020, May 2021 and June 2021,
and two instalments of ₹ 125 million each
due in May 2022 and June 2022
No prepayment charges. However, the Company
shall have an option to pre-pay the entire
outstanding debt on the interest reset date (as per
the terms of agreement) without pre-payment
premium after giving 15 days notice within 30
days after the interest reset date.
Refer note b
IndusInd Bank
Limited
1,000.00 11.10%
p.a.
825.00 64 One instalment of ₹ 50 million due in July
2016, six instalments of ₹ 75 million each
due in May 2017, June 2017, July 2017, May
2018, June 2018, July 2018, one instalment
of ₹ 125 million due in May 2019 and two
instalments of ₹ 100 million each due in June
2019 and July 2019
Pre-payment of loan by the Company, will be on
such terms as may be agreed to by the bank.
However, no premium shall be payable if the pre-
payment is effected at the instance of the bank.
Refer note a
HDFC Bank
Limited - Term
Loan I
500.00 11.15%
p.a.
350.00 68 Seven instalments of ₹ 50 millions each due
in July 2016, June 2017, July 2017, June
2018, July 2018, June 2019 and July 2019
No prepayment penalty shall be charged if the
amounts are prepaid on interest reset date on
annual basis.
Refer note a
HDFC Bank
Limited - Term
Loan II
360.00 10.70%
p.a.
360.01 41 Instalment of ₹ 20 million due in August
2017, ₹ 113.29 million in June 2018, ₹
113.36 million in July 2018 and ₹ 113.36
million in August 2018
No prepayment penalty shall be charged if the
amounts are prepaid on interest reset date on
annual basis.
Refer note a
HDFC Bank
Limited - Term
Loan III
1,000.00 10.70%
p.a.
825.00 40 Instalment of ₹ 125 million due in July 2016,
four instalments of ₹ 175 million each due in
June 2017, July 2017, June 2018 and July
2018
No prepayment penalty shall be charged if the
amounts are prepaid on interest reset date on
annual basis.
Refer note a
HDFC Bank
Limited - Term
Loan IV
1,200.00 9.95%
p.a
1,200.00 76 Four instalments of ₹ 75 million each due in
May 2017, June 2017, May 2018 and June
2018, four instalments of ₹ 100 million each
due in May 2019, June 2019, May 2020 and
June 2020, and four instalments of ₹ 125
million each due in May 2021, June 2021,
Additional interest of 3% over the interest rate
on the amount overdue/delayed.
Refer note c
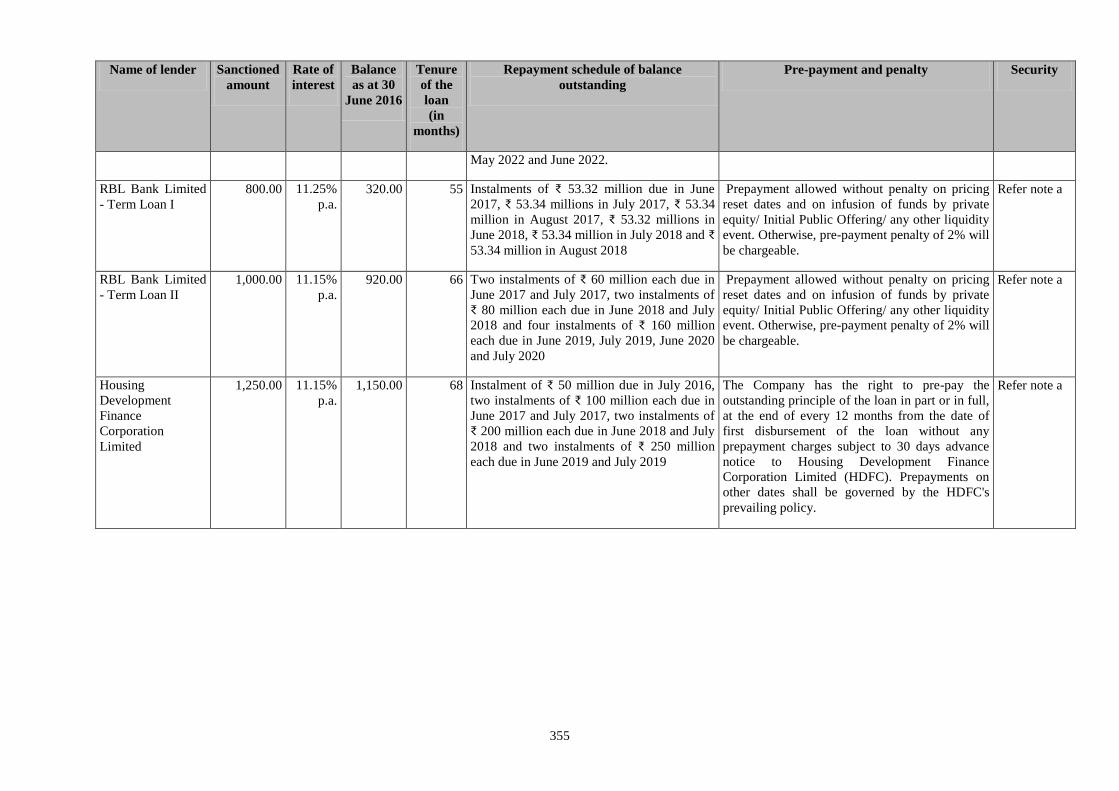
355
Name of lender Sanctioned
amount
Rate of
interest
Balance
as at 30
June 2016
Tenure
of the
loan
(in
months)
Repayment schedule of balance
outstanding
Pre-payment and penalty Security
May 2022 and June 2022.
RBL Bank Limited
- Term Loan I
800.00 11.25%
p.a.
320.00 55 Instalments of ₹ 53.32 million due in June
2017, ₹ 53.34 millions in July 2017, ₹ 53.34
million in August 2017, ₹ 53.32 millions in
June 2018, ₹ 53.34 million in July 2018 and ₹
53.34 million in August 2018
Prepayment allowed without penalty on pricing
reset dates and on infusion of funds by private
equity/ Initial Public Offering/ any other liquidity
event. Otherwise, pre-payment penalty of 2% will
be chargeable.
Refer note a
RBL Bank Limited
- Term Loan II
1,000.00 11.15%
p.a.
920.00 66 Two instalments of ₹ 60 million each due in
June 2017 and July 2017, two instalments of
₹ 80 million each due in June 2018 and July
2018 and four instalments of ₹ 160 million
each due in June 2019, July 2019, June 2020
and July 2020
Prepayment allowed without penalty on pricing
reset dates and on infusion of funds by private
equity/ Initial Public Offering/ any other liquidity
event. Otherwise, pre-payment penalty of 2% will
be chargeable.
Refer note a
Housing
Development
Finance
Corporation
Limited
1,250.00 11.15%
p.a.
1,150.00 68 Instalment of ₹ 50 million due in July 2016,
two instalments of ₹ 100 million each due in
June 2017 and July 2017, two instalments of
₹ 200 million each due in June 2018 and July
2018 and two instalments of ₹ 250 million
each due in June 2019 and July 2019
The Company has the right to pre-pay the
outstanding principle of the loan in part or in full,
at the end of every 12 months from the date of
first disbursement of the loan without any
prepayment charges subject to 30 days advance
notice to Housing Development Finance
Corporation Limited (HDFC). Prepayments on
other dates shall be governed by the HDFC's
prevailing policy.
Refer note a
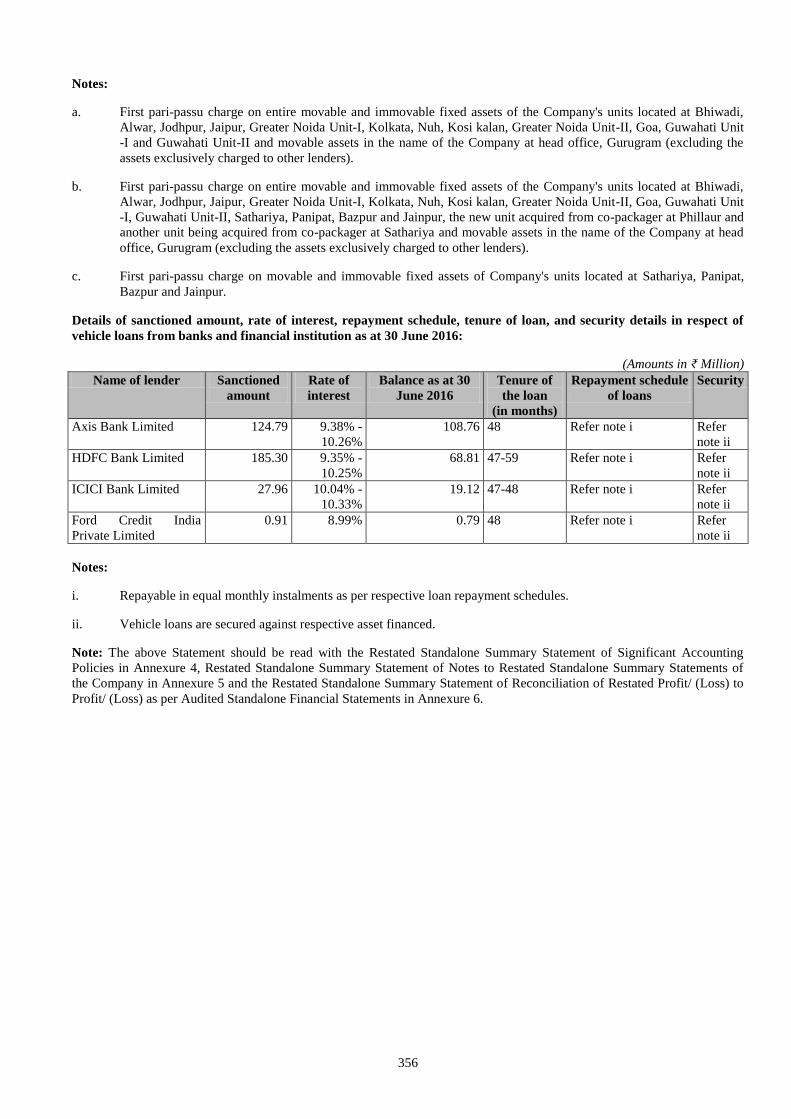
356
Notes:
a. First pari-passu charge on entire movable and immovable fixed assets of the Company's units located at Bhiwadi,
Alwar, Jodhpur, Jaipur, Greater Noida Unit-I, Kolkata, Nuh, Kosi kalan, Greater Noida Unit-II, Goa, Guwahati Unit
-I and Guwahati Unit-II and movable assets in the name of the Company at head office, Gurugram (excluding the
assets exclusively charged to other lenders).
b. First pari-passu charge on entire movable and immovable fixed assets of the Company's units located at Bhiwadi,
Alwar, Jodhpur, Jaipur, Greater Noida Unit-I, Kolkata, Nuh, Kosi kalan, Greater Noida Unit-II, Goa, Guwahati Unit
-I, Guwahati Unit-II, Sathariya, Panipat, Bazpur and Jainpur, the new unit acquired from co-packager at Phillaur and
another unit being acquired from co-packager at Sathariya and movable assets in the name of the Company at head
office, Gurugram (excluding the assets exclusively charged to other lenders).
c. First pari-passu charge on movable and immovable fixed assets of Company's units located at Sathariya, Panipat,
Bazpur and Jainpur.
Details of sanctioned amount, rate of interest, repayment schedule, tenure of loan, and security details in respect of
vehicle loans from banks and financial institution as at 30 June 2016:
(Amounts in ₹ Million)
Name of lender Sanctioned
amount
Rate of
interest
Balance as at 30
June 2016
Tenure of
the loan
(in months)
Repayment schedule
of loans
Security
Axis Bank Limited 124.79 9.38% -
10.26%
108.76 48 Refer note i Refer
note ii
HDFC Bank Limited 185.30 9.35% -
10.25%
68.81 47-59 Refer note i Refer
note ii
ICICI Bank Limited 27.96 10.04% -
10.33%
19.12 47-48 Refer note i Refer
note ii
Ford Credit India
Private Limited
0.91 8.99% 0.79 48 Refer note i Refer
note ii
Notes:
i. Repayable in equal monthly instalments as per respective loan repayment schedules.
ii. Vehicle loans are secured against respective asset financed.
Note: The above Statement should be read with the Restated Standalone Summary Statement of Significant Accounting
Policies in Annexure 4, Restated Standalone Summary Statement of Notes to Restated Standalone Summary Statements of
the Company in Annexure 5 and the Restated Standalone Summary Statement of Reconciliation of Restated Profit/ (Loss) to
Profit/ (Loss) as per Audited Standalone Financial Statements in Annexure 6.
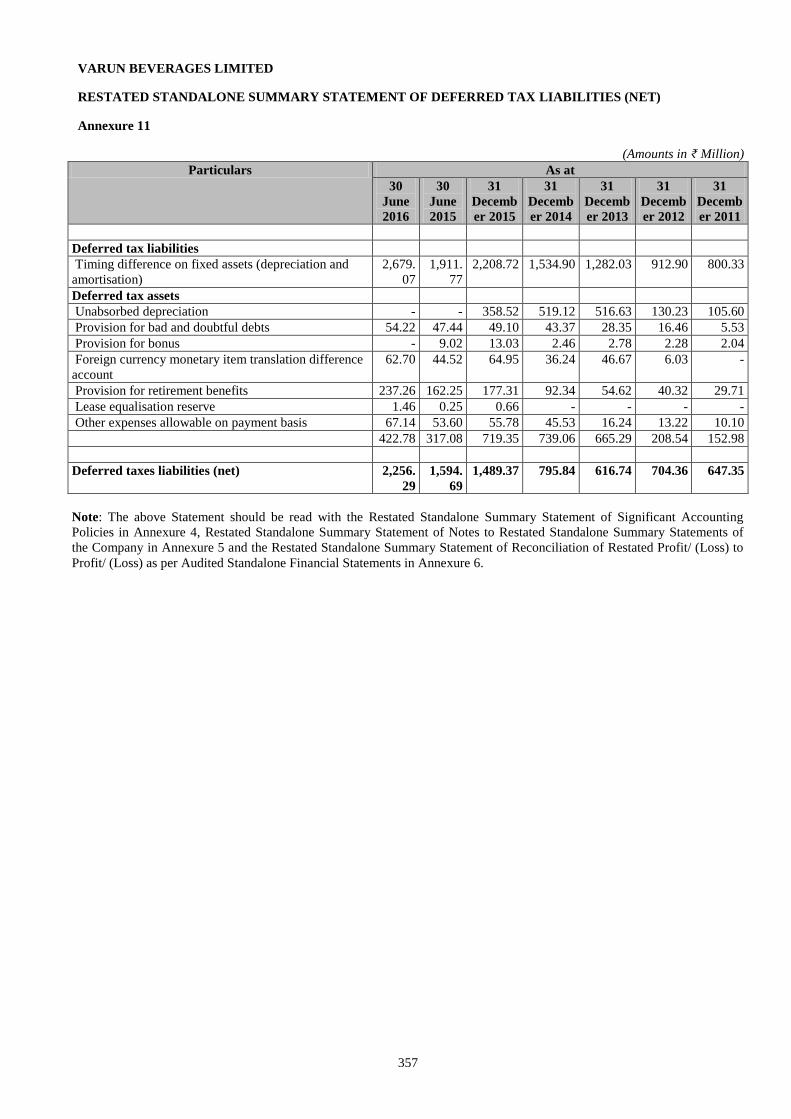
357
VARUN BEVERAGES LIMITED
RESTATED STANDALONE SUMMARY STATEMENT OF DEFERRED TAX LIABILITIES (NET)
Annexure 11
(Amounts in ₹ Million)
Particulars As at
30
June
2016
30
June
2015
31
Decemb
er 2015
31
Decemb
er 2014
31
Decemb
er 2013
31
Decemb
er 2012
31
Decemb
er 2011
Deferred tax liabilities
Timing difference on fixed assets (depreciation and
amortisation)
2,679.
07
1,911.
77
2,208.72 1,534.90 1,282.03 912.90 800.33
Deferred tax assets
Unabsorbed depreciation - - 358.52 519.12 516.63 130.23 105.60
Provision for bad and doubtful debts 54.22 47.44 49.10 43.37 28.35 16.46 5.53
Provision for bonus - 9.02 13.03 2.46 2.78 2.28 2.04
Foreign currency monetary item translation difference
account
62.70 44.52 64.95 36.24 46.67 6.03 -
Provision for retirement benefits 237.26 162.25 177.31 92.34 54.62 40.32 29.71
Lease equalisation reserve 1.46 0.25 0.66 - - - -
Other expenses allowable on payment basis 67.14 53.60 55.78 45.53 16.24 13.22 10.10
422.78 317.08 719.35 739.06 665.29 208.54 152.98
Deferred taxes liabilities (net) 2,256.
29
1,594.
69
1,489.37 795.84 616.74 704.36 647.35
Note: The above Statement should be read with the Restated Standalone Summary Statement of Significant Accounting
Policies in Annexure 4, Restated Standalone Summary Statement of Notes to Restated Standalone Summary Statements of
the Company in Annexure 5 and the Restated Standalone Summary Statement of Reconciliation of Restated Profit/ (Loss) to
Profit/ (Loss) as per Audited Standalone Financial Statements in Annexure 6.
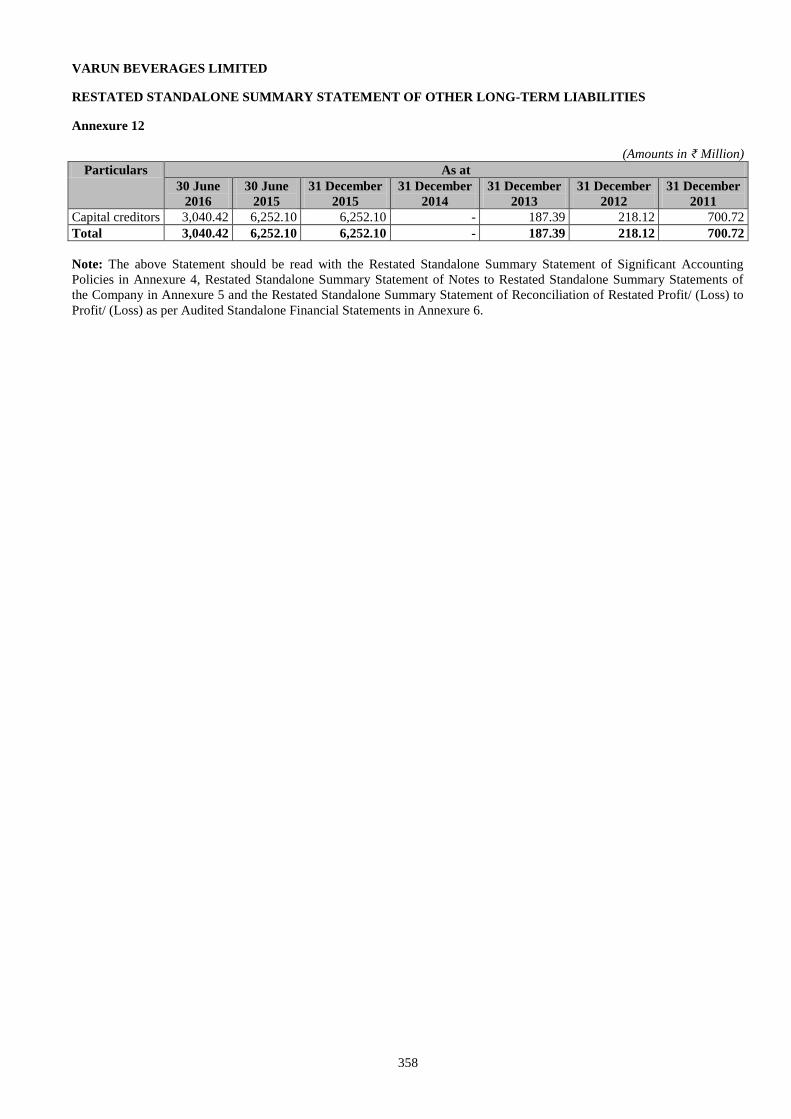
358
VARUN BEVERAGES LIMITED
RESTATED STANDALONE SUMMARY STATEMENT OF OTHER LONG-TERM LIABILITIES
Annexure 12
(Amounts in ₹ Million)
Particulars As at
30 June
2016
30 June
2015
31 December
2015
31 December
2014
31 December
2013
31 December
2012
31 December
2011
Capital creditors 3,040.42 6,252.10 6,252.10 - 187.39 218.12 700.72
Total 3,040.42 6,252.10 6,252.10 - 187.39 218.12 700.72
Note: The above Statement should be read with the Restated Standalone Summary Statement of Significant Accounting
Policies in Annexure 4, Restated Standalone Summary Statement of Notes to Restated Standalone Summary Statements of
the Company in Annexure 5 and the Restated Standalone Summary Statement of Reconciliation of Restated Profit/ (Loss) to
Profit/ (Loss) as per Audited Standalone Financial Statements in Annexure 6.
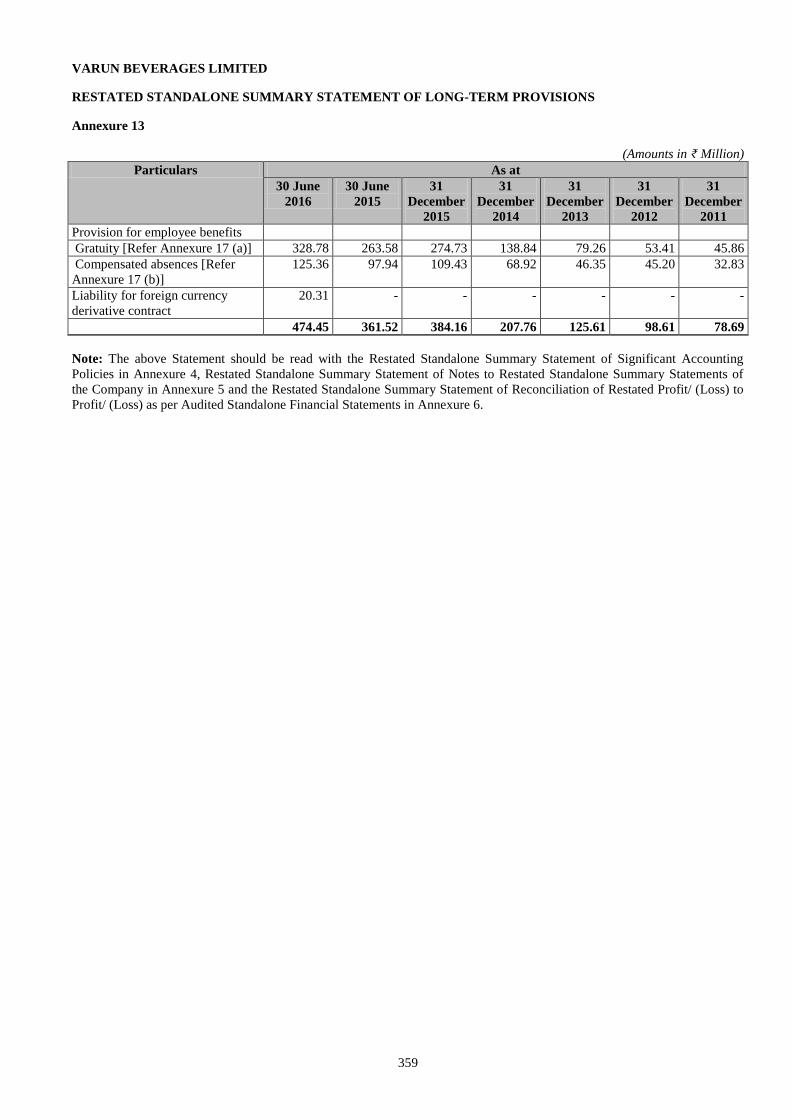
359
VARUN BEVERAGES LIMITED
RESTATED STANDALONE SUMMARY STATEMENT OF LONG-TERM PROVISIONS
Annexure 13
(Amounts in ₹ Million)
Particulars As at
30 June
2016
30 June
2015
31
December
2015
31
December
2014
31
December
2013
31
December
2012
31
December
2011
Provision for employee benefits
Gratuity [Refer Annexure 17 (a)] 328.78 263.58 274.73 138.84 79.26 53.41 45.86
Compensated absences [Refer
Annexure 17 (b)]
125.36 97.94 109.43 68.92 46.35 45.20 32.83
Liability for foreign currency
derivative contract
20.31 - - - - - -
474.45 361.52 384.16 207.76 125.61 98.61 78.69
Note: The above Statement should be read with the Restated Standalone Summary Statement of Significant Accounting
Policies in Annexure 4, Restated Standalone Summary Statement of Notes to Restated Standalone Summary Statements of
the Company in Annexure 5 and the Restated Standalone Summary Statement of Reconciliation of Restated Profit/ (Loss) to
Profit/ (Loss) as per Audited Standalone Financial Statements in Annexure 6.
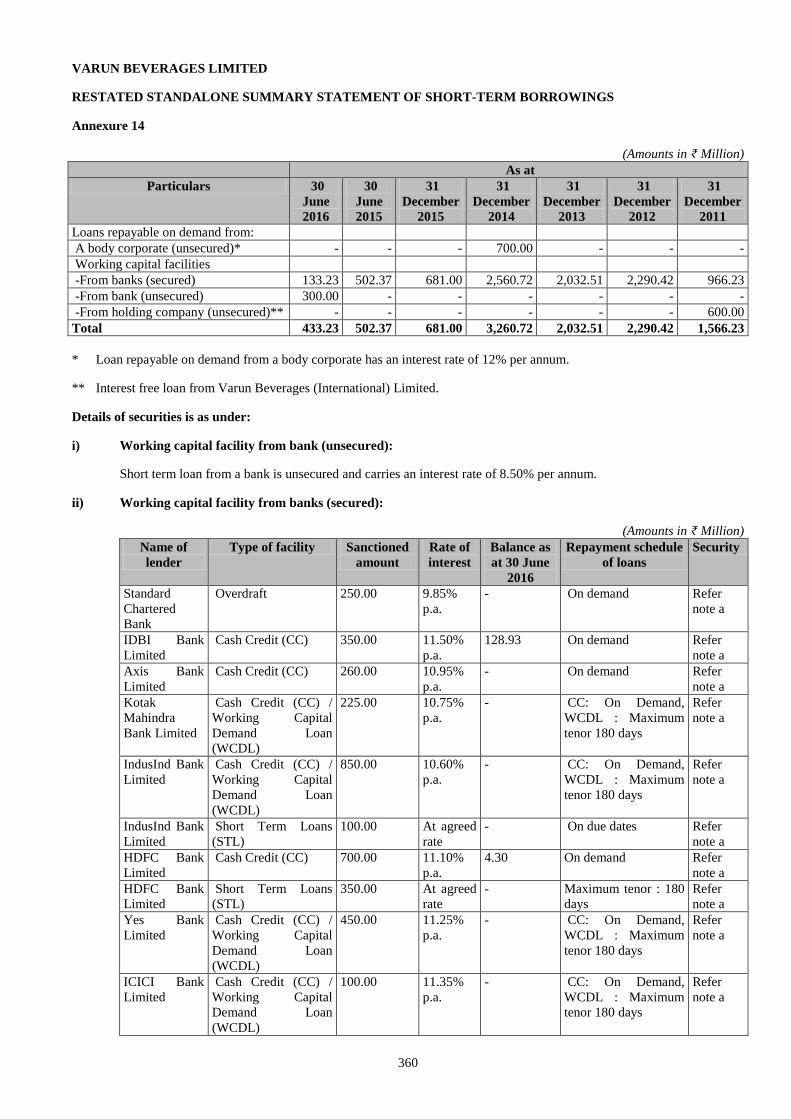
360
VARUN BEVERAGES LIMITED
RESTATED STANDALONE SUMMARY STATEMENT OF SHORT-TERM BORROWINGS
Annexure 14
(Amounts in ₹ Million)
As at
Particulars 30
June
2016
30
June
2015
31
December
2015
31
December
2014
31
December
2013
31
December
2012
31
December
2011
Loans repayable on demand from:
A body corporate (unsecured)* - - - 700.00 - - -
Working capital facilities
-From banks (secured) 133.23 502.37 681.00 2,560.72 2,032.51 2,290.42 966.23
-From bank (unsecured) 300.00 - - - - - -
-From holding company (unsecured)** - - - - - - 600.00
Total 433.23 502.37 681.00 3,260.72 2,032.51 2,290.42 1,566.23
* Loan repayable on demand from a body corporate has an interest rate of 12% per annum.
** Interest free loan from Varun Beverages (International) Limited.
Details of securities is as under:
i) Working capital facility from bank (unsecured):
Short term loan from a bank is unsecured and carries an interest rate of 8.50% per annum.
ii) Working capital facility from banks (secured):
(Amounts in ₹ Million)
Name of
lender
Type of facility Sanctioned
amount
Rate of
interest
Balance as
at 30 June
2016
Repayment schedule
of loans
Security
Standard
Chartered
Bank
Overdraft 250.00 9.85%
p.a.
- On demand Refer
note a
IDBI Bank
Limited
Cash Credit (CC) 350.00 11.50%
p.a.
128.93 On demand Refer
note a
Axis Bank
Limited
Cash Credit (CC) 260.00 10.95%
p.a.
- On demand Refer
note a
Kotak
Mahindra
Bank Limited
Cash Credit (CC) /
Working Capital
Demand Loan
(WCDL)
225.00 10.75%
p.a.
- CC: On Demand,
WCDL : Maximum
tenor 180 days
Refer
note a
IndusInd Bank
Limited
Cash Credit (CC) /
Working Capital
Demand Loan
(WCDL)
850.00 10.60%
p.a.
- CC: On Demand,
WCDL : Maximum
tenor 180 days
Refer
note a
IndusInd Bank
Limited
Short Term Loans
(STL)
100.00 At agreed
rate
- On due dates Refer
note a
HDFC Bank
Limited
Cash Credit (CC) 700.00 11.10%
p.a.
4.30 On demand Refer
note a
HDFC Bank
Limited
Short Term Loans
(STL)
350.00 At agreed
rate
- Maximum tenor : 180
days
Refer
note a
Yes Bank
Limited
Cash Credit (CC) /
Working Capital
Demand Loan
(WCDL)
450.00 11.25%
p.a.
- CC: On Demand,
WCDL : Maximum
tenor 180 days
Refer
note a
ICICI Bank
Limited
Cash Credit (CC) /
Working Capital
Demand Loan
(WCDL)
100.00 11.35%
p.a.
- CC: On Demand,
WCDL : Maximum
tenor 180 days
Refer
note a
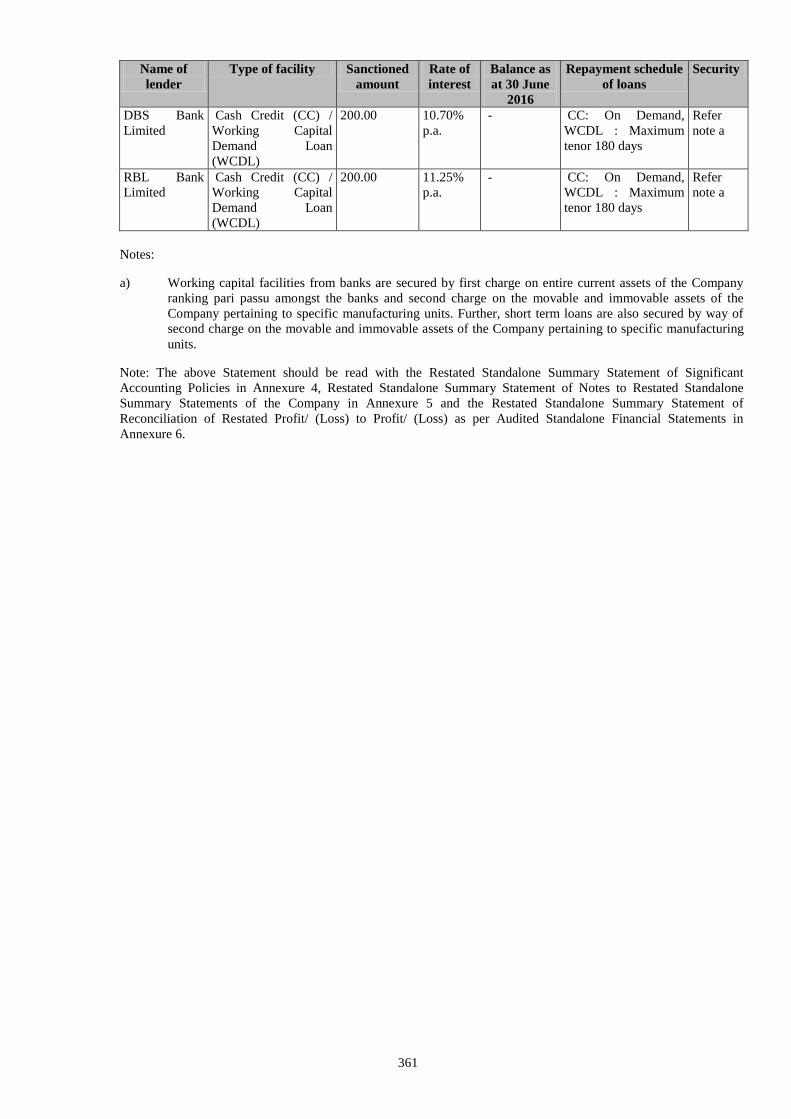
361
Name of
lender
Type of facility Sanctioned
amount
Rate of
interest
Balance as
at 30 June
2016
Repayment schedule
of loans
Security
DBS Bank
Limited
Cash Credit (CC) /
Working Capital
Demand Loan
(WCDL)
200.00 10.70%
p.a.
- CC: On Demand,
WCDL : Maximum
tenor 180 days
Refer
note a
RBL Bank
Limited
Cash Credit (CC) /
Working Capital
Demand Loan
(WCDL)
200.00 11.25%
p.a.
- CC: On Demand,
WCDL : Maximum
tenor 180 days
Refer
note a
Notes:
a) Working capital facilities from banks are secured by first charge on entire current assets of the Company
ranking pari passu amongst the banks and second charge on the movable and immovable assets of the
Company pertaining to specific manufacturing units. Further, short term loans are also secured by way of
second charge on the movable and immovable assets of the Company pertaining to specific manufacturing
units.
Note: The above Statement should be read with the Restated Standalone Summary Statement of Significant
Accounting Policies in Annexure 4, Restated Standalone Summary Statement of Notes to Restated Standalone
Summary Statements of the Company in Annexure 5 and the Restated Standalone Summary Statement of
Reconciliation of Restated Profit/ (Loss) to Profit/ (Loss) as per Audited Standalone Financial Statements in
Annexure 6.
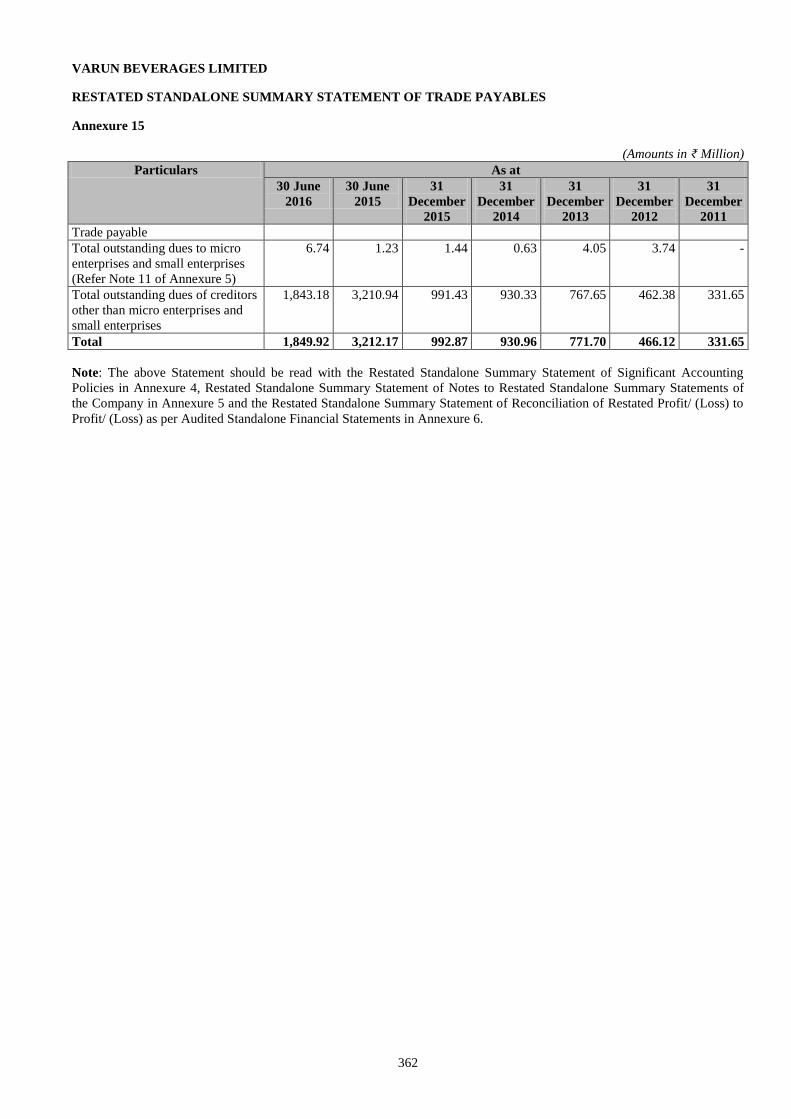
362
VARUN BEVERAGES LIMITED
RESTATED STANDALONE SUMMARY STATEMENT OF TRADE PAYABLES
Annexure 15
(Amounts in ₹ Million)
Particulars As at
30 June
2016
30 June
2015
31
December
2015
31
December
2014
31
December
2013
31
December
2012
31
December
2011
Trade payable
Total outstanding dues to micro
enterprises and small enterprises
(Refer Note 11 of Annexure 5)
6.74 1.23 1.44 0.63 4.05 3.74 -
Total outstanding dues of creditors
other than micro enterprises and
small enterprises
1,843.18 3,210.94 991.43 930.33 767.65 462.38 331.65
Total 1,849.92 3,212.17 992.87 930.96 771.70 466.12 331.65
Note: The above Statement should be read with the Restated Standalone Summary Statement of Significant Accounting
Policies in Annexure 4, Restated Standalone Summary Statement of Notes to Restated Standalone Summary Statements of
the Company in Annexure 5 and the Restated Standalone Summary Statement of Reconciliation of Restated Profit/ (Loss) to
Profit/ (Loss) as per Audited Standalone Financial Statements in Annexure 6.
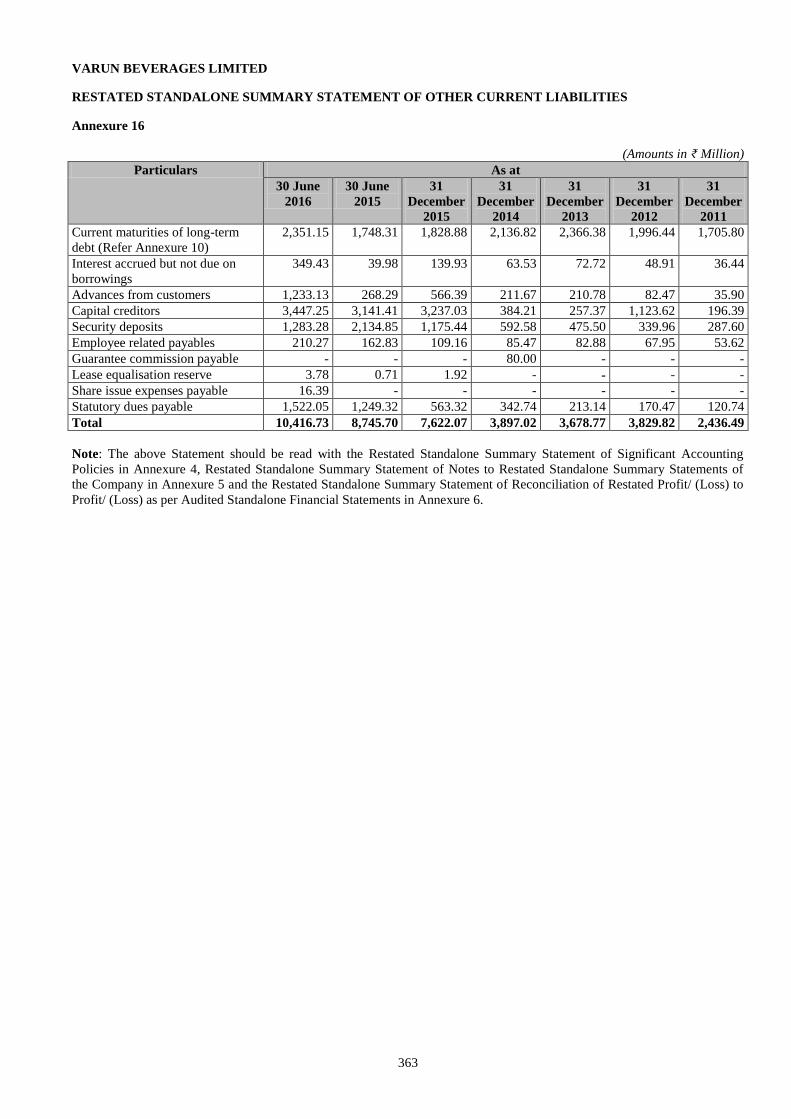
363
VARUN BEVERAGES LIMITED
RESTATED STANDALONE SUMMARY STATEMENT OF OTHER CURRENT LIABILITIES
Annexure 16
(Amounts in ₹ Million)
Particulars As at
30 June
2016
30 June
2015
31
December
2015
31
December
2014
31
December
2013
31
December
2012
31
December
2011
Current maturities of long-term
debt (Refer Annexure 10)
2,351.15 1,748.31 1,828.88 2,136.82 2,366.38 1,996.44 1,705.80
Interest accrued but not due on
borrowings
349.43 39.98 139.93 63.53 72.72 48.91 36.44
Advances from customers 1,233.13 268.29 566.39 211.67 210.78 82.47 35.90
Capital creditors 3,447.25 3,141.41 3,237.03 384.21 257.37 1,123.62 196.39
Security deposits 1,283.28 2,134.85 1,175.44 592.58 475.50 339.96 287.60
Employee related payables 210.27 162.83 109.16 85.47 82.88 67.95 53.62
Guarantee commission payable - - - 80.00 - - -
Lease equalisation reserve 3.78 0.71 1.92 - - - -
Share issue expenses payable 16.39 - - - - - -
Statutory dues payable 1,522.05 1,249.32 563.32 342.74 213.14 170.47 120.74
Total 10,416.73 8,745.70 7,622.07 3,897.02 3,678.77 3,829.82 2,436.49
Note: The above Statement should be read with the Restated Standalone Summary Statement of Significant Accounting
Policies in Annexure 4, Restated Standalone Summary Statement of Notes to Restated Standalone Summary Statements of
the Company in Annexure 5 and the Restated Standalone Summary Statement of Reconciliation of Restated Profit/ (Loss) to
Profit/ (Loss) as per Audited Standalone Financial Statements in Annexure 6.
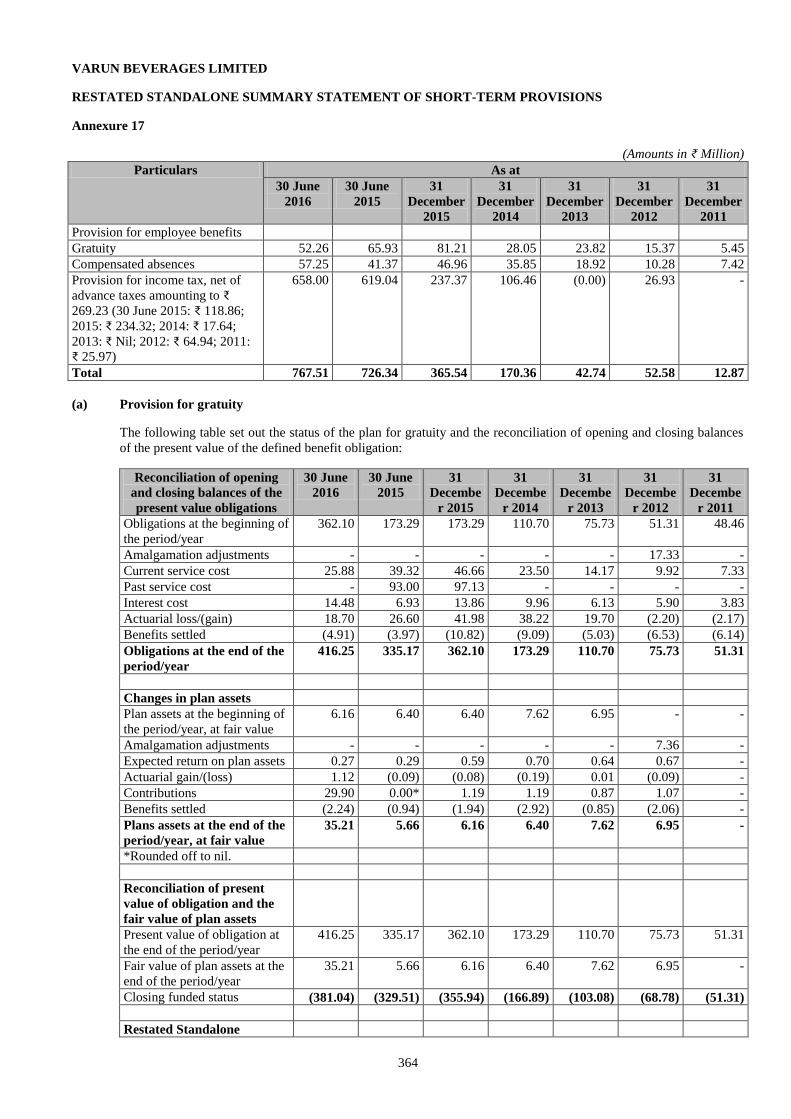
364
VARUN BEVERAGES LIMITED
RESTATED STANDALONE SUMMARY STATEMENT OF SHORT-TERM PROVISIONS
Annexure 17
(Amounts in ₹ Million)
Particulars As at
30 June
2016
30 June
2015
31
December
2015
31
December
2014
31
December
2013
31
December
2012
31
December
2011
Provision for employee benefits
Gratuity 52.26 65.93 81.21 28.05 23.82 15.37 5.45
Compensated absences 57.25 41.37 46.96 35.85 18.92 10.28 7.42
Provision for income tax, net of
advance taxes amounting to ₹
269.23 (30 June 2015: ₹ 118.86;
2015: ₹ 234.32; 2014: ₹ 17.64;
2013: ₹ Nil; 2012: ₹ 64.94; 2011:
₹ 25.97)
658.00 619.04 237.37 106.46 (0.00) 26.93 -
Total 767.51 726.34 365.54 170.36 42.74 52.58 12.87
(a) Provision for gratuity
The following table set out the status of the plan for gratuity and the reconciliation of opening and closing balances
of the present value of the defined benefit obligation:
Reconciliation of opening
and closing balances of the
present value obligations
30 June
2016
30 June
2015
31
Decembe
r 2015
31
Decembe
r 2014
31
Decembe
r 2013
31
Decembe
r 2012
31
Decembe
r 2011
Obligations at the beginning of
the period/year
362.10 173.29 173.29 110.70 75.73 51.31 48.46
Amalgamation adjustments - - - - - 17.33 -
Current service cost 25.88 39.32 46.66 23.50 14.17 9.92 7.33
Past service cost - 93.00 97.13 - - - -
Interest cost 14.48 6.93 13.86 9.96 6.13 5.90 3.83
Actuarial loss/(gain) 18.70 26.60 41.98 38.22 19.70 (2.20) (2.17)
Benefits settled (4.91) (3.97) (10.82) (9.09) (5.03) (6.53) (6.14)
Obligations at the end of the
period/year
416.25 335.17 362.10 173.29 110.70 75.73 51.31
Changes in plan assets
Plan assets at the beginning of
the period/year, at fair value
6.16 6.40 6.40 7.62 6.95 - -
Amalgamation adjustments - - - - - 7.36 -
Expected return on plan assets 0.27 0.29 0.59 0.70 0.64 0.67 -
Actuarial gain/(loss) 1.12 (0.09) (0.08) (0.19) 0.01 (0.09) -
Contributions 29.90 0.00* 1.19 1.19 0.87 1.07 -
Benefits settled (2.24) (0.94) (1.94) (2.92) (0.85) (2.06) -
Plans assets at the end of the
period/year, at fair value
35.21 5.66 6.16 6.40 7.62 6.95 -
*Rounded off to nil.
Reconciliation of present
value of obligation and the
fair value of plan assets
Present value of obligation at
the end of the period/year
416.25 335.17 362.10 173.29 110.70 75.73 51.31
Fair value of plan assets at the
end of the period/year
35.21 5.66 6.16 6.40 7.62 6.95 -
Closing funded status (381.04) (329.51) (355.94) (166.89) (103.08) (68.78) (51.31)
Restated Standalone
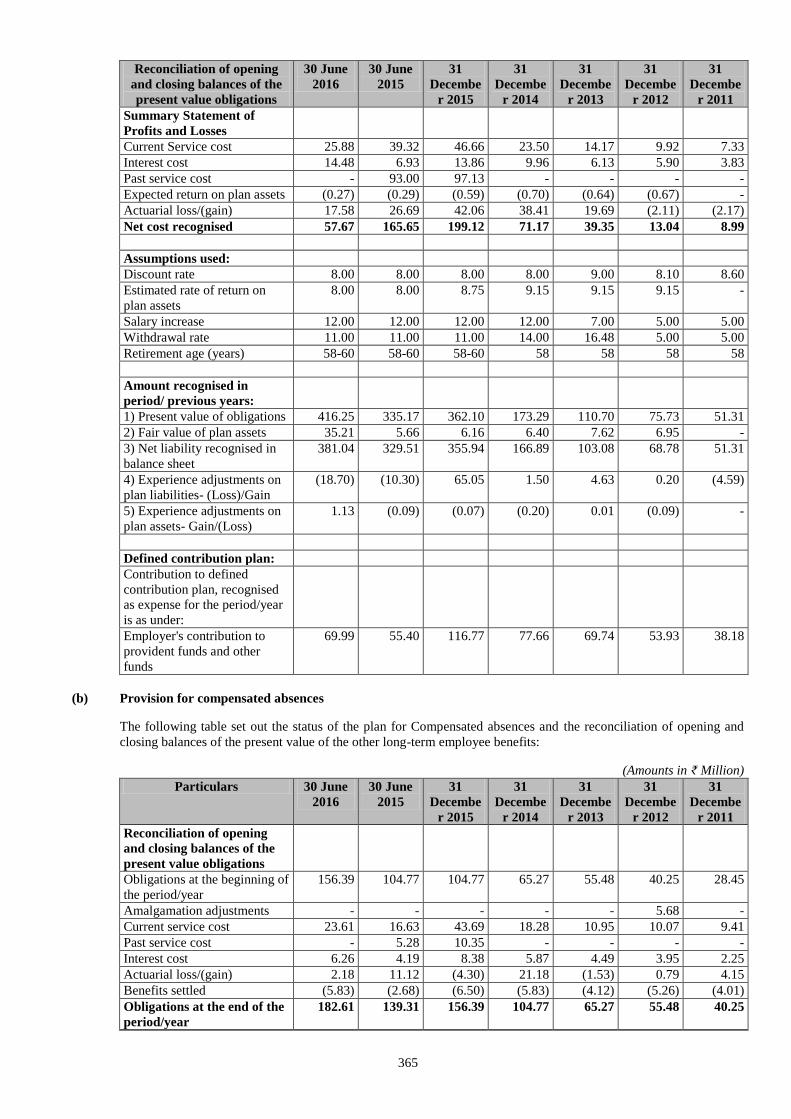
365
Reconciliation of opening
and closing balances of the
present value obligations
30 June
2016
30 June
2015
31
Decembe
r 2015
31
Decembe
r 2014
31
Decembe
r 2013
31
Decembe
r 2012
31
Decembe
r 2011
Summary Statement of
Profits and Losses
Current Service cost 25.88 39.32 46.66 23.50 14.17 9.92 7.33
Interest cost 14.48 6.93 13.86 9.96 6.13 5.90 3.83
Past service cost - 93.00 97.13 - - - -
Expected return on plan assets (0.27) (0.29) (0.59) (0.70) (0.64) (0.67) -
Actuarial loss/(gain) 17.58 26.69 42.06 38.41 19.69 (2.11) (2.17)
Net cost recognised 57.67 165.65 199.12 71.17 39.35 13.04 8.99
Assumptions used:
Discount rate 8.00 8.00 8.00 8.00 9.00 8.10 8.60
Estimated rate of return on
plan assets
8.00 8.00 8.75 9.15 9.15 9.15 -
Salary increase 12.00 12.00 12.00 12.00 7.00 5.00 5.00
Withdrawal rate 11.00 11.00 11.00 14.00 16.48 5.00 5.00
Retirement age (years) 58-60 58-60 58-60 58 58 58 58
Amount recognised in
period/ previous years:
1) Present value of obligations 416.25 335.17 362.10 173.29 110.70 75.73 51.31
2) Fair value of plan assets 35.21 5.66 6.16 6.40 7.62 6.95 -
3) Net liability recognised in
balance sheet
381.04 329.51 355.94 166.89 103.08 68.78 51.31
4) Experience adjustments on
plan liabilities- (Loss)/Gain
(18.70) (10.30) 65.05 1.50 4.63 0.20 (4.59)
5) Experience adjustments on
plan assets- Gain/(Loss)
1.13 (0.09) (0.07) (0.20) 0.01 (0.09) -
Defined contribution plan:
Contribution to defined
contribution plan, recognised
as expense for the period/year
is as under:
Employer's contribution to
provident funds and other
funds
69.99 55.40 116.77 77.66 69.74 53.93 38.18
(b) Provision for compensated absences
The following table set out the status of the plan for Compensated absences and the reconciliation of opening and
closing balances of the present value of the other long-term employee benefits:
(Amounts in ₹ Million)
Particulars 30 June
2016
30 June
2015
31
Decembe
r 2015
31
Decembe
r 2014
31
Decembe
r 2013
31
Decembe
r 2012
31
Decembe
r 2011
Reconciliation of opening
and closing balances of the
present value obligations
Obligations at the beginning of
the period/year
156.39 104.77 104.77 65.27 55.48 40.25 28.45
Amalgamation adjustments - - - - - 5.68 -
Current service cost 23.61 16.63 43.69 18.28 10.95 10.07 9.41
Past service cost - 5.28 10.35 - - - -
Interest cost 6.26 4.19 8.38 5.87 4.49 3.95 2.25
Actuarial loss/(gain) 2.18 11.12 (4.30) 21.18 (1.53) 0.79 4.15
Benefits settled (5.83) (2.68) (6.50) (5.83) (4.12) (5.26) (4.01)
Obligations at the end of the
period/year
182.61 139.31 156.39 104.77 65.27 55.48 40.25
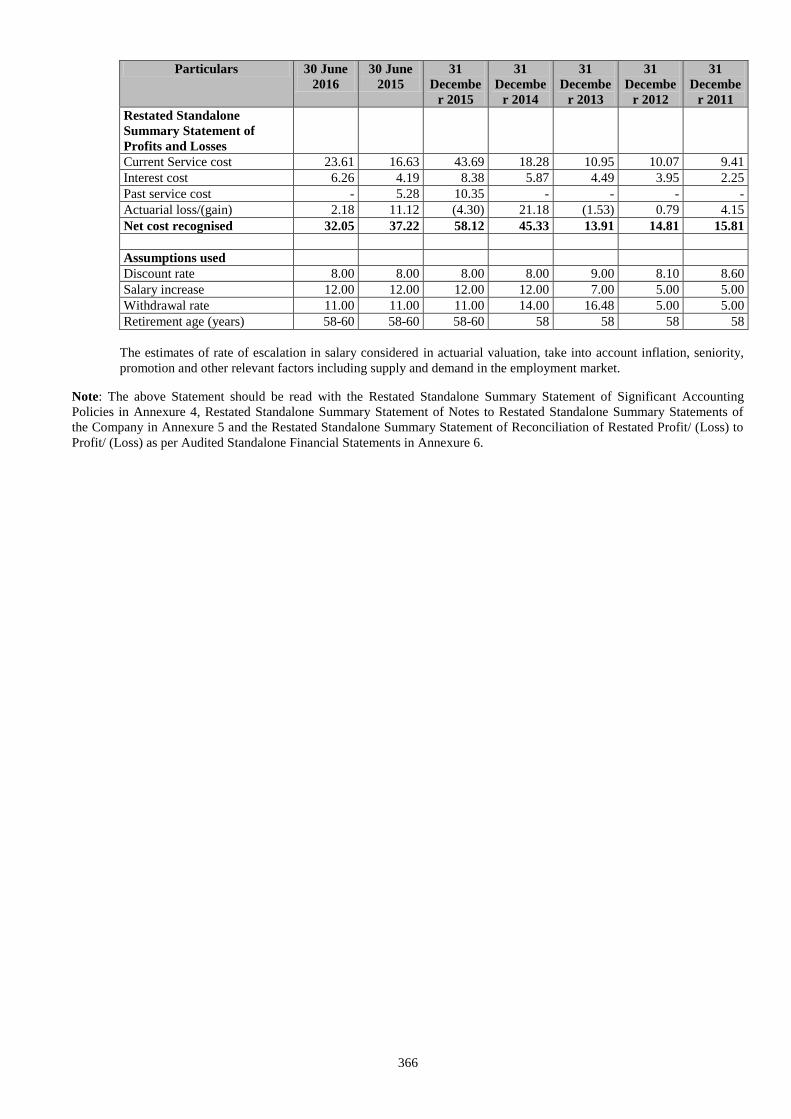
366
Particulars 30 June
2016
30 June
2015
31
Decembe
r 2015
31
Decembe
r 2014
31
Decembe
r 2013
31
Decembe
r 2012
31
Decembe
r 2011
Restated Standalone
Summary Statement of
Profits and Losses
Current Service cost 23.61 16.63 43.69 18.28 10.95 10.07 9.41
Interest cost 6.26 4.19 8.38 5.87 4.49 3.95 2.25
Past service cost - 5.28 10.35 - - - -
Actuarial loss/(gain) 2.18 11.12 (4.30) 21.18 (1.53) 0.79 4.15
Net cost recognised 32.05 37.22 58.12 45.33 13.91 14.81 15.81
Assumptions used
Discount rate 8.00 8.00 8.00 8.00 9.00 8.10 8.60
Salary increase 12.00 12.00 12.00 12.00 7.00 5.00 5.00
Withdrawal rate 11.00 11.00 11.00 14.00 16.48 5.00 5.00
Retirement age (years) 58-60 58-60 58-60 58 58 58 58
The estimates of rate of escalation in salary considered in actuarial valuation, take into account inflation, seniority,
promotion and other relevant factors including supply and demand in the employment market.
Note: The above Statement should be read with the Restated Standalone Summary Statement of Significant Accounting
Policies in Annexure 4, Restated Standalone Summary Statement of Notes to Restated Standalone Summary Statements of
the Company in Annexure 5 and the Restated Standalone Summary Statement of Reconciliation of Restated Profit/ (Loss) to
Profit/ (Loss) as per Audited Standalone Financial Statements in Annexure 6.
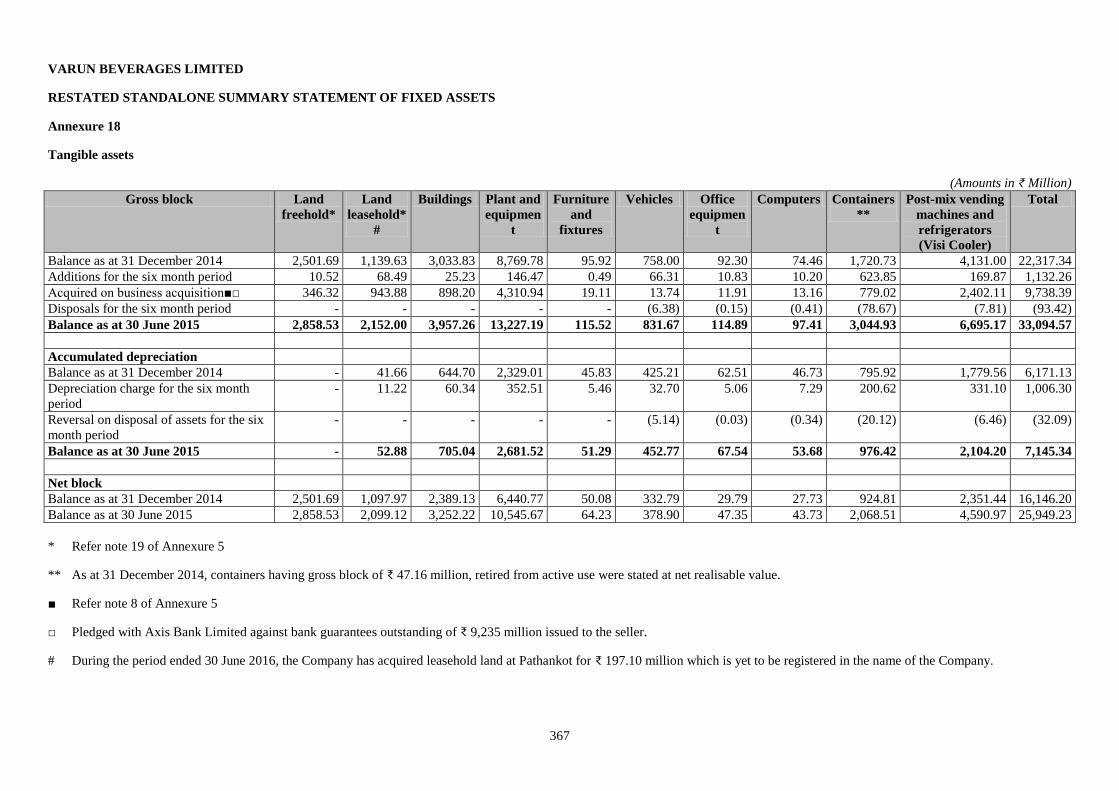
367
VARUN BEVERAGES LIMITED
RESTATED STANDALONE SUMMARY STATEMENT OF FIXED ASSETS
Annexure 18
Tangible assets
(Amounts in ₹ Million)
Gross block Land
freehold*
Land
leasehold*
#
Buildings Plant and
equipmen
t
Furniture
and
fixtures
Vehicles Office
equipmen
t
Computers Containers
**
Post-mix vending
machines and
refrigerators
(Visi Cooler)
Total
Balance as at 31 December 2014 2,501.69 1,139.63 3,033.83 8,769.78 95.92 758.00 92.30 74.46 1,720.73 4,131.00 22,317.34
Additions for the six month period 10.52 68.49 25.23 146.47 0.49 66.31 10.83 10.20 623.85 169.87 1,132.26
Acquired on business acquisition■□ 346.32 943.88 898.20 4,310.94 19.11 13.74 11.91 13.16 779.02 2,402.11 9,738.39
Disposals for the six month period - - - - - (6.38) (0.15) (0.41) (78.67) (7.81) (93.42)
Balance as at 30 June 2015 2,858.53 2,152.00 3,957.26 13,227.19 115.52 831.67 114.89 97.41 3,044.93 6,695.17 33,094.57
Accumulated depreciation
Balance as at 31 December 2014 - 41.66 644.70 2,329.01 45.83 425.21 62.51 46.73 795.92 1,779.56 6,171.13
Depreciation charge for the six month
period
- 11.22 60.34 352.51 5.46 32.70 5.06 7.29 200.62 331.10 1,006.30
Reversal on disposal of assets for the six
month period
- - - - - (5.14) (0.03) (0.34) (20.12) (6.46) (32.09)
Balance as at 30 June 2015 - 52.88 705.04 2,681.52 51.29 452.77 67.54 53.68 976.42 2,104.20 7,145.34
Net block
Balance as at 31 December 2014 2,501.69 1,097.97 2,389.13 6,440.77 50.08 332.79 29.79 27.73 924.81 2,351.44 16,146.20
Balance as at 30 June 2015 2,858.53 2,099.12 3,252.22 10,545.67 64.23 378.90 47.35 43.73 2,068.51 4,590.97 25,949.23
* Refer note 19 of Annexure 5
** As at 31 December 2014, containers having gross block of ₹ 47.16 million, retired from active use were stated at net realisable value.
■ Refer note 8 of Annexure 5
□ Pledged with Axis Bank Limited against bank guarantees outstanding of ₹ 9,235 million issued to the seller.
# During the period ended 30 June 2016, the Company has acquired leasehold land at Pathankot for ₹ 197.10 million which is yet to be registered in the name of the Company.
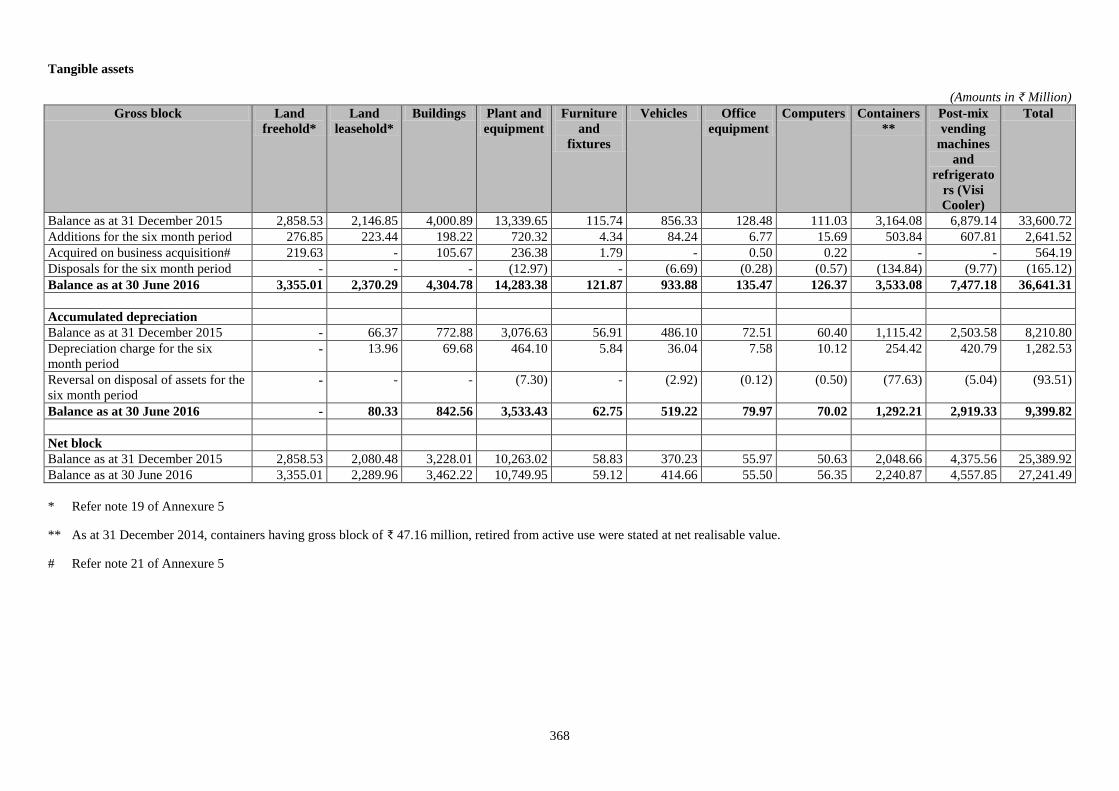
368
Tangible assets
(Amounts in ₹ Million)
Gross block Land
freehold*
Land
leasehold*
Buildings Plant and
equipment
Furniture
and
fixtures
Vehicles Office
equipment
Computers Containers
**
Post-mix
vending
machines
and
refrigerato
rs (Visi
Cooler)
Total
Balance as at 31 December 2015 2,858.53 2,146.85 4,000.89 13,339.65 115.74 856.33 128.48 111.03 3,164.08 6,879.14 33,600.72
Additions for the six month period 276.85 223.44 198.22 720.32 4.34 84.24 6.77 15.69 503.84 607.81 2,641.52
Acquired on business acquisition# 219.63 - 105.67 236.38 1.79 - 0.50 0.22 - - 564.19
Disposals for the six month period - - - (12.97) - (6.69) (0.28) (0.57) (134.84) (9.77) (165.12)
Balance as at 30 June 2016 3,355.01 2,370.29 4,304.78 14,283.38 121.87 933.88 135.47 126.37 3,533.08 7,477.18 36,641.31
Accumulated depreciation
Balance as at 31 December 2015 - 66.37 772.88 3,076.63 56.91 486.10 72.51 60.40 1,115.42 2,503.58 8,210.80
Depreciation charge for the six
month period - 13.96 69.68 464.10 5.84 36.04 7.58 10.12 254.42 420.79 1,282.53
Reversal on disposal of assets for the
six month period - - - (7.30) - (2.92) (0.12) (0.50) (77.63) (5.04) (93.51)
Balance as at 30 June 2016 - 80.33 842.56 3,533.43 62.75 519.22 79.97 70.02 1,292.21 2,919.33 9,399.82
Net block
Balance as at 31 December 2015 2,858.53 2,080.48 3,228.01 10,263.02 58.83 370.23 55.97 50.63 2,048.66 4,375.56 25,389.92
Balance as at 30 June 2016 3,355.01 2,289.96 3,462.22 10,749.95 59.12 414.66 55.50 56.35 2,240.87 4,557.85 27,241.49
* Refer note 19 of Annexure 5
** As at 31 December 2014, containers having gross block of ₹ 47.16 million, retired from active use were stated at net realisable value.
# Refer note 21 of Annexure 5
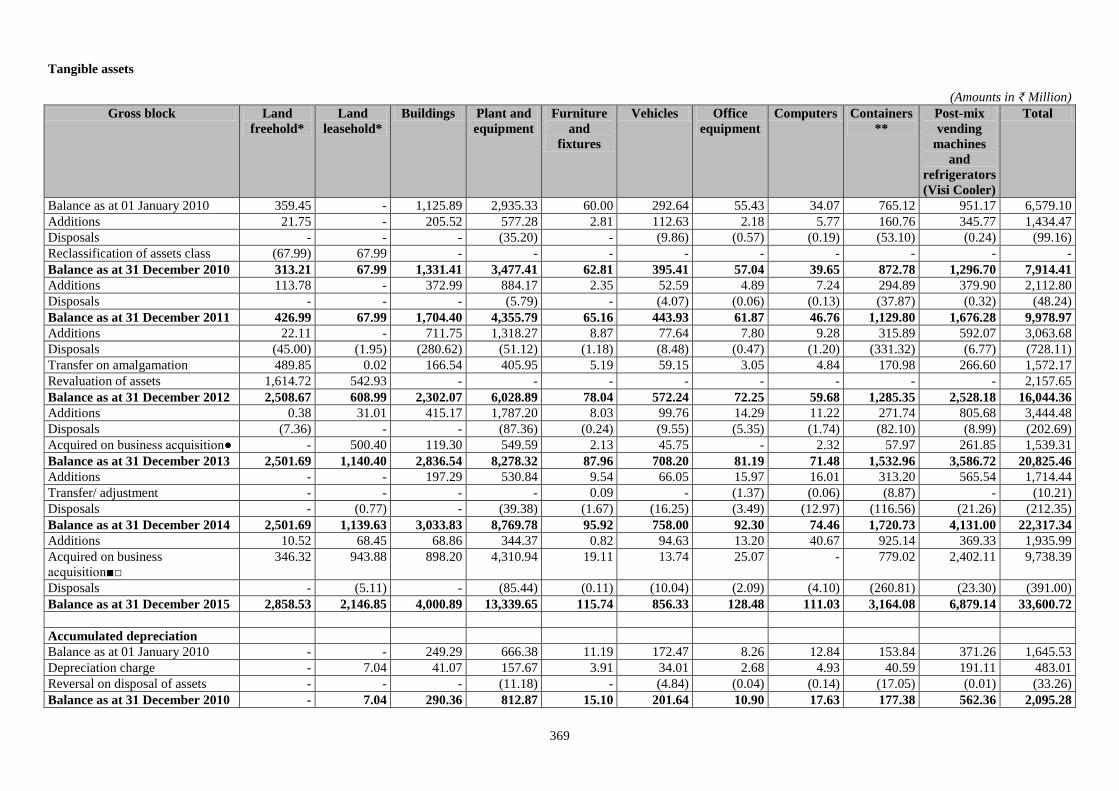
369
Tangible assets
(Amounts in ₹ Million)
Gross block Land
freehold*
Land
leasehold*
Buildings Plant and
equipment
Furniture
and
fixtures
Vehicles Office
equipment
Computers Containers
**
Post-mix
vending
machines
and
refrigerators
(Visi Cooler)
Total
Balance as at 01 January 2010 359.45 - 1,125.89 2,935.33 60.00 292.64 55.43 34.07 765.12 951.17 6,579.10
Additions 21.75 - 205.52 577.28 2.81 112.63 2.18 5.77 160.76 345.77 1,434.47
Disposals - - - (35.20) - (9.86) (0.57) (0.19) (53.10) (0.24) (99.16)
Reclassification of assets class (67.99) 67.99 - - - - - - - - -
Balance as at 31 December 2010 313.21 67.99 1,331.41 3,477.41 62.81 395.41 57.04 39.65 872.78 1,296.70 7,914.41
Additions 113.78 - 372.99 884.17 2.35 52.59 4.89 7.24 294.89 379.90 2,112.80
Disposals - - - (5.79) - (4.07) (0.06) (0.13) (37.87) (0.32) (48.24)
Balance as at 31 December 2011 426.99 67.99 1,704.40 4,355.79 65.16 443.93 61.87 46.76 1,129.80 1,676.28 9,978.97
Additions 22.11 - 711.75 1,318.27 8.87 77.64 7.80 9.28 315.89 592.07 3,063.68
Disposals (45.00) (1.95) (280.62) (51.12) (1.18) (8.48) (0.47) (1.20) (331.32) (6.77) (728.11)
Transfer on amalgamation 489.85 0.02 166.54 405.95 5.19 59.15 3.05 4.84 170.98 266.60 1,572.17
Revaluation of assets 1,614.72 542.93 - - - - - - - - 2,157.65
Balance as at 31 December 2012 2,508.67 608.99 2,302.07 6,028.89 78.04 572.24 72.25 59.68 1,285.35 2,528.18 16,044.36
Additions 0.38 31.01 415.17 1,787.20 8.03 99.76 14.29 11.22 271.74 805.68 3,444.48
Disposals (7.36) - - (87.36) (0.24) (9.55) (5.35) (1.74) (82.10) (8.99) (202.69)
Acquired on business acquisition● - 500.40 119.30 549.59 2.13 45.75 - 2.32 57.97 261.85 1,539.31
Balance as at 31 December 2013 2,501.69 1,140.40 2,836.54 8,278.32 87.96 708.20 81.19 71.48 1,532.96 3,586.72 20,825.46
Additions - - 197.29 530.84 9.54 66.05 15.97 16.01 313.20 565.54 1,714.44
Transfer/ adjustment - - - - 0.09 - (1.37) (0.06) (8.87) - (10.21)
Disposals - (0.77) - (39.38) (1.67) (16.25) (3.49) (12.97) (116.56) (21.26) (212.35)
Balance as at 31 December 2014 2,501.69 1,139.63 3,033.83 8,769.78 95.92 758.00 92.30 74.46 1,720.73 4,131.00 22,317.34
Additions 10.52 68.45 68.86 344.37 0.82 94.63 13.20 40.67 925.14 369.33 1,935.99
Acquired on business
acquisition■□
346.32 943.88 898.20 4,310.94 19.11 13.74 25.07 - 779.02 2,402.11 9,738.39
Disposals - (5.11) - (85.44) (0.11) (10.04) (2.09) (4.10) (260.81) (23.30) (391.00)
Balance as at 31 December 2015 2,858.53 2,146.85 4,000.89 13,339.65 115.74 856.33 128.48 111.03 3,164.08 6,879.14 33,600.72
Accumulated depreciation
Balance as at 01 January 2010 - - 249.29 666.38 11.19 172.47 8.26 12.84 153.84 371.26 1,645.53
Depreciation charge - 7.04 41.07 157.67 3.91 34.01 2.68 4.93 40.59 191.11 483.01
Reversal on disposal of assets - - - (11.18) - (4.84) (0.04) (0.14) (17.05) (0.01) (33.26)
Balance as at 31 December 2010 - 7.04 290.36 812.87 15.10 201.64 10.90 17.63 177.38 562.36 2,095.28
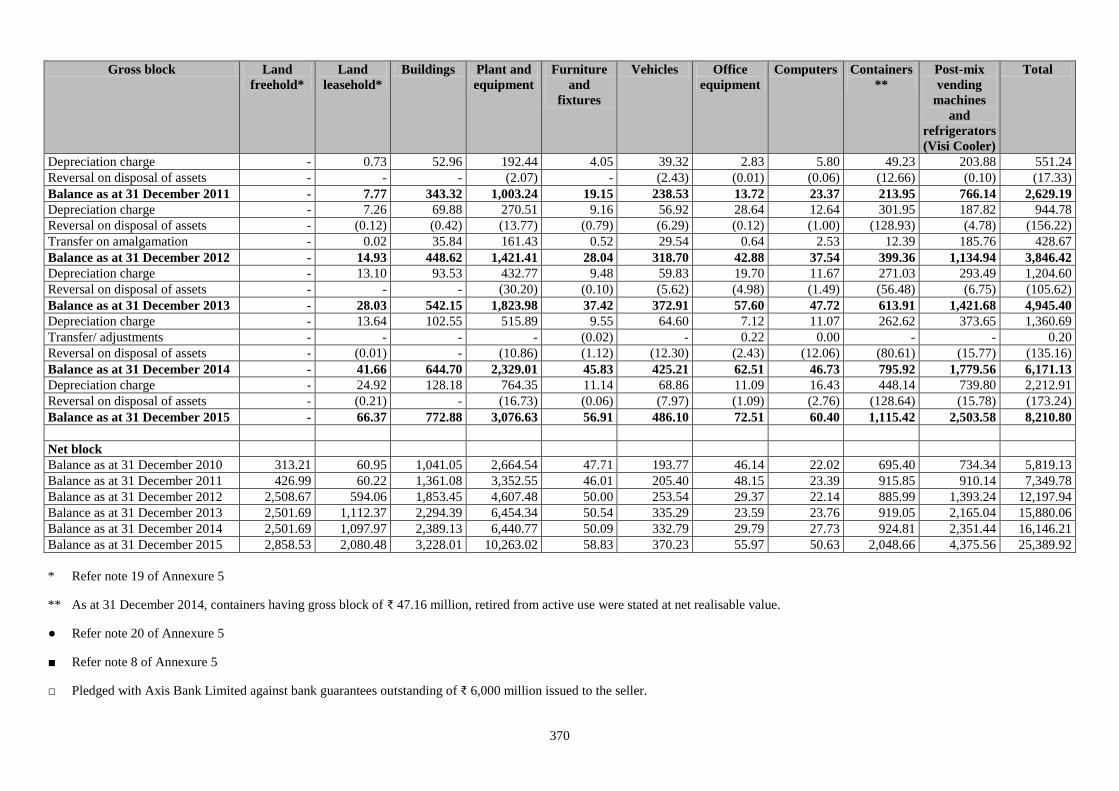
370
Gross block Land
freehold*
Land
leasehold*
Buildings Plant and
equipment
Furniture
and
fixtures
Vehicles Office
equipment
Computers Containers
**
Post-mix
vending
machines
and
refrigerators
(Visi Cooler)
Total
Depreciation charge - 0.73 52.96 192.44 4.05 39.32 2.83 5.80 49.23 203.88 551.24
Reversal on disposal of assets - - - (2.07) - (2.43) (0.01) (0.06) (12.66) (0.10) (17.33)
Balance as at 31 December 2011 - 7.77 343.32 1,003.24 19.15 238.53 13.72 23.37 213.95 766.14 2,629.19
Depreciation charge - 7.26 69.88 270.51 9.16 56.92 28.64 12.64 301.95 187.82 944.78
Reversal on disposal of assets - (0.12) (0.42) (13.77) (0.79) (6.29) (0.12) (1.00) (128.93) (4.78) (156.22)
Transfer on amalgamation - 0.02 35.84 161.43 0.52 29.54 0.64 2.53 12.39 185.76 428.67
Balance as at 31 December 2012 - 14.93 448.62 1,421.41 28.04 318.70 42.88 37.54 399.36 1,134.94 3,846.42
Depreciation charge - 13.10 93.53 432.77 9.48 59.83 19.70 11.67 271.03 293.49 1,204.60
Reversal on disposal of assets - - - (30.20) (0.10) (5.62) (4.98) (1.49) (56.48) (6.75) (105.62)
Balance as at 31 December 2013 - 28.03 542.15 1,823.98 37.42 372.91 57.60 47.72 613.91 1,421.68 4,945.40
Depreciation charge - 13.64 102.55 515.89 9.55 64.60 7.12 11.07 262.62 373.65 1,360.69
Transfer/ adjustments - - - - (0.02) - 0.22 0.00 - - 0.20
Reversal on disposal of assets - (0.01) - (10.86) (1.12) (12.30) (2.43) (12.06) (80.61) (15.77) (135.16)
Balance as at 31 December 2014 - 41.66 644.70 2,329.01 45.83 425.21 62.51 46.73 795.92 1,779.56 6,171.13
Depreciation charge - 24.92 128.18 764.35 11.14 68.86 11.09 16.43 448.14 739.80 2,212.91
Reversal on disposal of assets - (0.21) - (16.73) (0.06) (7.97) (1.09) (2.76) (128.64) (15.78) (173.24)
Balance as at 31 December 2015 - 66.37 772.88 3,076.63 56.91 486.10 72.51 60.40 1,115.42 2,503.58 8,210.80
Net block
Balance as at 31 December 2010 313.21 60.95 1,041.05 2,664.54 47.71 193.77 46.14 22.02 695.40 734.34 5,819.13
Balance as at 31 December 2011 426.99 60.22 1,361.08 3,352.55 46.01 205.40 48.15 23.39 915.85 910.14 7,349.78
Balance as at 31 December 2012 2,508.67 594.06 1,853.45 4,607.48 50.00 253.54 29.37 22.14 885.99 1,393.24 12,197.94
Balance as at 31 December 2013 2,501.69 1,112.37 2,294.39 6,454.34 50.54 335.29 23.59 23.76 919.05 2,165.04 15,880.06
Balance as at 31 December 2014 2,501.69 1,097.97 2,389.13 6,440.77 50.09 332.79 29.79 27.73 924.81 2,351.44 16,146.21
Balance as at 31 December 2015 2,858.53 2,080.48 3,228.01 10,263.02 58.83 370.23 55.97 50.63 2,048.66 4,375.56 25,389.92
* Refer note 19 of Annexure 5
** As at 31 December 2014, containers having gross block of ₹ 47.16 million, retired from active use were stated at net realisable value.
● Refer note 20 of Annexure 5
■ Refer note 8 of Annexure 5
□ Pledged with Axis Bank Limited against bank guarantees outstanding of ₹ 6,000 million issued to the seller.
371
Note: The above Statement should be read with the Restated Standalone Summary Statement of Significant Accounting Policies in Annexure 4, Restated Standalone Summary Statement of
Notes to Restated Standalone Summary Statements of the Company in Annexure 5 and the Restated Standalone Summary Statement of Reconciliation of Restated Profit/ (Loss) to Profit/
(Loss) as per Audited Standalone Financial Statements in Annexure 6.Statements in Annexure 6.
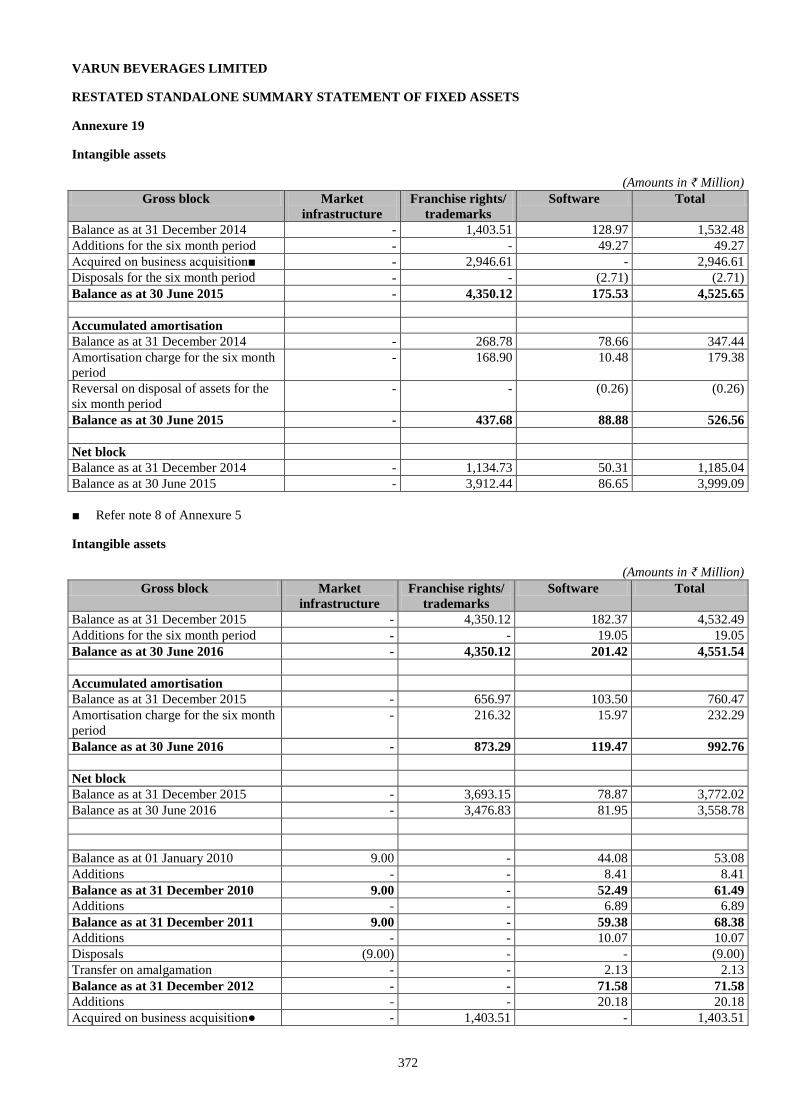
372
VARUN BEVERAGES LIMITED
RESTATED STANDALONE SUMMARY STATEMENT OF FIXED ASSETS
Annexure 19
Intangible assets
(Amounts in ₹ Million)
Gross block Market
infrastructure
Franchise rights/
trademarks
Software Total
Balance as at 31 December 2014 - 1,403.51 128.97 1,532.48
Additions for the six month period - - 49.27 49.27
Acquired on business acquisition■ - 2,946.61 - 2,946.61
Disposals for the six month period - - (2.71) (2.71)
Balance as at 30 June 2015 - 4,350.12 175.53 4,525.65
Accumulated amortisation
Balance as at 31 December 2014 - 268.78 78.66 347.44
Amortisation charge for the six month
period
- 168.90 10.48 179.38
Reversal on disposal of assets for the
six month period
- - (0.26) (0.26)
Balance as at 30 June 2015 - 437.68 88.88 526.56
Net block
Balance as at 31 December 2014 - 1,134.73 50.31 1,185.04
Balance as at 30 June 2015 - 3,912.44 86.65 3,999.09
■ Refer note 8 of Annexure 5
Intangible assets
(Amounts in ₹ Million)
Gross block Market
infrastructure
Franchise rights/
trademarks
Software Total
Balance as at 31 December 2015 - 4,350.12 182.37 4,532.49
Additions for the six month period - - 19.05 19.05
Balance as at 30 June 2016 - 4,350.12 201.42 4,551.54
Accumulated amortisation
Balance as at 31 December 2015 - 656.97 103.50 760.47
Amortisation charge for the six month
period
- 216.32 15.97 232.29
Balance as at 30 June 2016 - 873.29 119.47 992.76
Net block
Balance as at 31 December 2015 - 3,693.15 78.87 3,772.02
Balance as at 30 June 2016 - 3,476.83 81.95 3,558.78
Balance as at 01 January 2010 9.00 - 44.08 53.08
Additions - - 8.41 8.41
Balance as at 31 December 2010 9.00 - 52.49 61.49
Additions - - 6.89 6.89
Balance as at 31 December 2011 9.00 - 59.38 68.38
Additions - - 10.07 10.07
Disposals (9.00) - - (9.00)
Transfer on amalgamation - - 2.13 2.13
Balance as at 31 December 2012 - - 71.58 71.58
Additions - - 20.18 20.18
Acquired on business acquisition● - 1,403.51 - 1,403.51
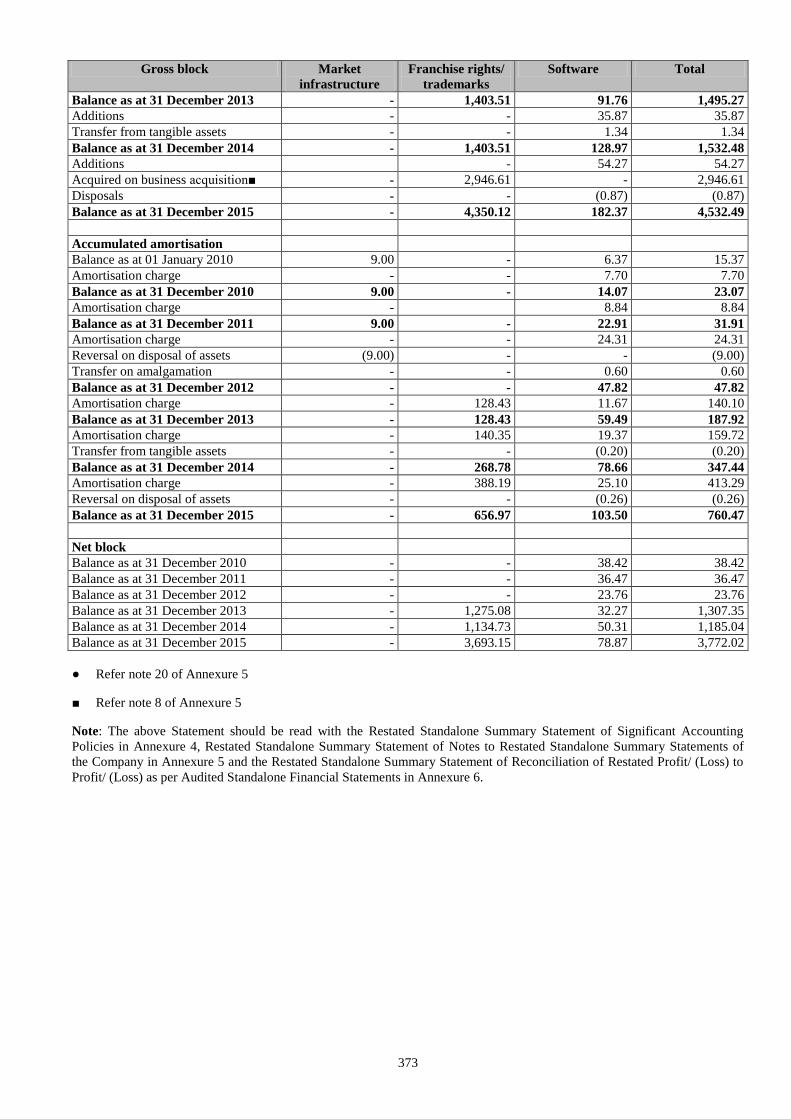
373
Gross block Market
infrastructure
Franchise rights/
trademarks
Software Total
Balance as at 31 December 2013 - 1,403.51 91.76 1,495.27
Additions - - 35.87 35.87
Transfer from tangible assets - - 1.34 1.34
Balance as at 31 December 2014 - 1,403.51 128.97 1,532.48
Additions - 54.27 54.27
Acquired on business acquisition■ - 2,946.61 - 2,946.61
Disposals - - (0.87) (0.87)
Balance as at 31 December 2015 - 4,350.12 182.37 4,532.49
Accumulated amortisation
Balance as at 01 January 2010 9.00 - 6.37 15.37
Amortisation charge - - 7.70 7.70
Balance as at 31 December 2010 9.00 - 14.07 23.07
Amortisation charge - 8.84 8.84
Balance as at 31 December 2011 9.00 - 22.91 31.91
Amortisation charge - - 24.31 24.31
Reversal on disposal of assets (9.00) - - (9.00)
Transfer on amalgamation - - 0.60 0.60
Balance as at 31 December 2012 - - 47.82 47.82
Amortisation charge - 128.43 11.67 140.10
Balance as at 31 December 2013 - 128.43 59.49 187.92
Amortisation charge - 140.35 19.37 159.72
Transfer from tangible assets - - (0.20) (0.20)
Balance as at 31 December 2014 - 268.78 78.66 347.44
Amortisation charge - 388.19 25.10 413.29
Reversal on disposal of assets - - (0.26) (0.26)
Balance as at 31 December 2015 - 656.97 103.50 760.47
Net block
Balance as at 31 December 2010 - - 38.42 38.42
Balance as at 31 December 2011 - - 36.47 36.47
Balance as at 31 December 2012 - - 23.76 23.76
Balance as at 31 December 2013 - 1,275.08 32.27 1,307.35
Balance as at 31 December 2014 - 1,134.73 50.31 1,185.04
Balance as at 31 December 2015 - 3,693.15 78.87 3,772.02
● Refer note 20 of Annexure 5
■ Refer note 8 of Annexure 5
Note: The above Statement should be read with the Restated Standalone Summary Statement of Significant Accounting
Policies in Annexure 4, Restated Standalone Summary Statement of Notes to Restated Standalone Summary Statements of
the Company in Annexure 5 and the Restated Standalone Summary Statement of Reconciliation of Restated Profit/ (Loss) to
Profit/ (Loss) as per Audited Standalone Financial Statements in Annexure 6.
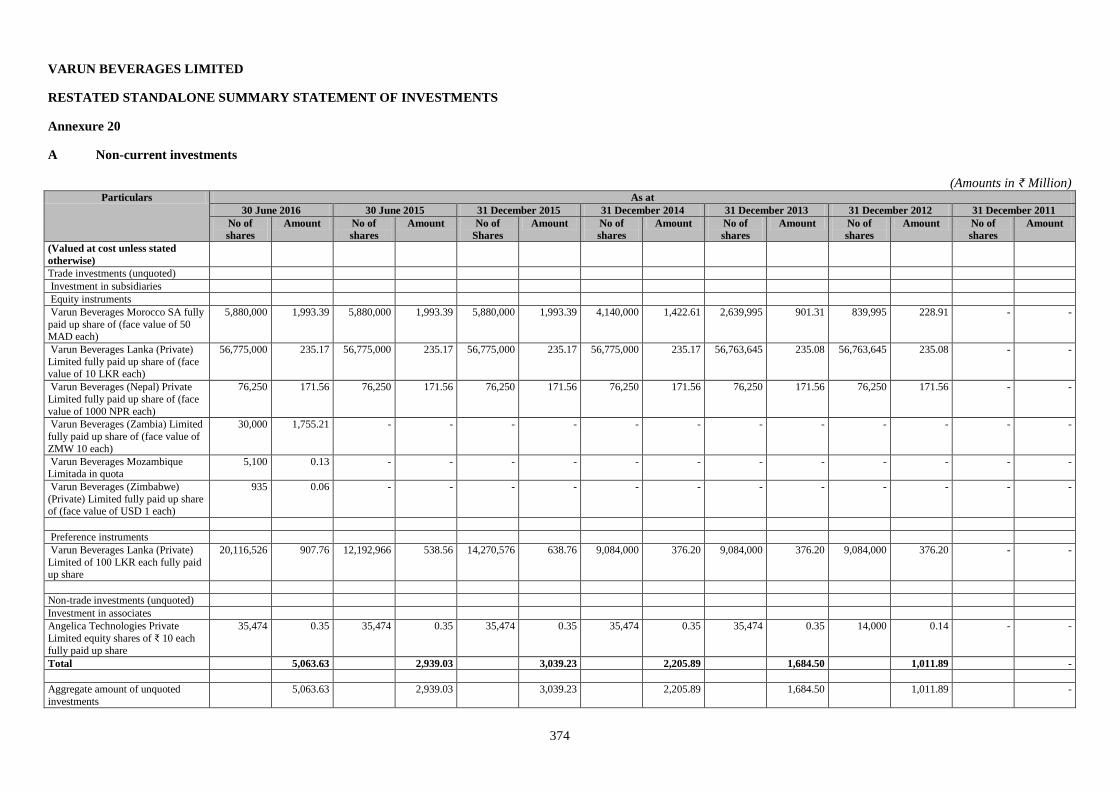
374
VARUN BEVERAGES LIMITED
RESTATED STANDALONE SUMMARY STATEMENT OF INVESTMENTS
Annexure 20
A Non-current investments
(Amounts in ₹ Million) Particulars As at
30 June 2016 30 June 2015 31 December 2015 31 December 2014 31 December 2013 31 December 2012 31 December 2011
No of
shares
Amount No of
shares
Amount No of
Shares
Amount No of
shares
Amount No of
shares
Amount No of
shares
Amount No of
shares
Amount
(Valued at cost unless stated
otherwise)
Trade investments (unquoted)
Investment in subsidiaries
Equity instruments
Varun Beverages Morocco SA fully
paid up share of (face value of 50 MAD each)
5,880,000 1,993.39 5,880,000 1,993.39 5,880,000 1,993.39 4,140,000 1,422.61 2,639,995 901.31 839,995 228.91 - -
Varun Beverages Lanka (Private)
Limited fully paid up share of (face value of 10 LKR each)
56,775,000 235.17 56,775,000 235.17 56,775,000 235.17 56,775,000 235.17 56,763,645 235.08 56,763,645 235.08 - -
Varun Beverages (Nepal) Private
Limited fully paid up share of (face
value of 1000 NPR each)
76,250 171.56 76,250 171.56 76,250 171.56 76,250 171.56 76,250 171.56 76,250 171.56 - -
Varun Beverages (Zambia) Limited
fully paid up share of (face value of
ZMW 10 each)
30,000 1,755.21 - - - - - - - - - - - -
Varun Beverages Mozambique Limitada in quota
5,100 0.13 - - - - - - - - - - - -
Varun Beverages (Zimbabwe)
(Private) Limited fully paid up share of (face value of USD 1 each)
935 0.06 - - - - - - - - - - - -
Preference instruments
Varun Beverages Lanka (Private)
Limited of 100 LKR each fully paid up share
20,116,526 907.76 12,192,966 538.56 14,270,576 638.76 9,084,000 376.20 9,084,000 376.20 9,084,000 376.20 - -
Non-trade investments (unquoted)
Investment in associates
Angelica Technologies Private
Limited equity shares of ₹ 10 each
fully paid up share
35,474 0.35 35,474 0.35 35,474 0.35 35,474 0.35 35,474 0.35 14,000 0.14 - -
Total 5,063.63 2,939.03 3,039.23 2,205.89 1,684.50 1,011.89 -
Aggregate amount of unquoted
investments
5,063.63 2,939.03 3,039.23 2,205.89 1,684.50 1,011.89 -
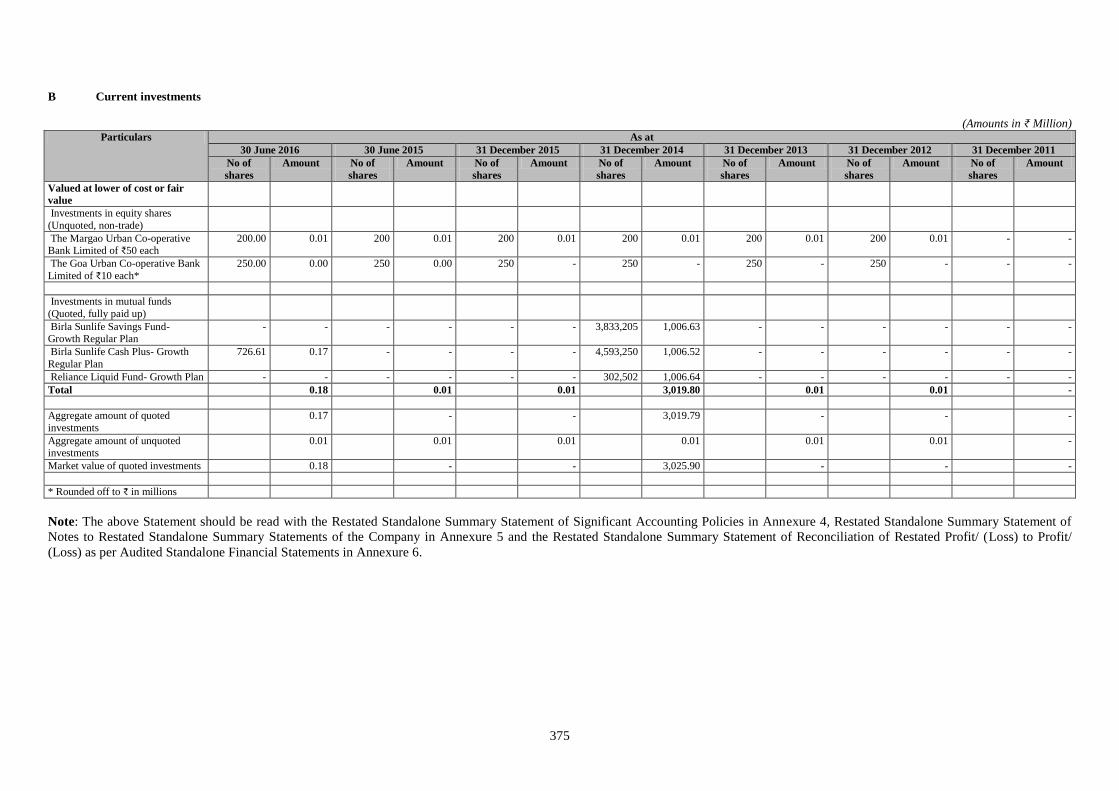
375
B Current investments
(Amounts in ₹ Million) Particulars As at
30 June 2016 30 June 2015 31 December 2015 31 December 2014 31 December 2013 31 December 2012 31 December 2011
No of
shares
Amount No of
shares
Amount No of
shares
Amount No of
shares
Amount No of
shares
Amount No of
shares
Amount No of
shares
Amount
Valued at lower of cost or fair
value
Investments in equity shares
(Unquoted, non-trade)
The Margao Urban Co-operative Bank Limited of ₹50 each
200.00 0.01 200 0.01 200 0.01 200 0.01 200 0.01 200 0.01 - -
The Goa Urban Co-operative Bank
Limited of ₹10 each*
250.00 0.00 250 0.00 250 - 250 - 250 - 250 - - -
Investments in mutual funds
(Quoted, fully paid up)
Birla Sunlife Savings Fund- Growth Regular Plan
- - - - - - 3,833,205 1,006.63 - - - - - -
Birla Sunlife Cash Plus- Growth
Regular Plan
726.61 0.17 - - - - 4,593,250 1,006.52 - - - - - -
Reliance Liquid Fund- Growth Plan - - - - - - 302,502 1,006.64 - - - - - -
Total 0.18 0.01 0.01 3,019.80 0.01 0.01 -
Aggregate amount of quoted
investments
0.17 - - 3,019.79 - - -
Aggregate amount of unquoted investments
0.01 0.01 0.01 0.01 0.01 0.01 -
Market value of quoted investments 0.18 - - 3,025.90 - - -
* Rounded off to ₹ in millions
Note: The above Statement should be read with the Restated Standalone Summary Statement of Significant Accounting Policies in Annexure 4, Restated Standalone Summary Statement of
Notes to Restated Standalone Summary Statements of the Company in Annexure 5 and the Restated Standalone Summary Statement of Reconciliation of Restated Profit/ (Loss) to Profit/
(Loss) as per Audited Standalone Financial Statements in Annexure 6.
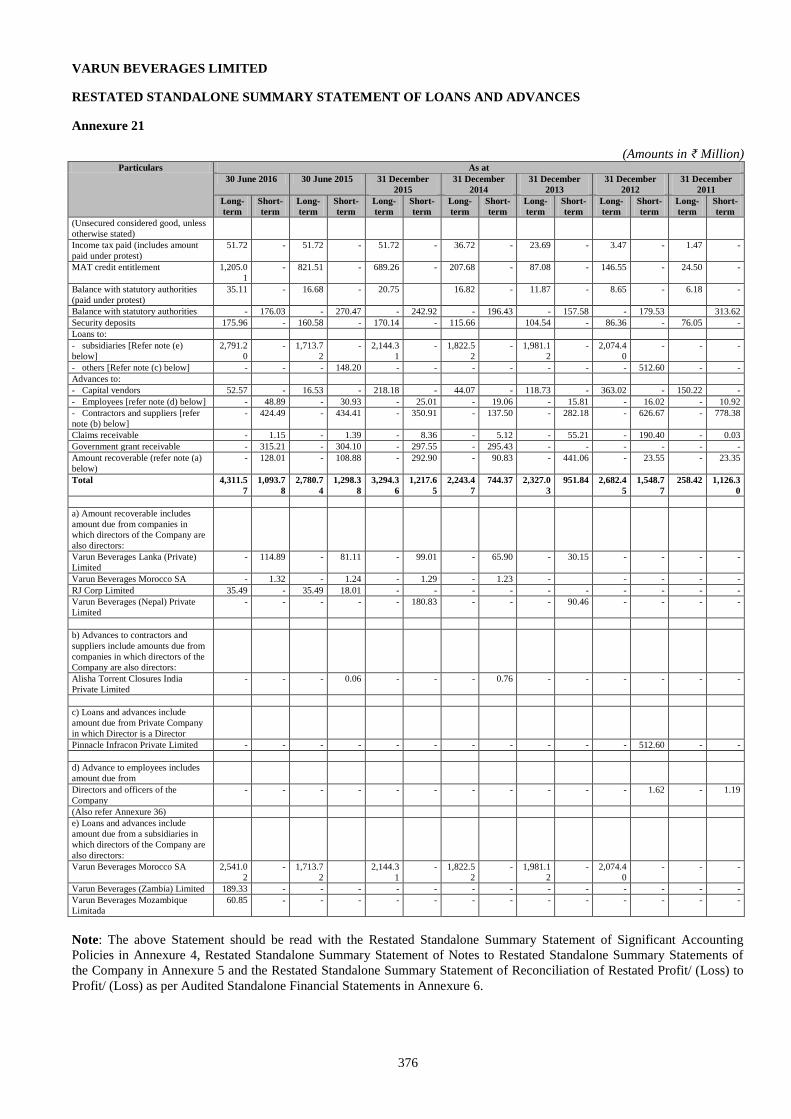
376
VARUN BEVERAGES LIMITED
RESTATED STANDALONE SUMMARY STATEMENT OF LOANS AND ADVANCES
Annexure 21
(Amounts in ₹ Million) Particulars As at
30 June 2016 30 June 2015 31 December
2015
31 December
2014
31 December
2013
31 December
2012
31 December
2011
Long-
term
Short-
term
Long-
term
Short-
term
Long-
term
Short-
term
Long-
term
Short-
term
Long-
term
Short-
term
Long-
term
Short-
term
Long-
term
Short-
term
(Unsecured considered good, unless
otherwise stated)
Income tax paid (includes amount
paid under protest)
51.72 - 51.72 - 51.72 - 36.72 - 23.69 - 3.47 - 1.47 -
MAT credit entitlement 1,205.0
1
- 821.51 - 689.26 - 207.68 - 87.08 - 146.55 - 24.50 -
Balance with statutory authorities
(paid under protest)
35.11 - 16.68 - 20.75 16.82 - 11.87 - 8.65 - 6.18 -
Balance with statutory authorities - 176.03 - 270.47 - 242.92 - 196.43 - 157.58 - 179.53 313.62
Security deposits 175.96 - 160.58 - 170.14 - 115.66 104.54 - 86.36 - 76.05 -
Loans to:
- subsidiaries [Refer note (e)
below]
2,791.2
0
- 1,713.7
2
- 2,144.3
1
- 1,822.5
2
- 1,981.1
2
- 2,074.4
0
- - -
- others [Refer note (c) below] - - - 148.20 - - - - - - - 512.60 - -
Advances to:
- Capital vendors 52.57 - 16.53 - 218.18 - 44.07 - 118.73 - 363.02 - 150.22 -
- Employees [refer note (d) below] - 48.89 - 30.93 - 25.01 - 19.06 - 15.81 - 16.02 - 10.92
- Contractors and suppliers [refer
note (b) below]
- 424.49 - 434.41 - 350.91 - 137.50 - 282.18 - 626.67 - 778.38
Claims receivable - 1.15 - 1.39 - 8.36 - 5.12 - 55.21 - 190.40 - 0.03
Government grant receivable - 315.21 - 304.10 - 297.55 - 295.43 - - - - - -
Amount recoverable (refer note (a)
below)
- 128.01 - 108.88 - 292.90 - 90.83 - 441.06 - 23.55 - 23.35
Total 4,311.5
7
1,093.7
8
2,780.7
4
1,298.3
8
3,294.3
6
1,217.6
5
2,243.4
7
744.37 2,327.0
3
951.84 2,682.4
5
1,548.7
7
258.42 1,126.3
0
a) Amount recoverable includes
amount due from companies in
which directors of the Company are
also directors:
Varun Beverages Lanka (Private)
Limited
- 114.89 - 81.11 - 99.01 - 65.90 - 30.15 - - - -
Varun Beverages Morocco SA - 1.32 - 1.24 - 1.29 - 1.23 - - - - -
RJ Corp Limited 35.49 - 35.49 18.01 - - - - - - - - - -
Varun Beverages (Nepal) Private
Limited
- - - - - 180.83 - - - 90.46 - - - -
b) Advances to contractors and
suppliers include amounts due from
companies in which directors of the
Company are also directors:
Alisha Torrent Closures India
Private Limited
- - - 0.06 - - - 0.76 - - - - - -
c) Loans and advances include
amount due from Private Company
in which Director is a Director
Pinnacle Infracon Private Limited - - - - - - - - - - - 512.60 - -
d) Advance to employees includes
amount due from
Directors and officers of the
Company
- - - - - - - - - - - 1.62 - 1.19
(Also refer Annexure 36)
e) Loans and advances include
amount due from a subsidiaries in
which directors of the Company are
also directors:
Varun Beverages Morocco SA 2,541.0
2
- 1,713.7
2
2,144.3
1
- 1,822.5
2
- 1,981.1
2
- 2,074.4
0
- - -
Varun Beverages (Zambia) Limited 189.33 - - - - - - - - - - - - -
Varun Beverages Mozambique
Limitada
60.85 - - - - - - - - - - - - -
Note: The above Statement should be read with the Restated Standalone Summary Statement of Significant Accounting
Policies in Annexure 4, Restated Standalone Summary Statement of Notes to Restated Standalone Summary Statements of
the Company in Annexure 5 and the Restated Standalone Summary Statement of Reconciliation of Restated Profit/ (Loss) to
Profit/ (Loss) as per Audited Standalone Financial Statements in Annexure 6.
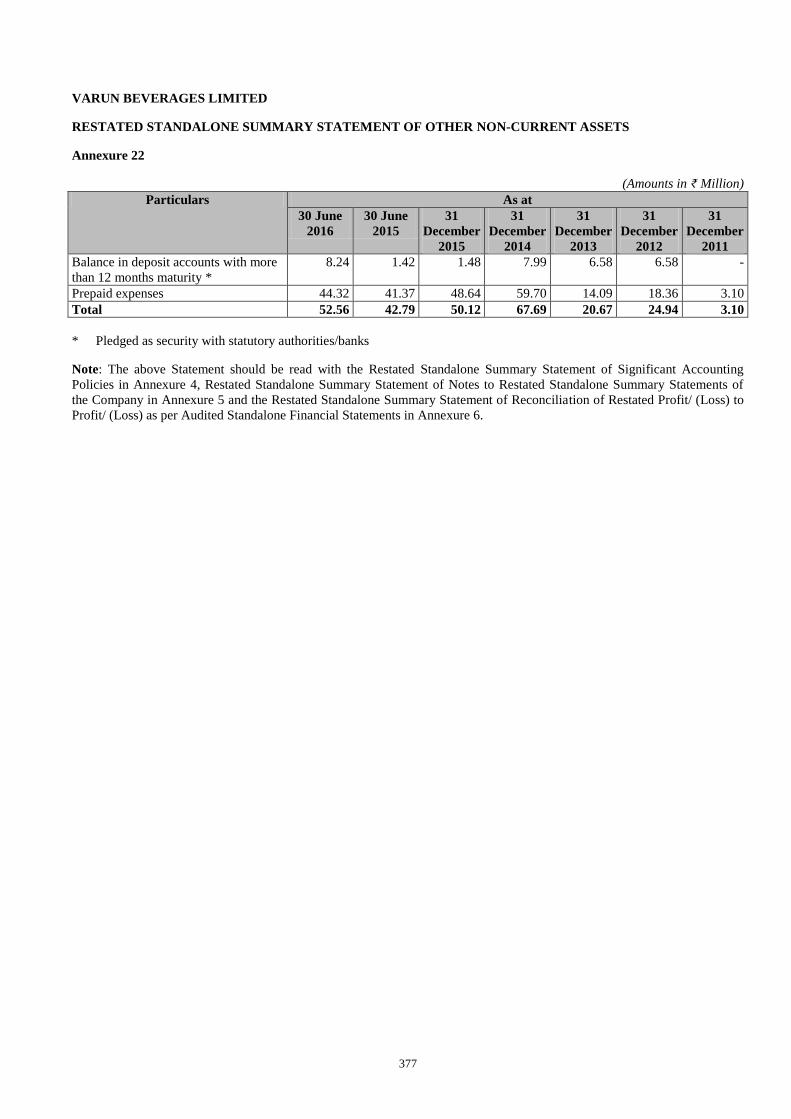
377
VARUN BEVERAGES LIMITED
RESTATED STANDALONE SUMMARY STATEMENT OF OTHER NON-CURRENT ASSETS
Annexure 22
(Amounts in ₹ Million)
Particulars As at
30 June
2016
30 June
2015
31
December
2015
31
December
2014
31
December
2013
31
December
2012
31
December
2011
Balance in deposit accounts with more
than 12 months maturity *
8.24 1.42 1.48 7.99 6.58 6.58 -
Prepaid expenses 44.32 41.37 48.64 59.70 14.09 18.36 3.10
Total 52.56 42.79 50.12 67.69 20.67 24.94 3.10
* Pledged as security with statutory authorities/banks
Note: The above Statement should be read with the Restated Standalone Summary Statement of Significant Accounting
Policies in Annexure 4, Restated Standalone Summary Statement of Notes to Restated Standalone Summary Statements of
the Company in Annexure 5 and the Restated Standalone Summary Statement of Reconciliation of Restated Profit/ (Loss) to
Profit/ (Loss) as per Audited Standalone Financial Statements in Annexure 6.
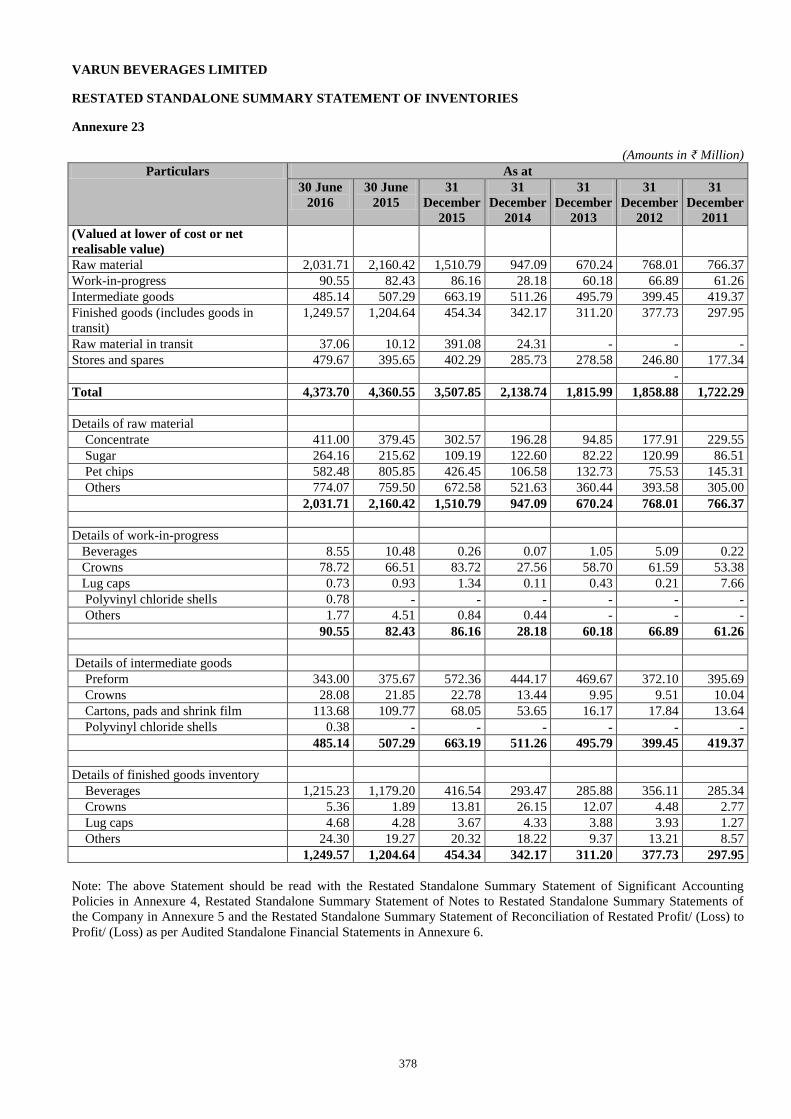
378
VARUN BEVERAGES LIMITED
RESTATED STANDALONE SUMMARY STATEMENT OF INVENTORIES
Annexure 23
(Amounts in ₹ Million)
Particulars As at
30 June
2016
30 June
2015
31
December
2015
31
December
2014
31
December
2013
31
December
2012
31
December
2011
(Valued at lower of cost or net
realisable value)
Raw material 2,031.71 2,160.42 1,510.79 947.09 670.24 768.01 766.37
Work-in-progress 90.55 82.43 86.16 28.18 60.18 66.89 61.26
Intermediate goods 485.14 507.29 663.19 511.26 495.79 399.45 419.37
Finished goods (includes goods in
transit)
1,249.57 1,204.64 454.34 342.17 311.20 377.73 297.95
Raw material in transit 37.06 10.12 391.08 24.31 - - -
Stores and spares 479.67 395.65 402.29 285.73 278.58 246.80 177.34
-
Total 4,373.70 4,360.55 3,507.85 2,138.74 1,815.99 1,858.88 1,722.29
Details of raw material
Concentrate 411.00 379.45 302.57 196.28 94.85 177.91 229.55
Sugar 264.16 215.62 109.19 122.60 82.22 120.99 86.51
Pet chips 582.48 805.85 426.45 106.58 132.73 75.53 145.31
Others 774.07 759.50 672.58 521.63 360.44 393.58 305.00
2,031.71 2,160.42 1,510.79 947.09 670.24 768.01 766.37
Details of work-in-progress
Beverages 8.55 10.48 0.26 0.07 1.05 5.09 0.22
Crowns 78.72 66.51 83.72 27.56 58.70 61.59 53.38
Lug caps 0.73 0.93 1.34 0.11 0.43 0.21 7.66
Polyvinyl chloride shells 0.78 - - - - - -
Others 1.77 4.51 0.84 0.44 - - -
90.55 82.43 86.16 28.18 60.18 66.89 61.26
Details of intermediate goods
Preform 343.00 375.67 572.36 444.17 469.67 372.10 395.69
Crowns 28.08 21.85 22.78 13.44 9.95 9.51 10.04
Cartons, pads and shrink film 113.68 109.77 68.05 53.65 16.17 17.84 13.64
Polyvinyl chloride shells 0.38 - - - - - -
485.14 507.29 663.19 511.26 495.79 399.45 419.37
Details of finished goods inventory
Beverages 1,215.23 1,179.20 416.54 293.47 285.88 356.11 285.34
Crowns 5.36 1.89 13.81 26.15 12.07 4.48 2.77
Lug caps 4.68 4.28 3.67 4.33 3.88 3.93 1.27
Others 24.30 19.27 20.32 18.22 9.37 13.21 8.57
1,249.57 1,204.64 454.34 342.17 311.20 377.73 297.95
Note: The above Statement should be read with the Restated Standalone Summary Statement of Significant Accounting
Policies in Annexure 4, Restated Standalone Summary Statement of Notes to Restated Standalone Summary Statements of
the Company in Annexure 5 and the Restated Standalone Summary Statement of Reconciliation of Restated Profit/ (Loss) to
Profit/ (Loss) as per Audited Standalone Financial Statements in Annexure 6.
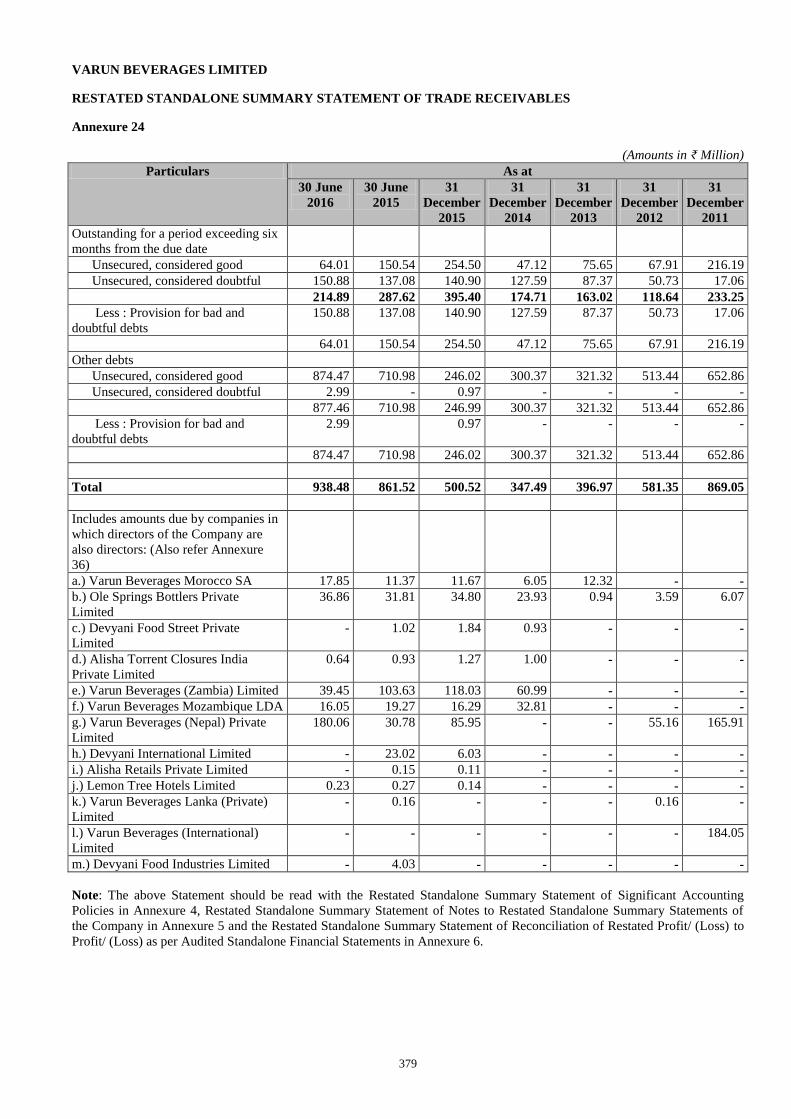
379
VARUN BEVERAGES LIMITED
RESTATED STANDALONE SUMMARY STATEMENT OF TRADE RECEIVABLES
Annexure 24
(Amounts in ₹ Million)
Particulars As at
30 June
2016
30 June
2015
31
December
2015
31
December
2014
31
December
2013
31
December
2012
31
December
2011
Outstanding for a period exceeding six
months from the due date
Unsecured, considered good 64.01 150.54 254.50 47.12 75.65 67.91 216.19
Unsecured, considered doubtful 150.88 137.08 140.90 127.59 87.37 50.73 17.06
214.89 287.62 395.40 174.71 163.02 118.64 233.25
Less : Provision for bad and
doubtful debts
150.88 137.08 140.90 127.59 87.37 50.73 17.06
64.01 150.54 254.50 47.12 75.65 67.91 216.19
Other debts
Unsecured, considered good 874.47 710.98 246.02 300.37 321.32 513.44 652.86
Unsecured, considered doubtful 2.99 - 0.97 - - - -
877.46 710.98 246.99 300.37 321.32 513.44 652.86
Less : Provision for bad and
doubtful debts
2.99 0.97 - - - -
874.47 710.98 246.02 300.37 321.32 513.44 652.86
Total 938.48 861.52 500.52 347.49 396.97 581.35 869.05
Includes amounts due by companies in
which directors of the Company are
also directors: (Also refer Annexure
36)
a.) Varun Beverages Morocco SA 17.85 11.37 11.67 6.05 12.32 - -
b.) Ole Springs Bottlers Private
Limited
36.86 31.81 34.80 23.93 0.94 3.59 6.07
c.) Devyani Food Street Private
Limited
- 1.02 1.84 0.93 - - -
d.) Alisha Torrent Closures India
Private Limited
0.64 0.93 1.27 1.00 - - -
e.) Varun Beverages (Zambia) Limited 39.45 103.63 118.03 60.99 - - -
f.) Varun Beverages Mozambique LDA 16.05 19.27 16.29 32.81 - - -
g.) Varun Beverages (Nepal) Private
Limited
180.06 30.78 85.95 - - 55.16 165.91
h.) Devyani International Limited - 23.02 6.03 - - - -
i.) Alisha Retails Private Limited - 0.15 0.11 - - - -
j.) Lemon Tree Hotels Limited 0.23 0.27 0.14 - - - -
k.) Varun Beverages Lanka (Private)
Limited - 0.16 - - - 0.16 -
l.) Varun Beverages (International)
Limited - - - - - - 184.05
m.) Devyani Food Industries Limited - 4.03 - - - - -
Note: The above Statement should be read with the Restated Standalone Summary Statement of Significant Accounting
Policies in Annexure 4, Restated Standalone Summary Statement of Notes to Restated Standalone Summary Statements of
the Company in Annexure 5 and the Restated Standalone Summary Statement of Reconciliation of Restated Profit/ (Loss) to
Profit/ (Loss) as per Audited Standalone Financial Statements in Annexure 6.
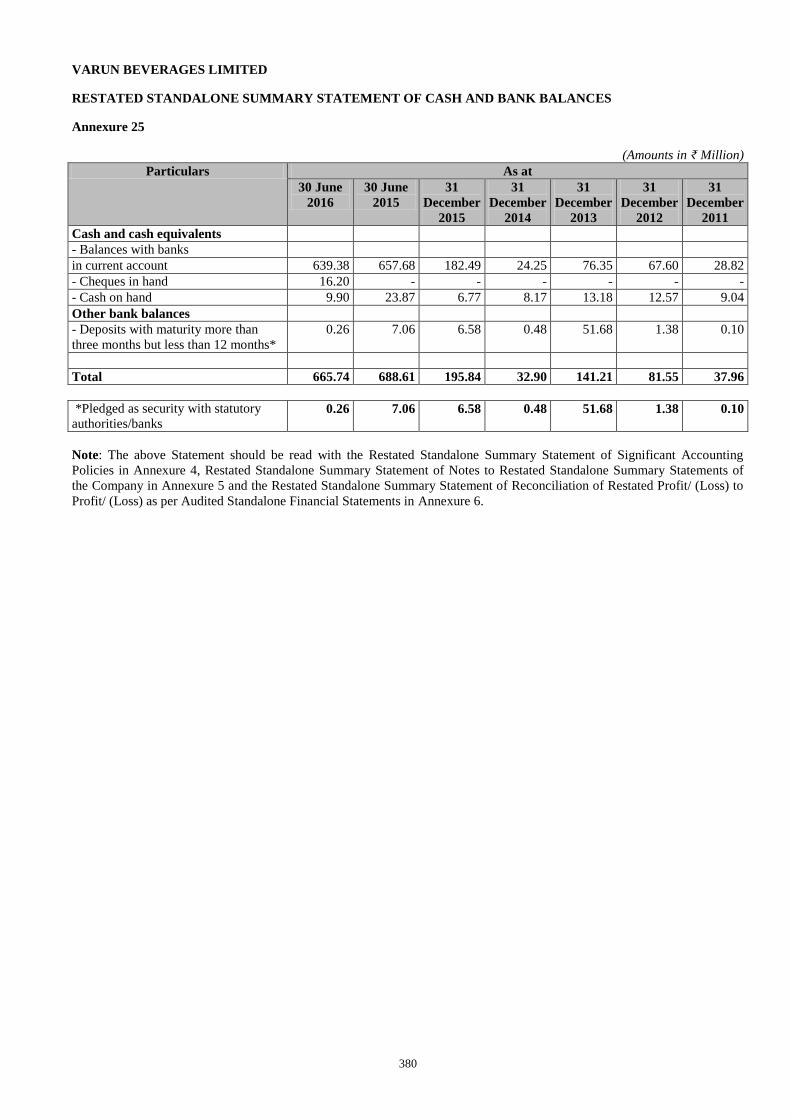
380
VARUN BEVERAGES LIMITED
RESTATED STANDALONE SUMMARY STATEMENT OF CASH AND BANK BALANCES
Annexure 25
(Amounts in ₹ Million)
Particulars As at
30 June
2016
30 June
2015
31
December
2015
31
December
2014
31
December
2013
31
December
2012
31
December
2011
Cash and cash equivalents
- Balances with banks
in current account 639.38 657.68 182.49 24.25 76.35 67.60 28.82
- Cheques in hand 16.20 - - - - - -
- Cash on hand 9.90 23.87 6.77 8.17 13.18 12.57 9.04
Other bank balances
- Deposits with maturity more than
three months but less than 12 months*
0.26 7.06 6.58 0.48 51.68 1.38 0.10
Total 665.74 688.61 195.84 32.90 141.21 81.55 37.96
*Pledged as security with statutory
authorities/banks 0.26 7.06 6.58 0.48 51.68 1.38 0.10
Note: The above Statement should be read with the Restated Standalone Summary Statement of Significant Accounting
Policies in Annexure 4, Restated Standalone Summary Statement of Notes to Restated Standalone Summary Statements of
the Company in Annexure 5 and the Restated Standalone Summary Statement of Reconciliation of Restated Profit/ (Loss) to
Profit/ (Loss) as per Audited Standalone Financial Statements in Annexure 6.
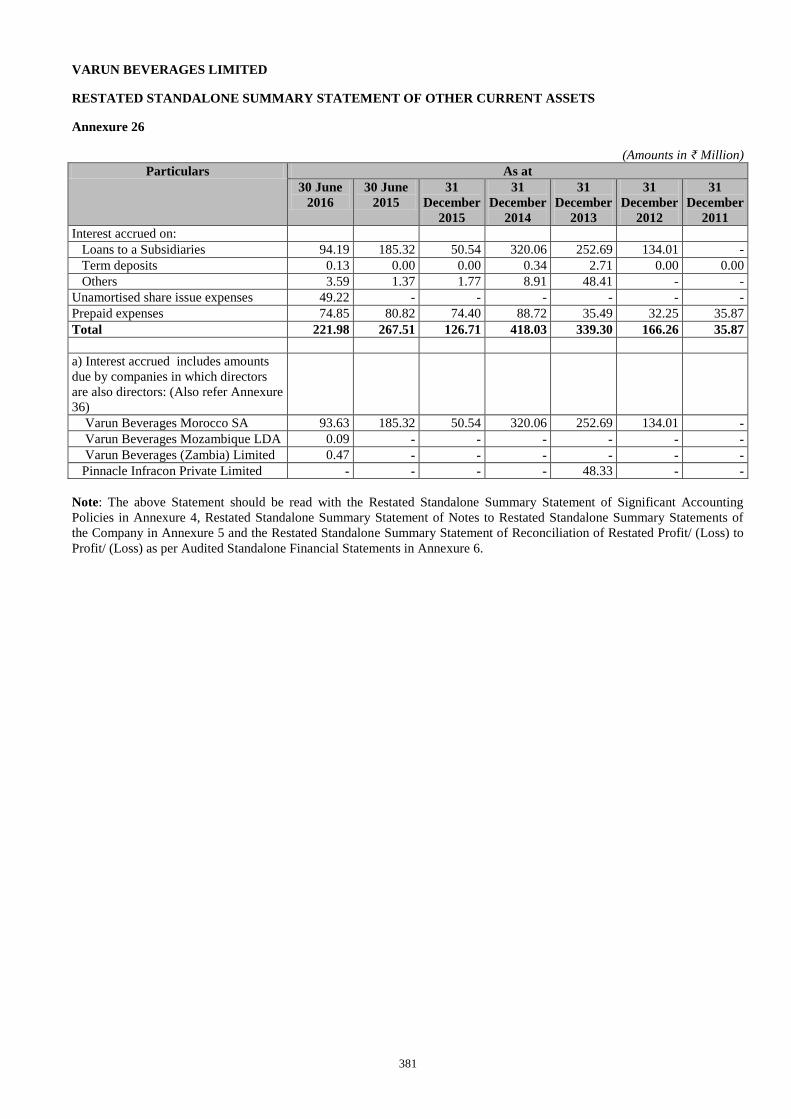
381
VARUN BEVERAGES LIMITED
RESTATED STANDALONE SUMMARY STATEMENT OF OTHER CURRENT ASSETS
Annexure 26
(Amounts in ₹ Million)
Particulars As at
30 June
2016
30 June
2015
31
December
2015
31
December
2014
31
December
2013
31
December
2012
31
December
2011
Interest accrued on:
Loans to a Subsidiaries 94.19 185.32 50.54 320.06 252.69 134.01 -
Term deposits 0.13 0.00 0.00 0.34 2.71 0.00 0.00
Others 3.59 1.37 1.77 8.91 48.41 - -
Unamortised share issue expenses 49.22 - - - - - -
Prepaid expenses 74.85 80.82 74.40 88.72 35.49 32.25 35.87
Total 221.98 267.51 126.71 418.03 339.30 166.26 35.87
a) Interest accrued includes amounts
due by companies in which directors
are also directors: (Also refer Annexure
36)
Varun Beverages Morocco SA 93.63 185.32 50.54 320.06 252.69 134.01 -
Varun Beverages Mozambique LDA 0.09 - - - - - -
Varun Beverages (Zambia) Limited 0.47 - - - - - -
Pinnacle Infracon Private Limited - - - - 48.33 - -
Note: The above Statement should be read with the Restated Standalone Summary Statement of Significant Accounting
Policies in Annexure 4, Restated Standalone Summary Statement of Notes to Restated Standalone Summary Statements of
the Company in Annexure 5 and the Restated Standalone Summary Statement of Reconciliation of Restated Profit/ (Loss) to
Profit/ (Loss) as per Audited Standalone Financial Statements in Annexure 6.
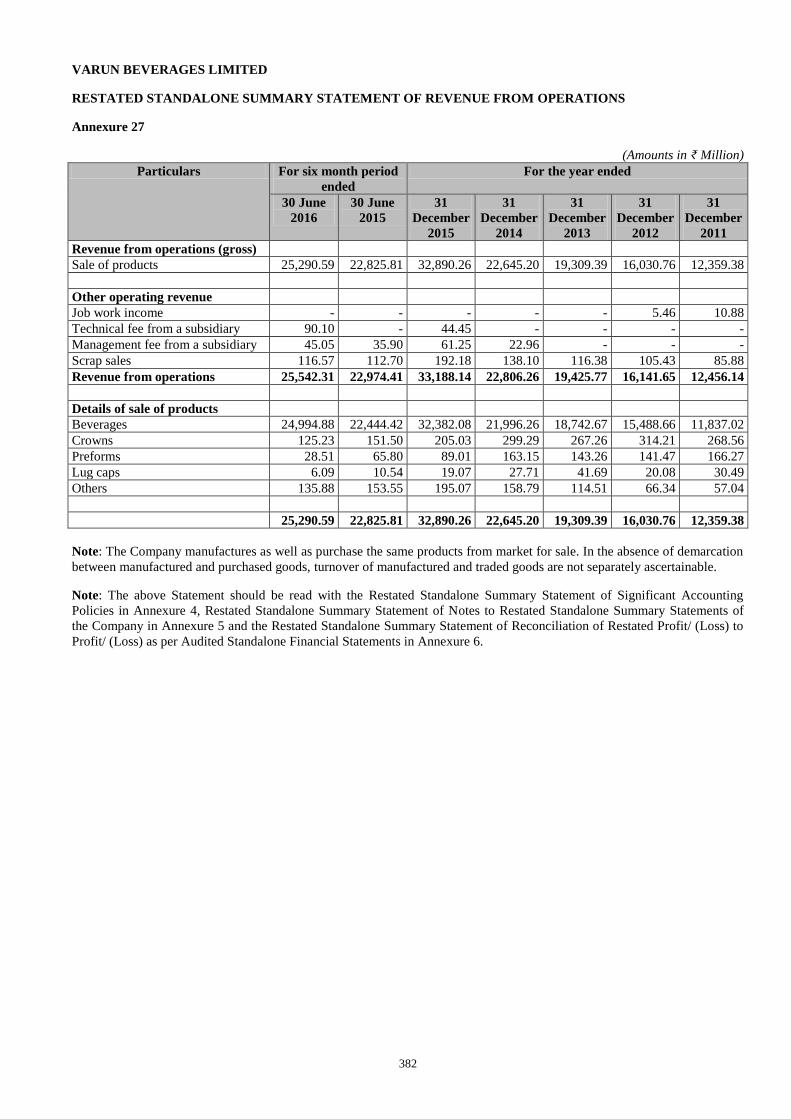
382
VARUN BEVERAGES LIMITED
RESTATED STANDALONE SUMMARY STATEMENT OF REVENUE FROM OPERATIONS
Annexure 27
(Amounts in ₹ Million)
Particulars For six month period
ended
For the year ended
30 June
2016
30 June
2015
31
December
2015
31
December
2014
31
December
2013
31
December
2012
31
December
2011
Revenue from operations (gross)
Sale of products 25,290.59 22,825.81 32,890.26 22,645.20 19,309.39 16,030.76 12,359.38
Other operating revenue
Job work income - - - - - 5.46 10.88
Technical fee from a subsidiary 90.10 - 44.45 - - - -
Management fee from a subsidiary 45.05 35.90 61.25 22.96 - - -
Scrap sales 116.57 112.70 192.18 138.10 116.38 105.43 85.88
Revenue from operations 25,542.31 22,974.41 33,188.14 22,806.26 19,425.77 16,141.65 12,456.14
Details of sale of products
Beverages 24,994.88 22,444.42 32,382.08 21,996.26 18,742.67 15,488.66 11,837.02
Crowns 125.23 151.50 205.03 299.29 267.26 314.21 268.56
Preforms 28.51 65.80 89.01 163.15 143.26 141.47 166.27
Lug caps 6.09 10.54 19.07 27.71 41.69 20.08 30.49
Others 135.88 153.55 195.07 158.79 114.51 66.34 57.04
25,290.59 22,825.81 32,890.26 22,645.20 19,309.39 16,030.76 12,359.38
Note: The Company manufactures as well as purchase the same products from market for sale. In the absence of demarcation
between manufactured and purchased goods, turnover of manufactured and traded goods are not separately ascertainable.
Note: The above Statement should be read with the Restated Standalone Summary Statement of Significant Accounting
Policies in Annexure 4, Restated Standalone Summary Statement of Notes to Restated Standalone Summary Statements of
the Company in Annexure 5 and the Restated Standalone Summary Statement of Reconciliation of Restated Profit/ (Loss) to
Profit/ (Loss) as per Audited Standalone Financial Statements in Annexure 6.
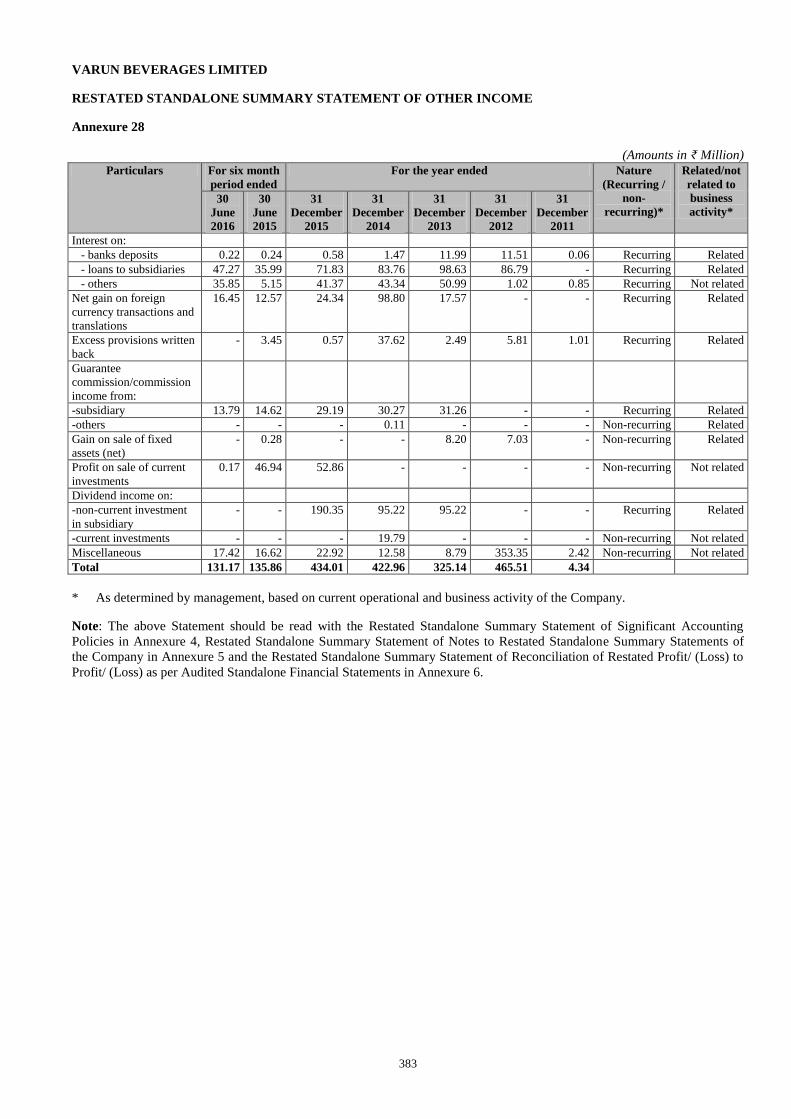
383
VARUN BEVERAGES LIMITED
RESTATED STANDALONE SUMMARY STATEMENT OF OTHER INCOME
Annexure 28
(Amounts in ₹ Million)
Particulars For six month
period ended
For the year ended Nature
(Recurring /
non-
recurring)*
Related/not
related to
business
activity* 30
June
2016
30
June
2015
31
December
2015
31
December
2014
31
December
2013
31
December
2012
31
December
2011
Interest on:
- banks deposits 0.22 0.24 0.58 1.47 11.99 11.51 0.06 Recurring Related
- loans to subsidiaries 47.27 35.99 71.83 83.76 98.63 86.79 - Recurring Related
- others 35.85 5.15 41.37 43.34 50.99 1.02 0.85 Recurring Not related
Net gain on foreign
currency transactions and
translations
16.45 12.57 24.34 98.80 17.57 - - Recurring Related
Excess provisions written
back
- 3.45 0.57 37.62 2.49 5.81 1.01 Recurring Related
Guarantee
commission/commission
income from:
-subsidiary 13.79 14.62 29.19 30.27 31.26 - - Recurring Related
-others - - - 0.11 - - - Non-recurring Related
Gain on sale of fixed
assets (net)
- 0.28 - - 8.20 7.03 - Non-recurring Related
Profit on sale of current
investments
0.17 46.94 52.86 - - - - Non-recurring Not related
Dividend income on:
-non-current investment
in subsidiary
- - 190.35 95.22 95.22 - - Recurring Related
-current investments - - - 19.79 - - - Non-recurring Not related
Miscellaneous 17.42 16.62 22.92 12.58 8.79 353.35 2.42 Non-recurring Not related
Total 131.17 135.86 434.01 422.96 325.14 465.51 4.34
* As determined by management, based on current operational and business activity of the Company.
Note: The above Statement should be read with the Restated Standalone Summary Statement of Significant Accounting
Policies in Annexure 4, Restated Standalone Summary Statement of Notes to Restated Standalone Summary Statements of
the Company in Annexure 5 and the Restated Standalone Summary Statement of Reconciliation of Restated Profit/ (Loss) to
Profit/ (Loss) as per Audited Standalone Financial Statements in Annexure 6.
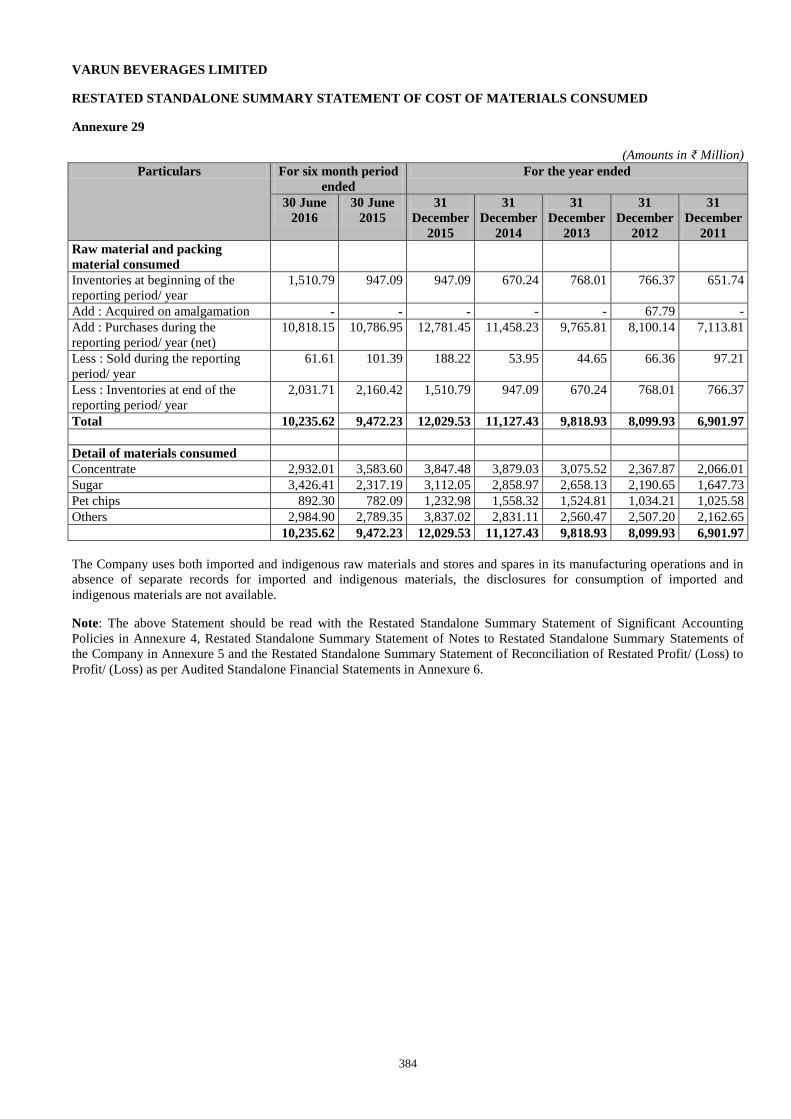
384
VARUN BEVERAGES LIMITED
RESTATED STANDALONE SUMMARY STATEMENT OF COST OF MATERIALS CONSUMED
Annexure 29
(Amounts in ₹ Million)
Particulars For six month period
ended
For the year ended
30 June
2016
30 June
2015
31
December
2015
31
December
2014
31
December
2013
31
December
2012
31
December
2011
Raw material and packing
material consumed
Inventories at beginning of the
reporting period/ year
1,510.79 947.09 947.09 670.24 768.01 766.37 651.74
Add : Acquired on amalgamation - - - - - 67.79 -
Add : Purchases during the
reporting period/ year (net)
10,818.15 10,786.95 12,781.45 11,458.23 9,765.81 8,100.14 7,113.81
Less : Sold during the reporting
period/ year
61.61 101.39 188.22 53.95 44.65 66.36 97.21
Less : Inventories at end of the
reporting period/ year
2,031.71 2,160.42 1,510.79 947.09 670.24 768.01 766.37
Total 10,235.62 9,472.23 12,029.53 11,127.43 9,818.93 8,099.93 6,901.97
Detail of materials consumed
Concentrate 2,932.01 3,583.60 3,847.48 3,879.03 3,075.52 2,367.87 2,066.01
Sugar 3,426.41 2,317.19 3,112.05 2,858.97 2,658.13 2,190.65 1,647.73
Pet chips 892.30 782.09 1,232.98 1,558.32 1,524.81 1,034.21 1,025.58
Others 2,984.90 2,789.35 3,837.02 2,831.11 2,560.47 2,507.20 2,162.65
10,235.62 9,472.23 12,029.53 11,127.43 9,818.93 8,099.93 6,901.97
The Company uses both imported and indigenous raw materials and stores and spares in its manufacturing operations and in
absence of separate records for imported and indigenous materials, the disclosures for consumption of imported and
indigenous materials are not available.
Note: The above Statement should be read with the Restated Standalone Summary Statement of Significant Accounting
Policies in Annexure 4, Restated Standalone Summary Statement of Notes to Restated Standalone Summary Statements of
the Company in Annexure 5 and the Restated Standalone Summary Statement of Reconciliation of Restated Profit/ (Loss) to
Profit/ (Loss) as per Audited Standalone Financial Statements in Annexure 6.
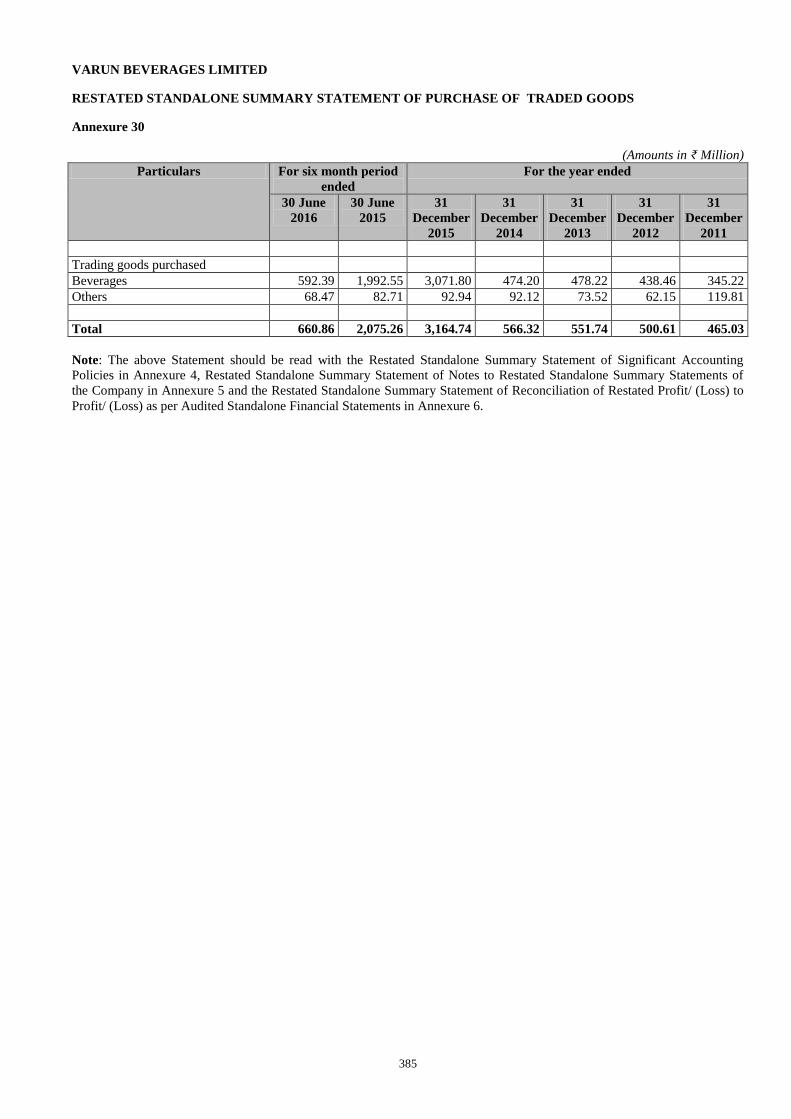
385
VARUN BEVERAGES LIMITED
RESTATED STANDALONE SUMMARY STATEMENT OF PURCHASE OF TRADED GOODS
Annexure 30
(Amounts in ₹ Million)
Particulars For six month period
ended
For the year ended
30 June
2016
30 June
2015
31
December
2015
31
December
2014
31
December
2013
31
December
2012
31
December
2011
Trading goods purchased
Beverages 592.39 1,992.55 3,071.80 474.20 478.22 438.46 345.22
Others 68.47 82.71 92.94 92.12 73.52 62.15 119.81
Total 660.86 2,075.26 3,164.74 566.32 551.74 500.61 465.03
Note: The above Statement should be read with the Restated Standalone Summary Statement of Significant Accounting
Policies in Annexure 4, Restated Standalone Summary Statement of Notes to Restated Standalone Summary Statements of
the Company in Annexure 5 and the Restated Standalone Summary Statement of Reconciliation of Restated Profit/ (Loss) to
Profit/ (Loss) as per Audited Standalone Financial Statements in Annexure 6.
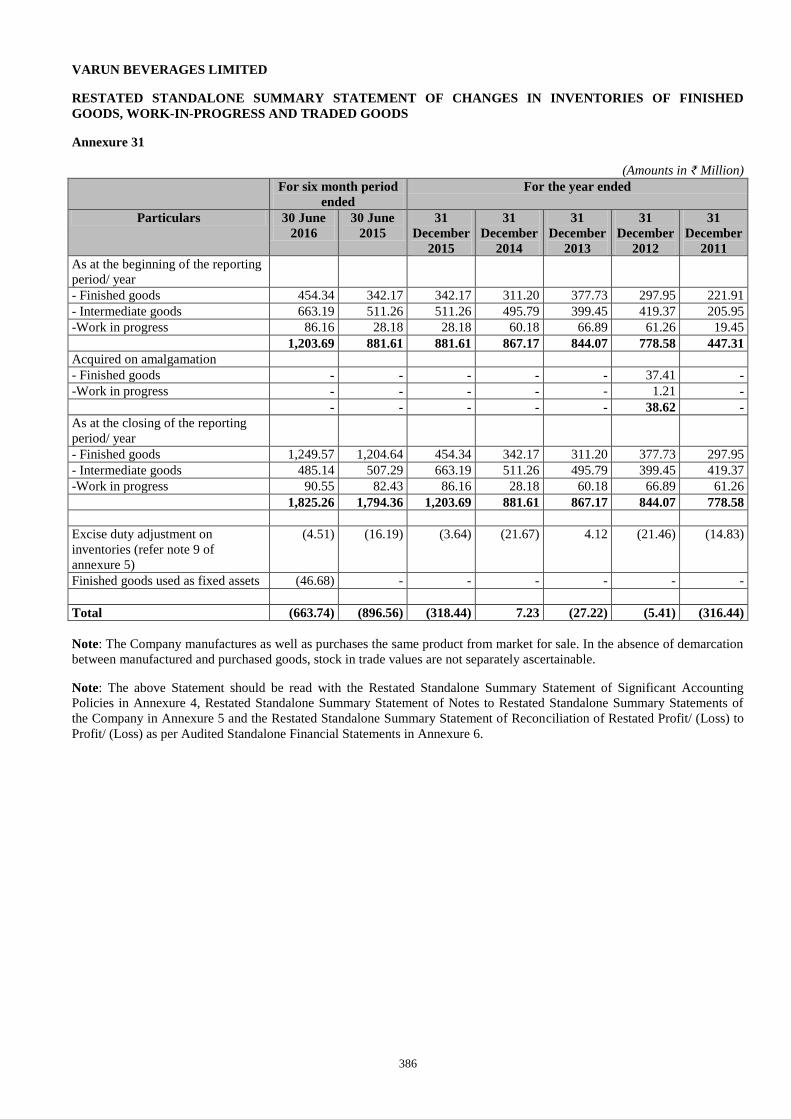
386
VARUN BEVERAGES LIMITED
RESTATED STANDALONE SUMMARY STATEMENT OF CHANGES IN INVENTORIES OF FINISHED
GOODS, WORK-IN-PROGRESS AND TRADED GOODS
Annexure 31
(Amounts in ₹ Million)
For six month period
ended
For the year ended
Particulars 30 June
2016
30 June
2015
31
December
2015
31
December
2014
31
December
2013
31
December
2012
31
December
2011
As at the beginning of the reporting
period/ year
- Finished goods 454.34 342.17 342.17 311.20 377.73 297.95 221.91
- Intermediate goods 663.19 511.26 511.26 495.79 399.45 419.37 205.95
-Work in progress 86.16 28.18 28.18 60.18 66.89 61.26 19.45
1,203.69 881.61 881.61 867.17 844.07 778.58 447.31
Acquired on amalgamation
- Finished goods - - - - - 37.41 -
-Work in progress - - - - - 1.21 -
- - - - - 38.62 -
As at the closing of the reporting
period/ year
- Finished goods 1,249.57 1,204.64 454.34 342.17 311.20 377.73 297.95
- Intermediate goods 485.14 507.29 663.19 511.26 495.79 399.45 419.37
-Work in progress 90.55 82.43 86.16 28.18 60.18 66.89 61.26
1,825.26 1,794.36 1,203.69 881.61 867.17 844.07 778.58
Excise duty adjustment on
inventories (refer note 9 of
annexure 5)
(4.51) (16.19) (3.64) (21.67) 4.12 (21.46) (14.83)
Finished goods used as fixed assets (46.68) - - - - - -
Total (663.74) (896.56) (318.44) 7.23 (27.22) (5.41) (316.44)
Note: The Company manufactures as well as purchases the same product from market for sale. In the absence of demarcation
between manufactured and purchased goods, stock in trade values are not separately ascertainable.
Note: The above Statement should be read with the Restated Standalone Summary Statement of Significant Accounting
Policies in Annexure 4, Restated Standalone Summary Statement of Notes to Restated Standalone Summary Statements of
the Company in Annexure 5 and the Restated Standalone Summary Statement of Reconciliation of Restated Profit/ (Loss) to
Profit/ (Loss) as per Audited Standalone Financial Statements in Annexure 6.
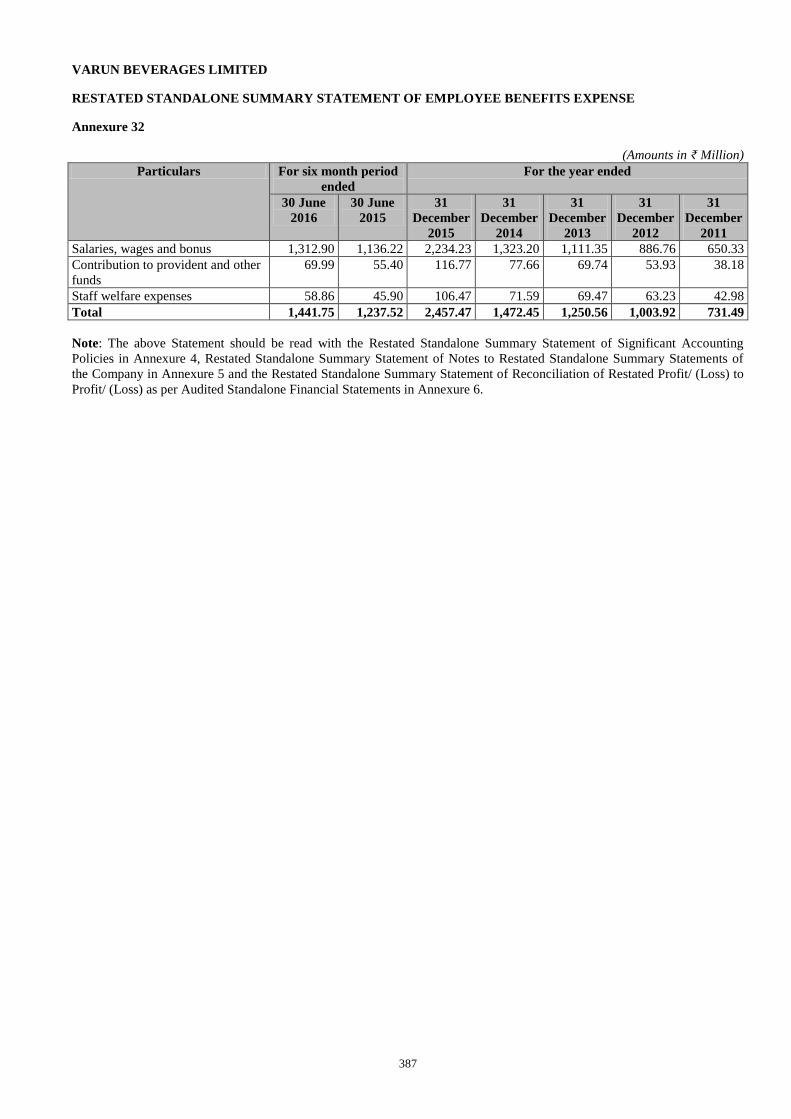
387
VARUN BEVERAGES LIMITED
RESTATED STANDALONE SUMMARY STATEMENT OF EMPLOYEE BENEFITS EXPENSE
Annexure 32
(Amounts in ₹ Million)
Particulars For six month period
ended
For the year ended
30 June
2016
30 June
2015
31
December
2015
31
December
2014
31
December
2013
31
December
2012
31
December
2011
Salaries, wages and bonus 1,312.90 1,136.22 2,234.23 1,323.20 1,111.35 886.76 650.33
Contribution to provident and other
funds
69.99 55.40 116.77 77.66 69.74 53.93 38.18
Staff welfare expenses 58.86 45.90 106.47 71.59 69.47 63.23 42.98
Total 1,441.75 1,237.52 2,457.47 1,472.45 1,250.56 1,003.92 731.49
Note: The above Statement should be read with the Restated Standalone Summary Statement of Significant Accounting
Policies in Annexure 4, Restated Standalone Summary Statement of Notes to Restated Standalone Summary Statements of
the Company in Annexure 5 and the Restated Standalone Summary Statement of Reconciliation of Restated Profit/ (Loss) to
Profit/ (Loss) as per Audited Standalone Financial Statements in Annexure 6.
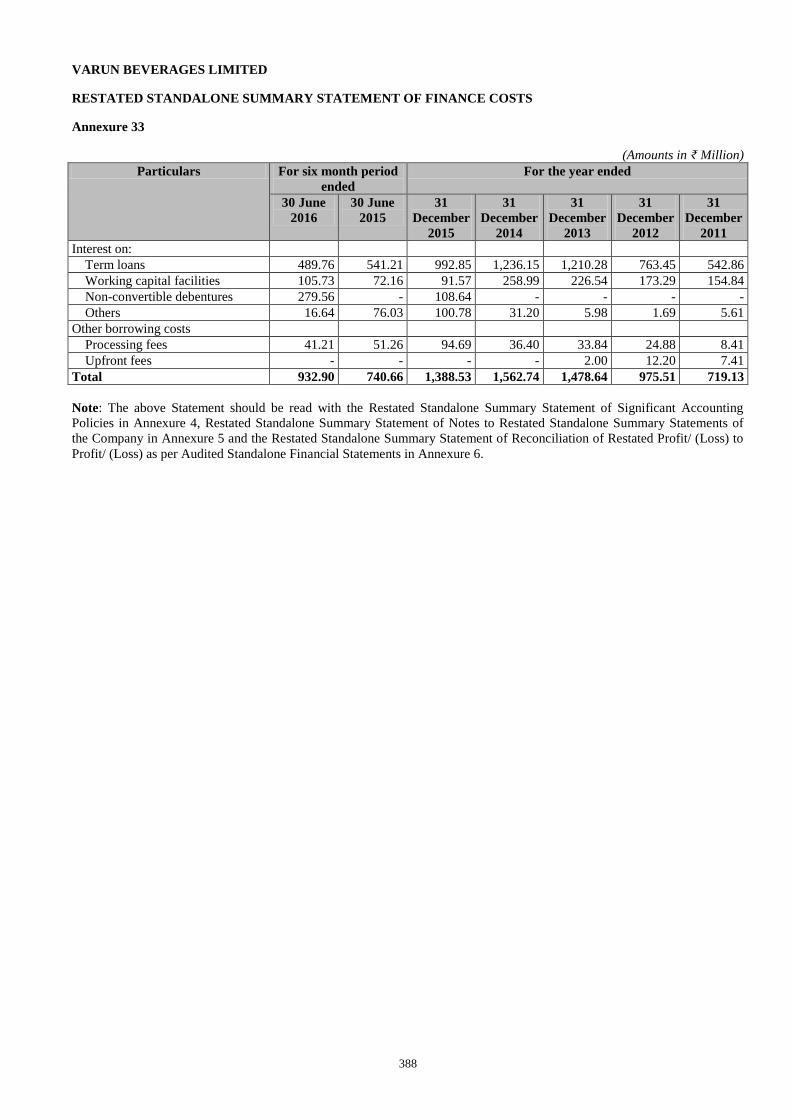
388
VARUN BEVERAGES LIMITED
RESTATED STANDALONE SUMMARY STATEMENT OF FINANCE COSTS
Annexure 33
(Amounts in ₹ Million)
Particulars For six month period
ended
For the year ended
30 June
2016
30 June
2015
31
December
2015
31
December
2014
31
December
2013
31
December
2012
31
December
2011
Interest on:
Term loans 489.76 541.21 992.85 1,236.15 1,210.28 763.45 542.86
Working capital facilities 105.73 72.16 91.57 258.99 226.54 173.29 154.84
Non-convertible debentures 279.56 - 108.64 - - - -
Others 16.64 76.03 100.78 31.20 5.98 1.69 5.61
Other borrowing costs
Processing fees 41.21 51.26 94.69 36.40 33.84 24.88 8.41
Upfront fees - - - - 2.00 12.20 7.41
Total 932.90 740.66 1,388.53 1,562.74 1,478.64 975.51 719.13
Note: The above Statement should be read with the Restated Standalone Summary Statement of Significant Accounting
Policies in Annexure 4, Restated Standalone Summary Statement of Notes to Restated Standalone Summary Statements of
the Company in Annexure 5 and the Restated Standalone Summary Statement of Reconciliation of Restated Profit/ (Loss) to
Profit/ (Loss) as per Audited Standalone Financial Statements in Annexure 6.
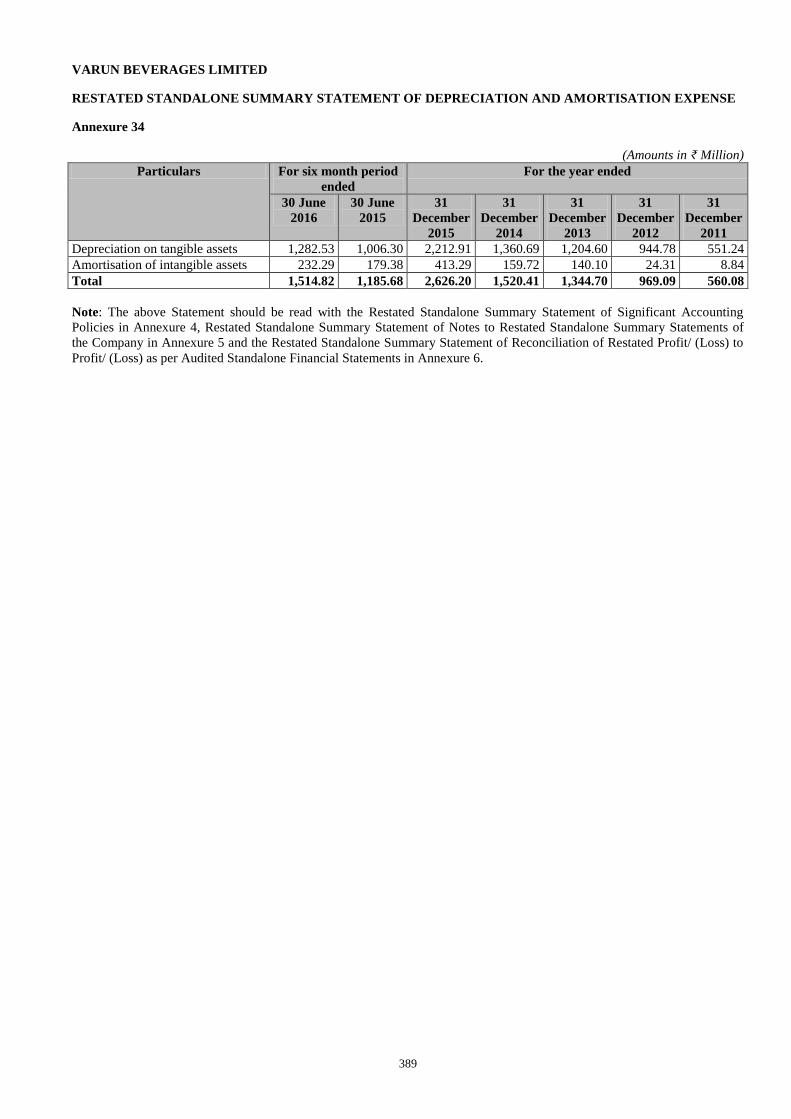
389
VARUN BEVERAGES LIMITED
RESTATED STANDALONE SUMMARY STATEMENT OF DEPRECIATION AND AMORTISATION EXPENSE
Annexure 34
(Amounts in ₹ Million)
Particulars For six month period
ended
For the year ended
30 June
2016
30 June
2015
31
December
2015
31
December
2014
31
December
2013
31
December
2012
31
December
2011
Depreciation on tangible assets 1,282.53 1,006.30 2,212.91 1,360.69 1,204.60 944.78 551.24
Amortisation of intangible assets 232.29 179.38 413.29 159.72 140.10 24.31 8.84
Total 1,514.82 1,185.68 2,626.20 1,520.41 1,344.70 969.09 560.08
Note: The above Statement should be read with the Restated Standalone Summary Statement of Significant Accounting
Policies in Annexure 4, Restated Standalone Summary Statement of Notes to Restated Standalone Summary Statements of
the Company in Annexure 5 and the Restated Standalone Summary Statement of Reconciliation of Restated Profit/ (Loss) to
Profit/ (Loss) as per Audited Standalone Financial Statements in Annexure 6.
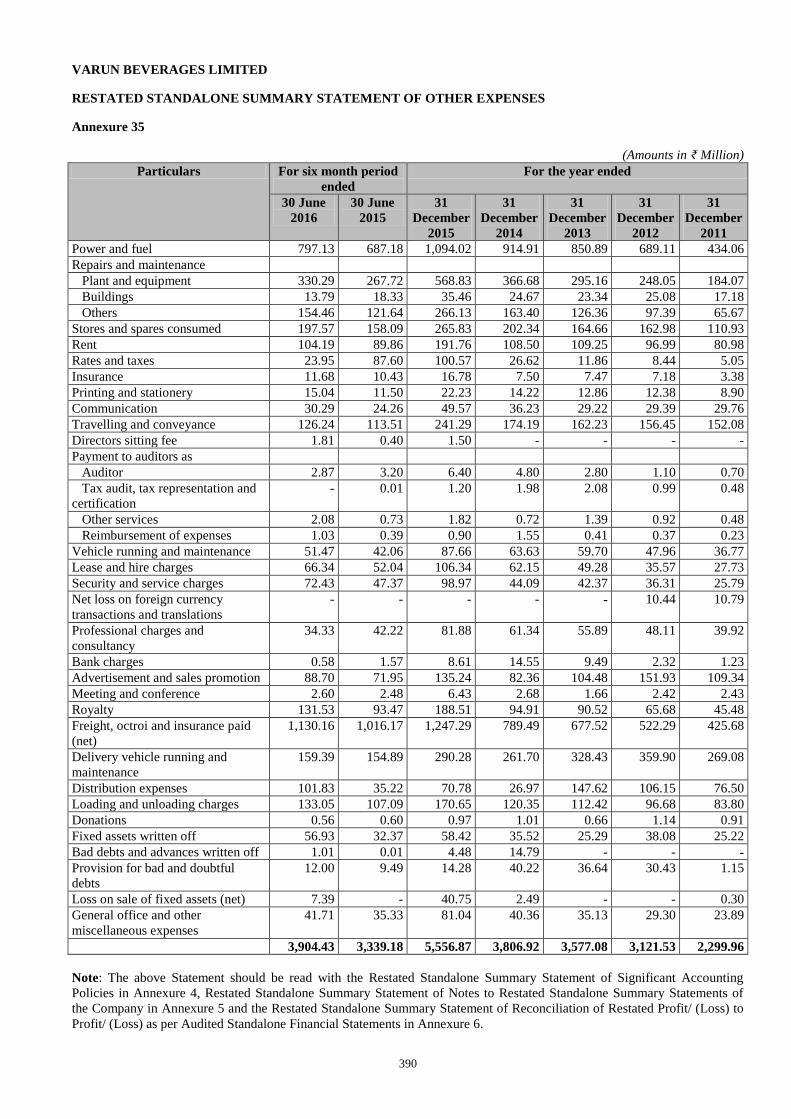
390
VARUN BEVERAGES LIMITED
RESTATED STANDALONE SUMMARY STATEMENT OF OTHER EXPENSES
Annexure 35
(Amounts in ₹ Million)
Particulars For six month period
ended
For the year ended
30 June
2016
30 June
2015
31
December
2015
31
December
2014
31
December
2013
31
December
2012
31
December
2011
Power and fuel 797.13 687.18 1,094.02 914.91 850.89 689.11 434.06
Repairs and maintenance
Plant and equipment 330.29 267.72 568.83 366.68 295.16 248.05 184.07
Buildings 13.79 18.33 35.46 24.67 23.34 25.08 17.18
Others 154.46 121.64 266.13 163.40 126.36 97.39 65.67
Stores and spares consumed 197.57 158.09 265.83 202.34 164.66 162.98 110.93
Rent 104.19 89.86 191.76 108.50 109.25 96.99 80.98
Rates and taxes 23.95 87.60 100.57 26.62 11.86 8.44 5.05
Insurance 11.68 10.43 16.78 7.50 7.47 7.18 3.38
Printing and stationery 15.04 11.50 22.23 14.22 12.86 12.38 8.90
Communication 30.29 24.26 49.57 36.23 29.22 29.39 29.76
Travelling and conveyance 126.24 113.51 241.29 174.19 162.23 156.45 152.08
Directors sitting fee 1.81 0.40 1.50 - - - -
Payment to auditors as
Auditor 2.87 3.20 6.40 4.80 2.80 1.10 0.70
Tax audit, tax representation and
certification
- 0.01 1.20 1.98 2.08 0.99 0.48
Other services 2.08 0.73 1.82 0.72 1.39 0.92 0.48
Reimbursement of expenses 1.03 0.39 0.90 1.55 0.41 0.37 0.23
Vehicle running and maintenance 51.47 42.06 87.66 63.63 59.70 47.96 36.77
Lease and hire charges 66.34 52.04 106.34 62.15 49.28 35.57 27.73
Security and service charges 72.43 47.37 98.97 44.09 42.37 36.31 25.79
Net loss on foreign currency
transactions and translations
- - - - - 10.44 10.79
Professional charges and
consultancy
34.33 42.22 81.88 61.34 55.89 48.11 39.92
Bank charges 0.58 1.57 8.61 14.55 9.49 2.32 1.23
Advertisement and sales promotion 88.70 71.95 135.24 82.36 104.48 151.93 109.34
Meeting and conference 2.60 2.48 6.43 2.68 1.66 2.42 2.43
Royalty 131.53 93.47 188.51 94.91 90.52 65.68 45.48
Freight, octroi and insurance paid
(net)
1,130.16 1,016.17 1,247.29 789.49 677.52 522.29 425.68
Delivery vehicle running and
maintenance
159.39 154.89 290.28 261.70 328.43 359.90 269.08
Distribution expenses 101.83 35.22 70.78 26.97 147.62 106.15 76.50
Loading and unloading charges 133.05 107.09 170.65 120.35 112.42 96.68 83.80
Donations 0.56 0.60 0.97 1.01 0.66 1.14 0.91
Fixed assets written off 56.93 32.37 58.42 35.52 25.29 38.08 25.22
Bad debts and advances written off 1.01 0.01 4.48 14.79 - - -
Provision for bad and doubtful
debts
12.00 9.49 14.28 40.22 36.64 30.43 1.15
Loss on sale of fixed assets (net) 7.39 - 40.75 2.49 - - 0.30
General office and other
miscellaneous expenses
41.71 35.33 81.04 40.36 35.13 29.30 23.89
3,904.43 3,339.18 5,556.87 3,806.92 3,577.08 3,121.53 2,299.96
Note: The above Statement should be read with the Restated Standalone Summary Statement of Significant Accounting
Policies in Annexure 4, Restated Standalone Summary Statement of Notes to Restated Standalone Summary Statements of
the Company in Annexure 5 and the Restated Standalone Summary Statement of Reconciliation of Restated Profit/ (Loss) to
Profit/ (Loss) as per Audited Standalone Financial Statements in Annexure 6.
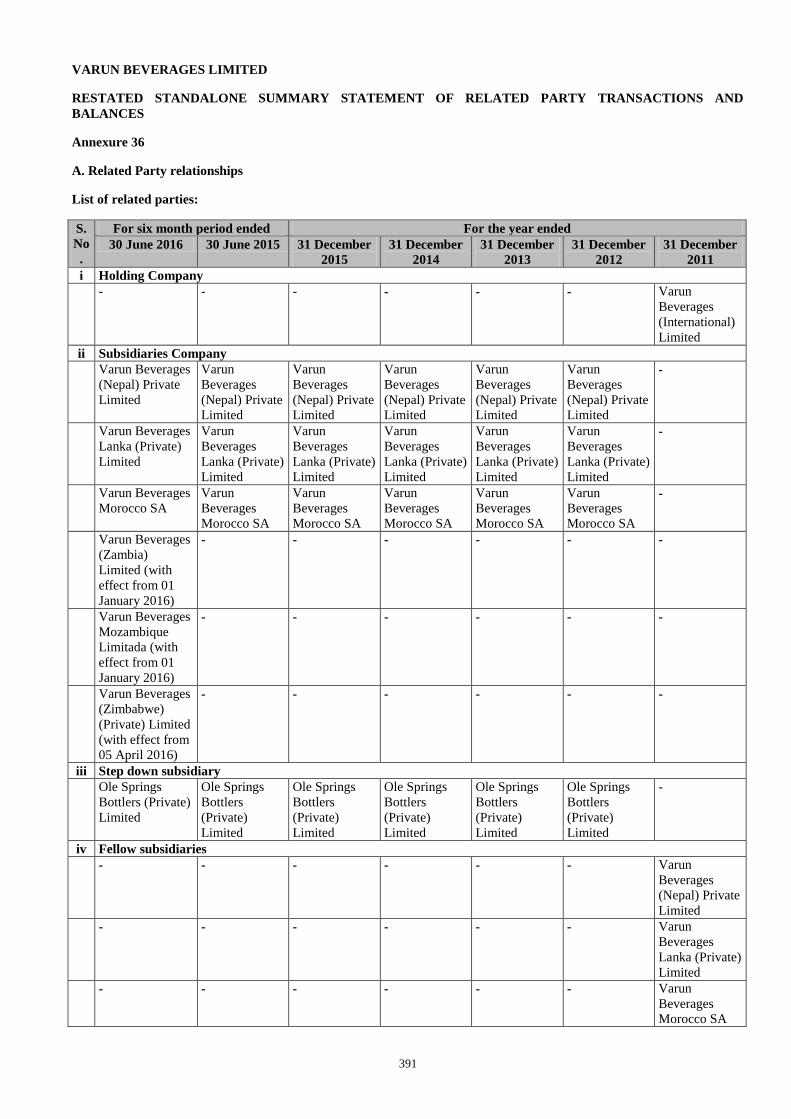
391
VARUN BEVERAGES LIMITED
RESTATED STANDALONE SUMMARY STATEMENT OF RELATED PARTY TRANSACTIONS AND
BALANCES
Annexure 36
A. Related Party relationships
List of related parties:
S.
No
.
For six month period ended For the year ended
30 June 2016 30 June 2015 31 December
2015
31 December
2014
31 December
2013
31 December
2012
31 December
2011
i Holding Company
- - - - - - Varun
Beverages
(International)
Limited
ii Subsidiaries Company
Varun Beverages
(Nepal) Private
Limited
Varun
Beverages
(Nepal) Private
Limited
Varun
Beverages
(Nepal) Private
Limited
Varun
Beverages
(Nepal) Private
Limited
Varun
Beverages
(Nepal) Private
Limited
Varun
Beverages
(Nepal) Private
Limited
-
Varun Beverages
Lanka (Private)
Limited
Varun
Beverages
Lanka (Private)
Limited
Varun
Beverages
Lanka (Private)
Limited
Varun
Beverages
Lanka (Private)
Limited
Varun
Beverages
Lanka (Private)
Limited
Varun
Beverages
Lanka (Private)
Limited
-
Varun Beverages
Morocco SA
Varun
Beverages
Morocco SA
Varun
Beverages
Morocco SA
Varun
Beverages
Morocco SA
Varun
Beverages
Morocco SA
Varun
Beverages
Morocco SA
-
Varun Beverages
(Zambia)
Limited (with
effect from 01
January 2016)
- - - - - -
Varun Beverages
Mozambique
Limitada (with
effect from 01
January 2016)
- - - - - -
Varun Beverages
(Zimbabwe)
(Private) Limited
(with effect from
05 April 2016)
- - - - - -
iii Step down subsidiary
Ole Springs
Bottlers (Private)
Limited
Ole Springs
Bottlers
(Private)
Limited
Ole Springs
Bottlers
(Private)
Limited
Ole Springs
Bottlers
(Private)
Limited
Ole Springs
Bottlers
(Private)
Limited
Ole Springs
Bottlers
(Private)
Limited
-
iv Fellow subsidiaries
- - - - - - Varun
Beverages
(Nepal) Private
Limited
- - -
- - - Varun
Beverages
Lanka (Private)
Limited
- - - - - - Varun
Beverages
Morocco SA
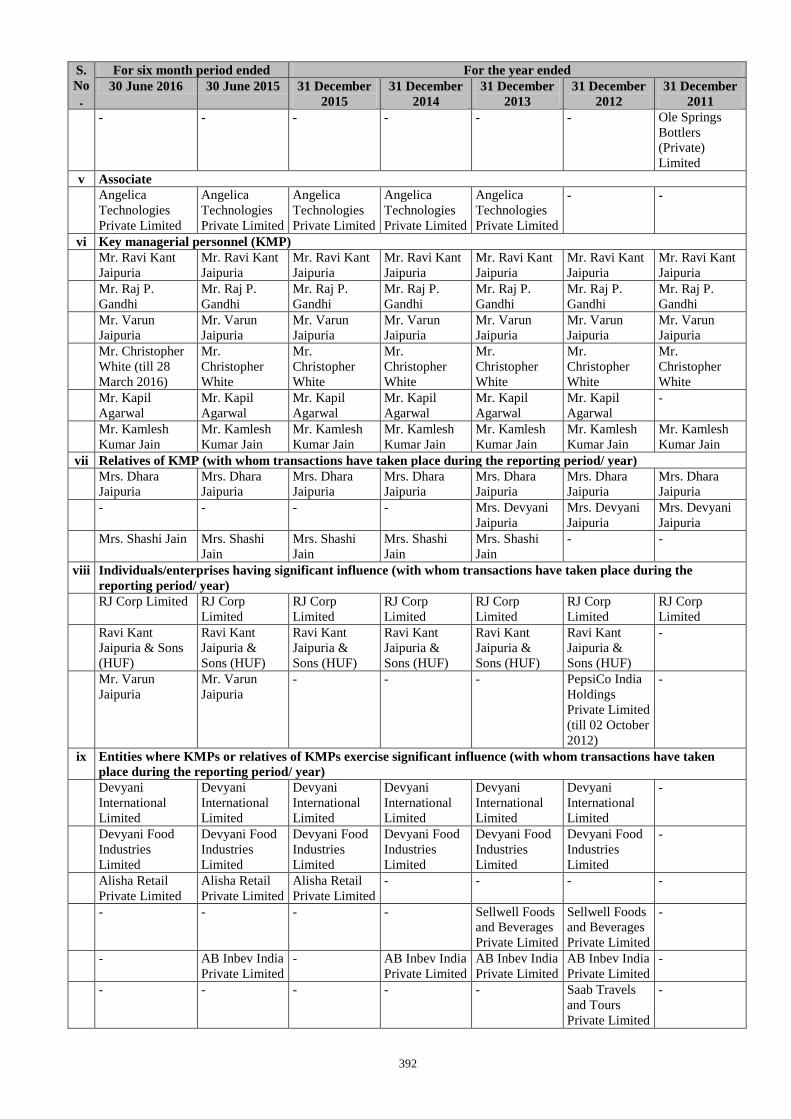
392
S.
No
.
For six month period ended For the year ended
30 June 2016 30 June 2015 31 December
2015
31 December
2014
31 December
2013
31 December
2012
31 December
2011
- - - - - - Ole Springs
Bottlers
(Private)
Limited
v Associate
Angelica
Technologies
Private Limited
Angelica
Technologies
Private Limited
Angelica
Technologies
Private Limited
Angelica
Technologies
Private Limited
Angelica
Technologies
Private Limited
- -
vi Key managerial personnel (KMP)
Mr. Ravi Kant
Jaipuria
Mr. Ravi Kant
Jaipuria
Mr. Ravi Kant
Jaipuria
Mr. Ravi Kant
Jaipuria
Mr. Ravi Kant
Jaipuria
Mr. Ravi Kant
Jaipuria
Mr. Ravi Kant
Jaipuria
Mr. Raj P.
Gandhi
Mr. Raj P.
Gandhi
Mr. Raj P.
Gandhi
Mr. Raj P.
Gandhi
Mr. Raj P.
Gandhi
Mr. Raj P.
Gandhi
Mr. Raj P.
Gandhi
Mr. Varun
Jaipuria
Mr. Varun
Jaipuria
Mr. Varun
Jaipuria
Mr. Varun
Jaipuria
Mr. Varun
Jaipuria
Mr. Varun
Jaipuria
Mr. Varun
Jaipuria
Mr. Christopher
White (till 28
March 2016)
Mr.
Christopher
White
Mr.
Christopher
White
Mr.
Christopher
White
Mr.
Christopher
White
Mr.
Christopher
White
Mr.
Christopher
White
Mr. Kapil
Agarwal
Mr. Kapil
Agarwal
Mr. Kapil
Agarwal
Mr. Kapil
Agarwal
Mr. Kapil
Agarwal
Mr. Kapil
Agarwal
-
Mr. Kamlesh
Kumar Jain
Mr. Kamlesh
Kumar Jain
Mr. Kamlesh
Kumar Jain
Mr. Kamlesh
Kumar Jain
Mr. Kamlesh
Kumar Jain
Mr. Kamlesh
Kumar Jain
Mr. Kamlesh
Kumar Jain
vii Relatives of KMP (with whom transactions have taken place during the reporting period/ year)
Mrs. Dhara
Jaipuria
Mrs. Dhara
Jaipuria
Mrs. Dhara
Jaipuria
Mrs. Dhara
Jaipuria
Mrs. Dhara
Jaipuria
Mrs. Dhara
Jaipuria
Mrs. Dhara
Jaipuria
- - - - Mrs. Devyani
Jaipuria
Mrs. Devyani
Jaipuria
Mrs. Devyani
Jaipuria
Mrs. Shashi Jain Mrs. Shashi
Jain
Mrs. Shashi
Jain
Mrs. Shashi
Jain
Mrs. Shashi
Jain
- -
viii Individuals/enterprises having significant influence (with whom transactions have taken place during the
reporting period/ year)
RJ Corp Limited RJ Corp
Limited
RJ Corp
Limited
RJ Corp
Limited
RJ Corp
Limited
RJ Corp
Limited
RJ Corp
Limited
Ravi Kant
Jaipuria & Sons
(HUF)
Ravi Kant
Jaipuria &
Sons (HUF)
Ravi Kant
Jaipuria &
Sons (HUF)
Ravi Kant
Jaipuria &
Sons (HUF)
Ravi Kant
Jaipuria &
Sons (HUF)
Ravi Kant
Jaipuria &
Sons (HUF)
-
Mr. Varun
Jaipuria
Mr. Varun
Jaipuria
- - - PepsiCo India
Holdings
Private Limited
(till 02 October
2012)
-
ix Entities where KMPs or relatives of KMPs exercise significant influence (with whom transactions have taken
place during the reporting period/ year)
Devyani
International
Limited
Devyani
International
Limited
Devyani
International
Limited
Devyani
International
Limited
Devyani
International
Limited
Devyani
International
Limited
-
Devyani Food
Industries
Limited
Devyani Food
Industries
Limited
Devyani Food
Industries
Limited
Devyani Food
Industries
Limited
Devyani Food
Industries
Limited
Devyani Food
Industries
Limited
-
Alisha Retail
Private Limited
Alisha Retail
Private Limited
Alisha Retail
Private Limited
- - - -
- - - - Sellwell Foods
and Beverages
Private Limited
Sellwell Foods
and Beverages
Private Limited
-
- AB Inbev India
Private Limited
- AB Inbev India
Private Limited
AB Inbev India
Private Limited
AB Inbev India
Private Limited
-
- - - - - Saab Travels
and Tours
Private Limited
-
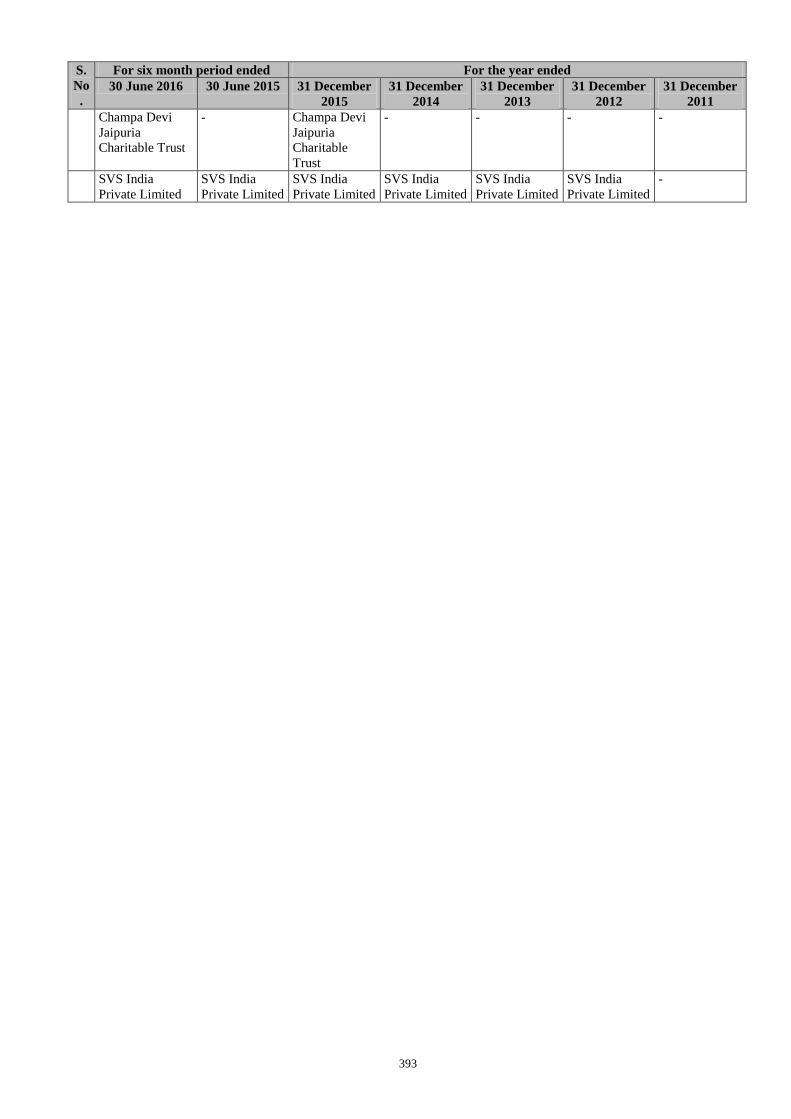
393
S.
No
.
For six month period ended For the year ended
30 June 2016 30 June 2015 31 December
2015
31 December
2014
31 December
2013
31 December
2012
31 December
2011
Champa Devi
Jaipuria
Charitable Trust
- Champa Devi
Jaipuria
Charitable
Trust
- - - -
SVS India
Private Limited
SVS India
Private Limited
SVS India
Private Limited
SVS India
Private Limited
SVS India
Private Limited
SVS India
Private Limited
-
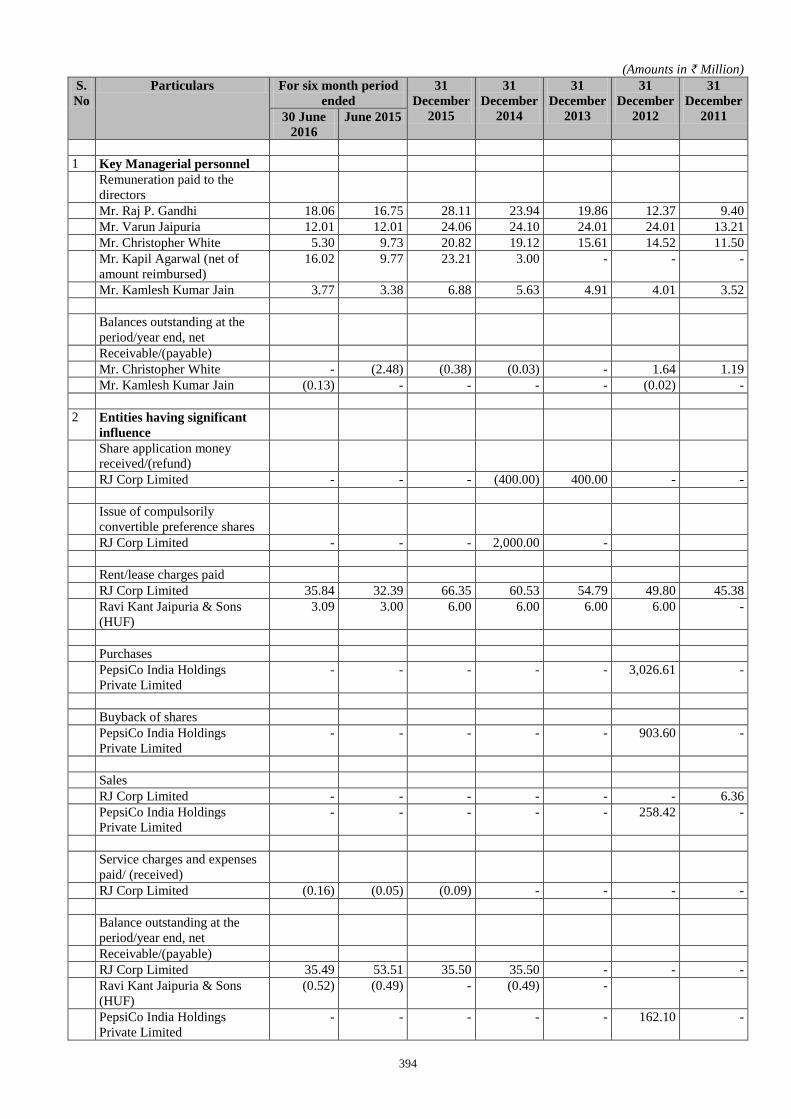
394
(Amounts in ₹ Million)
S.
No
Particulars For six month period
ended
31
December
2015
31
December
2014
31
December
2013
31
December
2012
31
December
2011 30 June
2016
June 2015
1 Key Managerial personnel
Remuneration paid to the
directors
Mr. Raj P. Gandhi 18.06 16.75 28.11 23.94 19.86 12.37 9.40
Mr. Varun Jaipuria 12.01 12.01 24.06 24.10 24.01 24.01 13.21
Mr. Christopher White 5.30 9.73 20.82 19.12 15.61 14.52 11.50
Mr. Kapil Agarwal (net of
amount reimbursed)
16.02 9.77 23.21 3.00 - - -
Mr. Kamlesh Kumar Jain 3.77 3.38 6.88 5.63 4.91 4.01 3.52
Balances outstanding at the
period/year end, net
Receivable/(payable)
Mr. Christopher White - (2.48) (0.38) (0.03) - 1.64 1.19
Mr. Kamlesh Kumar Jain (0.13) - - - - (0.02) -
2 Entities having significant
influence
Share application money
received/(refund)
RJ Corp Limited - - - (400.00) 400.00 - -
Issue of compulsorily
convertible preference shares
RJ Corp Limited - - - 2,000.00 -
Rent/lease charges paid
RJ Corp Limited 35.84 32.39 66.35 60.53 54.79 49.80 45.38
Ravi Kant Jaipuria & Sons
(HUF)
3.09 3.00 6.00 6.00 6.00 6.00 -
Purchases
PepsiCo India Holdings
Private Limited
- - - - - 3,026.61 -
Buyback of shares
PepsiCo India Holdings
Private Limited
- - - - - 903.60 -
Sales
RJ Corp Limited - - - - - - 6.36
PepsiCo India Holdings
Private Limited
- - - - - 258.42 -
Service charges and expenses
paid/ (received)
RJ Corp Limited (0.16) (0.05) (0.09) - - - -
Balance outstanding at the
period/year end, net
Receivable/(payable)
RJ Corp Limited 35.49 53.51 35.50 35.50 - - -
Ravi Kant Jaipuria & Sons
(HUF)
(0.52) (0.49) - (0.49) -
PepsiCo India Holdings
Private Limited
- - - - - 162.10 -
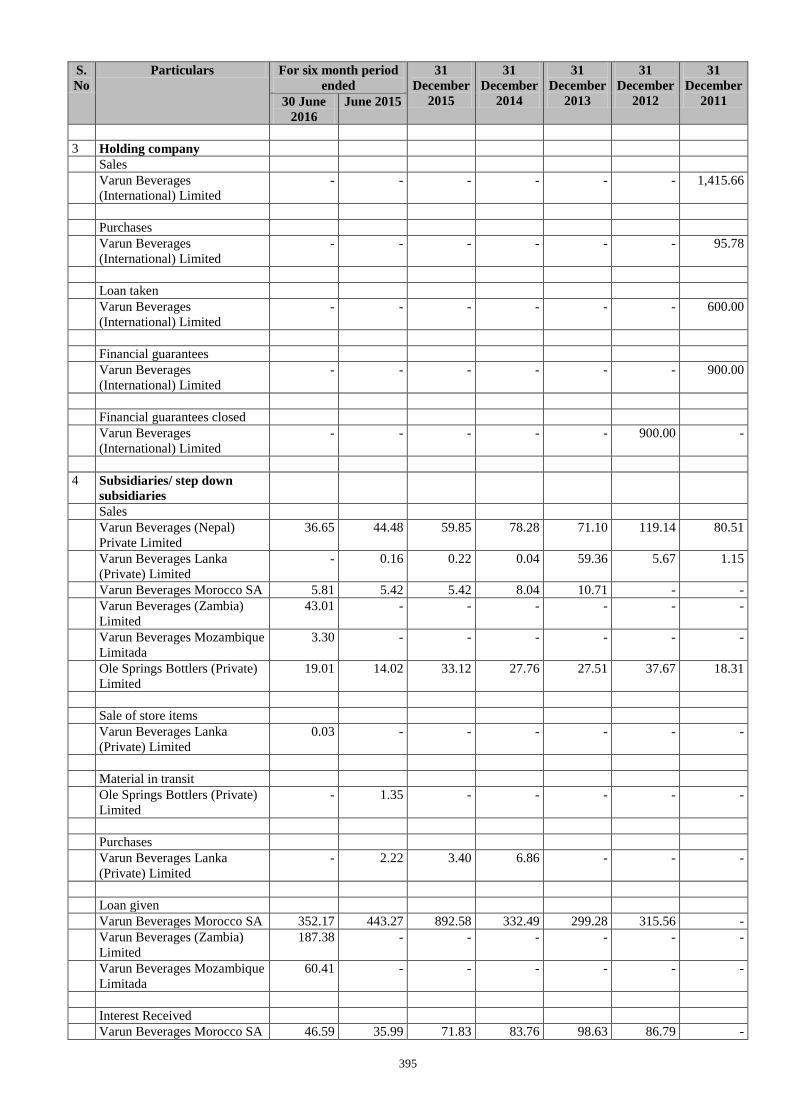
395
S.
No
Particulars For six month period
ended
31
December
2015
31
December
2014
31
December
2013
31
December
2012
31
December
2011 30 June
2016
June 2015
3 Holding company
Sales
Varun Beverages
(International) Limited
- - - - - - 1,415.66
Purchases
Varun Beverages
(International) Limited
- - - - - - 95.78
Loan taken
Varun Beverages
(International) Limited
- - - - - - 600.00
Financial guarantees
Varun Beverages
(International) Limited
- - - - - - 900.00
Financial guarantees closed
Varun Beverages
(International) Limited
- - - - - 900.00 -
4 Subsidiaries/ step down
subsidiaries
Sales
Varun Beverages (Nepal)
Private Limited
36.65 44.48 59.85 78.28 71.10 119.14 80.51
Varun Beverages Lanka
(Private) Limited
- 0.16 0.22 0.04 59.36 5.67 1.15
Varun Beverages Morocco SA 5.81 5.42 5.42 8.04 10.71 - -
Varun Beverages (Zambia)
Limited
43.01 - - - - - -
Varun Beverages Mozambique
Limitada
3.30 - - - - - -
Ole Springs Bottlers (Private)
Limited
19.01 14.02 33.12 27.76 27.51 37.67 18.31
Sale of store items
Varun Beverages Lanka
(Private) Limited
0.03 - - - - - -
Material in transit
Ole Springs Bottlers (Private)
Limited
- 1.35 - - - - -
Purchases
Varun Beverages Lanka
(Private) Limited
- 2.22 3.40 6.86 - - -
Loan given
Varun Beverages Morocco SA 352.17 443.27 892.58 332.49 299.28 315.56 -
Varun Beverages (Zambia)
Limited
187.38 - - - - - -
Varun Beverages Mozambique
Limitada
60.41 - - - - - -
Interest Received
Varun Beverages Morocco SA 46.59 35.99 71.83 83.76 98.63 86.79 -
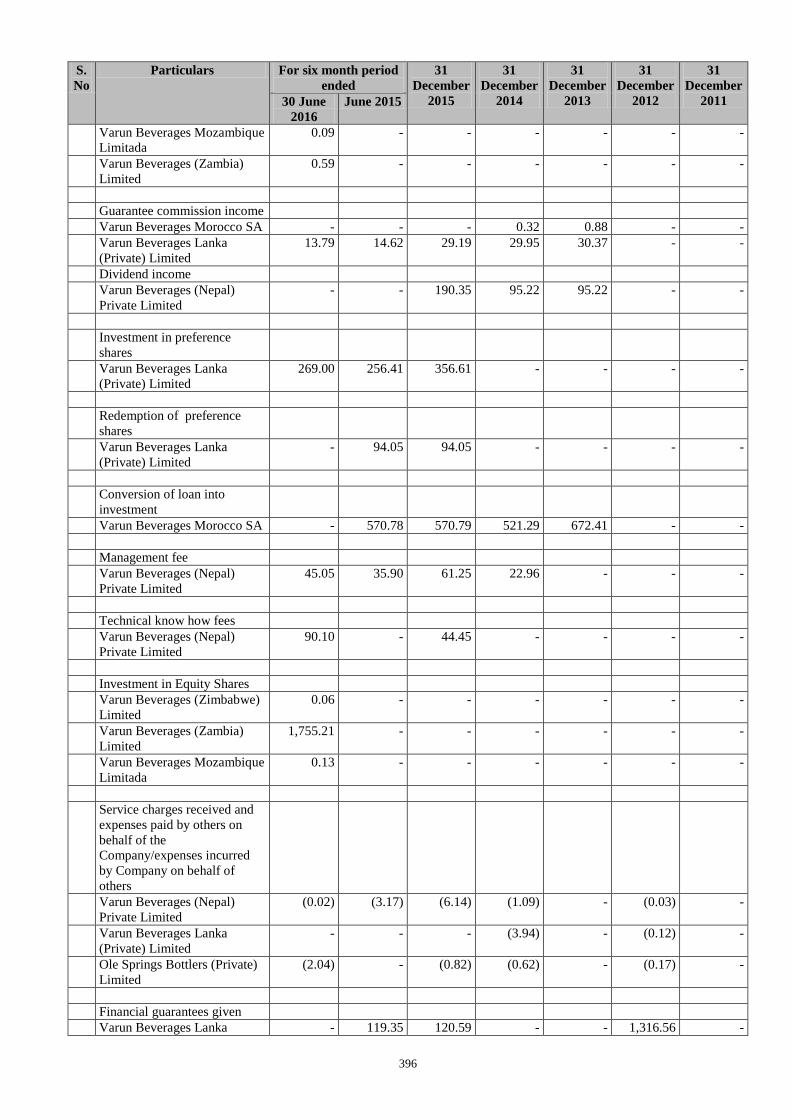
396
S.
No
Particulars For six month period
ended
31
December
2015
31
December
2014
31
December
2013
31
December
2012
31
December
2011 30 June
2016
June 2015
Varun Beverages Mozambique
Limitada
0.09 - - - - - -
Varun Beverages (Zambia)
Limited
0.59 - - - - - -
Guarantee commission income
Varun Beverages Morocco SA - - - 0.32 0.88 - -
Varun Beverages Lanka
(Private) Limited
13.79 14.62 29.19 29.95 30.37 - -
Dividend income
Varun Beverages (Nepal)
Private Limited
- - 190.35 95.22 95.22 - -
Investment in preference
shares
Varun Beverages Lanka
(Private) Limited
269.00 256.41 356.61 - - - -
Redemption of preference
shares
Varun Beverages Lanka
(Private) Limited
- 94.05 94.05 - - - -
Conversion of loan into
investment
Varun Beverages Morocco SA - 570.78 570.79 521.29 672.41 - -
Management fee
Varun Beverages (Nepal)
Private Limited
45.05 35.90 61.25 22.96 - - -
Technical know how fees
Varun Beverages (Nepal)
Private Limited
90.10 - 44.45 - - - -
Investment in Equity Shares
Varun Beverages (Zimbabwe)
Limited
0.06 - - - - - -
Varun Beverages (Zambia)
Limited
1,755.21 - - - - - -
Varun Beverages Mozambique
Limitada
0.13 - - - - - -
Service charges received and
expenses paid by others on
behalf of the
Company/expenses incurred
by Company on behalf of
others
Varun Beverages (Nepal)
Private Limited
(0.02) (3.17) (6.14) (1.09) - (0.03) -
Varun Beverages Lanka
(Private) Limited
- - - (3.94) - (0.12) -
Ole Springs Bottlers (Private)
Limited
(2.04) - (0.82) (0.62) - (0.17) -
Financial guarantees given
Varun Beverages Lanka - 119.35 120.59 - - 1,316.56 -
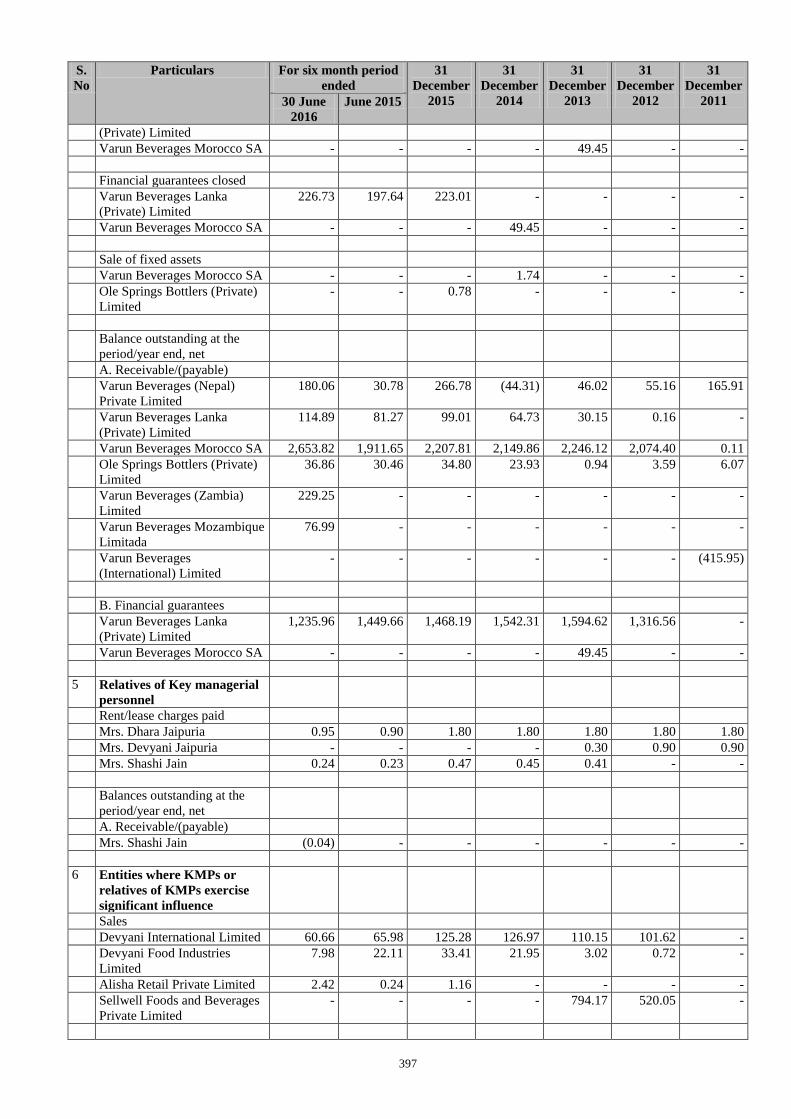
397
S.
No
Particulars For six month period
ended
31
December
2015
31
December
2014
31
December
2013
31
December
2012
31
December
2011 30 June
2016
June 2015
(Private) Limited
Varun Beverages Morocco SA - - - - 49.45 - -
Financial guarantees closed
Varun Beverages Lanka
(Private) Limited
226.73 197.64 223.01 - - - -
Varun Beverages Morocco SA - - - 49.45 - - -
Sale of fixed assets
Varun Beverages Morocco SA - - - 1.74 - - -
Ole Springs Bottlers (Private)
Limited
- - 0.78 - - - -
Balance outstanding at the
period/year end, net
A. Receivable/(payable)
Varun Beverages (Nepal)
Private Limited
180.06 30.78 266.78 (44.31) 46.02 55.16 165.91
Varun Beverages Lanka
(Private) Limited
114.89 81.27 99.01 64.73 30.15 0.16 -
Varun Beverages Morocco SA 2,653.82 1,911.65 2,207.81 2,149.86 2,246.12 2,074.40 0.11
Ole Springs Bottlers (Private)
Limited
36.86 30.46 34.80 23.93 0.94 3.59 6.07
Varun Beverages (Zambia)
Limited
229.25 - - - - - -
Varun Beverages Mozambique
Limitada
76.99 - - - - - -
Varun Beverages
(International) Limited
- - - - - - (415.95)
B. Financial guarantees
Varun Beverages Lanka
(Private) Limited
1,235.96 1,449.66 1,468.19 1,542.31 1,594.62 1,316.56 -
Varun Beverages Morocco SA - - - - 49.45 - -
5 Relatives of Key managerial
personnel
Rent/lease charges paid
Mrs. Dhara Jaipuria 0.95 0.90 1.80 1.80 1.80 1.80 1.80
Mrs. Devyani Jaipuria - - - - 0.30 0.90 0.90
Mrs. Shashi Jain 0.24 0.23 0.47 0.45 0.41 - -
Balances outstanding at the
period/year end, net
A. Receivable/(payable)
Mrs. Shashi Jain (0.04) - - - - - -
6 Entities where KMPs or
relatives of KMPs exercise
significant influence
Sales
Devyani International Limited 60.66 65.98 125.28 126.97 110.15 101.62 -
Devyani Food Industries
Limited
7.98 22.11 33.41 21.95 3.02 0.72 -
Alisha Retail Private Limited 2.42 0.24 1.16 - - - -
Sellwell Foods and Beverages
Private Limited
- - - - 794.17 520.05 -
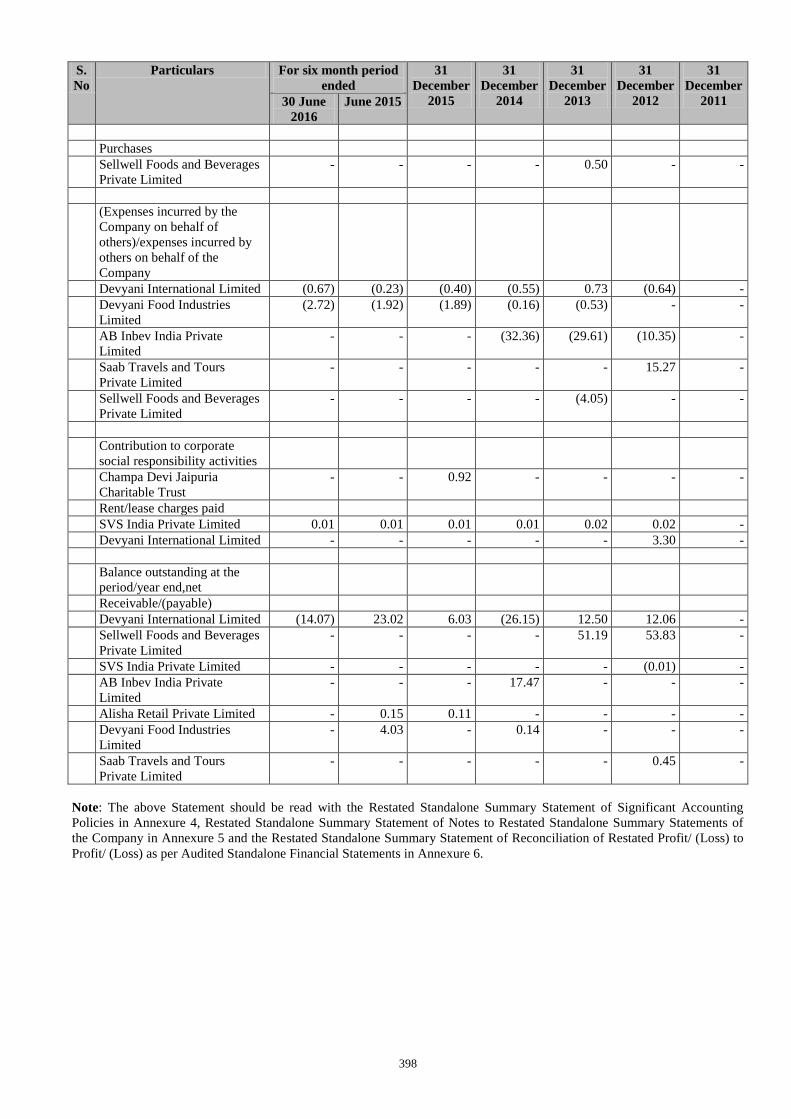
398
S.
No
Particulars For six month period
ended
31
December
2015
31
December
2014
31
December
2013
31
December
2012
31
December
2011 30 June
2016
June 2015
Purchases
Sellwell Foods and Beverages
Private Limited
- - - - 0.50 - -
(Expenses incurred by the
Company on behalf of
others)/expenses incurred by
others on behalf of the
Company
Devyani International Limited (0.67) (0.23) (0.40) (0.55) 0.73 (0.64) -
Devyani Food Industries
Limited
(2.72) (1.92) (1.89) (0.16) (0.53) - -
AB Inbev India Private
Limited
- - - (32.36) (29.61) (10.35) -
Saab Travels and Tours
Private Limited
- - - - - 15.27 -
Sellwell Foods and Beverages
Private Limited
- - - - (4.05) - -
Contribution to corporate
social responsibility activities
Champa Devi Jaipuria
Charitable Trust
- - 0.92 - - - -
Rent/lease charges paid
SVS India Private Limited 0.01 0.01 0.01 0.01 0.02 0.02 -
Devyani International Limited - - - - - 3.30 -
Balance outstanding at the
period/year end,net
Receivable/(payable)
Devyani International Limited (14.07) 23.02 6.03 (26.15) 12.50 12.06 -
Sellwell Foods and Beverages
Private Limited
- - - - 51.19 53.83 -
SVS India Private Limited - - - - - (0.01) -
AB Inbev India Private
Limited
- - - 17.47 - - -
Alisha Retail Private Limited - 0.15 0.11 - - - -
Devyani Food Industries
Limited
- 4.03 - 0.14 - - -
Saab Travels and Tours
Private Limited
- - - - - 0.45 -
Note: The above Statement should be read with the Restated Standalone Summary Statement of Significant Accounting
Policies in Annexure 4, Restated Standalone Summary Statement of Notes to Restated Standalone Summary Statements of
the Company in Annexure 5 and the Restated Standalone Summary Statement of Reconciliation of Restated Profit/ (Loss) to
Profit/ (Loss) as per Audited Standalone Financial Statements in Annexure 6.
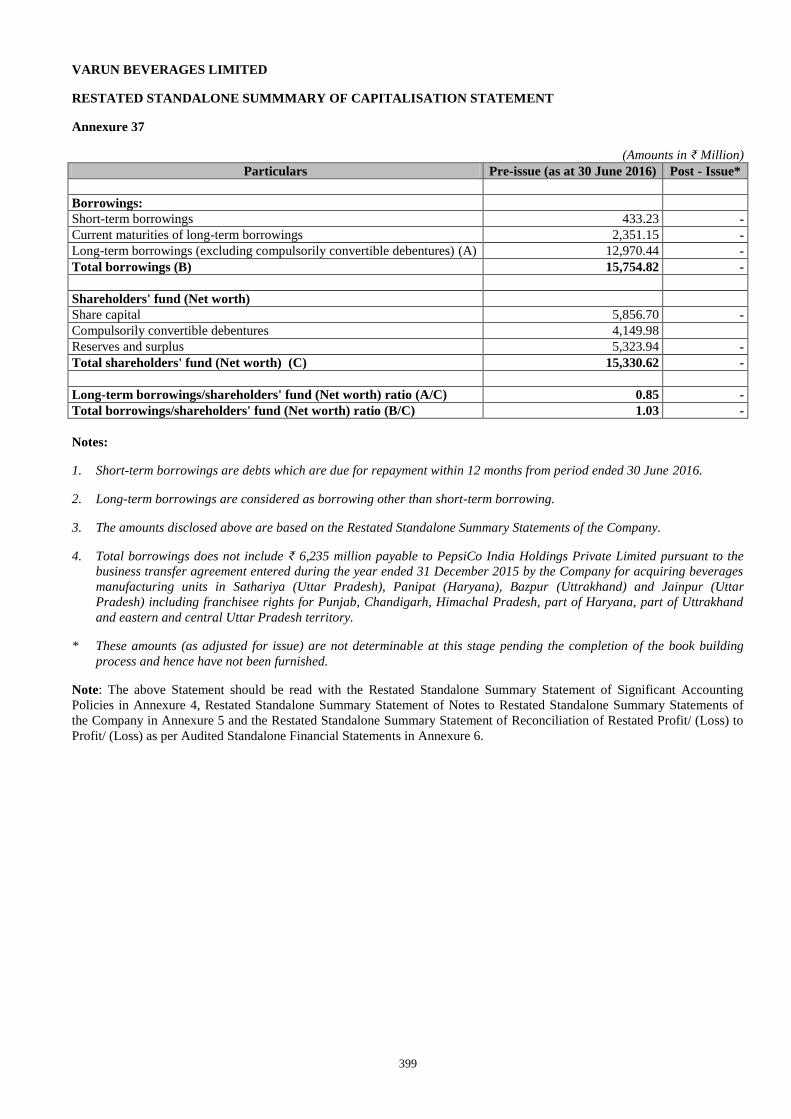
399
VARUN BEVERAGES LIMITED
RESTATED STANDALONE SUMMMARY OF CAPITALISATION STATEMENT
Annexure 37
(Amounts in ₹ Million)
Particulars Pre-issue (as at 30 June 2016) Post - Issue*
Borrowings:
Short-term borrowings 433.23 -
Current maturities of long-term borrowings 2,351.15 -
Long-term borrowings (excluding compulsorily convertible debentures) (A) 12,970.44 -
Total borrowings (B) 15,754.82 -
Shareholders' fund (Net worth)
Share capital 5,856.70 -
Compulsorily convertible debentures 4,149.98
Reserves and surplus 5,323.94 -
Total shareholders' fund (Net worth) (C) 15,330.62 -
Long-term borrowings/shareholders' fund (Net worth) ratio (A/C) 0.85 -
Total borrowings/shareholders' fund (Net worth) ratio (B/C) 1.03 -
Notes:
1. Short-term borrowings are debts which are due for repayment within 12 months from period ended 30 June 2016.
2. Long-term borrowings are considered as borrowing other than short-term borrowing.
3. The amounts disclosed above are based on the Restated Standalone Summary Statements of the Company.
4. Total borrowings does not include ₹ 6,235 million payable to PepsiCo India Holdings Private Limited pursuant to the
business transfer agreement entered during the year ended 31 December 2015 by the Company for acquiring beverages
manufacturing units in Sathariya (Uttar Pradesh), Panipat (Haryana), Bazpur (Uttrakhand) and Jainpur (Uttar
Pradesh) including franchisee rights for Punjab, Chandigarh, Himachal Pradesh, part of Haryana, part of Uttrakhand
and eastern and central Uttar Pradesh territory.
* These amounts (as adjusted for issue) are not determinable at this stage pending the completion of the book building
process and hence have not been furnished.
Note: The above Statement should be read with the Restated Standalone Summary Statement of Significant Accounting
Policies in Annexure 4, Restated Standalone Summary Statement of Notes to Restated Standalone Summary Statements of
the Company in Annexure 5 and the Restated Standalone Summary Statement of Reconciliation of Restated Profit/ (Loss) to
Profit/ (Loss) as per Audited Standalone Financial Statements in Annexure 6.
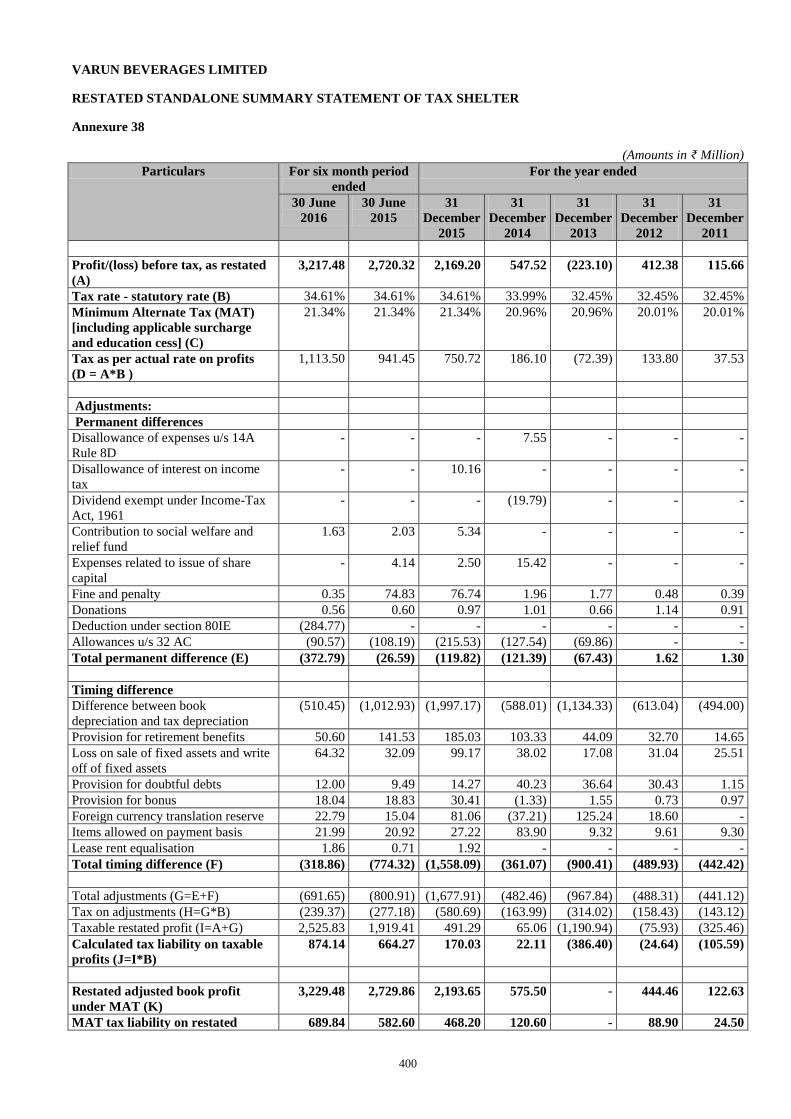
400
VARUN BEVERAGES LIMITED
RESTATED STANDALONE SUMMARY STATEMENT OF TAX SHELTER
Annexure 38
(Amounts in ₹ Million)
Particulars For six month period
ended
For the year ended
30 June
2016
30 June
2015
31
December
2015
31
December
2014
31
December
2013
31
December
2012
31
December
2011
Profit/(loss) before tax, as restated
(A)
3,217.48 2,720.32 2,169.20 547.52 (223.10) 412.38 115.66
Tax rate - statutory rate (B) 34.61% 34.61% 34.61% 33.99% 32.45% 32.45% 32.45%
Minimum Alternate Tax (MAT)
[including applicable surcharge
and education cess] (C)
21.34% 21.34% 21.34% 20.96% 20.96% 20.01% 20.01%
Tax as per actual rate on profits
(D = A*B )
1,113.50 941.45 750.72 186.10 (72.39) 133.80 37.53
Adjustments:
Permanent differences
Disallowance of expenses u/s 14A
Rule 8D
- - - 7.55 - - -
Disallowance of interest on income
tax
- - 10.16 - - - -
Dividend exempt under Income-Tax
Act, 1961
- - - (19.79) - - -
Contribution to social welfare and
relief fund
1.63 2.03 5.34 - - - -
Expenses related to issue of share
capital
- 4.14 2.50 15.42 - - -
Fine and penalty 0.35 74.83 76.74 1.96 1.77 0.48 0.39
Donations 0.56 0.60 0.97 1.01 0.66 1.14 0.91
Deduction under section 80IE (284.77) - - - - - -
Allowances u/s 32 AC (90.57) (108.19) (215.53) (127.54) (69.86) - -
Total permanent difference (E) (372.79) (26.59) (119.82) (121.39) (67.43) 1.62 1.30
Timing difference
Difference between book
depreciation and tax depreciation
(510.45) (1,012.93) (1,997.17) (588.01) (1,134.33) (613.04) (494.00)
Provision for retirement benefits 50.60 141.53 185.03 103.33 44.09 32.70 14.65
Loss on sale of fixed assets and write
off of fixed assets
64.32 32.09 99.17 38.02 17.08 31.04 25.51
Provision for doubtful debts 12.00 9.49 14.27 40.23 36.64 30.43 1.15
Provision for bonus 18.04 18.83 30.41 (1.33) 1.55 0.73 0.97
Foreign currency translation reserve 22.79 15.04 81.06 (37.21) 125.24 18.60 -
Items allowed on payment basis 21.99 20.92 27.22 83.90 9.32 9.61 9.30
Lease rent equalisation 1.86 0.71 1.92 - - - -
Total timing difference (F) (318.86) (774.32) (1,558.09) (361.07) (900.41) (489.93) (442.42)
Total adjustments (G=E+F) (691.65) (800.91) (1,677.91) (482.46) (967.84) (488.31) (441.12)
Tax on adjustments (H=G*B) (239.37) (277.18) (580.69) (163.99) (314.02) (158.43) (143.12)
Taxable restated profit (I=A+G) 2,525.83 1,919.41 491.29 65.06 (1,190.94) (75.93) (325.46)
Calculated tax liability on taxable
profits (J=I*B)
874.14 664.27 170.03 22.11 (386.40) (24.64) (105.59)
Restated adjusted book profit
under MAT (K)
3,229.48 2,729.86 2,193.65 575.50 - 444.46 122.63
MAT tax liability on restated 689.84 582.60 468.20 120.60 - 88.90 24.50
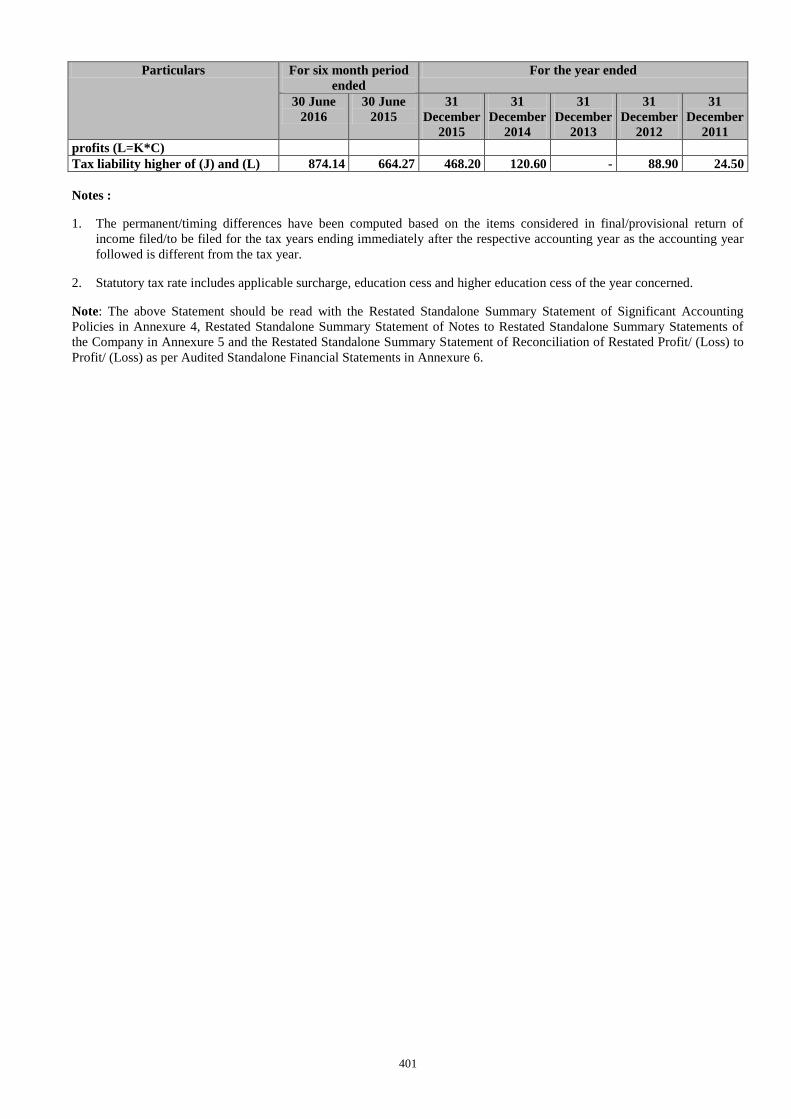
401
Particulars For six month period
ended
For the year ended
30 June
2016
30 June
2015
31
December
2015
31
December
2014
31
December
2013
31
December
2012
31
December
2011
profits (L=K*C)
Tax liability higher of (J) and (L) 874.14 664.27 468.20 120.60 - 88.90 24.50
Notes :
1. The permanent/timing differences have been computed based on the items considered in final/provisional return of
income filed/to be filed for the tax years ending immediately after the respective accounting year as the accounting year
followed is different from the tax year.
2. Statutory tax rate includes applicable surcharge, education cess and higher education cess of the year concerned.
Note: The above Statement should be read with the Restated Standalone Summary Statement of Significant Accounting
Policies in Annexure 4, Restated Standalone Summary Statement of Notes to Restated Standalone Summary Statements of
the Company in Annexure 5 and the Restated Standalone Summary Statement of Reconciliation of Restated Profit/ (Loss) to
Profit/ (Loss) as per Audited Standalone Financial Statements in Annexure 6.
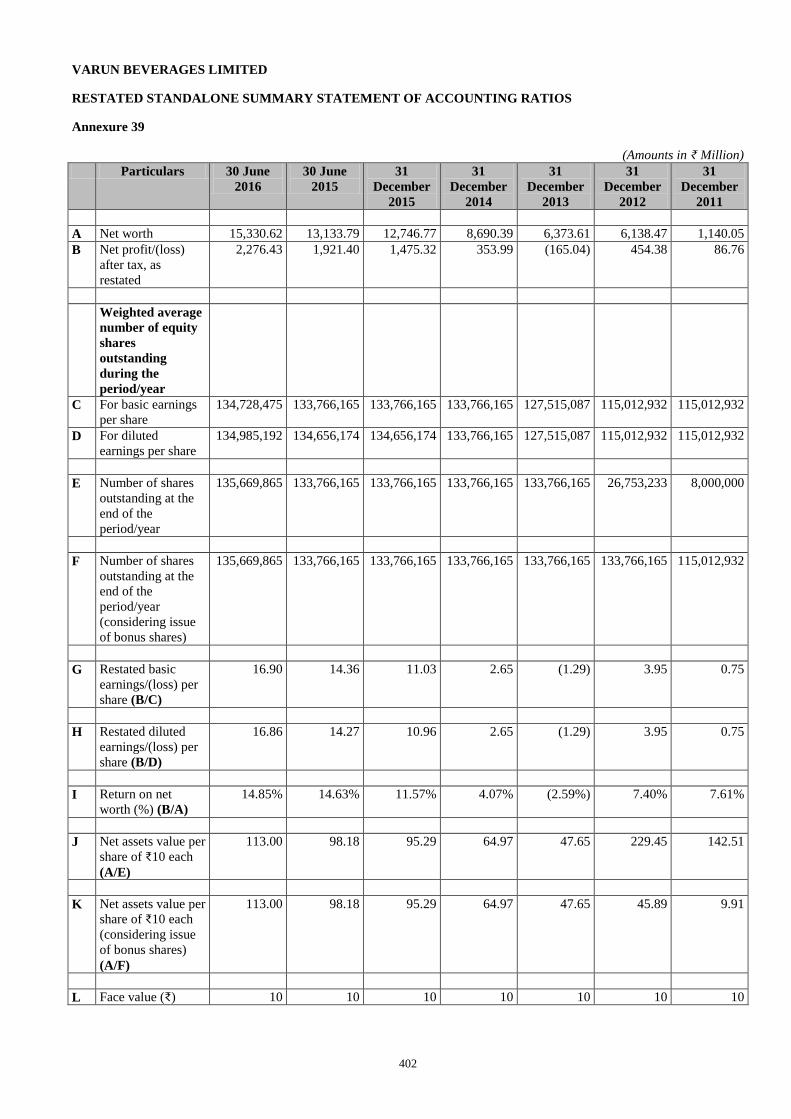
402
VARUN BEVERAGES LIMITED
RESTATED STANDALONE SUMMARY STATEMENT OF ACCOUNTING RATIOS
Annexure 39
(Amounts in ₹ Million)
Particulars 30 June
2016
30 June
2015
31
December
2015
31
December
2014
31
December
2013
31
December
2012
31
December
2011
A Net worth 15,330.62 13,133.79 12,746.77 8,690.39 6,373.61 6,138.47 1,140.05
B Net profit/(loss)
after tax, as
restated
2,276.43 1,921.40 1,475.32 353.99 (165.04) 454.38 86.76
Weighted average
number of equity
shares
outstanding
during the
period/year
C For basic earnings
per share
134,728,475 133,766,165 133,766,165 133,766,165 127,515,087 115,012,932 115,012,932
D For diluted
earnings per share
134,985,192 134,656,174 134,656,174 133,766,165 127,515,087 115,012,932 115,012,932
E Number of shares
outstanding at the
end of the
period/year
135,669,865 133,766,165 133,766,165 133,766,165 133,766,165 26,753,233 8,000,000
F Number of shares
outstanding at the
end of the
period/year
(considering issue
of bonus shares)
135,669,865 133,766,165 133,766,165 133,766,165 133,766,165 133,766,165 115,012,932
G Restated basic
earnings/(loss) per
share (B/C)
16.90 14.36 11.03 2.65 (1.29) 3.95 0.75
H Restated diluted
earnings/(loss) per
share (B/D)
16.86 14.27 10.96 2.65 (1.29) 3.95 0.75
I Return on net
worth (%) (B/A)
14.85% 14.63% 11.57% 4.07% (2.59%) 7.40% 7.61%
J Net assets value per
share of ₹10 each
(A/E)
113.00 98.18 95.29 64.97 47.65 229.45 142.51
K Net assets value per
share of ₹10 each
(considering issue
of bonus shares)
(A/F)
113.00 98.18 95.29 64.97 47.65 45.89 9.91
L Face value (₹) 10 10 10 10 10 10 10
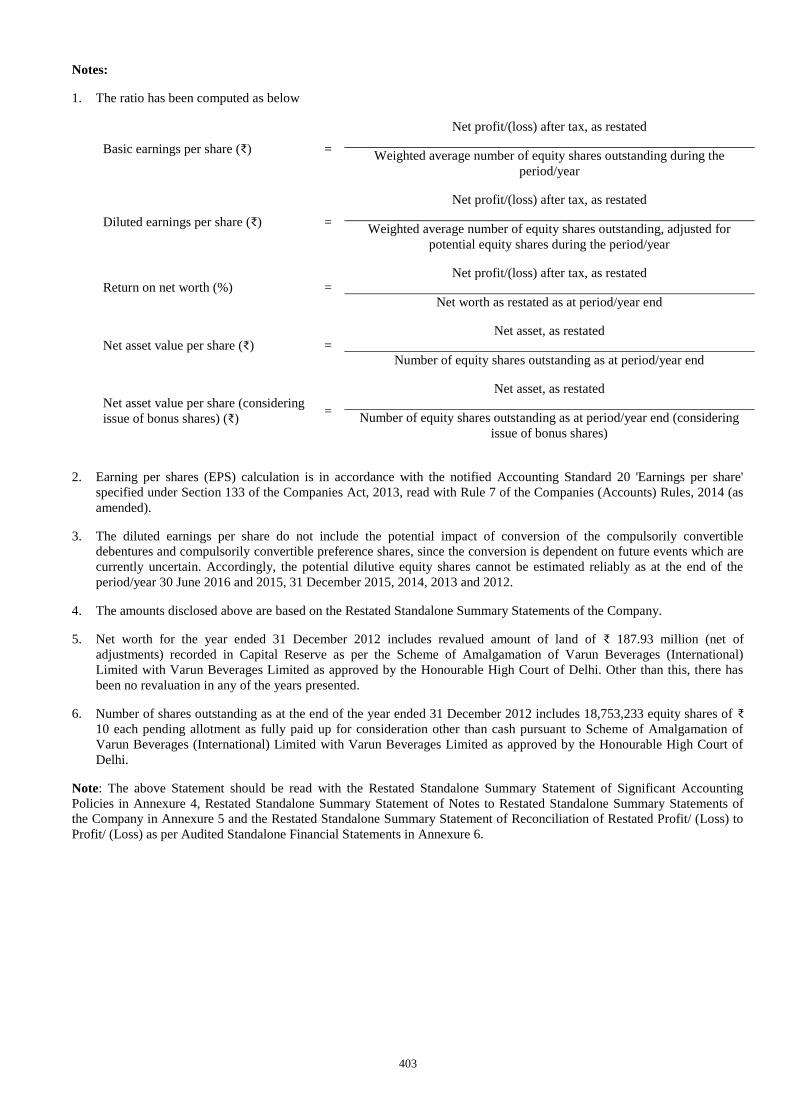
403
Notes:
1. The ratio has been computed as below
Basic earnings per share (₹) =
Net profit/(loss) after tax, as restated
Weighted average number of equity shares outstanding during the
period/year
Diluted earnings per share (₹) =
Net profit/(loss) after tax, as restated
Weighted average number of equity shares outstanding, adjusted for
potential equity shares during the period/year
Return on net worth (%) = Net profit/(loss) after tax, as restated
Net worth as restated as at period/year end
Net asset value per share (₹) = Net asset, as restated
Number of equity shares outstanding as at period/year end
Net asset value per share (considering
issue of bonus shares) (₹) =
Net asset, as restated
Number of equity shares outstanding as at period/year end (considering
issue of bonus shares)
2. Earning per shares (EPS) calculation is in accordance with the notified Accounting Standard 20 'Earnings per share'
specified under Section 133 of the Companies Act, 2013, read with Rule 7 of the Companies (Accounts) Rules, 2014 (as
amended).
3. The diluted earnings per share do not include the potential impact of conversion of the compulsorily convertible
debentures and compulsorily convertible preference shares, since the conversion is dependent on future events which are
currently uncertain. Accordingly, the potential dilutive equity shares cannot be estimated reliably as at the end of the
period/year 30 June 2016 and 2015, 31 December 2015, 2014, 2013 and 2012.
4. The amounts disclosed above are based on the Restated Standalone Summary Statements of the Company.
5. Net worth for the year ended 31 December 2012 includes revalued amount of land of ₹ 187.93 million (net of
adjustments) recorded in Capital Reserve as per the Scheme of Amalgamation of Varun Beverages (International)
Limited with Varun Beverages Limited as approved by the Honourable High Court of Delhi. Other than this, there has
been no revaluation in any of the years presented.
6. Number of shares outstanding as at the end of the year ended 31 December 2012 includes 18,753,233 equity shares of ₹
10 each pending allotment as fully paid up for consideration other than cash pursuant to Scheme of Amalgamation of
Varun Beverages (International) Limited with Varun Beverages Limited as approved by the Honourable High Court of
Delhi.
Note: The above Statement should be read with the Restated Standalone Summary Statement of Significant Accounting
Policies in Annexure 4, Restated Standalone Summary Statement of Notes to Restated Standalone Summary Statements of
the Company in Annexure 5 and the Restated Standalone Summary Statement of Reconciliation of Restated Profit/ (Loss) to
Profit/ (Loss) as per Audited Standalone Financial Statements in Annexure 6.
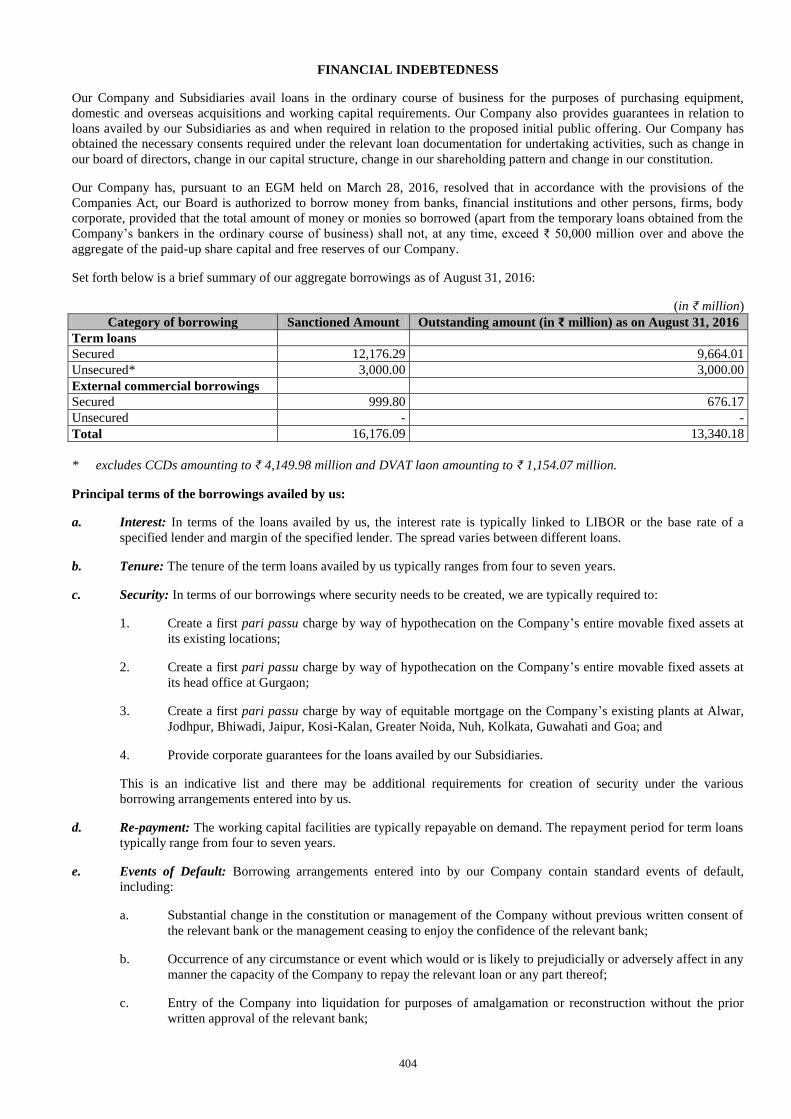
404
FINANCIAL INDEBTEDNESS
Our Company and Subsidiaries avail loans in the ordinary course of business for the purposes of purchasing equipment,
domestic and overseas acquisitions and working capital requirements. Our Company also provides guarantees in relation to
loans availed by our Subsidiaries as and when required in relation to the proposed initial public offering. Our Company has
obtained the necessary consents required under the relevant loan documentation for undertaking activities, such as change in
our board of directors, change in our capital structure, change in our shareholding pattern and change in our constitution.
Our Company has, pursuant to an EGM held on March 28, 2016, resolved that in accordance with the provisions of the
Companies Act, our Board is authorized to borrow money from banks, financial institutions and other persons, firms, body
corporate, provided that the total amount of money or monies so borrowed (apart from the temporary loans obtained from the
Company’s bankers in the ordinary course of business) shall not, at any time, exceed ₹ 50,000 million over and above the
aggregate of the paid-up share capital and free reserves of our Company.
Set forth below is a brief summary of our aggregate borrowings as of August 31, 2016:
(in ₹ million)
Category of borrowing Sanctioned Amount Outstanding amount (in ₹ million) as on August 31, 2016
Term loans
Secured 12,176.29 9,664.01
Unsecured* 3,000.00 3,000.00
External commercial borrowings
Secured 999.80 676.17
Unsecured - -
Total 16,176.09 13,340.18
* excludes CCDs amounting to ₹ 4,149.98 million and DVAT laon amounting to ₹ 1,154.07 million.
Principal terms of the borrowings availed by us:
a. Interest: In terms of the loans availed by us, the interest rate is typically linked to LIBOR or the base rate of a
specified lender and margin of the specified lender. The spread varies between different loans.
b. Tenure: The tenure of the term loans availed by us typically ranges from four to seven years.
c. Security: In terms of our borrowings where security needs to be created, we are typically required to:
1. Create a first pari passu charge by way of hypothecation on the Company’s entire movable fixed assets at
its existing locations;
2. Create a first pari passu charge by way of hypothecation on the Company’s entire movable fixed assets at
its head office at Gurgaon;
3. Create a first pari passu charge by way of equitable mortgage on the Company’s existing plants at Alwar,
Jodhpur, Bhiwadi, Jaipur, Kosi-Kalan, Greater Noida, Nuh, Kolkata, Guwahati and Goa; and
4. Provide corporate guarantees for the loans availed by our Subsidiaries.
This is an indicative list and there may be additional requirements for creation of security under the various
borrowing arrangements entered into by us.
d. Re-payment: The working capital facilities are typically repayable on demand. The repayment period for term loans
typically range from four to seven years.
e. Events of Default: Borrowing arrangements entered into by our Company contain standard events of default,
including:
a. Substantial change in the constitution or management of the Company without previous written consent of
the relevant bank or the management ceasing to enjoy the confidence of the relevant bank;
b. Occurrence of any circumstance or event which would or is likely to prejudicially or adversely affect in any
manner the capacity of the Company to repay the relevant loan or any part thereof;
c. Entry of the Company into liquidation for purposes of amalgamation or reconstruction without the prior
written approval of the relevant bank;
405
d. Non-payment of instalment/interest within the stipulated time;
e. Utilisation of a loan for purposes other than the sanctioned purpose;
f. Appointment of a receiver in respect of the whole or any part of the property or assets of the Company;
g. Certification by an accountant appointed by the relevant bank that the Company’s liabilities exceed its
assets or that the Company is carrying on business at a loss;
h. Creation of further security interest over assets secured in favour of a bank without the prior written consent
of such bank; and
i. The Company ceasing or threatening to cease to carry on its business.
This is an indicative list and there may be additional terms that may amount to an event of default under the various
borrowing arrangements entered into by us.
Additionally, our Company is required to ensure the aforementioned events of default and other events of default, as
specified under the corporate guarantees provided by our Company are not triggered.
Our Company has issued rated, listed, unsecured, redeemable non-convertible debentures issued on September 30, 2015 to
AION for an aggregate principal amount of ₹ 3,000 million on a private placement basis pursuant to the debenture trust deed
cum facility agreement dated September 17, 2015 among Axis Trustee Services Limited and the Company, Axis Trustee
Services Limited has a right to nominate one director on our Board and its committees.
Our Company has also issued rated, listed, secured, redeemable non-convertible debentures in December 2015 for an
aggregate principal amount of ₹ 2,000 million, which were allotted to RBL Bank Limited on December 1, 2015 on a private
placement basis. In this regard, a debenture trust deed dated January 6, 2016 was entered into by Axis Trustee Services
Limited and our Company. These non-convertible debentures are currently listed on the wholesale debt market segment of the
NSE.
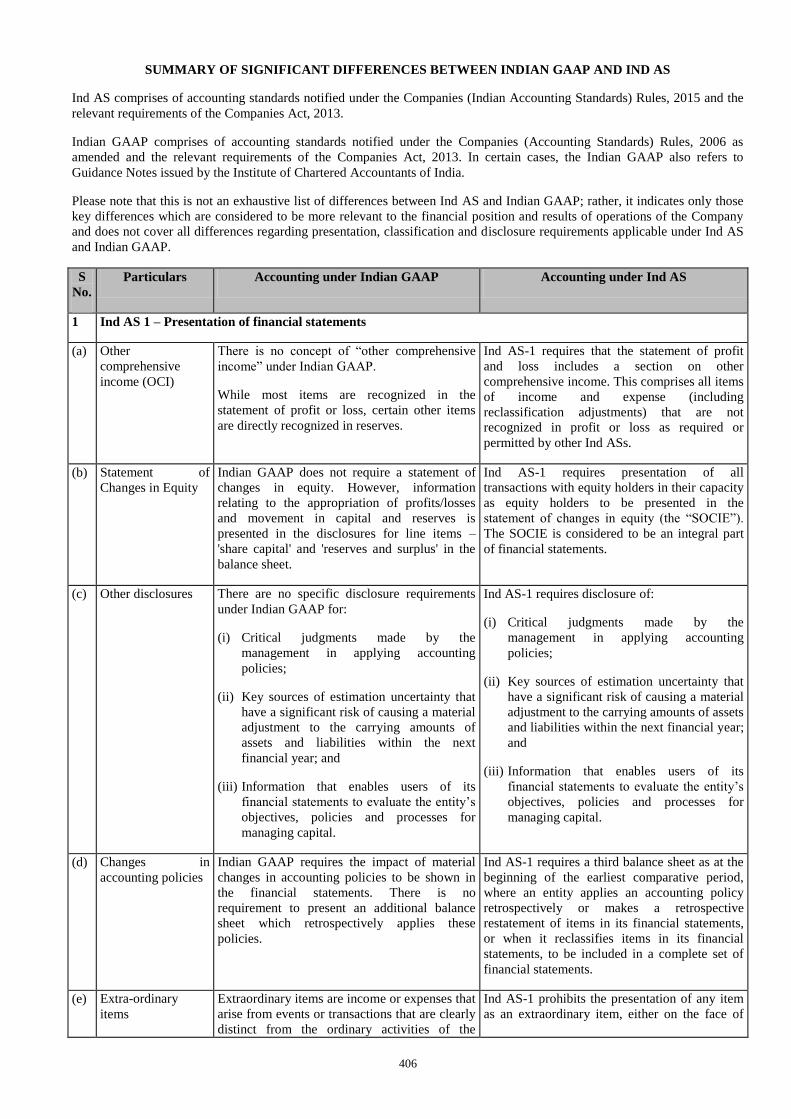
406
SUMMARY OF SIGNIFICANT DIFFERENCES BETWEEN INDIAN GAAP AND IND AS
Ind AS comprises of accounting standards notified under the Companies (Indian Accounting Standards) Rules, 2015 and the
relevant requirements of the Companies Act, 2013.
Indian GAAP comprises of accounting standards notified under the Companies (Accounting Standards) Rules, 2006 as
amended and the relevant requirements of the Companies Act, 2013. In certain cases, the Indian GAAP also refers to
Guidance Notes issued by the Institute of Chartered Accountants of India.
Please note that this is not an exhaustive list of differences between Ind AS and Indian GAAP; rather, it indicates only those
key differences which are considered to be more relevant to the financial position and results of operations of the Company
and does not cover all differences regarding presentation, classification and disclosure requirements applicable under Ind AS
and Indian GAAP.
S
No.
Particulars Accounting under Indian GAAP Accounting under Ind AS
1 Ind AS 1 – Presentation of financial statements
(a) Other
comprehensive
income (OCI)
There is no concept of “other comprehensive
income” under Indian GAAP.
While most items are recognized in the
statement of profit or loss, certain other items
are directly recognized in reserves.
Ind AS-1 requires that the statement of profit
and loss includes a section on other
comprehensive income. This comprises all items
of income and expense (including
reclassification adjustments) that are not
recognized in profit or loss as required or
permitted by other Ind ASs.
(b) Statement of
Changes in Equity
Indian GAAP does not require a statement of
changes in equity. However, information
relating to the appropriation of profits/losses
and movement in capital and reserves is
presented in the disclosures for line items –
'share capital' and 'reserves and surplus' in the
balance sheet.
Ind AS-1 requires presentation of all
transactions with equity holders in their capacity
as equity holders to be presented in the
statement of changes in equity (the “SOCIE”).
The SOCIE is considered to be an integral part
of financial statements.
(c) Other disclosures There are no specific disclosure requirements
under Indian GAAP for:
(i) Critical judgments made by the
management in applying accounting
policies;
(ii) Key sources of estimation uncertainty that
have a significant risk of causing a material
adjustment to the carrying amounts of
assets and liabilities within the next
financial year; and
(iii) Information that enables users of its
financial statements to evaluate the entity’s
objectives, policies and processes for
managing capital.
Ind AS-1 requires disclosure of:
(i) Critical judgments made by the
management in applying accounting
policies;
(ii) Key sources of estimation uncertainty that
have a significant risk of causing a material
adjustment to the carrying amounts of assets
and liabilities within the next financial year;
and
(iii) Information that enables users of its
financial statements to evaluate the entity’s
objectives, policies and processes for
managing capital.
(d) Changes in
accounting policies
Indian GAAP requires the impact of material
changes in accounting policies to be shown in
the financial statements. There is no
requirement to present an additional balance
sheet which retrospectively applies these
policies.
Ind AS-1 requires a third balance sheet as at the
beginning of the earliest comparative period,
where an entity applies an accounting policy
retrospectively or makes a retrospective
restatement of items in its financial statements,
or when it reclassifies items in its financial
statements, to be included in a complete set of
financial statements.
(e) Extra-ordinary
items
Extraordinary items are income or expenses that
arise from events or transactions that are clearly
distinct from the ordinary activities of the
Ind AS-1 prohibits the presentation of any item
as an extraordinary item, either on the face of
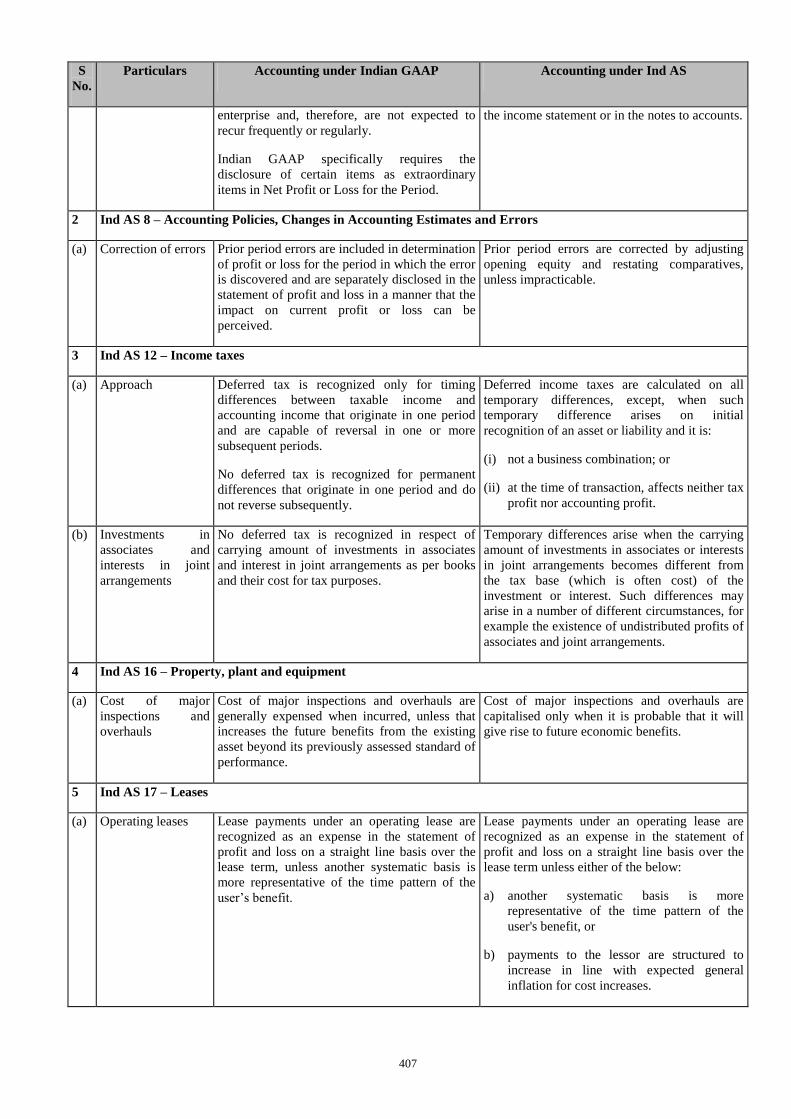
407
S
No.
Particulars Accounting under Indian GAAP Accounting under Ind AS
enterprise and, therefore, are not expected to
recur frequently or regularly.
Indian GAAP specifically requires the
disclosure of certain items as extraordinary
items in Net Profit or Loss for the Period.
the income statement or in the notes to accounts.
2 Ind AS 8 – Accounting Policies, Changes in Accounting Estimates and Errors
(a) Correction of errors Prior period errors are included in determination
of profit or loss for the period in which the error
is discovered and are separately disclosed in the
statement of profit and loss in a manner that the
impact on current profit or loss can be
perceived.
Prior period errors are corrected by adjusting
opening equity and restating comparatives,
unless impracticable.
3 Ind AS 12 – Income taxes
(a) Approach Deferred tax is recognized only for timing
differences between taxable income and
accounting income that originate in one period
and are capable of reversal in one or more
subsequent periods.
No deferred tax is recognized for permanent
differences that originate in one period and do
not reverse subsequently.
Deferred income taxes are calculated on all
temporary differences, except, when such
temporary difference arises on initial
recognition of an asset or liability and it is:
(i) not a business combination; or
(ii) at the time of transaction, affects neither tax
profit nor accounting profit.
(b) Investments in
associates and
interests in joint
arrangements
No deferred tax is recognized in respect of
carrying amount of investments in associates
and interest in joint arrangements as per books
and their cost for tax purposes.
Temporary differences arise when the carrying
amount of investments in associates or interests
in joint arrangements becomes different from
the tax base (which is often cost) of the
investment or interest. Such differences may
arise in a number of different circumstances, for
example the existence of undistributed profits of
associates and joint arrangements.
4 Ind AS 16 – Property, plant and equipment
(a) Cost of major
inspections and
overhauls
Cost of major inspections and overhauls are
generally expensed when incurred, unless that
increases the future benefits from the existing
asset beyond its previously assessed standard of
performance.
Cost of major inspections and overhauls are
capitalised only when it is probable that it will
give rise to future economic benefits.
5 Ind AS 17 – Leases
(a) Operating leases Lease payments under an operating lease are
recognized as an expense in the statement of
profit and loss on a straight line basis over the
lease term, unless another systematic basis is
more representative of the time pattern of the
user’s benefit.
Lease payments under an operating lease are
recognized as an expense in the statement of
profit and loss on a straight line basis over the
lease term unless either of the below:
a) another systematic basis is more
representative of the time pattern of the
user's benefit, or
b) payments to the lessor are structured to
increase in line with expected general
inflation for cost increases.
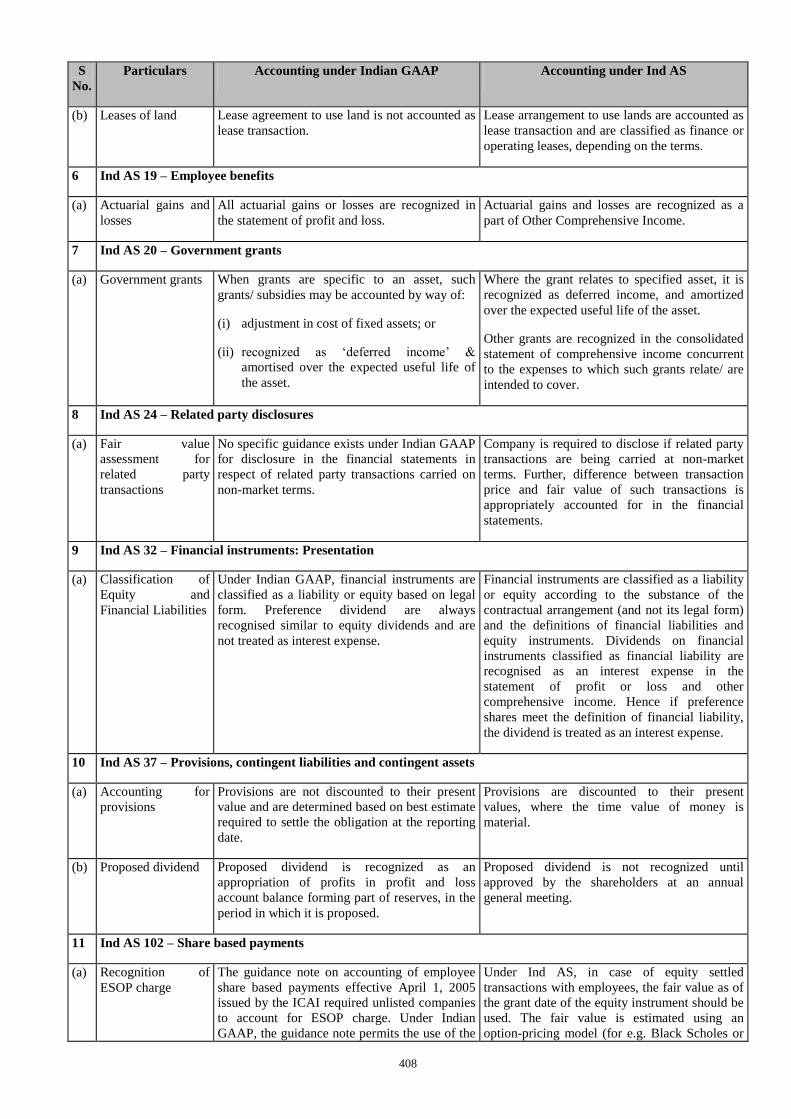
408
S
No.
Particulars Accounting under Indian GAAP Accounting under Ind AS
(b) Leases of land Lease agreement to use land is not accounted as
lease transaction.
Lease arrangement to use lands are accounted as
lease transaction and are classified as finance or
operating leases, depending on the terms.
6 Ind AS 19 – Employee benefits
(a) Actuarial gains and
losses
All actuarial gains or losses are recognized in
the statement of profit and loss.
Actuarial gains and losses are recognized as a
part of Other Comprehensive Income.
7 Ind AS 20 – Government grants
(a) Government grants When grants are specific to an asset, such
grants/ subsidies may be accounted by way of:
(i) adjustment in cost of fixed assets; or
(ii) recognized as ‘deferred income’ &
amortised over the expected useful life of
the asset.
Where the grant relates to specified asset, it is
recognized as deferred income, and amortized
over the expected useful life of the asset.
Other grants are recognized in the consolidated
statement of comprehensive income concurrent
to the expenses to which such grants relate/ are
intended to cover.
8 Ind AS 24 – Related party disclosures
(a) Fair value
assessment for
related party
transactions
No specific guidance exists under Indian GAAP
for disclosure in the financial statements in
respect of related party transactions carried on
non-market terms.
Company is required to disclose if related party
transactions are being carried at non-market
terms. Further, difference between transaction
price and fair value of such transactions is
appropriately accounted for in the financial
statements.
9 Ind AS 32 – Financial instruments: Presentation
(a) Classification of
Equity and
Financial Liabilities
Under Indian GAAP, financial instruments are
classified as a liability or equity based on legal
form. Preference dividend are always
recognised similar to equity dividends and are
not treated as interest expense.
Financial instruments are classified as a liability
or equity according to the substance of the
contractual arrangement (and not its legal form)
and the definitions of financial liabilities and
equity instruments. Dividends on financial
instruments classified as financial liability are
recognised as an interest expense in the
statement of profit or loss and other
comprehensive income. Hence if preference
shares meet the definition of financial liability,
the dividend is treated as an interest expense.
10 Ind AS 37 – Provisions, contingent liabilities and contingent assets
(a) Accounting for
provisions
Provisions are not discounted to their present
value and are determined based on best estimate
required to settle the obligation at the reporting
date.
Provisions are discounted to their present
values, where the time value of money is
material.
(b) Proposed dividend Proposed dividend is recognized as an
appropriation of profits in profit and loss
account balance forming part of reserves, in the
period in which it is proposed.
Proposed dividend is not recognized until
approved by the shareholders at an annual
general meeting.
11 Ind AS 102 – Share based payments
(a) Recognition of
ESOP charge
The guidance note on accounting of employee
share based payments effective April 1, 2005
issued by the ICAI required unlisted companies
to account for ESOP charge. Under Indian
GAAP, the guidance note permits the use of the
Under Ind AS, in case of equity settled
transactions with employees, the fair value as of
the grant date of the equity instrument should be
used. The fair value is estimated using an
option-pricing model (for e.g. Black Scholes or
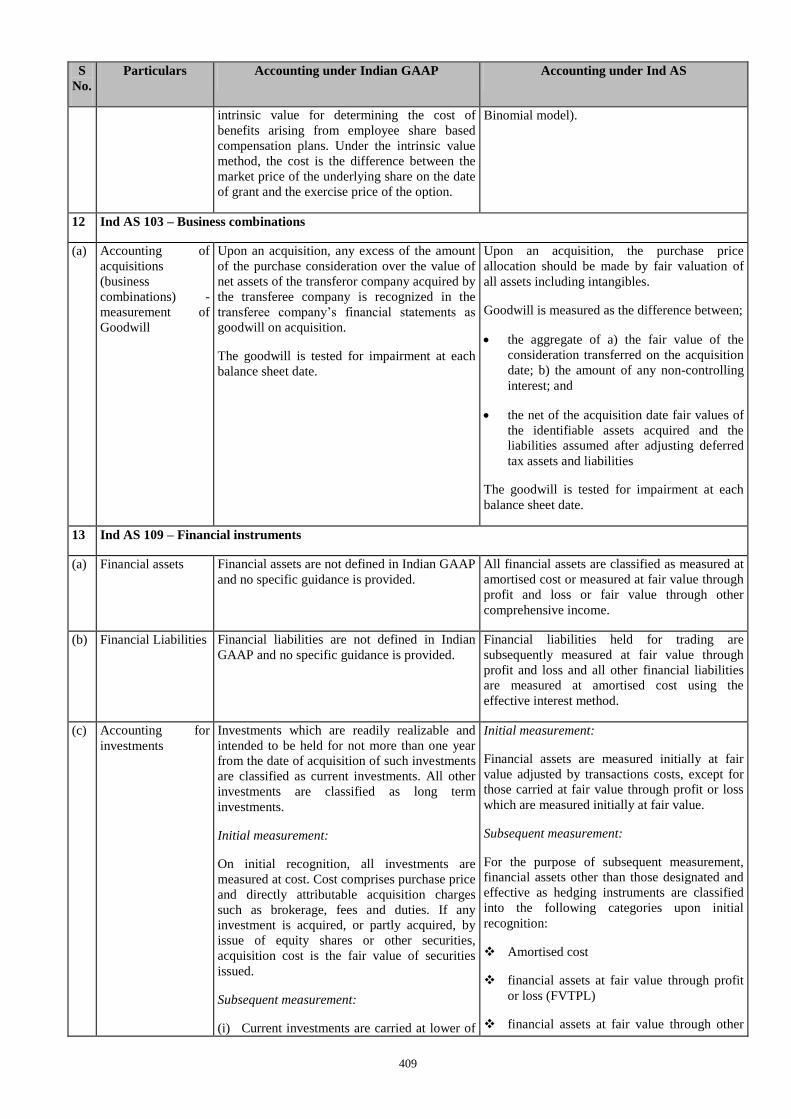
409
S
No.
Particulars Accounting under Indian GAAP Accounting under Ind AS
intrinsic value for determining the cost of
benefits arising from employee share based
compensation plans. Under the intrinsic value
method, the cost is the difference between the
market price of the underlying share on the date
of grant and the exercise price of the option.
Binomial model).
12 Ind AS 103 – Business combinations
(a) Accounting of
acquisitions
(business
combinations) -
measurement of
Goodwill
Upon an acquisition, any excess of the amount
of the purchase consideration over the value of
net assets of the transferor company acquired by
the transferee company is recognized in the
transferee company’s financial statements as
goodwill on acquisition.
The goodwill is tested for impairment at each
balance sheet date.
Upon an acquisition, the purchase price
allocation should be made by fair valuation of
all assets including intangibles.
Goodwill is measured as the difference between;
the aggregate of a) the fair value of the
consideration transferred on the acquisition
date; b) the amount of any non-controlling
interest; and
the net of the acquisition date fair values of
the identifiable assets acquired and the
liabilities assumed after adjusting deferred
tax assets and liabilities
The goodwill is tested for impairment at each
balance sheet date.
13 Ind AS 109 – Financial instruments
(a) Financial assets Financial assets are not defined in Indian GAAP
and no specific guidance is provided.
All financial assets are classified as measured at
amortised cost or measured at fair value through
profit and loss or fair value through other
comprehensive income.
(b) Financial Liabilities Financial liabilities are not defined in Indian
GAAP and no specific guidance is provided.
Financial liabilities held for trading are
subsequently measured at fair value through
profit and loss and all other financial liabilities
are measured at amortised cost using the
effective interest method.
(c) Accounting for
investments
Investments which are readily realizable and
intended to be held for not more than one year
from the date of acquisition of such investments
are classified as current investments. All other
investments are classified as long term
investments.
Initial measurement:
On initial recognition, all investments are
measured at cost. Cost comprises purchase price
and directly attributable acquisition charges
such as brokerage, fees and duties. If any
investment is acquired, or partly acquired, by
issue of equity shares or other securities,
acquisition cost is the fair value of securities
issued.
Subsequent measurement:
(i) Current investments are carried at lower of
Initial measurement:
Financial assets are measured initially at fair
value adjusted by transactions costs, except for
those carried at fair value through profit or loss
which are measured initially at fair value.
Subsequent measurement:
For the purpose of subsequent measurement,
financial assets other than those designated and
effective as hedging instruments are classified
into the following categories upon initial
recognition:
Amortised cost
financial assets at fair value through profit
or loss (FVTPL)
financial assets at fair value through other
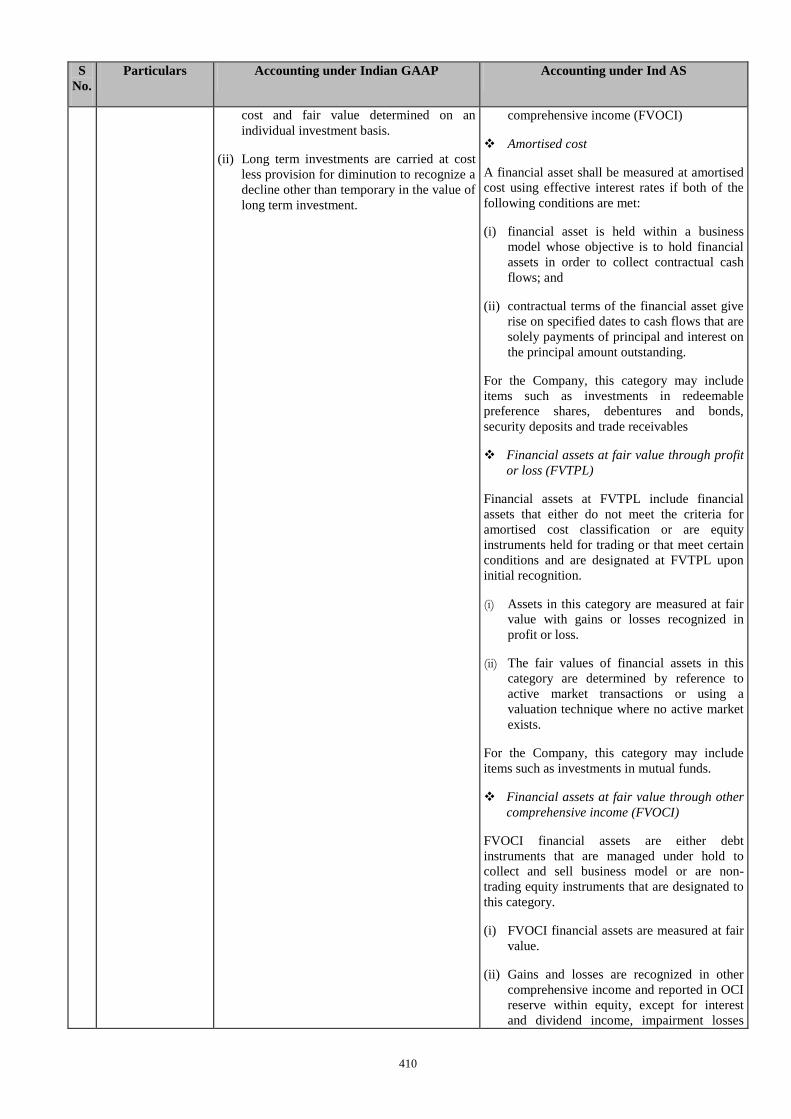
410
S
No.
Particulars Accounting under Indian GAAP Accounting under Ind AS
cost and fair value determined on an
individual investment basis.
(ii) Long term investments are carried at cost
less provision for diminution to recognize a
decline other than temporary in the value of
long term investment.
comprehensive income (FVOCI)
Amortised cost
A financial asset shall be measured at amortised
cost using effective interest rates if both of the
following conditions are met:
(i) financial asset is held within a business
model whose objective is to hold financial
assets in order to collect contractual cash
flows; and
(ii) contractual terms of the financial asset give
rise on specified dates to cash flows that are
solely payments of principal and interest on
the principal amount outstanding.
For the Company, this category may include
items such as investments in redeemable
preference shares, debentures and bonds,
security deposits and trade receivables
Financial assets at fair value through profit
or loss (FVTPL)
Financial assets at FVTPL include financial
assets that either do not meet the criteria for
amortised cost classification or are equity
instruments held for trading or that meet certain
conditions and are designated at FVTPL upon
initial recognition.
(i) Assets in this category are measured at fair
value with gains or losses recognized in
profit or loss.
(ii) The fair values of financial assets in this
category are determined by reference to
active market transactions or using a
valuation technique where no active market
exists.
For the Company, this category may include
items such as investments in mutual funds.
Financial assets at fair value through other
comprehensive income (FVOCI)
FVOCI financial assets are either debt
instruments that are managed under hold to
collect and sell business model or are non-
trading equity instruments that are designated to
this category.
(i) FVOCI financial assets are measured at fair
value.
(ii) Gains and losses are recognized in other
comprehensive income and reported in OCI
reserve within equity, except for interest
and dividend income, impairment losses
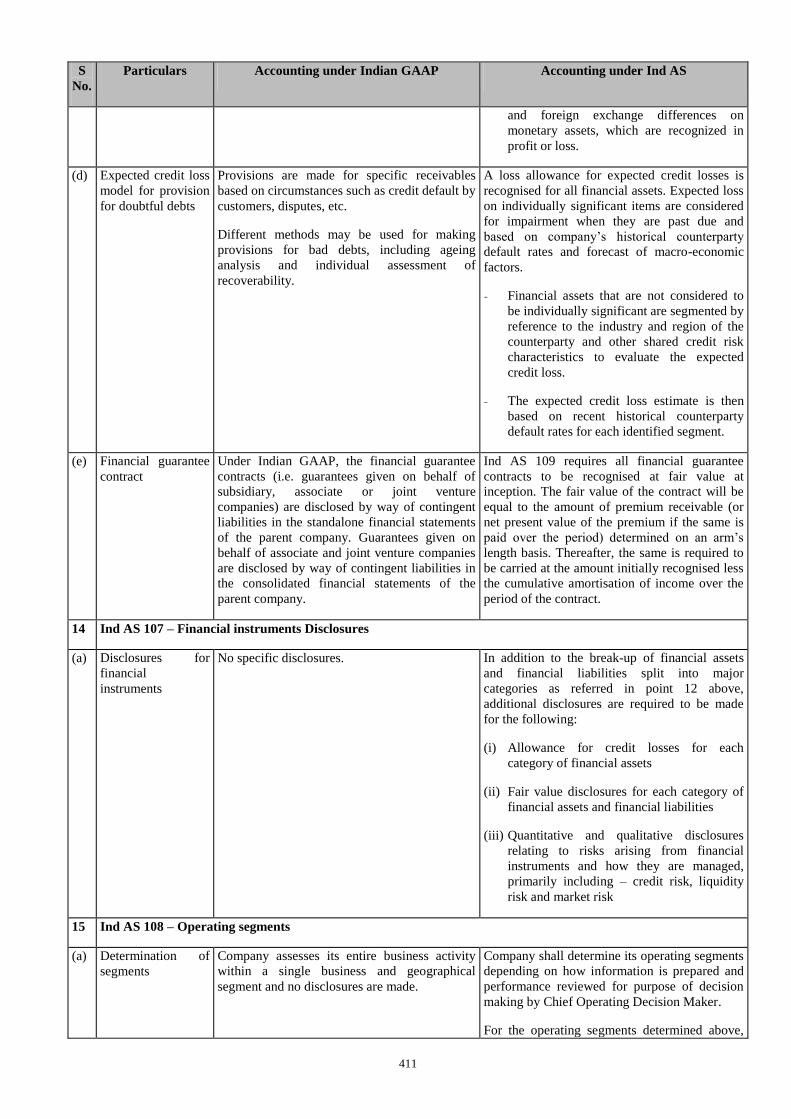
411
S
No.
Particulars Accounting under Indian GAAP Accounting under Ind AS
and foreign exchange differences on
monetary assets, which are recognized in
profit or loss.
(d) Expected credit loss
model for provision
for doubtful debts
Provisions are made for specific receivables
based on circumstances such as credit default by
customers, disputes, etc.
Different methods may be used for making
provisions for bad debts, including ageing
analysis and individual assessment of
recoverability.
A loss allowance for expected credit losses is
recognised for all financial assets. Expected loss
on individually significant items are considered
for impairment when they are past due and
based on company’s historical counterparty
default rates and forecast of macro-economic
factors.
- Financial assets that are not considered to
be individually significant are segmented by
reference to the industry and region of the
counterparty and other shared credit risk
characteristics to evaluate the expected
credit loss.
- The expected credit loss estimate is then
based on recent historical counterparty
default rates for each identified segment.
(e) Financial guarantee
contract
Under Indian GAAP, the financial guarantee
contracts (i.e. guarantees given on behalf of
subsidiary, associate or joint venture
companies) are disclosed by way of contingent
liabilities in the standalone financial statements
of the parent company. Guarantees given on
behalf of associate and joint venture companies
are disclosed by way of contingent liabilities in
the consolidated financial statements of the
parent company.
Ind AS 109 requires all financial guarantee
contracts to be recognised at fair value at
inception. The fair value of the contract will be
equal to the amount of premium receivable (or
net present value of the premium if the same is
paid over the period) determined on an arm’s
length basis. Thereafter, the same is required to
be carried at the amount initially recognised less
the cumulative amortisation of income over the
period of the contract.
14 Ind AS 107 – Financial instruments Disclosures
(a) Disclosures for
financial
instruments
No specific disclosures. In addition to the break-up of financial assets
and financial liabilities split into major
categories as referred in point 12 above,
additional disclosures are required to be made
for the following:
(i) Allowance for credit losses for each
category of financial assets
(ii) Fair value disclosures for each category of
financial assets and financial liabilities
(iii) Quantitative and qualitative disclosures
relating to risks arising from financial
instruments and how they are managed,
primarily including – credit risk, liquidity
risk and market risk
15 Ind AS 108 – Operating segments
(a) Determination of
segments
Company assesses its entire business activity
within a single business and geographical
segment and no disclosures are made.
Company shall determine its operating segments
depending on how information is prepared and
performance reviewed for purpose of decision
making by Chief Operating Decision Maker.
For the operating segments determined above,
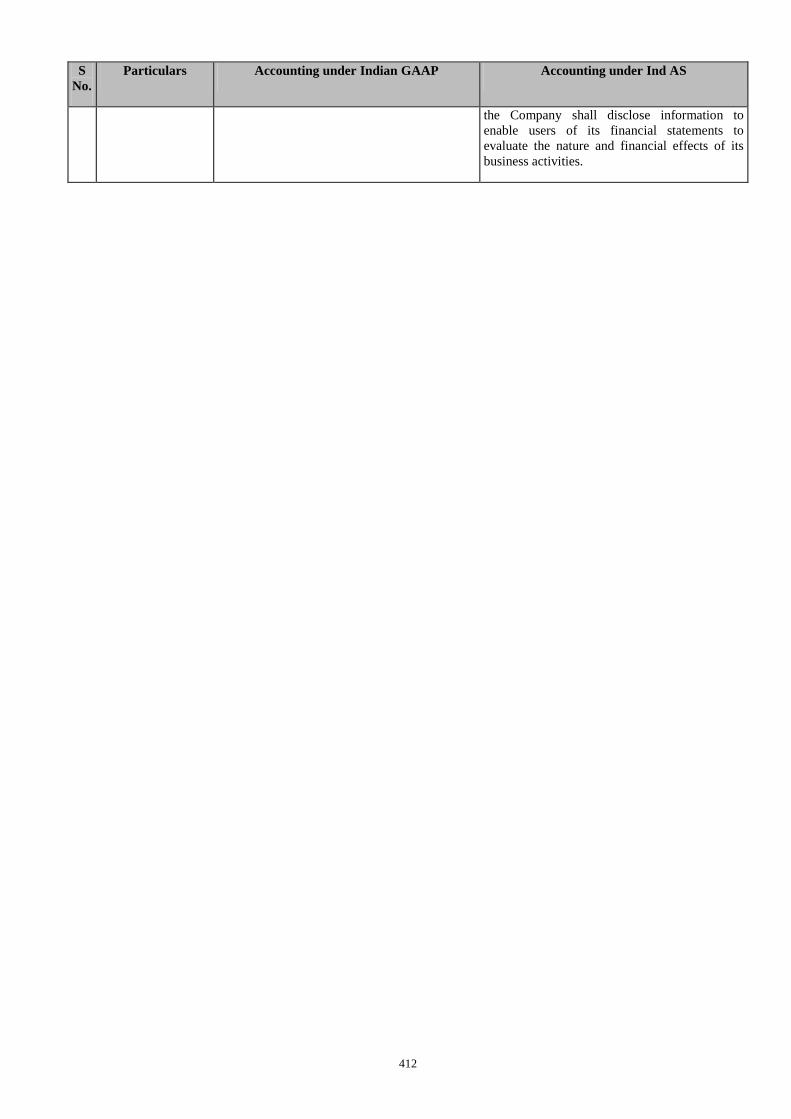
412
S
No.
Particulars Accounting under Indian GAAP Accounting under Ind AS
the Company shall disclose information to
enable users of its financial statements to
evaluate the nature and financial effects of its
business activities.
413
MANAGEMENT’S DISCUSSION AND ANALYSIS OF FINANCIAL CONDITION AND RESULTS OF
OPERATIONS
The following discussion of our financial condition and results of operations should be read in conjunction with our Restated
Consolidated Financial Statements and Restated Standalone Financial Statements beginning on page 210 and 310,
respectively, prepared in accordance with the Companies Act, Indian GAAP and the SEBI ICDR Regulations, including the
schedules, annexures and notes thereto and the reports thereon, included in the section “Financial Information” beginning
on page 210.
Indian GAAP differs in certain material respects from U.S. GAAP and IFRS. Indian GAAP also differs in certain material
respects from the Indian Accounting Standards 101 First-Time Adoption of Indian Accounting Standards (Ind AS) which will
be applicable to our Company and Group in the future in accordance with certain guidelines stipulated by the Ministry of
Corporate Affairs, GoI with effect from certain dates specified by various regulatory authorities, including the SEBI. We have
not attempted to quantify the impact of IFRS or U.S. GAAP or Ind AS on the financial information included in this RHP, nor
do we provide a reconciliation of our financial information to those of U.S. GAAP, IFRS or Ind AS. Given that Ind AS differs
in many respects from Indian GAAP, our financial statements prepared and presented in accordance with Ind AS relating to
any period subsequent to January 1, 2017, may not be comparable to our historical financial statements prepared under
Indian GAAP. In the event that any of our historical financial statements, including our financial statements for Fiscal 2017
are required to be also prepared in accordance with IndAS, such historical Ind AS financial statements may vary from our
historical India GAAP financial statements, and there can be no assurance that such variation will be material. In addition,
our Restated Standalone Financial Statements and the Restated Consolidated Financial Statements differs in certain respects
from both Indian GAAP and Ind AS. For further information, see “Risk Factors – Our Company, will be required to prepare
financial statements under Ind AS (which is India’s convergence to IFRS). Additionally, Ind AS requires Indian companies to
compute Income Tax under the Income Computation and Disclosure Standards (the “ICDS”). The transition to Ind AS in
India is very recent and there is no clarity on the impact of such transition on our Company. Ind AS also differs from IFRS
and US GAAP. The introduction of Ind AS and other regulatory developments affecting fiscal matters in India may
significantly affect preparation and presentation of our financial statements in the future and such financial statements
prepared in accordance with Ind AS may differ from the Restated Standalone Financial Statements and the Restated
Consolidated Financial Statements included in this Red Herring Prospectus. Accordingly, the degree to which the Indian
GAAP financial information included in this RHP will provide meaningful information is entirely dependent on the reader’s
level of familiarity with Indian accounting practices.
Some of the information in the following discussion, including information with respect to our future plans and business
strategies, contain forward-looking statements that involve risks and uncertainties. You should read the section “Forward-
Looking Statements” on page 20 for a discussion of the risks and uncertainties related to those statements and also the
section “Risk Factors” beginning on page 22 for a discussion of certain factors that may affect our business, financial
condition or results of operations. Our actual results may differ materially from those expressed in or implied by these
forward-looking statements. Historically, under the Companies Act, 1956, companies had the freedom to fix any annual
period as their fiscal year, however, with the introduction of the Companies Act, 2013, the fiscal year of company is required
to be from April 1 to March 31 each year. Our fiscal year ends on December 31 of each year, and references to a particular
Fiscal are to the twelve-month period ended December 31 of that year. Our fiscal year ending on December 31 is pursuant to
the approval letter dated December 15, 2015 from the CLB, Government of India.
Unless the context otherwise requires, in this section, references to “we”, “us” or “our” refers to Varun Beverages Limited
and its subsidiaries and associate companies on a consolidated basis, and includes references to entities that have merged
with, or that have been acquired by, our Company, including Devyani Beverages Limited, Varun Beverages (Nepal) Private
Limited, North East Pure Drinks Private Limited, Varun Beverages (International) Limited, Varun Beverages (Zambia)
Limited, Varun Beverages Mozambique, Limitada and Varun Beverages (Zimbabwe) (Private) Limited. Unless the context
otherwise requires, references to our “Company” refers to Varun Beverages Limited on a standalone basis. Unless
otherwise indicated, all financial information included herein are based on our Restated Consolidated Financial Statements
included in this Red Herring Prospectus beginning on page 210. Our Company did not have a subsidiary in Fiscal 2011 and
hence financial information included herein is derived from our Restated Standalone Financial Statements for Fiscal 2011.
Following the consolidation of certain of our Subsidiaries from Fiscal 2012 onwards, pursuant to the amalgamation of VBIL
into the Company with effect from January 1, 2012, the financial information included herein is derived from our Restated
Consolidated Financial Statements for Fiscal 2012, 2013, 2014, 2015 and the six months ended June 30, 2016.
The Sales Volume information presented in this section represents sales to our customers in our licensed territories but does
not include any sales to PepsiCo or any other franchisees of PepsiCo. Sales to PepsiCo and / or other PepsiCo franchisees
are reflected in our revenues from operations. However, such sales have not been significant in the last five Fiscals and the
six months ended June 30, 2016. We do not make any such sales other than in India. Sales Volume information in any Fiscal
period included in this section cannot be directly correlated to our revenues from operations in the respective Fiscal.
414
Overview
We are one of the largest franchisee in the world (outside USA) of carbonated soft drinks (“CSDs”) and non-carbonated
beverages (“NCBs”) sold under trademarks owned by PepsiCo. We produce and distribute a wide range of CSDs, as well as a
large selection of NCBs, including packaged drinking water. PepsiCo CSD brands produced and sold by us include Pepsi,
Diet Pepsi, Seven-Up, Mirinda Orange, Mirinda Lemon, Mountain Dew, Mountain Dew Game Fuel, Seven-Up Nimbooz
Masala Soda, Seven-Up Revive and Evervess. PepsiCo NCB brands produced and sold by us include Tropicana Slice,
Tropicana Frutz (Lychee, Apple and Mango), Nimbooz as well as packaged drinking water under the brand Aquafina. In
addition, we have also been granted the franchise for Ole brand of PepsiCo products in Sri Lanka.
We have been associated with PepsiCo since the 1990s and have over two and half decades consolidated our business
association with PepsiCo, increasing the number of licensed territories and sub-territories covered by us, producing and
distributing a wider range of PepsiCo beverages, introducing various SKUs in our portfolio, and expanding our distribution
network. As of June 30, 2016, we have been granted franchises for various PepsiCo products across 17 States and two Union
Territories in India. India is our largest market and contributed 82.48%, 80.67%, 84.38% and 83.46% of our revenues from
operations (net) in Fiscal 2013, Fiscal 2014, Fiscal 2015, and in the six months ended June 30, 2016, respectively. We have
also been granted the franchise for various PepsiCo products for the territories of Nepal, Sri Lanka, Morocco, Mozambique
and Zambia. In addition, we are in the process of setting up a greenfield facility in Zimbabwe in anticipation of franchise
rights being granted by PepsiCo Inc. for such territory. For further information on our franchise arrangements with PepsiCo
India / PepsiCo Inc. and / or the PepsiCo International Entities, see “Our Business – Relationship with PepsiCo” on page 136.
According to the Euromonitor Report, the beverage markets in India, Nepal, Morocco and Sri Lanka are some of the fastest
growing beverage markets in the world. (Source: Euromonitor Report). Our demonstrated ability to grow PepsiCo product
sales in our territories and sub-territories has led to PepsiCo India / PepsiCo Inc. and / or the PepsiCo International Entities
licensing additional franchises to us, including sub-territories in India that were earlier directly operated by PepsiCo or by
third-party bottlers. PepsiCo soft drinks total volume sales (based on sales to end consumers) in India was 1,654.9 million
litres in Fiscal 2011 and 2,688.1 million litres in Fiscal 2015. (Source: Euromonitor Report). Our Sales Volumes in our sub-
territories in India were 437.90 million litres (equivalent to 77.12 million unit cases) in Fiscal 2011 and 1,186.04 million litres
(equivalent to 208.88 million unit cases) in Fiscal 2015. Based on the Sales Volume of our products in our sub-territories in
India in Fiscal 2011 and Fiscal 2015 and Euromonitor Report data on PepsiCo soft drinks total volume sales (based on sales
to end consumers) in India in these years, our share of PepsiCo soft drinks total volume sales in India increased from 26.46%
in Fiscal 2011 to 44.12% in Fiscal 2015. Until February 2015, our licensed sub-territories in India included Delhi, Rajasthan,
West Bengal, Goa, Arunachal Pradesh, Assam, Meghalaya, Manipur, Mizoram, Nagaland, Tripura as well as certain
designated parts of the following sub-territories: Madhya Pradesh, Uttar Pradesh, Uttarakhand, Haryana and Maharashtra
(collectively, the “2015 Existing India Sub-Territories”). As part of PepsiCo's strategy of consolidating certain PepsiCo-
operated sub-territories in India under long-term bottling partners, pursuant to a business transfer agreement entered into with
PepsiCo India in November 2014, we were granted, with effect from February 28, 2015, franchises for the following
additional sub-territories in India: Punjab, Himachal Pradesh, Chandigarh UT, as well as the remaining parts of the following
sub-territories: Haryana, Uttarakhand and Uttar Pradesh (collectively, the “2015 New India Sub-Territories”). We believe
that our operational experience, widespread integrated distribution network and market knowledge adds significant value to
the distribution and sale of PepsiCo products in India, and we continue to leverage our long association with PepsiCo to
evaluate new beverages, packaging, SKUs and markets as consumer preferences evolve.
As of June 30, 2016, we operated 16 production facilities across India and five production facilities in our international
licensed territories. These 16 production facilities also include the Satharia – 2 production facility which we recently acquired
from our co-packer in September 2016. As of June 30, 2016, we had an estimated aggregate annual production capacity of
3,438.38 million litres (equivalent to 605.56 million unit cases) in India and an estimated aggregate annual production
capacity of 991.57 million litres (equivalent to 174.63 million unit cases) in our international production facilities. In addition,
we have set up backward integration facilities for production of preforms, crowns, corrugated boxes and pads, plastic crates
and shrink-wrap films in certain of our production facilities to ensure operational efficiencies and quality standards.
Additionally, we have two facilities dedicated to backward integration located at Jaipur and Alwar which manufacture
crowns, plastic shells, corrugated boxes and pads and shrink wrap film. We have over the years developed a wide-spread,
integrated distribution network across our licensed territories and sub-territories. As of June 30, 2016 our distribution network
in India included 60 depots and 1,438 delivery vehicles. Our distribution network covers urban, semi-urban and rural markets,
targeting a wide range of consumers.
We have also developed an extensive distribution network in our international markets which as of June 30, 2016 included 20
depots and 518 delivery vehicles. As of June 30, 2016, we had 562 primary distributors (i.e., distributors that recorded sales
in excess of 0.5 million litres of our PepsiCo beverages in the 12 months ended June 30, 2016) in India and 415 distributors in
our international operations. The 562 primary distributors in India accounted for 74.36% of our aggregate Sales Volumes in
India in the 12 months ended June 30, 2016.
In Fiscal 2013, Fiscal 2014, Fiscal 2015, and in the six months ended June 30, 2016, CSD Sales Volumes were 724.30 million
litres (equivalent to 127.56 million unit cases), 805.48 million litres (equivalent to 141.85 million unit cases), 1,111.50
415
million litres (equivalent to 195.76 million unit cases), and 857.90 million litres (equivalent to 151.08 million unit cases),
respectively, NCB Sales Volumes were 63.91 million litres (equivalent to 11.26 million unit cases), 71.60 million litres
(equivalent to 12.61 million unit cases), 82.11 million litres (equivalent to 14.46 million unit cases), and 63.70 million litres
(equivalent to 11.22 million unit cases), respectively, while packaged drinking water Sales Volumes were 83.23 million litres
(equivalent to 14.66 million unit cases), 87.04 million litres (equivalent to 15.33 million unit cases), 167.51 million litres
(equivalent to 29.50 million unit cases), and 122.44 million litres (equivalent to 21.56 million unit cases), respectively.
We are part of the RJ Corp group, a diversified business conglomerate with interests in beverages, quick-service restaurants,
dairy and healthcare. Our Promoter and Chairman, Mr. Ravi Kant Jaipuria has an established reputation as an entrepreneur
and business leader and is the only Indian company’s promoter to receive PepsiCo's International Bottler of the Year award,
which was awarded in 1997.
In Fiscal 2013, Fiscal 2014, Fiscal 2015, and in the six months ended June 30, 2016, we had revenues from operations (net) of
₹ 21,151.49 million, ₹ 25,024.07 million, ₹ 33,941.49 million and ₹ 25,296.51 million, respectively. In the period Fiscal 2011
to Fiscal 2015, revenues from operations (net) increased at a CAGR of 31.15%. In Fiscal 2013, Fiscal 2014, Fiscal 2015, and
in the six months ended June 30, 2016, EBITDA was ₹ 3,093.18 million, ₹ 4,001.06 million, ₹ 6,498.59 million and ₹
6101.96 million, respectively. While we incurred a loss after tax in Fiscal 2013 and 2014 of ₹ 395.30 million and ₹ 201.56
million, respectively, we recorded a net profit of ₹ 870.38 million in Fiscal 2015 and a profit of ₹ 2,097.45 million in the six
months ended June 30, 2016.
Introduction of Ind AS and Impact on Preparation and Presentation of our Historical and Future Financial
Statements
The Ministry of Corporate Affairs (“MCA”) has notified the Companies (Indian Accounting Standards) Rules, 2015 on
February 16, 2015 providing revised roadmap on implementation of Indian Accounting Standards (“Ind-AS”) which
stipulates implementation of Ind-AS in a phased manner beginning from accounting period 2016 – 2017 (“MCA
Roadmap”).
Our Company’s debt securities are listed and it had a net worth of less than ₹ 5,000 million as at December 31, 2014 and a net
worth of more than ₹ 5,000 million as at December 31, 2015.
Pursuant to the clarification provided by Bulletin 1 issued by the Ind AS Transition Facilitation Group (ITFG) if the net worth
of a company has or is expected to exceed ₹ 5,000 million after March 31, 2014, such company will be required to apply Ind
AS from the immediate next accounting year in the manner specified in sub-rule (1). Since the net worth of our Company
exceeded ₹ 5,000 million in the year ended December 31, 2015, Ind AS shall be applicable from the year ended December 31,
2017, with comparatives for the periods ended December 31, 2016. The transition date of convergence with Ind AS shall be
January 1, 2016.
Given that Ind-AS differs in many respects from Indian GAAP, our financial statements relating to any period subsequent to
January 1, 2017 (and for any prior comparative periods) may not be comparable to our historical financial statements
prepared under Indian GAAP. There can be no assurance that the adoption of Ind-AS will not materially affect the
preparation and presentation of our financial statements in the future. In addition, there can be no assurance that if Ind AS
were to be applied to our historical financial statements prepared under Indian GAAP, there will not be material differences in
applicable accounting policies and standards that will require material adjustments to our historical financial statements
prepared under Indian GAAP.
On a preliminary evaluation of the differences between Indian GAAP and Ind-AS, we believe that the following matters may
have an impact on the preparation and presentation of, in accordance with Ind-AS, our future financial statements, and, to the
extent applicable, our historical financial statements.
We have not completed the preparation of any of our financial statements in accordance with Ind-AS, and the matters
presented below are only an indicative.
Non-convertible debentures (NCDs). Under Indian GAAP, NCDs are recorded as long term debt and interest is charged on
the same at the coupon rate. Under Ind-AS, all such financial liabilities are carried at amortised cost using effective interest
method. Transaction costs are netted off in borrowings upon initial recognition and such transaction costs are expensed off
using effective interest rate. The coupon rate of debentures has been assumed to be at fair value.
Foreign currency loans from banks. Under Indian GAAP, foreign currency loans are recorded as long-term debt and interest
is charged on the same at the coupon rate. Also, the exchange difference on the loans is capitalized in foreign currency
monetary item translation reserve. Under Ind-AS, all such financial liabilities are carried at amortised cost using effective
interest method. Transaction costs are netted off in borrowings upon initial recognition and such transaction costs are
expensed off using effective interest rate. The interest rate of loans has been assumed to be at fair value. In addition, the
exchange differences related to the foreign currency loans existing at the commencement of the first Ind-AS financial
416
reporting period will continue to be capitalized. However, the exchange difference on any new loans shall be expensed in the
statement of profit and loss.
Other term loans. Under Indian GAAP, these loans are recorded as long-term debt and interest is charged on the same at the
coupon rate. Under Ind-AS, all such financial liabilities are carried at amortised cost using effective interest method.
Transaction costs are netted off in borrowings upon initial recognition and such transaction costs are expensed off using
effective interest rate. The interest rate of loans has been assumed to be at fair value.
Deferred value added tax (unsecured). Under Indian GAAP, these are recorded as long-term interest free debt. Under Ind
AS, the deferred value added tax will be fair valued at present value of cash flows discounted at the Company's average
borrowing rate. The difference between the carrying value and the present value shall be recorded as government grant in
retained earnings/ profit and loss account. Subsequently, the interest/ finance cost shall be accounted for in the profit and loss
account at the average borrowing rate.
Capital creditors. Under Indian GAAP, these are disclosed under the head “Other liabilities”. Under Ind-AS 16 “Property,
Plant and Equipment”, the cost of an item of property, plant and equipment is the cash price equivalent at the recognition
date. If payment is deferred beyond normal credit terms, the difference between the cash price equivalent and the total
payment is recognised as interest over the period of credit unless such interest is capitalised in accordance with Ind-AS 23
“Borrowing Cost”.
Actuarial gain/ losses in employee benefit expenses. Under Indian GAAP, liability for defined benefit plans is recorded
based on actuarial valuation which uses certain assumptions and actuarial gain/loss is recorded in the statement of profit and
loss. Under Ind-AS, such actuarial gain/loss is recorded in other comprehensive income.
Security deposits (assets). Under Indian GAAP, security deposits are recorded as loans and advances at their carrying value.
Under Ind-AS, the interest free long-term security deposits (asset) with a definite contractual tenure is required to be present
valued at the Company's average borrowing rate and the difference between the carrying value and the present value shall be
recorded as a deferred lease expense. Subsequently, the interest income shall be recognised on the deposits at the average
borrowing rate and the deferred lease expense shall be amortised in the statement of profit and loss on a straight line
depreciation basis.
Loan to subsidiary. Under Indian GAAP, long-term loans given to subsidiary are recorded as long-term loans and advances
at their carrying value. Under Ind-AS, loans given to subsidiary having a definite contractual tenure shall be present valued at
the company's average borrowing rate and the difference between the carrying value and the present value shall be recorded
as investment in subsidiary. Subsequently, the interest income will be recognised on the loans at the average borrowing rate.
Trade receivables. Under Indian GAAP, provision for doubtful debts is created on specific debtors which are identified as
doubtful. Under Ind-AS, there is a new expected credit loss model for calculating impairment on trade receivables. Ind-AS
allows recognition of life time expected credit losses and supports that the Company should follow a provision matrix for its
receivables which would be based on their age. We are currently evaluating the life term credit risk in our trade receivables
against which no provision has been made in our financial statements.
Government grants. Under Ind-AS, government grants in nature of promoters' contribution shall be credited to the statement
of profit and loss and cannot be directly transferred to reserves.
Leasehold land. Under Indian GAAP, leasehold land is recorded as fixed asset and total lease payments are recorded as
deferred liability. Also, the leasehold land is amortised on a systematic basis during the term of the lease. Under Ind-AS,
leases will be considered as finance lease and amortisation of leasehold land shall be reversed from retained earnings/ profit
and loss account. In addition, where there are deferred payment terms for payment of lease payments, the lease payments
shall be segregated into finance charge and lease payments.
Intangible assets. Under Indian GAAP, intangible assets cannot be assessed to have an indefinite life. Under Ind-AS, an
intangible can be assessed to have an indefinite useful life if there is no foreseeable limit over which it is expected to generate
economic benefits for the company. Such intangibles do not have to be periodically amortised but are tested for impairment,
at least annually or when there is a trigger for impairment. We are currently evaluating whether trademarks or other intangible
assets held by the company qualify for such indefinite life criteria.
Revenues. Under Indian GAAP, revenue is disclosed gross and excise duty is disclosed as a reduction from gross revenue.
Under Ind AS, revenue shall be disclosed gross of excise duty and excise duty shall be disclosed under the head expenses.
Lease rent paid. Under Indian GAAP, lease rent paid under operating lease is equalized over the total lease period. Under
Ind-AS, rent equalisation may be avoided by assuming that the increase in rent is representative of the economic inflation. We
are currently evaluating whether such lease rent amount is required to be equalized.
417
Financial guarantees. In our historical Indian GAAP financial statements, financial guarantees were disclosed as contingent
liabilities. Under Ind-AS, financial guarantees are to be initially recorded at fair value and subsequently, expected credit
losses, if any, is required to be estimated on each financial guarantee provided and provisions are required to be made for
such guarantees. In addition, guarantee premium income is required to be recorded under Ind-AS on straight line depreciation
method over the guarantee period.
Embedded lease arrangements. Under Ind-AS, if any sale of its produce (or a majority of its produce) from a unit is made by
an entity to our Company, then such arrangement is required to be segregated into purchases portion and lease portion and
each portion is required to be accounted for accordingly. We are currently evaluating the potential impact of such changes
under Ind-AS.
Derivatives and forward covers. Under Indian GAAP, in respect of contracts entered into to hedge foreign currency and
interest rate risk, gain/losses on settlement and losses on restatement (by marking them to market) at the Balance Sheet date.
Under Ind-AS, derivatives and forward covers are to be recorded at fair value through the statement of profit and loss.
We have not undertaken a detailed assessment of the impact of application of Ind-AS to our financial statements and we have
not provided any reconciliation of our Indian GAAP financial statements included in this Red Herring Prospectus under Ind-
AS. The preparation of our standalone and consolidated financial statements in accordance with Ind-AS will require our
management to make judgments, estimates and certain assumptions. The estimates and assumptions used in the preparation of
such financial statements in accordance with Ind-AS will be based upon management’s evaluation of the relevant facts and
circumstances as on the date of the relevant financial statements, and such estimates and underlying assumptions may be
reviewed in the future on an on-going basis.
There is not yet a significant body of established practice from which to draw references/judgments regarding the
implementation and application of Ind AS applicable to the preparation and presentation of our standalone and consolidated
financial statements, and without completing the preparation of our standalone and consolidated financial statements for the
six months ended June 30, 2016 and Fiscal 2016 under Ind AS, we are unable to provide a reconciliation of, or present any
comprehensive quantitative and / or qualitative analysis of the impact of the preparation and presentation of our future
financial statements, and to the extent applicable, our historical financial statements, in accordance with Ind-AS. There can be
no assurance that such differences will not be material, or that the preparation and presentation of our future financial
statements, or to the extent applicable, our historical financial statements in accordance with Ind-AS will not materially vary
from our historical financial statements prepared in accordance with Indian GAAP. For any investment decision, you should
rely solely on our restated audited financial statements prepared under Indian GAAP included in this Red Herring Prospectus.
Significant Factors Affecting Our Results of Operations and Financial Condition
Acquisition and integration of additional franchises
We have been associated with PepsiCo since the 1990s, and as of June 30, 2016, we had expanded our operations across 17
States and two Union Territories in India. We have also been granted the franchise for various PepsiCo products for Nepal,
Sri Lanka, Morocco, Mozambique and Zambia. In addition, we are in the process of setting up a greenfield facility in
Zimbabwe in anticipation of franchise rights being granted by PepsiCo Inc. for such territory. As a result of the acquisition of
these additional licensed territories and sub-territories in India as well as increased market penetration and organic growth,
our sales volumes have grown at a CAGR of 32.78% from 437.90 million litres (equivalent to 77.12 million unit cases) in
Fiscal 2011 to 1,361.12 million litres (equivalent to 239.72 million unit cases) in Fiscal 2015. Our revenues from operations
(net) increased at a CAGR of 31.15% between Fiscal 2011 and Fiscal 2015.
Our demonstrated ability to grow PepsiCo product sales has led to PepsiCo granting additional franchises to us, including for
sub-territories in India that were earlier directly operated by PepsiCo or by third-party bottlers. In addition to the franchises
for sub-territories in India that were granted prior to fiscal 2011, the Goa and North-East sub-territories were merged into our
Company pursuant to the amalgamation of VBIL into the Company with effect from January 1, 2012. We acquired the entire
Delhi sub-territory in Fiscal 2013 with effect from January 31, 2013. Subsequently, as part of PepsiCo’s strategy of
consolidating certain PepsiCo-operated sub-territories in India under long-term bottling partners, we entered into a business
transfer agreement with PepsiCo India in November 2014 pursuant to which we were granted, with effect from February 28,
2015, the franchise for the 2015 New India Sub-Territories, leading to a significant growth in our operations and increase in
sales and revenues in Fiscal 2015. The following tables set forth certain information relating to the Sales Volume (in million
litres and in equivalent unit cases) within India prior to and subsequent to the grant of the franchises relating to the 2015 New
India Sub-Territories:
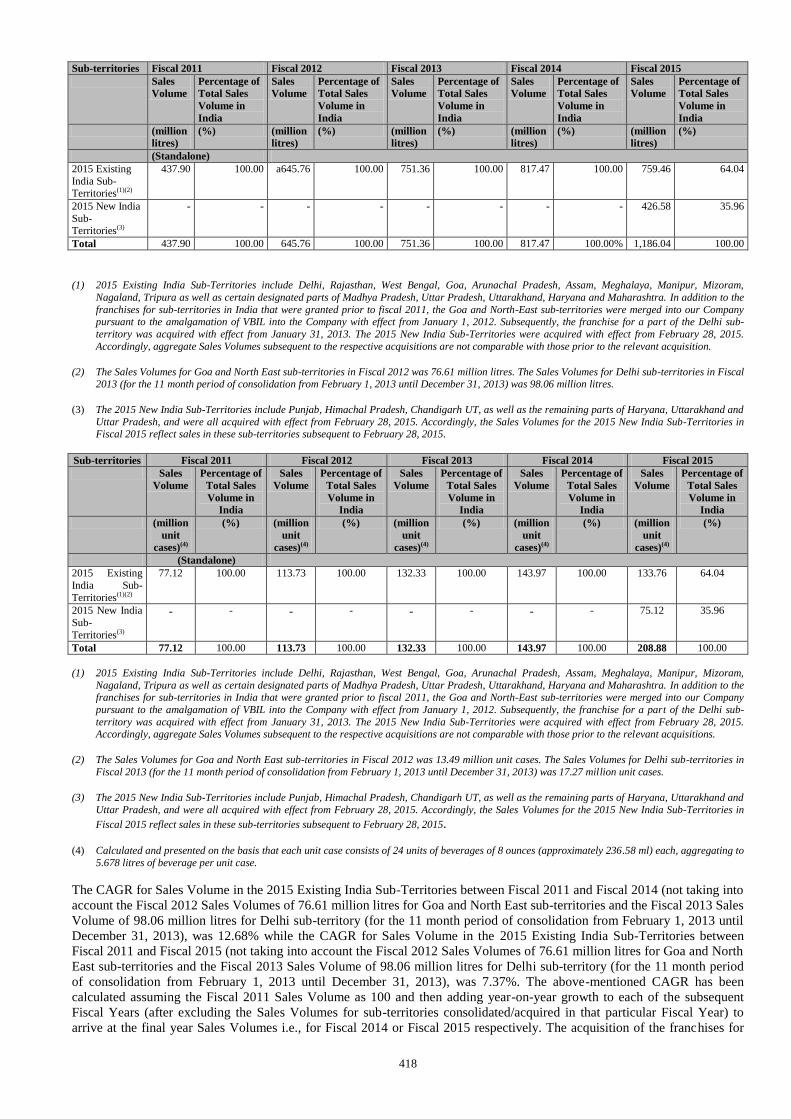
418
Sub-territories Fiscal 2011 Fiscal 2012 Fiscal 2013 Fiscal 2014 Fiscal 2015
Sales
Volume
Percentage of
Total Sales
Volume in
India
Sales
Volume
Percentage of
Total Sales
Volume in
India
Sales
Volume
Percentage of
Total Sales
Volume in
India
Sales
Volume
Percentage of
Total Sales
Volume in
India
Sales
Volume
Percentage of
Total Sales
Volume in
India
(million
litres)
(%) (million
litres)
(%) (million
litres)
(%) (million
litres)
(%) (million
litres)
(%)
(Standalone)
2015 Existing
India Sub-Territories(1)(2)
437.90 100.00 a645.76 100.00 751.36 100.00 817.47 100.00 759.46 64.04
2015 New India
Sub-Territories(3)
- - - - - - - - 426.58 35.96
Total 437.90 100.00 645.76 100.00 751.36 100.00 817.47 100.00% 1,186.04 100.00
(1) 2015 Existing India Sub-Territories include Delhi, Rajasthan, West Bengal, Goa, Arunachal Pradesh, Assam, Meghalaya, Manipur, Mizoram,
Nagaland, Tripura as well as certain designated parts of Madhya Pradesh, Uttar Pradesh, Uttarakhand, Haryana and Maharashtra. In addition to the
franchises for sub-territories in India that were granted prior to fiscal 2011, the Goa and North-East sub-territories were merged into our Company pursuant to the amalgamation of VBIL into the Company with effect from January 1, 2012. Subsequently, the franchise for a part of the Delhi sub-
territory was acquired with effect from January 31, 2013. The 2015 New India Sub-Territories were acquired with effect from February 28, 2015.
Accordingly, aggregate Sales Volumes subsequent to the respective acquisitions are not comparable with those prior to the relevant acquisition.
(2) The Sales Volumes for Goa and North East sub-territories in Fiscal 2012 was 76.61 million litres. The Sales Volumes for Delhi sub-territories in Fiscal 2013 (for the 11 month period of consolidation from February 1, 2013 until December 31, 2013) was 98.06 million litres.
(3) The 2015 New India Sub-Territories include Punjab, Himachal Pradesh, Chandigarh UT, as well as the remaining parts of Haryana, Uttarakhand and
Uttar Pradesh, and were all acquired with effect from February 28, 2015. Accordingly, the Sales Volumes for the 2015 New India Sub-Territories in Fiscal 2015 reflect sales in these sub-territories subsequent to February 28, 2015.
Sub-territories Fiscal 2011 Fiscal 2012 Fiscal 2013 Fiscal 2014 Fiscal 2015
Sales
Volume
Percentage of
Total Sales
Volume in
India
Sales
Volume
Percentage of
Total Sales
Volume in
India
Sales
Volume
Percentage of
Total Sales
Volume in
India
Sales
Volume
Percentage of
Total Sales
Volume in
India
Sales
Volume
Percentage of
Total Sales
Volume in
India
(million
unit
cases)(4)
(%) (million
unit
cases)(4)
(%) (million
unit
cases)(4)
(%) (million
unit
cases)(4)
(%) (million
unit
cases)(4)
(%)
(Standalone)
2015 Existing
India Sub-
Territories(1)(2)
77.12 100.00 113.73 100.00 132.33 100.00 143.97 100.00 133.76 64.04
2015 New India
Sub-
Territories(3)
- - - - - - - - 75.12 35.96
Total 77.12 100.00 113.73 100.00 132.33 100.00 143.97 100.00 208.88 100.00
(1) 2015 Existing India Sub-Territories include Delhi, Rajasthan, West Bengal, Goa, Arunachal Pradesh, Assam, Meghalaya, Manipur, Mizoram,
Nagaland, Tripura as well as certain designated parts of Madhya Pradesh, Uttar Pradesh, Uttarakhand, Haryana and Maharashtra. In addition to the franchises for sub-territories in India that were granted prior to fiscal 2011, the Goa and North-East sub-territories were merged into our Company
pursuant to the amalgamation of VBIL into the Company with effect from January 1, 2012. Subsequently, the franchise for a part of the Delhi sub-
territory was acquired with effect from January 31, 2013. The 2015 New India Sub-Territories were acquired with effect from February 28, 2015. Accordingly, aggregate Sales Volumes subsequent to the respective acquisitions are not comparable with those prior to the relevant acquisitions.
(2) The Sales Volumes for Goa and North East sub-territories in Fiscal 2012 was 13.49 million unit cases. The Sales Volumes for Delhi sub-territories in
Fiscal 2013 (for the 11 month period of consolidation from February 1, 2013 until December 31, 2013) was 17.27 million unit cases.
(3) The 2015 New India Sub-Territories include Punjab, Himachal Pradesh, Chandigarh UT, as well as the remaining parts of Haryana, Uttarakhand and
Uttar Pradesh, and were all acquired with effect from February 28, 2015. Accordingly, the Sales Volumes for the 2015 New India Sub-Territories in
Fiscal 2015 reflect sales in these sub-territories subsequent to February 28, 2015.
(4) Calculated and presented on the basis that each unit case consists of 24 units of beverages of 8 ounces (approximately 236.58 ml) each, aggregating to
5.678 litres of beverage per unit case.
The CAGR for Sales Volume in the 2015 Existing India Sub-Territories between Fiscal 2011 and Fiscal 2014 (not taking into
account the Fiscal 2012 Sales Volumes of 76.61 million litres for Goa and North East sub-territories and the Fiscal 2013 Sales
Volume of 98.06 million litres for Delhi sub-territory (for the 11 month period of consolidation from February 1, 2013 until
December 31, 2013), was 12.68% while the CAGR for Sales Volume in the 2015 Existing India Sub-Territories between
Fiscal 2011 and Fiscal 2015 (not taking into account the Fiscal 2012 Sales Volumes of 76.61 million litres for Goa and North
East sub-territories and the Fiscal 2013 Sales Volume of 98.06 million litres for Delhi sub-territory (for the 11 month period
of consolidation from February 1, 2013 until December 31, 2013), was 7.37%. The above-mentioned CAGR has been
calculated assuming the Fiscal 2011 Sales Volume as 100 and then adding year-on-year growth to each of the subsequent
Fiscal Years (after excluding the Sales Volumes for sub-territories consolidated/acquired in that particular Fiscal Year) to
arrive at the final year Sales Volumes i.e., for Fiscal 2014 or Fiscal 2015 respectively. The acquisition of the franchises for
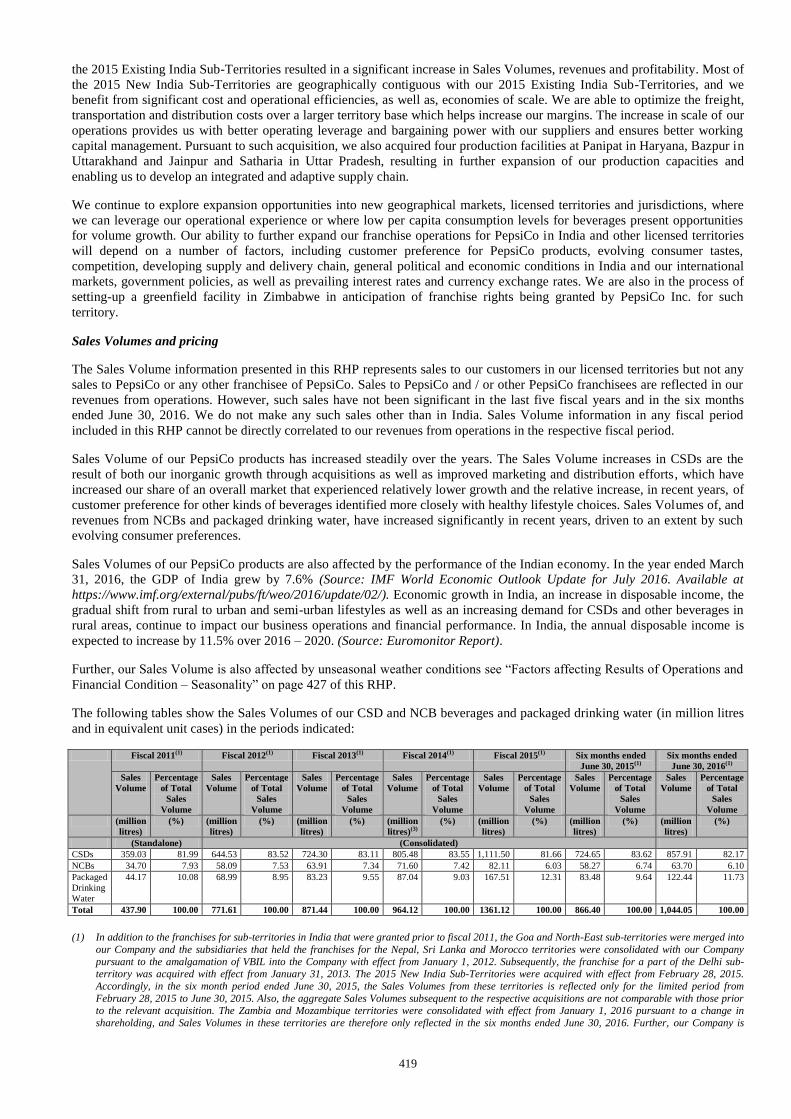
419
the 2015 Existing India Sub-Territories resulted in a significant increase in Sales Volumes, revenues and profitability. Most of
the 2015 New India Sub-Territories are geographically contiguous with our 2015 Existing India Sub-Territories, and we
benefit from significant cost and operational efficiencies, as well as, economies of scale. We are able to optimize the freight,
transportation and distribution costs over a larger territory base which helps increase our margins. The increase in scale of our
operations provides us with better operating leverage and bargaining power with our suppliers and ensures better working
capital management. Pursuant to such acquisition, we also acquired four production facilities at Panipat in Haryana, Bazpur in
Uttarakhand and Jainpur and Satharia in Uttar Pradesh, resulting in further expansion of our production capacities and
enabling us to develop an integrated and adaptive supply chain.
We continue to explore expansion opportunities into new geographical markets, licensed territories and jurisdictions, where
we can leverage our operational experience or where low per capita consumption levels for beverages present opportunities
for volume growth. Our ability to further expand our franchise operations for PepsiCo in India and other licensed territories
will depend on a number of factors, including customer preference for PepsiCo products, evolving consumer tastes,
competition, developing supply and delivery chain, general political and economic conditions in India and our international
markets, government policies, as well as prevailing interest rates and currency exchange rates. We are also in the process of
setting-up a greenfield facility in Zimbabwe in anticipation of franchise rights being granted by PepsiCo Inc. for such
territory.
Sales Volumes and pricing
The Sales Volume information presented in this RHP represents sales to our customers in our licensed territories but not any
sales to PepsiCo or any other franchisee of PepsiCo. Sales to PepsiCo and / or other PepsiCo franchisees are reflected in our
revenues from operations. However, such sales have not been significant in the last five fiscal years and in the six months
ended June 30, 2016. We do not make any such sales other than in India. Sales Volume information in any fiscal period
included in this RHP cannot be directly correlated to our revenues from operations in the respective fiscal period.
Sales Volume of our PepsiCo products has increased steadily over the years. The Sales Volume increases in CSDs are the
result of both our inorganic growth through acquisitions as well as improved marketing and distribution efforts, which have
increased our share of an overall market that experienced relatively lower growth and the relative increase, in recent years, of
customer preference for other kinds of beverages identified more closely with healthy lifestyle choices. Sales Volumes of, and
revenues from NCBs and packaged drinking water, have increased significantly in recent years, driven to an extent by such
evolving consumer preferences.
Sales Volumes of our PepsiCo products are also affected by the performance of the Indian economy. In the year ended March
31, 2016, the GDP of India grew by 7.6% (Source: IMF World Economic Outlook Update for July 2016. Available at
https://www.imf.org/external/pubs/ft/weo/2016/update/02/). Economic growth in India, an increase in disposable income, the
gradual shift from rural to urban and semi-urban lifestyles as well as an increasing demand for CSDs and other beverages in
rural areas, continue to impact our business operations and financial performance. In India, the annual disposable income is
expected to increase by 11.5% over 2016 – 2020. (Source: Euromonitor Report).
Further, our Sales Volume is also affected by unseasonal weather conditions see “Factors affecting Results of Operations and
Financial Condition – Seasonality” on page 427 of this RHP.
The following tables show the Sales Volumes of our CSD and NCB beverages and packaged drinking water (in million litres
and in equivalent unit cases) in the periods indicated:
Fiscal 2011(1) Fiscal 2012(1) Fiscal 2013(1) Fiscal 2014(1) Fiscal 2015(1) Six months ended
June 30, 2015(1)
Six months ended
June 30, 2016(1)
Sales
Volume
Percentage
of Total
Sales
Volume
Sales
Volume
Percentage
of Total
Sales
Volume
Sales
Volume
Percentage
of Total
Sales
Volume
Sales
Volume
Percentage
of Total
Sales
Volume
Sales
Volume
Percentage
of Total
Sales
Volume
Sales
Volume
Percentage
of Total
Sales
Volume
Sales
Volume
Percentage
of Total
Sales
Volume
(million
litres) (%) (million
litres)
(%) (million
litres)
(%) (million
litres)(3)
(%) (million
litres)
(%) (million
litres)
(%) (million
litres)
(%)
(Standalone) (Consolidated)
CSDs 359.03 81.99 644.53 83.52 724.30 83.11 805.48 83.55 1,111.50 81.66 724.65 83.62 857.91 82.17
NCBs 34.70 7.93 58.09 7.53 63.91 7.34 71.60 7.42 82.11 6.03 58.27 6.74 63.70 6.10
Packaged
Drinking
Water
44.17 10.08 68.99 8.95 83.23 9.55 87.04 9.03 167.51 12.31 83.48 9.64 122.44 11.73
Total 437.90 100.00 771.61 100.00 871.44 100.00 964.12 100.00 1361.12 100.00 866.40 100.00 1,044.05 100.00
(1) In addition to the franchises for sub-territories in India that were granted prior to fiscal 2011, the Goa and North-East sub-territories were merged into
our Company and the subsidiaries that held the franchises for the Nepal, Sri Lanka and Morocco territories were consolidated with our Company
pursuant to the amalgamation of VBIL into the Company with effect from January 1, 2012. Subsequently, the franchise for a part of the Delhi sub-territory was acquired with effect from January 31, 2013. The 2015 New India Sub-Territories were acquired with effect from February 28, 2015.
Accordingly, in the six month period ended June 30, 2015, the Sales Volumes from these territories is reflected only for the limited period from
February 28, 2015 to June 30, 2015. Also, the aggregate Sales Volumes subsequent to the respective acquisitions are not comparable with those prior to the relevant acquisition. The Zambia and Mozambique territories were consolidated with effect from January 1, 2016 pursuant to a change in
shareholding, and Sales Volumes in these territories are therefore only reflected in the six months ended June 30, 2016. Further, our Company is
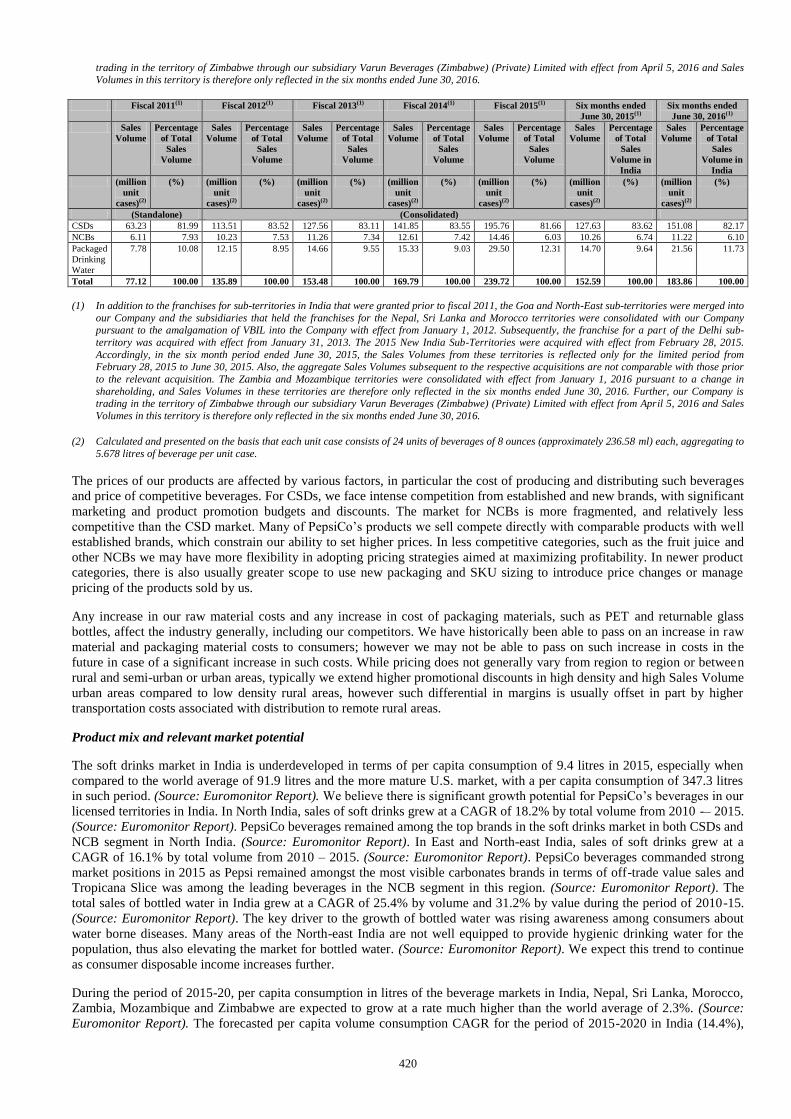
420
trading in the territory of Zimbabwe through our subsidiary Varun Beverages (Zimbabwe) (Private) Limited with effect from April 5, 2016 and Sales Volumes in this territory is therefore only reflected in the six months ended June 30, 2016.
Fiscal 2011(1) Fiscal 2012(1) Fiscal 2013(1) Fiscal 2014(1) Fiscal 2015(1) Six months ended
June 30, 2015(1)
Six months ended
June 30, 2016(1)
Sales
Volume
Percentage
of Total
Sales
Volume
Sales
Volume
Percentage
of Total
Sales
Volume
Sales
Volume
Percentage
of Total
Sales
Volume
Sales
Volume
Percentage
of Total
Sales
Volume
Sales
Volume
Percentage
of Total
Sales
Volume
Sales
Volume
Percentage
of Total
Sales
Volume in
India
Sales
Volume
Percentage
of Total
Sales
Volume in
India
(million
unit
cases)(2)
(%) (million
unit
cases)(2)
(%) (million
unit
cases)(2)
(%) (million
unit
cases)(2)
(%) (million
unit
cases)(2)
(%) (million
unit
cases)(2)
(%) (million
unit
cases)(2)
(%)
(Standalone) (Consolidated)
CSDs 63.23 81.99 113.51 83.52 127.56 83.11 141.85 83.55 195.76 81.66 127.63 83.62 151.08 82.17
NCBs 6.11 7.93 10.23 7.53 11.26 7.34 12.61 7.42 14.46 6.03 10.26 6.74 11.22 6.10
Packaged
Drinking
Water
7.78 10.08 12.15 8.95 14.66 9.55 15.33 9.03 29.50 12.31 14.70 9.64 21.56 11.73
Total 77.12 100.00 135.89 100.00 153.48 100.00 169.79 100.00 239.72 100.00 152.59 100.00 183.86 100.00
(1) In addition to the franchises for sub-territories in India that were granted prior to fiscal 2011, the Goa and North-East sub-territories were merged into
our Company and the subsidiaries that held the franchises for the Nepal, Sri Lanka and Morocco territories were consolidated with our Company pursuant to the amalgamation of VBIL into the Company with effect from January 1, 2012. Subsequently, the franchise for a part of the Delhi sub-
territory was acquired with effect from January 31, 2013. The 2015 New India Sub-Territories were acquired with effect from February 28, 2015.
Accordingly, in the six month period ended June 30, 2015, the Sales Volumes from these territories is reflected only for the limited period from February 28, 2015 to June 30, 2015. Also, the aggregate Sales Volumes subsequent to the respective acquisitions are not comparable with those prior
to the relevant acquisition. The Zambia and Mozambique territories were consolidated with effect from January 1, 2016 pursuant to a change in
shareholding, and Sales Volumes in these territories are therefore only reflected in the six months ended June 30, 2016. Further, our Company is trading in the territory of Zimbabwe through our subsidiary Varun Beverages (Zimbabwe) (Private) Limited with effect from April 5, 2016 and Sales
Volumes in this territory is therefore only reflected in the six months ended June 30, 2016.
(2) Calculated and presented on the basis that each unit case consists of 24 units of beverages of 8 ounces (approximately 236.58 ml) each, aggregating to
5.678 litres of beverage per unit case.
The prices of our products are affected by various factors, in particular the cost of producing and distributing such beverages
and price of competitive beverages. For CSDs, we face intense competition from established and new brands, with significant
marketing and product promotion budgets and discounts. The market for NCBs is more fragmented, and relatively less
competitive than the CSD market. Many of PepsiCo’s products we sell compete directly with comparable products with well
established brands, which constrain our ability to set higher prices. In less competitive categories, such as the fruit juice and
other NCBs we may have more flexibility in adopting pricing strategies aimed at maximizing profitability. In newer product
categories, there is also usually greater scope to use new packaging and SKU sizing to introduce price changes or manage
pricing of the products sold by us.
Any increase in our raw material costs and any increase in cost of packaging materials, such as PET and returnable glass
bottles, affect the industry generally, including our competitors. We have historically been able to pass on an increase in raw
material and packaging material costs to consumers; however we may not be able to pass on such increase in costs in the
future in case of a significant increase in such costs. While pricing does not generally vary from region to region or between
rural and semi-urban or urban areas, typically we extend higher promotional discounts in high density and high Sales Volume
urban areas compared to low density rural areas, however such differential in margins is usually offset in part by higher
transportation costs associated with distribution to remote rural areas.
Product mix and relevant market potential
The soft drinks market in India is underdeveloped in terms of per capita consumption of 9.4 litres in 2015, especially when
compared to the world average of 91.9 litres and the more mature U.S. market, with a per capita consumption of 347.3 litres
in such period. (Source: Euromonitor Report). We believe there is significant growth potential for PepsiCo’s beverages in our
licensed territories in India. In North India, sales of soft drinks grew at a CAGR of 18.2% by total volume from 2010 -– 2015.
(Source: Euromonitor Report). PepsiCo beverages remained among the top brands in the soft drinks market in both CSDs and
NCB segment in North India. (Source: Euromonitor Report). In East and North-east India, sales of soft drinks grew at a
CAGR of 16.1% by total volume from 2010 – 2015. (Source: Euromonitor Report). PepsiCo beverages commanded strong
market positions in 2015 as Pepsi remained amongst the most visible carbonates brands in terms of off-trade value sales and
Tropicana Slice was among the leading beverages in the NCB segment in this region. (Source: Euromonitor Report). The
total sales of bottled water in India grew at a CAGR of 25.4% by volume and 31.2% by value during the period of 2010-15.
(Source: Euromonitor Report). The key driver to the growth of bottled water was rising awareness among consumers about
water borne diseases. Many areas of the North-east India are not well equipped to provide hygienic drinking water for the
population, thus also elevating the market for bottled water. (Source: Euromonitor Report). We expect this trend to continue
as consumer disposable income increases further.
During the period of 2015-20, per capita consumption in litres of the beverage markets in India, Nepal, Sri Lanka, Morocco,
Zambia, Mozambique and Zimbabwe are expected to grow at a rate much higher than the world average of 2.3%. (Source:
Euromonitor Report). The forecasted per capita volume consumption CAGR for the period of 2015-2020 in India (14.4%),
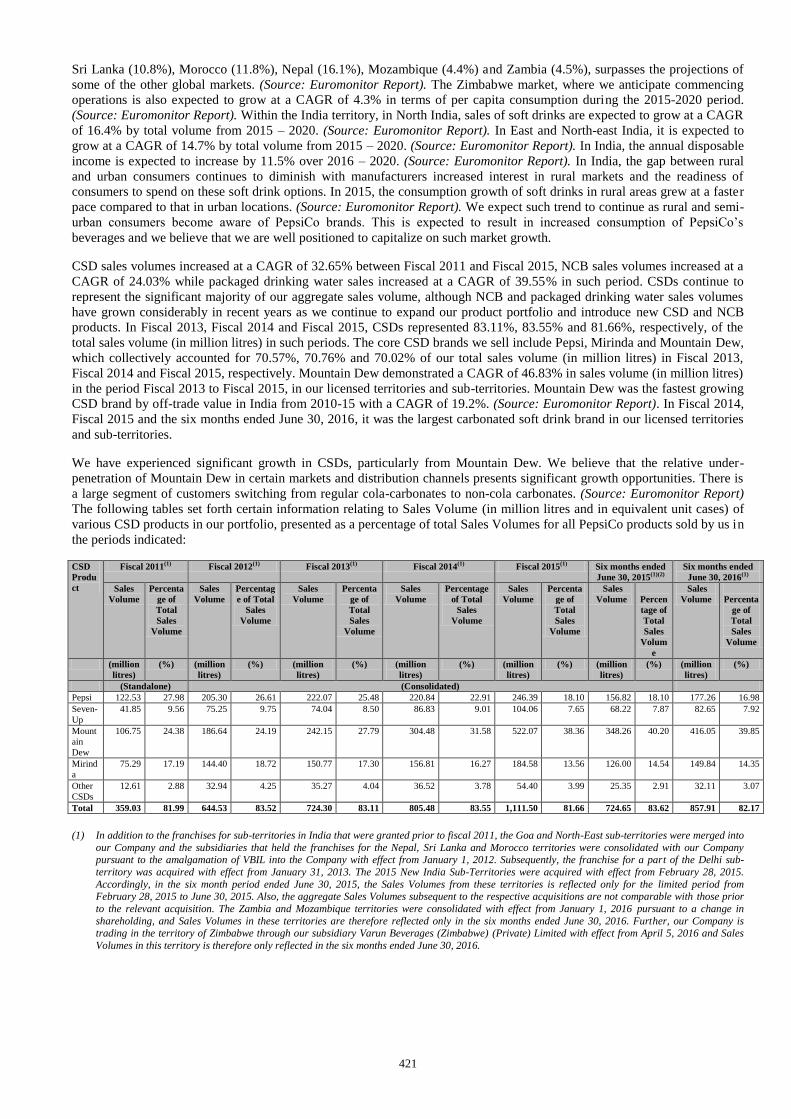
421
Sri Lanka (10.8%), Morocco (11.8%), Nepal (16.1%), Mozambique (4.4%) and Zambia (4.5%), surpasses the projections of
some of the other global markets. (Source: Euromonitor Report). The Zimbabwe market, where we anticipate commencing
operations is also expected to grow at a CAGR of 4.3% in terms of per capita consumption during the 2015-2020 period.
(Source: Euromonitor Report). Within the India territory, in North India, sales of soft drinks are expected to grow at a CAGR
of 16.4% by total volume from 2015 – 2020. (Source: Euromonitor Report). In East and North-east India, it is expected to
grow at a CAGR of 14.7% by total volume from 2015 – 2020. (Source: Euromonitor Report). In India, the annual disposable
income is expected to increase by 11.5% over 2016 – 2020. (Source: Euromonitor Report). In India, the gap between rural
and urban consumers continues to diminish with manufacturers increased interest in rural markets and the readiness of
consumers to spend on these soft drink options. In 2015, the consumption growth of soft drinks in rural areas grew at a faster
pace compared to that in urban locations. (Source: Euromonitor Report). We expect such trend to continue as rural and semi-
urban consumers become aware of PepsiCo brands. This is expected to result in increased consumption of PepsiCo’s
beverages and we believe that we are well positioned to capitalize on such market growth.
CSD sales volumes increased at a CAGR of 32.65% between Fiscal 2011 and Fiscal 2015, NCB sales volumes increased at a
CAGR of 24.03% while packaged drinking water sales increased at a CAGR of 39.55% in such period. CSDs continue to
represent the significant majority of our aggregate sales volume, although NCB and packaged drinking water sales volumes
have grown considerably in recent years as we continue to expand our product portfolio and introduce new CSD and NCB
products. In Fiscal 2013, Fiscal 2014 and Fiscal 2015, CSDs represented 83.11%, 83.55% and 81.66%, respectively, of the
total sales volume (in million litres) in such periods. The core CSD brands we sell include Pepsi, Mirinda and Mountain Dew,
which collectively accounted for 70.57%, 70.76% and 70.02% of our total sales volume (in million litres) in Fiscal 2013,
Fiscal 2014 and Fiscal 2015, respectively. Mountain Dew demonstrated a CAGR of 46.83% in sales volume (in million litres)
in the period Fiscal 2013 to Fiscal 2015, in our licensed territories and sub-territories. Mountain Dew was the fastest growing
CSD brand by off-trade value in India from 2010-15 with a CAGR of 19.2%. (Source: Euromonitor Report). In Fiscal 2014,
Fiscal 2015 and the six months ended June 30, 2016, it was the largest carbonated soft drink brand in our licensed territories
and sub-territories.
We have experienced significant growth in CSDs, particularly from Mountain Dew. We believe that the relative under-
penetration of Mountain Dew in certain markets and distribution channels presents significant growth opportunities. There is
a large segment of customers switching from regular cola-carbonates to non-cola carbonates. (Source: Euromonitor Report)
The following tables set forth certain information relating to Sales Volume (in million litres and in equivalent unit cases) of
various CSD products in our portfolio, presented as a percentage of total Sales Volumes for all PepsiCo products sold by us in
the periods indicated:
CSD
Produ
ct
Fiscal 2011(1) Fiscal 2012(1) Fiscal 2013(1) Fiscal 2014(1) Fiscal 2015(1) Six months ended
June 30, 2015(1)(2)
Six months ended
June 30, 2016(1)
Sales
Volume
Percenta
ge of
Total
Sales
Volume
Sales
Volume
Percentag
e of Total
Sales
Volume
Sales
Volume
Percenta
ge of
Total
Sales
Volume
Sales
Volume
Percentage
of Total
Sales
Volume
Sales
Volume
Percenta
ge of
Total
Sales
Volume
Sales
Volume
Percen
tage of
Total
Sales
Volum
e
Sales
Volume
Percenta
ge of
Total
Sales
Volume
(million
litres)
(%) (million
litres)
(%) (million
litres)
(%) (million
litres)
(%) (million
litres)
(%) (million
litres)
(%) (million
litres)
(%)
(Standalone) (Consolidated)
Pepsi 122.53 27.98 205.30 26.61 222.07 25.48 220.84 22.91 246.39 18.10 156.82 18.10 177.26 16.98
Seven-
Up
41.85 9.56 75.25 9.75 74.04 8.50 86.83 9.01 104.06 7.65 68.22 7.87 82.65 7.92
Mount
ain
Dew
106.75 24.38 186.64 24.19 242.15 27.79 304.48 31.58 522.07 38.36 348.26 40.20 416.05 39.85
Mirind
a
75.29 17.19 144.40 18.72 150.77 17.30 156.81 16.27 184.58 13.56 126.00 14.54 149.84 14.35
Other
CSDs
12.61 2.88 32.94 4.25 35.27 4.04 36.52 3.78 54.40 3.99 25.35 2.91 32.11 3.07
Total 359.03 81.99 644.53 83.52 724.30 83.11 805.48 83.55 1,111.50 81.66 724.65 83.62 857.91 82.17
(1) In addition to the franchises for sub-territories in India that were granted prior to fiscal 2011, the Goa and North-East sub-territories were merged into
our Company and the subsidiaries that held the franchises for the Nepal, Sri Lanka and Morocco territories were consolidated with our Company pursuant to the amalgamation of VBIL into the Company with effect from January 1, 2012. Subsequently, the franchise for a part of the Delhi sub-
territory was acquired with effect from January 31, 2013. The 2015 New India Sub-Territories were acquired with effect from February 28, 2015.
Accordingly, in the six month period ended June 30, 2015, the Sales Volumes from these territories is reflected only for the limited period from February 28, 2015 to June 30, 2015. Also, the aggregate Sales Volumes subsequent to the respective acquisitions are not comparable with those prior
to the relevant acquisition. The Zambia and Mozambique territories were consolidated with effect from January 1, 2016 pursuant to a change in
shareholding, and Sales Volumes in these territories are therefore reflected only in the six months ended June 30, 2016. Further, our Company is trading in the territory of Zimbabwe through our subsidiary Varun Beverages (Zimbabwe) (Private) Limited with effect from April 5, 2016 and Sales
Volumes in this territory is therefore only reflected in the six months ended June 30, 2016.
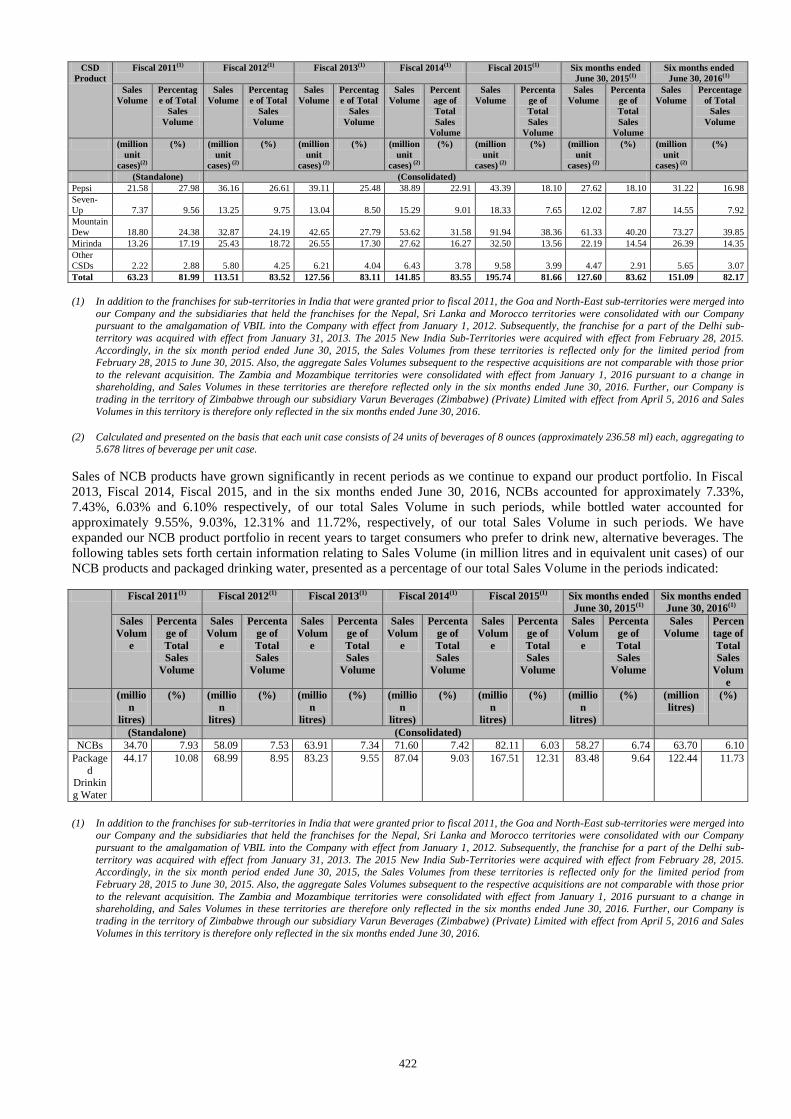
422
CSD
Product
Fiscal 2011(1) Fiscal 2012(1) Fiscal 2013(1) Fiscal 2014(1) Fiscal 2015(1) Six months ended
June 30, 2015(1)
Six months ended
June 30, 2016(1)
Sales
Volume
Percentag
e of Total
Sales
Volume
Sales
Volume
Percentag
e of Total
Sales
Volume
Sales
Volume
Percentag
e of Total
Sales
Volume
Sales
Volume
Percent
age of
Total
Sales
Volume
Sales
Volume
Percenta
ge of
Total
Sales
Volume
Sales
Volume
Percenta
ge of
Total
Sales
Volume
Sales
Volume
Percentage
of Total
Sales
Volume
(million
unit
cases)(2)
(%) (million
unit
cases) (2)
(%) (million
unit
cases) (2)
(%) (million
unit
cases) (2)
(%) (million
unit
cases) (2)
(%) (million
unit
cases) (2)
(%) (million
unit
cases) (2)
(%)
(Standalone) (Consolidated)
Pepsi 21.58 27.98 36.16 26.61 39.11 25.48 38.89 22.91 43.39 18.10 27.62 18.10 31.22 16.98
Seven-
Up 7.37 9.56 13.25 9.75 13.04 8.50 15.29 9.01 18.33 7.65 12.02 7.87 14.55 7.92
Mountain
Dew 18.80 24.38 32.87 24.19 42.65 27.79 53.62 31.58 91.94 38.36 61.33 40.20 73.27 39.85
Mirinda 13.26 17.19 25.43 18.72 26.55 17.30 27.62 16.27 32.50 13.56 22.19 14.54 26.39 14.35
Other
CSDs 2.22 2.88 5.80 4.25 6.21 4.04 6.43 3.78 9.58 3.99 4.47 2.91 5.65 3.07
Total 63.23 81.99 113.51 83.52 127.56 83.11 141.85 83.55 195.74 81.66 127.60 83.62 151.09 82.17
(1) In addition to the franchises for sub-territories in India that were granted prior to fiscal 2011, the Goa and North-East sub-territories were merged into
our Company and the subsidiaries that held the franchises for the Nepal, Sri Lanka and Morocco territories were consolidated with our Company pursuant to the amalgamation of VBIL into the Company with effect from January 1, 2012. Subsequently, the franchise for a part of the Delhi sub-
territory was acquired with effect from January 31, 2013. The 2015 New India Sub-Territories were acquired with effect from February 28, 2015.
Accordingly, in the six month period ended June 30, 2015, the Sales Volumes from these territories is reflected only for the limited period from February 28, 2015 to June 30, 2015. Also, the aggregate Sales Volumes subsequent to the respective acquisitions are not comparable with those prior
to the relevant acquisition. The Zambia and Mozambique territories were consolidated with effect from January 1, 2016 pursuant to a change in shareholding, and Sales Volumes in these territories are therefore reflected only in the six months ended June 30, 2016. Further, our Company is
trading in the territory of Zimbabwe through our subsidiary Varun Beverages (Zimbabwe) (Private) Limited with effect from April 5, 2016 and Sales
Volumes in this territory is therefore only reflected in the six months ended June 30, 2016.
(2) Calculated and presented on the basis that each unit case consists of 24 units of beverages of 8 ounces (approximately 236.58 ml) each, aggregating to 5.678 litres of beverage per unit case.
Sales of NCB products have grown significantly in recent periods as we continue to expand our product portfolio. In Fiscal
2013, Fiscal 2014, Fiscal 2015, and in the six months ended June 30, 2016, NCBs accounted for approximately 7.33%,
7.43%, 6.03% and 6.10% respectively, of our total Sales Volume in such periods, while bottled water accounted for
approximately 9.55%, 9.03%, 12.31% and 11.72%, respectively, of our total Sales Volume in such periods. We have
expanded our NCB product portfolio in recent years to target consumers who prefer to drink new, alternative beverages. The
following tables sets forth certain information relating to Sales Volume (in million litres and in equivalent unit cases) of our
NCB products and packaged drinking water, presented as a percentage of our total Sales Volume in the periods indicated:
Fiscal 2011(1) Fiscal 2012(1) Fiscal 2013(1) Fiscal 2014(1) Fiscal 2015(1) Six months ended
June 30, 2015(1)
Six months ended
June 30, 2016(1)
Sales
Volum
e
Percenta
ge of
Total
Sales
Volume
Sales
Volum
e
Percenta
ge of
Total
Sales
Volume
Sales
Volum
e
Percenta
ge of
Total
Sales
Volume
Sales
Volum
e
Percenta
ge of
Total
Sales
Volume
Sales
Volum
e
Percenta
ge of
Total
Sales
Volume
Sales
Volum
e
Percenta
ge of
Total
Sales
Volume
Sales
Volume
Percen
tage of
Total
Sales
Volum
e
(millio
n
litres)
(%) (millio
n
litres)
(%) (millio
n
litres)
(%) (millio
n
litres)
(%) (millio
n
litres)
(%) (millio
n
litres)
(%) (million
litres)
(%)
(Standalone) (Consolidated)
NCBs 34.70 7.93 58.09 7.53 63.91 7.34 71.60 7.42 82.11 6.03 58.27 6.74 63.70 6.10 Package
d Drinkin
g Water
44.17 10.08 68.99 8.95 83.23 9.55 87.04 9.03 167.51 12.31 83.48 9.64 122.44 11.73
(1) In addition to the franchises for sub-territories in India that were granted prior to fiscal 2011, the Goa and North-East sub-territories were merged into
our Company and the subsidiaries that held the franchises for the Nepal, Sri Lanka and Morocco territories were consolidated with our Company
pursuant to the amalgamation of VBIL into the Company with effect from January 1, 2012. Subsequently, the franchise for a part of the Delhi sub-
territory was acquired with effect from January 31, 2013. The 2015 New India Sub-Territories were acquired with effect from February 28, 2015. Accordingly, in the six month period ended June 30, 2015, the Sales Volumes from these territories is reflected only for the limited period from
February 28, 2015 to June 30, 2015. Also, the aggregate Sales Volumes subsequent to the respective acquisitions are not comparable with those prior
to the relevant acquisition. The Zambia and Mozambique territories were consolidated with effect from January 1, 2016 pursuant to a change in shareholding, and Sales Volumes in these territories are therefore only reflected in the six months ended June 30, 2016. Further, our Company is
trading in the territory of Zimbabwe through our subsidiary Varun Beverages (Zimbabwe) (Private) Limited with effect from April 5, 2016 and Sales
Volumes in this territory is therefore only reflected in the six months ended June 30, 2016.
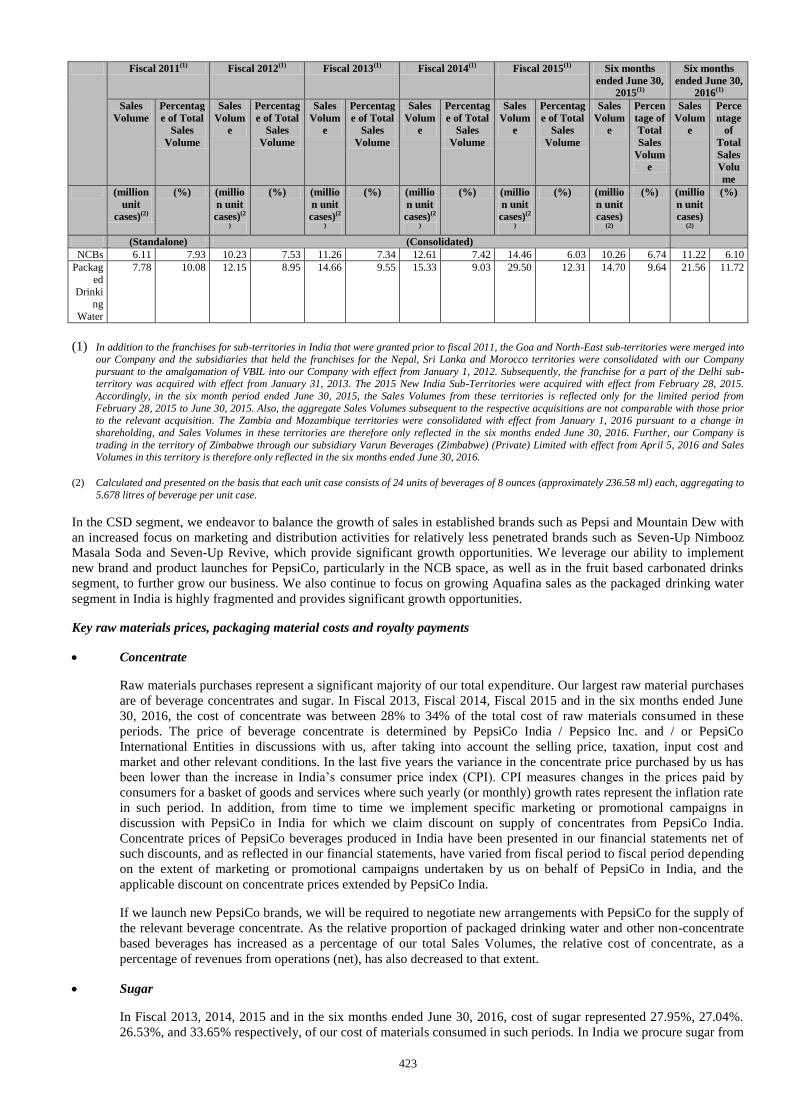
423
Fiscal 2011(1) Fiscal 2012(1) Fiscal 2013(1) Fiscal 2014(1) Fiscal 2015(1) Six months
ended June 30,
2015(1)
Six months
ended June 30,
2016(1)
Sales
Volume
Percentag
e of Total
Sales
Volume
Sales
Volum
e
Percentag
e of Total
Sales
Volume
Sales
Volum
e
Percentag
e of Total
Sales
Volume
Sales
Volum
e
Percentag
e of Total
Sales
Volume
Sales
Volum
e
Percentag
e of Total
Sales
Volume
Sales
Volum
e
Percen
tage of
Total
Sales
Volum
e
Sales
Volum
e
Perce
ntage
of
Total
Sales
Volu
me
(million
unit
cases)(2)
(%) (millio
n unit
cases)(2
)
(%) (millio
n unit
cases)(2
)
(%) (millio
n unit
cases)(2
)
(%) (millio
n unit
cases)(2
)
(%) (millio
n unit
cases)
(2)
(%) (millio
n unit
cases)
(2)
(%)
(Standalone) (Consolidated)
NCBs 6.11 7.93 10.23 7.53 11.26 7.34 12.61 7.42 14.46 6.03 10.26 6.74 11.22 6.10 Packag
ed
Drinking
Water
7.78 10.08 12.15 8.95 14.66 9.55 15.33 9.03 29.50 12.31 14.70 9.64 21.56 11.72
(1) In addition to the franchises for sub-territories in India that were granted prior to fiscal 2011, the Goa and North-East sub-territories were merged into our Company and the subsidiaries that held the franchises for the Nepal, Sri Lanka and Morocco territories were consolidated with our Company
pursuant to the amalgamation of VBIL into our Company with effect from January 1, 2012. Subsequently, the franchise for a part of the Delhi sub-territory was acquired with effect from January 31, 2013. The 2015 New India Sub-Territories were acquired with effect from February 28, 2015.
Accordingly, in the six month period ended June 30, 2015, the Sales Volumes from these territories is reflected only for the limited period from
February 28, 2015 to June 30, 2015. Also, the aggregate Sales Volumes subsequent to the respective acquisitions are not comparable with those prior to the relevant acquisition. The Zambia and Mozambique territories were consolidated with effect from January 1, 2016 pursuant to a change in
shareholding, and Sales Volumes in these territories are therefore only reflected in the six months ended June 30, 2016. Further, our Company is
trading in the territory of Zimbabwe through our subsidiary Varun Beverages (Zimbabwe) (Private) Limited with effect from April 5, 2016 and Sales Volumes in this territory is therefore only reflected in the six months ended June 30, 2016.
(2) Calculated and presented on the basis that each unit case consists of 24 units of beverages of 8 ounces (approximately 236.58 ml) each, aggregating to
5.678 litres of beverage per unit case.
In the CSD segment, we endeavor to balance the growth of sales in established brands such as Pepsi and Mountain Dew with
an increased focus on marketing and distribution activities for relatively less penetrated brands such as Seven-Up Nimbooz
Masala Soda and Seven-Up Revive, which provide significant growth opportunities. We leverage our ability to implement
new brand and product launches for PepsiCo, particularly in the NCB space, as well as in the fruit based carbonated drinks
segment, to further grow our business. We also continue to focus on growing Aquafina sales as the packaged drinking water
segment in India is highly fragmented and provides significant growth opportunities.
Key raw materials prices, packaging material costs and royalty payments
Concentrate
Raw materials purchases represent a significant majority of our total expenditure. Our largest raw material purchases
are of beverage concentrates and sugar. In Fiscal 2013, Fiscal 2014, Fiscal 2015 and in the six months ended June
30, 2016, the cost of concentrate was between 28% to 34% of the total cost of raw materials consumed in these
periods. The price of beverage concentrate is determined by PepsiCo India / Pepsico Inc. and / or PepsiCo
International Entities in discussions with us, after taking into account the selling price, taxation, input cost and
market and other relevant conditions. In the last five years the variance in the concentrate price purchased by us has
been lower than the increase in India’s consumer price index (CPI). CPI measures changes in the prices paid by
consumers for a basket of goods and services where such yearly (or monthly) growth rates represent the inflation rate
in such period. In addition, from time to time we implement specific marketing or promotional campaigns in
discussion with PepsiCo in India for which we claim discount on supply of concentrates from PepsiCo India.
Concentrate prices of PepsiCo beverages produced in India have been presented in our financial statements net of
such discounts, and as reflected in our financial statements, have varied from fiscal period to fiscal period depending
on the extent of marketing or promotional campaigns undertaken by us on behalf of PepsiCo in India, and the
applicable discount on concentrate prices extended by PepsiCo India.
If we launch new PepsiCo brands, we will be required to negotiate new arrangements with PepsiCo for the supply of
the relevant beverage concentrate. As the relative proportion of packaged drinking water and other non-concentrate
based beverages has increased as a percentage of our total Sales Volumes, the relative cost of concentrate, as a
percentage of revenues from operations (net), has also decreased to that extent.
Sugar
In Fiscal 2013, 2014, 2015 and in the six months ended June 30, 2016, cost of sugar represented 27.95%, 27.04%.
26.53%, and 33.65% respectively, of our cost of materials consumed in such periods. In India we procure sugar from
424
various sugar mills and wholesale distributors, primarily from the States of Uttar Pradesh and Maharashtra. Sugar
prices tend to be volatile, and we do not enter into any long-term supply contracts in place. We place orders
depending on our production requirements at negotiated prices, and typically procure sugar from a few key suppliers
in India. For our international operations, we procure sugar from various local suppliers through short term or spot
purchase agreements. Historically, sugar prices have fluctuated considerably. For instance, the price of sugar has
increased in recent times due to opening up of exports which may affect our results of operations in a material
manner. For example, a decrease in prices of sugar in Fiscal 2015 compared to that in Fiscal 2014 led to a decrease
in cost of materials consumed in Fiscal 2015 as a percentage of our revenue from operations (net) from sugar based
PepsiCo products produced by us. More recently, sugar prices have increased in India primarily due to opening up of
exports. In addition, as a result of the significant increase in the size of our operations in Fiscal 2015 following the
acquisition of the 2015 New India Sub-Territories, we benefited from economies of scale by being able to negotiate
favourable sugar prices from our suppliers. As the relative proportion of packaged drinking water and other non-
sugar based or lower sugar based CSDs has increased as a percentage of our total Sales Volumes, the relative cost of
sugar consumed, as a percentage of revenues from operations (net), has decreased.
Packaging materials
We incur significant expenses for packaging materials out of which the largest is PET resin which accounted for
13.26%, 11.84%, 9.01% and 7.44% of our cost of materials consumed in Fiscal 2013, 2014, 2015, and in the six
months ended June 30, 2016, respectively. The principal packaging materials used by us include returnable glass
bottles, PET bottles, aluminium cans, tetra-packs, shrink-wrap films, crowns, plastic closures, labels and corrugated
boxes. A significant majority of our packaging requirements are produced internally. We also procure some of our
packaging materials from third party suppliers. For further information, see “Our Business – Procurement and Raw
Materials – Packaging Material” on page 152. We make regular purchases of returnable glass bottles to maintain our
float at appropriate levels. These materials are purchased from a small number of suppliers, usually under short term,
fixed price contracts. As a result, our costs are exposed to fluctuations in the market prices of these materials. For
example, in Fiscal 2013, 2014, 2015, and in the six months ended June 30, 2016, the relatively lower prices of PET
resin, which is a key packaging raw material, has led to a decrease in our packaging material costs in such periods.
Our profit margins vary between beverage products and packaging types and sizes. Excluding packaging, production
costs are similar across our range of CSDs, but may vary significantly between NCBs. Packaging costs vary, with
returnable glass bottles being less expensive than PET, or aluminium cans. The incremental cost of producing larger-
sized serves in the same packaging type is proportionately lower than the increased volume, creating opportunities to
achieve higher margins where customers perceive value in terms of volume. The prices we are able to charge for our
products are significantly affected by the competitive landscape, in particular the price and availability of
comparable products in comparable packages and sizes. In addition, we intend to launch certain products and brands
in smaller packages to target the semi-urban and rural markets in India. As a result of these factors, the margins we
earn on our products may vary substantially, and the margins can vary in both absolute and relative terms from
financial period to period. As a result of the different margins between our products and packages, product and
package mix from financial period to period can have a significant effect on our operating profit. While we attempt
to adjust our product and package mix to maximize profitability, changes in consumer demand and the competitive
landscape can have a significant impact on our mix and therefore our profitability in any relevant period.
Royalty fees
Pursuant to the PepsiCo India Agreements, we are required to pay royalty to PepsiCo India in connection with the
use of trademark “LEHAR” in conjunction with Aquafina and Evervess trademark for our packaged drinking water
and soda water, respectively. As the relative proportion of packaged drinking water and soda water has increased as
a percentage of our total Sales Volumes in recent periods, our royalty payments to PepsiCo India in connection with
these products have also increased.
Production capacities, backward integration and operating efficiencies
As of June 30, 2016, we operated 16 production facilities across India and five production facilities in our
international licensed territories. We have recently completed acquisition of our Satharia – 2 production facility from
our co-packer in September 2016. As of June 30, 2016, we had an estimated aggregate annual production capacity of
3,438.38 million litres (equivalent to 605.56 million unit cases) in India and an estimated aggregate annual
production capacity of 991.57 million litres (equivalent to 174.63 million unit cases) in our international production
facilities. Our production facilities across India are strategically located in geographical proximity to various target
markets, which results in lower transportation and distribution expenses and enable us to leverage economies of
scale.
The following table sets forth the annual installed capacity of our production facilities in India as of December 31,
2015 and March 31, 2016.
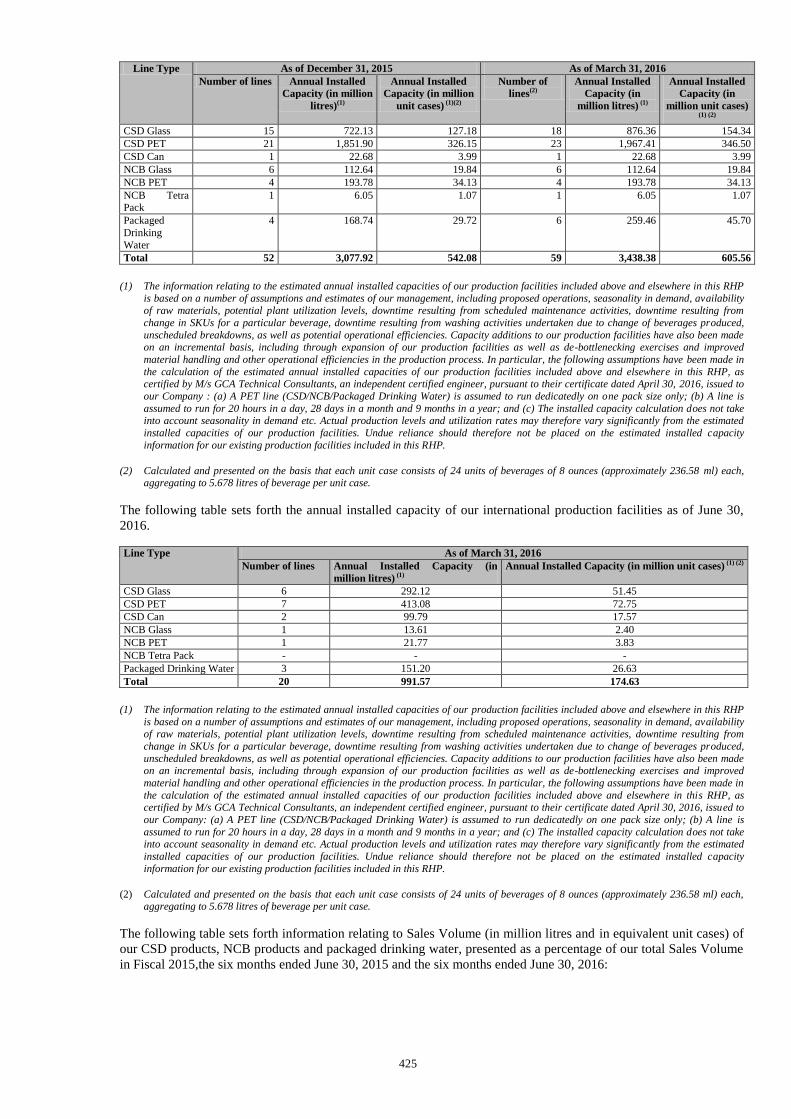
425
Line Type As of December 31, 2015 As of March 31, 2016
Number of lines Annual Installed
Capacity (in million
litres)(1)
Annual Installed
Capacity (in million
unit cases) (1)(2)
Number of
lines(2)
Annual Installed
Capacity (in
million litres) (1)
Annual Installed
Capacity (in
million unit cases)
(1) (2)
CSD Glass 15 722.13 127.18 18 876.36 154.34
CSD PET 21 1,851.90 326.15 23 1,967.41 346.50
CSD Can 1 22.68 3.99 1 22.68 3.99
NCB Glass 6 112.64 19.84 6 112.64 19.84
NCB PET 4 193.78 34.13 4 193.78 34.13
NCB Tetra Pack
1 6.05 1.07 1 6.05 1.07
Packaged
Drinking
Water
4 168.74 29.72 6 259.46 45.70
Total 52 3,077.92 542.08 59 3,438.38 605.56
(1) The information relating to the estimated annual installed capacities of our production facilities included above and elsewhere in this RHP
is based on a number of assumptions and estimates of our management, including proposed operations, seasonality in demand, availability
of raw materials, potential plant utilization levels, downtime resulting from scheduled maintenance activities, downtime resulting from
change in SKUs for a particular beverage, downtime resulting from washing activities undertaken due to change of beverages produced,
unscheduled breakdowns, as well as potential operational efficiencies. Capacity additions to our production facilities have also been made on an incremental basis, including through expansion of our production facilities as well as de-bottlenecking exercises and improved
material handling and other operational efficiencies in the production process. In particular, the following assumptions have been made in
the calculation of the estimated annual installed capacities of our production facilities included above and elsewhere in this RHP, as certified by M/s GCA Technical Consultants, an independent certified engineer, pursuant to their certificate dated April 30, 2016, issued to
our Company : (a) A PET line (CSD/NCB/Packaged Drinking Water) is assumed to run dedicatedly on one pack size only; (b) A line is
assumed to run for 20 hours in a day, 28 days in a month and 9 months in a year; and (c) The installed capacity calculation does not take into account seasonality in demand etc. Actual production levels and utilization rates may therefore vary significantly from the estimated
installed capacities of our production facilities. Undue reliance should therefore not be placed on the estimated installed capacity
information for our existing production facilities included in this RHP.
(2) Calculated and presented on the basis that each unit case consists of 24 units of beverages of 8 ounces (approximately 236.58 ml) each, aggregating to 5.678 litres of beverage per unit case.
The following table sets forth the annual installed capacity of our international production facilities as of June 30,
2016.
Line Type As of March 31, 2016
Number of lines Annual Installed Capacity (in
million litres) (1)
Annual Installed Capacity (in million unit cases) (1) (2)
CSD Glass 6 292.12 51.45
CSD PET 7 413.08 72.75
CSD Can 2 99.79 17.57
NCB Glass 1 13.61 2.40
NCB PET 1 21.77 3.83
NCB Tetra Pack - - -
Packaged Drinking Water 3 151.20 26.63
Total 20 991.57 174.63
(1) The information relating to the estimated annual installed capacities of our production facilities included above and elsewhere in this RHP
is based on a number of assumptions and estimates of our management, including proposed operations, seasonality in demand, availability of raw materials, potential plant utilization levels, downtime resulting from scheduled maintenance activities, downtime resulting from
change in SKUs for a particular beverage, downtime resulting from washing activities undertaken due to change of beverages produced,
unscheduled breakdowns, as well as potential operational efficiencies. Capacity additions to our production facilities have also been made on an incremental basis, including through expansion of our production facilities as well as de-bottlenecking exercises and improved
material handling and other operational efficiencies in the production process. In particular, the following assumptions have been made in
the calculation of the estimated annual installed capacities of our production facilities included above and elsewhere in this RHP, as certified by M/s GCA Technical Consultants, an independent certified engineer, pursuant to their certificate dated April 30, 2016, issued to
our Company: (a) A PET line (CSD/NCB/Packaged Drinking Water) is assumed to run dedicatedly on one pack size only; (b) A line is
assumed to run for 20 hours in a day, 28 days in a month and 9 months in a year; and (c) The installed capacity calculation does not take into account seasonality in demand etc. Actual production levels and utilization rates may therefore vary significantly from the estimated
installed capacities of our production facilities. Undue reliance should therefore not be placed on the estimated installed capacity
information for our existing production facilities included in this RHP.
(2) Calculated and presented on the basis that each unit case consists of 24 units of beverages of 8 ounces (approximately 236.58 ml) each, aggregating to 5.678 litres of beverage per unit case.
The following table sets forth information relating to Sales Volume (in million litres and in equivalent unit cases) of
our CSD products, NCB products and packaged drinking water, presented as a percentage of our total Sales Volume
in Fiscal 2015,the six months ended June 30, 2015 and the six months ended June 30, 2016:
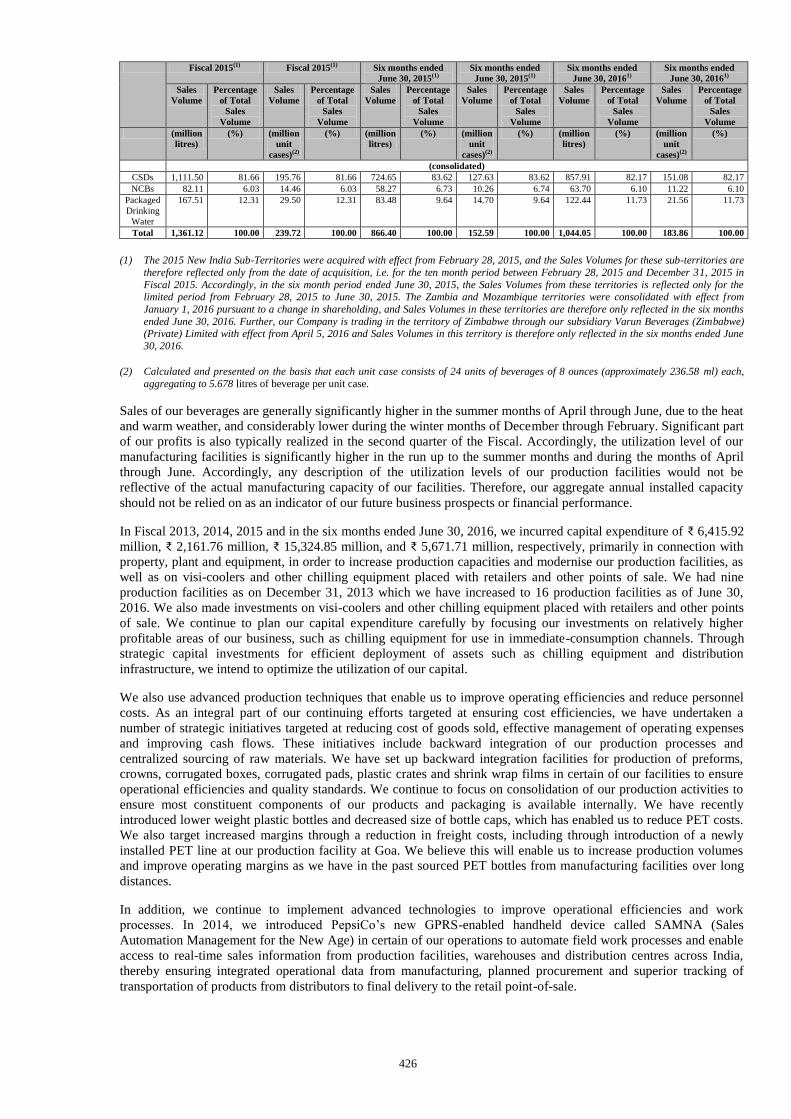
426
Fiscal 2015(1) Fiscal 2015(1) Six months ended
June 30, 2015(1)
Six months ended
June 30, 2015(1)
Six months ended
June 30, 20161)
Six months ended
June 30, 20161)
Sales
Volume
Percentage
of Total
Sales
Volume
Sales
Volume
Percentage
of Total
Sales
Volume
Sales
Volume
Percentage
of Total
Sales
Volume
Sales
Volume
Percentage
of Total
Sales
Volume
Sales
Volume
Percentage
of Total
Sales
Volume
Sales
Volume
Percentage
of Total
Sales
Volume
(million
litres)
(%) (million
unit
cases)(2)
(%) (million
litres)
(%) (million
unit
cases)(2)
(%) (million
litres)
(%) (million
unit
cases)(2)
(%)
(consolidated)
CSDs 1,111.50 81.66 195.76 81.66 724.65 83.62 127.63 83.62 857.91 82.17 151.08 82.17
NCBs 82.11 6.03 14.46 6.03 58.27 6.73 10.26 6.74 63.70 6.10 11.22 6.10
Packaged
Drinking
Water
167.51 12.31 29.50 12.31 83.48 9.64 14.70 9.64 122.44 11.73 21.56 11.73
Total 1,361.12 100.00 239.72 100.00 866.40 100.00 152.59 100.00 1,044.05 100.00 183.86 100.00
(1) The 2015 New India Sub-Territories were acquired with effect from February 28, 2015, and the Sales Volumes for these sub-territories are
therefore reflected only from the date of acquisition, i.e. for the ten month period between February 28, 2015 and December 31, 2015 in
Fiscal 2015. Accordingly, in the six month period ended June 30, 2015, the Sales Volumes from these territories is reflected only for the limited period from February 28, 2015 to June 30, 2015. The Zambia and Mozambique territories were consolidated with effect from
January 1, 2016 pursuant to a change in shareholding, and Sales Volumes in these territories are therefore only reflected in the six months
ended June 30, 2016. Further, our Company is trading in the territory of Zimbabwe through our subsidiary Varun Beverages (Zimbabwe) (Private) Limited with effect from April 5, 2016 and Sales Volumes in this territory is therefore only reflected in the six months ended June
30, 2016.
(2) Calculated and presented on the basis that each unit case consists of 24 units of beverages of 8 ounces (approximately 236.58 ml) each,
aggregating to 5.678 litres of beverage per unit case.
Sales of our beverages are generally significantly higher in the summer months of April through June, due to the heat
and warm weather, and considerably lower during the winter months of December through February. Significant part
of our profits is also typically realized in the second quarter of the Fiscal. Accordingly, the utilization level of our
manufacturing facilities is significantly higher in the run up to the summer months and during the months of April
through June. Accordingly, any description of the utilization levels of our production facilities would not be
reflective of the actual manufacturing capacity of our facilities. Therefore, our aggregate annual installed capacity
should not be relied on as an indicator of our future business prospects or financial performance.
In Fiscal 2013, 2014, 2015 and in the six months ended June 30, 2016, we incurred capital expenditure of ₹ 6,415.92
million, ₹ 2,161.76 million, ₹ 15,324.85 million, and ₹ 5,671.71 million, respectively, primarily in connection with
property, plant and equipment, in order to increase production capacities and modernise our production facilities, as
well as on visi-coolers and other chilling equipment placed with retailers and other points of sale. We had nine
production facilities as on December 31, 2013 which we have increased to 16 production facilities as of June 30,
2016. We also made investments on visi-coolers and other chilling equipment placed with retailers and other points
of sale. We continue to plan our capital expenditure carefully by focusing our investments on relatively higher
profitable areas of our business, such as chilling equipment for use in immediate-consumption channels. Through
strategic capital investments for efficient deployment of assets such as chilling equipment and distribution
infrastructure, we intend to optimize the utilization of our capital.
We also use advanced production techniques that enable us to improve operating efficiencies and reduce personnel
costs. As an integral part of our continuing efforts targeted at ensuring cost efficiencies, we have undertaken a
number of strategic initiatives targeted at reducing cost of goods sold, effective management of operating expenses
and improving cash flows. These initiatives include backward integration of our production processes and
centralized sourcing of raw materials. We have set up backward integration facilities for production of preforms,
crowns, corrugated boxes, corrugated pads, plastic crates and shrink wrap films in certain of our facilities to ensure
operational efficiencies and quality standards. We continue to focus on consolidation of our production activities to
ensure most constituent components of our products and packaging is available internally. We have recently
introduced lower weight plastic bottles and decreased size of bottle caps, which has enabled us to reduce PET costs.
We also target increased margins through a reduction in freight costs, including through introduction of a newly
installed PET line at our production facility at Goa. We believe this will enable us to increase production volumes
and improve operating margins as we have in the past sourced PET bottles from manufacturing facilities over long
distances.
In addition, we continue to implement advanced technologies to improve operational efficiencies and work
processes. In 2014, we introduced PepsiCo’s new GPRS-enabled handheld device called SAMNA (Sales
Automation Management for the New Age) in certain of our operations to automate field work processes and enable
access to real-time sales information from production facilities, warehouses and distribution centres across India,
thereby ensuring integrated operational data from manufacturing, planned procurement and superior tracking of
transportation of products from distributors to final delivery to the retail point-of-sale.
427
Expansion of distribution network and market penetration
Our expansive sales and distribution network enables us to reach a wide range of consumers and ensure effective
market penetration. Our distribution network is strategically located to maximize market penetration across our
licensed sub-territories in India, with an increased focus on growth markets such as semi-urban and rural sub-
territories. Our Sales Volumes depend on the reach of our distribution network. An important aspect of our
distribution system is the infrastructure-intensive process of selling and delivering our products to thousands of
distributors, dealers and small retailers. Our growth strategy for the CSD category is to increase our overall market
share by increasing the reach of our distribution network to cover a larger proportion of potential outlets, although
we estimate that the proportion of potential outlets that we could service profitably is significantly less than the total
number. However, while we expect increased Sales Volumes resulting from expansion of our distribution network,
we will be required to make significant investments in distribution infrastructure, including additional delivery
vehicles, refrigeration equipment, warehouse space and a larger float of glass bottles and PET shells, as well as
higher costs for additional sales and distribution staff. Although our direct purchases of fuel are relatively small as a
proportion of our total costs, we are exposed to fluctuations in the price of fuel through our dependence on freight
and delivery services, the prices we pay for which reflect, over time, increases in the cost of fuel.
As of June 30, 2016, our distribution network in India included 60 depots and 1,438 delivery vehicles. Our
distribution network covers urban, semi-urban and rural markets, targeting a wide range of consumers. We have also
developed an extensive distribution network in our international markets which as of June 30, 2016 included 20
depots and 518 delivery vehicles. As of June 30, 2016, we had 562 primary distributors (i.e., distributors that
recorded sales in excess of 0.5 million litres of our PepsiCo beverages in the 12 months ended June 30, 2016) in
India and 415 distributors in our international operations. The 562 primary distributors in India accounted for
74.36% of our aggregate Sales Volumes in India in the 12 months ended June 30, 2016.We intend to further expand
our distribution network by setting up additional depots, consolidating existing distributors and increasing the
number of distributors in under-penetrated markets. A large proportion of our distributors are small and/or family
run operations and we seek to develop a high degree of loyalty among such distributors by supporting the growth of
their businesses through provision of customized training, developing exclusive distributor relationships and
providing various support services for their business.
We continue to focus on increasing our retail presence, through increased brand promotion activities, increased in-
store product inventory as well as price competitiveness through strategic promotional schemes. The market for
beverages sold from vending machines and visi-coolers for immediate consumption is a fast growing segment,
resulting from an emerging on-the-go lifestyle and consumer convenience. Single-serve sales channels typically
involve higher margins compared to sales of multi-serve SKUs. Sales in this segment depend on strategic inventory
management, rapid inventory deployment, and effective availability and placement of relevant chilling equipment
such as vending machines, visi-coolers and fountain dispensers in close proximity to high density consumer areas.
Seasonality
Sales of our beverages are generally significantly higher in the summer months of April through June, due to the heat
and warm weather, and considerably lower during the winter months of December through February. In Fiscal 2015,
in India, approximately 47.25% of our revenues from operations (net) was recorded in the quarter of April through
June, while the remaining 52.75% was recorded in the other three quarters. A significant majority of our profits are
also typically realized in the second quarter of the relevant Fiscal year. Bad weather conditions, including unusually
cold or rainy periods, during the peak sales season during summer, may adversely affect our sales volume, results of
operations and financial condition, and could therefore have a disproportionate impact on our results of operations in
the relevant year. For example, in Fiscal 2013 and 2015, we faced significant adverse weather conditions in the form
of extended periods of heavy rains during the peak summer months, which adversely affected our peak season sales
in these fiscal years. Further, any bearing on crop harvest due to unseasonal rains may impact the purchasing power
of our customers from the rural markets and may adversely affect our revenue from such markets. Because of the
significant fluctuations in demand for CSDs and NCBs during different seasons of the year, any comparison of
revenues and results of operations between two quarters or other varying financial periods within the year will not be
meaningful and should not be relied on as an indicator of our future business prospects or financial performance.
Competition
The carbonated and non-carbonated beverage markets are highly competitive in India and the international markets
we operate in. We compete with, among others, bottlers of other global, regional and local brands of carbonated and
non-carbonated beverages. An increase in the number of competitors or level of marketing or investments
undertaken by such competitors may result in a reduction in the consumption of our products and may reduce our
market share, or we may be required to incur increased sales, marketing and distribution related expenses in order to
remain competitive. In addition, the success of our business depends on consumer behavior and preferences and their
428
affinity and loyalty to PepsiCo beverages and brands, and there can be no assurance of market acceptance and
consumer preference for new PepsiCo beverages or that there will be an increase in market share of PepsiCo
products.
In addition, we compete with aggressive marketing and promotional activities by other global, regional or local CSD
and NCB beverage producers as well as competition on price and promotional discounts announced from time to
time. Other global and premium beverage producers in our markets typically match the pricing of our products.
However, if the competition alters their pricing model, and we are unable to change our product prices in response to
such competitive measures, our results of operations and profitability may be materially and adversely affected.
Excise duty
Indirect taxes and statutory levies such as excise duty levied are an important component of the cost of our products
to our consumers. These statutory levies and taxes are paid by our consumers. We present our gross sales as well as
net sales (net of applicable excise duty). Changes in excise duty and other fiscal levies may affect our results of
operations if we are unable to pass on such levies and taxes to our customers.
Any significant increase in government levies such as excise duty will ultimately affect the price of our products. For
example, in the Union Budget 2016, the Finance Minister announced an excise duty hike to 21.00% on aerated sugar
drinks from the then prevailing 18.00%. In the 2015 Union Budget, excise duty on aerated drinking water increased
from 17.50% to 18.00%. The excise duty on packaged drinking water was 12.50% in 2015, while excise duty for
fruit based drinks was 6.00%. We currently pay, under protest, excise duty applicable to CSD products on our fruit
juice based product Seven-Up Nimbooz Masala Soda, which we believe given its fruit based nature should be
classified for excise duty at 6.00%. Since such increase in excise duty is an industry wide phenomenon, and similarly
affect our competitors, we have historically typically been able to pass on such increases in excise duties to the
consumer.
Basis of Consolidation
Our Restated Consolidated Summary Statements include the respective Restated Standalone Summary Statements of
our Company, our subsidiaries and the results of operations of our associates and are listed below:
Name of Subsidiary Country of
incorporation
Percentage of ownership
December 31, June 30,
2012 2013 2014 2015 2015 2016
Varun Beverages (Nepal) Private Limited Nepal 100.00% 100.00% 100.00% 100.00% 100.00% 100.00%
Varun Beverages Lanka (Private) Limited (“VBL
Lanka”)
Sri Lanka 99.98% 99.98% 100.00% 100.00% 100.00% 100.00%
Varun Beverages Morocco SA Morocco 100.00% 99.9994% 99.99981
%
100.00% 100.00% 100.00%
Ole Spring Bottlers Private Limited (“Ole”)* Sri Lanka 100.00% 100.00% 100.00% 100.00% 100.00% 100.00%
Varun Beverages (Zambia) Limited Zambia - - - - - 60.00%
Varun Beverages Mozambique Limitada Mozambique - - - - - 51.00%
Varun Beverages (Zimbabwe) (Private) Limited** Zimbabwe - - - - - 85.00%
* Subsidiary of VBL Lanka
** The Zimbabwe territory has been consolidated with effect from April 5, 2016 pursuant to change in shareholding.
Name of Associate Country of
incorporation
Percentage of ownership
December 31,
June 30,
2012 2013 2014 2015 2015 2016
Angelica Technologies Private Limited India - 47.30% 47.30% 47.30% - 47.30%
Lunarmech Technologies Private Limited# India - 35.00% 35.00% 35.00% - 35.00%
Ole Marketing (Private) Limited** Sri Lanka 33.33% 33.33% 33.33% - - -
# Angelica Technologies Private Limited holds 74% ownership in Lunarmech Technologies Private Limited.
** Associate of VBL Lanka till January 21, 2015.
During Fiscal 2015 and in Fiscal 2016, our Company executed certain share purchase agreements to acquire
controlling stakes (subject to completion of relevant closing terms/regulatory approvals) in entities which own
manufacturing facilities and distribution rights of certain PepsiCo products in Mozambique, Zambia and Zimbabwe.
The total monetary commitment for these acquisitions aggregates to approximately USD 25 million. We have been
granted the franchise for certain PepsiCo products in Zambia for five years until August 31, 2020 and in
Mozambique for five years until January 24, 2019. We are in the process of setting up a production facility in
Zimbabwe in anticipation of franchise rights being granted by PepsiCo Inc. for such territory.
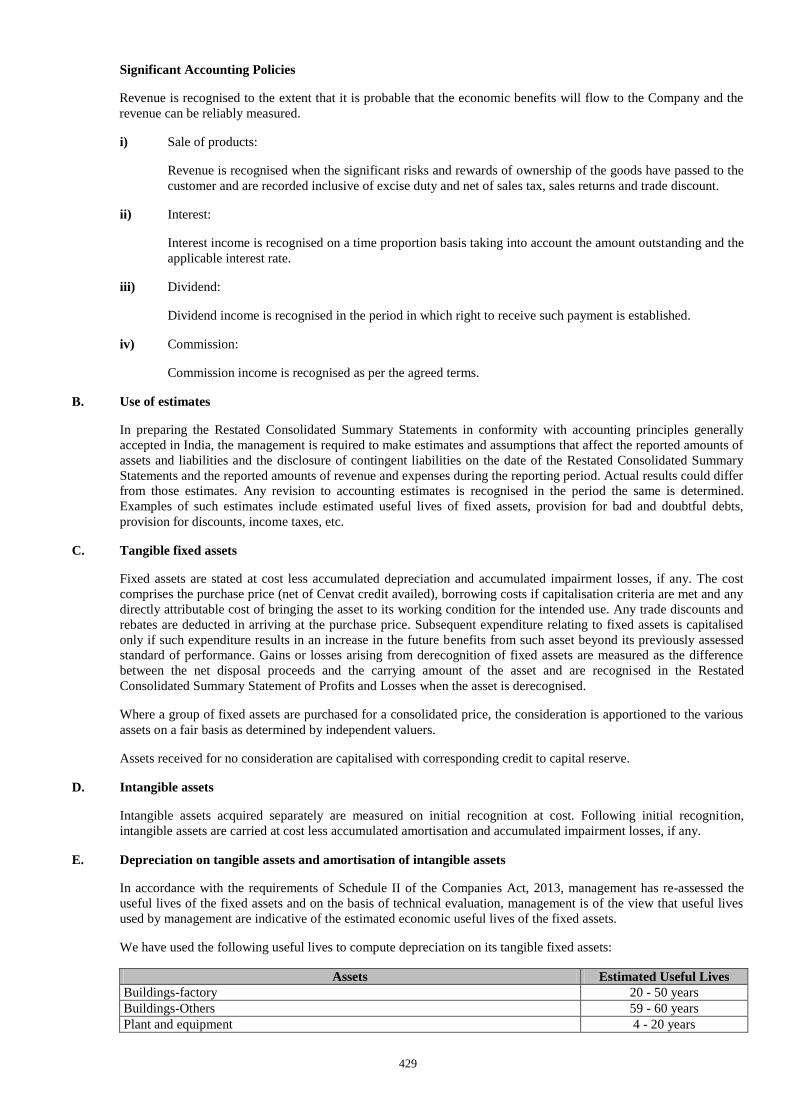
429
Significant Accounting Policies
Revenue is recognised to the extent that it is probable that the economic benefits will flow to the Company and the
revenue can be reliably measured.
i) Sale of products:
Revenue is recognised when the significant risks and rewards of ownership of the goods have passed to the
customer and are recorded inclusive of excise duty and net of sales tax, sales returns and trade discount.
ii) Interest:
Interest income is recognised on a time proportion basis taking into account the amount outstanding and the
applicable interest rate.
iii) Dividend:
Dividend income is recognised in the period in which right to receive such payment is established.
iv) Commission:
Commission income is recognised as per the agreed terms.
B. Use of estimates
In preparing the Restated Consolidated Summary Statements in conformity with accounting principles generally
accepted in India, the management is required to make estimates and assumptions that affect the reported amounts of
assets and liabilities and the disclosure of contingent liabilities on the date of the Restated Consolidated Summary
Statements and the reported amounts of revenue and expenses during the reporting period. Actual results could differ
from those estimates. Any revision to accounting estimates is recognised in the period the same is determined.
Examples of such estimates include estimated useful lives of fixed assets, provision for bad and doubtful debts,
provision for discounts, income taxes, etc.
C. Tangible fixed assets
Fixed assets are stated at cost less accumulated depreciation and accumulated impairment losses, if any. The cost
comprises the purchase price (net of Cenvat credit availed), borrowing costs if capitalisation criteria are met and any
directly attributable cost of bringing the asset to its working condition for the intended use. Any trade discounts and
rebates are deducted in arriving at the purchase price. Subsequent expenditure relating to fixed assets is capitalised
only if such expenditure results in an increase in the future benefits from such asset beyond its previously assessed
standard of performance. Gains or losses arising from derecognition of fixed assets are measured as the difference
between the net disposal proceeds and the carrying amount of the asset and are recognised in the Restated
Consolidated Summary Statement of Profits and Losses when the asset is derecognised.
Where a group of fixed assets are purchased for a consolidated price, the consideration is apportioned to the various
assets on a fair basis as determined by independent valuers.
Assets received for no consideration are capitalised with corresponding credit to capital reserve.
D. Intangible assets
Intangible assets acquired separately are measured on initial recognition at cost. Following initial recognition,
intangible assets are carried at cost less accumulated amortisation and accumulated impairment losses, if any.
E. Depreciation on tangible assets and amortisation of intangible assets
In accordance with the requirements of Schedule II of the Companies Act, 2013, management has re-assessed the
useful lives of the fixed assets and on the basis of technical evaluation, management is of the view that useful lives
used by management are indicative of the estimated economic useful lives of the fixed assets.
We have used the following useful lives to compute depreciation on its tangible fixed assets:
Assets Estimated Useful Lives
Buildings-factory 20 - 50 years
Buildings-Others 59 - 60 years
Plant and equipment 4 - 20 years
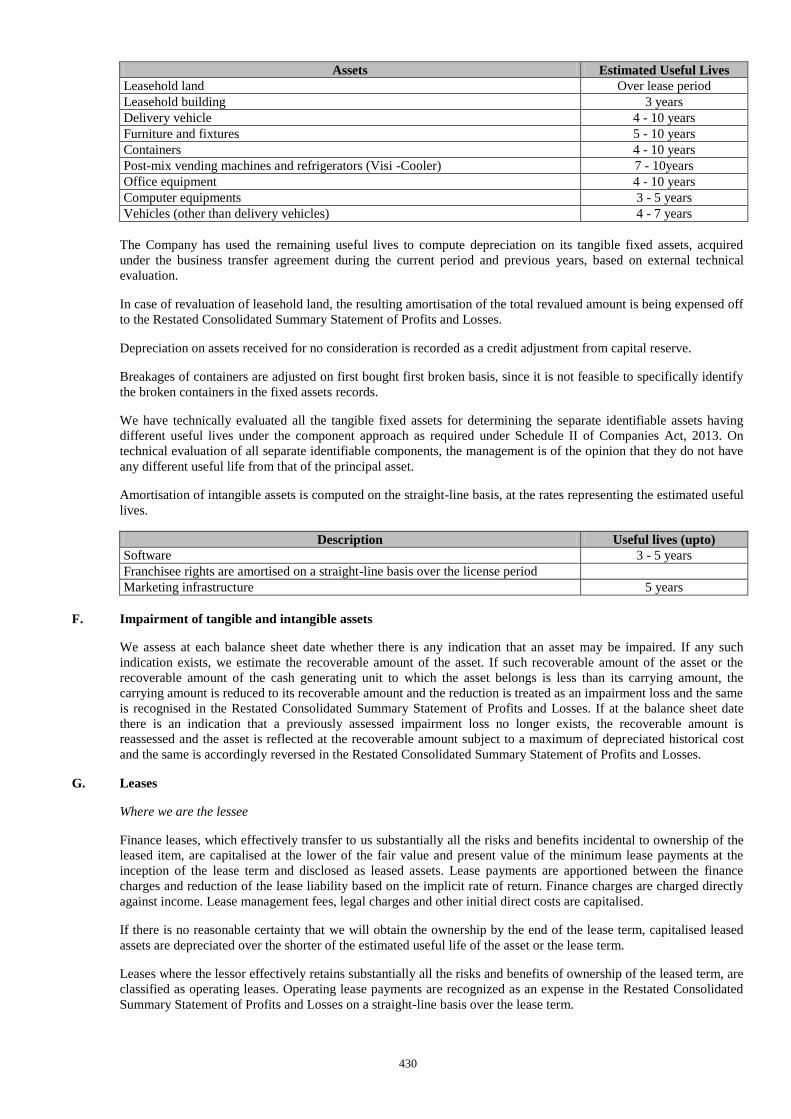
430
Assets Estimated Useful Lives
Leasehold land Over lease period
Leasehold building 3 years
Delivery vehicle 4 - 10 years
Furniture and fixtures 5 - 10 years
Containers 4 - 10 years
Post-mix vending machines and refrigerators (Visi -Cooler) 7 - 10years
Office equipment 4 - 10 years
Computer equipments 3 - 5 years
Vehicles (other than delivery vehicles) 4 - 7 years
The Company has used the remaining useful lives to compute depreciation on its tangible fixed assets, acquired
under the business transfer agreement during the current period and previous years, based on external technical
evaluation.
In case of revaluation of leasehold land, the resulting amortisation of the total revalued amount is being expensed off
to the Restated Consolidated Summary Statement of Profits and Losses.
Depreciation on assets received for no consideration is recorded as a credit adjustment from capital reserve.
Breakages of containers are adjusted on first bought first broken basis, since it is not feasible to specifically identify
the broken containers in the fixed assets records.
We have technically evaluated all the tangible fixed assets for determining the separate identifiable assets having
different useful lives under the component approach as required under Schedule II of Companies Act, 2013. On
technical evaluation of all separate identifiable components, the management is of the opinion that they do not have
any different useful life from that of the principal asset.
Amortisation of intangible assets is computed on the straight-line basis, at the rates representing the estimated useful
lives.
Description Useful lives (upto)
Software 3 - 5 years
Franchisee rights are amortised on a straight-line basis over the license period
Marketing infrastructure 5 years
F. Impairment of tangible and intangible assets
We assess at each balance sheet date whether there is any indication that an asset may be impaired. If any such
indication exists, we estimate the recoverable amount of the asset. If such recoverable amount of the asset or the
recoverable amount of the cash generating unit to which the asset belongs is less than its carrying amount, the
carrying amount is reduced to its recoverable amount and the reduction is treated as an impairment loss and the same
is recognised in the Restated Consolidated Summary Statement of Profits and Losses. If at the balance sheet date
there is an indication that a previously assessed impairment loss no longer exists, the recoverable amount is
reassessed and the asset is reflected at the recoverable amount subject to a maximum of depreciated historical cost
and the same is accordingly reversed in the Restated Consolidated Summary Statement of Profits and Losses.
G. Leases
Where we are the lessee
Finance leases, which effectively transfer to us substantially all the risks and benefits incidental to ownership of the
leased item, are capitalised at the lower of the fair value and present value of the minimum lease payments at the
inception of the lease term and disclosed as leased assets. Lease payments are apportioned between the finance
charges and reduction of the lease liability based on the implicit rate of return. Finance charges are charged directly
against income. Lease management fees, legal charges and other initial direct costs are capitalised.
If there is no reasonable certainty that we will obtain the ownership by the end of the lease term, capitalised leased
assets are depreciated over the shorter of the estimated useful life of the asset or the lease term.
Leases where the lessor effectively retains substantially all the risks and benefits of ownership of the leased term, are
classified as operating leases. Operating lease payments are recognized as an expense in the Restated Consolidated
Summary Statement of Profits and Losses on a straight-line basis over the lease term.
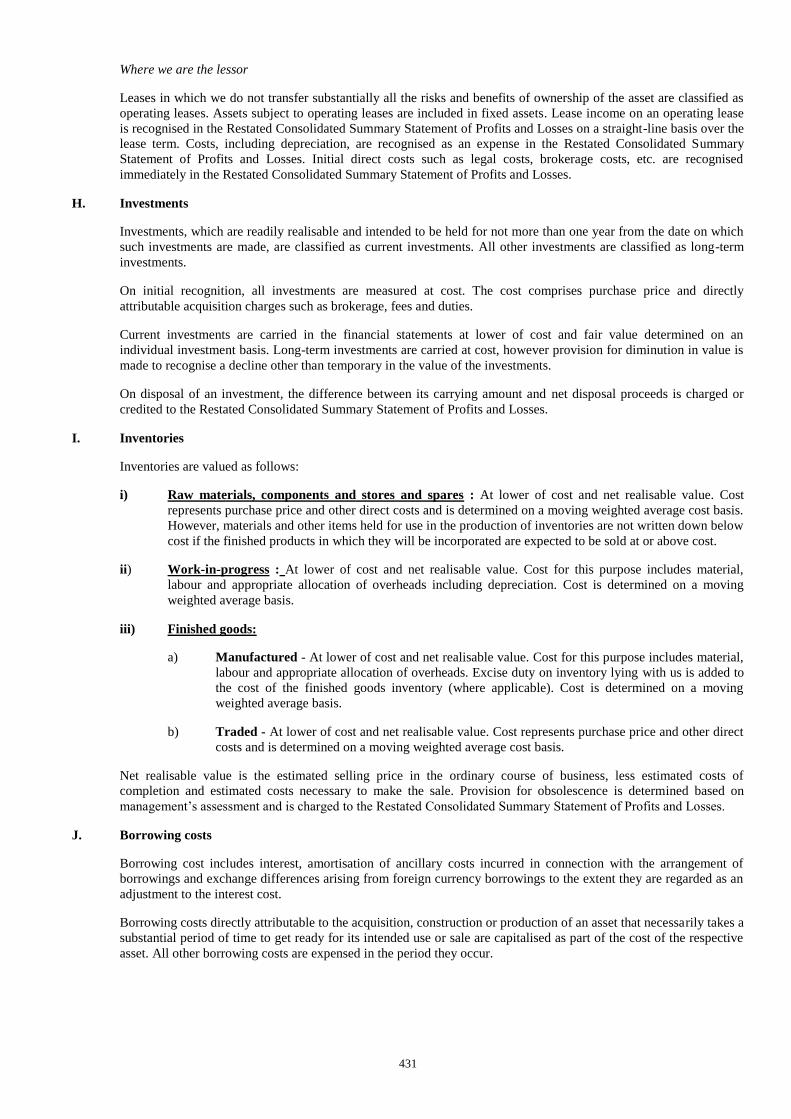
431
Where we are the lessor
Leases in which we do not transfer substantially all the risks and benefits of ownership of the asset are classified as
operating leases. Assets subject to operating leases are included in fixed assets. Lease income on an operating lease
is recognised in the Restated Consolidated Summary Statement of Profits and Losses on a straight-line basis over the
lease term. Costs, including depreciation, are recognised as an expense in the Restated Consolidated Summary
Statement of Profits and Losses. Initial direct costs such as legal costs, brokerage costs, etc. are recognised
immediately in the Restated Consolidated Summary Statement of Profits and Losses.
H. Investments
Investments, which are readily realisable and intended to be held for not more than one year from the date on which
such investments are made, are classified as current investments. All other investments are classified as long-term
investments.
On initial recognition, all investments are measured at cost. The cost comprises purchase price and directly
attributable acquisition charges such as brokerage, fees and duties.
Current investments are carried in the financial statements at lower of cost and fair value determined on an
individual investment basis. Long-term investments are carried at cost, however provision for diminution in value is
made to recognise a decline other than temporary in the value of the investments.
On disposal of an investment, the difference between its carrying amount and net disposal proceeds is charged or
credited to the Restated Consolidated Summary Statement of Profits and Losses.
I. Inventories
Inventories are valued as follows:
i) Raw materials, components and stores and spares : At lower of cost and net realisable value. Cost
represents purchase price and other direct costs and is determined on a moving weighted average cost basis.
However, materials and other items held for use in the production of inventories are not written down below
cost if the finished products in which they will be incorporated are expected to be sold at or above cost.
ii) Work-in-progress : At lower of cost and net realisable value. Cost for this purpose includes material,
labour and appropriate allocation of overheads including depreciation. Cost is determined on a moving
weighted average basis.
iii) Finished goods:
a) Manufactured - At lower of cost and net realisable value. Cost for this purpose includes material,
labour and appropriate allocation of overheads. Excise duty on inventory lying with us is added to
the cost of the finished goods inventory (where applicable). Cost is determined on a moving
weighted average basis.
b) Traded - At lower of cost and net realisable value. Cost represents purchase price and other direct
costs and is determined on a moving weighted average cost basis.
Net realisable value is the estimated selling price in the ordinary course of business, less estimated costs of
completion and estimated costs necessary to make the sale. Provision for obsolescence is determined based on
management’s assessment and is charged to the Restated Consolidated Summary Statement of Profits and Losses.
J. Borrowing costs
Borrowing cost includes interest, amortisation of ancillary costs incurred in connection with the arrangement of
borrowings and exchange differences arising from foreign currency borrowings to the extent they are regarded as an
adjustment to the interest cost.
Borrowing costs directly attributable to the acquisition, construction or production of an asset that necessarily takes a
substantial period of time to get ready for its intended use or sale are capitalised as part of the cost of the respective
asset. All other borrowing costs are expensed in the period they occur.
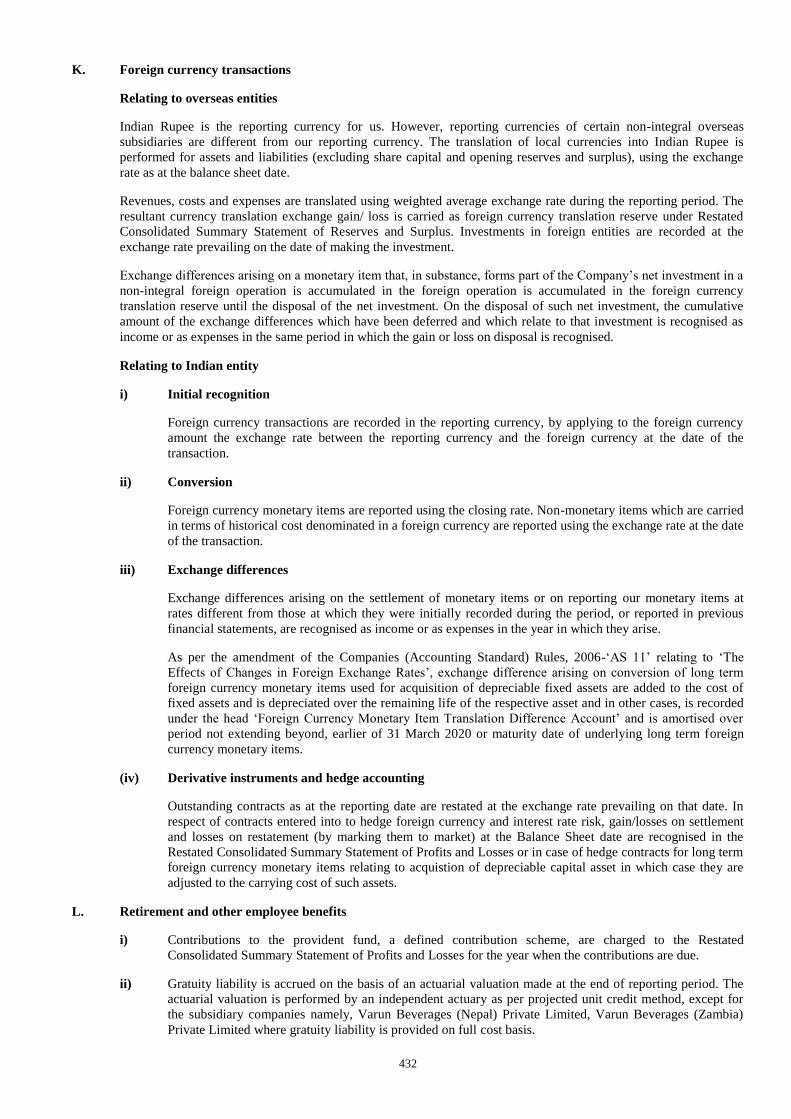
432
K. Foreign currency transactions
Relating to overseas entities
Indian Rupee is the reporting currency for us. However, reporting currencies of certain non-integral overseas
subsidiaries are different from our reporting currency. The translation of local currencies into Indian Rupee is
performed for assets and liabilities (excluding share capital and opening reserves and surplus), using the exchange
rate as at the balance sheet date.
Revenues, costs and expenses are translated using weighted average exchange rate during the reporting period. The
resultant currency translation exchange gain/ loss is carried as foreign currency translation reserve under Restated
Consolidated Summary Statement of Reserves and Surplus. Investments in foreign entities are recorded at the
exchange rate prevailing on the date of making the investment.
Exchange differences arising on a monetary item that, in substance, forms part of the Company’s net investment in a
non-integral foreign operation is accumulated in the foreign operation is accumulated in the foreign currency
translation reserve until the disposal of the net investment. On the disposal of such net investment, the cumulative
amount of the exchange differences which have been deferred and which relate to that investment is recognised as
income or as expenses in the same period in which the gain or loss on disposal is recognised.
Relating to Indian entity
i) Initial recognition
Foreign currency transactions are recorded in the reporting currency, by applying to the foreign currency
amount the exchange rate between the reporting currency and the foreign currency at the date of the
transaction.
ii) Conversion
Foreign currency monetary items are reported using the closing rate. Non-monetary items which are carried
in terms of historical cost denominated in a foreign currency are reported using the exchange rate at the date
of the transaction.
iii) Exchange differences
Exchange differences arising on the settlement of monetary items or on reporting our monetary items at
rates different from those at which they were initially recorded during the period, or reported in previous
financial statements, are recognised as income or as expenses in the year in which they arise.
As per the amendment of the Companies (Accounting Standard) Rules, 2006-‘AS 11’ relating to ‘The
Effects of Changes in Foreign Exchange Rates’, exchange difference arising on conversion of long term
foreign currency monetary items used for acquisition of depreciable fixed assets are added to the cost of
fixed assets and is depreciated over the remaining life of the respective asset and in other cases, is recorded
under the head ‘Foreign Currency Monetary Item Translation Difference Account’ and is amortised over
period not extending beyond, earlier of 31 March 2020 or maturity date of underlying long term foreign
currency monetary items.
(iv) Derivative instruments and hedge accounting
Outstanding contracts as at the reporting date are restated at the exchange rate prevailing on that date. In
respect of contracts entered into to hedge foreign currency and interest rate risk, gain/losses on settlement
and losses on restatement (by marking them to market) at the Balance Sheet date are recognised in the
Restated Consolidated Summary Statement of Profits and Losses or in case of hedge contracts for long term
foreign currency monetary items relating to acquistion of depreciable capital asset in which case they are
adjusted to the carrying cost of such assets.
L. Retirement and other employee benefits
i) Contributions to the provident fund, a defined contribution scheme, are charged to the Restated
Consolidated Summary Statement of Profits and Losses for the year when the contributions are due.
ii) Gratuity liability is accrued on the basis of an actuarial valuation made at the end of reporting period. The
actuarial valuation is performed by an independent actuary as per projected unit credit method, except for
the subsidiary companies namely, Varun Beverages (Nepal) Private Limited, Varun Beverages (Zambia)
Private Limited where gratuity liability is provided on full cost basis.
433
iii) Accumulated leave, which is expected to be utilised within next twelve months, is treated as short term
employee benefit. We measure the expected cost of such absences as the additional amount that it expects
to pay as a result of the unused entitlement that has accumulated at the reporting date.
We treat accumulated leave expected to be carried forward beyond twelve months, as long-term employee
benefit for measurement purposes. Such long-term compensated absences are computed based on the
actuarial valuation performed by an independent actuary using the projected unit credit method at the
reporting period end except for the subsidiary companies namely, Varun Beverages (Nepal) Private
Limited, Varun Beverages (Zambia) Private Limited and Varun Beverages Mozambique Limitada where
accumulated leave liability is provided on full cost basis.
iv) Actuarial gains/losses are immediately taken to the Restated Consolidated Summary Statement of Profits
and Losses.
M. Employee stock options
Accounting value of stock options is determined on the basis of ‘Intrinsic Value’ representing the excess of the fair
market value of Company's equity share on the date of grant over the exercise price of the options granted under the
"Employees Stock Option Scheme" of the Company, and is being amortised as "Employee Compensation Expense"
on a straight-line basis over the vesting period in accordance with the Guidance Note 18 "Share Based Payments"
issued by the Institute of Chartered Accountants of India.
N. Earnings/(loss) per share
Basic earnings/ (loss) per share are calculated by dividing the net profit or loss for the period attributable to equity
shareholders by the weighted average number of equity shares outstanding during the period. The weighted average
number of equity shares outstanding during the period is adjusted for events of bonus issue; bonus element in a
rights issue to existing shareholders; share split; and reverse share split (consolidation of shares).
For the purpose of calculating diluted earnings/(loss) per share, the net profit or loss for the period attributable to
equity shareholders and the weighted average number of shares outstanding during the period are adjusted for the
effects of all dilutive potential equity shares.
O. Provisions, contingent liabilities and contingent assets
A provision is recognised when an enterprise has a present obligation as a result of past event and it is probable that
an outflow of resources will be required to settle the obligation, in respect of which a reliable estimate can be made.
Provisions are not discounted to present value and are determined based on best estimate required to settle the
obligation at the balance sheet date. These are reviewed at each balance sheet date and adjusted to reflect the current
best estimates.
A contingent liability is a possible obligation that arises from past events whose existence will be confirmed by the
occurrence or non-occurrence of one or more uncertain future events beyond our control or a present obligation that
is not recognised because it is not probable that an outflow of resources will be required to settle the obligation. A
contingent liability also arises in extremely rare cases where there is a liability that cannot be recognised because it
cannot be measured reliably.
Contingent assets are not recognised in the Restated Consolidated Summary Statements.
P. Cash and cash equivalents
Cash and cash equivalents for Restated Consolidated Summary Statement of Cash Flows comprises cash at bank and
in hand and short-term investments with an original maturity of three months or less.
Q. Government grants
Grants from the government are recognised when there is reasonable assurance that the grant will be received and all
underlying conditions will be complied with.
Where the grants are in the nature of promoter’s contribution and no repayment is expected, then they are treated as
capital reserve. Grants that are determined to be of revenue nature are deducted from the related expenses.
434
R. Income taxes
Relating to Indian entity
Tax expense comprises current and deferred tax. Current income tax is measured at the amount expected to be paid
to the tax authorities in accordance with the Income-tax Act, 1961 enacted in India. Deferred income taxes reflects
the impact of current year timing differences between taxable income and accounting income for the year and
reversal of timing differences of earlier years.
Minimum Alternate Tax (“MAT”) credit is recognised as an asset only when and to the extent there is convincing
evidence that the entity will pay normal income tax during the specified period. In the year in which the MAT credit
becomes eligible to be recognised as an asset in accordance with the recommendations contained in the Guidance
Note issued by the Institute of Chartered Accountants of India, the said asset is created by way of a credit to the
Restated Consolidated Summary Statement of Profits and Losses and is disclosed as MAT credit entitlement. The
entity reviews this balance at each balance sheet date and writes down the carrying amount to the extent there is no
longer convincing evidence that the entity will pay normal income tax during the specified period.
Relating to overseas entity
Tax provisions for overseas subsidiaries/ associates are determined in accordance with the tax laws of their
respective country of incorporation.
For a period of six years reckoned from the year of assessment as may be determined by the Board of Investment of
Sri Lanka (BOI) (“tax exception period”) the provisions of the Inland Revenue Act No. 10 of 2006 relating to the
imposition, payment and recovery of income tax in respect of the profits and income of the Enterprise, i.e., Varun
Beverages Lanka (Private) Limited shall not apply to the profit and income of the Enterprise.
For the above purpose the year of assessment shall be reckoned from the year in which the Enterprise commences to
make profits or any year of assessment not later than two years reckoned from the date of commencement of
commercial operations, whichever year is earlier, as specified in a certificate issued by the Board of Investment of
Sri Lanka (BOI).
After the aforesaid tax exemption period referred to above, the profits and income of the Enterprise shall be charged
at the rate of fifteen percent.
Deferred taxes
Deferred tax is measured based on the tax rates and the tax laws enacted or substantively enacted at the balance sheet
date. Deferred tax assets and deferred tax liabilities are offset, if a legally enforceable right exists to set off current
tax assets against current tax liabilities and the deferred tax assets and deferred tax liabilities relate to the taxes on
income levied by same governing taxation laws. Deferred tax assets are recognised only to the extent that there is
reasonable certainty that sufficient future taxable income will be available against which such deferred tax assets can
be realised. In situations where the entity has unabsorbed depreciation or carry forward tax losses, all deferred tax
assets are recognised only if there is virtual certainty supported by convincing evidence that they can be realised
against future taxable profits.
At each balance sheet date the entity re-assesses unrecognised deferred tax assets. It recognises unrecognised
deferred tax assets to the extent that it has become reasonably certain or virtually certain, as the case may be that
sufficient future taxable income will be available against which such deferred tax assets can be realised.
The carrying amount of deferred tax assets are reviewed at each balance sheet date. The entity writes-down the carrying
amount of a deferred tax asset to the extent that it is no longer reasonably certain or virtually certain, as the case may be, that
sufficient future taxable income will be available against which deferred tax asset can be realised. Any such write-down is
reversed to the extent that it becomes reasonably certain or virtually certain, as the case may be, that sufficient future taxable
income will be available.
Principal Components of Income and Expenditure
Income
Revenue from Operations
Revenue from operations primarily includes revenue from sale of products. This includes revenue from scrap sales and
business development support in Morocco provided by our Company in certain years. Revenue is recognised when the
significant risks and rewards of ownership of the goods have passed to the customer and are recorded inclusive of excise duty
and net of sales tax, sales returns and trade discount.
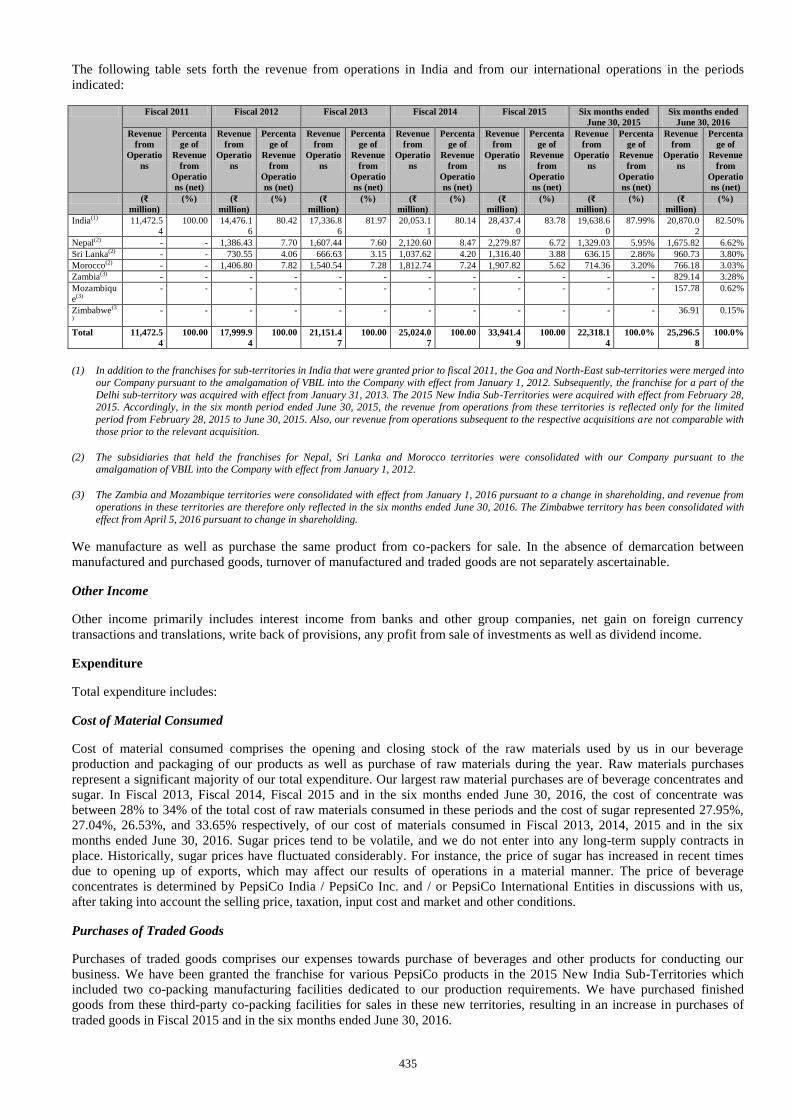
435
The following table sets forth the revenue from operations in India and from our international operations in the periods
indicated:
Fiscal 2011 Fiscal 2012 Fiscal 2013 Fiscal 2014 Fiscal 2015 Six months ended
June 30, 2015
Six months ended
June 30, 2016
Revenue
from
Operatio
ns
Percenta
ge of
Revenue
from
Operatio
ns (net)
Revenue
from
Operatio
ns
Percenta
ge of
Revenue
from
Operatio
ns (net)
Revenue
from
Operatio
ns
Percenta
ge of
Revenue
from
Operatio
ns (net)
Revenue
from
Operatio
ns
Percenta
ge of
Revenue
from
Operatio
ns (net)
Revenue
from
Operatio
ns
Percenta
ge of
Revenue
from
Operatio
ns (net)
Revenue
from
Operatio
ns
Percenta
ge of
Revenue
from
Operatio
ns (net)
Revenue
from
Operatio
ns
Percenta
ge of
Revenue
from
Operatio
ns (net)
(₹
million)
(%) (₹
million)
(%) (₹
million)
(%) (₹
million)
(%) (₹
million)
(%) (₹
million)
(%) (₹
million)
(%)
India(1) 11,472.5
4
100.00 14,476.1
6
80.42 17,336.8
6
81.97 20,053.1
1
80.14 28,437.4
0
83.78 19,638.6
0
87.99% 20,870.0
2
82.50%
Nepal(2) - - 1,386.43 7.70 1,607.44 7.60 2,120.60 8.47 2,279.87 6.72 1,329.03 5.95% 1,675.82 6.62%
Sri Lanka(2) - - 730.55 4.06 666.63 3.15 1,037.62 4.20 1,316.40 3.88 636.15 2.86% 960.73 3.80%
Morocco(2) - - 1,406.80 7.82 1,540.54 7.28 1,812.74 7.24 1,907.82 5.62 714.36 3.20% 766.18 3.03%
Zambia(3) - - - - - - - - - - - - 829.14 3.28%
Mozambiqu
e(3)
- - - - - - - - - - - - 157.78 0.62%
Zimbabwe(3
)
- - - - - - - - - - - - 36.91 0.15%
Total 11,472.5
4
100.00 17,999.9
4
100.00 21,151.4
7
100.00 25,024.0
7
100.00 33,941.4
9
100.00 22,318.1
4
100.0% 25,296.5
8
100.0%
(1) In addition to the franchises for sub-territories in India that were granted prior to fiscal 2011, the Goa and North-East sub-territories were merged into
our Company pursuant to the amalgamation of VBIL into the Company with effect from January 1, 2012. Subsequently, the franchise for a part of the
Delhi sub-territory was acquired with effect from January 31, 2013. The 2015 New India Sub-Territories were acquired with effect from February 28, 2015. Accordingly, in the six month period ended June 30, 2015, the revenue from operations from these territories is reflected only for the limited
period from February 28, 2015 to June 30, 2015. Also, our revenue from operations subsequent to the respective acquisitions are not comparable with
those prior to the relevant acquisition.
(2) The subsidiaries that held the franchises for Nepal, Sri Lanka and Morocco territories were consolidated with our Company pursuant to the amalgamation of VBIL into the Company with effect from January 1, 2012.
(3) The Zambia and Mozambique territories were consolidated with effect from January 1, 2016 pursuant to a change in shareholding, and revenue from
operations in these territories are therefore only reflected in the six months ended June 30, 2016. The Zimbabwe territory has been consolidated with
effect from April 5, 2016 pursuant to change in shareholding.
We manufacture as well as purchase the same product from co-packers for sale. In the absence of demarcation between
manufactured and purchased goods, turnover of manufactured and traded goods are not separately ascertainable.
Other Income
Other income primarily includes interest income from banks and other group companies, net gain on foreign currency
transactions and translations, write back of provisions, any profit from sale of investments as well as dividend income.
Expenditure
Total expenditure includes:
Cost of Material Consumed
Cost of material consumed comprises the opening and closing stock of the raw materials used by us in our beverage
production and packaging of our products as well as purchase of raw materials during the year. Raw materials purchases
represent a significant majority of our total expenditure. Our largest raw material purchases are of beverage concentrates and
sugar. In Fiscal 2013, Fiscal 2014, Fiscal 2015 and in the six months ended June 30, 2016, the cost of concentrate was
between 28% to 34% of the total cost of raw materials consumed in these periods and the cost of sugar represented 27.95%,
27.04%, 26.53%, and 33.65% respectively, of our cost of materials consumed in Fiscal 2013, 2014, 2015 and in the six
months ended June 30, 2016. Sugar prices tend to be volatile, and we do not enter into any long-term supply contracts in
place. Historically, sugar prices have fluctuated considerably. For instance, the price of sugar has increased in recent times
due to opening up of exports, which may affect our results of operations in a material manner. The price of beverage
concentrates is determined by PepsiCo India / PepsiCo Inc. and / or PepsiCo International Entities in discussions with us,
after taking into account the selling price, taxation, input cost and market and other conditions.
Purchases of Traded Goods
Purchases of traded goods comprises our expenses towards purchase of beverages and other products for conducting our
business. We have been granted the franchise for various PepsiCo products in the 2015 New India Sub-Territories which
included two co-packing manufacturing facilities dedicated to our production requirements. We have purchased finished
goods from these third-party co-packing facilities for sales in these new territories, resulting in an increase in purchases of
traded goods in Fiscal 2015 and in the six months ended June 30, 2016.
436
Changes in Inventories of Finished Goods, Work in Progress and Traded Goods
Changes in inventories of finished goods and work-in-progress comprises the opening and closing stock of the finished goods
manufactured by us as well as the stock acquired by us on certain corporate reorganizations and the work-in-progress stock.
Employee Benefits Expense
Employee benefits expense includes (i) salaries, wages and bonus, (ii) contribution to provident fund and other fund, and (iii)
staff welfare expenses relating to our employees.
Finance Costs
Finance costs include interest expense on (i) term loans, (ii) subordinated redeemable non-convertible debentures, (iii) cash
credit or working capital demand loans, and (iv) processing fees.
Depreciation and Amortization Expense
Depreciation represents depreciation on our fixed assets including freehold land, buildings, leasehold improvements, furniture
and fittings, vehicle, and office equipment. Depreciation costs relate principally to our production facilities and our
investments in chilling equipment and delivery vehicles.
During Fiscal 2012 we changed the rates of charging depreciation on some assets, based on useful life of the assets. The rates
so decided by our Company are higher than the rates prescribed in Schedule XIV to the Companies Act, 1956. As provided in
Accounting Standard 6 – Depreciation Accounting, where there is a revision of the estimated useful life of an asset, the
unamortised depreciable amount should be charged over the revised remaining useful life, and hence the depreciation for the
year has been computed accordingly. This revision of useful lives has resulted in a higher depreciation charge of ₹ 91.14
million. Had there been no change, the profit for Fiscal 2012 and net block of fixed assets would have been higher by ₹ 91.14
million. This adjustment has not been adjusted with retrospective effect in the preceding Fiscals, as it does not represent an
error/omission or a change in accounting policy. It represents a change in accounting estimate made in the latest period,
which does not have an impact on the earlier years.
VBNPL has changed its accounting policy relating to depreciation from written down value method to straight line method
during Fiscal 2013. As provided in Accounting Standard 6 – Depreciation Accounting, where there is a change in the method
of providing depreciation, the depreciation is recalculated in accordance with the new method from the date of asset coming
into use.
Other Expenses
Other expenses include power and fuel expenses, repair and maintenance expenses, stores and spares consumed, rent
expenses, rates and taxes, travelling and conveyance expenses, advertisement and sales promotion, freight, octroi and
insurance expenses, expenses for running and maintaining the delivery vehicles etc.
Results of Operations
The following table sets forth certain information with respect to our results of operations on a consolidated basis for the
periods indicated:
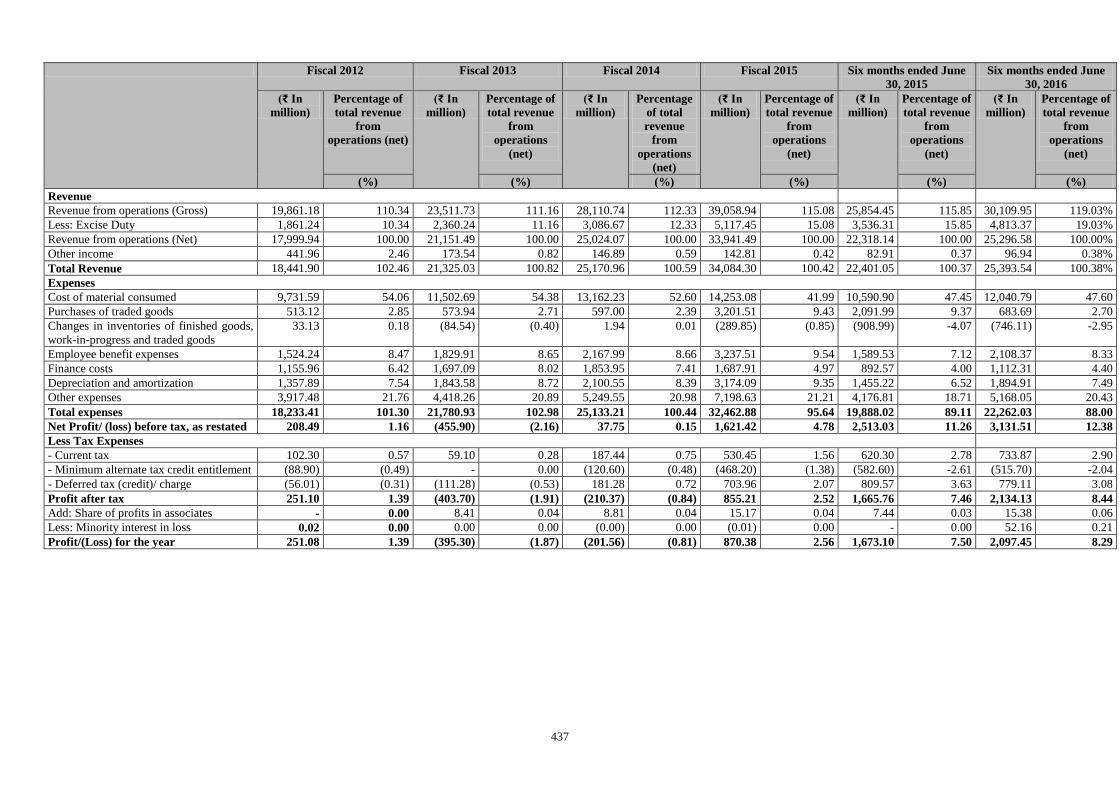
437
Fiscal 2012 Fiscal 2013 Fiscal 2014 Fiscal 2015 Six months ended June
30, 2015
Six months ended June
30, 2016
(₹ In
million)
Percentage of
total revenue
from
operations (net)
(₹ In
million)
Percentage of
total revenue
from
operations
(net)
(₹ In
million)
Percentage
of total
revenue
from
operations
(net)
(₹ In
million)
Percentage of
total revenue
from
operations
(net)
(₹ In
million)
Percentage of
total revenue
from
operations
(net)
(₹ In
million)
Percentage of
total revenue
from
operations
(net)
(%) (%) (%) (%) (%) (%)
Revenue
Revenue from operations (Gross) 19,861.18 110.34 23,511.73 111.16 28,110.74 112.33 39,058.94 115.08 25,854.45 115.85 30,109.95 119.03%
Less: Excise Duty 1,861.24 10.34 2,360.24 11.16 3,086.67 12.33 5,117.45 15.08 3,536.31 15.85 4,813.37 19.03%
Revenue from operations (Net) 17,999.94 100.00 21,151.49 100.00 25,024.07 100.00 33,941.49 100.00 22,318.14 100.00 25,296.58 100.00%
Other income 441.96 2.46 173.54 0.82 146.89 0.59 142.81 0.42 82.91 0.37 96.94 0.38%
Total Revenue 18,441.90 102.46 21,325.03 100.82 25,170.96 100.59 34,084.30 100.42 22,401.05 100.37 25,393.54 100.38%
Expenses
Cost of material consumed 9,731.59 54.06 11,502.69 54.38 13,162.23 52.60 14,253.08 41.99 10,590.90 47.45 12,040.79 47.60
Purchases of traded goods 513.12 2.85 573.94 2.71 597.00 2.39 3,201.51 9.43 2,091.99 9.37 683.69 2.70
Changes in inventories of finished goods,
work-in-progress and traded goods
33.13 0.18 (84.54) (0.40) 1.94 0.01 (289.85) (0.85) (908.99) -4.07 (746.11) -2.95
Employee benefit expenses 1,524.24 8.47 1,829.91 8.65 2,167.99 8.66 3,237.51 9.54 1,589.53 7.12 2,108.37 8.33
Finance costs 1,155.96 6.42 1,697.09 8.02 1,853.95 7.41 1,687.91 4.97 892.57 4.00 1,112.31 4.40
Depreciation and amortization 1,357.89 7.54 1,843.58 8.72 2,100.55 8.39 3,174.09 9.35 1,455.22 6.52 1,894.91 7.49
Other expenses 3,917.48 21.76 4,418.26 20.89 5,249.55 20.98 7,198.63 21.21 4,176.81 18.71 5,168.05 20.43
Total expenses 18,233.41 101.30 21,780.93 102.98 25,133.21 100.44 32,462.88 95.64 19,888.02 89.11 22,262.03 88.00
Net Profit/ (loss) before tax, as restated 208.49 1.16 (455.90) (2.16) 37.75 0.15 1,621.42 4.78 2,513.03 11.26 3,131.51 12.38
Less Tax Expenses
- Current tax 102.30 0.57 59.10 0.28 187.44 0.75 530.45 1.56 620.30 2.78 733.87 2.90
- Minimum alternate tax credit entitlement (88.90) (0.49) - 0.00 (120.60) (0.48) (468.20) (1.38) (582.60) -2.61 (515.70) -2.04
- Deferred tax (credit)/ charge (56.01) (0.31) (111.28) (0.53) 181.28 0.72 703.96 2.07 809.57 3.63 779.11 3.08
Profit after tax 251.10 1.39 (403.70) (1.91) (210.37) (0.84) 855.21 2.52 1,665.76 7.46 2,134.13 8.44
Add: Share of profits in associates - 0.00 8.41 0.04 8.81 0.04 15.17 0.04 7.44 0.03 15.38 0.06
Less: Minority interest in loss 0.02 0.00 0.00 0.00 (0.00) 0.00 (0.01) 0.00 - 0.00 52.16 0.21
Profit/(Loss) for the year 251.08 1.39 (395.30) (1.87) (201.56) (0.81) 870.38 2.56 1,673.10 7.50 2,097.45 8.29
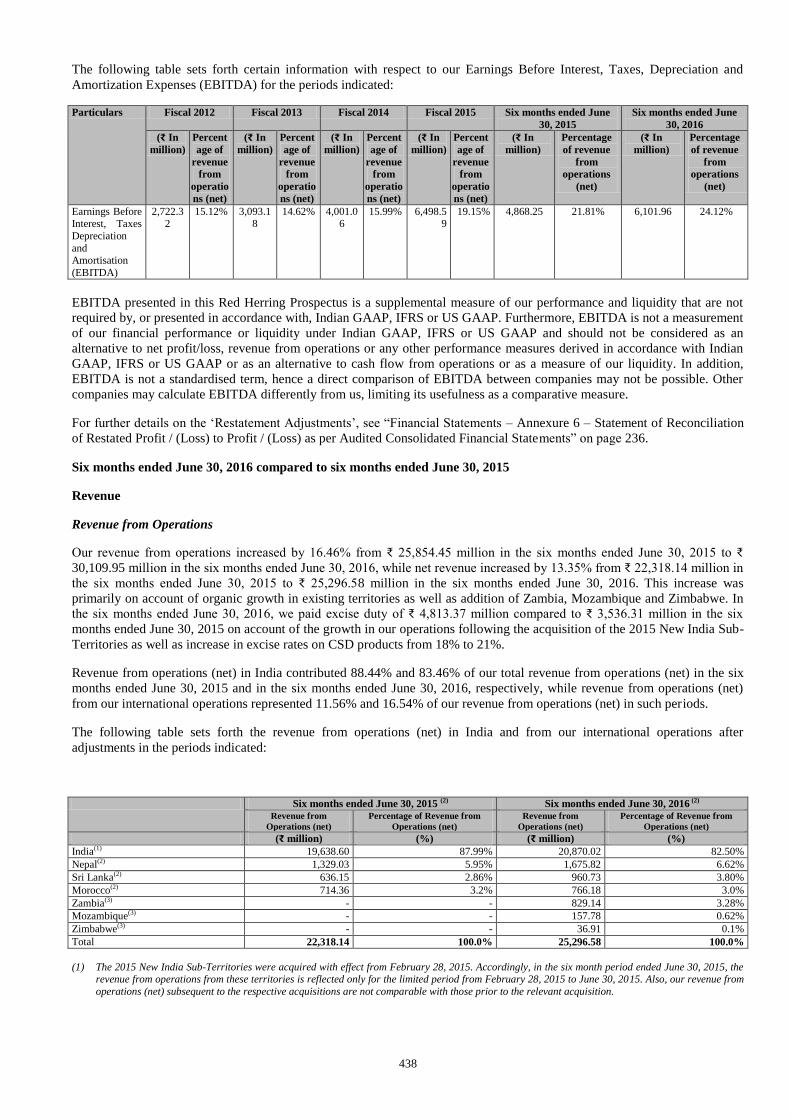
438
The following table sets forth certain information with respect to our Earnings Before Interest, Taxes, Depreciation and
Amortization Expenses (EBITDA) for the periods indicated:
Particulars Fiscal 2012 Fiscal 2013 Fiscal 2014 Fiscal 2015 Six months ended June
30, 2015
Six months ended June
30, 2016
(₹ In
million)
Percent
age of
revenue
from
operatio
ns (net)
(₹ In
million)
Percent
age of
revenue
from
operatio
ns (net)
(₹ In
million)
Percent
age of
revenue
from
operatio
ns (net)
(₹ In
million)
Percent
age of
revenue
from
operatio
ns (net)
(₹ In
million)
Percentage
of revenue
from
operations
(net)
(₹ In
million)
Percentage
of revenue
from
operations
(net)
Earnings Before Interest, Taxes
Depreciation
and Amortisation
(EBITDA)
2,722.32
15.12% 3,093.18
14.62% 4,001.06
15.99% 6,498.59
19.15% 4,868.25 21.81% 6,101.96 24.12%
EBITDA presented in this Red Herring Prospectus is a supplemental measure of our performance and liquidity that are not
required by, or presented in accordance with, Indian GAAP, IFRS or US GAAP. Furthermore, EBITDA is not a measurement
of our financial performance or liquidity under Indian GAAP, IFRS or US GAAP and should not be considered as an
alternative to net profit/loss, revenue from operations or any other performance measures derived in accordance with Indian
GAAP, IFRS or US GAAP or as an alternative to cash flow from operations or as a measure of our liquidity. In addition,
EBITDA is not a standardised term, hence a direct comparison of EBITDA between companies may not be possible. Other
companies may calculate EBITDA differently from us, limiting its usefulness as a comparative measure.
For further details on the ‘Restatement Adjustments’, see “Financial Statements – Annexure 6 – Statement of Reconciliation
of Restated Profit / (Loss) to Profit / (Loss) as per Audited Consolidated Financial Statements” on page 236.
Six months ended June 30, 2016 compared to six months ended June 30, 2015
Revenue
Revenue from Operations
Our revenue from operations increased by 16.46% from ₹ 25,854.45 million in the six months ended June 30, 2015 to ₹
30,109.95 million in the six months ended June 30, 2016, while net revenue increased by 13.35% from ₹ 22,318.14 million in
the six months ended June 30, 2015 to ₹ 25,296.58 million in the six months ended June 30, 2016. This increase was
primarily on account of organic growth in existing territories as well as addition of Zambia, Mozambique and Zimbabwe. In
the six months ended June 30, 2016, we paid excise duty of ₹ 4,813.37 million compared to ₹ 3,536.31 million in the six
months ended June 30, 2015 on account of the growth in our operations following the acquisition of the 2015 New India Sub-
Territories as well as increase in excise rates on CSD products from 18% to 21%.
Revenue from operations (net) in India contributed 88.44% and 83.46% of our total revenue from operations (net) in the six
months ended June 30, 2015 and in the six months ended June 30, 2016, respectively, while revenue from operations (net)
from our international operations represented 11.56% and 16.54% of our revenue from operations (net) in such periods.
The following table sets forth the revenue from operations (net) in India and from our international operations after
adjustments in the periods indicated:
Six months ended June 30, 2015 (2) Six months ended June 30, 2016 (2)
Revenue from
Operations (net)
Percentage of Revenue from
Operations (net)
Revenue from
Operations (net)
Percentage of Revenue from
Operations (net)
(₹ million) (%) (₹ million) (%)
India(1) 19,638.60 87.99% 20,870.02 82.50%
Nepal(2) 1,329.03 5.95% 1,675.82 6.62%
Sri Lanka(2) 636.15 2.86% 960.73 3.80%
Morocco(2) 714.36 3.2% 766.18 3.0%
Zambia(3) - - 829.14 3.28%
Mozambique(3) - - 157.78 0.62%
Zimbabwe(3) - - 36.91 0.1%
Total 22,318.14 100.0% 25,296.58 100.0%
(1) The 2015 New India Sub-Territories were acquired with effect from February 28, 2015. Accordingly, in the six month period ended June 30, 2015, the revenue from operations from these territories is reflected only for the limited period from February 28, 2015 to June 30, 2015. Also, our revenue from
operations (net) subsequent to the respective acquisitions are not comparable with those prior to the relevant acquisition.
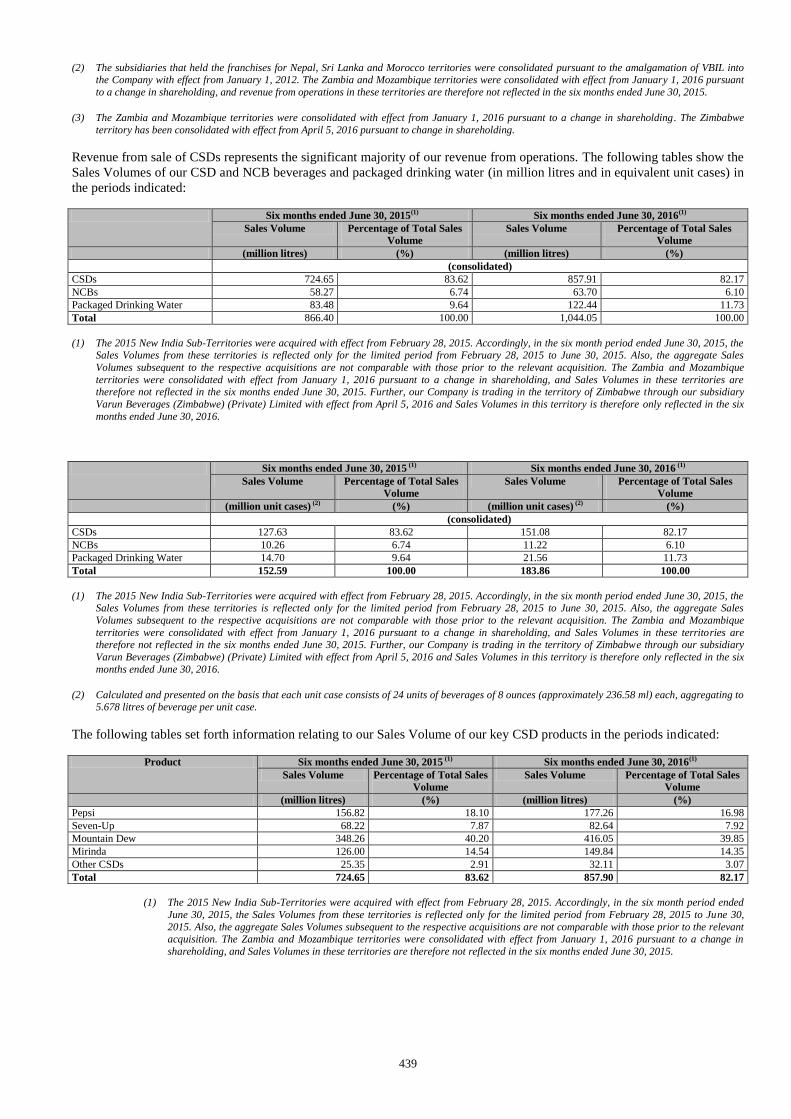
439
(2) The subsidiaries that held the franchises for Nepal, Sri Lanka and Morocco territories were consolidated pursuant to the amalgamation of VBIL into the Company with effect from January 1, 2012. The Zambia and Mozambique territories were consolidated with effect from January 1, 2016 pursuant
to a change in shareholding, and revenue from operations in these territories are therefore not reflected in the six months ended June 30, 2015.
(3) The Zambia and Mozambique territories were consolidated with effect from January 1, 2016 pursuant to a change in shareholding. The Zimbabwe
territory has been consolidated with effect from April 5, 2016 pursuant to change in shareholding.
Revenue from sale of CSDs represents the significant majority of our revenue from operations. The following tables show the
Sales Volumes of our CSD and NCB beverages and packaged drinking water (in million litres and in equivalent unit cases) in
the periods indicated:
Six months ended June 30, 2015(1) Six months ended June 30, 2016(1)
Sales Volume Percentage of Total Sales
Volume
Sales Volume Percentage of Total Sales
Volume
(million litres) (%) (million litres) (%)
(consolidated)
CSDs 724.65 83.62 857.91 82.17
NCBs 58.27 6.74 63.70 6.10
Packaged Drinking Water 83.48 9.64 122.44 11.73
Total 866.40 100.00 1,044.05 100.00
(1) The 2015 New India Sub-Territories were acquired with effect from February 28, 2015. Accordingly, in the six month period ended June 30, 2015, the Sales Volumes from these territories is reflected only for the limited period from February 28, 2015 to June 30, 2015. Also, the aggregate Sales
Volumes subsequent to the respective acquisitions are not comparable with those prior to the relevant acquisition. The Zambia and Mozambique
territories were consolidated with effect from January 1, 2016 pursuant to a change in shareholding, and Sales Volumes in these territories are therefore not reflected in the six months ended June 30, 2015. Further, our Company is trading in the territory of Zimbabwe through our subsidiary
Varun Beverages (Zimbabwe) (Private) Limited with effect from April 5, 2016 and Sales Volumes in this territory is therefore only reflected in the six
months ended June 30, 2016.
Six months ended June 30, 2015 (1) Six months ended June 30, 2016 (1)
Sales Volume Percentage of Total Sales
Volume
Sales Volume Percentage of Total Sales
Volume
(million unit cases) (2) (%) (million unit cases) (2) (%)
(consolidated)
CSDs 127.63 83.62 151.08 82.17
NCBs 10.26 6.74 11.22 6.10
Packaged Drinking Water 14.70 9.64 21.56 11.73
Total 152.59 100.00 183.86 100.00
(1) The 2015 New India Sub-Territories were acquired with effect from February 28, 2015. Accordingly, in the six month period ended June 30, 2015, the Sales Volumes from these territories is reflected only for the limited period from February 28, 2015 to June 30, 2015. Also, the aggregate Sales
Volumes subsequent to the respective acquisitions are not comparable with those prior to the relevant acquisition. The Zambia and Mozambique
territories were consolidated with effect from January 1, 2016 pursuant to a change in shareholding, and Sales Volumes in these territories are therefore not reflected in the six months ended June 30, 2015. Further, our Company is trading in the territory of Zimbabwe through our subsidiary
Varun Beverages (Zimbabwe) (Private) Limited with effect from April 5, 2016 and Sales Volumes in this territory is therefore only reflected in the six
months ended June 30, 2016.
(2) Calculated and presented on the basis that each unit case consists of 24 units of beverages of 8 ounces (approximately 236.58 ml) each, aggregating to 5.678 litres of beverage per unit case.
The following tables set forth information relating to our Sales Volume of our key CSD products in the periods indicated:
Product Six months ended June 30, 2015 (1) Six months ended June 30, 2016(1)
Sales Volume Percentage of Total Sales
Volume
Sales Volume Percentage of Total Sales
Volume
(million litres) (%) (million litres) (%)
Pepsi 156.82 18.10 177.26 16.98
Seven-Up 68.22 7.87 82.64 7.92
Mountain Dew 348.26 40.20 416.05 39.85
Mirinda 126.00 14.54 149.84 14.35
Other CSDs 25.35 2.91 32.11 3.07
Total 724.65 83.62 857.90 82.17
(1) The 2015 New India Sub-Territories were acquired with effect from February 28, 2015. Accordingly, in the six month period ended
June 30, 2015, the Sales Volumes from these territories is reflected only for the limited period from February 28, 2015 to June 30,
2015. Also, the aggregate Sales Volumes subsequent to the respective acquisitions are not comparable with those prior to the relevant acquisition. The Zambia and Mozambique territories were consolidated with effect from January 1, 2016 pursuant to a change in
shareholding, and Sales Volumes in these territories are therefore not reflected in the six months ended June 30, 2015.
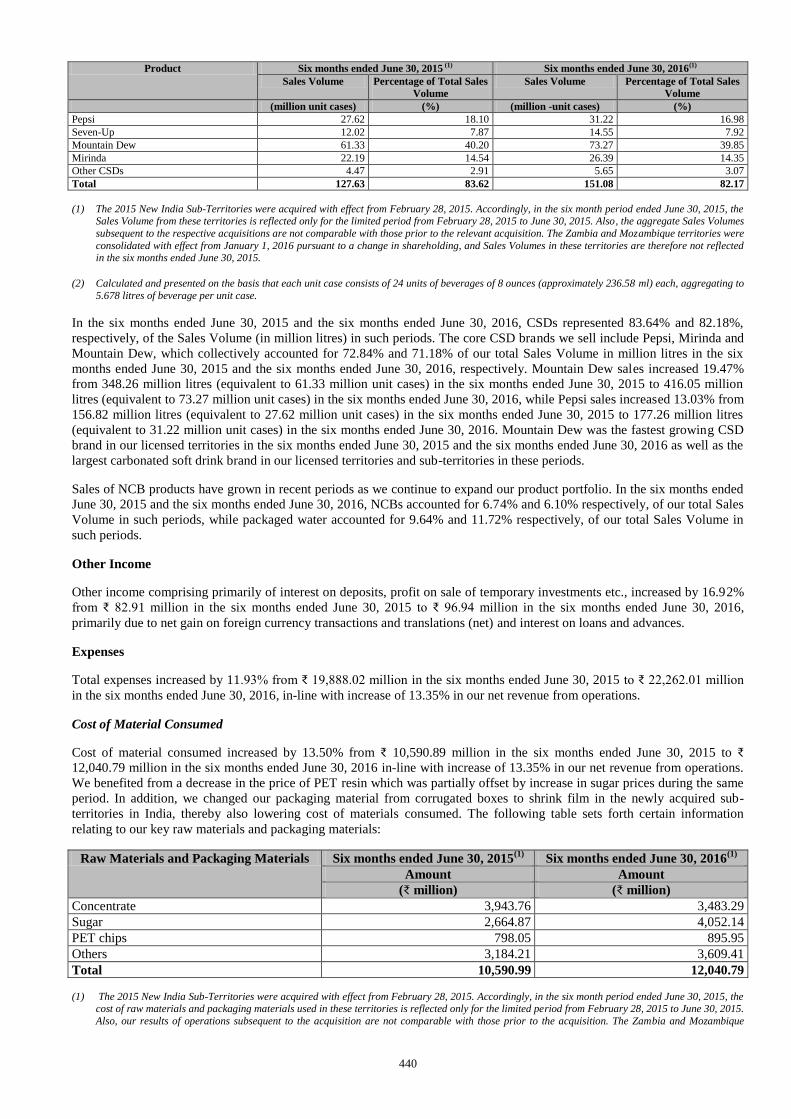
440
Product Six months ended June 30, 2015 (1) Six months ended June 30, 2016(1)
Sales Volume Percentage of Total Sales
Volume
Sales Volume Percentage of Total Sales
Volume
(million unit cases) (%) (million -unit cases) (%)
Pepsi 27.62 18.10 31.22 16.98
Seven-Up 12.02 7.87 14.55 7.92
Mountain Dew 61.33 40.20 73.27 39.85
Mirinda 22.19 14.54 26.39 14.35
Other CSDs 4.47 2.91 5.65 3.07
Total 127.63 83.62 151.08 82.17
(1) The 2015 New India Sub-Territories were acquired with effect from February 28, 2015. Accordingly, in the six month period ended June 30, 2015, the Sales Volume from these territories is reflected only for the limited period from February 28, 2015 to June 30, 2015. Also, the aggregate Sales Volumes
subsequent to the respective acquisitions are not comparable with those prior to the relevant acquisition. The Zambia and Mozambique territories were
consolidated with effect from January 1, 2016 pursuant to a change in shareholding, and Sales Volumes in these territories are therefore not reflected in the six months ended June 30, 2015.
(2) Calculated and presented on the basis that each unit case consists of 24 units of beverages of 8 ounces (approximately 236.58 ml) each, aggregating to
5.678 litres of beverage per unit case.
In the six months ended June 30, 2015 and the six months ended June 30, 2016, CSDs represented 83.64% and 82.18%,
respectively, of the Sales Volume (in million litres) in such periods. The core CSD brands we sell include Pepsi, Mirinda and
Mountain Dew, which collectively accounted for 72.84% and 71.18% of our total Sales Volume in million litres in the six
months ended June 30, 2015 and the six months ended June 30, 2016, respectively. Mountain Dew sales increased 19.47%
from 348.26 million litres (equivalent to 61.33 million unit cases) in the six months ended June 30, 2015 to 416.05 million
litres (equivalent to 73.27 million unit cases) in the six months ended June 30, 2016, while Pepsi sales increased 13.03% from
156.82 million litres (equivalent to 27.62 million unit cases) in the six months ended June 30, 2015 to 177.26 million litres
(equivalent to 31.22 million unit cases) in the six months ended June 30, 2016. Mountain Dew was the fastest growing CSD
brand in our licensed territories in the six months ended June 30, 2015 and the six months ended June 30, 2016 as well as the
largest carbonated soft drink brand in our licensed territories and sub-territories in these periods.
Sales of NCB products have grown in recent periods as we continue to expand our product portfolio. In the six months ended
June 30, 2015 and the six months ended June 30, 2016, NCBs accounted for 6.74% and 6.10% respectively, of our total Sales
Volume in such periods, while packaged water accounted for 9.64% and 11.72% respectively, of our total Sales Volume in
such periods.
Other Income
Other income comprising primarily of interest on deposits, profit on sale of temporary investments etc., increased by 16.92%
from ₹ 82.91 million in the six months ended June 30, 2015 to ₹ 96.94 million in the six months ended June 30, 2016,
primarily due to net gain on foreign currency transactions and translations (net) and interest on loans and advances.
Expenses
Total expenses increased by 11.93% from ₹ 19,888.02 million in the six months ended June 30, 2015 to ₹ 22,262.01 million
in the six months ended June 30, 2016, in-line with increase of 13.35% in our net revenue from operations.
Cost of Material Consumed
Cost of material consumed increased by 13.50% from ₹ 10,590.89 million in the six months ended June 30, 2015 to ₹
12,040.79 million in the six months ended June 30, 2016 in-line with increase of 13.35% in our net revenue from operations.
We benefited from a decrease in the price of PET resin which was partially offset by increase in sugar prices during the same
period. In addition, we changed our packaging material from corrugated boxes to shrink film in the newly acquired sub-
territories in India, thereby also lowering cost of materials consumed. The following table sets forth certain information
relating to our key raw materials and packaging materials:
Raw Materials and Packaging Materials Six months ended June 30, 2015(1)
Six months ended June 30, 2016(1)
Amount Amount
(₹ million) (₹ million)
Concentrate 3,943.76 3,483.29
Sugar 2,664.87 4,052.14
PET chips 798.05 895.95
Others 3,184.21 3,609.41
Total 10,590.99 12,040.79
(1) The 2015 New India Sub-Territories were acquired with effect from February 28, 2015. Accordingly, in the six month period ended June 30, 2015, the cost of raw materials and packaging materials used in these territories is reflected only for the limited period from February 28, 2015 to June 30, 2015.
Also, our results of operations subsequent to the acquisition are not comparable with those prior to the acquisition. The Zambia and Mozambique
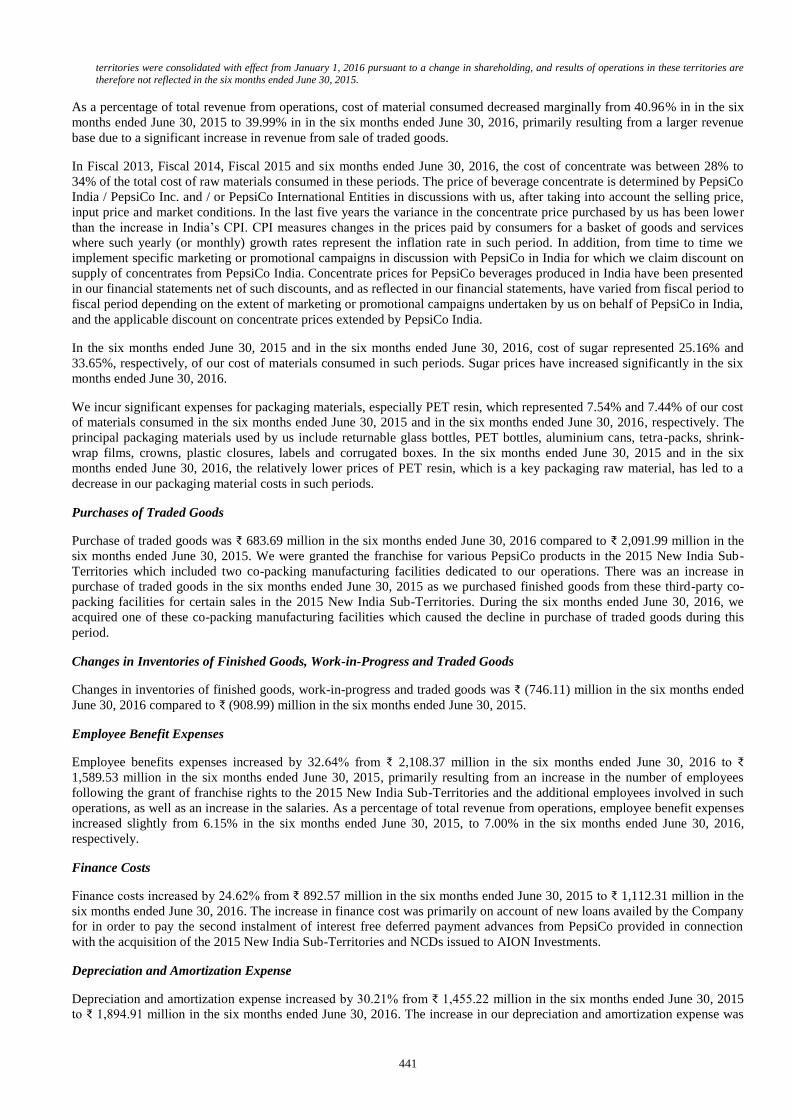
441
territories were consolidated with effect from January 1, 2016 pursuant to a change in shareholding, and results of operations in these territories are therefore not reflected in the six months ended June 30, 2015.
As a percentage of total revenue from operations, cost of material consumed decreased marginally from 40.96% in in the six
months ended June 30, 2015 to 39.99% in in the six months ended June 30, 2016, primarily resulting from a larger revenue
base due to a significant increase in revenue from sale of traded goods.
In Fiscal 2013, Fiscal 2014, Fiscal 2015 and six months ended June 30, 2016, the cost of concentrate was between 28% to
34% of the total cost of raw materials consumed in these periods. The price of beverage concentrate is determined by PepsiCo
India / PepsiCo Inc. and / or PepsiCo International Entities in discussions with us, after taking into account the selling price,
input price and market conditions. In the last five years the variance in the concentrate price purchased by us has been lower
than the increase in India’s CPI. CPI measures changes in the prices paid by consumers for a basket of goods and services
where such yearly (or monthly) growth rates represent the inflation rate in such period. In addition, from time to time we
implement specific marketing or promotional campaigns in discussion with PepsiCo in India for which we claim discount on
supply of concentrates from PepsiCo India. Concentrate prices for PepsiCo beverages produced in India have been presented
in our financial statements net of such discounts, and as reflected in our financial statements, have varied from fiscal period to
fiscal period depending on the extent of marketing or promotional campaigns undertaken by us on behalf of PepsiCo in India,
and the applicable discount on concentrate prices extended by PepsiCo India.
In the six months ended June 30, 2015 and in the six months ended June 30, 2016, cost of sugar represented 25.16% and
33.65%, respectively, of our cost of materials consumed in such periods. Sugar prices have increased significantly in the six
months ended June 30, 2016.
We incur significant expenses for packaging materials, especially PET resin, which represented 7.54% and 7.44% of our cost
of materials consumed in the six months ended June 30, 2015 and in the six months ended June 30, 2016, respectively. The
principal packaging materials used by us include returnable glass bottles, PET bottles, aluminium cans, tetra-packs, shrink-
wrap films, crowns, plastic closures, labels and corrugated boxes. In the six months ended June 30, 2015 and in the six
months ended June 30, 2016, the relatively lower prices of PET resin, which is a key packaging raw material, has led to a
decrease in our packaging material costs in such periods.
Purchases of Traded Goods
Purchase of traded goods was ₹ 683.69 million in the six months ended June 30, 2016 compared to ₹ 2,091.99 million in the
six months ended June 30, 2015. We were granted the franchise for various PepsiCo products in the 2015 New India Sub-
Territories which included two co-packing manufacturing facilities dedicated to our operations. There was an increase in
purchase of traded goods in the six months ended June 30, 2015 as we purchased finished goods from these third-party co-
packing facilities for certain sales in the 2015 New India Sub-Territories. During the six months ended June 30, 2016, we
acquired one of these co-packing manufacturing facilities which caused the decline in purchase of traded goods during this
period.
Changes in Inventories of Finished Goods, Work-in-Progress and Traded Goods
Changes in inventories of finished goods, work-in-progress and traded goods was ₹ (746.11) million in the six months ended
June 30, 2016 compared to ₹ (908.99) million in the six months ended June 30, 2015.
Employee Benefit Expenses
Employee benefits expenses increased by 32.64% from ₹ 2,108.37 million in the six months ended June 30, 2016 to ₹
1,589.53 million in the six months ended June 30, 2015, primarily resulting from an increase in the number of employees
following the grant of franchise rights to the 2015 New India Sub-Territories and the additional employees involved in such
operations, as well as an increase in the salaries. As a percentage of total revenue from operations, employee benefit expenses
increased slightly from 6.15% in the six months ended June 30, 2015, to 7.00% in the six months ended June 30, 2016,
respectively.
Finance Costs
Finance costs increased by 24.62% from ₹ 892.57 million in the six months ended June 30, 2015 to ₹ 1,112.31 million in the
six months ended June 30, 2016. The increase in finance cost was primarily on account of new loans availed by the Company
for in order to pay the second instalment of interest free deferred payment advances from PepsiCo provided in connection
with the acquisition of the 2015 New India Sub-Territories and NCDs issued to AION Investments.
Depreciation and Amortization Expense
Depreciation and amortization expense increased by 30.21% from ₹ 1,455.22 million in the six months ended June 30, 2015
to ₹ 1,894.91 million in the six months ended June 30, 2016. The increase in our depreciation and amortization expense was
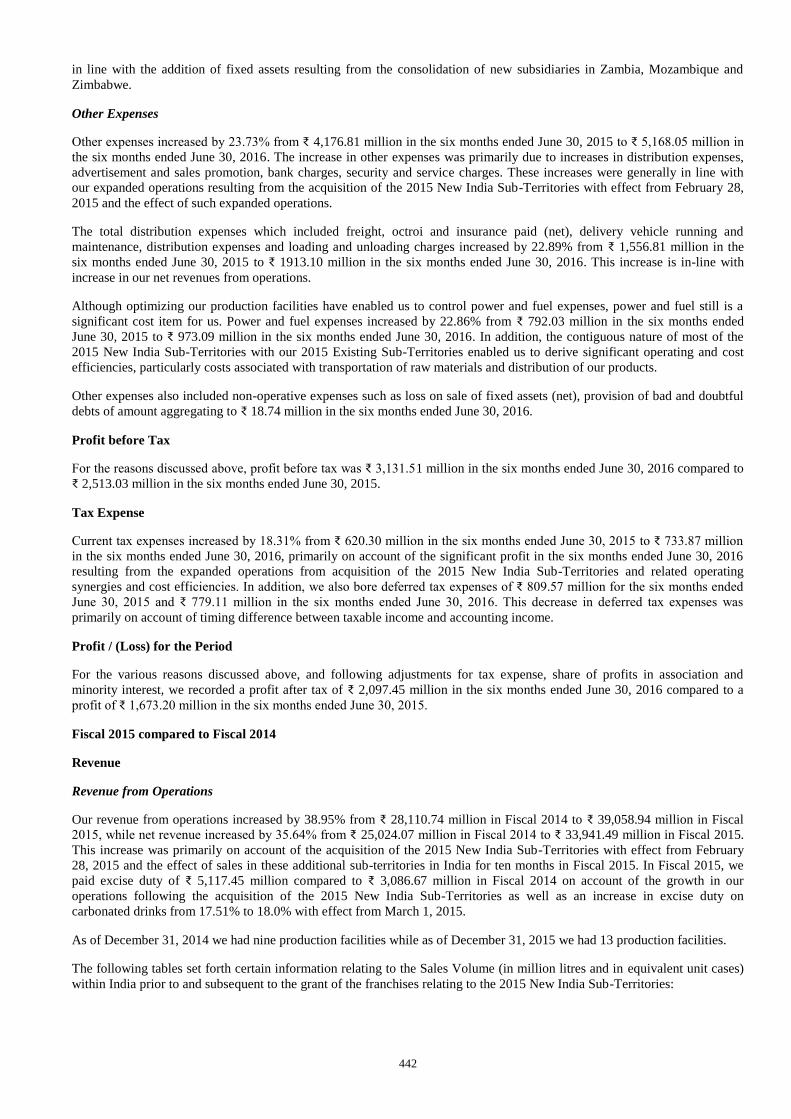
442
in line with the addition of fixed assets resulting from the consolidation of new subsidiaries in Zambia, Mozambique and
Zimbabwe.
Other Expenses
Other expenses increased by 23.73% from ₹ 4,176.81 million in the six months ended June 30, 2015 to ₹ 5,168.05 million in
the six months ended June 30, 2016. The increase in other expenses was primarily due to increases in distribution expenses,
advertisement and sales promotion, bank charges, security and service charges. These increases were generally in line with
our expanded operations resulting from the acquisition of the 2015 New India Sub-Territories with effect from February 28,
2015 and the effect of such expanded operations.
The total distribution expenses which included freight, octroi and insurance paid (net), delivery vehicle running and
maintenance, distribution expenses and loading and unloading charges increased by 22.89% from ₹ 1,556.81 million in the
six months ended June 30, 2015 to ₹ 1913.10 million in the six months ended June 30, 2016. This increase is in-line with
increase in our net revenues from operations.
Although optimizing our production facilities have enabled us to control power and fuel expenses, power and fuel still is a
significant cost item for us. Power and fuel expenses increased by 22.86% from ₹ 792.03 million in the six months ended
June 30, 2015 to ₹ 973.09 million in the six months ended June 30, 2016. In addition, the contiguous nature of most of the
2015 New India Sub-Territories with our 2015 Existing Sub-Territories enabled us to derive significant operating and cost
efficiencies, particularly costs associated with transportation of raw materials and distribution of our products.
Other expenses also included non-operative expenses such as loss on sale of fixed assets (net), provision of bad and doubtful
debts of amount aggregating to ₹ 18.74 million in the six months ended June 30, 2016.
Profit before Tax
For the reasons discussed above, profit before tax was ₹ 3,131.51 million in the six months ended June 30, 2016 compared to
₹ 2,513.03 million in the six months ended June 30, 2015.
Tax Expense
Current tax expenses increased by 18.31% from ₹ 620.30 million in the six months ended June 30, 2015 to ₹ 733.87 million
in the six months ended June 30, 2016, primarily on account of the significant profit in the six months ended June 30, 2016
resulting from the expanded operations from acquisition of the 2015 New India Sub-Territories and related operating
synergies and cost efficiencies. In addition, we also bore deferred tax expenses of ₹ 809.57 million for the six months ended
June 30, 2015 and ₹ 779.11 million in the six months ended June 30, 2016. This decrease in deferred tax expenses was
primarily on account of timing difference between taxable income and accounting income.
Profit / (Loss) for the Period
For the various reasons discussed above, and following adjustments for tax expense, share of profits in association and
minority interest, we recorded a profit after tax of ₹ 2,097.45 million in the six months ended June 30, 2016 compared to a
profit of ₹ 1,673.20 million in the six months ended June 30, 2015.
Fiscal 2015 compared to Fiscal 2014
Revenue
Revenue from Operations
Our revenue from operations increased by 38.95% from ₹ 28,110.74 million in Fiscal 2014 to ₹ 39,058.94 million in Fiscal
2015, while net revenue increased by 35.64% from ₹ 25,024.07 million in Fiscal 2014 to ₹ 33,941.49 million in Fiscal 2015.
This increase was primarily on account of the acquisition of the 2015 New India Sub-Territories with effect from February
28, 2015 and the effect of sales in these additional sub-territories in India for ten months in Fiscal 2015. In Fiscal 2015, we
paid excise duty of ₹ 5,117.45 million compared to ₹ 3,086.67 million in Fiscal 2014 on account of the growth in our
operations following the acquisition of the 2015 New India Sub-Territories as well as an increase in excise duty on
carbonated drinks from 17.51% to 18.0% with effect from March 1, 2015.
As of December 31, 2014 we had nine production facilities while as of December 31, 2015 we had 13 production facilities.
The following tables set forth certain information relating to the Sales Volume (in million litres and in equivalent unit cases)
within India prior to and subsequent to the grant of the franchises relating to the 2015 New India Sub-Territories:
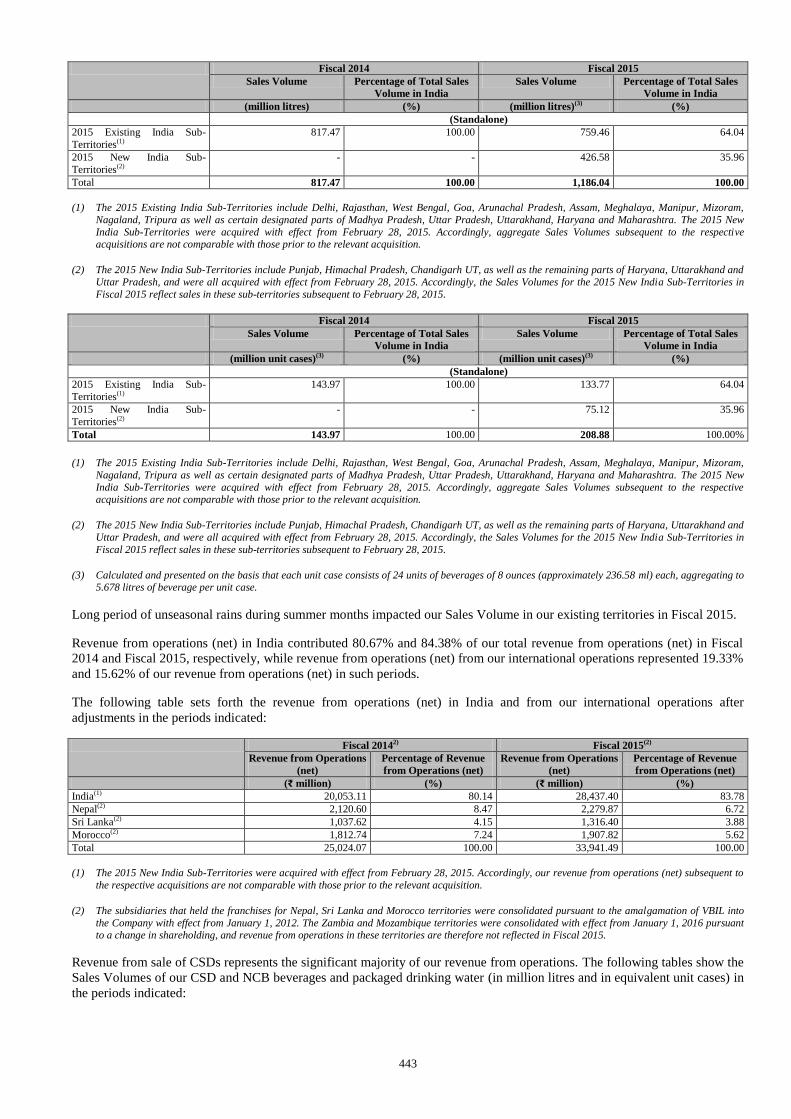
443
Fiscal 2014 Fiscal 2015
Sales Volume Percentage of Total Sales
Volume in India
Sales Volume Percentage of Total Sales
Volume in India
(million litres) (%) (million litres)(3) (%)
(Standalone)
2015 Existing India Sub-
Territories(1)
817.47 100.00 759.46 64.04
2015 New India Sub-
Territories(2)
- - 426.58 35.96
Total 817.47 100.00 1,186.04 100.00
(1) The 2015 Existing India Sub-Territories include Delhi, Rajasthan, West Bengal, Goa, Arunachal Pradesh, Assam, Meghalaya, Manipur, Mizoram,
Nagaland, Tripura as well as certain designated parts of Madhya Pradesh, Uttar Pradesh, Uttarakhand, Haryana and Maharashtra. The 2015 New
India Sub-Territories were acquired with effect from February 28, 2015. Accordingly, aggregate Sales Volumes subsequent to the respective acquisitions are not comparable with those prior to the relevant acquisition.
(2) The 2015 New India Sub-Territories include Punjab, Himachal Pradesh, Chandigarh UT, as well as the remaining parts of Haryana, Uttarakhand and
Uttar Pradesh, and were all acquired with effect from February 28, 2015. Accordingly, the Sales Volumes for the 2015 New India Sub-Territories in
Fiscal 2015 reflect sales in these sub-territories subsequent to February 28, 2015.
Fiscal 2014 Fiscal 2015
Sales Volume Percentage of Total Sales
Volume in India
Sales Volume Percentage of Total Sales
Volume in India
(million unit cases)(3) (%) (million unit cases)(3) (%)
(Standalone)
2015 Existing India Sub-
Territories(1)
143.97 100.00 133.77 64.04
2015 New India Sub-
Territories(2)
- - 75.12 35.96
Total 143.97 100.00 208.88 100.00%
(1) The 2015 Existing India Sub-Territories include Delhi, Rajasthan, West Bengal, Goa, Arunachal Pradesh, Assam, Meghalaya, Manipur, Mizoram,
Nagaland, Tripura as well as certain designated parts of Madhya Pradesh, Uttar Pradesh, Uttarakhand, Haryana and Maharashtra. The 2015 New
India Sub-Territories were acquired with effect from February 28, 2015. Accordingly, aggregate Sales Volumes subsequent to the respective acquisitions are not comparable with those prior to the relevant acquisition.
(2) The 2015 New India Sub-Territories include Punjab, Himachal Pradesh, Chandigarh UT, as well as the remaining parts of Haryana, Uttarakhand and
Uttar Pradesh, and were all acquired with effect from February 28, 2015. Accordingly, the Sales Volumes for the 2015 New India Sub-Territories in
Fiscal 2015 reflect sales in these sub-territories subsequent to February 28, 2015.
(3) Calculated and presented on the basis that each unit case consists of 24 units of beverages of 8 ounces (approximately 236.58 ml) each, aggregating to 5.678 litres of beverage per unit case.
Long period of unseasonal rains during summer months impacted our Sales Volume in our existing territories in Fiscal 2015.
Revenue from operations (net) in India contributed 80.67% and 84.38% of our total revenue from operations (net) in Fiscal
2014 and Fiscal 2015, respectively, while revenue from operations (net) from our international operations represented 19.33%
and 15.62% of our revenue from operations (net) in such periods.
The following table sets forth the revenue from operations (net) in India and from our international operations after
adjustments in the periods indicated:
Fiscal 20142) Fiscal 2015(2)
Revenue from Operations
(net)
Percentage of Revenue
from Operations (net)
Revenue from Operations
(net)
Percentage of Revenue
from Operations (net)
(₹ million) (%) (₹ million) (%)
India(1) 20,053.11 80.14 28,437.40 83.78
Nepal(2) 2,120.60 8.47 2,279.87 6.72
Sri Lanka(2) 1,037.62 4.15 1,316.40 3.88
Morocco(2) 1,812.74 7.24 1,907.82 5.62
Total 25,024.07 100.00 33,941.49 100.00
(1) The 2015 New India Sub-Territories were acquired with effect from February 28, 2015. Accordingly, our revenue from operations (net) subsequent to
the respective acquisitions are not comparable with those prior to the relevant acquisition.
(2) The subsidiaries that held the franchises for Nepal, Sri Lanka and Morocco territories were consolidated pursuant to the amalgamation of VBIL into
the Company with effect from January 1, 2012. The Zambia and Mozambique territories were consolidated with effect from January 1, 2016 pursuant to a change in shareholding, and revenue from operations in these territories are therefore not reflected in Fiscal 2015.
Revenue from sale of CSDs represents the significant majority of our revenue from operations. The following tables show the
Sales Volumes of our CSD and NCB beverages and packaged drinking water (in million litres and in equivalent unit cases) in
the periods indicated:
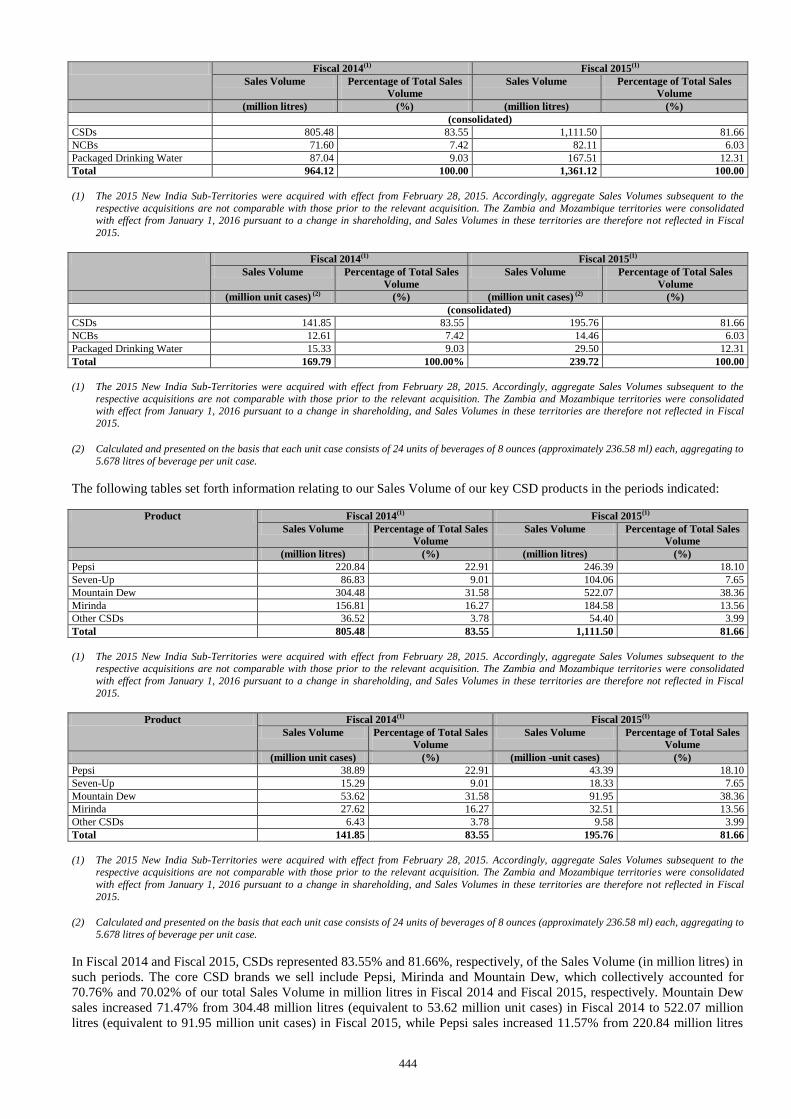
444
Fiscal 2014(1) Fiscal 2015(1)
Sales Volume Percentage of Total Sales
Volume
Sales Volume Percentage of Total Sales
Volume
(million litres) (%) (million litres) (%)
(consolidated)
CSDs 805.48 83.55 1,111.50 81.66
NCBs 71.60 7.42 82.11 6.03
Packaged Drinking Water 87.04 9.03 167.51 12.31
Total 964.12 100.00 1,361.12 100.00
(1) The 2015 New India Sub-Territories were acquired with effect from February 28, 2015. Accordingly, aggregate Sales Volumes subsequent to the
respective acquisitions are not comparable with those prior to the relevant acquisition. The Zambia and Mozambique territories were consolidated with effect from January 1, 2016 pursuant to a change in shareholding, and Sales Volumes in these territories are therefore not reflected in Fiscal
2015.
Fiscal 2014(1) Fiscal 2015(1)
Sales Volume Percentage of Total Sales
Volume
Sales Volume Percentage of Total Sales
Volume
(million unit cases) (2) (%) (million unit cases) (2) (%)
(consolidated)
CSDs 141.85 83.55 195.76 81.66
NCBs 12.61 7.42 14.46 6.03
Packaged Drinking Water 15.33 9.03 29.50 12.31
Total 169.79 100.00% 239.72 100.00
(1) The 2015 New India Sub-Territories were acquired with effect from February 28, 2015. Accordingly, aggregate Sales Volumes subsequent to the
respective acquisitions are not comparable with those prior to the relevant acquisition. The Zambia and Mozambique territories were consolidated with effect from January 1, 2016 pursuant to a change in shareholding, and Sales Volumes in these territories are therefore not reflected in Fiscal
2015.
(2) Calculated and presented on the basis that each unit case consists of 24 units of beverages of 8 ounces (approximately 236.58 ml) each, aggregating to
5.678 litres of beverage per unit case.
The following tables set forth information relating to our Sales Volume of our key CSD products in the periods indicated:
Product Fiscal 2014(1) Fiscal 2015(1)
Sales Volume Percentage of Total Sales
Volume
Sales Volume Percentage of Total Sales
Volume
(million litres) (%) (million litres) (%)
Pepsi 220.84 22.91 246.39 18.10
Seven-Up 86.83 9.01 104.06 7.65
Mountain Dew 304.48 31.58 522.07 38.36
Mirinda 156.81 16.27 184.58 13.56
Other CSDs 36.52 3.78 54.40 3.99
Total 805.48 83.55 1,111.50 81.66
(1) The 2015 New India Sub-Territories were acquired with effect from February 28, 2015. Accordingly, aggregate Sales Volumes subsequent to the respective acquisitions are not comparable with those prior to the relevant acquisition. The Zambia and Mozambique territories were consolidated
with effect from January 1, 2016 pursuant to a change in shareholding, and Sales Volumes in these territories are therefore not reflected in Fiscal
2015.
Product Fiscal 2014(1) Fiscal 2015(1)
Sales Volume Percentage of Total Sales
Volume
Sales Volume Percentage of Total Sales
Volume
(million unit cases) (%) (million -unit cases) (%)
Pepsi 38.89 22.91 43.39 18.10
Seven-Up 15.29 9.01 18.33 7.65
Mountain Dew 53.62 31.58 91.95 38.36
Mirinda 27.62 16.27 32.51 13.56
Other CSDs 6.43 3.78 9.58 3.99
Total 141.85 83.55 195.76 81.66
(1) The 2015 New India Sub-Territories were acquired with effect from February 28, 2015. Accordingly, aggregate Sales Volumes subsequent to the respective acquisitions are not comparable with those prior to the relevant acquisition. The Zambia and Mozambique territories were consolidated
with effect from January 1, 2016 pursuant to a change in shareholding, and Sales Volumes in these territories are therefore not reflected in Fiscal
2015.
(2) Calculated and presented on the basis that each unit case consists of 24 units of beverages of 8 ounces (approximately 236.58 ml) each, aggregating to 5.678 litres of beverage per unit case.
In Fiscal 2014 and Fiscal 2015, CSDs represented 83.55% and 81.66%, respectively, of the Sales Volume (in million litres) in
such periods. The core CSD brands we sell include Pepsi, Mirinda and Mountain Dew, which collectively accounted for
70.76% and 70.02% of our total Sales Volume in million litres in Fiscal 2014 and Fiscal 2015, respectively. Mountain Dew
sales increased 71.47% from 304.48 million litres (equivalent to 53.62 million unit cases) in Fiscal 2014 to 522.07 million
litres (equivalent to 91.95 million unit cases) in Fiscal 2015, while Pepsi sales increased 11.57% from 220.84 million litres
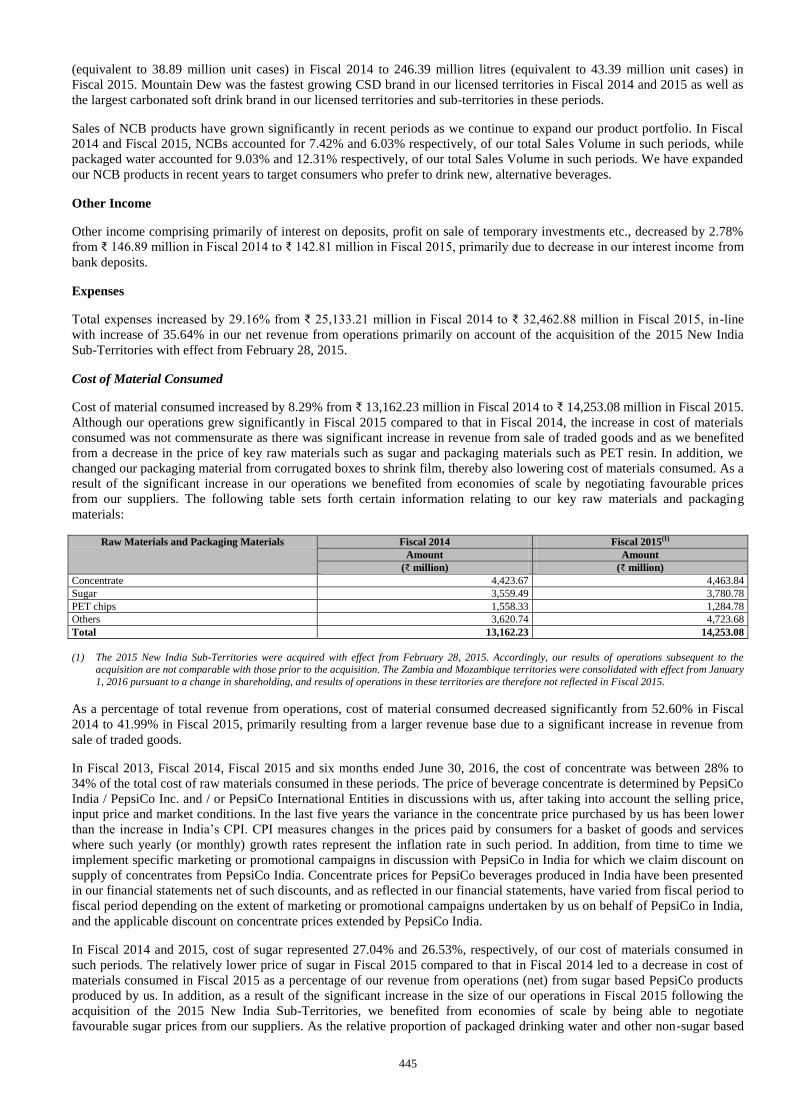
445
(equivalent to 38.89 million unit cases) in Fiscal 2014 to 246.39 million litres (equivalent to 43.39 million unit cases) in
Fiscal 2015. Mountain Dew was the fastest growing CSD brand in our licensed territories in Fiscal 2014 and 2015 as well as
the largest carbonated soft drink brand in our licensed territories and sub-territories in these periods.
Sales of NCB products have grown significantly in recent periods as we continue to expand our product portfolio. In Fiscal
2014 and Fiscal 2015, NCBs accounted for 7.42% and 6.03% respectively, of our total Sales Volume in such periods, while
packaged water accounted for 9.03% and 12.31% respectively, of our total Sales Volume in such periods. We have expanded
our NCB products in recent years to target consumers who prefer to drink new, alternative beverages.
Other Income
Other income comprising primarily of interest on deposits, profit on sale of temporary investments etc., decreased by 2.78%
from ₹ 146.89 million in Fiscal 2014 to ₹ 142.81 million in Fiscal 2015, primarily due to decrease in our interest income from
bank deposits.
Expenses
Total expenses increased by 29.16% from ₹ 25,133.21 million in Fiscal 2014 to ₹ 32,462.88 million in Fiscal 2015, in-line
with increase of 35.64% in our net revenue from operations primarily on account of the acquisition of the 2015 New India
Sub-Territories with effect from February 28, 2015.
Cost of Material Consumed
Cost of material consumed increased by 8.29% from ₹ 13,162.23 million in Fiscal 2014 to ₹ 14,253.08 million in Fiscal 2015.
Although our operations grew significantly in Fiscal 2015 compared to that in Fiscal 2014, the increase in cost of materials
consumed was not commensurate as there was significant increase in revenue from sale of traded goods and as we benefited
from a decrease in the price of key raw materials such as sugar and packaging materials such as PET resin. In addition, we
changed our packaging material from corrugated boxes to shrink film, thereby also lowering cost of materials consumed. As a
result of the significant increase in our operations we benefited from economies of scale by negotiating favourable prices
from our suppliers. The following table sets forth certain information relating to our key raw materials and packaging
materials:
Raw Materials and Packaging Materials Fiscal 2014 Fiscal 2015(1)
Amount Amount
(₹ million) (₹ million)
Concentrate 4,423.67 4,463.84
Sugar 3,559.49 3,780.78
PET chips 1,558.33 1,284.78
Others 3,620.74 4,723.68
Total 13,162.23 14,253.08
(1) The 2015 New India Sub-Territories were acquired with effect from February 28, 2015. Accordingly, our results of operations subsequent to the acquisition are not comparable with those prior to the acquisition. The Zambia and Mozambique territories were consolidated with effect from January
1, 2016 pursuant to a change in shareholding, and results of operations in these territories are therefore not reflected in Fiscal 2015.
As a percentage of total revenue from operations, cost of material consumed decreased significantly from 52.60% in Fiscal
2014 to 41.99% in Fiscal 2015, primarily resulting from a larger revenue base due to a significant increase in revenue from
sale of traded goods.
In Fiscal 2013, Fiscal 2014, Fiscal 2015 and six months ended June 30, 2016, the cost of concentrate was between 28% to
34% of the total cost of raw materials consumed in these periods. The price of beverage concentrate is determined by PepsiCo
India / PepsiCo Inc. and / or PepsiCo International Entities in discussions with us, after taking into account the selling price,
input price and market conditions. In the last five years the variance in the concentrate price purchased by us has been lower
than the increase in India’s CPI. CPI measures changes in the prices paid by consumers for a basket of goods and services
where such yearly (or monthly) growth rates represent the inflation rate in such period. In addition, from time to time we
implement specific marketing or promotional campaigns in discussion with PepsiCo in India for which we claim discount on
supply of concentrates from PepsiCo India. Concentrate prices for PepsiCo beverages produced in India have been presented
in our financial statements net of such discounts, and as reflected in our financial statements, have varied from fiscal period to
fiscal period depending on the extent of marketing or promotional campaigns undertaken by us on behalf of PepsiCo in India,
and the applicable discount on concentrate prices extended by PepsiCo India.
In Fiscal 2014 and 2015, cost of sugar represented 27.04% and 26.53%, respectively, of our cost of materials consumed in
such periods. The relatively lower price of sugar in Fiscal 2015 compared to that in Fiscal 2014 led to a decrease in cost of
materials consumed in Fiscal 2015 as a percentage of our revenue from operations (net) from sugar based PepsiCo products
produced by us. In addition, as a result of the significant increase in the size of our operations in Fiscal 2015 following the
acquisition of the 2015 New India Sub-Territories, we benefited from economies of scale by being able to negotiate
favourable sugar prices from our suppliers. As the relative proportion of packaged drinking water and other non-sugar based
446
or lower sugar based CSDs has increased as a percentage of our total Sales Volumes, the relative cost of sugar consumed, as a
percentage of revenues from operations (net), has decreased.
We incur significant expenses for packaging materials, especially PET resin, which represented 11.84% and 9.01% of our
cost of materials consumed in Fiscal 2014 and 2015, respectively. The principal packaging materials used by us include
returnable glass bottles, PET bottles, aluminium cans, tetra-packs, shrink-wrap films, crowns, plastic closures, labels and
corrugated boxes. In Fiscal 2014 and 2015, the relatively lower prices of PET resin, which is a key packaging raw material,
has led to a decrease in our packaging material costs in such periods.
Purchases of Traded Goods
Purchase of traded goods was ₹ 3,201.51 million in Fiscal 2015 compared to ₹ 597.00 million in Fiscal 2014. We were
granted the franchise for various PepsiCo products in the 2015 New India Sub-Territories which included two co-packing
manufacturing facilities dedicated to our operations. There is an increase in purchase of traded goods in Fiscal 2015 as we
purchased finished goods from these third-party co-packing facilities for certain sales in the 2015 New India Sub-Territories.
Changes in Inventories of Finished Goods, Work-in-Progress and Traded Goods
Changes in inventories of finished goods, work-in-progress and traded goods was ₹ (289.85) million in Fiscal 2015 compared
to ₹ 1.94 million in Fiscal 2014.
Employee Benefit Expenses
Employee benefits expenses increased by 49.33% from ₹ 2,167.99 million in Fiscal 2014 to ₹ 3,237.51 million in Fiscal 2015,
primarily resulting from an increase in the number of employees following the grant of franchise rights to the 2015 New India
Sub-Territories and the additional employees involved in such operations, as well as an increase in the salaries. As of
December 31, 2015 we had 4,187 full-time employees compared to 2,953 full time employees as of December 31, 2014, for
India operations. As a percentage of total revenue from operations, employee benefit expenses remained relatively steady at
8.66% and 9.54% in Fiscal 2014 and Fiscal 2015, respectively.
Finance Costs
Finance costs decreased by 8.96% from ₹ 1,853.95 million in Fiscal 2014 to ₹ 1,687.91 million in Fiscal 2015. The decrease
in finance cost was primarily on account of use of equity contribution for our operations and certain interest free deferred
payment advances from PepsiCo provided in connection with the acquisition of the 2015 New India Sub-Territories and also
on account of decrease in net debt.
Depreciation and Amortization Expense
Depreciation and amortization expense increased by 51.11% from ₹ 2,100.55 million in Fiscal 2014 to ₹ 3,174.09 million in
Fiscal 2015. The increase in our depreciation and amortization expense was in line with the addition of fixed assets resulting
from the acquisition of additional production facilities and distribution network infrastructure relating to the 2015 New India
Sub-Territories.
Other Expenses
Other expenses increased by 37.13% from ₹ 5,249.55 million in Fiscal 2014 to ₹ 7,198.63 million in Fiscal 2015. The
increase in other expenses was primarily due to increases in vehicle running and maintenance cost, lease and hire charges,
freight, octroi and insurance paid, as well as distribution expenses. These increases were generally in line with our expanded
operations resulting from the acquisition of the 2015 New India Sub-Territories with effect from February 28, 2015 and the
effect of such expanded operations.
The total distribution expenses which included freight, octroi and insurance paid (net), delivery vehicle running and
maintenance, distribution expenses and loading and unloading charges increased by 38.71% from ₹ 1,623.08 million in Fiscal
2014 to ₹ 2,251.34 million in Fiscal 2015. This increase is in-line with increase in our net revenues from operations.
Power and fuel represents a significant cost item and optimization of our production facility capacity enabled us to control
power and fuel expenses. As a result, power and fuel expenses increased marginally by 15.43% from ₹ 1,136.23 million in
Fiscal 2014 to ₹ 1,311.53 million in Fiscal 2015. In addition, the contiguous nature of most of the 2015 New India Sub-
Territories with our 2015 Existing Sub-Territories enabled us to derive significant operating and cost efficiencies, particularly
costs associated with transportation of raw materials and distribution of our products.
Other expenses also included non-operative expenses such as net loss on foreign currency transactions and translations (net)
and loss on sale of fixed assets (net) of amount aggregating to ₹ 113.67 million in Fiscal 2015.
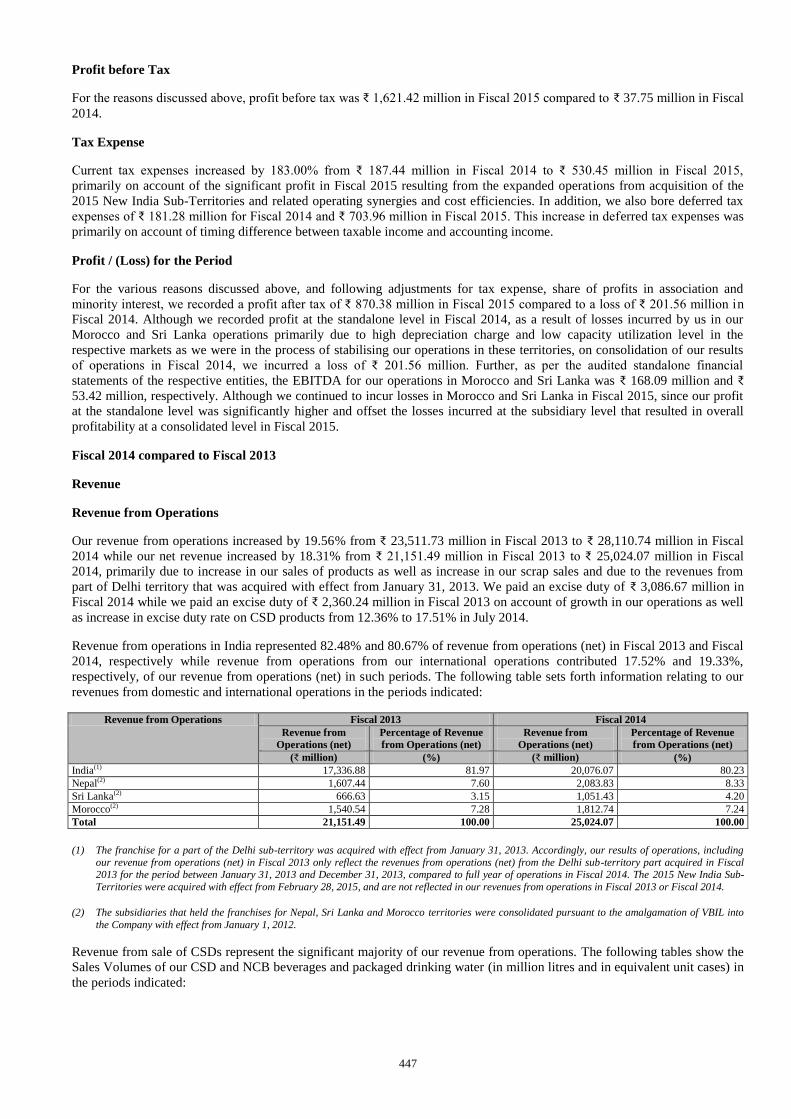
447
Profit before Tax
For the reasons discussed above, profit before tax was ₹ 1,621.42 million in Fiscal 2015 compared to ₹ 37.75 million in Fiscal
2014.
Tax Expense
Current tax expenses increased by 183.00% from ₹ 187.44 million in Fiscal 2014 to ₹ 530.45 million in Fiscal 2015,
primarily on account of the significant profit in Fiscal 2015 resulting from the expanded operations from acquisition of the
2015 New India Sub-Territories and related operating synergies and cost efficiencies. In addition, we also bore deferred tax
expenses of ₹ 181.28 million for Fiscal 2014 and ₹ 703.96 million in Fiscal 2015. This increase in deferred tax expenses was
primarily on account of timing difference between taxable income and accounting income.
Profit / (Loss) for the Period
For the various reasons discussed above, and following adjustments for tax expense, share of profits in association and
minority interest, we recorded a profit after tax of ₹ 870.38 million in Fiscal 2015 compared to a loss of ₹ 201.56 million in
Fiscal 2014. Although we recorded profit at the standalone level in Fiscal 2014, as a result of losses incurred by us in our
Morocco and Sri Lanka operations primarily due to high depreciation charge and low capacity utilization level in the
respective markets as we were in the process of stabilising our operations in these territories, on consolidation of our results
of operations in Fiscal 2014, we incurred a loss of ₹ 201.56 million. Further, as per the audited standalone financial
statements of the respective entities, the EBITDA for our operations in Morocco and Sri Lanka was ₹ 168.09 million and ₹
53.42 million, respectively. Although we continued to incur losses in Morocco and Sri Lanka in Fiscal 2015, since our profit
at the standalone level was significantly higher and offset the losses incurred at the subsidiary level that resulted in overall
profitability at a consolidated level in Fiscal 2015.
Fiscal 2014 compared to Fiscal 2013
Revenue
Revenue from Operations
Our revenue from operations increased by 19.56% from ₹ 23,511.73 million in Fiscal 2013 to ₹ 28,110.74 million in Fiscal
2014 while our net revenue increased by 18.31% from ₹ 21,151.49 million in Fiscal 2013 to ₹ 25,024.07 million in Fiscal
2014, primarily due to increase in our sales of products as well as increase in our scrap sales and due to the revenues from
part of Delhi territory that was acquired with effect from January 31, 2013. We paid an excise duty of ₹ 3,086.67 million in
Fiscal 2014 while we paid an excise duty of ₹ 2,360.24 million in Fiscal 2013 on account of growth in our operations as well
as increase in excise duty rate on CSD products from 12.36% to 17.51% in July 2014.
Revenue from operations in India represented 82.48% and 80.67% of revenue from operations (net) in Fiscal 2013 and Fiscal
2014, respectively while revenue from operations from our international operations contributed 17.52% and 19.33%,
respectively, of our revenue from operations (net) in such periods. The following table sets forth information relating to our
revenues from domestic and international operations in the periods indicated:
Revenue from Operations Fiscal 2013 Fiscal 2014
Revenue from
Operations (net)
Percentage of Revenue
from Operations (net)
Revenue from
Operations (net)
Percentage of Revenue
from Operations (net)
(₹ million) (%) (₹ million) (%)
India(1) 17,336.88 81.97 20,076.07 80.23
Nepal(2) 1,607.44 7.60 2,083.83 8.33
Sri Lanka(2) 666.63 3.15 1,051.43 4.20
Morocco(2) 1,540.54 7.28 1,812.74 7.24
Total 21,151.49 100.00 25,024.07 100.00
(1) The franchise for a part of the Delhi sub-territory was acquired with effect from January 31, 2013. Accordingly, our results of operations, including
our revenue from operations (net) in Fiscal 2013 only reflect the revenues from operations (net) from the Delhi sub-territory part acquired in Fiscal 2013 for the period between January 31, 2013 and December 31, 2013, compared to full year of operations in Fiscal 2014. The 2015 New India Sub-
Territories were acquired with effect from February 28, 2015, and are not reflected in our revenues from operations in Fiscal 2013 or Fiscal 2014.
(2) The subsidiaries that held the franchises for Nepal, Sri Lanka and Morocco territories were consolidated pursuant to the amalgamation of VBIL into
the Company with effect from January 1, 2012.
Revenue from sale of CSDs represent the significant majority of our revenue from operations. The following tables show the
Sales Volumes of our CSD and NCB beverages and packaged drinking water (in million litres and in equivalent unit cases) in
the periods indicated:
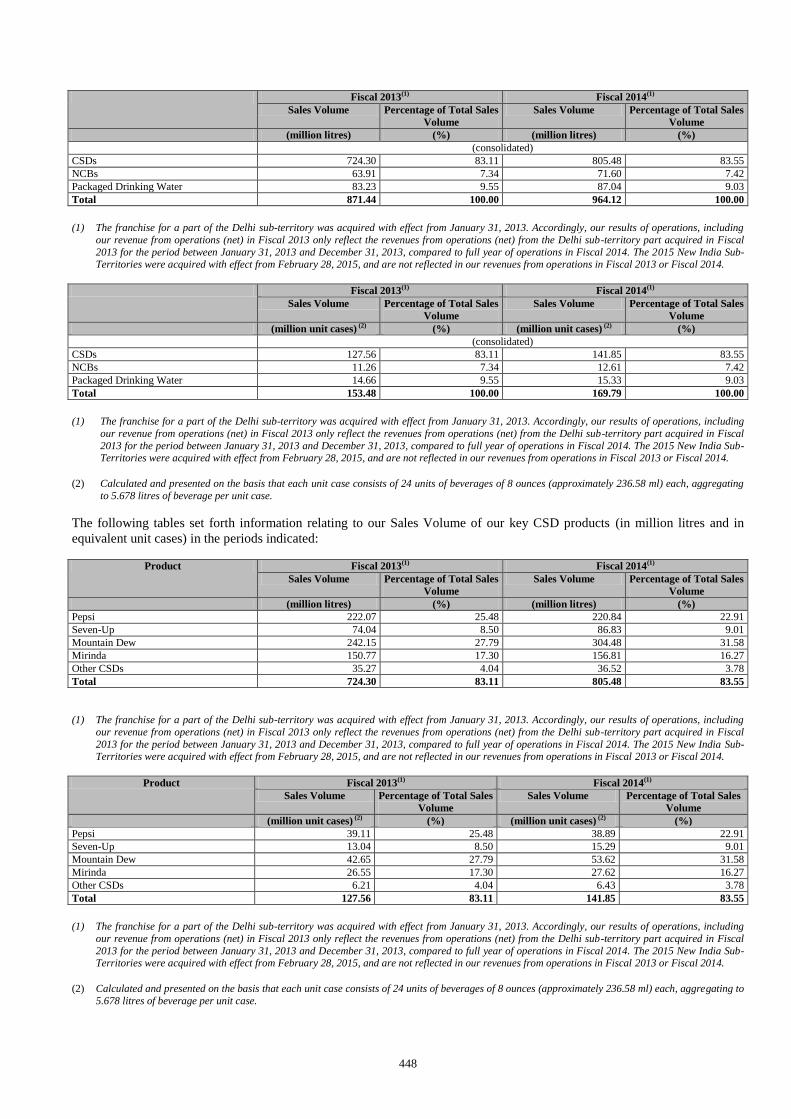
448
Fiscal 2013(1) Fiscal 2014(1)
Sales Volume Percentage of Total Sales
Volume
Sales Volume Percentage of Total Sales
Volume
(million litres) (%) (million litres) (%)
(consolidated)
CSDs 724.30 83.11 805.48 83.55
NCBs 63.91 7.34 71.60 7.42
Packaged Drinking Water 83.23 9.55 87.04 9.03
Total 871.44 100.00 964.12 100.00
(1) The franchise for a part of the Delhi sub-territory was acquired with effect from January 31, 2013. Accordingly, our results of operations, including
our revenue from operations (net) in Fiscal 2013 only reflect the revenues from operations (net) from the Delhi sub-territory part acquired in Fiscal
2013 for the period between January 31, 2013 and December 31, 2013, compared to full year of operations in Fiscal 2014. The 2015 New India Sub-Territories were acquired with effect from February 28, 2015, and are not reflected in our revenues from operations in Fiscal 2013 or Fiscal 2014.
Fiscal 2013(1) Fiscal 2014(1)
Sales Volume Percentage of Total Sales
Volume
Sales Volume Percentage of Total Sales
Volume
(million unit cases) (2) (%) (million unit cases) (2) (%)
(consolidated)
CSDs 127.56 83.11 141.85 83.55
NCBs 11.26 7.34 12.61 7.42
Packaged Drinking Water 14.66 9.55 15.33 9.03
Total 153.48 100.00 169.79 100.00
(1) The franchise for a part of the Delhi sub-territory was acquired with effect from January 31, 2013. Accordingly, our results of operations, including
our revenue from operations (net) in Fiscal 2013 only reflect the revenues from operations (net) from the Delhi sub-territory part acquired in Fiscal
2013 for the period between January 31, 2013 and December 31, 2013, compared to full year of operations in Fiscal 2014. The 2015 New India Sub-Territories were acquired with effect from February 28, 2015, and are not reflected in our revenues from operations in Fiscal 2013 or Fiscal 2014.
(2) Calculated and presented on the basis that each unit case consists of 24 units of beverages of 8 ounces (approximately 236.58 ml) each, aggregating
to 5.678 litres of beverage per unit case.
The following tables set forth information relating to our Sales Volume of our key CSD products (in million litres and in
equivalent unit cases) in the periods indicated:
Product Fiscal 2013(1) Fiscal 2014(1)
Sales Volume Percentage of Total Sales
Volume
Sales Volume Percentage of Total Sales
Volume
(million litres) (%) (million litres) (%)
Pepsi 222.07 25.48 220.84 22.91
Seven-Up 74.04 8.50 86.83 9.01
Mountain Dew 242.15 27.79 304.48 31.58
Mirinda 150.77 17.30 156.81 16.27
Other CSDs 35.27 4.04 36.52 3.78
Total 724.30 83.11 805.48 83.55
(1) The franchise for a part of the Delhi sub-territory was acquired with effect from January 31, 2013. Accordingly, our results of operations, including
our revenue from operations (net) in Fiscal 2013 only reflect the revenues from operations (net) from the Delhi sub-territory part acquired in Fiscal
2013 for the period between January 31, 2013 and December 31, 2013, compared to full year of operations in Fiscal 2014. The 2015 New India Sub-Territories were acquired with effect from February 28, 2015, and are not reflected in our revenues from operations in Fiscal 2013 or Fiscal 2014.
Product Fiscal 2013(1) Fiscal 2014(1)
Sales Volume Percentage of Total Sales
Volume
Sales Volume Percentage of Total Sales
Volume
(million unit cases) (2) (%) (million unit cases) (2) (%)
Pepsi 39.11 25.48 38.89 22.91
Seven-Up 13.04 8.50 15.29 9.01
Mountain Dew 42.65 27.79 53.62 31.58
Mirinda 26.55 17.30 27.62 16.27
Other CSDs 6.21 4.04 6.43 3.78
Total 127.56 83.11 141.85 83.55
(1) The franchise for a part of the Delhi sub-territory was acquired with effect from January 31, 2013. Accordingly, our results of operations, including
our revenue from operations (net) in Fiscal 2013 only reflect the revenues from operations (net) from the Delhi sub-territory part acquired in Fiscal
2013 for the period between January 31, 2013 and December 31, 2013, compared to full year of operations in Fiscal 2014. The 2015 New India Sub-Territories were acquired with effect from February 28, 2015, and are not reflected in our revenues from operations in Fiscal 2013 or Fiscal 2014.
(2) Calculated and presented on the basis that each unit case consists of 24 units of beverages of 8 ounces (approximately 236.58 ml) each, aggregating to
5.678 litres of beverage per unit case.
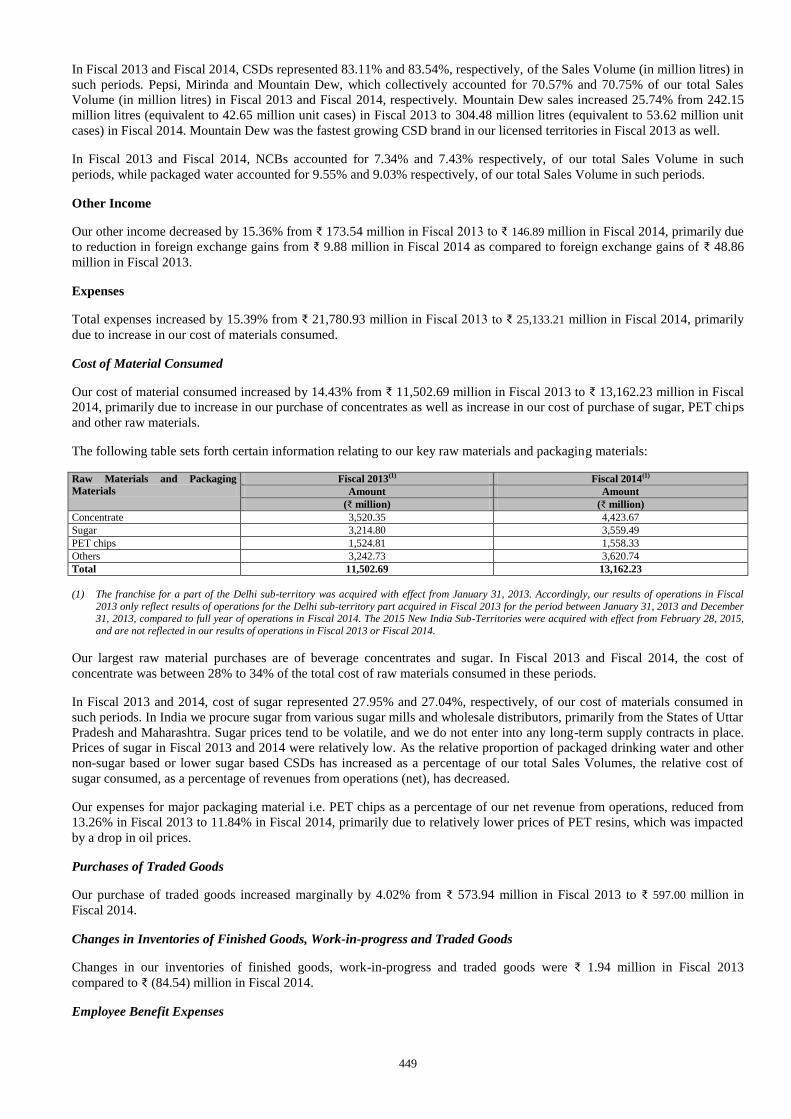
449
In Fiscal 2013 and Fiscal 2014, CSDs represented 83.11% and 83.54%, respectively, of the Sales Volume (in million litres) in
such periods. Pepsi, Mirinda and Mountain Dew, which collectively accounted for 70.57% and 70.75% of our total Sales
Volume (in million litres) in Fiscal 2013 and Fiscal 2014, respectively. Mountain Dew sales increased 25.74% from 242.15
million litres (equivalent to 42.65 million unit cases) in Fiscal 2013 to 304.48 million litres (equivalent to 53.62 million unit
cases) in Fiscal 2014. Mountain Dew was the fastest growing CSD brand in our licensed territories in Fiscal 2013 as well.
In Fiscal 2013 and Fiscal 2014, NCBs accounted for 7.34% and 7.43% respectively, of our total Sales Volume in such
periods, while packaged water accounted for 9.55% and 9.03% respectively, of our total Sales Volume in such periods.
Other Income
Our other income decreased by 15.36% from ₹ 173.54 million in Fiscal 2013 to ₹ 146.89 million in Fiscal 2014, primarily due
to reduction in foreign exchange gains from ₹ 9.88 million in Fiscal 2014 as compared to foreign exchange gains of ₹ 48.86
million in Fiscal 2013.
Expenses
Total expenses increased by 15.39% from ₹ 21,780.93 million in Fiscal 2013 to ₹ 25,133.21 million in Fiscal 2014, primarily
due to increase in our cost of materials consumed.
Cost of Material Consumed
Our cost of material consumed increased by 14.43% from ₹ 11,502.69 million in Fiscal 2013 to ₹ 13,162.23 million in Fiscal
2014, primarily due to increase in our purchase of concentrates as well as increase in our cost of purchase of sugar, PET chips
and other raw materials.
The following table sets forth certain information relating to our key raw materials and packaging materials:
Raw Materials and Packaging
Materials
Fiscal 2013(1) Fiscal 2014(1)
Amount Amount
(₹ million) (₹ million)
Concentrate 3,520.35 4,423.67 Sugar 3,214.80 3,559.49 PET chips 1,524.81 1,558.33 Others 3,242.73 3,620.74 Total 11,502.69 13,162.23
(1) The franchise for a part of the Delhi sub-territory was acquired with effect from January 31, 2013. Accordingly, our results of operations in Fiscal
2013 only reflect results of operations for the Delhi sub-territory part acquired in Fiscal 2013 for the period between January 31, 2013 and December 31, 2013, compared to full year of operations in Fiscal 2014. The 2015 New India Sub-Territories were acquired with effect from February 28, 2015,
and are not reflected in our results of operations in Fiscal 2013 or Fiscal 2014.
Our largest raw material purchases are of beverage concentrates and sugar. In Fiscal 2013 and Fiscal 2014, the cost of
concentrate was between 28% to 34% of the total cost of raw materials consumed in these periods.
In Fiscal 2013 and 2014, cost of sugar represented 27.95% and 27.04%, respectively, of our cost of materials consumed in
such periods. In India we procure sugar from various sugar mills and wholesale distributors, primarily from the States of Uttar
Pradesh and Maharashtra. Sugar prices tend to be volatile, and we do not enter into any long-term supply contracts in place.
Prices of sugar in Fiscal 2013 and 2014 were relatively low. As the relative proportion of packaged drinking water and other
non-sugar based or lower sugar based CSDs has increased as a percentage of our total Sales Volumes, the relative cost of
sugar consumed, as a percentage of revenues from operations (net), has decreased.
Our expenses for major packaging material i.e. PET chips as a percentage of our net revenue from operations, reduced from
13.26% in Fiscal 2013 to 11.84% in Fiscal 2014, primarily due to relatively lower prices of PET resins, which was impacted
by a drop in oil prices.
Purchases of Traded Goods
Our purchase of traded goods increased marginally by 4.02% from ₹ 573.94 million in Fiscal 2013 to ₹ 597.00 million in
Fiscal 2014.
Changes in Inventories of Finished Goods, Work-in-progress and Traded Goods
Changes in our inventories of finished goods, work-in-progress and traded goods were ₹ 1.94 million in Fiscal 2013
compared to ₹ (84.54) million in Fiscal 2014.
Employee Benefit Expenses
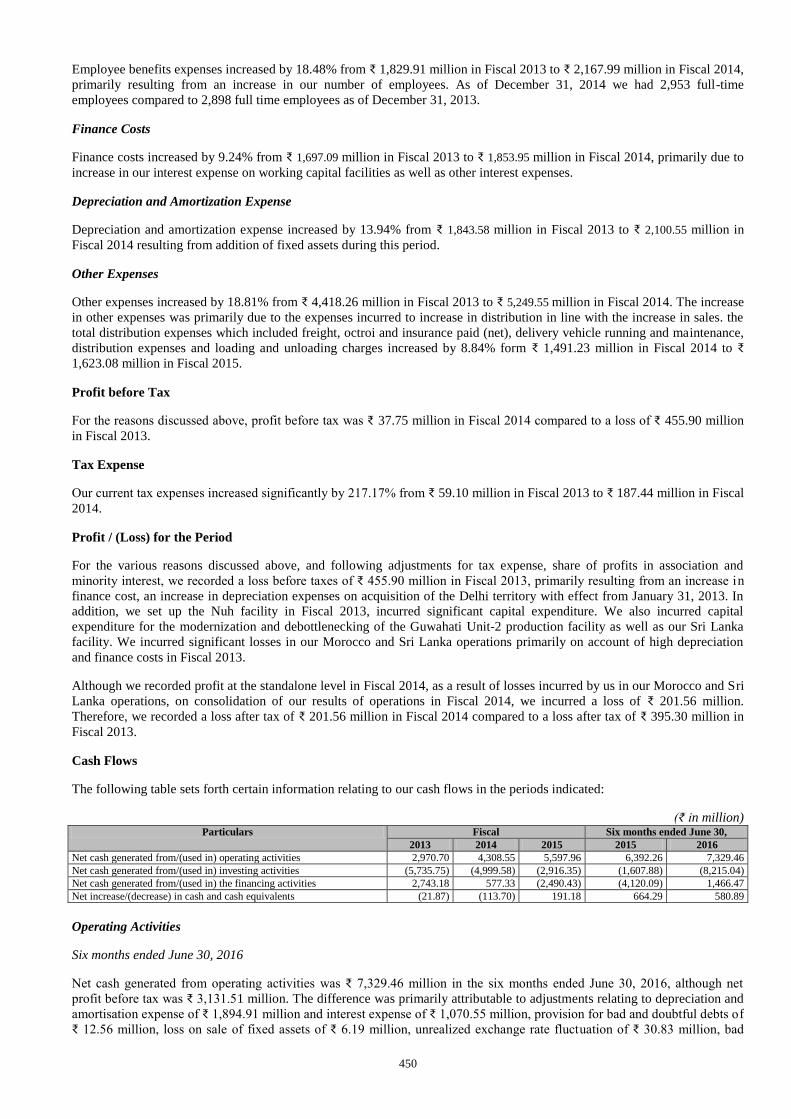
450
Employee benefits expenses increased by 18.48% from ₹ 1,829.91 million in Fiscal 2013 to ₹ 2,167.99 million in Fiscal 2014,
primarily resulting from an increase in our number of employees. As of December 31, 2014 we had 2,953 full-time
employees compared to 2,898 full time employees as of December 31, 2013.
Finance Costs
Finance costs increased by 9.24% from ₹ 1,697.09 million in Fiscal 2013 to ₹ 1,853.95 million in Fiscal 2014, primarily due to
increase in our interest expense on working capital facilities as well as other interest expenses.
Depreciation and Amortization Expense
Depreciation and amortization expense increased by 13.94% from ₹ 1,843.58 million in Fiscal 2013 to ₹ 2,100.55 million in
Fiscal 2014 resulting from addition of fixed assets during this period.
Other Expenses
Other expenses increased by 18.81% from ₹ 4,418.26 million in Fiscal 2013 to ₹ 5,249.55 million in Fiscal 2014. The increase
in other expenses was primarily due to the expenses incurred to increase in distribution in line with the increase in sales. the
total distribution expenses which included freight, octroi and insurance paid (net), delivery vehicle running and maintenance,
distribution expenses and loading and unloading charges increased by 8.84% form ₹ 1,491.23 million in Fiscal 2014 to ₹
1,623.08 million in Fiscal 2015.
Profit before Tax
For the reasons discussed above, profit before tax was ₹ 37.75 million in Fiscal 2014 compared to a loss of ₹ 455.90 million
in Fiscal 2013.
Tax Expense
Our current tax expenses increased significantly by 217.17% from ₹ 59.10 million in Fiscal 2013 to ₹ 187.44 million in Fiscal
2014.
Profit / (Loss) for the Period
For the various reasons discussed above, and following adjustments for tax expense, share of profits in association and
minority interest, we recorded a loss before taxes of ₹ 455.90 million in Fiscal 2013, primarily resulting from an increase in
finance cost, an increase in depreciation expenses on acquisition of the Delhi territory with effect from January 31, 2013. In
addition, we set up the Nuh facility in Fiscal 2013, incurred significant capital expenditure. We also incurred capital
expenditure for the modernization and debottlenecking of the Guwahati Unit-2 production facility as well as our Sri Lanka
facility. We incurred significant losses in our Morocco and Sri Lanka operations primarily on account of high depreciation
and finance costs in Fiscal 2013.
Although we recorded profit at the standalone level in Fiscal 2014, as a result of losses incurred by us in our Morocco and Sri
Lanka operations, on consolidation of our results of operations in Fiscal 2014, we incurred a loss of ₹ 201.56 million.
Therefore, we recorded a loss after tax of ₹ 201.56 million in Fiscal 2014 compared to a loss after tax of ₹ 395.30 million in
Fiscal 2013.
Cash Flows
The following table sets forth certain information relating to our cash flows in the periods indicated:
(₹ in million) Particulars Fiscal Six months ended June 30,
2013 2014 2015 2015 2016
Net cash generated from/(used in) operating activities 2,970.70 4,308.55 5,597.96 6,392.26 7,329.46
Net cash generated from/(used in) investing activities (5,735.75) (4,999.58) (2,916.35) (1,607.88) (8,215.04)
Net cash generated from/(used in) the financing activities 2,743.18 577.33 (2,490.43) (4,120.09) 1,466.47
Net increase/(decrease) in cash and cash equivalents (21.87) (113.70) 191.18 664.29 580.89
Operating Activities
Six months ended June 30, 2016
Net cash generated from operating activities was ₹ 7,329.46 million in the six months ended June 30, 2016, although net
profit before tax was ₹ 3,131.51 million. The difference was primarily attributable to adjustments relating to depreciation and
amortisation expense of ₹ 1,894.91 million and interest expense of ₹ 1,070.55 million, provision for bad and doubtful debts of
₹ 12.56 million, loss on sale of fixed assets of ₹ 6.19 million, unrealized exchange rate fluctuation of ₹ 30.83 million, bad
451
debts and advances written off of ₹ 1.01 million as well as fixed assets written off of ₹ 63.27 million. This was partially offset
by excess provisions written back of ₹ 0.60 million, interest income of ₹ 50.01 million and profit on sale of current
investments of ₹ 0.17 million. Our operating profit before working capital changes was ₹ 6,160.05 million. The main working
capital adjustments were increase in trade payables, other liabilities and provisions of ₹ 2,509.35 million and decrease in trade
receivables of ₹ 74.98 million which was offset primarily by an increase in inventories of ₹ 1,081.94 million and increase in
loan and advances of ₹ 21.57 million. Direct taxes paid were ₹ 311.41 million in the six months ended June 30, 2016.
Six months ended June 30, 2015
Net cash generated from operating activities was ₹ 6,392.26 million in the six months ended June 30, 2015, although net
profit before tax was ₹ 2,513.03 million. The difference was primarily attributable to adjustments relating to depreciation and
amortisation expense of ₹ 1,455.22 million and interest expense of ₹ 840.77 million, provision for bad and doubtful debts of ₹
9.71 million, unrealized exchange rate fluctuation of ₹ 45.18 million, bad debts and advances written off of ₹ 0.00 million as
well as fixed assets written off of ₹ 38.61 million. This was partially offset by gain on sale of fixed assets of ₹ 2.65 million,
excess provisions written back of ₹ 3.19 million, interest income of ₹ 13.32 million and profit on sale of current investments
of ₹ 46.94 million. Our operating profit before working capital changes was ₹ 4,836.42 million. The main working capital
adjustments were increase in trade payables, other liabilities and provisions of ₹ 5,394.83 million which was offset primarily
by an increase in inventories of ₹ 2,184.70 million, increase in trade receivables of ₹ 745.46 million and increase in loan and
advances of ₹ 759.46 million. Direct taxes paid were ₹ 149.37 million in the six months ended June 30, 2015.
Fiscal 2015
Net cash generated from operating activities was ₹ 5,597.96 million in Fiscal 2015, although net profit before tax was only ₹
1,621.42 million in such period. The difference was primarily attributable to adjustment relating to depreciation and
amortisation expense of ₹ 3,174.09 million and interest expense of ₹ 1,592.12 million, provision for bad and doubtful debts of
₹ 20.26 million, loss on sale of fixed assets of ₹ 40.25 million, unrealized exchange rate fluctuation of ₹ 36.07 million, bad
debts and advances written off of ₹ 4.46 million as well as fixed assets written off of ₹ 74.53 million. This was partially offset
by excess provisions written back of ₹ 4.43 million, interest income of ₹ 61.93 million and profit on sale of current
investments of ₹ 52.86 million. Our operating profit before working capital changes was ₹ 6,443.98 million. The main
working capital adjustments were increase in trade payables, other liabilities and provisions of ₹ 1,594.36 million which was
offset primarily by an increase in inventories of ₹ 1,354.11 million, increase in trade receivables of ₹ 26.57 million and
increase in loan and advances of ₹ 626.74 million. Direct taxes paid were ₹ 432.96 million in Fiscal 2015.
Fiscal 2014
Net cash generated from operating activities was ₹ 4,308.55 million in Fiscal 2014, although net profit before tax, was only ₹
37.75 million in such period. The difference was primarily attributable to adjustment relating to depreciation and amortisation
expense of ₹ 2,100.55 million, interest expense of ₹ 1,814.99 million, fixed assets written off of ₹ 47.06 million, provisions
for bad and doubtful debts of ₹ 42.66 million, net unrealized exchange rate fluctuation of ₹ 33.46 million, loss on sale of fixed
assets of ₹ 3.86 million as well as bad debts and advances written off of ₹ 14.79 million.
This was partially offset by excess provisions written back of ₹ 34.91 million, interest income of ₹ 69.10 million as well as
dividend income of ₹ 19.79 million. Our operating profit before working capital changes was ₹ 3,971.32 million. The main
working capital adjustments were decrease in loans and advances of ₹ 390.46 million and increase in trade payables, other
liabilities and provisions of ₹ 861.03 million which was offset primarily by, an increase in inventories of ₹ 428.44 million and
increase in trade receivables of ₹ 378.26 million. Direct taxes paid were ₹ 107.56 million in Fiscal 2014.
Fiscal 2013
Net cash generated from operating activities was ₹ 2,970.70 million in Fiscal 2013, although we suffered a loss before tax of
₹ 455.90 million in such period. The difference was primarily attributable to adjustment relating to depreciation and
amortisation expense of ₹ 1,843.58 million, interest expense of ₹ 1,660.72 million, fixed assets written off of ₹ 32.39 million,
provisions for bad and doubtful debts of ₹ 47.15 million and unrealized net exchange rate fluctuation of ₹ 116.67 million.
This was partially offset by excess provisions written back of ₹ 2.54 million, interest income of ₹ 95.11 million as well as net
gain on sale of fixed assets of ₹ 14.76 million. Our operating profit before working capital changes was ₹ 3,132.20 million.
The main working capital adjustments were decrease in trade receivables of ₹ 209.82 million and decrease in loans and
advances of ₹ 320.53 million. This was offset primarily by increase in inventories of ₹ 158.28 million and decrease in trade
payables, other liabilities and provisions of ₹ 490.87 million. Direct taxes paid were ₹ 42.70 million in Fiscal 2013.
Investing Activities
452
Six months ended June 30, 2016
Net cash used in investing activities was ₹ 8,215.04 million in the six months ended June 30, 2016. It was primarily on
account of purchase of fixed assets of ₹ 6,091.25 million in relation to acquisition of 2015 New India Sub-Territories and
consolidation of subsidiaries in Zambia, Mozambique and Zimbabwe, purchase of business for consolidated consideration of
₹ 564.18 million in relation to acquisition of a co-packing production facility at Phillaur and purchase of current investments
of ₹ 350.00 million. This amount was partly offset by proceeds received from sale of fixed assets of ₹ 33.36 million, proceeds
from sale of current investments of ₹ 350.00 million and interest received of ₹ 44.56 million in the six months ended June 30,
2016.
Six months ended June 30, 2015
Net cash used in investing activities was ₹ 1,607.88 million in the six months ended June 30, 2015. It was primarily on
account of purchase of fixed assets of ₹ 1,274.29 million, purchase of business for consolidated consideration of ₹ 3,450.00
million in relation to acquisition of 2015 New India Sub-Territories and purchase of current investments of ₹ 950.00 million.
This amount was partly offset by proceeds received from sale of fixed assets of ₹ 30.35 million, proceeds from sale of current
investments of ₹ 4,016.73 million and interest received of ₹ 19.33 million in the six months ended June 30, 2015.
Fiscal 2015
Net cash used in investing activities was ₹ 2,916.35 million in Fiscal 2015. This was primarily on account of purchase of
fixed assets of ₹ 2,724.17 million, purchase of business for consolidated consideration of ₹ 3,450.00 million in relation to
acquisition of 2015 New India Sub-Territories and purchase of current investments of ₹ 2,050.00 million. This amount was
partly offset by proceeds received from sale of fixed assets of ₹ 120.20 million, proceeds from sale of current investments of
₹ 5,122.65 million and interest received of ₹ 64.97 million in Fiscal 2015.
Fiscal 2014
Net cash used in investing activities was ₹ 4,999.58 million in Fiscal 2014. This was primarily on account of purchase of
fixed assets of ₹ 2,196.77 million and purchase of current investments of ₹ 3,019.79 million. This amount was partly offset by
proceeds received from sale of fixed assets of ₹ 79.94 million, interest received of ₹ 117.25 million and dividends received of
₹ 19.79 million in Fiscal 2014.
Fiscal 2013
Net cash used in investing activities was ₹ 5,735.75 million in Fiscal 2013. This was primarily on account of purchase of
fixed assets of ₹ 4,360.72 million, purchase of business for consolidated consideration of ₹ 1,570.00 million in relation to
acquisition of Delhi sub territory and purchase of non- current investments of ₹ 0.21 million. This amount was partly offset
by proceeds received from sale of fixed assets of ₹ 151.53 million and interest received of ₹ 43.65 million in Fiscal 2013.
Financing Activities
Six months ended June 30, 2016
Net cash generated from financing activities was ₹ 1,466.47 million in the six months ended June 30, 2016. It was primarily
on account of interest paid of ₹ 835.33 million and share issue expenses paid of ₹ 31.62 million. This amount was partly
offset by proceeds received from long term borrowing of ₹ 215.26 million, proceeds received from short term borrowings of ₹
33.54 million, issue of non-convertible debentures of ₹ 1,800.00 million and proceeds received from issue of equity shares of
₹ 284.62 million in the six months ended June 30, 2016.
Six months ended June 30, 2015
Net cash used in financing activities was ₹ 4,120.09 million in the six months ended June 30, 2015. It was primarily on
account of repayment of long term borrowing of ₹ 2,808.46 million, repayment of short term borrowings of ₹ 2,951.50
million as well as interest paid of ₹ 860.13 million. This amount was partly offset by proceeds received from issue of
preference shares of ₹ 2,500.00 million in the six months ended June 30, 2015.
Fiscal 2015
Net cash used in financing activities in Fiscal 2015 was ₹ 2,490.43 million in Fiscal 2015 primarily due to repayment of long
term borrowing of ₹ 4,115.78 million, repayment of short term borrowings of ₹ 2,561.05 million as well as interest paid of ₹
1,513.60 million in Fiscal 2015. This amount was partly offset by proceeds received from issue of preference shares of ₹
2,500.00 million and proceeds received from issue of non- convertible debentures of ₹ 3,200.00 million in Fiscal 2015.
Fiscal 2014
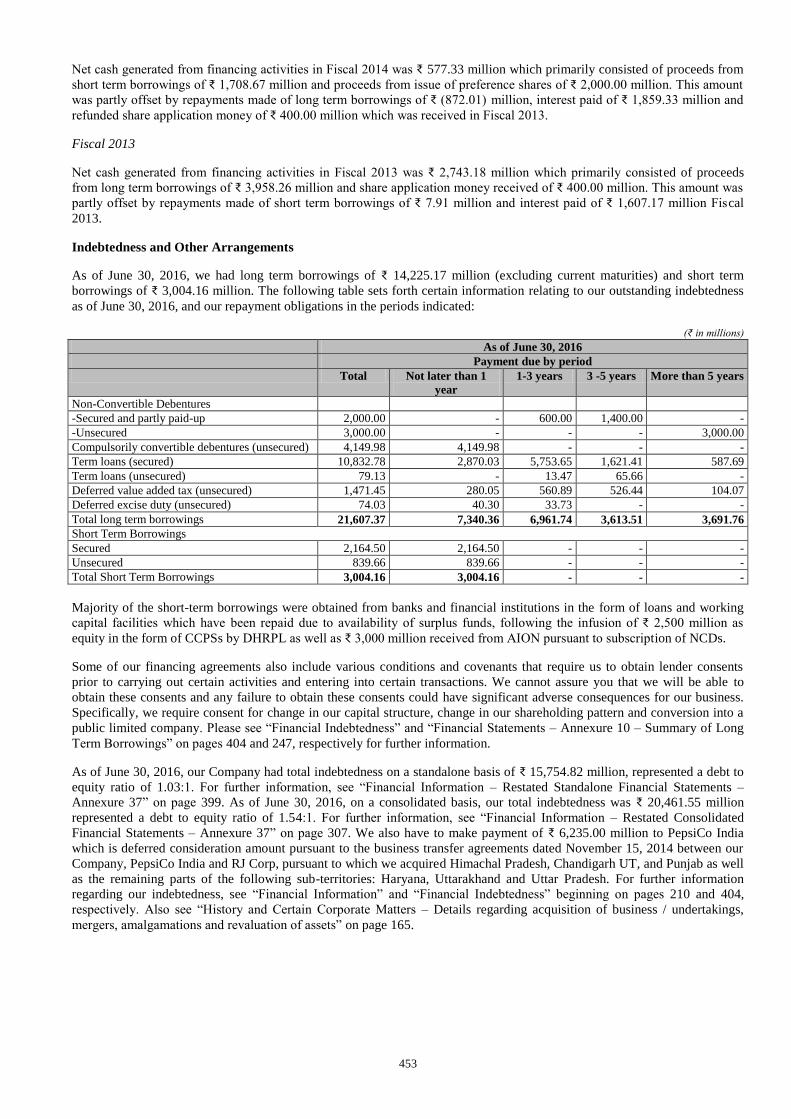
453
Net cash generated from financing activities in Fiscal 2014 was ₹ 577.33 million which primarily consisted of proceeds from
short term borrowings of ₹ 1,708.67 million and proceeds from issue of preference shares of ₹ 2,000.00 million. This amount
was partly offset by repayments made of long term borrowings of ₹ (872.01) million, interest paid of ₹ 1,859.33 million and
refunded share application money of ₹ 400.00 million which was received in Fiscal 2013.
Fiscal 2013
Net cash generated from financing activities in Fiscal 2013 was ₹ 2,743.18 million which primarily consisted of proceeds
from long term borrowings of ₹ 3,958.26 million and share application money received of ₹ 400.00 million. This amount was
partly offset by repayments made of short term borrowings of ₹ 7.91 million and interest paid of ₹ 1,607.17 million Fiscal
2013.
Indebtedness and Other Arrangements
As of June 30, 2016, we had long term borrowings of ₹ 14,225.17 million (excluding current maturities) and short term
borrowings of ₹ 3,004.16 million. The following table sets forth certain information relating to our outstanding indebtedness
as of June 30, 2016, and our repayment obligations in the periods indicated:
(₹ in millions) As of June 30, 2016
Payment due by period
Total Not later than 1
year
1-3 years 3 -5 years More than 5 years
Non-Convertible Debentures
-Secured and partly paid-up 2,000.00 - 600.00 1,400.00 -
-Unsecured 3,000.00 - - - 3,000.00
Compulsorily convertible debentures (unsecured) 4,149.98 4,149.98 - - -
Term loans (secured) 10,832.78 2,870.03 5,753.65 1,621.41 587.69
Term loans (unsecured) 79.13 - 13.47 65.66 -
Deferred value added tax (unsecured) 1,471.45 280.05 560.89 526.44 104.07
Deferred excise duty (unsecured) 74.03 40.30 33.73 - -
Total long term borrowings 21,607.37 7,340.36 6,961.74 3,613.51 3,691.76
Short Term Borrowings
Secured 2,164.50 2,164.50 - - -
Unsecured 839.66 839.66 - - -
Total Short Term Borrowings 3,004.16 3,004.16 - - -
Majority of the short-term borrowings were obtained from banks and financial institutions in the form of loans and working
capital facilities which have been repaid due to availability of surplus funds, following the infusion of ₹ 2,500 million as
equity in the form of CCPSs by DHRPL as well as ₹ 3,000 million received from AION pursuant to subscription of NCDs.
Some of our financing agreements also include various conditions and covenants that require us to obtain lender consents
prior to carrying out certain activities and entering into certain transactions. We cannot assure you that we will be able to
obtain these consents and any failure to obtain these consents could have significant adverse consequences for our business.
Specifically, we require consent for change in our capital structure, change in our shareholding pattern and conversion into a
public limited company. Please see “Financial Indebtedness” and “Financial Statements – Annexure 10 – Summary of Long
Term Borrowings” on pages 404 and 247, respectively for further information.
As of June 30, 2016, our Company had total indebtedness on a standalone basis of ₹ 15,754.82 million, represented a debt to
equity ratio of 1.03:1. For further information, see “Financial Information – Restated Standalone Financial Statements –
Annexure 37” on page 399. As of June 30, 2016, on a consolidated basis, our total indebtedness was ₹ 20,461.55 million
represented a debt to equity ratio of 1.54:1. For further information, see “Financial Information – Restated Consolidated
Financial Statements – Annexure 37” on page 307. We also have to make payment of ₹ 6,235.00 million to PepsiCo India
which is deferred consideration amount pursuant to the business transfer agreements dated November 15, 2014 between our
Company, PepsiCo India and RJ Corp, pursuant to which we acquired Himachal Pradesh, Chandigarh UT, and Punjab as well
as the remaining parts of the following sub-territories: Haryana, Uttarakhand and Uttar Pradesh. For further information
regarding our indebtedness, see “Financial Information” and “Financial Indebtedness” beginning on pages 210 and 404,
respectively. Also see “History and Certain Corporate Matters – Details regarding acquisition of business / undertakings,
mergers, amalgamations and revaluation of assets” on page 165.
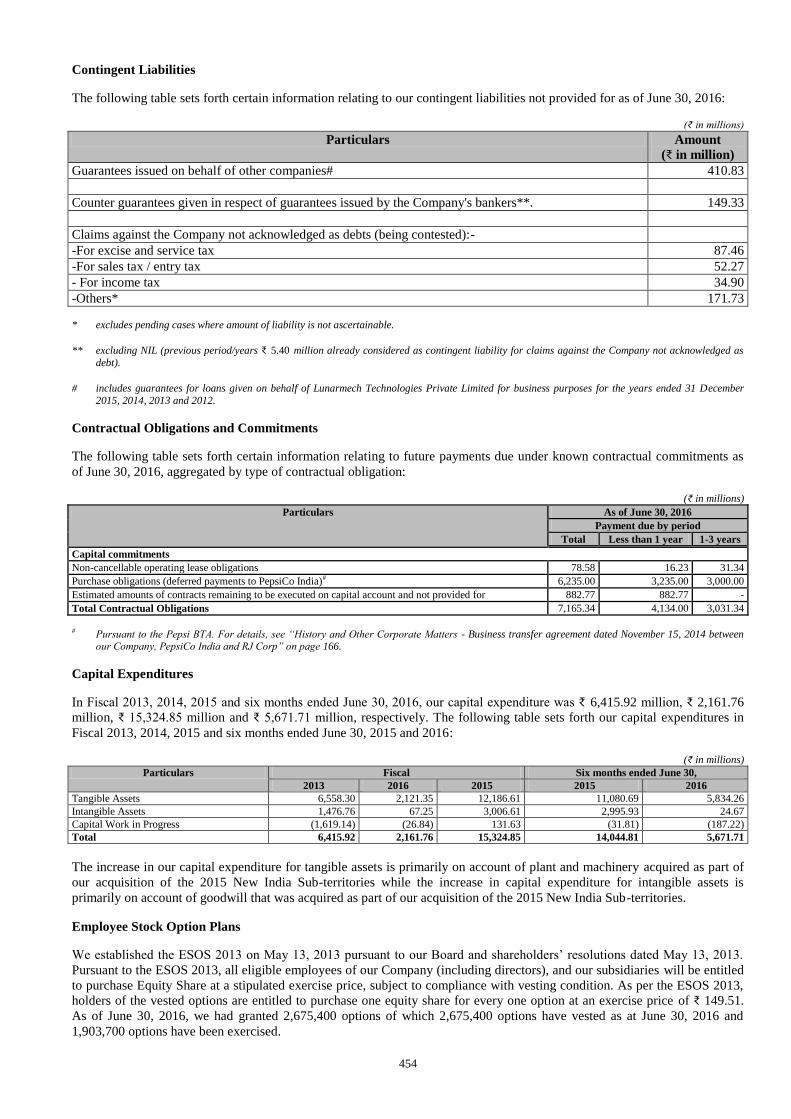
454
Contingent Liabilities
The following table sets forth certain information relating to our contingent liabilities not provided for as of June 30, 2016:
(₹ in millions)
Particulars Amount
(₹ in million)
Guarantees issued on behalf of other companies# 410.83
Counter guarantees given in respect of guarantees issued by the Company's bankers**. 149.33
Claims against the Company not acknowledged as debts (being contested):-
-For excise and service tax 87.46
-For sales tax / entry tax 52.27
- For income tax 34.90
-Others* 171.73 * excludes pending cases where amount of liability is not ascertainable.
** excluding NIL (previous period/years ₹ 5.40 million already considered as contingent liability for claims against the Company not acknowledged as
debt).
# includes guarantees for loans given on behalf of Lunarmech Technologies Private Limited for business purposes for the years ended 31 December
2015, 2014, 2013 and 2012.
Contractual Obligations and Commitments
The following table sets forth certain information relating to future payments due under known contractual commitments as
of June 30, 2016, aggregated by type of contractual obligation:
(₹ in millions) Particulars As of June 30, 2016
Payment due by period
Total Less than 1 year 1-3 years
Capital commitments
Non-cancellable operating lease obligations 78.58 16.23 31.34
Purchase obligations (deferred payments to PepsiCo India)# 6,235.00 3,235.00 3,000.00
Estimated amounts of contracts remaining to be executed on capital account and not provided for 882.77 882.77 -
Total Contractual Obligations 7,165.34 4,134.00 3,031.34
# Pursuant to the Pepsi BTA. For details, see “History and Other Corporate Matters - Business transfer agreement dated November 15, 2014 between our Company, PepsiCo India and RJ Corp” on page 166.
Capital Expenditures
In Fiscal 2013, 2014, 2015 and six months ended June 30, 2016, our capital expenditure was ₹ 6,415.92 million, ₹ 2,161.76
million, ₹ 15,324.85 million and ₹ 5,671.71 million, respectively. The following table sets forth our capital expenditures in
Fiscal 2013, 2014, 2015 and six months ended June 30, 2015 and 2016:
(₹ in millions) Particulars Fiscal Six months ended June 30,
2013 2016 2015 2015 2016
Tangible Assets 6,558.30 2,121.35 12,186.61 11,080.69 5,834.26
Intangible Assets 1,476.76 67.25 3,006.61 2,995.93 24.67
Capital Work in Progress (1,619.14) (26.84) 131.63 (31.81) (187.22)
Total 6,415.92 2,161.76 15,324.85 14,044.81 5,671.71
The increase in our capital expenditure for tangible assets is primarily on account of plant and machinery acquired as part of
our acquisition of the 2015 New India Sub-territories while the increase in capital expenditure for intangible assets is
primarily on account of goodwill that was acquired as part of our acquisition of the 2015 New India Sub-territories.
Employee Stock Option Plans
We established the ESOS 2013 on May 13, 2013 pursuant to our Board and shareholders’ resolutions dated May 13, 2013.
Pursuant to the ESOS 2013, all eligible employees of our Company (including directors), and our subsidiaries will be entitled
to purchase Equity Share at a stipulated exercise price, subject to compliance with vesting condition. As per the ESOS 2013,
holders of the vested options are entitled to purchase one equity share for every one option at an exercise price of ₹ 149.51.
As of June 30, 2016, we had granted 2,675,400 options of which 2,675,400 options have vested as at June 30, 2016 and
1,903,700 options have been exercised.
455
We established the ESOS 2016 on April 27, 2016 pursuant to our Board and shareholders’ resolutions dated April 27, 2016.
Pursuant to the ESOS 2016, all eligible employees of our Company (including directors), and our subsidiaries will be entitled
to purchase Equity Share at a stipulated exercise price, subject to compliance with vesting condition. As a result of future
grants of options under ESOS 2016, we will have to charge the difference between exercise price and the market price at the
time of grant to our profit and our loss statement, which may have an adverse impact on our net income.
For more details on ESOS 2013 and ESOS 2016, see “Capital Structure – Employee Stock Option Scheme 2013” and
“Capital Structure – Employee Stock Option Scheme 2016” on pages 93 and 96, respectively.
Related Party Transactions
We enter into various transactions with related parties in the ordinary course of business including issue of compulsorily
convertible preference shares, rent / lease charges paid, sales and purchases, services charges and expenses paid / received,
etc. For further information relating to our related party transactions, see “Financial Statements – Annexure 36 – Restated
Statement of Related Party Transactions” on page 303.
Changes in Accounting Policies
There have been no changes in our Company’s accounting policies during the last five fiscal years. However, our subsidiary
VBL Nepal has changed its accounting policy relating to depreciation from written down value method to straight line
method during the year ended 31 December 2013.
For more details, see “Financial Statements – Annexure 5 – Summary Statement of Notes to Restated Summary Statements”
on page 228.
Quantitative and Qualitative Disclosures about Market Risk
Interest Rate Risk
Interest rates for borrowings have been volatile in India in recent periods. Our operations are funded to an extent by debt, and
increases in interest expense may have an adverse effect on our results of operations and financial condition. Our current debt
facilities carry interest at variable rates as well as fixed rates. Although we engage in interest rate hedging transactions or
exercise any right available to us under our financing arrangements to terminate the existing debt financing arrangement on
the respective reset dates and enter into new financing arrangements, there can be no assurance that we will be able to do so
on commercially reasonable terms, that our counterparties will perform their obligations, or that these agreements, if entered
into, will protect us adequately against interest rate risks.
General
Market risk is the risk of loss of future earnings, to fair values or to future cash flows that may result from a change in the
price of a financial instrument. The value of a financial instrument may change as a result of changes in the foreign currency
exchange rates, interest rates, commodity prices, equity prices and other market changes that affect market risk sensitive
instruments. Market risk is attributable to all market risk sensitive financial instruments including investments, foreign
currency payables and debt.
Foreign Exchange Rate Risk
Changes in currency exchange rates influence our results of operations. A major portion of our revenues, particularly relating
to our international operations, is denominated in currencies other than Indian Rupees, most significantly the U.S. dollar. The
depreciation of the Indian Rupee against the U.S. Dollar and other foreign currencies may adversely affect our results of
operations by increasing the cost of financing any debt denominated in foreign currency that we may enter into or proposed
capital expenditure, if any, in foreign currencies. Furthermore, the financial reporting currency of our Company and our
operations in India is in Indian Rupees, while the financial reporting currency of our international subsidiaries is in the
relevant foreign currency. We incur currency transaction risks whenever one of our foreign subsidiaries enters into either a
purchase or sale transaction using a currency other than its functional currency. In particular, the purchases of raw materials
which are priced predominantly in Indian Rupees, while we currently sell our products in countries other than India, in local
currencies. Although we may, in the future, enter into hedging transactions to minimize our currency exchange risks, there
can be no assurance that such measures will enable us to avoid the effect of any adverse fluctuations in the value of the Indian
Rupee against the relevant foreign currencies.
Commodity Price Risk
We are subject to market risks related to the volatility in the price of our raw materials like sugar and packaging materials.
Our financial results can be affected significantly by fluctuations in these prices, which depend on many factors, including
demand for these materials, changes in the economy, worldwide production levels, worldwide inventory levels and
456
disruptions in the supply chain. For further details, see “- Key raw materials prices, packaging material costs and royalty
payments” on page 423.
Unusual or Infrequent Events or Transactions
Except as described in this Red Herring Prospectus, there have been no other events or transactions that, to our knowledge,
may be described as “unusual” or “infrequent”.
Known Trends or Uncertainties
Other than as described in this Red Herring Prospectus, particularly in the sections “Risk Factors” and “Management’s
Discussion and Analysis of Financial Condition and Results of Operations” beginning on pages 22 and 413, respectively, to
our knowledge, there are no known trends or uncertainties that are expected to have a material adverse impact on our
revenues or income from continuing operations.
Future Relationship between Cost and Income
Other than as described elsewhere in the sections “Risk Factors”, “Our Business” and “Management’s Discussion and
Analysis of Financial Condition and Results of Operations” on pages 22, 130 and 413, respectively, to our knowledge there
are no known factors that will have a material adverse impact on our operations and finances.
Seasonality of Business
Sales of our beverages are generally significantly higher in the summer months of April through June, due to the heat and
warm weather, and considerably lower during the winter months of December through February. Bad weather conditions,
including unusually cold or rainy periods, during the peak sales season during summer, may adversely affect our sales
volume, results of operations and financial condition, and could therefore have a disproportionate impact on our results of
operations in the relevant year. For example, in Fiscal 2013 and 2015, we faced significant adverse weather conditions in the
form of extended periods of heavy rains during the peak summer months, which adversely affected our peak season sales in
these fiscal years. See “Management’s Discussion and Analysis of Results of Operations and Financial Condition – Factors
Affecting Results of Operations and Financial Condition – Seasonality of Business” on page 456 of this RHP.
Significant Dependence on a Single or Few Customers or Suppliers
Given the nature of our business operations, we do not believe our business is dependent on any single or a few customers.
However, our largest raw material purchases are of beverage concentrates and sugar. In Fiscal 2013, Fiscal 2014, Fiscal 2015,
and in the six months ended June 30, 2016, the cost of concentrate was between 28% to 34% of the total cost of raw materials
consumed in these periods. From this perspective, we are dependent on PepsiCo for beverage concentrate supplies. See “Risk
Factors – PepsiCo India / Pepsico Inc. and / or PepsiCo International Entities are entitled to various rights under the PepsiCo
India Agreements and the PepsiCo International Agreements, including the right to unilaterally determine the price of the
PepsiCo beverage concentrates we purchase. In the event any such right is exercised by PepsiCo India / Pepsico Inc. and / or
PepsiCo International Entities in a manner adverse to our business interest, our business prospects and future financial
performance will be materially and adversely affected.” on page 23 of this RHP.
In Fiscal 2013, 2014, 2015, and in the six months ended June 30, 2016, cost of sugar represented 27.95%, 27.04%, 26.53%,
and 33.65% respectively, of our cost of materials consumed in such periods. In India we procure sugar from various sugar
mills and wholesale distributors, primarily from the States of Uttar Pradesh and Maharashtra. Sugar prices tend to be volatile,
and we do not enter into any long-term supply contracts in place. We place orders depending on our production requirements
at negotiated prices, and typically procure sugar from a few key suppliers in India. For our international operations, we
procure sugar from various local suppliers through short term or spot purchase agreements. For further information, see
“Management’s Discussion and Analysis of Results of Operations and Financial Condition – Factors Affecting Results of
Operations and Financial Condition – Key raw materials prices, packaging material costs and royalty payments” on page 423.
Competitive Conditions
We operate in a competitive environment. Please refer to the sections “Our Business”, “Industry Overview” and “Risk
Factors” on pages 130, 116 and 22, respectively, of this Red Herring Prospectus.
Significant Developments after June 30, 2016 that May Affect our Future Results of Operations
Except as disclosed in this section including under “Significant Factors Affecting Our Results of Operations and Financial
Condition”, “Our Business” and “History and Certain Corporate Matters” on pages 417, 130 and 162, respectively, to our
knowledge no circumstances have arisen since the date of the last financial information disclosed in this RHP which
materially and adversely affect or are likely to affect, our operations or profitability, or the value of our assets or our ability to
pay our material liabilities within the next 12 months.
457
SECTION VI: LEGAL AND OTHER INFORMATION
OUTSTANDING LITIGATION AND OTHER MATERIAL DEVELOPMENTS
Except as stated in this section, there are no (i) outstanding criminal proceedings, (ii) actions taken by statutory or regulatory
authorities or (iii) material litigation, in each case, involving any of our Company, Promoters, Directors, Subsidiaries and
Group Companies. All taxation matters have been disclosed in a consolidated manner (separately for direct and indirect
taxes).
In relation to (iii) above, our Board in its meeting held on March 28, 2016, has adopted a policy for identification of Group
Companies, material creditors and material legal proceedings. Accordingly, in relation to material legal proceedings, our
Board has considered as material each such case involving our Company, Promoters, Directors, Subsidiaries or Group
Companies, where the aggregate amount involved individually exceeds one per cent of the profit after tax of our Company as
per the Restated Standalone Financial Statements for the most recent financial year, or where the monetary liability is not
quantifiable, each such case involving our Company, Promoters, Directors, Subsidiaries or Group Companies, whose
outcome would have a bearing on the operations or performance of our Company. Accordingly, we have individually
disclosed outstanding litigation involving our Company and its Promoters, Directors, Subsidiaries and Group Companies,
where the aggregate amount involved exceeds one per cent of the standalone profit after tax of our Company for Financial
Year 2015 and for all litigations below such amount, we have provided summary and indicative disclosure. In relation to
criminal proceedings and actions by statutory/ regulatory authorities, no materiality threshold has been applied.
Except as stated in this section, there is no other litigation involving any other person or company whose outcome could have
a material adverse effect on our Company.
Dues owed by our Company to small scale undertakings as on June 30, 2016 have been disclosed in a consolidated manner,
and details of outstanding dues to small scale undertakings, which individually exceed ₹ 2.50 million have been considered as
material dues of our Company. Each creditor, to whom our Company individually owes a net aggregate amount that exceeds
5.00% of the trade payables as per the Restated Consolidated Financial Statements for the most recent financial year, has
been considered as a material creditor of our Company. Accordingly, consolidated information of outstanding dues owed to
small scale undertakings and other creditors, and other material creditors separately, giving details of number of cases and
amount for such dues, have been disclosed.
Further, except as stated in this section, there are no (i) material frauds committed against our Company in the five years
preceding the date of the RHP; (ii) pending proceedings initiated against our Company for economic offences; and (iii)
details of defaults and non-payment of statutory dues by our Company.
Litigation involving our Company
Litigation against our Company
A. Criminal Proceedings
1. Sanjay Sharma filed a criminal complaint (number 1552/2015) against our Company under the IPC before the
Additional Chief Judicial Magistrate – III, Ghaziabad, alleging criminal misappropriation of an aggregate amount of
₹ 3.11 million by our Company and its employees. The matter is currently pending.
2. Usha Kanwar and others filed two claims for compensation (numbers MAC 3/2015 and MAC 4/2015) before the
Motor Accident Claims Tribunal, Pali against, inter alia, our Company due to the death of two persons caused by an
accident in which Ram Singh, a driver employed by our Company, was driving the vehicle. The aggregate amount
involved in both cases is ₹ 37.71 million. The matter is currently pending.
3. Apart from the above, there are 11 applications filed by various persons before the Motor Accident Claims Tribunal
against drivers employed by our Company, primarily under sections 166 and 140, and certain other sections of the
MV Act, and the rules made thereunder, in relation to claiming compensation for rash driving, causing injury or
death. Our Company has been impleaded as a party in some of these cases. The aggregate amount involved in these
cases is approximately ₹ 18.05 million. These matters are currently pending at various stages of adjudication.
4. Bhagwan Singh and other villagers of Ajizpur filed a complaint to the Revenue Board, Tehsil Chhatta, Mathura
District alleging that the laying down of a pipeline by our Company in khasra number 229, circle road for the
disposal of water waste had been without the sanction of revenue officers and the land management committee. In
this regard, the Sub-Divisional Magistrate of Chatta, Mathura District issued a notice under section 133 of the
Cr.P.C. The matter is currently pending.
458
5. Certain bottles of Mirinda were purchased on April 5, 2003 by the Food Inspector, Dehradun, for testing due to the
alleged presence of floating objects in sealed bottles. As per the report of the State Public Laboratory, Lucknow,
dated May 17, 2003, the presence of floating substances was found in the tested sample. Consequently, a criminal
complaint (complaint number 1850/03) was filed under the PFA in the court of the Special Judicial Magistrate,
Economic Offences, Dehradun against, inter alia, our Company in its capacity as the manufacturer of the
aforementioned products. The matter is currently pending.
6. Apart from the above, our Company or its nominee is party to 67 matters initiated against it under the provisions of
the PFA and the FSSA, as the case may be. These matters include proceedings initiated against our Company or its
nominee for alleged misbranding of packed food products and for alleged adulteration in the content of products
manufactured by our Company. These matters are currently pending.
B. Civil Proceedings
1. There are certain civil proceedings against our Company that relate, inter alia, to consumer complaints and labour
disputes. These matters are currently pending before various authorities. However, there is no outstanding civil
litigation against our Company which involves a pecuniary repercussion of ₹ 14.75 million or more, nor any
outstanding litigation wherein monetary liability is not quantifiable and whose outcome would have a bearing on the
operations or performance of our Company.
C. Actions initiated by regulatory and statutory authorities
1. The registrar of companies submitted a report dated November 2, 2011, stating that our Board had failed to provide
complete details in respect of conservation of energy, technology absorption, foreign exchange earnings and outgo in
the manner prescribed under the Companies (Disclosure of Particulars in the Report of Board of Directors) Rules,
1988, since details required under the aforesaid rules had not been enclosed as annexures to the Director’s report for
Financial Years 2006, 2007, 2008 and 2009. Consequently, the registrar of companies submitted that our Company
was in violation of the provisions of section 217(1)(e) of the Companies Act, 1956. In this regard, our Company
filed a compounding application under section 621A of the Companies Act, 1956. The New Delhi Bench of the
Company Law Board (“CLB”) vide its order dated November 6, 2012 accepted our compounding application and
ordered the offence to be compounded. Our Company has paid a total amount of ₹ 36,000 as compounding fees and
communicated the CLB order to the RoC.
2. The RoC submitted a report dated March 10, 2010, stating that our Company had not prepared its balance sheet and
profit loss account in accordance with schedule VI of the Companies Act, 1956, from Financial Year 1996 to
Financial Year 2007. Consequently, the RoC submitted that our Company was in violation of the provisions of
section 211(7) read with schedule IV of the Companies Act, 1956. In this regard, our Company filed a compounding
application under section 621A of the Companies Act, 1956. The CLB vide its order dated September 19, 2011
accepted our compounding application and ordered the offence to be compounded. Our Company has paid a total
amount of ₹ 34,000 as compounding fees and communicated the CLB order to the RoC.
3. The Weights And Measures Department, Uttar Pradesh, issued a notice alleging that our Company was conducting
operations at the Satharia production facility without obtaining the requisite registration certificate under the Legal
Metrology Act. Summons were issued in the name of Manoj Dwivedi, Nitin Taylor and Kamlesh Kumar Jain from
the court of the Additional Chief Judicial Magistrate-I, Jaunpur, on the basis of the report of the Weights and
Measurements Department. Compounding in respect of Kamlesh Kumar Jain has been done by depositing the
requisite fee of ₹ 25,000. The matter is currently pending before the Additional Chief Judicial Magistrate-I, Jaunpur
and the amount involved is ₹ 0.05 million.
D. Tax Proceedings
We have disclosed claims relating to direct and indirect taxes involving our Company in a consolidated manner
giving details of number of cases and total amount involved in such claims.
Particulars Number of cases Aggregate amount involved (in ₹
million)
Company
Direct Tax(1)
- Disallowances 20 845.83
- Penalties 1 39.00
- Demand amounts 10 10.62
Indirect Tax(2)
94 171.81
(1) A search and seizure operation was conducted under section 132 of the IT Act on March 27, 2012 on M/s Jaipuria Group (R.K. Jaipuria
Group)(“Search and Seizure Operation”). Following the Search and Seizure Operation, our Company received assessment orders along
459
with demand notices for Assessment Year 2006-2007 to Assessment Year 2012-2013 from the Assistant Commissioner of Income Tax, Central Circle-7, New Delhi and Assistant Commissioner of Income Tax, Central Circle-12, New Delhi (“ACITs”). Our Company preferred
appeals before various Commissioners of Income Tax – Appeals (“CITs”) against the assessment orders of the ACITs. The CITs have
allowed certain of our appeals for the above block of assessments. The Income Tax Department has preferred appeals against the aforementioned orders of the CITs. Certain of our appeals before the CITs have been dismissed, and we have preferred appeals against
these dismissal orders. These appeals are currently pending before various ITATs.
(2) Our Company received an excise order on March 7, 2014 issued by the Commissioner of Central Excise, Noida II, stating that the products
“Nimbooz by Seven-Up” and “Nimbooz Masala Soda by Seven-Up” were classifiable, in accordance with the first schedule of the Central Excise Tariff Act, 1985, under central excise tariff item “lemonade” instead of tariff item “fruit pulp or fruit juice based drinks”. Pursuant
to this order, our Company was liable to pay central excise duty amounting to ₹ 73.55 million, as well as a penalty of ₹ 73.55 million on
account of non-payment of appropriate excise duty on the manufacture of the above mentioned products, that has been paid by our Company. Our Company has preferred an appeal against this order before the CESTAT, New Delhi. The matter is currently pending.
Litigation filed by our Company
A. Criminal Proceedings
1. There are 285 matters filed by our Company against some of our past distributors under the provisions of the NI Act.
All these matters have been filed in order to recover sums due to our Company, usually on account of products
supplied and returnable empty glass bottles, for which cheques issued in favour of our Company have been
dishonoured for various reasons such as insufficiency of funds or closure of the distributor’s account. In addition to
the aforementioned proceedings, our Company has also filed certain criminal complaints under sections 405, 406
and 420 of the IPC against some of our past distributors for breach of contract and cheating. These matters are
pending before various authorities.
2. Our Company filed a criminal complaint (number 125 of 2015) against Ashok Kumar (the “Accused”), proprietor of
M/s Hanuman Traders, one of the past distributors for our Company. In the course of proceedings initiated by our
Company against M/s Hanuman Traders and the Accused under the provisions of the NI Act, the Accused produced
challans to support his claim that he had returned all the empty bottles belonging to our Company, and contended
that our Company did not have any valid grounds to proceed against him. Consequently, our Company filed the
aforesaid criminal complaint under sections 193, 467, 468 and 471 of the IPC, alleging that the Accused gave false
evidence with the intention to contest our Company’s claims. The matter is currently pending before the Judicial
Magistrate, Gurgaon.
3. In addition to the above, our Company filed police complaints against certain individuals for using empty returnable
glass bottles belonging to our Company to manufacture and sell spurious soft drinks under the brand names ‘Pepsi’
and ‘Mirinda’. These complaints were typically filed under sections 420 and 34 of the IPC, sections 63 and 64 of the
Copyright Act, 1957, and sections 78 and 79 of the Trade Marks Act, 1999, as the case may be, to enable the police
authorities to take appropriate action.
B. Civil Proceedings
1. Our Company, by way of a writ petition (number 196/2014) under article 226 of the Constitution of India,
challenged amendments to the Goa Non-Biodegradable Garbage (Control) Act, 1996, which imposed a cess leviable
on any non-biodegradable packaging material of an amount of up to two per cent of the value of goods. Our
Company argued that the aforementioned amendments were ultra vires the legislative competence of the Goa
legislative assembly, since the legislative field was occupied by the Environment Protection Act, 1986 and the
Plastic Waste (Management and Handling) Rules, 2011. Our Company further argued that the aforementioned
amendments were in violation of Article 14 and Article 19(1)(g) of the Constitution of India since the amendments
targeted certain goods based on their packaging and consequently, constituted an unreasonable restriction on our
Company’s right to carry on its business. The High Court of Bombay at Goa passed an interim order dated May 7,
2014, ordering that no coercive penal action be taken against our Company until further orders were passed in the
matter. The matter is currently pending before the Panaji Bench of the High Court of Bombay at Goa.
2. Our Company entered into a lease deed dated March 23, 2015 with the Uttar Pradesh State Industrial Development
Corporation (the “Lease Deed”). Subsequently, the Assistant Inspector General of Stamps, Kanpur Dehat (the
“Authority”) vide the spot inspection report dated September 18, 2015, alleged that our Company had evaded stamp
duty while executing the Lease Deed. Pursuant to the spot inspection report, the Authority filed a suit before the
District Magistrate, Kanpur Dehat for the recovery of stamp duty under section 47A(3) of the Indian Stamp Act,
1899. During the pendency of the suit, our Company applied to avail the benefit of the Stamp Duty Samadhan
Scheme initiated by the State of Uttar Pradesh, under which pending matters could be disposed off by the district
magistrate if the assessee pays the deficit stamp duty along with interest and a token penalty of ₹ 10. However, the
District Magistrate, Kanpur Dehat denied the benefit under the aforementioned scheme and passed an order on April
28, 2016, directing our Company to deposit the deficit amount of stamp duty of ₹ 20.60 million, along with interest
calculated at 1.50 per cent per month, and a one time penalty of ₹ 20.60 million. Our Company filed an appeal
before the appellate authority, and the appellate authority, vide an order dated August 26, 2016, set aside the
460
aforementioned order of the District Magistrate, Kanpur Dehat, with a direction to decide the same on merits. Our
Company filed a writ petition before the High Court of Judicature at Allahabad (“High Court”), challenging the
order of the appellate authority. Vide an order dated September 22, 2016 (“Order”), the High Court has ordered a
stay on the penalty imposed upon our Company if our Company deposits the entire amount of deficiency along with
1.5% up to date interest within a period of four weeks from the Order. The High Court has also ordered that no
coercive action be taken against our Company in order to recover the amount of one-time penalty. The matter is
currently pending and the aggregate amount involved is ₹ 45.84 million, out of which our Company has already paid
a sum of ₹ 15.2 million at the time of filing the appeal before the appellate authority.
3. Apart from the above, there are certain civil proceedings initiated by our Company in the ordinary course of business
against certain of our past distributors. These matters are currently are pending before various authorities. However,
there is no outstanding civil litigation initiated by our Company which involves a pecuniary repercussion of ₹ 14.75
million or more, nor any outstanding litigation wherein monetary liability is not quantifiable and whose outcome
would have a bearing on the operations or performance of our Company.
Litigation involving our Directors
Litigation against our Directors
A. Criminal Proceedings
I. Ravi Kant Jaipuria
1. A complaint was filed before the Chief Judicial Magistrate, Jaipur under section 156(3) of the Cr.P.C against Ravi
Kant Jaipuria in his capacity as chairman of the Champa Devi Jaipuria Charitable Trust (the “Trust”). Following a
direction of the Chief Judicial Magistrate, Jaipur, an FIR was filed (FIR number 409/2015) at the Gandhi Nagar
police station in Jaipur against, inter alios, Ravi Kant Jaipuria. It was alleged that a conspiracy was entered into in
2002-2003 with government officials, which led to the allotment of 9,465 square metres of land at Sector 6,
Vidhyadhar Nagar, Jaipur at concessional rates, causing unlawful profit to the Trust and loss to the government. It
was further alleged that the Trust was not duly registered. A petition was filed by Ravi Kant Jaipuria under section
482 of the Cr.P.C before the Rajasthan High Court for quashing of the aforementioned FIR. The Rajasthan High
Court vide its orders dated November 6, 2015 and November 23, 2015, has ordered that no coercive action be taken
against Ravi Kant Jaipuria and directed the investigation authority to submit its report. Further, the Rajasthan High
Court vide its orders dated January 6, 2016, May 6, 2016 and July 27, 2016, maintained that no coercive action be
taken against Ravi Kant Jaipuria.
2. Nand Gopal (the “Complainant”), a past distributor of our Company appointed for the sale and distribution of
products of Devyani Beverages Limited (“DBL”) in Kiratpur, filed a criminal complaint (complaint number 824/99)
dated June 7, 1999, before the court of Additional Chief Judicial Magistrate-I, Najibabad, against, inter alios, Ravi
Kant Jaipuria under section 406 of IPC in his capacity as chairman of DBL. The Complainant alleged that DBL had
committed criminal breach of trust by not returning an amount of ₹ 30,000 which had been deposited by the
Complainant with DBL as security. A criminal miscellaneous petition (petition number 11699/2005) was filed on
behalf of Ravi Kant Jaipuria before the Allahabad High Court for quashing the aforesaid complaint. The Allahabad
High Court has stayed proceedings in this matter vide an order dated August 25, 2005. The matter is currently
pending.
3. Ravi Kant Jaipuria, in his capacity as a Director of our Company, is party to one matter initiated by the Food
Inspector, Tonk, Rajasthan, under the provisions of the PFA and the Prevention of Food Adulteration Rules, 1955.
This matter relates to alleged adulteration and misbranding of carbonated beverages. This matter is currently pending
before the Chief Judicial Magistrate, Tonk, Rajasthan.
II. Kamlesh Kumar Jain
1. A sample of synthetic soft drink concentrate was drawn on June 1, 2006. As per the public analyst report in relation
to the sample, the drawn sample was found to be adulterated. Consequently, a criminal complaint (complaint number
69/07) was filed under the PFA before the court of the Additional Chief Metropolitan Magistrate, Patiala House
Courts, New Delhi, against, inter alios, Kamlesh Kumar Jain in his capacity as director of Universal Dairy Products
Private Limited, where Universal Dairy Products Private Limited was acting as a distributor of the Company. On a
re-inspection of the sample by the Central Food Laboratory (“CFL”), the sample was found to not be adulterated.
However, the CFL submitted that misbranding has occurred, since the ‘vegetarian’ symbol was not printed on the
packaging and the extraneous addition of colouring matter was not mentioned. The accused, including Kamlesh
Kumar Jain, have been exempt from personally appearing in the matter on the orders of the Delhi High Court. The
matter is currently pending.
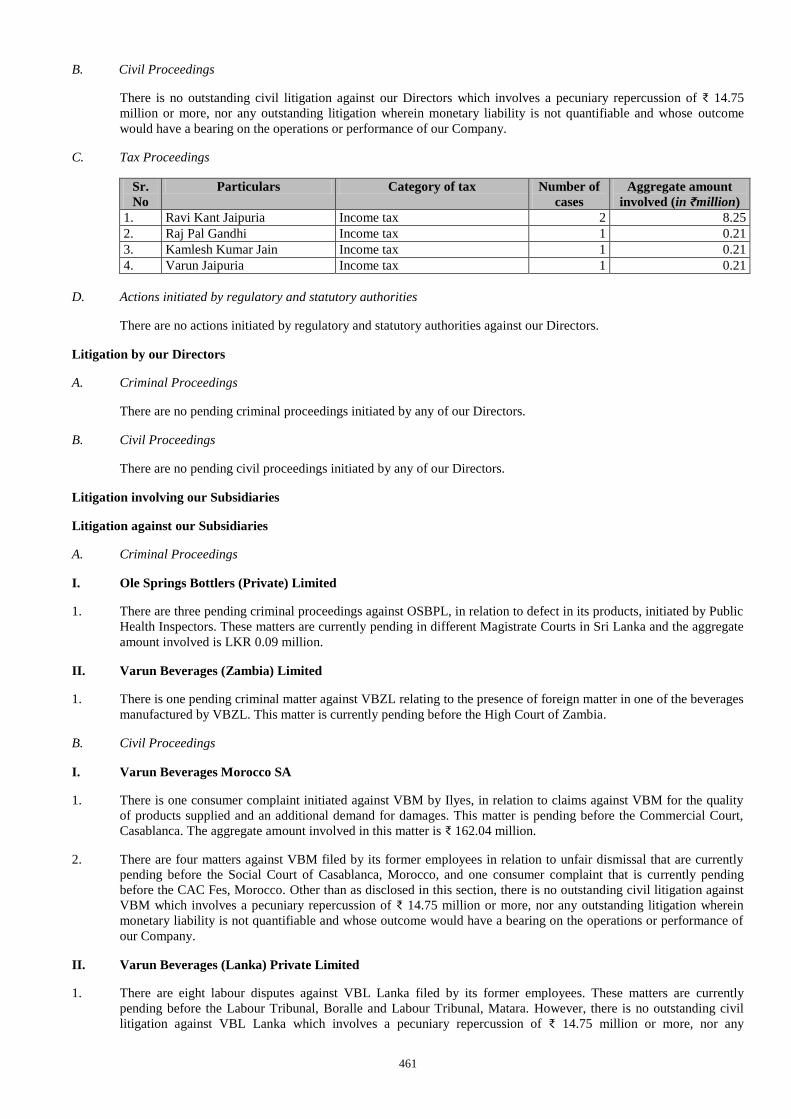
461
B. Civil Proceedings
There is no outstanding civil litigation against our Directors which involves a pecuniary repercussion of ₹ 14.75
million or more, nor any outstanding litigation wherein monetary liability is not quantifiable and whose outcome
would have a bearing on the operations or performance of our Company.
C. Tax Proceedings
Sr.
No
Particulars Category of tax Number of
cases
Aggregate amount
involved (in ₹million)
1. Ravi Kant Jaipuria Income tax 2 8.25
2. Raj Pal Gandhi Income tax 1 0.21
3. Kamlesh Kumar Jain Income tax 1 0.21
4. Varun Jaipuria Income tax 1 0.21
D. Actions initiated by regulatory and statutory authorities
There are no actions initiated by regulatory and statutory authorities against our Directors.
Litigation by our Directors
A. Criminal Proceedings
There are no pending criminal proceedings initiated by any of our Directors.
B. Civil Proceedings
There are no pending civil proceedings initiated by any of our Directors.
Litigation involving our Subsidiaries
Litigation against our Subsidiaries
A. Criminal Proceedings
I. Ole Springs Bottlers (Private) Limited
1. There are three pending criminal proceedings against OSBPL, in relation to defect in its products, initiated by Public
Health Inspectors. These matters are currently pending in different Magistrate Courts in Sri Lanka and the aggregate
amount involved is LKR 0.09 million.
II. Varun Beverages (Zambia) Limited
1. There is one pending criminal matter against VBZL relating to the presence of foreign matter in one of the beverages
manufactured by VBZL. This matter is currently pending before the High Court of Zambia.
B. Civil Proceedings
I. Varun Beverages Morocco SA
1. There is one consumer complaint initiated against VBM by Ilyes, in relation to claims against VBM for the quality
of products supplied and an additional demand for damages. This matter is pending before the Commercial Court,
Casablanca. The aggregate amount involved in this matter is ₹ 162.04 million.
2. There are four matters against VBM filed by its former employees in relation to unfair dismissal that are currently
pending before the Social Court of Casablanca, Morocco, and one consumer complaint that is currently pending
before the CAC Fes, Morocco. Other than as disclosed in this section, there is no outstanding civil litigation against
VBM which involves a pecuniary repercussion of ₹ 14.75 million or more, nor any outstanding litigation wherein
monetary liability is not quantifiable and whose outcome would have a bearing on the operations or performance of
our Company.
II. Varun Beverages (Lanka) Private Limited
1. There are eight labour disputes against VBL Lanka filed by its former employees. These matters are currently
pending before the Labour Tribunal, Boralle and Labour Tribunal, Matara. However, there is no outstanding civil
litigation against VBL Lanka which involves a pecuniary repercussion of ₹ 14.75 million or more, nor any
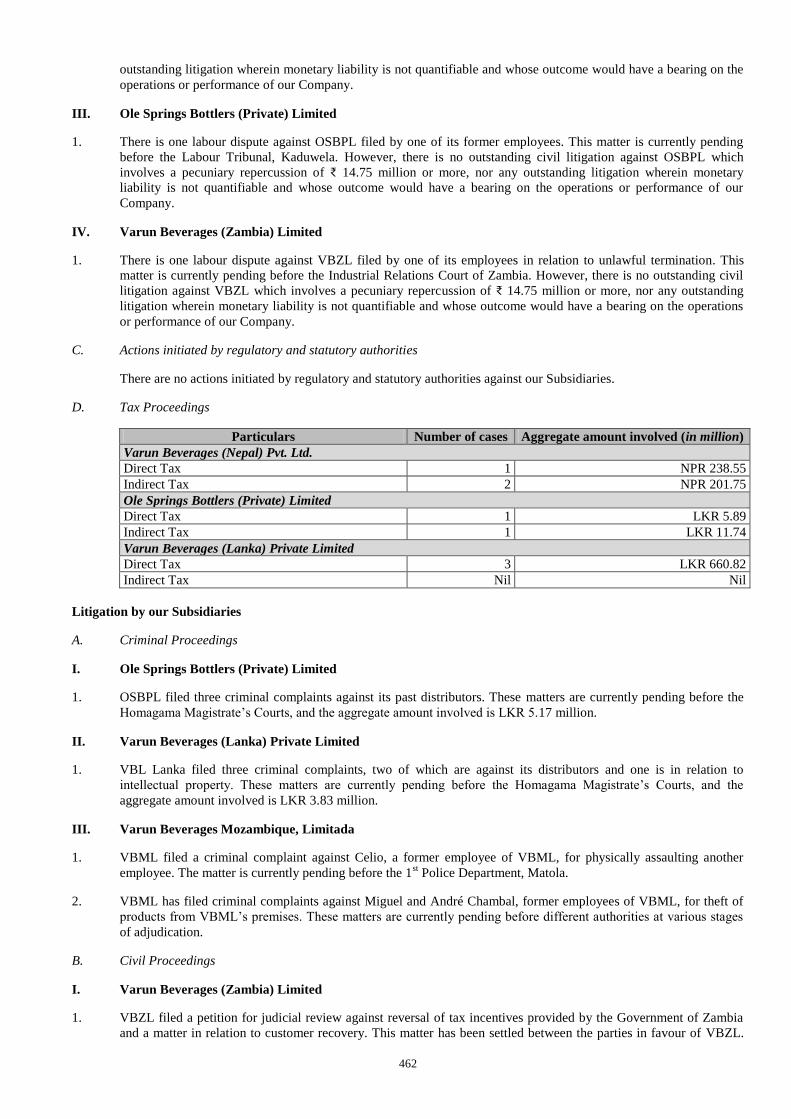
462
outstanding litigation wherein monetary liability is not quantifiable and whose outcome would have a bearing on the
operations or performance of our Company.
III. Ole Springs Bottlers (Private) Limited
1. There is one labour dispute against OSBPL filed by one of its former employees. This matter is currently pending
before the Labour Tribunal, Kaduwela. However, there is no outstanding civil litigation against OSBPL which
involves a pecuniary repercussion of ₹ 14.75 million or more, nor any outstanding litigation wherein monetary
liability is not quantifiable and whose outcome would have a bearing on the operations or performance of our
Company.
IV. Varun Beverages (Zambia) Limited
1. There is one labour dispute against VBZL filed by one of its employees in relation to unlawful termination. This
matter is currently pending before the Industrial Relations Court of Zambia. However, there is no outstanding civil
litigation against VBZL which involves a pecuniary repercussion of ₹ 14.75 million or more, nor any outstanding
litigation wherein monetary liability is not quantifiable and whose outcome would have a bearing on the operations
or performance of our Company.
C. Actions initiated by regulatory and statutory authorities
There are no actions initiated by regulatory and statutory authorities against our Subsidiaries.
D. Tax Proceedings
Particulars Number of cases Aggregate amount involved (in million)
Varun Beverages (Nepal) Pvt. Ltd.
Direct Tax 1 NPR 238.55
Indirect Tax 2 NPR 201.75
Ole Springs Bottlers (Private) Limited
Direct Tax 1 LKR 5.89
Indirect Tax 1 LKR 11.74
Varun Beverages (Lanka) Private Limited
Direct Tax 3 LKR 660.82
Indirect Tax Nil Nil
Litigation by our Subsidiaries
A. Criminal Proceedings
I. Ole Springs Bottlers (Private) Limited
1. OSBPL filed three criminal complaints against its past distributors. These matters are currently pending before the
Homagama Magistrate’s Courts, and the aggregate amount involved is LKR 5.17 million.
II. Varun Beverages (Lanka) Private Limited
1. VBL Lanka filed three criminal complaints, two of which are against its distributors and one is in relation to
intellectual property. These matters are currently pending before the Homagama Magistrate’s Courts, and the
aggregate amount involved is LKR 3.83 million.
III. Varun Beverages Mozambique, Limitada
1. VBML filed a criminal complaint against Celio, a former employee of VBML, for physically assaulting another
employee. The matter is currently pending before the 1st Police Department, Matola.
2. VBML has filed criminal complaints against Miguel and André Chambal, former employees of VBML, for theft of
products from VBML’s premises. These matters are currently pending before different authorities at various stages
of adjudication.
B. Civil Proceedings
I. Varun Beverages (Zambia) Limited
1. VBZL filed a petition for judicial review against reversal of tax incentives provided by the Government of Zambia
and a matter in relation to customer recovery. This matter has been settled between the parties in favour of VBZL.
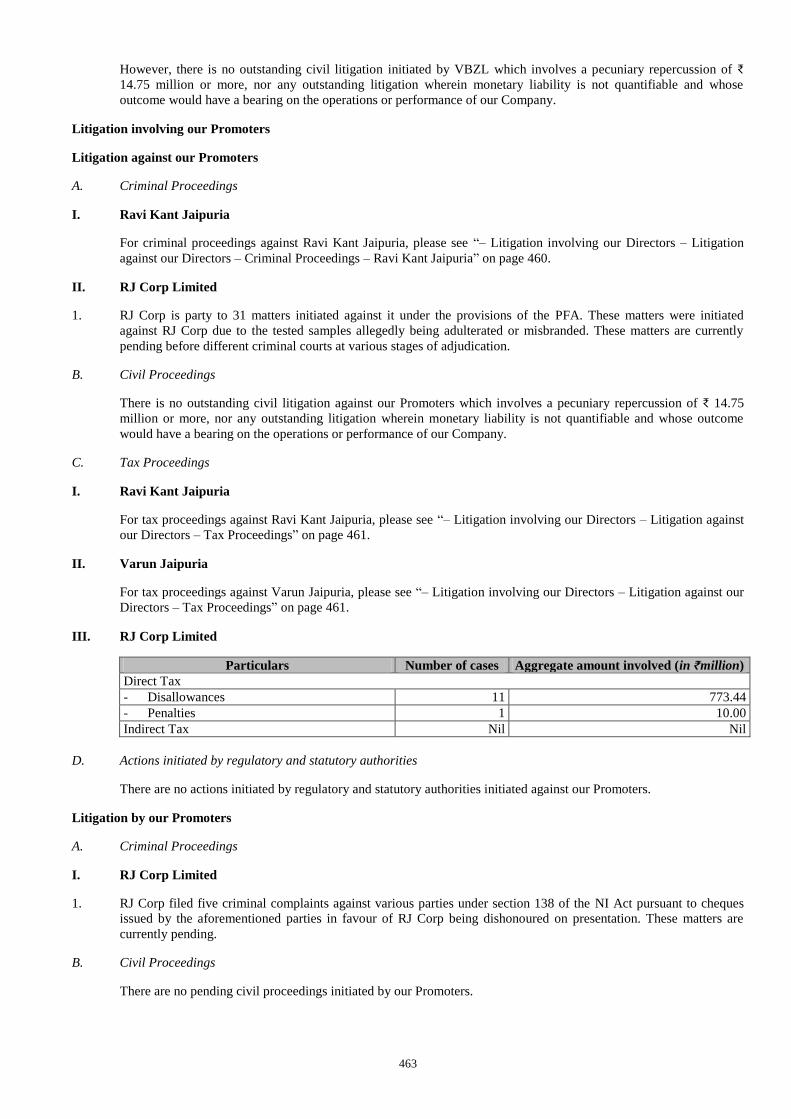
463
However, there is no outstanding civil litigation initiated by VBZL which involves a pecuniary repercussion of ₹
14.75 million or more, nor any outstanding litigation wherein monetary liability is not quantifiable and whose
outcome would have a bearing on the operations or performance of our Company.
Litigation involving our Promoters
Litigation against our Promoters
A. Criminal Proceedings
I. Ravi Kant Jaipuria
For criminal proceedings against Ravi Kant Jaipuria, please see “– Litigation involving our Directors – Litigation
against our Directors – Criminal Proceedings – Ravi Kant Jaipuria” on page 460.
II. RJ Corp Limited
1. RJ Corp is party to 31 matters initiated against it under the provisions of the PFA. These matters were initiated
against RJ Corp due to the tested samples allegedly being adulterated or misbranded. These matters are currently
pending before different criminal courts at various stages of adjudication.
B. Civil Proceedings
There is no outstanding civil litigation against our Promoters which involves a pecuniary repercussion of ₹ 14.75
million or more, nor any outstanding litigation wherein monetary liability is not quantifiable and whose outcome
would have a bearing on the operations or performance of our Company.
C. Tax Proceedings
I. Ravi Kant Jaipuria
For tax proceedings against Ravi Kant Jaipuria, please see “– Litigation involving our Directors – Litigation against
our Directors – Tax Proceedings” on page 461.
II. Varun Jaipuria
For tax proceedings against Varun Jaipuria, please see “– Litigation involving our Directors – Litigation against our
Directors – Tax Proceedings” on page 461.
III. RJ Corp Limited
Particulars Number of cases Aggregate amount involved (in ₹million)
Direct Tax
- Disallowances 11 773.44
- Penalties 1 10.00
Indirect Tax Nil Nil
D. Actions initiated by regulatory and statutory authorities
There are no actions initiated by regulatory and statutory authorities initiated against our Promoters.
Litigation by our Promoters
A. Criminal Proceedings
I. RJ Corp Limited
1. RJ Corp filed five criminal complaints against various parties under section 138 of the NI Act pursuant to cheques
issued by the aforementioned parties in favour of RJ Corp being dishonoured on presentation. These matters are
currently pending.
B. Civil Proceedings
There are no pending civil proceedings initiated by our Promoters.
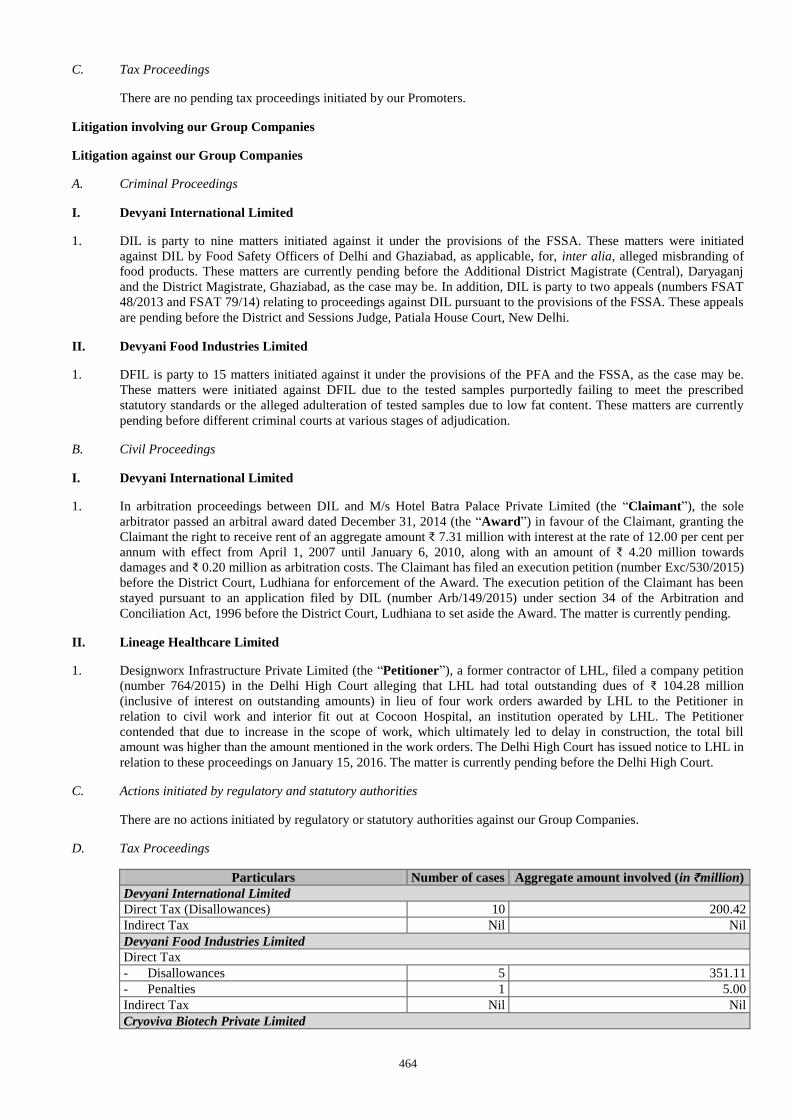
464
C. Tax Proceedings
There are no pending tax proceedings initiated by our Promoters.
Litigation involving our Group Companies
Litigation against our Group Companies
A. Criminal Proceedings
I. Devyani International Limited
1. DIL is party to nine matters initiated against it under the provisions of the FSSA. These matters were initiated
against DIL by Food Safety Officers of Delhi and Ghaziabad, as applicable, for, inter alia, alleged misbranding of
food products. These matters are currently pending before the Additional District Magistrate (Central), Daryaganj
and the District Magistrate, Ghaziabad, as the case may be. In addition, DIL is party to two appeals (numbers FSAT
48/2013 and FSAT 79/14) relating to proceedings against DIL pursuant to the provisions of the FSSA. These appeals
are pending before the District and Sessions Judge, Patiala House Court, New Delhi.
II. Devyani Food Industries Limited
1. DFIL is party to 15 matters initiated against it under the provisions of the PFA and the FSSA, as the case may be.
These matters were initiated against DFIL due to the tested samples purportedly failing to meet the prescribed
statutory standards or the alleged adulteration of tested samples due to low fat content. These matters are currently
pending before different criminal courts at various stages of adjudication.
B. Civil Proceedings
I. Devyani International Limited
1. In arbitration proceedings between DIL and M/s Hotel Batra Palace Private Limited (the “Claimant”), the sole
arbitrator passed an arbitral award dated December 31, 2014 (the “Award”) in favour of the Claimant, granting the
Claimant the right to receive rent of an aggregate amount ₹ 7.31 million with interest at the rate of 12.00 per cent per
annum with effect from April 1, 2007 until January 6, 2010, along with an amount of ₹ 4.20 million towards
damages and ₹ 0.20 million as arbitration costs. The Claimant has filed an execution petition (number Exc/530/2015)
before the District Court, Ludhiana for enforcement of the Award. The execution petition of the Claimant has been
stayed pursuant to an application filed by DIL (number Arb/149/2015) under section 34 of the Arbitration and
Conciliation Act, 1996 before the District Court, Ludhiana to set aside the Award. The matter is currently pending.
II. Lineage Healthcare Limited
1. Designworx Infrastructure Private Limited (the “Petitioner”), a former contractor of LHL, filed a company petition
(number 764/2015) in the Delhi High Court alleging that LHL had total outstanding dues of ₹ 104.28 million
(inclusive of interest on outstanding amounts) in lieu of four work orders awarded by LHL to the Petitioner in
relation to civil work and interior fit out at Cocoon Hospital, an institution operated by LHL. The Petitioner
contended that due to increase in the scope of work, which ultimately led to delay in construction, the total bill
amount was higher than the amount mentioned in the work orders. The Delhi High Court has issued notice to LHL in
relation to these proceedings on January 15, 2016. The matter is currently pending before the Delhi High Court.
C. Actions initiated by regulatory and statutory authorities
There are no actions initiated by regulatory or statutory authorities against our Group Companies.
D. Tax Proceedings
Particulars Number of cases Aggregate amount involved (in ₹million)
Devyani International Limited
Direct Tax (Disallowances) 10 200.42
Indirect Tax Nil Nil
Devyani Food Industries Limited
Direct Tax
- Disallowances 5 351.11
- Penalties 1 5.00
Indirect Tax Nil Nil
Cryoviva Biotech Private Limited
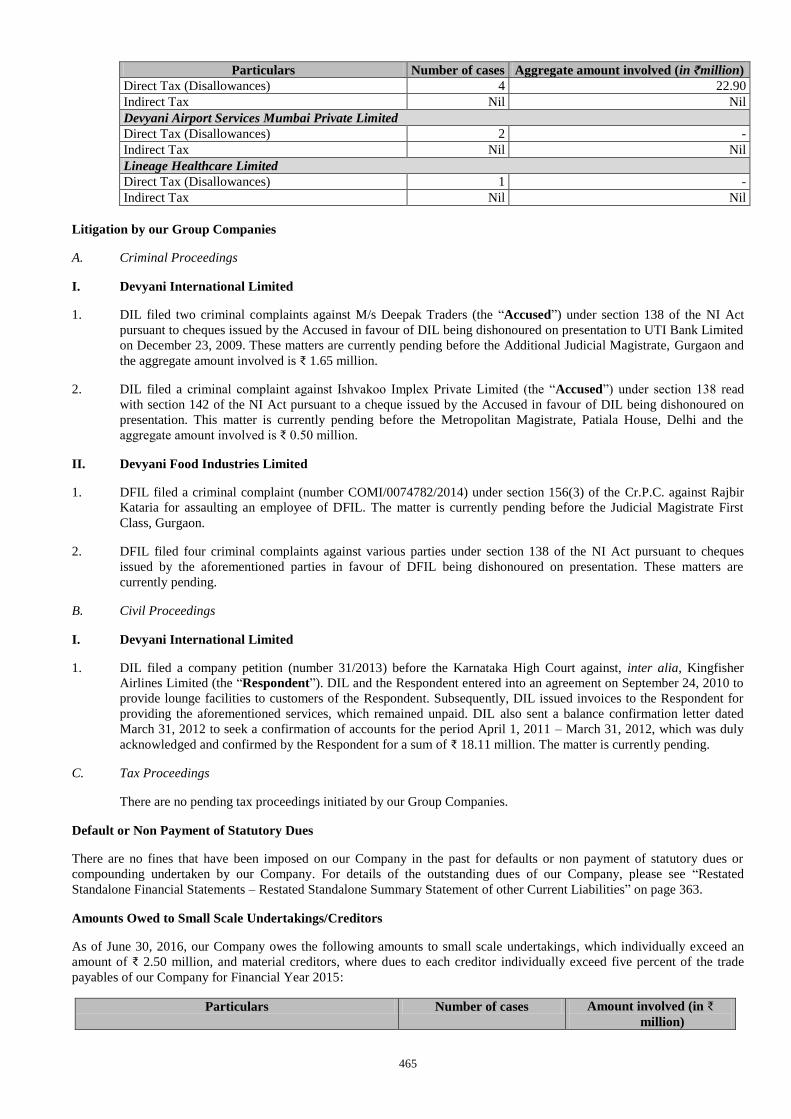
465
Particulars Number of cases Aggregate amount involved (in ₹million)
Direct Tax (Disallowances) 4 22.90
Indirect Tax Nil Nil
Devyani Airport Services Mumbai Private Limited
Direct Tax (Disallowances) 2 -
Indirect Tax Nil Nil
Lineage Healthcare Limited
Direct Tax (Disallowances) 1 -
Indirect Tax Nil Nil
Litigation by our Group Companies
A. Criminal Proceedings
I. Devyani International Limited
1. DIL filed two criminal complaints against M/s Deepak Traders (the “Accused”) under section 138 of the NI Act
pursuant to cheques issued by the Accused in favour of DIL being dishonoured on presentation to UTI Bank Limited
on December 23, 2009. These matters are currently pending before the Additional Judicial Magistrate, Gurgaon and
the aggregate amount involved is ₹ 1.65 million.
2. DIL filed a criminal complaint against Ishvakoo Implex Private Limited (the “Accused”) under section 138 read
with section 142 of the NI Act pursuant to a cheque issued by the Accused in favour of DIL being dishonoured on
presentation. This matter is currently pending before the Metropolitan Magistrate, Patiala House, Delhi and the
aggregate amount involved is ₹ 0.50 million.
II. Devyani Food Industries Limited
1. DFIL filed a criminal complaint (number COMI/0074782/2014) under section 156(3) of the Cr.P.C. against Rajbir
Kataria for assaulting an employee of DFIL. The matter is currently pending before the Judicial Magistrate First
Class, Gurgaon.
2. DFIL filed four criminal complaints against various parties under section 138 of the NI Act pursuant to cheques
issued by the aforementioned parties in favour of DFIL being dishonoured on presentation. These matters are
currently pending.
B. Civil Proceedings
I. Devyani International Limited
1. DIL filed a company petition (number 31/2013) before the Karnataka High Court against, inter alia, Kingfisher
Airlines Limited (the “Respondent”). DIL and the Respondent entered into an agreement on September 24, 2010 to
provide lounge facilities to customers of the Respondent. Subsequently, DIL issued invoices to the Respondent for
providing the aforementioned services, which remained unpaid. DIL also sent a balance confirmation letter dated
March 31, 2012 to seek a confirmation of accounts for the period April 1, 2011 – March 31, 2012, which was duly
acknowledged and confirmed by the Respondent for a sum of ₹ 18.11 million. The matter is currently pending.
C. Tax Proceedings
There are no pending tax proceedings initiated by our Group Companies.
Default or Non Payment of Statutory Dues
There are no fines that have been imposed on our Company in the past for defaults or non payment of statutory dues or
compounding undertaken by our Company. For details of the outstanding dues of our Company, please see “Restated
Standalone Financial Statements – Restated Standalone Summary Statement of other Current Liabilities” on page 363.
Amounts Owed to Small Scale Undertakings/Creditors
As of June 30, 2016, our Company owes the following amounts to small scale undertakings, which individually exceed an
amount of ₹ 2.50 million, and material creditors, where dues to each creditor individually exceed five percent of the trade
payables of our Company for Financial Year 2015:
Particulars Number of cases Amount involved (in ₹
million)
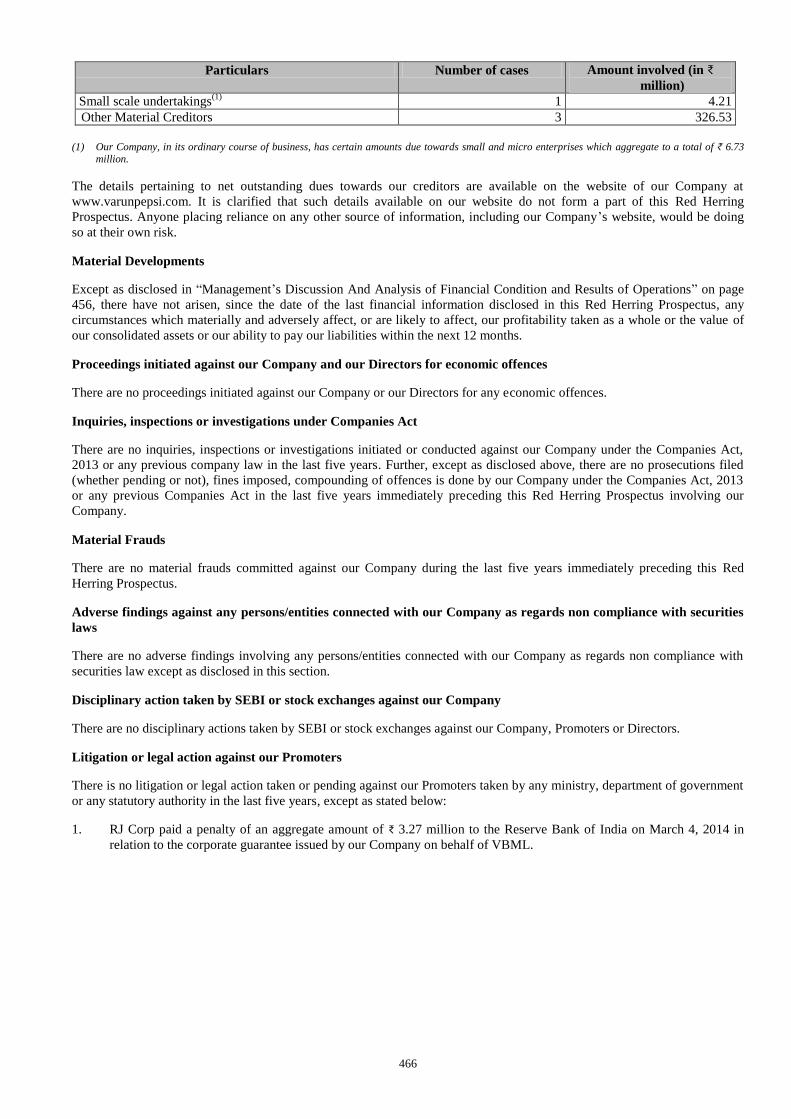
466
Particulars Number of cases Amount involved (in ₹
million)
Small scale undertakings(1)
1 4.21 Other Material Creditors 3 326.53
(1) Our Company, in its ordinary course of business, has certain amounts due towards small and micro enterprises which aggregate to a total of ₹ 6.73
million.
The details pertaining to net outstanding dues towards our creditors are available on the website of our Company at
www.varunpepsi.com. It is clarified that such details available on our website do not form a part of this Red Herring
Prospectus. Anyone placing reliance on any other source of information, including our Company’s website, would be doing
so at their own risk.
Material Developments
Except as disclosed in “Management’s Discussion And Analysis of Financial Condition and Results of Operations” on page
456, there have not arisen, since the date of the last financial information disclosed in this Red Herring Prospectus, any
circumstances which materially and adversely affect, or are likely to affect, our profitability taken as a whole or the value of
our consolidated assets or our ability to pay our liabilities within the next 12 months.
Proceedings initiated against our Company and our Directors for economic offences
There are no proceedings initiated against our Company or our Directors for any economic offences.
Inquiries, inspections or investigations under Companies Act
There are no inquiries, inspections or investigations initiated or conducted against our Company under the Companies Act,
2013 or any previous company law in the last five years. Further, except as disclosed above, there are no prosecutions filed
(whether pending or not), fines imposed, compounding of offences is done by our Company under the Companies Act, 2013
or any previous Companies Act in the last five years immediately preceding this Red Herring Prospectus involving our
Company.
Material Frauds
There are no material frauds committed against our Company during the last five years immediately preceding this Red
Herring Prospectus.
Adverse findings against any persons/entities connected with our Company as regards non compliance with securities
laws
There are no adverse findings involving any persons/entities connected with our Company as regards non compliance with
securities law except as disclosed in this section.
Disciplinary action taken by SEBI or stock exchanges against our Company
There are no disciplinary actions taken by SEBI or stock exchanges against our Company, Promoters or Directors.
Litigation or legal action against our Promoters
There is no litigation or legal action taken or pending against our Promoters taken by any ministry, department of government
or any statutory authority in the last five years, except as stated below:
1. RJ Corp paid a penalty of an aggregate amount of ₹ 3.27 million to the Reserve Bank of India on March 4, 2014 in
relation to the corporate guarantee issued by our Company on behalf of VBML.
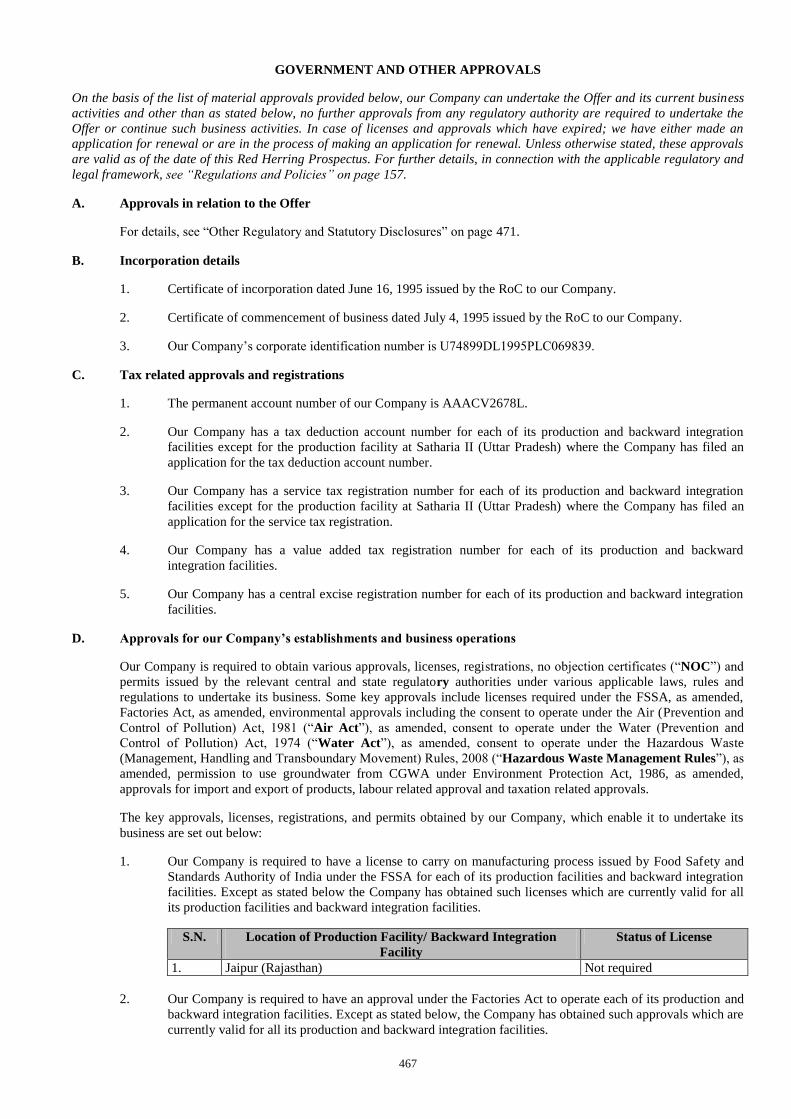
467
GOVERNMENT AND OTHER APPROVALS
On the basis of the list of material approvals provided below, our Company can undertake the Offer and its current business
activities and other than as stated below, no further approvals from any regulatory authority are required to undertake the
Offer or continue such business activities. In case of licenses and approvals which have expired; we have either made an
application for renewal or are in the process of making an application for renewal. Unless otherwise stated, these approvals
are valid as of the date of this Red Herring Prospectus. For further details, in connection with the applicable regulatory and
legal framework, see “Regulations and Policies” on page 157.
A. Approvals in relation to the Offer
For details, see “Other Regulatory and Statutory Disclosures” on page 471.
B. Incorporation details
1. Certificate of incorporation dated June 16, 1995 issued by the RoC to our Company.
2. Certificate of commencement of business dated July 4, 1995 issued by the RoC to our Company.
3. Our Company’s corporate identification number is U74899DL1995PLC069839.
C. Tax related approvals and registrations
1. The permanent account number of our Company is AAACV2678L.
2. Our Company has a tax deduction account number for each of its production and backward integration
facilities except for the production facility at Satharia II (Uttar Pradesh) where the Company has filed an
application for the tax deduction account number.
3. Our Company has a service tax registration number for each of its production and backward integration
facilities except for the production facility at Satharia II (Uttar Pradesh) where the Company has filed an
application for the service tax registration.
4. Our Company has a value added tax registration number for each of its production and backward
integration facilities.
5. Our Company has a central excise registration number for each of its production and backward integration
facilities.
D. Approvals for our Company’s establishments and business operations
Our Company is required to obtain various approvals, licenses, registrations, no objection certificates (“NOC”) and
permits issued by the relevant central and state regulatory authorities under various applicable laws, rules and
regulations to undertake its business. Some key approvals include licenses required under the FSSA, as amended,
Factories Act, as amended, environmental approvals including the consent to operate under the Air (Prevention and
Control of Pollution) Act, 1981 (“Air Act”), as amended, consent to operate under the Water (Prevention and
Control of Pollution) Act, 1974 (“Water Act”), as amended, consent to operate under the Hazardous Waste
(Management, Handling and Transboundary Movement) Rules, 2008 (“Hazardous Waste Management Rules”), as
amended, permission to use groundwater from CGWA under Environment Protection Act, 1986, as amended,
approvals for import and export of products, labour related approval and taxation related approvals.
The key approvals, licenses, registrations, and permits obtained by our Company, which enable it to undertake its
business are set out below:
1. Our Company is required to have a license to carry on manufacturing process issued by Food Safety and
Standards Authority of India under the FSSA for each of its production facilities and backward integration
facilities. Except as stated below the Company has obtained such licenses which are currently valid for all
its production facilities and backward integration facilities.
S.N. Location of Production Facility/ Backward Integration
Facility
Status of License
1. Jaipur (Rajasthan) Not required
2. Our Company is required to have an approval under the Factories Act to operate each of its production and
backward integration facilities. Except as stated below, the Company has obtained such approvals which are
currently valid for all its production and backward integration facilities.
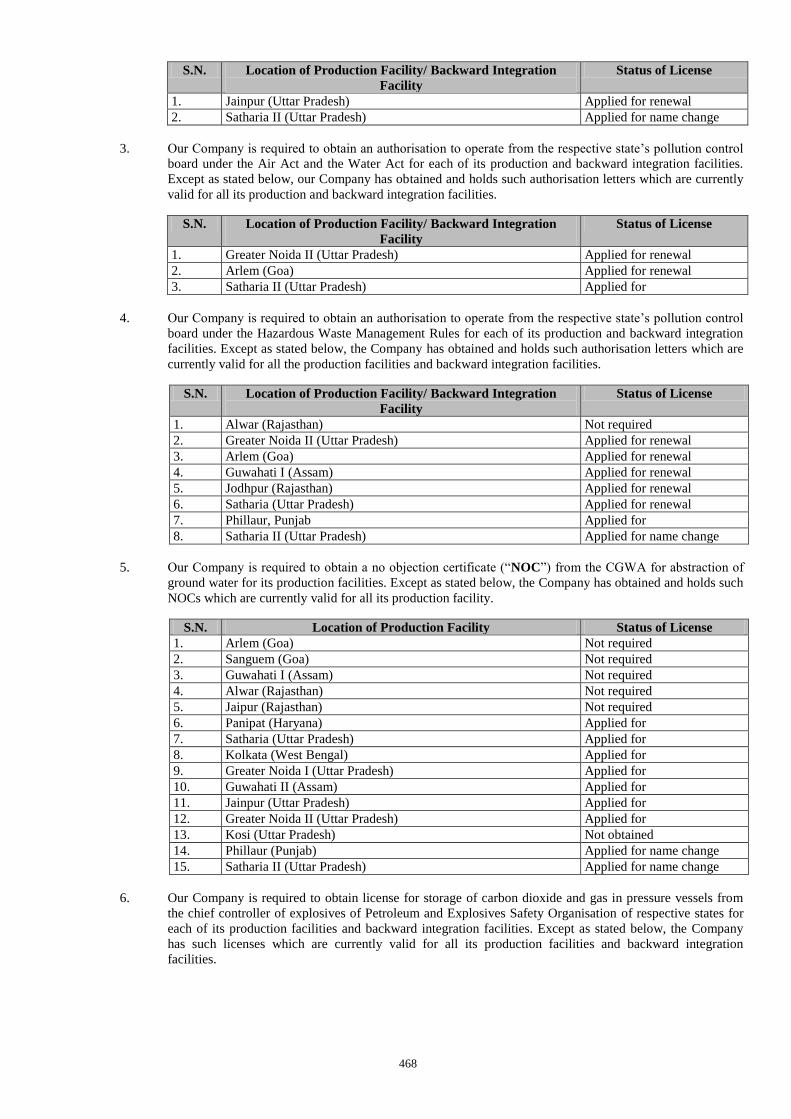
468
S.N. Location of Production Facility/ Backward Integration
Facility
Status of License
1. Jainpur (Uttar Pradesh) Applied for renewal
2. Satharia II (Uttar Pradesh) Applied for name change
3. Our Company is required to obtain an authorisation to operate from the respective state’s pollution control
board under the Air Act and the Water Act for each of its production and backward integration facilities.
Except as stated below, our Company has obtained and holds such authorisation letters which are currently
valid for all its production and backward integration facilities.
S.N. Location of Production Facility/ Backward Integration
Facility
Status of License
1. Greater Noida II (Uttar Pradesh) Applied for renewal
2. Arlem (Goa) Applied for renewal
3. Satharia II (Uttar Pradesh) Applied for
4. Our Company is required to obtain an authorisation to operate from the respective state’s pollution control
board under the Hazardous Waste Management Rules for each of its production and backward integration
facilities. Except as stated below, the Company has obtained and holds such authorisation letters which are
currently valid for all the production facilities and backward integration facilities.
S.N. Location of Production Facility/ Backward Integration
Facility
Status of License
1. Alwar (Rajasthan) Not required
2. Greater Noida II (Uttar Pradesh) Applied for renewal
3. Arlem (Goa) Applied for renewal
4. Guwahati I (Assam) Applied for renewal
5. Jodhpur (Rajasthan) Applied for renewal
6. Satharia (Uttar Pradesh) Applied for renewal
7. Phillaur, Punjab Applied for
8. Satharia II (Uttar Pradesh) Applied for name change
5. Our Company is required to obtain a no objection certificate (“NOC”) from the CGWA for abstraction of
ground water for its production facilities. Except as stated below, the Company has obtained and holds such
NOCs which are currently valid for all its production facility.
S.N. Location of Production Facility Status of License
1. Arlem (Goa) Not required
2. Sanguem (Goa) Not required
3. Guwahati I (Assam) Not required
4. Alwar (Rajasthan) Not required
5. Jaipur (Rajasthan) Not required
6. Panipat (Haryana) Applied for
7. Satharia (Uttar Pradesh) Applied for
8. Kolkata (West Bengal) Applied for
9. Greater Noida I (Uttar Pradesh) Applied for
10. Guwahati II (Assam) Applied for
11. Jainpur (Uttar Pradesh) Applied for
12. Greater Noida II (Uttar Pradesh) Applied for
13. Kosi (Uttar Pradesh) Not obtained
14. Phillaur (Punjab) Applied for name change
15. Satharia II (Uttar Pradesh) Applied for name change
6. Our Company is required to obtain license for storage of carbon dioxide and gas in pressure vessels from
the chief controller of explosives of Petroleum and Explosives Safety Organisation of respective states for
each of its production facilities and backward integration facilities. Except as stated below, the Company
has such licenses which are currently valid for all its production facilities and backward integration
facilities.
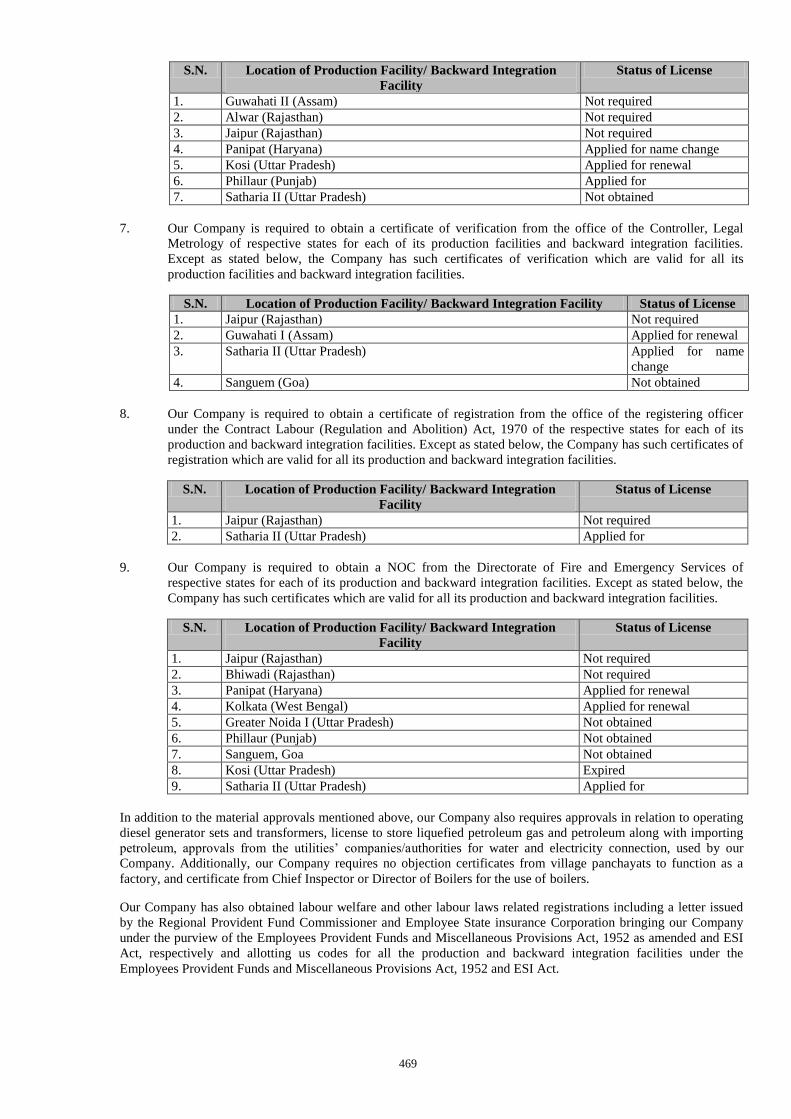
469
S.N. Location of Production Facility/ Backward Integration
Facility
Status of License
1. Guwahati II (Assam) Not required
2. Alwar (Rajasthan) Not required
3. Jaipur (Rajasthan) Not required
4. Panipat (Haryana) Applied for name change
5. Kosi (Uttar Pradesh) Applied for renewal
6. Phillaur (Punjab) Applied for
7. Satharia II (Uttar Pradesh) Not obtained
7. Our Company is required to obtain a certificate of verification from the office of the Controller, Legal
Metrology of respective states for each of its production facilities and backward integration facilities.
Except as stated below, the Company has such certificates of verification which are valid for all its
production facilities and backward integration facilities.
S.N. Location of Production Facility/ Backward Integration Facility Status of License
1. Jaipur (Rajasthan) Not required
2. Guwahati I (Assam) Applied for renewal
3. Satharia II (Uttar Pradesh) Applied for name
change
4. Sanguem (Goa) Not obtained
8. Our Company is required to obtain a certificate of registration from the office of the registering officer
under the Contract Labour (Regulation and Abolition) Act, 1970 of the respective states for each of its
production and backward integration facilities. Except as stated below, the Company has such certificates of
registration which are valid for all its production and backward integration facilities.
S.N. Location of Production Facility/ Backward Integration
Facility
Status of License
1. Jaipur (Rajasthan) Not required
2. Satharia II (Uttar Pradesh) Applied for
9. Our Company is required to obtain a NOC from the Directorate of Fire and Emergency Services of
respective states for each of its production and backward integration facilities. Except as stated below, the
Company has such certificates which are valid for all its production and backward integration facilities.
S.N. Location of Production Facility/ Backward Integration
Facility
Status of License
1. Jaipur (Rajasthan) Not required
2. Bhiwadi (Rajasthan) Not required
3. Panipat (Haryana) Applied for renewal
4. Kolkata (West Bengal) Applied for renewal
5. Greater Noida I (Uttar Pradesh) Not obtained
6. Phillaur (Punjab) Not obtained
7. Sanguem, Goa Not obtained
8. Kosi (Uttar Pradesh) Expired
9. Satharia II (Uttar Pradesh) Applied for
In addition to the material approvals mentioned above, our Company also requires approvals in relation to operating
diesel generator sets and transformers, license to store liquefied petroleum gas and petroleum along with importing
petroleum, approvals from the utilities’ companies/authorities for water and electricity connection, used by our
Company. Additionally, our Company requires no objection certificates from village panchayats to function as a
factory, and certificate from Chief Inspector or Director of Boilers for the use of boilers.
Our Company has also obtained labour welfare and other labour laws related registrations including a letter issued
by the Regional Provident Fund Commissioner and Employee State insurance Corporation bringing our Company
under the purview of the Employees Provident Funds and Miscellaneous Provisions Act, 1952 as amended and ESI
Act, respectively and allotting us codes for all the production and backward integration facilities under the
Employees Provident Funds and Miscellaneous Provisions Act, 1952 and ESI Act.
470
E. Approvals in relation to our Subsidiaries
Our Company has seven subsidiaries which are all incorporated and operate outside India. For details, see “Our
Subsidiaries” on page 170. Each of our subsidiaries have obtained the requisite approvals and registrations required
to conduct their business activities from the government authorities in the respective jurisdictions in which they
operate.
471
OTHER REGULATORY AND STATUTORY DISCLOSURES
Authority for the Offer
Our Board of Directors has approved the Fresh Issue pursuant to a resolution passed at their meeting held on March 28, 2016
and our Shareholders have approved the Offer pursuant to a resolution passed at the EGM held on April 27, 2016.
The Offer for Sale of has been authorised as follows:
i. up to 5,000,000 Equity Shares by Varun Jaipuria has been authorised pursuant his letter dated May 26, 2016; and
ii. up to 5,000,000 Equity Shares being offered by Ravi Kant Jaipuria & Sons (HUF) has been authorised by Ravi Kant
Jaipuria as the karta pursuant to the consent letter dated May 26, 2016.
Each of the Selling Shareholder has confirmed that the Equity Shares proposed to be offered and sold by it in the Offer are
eligible to be offered for sale in accordance with the SEBI ICDR Regulations, and that Equity Shares offered and sold by it
are free from any lien, charge, encumbrance or contractual transfer restrictions. Each of the Selling Shareholders has also
confirmed that it is the legal and beneficial owner of the Equity Shares being offered by it under the Offer for Sale.
Our Company received in-principle approvals from the BSE and the NSE for the listing of the Equity Shares pursuant to letter
bearing number DCS/IPO/NP/IP/183/2016-17 dated June 29, 2016 and letter bearing number NSE/LIST/78978 dated July 5,
2016 respectively.
Prohibition by SEBI or other Governmental Authorities
Our Company, our Promoters, our Directors, the members of the Promoter Group, the Group Companies, the persons in
control of our Company and the Selling Shareholders have not been prohibited or debarred from accessing or operating in
capital markets under any order or direction passed by SEBI or any other regulatory or governmental authority.
The companies, with which our Promoter, Directors or persons in control of our Company are or were associated as promoter,
directors or persons in control have not been prohibited from accessing in capital markets under any order or direction passed
by SEBI or any other regulatory or governmental authority. None of our Directors are in any manner associated with the
securities market and there has been no action taken by the SEBI against our Directors or any entity in which our Directors
are involved in as promoters or directors.
Prohibition by RBI
Neither our Company, nor our Promoters, relatives of our Promoters, Directors, Group Companies, nor the Selling
Shareholders have been identified as wilful defaulters by any bank or financial institution or consortium thereof, in
accordance with the guidelines on wilful defaulters issued by the RBI or any other governmental authority. There are no
violations of securities laws committed by any of them in the past or are currently pending against any of them.
Eligibility for the Offer
Our Company is eligible for the Offer in accordance with the eligibility criteria provided in Regulation 26(1) of the SEBI
ICDR Regulations, and as calculated from the audited financial information prepared in accordance with the Companies Act
and restated in accordance with the SEBI ICDR Regulations:
our Company has net tangible assets of at least ₹ 30 million in each of the preceding three full years (of 12 months
each) of which not more than 50% are held in monetary assets;
our Company has a minimum average pre-tax operating profit of ₹ 150 million calculated on a restated and
consolidated basis, during the three most profitable years out of the immediately preceding five years;
our Company has a pre-Offer net worth of at least ₹ 10 million in each of the three preceding full years (of 12
months each);
the proposed Offer size does not exceed five times the pre-Offer net worth as per the audited accounts for the year
ended December 31, 2015; and
our Company has not changed its name during the last one year.
Our Company’s net worth, net tangible assets and pre-tax operating profit derived from the Restated Consolidated Summary
Statements included in this Red Herring Prospectus as at and for the last five years ended Financial Year 2015 are set forth
below:
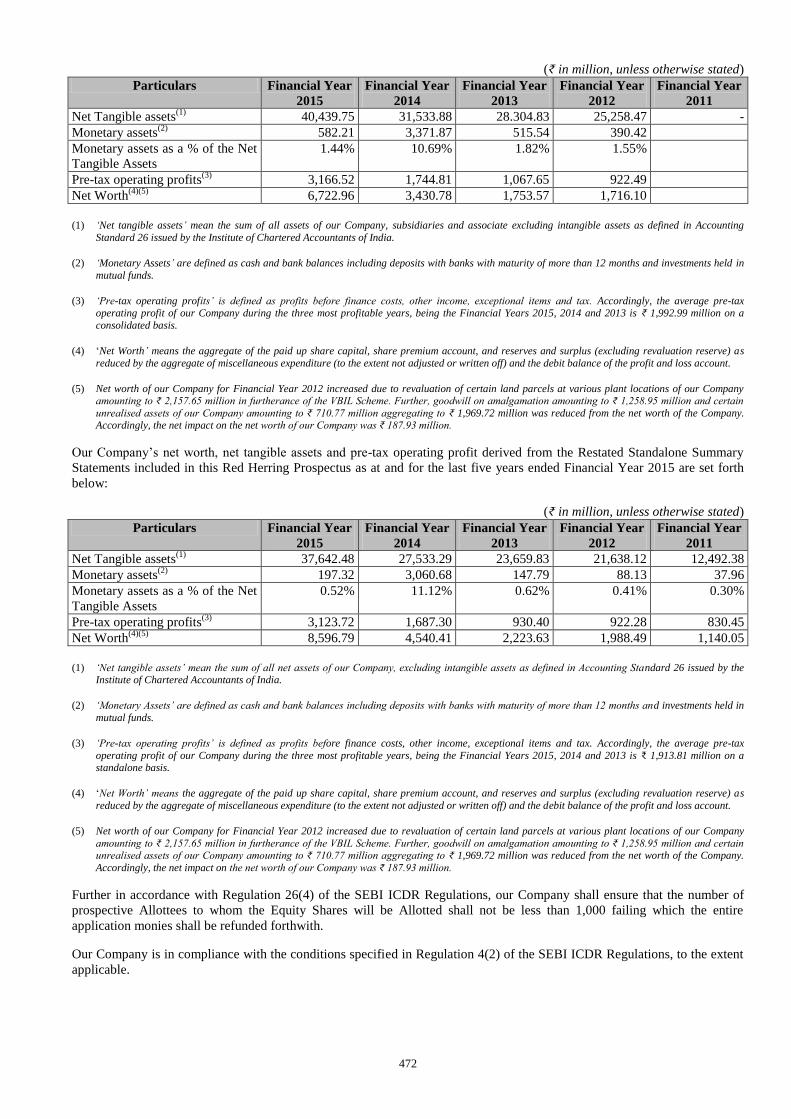
472
(₹ in million, unless otherwise stated)
Particulars Financial Year
2015
Financial Year
2014
Financial Year
2013
Financial Year
2012
Financial Year
2011
Net Tangible assets(1)
40,439.75 31,533.88 28.304.83 25,258.47 -
Monetary assets(2)
582.21 3,371.87 515.54 390.42
Monetary assets as a % of the Net
Tangible Assets
1.44% 10.69% 1.82% 1.55%
Pre-tax operating profits(3)
3,166.52 1,744.81 1,067.65 922.49
Net Worth(4)(5)
6,722.96 3,430.78 1,753.57 1,716.10
(1) ‘Net tangible assets’ mean the sum of all assets of our Company, subsidiaries and associate excluding intangible assets as defined in Accounting
Standard 26 issued by the Institute of Chartered Accountants of India.
(2) ‘Monetary Assets’ are defined as cash and bank balances including deposits with banks with maturity of more than 12 months and investments held in
mutual funds.
(3) ‘Pre-tax operating profits’ is defined as profits before finance costs, other income, exceptional items and tax. Accordingly, the average pre-tax
operating profit of our Company during the three most profitable years, being the Financial Years 2015, 2014 and 2013 is ₹ 1,992.99 million on a
consolidated basis.
(4) ‘Net Worth’ means the aggregate of the paid up share capital, share premium account, and reserves and surplus (excluding revaluation reserve) as
reduced by the aggregate of miscellaneous expenditure (to the extent not adjusted or written off) and the debit balance of the profit and loss account.
(5) Net worth of our Company for Financial Year 2012 increased due to revaluation of certain land parcels at various plant locations of our Company amounting to ₹ 2,157.65 million in furtherance of the VBIL Scheme. Further, goodwill on amalgamation amounting to ₹ 1,258.95 million and certain
unrealised assets of our Company amounting to ₹ 710.77 million aggregating to ₹ 1,969.72 million was reduced from the net worth of the Company. Accordingly, the net impact on the net worth of our Company was ₹ 187.93 million.
Our Company’s net worth, net tangible assets and pre-tax operating profit derived from the Restated Standalone Summary
Statements included in this Red Herring Prospectus as at and for the last five years ended Financial Year 2015 are set forth
below:
(₹ in million, unless otherwise stated)
Particulars Financial Year
2015
Financial Year
2014
Financial Year
2013
Financial Year
2012
Financial Year
2011
Net Tangible assets(1)
37,642.48 27,533.29 23,659.83 21,638.12 12,492.38
Monetary assets(2)
197.32 3,060.68 147.79 88.13 37.96
Monetary assets as a % of the Net
Tangible Assets
0.52% 11.12% 0.62% 0.41% 0.30%
Pre-tax operating profits(3)
3,123.72 1,687.30 930.40 922.28 830.45
Net Worth(4)(5)
8,596.79 4,540.41 2,223.63 1,988.49 1,140.05
(1) ‘Net tangible assets’ mean the sum of all net assets of our Company, excluding intangible assets as defined in Accounting Standard 26 issued by the
Institute of Chartered Accountants of India.
(2) ‘Monetary Assets’ are defined as cash and bank balances including deposits with banks with maturity of more than 12 months and investments held in
mutual funds.
(3) ‘Pre-tax operating profits’ is defined as profits before finance costs, other income, exceptional items and tax. Accordingly, the average pre-tax
operating profit of our Company during the three most profitable years, being the Financial Years 2015, 2014 and 2013 is ₹ 1,913.81 million on a standalone basis.
(4) ‘Net Worth’ means the aggregate of the paid up share capital, share premium account, and reserves and surplus (excluding revaluation reserve) as
reduced by the aggregate of miscellaneous expenditure (to the extent not adjusted or written off) and the debit balance of the profit and loss account.
(5) Net worth of our Company for Financial Year 2012 increased due to revaluation of certain land parcels at various plant locations of our Company
amounting to ₹ 2,157.65 million in furtherance of the VBIL Scheme. Further, goodwill on amalgamation amounting to ₹ 1,258.95 million and certain unrealised assets of our Company amounting to ₹ 710.77 million aggregating to ₹ 1,969.72 million was reduced from the net worth of the Company.
Accordingly, the net impact on the net worth of our Company was ₹ 187.93 million.
Further in accordance with Regulation 26(4) of the SEBI ICDR Regulations, our Company shall ensure that the number of
prospective Allottees to whom the Equity Shares will be Allotted shall not be less than 1,000 failing which the entire
application monies shall be refunded forthwith.
Our Company is in compliance with the conditions specified in Regulation 4(2) of the SEBI ICDR Regulations, to the extent
applicable.
473
DISCLAIMER CLAUSE OF SEBI
AS REQUIRED, A COPY OF THIS DRAFT RED HERRING PROSPECTUS HAS BEEN SUBMITTED TO SEBI.
IT IS TO BE DISTINCTLY UNDERSTOOD THAT SUBMISSION OF THIS DRAFT RED HERRING
PROSPECTUS TO SEBI SHOULD NOT, IN ANY WAY, BE DEEMED OR CONSTRUED THAT THE SAME HAS
BEEN CLEARED OR APPROVED BY SEBI. SEBI DOES NOT TAKE ANY RESPONSIBILITY EITHER FOR
THE FINANCIAL SOUNDNESS OF ANY SCHEME OR THE PROJECT FOR WHICH THE OFFER IS
PROPOSED TO BE MADE OR FOR THE CORRECTNESS OF THE STATEMENTS MADE OR OPINIONS
EXPRESSED IN THIS DRAFT RED HERRING PROSPECTUS. THE BOOK RUNNING LEAD MANAGERS,
KOTAK MAHINDRA CAPITAL COMPANY LIMITED, AXIS CAPITAL LIMITED, CLSA INDIA PRIVATE
LIMITED AND YES SECURITIES (INDIA) LIMITED HAVE CERTIFIED THAT THE DISCLOSURES MADE IN
THIS DRAFT RED HERRING PROSPECTUS ARE GENERALLY ADEQUATE AND ARE IN CONFORMITY
WITH SECURITIES AND EXCHANGE BOARD OF INDIA (ISSUE OF CAPITAL AND DISCLOSURE
REQUIREMENTS) REGULATIONS, 2009 IN FORCE FOR THE TIME BEING. THIS REQUIREMENT IS TO
FACILITATE INVESTORS TO TAKE AN INFORMED DECISION FOR MAKING AN INVESTMENT IN THE
PROPOSED OFFER.
IT SHOULD ALSO BE CLEARLY UNDERSTOOD THAT WHILE THE COMPANY IS PRIMARILY
RESPONSIBLE FOR THE CORRECTNESS, ADEQUACY AND DISCLOSURE OF ALL RELEVANT
INFORMATION IN THIS DRAFT RED HERRING PROSPECTUS, AND EACH SELLING SHAREHOLDER IS
SEVERALLY RESPONSIBLE FOR THE CORRECTNESS OF THE STATEMENTS AND UNDERTAKINGS
MADE BY IT IN THIS DRAFT RED HERRING PROSPECTUS ABOUT OR IN RELATION TO ITSELF AND
THE EQUITY SHARES BEING SOLD BY IT IN THE OFFER, THE BOOK RUNNING LEAD MANAGERS ARE
EXPECTED TO EXERCISE DUE DILIGENCE TO ENSURE THAT THE COMPANY AND THE SELLING
SHAREHOLDERS DISCHARGE THEIR RESPECTIVE RESPONSIBILITY ADEQUATELY IN THIS BEHALF
AND TOWARDS THIS PURPOSE, THE BOOK RUNNING LEAD MANAGERS HAVE FURNISHED TO SEBI, A
DUE DILIGENCE CERTIFICATE DATED JUNE 21, 2016 WHICH READS AS FOLLOWS:
WE, THE BOOK RUNNING LEAD MANAGERS TO THE ABOVE MENTIONED FORTHCOMING OFFER,
STATE AND CONFIRM AS FOLLOWS:
1. WE HAVE EXAMINED VARIOUS DOCUMENTS INCLUDING THOSE RELATING TO LITIGATION
LIKE COMMERCIAL DISPUTES, PATENT DISPUTES, DISPUTES WITH COLLABORATORS, ETC.
AND OTHER MATERIALS IN CONNECTION WITH THE FINALISATION OF THIS DRAFT RED
HERRING PROSPECTUS PERTAINING TO THE OFFER;
2. ON THE BASIS OF SUCH EXAMINATION AND THE DISCUSSIONS WITH THE ISSUER, ITS
DIRECTORS AND OTHER OFFICERS, OTHER AGENCIES, AND INDEPENDENT VERIFICATION OF
THE STATEMENTS CONCERNING THE OBJECTS OF THE OFFER, PRICE JUSTIFICATION AND
THE CONTENTS OF THE DOCUMENTS AND OTHER PAPERS FURNISHED BY THE ISSUER, WE
CONFIRM THAT:
(A) THIS DRAFT RED HERRING PROSPECTUS FILED WITH THE SECURITIES AND
EXCHANGE BOARD OF INDIA (“SEBI”) IS IN CONFORMITY WITH THE DOCUMENTS,
MATERIALS AND PAPERS RELEVANT TO THE OFFER;
(B) ALL THE LEGAL REQUIREMENTS RELATING TO THE OFFER AS ALSO THE
REGULATIONS, GUIDELINES, INSTRUCTIONS, ETC. FRAMED/ISSUED BY THE
SECURITIES AND EXCHANGE BOARD OF INDIA, THE CENTRAL GOVERNMENT AND
ANY OTHER COMPETENT AUTHORITY IN THIS BEHALF HAVE BEEN DULY COMPLIED
WITH; AND
(C) THE DISCLOSURES MADE IN THIS DRAFT RED HERRING PROSPECTUS ARE TRUE, FAIR
AND ADEQUATE TO ENABLE THE INVESTORS TO MAKE A WELL INFORMED DECISION
AS TO THE INVESTMENT IN THE PROPOSED OFFER AND SUCH DISCLOSURES ARE IN
ACCORDANCE WITH THE REQUIREMENTS OF THE COMPANIES ACT, THE SECURITIES
AND EXCHANGE BOARD OF INDIA (ISSUE OF CAPITAL AND DISCLOSURE
REQUIREMENTS) REGULATIONS, 2009, AS AMENDED (THE “SEBI ICDR REGULATIONS”)
AND OTHER APPLICABLE LEGAL REQUIREMENTS.
3. WE CONFIRM THAT BESIDES OURSELVES, ALL THE INTERMEDIARIES NAMED IN THIS DRAFT
RED HERRING PROSPECTUS ARE REGISTERED WITH SEBI AND THAT TILL DATE SUCH
REGISTRATION IS VALID.
474
4. WE HAVE SATISFIED OURSELVES ABOUT THE CAPABILITY OF THE UNDERWRITERS TO
FULFIL THEIR UNDERWRITING COMMITMENTS. – NOTED FOR COMPLIANCE
5. WE CERTIFY THAT WRITTEN CONSENT FROM THE PROMOTERS HAS BEEN OBTAINED FOR
INCLUSION OF THEIR EQUITY SHARES AS PART OF PROMOTER’S CONTRIBUTION SUBJECT
TO LOCK-IN AND THE EQUITY SHARES PROPOSED TO FORM PART OF PROMOTER’S
CONTRIBUTION SUBJECT TO LOCK-IN SHALL NOT BE DISPOSED/SOLD/TRANSFERRED BY THE
PROMOTERS DURING THE PERIOD STARTING FROM THE DATE OF FILING THIS DRAFT RED
HERRING PROSPECTUS WITH THE SECURITIES AND EXCHANGE BOARD OF INDIA TILL THE
DATE OF COMMENCEMENT OF LOCK-IN PERIOD AS STATED IN THIS DRAFT RED HERRING
PROSPECTUS.
6. WE CERTIFY THAT REGULATION 33 OF THE SEBI ICDR REGULATIONS, WHICH RELATES TO
EQUITY SHARES INELIGIBLE FOR COMPUTATION OF PROMOTERS’ CONTRIBUTION, HAS
BEEN DULY COMPLIED WITH AND APPROPRIATE DISCLOSURES AS TO COMPLIANCE WITH
THE SAID REGULATION HAVE BEEN MADE IN THIS DRAFT RED HERRING PROSPECTUS. –
COMPLIED WITH AND NOTED FOR COMPLIANCE
7. WE UNDERTAKE THAT SUB-REGULATION (4) OF REGULATION 32 AND CLAUSE (C) AND (D) OF
SUB-REGULATION (2) OF REGULATION 8 OF THE SEBI ICDR REGULATIONS SHALL BE
COMPLIED WITH. WE CONFIRM THAT ARRANGEMENTS HAVE BEEN MADE TO ENSURE THAT
PROMOTERS’ CONTRIBUTION SHALL BE RECEIVED AT LEAST ONE DAY BEFORE THE
OPENING OF THE OFFER. WE UNDERTAKE THAT AUDITORS’ CERTIFICATE TO THIS EFFECT
SHALL BE DULY SUBMITTED TO SEBI. WE FURTHER CONFIRM THAT ARRANGEMENTS HAVE
BEEN MADE TO ENSURE THAT PROMOTER’S CONTRIBUTION SHALL BE KEPT IN AN ESCROW
ACCOUNT WITH A SCHEDULED COMMERCIAL BANK AND SHALL BE RELEASED TO THE
COMPANY ALONG WITH THE PROCEEDS OF THE PUBLIC ISSUE. – NOT APPLICABLE
8. WE CERTIFY THAT THE PROPOSED ACTIVITIES OF THE COMPANY FOR WHICH THE FUNDS
ARE BEING RAISED IN THE PRESENT OFFER FALL WITHIN THE ‘MAIN OBJECTS’ LISTED IN
THE OBJECT CLAUSE OF THE MEMORANDUM OF ASSOCIATION OR OTHER CHARTER OF THE
COMPANY AND THAT THE ACTIVITIES WHICH HAVE BEEN CARRIED OUT UNTIL NOW ARE
VALID IN TERMS OF THE OBJECT CLAUSE OF ITS MEMORANDUM OF ASSOCIATION. –
COMPLIED WITH
9. WE CONFIRM THAT NECESSARY ARRANGEMENTS HAVE BEEN MADE TO ENSURE THAT THE
MONEYS RECEIVED PURSUANT TO THE OFFER ARE KEPT IN A SEPARATE BANK ACCOUNT AS
PER THE PROVISIONS OF SUB SECTION (3) OF SECTION 73 OF THE COMPANIES ACT, 1956 AND
THAT SUCH MONEYS SHALL BE RELEASED BY THE SAID BANK ONLY AFTER PERMISSION IS
OBTAINED FROM ALL THE STOCK EXCHANGES MENTIONED IN THE PROSPECTUS. WE
FURTHER CONFIRM THAT THE AGREEMENT ENTERED INTO BETWEEN THE BANKERS TO
THE OFFER AND THE COMPANY AND THE SELLING SHAREHOLDERS SPECIFICALLY
CONTAINS THIS CONDITION. – NOTED FOR COMPLIANCE. ALL MONIES RECEIVED OUT OF
THE OFFER SHALL BE CREDITED/TRANSFERRED TO A SEPARATE BANK ACCOUNT AS
REFERRED TO IN SUB-SECTION (3) OF SECTION 40 OF THE COMPANIES ACT, 2013.
10. WE CERTIFY THAT A DISCLOSURE HAS BEEN MADE IN THIS DRAFT RED HERRING
PROSPECTUS THAT THE INVESTORS SHALL BE GIVEN AN OPTION TO GET THE SHARES IN
DEMAT OR PHYSICAL MODE. – NOT APPLICABLE. UNDER SECTION 29 OF THE COMPANIES
ACT, 2013, EQUITY SHARES IN THE OFFER HAVE TO BE ISSUED IN DEMATERIALISED FORM
ONLY.
11. WE CERTIFY THAT ALL THE APPLICABLE DISCLOSURES MANDATED IN THE SEBI ICDR
REGULATIONS HAVE BEEN MADE IN ADDITION TO DISCLOSURES WHICH, IN OUR VIEW, ARE
FAIR AND ADEQUATE TO ENABLE THE INVESTOR TO MAKE A WELL INFORMED DECISION.
12. WE CERTIFY THAT THE FOLLOWING DISCLOSURES HAVE BEEN MADE IN THIS DRAFT RED
HERRING PROSPECTUS: – COMPLIED WITH
(A) AN UNDERTAKING FROM THE COMPANY THAT AT ANY GIVEN TIME, THERE SHALL BE
ONLY ONE DENOMINATION FOR THE EQUITY SHARES OF THE COMPANY; AND
(B) AN UNDERTAKING FROM THE COMPANY THAT IT SHALL COMPLY WITH SUCH
DISCLOSURE AND ACCOUNTING NORMS SPECIFIED BY SEBI FROM TIME TO TIME.
475
13. WE UNDERTAKE TO COMPLY WITH THE REGULATIONS PERTAINING TO ADVERTISEMENT IN
TERMS OF THE SEBI ICDR REGULATIONS WHILE MAKING THE OFFER. – COMPLIED WITH
AND NOTED FOR COMPLIANCE
14. WE ENCLOSE A NOTE EXPLAINING HOW THE PROCESS OF DUE DILIGENCE HAS BEEN
EXERCISED BY US IN VIEW OF THE NATURE OF CURRENT BUSINESS BACKGROUND OF THE
COMPANY, SITUATION AT WHICH THE PROPOSED BUSINESS STANDS, THE RISK FACTORS,
PROMOTERS’ EXPERIENCE, ETC. – COMPLIED WITH
15. WE ENCLOSE A CHECKLIST CONFIRMING REGULATION-WISE COMPLIANCE WITH THE
APPLICABLE PROVISIONS OF THE SEBI ICDR REGULATIONS, CONTAINING DETAILS SUCH AS
THE REGULATION NUMBER, ITS TEXT, THE STATUS OF COMPLIANCE, PAGE NUMBER OF THIS
DRAFT RED HERRING PROSPECTUS WHERE THE REGULATION HAS BEEN COMPLIED WITH
AND OUR COMMENTS, IF ANY. – COMPLIED WITH
16. WE ENCLOSE STATEMENT ON ‘PRICE INFORMATION OF PAST ISSUES HANDLED BY
MERCHANT BANKERS (WHO ARE RESPONSIBLE FOR PRICING THE OFFER)’, AS PER FORMAT
SPECIFIED BY THE SECURITIES AND EXCHANGE BOARD OF INDIA THROUGH CIRCULAR. –
COMPLIED WITH
17. WE CERTIFY THAT PROFITS FROM RELATED PARTY TRANSACTIONS HAVE ARISEN FROM
LEGITIMATE BUSINESS TRANSACTIONS. – COMPLIED WITH TO THE EXTENT OF THE
RELATED PARTY TRANSACTIONS REPORTED, IN ACCORDANCE WITH ACCOUNTING
STANDARD 18, IN THE FINANCIAL STATEMENTS OF THE COMPANY INCLUDED IN THE DRAFT
RED HERRING PROSPECTUS AND CERTIFIED BY APAS & CO. (FIRM REGISTRATION NO.
FRN000340C) PURSUANT TO ITS CERTIFICATE DATED JUNE 21, 2016.
18. WE CERTIFY THAT THE ENTITY IS ELIGIBLE UNDER 106Y (1) (A) OR (B) (AS THE CASE MAY BE)
TO THE LIST ON THE INSTITUTIONAL TRADING PLATFORM, UNDER CHAPTER XC OF THE
SEBI REGULATIONS (IF APPLICABLE) – NOT APPLICABLE
The filing of this Red Herring Prospectus does not, however, absolve any person who has authorised the issue of this Red
Herring Prospectus from any liabilities under Section 34 or Section 36 of Companies Act, 2013 or from the requirement of
obtaining such statutory and/or other clearances as may be required for the purpose of the Offer. SEBI further reserves the
right to take up at any point of time, with, the GCBRLMs and BRLM, any irregularities or lapses in this Red Herring
Prospectus.
All legal requirements pertaining to the Offer have been complied with at the time of filing of this Red Herring Prospectus
with the RoC in terms of Section 32 of the Companies Act, 2013. All legal requirements pertaining to the Offer will be
complied with at the time of registration of the Prospectus with the RoC in terms of Sections 26 and 30 of the Companies Act,
2013.
Caution - Disclaimer from our Company, the Selling Shareholders, our Directors, the GCBRLMs and the BRLM
Our Company, the Selling Shareholders, our Directors, the GCBRLMs and BRLM accept no responsibility for statements
made otherwise than in this Red Herring Prospectus or in the advertisements or any other material issued by or at our
Company’s instance and anyone placing reliance on any other source of information, including our Company’s website,
www.varunpepsi.com, would be doing so at his or her own risk.
The Selling Shareholders assume responsibility only for the statements and undertakings made by them in this Red Herring
Prospectus about or in relation to themselves and the Equity Shares being sold by them in the Offer, provided however that
Selling Shareholders assume no responsibility for any of the statements or undertakings made by the Company or any other
Selling Shareholder or any expert or any other person in this Red Herring Prospectus.
The GCBRLMs and the BRLM accept no responsibility, save to the limited extent as provided in the Offer Agreement and
the Underwriting Agreement to be entered into between the Underwriters, the Selling Shareholders and our Company.
All information shall be made available by our Company, the Selling Shareholders, the GCBRLMs and the BRLM to the
public and Bidders at large and no selective or additional information would be available for a section of the Bidders in any
manner whatsoever, including at road show presentations, in research or sales reports, at bidding centres or elsewhere.
None among our Company, the Selling Shareholders or any member of the Syndicate is liable for any failure in downloading
the Bids due to faults in any software/hardware system or otherwise.
476
Bidders will be required to confirm and will be deemed to have represented to our Company, the Selling Shareholders,
Underwriters and their respective directors, officers, agents, affiliates, and representatives that they are eligible under all
applicable laws, rules, regulations, guidelines and approvals to acquire the Equity Shares and will not issue, sell, pledge, or
transfer the Equity Shares to any person who is not eligible under any applicable laws, rules, regulations, guidelines and
approvals to acquire the Equity Shares. Our Company, the Selling Shareholders, Underwriters and their respective directors,
officers, agents, affiliates, and representatives accept no responsibility or liability for advising any Bidder on whether such
Bidder is eligible to acquire the Equity Shares.
The GCBRLMs and the BRLM and their respective associates and affiliates may engage in transactions with, and perform
services for, our Company, the Selling Shareholders and its group companies, affiliates or associates or third parties in the
ordinary course of business and have engaged, or may in the future engage, in commercial banking and investment banking
transactions with our Company, the Selling Shareholders and its respective group companies, affiliates or associates or third
parties, for which they have received, and may in the future receive, compensation.
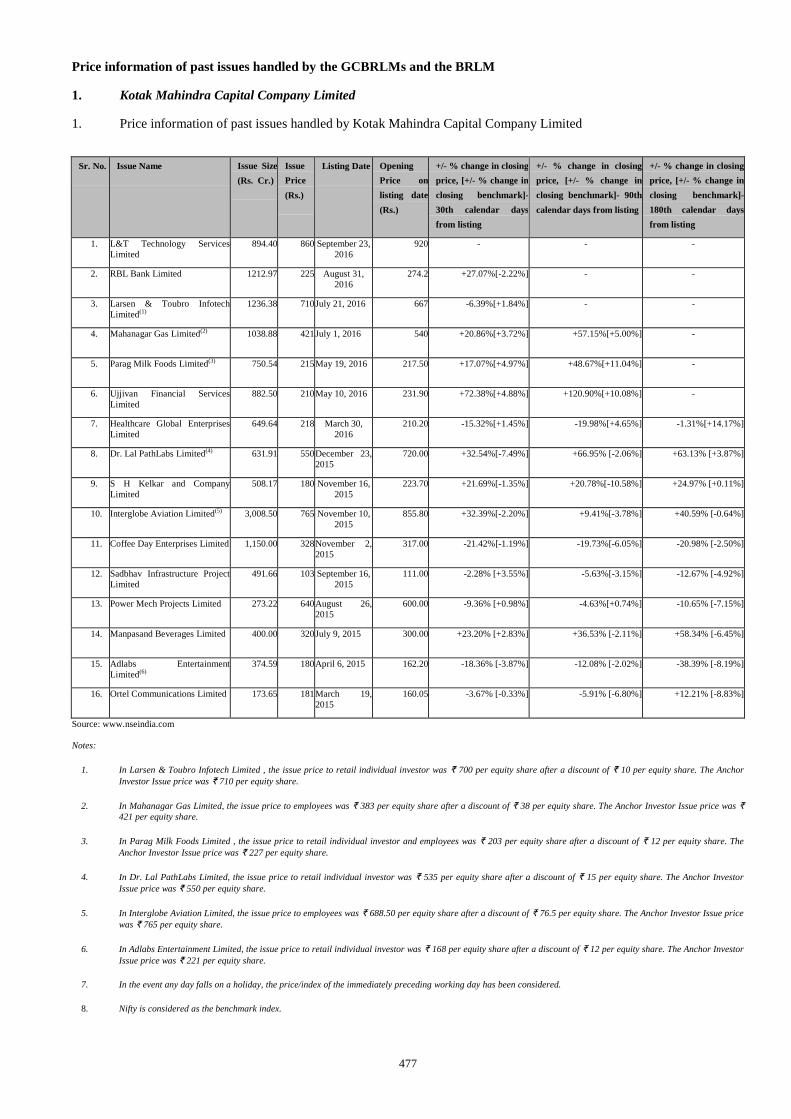
477
Price information of past issues handled by the GCBRLMs and the BRLM
1. Kotak Mahindra Capital Company Limited
1. Price information of past issues handled by Kotak Mahindra Capital Company Limited
Sr. No. Issue Name Issue Size
(Rs. Cr.)
Issue
Price
(Rs.)
Listing Date Opening
Price on
listing date
(Rs.)
+/- % change in closing
price, [+/- % change in
closing benchmark]-
30th calendar days
from listing
+/- % change in closing
price, [+/- % change in
closing benchmark]- 90th
calendar days from listing
+/- % change in closing
price, [+/- % change in
closing benchmark]-
180th calendar days
from listing
1. L&T Technology Services
Limited
894.40 860 September 23,
2016
920 - - -
2. RBL Bank Limited 1212.97 225 August 31,
2016
274.2 +27.07%[-2.22%]
- -
3. Larsen & Toubro Infotech
Limited(1)
1236.38 710 July 21, 2016
667 -6.39%[+1.84%] - -
4. Mahanagar Gas Limited(2) 1038.88 421 July 1, 2016 540 +20.86%[+3.72%] +57.15%[+5.00%] -
5. Parag Milk Foods Limited(3) 750.54 215 May 19, 2016 217.50 +17.07%[+4.97%] +48.67%[+11.04%] -
6. Ujjivan Financial Services
Limited
882.50 210 May 10, 2016 231.90 +72.38%[+4.88%] +120.90%[+10.08%]
-
7. Healthcare Global Enterprises
Limited
649.64 218 March 30,
2016
210.20 -15.32%[+1.45%] -19.98%[+4.65%] -1.31%[+14.17%]
8. Dr. Lal PathLabs Limited(4) 631.91
550 December 23,
2015
720.00 +32.54%[-7.49%] +66.95% [-2.06%] +63.13% [+3.87%]
9. S H Kelkar and Company
Limited
508.17 180 November 16,
2015
223.70 +21.69%[-1.35%] +20.78%[-10.58%] +24.97% [+0.11%]
10. Interglobe Aviation Limited(5) 3,008.50
765 November 10,
2015
855.80 +32.39%[-2.20%] +9.41%[-3.78%]
+40.59% [-0.64%]
11. Coffee Day Enterprises Limited 1,150.00 328 November 2,
2015
317.00 -21.42%[-1.19%] -19.73%[-6.05%] -20.98% [-2.50%]
12. Sadbhav Infrastructure Project
Limited
491.66 103 September 16,
2015
111.00 -2.28% [+3.55%] -5.63%[-3.15%] -12.67% [-4.92%]
13. Power Mech Projects Limited 273.22 640 August 26,
2015
600.00 -9.36% [+0.98%] -4.63%[+0.74%] -10.65% [-7.15%]
14. Manpasand Beverages Limited 400.00 320 July 9, 2015
300.00 +23.20% [+2.83%] +36.53% [-2.11%] +58.34% [-6.45%]
15. Adlabs Entertainment
Limited(6)
374.59 180 April 6, 2015
162.20 -18.36% [-3.87%] -12.08% [-2.02%] -38.39% [-8.19%]
16. Ortel Communications Limited 173.65 181 March 19,
2015
160.05 -3.67% [-0.33%] -5.91% [-6.80%] +12.21% [-8.83%]
Source: www.nseindia.com
Notes:
1. In Larsen & Toubro Infotech Limited , the issue price to retail individual investor was ₹ 700 per equity share after a discount of ₹ 10 per equity share. The Anchor
Investor Issue price was ₹ 710 per equity share.
2. In Mahanagar Gas Limited, the issue price to employees was ₹ 383 per equity share after a discount of ₹ 38 per equity share. The Anchor Investor Issue price was ₹ 421 per equity share.
3. In Parag Milk Foods Limited , the issue price to retail individual investor and employees was ₹ 203 per equity share after a discount of ₹ 12 per equity share. The
Anchor Investor Issue price was ₹ 227 per equity share.
4. In Dr. Lal PathLabs Limited, the issue price to retail individual investor was ₹ 535 per equity share after a discount of ₹ 15 per equity share. The Anchor Investor
Issue price was ₹ 550 per equity share.
5. In Interglobe Aviation Limited, the issue price to employees was ₹ 688.50 per equity share after a discount of ₹ 76.5 per equity share. The Anchor Investor Issue price
was ₹ 765 per equity share.
6. In Adlabs Entertainment Limited, the issue price to retail individual investor was ₹ 168 per equity share after a discount of ₹ 12 per equity share. The Anchor Investor
Issue price was ₹ 221 per equity share.
7. In the event any day falls on a holiday, the price/index of the immediately preceding working day has been considered.
8. Nifty is considered as the benchmark index.
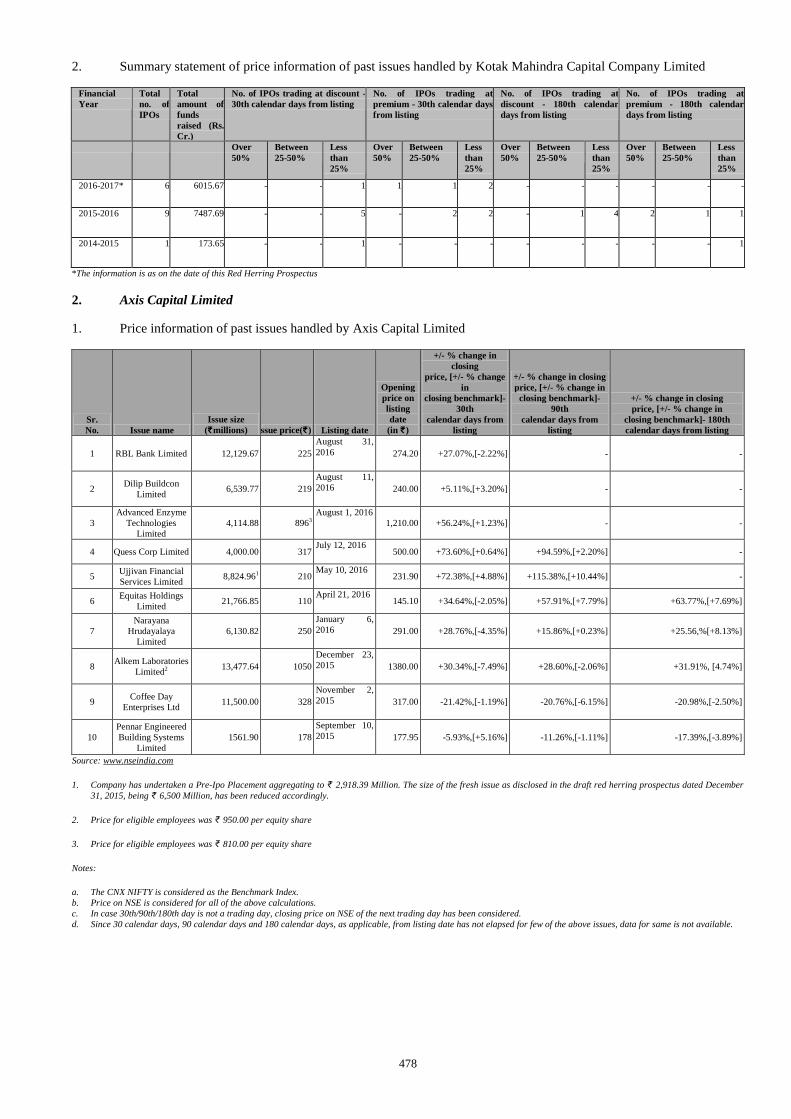
478
2. Summary statement of price information of past issues handled by Kotak Mahindra Capital Company Limited
Financial
Year
Total
no. of
IPOs
Total
amount of
funds
raised (Rs.
Cr.)
No. of IPOs trading at discount -
30th calendar days from listing
No. of IPOs trading at
premium - 30th calendar days
from listing
No. of IPOs trading at
discount - 180th calendar
days from listing
No. of IPOs trading at
premium - 180th calendar
days from listing
Over
50%
Between
25-50%
Less
than
25%
Over
50%
Between
25-50%
Less
than
25%
Over
50%
Between
25-50%
Less
than
25%
Over
50%
Between
25-50%
Less
than
25%
2016-2017* 6 6015.67 - - 1 1 1 2 - - - - - -
2015-2016 9 7487.69
- - 5 - 2 2 - 1 4 2 1 1
2014-2015 1 173.65 - - 1 - - - - - - - - 1
*The information is as on the date of this Red Herring Prospectus
2. Axis Capital Limited
1. Price information of past issues handled by Axis Capital Limited
Sr.
No. Issue name
Issue size
(₹millions) Issue price(₹) Listing date
Opening
price on
listing
date
(in ₹)
+/- % change in
closing
price, [+/- % change
in
closing benchmark]-
30th
calendar days from
listing
+/- % change in closing
price, [+/- % change in
closing benchmark]-
90th
calendar days from
listing
+/- % change in closing
price, [+/- % change in
closing benchmark]- 180th
calendar days from listing
1 RBL Bank Limited 12,129.67 225
August 31,
2016 274.20 +27.07%,[-2.22%] - -
2 Dilip Buildcon
Limited 6,539.77 219
August 11,
2016 240.00 +5.11%,[+3.20%] - -
3
Advanced Enzyme
Technologies
Limited
4,114.88 8963
August 1, 2016
1,210.00 +56.24%,[+1.23%] - -
4 Quess Corp Limited 4,000.00 317 July 12, 2016
500.00 +73.60%,[+0.64%] +94.59%,[+2.20%] -
5 Ujjivan Financial
Services Limited 8,824.961 210
May 10, 2016 231.90 +72.38%,[+4.88%] +115.38%,[+10.44%] -
6 Equitas Holdings
Limited 21,766.85 110
April 21, 2016 145.10 +34.64%,[-2.05%] +57.91%,[+7.79%] +63.77%,[+7.69%]
7
Narayana
Hrudayalaya
Limited
6,130.82 250
January 6,
2016 291.00 +28.76%,[-4.35%] +15.86%,[+0.23%] +25.56,%[+8.13%]
8 Alkem Laboratories
Limited2 13,477.64 1050
December 23,
2015 1380.00 +30.34%,[-7.49%] +28.60%,[-2.06%] +31.91%, [4.74%]
9 Coffee Day
Enterprises Ltd 11,500.00 328
November 2,
2015 317.00 -21.42%,[-1.19%] -20.76%,[-6.15%] -20.98%,[-2.50%]
10
Pennar Engineered
Building Systems
Limited
1561.90 178
September 10,
2015 177.95 -5.93%,[+5.16%] -11.26%,[-1.11%] -17.39%,[-3.89%]
Source: www.nseindia.com
1. Company has undertaken a Pre-Ipo Placement aggregating to ₹ 2,918.39 Million. The size of the fresh issue as disclosed in the draft red herring prospectus dated December
31, 2015, being ₹ 6,500 Million, has been reduced accordingly.
2. Price for eligible employees was ₹ 950.00 per equity share
3. Price for eligible employees was ₹ 810.00 per equity share
Notes:
a. The CNX NIFTY is considered as the Benchmark Index.
b. Price on NSE is considered for all of the above calculations.
c. In case 30th/90th/180th day is not a trading day, closing price on NSE of the next trading day has been considered.
d. Since 30 calendar days, 90 calendar days and 180 calendar days, as applicable, from listing date has not elapsed for few of the above issues, data for same is not available.
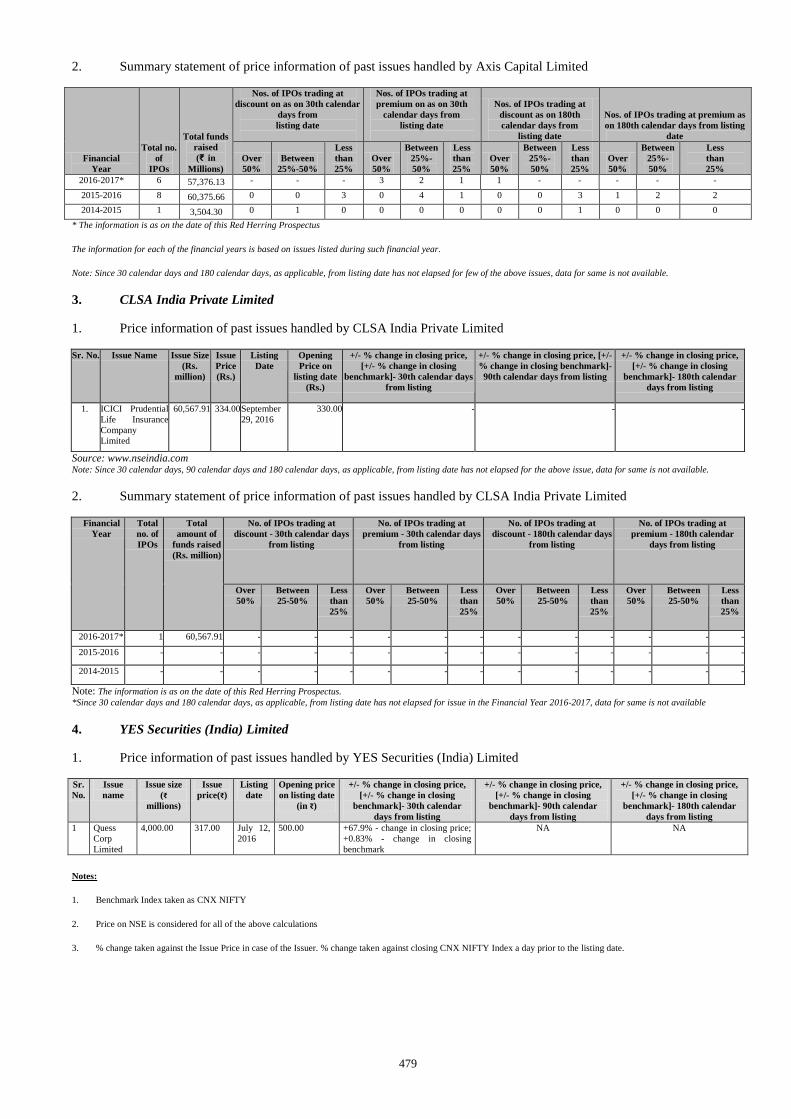
479
2. Summary statement of price information of past issues handled by Axis Capital Limited
Financial
Year
Total no.
of
IPOs
Total funds
raised
(₹ in
Millions)
Nos. of IPOs trading at
discount on as on 30th calendar
days from
listing date
Nos. of IPOs trading at
premium on as on 30th
calendar days from
listing date
Nos. of IPOs trading at
discount as on 180th
calendar days from
listing date
Nos. of IPOs trading at premium as
on 180th calendar days from listing
date
Over
50%
Between
25%-50%
Less
than
25%
Over
50%
Between
25%-
50%
Less
than
25%
Over
50%
Between
25%-
50%
Less
than
25%
Over
50%
Between
25%-
50%
Less
than
25%
2016-2017* 6 57,376.13 - - - 3 2 1 1 - - - - -
2015-2016 8 60,375.66 0 0 3 0 4 1 0 0 3 1 2 2
2014-2015 1 3,504.30 0 1 0 0 0 0 0 0 1 0 0 0
* The information is as on the date of this Red Herring Prospectus
The information for each of the financial years is based on issues listed during such financial year.
Note: Since 30 calendar days and 180 calendar days, as applicable, from listing date has not elapsed for few of the above issues, data for same is not available.
3. CLSA India Private Limited
1. Price information of past issues handled by CLSA India Private Limited
Sr. No. Issue Name Issue Size
(Rs.
million)
Issue
Price
(Rs.)
Listing
Date
Opening
Price on
listing date
(Rs.)
+/- % change in closing price,
[+/- % change in closing
benchmark]- 30th calendar days
from listing
+/- % change in closing price, [+/-
% change in closing benchmark]-
90th calendar days from listing
+/- % change in closing price,
[+/- % change in closing
benchmark]- 180th calendar
days from listing
1. ICICI Prudential
Life Insurance
Company
Limited
60,567.91 334.00 September
29, 2016
330.00 - - -
Source: www.nseindia.com Note: Since 30 calendar days, 90 calendar days and 180 calendar days, as applicable, from listing date has not elapsed for the above issue, data for same is not available.
2. Summary statement of price information of past issues handled by CLSA India Private Limited
Financial
Year
Total
no. of
IPOs
Total
amount of
funds raised
(Rs. million)
No. of IPOs trading at
discount - 30th calendar days
from listing
No. of IPOs trading at
premium - 30th calendar days
from listing
No. of IPOs trading at
discount - 180th calendar days
from listing
No. of IPOs trading at
premium - 180th calendar
days from listing
Over
50%
Between
25-50%
Less
than
25%
Over
50%
Between
25-50%
Less
than
25%
Over
50%
Between
25-50%
Less
than
25%
Over
50%
Between
25-50%
Less
than
25%
2016-2017* 1 60,567.91 - - - - - - - - - - - -
2015-2016 - -
- - - - - - - - - - - -
2014-2015 - - - - - - - - - - - - - -
Note: The information is as on the date of this Red Herring Prospectus.
*Since 30 calendar days and 180 calendar days, as applicable, from listing date has not elapsed for issue in the Financial Year 2016-2017, data for same is not available
4. YES Securities (India) Limited
1. Price information of past issues handled by YES Securities (India) Limited
Sr.
No.
Issue
name
Issue size
(₹
millions)
Issue
price(₹)
Listing
date
Opening price
on listing date
(in ₹)
+/- % change in closing price,
[+/- % change in closing
benchmark]- 30th calendar
days from listing
+/- % change in closing price,
[+/- % change in closing
benchmark]- 90th calendar
days from listing
+/- % change in closing price,
[+/- % change in closing
benchmark]- 180th calendar
days from listing
1 Quess
Corp
Limited
4,000.00 317.00 July 12,
2016
500.00 +67.9% - change in closing price;
+0.83% - change in closing
benchmark
NA NA
Notes:
1. Benchmark Index taken as CNX NIFTY
2. Price on NSE is considered for all of the above calculations
3. % change taken against the Issue Price in case of the Issuer. % change taken against closing CNX NIFTY Index a day prior to the listing date.
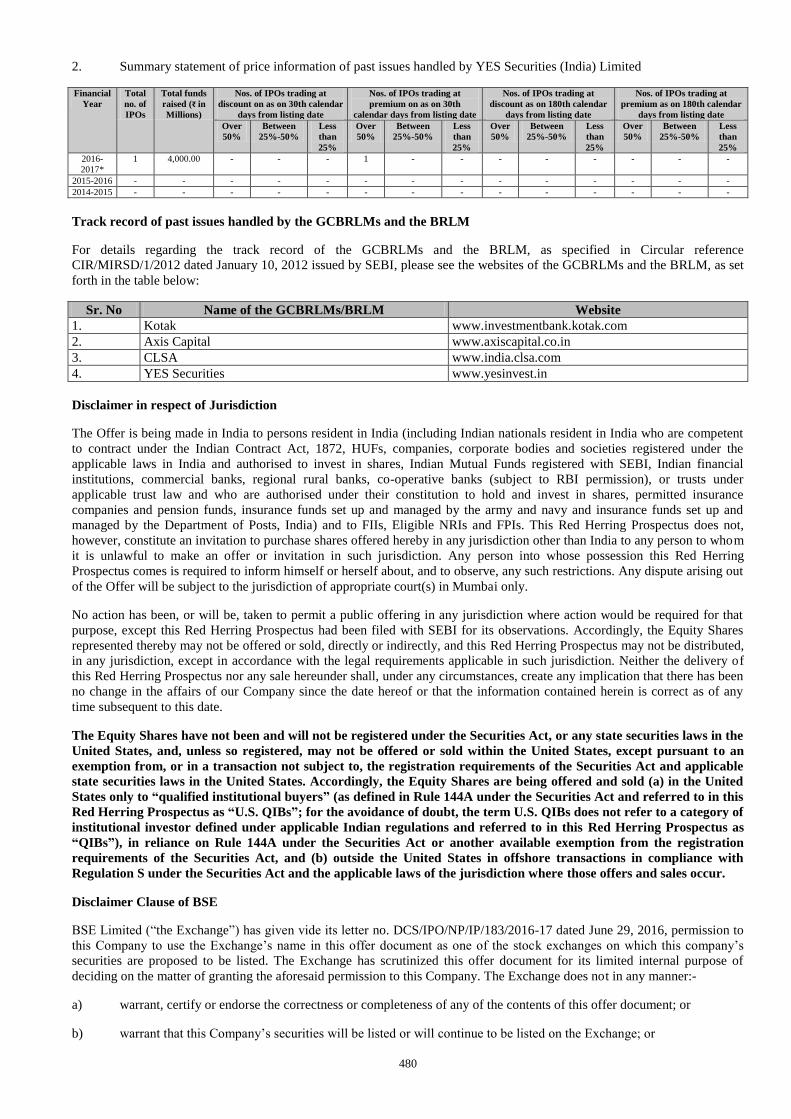
480
2. Summary statement of price information of past issues handled by YES Securities (India) Limited
Financial
Year
Total
no. of
IPOs
Total funds
raised (₹ in
Millions)
Nos. of IPOs trading at
discount on as on 30th calendar
days from listing date
Nos. of IPOs trading at
premium on as on 30th
calendar days from listing date
Nos. of IPOs trading at
discount as on 180th calendar
days from listing date
Nos. of IPOs trading at
premium as on 180th calendar
days from listing date
Over
50%
Between
25%-50%
Less
than
25%
Over
50%
Between
25%-50%
Less
than
25%
Over
50%
Between
25%-50%
Less
than
25%
Over
50%
Between
25%-50%
Less
than
25%
2016-
2017*
1 4,000.00 - - - 1 - - - - - - - -
2015-2016 - - - - - - - - - - - - - -
2014-2015 - - - - - - - - - - - - - -
Track record of past issues handled by the GCBRLMs and the BRLM
For details regarding the track record of the GCBRLMs and the BRLM, as specified in Circular reference
CIR/MIRSD/1/2012 dated January 10, 2012 issued by SEBI, please see the websites of the GCBRLMs and the BRLM, as set
forth in the table below:
Sr. No Name of the GCBRLMs/BRLM Website
1. Kotak www.investmentbank.kotak.com
2. Axis Capital www.axiscapital.co.in
3. CLSA www.india.clsa.com
4. YES Securities www.yesinvest.in
Disclaimer in respect of Jurisdiction
The Offer is being made in India to persons resident in India (including Indian nationals resident in India who are competent
to contract under the Indian Contract Act, 1872, HUFs, companies, corporate bodies and societies registered under the
applicable laws in India and authorised to invest in shares, Indian Mutual Funds registered with SEBI, Indian financial
institutions, commercial banks, regional rural banks, co-operative banks (subject to RBI permission), or trusts under
applicable trust law and who are authorised under their constitution to hold and invest in shares, permitted insurance
companies and pension funds, insurance funds set up and managed by the army and navy and insurance funds set up and
managed by the Department of Posts, India) and to FIIs, Eligible NRIs and FPIs. This Red Herring Prospectus does not,
however, constitute an invitation to purchase shares offered hereby in any jurisdiction other than India to any person to whom
it is unlawful to make an offer or invitation in such jurisdiction. Any person into whose possession this Red Herring
Prospectus comes is required to inform himself or herself about, and to observe, any such restrictions. Any dispute arising out
of the Offer will be subject to the jurisdiction of appropriate court(s) in Mumbai only.
No action has been, or will be, taken to permit a public offering in any jurisdiction where action would be required for that
purpose, except this Red Herring Prospectus had been filed with SEBI for its observations. Accordingly, the Equity Shares
represented thereby may not be offered or sold, directly or indirectly, and this Red Herring Prospectus may not be distributed,
in any jurisdiction, except in accordance with the legal requirements applicable in such jurisdiction. Neither the delivery of
this Red Herring Prospectus nor any sale hereunder shall, under any circumstances, create any implication that there has been
no change in the affairs of our Company since the date hereof or that the information contained herein is correct as of any
time subsequent to this date.
The Equity Shares have not been and will not be registered under the Securities Act, or any state securities laws in the
United States, and, unless so registered, may not be offered or sold within the United States, except pursuant to an
exemption from, or in a transaction not subject to, the registration requirements of the Securities Act and applicable
state securities laws in the United States. Accordingly, the Equity Shares are being offered and sold (a) in the United
States only to “qualified institutional buyers” (as defined in Rule 144A under the Securities Act and referred to in this
Red Herring Prospectus as “U.S. QIBs”; for the avoidance of doubt, the term U.S. QIBs does not refer to a category of
institutional investor defined under applicable Indian regulations and referred to in this Red Herring Prospectus as
“QIBs”), in reliance on Rule 144A under the Securities Act or another available exemption from the registration
requirements of the Securities Act, and (b) outside the United States in offshore transactions in compliance with
Regulation S under the Securities Act and the applicable laws of the jurisdiction where those offers and sales occur.
Disclaimer Clause of BSE
BSE Limited (“the Exchange”) has given vide its letter no. DCS/IPO/NP/IP/183/2016-17 dated June 29, 2016, permission to
this Company to use the Exchange’s name in this offer document as one of the stock exchanges on which this company’s
securities are proposed to be listed. The Exchange has scrutinized this offer document for its limited internal purpose of
deciding on the matter of granting the aforesaid permission to this Company. The Exchange does not in any manner:-
a) warrant, certify or endorse the correctness or completeness of any of the contents of this offer document; or
b) warrant that this Company’s securities will be listed or will continue to be listed on the Exchange; or
481
c) take any responsibility for the financial or other soundness of this Company, its promoters, its management or any
scheme or project of this Company;
and it should not for any reason be deemed or constructed that this offer document has been cleared or approved by the
Exchange. Every person who desires to apply for or otherwise acquires any securities of this Company may do so pursuant to
independent inquiry, investigation and analysis and shall not have any claim against the Exchange whatsoever by reason of
any loss which may be suffered by such person consequent to or in connection with such subscription/ acquisition whether by
reason of anything stated or omitted to be stated herein or for any other reason whatsoever.
Disclaimer Clause of the NSE
As required, a copy of this Offer Document has been submitted to National Stock Exchange of India Limited (hereinafter
referred to as NSE). NSE has given vide its letter Ref.: NSE/LIST/78978 dated July 5, 2016 permission to the Issuer to use
the Exchange’s name in this Offer Document as one of the stock exchanges on which this Issuer’s securities are proposed to
be listed. The Exchange has scrutinized this draft offer document for its limited internal purpose of deciding on the matter of
granting the aforesaid permission to this Issuer. It is to be distinctly understood that the aforesaid permission given by NSE
should not in any way be deemed or construed that the offer document has been cleared or approved by NSE; nor does it in
any manner warrant, certify or endorse the correctness or completeness of any of the contents of this offer document; nor does
it warrant that this Issuer’s securities will be listed or will continue to be listed on the Exchange; nor does it take any
responsibility for the financial or other soundness of this Issuer, its promoters, its management or any scheme or project of
this Issuer.
Every person who desires to apply for or otherwise acquire any securities of this Issuer may do so pursuant to independent
inquiry, investigation and analysis and shall not have any claim against the Exchange whatsoever by reason of any loss which
may be suffered by such person consequent to or in connection with such subscription /acquisition whether by reason of
anything stated or omitted to be stated herein or any other reason whatsoever.
Filing
A copy of this Red Herring Prospectus has been filed with SEBI at Corporate Finance Department, Plot No.C4-A, ‘G’ Block,
Bandra Kurla Complex, Bandra (East), Mumbai 400 051.
A copy of the Red Herring Prospectus, along with the documents required to be filed under Section 32 of the Companies Act,
2013 would be delivered for registration to the RoC and a copy of the Prospectus to be filed under Section 26 of the
Companies Act, 2013 would be delivered for registration with RoC at the Office of the Registrar of Companies, NCT of
Delhi and Haryana, 4th
Floor, IFCI Tower, 61, Nehru Place, New Delhi 110 019.
Listing
Applications have been made to the Stock Exchanges for permission to deal in and for an official quotation of the Equity
Shares. NSE will be the Designated Stock Exchange with which the Basis of Allotment will be finalised.
If the permissions to deal in, and for an official quotation of, the Equity Shares are not granted by any of the Stock Exchanges
mentioned above, our Company will forthwith repay, all moneys received from the Bidders in pursuance of the Red Herring
Prospectus. If such money is not repaid within the prescribed time, then our Company, the Selling Shareholders and every
officer in default shall be liable to repay the money, with interest, as prescribed under applicable law.
Our Company and the Selling Shareholders shall ensure that all steps for the completion of the necessary formalities for
listing and commencement of trading of the Equity Shares at all Stock Exchanges mentioned above are taken within six
Working Days of the Bid/Offer Closing Date.
Consents
Consents in writing of: (a) our Directors, our Company Secretary and Compliance Officer, Statutory Auditors, legal advisors,
Banker/Lenders to our Company, the GCBRLMs, the BRLM, the Syndicate Member, the Escrow Collection Bank, Refund
Bank and the Registrar to the Offer to act in their respective capacities, will be obtained and filed along with a copy of the
Red Herring Prospectus with the RoC, as required under the Companies Act and such consents shall not be withdrawn up to
the time of delivery of the Red Herring Prospectus for registration with the RoC.
In accordance with the Companies Act, 2013 and the SEBI ICDR Regulations, our the Statutory Auditors, namely Walker
Chandiok & Associates and O.P. Bagla & Co., have given their written consent for inclusion of their reports on the Restated
Consolidated Financial Statements and Restated Standalone Financial Statements of our Company dated September 22, 2016
and September 22, 2016, respectively, and the statement of tax benefits dated June 1, 2016 in the form and context, included
in this Red Herring Prospectus and such consent has not been withdrawn up to the time of delivery of this Red Herring
Prospectus for filing with SEBI.
482
Expert to the Offer
Except as stated below, our Company has not obtained any expert opinions:
Our Company has received written consents from the Statutory Auditors, Walker Chadiok & Associates and O.P. Bagla &
Co. to include their names as experts under Section 26 of the Companies Act, 2013 in this Red Herring Prospectus in relation
to the reports dated September 22, 2016 and September 22, 2016 on the Restated Consolidated Financial Statements and
Restated Standalone Financial Statements, respectively, of our Company and the statement of tax benefits dated June 1, 2016,
included in this Red Herring Prospectus and such consents have not been withdrawn up to the time of delivery of this Red
Herring Prospectus.
Offer Expenses
The expenses of the Offer include, among others, underwriting and management fees, selling commissions, printing and
distribution expenses, legal fees, statutory advertisement expenses, registrar and depository fees and listing fees. For further
details of Offer expenses, please see “Objects of the Offer” on page 101.
All expenses for the Offer shall be borne by our Company and the Selling Shareholders.
Fees Payable to the Syndicate
The total fees payable to the Syndicate (including underwriting commission and selling commission and reimbursement of
their out-of-pocket expense) will be as per the Syndicate Agreement dated October 13, 2016 a copy of which will be available
at the Registered office.
Commission payable to SCSBs, Registered Brokers, RTAs and CDPs
For details of the commission payable to SCBS, Registered Brokers, RTAs and CDPs see “Objects of the Offer” on page 101.
Fees Payable to the Registrar to the Offer
The fees payable by our Company to the Registrar to the Offer for processing of application, data entry, printing of Allotment
Advice/CAN/refund order, preparation of refund data on magnetic tape, printing of bulk mailing register will be as per the
agreement dated May 31, 2016 entered into, among our Company, the Selling Shareholders and the Registrar to the Offer.
The Registrar to the Offer will be reimbursed for all out-of-pocket expenses including cost of stationery, postage, stamp duty
and communication expenses. Adequate funds will be provided to the Registrar to the Offer to enable it to send refund orders
or Allotment advice by registered post/speed post/under certificate of posting.
Particulars regarding public or rights issues by our Company during the last five years
Our Company has not made any public or rights issues during the five years preceding the date of this Red Herring
Prospectus.
Previous issues of Equity Shares otherwise than for cash
Except as disclosed in the section “Capital Structure” on page 83, our Company has not issued any Equity Shares for
consideration otherwise than for cash.
Commission and Brokerage paid on previous issues of the Equity Shares
Since this is the initial public issue of Equity Shares, no sum has been paid or has been payable as commission or brokerage
for subscribing to or procuring or agreeing to procure subscription for any of the Equity Shares since our Company’s
inception.
Previous capital issue during the previous three years by listed Group Companies and associates of our Company
None of the Group Companies and associates of our Company are listed and have not undertaken a capital issue in the
preceding three years.
Performance vis-à-vis objects – Public/rights issue of our Company and/or listed Group Companies and associates of
our Company
Our Company has not undertaken any previous public or rights issue. None of the Group Companies or associates of our
Company have undertaken any public or rights issue in the last ten years preceding the date of the Draft Red Herring
Prospectus.
483
Outstanding Debentures or Bonds
Except for the NCDs, there are no outstanding debentures or bonds as of the date of filing this Red Herring Prospectus. For
further details of such NCDs, see “History and Certain Corporate Matters” on page 162 and “Financial Indebtedness” on page
404, respectively.
Outstanding Preference Shares or other convertible instruments issued by our Company
Except for the 771,700 options issued under ESOS 2013, our Company does not have any outstanding convertible
instruments as on date of this Red Herring Prospectus.
Partly Paid-up Shares
The Company does not have any party paid-up Equity Shares as on date of this Red Herring Prospectus.
Stock Market Data of Equity Shares
This being an initial public offer of our Company, the Equity Shares are not listed on any stock exchange and accordingly, no
stock market data is available for the Equity Shares.
Redressal of Investor Grievances
Bidders may contact the GCBRLMs and the BRLM for complaints, information or clarifications pertaining to the Offer.
The agreement between the Registrar to the Offer, our Company and the Selling Shareholders provides for retention of
records with the Registrar to the Offer for a period of at least three years from the last date of despatch of the letters of
allotment, demat credit and refund orders to enable the investors to approach the Registrar to the Offer for redressal of their
grievances.
All grievances other than those of Anchor Investors may be addressed to the Registrar to the Offer with a copy to the relevant
Designated Intermediary with whom the Bid cum Application Form was submitted. The Bidder should give full details such
as name of the sole or first Bidder, Bid cum Application Form number, Bidder DP ID, Client ID, PAN, date of the Bid cum
Application Form, address of the Bidder, number of the Equity Shares applied for and the name and address of the
Designated Intermediary where the Bid cum Application Form was submitted by the Bidder.
Further, the Bidder (other than Anchor Investor) shall also enclose the Acknowledgement Slip from the Designated
Intermediaries in addition to the documents or information mentioned hereinabove.
All grievances of the Anchor Investors may be addressed to the Registrar to the Offer, giving full details such as name of the
sole or first Bidder, Anchor Investor Application Form number, Bidders DP ID, Client ID, PAN, date of the Anchor Investor
Application Form, address of the Bidder, number of the Equity Shares applied for, Bid Amount paid on submission of the
Anchor Investor Application Form and the name and address of the Book Running Lead Manager where the Anchor Investor
Application Form was submitted by the Anchor Investor.
Our Company estimates that the average time required by our Company or the Registrar to the Offer or the SCSB for the
redressal of routine investor grievances shall be 10 Working Days from the date of receipt of the complaint. In case of non-
routine complaints and complaints where external agencies are involved, our Company will seek to redress these complaints
as expeditiously as possible.
Our Company has appointed a Stakeholders’ Relationship Committee comprising Ravindra Dhariwal, Raj Pal Gandhi, Udai
Dhawan and Parth Dasharathlal Gandhi as members. For details, please see “Our Management” on page 174.
Our Company has also appointed Mahavir Prasad Garg, Company Secretary of our Company as the Compliance Officer for
the Offer and he may be contacted in case of any pre-Offer or post-Offer related problems at the following address:
Mahavir Prasad Garg
Plot no. 31, Institutional Area
Sector – 44
Gurgaon 122002
Tel: +91 124 4643100
Fax: +91 124 4643303
E-mail: [email protected]
484
Changes in Auditors
Our Company has not changed its auditors in the last three years.
Capitalisation of Reserves or Profits
Our Company has not capitalised its reserves or profits at any time during the last five years, except as stated in the section
“Capital Structure” on page 83.
Revaluation of Assets
Except as stated in “History and Certain Corporate Matters” on page 162, our Company has not revalued its assets since its
incorporation.
485
SECTION VII: OFFER INFORMATION
TERMS OF THE OFFER
The Equity Shares being issued and transferred pursuant to this Offer shall be subject to the provisions of the Companies Act,
SEBI ICDR Regulations, SCRA, SCRR, the Memorandum and Articles of Association, the terms of the Red Herring
Prospectus, the Prospectus, the Abridged Prospectus, Bid cum Application Form, the Revision Form, the CAN/Allotment
Advice and other terms and conditions as may be incorporated in the Allotment Advices and other documents/certificates that
may be executed in respect of the Offer. The Equity Shares shall also be subject to laws as applicable, guidelines, rules,
notifications and regulations relating to the issue of capital and listing and trading of securities issued from time to time by
SEBI, the Government of India, the Stock Exchange, the RBI, RoC and/or other authorities, as in force on the date of the
Offer and to the extent applicable or such other conditions as may be prescribed by the SEBI, the RBI, the Government of
India, the Stock Exchanges, the RoC and/or any other authorities while granting its approval for the Offer. SEBI has notified
the SEBI Listing Regulations which governs the obligations which were prescribed under the Equity Listing Agreement.
Ranking of the Equity Shares
The Equity Shares being issued and transferred pursuant to the Offer shall be subject to the provisions of the Companies Act,
the MoA and AoA and shall rank pari-passu in all respects with the existing Equity Shares including in respect of the right to
receive dividend. The Allottees upon Allotment of Equity Shares under the Offer, will be entitled to dividend and other
corporate benefits, if any, declared by our Company after the date of Allotment. For further details, see “Main Provisions of
Articles of Association” on page 532.
Mode of Payment of Dividend
Our Company shall pay dividends, if declared, to the Shareholders in accordance with the provisions of Companies Act, the
Memorandum and Articles of Association and provisions of the SEBI Listing Regulations. For further details, in relation to
dividends, see “Dividend Policy” and “Main Provisions of the Articles of Association” on pages 209 and 532, respectively.
Face Value and Offer Price
The face value of each Equity Share is ₹ 10 and the Offer Price at the lower end of the Price Band is ₹ [●] per Equity Share
and at the higher end of the Price Band is ₹ [●] per Equity Share. The Anchor Investor Offer Price is ₹ [●] per Equity Share.
The Price Band and the minimum Bid Lot size for the Offer will be decided by our Company in consultation with the Selling
Shareholders, the GCBRLMs and the BRLM and advertised in all editions of Financial Express (a widely circulated English
national daily newspaper) and all editions of Jansatta (a widely circulated Hindi national daily newspaper, Hindi also being
the regional language in the place where our Registered Office is located) , at least five Working Days prior to the Bid/Offer
Opening Date and shall be made available to the Stock Exchanges for the purpose of uploading the same on their websites.
The Price Band, along with the relevant financial ratios calculated at the Floor Price and at the Cap Price, shall be pre-filled in
the Bid cum Application Forms available on the websites of the Stock Exchanges.
At any given point of time there shall be only one denomination of Equity Shares.
Compliance with disclosure and accounting norms
Our Company shall comply with all disclosure and accounting norms as specified by SEBI from time to time.
Rights of our Shareholders
Subject to applicable laws, rules, regulations and guidelines and the Articles of Association, our equity Shareholders shall
have the following rights:
Right to receive dividends, if declared;
Right to attend general meetings and exercise voting rights, unless prohibited by law;
Right to vote on a poll either in person or by proxy, in accordance with the provisions of the Companies Act;
Right to receive offers for rights shares and be allotted bonus shares, if announced;
Right to receive surplus on liquidation, subject to any statutory and preferential claim being satisfied;
Right of free transferability, subject to applicable laws including any RBI rules and regulations; and
486
Such other rights, as may be available to a shareholder of a listed public company under the Companies Act, the
SEBI Listing Regulations and the Articles of Association of our Company.
For a detailed description of the main provisions of the Articles of Association of our Company relating to voting rights,
dividend, forfeiture and lien, transfer, transmission and/or consolidation/splitting, see “Main Provisions of Articles of
Association” on page 532.
Market Lot and Trading Lot
Pursuant to Section 29 of the Companies Act, 2013 the Equity Shares shall be allotted only in dematerialised form. As per the
SEBI ICDR Regulations, the trading of the Equity Shares shall only be in dematerialised form. In this context, two
agreements have been signed amongst our Company, the respective Depositories and the Registrar to the Offer:
Agreement dated June 15, 2016 amongst NSDL, our Company and the Registrar to the Offer;
Agreement dated June 10, 2016 amongst CDSL, our Company and the Registrar to the Offer.
Since trading of the Equity Shares is in dematerialised form, the tradable lot is one Equity Share. Allotment in this Offer will
be only in electronic form in multiples of one Equity Share subject to a minimum Allotment of [] Equity Shares.
Joint Holders
Where two or more persons are registered as the holders of the Equity Shares, they shall be entitled to hold the same as joint
tenants with benefits of survivorship.
Jurisdiction
Exclusive jurisdiction for the purpose of this Offer is with the competent courts/authorities in Mumbai.
Nomination facility to Bidders
In accordance with Section 72 of the Companies Act, 2013 the sole Bidder, or the first Bidder along with other joint Bidders,
may nominate any one person in whom, in the event of the death of sole Bidder or in case of joint Bidders, death of all the
Bidders, as the case may be, the Equity Shares Allotted, if any, shall vest. A person, being a nominee, entitled to the Equity
Shares by reason of the death of the original holder(s), shall be entitled to the same advantages to which he or she would be
entitled if he or she were the registered holder of the Equity Share(s). Where the nominee is a minor, the holder(s) may make
a nomination to appoint, in the prescribed manner, any person to become entitled to equity share(s) in the event of his or her
death during the minority. A nomination shall stand rescinded upon a sale/transfer/alienation of equity share(s) by the person
nominating. A buyer will be entitled to make a fresh nomination in the manner prescribed. Fresh nomination can be made
only on the prescribed form available on request at our Registered Office or to the registrar and transfer agents of our
Company.
Any person who becomes a nominee by virtue of the provisions of Section 72 of the Companies Act, 2013 shall upon the
production of such evidence as may be required by the Board, elect either:
a) to register himself or herself as the holder of the Equity Shares; or
b) to make such transfer of the Equity Shares, as the deceased holder could have made.
Further, the Board may at any time give notice requiring any nominee to choose either to be registered himself or herself or to
transfer the Equity Shares, and if the notice is not complied with within a period of 90 days, the Board may thereafter
withhold payment of all dividends, bonuses or other moneys payable in respect of the Equity Shares, until the requirements of
the notice have been complied with.
Since the Allotment will be made only in dematerialized mode there is no need to make a separate nomination with our
Company. Nominations registered with respective depository participant of the Bidders would prevail. If the investor wants to
change the nomination, they are requested to inform their respective depository participant.
Withdrawal of the Offer
Our Company in consultation with the Selling Shareholders, the GCBRLMs and the BRLM, reserves the right to not to
proceed with the Offer after the Bid/Offer Opening Date but before the Allotment. In such an event, our Company would
issue a public notice in the newspapers in which the pre-Offer advertisements were published, within two days of the
Bid/Offer Closing Date or such other time as may be prescribed by SEBI, providing reasons for not proceeding with the
Offer. The Registrar to the Offer, shall notify the SCSBs to unblock the bank accounts of the ASBA Bidders within one
487
Working Day from the date of receipt of such notification. Our Company shall also inform the same to the Stock Exchanges
on which Equity Shares are proposed to be listed.
Notwithstanding the foregoing, this Offer is also subject to obtaining (i) the final listing and trading approvals of the Stock
Exchanges, which our Company shall apply for after Allotment, and (ii) the final RoC approval of the Prospectus after it is
filed with the RoC. If our Company and the Selling Shareholders withdraws the Offer after the Bid/ Offer Closing Date and
thereafter determines that it will proceed with an issue/offer for sale of the Equity Shares, our Company shall file a fresh draft
red herring prospectus with SEBI.
Bid/Offer Programme
BID/OFFER OPENS ON October 26, 2016 (Wednesday)(1)
BID/OFFER CLOSES ON October 28, 2016 (Friday) (1) Our Company may, in consultation with the Selling Shareholders, the GCBRLMs and the BRLM, consider participation by Anchor Investors in
accordance with the SEBI ICDR Regulations. The Anchor Investor Bid/Offer Period shall be one Working Day prior to the Bid/Offer Opening Date
An indicative timetable in respect of the Offer is set out below:
Event Indicative Date
Bid/Offer Closing Date October 28, 2016 (Friday)
Finalisation of Basis of Allotment with the Designated Stock Exchange On or about November 3, 2016
(Thursday)
Initiation of refunds (if any, for Anchor Investors)/unblocking of funds from ASBA
Account
On or about November 4, 2016
(Friday) Credit of Equity Shares to demat accounts of Allottees On or about November 7, 2016
(Monday) Commencement of trading of the Equity Shares on the Stock Exchanges On or about November 8, 2016
(Tuesday)
The above timetable, other than the Bid/Offer Closing Date, is indicative and does not constitute any obligation on our
Company or the Selling Shareholders, the GCBRLMs or the BRLM.
Whilst our Company and the Selling Shareholders shall ensure that all steps for the completion of the necessary
formalities for the listing and the commencement of trading of the Equity Shares on the Stock Exchanges are taken
within six Working Days of the Bid/Offer Closing Date, the timetable may be extended due to various factors, such as
extension of the Bid/Offer Period by our Company, revision of the Price Band or any delay in receiving the final listing
and trading approval from the Stock Exchanges. The commencement of trading of the Equity Shares will be entirely
at the discretion of the Stock Exchanges and in accordance with the applicable laws.
Submission of Bids (other than Bids from Anchor Investors):
Bid/Offer Period (except the Bid/Offer Closing Date)
Submission and Revision in Bids Only between 10.00 a.m. and 5.00 p.m. (Indian Standard Time (“IST”)
Bid/Offer Closing Date
Submission and Revision in Bids Only between 10.00 a.m. and 3.00 p.m. IST
On the Bid/Offer Closing Date, the Bids shall be uploaded until:
(i) 4.00 p.m. IST in case of Bids by QIBs and Non-Institutional Bidders, and
(ii) until 5.00 p.m. IST or such extended time as permitted by the Stock Exchanges, in case of Bids by Retail Individual
Bidders and Eligible Employees bidding in the Employee Reservation Portion.
On Bid/Offer Closing Date, extension of time will be granted by Stock Exchanges only for uploading Bids received by Retail
Individual Bidders and Eligible Employees bidding in the Employee Reservation Portion after taking into account the total
number of Bids received and as reported by the GCBRLMs and the BRLM to the Stock Exchanges.
It is clarified that Bids not uploaded on the electronic bidding system or in respect of which the full Bid Amount is not
blocked by SCSBs would be rejected.
In case of any discrepancy in the data entered in the electronic book vis-a-vis data contained in physical Bid – cum-
Application Form, for a particular Bidder the details of the Bid file received from Stock Exchanges may be taken as final data
for purposes of Allotment.
488
Due to limitation of time available for uploading the Bids on the Bid/Offer Closing Date, Bidders are advised to submit their
Bids one day prior to the Bid/Offer Closing Date. Any time mentioned in this Red Herring Prospectus is in IST. Bidders are
cautioned that, in the event a large number of Bids are received on the Bid/Offer Closing Date, some Bids may not get
uploaded due to lack of sufficient time. Such Bids that cannot be uploaded will not be considered for allocation under this
Offer. Bids will be accepted only during Monday to Friday (excluding any public holiday). None among our Company, the
Selling Shareholders, or any member of the Syndicate is liable for any failure in uploading the Bids due to faults in any
software/hardware system or otherwise.
Our Company in consultation with the Selling Shareholders, the GCBRLMs and the BRLM, reserves the right to revise the
Price Band during the Bid/Offer Period. The revision in the Price Band shall not exceed 20% on either side, i.e. the Floor
Price can move up or down to the extent of 20% of the Floor Price and the Cap Price will be revised accordingly.
In case of revision in the Price Band, the Bid/Offer Period shall be extended for at least three additional Working Days
after such revision, subject to the Bid/Offer Period not exceeding 10 Working Days. Any revision in Price Band, and
the revised Bid/Offer Period, if applicable, shall be widely disseminated by notification to the Stock Exchanges, by
issuing a press release and also by indicating the change on the terminals of the Syndicate Member. The requirement
for minimum subscription is not applicable to the Offer for Sale. In case of undersubscription of the Offer, the Equity
Shares in the Fresh Issue will be issued prior to the sale of Equity Shares in the Offer for Sale.
Minimum Subscription
If our Company does not receive (i) the minimum subscription of 90% of the Fresh Issue; and (ii) a subscription in the Offer
equivalent to at least 10% post-Offer paid up Equity Share capital of our Company (the minimum number of securities as
specified under Rule 19(2)(b)(iii) of the SCRR), including devolvement of Underwriters, if any, within 60 days from the date
of Bid/Offer Closing Date, our Company and the Selling Shareholders shall forthwith refund the entire subscription amount
received. If there is a delay beyond the prescribed time, our Company and the Selling Shareholders shall pay interest
prescribed under the Companies Act, 2013, the SEBI ICDR Regulations and applicable law.
Further, our Company shall ensure that the number of prospective allottees to whom the Equity Shares will be Allotted will
be not less than 1,000.
Any expense incurred by our Company on behalf of the Selling Shareholders with regard to refunds, interest for delays, etc.
for the Equity Shares being offered in the Offer will be reimbursed by the Selling Shareholders to our Company in proportion
to the Equity Shares being offered for sale by the Selling Shareholders in the Offer.
Arrangements for Disposal of Odd Lots
There are no arrangements for disposal of odd lots.
Restrictions, if any on Transfer and Transmission of Equity Shares
Except for the lock-in of the pre-Offer capital of our Company, Promoters’ minimum contribution and the Anchor Investor
lock-in as provided in “Capital Structure” on page 83 and except as provided in the Articles of Association there are no
restrictions on transfer of Equity Shares. Further, there are no restrictions on the transmission of shares/debentures and on
their consolidation/splitting, except as provided in the Articles of Association. For details, see “Main Provisions of the
Articles of Association” on page 532.
Option to Receive Securities in Dematerialized Form
Pursuant to Section 29 of the Companies Act, 2013, the Equity Shares in the Offer shall be allotted only in dematerialised
form. Further, as per the SEBI ICDR Regulations, the trading of the Equity Shares shall only be in dematerialised form on the
Stock Exchanges.
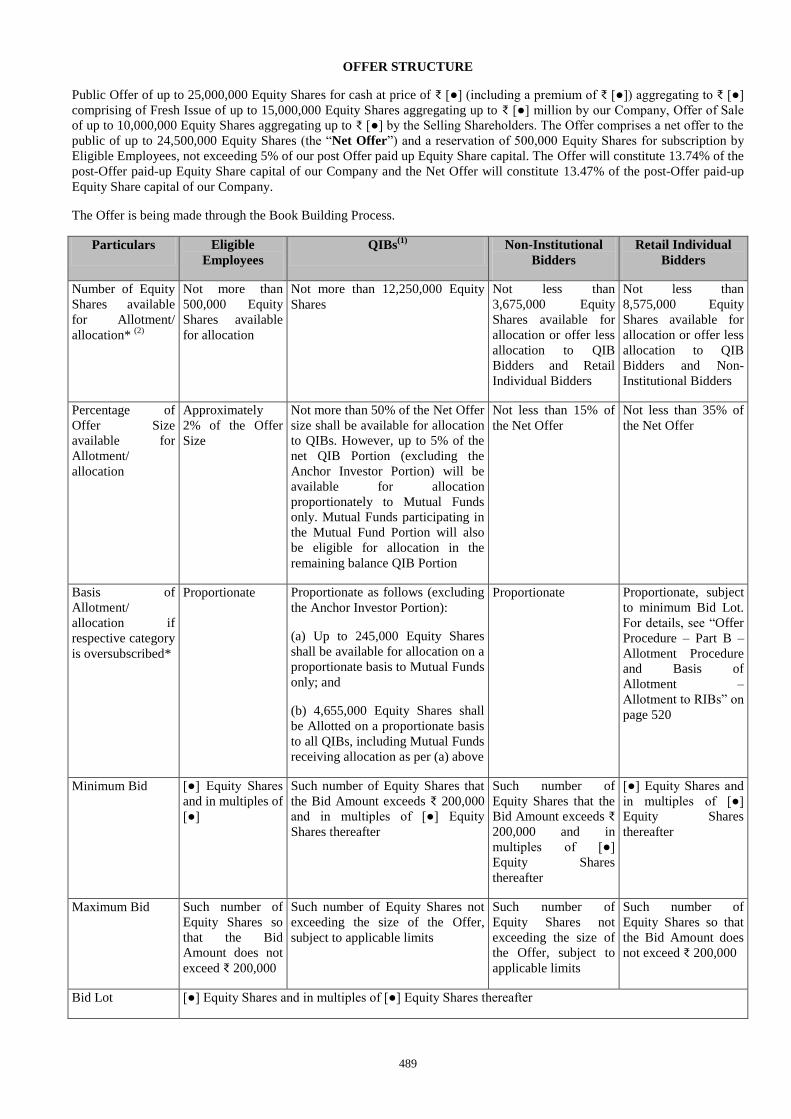
489
OFFER STRUCTURE
Public Offer of up to 25,000,000 Equity Shares for cash at price of ₹ [●] (including a premium of ₹ [●]) aggregating to ₹ [●]
comprising of Fresh Issue of up to 15,000,000 Equity Shares aggregating up to ₹ [●] million by our Company, Offer of Sale
of up to 10,000,000 Equity Shares aggregating up to ₹ [●] by the Selling Shareholders. The Offer comprises a net offer to the
public of up to 24,500,000 Equity Shares (the “Net Offer”) and a reservation of 500,000 Equity Shares for subscription by
Eligible Employees, not exceeding 5% of our post Offer paid up Equity Share capital. The Offer will constitute 13.74% of the
post-Offer paid-up Equity Share capital of our Company and the Net Offer will constitute 13.47% of the post-Offer paid-up
Equity Share capital of our Company.
The Offer is being made through the Book Building Process.
Particulars Eligible
Employees
QIBs(1)
Non-Institutional
Bidders
Retail Individual
Bidders
Number of Equity
Shares available
for Allotment/
allocation* (2)
Not more than
500,000 Equity
Shares available
for allocation
Not more than 12,250,000 Equity
Shares
Not less than
3,675,000 Equity
Shares available for
allocation or offer less
allocation to QIB
Bidders and Retail
Individual Bidders
Not less than
8,575,000 Equity
Shares available for
allocation or offer less
allocation to QIB
Bidders and Non-
Institutional Bidders
Percentage of
Offer Size
available for
Allotment/
allocation
Approximately
2% of the Offer
Size
Not more than 50% of the Net Offer
size shall be available for allocation
to QIBs. However, up to 5% of the
net QIB Portion (excluding the
Anchor Investor Portion) will be
available for allocation
proportionately to Mutual Funds
only. Mutual Funds participating in
the Mutual Fund Portion will also
be eligible for allocation in the
remaining balance QIB Portion
Not less than 15% of
the Net Offer
Not less than 35% of
the Net Offer
Basis of
Allotment/
allocation if
respective category
is oversubscribed*
Proportionate
Proportionate as follows (excluding
the Anchor Investor Portion):
(a) Up to 245,000 Equity Shares
shall be available for allocation on a
proportionate basis to Mutual Funds
only; and
(b) 4,655,000 Equity Shares shall
be Allotted on a proportionate basis
to all QIBs, including Mutual Funds
receiving allocation as per (a) above
Proportionate Proportionate, subject
to minimum Bid Lot.
For details, see “Offer
Procedure – Part B –
Allotment Procedure
and Basis of
Allotment –
Allotment to RIBs” on
page 520
Minimum Bid [●] Equity Shares
and in multiples of
[●]
Such number of Equity Shares that
the Bid Amount exceeds ₹ 200,000
and in multiples of [●] Equity
Shares thereafter
Such number of
Equity Shares that the
Bid Amount exceeds ₹
200,000 and in
multiples of [●]
Equity Shares
thereafter
[●] Equity Shares and
in multiples of [●]
Equity Shares
thereafter
Maximum Bid Such number of
Equity Shares so
that the Bid
Amount does not
exceed ₹ 200,000
Such number of Equity Shares not
exceeding the size of the Offer,
subject to applicable limits
Such number of
Equity Shares not
exceeding the size of
the Offer, subject to
applicable limits
Such number of
Equity Shares so that
the Bid Amount does
not exceed ₹ 200,000
Bid Lot [●] Equity Shares and in multiples of [●] Equity Shares thereafter
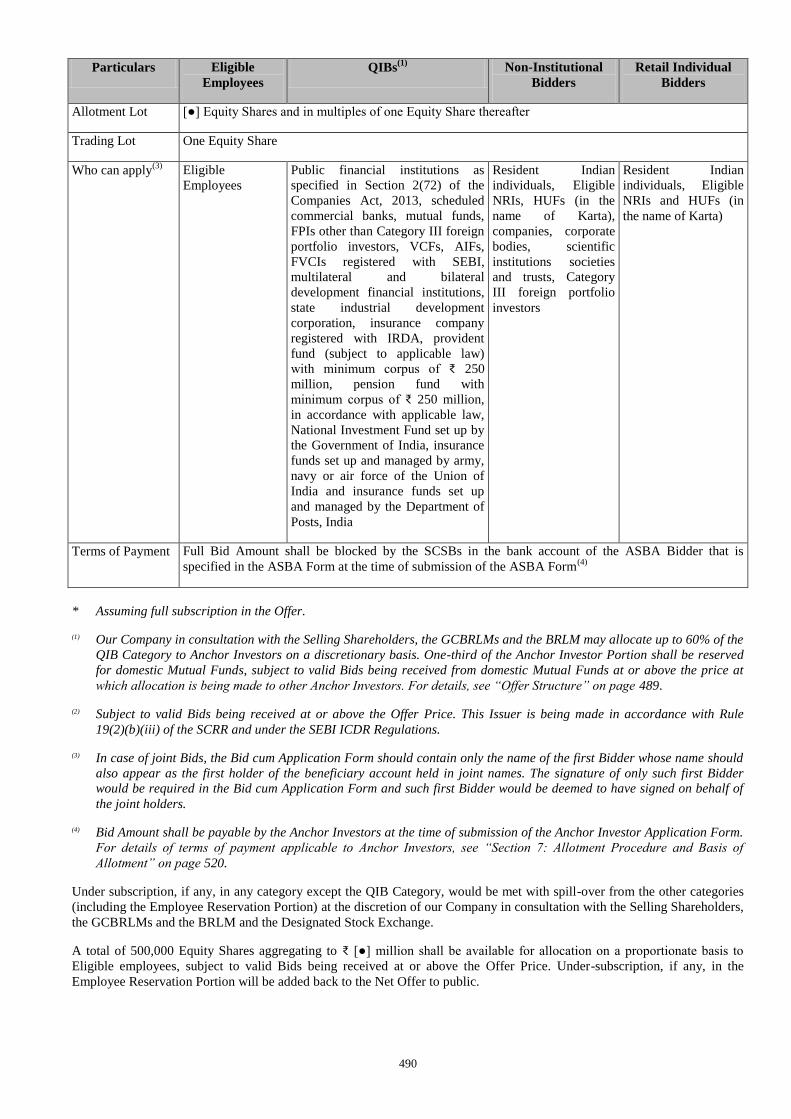
490
Particulars Eligible
Employees
QIBs(1)
Non-Institutional
Bidders
Retail Individual
Bidders
Allotment Lot [●] Equity Shares and in multiples of one Equity Share thereafter
Trading Lot One Equity Share
Who can apply(3)
Eligible
Employees
Public financial institutions as
specified in Section 2(72) of the
Companies Act, 2013, scheduled
commercial banks, mutual funds,
FPIs other than Category III foreign
portfolio investors, VCFs, AIFs,
FVCIs registered with SEBI,
multilateral and bilateral
development financial institutions,
state industrial development
corporation, insurance company
registered with IRDA, provident
fund (subject to applicable law)
with minimum corpus of ₹ 250
million, pension fund with
minimum corpus of ₹ 250 million,
in accordance with applicable law,
National Investment Fund set up by
the Government of India, insurance
funds set up and managed by army,
navy or air force of the Union of
India and insurance funds set up
and managed by the Department of
Posts, India
Resident Indian
individuals, Eligible
NRIs, HUFs (in the
name of Karta),
companies, corporate
bodies, scientific
institutions societies
and trusts, Category
III foreign portfolio
investors
Resident Indian
individuals, Eligible
NRIs and HUFs (in
the name of Karta)
Terms of Payment Full Bid Amount shall be blocked by the SCSBs in the bank account of the ASBA Bidder that is
specified in the ASBA Form at the time of submission of the ASBA Form(4)
* Assuming full subscription in the Offer.
(1) Our Company in consultation with the Selling Shareholders, the GCBRLMs and the BRLM may allocate up to 60% of the
QIB Category to Anchor Investors on a discretionary basis. One-third of the Anchor Investor Portion shall be reserved
for domestic Mutual Funds, subject to valid Bids being received from domestic Mutual Funds at or above the price at
which allocation is being made to other Anchor Investors. For details, see “Offer Structure” on page 489.
(2) Subject to valid Bids being received at or above the Offer Price. This Issuer is being made in accordance with Rule
19(2)(b)(iii) of the SCRR and under the SEBI ICDR Regulations.
(3) In case of joint Bids, the Bid cum Application Form should contain only the name of the first Bidder whose name should
also appear as the first holder of the beneficiary account held in joint names. The signature of only such first Bidder
would be required in the Bid cum Application Form and such first Bidder would be deemed to have signed on behalf of
the joint holders.
(4) Bid Amount shall be payable by the Anchor Investors at the time of submission of the Anchor Investor Application Form.
For details of terms of payment applicable to Anchor Investors, see “Section 7: Allotment Procedure and Basis of
Allotment” on page 520.
Under subscription, if any, in any category except the QIB Category, would be met with spill-over from the other categories
(including the Employee Reservation Portion) at the discretion of our Company in consultation with the Selling Shareholders,
the GCBRLMs and the BRLM and the Designated Stock Exchange.
A total of 500,000 Equity Shares aggregating to ₹ [●] million shall be available for allocation on a proportionate basis to
Eligible employees, subject to valid Bids being received at or above the Offer Price. Under-subscription, if any, in the
Employee Reservation Portion will be added back to the Net Offer to public.
491
OFFER PROCEDURE
All Bidders should review the General Information Document for Investing in Public Offers prepared and issued in
accordance with the circular (CIR/CFD/DIL/12/2013) dated October 23, 2013 notified by SEBI and updated circular dated
November 10, 2015 notified by SEBI (CIR/CFD/POL/CYCILL/11/2015) (the “General Information Document”) included
below under “Part B – General Information Document”, which highlights the key rules, processes and procedures
applicable to public issues in general in accordance with the provisions of the Companies Act, the SCRA, the SCRR and the
SEBI ICDR Regulations. The General Information Document has been updated to reflect the enactments and regulations, to
the extent applicable to a public issue. The General Information Document is also available on the websites of the Stock
Exchanges, the GCBRLMs and the BRLM. Please refer to the relevant provisions of the General Information Document
which are applicable to the Offer.
Our Company, the Selling Shareholders, the GCBRLMs and the BRLM do not accept any responsibility for the completeness
and accuracy of the information stated in this section and are not liable for any amendment, modification or change in the
applicable law which may occur after the date of this Red Herring Prospectus. Bidders are advised to make their independent
investigations and ensure that their Bids are submitted in accordance with applicable laws and do not exceed the investment
limits or maximum number of the Equity Shares that can be held by them under applicable law or as specified in this Red
Herring Prospectus.
PART A
Book Building Procedure
The Offer is being made through the Book Building Process wherein not more than 50% of the Net Offer shall be Allotted to
QIBs on a proportionate basis, provided that our Company, in consultation with the Selling Shareholders, the GCBRLMs and
the BRLM may allocate up to 60% of the QIB Category to Anchor Investors on a discretionary basis in accordance with the
SEBI ICDR Regulations, of which one-third shall be reserved for domestic Mutual Funds, subject to valid Bids being
received from them at or above the Anchor Investor Allocation Price. 5% of the net QIB Category (excluding the Anchor
Investor Portion) shall be available for allocation on a proportionate basis to Mutual Funds only, and the remainder of the
QIB Category shall be available for allocation on a proportionate basis to all QIB Bidders (other than Anchor Investors),
including Mutual Funds, subject to valid Bids being received at or above the Offer Price. Further, not less than 15% of the
Net Offer shall be available for allocation on a proportionate basis to Non-Institutional Bidders and not less than 35% of the
Net Offer shall be available for allocation to Retail Individual Bidders in accordance with the SEBI ICDR Regulations,
subject to valid Bids being received at or above the Offer Price. 500,000 Equity Shares aggregating up to ₹ [●] million shall
be made available for allocation on a proportionate basis to the Eligible Employees bidding in the Employee Reservation
portion, subject to valid Bids being received at or above the Offer Price.
Under-subscription, if any, in any category, except in the QIB Category, would be allowed to be met with spill over from any
other category or combination of categories (including the Employee Reservation Portion), at the discretion of our Company
in consultation with the Selling Shareholders, the GCBRLMs and the BRLM and the Designated Stock Exchange. Under-
subscription, if any, in the Employee Reservation Portion will be added back to the Net Offer. Under-subscription, if any, in
the Net Offer would be allowed to be met with the Employee Reservation Portion.
The Equity Shares, on Allotment, shall be traded only in the dematerialized segment of the Stock Exchanges.
Investors should note that the Equity Shares will be Allotted to all successful Bidders only in dematerialised form. The
Bid cum Application Forms which do not have the details of the Bidders’ depository account, including DP ID, Client
ID and PAN, shall be treated as incomplete and will be rejected. Bidders will not have the option of being Allotted
Equity Shares in physical form.
Bid cum Application Form
Copies of the ASBA Form and the abridged prospectus will be available with the Designated Intermediaries at the Bidding
Centers, and Registered Office of our Company. An electronic copy of the ASBA Form will also be available for download
on the websites of the NSE (www.nseindia.com) and the BSE (www.bseindia.com) at least one day prior to the Bid/Offer
Opening Date.
All Bidders (other than Anchor Investors) shall mandatorily participate in the Offer only through the ASBA process. ASBA
Bidders must provide bank account details and authorisation to block funds in the relevant space provided in the ASBA Form
and the ASBA Forms that do not contain such details will be rejected.
ASBA Bidders shall ensure that the Bids are made on ASBA Forms bearing the stamp of the Designated Intermediary,
submitted at the Bidding Centers only (except in case of electronic ASBA Forms) and the ASBA Forms not bearing such
specified stamp are liable to be rejected.
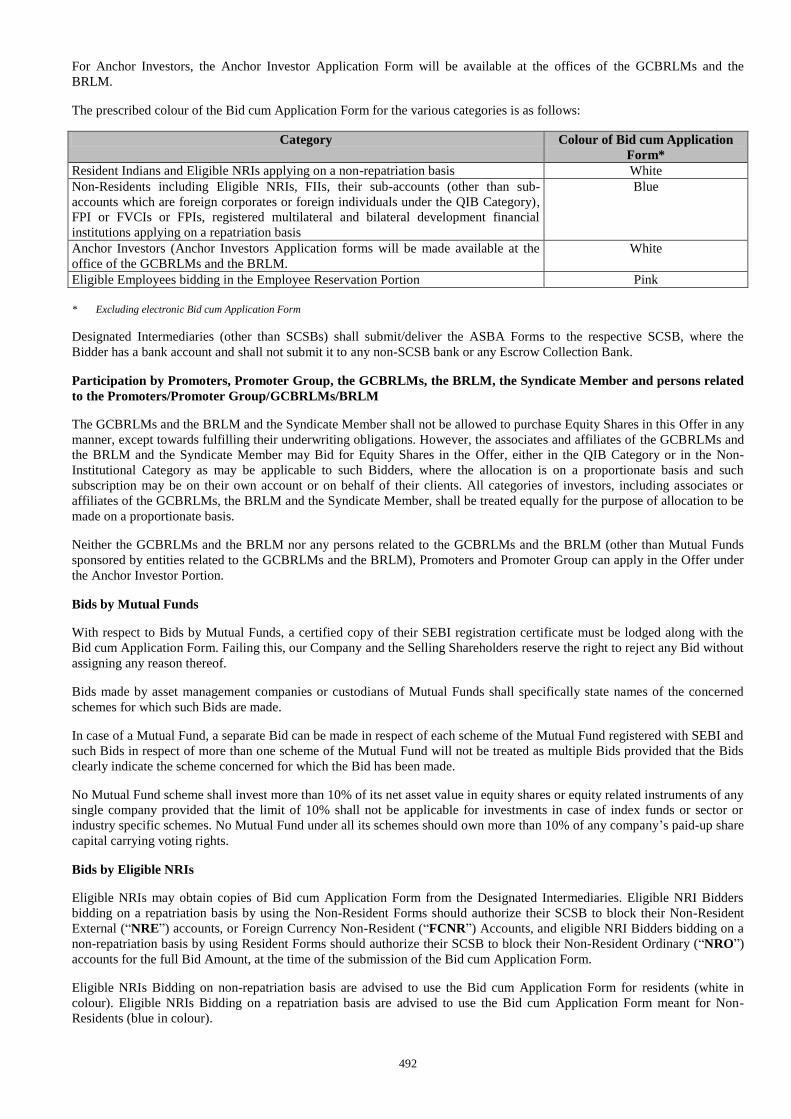
492
For Anchor Investors, the Anchor Investor Application Form will be available at the offices of the GCBRLMs and the
BRLM.
The prescribed colour of the Bid cum Application Form for the various categories is as follows:
Category Colour of Bid cum Application
Form*
Resident Indians and Eligible NRIs applying on a non-repatriation basis White
Non-Residents including Eligible NRIs, FIIs, their sub-accounts (other than sub-
accounts which are foreign corporates or foreign individuals under the QIB Category),
FPI or FVCIs or FPIs, registered multilateral and bilateral development financial
institutions applying on a repatriation basis
Blue
Anchor Investors (Anchor Investors Application forms will be made available at the
office of the GCBRLMs and the BRLM.
White
Eligible Employees bidding in the Employee Reservation Portion Pink
* Excluding electronic Bid cum Application Form
Designated Intermediaries (other than SCSBs) shall submit/deliver the ASBA Forms to the respective SCSB, where the
Bidder has a bank account and shall not submit it to any non-SCSB bank or any Escrow Collection Bank.
Participation by Promoters, Promoter Group, the GCBRLMs, the BRLM, the Syndicate Member and persons related
to the Promoters/Promoter Group/GCBRLMs/BRLM
The GCBRLMs and the BRLM and the Syndicate Member shall not be allowed to purchase Equity Shares in this Offer in any
manner, except towards fulfilling their underwriting obligations. However, the associates and affiliates of the GCBRLMs and
the BRLM and the Syndicate Member may Bid for Equity Shares in the Offer, either in the QIB Category or in the Non-
Institutional Category as may be applicable to such Bidders, where the allocation is on a proportionate basis and such
subscription may be on their own account or on behalf of their clients. All categories of investors, including associates or
affiliates of the GCBRLMs, the BRLM and the Syndicate Member, shall be treated equally for the purpose of allocation to be
made on a proportionate basis.
Neither the GCBRLMs and the BRLM nor any persons related to the GCBRLMs and the BRLM (other than Mutual Funds
sponsored by entities related to the GCBRLMs and the BRLM), Promoters and Promoter Group can apply in the Offer under
the Anchor Investor Portion.
Bids by Mutual Funds
With respect to Bids by Mutual Funds, a certified copy of their SEBI registration certificate must be lodged along with the
Bid cum Application Form. Failing this, our Company and the Selling Shareholders reserve the right to reject any Bid without
assigning any reason thereof.
Bids made by asset management companies or custodians of Mutual Funds shall specifically state names of the concerned
schemes for which such Bids are made.
In case of a Mutual Fund, a separate Bid can be made in respect of each scheme of the Mutual Fund registered with SEBI and
such Bids in respect of more than one scheme of the Mutual Fund will not be treated as multiple Bids provided that the Bids
clearly indicate the scheme concerned for which the Bid has been made.
No Mutual Fund scheme shall invest more than 10% of its net asset value in equity shares or equity related instruments of any
single company provided that the limit of 10% shall not be applicable for investments in case of index funds or sector or
industry specific schemes. No Mutual Fund under all its schemes should own more than 10% of any company’s paid-up share
capital carrying voting rights.
Bids by Eligible NRIs
Eligible NRIs may obtain copies of Bid cum Application Form from the Designated Intermediaries. Eligible NRI Bidders
bidding on a repatriation basis by using the Non-Resident Forms should authorize their SCSB to block their Non-Resident
External (“NRE”) accounts, or Foreign Currency Non-Resident (“FCNR”) Accounts, and eligible NRI Bidders bidding on a
non-repatriation basis by using Resident Forms should authorize their SCSB to block their Non-Resident Ordinary (“NRO”)
accounts for the full Bid Amount, at the time of the submission of the Bid cum Application Form.
Eligible NRIs Bidding on non-repatriation basis are advised to use the Bid cum Application Form for residents (white in
colour). Eligible NRIs Bidding on a repatriation basis are advised to use the Bid cum Application Form meant for Non-
Residents (blue in colour).
493
Bids by FPIs (including FIIs)
In terms of the SEBI FPI Regulations, an FII who holds a valid certificate of registration from SEBI shall be deemed to be a
registered FPI until the expiry of the block of three years for which fees have been paid as per the SEBI FII Regulations.
Accordingly, such FIIs can participate in this Offer in accordance with Schedule 2 of the FEMA Regulations. An FII shall not
be eligible to invest as an FII after registering as an FPI under the SEBI FPI Regulations.
In terms of the SEBI FPI Regulations, the issue of Equity Shares to a single FPI or an investor group (which means the same
set of ultimate beneficial owner(s) investing through multiple entities) must be below 10% of our post-Offer Equity Share
capital. Further, in terms of the FEMA Regulations, the total holding by each FPI shall be below 10% of the total paid-up
Equity Share capital of our Company and the total holdings of all FPIs put together shall not exceed 24% of the paid-up
Equity Share capital of our Company. The aggregate limit of 24% may be increased up to the sectoral cap by way of a
resolution passed by the Board of Directors followed by a special resolution passed by the Shareholders of our Company and
subject to prior intimation to RBI. In terms of the FEMA Regulations, for calculating the aggregate holding of FPIs in a
company, holding of all registered FPIs as well as holding of FIIs (being deemed FPIs) shall be included.
The existing individual and aggregate investment limits for an FII or sub account in our Company are 10% and 24% of the
total paid-up Equity Share capital of our Company, respectively.
FPIs are permitted to participate in the Offer subject to compliance with conditions and restrictions which may be specified
by the Government from time to time.
Subject to compliance with all applicable Indian laws, rules, regulations, guidelines and approvals in terms of Regulation 22
of the SEBI FPI Regulations, an FPI, other than Category III foreign portfolio investor and unregulated broad based funds,
which are classified as Category II foreign portfolio investor by virtue of their investment manager being appropriately
regulated, may issue, subscribe to or otherwise deal in offshore derivative instruments (as defined under the SEBI FPI
Regulations as any instrument, by whatever name called, which is issued overseas by a FPI against securities held by it that
are listed or proposed to be listed on any recognised stock exchange in India, as its underlying) directly or indirectly, only in
the event (i) such offshore derivative instruments are issued only to persons who are regulated by an appropriate regulatory
authority; and (ii) such offshore derivative instruments are issued after compliance with ‘know your client’ norms. An FPI is
also required to ensure that no further issue or transfer of any offshore derivative instrument is made by or on behalf of it to
any persons that are not regulated by an appropriate foreign regulatory authority.
Bids by SEBI registered VCFs, AIFs and FVCIs
The SEBI FVCI Regulations and the SEBI AIF Regulations, inter-alia, prescribe the investment restrictions on the VCFs,
FVCIs and AIFs registered with SEBI.
The holding by any individual VCF registered with SEBI in one venture capital undertaking should not exceed 25% of the
corpus of the VCF. Further, VCFs and FVCIs can invest only up to 33.33% of the investible funds by way of subscription to
an initial public offering.
The category I and II AIFs cannot invest more than 25% of the corpus in one investee company. A category III AIF cannot
invest more than 10% of the corpus in one investee company. A venture capital fund registered as a category I AIF, as
defined in the SEBI AIF Regulations, cannot invest more than 1/3rd
of its corpus by way of subscription to an initial public
offering of a venture capital undertaking. Additionally, the VCFs which have not re-registered as an AIF under the SEBI AIF
Regulations shall continue to be regulated by the VCF Regulation until the existing fund or scheme managed by the fund is
wound up.
All non-resident investors should note that refunds (in case of Anchor Investors), dividends and other distributions, if
any, will be payable in Indian Rupees only and net of bank charges and commission.
Bids by limited liability partnerships
In case of Bids made by limited liability partnerships registered under the Limited Liability Partnership Act, 2008, a certified
copy of certificate of registration issued under the Limited Liability Partnership Act, 2008, must be attached to the Bid cum
Application Form. Failing this, our Company in consultation with the Selling Shareholders reserves the right to reject any Bid
without assigning any reason thereof.
Bids by banking companies
In case of Bids made by banking companies registered with RBI, certified copies of: (i) the certificate of registration issued
by RBI, and (ii) the approval of such banking company’s investment committee are required to be attached to the Bid cum
Application Form, failing which our Company in consultation with the Selling Shareholders reserves the right to reject any
Bid without assigning any reason.
494
The investment limit for banking companies in non-financial services companies as per the Banking Regulation Act, 1949, as
amended (the “Banking Regulation Act”), and the Master Circular dated July 1, 2015 – Para-banking Activities, is 10% of
the paid-up share capital of the investee company or 10% of the banks’ own paid-up share capital and reserves, whichever is
less. Further, the investment in a non-financial services company by a banking company together with its subsidiaries,
associates, joint ventures, entities directly or indirectly controlled by the bank and mutual funds managed by asset
management companies controlled by the banking company cannot exceed 20% of the investee company’s paid-up share
capital. A banking company may hold up to 30% of the paid-up share capital of the investee company with the prior approval
of the RBI provided that the investee company is engaged in non-financial activities in which banking companies are
permitted to engage under the Banking Regulation Act.
Bids by SCSBs
SCSBs participating in the Offer are required to comply with the terms of the SEBI circulars dated September 13, 2012 and
January 2, 2013. Such SCSBs are required to ensure that for making applications on their own account using ASBA, they
should have a separate account in their own name with any other SEBI registered SCSBs. Further, such account shall be used
solely for the purpose of making application in public issues and clear demarcated funds should be available in such account
for such applications.
Bids by insurance companies
In case of Bids made by insurance companies registered with the IRDA, a certified copy of certificate of registration issued
by IRDA must be attached to the Bid cum Application Form. Failing this, our Company in consultation with the Selling
Shareholders reserves the right to reject any Bid without assigning any reason thereof.
The exposure norms for insurers, prescribed under the Insurance Regulatory and Development Authority (Investment)
Regulations, 2000, as amended, are broadly set forth below:
(a) equity shares of a company: the lower of 10% of the outstanding Equity Shares (face value) or 10% of the respective
fund in case of life insurer or 10% of investment assets in case of general insurer or reinsurer;
(b) the entire group of the investee company: not more than 15% of the respective fund in case of a life insurer or 15%
of investment assets in case of a general insurer or reinsurer or 15% of the investment assets in all companies
belonging to the group, whichever is lower; and
(c) the industry sector in which the investee company belong to: not more than 15% of the fund of a life insurer or a
general insurer or a reinsurer or 15% of the investment asset, whichever is lower.
The maximum exposure limit, in the case of an investment in equity shares, cannot exceed the lower of an amount of 10% of
the investment assets of a life insurer or general insurer and the amount calculated under (a), (b) and (c) above, as the case
may be.
Insurance companies participating in this Offer shall comply with all applicable regulations, guidelines and circulars issued
by IRDA from time to time.
Bids by provident funds/pension funds
In case of Bids made by provident funds/pension funds, subject to applicable laws, with minimum corpus of ₹ 250 million, a
certified copy of a certificate from a chartered accountant certifying the corpus of the provident fund/pension fund must be
attached to the Bid cum Application Form. Failing this, our Company in consultation with the Selling Shareholders reserves
the right to reject any Bid, without assigning any reason thereof.
Bids under Power of Attorney
In case of Bids made pursuant to a power of attorney or by limited companies, corporate bodies, registered societies, Eligible
FPIs (including FIIs), Mutual Funds, insurance companies, insurance funds set up by the army, navy or air force of the India,
insurance funds set up by the Department of Posts, India or the National Investment Fund and provident funds with a
minimum corpus of ₹ 250 million (subject to applicable law) and pension funds with a minimum corpus of ₹ 250 million, a
certified copy of the power of attorney or the relevant resolution or authority, as the case may be, along with a certified copy
of the memorandum of association and articles of association and/or bye laws must be lodged along with the Bid cum
Application Form. Failing this, our Company in consultation with the Selling Shareholders reserves the right to accept or
reject any Bid in whole or in part, in either case, without assigning any reason thereof.
Our Company in consultation with the Selling Shareholders, the GCBRLMs and the BRLM in their absolute discretion,
reserve the right to relax the above condition of simultaneous lodging of the power of attorney along with the Bid cum
Application Form.
495
Bids by Eligible Employees
The Bid must be for a minimum of [●] Equity Shares and in multiples of [●] Equity Shares thereafter so as to ensure that the
Bid Price payable by the Eligible Employee does not exceed ₹ 200,000. The Allotment in the Employee Reservation Portion
will be on a proportionate basis. Eligible Employees under the Employee Reservation Portion may Bid at Cut-off Price.
Bids under Employee Reservation Portion by Eligible Employees shall be:
(a) Made only in the prescribed Bid cum Application Form or Revision Form (i.e. pink colour form).
(b) The Bid must be for a minimum of [●] Equity Shares and in multiples of [●] Equity Shares thereafter so as to ensure
that the Bid Amount payable by the Eligible Employee does not exceed ₹ 200,000. The maximum Bid in this
category by an Eligible Employee cannot exceed ₹ 200,000.
(c) Eligible Employees should mention their employee number at the relevant place in the Bid cum Application Form.
(d) The Bidder should be an Eligible Employee as defined above. In case of joint bids, the first Bidder shall be an
Eligible Employee.
(e) Only Eligible Employees would be eligible to apply in this Offer under the Employee Reservation Portion.
(f) Bids by Eligible Employees will have to Bid like any other Bidder. Only those Bids, which are received at or above
the Offer Price, would be considered for Allotment under this category.
(g) Eligible Employees can apply at Cut-off Price. The Bid must be for a minimum of [●] Equity Shares and in
multiples of [●] Equity Shares thereafter subject to a maximum Bid Amount of ₹ 200,000.
(h) Bid by Eligible Employees can be made also in the “Net Offer to the Public” and such Bids shall not be treated as
multiple Bids.
(i) If the aggregate demand in this category is less than or equal to 500,000 Equity Shares at or above the Offer Price,
full allocation shall be made to the Eligible Employees to the extent of their demand.
(j) Under-subscription, if any, in the Employee Reservation Portion will be added back to the Net Offer. In case of
under-subscription in the Net Offer, spill over to the extent of under subscription shall be permitted from the
Employee Reservation Portion.
(k) If the aggregate demand in this category is greater than 500,000 Equity Shares at or above the Offer Price, the
allocation shall be made on a proportionate basis. For the method of proportionate basis of allocation, see “Offer
Procedure – Allotment Procedure and Basis of Allotment” on page 520.
The above information is given for the benefit of the Bidders. Our Company the Selling Shareholders, the GCBRLMs
and the BRLM are not liable for any amendments or modification or changes in applicable laws or regulations, which
may occur after the date of this Red Herring Prospectus. Bidders are advised to make their independent investigations
and ensure that any single Bid from them does not exceed the applicable investment limits or maximum number of the
Equity Shares that can be held by them under applicable law or regulation or as specified in this Red Herring
Prospectus.
General Instructions
Do’s:
1. Check if you are eligible to apply as per the terms of the Red Herring Prospectus and under applicable law, rules,
regulations, guidelines and approvals;
2. Ensure that you have Bid within the Price Band;
3. Read all the instructions carefully and complete the Bid cum Application Form in the prescribed form;
4. Ensure that you have mentioned the correct ASBA Account number in the Bid cum Application Form;
5. Ensure that your Bid cum Application Form bearing the stamp of a Designated Intermediary is submitted to the
Designated Intermediary at the Bidding Center within the prescribed time;
6. Ensure that you have funds equal to the Bid Amount in the ASBA Account maintained with the SCSB before
submitting the ASBA Form to any of the Designated Intermediaries;
496
7. If the first applicant is not the bank account holder, ensure that the Bid cum Application Form is signed by the
account holder. Ensure that you have mentioned the correct bank account number in the Bid cum Application Form;
8. Ensure that the signature of the First Bidder in case of joint Bids, is included in the Bid cum Application Forms;
9. In case of joint Bids, the Bid cum Application Form should contain the name of only the First Bidder whose name
should also appear as the first holder of the beneficiary account held in joint names;
10. Ensure that you request for and receive a stamped acknowledgement of the Bid cum Application Form for all your
Bid options from the concerned Designated Intermediary;
11. Ensure that you submit the revised Bids to the same Designated Intermediary, through whom the original Bid was
placed and obtain a revised acknowledgment;
12. Except for Bids (i) on behalf of the Central or State Governments and the officials appointed by the courts, who, in
terms of the SEBI circular dated June 30, 2008, may be exempt from specifying their PAN for transacting in the
securities market, and (ii) Bids by persons resident in the state of Sikkim, who, in terms of a SEBI circular dated July
20, 2006, may be exempted from specifying their PAN for transacting in the securities market, all Bidders should
mention their PAN allotted under the IT Act. The exemption for the Central or the State Government and officials
appointed by the courts and for investors residing in the State of Sikkim is subject to (a) the Demographic Details
received from the respective depositories confirming the exemption granted to the beneficiary owner by a suitable
description in the PAN field and the beneficiary account remaining in “active status”; and (b) in the case of residents
of Sikkim, the address as per the Demographic Details evidencing the same. All other applications in which PAN is
not mentioned will be rejected;
13. Ensure that the Demographic Details are updated, true and correct in all respects;
14. Ensure that thumb impressions and signatures other than in the languages specified in the Eighth Schedule to the
Constitution of India are attested by a Magistrate or a Notary Public or a Special Executive Magistrate under official
seal;
15. Ensure that the category and the investor status is indicated;
16. Ensure that in case of Bids under power of attorney or by limited companies, corporate, trust, etc., relevant
documents are submitted;
17. Ensure that Bids submitted by any person outside India is in compliance with applicable foreign and Indian laws;
18. Ensure that the depository account is active, the correct DP ID, Client ID and the PAN are mentioned in their Bid
cum Application Form and that the name of the Bidder, the DP ID, Client ID and the PAN entered into the online
IPO system of the Stock Exchanges by the relevant Designated Intermediary, as applicable, matches with the name,
DP ID, Client ID and PAN available in the Depository database; and
19. Ensure that you have correctly signed the authorisation/undertaking box in the Bid cum Application Form, or have
otherwise provided an authorisation to the SCSB via the electronic mode, for blocking funds in the ASBA Account
equivalent to the Bid Amount mentioned in the Bid cum Application Form at the time of submission of the Bid.
The Bid cum Application Form is liable to be rejected if the above instructions, as applicable, are not complied with.
Don’ts:
1. Do not Bid for lower than the minimum Bid size;
2. Do not Bid / Revise Bid Amount to less than the Floor Price or higher than the Cap Price;
3. Do not Bid for a Bid Amount exceeding ₹ 200,000 (for Bids by Retail Individual Bidders or an Eligible Employee
bidding under the Employee Reservation Portion);
4. Do not pay the Bid Amount in cheques, demand drafts or by cash, money order, postal order or by stock invest;
5. Do not send Bid cum Application Forms by post; instead submit the same to the Designated Intermediary only;
6. Do not Bid at Cut-off Price (for Bids by QIBs and Non-Institutional Bidders);
7. Do not instruct your respective banks to release the funds blocked in the ASBA Account under the ASBA process;
8. Do not submit the Bid for an amount more than funds available in your ASBA account.
497
9. Do not submit Bids on plain paper or on incomplete or illegible Bid cum Application Forms or on Bid cum
Application Forms in a colour prescribed for another category of Bidder;
10. Do not submit a Bid in case you are not eligible to acquire Equity Shares under applicable law or your relevant
constitutional documents or otherwise;
11. Do not Bid if you are not competent to contract under the Indian Contract Act, 1872 (other than minors having valid
depository accounts as per Demographic Details provided by the depository).
The Bid cum Application Form is liable to be rejected if the above instructions, as applicable, are not complied with.
Payment into Escrow Account for Anchor Investors
Our Company in consultation with the Selling Shareholders, the GCBRLMs and the BRLM, in its absolute discretion, will
decide the list of Anchor Investors to whom the CAN will be sent, pursuant to which the details of the Equity Shares allocated
to them in their respective names will be notified to such Anchor Investors. For Anchor Investors, the payment instruments
for payment into the Escrow Account should be drawn in favour of:
(a) In case of resident Anchor Investors: “Escrow Account - VBL IPO - Anchor Investor - R”
(b) In case of Non-Resident Anchor Investors: “Escrow Account - VBL IPO - Anchor Investor - NR”
Pre-Offer Advertisement
Subject to Section 30 of the Companies Act, 2013, our Company shall, after registering the Red Herring Prospectus with the
RoC, publish a pre-Offer advertisement, in the form prescribed by the SEBI ICDR Regulations in all editions of Financial
Express (a widely circulated English national daily newspaper) and all editions of Jansatta (a widely circulated Hindi national
daily newspaper, Hindi also being the regional language in the place where our Registered Office is located), each with wide
circulation.
Signing of the Underwriting Agreement and the RoC Filing
(a) Our Company, the Selling Shareholders and the Syndicate intend to enter into an Underwriting Agreement after the
finalisation of the Offer Price.
(b) After signing the Underwriting Agreement, an updated Red Herring Prospectus will be filed with the RoC in
accordance with applicable law, which then would be termed as the ‘Prospectus’. The Prospectus will contain details
of the Offer Price, the Anchor Investor Offer Price, Offer size, and underwriting arrangements and will be complete
in all material respects.
Impersonation
Attention of the applicants is specifically drawn to the provisions of sub-section (1) of Section 38 of the Companies Act,
2013, which is reproduced below:
“Any person who:
(a) makes or abets making of an application in a fictitious name to a company for acquiring, or subscribing for, its
securities; or
(b) makes or abets making of multiple applications to a company in different names or in different combinations of
his name or surname for acquiring or subscribing for its securities; or
(c) otherwise induces directly or indirectly a company to allot, or register any transfer of, securities to him, or to any
other person in a fictitious name, shall be liable for action under Section 447.”
The liability prescribed under Section 447 of the Companies Act, 2013 includes imprisonment for a term which shall not be
less than six months extending up to 10 years (provided that where the fraud involves public interest, such term shall not be
less than three years) and fine of an amount not less than the amount involved in the fraud, extending up to three times of
such amount.
Undertakings by our Company
Our Company undertakes the following:
adequate arrangements shall be made to collect all Bid cum Application Forms submitted by Bidders;
498
it shall not have any recourse to the proceeds of the Offer until final listing and trading approvals have been received
from the Stock Exchanges;
the complaints received in respect of the Offer shall be attended to by our Company expeditiously and satisfactorily;
all steps for completion of the necessary formalities for listing and commencement of trading at all the Stock
Exchanges where the Equity Shares are proposed to be listed are taken within six Working Days of the Bid/Offer
Closing Date will be taken;
if Allotment is not made application money will be refunded/unblocked in ASBA Account within 15 days from the
Bid/Offer Closing Date or such lesser time as specified by SEBI, failing which interest will be due to be paid to the
Bidders at the rate of 15% per annum for the delayed period;
the funds required for making refunds (to the extent applicable) as per the mode(s) disclosed shall be made available
to the Registrar to the Offer by our Company;
where refunds (to the extent applicable) are made through electronic transfer of funds, a suitable communication
shall be sent to the applicant within 15 days from the Bid/Offer Closing Date, giving details of the bank where
refunds shall be credited along with amount and expected date of electronic credit of refund;
Promoters’ contribution, if any, shall be brought in advance before the Bid/Offer Opening Date and the balance, if
any, shall be brought in on a pro rata basis before calls are made on the Allottees;
the certificates of the securities/refund orders to Eligible NRIs shall be despatched within specified time; and
no further issue of the Equity Shares shall be made till the Equity Shares offered through the Red Herring Prospectus
are listed or until the Bid monies are unblocked in ASBA Account/refunded on account of non-listing, under-
subscription, etc.
Undertakings by the Selling Shareholders
The Selling Shareholders undertake severally and not jointly that:
they shall deposit their Equity Shares in an escrow account opened with the Registrar to the Offer at least one
Working Day prior to the Bid/Offer Opening Date;
they shall not offer, lend, pledge, encumber, sell, contract to sell or otherwise transfer or dispose off, directly or
indirectly, any of the Equity Shares offered in the Offer for Sale;
they shall not have any recourse to the proceeds of the Offer for Sale until final listing and trading approvals have
been received from the Stock Exchanges;
they shall take all steps and provide all assistance to the Company, the GCBRLMs and the BRLM, as may be
required and necessary by the Selling Shareholders, for the completion of the necessary formalities for listing and
commencement of trading at all the stock exchanges where the Equity Shares are proposed to be listed within six
Working Days from the Bid/Offer Closing Date of the Offer, failing which they shall forthwith repay without
interest all monies received from Bidders to the extent of the Issued Shares. In case of delay, interest as per
applicable law shall be paid by them to the extent of the Offered Shares;
all monies received out of the Offer shall be credited/transferred to a separate bank account other than the bank
account referred to in sub-section (3) of Section 40 of the Companies Act, 2013; and
they shall give appropriate instructions for dispatch of the refund orders or Allotment Advice to successful Bidders
within the time specified under applicable law.
Utilisation of Offer Proceeds
The Board of Directors certify that:
all monies received out of the Fresh Issue shall be credited/transferred to a separate bank account other than the bank
account referred to in sub-section (3) of Section 40 of the Companies Act, 2013;
details of all monies utilised out of the Fresh Issue shall be disclosed, and continue to be disclosed till the time any
part of the Offer proceeds remains unutilised, under an appropriate head in the balance sheet of our Company
indicating the purpose for which such monies have been utilised;
499
details of all unutilised monies out of the Fresh Issue, if any shall be disclosed under an appropriate separate head in
the balance sheet indicating the form in which such unutilised monies have been invested;
the utilisation of monies received under the Promoters’ contribution, if any, shall be disclosed, and continue to be
disclosed till the time any part of the Offer Proceeds remains unutilised, under an appropriate head in the balance
sheet of our Company indicating the purpose for which such monies have been utilised; and
the details of all unutilised monies out of the funds received under the Promoters’ contribution, if any, shall be
disclosed under a separate head in the balance sheet of our Company indicating the form in which such unutilised
monies have been invested.
500
PART B
General Information Document for Investing in Public Offers
This General Information Document highlights the key rules, processes and procedures applicable to public issues in
accordance with the provisions of the Companies Act, the SCRA, the SCRR and the SEBI ICDR Regulations.
Bidders/Applicants should not construe the contents of this General Information Document as legal advice and should
consult their own legal counsel and other advisors in relation to the legal matters concerning the Offer. For taking an
investment decision, the Bidders/Applicants should rely on their own examination of the Issuer and the Offer, and should
carefully read the Red Herring Prospectus/Prospectus before investing in the Offer.
SECTION 1: PURPOSE OF THE GENERAL INFORMATION DOCUMENT (GID)
This document is applicable to the public issues undertaken through the Book-Building Process as well as to the Fixed Price
Issue. The purpose of the “General Information Document for Investing in Public Issues” is to provide general guidance to
potential Bidders/Applicants in IPOs and FPOs, on the processes and procedures governing IPOs and FPOs, undertaken in
accordance with the provisions of the SEBI ICDR Regulations.
Bidders/Applicants should note that investment in equity and equity related securities involves risk and Bidder/Applicant
should not invest any funds in the Offer unless they can afford to take the risk of losing their investment. The specific terms
relating to securities and/or for subscribing to securities in an Offer and the relevant information about the Issuer undertaking
the Offer are set out in the Red Herring Prospectus (“RHP”)/Prospectus filed by the Issuer with the Registrar of Companies
(“RoC”). Bidders/Applicants should carefully read the entire RHP/Prospectus and the Bid cum Application Form/Application
Form and the Abridged Prospectus of the Issuer in which they are proposing to invest through the Offer. In case of any
difference in interpretation or conflict and/or overlap between the disclosure included in this document and the
RHP/Prospectus, the disclosures in the RHP/Prospectus shall prevail. The RHP/Prospectus of the Issuer is available on the
websites of stock exchanges, on the website(s) of the BRLM(s) to the Offer and on the website of Securities and Exchange
Board of India (“SEBI”) at www.sebi.gov.in.
For the definitions of capitalized terms and abbreviations used herein Bidders/Applicants may see “Glossary and
Abbreviations”.
SECTION 2: BRIEF INTRODUCTION TO IPOs/FPOs
2.1 Initial public offer (IPO)
An IPO means an offer of specified securities by an unlisted Issuer to the public for subscription and may include an
offer for sale of specified securities to the public by any existing holder of such securities in an unlisted Issuer.
For undertaking an IPO, an Issuer is inter-alia required to comply with the eligibility requirements of in terms of
either Regulation 26(1) or Regulation 26(2) of the SEBI ICDR Regulations. For details of compliance with the
eligibility requirements by the Issuer, Bidders/Applicants may refer to the RHP/Prospectus.
2.2 Further public offer (FPO)
An FPO means an offer of specified securities by a listed Issuer to the public for subscription and may include offer
for sale of specified securities to the public by any existing holder of such securities in a listed Issuer.
For undertaking an FPO, the Issuer is inter-alia required to comply with the eligibility requirements in terms of
Regulation 26/ Regulation 27 of the SEBI ICDR Regulations. For details of compliance with the eligibility
requirements by the Issuer, Bidders/Applicants may refer to the RHP/Prospectus.
2.3 Other Eligibility Requirements:
In addition to the eligibility requirements specified in paragraphs 2.1 and 2.2, an Issuer proposing to undertake an
IPO or an FPO is required to comply with various other requirements as specified in the SEBI ICDR Regulations,
the Companies Act, 2013, the Companies Act, 1956 (to the extent applicable), the Securities Contracts (Regulation)
Rules, 1957 (the “SCRR”), industry-specific regulations, if any, and other applicable laws for the time being in
force.
For details in relation to the above Bidders/Applicants may refer to the RHP/Prospectus.
2.4 Types of Public Issues – Fixed Price Issues and Book Built Issues
In accordance with the provisions of the SEBI ICDR Regulations, an Issuer can either determine the Offer Price
through the Book Building Process (“Book Built Offer”) or undertake a Fixed Price Offer (“Fixed Price Offer”).
501
An Issuer may mention Floor Price or Price Band in the RHP (in case of a Book Built Offer) and a Price or Price
Band in the draft prospectus (in case of a Fixed Price Offer) and determine the price at a later date before registering
the Prospectus with the Registrar of Companies.
The cap on the Price Band should be less than or equal to 120% of the Floor Price. The Issuer shall announce the
Price or the Floor Price or the Price Band through advertisement in all newspapers in which the pre-issue
advertisement was given at least five Working Days before the Bid/Offer Opening Date, in case of an IPO and at
least one Working Day before the Bid/Offer Opening Date, in case of an FPO.
The Floor Price or the Offer price cannot be lesser than the face value of the securities.
Bidders/Applicants should refer to the RHP/Prospectus or Offer advertisements to check whether the Offer is a Book
Built Offer or a Fixed Price Offer.
2.5 OFFER PERIOD
The Offer may be kept open for a minimum of three Working Days (for all category of Bidders/Applicants) and not
more than ten Working Days. Bidders/Applicants are advised to refer to the Bid cum Application Form and
Abridged Prospectus or RHP/Prospectus for details of the Bid/Offer Period. Details of Bid/Offer Period are also
available on the website of the Stock Exchange(s).
In case of a Book Built Offer, the Issuer may close the Bid/Offer Period for QIBs one Working Day prior to the
Bid/Offer Closing Date if disclosures to that effect are made in the RHP. In case of revision of the Floor Price or
Price Band in Book Built Offers the Bid/Offer Period may be extended by at least three Working Days, subject to the
total Bid/Offer Period not exceeding 10 Working Days. For details of any revision of the Floor Price or Price Band,
Bidders/Applicants may check the announcements made by the Issuer on the websites of the Stock Exchanges, and
the advertisement in the newspaper(s) issued in this regard.
2.6 FLOWCHART OF TIMELINES
A flow chart of process flow in Fixed Price and Book Built Offers is as follows. Bidders/Applicants may note that
this is not applicable for Fast Track FPOs:
In case of Offer other than Book Build Offer (Fixed Price Offer) the process at the following of the below
mentioned steps shall be read as:
i. Step 7: Determination of Offer Date and Price
ii. Step 10: Applicant submits ASBA Form with any of the Designated Intermediaries
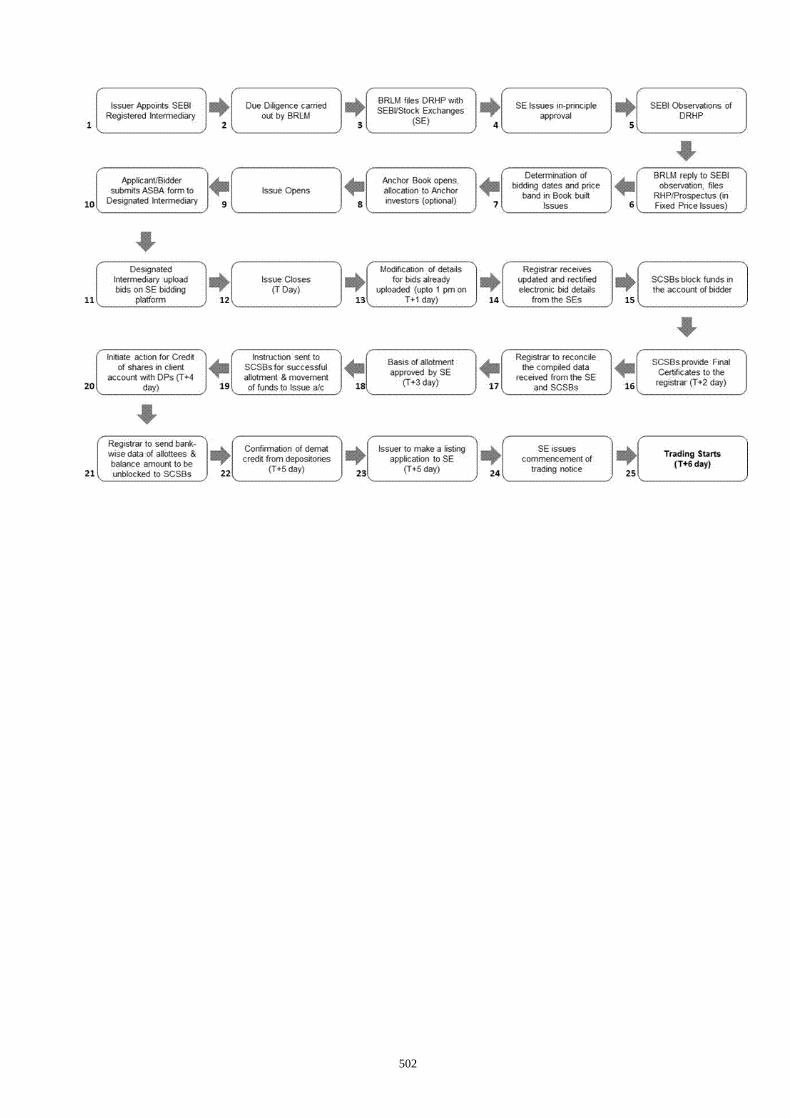
502
503
SECTION 3: CATEGORY OF INVESTORS ELIGIBLE TO PARTICIPATE IN THE OFFER
Each Bidder/Applicant should check whether it is eligible to apply under applicable law. Furthermore, certain categories of
Bidders/Applicants, such as NRIs, FIIs, FPIs and FVCIs may not be allowed to Bid/Apply in the Offer or to hold Equity
Shares, in excess of certain limits specified under applicable law. Bidders/Applicants are requested to refer to the
RHP/Prospectus for more details.
Subject to the above, an illustrative list of Bidders/Applicants is as follows:
Indian nationals resident in India who are competent to contract under the Indian Contract Act, 1872, in single or
joint names (not more than three);
Bids/Applications belonging to an account for the benefit of a minor (under guardianship);
Hindu Undivided Families or HUFs, in the individual name of the Karta. The Bidder/Applicant should specify that
the Bid is being made in the name of the HUF in the Bid cum Application Form/Application Form as follows:
“Name of sole or first Bidder/Applicant: XYZ Hindu Undivided Family applying through XYZ, where XYZ is the
name of the Karta”. Bids/Applications by HUFs may be considered at par with Bids/Applications from individuals;
Companies, corporate bodies and societies registered under applicable law in India and authorised to invest in equity
shares;
QIBs;
NRIs on a repatriation basis or on a non-repatriation basis subject to applicable law;
Indian Financial Institutions, regional rural banks, co-operative banks (subject to RBI regulations and the SEBI
ICDR Regulations and other laws, as applicable);
FIIs and sub-accounts registered with SEBI, other than a sub-account which is a foreign corporate or foreign
individual, bidding under the QIBs category;
Sub-accounts of FIIs registered with SEBI, which are foreign corporates or foreign individuals only under the Non
Institutional Bidder (“NIBs”) category;
FPIs other than Category III foreign portfolio investors Bidding under the QIBs category;
FPIs which are Category III foreign portfolio investors, Bidding under the NIBs category;
Scientific and/or industrial research organisations authorised in India to invest in the Equity Shares;
Trusts/societies registered under the Societies Registration Act, 1860, or under any other law relating to
trusts/societies and who are authorised under their respective constitutions to hold and invest in equity shares;
Limited liability partnerships registered under the Limited Liability Partnership Act, 2008;
Any other person eligible to Bid/Apply in the Offer, under the laws, rules, regulations, guidelines and policies
applicable to them and under Indian laws; and
As per the existing regulations, OCBs are not allowed to participate in an Offer.
SECTION 4: APPLYING IN THE OFFER
Book Built Offer: Bidders should only use the specified ASBA Form (or in case of Anchor Investors, the Anchor Investor
Application Form) bearing the stamp of a Designated Intermediary, as available or downloaded from the websites of the
Stock Exchanges. Bid cum Application Forms are available with the book running lead managers, the Designated
Intermediaries at the Bidding Centres and at the registered office of the Issuer. Electronic Bid cum Application Forms will be
available on the websites of the Stock Exchanges at least one day prior to the Bid/Offer Opening Date. For further details,
regarding availability of Bid cum Application Forms, Bidders may refer to the RHP/Prospectus.
Fixed Price Offer: Applicants should only use the specified Bid cum Application Form bearing the stamp of the relevant
Designated Intermediaries, as available or downloaded from the websites of the Stock Exchanges. Application Forms are
available with the Designated Branches of the SCSBs and at the Registered and Corporate Office of the Issuer. For further
details, regarding availability of Application Forms, Applicants may refer to the Prospectus.
504
Bidders/Applicants should ensure that they apply in the appropriate category. The prescribed colour of the Bid cum
Application Form for various categories of Bidders/Applicants is as follows:
Category Colour of the Bid cum
Application Form
Resident Indian, Eligible NRIs applying on a non repatriation basis White
NRIs, FVCIs, FIIs, their sub-accounts (other than sub-accounts which are foreign corporate(s)
or foreign individuals bidding under the QIB), FPIs, on a repatriation basis
Blue
Anchor Investors (where applicable) & Bidders Bidding/applying in the reserved category As specified by the Issuer
Securities issued in an IPO can only be in dematerialized form in compliance with Section 29 of the Companies Act, 2013.
Bidders/Applicants will not have the option of getting the Allotment of specified securities in physical form. However, they
may get the specified securities rematerialised subsequent to Allotment.
4.1 INSTRUCTIONS FOR FILLING THE BID CUM APPLICATION FORM/APPLICATION FORM
Bidders/Applicants may note that forms not filled completely or correctly as per instructions provided in this GID,
the RHP and the Bid cum Application Form/Application Form are liable to be rejected.
Instructions to fill each field of the Bid cum Application Form can be found on the reverse side of the Bid cum
Application Form. Specific instructions for filling various fields of the Resident Bid cum Application Form and
Non-Resident Bid cum Application Form and samples are provided below.
The samples of the Bid cum Application Form for resident Bidders and the Bid cum Application Form for non-
resident Bidders are reproduced below:
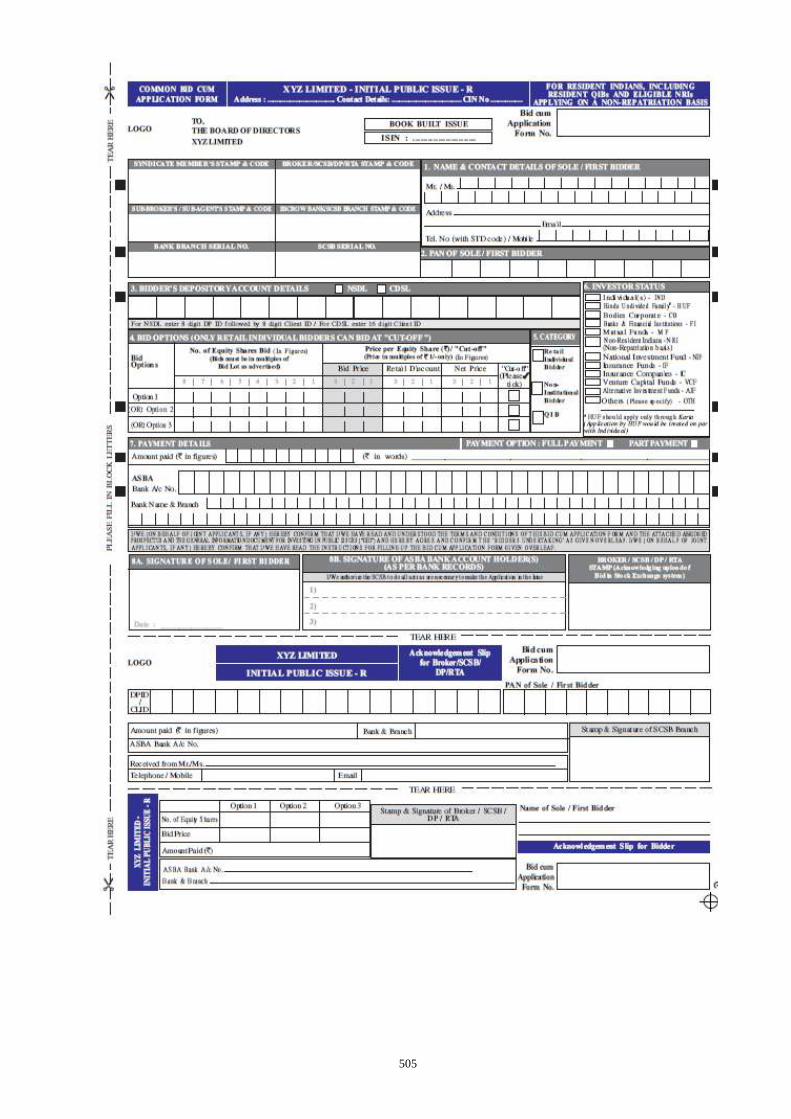
505
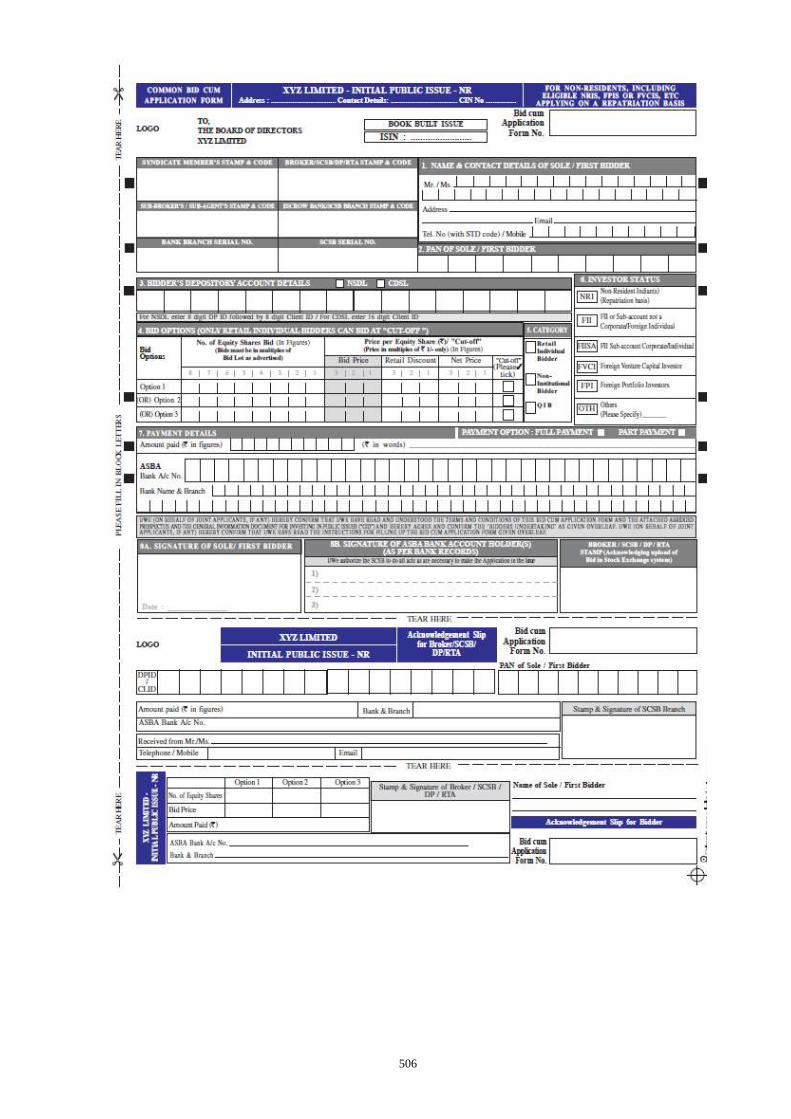
506
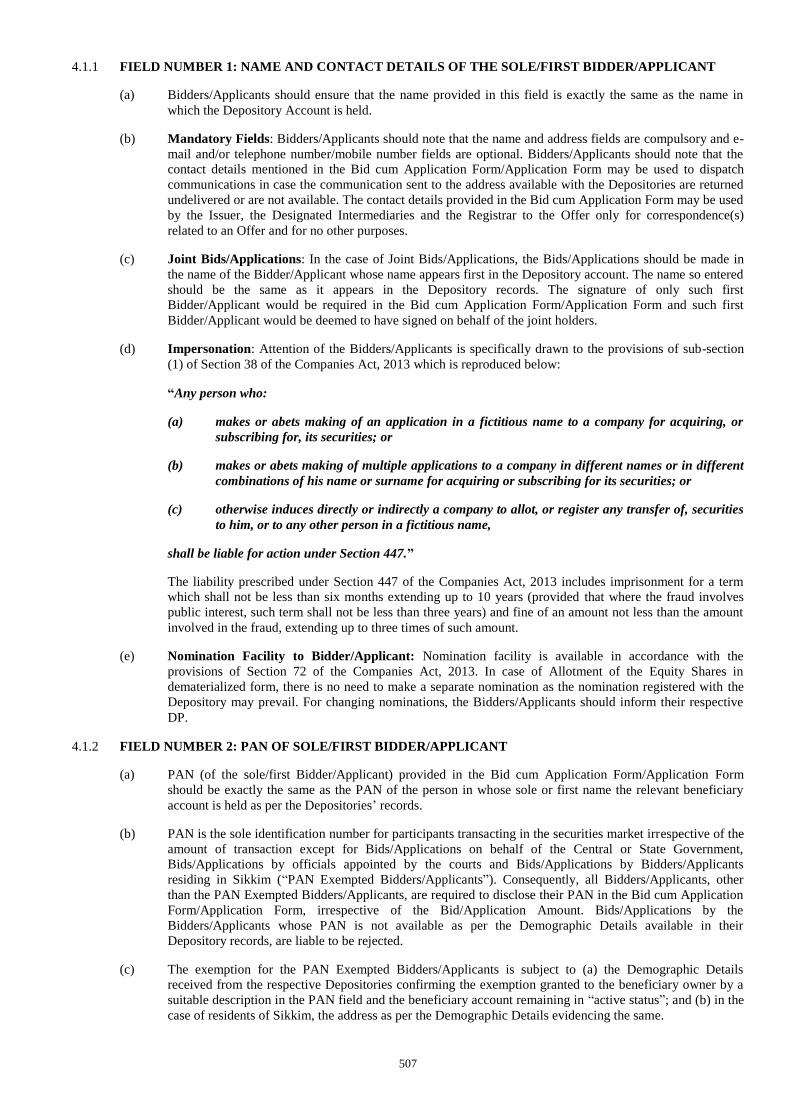
507
4.1.1 FIELD NUMBER 1: NAME AND CONTACT DETAILS OF THE SOLE/FIRST BIDDER/APPLICANT
(a) Bidders/Applicants should ensure that the name provided in this field is exactly the same as the name in
which the Depository Account is held.
(b) Mandatory Fields: Bidders/Applicants should note that the name and address fields are compulsory and e-
mail and/or telephone number/mobile number fields are optional. Bidders/Applicants should note that the
contact details mentioned in the Bid cum Application Form/Application Form may be used to dispatch
communications in case the communication sent to the address available with the Depositories are returned
undelivered or are not available. The contact details provided in the Bid cum Application Form may be used
by the Issuer, the Designated Intermediaries and the Registrar to the Offer only for correspondence(s)
related to an Offer and for no other purposes.
(c) Joint Bids/Applications: In the case of Joint Bids/Applications, the Bids/Applications should be made in
the name of the Bidder/Applicant whose name appears first in the Depository account. The name so entered
should be the same as it appears in the Depository records. The signature of only such first
Bidder/Applicant would be required in the Bid cum Application Form/Application Form and such first
Bidder/Applicant would be deemed to have signed on behalf of the joint holders.
(d) Impersonation: Attention of the Bidders/Applicants is specifically drawn to the provisions of sub-section
(1) of Section 38 of the Companies Act, 2013 which is reproduced below:
“Any person who:
(a) makes or abets making of an application in a fictitious name to a company for acquiring, or
subscribing for, its securities; or
(b) makes or abets making of multiple applications to a company in different names or in different
combinations of his name or surname for acquiring or subscribing for its securities; or
(c) otherwise induces directly or indirectly a company to allot, or register any transfer of, securities
to him, or to any other person in a fictitious name,
shall be liable for action under Section 447.”
The liability prescribed under Section 447 of the Companies Act, 2013 includes imprisonment for a term
which shall not be less than six months extending up to 10 years (provided that where the fraud involves
public interest, such term shall not be less than three years) and fine of an amount not less than the amount
involved in the fraud, extending up to three times of such amount.
(e) Nomination Facility to Bidder/Applicant: Nomination facility is available in accordance with the
provisions of Section 72 of the Companies Act, 2013. In case of Allotment of the Equity Shares in
dematerialized form, there is no need to make a separate nomination as the nomination registered with the
Depository may prevail. For changing nominations, the Bidders/Applicants should inform their respective
DP.
4.1.2 FIELD NUMBER 2: PAN OF SOLE/FIRST BIDDER/APPLICANT
(a) PAN (of the sole/first Bidder/Applicant) provided in the Bid cum Application Form/Application Form
should be exactly the same as the PAN of the person in whose sole or first name the relevant beneficiary
account is held as per the Depositories’ records.
(b) PAN is the sole identification number for participants transacting in the securities market irrespective of the
amount of transaction except for Bids/Applications on behalf of the Central or State Government,
Bids/Applications by officials appointed by the courts and Bids/Applications by Bidders/Applicants
residing in Sikkim (“PAN Exempted Bidders/Applicants”). Consequently, all Bidders/Applicants, other
than the PAN Exempted Bidders/Applicants, are required to disclose their PAN in the Bid cum Application
Form/Application Form, irrespective of the Bid/Application Amount. Bids/Applications by the
Bidders/Applicants whose PAN is not available as per the Demographic Details available in their
Depository records, are liable to be rejected.
(c) The exemption for the PAN Exempted Bidders/Applicants is subject to (a) the Demographic Details
received from the respective Depositories confirming the exemption granted to the beneficiary owner by a
suitable description in the PAN field and the beneficiary account remaining in “active status”; and (b) in the
case of residents of Sikkim, the address as per the Demographic Details evidencing the same.
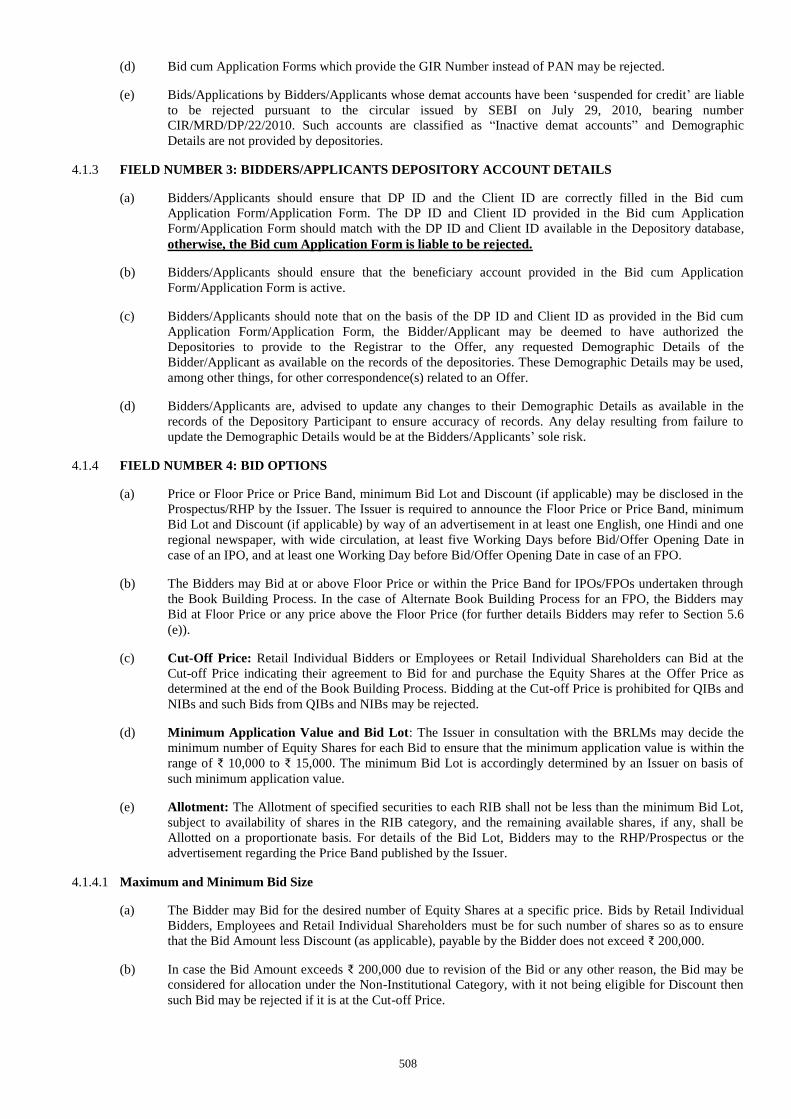
508
(d) Bid cum Application Forms which provide the GIR Number instead of PAN may be rejected.
(e) Bids/Applications by Bidders/Applicants whose demat accounts have been ‘suspended for credit’ are liable
to be rejected pursuant to the circular issued by SEBI on July 29, 2010, bearing number
CIR/MRD/DP/22/2010. Such accounts are classified as “Inactive demat accounts” and Demographic
Details are not provided by depositories.
4.1.3 FIELD NUMBER 3: BIDDERS/APPLICANTS DEPOSITORY ACCOUNT DETAILS
(a) Bidders/Applicants should ensure that DP ID and the Client ID are correctly filled in the Bid cum
Application Form/Application Form. The DP ID and Client ID provided in the Bid cum Application
Form/Application Form should match with the DP ID and Client ID available in the Depository database,
otherwise, the Bid cum Application Form is liable to be rejected.
(b) Bidders/Applicants should ensure that the beneficiary account provided in the Bid cum Application
Form/Application Form is active.
(c) Bidders/Applicants should note that on the basis of the DP ID and Client ID as provided in the Bid cum
Application Form/Application Form, the Bidder/Applicant may be deemed to have authorized the
Depositories to provide to the Registrar to the Offer, any requested Demographic Details of the
Bidder/Applicant as available on the records of the depositories. These Demographic Details may be used,
among other things, for other correspondence(s) related to an Offer.
(d) Bidders/Applicants are, advised to update any changes to their Demographic Details as available in the
records of the Depository Participant to ensure accuracy of records. Any delay resulting from failure to
update the Demographic Details would be at the Bidders/Applicants’ sole risk.
4.1.4 FIELD NUMBER 4: BID OPTIONS
(a) Price or Floor Price or Price Band, minimum Bid Lot and Discount (if applicable) may be disclosed in the
Prospectus/RHP by the Issuer. The Issuer is required to announce the Floor Price or Price Band, minimum
Bid Lot and Discount (if applicable) by way of an advertisement in at least one English, one Hindi and one
regional newspaper, with wide circulation, at least five Working Days before Bid/Offer Opening Date in
case of an IPO, and at least one Working Day before Bid/Offer Opening Date in case of an FPO.
(b) The Bidders may Bid at or above Floor Price or within the Price Band for IPOs/FPOs undertaken through
the Book Building Process. In the case of Alternate Book Building Process for an FPO, the Bidders may
Bid at Floor Price or any price above the Floor Price (for further details Bidders may refer to Section 5.6
(e)).
(c) Cut-Off Price: Retail Individual Bidders or Employees or Retail Individual Shareholders can Bid at the
Cut-off Price indicating their agreement to Bid for and purchase the Equity Shares at the Offer Price as
determined at the end of the Book Building Process. Bidding at the Cut-off Price is prohibited for QIBs and
NIBs and such Bids from QIBs and NIBs may be rejected.
(d) Minimum Application Value and Bid Lot: The Issuer in consultation with the BRLMs may decide the
minimum number of Equity Shares for each Bid to ensure that the minimum application value is within the
range of ₹ 10,000 to ₹ 15,000. The minimum Bid Lot is accordingly determined by an Issuer on basis of
such minimum application value.
(e) Allotment: The Allotment of specified securities to each RIB shall not be less than the minimum Bid Lot,
subject to availability of shares in the RIB category, and the remaining available shares, if any, shall be
Allotted on a proportionate basis. For details of the Bid Lot, Bidders may to the RHP/Prospectus or the
advertisement regarding the Price Band published by the Issuer.
4.1.4.1 Maximum and Minimum Bid Size
(a) The Bidder may Bid for the desired number of Equity Shares at a specific price. Bids by Retail Individual
Bidders, Employees and Retail Individual Shareholders must be for such number of shares so as to ensure
that the Bid Amount less Discount (as applicable), payable by the Bidder does not exceed ₹ 200,000.
(b) In case the Bid Amount exceeds ₹ 200,000 due to revision of the Bid or any other reason, the Bid may be
considered for allocation under the Non-Institutional Category, with it not being eligible for Discount then
such Bid may be rejected if it is at the Cut-off Price.
509
(c) For NRIs, a Bid Amount of up to ₹ 200,000 may be considered under the Retail Category for the purposes
of allocation and a Bid Amount exceeding ₹ 200,000 may be considered under the Non-Institutional
Category for the purposes of allocation.
(d) Bids by QIBs and NIBs must be for such minimum number of shares such that the Bid Amount exceeds ₹
200,000 and in multiples of such number of Equity Shares thereafter, as may be disclosed in the Bid cum
Application Form and the RHP/Prospectus, or as advertised by the Issuer, as the case may be,. NIBs and
QIBs are not allowed to Bid at Cut-off Price.
(e) In case the Bid Amount reduces to ₹ 200,000 or less due to a revision of the Price Band, Bids by the NIBs
who are eligible for allocation in the Retail Category would be considered for allocation under the Retail
Category.
(f) For Anchor Investors, if applicable, the Bid Amount shall be least ₹ 10 crores. One-third of the Anchor
Investor Portion shall be reserved for domestic Mutual Funds, subject to valid Bids being received from
domestic Mutual Funds at or above the price at which allocation is being done to other Anchor Investors.
Bids by various schemes of a Mutual Fund shall be aggregated to determine the Bid Amount. A Bid cannot
be submitted for more than 60% of the QIB Category under the Anchor Investor Portion. Anchor Investors
cannot withdraw their Bids or lower the size of their Bids (in terms of quantity of Equity Shares or the Bid
Amount) at any stage after the Anchor Investor Bid/Offer Period and are required to pay the Bid Amount at
the time of submission of the Bid. In case the Anchor Investor Offer Price is lower than the Offer Price, the
balance amount shall be payable as per the pay-in-date mentioned in the revised CAN. In case the Offer
Price is lower than the Anchor Investor Offer Price, the amount in excess of the Offer Price paid by the
Anchor Investors shall not be refunded to them.
(g) A Bid cannot be submitted for more than the Offer size.
(h) The maximum Bid by any Bidder including QIB Bidder should not exceed the investment limits prescribed
for them under the applicable laws.
(i) The price and quantity options submitted by the Bidder in the Bid cum Application Form may be treated as
optional bids from the Bidder and may not be cumulated. After determination of the Offer Price, the highest
number of Equity Shares Bid for by a Bidder at or above the Offer Price may be considered for Allotment
and the rest of the Bid(s), irrespective of the Bid Amount may automatically become invalid. This is not
applicable in case of FPOs undertaken through Alternate Book Building Process (For details of Bidders
may refer to (Section 5.6 (e))
4.1.4.2 Multiple Bids
(a) Bidder should submit only one Bid cum Application Form. Bidder shall have the option to make a
maximum of three Bids at different price levels in the Bid cum Application Form and such options are not
considered as multiple Bids.
Submission of a second Bid cum Application Form to either the same or to another Designated
Intermediary and duplicate copies of Bid cum Application Forms bearing the same application number shall
be treated as multiple Bids and are liable to be rejected.
(b) Bidders are requested to note the following procedures may be followed by the Registrar to the Offer to
detect multiple Bids:
i. All Bids may be checked for common PAN as per the records of the Depository. For Bidders other
than Mutual Funds and FII sub-accounts, Bids bearing the same PAN may be treated as multiple
Bids by a Bidder and may be rejected.
ii. For Bids from Mutual Funds and FII sub-accounts, submitted under the same PAN, as well as Bids
on behalf of the PAN Exempted Bidders, the Bid cum Application Forms may be checked for
common DP ID and Client ID. Such Bids which have the same DP ID and Client ID may be
treated as multiple Bids and are liable to be rejected.
(c) The following Bids may not be treated as multiple Bids:
i. Bids by Reserved Categories Bidding in their respective Reservation Portion as well as bids made
by them in the Net Offer portion in public category.
ii. Separate Bids by Mutual Funds in respect of more than one scheme of the Mutual Fund provided
that the Bids clearly indicate the scheme for which the Bid has been made.
510
iii. Bids by Mutual Funds, and sub-accounts of FIIs (or FIIs and its sub-accounts) submitted with the
same PAN but with different beneficiary account numbers, Client IDs and DP IDs.
iv. Bids by Anchor Investors under the Anchor Investor Portion and the QIB Category.
4.1.5 FIELD NUMBER 5: CATEGORY OF BIDDERS
(a) The categories of Bidders identified as per the SEBI ICDR Regulations for the purpose of Bidding,
allocation and Allotment in the Offer are RIBs, NIBs and QIBs.
(b) Up to 60% of the QIB Category can be allocated by the Issuer, on a discretionary basis subject to the
criteria of minimum and maximum number of Anchor Investors based on allocation size, to the Anchor
Investors, in accordance with SEBI ICDR Regulations, with one-third of the Anchor Investor Portion
reserved for domestic Mutual Funds subject to valid Bids being received at or above the Offer Price. For
details regarding allocation to Anchor Investors, Bidders may refer to the RHP/Prospectus.
(c) An Issuer can make reservation for certain categories of Bidders/Applicants as permitted under the SEBI
ICDR Regulations. For details of any reservations made in the Offer, Bidders/Applicants may refer to the
RHP/Prospectus.
(d) The SEBI ICDR Regulations specify the allocation or Allotment that may be made to various categories of
Bidders in an Offer depending upon compliance with the eligibility conditions. Details pertaining to
allocation are disclosed on reverse side of the Revision Form. For Offer specific details in relation to
allocation Bidder/Applicant may refer to the RHP/Prospectus.
4.1.6 FIELD NUMBER 6: INVESTOR STATUS
(a) Each Bidder/Applicant should check whether it is eligible to apply under applicable law and ensure that any
prospective Allotment to it in the Offer is in compliance with the investment restrictions under applicable
law.
(b) Certain categories of Bidders/Applicants, such as NRIs, FPIs and FVCIs may not be allowed to Bid/Apply
in the Offer or hold Equity Shares exceeding certain limits specified under applicable law.
Bidders/Applicants are requested to refer to the RHP/Prospectus for more details.
(c) Bidders/Applicants should check whether they are eligible to apply on non-repatriation basis or repatriation
basis and should accordingly provide the investor status. Details regarding investor status are different in
the Resident Bid cum Application Form and Non-Resident Bid cum Application Form.
(d) Bidders/Applicants should ensure that their investor status is updated in the Depository records.
4.1.7 FIELD NUMBER 7: PAYMENT DETAILS
(a) The full Bid Amount (net of any Discount, as applicable) shall be blocked in the ASBA Account based on
the authorisation provided in the ASBA Form. If Discount is applicable in the Offer, RIBs should indicate
the full Bid Amount in the Bid cum Application Form and funds shall be blocked for the Bid Amount net of
Discount. Only in cases where the RHP/Prospectus indicates that part payment may be made, such an
option can be exercised by the Bidder. In case of Bidders specifying more than one Bid Option in the Bid
cum Application Form, the total Bid Amount may be calculated for the highest of three options at net price,
i.e. Bid price less Discount offered, if any.
(b) RIBs who Bid at Cut-off Price shall arrange to block the Bid Amount based on the Cap Price.
(c) All Bidders (except Anchor Investors) have to participate in the Offer only through the ASBA mechanism.
(d) Bid Amount cannot be paid in cash, through money order or through postal order.
4.1.7.1 Instructions for Anchor Investors:
(a) Anchor Investors may submit their Bids with a Book Running Lead Manager.
(b) Payments should be made either by direct credit, RTGS or NEFT.
(c) The Escrow Collection Banks shall maintain the monies in the Escrow Account for and on behalf of the
Anchor Investors until the Designated Date.
511
4.1.7.2 Payment instructions for ASBA Bidders
(a) Bidders may submit the ASBA Form either
i. in electronic mode through the internet banking facility offered by a SCSB authorizing blocking of
funds that are available in the ASBA account specified in the Bid cum Application Form, or
ii. in physical mode to any Designated Intermediary.
(b) Bidders must specify the Bank Account number in the Bid cum Application Form. The Bid cum
Application Form submitted by Bidder and which is accompanied by cash, demand draft, cheque, money
order, postal order or any mode of payment other than blocked amounts in the ASBA Account maintained
with a SCSB, will not be accepted.
(c) Bidders should ensure that the Bid cum Application Form is also signed by the ASBA Account holder(s) if
the Bidder is not the ASBA Account holder.
(d) Bidders shall note that for the purpose of blocking funds under ASBA facility clearly demarcated funds
shall be available in the account.
(e) From one ASBA Account, a maximum of five Bids cum Application Forms can be submitted.
(f) Bidders should submit the Bid cum Application Form only at the Bidding Centers, i.e. to the respective
member of the Syndicate at the Specified Locations, the SCSBs, the Registered Broker at the Broker
Centres, the RTA at the Designated RTA Locations or CDP at the Designated CDP Locations.
(g) Bidders bidding through a Designated Intermediary, other than a SCSB, should note that ASBA Forms
submitted to such Designated Intermediary may not be accepted, if the SCSB where the ASBA Account, as
specified in the Bid cum Application Form, is maintained has not named at least one branch at that location
for such Designated Intermediary, to deposit ASBA Forms.
(h) Bidders bidding directly through the SCSBs should ensure that the ASBA Form is submitted to a
Designated Branch of a SCSB where the ASBA Account is maintained.
(i) Upon receipt of the ASBA Form, the Designated Branch of the SCSB may verify if sufficient funds equal
to the Bid Amount are available in the ASBA Account, as mentioned in the Bid cum Application Form.
(j) If sufficient funds are available in the ASBA Account, the SCSB may block an amount equivalent to the
Bid Amount mentioned in the ASBA Form and for application directly submitted to SCSB by investor, may
enter each Bid option into the electronic bidding system as a separate Bid.
(k) If sufficient funds are not available in the ASBA Account, the Designated Branch of the SCSB may not
accept such Bids and such bids are liable to be rejected.
(l) Upon submission of a completed ASBA Form each Bidder may be deemed to have agreed to block the
entire Bid Amount and authorized the Designated Branch of the SCSB to block the Bid Amount specified
in the ASBA Form in the ASBA Account maintained with the SCSBs.
(m) The Bid Amount may remain blocked in the aforesaid ASBA Account until finalisation of the Basis of
Allotment and consequent transfer of the Bid Amount against the Allotted Equity Shares to the Public Offer
Account, or until withdrawal or failure of the Offer, or until withdrawal or rejection of the Bid, as the case
may be.
(n) SCSBs bidding in the Offer must apply through an Account maintained with any other SCSB; else their
Bids are liable to be rejected.
4.1.7.2.1 Unblocking of ASBA Account
(a) Once the Basis of Allotment is approved by the Designated Stock Exchange, the Registrar to the Offer may
provide the following details to the controlling branches of each SCSB, along with instructions to unblock
the relevant bank accounts and for successful applications transfer the requisite money to the Public Issue
Account designated for this purpose, within the specified timelines: (i) the number of Equity Shares to be
Allotted against each Bid, (ii) the amount to be transferred from the relevant bank account to the Public
Issue Account, for each Bid, (iii) the date by which funds referred to in (ii) above may be transferred to the
Public Issue Account, and (iv) details of rejected Bids, if any, to enable the SCSBs to unblock the
respective bank accounts.
512
(b) On the basis of instructions from the Registrar to the Offer, the SCSBs may transfer the requisite amount
against each successful Bidder to the Public Issue Account and may unblock the excess amount, if any, in
the ASBA Account.
(c) In the event of withdrawal or rejection of the ASBA Form and for unsuccessful Bids, the Registrar to the
Offer may give instructions to the SCSB to unblock the Bid Amount in the relevant ASBA Account within
six Working Days of the Bid/Offer Closing Date.
4.1.7.3 Discount (if applicable)
(a) The Discount is stated in absolute rupee terms.
(b) Bidders applying under RIB category, Retail Individual Shareholder and employees are only eligible for
discount. For Discounts offered in the Offer, Bidders may refer to the RHP/Prospectus.
(c) The Bidders entitled to the applicable Discount in the Offer may block the Bid Amount less Discount.
Bidder may note that in case the net amount blocked (post Discount) is more than two lakh Rupees, the Bidding
system automatically considers such applications for allocation under Non-Institutional Category. These applications
are neither eligible for Discount nor fall under RIB category.
4.1.8 FIELD NUMBER 8: SIGNATURES AND OTHER AUTHORISATIONS
(a) Only the First Bidder/Applicant is required to sign the Bid cum Application Form/ Application Form.
Bidders/Applicants should ensure that signatures are in one of the languages specified in the Eighth
Schedule to the Constitution of India.
(b) If the ASBA Account is held by a person or persons other than the Bidder/Applicant, then the Signature of
the ASBA Account holder(s) is also required.
(c) The signature has to be correctly affixed in the authorisation/undertaking box in the Bid cum Application
Form/Application Form, or an authorisation has to be provided to the SCSB via the electronic mode, for
blocking funds in the ASBA Account equivalent to the Bid Amount mentioned in the Bid cum Application
Form/Application Form.
(d) Bidders/Applicants must note that Bid cum Application Form/Application Form without signature of
Bidder/Applicant and/or ASBA Account holder is liable to be rejected.
4.1.9 ACKNOWLEDGEMENT AND FUTURE COMMUNICATION
(a) Bidders should ensure that they receive the Acknowledgment Slip duly signed and stamped by the
Designated Intermediary, as applicable, for submission of the ASBA Form.
(b) All communications in connection with Bids made in the Offer may be addressed to the Registrar to the
Offer with a copy to the relevant Designated Intermediary to whom the Bid cum Application Form was
submitted. The Bidder should give full details such as name of the sole or first Bidder/Applicant, Bid cum
Application Form number, Bidders’/Applicants’ DP ID, Client ID, PAN, date of the submission of Bid cum
Application Form, address of the Bidder, number of the Equity Shares applied for and the name and address
of the Designated Intermediary where the Bid cum Application Form was submitted by the Bidder.
Further, the investor shall also enclose a copy of the Acknowledgment Slip duly received from the
Designated Intermediaries in addition to the information mentioned hereinabove.
For further details, Bidder/Applicant may refer to the RHP/Prospectus and the Bid cum Application Form.
4.2 INSTRUCTIONS FOR FILING THE REVISION FORM
(a) During the Bid/Offer Period, any Bidder/Applicant (other than QIBs and NIBs, who can only revise their
bid upwards) who has registered his or her interest in the Equity Shares at a particular price level is free to
revise his or her Bid within the Price Band using the Revision Form, which is a part of the Bid cum
Application Form.
(b) RIB may revise their bids or withdraw their Bids till the Bid/Offer Closing Date.
(c) Revisions can be made in both the desired number of Equity Shares and the Bid Amount by using the
Revision Form.
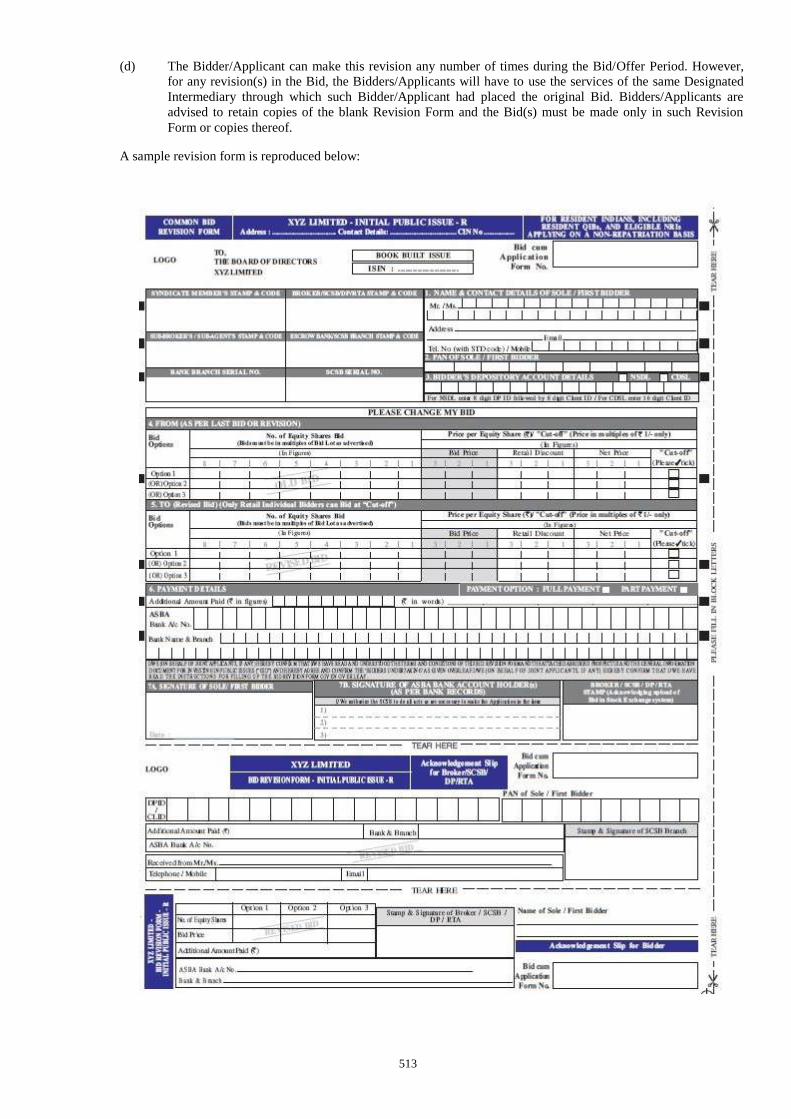
513
(d) The Bidder/Applicant can make this revision any number of times during the Bid/Offer Period. However,
for any revision(s) in the Bid, the Bidders/Applicants will have to use the services of the same Designated
Intermediary through which such Bidder/Applicant had placed the original Bid. Bidders/Applicants are
advised to retain copies of the blank Revision Form and the Bid(s) must be made only in such Revision
Form or copies thereof.
A sample revision form is reproduced below:
514
Instructions to fill each field of the Revision Form can be found on the reverse side of the Revision Form. Other than
instructions already highlighted at paragraph 4.1 above, point wise instructions regarding filling up various fields of
the Revision Form are provided below:
4.2.1 FIELDS 1, 2 AND 3: NAME AND CONTACT DETAILS OF SOLE/FIRST BIDDER/APPLICANTS, PAN
OF SOLE/FIRST BIDDER/APPLICANT & DEPOSITORY ACCOUNT DETAILS OF THE
BIDDER/APPLICANT
Bidders/Applicants should refer to instructions contained in paragraphs 4.1.1, 4.1.2 and 4.1.3.
4.2.2 FIELD 4 & 5: BID OPTIONS REVISION ‘FROM’ AND ‘TO’
(a) Apart from mentioning the revised options in the Revision Form, the Bidder/Applicant must also mention
the details of all the bid options given in his or her Bid cum Application Form or earlier Revision Form. For
example, if a Bidder/Applicant has Bid for three options in the Bid cum Application Form and such
Bidder/Applicant is changing only one of the options in the Revision Form, the Bidder/Applicant must still
fill the details of the other two options that are not being revised, in the Revision Form. The Designated
Intermediaries may not accept incomplete or inaccurate Revision Forms.
(b) In case of revision, Bid options should be provided by Bidders/Applicants in the same order as provided in
the Bid cum Application Form.
(c) In case of revision of Bids by RIBs, Employees and Retail Individual Shareholders, such
Bidders/Applicants should ensure that the Bid Amount, subsequent to revision, does not exceed ₹ 200,000.
In case the Bid Amount exceeds ₹ 200,000 due to revision of the Bid or for any other reason, the Bid may
be considered, subject to eligibility, for allocation under the Non-Institutional Category, not being eligible
for Discount (if applicable) and such Bid may be rejected if it is at the Cut-off Price. The Cut-off Price
option is given only to the RIBs, Employees and Retail Individual Shareholders indicating their agreement
to Bid for and purchase the Equity Shares at the Offer Price as determined at the end of the Book Building
Process.
(d) In case the total amount (i.e., original Bid Amount plus additional payment) exceeds ₹ 200,000, the Bid will
be considered for allocation under the Non-Institutional Category in terms of the RHP/Prospectus. If,
however, the RIB does not either revise the Bid or make additional payment and the Offer Price is higher
than the cap of the Price Band prior to revision, the number of Equity Shares Bid, where possible. shall be
adjusted downwards for the purpose of allocation, such that no additional payment would be required from
the RIB and the RIB is deemed to have approved such revised Bid at Cut-off Price.
(e) In case of a downward revision in the Price Band, RIBs and Bids by Employees under the Reservation
Portion, who have bid at the Cut-off Price could either revise their Bid or the excess amount paid at the time
of Bidding may be unblocked after the allotment is finalised.
4.2.3 FIELD 6: PAYMENT DETAILS
(a) All Bidders/Applicants are required to authorise that the full Bid Amount (less Discount (if applicable) is
blocked. In case of Bidders/Applicants specifying more than one Bid Option in the Bid cum Application
Form, the total Bid Amount may be calculated for the highest of three options at net price, i.e. Bid price less
discount offered, if any.
(b) Bidder/Applicants may issue instructions to block the revised amount based on cap of the revised Price
Band (adjusted for the Discount (if applicable) in the ASBA Account, to the same Designated Intermediary
through whom such Bidder/Applicant had placed the original Bid to enable the relevant SCSB to block the
additional Bid Amount, if any.
(c) In case the total amount (i.e., original Bid Amount less discount (if applicable) plus additional payment)
exceeds ₹ 200,000, the Bid may be considered for allocation under the Non-Institutional Category in terms
of the RHP/Prospectus. If, however, the Bidder/Applicant does not either revise the Bid or make additional
payment and the Offer Price is higher than the cap of the Price Band prior to revision, the number of Equity
Shares Bid for, where possible, may be adjusted downwards for the purpose of Allotment, such that
additional amount is required blocked and the Bidder/Applicant is deemed to have approved such revised
Bid at the Cut-off Price.
(d) In case of a downward revision in the Price Band, RIBs, Employees and Retail Individual Shareholders,
who have bid at the Cut-off Price, could either revise their Bid or the excess amount blocked at the time of
Bidding may be unblocked after the finalisation of basis of allotment.
515
4.2.4 FIELDS 7 : SIGNATURES AND ACKNOWLEDGEMENTS
Bidders/Applicants may refer to instructions contained at paragraphs 4.1.8 and 4.1.9 for this purpose.
4.3 INSTRUCTIONS FOR FILING APPLICATION FORM IN ISSUES MADE OTHER THAN THROUGH
THE BOOK BUILDING PROCESS (FIXED PRICE ISSUE)
4.3.1 FIELDS 1, 2, 3 NAME AND CONTACT DETAILS OF SOLE/FIRST BIDDER/APPLICANT, PAN OF
SOLE/FIRST BIDDER/APPLICANT & DEPOSITORY ACCOUNT DETAILS OF THE
BIDDER/APPLICANT
Applicants should refer to instructions contained in paragraphs 4.1.1, 4.1.2 and 4.1.3.
4.3.2 FIELD 4: PRICE, APPLICATION QUANTITY & AMOUNT
(a) The Issuer may mention Offer Price or Price Band in the draft Prospectus. However a prospectus registered
with RoC contains one price or coupon rate (as applicable).
(b) Minimum Application Value and Bid Lot: The Issuer in consultation with the Lead Manager may decide
the minimum number of Equity Shares for each Bid to ensure that the minimum application value is within
the range of ₹ 10,000 to ₹ 15,000. The minimum Lot size is accordingly determined by an Issuer on basis of
such minimum application value.
(c) Applications by RIBs, Employees and Retail Individual Shareholders, must be for such number of shares so
as to ensure that the application amount payable does not exceed ₹ 200,000.
(d) Applications by other investors must be for such minimum number of shares such that the application
amount exceeds ₹ 200,000 and in multiples of such number of Equity Shares thereafter, as may be disclosed
in the application form and the Prospectus, or as advertised by the Issuer, as the case may be.
(e) An application cannot be submitted for more than the Offer size.
(f) The maximum application by any Applicant should not exceed the investment limits prescribed for them
under the applicable laws.
(g) Multiple Applications: An Applicant should submit only one Application Form. Submission of a second
Application Form to either the same or other SCSB and duplicate copies of Application Forms bearing the
same application number shall be treated as multiple applications and are liable to be rejected.
(h) Applicants are requested to note the following procedures may be followed by the Registrar to the Offer to
detect multiple applications:
i. All applications may be checked for common PAN as per the records of the Depository. For
Applicants other than Mutual Funds and FII sub-accounts, Applications bearing the same PAN may
be treated as multiple applications by an Applicant and may be rejected.
ii. For applications from Mutual Funds and FII sub-accounts, submitted under the same PAN, as well as
Applications on behalf of the PAN Exempted Applicants, the Application Forms may be checked for
common DP ID and Client ID. In any such applications which have the same DP ID and Client ID,
these may be treated as multiple applications and may be rejected.
(i) The following applications may not be treated as multiple Bids:
i. Applications by Reserved Categories in their respective reservation portion as well as that made by
them in the Offer portion in public category.
ii. Separate applications by Mutual Funds in respect of more than one scheme of the Mutual Fund
provided that the Applications clearly indicate the scheme for which the Bid has been made.
iii. Applications by Mutual Funds, and sub-accounts of FIIs (or FIIs and its sub-accounts) submitted
with the same PAN but with different beneficiary account numbers, Client IDs and DP IDs.
4.3.3 FIELD NUMBER 5 : CATEGORY OF APPLICANTS
(a) The categories of applicants identified as per the SEBI ICDR Regulations for the purpose of Bidding,
allocation and Allotment in the Offer are RIBs, individual applicants other than RIB’s and other investors
(including corporate bodies or institutions, irrespective of the number of specified securities applied for).
516
(b) An Issuer can make reservation for certain categories of Applicants permitted under the SEBI ICDR
Regulations. For details of any reservations made in the Offer, applicants may refer to the Prospectus.
(c) The SEBI ICDR Regulations specify the allocation or Allotment that may be made to various categories of
applicants in an Offer depending upon compliance with the eligibility conditions. Details pertaining to
allocation are disclosed on reverse side of the Revision Form. For Offer specific details in relation to
allocation applicant may refer to the Prospectus.
4.3.4 FIELD NUMBER 6: INVESTOR STATUS
Applicants should refer to instructions contained in paragraphs 4.1.6.
4.3.5 FIELD 7: PAYMENT DETAILS
(a) All Applicants (other than Anchor Investors) are required to make use of ASBA for applying in the Offer
(b) Application Amount cannot be paid in cash, through money order, cheque, demand draft or through postal
order or through stock invest.
4.3.5.1 Payment instructions for Applicants
Applicants should refer to instructions contained in paragraphs 4.1.7.2.
4.3.5.2 Unblocking of ASBA Account
Applicants should refer to instructions contained in paragraphs 4.1.7.2.1.
4.3.5.3 Discount (if applicable)
Applicants should refer to instructions contained in paragraphs 4.1.7.3.
4.3.6 FIELD NUMBER 8: SIGNATURES AND OTHER AUTHORISATIONS & ACKNOWLEDGEMENT AND
FUTURE COMMUNICATION
Applicants should refer to instructions contained in paragraphs 4.1.8 & 4.1.9.
4.4 SUBMISSION OF BID CUM APPLICATION FORM/APPLICATION FORM/REVISION FORM
4.4.1 Bidders/Applicants may submit completed Bid cum application form/Revision Form in the following
manner:-
Mode of Application Submission of Bid cum Application Form
Anchor Investors
Application Form
1) To the Book Running Lead Managers at the locations mentioned in the
Anchor Investors Application Form
ASBA Form (a) To members of the Syndicate in the Specified Locations or Registered Brokers
at the Broker Centres or the RTA at the Designated RTA Location or the DP
at the Designated DP Location
(b) To the Designated Branches of the SCSBs
(a) Bidders/Applicants should submit the Revision Form to the same Designated Intermediary through which
such Bidder/Applicant had placed the original Bid.
(b) Upon submission of the Bid cum Application Form, the Bidder/Applicant will be deemed to have
authorized the Issuer to make the necessary changes in the RHP and the Bid cum Application Form as
would be required for filing Prospectus with the RoC and as would be required by the RoC after such filing,
without prior or subsequent notice of such changes to the relevant Bidder/Applicant.
(c) Upon determination of the Offer Price and filing of the Prospectus with the RoC, the Bid cum Application
Form will be considered as the application form.
517
SECTION 5: OFFER PROCEDURE IN BOOK BUILT OFFER
Book Building, in the context of the Offer, refers to the process of collection of Bids within the Price Band or above
the Floor Price and determining the Offer Price based on the Bids received as detailed in Schedule XI of SEBI ICDR
Regulations. The Offer Price is finalised after the Bid/Offer Closing Date. Valid Bids received at or above the Offer
Price are considered for allocation in the Offer, subject to applicable regulations and other terms and conditions.
5.1 SUBMISSION OF BIDS
(a) During the Bid/Offer Period, Bidders/Applicants may approach any of the Designated Intermediaries to
register their Bids. Anchor Investors who are interested in subscribing for the Equity Shares should
approach the Book Running Lead Manager, to register their Bid.
(b) In case of Bidders/Applicants (excluding NIBs and QIBs) Bidding at Cut-off Price, the Bidders/Applicants
may instruct the SCSBs to block Bid Amount based on the Cap Price less discount (if applicable).
(c) For details of the timing on acceptance and upload of Bids in the Stock Exchanges Platform
Bidders/Applicants are requested to refer to the RHP.
5.2 ELECTRONIC REGISTRATION OF BIDS
(a) The Designated Intermediary may register the Bids using the on-line facilities of the Stock Exchanges. The
Designated Intermediaries can also set up facilities for off-line electronic registration of Bids, subject to the
condition that they may subsequently upload the off-line data file into the on-line facilities for Book
Building on a regular basis before the closure of the issue.
(b) On the Bid/Offer Closing Date, the Designated Intermediaries may upload the Bids till such time as may be
permitted by the Stock Exchanges and as disclosed in the Red Herring Prospectus.
(c) Only Bids that are uploaded on the Stock Exchanges Platform are considered for allocation/Allotment. The
Designated Intermediaries are given till 1 p.m. on the next Working Day following the Bid/Offer Closing
Date to modify select fields uploaded in the Stock Exchange Platform during the Bid/Offer Period after
which the Stock Exchange(s) send the bid information to the Registrar to the Offer for further processing.
5.3 BUILD UP OF THE BOOK
(a) Bids received from various Bidders/Applicants through the Designated Intermediaries may be electronically
uploaded on the Bidding Platform of the Stock Exchanges’ on a regular basis. The book gets built up at
various price levels. This information may be available with the BRLMs at the end of the Bid/Offer Period.
(b) Based on the aggregate demand and price for Bids registered on the Stock Exchanges Platform, a graphical
representation of consolidated demand and price as available on the websites of the Stock Exchanges may
be made available at the Bidding centres during the Bid/Offer Period.
5.4 WITHDRAWAL OF BIDS
(a) RIBs can withdraw their Bids until Bid/Offer Closing Date. In case a RIB wishes to withdraw the Bid
during the Bid/Offer Period, the same can be done by submitting a request for the same to the concerned
Designated Intermediary who shall do the requisite, including unblocking of the funds by the SCSB in the
ASBA Account.
(b) The Registrar to the Offer shall give instruction to the SCSB for unblocking the ASBA Account upon or
after the finalisation of basis of allotment. QIBs and NIBs can neither withdraw nor lower the size of their
Bids at any stage.
5.5 REJECTION & RESPONSIBILITY FOR UPLOAD OF BIDS
(a) The Designated Intermediaries are individually responsible for the acts, mistakes or errors or omission in
relation to:
i. the Bids accepted by the Designated Intermediary,
ii. the Bids uploaded by the Designated Intermediary, and
iii. the Bid cum application forms accepted but not uploaded by the Designated Intermediary.
518
(b) The BRLMs and their affiliate Syndicate Members, as the case may be, may reject Bids if all information
required is not provided and the Bid cum Application Form is incomplete in any respect.
(c) The SCSBs shall have no right to reject Bids, except in case of unavailability of adequate funds in the
ASBA account or on technical grounds.
(d) In case of QIB Bidders, only the (i) SCSBs (for Bids other than the Bids by Anchor Investors); and (ii)
BRLMs and their affiliate Syndicate Members (only in the Specified Locations) have the right to reject
bids. However, such rejection shall be made at the time of receiving the Bid and only after assigning a
reason for such rejection in writing.
(e) All bids by QIBs, NIBs & RIBs Bidders can be rejected on technical grounds listed herein.
5.5.1 GROUNDS FOR TECHNICAL REJECTIONS
Bid cum Application Forms/Application Forms can be rejected on the below mentioned technical grounds either at
the time of their submission to any of the Designated Intermediaries, or at the time of finalisation of the Basis of
Allotment. Bidders/Applicants are advised to note that the Bids/Applications are liable to be rejected, which have
been detailed at various placed in this GID:-
(a) Bid/Application by persons not competent to contract under the Indian Contract Act, 1872, as amended,
(other than minors having valid Depository Account as per Demographic Details provided by Depositories);
(b) Bids/Applications by OCBs;
(c) In case of partnership firms, Bid/Application for Equity Shares made in the name of the firm. However, a
limited liability partnership can apply in its own name;
(d) In case of Bids/Applications under power of attorney or by limited companies, corporate, trust, etc.,
relevant documents are not being submitted along with the Bid cum application form;
(e) Bids/Applications by persons prohibited from buying, selling or dealing in the shares directly or indirectly
by SEBI or any other regulatory authority;
(f) Bids/Applications by any person outside India if not in compliance with applicable foreign and Indian laws;
(g) PAN not mentioned in the Bid cum Application Form/Application Forms except for Bids/Applications by
or on behalf of the Central or State Government and officials appointed by the court and by the investors
residing in the State of Sikkim, provided such claims have been verified by the Depository Participant;
(h) In case no corresponding record is available with the Depositories that matches the DP ID, the Client ID
and the PAN;
(i) Bids/Applications for lower number of Equity Shares than the minimum specified for that category of
investors;
(j) Bids/Applications at a price less than the Floor Price & Bids/Applications at a price more than the Cap
Price;
(k) Bids/Applications at Cut-off Price by NIBs and QIBs;
(l) The amounts mentioned in the Bid cum Application Form/Application Forms do not tally with the amount
payable for the value of the Equity Shares Bid/Applied for;
(m) Bids/Applications for amounts greater than the maximum permissible amounts prescribed by the
regulations;
(n) Submission of more than five ASBA Forms/Application Forms per ASBA Account;
(o) Bids/Applications for number of Equity Shares which are not in multiples Equity Shares as specified in the
RHP;
(p) Multiple Bids/Applications as defined in this GID and the RHP/Prospectus;
(q) Bids not uploaded in the Stock Exchanges bidding system.
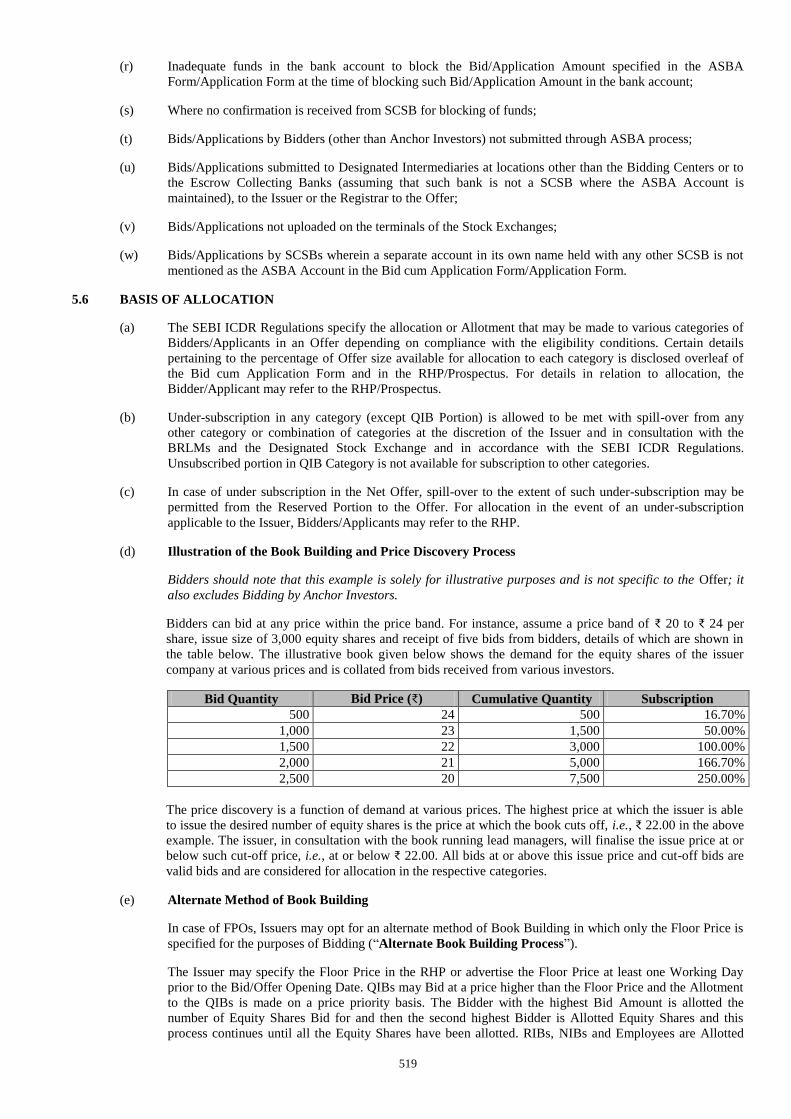
519
(r) Inadequate funds in the bank account to block the Bid/Application Amount specified in the ASBA
Form/Application Form at the time of blocking such Bid/Application Amount in the bank account;
(s) Where no confirmation is received from SCSB for blocking of funds;
(t) Bids/Applications by Bidders (other than Anchor Investors) not submitted through ASBA process;
(u) Bids/Applications submitted to Designated Intermediaries at locations other than the Bidding Centers or to
the Escrow Collecting Banks (assuming that such bank is not a SCSB where the ASBA Account is
maintained), to the Issuer or the Registrar to the Offer;
(v) Bids/Applications not uploaded on the terminals of the Stock Exchanges;
(w) Bids/Applications by SCSBs wherein a separate account in its own name held with any other SCSB is not
mentioned as the ASBA Account in the Bid cum Application Form/Application Form.
5.6 BASIS OF ALLOCATION
(a) The SEBI ICDR Regulations specify the allocation or Allotment that may be made to various categories of
Bidders/Applicants in an Offer depending on compliance with the eligibility conditions. Certain details
pertaining to the percentage of Offer size available for allocation to each category is disclosed overleaf of
the Bid cum Application Form and in the RHP/Prospectus. For details in relation to allocation, the
Bidder/Applicant may refer to the RHP/Prospectus.
(b) Under-subscription in any category (except QIB Portion) is allowed to be met with spill-over from any
other category or combination of categories at the discretion of the Issuer and in consultation with the
BRLMs and the Designated Stock Exchange and in accordance with the SEBI ICDR Regulations.
Unsubscribed portion in QIB Category is not available for subscription to other categories.
(c) In case of under subscription in the Net Offer, spill-over to the extent of such under-subscription may be
permitted from the Reserved Portion to the Offer. For allocation in the event of an under-subscription
applicable to the Issuer, Bidders/Applicants may refer to the RHP.
(d) Illustration of the Book Building and Price Discovery Process
Bidders should note that this example is solely for illustrative purposes and is not specific to the Offer; it
also excludes Bidding by Anchor Investors.
Bidders can bid at any price within the price band. For instance, assume a price band of ₹ 20 to ₹ 24 per
share, issue size of 3,000 equity shares and receipt of five bids from bidders, details of which are shown in
the table below. The illustrative book given below shows the demand for the equity shares of the issuer
company at various prices and is collated from bids received from various investors.
Bid Quantity Bid Price (₹) Cumulative Quantity Subscription
500 24 500 16.70%
1,000 23 1,500 50.00%
1,500 22 3,000 100.00%
2,000 21 5,000 166.70%
2,500 20 7,500 250.00%
The price discovery is a function of demand at various prices. The highest price at which the issuer is able
to issue the desired number of equity shares is the price at which the book cuts off, i.e., ₹ 22.00 in the above
example. The issuer, in consultation with the book running lead managers, will finalise the issue price at or
below such cut-off price, i.e., at or below ₹ 22.00. All bids at or above this issue price and cut-off bids are
valid bids and are considered for allocation in the respective categories.
(e) Alternate Method of Book Building
In case of FPOs, Issuers may opt for an alternate method of Book Building in which only the Floor Price is
specified for the purposes of Bidding (“Alternate Book Building Process”).
The Issuer may specify the Floor Price in the RHP or advertise the Floor Price at least one Working Day
prior to the Bid/Offer Opening Date. QIBs may Bid at a price higher than the Floor Price and the Allotment
to the QIBs is made on a price priority basis. The Bidder with the highest Bid Amount is allotted the
number of Equity Shares Bid for and then the second highest Bidder is Allotted Equity Shares and this
process continues until all the Equity Shares have been allotted. RIBs, NIBs and Employees are Allotted
520
Equity Shares at the Floor Price and Allotment to these categories of Bidders is made proportionately. If the
number of Equity Shares Bid for at a price is more than available quantity then the Allotment may be done
on a proportionate basis. Further, the Issuer may place a cap either in terms of number of specified
securities or percentage of issued capital of the Issuer that may be Allotted to a single Bidder, decide
whether a Bidder be allowed to revise the bid upwards or downwards in terms of price and/or quantity and
also decide whether a Bidder be allowed single or multiple bids.
SECTION 6: OFFER PROCEDURE IN FIXED PRICE ISSUE
Applicants may note that there is no Bid cum Application Form in a Fixed Price Offer. As the Offer Price is mentioned
in the Fixed Price Offer therefore on filing of the Prospectus with the RoC, the Application so submitted is considered as the
application form.
Applicants may only use the specified Application Form for the purpose of making an Application in terms of the Prospectus
which may be submitted through the Designated Intermediary.
Applicants may submit an Application Form either in physical form to the any of the Designated Intermediaries or in the
electronic form to the SCSB or the Designated Branches of the SCSBs authorising blocking of funds that are available in the
bank account specified in the Application Form only (“ASBA Account”). The Application Form is also made available on the
websites of the Stock Exchanges at least one day prior to the Bid/Offer Opening Date.
In a fixed price Offer, allocation in the net offer to the public category is made as follows: minimum fifty per cent to Retail
Individual Bidders; and remaining to (i) individual investors other than Retail Individual Bidders; and (ii) other Applicants
including corporate bodies or institutions, irrespective of the number of specified securities applied for. The unsubscribed
portion in either of the categories specified above may be allocated to the Applicants in the other category.
For details of instructions in relation to the Application Form, Bidders/Applicants may refer to the relevant section of the
GID.
SECTION 7: ALLOTMENT PROCEDURE AND BASIS OF ALLOTMENT
The Allotment of Equity Shares to Bidders/Applicants other than Retail Individual Bidders and Anchor Investors may be on
proportionate basis. For Basis of Allotment to Anchor Investors, Bidders/Applicants may refer to RHP/Prospectus. No Retail
Individual Bidder will be Allotted less than the minimum Bid Lot subject to availability of shares in Retail Individual Bidder
Category and the remaining available shares, if any will be Allotted on a proportionate basis. The Issuer is required to receive
a minimum subscription of 90% of the Net Offer (excluding any Offer for Sale of specified securities). However, in case the
Offer is in the nature of Offer for Sale only, then minimum subscription may not be applicable.
7.1 ALLOTMENT TO RIBs
Bids received from the RIBs at or above the Offer Price may be grouped together to determine the total demand
under this category. If the aggregate demand in this category is less than or equal to the Retail Category at or above
the Offer Price, full Allotment may be made to the RIBs to the extent of the valid Bids. If the aggregate demand in
this category is greater than the allocation to in the Retail Category at or above the Offer Price, then the maximum
number of RIBs who can be Allotted the minimum Bid Lot will be computed by dividing the total number of Equity
Shares available for Allotment to RIBs by the minimum Bid Lot (“Maximum RIB Allottees”). The Allotment to the
RIBs will then be made in the following manner:
(a) In the event the number of RIBs who have submitted valid Bids in the Offer is equal to or less than
Maximum RIB Allottees, (i) all such RIBs shall be Allotted the minimum Bid Lot; and (ii) the balance
available Equity Shares, if any, remaining in the Retail Category shall be Allotted on a proportionate basis
to the RIBs who have received Allotment as per (i) above for the balance demand of the Equity Shares Bid
by them (i.e. who have Bid for more than the minimum Bid Lot).
(b) In the event the number of RIBs who have submitted valid Bids in the Offer is more than Maximum RIB
Allottees, the RIBs (in that category) who will then be Allotted minimum Bid Lot shall be determined on
the basis of draw of lots.
7.2 ALLOTMENT TO NIBS
Bids received from NIBs at or above the Offer Price may be grouped together to determine the total demand under
this category. The Allotment to all successful NIBs may be made at or above the Offer Price. If the aggregate
demand in this category is less than or equal to the Non-Institutional Category at or above the Offer Price, full
Allotment may be made to NIBs to the extent of their demand. In case the aggregate demand in this category is
greater than the Non-Institutional Category at or above the Offer Price, Allotment may be made on a proportionate
basis up to a minimum of the Non-Institutional Category.
521
7.3 ALLOTMENT TO QIBs
For the Basis of Allotment to Anchor Investors, Bidders/Applicants may refer to the SEBI ICDR Regulations or
RHP/Prospectus. Bids received from QIBs Bidding in the QIB Category (net of Anchor Portion) at or above the
Offer Price may be grouped together to determine the total demand under this category. The QIB Category may be
available for Allotment to QIBs who have Bid at a price that is equal to or greater than the Offer Price. Allotment
may be undertaken in the following manner:
(a) In the first instance allocation to Mutual Funds for up to 5% of the QIB Category may be determined as
follows: (i) In the event that Bids by Mutual Fund exceeds 5% of the QIB Category, allocation to Mutual
Funds may be done on a proportionate basis for up to 5% of the QIB Category; (ii) In the event that the
aggregate demand from Mutual Funds is less than 5% of the QIB Category then all Mutual Funds may get
full Allotment to the extent of valid Bids received above the Offer Price; and (iii) Equity Shares remaining
unsubscribed, if any and not allocated to Mutual Funds may be available for Allotment to all QIBs as set
out at paragraph 7.4(b) below;
(b) In the second instance, Allotment to all QIBs may be determined as follows: (i) In the event of
oversubscription in the QIB Category, all QIBs who have submitted Bids above the Offer Price may be
Allotted Equity Shares on a proportionate basis for up to 95% of the QIB Category; (ii) Mutual Funds, who
have received allocation as per (a) above, for less than the number of Equity Shares Bid for by them, are
eligible to receive Equity Shares on a proportionate basis along with other QIBs; and (iii) Under-
subscription below 5% of the QIB Category, if any, from Mutual Funds, may be included for allocation to
the remaining QIBs on a proportionate basis.
7.4 ALLOTMENT TO ANCHOR INVESTOR (IF APPLICABLE)
(a) Allocation of Equity Shares to Anchor Investors at the Anchor Investor Offer Price will be at the discretion
of the Issuer in consultation with the Selling Shareholders and the BRLMs, subject to compliance with the
following requirements:
i. not more than 60% of the QIB Category will be allocated to Anchor Investors;
ii. one-third of the Anchor Investor Portion shall be reserved for domestic Mutual Funds, subject to
valid Bids being received from domestic Mutual Funds at or above the price at which allocation is
being done to other Anchor Investors; and
iii. allocation to Anchor Investors shall be on a discretionary basis and subject to:
a maximum number of two Anchor Investors for allocation up to ₹ 100 million;
a minimum number of two Anchor Investors and maximum number of 15 Anchor
Investors for allocation of more than ₹ 100 million and up to ₹ 2,500 million subject to
minimum Allotment of ₹ 50 million per such Anchor Investor; and
a minimum number of five Anchor Investors and maximum number of 15 Anchor
Investors for allocation of more than ₹ 2,500 million, and an additional 10 Anchor
Investors for every additional ₹ 2,500 million or part thereof, subject to minimum
Allotment of ₹ 50 million per such Anchor Investor.
(b) An Anchor Investor shall make an application of a value of at least ₹ 100 million in the Offer.
(c) A physical book is prepared by the Registrar on the basis of the Anchor Investor Application Forms
received from Anchor Investors. Based on the physical book and at the discretion of the Issuer in
consultation with the BRLMs, selected Anchor Investors will be sent a CAN and if required, a revised
CAN.
(d) In the event that the Offer Price is higher than the Anchor Investor Offer Price: Anchor Investors will
be sent a revised CAN within one day of the Pricing Date indicating the number of Equity Shares allocated
to such Anchor Investor and the pay-in date for payment of the balance amount. Anchor Investors are then
required to pay any additional amounts, being the difference between the Offer Price and the Anchor
Investor Offer Price, as indicated in the revised CAN within the pay-in date referred to in the revised CAN.
Thereafter, the Allotment Advice will be issued to such Anchor Investors.
(e) In the event the Offer Price is lower than the Anchor Investor Offer Price: Anchor Investors who have
been Allotted Equity Shares will directly receive Allotment Advice.
522
7.5 BASIS OF ALLOTMENT FOR QIBs (OTHER THAN ANCHOR INVESTORS), NIBs AND RESERVED
CATEGORY IN CASE OF OVER-SUBSCRIBED ISSUE
In the event of the Offer being over-subscribed, the Issuer may finalise the Basis of Allotment in consultation with
the Designated Stock Exchange in accordance with the SEBI ICDR Regulations.
The allocation may be made in marketable lots, on a proportionate basis as explained below:
(a) Bidders may be categorized according to the number of Equity Shares applied for;
(b) The total number of Equity Shares to be Allotted to each category as a whole may be arrived at on a
proportionate basis, which is the total number of Equity Shares applied for in that category (number of
Bidders in the category multiplied by the number of Equity Shares applied for) multiplied by the inverse of
the over-subscription ratio;
(c) The number of Equity Shares to be Allotted to the successful Bidders may be arrived at on a proportionate
basis, which is total number of Equity Shares applied for by each Bidder in that category multiplied by the
inverse of the over-subscription ratio;
(d) In all Bids where the proportionate Allotment is less than the minimum Bid Lot decided per Bidder, the
Allotment may be made as follows: the successful Bidders out of the total Bidders for a category may be
determined by a draw of lots in a manner such that the total number of Equity Shares Allotted in that
category is equal to the number of Equity Shares calculated in accordance with (b) above; and each
successful Bidder may be Allotted a minimum of such Equity Shares equal to the minimum Bid Lot
finalised by the Issuer;
(e) If the proportionate Allotment to a Bidder is a number that is more than the minimum Bid lot but is not a
multiple of one (which is the marketable lot), the decimal may be rounded off to the higher whole number if
that decimal is 0.5 or higher. If that number is lower than 0.5 it may be rounded off to the lower whole
number. Allotment to all Bidders in such categories may be arrived at after such rounding off; and
(f) If the Equity Shares allocated on a proportionate basis to any category are more than the Equity Shares
Allotted to the Bidders in that category, the remaining Equity Shares available for Allotment may be first
adjusted against any other category, where the Allotted Equity Shares are not sufficient for proportionate
Allotment to the successful Bidders in that category. The balance Equity Shares, if any, remaining after
such adjustment may be added to the category comprising Bidders applying for minimum number of Equity
Shares.
7.6 DESIGNATED DATE AND ALLOTMENT OF EQUITY SHARES
(a) Designated Date: On the Designated Date, the Escrow Collection Banks shall transfer the funds
represented by allocation of Equity Shares to Anchor Investors from the Escrow Account, as per the terms
of the Escrow Agreement, into the Public Issue Account with the Bankers to the Offer. The balance amount
after transfer to the Public Issue Account shall be transferred to the Refund Account. Payments of refund to
the Bidders applying in the Anchor Investor Portion shall be made from the Refund Account as per the
terms of the Escrow Agreement and the RHP. On the Designated Date, the Registrar to the Offer shall
instruct the SCSBs to transfer funds represented by allocation of Equity Shares from ASBA Accounts into
the Public Issue Account.
(b) Issuance of Allotment Advice: Upon approval of the Basis of Allotment by the Designated Stock
Exchange, the Registrar shall upload the same on its website. On the basis of the approved Basis of
Allotment, the Issuer shall pass necessary corporate action to facilitate the Allotment and credit of Equity
Shares. Bidders/Applicants are advised to instruct their Depository Participant to accept the Equity Shares
that may be allotted to them pursuant to the Offer.
Pursuant to confirmation of such corporate actions, the Registrar will dispatch Allotment Advice to the
Bidders/Applicants who have been Allotted Equity Shares in the Offer.
(c) The dispatch of Allotment Advice shall be deemed a valid, binding and irrevocable contract.
(d) Issuer will ensure that: (i) the Allotment of Equity Shares; and (ii) credit of shares to the successful
Bidders/Applicants Depository Account will be completed within six Working Days of the Bid/Offer
Closing Date.
523
SECTION 8: INTEREST AND REFUNDS
8.1 COMPLETION OF FORMALITIES FOR LISTING & COMMENCEMENT OF TRADING
The Issuer shall ensure that all steps for the completion of the necessary formalities for listing and commencement of
trading at all the Stock Exchanges are taken within six Working Days of the Bid/Offer Closing Date. The Registrar
to the Offer may initiate corporate action for credit to Equity Shares the beneficiary account with Depositories within
six Working Days of the Bid/Offer Closing Date.
8.2 GROUNDS FOR REFUND
8.2.1 NON RECEIPT OF LISTING PERMISSION
An Issuer makes an application to the Stock Exchange(s) for permission to deal in/list and for an official quotation of
the Equity Shares. All the Stock Exchanges from where such permission is sought are disclosed in RHP/Prospectus.
The Designated Stock Exchange may be as disclosed in the RHP/Prospectus with which the Basis of Allotment may
be finalised.
If the Issuer fails to make application to the Stock Exchange(s) or obtain permission for listing of the Equity Shares,
in accordance with the provisions of Section 40 of the Companies Act, 2013, the Issuer shall be punishable with a
fine which shall not be less than ₹ 5 lakhs but which may extend to ₹ 50 lakhs and every officer of the Issuer who is
in default shall be punishable with imprisonment for a term which may extend to one year or with fine which shall
not be less than ₹ 50,000 but which may extend to ₹ 3 lakhs, or with both.
If the permissions to deal in and an official quotation of the Equity Shares are not granted by any of the Stock
Exchange(s), the Issuer may forthwith take steps to refund, without interest, all moneys received from
Bidders/Applicants.
If such money is not refunded to the Bidders/Applicants within the prescribed time after the Issuer becomes liable to
repay it, then the Issuer and every director of the Issuer who is an officer in default may, on and from such expiry of
such period, be liable to repay the money, with interest at such rate, as disclosed in the RHP/Prospectus.
8.2.2 NON RECEIPT OF MINIMUM SUBSCRIPTION
If the Issuer does not receive a minimum subscription of 90% of the Net Offer, including devolvement to the
Underwriters, the Issuer may forthwith, take steps to unblock the entire subscription amount received within six
Working Days of the Bid/Offer Closing Date and repay, without interest, all moneys received from Anchor
Investors. In case the Offer is in the nature of Offer for Sale only, then minimum subscription may not be applicable.
If there is a delay beyond the prescribed time after the Issuer becomes liable to pay the amount received from
Bidders, then the Issuer and every director of the Issuer who is an officer in default may on and from expiry of 15
Working Days, be jointly and severally liable to repay the money, with interest at the rate of 15% per annum in
accordance with the Companies (Prospectus and Allotment of Securities) Rules, 2014, as amended.
8.2.3 MINIMUM NUMBER OF ALLOTTEES
The Issuer may ensure that the number of prospective Allottees to whom Equity Shares may be Allotted may not be
less than 1,000 failing which the entire application monies may be refunded forthwith.
8.2.4 IN CASE OF ISSUES MADE UNDER COMPULSORY BOOK BUILDING
In case an Issuer not eligible under Regulation 26(1) of the SEBI ICDR Regulations comes for an Offer under
Regulation 26(2) of SEBI ICDR Regulations but fails to Allot at least 75% of the Net Offer to QIBs, in such case
full subscription money is to be refunded.
8.3 MODE OF REFUND
(a) In case of ASBA Bids: Within six Working Days of the Bid/Offer Closing Date, the Registrar to the Offer
may give instructions to SCSBs for unblocking the amount in ASBA Accounts for unsuccessful Bids or for
any excess amount blocked on Bidding.
(b) In case of Anchor Investors: Within six Working Days of the Bid/Offer Closing Date, the Registrar to the
Offer may dispatch the refund orders for all amounts payable to unsuccessful Anchor Investors.
(c) In case of Anchor Investors, the Registrar to the Offer may obtain from the depositories the Bidders’ bank
account details, including the MICR code, on the basis of the DP ID, Client ID and PAN provided by the
524
Anchor Investors in their Anchor Investor Application Forms for refunds. Accordingly, Anchor Investors
are advised to immediately update their details as appearing on the records of their depositories. Failure to
do so may result in delays in dispatch of refund orders or refunds through electronic transfer of funds, as
applicable, and any such delay may be at the Anchor Investors’ sole risk and neither the Issuer, the
Registrar to the Offer, the Escrow Collection Banks, or the Syndicate, may be liable to compensate the
Anchor Investors for any losses caused to them due to any such delay, or liable to pay any interest for such
delay. Please note that refunds shall be credited only to the bank account from which the Bid Amount was
remitted to the Escrow Bank.
8.3.1 Electronic mode of making refunds for Anchor Investors
The payment of refund, if any, may be done through various electronic modes as mentioned below:
(a) NECS—Payment of refund may be done through NECS for Bidders/Applicants having an account at any of
the centers specified by the RBI. This mode of payment of refunds may be subject to availability of
complete bank account details including the nine-digit MICR code of the Bidder/Applicant as obtained
from the Depository;
(b) NEFT—Payment of refund may be undertaken through NEFT wherever the branch of the Anchor
Investors’ bank is NEFT enabled and has been assigned the Indian Financial System Code (“IFSC”), which
can be linked to the MICR of that particular branch. The IFSC Code may be obtained from the website of
RBI as at a date prior to the date of payment of refund, duly mapped with MICR numbers. Wherever the
Anchor Investors have registered their nine-digit MICR number and their bank account number while
opening and operating the demat account, the same may be duly mapped with the IFSC Code of that
particular bank branch and the payment of refund may be made to the Anchor Investors through this
method. In the event NEFT is not operationally feasible, the payment of refunds may be made through any
one of the other modes as discussed in this section;
(c) RTGS—Anchor Investors having a bank account at any of the centers notified by SEBI where clearing
houses are managed by the RBI, may have the option to receive refunds, if any, through RTGS.
(d) Direct Credit—Anchor Investors having their bank account with the Refund Banker may be eligible to
receive refunds, if any, through direct credit to such bank account;
Please note that refunds through the abovementioned modes shall be credited only to the bank account from which
the Bid Amount was remitted to the Escrow Bank.
For details of levy of charges, if any, for any of the above methods, Anchor Investors may refer to RHP/Prospectus.
8.4 INTEREST IN CASE OF DELAY IN ALLOTMENT OR REFUND
The Issuer may pay interest at the rate of 15% per annum if Allotment is not made and refund instructions have not
been given to the clearing system in the disclosed manner/instructions for unblocking of funds in the ASBA Account
are not dispatched within the 15 days of the Bid/Offer Closing Date.
The Issuer may pay interest at 15% per annum for any delay beyond 15 days from the Bid/Offer Closing Date, if
Allotment is not made.
SECTION 9: GLOSSARY AND ABBREVIATIONS
Unless the context otherwise indicates or implies, certain definitions and abbreviations used in this document may have the
meaning as provided below. References to any legislation, act or regulation may be to such legislation, act or regulation as
amended from time to time.
Term Description
Allotment/Allot/Allotted The allotment of Equity Shares pursuant to the Offer to successful Bidders/Applicants
Allotment Advice Note or advice or intimation of Allotment sent to the Bidders/Applicants who have
been Allotted Equity Shares after the Basis of Allotment has been approved by the
designated Stock Exchanges
Allottee An Bidder/Applicant to whom the Equity Shares are Allotted
525
Term Description
Anchor Investor A Qualified Institutional Buyer, applying under the Anchor Investor Portion in
accordance with the requirements specified in SEBI ICDR Regulations, 2009 and the
Red Herring Prospectus.
Anchor Investor Application Form The form used by an Anchor Investor to make a Bid in the Anchor Investor Portion and
which will be considered as an application for Allotment in terms of the Red Herring
Prospectus and Prospectus
Anchor Investor Portion Up to 60% of the QIB Category which may be allocated by the Issuer in consultation
with the BRLMs, to Anchor Investors on a discretionary basis. One-third of the Anchor
Investor Portion is reserved for domestic Mutual Funds, subject to valid Bids being
received from domestic Mutual Funds at or above the price at which allocation is being
done to Anchor Investors
Application Supported by Blocked
Amount/ASBA
An application, whether physical or electronic, used by ASBA Bidders/Applicants, to
make a Bid and authorising a SCSB to block the Bid Amount in the specified bank
account maintained with such SCSB
Application Supported by Blocked
Amount Form/ASBA Form
An application form, whether physical or electronic, used by ASBA
Bidders/Applicants, which will be considered as the application for Allotment in terms
of the Red Herring Prospectus and the Prospectus
ASBA Account Account maintained with a SCSB which may be blocked by such SCSB to the extent of
the Bid Amount of the ASBA Bidder
ASBA Bidder All Bidders/Applicants except Anchor Investors
Banker(s) to the Offer/Escrow
Collection Bank(s)/Collecting
Banker
The banks which are clearing members and registered with SEBI as Banker to the
Offer with whom the Escrow Account(s) for Anchor Investors may be opened, and as
disclosed in the RHP/Prospectus and Bid cum Application Form of the Issuer
Basis of Allotment The basis on which the Equity Shares may be Allotted to successful Bidders/Applicants
under the Offer
Bid An indication to make an offer during the Bid/Offer Period by a prospective Bidder
pursuant to submission of Bid cum Application Form or during the Anchor Investor
Bid/Offer Period by the Anchor Investors, to subscribe for or purchase the Equity
Shares of the Issuer at a price within the Price Band, including all revisions and
modifications thereto. In case of issues undertaken through the fixed price process, all
references to a Bid should be construed to mean an Application
Bid Amount The highest value of the optional Bids indicated in the Bid cum Application Form and
payable by the Bidder upon submission of the Bid (except for Anchor Investors), less
discounts (if applicable). In case of issues undertaken through the fixed price process,
all references to the Bid Amount should be construed to mean the Application Amount
Bid cum Application Form The Anchor Investor Application Form or the ASBA Form, as the context requires
Bid/Offer Closing Date Except in the case of Anchor Investors (if applicable), the date after which the
Designated Intermediaries may not accept any Bids for the Offer, which may be
notified in an English national daily, a Hindi national daily and a regional language
newspaper at the place where the registered office of the Issuer is situated, each with
wide circulation. Bidders/Applicants may refer to the RHP/Prospectus for the Bid/Offer
Closing Date
Bid/Offer Opening Date The date on which the Designated Intermediaries may start accepting Bids for the
Offer, which may be the date notified in an English national daily, a Hindi national
daily and a regional language newspaper at the place where the registered office of the
Issuer is situated, each with wide circulation. Bidders/Applicants may refer to the
RHP/Prospectus for the Bid/Offer Opening Date
526
Term Description
Bid/ Offer Period Except in the case of Anchor Investors (if applicable), the period between the Bid/Offer
Opening Date and the Bid/Offer Closing Date inclusive of both days and during which
prospective ASBA Bidders/Applicants can submit their Bids, inclusive of any revisions
thereof. The Issuer may consider closing the Bid/Offer Period for QIBs one working
day prior to the Bid/ Offer Closing Date in accordance with the SEBI ICDR
Regulations, 2009. Bidders/Applicants may refer to the RHP/Prospectus for the
Bid/Offer Period
Bidder/Applicant Any prospective investor who makes a Bid/Application pursuant to the terms of the
RHP/Prospectus and the Bid cum Application Form. In case of issues undertaken
through the fixed price process, all references to an Applicants should be construed to
mean an Bidder/Applicants
Book Built Process/Book Building
Process/Book Building Method
The book building process as provided under SEBI ICDR Regulations, 2009, in terms
of which the Offer is being made
Broker Centres Broker centres notified by the Stock Exchanges, where Bidders/Applicants can submit
the ASBA Forms to a Registered Broker. The details of such broker centres, along with
the names and contact details of the Registered Brokers are available on the websites of
the Stock Exchanges.
BRLM(s)/Book Running Lead
Manager(s)/Lead Manager/LM
The Book Running Lead Manager to the Offer as disclosed in the RHP/Prospectus and
the Bid cum Application Form of the Issuer. In case of issues undertaken through the
fixed price process, all references to the Book Running Lead Manager should be
construed to mean the Lead Manager or LM
Business Day Monday to Saturday (except 2nd
and 4th
Saturday of a month and public holidays)
CAN/Confirmation of Allocation
Note
Notice or intimation of allocation of the Equity Shares sent to Anchor Investors, who
have been allocated the Equity Shares, after the Anchor Investor Bid/ Offer Period
Cap Price The higher end of the Price Band, above which the Offer Price and the Anchor Investor
Offer Price may not be finalised and above which no Bids may be accepted
Client ID Client Identification Number maintained with one of the Depositories in relation to
demat account
Collecting Depository Participant
or CDPs
A depository participant as defined under the Depositories Act, 1996, registered with
SEBI and who is eligible to procure Bids at the Designated CDP Locations in terms of
circular no. CIR/CFD/POLICYCELL/11/2015 dated November 10, 2015 issued by
SEBI
Cut-off Price Offer Price, finalised by the Issuer in consultation with the Book Running Lead
Manager(s), which can be any price within the Price Band. Only RIBs, Retail
Individual Shareholders and employees are entitled to Bid at the Cut-off Price. No
other category of Bidders/Applicants are entitled to Bid at the Cut-off Price
DP Depository Participant
DP ID Depository Participant’s Identification Number
Depositories National Securities Depository Limited and Central Depository Services (India)
Limited
Demographic Details Details of the Bidders/Applicants including the Bidder/Applicant’s address, name of
the Applicant’s father/husband, investor status, occupation and bank account details
Designated Branches Such branches of the SCSBs which may collect the Bid cum Application Forms used
by Bidders/Applicants (excluding Anchor Investors) and a list of which is available on
http://www.sebi.gov.in/cms/sebi_data/attachdocs/1316087201341.html
527
Term Description
Designated CDP Locations Such locations of the CDPs where Bidders can submit the ASBA Forms to Collecting
Depository Participants.
The details of such Designated CDP Locations, along with names and contact details of
the Collecting Depository Participants eligible to accept ASBA Forms are available on
the respective websites of the Stock Exchanges (www.bseindia.com and
www.nseindia.com)
Designated Date The date on which funds are transferred by the Escrow Collection Bank(s) from the
Escrow Account and the amounts blocked by the SCSBs are transferred from the
ASBA Accounts, as the case may be, to the Public Issue Account or the Refund
Account, as appropriate, after the Prospectus is filed with the RoC, following which the
board of directors may Allot Equity Shares to successful Bidders/Applicants in the
Offer
Designated Intermediaries Syndicate, sub-syndicate/agents, SCSBs, Registered Brokers, CDPs and RTAs, who
are authorized to collect ASBA Forms from the ASBA Bidders, in relation to the Offer
Designated RTA Locations Such locations of the RTAs where Bidders can submit the ASBA Forms to RTAs.
The details of such Designated RTA Locations, along with names and contact details of
the RTAs eligible to accept ASBA Forms are available on the respective websites of
the Stock Exchanges (www.bseindia.com and www.nseindia.com)
Designated Stock Exchange The designated stock exchange as disclosed in the RHP/Prospectus of the Issuer
Discount Discount to the Offer Price that may be provided to Bidders/Applicants in accordance
with the SEBI ICDR Regulations, 2009.
Draft Prospectus The draft prospectus filed with SEBI in case of Fixed Price Issues and which may
mention a price or a Price Band
Employees Employees of an Issuer as defined under SEBI ICDR Regulations, 2009 and including,
in case of a new company, persons in the permanent and full time employment of the
promoting companies excluding the promoters and immediate relatives of the
promoters. For further details, Bidder/Applicant may refer to the RHP/Prospectus
Equity Shares Equity Shares of the Issuer
Escrow Account Account opened with the Escrow Collection Bank(s) and in whose favour the Anchor
Investors may transfer money through NEFT/RTGS/direct credit in respect of the Bid
Amount when submitting a Bid
Escrow Agreement Agreement to be entered into among the Issuer, the Registrar to the Offer, the Book
Running Lead Manager(s), the Escrow Collection Bank(s) and the Refund Bank(s) for
collection of the Bid Amounts from Anchor Investors and where applicable, remitting
refunds of the amounts collected to the Anchor Investors on the terms and conditions
thereof
Escrow Collection Bank(s) Refer to definition of Banker(s) to the Offer
FCNR Account Foreign Currency Non-Resident Account
First Bidder/Applicant The Bidder/Applicant whose name appears first in the Bid cum Application Form or
Revision Form
FII(s) Foreign Institutional Investors as defined under the SEBI (Foreign Institutional
Investors) Regulations, 1995 and registered with SEBI under applicable laws in India
Fixed Price Offer/Fixed Price
Process/Fixed Price Method
The Fixed Price process as provided under SEBI ICDR Regulations, 2009, in terms of
which the Offer is being made
528
Term Description
Floor Price The lower end of the Price Band, at or above which the Offer Price and the Anchor
Investor Offer Price may be finalised and below which no Bids may be accepted,
subject to any revision thereto
FPIs Foreign Portfolio Investors as defined under the Securities and Exchange Board of
India (Foreign Portfolio Investors) Regulations, 2014
FPO Further public offering
Fresh Issue The public issue of up to 15,000,000 Equity Shares of face value of ₹ 10 each for cash
at a price of ₹ [●] each, aggregating up to ₹ [●] million
Foreign Venture Capital Investors
or FVCIs
Foreign Venture Capital Investors as defined and registered with SEBI under the SEBI
(Foreign Venture Capital Investors) Regulations, 2000
IPO Initial public offering
Issuer/Company The Issuer proposing the initial public offering/further public offering as applicable
Maximum RIB Allottees The maximum number of RIBs who can be Allotted the minimum Bid Lot. This is
computed by dividing the total number of Equity Shares available for Allotment to
RIBs by the minimum Bid Lot.
MICR Magnetic Ink Character Recognition - nine-digit code as appearing on a cheque leaf
Mutual Fund A mutual fund registered with SEBI under the SEBI (Mutual Funds) Regulations, 1996
Mutual Funds Portion 5% of the QIB Category (excluding the Anchor Investor Portion) available for
allocation to Mutual Funds only, being such number of equity shares as disclosed in the
RHP/Prospectus and Bid cum Application Form
NECS National Electronic Clearing Service
NEFT National Electronic Fund Transfer
NRE Account Non-Resident External Account
NRI NRIs from such jurisdictions outside India where it is not unlawful to make an offer or
invitation under the Offer and in relation to whom the RHP/Prospectus constitutes an
invitation to subscribe to or purchase the Equity Shares
NRO Account Non-Resident Ordinary Account
Net Offer The Offer less reservation portion
Non Institutional Bidders or NIBs All Bidders/Applicants, including sub accounts of FIIs registered with SEBI which are
foreign corporates or foreign individuals and FPIs which are Category III foreign
portfolio investors, that are not QIBs or RIBs and who have Bid for Equity Shares for
an amount of more than ₹ 200,000 (but not including NRIs other than Eligible NRIs)
Non-Institutional Category The portion of the Offer being such number of Equity Shares available for allocation to
NIBs on a proportionate basis and as disclosed in the RHP/Prospectus and the Bid cum
Application Form
Non-Resident A person resident outside India, as defined under FEMA and includes Eligible NRIs,
FPIs and FVCIs registered with SEBI
OCB/Overseas Corporate Body A company, partnership, society or other corporate body owned directly or indirectly to
the extent of at least 60% by NRIs including overseas trusts, in which not less than
60% of beneficial interest is irrevocably held by NRIs directly or indirectly and which
was in existence on October 3, 2003 and immediately before such date had taken
benefits under the general permission granted to OCBs under FEMA
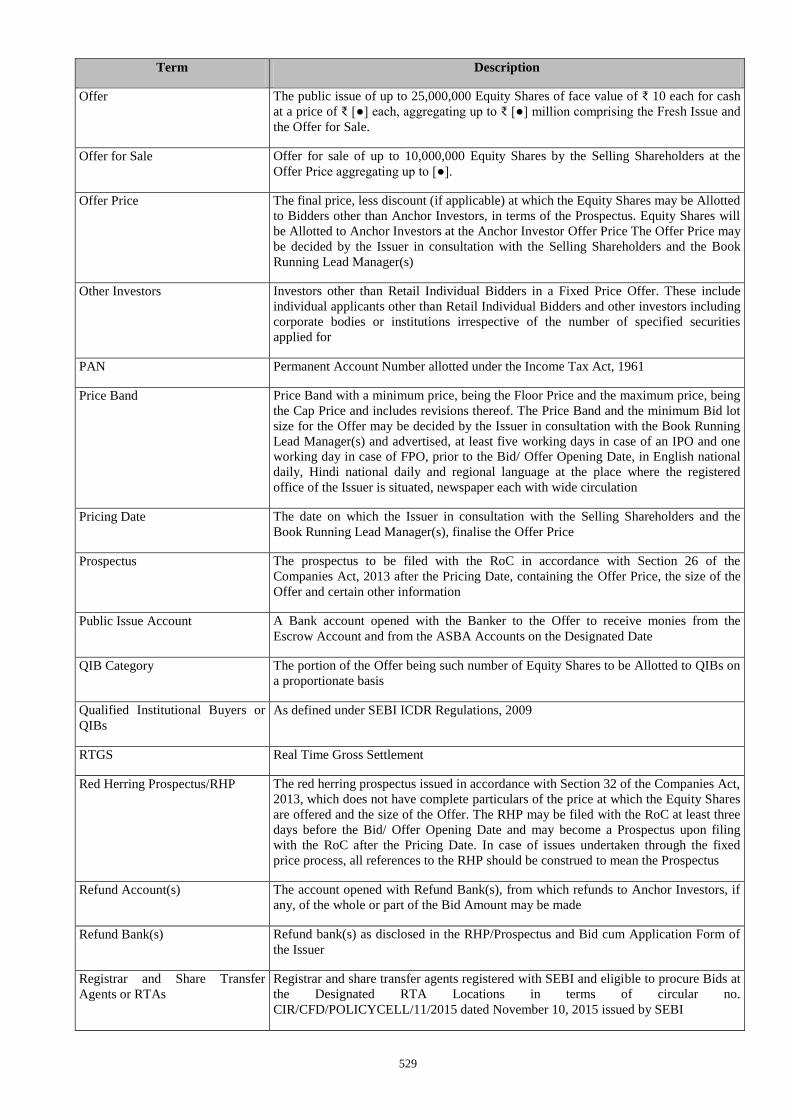
529
Term Description
Offer The public issue of up to 25,000,000 Equity Shares of face value of ₹ 10 each for cash
at a price of ₹ [●] each, aggregating up to ₹ [●] million comprising the Fresh Issue and
the Offer for Sale.
Offer for Sale Offer for sale of up to 10,000,000 Equity Shares by the Selling Shareholders at the
Offer Price aggregating up to [●].
Offer Price The final price, less discount (if applicable) at which the Equity Shares may be Allotted
to Bidders other than Anchor Investors, in terms of the Prospectus. Equity Shares will
be Allotted to Anchor Investors at the Anchor Investor Offer Price The Offer Price may
be decided by the Issuer in consultation with the Selling Shareholders and the Book
Running Lead Manager(s)
Other Investors Investors other than Retail Individual Bidders in a Fixed Price Offer. These include
individual applicants other than Retail Individual Bidders and other investors including
corporate bodies or institutions irrespective of the number of specified securities
applied for
PAN Permanent Account Number allotted under the Income Tax Act, 1961
Price Band Price Band with a minimum price, being the Floor Price and the maximum price, being
the Cap Price and includes revisions thereof. The Price Band and the minimum Bid lot
size for the Offer may be decided by the Issuer in consultation with the Book Running
Lead Manager(s) and advertised, at least five working days in case of an IPO and one
working day in case of FPO, prior to the Bid/ Offer Opening Date, in English national
daily, Hindi national daily and regional language at the place where the registered
office of the Issuer is situated, newspaper each with wide circulation
Pricing Date The date on which the Issuer in consultation with the Selling Shareholders and the
Book Running Lead Manager(s), finalise the Offer Price
Prospectus The prospectus to be filed with the RoC in accordance with Section 26 of the
Companies Act, 2013 after the Pricing Date, containing the Offer Price, the size of the
Offer and certain other information
Public Issue Account A Bank account opened with the Banker to the Offer to receive monies from the
Escrow Account and from the ASBA Accounts on the Designated Date
QIB Category The portion of the Offer being such number of Equity Shares to be Allotted to QIBs on
a proportionate basis
Qualified Institutional Buyers or
QIBs
As defined under SEBI ICDR Regulations, 2009
RTGS Real Time Gross Settlement
Red Herring Prospectus/RHP The red herring prospectus issued in accordance with Section 32 of the Companies Act,
2013, which does not have complete particulars of the price at which the Equity Shares
are offered and the size of the Offer. The RHP may be filed with the RoC at least three
days before the Bid/ Offer Opening Date and may become a Prospectus upon filing
with the RoC after the Pricing Date. In case of issues undertaken through the fixed
price process, all references to the RHP should be construed to mean the Prospectus
Refund Account(s) The account opened with Refund Bank(s), from which refunds to Anchor Investors, if
any, of the whole or part of the Bid Amount may be made
Refund Bank(s) Refund bank(s) as disclosed in the RHP/Prospectus and Bid cum Application Form of
the Issuer
Registrar and Share Transfer
Agents or RTAs
Registrar and share transfer agents registered with SEBI and eligible to procure Bids at
the Designated RTA Locations in terms of circular no.
CIR/CFD/POLICYCELL/11/2015 dated November 10, 2015 issued by SEBI
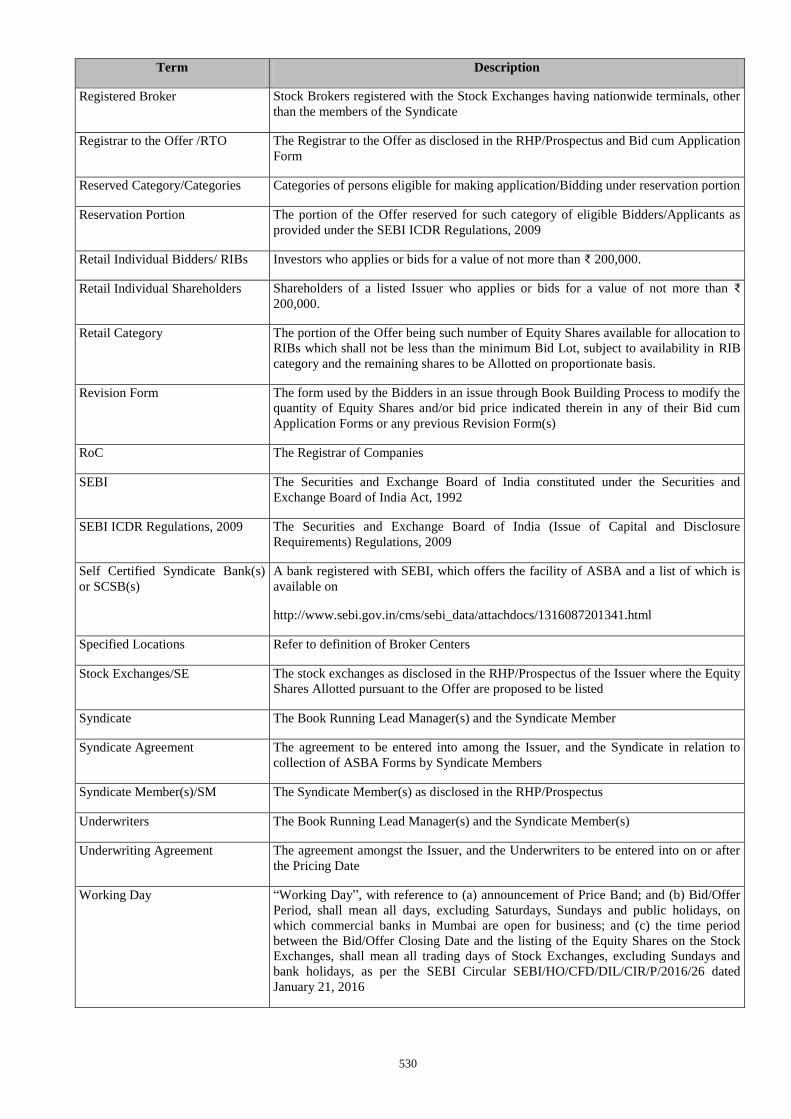
530
Term Description
Registered Broker Stock Brokers registered with the Stock Exchanges having nationwide terminals, other
than the members of the Syndicate
Registrar to the Offer /RTO The Registrar to the Offer as disclosed in the RHP/Prospectus and Bid cum Application
Form
Reserved Category/Categories Categories of persons eligible for making application/Bidding under reservation portion
Reservation Portion The portion of the Offer reserved for such category of eligible Bidders/Applicants as
provided under the SEBI ICDR Regulations, 2009
Retail Individual Bidders/ RIBs Investors who applies or bids for a value of not more than ₹ 200,000.
Retail Individual Shareholders Shareholders of a listed Issuer who applies or bids for a value of not more than ₹
200,000.
Retail Category The portion of the Offer being such number of Equity Shares available for allocation to
RIBs which shall not be less than the minimum Bid Lot, subject to availability in RIB
category and the remaining shares to be Allotted on proportionate basis.
Revision Form The form used by the Bidders in an issue through Book Building Process to modify the
quantity of Equity Shares and/or bid price indicated therein in any of their Bid cum
Application Forms or any previous Revision Form(s)
RoC The Registrar of Companies
SEBI The Securities and Exchange Board of India constituted under the Securities and
Exchange Board of India Act, 1992
SEBI ICDR Regulations, 2009 The Securities and Exchange Board of India (Issue of Capital and Disclosure
Requirements) Regulations, 2009
Self Certified Syndicate Bank(s)
or SCSB(s)
A bank registered with SEBI, which offers the facility of ASBA and a list of which is
available on
http://www.sebi.gov.in/cms/sebi_data/attachdocs/1316087201341.html
Specified Locations Refer to definition of Broker Centers
Stock Exchanges/SE The stock exchanges as disclosed in the RHP/Prospectus of the Issuer where the Equity
Shares Allotted pursuant to the Offer are proposed to be listed
Syndicate The Book Running Lead Manager(s) and the Syndicate Member
Syndicate Agreement The agreement to be entered into among the Issuer, and the Syndicate in relation to
collection of ASBA Forms by Syndicate Members
Syndicate Member(s)/SM The Syndicate Member(s) as disclosed in the RHP/Prospectus
Underwriters The Book Running Lead Manager(s) and the Syndicate Member(s)
Underwriting Agreement The agreement amongst the Issuer, and the Underwriters to be entered into on or after
the Pricing Date
Working Day “Working Day”, with reference to (a) announcement of Price Band; and (b) Bid/Offer
Period, shall mean all days, excluding Saturdays, Sundays and public holidays, on
which commercial banks in Mumbai are open for business; and (c) the time period
between the Bid/Offer Closing Date and the listing of the Equity Shares on the Stock
Exchanges, shall mean all trading days of Stock Exchanges, excluding Sundays and
bank holidays, as per the SEBI Circular SEBI/HO/CFD/DIL/CIR/P/2016/26 dated
January 21, 2016
531
RESTRICTIONS ON FOREIGN OWNERSHIP OF INDIAN SECURITIES
Foreign investment in Indian securities is regulated primarily through the Industrial Policy, 1991 of the Government of India
and FEMA. While the Industrial Policy, 1991 prescribes the limits and the conditions subject to which foreign investment can
be made in different sectors of the Indian economy, FEMA regulates the precise manner in which such investment may be
made. Under the Industrial Policy, unless specifically restricted, foreign investment is freely permitted in all sectors of Indian
economy up to any extent and without any prior approvals, but the foreign investor is required to follow certain prescribed
procedures for making such investment. The government bodies responsible for granting foreign investment approvals are
FIPB and the RBI.
The Government has from time to time made policy pronouncements on foreign direct investment (“FDI”) through press
notes and press releases. The Department of Industrial Policy and Promotion, Ministry of Commerce and Industry,
Government of India (“DIPP”), issued the Consolidated Foreign Direct Investment Policy notified by the DIPP D/o IPP F.
No. 5(1)/2016-FC-1 dated June 7, 2016 effective from June 7, 2016 (the “FDI Policy “), consolidates and supersedes all
previous press notes, press releases and clarifications on FDI issued by the DIPP that were in force and effect as on May 11,
2015. The Government proposes to update the consolidated circular on FDI Policy once every year and therefore, Policy will
be valid until the DIPP issues an updated circular.
The transfer of shares between an Indian resident and a non-resident does not require the prior approval of the FIPB or the
RBI, provided that (i) the activities of the investee company are under the automatic route under the FDI Policy and the
transfer does not attract the provisions of the Takeover Regulations; (ii) the non-resident shareholding is within the sectoral
limits under the FDI policy; and (iii) the pricing is in accordance with the guidelines prescribed by the SEBI/RBI.
As per the existing policy of the Government of India, OCBs cannot participate in the Offer.
The Equity Shares have not been and will not be registered under the Securities Act, or any state securities laws in the United
States, and, unless so registered, may not be offered or sold within the United States, except pursuant to an exemption from,
or in a transaction not subject to, the registration requirements of the Securities Act and applicable state securities laws in the
United States. Accordingly, the Equity Shares are being offered and sold (a) in the United States only to “qualified
institutional buyers” (as defined in Rule 144A under the Securities Act and referred to in this Red Herring Prospectus as
“U.S. QIBs”; for the avoidance of doubt, the term U.S. QIBs does not refer to a category of institutional investor defined
under applicable Indian regulations and referred to in this Red Herring Prospectus as “QIBs”), in reliance on Rule 144A
under the Securities Act or another available exemption from the registration requirements of the Securities Act, and (b)
outside the United States in offshore transactions in compliance with Regulation S under the Securities Act and the applicable
laws of the jurisdiction where those offers and sales occur.
The above information is given for the benefit of the Bidders. Our Company, the GCBRLMs and the BRLM are not liable for
any amendments or modification or changes in applicable laws or regulations, which may occur after the date of this Red
Herring Prospectus. Bidders are advised to make their independent investigations and ensure that the number of Equity
Shares Bid for do not exceed the applicable limits under laws or regulations.
532
SECTION VIII: MAIN PROVISIONS OF ARTICLES OF ASSOCIATION
Capitalised terms used in this section have the meaning that has been given to such terms in the Articles of Association of our
Company. Pursuant to Schedule I of the Companies Act, 2013 and the SEBI Regulations, the main provisions of the Articles
of Association of our Company are detailed below:
The Articles of the Company comprise of three parts, Chapter I, Chapter II and Chapter III, which parts shall, unless the
context otherwise requires, co-exist with each other. Chapter II shall be automatically terminated, deleted and cease to have
any force and effect from the date of listing of shares of the Company on a stock exchange in India subsequent to an initial
public offering of the Equity Shares of the Company without any further action by the Company or by the Members. Chapter
III will terminate in accordance with the terms of Debenture Trust Deed as provided under Article 79 (F).
Chapter I
Authorised Share Capital
Article 5(a) provides that “The Authorised Share Capital of the Company is as mentioned in Clause V of the Memorandum of
Association of the Company.”
Article 5(b) provides that “The Paid up Share Capital shall be at all times a minimum of such amount as may be prescribed
under the Act.”
Article 5(c) provides that “The Company has the power to increase its authorised or issued Paid up Share Capital.”
Article 5(d) provides that “The Share Capital of the Company may be classified into Equity Shares with differential rights as
to dividend, voting or otherwise in accordance with the applicable provisions of the Act, Rules, and Law, from time to time.”
Article 5(e) provides that “Subject to Article 5(d), all Equity Shares shall be of the same class and shall be alike in all respects
and the holders thereof shall be entitled to identical rights and privileges including without limitation to identical rights and
privileges with respect to dividends, voting rights, and distribution of assets in the event of voluntary or involuntary
liquidation, dissolution or winding up of the Company.”
Article 5(f) provides that “The Board may also have the power to allot and issue shares of the Company as payment or part
payment for any property purchased by the Company or in respect of goods sold or transferred or machinery or appliances
supplied or for services rendered to the Company in or about the acquisition and/or in the conduct of its business or for any
goodwill provided to the Company; and any shares which may be so allotted may be issued as fully/partly paid up shares and
if so issued shall be deemed as fully/partly paid up shares. However, the aforesaid shall be subject to the approval of
Members under the relevant provisions of the Act and Rules.”
Increase, reduction and alteration in capital
Article 19(a) provides that “Subject to these Articles and Section 61 of the Act, the Company may, by Ordinary Resolution in
General Meeting from time to time, alter the conditions of its Memorandum as follows, that is to say;
(a) it may increase its Share Capital by such amount as it thinks expedient;
(b) consolidate and divide all or any of its Share Capital into shares of a larger amount than its existing shares:
Provided that no consolidation and division which results in changes in the voting percentage of shareholders shall
take effect unless it is approved by the Tribunal on an application made in the prescribed manner;
(c) convert all or any of its fully paid-up shares into stock, and reconvert that stock into fully paid-up shares of any
denomination;
(d) sub-divide its shares, or any of them, into shares of smaller amount than is fixed by the memorandum, so, however,
that in the sub-division the proportion between the amount paid and the amount, if any, unpaid on each reduced
share shall be the same as it was in the case of the share from which the reduced share is derived; and
(e) cancel shares which, at the date of the passing of the resolution in that behalf, have not been taken or agreed to be
taken by any person, and diminish the amount of its share capital by the amount of the shares so cancelled. Such
cancellation of shares shall not be deemed to be a reduction of Share Capital.”
Article 19(b) provides that “The Company may, subject to the applicable provisions of the Act, from time to time, reduce its
Capital, any capital redemption reserve account and the securities premium account in any manner for the time being
authorized by Law. This Article is not to derogate any power the Company would have under Law, if it were omitted.”
533
Payment of commission and brokerage
Article 12(a) provides that “Subject to the applicable provisions of the Act, the Company may at any time pay a commission
to any person in consideration of his subscribing or agreeing to subscribe or procuring or agreeing to procure subscription,
(whether absolutely or conditionally), for any shares or Debentures in the Company in accordance with the provisions of the
Act.”
Article 12(b) also provides that “The Company may also, on any issue of shares or Debentures, pay such brokerage as may be
lawful.”
Calls
Article 15(a) provides that “Subject to the provisions of Section 49 of the Act, the Board may, from time to time, subject to
the terms on which any shares may have been issued and subject to the conditions of allotment, by a resolution passed at a
meeting of the Board, (and not by circular resolution), make such call as it thinks fit upon the Members / security holder in
respect of any monies unpaid on the securities held by them respectively and each Member shall pay the amount of every call
so made on him to the Person or Persons and Members and at the times and places appointed by the Board. A call may be
made payable by installments.”
Article 15(b) provides that “The joint holder of a share shall be jointly and severally liable to pay all instalments and calls due
in respect thereof.”
Article 15(c) provides that “The Board may, from time to time at its discretion, extend the time fixed for the payment of any
call and may extend such time as to all or any of the Member whom owing to their residence at a distance or other cause the
Board may deem fairly entitled to such extension; but no Member shall be entitled to such extension save as a matter of grace
and favour.”
Articles 15(d) provides that “No call shall exceed one-fourth of the nominal amount of share, or be made payable within one
month after the last preceding call was payable; and
Articles 15(d)(i) provides that “If the sum payable in respect of any call or instalment be not paid on or before the day
appointed for payment thereof, the holder for the time being in respect of the share for which the call shall-have been made or
the instalment shall be due, shall pay interest for the same at the rate of 12 percent interest per annum, from the day appointed
for the payment thereof to the time of the actual payment or at such lower rate (if any) as the Board may determine.”
Articles 15(d)(ii) provide that “The Board shall be at liberty to waive payment of any such interest either wholly or in part.”
Article 15(e) provides that “If by the terms of any share or otherwise any amount is made payable upon allotment or at any
fixed time, or by investments at fixed time or whether on account of the amount of the share or by way of premium, every
such amount or installment, shall be payable as if it were a call duly made by the Board end of which due notice had been
given, and all the provisions herein contained in respect of calls shall relate to amount or installment accordingly.”
Article 15(g) provides that “The Board may, if it thinks fit (subject to the provisions of the Act) agree to and receive from any
Member willing to advance the same, the whole or any part of the money due upon the shares held by him beyond the sums
actually called up, and upon the amount so paid or satisfied in advance or so much thereof as from time to time and at any
time thereafter as exceeds the amount of the calls then made upon and due in respect of the shares in respect of which such
advance has been made, the Company may pay interest, as the Member paying such sum in advance and the Board agree
upon, provided that the money paid in advance of calls shall not confer a right to participate in profits or dividend. The
Directors may at any time repay the amount so advanced. However, no member shall be entitled to voting rights in respect of
the money(ies) so paid by him until the same would but for such payment, become presently payable.”
Article 15(h) provides that “A call may be revoked or postponed at the discretion of the Board and the provisions of these
Articles shall mutatis mutandis apply to the calls on Debentures of the Company.”
Forfeiture, surrender and lien
Article 16(a)(i) provides that
(i) “If any member fails to pay any call or instalment of a call on or before the day appointed for the payment of the
same, the Board may, at any time & thereafter during such time as the call or instalment remains unpaid serve a
notice on such member requiring him to pay the same, together with any interest that may have accrued and all
expenses that may have been accrued / and all expenses that may have been incurred by the Company for the reason
of such non-payment.”
(ii) The notice shall name a day and a place or places on and at which such call or installment and such Interest and
expenses as aforesaid are to be paid. The notice shall also state that in the event of non payment at or before the time
534
and at the place appointed the shares in respect of which such call was made or installments is payable will be liable
to be forfeited. If notice is not complied with shares may be forfeited.
(iii) If the requirements of any such notice as aforesaid, be not complied with any shares in respect of which such notice
has been given may, at any time thereafter, before payment of all calls or installments, interest and expenses due in
respect thereof, be forfeited by a resolution of the Board to that effect.”
Article 16(c) provides that “Any share so forfeited shall be deemed to be the property of the Company and the Board may
sell, re-allot or otherwise dispose of the same in such manner as it thinks fit and the certificate or certificates originally issued
in respect of the relevant shares shall, (unless the same shall on demand by the Company have been previously surrendered to
it by the defaulting Member), stand cancelled and become null and void and of no effect and the Board shall be entitled to
issue a new certificate or certificates in respect of the said shares to any person or persons entitled thereto.”
Article 16(e) provides that “A person whose share has been forfeited shall cease to be a member in respect of the share
forfeited but shall, notwithstanding the forfeiture, remain liable to pay to the Company all monies which, at the date of
forfeiture, were payable by him to the company in respect of such shares.”
Articles 16(g) provides that “The provisions of forfeiture to apply to non- payment of any sum which by the terms of issue of
a share, becomes payable at a fixed time whether on account of the nominal value of a share or by way of premium as if the
same had been payable by virtue of a call duly made and notified.”
Article 17(a) provides that “The Company shall have a first and paramount lien upon every share not being a fully paid up
share registered in the name of each member (whether solely or jointly with others), and upon the proceeds of sale thereof for
moneys called off payable at a fixed time in respect of such share whether the time for the payment thereof shall have actually
arrived or not and no equitable interest in any share shall be created except upon the footing and condition that this Article is
to have fully effect. Such lien shall extend to all dividends from time to time declared in respect of such shares subject to
Section 205A of the Companies Act, 1956 or Section 124 of the Companies Act, 2013, as may be applicable. Unless
otherwise agreed the registration of a transfer of shares shall operate as a waiver of the company’s lien if any on such notice.”
Articles 17(b) provides that “For the purpose of enforcing such lien, the Board may sell the shares subject thereto in such
manner as it think fit, but no sale shall be made until such time for payment as aforesaid shall have arrived and until notice in
writing of the intention to sell have been served on such member, his executor or administrations or his payment of the
moneys called or payable at a fixed time in respect such shares for thirty days after the date of such notice.”
Articles 17(d) provides that “Upon any sale after forfeiture or of enforcing a lien in purported exercise of the powers herein
before given the Board may appoint some person to execute an instrument of transfer of the share sold and cause the
purchaser’s name to be entered in the Register in respect of the shares sold and the purchaser shall not be bound to see to the
regularity of the proceedings, nor to the application of the purchase money, and after his name has been entered in the
Register in respect of such share the validity of the sale shall not be impeached by any person, aggrieved by the sale shall be
in damages only and against the Company exclusively.”
Article 17(f) provides that “The Company shall have a first and paramount lien:
(a) on every Debenture (not being a fully paid Debenture), for all money (whether presently payable or not) called, or
payable at a fixed time, in respect of that Debenture;
(b) on all Debentures (not being fully paid Debentures) standing registered in the name of a single person, for all money
presently payable by him or his estate to the Company; and
(c) the Board may, at any time, declare any Debentures wholly or in part to be exempt from the provisions of this
Article.
The Company’s lien, if any, on the Debentures, shall extend to all interest and premium payable in respect of such
Debentures.
Unless otherwise agreed, the registration of a transfer of Debentures shall operate as a waiver of the Company’s lien, if any,
on such Debentures and the fully paid up Debentures shall be free from all lien and that in case of partly paid Debentures, the
Company’s lien shall be restricted to money called or payable at a fixed price in respect of such Debentures.”
For the purpose of enforcing such lien, the Board may sell the Debentures, subject thereto in such manner as they shall think
fit, and for that purpose may cause to be issued a duplicate certificate in respect of such Debentures and may authorize the
debenture trustee acting as trustee for the holders of Debentures or one of the holder of Debentures to execute and register the
transfer thereof on behalf of and in the name of any purchaser. The purchaser shall not be bound to see to the application of
the purchase money, nor shall his title to the Debentures be affected by any irregularity or invalidity in the proceedings in
reference to the sale.
535
Provided no sale shall be made:
(a) unless a sum in respect of which the lien exists is presently payable; or
(b) until the expiration of 14 days after a notice in writing stating and demanding payment of such part of the amount in
respect of which the lien exists as is presently payable, has been given to the registered holder for the time being of
the Debenture or the person entitled thereto by reason of his death or insolvency.
The net proceeds of any such sale shall be received by the Company and applied in payment of such part of the
amount in respect of which the lien exists as is presently payable. The residue, if any, shall (subject to a like lien for
sums not presently payable as existed upon the Debentures before the sale) be paid to the Person entitled to the
Debentures at the date of the sale.
No holder of Debentures shall exercise any voting right in respect of any Debentures registered in his name on which any
calls or other sums presently payable by him have not been paid, or in regard to which the Company has exercised any right
of lien.”
Transfer and transmission of shares
Article 18(c) provides that “Every such instrument of transfer shall be executed by both, the transferor and the transferee and
attested and the transferor shall be deemed to remain the holder of such share until the name of the transferee shall have been
entered in the Register of Members in respect thereof.”
Article 18(e) provides that “Subject to the provisions of Sections 58 and 59 of the Act, these Articles and other applicable
provisions of the Act or any other Law for the time being in force, the Board may, refuse to register the transfer of, or the
transmission by operation of law of the right to, any securities or interest of a Member in the Company and shall promptly
communicate the same to the transferee and transferor or to the person giving notice of such transmission, as the case may be,
giving reasons for such refusal.
Provided that, registration of a transfer shall not be refused on the ground of the transferor being either alone or jointly with
any other Person or Persons indebted to the Company on any account whatsoever except where the Company has a lien on
shares.”
Article 18(h) provides that “In case of the death of any one or more Members named in the Register of Members as the joint-
holders of any shares, the survivors shall be the only Member or Members recognized by the Company as having any title to
or interest in such shares, but nothing therein contained shall be taken to release the estate of a deceased joint-holder from any
liability on shares held by him jointly with any other Person.”
Article 18(l) provides that “A Person becoming entitled to a share by reason of the death or insolvency of a Member shall be
entitled to the same Dividends and other advantages to which he would be entitled if he were the registered holder of the
shares, except that he shall not, before being registered as a Member in respect of the shares, be entitled to exercise any right
conferred by membership in relation to meetings of the Company.
Provided that the Directors shall, at any time, give notice requiring any such Person to elect either to be registered himself or
to transfer the shares, and if such notice is not complied with within 90 (ninety) days, the Directors may thereafter withhold
payment of all Dividends, bonuses or other monies payable in respect of the shares until the requirements of the notice have
been complied with.”
Article 18(n) provides that “Before the registration of a transfer, the certificate or certificates of the share or shares to be
transferred must be delivered to the Company along with a properly stamped and executed instrument of transfer in
accordance with the provisions of Section 56 of the Act.”
Article 18(q) provides that “There shall be a common form of transfer in accordance with the Act and Rules.”
Borrowing Powers
Article 25(a) provides that “Subject to the provisions of Sections 73, 179 and 180, and other applicable provisions of the Act
and these Articles, the Board may, from time to time, at its discretion by resolution passed at the meeting of a Board, raise or
borrow either from the Directors or from elsewhere any sum or sums on such terms and conditions as it may think best in the
interest of the company or may secure the payment thereof in such manner as it thinks fit, and in particular by the issue of
bonds, perpetual or redeemable debentures or debenture-stock, or any mortgage, or other tangible security of the undertaking
of the whole or any part of the Company (both present and future) but shall not create a charge on its capital for the time
being without the sanction of the Company in the General Meeting. Provided that the Board shall not, without the sanction of
the Company in General Meeting borrow any sum of money which together with money already borrowed by the Company
(apart from temporary loans obtained from the Company’s bankers in the ordinary course of business) will exceed the
536
aggregate for the time being of the paid-up capital of the Company and its free reserves, that is to say, reserves not set aside
for any specific purpose.”
Article 25(b) provides that “Any debentures, debenture-stock, bonds or other securities may be issued at a discount, premium
or otherwise and with any special privileges to redemption, surrender, drawings, allotment of shares, appointment of
Directors and otherwise, debentures, debenture-stock, bonds and other securities may be made assignable free from any
equities between the Company and the person to whom the same may be issued.”
Convening General Meetings
Article 27(b) provides that “No business shall be transacted at any General Meeting unless a quorum of members is present at
the time when the meeting proceeds to business. The quorum for the Members’ Meeting shall be in accordance with Section
103 of the Act.”
Votes of Members
Article 27(l) provides that “Save as hereinafter provided, on a show of hands every member present in person and being a
holder of an equity share shall have one vote and every member present either as a General proxy on behalf of a holder of
equity shares if he is not entitled to vote in his own right or as a duly authorized representative of a body corporate, being a
holder of equity shares, shall have one vote.
(i) Save as hereinafter provided on a poll the voting rights of a holder of Equity Shares shall be as specified in Section
47 of the Act.
(ii) The holders of Preference Shares shall have a right to vote on a resolution placed before the Company which directly
effects the rights attached to such preference shares and subject as aforesaid the holders of preference shares shall in
respect of such capital be entitled to vote on every resolution placed before the Company at a meeting if the dividend
due on such capital or any part of such dividend remains unpaid in respect of an aggregate period of not less than
two years preceding the date of commencement of the meeting and where the holders of an preference share have a
right to vote as aforesaid on any resolution every such member personally present shall have one vote and on a poll
his voting right in respect of such preference shares to the total of the capital paid up on the preference shares.
Provided that no body corporate shall vote by proxy so long as resolution of its Board of Directors under the
provisions of Section 113 of the Act is in force and the representative named in such resolution is present at the
Meeting at which the vote by proxy is rendered.
(iii) Any Person entitled to transfer any shares of the Company may vote at any General Meeting in respect thereof in the
same manner as if he were the registered holder of such shares, provided that forty-eight hours at least before the
time of holding the meeting or adjourned meeting, as the case may be, at which he proposes to vote, he shall satisfy
the Board of his right to such shares and give such indemnity (if any) as the Board may require unless the Board
shall have previously admitted his right to vote at such meeting in respect thereof.
(iv) A vote given in accordance with the terms of an instrument of proxy shall be valid notwithstanding the previous
death of the principal, or revocation of the proxy or of any power of attorney under which such proxy was signed, or
the transfer of the Share in respect of which the vote is given, provided that no intimation in writing of the death,
revocation or transfer shall have been received at the Office before the meeting.
(v) No objection shall be made to the validity of any vote, except at the Meeting or poll at which such vote shall be
tendered, and every vote whether given personally or by proxy, not disallowed at such meeting or poll shall be
deemed valid for all purposes of such meeting or poll whatsoever.
(vi) The Chairman of any meeting shall be the sole judge of the validity of every vote tendered at such meeting. The
Chairman present at the taking of a poll shall be the sole judge of the validity of every vote tendered at such poll.
The minutes of all proceedings of every General Meeting shall be prepared, entered, signed, kept and maintained in
such manner, within such time and at such place as may be required under the Act. The book containing the Minutes
of proceedings of General Meetings shall be open, during business hours, for such periods not being less in the
aggregate than two hours in each day as the Board determines, for the inspection of any Member without charge.
Article 27(p) provides that “the Company shall also provide e-voting facility to the Members of the Company in terms of the
provisions of the Act, the SEBI Listing Regulations or any other Law, if applicable to the Company.”
Article 27 (g) provides that “Every question submitted to a meeting shall be decided, in the first instance by a show of hands
and in the case of equality of votes, both on a show of hands and on a poll, the Chairman of the meeting shall have a casting
vote in addition to votes to which he may be entitled to as a member.”
537
Article 27(i) (iv) provides that “The demand for a poll shall not prevent the continuance of a meeting for the transaction of
any business other than the question on which a poll has been demanded.”
Proxies
Article 27(t) provides that “Votes may be given either personally, or in the case of a body corporate, by a representative duly
authorized as aforesaid or in case of a Poll by proxy.”
Article 27 (t)(i) provides that “The instrument appointing a proxy (general or special) shall be in writing under the hands of
the appointer or of his Attorney duly authorized in writing and in such form as may be prescribed under the Act or as near
thereto as possible or in any other form which the Board may accept or if such appointer is a body corporate be under its
common seal or the hand of its Office or Attorney duly authorized. A proxy who is appointed for a specified meeting shall be
called a Special Proxy. Any other proxy shall be called a general Proxy.”
Article 27(t)(ii) provides that “The instrument appointing a proxy and the Power of Attorney or other authority (if any) under
which it is signed or a notarially certified copy of that power or authority shall be deposited at the Office not less than forty-
eight hours before the time for holding the meeting at which the person named in the instrument purports to vote in respect
thereof and in default the instrument of proxy shall not be treated as valid.”
Article 27(t)(iii) provides that “A vote given in accordance with the terms of an instrument appointing a proxy shall be valid
notwithstanding the previous death or insanity of the principal or revocation of the instrument, or transfer of the share in
respect of which the vote is given, provided no intimation in writing of the death, insanity, revocation or transfer of the share
shall have been received by the Company at the Office before the vote is given. Provided nevertheless that the Chairman of
any meeting shall be entitled to require such evidence as he may in his discretion think fit of the due execution of an
instrument of proxy and that the same has not been revoked.”
Directors
Article 28(i) provides that “subject to the applicable provisions of the Act, the number of Directors of the Company shall not
be less than 3 (three) and not more than 12 (twelve). The Company shall also comply with the provisions of the Act and the
provisions of the Listing Regulations. The Board shall have an optimum combination of executive, non-executive, women,
resident and Independent Directors, as may be prescribed by the Act or any other applicable Law for the time being in force.
The following shall be the first Directors of the Company
(a) Shri Chuni Lal Jaipuria
(b) Shri Ravi Kant Jaipuria
(c) Smt. Dhara Jaipuria.”
Article 28(vii)(b) provides that “Subject to the applicable provisions of the Act, a Director (other than a Managing Director or
an executive Director) may receive a sitting fee not exceeding such sum as may be prescribed by the Act or the Central
Government from time to time for each meeting of the Board or any Committee thereof attended by him.”
Article 28(viii) provides that “If any Director, being willing shall be called upon to perform extra services or to make any
special exertions for any of the purposes of the company as a member of the committee of the Board then, subject to Sections
197 of the Act, the Board may remunerate the Director so doing either by a fixed sum or by a percentage of profits or
otherwise and such remuneration may be either in addition to or in substitution for any other remuneration to which he may
be entitled.”
Article 33 provides that “Subject to Section 161 of the Act, any Director (hereinafter called the “Original Director”) shall be
entitled to nominate an alternate director (subject to such person being acceptable to the Chairman) (the “Alternate
Director”) to act for him during his absence for a period of not less than 3 (three) months from India. The Board may appoint
such a person as an Alternate Director to act for a Director during the Original Director’s absence for a period of not less than
three months from India. An Alternate Director appointed under this Article shall not hold office for a period longer than that
permissible to the Original Director in whose place he has been appointed and shall vacate office if and when the Original
Director returns to the State. If the term of the office of the Original Director is determined before he so returns to the State,
any provisions in the Act or in these Articles for automatic re-appointment shall apply to the Original Director and not to the
Alternate Director.”
Key Managerial Personnel/Managing Director/Whole-Time Director
Article 38 provides that “Notwithstanding anything contained herein, Managing Director(s) / whole time director(s) /
executive director(s) / manager shall be subject to the same provisions as to resignation and removal as the other Directors of
538
the Company, and if he ceases to hold the office of a Director he shall ipso facto and immediately cease to be Managing
Director(s) / whole time director(s) / executive director(s) / manager.”
Article 39 provides that “Subject to the superintendence, control and direction of the Board, the day-to-day management of
the Company shall be in the hands of the Managing Director(s)/ whole time director(s) / executive director(s)/ manager(s) in
the manner as deemed fit by the Board and subject to the applicable provisions of the Act, and these Articles.”
Proceedings of the Board
Article 35(iii) provides that “Such number of Directors as may be prescribed under the Act, shall constitute a quorum. If any
duly convened Board Meeting cannot be held for want of a quorum, then such a meeting shall automatically stand adjourned
for such day and time as may be prescribed under the Act or agreed to by all the Directors in accordance with the provisions
of the Act.
If the quorum is not available at such an adjourned meeting, the Directors present shall constitute the quorum and may
transact business for which the meeting has been called.”
Article 27(g) provides that “Every question submitted to a meeting shall be decided, in the first instance by a show of hands
and in the case of equality of votes, both on a show of hands and on a poll, the Chairman of the meeting shall have a casting
vote in addition to votes to which he may be entitled to as a member.”
Article 35(vi) provides that “A resolution may be passed by the Board or by a Committee thereof by circulation, unless
prohibited by the Act, in such manner as may be prescribed under the applicable provisions of the Act.”
Dividends
Article 54(b) provides that “Subject to the provisions of the Act the Company in General Meeting may declare Dividends, to
be paid to Members according to their respective rights and interests in the profits. No Dividends shall exceed the amount
recommended by the Board, but the Company in General Meeting may, declare a smaller Dividend, and may fix the time for
payments as per the applicable provisions of the Act.
(i) No Dividend shall be declared or paid except in accordance with the provisions of the Act.
(ii) The declaration of the Board as to the amount of the net profits shall be conclusive.”
Article 54(c) provides that “The Board may, from time to time, pay to the Members such interim Dividend as in their
judgment the position of the Company justifies.”
Article 48 provides that “The Board may from time to time before recommending any dividend set apart any such portion of
the profit of the Company as it thinks fit as reserves to meet contingencies or for the liquidations of the debentures, debts or
other liabilities of the Company, for equalization of dividends for repairing, improving or maintaining any of the property of
the Company and such other purposes of the Company as the Board in its absolute discretion thinks conducive to the interest
of the Company and may subject to the provisions of Section 186 of the Act, invest the several sums so set aside upto such
investments (other than shares of the Company) as it may think fit, and from time to time deal with and vary such investments
and dispose of all or any part thereof for the benefit of the Company, and may divide the Reserve into such special funds as
the Board thinks fit, with full power to employ the Reserve or any part thereof in the business of the Company and that
without being bound to keep the same separate from other assets.”
Article 54(a) provides that “The profits of the Company, subject to any special rights relating thereto being created or
authorised to be created by the Memorandum or these Articles and subject to the provisions of these Articles shall be divisible
among the Members in proportion to the amount of Capital Paid-up or credited as Paid-up and to the period during the year
for which the Capital is Paid-up on the shares held by them respectively. Provided always that, (subject as aforesaid), any
Capital Paid-up on a Share during the period in respect of which a Dividend is declared, shall unless the Directors otherwise
determine, only entitle the holder of such Share to an apportioned amount of such Dividend as from the date of payment.”
Article 54(d)(ii) provides that “No amount paid or credited as paid on shares in advance of calls shall be treated for the
purpose of this regulation as paid on shares.”
Article 54(d)(iii) provides that “all Dividends shall be apportioned and paid proportionately to the amounts paid or credited as
paid on the shares during any portion or portions of the period in respect of which the Dividend is paid, but if any shares are
issued on terms providing that it shall rank for Dividend as from a particular date such shares shall rank for Dividend
accordingly.”
539
Capitalisation of Reserves
Article 50 provides that “any general meeting may resolve that any moneys, investments of other assets forming part of the
undivided profits of the Company standing to the credit of the Reserves, or any Capital Redemption Reserve Account, or in
the hands of the Company and available for dividend or representing premiums received on the issue of shares and standing
to the credit of the Share Premium Account be entitled and distributed amongst such of the Members as would be entitled to
receive the same if distributed by way of dividend and in the same proportions on the footing that they become entitled
thereto as capital and that all or any part of such capitalized fund be applied on behalf of such Members in paying up in full
unissued shares, of the Company which shall be distributed accordingly or in or towards payment of the uncalled liability or
any issued shares, and that such distribution or payment shall be accepted by such Members in full satisfaction of their
interest in the said capitalized sum and any sum standing to the credit of a share Premium Account are Capital Redemption
Reserve Account may, for the purpose of this Article only be applied in the paying of unissued share to be issued to members
of Company as fully paid bonus shares.”
Winding up
Article 62 provides that
(a) “If the company shall be wound up, the Liquidator may, with the sanction of a special Resolution of the company
and any other sanction required by the Act divide amongst the Members, in specie or kind the whole or any part of
the assets of the company, whether they shall consist of property of the same kind or not.
(b) For the purpose aforesaid, the Liquidator may set such value as he deems fair upon any property to be divided as
aforesaid and may determine how such division shall be carried out as between the Members or different classes of
Members.”
Indemnity
Article 63 provides that “Subject to the provisions of Section 197 of the Act, every Director, Manager and other officer or
employee of the company shall be indemnified by the company against any liability incurred by him and it shall be the duty
of the Directors to pay out the funds of the company all costs, losses and expenses which any director, Manager, officer or
employee may incur or become liable to by reason of any contact entered into by him on behalf of the company or in any way
in the discharge of his duties and in particular, and so as not to limit the generality of the foregoing provisions against all
liabilities incurred by him as such Director, Manager, Officer or employee in defending any proceedings Whether civil or
criminal in which judgment is given in his favour or he is acquitted or in connection with any application under section 463 of
the Act in which relief is granted by the court and the amount for which such indemnity is provided shall immediately attach
as a lien on the property of the company and have priority as between the Members over all the claims.”
540
Chapter II
Definitions
65
Any expressions used but not defined in this Chapter but defined in the Agreement, shall have the meaning ascribed to it
therein. In this Chapter, and unless the context requires otherwise, the following words and expressions, when beginning with
capital letter, shall have the following meanings:
“Agreed Return” shall have the meaning ascribed to it in clause 1.1 (Definitions) of the Agreement;
“Investor” means Standard Chartered Private Equity Mauritius II Limited, a corporation incorporated with limited liability
under the laws of Republic of Mauritius, with its registered office at C/o Abax Corporate Services Ltd, 6th Floor, Tower A, 1
Cybercity, Ebene Mauritius;
“Investor 2” means AION Investments II Singapore Pte. Ltd., a corporation incorporated with limited liability under the laws
of Singapore, with its principal office at 61 Robinson Road, 11th Floor Suite, 1 Robinson Centre, Singapore 068893 (which
expression shall, unless it be repugnant to the context or meaning there of, be deemed to mean and include its successors and
permitted assigns/ transferees); “Investors” means both, the Investor and the Investor 2;
“Promoters” means RJ Corp Limited, Ravi Kant Jaipuria & Sons (HUF) and Varun Jaipuria;
“Reserved Matters” means the following matters:
(a) The commencement of a new business line that requires an investment by the Company, of an amount in excess of ₹
100 Crore. For the avoidance of doubt it is clarified that new business line excludes any existing business of the
Company or its subsidiaries.
(b) Capital expenditure/investments, across the Company, its subsidiaries and joint ventures, if the cumulative new
capital expenditure / investment exceeds the amount of gross block in the immediate preceding Financial Year of the
Company for which the certificate from a Chartered Accountant is available.
(c) Incurrence of Indebtedness that results in the Total debt/Equity ratio of the Company and Subsidiaries on a
consolidated basis, exceeding 2x.
(d) Any recapitalization or dissolution, winding-up or liquidation of the Company or any of its Subsidiaries.
(e) Making dividend payments (except making dividend payments from wholly owned subsidiaries to the Company) or
buyback of shares.
(f) Merger, amalgamation or consolidation, including joint ventures, of the Company or any Subsidiary with any other
entity (i.e. other than with Company and its wholly owned subsidiary(ies)).
(g) Amendment in the memorandum and articles of the Company or memorandum or articles of association of any
Subsidiary that would have an adverse effect on the rights of the Investor under the Agreement.
(h) Any material change in accounting policy or changing the joint/statutory auditors of the Company or its Subsidiaries
except when the incoming auditors are one of the auditors mentioned in Clause 14.7 of the Agreement.
(i) Causing or permitting the Company or any Subsidiary to cease carrying on a material part of its business and selling
off / disposing off the whole or any material part of the assets of the Company and its Subsidiaries. However, if such
cessation/sale is in a manner such that the business remains within the Group and such action does not adversely
impact the rights of the Investor under the Agreement in any adverse manner, then the same would not be a Reserved
Matter.
(j) Any arrangements, contracts or agreements with any Connected Person or Concern or any Affiliates. This shall not
include the existing arrangements, contracts or agreements, the sum of which does not exceed 6% (six percent) of the
consolidated turnover of the Company and the Subsidiaries, so long as these continue/get renewed on an arm’s
length basis and are disclosed to the Board on quarterly basis.
(k) Any commitment or agreement to do any of the foregoing.
Number of Directors
Article 66(a) provides that “The Board of the Company shall at all times comprise a maximum of 12 (twelve) directors of
whom the Investor shall be entitled to appoint and maintain in office 1(one) non retiring director (and to remove from office
541
any director so appointed and to appoint another in place of the director so removed) (“Investor Director”). For the sake of
clarity, the Promoters shall have the right to appoint (remove or replace in office) a majority of directors on the Board.”
Investor Nominee Director
Article 66(b) provides that “To the extent permissible by Law, the appointment of the Investor Director shall be by direct
nomination by the Investor and any appointment or removal under this Article shall, unless the contrary intention appears,
take effect from the date it is notified to the Company in writing. If the Law does not permit the Person nominated by the
Investor to be appointed as a director of the Company merely by nomination by the Investor, the Company shall, (and the
Promoters shall exercise their voting rights in the Company to) ensure that the Board forthwith (and in any event within
7(seven) Business Days of such nomination or at its next Board meeting, whichever is earlier) appoints such Person as a
director of the Company and further that, unless the Investor changes or withdraws such nomination, such Person is also
elected as a director of the Company at the next general meeting of the shareholders of the Company, provided that, neither
the Company nor the Promoters will have any obligation under the Agreement or these Articles to procure the appointment of
the person nominated by the Investor, if such person is prohibited from appointment to the office of a director under
applicable Laws.”
Alternate Director
Article 66(f) provides that “The Investor shall be entitled, from time to time, to nominate a Person to be appointed as the
alternate director to its Investor Director; and each of the Company and the Promoters shall exercise all their respective rights
and powers and shall take all requisite actions within their power to ensure that such Person is appointed forth with as the
Investor Director’s alternate director.”
Proceedings of the Board of Directors
Meeting of Directors, Agenda and Place of Board Meetings
Article 67 provides, “Meetings of the Board of the Company shall be held pursuant to a notice of at least 7(seven) days unless
in any particular case a majority of the directors, including the Investor Director, agree otherwise. However, in case the
agenda for such meeting includes (i) a Reserved Matter relating to the Company, the meeting of the Board of the Company
shall be held pursuant to a notice of 14 (fourteen) days; and (ii) a Subsidiary Reserved Matter, the meeting of the Board shall
be held pursuant to a notice of 7(seven) days; unless in any particular case a majority of the directors, including the Investor
Director, agree otherwise. The agenda for each Board meeting of the Company and all papers connected therewith and/or
proposed to be placed or tabled before the Board of the Company shall be circulated together with the notice for such meeting
and, no items save and except those specified in the agenda may be discussed at any Board meeting of the Company unless a
majority of the Directors (which majority shall include the Investor Director in case such matter is a Reserved Matter) agree
otherwise.”
Investor Approval
Article 68 provides that “The Company and the Promoters shall procure and ensure that no action or decision relating to any
of the Reserved Matters shall be taken by the Company or any of its Subsidiaries (whether by the Board, any committee, the
shareholders of the Company or any of its employees, officers or managers) unless the Investor’s Consent is obtained for such
action or decision. Such decision shall be rendered in the manner set out in Clause 11.2 of the Agreement.”
Inconsistency
Article 78 provides that “In the event of any inconsistency between (y) the provisions of this Chapter II on the one hand; and
(z) the provisions of Chapter I on the other hand, then the provisions of this Chapter II shall prevail. However, in case of any
inconsistency between (yy) the provisions of this Chapter II on the one hand and (zz) rights of PepsiCo under the PepsiCo
Agreement, the provisions of the PepsiCo Agreement will prevail.”
542
Chapter III
Debenture Trustee’s rights
79
(A) Pursuant to the terms of the Debenture Trust Deed dated September 17, 2015 (“Debenture Trust Deed”) executed
between the Company and Axis Trustee Services Limited, a company incorporated under the Companies Act, 1956
and having its registered office at Axis House, 2nd Floor, Bombay Dyeing Mills Compound, Pandurang Budhkar
Marg, Worli, Mumbai 400 025 (“Debenture Trustee”), the Company shall appoint 1 individual nominated by the
Debenture Trustee (acting in accordance with the Approved Instructions (as defined in clause 1.1 (Definitions) of the
Debenture Trust Deed)) as a non-retiring director (“Trustee’s Director”) on the Board and on all committees of the
Board. The Company shall also appoint any alternate director(s) to Trustee’s Director nominated by the Debenture
Trustee (acting in accordance with the Approved Instructions) to attend any meetings of the Board or committees
thereof during the absence of the Trustee’s Director and any replacements for the Trustee’s Director nominated by
the Debenture Trustee (acting in accordance with the Approved Instructions). The Trustee’s Director shall be entitled
to attend and vote in any meeting of the Board and/or committee of the Board in which he or she is a member.
Notwithstanding anything in these Articles the Board shall have the power to appoint the Trustee’s Director as a
nominee director.
(B) Notwithstanding anything contained herein, a valid quorum of any meeting of the Board or committee of the Board,
at which any matter specified in Clause 15.3 of the Debenture Trust Deed is to be discussed, shall require the
presence of the Trustee’s Director(s). In the event that the Trustee’s Director is not present at any such meeting, such
meeting shall be automatically adjourned to the same time on the day falling 7 (seven) days after the date of the
meeting of the Board or any committee of the Board. In the event that the Trustee’s Director is not present at such
adjourned Board meeting, the directors then present shall constitute a quorum (provided that the directors present
would otherwise constitute a quorum under these Articles) and the presence of the Trustee’s Director shall not be
required at such meeting for constituting quorum.
(C) The Company shall not (whether directly or indirectly), without the prior written approval of the Debenture Trustee
(acting in accordance with Approved Instructions) take any action or decision relating to the matters set out in
Clause 15.3 of the Debenture Trust Deed. It is clarified for the avoidance that the powers granted to the Debenture
Trustee under this Clause 15.3 shall be exercised by the Debenture Trustee (acting in accordance with Approved
Instructions) and the Trustee’s Director shall not be entitled to exercise the powers vested with the Debenture
Trustee under Clause 15.3 of the Debenture Trust Deed.
(D) The Company shall provide the Trustee’s Director(s) the agenda and all relevant papers in respect of a meeting of
the Board or a resolution to be passed by circulation, in which a matter set out in Clause 15.3 of the Debenture Trust
Deed is proposed to be discussed at least 14 (fourteen) days prior to such meeting or the date on which the resolution
is circulated for voting by the directors.
(E) In the event of any inconsistency between (i) the provisions of Article 79 of this Chapter II on the one hand; and (ii)
the provisions of Chapter I, on the other hand, then the provisions of Article 79 of this Chapter II shall prevail.
(F) Pursuant to the Termination of the Debenture Trust Deed under the terms thereof, the provisions of this Article 79 of
Chapter II of these Articles shall automatically terminate and cease to have effect without any further action.
543
SECTION IX: OTHER INFORMATION
MATERIAL CONTRACTS AND DOCUMENTS FOR INSPECTION
The copies of the following contracts which have been entered or are to be entered into by our Company (not being contracts
entered into in the ordinary course of business carried on by our Company or contracts entered into more than two years
before the date of this Red Herring Prospectus) which are or may be deemed material will be attached to the copy of the Red
Herring Prospectus which will be delivered to the RoC for registration. Copies of the abovementioned contracts and also the
documents for inspection referred to hereunder, may be inspected at the Registered and Corporate Office between 10 a.m.
and 5 p.m. on all Working Days from the date of the Red Herring Prospectus until the Bid/Offer Closing Date.
A. Material Contracts for the Offer
1. Registrar Agreement dated May 31, 2016 entered into between our Company, the Selling Shareholders and
the Registrar to the Offer.
2. Offer Agreement dated June 21, 2016 entered into between our Company, the Selling Shareholders, the
GCBRLMs and the BRLM.
3. Escrow Agreement dated October 13, 2016 entered into between our Company, the Selling Shareholders,
the Registrar to the Offer, the GCBRLMs, the BRLM, the Escrow Collection Bank, the public issue account
bank (being HDFC Bank Limited) and the Refund Bank.
4. Share Escrow Agreement dated October 13, 2016 entered into between our Company, the Selling
Shareholders and the Share Escrow Agent.
5. Syndicate Agreement dated October 13, 2016 entered into between our Company, the Selling Shareholders,
the GCBRLMs, the BRLM, the Syndicate Member and the Registrar to the Offer.
6. Underwriting Agreement dated [●], 2016 entered into between our Company, the Selling Shareholders, the
Registrar to the Offer and the Underwriters.
7. Monitoring Agency Agreement dated October 13, 2016 entered into between Yes Bank Limited and the
Company.
B. Material Documents
1. Certified copies of the updated Memorandum of Association and Articles of Association of our Company
as amended from time to time.
2. Certificate of incorporation dated June 16, 1995.
3. Resolution of the Board of Directors dated March 28, 2016 in relation to the Offer and other related matters.
4. Shareholders’ resolution dated April 27, 2016 in relation to the Offer and other related matters.
5. Letter dated May 26, 2016 issued by Varun Jaipuria authorising the Offer for Sale.
6. Letter dated May 26, 2016 issued by Ravi Kant Jaipuria (karta) on behalf of Ravi Kant Jaipuria & Sons
(HUF) authorising the Offer for Sale.
7. Share purchase agreement dated October 9, 2015 between the Company, Arctic International Private
Limited and Varun Beverages Mozambique LDA.
8. Share purchase agreement dated October 20, 2015 between the Company, AIPL and Varun Beverages
(Zambia) Limited.
9. Shareholders’ Agreement dated February 8, 2016 between our Company and Glaciem (Private) Limited.
10. Business transfer agreement dated November 15, 2014 between our Company, PepsiCo India and RJ Corp.
11. Business transfer agreement dated November 15, 2014 between our Company, ADBL and RJ Corp.
12. Business transfer agreement dated January 29, 2013 between our Company and Pearl Drinks Limited.
13. Securities purchase cum investment agreement dated September 18, 2015 between the Company, AION
and SCPE.
544
14. Deed of adherence dated September 18, 2015 between the Company, AION, SCPE, RJ Corp Limited, Ravi
Kant Jaipuria & Sons (HUF) and Varun Jaipuria.
15. Investment Agreement dated July 18, 2011 between VBIL, SCPE, RJ Corp, Ravi Kant Jaipuria & Sons
(HUF) and Varun Jaipuria as amended by an amendment and supplemental agreement dated September 29,
2012 and an amendment agreement dated June 13, 2016.
16. RJCL Investment Agreement dated October 20, 2014 between our Company and RJ Corp.
17. DHRPL Investment Agreement dated February 16, 2015 between our Company and Devyani Hotels and
Resorts Private Limited.
18. Two deeds of guarantee each dated March 3, 2015 issued by the Company in favour of Standard Chartered
Bank on behalf of VBL Lanka.
19. Guarantee dated April 19, 2011 issued by VBIL (now merged with our Company) in favour of The People’s
Bank on behalf of VBL Lanka.
20. Copy of the scheme of Employee Stock Options Scheme 2013.
21. Copy of the scheme of Employee Stock Options Scheme 2016.
22. Scheme of amalgamation for merger of VBIL with our Company as approved by the order of High Court of
Delhi dated March 12, 2013.
23. Scheme of amalgamation for merger of DBL with our Company as approved by the order of High Court of
Delhi effective from April 1, 2004.
24. Copies of annual reports of our Company for the last five years.
25. The examination reports dated September 22, 2016 of the Statutory Auditors, on our Company’s Restated
Financial Statements, included in this Red Herring Prospectus.
26. Consent letter dated June 21, 2016 from the Statutory Auditors of our Company for inclusion of their name
as experts.
27. The Statement of Tax Benefits dated June 1, 2016 from the Statutory Auditors.
28. Consent of the Directors, GCBRLMs, BRLM, Syndicate Member, Domestic Legal Counsel to our
Company, Domestic Legal Counsel to the GCBRLMs and the BRLM, International Legal Counsel to the
GCBRLMs and the BRLM, Registrar to the Offer, Escrow Collection Bank, Bankers to the Offer, Bankers
to our Company, Chief Financial Officer, Company Secretary and Compliance Officer as referred to in their
specific capacities.
29. Consent letters dated May 16, 2016 and September 21, 2016 from Euromonitor Ltd.
30. Due Diligence Certificate dated June 21, 2016 addressed to SEBI from the GCBRLMs and the BRLM.
31. In-principle listing approvals dated June 29, 2016 and July 5, 2016 issued by BSE and NSE, respectively.
32. Tripartite agreement dated June 15, 2016 among our Company, NSDL and the Registrar to the Offer.
33. Tripartite agreement dated June 10, 2016 among our Company, CDSL and the Registrar to the Offer.
34. SEBI observation letters no. CFD/DIL/NR/SK/20565/2016 dated July 21, 2016 and no. CFD/DIL-
II/NR/SK/OW/24706/2016 dated August 31, 2016.
Any of the contracts or documents mentioned in this Red Herring Prospectus may be amended or modified at any time if so
required in the interest of our Company or if required by the other parties, without reference to the Shareholders subject to
compliance of the provisions contained in the Companies Act and other relevant statutes.
545
DECLARATION
We hereby certify and declare that all relevant provisions of the Companies Act and the guidelines issued by the Government
or the regulations or guidelines issued by SEBI, established under Section 3 of the SEBI Act, as the case may be, have been
complied with and no statement made in this Red Herring Prospectus is contrary to the provisions of the Companies Act, the
SCRA, the SEBI Act or rules or regulations made thereunder or guidelines issued, as the case may be. We further certify that
all the statements in this Red Herring Prospectus are true and correct.
SIGNED BY DIRECTORS OF OUR COMPANY
________________________
Ravi Kant Jaipuria
(Chairman)
________________________
Varun Jaipuria
(Whole-time Director)
________________________
Raj Pal Gandhi
(Whole-time Director)
________________________
Kapil Agarwal
(Whole-time Director)
________________________
Kamlesh Kumar Jain
(Whole-time Director)
________________________
Udai Dhawan
(Nominee Director)
________________________
Ravindra Dhariwal
(Independent Director)
________________________
Girish Ahuja
(Independent Director)
________________________
Naresh Kumar Trehan
(Independent Director)
________________________
Pradeep Sardana
(Independent Director)
________________________
Geeta Kapoor
(Independent Director)
________________________
Sanjoy Mukerji
(Independent Director)
SIGNED BY CHIEF FINANCIAL OFFICER OF OUR COMPANY
________________________
Kamlesh Kumar Jain
(Chief Financial Officer)
Date: October 18, 2016
Place: Delhi
546
DECLARATION
The undersigned Selling Shareholder, hereby certifies that all statements and undertakings made by it in this Red Herring
Prospectus about or in relation to it or its holding of Equity Shares which are being offered through the Offer for Sale, are true
and correct. The undersigned Selling Shareholder further certifies that other than as stated in this Red Herring Prospectus, all
approvals and permissions, if any, required by it towards the Offer for Sale have been obtained, are currently valid and have
been complied with. The undersigned Selling Shareholder assumes no responsibility for any other statement including the
statements made by the Company or any expert or any other person(s) in this Red Herring Prospectus.
Signed by
----------------------------------------
Ravi Kant Jaipuria & Sons (HUF)
Name: Ravi Kant Jaipuria
Designation: Karta
Date: October 18, 2016
Place: Delhi
547
DECLARATION
The undersigned Selling Shareholder, hereby certifies that all statements and undertakings made by him in this Red Herring
Prospectus about or in relation to him or his holding of Equity Shares which are being offered through the Offer for Sale, are
true and correct. The undersigned Selling Shareholder further certifies that other than as stated in this Red Herring
Prospectus, all approvals and permissions, if any, required by him towards the Offer for Sale have been obtained, are
currently valid and have been complied with. The undersigned Selling Shareholder assumes no responsibility for any other
statement including the statements made by the Company or any expert or any other person(s) in this Red Herring Prospectus.
Signed by
Varun Jaipuria
Date: October 18, 2016
Place: Delhi