properties of microinjection molding of polymer multiwalled carbon nanotube conducting composites
TRANSCRIPT

NRC Publications Archive (NPArC)Archives des publications du CNRC (NPArC)
Publisher’s version / la version de l'éditeur: Polymer Engineering and Science, 51, 5, pp. 992-1003, 2011-03-07
Properties of microinjection molding of polymer multiwalled carbon nanotube conducting compositesAbbasi, Samaneh; Derdouri, Abdessalem; Carreau, Pierre J.
Contact us / Contactez nous: [email protected].
http://nparc.cisti-icist.nrc-cnrc.gc.ca/npsi/jsp/nparc_cp.jsp?lang=frL’accès à ce site Web et l’utilisation de son contenu sont assujettis aux conditions présentées dans le site
Web page / page Webhttp://dx.doi.org/10.1002/pen.21904http://nparc.cisti-icist.nrc-cnrc.gc.ca/npsi/ctrl?action=rtdoc&an=18375249&lang=enhttp://nparc.cisti-icist.nrc-cnrc.gc.ca/npsi/ctrl?action=rtdoc&an=18375249&lang=fr
LISEZ CES CONDITIONS ATTENTIVEMENT AVANT D’UTILISER CE SITE WEB.
READ THESE TERMS AND CONDITIONS CAREFULLY BEFORE USING THIS WEBSITE.
Access and use of this website and the material on it are subject to the Terms and Conditions set forth athttp://nparc.cisti-icist.nrc-cnrc.gc.ca/npsi/jsp/nparc_cp.jsp?lang=en

Properties of Microinjection Molding of PolymerMultiwalled Carbon Nanotube Conducting Composites
Samaneh Abbasi,1 Abdessalem Derdouri,2 Pierre J. Carreau1
1 CREPEC, Department of Chemical Engineering, Ecole Polytechnique, Montreal, QC, Canada
2 CREPEC, Industrial Materials Institute, National Research Council Canada, Boucherville, QC, Canada
The effects of processing conditions on the micro-structure and properties of polypropylene/multiwalledcarbon nanotube (PP/MWCNT) and polycarbonate/multiwalled carbon nanotube (PC/MWCNT) compositeswere studied. Samples of various MWCNT loadingswere prepared by diluting commercial masterbatches.Different processing conditions were then used to sys-tematically change the degree of nanotube alignment,from random to highly aligned. The crystallinity of thePP/MWCNT nanocomposites was found to go througha maximum as a function of nanotube content whilethe overall rate of crystallization increased. For thehighly sheared microinjected PP/MWCNT samples welloriented crystals were formed. Electrical conductivityof the nanocomposites was improved by the presenceof the crystalline structure; however, the high degree ofnanotube alignment in the microparts resulted in a sig-nificant increase in the electrical percolation threshold.The PP nanocomposites exhibited mechanical proper-ties significantly enhanced by nanotube loading; thiseffect was small in the case of the PC nanocomposi-tes. POLYM. ENG. SCI., 51:992–1003, 2011. ª 2011 Society of
Plastics Engineers
INTRODUCTION
After their discovery in 1991 by Iijima [1, 2] carbon
nanotubes (CNTs) became attractive candidates for funda-
mental investigations due to their unique electronic struc-
ture and extraordinary properties. Since then, an extensive
research effort has been devoted to the nanotube fabrica-
tion, characterization, and development of applications
[3]. Their intrinsic structure, size scale and aspect ratio
suggest a variety of applications such as nanoelectronics,
sensors, and field emission as well as high performance
nanocomposites.
Recently, considerable attention has been devoted to
carbon nanotube/polymer composites from both process-
ing and application points of view. Besides the individual
properties of carbon nanotubes, numerous potential bene-
fits are expected when they are employed as reinforcing
agents in nanocomposites. One of the key interest in car-
bon nanotubes incorporated into polymeric materials
stems from their potential to develop conductive polymer
composites at relatively low concentrations [4–9].
The high electrical conductivity in conductive particles
based nanocomposites is explained in term of percolation
i.e., the structure in which the particles touch one another,
resulting in a continuous electrically conductive path. The
filler concentration at which the electrical conductivity
increases abruptly is known as the percolation threshold.
It depends not only on the types of filler and polymer but
also on the dispersion state of the filler and the morphol-
ogy of the matrix [10–13].
The percolation threshold is found to be much higher
in the case of thermoplastic matrices [8, 14-17] in com-
parison to thermoset filled systems [18]. In semicrystalline
matrices, additional complexity arises due to the crystalli-
zation induced phase separation and subsequent rejection
of the nanotubes by the advancing crystalline phase [19,
20]. It is well known that carbon nanotubes are well
dispersed in polar polymers such as poly (methyl-methac-
rylate) (PMMA) [15] and polycarbonate (PC) [16]. How-
ever, in nonpolar polymers such as polypropylene (PP),
CNT dispersion remains a big challenge and might affect
the percolation threshold as well.
Incorporation of carbon particles into incompatible
polymer blends can provide them with electrical conduc-
tivity at very low filler content due to a double percolation
phenomenon [21, 22]. Double percolation refers to the
structure in which there are two types of percolation in the
same composite material. The first one, which is typically
observed in reinforced composite materials, is associated
with the electrical continuity of the conductive particles in
the filler-rich phase and the second one is associated with
the continuity of this phase in the blend. The improvement
in electrical conductivity will depend on the conductive
Correspondence to: Pierre J. Carreau; e-mail: [email protected]
Contract grant sponsor: NSERC (Natural Science and Engineering
Research Council of Canada).
DOI 10.1002/pen.21904
Published online in Wiley Online Library (wileyonlinelibrary.com).
VVC 2011 Society of Plastics Engineers
POLYMER ENGINEERING AND SCIENCE—-2011

particle concentration threshold in the filler-rich phase and
on the volume fraction of the filler-rich phase required to
induce co-continuity in the blend [22].
It is well known that the microstructure of plastic parts
is the result of complex changes imposed to the base
polymer by special processing conditions [23]. Typical
thermoplastic processing involves pellets melting, plasti-
cation, melt flow, pressurization and shaping and finally
solidification from the molten state, either by crystalliza-
tion or vitrification. The complex thermo-mechanical
history imposed on the polymer during processing leads
to substantial spatial variations of chain orientation under
shear and elongational flows and to the formation of a
superstructure controlled by the local dynamics of the
process. These effects result in a large anisotropy of the
final physical properties particularly if the polymer is
semicrystalline and is filled with particles of large aspect
ratio (glass or carbon fibers, clay or mica platelets, carbon
nanotubes, or nanofibrils, etc.). The objective of this work
is to develop a clear understanding of how processing
conditions influence the nanotube network and subse-
quently the nanocomposites properties.
With the recent trend towards product miniaturization,
the rapid development of microsystem technologies has
opened up new applications for polymer nanocomposites.
Particularly, carbon nanotube based polymer composites
are suitable candidates for the fabrication of microscale
components where the nano size of the added particles is
an advantage and only grams of materials are necessary
to manufacture high-valued products. A number of proc-
essing technologies have been explored to produce
polymer-based microdevices amongst which microinjec-
tion molding is one of the most suitable for producing
microparts cheaply and with high precision. Microinjec-
tion molded parts are defined as (1) parts with a weight
grams down to milligrams, (2) parts with microstructured
regions, and (3) parts with microprecision dimensions. In
the first category the parts have masses of a few milli-
grams, but their dimensions are not necessarily on the
micron scale. Parts of the second category are character-
ized by local micro features on the micron order, such as
microholes and slots. The third category includes parts of
any dimensions that have tolerances in the micron
range [24].
As in the case of conventional injection molding, the
properties of parts made by microinjection molding are
strongly affected by the processing parameters. However,
because of the exceptional characteristics of microinjec-
tion molding, these parameters and their effects are not
necessarily the same as encountered in conventional
molding. Microinjection molding features extreme injec-
tion pressures, very high shear and cooling rates as well
as very short cycle times compared to the conventional
process. Significant reports on microinjection molding
appeared during this decade most of which were on neat
polymers [25–29]. Some studies did consider polymer
compounds containing fillers such as short glass fibers,
glass particles, and nanoceramic materials as illustrated
by the work of Huang et al. [30, 31].
Another interesting processing alternative for produc-
ing microparts is microinjection-compression molding.
This process is regarded as an extension of microinjection
molding by incorporating a compression phase to compact
the material inside the mold cavity. After injection of the
melt into a slightly open mold, the polymer proceeds to
the extremities of the cavity under relatively low pressure
and stress [32] as the mold closes fully.
It is the aim of this study to investigate the influence
of crystalline structure, nanotube loading and microinjec-
tion molding conditions on the properties of polymer/
MWCNT nanocomposites with a special focus on the
electrical conductivity. To this end, we chose two poly-
mers, a polar amorphous polycarbonate (PC) and an iso-
tactic polypropylene (iPP) as a nonpolar semicrystalline
polymer. Polycarbonate, a typical amorphous polymer, is
an important commercially available engineering thermo-
plastic for injection molding applications because of its
excellent processability and mechanical properties.
Recently, carbon nanotubes have been used as a special
filler to be incorporated into PC for stiffness reinforce-
ment as well as thermal and electrical conductivity
enhancement [8, 14, 33–36]. Polypropylene is also one of
the most commonly used polymers in the preparation of
such nanocomposites owing to its well-balanced physical
and mechanical properties combined with benefits like
low cost, low density, good processability, and wide range
of applications [37–40]. However, PP exhibits very poor
compatibility and low adhesion to other polymers and
inorganic fillers due to its nonpolarity and crystallizability.
It has been found that in PP/clay nanocomposites crystal-
lization of the PP matrix led to the expulsion of clay
platelets from the crystalline phase by thermodynamic
forces [41]. A similar phenomenon is expected to occur
when carbon nanotubes are used instead of clay platelets.
Their rejection by the growing crystalline phase may
result in a conductive nanotubes network at lower concen-
trations according to the concept of double percolation.
We optimized the nanocomposites preparation to obtain
the best possible nanotube dispersion as observed by trans-
mission electron microscopy (TEM) and scanning electron
microscopy (SEM). Thereafter, samples were prepared by
compression molding and micromolding under different
processing conditions and using different cavity shapes.
Finally, we employed a variety of characterization methods
to investigate the effect of the processing conditions on the
structure and properties of the polymer/CNTs composites.
EXPERIMENTAL
Materials
Masterbatches of 20 wt% MWCNT in PP and 15 wt%
MWCNT in PC were purchased from Hyperion Catalysis
DOI 10.1002/pen POLYMER ENGINEERING AND SCIENCE—-2011 993

International, Cambridge, MA. According to the supplier,
the carbon nanotubes are vapor grown and typically
consist of 8–15 graphite layers wrapped around a hollow
5-nm core [42]. The diameter range was stated to vary
from 15 to 50 nm and the length range between 1 and
10 lm as confirmed by TEM characterization. The mas-
terbatches were then diluted with a polycarbonate (Calibre
1080) supplied by DOW Chemical and with an isotactic
polypropylene (PP HD120) supplied by Borealis Co. to
prepare nanocomposite samples of various loadings. The
polycarbonate (PC1080) has a density of 1200 kg/m3
according to ASTM D792, with a melt flow rate of
11 g/10 min at 2508C and a water absorption of 0.20%
after 24 h at 238C according to ASTM D570. The poly-
propylene (PP HD120) has a density of 908 kg/m3
according to ASTM D792, with a melt flow rate of
8 g/10 min at 2308C. A polypropylene grafted maleic
anhydride (PP-g-MA Polybond PB3150 with 0.5 wt%
MA and with a melt flow rate of 20 g/10 min at 1908C)
was used as a compatibilizer in an attempt to improve the
nanotube dispersion in PP/MWCNT nanocomposites.
Nanocomposite Preparation and Molding
The composites were made by melt mixing the master-
batches with the neat polymers. The polycarbonate and
PC/MWCNT masterbatch were dried for a minimum of 4
h at 1208C prior to mixing. The polypropylene, PP/
MWCNT and PP-g-MA were also dried for 1 h at 908C.
Six samples with MWCNT contents between 0.5 and
15 wt% were prepared using a lab twin-screw extruder,
Leistritz ZSE 18HP, operating at 100 rpm and 2108C for
the PC and at 250 rpm and 1908C for the PP nanocompo-
sites (conditions previously optimized via a set of
controlled experiments). Microinjection molding and
microinjection-compression molding were then employed
to produce parts of different shapes and dimensions. Prior
to each process, the nanocomposites were dried under the
conditions previously mentioned. Compression molded
disks were also prepared (Carver laboratory press, model
3912) to compare the nanocomposite properties before
and after microinjection molding. Microinjection molding
was done using a Battenfeld Microsystem 50 machine. In
the case of the PC/MWCNT nanocomposites, injection
was done at an average barrel temperature of 3008C and
under a pressure of �100 MPa while the injection speed
was constant at 400 mm/s. The mold temperature was
kept constant at 808C and the cooling time was set to
10 s. For the PP/MWCNT nanocomposites, we used an
average barrel temperature of 2608C, a pressure of �100
MPa and a constant injection speed of 400 mm/s. To
reduce shrinkage the mold temperature was optimized and
kept constant at 208C while the cooling time was set to
10 s. For mechanical tests, we used a mold with the dog-
bone shape cavity of 15 mm long, with the center section
of 1 mm wide by 0.78 mm thick by 4.3 mm long, gated
at one end (see Fig. 1); while the electrical measurements
were done using a disk shape mold of 25 mm in diameter
and 1 mm thick, gated at the centre. Finally, microinjec-
tion-compression molding was employed to evaluate the
effect of applying a compression step at the end of the
injection phase on the part properties, using the centrally
gated disk cavity with the same dimensions as described
before. The process consisted of injecting the melt into
the cavity, while the mold was not totally closed. This led
to an initial cavity filling under a lower pressure than if
the mold was closed. After the injection stage, the mold
was closed to compress the melt and to completely fill
the cavity. The operating conditions in this experiment
were the same as for microinjection molding in the injec-
tion phase, while during the compression phase, the mold
closing speed and gap used were set to 1.5 mm/s and
1.2 mm, respectively.
Morphological Characterization
The morphology of the nanocomposites was studied
through scanning and transmission electron microscopy
(SEM, TEM). For SEM we used a high resolution Hitachi
S-4700 microscope. In the case of PC nanocomposite,
SEM was done on the surface of an ultramicrotomed
sample cut with a diamond knife at room temperature.
The surface of the PP nanocomposite sample was etched
using a potassium permanganate solution to eliminate the
amorphous phase from the surface. The quality of the dis-
persion could be seen much better with this method rather
than using an ultramicrotomed surface. All SEM samples
were then coated with a vapor deposit of platinum for
25 s. TEM was done on ultrathin nanocomposites cross-
sections for a better observation of the morphology, using
a Hitachi HD-2000 microscope.
Crystallinity Measurements
Differential scanning calorimetry (DSC) and X-ray dif-
fraction (XRD) were used to study the crystallization
behavior of PP/MWCNT nanocomposite. Nonisothermal
crystallization analysis was performed using a TA instru-
ment Q-100 differential scanning calorimeter. Samples of
about 5–10 mg were heated from 25 to 2608C at a heating
FIG. 1. Microinjected tensile bar produced using a mold with dog-bone
shape cavity (dimensions in the sketch are in mm).
994 POLYMER ENGINEERING AND SCIENCE—-2011 DOI 10.1002/pen

rate of 108C/min and then held for 5 min to eliminate the
thermal history of the materials. The samples were subse-
quently cooled to 258C at a cooling rate of 108C/min
before starting a second heating at the same rate to the
same final temperature. The degree of crystallinity was
calculated using the following equation [43]:
Xc ¼DHf
DH0f 1� wð Þ
� 100% (1)
In this equation, DHf is the enthalpy of fusion of the
samples and DH0f (207 J/g) is the enthalpy of fusion of
the 100% crystalline polypropylene [44]. The weight per-
cent of MWCNT, w, was introduced in this equation to
correct for the effect of nanoparticle content. The com-
pression and microinjection molded samples were also
examined by wide angle X-ray diffraction (WAXD). The
tests were carried out using a Bruker AXS X-Ray goni-
ometer equipped with a Hi-STAR two-dimensional area
detector. The generator voltage and current were 40 kV
and 40 mA, respectively and the copper Cu Ka
radiation (k ¼ 1.542 A) was selected by a graphite crystal
monochromator.
Electrical Conductivity Measurements
The volume resistivity of the nanocomposites were
determined by measuring the DC resistance across the
thickness of compression molded disks using a Keithley
electrometer model 6517 equipped with a two probe test
fixture. All the connections were made using short wires
to insure that the resistivity of the whole set up was negli-
gible. The resistivity of the set up was measured each
time before the tests to make sure that the system was
working properly. This equipment allows resistance meas-
urements up to 1017 O. The applied voltage, adapted to
the expected resistance, was in the range of 1000 V for
the neat polymers and samples containing up to 1wt%
MWCNT and 100 V for samples containing 2 wt% and
more MWCNTs. However, since for the more conductive
samples, the accuracy of this equipment failed, samples
containing more than 1 wt% MWCNTs were tested using
the more adequate Keithley electrometer model 6220 con-
nected to a current source (Aligent 34401 A, 6 [1/2] Digit
Multimeter). For each sample the I-V curve was obtained
and the sample resistance was determined from the slope
of the curve. The resistance was then converted to volume
resistivity, qv, using the formula
rv ¼ ARv=D (2)
where A is the contact surface area, D is the thickness of
the sample, and Rv is the measured resistance. The electri-
cal conductivity (s) of the nanocomposites is the inverse
of volume resistivity. Prior to measurements all samples
were dried under the conditions previously described.
Mechanical Properties
An Instron Micro Tester model 5548 was used to mea-
sure the tensile strength, modulus and elongation at break
of the nanocomposites using microinjected tensile bars
having a gage length of 4.3 mm. The tests were per-
formed at room temperature using a crosshead speed of
50 mm/min, based on ASTM D638, and acquisition rate
of 13 data per second. The tensile strength and elongation
at break could be directly obtained from the stress-strain
curves. To obtain the elastic modulus, a linear regression
technique was utilized to define the slope of the stress-
strain curve in the initial region before yield. All the
reported values were averaged over six specimens for
each composition with a maximum deviation of 68%.
RESULTS
Morphology
SEM micrographs of the surfaces of compression
molded and microinjected samples for the nanocomposites
of 3wt% MWCNTs in PP and 5wt% MWCNTs in PC are
shown in Fig. 2. It is worth mentioning that when the
surface of the PP sample is chemically etched the pres-
ence of nanotubes can be better detected. It is clear that
for the polypropylene nanocomposites, nanotube aggre-
gates are formed and the distribution is not uniform
(Fig. 2a). In contrast the nanotubes are well dispersed in
the polycarbonate matrix and the distribution at the micro
level is quite uniform (Fig. 2b). The presence of nanotube
aggregates even after improving the mixing conditions
and using PP-g-MA as a compatibilizer indicates that
polypropylene is a difficult host, in the sense that the
carbon nanotubes were not fully dispersed as individual
entities. Although some small aggregates were also seen
in the PC/MWCNT nanocomposites most of the nano-
tubes were dispersed individually even under the most
unfavorable conditions.
These results reveal clearly a large difference between
the compatibility of MWCNTs with PC as a polar amor-
phous polymer and with PP as a nonpolar polymer with a
high degree of crystallinity. Because of the presence of
strong polar-polar bonds, the nanotubes are better dis-
persed in PC without the formation of many aggregates;
for polypropylene the lack of such polar bonds results in
a poor dispersion of the nanotubes. In addition, the
growth of the crystalline phase in the later case may
result in the expulsion of the nanotubes towards the amor-
phous phase and lead to the formation of large aggregates
in the PP-based nanocomposites [20].
Figure 2 also indicates that the nanotubes are somehow
better distributed in the case of the microinjected samples.
The drastically high deformation rates in microinjection
molding contribute strongly to the nanotube distribution
within the polymer matrix. In the case of the PP/MWCNT
nanocomposites, the formation of smaller crystals in the
DOI 10.1002/pen POLYMER ENGINEERING AND SCIENCE—-2011 995

microinjected samples with the same degree of crystallin-
ity (as it will be shown later) may be considered as
another cause for the better distribution of the nanotubes.
In fact, at constant degree of crystallinity, smaller crystals
create narrower and more distributed path for amorphous
phase located between them. However, aggregates are still
observed in these samples. On the other hand, since the
nanocomposite electrical conductivity is one of the main
interest of this work, a well dispersed system may not be
required for the formation of an electrically conductive
network. As Fig. 3 shows for both PP and PC nano-
composites, an interconnected network of entangled
MWCNTs exists forming a percolated network. This net-
work seems to be even stronger and more efficient in the
case of the PP nanocomposites in spite of worse disper-
sion quality. The presence of a crystalline phase in the PP
matrix creates a structure similar to the case of a two-
phase polymer blend with one phase being the crystals
and the other phase the amorphous domain [45]. From a
thermodynamic point of view, fillers and other kinds of
impurities can never exist in a crystal [41, 46, 47] and,
therefore, nanotubes are expected to be found only in the
amorphous phase. The white and somehow parallel strips
seen in Fig. 3a, indicated by the arrows, are the lamellae
edge of crystals. The crystalline phase rejects the
nanotubes to the edges of the lamellae during the crystal-
lization growth stage. Therefore, as the figure illustrates,
the nanotubes are located in the amorphous phase
between the lamellae and form a continuous path in this
blend-like structure. Consequently according to the con-
cept of double percolation threshold a strong nanotube
network is formed even at lower content compared to
what is observed in the PC/MWCNT nanocomposites.
The overall percolation threshold in PP is equal to the
threshold of the amorphous phase, which is a fraction of
the polymeric matrix, and therefore fewer nanotubes are
needed to create a conductive network.
The formation of networks and the quality of the
dispersion can be observed more clearly in TEM micro-
graphs (see Fig. 4). The micrographs show some isolated
nanotubes (particularly in the PP case) although most of
them are grouped in dispersed bundles. In spite of
the nonuniform dispersion in the PP nanocomposites
(Fig. 4a), a strong connection between the nanotubes and
consequently a complete network provide a suitable
conductive pathway for the electrical current. In the PC
FIG. 2. SEM micrographs of (a) etched surface of PP/3wt% MWCNT and (b) crayon surfaces of PC/5wt%
MWCNT nanocomposites. The top and the bottom micrographs are related to the compression molded and
microinjected samples, respectively.
996 POLYMER ENGINEERING AND SCIENCE—-2011 DOI 10.1002/pen

nanocomposites (Fig. 4b), the nanotubes are well dis-
persed within the samples and the nanotube network
seems to be not as well connected as that formed in the
PP nanocomposites.
Crystallization and Crystalline Structure
Carbon nanotubes are well known to impart profound
changes to the crystallization behavior of semicrystalline
polymers [48, 49]. The presence of nanotubes provides a
tremendous amount of heterogeneous nucleation sites for
crystallization as they act as effective nucleating agents
[48, 50]. The overall crystallization process is therefore
expected to be accelerated as a result of this heterogene-
ous nucleation process. The effects of nanotube loading
on the crystallization and crystalline characteristics of PP/
MWCNT nanocomposites were examined using DSC.
Figure 5 shows the DSC thermograms recorded during
the first heating and cooling cycles for microinjection
molding samples of various nanotube loadings. The
thermograms recorded from the first heating of the
compression molded samples (not shown here) were also
analyzed and the results were compared as follows. The
peak crystallization temperature is reported in Table 1 as
TC along with the melting temperature Tm and the degree
of crystallinity for compression and microinjection
molded samples. A slight difference in the melting behav-
ior between the two types of samples can be seen: a
higher melting point is recorded for microinjected
samples with up to 1% nanotube content, suggesting the
presence of more perfected crystals possibly due to higher
molecular orientation. This distinction in the melting
behavior is totally absent in the 5% nanotube sample.
When analyzing the cooling portion of the thermograms
no such a distinction between the compression and
microinjection molded samples could be made for all
nanotube concentrations. However, it is obvious that the
crystallization onset temperature and the peak temperature
increase with nanotube concentration. This suggests
that crystal nucleation takes largely place at the surface of
FIG. 3. High resolution SEM micrographs of (a) etched surface of PP/3wt% MWCNT and (b) crayon surfa-
ces of PC/5wt% MWCNT nanocomposites. The arrays indicate the lamellae of the formed spherulites of PP.
FIG. 4. TEM micrographs of thin sections of (a) PP/3wt% MWCNT and (b) PC/5wt% MWCNT nanocom-
posites.
DOI 10.1002/pen POLYMER ENGINEERING AND SCIENCE—-2011 997

the MWCNTs. Furthermore, the results show that
this effect is more pronounced at a lower MWCNT
content than at higher content. As more nanotubes are
added saturation of the nucleating sites is reached and
the accelerating effect on the crystallization process
disappears.
The overall crystallization rate due to the combined
effects of nucleation and growth is affected by the crystal-
lization temperature. The degree of supercooling or the
difference between Tm and Tc is then a good indication of
the crystallizability or crystallization rate. The smaller this
difference, the larger the overall rate [51]. As Fig. 5
and Table 1 show Tc increases significantly with nanotube
loading, while the effect is not so pronounced in the case
of Tm (particularly for the compression molded samples)
and as a result the difference between Tm and Tcdecreases with nanotube loading. From a thermodynamic
point of view, a higher temperature decreases the melt
viscosity and favors the mobility of the polymer chains
towards the crystallizing surface and thus accelerates the
growth process.
The half crystallization time (t1/2), defined as the time
required to reach 50% relative crystallinity, is usually
reported to compare the rate of crystallization of different
samples. The relative crystallinity is calculated by using
the following equation [52]:
Xr ¼
Z
T
T0
QdT
,
Z
T1
T0
QdT (3)
where Q is the heat flow at temperature T and T0 and T!are the onset and termination crystallization temperature,
respectively. The time related to the current temperature
can be calculated as follows:
t ¼ ðT0 � TÞ=CR (4)
where CR is the cooling rate (108C/min). The crystalliza-
tion curves during cooling are reported in Fig. 6 as a
function of time. As it is observed, the rate of crystalliza-
tion increases with nanotube content and this effect is
clearly more important at low nanotube loading.
The values for the degree of crystallinity of the nano-
composites of different nanotube content for compression,
microinjected and microinjection-compression molded
samples are reported in Table 1. In all cases, the results
show first an increase then a decrease in the degree of
crystallinity as a function of nanotube content. A
MWCNT content below 2 wt% causes an increase in
crystallinity. A decrease in crystallinity is observed for
MWCNT contents larger than 2%. It will be shown there-
after basedon electrical conductivity that 2 wt% MWCNT
is the critical amount of nanotubes for a network forma-
tion and electrical percolation threshold in PP nanocom-
posites. Polymer crystallization is controlled first by
crystal nucleation and second by crystal growth. In this
particular case, the addition of up to 2 wt% nanotubes to
the PP matrix results in a rapid increase of the number of
nucleating sites, an increase in the nucleation rate and the
degree of crystallinity as well; above 2 wt% the rate of
nucleation keeps increasing, albeit more slowly before
leveling off. On the other hand, the formation of a nano-
tube network restricts the polymer chains motion and,
therefore, the formed crystals cannot grow properly and,
consequently, the overall crystallization decreases.
FIG. 5. First heating/cooling DSC thermograms - PP nanocomposites
of various nanotube loadings - Arrows indicate thermograms for com-
pression molded (black) and microinjection molded (blue) samples.
TABLE 1. Nonisothermal crystallization and melting parameter for various nanotube loadings for PP samples prepared in compression (C),
microinjection-compression (M-C), and microinjection (M) molding.
MWCNT (wt%) TC (8C)
Crystallinity (%) (DSC results) Crystallinity (%) (XRD results) Tm (8C)
C M-C M C C M
0 122.0 38.6 47.8 44.4 39.9 162.1 166.0
0.5 124.4 43.7 50.9 47.6 49.7 162.3 165.9
1 128.4 52.2 57.6 54.6 51.3 163.5 165.2
2 131.0 53.7 59.6 56.2 52.2 163.6 163.9
3 132.1 52.8 57.3 53.8 50.0 163.7 163.8
5 134.1 43.2 45.8 44.7 47.5 163.7 163.7
The degree of crystallinity of compression molded samples obtained from XRD results is also reported.
998 POLYMER ENGINEERING AND SCIENCE—-2011 DOI 10.1002/pen
The effects of microinjection and microinjection-com-
pression processing are shown in Table 1. Clearly these
processes do not dramatically influence the crystallinity of
the nanocomposites. The extremely high shear rates of
these processes during the injection phase are expected to
orient the polymer chains in the flow direction and to
result in larger crystallinity. However, since injection is
very fast and the whole cycle takes only few seconds, the
chains do not have enough time to fully crystallize under
the very high cooling rate. In microinjection-compression
molding this effect is less pronounced as the cycle time is
longer due to the compression phase and the cooling rate
is slower. These, combined with applying a certain level
of pressure after injection, result in a relatively larger
crystallinity. The values of Tm for compression and
microinjection samples are also shown in this table. It is
well known that polymer chains are oriented under shear,
and this results in a reduction of the entropy, S, of poly-
mer melts. The equilibrium melting temperature is defined
by [53]:
DG ¼ DH � T0mDS ¼ 0 (5)
where DG is the free energy, DH and DS are the enthalpy
and entropy of fusion, respectively. Considering that the
enthalpy is not affected by flow, the equilibrium melting
temperature must increase as a result of the entropy
reduction [54]. For microinjection molded samples, in
spite of short cycling time, the equilibrium melt tempera-
ture of the neat PP increases due to high deformation rate
of the process, which results in highly oriented polymer
chains. However, as shown in Table 1 there is no differ-
ence between the melting points for the 5 wt% nanocom-
posite samples obtained by compression and microinjec-
tion. Obviously, the presence of nanotubes hinders the
polymer chain orientation. Accordingly, the influence of
microinjection and microinjection-compression on the
degree of crystallinity decreases with nanotube loading.
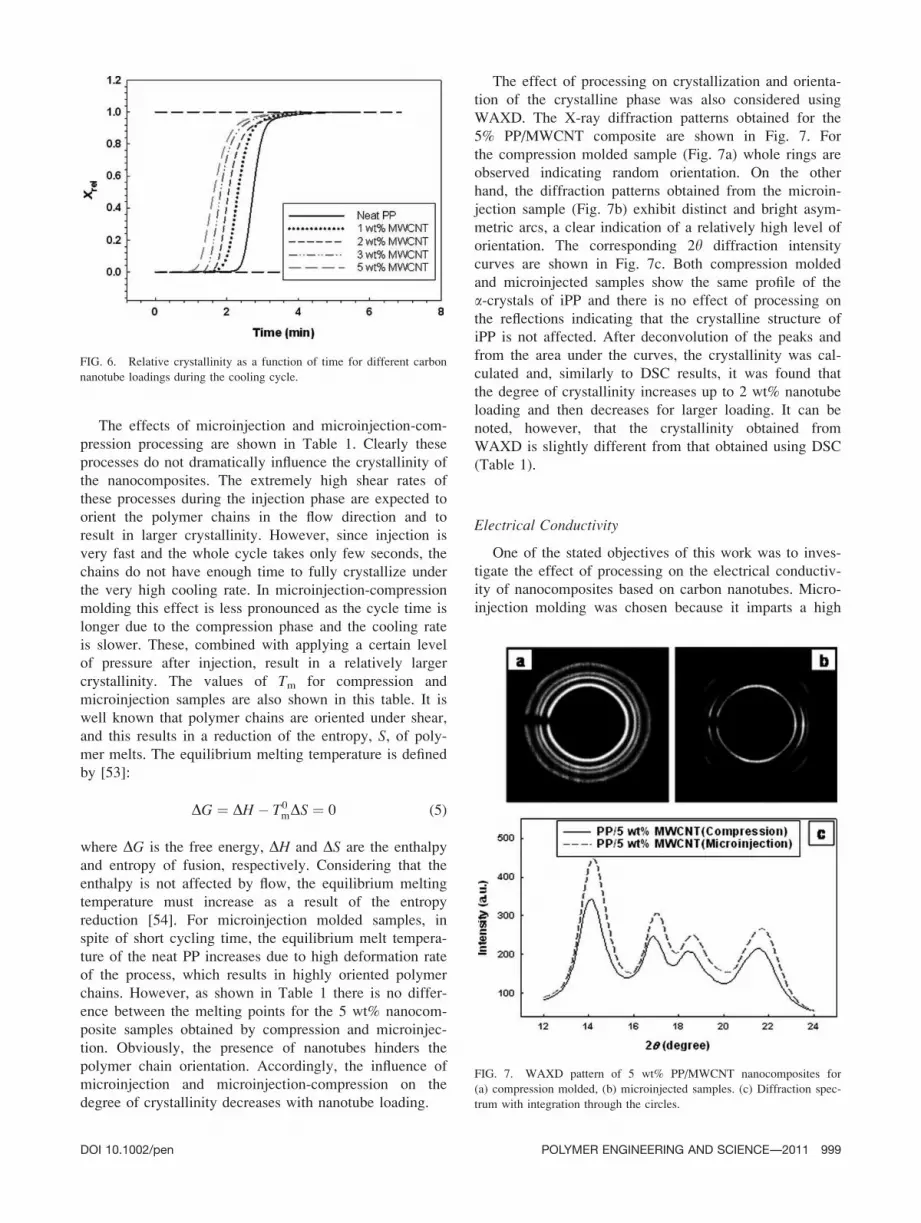
The effect of processing on crystallization and orienta-
tion of the crystalline phase was also considered using
WAXD. The X-ray diffraction patterns obtained for the
5% PP/MWCNT composite are shown in Fig. 7. For
the compression molded sample (Fig. 7a) whole rings are
observed indicating random orientation. On the other
hand, the diffraction patterns obtained from the microin-
jection sample (Fig. 7b) exhibit distinct and bright asym-
metric arcs, a clear indication of a relatively high level of
orientation. The corresponding 2y diffraction intensity
curves are shown in Fig. 7c. Both compression molded
and microinjected samples show the same profile of the
a-crystals of iPP and there is no effect of processing on
the reflections indicating that the crystalline structure of
iPP is not affected. After deconvolution of the peaks and
from the area under the curves, the crystallinity was cal-
culated and, similarly to DSC results, it was found that
the degree of crystallinity increases up to 2 wt% nanotube
loading and then decreases for larger loading. It can be
noted, however, that the crystallinity obtained from
WAXD is slightly different from that obtained using DSC
(Table 1).
Electrical Conductivity
One of the stated objectives of this work was to inves-
tigate the effect of processing on the electrical conductiv-
ity of nanocomposites based on carbon nanotubes. Micro-
injection molding was chosen because it imparts a high
FIG. 6. Relative crystallinity as a function of time for different carbon
nanotube loadings during the cooling cycle.
FIG. 7. WAXD pattern of 5 wt% PP/MWCNT nanocomposites for
(a) compression molded, (b) microinjected samples. (c) Diffraction spec-
trum with integration through the circles.
DOI 10.1002/pen POLYMER ENGINEERING AND SCIENCE—-2011 999

degree of shearing and orientation on the polymer chains
and nanotubes as opposed to compression molding proc-
essing. Moreover, investigating electrical conductivity
may be useful to the understanding of the relationship
between the nanocomposite microstructure and the final
properties of the microparts. Figure 8 presents the effect
of the nanotube loading on the electrical conductivity of
the disk shaped nanocomposite samples prepared by the
same processing methods as previously.
The electrical conductivity above the threshold can be
described by a power-law expression [6, 36]:
s ¼ bc;sm� mc;s
mc;s
� �q
for m � mc;s (6)
where bc,s and q are power-law constants and mc,s is the
electrical percolation threshold (wt%). This power-law
expression is found to describe very well the data of
Fig. 8 above the percolation threshold given by the left
limit of the dashed line corresponds to the percolation
threshold value in each case. For compression molded sam-
ples the percolation threshold is found to be around 3 wt%
of nanotubes for the PC nanocomposites and around
1 wt% for the PP nanocomposites. At these critical concen-
tration levels, the electrical conductivity rises suddenly by
more than 10 decades and nanocomposites containing more
than 1 and 3 wt% (in PP and PC, respectively) can be con-
sidered as electrically conductive. This sudden rise in the
electrical conductivity is due to the formation of a network
of connected nanotubes paths. Beyond this percolation
threshold the electrical conductivity increases more gradu-
ally and asymptotically towards a plateau. This is a typical
percolation behavior, which is usually observed in nano-
composites of conductive fillers and can be referred as an
ideal percolation behavior [13, 55].
Conversely, as can be seen from Fig. 8, no step-like
increase in electrical conductivity is observed for both
PP- and PC-based nanocomposites prepared by microinjec-
tion. In the microinjected samples the nanotubes are well
aligned in the flow direction due to the very high
deformation rates of the process [36] and are less likely to
interconnect. A conductive pathway resulting from a prox-
imity effect would form only at high nanotube contents
and consequently the percolation threshold is expected to
rise. The percolation threshold of microinjected samples,
as determined using Eq. 6, occurs at about 6 and 4 wt%
of nanotubes loading in the PC and PP nanocomposites,
respectively. Our preliminary results (not presented here)
revealed that for a dog-bone shaped mold cavity, where
the main flow is longitudinal, the percolation threshold is
higher (about 9 wt%) and the electrical conductivities are
about one order of magnitude lower than those of the disk
shaped cavity samples. The radial flow of the centrally
gated disk-shape cavity is largely elongational in the cen-
ter zone while shear flow is dominant near the cavity walls
[56]. This yields a more complex orientation of the nano-
tubes: in the radial direction near the walls and in the
transverse or azimutal directions within the core. This
mixed orientation leads to a more random overall orienta-
tion and more interaction between the nanotubes resulting
in a lower electrical percolation threshold.
The electrical threshold pertaining to microinjection-
compression molded samples is found to be close to
the one obtained in compression molded samples. As
described before, this process has two phases: an injection
phase with a high deformation rate-low pressure step and
a compression phase with low deformation rate-high pres-
sure step. Because of the high deformation rate the nano-
tubes are well aligned near the cavity walls at the end of
the first step or injection phase. However, the compres-
sion phase is similar to a squeeze flow, which forces the
nanotubes to partially rearrange in the transverse direction
and results in a somehow isotropic arrangement of the
nanotubes. This is more favorable for the creation of a
nanotube network. The effect of the presence of a crystal-
line structure on the electrical conductivity is also
observed in Fig. 8. Clearly for all processes, the electrical
conductivity is about one order of magnitude larger
and the percolation threshold is somehow lower in the
case of PP nanocomposite. This is explained by the con-
cept of double percolation threshold. Polypropylene can
be considered as a two-phase blend where the nanotubes
are mostly located in the amorphous phase (as shown
before in the morphological study). Accordingly there are
two types of percolation in the nanocomposite at the same
time: percolation resulting in the continuity of the filler-
rich phase or amorphous phase and percolation of nano-
tubes in this phase.
Mechanical Property
Typical stress-strain curves of both PP/MWCNT and
PC/MWCNT nanocomposites with respect to nanotube
content are shown in Fig. 9. The neat PP presents the
FIG. 8. Effect of polymer processing conditions on electrical conduc-
tivity and percolation threshold of the PP/MWCNT (filled symbols) and
PC/MWCNT (open symbols) nanocomposites. The lines shown are the
best fits of Eq. 5.
1000 POLYMER ENGINEERING AND SCIENCE—-2011 DOI 10.1002/pen
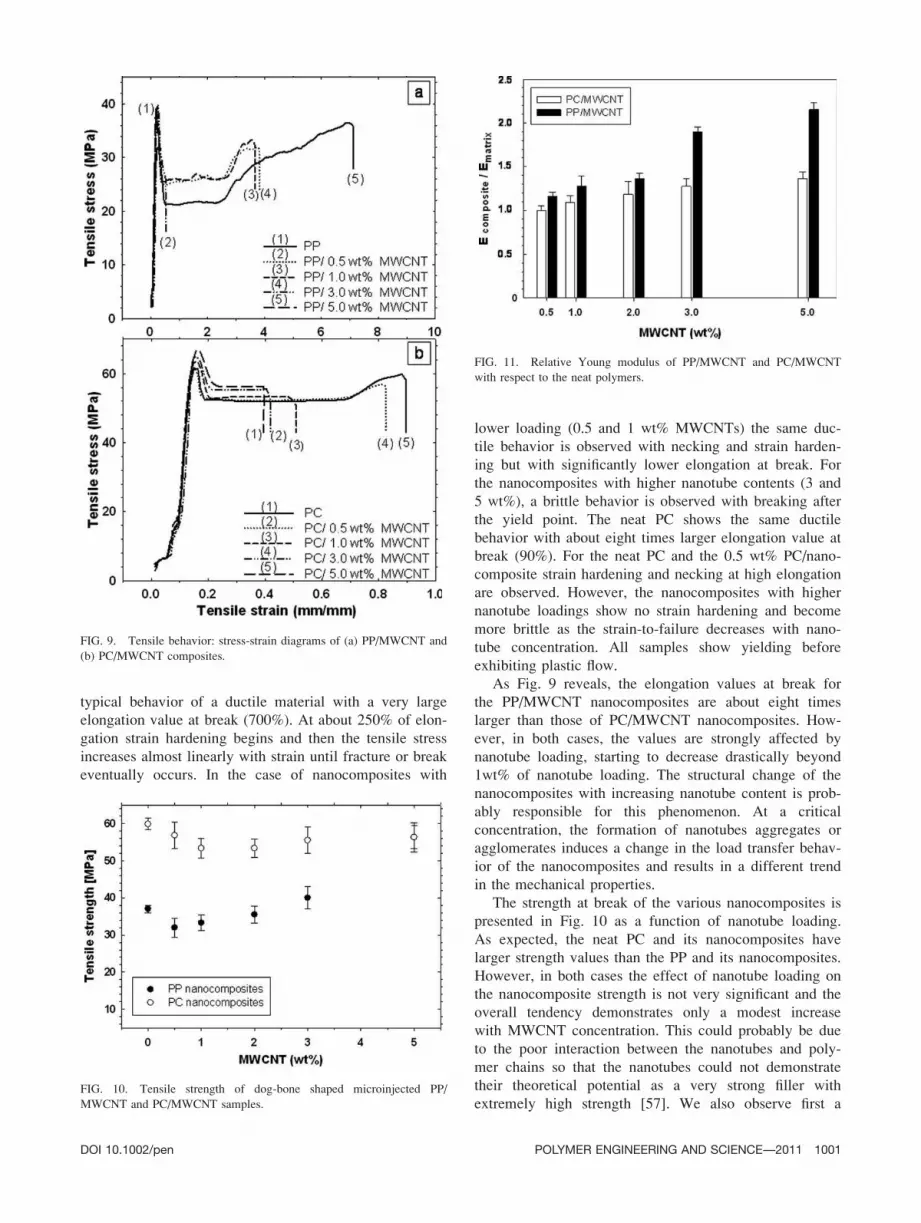
typical behavior of a ductile material with a very large
elongation value at break (700%). At about 250% of elon-
gation strain hardening begins and then the tensile stress
increases almost linearly with strain until fracture or break
eventually occurs. In the case of nanocomposites with
lower loading (0.5 and 1 wt% MWCNTs) the same duc-
tile behavior is observed with necking and strain harden-
ing but with significantly lower elongation at break. For
the nanocomposites with higher nanotube contents (3 and
5 wt%), a brittle behavior is observed with breaking after
the yield point. The neat PC shows the same ductile
behavior with about eight times larger elongation value at
break (90%). For the neat PC and the 0.5 wt% PC/nano-
composite strain hardening and necking at high elongation
are observed. However, the nanocomposites with higher
nanotube loadings show no strain hardening and become
more brittle as the strain-to-failure decreases with nano-
tube concentration. All samples show yielding before
exhibiting plastic flow.
As Fig. 9 reveals, the elongation values at break for
the PP/MWCNT nanocomposites are about eight times
larger than those of PC/MWCNT nanocomposites. How-
ever, in both cases, the values are strongly affected by
nanotube loading, starting to decrease drastically beyond
1wt% of nanotube loading. The structural change of the
nanocomposites with increasing nanotube content is prob-
ably responsible for this phenomenon. At a critical
concentration, the formation of nanotubes aggregates or
agglomerates induces a change in the load transfer behav-
ior of the nanocomposites and results in a different trend
in the mechanical properties.
The strength at break of the various nanocomposites is
presented in Fig. 10 as a function of nanotube loading.
As expected, the neat PC and its nanocomposites have
larger strength values than the PP and its nanocomposites.
However, in both cases the effect of nanotube loading on
the nanocomposite strength is not very significant and the
overall tendency demonstrates only a modest increase
with MWCNT concentration. This could probably be due
to the poor interaction between the nanotubes and poly-
mer chains so that the nanotubes could not demonstrate
their theoretical potential as a very strong filler with
extremely high strength [57]. We also observe first a
FIG. 9. Tensile behavior: stress-strain diagrams of (a) PP/MWCNT and
(b) PC/MWCNT composites.
FIG. 10. Tensile strength of dog-bone shaped microinjected PP/
MWCNT and PC/MWCNT samples.
FIG. 11. Relative Young modulus of PP/MWCNT and PC/MWCNT
with respect to the neat polymers.
DOI 10.1002/pen POLYMER ENGINEERING AND SCIENCE—-2011 1001

slight decrease of the strength at break then an increase
with MWCNT loading after 1 wt% in PC and after
2 wt% in PP, probably due to the formation of nanotube
networks at these concentrations.
The effect of MWCNT loading on the Young modulus
of the nanocomposites is shown in Fig. 11. In order to
compare the effect of nanotubes on the modulus of PP
and PC, the raw values are normalized with respect to the
neat polymer modulus. It is observed that the addition of
nanotubes significantly affects the Young modulus of PP
while the effect is less significant in the case of the PC/
MWCNT nanocomposites. The modulus of the PP
increases by more than 90% with only 3 wt% of nano-
tubes largely due to the increased degree of crystallinity,
while for the PC the increase is considerably less, about
30% for the same nanotube content. However, the rate of
increase of the elastic modulus is quite modest for larger
nanotube loadings.
CONCLUSIONS
In this work we have examined the effects of crystal-
line structure and polymer processing on PP/MWCNT
and PC/MWCNT nanocomposite properties. Three differ-
ent polymer processing methods, compression molding,
microinjection-compression molding and microinjection
molding have been investigated. The study of the crystal-
line behavior of PP/MWCNT nanocomposites revealed
that the presence of the nanotubes significantly affected
the nanocomposite structure. The degree of crystallinity
went through a maximum at 2 wt % nanotube and then
the crystallinity decreased due to the formation of nano-
tube networks, which restricted the polymer chains
motion and slowed down the crystal growth. It was also
found that the high deformation values of the microinjec-
tion molding only slightly changed the overall crystallin-
ity because of very short cycle time of the process. How-
ever, the crystals were all oriented in the flow direction.
Interestingly, changing the type of processing strongly
affected the electrical conductivity of the nanocomposites.
The percolation thresholds rose significantly in both PP
and PC nanocomposites using processing involving larger
deformation rates. In these cases no neat percolation
threshold was observed. The presence of a crystalline
structure was also found to improve the electrical conduc-
tivity of PP/nanocomposites according to the concept of
double percolation threshold. The strength and modulus
of the nanocomposites were also found to be significantly
improved by the addition of nanotubes especially in case
of the PP/MWCNT nanocomposites. However, the elon-
gation at break was found to decrease significantly with
nanotube content.
ACKNOWLEDGMENTS
The authors are also thankful to Ms. Weawkamol Lee-
lapornpisit for her great help in the morphological studies.
Financial support from NSERC (Natural Science and
Engineering Research Council of Canada) is gratefully
acknowledged.
REFERENCES
1. S. Iijima, Nature, 354, 6348 (1991).
2. S. Iijima and T. Ichihashi, Nature, 363, 6430 (1993).
3. M. Meyyappan, Carbon Nanotubes: Science and Applica-
tions, CRC Press, Boca Raton (2005).
4. O. Meincke, D. Kaempfer, H. Weickmann, C. Friedrich, M.
Vathauer, and H.O. Warth, Polymer, 45, 739 (2004).
5. M. Moniruzzaman and K.I. Winey, Macromolecules, 39,
5194 (2006).
6. G. Hu, C. Zhao, S. Zhang, M. Yang, and Z.G. Wang, Poly-
mer, 47, 480 (2006).
7. Y.T. Sung, M.S. Han, K. H. Song, J.W. Jung, H.S. Lee,
C.K. Kum, J. Joo, and W.N. Kim, Polymer, 47, 4434
(2006).
8. G.T. Pham, Y.B. Park, S. Wang, Z. Liang, B. Wang, C.
Zhang, P. Funchess, and L. Kramer, Nanotechnology, 19,
325705 (2008).
9. W.Y. Wang, G.H. Luo, F. Wei, and J. Luo, Polym. Eng.
Sci., 49, 2144 (2009).
10. L. Karasek and M. Sumita, J. Mater. Sci., 31, 281 (1996).
11. M. Sumita, S. Asai, N. Miyadera, E. Jojima, and K. Miya-
saka, Colloid Polym. Sci., 264, 212 (1986).
12. M. Sumita, H. Abe, H. Kayaki, and K. Miyasaka, J.
Macromol. Sci., Part B, 25, 171 (1986).
13. D. Wu, L. Wu, W. Zhou, T. Yang, and M. Zhang, Polym.
Eng. Sci., 49, 1727 (2009).
14. P. Potschke, A.R. Bhattacharyya, and A. Janke, Carbon,
42, 965 (2004).
15. J. Zeng, B. Saltysiak, W.S. Johnson, D.A. Schiraldi, and S.
Kuma, Compos. B, 35, 173 (2004).
16. B. Lin, U. Sundararaj, and P. Potschke, Macromol. Mater.
Eng., 291, 227 (2006).
17. F. Du, R.C. Scogna, W. Zhou, S. Brand, J.E. Fischer, and
K.I. Winey, Macromolecules, 37, 9048 (2004).
18. J.K.W. Sandler, J.E. Kirk, I.A. Kinloch, M.S.P. Shaffer, and
A.H. Windle, Polymer, 44, 5893 (2003).
19. K. Jeon, L. Lumata, T. Tokumoto, E. Steven, J. Brooks, and
R.G. Alamo, Polymer, 48, 4751 (2007).
20. S.C. Tjong, G.D. Liang, and S.P. Bao, Polym. Eng. Sci.,
48, 177 (2008).
21. M. Sumita, K. Sakata, S. Asai, K. Miyasaka, and H. Naka-
gawa, Polym. Bull., 25, 265 (1991).
22. M. Sumita, K. Sakata, Y. Hayakawa, S. Asai, K. Miyasaka,
and M. Tanemura, Colloid Polym. Sci., 270, 134 (1992).
23. V. Tan and M.R. Kamal, J. Appl. Polym. Sci., 22, 2341
(1978).
24. C. Kukla, H. Loibl, and H. Detter, Kunstsoffe Plast, Europe
88, 6 (1998).
25. B. Sha, S. Dimov, C. Griffiths, M.S. Packianather, Int. J.
Adv. Manuf. Technol., 33, 147 (2007).
26. J. Zhao, R.H. Mayes, G. Chen, H. Xie, and P.S. Chan,
Polym. Eng. Sci., 43, 1542 (2003).
1002 POLYMER ENGINEERING AND SCIENCE—-2011 DOI 10.1002/pen

27. C.H. Wu and W.J. Liang, Polym. Eng. Sci., 45, 1021
(2005).
28. Y.C. Su, J. Shah, L. Lin, J. Micromech. Microeng., 14, 415
(2004).
29. R.D. Chien, Sens. Actuators, A: Phys., 128, 238 (2006).
30. C.K. Huang, Eur. Polym. J., 42, 2174 (2006).
31. C.K. Huang, S.W. Chen, and C.T. Yang, Polym. Eng. Sci.,
45, 1471 (2005).
32. S. Abbasi, P.J. Carreau, and A. Derdouri, Polymer, 51, 922
(2010).
33. W. Ding, A. Eitan, F.T. Fisher, X. Chen, D.A. Dikin, R.
Andrews, L.C. Brinson, L.S. Schadler, and R.S. Ruoff,
Nano Lett., 3, 1593 (2003).
34. S. Singh, Y. Pei, R. Miller, and P.R. Sundararajan, Adv.
Funct. Mater., 13, 868 (2003).
35. P. Potschke, M. Abdel-Goad, I. Alig, S. Dudkin, and D.
Lellinger, Polymer, 45, 8863 (2004).
36. S. Abbasi, P.J. Carreau, A. Derdouri, and M. Moan, Rheo-
logica Acta, 48, 943 (2009).
37. X. Chen, J. Hu, L. Zhou, W. Li, Z. Yang, Y. Wang, J.
Mater. Sci. Technol., 24, 279 (2008).
38. T.E. Chang, L.R. Jensen, A. Kisliuk, R.B. Pipes, R. Pyrz,
and A.P. Sokolov, Polymer, 46, 439 (2005).
39. A.A. Koval’chuk, A.N. Shchegolikhin, V.G. Shevchenko,
P.M. Nedorezova, A.N. Klyamkina, and A.M. Aladyshev,
Macromolecules, 41, 3149 (2008).
40. K. Prashantha, J. Soulestin, M.F. Lacrampe, P. Krawczak, G.
Dupin, and M. Claes, Compos. Sci. Technol., 69, 1756 (2009).
41. H.G. Kilian, G. Lagaly, and I. Chudacek, ‘‘Relationships of
Polymeric Structure and Properties,’’ Progress in Colloid and
Polymer Science, Vol. 78, Springer, Berlin/Heidelberg (1988).
42. P. Potschke, T.D. Fornes, and D.R. Paul, Polymer, 43,
3247 (2002).
43. D.W. Litchfield and D.G. Baird, Polymer, 49, 5027 (2008).
44. G.W. Lee, S. Jagannathan, H.G. Chae, M.L. Minus, and S.
Kumar, Polymer, 49, 1831 (2008).
45. L.E. Nielsen and R.F. Landel, Mechanical Properties of
Polymers and Composites, 2nd ed., Marcel Dekker, New
York (1993).
46. A. Sharples, Introduction to Polymer Crystallization, St.
Martin’s Press, New York (1966).
47. T.S. Nordmark and G.R. Ziegler, Carbohydrate Polym., 49,
439 (2002).
48. D. Wu, L. Wu, G. Yu, B. Xu, and M. Zhang, Polym. Eng.
Sci., 48, 1057 (2008).
49. J.Y. Kim., S.-I. Han, S.H. Kim, Polym. Eng. Sci., 47, 1715
(2007).
50. S.Y. Lin, E.C. Chen, K.Y. Liu, and T.M. Wu, Polym. Eng.
Sci., 49, 2447 (2009).
51. C.-F. Ou, M.-S. Chao, S.-L. Europ, Polym. J., 36, 2665
(2000).
52. V.A. Alvarez, P.M. Stefani, and A. Vazquez, J. Thermal
Anal. Calorimetry, 79, 187 (2005).
53. B. Monasse, J. Mater. Sci., 30, 5002 (1995).
54. T.W. Haas and B. Maxwell, Polym. Eng. Sci., 9, 225
(1969).
55. X. Feng, G. Liao, J. Du, L. Dong, K. Jin, and X. Jian,
Polym. Eng. Sci., 48, 1007 (2008).
56. M. Vincent, E. Devilers, and J.F. Agassant, J. Non-Newton
Fluid Mech., 73, 317 (1997).
57. Z. Fang, J. Wang, and A. Gu, Poly. Eng. Sci., 46, 670
(2006).
DOI 10.1002/pen POLYMER ENGINEERING AND SCIENCE—-2011 1003