analysis of gate freeze-off time in injection molding
TRANSCRIPT
1
THIS IS THE PEER REVIEWED VERSION OF
THE FOLLOWING ARTICLE:
R. Pantani, F. De Santis, V. Brucato, G. Titomanlio
“ANALYSIS OF GATE FREEZE-OFF TIME IN INJECTION MOLDING”
Polymer Engineering and Science – 44 – 2004 – p. 1-17
DOI: 10.1002/pen.20000
WHICH HAS BEEN PUBLISHED IN FINAL FORM AT
http://onlinelibrary.wiley.com/doi/10.1002/pen.20000/abstract
This article may be used only for non-commercial purposes
2
ANALYSIS OF GATE FREEZE-OFF TIME IN INJECTION MOLDING
R. Pantani*, F. De Santis, V. Brucato, G. Titomanlio
Dept. of Chemical and Food Engineering
University of Salerno
I-84084 Fisciano (SA)
ITALY
* to whom correspondence should be addressed
Dr. Roberto Pantani
University of Salerno
Dept. of Chemical and Food Engineering
via Ponte don Melillo
I-84084 Fisciano (SA)
ITALY
tel. +39 089 96 4013
fax +39 089 96 4057
e-mail: [email protected]
3
ANALYSIS OF GATE FREEZE-OFF TIME IN INJECTION MOLDING
R. Pantani, F. De Santis, V. Brucato, G. Titomanlio
Dept. of Chemical and Food Engineering
University of Salerno
I-84084 Fisciano (SA)
ITALY
e-mail address: [email protected]
ABSTRACT
Gate solidification time in injection molding technology is an important topic, determining
cycle time, which on its turn represents an important issue in the economic balance of the
production.
In this work, a study of the effect of both gate and cavity geometries on gate solidification
time was conducted, with reference to a commercial polymer, injection molded with constant
holding pressure into a rectangular cavity. Three cavity lengths and, for each of them, two
cavity thicknesses were adopted. Special dies containing different gates were assembled in the
mould.
Gate thickness was found to be the most important factor determining gate sealing time,
however also cavity geometry is quite important. A clear indication on gate solidification
could be drawn also by analyzing time evolution of pressure distribution in the mold.
The solidification phenomenon leading to gate sealing was analyzed by a simple model,
which keeps into account also the effect of cavity geometry, by comparing heat flow through
gate walls with energy required to solidify packing flow rate. Model results satisfactorily
describe main features of experimental data.
Keywords: injection molding, packing flow, gate, solidification, modeling
4
INTRODUCTION
Injection molding is commonly schematized into three main phases: filling step, during which
a molten resin is injected into a cavity colder than its solidification temperature;
packing/holding step, when further mass is driven inside the cavity by applying an
overpressure inside the injection chamber; cooling step, which starts when the gate (which is
the last part of the channel feeding the cavity, normally having a cross section smaller than
the cavity itself) solidifies and lasts until de-molding, when a sufficient material solidification
inside the cavity is reached.
Packing phase is by far the most critical part of the process for technical applications. This
step was expressly introduced to counteract part shrinkage. It gives the operator the chance of
controlling pressure levels inside the cavity during solidification, thus influencing
morphology and many important properties of the final product such as dimensional accuracy
and stability (1,2). Packing phase is effective until gate solidifies, as mass is not allowed to
enter the cavity afterwards. Gate sealing time is unknown to the operator and is strongly
dependent upon process conditions and mold geometry. This normally compels to
experimentally determine gate sealing time when process conditions or mold geometry are
changed.
Despite of a significant effort spent on numerical simulation of injection molding process,
gate design is still an open challenge for industry and researchers (3). Indeed, the general
problem of the cooling and solidification of a flowing viscous melt has been faced in the past
by several scientists: a review is given by Pearson (4). The general solution of the entrance
heat transfer problem has been given as early as 1928 by Leveque (5). Since then several
attempts have been made to extend the solution to power-law fluids with high viscosity, e.g.
Richardson (6,7) or Gottifredi et al. (8, 9). Solutions are quite complex, since the energy
5
equation and the momentum equation are coupled through the convective term and
temperature-dependent physical properties. Simplified models often rely on the assumption of
constant convection terms (10,11) and further simplifications even involve decoupling of the
equations by assuming a priori that the flow channel narrows with time following specific
phenomenological equations (12). These models can successfully be applied during the filling
step, when the flow rate is about constant, and indeed well predict the frozen layer
development with time as well as the pressure profile. However, in the normal practice of
injection molding process, filling step is performed in the shortest possible time (13) and
usually takes only about 10% of the whole cycle time from injection start to gate
solidification. This means that most of gate solidification time happens during the
packing/holding step, during which flow rate, and thus convection terms, is not constant but
gradually decreases with time.
Due to the complexity of the mechanisms influencing gate solidification, it is still unclear
which are the parameters that determine the duration of the packing phase. Among these, gate
and cavity geometry are certainly significant, nevertheless their role is not yet understood.
In this work, a study on the effect of both gate and cavity geometries on gate solidification
time is reported. Gate freeze-off time was evaluated by monitoring the weight of the moldings
on increasing holding time. The solidification phenomenon at gate leading to cavity sealing
was analyzed by a simple model, which describes also the role of cavity geometry.
EXPERIMENTAL
MATERIAL
A heterophasic polypropylene (HIFAX BA 238 G3, kindly supplied by Montell), containing
about 26% weight percentage of an Ethylene-Propylene rubber phase and a small percentage
of talc, was used along this work. The resin was quite well characterized in the literature: in
6
particular, thermal properties are reported in C-Mold 99.1 data base (14) an also given by
Pantani et al. (15) whereas volumetric parameters and the P-V-T behaviour were described by
Pantani and Titomanlio (16). Material crystallisation kinetics, as characterized by Pantani and
Titomanlio (16), due to the presence of talc which acts as a nucleating agent, is very fast. This
means that the crystallisation (and thus solidification) happens in a very narrow temperature
range, which only slightly changes with cooling rate. Material solidification in process
condition was characterised by Pantani et al. (15).
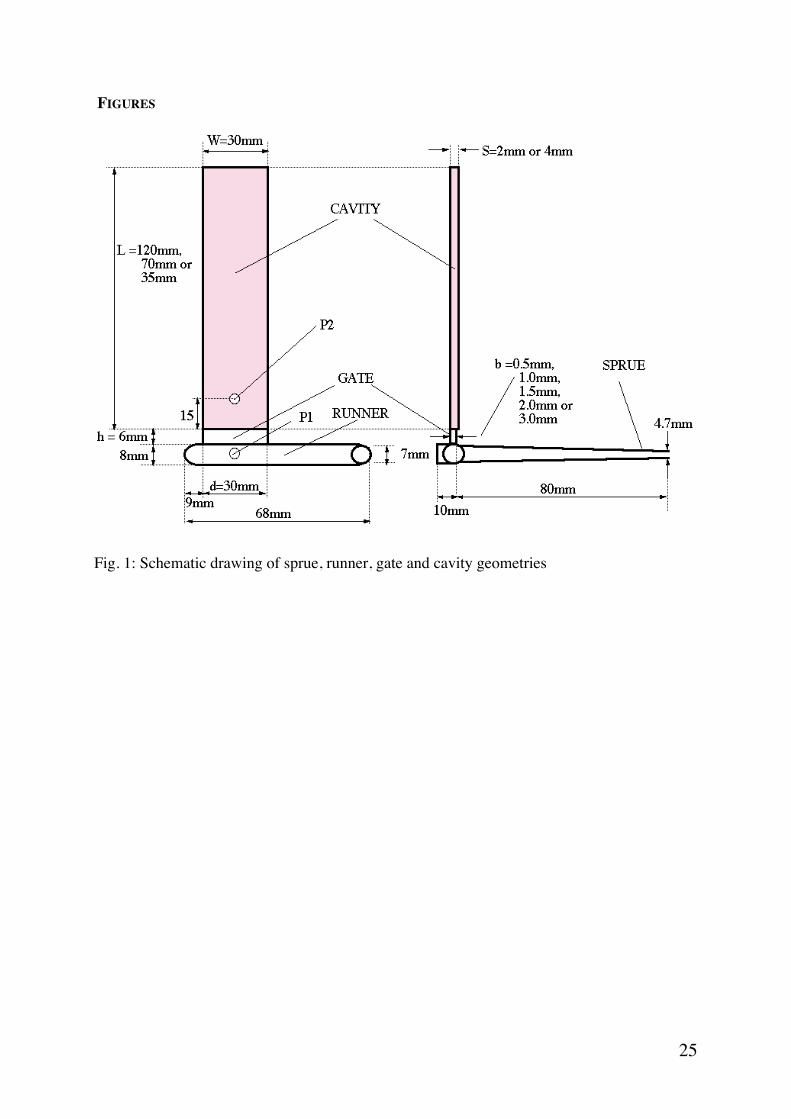
GATE THICKNESS, CAVITY GEOMETRY AND INJECTION MOLDING TESTS
A 65-ton Penta reciprocating screw injection molding machine was used for injection molding
experiments. A nozzle of diameter 2.2mm and length 40mm was adopted. The sprue tapered
from a diameter of 7mm (at mold side) to a diameter of 4.7mm (at nozzle side) over a length
of 80mm. The runner had a diameter of 8mm and was 68mm long. The material was injected
into a line gated rectangular cavity having a width, W, of 30mm. Special dies containing
different cavities could be assembled in the mold. In particular use was made of cavities
having thickness, S, either of 2mm or 4mm and length, L, of 120mm or 65mm or 35mm.
Several gates were adopted, all of them having the same width, d, of the cavity, length, h, of
6mm and thicknesses, b, ranging in the interval from 0.5mm to 3mm (the 3mm thick gate was
used only with the 4mm thick cavity). Two Kistler piezoelectric pressure transducers were
placed along the flow path, one in the runner just before the gate and the other inside the
cavity 15mm downstream to the gate. These positions will be referred to as P1 and P2,
respectively. Transducers signals were read by a fast data acquisition system and stored in a
desktop computer. A complete description of cavity geometry is given in fig. 1.
For all molding tests, barrel and mold temperatures were 503K and 303K, respectively and a
constant holding pressure of 45MPa was adopted. Flow rate was set in the machine controller
7
to 34 cm3/sec, leading to a filling time ranging from about 0.6sec for the smallest cavity to
about 1sec for the largest one. The time spent by the melt front to reach gate position was
about 0.5sec for all molding tests.
For each cavity and gate geometry, several injection molding tests were carried out adopting
holding times decreasing from values longer down to times shorter than gate sealing time.
Each sample was weighed after ejection, thus obtaining a weight versus holding time plot for
each geometry.
EXPERIMENTAL RESULTS
PRESSURE CURVES
The typical pressure evolution inside the cavity during an injection molding cycle is
schematized in fig. 2. Pressure remains zero until the polymer melt reaches the transducer
position (time t’). The pressure then smoothly increases because of the pressure loss due to
the polymer flow along an increasing path, that extends from transducer to the position of the
moving flow front (where pressure is zero). As soon as the polymer completely fills the cavity
(time t”, end of filling step), pressure sharply increases. The machine control switches from a
constant flow rate to a constant pressure and the packing/holding step begins (if a late switch
happens, a peak can be present in pressure profile at t”). At time t’”, gates solidifies thus
sealing the cavity, and pressure decreases because of the progressive increase of material
density due to cooling.
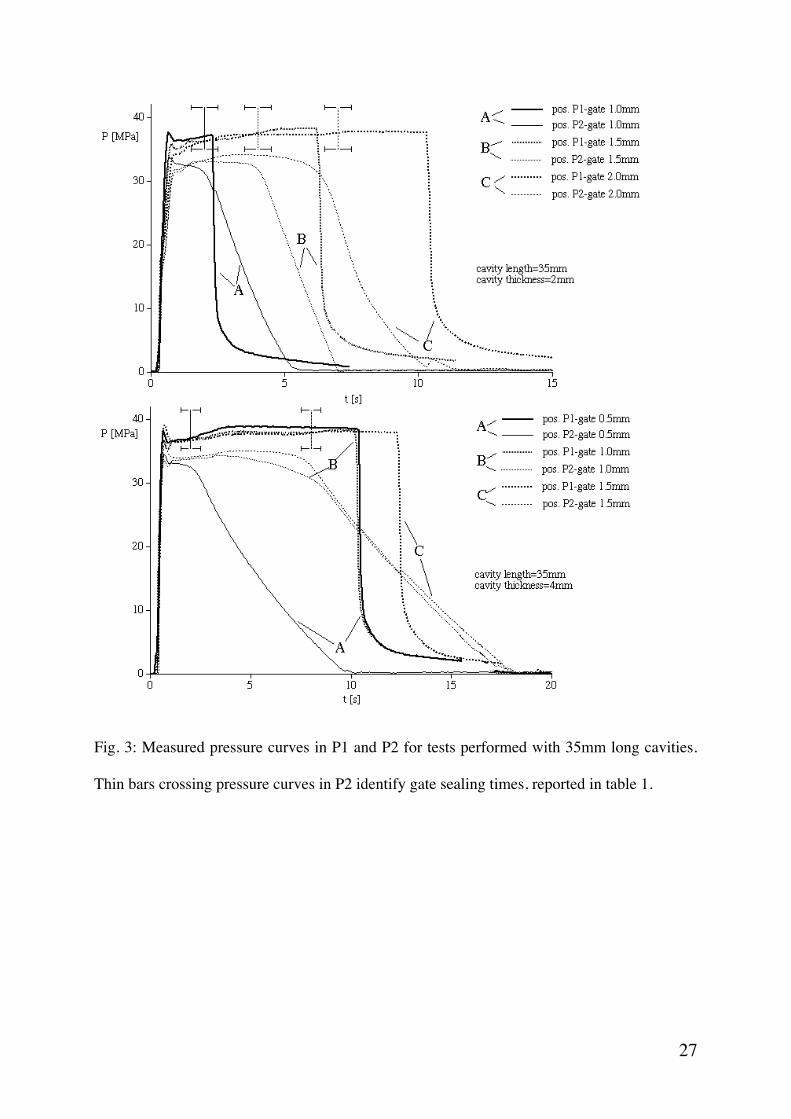
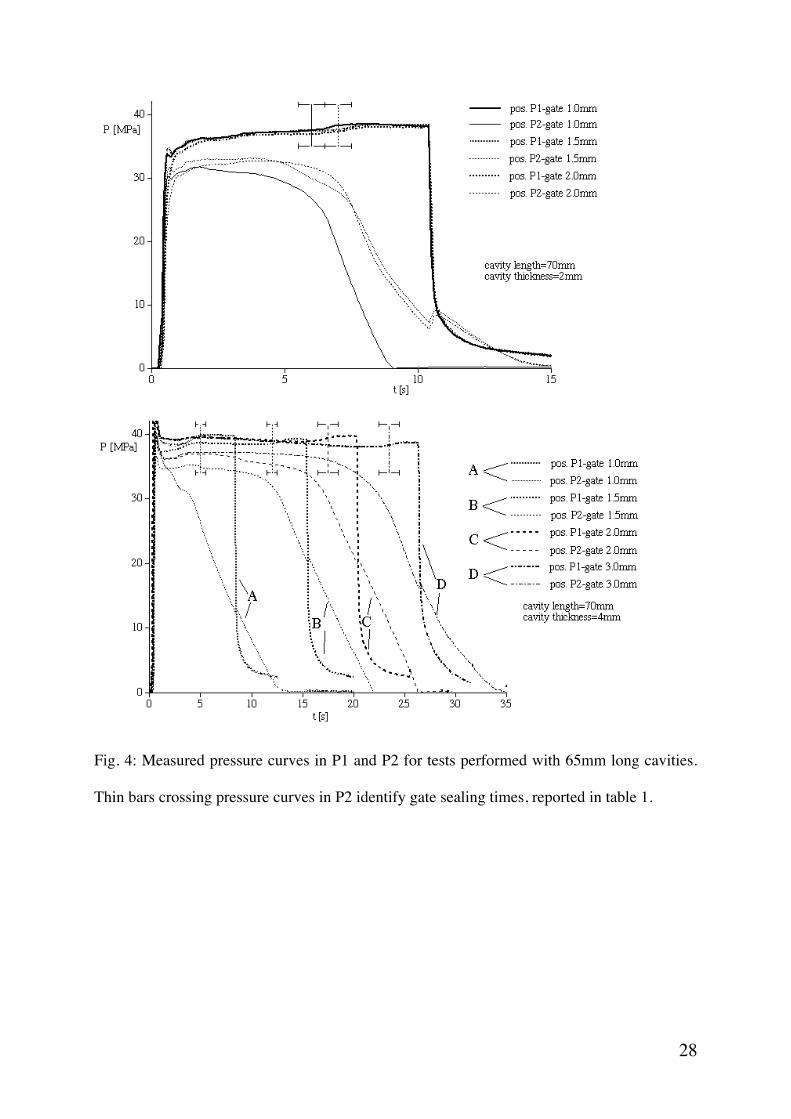
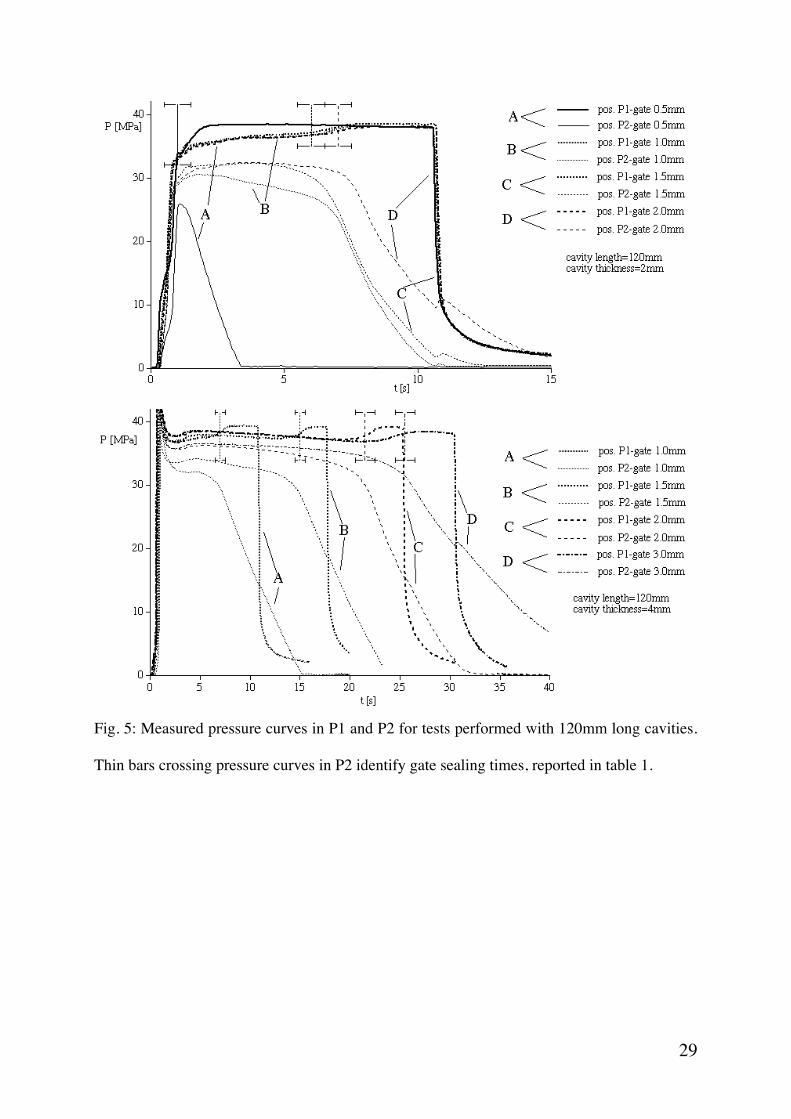
Experimental pressure curves both in the runner, P1, and inside the cavity, P2, for most of the
tests performed adopting holding times longer than gate sealing times and cavity lengths of
35mm, 65mm and 120mm, are reported in figures 3, 4 and 5, respectively.
As expected, for a given cavity, gate thickness strongly influences pressure evolution inside
the cavity: apart from minor effects due to a not complete reproducibility of holding pressure
8
profile, a thicker gate causes a delay in the time when pressures drop inside the cavity. For the
same gate, cavity geometry (i.e. cavity thickness and length) influences pressure evolution in
P2. The effect of cavity length and thickness is quite straightforward: a longer cavity, for the
same cavity thickness, causes a delay of the time when pressures drop inside the cavity; for
the same cavity length, a thicker cavity assures a slower pressure decrease inside the cavity.
Consequently, an increase of either cavity length or thickness leads to an increase of the time
when cavity pressure attains zero.
GATE SOLIDIFICATION TIME
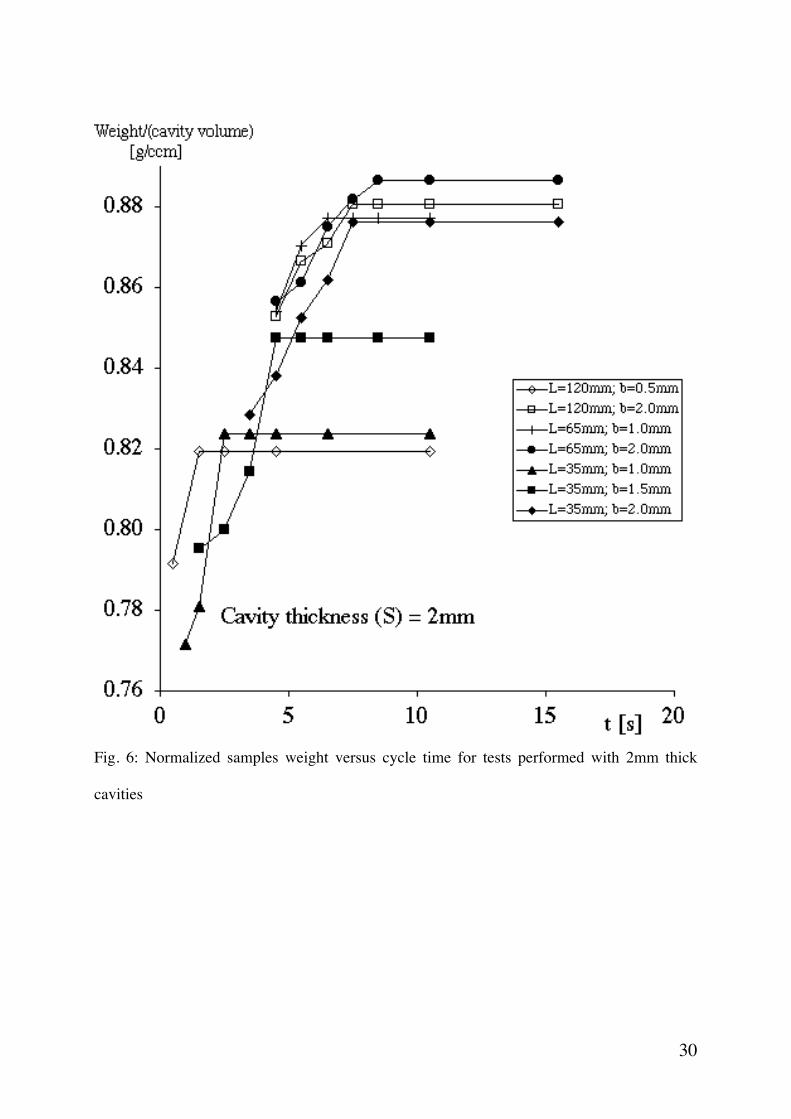
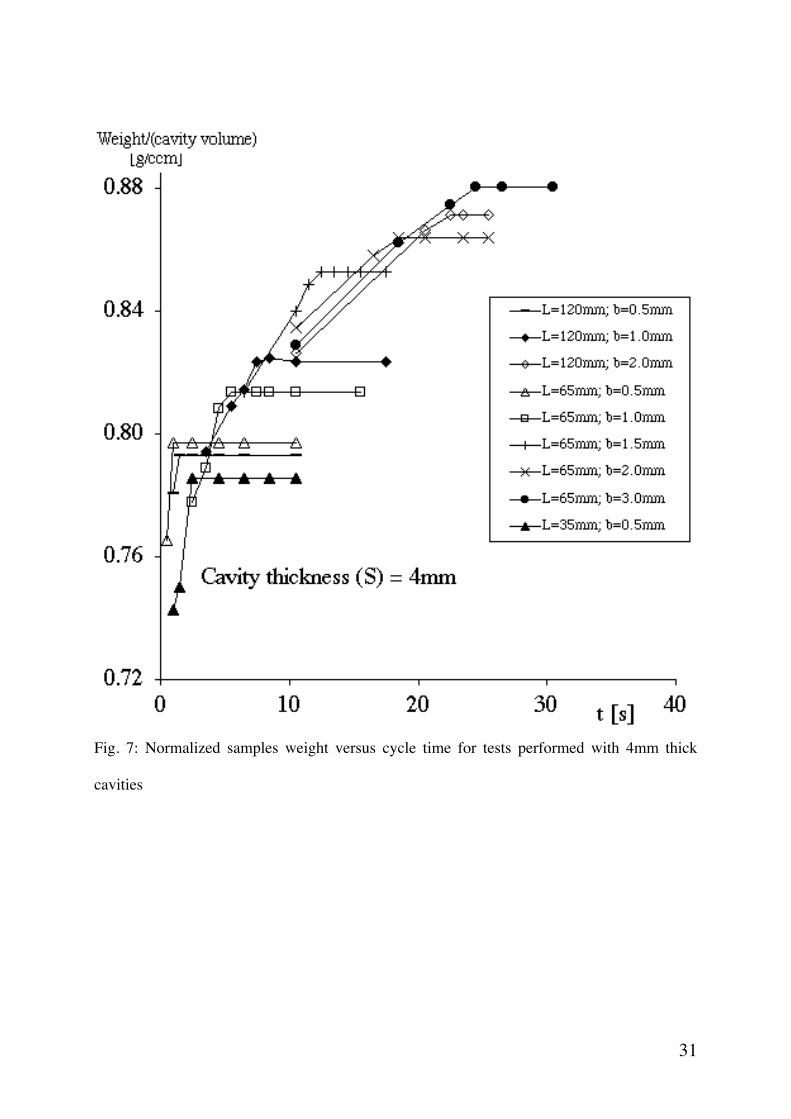
SAMPLES WEIGHT MEASUREMENTS
As specified above, for each geometry, several tests were performed adopting different
holding times, both shorter and longer than gate sealing time. Each sample was weighed after
cutting out the scraps (only the part marked in gray in fig. 1 was weighed). The dependence of
the weight of most of the samples upon time elapsed from the beginning of molding cycle up
to the end of holding step is shown in figures 6 and 7 with reference to tests performed with
cavities 2mm and 4mm thick, respectively. In order to report all data on a comparable scale,
the weight of each sample is plotted after normalization to the volume of the cavity where it
was molded. For each test, samples weight increases with holding time up to the time when
gate solidifies, and remains constant for longer holding times. Indeed, gate solidification time
is usually identified as the time after which sample weight does not increase any more. Of
course, weight data of figures 5 and 6 provide a time interval where the gate passes from an
open condition (the weight is still increasing with time) to complete solidification (the weight
does not increase any more). For each molding condition, a time interval within which gate
solidifies can be identified from data similar to those presented in figures 5 and 6; it is
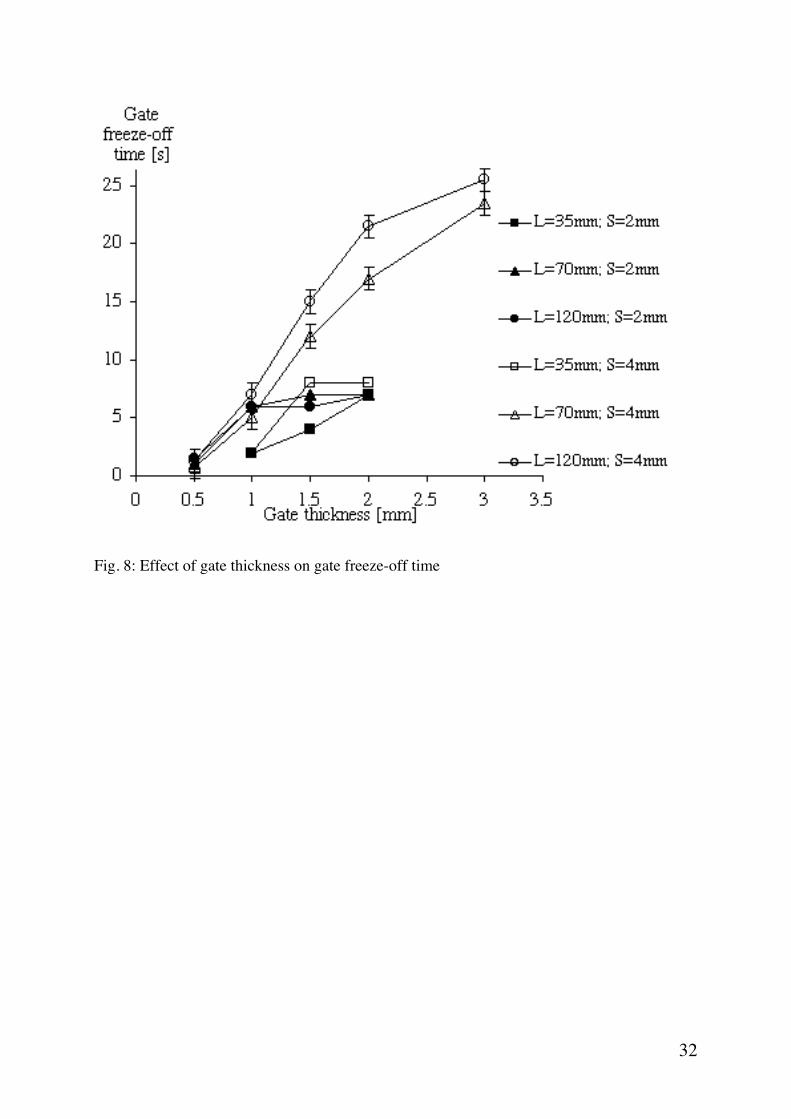
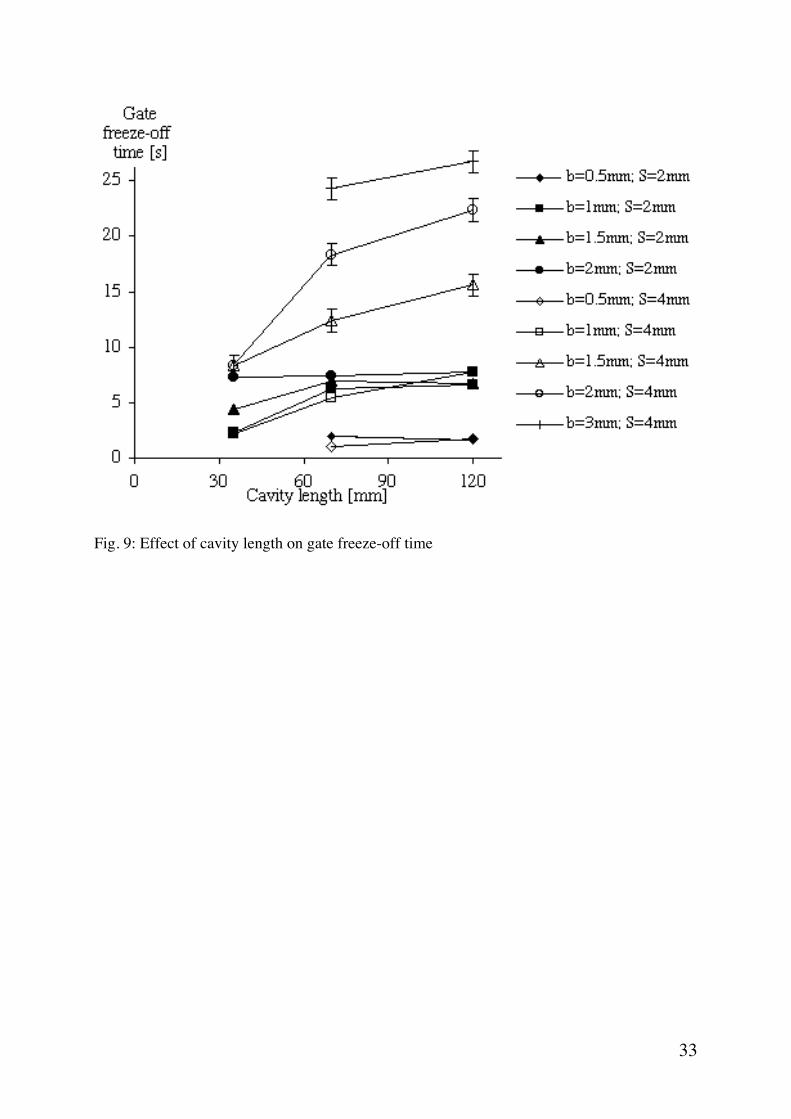
reported in table 1 and in figures 7 and 8 versus gate thickness and cavity length.
9
Solidification times (and related uncertainty bars) are also reported in figures from 3 to 5 as
thin bars crossing pressure profiles in P1.
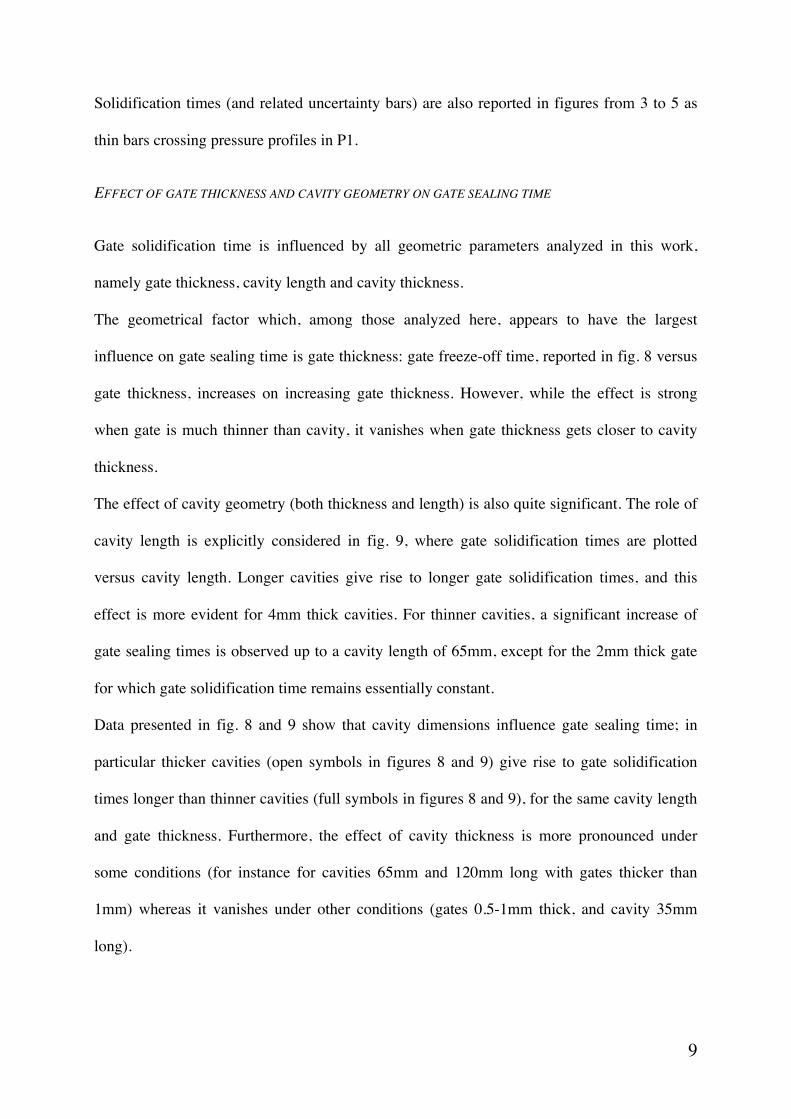
EFFECT OF GATE THICKNESS AND CAVITY GEOMETRY ON GATE SEALING TIME
Gate solidification time is influenced by all geometric parameters analyzed in this work,
namely gate thickness, cavity length and cavity thickness.
The geometrical factor which, among those analyzed here, appears to have the largest
influence on gate sealing time is gate thickness: gate freeze-off time, reported in fig. 8 versus
gate thickness, increases on increasing gate thickness. However, while the effect is strong
when gate is much thinner than cavity, it vanishes when gate thickness gets closer to cavity
thickness.
The effect of cavity geometry (both thickness and length) is also quite significant. The role of
cavity length is explicitly considered in fig. 9, where gate solidification times are plotted
versus cavity length. Longer cavities give rise to longer gate solidification times, and this
effect is more evident for 4mm thick cavities. For thinner cavities, a significant increase of
gate sealing times is observed up to a cavity length of 65mm, except for the 2mm thick gate
for which gate solidification time remains essentially constant.
Data presented in fig. 8 and 9 show that cavity dimensions influence gate sealing time; in
particular thicker cavities (open symbols in figures 8 and 9) give rise to gate solidification
times longer than thinner cavities (full symbols in figures 8 and 9), for the same cavity length
and gate thickness. Furthermore, the effect of cavity thickness is more pronounced under
some conditions (for instance for cavities 65mm and 120mm long with gates thicker than
1mm) whereas it vanishes under other conditions (gates 0.5-1mm thick, and cavity 35mm
long).
10
As mentioned above, gate solidification time increases with cavity length and thickness. The
simplest combination of the two effects would infer that gate solidification time increases
with cavity volume. Unfortunately, data reported in table 1 exclude that cavity volume is the
determining factor for gate sealing time. For the same gate thickness of 1mm, for instance, the
series of data collected with cavity length 35mm and cavity thickness 4mm shows gate
sealing times very different with respect to the series performed with a cavity 65mm long and
2mm thick (2sec and 6sec, respectively), in spite of the very similar cavity volumes. The same
happens for a gate thickness of 2mm: the series of data collected with cavity length 120mm
and cavity thickness 2mm shows gate sealing times much shorter with respect to the series
performed with a cavity 65mm long and 4mm thick (7sec and 17sec, respectively).
PREDICTIONS OF GATE SEALING TIME BY CAE
C-Mold 99.1 of AC Technology provides reasonably good predictions of pressure evolution
during injection molding of the material adopted in this work (17). The same software was
therefore adopted in this work to analyze the evolution of frozen layer at gate position for
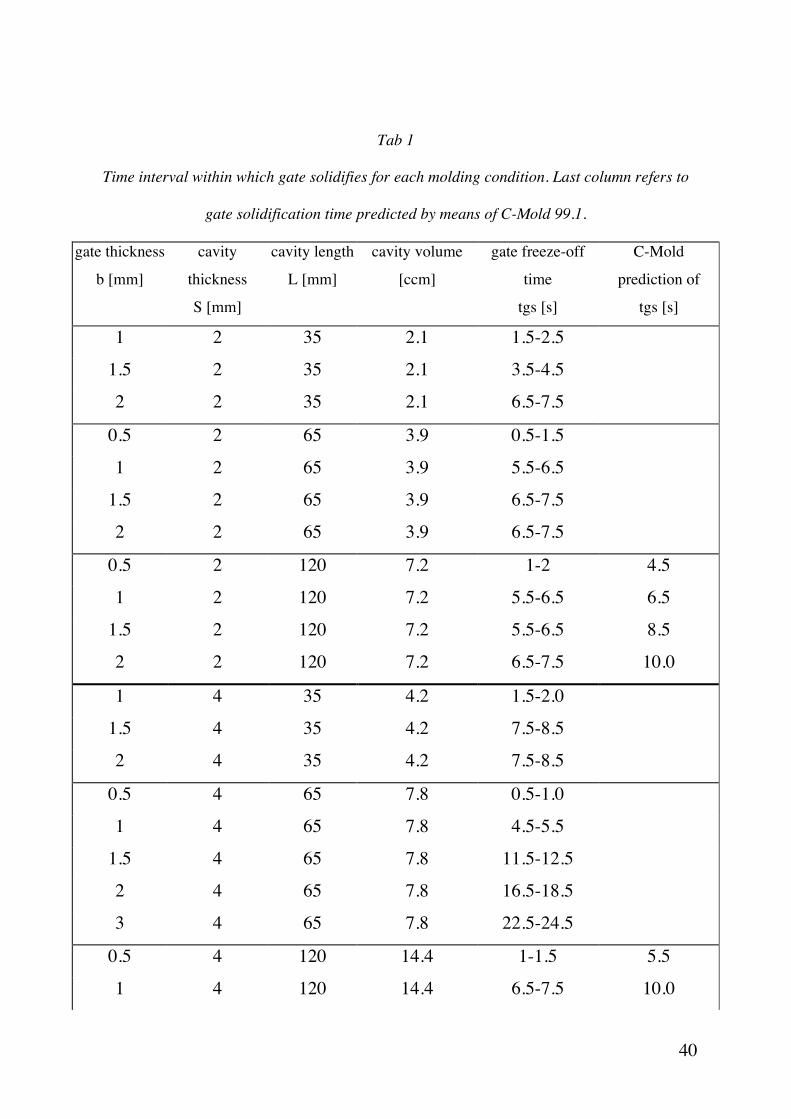
injection molding tests performed with a cavity 120mm long. Results are reported in table 1,
and generally overestimate experimental results, especially for tests performed with the 2mm
thick cavity. This confirms that prediction of gate sealing time is still a challenging topic in
modeling and simulation of injection molding.
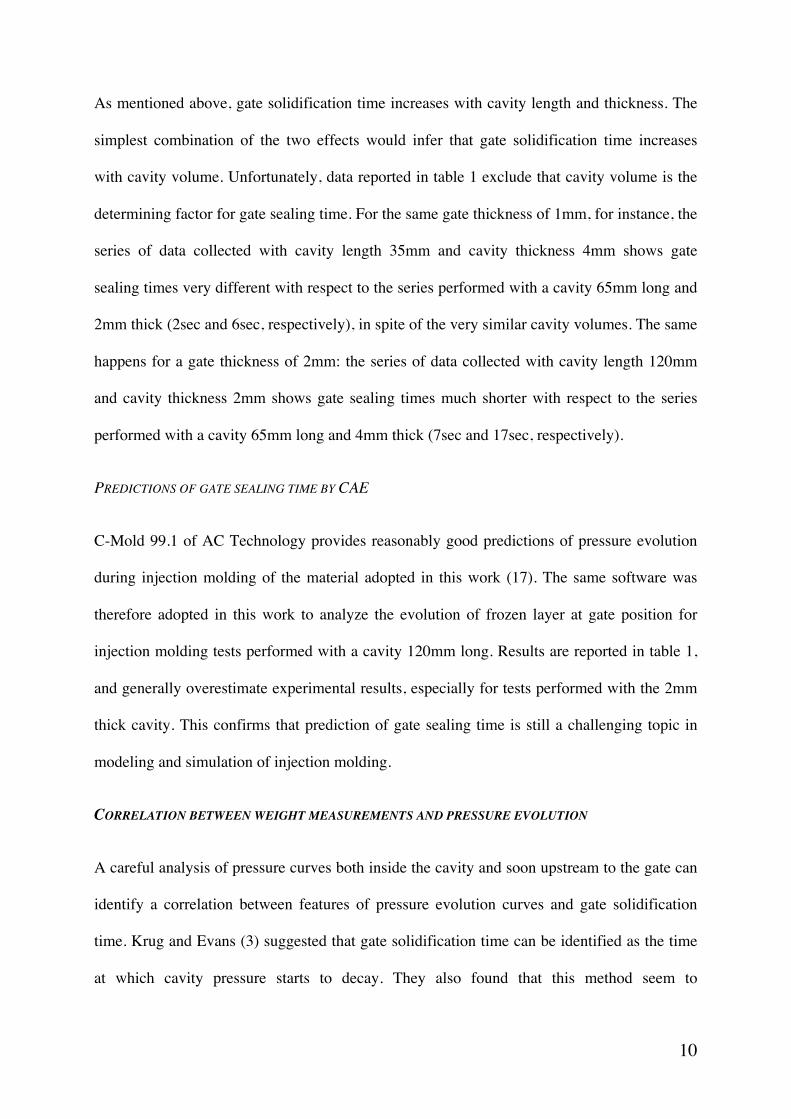
CORRELATION BETWEEN WEIGHT MEASUREMENTS AND PRESSURE EVOLUTION
A careful analysis of pressure curves both inside the cavity and soon upstream to the gate can
identify a correlation between features of pressure evolution curves and gate solidification
time. Krug and Evans (3) suggested that gate solidification time can be identified as the time
at which cavity pressure starts to decay. They also found that this method seem to
11
underestimate the solidification time identified by the analysis of samples weight
measurements.
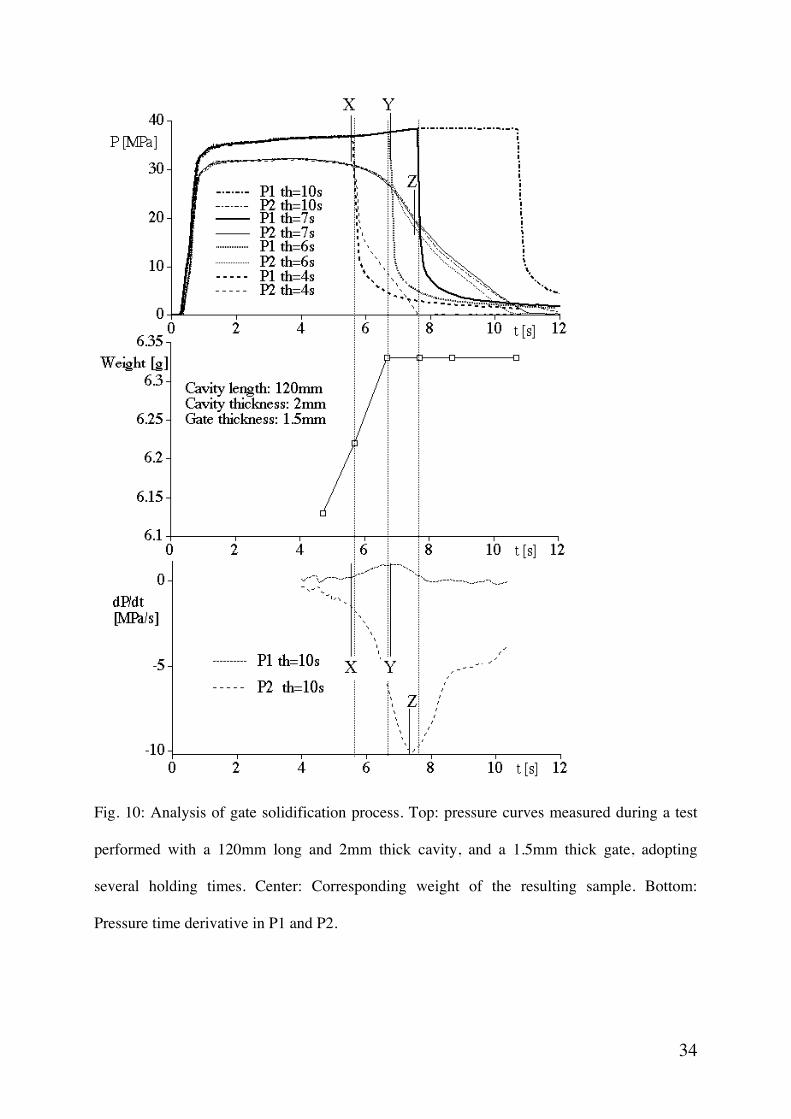
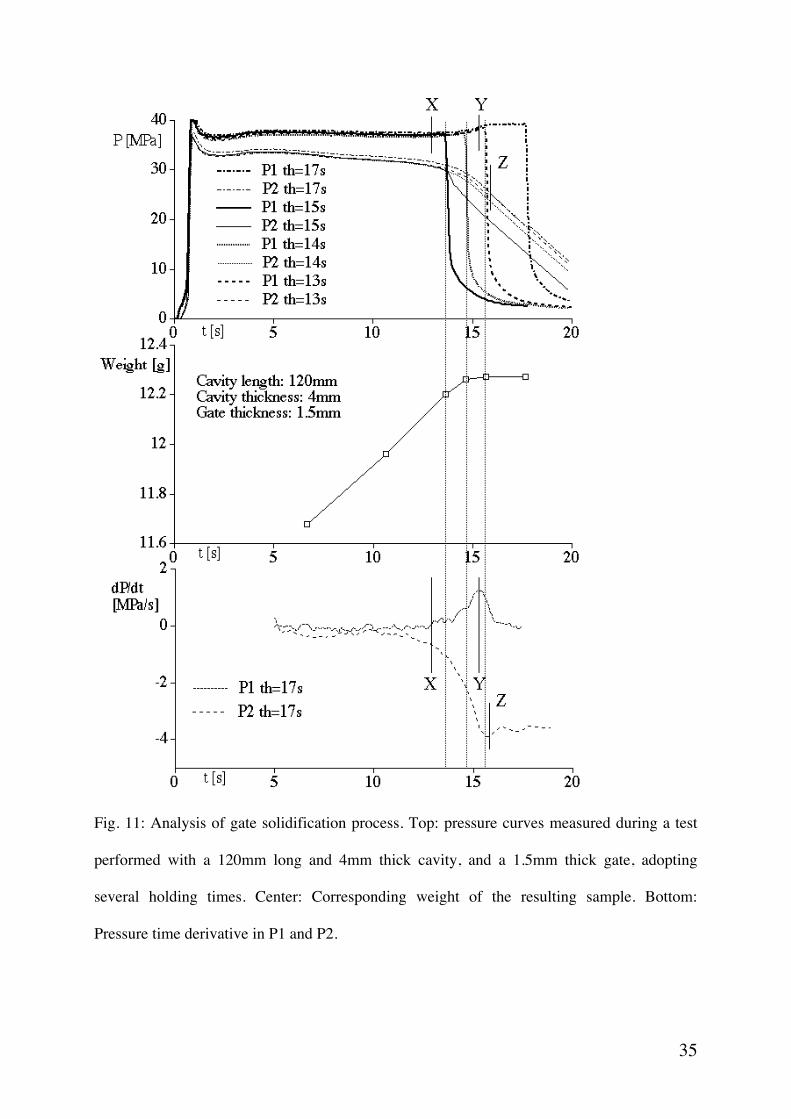
Weight data and pressure evolution for several holding times are considered in figures 10 and
11 for two cavity geometries.
Pressure profiles in P2 (inside the cavity) do not change with holding time, and sample weight
keeps constant at its plateau value as long as holding phase is longer than gate freeze-off time.
If, vice versa, holding pressure is released before complete gate solidification, a dramatic
change of pressure evolution in P2 (inside the cavity) takes place: due to the inversion of
pressure gradients, some material leaves the cavity and pressure quickly fades. This
phenomenon, usually called “backflow”, determines lower samples weight.
An interesting common feature of pressure evolution soon upstream to the gate was already
reported by Saiu et al. (18) and by Pantani et al. (18) at the occurrence of gate sealing time: as
it is clearly shown in figures 10 and 11, soon before gate solidification time pressure upstream
to the gate (pos. P1) starts to grow, the point where the increase starts being marked with a
“X” in figures 10 and 11 (“X” was identified as the time when pressure increase in pos. P1
reaches a rate of 0.5MPa/s). Soon after gate completely solidifies, pressure time derivative,
plotted in the bottom of figures 10 and 11, reaches a maximum, which corresponds to an
inflection point in the pressure curve (this point is marked with a “Y” in figures 10 and 11),
and pressure becomes constant afterwards (pressure time derivative approaches zero again).
The same feature can be easily detected in all pressure plots presented in this work. Thus, the
occurrence of a pressure rise and of an inflection point in pressure evolution soon upstream to
the gate is a clear clue toward the determination of gate sealing time, when constant holding
pressure is applied. Indeed, from data shown in this work, it can be concluded that gate is still
open when pressure soon upstream to the gate starts to increase (time “X”) and it is already
12
completely solidified when the inflection point is reached (time “Y”). Gate sealing takes thus
place in the time interval “X”-“Y”.
Some remarks can be also devoted to the evolution of pressure profile inside the cavity. After
gate solidification, the mass inside the cavity remains constant, and pressure evolution is thus
determined only by volumetric properties. In particular, after gate complete solidification,
average material density holds constant value since both the mass of material present inside
the cavity and the volume of the cavity itself are constant. Time derivative of average material
density can be written as
1
!d!dt= "#dT
dt+ $dP
dt (1)
where ! is density, " and # are material thermal expansion and compressibility coefficients,
and the superimposed bar indicates averaging over the whole cavity. Since, after gate sealing
time and as long as the polymer completely fills the cavity, time derivative of cavity average
density is zero, pressure evolution follows temperature profile according to the equation
dPdt= !
"dTdt
(2)
According to eq. 2, after gate sealing, being ! " a weak function of temperature and
pressure, second time derivative of cavity pressure should be positive as it happens for the
second time derivative of the temperature of a cooling slab. Thus, pressure profile should be
concave upwards; vice versa, as it is clear from data observation, during the packing step
pressure profiles are concave downwards. Cavity pressure derivative is shown in figures 10
and 11 versus time; the occurrence of a minimum in these plots, marked with a “Z” in figures
10 and 11, indeed, closely follows gate complete solidification time.
13
MODELING OF GATE SOLIDIFICATION
DESCRIPTION OF THE MODEL
Evolution of solidification inside the gate is a quite complex phenomenon, which involves
several aspects. However, some relevant features can be identified in order to simplify the
problem.
During the filling step, cooling inside the gate is counteracted by the continuous incoming of
new hot material from the runner. At the beginning of the packing step, the convective term in
the energy balance is still high, but it gradually fades, since cooling rate inside the cavity
reduces with time and a decreasing flow rate of material is required to balance the polymer
density increase inside the cavity. If the effect of convection were not significant inside the
gate, cooling rate there would be much quicker and gate solidification time much shorter
(12,19). Gate solidification takes place when the heat lost through gate walls by conduction
overcomes the energy entering the gate from the runner because of convection.
The gate freeze-off time can be therefore intended as the sum of three terms:
a time at which the flow front reaches the gate, tlag; this is a process variable and was kept as
about 0.5sec for all molding tests performed in this work
a “convective” period, when convection is high enough to reduce substantially the cooling
rate and
a “conductive” period, when the heat lost by conduction through gate walls gives rise to a
rapid cooling to solidification temperature at gate midplane.
The “conductive” period is upper constrained by the solidification time of a slab having the
same thickness of the gate, but it is in facts much shorter. In fact, during the “convective”
period, the gate cools down slowly, a significant fraction of the gate cross section solidifies
and eventually temperature at midplane approaches solidification temperature. The
14
“conductive” period is therefore negligible with respect to the “convective” one, except when
the latter is very small.
The gate freeze-off time, tgs, will be thus considered as made of two main contributions:
tgs = tlag + tconv (3)
where tlag is 0.5sec in this work and tconv (the duration of the “convective” period) is the true
unknown. The following analysis is therefore focused on the estimate of tconv as the time the
convective heat flow rate through the gate drops down becoming comparable to the transverse
conductive term.
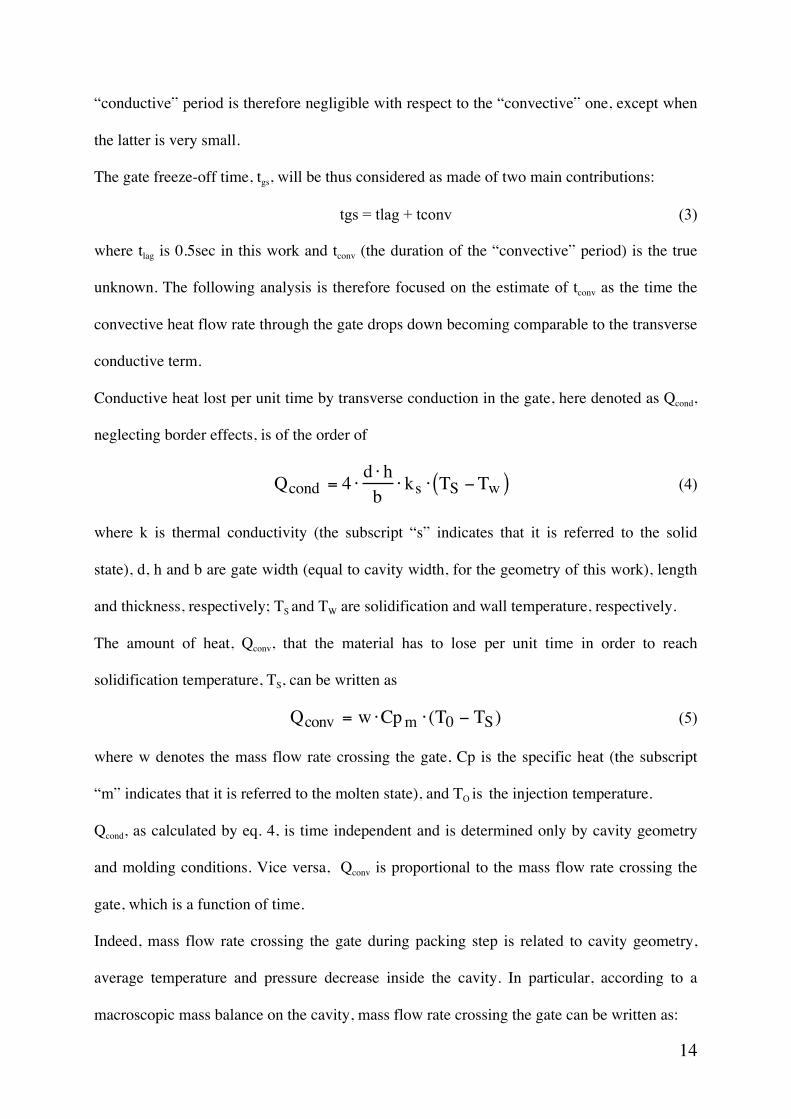
Conductive heat lost per unit time by transverse conduction in the gate, here denoted as Qcond,
neglecting border effects, is of the order of
Qcond = 4 !d ! h
b! ks ! TS "Tw( ) (4)
where k is thermal conductivity (the subscript “s” indicates that it is referred to the solid
state), d, h and b are gate width (equal to cavity width, for the geometry of this work), length
and thickness, respectively; TS and TW are solidification and wall temperature, respectively.
The amount of heat, Qconv, that the material has to lose per unit time in order to reach
solidification temperature, TS, can be written as
Qconv = w !Cpm ! (T0 " TS) (5)
where w denotes the mass flow rate crossing the gate, Cp is the specific heat (the subscript
“m” indicates that it is referred to the molten state), and TO is the injection temperature.
Qcond, as calculated by eq. 4, is time independent and is determined only by cavity geometry
and molding conditions. Vice versa, Qconv is proportional to the mass flow rate crossing the
gate, which is a function of time.
Indeed, mass flow rate crossing the gate during packing step is related to cavity geometry,
average temperature and pressure decrease inside the cavity. In particular, according to a
macroscopic mass balance on the cavity, mass flow rate crossing the gate can be written as:
15
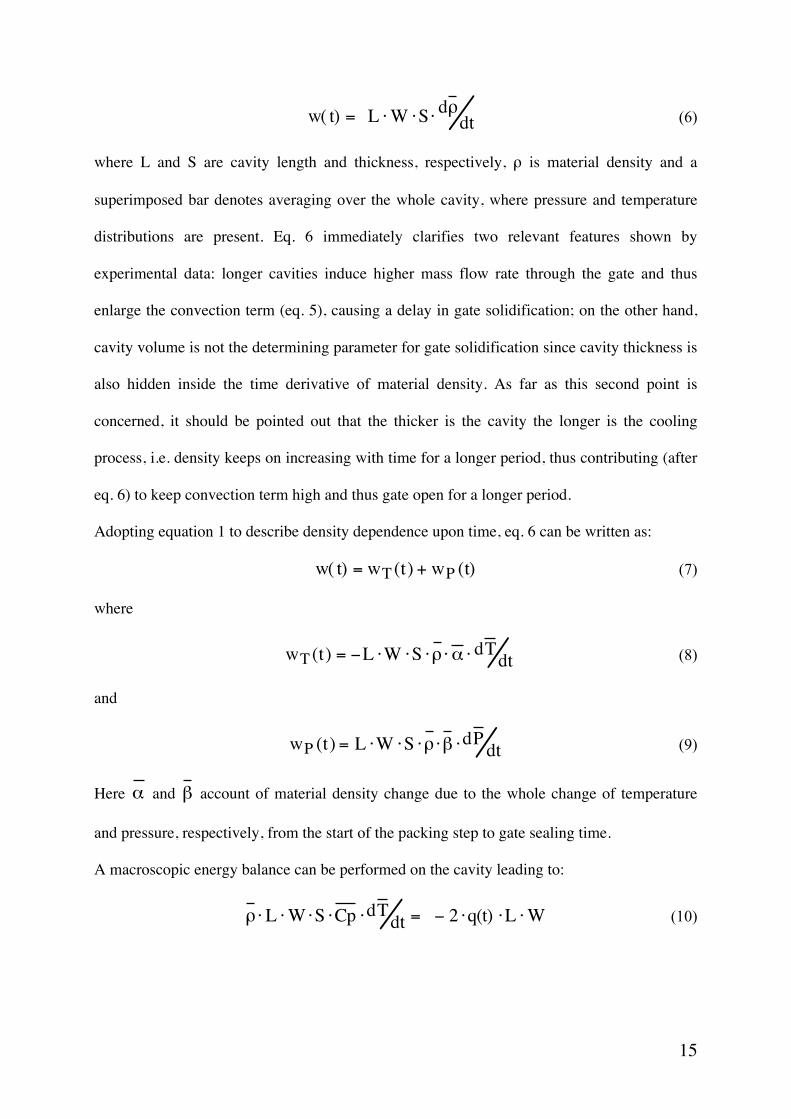
w( t) = L !W !S !d"
dt (6)
where L and S are cavity length and thickness, respectively, ! is material density and a
superimposed bar denotes averaging over the whole cavity, where pressure and temperature
distributions are present. Eq. 6 immediately clarifies two relevant features shown by
experimental data: longer cavities induce higher mass flow rate through the gate and thus
enlarge the convection term (eq. 5), causing a delay in gate solidification; on the other hand,
cavity volume is not the determining parameter for gate solidification since cavity thickness is
also hidden inside the time derivative of material density. As far as this second point is
concerned, it should be pointed out that the thicker is the cavity the longer is the cooling
process, i.e. density keeps on increasing with time for a longer period, thus contributing (after
eq. 6) to keep convection term high and thus gate open for a longer period.
Adopting equation 1 to describe density dependence upon time, eq. 6 can be written as:
w( t) = wT(t) + wP (t) (7)
where
wT (t) = !L "W "S "#" $ " dTdt (8)
and
wP (t) = L !W !S !"!# !dP dt (9)
Here ! and ! account of material density change due to the whole change of temperature
and pressure, respectively, from the start of the packing step to gate sealing time.
A macroscopic energy balance can be performed on the cavity leading to:
!"L "W "S "Cp "dTdt = # 2 "q(t) "L "W (10)
16
where q is essentially the heat flux across cavity walls and Cp accounts of the whole
enthalpic jump from the start of the packing step to the gate sealing time, including latent heat
of crystallization. Substitution of eq. 11 into eq. 8 gives
wT(t) = 2 !L !W !q(t)
Cp! " (11)
Heat flow, q(t), through cavity walls can be simply calculated as the heat lost by a slab of
thickness S as reported by Carslaw and Jaeger (20)
q(t) =k ! (T0 " Tw )
# !e ! t1 + 2 ! ("1)
n ! exp "n
2 !S2
4 !e ! t
$
% & &
'
( ) )
n=1
*
+,
- . .
/
0 1 1
(12)
which can be written as
q(t) = f !( ) "2 " k " (T0 # Tw)
S (13)
where f(!) =1
"# !1+ 2 # ($1)n # exp $
n2
!
%
& ' '
(
) * *
n=1
+
,-
. / /
0
1 2 2
(14)
can be interpreted as a dimensionless heat flux and
! =4 " t "e
S2
(15)
is the dimensionless time,
e =k
!"Cp (16)
being the thermal diffusivity. Eq. 12 can thus be rearranged as
wT = 4 !L !W
S!" ! k ! (T0 #Tw )
Cp! f $( ) (17)
The amount of heat that has to be subtracted per unit time through gate walls before reaching
solidification temperature can thus be written as
17
Qconv = 4L !W
S
" ! k ! (T0 # Tw )
Cpf $( ) +
4 ! e !L !W ! %!&
S!dP
d$
'
( ) )
*
+ , , !Cpm (T0 # TS)
(18)
It changes with time because both f($) and time derivative of cavity pressure are function of
time.
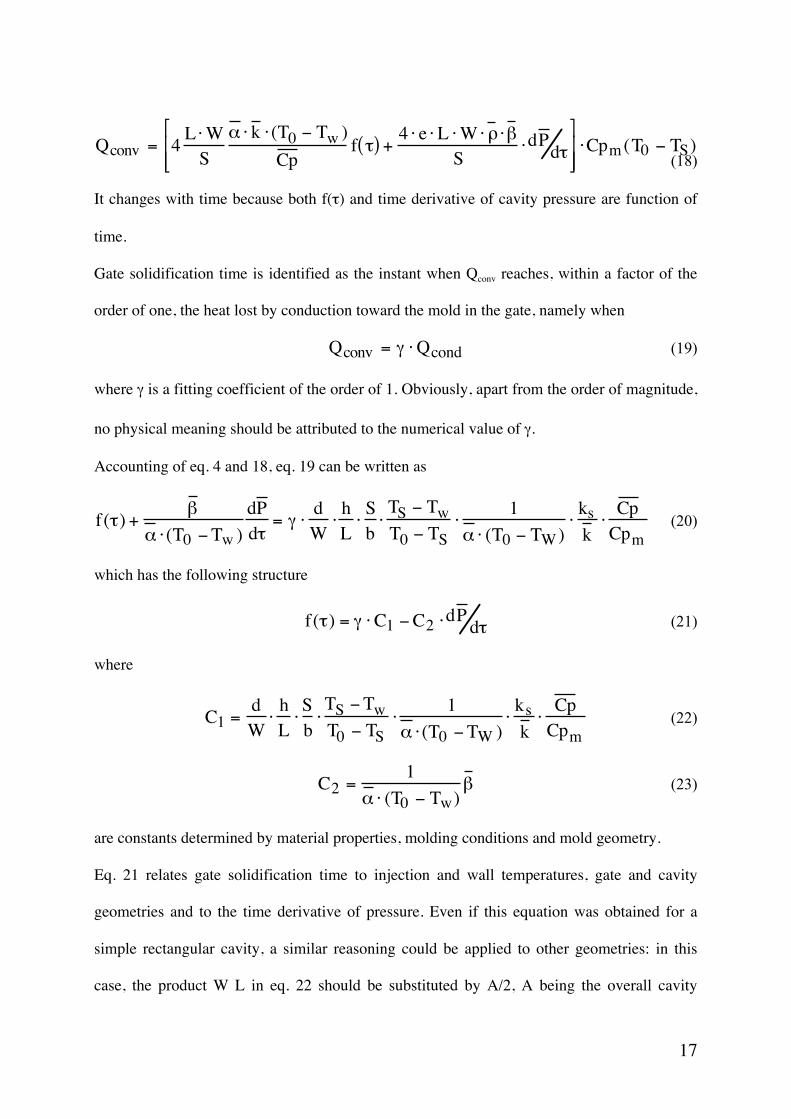
Gate solidification time is identified as the instant when Qconv reaches, within a factor of the
order of one, the heat lost by conduction toward the mold in the gate, namely when
Qconv = ! "Qcond (19)
where % is a fitting coefficient of the order of 1. Obviously, apart from the order of magnitude,
no physical meaning should be attributed to the numerical value of %.
Accounting of eq. 4 and 18, eq. 19 can be written as
f(!) +"
# $ (T0 %Tw )
dP
d!= & $
d
W$
h
L$
S
b$
TS % Tw
T0 % TS
$1
# $ (T0 % TW )$
ks
k $
Cp
Cpm
(20)
which has the following structure
f(!) = " #C1 $C2 #dPd! (21)
where
C1 =d
W!
h
L!S
b!TS "Tw
T0 " TS
!1
# ! (T0 "TW )!
ks
k !
Cp
Cpm
(22)
C2 =1
! " (T0 # Tw)$ (23)
are constants determined by material properties, molding conditions and mold geometry.
Eq. 21 relates gate solidification time to injection and wall temperatures, gate and cavity
geometries and to the time derivative of pressure. Even if this equation was obtained for a
simple rectangular cavity, a similar reasoning could be applied to other geometries: in this
case, the product W L in eq. 22 should be substituted by A/2, A being the overall cavity
18
surface, and S becomes the volume to surface ratio. Obviously, a different expression with
respect to eq. 14 should be substituted in f($).
MODEL VALIDATION
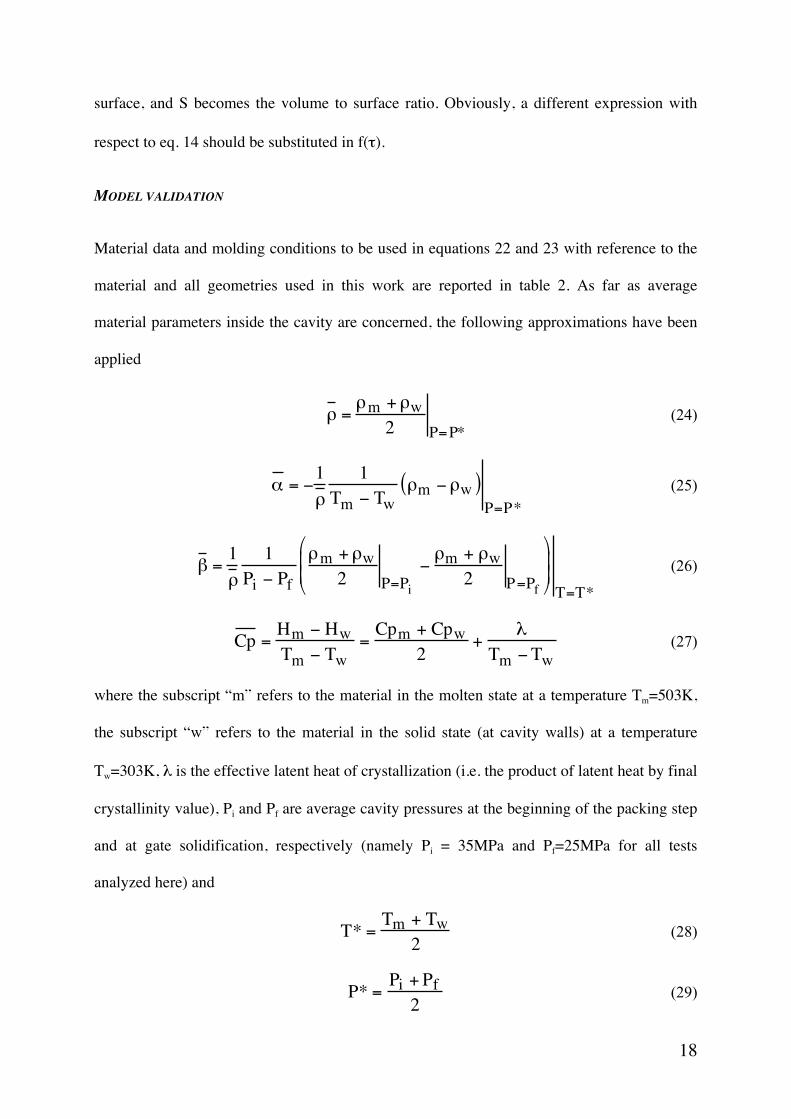
Material data and molding conditions to be used in equations 22 and 23 with reference to the
material and all geometries used in this work are reported in table 2. As far as average
material parameters inside the cavity are concerned, the following approximations have been
applied
! =!m + !w
2 P=P* (24)
! = "1
#
1
Tm " Tw#m " #w( )
P=P*
(25)
! =1
"
1
Pi # Pf
"m + "w2 P=P
i
#"m + "w
2 P=Pf
$
%
& &
'
(
) ) T=T*
(26)
Cp =Hm ! Hw
Tm ! Tw=Cpm + Cpw
2+
"
Tm !Tw (27)
where the subscript “m” refers to the material in the molten state at a temperature Tm=503K,
the subscript “w” refers to the material in the solid state (at cavity walls) at a temperature
Tw=303K, & is the effective latent heat of crystallization (i.e. the product of latent heat by final
crystallinity value), Pi and Pf are average cavity pressures at the beginning of the packing step
and at gate solidification, respectively (namely Pi = 35MPa and Pf=25MPa for all tests
analyzed here) and
T* =Tm + Tw
2 (28)
P* =Pi +Pf
2 (29)
19
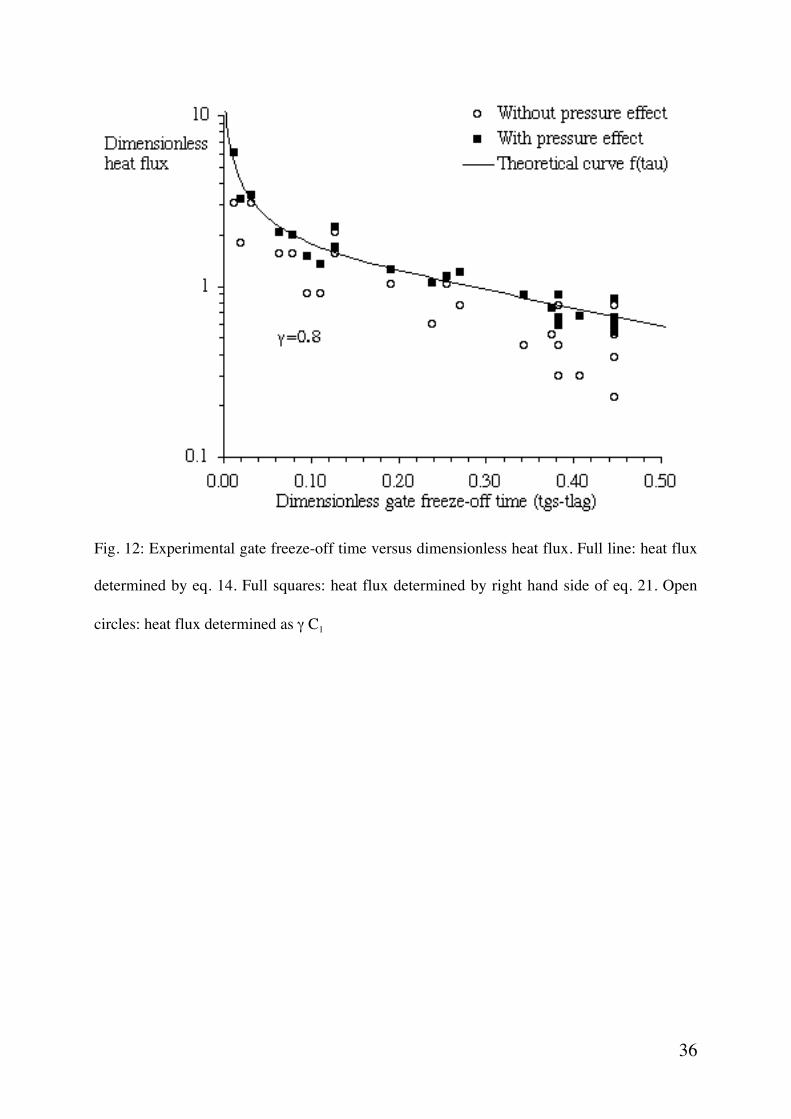
The values of C1 and C2 can be calculated a priori from material properties, mold geometry
and process conditions. Vice versa, the derivative of pressure in eq. 21 is related to process
evolution and here it was obtained for each molding test from experimental pressure curves in
P2 at gate sealing time, i.e. halfway between points denoted by “X” and “Y” in figures 10 and
11. After choosing a value for %, the right hand side of eq. 21 can be evaluated for each
molding condition and plotted versus the respective experimental gate sealing time (minus a
filling time lag of 0.5sec). According to eq. 21, if a proper choice of % is adopted, all points of
this plot should lay around a plot of f($) as calculated by eq. 14 (reported as a full line in fig.
12). Symbols reported in fig. 12 were calculated using for % a best-fitting value of 0.8, which,
as expected, is of the order of 1.
Unfortunately, eq. 21 is not predictive, due to the presence of the time derivative of pressure,
which depends on molding conditions. The effect of pressure cannot however be neglected.
Indeed, setting C2 to zero in eq. 21, points reported in fig. 12 undergo significant changes:
although a clear dependence on solidification time is still present (and a value of % of 1.3
could horizontally shift the points to lay around the theoretical curve) the scatter of the data
becomes much more pronounced.
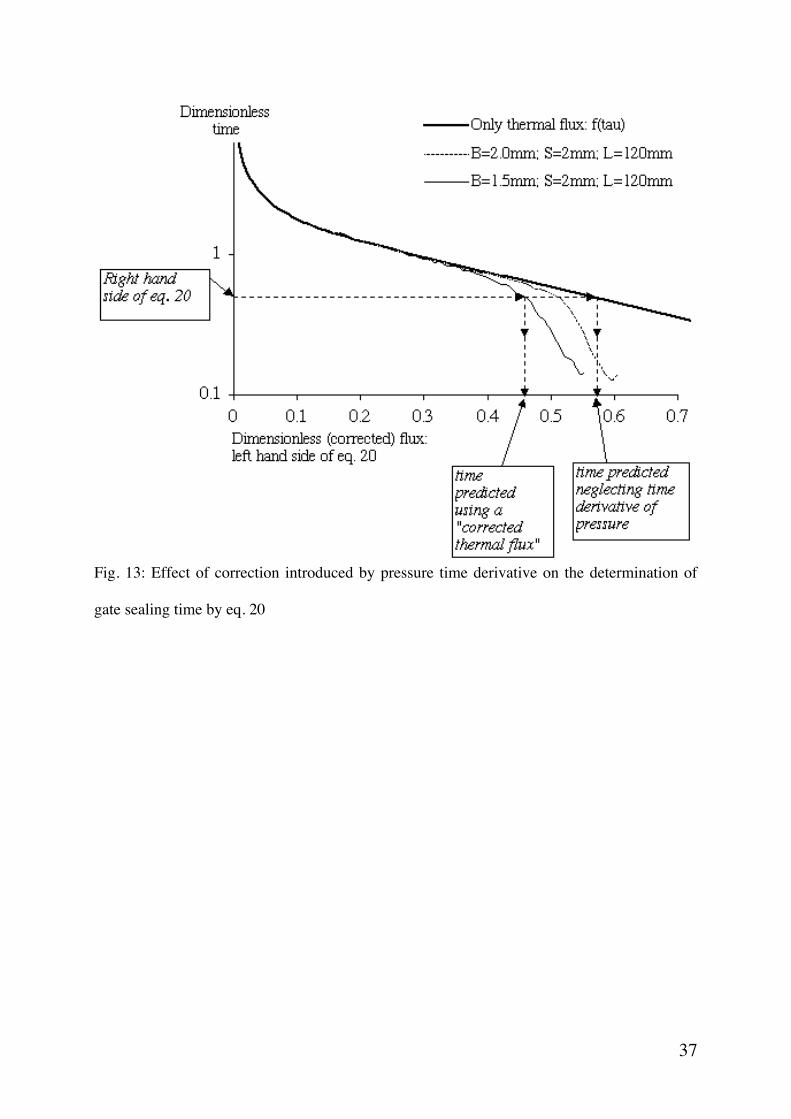
CALCULATION OF GATE FREEZE-OFF TIME
The simple model presented above seems to give a satisfactory interpretation of main
phenomena, which determine gate solidification time. The presence of pressure time
derivative in eq. 21 makes however the determination of gate solidification time quite difficult
(even if the value of % is assumed as known and the curve of pressure evolution is available).
In fact, gate solidification time is present on both sides of the equation and a trial and error
procedure is required to solve eq. 21. If, however, time derivative of pressure is moved to the
left hand side of eq. 21, like it was in eq. 20, geometrical and material parameters are left on
20
one side and a “corrected” time dependent thermal flux on the other. Of course, the plot of
this “corrected” thermal flux is different for each pressure profile and thus for each molding
test; it can however be obtained from pressure evolution data. Resulting curves are shown in
fig. 13 for some of the molding conditions adopted, and could be used to avoid iterations in
the determination of solidification time, according to the procedure depicted in fig. 13. Also
predictions obtained by eq. 14, where pressure term is neglected, are reported as a reference in
fig. 13.
A comparison between experimental sealing times and sealing times predicted by means of
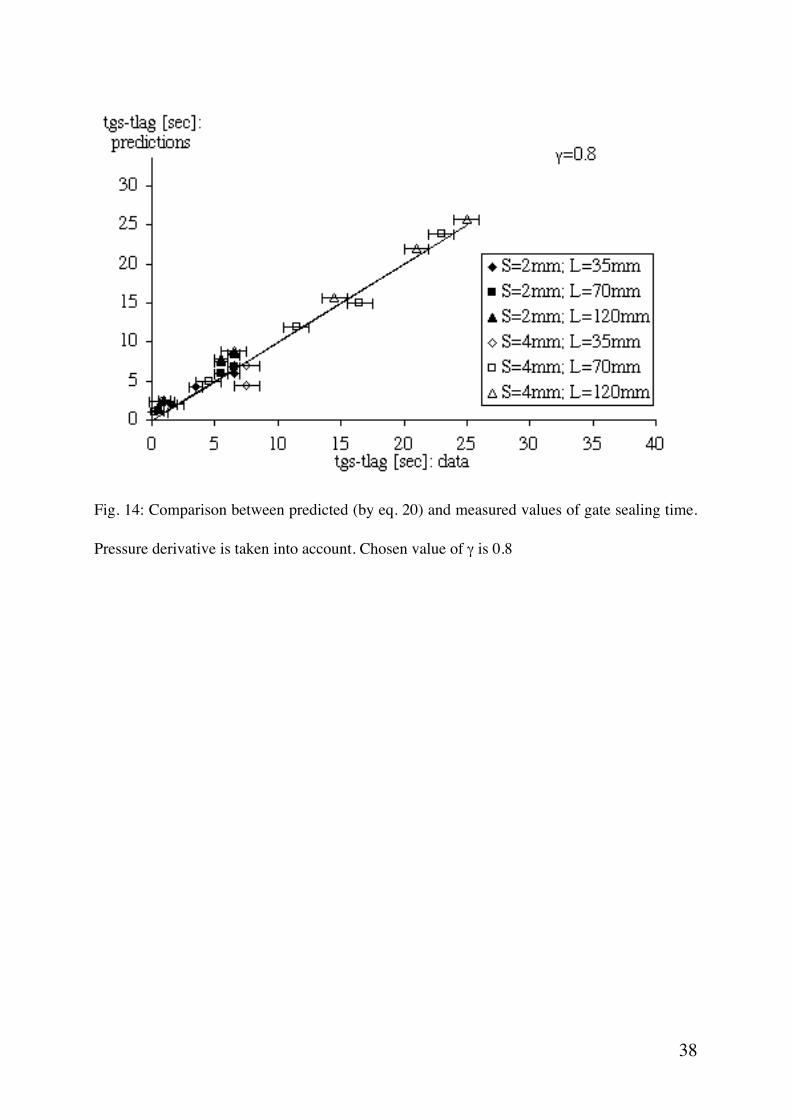
eq. 20 is shown in fig 14, adopting the value 0.8 previously identified for %. The agreement is
satisfactory; vice versa, if the pressure term in eq. 20 is neglected, a huge scatter would
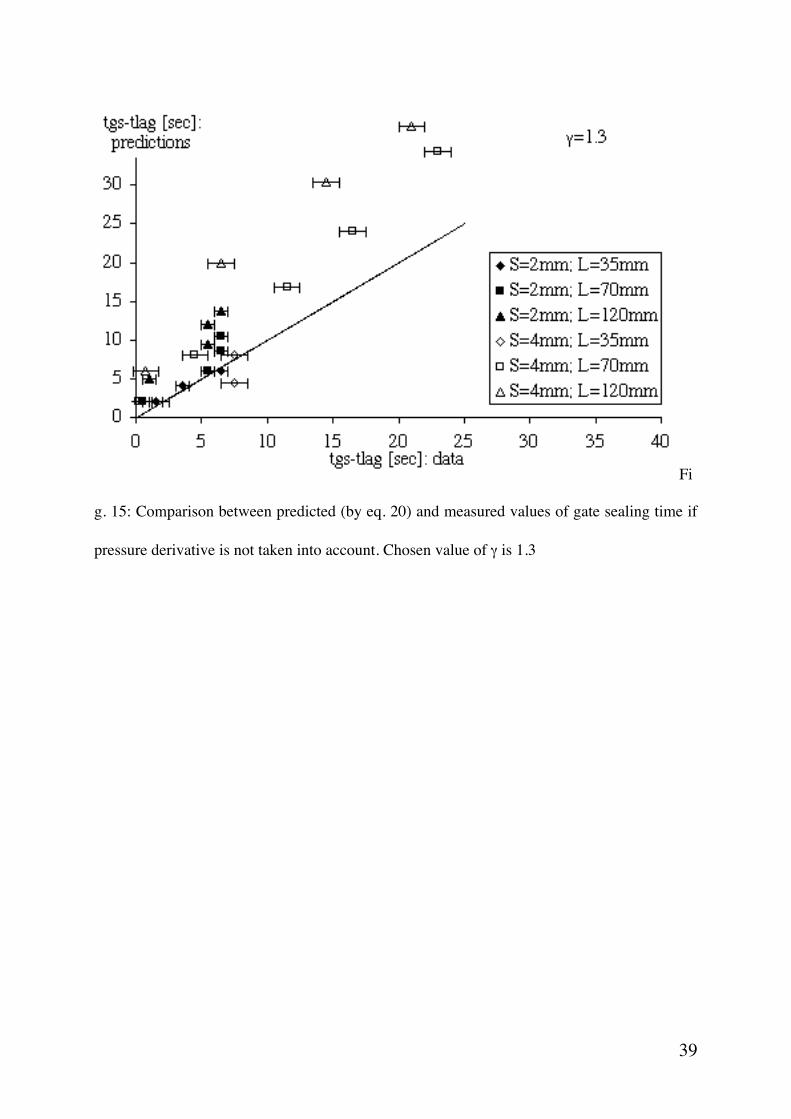
appear, and it would persist also after adopting a value of 1.3 identified in the previous section
for the fitting parameter, %, although the data move around the diagonal, as shown in fig. 15.
CONCLUSIONS
In this work, a study on the effect of both gate and cavity geometries on gate solidification
time was carried out, with reference to an isotactic polypropylene injection molded with a
constant holding pressure into a rectangular cavity. Gate freeze-off time was evaluated by
monitoring the weight of the moldings on increasing holding time.
Main experimental results are:
a clear indication on gate solidification can be drawn by analyzing the time evolution of
pressure soon upstream to the gate
gate thickness is the most important factor determining the gate sealing time (a thicker gate
determines a delayed solidification time), however cavity geometry is rather important (both
cavity length and thickness play a role on gate freeze-off time for the same gate thickness)
21
The solidification phenomenon leading to gate sealing was analyzed by a simple model,
which keeps into account also the effect of cavity geometry. The model assumes that the
controlling mechanism, which determines gate solidification, is the balance between heat lost
by cross conduction through gate walls and packing convection energy, which decreases with
time. Model results well describe experimental data obtained by changing several geometric
factors (gate and cavity thicknesses, cavity length). Further experimental work, changing also
other operating parameters, as injection and wall temperature or the material used, would be
needed to assess a general validity of the model and to confirm the value adopted for the
single adjustable parameter of the model.
22
REFERENCES
1. V. Leo, and CH. Cuvelliez, Polym. Eng. Sci., 36, 1961 (1996).
2. R. Pantani, and G. Titomanlio, Int. J. of Forming Proc. , 2, 211 (1999).
3. S. Krug, J.R.G. Evans, Ceramics International , 25, 661 (1999).
4. J.R.A. Pearson, Mechanics of polymer processing. Elsevier Applied Science Pub. (1985).
5. M.A. Levenque, Ann. Mines, 13, 201; 13, 305; 13, 381 (1928).
6. S.M. Richardson, Rheol. Acta, 22, 223 (1983).
7. S.M. Richardson, Rheol. Acta, 24, 497; 24, 509 (1985).
8. J.C. Gottifredi, O.D. Quiroga, and A.F. Flores, Int. J. Heat Mass Transfer, 26, 1215
(1983).
9. J.C. Gottifredi, and A.F. Flores, Int. J. Heat Mass Transfer, 28, 903 (1985).
10. H. Janeschitz-Kriegl, Rheol. Acta, 18, 693 (1979).
11. K.M.B. Jansen, and J. van Dam, Rheol. Acta, 31, (1992).
12. I.T. Barrie, Engl. Plast. Polym., 38, 47 (1970).
13. C-Mold 99.1 Design Guide, AC Technology, Ithaca, NY (1998).
14. C-Mold 99.1 data base, AC Technology, Ithaca, NY (1999).
15. R. Pantani, V. Speranza, and G. Titomanlio, Int. Polym. Proc., 16, 61 (2001).
16. R. Pantani, and G. Titomanlio, J. of Applied Polym. Sci., 81, 267 (2001).
17. A J Pontes, R Pantani, G Titomanlio, A S Pouzada, Int. Polym. Proc., 14, 284 (2000)
18. M. Saiu, V. Brucato, S. Piccarolo, and G. Titomanlio, Int. Polym. Proc., 7, 267 (1992).
19. R. Pantani, V. Speranza, and G. Titomanlio, Polym. Eng. Sci., 41, 2022 (2001).
20. H.S. Carslaw, and J.C. Jaeger, Conduction of Heat in Solids, Oxford Science Pub. (1986).
23
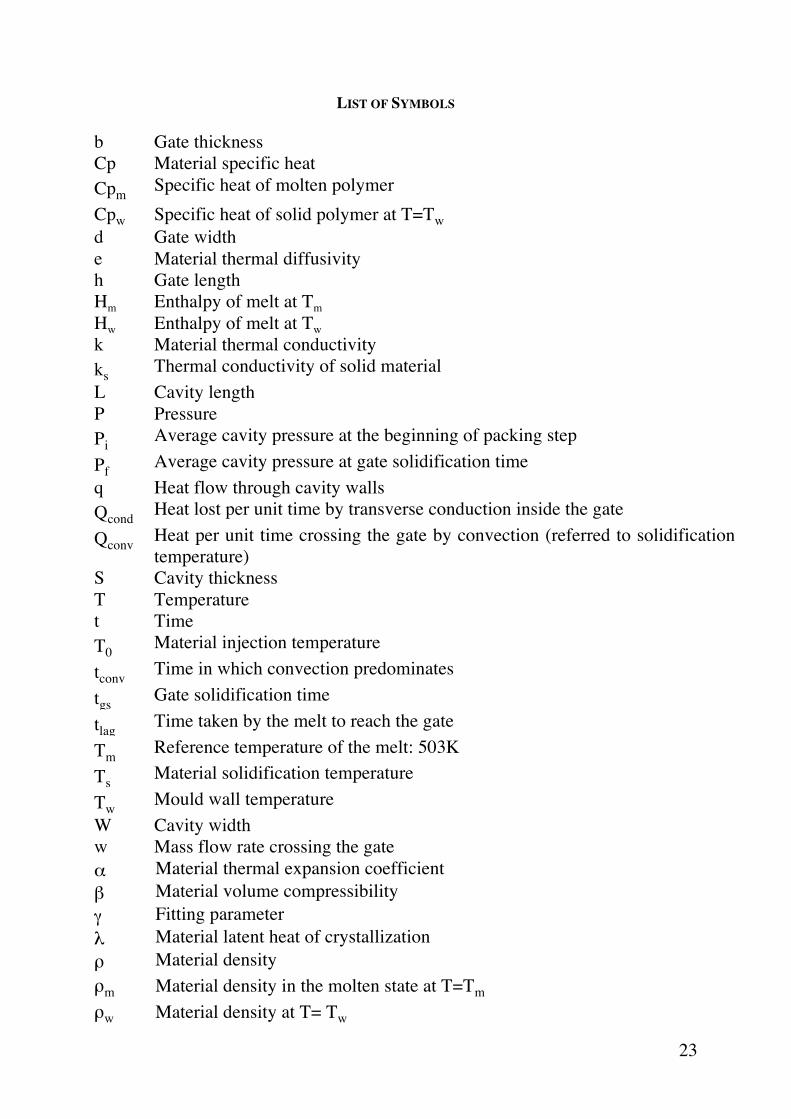
LIST OF SYMBOLS
b Gate thickness
Cp Material specific heat
Cpm Specific heat of molten polymer
Cpw Specific heat of solid polymer at T=Tw
d Gate width
e Material thermal diffusivity
h Gate length
Hm Enthalpy of melt at Tm
Hw Enthalpy of melt at Tw
k Material thermal conductivity
ks Thermal conductivity of solid material
L Cavity length
P Pressure
Pi Average cavity pressure at the beginning of packing step
Pf Average cavity pressure at gate solidification time
q Heat flow through cavity walls
Qcond Heat lost per unit time by transverse conduction inside the gate
Qconv Heat per unit time crossing the gate by convection (referred to solidification
temperature)
S Cavity thickness
T Temperature
t Time
T0 Material injection temperature
tconv Time in which convection predominates
tgs Gate solidification time
tlag Time taken by the melt to reach the gate
Tm Reference temperature of the melt: 503K
Ts Material solidification temperature
Tw Mould wall temperature
W Cavity width
w Mass flow rate crossing the gate
" Material thermal expansion coefficient
# Material volume compressibility
% Fitting parameter
& Material latent heat of crystallization
! Material density
!m Material density in the molten state at T=Tm
!w Material density at T= Tw
24
$ Dimensionless time
25
FIGURES
Fig. 1: Schematic drawing of sprue, runner, gate and cavity geometries

26
Fig. 2: Typical pressure profile inside the cavity during an injection molding test
27
Fig. 3: Measured pressure curves in P1 and P2 for tests performed with 35mm long cavities.
Thin bars crossing pressure curves in P2 identify gate sealing times, reported in table 1.
28
Fig. 4: Measured pressure curves in P1 and P2 for tests performed with 65mm long cavities.
Thin bars crossing pressure curves in P2 identify gate sealing times, reported in table 1.
29
Fig. 5: Measured pressure curves in P1 and P2 for tests performed with 120mm long cavities.
Thin bars crossing pressure curves in P2 identify gate sealing times, reported in table 1.
30
Fig. 6: Normalized samples weight versus cycle time for tests performed with 2mm thick
cavities
31
Fig. 7: Normalized samples weight versus cycle time for tests performed with 4mm thick
cavities
32
Fig. 8: Effect of gate thickness on gate freeze-off time
33
Fig. 9: Effect of cavity length on gate freeze-off time
34
Fig. 10: Analysis of gate solidification process. Top: pressure curves measured during a test
performed with a 120mm long and 2mm thick cavity, and a 1.5mm thick gate, adopting
several holding times. Center: Corresponding weight of the resulting sample. Bottom:
Pressure time derivative in P1 and P2.
35
Fig. 11: Analysis of gate solidification process. Top: pressure curves measured during a test
performed with a 120mm long and 4mm thick cavity, and a 1.5mm thick gate, adopting
several holding times. Center: Corresponding weight of the resulting sample. Bottom:
Pressure time derivative in P1 and P2.
36
Fig. 12: Experimental gate freeze-off time versus dimensionless heat flux. Full line: heat flux
determined by eq. 14. Full squares: heat flux determined by right hand side of eq. 21. Open
circles: heat flux determined as % C1
37
Fig. 13: Effect of correction introduced by pressure time derivative on the determination of
gate sealing time by eq. 20
38
Fig. 14: Comparison between predicted (by eq. 20) and measured values of gate sealing time.
Pressure derivative is taken into account. Chosen value of % is 0.8
39
Fi
g. 15: Comparison between predicted (by eq. 20) and measured values of gate sealing time if
pressure derivative is not taken into account. Chosen value of % is 1.3
40
Tab 1
Time interval within which gate solidifies for each molding condition. Last column refers to
gate solidification time predicted by means of C-Mold 99.1.
gate thickness
b [mm]
cavity
thickness
S [mm]
cavity length
L [mm]
cavity volume
[ccm]
gate freeze-off
time
tgs [s]
C-Mold
prediction of
tgs [s]
1 2 35 2.1 1.5-2.5
1.5 2 35 2.1 3.5-4.5
2 2 35 2.1 6.5-7.5
0.5 2 65 3.9 0.5-1.5
1 2 65 3.9 5.5-6.5
1.5 2 65 3.9 6.5-7.5
2 2 65 3.9 6.5-7.5
0.5 2 120 7.2 1-2 4.5
1 2 120 7.2 5.5-6.5 6.5
1.5 2 120 7.2 5.5-6.5 8.5
2 2 120 7.2 6.5-7.5 10.0
1 4 35 4.2 1.5-2.0
1.5 4 35 4.2 7.5-8.5
2 4 35 4.2 7.5-8.5
0.5 4 65 7.8 0.5-1.0
1 4 65 7.8 4.5-5.5
1.5 4 65 7.8 11.5-12.5
2 4 65 7.8 16.5-18.5
3 4 65 7.8 22.5-24.5
0.5 4 120 14.4 1-1.5 5.5
1 4 120 14.4 6.5-7.5 10.0
41
1.5 4 120 14.4 13.5-14.5 14.5
2 4 120 14.4 20.5-22.5 22.5
3 4 120 14.4 24.5-26.5 27.0
42
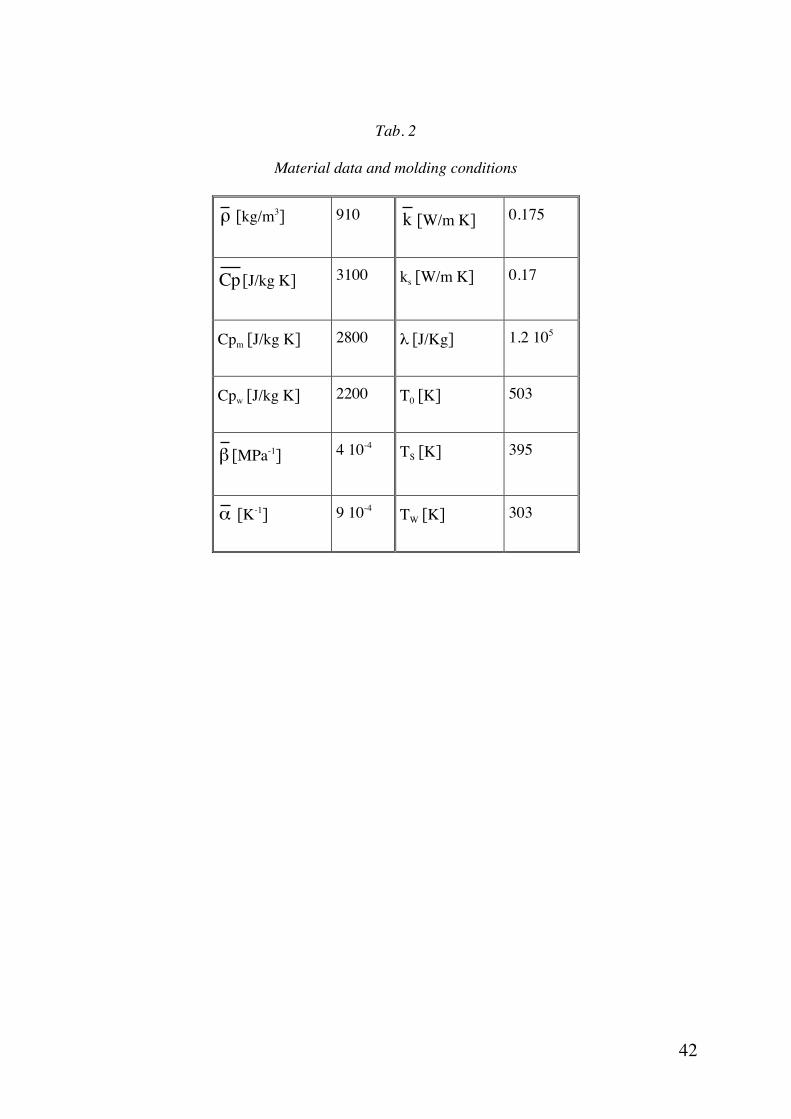
Tab. 2
Material data and molding conditions
! [kg/m3] 910 k [W/m K] 0.175
Cp [J/kg K] 3100 ks [W/m K] 0.17
Cpm [J/kg K] 2800 & [J/Kg] 1.2 105
Cpw [J/kg K] 2200 T0 [K] 503
! [MPa-1] 4 10-4 TS [K] 395
! [K-1] 9 10-4 TW [K] 303

43