project fiat_investor presentation - necessity retail reit
TRANSCRIPT
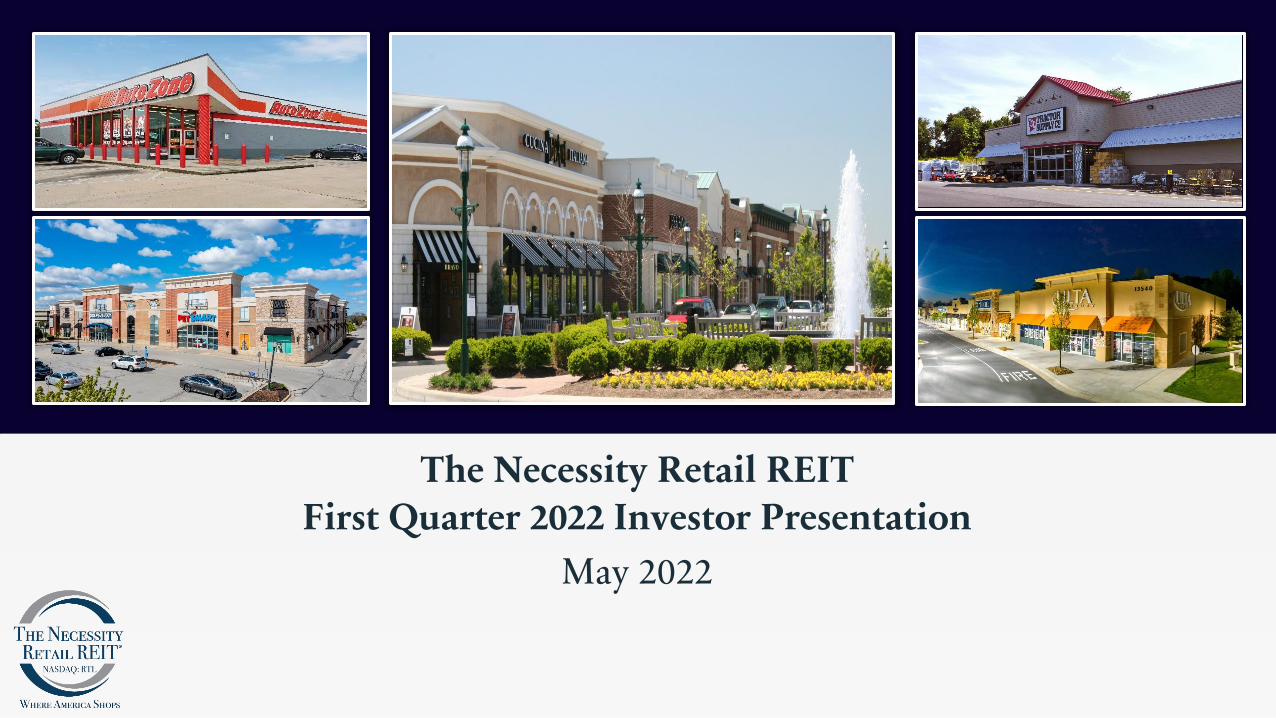
The Necessity Retail REITFirst Quarter 2022 Investor Presentation
May 2022
1The Necessity Retail REIT® Where America Shops | www.necessityretailreit.com
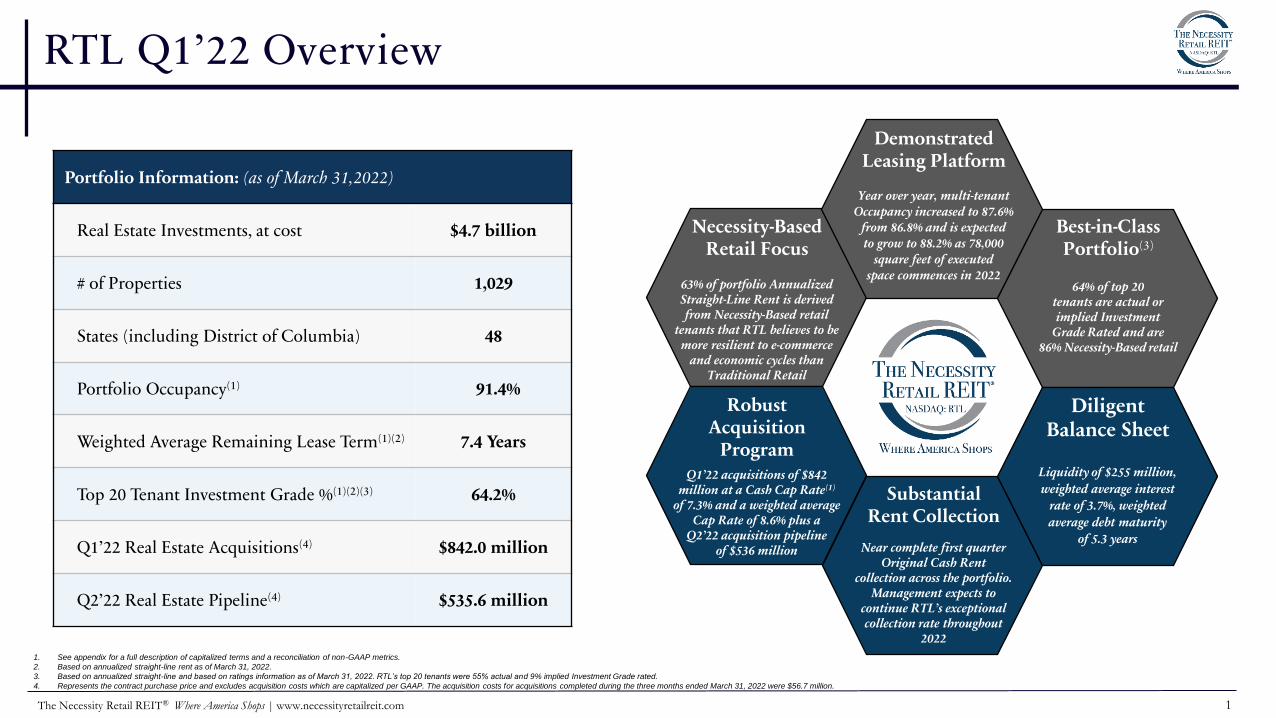
RTL Q1’22 Overview
Necessity-BasedRetail Focus
63% of portfolio Annualized Straight-Line Rent is derived from Necessity-Based retail
tenants that RTL believes to be more resilient to e-commerce
and economic cycles than Traditional Retail
Demonstrated Leasing Platform
Year over year, multi-tenant Occupancy increased to 87.6%
from 86.8% and is expected to grow to 88.2% as 78,000
square feet of executed space commences in 2022
Best-in-Class Portfolio(3)
64% of top 20tenants are actual or implied Investment
Grade Rated and are 86% Necessity-Based retail
Diligent Balance Sheet
Liquidity of $255 million,
weighted average interest
rate of 3.7%, weighted
average debt maturity
of 5.3 years
RobustAcquisition
ProgramQ1’22 acquisitions of $842
million at a Cash Cap Rate(1)
of 7.3% and a weighted average Cap Rate of 8.6% plus a
Q2’22 acquisition pipeline of $536 million
SubstantialRent Collection
Near complete first quarter Original Cash Rent
collection across the portfolio. Management expects to
continue RTL’s exceptional collection rate throughout
2022
Portfolio Information: (as of March 31,2022)
Real Estate Investments, at cost $4.7 billion
# of Properties 1,029
States (including District of Columbia) 48
Portfolio Occupancy(1) 91.4%
Weighted Average Remaining Lease Term(1)(2) 7.4 Years
Top 20 Tenant Investment Grade %(1)(2)(3) 64.2%
Q1’22 Real Estate Acquisitions(4) $842.0 million
Q2’22 Real Estate Pipeline(4) $535.6 million
1. See appendix for a full description of capitalized terms and a reconciliation of non-GAAP metrics.
2. Based on annualized straight-line rent as of March 31, 2022.
3. Based on annualized straight-line and based on ratings information as of March 31, 2022. RTL’s top 20 tenants were 55% actual and 9% implied Investment Grade rated.
4. Represents the contract purchase price and excludes acquisition costs which are capitalized per GAAP. The acquisition costs for acquisitions completed during the three months ended March 31, 2022 were $56.7 million.
2The Necessity Retail REIT® Where America Shops | www.necessityretailreit.com
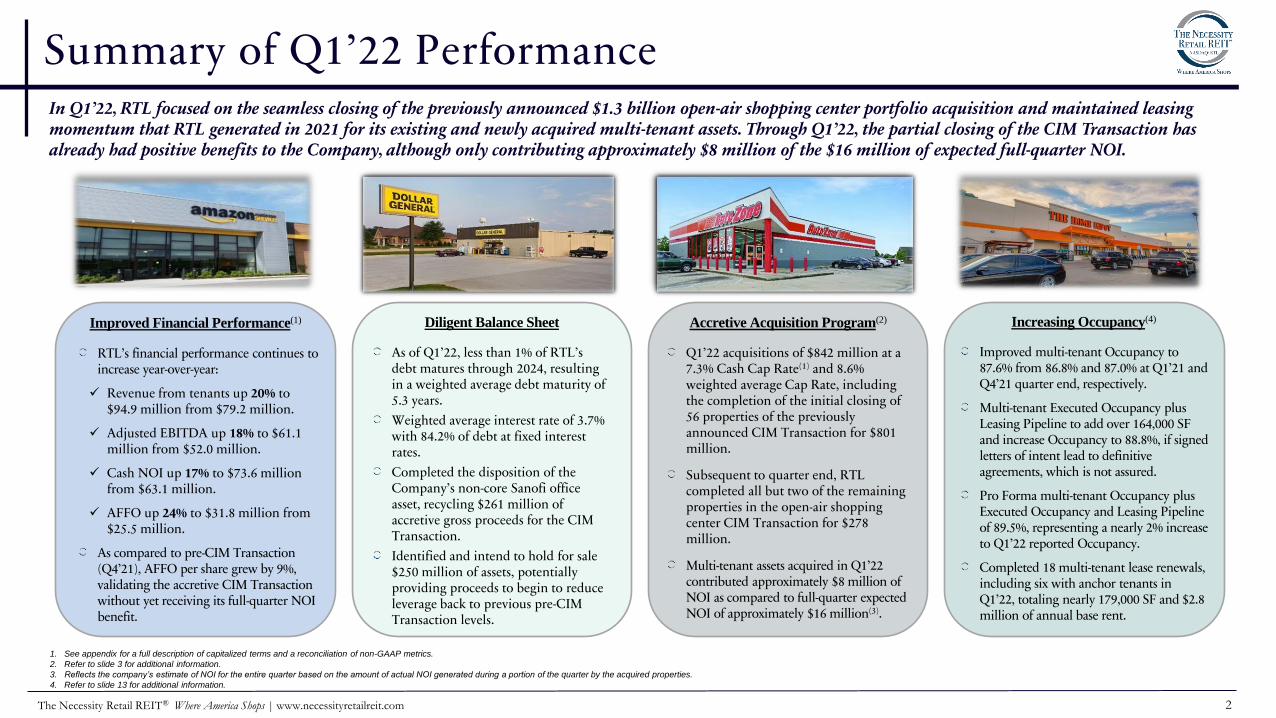
Summary of Q1’22 Performance
1. See appendix for a full description of capitalized terms and a reconciliation of non-GAAP metrics.
2. Refer to slide 3 for additional information.
3. Reflects the company’s estimate of NOI for the entire quarter based on the amount of actual NOI generated during a portion of the quarter by the acquired properties.
4. Refer to slide 13 for additional information.
Improved Financial Performance(1) Accretive Acquisition Program(2)
Q1’22 acquisitions of $842 million at a 7.3% Cash Cap Rate(1) and 8.6% weighted average Cap Rate, including the completion of the initial closing of 56 properties of the previously announced CIM Transaction for $801 million.
Subsequent to quarter end, RTL completed all but two of the remaining properties in the open-air shopping center CIM Transaction for $278 million.
Multi-tenant assets acquired in Q1’22 contributed approximately $8 million of NOI as compared to full-quarter expected NOI of approximately $16 million(3).
RTL’s financial performance continues to increase year-over-year:
✓ Revenue from tenants up 20% to $94.9 million from $79.2 million.
✓ Adjusted EBITDA up 18% to $61.1 million from $52.0 million.
✓ Cash NOI up 17% to $73.6 million from $63.1 million.
✓ AFFO up 24% to $31.8 million from $25.5 million.
As compared to pre-CIM Transaction (Q4’21), AFFO per share grew by 9%, validating the accretive CIM Transaction without yet receiving its full-quarter NOI benefit.
Improved multi-tenant Occupancy to 87.6% from 86.8% and 87.0% at Q1’21 and Q4’21 quarter end, respectively.
Multi-tenant Executed Occupancy plus Leasing Pipeline to add over 164,000 SF and increase Occupancy to 88.8%, if signed letters of intent lead to definitive agreements, which is not assured.
Pro Forma multi-tenant Occupancy plus Executed Occupancy and Leasing Pipeline of 89.5%, representing a nearly 2% increase to Q1’22 reported Occupancy.
Completed 18 multi-tenant lease renewals, including six with anchor tenants in Q1’22, totaling nearly 179,000 SF and $2.8 million of annual base rent.
Increasing Occupancy(4)Diligent Balance Sheet
As of Q1’22, less than 1% of RTL’s debt matures through 2024, resulting in a weighted average debt maturity of 5.3 years.
Weighted average interest rate of 3.7% with 84.2% of debt at fixed interest rates.
Completed the disposition of the Company’s non-core Sanofi office asset, recycling $261 million of accretive gross proceeds for the CIM Transaction.
Identified and intend to hold for sale $250 million of assets, potentially providing proceeds to begin to reduce leverage back to previous pre-CIM Transaction levels.
In Q1’22, RTL focused on the seamless closing of the previously announced $1.3 billion open-air shopping center portfolio acquisition and maintained leasing momentum that RTL generated in 2021 for its existing and newly acquired multi-tenant assets. Through Q1’22, the partial closing of the CIM Transaction has already had positive benefits to the Company, although only contributing approximately $8 million of the $16 million of expected full-quarter NOI.
3The Necessity Retail REIT® Where America Shops | www.necessityretailreit.com
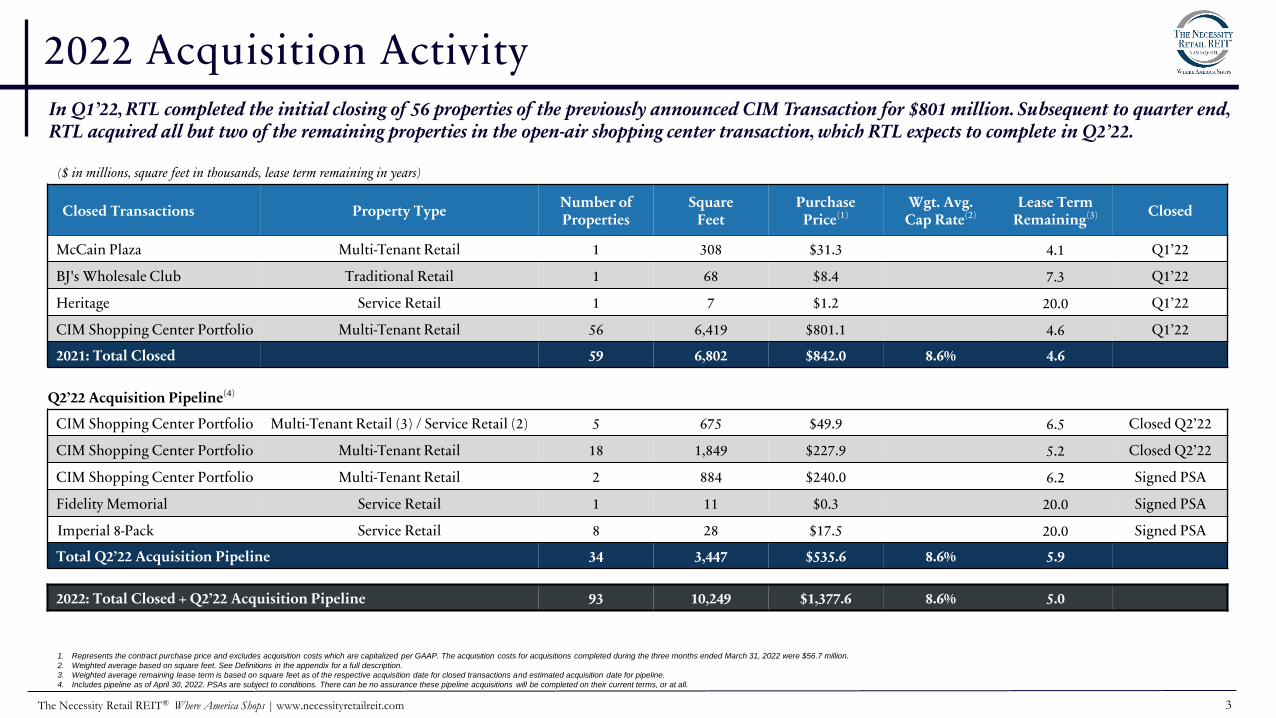
2022 Acquisition Activity
($ in millions, square feet in thousands, lease term remaining in years)
Closed Transactions Property TypeNumber of Properties
Square Feet
Purchase Price(1)
Wgt. Avg. Cap Rate(2)
Lease Term Remaining(3) Closed
McCain Plaza Multi-Tenant Retail 1 308 $31.3 4.1 Q1’22
BJ's Wholesale Club Traditional Retail 1 68 $8.4 7.3 Q1’22
Heritage Service Retail 1 7 $1.2 20.0 Q1’22
CIM Shopping Center Portfolio Multi-Tenant Retail 56 6,419 $801.1 4.6 Q1’22
2021: Total Closed 59 6,802 $842.0 8.6% 4.6
Q2’22 Acquisition Pipeline(4)
CIM Shopping Center Portfolio Multi-Tenant Retail (3) / Service Retail (2) 5 675 $49.9 6.5 Closed Q2’22
CIM Shopping Center Portfolio Multi-Tenant Retail 18 1,849 $227.9 5.2 Closed Q2’22
CIM Shopping Center Portfolio Multi-Tenant Retail 2 884 $240.0 6.2 Signed PSA
Fidelity Memorial Service Retail 1 11 $0.3 20.0 Signed PSA
Imperial 8-Pack Service Retail 8 28 $17.5 20.0 Signed PSA
Total Q2’22 Acquisition Pipeline 34 3,447 $535.6 8.6% 5.9
2022: Total Closed + Q2’22 Acquisition Pipeline 93 10,249 $1,377.6 8.6% 5.0
1. Represents the contract purchase price and excludes acquisition costs which are capitalized per GAAP. The acquisition costs for acquisitions completed during the three months ended March 31, 2022 were $56.7 million.
2. Weighted average based on square feet. See Definitions in the appendix for a full description.
3. Weighted average remaining lease term is based on square feet as of the respective acquisition date for closed transactions and estimated acquisition date for pipeline.
4. Includes pipeline as of April 30, 2022. PSAs are subject to conditions. There can be no assurance these pipeline acquisitions will be completed on their current terms, or at all.
In Q1’22, RTL completed the initial closing of 56 properties of the previously announced CIM Transaction for $801 million. Subsequent to quarter end, RTL acquired all but two of the remaining properties in the open-air shopping center transaction, which RTL expects to complete in Q2’22.
4The Necessity Retail REIT® Where America Shops | www.necessityretailreit.com
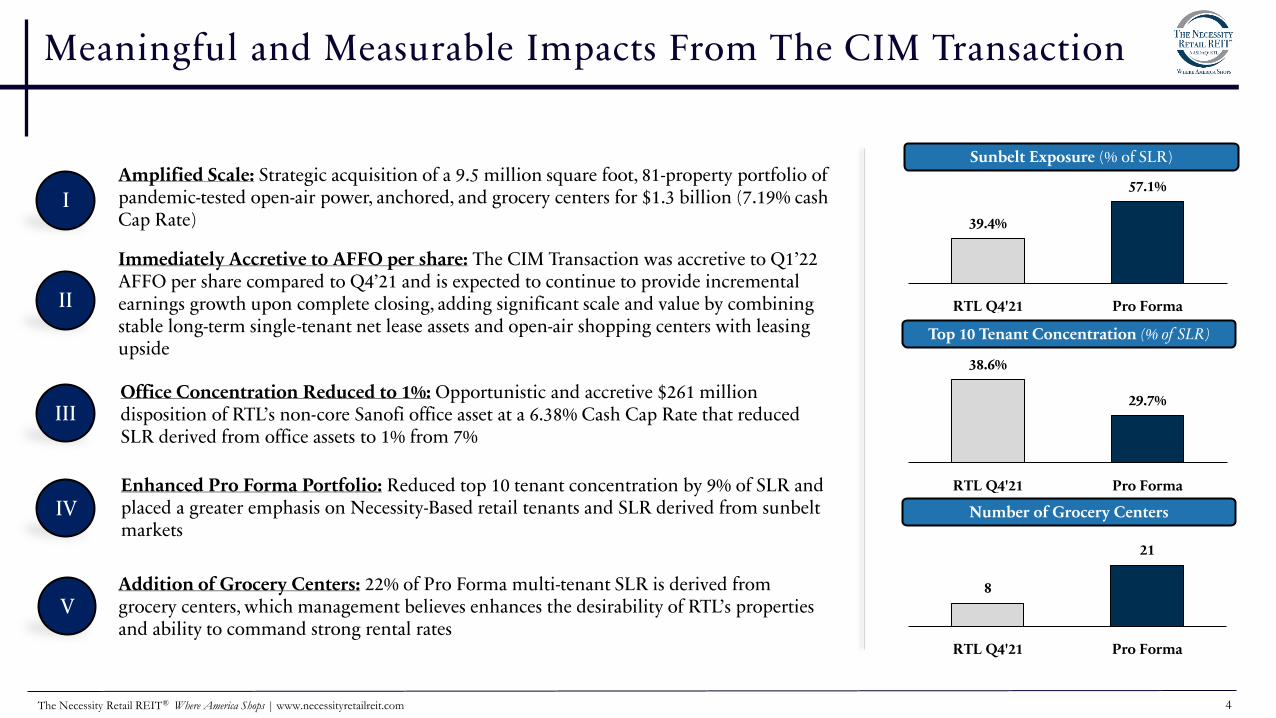
Meaningful and Measurable Impacts From The CIM Transaction
I
II
III
IV
V
Amplified Scale: Strategic acquisition of a 9.5 million square foot, 81-property portfolio of pandemic-tested open-air power, anchored, and grocery centers for $1.3 billion (7.19% cash Cap Rate)
Immediately Accretive to AFFO per share: The CIM Transaction was accretive to Q1’22 AFFO per share compared to Q4’21 and is expected to continue to provide incremental earnings growth upon complete closing, adding significant scale and value by combining stable long-term single-tenant net lease assets and open-air shopping centers with leasing upside
Addition of Grocery Centers: 22% of Pro Forma multi-tenant SLR is derived from grocery centers, which management believes enhances the desirability of RTL’s properties and ability to command strong rental rates
Office Concentration Reduced to 1%: Opportunistic and accretive $261 million disposition of RTL’s non-core Sanofi office asset at a 6.38% Cash Cap Rate that reduced SLR derived from office assets to 1% from 7%
Enhanced Pro Forma Portfolio: Reduced top 10 tenant concentration by 9% of SLR and placed a greater emphasis on Necessity-Based retail tenants and SLR derived from sunbelt markets
Sunbelt Exposure (% of SLR)
Top 10 Tenant Concentration (% of SLR)
38.6%
29.7%
RTL Q4'21 Pro Forma
Number of Grocery Centers
8
21
RTL Q4'21 Pro Forma
39.4%
57.1%
RTL Q4'21 Pro Forma
5The Necessity Retail REIT® Where America Shops | www.necessityretailreit.com
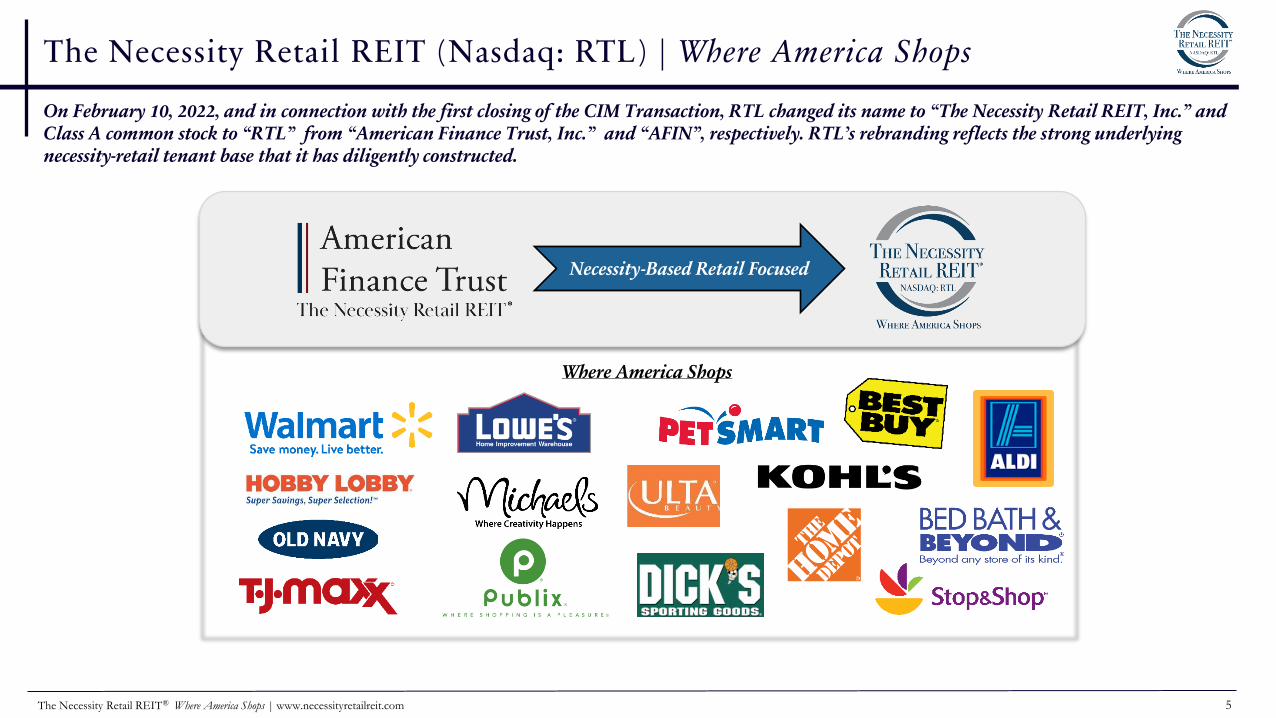
The Necessity Retail REIT (Nasdaq: RTL) | Where America Shops
On February 10, 2022, and in connection with the first closing of the CIM Transaction, RTL changed its name to “The Necessity Retail REIT, Inc.” and Class A common stock to “RTL” from “American Finance Trust, Inc.” and “AFIN”, respectively. RTL’s rebranding reflects the strong underlying necessity-retail tenant base that it has diligently constructed.
Necessity-Based Retail Focused
Where America Shops
6The Necessity Retail REIT® Where America Shops | www.necessityretailreit.com
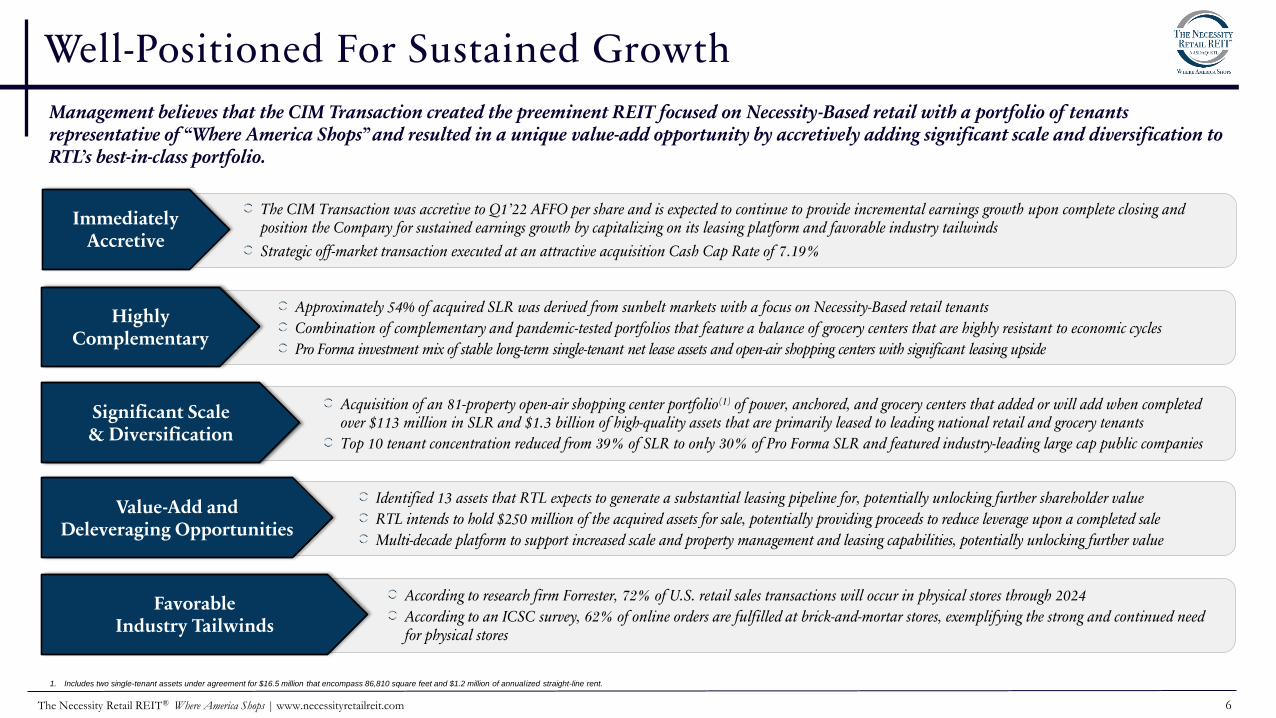
Well-Positioned For Sustained Growth
Management believes that the CIM Transaction created the preeminent REIT focused on Necessity-Based retail with a portfolio of tenants representative of “Where America Shops” and resulted in a unique value-add opportunity by accretively adding significant scale and diversification to RTL’s best-in-class portfolio.
According to research firm Forrester, 72% of U.S. retail sales transactions will occur in physical stores through 2024
According to an ICSC survey, 62% of online orders are fulfilled at brick-and-mortar stores, exemplifying the strong and continued need for physical stores
Favorable Industry Tailwinds
The CIM Transaction was accretive to Q1’22 AFFO per share and is expected to continue to provide incremental earnings growth upon complete closing and position the Company for sustained earnings growth by capitalizing on its leasing platform and favorable industry tailwinds
Strategic off-market transaction executed at an attractive acquisition Cash Cap Rate of 7.19%
ImmediatelyAccretive
Identified 13 assets that RTL expects to generate a substantial leasing pipeline for, potentially unlocking further shareholder value
RTL intends to hold $250 million of the acquired assets for sale, potentially providing proceeds to reduce leverage upon a completed sale
Multi-decade platform to support increased scale and property management and leasing capabilities, potentially unlocking further value
Value-Add and Deleveraging Opportunities
Approximately 54% of acquired SLR was derived from sunbelt markets with a focus on Necessity-Based retail tenants
Combination of complementary and pandemic-tested portfolios that feature a balance of grocery centers that are highly resistant to economic cycles
Pro Forma investment mix of stable long-term single-tenant net lease assets and open-air shopping centers with significant leasing upside
HighlyComplementary
Acquisition of an 81-property open-air shopping center portfolio(1) of power, anchored, and grocery centers that added or will add when completed over $113 million in SLR and $1.3 billion of high-quality assets that are primarily leased to leading national retail and grocery tenants
Top 10 tenant concentration reduced from 39% of SLR to only 30% of Pro Forma SLR and featured industry-leading large cap public companies
Significant Scale& Diversification
1. Includes two single-tenant assets under agreement for $16.5 million that encompass 86,810 square feet and $1.2 million of annualized straight-line rent.
7The Necessity Retail REIT® Where America Shops | www.necessityretailreit.com
28%
13%
11%
48%
Power Center
Anchored Center
Grocery Center
Single-Tenant
Pro Forma Portfolio MetricsOn a Pro Forma basis, the CIM Transaction resulted in various portfolio enhancements including improved multi-tenant Occupancy, reduced top 10 tenant SLR concentration, reduced SLR derived from office assets, and increased emphasis on Necessity-Based retail tenants.
Portfolio Metrics RTL Portfolio (as of 3/31/22) Remaining CIM Transaction Portfolio(1) Pro Forma
Real Estate Investments, at cost $4.7 billion $0.5 billion(2) $5.2 billion
# of Properties 1,029 25 1,054
States (including District of Columbia) 48 15 48
Square Feet (SF) 26.2 million 3.1 million 29.3 million
Annualized Straight Line Rent (SLR) $346.0 million $41.6 million $387.6 million
Occupancy(3) (%) 91.4% 92.8% 91.5%
Executed Occupancy(3) (%) 91.7% 92.8% 91.8%
Weighted Average Remaining Lease Term(3) 7.4 Years 5.8 Years 7.3 Years
Property Segment (% of Portfolio SLR)
$386million
Geographic Diversification (% of Portfolio SLR)
GA 10%
NC 7%
OH 7%
FL 6%
AL 5%
IL 5%
TX 5%SC 5%KY 4%
PA 4%
All Other
41%
47 States+ D.C.
Office Property Exposure (% of Portfolio SLR)
7%
1%
RTL Q4'21 Pro Forma
Sanofi disposition and Pro Forma CIM Transaction
resulted in a 6% reduction in SLR derived from office
assets
Multi-Tenant 52%
1. As of September 30, 2021 and, in part, based on seller provided information. Includes two single-tenant assets under agreement for $16.5 million that encompass 86,810 square feet and $1.2 million of annualized straight-line rent.
2. Represents the contract purchase price and excludes acquisition costs which are capitalized per GAAP.
3. See appendix for a full description of capitalized terms.
8The Necessity Retail REIT® Where America Shops | www.necessityretailreit.com
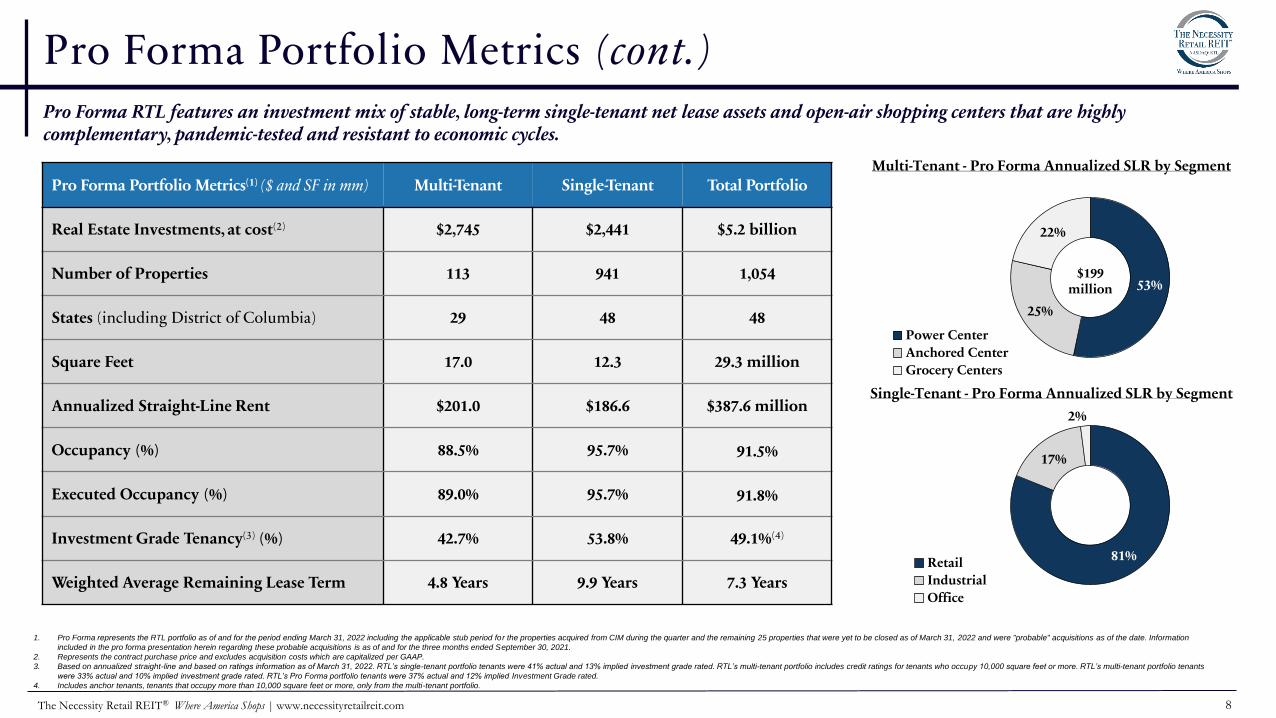
Pro Forma Portfolio Metrics (cont.)
Pro Forma Portfolio Metrics(1) ($ and SF in mm) Multi-Tenant Single-Tenant Total Portfolio
Real Estate Investments, at cost(2) $2,745 $2,441 $5.2 billion
Number of Properties 113 941 1,054
States (including District of Columbia) 29 48 48
Square Feet 17.0 12.3 29.3 million
Annualized Straight-Line Rent $201.0 $186.6 $387.6 million
Occupancy (%) 88.5% 95.7% 91.5%
Executed Occupancy (%) 89.0% 95.7% 91.8%
Investment Grade Tenancy(3) (%) 42.7% 53.8% 49.1%(4)
Weighted Average Remaining Lease Term 4.8 Years 9.9 Years 7.3 Years
Pro Forma RTL features an investment mix of stable, long-term single-tenant net lease assets and open-air shopping centers that are highly complementary, pandemic-tested and resistant to economic cycles.
1. Pro Forma represents the RTL portfolio as of and for the period ending March 31, 2022 including the applicable stub period for the properties acquired from CIM during the quarter and the remaining 25 properties that were yet to be closed as of March 31, 2022 and were "probable" acquisitions as of the date. Information
included in the pro forma presentation herein regarding these probable acquisitions is as of and for the three months ended September 30, 2021.
2. Represents the contract purchase price and excludes acquisition costs which are capitalized per GAAP.
3. Based on annualized straight-line and based on ratings information as of March 31, 2022. RTL’s single-tenant portfolio tenants were 41% actual and 13% implied investment grade rated. RTL’s multi-tenant portfolio includes credit ratings for tenants who occupy 10,000 square feet or more. RTL’s multi-tenant portfolio tenants
were 33% actual and 10% implied investment grade rated. RTL’s Pro Forma portfolio tenants were 37% actual and 12% implied Investment Grade rated.
4. Includes anchor tenants, tenants that occupy more than 10,000 square feet or more, only from the multi-tenant portfolio.
53%
25%
22%
Power Center
Anchored Center
Grocery Centers
Multi-Tenant - Pro Forma Annualized SLR by Segment
$199million
81%
17%
2%
Retail
Industrial
Office
Single-Tenant - Pro Forma Annualized SLR by Segment
9The Necessity Retail REIT® Where America Shops | www.necessityretailreit.com
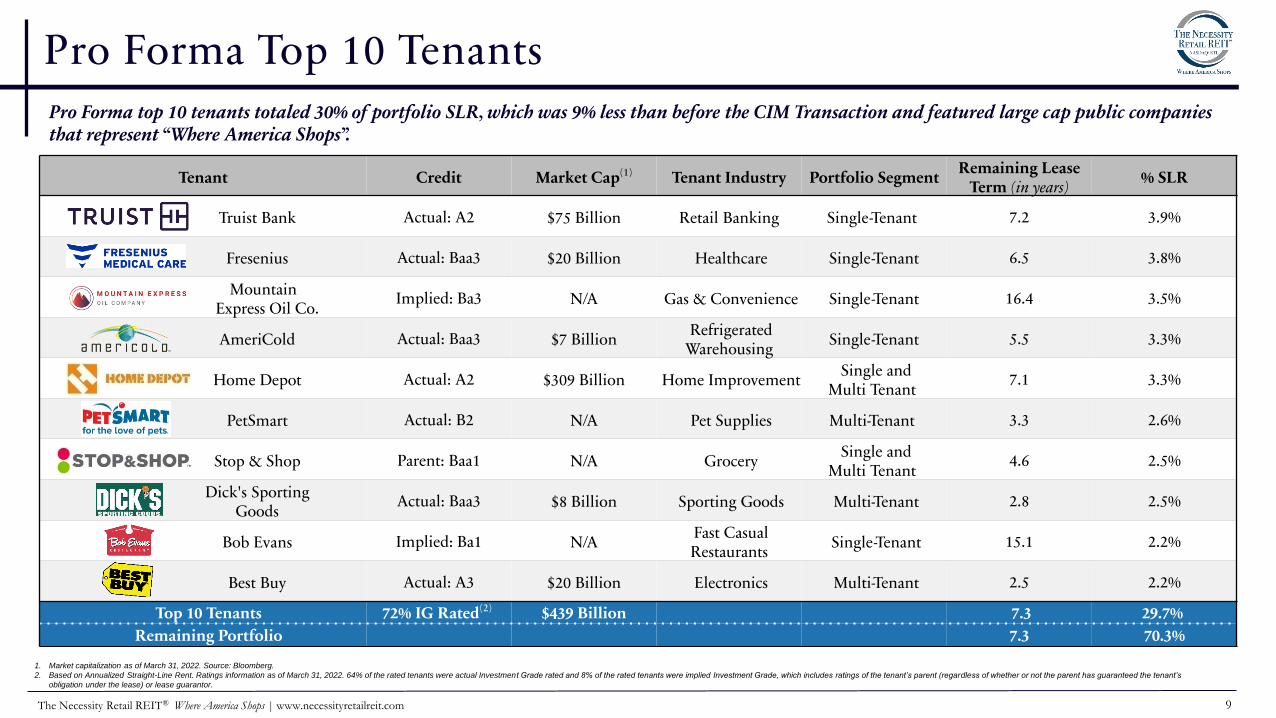
Pro Forma Top 10 TenantsPro Forma top 10 tenants totaled 30% of portfolio SLR, which was 9% less than before the CIM Transaction and featured large cap public companies that represent “Where America Shops”.
Tenant Credit Market Cap(1) Tenant Industry Portfolio SegmentRemaining Lease
Term (in years)% SLR
Truist Bank Actual: A2 $75 Billion Retail Banking Single-Tenant 7.2 3.9%
Fresenius Actual: Baa3 $20 Billion Healthcare Single-Tenant 6.5 3.8%
Mountain Express Oil Co.
Implied: Ba3 N/A Gas & Convenience Single-Tenant 16.4 3.5%
AmeriCold Actual: Baa3 $7 BillionRefrigerated
WarehousingSingle-Tenant 5.5 3.3%
Home Depot Actual: A2 $309 Billion Home ImprovementSingle and
Multi Tenant7.1 3.3%
PetSmart Actual: B2 N/A Pet Supplies Multi-Tenant 3.3 2.6%
Stop & Shop Parent: Baa1 N/A GrocerySingle and
Multi Tenant4.6 2.5%
Dick's SportingGoods
Actual: Baa3 $8 Billion Sporting Goods Multi-Tenant 2.8 2.5%
Bob Evans Implied: Ba1 N/AFast Casual Restaurants
Single-Tenant 15.1 2.2%
Best Buy Actual: A3 $20 Billion Electronics Multi-Tenant 2.5 2.2%
Top 10 Tenants 72% IG Rated(2) $439 Billion 7.3 29.7%
Remaining Portfolio 7.3 70.3%
1. Market capitalization as of March 31, 2022. Source: Bloomberg.
2. Based on Annualized Straight-Line Rent. Ratings information as of March 31, 2022. 64% of the rated tenants were actual Investment Grade rated and 8% of the rated tenants were implied Investment Grade, which includes ratings of the tenant’s parent (regardless of whether or not the parent has guaranteed the tenant’s
obligation under the lease) or lease guarantor.
10The Necessity Retail REIT® Where America Shops | www.necessityretailreit.com
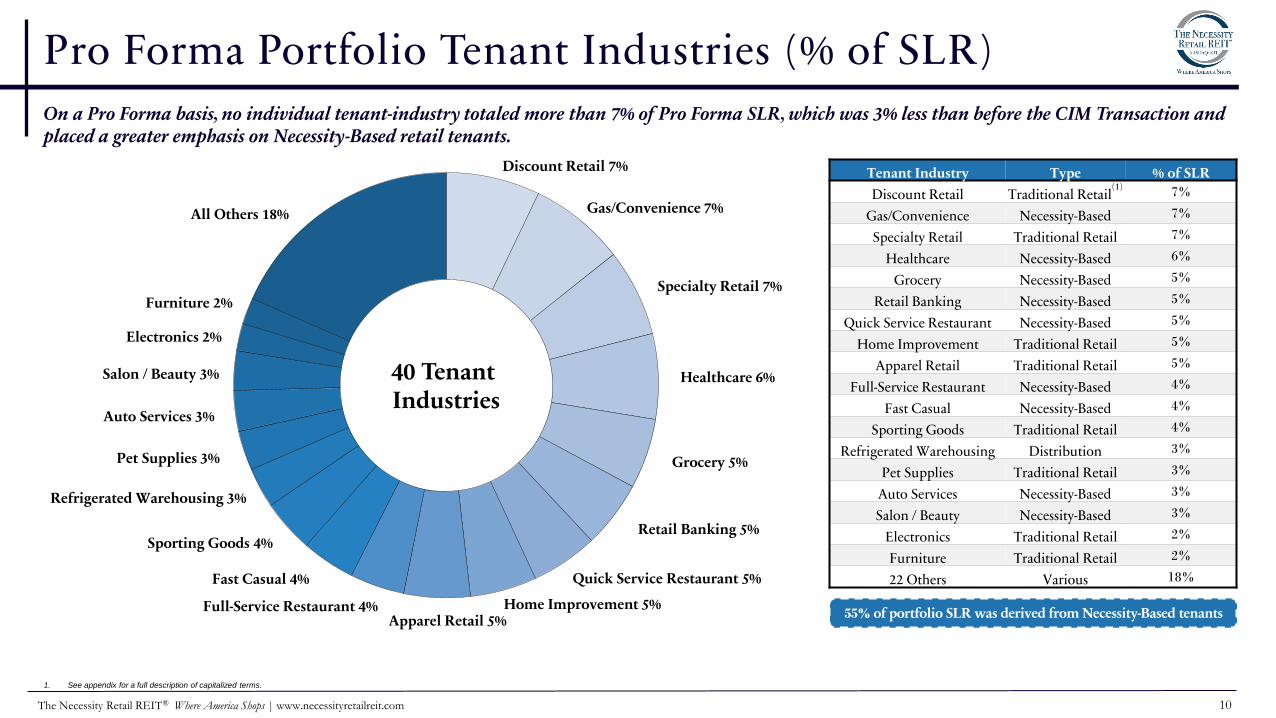
Pro Forma Portfolio Tenant Industries (% of SLR)
On a Pro Forma basis, no individual tenant-industry totaled more than 7% of Pro Forma SLR, which was 3% less than before the CIM Transaction and placed a greater emphasis on Necessity-Based retail tenants.
Tenant Industry Type % of SLR
Discount Retail Traditional Retail(1)
7%
Gas/Convenience Necessity-Based 7%
Specialty Retail Traditional Retail 7%
Healthcare Necessity-Based 6%
Grocery Necessity-Based 5%
Retail Banking Necessity-Based 5%
Quick Service Restaurant Necessity-Based 5%
Home Improvement Traditional Retail 5%
Apparel Retail Traditional Retail 5%
Full-Service Restaurant Necessity-Based 4%
Fast Casual Necessity-Based 4%
Sporting Goods Traditional Retail 4%
Refrigerated Warehousing Distribution 3%
Pet Supplies Traditional Retail 3%
Auto Services Necessity-Based 3%
Salon / Beauty Necessity-Based 3%
Electronics Traditional Retail 2%
Furniture Traditional Retail 2%
22 Others Various 18%
Discount Retail 7%
Gas/Convenience 7%
Specialty Retail 7%
Healthcare 6%
Grocery 5%
Retail Banking 5%
Quick Service Restaurant 5%
Home Improvement 5%Apparel Retail 5%
Full-Service Restaurant 4%
Fast Casual 4%
Sporting Goods 4%
Refrigerated Warehousing 3%
Pet Supplies 3%
Auto Services 3%
Salon / Beauty 3%
Electronics 2%
Furniture 2%
All Others 18%
40 Tenant Industries
55% of portfolio SLR was derived from Necessity-Based tenants
1. See appendix for a full description of capitalized terms.
11The Necessity Retail REIT® Where America Shops | www.necessityretailreit.com
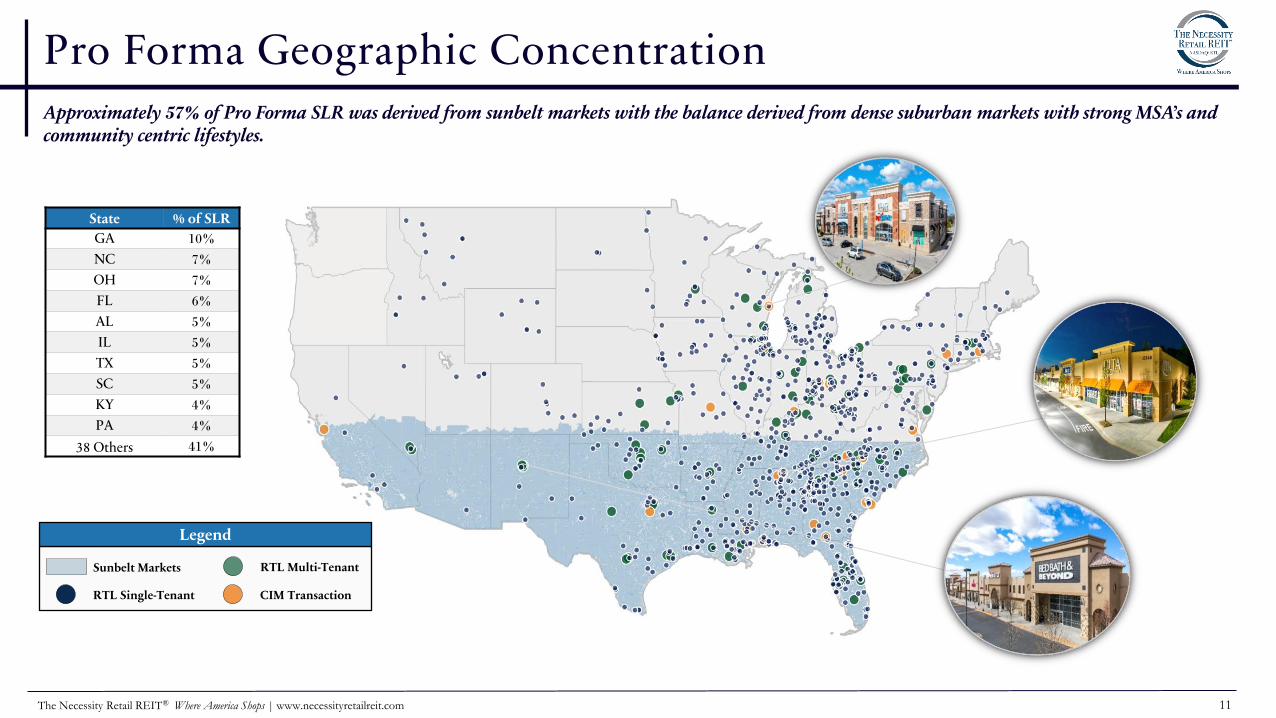
Pro Forma Geographic ConcentrationApproximately 57% of Pro Forma SLR was derived from sunbelt markets with the balance derived from dense suburban markets with strong MSA’s and community centric lifestyles.
Sunbelt Markets
RTL Single-Tenant
RTL Multi-Tenant
CIM Transaction
State % of SLR
GA 10%
NC 7%
OH 7%
FL 6%
AL 5%
IL 5%
TX 5%
SC 5%
KY 4%
PA 4%
38 Others 41%
Legend
12The Necessity Retail REIT® Where America Shops | www.necessityretailreit.com
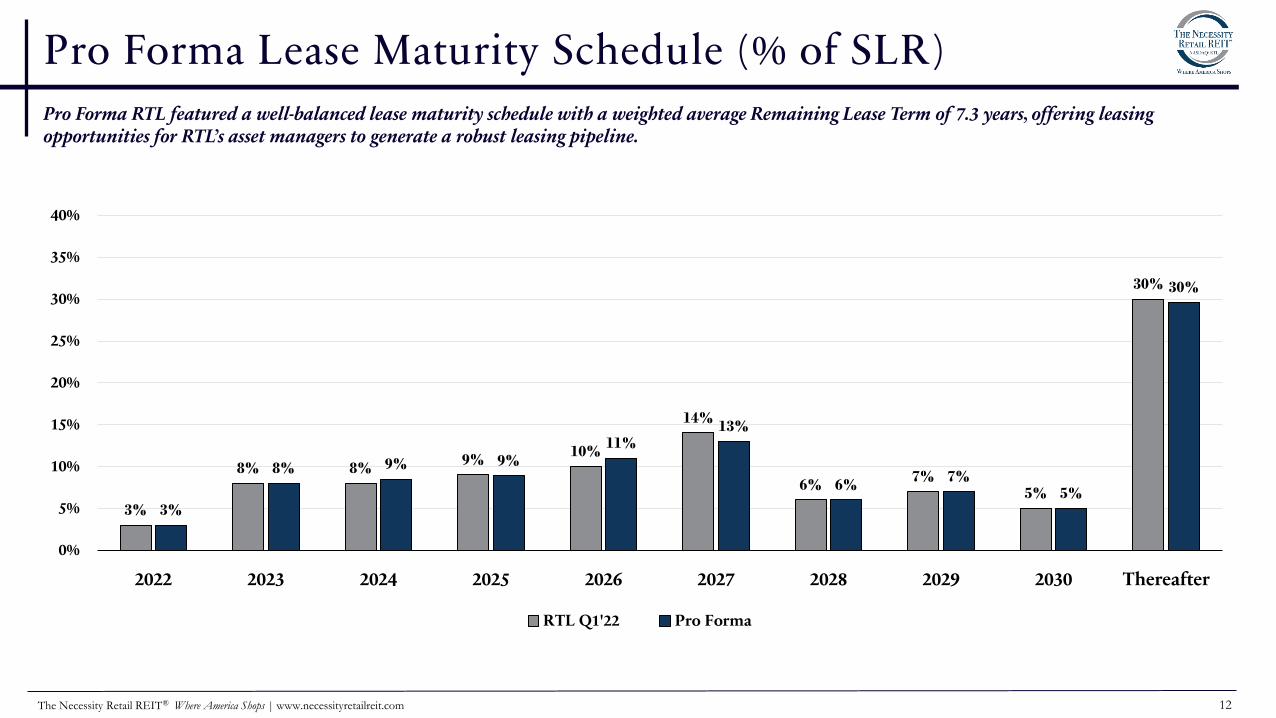
Pro Forma Lease Maturity Schedule (% of SLR)
Pro Forma RTL featured a well-balanced lease maturity schedule with a weighted average Remaining Lease Term of 7.3 years, offering leasing opportunities for RTL’s asset managers to generate a robust leasing pipeline.
3%
8% 8%9%
10%
14%
6%7%
5%
30%
3%
8% 9% 9%11%
13%
6%7%
5%
30%
0%
5%
10%
15%
20%
25%
30%
35%
40%
2022 2023 2024 2025 2026 2027 2028 2029 2030 Thereafter
RTL Q1'22 Pro Forma
13The Necessity Retail REIT® Where America Shops | www.necessityretailreit.com
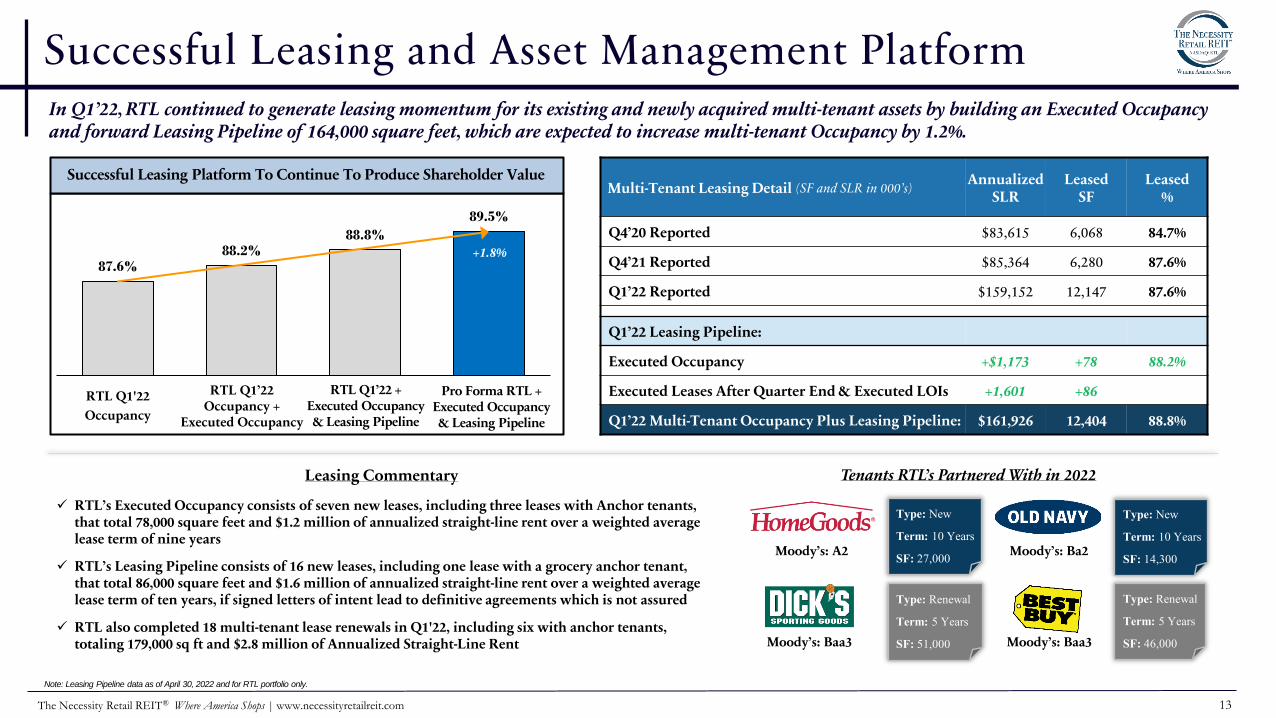
87.6%88.2%
88.8%
89.5%
RTL Q1'22
Occupancy
Successful Leasing and Asset Management Platform
Multi-Tenant Leasing Detail (SF and SLR in 000’s)Annualized
SLRLeased
SF Leased
%
Q4’20 Reported $83,615 6,068 84.7%
Q4’21 Reported $85,364 6,280 87.6%
Q1’22 Reported $159,152 12,147 87.6%
Q1’22 Leasing Pipeline:
Executed Occupancy +$1,173 +78 88.2%
Executed Leases After Quarter End & Executed LOIs +1,601 +86
Q1’22 Multi-Tenant Occupancy Plus Leasing Pipeline: $161,926 12,404 88.8%
Successful Leasing Platform To Continue To Produce Shareholder Value
Leasing Commentary
✓ RTL’s Executed Occupancy consists of seven new leases, including three leases with Anchor tenants, that total 78,000 square feet and $1.2 million of annualized straight-line rent over a weighted average lease term of nine years
✓ RTL’s Leasing Pipeline consists of 16 new leases, including one lease with a grocery anchor tenant, that total 86,000 square feet and $1.6 million of annualized straight-line rent over a weighted average lease term of ten years, if signed letters of intent lead to definitive agreements which is not assured
✓ RTL also completed 18 multi-tenant lease renewals in Q1'22, including six with anchor tenants, totaling 179,000 sq ft and $2.8 million of Annualized Straight-Line Rent
Note: Leasing Pipeline data as of April 30, 2022 and for RTL portfolio only.
In Q1’22, RTL continued to generate leasing momentum for its existing and newly acquired multi-tenant assets by building an Executed Occupancy and forward Leasing Pipeline of 164,000 square feet, which are expected to increase multi-tenant Occupancy by 1.2%.
Tenants RTL’s Partnered With in 2022
Moody’s: A2 Moody’s: Ba2
Moody’s: Baa3
Type: New
Term: 10 Years
SF: 27,000
Type: Renewal
Term: 5 Years
SF: 51,000
Type: New
Term: 10 Years
SF: 14,300
Type: Renewal
Term: 5 Years
SF: 46,000Moody’s: Baa3
Pro Forma RTL + Executed Occupancy & Leasing Pipeline
RTL Q1’22 + Executed Occupancy & Leasing Pipeline
+1.8%
RTL Q1’22 Occupancy +
Executed Occupancy
14The Necessity Retail REIT® Where America Shops | www.necessityretailreit.com
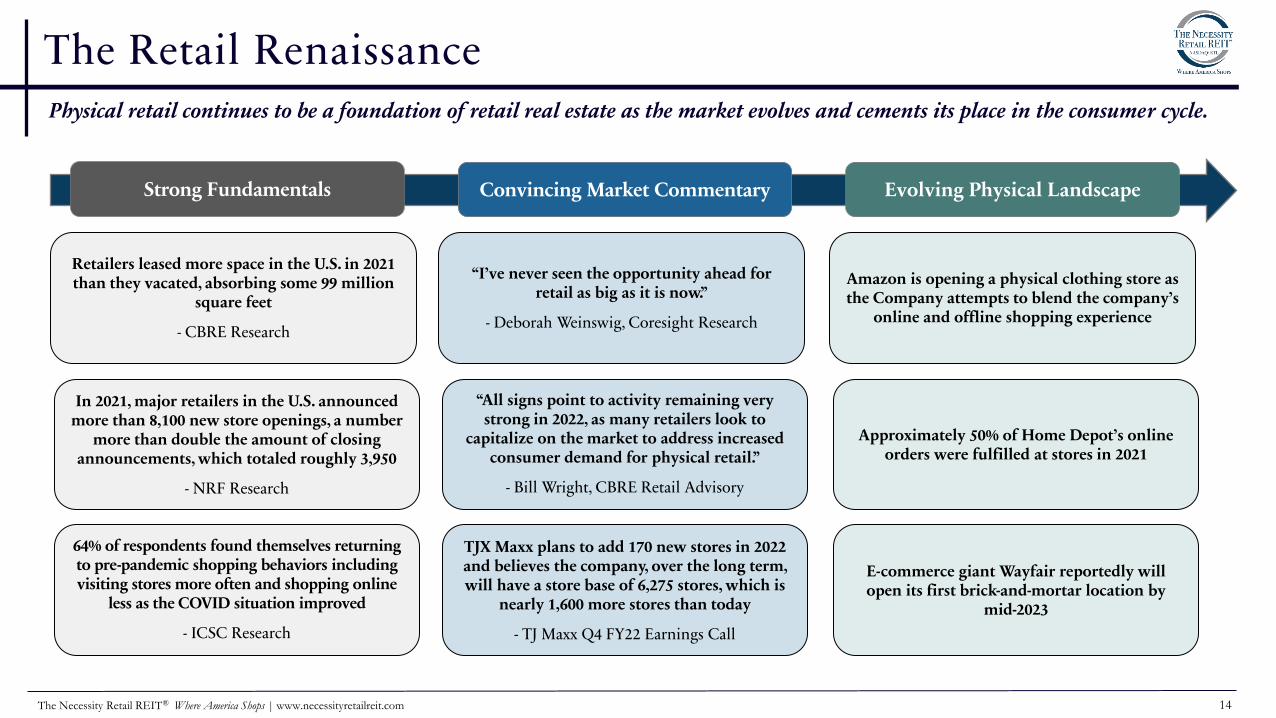
The Retail Renaissance Physical retail continues to be a foundation of retail real estate as the market evolves and cements its place in the consumer cycle.
Retailers leased more space in the U.S. in 2021 than they vacated, absorbing some 99 million
square feet
- CBRE Research
In 2021, major retailers in the U.S. announced more than 8,100 new store openings, a number
more than double the amount of closing announcements, which totaled roughly 3,950
- NRF Research
64% of respondents found themselves returning to pre-pandemic shopping behaviors including visiting stores more often and shopping online
less as the COVID situation improved
- ICSC Research
“I’ve never seen the opportunity ahead for retail as big as it is now.”
- Deborah Weinswig, Coresight Research
“All signs point to activity remaining very strong in 2022, as many retailers look to
capitalize on the market to address increased consumer demand for physical retail.”
- Bill Wright, CBRE Retail Advisory
TJX Maxx plans to add 170 new stores in 2022 and believes the company, over the long term, will have a store base of 6,275 stores, which is
nearly 1,600 more stores than today
- TJ Maxx Q4 FY22 Earnings Call
Amazon is opening a physical clothing store as the Company attempts to blend the company’s
online and offline shopping experience
Approximately 50% of Home Depot’s online orders were fulfilled at stores in 2021
E-commerce giant Wayfair reportedly will open its first brick-and-mortar location by
mid-2023
Strong Fundamentals Convincing Market Commentary Evolving Physical Landscape
15The Necessity Retail REIT® Where America Shops | www.necessityretailreit.com
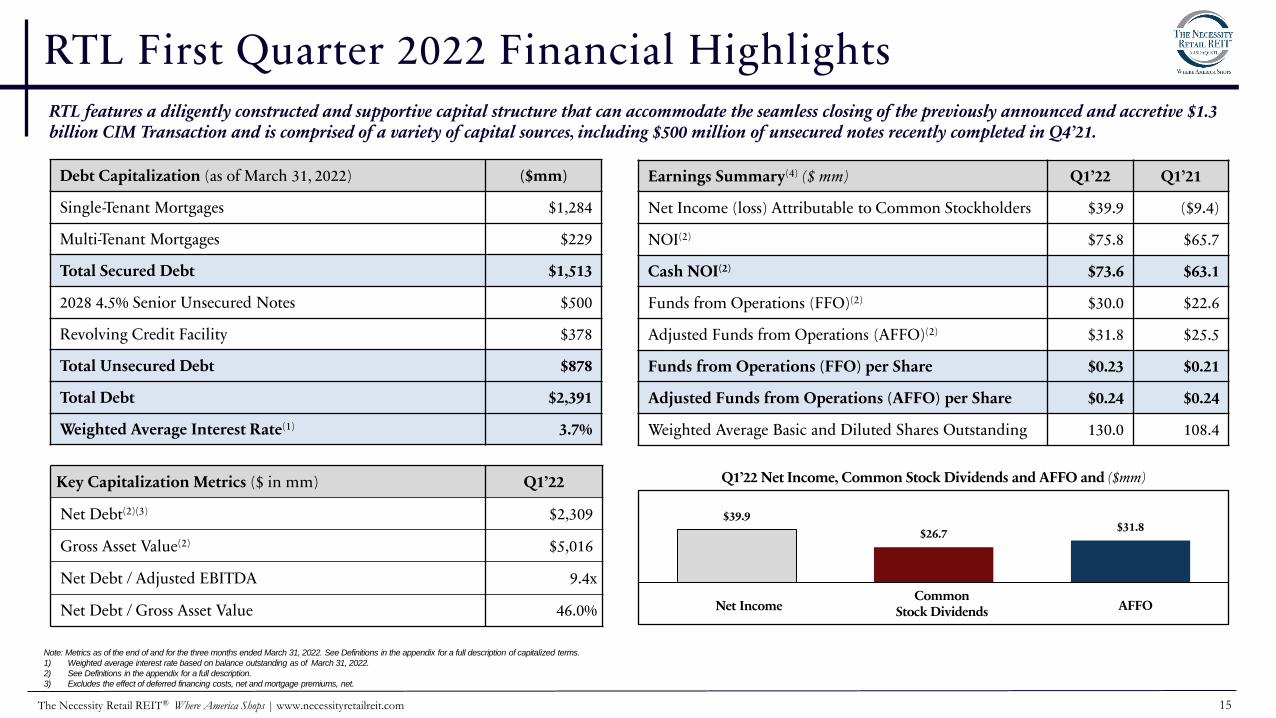
$39.9
$26.7 $31.8
Net Income Common Stock Dividen ds AFFO
RTL First Quarter 2022 Financial Highlights
Note: Metrics as of the end of and for the three months ended March 31, 2022. See Definitions in the appendix for a full description of capitalized terms.
1) Weighted average interest rate based on balance outstanding as of March 31, 2022.
2) See Definitions in the appendix for a full description.
3) Excludes the effect of deferred financing costs, net and mortgage premiums, net.
Earnings Summary(4) ($ mm) Q1’22 Q1’21
Net Income (loss) Attributable to Common Stockholders $39.9 ($9.4)
NOI(2) $75.8 $65.7
Cash NOI(2) $73.6 $63.1
Funds from Operations (FFO)(2) $30.0 $22.6
Adjusted Funds from Operations (AFFO)(2) $31.8 $25.5
Funds from Operations (FFO) per Share $0.23 $0.21
Adjusted Funds from Operations (AFFO) per Share $0.24 $0.24
Weighted Average Basic and Diluted Shares Outstanding 130.0 108.4
Q1’22 Net Income, Common Stock Dividends and AFFO and ($mm)
Debt Capitalization (as of December 31, 2021)
Net Income AFFOCommon
Stock Dividends
RTL features a diligently constructed and supportive capital structure that can accommodate the seamless closing of the previously announced and accretive $1.3 billion CIM Transaction and is comprised of a variety of capital sources, including $500 million of unsecured notes recently completed in Q4’21.
Key Capitalization Metrics ($ in mm) Q1’22
Net Debt(2)(3) $2,309
Gross Asset Value(2) $5,016
Net Debt / Adjusted EBITDA 9.4x
Net Debt / Gross Asset Value 46.0%
Debt Capitalization (as of March 31, 2022) ($mm)
Single-Tenant Mortgages $1,284
Multi-Tenant Mortgages $229
Total Secured Debt $1,513
2028 4.5% Senior Unsecured Notes $500
Revolving Credit Facility $378
Total Unsecured Debt $878
Total Debt $2,391
Weighted Average Interest Rate(1) 3.7%
16The Necessity Retail REIT® Where America Shops | www.necessityretailreit.com
1) As of March 31, 2022, unless otherwise indicated.
2) Refer to slide 3 for additional details. Excludes the Company’s Q1’22 McCain Plaza acquisition. The acquisition totaled approximately $0.6 million of Q1’22 contributed NOI.
3) As of September 30, 2021 and based, in part, on seller provided information
4) See “Non-GAAP measures” for a description of NOI and page 26 for a reconciliation of NOI to net income, the most directly comparable GAAP financial measure.
5) Reflects the company’s estimate of NOI for the entire quarter based on the amount of actual NOI generated during a portion of the quarter by the acquired properties.
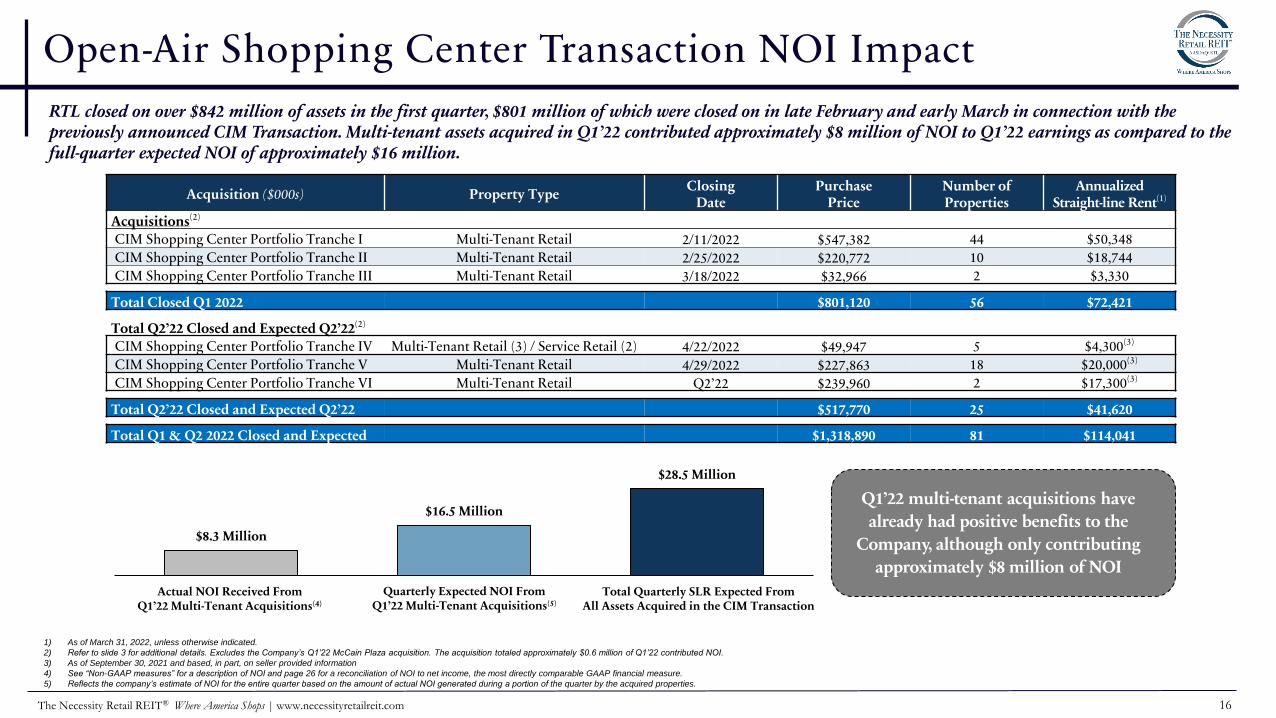
RTL closed on over $842 million of assets in the first quarter, $801 million of which were closed on in late February and early March in connection with the previously announced CIM Transaction. Multi-tenant assets acquired in Q1’22 contributed approximately $8 million of NOI to Q1’22 earnings as compared to the full-quarter expected NOI of approximately $16 million.
Acquisition ($000s) Property TypeClosing
DatePurchase
PriceNumber of Properties
AnnualizedStraight-line Rent(1)
Acquisitions(2)
CIM Shopping Center Portfolio Tranche I Multi-Tenant Retail 2/11/2022 $547,382 44 $50,348
CIM Shopping Center Portfolio Tranche II Multi-Tenant Retail 2/25/2022 $220,772 10 $18,744
CIM Shopping Center Portfolio Tranche III Multi-Tenant Retail 3/18/2022 $32,966 2 $3,330
Total Closed Q1 2022 $801,120 56 $72,421
Total Q2’22 Closed and Expected Q2’22(2)
CIM Shopping Center Portfolio Tranche IV Multi-Tenant Retail (3) / Service Retail (2) 4/22/2022 $49,947 5 $4,300(3)
CIM Shopping Center Portfolio Tranche V Multi-Tenant Retail 4/29/2022 $227,863 18 $20,000(3)
CIM Shopping Center Portfolio Tranche VI Multi-Tenant Retail Q2’22 $239,960 2 $17,300(3)
Total Q2’22 Closed and Expected Q2’22 $517,770 25 $41,620
Total Q1 & Q2 2022 Closed and Expected $1,318,890 81 $114,041
Q1’22 multi-tenant acquisitions have
already had positive benefits to the
Company, although only contributing
approximately $8 million of NOI
$8.3 Million
$16.5 Million
$28.5 Million
Actual NOI Received From Q1’22 Multi-Tenant Acquisitions(4)
Quarterly Expected NOI From Q1’22 Multi-Tenant Acquisitions(5)
Total Quarterly SLR Expected From All Assets Acquired in the CIM Transaction
Open-Air Shopping Center Transaction NOI Impact
17The Necessity Retail REIT® Where America Shops | www.necessityretailreit.com
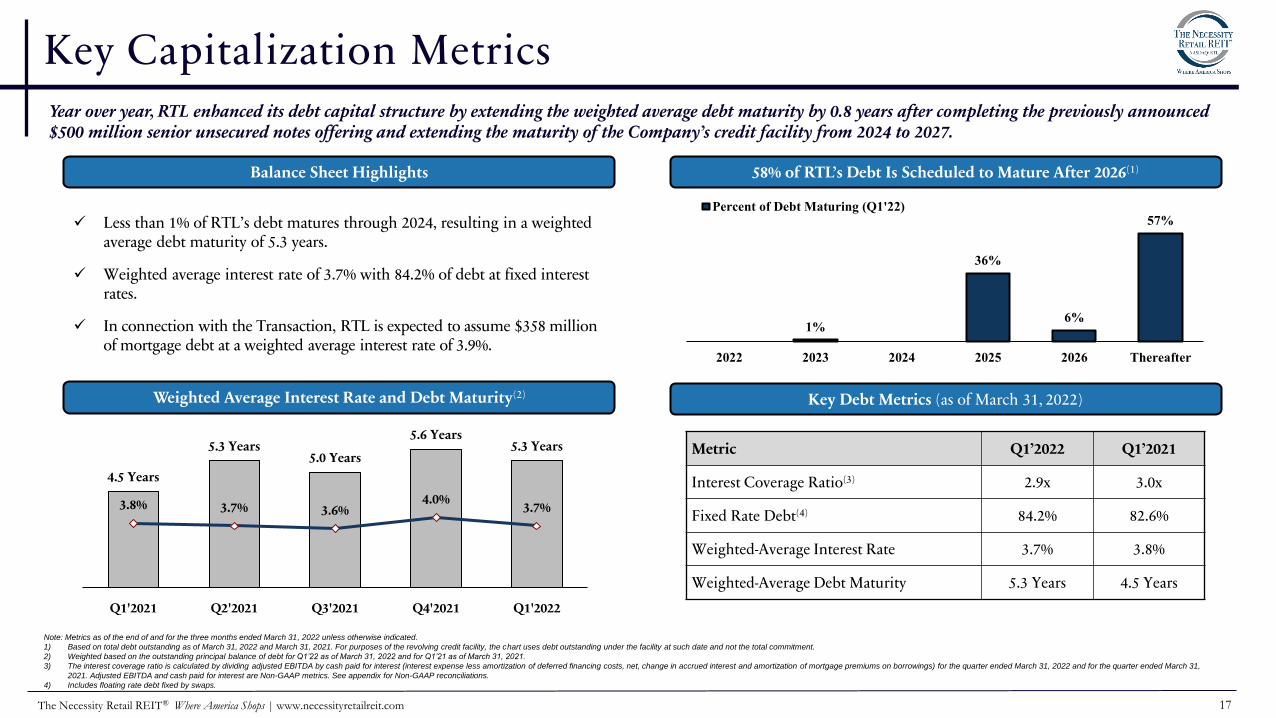
1%
36%
6%
57%
2022 2023 2024 2025 2026 Thereafter
Percent of Debt Maturing (Q1'22)
Key Capitalization Metrics
4.5 Years
5.3 Years5.0 Years
5.6 Years5.3 Years
3.8% 3.7% 3.6%4.0%
3.7%
2
2.5
3
3.5
4
4.5
5
5.5
6
1.5%
2.5%
3.5%
4.5%
5.5%
6.5%
Q1'2021 Q2'2021 Q3'2021 Q4'2021 Q1'2022
✓ Less than 1% of RTL’s debt matures through 2024, resulting in a weighted average debt maturity of 5.3 years.
✓ Weighted average interest rate of 3.7% with 84.2% of debt at fixed interest rates.
✓ In connection with the Transaction, RTL is expected to assume $358 million of mortgage debt at a weighted average interest rate of 3.9%.
Note: Metrics as of the end of and for the three months ended March 31, 2022 unless otherwise indicated.
1) Based on total debt outstanding as of March 31, 2022 and March 31, 2021. For purposes of the revolving credit facility, the chart uses debt outstanding under the facility at such date and not the total commitment.
2) Weighted based on the outstanding principal balance of debt for Q1’22 as of March 31, 2022 and for Q1’21 as of March 31, 2021.
3) The interest coverage ratio is calculated by dividing adjusted EBITDA by cash paid for interest (interest expense less amortization of deferred financing costs, net, change in accrued interest and amortization of mortgage premiums on borrowings) for the quarter ended March 31, 2022 and for the quarter ended March 31,
2021. Adjusted EBITDA and cash paid for interest are Non-GAAP metrics. See appendix for Non-GAAP reconciliations.
4) Includes floating rate debt fixed by swaps.
Metric Q1’2022 Q1’2021
Interest Coverage Ratio(3) 2.9x 3.0x
Fixed Rate Debt(4) 84.2% 82.6%
Weighted-Average Interest Rate 3.7% 3.8%
Weighted-Average Debt Maturity 5.3 Years 4.5 Years
Balance Sheet Highlights
Weighted Average Interest Rate and Debt Maturity(2) Key Debt Metrics (as of March 31, 2022)
58% of RTL’s Debt Is Scheduled to Mature After 2026(1)
Year over year, RTL enhanced its debt capital structure by extending the weighted average debt maturity by 0.8 years after completing the previously announced $500 million senior unsecured notes offering and extending the maturity of the Company’s credit facility from 2024 to 2027.
18The Necessity Retail REIT® Where America Shops | www.necessityretailreit.com
Strong Recent Track Record To DeleveragePost-CIM Transaction, RTL will resume its previously announced and successful deleveraging initiative and expects to return to leverage levels consistent with prior quarters.
Deleveraging Post CIM Transaction
RTL partially funded the CIM Transaction through assumed property-level debt and borrowings under its credit facility, which have resulted in a near-term increase in leverage
RTL funded the Q1’22 closings of the CIM Transaction through a combination of $367 million of cash on the balance sheet, including $261 million of net proceeds from the Sanofi office disposition, $378 million draw under the Company’s credit facility, $19 million of property-level assumed mortgage debt and the issuance of $53 million of the Company’s Class A common stock to CIM
The CIM Transaction was accretive to Q1’22 AFFO per share and is expected to continue to provide incremental earnings growth upon complete closing and position the Company for sustained earnings growth by capitalizing on its leasing platform and favorable industry tailwinds
Post CIM Transaction, RTL expects to deleverage its balance sheet through:
✓ Identified $250 million of the acquired assets that RTL intends to hold for sale, potentially providing proceeds to reduce leverage upon a completed sale
✓ Identified 13 assets that have strong leasing potential, which RTL expects to develop a substantial leasing pipeline for immediately upon closing
✓ Increasing earnings through external and internal growth factors such as property acquisitions and multi-tenant leasing activity
✓ Fund future acquisitions in all cash or at lower debt to equity ratios
✓ Opportunistic equity issuance over time
19The Necessity Retail REIT® Where America Shops | www.necessityretailreit.com
Experienced Management Team
Jason Slear
Executive Vice President of Real Estate Acquisitions and Dispositions
▪ Responsible for sourcing, negotiating, and closing AR Global's real estate acquisitions and dispositions
▪ Oversaw the acquisition of over $3.5 billion of real estate assets and the lease-up of over 10 million square feet during professional career
Michael Weil
Chief Executive Officer, President and Chairman of the Board of Directors
▪ Founding partner of AR Global
▪ Previously served as Senior VP of sales and leasing for American Financial Realty Trust
▪ Served as president of the Board of Directors of the Real Estate Investment Securities Association (n/k/a ADISA)
Boris Korotkin
Senior Vice President of Capital Markets and Corporate Strategy
▪ Responsible for leading all debt capital market transactions
▪ Former Executive Vice President of Transaction Structuring for American Financial Realty Trust
Ori Kravel
Senior Vice President of Corporate Development
▪ Responsible for corporate development and business strategy
▪ Executed over $12 billion of capital market transactions and over $25 billion of M&A transactions
Jason Doyle
Chief Financial Officer, Treasurer and Secretary
▪ Mr. Doyle previously served as chief accounting officer of Global Net Lease, Inc. (“GNL”) and Chief Financial Officer, Secretary, and Treasurer of Healthcare Trust, Inc. (“HTI”). Prior to joining AR
Global and GNL, Mr. Doyle held various financial and practice leadership roles, including Acting VP Finance at Markforged, Inc. Associate Controller, Head of Global Accounting Operations at
Charles River Associates and VP Finance and Practice Director, Transportation at AST Corporation, a privately-held software and management consulting firm

20The Necessity Retail REIT® Where America Shops | www.necessityretailreit.com
Legal Notices
21The Necessity Retail REIT® Where America Shops | www.necessityretailreit.com
Disclaimers
Disclaimers
This presentation includes estimated projections of future operating results or activities such as leasing activity, among other things. These projections were not prepared in accordance with published guidelines of the SEC or the guidelines establishedby the American Institute of Certified Public Accountants for preparation and presentation of financial projections. This information is not fact and should not be relied upon as being necessarily indicative of future results; the projections wereprepared in good faith by management and are based on numerous assumptions that may prove to be wrong. Important factors that may affect actual results and cause the projections to not be achieved include, but are not limited to, risks anduncertainties relating to the company and other factors described in the “Risk Factors” section of the Company's Annual Report on Form 10-K for the year ended December 31, 2021, the Company's subsequent Quarterly Reports on Form 10-Q and infuture filings with the SEC. The projections also reflect assumptions as to certain business decisions that are subject to change. As a result, actual results may differ materially from those contained in the estimates. Accordingly, there can be no assurancethat the estimates will be realized. The industry in which we operate is subject to a high degree of uncertainty and risk due to variety of factors, including those described in the “Risk Factors” and "Management's Discussion and Analysis of FinancialCondition and Results of Operations" sections of the Company's Annual Report on Form 10-K for the year ended December 31, 2021, filed with the SEC on February 24, 2022 and the Company's subsequent Quarterly Reports on Form 10-Q, CurrentReports on Form 8-K and Annual Reports on Form 10-K filed with the SEC. These and other factors could cause results to differ materially from those expressed in these publications and reports.
This presentation contains estimates and information concerning the Company’s industry that is based on industry publications. The Company has not independently verified the accuracy of the data contained in these industry publications. Theseestimates and information involve a number of assumptions and limitations, and you are cautioned not to rely on or give undue weight to this information.
The majority of the concessions granted to the Company's tenants as a result of the COVID-19 pandemic are rent deferrals or temporary rent abatements with the original lease term unchanged and collection of deferred rent deemed probable. TheCompany's revenue recognition policy requires that it must be probable that the Company will collect virtually all of the lease payments due and does not provide for partial reserves, or the ability to assume partial recovery. In light of the COVID-19pandemic, the FASB and SEC agreed that for leases where the total lease cash flows will remain substantially the same or less than those after the COVID-19 related effects, companies may choose to forgo the evaluation of the enforceable rights andobligations of the original lease contract as a practical expedient and account for rent concessions as if they were part of the enforceable rights and obligations of the parties under the existing lease contract. As a result, rental revenue used to calculateNet Income and NAREIT FFO has not been, and the Company does not expect it to be, significantly impacted by these types of deferrals. In addition, since the Company currently believes that these deferral amounts are collectable, they have beenexcluded from the increase in straight-line rent for AFFO purposes the amounts recognized under GAAP relating to these types of rent deferrals. Conversely, for abatements where contractual rent has been reduced, the reduction is reflected over theremaining lease term for accounting purposes but represents a permanent reduction and the Company has, accordingly, reduced its AFFO.
Credit Ratings
A securities rating is not a recommendation to buy, sell or hold securities and may be subject to revision or withdrawal at any time. Each rating agency has its own methodology for assigning ratings and, accordingly, each rating should be evaluatedindependently of any other rating.
22The Necessity Retail REIT® Where America Shops | www.necessityretailreit.com
Forward-Looking StatementsCertain statements made in this presentation are “forward-looking statements” (as defined in Section 21E of the Exchange Act), including estimated projections of future operating results, and the impact of the proposed acquisition, and which reflect the expectations of the Company regarding future events. The forward-looking statements involve a number of risks, uncertainties and other factors that could cause actual results to differ materially from those contained in the forward-looking statements. Such forward-looking statements include, but are not limited to, market and other expectations, objectives, and intentions, as well as any other statements that are not historical facts.
Our potential risks and uncertainties are presented in the section titled “Item 1A-Risk Factors” disclosed in our Annual Report on Form 10-K for the year ended December 31, 2021 filed with the SEC on February 24, 2022, and the Company's subsequent Quarterly Reports on Form 10-Q filed with the SEC. Forward-looking statements speak as of the date they are made and, we disclaim any obligation to update and revise statements contained in these materials to reflect changed assumptions, the occurrence of unanticipated events or changes to future operating results over time, unless required by law. The following are some of the risks and uncertainties relating to us, although not all risks and uncertainties, that could cause our actual results to differ materially from those presented in our forward-looking statements:
▪ We may be unable to acquire properties on advantageous terms or our property acquisitions may not perform as we expect.
▪ We are subject to risks associated with a pandemic, epidemic or outbreak of a contagious disease, such as the ongoing global COVID-19 pandemic, including negative impacts on our tenants and their respective businesses.
▪ Certain of the agreements governing our indebtedness may limit our ability to pay dividends on our Class A common stock, our Series A Preferred Stock and our Series C Preferred Stock, and our ability to repurchase shares.
▪ If we are not able to generate sufficient cash from operations, we may have to reduce the amount of dividends we pay or identify other financing sources.
▪ Funding dividends from other sources such as borrowings, asset sales or equity issuances limits the amount we can use for property acquisitions, investments and other corporate purposes.
▪ Our operating results are affected by economic and regulatory changes that have an adverse impact on the real estate market in general.
▪ Inflation and continuing increases in the inflation rate may have an adverse effect on our investments and results from operations.
▪ In owning properties we may experience, among other things, unforeseen costs associated with complying with laws and regulations and other costs, potential difficulties selling properties and potential damages or losses resulting from climate change.
▪ We depend on tenants for our rental revenue and, accordingly, our rental revenue is dependent upon the success and economic viability of our tenants. If a tenant or lease guarantor declares bankruptcy or becomes insolvent, we may be unable to collect balances due under relevant leases.
▪ Our tenants may not be diversified including by industry type or geographic location.
▪ The performance of our retail portfolio is linked to the market for retail space generally and factors that may impact our retail tenants, such as the increasing use of the Internet by retailers and consumers.
▪ Certain of our tenants are facing increased competition with other non-traditional and online grocery retailers and higher costs due to inflation and supply chain issues, which may negatively impact their businesses.
▪ We depend on our Advisor and Property Manager to provide us with executive officers, key personnel and all services required for us to conduct our operations.
▪ All of our executive officers face conflicts of interest, such as conflicts created by the terms of our agreements with our Advisor and compensation payable thereunder, conflicts allocating investment opportunities to us, and conflicts in allocating their time and attention to our matters. Conflicts that arise may not be resolved in our favor and could result in actions that are adverse to us.
▪ We have long-term agreements with our Advisor and its affiliates that may be terminated only in limited circumstances.
▪ We have substantial indebtedness and may be unable to repay, refinance, restructure or extend our indebtedness as it becomes due. Increases in interest rates could increase the amount of our debt payments. We may incur additional indebtedness in the future.
▪ The stockholder rights plan adopted by our board of directors, our classified board and other aspects of our corporate structure and Maryland law may discourage a third party from acquiring us in a manner that might result in a premium price to our stockholders.
▪ Restrictions on share ownership contained in our charter may inhibit market activity in shares of our stock and restrict our business combination opportunities.
▪ We may fail to continue to qualify as a REIT.
In addition, this presentation discusses the acquisition of an 81-property portfolio. Subsequent to the quarter ending March 31, 2022, the Company completed 79 of the 81 property acquisitions. The remaining two properties in the transaction are subject to closing conditions that are outside the Company’s control and may not be met. The transaction may not be completed on the contemplated terms, or at all, or may be delayed.

23The Necessity Retail REIT® Where America Shops | www.necessityretailreit.com
Appendix
24The Necessity Retail REIT® Where America Shops | www.necessityretailreit.com
DefinitionsAFFO: In calculating AFFO, we start with FFO, then we exclude certain income or expense items from AFFO that we consider to be more reflective of investing activities, such as non-cash income and expense items and the income and expense effects of other activities that are not a fundamental attribute of ourday to day operating business plan, such as amounts related to litigation arising out of the merger with American Realty Capital-Retail Centers of America, Inc. in February 2017 (the “Merger”). These amounts include legal costs incurred as a result of the litigation, portions of which have been and may in the futurebe reimbursed under insurance policies maintained by us. Insurance reimbursements are deducted from AFFO in the period of reimbursement. We believe that excluding the litigation costs and subsequent insurance reimbursements related to litigation arising out of the Merger helps to provide a betterunderstanding of the operating performance of our business. Other income and expense items also include early extinguishment of debt and unrealized gains and losses, which may not ultimately be realized, such as gains or losses on derivative instruments and gains and losses on investments. In addition, byexcluding non-cash income and expense items such as amortization of above-market and below-market leases intangibles, amortization of deferred financing costs, straight-line rent, and share-based compensation related to restricted shares and the 2018 OPP from AFFO, we believe we provide useful informationregarding those income and expense items which have a direct impact on our ongoing operating performance. By providing AFFO, we believe we are presenting useful information that can be used to, among other things, assess our performance without the impact of transactions or other items that are not relatedto of our portfolio of properties. AFFO presented by us may not be comparable to AFFO reported by other REITs that define AFFO differently.
Annualized Straight-Line Rent (“SLR”): Straight-line rent which is annualized and calculated using the most recent available lease terms as of the period end indicated.
Cash Cap Rate: For acquisitions, cash cap rate is a rate of return on a real estate investment property based on the expected, annualized cash rental income during the first year of ownership that the property will generate under its existing lease or leases. For dispositions, cash cap rate is a rate of return based on theannualized cash rental income of the property to be sold. For acquisitions, cash cap rate is calculated by dividing this annualized cash rental income the property will generate (before debt service and depreciation and after fixed costs and variable costs) by the purchase price of the property, excluding acquisitioncosts. For dispositions, cash cap rate is calculated by dividing the annualized cash rental income by the contract sales price for the property, excluding acquisition costs. Weighted average cash cap rates are based on square feet unless otherwise indicated.
Cash NOI: We define Cash NOI as NOI excluding amortization of above/below market lease intangibles and straight-line adjustments that are included in GAAP lease revenues.
Executed Occupancy: Includes Occupancy as defined below as of a particular date as well as all leases fully executed by both parties as of the same date where the tenant has yet to take possession as of such date. For Q1’22 and as of April 30, 2022, there are seven additional leases executed where rent commencesover time in 2022 totaling approximately 78,000 square feet.
FFO: We define FFO, a non-GAAP measure, consistent with the standards established over time by the Board of Governors of NAREIT, as restated in a White Paper and approved by the Board of Governors of NAREIT effective in December 2018 (the "White Paper"). The White Paper defines FFO as net income or loss computed in accordance with GAAP excluding depreciation and amortization related to real estate, gains and losses from sales of certain real estate assets, gain and losses from change in control and impairment write-downs of certain real estate assets and investments in entities when the impairment is directly attributable to decreases in the value of depreciable real estate held by the entity. Adjustments for unconsolidated partnerships and joint ventures are calculated to exclude the proportionate share of the non-controlling interest to arrive at FFO attributable to stockholders. Our FFO calculation complies with NAREIT's definition.
Gross Asset Value: Total gross asset value of $5.0 billion, comprised of total assets of $4.3 billion plus accumulated depreciation and amortization of $0.7 billion as of March 31, 2022.
Investment Grade: As used herein, Investment Grade includes both actual investment grade ratings of the tenant or guarantor, if available, or implied investment grade. Implied investment grade may include actual ratings of tenant parent, guarantor parent (regardless of whether or not the parent has guaranteed the tenant’s obligation under the lease) or by using a proprietary Moody’s analytical tool, which generates an implied rating by measuring a company’s probability of default. The term “parent" for these purposes includes any entity, including any governmental entity, owning more than 50% of the voting stock in a tenant. Ratings information is as of March 31, 2022 and based on Annualized Straight-Line Rent.
Leasing Pipeline: Leasing Pipeline includes (i) all leases fully executed by both parties as of April 30, 2022, but after March 31, 2022 and (ii) all leases under negotiation with an executed LOI by both parties as of April 30, 2022. This represents four executed leases totaling approximately 20,000 square feet and 12LOIs totaling approximately 66,000 square feet. No lease terminations occurred during this period. Leasing pipeline should not be considered an indication of future performance.
Liquidity: As of March 31, 2022, the Company had $82 million in cash and cash equivalents, and $173 million available for future borrowings under the Company's credit facility.
LOI: Means a non-binding letter of intent.
Necessity-Based: We define Necessity-Based as properties that are leased to tenants that operate in what we believe to be service-based or essential industries such as auto services, distribution, financial services, gas/convenience, grocery. healthcare, and quick service restaurants, among others.
Net Debt: For Q1’2022, represents total debt of $2.4 billion less cash and cash equivalents of $82 million as of March 31, 2022.
NOI: Defined as a non-GAAP financial measure used by us to evaluate the operating performance of our real estate. NOI is equal to total revenues, excluding contingent purchase price consideration, less property operating and maintenance expense. NOI excludes all other items of expense and income included inthe financial statements in calculating net (loss).
Occupancy: Represents percentage of square footage of which the tenant has taken possession of divided by the respective total rentable square feet as of the date or period end indicated.
Pro Forma: As used herein, Pro Forma represents the RTL portfolio as of and for the period ending March 31, 2022 including the applicable stub period for the properties acquired from CIM during the quarter and the remaining 25 properties that were yet to be closed as of March 31, 2022 and were "probable"acquisitions as of the date. Information included in the pro forma presentation herein regarding these probable acquisitions is as of and for the three months ended September 30, 2021.
PSA: Means a definitive purchase and sale agreement.
Remaining Lease Term: Represents the outstanding tenant lease term. Weighted based on Annualized Straight-Line Rent as of the date or period end indicated.
Traditional Retail: RTL definition of Traditional Retail includes retail properties leased to tenants in the auto retail, department store, discount retail, electronics, furniture, home improvement, home furnishing, specialty retail, and sporting good sectors.
25The Necessity Retail REIT® Where America Shops | www.necessityretailreit.com
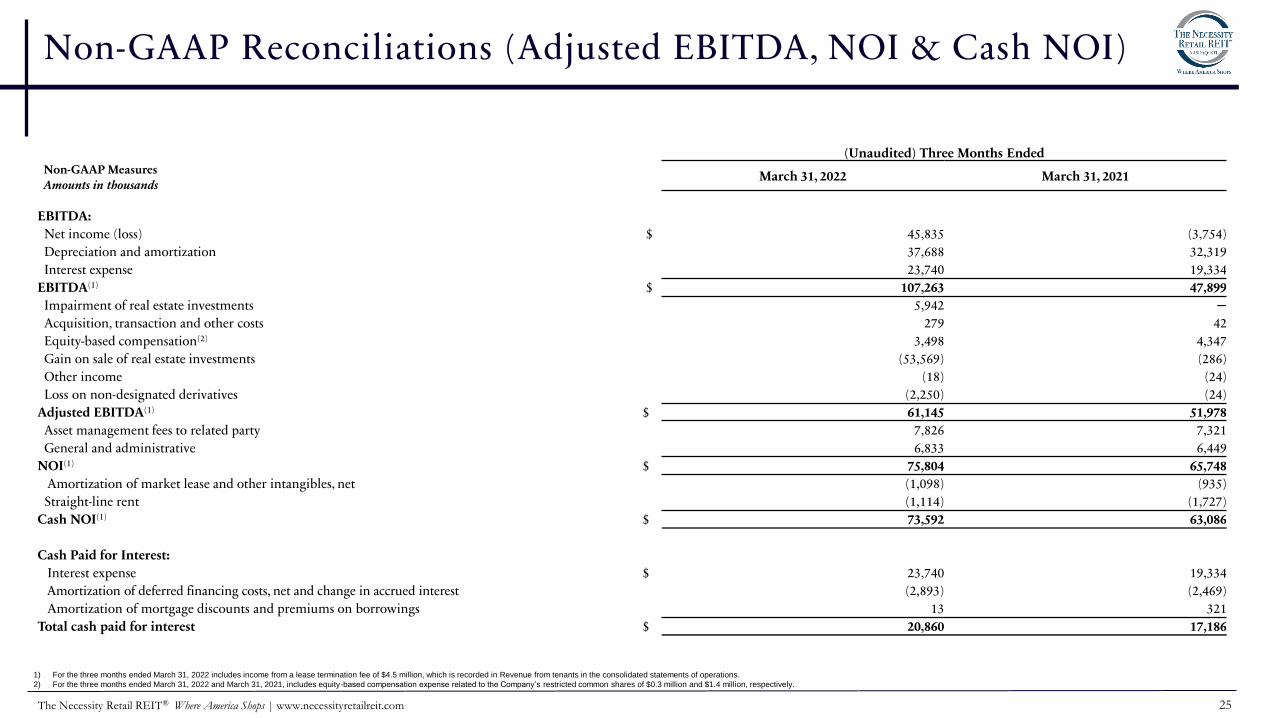
Non-GAAP Reconciliations (Adjusted EBITDA, NOI & Cash NOI)
(Unaudited) Three Months Ended
March 31, 2022 March 31, 2021
EBITDA:
Net income (loss) $ 45,835 (3,754)
Depreciation and amortization 37,688 32,319
Interest expense 23,740 19,334
EBITDA(1) $ 107,263 47,899
Impairment of real estate investments 5,942 ─
Acquisition, transaction and other costs 279 42
Equity-based compensation(2) 3,498 4,347
Gain on sale of real estate investments (53,569) (286)
Other income (18) (24)
Loss on non-designated derivatives (2,250) (24)
Adjusted EBITDA(1) $ 61,145 51,978
Asset management fees to related party 7,826 7,321
General and administrative 6,833 6,449
NOI(1) $ 75,804 65,748
Amortization of market lease and other intangibles, net (1,098) (935)
Straight-line rent (1,114) (1,727)
Cash NOI(1) $ 73,592 63,086
Cash Paid for Interest:
Interest expense $ 23,740 19,334
Amortization of deferred financing costs, net and change in accrued interest (2,893) (2,469)
Amortization of mortgage discounts and premiums on borrowings 13 321
Total cash paid for interest $ 20,860 17,186
Non-GAAP MeasuresAmounts in thousands
1) For the three months ended March 31, 2022 includes income from a lease termination fee of $4.5 million, which is recorded in Revenue from tenants in the consolidated statements of operations.
2) For the three months ended March 31, 2022 and March 31, 2021, includes equity-based compensation expense related to the Company’s restricted common shares of $0.3 million and $1.4 million, respectively.
26The Necessity Retail REIT® Where America Shops | www.necessityretailreit.com
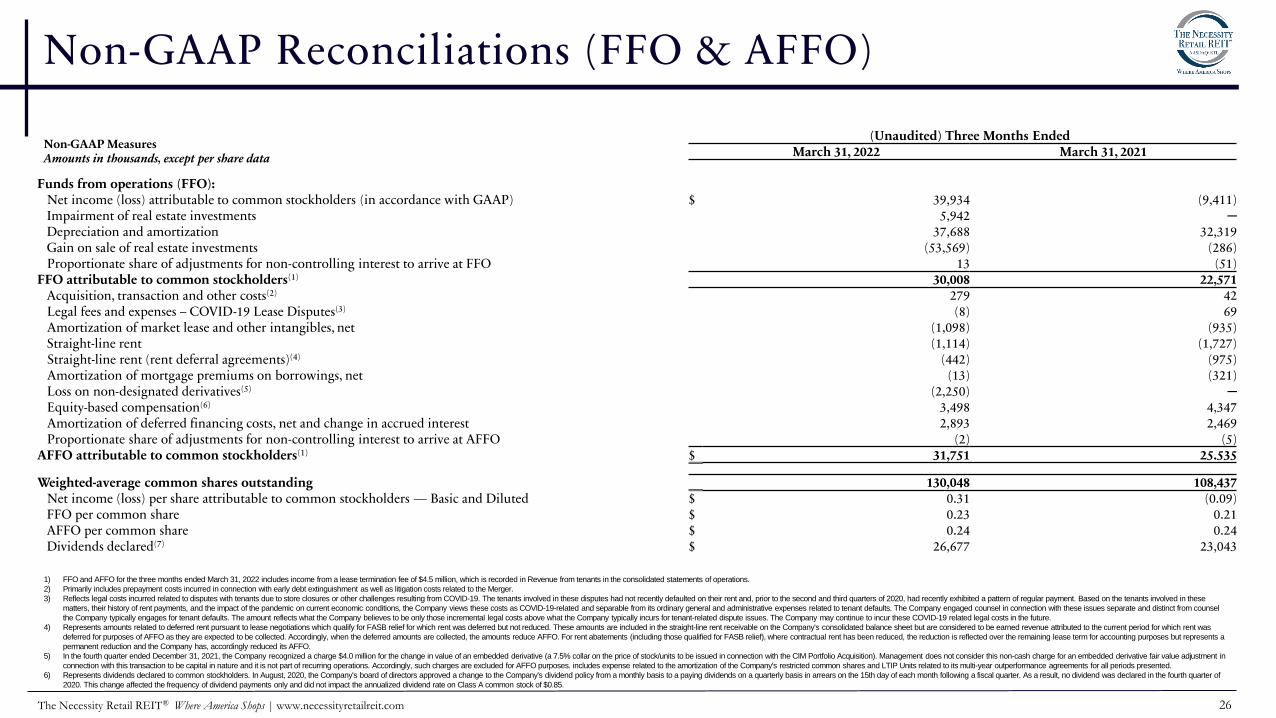
Non-GAAP Reconciliations (FFO & AFFO)
(Unaudited) Three Months EndedMarch 31, 2022 March 31, 2021
Funds from operations (FFO):Net income (loss) attributable to common stockholders (in accordance with GAAP) $ 39,934 (9,411) Impairment of real estate investments 5,942 ─
Depreciation and amortization 37,688 32,319Gain on sale of real estate investments (53,569) (286)Proportionate share of adjustments for non-controlling interest to arrive at FFO 13 (51)
FFO attributable to common stockholders(1) 30,008 22,571Acquisition, transaction and other costs(2) 279 42Legal fees and expenses – COVID-19 Lease Disputes(3) (8) 69Amortization of market lease and other intangibles, net (1,098) (935)Straight-line rent (1,114) (1,727)Straight-line rent (rent deferral agreements)(4) (442) (975)Amortization of mortgage premiums on borrowings, net (13) (321)Loss on non-designated derivatives(5) (2,250) ─
Equity-based compensation(6) 3,498 4,347Amortization of deferred financing costs, net and change in accrued interest 2,893 2,469Proportionate share of adjustments for non-controlling interest to arrive at AFFO (2) (5)
AFFO attributable to common stockholders(1) $ 31,751 25.535
Weighted-average common shares outstanding 130,048 108,437Net income (loss) per share attributable to common stockholders — Basic and Diluted $ 0.31 (0.09)FFO per common share $ 0.23 0.21AFFO per common share $ 0.24 0.24Dividends declared(7) $ 26,677 23,043
Non-GAAP MeasuresAmounts in thousands, except per share data
1) FFO and AFFO for the three months ended March 31, 2022 includes income from a lease termination fee of $4.5 million, which is recorded in Revenue from tenants in the consolidated statements of operations.
2) Primarily includes prepayment costs incurred in connection with early debt extinguishment as well as litigation costs related to the Merger.
3) Reflects legal costs incurred related to disputes with tenants due to store closures or other challenges resulting from COVID-19. The tenants involved in these disputes had not recently defaulted on their rent and, prior to the second and third quarters of 2020, had recently exhibited a pattern of regular payment. Based on the tenants involved in these
matters, their history of rent payments, and the impact of the pandemic on current economic conditions, the Company views these costs as COVID-19-related and separable from its ordinary general and administrative expenses related to tenant defaults. The Company engaged counsel in connection with these issues separate and distinct from counsel
the Company typically engages for tenant defaults. The amount reflects what the Company believes to be only those incremental legal costs above what the Company typically incurs for tenant-related dispute issues. The Company may continue to incur these COVID-19 related legal costs in the future.
4) Represents amounts related to deferred rent pursuant to lease negotiations which qualify for FASB relief for which rent was deferred but not reduced. These amounts are included in the straight-line rent receivable on the Company's consolidated balance sheet but are considered to be earned revenue attributed to the current period for which rent was
deferred for purposes of AFFO as they are expected to be collected. Accordingly, when the deferred amounts are collected, the amounts reduce AFFO. For rent abatements (including those qualified for FASB relief), where contractual rent has been reduced, the reduction is reflected over the remaining lease term for accounting purposes but represents a
permanent reduction and the Company has, accordingly reduced its AFFO.
5) In the fourth quarter ended December 31, 2021, the Company recognized a charge $4.0 million for the change in value of an embedded derivative (a 7.5% collar on the price of stock/units to be issued in connection with the CIM Portfolio Acquisition). Management does not consider this non-cash charge for an embedded derivative fair value adjustment in
connection with this transaction to be capital in nature and it is not part of recurring operations. Accordingly, such charges are excluded for AFFO purposes. includes expense related to the amortization of the Company's restricted common shares and LTIP Units related to its multi-year outperformance agreements for all periods presented.
6) Represents dividends declared to common stockholders. In August, 2020, the Company's board of directors approved a change to the Company's dividend policy from a monthly basis to a paying dividends on a quarterly basis in arrears on the 15th day of each month following a fiscal quarter. As a result, no dividend was declared in the fourth quarter of
2020. This change affected the frequency of dividend payments only and did not impact the annualized dividend rate on Class A common stock of $0.85.
27The Necessity Retail REIT® Where America Shops | www.necessityretailreit.com
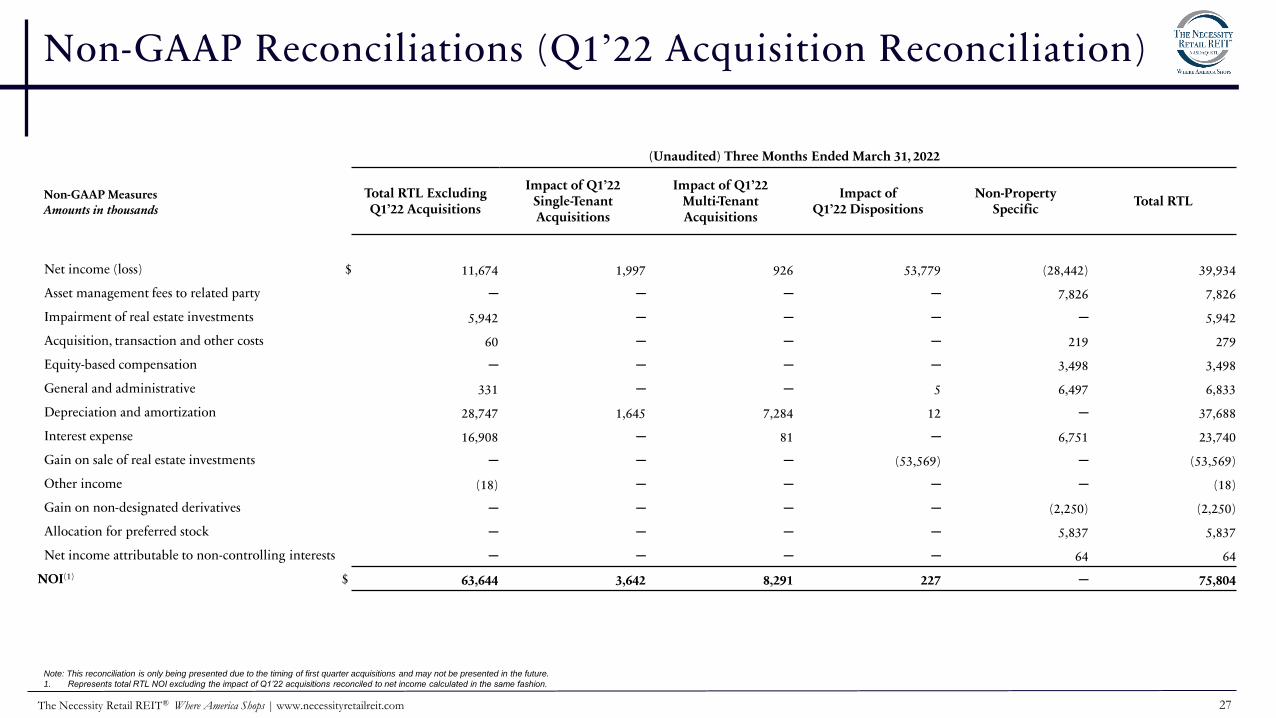
Non-GAAP Reconciliations (Q1’22 Acquisition Reconciliation)
(Unaudited) Three Months Ended March 31, 2022
Total RTL Excluding Q1’22 Acquisitions
Impact of Q1’22 Single-Tenant Acquisitions
Impact of Q1’22 Multi-Tenant Acquisitions
Impact of Q1’22 Dispositions
Non-PropertySpecific
Total RTL
Net income (loss) $ 11,674 1,997 926 53,779 (28,442) 39,934
Asset management fees to related party ─ ─ ─ ─ 7,826 7,826
Impairment of real estate investments 5,942 ─ ─ ─ ─ 5,942
Acquisition, transaction and other costs 60 ─ ─ ─ 219 279
Equity-based compensation ─ ─ ─ ─ 3,498 3,498
General and administrative 331 ─ ─ 5 6,497 6,833
Depreciation and amortization 28,747 1,645 7,284 12 ─ 37,688
Interest expense 16,908 ─ 81 ─ 6,751 23,740
Gain on sale of real estate investments ─ ─ ─ (53,569) ─ (53,569)
Other income (18) ─ ─ ─ ─ (18)
Gain on non-designated derivatives ─ ─ ─ ─ (2,250) (2,250)
Allocation for preferred stock ─ ─ ─ ─ 5,837 5,837
Net income attributable to non-controlling interests ─ ─ ─ ─ 64 64
NOI(1) $ 63,644 3,642 8,291 227 ─ 75,804
Non-GAAP MeasuresAmounts in thousands
Note: This reconciliation is only being presented due to the timing of first quarter acquisitions and may not be presented in the future.
1. Represents total RTL NOI excluding the impact of Q1’22 acquisitions reconciled to net income calculated in the same fashion.