proceedings of the tenth symposium of aer - international
TRANSCRIPT
SK01ST075
INIS-SK--01-008
Atomic Energy Research (AER)
Proceedings ofthe tenth Symposium of AER
Moscow>Q Russia18-22 October 2000
Atomic Energy Research (AER)
Proceedings ofthe tenth Symposium of AER
MoscowRussia
18-22 October 2000

Kiadja a KFKI Atomenergia KutatdintezetBudapest
ISBN 963-372-621-2 6ISBN 963-372-622-0
Foreword
The present volume contains 80 papers, presented on the tenthSymposium ofAER, held in Moscow, Russia, 18 - 22 September 2000.The papers are presented in their original form, i.e. no corrections ormodifications were carried out. The content of this volume is dividedinto thematic groups: Core Operation, Fuel Mamagement and Design,Spectral and Core Calculation Methods, Spent Fuel, Transmutations,Core Monitoring, Surveillance and Testing, Reactor Dynamics andSafety Analysis - according to the presentation sequence on theSymposium. At the end of the volume an alphabetical author index isgiven.
Budapest, October 2000
Istvdn Vidovszky

PLEASE BE AWARE THATALL OF THE MISSING PAGES IN THIS DOCUMENT
WERE ORIGINALLY BLANK
Contents
CORE OPERATION; FUEL MANAGEMENT AND DESIGN
P. Darjlek: AER working group B activities in 2000 11
Yu.A. Kukushkin, V.L. Molchanov, V.V. Rozhkov:Improvement of VVER and RBMK reactor fuel state andprospects 15
I. Nemes: Investigation of neutronphysical features ofVVER-440 assembly containing differently enriched pinsand Gd burnable poison " 21
Tz. Haralampieva, A. Antov, S. Stefanova, G. Passage:Overview on the fuel cycle safety and economycharacteristics improvement of the VVER-440/V-230reactors at the Kozloduy NPP 39
A.N. Nov&ov, A.A. Gagarinski, M.P. Lizorkin,V.N. Proselkov, V.V. Saprykin: Experience ofdevelopment and implementation of advanced fuelcycle in the WER-440 reactors 63
G.L. Lunin, A.N. Novikov, V.L Pavlov, A.M. Pavlovichev,P.E. Filimonov: Development of four-years fuel cyclebased on advanced FA with U-Gd fuel and its implementationto the operating WER-1000 units 75
Gy. Hegyi: The Dukovany load follow benchmark solution 97
Yu.K. Bibilashvily, V.N. Proselkov, A.S. Scheglov,V.F. Kuznetsov: Calculation and experimental substantiationof the VVER fuel ability at high burnups 105
A.S. Dukhovenski, L.L. Kobzar, S.V. Marin, D.A. Oleksuk,M.S. Yudkevich: Concept for VVER-1500 111
P.E. Filimonov, S.P. Averiyanova: Development ofmethods for control the power and power distributionof VVER-1000 reactor in load follow regimes 127
A.S. Scheglov, V.N. Proselkov, V.D. Sidorenko,G. Passage, S. Stefanova, Tz. Haralampieva,Tz. Peychinov: Comparative calculations of the VVERfuel rod thermo-physical characteristics employingthe TOPRA-S and the TRANSURANUS computer codes 133
R. Moukhamadeev, A. Suvorov: Verification of SABINE-3.1code for calculations of radioactive inventory inreactor shield 147
V.A. Adeev, S.V. Burlov, Y.N. Pytkin), V.V. Saprykin:Features and ways of fuel cycles upgrade at units 1&2ofKOLANPP 159
SPECTRAL AND CORE CALCULATION
J.§varny": Information of AER working group A onimprovement, extension and validation of parameterizedfew-group libraries for VVER-440 and WER-1000 167
S.S. Aleshin, P.A. Bolobov, S.N. Bolshagin, A.P. Lazarenko,A.V. Markov, V.V. Morozov, V.D. Sidorenko, A.A. Suslov,V.M. Tsvetkov: Verification of third generation codepackage for VVER 169
A.V. Avvakumov, V.M. Malofeev: BARS - a heterogeneouscode for 3D pin-by-pin LWR steady-state and transientcalculation . 229
Zs. Sz6cs6nyi, L, Korpa"s: Calculation uncertainty ofdistribution-like parameters in NPP of Paks 249
P.T. Petkov, Tz. Haralampieva, T. Simeonov, I. Stojanova,K. Kamenov: Generation of a library of two-groupdiffusion parameters for SPPS-1.6 By HELIOS 259
P.T. Petkov: Development of a neutron transport code formany-group two-dimensional heterogeneous calculations bythe method of characteristics 271
P. MikoteS: Spectral calculations of VVER-440 FA with Gdburnable absorbers 281
A. Tanskanen: DIMER: A discrete mesh generator forthree-dimensional tort radiation transport code 311
N.I. Laletin, A.A. Kovalishin: Application of the SHM andSPCM for calculations of some problems for W E R and PWR 317
P. Darjlek, C. Strmensky: HELIOS calculations 331
G. Manturov, B. Bohmer: Neutron flux uncertainty andcovariances for spectrum adjustment and estimation ofWER-1000 pressure vessel fluences 345
L.P. Abagjan, N.I. Alexeyev, V.I. Bryzgalov, E.A. Gomin,A.E. Glushkov, S.S. Gorodkov, M.I. Gurevich, M.A. Kalugin,S.V. Marin, D.A. Shkarovsky, M.S. Yudkevich: Use of MGUcode for Monte-Carlo calculations of WER reactors 353
A.V. Avvakumov, V.M. Malofeev, V.S. Sidorov:Pin-by-pin modeling of fuel cycle and reactivityinitiated accidents in LWR 365
V.I. Lebedev: Explicit difference schemes with variable timesteps for solving stiff systems of equations 387
G. Hordtfsy, Cs. Mariczy: The solution of the LEUand MOX WER-1000 calculation benchmark with theKARATE-Multicell code 391
P.T. Petkov: Calculation of accurate albedo boundaryconditions for three-dimensional nodal diffusion codesby the method of characteristics 407
N.I. Laletin, N.V. Sultanov: Calculations of VVER cellsand assemblies by WIMS-7B code 419
A.N. Novikov: Development of VVER physical calculationcodes 433
I.R. Suslov: A preliminary result of calculation ofextrapolated-to-zero-mesh-size solution (EZMSS) of thesecond AER kinetic benchmark by finite difference code MAG 449
S.M. Zaritsky, P.A. Platonov: Problems of VVER vesselsirradiation and dosimetry 445
I.N.Aborina, P.A.Bolobov, Yu.A.Krainov: Calculation andexperimental studies of power distribution in the vicinityof normal and modernized control rods of VVER-440 reactor 471
SPENT FUEL, TRANSMUTATIONS
V. Chrapciak: AER Working group E activities in 2000 501
T. Varjoranta: W E R nuclear waste management;regulatory experience in Finland 503
A. Koudriavtseva: Regulating aspects of NPP decommissioningin Russia 511
M. LaScek," V. Necas, P. Dayflek: Risk assessment basis forW E R - 440 spent nuclear fuel 517
J. Svanry': On the application of MCNP4 code in nuclearreactor design calculations 523
V. Chrapciak: The numerical benchmark CB2-S 535
f. Mikola*§: A simplified solution of the benchmark problem offuel burnup and isotopic composition in VVER-440 spent fuel 561
M. R. Gual: The calculational VVER burnup credit benchmarkno. 3 Results with the ENDF/B-VI Rev.5(1999) 575
A. Schaberg, H. Spilker: Behaviour of high burn-up fuel rodcladding during long-term dry storage in CASTOR casks 583
V. Lelek: AER working group F "TRANSMUTATIONS"activities in 2000 597,
V. Lelek: Establishing the design basis for a moltensalt demonstrational transmulter * 599
V. Lelek: Open problems in reprocessing of a moltensalt reactor fuel 607
V. Lelek, T. Marek: Generalized perturbation theory andsource of information through chemical measurements 615
P.N. Alekseev, A.A. Dudnikov, V.V. Ignatiev, N.N.Ponomarev-Stepnoy, V.N. Prusakov, S.A. Subbotin: Nuclearpower technology system with molten salt reactor forTransuranium nuclides burning in closed fuel cycle 625
A.A. Dudnikov, S.A. Subbotin: Calculational investigations ofplutonium and minor actinides burning in VVER-MSR system 645
CORE MONITORING, SURVEILLANCE AND TESTING
I. Nemes: AER working group C activities in 2000 665
N.I. Alexeyev, G.Ya. Andrianov, V.I. Baribkin, Yu.A.Iepanechnikov, V.S. Ionov, Yu. I. Kravchenko, Yu.A.Krainov, A.Yu. Nasedkin, V.K. Obukhov, V.V. Sarbukov:Experimental investigations of the VVER physics in RRCKurchatov Institute 669
V.S. Ionov, V.F. Gorokhov, Yu.A. Krainov, I.V. Saprykin,V.V. Saprykin, Yu.N. Poliakov, I.A. Boev, D.I. Lisicin:Preparing and measuring of the recriticality temperatureat the VVER-440 reactor of 4-th unit of NV NPP at the endof 25-th fuel cycle 691
A.S. Kuzil, S.P. Padun, V.l. Bourian: Developmentof the in-core monitoring system for VVER-440 703
A.M. Tziboula, I.P. Matveenko, A.L. Kotchetkov, G.M.Mikhailov,V.I. Lependin, V.A. Doulin: Experimentalinvestigations of the LWR cores neutron-physicalcharacteristics using IPPE facilities 717
V.F. Shikalov: Practice and tendency of control of localenergy release for safety improvement of nuclear powerplant with W E R units 727
S.S. Gorodkov, S.V. Marin, S.A. Tsimbalov: In-core SPNDresponse calculation with MCU4 and EGS4 codes 735
REACTOR DYNAMICS AND SAFETY ANALYSIS
P. Siltanen: AER working group D on W E R safetyanalysis, Minutes of the meeting in Espoo, Finland,19-21 June 2000 741
S. Kliem, A. Seidel, U. Grundmann: Definition ofthe 6-th dynamic AER benchmark - MSLB in a NPPwith WER-440 749
S. Mittag, S. Kliem, F.P. Weiss, R. Kyrki-Rajamäki,A. Hämäläinen, S. Langenbuch, S. Danilin, J. Hadek,Gy. Hegyi, A. Kuchin, D. Panayotov: Validation of coupledneutron-kinetic / thermal-hydraulic codes for W E R 763
V.A. Bolnov, A.V. Budnikov, S.A. Danilin, S.A.Kryukov, M.P. Lizorkin, Yu.G. Nikiporetz, V.l.Pechenkin, D.L. Shishkov: Code package TIGER-1.W E R units calculations results 783
V.K. Ivanov, M.P. Lizorkin, MX. Lukashenko,D.L. Shishkov: BIPR8KN and RELAP codes inter-connection for coupled dynamic calculations ofa neutron physics and thermo-hydraulics of aW E R facility, with three - dimensional corerepresentation 811
J. Svarny", V. Krysl: Rod drop experiment analysisprovided in SKODA JS 819
M. Sedlácek, M. Minar5in: Results of rod dropmeasurements at NPP Mochovce, Unit 1, Cycle 2 853
S.V. Tsyganov, L.K. Shishkov: Once more on theproblem of high negative reactivity measurements 869
G. Alekova, T. Apostolov, R. Prodanova: WWER-1000steady state calculations by HEXAB-3DI-RADMAGRU codesystem 875
V. Chrapciak: Calculations of criticality, nuclidecompositions, decay heat, sources and shielding forWER-440 fuel by new version of the SCALE 4.4 code 887
J.Bajgl: Special application of MOBY-DICK-SK code 907
U. Rohde, S. Kleim, A. Seidel, V. Khakdmanchuk,A. Kuchin: On usage of couple neutron-kinetic andthermal-hydraulic computer code DYN3D-ATHLET to studysafety of WER-1000 type reactors under transient andemergency operational modes 913
VI. SAFETY ISSUES
V.A. Voznesenski, A.N. Novikov, L.K. Shishkov: Safeoperation criteria of NPP with VVER and design limits 921
I. Tinka, E. Tinkova': Innovative process of the DukovanyNPP safety analysis report connected with the fuel cyclesmodernisation 929
V. Pete"nyi, J. MajerSik: Methodical process in the caseof non-fulfillment of the physical startup tests acceptancecriteria 937
M. Makai: Chaos and safety in nuclear reactors 945
V.A. Silin, V.V. Mitkin: Concept of device for molten coreretention and cooling 954
Gy. Hegyi, A. Kereszturi, I. Trosztel: Study of an asymmetricsteam line break problem by the coupled code systemATHLET/KIK03D 971
A.I. Popykin, V.V. Ignatenko, O.Yu. Kavun: RIA calculationfor VVER-440/213 with RADUGA code 989
E. Temesv£ri, G. Horddsy: Determination of the safetymargin of criticality calculations made by MCNP usingdifferent libraries 1005
V.V. Danichev, V.I. Lebedev, A.A. Nazarenko, L.P.Smirnov, V.S. Ustinov: Problem of three-dimensionalmodeling of non-stationary thermal-hydraulicprocesses in nuclear power units 1021
A.A. Pinegin, B.E. Shumski: Features of vver corebehaviorin approaching the state of repeatedcriticality 1031
Ya.Kozmenkov, Yu.Orekhov, U.Grundmann, S.Kleim,U.Rohde, A.Seidel: Benchmarking of DYN3D/RELAP5code package usingthe fifth aer dynamic problemfor coupled codes 1043
FINAL DISCUSSION
P.Siltanen: Final discussion 1049
Athor Index 1053

Core Operation; Fuel Management and Design
Summary and conclusions of Group B 2000 Meeting were prepared. The Meeting washeld in Slovakia ( Modra-Harmonioa). The activity is held in area of solution andformulation of benchmark problems and recent improvements of W E R fuelmanagement.The experience of reactor operation, experiments with fresh and spent fuel,development of more precise computer codes and benchmark calculations make itpossible to create advanced fuel and fuel cycle designs.
The results of Russian investigations on advanced fviel cycles of WER-440 andWER-1000 reactors are summarized in the papers presented by Y. Kukushkin ( AO"TVEL") and representatives of RRC "Kurchatov Institute" V. Proselkov,A. Pavlovichev and P. Filimonov. The papers consider the issues of organizationactivity within the frame of Association "TVEL-NAUKA", analyze the main trends inadvancing fuel and operating conditions of W E R reactors. They present the results ofpilot operation of advanced fuel, indicate the prospects for the W E R fiiel cycleprogress. Basing on the presented results it was concluded that the upgraded Russianfuel for W E R reactors meets the up-to-date requirements of Russian and foreignCustomers.
The neutronic characteristics of WER-440 fuel assemblies with different amounts andlocation of uranium-gadolinium fuel rods were presented by I. N ernes.
The experience gained in operation of WER-440/ V-230 cores at NPP Kozloduy andin fuel performance is presented in the paper of Ts. Haralampieva. The results relatedto the increase in fuel bumup, suppression of the neutron fluence to the reactor vesselobtained using low-leakage loading patterns are described.
In the paper of Gy. Hegyi the calculation results obtained by KARATE-440 and othercodes on Dukovany NPP Load Follow Operational Benchmark are presented andcompared with the measurement data.
A. Dukhovensfd presented the preliminary concept of FA design for the WER-1500reactor based on the principle of neutron spectrum shift to increase fuel burnup.
The paper of A. Scheglov et.al. gives the comparison of the calculation results of fuelthermal-physical characteristics calculations.
The paper of R. Moukhamadeev and A. Suvorov is dedicated to the verification of themethodology for calculating shield activation.
The paper of V. Adeev et al. describes the current status and prospects forimplementation of new fuel cycles at Kola NPP.
AER Working Group B Activities in 2000
Petr DafflekVUJE Trnava, Slovakia
ABSTRACT
Review of AER Working Group B Meeting in SLOVAKIA - Modra-Harmonia is given.
Regular meeting of Core Design Group was organized by VUJE Tmava, Inc. and held at Modra-
Harmonia, Slovakia, May 10+12,2000, together with Working Group A.
Main topics of the meeting were as follows:
Load Follow Benchmark - another solutions
New successful solution of the benchmark by KARATE-440 code complex was presented by G. Hegyi.
Solution is supported by sensitivity study. Modification of benchmark description,is discussed.
New benchmark problem
New benchmark: "Calculation of foel cycle with different fuel types" was suggested by J. Bajgl.Benchmark is based on experimental data from Dukovany NPP Unit 2. Various FA types are involved- non-profiled fuel, radially profiled fuel and fuel with Gd2O3 and various fuel cycle lengths (from 3 to5 years) are supposed. "Idea!" and "real" calculations will be performed. Final report is planned at theyear 2002. Intention to solve the problem was expressed by almost all participants.
11

Recent improvements of WER fuel management
Development of C-PORCA 5.0 and CERBER codes at the field of input preparation support and resultvisualisation and handling was presented by Hungarian delegation (I. Nemes, E. Javor). Code system
is developed for WINDOWS type computer operation systems.
Comparison of "ideal" and "real", coarse - mesh and fine - mesh core calculations were presented by
J. Gerza (NPP Dukovany). Different number of axial meshes was tested as well. Better accuracy of
"real" calculations was pointed out.
Comparison of two independent codes C-PORCA and KARATE-440 (both with diffusion data support)at the calculation practice of NPP Paks was presented by L. Korpas {NPP Paks).
Future activities
• Benchmarks
Load Follow Benchmark-summary preparation
WER 1000 benchmark - solutions
Fuel cycle with different fuel types - benchmark definition and first solutions
• Recent improvements of WER fuel management
12
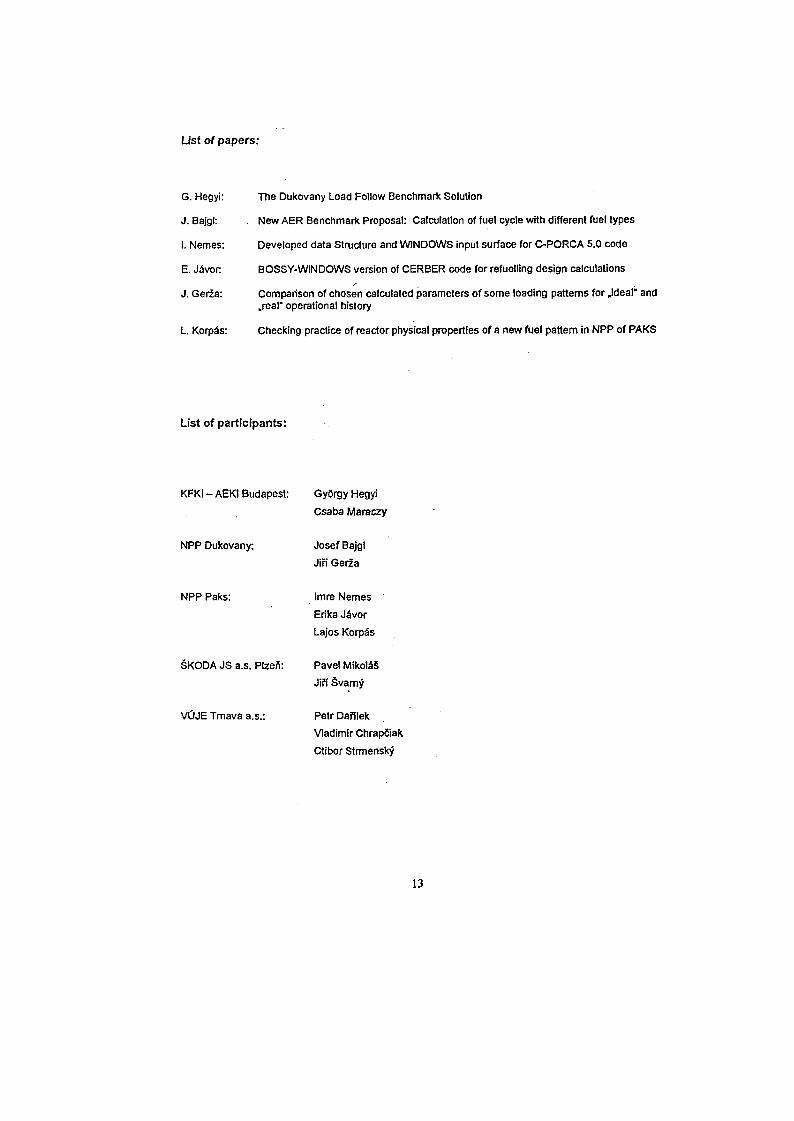
List of papers:
G. Hegyi: The Dukovany Load Follow Benchmark Solution
J. Bajgl: . New AER Benchmark Proposal: Calculation of fuel cycle with different fuel types
I. Nemes: Developed data Structure and WINDOWS input surface for C-PORCA 5.0 code
E. Javon BOSSY-WINDOWS version of CERBER code for refuelling design calculations
J. Ger2a: Comparison of chosen calculated parameters of some loading patterns for .ideal" and.real" operational history
L. KorpSs: Checking practice of reactor physical properties of a new fuel pattern in NPP of PAKS
List of part icipants:
KFKI-AEKI Budapest:
NPP Dukovany:
NPP Paks:
SKODA JS a.s. Plzen:
VOJE Tmava a.s.:
GySrgy Hegyi
Csaba Maraczy
Josef Bajgl
Jin Geria
Imre Nemes
Erika Javor
Lajos KorpSs
Pavel MikolaS
Jiff SvamJ
Petr Dafilek
Vladimir Chrapciak
Ctibor Strmensky'
13
"VVER Reactor Physics and Reactor Safety"
STATE AND PERSPECTIVES OF NUCLEAR FUELFOR VVER REACTORS
Report
10lh AER Symposium on VVER Reactor Physics and Reactor Safety.iMoscow, Russia
September, 18-22,2000
V. Moltchanov (AO "TVEL")
Y. Kukushkin (AO"TVEL")
Moscow
10"1 AER Symposium
. 15
,2: . "VVIHR Reactor Physics and Reactor Safely"TVEL: State and perspectives of nuclear fuel for VV1HR reactors
Open Joint Stock company "TVEL" was set up in 1996 under the Orderof the President of Russia with the purpose of the management of the statepacket of shares of the factories- manufactures of nuclear fuel: AO "MSZ"(Electrostal). AO " NZChK". (Novosibirsk), AO "ChMZ" (Glazov) andothers.
The strategy of AO "TVEL" as a supplier of Russian nuclear fuel isto provide for the maximum package of the services in the fuel supply forNPPs. In settling such a strategic task the central place is occupied byeffective scientific and technical policy in the field of development,licensing and accompanying the fuel operation as well as technicalrefitting of the production.
Under the conditions of strong competence in the nuclear fuel marketonly a powerful corporate structure can settle the set task and an importantmoment here is the setting up, in 1999, of the Association of participant ofnuclear fuel fabrication "TVEL -NAUKA" which incorporated AO "TVEL'"and leading scientific and design nuclear centres of Russia.
The main direction of the work under the modem conditions of themarket relations is to provide for the competitiveness of the nuclear fuel onthe markets traditional for Russia and widening the markets.
The needed base for this is available:• Constantly increasing scientific - technical and process potential;• Nuclear fuel developing, fabrication and operation experience
accumulated during 50 years;• All-sided knowledge of the design peculiarities, operation conditions
and safety provision for VVER reactors.
The ways of improving technical and economic properties of nuclear fuel forNPPs with VVER and PWR reactors are quite traditional; they include:• Improvement of safety and economy of fuel cycles at NPPs;• Boosting serviceability (failure rate at 10'5 I/year or better);• Achievement of high and super-high burn up (55- 60 MWd/kgU);• - Provision of the design reliability and stability of FA against
deformation;• Increasing the fuel campaign (18 and 24 months);• Use of corrosion-resistant design materials providing for the above
properties.
These directions of work are actively advised by NPP operators.
10"1 AER Symposium
16
Also the problems discovered during the process of YVER reactorsoperation in the mid-90s shall be noted:• Increase of the time of insertion of control assemblies into WER-1000
reactors due to the deformation of the FA guiding thimbles;• Fuel rod damage in VVER-440 reactors of the first generation due to the
non-stable hydro-dynamics of the coolant flow at the inlet to the core underreactor "'ageing".
All this required from the supplier of the Russian nuclear fuel AO "TVEL" toperform all-sided critical analysis as to fuel design, fabrication and operation.As a result, a complex program for nuclear fuel and fuel cycles optimisationwas developed under the guidance of Minatom of Russia: the programforesees a stage by stage implementation of new fuel to NPPs of Russia withfurther transfer to foreign markets.
The principal moment in the improvement of the stability andflexibility of the fabrication and sales policy of OAO "T\ ;EL" is thefollowing:• The possibility to fabricate nuclear fuel for VVER-440 and W E R -
1000 reactors at any of two factories (OAO "MSZ" and OAO "NZChK");
• Availability of an alternative designer of nuclear fuel for VVER-1000reactors, the pilot operation of which is underway at KalininskayaNPP.The general measures taken lately for VVER-440 and VVER-1000reactors related to the modernisation of nuclear fuel had the followingengineer and physical principles:
• Refusal of stainless steel within the core and transition to Zirconiumalloys (spacers and guiding thimbles in FA);
• Profiling fuel in the core cross-section;• Transition to fuel loading pattern "in-in-outM.
This allowed to significantly increase the neutron balance in the core. Ageneral thing is also the introduction of U-Gd fuel (YrT); for VVER-1000 itis accompanied by the refusal of rods with burnable absorber.
The main work related to nuclear fuel for VVER reactors is aimed atincreasing the fuel burn up. The main factor for the Russian nuclear fuel isthe availability of the alloy Zr+1% Nb, meeting all the modem requirements(including those under accident modes) that its used as the material for fuelrod claddings as well as in the FA design. The alloy 3-635 is consideredperspective and it is actively introduced into pilot-industrial operation inVVER-1000 FA.
10 AER Symposium
17
TVEL Slate and perspectives of nuclear fuel for VVER reactors
Nuclear fuel for VVER-440
Currently the state of work reialed to the optimisation of nuclear fuel ischaracterised by the following:
• Pilot-industrial operation of nuclear fuel on unit Ke 4 of Kola NPP and unitNs 2 of Rovno NPP continues in the 5-year cycle.The 5-year cycle meetsthe best properties of foreign PWR reactors as to the main property - useof fuel (specific consumption of natural Uranium).
• Set of work on licensing the 4-year cycle for NPP "Dukovany" (CzechRepublic). NPP "Mohovce" , unit Jfe l (Slovakia), NPP "Paks" (Hungary)is over. On a number of NPPS ("Dukovany", "Mohovce")has alreadyperformed the industrial implementation of such fuel cycles; the optimisedfuel shall be delivered to NPP "Paks" in 2000.
• A set of scientific research work is performed to provide for licensing the4-year cycle for units N° 4 and 4 of NPP «Bohunice» (Slovakia).
The probjem of VVER-440 reactors "ageing" (first generation, type B-230, B-179 and B-270) directly influences the operation reliability ofcassettes, that required the development of FA designs having improvedvibration stability of the fuel bundles. In 1999 such a cassette design wasdeveloped and a pilot batch was inserted in unit N° 3 ofNovovoronezhskaya NPP; such cassettes were also delivered to NPP"Kozloduy" (Bulgaria").
With the purpose to increase the operation reliability of cassettesand widening the algorithms of reactor control (manoeuvring) a set ofscientific research pilot design work was finalised in 1999 to justify thedesign of FA APK with optimised contact unit/joint. In 2000 a pilot batchof FAs shall be delivered to Novovoronezhskaya NPP.
The work on creation and the following introduction of modernized modelsof control assemblies and FA ARK at nuclear power plants is being carriedout since 1999. This work is aimed at decreasing of coolant leakages bypassthe fuel rod bundles (that is on increasing heat-technological reliability andTVEL cooling) and at some improving water-uranium ratio.
Optimized five year fuel cycles with using U-Gd fuel for VVER cores(type V-213) are being developed on the basis of the modernized models ofcontrol assemblies and FA ARK. Expected depth of fuel burn up in assembliesis up to 53 MWd/kgU. •
The first pilot industrial batch of the modernized models to be used in fiveyear cycles is to be inserted in Unit 3 of Kolskaya NPP and at one of the Unitsof Dukovany NPP (Czech Republic) in 2003. Duration of fuel campaign forDukovany NPP is to be up to 320 effective days.
10Ul AER Symposium
18
oi<«cMIKI perspecuves ol'nuclear fuel for VYER reactors
Nuclear fuel for VVER-1000
It is common knowledge that FA without shroud tubes are used in FAYVER-1000 (with the exception of unit M* 5 of Novovoronezhskaya NPP) andrecently the most attention has been paid to the development andimplementation of optimised FA (YTBC), that has support skeleton ofzirconium alloy. Heavier absorber rods comprising a composition of Dytitanate ( in the lower part) and Boron carbide are implemented for theprovision of design drop time of the control assembly. Also measures todecrease the axial forces influencing the FA design, including the headpiece,are developed and implemented.
In parallel the task to create FA of alternative design (TBCA) and itspilot-industrial operation at unit .Ne 1 of Kalininskaya NPP was set. The TBCAdesign is based on using a strong support skeleton providing for sufficientdeformation stability of the cassette. The taslpvas fulfilled in 1998.
On the whole, the following can be noted for the fuel for-VVER-1000reactor:• Starting from 1999 optimised fuel with zirconium spacers and thimbles
(YTBC) with U-Gd fuel are inserted to Balakovskaya NPP, that allowedto improve the NPP reliability and fuel economy;
• TBCA pilot-industrial operation is being widened on unit Nz 1 ofKalininskaya NPP (currently 108 TBCA are operated, including 60 pieces- for the third campaign). A decision oh further widening of TBCAimplementation on unit N° 1 of Kalkvinskaya NPP is taken.
• A decision is taken on forming the core of unit N° 1 of Rostovskaya NPPon the basis of YTBC providing for a 4-year cycle with U-Gd fuel under
• stationary supply. The necessary justified materials for fuel licensing aredeveloped, and fuel is supplied to NPP.
• The core of Rostovskaya NPP is of reference prototype of that of NPP inChina, Iran and India.
The main tasks of the nuclear fuel optimisation for VVER-1000 reactors in thenear future are: - ^• Finalisation of the development and implementation at Russian and
foreign NPPs of the nuclear fuel with the 4-year fuel cycle on thebasis of FA designs with improved deformation stability and using U-Gdfuel;
• Development of fuel cycles 18...24 months long;• Justification and implementation of nuclear fuel with super-high burn
up (over 55 MWd/kgU) using perspective design materials and fuelcompositions.
10' AER Symposium
19
Slate and perspectives of nuclear fuel lor WER reactors
Scientific rcsearcli pilot design work for theprovision of licensing of the nuclear fuel.
The set of scientific research pilot design work for the provision oflicensing of the nuclear fuel of new generation includes detail calculationexperimental researches and justification of all the aspects of the nuclearfuel behaviour under normal and accident conditions (including LOCA andRIA).
An important rote for the justification of the new fuel design, researchesin the field of operation reliability and influence of operation conditionslies with detail post-reactor investigations of FA (full-scale) in hotchambers of NIIAR (Dimitrovgrad). The great database on the results ofthe full-scale post-reactor investigations of VVER FA provided the neededscientific technical, basis for the justification of the 4-year fuel cycle inreactors VVER-1000 and 5-year cycle in reactors VVER-440.
A significant set of work to provide for the nuclear fuel licensingis the development, verification and certification of the neutron physical,thermal hydraulic and strength calculation codes as well as the calculationcodes for the thermal mechanical properties of the cores VVER-1000,metal engineering provision of the researches and study of the physicalmechanical and radiation properties of fuel and construction materials.
CONCLUSION
It is obvious that making the nuclear fuel operation modes morerigid - transition to 4 and 5- year fuel cycles, campaign prolongation(18,24 months), manoeuvring, super-high burn up, reactor ageing -leads to decreasing the operation reliability of nuclear fuel. And thiscontradiction between the operator's requirements to make theoperation mode more rigid to decrease the fuel component to themaximum, on one hand, and the need to maintain the operationreliability of the nuclear fuel at the modern level - on the other hand-requires optima] and deeply dwelled solutions related to the creationof new nuclear fuel.
The central aspect of the creation of the new generation of nuclear-fuel is the provision of high quality of the finish product at ourfactories. The quality system of all the factories is certified accordingto" ISO 9000 standards and currently the work to set up themanagement system according to TQM is underway.
This is the ideology of OAO "TVEL" and Russian nuclear centresfor the creation of the new generation of nuclear fuel and fuel cyclesfor VVER-reactors for the near future.
10 AER Symposium
SK01ST076
Investigation of neutronphysical features of VVER-440 assembly containing differentlyenriched pins and Gd burnable poison
Imre Nemes
PaksNPPLtd.Hungary
Abstract
In this paper different pin-distributions of VVER-440 fuel assembly are examined.Assemblies contain 3 Gd-dopted pins ( Hungarian design ), 6 Gd-dopted pins near theassembly comers ( Russian design ) and differently profiled U5-enrichment in different pins.The main neutronphysical characteristics of this assemblies - as the function of burnup — arecalculated using HELIOS code. The calculated parameters of different assembly designs areanalyzed from the standpoint of fuel cycle economy and refueling design practice.
1. Introduction
The application of VVER fuel for longer operation time and higher bumup is recently a topicof development works. 4-batch refueling strategies for the VVER-440 fuel has beenintroduced in most of WER user countries and utilities are looking for the furtherimprovement of fuel cycle strategies. The fuel providing the opportunity of (partially of fully)5-batch refueling strategy should have higher U-235 enrichment and burnable poison. HigherU-235 enrichment supply, the reactivity reserve for higher burnup, the burnable poison makespossible to decrease BOC reactivity of fuel. Fuel suppliers offer GdjOj as burnable poison,integrated into the pellet.
In different papers of Russian and Czech authors [1,2,3] some design of different arrangementof VVER-440 fuel containing Gd2C>3 burnable poison has been published. We examined twoof them having approximately 4.4 and 4.2 % U-235 average enrichment. Using the ideadeveloped during development work of BNFL VVER-440 fuel design we formed andexamined two alternative pattern design having the same enrichment but different amount ofGd-pins then original Russian versions.
21
2. Method of calculation
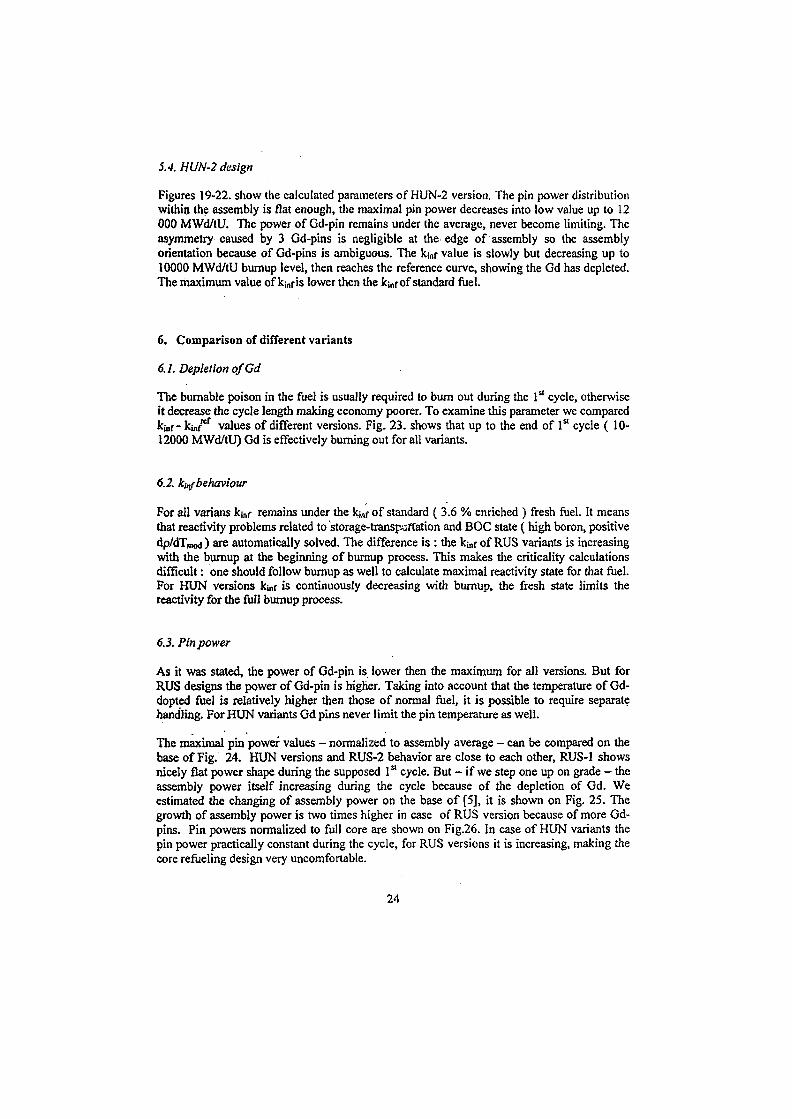
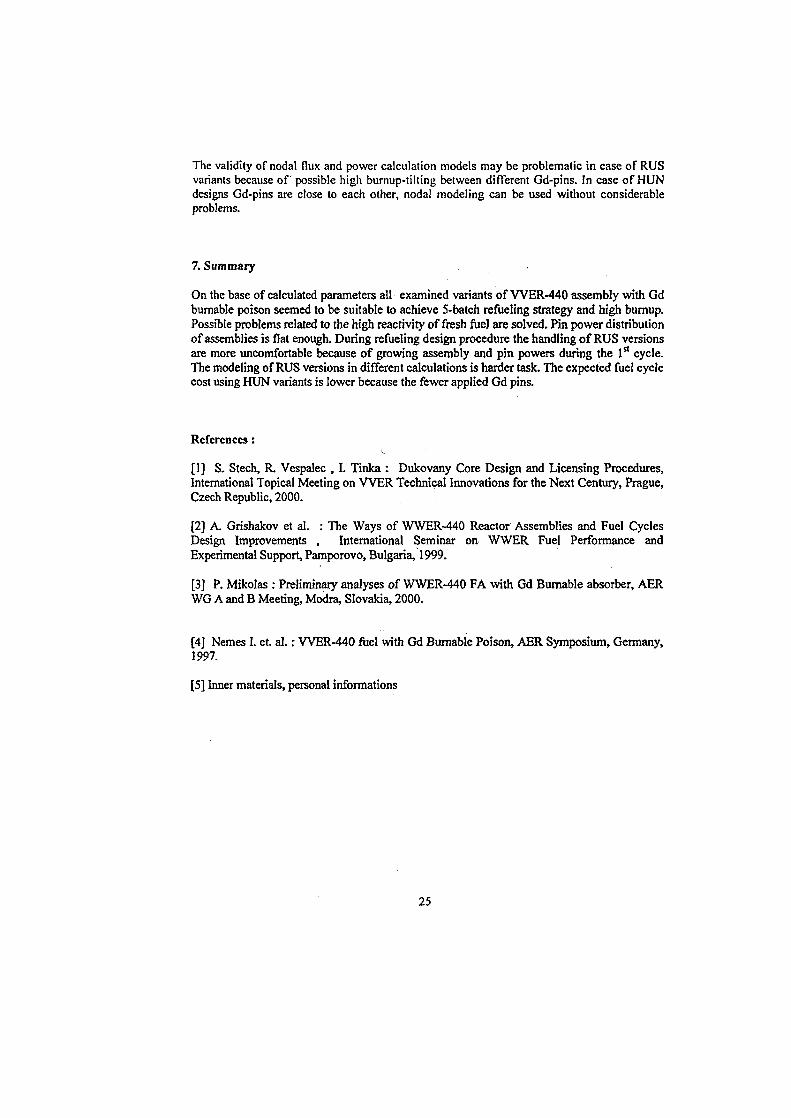
For the calculation we used HELIOS code 1.6 version with k=3 option using 45-grouphyO45r>18g16a library. One assembly structure was calculated according to Fig. 3.geometry. At the outer border white albedo boundary condition was used. For normal fuelpins hole, fuel, gap and tube parts were distinguished, moderator region of pincells weredivided into 6 parts. For side- and corner cells further non-fuel regions such as shroud and gapbetween assemblies has been added (Fig. 1). The pins containing Gd divided into 8 concentricrings and horizontally 6 sectors, each part (48 pellet-part at all) handled separately duringburnup calculations (Fig.2). The burnup steps of calculation were 500 MWd/tU up to 10000,1000, MWd/tU from 10000 to 20000 and 2000 MWdAU from 20000 to 40000 MWd/tUburnup level. For the fresh fuel the natural isotopic content of Gd was supposed. The boronconcentration during full calculation was 500 ppm, the moderator temperature is 555.5 , thefuel temperature is 843.2 K. The power of system is 32 W/g (initial heavy metal ) ,equilibrium xenon is supposed.
3. Examined configurations
As a starting point we calculated the neutronphysical features of two Russian design ofWER-440 fuel with Gd burnable poison see on Fig. 3 and 4. The first one ( called RUS-1 inthe followings) have 4.38% the second ( RUS-2) design 4.21% average U-235 enrichment.The enrichment of (1 or 3 ) corner pins is 3.6%, the side pins is: 4%. 6 pins containing 3.35%GdjOj and 4 % U-235 enriched fuel are placed next to corner pin. The U5 enrichment of innerpins are: 4.6 % in RUS-1 and 4.4% in RUS-2 design.
A VVER-440 fuel assembly pattern containing Gd burnable poison was developed earlier andpublished in [4 ]. Following the basic idea of that pattern two alternative designs of Russianfuel assemblies was investigated ( called HUN-1 and HUN-2 ). All geometric and materialproperties of HUN designs are the same as RUS variant except U5 and Gd enrichmentdistribution. In HUN design we used the same enrichment of pins ( both U5 and Gdenrichment) as it was used in RUS designs, but distributed differently.
HUN-1 pattern is the alternative of RUS-1 , HUN-2 is alternative for RUS-2 design. BothHUN-1 and HUN-2 have only 3 pins containing Gd. The Gd pins surround the assemblycenter in 120 degree. Gd content removed from the corner vicinity. The U5 enrichment of Gdpins is 4%, the GdjO3 content is 3.35%. The average U5 enrichment of HUN design isapproximately the same (slightly lower) then the appropriate RUS versions.
4. Studied parameters
For the mentioned cases we calculated the k;nf values and the pin power distribution as afunction of burnup. As additional parameters the followings has been calculated:
as function of burnup ) for the "reference" fuel. Reference fuel have the same U5enrichment but no Gd.kjnf value at 0 burnup for the "standard" fuel. Standard fuel have 3.6% enrichments ineach pins. For the calculated case we got kjnf=l.24539 ( boron, temperatures , etc. seeabove)
22
For the detailed analysis if neutronphysical behavior we chosed the examination of followingparameters:
• pin power distribution at 0 at 10000 MWd/tU burnups - representing I51 cycle BOC andEOC state of fuel
• kinfas function ofburnup for the examined and for it's reference fuel
• maximal pin power of the examined fuel as the function of bumup
• pin power of the Gd-pind as the function ofburnup
5. General characteristics
5.1. RUS-J design
Figures 7-10. show the calculated parameters of RUS-1 version. The pin power distributionwithin the assembly is very flat, the maximal pin power changes slowly up to 12 000MWd/tU. The power of Gd-pin remains under the average, never become limiting, but thereis low difference between the maximal and Gd-pin power. The kjnf value is increasing up to10000 MWd/tU bumup level, then reaches the reference curve, showing the Gd has depleted.The maximum value of kjnf is considerable lower then the kjnfof standard fiiel.
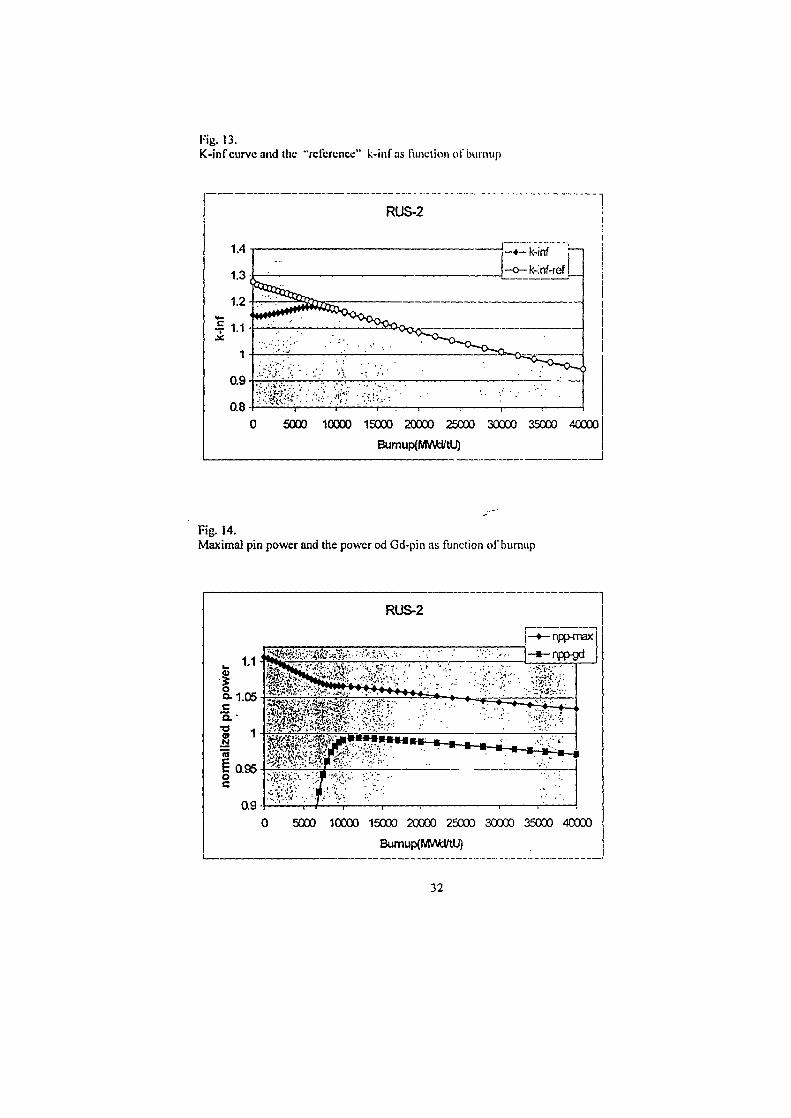
5.2. RUS-2 design
Figures 11-14. show the calculated parameters of RUS-2 version. The pin power distributionwithin the assembly is flat enough, the maximal pin power decreases into low value up to 12000 MWd/tU. The power of Gd-pin remains under the average, never become limiting, butthere is low difference between the maximal and Gd-rpin power. The k;nr value is increasing upto 10000 MWd/tU bumup level, then reaches the reference curve, showing_the Gd hasdepleted. The maximum value of kinf is considerable lower then the kmf of standard fuel.
5.5. HUN-1 design
Figures 15-18. show the calculated parameters of HUN-1 version. The pin power distributionwithin the assembly is flat enough, the maximal pin power decreases into low value up to 12000 MWd/tU. The power of Gd-pin remains under the average, never become limiting. Theasymmetry caused by 3 Gd-pins is negligible at the edge of assembly so the assemblyorientation because of Gd pins is ambiguous. The k-mr value is slowly but decreasing up to10000 MWd/tU burnup level, then reaches the reference curve, showing the Gd has depleted.The maximum value of k,nf is lower then the kjnrof standard fuel.
23
5.4. HUN-2 design
Figures 19-22. show the calculated parameters of HUN-2 version. The pin power distributionwithin the assembly is flat enough, the maximal pin power decreases into low value up to 12000 MWd/tU. The power of Gd-pin remains under the average, never become limiting. Theasymmetry caused by 3 Gd-pins is negligible at the edge of assembly so the assemblyorientation because of Gd-pins is ambiguous. The kjnf value is slowly but decreasing up to10000 MWd/tU bumup level, then reaches the reference curve, showing the Gd has depleted.The maxjmum value of k,nf is lower then the kinr of standard fuel.
6. Comparison of different variants
6.1. Depletion of Gd
The burnable poison in the fuel is usually required to burn out during the 1st cycle, otherwiseit decrease the cycle length making economy poorer. To examine this parameter we comparedkjnf - kinfref values of different versions. Fig. 23. shows that up to the end of l a cycle (10-12000 MWd/tU) Gd is effectively burning out for all variants.
6.2. k-^f behaviour
For all varians kjnf remains under the kjnf of standard ( 3.6 % enriched ) fresh fuel. It meansthat reactivity problems related to'storage-transpafiation and BOC state (high boron, positivedp/dTmod) are automatically solved. The difference is : the kmr of RUS variants is increasingwith the burnup at the beginning of burnup process. This makes the criticality calculationsdifficult: one should follow bumup as well to calculate maximal reactivity state for that fuel.For HUN versions kjnf is continuously decreasing with burnup, the fresh state limits thereactivity for the full burnup process.
6.3. Pin power
As it was stated, the power of Gd-pin is lower then the maximum for all versions. But forRUS designs the power of Gd-pin is higher. Taking into account that the temperature of Gd-dopted fuel is relatively higher then those of normal fuel, it is possible to require separatehandling. For HUN variants Gd pins never limit the pin temperature as well.
The maximal pin power values - normalized to assembly average - can be compared on thebase of Fig. 24. HUN versions and RUS-2 behavior are close to each other, RUS-1 showsnicely flat power shape during the supposed 1st cycle. But — if we step one up on grade — theassembly power itself increasing during the cycle because of the depletion of Gd. Weestimated the changing of assembly power on the base of [5], it is shown on Fig. 25. Thegrowth of assembly power is two times higher in case of RUS version because of more Gd-pins. Pin powers normalized to full core are shown on Fig.26. In case of HUN variants thepin power practically constant during the cycle, for RUS versions it is increasing, making thecore refueling design very uncomfortable.
24
The validity of nodal flux and power calculation models may be problematic in case of RUSvariants because of possible high burnup-tilting between different Gd-pins. In case of HUNdesigns Gd-pins are close to each other, nodal modeling can be used without considerableproblems.
7. Summary
On the base of calculated parameters all examined variants of VVER-440 assembly with Gdburnable poison seemed to be suitable to achieve 5-batch refueling strategy and high burnup.Possible problems related to the high reactivity of fresh fuel are solved. Pin power distributionof assemblies is flat enough. During refueling design procedure the handling of RUS versionsare more uncomfortable because of growing assembly and pin powers during the 1st cycle.The modeling of RUS versions in different calculations is harder task. The expected ruel cyclecost using HUN variants is lower because the fewer applied Gd pins.
References:
[1] S. Stech, R. Vespalec , I. Tinka : Dukovany Core Design and Licensing Procedures,International Topical Meeting on WER Technical Innovations for the Next Century, Prague,Czech Republic, 2000.
[2] A. Grishakov et al. : The Ways of WWER-440 Reactor Assemblies and Fuel CyclesDesign Improvements , International Seminar on WWER Fuel Performance andExperimental Support, Pamporovo, Bulgaria, 1999.
[3] P. Mikolas : Preliminary analyses of WWER-440 FA with Gd Burnable absorber, AERWG A and B Meeting, Modra, Slovakia, 2000.
[4] Nemes I. et. al.: WER-440 fuel with Gd Burnable Poison, AER Symposium, Germany,1997.
[5] Inner materials, personal informations
25
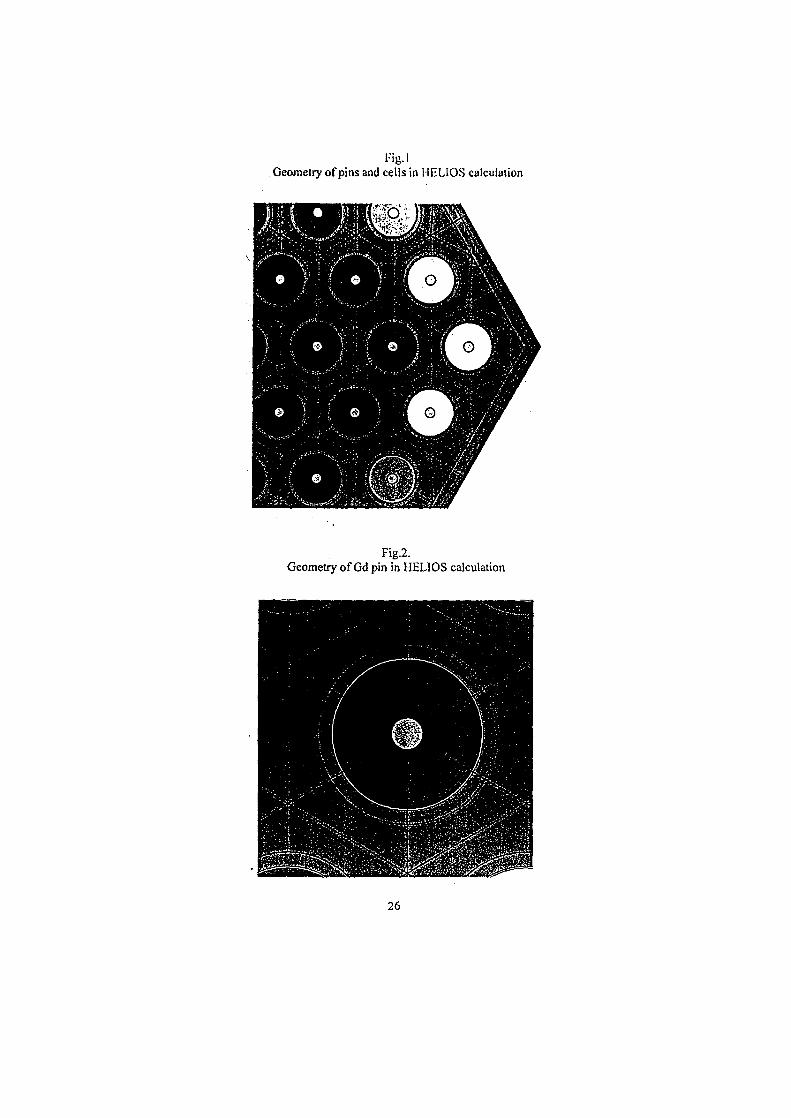
Fig. IGeometry of pins and cells in HELIOS calculation
Fig.2.Geometry of Gd pin in HELIOS calculation
26
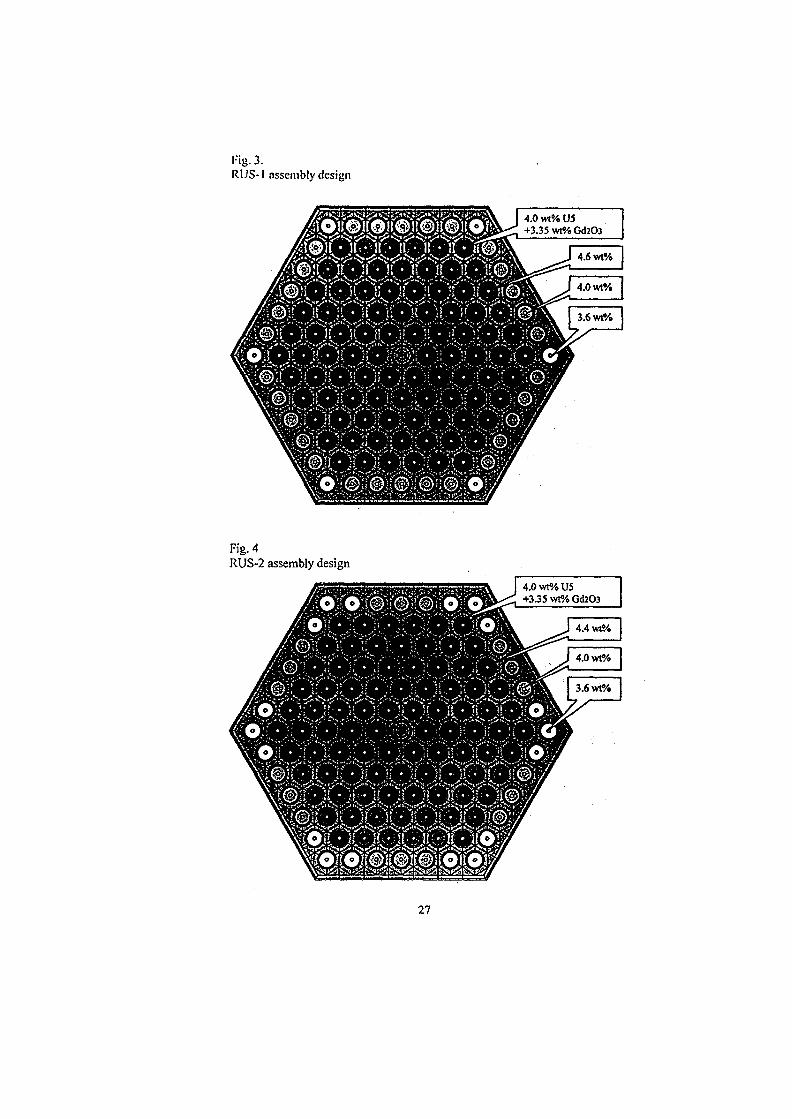
Fig- 3.RUS-1 assembly design
4.0 wt% V5+3.35wt%Gd2O3
Fig. 4RUS-2 assembly design
27
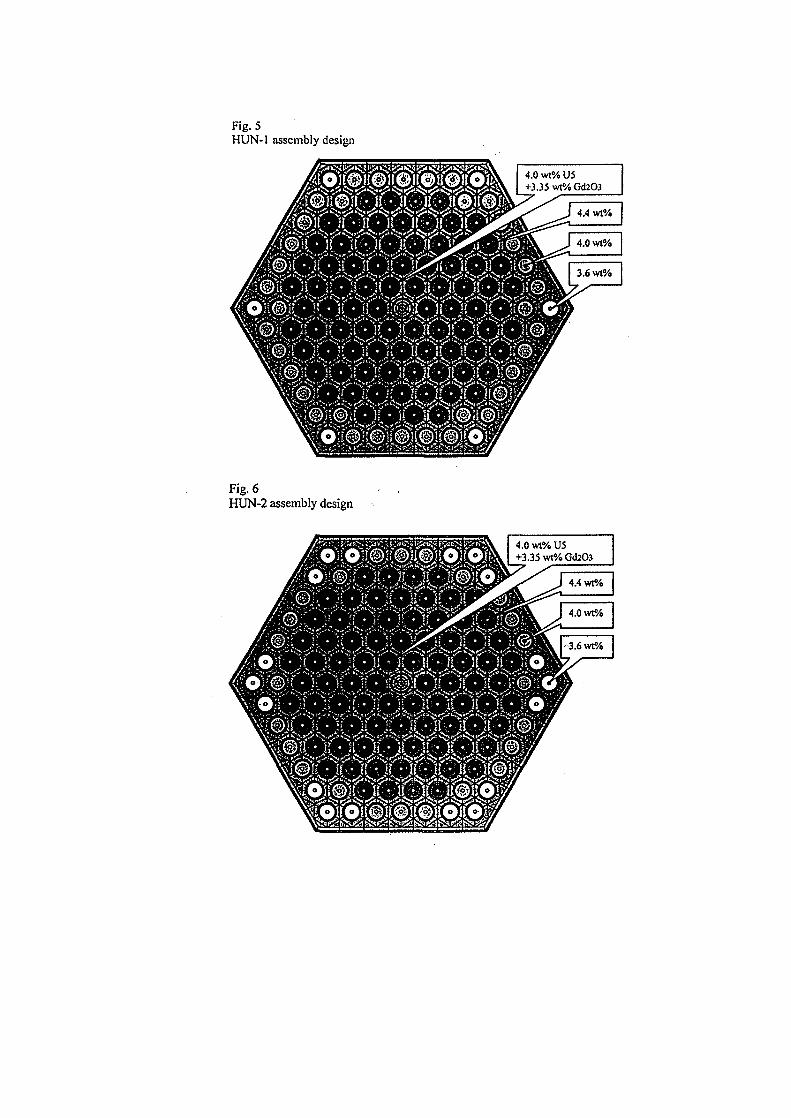
Fig. 5HUN-1 assembly design
Fig. 6HUN-2 assembly design
4.0 wt% U5+3.35wt%Gd2O3
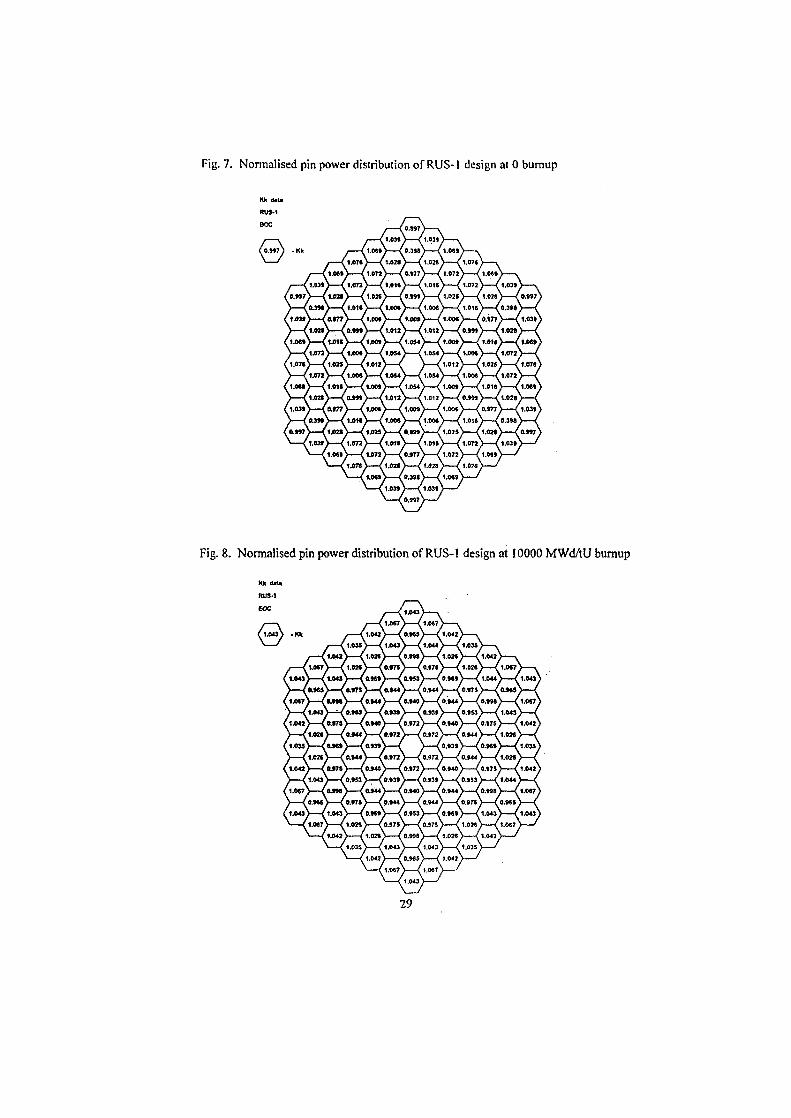
Fig. 7. Normalised pin power distribution of RUS-1 design at 0 burnup
Fig. 8. Normalised pin power distribution of RUS-1 design at 10000 MWd/tU burnup
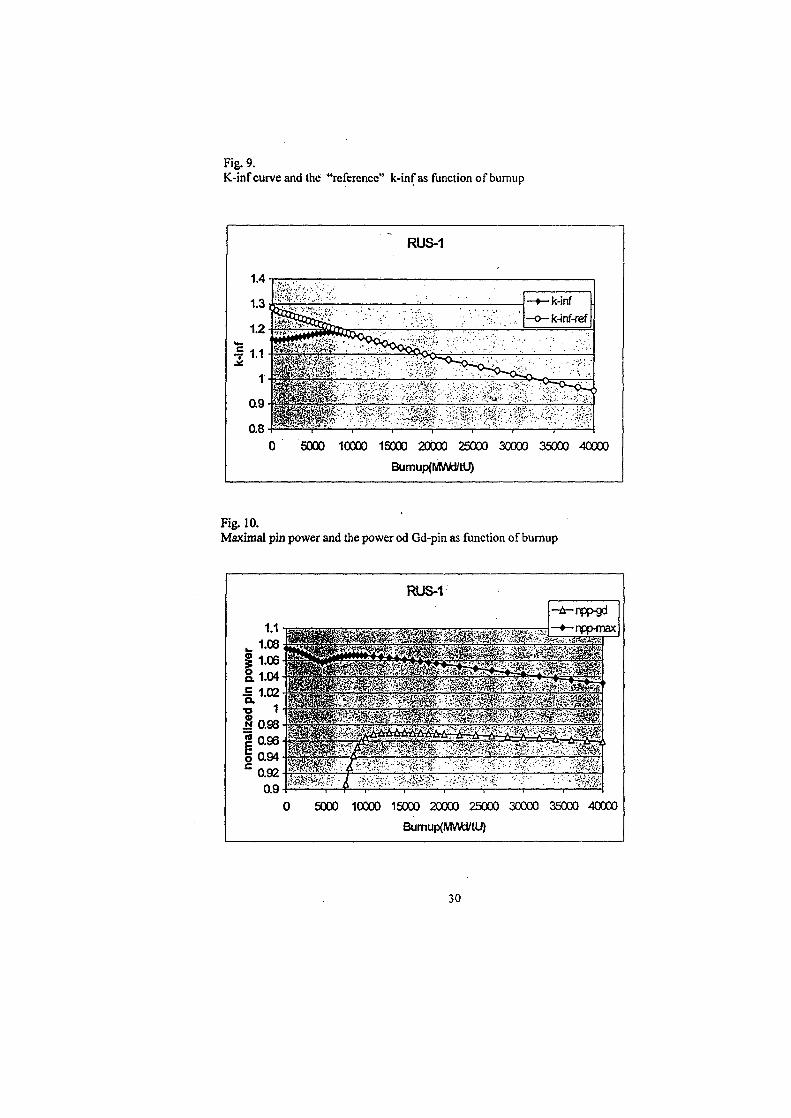
Fig. 9.K-inf curve and the "reference" k-inf as function of burnup
RUS-1
-•—k-inf
—o—k-inf-ref
0 5000 10000 15000 20000 25000 30000 35000 40000
Bumup{IWW/tU)
Fig. 10.Maximal pin power and the power od Gd-pin as function of burnup
RUS-1->ir-npp-gd
-•-npp-max
0 5000 10000 15000 20000 25000 30000 35000 40000
Bumup(MWdmJ)
30
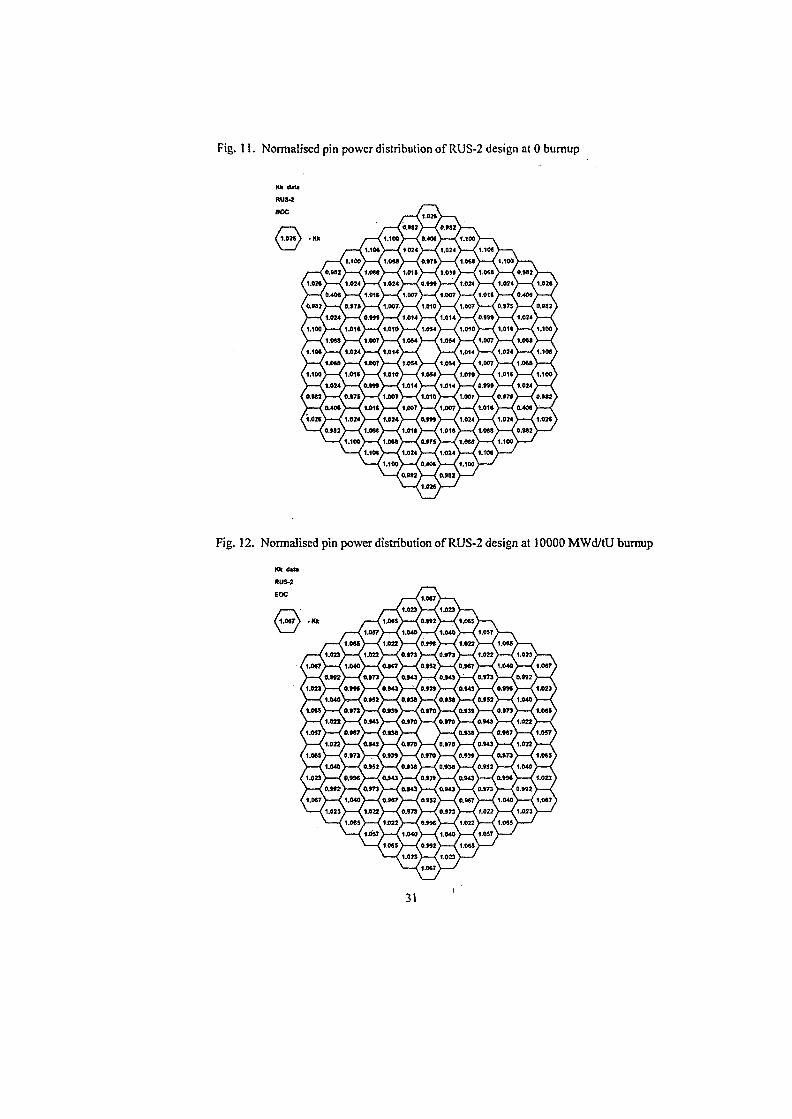
Fig. 11. Normalised pin power distribution of RUS-2 design at 0 bumup
Fig. 12. Normalised pin power distribution of RUS-2 design at 10000 MWd/tU bumup
1.05? >—f 1.040 ) ( 1.040 ) ( 1.057
1.04O >.—( 0.«S» ) ( 0.1M
1.02J >—< «.»« ) < O.WO >—< 0.»70 ) ( O.»43 V—< 1.012
LOW >—< o.ro >—< O.»M >—(o.tre1.O40 >—( 0.»52 >—( O.»M > ( 0.»J«
0.»« >—< 03O ) { 0.»» ) ( 0.941 > ( O.«S« >—< 1.021
0.»I ) ( 0.»73 ) 1 0.M1 V—< O.»4J
1.0M V—-( 1.040 ) ( 0.K7 >—-< ft»52 ) ( O.W7 >—C 1.040
1.021 >—< 1.022 > — ( 0.S7J 1 ( O.»73
1.022 ) ( O.»» ) ( 1.022 ) — < LOSS
I:ig. 13.K-inf curve and the "reference" k-infus function ofbumup
RUS-2
I
5000 10000 15000 20000 25000 30000 35000 40000
Bumup(IVM*i/tU)
Fig. 14.Maximal pin power and the power od Gd-pin us function of bumup
RUS-2
|—•— npp-max
i-npt>gd
5000 10000 15000 20000 25000 30000 35000 40000
Bumup(MWtl/tU)
32
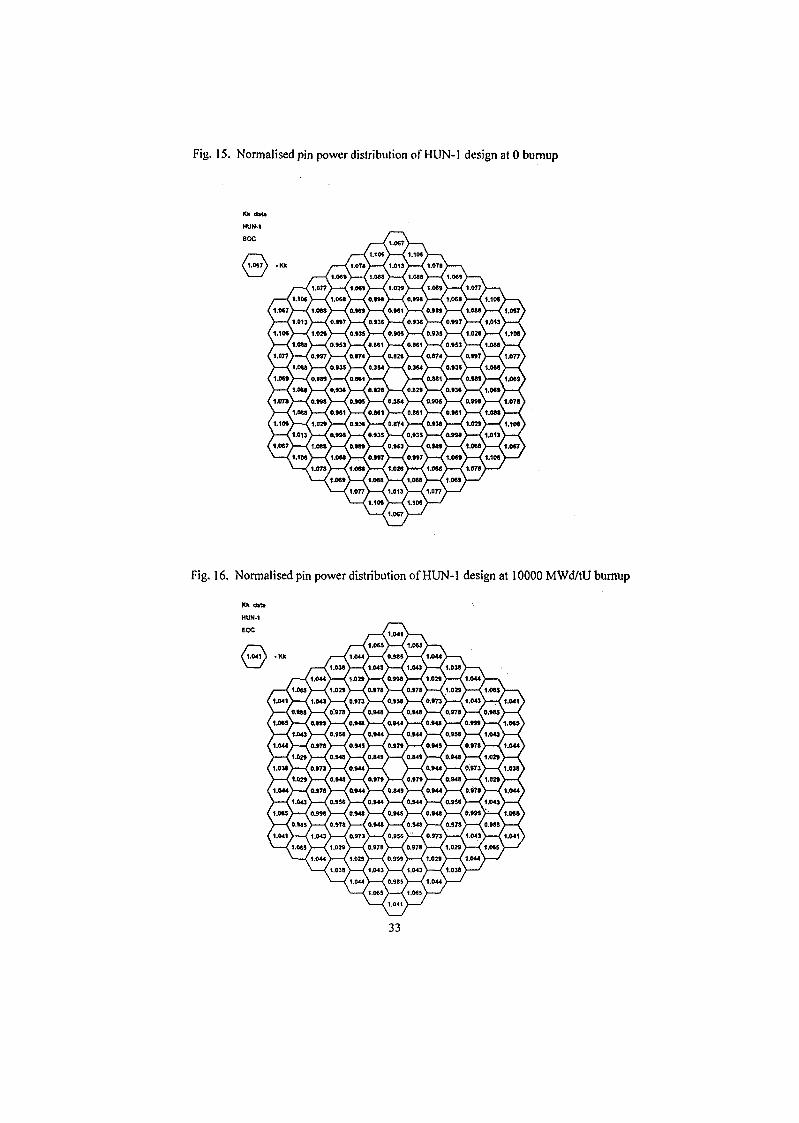
Fig. 15. Normalised pin power distribution of HUN-1 design at 0 bumup
Fig. 16. Normalised pin power distribution of HUN-1 design at 10000 MWd/tU bumup
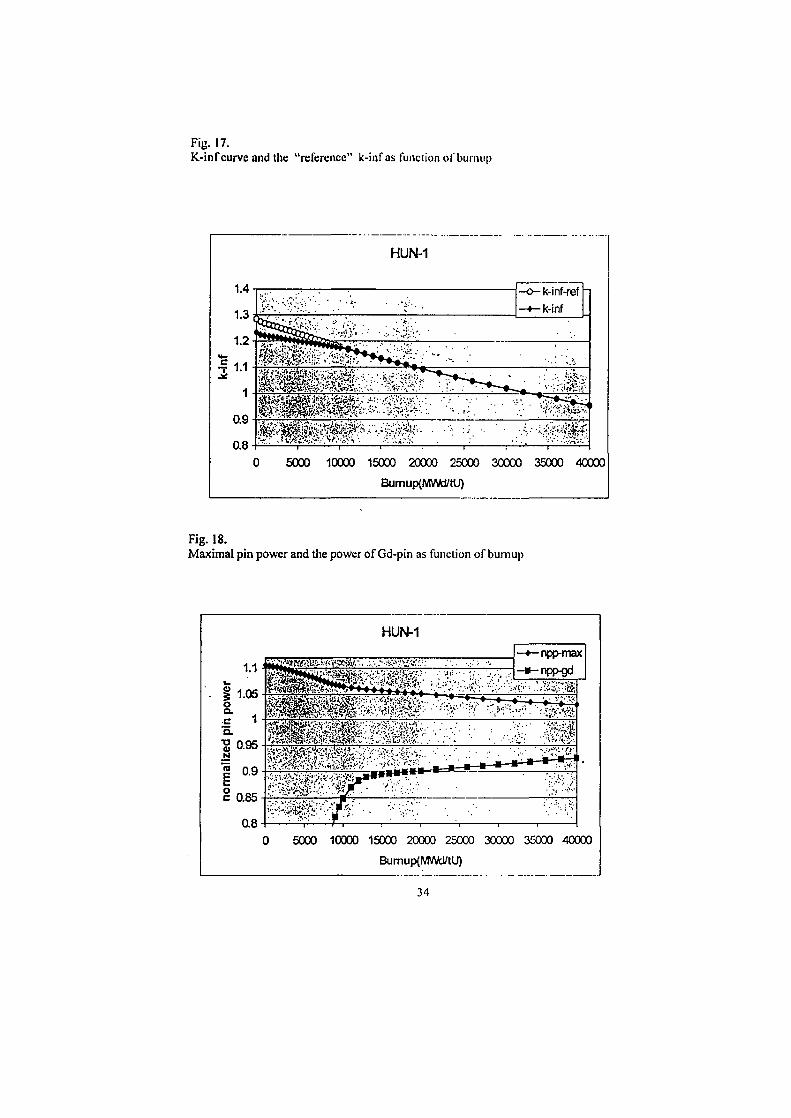
Fig. 17.K-inf curve and the "reference" k-inf as function of burniip
HUN-1
0 5000 10000 15000 20000 25000 30000 35000 40000
Bumup{MWd/tU)
Fig. 18.Maximal pin power and the power of Gd-pin as function of bumup
HUN-1
5000 10000 15000 20000 25000 30000 35000 40000
Burnup<MV\fcl/tU)
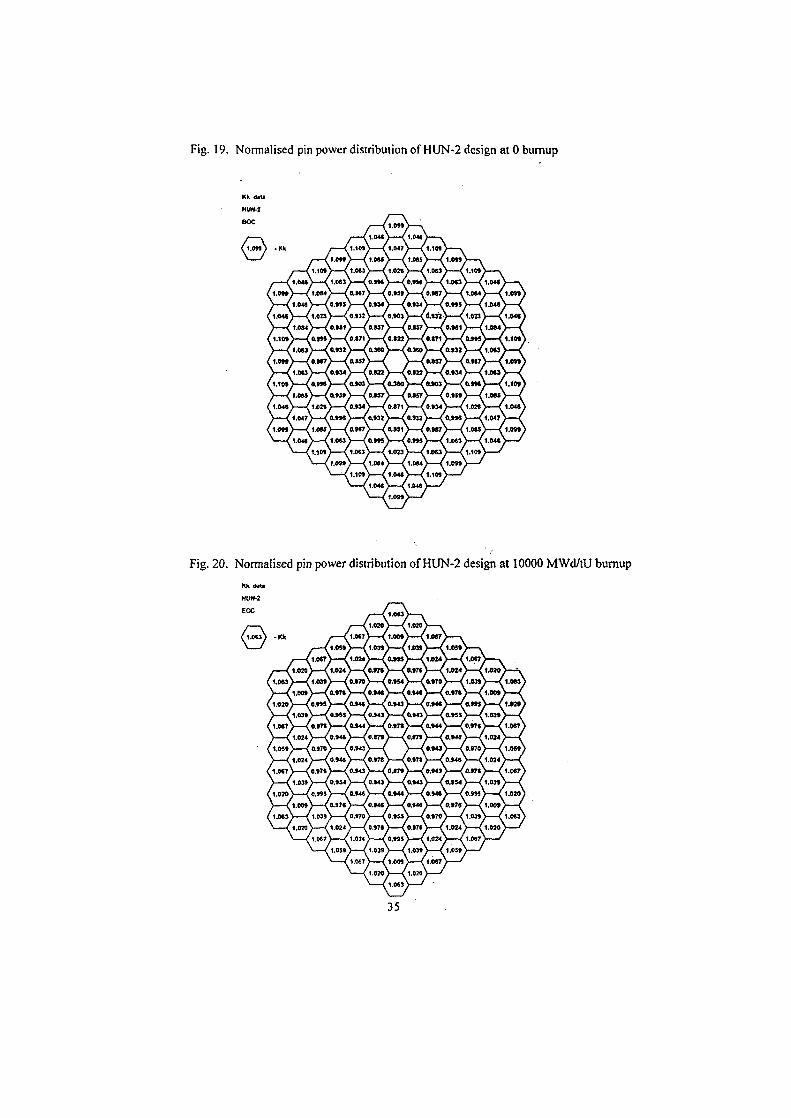
Fig. 19. Normalised pin power distribution of HUN-2 design at 0 burnup
Fig. 20. Normalised pin power distribution of HUN-2 design at 10000 MWd/tU burnup
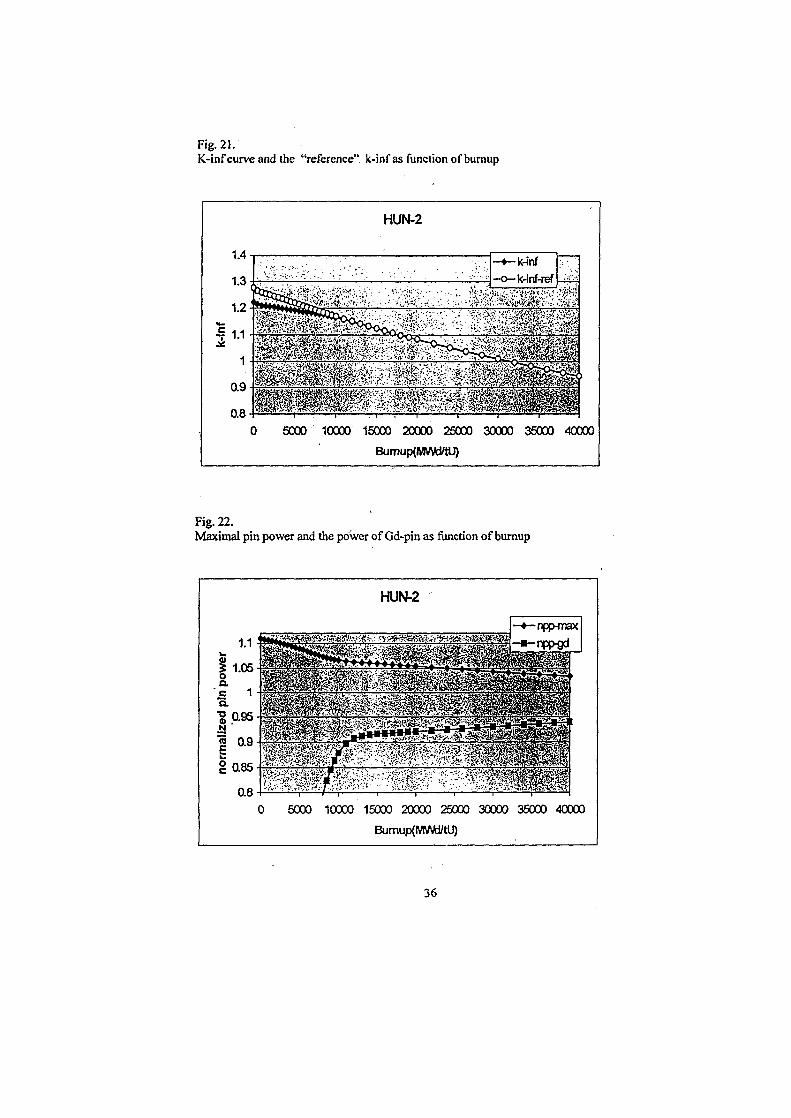
Fig. 21.K-inf curve and the "reference" k-inf as function of burnup
HUN-2
-k-inf
-k-inf-ref
50CX) 10000 15000 20000 25000 30000 35000 40000
Bumup{MMti/tU)
Fig. 22.Maximal pin power and the power of Gd-pin as function of burnup
HUN-2
-npp-max
0 5000 10000 15000 20000 25000 30000 35000 40000
Bumup{NMJH/tU)
36
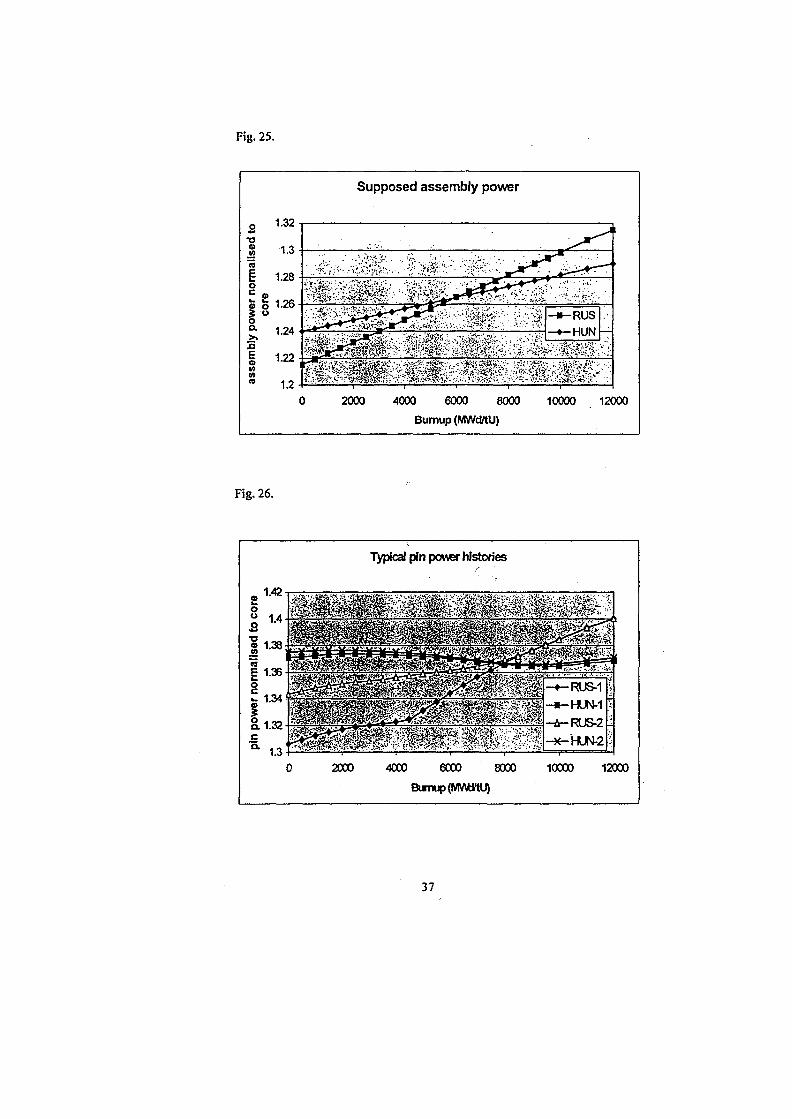
Fig. 25.
Supposed assembly power
•oon
US© o
I"J3
O«
re
1.32
1.3
1.28
1.26
1.24
1.22
1.2
" . . . - ' • •''•',lt.:'-J'^i- . ., -'".'r; - ' ' . ' - ....''->'- . '
0 2000 4000 6000 8000 10000 12000
Bumup (IWVd/tU)
Fig. 26.
Typical pin power histories
2000 4000 6000 8000
Bumup(IVMmU)
10000 12000
37
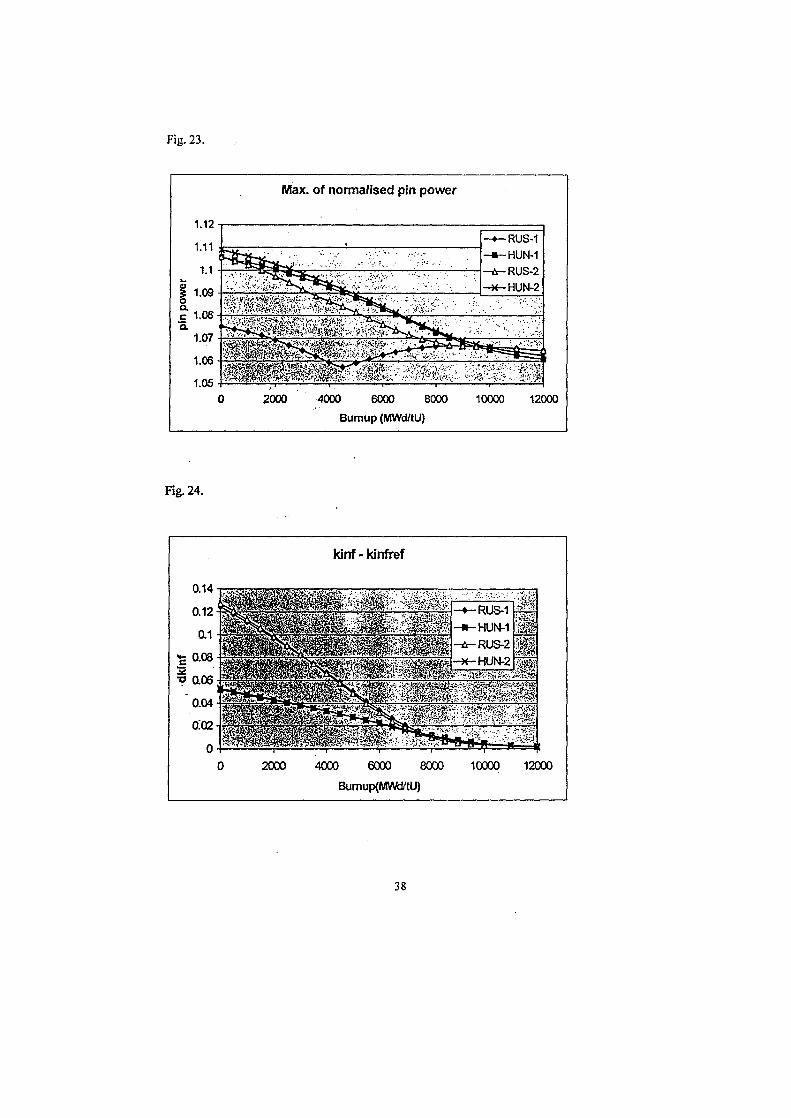
Fig. 23.
Max. of normalised pin power
- f-RUS-1-*-HUN-1-A-RUS-2-X-HUN-2
2000 4000 6000 8000
Bumup (MWd/tU)
10000 12000
Fig. 24.
kinf - kinfref
0 2000 4000 6000 8000 10000 12000
Bumup<MWa/tU)
38
SK01ST077
10th AER SYMPOSIUM on WER Reactor Physics and Reactor Safety
September 18-22, 2000, Moscow, Russia
Overview on the Fuel Cycle Safety and Economic Characteristics
Improvement of the WWER-440/B-230 Reactors at the
KozloduyNPP
Tz. Haralampieva, A. Antov, Kozloduj NPP
Sv, Stefanova, G. Passage, Institute for Nuclear Research and Nuclear Energy,
BAS
Introduction
This report presents the significant experience gained during the design and
operation of the fuel cycles of the four WWER-440/B-230 NPP units at" the Kozloduy
NPP.
Subject of the presentation are the activities on reactor core performance
management, including calculations and analyses for reloading scheme design,
comparisons with results of the start-up physical experiments and operational
measurements, safety and reliability assurance during reactor operation, fuel cycle
efficiency estimation, etc.
The main principles and methods applied during these activities are focused on
attainment of higher efficiency and economy of the fuel utilization obeying the
nuclear safety criteria and requirements and using the up-to-date achievements of
the reactor physics and technology as well as computer codes and equipment
This report presents the main stages of the NPP Kozloduy WWER^440 reactors
fuel cycles performance development and improvement.
The results obtained during this activity related to the discharged fuel assemblies
number and bum-up, a suppression of the reactor vessel neutron fluence during the
cycles, application of low-leakage (in-in-out) reloading schemes, accuracy precision
increase of the neutron-physical calculations and analyses, etc.
I. Design characteristics of the WWER-440 fuel cycles
The Kozloduy NPP operates four WWER-440 units, commissioned consequently
as follows:
Unit 1 - June 1974
Unit 2 - August 1975
Unit 3 -December 1981
Unit 4 - April 1982
KOZLODUY NPP - EAD 1
39
The rnaia reactor core design characteristics of the four WWER-440 reactors are
identical in principal [12, 13]: fuel assembly hexagonal geometry, narrow triangular
grid of the fuel rod arrangement inside the assembly, specific power control and
regulation system elements, etc. At the same time, there are a number of different
design features of the units 1, 2, 3 and 4, respectively. For instance, the units 3 and
4 design comprises in higher degree the contemporary increased safety operation
requirements.
The WWER-440 design power amounts 1375 MWe and the original reactor core
design contains 349 working fuel assemblies (WA) and 37 control assemblies (ARC),
distributed in six groups. The ARC assemblies for power control comprise two parts:
an upper absorbing part and a lower working part, similar to the regular working
assembly.
The first design fuel loading of the WWER-440 core contains assemblies with
diverse initial U-235 enrichment, as follows:
114WA - 1.6%(12CA)
133 WA - 2.4%(25CA)
102WA - 3.6%
According to the design, at every subsequent reloading, 1/3 of the burnt fuel has
to be replaced with fresh fuel assemblies, placed on the periphery of the core. Thus,
a two-zone core structure is being realized Jfresh fuel on the core periphery and
partly burnt fuel in the central part), which assures a very good smoothing of the core
power distribution. The mean designfuel cycle length is about 7000 full power hours
(290-300 full power days). After the third transition cycle, the mean number of fresh
assemblies in reload batch is 102 3.6% enriched WA, 6 2.4% enriched WA every
other reloading and 12-13 2.4% enriched CA. According to the design, the fuel cycle
in-core operation time is one cycle for the 1.6% WA, two cycles for the 2.4% WA and
three cycles for the 3.6% WA. At that, in the design achieved average burn-up of the
discharged fuel is as follows:
1.6% ~ 11.6MWd/kgU
2.4% ~ 22-23 MWd/kgU
3.6% ~ ' 28.3-31.7 MWd/kgU
The fuel burn-up in the WWER-440 reactors depends on the water-uranium ratio,
the initial fuel enrichment,"geometry, the core size and the structure materials
neutron-physics properties, etc. At constant values of the above core characteristics,
the task to optimize the core fuel loading patterns in order to achieve most efficient
fuel utilization, is very actual. It is. known that the achievement of the higher fuel
KOJXODUY NPP - EAD 2
— , - - K a t Hie nxea fuel enrichment depends on increasing the number of refuelings
during the core life (reduction in the number of fuel replaced assemblies in core). On
the other hand the burnup rises linearly with increase in the make-up fuel enrichment
II. Main stages of the core management and fuel design characteristics
improvement
During the initial phase of the WWER-440 power commissioning at the Kozloduy
NPP, a significant number of predictive reactor calculations and analyses, start-up
physical tests and experimental investigations and core measurements , compilation
and processing of significant quantity of operational data were carried out.
On the base of the gained experience and knowledge, preconditions have been
created for an improvement of the core performance and better fuel utilization.
Later in time, the investigations carried out in this direction have been expanded
and have involved safety and reliability enhancement at operation, expansion of the
neutron-physical calculations and analyses scope, improvement of their precision,
successful introduction of new design features fuel, etc.
The Kozloduy NPP specialists in co-operation with teams from research institutes
and organisations performed a series of investigations and projects. Developments
have been completed and implemented into the practice, aiming at the WWER-440
fuel cycle improvement.
The main stages of these investigations are presented and discussed briefly in
this part of the paper.
The presentation of the particular investigation essence is given as far as
possible, in a chronological sequence. The main activities and results of improved
characteristics are briefly described, the reactor computer code software is
presented, and the year of the development and implementation is pointed.
1. Enhancement of the Original fuel utilization efficiency
Calculations and investigations to enhance the design burnup of discharged fuel
were carried out The burnup of the fuel, initially enriched by 1.6%, 2.4% and 3.6%
U-235, has been analysed. It has been proved, that the assemblies of 1.6%
enrichment can be effectively utilized in the core up to burnup of 20 MWd/kgU, the
2.4% assemblies - up to 0 MWd/kgU and the 3.6 ones - up to 40-45 MWd/kgU at
least. It has been observed, that the increase of the burnup 'at constant initial
enrichment, is accompanied by increase of the plutonium fissile isotopes contribution
into the fission process. It is accounted for, that the limiting maximal permissible
bumup factor are the specific structural design features of the fuel assemblies and of
the fuel rods, which mainly determine the in-core operation time, preserving the fuel
rod tightness.
KOZLODUY NPP-EAD 3
On this basis, and in agreement with the WWER-440 Designer, the RRC"Kurchatov Institute", and the fuel Supplier (Russia), the in-core operation period ofthe 1.6% and 2.4% assemblies has been prolonged up to three years, and 3.6%enriched assemblies have been used partly during four cycles.
These possibilities for more flexible core design, corresponding to the
requirements of the electric power network system, have been applied to define the
economically optimal fuel cycle scheme.
The reactor computer codes design complex of RRC "Kurchatov Institute" [7]
consists of:
POP-UNIRASOS (a code to calculate the reactor lattice characteristics);
BIPR-5 (a diffusion code for 3-D core modelling along the assemblies);
SHESTIGRANIK (a code to model the power distribution and the burnup
distribution along the fuel rods in the assembly);
is used too as a tool for core characteristics calculation and loading pattern
optimization.
The fuel assembly core arrangement (core loading pattern scheme) is being
optimized to achieve maximum power distribution uniformity along the assemblies.
The fresh WA are placed into the core periphery (schemes out-in-in).
Period of application -1976-1984.
2. Core neutron leakage minimization
In the process of core loading and burnup optimization various cores loading
pattern schemes, differing from the original design, have been developed and
applied. The so- called low-leakage schemes (in-in-out) for NPP-Kozloduy WWER
440 were introduced. The Units 1 to 3 have been modified through introduction of 36
non-fuel shielding (dummy) assemblies into the periphery.
The low neutron leakage loading schemes are characterized by placing fuel with
low fissile qualities - high burnup or low enriched assemblies, in the core periphery.
These Schemes, after an appropriate agreement with the Designer, have been
applied for WWER-440 core refuelling design at Kozloduy - NPP (1984). Later on, in
addition to' this fuel arrangement, 36 non-fuel dummy assemblies, in the core most
outer periphery positions, have been introduced(1987). As a result, the following has
been achieved:
- significant decrease of the fast neutron fluence on the reactor vessels (Fig. 4);
- mean design fuel cycle duration increase at the same number of fresh
assemblies in the core and burnup distribution non-uniformity decrease of the
discharged fuel;
KOZLODUY NPP - EAD 4
42
- neutron-physical characteristics assessment and optimization of the coredesign during the introduction of the 36 dummy assemblies into Units 1-3.
Regarding the applied computer software - better and more efficient neutron-
physical and mathematical models to simulate the in-core processes have been
applied - the codes
BIPR-5AK, SPPS-0 [5], etc.
Period of application 1984-1987.
3. Implementation of a strategy focused on optimal loading schemes of the
Units 1-3 core consisting of 313 fuel assemblies and 36 dummy assemblies inorder to reduce the flux of fast neutrons at the reactor pressure vessel and of
the Unit 4, with original core design with 349 fuel assemblies.
The used core design principles for fuel cycle optimization included the use of
low neutron leakage loading of the core;'partial use of 3.6% enriched fuel during 4
burnup cycles, use of stretch-out operation with power coast-down and, most
important, the use of 3.6% enriched followers in CA assemblies. The purpose was
to satisfy the requirements for safe operation, to minimize the neutron fluence on the
reactor vessel and to achieve good economical results.
The developed at the INRNE-BAS reactor more precise computer code complex
SPPS-1 and HEXAB-2DB has been developed, verified and used for operational
calculations.
Period of implementation -1988-1992.
4. Expansion of the scope of the core and fuel reactor-physical analyses fn
compliance with the Complex Programme for Safety and Reliability
Improvement of the Kozloduy NPP, Units 1-4, Operation
The procedure of selecting each of the particular reactor core desigri"scheme was
updated according to the enhanced nuclear safety criteria with performance of
complex calculations and analyses implemented to prove the existence of sufficient
margins of the neutron-physical and the thermohydraulic core characteristics. In co-
operation with specialists from INRNE-BAS, calculations and analyses for each
particular fuel reloading are being performed, which include:
- main neutron-physical core characteristics determination;
- main thermohydraulic core characteristics determination (assessment of
DNBR using the Bezrukov-1976 and Smolin-1978 VWVER specific
correlations, of the maximum fuel and cladding temperatures and the coolant
void fraction at steady-state and at the 6 from 6 MCP loss-of-power, etc.).
KOZLODUY NPP - EAD
43
The thermohydraulic codes COBSOFM and COBRA-41 [17] are implemented at
the Kozloduy NPP under the supervision of the INRNE-BAS specialists.
The fuel rod thermomechanical characteristics and margins are obtained and
analysed at steady-state operation and in compliance with the operation power
histories of highest-loaded assemblies and assemblies with expanded (four cycles )
core presence.
The thermomechanical calculations are performed by the INRNE-BAS specialists
using the PIN-micro [15] and the TRANSURANUS [16] codes.
Period of implementation -1992-1998.
The period from 1992 on up to now, is characterized by a principally new
approach of the investigations and analyses covered the WWER-440 core and fuel
characteristics. It has been required to improve the operation safety of the WWER-
440/B230 type reactors, operating in our country, Slovak and Russia.
In this sense, particular importance obtain the projects related to the fuel
reloading safety assessment, introduction of fuel with improved features compared to
the original design, improvement of the neutron-physical calculation accuracy and
precision, etc.
5. Development and successful implementation of a safety assessment
methodology at every fuel reloading, in compliance with the current nuclear
safety requirements
The experience gained by the reactor-physical analyses performance for the
WWER-440 (Units 1-4) core margins assessment and the profound study of the
international experience reveal the necessity to develop a strictly regulated approach
for safety assessment of each particular core reloading. That way is assured the
efficient solution of the fuel cycle design improvement issue - the implementation of
new improved design fuel, new improved core design schemes, assurance of 4-cycle
fuel assembly utilization, etc. A methodology was developed and implemented
enabling safety evaluation for each specific core reload. It is based on the definition
and assessment of so-colled key safety neutron-physical (NPH) and thermohydraulic
(TH) parameters, depending on the chosen reloading scheme and influencing
significantly, the. safety. It essence consist in the comparison of the NPH and TH
actual values of the parameters with its limiting (permissible) values.
In the common case, the limiting values are determined on the basis of the
conservative accident analyses and design documentation, and the actual values are
obtained by the NPH and the TH calculations and analyses during the selection of
the reloading scheme.
KOZLODUY NPP - EAD
44
in the case, when all NPH and TH key parameters are in the range of the
permissible value limits for a given fuel reloading safety assessment, it can be
concluded, that the safety requirements have been satisfied.
The final part of the methodology application is related to the comparison of the
calculated NPH predictions with the start-up physical experiments data, conducted at
the beginning of each new fuel cycle beginning. A particular scope of reactor-
physical experiments has been approved. It is assumed, that each experiment
satisfies the methodology requirements, if the corresponding success criterion is
satisfied. In the most general form, the success criteria require the measured and the
calculated values not to exceed the prescribed limits, complying with the nuclear
safety requirements.
The final stage of the methodology is connected with the preparation of a final
report, containing the main operation NPH characteristics for the cycle considered
and the necessary current information used at the operation. The principles and the
first results obtained from the application of the methodology described above, are
presented in the Contract No. 175/96/05.03.1995 Report. At present it is being
applied to choose the fuel reloadings at all Kozloduy NPP WWER-440 reactors.
The methodology is subjected to further development and improvement on the
base of additional accident analyses and evaluation of the actual fuel characteristics.
It is purposeful to prepare correspondingly regulated documents, based on the
methodology. The implementation of the methodology has been initiated in 1997.
6. Precision increase of the neutron-physical calculations, implementationof new advanced methods and computer codes, in compliance with the actualquality assurance requirements
During the development of the in-core fuel arrangement and reloading scheme
design of each particular fuel cycle, a series of variant calculations and"analyses are
carried out
The analyses are performed by means of complexes (sets) of reactor and
neutron-physics computer codes for modelling the sophisticated reactor core
physical processes. The computer codes are validated and licensed on the base of
precision evaluation of their capabilities to describe the in-reactor processes.
Comparisons with more precise analytical methods and models are performed, as
well as comparisons using research and zero-power reactor experimental data, and
operational data from reactors of the similar type.
The very first WWER-440 core design had been carried out applying the reactor-
physics code complex, developed at the "Kurchatov" Institute in Moscow in the early
70ties.
KOZLODUY NPP - E A D
The computer technology progress, the necessity to optimize the fuel
characteristics and the increased nuclear safety requirements imposed gradually
improvement of the computer codes in the complex and also replacement with newer
modern codes.
The improvement and the development of new computer codes and their
validation during the years involved the efforts of many specialists from the Kozloduy
NPP and of sciences from the Institute for Nuclear Research and Nuclear Energy of
the Bulgarian Academy of Science (INRNE-BAS).
Up to the present stage, the complex of neutron-physics codes WIMS-D4 [4]
(calculation of the reactor lattice characteristics), SPPS-1.6 [1,2,3] (simulation of the
in-core processes), HEXAB-2DB [6) (calculation of the in-core fuel rod power
distribution's developed and successfully applied at Kozloduy NPP. The new code
complex of the Designer, the "Kurchatov" Institute, to calculate the neutron-physical
characteristics, KASSETA, BIPR-7, PERMAK [7, 8] has been implemented too. The
schematic consequence of the neutron-physical calculations process and the
computer codes used, are shown in Fig. 9.
The currently used few-group input parameters library for the SPPS-1.6 code
contains data for WWER-440 assemblies with design initial fuel enrichments, but
with diverse geometrical and technological characteristics, corresponding to the
available in the operation [3].'
The comparison analysis of measured experimental and' operational data [5]
shows, that at present, all necessary neutron-physical characteristics for the WWER-
440 reactors operation are predicted with an acceptable level of accuracy, using the
our code complex described above,. At the same time, the results obtained reveal a
significantly higher precision regarding the assembly-wise power distribution. At that,
this acciirasy precision is not depending on the in-core fuel arrangement, e.g. low-
leakage reloading schemes, placement of non-fuel shielding (dummy) assemblies at
the core periphery, application of new type fuel, etc. The latter is of a significant
importance to assure high-degree of. nuclear safety and efficiency during WWER-
440 units operation at the Kozloduy NPP.
7. Stage-wise implementation of advanced fuel with improved
characteristics.
According to the original design, the WWER-440 fuel is for three-year in-core
operation and guarantied average burnup about 28.6 MWd/kgU.
Since the more than 30-year operational practice, a series of fuel and fuel cycle
improvements have been introduced, which contribute to the WWER-440 reactors
economical efficiency and safety enhancement.
KOZLODUY N P P - E A D
46
The most important improvements, implemented up to now at the Kozloduy NPP,are the following:
- fuel pellet design and fabrication quality optimization;
- fuel rod initial (filling) gas (helium) pressure increase, 0.4-0.75 MPa;
- assembly shroud thickness decrease, from 2.1 to 1.5 mm;
- replacement of the stainless steel with zirconium spacer grids;
- fuel assembly mechanical design optimization, fabrication of vibration
resistant assemblies;
- design enrichment increase from 1.6% and 2.4% to 3.6% of the control
assemblies fuel part.
Most of the fuel improvements listed above, have been implemented after the
completion of comprehensive neutron-physical, thermohydraulic and
thermomechanical analyses [9,10,11].
First of all, the input description for the neutron-physical calculations reflects each
fuel design or material composition change, which, as a rule, requires a new few-
group input parameters library preparation to be used for the coarse mesh (BIPR-7,
SPPS-1.6) and fine-mesh NP codes. The next stage consists of in carrying out
design NP calculations to determine the fuel design change influence on the main
NP core reloading characteristics: fuel cycle length , critically parameters at start-up
and operation, reactivity coefficients, characteristics of the power generation and
bumup distribution, etc. On the basis of the core HP characteristics, theromhydralics
analyses evaluate the core operational margins. On the other hand the carried out
thermomechanical calculations make possible to determine the influence of the new
and improved fuel design features on its operational behavior.
The introduction of fuel assemblies with zirconium spacer grids, already
implemented into all Kozloduy NPP, WWER-440 units, could be pointed out as an
example for a most complete approach in this respect.
Since 1993 on, by means of the obtained and implemented at the INRNE-BAS
and Kozloduy NPP computer code PIN-micro [16] for steady-state thermomechanical
analysts of WWER fuel rods, calculations of a number of assemblies operated at the
I-IV Units, have been performed. Using the results obtained, quantitative evaluations
have been done, related to the implementation of improved fuel with better
technological and operational characteristics.
In Figures 7 and 8, typical results of comparative calculations, corresponding to
the transition to higher initial pellet density, 10.6 g/cm3 and to higher initial filling gas
(helium) pressure, 0.6 MPa, are presented. In both cases, the improvement of the
KOZLODUY NPP-EAD
47
fuel initial characteristics, leads to improvement of the operational indices (lower fuel
temperature) and increase of the thermomechanical margins.
Since 1996 on, the universal (steady-state, transient and accident)
thermomechanical computer code TRANSURANUS, validated for WWER reactors,
has been implemented at the INRNE-BAS. For first time several operational
transients at reactor start-up, loss of main circulation pump power and disturbance of
the natural circulation cooling after reactor shut-down, have been analyzed. The
TRANSURANUS code is currently applied to evaluate the permissible maximum
linear heat rate during WWER-440 fuel rods operation [19J.
III. Main results
During the passed period of the Kozloduy NPP, Units 1-4, operation, more than
70 fuel cycles have been completed (realized) as a whole, and the overall number of
the discharged assemblies exceeds 7000 (Table 1). In Fig. 1, the distributions of the
discharged fuel assemblies versus the in-core life time,(1a), and versus the-
enrichment (1b) are shown.
Through the stage-wise improvement of the fuel cycle design characteristics, a
real average assembly burnup increase has been achieved: from 31 MWd/kgU at the
beginning, to 35-38 MWd/kgU at present. Thanks to the implementation of low-
leakage reloading schemes, at all 1-4 Units with or without dummy assemblies, the
introduction of assemblies with decreased shroud thickness 1.5 mm (higher water to
uranium ratio), with increased initial filling gas (helium) pressure 0.6 MPa and with
zirconium spacer grids (lower parasitic neutron capture (absorption)), an actual
improvements in core and fuel performance were reached. Practically, a significant
efficiency enhancements improvement of the fuel utilization in the Kozloduy NPP,
WWER-440 reactors, were realized.
Decrease of the fresh fuel assemblies number in average from 102 to 90 (84-96
has been achieved without decreasing cycle lengthfabout 280-300 FPD). Practically,
a significant improvement of the economical characteristics of the fuel utilization in
the Kozloduy NPP, WWER-440 reactors, has been realized.
Units 1-4 discharged assemblies bumup distribution sorted by fuel enrichment, is
given in Fig. 2.
For each of the Units 1-4, the number of the discharged assemblies and the
corresponding mean burnup during the following up to now fuel cycles, is
demonstrated in Fig. 3. Independent of the differences between the particular units
and theirs operational regimes, a permanent tendency to decrease of the discharged
assembly number and increase of the mean burnup, can be observed.
KOZLODUY NPP - EAD 10
48
The results, shown in Fig. 5, are an attempt to demonstrate visually the
achievements regarding the discharged fuel burnup increasing , in the process of the
fuel cycle characteristics improvement.lt can be seen, that the mean discharged fuel
burnup increases with 2-4 MWd/kgU in average.
The influence of the low-leakage reloading scheme application and of the
shielding (dummy) assemblies presence in Units 1-3, on the reducing of reactor
vessel fast neutron fluence, is demonstrated in Fig. 4. In this case, the current
fluence to the first cycle fluence ratio, is given. A significant decrease of the fluence
accumulation and increase of the reactor vessel recourse can be observed. In the
case of Unit 1 it was proven experimentally.
Some calculated results by means of BIPR-7 code for two types of possible fuel
cycles of Unit 4 using 3.6% enriched working assemblies only (A) and subsequently
introducing advanced 3.82% profiled assemblies (B) are presented at Table 2. The
tendency of the discharged assembly number decrease and the iacrease of the
achieved average bumup is demonstrated in Fig. 6, based upon the completed up to
now and the planned in future cycles of Unit 4.
But yet, together with the demonstrated considerable positive results regarding
the WWER-440 fuel utilization at the Kozloduy NPP, during the last years (since
1990), a tendency of fuel assembly failures increase has been observed since 1990,
i.e. increase of the assemblies number identified as leaking At that, as shown in
Table 1, the number of the leaking assemblies after one or two cycles, has been
mainly increased. The causes for the increased number of leaking assemblies might
be of different origin. Up to now a systematic approach has been developed and will
be implemented at Kozloduy NPP in order to avoid the fuel failures. It is based on
the mutual efforts of the operation staff specialists, the fuel Designer and Supplier
representatives, scientific consultants, etc. The goal is consequently to reveal and to
eliminate the possible failure causes, to introduce fuel with enhanced mechanical
stability, to exclude abrupt power changes during operation and movements of the
6th group of control assemblies, etc. At present, fresh working assemblies with
enhanced vibration resistance, are placed into the Unit 2 core, aiming significant
decrease of the fuel failures.
IV. Conclusions
A series of investigations and researches studies, related to the fuel cycle
characteristics improvement has been carried out during the observed period of
WWER-440 operation at the Kozloduy NPP. After comprehensive analysis and
evaluation, the most significant of them have been implemented into operation.
1. The use of assemblies with 3.6% enrichment in a four-year cycle has
been implemented;
KOZLODUYNPP-EAD
- 49

2. Low-leakage fuel loading pattern schemes have been introduced andapplied;
3. Fuel with improved, compared to the original design, characteristics -higher initial gas (Helium) pressure under the cladding, thinner assemblyshroud tube thickness, Zirconium spacer grids, enhanced vibro-resistance, etc., has been implemented and successfully utilized atpresent in all units;
4. A systematical approach is applied to reveal and eliminate the fuelfailure causes;
5. The process of precision evaluation and improvement of the appliedcomputer codes, as well as the verification, . validation andimplementation of new computer codes, based on contemporaryimproved methods to describe the fuel and reactor core characteristics(e.g. the spectral code HELIOS [14]), is going on.
6. The core' design safety evaluation methodology is developed andapplied.
The most important achievements and results can be summarized as follows:
- Reduction of the specific fuel costs, i.e. increase of the discharged fuelaverage burnup, up to 36-38 MWd/kgU, and reduction of the fresh fuelassemblies number to be reloaded, 84-96 per fuel cycle;
- Reduction of the neutron fluence on the reactor pressure vessels andcreation of prerequisites to extend their operation recourse;
- Reduction of the spent fuel quantity and as a consequence, reduction ofthe reactor decommissioning costs.
KOZLODUYNPP-EAD 12
References
1. П.Т.Петков. SPPS-1.6. Физико-математичен модел и ръководство за
използване,1 София, 1994г. Договорни задачи между ИЯИЯЕ - БАН и АЕЦ "Козлодуй",
N653, 654.
2. P.T.Petkov. SPPS-1.6 - A 3D Diffusion Code for Neutronics Calculations of the
WER-440 Reactors. Proc. of the Forth Symposium of AER, Sozopol, 10-15 Oct., 1994.
3. П.Т.Петков. Генериране на ефективни малогрупови параметри и гранични
условия за дифузионни пресмятания на реакторите ВВЕР-440. НТС "Математически
модели в ядрената безопасност и радиационната защита", София, 7-8 април 1993г.
4. J.R Askew, F.J. Fayers, P.B.Kemshel. A General Description of the Lattice Code
WIMSJ.BNES, Oct., 1966.
5. Петков П.Т. SPPS-1.6. Верифициране на програмата и библиотеката
групови дифузионни параметри. Отчет по II етап по договор N 2415302, София,
ИЯИЯЕ-БАН, октомври 1995г. .
6. П.Т.Петков, И.С.Георгиева. HEXAB-2DB - Программа для оперативньж
расчетов козффициентов неравномерности мощности по твзлам в активной зоне
ВВЗР-440. Материал XVI Симпозиума ВМК по физике ВВЗР, Москва, 1987.
7. А.Н.Новиков, В.В.Пшенин, М.Р.Лизоркин, В.В.Сапрьжин, В.Д.Сидоренко,
ААСуслов. РИЦ Курчатовский ин. Code package for WWER CORES ANALYSIS and
some ASPECTS of FUEL CYCLES IMPROVING, сб. Теория и рас-нет ядернмх реакторов
и переноса излучений, УДК 621.039.5
8. Программа БИПР-7 - описание алгоритма и инструкция для пользовтеля
ИЯР, РНЦ "Курчатовский институт", Москва 1995.
9. Отчет "Влияние на изменението на геометричните размери на работните
горивни касети върху НФХ на горивните зареждания на реакторите SBEP-440 на
блокове IOIV. АЕЦ "Козлодуй". ЕП-1, ИО-1, юли 1995г.
10. Обосновка за използване на 12 работни горивни касети с циркониеви
дистанциониращи решетки в 13-то горивно зареждане на четвърти блок, отчет с-р
"ПХАЗ", ИО-1, декември, 1995 г. гр. Козлодуй.
11. Безопасностни критерии и оценки на неутронно-физичните характеристики
на активната зона при използване на ново усъвършенствано гориво, отчет по Договор
№ 175-96/05.03.1995г. с КИАЕМЦ, с-р ПХАЗ, Козлодуй, юли 1997г.
12. Атомная злектростанция "Козлодуй-И", Технический проект, часть IX,
Техническое обоснование безопаснасти сооружения и зксплуатации атомной станции,
Москва, 1973г.
KOZLODUYNPP-EAD I3
51
13. KaMbiuiaH A.H., HOBHKOS A.H.. On3vmecKne xapaKTepucTMKW H ewropaHne
Tonnnea peaiaopoB 8B3P, c6opm« MAI"AT3 "Reactor Burnup Physics" (1973)
14. Casal JJ, Stamm'ler RJJ.( Villarino E A and Ferri A A, 'HELIOS: Geometric
capabilities of a new fuel-assembly program,* Intl Topical Meeting on Advances in
Mathematics, Computations, and Reactor Physics, Pittsbirgh, 1991, Vol. 2, p. 10.2.1 1-13.
15. K. Lassmann, TRANSURANUS: a fuel rod analysis code ready for use. Journal
of Nuclear Materials, 188 (1992), p. 295-302.
16. R. Pazdera, M. Valach, P. Strijov, K. Dubrovin, V. Murashov, A.Senkin,
V. Yakovlev, User's Guide for (he Computer Code PIN-micro. UJV9515-T. Rez, CSFR,
November 1991.
17. Wheeler C.L., Stewart C.W. at al. COBRA-NI: An Interim Version of COBRA for
thermal - Hydraulic Analysis of Rod Bundle Nuclear Fuel Elements and Cores. BNWL -
1962, UC-32, March 1976.
18. riporpaMa 3a cy6xaHaneH TepMoxnapaBnuseH aHann3 COBRA-4I;
BepM<pHKau,vtH Ha nporpaMaTa. OmeT Ha MiRMHE-BAH, MapT 1996r.
19. Contract Ns 2810431/13.07.1999 between NEC EAD Kozloduy NPP branch and
INRNE-BAS
KOZLODUY NPP-EAD 14
52
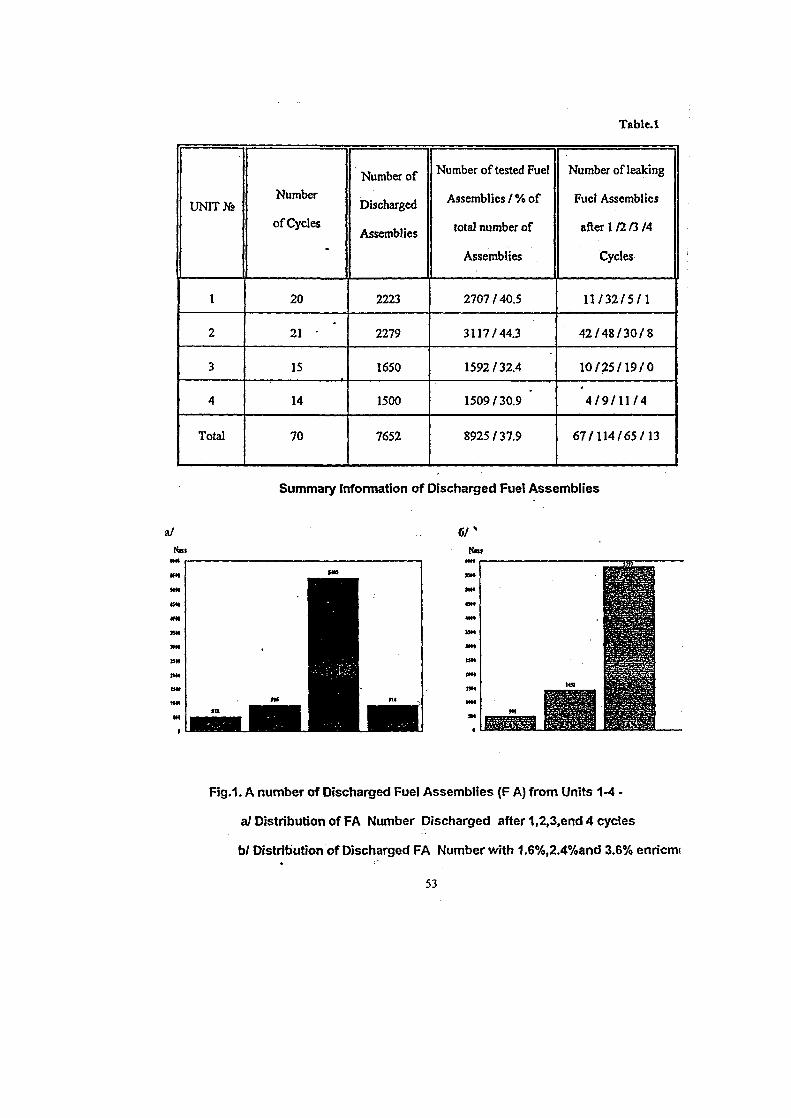
Table.1
UNITJfe
1
2
3
4
Total
Number
ofCycles
20
21 •
15
14
70
Number of
Discharged
Assemblies
2223
2279
1650
1500
7652
Number of tested Fuel
Assemblies/% of
total number of
Assemblies
2707/40.5
3117/44.3
1592/32.4
1509/30.9
8925/37.9
Number of leaking
Fuel Assemblies
after 1/2/3/4
Cycles
11/32/5/1
42/48/30/8
10/25/19/0
4/9/11/4
67/114/65/13
a/
Summary Information of Discharged Fuel Assemblies
MM
XH
Fig.1. A number of Discharged Fuel Assemblies (F A) from Units 1-4 -
a/Distribution of FA Number Discharged after 1,2,3,end 4 cycles
b/ Distribution of Discharged FA Number with 1.6%,2.4%and 3.6% enrictrv
53
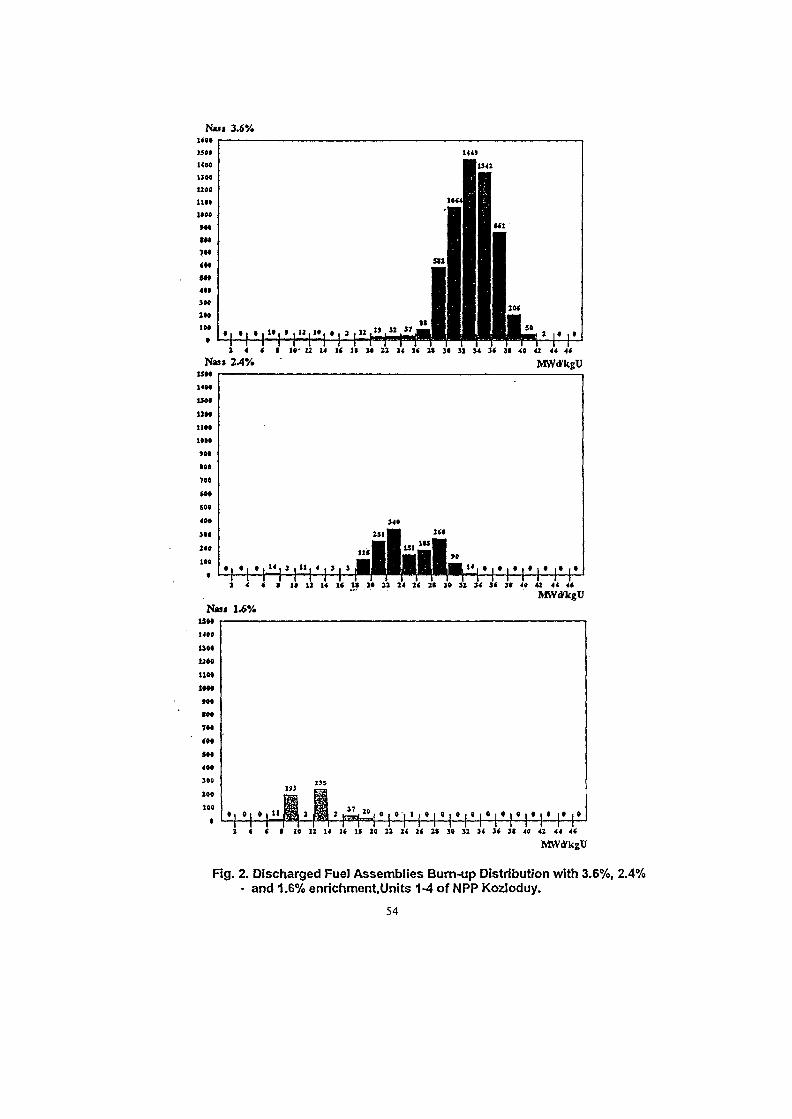
1 4 f I !•- 12 14 U I I 2« 21 14 1< I t }• 31 34 3* 31 49 42 44 4«2-4% MWtfkgU
• • • i • i >4 , I , 11 , 4 , 3 , 1
1 4 < I I t II U U 11 >« 22 24 2< J» 3» 32 ]4 St 3< 4« 42 44 4<
2 4 < I It U l l II II 20 22 24 I< 28 }« 32 34 Si 31 49 42 44 4(
Fig. 2. Discharged Fuel Assemblies Bum-up Distribution with 3.6%, 2.4%• and 1.6% enrichment,Units 1-4 of NPP Kozloduy.
54
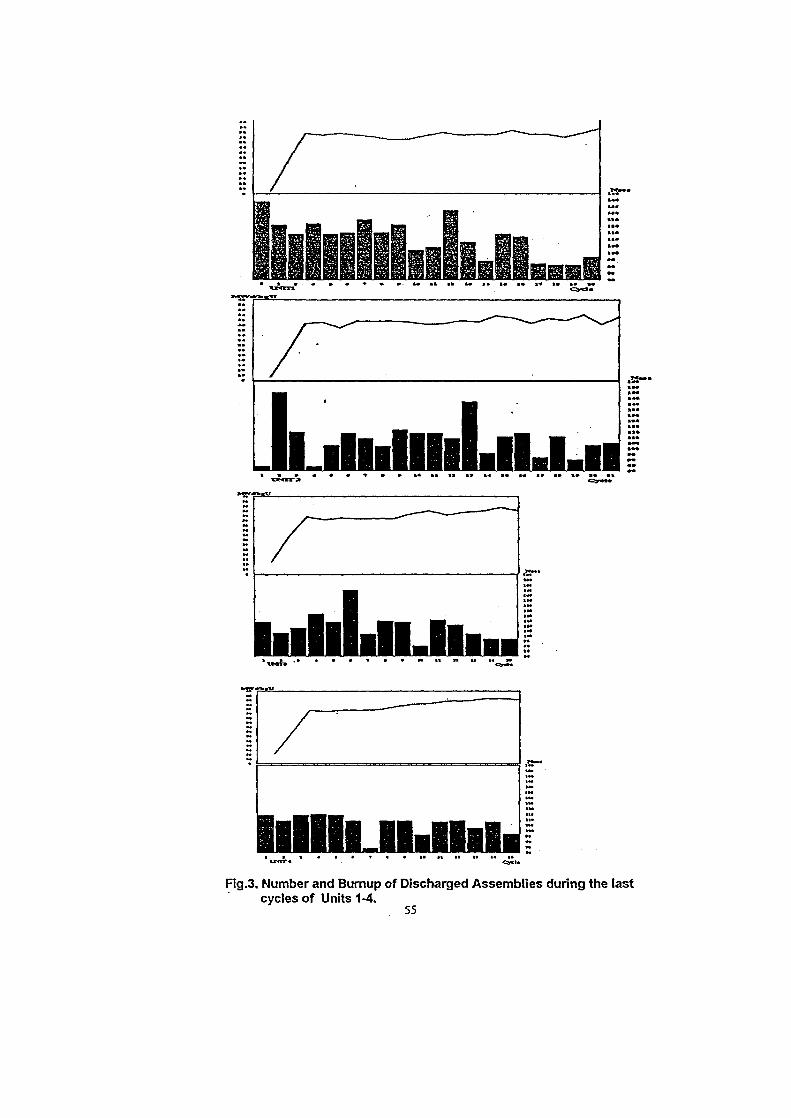
,55—
•illJiH-lliJ
Fig.3. Number and Bumup of Discharged Assemblies during the lastcycles of Units 1-4.
55
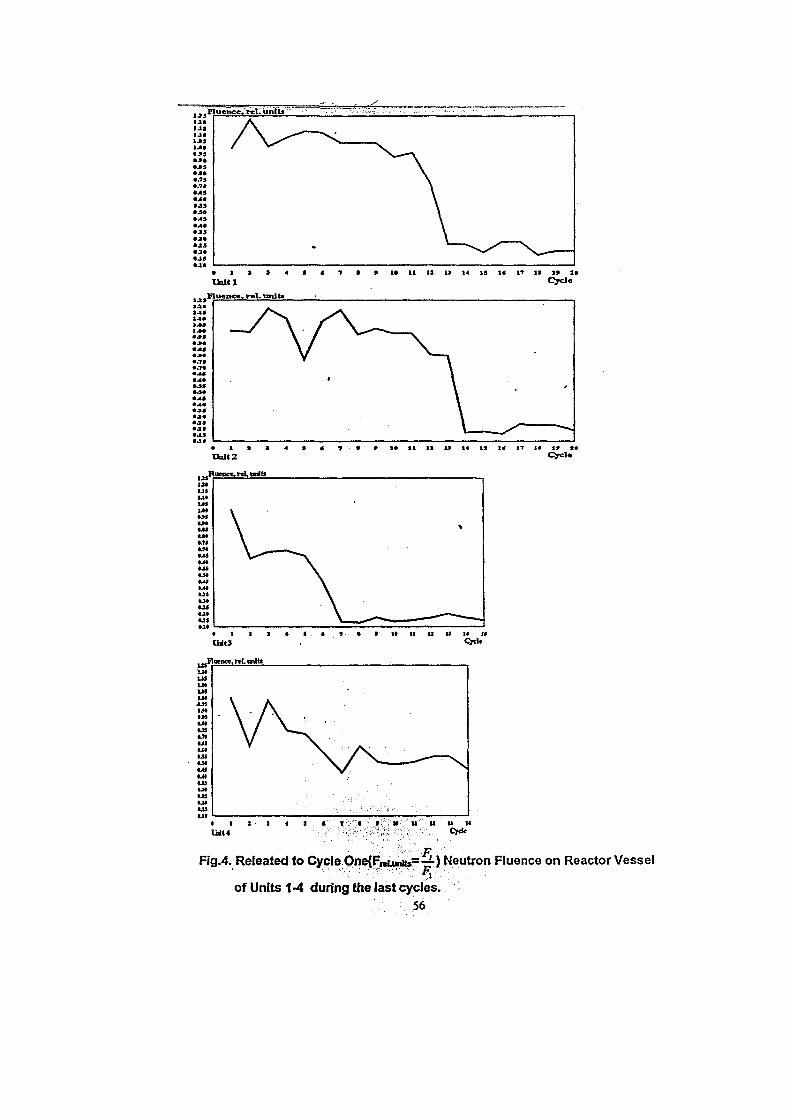
XM14
Fig.4. Releated to Cycle OneiFnUa**-—) Neutron Fluence on Reactor Vessel
55of Units 1-4 during the last cycles.56
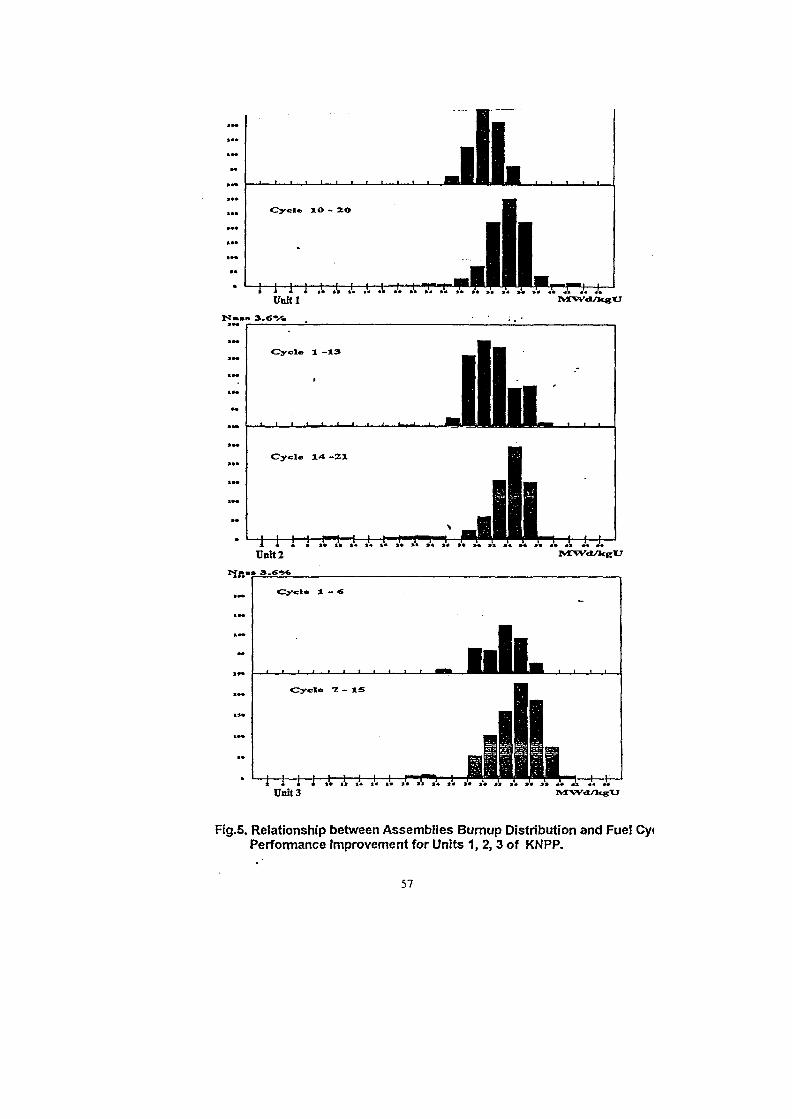
1 1 1 1 i. .', J. .'. .1U n K l
I 1 1 I J, A .1 .1 .1MWdrttgU
Fig.5. Relationship between Assemblies Bumup Distribution and Fuel CyiPerformance Improvement for Units 1, 2, 3 of KNPP.
57
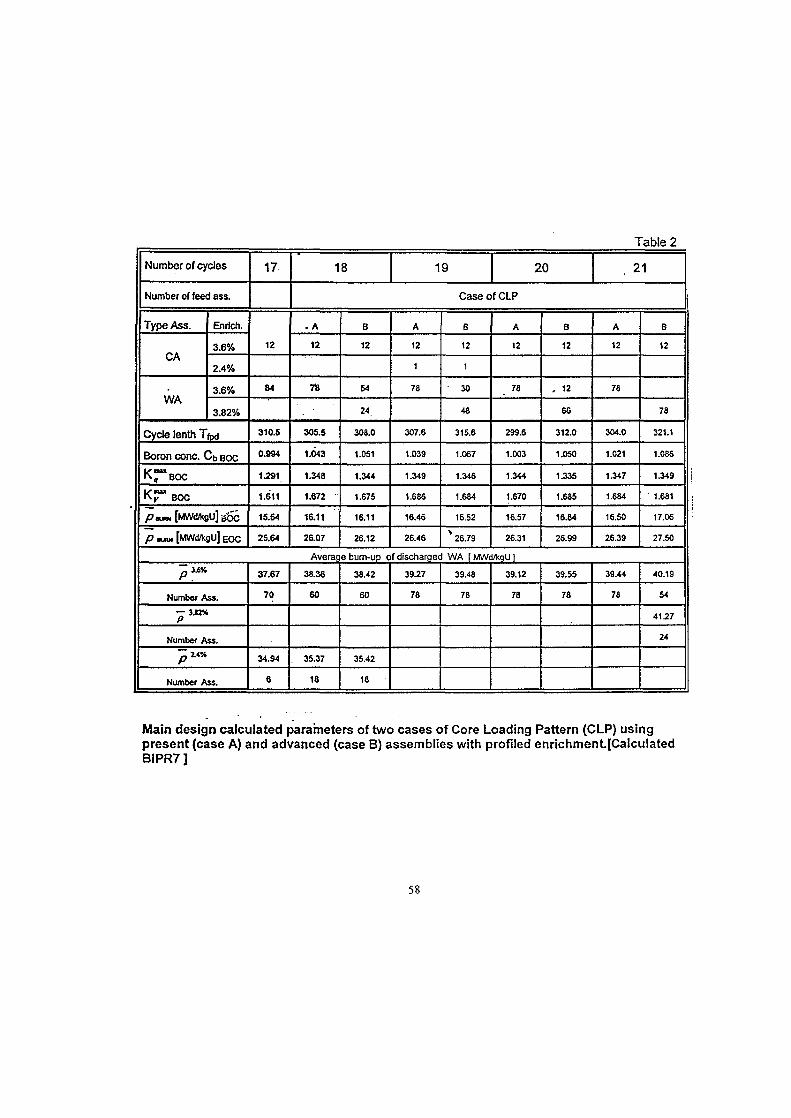
Table 2
Number of cycles
Number of feed ass.
Type Ass.
CA
WA
Enrich.
3.6%
2.4%
3.6%
3.82%
Cycle tenth Tfpd
Boron cone. Cb BOC
KJ^BOCtXBUX
• V BOC
p««[MW(W<gU]B6c
p wum [MWdfcgU] EOC
17
12
84
310.5
0.994
1.291
1.611
15.54
25.64
18 19 20 . 21
Case of CLP
- A
12
78
305.5
1.043
1.348
1.672
16.11
26.07
Averag
pi.6%
Number Ass.
— 3JO%P
Number Ass.
p2A%
Number Ass.
37.67
70
34.94
6
38.36
60
35.37
18
B
12
54
24
308.0
1.051
1.344
1.675
16.11
26.12
A
12
1
78
307.6
1.039
1.349
1.686
16.46
26.46
B
12
1
• 30
48
315.6
1.067
1.346
1.684
. 16.52
> 26.79
A
12
78
299.6
1.003
1.344
1.670
16.57
26.31
B
12
, 12
66
312.0
1.050
1.335
1.685
16.84
26.99
A
12
78
304.0
1.021
1.347
1.684
16.50
26.39
B
12
78
321.1
1.086
1.349
1.681
17.06
27.50
e burn-up of discharged WA [MWd/kqUl
38.42
60
3S.42
18
39.27
78
39.48
78
39.12
78
39.55
78
39.44
78
40.19
54
41.27
24
Main design calculated parameters of two cases of Core Loading Pattern (CLP) usingpresent (case A) and advanced (case B) assemblies with profiled enrichment.[CaIcutatedBIPR7 ]
58
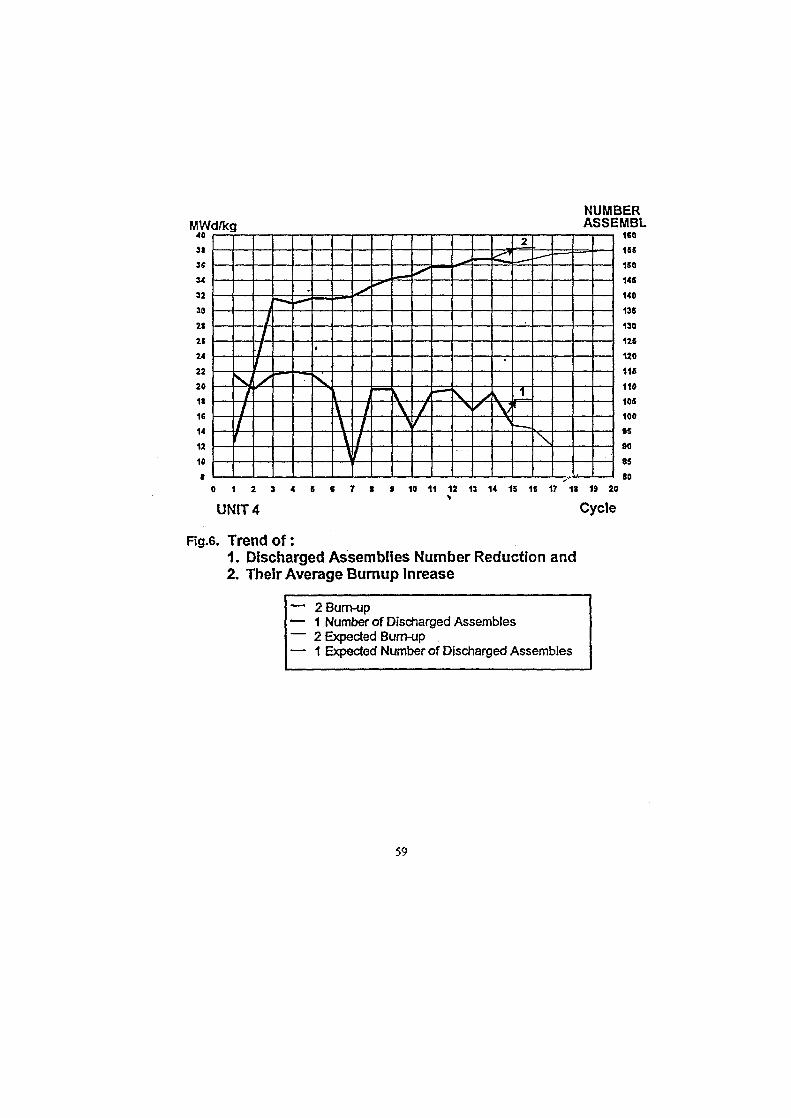
MWd/kg40
31
JS
34
32
39
2S
2S
24
22
20
18
16
14
12
10
j
/
/
/
I7//
f
\
\1
\
^*
h/XiVT
— • —
v~\\
//
s
•
V>
2•
_ —
1I
k .
^ — •
\
•J. '-3
NUMBERASSEMBL
160
1S5
150
14S
140
13S
130
125
120
115
110
10S
100
95
90
85
80• 10 11 12 13 14 15 16 17 18 19 20
UNIT 4 Cycle
Fig.6. Trend o f :1. Discharged Assemblies Number Reduction and2. Their Average Burnup Inrease
— 2 Bum-up— 1 Number of Discharged Assembles
2 Expected Burn-up— 1 Expected Number of Discharged Assembles
59
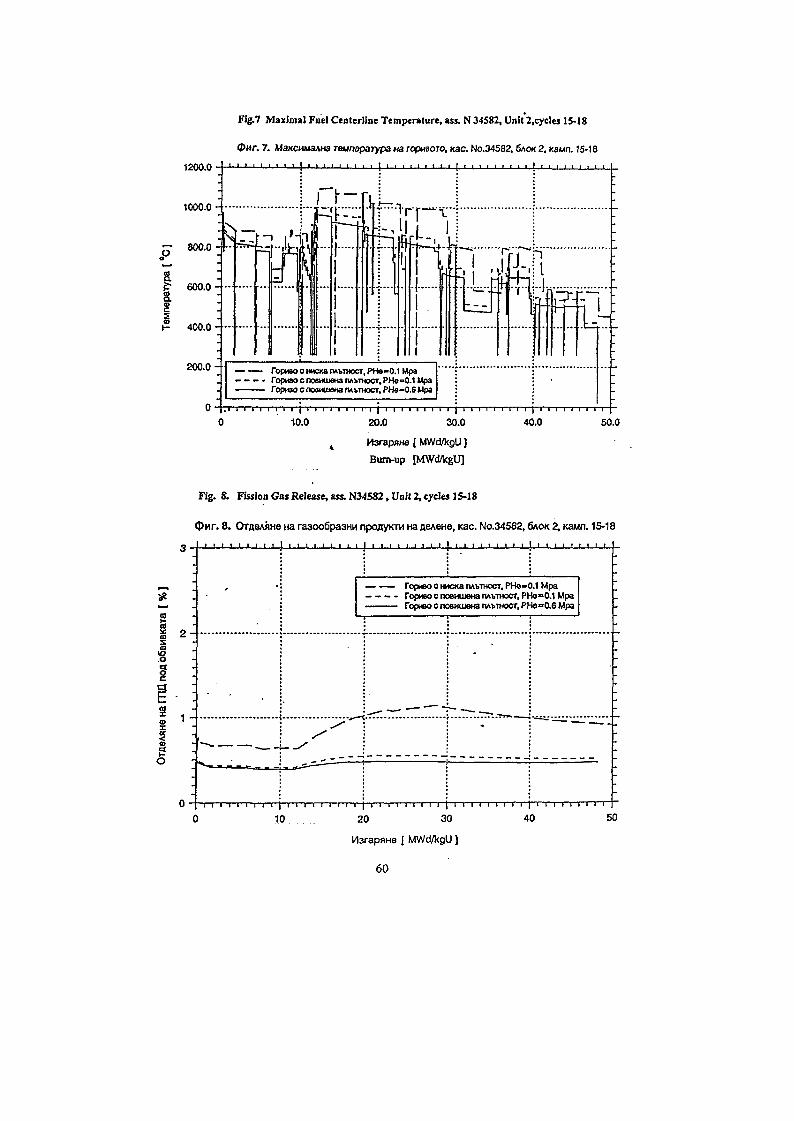
Fig.7 Maximal Fuel Centeriine Temptralure, ass. N 34582, Unit 2,cycles 15-18
<t>t»r. 7. MaKCMMaAHa Tewneparypa Ha ropnBOTO. Kac. No.34S82, 5AOK 2, namin. 15-18
1200 0 -
1000.0-
~ 800.0-
£• 600.0-
H 400.0-
200.0-
0 -
1 1 1 1 1
s.1 l ' -...Ik-.
r
1
\
1 1 1
n1 1 1 1
1 I1
1
— — TopMBO o HMCxa IMMHOCT, PHe»0.1 Mpa— - - - ropuso c noeMiueHa IUHHOCT, PHo=0.1 Mpa' roptoocnosKUieHanAvmoCT.PH9-0.6Mpa
r i i i i i i i i | i i i i i i , i ! j i i , i , i i ! i
i1 h
hffi •
• 1 1
~i
i
-• —
:
•
-
•
-
-
10.0 20.0 30.0 40.0 50.0
v M3rapflHe{MWd/kgU]
Bum-up [MWd/kgU]
Fig. 8. Fission Gas Release, ass. N34532, Unit 2, cycles 15-18
<J)nr. 8. OtfleAflHe na ra3oo6pa3HH npOAyicrvi na AeAeHe, Kac. No.34582, 6AOK 2, Kawn. 15-18
2 -
1 -
E?o
0 [ i i0
["opteo c HMCKa nM.TH0CT, P H B = 0 . 1 Mparofweo c noenu»Ha riM,TOOCT, PHa»0.1 Mpa
———— TopHBO c noetttueKa rvH>mocT, PHo=0.6 Mpa
i i ) r | r r i i i i i i i | i i i i i i i i i | i i i i i i i i i | i i i i i i
10 20 30
M3rap»He I MWd/kgU J
40 50
60
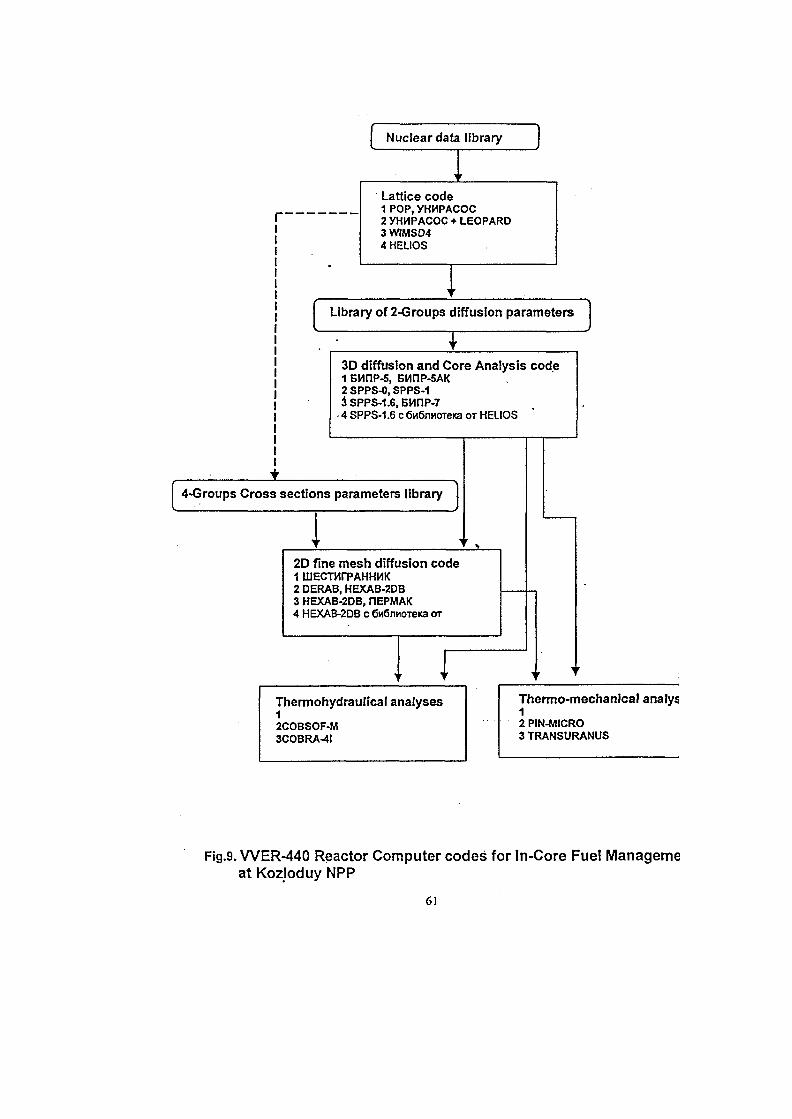
Nuclear data library
Lattice code1 POP, yHMPACOC2 YHMPACOC • LEOPARD3 WIMS044 HELIOS
Library of 2-Groups diffusion parameters
3D diffusion and Core Analysis code1 EMnP-5, EMnP-5AK2 SPPS-O, SPPS-13 SPPS-1.6, BMnP-7
• 4 SPPS-1.6 c 6n6nHOTeKa OT HELIOS
4-Groups Cross sections parameters library
2D fine mesh diffusion code1 UJECTMtTAHHHK2 DERAB, HEXAB-2DB3 HEXAB-2DB, F1EPMAK4 HEXAB-2DB c 6n6nnoTeKa or
Thermohydraulical analyses12COBSOF-M3COBRA-4I
Thermo-mechanical analys12 PIN-MICRO3 TRANSURANUS
Fig.9. WER-440 Reactor Computer codes for In-Core Fuel Managemeat Kozloduy NPP
61
SK01ST078
EXPERIENCE OF DEVELOPMENTS AND IMPLEMENTATIONOF ADVANCED FUEL CYCLES OF WER-440 REACTORS
AA.Gagarinski, M.P.Lizorkin, A.N.Novikov, V.N.Proselkov,V.V.Saprykin
RRC "Kurchatov Institute", Moscow, Russia
ABSTRACT
The paper presents the experience of development and implementation of advancefour- and five-year fuel cycles in the VVER-440 reactors, the results of experiment*operation of the new fuel design and the main neutronic characteristics of the core.
In the design three-year fuel cycles of VVER-440 reactors the fuel assemblies with steespacer grids were used, the average fuel burnup of discharged fuel was ~29 MW*day/kg an<the specific consumption of natural uranium was ~ 0.241kg/M W*day. The experience gained in operation of the fuel burnups up to ~ 50 MW*day/kgobtained data of post-reactor investigations of spent fuel, development of neutronic andthermal-hydraulic calculation codes, thermal-mechanical codes and codes of accidenianalysis made it possible to substantiate the increase in fuel bumup of the VVER reactors,eliminate the excess conservatism in designing and operation, laid at that stage, and staridevelopment of advanced fuel cycles with advanced design fuel assemblies.
Lately in Russia an extensive series of calculation and R&D works were carried out for thesubstantiation of the possibilities of improvement of various VVER-440 fuel cycles:• a series of developments on increasing the efficiency of fuel was carried out;• technology of FA and fuel pins fabrication and their operation characteristics were
improved (the quality of fabrication of fuel pellets and casing tubes was enhanced, theinitial helium pressure to the cladding increased, the FA design optimized);
• the five-year fuel cycle with the use of 4.4% enriched working fuel assemblies (notenrichment shaped ones) was successfully implemented at the Kola NPP unit 3;
• the advanced four-year fuel cycle with the use of working FA and fuel followers withprofiled average fuel enrichment 3.82% was implemented at the NovoVoronezh NPP unit4 (Fig.l); the similar fuel cycles are being introduced at the NPP with VVER-440 inCzechia, Slovakia, Hungary (the main characteristics of the type advanced four-year fuelcycle on example of Dukovany NPP unit 4 are listed in Table 1);
• since 2000 at the NovoVoronezh NPP-4 the pilot operation of the fuel followers withmodernized (based on the hafnium plates) joint eliminating the local ramps of linear heat
63
generation rates of fuel pins in the working fuel assemblies next to the CR, has beencarried out.
The implementation of four-year fuel cycles in the VVER-440 reactors does not restrict thepossibility of further increase in the efficiency of fuel utilization and enhancement of thesafety of these reactor plants.
The experience of Kola NPP-3 operation with the fuel assemblies with the starting fuelenrichment 4.4% (not enrichment shaped) evidences the possibility of realization of five yearfuel cycles and increase in the fuel burnup (50.0 MW*day/kg and higher).
However the implementation of the fuel cycles using the highly enriched fuel encountersdifficulties associated with ensurance of safety in fuel handling. Taking this into account therealization of five-year fuel cycle in the VVER-440 of Rovno NPP unit 2 has begun. Thisfuel cycle is based on the use of enrichment shaped fuel assemblies with the initial averagefuel enrichment 4.21%, with the fuel ponds having normal pitches of FA arrangementprovided at this NPP.
For the Kola NPP unit 4 the five-year fuel cycle using enrichment shaped fuel assemblieswith the average enrichment 4.40%, containing fuel pins with gadolinium-based burnableabsorber integrated to the fuel has been developed and implemented since 1998 (Table 2).The use of the burnable absorber permits the multiplying properties of fuel assemblies to beeffectively reduced (by ~ 8% comparing with the 3.8% enriched fuel assemblies) andenhances fuel handling safety. At present 36 fuel assemblies (12 + 24) with uranium-gadolinium fuel are used in the reactor.
At the same time the possibility of realization of the universal (suitable also forimplementation at the NPP with fuel ponds with small pitches of FA arrangement) five-yearfuel cycle in the VVER-440 reactors with 349 FA in the core, is demonstrated. The specificfeature of this fuel cycle is the use of FA with uranium-gadolinium (U-Gd) fuel (Fig.2).
The main neutronic characteristics of this fuel cycle are given in Table 3.
The results of trials .and tests and experience of fuel operation with high fuel burnup, beinggained are indicative of the existence of essential resources for further improvement of thetechno-economic characteristics of VVER-440 fuel cycles. The possibilities ofmodernization of fuel cycles involve:• increase in the efficiency of fuel utilization due to transition to the five- and six-year fuel
cycles saving the conditions for ensuring the fuel handling safety at the expense of the useof burnable absorber integrated into fuel;
• the possibility of rising the FA power due to the increase and improvement of the coolantflow rate distribution in the fuel assemblies due to increased turnkey size o FA up to 145mm and increase in the pitch in the fuel bundles of FA up to 12.3 mm;
64
reduction in the linear heat generation rate ramps due to modernization of the fuefollower joint and to the optimization of refueling patterns (and, as a result of this, th<increased possibility of realization of power load-following);the possibility of increasing the fuel load operation length due to the increase in th<uranium content in the fuel assemblies by increasing the effective length of the fuel stacland change in the outer and inner diameters of fuel pellets and fuel claddings.
The preliminary analyses of the possibility of implementation of the five- and six-yearVVER-440 fuel cycles (more than half of working fuel assemblies have been operated in thereactor for six years) were performed.
The five-year fuel cycle is realized on the basis of the use of the advanced fuel assemblies:the working fuel assembly with uranium-gadolinium fuel and profiled average fuelenrichment 4.38%, which differ from the normal fuel assemblies mainly in the larger pitch inthe fuel pin array (12.3 mm), longer fuel stack (2480 mm) and the fuel .-followers withincreased turnkey size (145 mm), reduced casing thickness (1.5 mm) with increased pitch(12.3 mm), increased fuel stack height (2360 mm) and the hafnium plate in the joint forreducing the power distribution burst in the fuel pins of the periphery row of neighboringworking fuel assemblies.
In the case of this fuel cycle the length of reactor operation between the refuelings is 324eff.days in the established refueling pattern, including 22 eff.days as a result of prolongationof the fuel cycle at the expense of partial use of power and temperature effects.
In the established refueling regimes 72 fuel assemblies are fed up into the core: to the oddload - 66 working fuel assemblies with average enrichment 4.38% and six fuel followerswith average enrichment 3.82%, to the even load-60 working assemblies and 12 fuelfollowers are loaded.
The average burnup of discharged fuel (over the fuel assemblies) is ~ 50-51 MWday/kg.
The average bumup in the maximum depleted working assembly is ~ 53 MWday/kg.
The possibility of realization of power load following in the use of five-year fuel cycle waspreliminary analyzed.
The six-year fuel cycle is realized with the use of working fuel assemblies with the averageenrichment 4.86% and fuel followers with average enrichment 3.82%. Their main differencefrom the normal fuel assemblies is an increased pitch in the fuel pin array 12.3 mm) higherfuel stack, 2480 mm and 2400 mm in the working assembly and in the fuel follower,
65
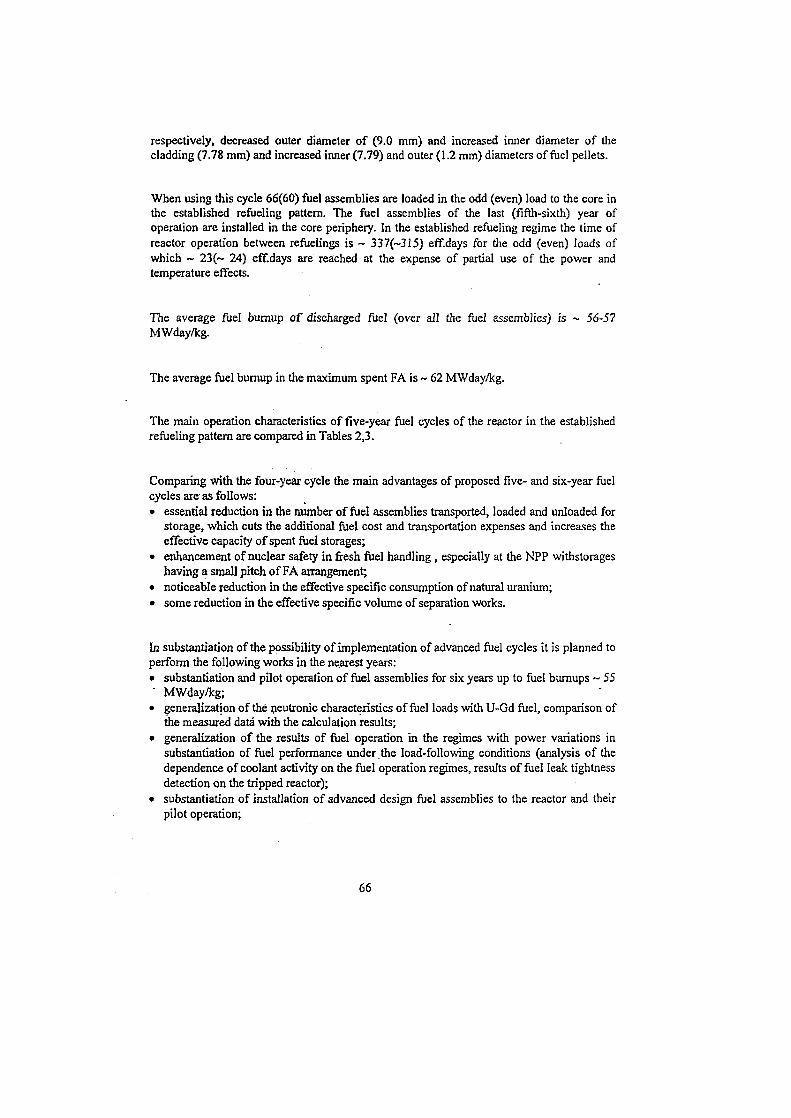
respectively, decreased outer diameter of (9.0 mm) and increased inner diameter of thecladding (7.78 mm) and increased inner (7.79) and outer (1.2 mm) diameters of fuel pellets.
When using this cycle 66(60) fuel assemblies are loaded in the odd (even) load to the core inthe established refueling pattern. The fuel assemblies of the last (fifth-sixth) year ofoperation are installed in the core periphery. In the established refueling regime the time ofreactor operation between refuelings is ~ 337(~315) eff.days for the odd (even) loads ofwhich ~ 23(~ 24) eff.days are reached at the expense of partial use of the power andtemperature effects.
The average fuel bumup of discharged fuel (over all the fuel assemblies) is ~ 56-57MWday/kg.
The average fuel burnup in the maximum spent FA is ~ 62 MWday/kg.
The main operation characteristics of five-year fuel cycles of the reactor in the establishedrefueling pattern are compared in Tables 2,3.
Comparing with the four-year cycle the main advantages of proposed five- and six-year fuelcycles are as follows:• essential reduction in the number of fuel assemblies transported, loaded and unloaded for
storage, which cuts the additional fuel cost and transportation expenses and increases theeffective capacity of spent fuel storages;
• enhancement of nuclear safety in fresh fuel handling, especially at the NPP withstorageshaving a small pitch of FA arrangement;
• noticeable reduction in the effective specific consumption of natural uranium;• some reduction in the effective specific volume of separation works.
In substantiation of the possibility of implementation of advanced fuel cycles it is planned toperform the following works in the nearest years:• substantiation and pilot operation of fuel assemblies for six years up to fuel bumups ~ 55" MWday/kg;
• generalization of the neutronic characteristics of fuel loads with U-Gd fuel, comparison ofthe measured data with the calculation results;
• generalization of the results of fuel operation in the regimes with power variations insubstantiation of fuel performance under the load-following conditions (analysis of thedependence of coolant activity on the fuel operation regimes, results of fuel leak tightnessdetection on the tripped reactor);
• substantiation of installation of advanced design fuel assemblies to the reactor and theirpilot operation;
66
• development and substantiation of calculation approximations and correction ofcalculation codes for ensuring the representativeness of calculations of "hybrid" fuelloads;
• correction of ICIS software for maintaining the representativeness of control of powerdistribution in "hybrid" fuel loads;
• substantiation of representativeness of measurements of power distribution in the core in"hybrid" fuel load operation;
• comparison of the calculation data with the results of measurements in "hybrid" loadoperation;
• complex of calculation-experimental works in substantiation of fuel pin operability at fuelburnups ~ 62 MWday/kg and ~ 66 M\Vday/kg for the five- and six-year fuel cycles,respectively;
• post-reactor investigations of fuel assembly having operated for six years up to theaverage fuel burnup ~ 55 MWday/kg.
67
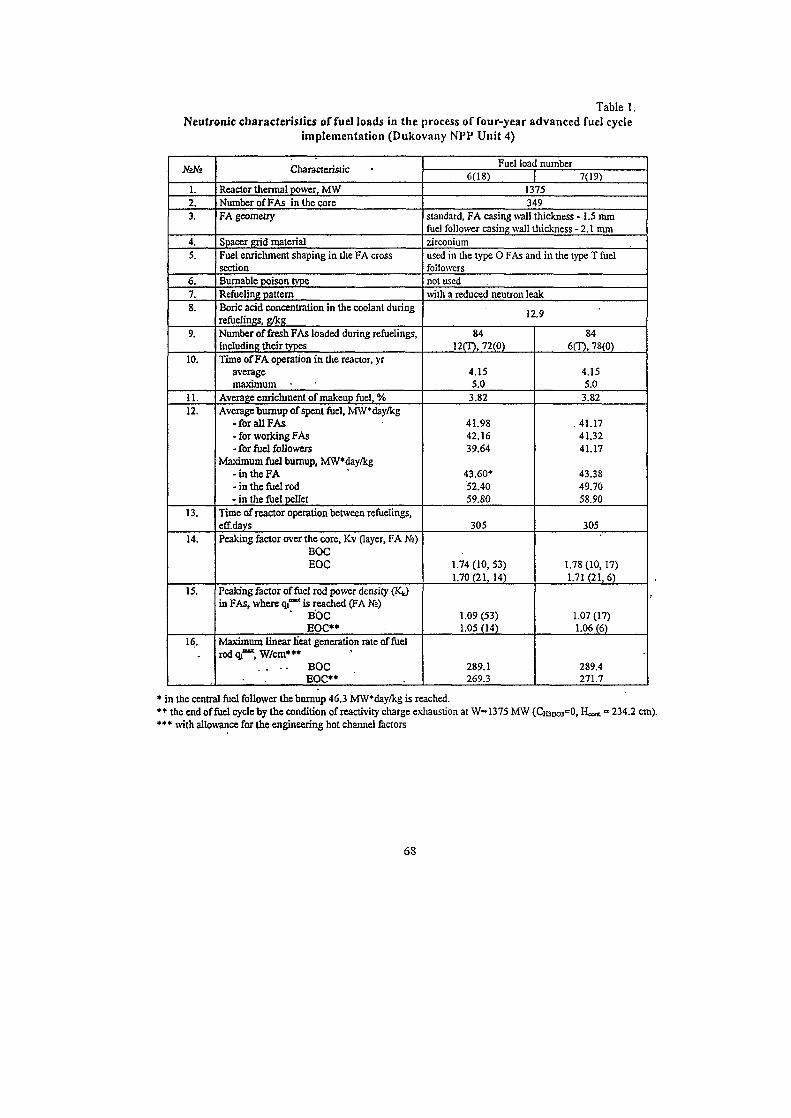
Table 1.Neutronic characteristics of fuel loads in the process of four-year advanced fuel cycle
implementation (Dukovany NPP Unit 4)
XiNe
1.2.3.
4.5.
6.7.8.
9.
10.
11.12.
13.
14.
15.
16.
Characteristic
Reactor thermal power, MWNumber of FAs in the coreFA geometry
Spacer grid materialFuel enrichment shaping in the FA crosssectionBurnable poison typeRefueling patternBoric add concentration in the coolant duringrefuelings, g/kgNumber of fresh FAs loaded during refuelings,including their typesTime of FA operation in the reactor, yr
averagemaximum
Average enrichment of makeup fuel, %Average burnup of spent fuel, MW*day/kg
-forallFAs- for working FAs- for fuel followers
Maximum fuel bumup, MW*day/kg- in the FA- in the fuel rod- in the fuel pellet
Time of reactor operation between refuelings,eff.daysPeaking factor over the core, Kv (layer, FA Hi)
BOCEOC
Peaking factor of fuel rod power density (KJin FAs, where qj°" is reached (FA X°)
' BOCEOC**
Maximum linear h'eat generation rate of fuelrod a/**, W/cm***
. . . BOCEOC**
Fuel load number6(18) 7(19)
1375349
standard, FA casing wall thickness -1.5 nunfuel follower casing wall thickness - 2.1 mmzirconiumused in the type 0 FAs and in the type T fuelfollowersnot usedwith a reduced neutron leak
12.9
8412(T), 72(0)
4.155.03.82
41.9842.1639.64
43.60*52.4059.80
305
1.74(10,53)1.70(21,14)
1.09 (53)1.05 (14)
289.1269.3
846(T),78(0)
4.155.0
3.82
. 41.1741.3241.17
43.3849.7058.90
305
1.78(10,17)1.71 (21, 6)
1.07 (17)1.06 (6)
289.4271.7
* in the central fuel follower the burnup 46.3 MW*day/kg is reached.• • the end of fuel cycle by the condition of reactivity charge exhaustion at W=1375 MW (CH3BO3=0, H***. = 234.2 cm).*•* with allowance for the engineering hot channel factors
68
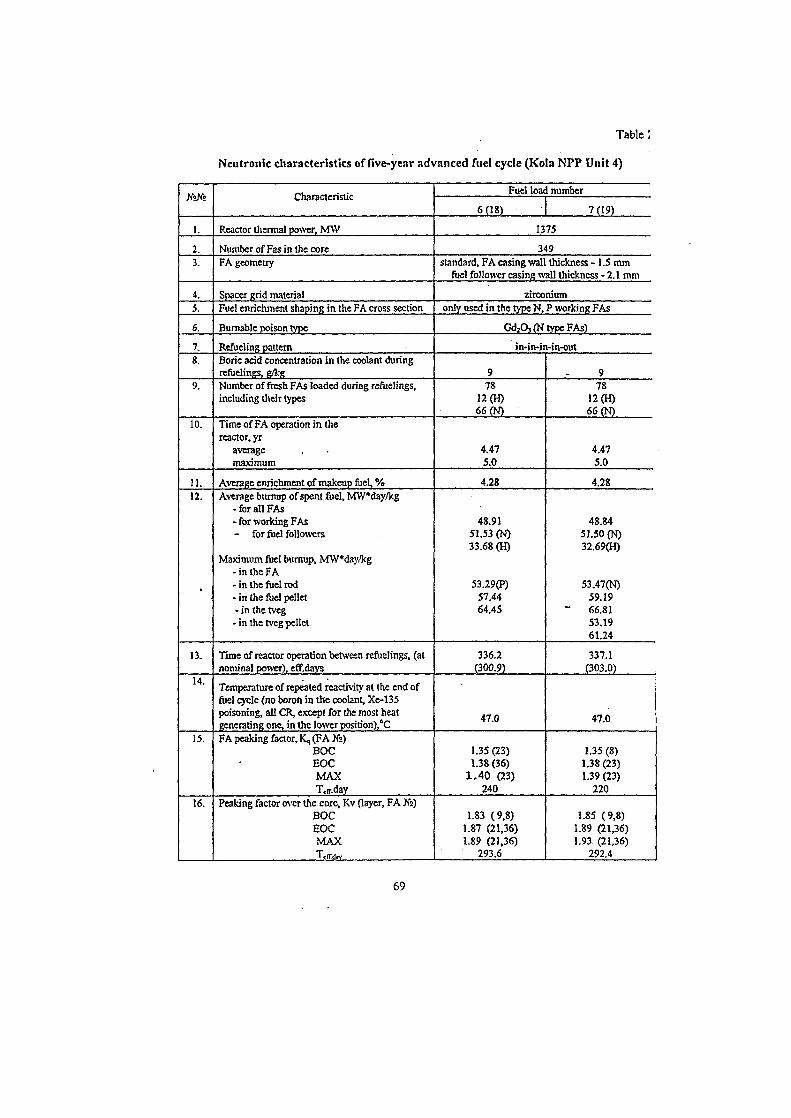
Table;
Neutronic characteristics of five-year advanced fuel cycle (Kola NPP Unit 4)
Kttk
1.
2.3.
4.5.
6.
7.8.
9.
10.
11.12.
13.
14.
15.
16.
Characteristic
Reactor thermal power, MW
Number of Fas in the coreFA geometry
Spacer grid materialFuel enrichment shaping in the FA cross section
Burnable poison type
Refueling patternBoric acid concentration in the coolant duringrefuelings, g/3cgNumber of fresh FAs loaded during refuelings,including their types
Time of FA operation in thereactor, yr
averagemaximum
Average enrichment of makeup fuel, %Average bumup of spent fuel, MW*day/kg
-forall FAs- for working FAs- for fuel followers
Maximum fuel bumup, MW*day/kg- in the FA- in the fuel rod- in the fuel pellet- in the tveg-in the tveg pellet
Time of reactor operation between refuelings, (atnominal power), eff.days
Temperature of repeated reactivity at the end offuel cycle (no boron in the coolant, Xe-135poisoning, all CR, except for the most heatgenerating one, in the lower position),'CFA peaking factor, K, (FA X»)
BOCEOCMAXT«ff.daY
Peaking factor over the core, Kv (layer, FA >f°)BOCEOCMAXTeltdav
Fuel load number
6(18) 7(19)
1375
349standard, FA casing wall thickness -1.5 mm
fuel follower casing wall thickness -2.1 mm
zirconiumonly used in the type N, P working FAs
Gd2Oj(N type FAs)
in-in-in-in-out
978
12 (H)66 (N)
4.475.0
4.28
48.9151.53 (N)33.68 (H)
53.29(P)57.4464.45
336.2(300.9)
47.0
1.35 (23)1.38 (36)
1 .40 (23)240
1.83 (9,8)1.87 (21,36)1.89 (21,36)
293.6
978
12 (H)66 (N)
4.475.0
4.28
48.8451.50 (N)32.69(H)
53.47(N)59.1966.8153.1961.24
337.1(303.0)
47.0
1.35 (8)1.38(23)1.39 (23)
220
1.85 (9,8)1.89 (21,36)1.93 (21,36)
292.4
69
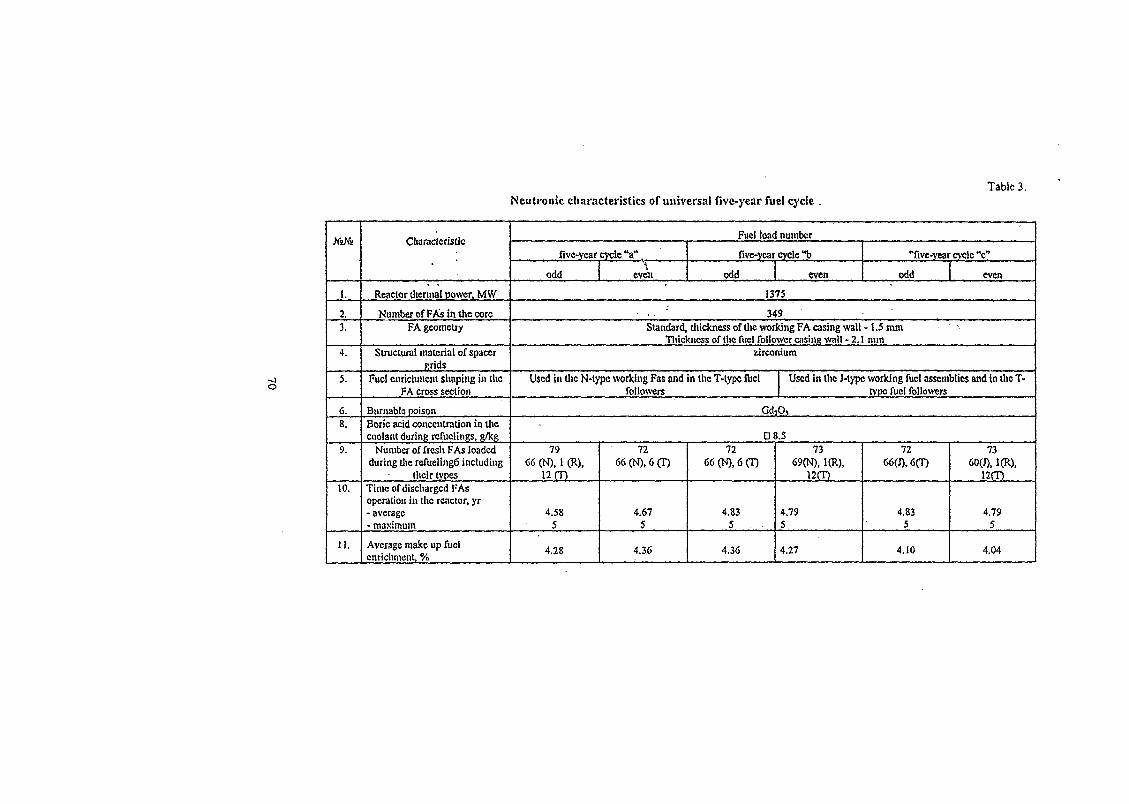
Table 3.Neutronic characteristics of universal five-year fuel cycle .
JfeNs
1.
2.3.
4.
5,
6.8.
9.
10.
11.
Characteristic
Reactor thermal power, MW
Number of FAs in the coreFA geometry
Structural material of spacer(•rids
Fuel enrichment shaping in theFA cross section
Burnable poisonBoric acid concentration in thecoolant during rcfuelings, g/kg
Number of fresh FAs loadedduring ihe refueltng6 including
their typesTime of discharged FAsoperation in the reactor, yr- average- maximum
Average make up fuelenrichment, %
Fuel load number
five-year cycle "a",
odd even
five-year cycle "b
odd even
1373
349Standard, thickness of the working FA casing wall
Thickness of the fuel follower casing wall - 2.
"five-year cvde "c"
odd
-1.5 mmmm
even
zirconium
Used in the N-typc working Fas and in the T-typo fuelfollowers
Used in the J-typc working fuel assemblies and in the T-tvpe fuel followers
Gd2O3
79C6 (N), 1 (R),
12 fT)
4.585
4.28
7266 (N), 6 <T)
4.675
4.36
0 8,572
66 (N), 6 (T)
4.835
4.36
7369(N), I(R),
12(T)
4.795
4.27
7266(J),6(T)
4.835
4.10
7360(J), 1(R),
llfT)
4.795
4.04
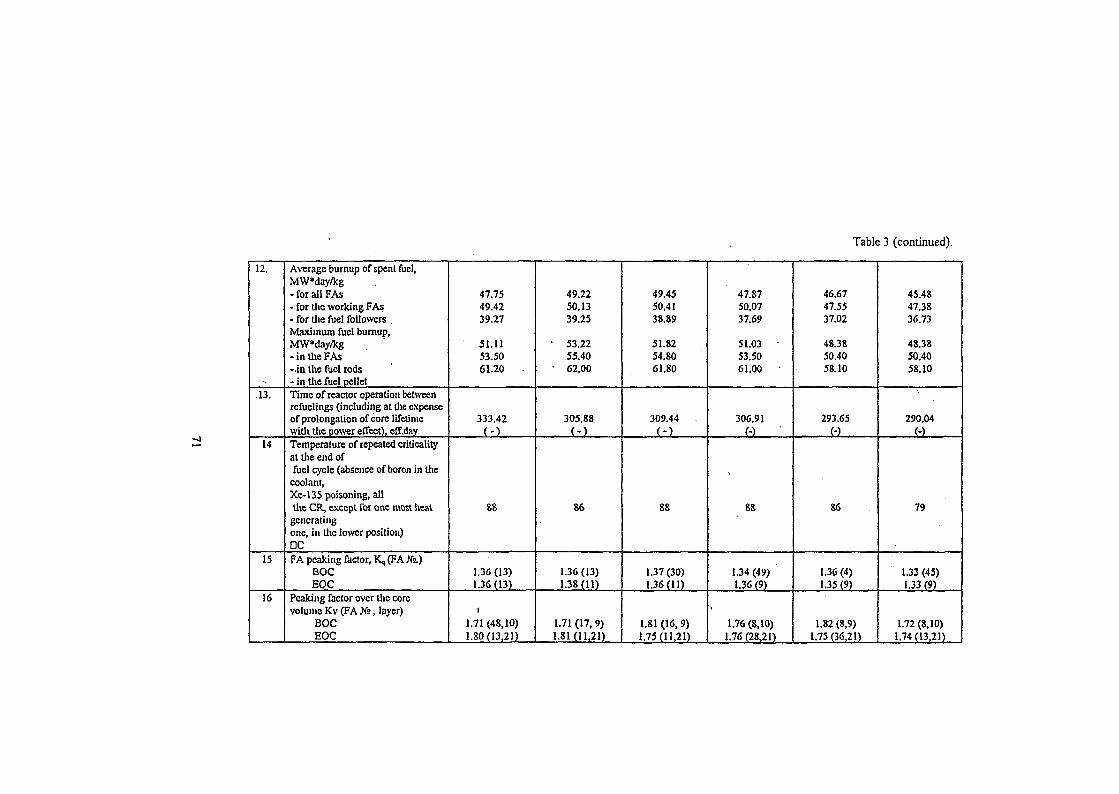
Table 3 (continued).
12.
-13.
14
15
16
Average burnup of spent fuel,MW*day/kg-forallFAs- for the working FAs- for the fuel followers .Maximum fuel burnup,MW*day/kg- in the FAs-.in the fuel rods- in the fuel pelletTime of reactor operation betweenrefuelings (including at the expenseof prolongation of core lifetimewith the power effect), eff.dayTemperature of repeated criticalityat the end offuel cycle (absence of boron in thecoolant,Xe-135 poisoning, allthe CR, except for one most heat
generatingone, in the lower position)DCFA peaking factor, K, (FA Ks.)
BOCEOC
Peaking factor over the corevolume Kv (FA Xs, layer)
BOCEOC
47.7549.4239.27
51.1153.5061.20 •
333.42( - )
88
1.36(13)1.36(13)
i
1.71 (48,10)1.80(13,21)
49.2250.1339.25
• 53.2255.40
• 62.00
305.88( - )
86
1.36(13)1.38(11)
1.71 (17, 9)1.81(11,21)
49.4550.4138.89
51.8254.8061.80
309.44( - )
88
1.37(30)1.36(11)
1.81 (16,9)1.75(11,21)
47.8750.0737.69
51.03 •53.5061,00 •
306.91(-)
88
1.34(49)1.36 (9)
1
1.76(8,10)1.76(28,21)
46.6747.5537.02
48.3850.4058.10
293.65(•)
86
1.36 (4)1.35(9)
1.82 (8,9)1.75 (36,21)
45.4847.3836.73
48.3850.4058.10
290.04(-)
79
1.33(45)1.33 (9)
1.72 (8,10)1.74(13,21)
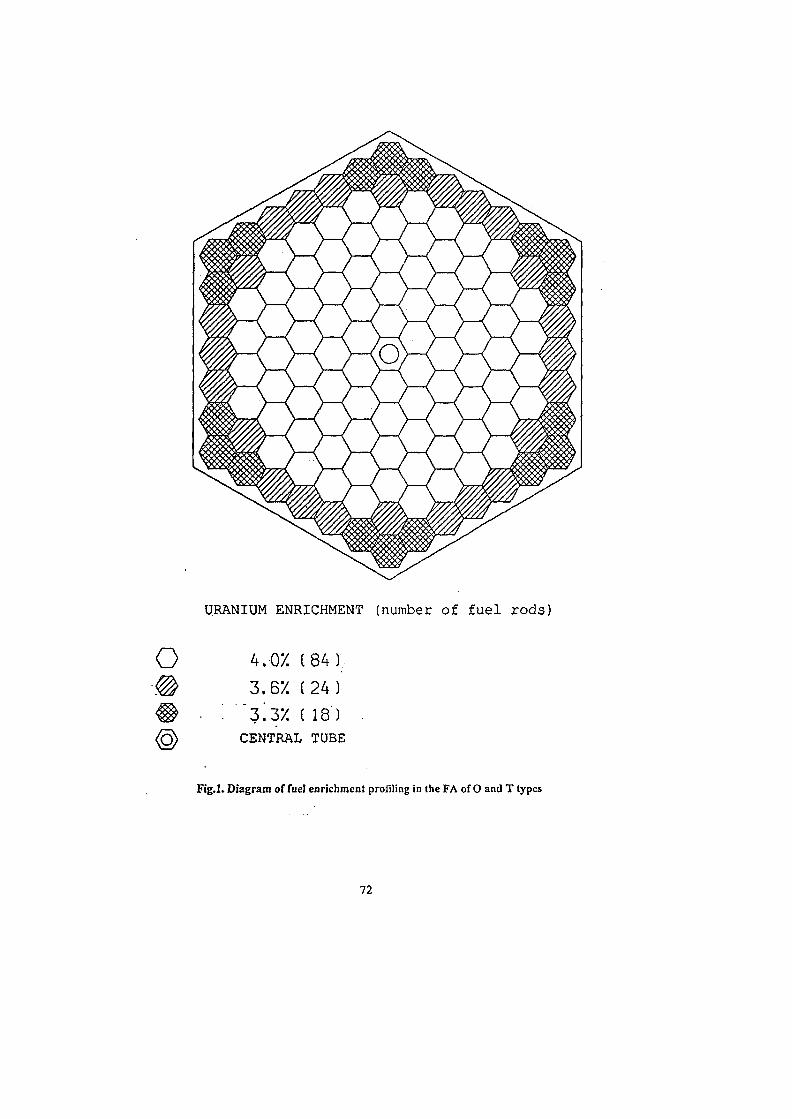
oURANIUM ENRICHMENT (number of fuel rods)
4.OX (84),3.6X (24)
• '. "z'.y/. i 1 8 ) .CENTRAL TUBE
Fig.l. Diagrain of fuel enrichment profiling in the FA of O and T types
72
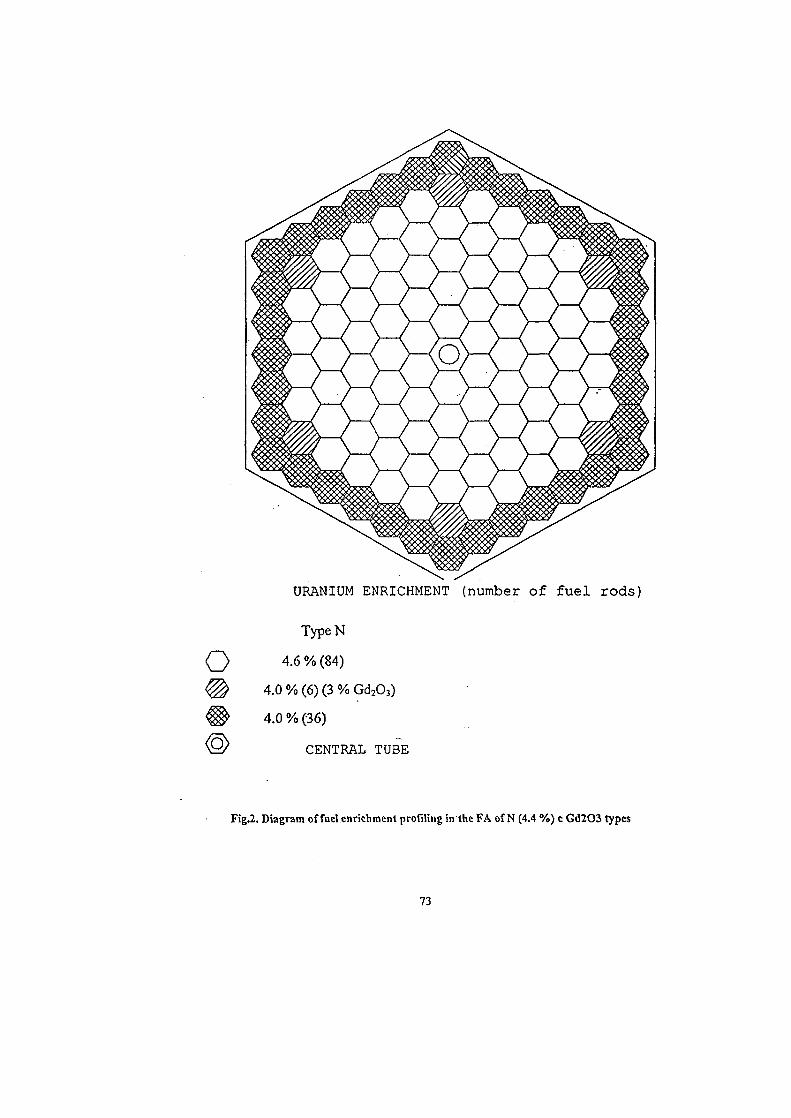
URANIUM ENRICHMENT (number of fuel rods)
TypeN
4.6 % (84)
4.0 % (6) (3 % Gd2O3)
4.0 % (-36)
CENTRAL TUBE
Fig.2. Diagram of fuel enrichment profiling in the FA of N (4.4 %) c Gd2O3 types
73
SK01ST079
10 Symposium ofAERMoscow, Russia, 18 - 20 September 2000
DEVELOPMENT OF FOUR-YEAR FUEL CYCLE BASED ON THE ADVANCEDFUEL ASSEMBLY WITH URANIUM-GADOLINIUM FUEL
AND ITS IMPLEMENTATION TO THE OPERATING WER-1000 UNITS
Lunin G., Novikov A., Pavlov V., Pavlovichev A., Filimonov P.Russian Research Centre "Kurchatov Institute"
ABSTRACT
Over the past few years in Russia the investigations aimed at the increase of thereliability, safety and efficiency of operation of the WER-1000 reactors as well as of itscompetitiveness in the world market were carried out.
In the frame of these investigations the four-year fuel cycle, based on advanced FAwith zirconium alloy spacer grids and guide tubes and with fuel pellet having a reduceddiameter of the central hole (1.5 mm), has been developed. For the compensation of a part ofexcess reactivity, GdaOj integrated burnable absorbers are used. CPS absorbing rods contain acombine absorber (B4C + DyiO3*TiO2). A part of depleted fuel is located on the coreperiphery. The algorithms controlling the reactor power and power distribution have beenupdated.
For checking of the solutions adopted and for verification of code package developedat the RRC "Kurchatov Institute" the wide-scale experimental operation of advanced FA andits individual components is carried out.
The two-stage implementation of the four-year fuel cycle to practice of the WER-1000 reactor operation is considered expedient. At the first stage (till 2001) it is planned totransfer the VVER-1000 reactors to the regime of fuel utilization when only a part of FAs willbe operated in four fuel cycles. At the next stage;- upon the confirmation of advanced FAserviceability, the NPP with the VVER-1000 will be transferred to four-year operation of alladvanced FAs.
75
I. INTRODUCTION
Over the past few years in Russia the investigations aimed at the increase of thereliability, safety and efficiency of operation of the VVER-1000 reactors as well as of itscompetitiveness in the world market were carried out.
In the frame of these investigations the four-year fuel cycle, based on advanced FAwith zirconium spacer grids and guide tubes and with fuel pellet having a reduced diameter ofthe central hole (1.5 mm), has been developed. For the compensation of a part of excessreactivity, a GdjOj integrated burnable absorber is used. CPS absorbing rods contain acombine absorber (B4C + Dy2O3*TiO2). A part of depleted fuel is located on the coreperiphery. The algorithms controlling the reactor power and power distribution have beenupdated.
The implementation of the advanced four-year fuel cycle was preceded by tests ofsome of its elements at the operating NPP: FA with zirconium guide tubes and spacer grids,fuel rods with the increased fuel load, uranium-gadolinium fuel elements (U-Gd rods),combined absorbers of CPS. By the present a considerable amount of operation informationhas been accumulated, both on individual elements of the advanced fuel cycle and on thewhole cycle. Beginning from the year 2000 the Balakovo NPP power units have been loadedonly by the advanced fuel. Basing on the experience gained in the designing of the advancecycle and on the results of its operation, the VVER-1000 core designs are being developed forforeign customers (China and India).
At the RRC "Kurchatov Institute" the package of new generation codes has beenworked out for calculating the neutronic characteristics of the WER-1000 core with theadvanced fuel. The code package is used for the choice and substantiation of the neutroniccharacteristics of the advanced cycle, performance of neutronic calculations, substantiationand calculation support of the pilot operation of the advanced FA.
Below the main phases of the development and pilot operation of advanced fuel cycleare briefly described, and the main neutronic characteristics of this cycle are presented.
2. DESCRIPTION OF ADVANCED FUEL CYCLE COMPONENTS
Zirconium spacer grids and guide tubes
The replacement of steel structural elements of FA by zirconium ones makes itpossible to reduce the parasitic capture of neutrons and to improve the neutron balance in thefuel lattice. As a result, the opportunity is created to decrease the enrichment of fuel (savingits multiplying properties, Fig.l) and, thus, reduce the cost of fuel.
The first six FAs with zirconium spacer grids (ZSG) and zirconium guide tubes (ZGT)were loaded in 1993 the 6-th cycle of Balakovo NPP-1. These were the FAs with the standard
76
fuel rods, standard geometrical dimensions of the central and guide tubes provided withremovable boric burnable absorbers (BA). The average fuel enrichment in the FAs was4.23%. After the 8-th cycle all the FAs were removed from the core, the average fueldischarge burnup reached almost 43 MW*day/kg. The similar FAs were installed in theRovno NPP-3 and in the 7-th cycle of the Balakovo NPP-1.
In the 8-th cycle of Balakovo NPP-1 24 fresh FAs with the ZSG and ZGT were used,the fuel enrichment was 4%. In six FAs the advanced fuel pellets with the central hole;diameter 1.5 mm were set instead of the standard fuel pellets. As the water-uranium ratio ofthe fuel lattice reduced, the negative coolant temperature feed-back increased, and the increasein the mass of fuel loaded into the FA comparing with the standard one (by about 7%) made it Ipossible to enhance the energy content of the fuel loading.
The subsequent implementation of FA with the ZSG and ZGT was accomplished onthe basis of the advanced FA (see Fig.2), whose fuel enrichment spectrum (3.3, 3.6 and 4%)and geometry of guide and central tubes were unified, and the fuel rod mass was increased. Asthe burnable absorber the removable boric BPs (Zaporozhie NPP) and the U-Gd rods(Balakovo and Zaporozhie NPPs) were used.
In 2000 all Balakovo NPP units were loaded by FAs with U-Gd rods. By the presentthe core of Balakovo NPP-1 contains 131 "zirconium" FAs (including 96 FAs with U-Gdrods), the Balakovo NPP-2 core - 55 FAs (all with U-Gd rods), the Balakovo NPP-3 - 91 FAs(all with U-Gd rods), and Balakovo NPP-4 - 49 FAs (all with U-Gd rods).
From the comparison of the calculation results and experimental data (the criticalparameters of the core, reactivity coefficients, worth of some CPS group's at zero and nominalpower levels, power distribution) the conclusion was made thai-the characteristics of the corewith advanced fuel are calculated within the certificates accuracy.
Uranium-gadolinium rods
The pilot operation of FAs with U-Gd rods in Russia was preceded by research workson the development of technology for manufacturing the domestic U-Gd fuel "and on theanalysis of its characteristics, which had been carried for some years [1]. In the RRC"Kurchatov Institute" the calculation methods and codes for calculation of the neutroniccharacteristics of fuel lattices containing fuel rods with gadolinium were developed, and thelibraries of gadolinium isotope constants were prepared. The RRC "Kurchatov Institute"specialists participated in the measurements of the parameters of uranium-gadolinium lattices,carried out on the ZR-6 and LR-0 assemblies and on the RRC "Kurchatov Institute" criticaltest facility "II" with the purpose of verification of calculation procedures and codes [2].
The investigations made it possible to make a conclusion on the possibility of usingthe RRC "Kurchatov Institute" code" package for the calculation of the neutroniccharacteristics of FAs with the U-Gd rods for the substantiation of their pilot operation.
In March, 1994 12 FAs with the U-Gd rods (Fig.3) were installed in the core of theBalakovo NPP-3 ( 5-th cycle). These were the standard FAs, in each of which 18 U-Gd rodswith the 8% mass content of gadolinium oxide (GdiCh) were located. The number of U-Gdrods in each FA, their arrangement in the bundle and Gd2C>3 content in the fuel were chosen
77
basing on variant calculations. As the heat conductivity of UO2 in the presence ofreduces, at the equal linear heat generation rates of fuel rod and U-Gd rod the fuel temperaturein the latter is higher. In order to limit the U-Gd rod power (by the time of absorber depletion)the fuel enrichment in the U-Gd rods was reduced to 3.6% (in the fuel rods it was 4.4%). Inthe 6-th cycle of Balakovo NPP-3 the number of fresh pilot FAs with U-Gd rods wasincreased to 24. The same FAs were used but in them the first periphery row was graded withthe 3.6% enriched fuel rods.
The comparison of the measured and calculated core parameters during the operationof the 5-th and 6-th cycles revealed that the U-Gd rod efficiency was underestimated in thecalculation and that the U-Gd rod characteristics had to be changed. Therefore the number ofU-Gd rods in the FA was reduced to 12, GdzOj content was decreased to 5%, and the U-Gdrod fuel enrichment was 3.3% (see Fig.4). It was these FAs with U-Gd that were loaded to the7-th cycle of Balakovo NPP-3 and to the 8-th cycle of Zaporozhie NPP-3.
The pilot operation of FAs with U-Gd rods permitted to prove the U-Gd rodsoperability and reliability, to determine the U-Gd rods parameters (U-Gd rod fuel enrichment -3.3%, gadolinium oxide content in the fuel - 5%) and to estimate the accuracy of thecalculation of the cores with U-Gd rods.
It is evident that the gadolinium efficiency as an absorber increases when it is used inthe FA where steel is replaced by zirconium and the fuel enrichment is reduced by about 10%comparing with the "steel" FA. Therefore the advanced FA implemented now contain sixU-Gd rods each (Fig.5). These are the FAs which are being operated at the Balakovo NPP unit1 (96), unit 2 (55), unit 3 (91) and unit 4 (49). The number of U-Gd rods in the advanced FAcan be increased up to 9-12, when the fuel loadings for the operation longer than 7000 EFPHare formed.
Combined control rods
By its functional purpose the VVER-1000 control and protection system is dividedinto two parts. During the normal operation the major part of CPS AR is withdrawn from thecore and is designed for rapid termination of the chain reaction (group of protection) and theother part, consisting of 1-3 groups, serves for control of power and power distribution. Thelower parts of absorbing rods, both of protection and control groups, are the most exposed toneutron irradiation. This essentially affects trie in-use life of the CPS absorber rods.
In 1995 the pilot operation of combined CPS absorber rods began. The upper part ofthese rods-contains boron carbide (B4C), the absorbing material traditionally used for theVVER-1000 reactors, and the lower part (about 300 mm in length) is made of dysprosiumtitanate (Dy2O3*TiO2). The use of dysprosium as an absorber, makes it possible to solve anumber of operational problems. In particular, dysprosium is a (n,y) absorber and, hence, it isless subjected to radiation damage than a boron-containing absorber which interacts withneutrons in (n,cc) reaction. The heat release in a rod also decreases because the absorption ofy-quanta in it is low. Finally, the reduction in the physical efficiency of the dysprosium-basedabsorber in depletion goes slower than in the case of boron absorbers as in the successivecapture of neutrons, the absorbing isotopes of dysprosium are again formed.
78
For substantiating the industrial operation of combined absorbers and their;implementation to the VVER-1000 reactors, a series of calculation and experimental studies;were carried out at the RRC "Kurchatov Institute". It was shown the efficiency of dysprosium:titanate comparing with that of boron carbide is about 70%, and the reduction in the efficiencywill not exceed 0.5% of the full " worth" of the standard CPS AR in the case of usingdysprosium titanate in the lower part of absorbing rod (-10% of its full length). This estimate >agrees with the measured values of the worth of CPS AR with combined absorbers whichwere first installed in the VVER-1000 of Kalinin NPP-1. Here the attempts to state thedifference in the integral worth of symmetrical groups with the standard and combinedabsorbers (taking into account the measurement error and the asymmetry of the multiplyingproperties of the core) ended in failure.
The difference worth of the working group with the combined absorbers differs fromthe standard ones (Fig.6), its change (reduction or increase) being 40-100% at some times ofgroup movement. At the same time the integral worth of the combined absorber does notpractically differ from the standard one. At present all units of Balakovo and Kalinin NPPs areprovided with the combined absorbers.
Low leakage loading patterns. FA operation in four cycles
By the present an extensive experience of VVER-1000 operation with a low leakageloading patterns, when FAs with irradiated fuel were installed on the core periphery, has beengained. In the South-Ukrainian NPP-1, having 49 CPS drives, the requirements on the scramsystem efficiency in the transition of the unit to the three-year fuel cycle were only met byreducing the radial neutron leakage. The consistent use of the loading patterns with partlyirradiated fuel located at the core periphery takes place in the Balakovo NPP units 1-4 in theconnection with the implementation of FA with U-Gd fuel there. For example, in the 6-th,7-th and 8-th cycles of unit 3 the number of FAs with irradiated fuel at the core periphery was18, 18 and 24, respectively, and in the 9-th cycle of unit 1 it was 29 (all 29 FAs are of thefourth year of operation).
The experience of four year operation of FAs in the VVER-1000 reactor has been onlygained with the standard "steel" FAs: about 800 FAs were operated in the WER-1000reactors of Zaporozhie, Rovno and South-Ukrainian NPPs, with the average fuel dischargeburnup exceeding 48 MW*day/kg in some FAs [3].
Distribution of CPS AR over groups, algorithms of power and power distributioncontrol in the core
In the frame of works on improvement of the VVER-1000 fuel cycle, investigations ofvarious control methods for power and power distribution in the core of this reactor had beenperformed at the RRC "Kurchatov Institute" for several years [4,6]. Basing on the data ofcalculation and experimental investigations the following modifications comparing the V-320
. design were proposed:- change in the CPS AR distribution over the groups, including the location of the working
(No. 10) CPS AR group in the core (Fig.7). As a result, the deformation of radial powerdistribution during a movement of the control rod groups is decreased, and the spectrum ofpossible loading patterns is extended;
79
- change in the overlapping CPS AR groups (up to 50% of the core height). As a result theefficiency of warning protection is increased and the possibility of effective control ofpower distribution is extended. In the manual control of power distribution the extent ofoverlapping can be varied;
- improvement of algorithms of power control offering the possibility of simultaneouscontrol of reactor power and axial power distribution and decrease in the amounts ofliquid wastes.
In 1998 the experiments on daily reactor power load following were carried out in theZaporozhye NPP-5, using two group of CPS AR with variable overlapping. The testsconfirmed the advantage of the proposed control procedure and also showed the expedience ofchange in the CPS AR distribution over the group.
3. CODE PACKAGE FOR NEUTRONIC CALCULATIONS
In the RRC "Kuxchatov Institute" the code package of new generation for neutroniccalculations of VVER reactors with advanced fuel has been developed. It contains thefollowing codes [7,8[:TVS-M code. This code is designed for calculation and approximation of few-group neutroncross-sections of cells and assemblies for the codes of BIPR and PERMAK-type and as wellas for derivatives of these cross-sections as the functions of the reactor parameters and fuelburnup.BIPR-7A code. This code is designed for performing calculations of the criticality parameters,reactivity effects and coefficients,- differential and integral reactivity worth of control rods,three-dimensional power distributions in VVER reactor cores, calculational simulation ofburn up processes and refuelling, xenon-135 and samarium-149 transients.PERMAK-A code. This is used for carrying out the pin-by-pin burnup calculations of coreand for obtaining information on changes in linear heat generation rates of fuel rods during themovement of the CPS control group, in load-following mode of operation and during xenontransients.IR code. This is a specialised version of the BIPR code oriented to the simulation ofnonsteady state operation regimes of the VVER-1000 reactor.
The detailed analysis of the representativeness of the calculation results of WER-1000 neutronic characteristics by the TVS-M, BIPR7-A, PERMAK-A, IR code package wasperformed using:- results of calculations by precision codes;- measurements data obtained on the critical test facilities;- results of measurements carried out during the startup and operation of VVER-1000
reactors.Below the examples of comparison of calculation and experimental values of some
neutronic characteristics of VVER-1000 core are given.
Differences between calculated values of critical boric acid concentration and themeasured ones obtained during VVER-1000 operation at power levels are shown on Fig. 8.Fig. 9 gives distribution of differences between calculated values of critical boric acidconcentration and corresponding values measured at zero power level states. Analysing these
80
dependencies it should be taken into account the following: typical range of critical boric acidconcentrations is 6-7 g/kg for the first moment of VVER-1000 fuel loading operation at powerlevel (7-9 g/kg for zero power level) and measuring error for boric acid concentrations in thisrange (6-9 g/kg) is equal to about 5% (0.3-0.5 g/kg). Therefore (as it follows from the datapresented) calculated and measured values of boric acid concentration are consistent withinmeasuring error.
Fig. 10 shows the distribution of differences between calculated and measured valuesof the temperature reactivity coefficient (for fuel and coolant together). The characteristicrange of temperature reactivity coefficients at the first moment of VVER-1000 fuel loadingoperation in the state at zero power level is (5-s-10)*10"J 1/°C. It is seen that the calculated andmeasured values of the temperature reactivity coefficient are consistent within limits of 3*10'5
Fig. 11 represents the distribution of differences between calculated and measuredvalues of FA relative power. The distributions are plotted for FAs the relative power of whichis above unity for the initial period of the fuel loading operation. The data demonstrate that thecalculated and measured values of the relative power for the hottest fuel assemblies of thecore are consistent within the limits of 5%.
Summarising the results of verification of the TVS-M, BIPR7-A, PERMAK-A, IRcode package, the following estimate of the error in the calculation of the WER-1000 coreparameters can be given:
- critical boron concentration at the beginning of cycle ( nominal power) 5%-reactivity worth of CPS 10%-reactivity worth of individual groups of CPS 20%- temperature coefficient of reactivity at the beginning of cycle 3*10*5/°C-relative power of the hottest FAs 5%-cycle length 3%
4. FOUR-YEAR URANIUM-GADOLINIUM FUEL CYCLE _OF VVER-1000 REACTOR (FIRST STAGE)
In the advanced four-year fuel cycle (first stage) the main tendencies of developmentof pressure-water reactors are reflected:- improvement of the neutron balance due to the use of structural materials slightly
absorbing neutrons;- application of burnable absorber integrated with the fuel;- use of loading patterns with a reduced radial neutron leakage;- increase in the burnup of discharged fuel;
improvement of CPS groups arrangement and updated power control algorithms.
The two-stage implementation of the four-year fuel cycle to practice of theVVER-1000 reactor operation was considered expedient. At the first stage it is planned totransfer the VVER-1000 reactors to the regime when only a part of FAs is operated for fouryears. At the next stage, if the FAs availability is confirmed, the VVER-1000 reactors will bebrought to the four-year fuel operation regime,
81
First fuel cycle
The first fuel loading is formed of 54 FAs with 1.6% enriched fuel, 67 FAs with 2.4%enriched fuel and 42 FAs with the average fuel enrichment 3.53% ( fuel rods with enrichment3.3% and 3.6%). The conventional loading pattern is used - the FAs with maximum enrichedfuel are installed on the periphery, the FAs with minimum and intermediate enrichments - inthe centre of the core. The average fuel enrichment is 2.45%. For the compensation of a partof excess reactivity and for formation of power distribution in the core, in 42 FAs the U-Gdrods with the gadolinium content 8% are used. The simplified maps of FAs used in advancedfuel cycle are shown in Fig. 12. The map of first fuel cycle is presented in Fig. 13.
Main first cycle characteristics:- time of operation at the nominal parameters - 300 EFPD;- at the zero power level at any time of fuel cycle with all the AR withdrawn from the core
the density (temperature) coefficient of reactivity is positive (negative);- maximum relative power of fuel rod is observed in the beginning of cycle and does not
exceed 1.50;- maximum relative power of U-Gd rod is observed at the end of cycle and is 1.20;- maximum linear thermal power of fuel rod is observed in the beginning of cycle and does
not exceed 350 W/cm (without allowance for the engineering safety factor);maximum linear thermal power of U-Gd rod is observed at the end of cycle and does notexceed 230 W/cm (without allowance for the engineering safety factor).
Transient and equilibrium fuel cycles
During the transient cycles the transfer to the equilibrium cycle is accomplished andthe loading pattern is completely changed (in comparison with the first loading pattern): aconsiderable part of fresh FAs (30 or 31) is located in the central part of the core, the rest 18FAs - on the core periphery (Fig. 14).
In the transient and equilibrium cycles the fuel rods with 3.3%, 3.6% and 4% enrichedfuel are used. They form two types of FAs with the average fuel enrichment 3.53% and 3.90%(Fig. 12). The rods with the fuel of lower enrichment (3.3% or 3.6%) are located on theperiphery part of these FAs. The FAs of this types contain U-Gd rods, six in each one. Thefuel enrichment of U-Gd rods and the content of gadolinium in them are 3.3% and 5%respectively. The major number of FAs (30 or 31) is operated in the reactor during three fuelcycles in the central part,, and the rest ones - during four fuel cycles, and in the course of twoor three fuel cycles they are on the core periphery. This regime of fuel irradiation permits thedifference between the medium and maximum fuel burnup of discharged FA to be minimized.The location of 18 FAs of the final (fourth) year of operation on the periphery core creates theconditions for reducing fast neutron fluence on reactor vessel and favours the increase in theefficiency of the CPS.
The equilibrium composition of fresh fuel is established beginning from the secondrefueling: the total number of loaded fresh FAs with the U-Gd rods is 48(49), including 30FAs with the fuel of average enrichment 3.9% and 18 (19) FAs with the fuel of averageenrichment 3.53%.
82
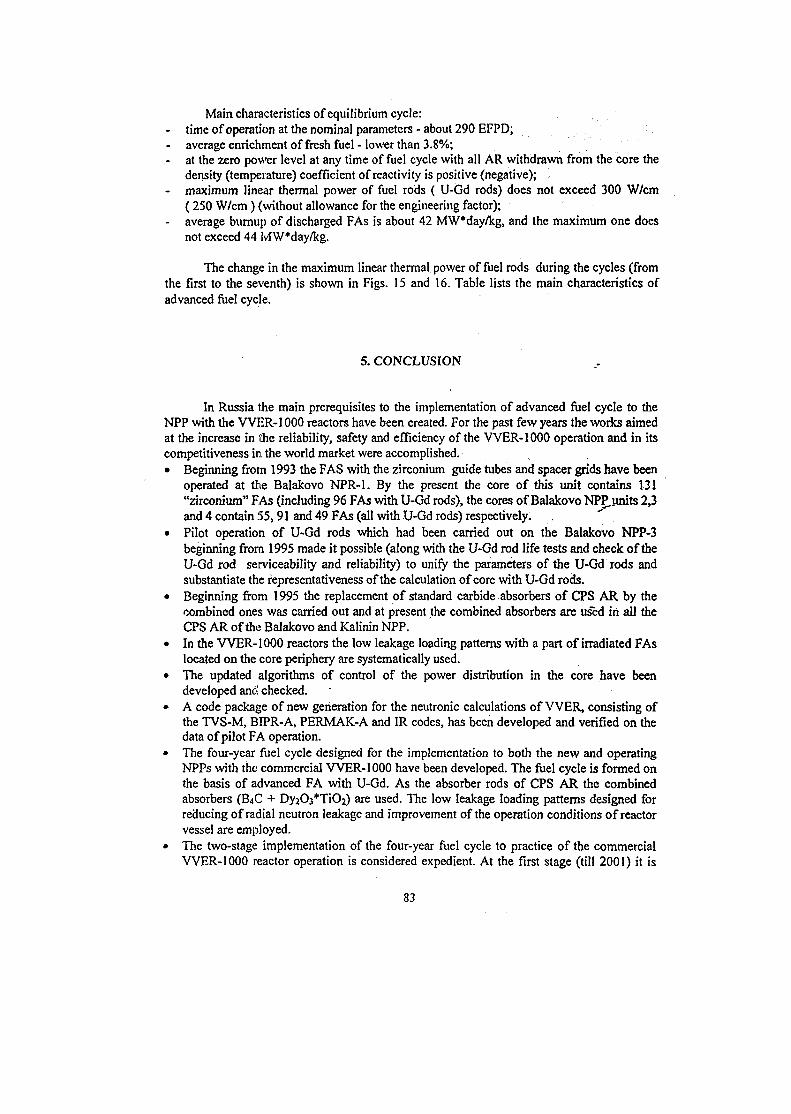
Main characteristics of equilibrium cycle:- time of operation at the nominal parameters - about 290 EFPD;- average enrichment of fresh fuel-lower than 3.8%;- at the zero power level at any time of fuel cycle with all AR withdrawn from the core the
density (temperature) coefficient of reactivity is positive (negative);- maximum linear thermal power of fuel rods ( U-Gd rods) does not exceed 300 W/cm
(250 W/cm ) (without allowance for the engineering factor);- average burnup of discharged FAs is about 42 MW*day/kg, and the maximum one does
not exceed 44 MW*day/kg.
The change in the maximum linear thermal power of fuel rods during the cycles (fromthe first to the seventh) is shown in Figs. 15 and 16. Table lists the main characteristics ofadvanced fuel cycle.
5. CONCLUSION
In Russia the main prerequisites to the implementation of advanced fuel cycle to theNPP with the WER-1000 reactors have been created. For the past few years the works aimedat the increase in the reliability, safety and efficiency of the VVER-1000 operation and in itscompetitiveness in the world market were accomplished.• Beginning from 1993 the FAS with the zirconium guide tubes and spacer grids have been
operated at the Balakovo NPR-1. By the present the core of this unit contains 131"zirconium" FAs (including 96 FAs with U-Gd rods), the cores of Balakovo NPRunits 2,3and 4 contain 55,91 and 49 FAs (all with U-Gd rods) respectively.
• Pilot operation of U-Gd rods which had been carried out on the Balakovo NPP-3beginning from 1995 made it possible (along with the U-Gd rod life tests and check of theU-Gd rod serviceability and reliability) to unify the parameters of the U-Gd rods andsubstantiate the representativeness of the calculation of core with U-Gd rods.
• Beginning from 1995 the replacement of standard carbide absorbers of CPS AR by thecombined ones was carried out and at present the combined absorbers are used in all theCPS AR of the Balakovo and Kalinin NPP.
• In the WER-1000 reactors the low leakage loading patterns with a part of irradiated FAslocated on the core periphery are systematically used.
• The updated algorithms of control of the power distribution in the core have beendeveloped and checked.
• A code package of new generation for the neutronic calculations of VVER, consisting ofthe TVS-M, BIPR-A, PERMAK-A and IR codes, has been developed and verified on thedata of pilot FA operation.
• The four-year fuel cycle designed for the implementation to both the new and operatingNPPs with the commercial WER-1000 have been developed. The fuel cycle is formed onthe basis of advanced FA with U-Gd. As the absorber rods of CPS AR the combinedabsorbers (B4C + Dy2O3*TiO2) are used. The low leakage loading patterns designed forreducing of radial neutron leakage and improvement of the operation conditions of reactorvessel are employed.
• The two-stage implementation of the four-year fuel cycle to practice of the commercialVVER-1000 reactor operation is considered expedient. At the first stage (till 2001) it is
83
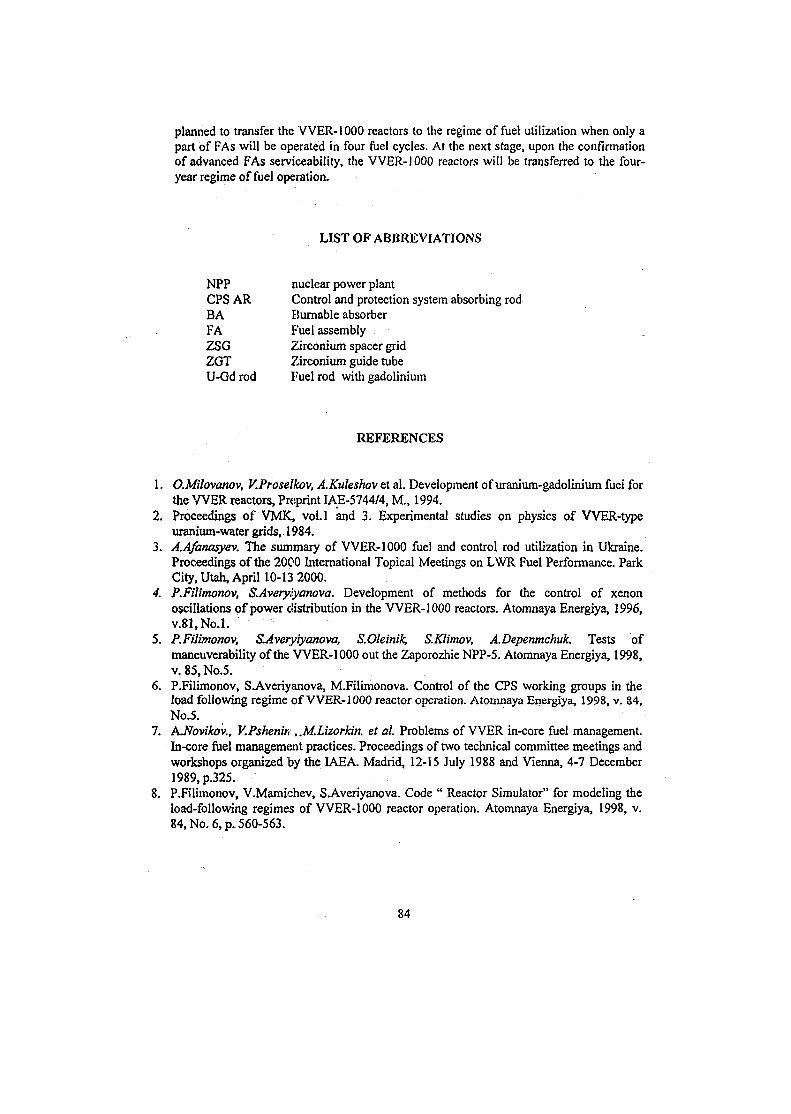
planned to transfer the VVER-1000 reactors to the regime of fuel utilization when only apart of FAs will be operated in four fuel cycles. At the next stage, upon the confirmationof advanced FAs serviceability, the VVER-1000 reactors will be transferred to the four-year regime of fuel operation.
LIST OF ABBREVIATIONS
NPPCPSARBAFAZSGZGTU-Gd rod
nuclear power plantControl and protection system absorbing rodBurnable absorberFuel assemblyZirconium spacer grid5'irconium guide tubeFuel rod with gadolinium
REFERENCES
1. O.Milovanov, V.Proselkov, A.Kuleshov et al. Development of uranium-gadolinium fuel forthe W E R reactors, Preprint IAE-5744/4, M., 1994.
2. Proceedings of VMK, vol.1 and 3. Experimental studies on physics of VVER-typeuranium-water grids, 1984.
3. AAfanasyev. The summary of VVER-1000 fuel and control rod utilization in Ukraine.Proceedings of the 2000 International Topical Meetings on LWR Fuel Performance. ParkCity, Utah, April 10-13 2000.
4. P.Filimonov, S.Averyiyanova. Development of methods for the control of xenonoscillations of power distribution in the VVER-1000 reactors. Atomnaya Energiya, 1996,v.81,No.l.
5. P.Filimonov, S.Averyiyanova, S.Oleinik, S.Klimov, A.Depenmchuk. Tests ofmaneuverability of the WER-1000 out the Zaporozhie NPP-5. Atomnaya Energiya, 1998,v.85,No.5.
6. P.Filimonov, S.Averiyanova, M.Filimonova. Control of the CPS working groups in theload following regime of VVER-1000 reactor operation. Atomnaya Energiya, 1998, v. 84,No.5.
7. AJfovikov., V.Pshenin , .MMzorkin. et al. Problems of VVER in-core fuel management.In-core fuel management practices. Proceedings of two technical committee meetings andworkshops organized by the IAEA. Madrid, 12-15 July 1988 and Vienna, 4-7 December1989,p.325.
8. P.Filimonov, V.Mamichev, S.Averiyanova. Code " Reactor Simulator" for modeling theload-following regimes of VVER-1000 reactor operation. Atomnaya Energiya, 1998, v.84, No. 6, p. 560-563.
84
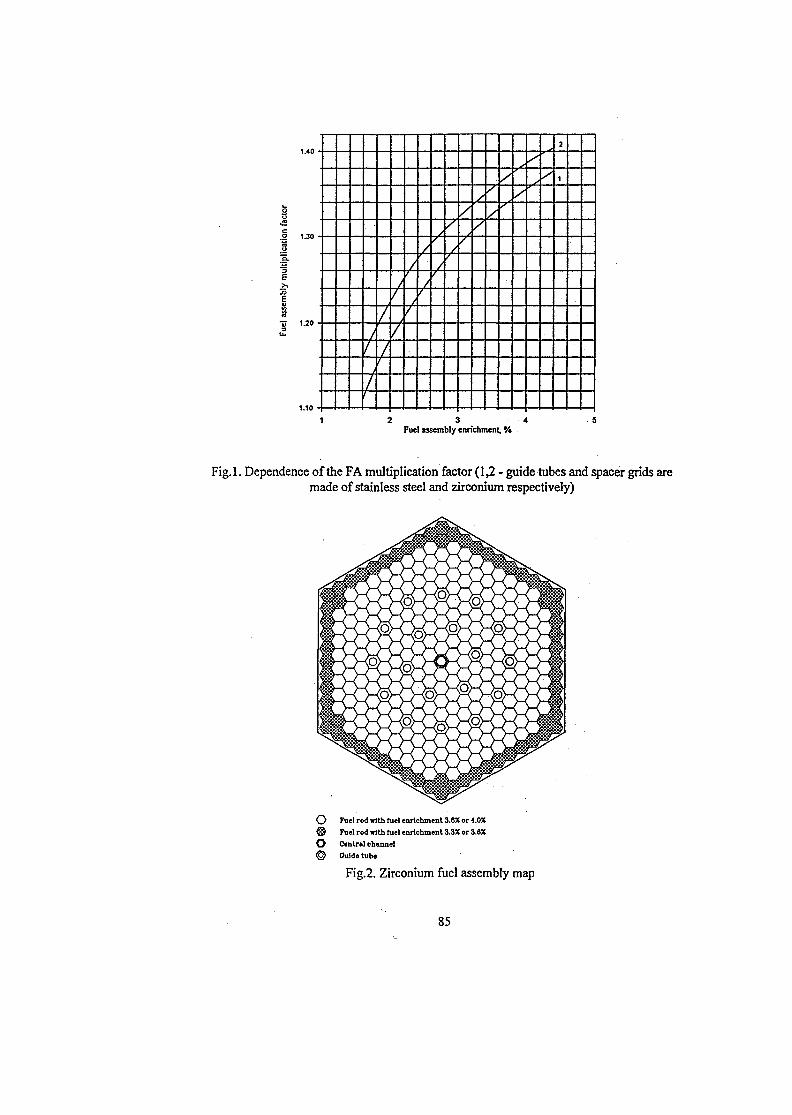
ctor
to
ilti
plIE
1.10 -
/
/
/
/
f
f
f
/
/
f
/
/
/
/
y
i
i
2 3 4Fuel assembly enrichment, %
Fig. 1. Dependence of the FA multiplication factor (1,2 - guide tubes and spacer grids aremade of stainless steel and zirconium respectively)
O Fuel rod with fuel enrichment 3.6X or 4.0X
@ Fuel rod with fuel enrichment 3.3JC or 3.6X
O Central channel
© Guide tube
Fig.2. Zirconium fuel assembly map
85
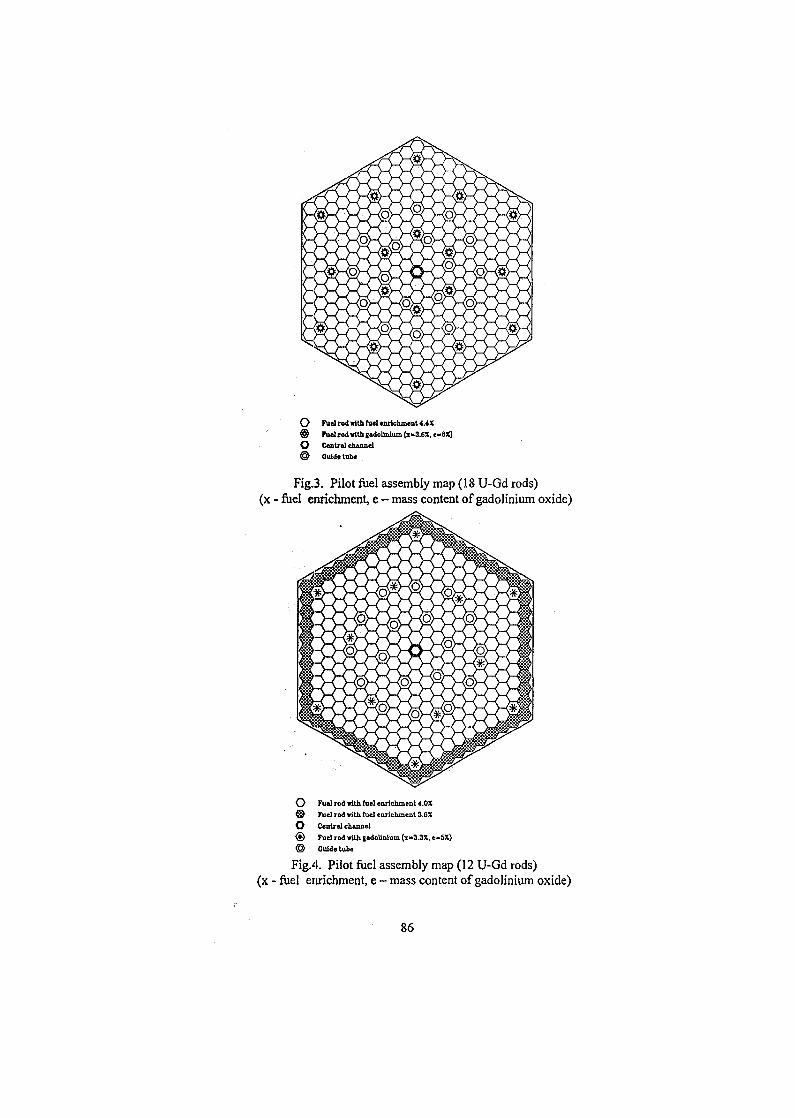
O Fu»l rod with tuel enrichment 4 . «© Fuel rod with gadolinium (*«3.6%.e«8X)C^ Cf Tit nil c© Quid* tub*
Fig.3. Pilot fuel assembly map (18 U-Gd rods)(x - fuel enrichment, e - mass content of gadolinium oxide)
O Fuelrodwith/uelearichmenH.OX® Fuel rod with tuej enrichment 3.6XO Central channel
® Fuel rod with jodoUnium (x-3.3X. e© Guide tube
Fig.4. Pilot fuel assembly map (12 U-Gd rods)(x - fuel enrichment, e - mass content of gadolinium oxide)
86
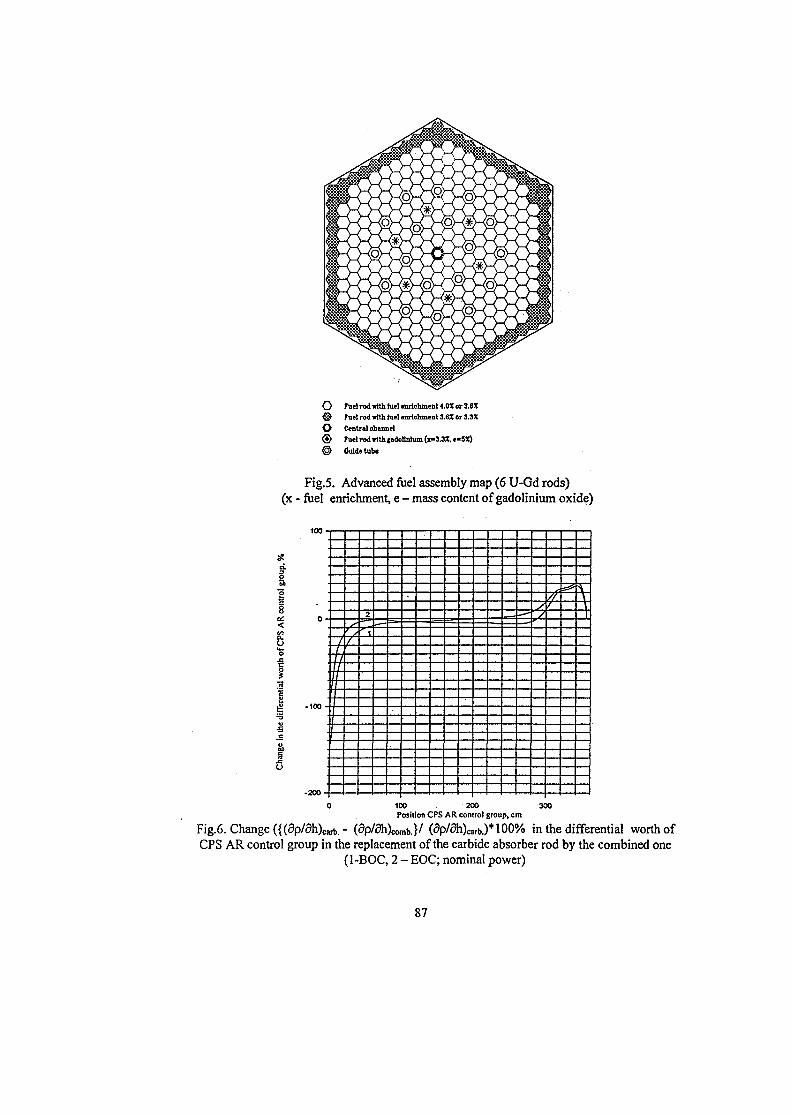
O rudrod»ithfuel«nrlchmenl4.0Xor3.6*® Taut rod irith fuel enrichment 3.6% 6r3.3%O Central channel® Fuel rod wfll |ado!tolum (x-3.3X. e«5X)© Guide tube
Fig.5. Advanced fuel assembly map (6 U-Gd rods)(x - fuel enrichment, e - mass content of gadolinium oxide)
o
0 -
1L
] / /] / /illif
II"}[1
11111
2- — -—~
—--
•v\\_i
100 , 200 300Position CPS AR control group, cm
Fig.6. Change ({(5p/5h)carb. - (5p/ah)comb.}/ (ap/5h)carb.)*100% in the differential worth ofCPS AR control group in the replacement of the carbide absorber rod by the combined one
(1-BOC, 2 - EOC; nominal power)
87
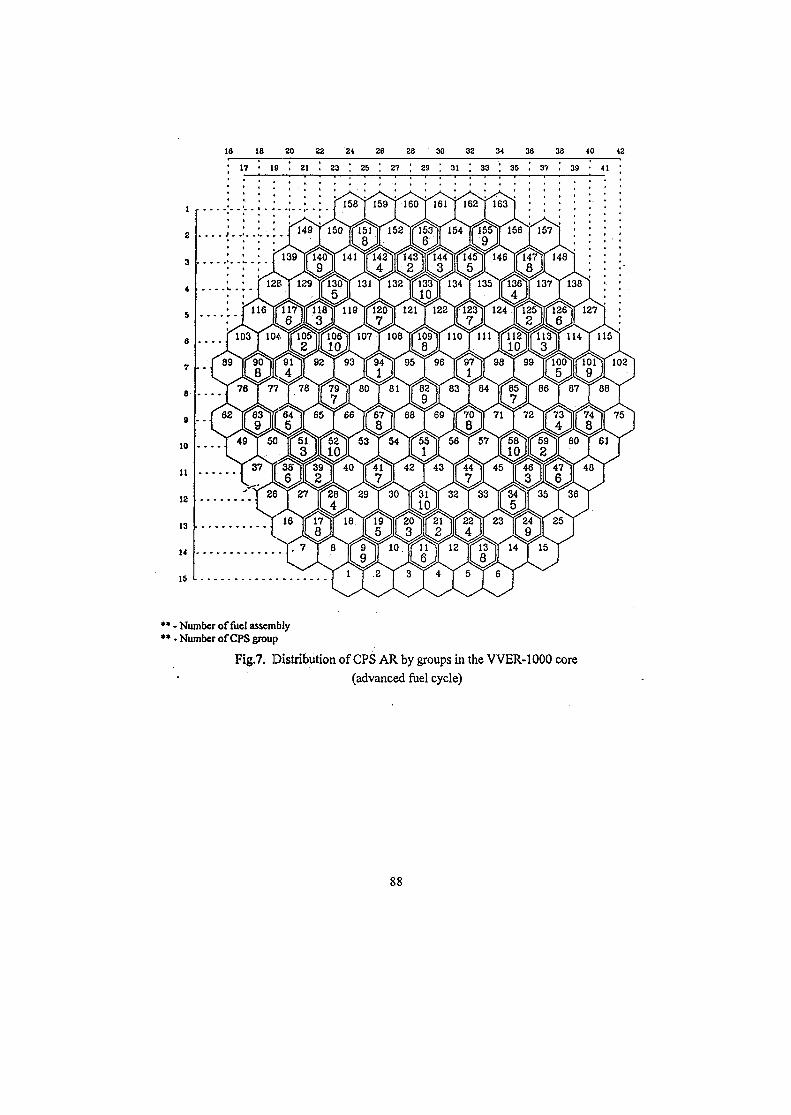
IS IB 20 22 24 26 28 30 32 34 36 38 40 42
17 19 . 21 . 23 ] 25 ! 27 | 29 ', 31 | 33 ', 35 .' 3? ! 39
•• - Number of fuel assembly*• - Number of CPS group
Fig.7. Distribution of CPS AR by groups in the WER-1000 core(advanced fuel cycle)
88
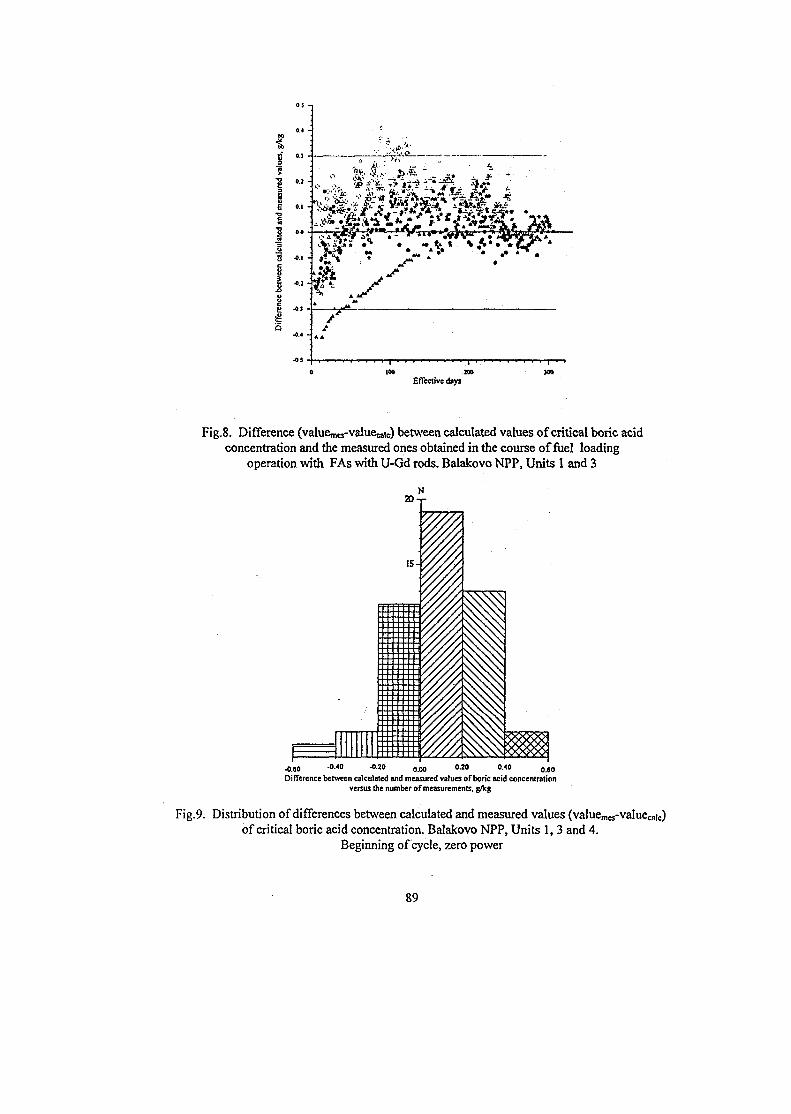
15
Effective days
Fig.8. Difference (valuen^-valuecaic) between calculated values of critical boric acidconcentration and the measured ones obtained in the course of fuel loading
operation with FAs with U-Gd rods. Balakovo NPP, Units 1 and 3
-0.60 •°-4 0 -°-2 0 0.00 02a 0M 0.60Difference between calculated and measured values of boric acid concentration
versus the number of measurements, g/kg
Fig.9. Distribution of differences between calculated and measured values (valuemes-valueca!c)of critical boric acid concentration. Balakovo NPP, Units 1,3 and 4.
Beginning of cycle, zero power
89
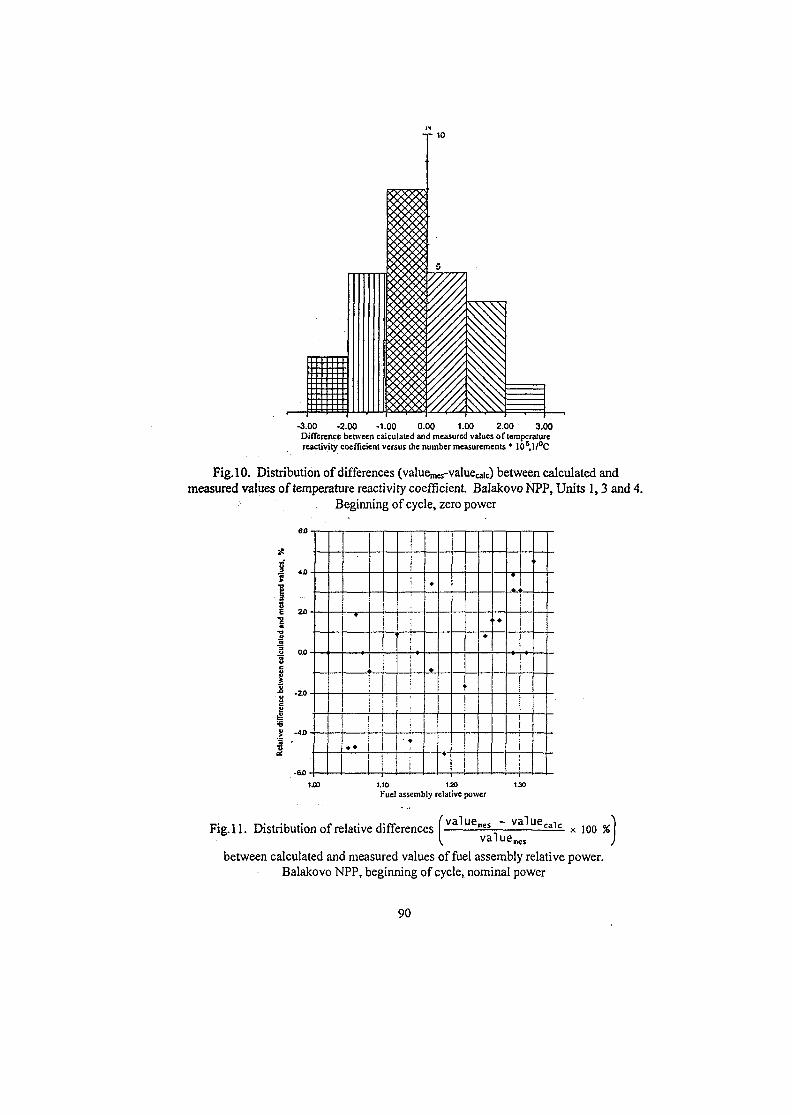
-3.00 -2.00 -1.00 0.00 1.00 2.00 3.00Difference between calculated and measured values of temperaturereactivity coefficient versus the number measurements • 105,l/°C
Fig. 10. Distribution of differences (valuemes-valuecaic) between calculated andmeasured values of temperature reactivity coefficient. Balakovo NPP, Units 1,3 and 4.
Beginning of cycle, zero power
1.10 1.20Fuel assembly relative power
4.0-
2 0 -
- 2 0 -
-4.0-
• 6 0 -
• • i
1
•
!
|
ii
I
Fig.ll. Distribution of relative differences 2S i- ^^- x ioo %^ valuenes
between calculated and measured values of fuel assembly relative power.Balakovo NPP, beginning of cycle, nominal power
90
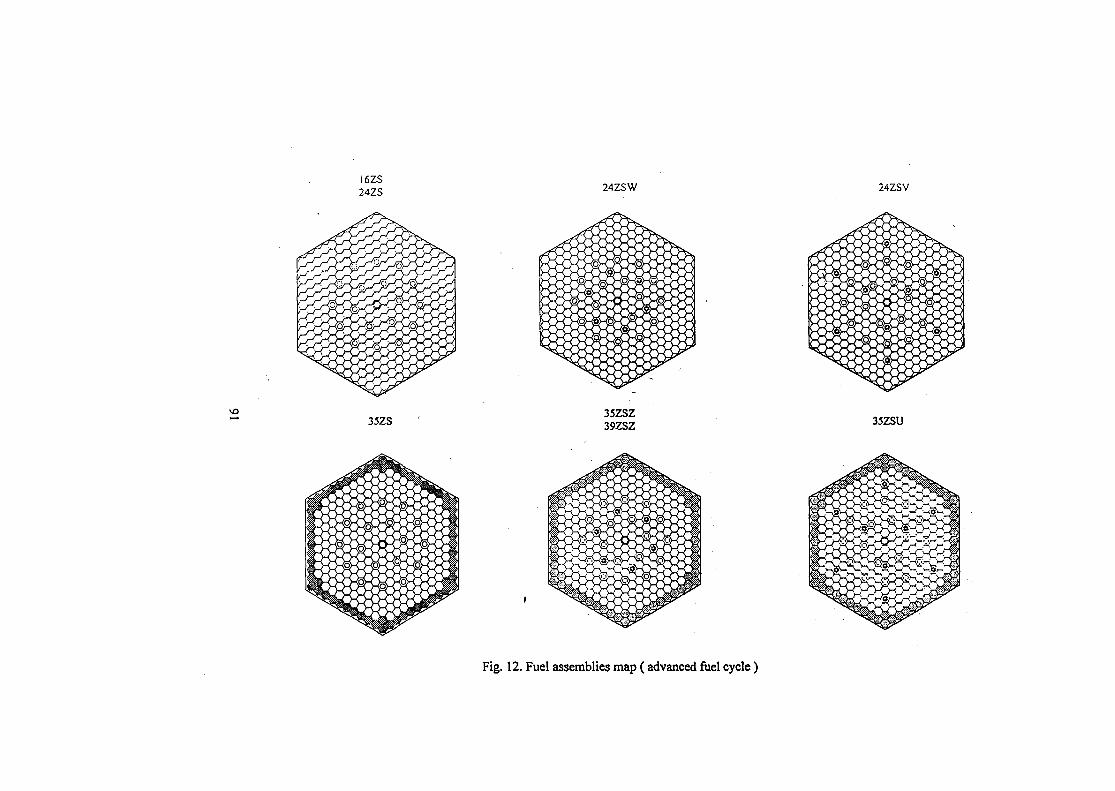
16ZS24ZS 24ZSW 24ZSV
35ZS35ZSZ39ZSZ 35ZSU
Fig. 12. Fuel assemblies map ( advanced fuel cycle )
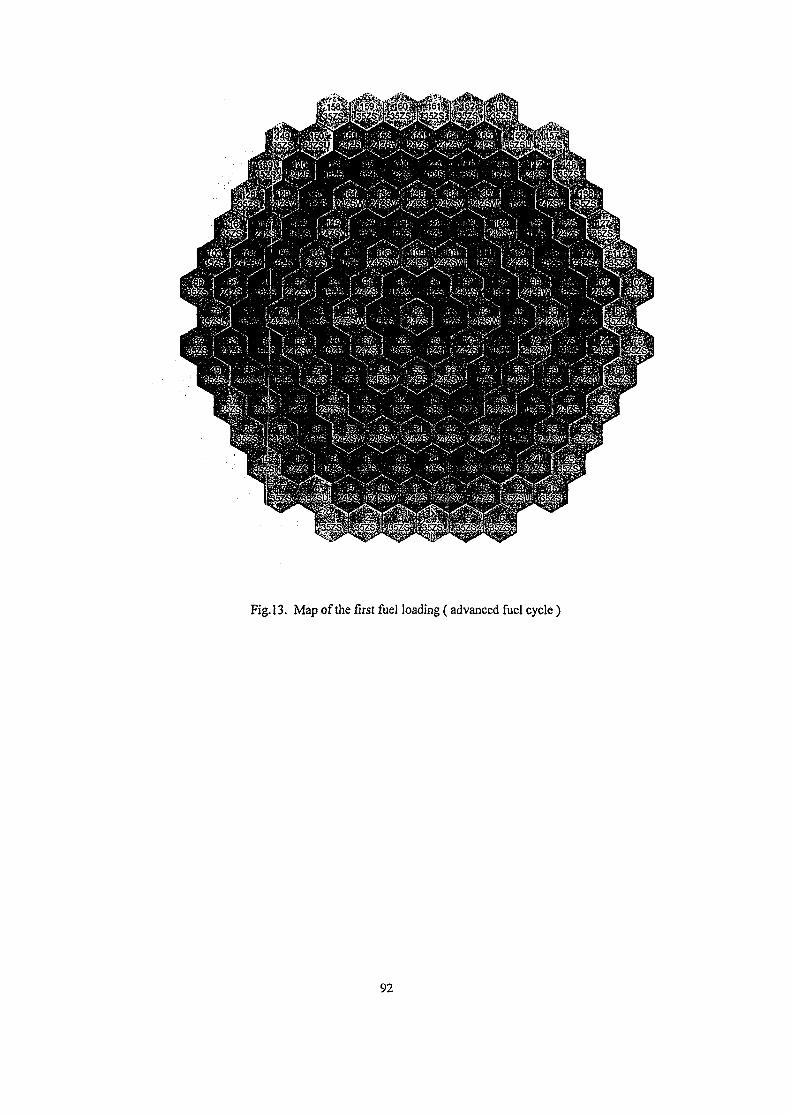
Fig. 13. Map of the first fuel loading (advanced fuel cycle )
92
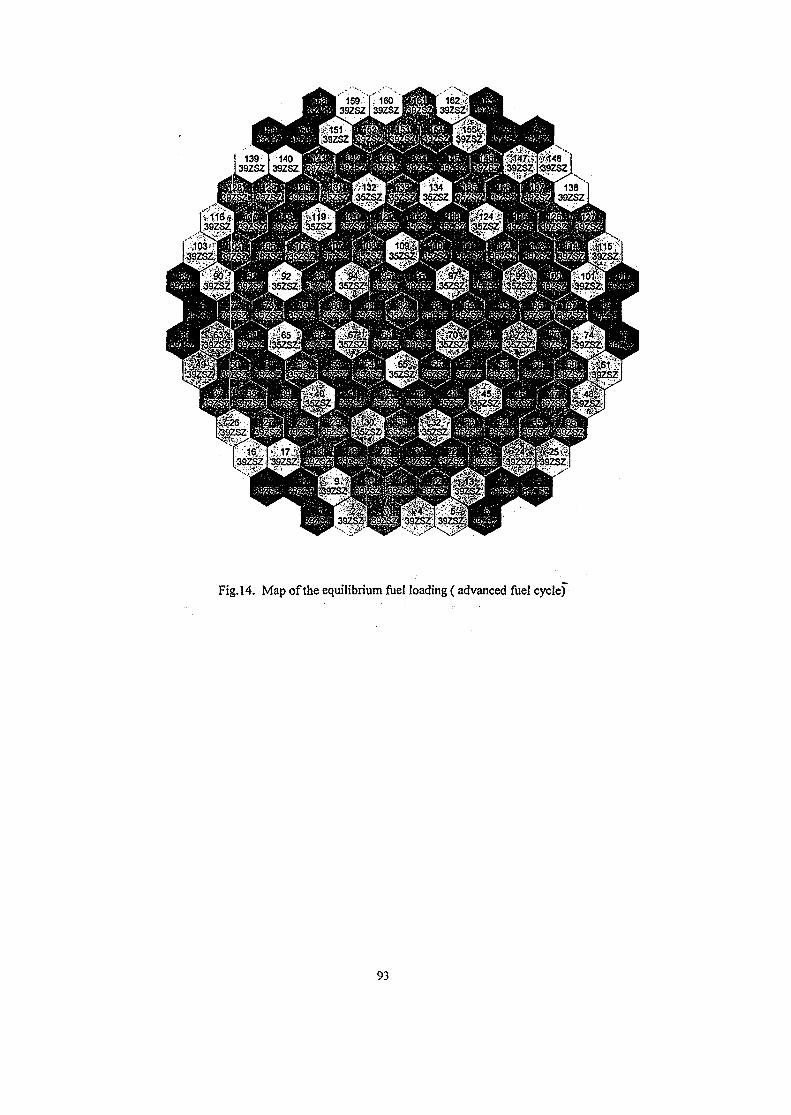
Fig. 14. Map of the equilibrium fuel loading ( advanced fuel cycle J
93
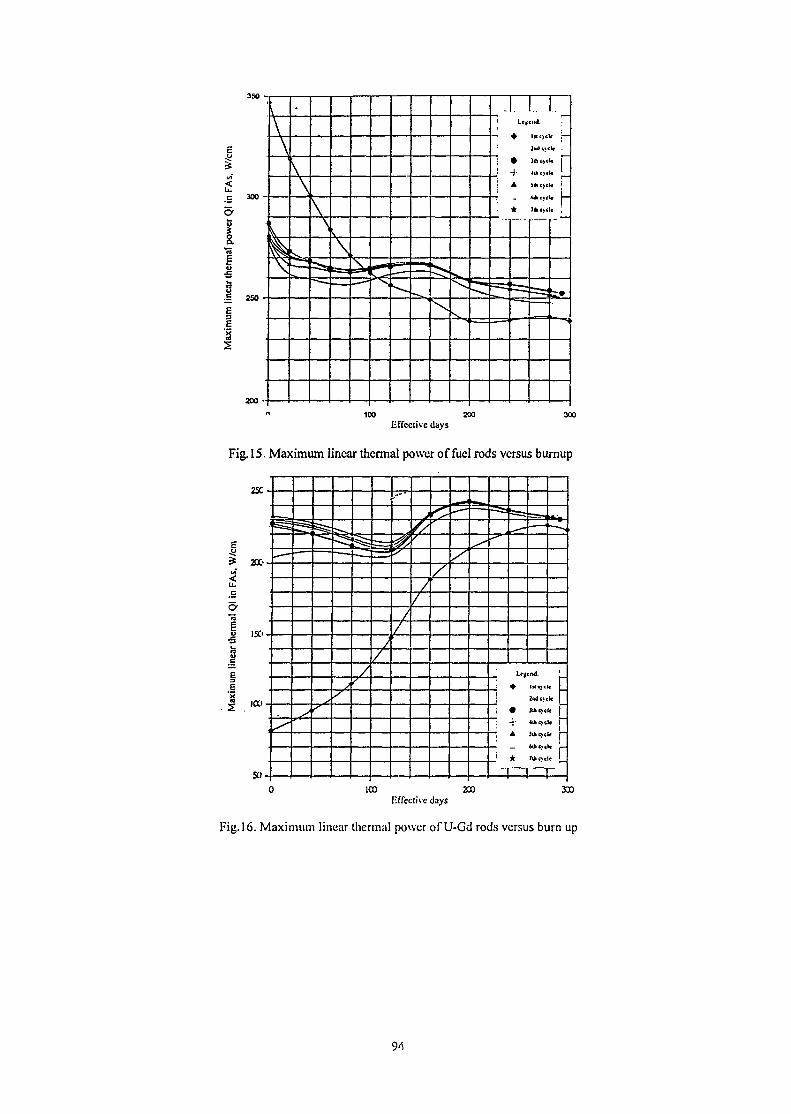
350
gisc 300
\
\
.
\
\
\
——-
i + ••««
' i
I i• • )(kC)Ck j
- ! .. 44. . .J . | -
. * 7i»<>tl, ;
100 200Effective days
Fig. 15. Maximum linear thermal power of fuel rods versus burnup
25C -
E
o-
^ I S ' -
cs
sE
Max
i
.—- — —
J
-
/
-
:!;
!
i-
,
• ••<!«
-:• 4ihe>«
A SUic^c
— 6ifacvc
•k l ioi
c
ICO 23)Effective days
300
Fig. 16. Maximum linear thermal power of U-Gd rods versus burn up
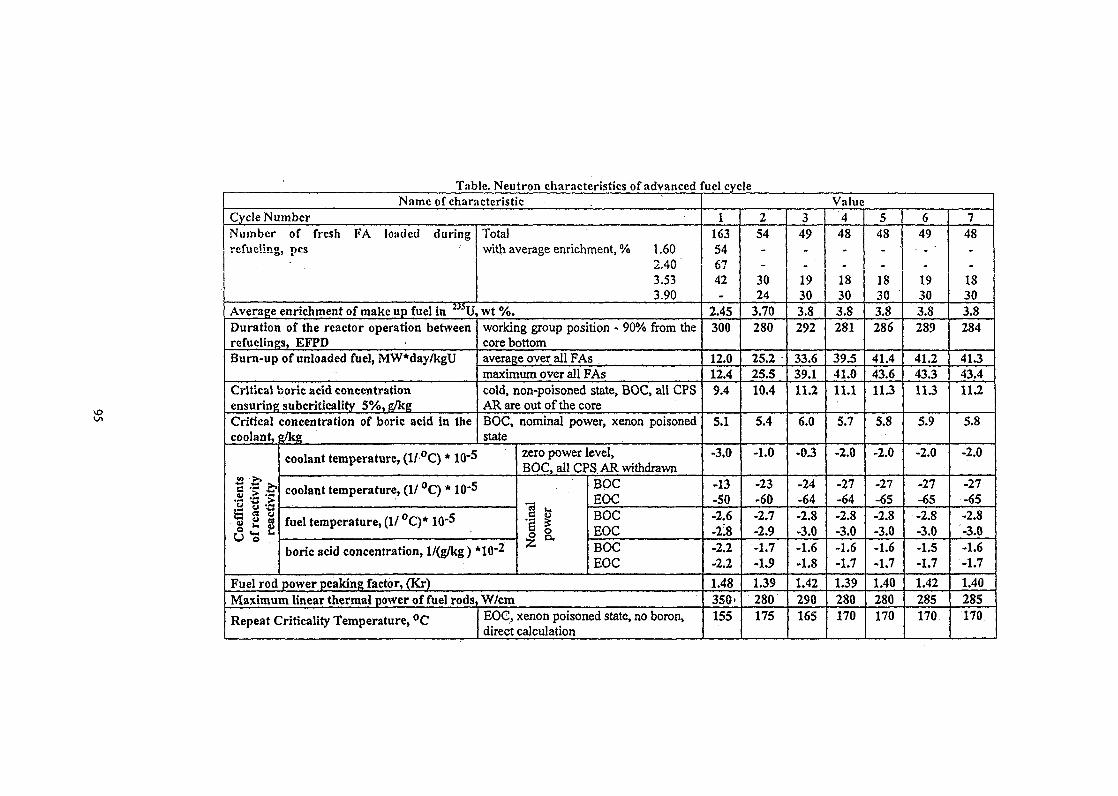
Table. Neutron characteristics of advanced fuel cycleName of characteristic
Cycle NumberNumber of fresh FA loaded duringrefue!ings pes '
Totalwith average enrichment, % 1.60
2.403.533.90
Average enrichment of make up fuel in 2>5U, wt %.Duration of the reactor operation betweenrefuelings, EFPDBurn-up of unloaded fuel, MW*day/kgU
Critical boric acid concentrationensuring subcriticality 5%, g/kgCriticalcoolant,
Coe
ffic
ient
sof
rea
ctiv
ity
reac
tivi
ty
concentration of boric acid in thee/kg
working group position - 90% from thecore bottomaverage over all FAsmaximum over all FAscold, non-poisoned state, BOC, all CPSAR are out of the coreBOC, nominal power, xenon poisonedstate
coolant temperature, (1/ °C) * 10"5
coolant temperature, (1/ °C) * 10"5
fuel temperature, (1/ °C)* 10'5
boric acid concentration, l/(g/kg ) *10"2
zero power level,BOC, all CPS AR withdrawn
Nom
inal
pow
er
BOCEOCBOCEOCBOCEOC
Fuel rod power peaking factor, (Kr)Maximum linear thermal power of fuel rods, W/cm
Repeat Criticality Temperature, °C EOC, xenon poisoned state, no boron,direct calculation
Value1
163546742
2.45300
12.012.49.4
5.1
-3.0
-13-50-2.6-218-2.2-2.2
1.48350-155
254
3024
3.70280
25.225.510.4
5.4
-1.0
-23-60-2.7-2.9-1.7-1.9
1.39280175
349
19303.8292
33.639.111.2
6.0
-0.3
-24-64-2.8-3.0-1.6-1.8
1.42290165
448
18303.8281
39.541.011.1
5.7
-2.0
-27-64-2.8-3.0-1.6-1.7
1.39280170
548
18303.8286
41.443.6113
5.8
-2.0
-27-65-2.8-3.0-1.6-1.7
1.40280170
649
19303.8289
41.243.311.3
5.9
-2.0
-27-65-2.8-3.0-1,5-1.7
1.42285170
748
18303.8284
41.343.411.2
5.8
-2.0
-27-65-2.8-3.0-1.6-1.7
1.40285170
SK01ST080
The Dukovany Load Follow Benchmark Solution
Gy.HegyiKFKI Atomic Energy Research Institute
Reactor Analysis LaboratoryH-1525 Budapest 114, POB 49, Hungary
Phone:+36 1 392-2222Fax: +36 1 [email protected]
ABSTRACT
In this paper the results of KARATE-440 calculations on Dukovany NPP Load FollowOperational Benchmark are presented, the corresponding differences are analyzed. Thesimulation of the plant processes and the comparison of the results with the measurements areof particular interest as these efforts make our codes to be validated in a higher level.Even if some small modification in the description of the benchmark can be suggested,satisfactory agreement was found between measured and calculated data.
1. INTRODUCTION
An operational benchmark for the Unit 2 of Dukovany NPP[1] was specified in which differenttypes of acceptable power maneuvering modes were checked at the 125 full power day of the1 lth Cycle Unit 2. As it is well-known fact the primary control mode is recommended to useduring normal operation, when the nuclear power is kept on constant value by moving thecontrol bank No. 6. If the power of the core can not be kept on a fix value secondary ortertiary control mode is used when the main steam collector pressure is kept constant by theautomatic control system. The 2 day long test was divided into 6 steps, in which different typesof control modes were used and different power changes were realized. The appropriate coreparameters (power, inlet and outlet temperature, control rod position) were measured andcollected as a function of time at all cases. The benchmark specification was outlined in theseventh Symposium of AER at Zittau, Germany [1] and it was added to the AER BenchmarkBook[2], too.
The GLOBUSKA module which calculates the core parameters in the frame of the KARATE-440 code package[3,4] comprises thermohydraulic model for the coolant in the assemblies ofthe core but the primary circuit is modeled up to the heat exchanger. Model for automaticcontrol system is not included as it can not be part of a stationary code system. In such a wayour simulation covers the core parameters only. First the given steady state condition isinvestigated then the reactivity coefficients are evaluated in the vicinity of the measuredparameters. The contribution of the uncertainties of the measurement to the Jkeff is evaluated.The measurements are simulated as a Xenon transient where measured data are known. Goodagreement v/as found among measured and calculated data.
97
2. INVESTIGATION OF THE INPUT DATA
The spatial burnup distribution at the start of the transient is attached to the benchmarkspecification that is created by the MOBY-DICK code with its own XS-library. In the usage ofthese data axially equidistant nodes were supposed (it is not defined in the specification). Allinformation is given for a 60 ° base sector using standard location numbers. As the well-knowntypes of assemblies were used there was not necessary to give their detailed specification.
The burnup distribution calculated in this way in a given state is not fully consistent as an inputto an other nodal code and other cross section libraries.A burnup calculation tends to compensate for deviations in flux and power distributions, e.g. ifpower is overpredicted in certain location the burnup will be higher and thus the reactivity islower in a later time. Therefore it is possible that the use of burnups calculated with anothercode will lead to additional errors through inconsistent burnup distribution. When the accuracyof the codes and the neutronic data are roughly equal it does not make much difference to useburnups calculated by any of the codes. Consistent burnup distribution for different calculationsystems can be obtained by simulation of several cycles with the same nodal method and crosssections that will be used in the transient simulation. Thus it would be preferred to createburaup distribution by simulation of cycles instead of using a single burnup distribution [5,6].Similar problems can arise from the uncertainties of some isotopes (e.g. Plutonium, Samarium).
The coolant flow rate (net or total with bypass) through the reactor core would be an otherimportant parameter of the calculation as the temperature rise of the core (originated from theloop temperature measurements) itself is not enough to give the input of the corethermohydraulics. Steady state assembly-wise power distribution of the core can be checked onthe basis of assembly outlet temperatures and SPND detector signals. The above mentionedinformation could make the benchmark more attractive.
3. CREATION OF CORE BURNUP STATE
The calculations were carried out by the GLOBUSKA code using of 40 equidistant axial layersand 60 degree symmetry. The description of the fuel types, the inlet coolant temperature andthe 3D burnup distribution were used from the input specification. The further burnupdependent steady state parameters were given by KARATE-440. Concerning thethermohydraulic input only the inlet temperatures were used from the measurement, the bypassdata and assembly-flowjate were taken from our practice. The latest parameter was tuned toreach the given loop AT, measured at the beginning of the transient.
In Figure 1 the radial power peaking of the core calculated by GLOBUSKA and the referencesolution (prepared by MOBY-DICK) can be seen. Some calculated critical boron acidconcentrations are collected in Table 1. These values show good agreement between measuredand calculated data, however in the lack of core flow rate the comparison can not be absolutelycorrect.
Table 1: Measured and calculated boron concentration in the initial statecodesBIPR-7A/ KASETTA-2r81MOBY-DICKmKARATE-440Experiment[2]
CB [g/kgl3.173.173.003.05*2.90
98
Concerning some ambiguous data and the error of the measured parameters the inputdependent sensitivity of the criticality calculation was studied and the following results weregiven:
1. In the specification of the benchmark there is a 0.5% discrepancy in the bumup betweenTable 2 and Figure 4 (see fl] and [2]). Probably it comes from the rounding of the inputdata. On an other place the error of burnup is specified as 7 %. Using the KARATE- 4401% of homogeneous increase in burnup causes:
Ap= -133 pern at the given nominal reactor state:
2. Because of the ambiguous flow rate its influence was investigated by decreasing the usedsteady state inlet flow by 10 % . Its effect was:
Ap = -78 pem
3. The following reactivity coefficients at the given reactor state were calculated to evaluatethe effect of the uncertainty of the inlet parameters:
-38.0pcm/K
-8.4pcm/cm atH=190cm
Ap/AcB= -1295 pem/g/kg
3. TRANSIENT CALCULATION
The measured process was taken as an unusual xenon transient where not only the control rodand the boron acid concentration were changed, but the inlet temperature and the flow rate,too. The produced thermal power was delivered by the secondary side. The boronconcentration and the steady state flow rate of the core were tuned before the transient. Theirrelative changes during the process are given in the input specification (see [2]). _
In the simulation all of these parameters were used as the time dependent input parameters ofKARATE-440 and the eigenvalue was calculated as a function of time during the xenontransient. The main input parameters of the calculation can be seen in Figures 2-5. In Figure 6the calculated keir as the function of time and the estimated error bar of the calculation arepresented. The margin of error, can be settled as:
where the given uncertainties of the input figuresAT™ = 1.00 K, (not given in the specification)AH6= 1.00 cm,AcB = 0.05 g/kg. come from the specification (see[2]).
Even the range (a ~ 76 pem) is more narrower as it was given in the input specification thecalculated eigenvalues are within the error limits. In this interpretation all the measured data
99
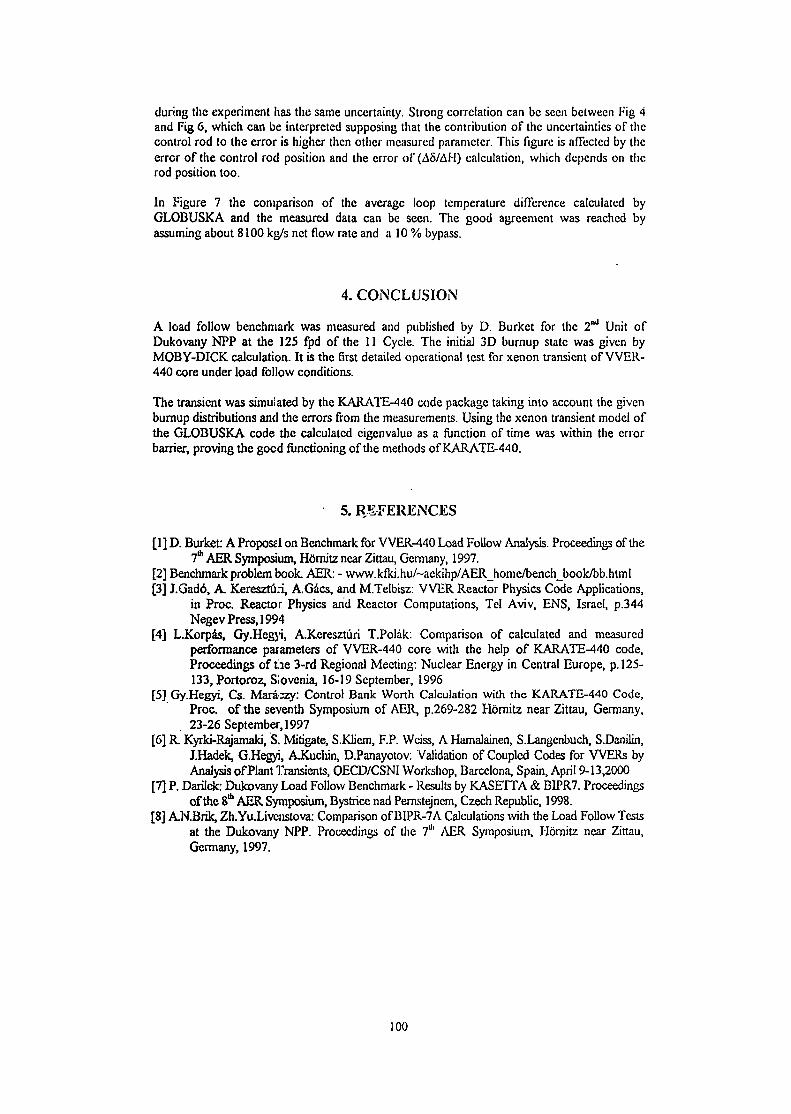
during the experiment has the same uncertainty. Strong correlation can be seen between Fig 4and Fig 6, which can be interpreted supposing that the contribution of the uncertainties of thecontrol rod to the error is higher then other measured parameter. This figure is affected by theerror of the control rod position and the error of (A8/AH) calculation, which depends on therod position too.
In Figure 7 the comparison of the average loop temperature difference calculated byGLOBUSKA and the measured data can be seen. The good agreement was reached byassuming about 8100 kg/s net flow rate and a 10 % bypass.
4. CONCLUSION
A load follow benchmark was measured and published by D. Burket for the 2nd Unit ofDukovany NPP at the 125 fpd of the 11 Cycle. The initial 3D burnup state was given byMOBY-DICK calculation. It is the first detailed operational test for xenon transient of VVER-440 core under load follow conditions.
The transient was simulated by the KARATE-440 code package taking into account the givenbumup distributions and the errors from the measurements. Using the xenon transient model ofthe GLOBUSKA code the calculated eigenvalue as a function of time was within the errorbarrier, proving the good functioning of the methods of KARATE-440.
5. REFERENCES
[1] D. Burket: A ProposEl on Benchmark for VVER-440 Load Follow Analysis. Proceedings of the7* AER Symposium, Hornitz near Zittau, Germany, 1997.
[2] Benchmark problem book. AER: - www.kfki.hu/~aekihp/AER_home/bench_book/bb.html[3] J.Gado, A. Keresztiiri, A.Gacs, and M.Telbisz: VVER Reactor Physics Code Applications,
in Proc. Reactor Physics and Reactor Computations, Tel Aviv, ENS, Israel, p.344Negev Press, 1994
[4] L.Korpas, Gy.Hegyi, A.Keresztiiri T.Polak: Comparison of calculated and measuredperformance parameters of VVER-440 core with the help of KARATE-440 code,Proceedings of tie 3-rd Regional Meeting: Nuclear Energy in Central Europe, p. 125-133, Portoroz, Slovenia, 16-19 September, 1996
[5] Gy.Hegyi, Cs. Mara:zy: Control Bank Worth Calculation with the KARATE-440 Code,Proc. of the seventh Symposium of AER, p.269-282 Homitz near Zittau, Germany,23-26 September, 1997
[6] R Kyrki-Rajamaki, S. Mitigate, S.Klicm, F.P. Weiss, A Hamalainen, S.Langenbuch, S.Danilin,J.Hadek, G.Hegyi, AKuchin, D.Panayotov: Validation of Coupled Codes for WERs byAnalysis of Plant Transients, OECD/CSNI Workshop, Barcelona, Spain, April 9-13,2000
[7] P. Darilek: Dukovany Load Follow Benchmark - Results by KASETTA & BIPR7. Proceedingsof the 8th AER Symposium, Bystricc nad Pemstejncm, Czech Republic, 1998.
[8] AN.Brik, Zh.Yu.Livcnstova: Comparison of B1PR-7A Calculations with the Load Follow Testsat the Dukovany NPP. Proceedings of the 7Ul AER Symposium, Hornitz near Zittau,Germany, 1997.
100
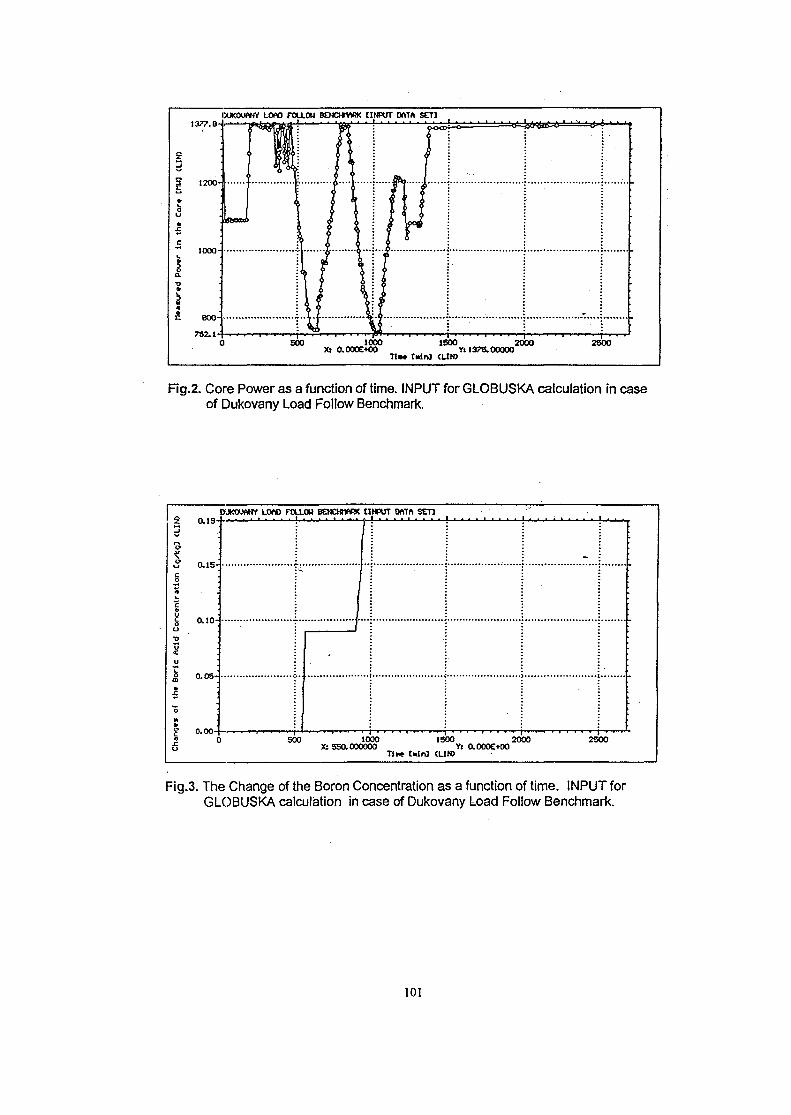
1377.8
1200-
IXJKOUANY LOAD FOLLOW BENCHT1ARK CINPUT OATA SCTJ
500 1000 1S00 2000aoooe+oo Y: 1375.00000
Tine tain] <UN>
2500
Fig.2. Core Power as a function of time. INPUT for GLOBUSKA calculation in caseof [Dukovany Load Follow Benchmark.
DUKWANY LOAD FOLL.OM BENCW1ARK tINPUT DATft SET3
S 0.15-
|
•V
c
i 0.10-0
•0
§ :u ;
0 0.0s-| :
*5M0>
. 0
•
500 1000 ISOO 2000 2500X: 550.000000 Yl O.OOOE+00
Tine Cain] <LIN>
Fig.3. The Change of the Boron Concentration as a function of time. INPUT forGLOBUSKA calculation in case of Dukovany Load Follow Benchmark.
101
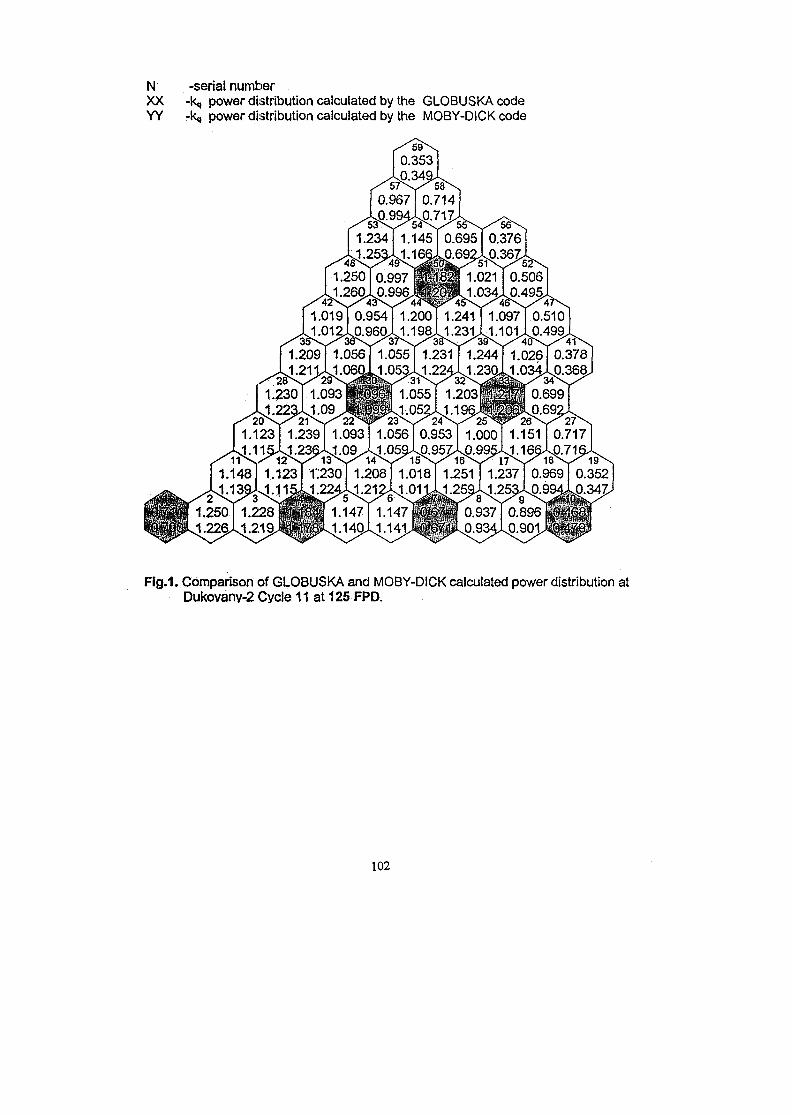
N -serial numberXX -kq power distribution calculated by the GLOBUSKA codeYY -kq power distribution calculated by the MOBY-DICK code
Fig.1. Comparison of GLOBUSKA and MOBY-DICK calculated power distribution atDukovany-2 Cycle 11 at 125 FPD.
102
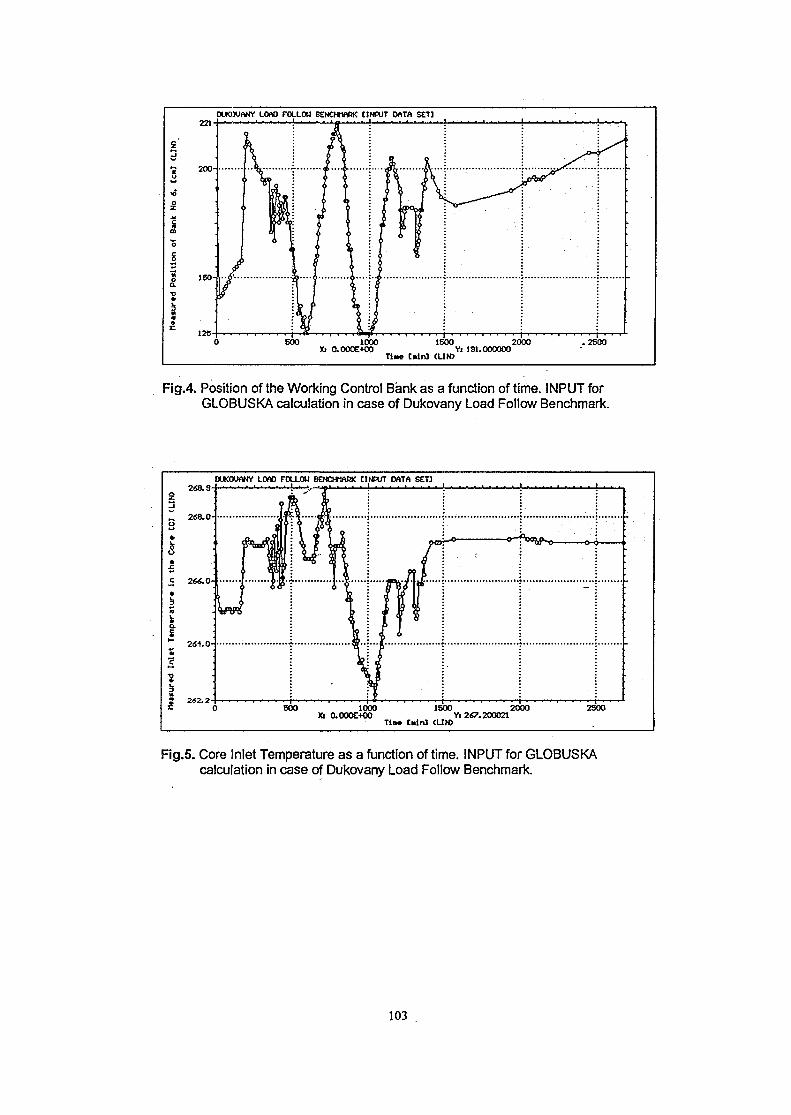
DUKOUANY LOAD FOLLOW BENCHrtftRK CINPUT DATA SET]221-H-"-
500 1000 1500 2000X! 0.0OOE+O0 Yl 191.000000
Tiae Cininl (UN)
.2500
Fig.4. Position of the Working Control Bank as a function of time. INPUT forGLOBUSKA calculation in case of Dukovany Load Follow Benchmark.
2*8.9-2
X 258.0-o
•
•JZ
!
^ 264.0-*
•
DUK0WNY LOAD FOLLOW BENCHMftRK CINPUT DATA SET3
it
.1n I \i\\
c
2 ~ * 6 500 ' 1000 1500 2000 ' 2500Xt 0.0OOE+O0 Yt 2«7.200021
Tin* Cain] (UN)
Fig.5. Core Inlet Temperature as a function of time. INPUT for GLOBUSKAcalculation in case of Dukovany Load Follow Benchmark.
103
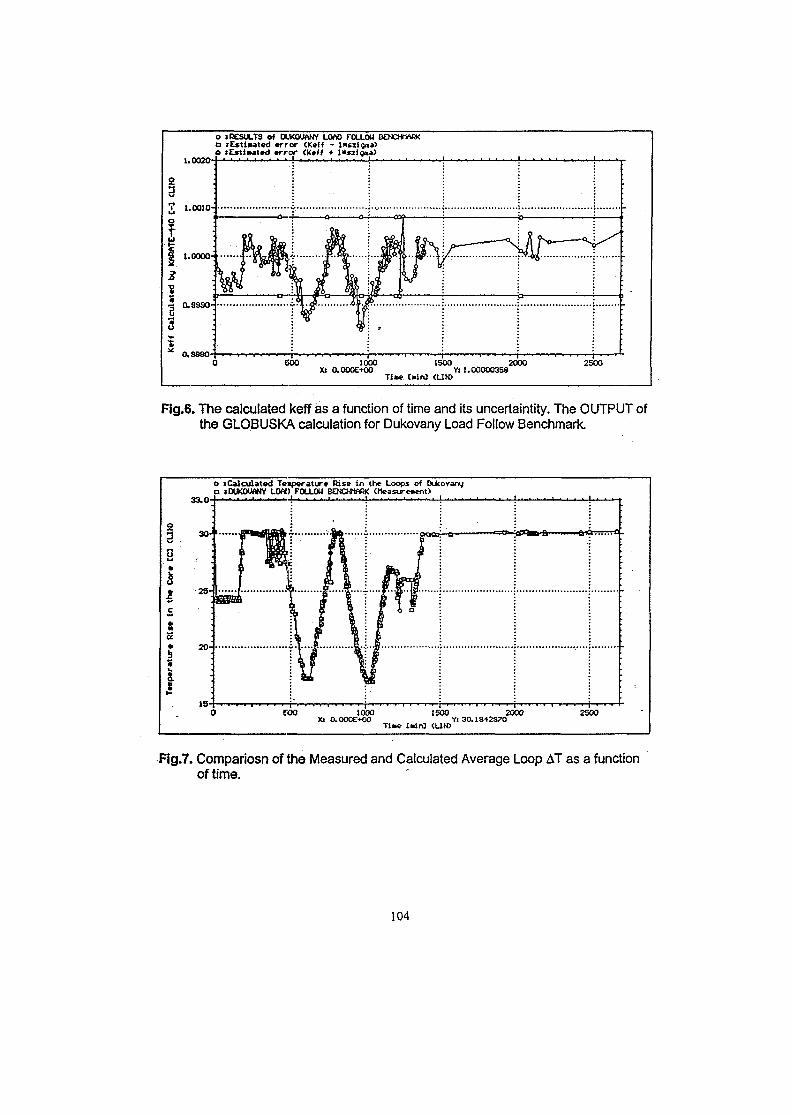
1.0020-
O »RESULTS O( DUKOUANY LOAO F0U.0U BENCHMARKa lEstiaated error (Keff - lKsziqaa)a tEstJMted error <Kef» • l«szig*»>
2
V 1.0OJO-
1.0000-
0.9390-
assso-EIOO 1000
X> O.OOOE+00Tiae CwrO <LIN)
1500 2000Y: 1.00000358
2500
Fig.6. The calculated keff as a function of time and its uncertaintity. The OUTPUT ofthe GLOBUSKA calculation for Dukovany Load Follow Benchmark.
33.0-
3 0 J
25-
15-
o sCalculated Tena lOUKOUANY LOAD
1 [PFlw
, W
ipsraturc Rise inFOLLOU BENCHMARI
; A\ ! \v \
the Loops of Ouk< (tteasure»ent>
ftoen
-ml1
ovang
- u " > • if*jn, Q a-1
1000 1500 2000X: aOOOE+00 Yi 30.1942370
Tine Cain} <LIN>
2500
Fig.7. Compariosn of the Measured and Calculated Average Loop AT as a functionof time.
104
SK01ST081
CALCULATION AND EXPERIMENTAL SUBSTANTIATIONOF THE VVER FUEL OPERABILITY AT HIGH FUEL BURNUPS
Yu.K.BibilasliviliARSRIIM, Moscow
V.N.Proselkov, A.S.Scheglov, V.F.KuznetsovRRC "Kurchatov Institute", Moscow,
Russia
ABSTRACT
In the design three-year fuel cycles of VVER-440 and two-year fuel cycles of VVER1000 the fuel assemblies with steel spacer grids (and guiding channels in VVER-100*FA) were: used. The average burnup of spent fuel is ~ 29 MW*day/kg. The experience ofuel operation, data of post-reactor investigations of spent fuel, results of speciaexperiments with fresh and spent fuel, development of thermal-mechanical codes anccodes of accident analysis, made it possible to substantiate in complex the increase irWER fuel burnup, eliminate the excess conservatism in designing and operation ancbegin to develop new fuel cycles with advanced fuel assemblies.
The paper presents the main principles, criteria and results of substantiation of VVERfuel rod availability at high burnups under normal operation conditions and of theanalysis of fuel behavior in design accidents.
In the implementation of advanced four- and five-year fuel cycles in the WER-440reactors the fuel burnup increases on the average up to ~ 54 MWday/kg in themaximum spent fuel assembly, and up to ~ 60 MWday/kg in the fuel rod. The increasein the fuel burnup results in the reduction in the heat conductivity of uranium dioxide,increase in fission gas release from the fuel, hard contact of fuel pellets with thecladding, etc. This required refinement of old acceptance criteria for the substantiationof fuel pin operability and introduction of new ones, performance of post-reactorinvestigation of fuel assemblies with high fuel burnups (~ 49 MWday/kg), correction ofcalculation codes in accordance with the post-reactor investigation results as well asspecial experiments in the research reactor MIR and the IGR and GIDRA reactors.The latters involve studies of the behavior of VVER-440 fuel pins with high fuel burnupin transients (investigation of fission gas release from the fuel), studies of fuel andcladdings behavior in LOCA and RIA accidents.
105
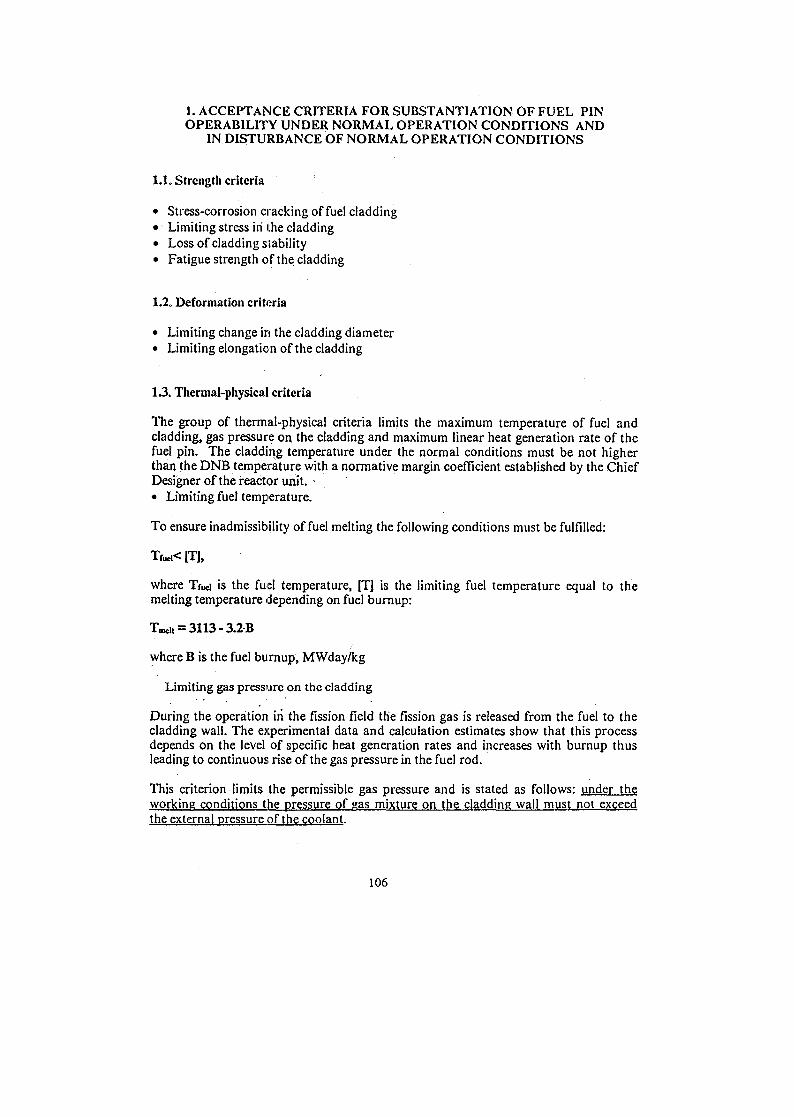
1. ACCEPTANCE CRITERIA FOR SUBSTANTIATION OF FUEL PINOPERABIL1TY UNDER NORMAL OPERATION CONDITIONS AND
IN DISTURBANCE OF NORMAL OPERATION CONDITIONS
1.1. Strength criteria
• Stress-corrosion cracking of fuel cladding• Limiting stress in the cladding• Loss of cladding stability• Fatigue strength of the cladding
1.2, Deformation criteria
Limiting change in the cladding diameterLimiting elongation of the cladding
13 . Thermal-physical criteria
The group of thermal-physical criteria limits the maximum temperature of fuel andcladding, gas pressure on the cladding and maximum linear heat generation rate of thefuel pin. The cladding temperature under the normal conditions must be not higherthan the DNB temperature with a normative margin coefficient established by the ChiefDesigner of the reactor unit. •• Limiting fuel temperature.
To ensure inadmissibility of fuel melting the following conditions must be fulfilled:
[TJ,
where Tf«i is the fuel temperature, [TJ is the limiting fuel temperature equal to themelting temperature depending on fuel burnup:
= 3113-3.2B
where B is the fuel burnup, MWday/kg
Limiting gas pressure on the cladding
During the operation iri the fission field the fission gas is released from the fuel to thecladding wall. The experimental data and calculation estimates show that this processdepends on the level of specific heat generation rates and increases with burnup thusleading to continuous rise of the gas pressure in the fuel rod.
This criterion limits the permissible gas pressure and is stated as follows: under theworking conditions the pressure of gas mixture on the cladding wall must not exceedthe external pressure of the coolant.
106
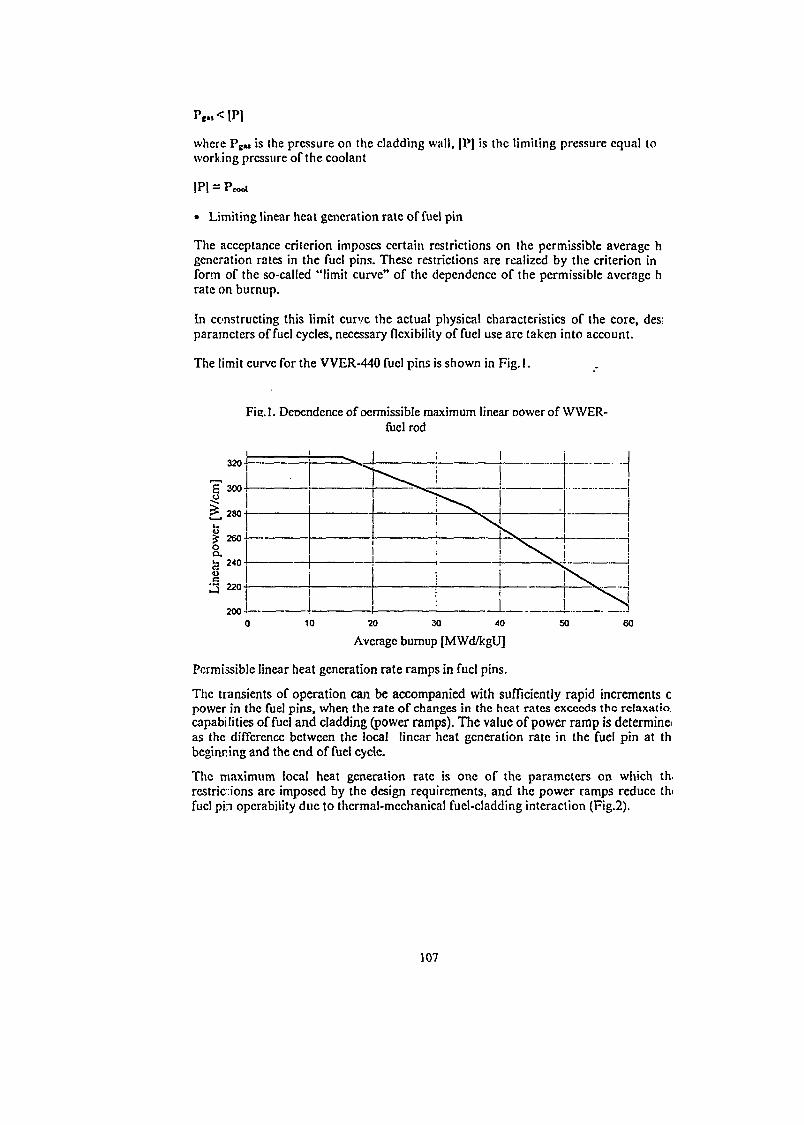
where PgM is the pressure on the cladding wall, |PJ is the limiting pressure equal towork ing pressure of the coolant
IP] = Pcool
• Limiting linear heat generation rate of fuel pin
The acceptance criterion imposes certain restrictions on the permissible average hgeneration rates in the fuel pins. These restrictions are realized by the criterion inform of the so-called "limit curve" of the dependence of the permissible average hrate on burnup.
In constructing this limit curve the actual physical characteristics of the core, des;parameters of fuel cycles, necessary flexibility of fuel use are taken into account.
The limit curve for the VVER-440 fuel pins is shown in Fig. I.
Fie.l. Dependence of oermissible maximum linear cower of WWER-fuel rod
320 J
B 300
^,280
260 —O
240uc 220
200 J
i
! \
i ii
10 20 30 40
Average burnup [MWd/kgU]
50 60
Permissible linear heat generation rate ramps in fuel pins.
The transients of operation can be accompanied with sufficiently rapid increments cpower in the fuel pins, when the rate of changes in the heat rates exceeds the relaxatio.capabilities of fuel and cladding (power ramps). The value of power ramp is determineas the difference between the local linear heat generation rate in the fuel pin at thbeginning and the end of fuel cycle.
The maximum local heat generation rate is one of the parameters on which th.restrictions arc imposed by the design requirements, and the power ramps reduce thifuel p h opcrability due to thermal-mechanical fuel-cladding interaction (Fig.2).
107
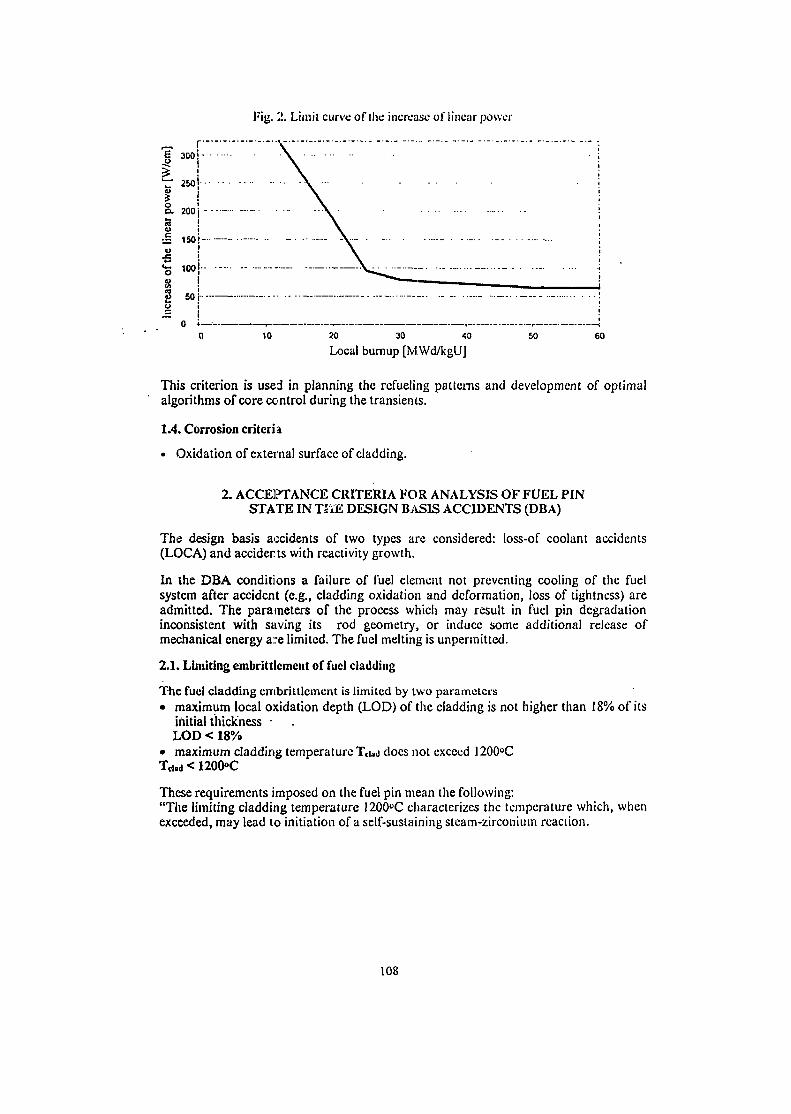
Fig. 2. Limit curve of the increase ut'lincar power
g 300
10
Local bumup [MWd/kgUJ
This criterion is used in planning the refueling patterns and development of optimalalgorithms of core control during the transients.
1.4. Corrosion criteria
• Oxidation of external surface of cladding.
2. ACCEPTANCE CRITERIA FOR ANALYSIS OF FUEL PINSTATE IN TiiE DESIGN BASIS ACCIDENTS (DBA)
The design basis accidents of two types are considered: loss-of coolant accidents(LOCA) and accidents with reactivity growth.
In the DBA conditions a failure of fuel element not preventing cooling of the fuelsystem after accident (e.g., cladding oxidation and deformation, loss of tightness) areadmitted. The parameters of the process which may result in fuel pin degradationinconsistent with saving its rod geometry, or induce some additional release ofmechanical energy a::e limited. The fuel melting is unpermitted.
2.1. Limiting embrittlement of fuel cladding
The fuel cladding cmbrilllement is limited by two parameters• maximum local oxidation depth (LOD) of the cladding is not higher than 18% of its
initial thickness -LOD < 18%
• maximum cladding temperature Tdaj does not exceed 1200°CTda<i < 1200°C
These requirements imposed on the fuel pin mean the following:"The limiting cladding temperature 1200°C characterizes the temperature which, whenexceeded, may lead i.o initiation of a self-sustaining steam-zirconium reaction.
108
"The local oxidation depth (LOD) equal to 18% of the initial cladding wall thickness"means embrittlement of the cladding material, which may result in brittle fracture of thefuel rod from loads arising during the emergency core cooling, FA discharge, fuelhandling and shipment.
2.2. Limiting fuel temperature
The inadmissibility of fuel melting under the conditions of design basis accidents isreached by fulfilling the condition
Tfuci<Tniti,(B)
where Tfmri is the fuel temperature, Tnwit is the melting temperature depending on fuelburnup B
2.3. Limiting enthalpy
For the analysis of accidents induced by reactivity growth (RIA) the acceptancecriterion which limits the maximum value of fuel enthalpy averaged over the crosssection (average radial) at any core point by a value which ensures the absence of fuelpin fragmentation for all the range of fuel burnup in the core is used (Fig.3).
The investigations showed:• Fragmentation of VVER fuel pins with high burnup was not observed up to ~ 250
cal/g.• High plasticity of VVER fuel claddings at the end of basic irradiation is a key factor
ensuring a high level of peak enthalpy of fuel degradation in RIA.
109
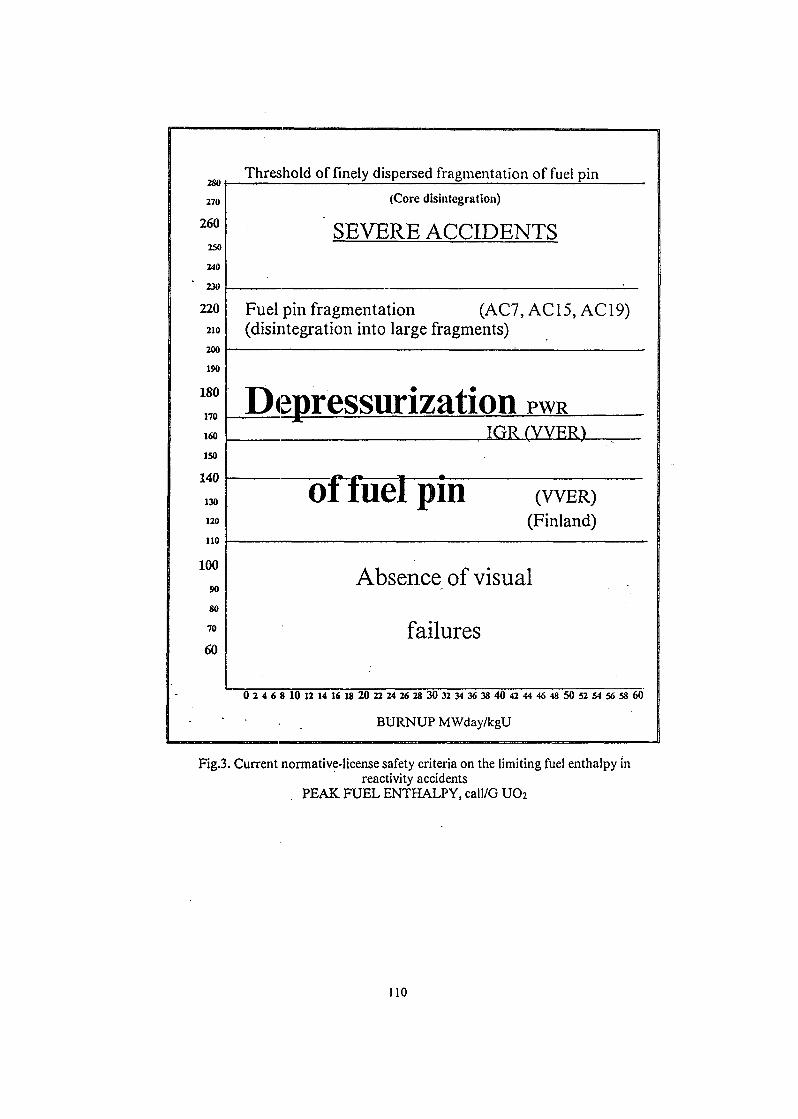
Threshold of finely dispersed fragmentation of fuel pin
270 (Core disintegration)
260 SEVERE ACCIDENTS250
240
230
220210
200
190
Fuel pin fragmentation (AC7, AC 15, AC 19)(disintegration into large fragments)
Depressurization180
160 IGR (VVER1ISO
140 i " 1 ^ 1 * 1 •
of fuel pin130
120
110
100
90
80
70
60
(VVER)(Finland)
Absence of visual
failures
0 2 4 6 8 10 12 14 16 18 20 22 24 26 28 30 32 34 36 38 40 « 44 46 48 50 52 54 56 58 60
• • • . BURNUP MWday/kgU
Fig.3. Current normative-license safety criteria on the limiting fuel enthalpy inreactivity accidents
PEAK FUEL ENTHALPY, call/G UO2
110
SK01ST082
CONCEPT OF FA FOR THE VVER-1500
Dukhovenski A., Kobzar L, MarinS., Oleksyuk D., Yudkevich MInstitute of Nuclear Reactors, RRC "Kurchatov Institute"
ABSTRACT
The concept design of WER-1500 was developed. The limiting dimensions of the core andcharacteristics of the main reactor plant equipment were determined. For the purpose ofoptimal utilization of the fuel, studies of the neutronic and thermal-hydraulic parameters arebeing carried out, their results will be used for the development of FA design. The preliminaryresults show that in the FA design development it is expedient to make the main emphasis topartial spectral reactivity compensation. The main calculation results are presented in thispaper.
1. MAIN CHARACTERISTICS OF WER-1500 CORE
By the present the problems of development of the main equipment for the VVER-1500reactor plant have been checked in detail. One of the main factors taken into account was thepossibility of domestic manufacturing of the equipment. Developments showed, in particular,that for the power unit of 1500 MW(e) some reactor plant components should have thecharacteristics of definite limiting values so that they would be acceptable for the existingproduction basis.
First of all this refers to the reactor vessel. Upon lifting the restrictions associated with itspossible rail transportation, the reactor vessel dimensions are now restricted by the limitingcharacteristics of metallurgical production. On the basis of the checks it has been establishedthat the equivalent diameter of the core should correspond to the diameter of a circle with anarea equal to that occupied by 211 FA of the VVER-1000 reactor. If the conventional fuel pindiameter of 9.1 mm and the geometric parameters of VVER-1000 fuel lattice are chosen, then,in accordance with the conditions of ensurance of acceptable thermal loads the core heightshould be 4.2 m.
Another hard enough restriction is the power of the MCP drive (not higher than 10 MW),which, in tum, determines the limiting coolant flow rate and the pump pressure. To meet this
111
condition it became necessary to increase the core preheating to 37°C, as compared with thecore preheating in the VVER-1000.
The average coolant temperature in the core is determined by the limiting area of coolingsurface in the steam generators and by the pressure of live steam required for a 1500 MW(e)turbogenerator.
The checks made it possible to form eventually the reactor characteristics which are shown inTable 1 and to choose the thermal-hydraulic core parameters, at which the calculation of FAlocation pattern should be performed for the organization of fuel cycles. At first the FA of theVVER-1000 reactor with the core height increased up to 4.2 m and the four-year fuel cyclewith cycle lengths of 12 months were chosen for this purpose.
2. SPECTRAL REACTIVITY CONTROL
It is known that in the fuel lattices of operating pressurized light-water reactors the breedingratio (BR) of fissile isotopes is about 0.5. It is also known that as the experience is gained atendency to the increase in the burnup of the unloaded fuel grows. This tendency is mainlyensured by the increEise in the initial fuel enrichment.
The calculation studies using the multigroup codes carried out at the RRC "KI" in the mid-80sshowed that the increase in the fuel enrichment is accompanied by the reduction in thebreeding ratio, i.e. the amount of U-238 in the fuel cycle decreases. This unfavorable effectmust be taken into account in the development of FA for advanced reactors, and measures forits compensation, although partial, ensured by appropriate design capabilities of FA and thereactor should be taken.
According to the data obtained the BR increases most when the fuel enrichment is reduced tobelow 3% (which contradicts to the tendency of increasing the bumup), and when the pitch inthe fuel lattice is decreases. Of course, the possibility of changing the pitch in the process offuel depletion would be the most attractive. However from the viewpoint of designing it-isalmost an insurmountable problem. Therefore, the more real approach seems to be a stepwisechange of the Water-fuel ration of the fuel lattice. In this case the cell pitch should be takensmaller comparing with the pitch once chosen, for example, for the VVER-1000 FA. A part ofcells should be initially assigned for removed rods made of scattering material. Upon removalof these rods the water-fuel ratio of the lattice will increase, and this will enable the burnout offissile isotopes which, due to the increased BR, were produced during the FA operation withinserted scatterers. Thus, the change in the neutron flux spectrum in the course of fuel cycle isused for the compensation for the initial reactivity charge and for more complete fuel use [1].
112
The above mentioned method was multiply considered in the designs of pressurized ligtiwater reactors. For example, in the APWR reactor, developed jointly by the Westinghouse a*Mitsubishi companies [2], they propose to use the FA with 19x19 geometry where 64 cellwhich originally were occupied by 16 guiding tubes (four cells for each tube) are separated. /the beginning the water "displacing rods are set into the tubes. Then, as the fuel is deplete!these rods are removed from the operating reactor by means of pneumatic drives (88 piece!which are specially designed for this purpose (!). It is expected that the realization of thipattern of FA use would give 20% reduction in the fuel cycle cost.
Even greater reduction in the fuel cycle cost (up to 30%) was expected to obtain in the RCV!reactor developed by Framatom in the mid-80s [3]. It was expected that, using the hexagonaFA with 331 (diameter of fuel pin 9.5 mm), 48 hollow tubes, where the displacer rods wenoriginally inserted, could be used for changes in the neutron flux spectrum. The wateruranium ratio then would change from 1.6 to 2.0.
In the above mentioned APWR option it is noticeable that the guiding tubes occupy four cellseach, i.e. their diameter is 25 mm. Thus upon the removal of the displacer rods from the tubesthe local water-fuel ratio of the lattice will increase, which may result in an increased peakingfactor. A rrutigating factor is, of course, that by the moment of withdrawal of the displacers (intwo cycles) the fuel will partly deplete, which is a flattening factor. At the same time it can bepointed out that the FA with four-time increased cells of guiding tubes have long been usedafor the control rods of the reactors developed by the "Combustion Engineering" Inc. company[4] and are manufactured by some firms [5]. It should be emphasized that in this case .the FAare located under the control rods from the very beginning of operation (i.e. with the freshfuel) and, hence, have an increased (but acceptable) peaking factor. The spacer grids are fixedon five tubes (one in the center), which is due to the square cross section of the FA with14x14 and 16x16 geometry.
The above prerequisites were taken into account in the formation of the concept of FA for theVVER-1500 core option. The shape and cross sections of the VVER-1000 FA were taken asthe basis. A tighter arrangement of fuel pins is reached due to the increase in the number ofcells in the FA from 331 (VVER-1000) to 397, i.e. one more row of cells must be additionallylocated. In this geometry seven groups of cells (one cell in the center) with seven cells eachare designed for location of the guiding tubes. The FA arrangement is shown in Fig.l. Thus,the number of fuel pins in the FA is 397-7x7=348, and the cooling surface is increased by12% comparing with the VVER-1000 FA (without taking into account the increased core).This should essentially affect the DNBR.
At the same time of primary importance is improvement of the fuel utilization characteristics.This substantiates transition to the FA design, which makes it possible to realize partialspectral control of reactivity. It can be quantitatively established only by calculations, and thecode used for this purpose should explicitly describe the effect of the neutron flux spectrumon the processes of fission and capture in the fuel depletion.
113
It addition to the determination of fuel burnup reached at the specified fuel enrichment, theneutronic calculation also involves:• determination of the lengths of fuel cycle with inserted dtsplacer rods (cycle 1) and upon
the withdrawal of diisplacers (cycle 2);• determination of the peaking factors at the beginning and at the end of the fuel cycles;• determination of the; efficiency of CR absorbers at the beginning and the end of cycle 2,
when they can be inserted into the guiding tubes upon withdrawal of the displacer rods;• power distribution over the fuel rods at the beginning and the end of both cycles and the
use of these data in the cell-by-cell thermal-hydraulic calculation of DNBR.
The neutronic calculation was performed using the certificated MCU-REA code package [6],which is briefly described below.
The calculations of heat-technological margins for the FA of VVER-1500 reactor have beenmade by the SC-1 code, developed at the Institute of Nuclear Reactors of RRC "KurchatovInstitute". The code is presented to certification.
3. MAIN FEATURES OF MCU-REA CODE PACKAGE
This code package consists of two codes linked by the common code interface of the currentversion of the MCU and BURNUP-2 codes. The MCU code solves the neutron transportequation, without approximation of neutron-material interaction models and simplifyingassumptions in the three-dimensional description of systems solved by the Monte-Carlomethod. The BURNUP-2 code serves for the calculation of the time dependence of changes inthe isotope composition of nuclear fuel in the neutron field and of burnable poisons ofcalculated systems. The two codes are linked by the code interface with respect to powerdistribution, neutron flux, isotope composition of materials and isotope cross sectionsaveraged over the neutron spectrum.
The codes are provided with a universal library of neutronic constants, DLC/MCUDAT-2.1,based on the fundamental nuclear data and permitting the systems with the fast, intermediateand-thermal neutron spectra to be calculated. The library contains sections of neutronic datawhich are necessary for solving the stationary neutron transport equation and kinetics ofisotope composition offuel.and fission products.
With the specified isotope composition of materials, the MCU code in the MCU-REA codepackage calculates: effective neutron multiplication factor, isotope cross sections, spatial-energy neutron flux distribution and power distribution. The BURNUP-2 code calculates theconcentration of isotopes of depleted materials at each time step. The code package MCU-REA is used for solving problems of refueling and change in the time discrete change in thematerial composition of the system calculated.
114

As applied to solving the problem of VVER-1500 neutronic characteristics, the FA with theboundary conditions of reflection on the side surfaces of hexagonal fuel assembly; the axialneutron leak was accounted for in the buckling approximation. For the cycle 1 with inserteddisplacers the fuel load consisted of uranium dioxide with 4.4% uranium-235 enrichment. Inthe guiding tul>es the displacers of zirconium alloy are located. The neutronic characteristicsof FA were determined with a discrete time step (at the beginning of fuel cycle T=5 days,subsequent steps are 100 days).
In accordance with the adopted determination the fuel cycle length was a time interval whenthe effective neutron multiplication factor reduced from the initial value to 0.95. This timewas adopted as the beginning of cycle 2. In the beginning of cycle 2 the isotope compositionof the fuel pellet is the same as that at the end of cycle 1, and the guiding tubes are filled withwater.
The calculation time dependence of the effective neutron multiplication factor for cycles 1 and2 is shown in Fig.2. The power distribution over the FA cross section is given in Fig.4.
4. MAIN FEATURES OF SC-1 CODE
The SC-1 code calculates the hydraulic resistance of the separated core section and thedistribution of the coolant parameters (flow rates, enthalpies, steam contents), DNBR and fuelpin temperatures in the core height and over the cross section of the core section considered.
The SC-1 code is based on the cell-by-cell method when the cross section of the core partconsidered is divided into cells. The latter are considered as parallel channels interacting dueto turbulent and convective transverse mixing of the coolant.
The SC-1 code realizes the model of homogeneous two-phase flow with account forunbalanced steam produced due to surface boiling and steam slipping relative to the liquidphase. The system of differential equations of this model contains equations of continuity,conservation of energy and conservation of pulse in the axial direction and the equation ofconservation of pulse in the radial direction for each link between cell pairs.
In addition to the main system of differential equations the equation of state for water andclosing relations are used. In the SC-1 code the closing relations for the main thermal-physicalprocesses contain correlations recommended for the VVER-reactors as well as othercorrelations used in the world practice.
115
The following boundary conditions are specified for the SC-1 code: the pressure, temperatureor enthalpy of the coolant at the core inlet, coolant flow rate and its distribution over the cellsin the inlet cross section and power distribution field. Instead of the coolant flow rate thepressure difference in the core can be specified.
The possibility is offered of specifying the geometrical characteristics and materialcomposition of all structural elements of the VVER core, depending on the material propertiesand temperature.
It is also possible to solve problems with changes in the core height in the flow sections ofcells, wetted and heated parameters, gaps between the fuel pins. This makes it possible to usethe SC-1 code for the analysis of FA with local breaks of geometry.
For the calculation of critical heat flux the code contains seven correlations. One of them ischosen as the basic one v/hen the input data are specified; it is provided with more detailedinformation than the rest of correlations. In the calculations performed for the determinationof critical heat fluxes the formula of OKB "Gidropress" was used as the basic correlation [7].
5. INPUT DATA FOR THERMAL-HYDRAULIC CALCULATION
The calculations were made for the "hot" FA of VVER-1500. Fig.3 shows the FA crosssection divided into cells. The FA contained an adjacent fraction of interassembly space. Thetraditional division of the FA cross section into elementary cells was used. In the central zoneof the bundle the cells are confined by the fuel pin perimeters and straight lines connecting thefuel pin centers; in the periphery zone - by the fuel pin perimeters, straight lines connectingthe fuel pin centers and by the perpendiculars dropped from the fuel pin centers to the FAboundaries. The FA boundaries are straight, equidistant from the peripheral fuel pins ofneighbor FA. The total number of cells in the FA cross section is 708.
Table 3 lists the nominal VVER-1500 characteristics for two versions differing in the coolantflow rate: in version 1 the flow rate is 92600 m3/h, in version 2 - 96800 m3/h.
The flow rate of version 1 is close to the value which was obtained taking into account thereduction in the pitch and the characteristics of the VVER-1500 MCP.
The relative power distribution of the "hot" FA is taken as 1.35 and 1.25 in the beginning andthe end of fuel cycle, respectively.
116
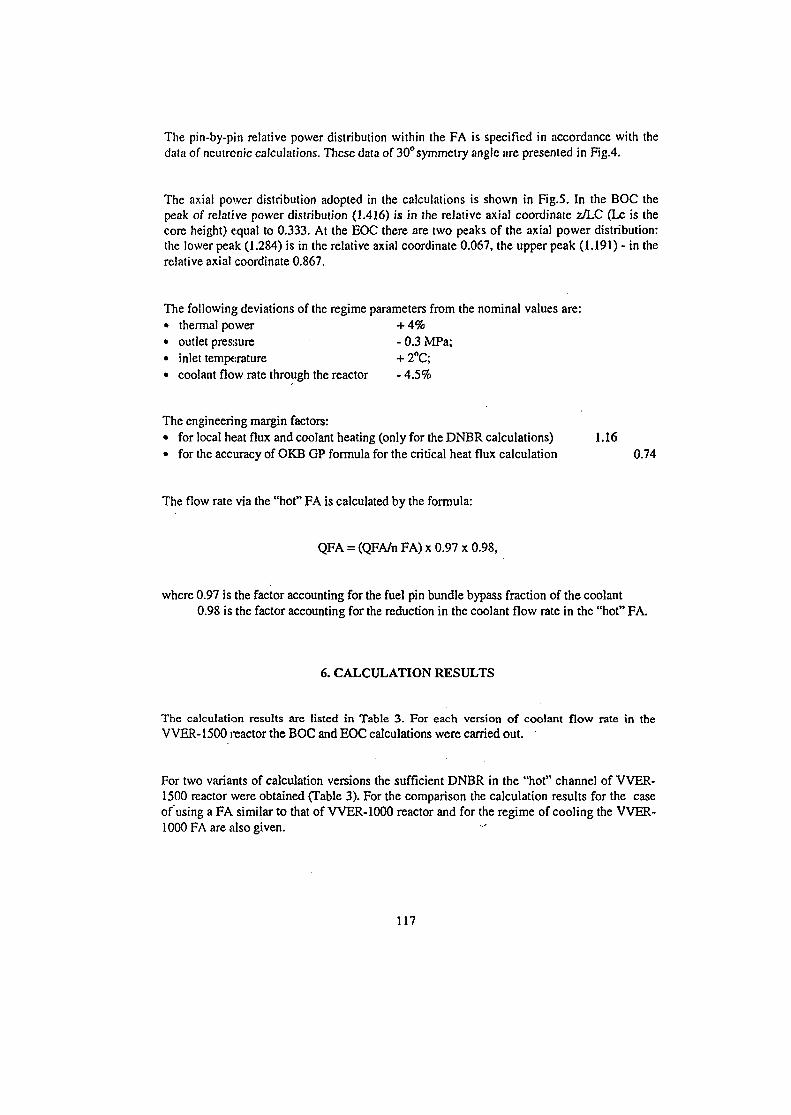
The pin-by-pin relative power distribution within the FA is specified in accordance with thedata of neutronic calculations. These data of 30°symmetry angle are presented in Fig.4.
The axial power distribution adopted in the calculations is shown in Fig.5. In the BOC thepeak of relative power distribution (1.416) is in the relative axial coordinate z/LC (Lc is thecore height) equal to 0.333. At the EOC there are two peaks of the axial power distribution:the lower peak (1.284) is in the relative axial coordinate 0.067, the upper peak (1.191) - in therelative axial coordinate 0.867.
The following deviations of the regime parameters from the nominal values are:• thermal power + 4%• outlet pressure - 0.3 MPa;• inlet temperature + 2°C;• coolant flow rate through the reactor - 4.5%
The engineering margin factors:• for local heat flux and coolant heating (only for the DNBR calculations) 1.16• for the accuracy of OKB GP formula for the critical heat flux calculation 0.74
The flow rate via the "hot" FA is calculated by the formula:
QFA = (QFA/n FA) x 0.97 x 0.98,
where 0.97 is the factor accounting for the fuel pin bundle bypass fraction of the coolant0.98 is the factor accounting for the reduction in the coolant flow rate in the "hot" FA.
6. CALCULATION RESULTS
The calculation results are listed in Table 3. For each version of coolant flow rate in theVVER-1500 reactor the BOC and EOC calculations were carried out.
For two variants of calculation versions the sufficient DNBR in the "hot" channel of VVER-1500 reactor were obtained (Table 3). For the comparison the calculation results for the caseof using a FA similar to that of VVER-1000 reactor and for the regime of cooling the VVER-1000 FA are also given.
117
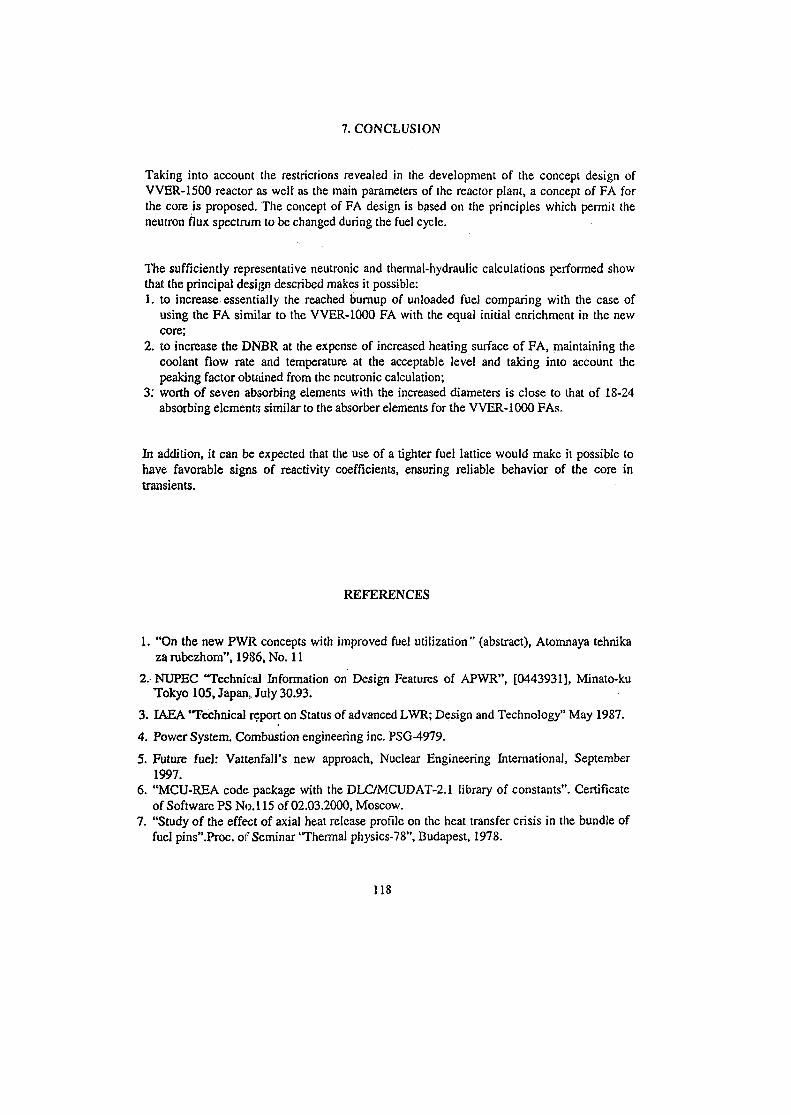
7. CONCLUSION
Taking into account the restrictions revealed in the development of the concept design ofVVER-1500 reactor as well as the main parameters of the reactor plant, a concept of FA forthe core is proposed. The concept of FA design is based on the principles which permit theneutron flux spectrum to be changed during the fuel cycle.
The sufficiently representative neutronic and thermal-hydraulic calculations performed showthat the principal design described makes it possible:1. to increase essentially the reached burnup of unloaded fuel comparing with the case of
using the FA similar to the VVER-1000 FA with the equal initial enrichment in the newcore;
2. to increase the DNBR at the expense of increased heating surface of FA, maintaining thecoolant flow rate and temperature at the acceptable level and taking into account thepeaking factor obtained from the neutronic calculation;
3: worth of seven absorbing elements with the increased diameters is close to that of 18-24absorbing elements similar to the absorber elements for the VVER-1000 FAs.
In addition, it can be expected that the use of a tighter fuel lattice would make it possible tohave favorable signs of reactivity coefficients, ensuring reliable behavior of the core intransients.
REFERENCES
1. "On the new PWR concepts with improved fuel utilization" (abstract), Atomnaya tehnikaza rubezhom", 1986, No. 11
2. NUPEC "Technical Information on Design Features of APWR", [0443931], Minato-kuTokyo 105, Japan,, July 30.93.
3. IAEA "Technical report on Status of advanced LWR; Design and Technology" May 1987.
4. Power System. Combustion engineering inc. PSG-4979.
5. Future fuel: Vattenfall's new approach, Nuclear Engineering International, September1997.
6. "MCU-REA code package with the DLC/MCUDAT-2.1 library of constants". Certificateof Software PS No.l 15 of 02.03.2000, Moscow.
7. "Study of the effect of axial heat release profile on the heat transfer crisis in the bundle offuel pins".Proc. of Seminar'Thermal physics-78", Budapest, 1978.
118
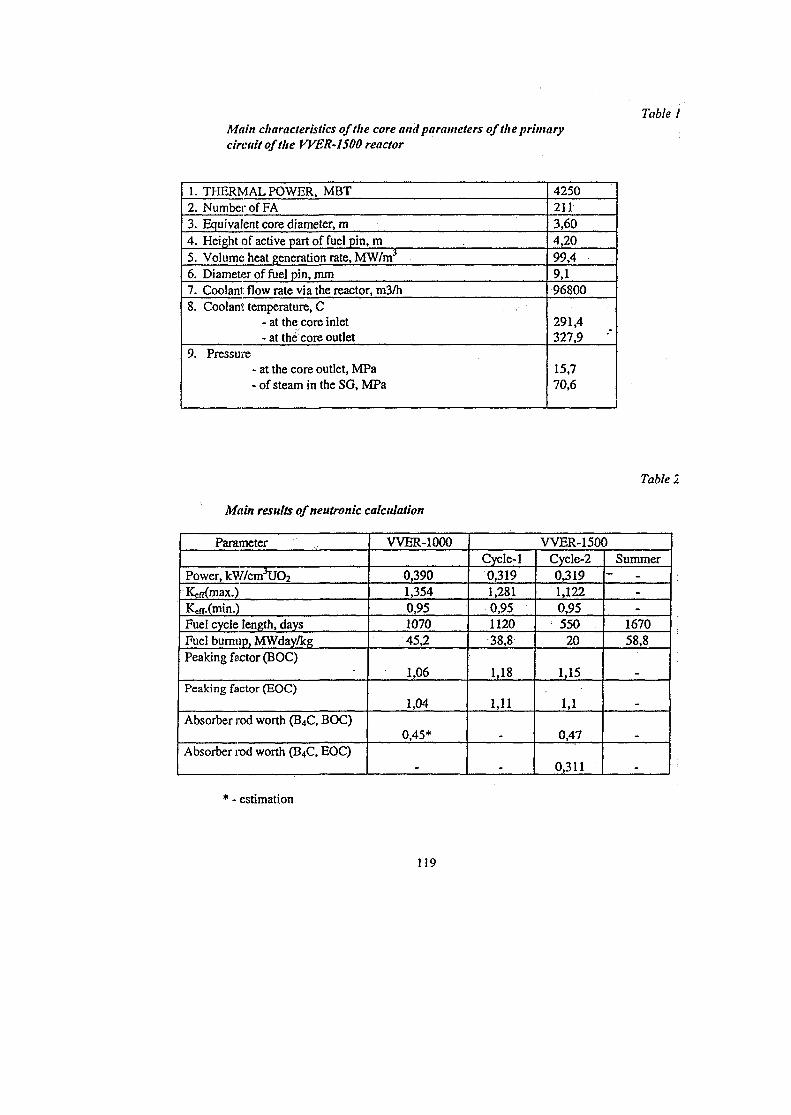
Table 1Main characteristics of the core and parameters of the primarycircuit of the WER-1500 reactor
1. THERMAL POWER, MBT2. Number of FA3. Equivalent core diameter, m4. Height of active part of fuel pin, m5. Volume heat generation rate, MW/m3
6. Diameter of fuel pin, mm7. Coolant flow rate via the reactor, m3/h8. Coolant temperature, C
- at the core inlet- at the core outlet
9. Pressure- at the core outlet, MPa- of steam in the SG, MPa
42502113,604,2099,49,196800
291,4327,9
15,770,6
Table 2
Main results ofneutromc calculation
Parameter
Power, kW/cn^UOzKefrtmax.)K<.fr.(min.)Fuel cycle length, daysFuel bumup, MWday/kgPeaking factor (BOC)
Peaking factor (EOC)
Absorber rod worth (B4C, BOC)
Absorber rod worth (B4C, EOC)
WER-1000
0,3901,3540,95107045,2
1,06
1,04
0,45*
VVER-1500Cycle-10,3191,2810,95112038,8
1,18
1,11
_
Cycle-20,3191,1220,95550
20
1,15
1,1
0,47
0,311
Summer-
--
167058,8
—
* - estimation
119
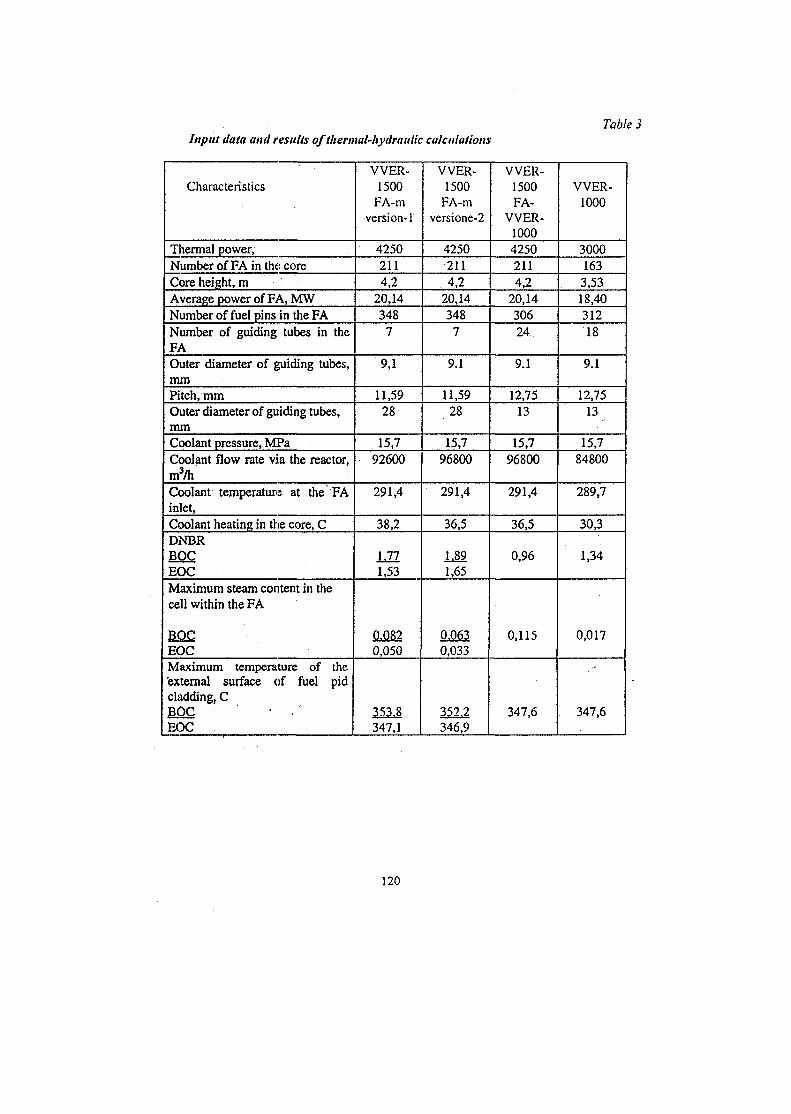
Table 3Input data and results of thermal-hydraulic calculations
Characteristics
Thermal power,Number of FA in the coreCore height, mAverage power of FA, MWNumber of fuel pins in the FANumber of guiding tubes in theFAOuter diameter of guiding tubes,mmPitch.mmOuter diameter of guiding tubes,mmCoolant pressure, MPaCoolant flow rate via the reactor,m3/hCoolant temperature at the FAinlet,Coolant heating in the core, CDNBRBOCEOCMaximum steam content in thecell within the FA
BOCEOCMaximum temperature of theexternal surface of fuel pidcladding, CBOC • •EOC
VVER-1500
FA-mversion-1
42502114,2
20,14348
7
9,1
11,5928
15,792600
291,4
38,2
1.771,53
0.0820,050
353.8347,1
VVER-1500
FA-mversione-2
42502114,2
20,143487
9.1
11,5928
15,796800
291,4
36,5
1.891,65
0.0630,033
352.2346,9
VVER-1500FA-
VVER-100042502114,2
20,1430624
9.1
12,7513
15,796800
291,4
36,5
0,96
0,115
347,6
VVER-1000
30001633,5318,4031218
9.1
12,7513
15,784800
289,7
30,3
1,34
0,017
347,6
120
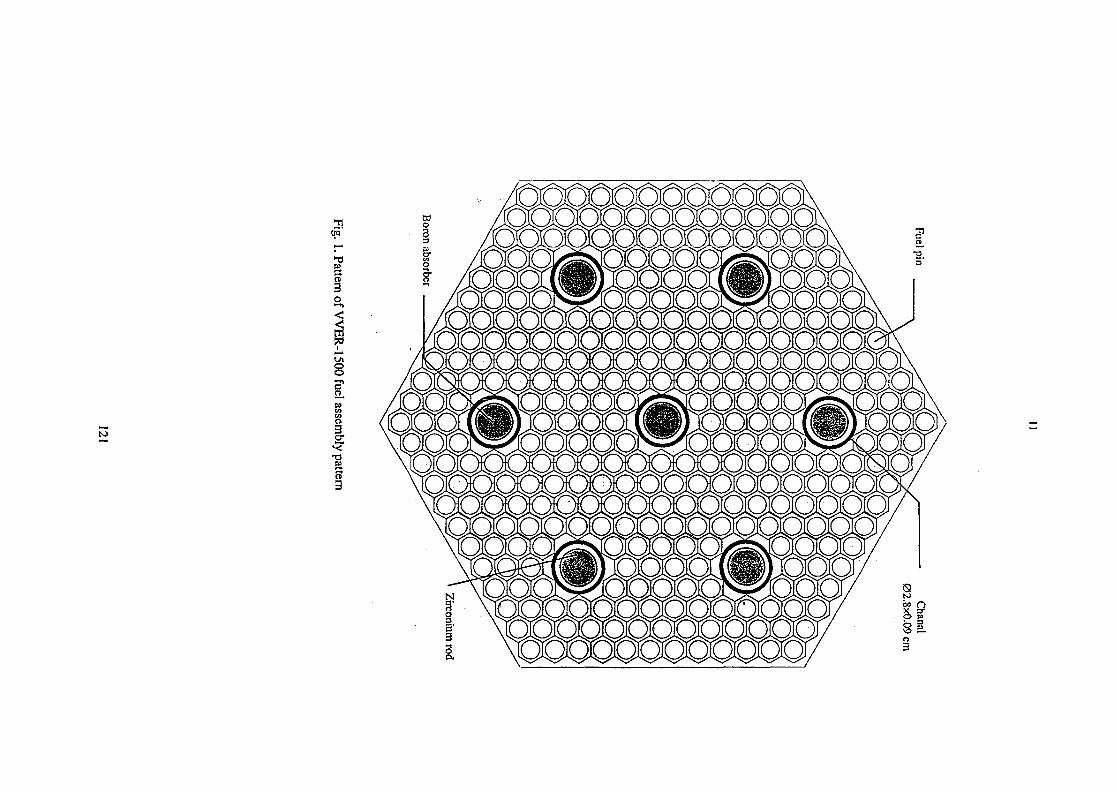
tw
3
3o
0QO0O000OOCX
t ooooo
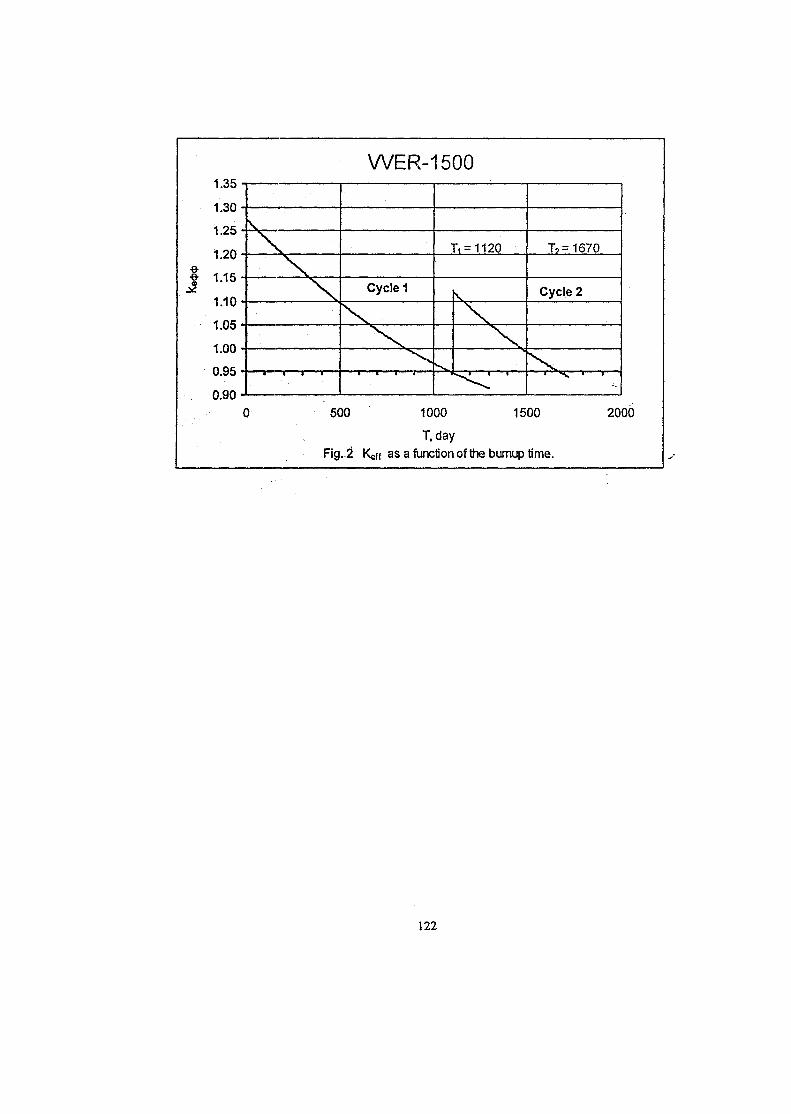
WER-1500
•9-•8-
1.35
1.30
1.25
1.20
1.15
1.10
1.05
1.00
0.95
0.90
v\
\\ Cycle 1
\
Ti = 1120
k
\
T,= 1670
Cycle 2
500 1000 1500
T.dayFig. 2 Keff as a function of the burnup time.
2000
122
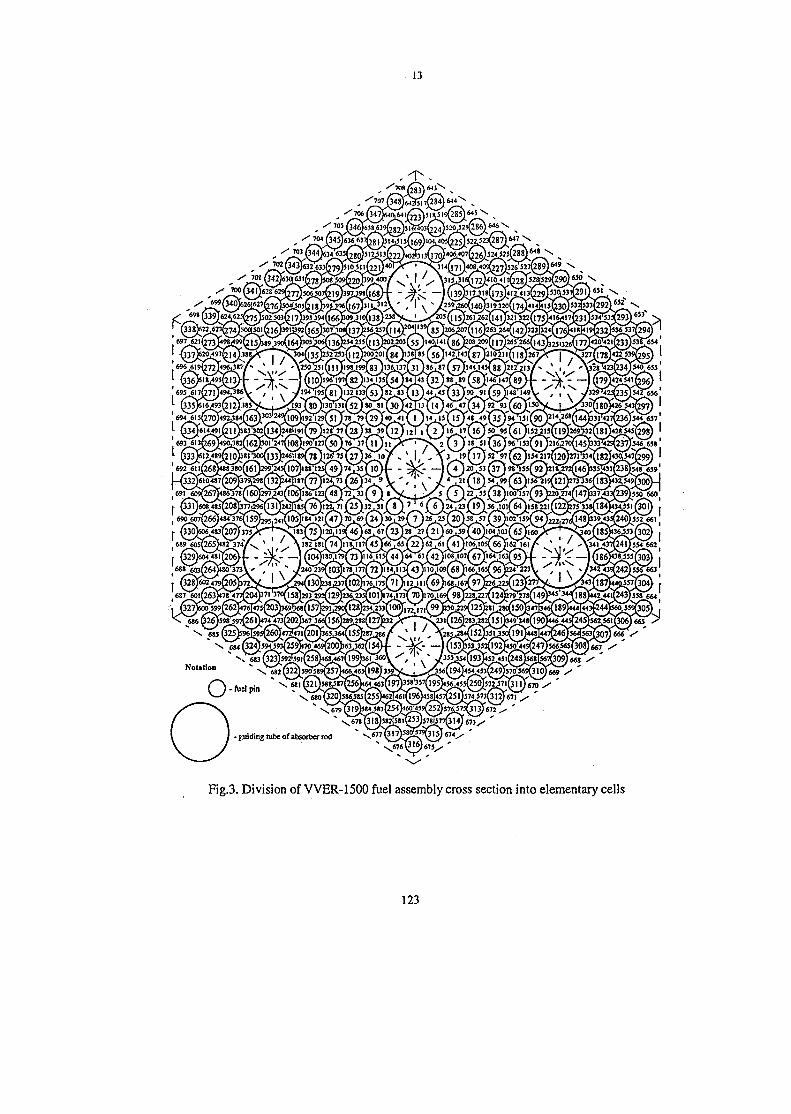
13
54 ) 84143 32 ) 88 J!9 55 1I46J47 89
I94'I9S 8! }I32 I33( 53 ) 82 83 ( 13 ) « . 45 33 )*>
24,(105)184 121(47)70.69(24130,29
Fig.3. Division of VVER-1500 fuel assembly cross section into elementary cells
123
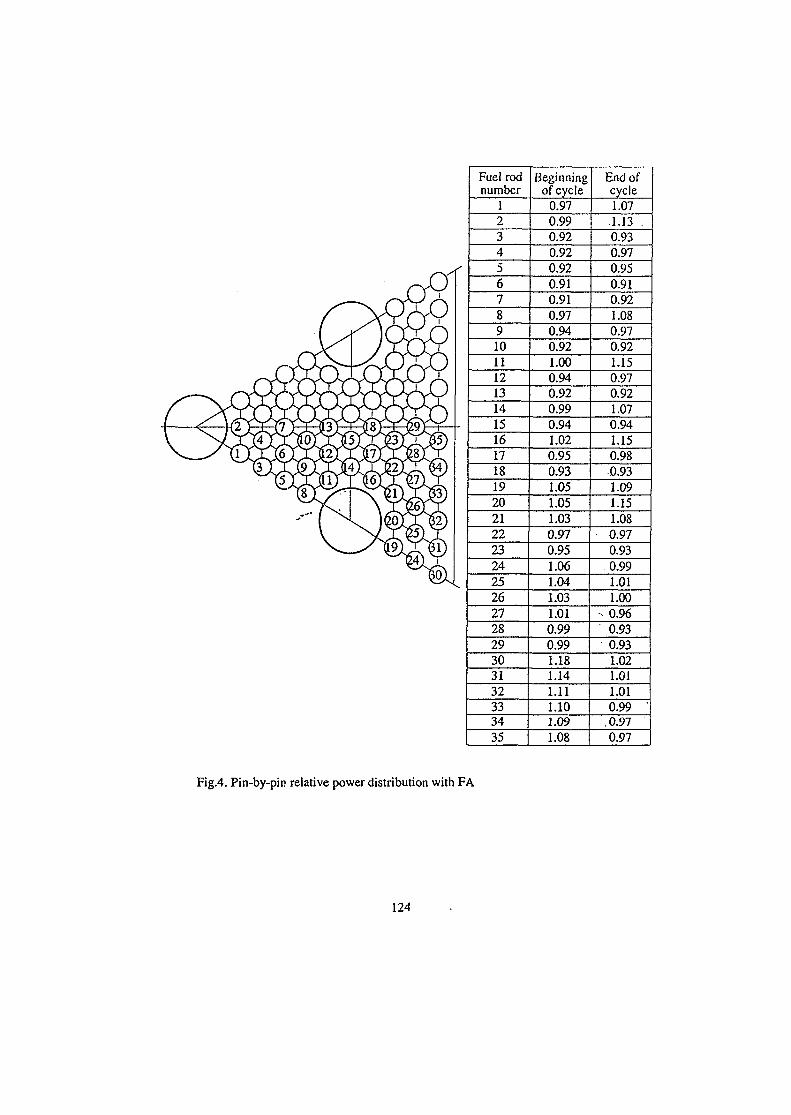
Fuel rodnumber
1234567891011121314151617181920212223242526272829303132333435
Beginningof cycle
0.970.990.920.920.920.910.910.970.940.921.000.940.920.990.941.020.950.931.051.051.030.970.951.061.041.031.010.990.991.181.141.111.101.091.08
End ofcycle1.07.1.13 .0.930.970.950.910.921.080.970.921.150.970.921.070.941.150.980.931.091.151.080.970.930.991.011.000.960.930.931.021.011.010.99 '
. 0.970.97
Fig.4. Pin-by-pin, relative power distribution with FA
124
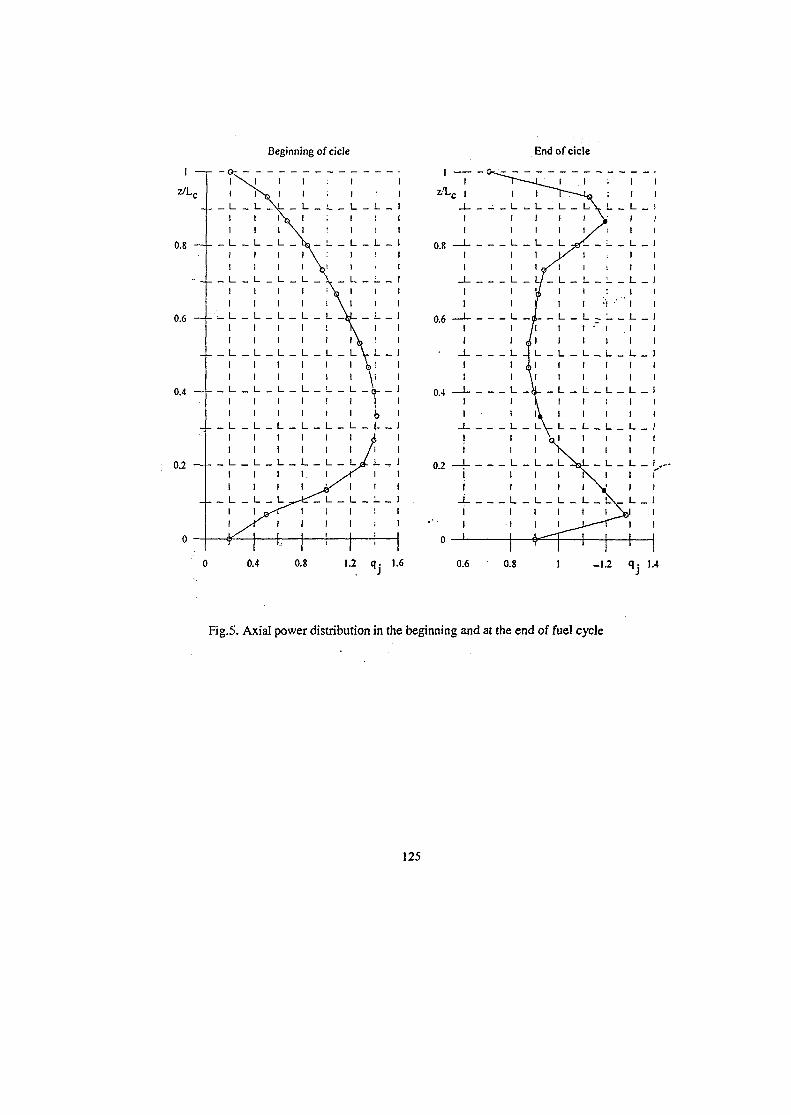
Beginning of cicle Endofcicle
1 —
z/Lc
0.8 —
0.6 —
0.4 —
0.2 —
- _ 1 L \ _ L _ 1- _1 1 \ I :1 1 \l
_ _ 1 1 1 \ _ :1 1 I l \ :
- _ l _ _ L _ U _ L _ \ _11
1 1 '• \1 \
_ _ L _ 1 1 1 L_\1 i
1 1 1 1 11 1 1 1 11 1 ! 1 11 1 !1 1 1 I !1 1 1 !1 1 11 1 1 1 I1 1 1 1 1t i l l !
_ _ ! L _ I _ _ 1 _ _ L _1 1 1 1 1 yA1 i 1
_ _ 1 L _ L^i^I L _1 a^T 1 11 y 1 1 1if if
I1
1 L _[
!
1 i'
1 i1
1
_ _ i- _.V 1
\ > >L A . J
\>!\ l
1 Jj J
!b
L _ L _ I
&A
LJ. i. _ Jr i
!I J J
i
j
i
' 10.4 0.8 1.2 q.} 1.6
Fig.5. Axial power distribution in the beginning and at the end of fuel cycle
125
illllliSK01ST083
INVESTIGATION AND DEVELOPMENT OF METHODS FOR CONTROL OFPOWER AND POWER DISTRIBUTION IN THE VVER-1000 REACTOR
Filimonov P.E., Averiyanova S.P. (RRC "KurchatovInstitute, INR)
ABSTRACT
For the past seven years a series of works on the investigation and development of methods forcontrol of power distribution in the WER-1000 core under non-steady operation conditionswas carried out at the RRC "Kurchatov Institute". These were:1. development of control methods;2. development of the IR code for in-line forecasting the reactor operation and its
implementation at the NPP;3. development of improved control algorithms for the WER-1000 reactor;4. tests of daily power load following regime at the Zaporozhie NPP.
1. WORKS ON CONTROL METHODS.
Method of offset-offset phase diagram.
One of the problems of W E R reactor control is the prevention and suppression of axial xenonoscillations of power distribution in the core. This reduces practically to the control of axialoff-set (offset is the percentage ratio of the difference in the power of the upper and lower corehalves to their sum).
The process of free (in the absence of controlling actions) xenon oscillations, i.e. periodicalaxial displacements of the peak power distribution, is described in time by sinusoidal change ofoffset and determined by axial redistribution of xenon nucleus concentration. The offset valueto which the damping oscillations approach in damping (the sinusoidal "axis") corresponds tothe equilibrium stationary state xenon distribution.
In the analysis of processes associated with xenon oscillations it was proposed to consider twovalues of axial offset: at each instant: "actual offset" which reflects the current actual powerdistribution and "equilibrium offset" representing the position of the equilibrium point at thegiven moment. On tliis basis the method for the analysis of transients and practical control ofthe reactor was developed, which uses the so-called offset-offset diagram - the phase diagram
127
of nonequilibrium process in the axes of actual and equilibrium offsets. The method waspublished in [1] where a system of equations of free xenon oscillations was written andanalyzed, and the recommendations on the control for offset were obtained. The method of thereactor control using the offset-offset diagram has been patented [2].
Method for adapting the reactor calculation model to the nonequilibrium state ofreactor.
In the solution of problems of calculation modeling of reactor operation under non-steady stateconditions, the problem of adopting the calculation model (code) to the actual current state ofthe reactor with the nonsteady state, in the general case, xenon distribution has the principleimportance.
A method of "adopting by actual offset" which consists in the repetition of the reactor historyby modeling process with some additional controlling actions directed to maintaining the valueof actual axial offset at each moment was proposed. The method was described in [3] wherethe convergence of the modeling and actual processes in the use of actual offset adapting wasproved by the method of offset-offset diagram (see above). Also some solutions of the modelproblem, adapting of the calculation (the IR code) (see below), for various non-equilibriumprocesses having been modeled by the same code are presented.
In the method of adapting by actual offset was realized as one of the IR code modes. Thepractice of modeling the real (registrated at the NPP) transients confirms the efficiency of thismethod.
Reactor control by the method of control rod group train.
The modern methods of reactor control in the load-following operation regime envisage theuse of several groups of control rods (CR), which move in the core with the variable distancebetween them. A control method with the use of the "CR group train" was proposed. In thismethod the distance between each pair of neighbor groups changes in the same way (by theiraxial position). Hence at each moment all the distances are equal. Independently of the numberof groups, this makes it possible to specify their position by means of two parameters? the totaldepth of insertion and die distance. This .simplifies the procedure of control and creates thebasis for effective automation of control. The method was described in [4] where the formulasof representing the position of an arbitrary number of participating control groups dependingon two train's parameters: the total depth of insertion and distance are derived ; the results ofcalculation analysis of the efficiency of the method and of the calculation of the typicalchanging of the WER-1000 reactor power under the control of group train. In this paper theway of automatic power control and axial offset using the group train is also proposed. '
Method of calculation estimation of pin-by-pin power distribution in modeling non-steady state processes.
The accurate calculation of pin-by-pin power distribution in the W E R reactors is performedusing the PERMAK code for steady states. A method for estimating the pin-by-pin power
128
distribution of non-steady state processes in the course of calculation modeling using thesteady state conditions preliminary calculated by the PERMAK code was proposed. Thismethod has been realized in the IR code [5].
Method of spatial localization of xenon processes.
For control of the reactor operating in the daily load schedule a method of "spatial localizationof xenon processes" was developed. The essence of this method is that when the reactor powerdecreases the axial power distribution is formed by two CR groups in such a way that thepower changes only in the upper half of the core; in this case the of xenon transients occur in asmall,volume and they cannot induce high spatial oscillations of power distribution. Thismethod requires that Che offset value would be changed by a definite schedule and this makes itdifferent from the commonly accepted principle of maintaining a constant offset. Theadvantage of this method is that it does not need the boron control for reactor operation andthus no liquid radioactive wastes are produced, the load-following can be made at any timeduring the fuel cycle. On the basis of the method a control algorithm was developed, whichwas tested at the Zaporozhie NPR (see below).
Explanation of the effect of maintaining the offset stability
As known, as the WER-1000 fuel load burns out the axial power distribution becomes lessstable. The calculations show that free xenon oscillations of offset should have a divergentcharacter at the end of fuel cycle. Nevertheless the operation experience shows that the reactoris stable during the whole fuel cycle, and no divergent oscillations are observed. The followingexplanation of this effect was proposed. Under normal operation conditions the reactor alwaysoperates with the switched-on power regulator (ARM) which controls the CR working groupinserted into the upper part of the core. By the end of the fuel cycle the fuel burnup is higher inthe core center andlower part. As a result, the peak of multiplying properties displaces to theupper part of the core and then the ARM, in addition to its role as a stabilizer of integralpower, also acts as a stabilizer of axial offset. With the increase in the offset, the powerredistribution to the upper part of the core (to the region of higher multiplying" properties)induces the rise of reactivity which the ARM compensates by lowering the working group, andthis, in turn, results in the decrease in the offset, i.e. in the suppression of oscillations. Thiseffect of offset stabilization due to the ARM operation was described in [5], which gives asexample the real, registrated at the Unit 5 of NVNPP, case of suppressing xenon oscillationsonly by the ARM operation, without operator's intervention.
2. CREATION OF CALCULATION CODE FOR ON-LINEFORECASTING THE REACTOR OPERATION AND ITS IMPLEMENTATION AT
NPP.
According to the requirements of GOST R50088-92 for the NPP equipped with W E Rreactors of in-line calculation forecasting of reactor behavior under nonsteady operationconditions shall be ensured. For this purpose the above mentioned IR (Reactor Simulator)
129
code was created. The IR code is designed for solving the problems of forecasting in thesystem of controlling the NPP units with VVER-1000 reactors as well as for performingcalculations in works on improvement of fuel cycles and algorithms of reactor control.
The code was certificated in the RF Gosatomnadzor [6]. When preparing the code tocertification, its verification by modeling the real nonsteady state processes recorded at theNovoVoronezh, Zaporozhie and Balakovo NPPs was carried out. The code's description isgiven in [7].
The code was implemented to the pilot operation at the NovoVoronezh, Zaporozhie andRovno NPPs. Using the IR code the experiment on the Zaporozhie NPP on the WER-1000reactor manoewring was prepared (see below), the data on the change in the heat generationrates to the fuel pins in the load-follow operation regime. These data are used for the analysisof fuel thermal-mechanical resistance. The IR code is used in designing calculations forsubstantiation of new algorithms of power and power distribution control of WER-1000reactors.
At present the work on the IR code adaptation to the normal ICIS of WER-1000 is beingcarried out as well as: the work on the IR code adaptation to the code of the calculation of theNPP unit dynamics as a module ensuring the reactor calculation.
3. DEVELOPMENT OF IMPROVED CONTROL ALGORITHMSFOR THE VVER-1000 REACTOR
For some years the works on improvement of the existing algorithms for the WER-1000power and power distribution control had been carried out. It was shown by the IR calculationmodeling that the VVER-1000 reactor can operate in the load-following regime from theviewpoint of the power and power distribution control. On the basis of calculation studies,results obtained from tests of load-following regimes at the Zaporozhie NPP (see below) andtaking into the international experience the improved algorithms of power and powerdistribution control for the commercial WER-1000, universal with regard to both the baseload and load-following operation regimes were developed.
The main feature of the advanced algorithms is the use of three CR groups inserted to the coreat a shortened distance (60%H - instead of 80%H). The number of CR in the groups and their,arrangement in the core are chosen so that using three control rod groups the reactor could beunloaded to any power level without changing the boric acid concentration in the coolant andat minimum change in the spatial power distribution. In addition, the improved algorithmsenvisage the use of the most up-to-date methods for controlling the power distribution andxenon transients, in particular, the above method of spatial localization of xenon processes andthat of offset-offset phase diagram.
The improved algorithms will be first implemented for the base load operation regime at theRostov NPP Unit 1 which is under construction. At the operating NPP with the WER-1000the use of improved control algorithms is planned to be implemented simultaneously with thetransition to the new fuel cycle with the uranium-gadolinium fuel. Similar control algorithms
130
were developed for the reactor with an increased number of CR in the frame of new designs ofNPP with the VVER-1000.
4. TEST OF DAILY LOAD-FOLLOWING REGIME AT THE ZAPOROZHEE NPP
In March-April of 1998 the tests of reactor operation in the daily load schedule (with thepower reduction from 100% to 80% for five night hours) were carried out. The controlalgorithm based on the above method of spatial localization of xenon processes was used. Thetests had been carried out for five days (five cycles of daily load-following cycles were fulfilled)under the EOC conditions; the control was accomplished by two CR groups and changing thereactor coolant temperature; the boron control system was not used. In the course of testsvarious versions of control by means of CR groups and changing the coolant temperature,various regimes of reactor power regulators and turbine were tested. On the whole the controldid not offer serious difficulties, the calculation forecast of the reactor behavior was confirmed.The tests performed have demonstrated for the first time the real possibility of the WER-1000power unit to operate in the daily load schedule. The course of tests and the results obtainedare described in [8].
REFERENCES
1. P..Filimonov. Control of power distribution in the W E R reactors using the offset-offsetdiagram. Atomnaya Energiya, v. 73, No. 3, 1992.
2. Patent No.2030800 applied for the invention " Method of the control of axial powerdistribution in the nuclear reactor".
3. P.Filimonov, S.Averiyanova. Adapting of a calculation model for the current reactor state.Atomnaya Energia, v. 80, No. 6, 1996.
4. P..Filimonov, S..Averiyanova, MFilimonova. Control of working CR groups~in the load-following regime of WER-1000 reactor. - Atomnaya Energiya, v. 84, No. 5, 1998.
5. P.Filimonov. Y.Krainov. V.Proselkov Status Prospects of Activities of Algorithms andMethods in WER-1000 Core Control. - W E R Reactor Fuel Performance, Modeling andExperimental Support. Proceedings of an International Seminar, held in StConstantine,Varna, Bulgaria, on 7-11 November 1994/
6. P.Filimonov, V.Mamichev, S.Averiyanova. The IR code. Certificate No. 113, 02.03.2000.7. P.Filimonov, V.Mamichev, S.Averiyanova. The Code " Reactor Similator" for modeling
load-following operation regimes of WER-1000. Atomnaya Energiya, v. 84, No. 6,1998.8. P.Filimonov, S.Averiyanova, S.Oleinik, S.Klimov, A.Depenchuk. Tests of WER-1000
manoeuvring at the Zaporozhie NPP Unit 5. Atomnaya Energiya, v. 85, No. 5, 1998.
131
SK01ST084
Comparative calculations of the WWER fuel rod Ihcrmophysicn! characteristicsemploying the TOPRA-s and the TRANSURANUS computer codes.
Scheglov A.S., Proselkov V.N., Sidorenko V.D. (INR RRC KI),Passage G., Stefanova S. (INRNE, BAS, Bulgaria),Haralampieva Tz., Peychinov Tz. (KNPP, Bulgaria)
ABSTRACT
A short description of the TOPRA-s computer code is presented. The code isdeveloped to calculate the thermophysical cross-section characteristics of the WWER fuelrods: fuel temperature distributions and fuel-to-cladding gap conductance. The TOPRA-sinput does not require the fuel rod irradiation pre-history (time dependent distributions oflinear power, fast neutron flux and coolant temperature along the rod). The required inputconsists of the considered cross-section data (coolant temperature, burnup, linear power) andthe overall fuel rod data (burnup and linear power). TOPRA-s is included into the KASKADcode package. Some results of the TOPRA-s code validation using the SOFIT-1 and IFA-503.1 experimental data, are shown.
A short description of the TRANSURANUS code for thermal and mechanicalpredictions of the LWR fuel rod behavior at various irradiation conditions and its version forWWER reactors, are presented.
The results of the TOPRA-s and TRANSURANUS comparative calculations ofWWER fuel rod thermophysical characteristics are summarized. The-"'results showreasonable agreement of the fuel temperatures calculated by the two codes. Thediscrepancies of the fiiel-to-cladding gap conductance at high burnup are discussed. In thisregard it is stated, that these discrepancies (for gap conductance values greater than 0.8-i W/cm2K) influence relatively weakly the calculated fuel temperature values.
It is shown in [1], that for the WWER fuel rods it is possible to significantly simplifythe models describing the diverse processes taking place in the fuel rod during the in-reactoroperation, without any significant precision worsening of the calculated fuel temperaturefield. At that, it is possible to avoid the use-of the preceding (up to the calculated time point)power history and to consider each of the fuel rod cross-sections separately using the rodaverage linear power and burnup only. Before all, this, concept can be applied to "typical" fuelrods, i.e. to rods operating at working conditions, representative for the most of the fuel rodsof a particular reactor design at steady state (base) operation conditions. On the base of thisspecific approach, the TOPRS-s code has been developed in the KNC "Kurchatov Institute".
1. THE TOPRA-s CODE
The: main correlations used in the TOPRA-s code for simplified engineeringcalculations of the WWER fuel rod temperature distribution, are described in []]. Results ofits validation against experimental data are presented. The code has been developed on the
133
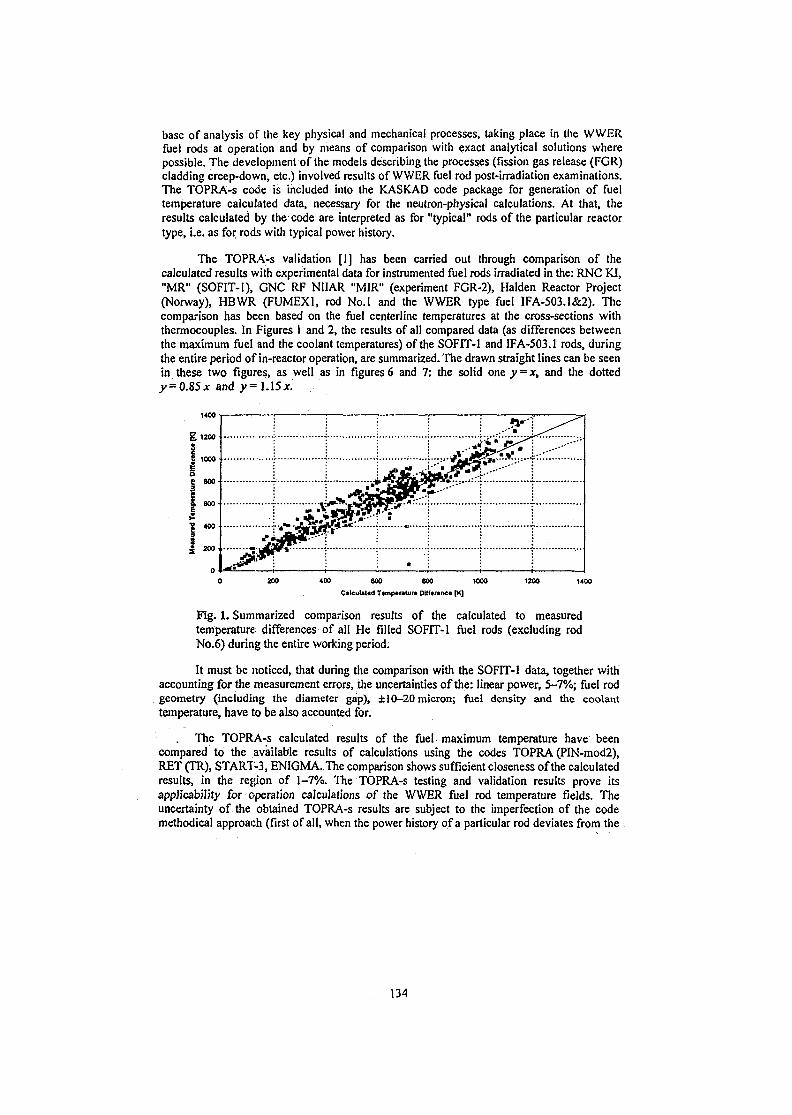
base of analysis of the key physical and mechanical processes, taking place in the WWERfuel rods at operation and by means of comparison with exact analytical solutions wherepossible. The development of the models describing the processes (fission gas release (FGR)cladding creep-down, etc.) involved results of WWER fuel rod post-irradiation examinations.The TOPRA-s code is included into the KASKAD code package for generation of fueltemperature calculated data, necessary for the neutron-physical calculations. At that, theresults calculated by the code are interpreted as for "typical" rods of the particular reactortype, i.e. as for rods with typical power history.
The TOPRA-s validation [1] has been carried out through comparison of thecalculated results with experimental data for instrumented fuel rods irradiated in the: RNC KI,"MR" (SOFIT-I), GNC RF NHAR "MIR" (experiment FGR-2), Halden Reactor Project(Norway), HBWR (FUMEX1, rod No.l and the WWER type fuel IFA-503.1&2). Thecomparison has been based on the fuel centeriine temperatures at the cross-sections withthermocouples. In Figures 1 and 2, the results of all compared data (as differences betweenthe maximum fuel and the coolant temperatures) of the SOFIT-1 and IFA-503.1 rods, duringthe entire period of in-reactor operation, are summarized. The drawn straight lines can be seenin these two figures, as well as in figures 6 and 7: the solid one y — x, and the dottedy = 0.S5x and y=\A5x.
0 200 400 600 600 1000 1200 1400Calculated Ttmperaturt Different* [K]
Fig. 1. Summarized comparison results of the calculated to measuredtemperature differences of all He filled SOFIT-1 fuel rods (excluding rodNo.6) during the entire working period.
It must be noticed, that during the comparison with the SOFIT-1 data, together withaccounting for the measurement errors, the uncertainties of the: linear power, 5—7%; fuel rodgeometry (including the diameter gap), ±10-20 micron; fuel density and the coolanttemperature, have to be also accounted for.
. The TOPRA-s calculated results of the fuel maximum temperature have beencompared to the available results of calculations using the codes TOPRA (PIN-mod2),RET (TR), START-3, ENIGMA. The comparison shows sufficient closeness of the calculatedresults, in the region of 1-7%. The TOPRA-s testing and validation results prove itsapplicability for operation calculations of the WWER fuel rod temperature fields. Theuncertainty of the obtained TOPRA-s results are subject to the imperfection of the codemethodical approach (first of all, when the power history of a particular rod deviates from the -
134
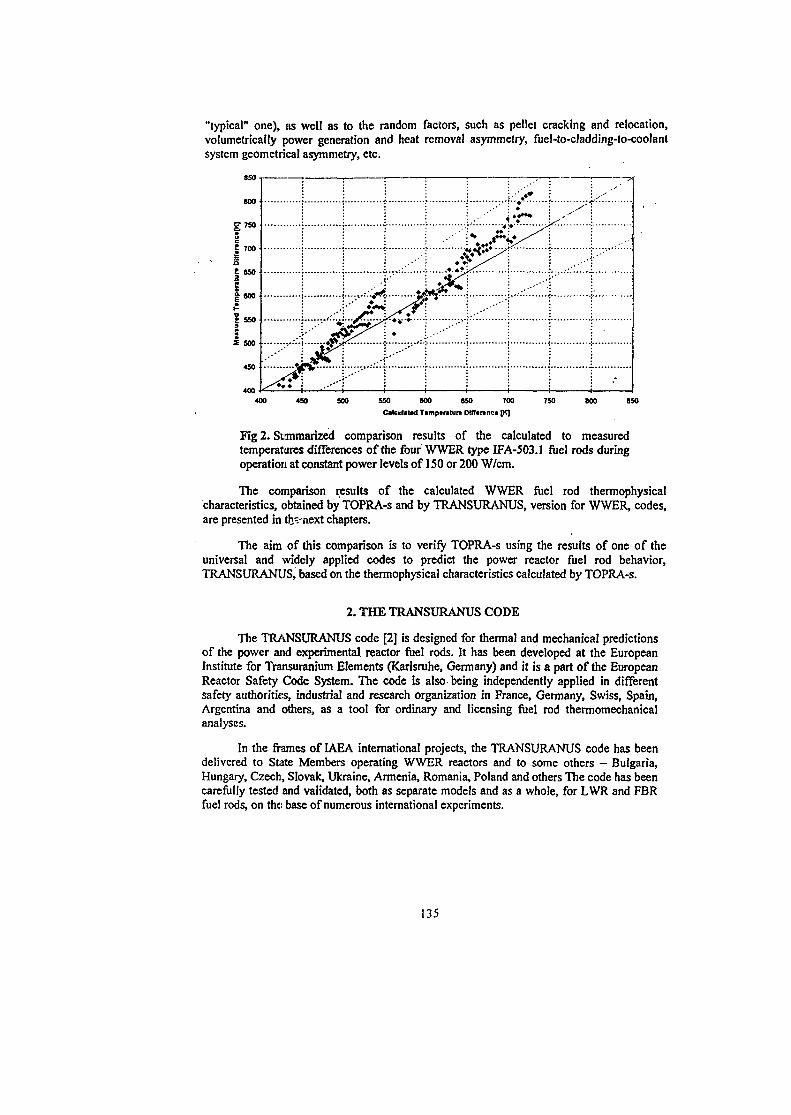
"typical" one), as well as to the random factors, such as pellet cracking and relocation,vofumetrically power generation and heat removal asymmetry, fuel-to-cladding-to-coolantsystem geometrical asymmetry, etc.
850
800
g75O
1700
§t 650
600
| 5 5 0
3 500
+J
• « •>«
•
*• .» • /?..
:r* >';j• ^
-
550 600 850 700
Calculated Timptratura Dinirtnct [K]800
Fig 2. Summarized comparison results of the calculated to measuredtemperatures differences of the four WWER type IFA-503.1 fuel rods duringoperation at constant power levels of 150 or 200 W/cm.
The comparison results of the calculated WWER fuel rod thermophysica!characteristics, obtained by TOPRA-s and by TRANSURANUS, version for WWER, codes,are presented in th?.-next chapters.
The aim of this comparison is to verify TOPRA-s using the results of one of theuniversal and widely applied codes to predict the power reactor fuel rod behavior,TRANSURANUS, based on the thermophysical characteristics calculated by TOPRA-s.
2. THE TRANSURANUS CODE
The TRANSURANUS code [2] is designed for thermal and mechanical predictionsof the power and experimental reactor fuel rods. It has been developed at the EuropeanInstitute for Transuranium Elements (Karlsruhe, Germany) and it is a part of the EuropeanReactor Safety Code System. The code is also being independently applied in differentsafety authorities, industrial and research organization in France, Germany, Swiss, Spain,Argentina and others, as a tool for ordinary and licensing fuel rod thermomechanicalanalyses.
In the frames of IAEA international projects, the TRANSURANUS code has beendelivered to State Members operating WWER reactors and to some others - Bulgaria,Hungary, Czech, Slovak, Ukraine, Armenia, Romania, Poland and others The code has beencarefully tested and validated, both as separate models and as a whole, for LWR and FBRfuel rods, on the: base of numerous international experiments.
135
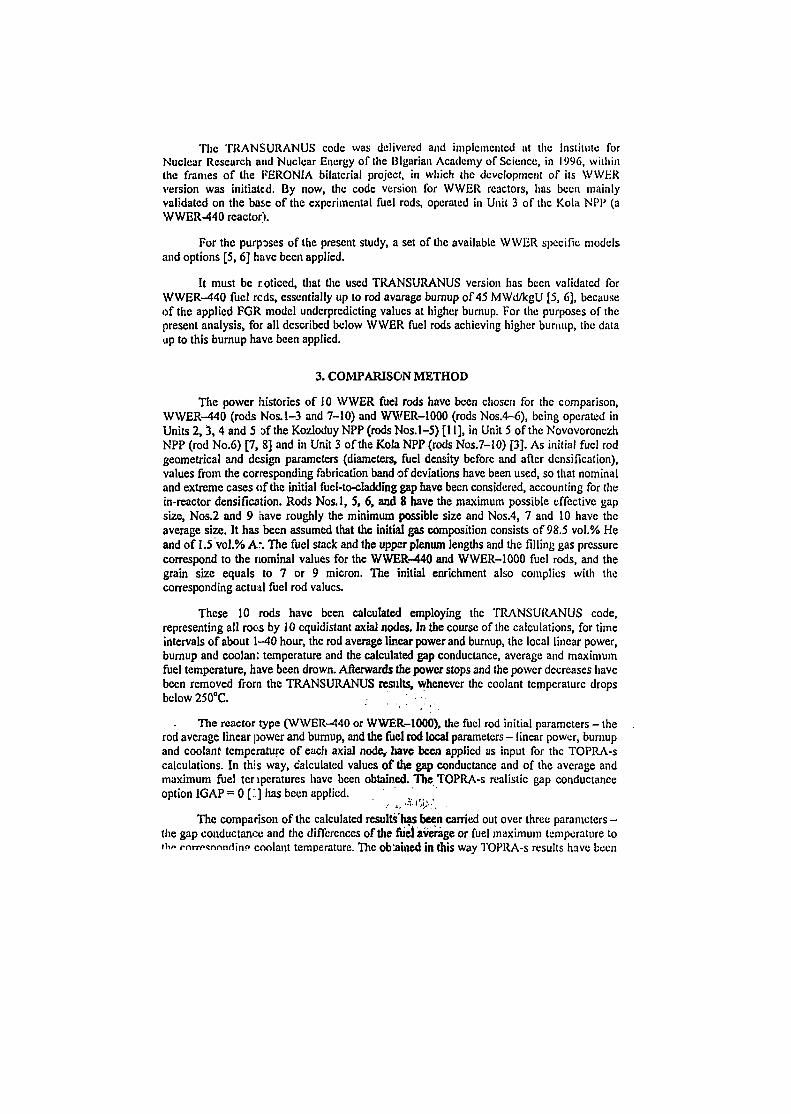
The TRANS URANUS code was delivered and implemented at the Institute forNuclear Research and Nuclear Energy of the Blgarian Academy of Science, in 1996, withinthe frames of the FERONlA bilaterial project in which the development of its WWERversion was initiated. By now, the code version for WWER reactors, has been mainlyvalidated on the base of the experimental fuel rods, operated in Unit 3 of the Kola NPP (aWWER-440 reactor).
For the purposes of the present study, a set of the available WWER specific modelsand options [S, 6] have been applied.
It must be noticed, that the used TRANSURANUS version has been validated forWWER-440 fuel reds, essentially up to rod avarage burnup of 45 MWd/kgU [5, 6], becauseof the applied FGR model undcrpredicting values at higher burnup. For the purposes of thepresent analysis, for all described below WWER fuel rods achieving higher bur imp, the dataup to this burnup have been applied.
3. COMPARISON METHOD
The power histories of 10 WWER fuel rods have been chosen for the comparison,WWER-440 (rods Nos.1-3 and 7-10) and WWER-1000 (rods Nos.4-6), being operated inUnits 2, 3, 4 and 5 af the Kozloduy NPP (rods Nos.1-5) [11], in Unit 5 of the NovovoronczhNPP (rod No.6) [7, 8] and in Unit 3 of the Kola NPP (rods Nos.7-10) [3]. As initial fuel rodgeometrical and design parameters (diameters, fuel density before and after densification),values from the corresponding fabrication band of deviations have been used, so that nominaland extreme cases of the initial fuel-to-cladding gap have been considered, accounting for thein-reactor densification. Rods Nos.l, 5, 6, and 8 have the maximum possible effective gapsize, Nos.2 and 9 riave roughly the minimum possible size and Nos.4, 7 and 10 have theaverage size. It has been assumed that the initial gas composition consists of 98.5 vol.% Heand of 1.5 vol.% A \ The fuel stack and the upper plenum lengths and the Tilling gas pressurecorrespond to the nominal values for the WWER-440 and WWER-1000 fuel rods, and thegrain size equals to 7 or 9 micron. The initial enrichment also complies with thecorresponding actual fuel rod values.
These 10 rods have been calculated employing the TRANSURANUS code,representing all rocs by 10 equidistant axial nodes. In the course of the calculations, for timeintervals of about 1—40 hour, the rod average linear power and burnup, the local linear power,burnup and coolan: temperature and the calculated gap conductance, average and maximumfuel temperature, have been drown. Afterwards the power stops and the power decreases havebeen removed from the TRANSURANUS results, whenever the coolant temperature dropsbelow 250°C. . ^
The reactor type (WWER-440 or WWER-1000), the fuel rod initial parameters - therod average linear power and bumup, and the fuel rod local parameters - linear power, burnupand coolant temperature of each axial node, have been applied as input for the TOPRA-scalculations. In this way, calculated values of the gap conductance and of the average andmaximum fuel tenperaturcs have been obtained. The TOPRA-s realistic gap conductanceoption IGAP = 0 [.'.] has been applied.
•••• '- • i i ' i > ' .
The comparison of the calculated results has been carried out over three parameters -the gap conductance and the differences of the fuel average or fuel maximum temperature tothe rnrrr<:nnnHin!> coolant temperature. The obtained in this way TOPRA-s results have been
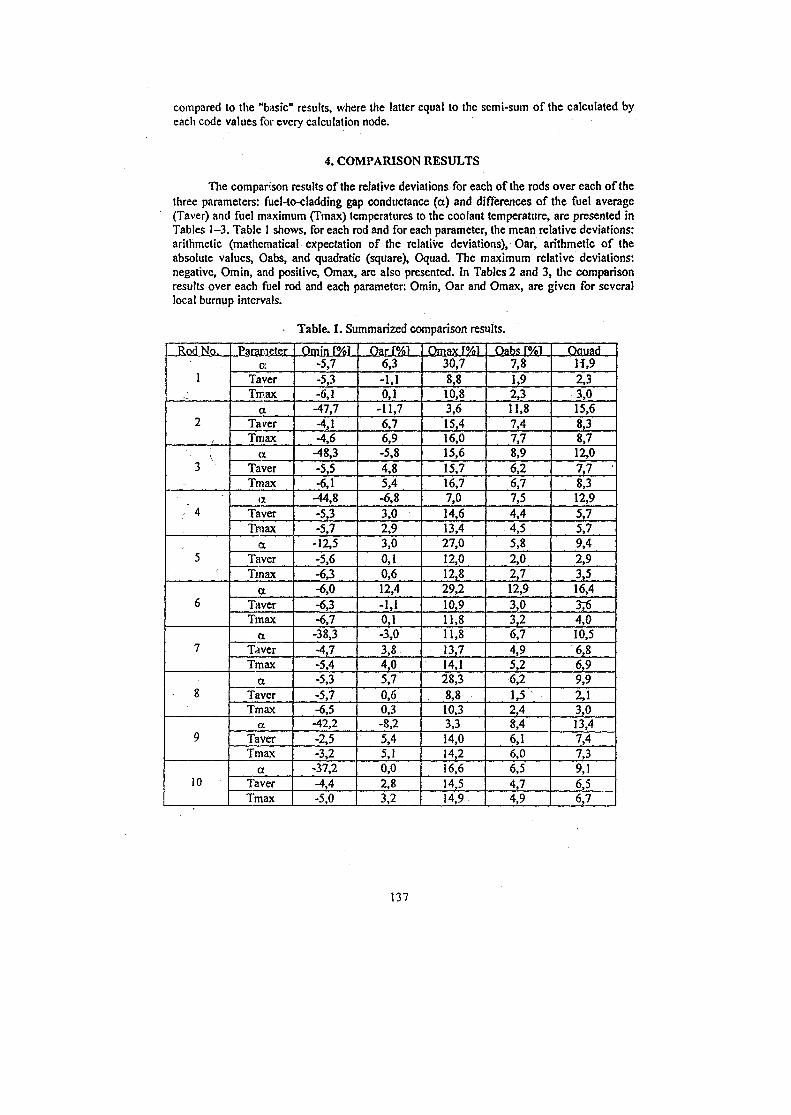
compared to the "basic" results, where the latter equal to the semi-sum of the calculated byeach code values for every calculation node.
4. COMPARISON RESULTS
The comparison results of the relative deviations for each of the rods over each of thethree parameters: fuel-to-cladding gap conductance (a) and differences of the fuel average(Taver) and fuel maximum (Tmax) temperatures to the coolant temperature, are presented inTables 1-3. Table 1 shows, for each rod and for each parameter, the mean relative deviations:arithmetic (mathematical expectation of the relative deviations), Oar, arithmetic of theabsolute values, Oabs, and quadratic (square), Oquad. The maximum relative deviations:negative, Omin, and positive, Omax, are also presented. In Tables 2 and 3, the comparisonresults over each fuel rod and each parameter. Omin, Oar and Omax, are given for severallocal burnup intervals.
Table. 1. Summarized comparison results.
Rod No.
1
2
•• [
, 4
5
6
7
8
9
10
Parametera
TaverTmax
aTaverTmax
(X
TaverTmax
aTaverTmax
aTaverTmax
aTaverTmax
aTaverTmax
aTaverTmax
oTaverTmax
aTaverTmax
Omin r%l-5,7-5,3-6,1-47,7-4,1-4,6
-48,3-5,5-6,1
-44,8-5,3-5,7
-12,5-5,6-6,3-6,0-6,3-6,7
-38,3-4,7-5,4-5,3-5,7-6,5-42,2-2,5-3,2
-37,2-4,4-5,0
Oar r%l6,3-1,10,1
-11,76,76,9-5,84,85,4-6,83,02,93,00,10,612,4
-M0,1-3,03,84,05,70,60,3-8,25,45,10,02,83,2
J3max f%l30,78,810,83,615,416,015,615,716,77,014,613,427,012,012,829,210,911,811,813,714,128,38,810,33,314,014,216,614,514,9
Oabs r%l7,81,92,311,87,47,78,96,26,77,54,44,55,82,02,712,93,03,26,74,95,26,21,52,48,46,16,06,54,74,9
OauadH,92,33,015,68,38,712,07,78,312,95,75,79,42,93,516,43T64,010,56,86,99,92,13,013,47,47,39,16,56,7
137
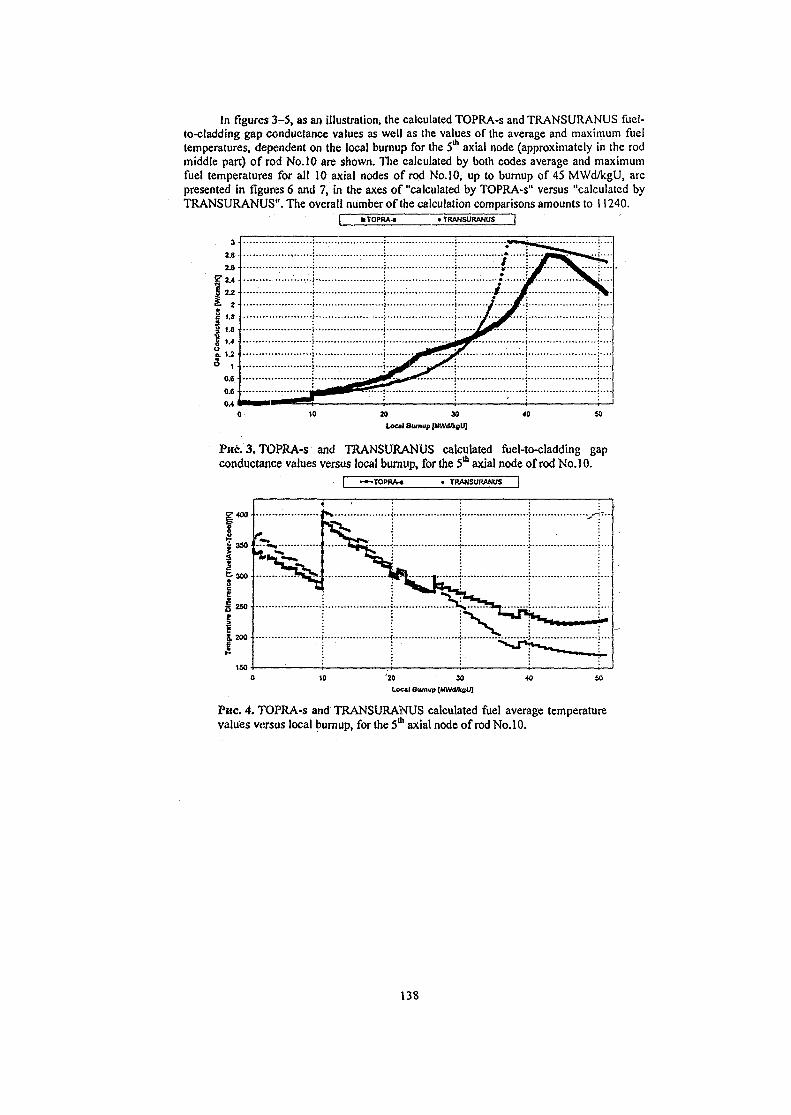
In figures 3-5, as an illustration, the calculated TOPRA-s and TRANSURANUS fuel-to-cladding gap conductance values as well as the values of the average and maximum fueltemperatures, dependent on the local burnup for the 5th axial node (approximately in the rodmiddle part) of rod No. 10 are shown. The calculated by both codes average and maximumfuel temperatures for all 10 axial nodes of rod No.10, up to burnup of 45 MWd/kgU, arepresented in figures 6 and 7, in the axes of "calculated by TOPRA-s" versus "calculated byTRANSURANUS". The overall number of the calculation comparisons amounts to 11240.
• TRANSURANUS
3^»
2.8
I"§ 1.8$ 1.8
1 1.4a \2
3 ,0.8
0.6
0.4
a**
t
I....J
fcf.
* >
20 30
Local Sunup [MWdJkgU)
40
PHC. 3 . TOPRA-s and TRANSURANUS calculated fuel-to-cladding gapconductance values versus local buraup, for the 5th axial node of rod No. 10.
TRANSURANUS
t. 200
f
•
>
j.
"^or^
"20 30Local Bumup (MWd/kgU]
PHC. 4. TOPRA-s and TRANSURANUS calculated fuel average temperaturevalues versus local burnup, for the 5* axial node of rod No. 10.
138
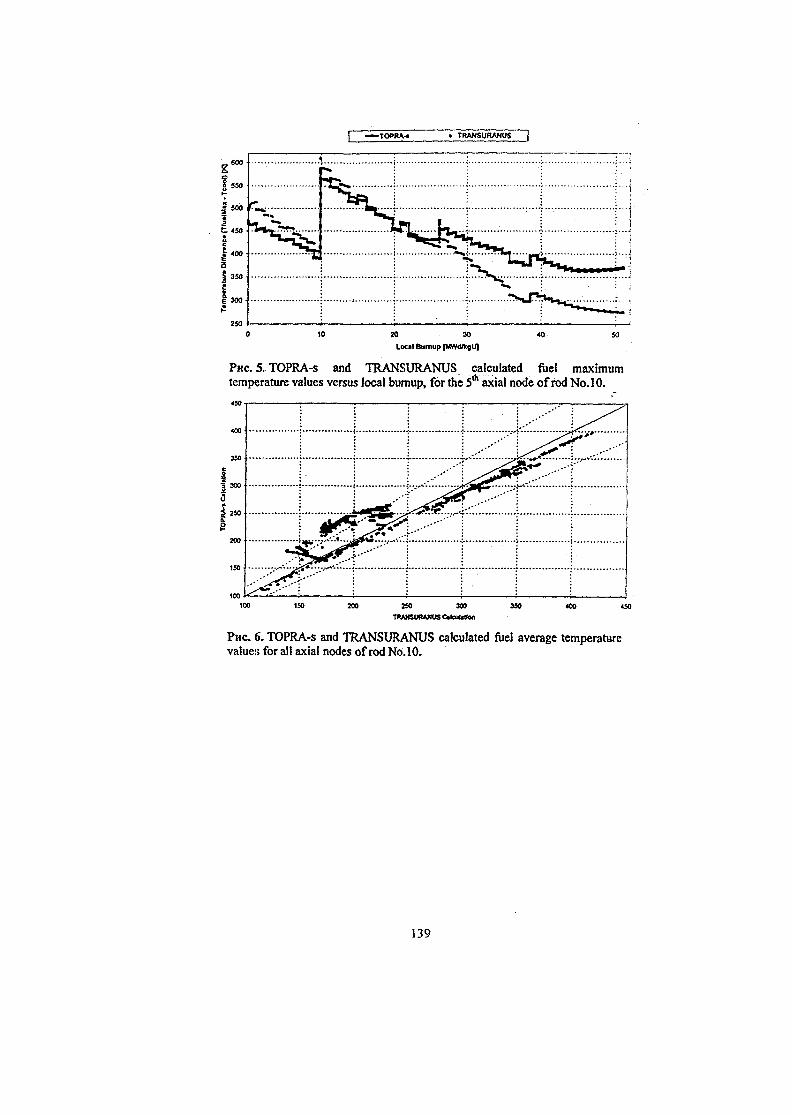
-TOPWW TRANSURANUS
II 550
| 500
I-20 30
Local Bumup [MWd/kgU)
SO
PHC. 5., TOPRA-s and TRANSURANUS calculated fuel maximumtemperature values versus local burnup, for the 5th axial node of rod No.lO.
3 300
5
i-e
200
r
2S0 300
TOAHSURANOSCilcUjBon
400
P H C <5. TOPRA-s and TRANSURANUS calculated fuel average temperaturevalues for all axial nodes of rod No.lO.
139
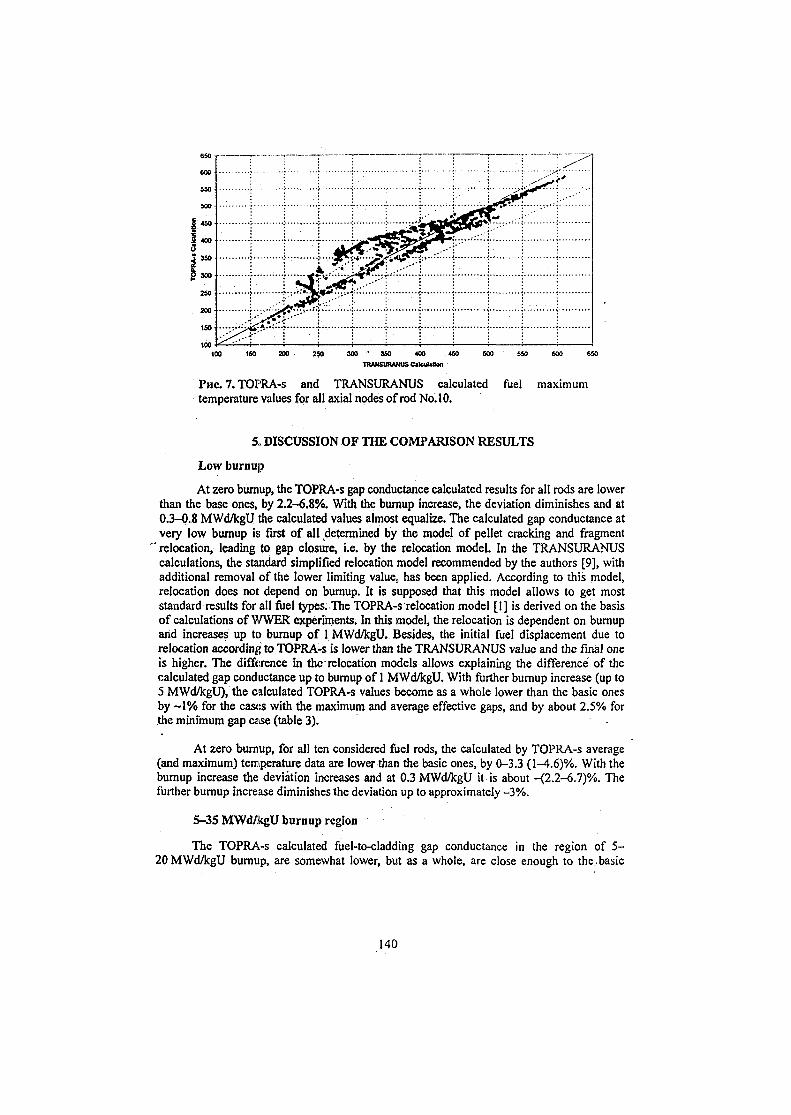
450
! 400
' 350
1 300
2SO
200
ISO
250 300 • 3S0 400 4S0
TRAMSUBAHUS Cilc«il»Hoo
PHC. 7. TOFRA-s and TRANSURANUS calculated fuel maximumtemperature values for all axial nodes of rod No. 10.
5., DISCUSSION OF THE COMPARISON RESULTS
Low burnup
At zero burnup, the TOPRA-s gap conductance calculated results for all rods are lowerthan the base ones, by 2.2-6.8%. With the burnup increase, the deviation diminishes and at0.3-0.8 MWd/kgU the calculated values almost equalize. The calculated gap conductance atvery low burnup is first of all determined by the model of pellet cracking and fragment
" relocation, leading to gap closure, i.e. by the relocation model. In the TRANSURANUScalculations, the standard simplified relocation model recommended by the authors [9], withadditional removal of the lower limiting value, has been applied. According to this model,relocation does not depend on burnup. It is supposed that this model allows to get moststandard results for all fuel types. The TOPRA-s relocation model [1] is derived on the basisof calculations of WWER experiments. In this model, the relocation is dependent on burnupand increases up to burnup of 1 MWd/kgU. Besides, the initial fuel displacement due torelocation according to TOPRA-s is lower than the TRANSURANUS value and the final oneis higher. The difference in the relocation models allows explaining the difference' of thecalculated gap conductance up to burnup of 1 MWd/kgU. With further burnup increase (up to5 MWd/kgU), the calculated TOPRA-s values become as a whole lower than the basic onesby ~ 1 % for the cases with the maximum and average effective gaps, and by about 2.5% forthe minimum gap case (table 3).
At zero burnup, for all ten considered fuel rods, the calculated by TOPRA-s average(and maximum) temperature data are lower than the basic ones, by 0-3.3 (1-4.6)%. With theburnup increase the deviation increases and at 0.3 MWd/kgU it is about -(2.2-6.7)%. Thefurther burnup increase diminishes the deviation up to approximately -3%.
5-35 MWd/kgU burnup region
The TOPRA-s calculated fuel-to-cladding gap conductance in the region of 5-20 MWd/kgU burnup, are somewhat lower, but as a whole, are close enough to the.basic
140
ones. Exceptions are the rods with the minimum effective gap. A significant discrepancy ofthe gap conductance can be observed at a higher burnup. The used relocation models canexplain this. According to the TRANSURANUS model applied in the calculations, after thegap closure the partial decrease of the fuel diameter due to a reverse fuel fragmentsmovement, is not accounted for. This results in earlier fuel-to-cladding hard contact,compared to the model accounting for the reverse movement. The model applied in TOPRA-saccounts for this, not only in the case of a closed gap, but at small gaps as well. As a result,the predicted TOPRA-s gap size has achieved 10 micron, while TRANSURANUS predicts azero gap size. The resulting TOPRA-s gap conductance is about twice lower than the onepredicted by TRANSURANUS. This can explain the differences in the calculated gapconductance at --25 MWd/kgU, which is, for the rods with the average and maximumeffective gap size calculated by TOPRA-s, ~5-30% lower than the basic ones. For the casewith the minimum gap size, this discrepancy appears earlier, at ~10 MWd/kgU. For example,for rod No.2, the 10* section, at 9.7 MWd/kgU burnup, the deviation is -14.7% (the TOPRA-s calculated gap conductance equals 0.776 W/cnrK, whereas the TRANSURANUS -1.04 W/cm2K); for the 1st section at 14.996 MWd/kgU the deviation is -44.7% (the TOPRA-scalculated conductance equals to 1.30 W/cnrK and the TRANSURANUS - to3.41 W/cm2K).
It should be noticed that the discrepancies between the gap conductance values, whenthe conductance values are higher than 0.8-1 W/cm2K, relatively weakly influence the fueltemperature. As an example, the results of the TOPRA-s calculation for a WWER-440 fuelrod cross-section with burnup of 35 MWd/kgU (both of the fuel rod and of the cross section)and linear power of 150 W/cm, can be demonstrated. Varying the gap conductance by 50%(from 0.8 to 1.2 W/cm - changes due to the roughness parameter variation) in this case leadsto 7.3% decrease of the calculated maximum and 10% of the average fuel-to-coolanttemperature differences.
The TOPRA-s calculated average or maximum temperatures for the fuel rods withaverage and maximum gaps, lie mainly within the ±5% range of deviation compared to thebasic ones. For the fuel rods with minimum effective gap, at bumup higher than-12 MWd/kgU, the TOPRA-s temperature predictions become by 3-11% higher than thebasic ones. This can be explained by the gap conductance predicted lower than the basic oneas well as by the TOPRA-s more conservative fuel thermal conductivity correlation (seebelow) • ,
Region of burnup higher than 35-45 MWd/kgU
At this burnup the fuel-to-cladding gap equals to zero and an onset of fuel-to-claddingmechanical interaction of hard contact type occurs. The predicted by TOPRA-s gapconductance for the rods with the average and minimum effective gap, is lower and for therods with the maximum gap — higher than the basic ones. Considering the comparison resultsat high burnup, it has to be accounted for the influence of the coefficients in the appliedRoss&Stout type gap conductance correlations. At the same time, in this burnup region, thegap gas thermal conductivity decrease due to FGR intensification from the developing fuelpellet rim layer begins to significantly manifest. At that, TOPRA-s accounts for theincomplete gas mixing at gaps less than 20 micron, while the applied TRANSURANUSmodel is based on the assumption of instantaneous gas mixing under the cladding (includingthe gas. plenum). The latter leads to lower calculated by TOPRA-s gap conductance comparedto the TRANSURANUS predictions. For the rods with the maximum effective gap, the fact is
141
revealing, that according to the TRANSURANUS results, the gap closure rate is somewhatlower compared to the calculated by TOPRA-s. Thus, for rod No. 1, at the end of the in-reactor operation: for the 9th section at burnup of 37.4 MWd/kgU the calculated by TOPRA-sgap is 16.7 micron and the conductance is 0.786 W/cm2K, whereas the calculated byTRANSURANUS gap is 22.6 micron and the conductance is 0.572 W/cm2K, and theresulting deviation is +15.7%. And for the 8th axial section, at burnup of 44.7 MWd/kgU, thecalculated by TOPRA-s gap size is 8.2 micron and the conductance is 1.19 W/cm2K, whereasthe calculated by TRANSURANUS gap size is 13.7 micron and the conductance equals to0.83 W/cm2K, and the resulting deviation is +18%.
At high burnup, the calculated by TOPRA-s fuel temperatures are higher than thebasic ones by ~3~15%, for cross-section burnup of-50 MWd/kgU (in figures 6 and 7, theresults go outside the limit of the dotted y= 1,15 x line). This can be explained both by thediscrepancies in the gap conductance and by the fuel thermal conductivity values at theconsidered temperatures and bumup. The values obtained using the TOPRA-s correlation [10]are lower than the correspondent values obtained using the TRANSURANUS fuel thermalconductivity correlation for WWER foe! rods. The latter has been analyzed and compared toother western correlations and according to the authors' estimation [6], it gives the highestconductivity values. It could be supposed, that the fuel thermal conductivity dependence ontemperature and its degradation with burnup, should be close enough and independent on thefuel manufacturer. In this regard, it might be suggested to apply in the TRANSURANUScalculations for WWER high burnup rods, of a more conservative thermal conductivitycorrelation.
It is desirable to notice, that the fuel maximum temperature deviations are close (andsomewhat higher) to the fuel average ones, practically in all brunup intervals.
6. CONCLUSIONS
As a whole, the comparison results show a reasonable agreement of the fueltemperature predictions, taking into account the significant uncertainty if the fuel rodcharacteristics during irradiation. The fuel-to-cladding gap conductance discrepancies in theregion of burnup higher than 20-30 MWd/kgU are significant. In this connection it isnecessary to notice, that the discrepancies in the gap conductance in the region of burnup highenough, at values higher than 0.8-1 W/cm2K, insignificantly influence the calculated fueltemperatures. At that, practically all discrepancies can be explained by differences in the:
• Relocation models (the model applied in the TOPRA-s code seems to be more physical);
• Fuel thermal conductivity correlations versus bumup (according to the estimations in [6],• In the TRANSURANUS calculations, the applied WWER specific fuel thermal
conductivity correlation accounts weaker for the conductivity degradation at high bumup,compared tto other LWR correlations);
• Model accounting for the incomplete gas mixing under the cladding at low gap sizes andafter fuel-to-cladding contact in TOPRA-s (i.e. taking into account the fact, that thereleased from the fuel surface fission gas products do not completely and instantaneouslymix with the gases under the cladding, including the gas plenum, but partly remain in theroughness volume and in the gap).
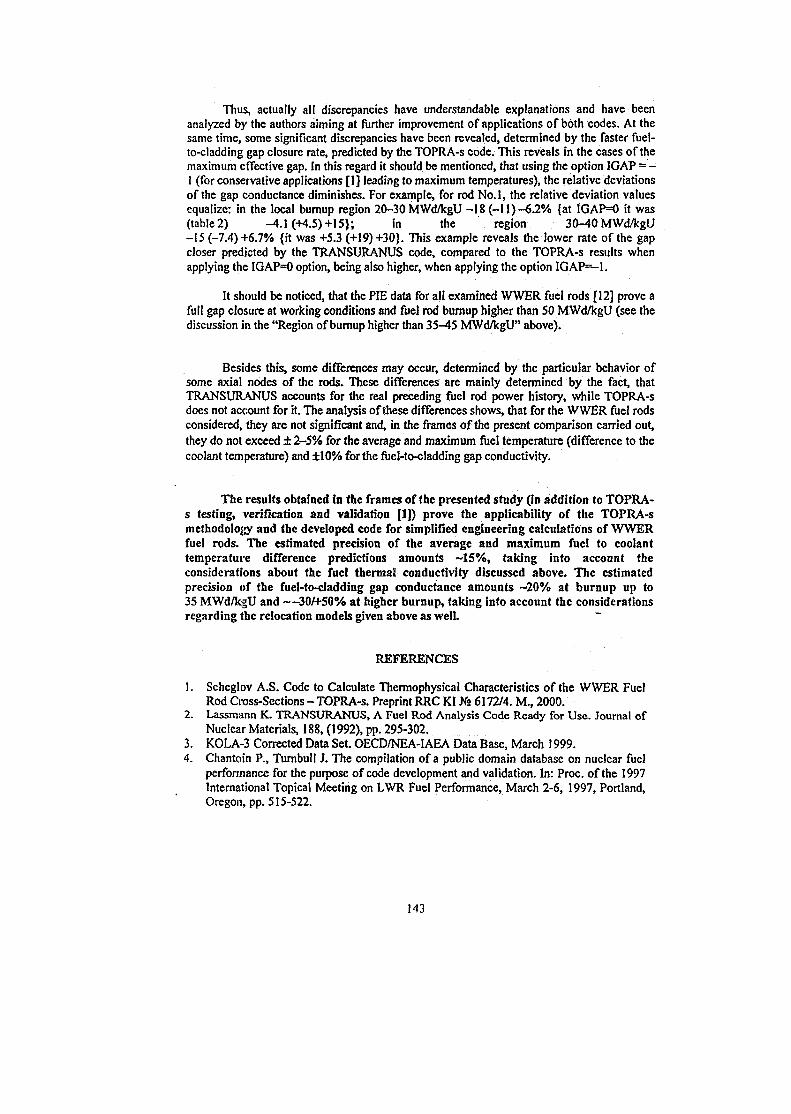
Thus, actually all discrepancies have understandable explanations and have beenanalyzed by the authors aiming at further improvement of applications of both codes. At thesame time, some significant discrepancies have been revealed, determined by the faster fuel-to-cladding gap closure rate, predicted by the TOPRA-s code. This reveals in the cases of themaximum effective gap. In this regard it should be mentioned, that using the option IGAP = -1 (for conservative applications [1] leading to maximum temperatures), the relative deviationsof the gap conductance diminishes. For example, for rod No.l, the relative deviation valuesequalize: in the local burnup region 20-30 MWd/kgU -18 (-11)-6.2% {at IGAP=0 it was(table 2) -4.1 (+4.5) +15}; in the region 30-40 MWd/kgU-15 (-7.4)+6.7% {it was +5.3 (+19)+30}. This example reveals the lower rate of the gapcloser predicted by the TRANSURANUS code, compared to the TOPRA-s results whenapplying the IGAP=0 option, being also higher, when applying the option IGAP—1.
It should be noticed, that the PIE data for all examined WWER fuel rods [12) prove afull gap closure at working conditions and fuel rod burnup higher than 50 MWd/kgU (see thediscussion in the "Region of burnup higher than 35-45 MWd/kgU" above).
Besides this, some differences may occur, determined by the particular behavior ofsome axial nodes of the rods. These differences are mainly determined by the fact, thatTRANSURANUS accounts for the real preceding fuel rod power history, while TOPRA-sdoes not account for it. The analysis of these differences shows, that for the WWER fuel rodsconsidered, they are not significant and, in the frames of the present comparison carried out,they do not exceed ± 2-5% for the average and maximum fuel temperature (difference to thecoolant temperature) and ±10% for the fuel-to-cladding gap conductivity.
The results obtained in the frames of the presented study (in addition to TOPRA-s testing, verification and validation [1}) prove the applicability of the TOPRA-smethodology and the developed code for simplified engineering calculations of WWERfuel rods. The estimated precision of the average and maximum fuel to coolanttemperature difference predictions amounts -15%, taking into account theconsiderations about the fuel thermal conductivity discussed above. The estimatedprecision of the fuel-to-cladding gap conductance amounts ~20% at burnup up to35 MWd/kgU and —30/+50% at higher burnup, taking into account the considerationsregarding ithe relocation models given above as well.
REFERENCES
1. Scheglov A.S. Code to Calculate Thermophysical Characteristics of the WWER FuelRod Cross-Sections - TOPRA-s. Preprint RRC KI Ks 6172/4. M., 2000.
2. Lassmann K. TRANSURANUS, A Fuel Rod Analysis Code Ready for Use. Journal ofNuclear Materials, 188, (1992), pp. 295-302.
3. KOLA-3 Corrected Data Set. OECD/NEA-IAEA Data Base, March 1999.4. Chantoin P., Turnbull J. The compilation of a public domain database on nuclear fuel
performance for the purpose of code development and validation. In: Proc. of the 1997International Topical Meeting on LWR Fuel Performance, March 2-6, 1997, Portland,Oregon, pp. 515-522.
143
5. Passage G., Drenska M., Kamburov N., Stefanova S., Haralampieva Zv. UncertaintyAnalysis of the Initial Fabrication Characteristics and Technological ParametersInfluence on the WWER-440 (Kola-3 NPP) Fuel Rod Behavior Employing theTRANSURANUS Code. In: Proc. of the Third International Seminar WWER FuelPerformance, Modelling and Experimental Support. 4-8 Oct., 1999, Pamporovo,Bulgaria, pp. 271-183.
6. Stefanova S., Drenska M., Passage G., Kamburov R , Kafedzhieva Z. Analysis of the I-IV units (WWER-440) fuel rods performance and the limiting maximum linear heatrates and mechanical loads, on the basis of neutron-physical and thermomechanica!calculations with improved computer codes. Contract Reports of the Institute forNuclear Research and Nuclear Energy for the National Electric Company, KozloduyNuclear Power Plant, Parts 1-4, July 1998 - March 2000.
7. Sunderland E)., Montgomery R., Rashid Y. et al. Analysis of WWER-I000 Fuel RodDesigns under Steady-State and RIA Transient Conditions and Implications forExperimental Support. Ibid [5], pp. 181-188.
8. Scheglov A., Proselkov V., Bibilaschvili Yu. et al. Thermal physical characteristics ofthe fuel element for WWER-1000 - unit 5 of Novovoronezh NPP. Atomic Energy.1993,v.74.is.5,pp.450-452.
9. LOsOnenP., LassmannK., vandeLaarJ. TRANSURANUS Calculations onExperimental WWER Fuel Rods. In: Proc. of the Second International Seminar WWERFuel Performance, Modelling and Experimental Support. 21-25 April, 1997, Sandanski,Bulgaria, pp. 156-161.
10. Scheglov A.S., Proselkov V.N. Methods and Approaches to Calculate Dependencies ofThermal-Physical Parameters of WWER-440 Fuel Rods versus Burnup and Linear HeatRate. 7th AER Symposium on VVER Reactor Physics and Reactor Safety. Sept 23-26,1997, Homitz nearZittau, Germany, pp. 749-758.
11. Stefanova S.,, Simeonova V., Passage G., Haralampieva Tz., Peychinov Tz.,Lassmann K.. Comparative Calculations of WWER Operational Fuel Rods withTRANSURANUS and PIN-micro Codes. Ibid [9], pp. 202-208.
12. Solonin M., Bibilashvili Yu., Ioltoukhovsky A. et. al. WWER Fuel Performance andMaterial Development for Extended Burnup in Russia. Ibid. [9], pp. 48-57.
144
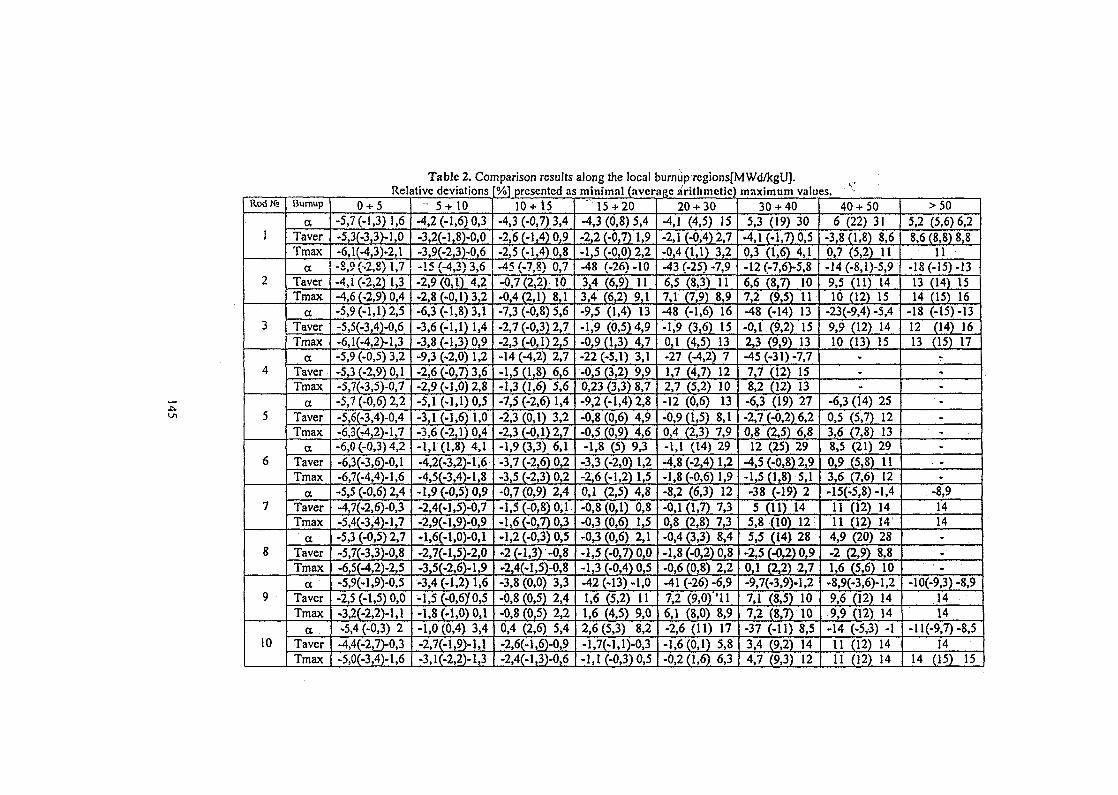
RodKs
1
2
3
4
5
6
7
8
9
10
Burnup
aTaverTmax
aTaverTmax
aTaverTmax
aTaverTmax
aTaverTmax
aTaverTmax
aTaverTmax
aTaverTmax
aTaverTmax
a . _,TaverTmax
Table 2. Comparison resultsRelative deviations \%] presented as
0 + 5-5,7(-1,3) 1,6-5,3(-3,3)-l,0-6,l(-4,3)-2,l-8,9 (-2,8) 1,7-4,1 (-2,2) 1,3-4,6 (-2,9) 0,4-5,9 (-1,1) 2,5-5,5(-3,4)-0,6-6,l(-4,2)-l,3-5,9 (-0,5) 3,2-5,3 (-2,9) 0,1-5,7(-3,5)-0,7-5,7 (-0,6) 2,2-5,6(-3,4)-0,4-6,3(-4,2)-l,7-6,0 (-0,3) 4,2-6,3(-3,6)-0,l-6,7(-4,4)-l,6-5,5 (-0.6) 2.4-4,7(-2,6)-0,3-5,4(-3,4)-l,7-5,3 (-0,5) 2,7-5,7(-3,3)-0,8-6,5(-4,2)-2,5-5,9(-l,9)-0,5-2,5 (-1,5) 0,0-3,2(-2,2)-l,l-5,4 (-0,3) 2-4,4(-2,7)-0,3-5,0(-3,4)-l,6
- 5+10-4,2 (-1,6) 0,3-3,2(-l,8)-0,0-3,9(-2,3)-0,6-15 (-4,3) 3,6-2,9(0,1) 4,2-2,8 (-0,1) 3,2-6,3 (-1,8) 3,1-3,6 (.1,1) 1,4-3,8 (-1,3) 0,9-9,3 (-2,0) 1,2-2,6 (-0,7) 3,6-2,9 (-1,0) 2,8-5,1 (-1,1) 0,5-3,1 (-1,6) 1,0-3,6 (-2,1) 0,4-1,1 (1,8) 4.1-4,2(-3,2)-l,6-4,5(-3,4)-l,8-1,9 (-0,5) 0.9-2,4(-l,5)-0,7-2,9(-l,9)-0,9-l,6(-l,0)-0,l-2,7(-l,5)-2,0-3.5(-2,6)-l,9-3,4 (-1,2) 1,6-l,5(-0,6)f0,5-1,8 (-1,0) 0,1-1,0 (0,4) 3.4-2,7(-l,9)-l,l-3,l(-2,2)-l,3
10+15-4,3 (-0,7) 3,4-2,6 (-1,4) 0,9-2,5 (-1,4) 0,8-45 (-7,8) 0,7-0,7(2,2) 10-0,4 (2,1) 8,1-7,3 (-0,8) 5,6-2,7 (-0,3) 2,7-2,3 (-0,1)2,5-14 (-4,2) 2,7-1,5 (1,8) 6,6-1,3 (1,6) 5,6-7,5 (-2,6) 1.4-2,3 (0,1) 3,2-2,3 (-0,1) 2,7-1,9(3,3) 6,1-3,7 (-2,6) 0,2-3,5 (-2,3) 0,2-0,7(0,9)2,4-1,5 (-0,8) 0,1-1,6 (-0,7) 0,3-1,2 (-0,3) 0.5-2 (-1,3) -0,8-2,4(-l,5)-0,8-3.8 (0,0) 3,3-0,8(0,5) 2,4-0,8(0,5)2,20.4 (2,6) 5,4-2,6(-l,6)-0,9-2,4(-l,3)-0,6
along the local burnupregions[MWd/kgU].minimal (average arithmetic) maximum values. •
15 + 20-4,3(0,8)5,4-2,2 (-0,7) 1,9-1,5 (-0,0) 2,2-48 (-26)-103,4 (6,9) 113,4 (6,2) 9,1-9,5 (1,4) 13-1,9 (0,5)4,9-0,9(1,3) 4,7-22 (-5,1) 3,1-0,5 (3,2) 9,90,23 (3,3) 8,7-9,2 (-1,4) 2,8-0,8 (0,6) 4,9-0,5 (0,9) 4,6-1,8 (5) 9.3-3,3 (-2,0) 1,2-2,6 (-1,2) 1,50.1 (2,5) 4,8-0,8(0,1) 0,8-0,3(0,6) 1,5-0.3 (0,6) 2,1-1,5 (-0,7) 0.0-1,3 (-0.4) 0,5-42 (-13) -1,01.6 (5,2) 111.6 (4,5) 9,02,6(5,3) 8,2-l,7(-l,l)-0,3-1,1 (-0,3) 0,5
20 + 30-4,1 (4,5) 15-2,1 (-0,4)2,7-0,4(1,1) 3,2-43 (-25) -7.96,5 (8,3) 117,1 (7,9) 8,9-48 (-1,6) 16-1,9 (3,6) 150,1 (4,5) 13-27 (-4,2) 71,7 (4,7) 122,7 (5,2) 10-12 (0,6) 13-0,9(1,5) 8,10,4 (2,3) 7,9-1,1 (14) 29-4,8 (-2,4) 1,2-1,8 (-0,6) 1,9-8,2 (6,3) 12-0,1 (1,7) 7,30,8 (2,8) 7,3-0,4(3,3) 8,4-1,8 (-0,2) 0,8-0,6 (0,8) 2,2-41 (-26) -6,97,2 (9,0)'116,1 (8,0) 8,9-2,6 (11) 17-1,6(0,1) 5,8-0,2(1,6) 6,3
30 + 405,3 (19) 30
-4,1 (-1,7)0,50,3 (1,6) 4,1-12 (-7,6)-5,86,6 (8,7) 107,2 (9,5) 11-48 (-14) 13-0,1 (9,2) 152,3 (9,9) 13-45 (-31) -7,77,7 (12) 158,2 (12) 13-6,3 (19) 27-2,7 (-0,2) 6,20,8 (2,5) 6,812 (25) 29
-4,5 (-0,8) 2,9-1,5(1,8) 5,1-38 (-19) 25 (11) 14
5,8 (10) 125,5 (14) 28
-2,5 (-0,2) 0,90,1 (2,2) 2,7-9,7(-3,9)-l,27,1 (8.5) 107,2 (8,7) 10-37 (-11) 8,53,4 (9,2) 144,7 (9,3) 12
40 + 506 (22) 31
-3,8(1,8) 8,60,7 (5,2) 11-14(-8,i)-5,99,5 (11) 1410 (12) 15
-23(-9,4)-5,49,9 (12) 1410 (13) 15
---
-6,3 (14) 250,5 (5,7) 123,6 (7,8) 138,5 (21) 290,9 (5,8) 113,6 (7,6) 12-15(-5,8)-l,411 (12) 1411 (12) 144,9 (20) 28-2 (2,9) 8,81,6 (5,6) 10-8,9(-3,6)-l,29,6 (12) 149,9 (12) 14-14 (-5,3) -111 (12) 1411 (32) 14
>505,2 (5,6) 6,28,6 (8,8) 8,8
11-18 (-15)-1313 (14) 1514 (15) 16
-18 (-15)-1312 (14) 1613 (15) 17
-
-----
. --
-8,91414---
-10(-9,3)-8,91414
-ll(-9,7)-8,514
14 (15) 15
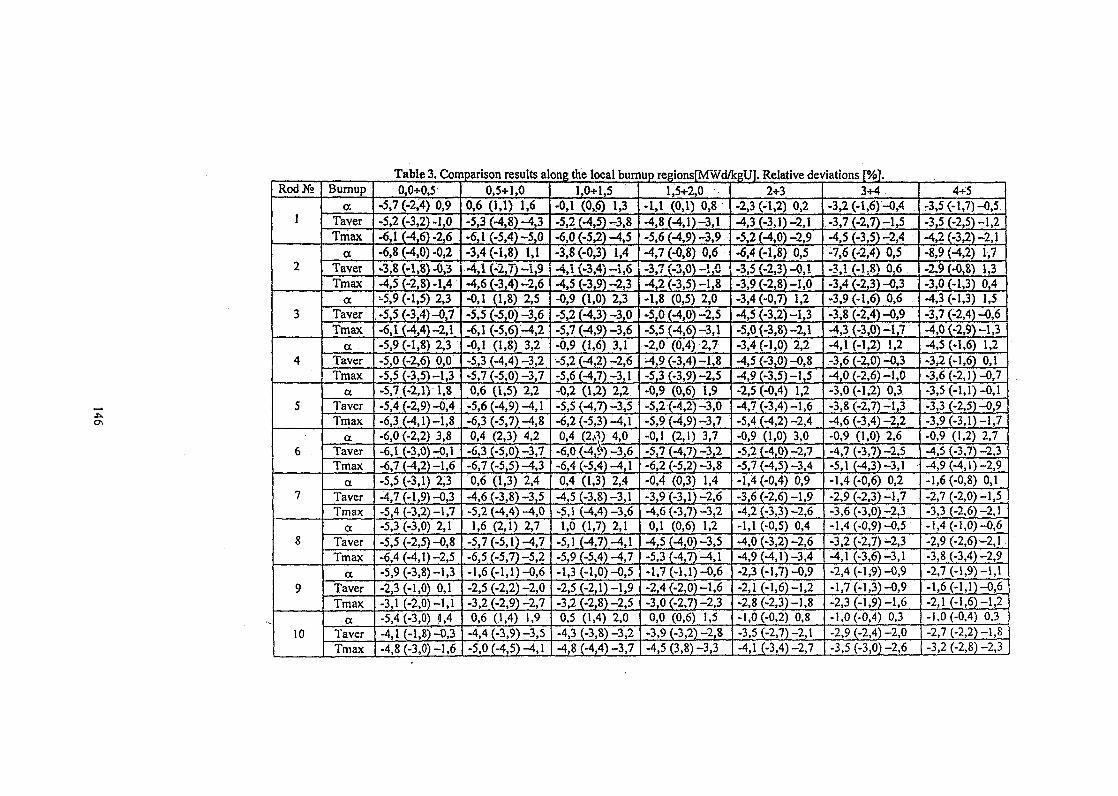
RodXa
1
2
3
4
5
6
7
8
9
10
Burnupa
TaverTmax
aTaverTmax
ocTaverTmax
aTaverTmax
aTaverTmax
aTaverTmax
aTaverTmax
aTaver JTmax
aTaverTmax
aTaverTmax
Table 3. Comparison results along the local burnup regions[MWd/kgU]. Relative deviations [%].0,0+0,5
-5,7 (-2,4) 0,9-5.2 (-3,2)-1,0-6,11-4,6)-2,6-6,8 (-4,0)-0,2-3,8 (-1,8) -0,3-4,5(-2,8)-lf4-5,9 (-1,5) 2,3-5,5 (-3,4)-0,7-6,1 (-4,4)-2,1-5,9 (-1,8) 2,3-5,0 (-2,6) 0,0-5,5 (-3,5)-1,3-5,7 (-2,1) 1,8-5,4 (-2,9) -0,4-6,3 (-4,1)-1,8-6,0 (-2,2) 3,8-6,1 (-3,0)-0,1-6,7 (-4,2) -1.6-5,5 (-3,1) 2,3-4,7 (-1,9)-0,3-5,4 (-3,2)-1,7-5,3 (-3,0) 2,1-5,5 (-2,5)-0,8-6,4 (-4,1)-2,5-5,9 (-3,8)-1,3-2,3 (-1,0) 0,1-3,1 (-2,0)-1,1-5,4 (-3,0) 1,4-4,1 (-1,8) -0,3-4,8 (-3,0)-1,6
0,5+1,00,6 (1,1) 1,6-5,3 (-4,8)-4,3-6,1 (-5,4)-5,0-3,4 (-1,8) 1,1-4,i(-2,7)-i,9-4,6 (-3,4)-2,6-0,1 (1,8) 2,5-5,5 (-5,0)-3,6-6,1 (-5,6)-4,2-0,1 (1,8) 3,2-5,3 (-4,4)-3,2-5,7 (-5,0)-3,70,6 (1,5) 2,2-5,6 (-4,9)-4,1-6,3 (-5,7)-4,80,4 (2,3) 4,2-6,3 (-5,0) -3,7-6,7 (-5,5)-4,30,6 (1,3) 2,4
-4,6 (-3,8)-3,5-5,2 (-4,4) -4,01,6 (2,1) 2,7
-5,7 (-5,l)-4,7-6,5 (-5,7)-5,2-1,6 (-1,1) -0,6-2,5 (-2,2) -2,0-3,2 (-2,9)-2,70,6 (1,4) 1,9-4,4 (-3,9) -3,5-5,0 (-4,5)-4,1
1,0+1,5-0,1 (0,6) 1,3-5,2 (-4,5)-3,8-6,0 (-5,2)-4,5-3,8 (-0,3) 1,4•4,1 (-3,4)-1,6-4,5 (-3,9) -2,3-0,9 (1,0) 2,3-5,2 (-4,3) -3,0-5,7 (-4,9)-3,6-0,9 (1,6) 3,1-5,2 (-4,2)-2,6-5,6 (-4,7)-3,1-0,2 (1,2) 2,2-5,5 (-4,7)-3,5-6,2 (-5,3)-4,10,4 (2tf) 4,0-6,0 (-4,*) -3,6-6,4 (-5,4)-4,10,4 (1,3) 2,4-4,5 (-3,8)-3,1-5,1 (-4,4)-3,61,0 (1,7) 2,1
-5,1 (4,7)-4,1-5,9 (-5,4) -4,7-1,3 (-1,0)-0,5-2,5 (-2,1)-1,9-3,2 (-2,8)-2,50,5 (1,4) 2,0-4,3 (-3,8)-3,24,8 (4,4)-3,7
1,5+2,0-1,1 (0,1) 0,8-4,8 (-4,1) -3,1-5,6 (-4,9)-3,9-4,7 (-0,8) 0,6-3,7 (-3,0)-1,0-4,2 (-3,5)-1,8-1,8 (0,5) 2,0-5,0 (-4,0)-2,5-5,5 (-4,6)-3,1-2,0 (0,4) 2,7-4,9 (-3,4)-1,8-5,3 (-3,9)-2,5-0,9 (0,6) 1,9-5,2 (-4,2)-3,0-5,9 (-4,9)-3,7-0,1 (2,1) 3,7-5,7 (4,7)-3,2-6,2 (-5,2)-3,8-0,4 (0,3) 1,4-3,9 (-3,0-2,6-4,6 (-3,7)-3,20,1 (0,6) 1,2
-4,5 (4,0)-3,5-5,3 (-4,7)-4,1-1,7 (-1,1) -0,6-2,4 (-2,0)-1,6-3,0 (-2,7)-2,30,0 (0,6) 1,5-3,9 (-3,2)-2,8-4,5 (3,8)-3,3
2+3-2,3 (-1,2) 0,2-4,3 (-3,0-2,1-5,2 (-4,0)-2,9-6,4 (-1,8) 0,5=3,5 (-2,3)-0,1-3,9 (-2,8)-1,0-3,4 (-0,7) 1,2-4,5 (-3,2)-1,3-5,0 (-3,8)-2,1-3,4 (-1,0) 2,2-4,5 (-3,0)-0,8-4,9 (-3,5) -1,5-2,5 (-0,4) 1,2-4,7 (-3,4)-1,6-5,4 (-4,2)-2,4-0,9 (1,0) 3,0-5,2 (4,0)-2,7-5,7 (-4,5)-3,4-1,4 (-0,4) 0,9-3,6 (-2,6)-1,94,2 (-3,3)-2,6-1,1 (-0,5) 0,44,0 (-3,2)-2,6-4,9(4,0-3,4-2,3 (-1,7)-0,9-2,1 (-1,6)-1,2-2,8 (-2,3)-1,8-1,0 (-0,2) 0,8-3,5 (-2,7)-2,14,1 (-3,4)-2,7
3+4-3,2 (-1,6) -0,4-3,7 (-2,7)-1,5-4,5 (-3,5)-2,4-7,6 (-2,4) 0,5-3,1 (-1,8) 0,6-3,4 (-2,3)-0,3-3,9 (-1,6) 0,6-3,8 (-2,4)-0,9-4,3 (-3,0)-1,7-4,1 (-U2) 1,2-3,6 (-2,0)-0,3-4,0 (-2,6) -1,0-3,0 (-1,2) 0,3-3,8 (-2,7)-1,3-4,6 (-3,4)-2,2-0,9 (1,0) 2,6-4,7 (-3,7)-2,5-5,1 (-4,3)-3,1-1,4 (-0,6) 0,2-2,9 (-2,3)-1,7-3,6 (-3,0) -2,3-1,4 (-0,9)-0,5-3,2 (-2,7)-2,3-4,1 (-3,6)-3,1-2,4 (-1,9)-0,9-1,7 (-1,3)-0,9-2,3 (-1,9)-1,6-1,0 (-0,4) 0,3-2,9 (-2,4) -2,0-3,5 (-3,0) -2,6
4+5-3,5 (-1,7)-0,5-3,5 (-2,5)-1,2-4,2 (-3,2)-2,1-8,9 (-4,2) 1,7-2,9 (-0,8) 1,3-3,0 (-1,3) 0,4-4,3 (-1,3) 1,5-3,7 (-2,4)-0,6-4,0 (-2,9)-1,3-4,5 (-1,6) 1,2-3,2 (-1,6) 0,1-3,6 (-2,0-0,7-3,5 (-1,0-0,1-3,3 (-2,5)-0,9-3,9 (-3,0-1,7-0,9 (1,2) 2,74,51-3,71-2,3.4,9 (-4,11-2,9-1,6 (-0,8) 0,1-2,7 (-2,0)-1,5-3,3 (-2,61-2,1-1,4 (-1,0)-0,6-2,9 (-2,6)-2,1-3,8 (-3,4) -2,9-2,7 (-1,9)-1,1-1,6 (-1,0-0,6-2,1 (-1,6)-1,2-1.0 (-0.4) 0.3-2,7 (-2,2)-1,8-3,2 (-2,8) -2,3
SK01ST085
VERIFICATION OF USING SABINE-3.1 CODE FOR CALCULATIONS OFRADIOACTIVE INVENTORY IN REACTOR SHIELD
R.Moukhamadeev, A. Suvorov, SSCIPPE, Obninsk, Russia
ABSTRACT
This report presents the results of calculations of radioactive inventory and doses of activationradiation for the International Benchmark Calculations Of Radioactive Inventory for FissionReactor Decommissioning, IAEA, and measurements of activation doses in shield ofVVER-440 (Armenian NPP), using one-dimension modified code SABINE-3.1.
For decommissioning of NPP it is very important to evaluate in correct manner radioactiveinventory in reactor construction and shield materials. One-dimension code SABINE-3.1 [1,2](removing-diffusion method for neutron calculation) was modified to perform calculation ofradioactive inventory in reactor shield materials and dose from activation photons behindthem; These calculations are carried out on the base of nuclear constant system ABBN-78 andnew library of activation data for a number of long-lived isotopes, prepared by authors on thebase of [9], which present at shield materials as microimpurities and manage radiationsituation under the decay more than 1 year.
Calculations of radioactive inventory performs in accordance with formula:
4 ( r , r ,D = -x^(l-exp(-/l /r))-exp(-i jr)-pf -^aKy K j
here:
At (r,%T) - activity of nuclide / (Bq/g) in mesh point r, under irradiation time x, and decaytime 7";
Pi - nuclear concentration of parent nuclide / on release reaction channel K in mesh point r;At - constant of half-life for nuclide i;a^ - micro cross section of release reaction of nuclide i on channel K for neutron group/ ;<3>J(r)- neutron flux of group/ in mash point r;K - release reaction channel for nuclide /;Y - material density.
For calculations it were used 28 group constants for reactions Co5*f», CoM, Eu'5Y",#Eu1M,l 5 Y 1 5 4 , Li'faoJH3, Na^ft^Na22, Ca'VttfCa41, Ca4Yn.#Ca4S, Fe'Y^Mn54, FeMfa# Fc55,
i3', Ni5Y«,'WCo57, Kix(n,a)Fesi, N\M(n,})Kt6\ NiM(n,2n)Kiu, wffapJCo60. Data on the releaseof activation photons are taken from ORIGEN-2.Icode [7,8] libraries. 5
147
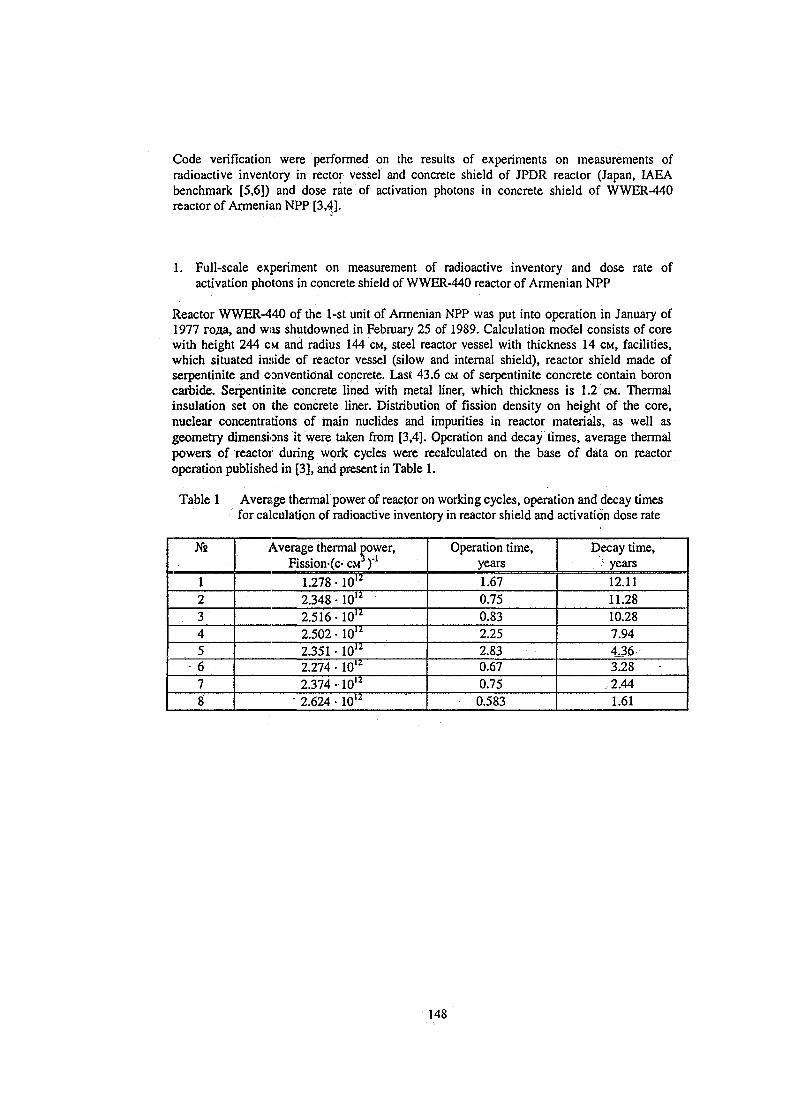
Code verification were performed on the results of experiments on measurements ofradioactive inventory in rector vessel and concrete shield of JPDR reactor (Japan, IAEAbenchmark [5,6]) and dose rate of activation photons in concrete shield of WWER-440reactor of Armenian NPP [3,4;].
1. Full-scale experiment on measurement of radioactive inventory and dose rate ofactivation photons in concrete shield of WWER-440 reactor of Armenian NPP
Reactor WWER-440 of the 1-st unit of Armenian NPP was put into operation in January of1977 ro.ua, and was shutdowned in February 25 of 1989. Calculation model consists of corewith height 244 CM and radius 144 CM, steel reactor vessel with thickness 14 CM, facilities,which situated inside of reactor vessel (silow and internal shield), reactor shield made ofserpentinite and conventional concrete. Last 43.6 CM of serpentinite concrete contain boroncarbide. Serpentinite concrete lined with metal liner, which thickness is 1.2 CM. Thermalinsulation set on the concrete liner. Distribution of fission density on height of the core,nuclear concentrations of main nuclides and impurities in reactor materials, as well asgeometry dimensions it were taken from [3,4]. Operation and decay times, average thermalpowers of reactor during work cycles were recalculated on the base of data on reactoroperation published in [3], and present in Table 1.
Table 1 Average thermal power of reactor on working cycles, operation and decay timesfor calculation of radioactive inventory in reactor shield and activation dose rate
12345678
Average thermal power,Fission-(c- CM ) ' '
1.278 • 1012
2.348-1012
2.516 • 1012
2.502 • 1012
2.351 • 1012
2.274 • 1012
2.374 • 1012
• 2.624 • 1012
Operation time,years
1.670.750.832.252.830.670.750.583
Decay time,> years
12.1111.2810.287.944,36-3.28
^2.441.61
148
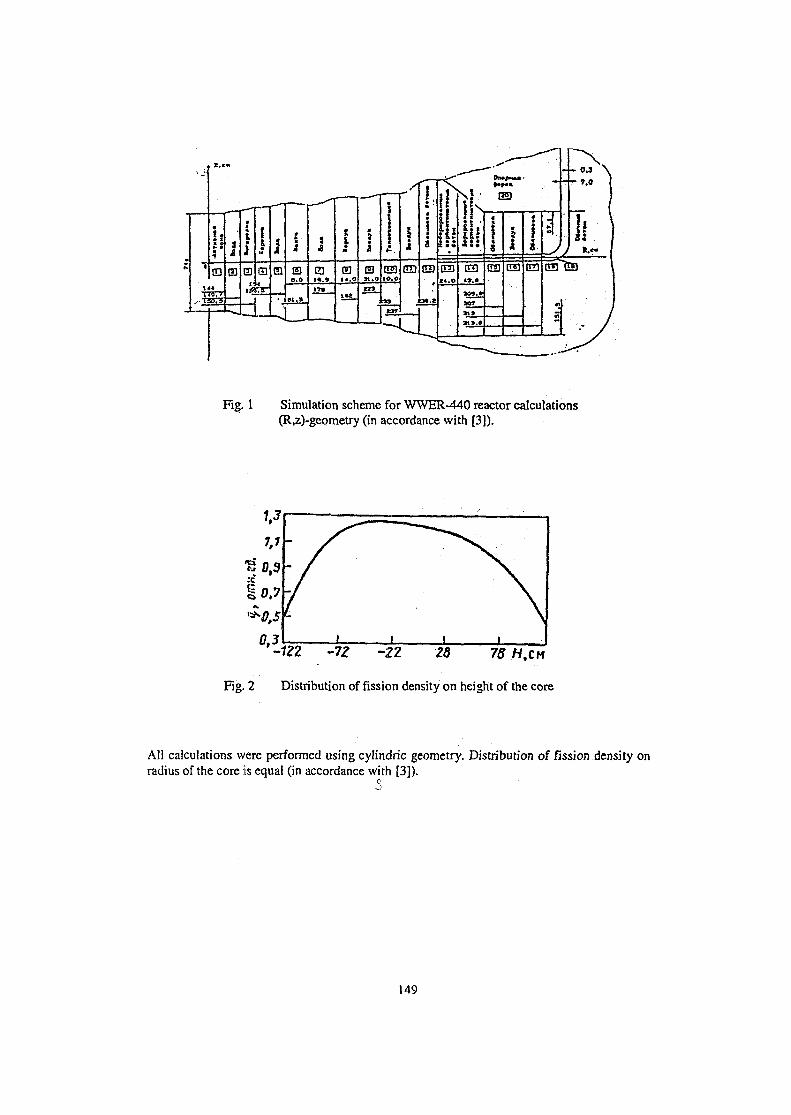
Fig. 1 Simulation scheme for WWER-440 reactor calculations(R,z)-geometry (in accordance with [3]).
-122 -7Z -21 28 73 H.CM
Fig. 2 Distribution of fission density on height of the core
All calculations were performed using cylindric geometry. Distribution of fission density onradius of the core is equal (in accordance with [3]).
149
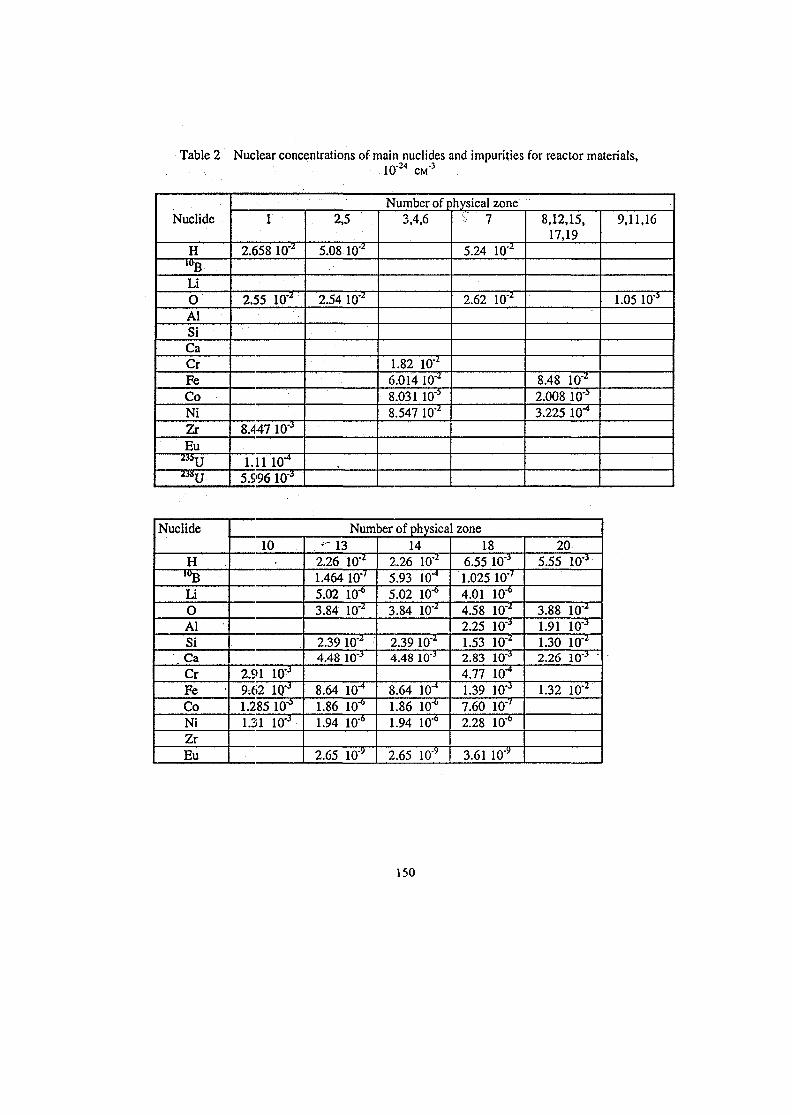
Table 2 Nuclear concentrations of main nuclides and impurities for reactor materials,l O " 2 4 CM"3
Nuclide
HIUBLi0AlSiCaCrFeCoNiZrEu
:BSU
Number of physical zone1
2.658 10"2
2.55 1 0 ' r
8.447 10"j
1.11 10"4
5.996 10 J
2.5
5.08 10"2
2.54 10"2
3.4,6
1.82 10"2
6.014 10"2
8.031 10"5
8.547 10"2
S 7
5.24 lO"2
2.62 10"2
8,12,15,17,19
8.48 W2
2.008 10"*3.225 10"4
9,11,16
1.05 10"3
Nuclide
H10BUOAlSiCaCrFeCoNiZrEu
Number of physical zone10
2.91 10-*9;62 1Q-J
1.285 Iff*1.31 10'J
•' 132.26 10^1.464 10''5.02 lO"6
3.84 lO^
2.3910"'4.48 10-3
8.64 10-4
1.86 10-6
1.94 10-"
2.65 10*
142.26 10-i!
5.93 10"4
5.02 10*3.84 10^
2.39 10'2
4.48 10-3
8.64 10"4
1.86 10*1.94 10"6
2.65 10-y
186.55 lO^1.025 10"'4.01 10"6
4.58 10"2
2.25 10"1.53 10"2
2.83 1O"J
4.77 10"4
1.39 10"J
7.60 10"'2.28 10"6
3.61 10*
205.55 10"j
3.88 10'2
1.91 10"-1
1.30 10-:i
2.26 10"3
1.32 10"2
150
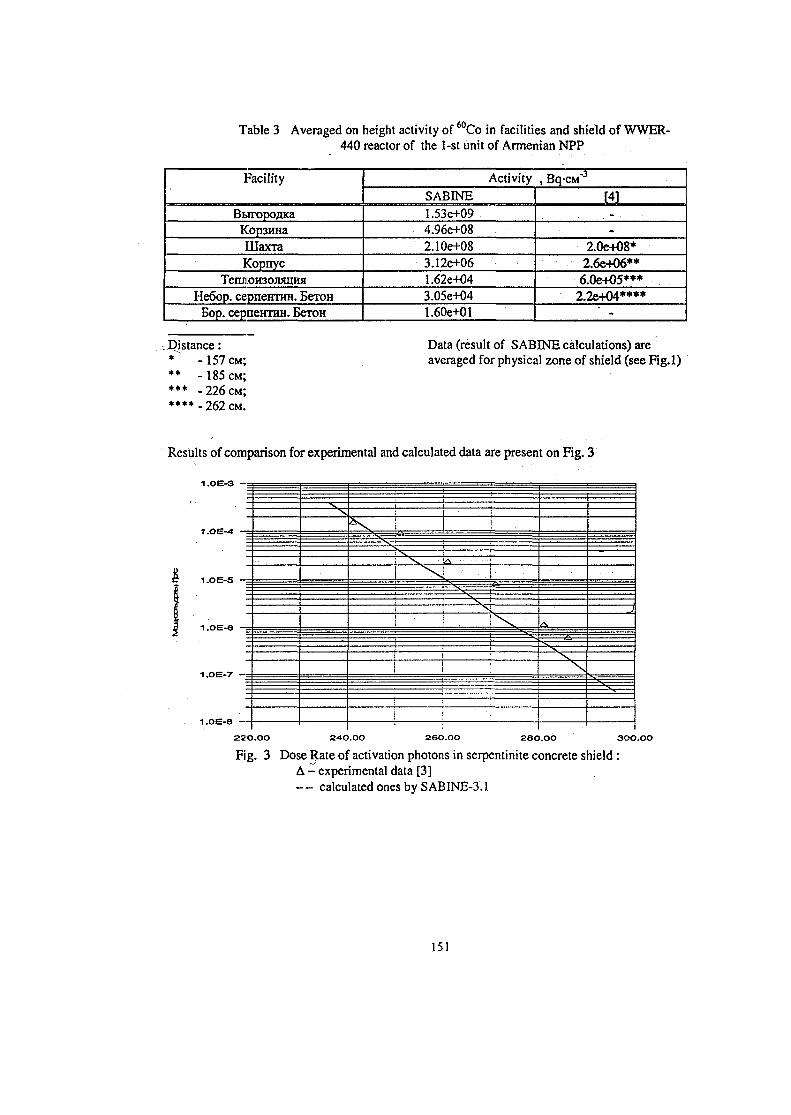
Table 3 Averaged on height activity of 6 0Co in facilities and shield of WWER-440 reactor of the 1-st unit of Armenian NPP
Facility
ВнгородкаКорзинаШахтаКорпус
ТеплоизоляцияНебор. серпентин. Бетон
Бор. серпентин. Бетон
Activity , Bq-см"3
SABINE
1.53е+094.96е+082.10е+083.12е+061.62е+043.05е+041.60е+01
[4]-
•
2.0е+О8*2.6е4О6**
6.0е+05***2.2е+04****
-
Distance :••" - 1 5 7 см;
** -185 см;**• -226 см;****-262см.
Data (result of SABINE calculations) areaveraged for physical zone of shield (see Fig.l)
Results of comparison for experimental and calculated data are present on Fig. 3
i 1: i •
\ . i 1 i
! V • |д |
1 \ J -,.i-
I i X
i • i . i \
1 j j
! i !
1 ! ! . NH
J
2BO.OO 300.00
Fig. 3 Dose Rate of activation photons in serpentinite concrete shield :Д — experimental data [3]— calculated ones by SABINE-3.1
151
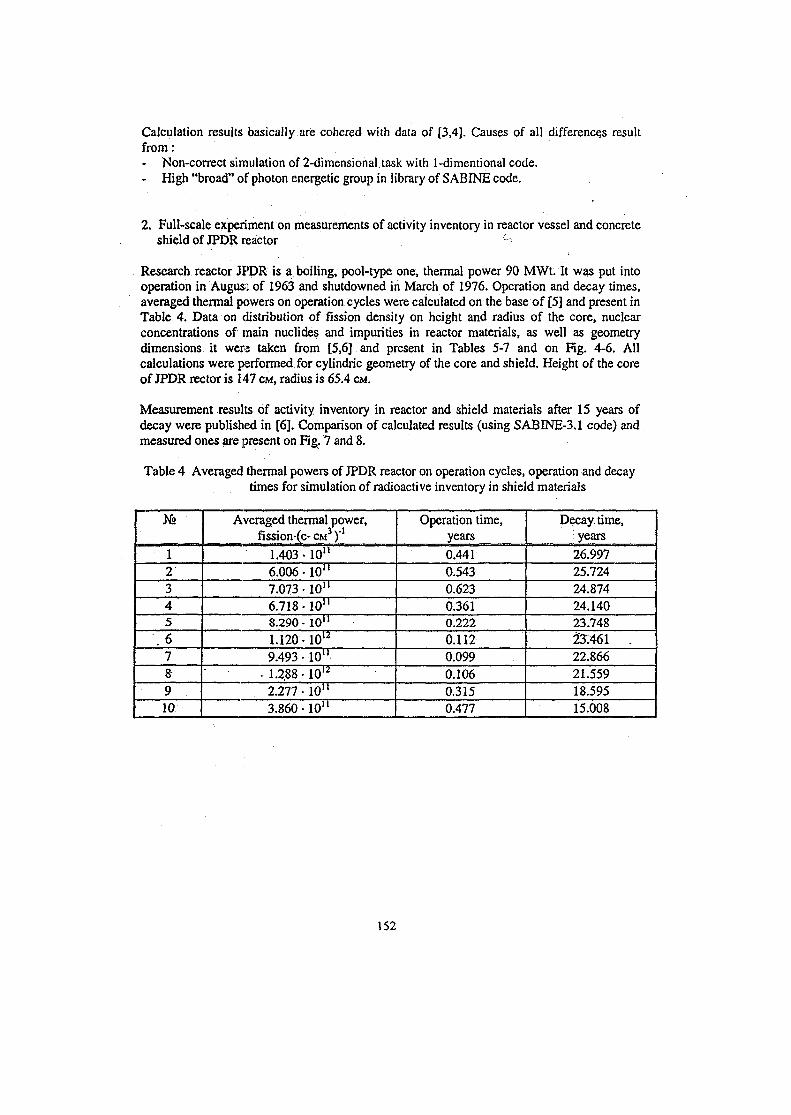
Calculation results basically are cohered with data of [3,4]. Causes of all differences resultfrom:- Non-correct simulation of 2-dimensional task with 1-dimentional code.- High "broad" of photon energetic group in library of S ABINE code.
2. Full-scale experiment on measurements of activity inventory in reactor vessel and concreteshield of JPDR reactor c-
Research reactor JPDR is a boiling, pool-type one, thermal power 90 MWt. It was put intooperation in August of 1963 and shutdowned in March of 1976. Operation and decay times,averaged thermal powers on operation cycles were calculated on the base of [5] and present inTable 4. Data on distribution* of fission density on height and radius of the core, nuclearconcentrations of main nuclides and impurities in reactor materials, as well as geometrydimensions it were taken from [5,6] and present in Tables 5-7 and on Fig. 4-6. Allcalculations were performed for cylindric geometry of the core and shield. Height of the coreof JPDR rector is 147 CM, radius is 65.4 CM.
Measurement results of activity inventory in reactor and shield materials after 15 years ofdecay were published in [6]. Comparison of calculated results (using SABINE-3.1 code) andmeasured ones are present on Fig. 7 and 8.
Table 4 Averaged thermal powers of JPDR reactor on operation cycles, operation and decaytimes for simulation of radioactive inventory in shield materials
12345
. 678-910
Averaged thermal power,fission-(c-CM3 )"'
1.403 • 10"6.006-10"7.073 • 10"6.718-10"8.290-10"1.120 • 1012
9.493-10"' • - 1.2.88- 1012
2.277-10"3.860-10"
Operation time,years
0.4410.5430.6230.3610.2220.1120.0990.1060.3150.477
Decay, time,iyears
26.99725.72424.87424.14023.74823:461 .22.86621.55918.59515.008
152
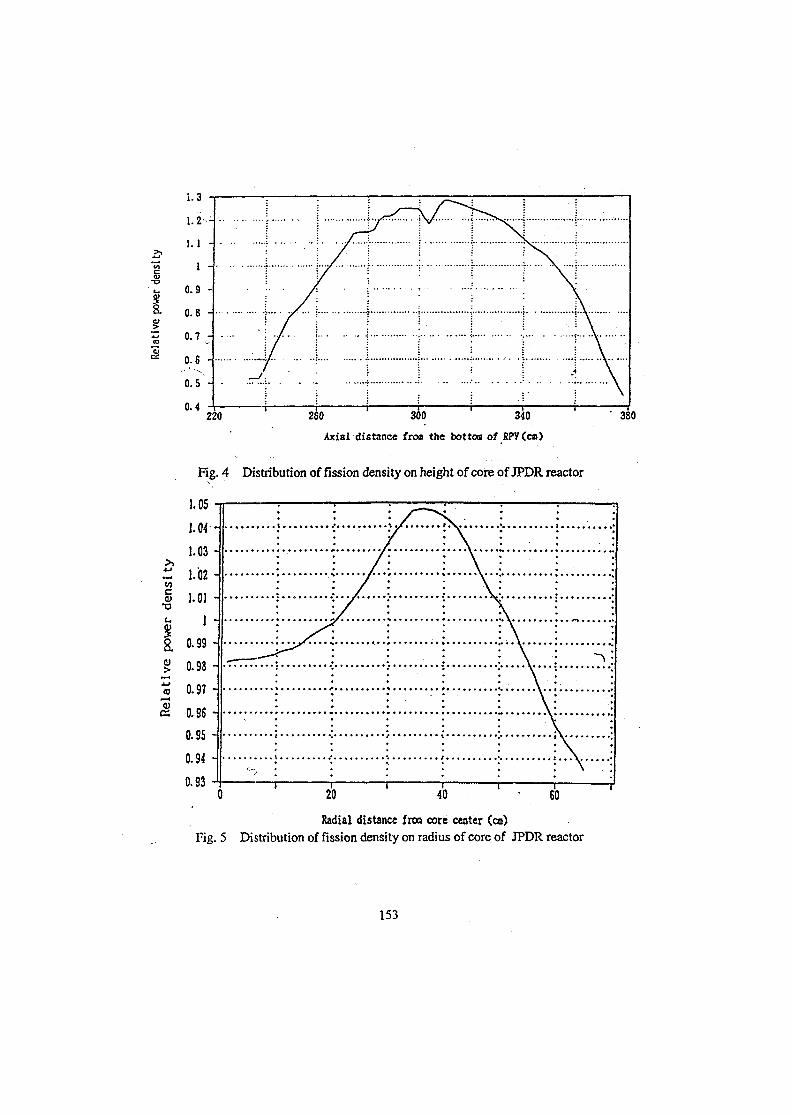
a
1
J -
1 -
1 -
9 -
8 -
7 -
6 -
5 -
//
•.. ./7/
/
j" \
\ s......
N\
•\
220 260 300 340
Axial distance froa the bottom of RPY(cn)
' 380
Fig. 4 Distribution of fission density on height of core of JPDR reactor
>1
•ou
I
Radial distance froc core center (en)Fig. 5 Distribution of fission density on radius of core of JPDR reactor
153
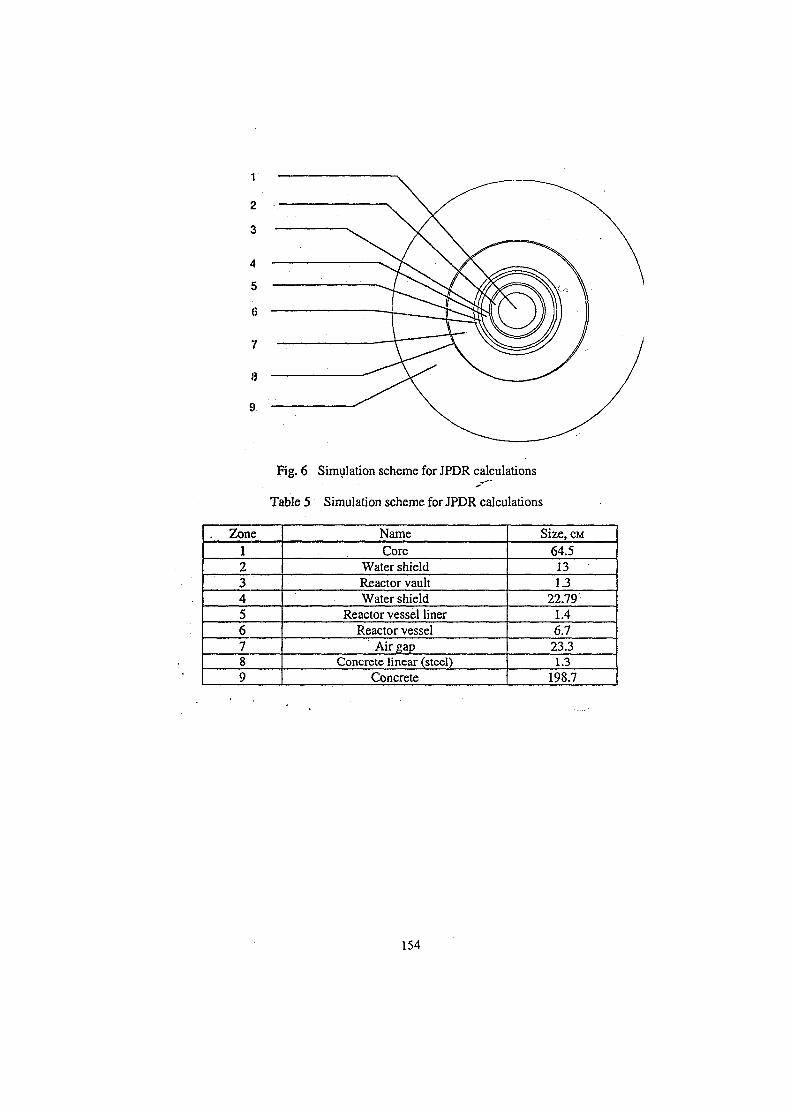
1
2
3
4
5
6
7
13
9
Fig. 6 Simulation scheme for JPDR calculations
Table 5 Simulation scheme for JPDR calculations
. Zone123456789
NameCore
Water shieldReactor vaultWater shield
Reactor vessel linerReactor vessel
Air gapConcrete linear (steel)
Concrete
Size, CM64.5131.3
22.791.46.723.31.3
198.7
154
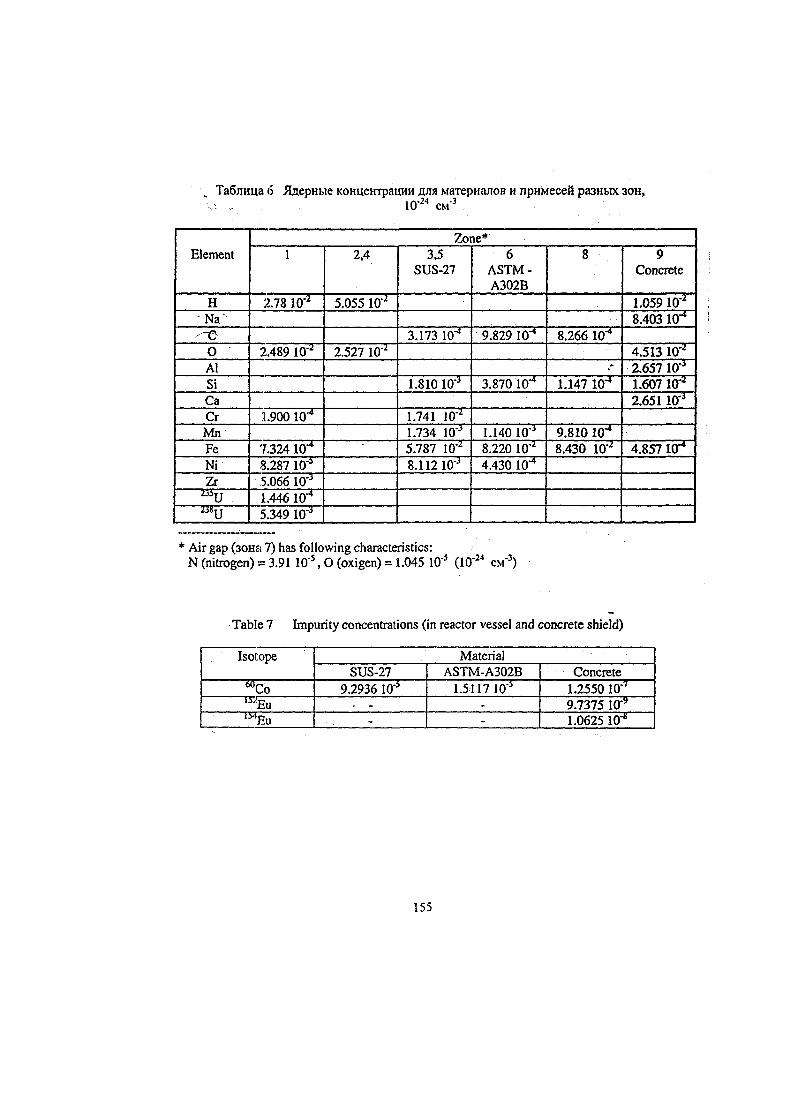
Таблица 6 Ядернме концентрации для материалов и примесей разньпс зон,- , Ю'24 см"3
Element
HNa s
^е0AlSiСаCrMirFeNiZr
aiv
Zone*1
2.78 lu' 2
2.489 10*2
1.900 10-4
7.324 10 4
8.287 ÎO'1
5.066 1O'J
1.446 104
5.349 КГ*
2,4
5.055 10-2
2.527 102
3,5SUS-27
3.173 10"4
1.810 1O'J
1.741 10 .1.734 10--1
5.787 W*8.112 10"J
6ASTM-A302B
9.829 10-4
3.870 10"4
1.140 10-J
8.220 Wz
4.430 10-4
8
8.266 10 4
.-1.147 lu"4
9.810 10-4
8.430 W'
9Concrète
1.059 10"2
8.403 Ю 4
4.513 ÎO"'2.657 10 J
1.607 10"!
2.651 ÎO'3
4.857 10"4
: Air gap (зона 7) has following characteristics:N (nitrogen) = 3.91 10"5,0 (oxigen) = 1.045 10" см"3)
Table 7 Impurity concentrations (in reactor vessel and concrete shield)
Isotope
wCbi MEui M Eu
MaterialSUS-27
9.2936 10^- -
ASTM-A302B1.5117 10 s
--
Concrete1.2550 10-7
9.7375 10^1.0625 10"s
155
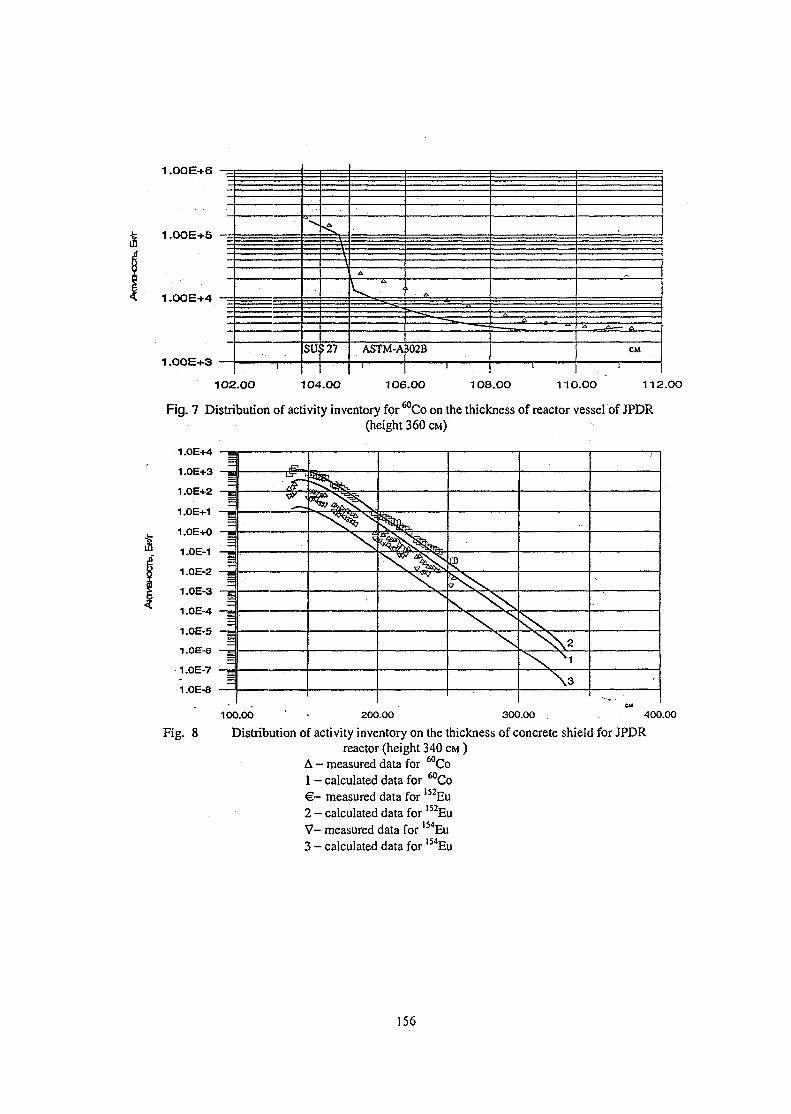
1 .OOE+6 •—|
-
i
su
n3 27 ASTM-A
• &
i- z==- =
302B
I 1
^ r -
CM
I
1O2.OO 1O4.OO 106.00 108.00 110.00 112.00
Fig. 7 Distribution of activity inventory for ^Co on the thickness of reactor vesselof JPDR(height 360 CM)
1.0E+4
1.0E+3
1.0E+2
1.0E+1
1.0E+0
1.0E-1
1.0E-2
1.0E-3
1.0E-4
1.0E-5
1.0E-6
1.0E-7
1.0E-8
100.00 ' • 200.00 300.00 400.00
Fig. 8 Distribution of activity inventory on the thickness of concrete shield for JPDRreactor (height 340 CM )
A - measured data for 60Co1 - calculated data for ^Co€ - measured data for 152Eu2 - calculated data for !52EuV- measured data for 154Eu3 - calculated data for 154Eu
Hi
—
IllH
i
=III
=
inn
=
I
^ .
\ \ \
\\ N1
\ 3
156
Discrepancy for calculated activity of l54Eu and measured one results from simple formula for
calculating of activity, which doesn't take into account channels of reaction on target isotopes
and use only li3Eu (n,yf: l54Eu. These kind of reaction present in constant system ABBN-90
and JENDL-2. Nonetheless, generally there is a good coherence of results.
As result it should be noted, that SABINE-3.1 code may be used for conceptual analysis of
activation inventory in reactor shield for decommissioning purposes and dose rates of
activation photons during dismantling processes.
Literature
1. A . n . CyBopoB,, P.H.MyxaMaaeeB. MoflepHraaujia nporpaMMM pacMera paflHauHOHHOfi 3amHTbiSABINE-3// MaTepnanu VII POCCHBCKOH HayHHoB KOH^epemwH no 3aintrre OT.HOHKJHpyiomHXHanyKeHHfi flflepHO-TexHmecKHx ycraHOBOK, 20-22 cefrraSpa 1998r. / O 3 H , OSHHHCK, 1998
2. A . n . CyjBopoB, P.H.MyxaMafleeB. BepH({>nKau,H« pacneroB aicrHBauHH pannauHOHHoK 3aiium>ino MO^H({)HUHpOBaHHOH nporpaMMe SABINE-3.1// MaTepHanu VII POCCHHCKOH HaysHoftKOH(j>epeHUHH no 3auurre OT HOHH3HpyK>mHX H3JiyMeHHH aaepHO-TexHHnecKHX ycraHOBOK, 20-22ceirra6pa 199«r. / O 3 H , O6HHHCK, 1998
3. C.E.EopHcoB, B.Il.MauiKOBHH, B.A.HeperHH, B.B.JIbiceHKO, CX-UbinnH, B . H . I ^ O ^ H H , PenepHtifinoxiHOMacurraGHbifi MaKpocKommecKHfi aKcnepHMetrr H. pacner MOIIIHOCTH JUXHA
aKTHBauHOHHoro y-H3JiyHeHH« B 3amHTe BOflo-BOAHHoro pe£icropa // ATOMHaa SHepraa, T . 7 9 ,Bwn.2, aBryci 1995
4. C.E.BopHcoB, A.B.KyflpflBueBa, B.n.MauiKOBMM, M.H.MopeB, B.A.HeperHH, B.BJIBICCHKO,C.r.I^binHH, B.HJJO(}>HH, <I>H3HHeCKHe 3aKOHOMepHOCTH (j)OpMHpOBaHHa HaBe^eHHOHaKTHBHOCTH B MarepHanax BOAo-BO^aHBix peaicropoB B npoSneMe c tumw HX C 3KCnnyaraijHH //MarepHanw VI POCCHHCKOK HaynHoii KOH^epeHUHH no 3amnTe OT HOHH3HpyroiHHX H3JryneHHfi
K, 20-23 ceHTfl6pa 1994r. / <t>3H, OSHHHCK, 1994, T .Z C . 1 5 7
5. International Benchmark Calculations of Radioactive Inventory for Fission ReactorDecommissioning, Ed. By N.P. Kocherov, INDC(NDC)-335. IAEA, 1996
6. Accuracy Verification for Calculation of Inventory in JPDR Due to Neutron Activation, TakenorySukegawa, Nobuo Sasamoto and Kazuo Fujiki, LNDC(JPN)-164,1993
7. A.G.Croff, "User's Manual for the ORIGEN2 Computer Code", ORNL/TM-7175, July 1980
8 / A.G. Croff, "ORIGEN-2 : A Versatile Computer Code for Calculating the Nuclide Compositionsand Characteristics of Nuclear Materials", Nucl. Tech. 62(1983), p.335-352
9 . Handbook of Nuclear Activation Data. Technical report Series N 273, IAEA, Vienna, 1987
157
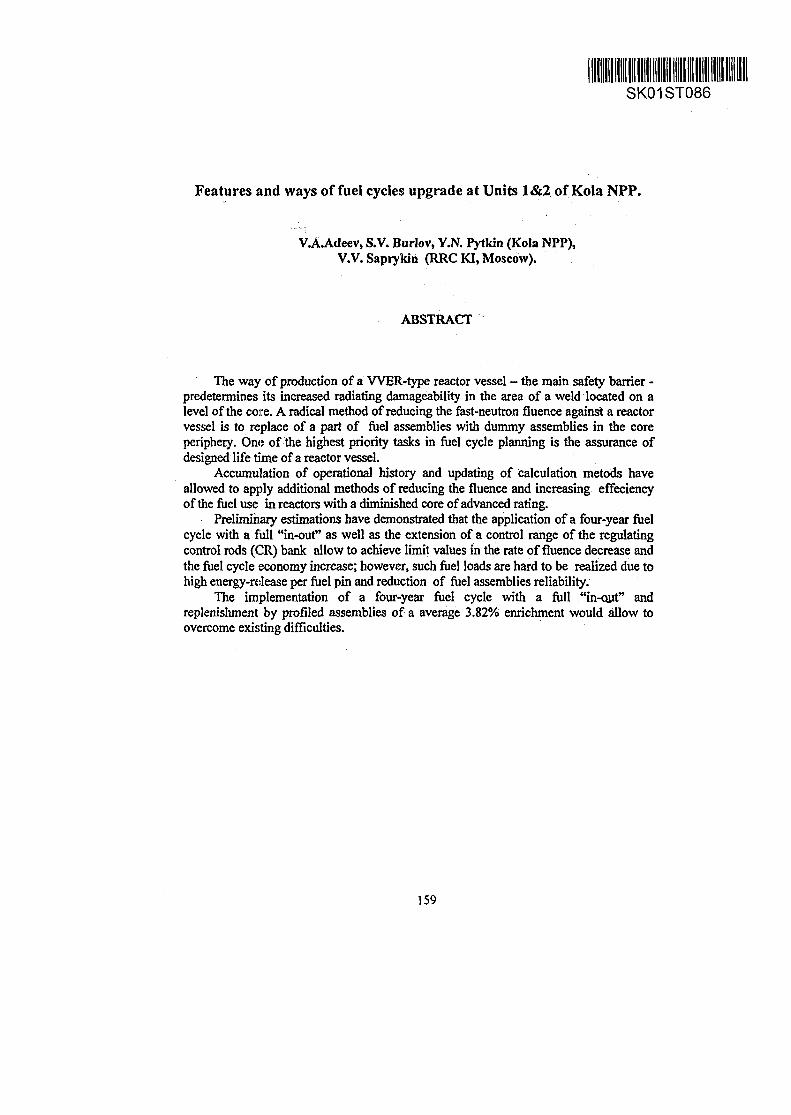
SK01ST086
Features and ways of fuel cycles upgrade at Units 1&2 of Kola NPP.
V.A.Adeev, S.V. Burlov, Y.N. Pytkin (Kola NPP),V.V.Saprykin (RRC KI, Moscow).
ABSTRACT
The way of production of a WER-type reactor vessel - the main safety barrier -predetermines its increased radiating damageability in the area of a weld located on alevel of the core. A radical method of reducing the fast-neutron fluence against a reactorvessel is to replace of a part of fuel assemblies with dummy assemblies in the coreperiphery. One of the highest priority tasks in fuel cycle planning is the assurance ofdesigned life time of a reactor vessel.
Accumulation of operational history and updating of calculation metods haveallowed to apply additional methods of reducing the fluence and increasing effeciencyof the fuel use in reactors with a diminished core of advanced rating.
Preliminary estimations have demonstrated that the application of a four-year fuelcycle with a full "in-out" as well as the extension of a control range of the regulatingcontrol rods (CR) bank allow to achieve limit values in the rate of fluence decrease andthe fuel cycle economy increase; however, such fuel loads are hard to be realized due tohigh energy-release per fuel pin and reduction of fuel assemblies reliability.
The implementation of a four-year fuel cycle with a full "in-out" andreplenishment by profiled assemblies of a average 3.82% enrichment would allow toovercome existing difficulties.
159
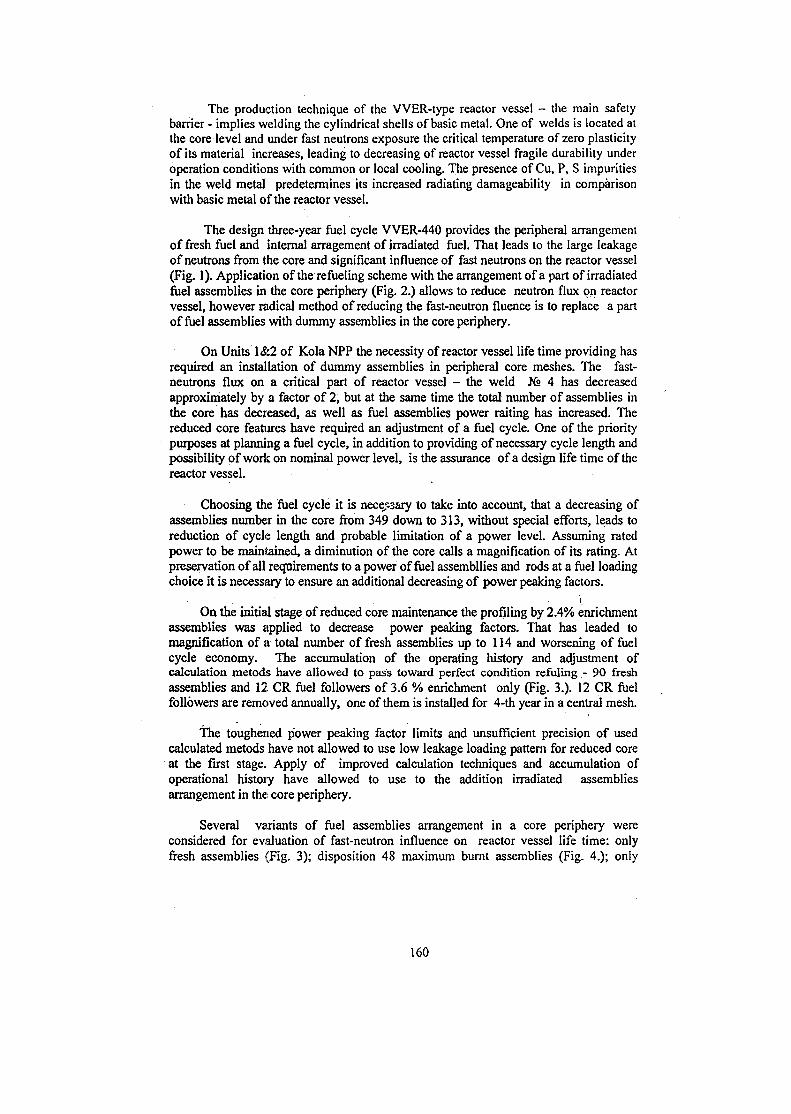
The production technique of the VVER-type reactor vessel - the main safetybarrier - implies welding the cylindrical shells of basic metal. One of welds is located atthe core level and under fast neutrons exposure the critical temperature of zero plasticityof its material increases, leading to decreasing of reactor vessel fragile durability underoperation conditions with common or local cooling. The presence of Cu, P, S impuritiesin the weld metal predetermines its increased radiating damageability in comparisonwith basic metal of the reactor vessel.
The design three-year fuel cycle VVER-440 provides the peripheral arrangementof fresh fuel and internal arragement of irradiated fuel. That leads to the large leakageof neutrons from the core and significant influence of fast neutrons on the reactor vessel(Fig. 1). Application of the refueling scheme with the arrangement of a part of irradiatedfuel assemblies in the core periphery (Fig. 2.) allows to reduce neutron flux on reactorvessel, however radical method of reducing the fast-neutron fluence is to replace a partof fuel assemblies with dummy assemblies in the core periphery.
On Units 1&2 of Kola NPP the necessity of reactor vessel life time providing hasrequired an installation of dummy assemblies in peripheral core meshes. The fast-neutrons flux on a critical part of reactor vessel - the weld Jfa 4 has decreasedapproximately by a factor of 2, but at the same time the total number of assemblies inthe core has decreased, as well as fuel assemblies power raiting has increased. Thereduced core features have required an adjustment of a fuel cycle. One of the prioritypurposes at planning a fuel cycle, in addition to providing of necessary cycle length andpossibility of work on nominal power level, is the assurance of a design life time of thereactor vessel.
Choosing the fuel cycle it is necessary to take into account, that a decreasing ofassemblies number in the core from 349 down to 313, without special efforts, leads toreduction of cycle length and probable limitation of a power level. Assuming ratedpower to be maintained, a diminution of the core calls a magnification of its rating. Atpreservation of all requirements to a power of fuel assembllies and rods at a fuel loadingchoice it is necessary to ensure an additional decreasing of power peaking factors.
\On the initial stage of reduced core maintenance the profiling by 2.4% enrichment
assemblies was applied to decrease power peaking factors. That has leaded tomagnification of a total number of fresh assemblies up to 114 and worsening of fuelcycle economy. The accumulation of the operating history and adjustment ofcalculation metods have allowed to pass toward perfect condition refilling - 90 freshassemblies and 12 CR fuel followers of 3.6 % enrichment only (Fig. 3.). 12 CR fuelfollowers are removed annually, one of them is installed for 4-th year in a central mesh.
The toughened power peaking factor limits and unsufficient precision of usedcalculated metods have not allowed to use low leakage loading pattern for reduced coreat the first stage. Apply of improved calculation techniques and accumulation ofoperational histoiy have allowed to use to the addition irradiated assembliesarrangement in the: core periphery.
Several variants of fuel assemblies arrangement in a core periphery wereconsidered for evaluation of fast-neutron influence on reactor vessel life time: onlyfresh assemblies (Fig. 3); disposition 48 maximum burnt assemblies (Fig. 4.); only
160
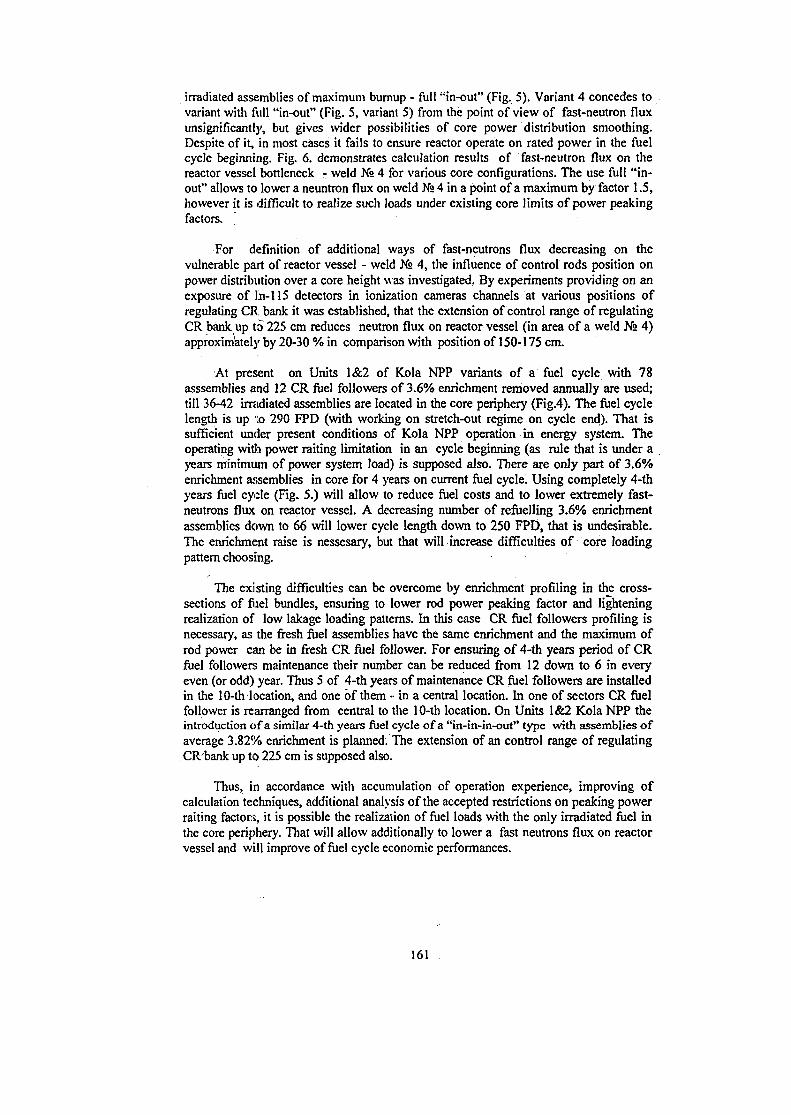
irradiated assemblies of maximum bumup - full "in-out" (Fig. 5). Variant 4 concedes tovariant with full "in-out" (Fig. 5, variant 5) from the point of view of fast-neutron fluxunsignificantly, but gives wider possibilities of core power distribution smoothing.Despite of it, in most cases it fails to ensure reactor operate on rated power in the fuelcycle beginning. Fig. 6. demonstrates calculation results of fast-neutron flux on thereactor vessel bottleneck - weld Na 4 for various core configurations. The use full "in-out" allows to lower a neuntron flux on weld Ns 4 in a point of a maximum by factor 1.5,however it is difficult to realize such loads under existing core limits of power peakingfactors.
For definition of additional ways of fast-neutrons flux decreasing on thevulnerable part of reactor vessel - weld Ka 4, the influence of control rods position onpower distribution over a core height was investigated. By experiments providing on anexposure of ln-115 detectors in ionization cameras channels at various positions ofregulating CR bank it was established, that the extension of control range of regulatingCR bank up to 225 cm reduces neutron flux on reactor vessel (in area of a weld Jfe 4)approximately by 20-30 % in comparison with position of 150-175 cm.
At present on Units 1&2 of Kola NPP variants of a fuel cycle with 78asssemblies and 12 CR fuel followers of 3.6% enrichment removed annually are used;till 36-42 irradiated assemblies are located in the core periphery (Fig.4). The fuel cyclelength is up to 290 FPD (with working on stretch-out regime on cycle end). That issufficient under present conditions of Kola NPP operation in energy system. Theoperating with power raiting limitation in an cycle beginning (as rule that is under ayears minimum of power system load) is supposed also. There are only part of 3.6%enrichment assemblies in core for 4 years on current fuel cycle. Using completely 4-thyears fuel cycle (Fig. 5.) will allow to reduce fuel costs and to lower extremely fast-neutrons flux on reactor vessel. A decreasing number of refuelling 3.6% enrichmentassemblies down to 66 will lower cycle length down to 250 FPD, that is undesirable.The enrichment raise is nessesary, but that will increase difficulties of core loadingpattern choosing.
The existing difficulties can be overcome by enrichment profiling in the cross-sections of fuel bundles, ensuring to lower rod power peaking factor and lighteningrealization of low lakage loading patterns. In this case CR fuel followers profiling isnecessary, as the fresh fuel assemblies have the same enrichment and the maximum ofrod power can be in fresh CR fuel follower. For ensuring of 4-th years period of CRfuel followers maintenance their number can be reduced from 12 down to 6 in everyeven (or odd) year. Thus 5 of 4-th years of maintenance CR fuel followers are installedin the 10-th location, and one of them - in a central location. In one of sectors CR fuelfollower is rearranged from central to the 10-th location. On Units 1&2 Kola NPP theintroduction of a similar 4-th years fuel cycle of a "m-in-in-out" type with assemblies ofaverage 3.82% enrichment is planned. The extension of an control range of regulatingCR'bank up to 225 cm is supposed also.
Thus, in accordance with accumulation of operation experience, improving ofcalculation techniques, additional analysis of the accepted restrictions on peaking powerraiting factors, it is possible the realization of fuel loads with the only irradiated fuel inthe core periphery. That will allow additionally to lower a fast neutrons flux on reactorvessel and will improve of fuel cycle economic performances.
161
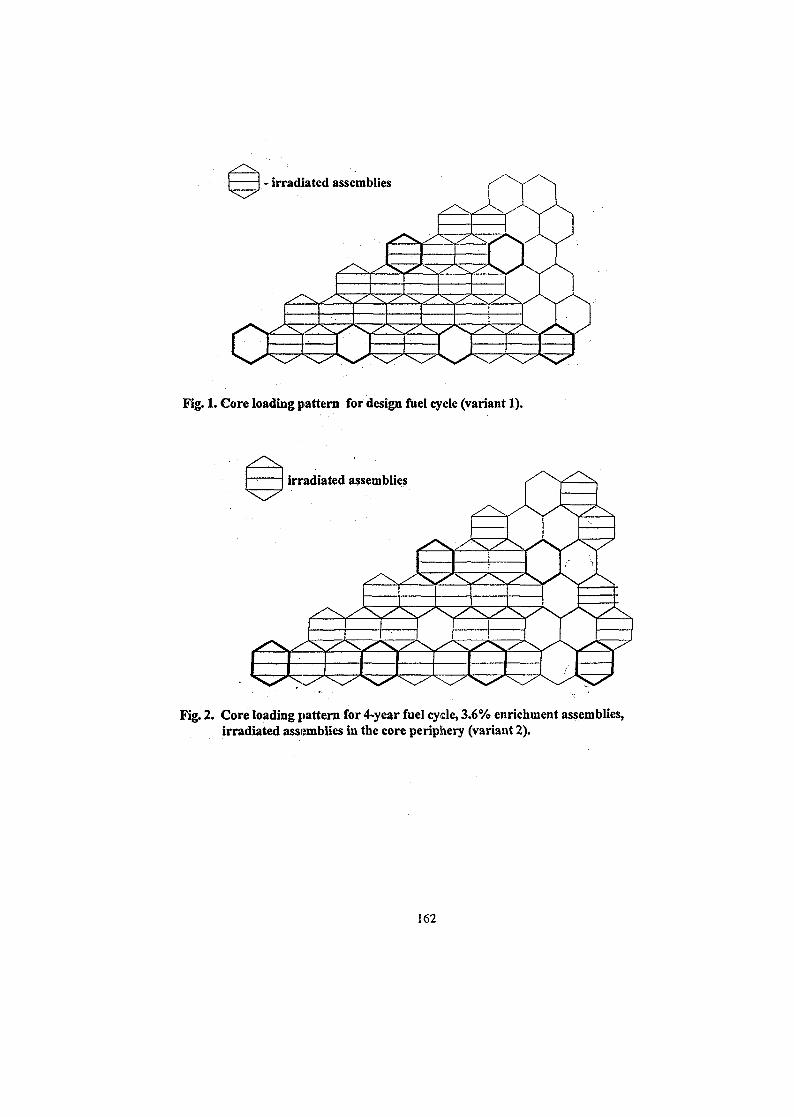
- irradiated assemblies
Fig. 1. Core loading pattern for design fuel cycle (variant 1).
irradiated assemblies
Fig. 2. Core loading pattern for 4-year fuel cycle, 3.6% enrichment assemblies,irradiated assemblies in the core periphery (variant 2).
162
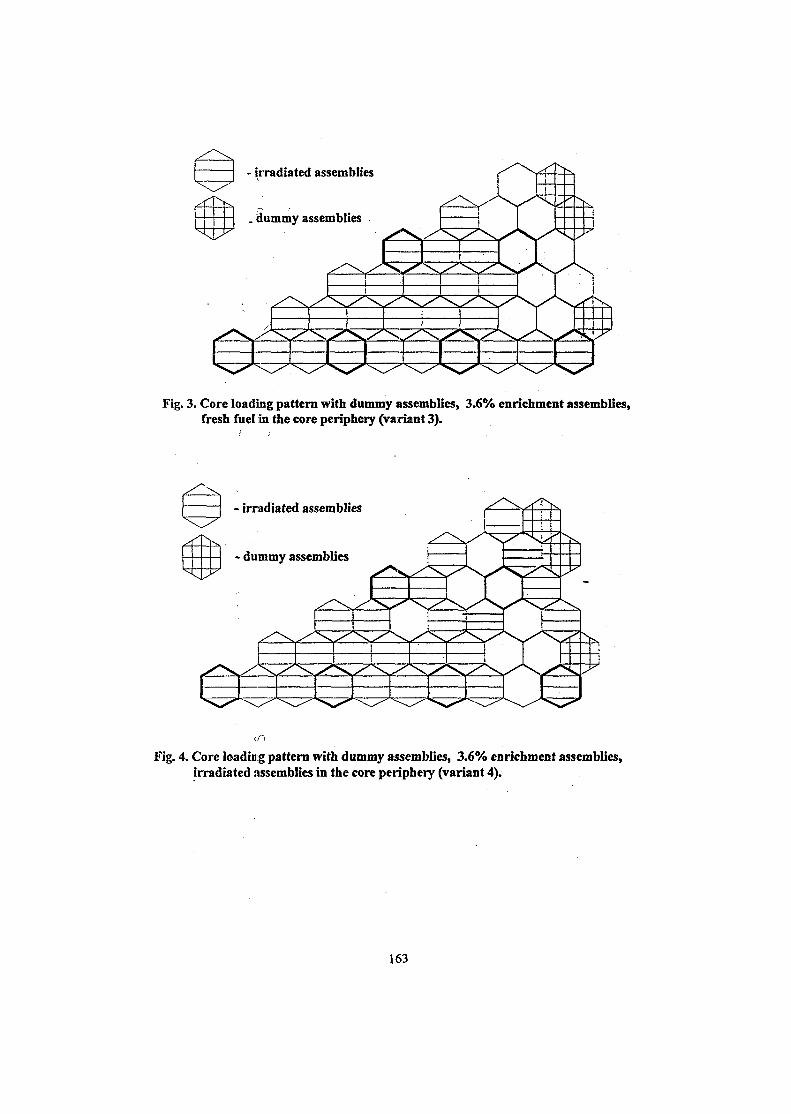
1i
>
- irradiated assemblies
. dummy assemblies
Fig. 3. Core loading pattern with dummy assemblies, 3.6% enrichment assemblies,fresh fuel iin the core periphery (variant 3).
- irradiated assemblies
* dummy assemblies
Fig. 4. Core loading pattern with dummy assemblies, 3.6% enrichment assemblies,irradiated assemblies in the core periphery (variant 4).
163
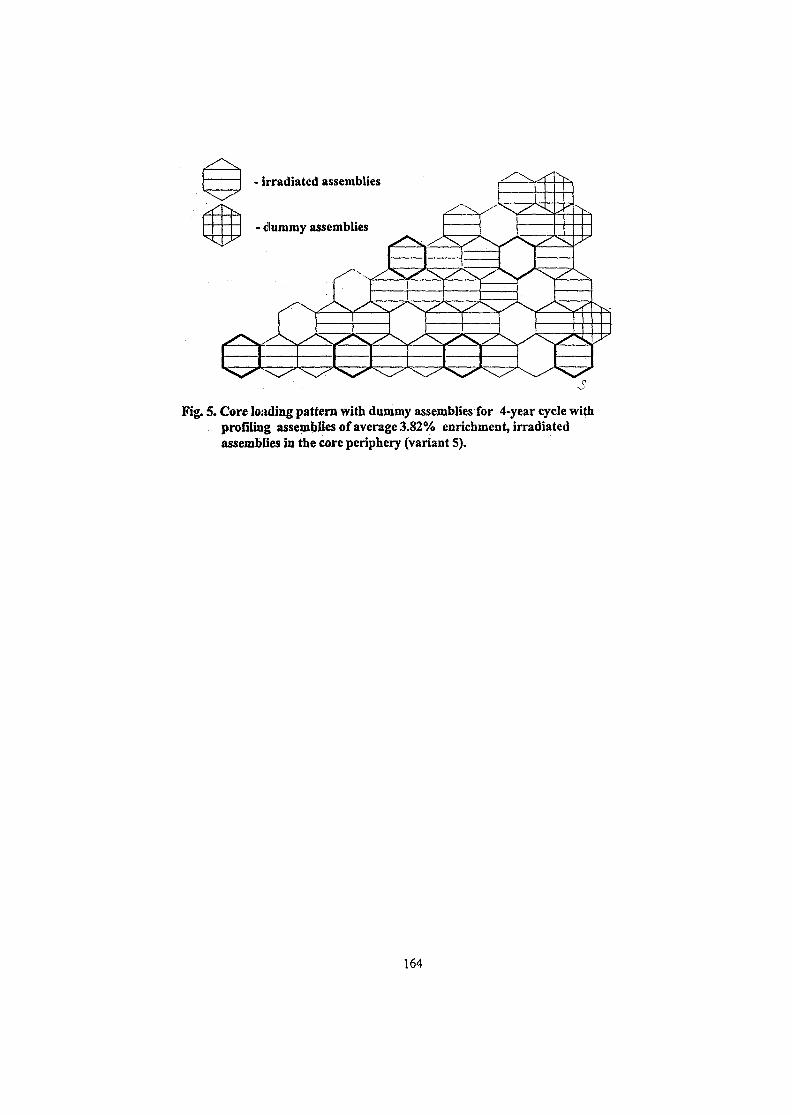
Fig. 5. Core loading pattern with dummy assemblies for 4-year cycle withprofiling assemblies of average 3.82% enrichment, irradiatedassemblies in the core periphery (variant S).
164
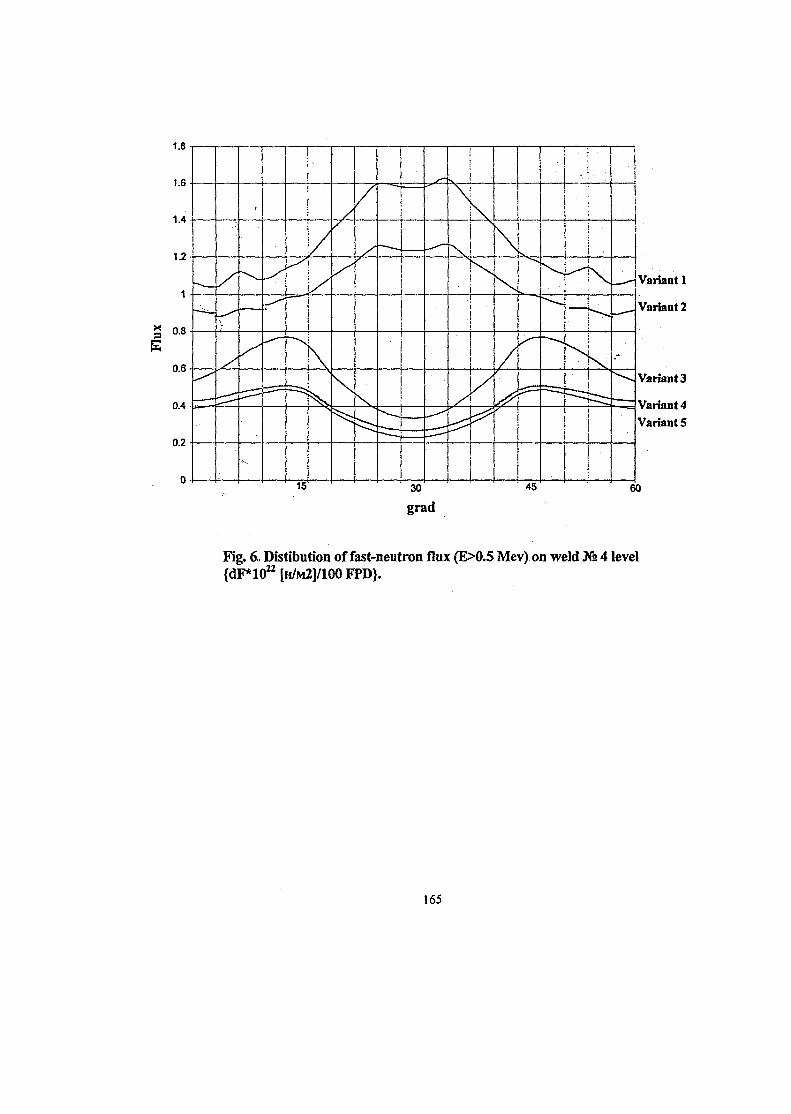
Variant 1
Variant 2
Variant 3
Variant 4
Variants
Fig. 6,, Distibution of fast-neutron flux (E>0.5 Mev) on weld Jfe 4 level{dF*1022
[H/M2]/100 FPD}.
165
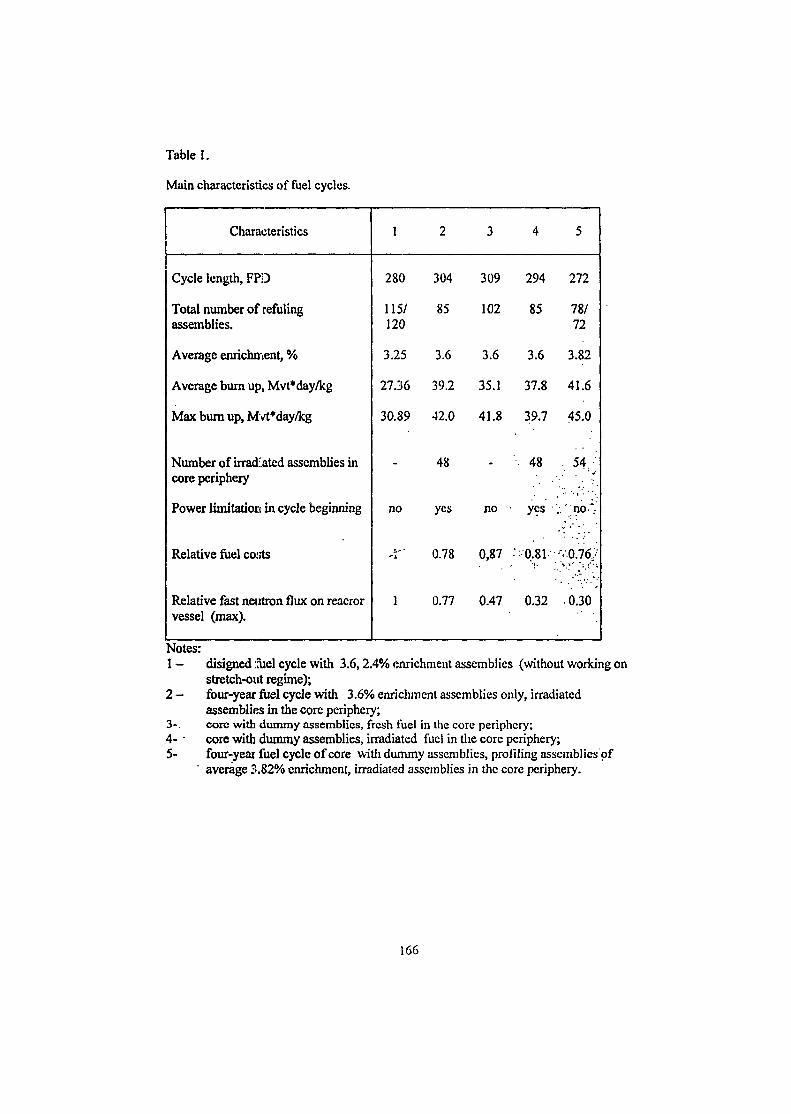
Table 1.
Main characteristics of fuel cycles.
Characteristics
Cycle length, FPD
Total number of refutingassemblies.
Average enrichment, %
Average burn up, Mvt*day/kg
Max burn up, Mvt*day/kg
Number of irradiated assemblies incore periphery
Power limitation in cycle beginning
Relative fuel costs
Relative fast neutron flux on reacrorvessel (max).
1
280
115/120
3.25
27.36
30.89
-
no
1
2
304
85
3.6
39.2
42.0
48
yes
0.78
0.77
3
309
102
3.6
35.1
41.8
-
no
0,87
0.47
4
294
85
3.6
37.8
39.7
48
yes
• 0.81
0.32
5
272
78/72
3.82
41.6
45.0
. 54/
•-•': n o - V
-. 0.76, •
0.30
Notes:1 -
2 -
3-.4- •5-
disigned :;uel cycle with 3.6,2.4% enrichment assemblies (without working onstretch-out regime);four-year fuel cycle with 3.6% enrichment assemblies only, irradiatedassemblies in the core periphery;core with dummy assemblies, fresh fuel in the core periphery;core with dummy assemblies, irradiated fuel in the core periphery;four-yeai fuel cycle of core with dummy assemblies, profiling assemblies ofaverage 3.82% enrichment, irradiated assemblies in the core periphery.
166
Information of AER working group A on improvement extension andvalidation of parametrized few-group libraries for WER-440
andVVER-1000
J.SvarnySKODA JS a.s.,Orlik 266,31606 Plzen
Czech Republic
AER Working Group A&B had its 9* joint meeting was held at VUJE Trnava a.s., Modra -
Harmonia, VUJE's pension J/illa Szondra",. Slovakia. May 10*12, 2000. There were
altogether' 12 participants from 5 member organisations and with 11 presentations. List of
participants can be seen in attachment
Main objectives of the WGA part meeting:
r • . .
1. Continuation in benchmark comparison in group A
2. Extension of libraries
3. Upgrade of present libraries
During the meeting were presented papers and information to the above topics:
Adi. Preliminary analysis of WER-440 FA with Gd burnable absorber presented
by P. Mikolas has shown that the quality of calculations of this type of FA on the spectral
code level could determine the quality of macrocode calculations. For this reason WG A
proposeto prepare by SKODA JS (to next Symposium or SC meeting) a draft of a new
FA benchmark with Gd burnable absorber.
P. Mikofas: Preliminary Analyses ofWWER-440 FA with Gd Burnable Absorbers
Ad2. A new delayed neutron libraries of MOBY-DICK calculation system were reported by
J. Svarny and their comparisons on the rod drop experiments analysis were provided. It
167
was stressed that the problem of rod drop experiment analysis is also problem of correct
detailed description of delayed neutron characteristics
J.Svarny: Application of different delayed neutron data sets to rod drop experiments
analysis
Ad3. The observations by P. Darilek on the standard BIPR's few group data set preparation
has shown differences between spectral codes KASSETA and HELIOS which problem
deserve closer attention in next group activity.
P.Darilet HELIOS calculation
Problems with correct calculation of gamma matrices for coupler were presented by J.
Svarny and new multidimensional gamma matrix was introduced.
J.Svarny: The MCNP analysis of gamma matrices in coupler
Standard gamma matrices used in MOBY-DICK's few group library were revised by P.
Mikolas for coupler region by direct spectral code WIMS calculations and impacts of
technological parameters changes and burn-up processes were reviewed.
P.Mikolas: Analyses of Influence of Adjacent Fuel Assemblies and Core States on
Control Rod Boundary Conditions and Pin Power Distribution
List of participants
KFKI-AEKI Budapest
NPP Dukovaoy
NPPPaks
Gyorgy Hegyi
Csaba Maraczy
JsefBajgl
Jiri Gerza
Imre Nemes
Erika Javor
LajosKorpas
SKODA JS a.s. Plzen Jiri Svarny
Pavel Mikolas
VUJE Trnava a.s. Petr Darilek ,
Vladimir Chrapciak
Ctibor Strmensky
168
INIS-SK-OI-OIO
IIPSK01ST087
VERIFICATION OF 3 " GENERATION CODE PACKAGEFOR NEUTRONIC CALCULATIONS OF VVERs
V.D. Sidorcnko, S.S. Alcshin. P.A. liolobov. S.N. liolshagin, A.P. Leizarenko.A. V.Markov, V. V. Morozov, A.A. Syslov. V.M. Tsvelkov
ABSTRACT
Materials on verification of the 3"*1 generation code package for W E R sncutronic calculations are presented. The package includes:
- spectral code TVS-M;
- 2-D fine mesh diffusion code PERMAK-A for 4- or 6-group calculationofVVERcoreburnup;... ..-
- 3-D coarse mesh diffusion code BIPR-7A for 2-group calculations ofquasi-stationary W E R s regimes.
The: materials include both TVS-M verification data and verification data onPERMAK-A and BIPR-7A codes using constant libraries generated with TVS-M. Allmaterials zxc related to the fuel without Gd.
TVS-M verification materials include results of comparison both withbenchmark calculations obtained by other codes and with experiments carried out atZR-6 critical facility. PERMAK-A verification materials contain results ofcomparison with TVS-M calculations and with ZR-6 experiments. BIPR-7A materialsinclude comparison with operation data for Ducovany-2 and Loviisa-1 NPPs ( W E R -440) and :for Balacovo NPP Unit 4 (WER-1000).
The verification materials demonstrate rather good accuracy of calculationsobtained with the use of code package of the 3"1 generation.
INTRODUCTION
The calculations of the neutronic characteristics of WER-440 and -1000 fuelloads were carried out at the RRC KI using the code package of second generation(package 2), developed in the 80s. The main codes entering this package are:
- . B1PR-7 code making 3-D. coarse-mesh diffusion two-group calculation ofvarious quasi-stationary regimes of the core operation, including the calculation ofburnup and refueling;
- PERMAK-360B code, which performs 2-D pin-by-pin diffusion four-groupcalculaiion in some cross section of the core;
- spcsctral code KASSETA-2, which prepares the constant libraries for the BIPR-7and PERMAK-360B codes.
169
Each of these coaes ana tne pacKage as a whole were certificated in the RFGosatomnadzor.
In the connection with the development of advanced fuel cycles for VVER-440and 1000 at the RRC K.I a code package of the third generation (code package 3)intended for physical calculations of these fuel cycles was developed. The paperpresents the materials on verification of code package 3 for the fuel not containinggadolinium.
1. MAIN PACKAGE 3 CODES.
The package consists of codes with the same functions as the package 2 codes.The BIPR-7A code is very similar to the B1PR-7: the calculation algorithm remainednearly unchanged, the volume of input information was extended, the system ofapproximation of group constants depending on burnup and parameters of FA statewas improved. The code was certificated in the RF-Gosatomnadzor.
The PERMAK-AT code has the same functions as the PERMAK-360B.However, in the interaction with the BIPR-7A, it permits the calculation to be carriedout simultaneously in several core cross sections for the given fuel load. In addition, itmakes it possible to perform the calculation of core bumup both in four and sixgroups. Also, it can perform the calculation with effective diffusion constants, takinginto account the actual distribution of neutrons inside the calculation cell thatincreases the calculation accuracy. Finally, the code involves the thermal-hydraulicmodules, which permit a detailed information on various thermal-hydrauliccharacteristics of fuel assembly to be obtained. The code was certificated in the RFGosatomnadzor.
The most significant'difference of code package 3 from code package 2 is thatthe former uses the TVS-M spectral code [1] for the generation of constant librariesfor the B1PR-7A and PERMAK-AT codes. This code pertains to the class ofengineering codes of higher accuracy and corresponds to the present-day capability ofsimilar-purpose codes. The code uses the nuclear data library differing mainly in thedata format only from the data libraries of well-known Russian certificated precisioncodes MCU/RFFI-A [2] MCU-REA [3]. In the latter, the same as in the TVS-M code,an earlier version of the DLC/MCUDAT-1.0 library and a later one DLC/MCUDAT-2.1 can be employed. Both versions give about equal agreement with the experimentaldata and in this respect are nearly equally substantiated. "
The TVS-M code performs the multipoint calculation of individual types ofFA cells in the epithermal region of E > 0.625 eV. The number of break points ispractically arbitrary. In the thermal region the calculation of cells is made in 24groups. The spatial calculation of neutron distribution in the cell is performed by thepassing-through probability method (PTP). The calculation of neutron distribution in
• the fuel assembly is made in 48 groups with the use of diffusion approximation witheffective diffusion constants. The calculation of changes in the nuclide compositionduring depleting is made for each fuel pin and absorber rod. The changes in theconcentrations of 21 heavy nuclides and 98 fission products in the fuel pin areaccounted. The code was certificated in the RF Gosatomnadzor.
170
2. VERIFICATION OF TVS-M CODE
For the verification of the TVS-M code the comparison with the MCU/RFFI-Aand MCLF-REA calculations was used. Here the comparison with the calculations forthe VVER-440 is presented. Also, the comparison of calculations with theexperiments carried out on the ZR-6 FA was made.
As an example, Table 1 shows the TVS-M and MCU/RFFI-A calculations ofKtjrwiih theDLC/MCUDAT-1.0 library for different states of fresh (F) and spent (B «20 MWd/kgHM) fuel lattice of VVER-440 with the initial enrichment 3.6% andspecified axial buckling. As seen from the table the TVS-M calculation agrees wellwith the MCU/RFFI-A calculation practically for all the FA states.
Table 2 gives the comparison of calculations by the same codes for variousstates of FA with 1.6%, 3.3%, 3.6%, 4:4% enrichment and 4%/3.6%/3.3% enrichmentshaped fuel assembly with the average enrichment 3.82%. The calculations weremade for the zero axial buckling. The TVS-M calculation mainly underestimates K«e,the maximum difference for the 3.82% enriched FA in the cold state and at the boronconcentration 2000 ppm is 0.47%. In the working and hot state the error in the TVS-M calculation does not exceed 0.2%.
Table 3 shows the comparison of TVS-M and MCU-REA calculations #with the: DLC/MCUDAT-2.1 for the working state of 3.6% enriched FA and 3.82%enrichment shaped FA depending on the burnup. At a zero bumup the K^j values arenearly the same, however the average rate of change in the multiplying propertiesobtained by the TVS-M code is higher than the similar value obtained by the MCU-REA code by 2%. This difference can be considered as not large.
Table 4 presents the TVS-M and MCU/RFFI-A calculations of/^p-with theDLC/MCUDAT-1.0 library for some states of 3.6% cell of Table 1 and the cold stateof 3.6% enriched FA. The calculations agree well, including for the spent cell.
Figs. 1-4 show the pin-by-pin distribution of fission rates for the cold and hotstates of 3.6% enriched FA and 3.82% enrichment shaped FA, calculated by theTVSM, MCU/RFFI-A and KASSETA-2 codes. The KASSETA-2 codeunderestimates by 3-3.5% the fission rate in the corner fuel pins of the enrichmentshaped FA; the TVS-M code underestimates the fission rate in the same fuel pins byas low as 2%. In the rest of fuel pins the difference between the calculations by all thecodes is lower.
In general, it can be concluded that the TVS-M calculation for WER-440 fuelcells and assemblies agrees reasonably with the MCU calculation.
.An important criterion of TVS-M calculation accuracy is the comparison withthe ZR-6 experiment The experiments on the ZR-6 pertain to the benchmark class,,and many of them are introduced into the international bank of experiments of thisclass [4]. Tables 5-12 list the K^ values calculated by the MCU-REA and TVS-Mcodes with the DLC/MCUDAT-2.1 library for various configurations of ZR-6 withthe 1.27 cm pitch. The tables show the series of calculations for qualitatively differentmaterial and geometrical configurations: homogeneous and two-zone cylindricalincluding those with the water temperature up to 130°C; configurations with waterspaces and absorber rods instead of some fuel pins; configurations with assemblystructure. In each series the Kejf averaged by the series and root-mean-square deviation
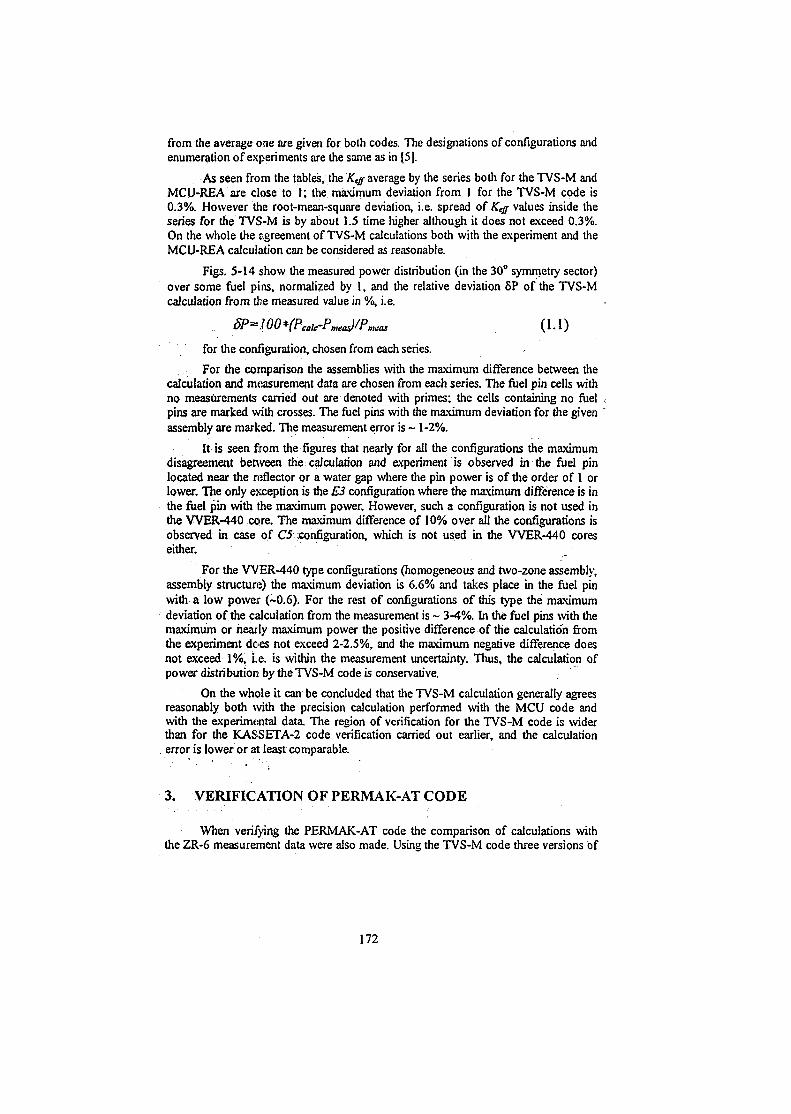
from the average one are given for both codes. The designations of configurations andenumeration of experiments are the same as in [5].
As seen from the tables, the Keg average by the series both for the TVS-M andMCU-REA are dose to 1; the maximum deviation from 1 for the TVS-M code is0.3%. However the root-mean-square deviation, i.e. spread of .K^ values inside theseries for the TVS-M is by about 1.5 time higher although it does not exceed 0.3%.On the whole the agreement of TVS-M calculations both with the experiment and theMCU-REA calculation can be considered as reasonable.
Figs. 5-14 show the measured power distribution (in the 30° symmetry sector)over some fuel pins, normalized by 1, and the relative deviation SP of the TVS-Mcalculation from the measured value in %, i.e.
sp=.wo*(pcatc-pmej/pmi:as (i.i)for the configuration, chosen from each series.
For the comparison the assemblies with the maximum difference between thecalculation and measurement data are chosen from each series. The fuel pin cells withno measurements carried out are denoted with primes; the cells containing no fuelpins are marked with crosses. The fuel pins with the maximum deviation for the givenassembly are marked. The measurement error is - 1-2%.
It is seen firom the figures that nearly for all the configurations the maximumdisagreement between the calculation and experiment is observed in the fuel pinlocated near the reflector or a water gap where the pin power is of the order of 1 orlower. The only exception is the E3 configuration where the maximum difference is inthe fuel pin with the maximum power. However, such a configuration is not used inthe WER-440 core. The maximum difference of 10% over all the configurations isobserved in case of C5 configuration, which is not used in the WER-440 coreseither. .
For the VVER-440 type configurations (homogeneous and two-zone assembly,assembly structure) the maximum deviation is 6.6% and takes place in the fuel pinwith a low power (~0.6). For the rest of configurations of this type the maximumdeviation of the calculation from the measurement is - 3-4%. In the fuel pins with themaximum or nearly maximum power the positive difference of the calculation fromthe experiment does not exceed 2-2.5%, and the maximum negative difference doesnot exceed 1%, i.e. is within the measurement uncertainty. Thus, the calculation ofpower distribution by the TVS-M code is conservative.
On the whole it can be concluded that the TVS-M calculation generally agreesreasonably both with the precision calculation performed with the MCU code andwith the experimental data The region of verification for the TVS-M code is widerthan for the KASSETA-2 code verification carried out earlier, and the calculationerror is lower or at least comparable.
3 . V E R I F I C A T I O N O F P E R M A K - A T C O D E
When verifying the PERMAK-AT code the comparison of calculations withthe ZR-6 measurement data were also made. Using the TVS-M code three versions of
172
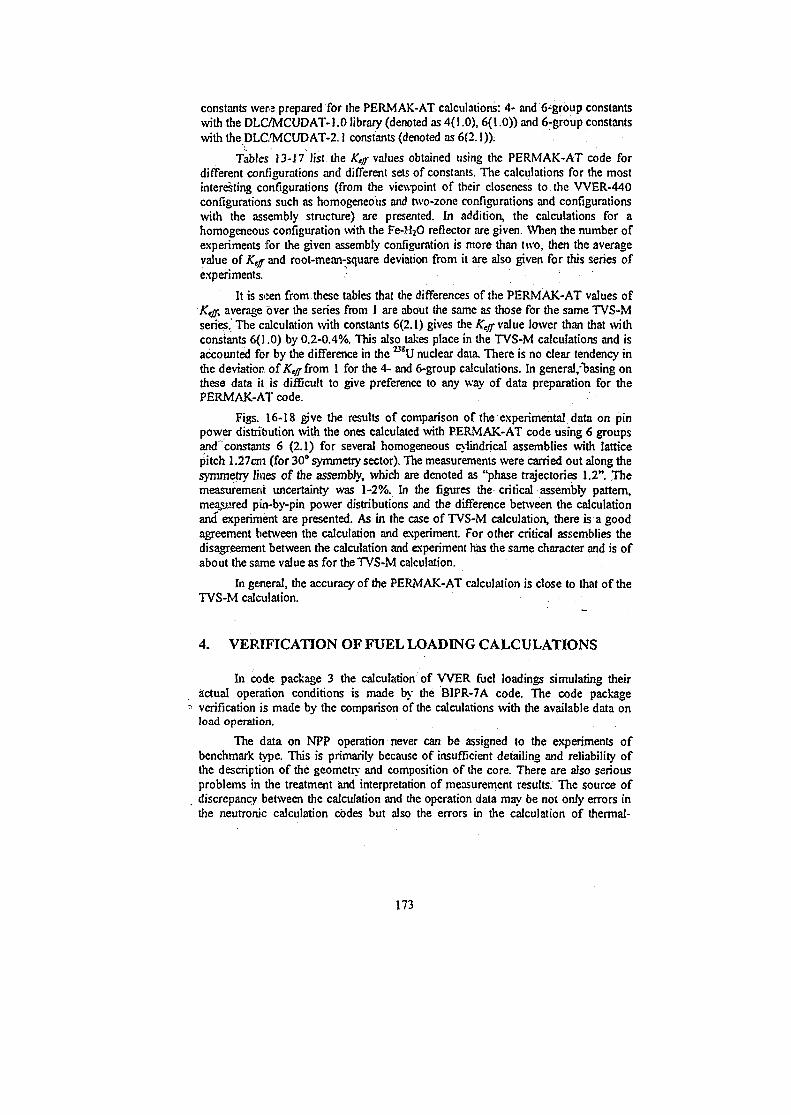
constants were prepared for the PERMAK-AT calculations: 4- and 6-group constantswith the DLC/MCUDAT-1.0 library (denoted as 4(1.0), 6(1.0)) and 6-group constantswith the DLC/MClfDAT-2.1 constants (denoted as 6(2.1)).
Tables 13-J7 list the Ke/r values obtained using the PERMAK-AT code fordifferent configurations and different sets of constants. The calculations for the mostinteresting configurations (from Ihe viewpoint of their closeness to the WER-440configurations such as homogeneous and two-zone configurations and configurationswith the assembly structure) are presented. In addition, the calculations for ahomogeneous configuration with the Fe-H2O reflector are given. When the number ofexperiments for the given assembly configuration is more than two, then the averagevalue of Keff and root-mean-square deviation from it are also given for this series ofexperiments. ?
It is seen from these tables that the differences of the PERMAK-AT values ofKeff, average over the series from 1 are about the same as those for the same TVS-Mseries^The calculation with constants 6(2.1) gives the / revalue lower than that withconstants 6(1.0) by 0.2-0.4%. This also takes place in the TVS-M calculations and isaccounted for by the difference in the 238U nuclear data. There is no clear tendency inthe deviation of K^rfrom 1 for the 4- and 6-group calculations. In general,T)asing onthese data it. is difficult to give preference to anv wav of data preparation for thePERMAK-AT code.
Figs. 16-18 give the results of comparison of the experimental data on pinpower distribution with the ones calculated with PERMAK-AT code using 6 groupsaixTconstants 6 (2.1) for several homogeneous cylindrical assemblies with latticepitch 1.27cm (for 30° symmetry sector). The measurements were carried out along thesymmetry lines of the assembly, which are denoted as "phase trajectories 1.2". Themeasurement uncertainty was 1-2%. In the figures the critical assembly pattern,measured pin-by-pin power distributions and the difference between the calculationand experiment are presented. As in the case of TVS-M calculation, there is a goodagreement between the calculation and experiment. For other critical assemblies thedisagreement between the calculation and experiment has the same character and is ofabout the same value as for the TVS-M calculation.
In general, the accuracy of the PERMAK-AT calculation is close to that of theTVS-M calculation.
4. VERIFICATION OF FUEL LOADING CALCU LATIONS
In code package 3 the calculation of W E R fuel loadings simulating theiractual operation conditions is made by the BIPR-7A code. The code packageverification is made by the comparison of the calculations with the available data onload operation.
The data on NPP operation never can be assigned to the experiments ofbenchmark type. This is primarily because of insufficient detailing and reliability ofthe description of the geometry and composition of the core. There are also seriousproblems in the treatment and interpretation of measurement results. The source ofdiscrepancy between the calculation and the operation data may be not only errors inthe neutronic calculation codes but also the errors in the calculation of thermal-
173
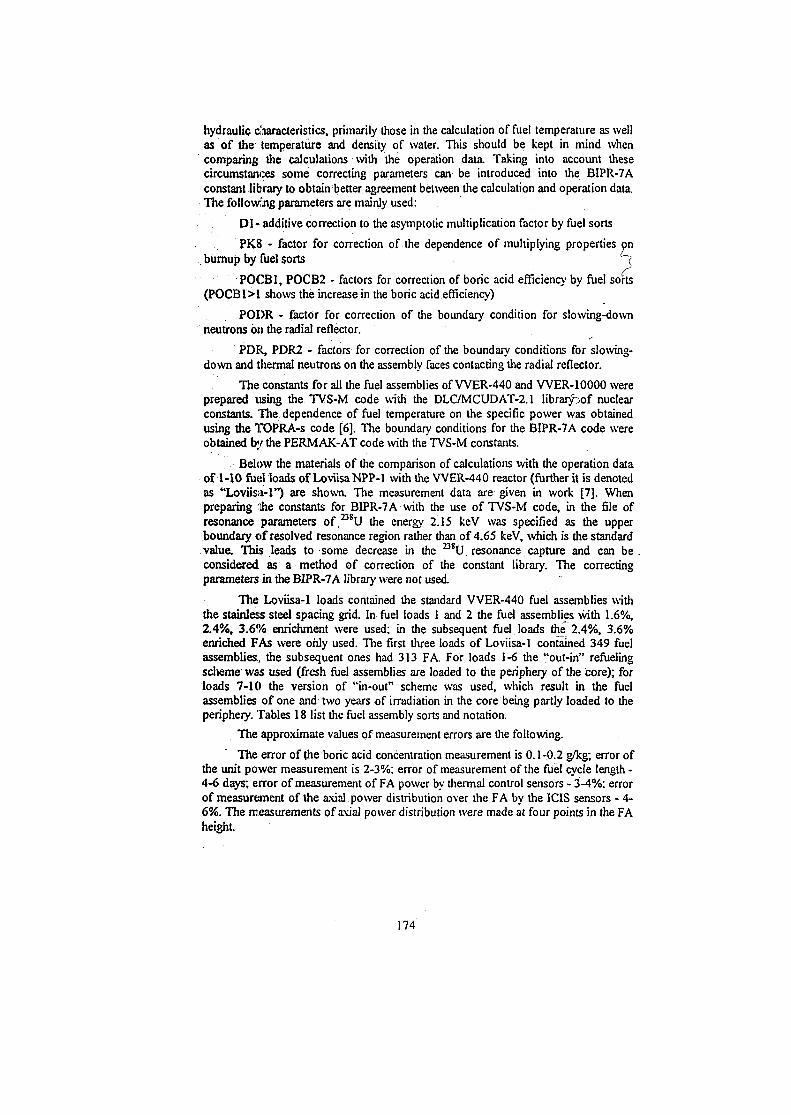
hydraulic characteristics, primarily those in the calculation of fuel temperature as wellas of the temperature and density of water. This should be kept in mind whencomparing the calculations with the operation data Taking into account thesecircumstances some correcting parameters can be introduced into the BIPR-7Aconstant library to obtain better agreement between the calculation and operation data.The following parameters are mainly used:
D l - additive correction to the asymptotic multiplication factor by fuel sorts
PK8 - factor for correction of the dependence of multiplying properties onburnup by ifuel sorts h
POCB1, POCB2 - factors for correction of boric acid efficiency by fuel sorts(POCB1>1 shows the increase in the boric acid efficiency)
PODR - factor for correction of the boundary condition for slowing-downneutrons on the radial reflector.
PDR, PDR2 - factors for correction of the boundary conditions for slowing-down and thermal neutrons on the assembly faces contacting the radial reflector.
The constants for all the fuel assemblies of WER-440 and WER-10000 wereprepared using the TVS-M code with the DLC/MCUDAT-2.1 Iibrarpof nuclearconstants. The dependence of fuel temperature on the specific power was obtainedusing the TOPRA-s code [6]. The boundary conditions for the BIPR-7A code wereobtained by the PERMAK-AT code with the TVS-M constants.
Below the materials of the comparison of calculations with the operation dataof 1-10 fuel loads of LoviisaNPP-1 with the WER-440 reactor (further it is denotedas "Loviisa-1") are shown. The measurement data are given in work [7]. Whenpreparing the constants for BIPR-7A with the use of TVS-M code, in the file ofresonance parameters of , 2 3^ the energy 2.15 keV was specified as the upperboundary of resolved resonance region rather than of 4.65 keV, which is the standardvalue. This leads to some decrease in the ^ ' U . resonance capture and can be .considered as a method of correction of the constant library. The correctingparameters in the BIPR-7A library were not used.
The Loviisa-1 loads contained the standard WER-440 fuel assemblies withthe stainless steel spacing grid. In fuel loads 1 and 2 the fuel assemblies with 1.6%,2.4%, 3.6% enrichment were used: in the subsequent fuel loads the 2.4%, 3.6%enriched FAs were only used. The first three loads of Loviisa-1 contained 349 fuelassemblies, the subsequent ones had 313 FA. For loads 1-6 the "out-in" refuelingscheme was used (fresh fuel assemblies are loaded to the periphery of the core); forloads 7-10 the version of "in-out" scheme was used, which result in the fuelassemblies of one and two years of irradiation in the core being partly loaded to theperiphery. Tables 18 list the fuel assembly sorts and notation.
The approximate values of measurement errors are the following.
The error of the boric acid concentration measurement is 0.1-0.2 g/kg; error ofthe unit power measurement is 2-3%: error of measurement of the fuel cycle length -4-6 days; error of measurement of FA power by thermal control sensors - 3-4%: errorof measurement of the axial power distribution over the FA by the ICIS sensors - 4-6%. The measurements of axial power distribution were made at four points in the FAheight
174
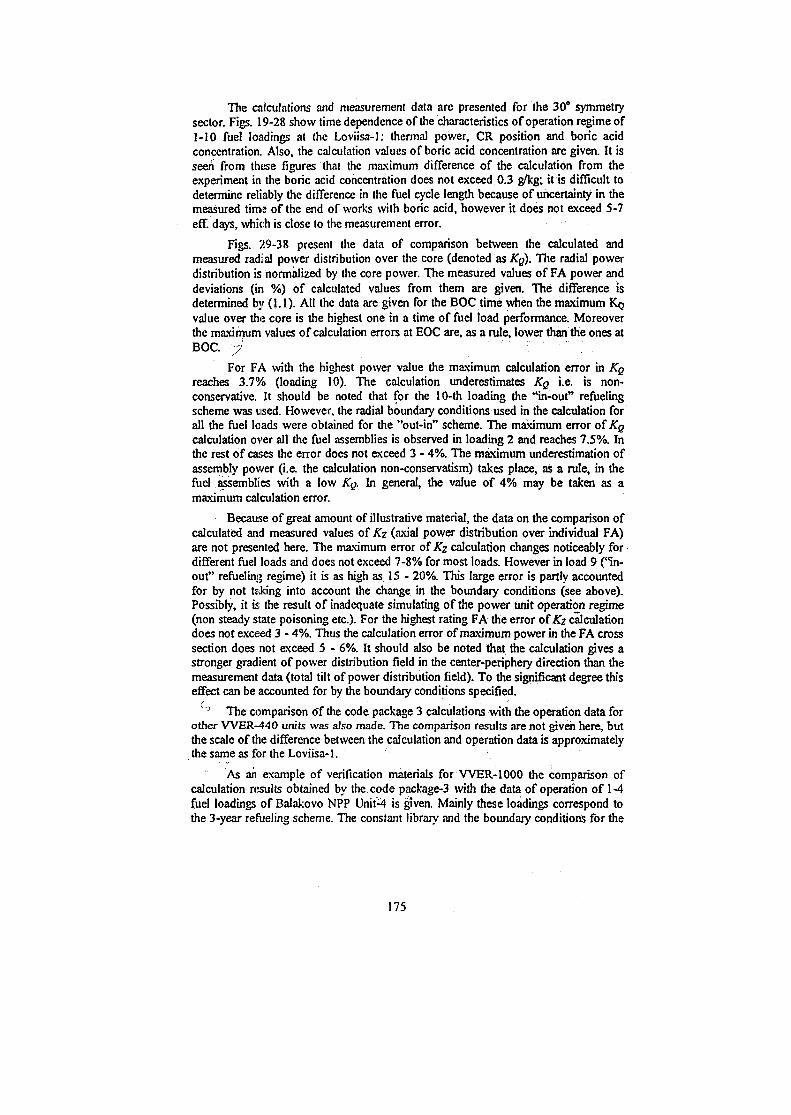
The calculations and measurement data are presented for the 30° symmetrysector. Figs. 19-28 show time dependence of the characteristics of operation regime of1-10 fuel loadings at the Loviisa-1: thermal power, CR position and boric acidconcentration. Also, the calculation values of boric acid concentration are given. It isseen from these figures that the maximum difference of the calculation from theexperiment in the boric acid concentration does not exceed 0.3 g/kg; it is difficult todetermine reliably the difference in the fuel cycle length because of uncertainty in themeasured time of the end of works with boric acid, however it does not exceed 5-7eff. days, which is close to the measurement error.
Figs. 29-38 present the data of comparison between the calculated andmeasured radial power distribution over the core (denoted as KQ). The radial powerdistribution is normalized by the core power. The measured values of FA power anddeviations (iri %) of calculated values from them are given. The difference isdetermined by (1.1). All the data are given for the BOC time when the maximum KQvalue over the core is the highest one in a time of fuel load performance. Moreoverthe maximum values of calculation errors at EOC are, as a rule, lower than the ones at
For FA with the highest power value the maximum calculation error in KQreaches 3.7% (loading 10). The calculation underestimates KQ i.e. is non-conservative. It should be noted that for the 10-th loading the "in-out" refuelingscheme was used. However, the radial boundary conditions used in the calculation forall the fuel loads were obtained for the "out-in" scheme. The maximum error of KQcalculation over all the fuel assemblies is observed in loading 2 and reaches 7.5%. Inthe rest of cases the error does not exceed 3 - 4%. The maximum underestimation ofassembly power (i.e. the calculation non-conservatism) takes place, as a rule, in thefuel assemblies with a low Kg. In general, the value of 4% may be taken as amaximum calculation error.
Because of great amount of illustrative material, the data on the comparison ofcalculated and measured values of Kz (axial power distribution over individual FA)are not presented here. The maximum error of Kz calculation changes noticeably fordifferent fuel loads and does not exceed 7-8% for most loads. However in load 9 ("in-out" refueling regime) it is as high as 15 - 20%. This large error is partly accountedfor by not teking into account the change in the boundary conditions (see above).Possibly, it is the result of inadequate simulating of the power unit operation regime(non steady state poisoning etc.). For the highest rating FA the error of Kz calculationdoes not exceed 3 - 4%. Thus the calculation error of maximum power in the FA crosssection does not exceed 5 - 6%. It should also be noted that the calculation gives astronger gradient of power distribution field in the center-periphery direction than themeasurement data (total tilt of power distribution field). To the significant degree thiseffect can be accounted for by the boundary conditions specified.
The comparison o'f the code package 3 calculations with the operation data forother WER-440 units was also made. The comparison results are not given here, butthe scale of tine difference between the calculation and operation data is approximatelythe same as for the Loviisa-1.
As an example of verification materials for WER-1000 the comparison ofcalculation results obtained by the code package-3 with the data of operation of 1-4fuel loadings of Balakovo NPP Unit-4 is givea Mainly these loadings correspond tothe 3-year refueling scheme. The constant library and the boundary conditions for the
175
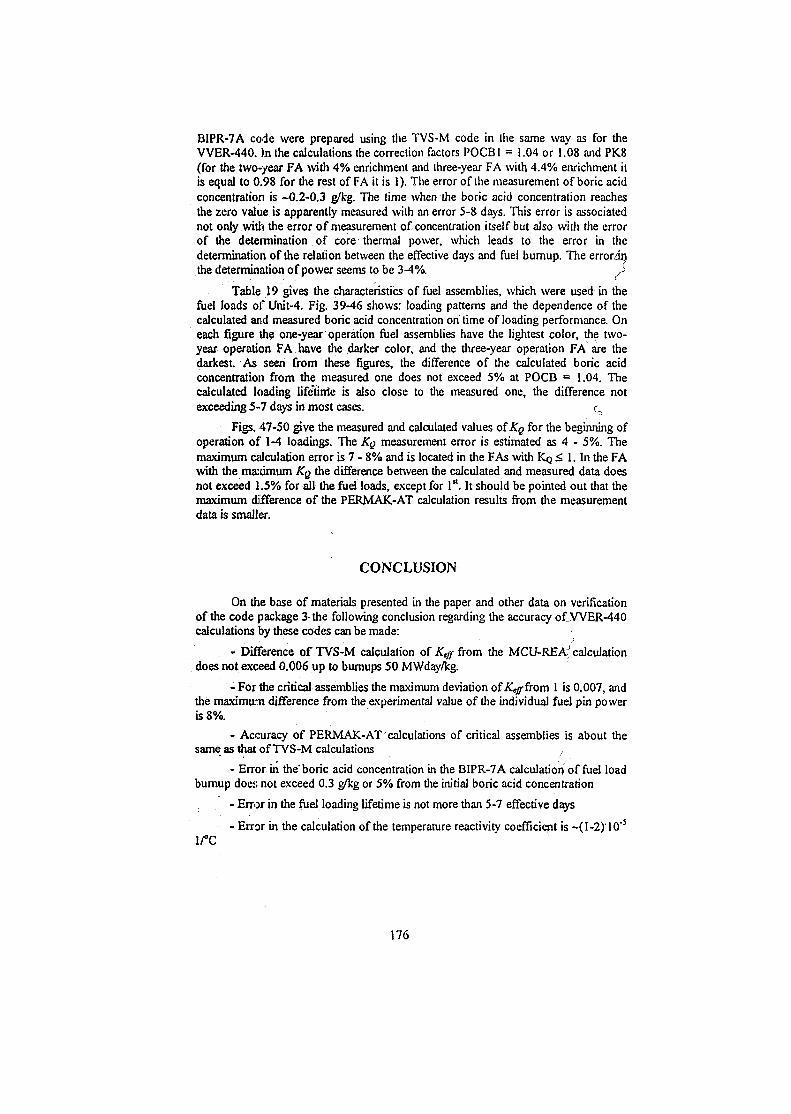
BIPR-7A code were prepared using the TVS-M code in the same way as for theVVER-440. In the calculations the correction factors POCB1 = 1.04 or 1.08 and PK8(for the two-year FA with 4% enrichment and three-year FA with 4.4% enrichment itis equal to 0.98 for the rest of FA it is 1). The error of the measurement of boric acidconcentration is -0.2-0.3 g/kg. The time when the boric acid concentration reachesthe zero value is apparently measured with an error 5-8 days. This error is associatednot only with the error of measurement of concentration itself but also with the errorof the determination of core thermal power, which leads to the error in thedetermination of the relation between the effective days and fuel bumup. The error4nthe determination of power seems to be 3-4%. S
Table 19 gives the characteristics of fuel assemblies, which were used in thefuel loads of Unit-4. Fig. 39-46 shows: loading patterns and the dependence of thecalculated and measured boric acid concentration on time of loading performance. Oneach figure the one-year operation fuel assemblies have the lightest color, the two-year operation FA have the darker color, and the three-year operation FA are thedarkest. As seen from these figures, the difference of the calculated boric acidconcentration from the measured one does not exceed 5% at POCB = 1.04. Thecalculated loading life'tirrie is also close to the measured one, the difference notexceeding 5-7 days in most cases. c,
Figs. 47-50 give the measured and calculated values of Kg for the beginning ofoperation of 1-4 loadings. The Kg measurement error is estimated as 4 - 5%. Themaximum calculation error is 7 - 8% and is located in the FAs with KQ < 1. In the FAwith the maximum Kg the difference between the calculated and measured data doesnot exceed 1.5% for all the fuel loads, except for 1st. It should be pointed out that themaximum difference of the PERMAK-AT calculation results from the measurementdata is smaller.
CONCLUSION
On the base of materials presented in the paper and other data on verificationof the code package 3 the following conclusion regarding the accuracy ofJWER-440calculations by these codes can be made:
- Difference of TVS-M calculation of Ke/f from the MCU-REA^calculationdoes not exceed 0.006 up to bumups 50 MWday/kg.
- For the critical assemblies the maximum deviation of Kegfrom 1 is 0.007, andthe maximum difference from the experimental value of the individual fuel pin poweris 8%.
- Accuracy of PERMAK-AT calculations of critical assemblies is about thesame as that of TVS-M calculations
- Error in the" boric acid concentration in the BIPR-7A calculation of fuel loadbumup does not exceed 0.3 g/kg or 5% from the initial boric acid concentration
- Error in the fuel loading lifetime is not more than 5-7 effective days
- Error in the calculation of the temperature reactivity coefficient is ~(l-2)10'5
176
• Calculated total CR worth with one and two control rods withdrawn agreeswith the experimental one within the measurement error, which is ~ 15%
• Error in the calculation of the differential efficiency of CR is 15 - 20%
• Calculation underestimates the power of peripheral fuel assemblies of 3-4year by 10 - 12%. However, the power of these fuel assemblies is low. At thebeginning of cycle the error in assembly power calculation is 4-5% in case of thehighest rated fuel assembly, the calculation being conservative, as a rule
- When calculating axial power distribution in the highest rated fuel assembliesthe calculation error is 4 - 5%
- Error in the calculation of power in the highest rated fuel pellet is 7-8%.
The errors in the calculations by the code package 3 are generally close tothose of the code package 2 for the region where the verification of code package 2was carried out.
However the region of verification and the methodical substantiation of codesiused in the code package 3 are essentially higher. The verification materials aretransferred to the RF Gosatomnadzor for certification. At present materials onverification of the code package for the fuel with integrated gadolinium are beingprepared. • - . . . . '
REFERENCES
1. V.D. Sidorenko e.a Spectral Code TVS-M for Calculation of Characteristics ofCells, Supercells and Fuel Assemblies of WER-Type Reactors. 5-th Symposiumof the AER, Dobogoko, October 15-20. 1995
2. E.A. Gomin, L.V. Maiorov. The MCU-RFFI Monte Carlo Code for ReactorDesign Applications. Proc. of Intern. Conf. on Mathem. and Comput. Reac. Phys.and Emir. Analyses. April 30-May 4 1995, Portland, Oregon, USA
3. Gomin E.A., Maiorov L.V. "The MCU Monte Carlo Code for 3D Depletion, Calculation", Proc. of Intern. Conf. on Math, and Comp. Reac. Phys. and Envir.
Anal. inNucl. Appl., M&c'99-Madrid. Sept 27-30 1999, Madrid, Spain
4. International Handbook of Evaluated Criticality Safety Benchmark Experiments,v. IV, NEA/NSC/DOC(95)03/TV
5. Temporary International Collective (TIC) for Joint Research into the Physical ofWWER-Type Reactors. Final Report of TIC, vol. 1, "Experimental Investigationsof the Physical Properties of WWER-Type Uranium-Water Lattices", AkademiaiKiado, Budapest, 1985
6. Scheglov A.S. Code to Calculate Thermo-Physical Characteristics of the WWERFuel Rod Cross-Sections-TOPRA-S. Preprint RRC KI Hs 6172/4, M., 2000
7. E. Kaloinen. Test problem of calculation of reactivity coefficients in LOVIISAWER-440 reactors. Material of XVI Symposium WWER, Moscow, 1987
177
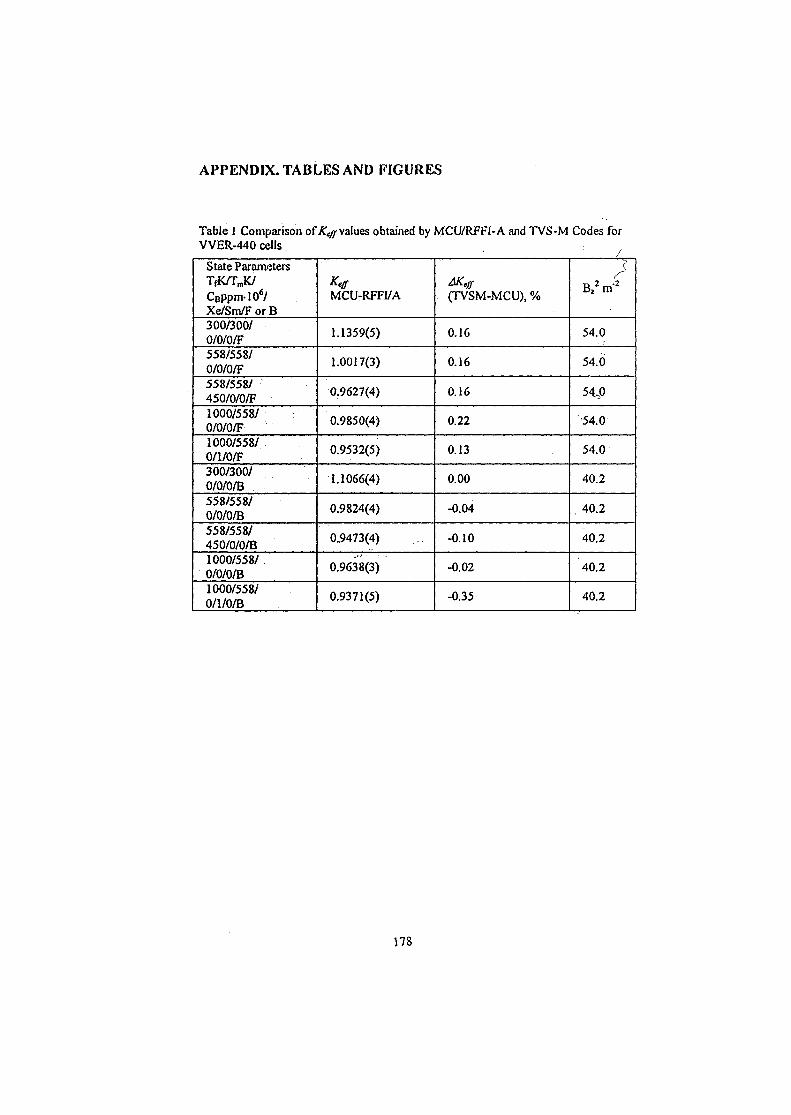
APPENDIX. TABLES AND FIGURES
Table 1 Comparison of Rvalues obtained by MCU/RFFI-A and TVS-M Codes forVVER-440 ceils
State ParametersT(¥JTJUCeppm-io6/Xe/Sm/F or B300/300/0/0/0/F558/558/0/0/0/F558/558/450/0/0/F1000/558/0/0/0/F1000/558/0/1/0/F300/300/0/0/0/B558/558/0/0/0/B558/558/450/0/0/B1000/558/0/0/0/B1000/558/0/1/0/B
MCU-RFFI/A
1.1359(5)
1.0017(3)
0.9627(4)
0.9850(4)
0.9532(5)
1.1066(4)
0.9824(4)
0:9473(4)
0.9638(3)
0.9371(5)
(TVSM-MCU), %
0.16
0.16
0.16
0.22
0.13
0.00
-0.04
-0.10
-0.02
-0.35
B^nY2
54.0
54.0
5CP
54.0
54.0
40.2
40.2
40.2
40.2
40.2
178
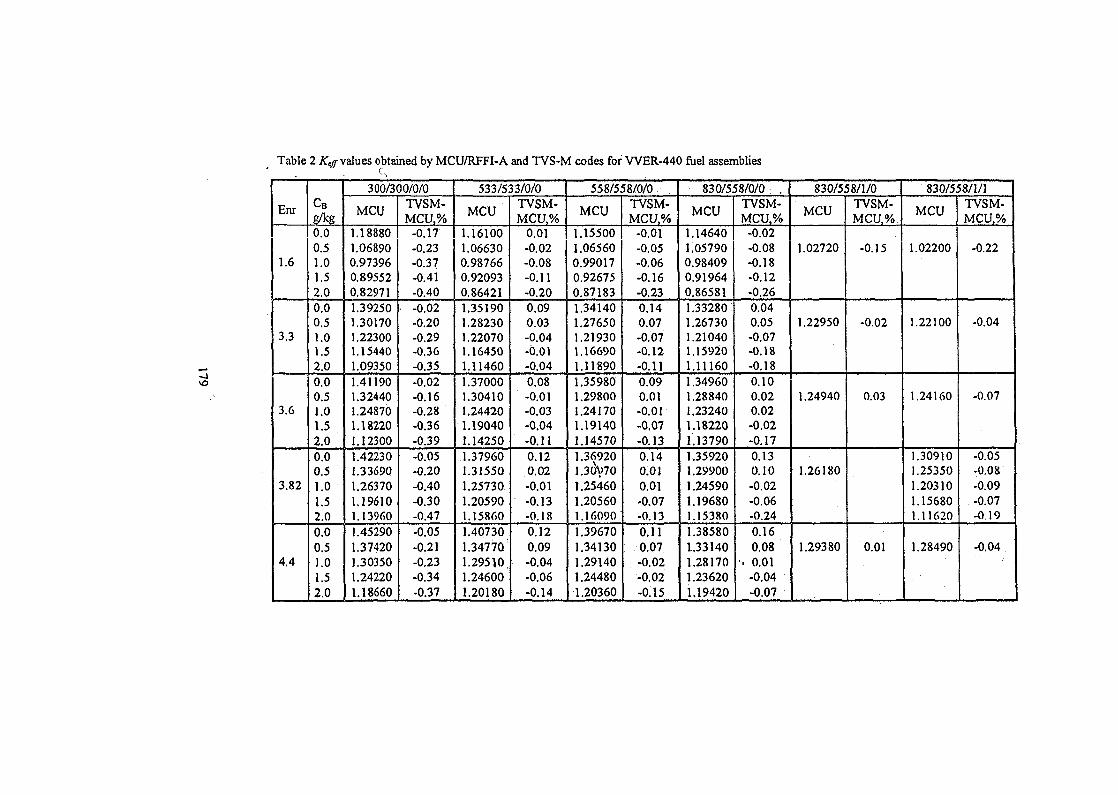
Table 2 Rvalues obtained by MCU/RFFI-A and TVS-M codes for WER-440 fuel assemblies
jvO
Enr
1.6
3.3
3.6
3.82
4.4
CB
g^g0.00.51.01.52.00.00.51.01.52.00.00.51.01.52.00.00.51.01.52.00.00.51.01.52.0
300/300/0/0
MCU
1.188801.068900.973960.895520.829711.392501.301701.223001.154401.093501.411901.324401.248701.182201.123001.422301.336901.263701.196101.139601.452901.374201.303501.242201.18660
TVSM-MCU,%
-0.17-0.23-0.37-0.41-0.40-0.02-0.20-0.29-0.36-0.35-0.02-0.16-0.28-0.36-0.39-0.05-0.20-0.40-0.30-0.47-0.05-0.21-0.23-0.34-0.37
533/533/0/0
MCU
1.161001.066300.987660.920930.864211.351901.282301.220701.164501.11460.37000.30410.24420
1.190401.14250].37960
1.31550.25730.20590.15860
1.407301.34770.29510
1.246001.20180
TVSM-MCU,%
0.01-0.02-0.08-0.11-0.200.090.03-0.04-0.01-0.040.08-0.01-0.03-0.04-0.110.120.02-0.01-0.13-0.180.120.09-0.04-0.06-0.14
558/558/0/0
MCU
1.155001.065600.990170.926750.871831.341401.276501.219301.166901.118901.359801.298001.24170.19140
1.145701.36920l.30N>70.25460
1.205601.160901.39670t .341301.291401.244801.20360
TVSM-MCU,%
-0.01-0.05-0.06-0.16-0.230.140.07-0.07-0.12-0.110.090.01-0.01-0.07-0.130.140.010.01•0.07-0.130.110.07-0.02-0.02-0.15
830/558/0/0: .
MCU
1.146401.057900.984090.919640.865811.332801.267301.210401.159201.111601.349601.288401.232401.18220.13790.35920.29900.24590.19680.15380
1.385801.331401.281701.236201.19420
TVSM-MCU,%
-0.02-0.08-0.18-0.12-0.260.040.05-0.07-0.18-0.180.100.020.02-0.02-0.170.130.10-0.02-0.06-0.240.160.08
•• 0.01-0.04-0.07
830/558/1/0
MCU
1.02720
1.22950
1.24940
1.26180
1.29380
TVSM-MCU,%
-0.15
-0.02
0.03
0.01
830/558/1/1
MCU
1.02200
1.22100
1.24160
1.309101.253501.203101.156801.11 f>20
1.28490
TVSM-MCU,%
-0.22
-0.04
-0.07
-0.05-0.08-0.09-0.07-0.19
-0.04
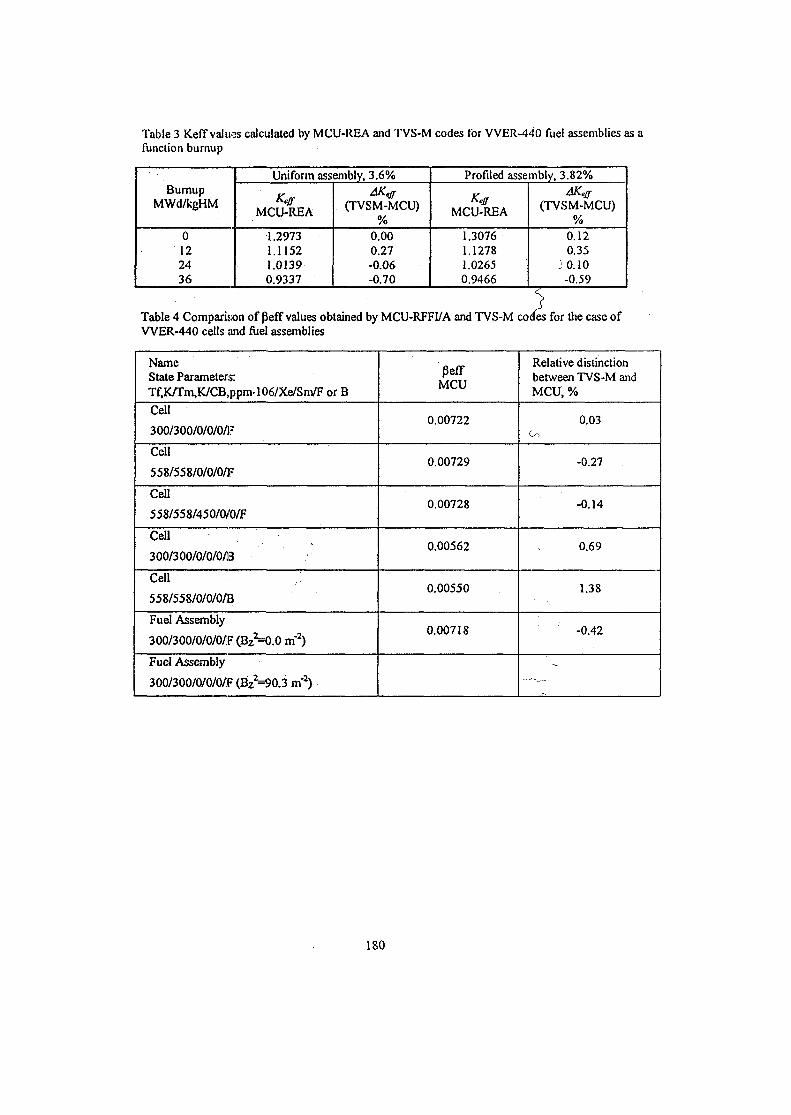
Table 3 Keff values calculated by MCU-REA and TVS-M codes tor VVER-440 fuel assemblies as afunction burnup
BurnupMWd/kgHM
0122436
Uniform assembly, 3.6%
KeffMCU-REA
1.29731.11521.01390.9337
AKeff
(TVSM-MCU)%
0.000.27-0.06-0.70
Profiled assembly, 3.82%
KeffMCU-REA
1.30761.12781.02650.9466
AKeff(TVSM-MCU)
%0.120.35
3 0.10-0.59
Table 4 Comparison of Peff values obtained by MCU-RFFI/A and TVS-M codes for the case ofVVER-440 cells and fuel assemblies
NameState Parameter:;:Tf,K/Tm,K/CB,ppnvlO6/Xe/Sm/F or BCell
300/300/0/0/0/]?
Cell
558/558/0/0/0/F
Cell
558/558/450/0/0/F
Cell
300/300/0/0/0/13
Cell
558/558/0/0/0/B
Fuel Assembly
300/300/0/0/O/F (Bz^O.O rn2)
Fuel Assembly
300/300/0/0/O/F (Bz2=90.3 m"2)
PeffMCU
0.00722
0.00729
0.00728
0.00562
0.00550
0.00718
Relative distinctionbetween TVS-M andMCU, %
0.03Co
-0.27
-0.14
0.69
1.38
-0.42
180
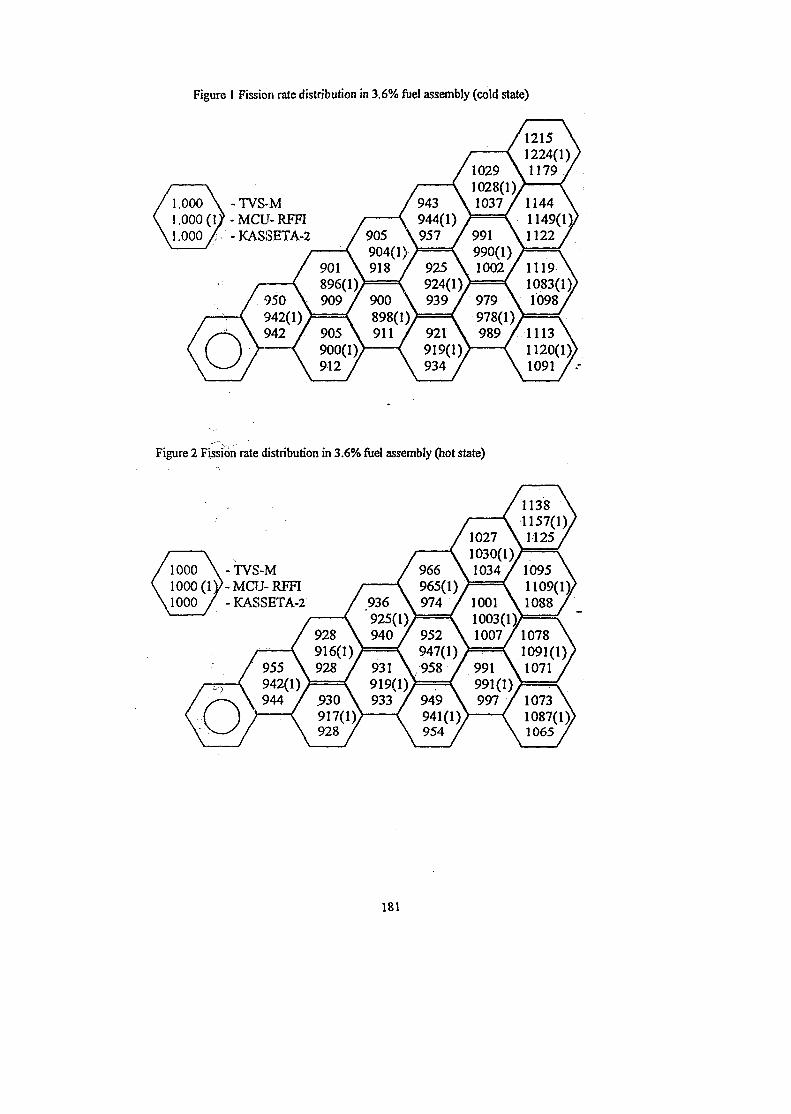
Figure I Fission rate distribution in 3.6% fuel assembly (cold state)
- TVS-M- MCU- RFFI- KASSETA-2
Figure 2 Fission rate distribution in 3.6% fuel assembly (hot state)
-TVS-M-MCU-RFFI- KASSETA-2
181
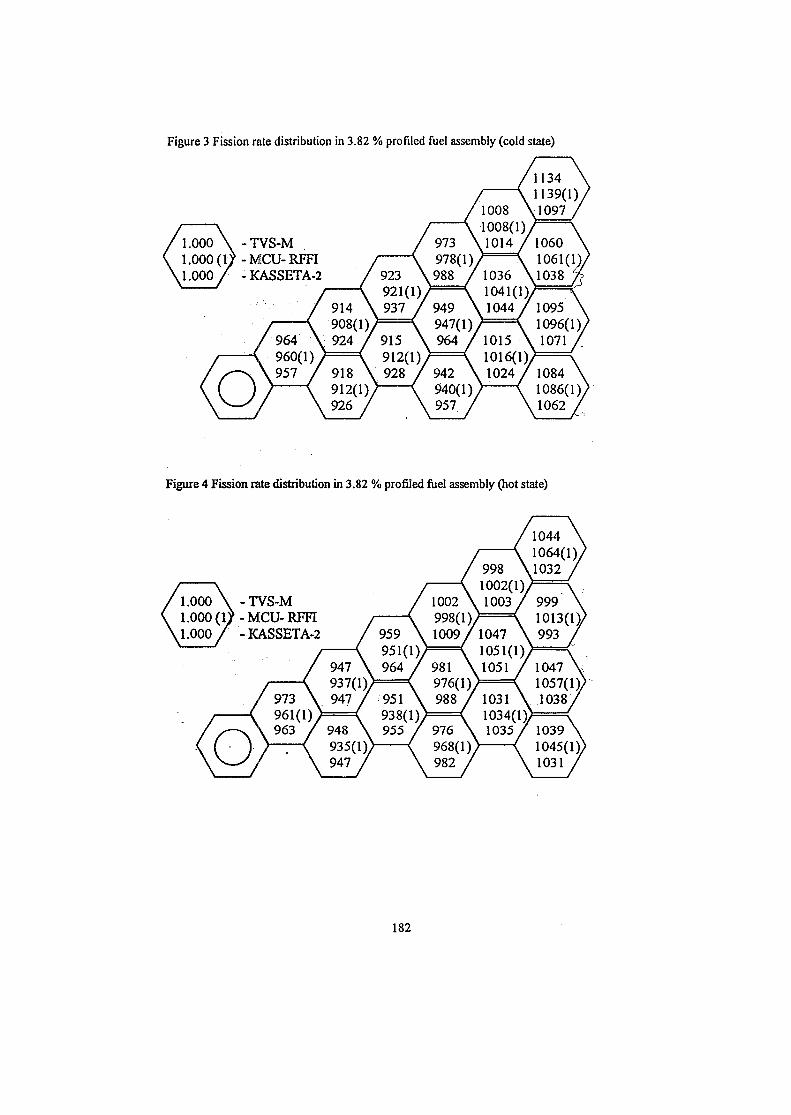
Figure 3 Fission rate distribution in 3.82 % profiled fuel assembly (cold state)
- TVS-M(I?-MCU-RFFI
- KASSETA-2
Figure 4 Fission rate distnbution in 3.82 % profiled fuel assembly (hot state)
- TVS-M-M:CU-RFFI-KASSETA-2
182
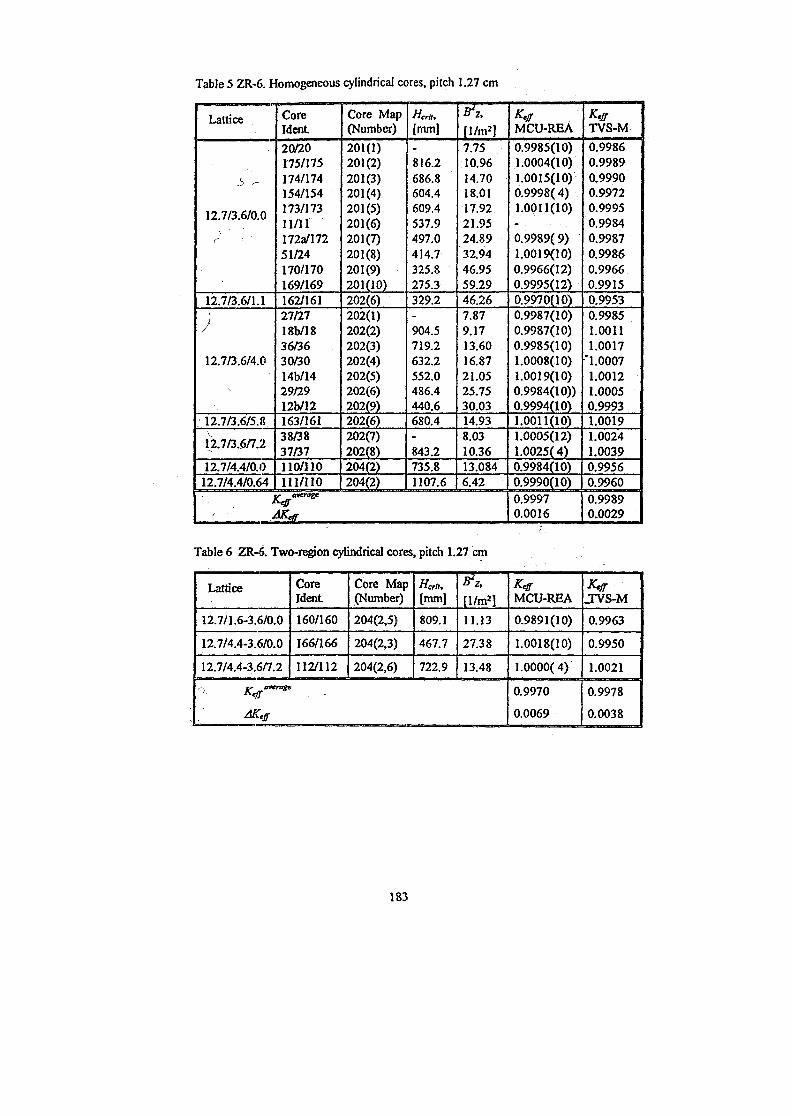
Table 5 ZR-6. IHIomogeneous cylindrical cores, pitch 1.27 cm
Lattice
12.7/3.6/0.0> ' • ,
12.7/3.6/1.1
12.7/3.6/4.0
12.7/3.6/5.«
12.7/3.6/7.2
12.7/4.4/0.012.7/4.4/0.64
CoreIdent
20/20175/175174/174154/154173/17311/11172a/17251/24170/170169/169162/16127/2718b/1836/3630/3014b/1429/2912b/12163/16138/3837/37110/110111/110
Core Map(Number)
201(1)201(2)201(3)201(4)201(5)201(6)201(7)201(8)201(9)201(10)202(6)202(1)202(2)202(3)202(4)202(5)202(6)202(9)202(6)202(7)202(8)204(2)204(2)
Hcr«,
[mm]
816.2686.8604.4609.4537.9497.0414.7325.8275.3329.2
904.5719.2632.2552.0486.4440.6680.4
843.2735.81107.6
ft[1/m2}7.7510.9614.7018.0117.9221.9524.8932.9446.9559.2946.267.879.1713.6016.8721.0525.7530.0314.938.0310.3613.0846.42
AH*
KeffMCU-REA0.9985(10)1.0004(10)1.0015(10)0.9998(4)1.0011(10)
0.9989( 9)1.0019(10)0.9966(12)0.9995(12)0.997000)0.9987(10)0.9987(10)0.9985(10)1.0008(10)1.0019(10)0.9984(10))0.9994(10)1.0011(10)1.0005(12)1.0025(4)0.9984(10)0.9990(10)0.99970.0016
K'ffTVS-M
0.99860.99890.99900.99720.99950.99840.99870.99860.99660.99150.99530.99851.00111.0017
"1.00071.00121.00050.99931.00191.00241.00390.99560.99600.99890.0029
Table 6 ZR-6. Two-region cylindrical cores, pitch 1.27 cm
Lattice
12.7/1.6-3.6/0.0
12.7/4.4-3.6/0.0
12.7/4.4-3.6/7.2
• %T
CoreIdent
160/160
166/166
112/112
Core Map(Number)
204(2,5)
204(2,3)
204(2,6)
ffcrlt,
[mm]
809.1
467.7
722.9
11.13
27.38
13.48
MCU-REA
0.9891(10)
1.0018(10)
1.0000(4)
0.9970
0.0069
.TVS-M
0.9963
0.9950
1.0021
0.9978
0.0038
183
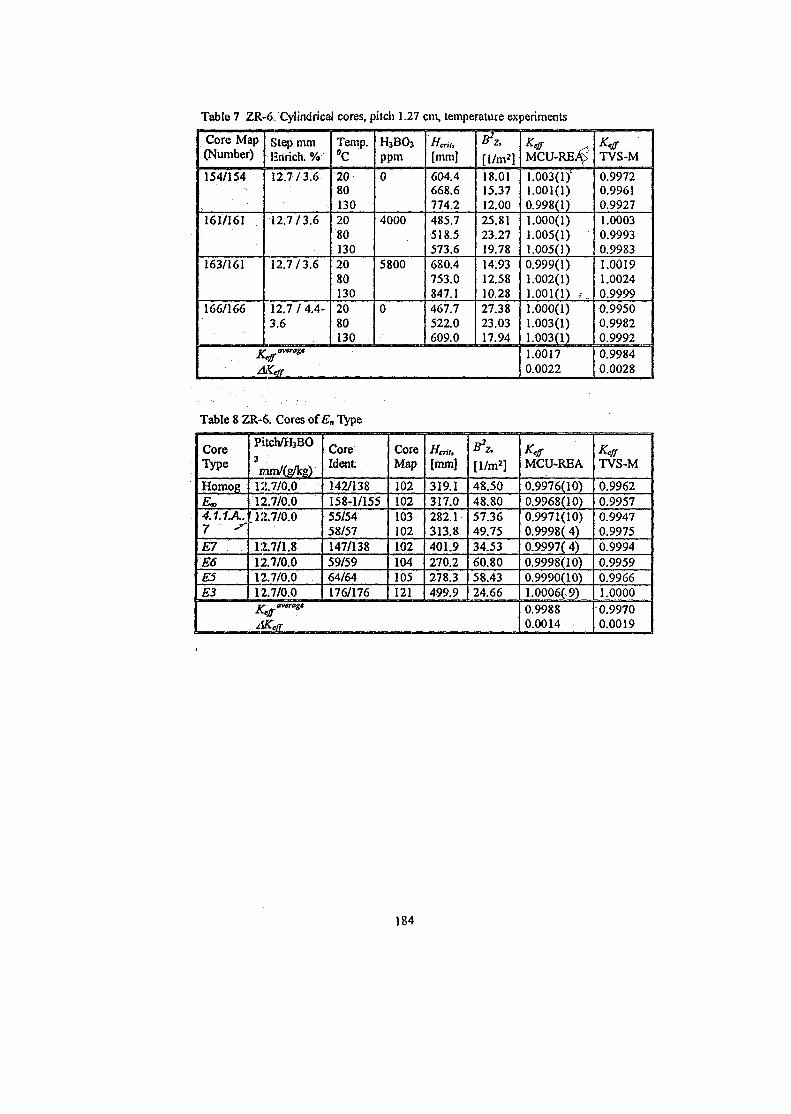
Table 7 ZR-6. Cylindrical cores, pitch 1.27 cm, temperature experiments
Core Map(Number)
154/154
161/161
163/161
166/166
Step mmEnrich. %
12.7 / 3.6
12.7/3.6
12.7/3.6
12.7 / 4.4-3.6
Temp.°C
2080130208013020801302080130
H3BO3ppm
0
4000
5800
0
Hcnh
[mm]
604.4668.6774.2485.7518.5573.6680.4753.0847.1467.7522.0609.0
[1/m2]18.0115.3712.0025.8123.2719.7814.9312.5810.2827.3823.0317.94
AKe/r
MCU-RE^
1.003(1)'1.001(1)0.998(1)1.000(1)1.005(1)1.005(1)0.999(1)1.002(1)1.001(1) i.1.000(1)1.003(1)1.003(1)1.00170.0022
KtffTVS-M
0.99720.99610.99271.00030.99930.99831.00191.00240.99990.99500.99820.99920.99840.0028
Table 8 ZR-6. Cores of En Type
CoreType
Homog
4.1.1. A.7 'E7E6ESE3
Pitch/H3BO3
mm/(g/kg)12.7/0.012.7/0.0
; 12.7/0.0
12.7/1.812.7/0.012.7/0.012.7/0.0
CoreWent.
142/138158-1/15555/5458/57147/13859/5964/64176/176
CoreMap
102102103102102104105121
Hcrit,
[mm]
319.1317.0282.1313.8401.9270.2278.3499.9
[1/m2]
48.5048.8057.3649.7534.5360.8058.4324.66
MCU-REA
0.9976(10)0.9968(10)0.9971(10)0.9998(4)0.9997(4)0.9998(10)0.9990(10)1.0006(9)0.99880.0014
Keg-TVS-M
0.99620.99570.99470.99750.99940.99590.99661.00000.99700.0019
184
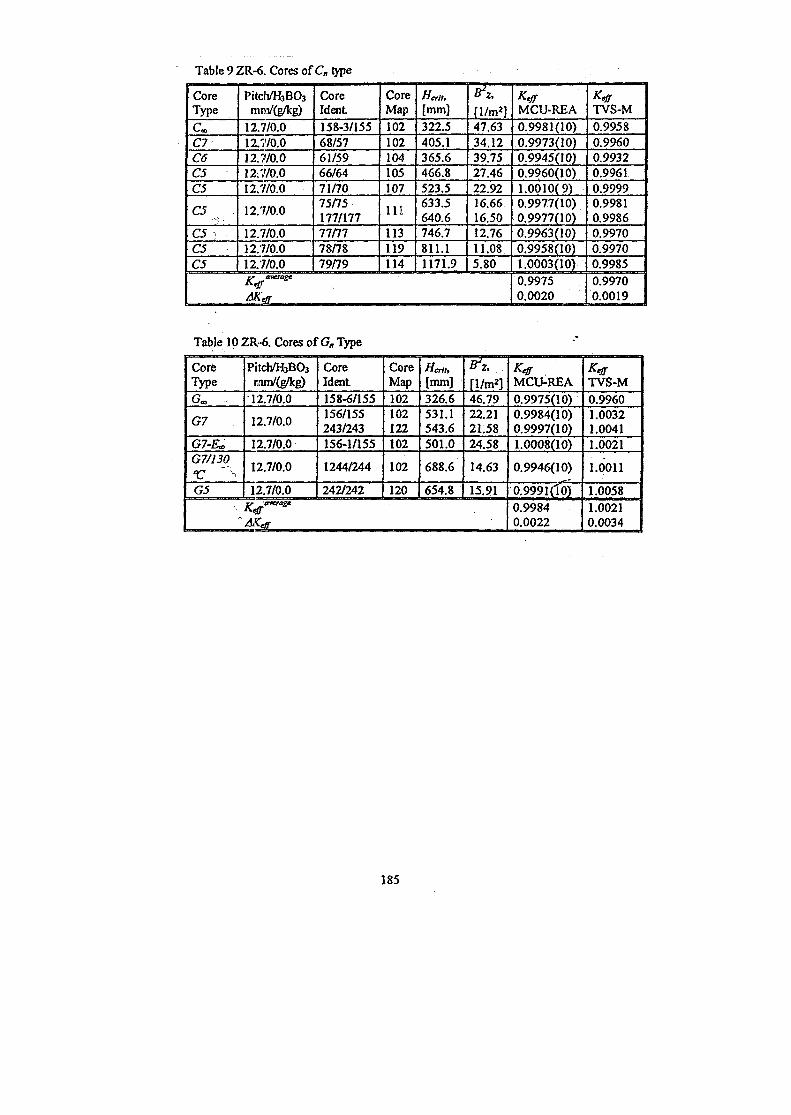
Table 9 ZR-6. Cores of Cn type
CoreType
c.C7C6C5C5
C5
C5 •)CSC5
Pitch/H3BO3mining/kg)
12.7/0.012.7/0.012.7/0.012.7/0.012.7/0.0
12.7/0.0
12.7/0.012.7/0.012.7/0.0
CoreIdenL158-3/15568/5761/5966/6471/7075/75177/17777/7778/7879/79
CoreMap102102104105107
111
113119114
Hcril,[mm]322.5405.1365.6466.8523.5633.5640.6746.7811.11171.9
^ 2 ,
[1/m*]47.6334.1239.7527.4622.9216.6616.5012.7611.085.80
AKeff
Ktff
MCU-REA0.9981(10)0.9973(10)0.9945(10)0.9960(10)1.0010(9)0.9977(10)0.9977(10)0.9963(10)0.9958(10)1.0003(10)0.99750.0020
K<ffTVS-M0.99580.99600.99320.99610.99990.99810.99860.99700.99700.99850.99700.0019
Table 10 ZR-6. Cores of G« Type
CoreTypeGM
G7
G7-E*G7/130
G5
Pitdi/H3BO3
mm/(g/kg)12.7/0.0
12.7/0.0
12.7/0.0
12.7/0.0
12.7/0.0
CoreIdenL158-6/155156/155243/243156-1/155
1244/244
242/242
CoreMap102102122102
102
120
Herit,[mm]326.6531.1543.6501.0
688.6
654.8
[1/m2]46.7922.2121.5824.58
14.63
15.91
KeffMCU-REA0.9975(10)0.9984(10)0.9997(10)1.0008(10)
0.9946(10)
0.9991(10)0.99840.0022
KeffTVS-M0.99601.00321.00411.0021
1.0011
1.00581.00210.0034
185
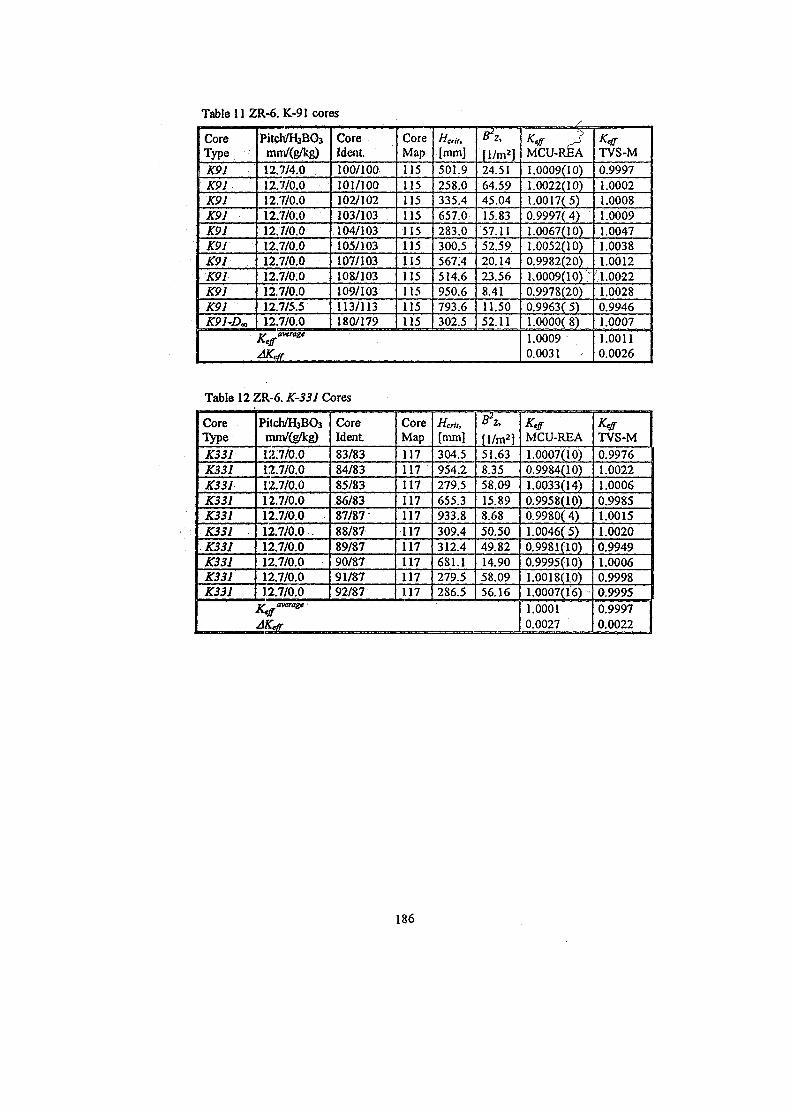
Table 11 ZR-6. Iit-91 cores
CoreTypeK91K9IK91K9JK9JK9IK91K91K91K91K9J-D*
PUCI11/H3BO3mm/(g/kg)12.7/4.012.7/0.012.7/0.012.7/0.012.7/0.012.7/0.012.7/0.012.7/0.012.7/0.012,7/5.512.7/0.0
CoreWent.100/100101/100102/102103/103104/103105/103107/103108/103109/103113/113180/179
CoreMap115115115115115115115115115115115
Hcric,
[mm]501.9258.0335.4657.0283.0300.5567.4514.6950.6793.6302.5
^z ,[1/m2]24.5164.5945.0415.8357.1152.5920.1423.568.4111.5052.11
MCU-REA1.0009(10)1.0022(10)1.0017(5)0.9997( 4)1.0067(10)1.0052(10)0.9982(20)1.0009(10)"0.9978(20)0.9963( 5)1.0000( 8)1.00090.0031
K-effTVS-M0.99971.00021.00081.00091.00471.00381.0012
',1.00221.00280.99461.00071.00110.0026
Table 12 ZR-6. K-331 Cores
CoreTypeK33JK331K331K331K331K331K331K331K331K331
Pilch/HbBOjmm/(g/kg)12:7/0.012.7/0.012.7/0.012.7/0.012.7/0.012.7/0.0 .12.7/0.012.7/0.012.7/0.012.7/0.0
CoreWent83/8384/8385/8386/8387/8788/8789/8790/8791/8792/87
CoreMap117117117117117117117117117117
Hcrih
[mm]304.5954.2279.5655.3933.8309.4312.4681.1279.5286.5
&Z.
fl/m2]51.638.3558.0915.898.6850.5049.8214.9058.0956.16
KeffMCU-REA1.0007(10)0.9984(10)1.0033(14)0.9958(10)0.9980( 4)1.0046(5)0.998lil0)0.9995(10)1.0018(10)1.0007(16)-1.00010.0027
K<ffTVS-M0.99761.00221.00060.99851.00151.00200.99491.00060.99980.99950.99970.0022
186
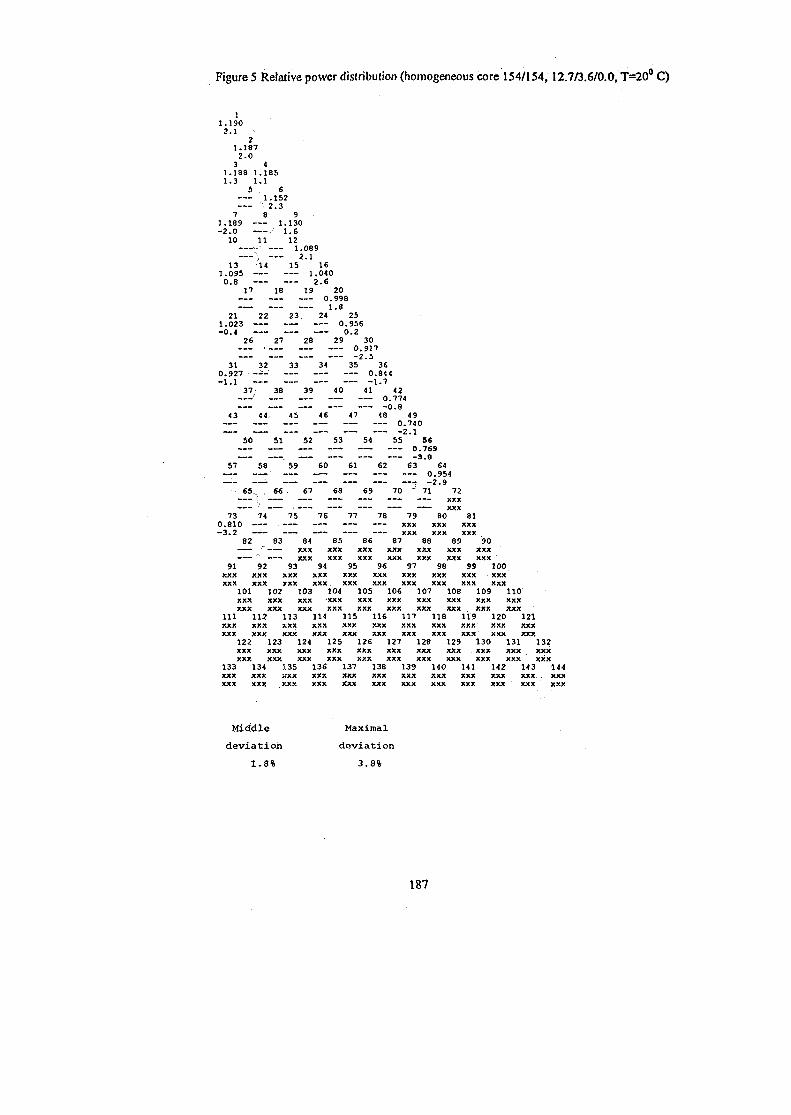
Figure 5 Relative power distribution (homogeneous core 154/154, 12.7/3.6/0.0, T=20° C)
I1.1902.1
21.1872.03 4
1.188 1.1851.3 1,1
5 . 61.1522.3
7 8 91.189 1.130-2.0 J 1.610 11 12
. t.089""; 2.1
13 14 15 161.095 1.0400.8 2.6
17 18 19 200.9981.8
21 22 23. 24 251.023 0.956-0.4 0.2
26 27 28 29 300.917-2.5
31 32 33 34 35 360.927 ----- 0.844-1.1 — - -1.7
Zl 38 39 40 41 421 0.774
-0.843 44 15 46 47 48 49
-— 0.74050 51 52 53 54 55 ' 5S
0.7S9-3.8
57 58 59 60 61 62 63 640.954
__^ . -2.9- 65. .66 67 68 69 70 ' 71 72
73 74 75 76 77 78 79 80 810.810 xxx xxx xxx~3*2 —-— — ~ xxx xxx xxx
82 83 84 85 86 87 88 89 90r xxx xxx xxx xxx xxx xxx xxx' • xxx xxx xxx xxx xxx xxx xxx
91 92 93 94 95 96 97 98 99 100xxx xxx xxx xxx xxx xxx xxx xxx xxx xxxxxx xxx xxx xxx xxx xxx xxx xxx xxx xxx
101 102 103 104 105 106 107 108 109 110xxx xxx xxx -xxx xxx xxx xxx xxx xxx xxxxxx xxx xxx xxx xxx xxx xxx xxx xxx xxx
111 112 113 114 115 116 117 118 119 120 121XXX XXX XXX XXX XXX XXX XXX XXX XXX XXX XXXXXX XXX XXX XXX XXX XXX XXX XXX XXX XXX XXX -
122 123 124 125 126 127 128 129 130 131 132XXX XXX XXX XXX XXX XXX XXX XXX XXX XXX XXXXXX XXX XXX XXX XXX XXX XXX XXX XXX XXX XXX
133 134 135 136 137 138 139 140 141 UZ 143 144XXX XXX XXX XXX XXX XXX XXX XXX XXX XXX XXX XXIXXX XXX XXX XXX X~XX XXX XXX XXX XXX XXX XXX XX*
Middle Maximal
deviation deviation
1.8% 3.8%
187
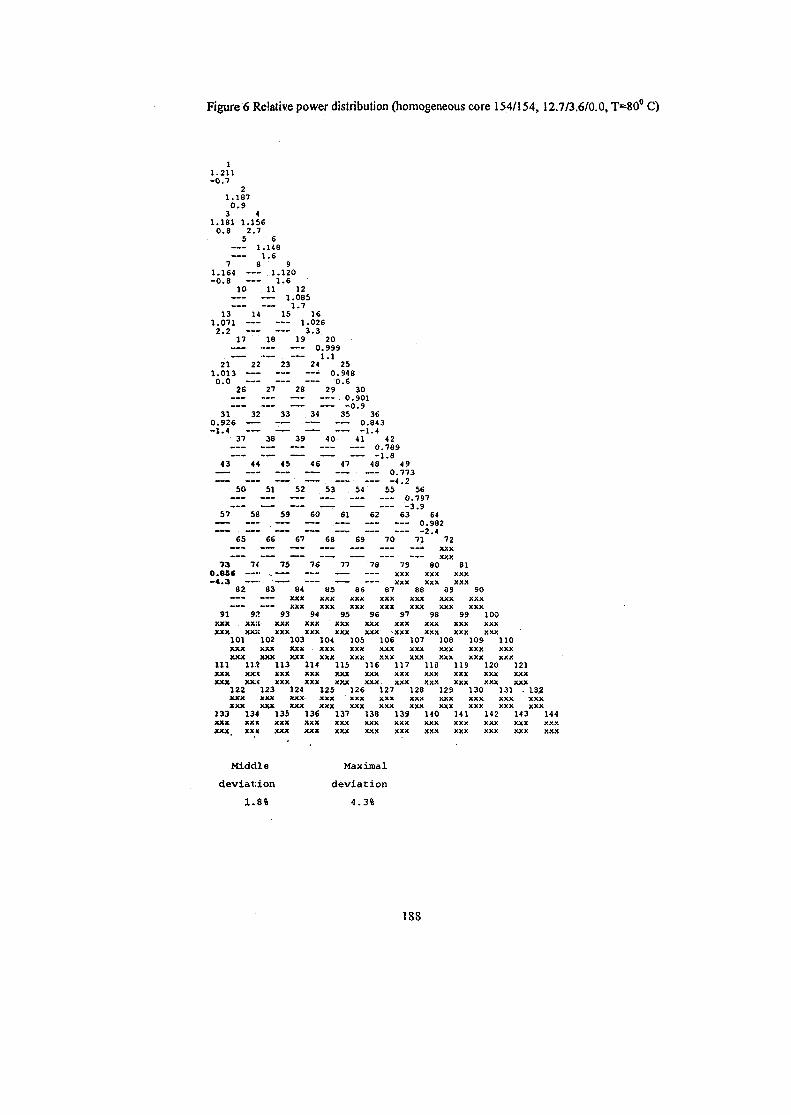
Figure 6 Relative power distribution (homogeneous core 154/154,12.7/3.6/0.0, T=80° C)
11.211-0.7
21.1870.9
3 41.181 1.156
0.8 2.75 6
1.148
7 8 ' 91.164 1.120-0.8 1.6
10 11 121.0851.7
13 14 15 161.071 1.0262.2 3.3
17 18 19 200.999
21 22 23 24 ' 251.013 — 0.9480.0 0.6
26 27 28 29 300.901
31 32 33 34 35 ' 360.926 0.843-1 .4 -1.4
37 38 39 40 41 420.789
43 44 45 46 47 48 ' 490.773
SO 51 52 53 54 55 ' 56___ . . . 0.797
57 58 59 60 61 62 63 ' 64
65 66 67 68 69 70 7J ' 72»»«» '• — — — — » w— . - • — XXX
— --— —- — xxx73 7« 75 76 77 78 79 80 81
0.856 — • . . — - — — - xxx xxx xxx—4.3 —— • — xxx xxx xxx
82 83 84 85 86 87 88 89 90— • xxx xxx xxx xxx xxx xxx xxx-— -— xxx xxx xxx xxx xxx xxx xxx
91 9X 93 94 95 96 97 98 99 100XXX XXJC XXX XXX XXX XXX XXX XXX XXX XXXXXX XXX XXX XXX XXX XXX XXX XXX XXX XXX
101 102 103 104 105 106 107 108 109 110XXX XXX XXX XXX XXX XXX XXX XXX XXX XXXxxx xxx xxx xxx xxx xxx xxx xxx xxx xxx
111 112 113 114 115 116 117 118 119 120 121xxx xxx xxx xxx xxx xxx xxx xxx xxx xxx xxxXXX XXX XXX XXX XXX XXX XXX XXX XXX XXX XXX
122 123 124 125 126 127 128 129 130 131 . 13,2XXX XXX XXX XXX XXX XXX XXX XXX XXX XXX XXXxxx xxx xxx xxx xxx xxx xxx xxx xxx xxx xxx
133 134 135 136 137 138 139 140 141 142 143 144xxx xxx xxx xxx xxx xxx xxx xxx xxx xxx xxx xxxXXX XXX XXX XXX XXX XXX XXX XXX XXX XXX XXX XXX
Middle
deviation
1.8%
Maximal
deviation
4.3%
188
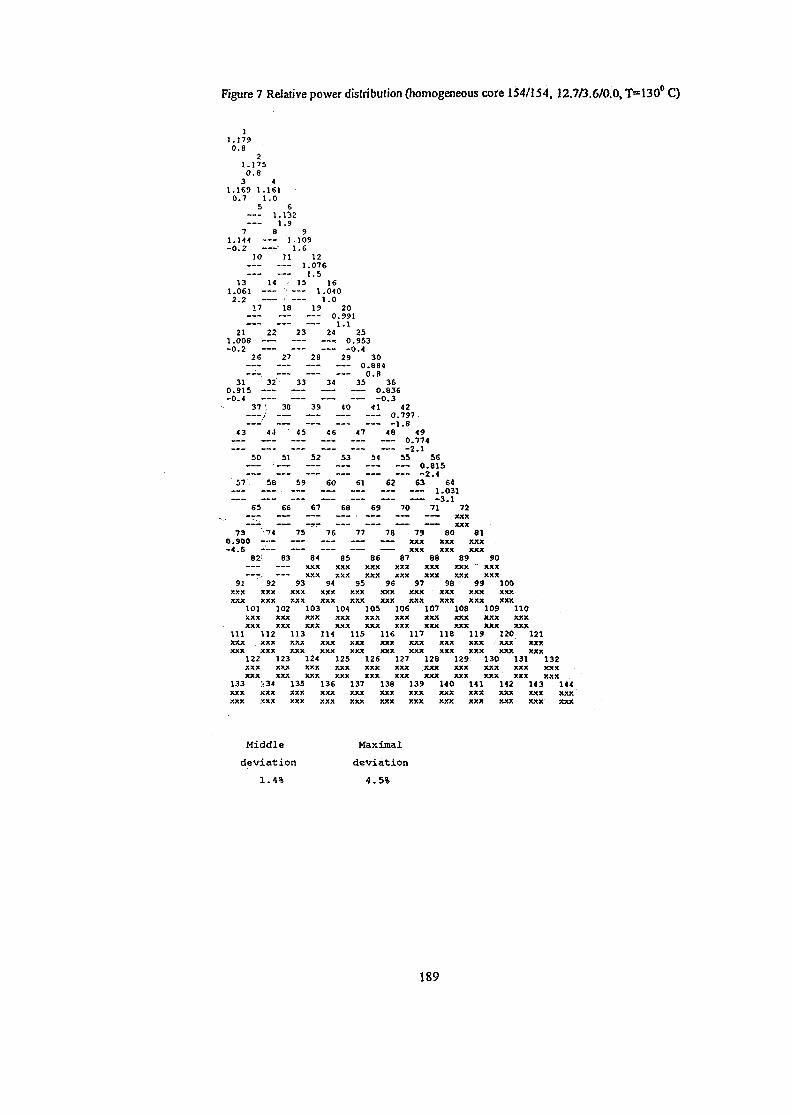
Figure 7 Relative power distribution (homogeneous core 154/154, 12.7/3.6/0.0, T=130° C)
i1.1790.8
21.1750.8
3 41.169 1.161
0.7 1.05 6
1.1321.9
7 8 < 91.144 1.109- 0 . 2 —V 1.6
io n 12j .076
1.513 14 - 15 16
1.061 — "> 1.0402.2 < 1.0
17 18 19 20. 0.991
. !.j21 22 23 24 25
1.008 1 0.953-0.2 -0.4
26 27 28 29 300.884
_ - - 0.831 32 33 34 35 36
0.915 0.836-0.4 - — - 0 . 3
37 \ 38 39 40 41 42; 0.797
1 -1 .943 41 ' 45 46 47 48 49
„ _ —.IT.. , . . . _ —.—— •••• . «—... Q 7 7 4„ - , _ «.—,. — — ——_ —™ ™— —2 1
50 51 52 53 54 55 " 560.815
_ „ _ ^ ™ ——— -.—._ _ _ . . • • • » » 2 4
57 . 58 59 60 61 62 63 64a . 031
65 66 67 68 69 70 71 * 72
73 74 75 76 77 78 79 80 810.900 —— —— — - XXX XXX XXX-4.5 — - XXX XXX XXX
82 83 84 85 86 87 88 89 90-— XXX XXX XXX XXX XXX XXX ~ XXX
•'. XXX XXX XXX XXX XXX XXX XXX91 92 93 94 95 96 97 98 99 100
XXX XXX XXX XXX XXX XXX XXX XXX XXX XXXXXX XXX XXX XXX XXX XXX XXX XXX XXX XXX
101 102 103 104 105 106 107 108 109 110XXX XXX XXX XXX XXX XXX XXX XXX XXX XXXXXX XXX XXX XXX XXX XXX XXX XXX XXX XXX
111 112 113 114 115 116 117 118 119 120 121XXX XXX XXX XXX XXX XXX XXX XXX XXX XXX XXXXXX XXX XXX XXX XXX XXX XXX XXX XXX XXX XXX
122 123 124 125 126 127 128 129 130 131 132XXX XXX XXX XXX XXX XXX XXX XXX XXX XXX XXXXXX XXX XXX XXX XXX XXX XXX XXX XXX XXX XXX
133 J34 135 136 137 138 139 140 141 142 143 144XXX XXX XXX XXX XXX XXX XXX XXX XXX XXX XXX XXXXXX ,*CXX XXX XXX XXX XXX XXX XXX XXX XXX XXX XXX
Middle Maximal
deviation deviation
1.4% 4.5%
189
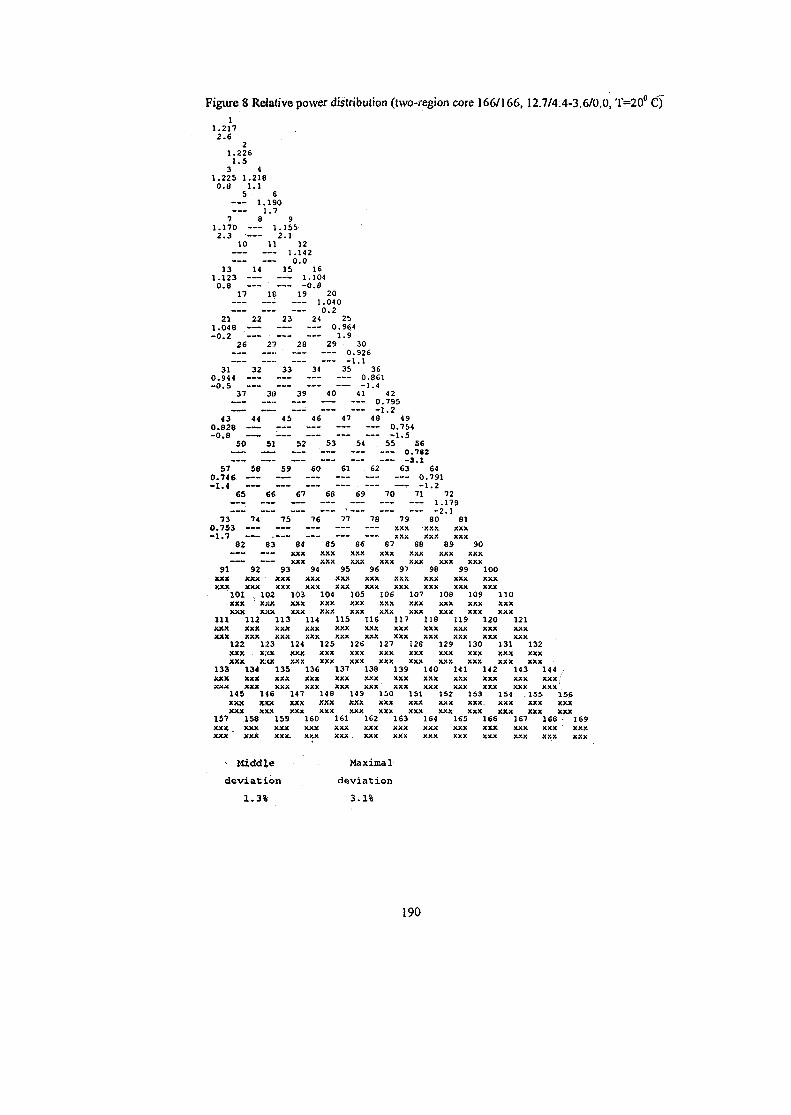
Figure 8 Relative power distribution (two-region core 166/166,12.7/4.4-3.6/0.0, T=20°l
1.2172.6
21.226
1.53 4
1.225 1.2180.8 1.1
5 61.190
1.77 8 9
1.170 1.1552.3 2.1
10 11 121.1420.0
13 14 15 161.123 — 1.1040,8 -0.8
17 16 19 20—.. 1.040
0.221 22 23 24 25
1.048 0.964-0.2 - 1-9
26 27 28 29 30_— 0.926
-1.131 32 33 34 35 36
0.944 0.861-0.5 -1.4
37 38 39 40 41 420.795
43 44 45 46 47 48 ' 490.828 0.754-0.8 '• -1.5
50 51 52 53 54 55 56— 0.782
57 58 59 60 61 62 63 640.746 0.791-1.4 — ' -1.2
65 66 67 68 69 70 71 72_-_ i.n9
> -2 .173 74 75 76 77 78 79 80 81
0*753 —-- xxx xxx xxx- 1 . 7 — • - — xxx xxx xxx
82 83 84 85 86 87 88 89 90— — — — xxx xxx xxx xxx xxx xxx xxx~ — ™ xxx xxx xxx xxx xxx xxx xxx
91 92 93 94 95 96 97 98 99 100xxx xxx xxx xxx xxx xxx xxx xxx xxx xxxxxx xxx xxx xxx xxx xxx xxx xxx xxx xxx
101 , 102 103 104 105 106 10' 108 109 110XXX XXX XXX XXX XXX XXX XXX XXX XXX XXXxxx x;u( xxx xxx xxx xxx xxx xxx xxx xxx
111 112 113 114 115 116 117 118 119 120 121xxx xxx xxx xxx xxx xxx xxx xxx xxx xxx xxxxxx xxx xxx xxx xxx xxx xxx xxx xxx xxx xxx
122 123 124 125 126 127 128 129 130 131 132xxx xxx xxx xxx xxx xxx xxx xxx xxx xxx xxxxxx xxx xxx xxx xxx xxx xxx xxx xxx xxx xxx
133 134 135 136 137 138 139 140 141 142 143 144xxx xxx xxx xxx xxx xxx xxx xxx xxx xxx xxx xxx:xxx xxx xxx xxx xxx xxx' xxx xxx xxx xxx xxx xxx -
145 146 147 148 149 150 151 152 153 1S4 .155 156XXX XXX XXX XXX XXX XXX XXX XXX XXX. XXX XXX XXXXXX XXX XXX XXX XXX XXX XXX XXX XXX XXX XXX XXX
157 158 159 160 161 162 163 164 165 16S 167 168 • 169XXX . XXX XXX XXX XXX XXX XXX XXX XXX XXX XXX XXX XXXXXX XXX XXX. XXX XXX . XXX XXX XXX XXX XXX XXX XXX XXX
- Middle
deviation
1.3%
Maximal
deviation
3.1%
190
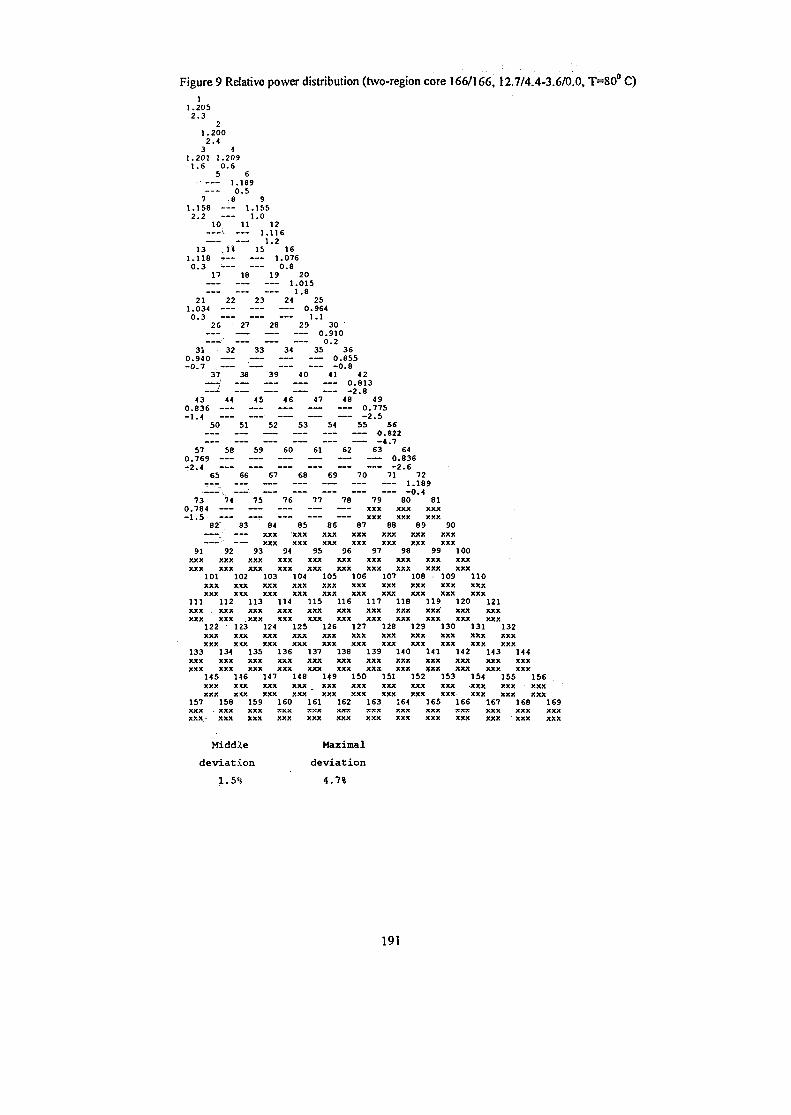
Figure 9 Relative power distribution (two-region core 166/166,12.7/4.4-3.6/0.0, T=80° C)I
1.2052.3
21.2002.4
3 41.201 1.2091.6 0.6
5 61.1890.5
•7 8 91.158 1.1552.2 1.0
10 11 121. 1.116
1.213 .14 15 16
1.118 4-- 1.0760.3 • 0.8
17 18 19 201.0151.8
21 22 23 24 251.034 0.9640.3 1.1
26 27 28 29 300.9100.2
31 32 33 34 35 360.940 0.855-0.7 — -0.8
37 38 39 40 41 42
zz2 i n ~z ~z i n -j.843 44 45 46 47 48 49
0.836 0.775—1 4 «.—— ™—' _ _ _ ___ « _ « 2 5
50 51 52 53 54 55 SS0.822
57 58 59 60 61 62 63 640.769 0.836
65 66 67 68 69 70 71 ' 72___ »1——1 „ • — ——• __— —__ 1 189
.!__^ _._' «— — — —.— _—— ___ .. ft 4
73 74 75 76 77 78 79 80 " 810.784 ™ — - -— — - xxx xxx xxx**1 * 5 —••*—• - **t* •••« ^__ ~~** XXX XXX XXX
82 83 84 85 86 87 88 89 90r xxx xxx xxx xxx xxx xxx xxx
— - ' xxx xxx xxx xxx xxx xxx xxx91 92 93 94 95 96 97 98 99 100
xxx xxx xxx xxx xxx xxx xxx xxx xxx xxxXXX XXX XXX XXX XXX XXX XXX XXX XXX XXX
101 102 103 104 105 106 107 108 109 110XXX XXX XXX XXX XXX XXX XXX XXX XXX XXXxxx xxx xxx xxx xxx xxx xxx xxx xxx xxx
111 112 113 114 115 116 117 118 119 120 121XXX . XXX XXX XXX XXX XXX XXX XXX XXX' XXX XXXxxx xxx xxx xxx xxx xxx xxx xxx xxx xxx xxx
122 123 124 125 126 127 128 129 130 131 132XXX XXX XXX XXX XXX XXX XXX XXX XXX XXX XXXXXX XXX XXX XXX XXX XXX XXX XXX XXX XXX XXX
133 134 135 136 137 138 139 140 141 142 143 144xxx xxx xxx xxx xxx xxx xxx xxx xxx xxx xxx xxxxxx xxx xxx xxx xxx xxx xxx xxx xxx xxx xxx xxx
145 146 147 148 149 150 151 152 153 154 155 156XXX XXX XXX XXX _ XXX XXX XXX XXX XXX XXX XXX XXXXXX XXX XXX XXX XXX XXX XXX XXX XXX XXX XXX XXX
157 158 159 160 161 162 163 164 165 166 167 168 169XXX XXX XXX XXX XXX XXX XXX XXX XXX XXX XXX XXX XXXXXX XXX XXX XXX XXX XXX XXX XXX XXX XXX XXX XXX XXX
Middle Maximal
deviation deviation
1.5% 4.7%
191
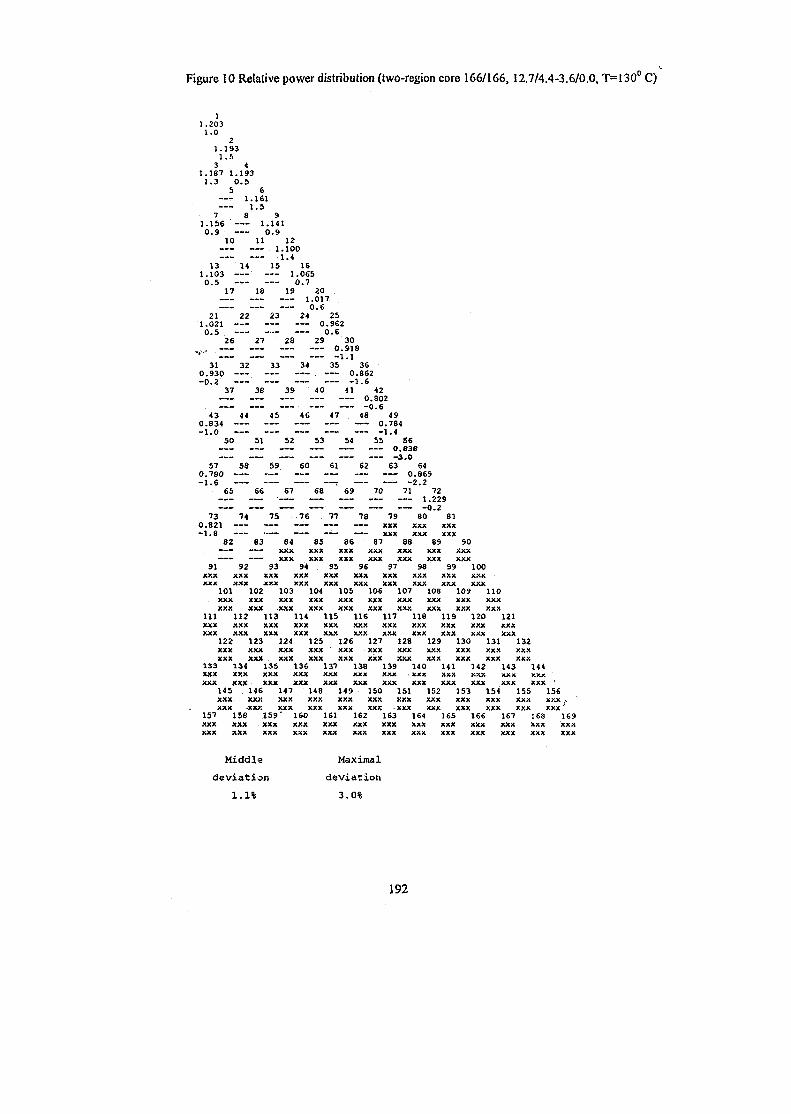
Figure 10 Relative power distribution (two-region core 166/166,12.7/4.4-3.6/0.0, T=130° C)
i1.2031.0
21.193
1.53 4
1.187 1.1931.3 0.5
S 61.161
1.57 8 9
1.156 1.1410.9 0.9
10 11 121.100
1.413 14 15 16
1.103 1.065O.s —.- 0.7
17 18 19 20 .1.0170.6
21 22 23 24 251.021 — - 0.9620.5 — - 0.6
26 27 28 29 30v . , 0.918
31 32 33 34 35 360.930 0.862-0.2 -1 .6
37 38 39 ' 40 41 420.802-0.6
43 44 45 46 47 48 490.834 0.784-1 .0 — -1.4
50 51 52 53 54 55 S«0.838_3,0
57 58 59 60 61 62 63 640.780 0.869• • I 6 • — » «•_•- « — —.—. _—— •_»•. —2 2
65 66 67 68 69 70 71 72
73 74 75 76 77 78 79 80 ' 810.821 - — — - — —— xxx xxx xxx-1.8 - — — — — - xxx xxx xxx
82 83 84 85 86 87 88 89 90—— xxx xxx xxx xxx xxx xxx xxx
xxx xxx xxx xxx xxx xxx xxx91 92 93 94 95 96 97 98 99 100
xxx xxx xxx xxx xxx xxx xxx xxx xxx xxxxxx xxx xxx xxx xxx xxx xxx xxx xxx xxx
101 102 103 104 105 106 107 108 109 110xxx xxx xxx xxx xxx xxx xxx xxx xxx xxxXXX XXX XXX XXX XXX XXX XXX XXX XXX XXX
111 112 113 114 115 116 117 118 119 120 121xxx xxx xxx xxx xxx xxx xxx xxx xxx xxx xxxxxx xxx xxx xxx xxx xxx xxx xxx xxx xxx xxx
122 123 124 125 126 127 128 129 130 131 132XXX XXX. XXX XXX XXX XXX XXX XXX XXX XXX XXXXXX XXX XXX XXX XXX XXX XXX XXX XXX XXX XXX
133 134 135 136 137 138 139 140 141 142 143 144XXX XXX XXX XXX XXX XXX XXX XXX XXX XXX XXX XXXxxx xxx xxx xxx xxx xxx xxx xxx xxx xxx xxx xxx
145 146 147 148 149 150 151 152 153 154 155 156XXX XXX XXX XXX XXX XXX XXX XXX XXX XXX XXX xxx ~xxx -xxx xxx xxx xxx xxx • xxx xxx xxx xxx xxx xxxJ
157 158 159° 160 161 162 163 164 165 166 167 168 169XXX XXX XXX XXX XXX XXX XXX XXX XXX XXX XXX XXX XXXxxx xxx xxx xxx xxx xxx xxx xxx xxx xxx xxx xxx xxx
Middle Maximal
deviation deviation
1.1% 3.0%
192
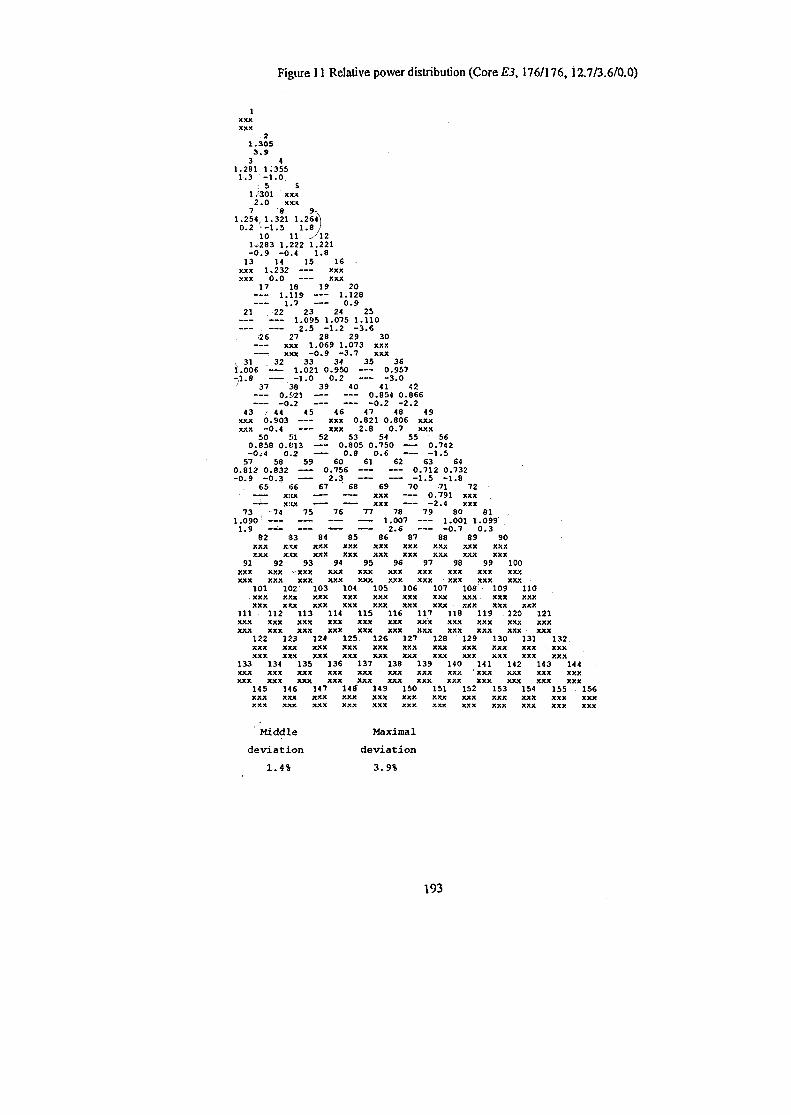
Figure 11 Relative power distribution (Core E3, 176/176,12.7/3.6/0.0)
1xxxxxx
21.3053.9
3 41.281 1.3551.3 -1 .0
... 5 '81 .'301 xxx
2.0 xxx
1.254, 1.321 1.0.2 ^-1.5 1.8
10 111,283 1.222 1.221-0 .9 -0.4 1.8
13 14 15 16xxx 1.232 xxxxxx 0.0 xxx
17 18 19 20— - 1.119 1.128
1.7 0.921 22 23 24 25
1.095 1.075 1.1102.5 -1.2 -3 .6
36 27 28 29 30xxx 1.069 1.073 xxx
: xxx -0 .9 -3.7 xxx, 31 32 33 34 35 361.006 1.021 0.950 0.957-,1.8 -1 .0 0.2 -3.0' 37 218 39 40 41 42
0.921 0.854 0.866-0.2 -0 .2 -2 .2
43 / 44 45 46 47 48 49xxx 0.903 xxx 0.821 0.806 xxxxxx -0.4 xxx 2.8 0.7 xxx
50 51 52 S3 54 55 560.858 0.013 0.805 0.750 0.742-0*4 0.2 0.8 0.6 -1.5
57 58 59 60 61 62 63 640.812 0.832 0.756 ': 0.712 0.732-0.9 -0.3 2.3 -1.5 -1.8
65 66 67 68 69 70 71 72— — xxx xxx 0.791 xxx--- x:tx xxx -2.4 xxx
73 74 75 76 77 78 79 80 811.090' 1.007 1.001 1.0991.9 — 2.6 -0.7 0.3
82 133 84 85 86 87 88 89 90xxx xxx xxx xxx xxx xxx xxx xxx xxxxxx xxx xxx xxx xxx xxx xxx xxx xxx
91 92 93 94 95 96 97 98 99 100XXX XXX -XXX XXX XXX XXX XXX XXX XXX XXXxxx xxx xxx xxx xxx xxx xxx xxx xxx xxx
101 102 103 104 105 106 107 108 109 110XXX XXX XXX XXX XXX XXX XXX XXX XXX XXXXXX XXX XXX XXX XXX XXX XXX XXX XXX XXX
111 112 113 114 115 116 117 118 119 120 121XXX XXX XXX XXX XXX XXX XXX XXX XXX XXX XXXxxx xxx xxx xxx xxx xxx xxx xxx xxx xxx xxx
122 123 124 125 126 127 128 129 130 131 132XXX XXX XXX XXX XXX XXX XXX XXX XXX XXX XXXxxx xxx xxx xxx xxx xxx xxx xxx xxx xxx xxx
133 134 135 136 137 138 139 140 141 142 143 144xxx xxx xxx xxx xxx xxx xxx xxx ' xxx xxx xxx xxxxxx xxx xxx xxx xxx xxx xxx xxx xxx xxx xxx xxx
145 146 147 148" 149 150 151 152 153 154 155 156XXX XXX XXX XXX XXX XXX XXX XXX XXX XXX XXX XXXxxx xxx xxx xxx xxx xxx xxx xxx xxx xxx xxx xxx
Middle Maximal
deviation deviation
1.4% 3.9%
193
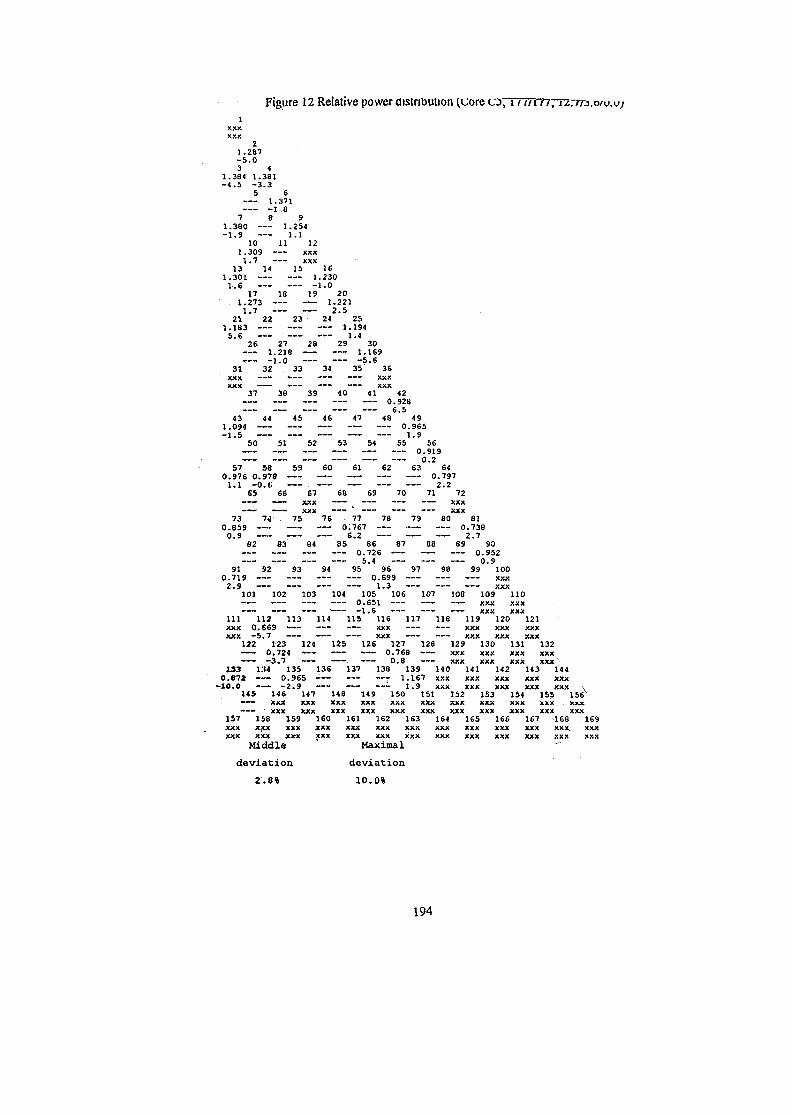
Figure 12 Relative power distribution (Core c j , I777T777TZ77T.J.O/U.I>/
IXXXXXX
21.287-5 .03 4
1.384 1.381-4.5 -3 .3
5 61.371-1.8
7 8 91.380 1.254-1.9 1.1
10 11 121.309 - — xxx1.7 XXX
13 14 15 161.301 1.230
1.6 - 1 . 017 18 19 20
1.273 1.2211,7 2.5
21 22 23 24 251.183 1.194
5.6 1.426 27 28 29 30
1.218 1.169-B.0 -»~ -5 .6
31 32 33 34 35 36
xxx — xxx37 38 39 40 41 42
0.9286.5
43 44 45 46 47 48 491.094 0.965- 1 . 5 1.9
50 51 52 53 54 55 56___ 0.919
57 58 59 60 61 62 63 " 640.976 0.978 0.797
1.1 -0.6 • 2.265 66 67 68 69 70 71 72
— — xxx xxx— xxx •— ' xxx
73 74 75 76 77 78 79 80 810.859 0;767 0.738
0.9 6.2 2.782 83 84 85 86 87 88 89 90
^— 0.726 0.9525.4 0.9
91 92 93 94 95 96 97 98 99 1000.719 0.699 xxx2.9 1.3 xxx
101 102 103 104 105 106 107 108 109 1100.651 xxx xxx
-— -1.6 xxx xxx111 112 113 114 115 116 117 118 119 120 121xxx 0.669 — — - xxx xxx xxx xxxxxx -5.7 — - -— xxx xxx xxx xxx
122 123 124 125 126 127 128 129 130 131 132— 0.724 — - ™ 0.768 xxx xxx xxx xxx-— -3.7 — 0.8 — - xxx xxx xxx xxx
X33 134 135 136 137 138 139 140 141 142 143 1440.872 — - 0.965 -— — - — r 1.167 xxx xxx xxx xxx xxx-10.0 — — -2.9 -— -•— — - 1.9 xxx xxx xxx xxx xxx \
145 146 147 148 149 150 151 152 153 154 155 156V™ XXX XXX XXX XXX XXX XXX XXX XXX XXX XXX • xxx— - xxx xxx xxx xxx xxx xxx xxx xxx xxx xxx xxx
157 158 159 160 161 162 153 164 165 166 167 168 . 169XXX XXX XXX XXX XXX XXX XXX XXX XXX XXX XXX XXX, XXXXXX XXX XXX XXX XXX XXX XXX XXX XXX XXX XXX XXX XXX
Middle Maximal
deviation deviation
2.8% 10.0%
194
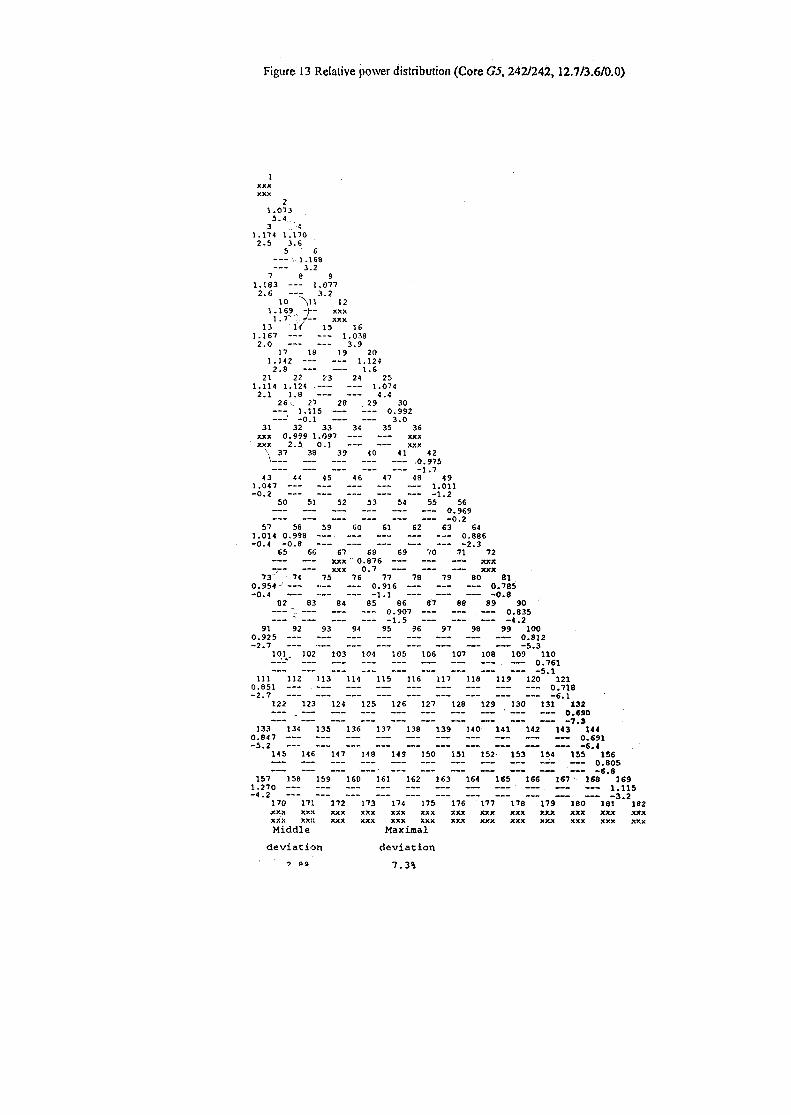
Figure 13 Relative power distribution (Core G5,242/242,12.7/3.6/0.0)
iXXXXXX
21.0135.4
3 '•«1.174 1.1702.5 3.6
5 6— -1.168
3.27 8 9
1.183 1.0772.6 — - 3.2
10 Al l 121.169 J-- xxx1.T" •" ' . /— xxx
13 1/ 15 161.167 - — 1.0382.0 3.9
17 18 19 201.142 1.124
2.8 1.621 22 23 24 25
1.114 1.124 . 1.0742.1 1.9 4.4
26 v 27 28 29 301.115 0.992
" -0 .1 3.031 32 33 34 35 3«
xxx 0.999 1.097 xxx'xxx 2.5 0.1 xxx
\ 37 38 39 40 41 42\ .0.975
_j.-j43 «< 45 46 47 48 49
1.047 1.011-0.2 — -1.2
50 51 52 53 54 55 560.969-0.2
57 58 59 60 61 62 63 641.014 0.998 0.886-0.4 -0.8 -2.3
65 66 67 68 69 70 71 72XXX " 0 . 8 7 6 — xxxxxx 0.7 — xxx
7 3 ' 74 75 76 77 78 79 80 810.954 0.916 0.785-0.4 - — -1.1 — -0.8
82 83 84 85 86 87 88 89 90— 0.907 0.835
_!.5 _4.291 92 93 94 95 96 97 98 99 100
0.925 0.812-2 .7 • -5 .3
101. 102 103 104 105 106 107 108 109 110__*_* _„._ — • ,.__ -._— — —-.— ——— -._•— A 761
111 112 113 114 115 116 117 118 119 120 ' 1210.851 0.718-2.7 -6.1
122 123 124 125 126 127 128 129 130 131 1320.690
133 134 135 136 137 138 139 140 141 142 143 ' 1440.847 0.691-5.2 -S.4
145 146 147 148 149 150 151 152- 153 154 155 156___ 0.805
157 158 159 160 161 162 163 164 165 166 167 168 ' 1691.270 1.115
-4.2 — — , —__ «.«_ — ___ .j 9170 171 172 173 174 175 176 177 178 179 180 181 * 182XXX XXJl XXX XXX XXX XXX XXX XXX XXX XXX XXX XXX XXXXXX XXX XXX XXX XXX XXX XXX XXX XXX XXX XXX XXX XXX
Middle Maximal
deviation deviation
' «* 7.3%
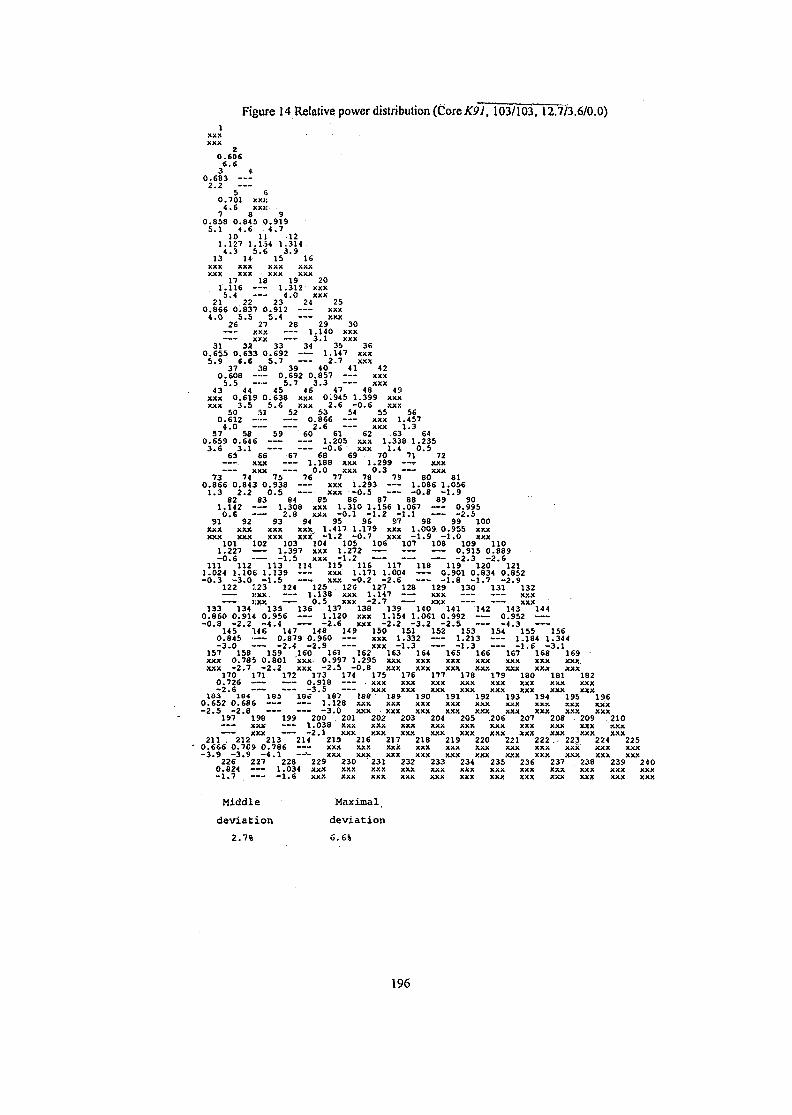
Figure 14 Relative power distribution (Core K9J, 103/103,12.7/3.6/0.0)J
XXXXXX
20.606
6.63 4
0.6832.2
5 60.701 XXX
4.6 XXJC7 8 9
0.858 0.845 0.9195.1 4.6 4.7
10 11 121.127 1.154 1.314
4.3 5.6 3 .913 14 15 16
XXX XXX XXX XXXXXX XXX XXX XXX
17 18 19 201.116 1.312 xxx5.4 4.0 xxx
21 22 23 24 250.866 0.837 0.912 xxx4.0 5.5 5.4 xxx
26 27 28 29 30xxx 1.140 xxx
— — xx,x 3.1 xxx31 32 33 34 35 36
0.655 0.633 0.692 1.147 xxx5.9 6.6 5.7 2.7 xxx
37 38 39 40 41 420.608 0.692 0.857 xxx
5.5 5.7 3.3 xxx43 44 45 46 47 48 49
xxx 0.619 0.638 xxx 0.945 1.399 xxxxxx 3.5 5.6 xxx 2.6 -0.6 xxx
50 SI 52 53 54 55 560.612 0.866 xxx 1.4574.0 — - 2.6 xxx 1.3
57 58 59 60 61 62 63 640.659 0.646 1.205 xxx 1.338 1.2353.6 3.1 -0.6 xxx 1.4 0.5
65 66 67 68 69 70 71 72— xxx —— 1.188 xxx 1.299 — ^ xxx*— xxx —— 0.0 xxx 0.3 — - xxx
73 74 75 76 77 78 79 80 810.866 0.843 0.938 xxx 1.293 1.086 1.0561.3 2.2 0.5 -— xxx -0.5 -0.8 -1.9
82 83 84 85 86 87 88 89 901.142 1.308 xxx 1.310 1.156 1.067 0.9950.6 2.8 xxx -0.1 -1 .2 -1.1 -2.5
91 92 93 94 95 96 97 98 99 100xxx xxx xxx xxx 1.417 1.179 xxx 1.009 0.955 xxxxxx xxx xxx xxif -1.2 -0.7 xxx -1 .9 -1.0 xxx
101 102 103 104 105 106 107 108 109 1101.227 1.397 xxx 1.272 0.915 0.889-0.6 -1.5 xxx -1.2 -2.3 -2 .6
111 112 113 114 115 116 117 118 119 120 1211.024 1.106 1.139 xxx 1.171 1.004 0.901 0.834 0.852-0.3 -3.0 -1.5 —-> xxx -0.2 -2.6 -1.8 -1.7 -2.9
122 1.23 124 125 126 127 128 129 130 131 132XXX 1.138 xxx 1.147 xxx XXX
— xxx — 0.5 xxx -2.7 xxx -— xxx133 134 135 136 137 138 139 140 141 142 143 1440.860 0.914 0.956 1.120 xxx 1.154 1.061 0.992 0.952-0.8 -2.2 -4.4 -2.6 xxx -2.2 -3.2 -2.5 -4.3
145 146 147 148 149 150 151 152 153 154 155 1560.845 0.879 0.960 xxx 1.332 1.213 1.184 1.344-3.0 -2.4 -2.9 xxx -1.3 -1.3 -1.6 -3.1
157 158 159 J60 161 162 163 164 165 166 167 168 169xxx 0.783 0.801 xxx- 0.997 1.295 xxx xxx xxx xxx xxx xxx xxxxxx -2.7 -2.2 xxx -2.5 -0.8 xxx xxx xxx xxx xxx xxx xxx
170 171 172 173 174 175 176 177 178 179 180 181 1820.726 — - — - 0.918 • xxx xxx xxx xxx xxx xxx xxx xxx-2.6 — -3.5 xxx xxx xxx xxx xxx xxx xxx xxx
183 184 18S 186 187 188 • 189 190 191 192 193 194 195 1960.652 0.686 — 1.128 xxx xxx xxx xxx xxx xxx xxx xxx xxx-2.5 -2.8 — --- -3.0 xxx xxx xxx xxx xxx xxx xxx xxx xxx
197 198 199 200 201 202 203 204 205 .206 207 208 209 . 210xxx — 1.038 xxx xxx xxx xxx xxx xxx xxx xxx xxx xxx
—*- XXX — -2.1 XXX XXX XXX XXX XXX XXX XXX XXX XXX XXX211 . 212 213 214 215 216 217 218 219 220 221 222. 223 224 2250.666 0.709 0.786 xxx xxx xxx xxx xxx xxx xxx xxx xxx xxx xxx- 3 . 9 - 3 . 9 - 4 . 1 - - " - XXX XXX XXX XXX XXX XXX XXX XXX XXX XXX XXX
226 227 228 229 230 ' 231 232 233 234 235 236 237 238 239 2400.824 1.034 xxx xxx xxx xxx xxx xxx xxx xxx xxx xxx xxx xxx-1 .7 — -1.6 xxx xxx xxx xxx xxx xxx xxx xxx xxx xxx xxx xxx
Middle Maximalr
deviation deviation
2.7% 6.6%
196
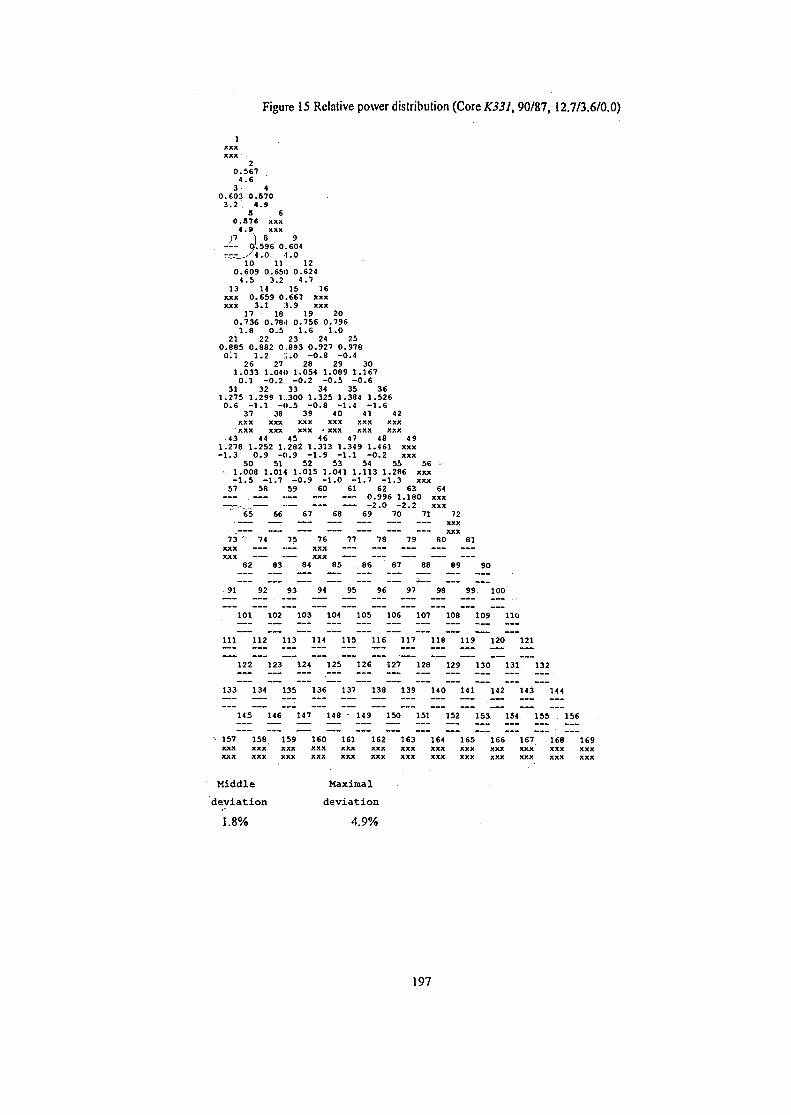
Figure 15 Relative power distribution (Core K331,90/87,12.7/3.6/0.0)
XXXXXX -
20.567
4.63 - 4
0.603 0.5703.2 . 4.9
5 60.57S xxx
4.9 xxxP ) 8 9
0/.596 0.604T?z^S*.O 4.0
10 11 120.609 0.650 0.624
4.5 3.2 4.713 14 15 16
xxx 0.659 0.661 xxxxxx 3.1 3.9 xxx
17 18 19 200.736 0.784 0.756 0.796
1.8 0.5 1.6 1.021 22 23 24 25
0.885 0.882 0,893 0.927 0.978o : i 1.2 11.0 -0 .8 -0.4
26 27 28 29 301.033 1.040 1.054 1.089 1.1670.1 -0.2 -0 .2 -0.5 -0 .6
31 32 33 34 35 361.275 1.299 1..300 1.325 1.384 1.5260.6 -1 .1 -0.5 -0 .8 -1.4 -1 .6
37 38 39 40 41 42xxx xxx xxx xxx xxx xxxXXX XXX XXX • XXX XXX XXX
43 44 45 46 47 48 491.278 1.252 1.282 1.313 1.349 1.461 xxx-1.3 0.9 -0.9 -1 .9 -1.1 -0 .2 xxx
50 51 52 53 54 55 56 <•1.008 l.OH; 1.015 1.041 1.113 1.286 xxx- 1 . 5 -1.7 -0 .9 -1 .0 -1 .7 -1 .3 xjot
57 58 59 60 61 62 63 640.996 1.180 xxx
"'~65 66 67 68 69 70 71 72
73 " 74 75 76 77 78 79 80 81x x x » ~ A «»__ x x x *• ^ —*"*— »—— A H * M W
XXX ™~'"*" *»*••• XXX —"™ ™"•" —*-*• »*>» A^A
82 83 84 85 . 86 87 88 89 90
91 92 93 94 95 96 97 98 99 100
101 102 103 104 105 106 107 108 109 110
111 112 113 114 115 116 117 118 119 120 121
122 123 124 125 126 127 128 129 130 131 132
133 134 135 136 137 138 139 140 141 142 143 144
145 146 147 148 - 149 150 151 152 153 154 155 156
\ 157 158xxx xxxxxx xxx
Middle
deviation
1.8%
159xxxxxx
160 161 162xxx xxx xxxxxx xxx xxx
Maximal
deviation
4.9%
163xxxxxx
164xxxxxx
165xxxxxx
166xxxxxx
167xxxxxx
168xxxxxx
169xxxxxx
197
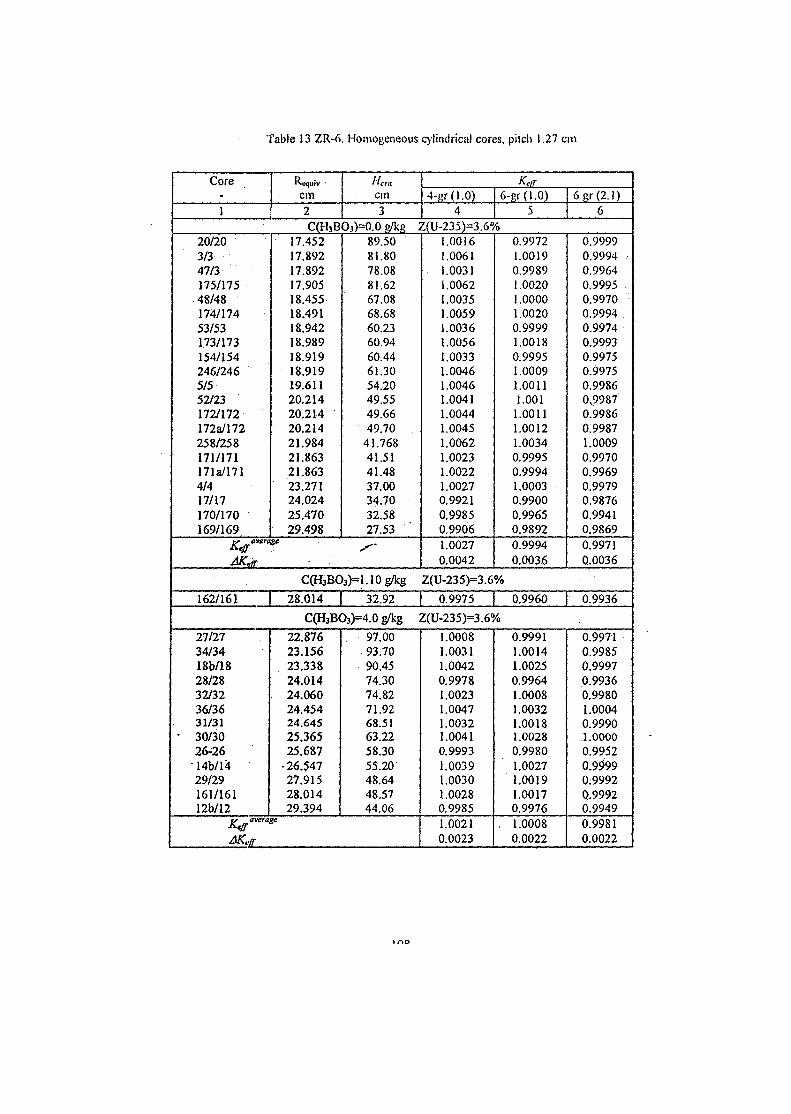
Table 13 ZR-6, Homogeneous cylindrical cores, pilch 1.27 cm
Core-1
cm2
Hemcm3
Ke/r4-Sr(1.0)
46-gr(1.0)
56gr(2.1)
6C(H3BO3)=0.0 g/kg Z(U-235)=3.6%
20/203/347/3175/17548/48174/17453/53173/173154/154246/2465/552/23172/172172a/172258/258171/171171a/1714/417/17170/170169/169
17:45217.89217.89217.90518.45518.49118.94218.98918.91918.91919.61120.21420.21420.21421.98421.86321.86323.27124.02425.47029.498
t/- average
AKeir
89.5081.8078.0881.6267.0868.6860.2360.9460.4461.3054.2049.5549.6649.7041.76841.5141.4837.0034.7032.5827.53
C(H3BO3H.10g/kg
162/161 28.014 32.92
C(H3BO3)=4.0 g/kg :
27/2734/3418b/1828/2832/3236/3631/31
• 30/3026-26
• 14b/14 •29/29161/16112b/12
22.87623.15623.33824.01424.06024.45424.64525.36525.687
•26.54727.91528.01429.394
AKefr
97.0093.7090.4574.3074.8271.9268.5163.2258.3055.2048.6448.5744.06
.00161.0061.0031
1.0062.0035
1.00591.00361.0056.0033.0046
1.0046.0041.0044
1.0045.0062.0023.0022
1.00270.99210.99850.99061.00270.0042
0.99721.00190.99891.00201.00001.00200.99991.00180.99951.00091.00111.0011.00111.00121.00340.99950.99941.00030.99000.99650.98920.99940.0036
Z(U-235)=3.6%
0.9975 | 0.9960
Z(U-235)=3.6%
1.00081.00311.00420.99781.00231.00471.00321.00410.99931.00391.00301.00280.99851.00210.0023
0.99911.00141.00250.99641.00081.00321.00181.00280.99801.00271.00191.00170.9976
, 1.00080.0022
0.99990.99940.99640.99950.99700.9994 .0.99740.99930.99750.99750.99860v99870.99860.99871.00090.99700.99690.99790.98760.99410.98690.99710.0036
0.9936
0.99710.99850.99970.99360.99801.00040.99901.00000.99520.99990;9992Q.99920.99490.99810.0022
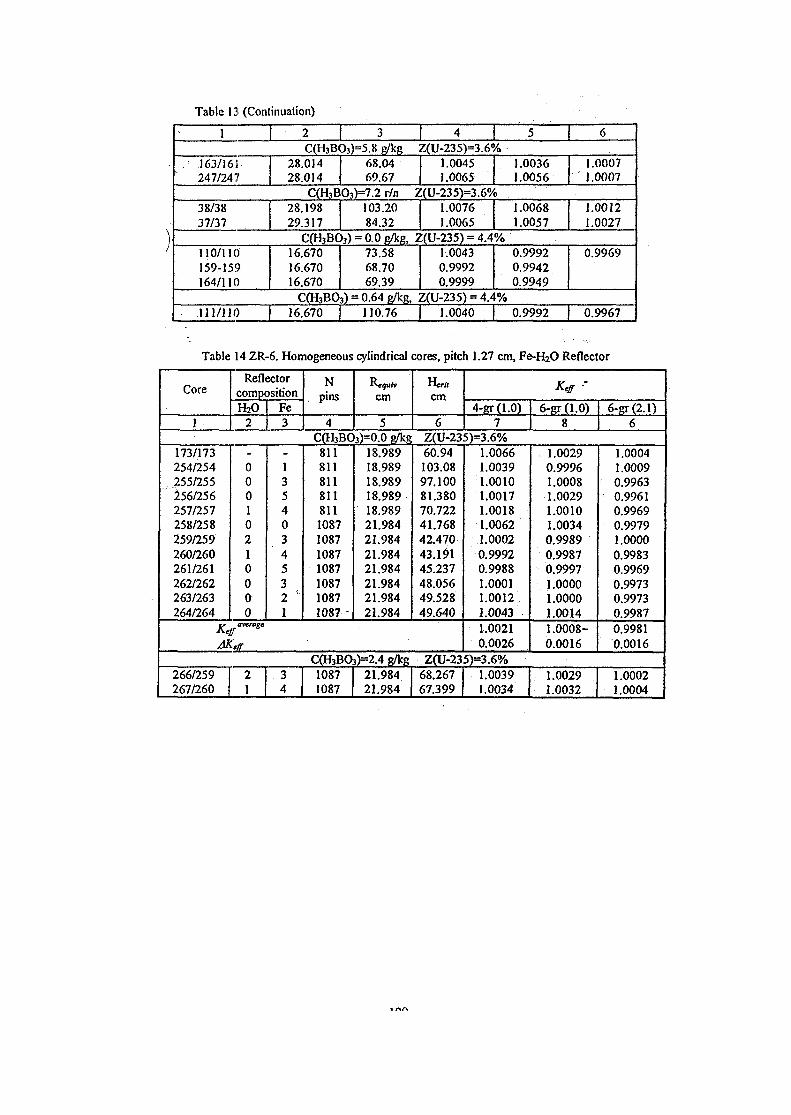
Table 13 (Continuation)
1 2 3 4 5 6C(H3BOj)=5.8 g/kg Z(U-235)=3.6%
. .163/161" 247/247
28.01428.014
68.0469.67
1.00451.0065
1.00361.0056
1.00071.0007
C(H3BO3)=7.2 r/n Z(U-235)=3.6%38/3837/37
28.19829.317
103.2084.32
1.00761.0065
1.00681.0057
1.00121.0027
C(H3BO3) = 0.0 g/kg, Z(U-235) = 4.4%110/110159-159164/110
16.67016.67016.670
73.5868.7069.39
1.00430.99920.9999
0.99920.99420.9949
0.9969
C(H3BO3) = 0.64 g/kg, Z(U-235) = 4.4%111/110 1 16.670 1 110.76 1.0040 0.9992 0.9967
Table 14 ZR-6. Homogeneous cylindrical cores, pitch 1.27 cm, Fe-HhO Reflector
Core
1
ReflectorcompositionH2O
2Fe3
Npins
4
cm
5
cm
6
Keff •'
4-gr(1.0)7
6-gr(1.0)8
6-gr(2.1)6
C(H3BO3)=0.0 g/kg Z(U-235)=3.6%173/173254/254255/255
" 256/256257/257258/258259/259260/260261/261262/262263/263264/264
00010210000
1354034532 *1
8118118118118111087108710871087108710871087 •
18.98918.98918.98918.98918.98921.98421.98421.98421.98421.98421.98421.984
60.94103.0897.10081.38070.72241.76842.47043.19145.23748.05649.52849.640
KeffWKrtt8°
AKeff
1.00661.00391.00101.00171.00181.00621.00020.99920.99881.00011.00121.00431,00210.0026
1.00290.99961.00081.00291.00101.00340.99890.99870.99971.00001.00001.00141.0008-0.0016
1.00041.00090.99630.99610.99690.99791.00000.99830.99690.99730.99730.99870.99810.0016
C(H3BO3)=2.4 g/kg Z(U-235)=3.6%266/259267/260
21
34
10871087
21.98421.984
68.26767.399
1.00391.0034
1.00291.0032
1.00021.0004
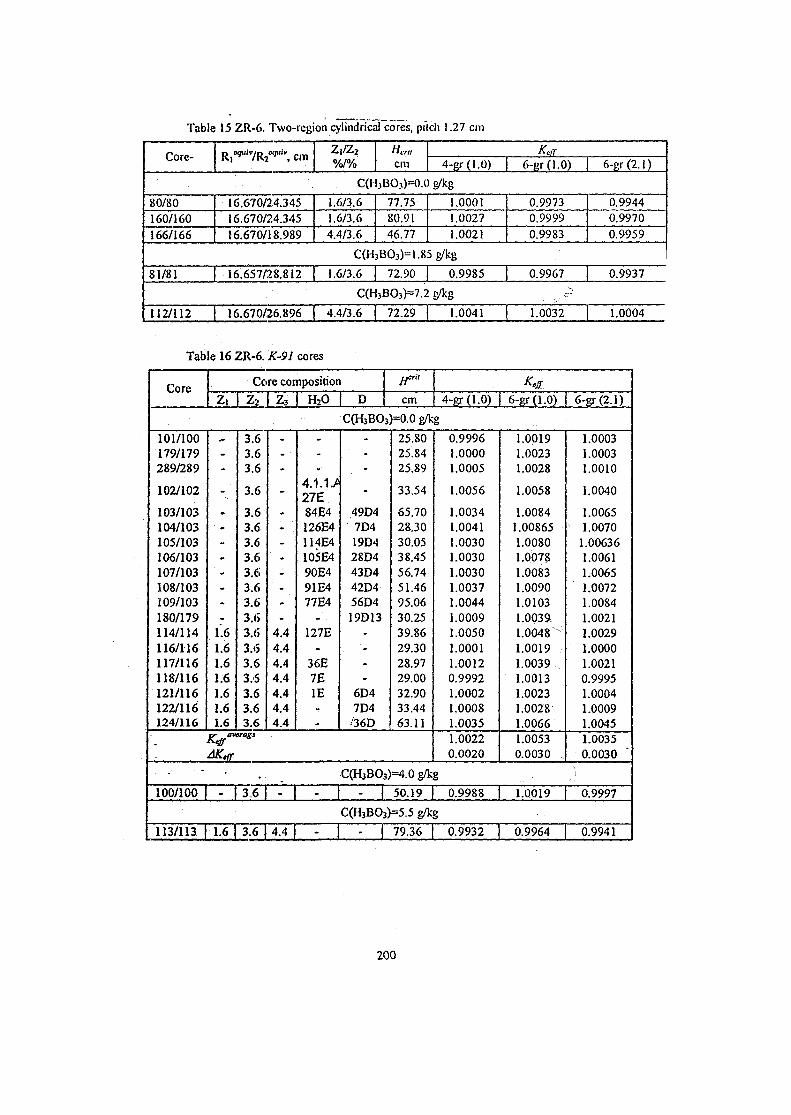
Table
Core-
15 ZR-6. Two-region cylindrical cores, pitch 1.27 cm
R,69"'7R2K/"", cm z,/z2
%/%cm
Keff4-gr(1.0) 6-fir(1.0) 6-sr(2.1)
C(H,BO3)=0.0 g/kg
80/80160/160166/166
81/81
112/112
16.670/24.34516.670/24.34516.670/18.989
16.657/28.812
16.670/26.896
1.6/3.61.6/3.64.4/3.6
77.7580.9146.77
1.00011.00271.0021
C(H,BO3)= 1.85 g/kg
1.6/3.6 72.90
C(H3BO3)=7.2
4.4/3.6 72.29
0.9985
g^g1.0041
0.99730.99990.9983
0.9967
1.0032
0.99440.99700.9959
0.9937
1.0004
Table 16 ZR-6.
Corez,
K-91 cores
Core compositior
z 2 z3H2O D cm 4-gr(1.0) 6-gr(1.0) 6-gr(2.1)
C(H3BO3)=0.0 g/kg
101/100179/179289/289
102/102
103/103104/103105/103106/103107/103108/103109/103180/179114/114116/116117/116118/116121/116122/116124/116
.-
100/100
-----
• -
-
-
1.61.61.61.61.61.61.6
AKttr
' 1
3.63.63.6
3.6
3.63.63.63.63.63.63.63.63.(53.63.63.63.63.63.6
vagt
3.6
.• -
-
-
-
-
-
4.44.44.44.44.44.44.4
-
-
-
4.1.1.-*27E84E4126E4114E4105E490E491E477E4
-127E
-36E7EIE--
-
-
-
-
49D47D419D428D443D442D456D419D13
--
-6D47D436D
25.8025.8425.89
33.54
65.7028.3030.0538.4556.7451.4695.0630.2539.8629.3028.9729.0032.9033.4463.11
0.99961.00001.0005
1.0056
1.00341.00411.00301.00301.00301.00371.00441.00091.00501.00011.00120.99921.00021.00081.00351.00220.0020
C(H3BO3)=4.0g/kg
- I 50.19 0.9988
1.0019 ]
1.00231.0028
1.0058
1.00841.008651.00801.00781.00831.00901.01031.003ft.1.0048"1.00191.00391.00131.00231.00281.00661.00530.0030 _
1.0.019
1.00031.00031.0010
1.0040
1.0065x 1.0070
1.006361.00611.00651.00721.00841.00211.00291.00001.00210.99951.00041.00091.00451.00350.0030
0.9997
C(H3BO3)=5.5 g/kg
113/113 1.6 | 3.6 4.4 - - I 79.36 | 0.9932 0.9964 0.9941
200
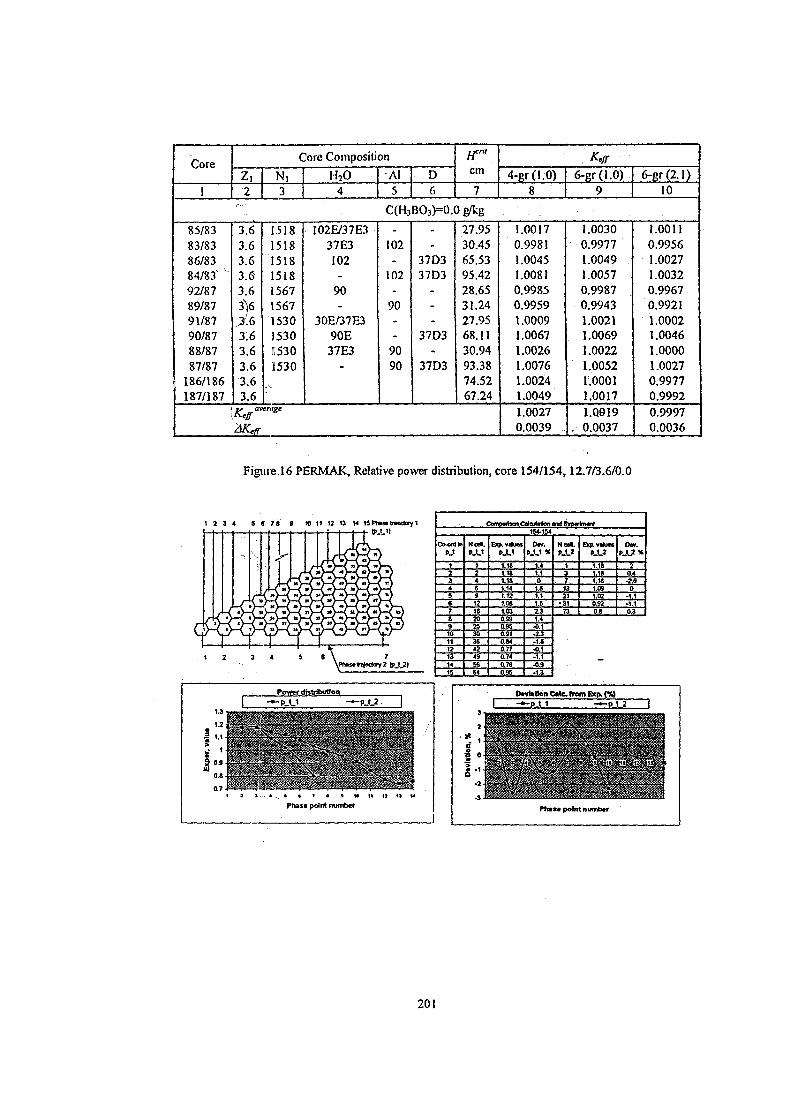
Core
1
85/8383/8386/8384/83' "92/8789/8791/8790/8788/8787/87
186/186187/187
Core Composition
Zi2
3.63.63.63.63.63 J 6
% (\
3.63.63.63.63.6
Ni3
H2O4
1.518
1518
15181518156715671530153015301530
I02E/37E337E3102
.
90-
30E/37E390E37E3
r> average
KAKefT
A!5
D6
C(H3BO3)=0.<
-
102-
102-
90--
9090
--
37D337D3
---
37D3-
37D3
jfH,
cm7
>g/kg
27.9530.4565.5395.4228.6531.2427.9568.1130.9493.3874.5267.24
4-gr(I.O)8
1.00170.99811.00451.00810.99850.99591.00091.00671.00261.00761.00241.00491.00270.0039 .
6-gr(1.0)9
1.00300.99771.0049 .1.00570.99870.99431.00211.00691.00221.00521.00011.00171.Q019
-• 0.0037
6-gr(2.1)10
1.00110.99561.00271.00320.99670.99211.00021.00461.00001.00270.99770.99920.99970.0036
Figuie 16 PERMAK, Relative power distribution, core 154/154,12.7/3.6/0.0
1 2 3 4 5 9 7 8 9 11 12 13 14 15 Phase tisectoryl
' > • • - ' » * •-v'J^'Svs"11 ' ' '?* -*•• ' • *.-••
P-U P_UD«y.
-LI.
Exp. values
2
* ' :
1--*• 3 '
Dtvtation Calc from Exp. (%)1 - * - P t_1 -» -P t 2 I
;• • V .-• - I - - " >'i ' /--•!< • -' • -. '•Phas« point number
201
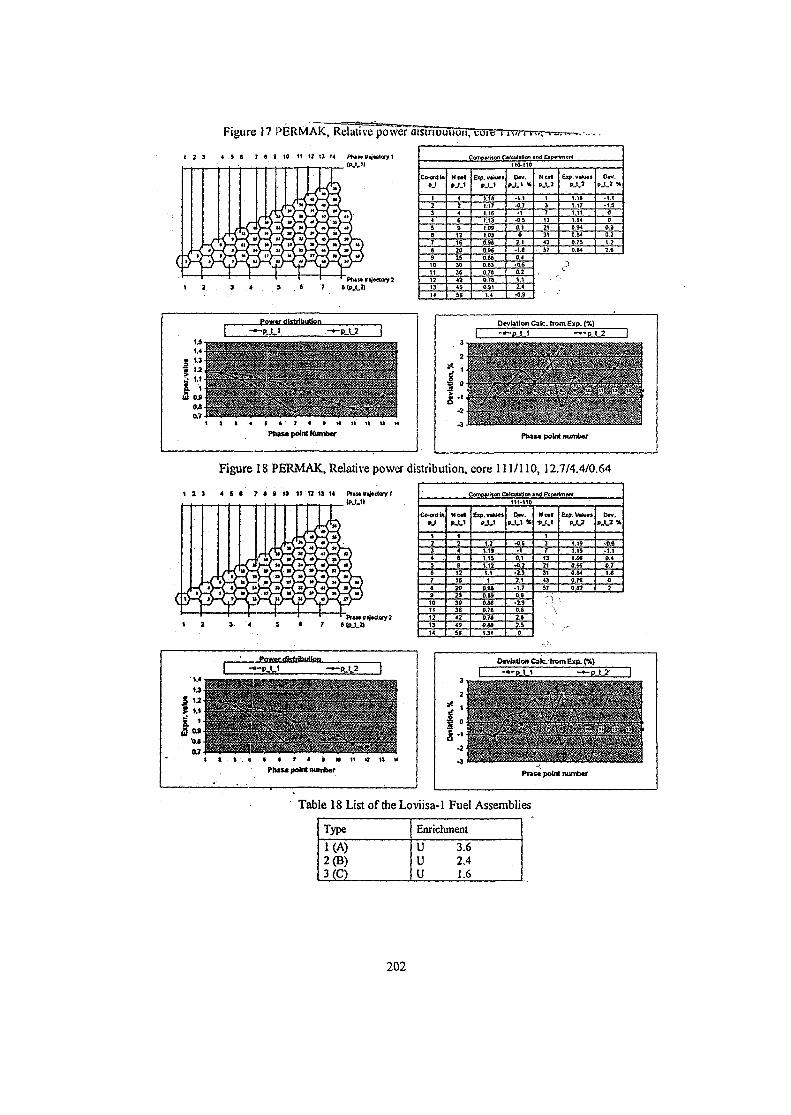
Comparison Catcuttttot #ftd Experiment
110-110
Co-ordln
PJ
1234
567ft910I t121314
P_tJ
t2469121620253036424956
Btp. *»•)«•»
1.1ft
1.171.161.13t.O91.050.34
0.9$0.660.830.7fl0.7ft0.911.4
D*v.
-1.1-0.7• 1
•0.50.10
2.1-t.fi0.4-0.6
0.21.1Z*•0.9
Heel
137132t3143
Exp.vakKi
1.141.171.111.040.940.&40.750.6*
Oev.
-1.1•1.5
00
0.30.21.22.6
Power distribution
Pha» point Numtxr
Deviation Calc. from Exp. (%)
| ., 0/^^.^. ^/y-^.Phas« point numtwr
Figure 18 PERMAK, Relative power distribution, core 111/110,12.7/4.4/0.64
10 tl 1} u 14 Prmtnfedvyt(P-t.ll
Conpwton C»teul»&cri »nd Experiment
111-110
P j
123
5
01
21314
HealPJL1
124
9121620253036424955
Exp.vrtmPJ-1
1.11.19
1.121.11
0.9»0.(9O.UC7»
0 7 «Q.Q&1.31
Dn.P-U «
•1
, - • • »
•3.32.1-1.70.9-J.90.62»2.50
Nei l
13
213143
57
1.191.15
0 960.M0.7«
0.82
O«v.
-0.6•1.1
0.71.60J
Power rfkfrihution Deviation Calc from Exp. (%)- p t 1 -
Prasi point nurrber
Table 18 List of the Loviisa-1 Fuel Assemblies
Type
1(A)2(B)3(C)
Enrichment
U 3.6U 2.4U 1.6
202
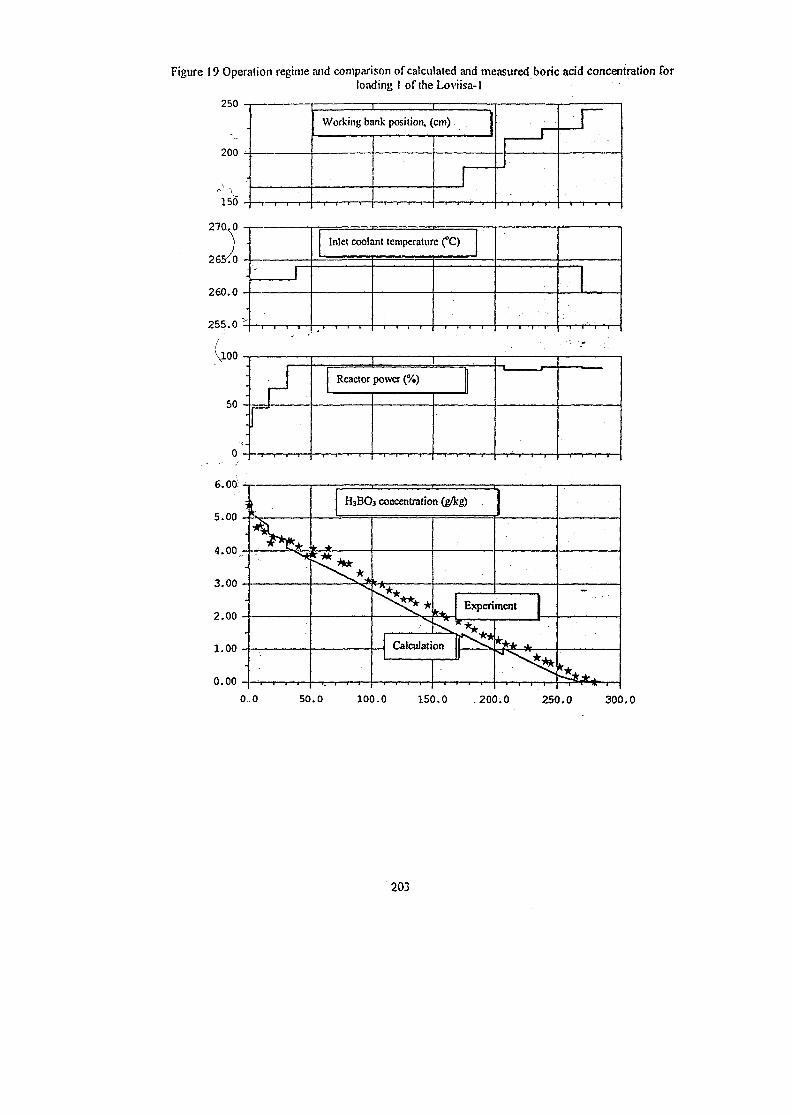
Figure 19 Operation regime and comparison of calculated and measured boric acid concentration forloading 1 of the Loviisa-1
?no -
7
150 - —T—I—r—T—
1 I
Working bank position, (cm) j
—i—r—-l—i— —r—r—^—|— • t - t —i—r—-
r~
- i — i 1 1 • % i ' • —T—I—r—!—
270.0
26K0
260.0
255.0
-
-_—r-
Inlet coolant temperature (°C)
•
50 -
0 -
rh
Reactor power (%)II
—i—i—i—i— —i—i—i—i— •—r^-i—i—i— —l—i—i—i—
6.00;
5.00
4. 00.;
3.00
2 . 0 0 •
1 . 0 0 •
0.00 -0.,
H3BO3 concentration (g/kg)
<*•** Experiment
Calculation
50.0 100.0 150.0 200.0 250.0 300.0
203
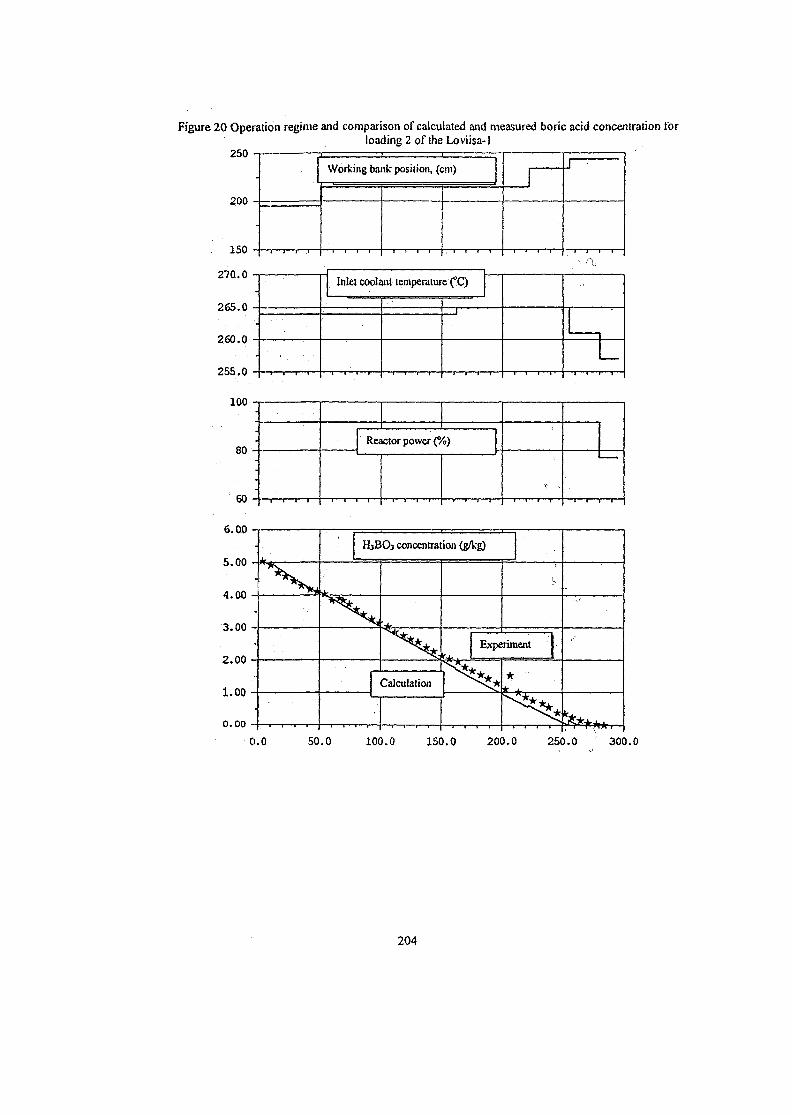
1
- —-,—J—J—-J—
Working bank position, (cm)i . . . . — . — , , - , . . • , • • • ' • . • . • • . . . .• ... — . 1
——j—j—f-—,— —i—i—i—i— —i—i—r-~i— —T ? 1 1
1
1~~7 f 1
Figure 20 Operation regime and comparison of calculated and measured boric acid concentration lorloading 2 of the Loviisa-1
250
200
150
270.0
265.0
260.0
255.0
100
-
- . •
Inlet coolant temperature (°C)
1
60 -
-
Reactor power (%)
6.00
0.0 50.0 100.0 150.0 200.0 250.0 300.0
204
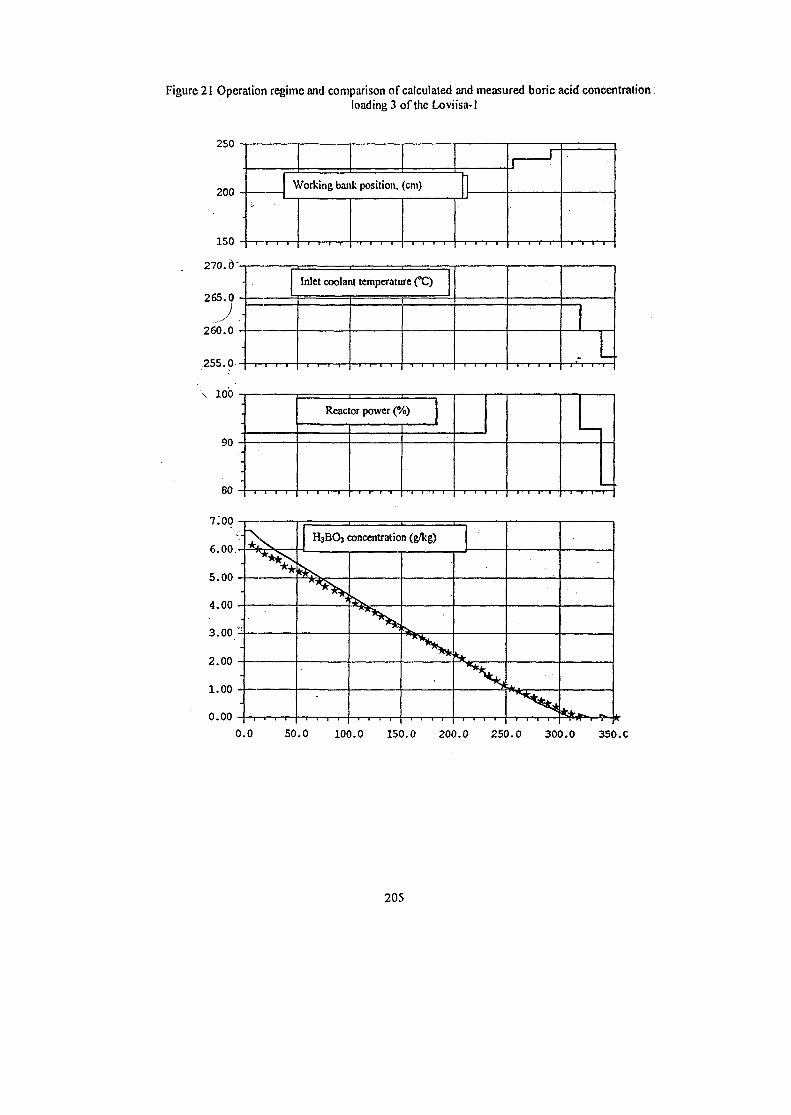
Figure 21 Operation regime and comparison of calculated and measured boric acid concentrationloading 3 of the Loviisa-1
200 - -
150 - -
Working bank position, (cm)1
1 '
270.6
265.0
260.0
255.0
\ 100
90
80
7.00
•
•
Inlet coolant temperature (°C)
1 ,,. L
-
•
Reactor power (%)
6.00
5.00
4.00
3.00/4
2.00
1.00
0.00
H3BO3 concentration (g/kg)
0.0 50.0 100.0 150.0 200.0 250.0 300.0 350.C
205
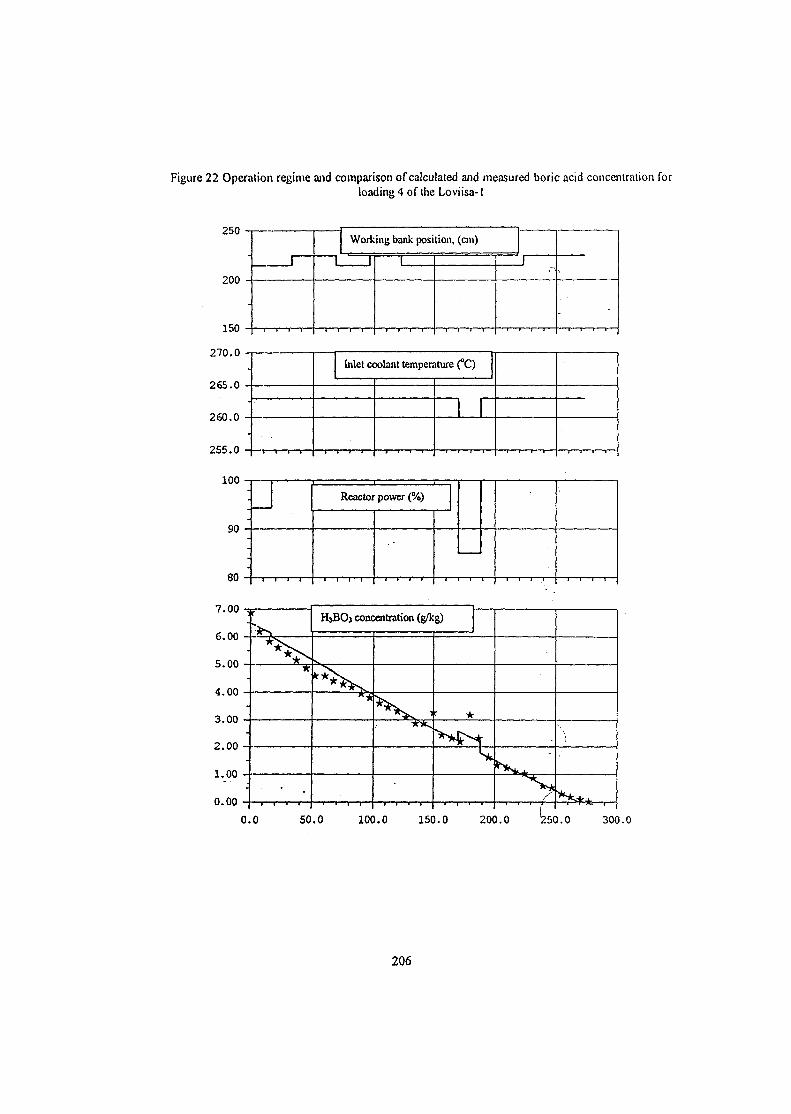
-
Working bank position, (cm)
1—1
—I—1—1—1—
1 1
1—i—i—i—i—
>
-
Figure 22 Operation regime and comparison of calculated and measured boric acid concentration forloading 4 of the Loviisa-1
250
200
150
270.0
265.0
260.0
255.0
100
90
80
-
T 1 I 1
Inlet coolant temperature (°C)
-
-
-
Reactor power (%)1
50.0 100.0 150.0 200.0 250.0 300.0
206
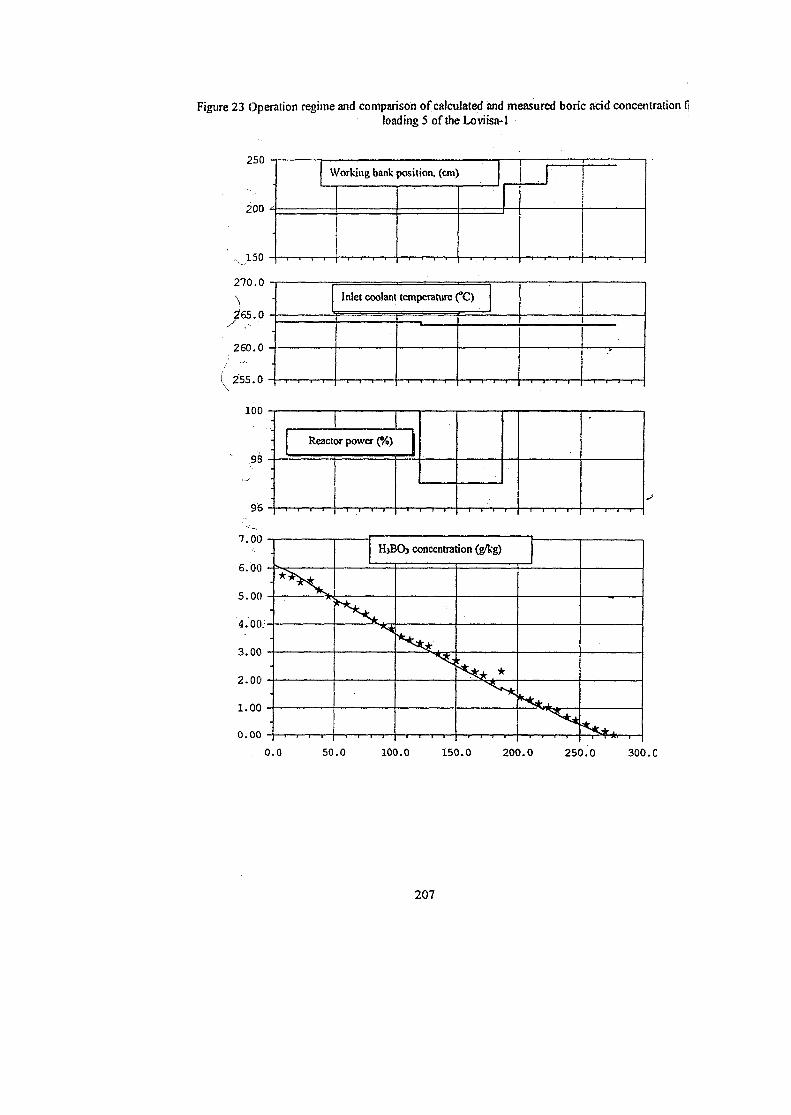
Figure 23 Operation regime and comparison of calculated and measured boric acid concentration flloading 5 of the Loviisa-1
270.0
265.0 -
260.0
I 255.0
7.00
6.00
5.00
4.00;
3.00
2.00
1.00
0.00
200 *
Working bank position, (cm)
•
•
-
Inlet coolant temperature (°C)
. •
96 -
Reactor power (%)
•
-
•
-
-
H3BO3 concentration (g/kg)
* * *
-
* * * * *
0.0 50.0 100.0 150.0 200.0 250.0 300.C
207
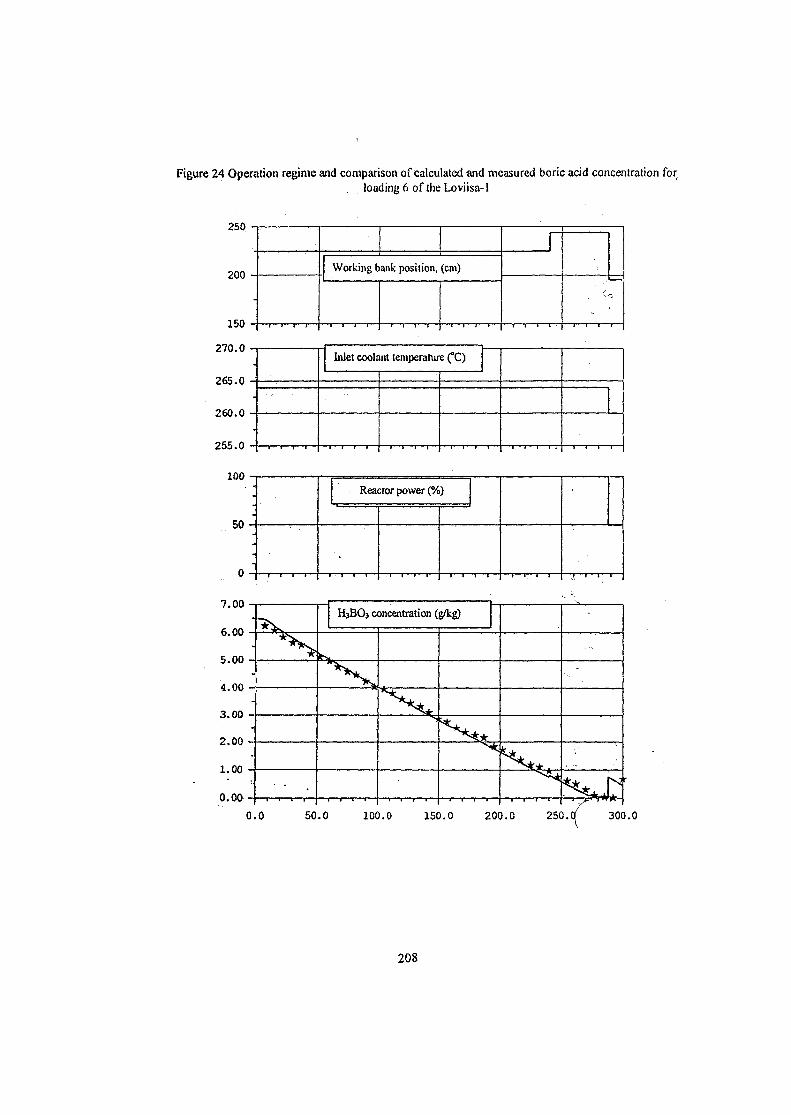
Figure 24 Operation regime and comparison of calculated and measured boric acid concentration forloading 6 of the Lo viisa-1
200 -
150 -
Working bank position, (cm)
1
270.0
265.0
260.0
255.0
100
50
•
. • • • •
•
Inlet coolant temperature C"C)
-
Reactor power (%)
•
7.00
6.00 -
5.00 -
4.00
3.00 -
2.00 -
1.00
0.00
H3BO3 concentration (g/kg)
0.0 50.0 100.0 150.0 200.0 250. 300.0
208
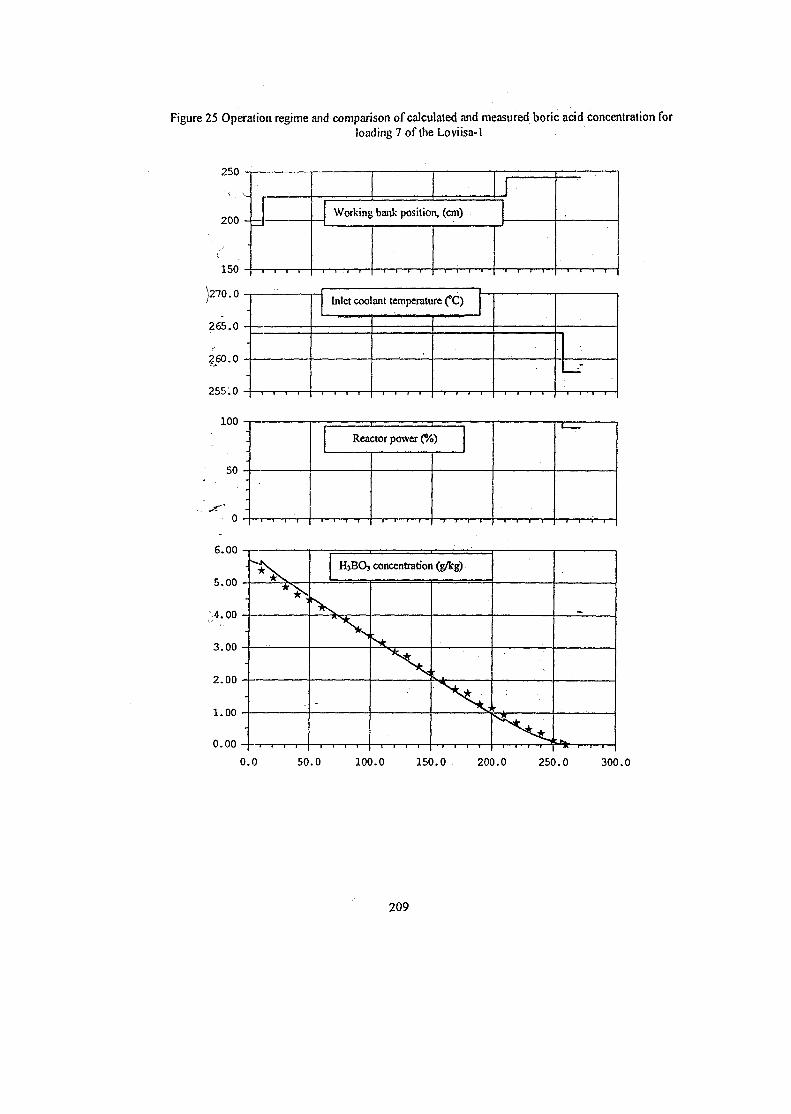
Figure 25 Operation regime and comparison of calculated and measured boric acid concentration forloading 7 of the Loviisa-1
^ou -
v.
200 -
150 -
J1
Working bank position, (cm)
270.0 -
265.0 -
260.0 -
255.0 -
Inlet coolant temperature (°C)
IL-
100
50
6.00
5.00
;4.00
3.00
2.00
1.00
0.00 •
Reactor power (%)
H3BO3 concentration (g/kg)
•
. . . .
0.0 50.0 100.0 150.0 200.0 250.0 300.0
209
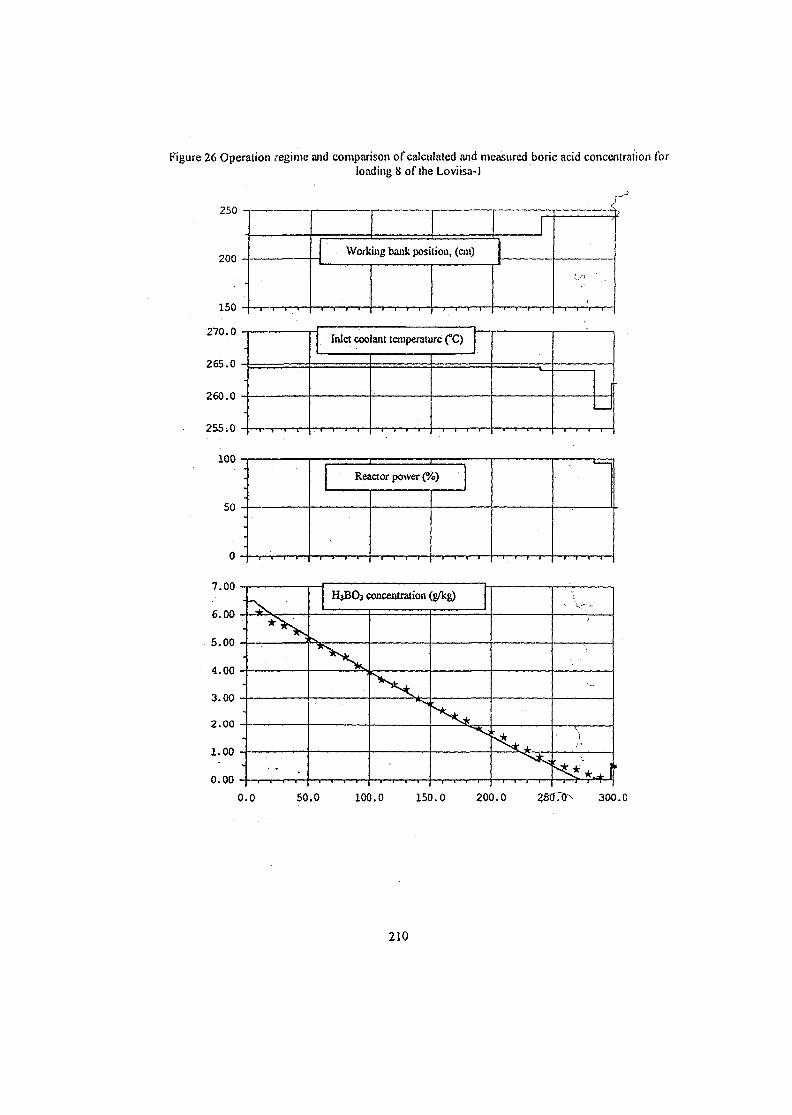
Figure 26 Operation regime and comparison ofcalculated and measured boric acid conceniration forloading 8 of the Loviisa-1
i3U -1
200 -
150 -
Working bank position, (cm)
270.0
265.0
260.0
255.0
100
50
-
-
-
Inlet coolant temperature (°C)
["u
7.00
6.00
5.00
4.00
3.00
2.00
1.00
0.00
-
, [ I I J .
Reactor power (%)
•
1
-
-
H3BO3 concentration (g/kg) t
\
• I
^ v r0.0 50.0 100.0 150.0 200.0 2S0T0^ 300.C
210
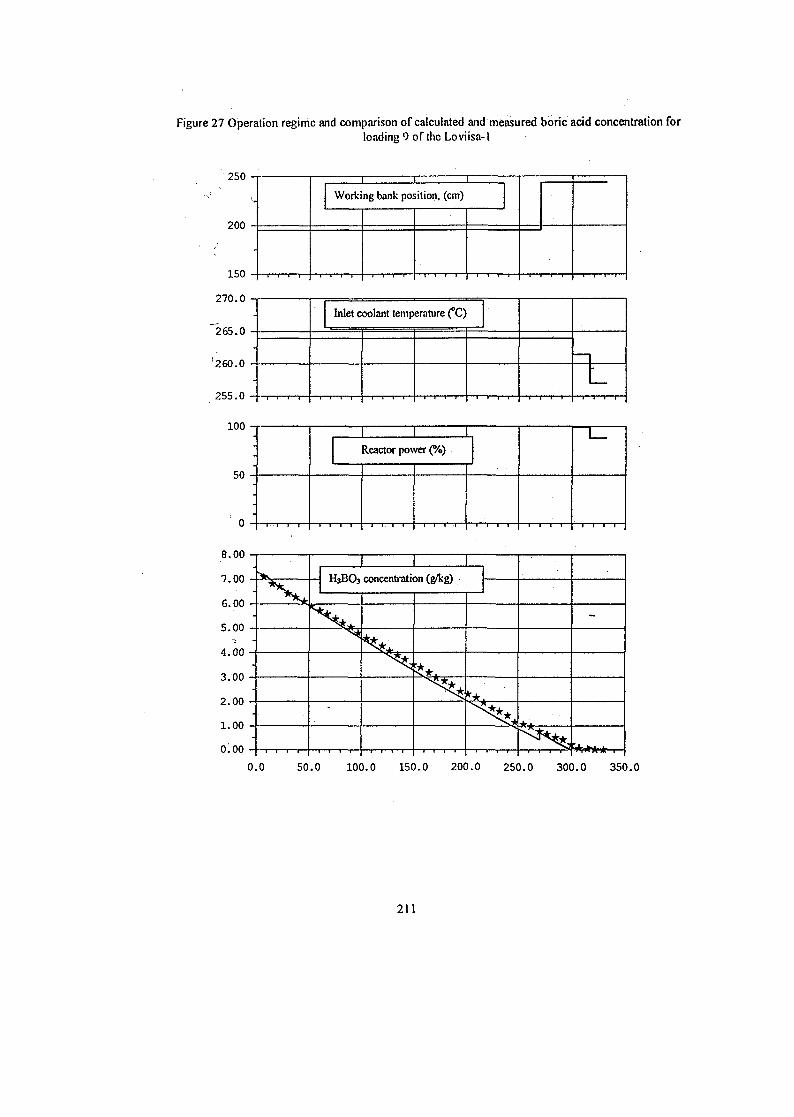
Figure 27 Operation regime and comparison of calculated and measured boric acid concentration forloading 9 of the Loviisa-1
250 -r
200
150
270.0
"265.0
'260.0
255.0
100
50
-
Working bank position, (cm)
•
-
•
Inlet coolant temperature (°C)
—
8.00
7.00
6.00
5.00
4.00
3.00
2.00
1.00
0.00
1Reactor power (%)
L_
*****
1 1 1H3BO3 concentration (g/kg)
—T—r—T—i—
* * *
1 1—T 1 —1—1—1—^*
-
* * * * *
0.0 50.0 100.0 150.0 200.0 250.0 300.0 350.0
211
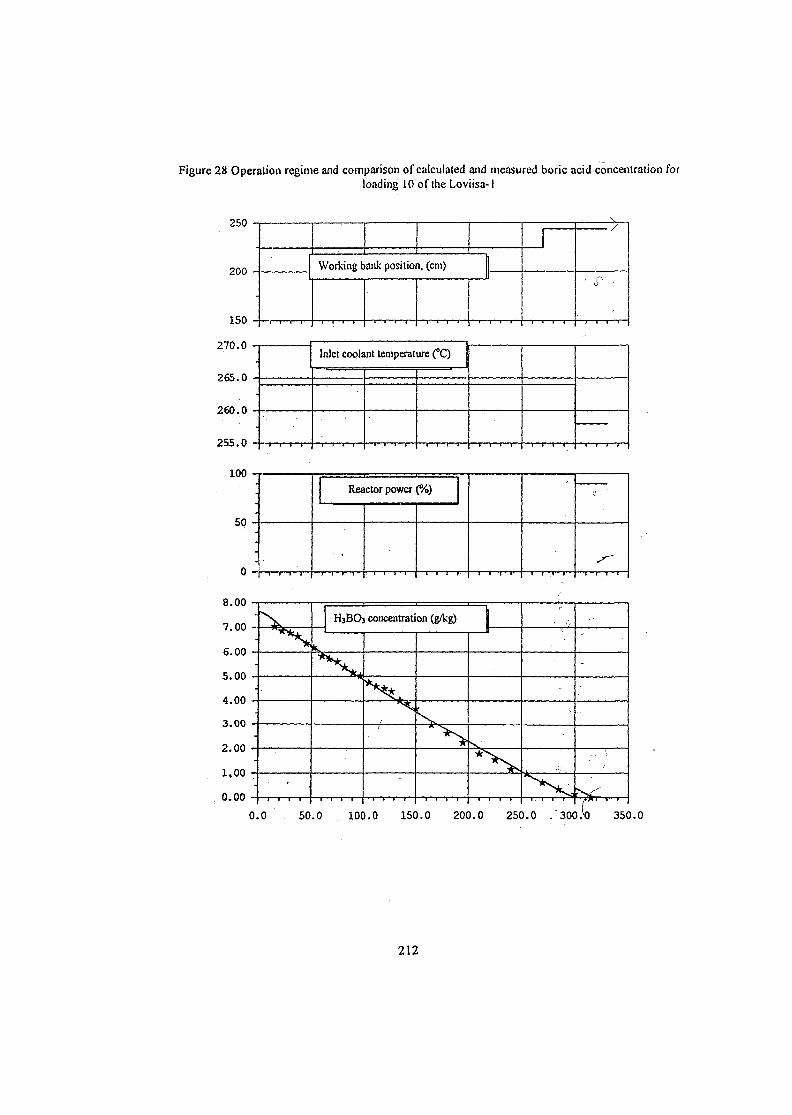
Figure 28 Operation regime and comparison of calculated and measured boric acid concentration forloading 10 of the Loviisa-1
200
150
270.0
265.0
260.0
255.0
~ —"I !""t"* 1
Working bank position, (cm)
—-p—]—,—i— —T—i—r—j— —i—i—i—i—
ftII
-™_ 1 1 1 1 —i—i—i—t—
-
-
Inlet coolant temperature (°C)
—i—i—i—i— —i—i—i—i— —m—i—i—
100 -r
50
•
Reactor power (%)
8.00 -r
7.00 -
6.00 -
5.00
4.00
3.00
2.00
1,00
0.00
H3BO3 concentration (g/kg)r
-
\
0.0 50.0 100.0 150.0 200.0 250.0 /300:0 350.0
212
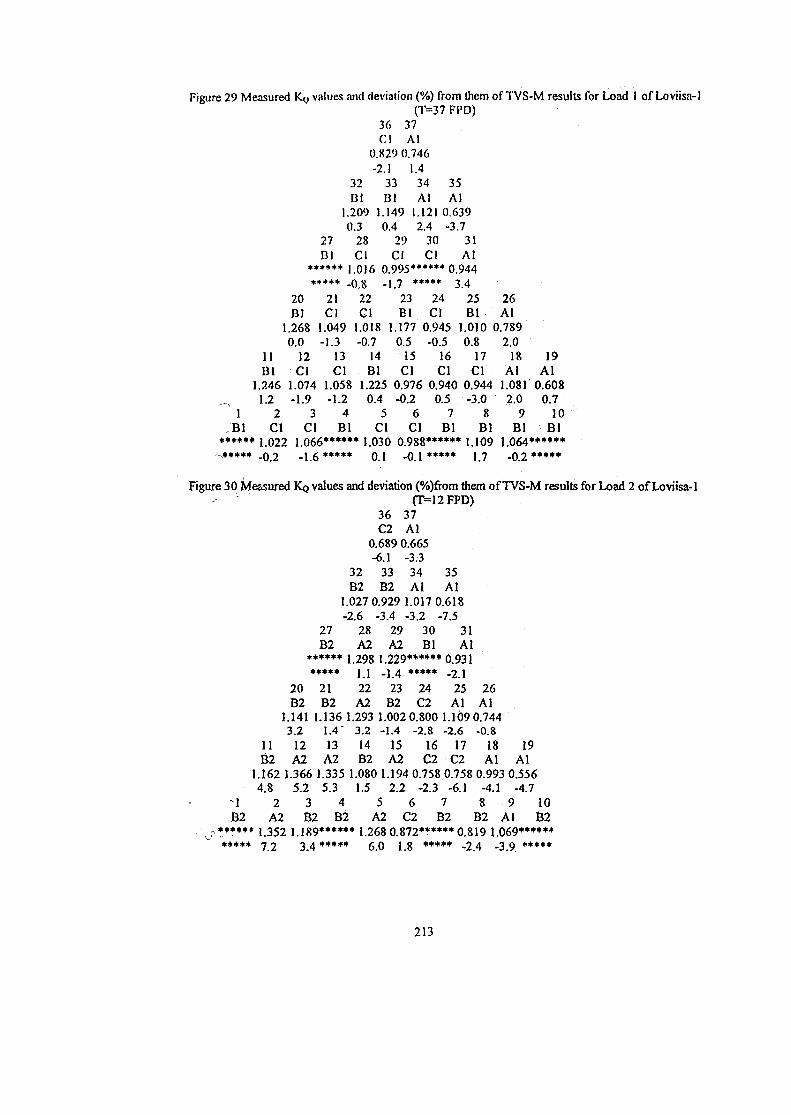
Figure 29 Measured KQ values and devialion (%) from them of TVS-M results for Load 1 of Loviisa-1(T=37FPD)
36 37Cl Al
0.829 0.746-2.1 1.4
32 33 34 35Bl Bl Al Al
1.209 1.149 1.121 0.6390.3 0.4 2.4 -3.7
27 28 29 30 31Bl CI CI Cl Al
****** 1.016 0.995****** 0.944***** -0.8 -1.7 ***** 3.4
20 21 22 23 24 25 26Bl Cl Cl Bl Cl Bl Al
1.268 1.049 1.018 1.177 0.945 1.010 0.7890.0 -1.3 -0.7 0.5 -0.5 0.8 2.0
11 12 13 14 15 16 17 18 19Bl Cl Cl Bl Cl Cl Cl Al Al
1.246 1.074 1.058 1.225 0.976 0.940 0.944 1.081 0.6081.2 -1.9 -1.2 0.4 -0.2 0.5 -3.0 2.0 0.7
1 2 3 4 5 6 7 8 9 10Bl Cl Cl Bl Cl Cl Bl Bl Bl Bl
****** 1.022 1.066****** 1.030 0.988****** 1.109 1.064*********** -0.2 -1.6***** 0.1 -o.l***** 1.7 -0.2*****
Figure 30 Measured KQ values and deviation (%)from them of TVS-M results for Load 2 of Loviisa-1- '' (T=12FPD)
36 37C2 Al
0.689 0.665-6.1 -3.3
32 33 34 35B2 B2 Al Al
1.027 0.929 1.017 0.618-2.6 -3.4 -3.2 -7.5
27 28 29 30 31B2 A2 A2 Bl Al
****** 1.298 1.229****** 0.931***** 1.1 -1.4 ***** -2.1
20 21 22 23 24 25 26B2 B2 A2 B2 C2 Al Al
1.141 1.136 1.293 1.002 0.800 1.109 0.7443.2 1.4" 3.2 -1.4 -2.8 -2.6 -0.8
11 12 13 14 15 16 17 18 19B2 A2 A2 B2 A2 C2 C2 Al Al
1.162 1.366 1.335 1.080 1.194 0.758 0.758 0.993 0.5564.8 5.2 5.3 1.5 2.2 -2.3 -6.1 -4.1 -4.7
1 2 3 4 5 6 7 8 9 10
B2 A2 B2 B2 A2 C2 B2 B2 Al B2, j . ****** 1.352 1.189****** 1.268 0.872****** 0.819 1.069******
***** -j 2 34 ***** go 18 ***** -2 4 -3 9 *****
213
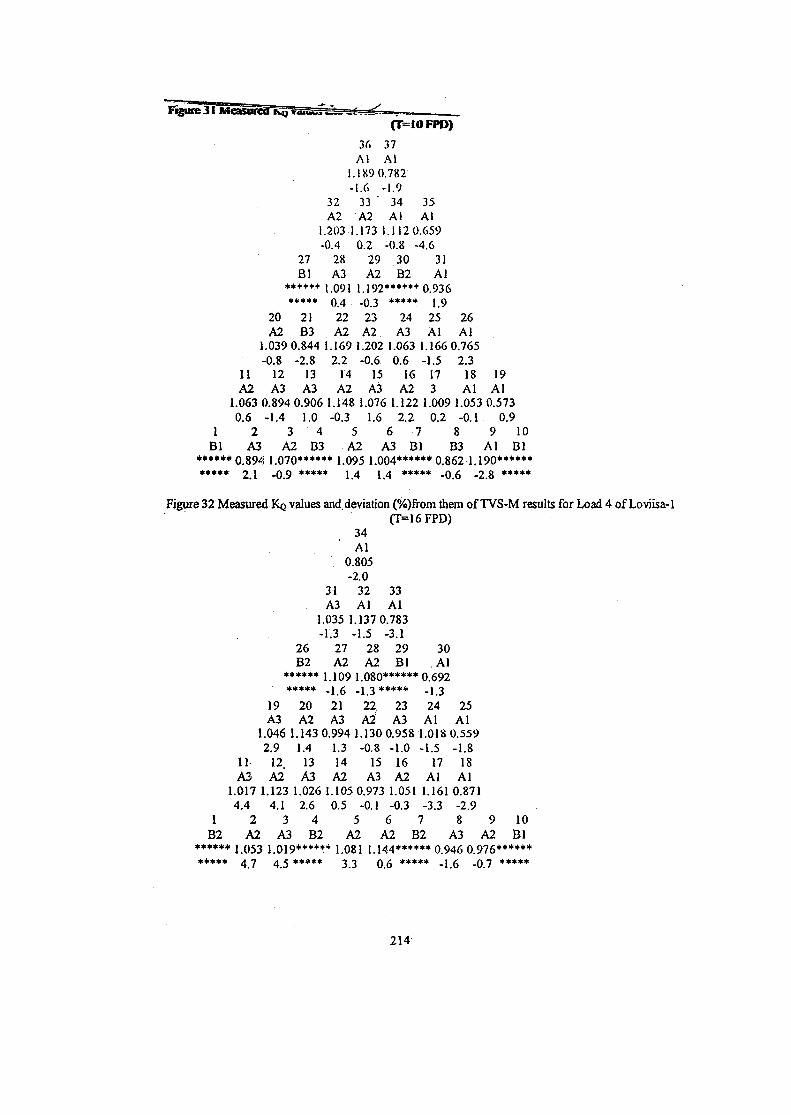
(T=IO FPD)
36 37Al Al
1.189 0.782-1.6 -1.9
33 * 34 35A2 Al Al
1.173 1.112 0.6590.2 -0.8 -4.6
29 30 31A2 B2 Al
1.192****** 0.936-0.3 ***** 1.923 24 25 26A2 A3 Al Al
1.039 0.844 1.169 1,202 1.063 1.166 0.765-0.8 -2.8 2.2 -0.6 0.6 -1.5 2.3
11 12 13 14 15 16 17 18 19A2 A3 A3 A2 A3 A2 3 Al Al
1.063 0.894 0.906 1.148 1.076 1.122 1.009 1.053 0.5730.6 -1.4 1.0 -0.3 1.6 2.2 0.2 -0.1 0.9
1 2 3 4 5 6 7 8 9 10Bl A3 A2 B3 A2 A3 Bl B3 Al Bl
****** 0.894 1.070****** 1.095 1.004****** 0.862 1.190*********** 2.1 -0.9 ***** 1.4 1.4 *•*•• -0.6 -2.8 *****
27Bl
***********
20 21A2 B3
32A2
1.203-0.4
28A3
1 1.0910.422A2
Figure 32 Measured KQ values and.deviation (%)from them of TVS-M results for Load 4 of Lovnsa-1
26B2
***********
19 20A3 A2
34Al
0.805-2.0
31 32A3 Al
1.035 1.137-1.3 -1.5
27 28A2 A2
(7=16 FPD)
33Al
0.783-3.1
29 30Bl Al
1.109 1.080****** 0.692-1.6 -1.321 22.A3 A2
***** -1.323 24 25A3 Al Al
1.046 1.143 0.994 1.130 0.958 1.018 0.5592.9 1.4 1.3 -0.8 -1.0 -1.5 -1.8
11- 12. 13 14 15 16 17 18A3 A2 A3 A2 A3 A2 Al Al
1.017 1.123 1.026 1.105 0.973 1.051 1.161 0.8714.4 4.1 2.6 0.5 -0.1 -0.3 -3.3 -2.9
1 2 3 4 5 6 7 8 9B2 A2 A3 B2 A2 A2 B2 A3 A2
10Bl
****** 1.053 1.019****** 1.081 1.144******0.946 0.976*********** 4.7 4.5 ***** 3.3 0.6 ***** -1.6 -0.7 *****
214
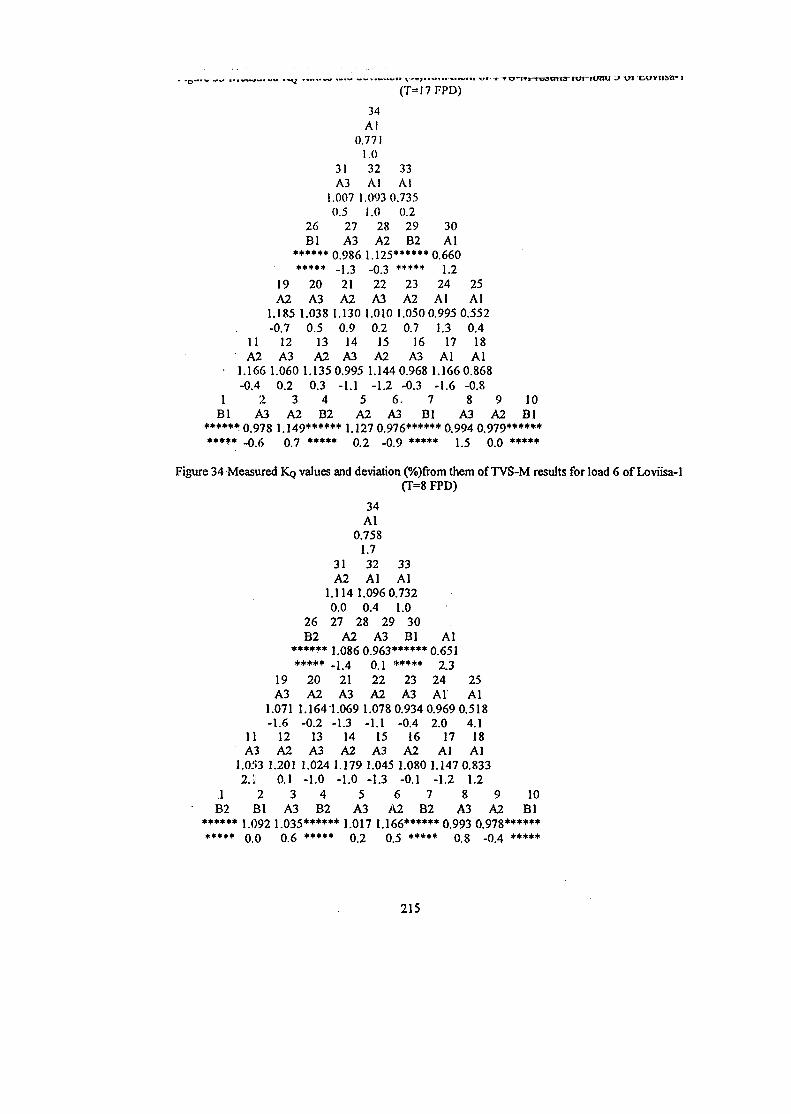
atnt3 -fui~rtraiu ^ v i
(T=)7FPD)34
Al0.771
1.031 32 33A3 Al Al
1.007 1.093 0.7350.5 1.0 0.2
26 27 28 29 30Bl A3 A2 B2 Al
****** 0.986 1.125****** 0.660***** -1,3 -0.3 ***** 1.2
19 20 21 22 23 24 25A2 A3 A2 A3 A2 Al Al
1.185 1.038 1.130 1.010 1.050 0.995 0.552-0.7 0.5 0.9 0.2 0.7 1.3 0.4
11 12 13 14 15 16 17 18A2 A3 A2 A3 A2 A3 Al Al
1.166 1.060 1.135 0.995 1.144 0.968 1.166 0.868-0.4 0.2 0.3 -1.1 -1.2 -0.3 -1.6 -0.8
1 2 3 4 5 6. 7 8 9 10Bl A3 A2 B2 A2 A3 Bl A3 A2 Bl
****** 0.978 1.149****** 1.127 0.976****** 0.994 0.979*********** -0.<> 0.7 ***** 0.2 -0.9 ***** 1.5 0.0 *****
Figure 34 Measured KQ values and deviation (%)from them of TVS-M results for load 6 of Loviisa-1(T=8 FPD)
1
26B2
******• • • • *
19 20A3 A2
34Al
0.7581.7
31 32A2 Al
33Al
.114 1.096 0.7320.0 0.427 28 2<
A2 A3
1.0> 30
Bl Al1.086 0.963****** 0.651-1.4 0.1
21 22A3 A2
1.071 1.164 1.069 1.078-1.6 -0.2
11 12 13A3 A2 A3
1.053 1.201 1.0242.3 0.1 -1.0
1 2 3 4B2 Bl A3 B2
-1.3 -1.114 15A2 A3
1.179 1.04f-1.0 -1.3
5
*****23A3
2.324Al
0.934 0.969-0.4
16A2
i 1.080-0.1
6
2.017
Al1.147-1.2
7A3 A2 B2
25Al
0.5184.1
18Al
0.8331.2
8 9A3 A2
10Bl
****** 1.092 1.035****** 1.017 1.166****** 0.993 0.978*********** 0.0 0.6 ***** 0.2 0.5 ***** 0.8 -0.4 *****
215
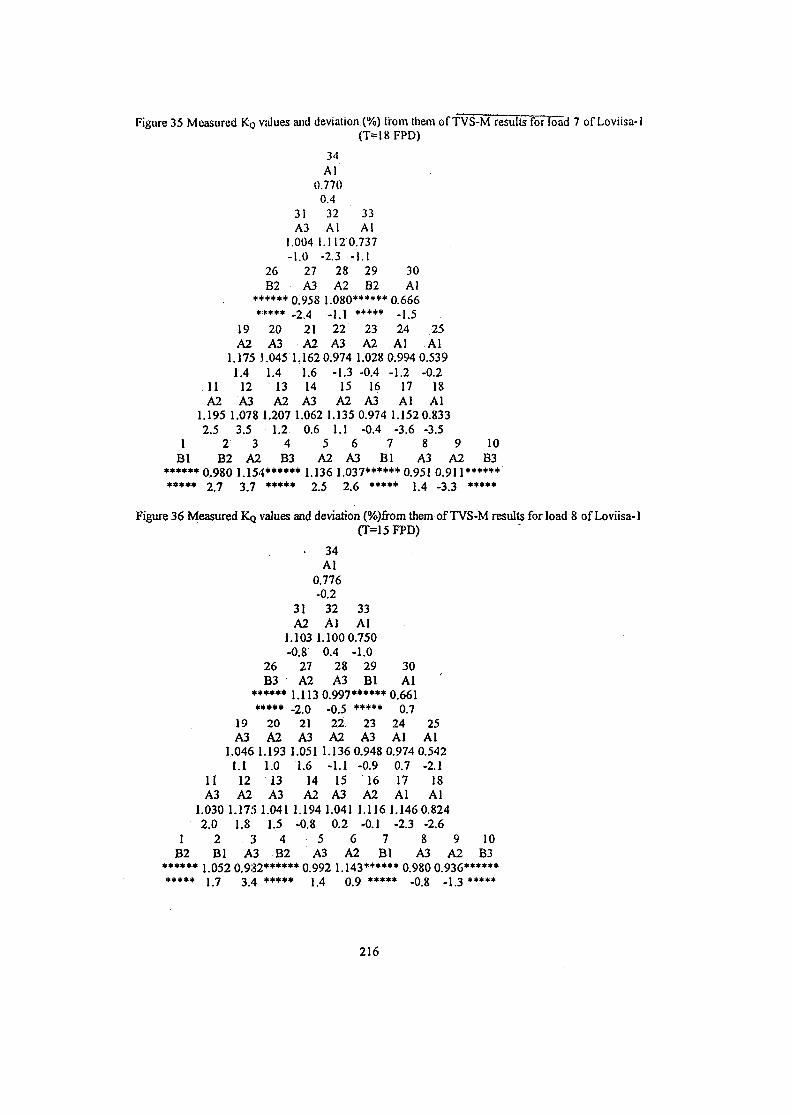
Figure 35 Measured KQ values and deviation (%) from them of TVS-M resultsToFload 7 of Loviisa-1(T=18FPD)
34Al
0.7700.4
31 32 33A3 Al Al
1.004 1.112 0.737-1.0 -2.3 -1.1
26 27 28 29 30B2 A3 A2 B2 Al
****** 0.958 1.080****** 0.666***** _2.4 - l . j • • * • • . ] 5
19 20 21 22 23 24 25A2 A3 A2 A3 A2 Al Al
1.175 1.045 1.162 0.974 1.028 0.994 0.5391.4 1.4 1.6 -1.3 -0.4 -1.2 -0.2
11 12 13 14 15 16 17 18A2 A3 A2 A3 A2 A3 Al Al
1.195 1.078 1.207 1.062 1.135 0.974 1.152 0.8332.5 3.5 1.2 0.6 1.1 -0.4 -3.6 -3.5
1 2 3 4 5 6 7 8 9 10Bl B2 A2 B3 A2 A3 Bl A3 A2 B3
••••*• 0.980 1.154****** 1.136 1.037****** 0.951 0.911*********** 2 7 3 7 ••••• 2 5 2 6 ***** 14 -3 3 *****
Figure 36 Measured KQ values and deviation (%)from them of TVS-M results for load 8 of Loviisa-1(T=15FPD)
]
11A3
1.0302.0
1 2B2 Bl
1
26B3
***********
19A3
1.046 11.1
12A2
1.1751.8
3A3
20A2
1.1931.013A3
1.0411.5
4B2
• 34Al
0.776-0.2
31 32A2 Al
33Al
.103 1.100 0.750•0.8 0.4
27 28A2 A3
-1.029Bl
1.113 0.997******-2.0 -0.5
21 22A3 A2
*****23A3
1.051 1.136 0.94811.6 -1.1
14 15A2 A3
1.194 1.041-0.8 0.2
5
-0.916
A21 1.116
-0.16 7
30Al
0.6610.7
24Al
3.9740.717Al
1.146-2.3
A3 A2 Bl 4
25Al
0.542-2.1
18Al
0.824-2.68 9 10\3 A2 B3
****** 1.052 0.982****** 0.992 1.143****** 0.980 0.936******* * * * * j 7 3 4 * * * * * j 4 0 9 ***** _ 0 8 _j 3 *****
216
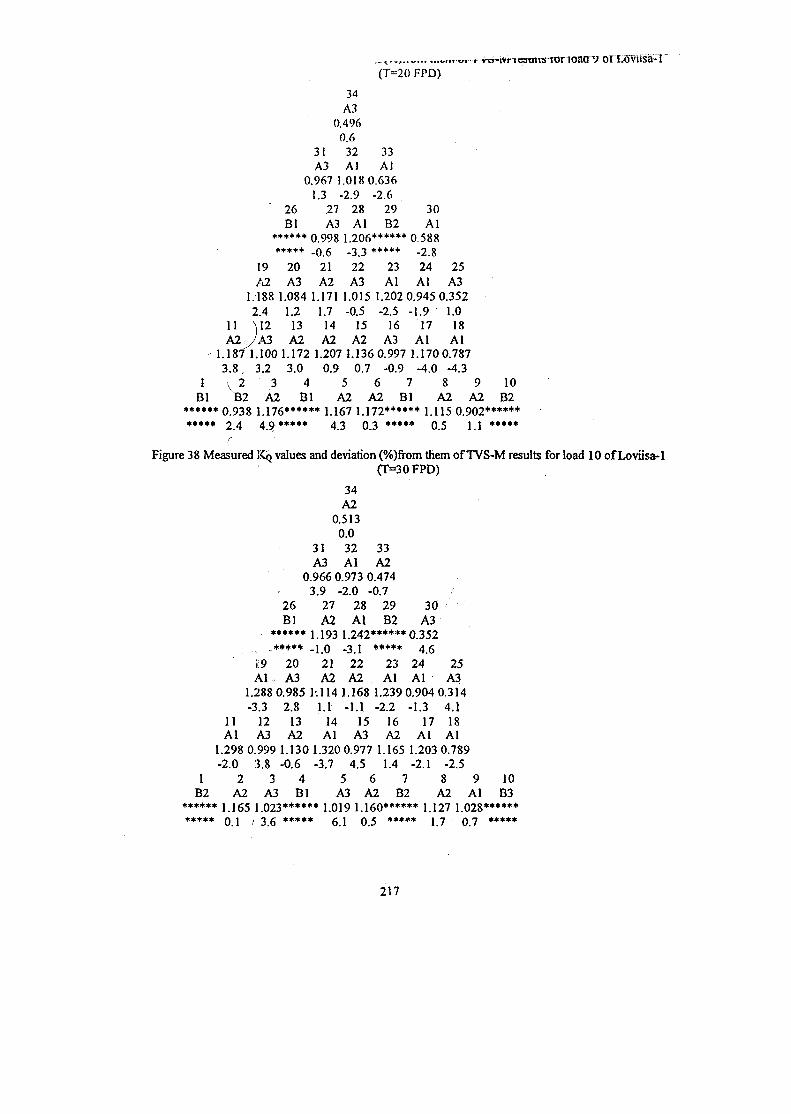
._ v..,.. _ .,..,«•• -i-rtj-ivr-rcstnvs-ror roacrv(T=20 FPD)
34A3
0.4960.6
31 32 33A3 Al Al
0.967 1.018 0.6361.3 -2.9 -2.6
26 27 28 29 30Bl A3 Al B2 Al
****** 0.998 1.206****** 0.588*•••• -0.6 -3.3 ***** -2.8
19 20 21 22 23 24 25A2 A3 A2 A3 Al Al A3
1.188 1.084 1.171 1.015 1.202 0.945 0.3522.4 1.2 1.7 -0.5 -2.5 -1.9 1.0
11 \I2 13 14 15 16 17 18A2JAS A2 A2 A2 A3 Al Al
1.187 1.100 1.172 1.207 1.136 0.997 1.170 0.7873.8. 3.2 3.0 0.9 0.7 -0.9 -4.0 -4.3
1 1 2 3 4 5 6 7 8 9 10Bl B2 A2 Bl A2 A2 Bl A2 A2 B2
****** 0.938 1.176****** 1.167 1.172****** 1.115 0.902*********** 2.4 4.9***** 4.3 0.3 ***** 0.5 1.1 *****
r
Figure 38 Measured KQ values and deviation (%)from them of TVS-M results for load 10 of Loviisa-1(T=30 FPD)
0
26Bl
******.*****
19Al
1.288 I-3.3
11 12Al A3
1.298 0.999-2.0 3.8
1 2 3B2 A2 A3
20A3
0.9852.8
13A2
1.130-0.6
4Bl
34A2
0.513
31A3
.966 (3.9
27A2
1.193-1.0
21A2
1.1141.1
14Al
1.32C-3.7
0.032 33Al A2
).973 0.474-2.0 -0.7
28 29Al B2
1.242******-3.1 *****
22 23A2 Al
30A3
0.3524.6
24Al
1.168 1.239 0.904-1.1 -2.2
15 16A3 A2
) 0.977 1.1654.5 1.4
5 6 7A3 A2 B:
-1.317
Al1.203-2.1
25A3
0.3144.118
Al0.789-2.5
8 9A2 Al
10B3
****** 1.165 1.023****** 1.019 1.160****** 1.127 1.028*********** 0.1 / 3.6 ***** 6.1 0.5 ***** 1.7 0.7 *****
217
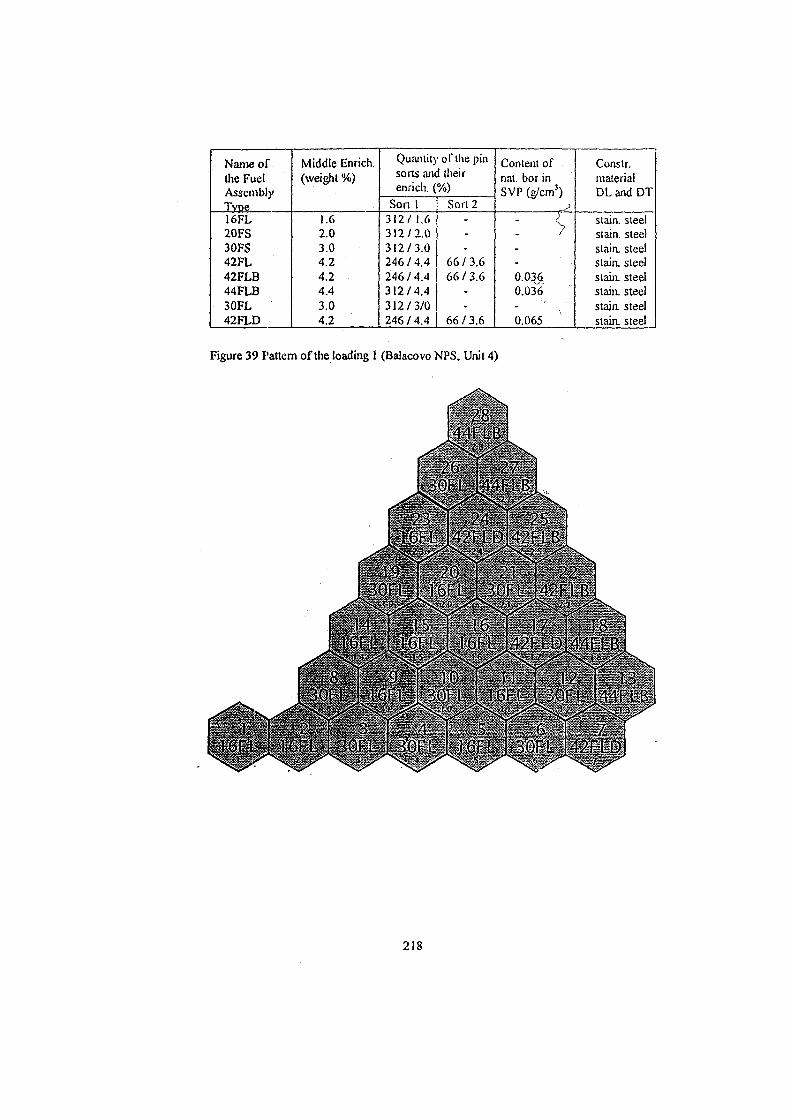
Name ofthe FuelAssemblyTvpe16FL20FS30FS42FL42FLB44FLB30FL42FLD
Middle Enrich,(weight %)
1.62.03.04.24.24.43.04.2
Quantity oC the pinsorts and theirenrich. (%)
Sort I j Sort 2312/ 1.6312/2.0312/3.0246/4.4246 / 4.4312/4.4312/3/0246/4.4
66/3.666/3.6
66/3.6
Content ofnat. bor inSVP (g/cm3)
: *.
0.03£0.036
0.065
Constr.materialDL and DT
stain, steelstain, steelstaia steelstain, steelstain, steelslain, steelstaja steelstain, steel
Figure 39 Pattern of the loading 1 (Balacovo NPS, Unit 4)
218
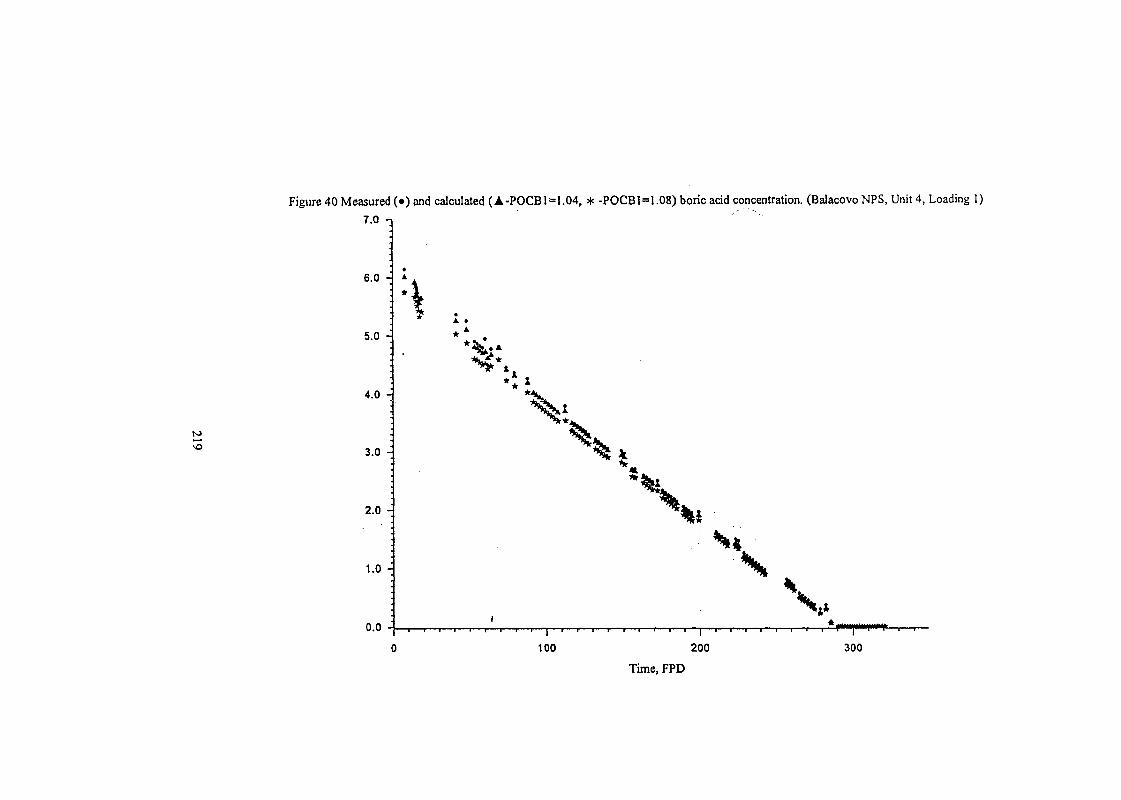
to
Figure 40 Measured (•) and calculated (A-POCB1=1.04, * -POCB1=1.08) boric acid concentration. (Balacovo NPS, Unit 4, Loading 1)
7.0 n
6.0 -
5.0 -
4.0 -
3.0 -
2.0 -
1.0 -
0.0
100 200I
300
Time, FPD
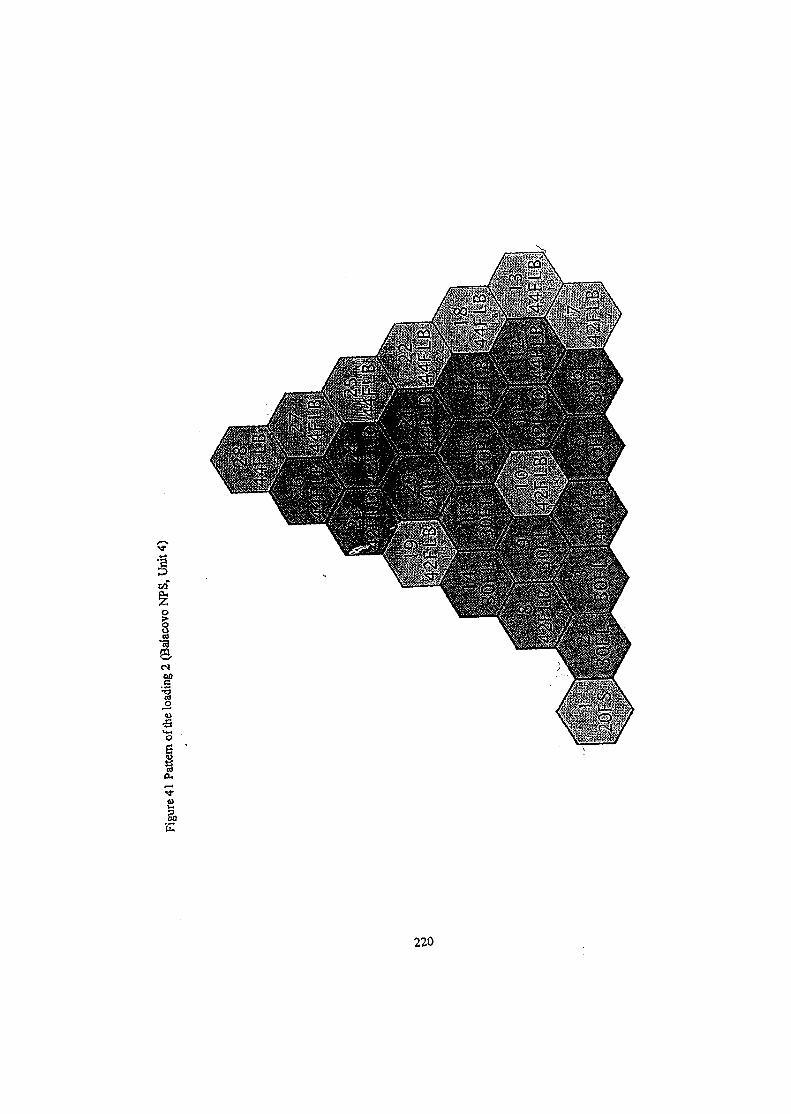
3
s
i
\
220
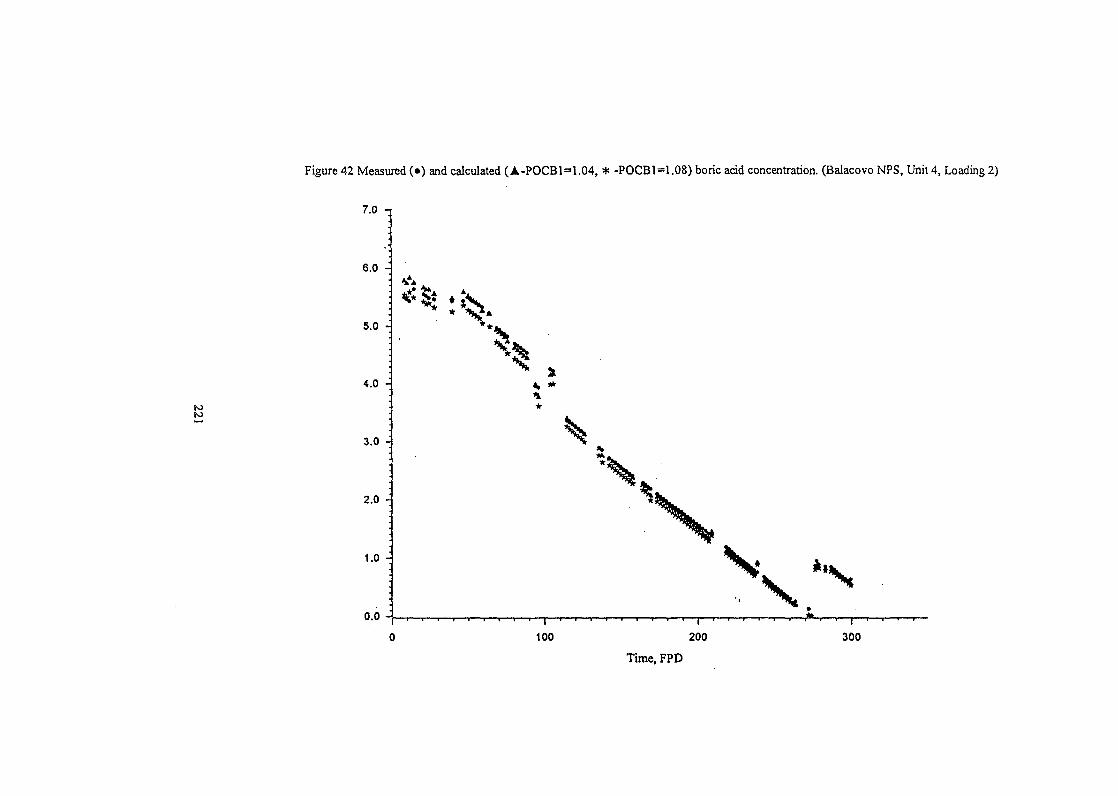
to
Figure 42 Measured (•) and calculated (A-POCB1=1.04, * -POCB1=1.08) boric acid concentration. (Balacovo NPS, Unit 4, Loading 2)
7.0 i
6.0 -
5.0 -
4.0 -
3.0 -
2.0 -
1.0 -
0.0 -
A,
100 200
Time, FPD
\ .
**sr
300
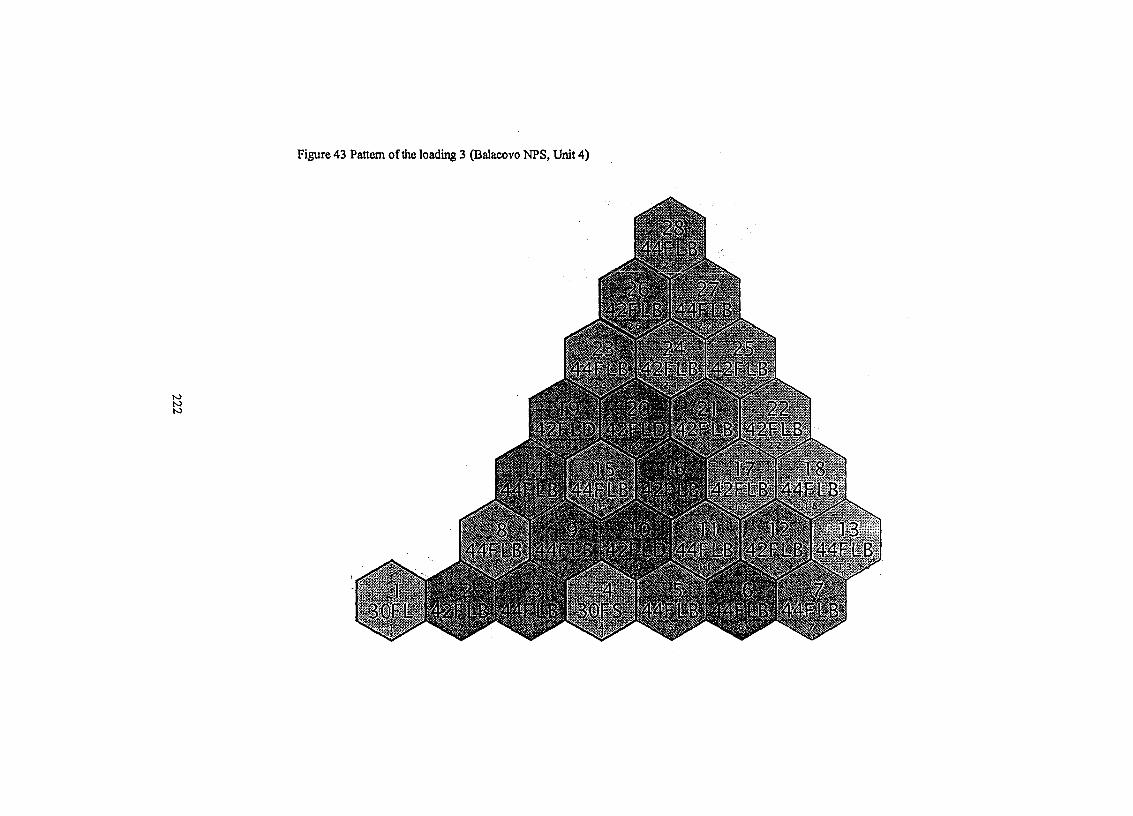
Figure 43 Pattern of the loading 3 (Balacovo NPS, Unit 4)
tototo
27-44FLB
'44FHBM42FLB-
42F11B- 42FLB
42FLBI44FLB1
l-V It
144F.LB;|:42F.LBI44FLB
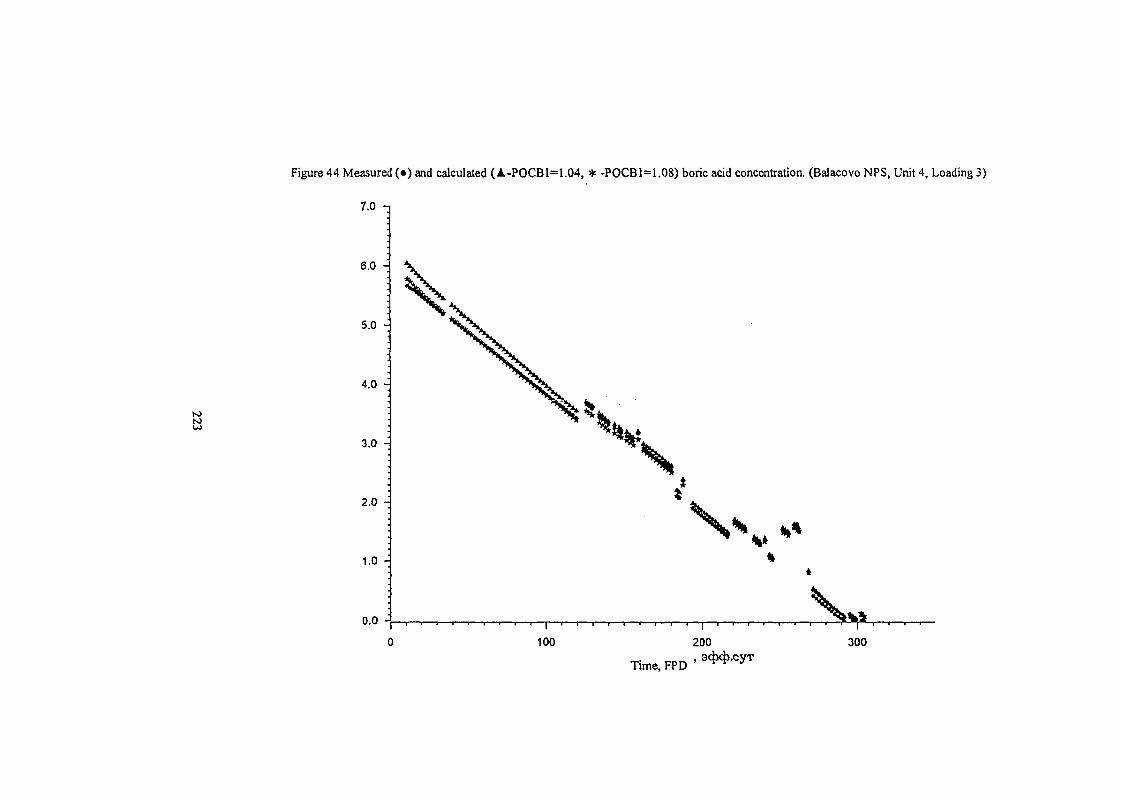
Figure 44 Measured (•) and calculated (A-POCB1=1.04, * -POCB1=1.08) boric acid concentration. (Balacovo NPS, Unit 4, Loading 3)
7.0 T
6.0 -
5.0 -
4.0 -
3.0 -
2.0 -
1.0 -
0.0 J
100 200 300
Time, FPD '
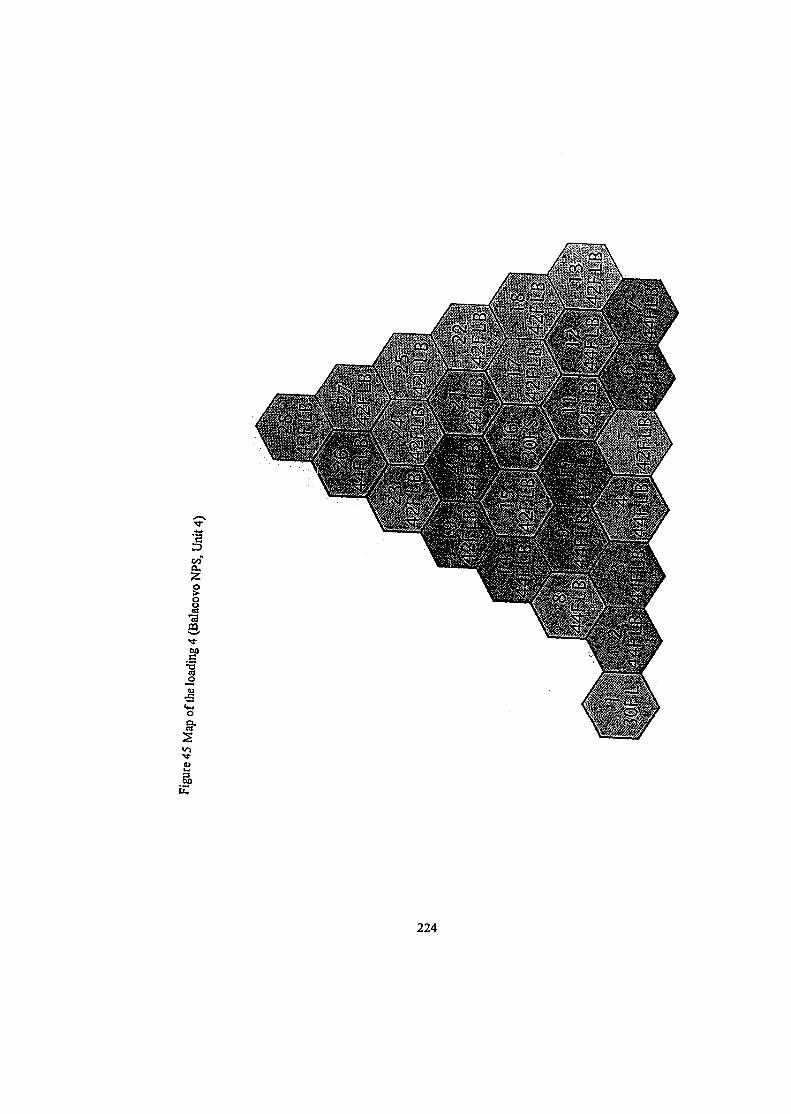
3CO
&
I73S
224
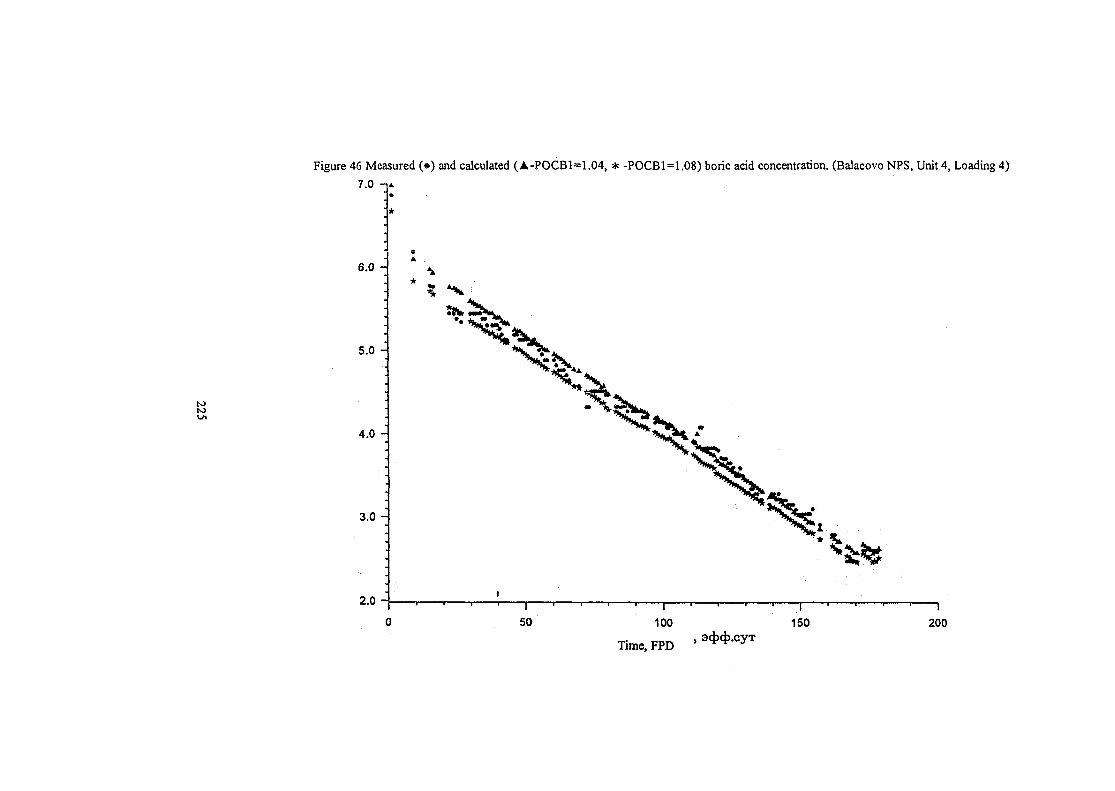
Figure 46 Measured (•) and calculated (A-POCB1=1.04, * -POCB1=1.08) boric acid concentration. (Balacovo NPS, Unit 4, Loading 4)7.0 -i*
6.0 -
5.0 -
4.0 -
3.0 -
2.0 -i
50I
100
Time, FPD, 3(|){|).CyT
1501
200
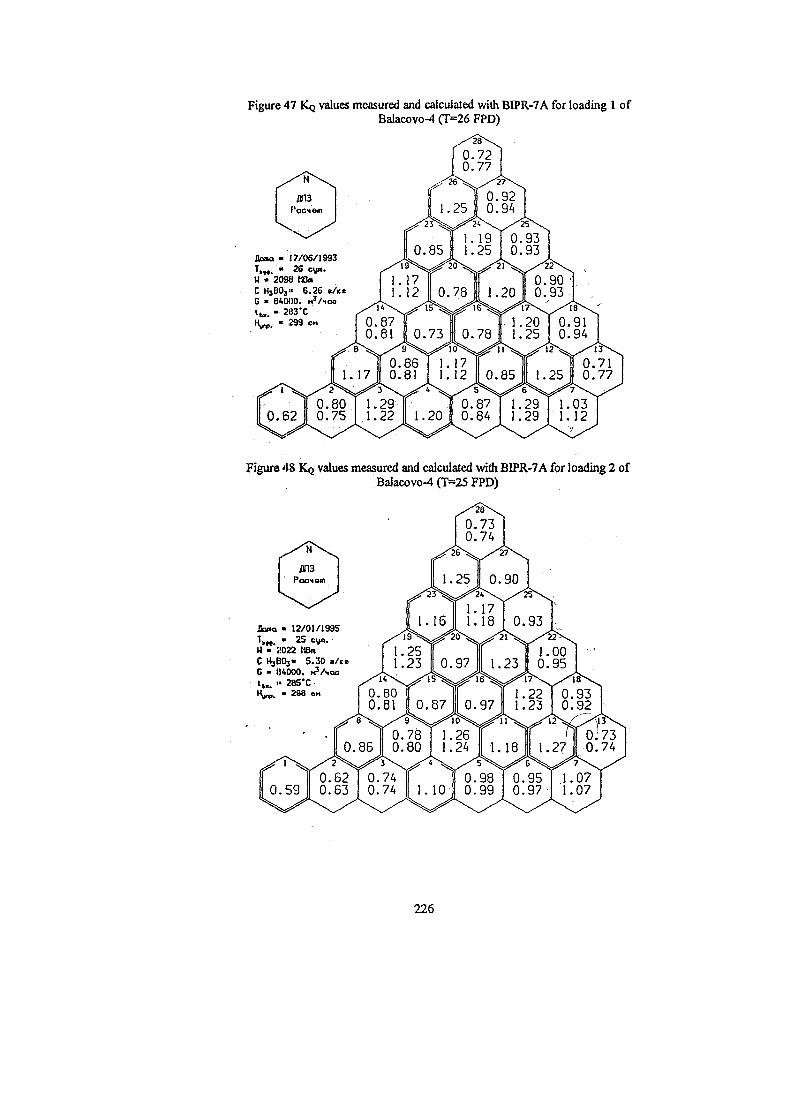
Figure 47 KQ values measured and calculated with BIPR-7 A for loading 1 ofBalacovo-4 (T=26 FPD)
17/06/:993W • 2S eym.U « 209(1 KB»C H3BO3" 6.26 s / c iC - 84000. M3/HOCtt*. - 2I33*CH ^ - ,299 CM
Figure 48 KQ values measured and calculated with BIPR-7A for loading 2 ofBalacovo-4 (T=25 FPD)
Anna * 12/01/199ST>ff. • 25 oym.H - ;!022 KBnC Hj!10,« 5.30 t/icsG > H4000. HVSQCt , , . » 2B5*CH,^, - 298 CM
226
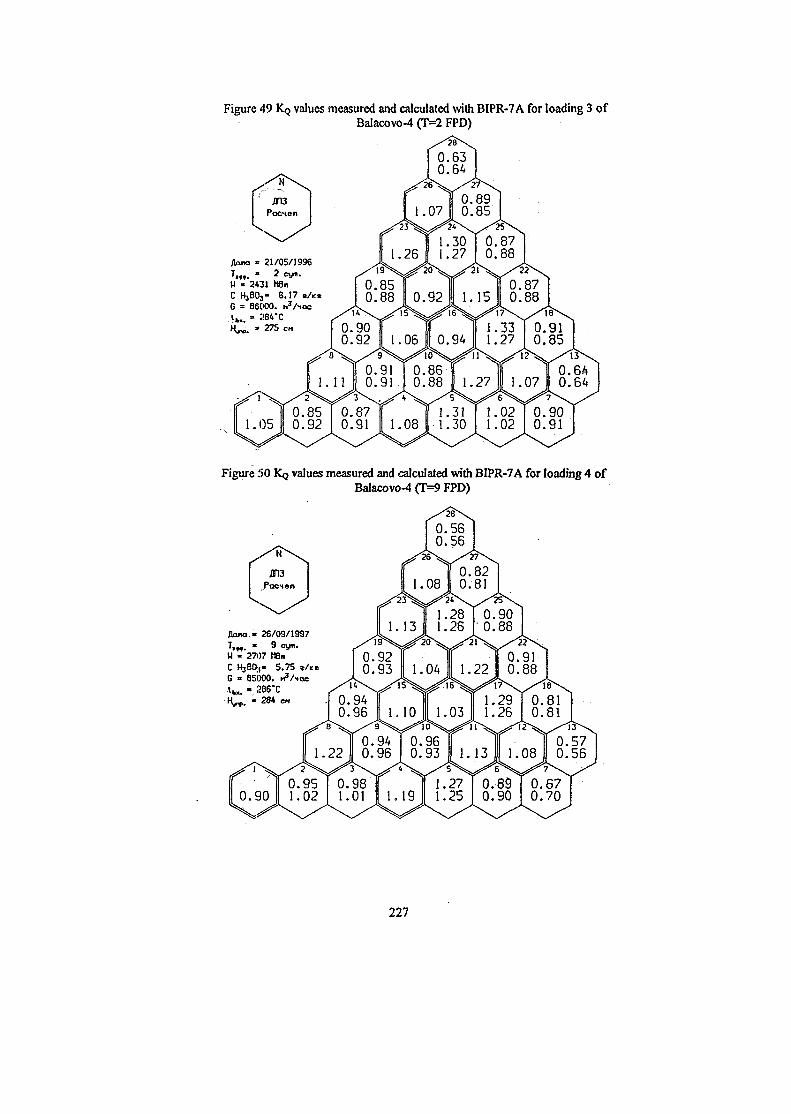
Figure 49 KQ values measured and calculated with BIPR-7 A for loading 3 ofBalacovo-4 (T=2 FPD)
21/05/1996" 2
U « 2431 hBnC HjBOj- 6.17 «/<»G = 86000. n 3 / ioc
Figure 50 KQ values measured and calculated with BEPR-7A for loading 4 ofBalacovo-4 (T=9 FPD)
Dana.' 26/09/1997T,M. - 9 cym.H - 2707 MBmC KjBO;!- 5.75 z/ttG - 85000. HVIOCt t ) u « 286*C(Co « 284 CM
227
SK01ST088
BARS - A HETEROGENEOUS CODE FOR 3D PIN-BY-PIN LWRSTEADY-STATE AND TRANSIENT CALCULATION
A.V. Avvakumov and V.M. MalofeevPJIC «Kurchatov Institute)), Nuclear Safety Institute, Russia
e-mail: [email protected], [email protected]
ABSTRACT
A 3D pin-by-pin dynamic model for LWR detailed calculation was developed. The model isbased on a coupling of the BARS neutronic code with the RELAP5/MOD3.2 thermalhydraulic code. This model is intended to calculate a fuel cycle, a xenon transient, and a widerange of reactivity initiated accidents in a VVER and a PWR. Galanin-Feinberg heterogeneousmethod was realized in the BARS code. Some results for a validation of the heterogeneousmethod are presented for reactivity coefficients, a pin-by-pin power distribution, and a fastpulse transients
1. INTRODUCTION
Large deformations of the power distribution in the core accompany the course of certainreactivity initiated accidents (RIAs) such as rod ejection, steam line break and boron dilutionin a W E R and a PWR. At present 3 D best-estimate neutronic models are widely used for theanalysis of these accidents instead of very conservative 1 D - 2 D methodologies.
Practically in all modern best-estimate neutronic codes the fuel assembly is represented ashomogenized region (an assembly.-by-assembly approach). As indicated in Reference 1 such acode could underestimate fuel enthalpy for the rod drop accident in a boiling water reactor byapproximately 100%. The main sources of the underestimation in the calculated fuel enthalpyfor this accident were an uncertainty in control rod worth and a systematic error due to intra-assembly power peaking. If the code calculates only an assembly averaged power distributionthe latter error could be considerable. To eliminate this systematic error methods for a pin-by-pin reconstruction of the power distribution within the assembly are begun to apply indynamic calculations. However, the reconstruction approaches require a special validation fortransients.
229
Since a best-estimate dynamic code is meant to calculate events that have not been observedin actual plants a comparison with other codes is made to validate one for the events of.interest. However, the comparison for codes of the similar neutronic nature (the assembly-by-assembly diffusion approach) does not allow to clarify understanding the uncertainty in thecalculated results for a number of the key parameters. To improve this understanding thecomparison should be done with the qualitatively different code with more rigorous neutronicmodel. .
Recently in Russian Research Centre «Kurchatov Institute)) a plant dynamic model for VVERand PWR RIA calculation has been developed. The model is based on the coupling of theRELAP5/MOD3.2 thermal hydraulic code with the BARS 3 D detailed neutronic code and isintended to calculate a fuel cycle, a xenon transient, and a wide range of RIAs in light waterreactors (LWRs) including control rod ejection, boron dilution and steam Hne break [2-5]. TheBARS code performs the reactor calculation in framework of full-scale'pin-by-pin neutronicmodel with an explicit representation of each fuel pin (up to 80,000 calculational cells). Thismodel is based on an advanced method of heterogeneous reactor theory that is more rigorousthan widely used homogeneous diffusion approach and is appropriated to direct pin-by-pincalculations. The heterogeneous reactor method was proposed by A.Galanin and S.Feinberg[6]. For a long time it was been developed and successfully applied in calculations of channel-type heavy water and graphite reactors [3, 7-10]. The BARS code has been certified to analyzeRBMK reactors by Nuclear Regulatory Body of Russian Federation (GAN).
This paper summarizes an experience in application of the BARS heterogeneous code in LWRanalysis. Features of the heterogeneous method, RELAP-BARS LWR plant dynamic model,and the BARS pin-by-pin fuel cycle model are featured. A review of the validation results ofthe heterogeneous method are presented.
2. ADVANCED HETEROGENEOUS METHOD FOR LWR PIN-BY-PINCALCULATIONS
The heterogeneous method realized in the BARS code is based on analytical representation ofthe neutron flux distribution in the form of Green's functions superposition. For LWRapplications this method allows directly to take into account detailed structure of the core byexplicit representation of fuel pins, absorber rods, etc. The Green's functioii-is derived from asolutipn of a few group diffusion equation for an infinite uniform media With a singular source-at the cell axis. The intensities of the singular sources are determined in such a way thatrelationship between neutron flux and current at the boundary of each reactqr cell coincideswith that obtained from the precise transport calculation of a single cell. The latter relationshipis defined by means of a boundary condition matrix (A-matrix). This matrix is determined as aresult of a set of neutron transport calculations for the cell with varying neutron currents at thecell boundary [11]. In comparison with few group neutron cross sections A-matrices providefor the same accuracy of the reactor calculation by smaller number of energy groups.
230
An axial dependence of the neutron flux is found by Fourier series expansion. As a result ofthe solution of the original differential equations, a set of linear algebraic equations isobtained. These general heterogeneous equations connect all pairs of the reactor cells. It leadsto unresolved computation problem in reactor calculations because the reactors with onlysmall number of cells could be calculated by using even modern computers. To produceequations to connect only neighboring cells a difference approximation of the Green'sfunctions is performed [9].
To calculate fast transients, the heterogeneous method uses «time absorptions matrices insteadof the traditional neutron velocities [3]. The spatial-time neutron flux distribution within atime step is represented in a form of a product of a time-dependent amplitude function and aspatial-dependent form-function (quasi-static approach). The amplitude function is determinedby solving point kinetic equations. Parameters of the reactor point kinetics are found using aperturbation theory method. The form-function is determined by solving linear equationssystem with k delayed neutron source. To reduce the number of 3 D calculatiops during thetransient a^special term describing the reactivity dependence due to reactor energy releasefeedback is included into the point kinetic equations.
It should be noted that the heterogeneous theory does not require the validity of the diffusionapproximation over the reactor. The diffusion equations are used only to determine Green'sfunction shape that weakly influences the reactor calculation accuracy. It is very important forpin-by-pin calculation of LWRs with heterogeneous structure of modern fuel assemblies. Itshould be also noted that unlike a homogenized assembly LWR calculation a pin-by-pin onerequires a rather large number of energy groups because of a small size of cells. As the BARSvalidation results showed, A-iiiStrix approach allows to make pin-by-pin LWR calculationswith reasonable accuracy using only 4-5 groups.
The neutron data base of BARS (A-matrices) is calculated by the TRIFON code [11].TRIFON solves the multigroup neutron transport equation in various reactor cells using thecollision probability method taking into account detailed structure of resonant cross sections.Strong resonances are calculated explicitly by an additional division of the basic-energy meshwithin the resonance. Weak resonances are taken into account approximately in framework ofthe effective .resonance level model [12]. This approach allowed to reduce significantly arequired total number of groups. -
The neutron database of TRIFON was generated by the NJOY code on the basis of ENDF/B-VI library [13,14]. The TRIFON basic energy mesh consists of 89 groups (24 in fast neutronregion and 65 in thermal one). The major resonances of234!), 236U, 240Pu, 42Pu and 11 moststrong resonances of 238U are calculated explicitly. The resonances of 23SU above 210 eV arecalculated by 6 effective resonance levels. The total number of energy groups is about 350.This resonant treatment was validated by comparison with calculational results obtained bythe UNK code, which uses very fine energy mesh with 7,000 energy groups [15,16].
231
3. RELAP - BARS PLANT DYNAMIC MODEL
A specific feature of the RELAP - BARS coupling is a large computational cost per one timestep of the BARS code in comparison with RELAP5/MOD3 code. Mentioned above featureof the BARS kinetic method allows to choose time step for whole reactor calculationsdepending only on degree of variations in power shape, in spite of varjStions in total reactorpower, thermal hydraulic parameters and feedbacks. la-virtue of it, the BARS time step, as arule, is much larger than the RELAP one, with the exception of time periods of a fastreactivity insertion (a control rod ejection). For this reason, the neutronic calculation in eachtime step is divided into the following stages:
1. The calculation of the neutron flux spatial-energy form-function and the delayed neutronprecursor distributions. It requires the largest computational time. i ^
2. The calculation of point kinetic parameters, the amplitude function and the determinationof the pin-by-pin power distribution. This stage requires a much smaller computationaltime compared with a single step calculation by RELAP.
The first stage calculations are performed rather seldom depending on the reactor powerdistribution changes., The second stage calculations are carried out at each time stepdetermined by RELAP.
The RELAP-BARS coupling is based on certain options of the RELAP5/MOD3 code thatallows to tabulate the reactor power distribution as a function of spatial coordinates and time,and to connect an additional subroutine to the RELAP code. In the framework of the RELAPmodel, the BARS ne utronic calculation can be considered as determination of the core powerdistribution as a function of spatial coordinates and time for the RELAP next time step takinginto account thermal hydraulic feedbacks. In this case the BARS code can be considered as asubroutine of the RELAP code, while preserving the logic of thermal hydraulic calculations.
To provide the data exchange between the RELAP and BARS codes, the, COTT interface codeis used. This code calculates also pin-by-pin fuel temperature distribution by thereconstruction method [5] and some additional thermal hydraulic parameters, which are notcalculated by RELAP. Besides, the COTT code contains simplified thermal hydraulic optionbased on 1 D single- or two-phase homogeneous flow with a slip ration. This option is usedfor thermal-hydraulic calculation of the; core during slow transients such as fuel cyclemodeling.
Before the transient modeling, the plant initial steady state, is calculated. The neutroniccalculation of the reactor steady state is performed by the BARS steady-state option, whichsolves the non-linear eigenvalue problem. During the coupled neutronic - thermal hydrauliccalculation the core initial conditions can be automatically adjusted.
The following adjustment possibilities are available:• to change the neutron generation rate;• to change the axial position of some control rods or control rod banks;• to change the boric acid concentration in the coolant.
232
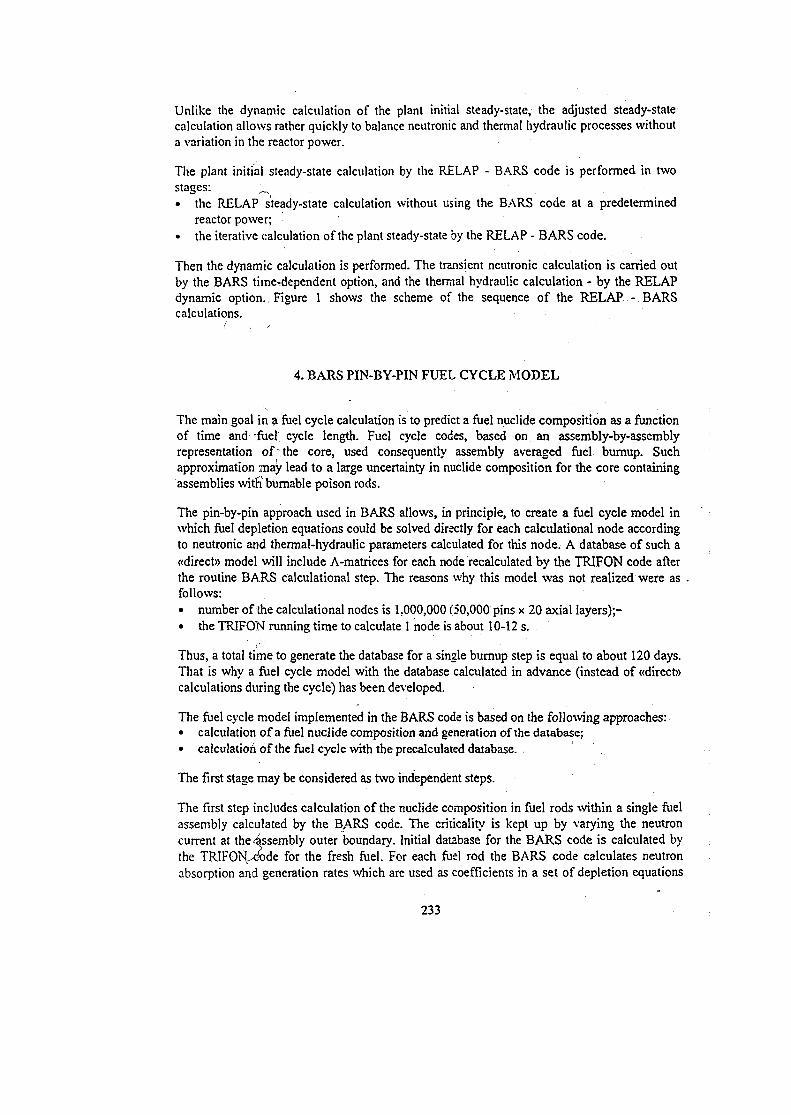
Unlike the dynamic calculation of the plant initial steady-state, the adjusted steady-statecalculation allows rather quickly to balance neutronic and thermal hydraulic processes withouta variation in the reactor power.
The plant initial steady-state calculation by the RELAP - BARS code is performed in twostages:• the RELAP steady-state calculation without using the BARS code at a predetermined
reactor power;• the iterative calculation of the plant steady-state by the RELAP - BARS code.
Then the dynamic calculation is performed. The transient neutronic calculation is carried outby the BARS timerdependent option, and the thermal hydraulic calculation - by the RELAPdynamic option.. Figure 1 shows the scheme of the sequence of the RELAP - BARScalculations.
4. BARS PIN-BY-PIN FUEL CYCLE MODEL
The main goal in a fuel cycle calculation is to predict a fuel nuclide composition as a functionof time and fuel cycle length. Fuel cycle codes, based on an assembly-by-assemblyrepresentation of , the core, used consequently assembly averaged fuel bumup. Suchapproximation may lead to a large uncertainty in nuclide composition for the core containingassemblies witft burnable poison rods.
The pin-by-pin approach used in BARS allows, in principle, to create a fuel cycle model inwhich fuel depletion equations could be solved directly for each calculational node accordingto neutronic and thermal-hydraulic parameters calculated for this node. A database of such a«direct» model will include A-matrices for each node recalculated by the TRIFON code afterthe routine BAJRS calculational step. The reasons why this model was not realized were as .follows:• number of the calculational nodes is 1.000,000 (50,000 pins x 20 axial Iayers);-• the TRIFON running time to calculate I node is about 10-12 s.
Thus, a total time to generate the database for a single burnup step is equal to about 120 days.That is why a fuel cycle model with the database calculated in advance (instead of «direct»calculations during the cycle) has been developed.
The fuel cycle model implemented in the BARS code is based on the following approaches:• calculation of a fuel nuclide composition and generation of the database;• calculation of the fuel cycle with the precalculated database. ,
The first stage may be considered as two independent steps.
The first step includes calculation of the nuclide composition in fuel rods within a single fuelassembly calculated by the BARS code. The criticality is kept up by varying the neutroncurrent at the Assembly outer boundary. Initial database for the BARS code is calculated bythe TRIFOH-dode for the fresh fuel. For each fuel rod the BARS code calculates neutronabsorption and generation rates which are used as coefficients in a set of depletion equations
233
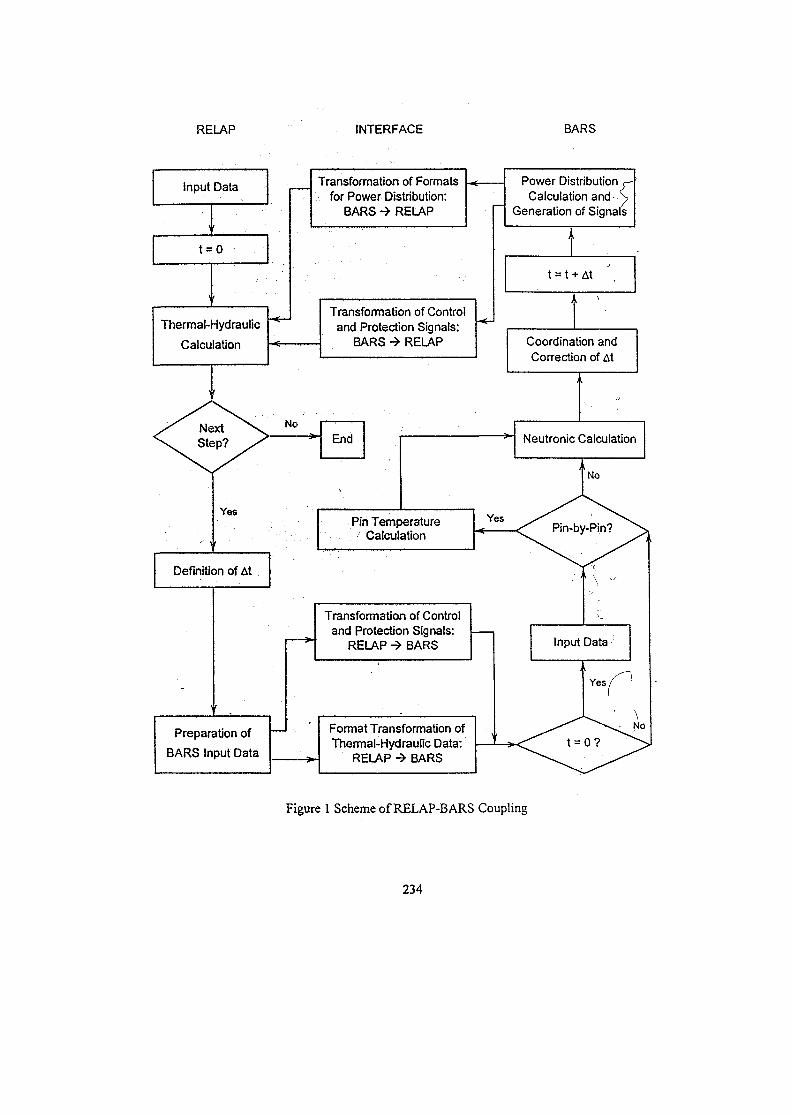
RELAP INTERFACE BARS
Input Data
t=0
Thermal-Hydraulic
Calculation
Transformation of Formatsfor Power Distribution:
BARS •» RELAP
Yes
Definition of At
Preparation of
BARS Input Data
Transformation of Controland Protection Signals:
BARS -> RELAP
No
End
Pin TemperatureCalculation
Transformation of Controland Protection Signals:
RELAP -> BARS
Format Transformation ofThermal-Hydraulic Data:
RELAP •* BARS
Power Distribution re-calculation and ^
Generation of Signals
t = t + At
Coordination andCorrection of At
Neutronic Calculation
Yes
Input Data
Yes/
Figure 1 Scheme of RELAP-BARS Coupling
234
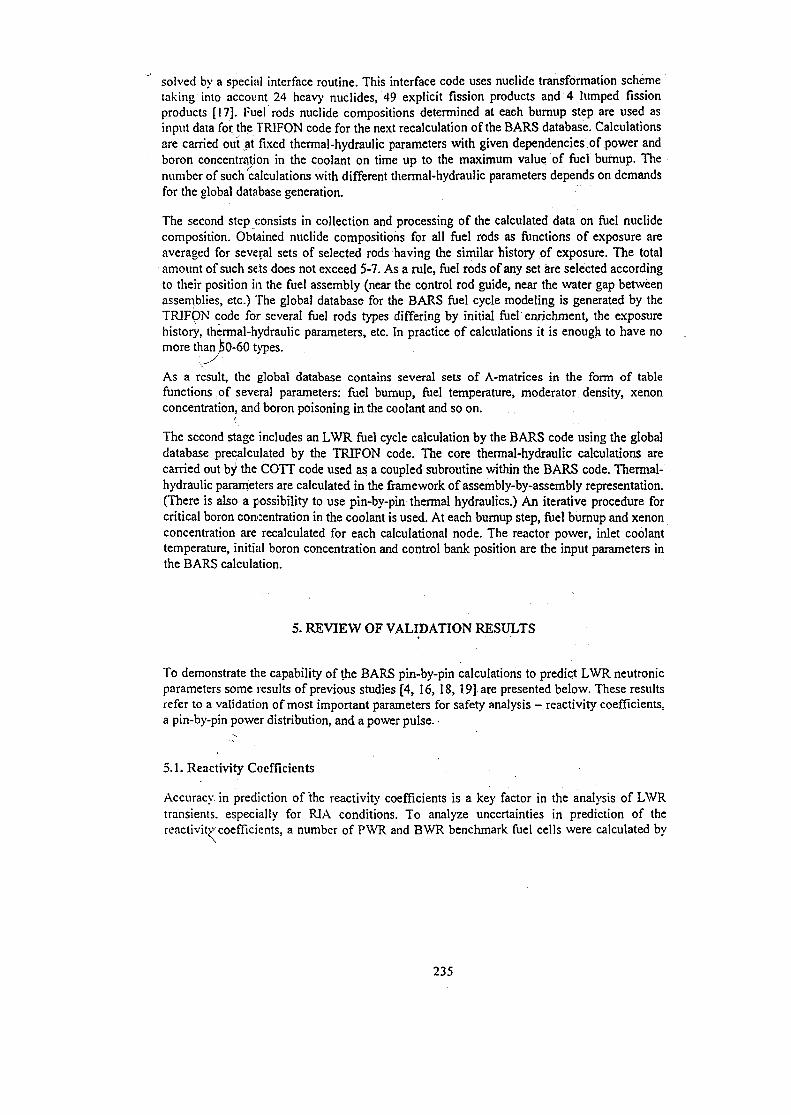
solved by a special interface routine. This interface code uses nuclide transformation schemetaking into account 24 heavy nuclides, 49 explicit fission products and 4 lumped fissionproducts [17]. Fuel rods nuclide compositions determined at each burnup step are used asinput data for the TRIFON code for the next recalculation of the BARS database. Calculationsare carried out at fixed thermal-hydraulic parameters with given dependencies of power andboron concentration in the coolant on time up to the maximum value of fuel burnup. Thenumber of such calculations with different thermal-hydraulic parameters depends on demandsfor the global database generation.
The second step consists in collection and processing of the calculated data on fuel nuclidecomposition. Obtained nuclide compositions for all fuel rods as functions of exposure areaveraged for several sets of selected rods having the similar history of exposure. The totalamount of such sets does not exceed 5-7. As a rule, fuel rods of any set are selected accordingto their position in the fuel assembly (near the control rod guide, near the water gap betweenassemblies, etc.) The global database for the BARS fuel cycle modeling is generated by theTRIFON code for several fuel rods types differing by initial fuel enrichment, the exposurehistory, thermal-hydraulic parameters, etc. In practice of calculations it is enough to have nomore than 50-60 types.
As a result, the global database contains several sets of A-matrices in the form of tablefunctions of several parameters: fuel bumup, fuel temperature, moderator density, xenonconcentration, and boron poisoning in the coolant and so on.
The second stage includes an LWR fuel cycle calculation by the BARS code using the globaldatabase precalculated by the TRIFON code. The core thermal-hydraulic calculations arecarried out by the COTT code used as a coupled subroutine within the BARS code. Thermal-hydraulic parameters are calculated in the framework of assembly-by-assembly representation.(There is also a possibility to use pin-by-pin thermal hydraulics.) An iterative procedure forcritical boron concentration in the coolant is used. At each burnup step, fuel burnup and xenonconcentration are recalculated for each calculational node. The reactor power, inlet coolanttemperature, initial boron concentration and control bank position are the input parameters inthe BARS calculation.
5. REVIEW OF VALIDATION RESULTS
To demonstrate the capability of the BARS pin-by-pin calculations to predict LWR neutronicparameters some results of previous studies [4, 16, 18, 19] are presented below. These resultsrefer to a validation of most important parameters for safety analysis - reactivity coefficients,a pin-by-pin power distribution, and a power pulse. •
5.1. Reactivity Coefficients
Accuracy in prediction of the reactivity coefficients is a key factor in the analysis of LWRtransients, especially for RIA conditions. To analyze uncertainties in prediction of thereactivity'coefficients, a number of PWR and BWR benchmark fuel cells were calculated by
235
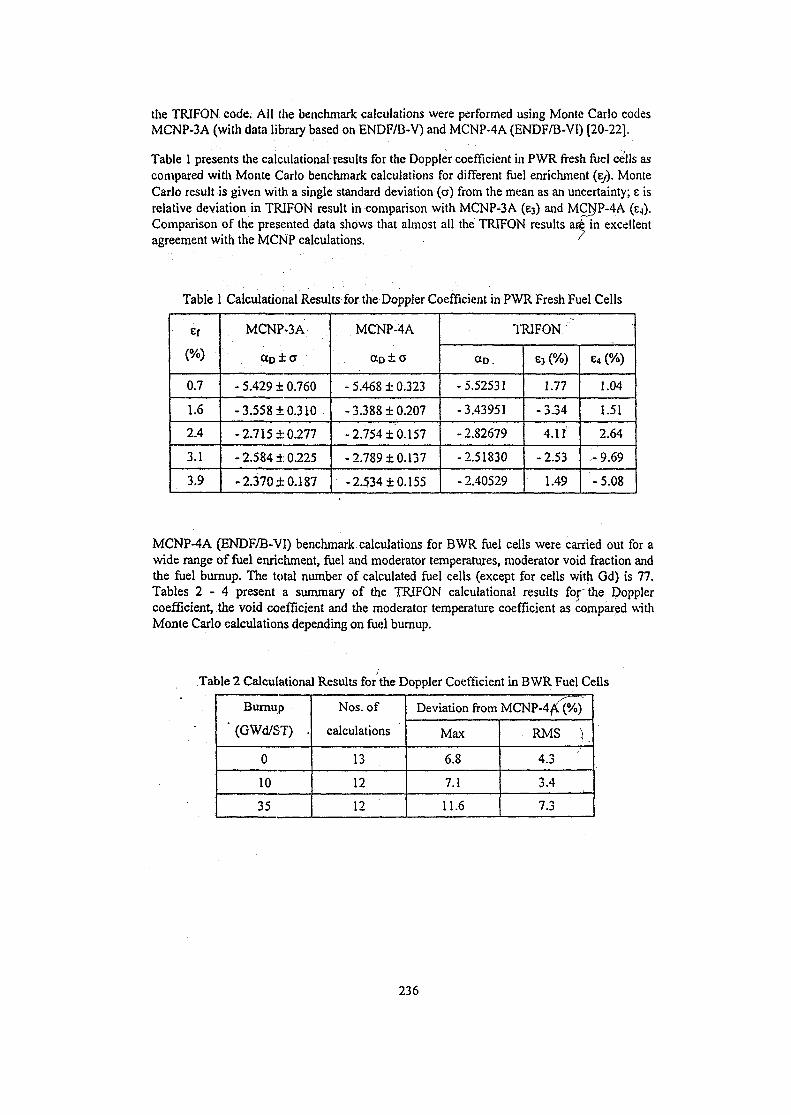
the TRIFON code. AH the benchmark calculations were performed using Monte Carlo codesMCNP-3A (with data library based on ENDF/B-V) and MCNP-4A (ENDF/B-VI) [20-22].
Table 1 presents the calculational results for the Doppler coefficient in PWR fresh fuel cells ascompared with Monte Carlo benchmark calculations for different fuel enrichment (E/). MonteCarlo result is given with; a single standard deviation (o) from the mean as an uncertainty; E isrelative deviation in TRIFON result in comparison with MCNP-3A (£3) and MCNP-4A (E^).Comparison of the presented data shows that almost all the TRIFON results arsin excellentagreement with the MCNP calculations. '
Table 1 Calculational Results for the Doppler Coefficient in PWR Fresh Fuel Cells
Ef
(%)
0.7
1.6
2.4
3.1
3.9
MCNP-3A
CtD±C
- 5.429 ± 0.760
-3.558 + 0.310
-2.715 ±0.277
-2.584 ±0.225
-2.370 ±0.187
MCNP-4A
CtD±C
- 5.468 ± 0.323
- 3.388 ± 0.207
-2.754 ±0.157
-2.789 ±0.137
-2.534 ±0.155
TRIFON
<XD.
-5.52531
-3.43951
-2.82679
-2.51830
- 2.40529
£3(%)
1.77
-3.34
4.11
-2.53
1.49
E4(%)
1.04
1.51
2.64
- 9.69
-5.08
MCNP-4A (ENDF/B-VI) benchmark calculations for BWR fuel cells were carried out for awide range of fuel enrichment, fuel and moderator temperatures, moderator void fraction andthe fuel burnup. The total number of calculated fuel cells (except for cells with Gd) is 77.Tables 2 - 4 present a summary of the TRIFON calculational results iof the Dopplercoefficient, the void coefficient and the moderator temperature coefficient as compared withMonte Carlo calculations depending on fuel burnup.
Table 2 Calculational Results for the Doppler Coefficient in BWR Fuel Cells
Bumup
' (GWd/ST) •
0
10
35
Nos. of
calculations
13
12
12
Deviation from MCNP-4A^(%)
Max
6.8
7.1
11.6
RMS \ :
4.3
3.4
7.3
236
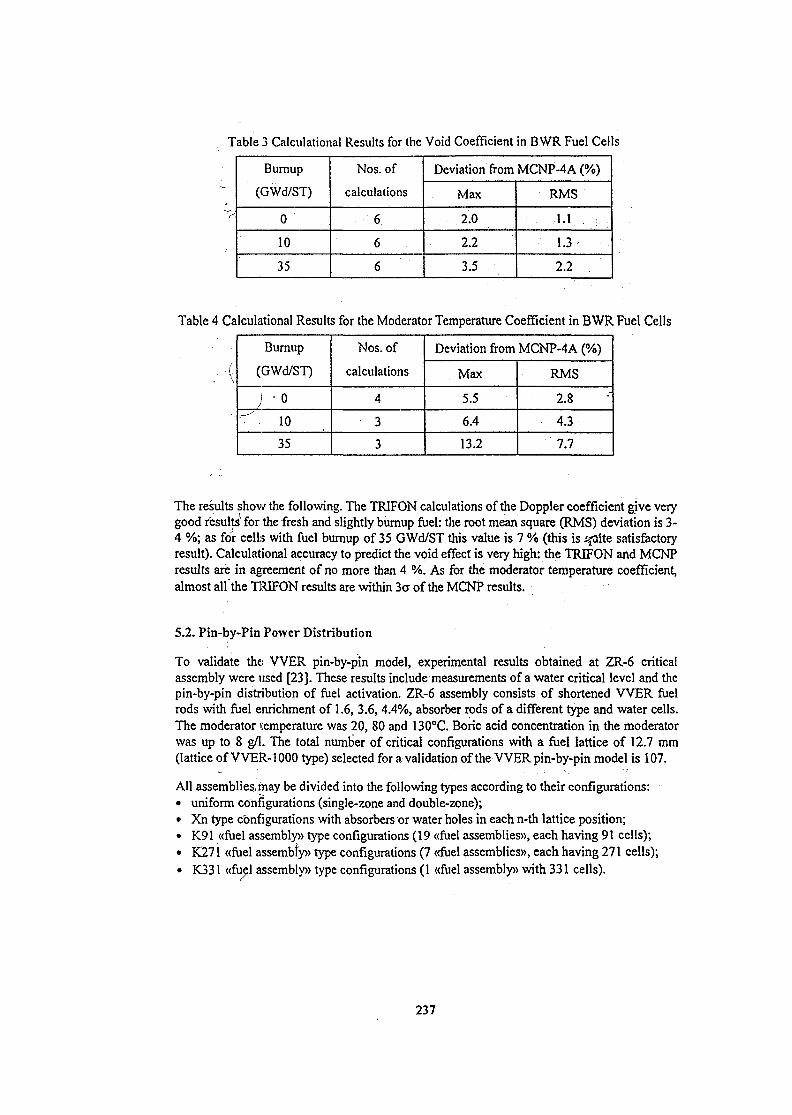
Table 3 Calculational Results for the Void Coefficient in B WR Fuel Cells
Burnup
(GWd/ST)
0
10
35
Nos. of
calculations
6
6
6
Deviation from MCNP-4A (%)
Max
2.0
2.2
3.5
RMS
1.1
1.3
2.2
Table 4 Calculational Results for the Moderator Temperature Coefficient in BWR Fuel Cells
Burnup
(GWd/ST)
; -o^ 10
35
Nos. of
calculations
4
3
3
Deviation from MCNP-4A (%)
Max
5.5
6.4
13.2
RMS
2.8
4.3
7.7
The results show the following. The TRIFON calculations of the Doppler coefficient give verygood results'for the fresh and slightly burnup fuel: the root mean square (RMS) deviation is 3-4 %; as for cells with fuel burnup of 35 GWd/ST this value is 7 % (this is sjaite satisfactoryresult). Calculational accuracy to predict the void effect is very high: the TRIFON and MCNPresults are in agreement of no more than 4 %. As for the moderator temperature coefficient,almost allthe TRIFON results are within 3CT of the MCNP results.
5.2. Pin-by-Pin Power Distribution
To validate the VVER pin-by-pin model, experimental results obtained at ZR-6 criticalassembly were used [23]. These results include measurements of a water critical level and thepin-by-pin distribution of fuel activation. ZR-6 assembly consists of shortened W E R fuelrods with fuel enrichment of 1.6, 3.6, 4.4%, absorber rods of a different type and water cells.The moderator temperature was 20, 80 and 130°C. Boric acid concentration in the moderatorwas up to 8 g/1. The total number of critical configurations with a fuel lattice of 12.7 mm(lattice of VVER-1000 type) selected for a validation of the VVER pin-by-pin model is 107.
All assemblies; may be divided into the following types according to their configurations:• uniform configurations (single-zone and double-zone);• Xn type configurations with absorbers or water holes in each n-th lattice position;• K91 «fuel assembly» type configurations (19 «fuel assemblies)), each having 91 cells);• K271 «fuel assembfy» type configurations (7 «fuel assemblies)), each having 271 cells);• K331 «fuel assembly)) type configurations (1 «fuel assembly)) with 331 cells).
237
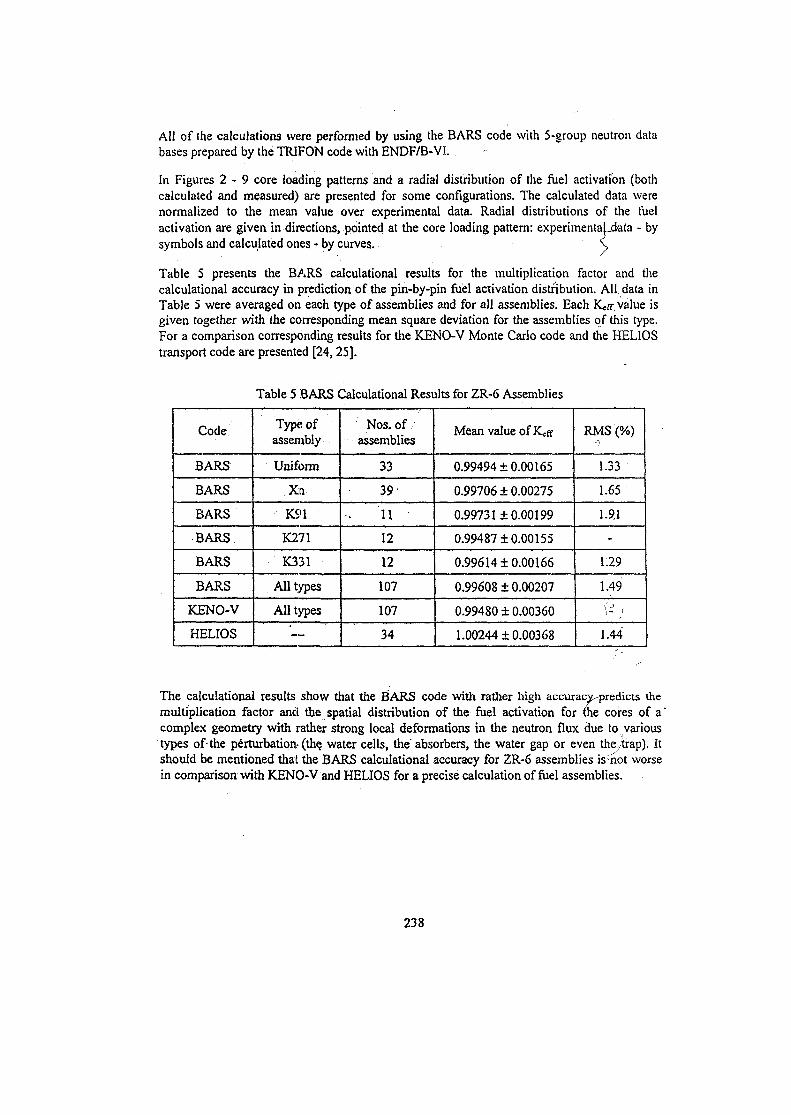
All of the calculations were performed by using the BARS code with 5-group neutron databases prepared by the TRIFON code with ENDF/B-VI.
In Figures 2 - 9 core loading patterns and a radial distribution of the fuel activation (bothcalculated and measured) are presented for some configurations. The calculated data werenormalized to the mean value over experimental data. Radial distributions of the fuelactivation are given in directions, pointed at the core loading pattern: experimentaLdata - bysymbols and calculated ones - by curves. \
Table 5 presents the BARS calculational results for the multiplication factor and thecalculational accuracy in prediction of the pin-by-pin fuel activation distribution. All data inTable 5 were averaged on each type of assemblies and for all assemblies. Each Ke/r. value isgiven together with the corresponding mean square deviation for the assemblies of this type.For a comparison corresponding results for the KENO-V Monte Carlo code and the HELIOStransport code are presented [24,25].
Table 5 BARS Calculational Results for ZR-6 Assemblies
Code
BARS
BARS
BARS
BARS
BARS
BARS
KENO-V
HELIOS
Type ofassembly
Uniform
Xn
K91.
K271
K331
All types
All types
—
Nos.ofassemblies
33
39
U
12
12
107
107
34
Mean value of Kcir
0.99494 ±0.00165
0.99706 ±0.00275
0.99731 ±0.00199
0.99487 ±0.00155
0.99614 ±0.00166
0.99608 ± 0.00207
0.99480 ± 0.00360
1.00244 + 0.00368
RMS(°/o)
1.33
1.65
1.91
-
1.29
1.49
i - /1.44
The calculational results show that the BARS code with rather high accuracy-predicts themultiplication factor and the spatial distribution of the fuel activation for uie cores of a"complex geometry with rather strong local deformations in the neutron flux due to varioustypes of-the perturbation-(the water cells, the absorbers, the water gap or even theytrapj.ltshould be mentioned that the BARS calculational accuracy for ZR-6 assemblies is-not worsein comparison with KENO-V and HELIOS for a precise calculation of fuel assemblies.
238
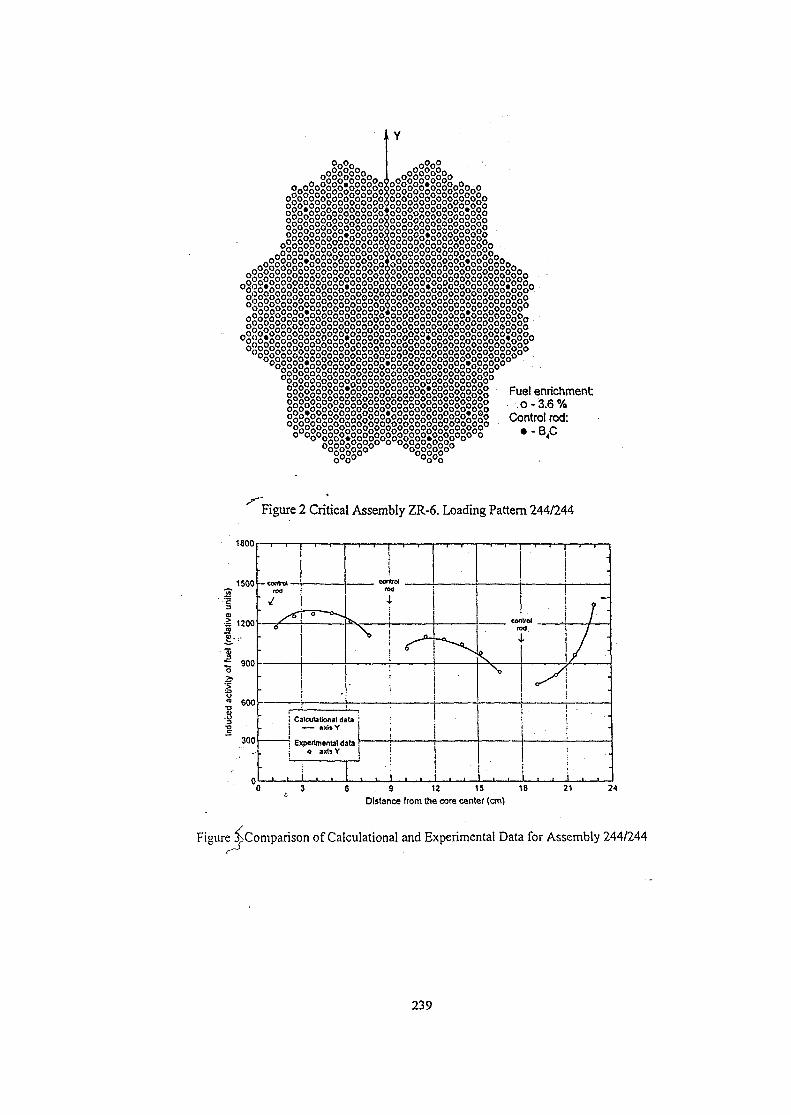
gogogggggggggggggogo-gSgSgogSgogogogogSgogggg°ggggggSgggggS°§g§gSgSgogogogoggggggggggggogSgogggg°ggggg§ § g g S g
oXoXoXo"o«o*tfo«oXo"oXoXoXoXoXo"Q"o
o"o"oXo"oXoxoXo2oSo2oSoxo»50o°o°o°X°^
"oXo"o°ogogogoS>°o°
<o2o
|8|i|i|lli|ili|i|i|i§i|i|I|i|I§i|l|l|i|i|i|i|i|i|
WgSgSg8°§g§g§sSggg§ggg§pgSsog§
"Oo§Sgggg20gggogggogogo2ogogogo0c
ogggggggo0 ° °oggggggg°o°o° °o°o
Fuel enrichment:o -3 .6%
Control rod:• -ep
Figure 2 Critical Assembly ZR-6. Loading Pattern 244/244
1800
1500 -
£ 1200
2?I
6 9 12 15 18Distance from the core center (cm)
21
Figure ^Comparison of Calculational and Experimental Data for Assembly 244/244
239
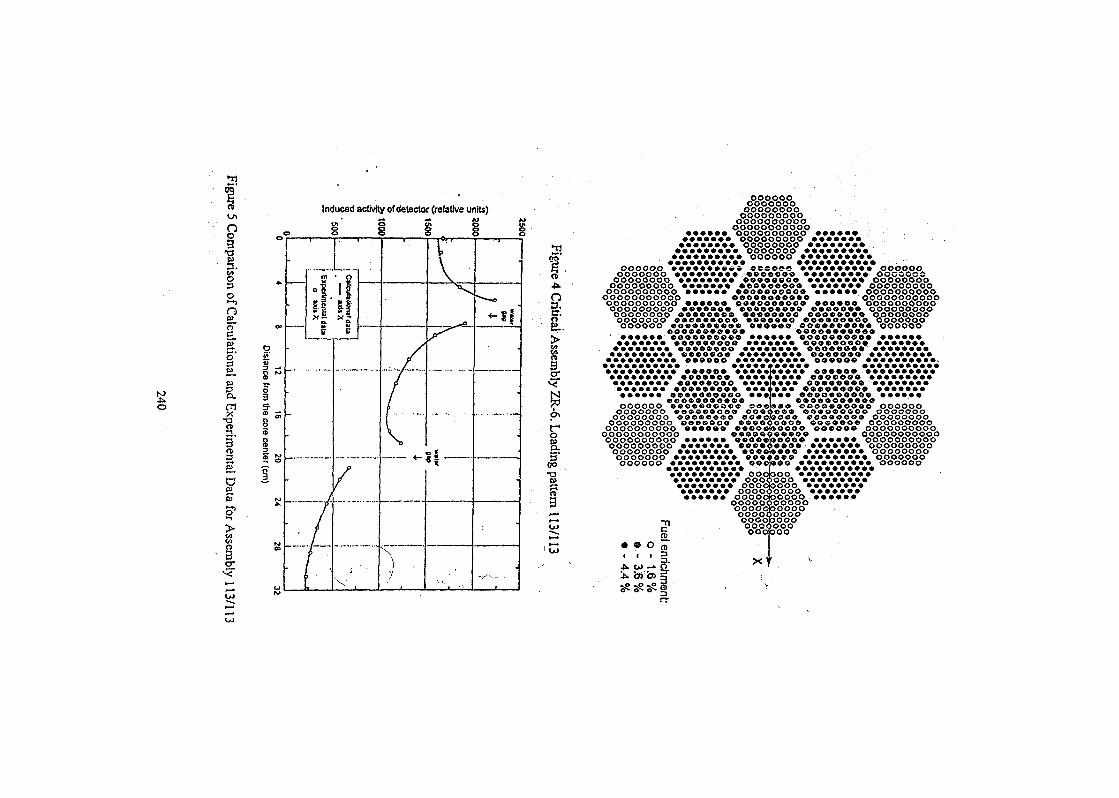
g.tnx•a
3IE.D
I*5T
Induced activity of detector (relative units)ooooooooooooooooooooo
ooooooooooooooooo oooooooooo
OOOOOOO OOOOOOOOO OOOOOOOoooooooo oooooooo ooooooooooooooooo ooooooo oooooooooOOOOOOOOOO OOOOOO OOOOOOOOOO
ooooooooooo oooooooooooOOOOOO oooooooese sessse oooooooooo ooooooooooooo ooooooooo ooooooo OOOOOOOOO OOOOCOOoooooooo oooooooo oooooooo oooooooo oooooooo
OOOOOOOOO OOOOOOO OOOOOOOOO OOOOOOO OOOOOOOOOOOOOOOOOOO OOOOOO 0000000000 OOOOOO OOOOOOOOOOOOOOOOOOOOO OOOOOOOOOOO OOOOOOOOOOOoooooooooo oooooo oooooooooo ooooeo ooooooooooooooooooo ooooooo ooooooooo ooooooo ooooooooooooooooo oooooeeo oooVoeoo oeoooooo ooooooooooooooo ooooooooo ooooooo eoooooooo ooooooooooooo ooooaeoooo oooooo oooooooooo ooooooeooooeoeooo eoooooooooo' oooooo eooeoeeeoo oooooo oooooooooo oooooo••••••• ooooooooo ooooooo oeoeooooo ooooooooooooooo oeooo«eo oooooooo oooeeaoo ••••••••••••••••• oeeoooo ooooooooo ooooooo ooooooooo~ »oa eooooo •••••••••• ooooaoooooooooooo oooooo ••«OOOOOOOOO OOOOOOO OOOOIoooooooo oooooooo oooooooo oooooooo ooooooooooooooo ooeoooeoo oooi
ooooooooooeooooooo ooooooooo ooo
»O ' OOOOOOOOOOO
eooooo • • • • • • • • • •oooo ooooeoo oooooooooooo oeoeooooo oooooooOOOOOO OOOOOOOOOO OOOOOO OOOOOOOOOO OOOOOO
eeoooooooooOOOOOO 0OOOOO9QOO O S e » 9 0 OOOOOOOOOO OOOOOOooo ooooooooo ooooooooooooooo ooooeooo eooolboeo oooeoooo ooooooooooooooooo ceooooe ooooooooo eoooeoo ooooooooooooooooooo oooooo coooo]«oooo 000000 ooooooooooooooooooooo ooooooooooe ooooooooooooooooooooo oooooo eooooaoeoo oooooo ooooooooooooooooooo ooooooo «oooeoooo ooooooo ooooooooooooooooo oooooooo 0000900c oooooooo ooooooooooooooo ooooooooo ooooees ooooooooo ooooooooooooo oooooooooo oooooo oooooooooo ooooooooooooooooo ooooooooooo•ooooooooo OOOOOO oooooooooo• • • • • • 0 0 0 ooooooo ooooooooo• • • • • • • • oooofoooo oooooooo•oooooo ooooooooo ooooooooooooo ooooqboooo oooooo
00000600000
• « O
^oo|?ooo°o0o0ofo0o°o0
ooolooo
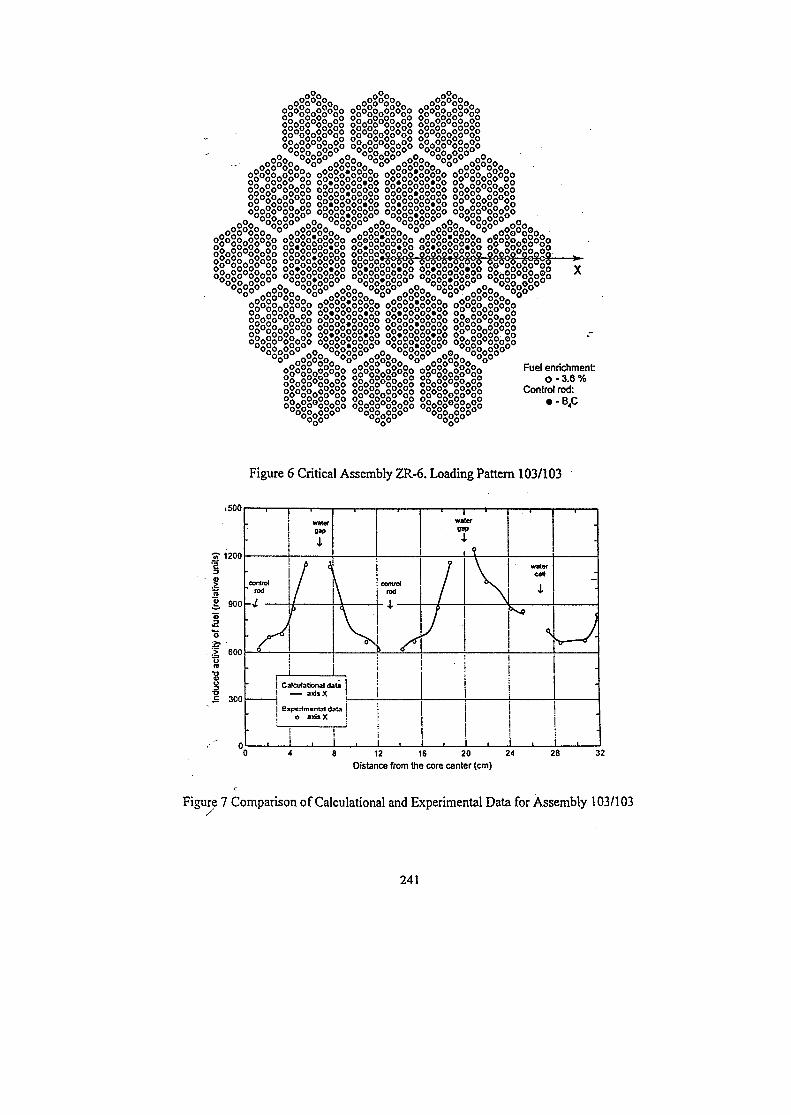
o'i iJ6^6i;'2o 6ogo°o°ogogo o
2SoS2o2§°S2Xo^s
Sgog§
o2 xo o!,o2o2o°,°S62i
IP-!6i626°6262 26062o26°62
!o«0«O rJ2S2S2S0S0g g000g0g000g,oogo»ogog6 6°6S6»52626 6°626rt626«o°6"o2»So o" "o»ou^60§g fpppgo o:
~°°°"*°2o2° o252o;6°6°o o°6°6;6°6°o 0S6!£Mf ***o o
goggoggSgc!'g°»§°o°oSo°
S2§Sg g gSg g S 5 S 6 . _2g°§°o2g°gg"*m»i W f t W f t O °rtortortor»ort° or»°r»urturvorto °rt°ftor\OrtO^O
nil msMsmmiH;°S6ooo°Soo S6S°S°S°!iof3 6°i°6u6°t)u6 6
°g2g°S2g2g° oSsSlSogsSS SgSgSsggSg? °•°g°S2o,
"0«0«0« .0"0.,o262o.uo«o
:o«g-2g2S2g2o'o"ou
SoioSoSoSoS So°ogogo°o0
n»626°6^o2626:o og.^.s
log"ogogoSogogo o S | o p
Fuel enrichment:o -3 .6%
Control rod:• -B<C
Figure 6 Critical Assembly ZR-6. Loading Pattern 103/103
•500
•K-1200
2, 900
600
= 300
COfitrol' rod
-•I
•
•
*water
9»P
I
/ ^
A\
1
k
Calculattonaldataaxisx
Experimental data !0 axil X !
:
controlrod
4
1 i :
i . i . i .
' 1 l
water
77waterceH
4.
-
-
1
i12 16 20 24
Distance from the core center (cm)28 32
Figure 7 Comparison of Calculational and Experimental Data for Assembly 103/103
241
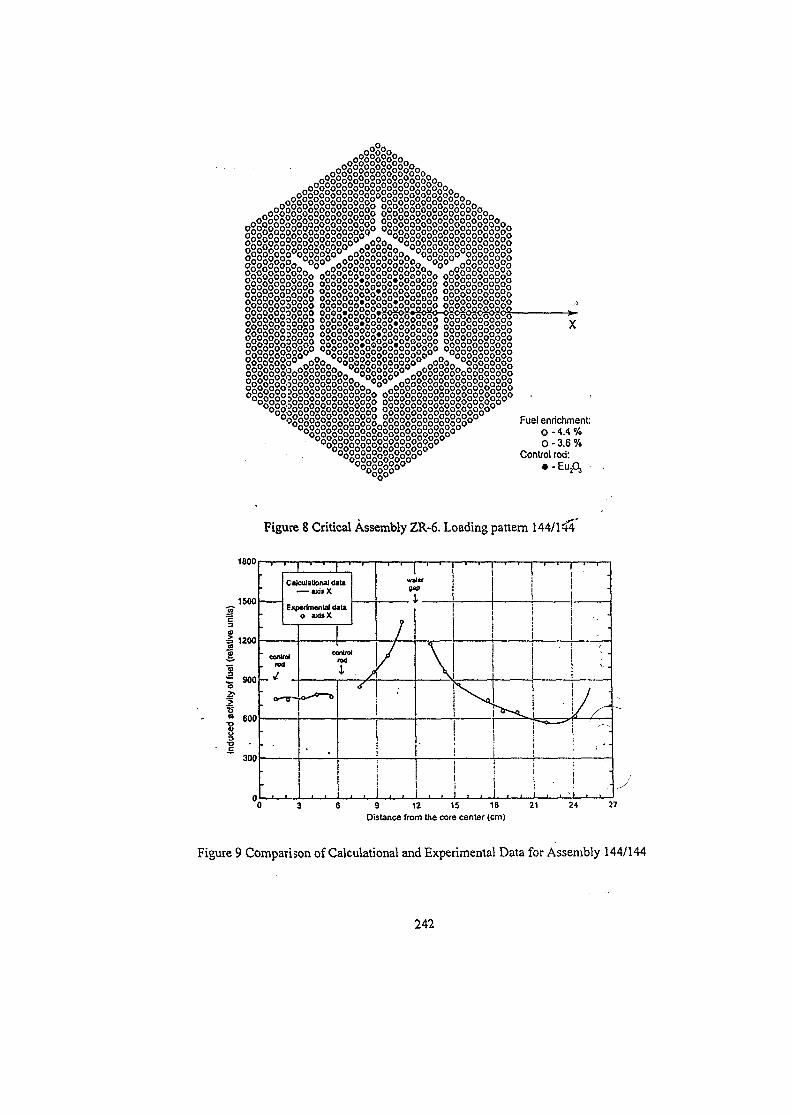
Figure 9 Comparison of Calculations! and Experimental Data for Assembly 144/144
5.3. Power Pulse Transient
To validate the BARS pin-by-pin transient model, experimental results of the power dynamicbehavior obtained at the pulsed graphite reactor IGR were used. IGR is intended to test reactorfuel rods under RIA conditions.
The basic feature "of such transients is the fact that the power rise is initiated by a control rodwithdrawal and is suppressed by the negative temperature feedback: the increase in thegraphite temperature leads to the increase in the thermal neutron leakage and, as a result, to alarge negative reactivity insertion. Such experiments that model the control rod ejectionaccident in LWR with temperature feedback are unknown.
The reactor core (see Figure 10) consists of graphite columns impregnated with highlyenriched uranium. In the core center there is a central experimental channel where the capsulecontaining test fuel rod samples is to be loaded. The core is surrounded by a graphite reflector,a thermal shield and a water tank. To control reactor operations 16 Gd rods in the core and inthe reflector are used. The time dependence of the reactor power was measured by means of aset of out-cpre ionization chambers in the water tank and in-core detectors located near theexperimental capsule.
The dynamic behavior of IGR in pulse experiments is characterized by: sharp changes in thereactor power; significant deformations of the neutron flux; strong heterogeneity in the coregraphite temperaiure distribution; effects of the control rod interference and the graphiteheating up on the control rod worth; a strong dependence of the prompt neutron lifetime andthe feedback, coefficient on the reactor core temperature.
The validation of the BARS transient module was performed on the basis of experimentscarried out at IGR with inserted reactivity within 0.9 - 1.8 P (P - delayed neutron fraction).The IGR power time profile was recorded by 6 ionization chambers and 3 in-core detectors.Figure 11 shows (he comparison of the calculational and experimental results for the test withinserted reactivity of 1.8 (5. As shown in the figure, calculated and measured power timeprofiles are in an excellent agreement.
6. CONCLUSIONS
This study summarizes an experience in application of the BARS detailed neutronic code inLWR analysis. The pin-by-pin model, based on the heterogeneous reactor theory, wasimplemented in the BARS code. A coupling of BARS with RELAP5/MOD3 and someinterface codes allow by now to solve a wide range of problems of interest for VVERs andPWRs and to calculate:• steady states at different conditions (including determination of reactivity effects);• slow transients (including modeling of fuel cycle);• fast transients (including RIAs such as control rod ejection and boron dilution).
Some validation results of the BARS code and the TRIFON neutron data base generation codeare presented.
243
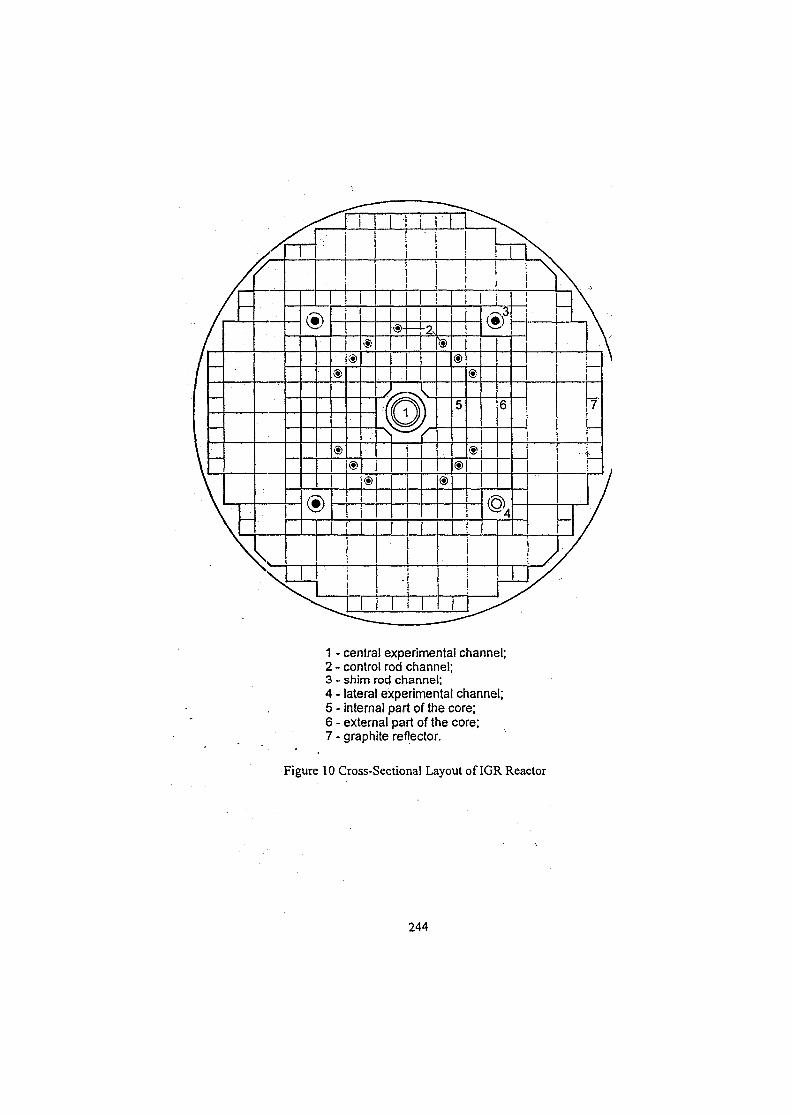
/1
\
//————
V\
//
s\
yy
1
1
®
®
-.
i
®
®
®
jf
(
® 1
G
-42,
k)f
®
®
1
11
®
5
®
®
I
®i
6
%
i
\
\\
I
1
//
\\
7
—
/
/
1 - central experimental channel;2 - control rod channel;3 - shim rod channel;4 - lateral experimental channel;5 - internal part of the core;6 - external part of the core;7 - graphite reflector.
Figure 10 Cross-Sectional Layout of IGR Reactor
244
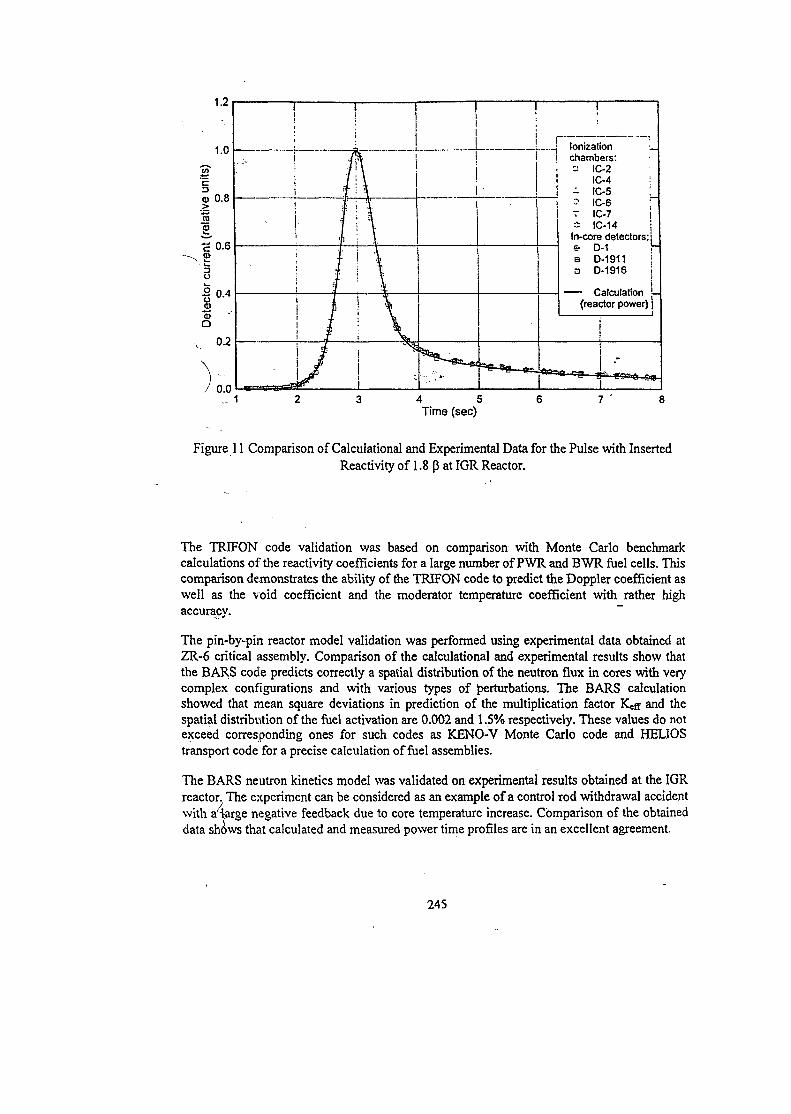
1.2
1.0
"E
0.8
is
•£ 0.6t3O
jo.4j"5Q
0.2
/ 0.0.- 1
I•
I
i , ^J 1
1
"i
1
lonizationchambers'.-' IC-2
IC-4- IC-5•? IC -6
v IC-75 IC-14In-core detectors:& D-1B D-19113 D-1916
——• Calculation(reactor power)
j
—
i
iii
11
4 5Time (sec)
7 '
Figure 11 Comparison of Calculational and Experimental Data for the Pulse with InsertedReactivity of 1.8 p at IGR Reactor.
The TRIFON code validation was based on comparison with Monte Carlo benchmarkcalculations of the reactivity coefficients for a large number of PWR and BWR fuel cells. Thiscomparison demonstrates the ability of the TRIFON code to predict the Doppler coefficient aswell as the void coefficient and the moderator temperature coefficient with rather highaccuracy.
The pin-by-pin reactor model validation was performed using experimental data obtained atZR-6 critical assembly. Comparison of the calculational and experimental results show thatthe BARS code predicts conectly a spatial distribution of the neutron flux in cores with verycomplex configurations and with various types of perturbations. The BARS calculationshowed that mean square deviations in prediction of the multiplication factor K«ff and thespatial distribution of the fuel activation are 0.002 and 1.5% respectively. These values do notexceed corresponding ones for such codes as KENO-V Monte Carlo code and HELIOStransport code for a precise calculation of fuel assemblies.
The BARS neutron kinetics model was validated on experimental results obtained at the IGRreactor. The experiment can be considered as an example of a control rod withdrawal accidentwith aHarge negative feedback due to core temperature increase. Comparison of the obtaineddata shows that calculated and measured power time profiles are in an excellent agreement.
245
REFERENCES
1. D. Diamond and L. Neymotin, «Scnsitivity Studies for the BWR Rod Drop Accident,))Letter Report FIN W6382, October 31,1996.
2. «R£LAP5/MOD3.2 Code Manual,* NUREG/CR-5535, INEL-95/0174, 1995.<'
3. A. Avvakumov and V. Malofeev, «Three-Dimensional Simulation of Delayed NeutronTransients in a Heterogeneous Reactor,» At. Energy, 70, 1, 1991.
4. A. Avvakumov and V. Malofeev, «An Advanced 3 D Pin-by-Pin Neutronic Model for theLWR. RIA Analysis: Features, Advantages and Validation,)) Report No. 90-12/1-8-97,Nuclear Safety Institute of Russian Research Centre «Kurchatov Institute)), 1997.
5. A. Awakumov, V. Malofeev, and V. Sidorov, «Analysis of Pin-by-Pin Effects for LWRRod Ejection Accident,)) NUREG/IA-0175, NSI RRC KI 90-12/1-3-00,1PSN/00-13,2000.
6. A. Galanin, Proceedings of the First International Conference on the Peaceful Use ofAtomic Energy, Geneva, 5,477,1955. S. Feinberg, Ibid., 484.
7. J. Lugou and C. Magnot, «Three-Dimensional Theory of Heterogeneous Reactors,»Nuclear Science and Engineering, 19, 58,1964.
8. D. Blackburn, «Finite-Difference Formulation of the Multi-Group Source-SinkEquations,)) Proceedings of the EAES Symposium on Advances in the Reactor Theory,Karlsrue, April 1962.
9. B. Kochurov and V. Malofeev, «A Difference Approach to the Solution of HeterogeneousReactor Equations,)) Annals of Nuclear Energy, 4,21,1977.
10. B. Kochurov, «An Advanced Method of Heterogeneous Reactor Theory,» JAERI-Review,94-002, JAERI, 1994.
11. A. Kwaratzhely and B. Kochurov, «A Method for Calculation of Neutronic Parameters ina Heterogeneous Reactor Cell,» At. Energy, 58,2, 1985.
12. B. Kochurov, «Effective Resonance Levels,» At. Energy, 60, 3, 1986.
13. R.E. McFarlane, «NJOY91.91: A Code System for Producing Pointwise and MultigroupNeutron and Photon Cross Sections from ENDF/B Evaluated Nuclear Data,» ORNL PSR-171, Oak Ridge National Laboratory, 1993.
14.«ENDF/B Summary Documentation,)) BNL-NCS-17541 (ENDF-201), 41" ed. (ENDF/B-VI), P. F. Rose, Ed., Brookhaven National Laboratory (Oct. 1991; Release-2, 1993;Release-3, 1996).
15. V. Davidenko and V. Tsybulsky, «Detailed Calculation of Neutron Spectrum in a Cell of aNuclear Reactor,» Proceedings of the International Conference on the Physics of NuclearScience and Technology, Long Island, NY, October 1998.
246
16. A. Avvakumov, et al., ((Validation of the BARS Code Package with ENDF/B Based DataLibrary,» Report No. 90-12/1-4-98, Nuclear Safety Institute of Russian Research Centre«Kurchatov Institute)), 1998.
17. A.D. Galanin, «Revision of Scheme for the Major Fission Products with Weak EffectiveFission Product,)) Preprint ITEP-135,1989 (Rus).
18. A. Awakumov and V. Malofeev, «Validation of an Advanced Heterogeneous Model forx LWR Detailed Pin-by-Pin Calculations,)) Proceedings of the International Conference on
) the Physics of Nuclear Science and Technology, Long Island, NY, October 1998.
19. A. Awakumov and V. Malofeev, ((Validation of a Pin-by-Pin Neutron Kinetics Methodfor LWRs,» Proceedings of the International Twenty-Sixth Water Reactor SafetyInformation Meeting, Bethesda, Maryland, October 1998.
20. R.D. Mosteller, et al., ((Benchmark Calculations for the Doppler Coefficient of.Reactivity,)) Nuclear Science and Engineering, 107,265,1991.
2LF . Rahnema and H.N.M. Gheorghiu, «ENDF/B-VI Benchmark Calculations for theDoppler Coefficient of Reactivity,)) Annals of Nuclear Energy, 23,12,1996.
22. F. Rahnerna, D. Has, and S. Sitaraman, «Boiling Water Reactor Benchmark Calculations,))Nuclear Technology, 117,184,1997.
23. ((Experimental Investigations of the Physical Properties of VVER-type Uranium-WaterLattices,* Final Report of TIC, Budapest, Akademiai Kiado, 1 (1985), 3 (1991).
24. «The W E R Experiments: Regular and Perturbed Hexagonal Lattices of Low-EnrichedUO2 Fuel Rods in Light Water,» Report LEU-COMP-THERM-015, vol. IV, KFKI,Budapest, 1996.
25. S.P. Szabo and R.J. Stammler, «HELIOS: Benchmarking Against Hexagonal TICExperiments,)) Proceedings of the International Conference on the Physics of NuclearScience and Technology, Long Island, NY, October 1998.
247
SK01ST089
10th AER symposium on VVER Reactor Physics and Reactor SafetySeptember 18-22, 2000
Moscow, Russia
Calculation uncertainty of distribution-like parameters in NPP of Paks
Zsolt SzecsenyiLajos Korpas
NPP of Paks, Hungary
Abstract
In the reactor-physical point of view there were two important events in the NuclearPower Plant of Paks in this year. The Russian type profiled assemblies were loaded intothe Paks Unit 3, and new limitation system was introduced on the same Unit. It wasrequired to solve a lot of problems because of these both events. One of these problemswas the determination of uncertainty of quantities of the new limitation considering thefabrication uncertainties for the profiled assembly. The importance of determination ofuncertainty is to guarantee on 99.9% level the avoidance of fuel failure. In this paper theprinciples of determination of calculation accuracy, applied methods and obtainedresults are presented in case of distribution-like parameters. A few elements of themethod have been presented on earlier symposiums, so in this paper the whole method isjust outlined. For example the GPT method was presented in the following paper:Uncertainty analysis of pinwise power distribution of WER-440 assembly consideringfabrication uncertainties. Finally in the summary of this paper additional intrinsicopportunities in the method are presented.
249
Introduction
In this paper the main goal is to determine the uncertainty of quantities of the newlimitation. In the planning phase with full knowledge of these uncertainties theavoidance of violation of reactor physical limits on 99.9% level can be provided.Mathematically that means the following:The mentioned reactor physical parameter is indicated with p as probability variable.The reactor physical limit belongs to p is indicated with pk. The density function of
probability variable is indicated with fp and the expected value of probability variable
is indicated with Mp. Because the investigated parameters are limited from above,
therefore the maximal value of parameter (pm) is searched, so that the following
condition has to be satisfied:
and
If the mentioned probability variable follows normal distribution, then difference of thelimit and maximum value is approximately equal to three standard deviation ofprobability variable. Consequently if during planning of loading pattern the calculatedvalue of given parameter is not greater then the pm value, then the limit will not beviolated on the above mentioned probability. This pn value is named operational limit.In this paper are determined the uncertainty of distribution-like limit parameters. Theseare average quantities for given value elements of reactor or depend on the space or timecoordinates of reactor. The mentioned parameters and the absolute limit values are thefollowing:
Pin wise linear heat irate, 325 W/cm- Assembly power, 5.96 MW- Pin power, 57 kW- Sub channel outlet temperature, 325 °C
General description of method
From the previous chapter it can be seen that, operational limit of the mentionedparameter can be determined if the probability density functions are known. For thedetermination of these density functions it has to be examined that bow these arecalculated and where from theirs uncertainty where are derived.The reactor physical parameters are calculated using reactor describing parameters,models codes and different expressions. In the determination of given parameter morecodes may be applied and sometimes the output of the given code will be input of other.On the next picture a scheme is presented consisting of three codes. Certainly in such acalculation process more or less part can be contained too. The three codes system ispresented here because the above mentioned parameters are calculated by this kind ofsystem. The three levels are the following:
Assembly wise calculationPin wise calculationThe given parameter value calculation with using a simple expression.
250
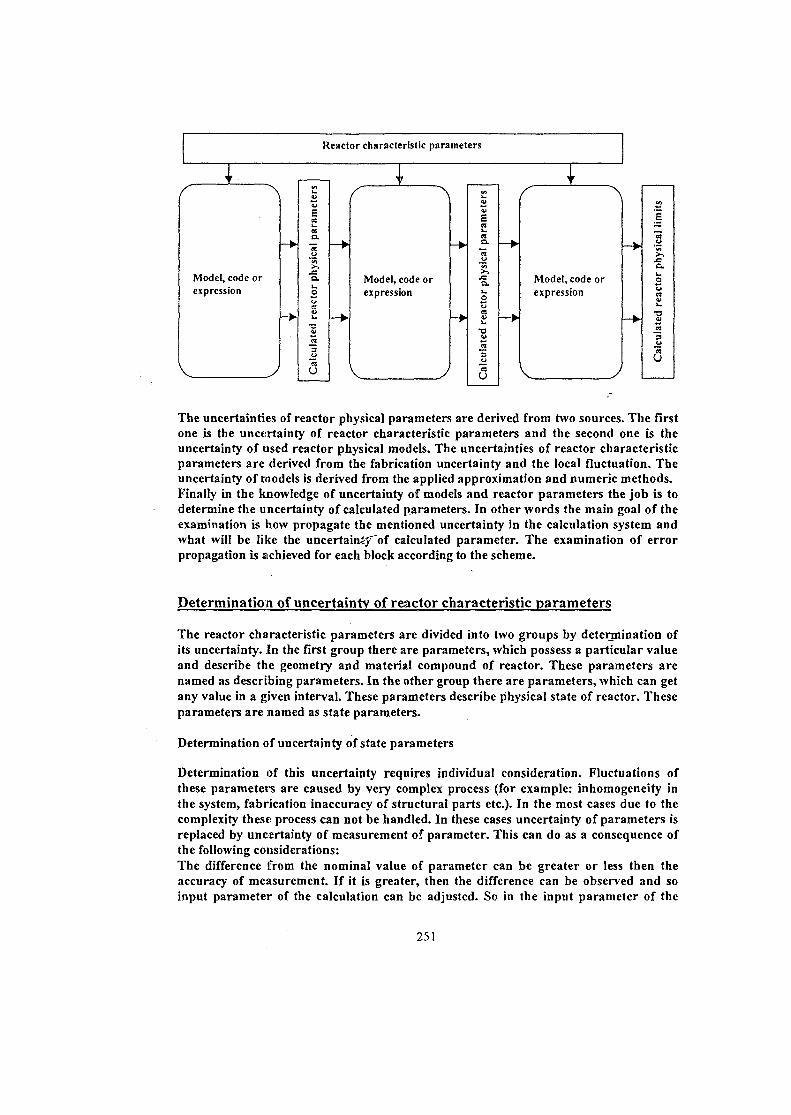
Reactor characteristic parameters
f
Model, code orexpression
v J
ters
para
me
phys
ica
o
Cal
cula
ted
rea(
f
Model, code orexpression
v y
—w
^ara
met
phys
ical
orC
alcu
late
d re
ad
f
r \
Model, code orexpression
V )
cal l
imit
tor
phys
iea
cC
alcu
late
d r
The uncertainties of reactor physical parameters are derived from two sources. The firstone is the uncertainty of reactor characteristic parameters and the second one is theuncertainty of used reactor physical models. The uncertainties of reactor characteristicparameters are derived from the fabrication uncertainty and the local fluctuation. Theuncertainty of models is derived from the applied approximation and numeric methods.Finally in the knowledge of uncertainty of models and reactor parameters the job is todetermine the uncertainty of calculated parameters. In other words the main goal of theexamination is how propagate the mentioned uncertainty in the calculation system andwhat will be like the uncertaini/'of calculated parameter. The examination of errorpropagation is achieved for each block according to the scheme.
Determination of uncertainty of reactor characteristic parameters
The reactor characteristic parameters are divided into two groups by determination ofits uncertainty. In the first group there are parameters, which possess a particular valueand describe the geometry and material compound of reactor. These parameters arenamed as describing parameters. In the other group there are parameters, which can getany value in a given interval. These parameters describe physical state of reactor. Theseparameters are named as state parameters.
Determination of uncertainty of state parameters
Determination of this uncertainty requires individual consideration. Fluctuations ofthese parameters are caused by very complex process (for example: inhomogeneity inthe system, fabrication inaccuracy of structural parts etc.). In the most cases due to thecomplexity these process can not be handled. In these cases uncertainty of parameters isreplaced by uncertainty of measurement of parameter. This can do as a consequence ofthe following considerations:The difference from the nominal value of parameter can be greater or less then theaccuracy of measurement. If it is greater, then the difference can be observed and soinput parameter of the calculation can be adjusted. So in the input parameter of the
251
calculation only that fluctuation can not be taken into account which is within theaccuracy of measurement. For this reason the uncertainty of input parameters can bereplaced by uncertainty of measurement.
Determination of uncertainly of describing parameters
The probability density function of these parameters can be determined in two ways.The first way is that if the statistics is composed from numerous measurement check ofthe product. The other way is that if the probability density function is determined fromthe tolerance of the measurements. Measured data are not at our disposal, therefor thesecond way have been used. The probability density function is determined from thetolerance of the measurements in the following manner:For the determination of the density function two conditions have to be taken. The firstcondition is that, the distribution of real value of measurements is Gaussian. The secondone is that, the measured values to be found with 99.9% level in the interval, which oneis designated by tolerance of measurement and accuracy of measurement check. On thebasic of two conditions the expected value and standard deviation can be determined, ifthese parameters are known then the density function of normal distribution isunambiguously determined. The expected value will be equal to the nominal value ofparameter, and the standard deviation will be equal to the third part of interval of thetolerance and accuracy of measurement.
Transformation of uncertainty of the reactor characteristic parameters intothe uncertainty of direct input parameters of codes
A part of reactor characteristic parameters is direct input parameters of calculation (forexample the inlet temperature, cooling flow rate and reactor power). The other part ofparameters (for example the geometrical data of assembly, the material component) inindirect manner shows effect by way of other parameters. Effect of elements of this partcan be taken into account, if theirs uncertainty is transformed to the uncertainty ofdirect input parameters of codes (derived input parameter uncertainty). For examplethe uncertainty of geometrical data of assembly is transformed to the uncertainty ofcross section. A process of transformation is the following:
1. Determination of density function of reactor characteristic parameters2. Determination of relation between the reactor characteristic parameters and
direct input parameters3. Conversion of density function of the reactor characteristic parameters to the
• density function of direct input parameters with a Monte-Carlo simulation
The determination of density function of reactor characteristic parameters and thedetermination of the function between the reactor parameters and input parametersdepend on the kind of parameter. The transformation of density function is the same forall the parameters. The Monte-Carlo simulation is carried out in the following manner:According to the probability of density function a parameter value is drawn than on thebasis of the characteristic and input parameter function is determined the direct inputparameter value. After a sufficiently a large number of drawing from the occurrencefrequency the probability density function can be reproduced.
252
Determination of the model error
Determination of the model error is executed with using of solution of benchmarkproblem and comparison of measured and calculated data. This examination is realisedtogether with the code validation.
Examination of error propagation through the models
As it has already been mentioned the examination is carried out as parts according tothe block schema. This examination method has got two basic reasons. The first is that,since the codes use the output parameters of other codes as input and in the outputparameters appears the model error so this model error will be transformed in the nextcode. This problem can be handled whit the successional examination. The other reasonis that the examination of error propagation in a system consisting of more models iscomplicated.For the examination of error propagation it is used two methods. The first is aMonte-Carlo simulation method, which has got two variants. In both of cases thesimulation is similar to the simulation which was used in the case of transformation ofthe reactor characteristic parameters into the direct input parameters. According to theprobability of density function a parameter value is drawn on the basis of thecharacteristic and input parameter function is determined the direct input parametervalue. After a sufficiently large_ number of drawings from the occurrence 'frequency ofobtained values it can be the probability density function. The difference between thetwo variants is in the result calculation. In the first case the results are calculated directmanner with using the codes. This method is used when the model is simple andcalculation time of code is sort. In that case when the calculation time is long it can notbe executed enough calculation for the statistic. In this case not the parameter value iscalculated but the deviation of output parameter from the nominal value which is arisenfrom changing of input parameter compared to nominal value. This deviation can becalculated in simple manner with a matrix multiplication if it is known th* sensitivitymatrix of calculated parameters against input modification. The sensitivity matrix isdetermined with the application of General Perturbation Theory [1]. Certainly theMonte-Carlo method and the GPT also possess uncertainty, which have to be taken intoaccount at the given result.The second error propagation method is a statistical method. Basis of this method is thegiven parameter statistical comparison with measured data. This method is appliedwhen a lot of measured data are our disposal, the given parameter is normaldistribution and the application of above mentioned method would be complicated.(The other is a statistical method, it is based on the comparison of measured data withthe calculations ones.) In this case it can be determined the probability* density functionof the calculated parameter from the comparison of the measured and calculated data.Suppose that, for the determination of physical quantity calculation and measurement isalso available, the calculated and measured values are symbolised with vs and vm. It can
be associated fvm and frs probability density functions to the measurement and thecalculation. In the case of comparison of measured and calculation values a differencebetween two probability variables (v5-vm) are established. If the two variables are
253
normal distribution as it was supposed, then the result will be normal distribution too.The expected value of difference of variables will be the difference of expected values(M = MVI-Mvm) and the second moment will be the sum of second moments
(a1 = crj; + <r\m ). In consequence of these facts if there are not systematic error of both
quantities then the expected value of two quantities arc the same and resultant expectedvalue is zero. If the uncertainty of measurement is known then the uncertainty ofcalculation can be determined from the comparison of calculation and measurement. Ifthe uncertainty of measurement is not known then it can be used the standard deviationof comparison because of this standard deviation is greater then the standard deviationof calculation. In this way it is conservative way of approach, in many cases thisstandard deviation is used. This method is relatively simple, but in the most of cases wedo not possess enough measured data.
As an example uncertainty of linear heat rate is given.The linear heat rate is determined by a three level calculation. The first level is theassembly wise calculation with using the C-PORCA code. The second level is the pinwise calculation with using the APOSTOL code and the third level is the linear heat ratecalculation with the following function:
where kq is the assembly wise power distribution, Preail is the reactor power, kk is thepin wise power distribution, kz axial power distribution and lasB is the entire length ofrods. The kq and the kz is arisen from the assembly wise calculation, the kk from thepin wise calculation acid rector power and the all length rod are reactor characteristicparameters. The uncertainty of the kq and the kz parameters are determined fromcomparisons of measured and. calculated values [2]. The following data are related toprofiled assembly with enrichment 3-82%. The standard deviations of two parametersare the following:
akq = 0.025
a^ = 0.0323
For the determination of uncertainty of pin wise power distribution the GPT and theMonte-Carlo methods were used.
254
In the Monte-Carlo simulation the following uncertainties of parameters are taken intoaccount:
- Enrichment- Fuel density- Rod mass- Rod length- Pellets diameter- Diameter of pellet boring- Outer diameter of clad
Assembly wall thickness- Lattice pitch- Water gap- Assembly shroud thickness
Central tube diameter- Moderator temperature- Fuel temperature• Boron acid concentration- Fast flux
The first twelve parameters are the characteristics of the geometry of assembly, theuncertainties of these parameters were derived from their tolerances. The otherparameters are derived from the assembly wise calculation. Uncertainties of theseparameters are determined with either the same way as kg or the Monte-Carlosimulation. Except the fast flux the all parameter uncertainty has to be converted to theuncertainty of cross sections. The mentioned parameters and cross sections relations erecalculated by HELIOS code [3]. After the determination of sensitivity matrix theuncertainty of kk can be determined in accordance with input parameters byMonte-Carlo simulation. Naturally by the further calculation the uncertainty of GPTmethod and Monte-Carlo simulation and the uncertainty of model of kk calculationhave to be added to the derived uncertainty. Then the standard deviation of kk is thefollowing:
atl = 0.03733
It is substituted the uncertainty of reactor power for accuracy of measurement. Theaccuracy of reactor power measurement is 2%. This means that the power can change
• unnoticeable within this range. Taking the power alteration as normal distribution andthe 2% range as three standard deviations the standard deviation in absolute value willbe equal for nominal power:
rP= 9.167 MW
255
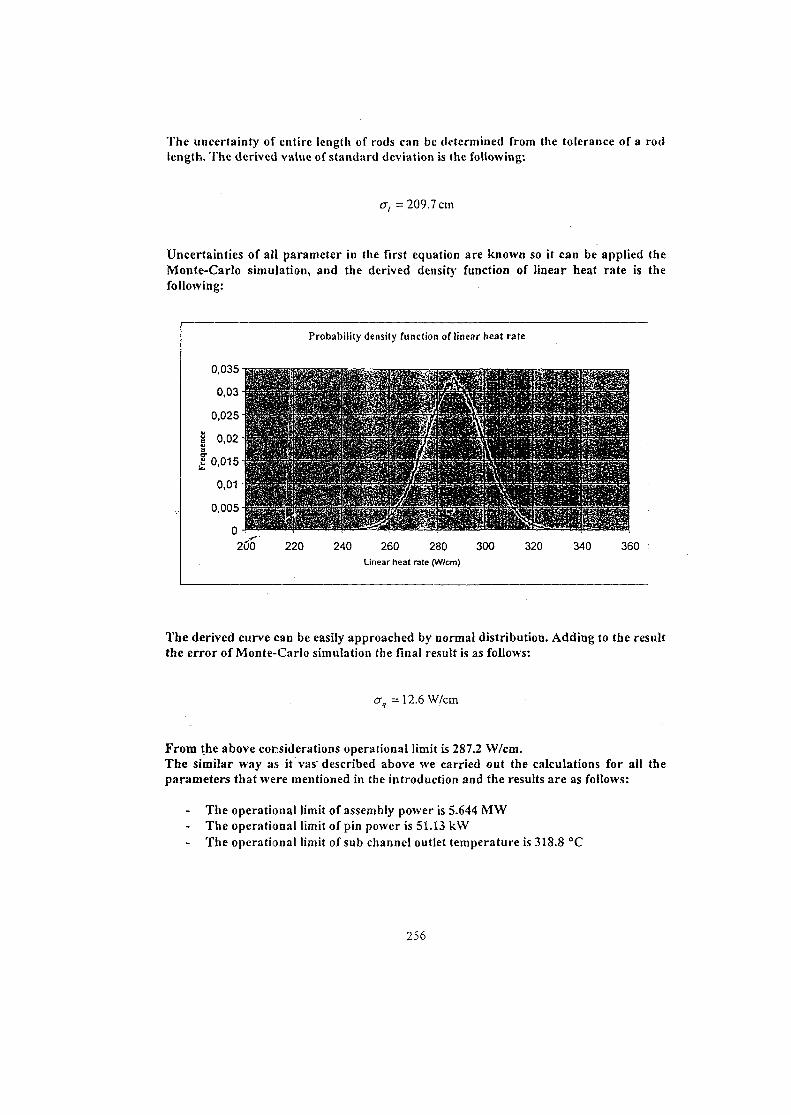
The uncertainty of entire length of rods can be determined from the tolerance of a rodlength. The derived value of standard deviation is the following:
a, =209.7 cm
Uncertainties of alt parameter in the first equation are known so it can be applied theMonte-Carlo simulation, and the derived density function of linear heat rate is thefollowing:
0,035
Probability density function of linear heat rate
20"0 220 240 260 280 300 320 340 360Linear heat rate (W/cm)
The derived curve can be easily approached by normal distribution. Adding to the resultthe error of Monte-Carlo simulation the final result is as follows:
aq =12.6 W/cm
From the above considerations operational limit is 287.2 W/cm.The similar way as it vas' described above we carried out the calculations for all theparameters that were mentioned in the introduction and the results are as follows:
The operational limit of assembly power is 5.644 MWThe operational limit of pin power is 51.13 kWThe operational limit of sub channel outlet temperature is 318.8 °C
256
Conclusion
On the basis of the obtained results it can be seen that by using the method reserve isreleased as compared with the traditional 17% engineering factor. The derived resultsare correct because this method can determined mathematically exactly theuncertainties and it can be taken into account all parameters which affect theuncertainty of examined parameters.Above described methods are converted into appropriate codes and these codes arelinked together so the effect of any change in the input parameters can be easilyrecalculated. The parts of the system namely are as follows:
- GAMMA code: adjoint functions generator- SIMILA code: Monte-Carlo simulation- SCANNING code: determination of pin wise uncertainties using sensitivity
coefficients and cross sections uncertaintiesDue to the relative speed of applied methods the uncertainties of other reactor states, forexample different assembly configuration, different boron acid concentration and powerlevel can be covered.In the near future the described methods will be extended for other importantcalculated reactor physical quantities and for results of in-core measurements.
References:
1. L. Korpas, I. P6s, Zs. Szecs^nyk Uncertainty analysis of pin wise power distributionof WER-440 assembly considering fabrication uncertainties, Fifth Symposium ofAER, Dobog6ko, Hungary
2. I. P6s, S. Patai Szab6,1. Nemes: C-PORCA 4.0 Version Description and ValidationProcedure, Sixth Symposium of AER, Kirkkonummi, Finland
3. S. Patai Szab6: HELIOS test on hexagonal lattices, Sixth Symposium of AER,Kirkkonummi, Finland •
257
SK01ST090
GENERATION OF A LIBRARY OF TWO-GROUP DIFFUSION PARAMETERSFOR SPPS-1.6 by HELIOS
P. T. PetkovInstitute for Nuclear Research and Nuclear Energy, Sofia, Bulgaria
C. V. Haralampieva, T. Simeonov, I. Stojanova, K. KamenovNPP-Kozloduy
ABSTRACT
The two-group three-dimensional nodal diffusion code SPPS-1.6 has been used formany years for steady-state neutronics calculations of the WWER-440 reactors at Ko-zloduy NPP. The old library of two-group diffusion parameters for SPPS-1.6 has beengenerated by WIMSD4 with a nuclear data library compiled from three different libraries.The current paper presents our experience in generating a new library for SPPS-1.6 bythe HELIOS lattice code.
The accuracy of the CCCP method in calculating a single WWER-440 assembly hasbeen studied first. Among all possible angular discretizations of the interface partial cur-rents, called coupling orders, only coupling order 3 is suitable for hexagonal cells. Dividingeach cell side into 3 segments an accuracy of 100 pcm has been achieved. The accuracy incalculating the absorber problem was estimated at 1%, which means about 10% error inthe control assemblies efficiency. The accuracy for small core-reflector problems is 1% aswell. The general conclusion is that HELIOS is accurate enough for assembly calculations,but inadequate for absorber and core-reflector problems.
The strategy of library generation had to be changed substantially, because of essentialdifferences in the input options for HELIOS and WIMSD4. Effective depletion chainshave been developed so that the simple chains in SPPS-1.6 will be equivalent to themore complicated ones in HELIOS. Two additional depletion calculations with essentiallydifferent power levels are performed in order to generate different isotope compositions ofthe fuel.
Describing the geometry of the fuel assemblies for HELIOS is not an easy task. Anauxiliary code, HEL440, which uses human input data, has been developed to prepare allthe bulk of geometry and other data for fuel assembly, absorber, and core-reflector calcu-lations. Another auxiliary code, HELSS3, has been developed to extract the calculationresults from the HERMES data base, where HELIOS stores its results. Finally, a fullyautomatic procedure for library generation has been established.
A new library for hot power states only has been generated, including new face-groupto face-group albedo boundary conditions. The new library is compared to another onegenerated by WIMSD4. Preliminary results of comparison with experimental data arepresented as well.
259
IntroductionThe two-group three-dimensional nodal diffusion code SPPS-1.6[l] has been used formany years for steady-state neutronics calculations of the WWER-440 reactors at Ko-zloduy NPP. The old 1995-library of two-group diffusion parameters for SPPS-1.6 hasbeen generated by WIMSD4{2, 3] with a nuclear data library compiled from three dif-ferent libraries[4, 5, 6]. It proved to be adequate, but the WIMSD4 code is limited toregular fuel lattices. In order to extend the applicability of the code package to presentday assembly designs the old WIMSD4 had to be replaced. The current paper presentsour experience in generating a new library for SPPS-1.6 by the HELIOS lattice code[7].
HELIOS solves the transport equation by the current-coupling collision probability(CCCP) method, v/hich combines the accurate collision probability (CP) method, appliedwithin the space elements, with the current coupling (CC) method, which connects thespace element. In the CC-method the out-going neutron current through a segment ofthe space element's boundary is assumed spatially constant. The half-sphere of neutrondirections is divided into a number of sectors and cosine current is assumed in each sector.This approximation is a very crude one to describe the extremely complicated distributionof the angular neutron flux. Therefore, the accuracy of the CCCP method has beenstudied first. The results of this study and solutions for other problems encountered withHELIOS are briefly described in the next section.
The new library generated by HELIOS has been compared to another library generatedby WIMSD4. The results of their comparison are presented in the next section. Thenthe calculation of new albedo boundary conditions is briefly discussed. The results ofSPPS-1.6 with the new library are compared with experimental data in the third section.
Library generation by HELIOSThe major problem with HELIOS is the CC-approximatipn. The accurate collision prob-ability method is too slow if used for assembly calculations and the CC-method is a crudeapproximation for the neutron transport. In order to choose efficient spatial and angulardiscretization the accurate CP-solution for a 30° sector of an assembly has been comparedwith solutions with different coupling orders. Each fuel cell is a separate space elementand the gap is attached to the neighbor fuel cells. The fuel is divided radially into 2regions with volume ratio of 9 to 1. The effect of the central hole is about 10 pern andit has been neglected. The moderator is divided into 6 regions across the cell corners.Finer spatial discretization is not justified. The results in Table 1 show that neither of thecoupling orders is acceptable if the fuel cell sides are not divided into segments. Whenthe fuel cell sides are divided into 3 segments each (Table 2) the accuracy of couplingorders +3 and -4 is acceptable, but coupling order +3 is much faster. The accuracy of theresults with coupling order +3 has been tested for different enrichments and technologyparameters, the results showing that it is within 100 pcm.
The effect of the CC-approximation has been studied for the absorber problem andfor a small core-reflector problem as well. The absorber itself has been described as asingle space element and the fuel assemblies as described above. An accurate solutionwith coupling order 0 has been used as reference. The best results have been obtainedwith coupling order 3 inside the assemblies and 4 between the assemblies and absorber,but the error in koo is 1%, which means 10% error of the control assembly's efficiency.For core-reflector problems the macro-cells in the reflector cannot be coupled exactly,
260
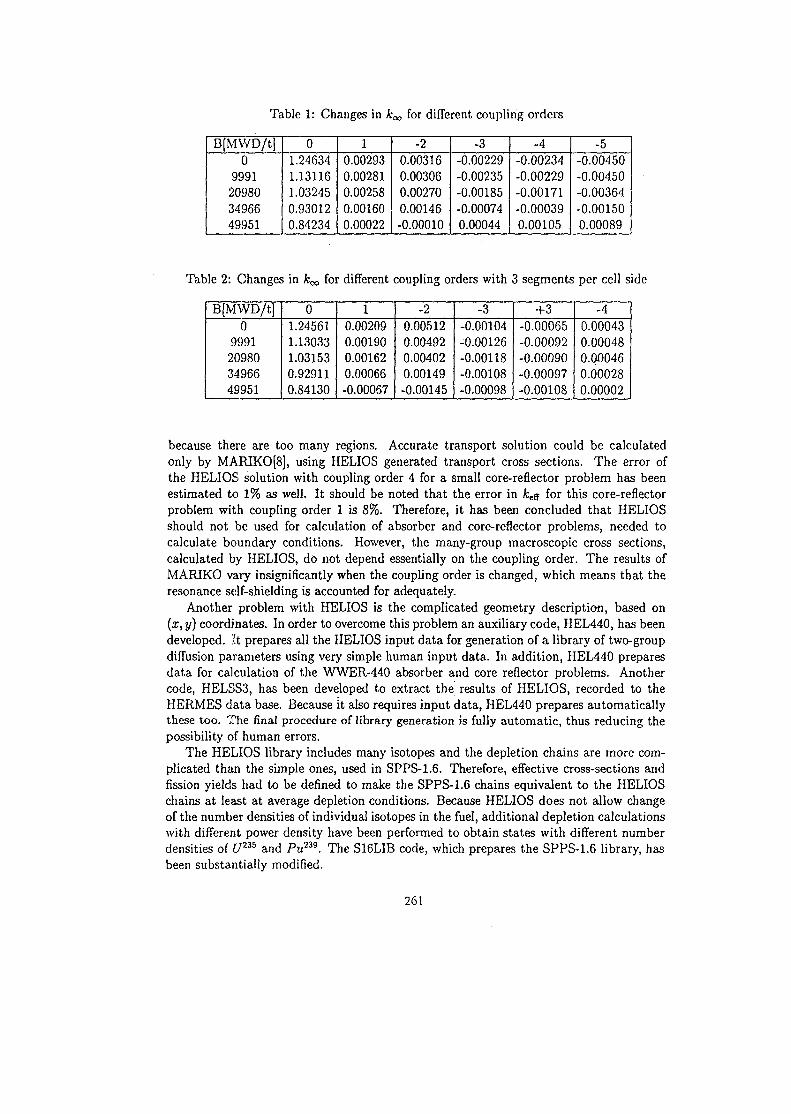
Table 1: Changes in Ar for different coupling orders
B[MWD/t]0
9991209803496649951
01.246341.131161.032450.930120.84234
10.002930.002810.002580.001600.00022
-20.003160.003060.002700.00146-0.00010
-3-0.00229-0.00235-0.00185-0.000740.00044
-4-0.00234-0.00229-0.00171-0.000390.00105
-5-0.00450-0.00450-0.00364-0.001500.00089
Table 2: Changes in fcTO for different coupling orders with 3 segments per cell side
B[MWD/t]0
9991209803496649951
01.245611.130331.031530.929110.84130
1
0.002090.001900.001620.00066-0.00067
-2
0.005120.004920.004020.00149-0.00145
-3-0.00104-0.00126-0.00118-0.00108-0.00098
+3-0.00065-0.00092-0.00090-0.00097-0.00108
-40.000430.000480.000460.000280.00002
because there are too many regions. Accurate transport solution could be calculatedonly by MARIK0[8], using HELIOS generated transport cross sections. The error ofthe HELIOS solution with coupling order 4 for a small core-reflector problem has beenestimated to 1% as well. It should be noted that the error in fceff for this core-reflectorproblem with coupling order 1 is 8%. Therefore, it has been concluded that HELIOSshould not be used for calculation of absorber and core-reflector problems, needed tocalculate boundary conditions. However, the many-group macroscopic cross sections,calculated by HELIOS, do not depend essentially on the coupling order. The results ofMARIKO vary insignificantly when the coupling order is changed, which means that theresonance self-shielding is accounted for adequately.
Another problem with HELIOS is the complicated geometry description, based on(2:, y) coordinates. In order to overcome this problem an auxiliary code, HEL440, has beendeveloped. It prepares all the HELIOS input data for generation of a library of two-groupdiffusion parameters using very simple human input data. In addition, HEL440 preparesdata for calculation of the WWER-440 absorber and core reflector problems. Anothercode, HELSS3, has been developed to extract the results of HELIOS, recorded to theHERMES data base. Because it also requires input data, HEL440 prepares automaticallythese too. The final procedure of library generation is fully automatic, thus reducing thepossibility of human errors.
The HELIOS library includes many isotopes and the depletion chains are more com-plicated than the simple ones, used in SPPS-1.6. Therefore, effective cross-sections andfission yields had to be defined to make the SPPS-1.6 chains equivalent to the HELIOSchains at least at average depletion conditions. Because HELIOS does not allow changeof the number densities of individual isotopes in the fuel, additional depletion calculationswith different power density have been performed to obtain states with different numberdensities off/235 and Pv?39. The S16LIB code, which prepares the SPPS-1.6 library, hasbeen substantially modified.
261
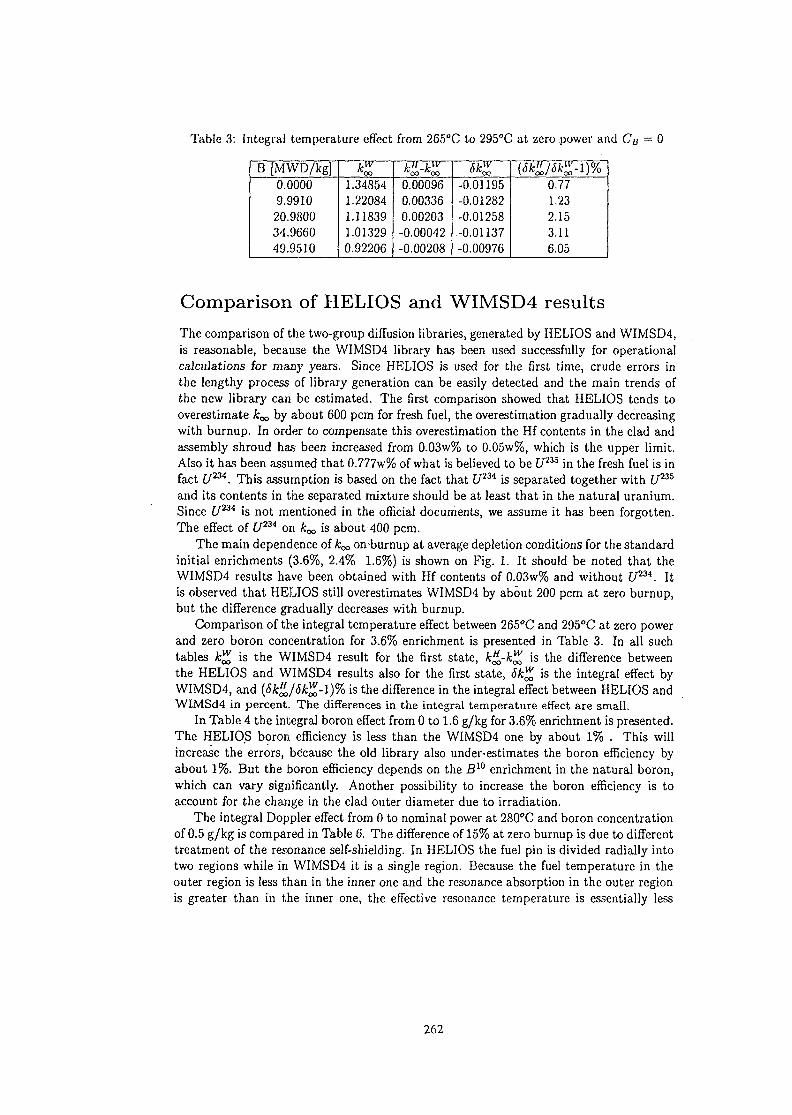
Table 3: Integral temperature effect from 265°C to 295°C at zero power and CQ = 0
B [MWD/kg]0.00009.991020.980034.966049.9510
1.348541.220841.118391.013290.92206
Ul 1.1V
0.000960.003360.00203-0.00042-0.00208
«£-0.01195-0.01282-0.01258-0.01137-0.00976
(i*»/tt£-l)%0.771.232.153.116.05
Comparison of HELIOS and WIMSD4 results
The comparison of the two-group diffusion libraries, generated by HELIOS and WIMSD4,is reasonable, because the WIMSD4 library has been used successfully for operationalcalculations for many years. Since HELIOS is used for the first time, crude errors inthe lengthy process of library generation can be easily detected and the main trends ofthe new library can be estimated. The first comparison showed that HELIOS tends tooverestimate k^ by about 600 pcm for fresh fuel, the overestimation gradually decreasingwith burnup. In order to compensate this overestimation the Hf contents in the clad andassembly shroud has; been increased from 0.03w% to 0.05w%, which is the upper limit.Also it has been assumed that 0.777w% of what is believed to be U2V> in the fresh fuel is infact U234. This assumption is based on the fact that U234 is separated together with £/235
and its contents in the separated mixture should be at least that in the natural uranium.Since U234 is not mentioned in the official documents, we assume it has been forgotten.The effect of U234 on A:,*, is about 400 pcm.
The main dependence of £<» on burnup at average depletion conditions for the standardinitial enrichments (3.6%, 2.4% 1.6%) is shown on Fig. 1. It should be noted that theWIMSD4 results have been obtained with Hf contents of 0.03w% and without U234. Itis observed that HELIOS still overestimates WIMSD4 by about 200 pcm at zero burnup,but the difference gradually decreases with burnup.
Comparison of the integral temperature effect between 265"C and 295°C at zero powerand zero boron concentration for 3.6% enrichment is presented in Table 3. In all suchtables k™ is the WIMSD4 result for the first state, k^-k™ is the difference betweenthe HELIOS and WIMSD4 results also for the first state, 5k™ is the integral effect byWIMSD4, and {6k^/6k^-l)% is the difference in the integral effect between HELIOS andWIMSd4 in percent, The differences in the integral temperature effect are small.
In Table 4 the integral boron effect from 0 to 1.6 g/kg for 3.6% enrichment is presented.The HELIOS boron efficiency is less than the WIMSD4 one by about 1% . This willincrease the errors, because the old library also under-estimates the boron efficiency byabout 1%. But the boron efficiency depends on the J510 enrichment in the natural boron,which can vary significantly. Another possibility to increase the boron efficiency is toaccount for the change in the clad outer diameter due to irradiation.
The integral Doppler effect from 0 to nominal power at 280°C and boron concentrationof 0.5 g/kg is compared in Table 6. The difference of 15% at zero burnup is due to differenttreatment of the resonance self-shielding. In HELIOS the fuel pin is divided radially intotwo regions while in WIMSD4 it is a single region. Because the fuel temperature in theouter region is less than in the inner one and the resonance absorption in the outer regionis greater than in the inner one, the effective resonance temperature is essentially less
262
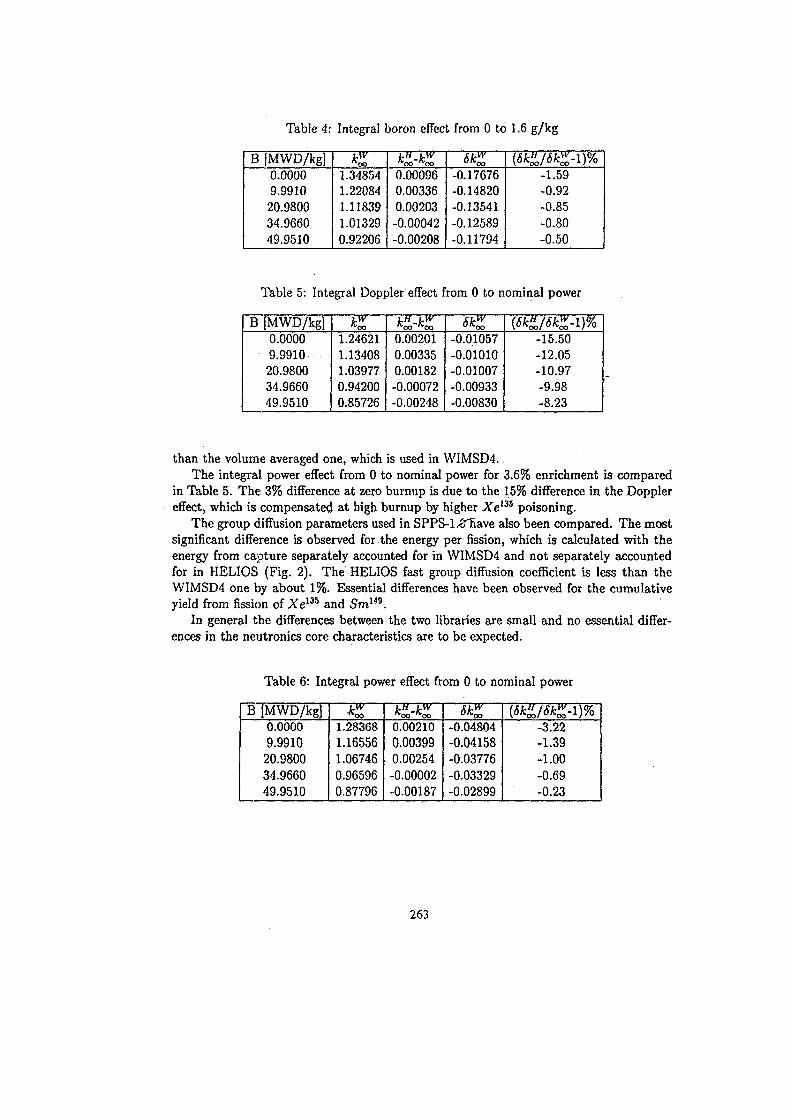
Table 4: Integral boron effect from 0 to 1.6 g/kg
B [MWD/kg]0.00009.991020.980034.966049.9510
L\VK<x>
1.348541.220841.118391.013290.92206
UH I.W
0.000960.003360.00203-0.00042-0.00208
-0.17676-0.14820-0.13541-0.12589-0.11794
-1.59-0.92-0.85-0.80-0.50
Table 5: Integral Doppler effect from 0 to nominal power
B [MWD/kg]0.00009.991020.980034.966049.9510
^ 0 0
1.246211.134081.039770.942000.85726
rcoo Koo0.002010.003350.00182-0.00072-0.00248
* f coo-0.01057-0.01010-0.01007-0.00933-0.00830
(tt£/«£-l)%-15.50-12.05-10.97-9.98-8.23
than the volume averaged one, which is used in WIMSD4.The integral power effect from 0 to nominal power for 3.6% enrichment is compared
in Table 5. The 3% difference at zero burnup is due to the 15% difference in the Dopplereffect, which is compensated at high burnup by higher Xem poisoning.
The group diffusion parameters used in SPPS-l.-&Tiave also been compared. The mostsignificant difference is observed for the energy per fission, which is calculated with theenergy from capture separately accounted for in WIMSD4 and not separately accountedfor in HELIOS (Fig. 2). The HELIOS fast group diffusion coefficient is less than theWIMSD4 one by about 1%. Essential differences have been observed for the cumulativeyield from fission of Xe135 and Smm.
In general the differences between the two libraries are small and no essential differ-ences in the neutronics core characteristics are to be expected.
Table 6: Integral power effect from 0 to nominal power
B [MWD/kg]0.00009.991020.980034.966049.9510
uw*oo1.28368
1.165561.067460.965960.87796
L.H UW"•oo'^-oo0.002100.003990.00254-0.00002-0.00187
xuw0A;oo-0.04804
-0.04158-0.03776-0.03329-0.02899
(5k«/6kZ-l)%-3.22-1.39-1.00-0.69-0.23
263
Boundary conditionsFor calculation of boundary conditions a new code[9], based on the method of charac-teristics, has been used with the macroscopic cross sections generated by HELIOS. Theabsorber part of the WWER-440 control assembly has been divided axially into four sec-tions. The lowest section represents the section of the fuel part just above the fuel, whichcontains the steel inserts. The second section contains no steel, but a part of the clad anda lot of moderator. Both these section are with height of 11.75 cm in accordance with theaxial node size in SPPS-1.6 with 21 axial layers. The third section is 23.5 cm high andincludes the steel head of the fuel part and the steel end of the absorber part. The forthsection is with the boron steel inserts. Accurate face-group to face-group albedo matriceshave been calculated for 5 different combinations of the coolant temperature and boronconcentration. The transport calculations have been performed in two-dimensional realgeometry in 35 groups.
The albedo boundary conditions for the radial reflector have been calculated also intwo-dimensional real geometry, but in 17 groups. The first 7 of these 17 groups coincidewith the first 7 of the 35-group HELIOS library. Three core-reflector problems havebeen used for the standard core (30° sectors starting at assembly positions with numbersin the 60° sector 08, 13, and 37) and two for the reduced core (30° sectors starting atassembly positions 06 and 20) to calculate the face-group to face-group albedoes in a 30°sector of the core. Again 5 different combinations of the coolant temperature and boronconcentration have been used. The CPU time needed to calculate the albedoes for theradial reflector for full power states only for both the standard and reduced cores wasabout 60 hours on a 500 MHz Pentium II PC.
Results with the new libraryThe results presented in this paper are preliminary, because the albedo boundary condi-tions were calculated at the very last moment. Some minor corrections have been included.AH albedo coefficients on the radial boundary have been multiplied by 0.98 for the originalcore and by 0.95 for the reduced core in order to improve the agreement with experimentaldata on the radial core periphery. The B10 contents in natural boron has been increasedfrom 0.198 to 0.200 a%. The fuel temperature dependence on power density, which hasbeen calculated for the latest fuel [10], has been corrected to correspond to about 900 Kat nominal power, because the fuel cycles concerned are all with the old fuel. The lasttwo corrections aimed at improving the critical boron concentration. The amplitudes ofthe-transient mode on radial faces have been corrected by a factor of 0.95.
The main core parameters for the first 3 cycles and cycle 11 of Loviisa-1 are comparedin Table 7 (a is the RMS error, e+ and e~ are the maximum positive and negative absoluteerrors in the relative assembly powers, fc|j and k^ are the experimental and calculatedassembly-wise power peaking factors, e(aj) is the average absolute error in the relativeassembly powers for assemblies of type a irradiated for j - th cycle, and assembly typesA, B, and C correspond to initial enrichment of 3.6%, 2.4%, and 1.6%). Despite thecorrections of the radial boundary conditions, the powers of the peripheral assemblies areoverestimated by about 2% for cycles 1-3 and 1% for cycle 11 at the end-of-cycle states(Figures 3 and 4). Similar results had been obtained when the 1995-library was testedand then the boron dependence of the radial boundary conditions had been decreasedtwice. Most probably the reason is not in the radial boundary conditions, but spectral,
264
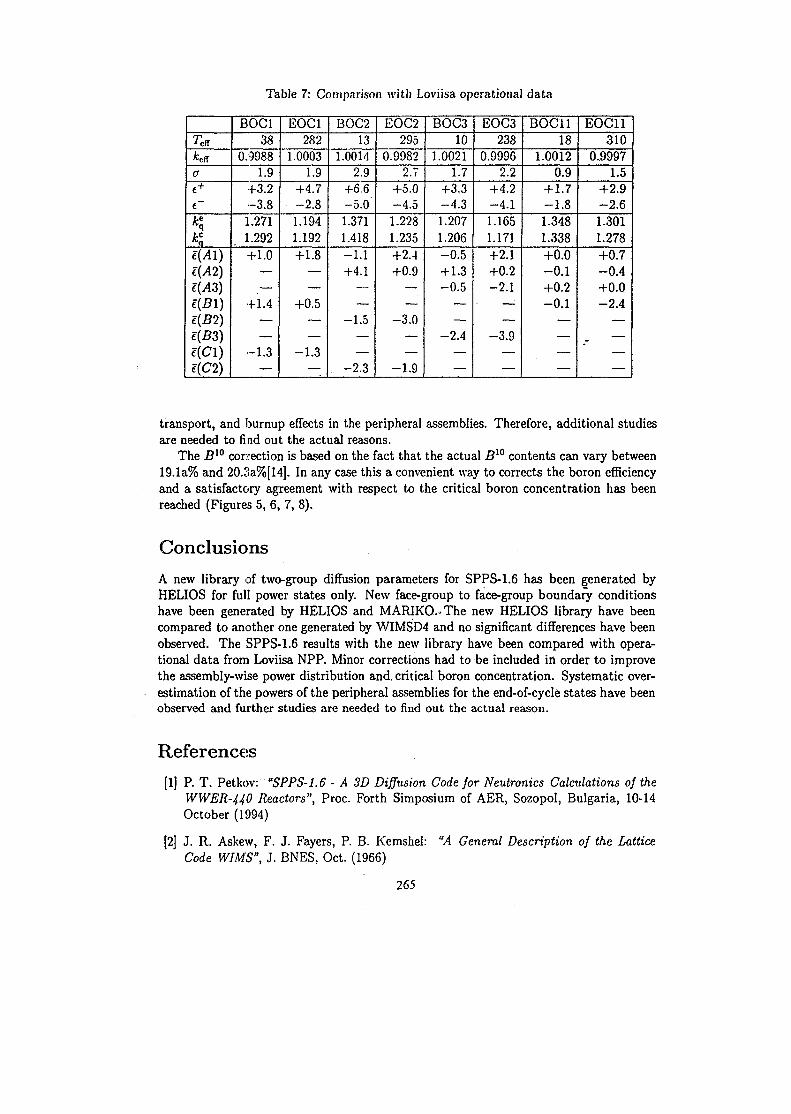
Table 7: Comparison with Loviisa operational data
a£+
e~ke
q
£(A1)
£(/13)£(B1)<f(B2)e(B3)e(Cl)e(C2)
BOCl38
0.99881.9
+3.2-3.8
1.2711.292+1.0
——
+1.4——
-1.3—
EOC1282
1.00031.9
+4.7-2.81.1941.192+1.8
——
+0.5——
-1.3—
BOC213
1.00142.9
+6.6-5.01.3711.418-1.1+4.1
——
-1.5——
-2.3
EOC2295
0.99822.7
+5.0-4.51.2281.235+2.4+0.9
——
-3.0——
-1.9
BOC310
1.00211.7
+3,3-4 .31.2071.206-0.5+1.3-0.5
——
-2.4——
EOC3238
0.99962.2
+4.2-4.11.1651.171+2.1+0.2-2.1
—:—
-3.9——
BOCll18
1.00120.9
+1.7-1 .81.3481.338+0.0-0 .1+0.2-0 .1
————
EOC11310
0.99971.5
+2.9-2.61.3011.278+0.7-0.4+0.0-2.4
————
transport, and burnup effects in the peripheral assemblies. Therefore, additional studiesare needed to find out the actual reasons.
The B10 correction is based on the fact that the actual Bw contents can vary between19.1a% and 20.3a%[14]. In any case this a convenient way to corrects the boron efficiencyand a satisfactory agreement with respect to the critical boron concentration has beenreached (Figures 5, 6, 7, 8).
ConclusionsA new library of two-group diffusion parameters for SPPS-1.6 has been generated byHELIOS for full power states only. New face-group to face-group boundary conditionshave been generated by HELIOS and MARIKQ.-The new HELIOS library have beencompared to another one generated by WIMSD4 and no significant differences have beenobserved. The SPPS-1.6 results with the new library have been compared with opera-tional data from Loviisa NPP. Minor corrections had to be included in order to improvethe assembly-wise power distribution and. critical boron concentration. Systematic over-estimation of the powers of the peripheral assemblies for the end-of-cycle states have beenobserved and further studies are needed to find out the actual reason.
References[1] P. T. Petkov: "SPPS-1.6 - A 3D Diffusion Code for Neutronics Calculations of the
WWER-440 Reactors", Proc. Forth Simposium of AER, Sozopol, Bulgaria, 10-14October (1994)
[2] J. R. Askew, F. J. Fayers, P. B. Kemshel: "A General Description of the LatticeCode WIMS", J. BNES, Oct. (1966)
265
[3] P. T. Petkov: "Modifications in the WIMS-D4 Code and its library", Proc. ForthSimposium of AER, Sozopol, Bulgaria, 10-14 October (1994)
[4] A. Trkov, A. Holubar, M. Ravnik: "WIMS Library Update Project: Phase Report onStage 2", IJS-DP-6243, Nov.20, 1991
[5] Jung-Do Kim: "WIMKAL-88. The 1988 Version of WIMS-KAERI Library" IAEA-NDS-92. August 1990
[6] C. J. Taubman: "The WIMS 69-Group Library Tape 166259", AEEW-M1324, 1976
[7] J. J. Casal at ah "Geometric Capabilities of a New Fuel-Assembly Program", Proc.ITM Advances in Mathematics, Computations, and Reactor Physics, Pittsburg, PA,USA (1991)
[8] P. T. Petkov: "Development of a Neutron Transport Code for Many-Group Two-Dimensional Heterogeneous Calculations by the Method of Characteristics", 10thSymposium of AER, September 18-22, Moscow, Russia (2000)
[9] P. T. Petkov: "Calculation of Accurate Albedo Boundary Conditions for Three-Dimensional Nodal Diffusion Codes bt the Method of Characteristics", 10th Sym-posium of AER, September 18-22, Moscow, Russia (2000)
[10] S. Stefanova: "Private communication"
[11] E. Temesvari et al.: "A Proposal of a Benchmark for Calculation of the Power Distri-bution Next to the Absorber", Proc. Ninth Simposium of AER, Demanovska Dolina,Slovakia, October (1999) '
[12] P. Siltanen: "VVER-440 Core Simulator Test Problem on Loviisa-1 Cycles 1, 2, and3", Meeting of Thematic Group 6 of VMK, Moskow, May 1983
[13] P. Siltanen, M. Antila: "Test Problem on Low Leakage Cores of Loviisa NPS", Meet-ing of Thematic Group 2 of VMK, March 1989
[14] M. Ledere, V. S. Shirley: "Table of Isotopes", (7th Edition), John Wiley and Sons,Inc., New York (1978)
266
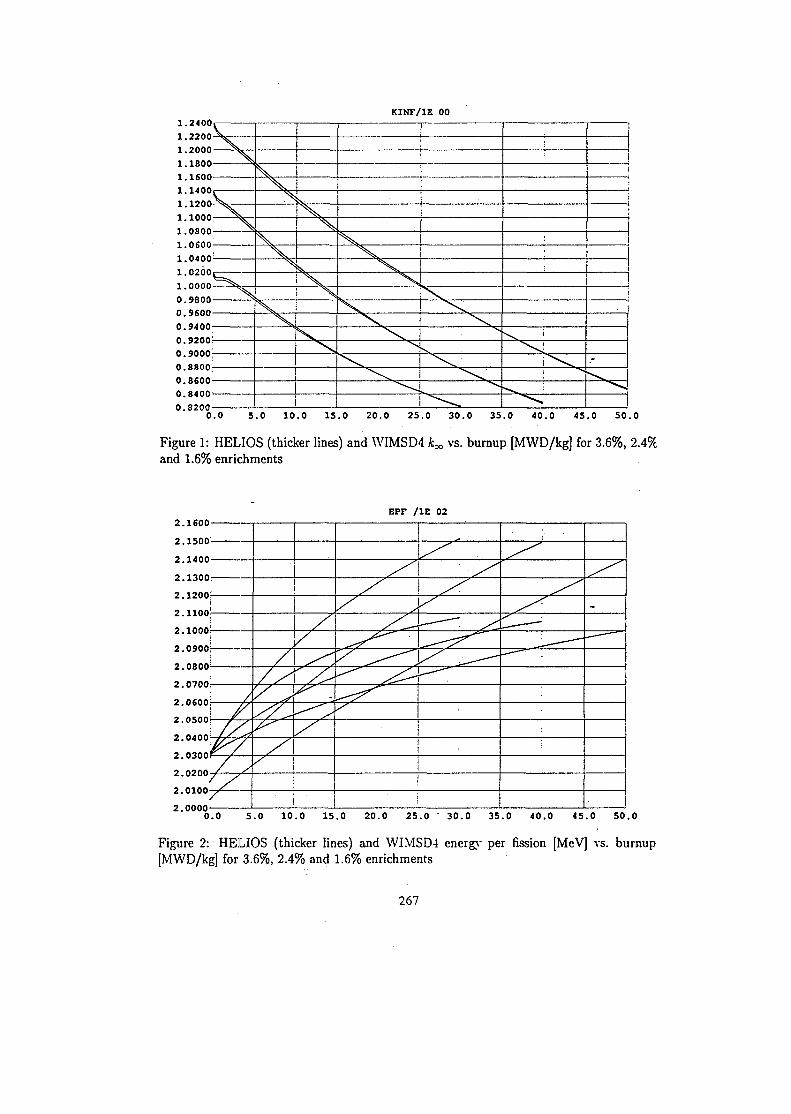
KIMF/1E 001.2400
1.20001.18001.16001.14001.12001.10001.0800.0600.0400.0200.0000
0.98000.96000.94000.9200-0.90000.88000.86000.8400-0.8200
XX
vXX
X
XXXX
x.X
N
XX.X.
X\
\ ^ -
0.0 5.0 10.0 15.0 20.0 25.0 30.0 35.0 40.0 45.0 50.0
Figure 1: HELIOS (thicker lines) and WIMSD4 kx vs. burnup [MWD/kg] for 3.6%, 2.4%and 1.6% enrichments
EPF /IE 022.1600
2.0300)
2.0200
2.0100
2.00000.0 .0 10.0 15.0 20.0 25.0 30.0 35.0 40.0 45.0 50.0
Figure 2: HELIOS (thicker lines) and WIMSD4 energy per fission [MeV] vs. burnup[MWD/kg] for 3.6%, 2.4% and 1.6% enrichments
267
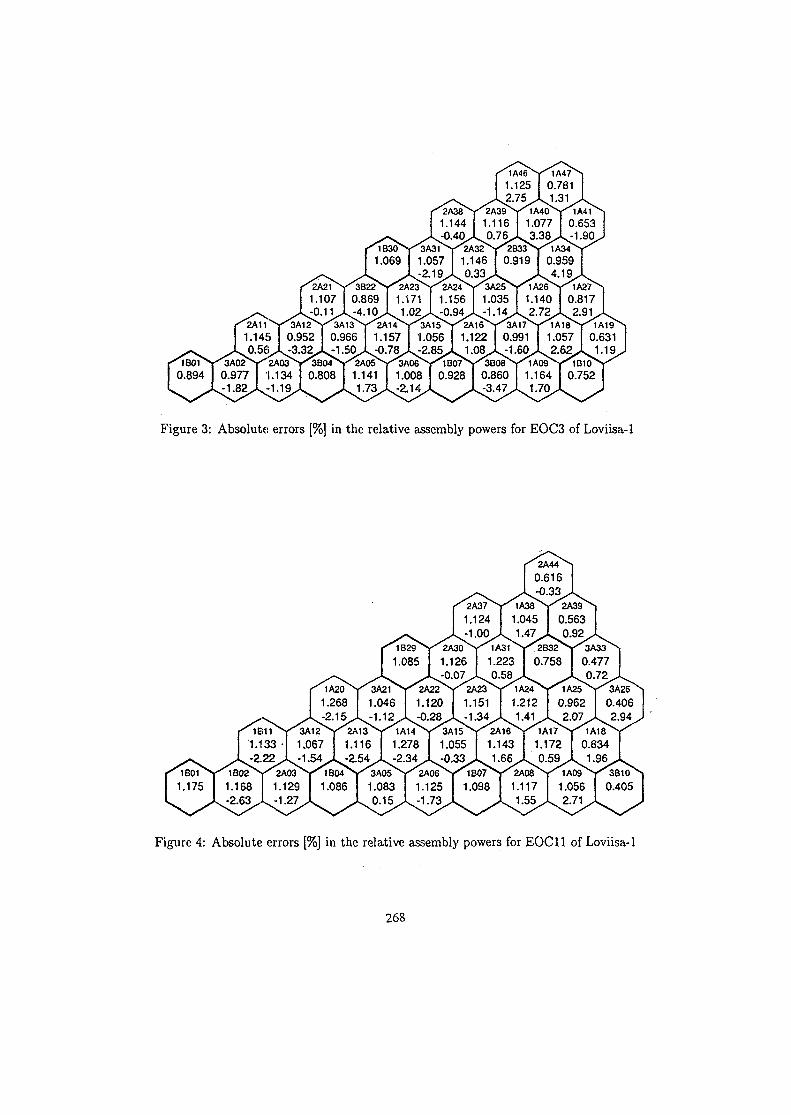
Figure 3: Absolute errors [%] in the relative assembly powers for E0C3 of Loviisa-1
Figure 4: Absolute errors [%] in the relative assembly powers for EOCll of Loviisa-1
268
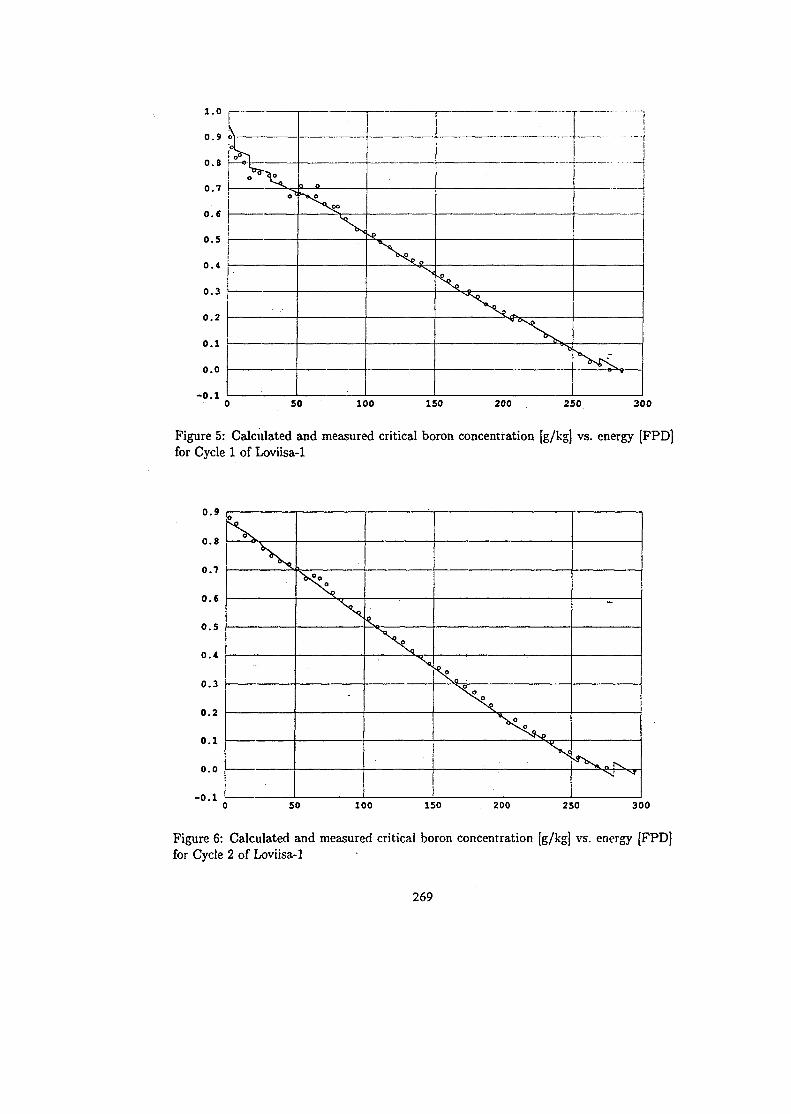
1.0
0.9
0.S
0.7
0.6
0.5
0.4 |
0.3 |
0.2
0.1
0.0
- 0 . 1
!
i•
0 O
—
SO 1 0 0 150 200 2 5 0 300
Figure 5: Calculated and measured critical boron concentration [g/kg] vs. energy [FPD]for Cycle 1 of Loviisa-1
0 . 9
0.8
0.7
0 . 6
0 . 5
0.4
0 .3
0.2
0.1
0.0
- 0 . 150 100 150 200 250 300
Figure 6: Calculated and measured critical boron concentration [g/kg] vs. energy [FPD]for Cycle 2 of Loviisa-1
269
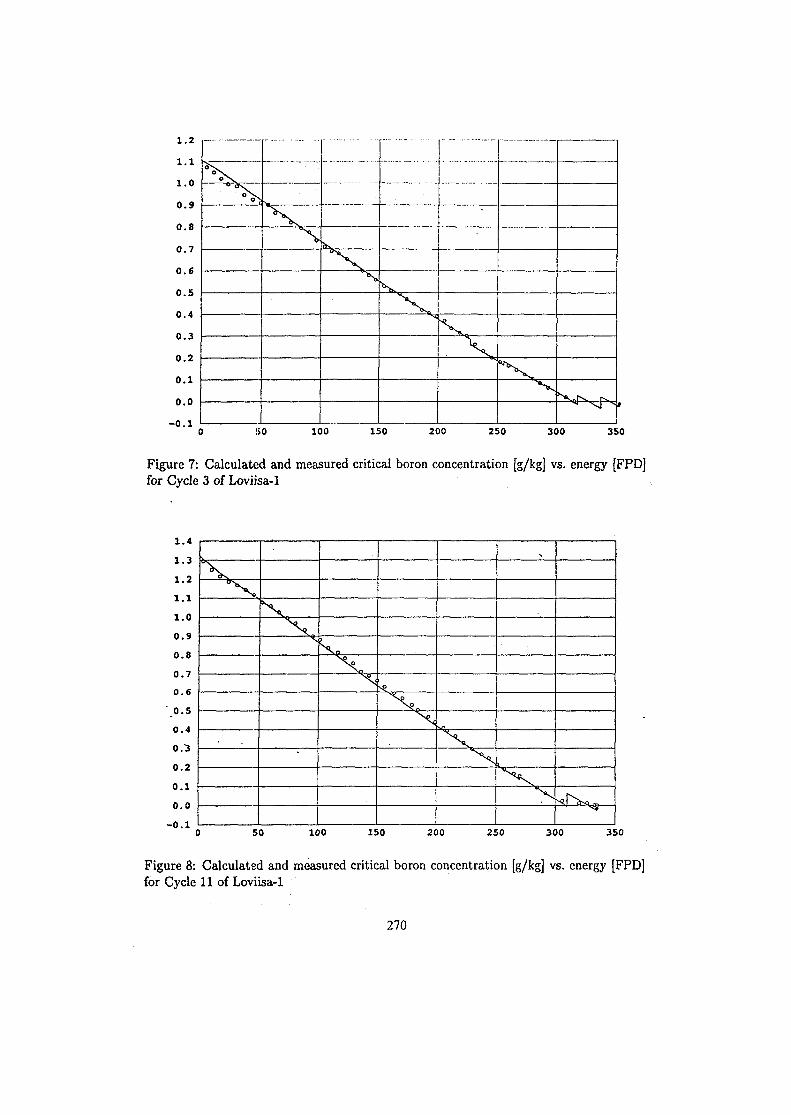
X.2
1.1
1.0
0.9
0.8
0.7
0.6
0.5
0.4
0.3
0.2
0.1
0.0
-0.1
5s .
X,\
X
—
*x.
100 150 200 250 300 350
Figure 7: Calculated and measured critical boron concentration [g/kg] vs. energy [FPD]for Cycle 3 of Loviisa-1
1.4
1.3
1.2
l . i
1.0
0.9
0.8
0.7
0.6
0.5
0.4
0.3
0.2
0.1
0.0
-0.1
\
N N
•-s
X
1I
a
X
50 100 150 200 250 300 350
Figure 8: Calculated and measured critical boron concentration [g/kg] vs. energy [FPD]for Cycle 11 of Loviisa-1
270
SK01ST091
DEVELOPMENT OF A NEUTRON TRANSPORT CODE FOR MANY-GROUPTWO-DIMENSIONAL HETEROGENEOUS CALCULATIONS BY THE METHOD
OF CHARACTERISTICS
Petko T. PetkovInstitute for Nuclear Research and Nuclear Energy, Sofia, Bulgaria
e-mail: [email protected]
ABSTRACT
The method of characteristics (MOC) is gaining increased popularity in the reactorphysics community all over the world because it gives a new degree of freedom in nuclearreactor analysis. The MARIKO code solves the neutron transport equation by the MOC intwo-dimensional real geometry. The domain of solution can be a rectangle or right hexagonwith periodic boundary conditions on the outer boundary. Any reasonable symmetryinside the domain can be fully accounted for. The geometry is described in three levels -macro-cells, cells, and regions. The macro-cells and cells can be any polygon. The outeiboundary of a region can be any combination of straight line and circular arc segments.Any level of embedded regions is allowed. Procedures for automatic geometry descriptionof hexagonal fuel assemblies and reflector macro-cells have been developed. The initiairay tracing procedure is performed for the full rectangular or hexagonal domain, but onlyazimuthal angles in the smallest symmetry interval are tracked.
The MOC integration procedure is computationally too heavy to be used for theself-scattering, up-scattering, and fission-source iterations. The method of transmissionprobabilities (TP) is combined with the MOC for all these. .The iteration strategy includessolution of the TP-equations once before and once after the MOC integration in each groupin order to accelerate the convergence of the self-scattering source. In addition a multi-group version of the TP method is applied once before and once after the pass over allthermal groups in order to accelerate the convergence of the up-scattering source. Afteia full outer iteration with the MOC integration one or more additional outer iterationscan be performed without the MOC integration, i.e. with the escape and transmissionprobabilities calculated in the last full outer iteration. Only 6 full outer iterations areneeded for convergence in case of many-group calculation of a 30° sector of a WWER-44Cassembly and 9-12 iterations for small core-reflector problems. In case of large core-reflector problems with 10000-16000 regions the number of outer iterations required foiconvergence is 16-26. But the convergence rate in case of full core calculations is venslow still.
271
IntroductionThe method of characteristics (MOC) became the standard transport method in WIMSEJl,2] and in CASMO-4[3] in 1993. Since then many new transport codes based on MOChave been developed[4, 5, 6]. The method of characteristics has great advantages com-pared to the collision probability method, because it is applicable for large problems andsolves the neutron transport equation for the generic angular neutron flux, from whichany reactor physics quantity can be calculated. Compared to the 5V methods MOC hasthe advantage of being capable to model the real geometry of the fuel lattices withoutany homogenization.
Like the S/v methods, MOC solves the neutron transport equation in each group inselected discrete directions, but unlike the 5# method it follows strictly the neutron raysthrough the problem region, thus using the exact solution of the transport equation inits characteristics form. The problem region is covered with sufficient number of paralleltracks for each selected direction, so that the spatial dependence of the angular flux willbe adequately accounted for. Any geometry can be treated, provided adequate ray tracingroutines are available. The only approximation is in the representation of the spatial andangular dependence of the group neutron source. The MOC can treat linearly anisotropicscattering without any special complications. The accuracy of the solution depends on thenumber of selected directions, the track spacing, and the detail in spatial representationof the neutron source, i.e. on the power of the available computer.
The theory of MOC is very simple, but its implementation is not. This paper presentsthe author's experience in developing the neutron transport code MARIK0[7, 8], basedon MOC. In the next section the basic equations of MOC and the method of transmissionprobabilities, which are combined in MARIKO, are presented. Then some key topicsof the geometry modeling are discussed. In the next section the generation of periodictracks, originally used in CACTUS[9, 10], for both rectangular and hexagonal domainsis outlined. Some key topics of the initial tracking and the fay tracing are discussedin the next two sections. The iteration strategy is outlined next. The results of sometest calculations of a WWER-440 fuel assembly, showing the sensitivity of the results onvarious parameters, are presented also.
Basic equations
A neutron direction, £2mn, is defined by the azimuthal angle (the angle between the pro-jection of Qmn on the (x, y) plane and the x axis), ipm, and the polar level (the anglebetween JlTOn and the (x,y) plane), 6n. The same azimuthal angles are used in all polarlevels, because the ray tracing is the same for all polar levels.
The static neutron transport equation for direction flmn in case of linearly anisotropicscattering is the following[ll]:
s ^ r ) , (1)h h h
where:
&gmn is 47r times the angular flux in group g and direction nm n ;
4>h and Jh are the scalar flux and current in group h\
272
Ej is the total cross section for group g;
A is the static eigenvalue;
Xs is the fission spectrum for group g;
i/T,{ is the macroscopic neutron production cross section in group h\
EJ° and ££!_>, are the zeroth and first terms in the expansion of the scatteringcross section in a series of Legendre polynomials.
The neutron source in group 3, region i, and direction fimn, which corresponds to theRHS of Eq. 1, is presented in the following form:
Qg«nn{x,v) = Qgi + 3QxmnQlgi + 3QymnQlgi + Q'xgi(x - Xi) + Q'ygi(y - w ) ,
where (a;,-, yt) is the centroid point of region i and
Q'asi = A - ' ^ S ^ . - ^ M + Eh h
The (x, y)-projection of a neutron ray is called a track. An auxiliary Cartesian (u, v)coordinate system, rotated towards (a;, y) to an angle of (pm, is introduced, so that alltracks in azimuthjil angle <pm are parallel to the w-axis. Each track is divided into tracksegments by the region boundaries. r Tie source along segment s in region i will be also alinear function:
<3mn»(«) = Qmm + Q'uiiu ~ «s),
where us is the u-coordinate of the segment's mid-point and Qmn, is the segment-averagedsource. The group index in this equation and below is omitted. With this source thetransport equation is written in its characteristics form
This equation is solved for the out-flux at the segment's end-point, $™^, provided thein-flux at the segment's start point, $j^n j , is known:
£. = *£L«[1 - El{rmns)) + 9^El(Tmns) + ^°fnB3(rmns), (2)
where rmn$ = E,Lm4/cos0n is the optical segment length, with Lms the segment length.The Ei functions are defined as follows:
E1{T) = l - e - T ,
E3(r) =
Eq. 2 is applied to calculate the out-fluxes for each segment along the periodic track. TheRHS of Eq. 2 has clear physical meaning. The first term is the transmission probabilityfor the angular flux between the start and end points of the segment. If the start point
273
is on edge I and the end point is on edge k of region i, then the first term, multipliedby cos9n6m (6m is the the track separation), is the contribution from this segment tothe transmission probability, Tuk, for the in-coming neutrons on edge / of region i toreach edge A; without collision. The next two terms, also multiplied by cos #„<$„,, can berecognized as contribution to the escape probability, Rik, for the source neutrons in regioni to escape through edge k without collision.
The out-going partial currents, j * k , the region to edge escape probabilities, Rik, and theedge to edge transmission probabilities, Tnk, are calculated by the following expressions:
Rik = E Ww,COSMm E f^Slfrmn.) +mn s€.ik L ^
where Wmn is the integration weight of direction Qmn, s € ik means summation overall segments in the current direction in region i ending on edge k, and s 6 ilk meanssummation over all segments in the current direction in region i starting on edge / andending on edge k The region-averaged flux, $,-mn> and the region-averaged x- and y-components of the current are calculated by
ZiJci = <3a» + E Wam A m n COS 0n A$,m n , Ot = Z,y,mn
where
s G i means all segments in the current direction in region i, Ai is the area of region i.The calculation of Wmn is discussed in [7].
Since the linear source is only an approximation, not directly related to the neutronbalance, the second equation of the Pi-approximation to the transport equation is usedto calculate the region-averaged x- and y-derivatives of the scalar flux:
4>'agi = -yLlgiJagi + 3 E S k ' - j ^ o M , a = x,y,h
where Ei is the current-weighted total cross section.For-the method of transmission probabilities the neutron balance equation for region
i can be written as
and the equations for the out-going partial currents are
These equations are transformed into equivalent ones with the self-scattering terms ex-cluded.
274
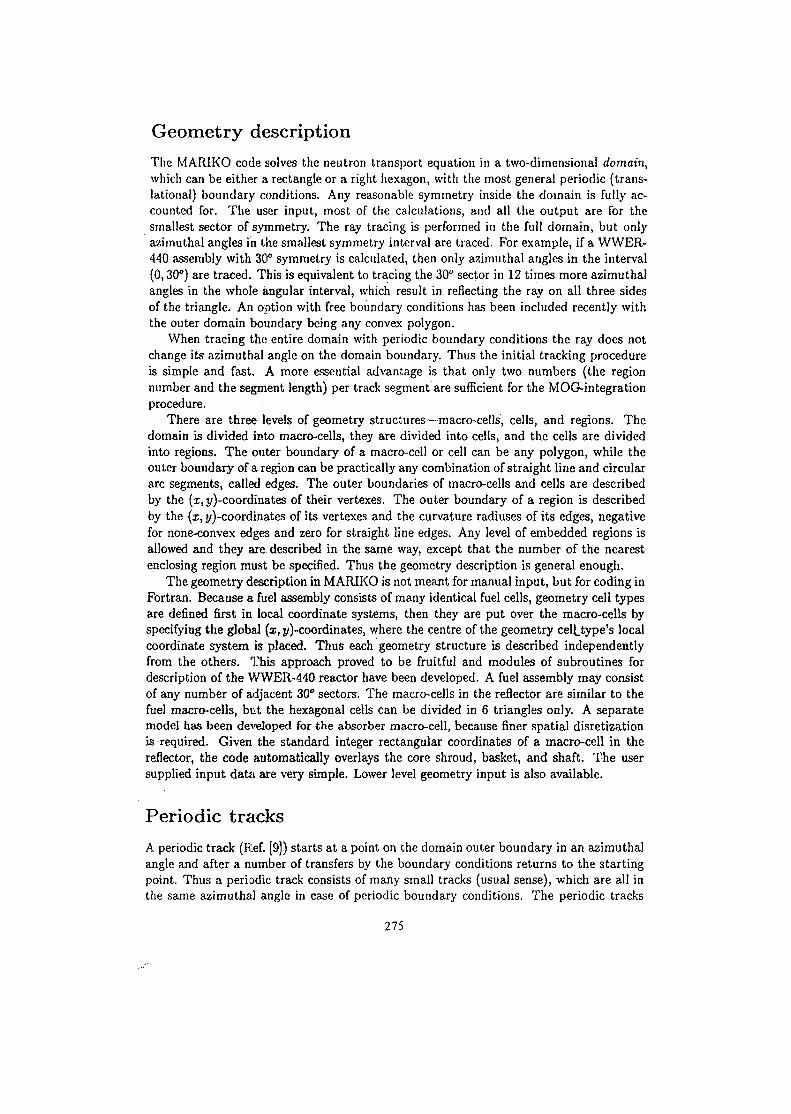
Geometry descriptionThe MARIKO code solves the neutron transport equation in a two-dimensional domain,which can be either a rectangle or a right hexagon, with the most general periodic (trans-lational) boundary conditions. Any reasonable symmetry inside the domain is fully ac-counted for. The user input, most of the calculations, and all the output are for thesmallest sector of symmetry. The ray tracing is performed in the full domain, but onlyazimuthal angles in the smallest symmetry interval are traced. For example, if a WWER-440 assembly with 30° symmetry is calculated, then only azimuthal angles in the interval(0,30°) are traced. This is equivalent to tracing the 30" sector in 12 times more azimuthalangles in the whole angular interval, which result in reflecting the ray on all three sidesof the triangle. An option with free boundary conditions has been included recently withthe outer domain boundary being any convex polygon.
When tracing the entire domain with periodic boundary conditions the ray does notchange its azimuthal angle on the domain boundary. Thus the initial tracking procedureis simple and fast. A more essential advantage is that only two numbers (the regionnumber and the segment length) per track segment are sufficient for the MOG-integrationprocedure.
There are three levels of geometry structures—macro-cells, cells, and regions. Thedomain is divided into macro-cells, they are divided into cells, and the cells are dividedinto regions. The outer boundary of a macro-cell or cell can be any polygon, while theouter boundary of a region can be practically any combination of straight line and circulararc segments, called edges. The outer boundaries of macro-cells and cells are describedby the [x, y)-coordinates of their vertexes. The outer boundary of a region is describedby the (x, j/)-coordinates of its vertexes and the curvature radiuses of its edges, negativefor none-convex edges and zero for straight line edges. Any level of embedded regions isallowed and they are. described in the same way, except that the number of the nearestenclosing region must be specified. Thus the geometry description is general enough.
The geometry description in MARIKO is not meant for manual input, but for coding inFortran. Because a fuel assembly consists of many identical fuel cells, geometry cell typesare defined first in local coordinate systems, then they are put over the macro-cells byspecifying the global ( i , y)-coordinates, where the centre of the geometry celLtype's localcoordinate system Is placed. Thus each geometry structure is described independentlyfrom the others. This approach proved to be fruitful and modules of subroutines fordescription of the WWER-440 reactor have been developed. A fuel assembly may consistof any number of adjacent 30° sectors. The macro-cells in the reflector are similar to thefuel macro-cells, but the hexagonal cells can be divided in 6 triangles only. A separatemodel has been developed for the absorber macro-cell, because finer spatial disretizationis required. Given the standard integer rectangular coordinates of a macro-cell in thereflector, the code automatically overlays the core shroud, basket, and shaft. The usersupplied input data are very simple. Lower level geometry input is also available.
Periodic tracksA periodic track (Fief. [9]) starts at a point on the domain outer boundary in an azimuthalangle and after a number of transfers by the boundary conditions returns to the startingpoint. Thus a periodic track consists of many small tracks (usual sense), which are all inthe same azimuthal angle in case of periodic boundary conditions. The periodic tracks
275
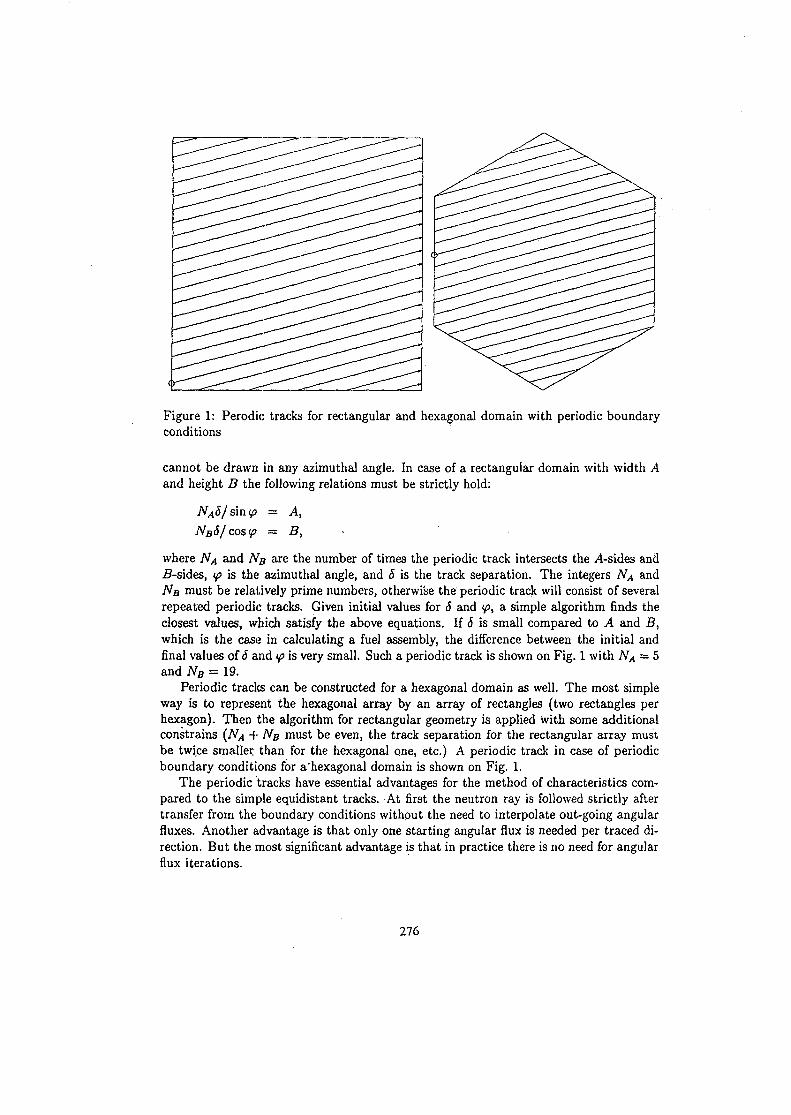
Figure 1: Perodic tracks for rectangular and hexagonal domain with periodic boundaryconditions
cannot be drawn in any azimuthal angle. In case of a rectangular domain with width Aand height B the following relations must be strictly hold:
NA5/ sin <p = A,
NB6/ cos <p = B,
where NA and NB are the number of times the periodic track intersects the A-sides and2?-sides, ip is the azimuthal angle, and 8 is the track separation. The integers NA andNB must be relatively prime numbers, otherwise the periodic track will consist of severalrepeated periodic tracks. Given initial values for 8 and (p, a simple algorithm finds theclosest values, which satisfy the above equations. If 6 is small compared to A and B,which is the case in calculating a fuel assembly, the difference between the initial andfinal values of 8 and ip is very small. Such a periodic track is shown on Fig. 1 with NA = hand NB = 19.
Periodic tracks can be constructed for a hexagonal domain as well. The most simpleway is to represent the hexagonal array by an array of rectangles (two rectangles perhexagon). Then the algorithm for rectangular geometry is applied with some additionalconstrains {NA + NB must be even, the track separation for the rectangular array mustbe twice smaller, than for the hexagonal one, etc.) A periodic track in case of periodicboundary conditions for a'hexagonal domain is shown on Fig. 1.
The periodic tracks have essential advantages for the method of characteristics com-pared to the simple equidistant tracks. At first the neutron ray is followed strictly aftertransfer from the boundary conditions without the need to interpolate out-going angularfluxes. Another advantage is that only one starting angular flux is needed per traced di-rection. But the most significant advantage is that in practice there is no need for angularflux iterations.
276
Initial trackingThe initial tracking is aimed at preparing information for the real ray tracing so that thelatter will be as fast as possible, because the initial tracking is performed only once andthe ray tracing is performed many times. Initial tracking is performed for all azimuthalangles in the smallest symmetry interval. Because a periodic track is in a single azimuthalangle, it is convenient to rotate the domain so that the tracks are horizontal in the new(u,v) coordinate system. Each track is divided by the region boundaries into (track)segments. The first quantity to be determined is the segment length. It is sufficient forthe flat source approximation, but for the linear source approximation the u-coordinateof the segment's mid point is also needed. In MARJKO only the u-coordinate of thestarting point of the first segment on a track is saved, and the segment lengths are usedto calculate the required us following the track from left to right. The u-coordinate of thesegments mid-points is the same for all segments on a track and it is saved per track aswell. Because the number of tracks is many times less than the number of segments, thisgives significant memory savings.
Another quantity to be prepared by the initial tracking is the region number by seg-ment number. In MARIKO a single integer number is used to save both the global regionnumber (in the entire domain) and the edge-couple number local to the intersected region.The global region number is multiplied by 256 and the local edge-couple number is added.Thus the total number of regions cannot exceed 224 - 1 and the number of edges of aregion cannot exceed 16. Both margins seem reasonable. In integrating the transmissionprobabilities the edge-couple number in the smallest sector of symmetry is needed and itis calculated by one addition, using an auxiliary array by global region number, which isthe base edge-couple number in the smallest sector of symmetry minus the global regionnumber times 256. Thus two 4-byte'words per segment and another two per track aresufficient to save all data for the ray tracing.
The starting angular flux
The starting angular flux is needed to start the integration along the periodic track, but itis unknown. An initial value with unknown error is available from the previous sweep inthe same group and neutron direction or from the initial guess. In order to be precise andto do the MOC-integration with the true angular flux, the following procedure is availablein MARIKO. Starting from the periodic track's starting point with the available initialstarting angular flux, an optical length of rmax is passed calculating only the angular fluxwithout integration, where rm o I is an input quantity. If rm o i = 10, it is obvious that theerror in the starting angular flux will be completely "forgotten" after passing 10 meanfree paths. The integration starts from this point on, continues to the end of the periodictrack, and then the initial rmax part of it is passed again, this time with integration. Onreaching the end of the periodic track, the new value of the starting angular flux is saved.
Since the total optical length of the periodic track is much longer than rm0I (except insingle fuel cell calculations), the cost of this additional procedure is negligible. After thisprocedure had been implemented, a study for the optimum value of r m a i was performed.It was found that in case of assembly calculations, setting rm a i equal to 0 does not changeneither the final results nor the convergence behavior of the whole iteration process. Theexplanation is simple—because the error in the starting flux is small and dies out in adistance much smaller than the total length of the periodic track, the impact of the error
277
on the integrated results is negligible. Therefore, the integration may start from the verybeginning of the periodic track.
Iteration strategy
The MOC in its simplest version is used to calculate only the scalar flux by region, whichleads to slow convergence because of the self-scattering and up-scattering even for singlecell problems. But having the generic angular neutron flux, it is possible to calculate thepartial currents trough region edges and region to edge escape probabilities as well asedge to edge transmission probabilities. In the very first version of MARIKO the simplemesh re-balance method (MRM) has been tested for acceleration of the self-scatteringand up-scattering iterations. It does not require escape and transmission probabilities,but its efficiency is not good even in case of single cell problems with MOX fuel andfine spatial discretization. That is why the method of transmission probabilities (MTP)was adopted. It should be noted that this version of the MTP is exact, because theescape and transmission probabilities are calculated each time the MOC integration for aneutron group is performed. Of course, these probabilities depend on the current angularflux distribution, especially in the fast energy range, hut when the solution has convergedthe solution of the MTP is fully consistent with that of the MOC. In order to get fullconsistency double precision must be used in calculating the final coefficients, althoughthey can be stored in single precision.
The MTP is used in two different ways in each outer iteration (with fixed fissionsource). For a particular neutron group it is applied once before and once after theMOC-integration. The first time it is used with the old coefficients from the last passthrough the same group (the MRM is used in the very first pass) and aims at improvingthe scalar flux distribution for the current group in accordance with the new in-sourcefrom fission and in-scattering. Then the MOC-integration is performed and new scalarfluxes, currents, partial currents, and escape and transmission probabilities are calculatedfor the current group. The MTP is applied again to improve the scalar flux distributionfurther. This procedure is applied for each group, and it is sufficient to account for theself-scattering effects.
For the up-scattering effects a many-group version of the MTP has been developed. Itsolves the equations simultaneously for all thermal groups. It is applied once before thethermal groups are to be passed, but after the last fast group has been passed, and onceafter they have been passed. This turned out to be the only way to account efficientlyfor the up-scattering effects in case of core-reflector problems, when the coupling throughthe scattering is probably stronger than the spatial coupling. No additional pass throughthe lowest energy groups is necessary.
With this iteration strategy the convergence rate in all energy ranges is nearly thesame. In some cases it is advantageous to repeat the iteration in each one of the highestenergy groups. However, the estimates of the dominance ratio for the power iterationsare unstable. In small-size problems the convergence rate of the outer iterations is veryhigh. Depending on the convergence criteria, 5-6 outer iterations are sufficient for manygroup calculations of a 30° sector of a WWER-440 fuel assembly. For the WWER-440absorber problem 8-11 outer iterations are sufficient. For small core-reflector problems9-12 outer iterations are sufficient as well. Medium size problems with 10000-16000 regionrequire 16-26 outer iterations. But for full core problems no solution for acceleration ofthe outer iterations has been found. One possibility is to use the MTP for additional
278
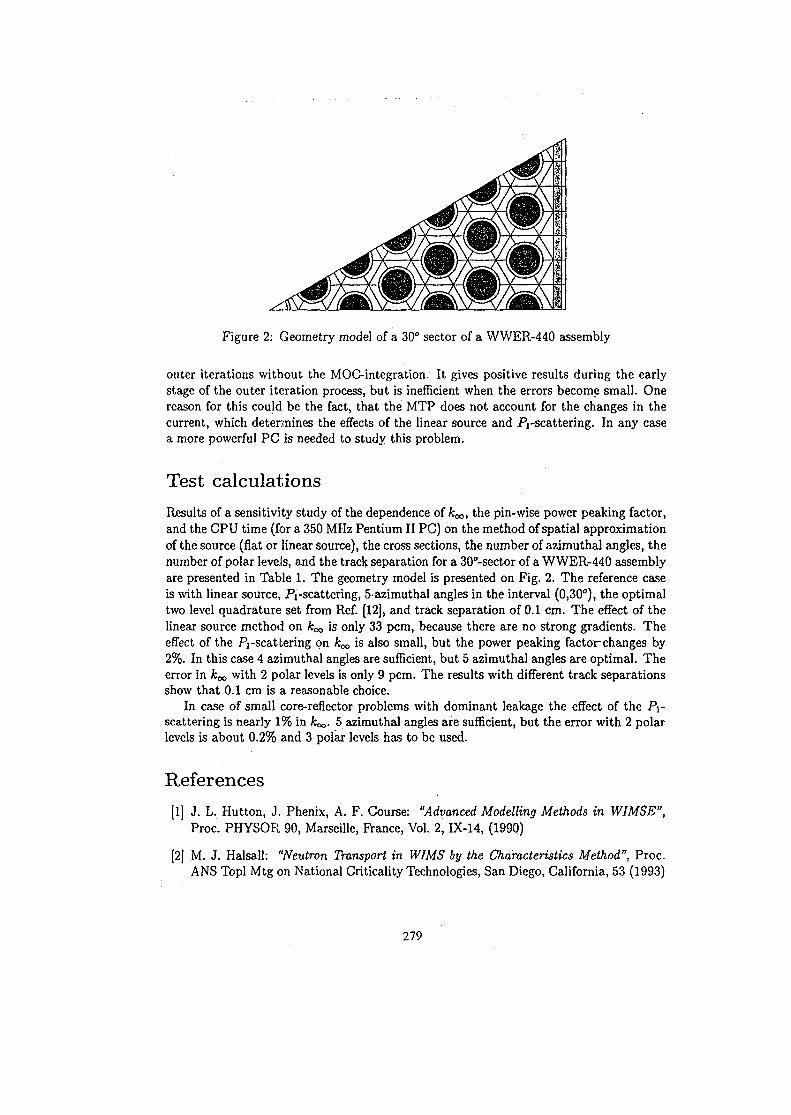
Figure 2: Geometry model of a 30° sector of a WWER-440 assembly
outer iterations without the MOC-integration. It gives positive results during the earlystage of the outer iteration process, but is inefficient when the errors become small. Onereason for this could be the fact, that the MTP does not account for the changes in thecurrent, which determines the effects of the linear source and Pj-scattering. In any casea more powerful PC is needed to study this problem.
Test calculations
Results of a sensitivity study of the dependence of fcoo, the pin-wise power peaking factor,and the CPU time (for a 350 MHz Pentium II PC) on the method of spatial approximationof the source (flat or linear source), the cross sections, the number of azimuthal angles, thenumber of polar levels, and the track separation for a 30"-sector of a WWER-440 assemblyare presented in Table 1. The geometry model is presented on Fig. 2. The reference caseis with linear source, Pi-scattering, 5-azimuthal angles in the interval (0,30°), the optimaltwo level quadrature set from Ref. [12], and track separation of 0.1 cm. The effect of thelinear source method on ArTO is only 33 pcm, because there are no strong gradients. Theeffect of the Pi -scattering on £«, is also small, but the power peaking factor changes by2%. In this case 4 azimuthal angles are sufficient, but 5 azimuthal angles are optimal. Theerror in koo with 2 polar levels is only 9 pcm. The results with different track separationsshow that 0.1 cm is a reasonable choice.
In case of small core-reflector problems with dominant leakage the effect of the .Pi-scattering is nearly 1% in koo. 5 azimuthal angles are sufficient, but the error with 2 polarlevels is about 0.2% and 3 polar levels has to be used.
References(1] J. L. Hutton, J. Phenix, A. F. Course: "Advanced Modelling Methods in WIMSE",
Proc. PHYSOR 90, Marseille, France, Vol. 2, IX-14, (1990)
[2] M. J. Halsall: "Neutron Transport in WIMS by the Characteristics Method", Proc.ANS Topi Mtg on National Criticality Technologies, San Diego, California, 53 (1993)
279
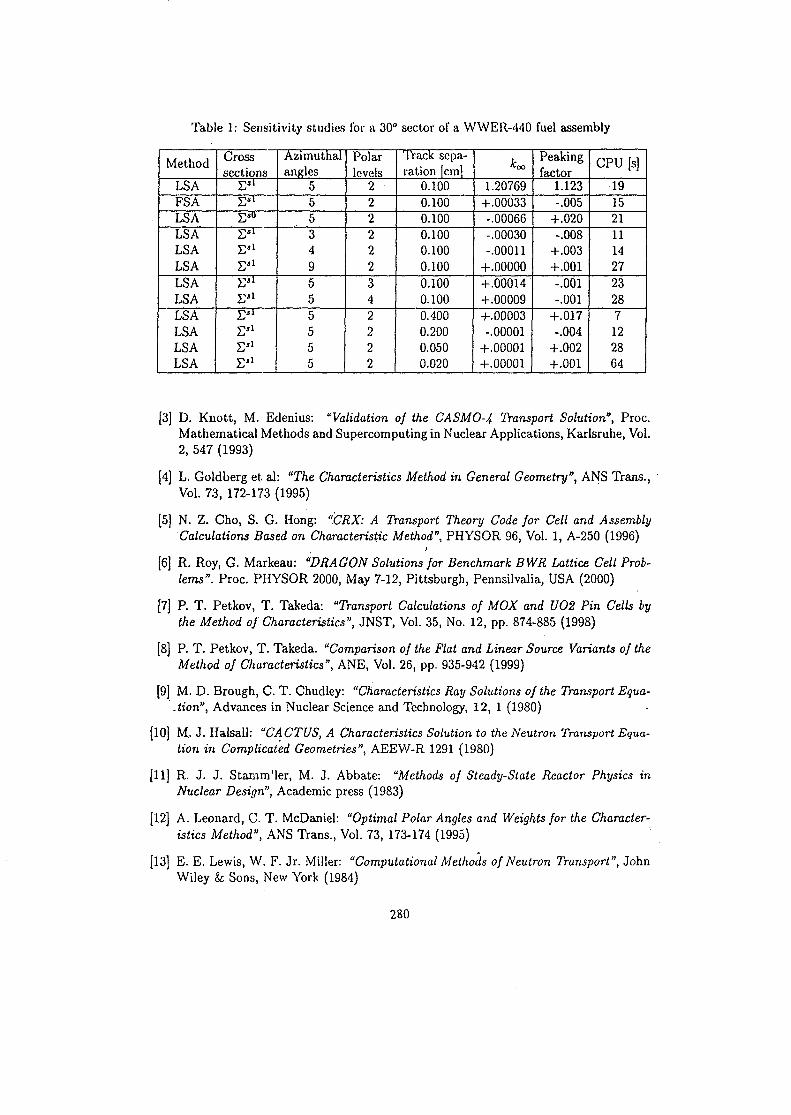
Table 1: Sensitivity studies for a 30° sector of a WWER-440 fuel assembly
Method
LSAFSALSALSALSALSALSALSALSALSALSALSA
Crosssections
E51
E50
£51
E "E*1
E*1
E*1
E'1
E*1
E*1
Azimuthalangles
555349555555
Polarlevels
222222342222
Track sepa-ration [cm]
0.1000.1000.1000.1000.1000.1000.1000.1000.4000.2000.0500.020
1.20769+.00033-.00066-.00030-.00011
+.00000+.00014+.00009+.00003-.00001
+.00001+.00001
Peakingfactor
1.123-.005
+.020-.008
+.003+.001-.001-.001
+.017-.004
+.002+.001
CPU [s]
19152111142723287122864
[3] D. Knott, M. Edenius: "Validation of the CASMO-4 Transport Solution", Proc.Mathematical Methods and Supercomputing in Nuclear Applications, Karlsruhe, Vol.2, 547 (1993)
[4] L. Goldberg et, ah "The Characteristics Method in General Geometry", ANS Trans.,Vol. 73, 172-173 (1995)
[5] N. Z. Cho, S. G. Hong: "GRX: A Transport Theory Code for Cell and AssemblyCalculations Based on Characteristic Method", PHYSOR 96, Vol. 1, A-250 (1996)
[6] R. Roy, G. Markeau: "DRAGON Solutions for Benchmark BWR Lattice Cell Prob-lems". Proc. PHYSOR 2000, May 7-12, Pittsburgh, Pennsilvalia, USA (2000)
[7] P. T. Petkov, T. Takeda: "Transport Calculations of MOX and UO2 Pin Celb bythe Method of Characteristics", JNST, Vol. 35, No. 12, pp. 874-885 (1998)
[8] P. T. Petkov, T. Takeda. "Comparison of the Flat and Linear Source Variants of theMethod of Characteristics", ANE, Vol. 26, pp. 935-942 (1999)
[9] M. D. Brough, C. T. Chudley: "Characteristics Ray Solutions of the Transport Equa-tion", Advances in Nuclear Science and Technology, 12, 1 (1980)
[10] M.. J. Halsall: "CACTUS, A Characteristics Solution to the Neutron Transport Equa-tion in Complicated Geometries", AEEW-R 1291 (1980)
[11] R. J. J. Stamm'ler, M. J. Abbate: "Methods of Steady-State Reactor Physics inNuclear Design", Academic press (1983)
[12] A. Leonard, C. T. McDaniel: "Optimal Polar Angles and Weights for the Character-istics Method", ANS Trans., Vol. 73, 173-174 (1995)
[13] E. E. Lewis, W. F. Jr. Miller: "Computational Methods of Neutron Transport", JohnWiley & Sons, New York (1984)
280
SK01ST092
SPECTRAL CALCULATIONS OF VVER-440 FA WITH Gd BURNABLEABSORBERS
P.MikolaS
§KODA JS a.s., Plzeft, Czech Republic
ABSTRACT
Paper describes some analyses of VVER-440 FA with Gd burnable absorber (Gd2
Analyses consist in comparison of FA with and without Gd absorber incl. variantswith different Gd absorbers and a methodology of FA burnup calculation with the aim offinding of an optimal variant of such a FA and a methodology of its calculation.
A benchmark forfnirnup comparison of FA with Gd as a continuation of benchmarkfor FA bumup comparison from 1996 is also proposed.
1. INTRODUCTION
Fuel assemblies (FA) loaded into WER-440 core on NPP Dukovany do not containburnable absorber. Having in mind the request of improving of the efficiency of fuel economy,a five year cycle should be used in the future. Therefore, a use of burnable absorbers in FAseems to be necessary. A common practice is Gd absorber in the form of Gd2O3 dispersed inUO2 of some of fuel pins of FA. -
This paper describes the basic characteristics of FA containing Gd (especially kjnf,relative pin power distribution and Gd concentrations changes) in bumup process. Result ofcomparisons are shown and judged and recommendations for design calculations are given.
281
2. FUEL ASSEMBLY MODEL
Fig. la shows a scheme of a VVER-440 FA with its enrichment and Gd pin location in60 deg. symmetry. This design is taken as a starting one and the other analyses are related tothis design. (Fig. Ib shows enrichment of other design with Gd (in this paper also calledGd42), Fig. 1c shows ,,advanced" FA 0 4.21 w% U235 enrichment (without Gd) and Fig. Idshows ,,advanced" FA <Z 3.82w% U enrichment (without Gd).)
The starting calculation model is similar to this one, which has been used at few grouplibrary preparation. In addition, a special option for burnable poison depletion (which consistsin correction of reaction rates in burnable absorber in time interval) and a method of anexplicit individual depletion of each fuel pin (see later) has been applied. All input data weretaken (if not stated otherwise) from the passport of advanced fuel, although it is clear, thatsome data must be different for Gd pins. One sixth of FA is calculated.
The main aim of these analyses was to check kjnf dependence, relative pin powerdistribution and Gd isotopic concentrations development at FA burnup. Some options, whichmust be taken into account, were also pointed out.
3. COMPARISON CALCULATIONS OF DIFFERENT FA'S
a) Basic comparison of four FA designs
First, four FA were compared: FA with Gd (an average U235 enrichment approx. 4.4w% with 6 pins with Gd2O3), the same FA without Gd pins and two FA without Gd, withan average enrichment 3.82 w% U235 or 4.21 w% U235, respectively.
From Fig. la (kjnf dependence) it is clear, that reactivity is reduced for fresh FA withGd, and reactivity increases to some extent with bumup. After Gd burns out, thedifferences are almost constant. (Remarkable is, that kjnf (after Gd burns out) is almost thesame like without Gd). Figs. 2a-5a show values of relative pin power distribution in'selected pins, namely No. 12, No. 14, No. 17 and No.20 (see Fig. II) during bumup process(assemblies are marked as in Fig. la). From this picture is obvious, that after huge powerdepression in fresh fuel with Gd comes to the flattening of pin powers and further pinpowers are veiy similar. Fuel pin No. 14 (Fig.3a) is influenced by Gd in the beginning ofburnup, fuel pin in the ,,corner" (No. 17) is influenced in the beginning of FA bumup, laterpower is high (fuel enrichment profilation is desirable). On the contrary, fuel pin No.20 hasrel. power higher in the beginning of burnup, after Gd burns out, it is relatively small.
282
b) Different variants relating to Gd
In addition to basic variants, also further models were evaluated, namely 1) with lowerGd2O3 content, [05Gd44], 2) with fuel pins profilation (,,pins in the corner" has lowerenrichment [Gd42=Gd434] and 3) Gd pin was shifted to the position No.8 [08Gd44].
Results are summarised on Figs. lbz-5bz (shown only to burnup 20000 MWd/tU,because for higher burnups results ,,are not interesting"). From Fig. lbz is seen, that max.kini- for FA with lower Gd2C>3 content is higher, of course k|nf of FA with profilation islower.
Relative powers in pins No. 12 do not practically differ exc. case where Gd is in pinNo.8. For this case, also relative power distribution in pin No.8 is shown (Fig. 2bzPP12(08)), where is also seen slower approach to the limiting value. Fig. 3bz shows fuelpin No. 14 (difference for profiled FA), from Fig. 4bz (pin No. 17) is obvious, whyprofilation is desirable, and also, why it is not suitable to shift Gd pin into position No.8.Relative powers in pins No.20 are very similar, their relative powers would be desirable tolower for fresh FA (for example, by lowering of enrichment in ,,profiled" fuel pins).
c) Calculations methodology
The influence of some designs on kjnf and relative pin power distribution has beenevaluated in the previous paragraph (flux density in subregion is constant; only fuel pelletwith Gd is subdivided into 5 annuli, each annulus and fuel pin depletes differently (if notstated otherwise), fuel pellet is one region). Some other aspects are now evaluated. FromFigs. lc-5c is seen that moderator regions subdivision is not very important [meGd44], butnot negligible. More serious is burnup' process in this sense that in variant [ddGd44]depletes (on the contrary to base variant Gd44) each pin differently (21 FP in 60 deg. FAsymmetry). The same is in variant [21Gd44], where different FP are defined in thebeginning of depletion.
Although the influence on klnf is minimal (see Fig. Ic(cont.)), the influence on relativepin power distribution is important, as seen esp. from Figs. 4c, 5c. This phenomenon is notso strong, if FA is profiled (as seen from Figs. Id-5d [Gd42=Gd434] - profiled FA; burnupfor groups of pins, ddGd42 -profiled FA; burnup of each FP different). From the analysisis obvious, that different burnup of each FP is necessary.
Also an important option is length of time step at burnup, the most precise would bethe highest as possible number of full spectral calculations where a new space and energyneutron flux distribution is determined on the base of changed isotopic densities. Thesecalculations are time demanding. These calculations could be partially replaced by zerodimensional calculations, where a new spectrum is determined from a homogeneoussolution. Figs. lez-5ez show k;nf dependencies and relative pin power distribution fordifferent variants, namely the base one [Gd44], with tenfold number of zero dimensional
283
calculations [50Gd44], {in 69 energy group structure at spectral calculation [69Gd44]},twofold number of full spectral calculations [d2Gd44] and fourfold number of fullspectral calculations [d4Gd44]. It is seen that zero dimensional calculations replace (tosome extent) spectral calculations, but differences still remain which are remarkable by Gdisotopes concentrations comparison (Figs. lecz-5ecz). Esp. from Figs. 2ecz-4ecz (Gd1",Gd15 ) is obvious, how these concentrations depend on the calculation process.
From the point of view of few group library preparation are these differences not quitenegligible and it is necessary to find a compromise between the accuracy and speed ofcalculation.
An influence of exact description of FP with Gd has also been checked. In addition tothe reference variant, three other variants were calculated, namely: 1) fuel pellet with Gd issubdivided into 10 regions (annuli) of the same volume instead of 5 annuli [10Gd44], 2)special option for burnable poisons (flux density correction at burnup) is not used[npGd44] and 3) fuel pellet with Gd is modelled like only one region (without specialoption) [lpGd44].
As shown on Figs. lfz-5fz, is obvious that variants ad 2) and 3) are not acceptable.Differences between variants with 5 regions (base variant) and 10 regions in Gd pellet aresmall, therefore 5 regions will be applied (time saving).
d) Other analyses of FA with Gd
As pointed out in the previous paragraphs, fuel enrichment profilation seems to benecessary. After some additional analyses, two FA designs with Gd burnable absorber havebeen accepted. Their profilation is shown on Figs. Ie, If. Relative pin power distributions ofall pins for three types of FA (two of them with Gd - Figs. Ie, If and Ic) are shown onFigs.lg, lh and li. There are seen differences in relative pin power distribution, particularlythe fact, that relative pin power distribution in FA with Gd is more ,,unbalanced". Also,fuel enrichment in pins seems not to be ,,optimal". Relatively fine time step (which is veryimportant) has been used for bumup process (51 time steps in interval <0-60MWd/kgU>).FA features can be also improved using bigger pin pitch (12.2-»12.3) mm. Althoughdifferences in kjnf are relatively small (see Figs. 2(gh)), relative pin power distributionsdiffer significantly, especially in pins along FA shell (No. 17, No.20; Figs. 3(gh)-s-6(gh)).
4. RESULTS SUMMARY
Based on calculations described in the previous chapter, for FA with Gd absorber canbe stated as follows:
284
- Gd is almost burnt out after first cycle. Some residual reactivity loss is caused by Gd(it is caused not only by Gd isotopes presence, but also by less uranium amount in Gdpin);
- GdjOj content influences speed of Gd depletion, its optimum depends also on theother then only neutron-physical criteria;
- UO2 enrichment profilation is an necessary option, which depends not only onneutron-physical conditions;
- Position of Gd pin seems to be optimal (its shift to the centre of FA is not suitable, itslocation in the comer of FA would have unpredictable influences on adjacent FAs);
- Subdivision of moderator around fuel pin is desirable; a compromise betweenaccuracy and speed of calculation has been found;
- Explicit burnup of each fuel pin is necessary. A question remains if each- pin has tohave its own cross-sections in pin-to-pin whole core diffusion calculation;
- Time step at burnup must be shorter than for fuel without Gd. Optimum is acompromise between possible accuracy and speed of calculations. Not only fromresults discussed, probably time step will be shorter in the beginning of burnup of FAand after Gd burns out, step will be longer;
- Special option for Gd burnup is requested. Subdivision of Gd fuel pellet is necessary,5 regions seems to be adequate;
- FA features can be improved using larger pin pitch (this is not only a feature of FAwith Gd absorber)
5. CONCLUSION
Paper summarises some neutron-physical features of VVER-440 FA with Gd burnableabsorber (Gd2O3). Because of high importance of such a FA for VVER-440 in the future issupposed, a benchmark for burnup of FA with Gd burnable absorber is proposed. Proposal isdescribed in the Appendix.
6. REFERENCE
[1] Coll.:WIMS, A Modular Scheme for Neutronics Calculations, User Guide,ANSWERS/WIMS(95)4, Winfrith, UK, 1996 (Rev. 1998)
285
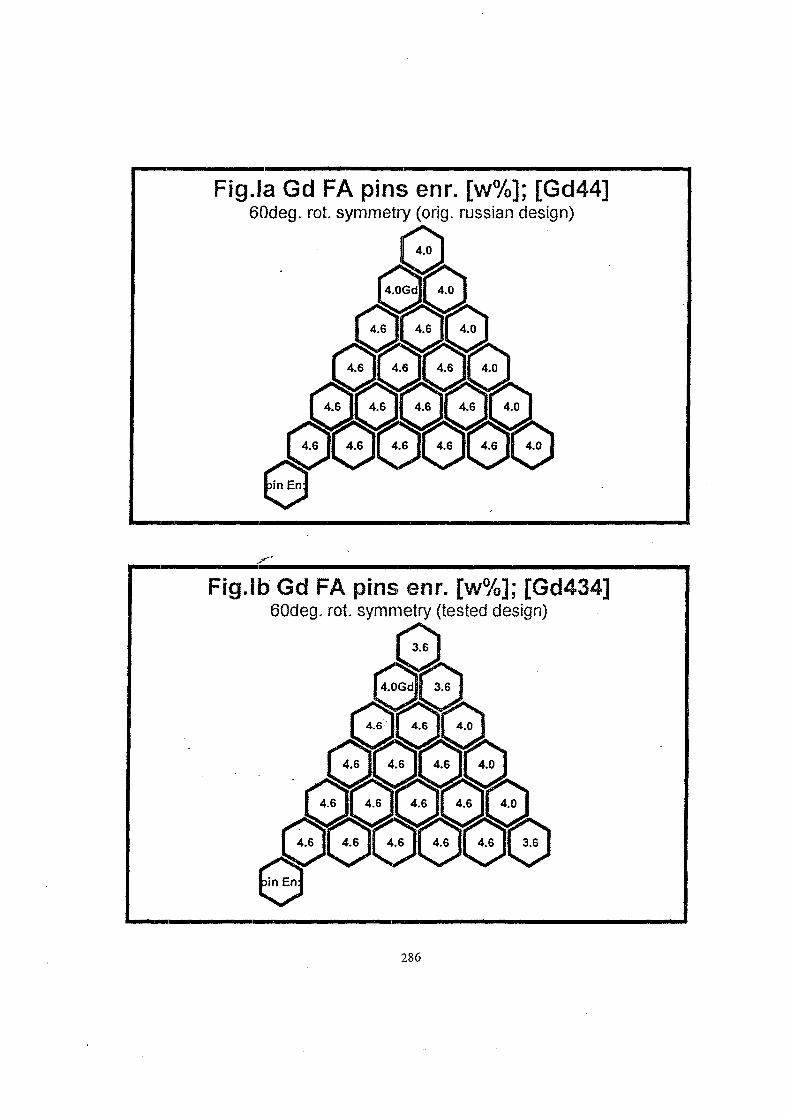
Fig.la Gd FA pins enr. [w%]; [Gd44]60deg. rot. symmetry (orig. russian design)
Fig.lb Gd FA pins enr. [w%]; [Gd434]60deg. rot. symmetry (tested design)
286
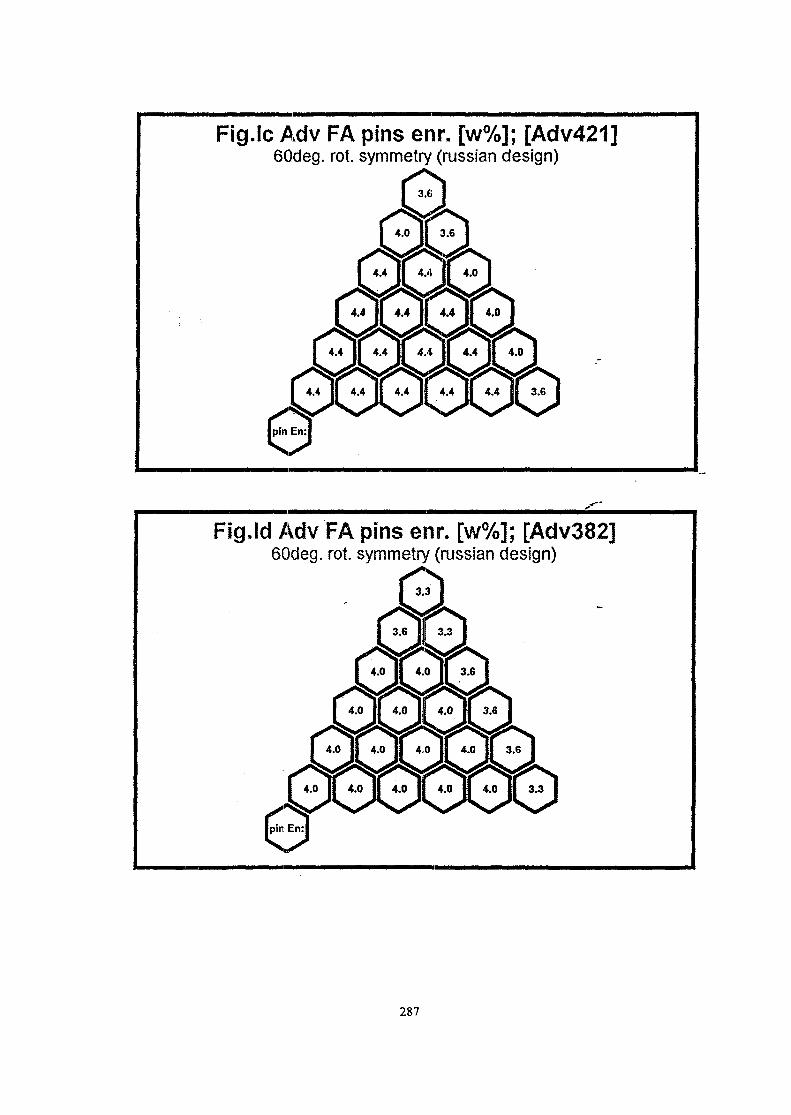
Fig.ic Adv FA pins enr. [w%]; [Adv421]60deg. rot. symmetry (russian design)
4.0
3.6
Fig.ld Adv FA pins enr. [w%]; [Adv382]60deg. rot. symmetry (russian design)
3.3
287
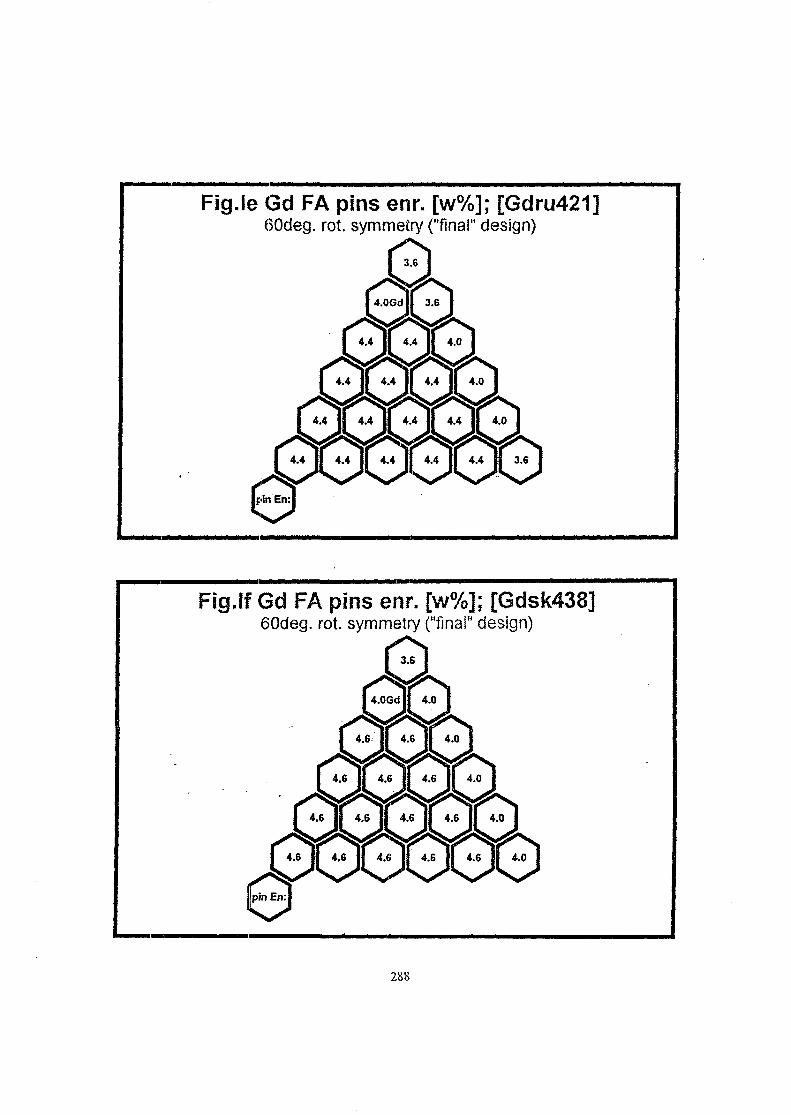
Fig.ie Gd FA pins enr. [w%]; [Gdru421]60deg. rot. symmetry ("final" design)
Fig.lf Gd FA pins em. [w%]; [Gdsk438]60deg. rot. symmetry ("final" design)
288
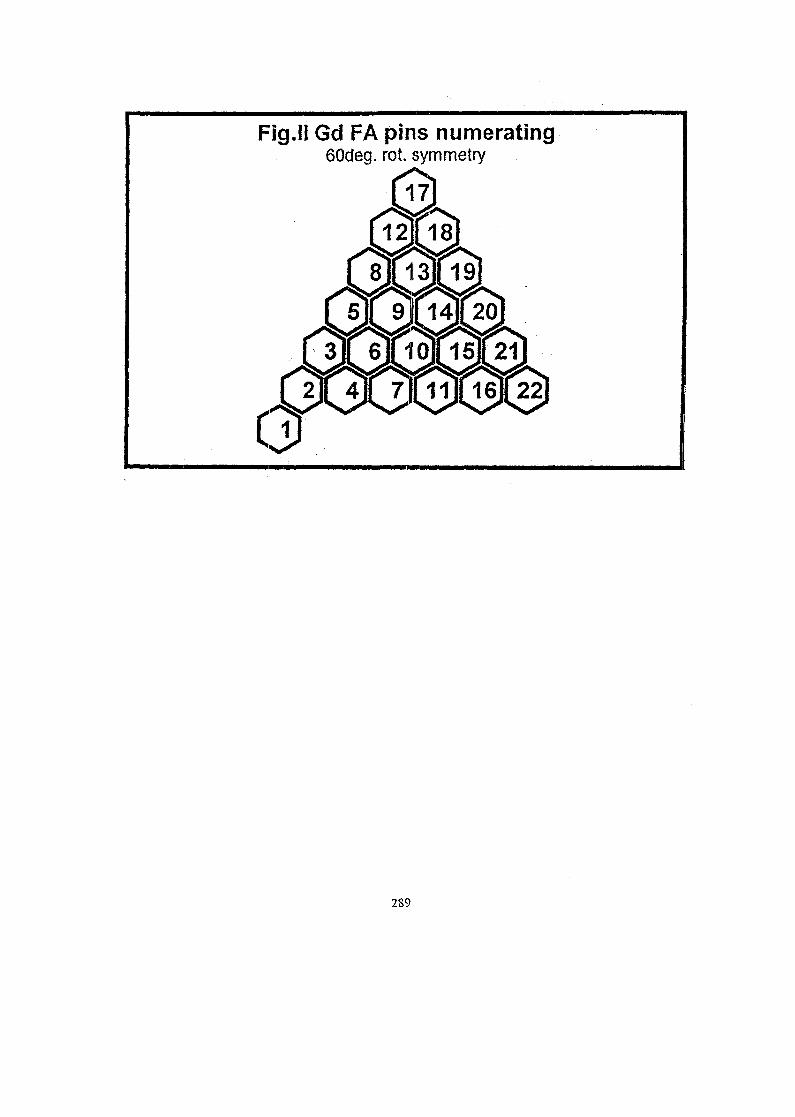
Fig.ll Gd FA pins numerating60deg. rot. symmetry
289
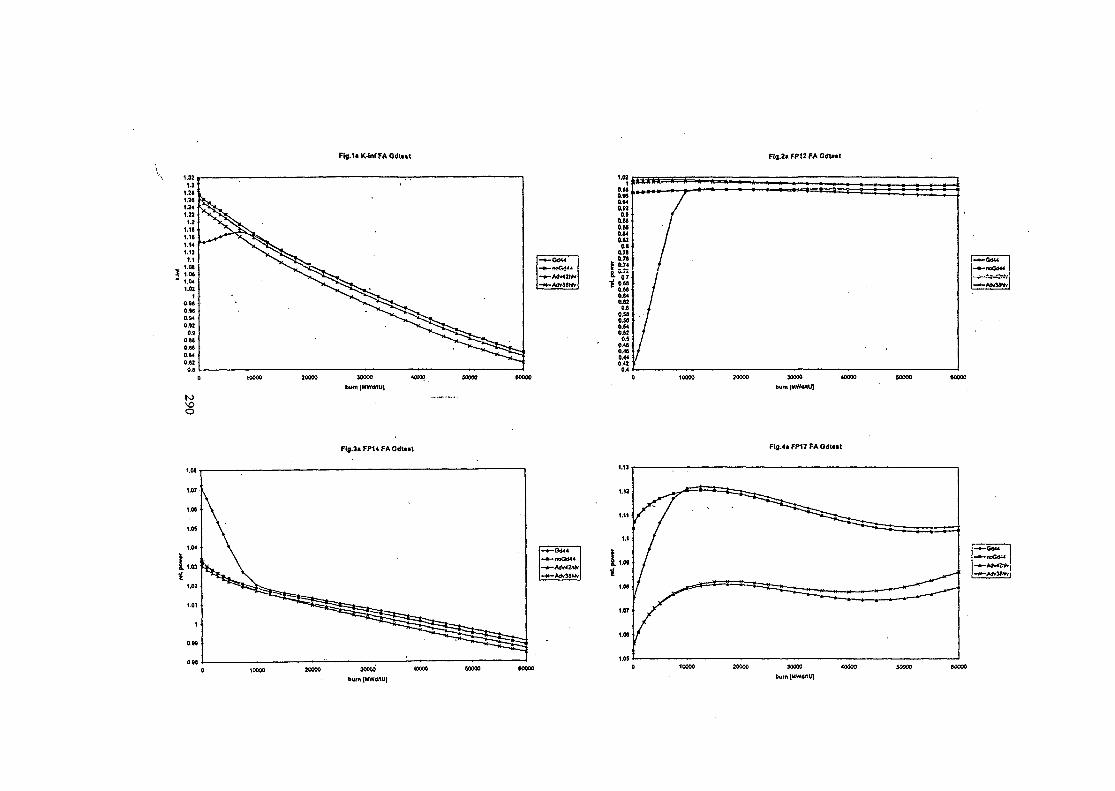
Flg.1«K-lnf FA Gdt.»t Flg.2i FP12 FA Cdtut
20000 30000 40000
bum [MWdAU]
too
Flj.Ja FP14FAGdt.il Flg.4a FP17 FA Gdt.tt
20000 MOW <00O0
burn (MWdAU)
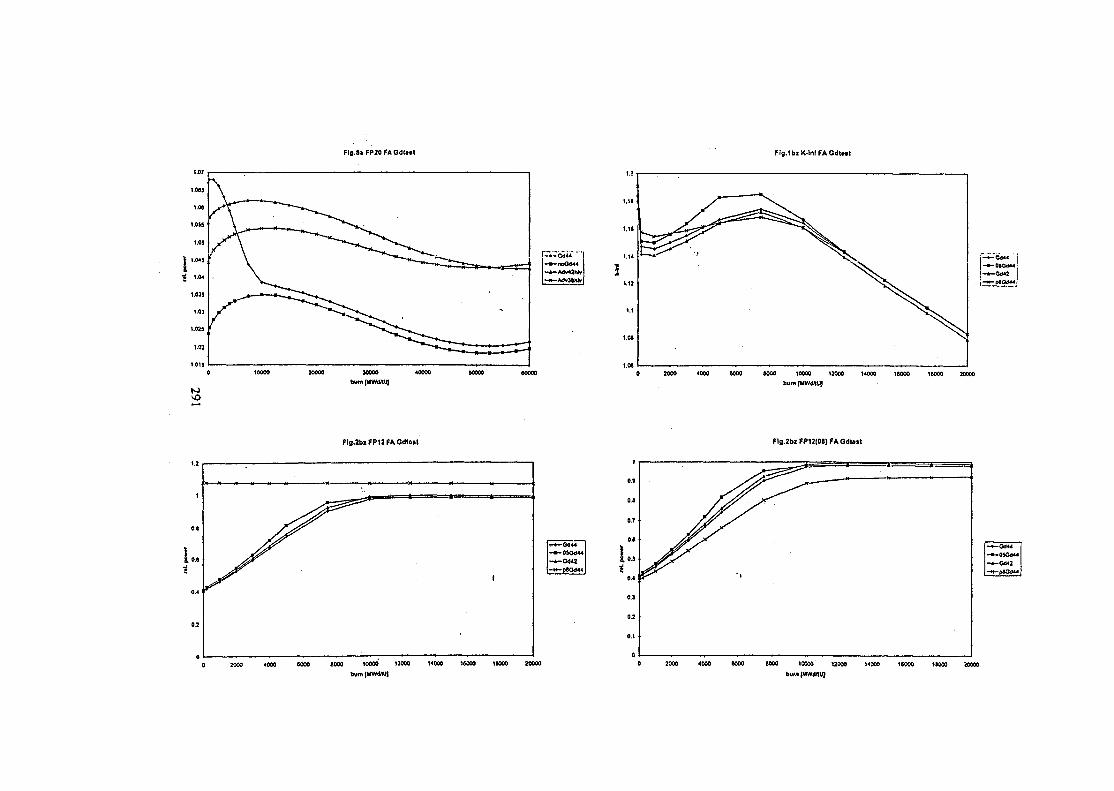
Flg.5< FP20 FA Gdt»»t Flg.ibiK-lnfFAOdtut
- G d 4 4
-noO<M4
3000 4000 eooo woo 10000 12000 14000 itooo igooo joooo
- O M J-stag**}
Flg.2blFP12FAGdUat Flg.2bz FP12(0I) FA Odlost
2000 4000 eooo eooo 10000 12000 14000 leooo teooo 20000 2000 4000 eooo eooo 10000 12000 14000 teooo leooo 20000
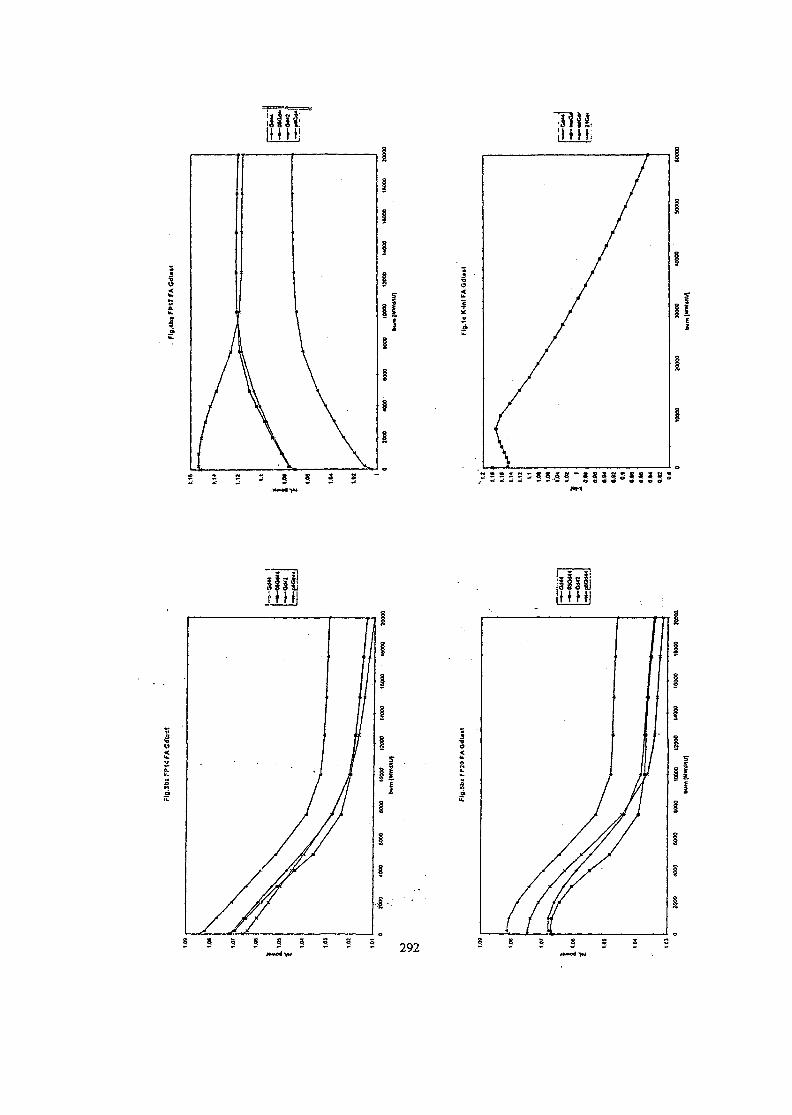
Is
292
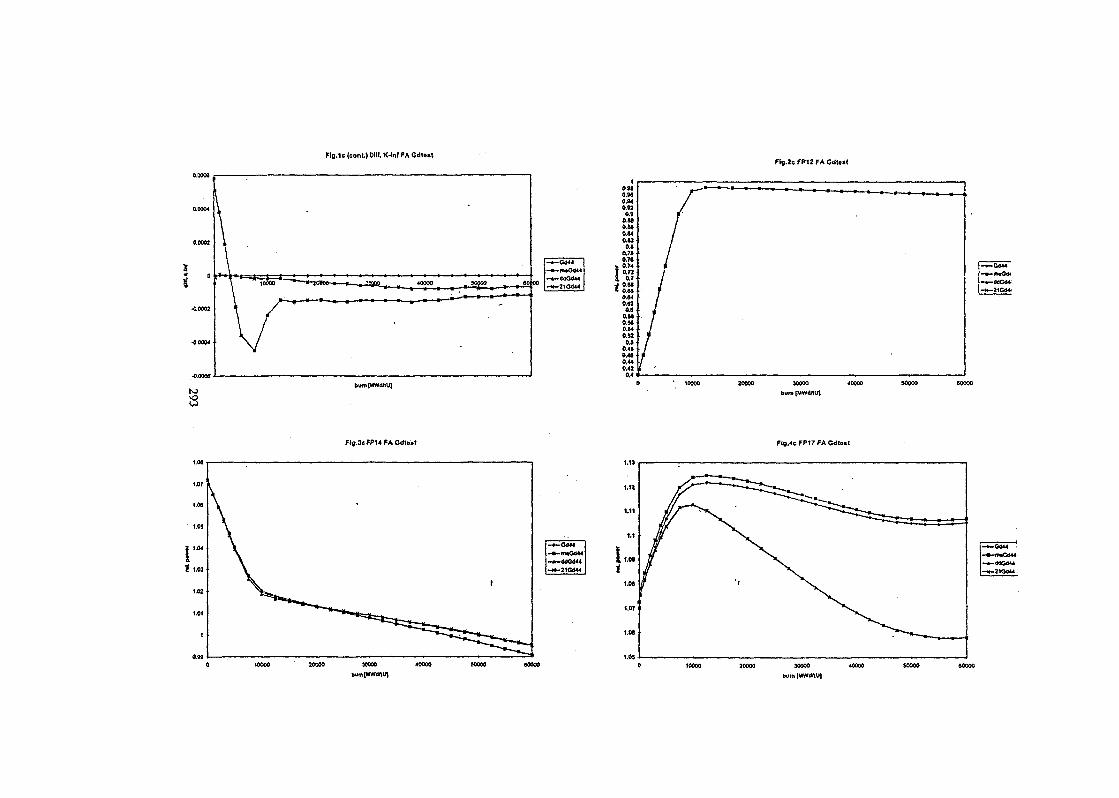
Fig.1t (com) DIH. K-Inf FA Gdto.tFig.2c FP12 FA Gdtett
N>O
200W 30000 40000Hum IMWdMJ
Flg.3cFP14MCdH»t Fls.4c fPUFA Gdtoit
-OU4-mtOd-M0IH4
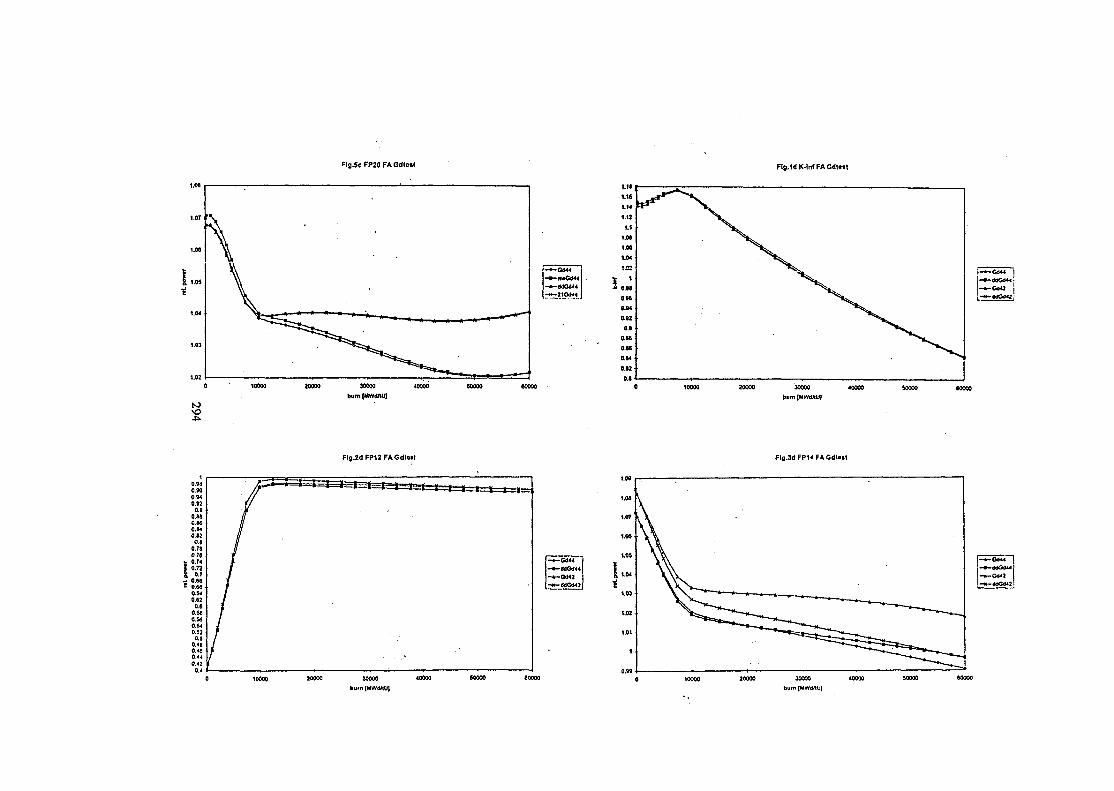
Flg.ScFP20FAGdloiC Flg.1dK-ln(FAGdltst
—-0M4
1.W1.14
1.1!
1.1
1.M
i.oe
1.04
1.8!
flfiA
0.Hane.i
0.H
O.M
0.U
0.82
0.1
Flg.2dFP12FAGdta>t Fls.3dFP14FAGdl«M
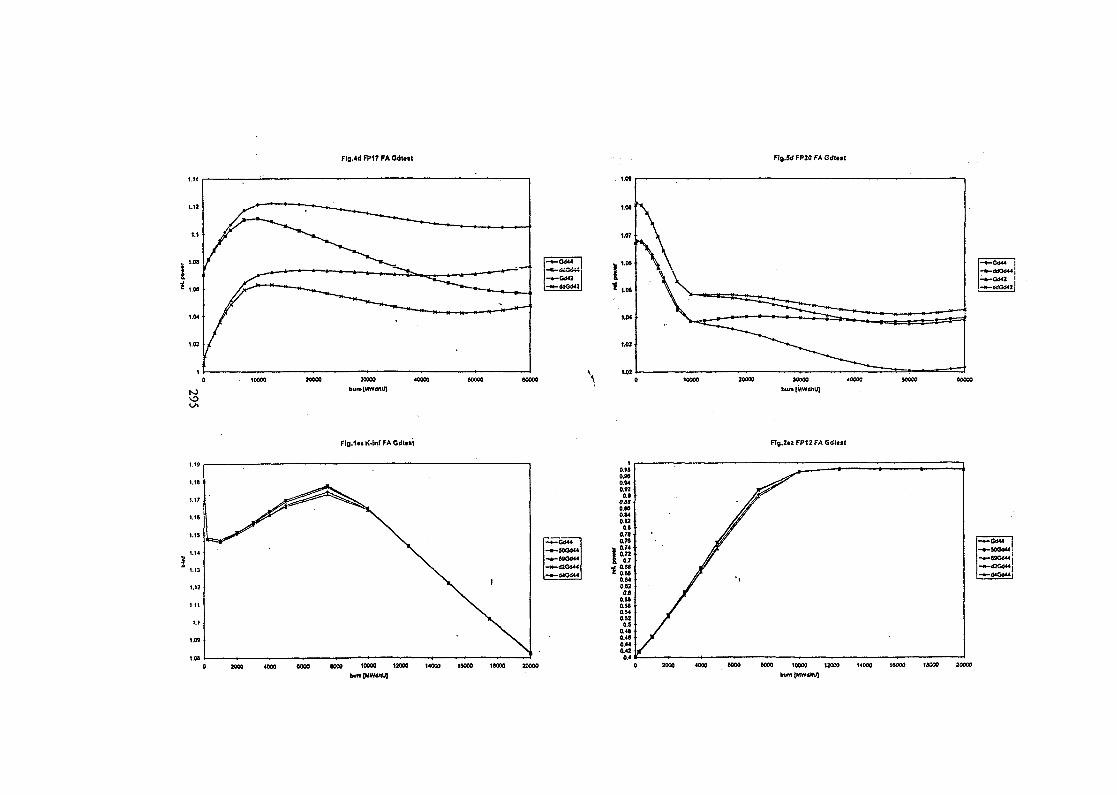
Flg.4dFP17FAGdtt«t Flg.5dFP20FAGdt.it
-Od44
-aui
Flg.in K-lnf FA OdMst Flg.2«z FP12 FA CdUst
- C « 4
-6KXH4
2000 4000 MOO WOO 10000 12000 14000 18000 18000 20000
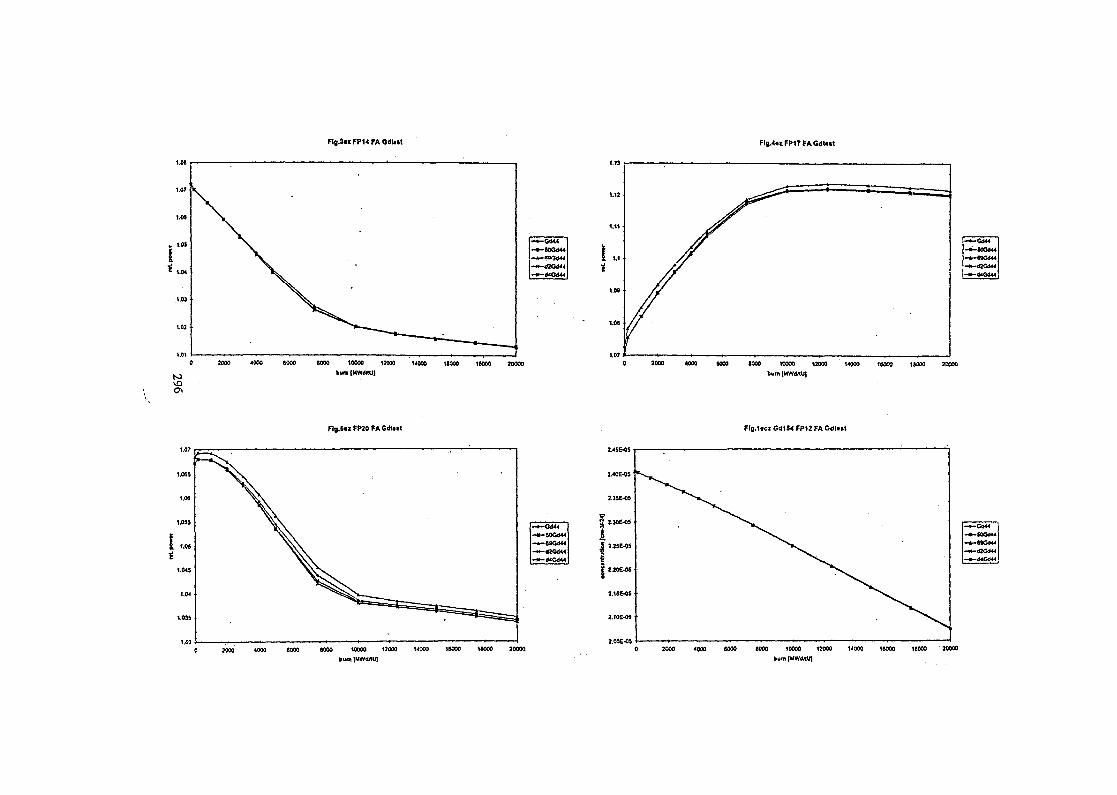
Flg.3«FP14FAGdtut F1n.4«lFP17FAGdtt«t
-<XM4-KXM44-•9S444
10000 120OO 14000 16000 1UO0 20000bum (MWd/tu]
2000 4009 WOO MOO 10000 12000 14000 16O0O 1M0O
Flg.5tzFP20FAGdl . i t i G01S4 FP12 FA C d t u t
4ooo eooo eooo 10000 «ooo uooo itooo itooo 20000 2000 4ooo eooo eooo 10000 12000bum fMwotu)
14000 1SOO0 18000 20000
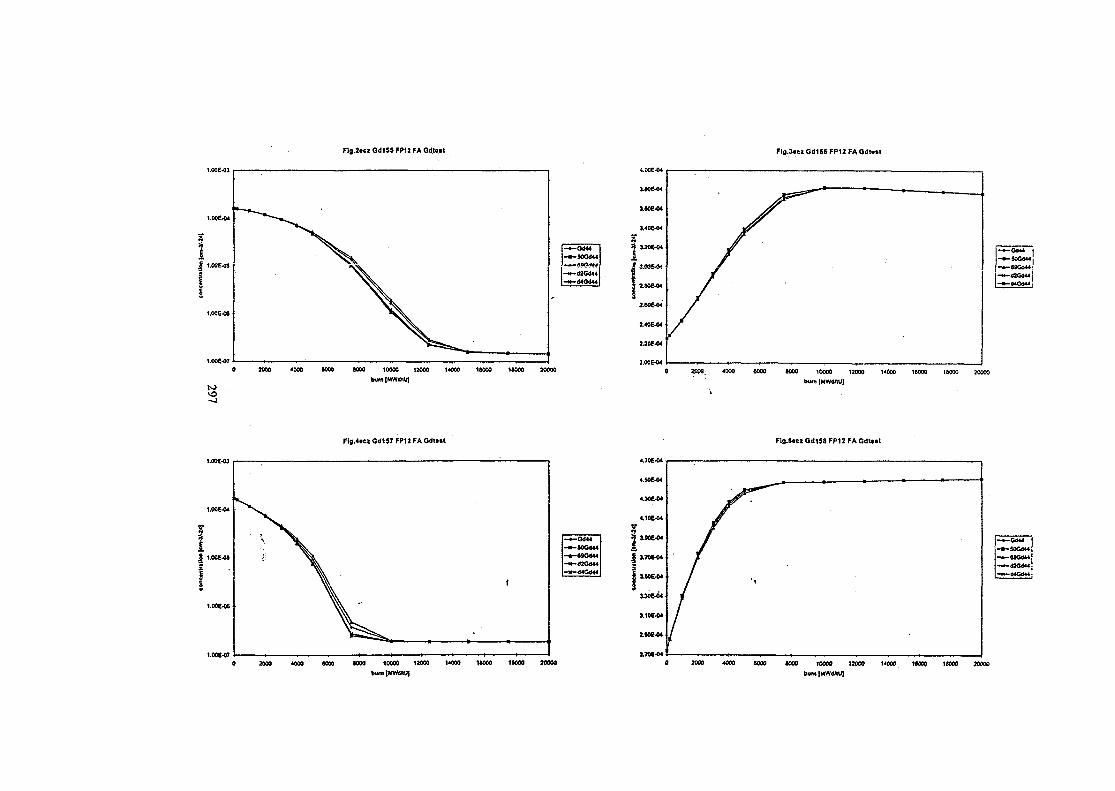
Flg.2tcl GdiSS FP12 FA Gdlell Flg.J.ci Sd1S6 FP12 FA Gdl t i t
0 2000 4000 (000 (000 10000 12000 14000 1W0O 1(000 20000 8000 10O00 12000
bum [MWd/tU]
1400O 16000
Flg .4 .c i Gd157 FP12 FA G d t n t F l s . S t c i Gd1S8 FP12 FA Gdte . t
0 2000 4000 MOO (000 10000 12000 140O0 1(000 1(000 20000 «09 10000 12000
bum (MWiWU)1MC0 1W00
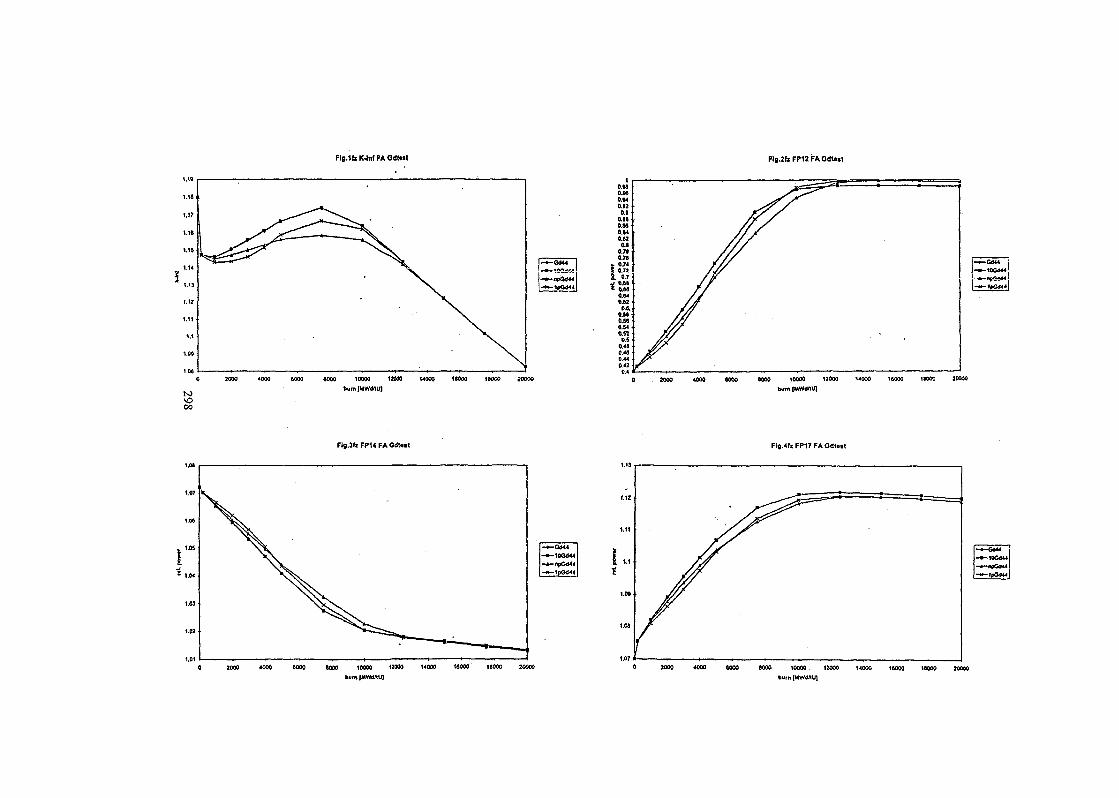
Flg.1liK-ln(FAGdUit Flg.2flFP1IFA0<ita»t
CO
toooo 12mirnlMWdMl)
sow 40W «oo m 100W uooo 14000 leow n o w 20000
Flo.3(zFP14FAGdta>t Flg.<rz FP17 FA Cd lc . t
-G<M4-10G444
-1pO<l44
2000 4000 MOO aOW 10O0O 12000 140W 18000 HOW 200W
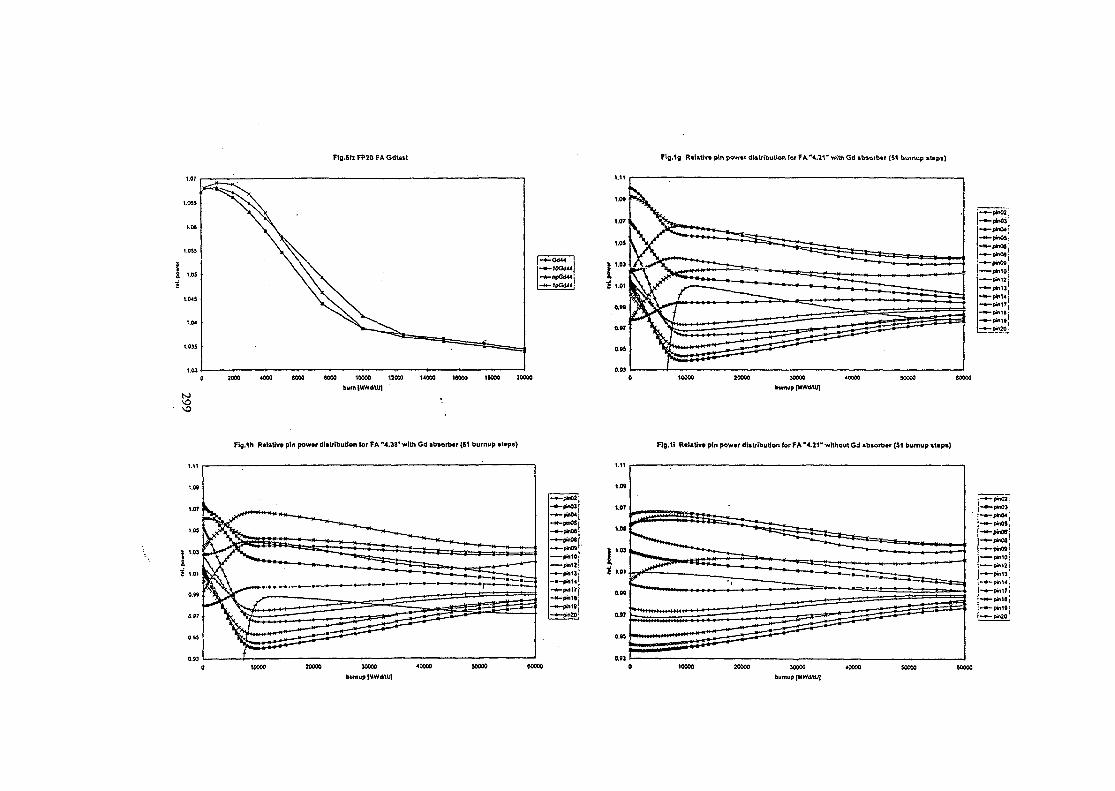
Flg.5llFP20FAGdt.il FIg.ig RtUtlvs pin power distribution for FA "4.21" with Gdabsorb«r (51 burnup stops)
WOO 10000 UOOO 14000 16000 1H00 20000
bum IMWdftU)
Flg.ih Ralattvt pin powtr distribution lor FA "4.38" with Gd absorbsr (51 burnup sups) Flg.1l RsUtlvs pin powsr distribution for FA "4.21" without Gd absorbtr (51 bumup sups)
-»-pwa
~SpWO
ss
1.07
1.0S
| 1.03
$ 1.01
O H
0.97
0.99
0.9}30000
burnup [MWd/tU]
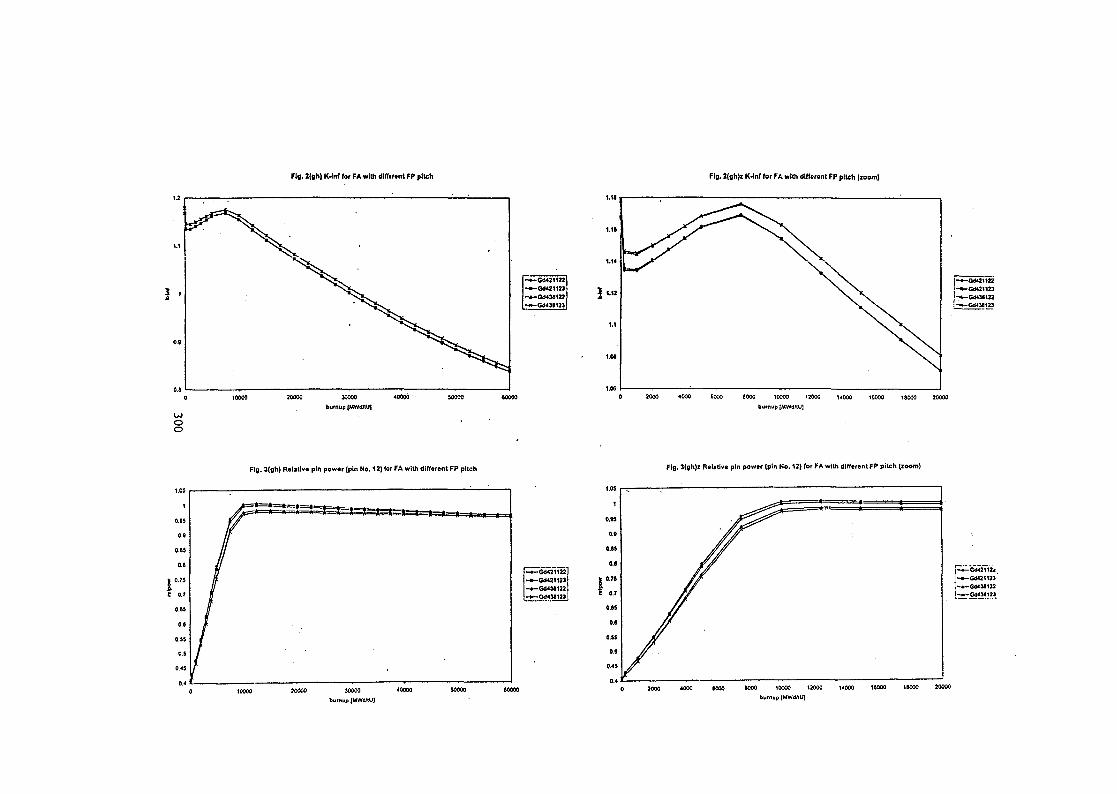
Fig. 2<gh) K-Inf tor FA will) different FP pitch Fig. 2(gh)z K-Inf (or FA with different FP pitch (zoom)
tOOOO 20000 30000 4OO00' SOOOO
- G O 4 2 1 1 2 3-044U122-&HM123
2000 4000 6000 8000 10000 12000 14000 16000 18000 20000
Fig. 3(gh) Relative pin power (pin No. 12) for FA with different FP pitch Fig. 3(gh)z Relative pin power (pin No. 12) for FA with different FP pitch (zoom)
JOOOO <»00burnup [MWdMJ]
JOOO 4000 MOO «O00 10000 12000 14000 18000 1 M 0 0 20000
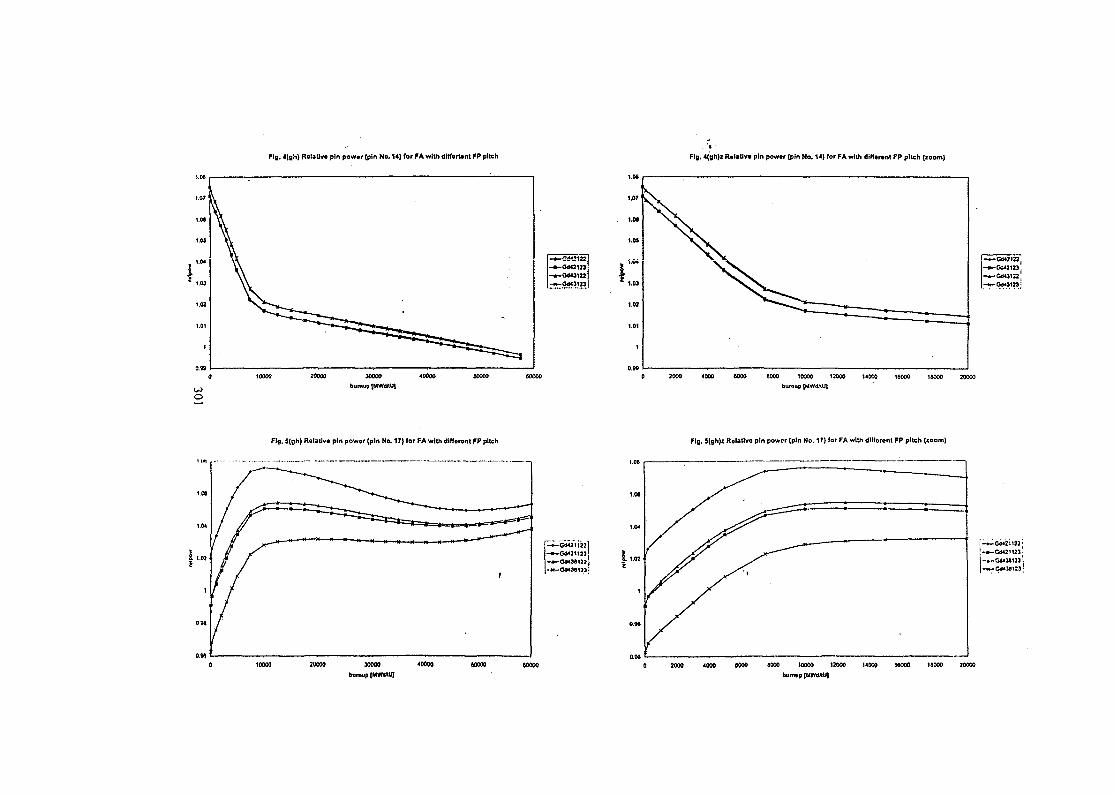
Fig. 4(gh) Ralativa pin powar (pin No. 14) for FA with dlNartanl FP pitch Fig. 4(gh)z RalaUva pin powar (pin No. 14) (or FA with dIKarant FP pitch (zoom)
tOOM 20000 MOW 40000 SOOW 80000 2000 4000 WOO >000 tOOOO 12W0 HOOO 16000 1(000 20000
Fig. S(gh) Rotative pin powor (p in No. 17) for FA wi th dlfforont FP pitch Fig . 5(gh)z Rolatlvo pin powor (pin No. 17) tor FA with dlfforont FP pitch (zoom)
•~GO42li*22j
G<M3>122-H-OMUI33
30000
bumup [MVraUJ
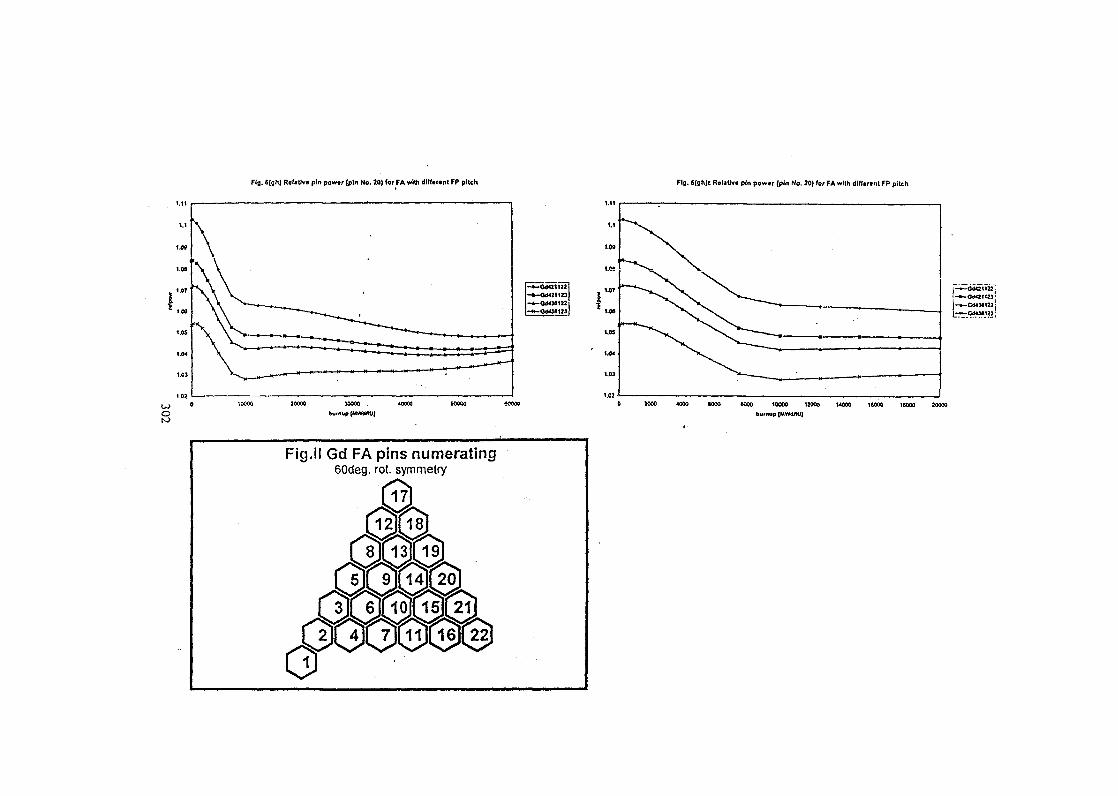
Fig. 6(9M Rclitlve pin powtr (pin No. 20) (or FA with ditfonnt FP pilch Fig. 6(gh)i Rolitlvt pin pow.r (pin No. 20) lor FA with different FP pilch
Fig.11 Gd FA pins numerating60deg. rot. symmetry
3000 4000 (000 >000 10OO0 U0OO 14000 16000 I BOO 50000
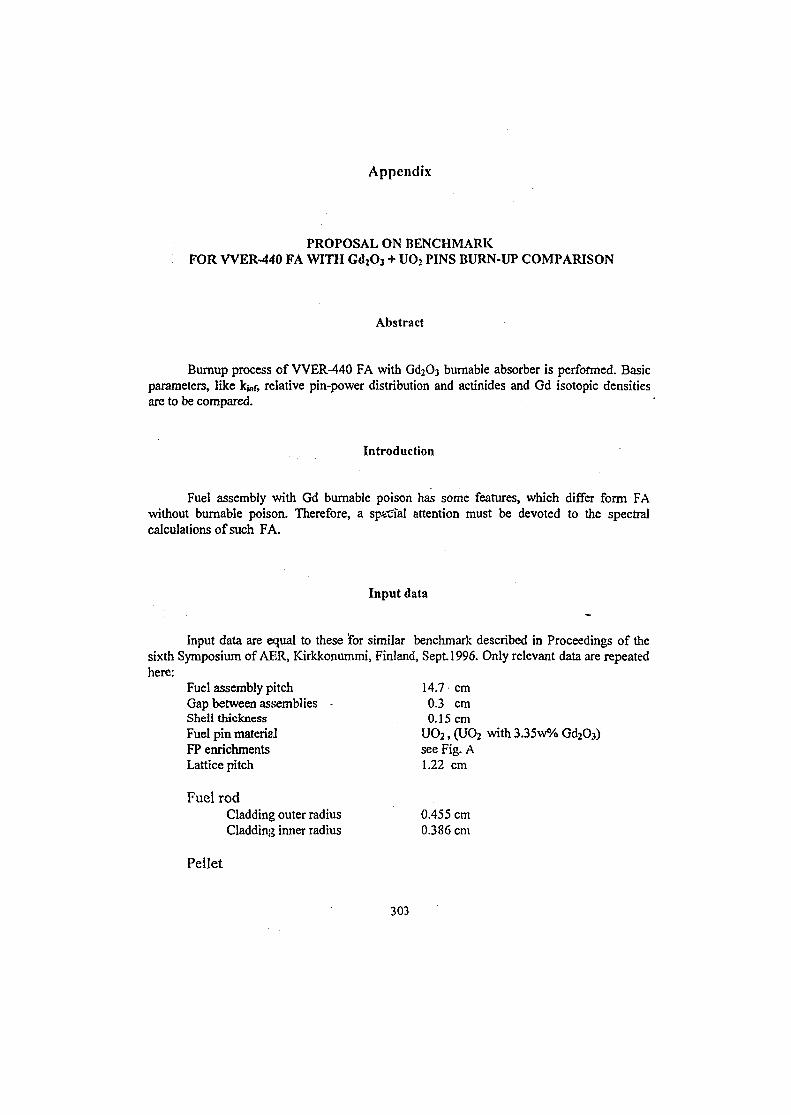
Appendix
PROPOSAL ON BENCHMARKFOR VVER-440 FA WITH Gd2O3 + UO2 PINS BURN-UP COMPARISON
Abstract
Burnup process of VVER-440 FA with Gd2O3 burnable absorber is performed. Basicparameters, like kjnr, relative pin-power distribution and actinides and Gd isotopic densitiesare to be compared.
Introduction
Fuel assembly with Gd burnable poison has some features, which differ form FAwithout burnable poison. Therefore, a special attention must be devoted to the spectralcalculations of such FA.
Input data
Input data are equal to these for similar benchmark described in Proceedings of thesixth Symposium of AliR, Kirkkonummi, Finland, Sept. 1996. Only relevant data are repeatedhere:
Fuel assembly pitch 14.7 cmGap between assemblies - 0.3 cmShell thickness 0.15 cmFuel pin material UO2, (UO2 with 3.35w% Gd2O3)FP enrichments see Fig. ALattice pitch 1.22 cm
Fuel rodCladding outer radius 0.455 cmCladding inner radius 0.386 cm
Pellet
303
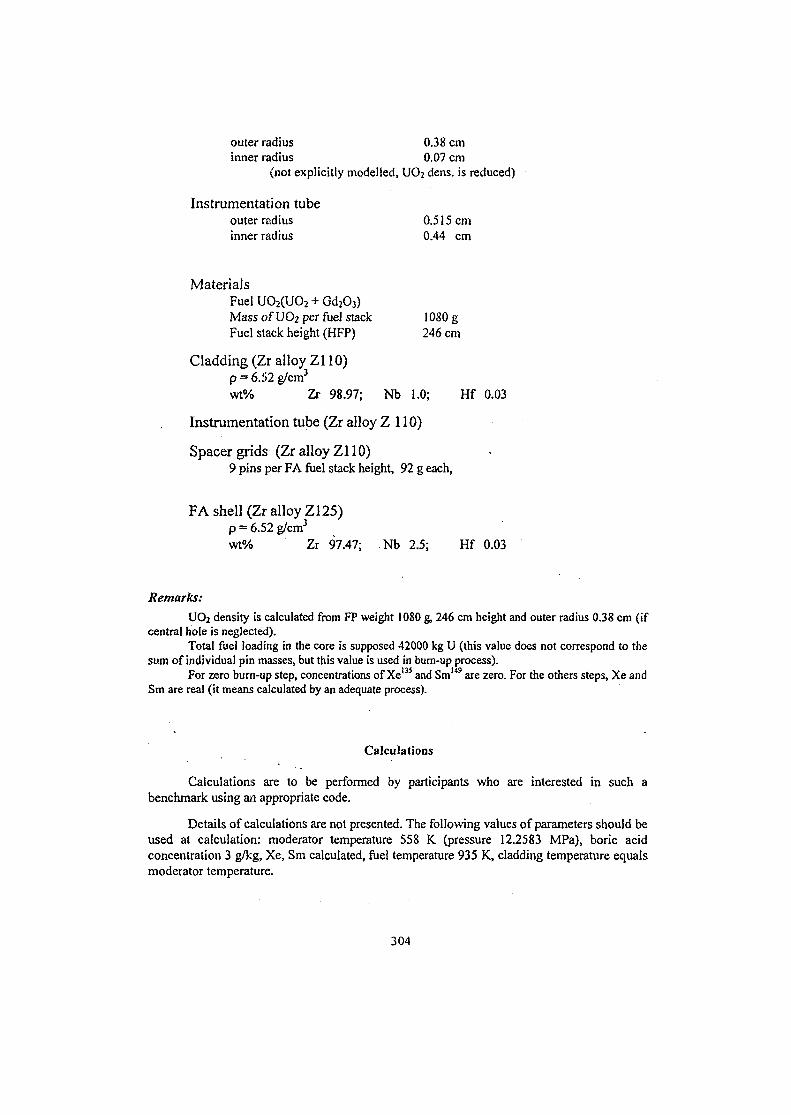
outer radius 0.38 cminner radius 0.07 cm
(not explicitly modelled, UO2 dens, is reduced)
Instrumentation tubeouter radius 0.515 cminner radius 0.44 cm
MaterialsFuel UO2(UO2 + Gd2O3)Mass of UO2 per fuel stack 1080 gFuel stack height (HFP) 246 cm
Cladding (Zr alloy Zl 10)p = 6.52 g/cm3
wt% Zr 98.97; Nb 1.0; Hf 0.03
Instrumentation tube (Zr alloy Z 110)
Spacer grids (Zr alloy Z110)9 pins per FA fuel stack height, 92 g each,
FA shell (Zr alloy Zl25)p = 6.52 g/cm3
wt% Zr 97.47; Nb 2.5; Hf 0.03
Remarks:
UO2 density is calculated from FP weight 1080 g, 246 cm height and outer radius 0.38 cm (ifcentra] hole is neglected).
Total fuel loading in the core is supposed 42000 kg U (this value does not correspond to thesum of individual pin masses, but this value is used in bum-up process).
For zero burn-up step, concentrations of Xe133 and Sm149 are zero. For the others steps, Xe andSm are real (it means calculated by an adequate process).
Calculations
Calculations are to be performed by participants who are interested in such abenchmark using an appropriate code.
Details of calculations are not presented. The following values of parameters should beused at calculation: moderator temperature 558 K (pressure 12.2583 MPa), boric acidconcentration 3 g/kg, Xe, Sm calculated, fuel temperature 935 K, cladding temperature equalsmoderator temperature.
304
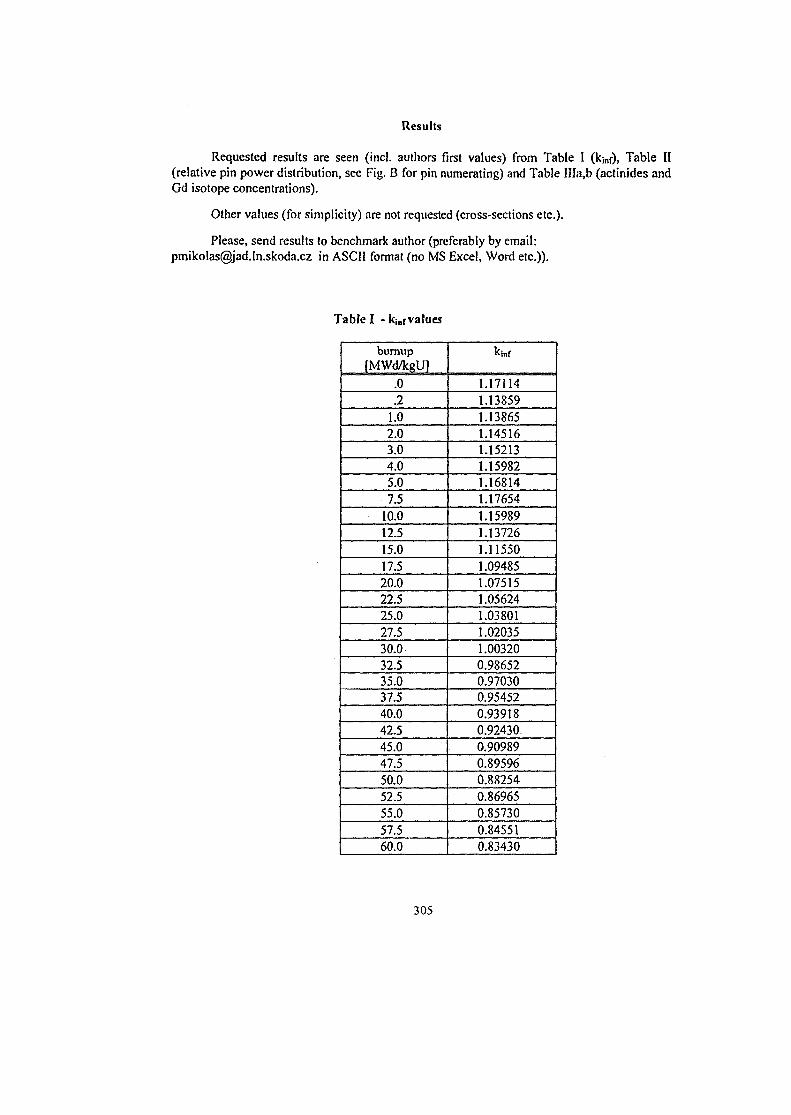
Results
Requested results are seen (inch authors first values) from Table I (kjnf), Table II(relative pin power distribution, see Fig. B for pin numerating) and Table IHa,b (actinides andGd isotope concentrations).
Other values (for simplicity) are not requested (cross-sections etc.).
Please, send results to benchmark author (preferably by email:[email protected] in ASCII format (no MS Excel, Word etc.)).
Table I - kinf values
bumup[MWd/kgU]
.0
.21.02.03.04.05.07.5
10.012.515.017.520.022.525.027.530.032.535.037.540.042.545.047.550.052.555.057.560.0
kinf
1.171141.138591.138651.145161.152131.159821.168141.176541.159891.137261.115501.094851.075151.056241.038011.020351.003200.986520.970300.954520.939180.92430.0.909890.895960.882540.869650.857300.845510.83430
305
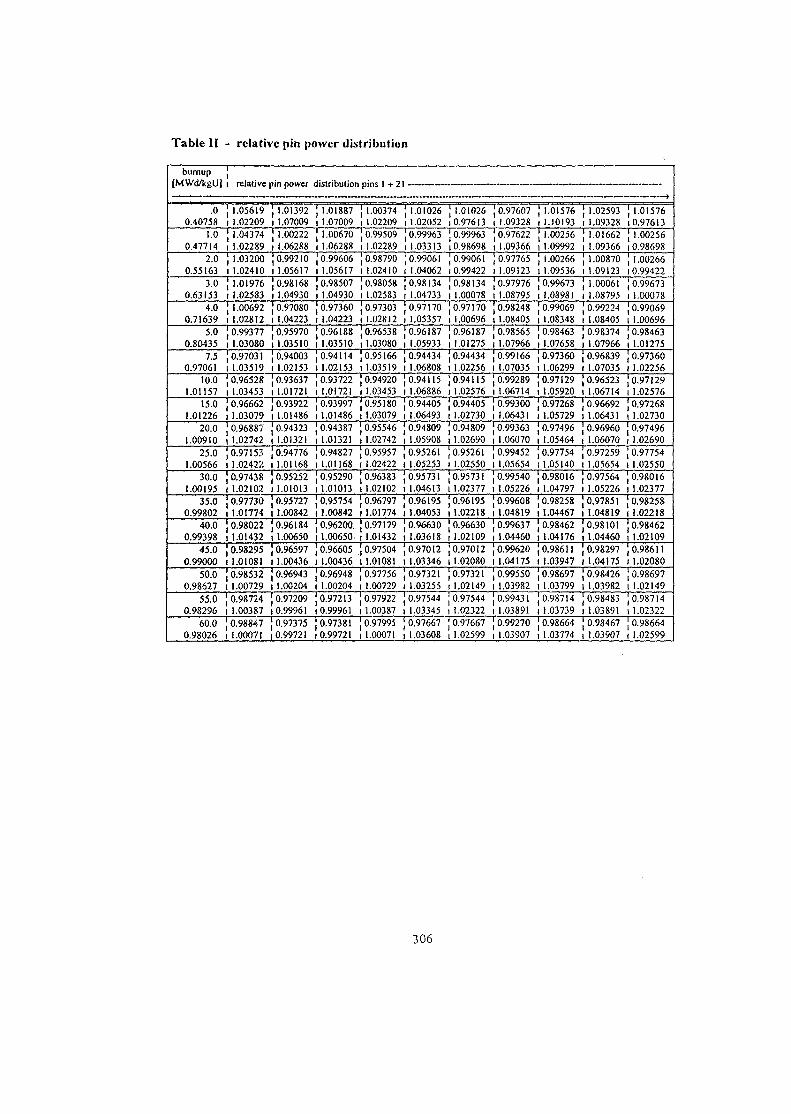
Table II - relative pin power distribution
burnup[MWd/kgU]
.00.40758
1.00.47714
2.00.55163
3.00.63153
4.00.71639
5.00.80435
7.50.97061
10.01.01157
15.01.01226
20.01.00910
25.01.00566
30.01.00195
35.00.99802
40.00.99398
45.00.99000
50.00.98627
55.00.98296
60.00.98026
relative pin power distribution pins 1+21
.05619 [ 1.01392
.02209 i 1.07009
.04374 j 1.00222
.02289 i 1.06288
.03200 [0.99210
.02410 I 1.05617
.01976 [0.98168
.02583 I 1.04930
.00692 [0.97080
.02812 I 1.04223,0.99377 10.95970
1.03080 i 1.035100.97031 [0.940031.03519 I 1.021530.96528 [0.936371.03453 i 1.017210.96662 [0.939221.03079 i 1.014860.96887 [0.943231.02742 i 1.013210.97153 [0.947761.02422 I 1.011680.97438 [0.952521.02102 I 1.010130.97730 [0.957271.01774 | 1.008420.98022 [0.961841.01432 i 1.006500.98295 [0.965971.01081 1 1.004360.98532 [0.969431.00729 I 1.002040.9872.4 [0.972091.00387 i 0.999610.98847 [0.973751.00071 i 0.99721
1.018871.070091.006701.062880.996061.056170.985071.049300.973601.042230.961881.035100.941141.021530.937221.017210.939971.014860.943871.013210.948271.011680.952901.010130.957541.008420.96200.1.00650-0.966051.004360.969481.002040.972130.999610.973810.99721
1.003741.022090.995091.022890.987901.024100.980581.025830.973031.028120.965381.030800.951661.035190.949201.034530.951801.030790.955461.027420.959571.024220.963831.021020.967971.017740.971791.014320.975041.010810.977561.007290.979221.003870.979951.00071
1.01026 [ 1.01026 [0.976071.02052 i 0.97613 i 1.093280.99963 j 0.99963 [0.976221.03313 ,0.98698 i 1.093660.9906! [0.99061 [0.977651.04062 10.99422 I 1.091230.98134 [0.98134 [ 0.979761.04733 I 1.00078 I 1.087950.97170 [0.97170 [0.982481.05357 i 1.00696 i 1.084050.96187 [0.96187 [0.985651.05933 i 1.01275 i 1.079660.94434 ] 0.94434 [0.991661.06808 I 1.02256 I 1.070350.94115 [0.94115 J 0.992891.06886 I 1.02576 I 1.067140.94405 [0.94405 [0.993001.06493 i 1.02730 i 1.064310.94809 [0.94809 j 0.993631.05908 i 1.02690 i 1.060700.95261 [0.95261 [0.994521.05253 I 1.02550 1 1.056540.95731 [0.95731 [0.995401.04613 I 1.02377 I 1.052260.96195 [0.96195 [0.996081.04053 i 1.02218 i 1.048190.96630 [0.96630 [0.996371.03618 i 1.02109 i 1.044600.97012 [0.97012 [0.996201.03346 11.02080 I 1.041750.97321 [0.97321 [0.995501.03255 i 1.02149 I 1.039820.97544 [0.97544 [0.994311.03345 i 1.02322 i 1.0389!0.97667 [0.97667 [0.992701.03608 i 1.02599 i 1.03907
1.015761.101931.002561.099921.002661.095360.996731.089810.990691.083480.984631.076580.973601.062990.971291.059200.972681.057290.974961.054640.977541.051400.980161.047970.982581.044670.984621.041760.986111.039470.986971.037990.987141.037390.986641.03774
1.02593 [ 1.015761.09328 (0.976131.01662 [ 1.002561.09366 (0.986981.00870 [ 1.002661.09123 10.994221.00061 [0.996731.08795 i 1.000780.99224 [0.990691.08405 i 1.006960.98374 [0.984631.07966 i 1.012750.96839 [0.973601.07035 i 1.022560.96523 [0.971291.06714 i 1.025760.96692 [0.972681.06431 il.0273O0.96960 [0.974961.06070 i 1.026900.97259 [0.977541.05654 I 1.025500.97564 [0.980161.05226 i 1.023770.97851 [0.982581.04819 i 1.022180.98101 [0.984621.04460 i 1.021090.98297 [0.986111.04175 I 1.020800.98426 [0.986971.03982 i 1.021490.98483 [0.987141.03891 i 1.023220.98467 [0.986641.03907 ( 1.02599
306
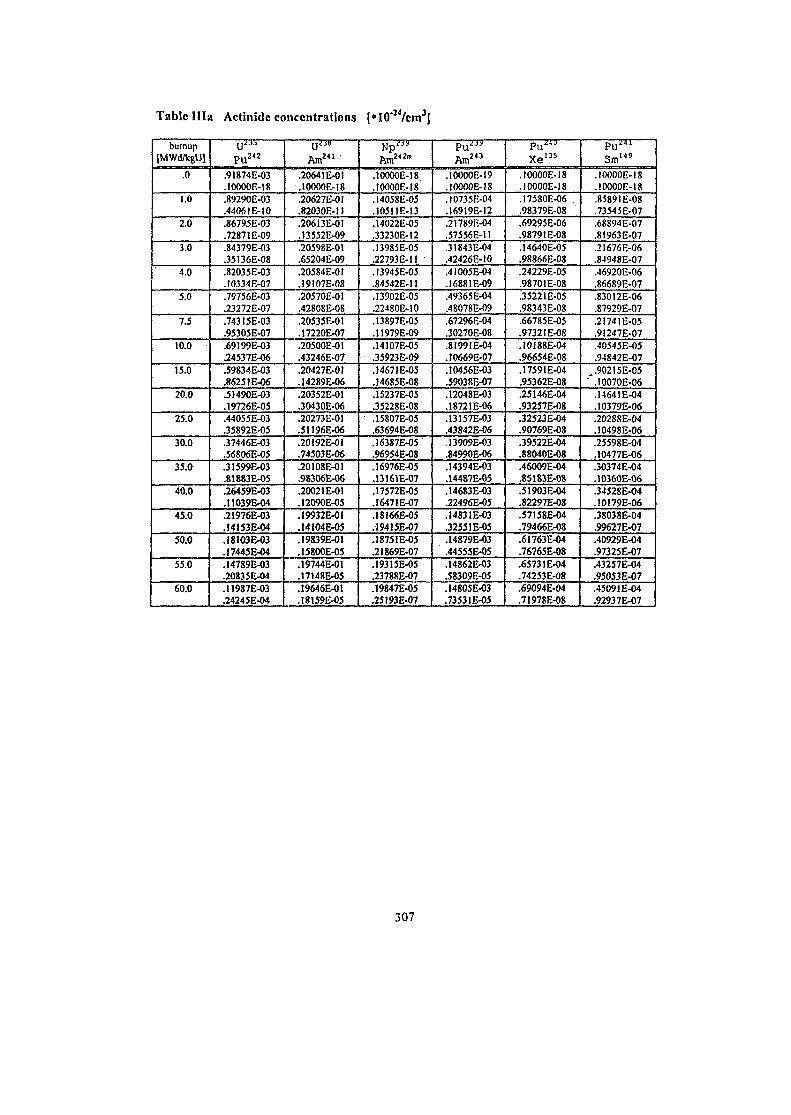
Table Ilia Actinidc concentrations [*I0"24/cm:5|
burnup[MWd/kgU]
.0
1.0
2.0
3.0
4.0
5.0
7.5
10.0
15.0
20.0
25.0
30.0
35.0
40.0
45.0
50.0
55.0
60.0
U / Jb
p u 2 «
.9I874E-03
.10000E-18
.8929OE-O3
.4406 IE-10
.86795E-03
.72871E-09
.84379E-03
.35136E-08
.82035E-O3
.I0334E-07
.79756E-03
.23272E-07
.74315E-O3
.95305E-O7
.69199E-O3
.24537E-06
.59834E-03
.86251E-06
.51490E-03
.19726E-05
.44055E-03
.35892E-O5
.37446E-03
.568O6E-O5
.31599E-03-81883E-O5.26459E-03.11039E-O4.21976E-03.I4153E-04.18IO3E-O3J7445E-04.14789E-03.20835E-O4.I1987E-03.24245E-O4
Am 2 4 1
.20641E-0I
.I0OO0E-18
.20627E-0I
.82030E-1I
.20613E-01
.I3552E-09
.20598E-0I
.65204E-09
.20584E-0I
.I9I07E-08
.20570E-01
.42808E-08
.20535E-01
.17220E-07
.20500E-01
.43246E-07
.20427E-0I
.14289E-06
.20352E-01
.30430E-06
.20273E-01
.51196E-06
.20192E-01
.74503E-06
.20108E-01.98306E-06.20021E-01.12090E-05.I9932E-0!.I4104E-05.19839E-01.15800E-05.19744E-01.17148E-05.19646E-01.18I59E-05
Am2 4 2*
.10000E-18
.I00OOE-I8
.14058E-05
.I051IE-13
.14022E-05
.33230E-12
.I3985E-05
.22793E-II
.13945E-O5
.84542E-11
.I39O2E-O5
.22480E-I0
.13897E-05
.11979E-O9.14107E-05.35923E-O9.14671E-05.14685E-08.15237E-05.35228E-08.15807E-O5.63694E-08.I6387E-O5.96954E-08.16976E-05.13161E-O7.17572E-05.I6471E-07.I8166E-05.19415E-07.18751E-O5.21869E-07.19315E-05.23788E-O7.I9847E-05.25193E-07
P u " 9
Am243
.I0OOOE-I9
.tOOOOE-18
.I0735E-04
.16919E-12
.21789E-04
.57556E-1I
.3I843E-04
.42426E-10
.41005E-04
.I6881E-09
.49365E-04
.48078E-09
.67296E-04
.30270E-08
.81991E-04
.1O669E-07
.I0456E-03
.59038E-07
.12048E-03
.18721E-06
.13157E-03
.43842E-06
.13909E-03
.84990E-06
.14394E-03
.14487E-05
.14683E-03
.22496E-05
.14831E-03J2551E-05.14879E-03.44555E-05.14862E-03.58309E-05.14805E-03.73531E-05
Xe 1 3 5
.I0000E-18
.I0000E-I8
.I7580E-06 .
.98379E-08
.69295E-06
.98791E-08
.I4640E-05
.98866E-08
.24229E-05
.98701E-08
.35221E-05
.98343E-08
.66785E-05
.97321 E-08
.10188E-04
.96654E-08
.17591E-04
.95362E-08
.25146E-04
.93257E-08
.32523E-04
.90769E-08
.39522E-04
.88040E-08
.46009E-04
.85183E-08
.5I903E-04
.82297E-08
.57158E-04
.79466E-08
.6J763E-04
.76765E-08
.65731E-O4
.74253E-08
.69094E-04
.71978E-08
Pu2 1 1
Sm149
.10000E-18
.I0OO0E-18
.85891 E-08
.73545E-07
.68894E-07
.81963E-07
.2I676E-06
.84948E-07
.46920E-06
.86689E-07
.830I2E-06
.87929E-07
.21741 E-05
.9I247E-07
.40545E-05
.94842E-07
.902I5E-05' .10070E-06
.14641E-04
.I0379E-06
.20288E-O4
.10498E-06
.25598E-04
.10477E-06
.30374E-04
.I0360E-06
.34528E-O4
.10179E-06
.38038E-04
.99627E-07
.40929E-04
.97325E-07
.43257E-O4
.95053E-07
.45091E-04
.92937E-07
307
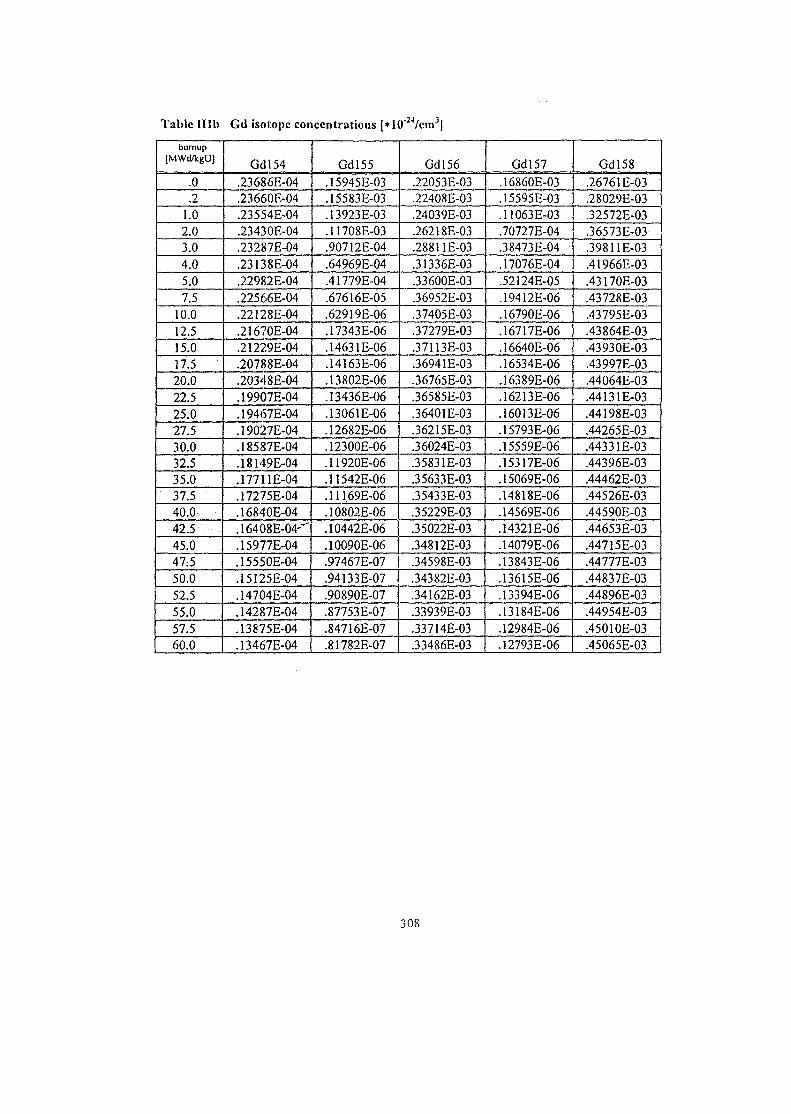
Table Illbburnup
[MWd/kgU]
.0
.21.02.03.04.05.07.5
10.012.515.017.520.022.525.027.530.032.535.037.540.042.545.047.550.052.555.057.560.0
Gd isotope concentrations [*10"24/cm3|
Gdl54.23686E-04.23660E-04.23554E-04.23430E-04.23287E-04.23138E-04.22982E-04.22566E-04.22128E-04.21670E-04.21229E-04.20788E-04.20348E-04.19907E-04.194(57E-04.19027E-04.18587E-04.18149E-04.17711E-04.17275E-04.16840E-04.16408E-04-''.15977E-04.15550E-04.15125E-04.14704E-04.14287E-04.13875E-04.13467E-04
Gdl55.15945E-03.15583E-03.13923E-03.11708E-03.90712E-04.64969E-04.41779E-04.67616E-05.62919E-06.17343E-06.14631E-06.14163E-06.13802E-06.13436E-06.13061E-06.12682E-06.12300E-06.11920E-06.U542E-06.11169E-06.10802E-06.10442E-06.10090E-06.97467E-07.94133E-07.90890E-07.87753E-07.84716E-07.81782E-07
Gdl56.22053E-03.22408E-03.24039E-03.26218E-03.28811E-03.31336E-03.33600E-03.36952E-03.37405E-03.37279E-03.37113E-03.36941E-03.36765E-03.36585E-03.36401E-03.36215E-03.36024E-03.35831E-O3.35633E-03.35433E-03.35229E-03.35022E-03.34812E-03.34598E-03.34382E-03.34162E-03.33939E-03.33714E-03.33486E-03
Gdl57.16860E-03.15595E-03.11063E-03.70727E-04.38473E-04.17076E-04.52124E-05.19412E-06.16790E-06.16717E-06.16640E-06.16534E-06.16389E-06.16213E-06.16013E-06.15793E-06.15559E-06.15317E-06.15069E-06.14818E-06.14569E-06.14321E-06.14079E-06.13843E-06.13615E-06.13394E-06-13I84E-06.12984E-06.12793E-06
Gdl58.26761E-03.28029E-03.32572E-03.36573E-O3.39811E-03.41966E-03.43170E-03.43728E-03.43795E-03.43864E-03.43930E-03.43997E-03.44064E-03.44131E-03.44198E-03.44265E-03.44331E-03.44396E-03.44462E-03.44526E-03.44590E-03.44653E-03.44715E-03.44777E-03.44837E-03.44896E-03.44954E-03.45010E-03.45065E-03
308
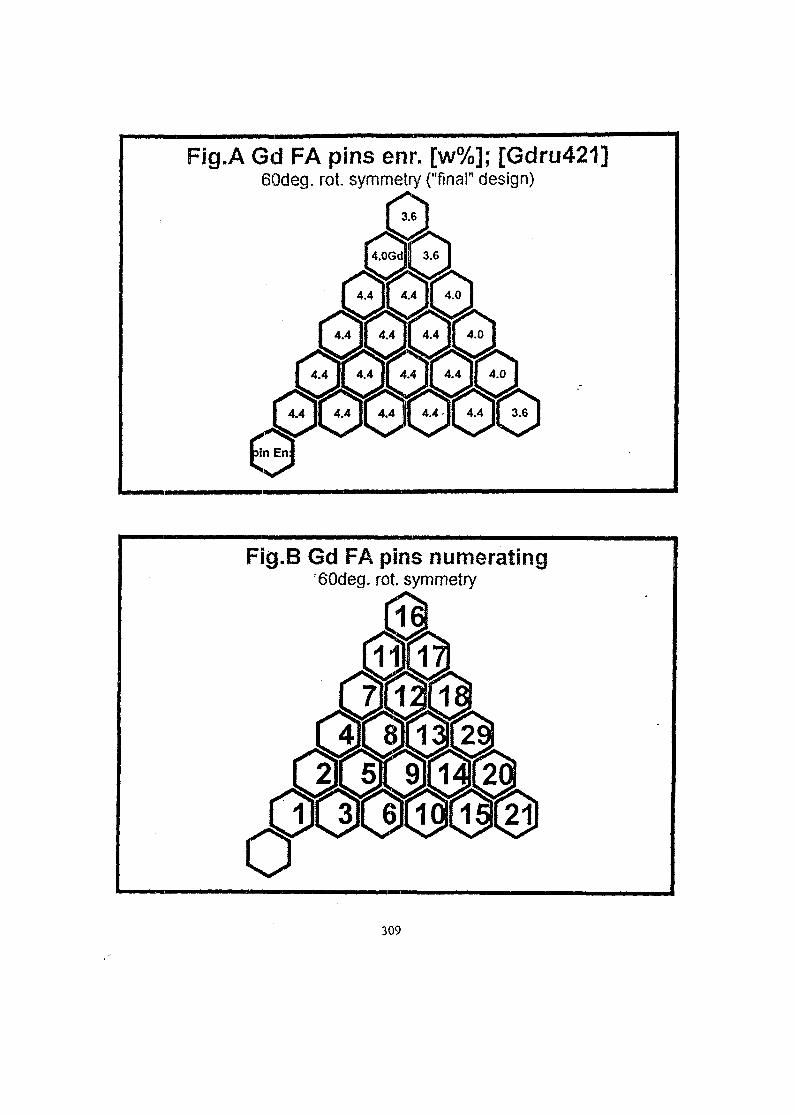
Fig.A Gd FA pins enr. [w%]; [Gdru421]60deg. rot. symmetry ("final" design)
4.0
4.4 II 3.6
Fig.B Gd FA pins numerating60deg. rot. symmetry
101921
309
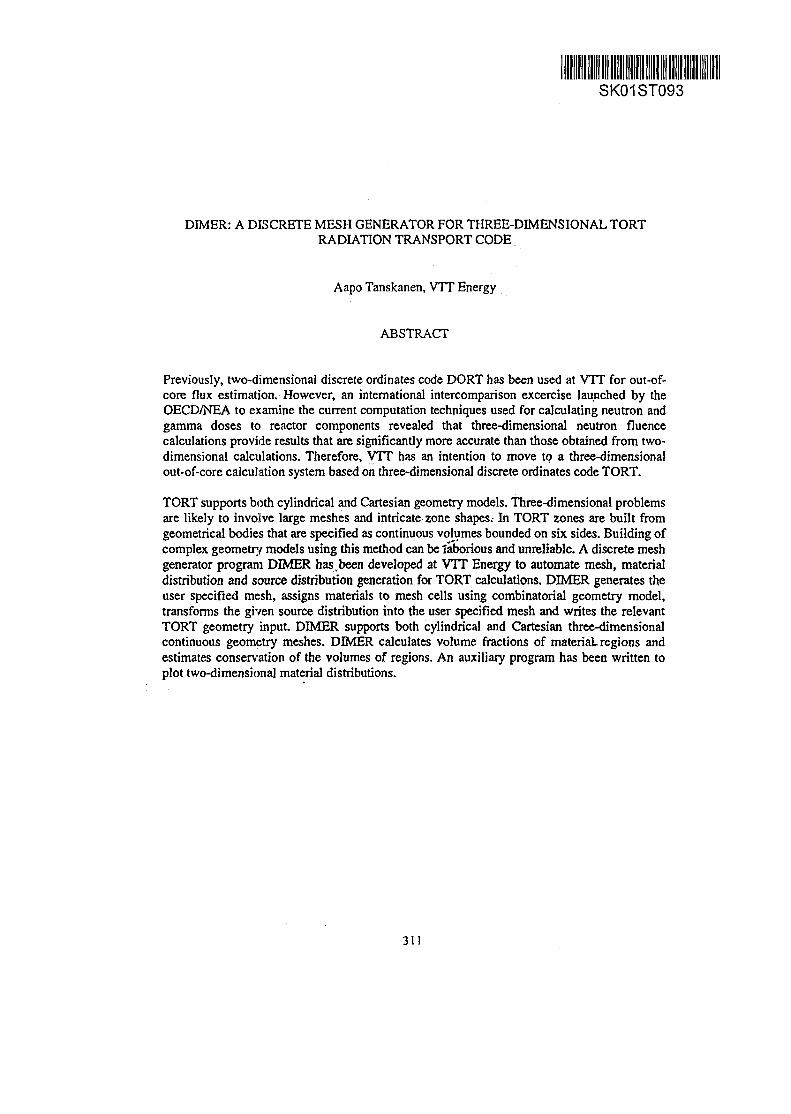
SK01ST093
DIMER: A DISCRETE MESH GENERATOR FOR THREE-DIMENSIONAL TORTRADIATION TRANSPORT CODE
Aapo Tanskanen, VTT Energy
ABSTRACT
Previously, two-dimensional discrete ordinates code DORT has been used at VTT for out-of-core flux estimation. However, an international intercomparison excercise launched by theOECD/NEA to examine the current computation techniques used for calculating neutron andgamma doses to reactor components revealed that three-dimensional neutron fluencecalculations provide results that are significantly more accurate than those obtained from two-dimensional calculations. Therefore, VTT has an intention to move to a three-dimensionalout-of-core calculation system based on three-dimensional discrete ordinates code TORT.
TORT supports both cylindrical and Cartesian geometry models. Three-dimensional problemsare likely to involve large meshes and intricate zone shapes.- In TORT tones are built fromgeometrical bodies that are specified as continuous volumes bounded on six sides. Building ofcomplex geometry models using this method can be laborious and unreliable. A discrete meshgenerator program DMER has,been developed at VTT Energy to automate mesh, materialdistribution and source distribution generation for TORT calculations. DIMER generates theuser specified mesh, assigns materials to mesh cells using combinatorial geometry model,transforms the given source distribution into the user specified mesh and writes the relevantTORT geometry input DIMER supports both cylindrical and Cartesian three-dimensionalcontinuous geometry meshes. DIMER calculates volume fractions of material, regions andestimates conservation of the volumes of regions. An auxiliary program has been written toplot two-dimensional material distributions.
311
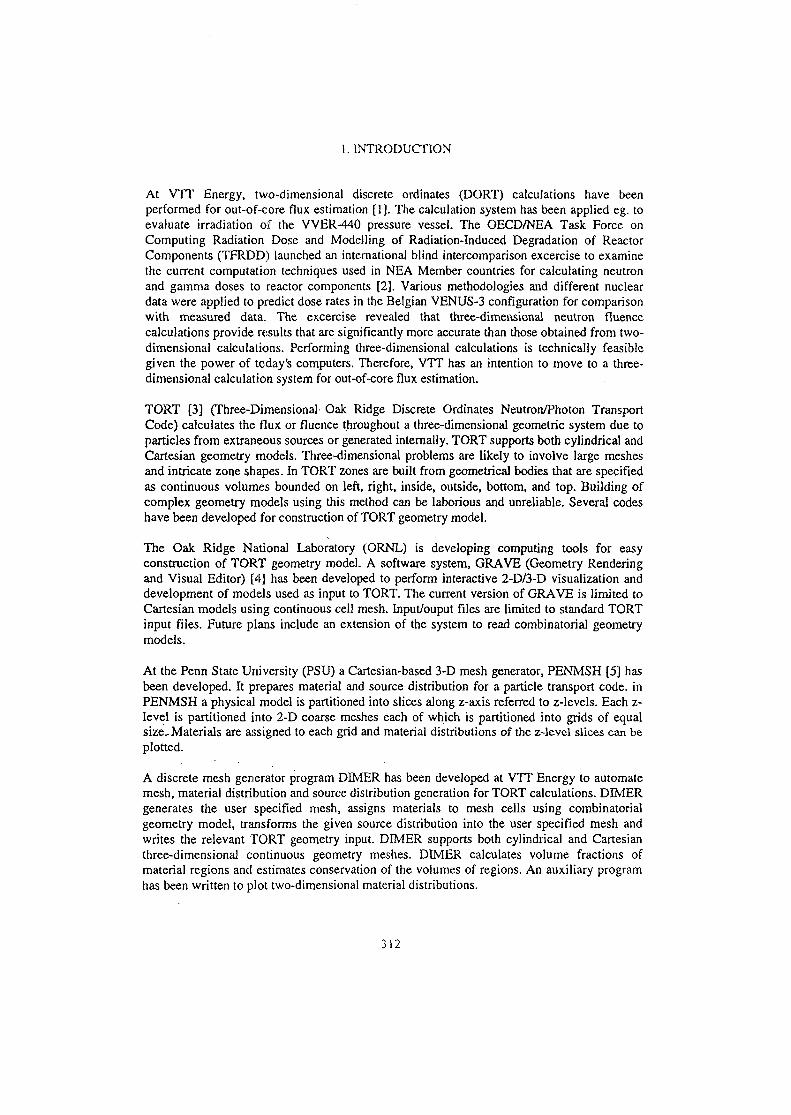
1. INTRODUCTION
At VTT Energy, two-dimensional discrete ordinates (DORT) calculations have beenperformed for out-of-core flux estimation [1]. The calculation system has been applied eg. toevaluate irradiation of the VVER-440 pressure vessel. The OECD/NEA Task Force onComputing Radiation Dose and Modelling of Radiation-Induced Degradation of ReactorComponents (TFRDD) launched an international blind intercomparison excercise to examinethe current computation techniques used in NEA Member countries for calculating neutronand gamma doses to reactor components [2]. Various methodologies and different nucleardata were applied to predict dose rates in the Belgian VENUS-3 configuration for comparisonwith measured data. The excercise revealed that three-dimensional neutron fluencecalculations provide results that are significantly more accurate than those obtained from two-dimensional calculations. Performing three-dimensional calculations is technically feasiblegiven the power of today's computers. Therefore, VTT has an intention to move to a three-dimensional calculation system for out-of-core flux estimation.
TORT [3] (Three-Dimensional Oak Ridge Discrete Ordinates Neutron/Photon TransportCode) calculates the flux or fluence throughout a three-dimensional geometric system due toparticles from extraneous sources or generated internally. TORT supports both cylindrical andCartesian geometry models. Three-dimensional problems are likely to involve large meshesand intricate zone shapes. In TORT zones are built from geometrical bodies that are specifiedas continuous volumes bounded on left, right, inside, outside, bottom, and top. Building ofcomplex geometry models using this method can be laborious and unreliable. Several codeshave been developed for construction of TORT geometry model.
The Oak Ridge National Laboratory (ORNL) is developing computing tools for easyconstruction of TORT geometry model. A software system, GRAVE (Geometry Renderingand Visual Editor) [4] has been developed to perform interactive 2-D/3-D visualization anddevelopment of models used as input to TORT. The current version of GRAVE is limited toCartesian models using continuous cell mesh. Input/ouput files are limited to standard TORTinput files. Future plans include an extension of the system to read combinatorial geometrymodels.
At the Penn State University (PSU) a Cartesian-based 3-D mesh generator, PENMSH [5] hasbeen developed. It prepares material and source distribution for a particle transport code, inPENMSH a physical model is partitioned into slices along z-axis referred to z-levels. Each z-level is partitioned into 2-D coarse meshes each of which is partitioned into grids of equalsize.- Materials are assigned to each grid and material distributions of the z-level slices can beplotted.
A discrete mesh generator program DIMER has been developed at VTT Energy to automatemesh, material distribution and source distribution generation for TORT calculations. DIMERgenerates the user specified mesh, assigns materials to mesh cells using combinatorialgeometry model, transforms the given source distribution into the user specified mesh andwrites the relevant TORT geometry input. DIMER supports both cylindrical and Cartesianthree-dimensional continuous geometry meshes. DIMER calculates volume fractions ofmaterial regions and estimates conservation of the volumes of regions. An auxiliary programhas been written to plot two-dimensional material distributions.
312
2. DIMER METHODOLOGY
DIMER supports only continuous Cartesian and cylindrical meshes. The physical model isfirst partitioned into slices along z-axis that can have an arbitrary subdivision. The horizontalmesh is the same for all the slices and each slice has an axially uniform material distribution.Axial slices are further partitioned into two-dimensional x-y (or r-8) mesh. Materialassignment is carried out for each axial slice individually, i.e. material assignment is inessence carried out in two-dimensional geometry. Material regions are constructed byassigning materials into mesh cells. The current version of DIMER supports three basic formsof geometrical bodies: circle, rectangle and sector. Material regions are defined asintersections of the elementary bodies or their inverses. Union operator is not supported.Thus, DIMER is not its flexible and versatile as for example the geometry packages of MonteCarlo codes, but for most purposes it is quite adequate. In order to define whether a materialshould be assigned to a mesh cell, DIMER places so-called subcell points within the meshcell. If majority of the subcell points belong to the region the material is assigned to the meshcell. Each specified region overlays all the previous ones. DIMER calculates volume fractionsof material regions and estimates conservation of the volumes of the regions. An auxiliaryplotting routine has been developed in Perl to plot two-dimensional material distributions ofthe axial slices. DIMER prepares the TORT geometry andmaterial distribution arrays: 84$,85$, 86$, 2*. 3*, 4*. 8$, 9$, 14*, 15*. 16*, 17*. 18* and 19* [2]. Furthermore, DIMERtransforms a three-dimensional pinwise source distribution (given in square lattice) into theuser specified mesh and prepares the three-dimensional TORT source distribution array 96*.
3. SAMPLE CASE: VENUS-3
DIMER was applied to generate Cartesian and cylindrical TORT mesh models of a quadrantof the VENUS-3 reactor. Figure 1 shows one of the axial slices of the Cartesian model thathad all in all over 30 000 mesh cells. The Cartesian model has been used in validation ofVTT's new TORT based out-of-core flux calculation system against the VENUS=3 benchmark[3]. The calculated benchmark results were in good agreement with the reference results.Figure 2 shows a far more detailed cylindrical model'of the same reactor quadrant, that hasnot been used in actual calculations.
4. CONCLUSIONS
DIMER automates mesh, material distribution and source distribution generation for TORTcalculations. It is a simple but efficient code developed for a specific purpose. The code hasbeen applied to generate both Cartesian and cylindrical TORT geometry models of a quadrantof the VENUS-3 reactor. The Cartesian model has been succesfully used to validate VTT'snew TORT based out-of-core flux calculation system. Since it is likely that GRAVE willbecome a standard tool for TORT geometry modelling, there is presently no reason for furtherdevelopment of DIMER or its auxiliary plotting program.
313
5. REFERENCES
[1] Wasastjerna, F. Out-Of-Core Flux Calculation Methods in Finland. In: Proceedings ofthe second Symposium of AER, Paks Hungary 21-26 September, 1992. pp. 51-58.
[2] Rhoades, W. A., Sipmson, D. B. The TORT Three-Dimensional Discrete OrdinatesNeutron/Photon Transport Code (TORT Version 3). Oak Ridge National Laboratory,ORNL/TM-13221, 1997.
[3] Prediction of Neutron Embrittlement in the Reactor Pressure Vessel: Venus-1 andVenus-3 Benchmarks. OECD NEA Nuclear Science Committee, Task Force onComputing Radiation Dose and Modelling of Radiation -Induced Degradation ofReactor Components. Paris: IPSN, 1999.
[4] Blakeman, E. D. GRAVE: An Interactive Geometry Construction and VisualizationSoftware System for the TORT Radiation Transport Code. In: Proceedings ofPHYSOR'99 - ANS International Topical Meeting on Advances in Reactor Physics andMathematics and Computation into the Next Millenium. May 7-12, 2000. Pittsburgh,Pensylvania, USA. American Nuclear Society, 2000.
[5] Haghighat, A. PENMSH - A 3-D Mesh Generator. WWW-pages:[http://gracie.psu.edu/~haghigha/penmsh.htnil]. 11.9.2000.
314
n i s i • ) E8»D'i>
Figure 1. An axial slice of the Cartesian TORT mesh model of a quadrant of the VENUS-3reactor.
315
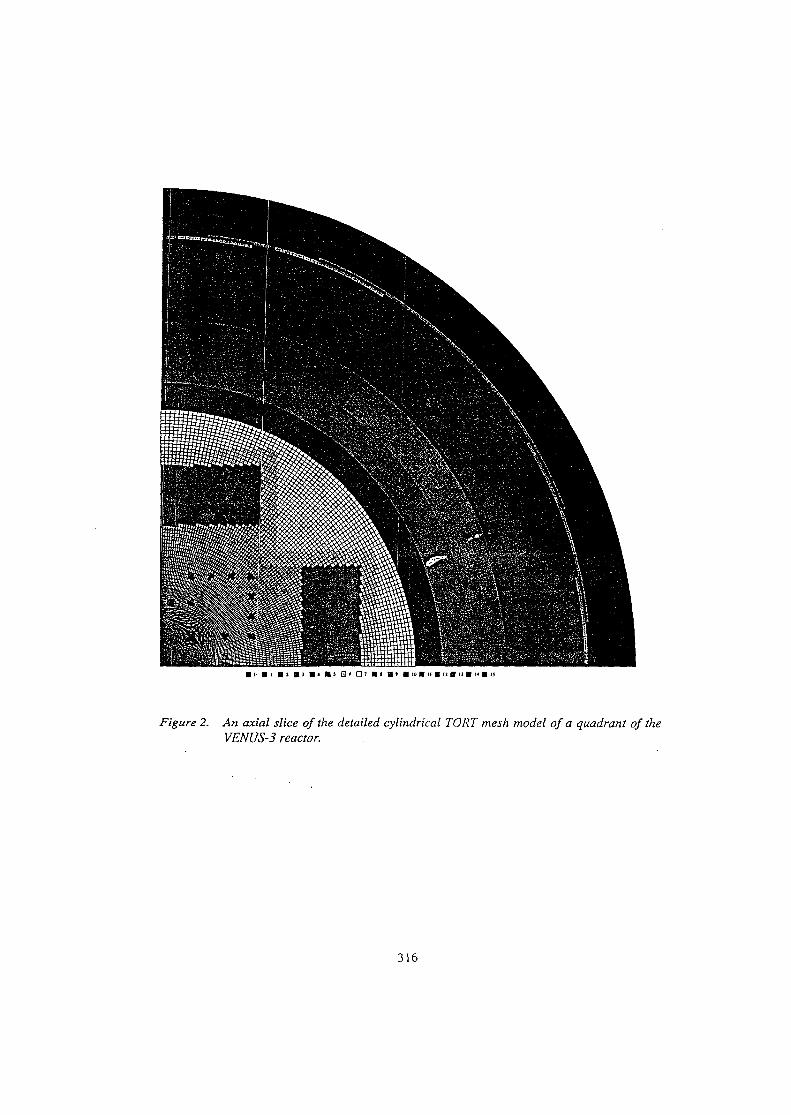
Figure 2. An axial slice of the detailed cylindrical TORT mesh model of a quadrant of theVENUS-3 reactor.
316
SK01ST094
APPLICATION OF THE SHM AND SPSM FOR CALCULATIONS OF SOME PROBLEMSFOR VVER AND PVVR
N. Laletin, A. Kovalishin, N. Sultanov
RSC Kurchatov Institute
INTRODUCTIONResults of SHM calculations applied to VVER and PWR reactors are presented to demonstrate
here the potential of the Surface Harmonics Method (SHM) and the Surface Pseudo-Sources Method(SPSM). These methods indeed were developed as a solution to the problem of improvement of neutronfield calculations in the cores of nuclear reactors with nonuniform lattices.
I. DESCRIPTION OF VVER-1000 TEST PROBLEM
This paper was aimed at analyzing the influence of homogenization approximation for fuel assemblieson the error in the main calculations of nuclear reactor functionals.
We considered the VVER-1000 core nonuniform in height, consisted of heterogenous fuelassemblies. The core is 354 cm high, upper and lower front reflectors are 34.5 cm high. The 8-groupdiffusion constants of actual cells of VVER-1000 type reactors provided by TBC-M code are given forevery elementary cell. The groups 1-5 are "fast", i.e. there are no transitions with increased neutronenergy. The groups 6-8 are thermal with increased-energy transitions. The reference computation hasbeen carried out on a lattice with a single node in ever}' cell, 5-cm axial mesh-size (92 slab in height),and under 8-group approximation. The violation of lattice regularity at the boundaries of assemblies wasaccounted for in the same way as in the paper9 by introducing cells of "irregular" shape in those points.Note that reference calculation took 13 days when using SUN/400MHz workstation.
II. SERIES OF COARSE MESH-SIZE CALCULATIONS WITH HOMOGENIZATIONPROCEDURE APPLIED
All coarse mesh-size computations have been carried out using the SHM-HEX code but with variouscharacteristics of fuel assemblies. We had carried out calculations within 12 slabs of 35.4 cm in height.Besides the reference calculation we also carried out two additional ones: with and without assemblyhomogenization. Thus we could compare the influence of homogenization effect on precision offunctionals obtained. The following assemblies characteristics were prepared for calculation withhomogenization:
Each assembly was computed under the zero-current boundary condition. Values of KK andcorresponding group inner-assembly distributions were obtained. Using those distributions we gotaveraged cross-sections of absorption, scattering, multiplication, and inter-group transitions for the next8-group coarse mesh calculations. For homogeneous assemblies we computed characteristics of theassemblies required for SHM equations, i.e. the ratios of Sn for different harmonics of the group fluxmatrixes to matrixes of the group currents. Corresponding distributions for the trial functions andmatrixes Sn themselves were computed using analytical inversion of problem operators. The <6F> SHMapproximation was applied then for calculating active zone. Such a calculation approximatelycorresponds to nodal approaches, which allow obtaining nearly precise solution of diffusion differential
317
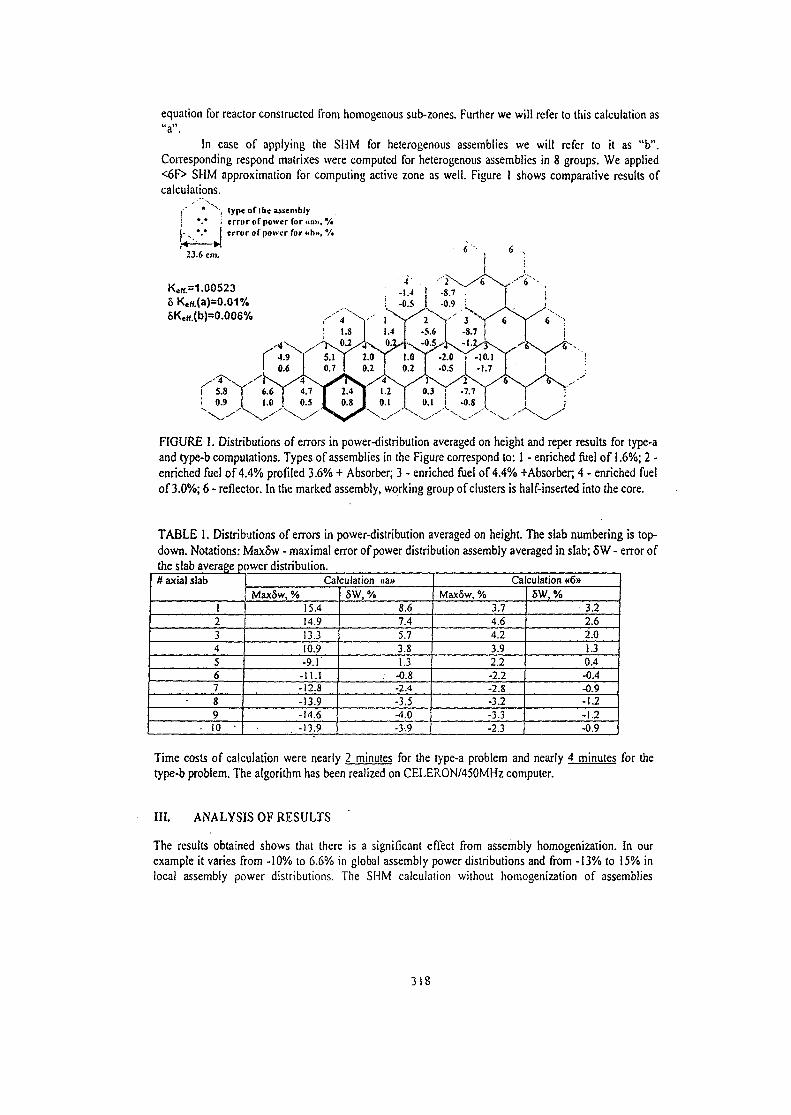
equation for reactor constructed from homogenous sub-zones. Further we will refer to this calculation as"a".
In case of applying the SHM for helerogenous assemblies we will refer to it as "b".Corresponding respond matrixes were computed for heterogenous assemblies in 8 groups. We applied<6F> SHM approximation for computing active zone as well. Figure 1 shows comparative results ofcalculations.
i * Xi type of the assemblyerror of power for «a», %error ot power for «b», %
23.6 cm.
Ke«.=1.005235 Ke«.(a)=0.01%8Ke(f.(b)=0.006%
FIGURE I. Distributions of errors in power-distribution averaged on height and reper results for type-aand type-b computations. Types of assemblies in the Figure correspond to: 1 - enriched fuel of 1.6%; 2 -enriched fuel of 4.4% profiled 3.6% + Absorber; 3 - enriched fuel of 4.4% +Absorber, 4 - enriched fuelof 3.0%; 6 - reflector. In the marked assembly, working group of clusters is half-inserted into the core.
TABLE I. Distributions of errors in power-distribution averaged on height. The slab numbering is top-down. Notations: Max5w - maximal error of power distribution assembly averaged in slab; 5W - error ofthe slab average power distribution.# axial slab
123456789
• 10 •
Calculation «a»MaxSw, %
15.414.913.310.9-9.1
-11.1-12.8-13.9-14.6
. -13.9
5W, %8.67.45.73.81.3
. -0.8-2.4-3.5-4.0-3.9
Calculation «6»Max5w, %
3.74.64.23.92.2-2.2-2.8-3.2-3.3-2.3
5W, %3.22.62.01.30.4-0.4-0.9-1.2-1.2-0.9
Time costs of calculation were nearly 2 minutes for the type-a problem and nearly 4 minutes for thetype-b problem. The algorithm has been realized on CELERON/450MHz computer.
III. ANALYSIS OF RESULTS
The results obtained shows that there is a significant effect from assembly homogenization. In ourexample it varies from -10% to 6.6% in global assembly power distributions and from -13% to 15% inlocal assembly power distributions. The SHM calculation without homogenization of assemblies
318
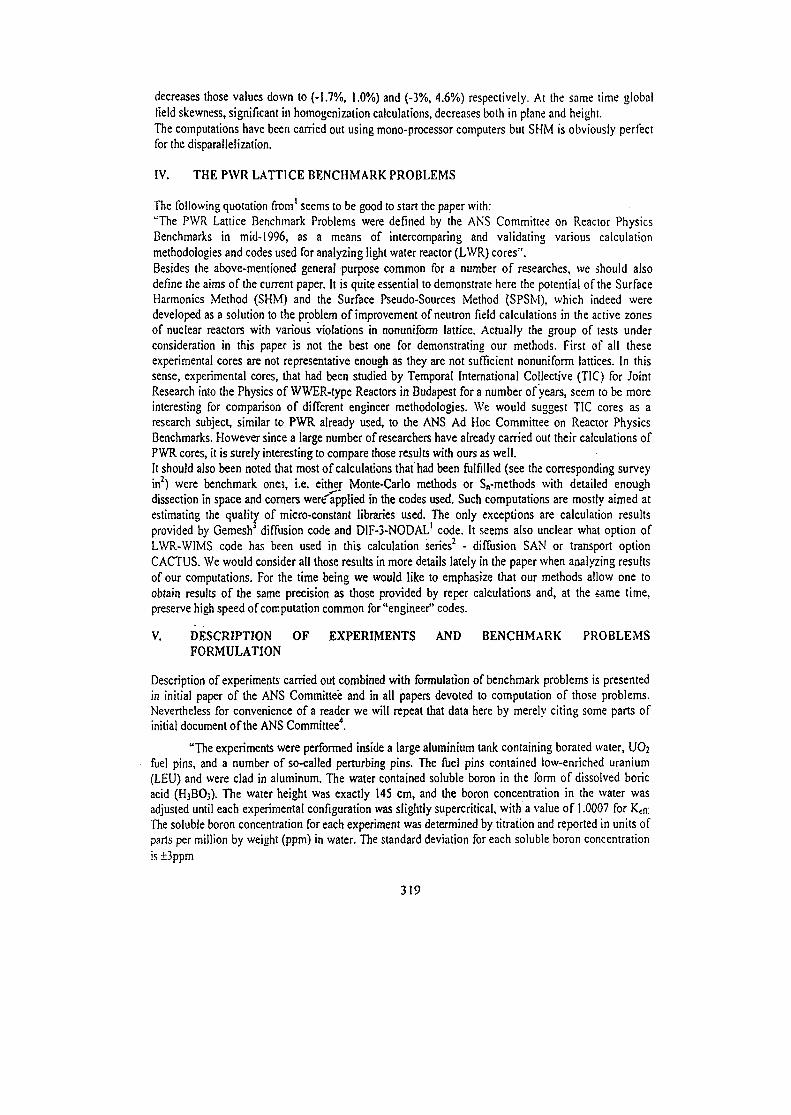
decreases those values down to (-1.7%, 1.0%) and (-3%, 4.6%) respectively. At the same time globalfield skewness, significant in homogenization calculations, decreases both in plane and height.The computations have been carried out using mono-processor computers but SHM is obviously perfectfor the disparalletization.
IV. THE PWR LATTICE BENCHMARK PROBLEMS
The following quotation from1 seems to be good to start the paper wiih:'"The PWR Lattice Benchmark Problems were defined by the ANS Committee on Reactor PhysicsBenchmarks in mid-1996, as a means of intercomparing and validating various calculationmethodologies and codes used for analyzing light water reactor (LWR) cores".Besides the above-mentioned general purpose common for a number of researches, we should alsodefine she aims of the current paper. It is quite essential to demonstrate here the potential of the SurfaceHarmonics Method (SHM) and the Surface Pseudo-Sources Method (SPSM), which indeed weredeveloped as a solution to the problem of improvement of neutron field calculations in the active zonesof nuclear reactors with various violations in nonuniform lattice. Actually the group of tests underconsideration in this paper is not the best one for demonstrating our methods. First of all theseexperimental cores are not representative enough as they are not sufficient nonuniform lattices. In thissense, experimental cores, that had been studied by Temporal International Collective (TIC) for JointResearch into the Physics of WWER-type Reactors in Budapest for a number of years, seem to be moreinteresting for comparison of different engineer methodologies. We would suggest TIC cores as aresearch subject, similar to PWR already used, to the ANS Ad Hoc Committee on Reactor PhysicsBenchmarks. However since a large number of researchers have already carried out their calculations ofPWR cores, it is surely interesting to compare those results with ours as well.It should also been noted that most of calculations that had been fulfilled (see the corresponding surveyin2) were benchmark ones, i.e. either Monte-Carlo methods or Sn-methods with detailed enoughdissection in space and corners were applied in the codes used. Such computations are mostly aimed atestimating the quality of micro-constant libraries used. The only exceptions are calculation resultsprovided by Gemesh diffusion code and DIF-3-NODAL1 code. It seems also unclear what option ofLWR-WIMS code has been used in this calculation series2 - diffusion SAN or transport optionCACTUS. We would consider all those results in more details lately in the paper when analyzing resultsof our computations. For the time being we would like to emphasize that our methods allow one toobtain results of the same precision as those provided by reper calculations and, at the iame time,preserve high speed of computation common for "engineer" codes.
V. DESCRIPTION OF EXPERIMENTS AND BENCHMARK PROBLEMSFORMULATION
Description of experiments carried out combined with formulation of benchmark problems is presentedin initial paper of the ANS Committee and in all papers devoted to computation of those problems.Nevertheless for convenience of a reader we will repeat that data here by merely citing some parts ofinitial document of the ANS Committee4.
"The experiments were performed inside a large aluminium tank containing borated water, UO2fuel pins, and a number of so-called perturbing pins. The fuel pins contained low-enriched uranium(LEU) and were clad in aluminum. The water contained soluble boron in the form of dissolved boricacid (H3BO3). The water height was exactly 145 cm, and the boron concentration in the water wasadjusted until each experimental configuration was slightly supercritical, with a value of 1.0007 for Kcn:The soluble boron concentration for each experiment was determined by titration and reported in units ofparts per million by weight (ppm) in water. The standard deviation for each soluble boron concentrationis ±3 ppm
319
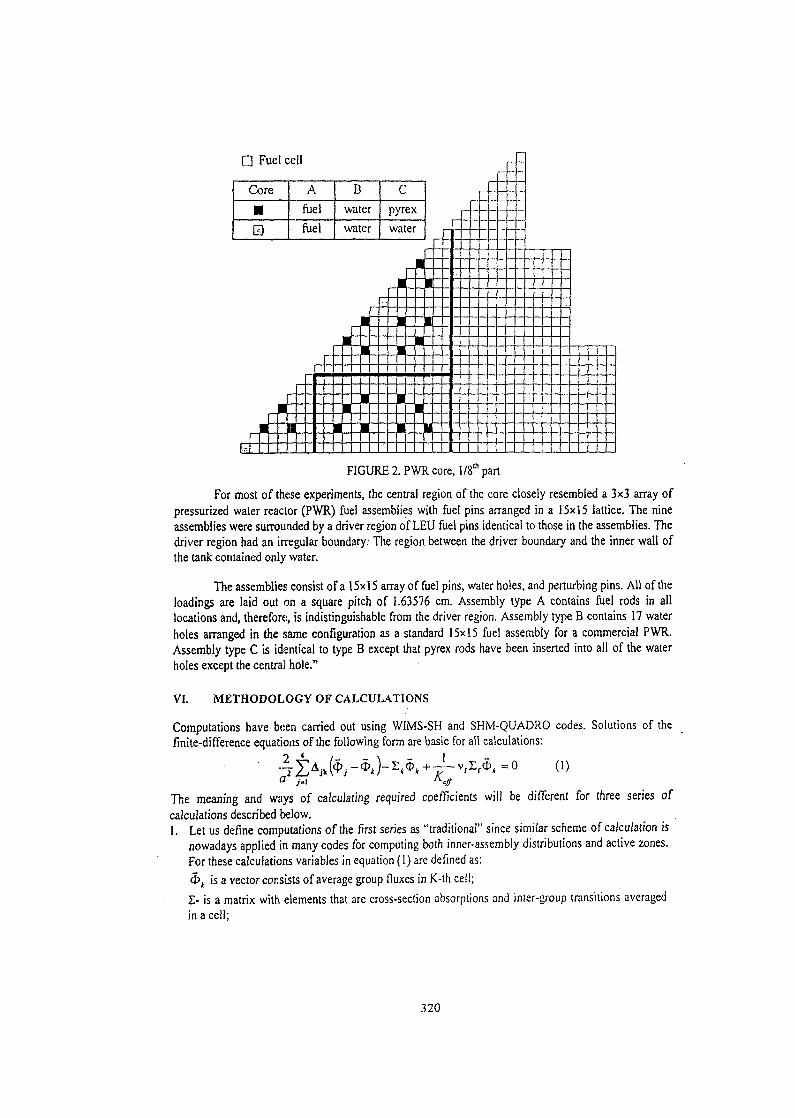
D Fuel cell
Core
•GD
A
fuel
fuel
Bwater
water
C
pyrex
water
FIGURE 2. PWR core, l/8th part
For most of these experiments, the central region of the core closely resembled a 3x3 array ofpressurized water reactor (PWR) fuel assemblies with fuel pins arranged in a 15x15 lattice. The nineassemblies were surrounded by a driver region of LEU fuel pins identical to those in the assemblies. Thedriver region had an inegular boundary: The region between the driver boundary and the inner wall ofthe tank contained only water.
The assemblies consist of a 15x15 array of fuel pins, water holes, and perturbing pins. All of theloadings are laid out on a square pitch of 1.63576 cm. Assembly type A contains fuel rods in alllocations and, therefore, is indistinguishable from the driver region. Assembly type B contains 17 waterholes arranged in the same configuration as a standard 15x15 fuel assembly for a commercial PWR.Assembly type C is identical to type B except that pyrex rods have been inserted into all of the waterholes except the centra] hole."
VI. METHODOLOGY OF CALCULATIONS
Computations have been carried out using W1MS-SH and SHM-QUADRO codes. Solutions of thefinite-difference equations of the following form are basic for all calculations:
The meaning and ways of calculating required coefficients will be different for three series of
calculations described below.1. Let us define computations of the first series as "traditional" since similar scheme of calculation is
nowadays applied in many codes for computing both inner-assembly distributions and active zones.For these calculations variables in equation (1) are defined as:
0k is a vector consists of average group fluxes in K-th cell;
I - is a matrix with elements that are cross-section absorptions and inter-group transitions averagedin a cell;
320
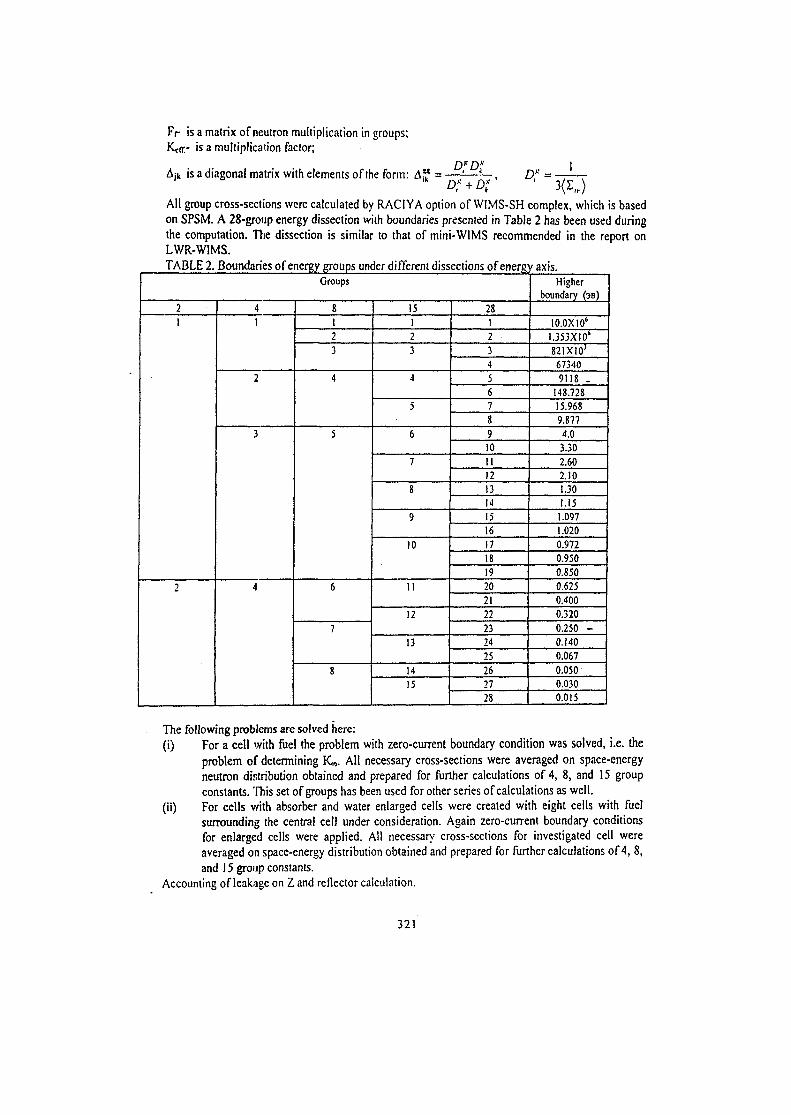
Fr is a matrix of neutron multiplication in groups;Keir- is a multiplication factor;
Ajk is a diagonal matrix with elements of the form: A" = — ~ — ~ , £>* = -
All group cross-sections were calculated by RACIYA option of WIMS-SH complex, which is basedon SPSM. A 28-group energy dissection with boundaries presented in Table 2 has been used duringthe computation. The dissection is similar to that of mini-WIMS recommended in the report onLWR-W1MS.TABLE 2. Boundaries of energy groups under different dissections of energy axis.
Groups
21
2
41
2
3
4
8123
4
5
6
7
8
15123
4
5
6
7
8
9
10
11
12
13
1415
2812345678910111213141516171819202122232425262728
Higherboundary (3B)
10.0XI04
1.353X10'
821X10'
67340
9118 .
148.72815.968
9.8774.03.30
2.602.10
1.30
1.15
1.097
1.020
0.972
0.950
0.850
0.625
0.400
0.320
0.250 -
0.140
0.067
0.050
0.030
0.015
The following problems are solved here:(i) For a cell with fuel the problem with zero-current boundary condition was solved, i.e. the
problem of determining K«. All necessary cross-sections were averaged on space-energyneutron distribution obtained and prepared for further calculations of 4, 8, and 15 groupconstants. This set of groups has been used for other series of calculations as well.
(ii) For cells v/ith absorber and water enlarged cells were created with eight cells with fuelsurrounding the central cell under consideration. Again zero-current boundary conditionsfor enlarged cells were applied. All necessary cross-sections for investigated cell wereaveraged on space-energy distribution obtained and prepared for further calculations of 4, 8,and 15 group constants.
Accounting of leakage on Z and reflector calculation.
321
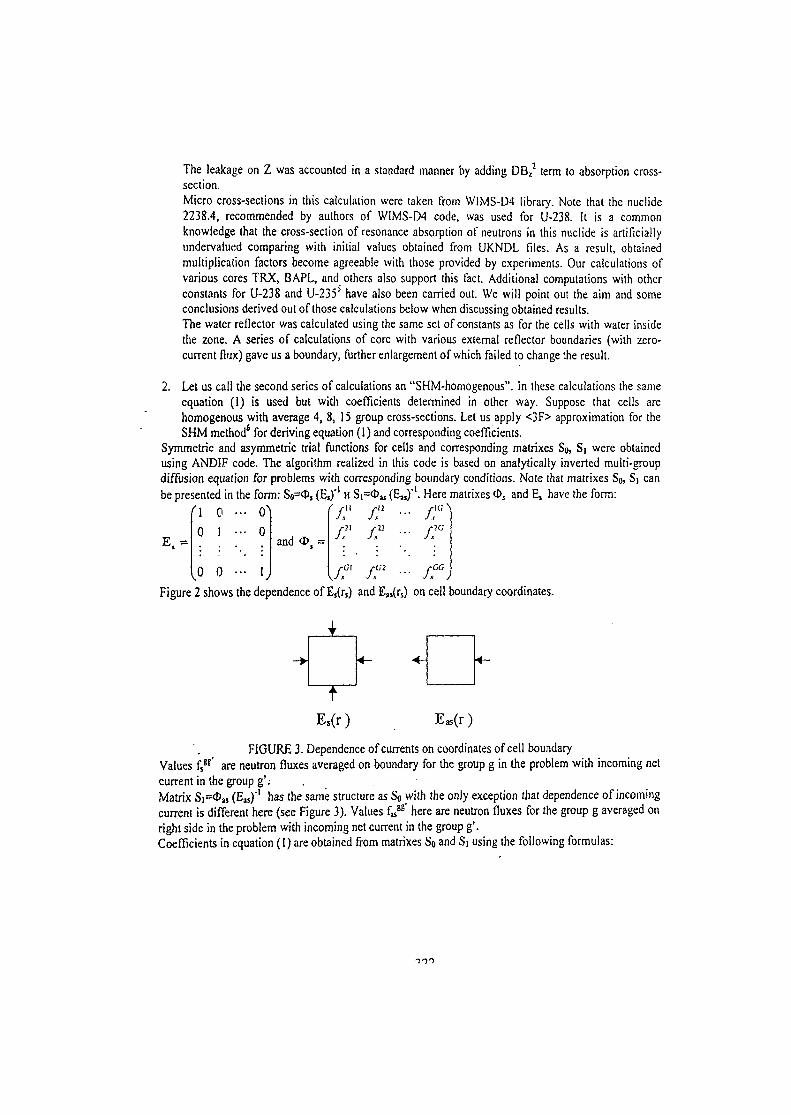
The leakage on Z was accounted in a standard manner by adding DBZ2 term to absorption cross-
section.Micro cross-sections in this calculation were taken from WIMS-D4 library. Note that the nuclide2238.4, recommended by authors of WIMS-D4 code, was used for U-238. It is a commonknowledge that the cross-section of resonance absorption of neutrons in this nuclide is artificiallyundervalued comparing with initial values obtained from UKNDL files. As a result, obtainedmultiplication factors become agreeable with those provided by experiments. Our calculations ofvarious cores TRX, BAPL, and others also support this fact. Additional computations with otherconstants for U-238 and U-2353 have also been carried out. We will point oul the aim and someconclusions derived out of those calculations below when discussing obtained results.The water reflector was calculated using the same set of constants as for the cells with water insidethe zone. A series of calculations of core with various external reflector boundaries (with zero-current flux) gave us a boundary, further enlargement of which failed to change the result.
2. Let us call the second series of calculations an "SHM-homogenous". In these calculations the sameequation (I) is used but with coefficients determined in other way. Suppose that cells arehomogenous with average 4, 8, 15 group cross-sections. Let us apply <3F> approximation for theSHM method6 for deriving equation (1) and corresponding coefficients.
Symmetric and asymmetric trial functions for cells and corresponding matrixes So, S| were obtainedusing ANDIF code. The algorithm realized in this code is based on analytically inverted multi-groupdiffusion equation for problems with corresponding boundary conditions. Note that matrixes So, Si canbe presented in the form: So=<I>j (Es)'' H Si=Oas (Eas)"'. Here matrixes O5 and Es have the form:
E =0 0
0 0
17"and
f!2
\ J -fCI f!cc
Figure 2 shows the dependence of E,(rs) and E,,(rs) on cell boundary coordinates.
E,(r) E*(r)
FIGURE 3. Dependence of currents on coordinates of cell boundaryValues fs
8S> are neutron fluxes averaged on boundary for the group g in the problem with incoming netcurrent in the group g'.-Matrix S I - O M (Eas)'1 has the same structure as So with the only exception that dependence of incomingcurrent is different here (see Figure 3). Values f^ here are neutron fluxes for the group g averaged onright side in the problem with incoming net current in the group g'.Coefficients in equation (1) are obtained from matrixes So and Si using the following formulas:
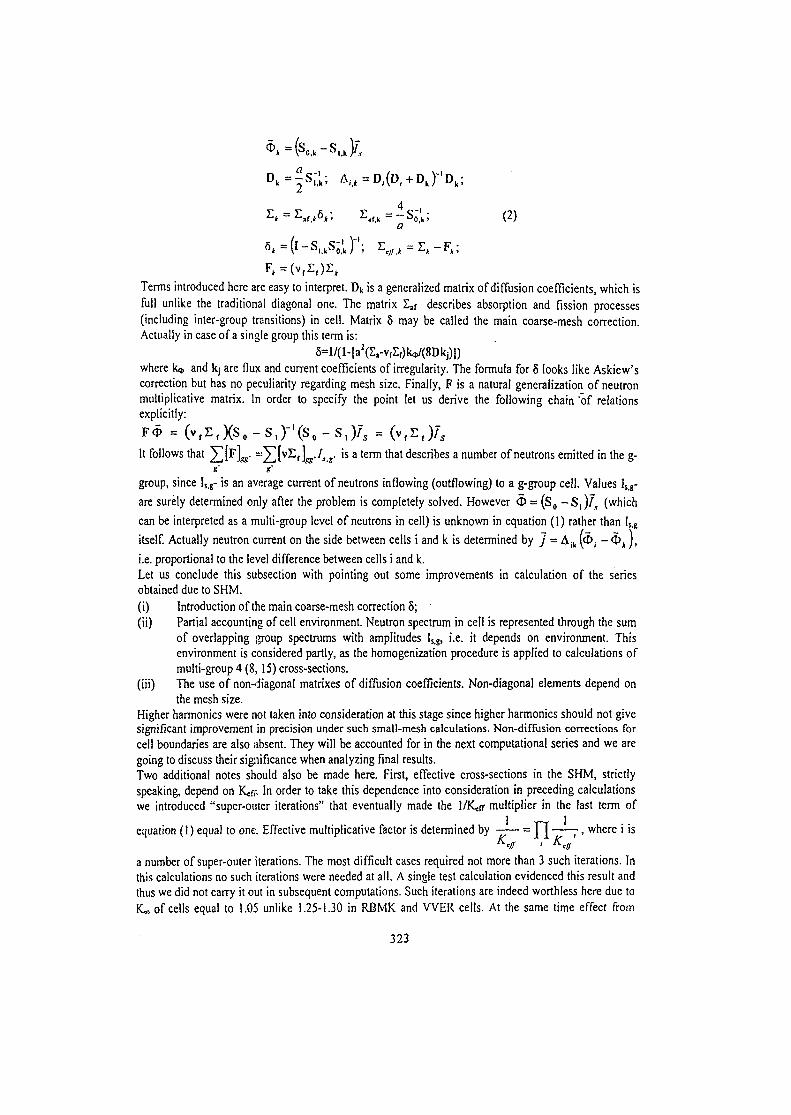
a
Terms introduced here are easy to interpret. Dk is a generalized matrix of diffusion coefficients, which isfull unlike the traditional diagonal one. The matrix Zaf describes absorption and fission processes(including inter-group transitions) in cell. Matrix 5 may be called the main coarse-mesh correction.Actually in case of a single group this term is:
5=l/(l-[a2(Z,-vfIf)lW(8Dkj)i)where k<t, and kj are flux and current coefficients of irregularity. The formula for 5 looks like Askiew'scorrection but has no peculiarity regarding mesh size. Finally, F is a natural generalization of neutronmultiplicative matrix. In order to specify the point let us derive the following chain "of relationsexplicitly:
FO = (v^XS.-Sj-'CS.-S.fo = (v,Ef)7s
It follows that ^ [ F ] ^ . = : X [ v S f L-^.«' 'S a t e r m * a t describes a number of neutrons emitted in the g-
group, since Is.g- is an average current of neutrons inflowing (outflowing) to a g-group cell. Values Isg-
are surely determined only after the problem is completely solved. However O = (So - S , ) 7 , (which
can be interpreted as a multi-group level of neutrons in cell) is unknown in equation (1) rather than Is,g
itself. Actually neutron current on the side between cells i and k is determined by j = Aik ( o , - <&k),
i.e. proportional to the level difference between cells i and k.Let us conclude this subsection with pointing out some improvements in calculation of the seriesobtained due to SHM.(i) Introduction of the main coarse-mesh correction 8;(ii) Partial accounting of cell environment. Neutron spectrum in cell is represented through the sum
of overlapping group spectrums with amplitudes Is,g, i.e. it depends on environment. Thisenvironment is considered partly, as the homogenization procedure is applied to calculations ofmulti-group 4 (8, 15) cross-sections,
(iii) The use of non-diagonal matrixes of diffusion coefficients. Non-diagonal elements depend onthe mesh size.
Higher harmonics were not taken into consideration at this stage since higher harmonics should not givesignificant improvement in precision under such small-mesh calculations. Non-diffusion corrections forcell boundaries are also absent. They will be accounted for in the next computational series and we aregoing to discuss their significance when analyzing final results.Two additional notes should also be made here. First, effective cross-sections in the SHM, strictlyspeaking, depend on Keif. In order to take this dependence into consideration in preceding calculationswe introduced "super-outer iterations" that eventually made the l/K rr multiplier in the last term of
equation (!) equal to one. Effective multiplicative factor is determined by = J~J - , where i is
a number of super-outer iterations. The most difficult cases required not more than 3 such iterations. Inthis calculations no such iterations were needed at all. A single test calculation evidenced this result andthus we did not carry it out in subsequent computations. Such iterations are indeed worthless here due toK« of cells equal to 1.05 unlike 1.25-1.30 in RBMK and VVER cells. At the same time effect from
323
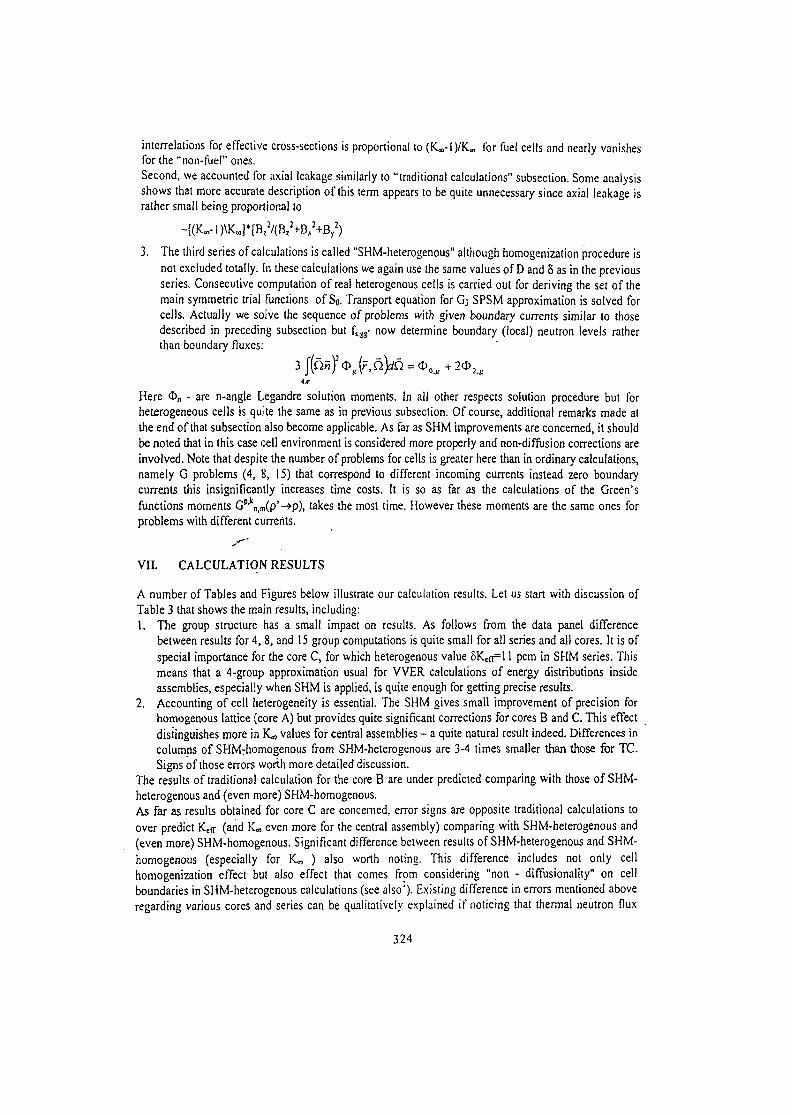
interrelations for effective cross-sections is proportional to (K«,-iyKw for fuel cells and nearly vanishesfor the "non-fuel" ones.Second, we accounted for axial leakage similarly to "traditional calculations" subsection. Some analysisshows that more accurate description of this term appears to be quite unnecessary since axial leakage israther small being proportional to
~[(KM-l)\K«]*[Bz2/(Br
2+Bx2+B/)
3. The third series of calculations is called "SHM-heterogenous" although homogenization procedure isnot excluded totally. In these calculations we again use the same values of D and 8 as in the previousseries. Consecutive computation of real heterogenous cells is carried out for deriving the set of themain symmetric trial functions of So. Transport equation for G3 SPSM approximation is solved forcells. Actually we solve the sequence of problems with given boundary currents similar to thosedescribed in preceding subsection but f5gg- now determine boundary (local) neutron levels ratherthan boundary fluxes:
Here d>n - are n-angle Legandre solution moments. In all other respects solution procedure but forheterogeneous cells is quite the same as in previous subsection. Of course, additional remarks made atthe end of that subsection also become applicable. As far as SHM improvements are concerned, it shouldbe noted that in this case cell environment is considered more properly and non-diffusion corrections areinvolved. Note that despite the number of problems for cells is greater here than in ordinary calculations,namely G problems (4, 8, 15) that correspond to different incoming currents instead zero boundarycurrents this insignificantly increases time costs. It is so as far as the calculations of the Green'sfunctions moments Gp'kn,m(p'->p), takes the most time. However these moments are the same ones forproblems with different currents.
VII. CALCULATION RESULTS
A number of Tables and Figures below illustrate our calculation results. Let us start with discussion ofTable 3 that shows the main results, including:1. The group structure has a small impact on results. As follows from the data panel difference
between results for 4,8, and 15 group computations is quite small for all series and all cores. It is ofspecial importance for the core C, for which heterogenous value 5Ken= 11 pcm in SHM series. Thismeans that a 4-group approximation usual for VVER calculations of energy distributions insideassemblies, especially when SHM is applied, is quite enough for getting precise results.
2. Accounting of cell heterogeneity is essential. The SHM gives small improvement of precision forhomogenous lattice (core A) but provides quite significant corrections for cores B and C. This effectdistinguishes more in K« values for central assemblies - a quite natural result indeed. Differences incolumns of SHMrhomogenous from SHM-heterogenous are 3-4 times smaller than those for TC.Signs of those errors worth more detailed discussion.
The results of traditional calculation for the core B are under predicted comparing with those of SHM-heterogenous and (even more) SHM-homogenous.As far as results obtained for core C are concerned, error signs are opposite traditional calculations toover predict Kctr (and K« even more for the central assembly) comparing with SHM-heterogenous and(even more) SHM-homogenous. Significant difference between results of SHM-heterogenous and SHM-homogenous (especially for KOT ) also worth noting. This difference includes not only cellhomogenization effect but also effect that comes from considering "non - diffusionality" on cellboundaries in SHM-heterogenous calculations (see also7). Existing difference in errors mentioned aboveregarding various cores and series can be qualitatively explained if noticing that thermal neutron flux
324
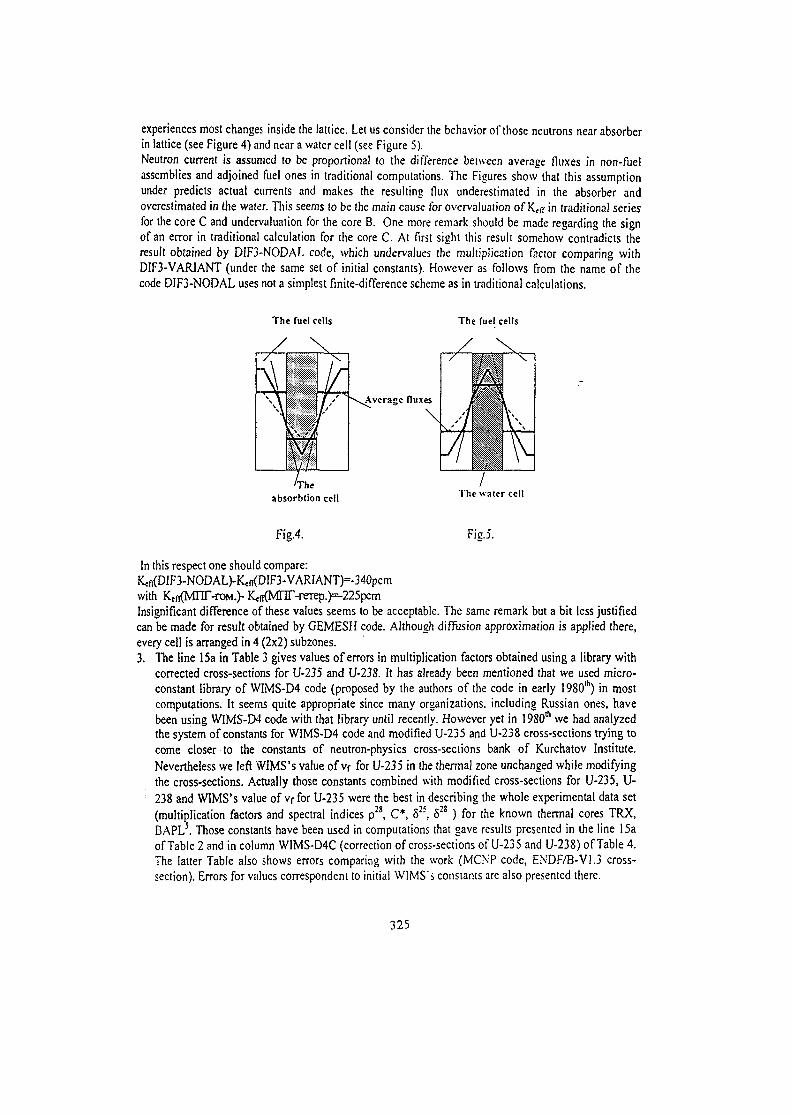
experiences most changes inside the lattice. Let us consider the behavior of those neutrons near absorberin lattice (see Figure 4) and near a water cell (see Figure 5).Neutron current is assumed to be proportional to the difference between average (luxes in non-fuelassemblies and adjoined fuel ones in traditional computations. The Figures show that this assumptionunder predicts actual currents and makes the resulting flux underestimated in the absorber andoverestimated in the water. This seems to be the main cause for overvaluation of K^in traditional seriesfor the core C and undervaluation for the core B. One more remark should be made regarding the signof an error in traditional calculation for the core C. At first sight this result somehow contradicts theresult obtained by DIF3-N0DAL code, which undervalues the multiplication factor comparing withDIF3-VARIANT (under the same set of initial constants). However as follows from the name of thecode DIF3-N0DAL uses not a simplest finite-difference scheme as in traditional calculations.
The fuel cells The fuel cells
i jr\Average fluxes
'Theabsorbtion cell The water cell
Fig.4. Fig.5.
In this respect one should compare:Ktn{DIF3-NODAL)-K£n<DIF3-VARIANT)=-340pcmwith KcfT(MIT^X)M>K<fj(Mrir-reTep.)==-225pcrnInsignificant difference of these values seems to be acceptable. The same remark but a bit less justifiedcan be made for result obtained by GEMESH code. Although diffusion approximation is applied there,every cell is arranged in 4 (2x2) subzones.3. The line 15a in Table 3 gives values of errors in multiplication factors obtained using a library with
corrected cross-sections for U-235 and U-238. It has already been mentioned that we used micro-constant library of WIMS-D4 code (proposed by the authors of the code in early 1980th) in mostcomputations. It seems quite appropriate since many organizations, including Russian ones, havebeen using WIMS-D4 code with that library until recently. However yet in 1980th we had analyzedthe system of constants for WIMS-D4 code and modified U-235 and U-238 cross-sections trying tocome closer to the constants of neutron-physics cross-sections bank of Kurchatov Institute.Nevertheless we left WIMS's value of Vf for U-235 in the thermal zone unchanged while modifyingthe cross-sections. Actually those constants combined with modified cross-sections for U-235, U-238 and WIMS's value of Vf for U-235 were the best in describing the whole experimental data set(multiplication factors and spectral indices p28, C*, 525, 528 ) for the known thermal cores TRX,BAPL5. Those constants have been used in computations that gave results presented in the line 15aof Table 2 and in column WIMS-D4C (correction of cross-sections of U-235 and U-238) of Table 4.The latter Table also shows errors comparing with the work (MCN'P code, ENDF/B-V1.3 cross-section). Errors for values correspondent to initial WIMS's constants are also presented there.
325
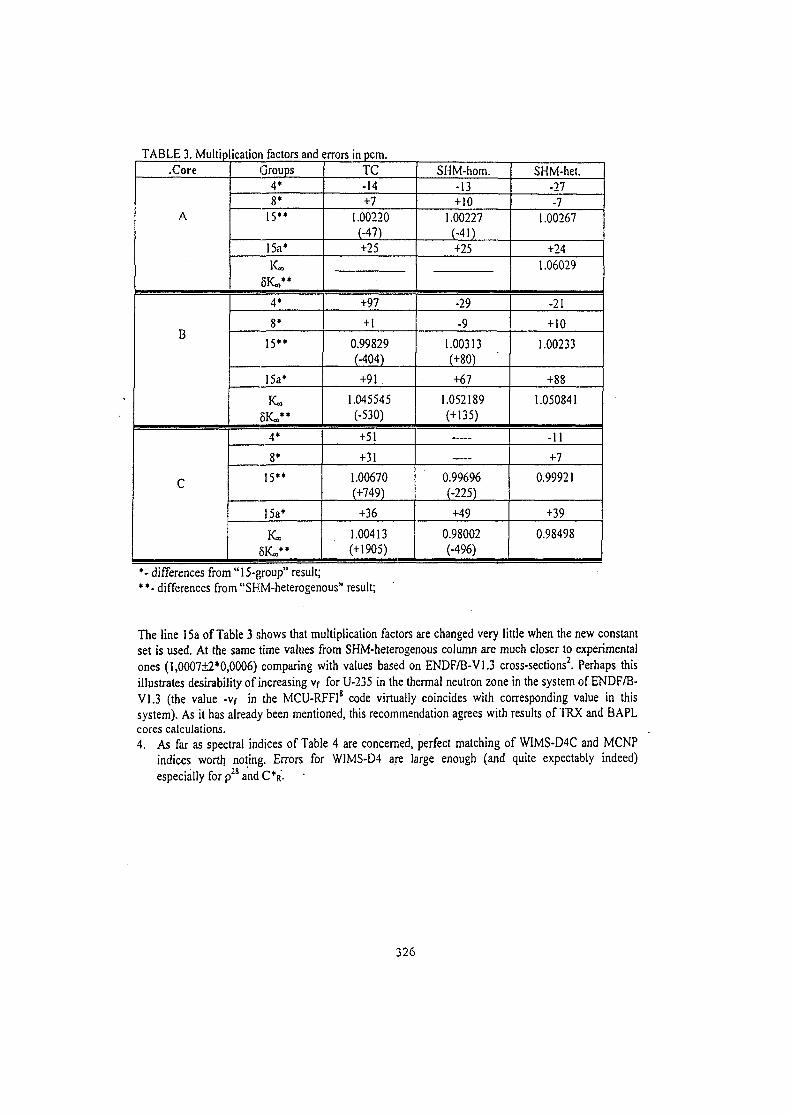
TABLE 3. Multiplication factors and errors in pern..Core
A
B
C
Groups4*8*15**
15a*K.
8K»M
4*
8*
15**
15a*
K.5IC**4*
8*
15**
15a*
K.5K***
TC-14+7
1.00220(-47)+25
+97
+1
0.99829(-404)
+91
1.045545(-530)
+51
+31
1.00670(+749)
+36
1.00413(+1905)
SHM-hom.-13+10
1.00227(-41)+25
-29
-9
1.00313(+80)
+67
1.052189(+135)
—
0.99696(-225)
+49
0.98002(-496)
SHM-het.-27-7
1.00267
+241.06029
-21
+ 10
1.00233
+88
1.050841
-11
+7
0.99921
+39
0.98498
*- differences from "15-group" result;**- differences from "SHM-heterogenous" result;
The line 15a of Table 3 shows that multiplication factors are changed very little when the new constantset is used. At the same time values from SHM-heterogenous column are much closer to experimentalones (1,0007+2*0,0006) comparing with values based on ENDF/B-VI.3 cross-sections2. Perhaps thisillustrates desirability of increasing Vf for U-235 in the thermal neutron zone in the system of ENDF/B-VI.3 (the value -Vf in the MCU-RFF18 code virtually coincides with corresponding value in thissystem). As it has already been mentioned, this recommendation agrees with results of TRX and BAPLcores calculations.4. As far as spectral indices of Table 4 are concerned, perfect matching of WIMS-D4C and MCNP
indices worth noting. Errors for WIMS-D4 are large enough (and quite expectably indeed)
especially for p28 and C*R.
326
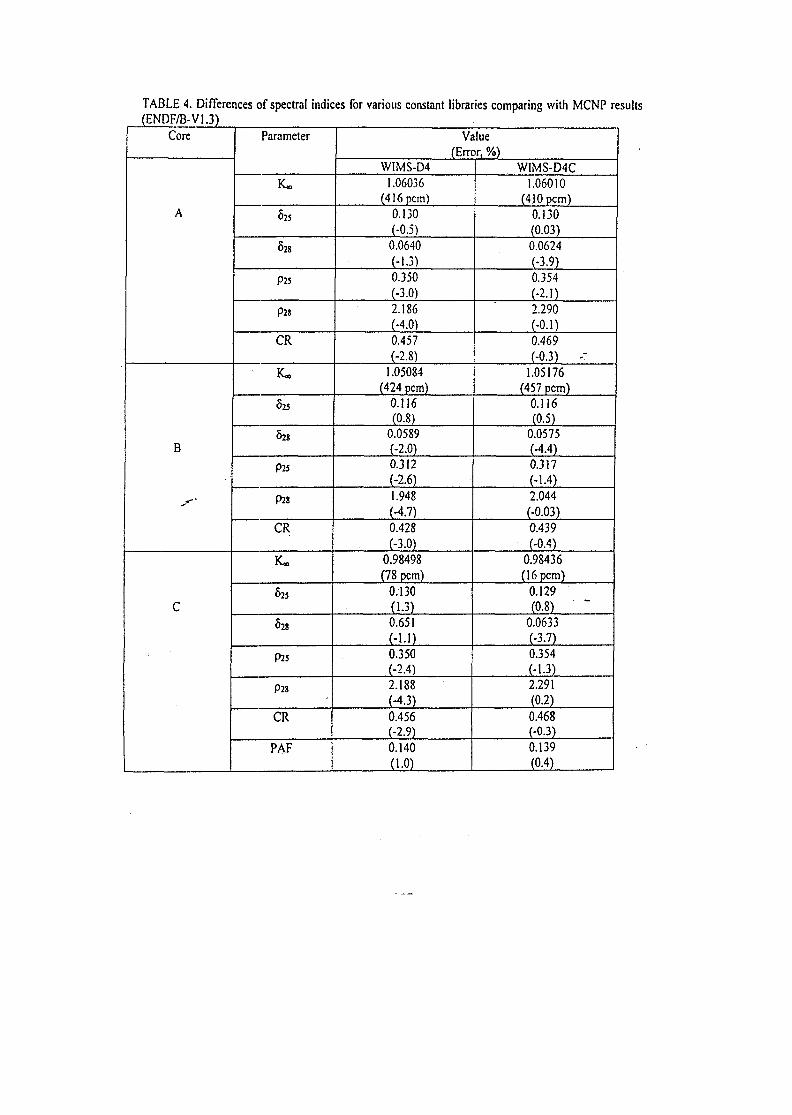
TABLE 4. Differences of spectral indices for various constant libraries comparing with MCNP results(ENDF/B-VI.3)
Core
A
B
C
Parameter
K.
825
628
P25
P28
CR
K»
625
528
P25
P28
CR
K.
825
628
P25
P28
CR
PAP
Value(Error, %)
WIMS-D41.06036
(416 pcm)0.130(-0.5)0.0640(-1.3)0.350(-3.0)2.186(-4.0)0.457(-2.8)
1.05084(424 pcm)
0.116(0.8)
0.0589(-2.0)0.312(-2.6)1.948(-4.7)0.428(-3.0)
0.98498(78 pcm)
0.130(1.3)0.651
(-1.1)0.350(-2.4)2.188(-4.3)0.456(-2.9)0.140
(1.0)
WIMS-D4C1.06010
(410 pcm)0.130(0.03)0.0624(-3.9)0.354(-2.1)2.290(-0.1)0.469(-0.3) -
1.05176(457 pcm)
0.116(0.5)
0.0575(-4.4)0.317(-1.4)2.044
(-0.03)0.439(-0.4)
0.98436(16 pcm)
0.129(0.8)
0.0633(-3.7)0.354
(-1.3)2.291(0.2)0.468(-0.3)0.139(0.4)
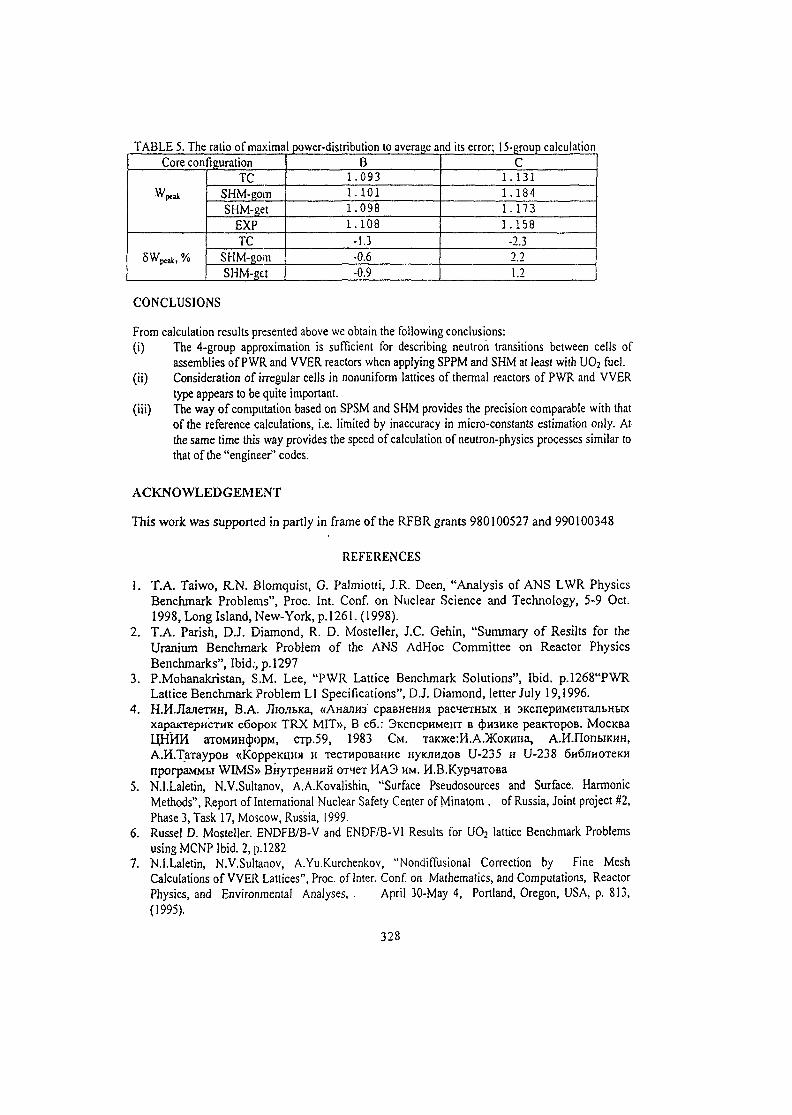
TABLE 5. The ratio of maximal power-distribution to average and its error; 15-group calculationCore configuration
Wpca
SWpcak, %
TCSHM-gomSHM-get
EXPTC
SHM-gomSHM-get
B1.0931.1011.0981.108
-1.3-0.6-0.9
C1.1311.1841.1731.158
-2.32.21.2
CONCLUSIONS
From calculation results presented above we obtain the following conclusions:(i) The 4-group approximation is sufficient for describing neutron transitions between cells of
assemblies of PWR and VVER reactors when applying SPPM and SHM at least with UO2 fuel.(ii) Consideration of irregular cells in nonuniform lattices of thermal reactors of PWR and VVER
type appears to be quite important,(iii) The way of computation based on SPSM and SHM provides the precision comparable with that
of the reference calculations, i.e. limited by inaccuracy in micro-constants estimation only. At-the same time this way provides the speed of calculation of neutron-physics processes similar tothat of the "engineer" codes.
ACKNOWLEDGEMENT
This work was supported in partly in frame of the RFBR grants 980100527 and 990100348
REFERENCES
1. T.A. Taiwo, R.N. Blomquist, G. Palmiotti, J.R. Deen, "Analysis of ANS LWR PhysicsBenchmark Problems", Proc. Int. Conf. on Nuclear Science and Technology, 5-9 Oct.1998, Long Island, New-York, p. 1261. (1998).
2. T.A. Parish, D.J. Diamond, R. D. Mosteiler, J.C. Gehin, "Summary of Resilts for theUranium Benchmark Problem of the ANS AdHoc Committee on Reactor PhysicsBenchmarks", Ibid., p. 1297
3. P.Mohanakristan, S.M. Lee, "PWR Lattice Benchmark Solutions", Ibid. p.l268"PWRLattice Benchmark Problem LI Specifications", D.J. Diamond, letter July 19,1996.
4. H.HJIaneTHH, B.A. JlKWifcica, «AHa^H3 cpaBHeHHs pacneTHMx H 3KcnepHMeHTajitHbixxapaxTepHCTHK c6opoK TRX MIT», B c6.: 3KcnepnMeHT B cpH3HKe peaicropoB. MocKBaLJjHfHH aTOMHHcbopM, crp.59, 1983 CM. Taic>Ke:H.A.}KoKHHa, A.M.rionwKHH,A.H.TaTaypoB «KoppeKUHs H TecTHpoBaHHe Hyioin,a;oB U-235 H U-238 6H6JIHOTCKHnporpaMMti WIMS» BkyTpeHHHH OTHCT H A 3 HM. H.B.KypnaTOBa
5. N.I.Laletin, N.V.Sultanov, A.A.Kovalishin, "Surface Pseudosources and Surface. HarmonicMethods", Report of International Nuclear Safety Center of Minatom . of Russia, Joint project #2,Phase 3, Task 17, Moscow, Russia, 1999.
6. Russel D. Mosteiler. ENDFB/B-V and ENDF/B-VI Results for UO2 lattice Benchmark Problemsusing MCNP Ibid. 2, p. 1282
7. N.I.Laletin, N.V.Sultanov, A.Yu.Kurchenkov, liNondiffusional Correction by Fine MeshCalculations of VVER Lattices", Proc. of Inter. Conf. on Mathematics, and Computations, ReactorPhysics, and Environmental Analyses, . April 30-May 4, Portland, Oregon, USA, p. 813,(1995).
328

8. AJE. FnyuiKOB, EAFOMHH, MH.FypeBHM, JIBJWafiopoB, «AHHOTOI»W nporpaMMM MCU-RFFI»,BAHT, cep. Oromca JtaepHbcc peaicropoB, Bbtn. 3, o p . 48,1995
9. A.A.Kovalishin, N.I.Laletin, "The calculations of the VVER-440 type core benchmark problem bysurface harmonics method", In proc. Intern. Conf. M<feC Madrid-99, Sept. 1999, Madrid, Spain.
329
SK01ST095
HELIOS Calculations
Petr Dafilek, Ctibor StrmenskyVUJETrnava, Slovakia
ABSTRACT
Comparison of HELIOS and KASSETA-TWEG spectral codes is presented. Benchmark for WER-440
FA Bum-Up Comparison (P. MikolaS, Sixth Symposium of AER, Kirkkonummi 1996) and typical
KASSETA type bum-up calculation for macrocode data preparation are used for comparison.
Differences of reactivity effects are discussed.
INTRODUCTION
Various spectral codes are available for preparation of diffusion data used as input at macro-
calculations of WER-440 reactors.
Code KASSETA [1] - older code - is used systematically for this purpose. Code performs transport
spectral calculations at cells (pins, central tube, ...) and diffusion calculation of the whole assembly.
Hexagonal geometry and selected materials only (WER fuel type) are acceptable.
Spectral code HELIOS [2] is one of recent programs, usable for mentioned purpose. Code uses CCCP
(Current Coupling Collision Probability) method for any 2D geometry and broad assortment of
materials.
Comparison of spectral codes performed earlier [3] suggested deviation of KASSETA results at higher
bum-ups and good accuracy of HELIOS results comparable with other spectral codes. Verification of
there conclusions is described at this paper. Calculation tests are based on direct comparison of
KASSETA and HELIOS codes as well as on (repeated) solution of "Benchmark for WER-440 FA
Bum-up Comparison" [3],
Direct comparison of KASSETA and HELIOS codes
Main task of KASSETA code is preparation of diffusion data for static core simulator BIPR7 [4J.
Spectral calculations .tree" is described at Tablei. Diffusion data based on KASSETA calculations in
accordance with Table 1 are used regularly at BIPR7 code.
331
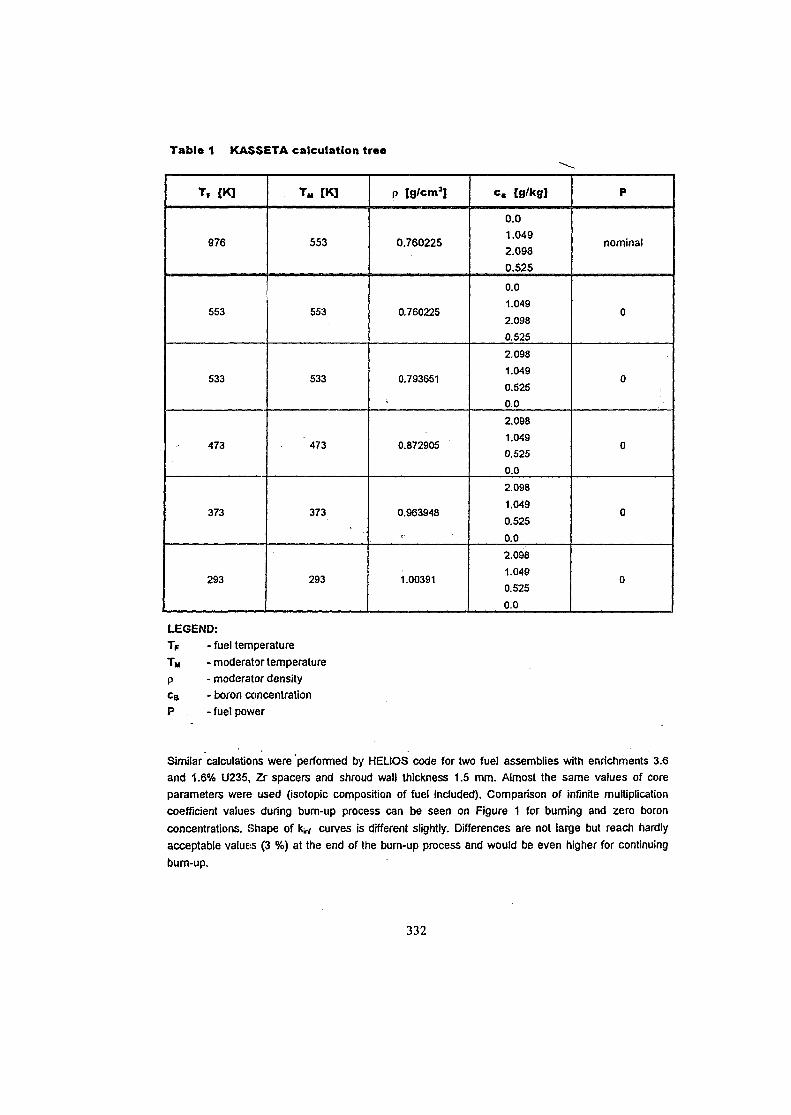
Table 1 KASSETA calculation tree
976
553
533
473
373
293
TM [K]
553
553
533
473
373
293
P Ig/cnv1]
0.760225
0.760225
0.793651
0.872905
0.963948
T
1.00391
c. [g/kgj
0.01.0492.0980.525
0.0
1.049
2.098
0.525
2.098
1.049
0.525
0.0
2.098
1.049
0.525
0.0
2.098
1.049
0.525
0.0
2.098
1.049
0.525
0.0
P
nominal
0
0
0
0
0
LEGEND:
TV - fuel temperature
Tin -moderator temperature
p - moderator density
cB - boron concentration
P . - fuel power
Similar calculations were performed by HELIOS code for two fuel assemblies with enrichments 3.6
and 1.6% U235, Zr spacers and shroud wall thickness 1.5 mm. Almost the same values of core
parameters were used (isotopic composition of fuel included). Comparison of infinite multiplication
coefficient values during bum-up process can be seen on Figure 1 for burning and zero boron
concentrations. Shape of kw curves is different slightly. Differences are not large but reach hardly
acceptable values (3 %) at the end of the burn-up process and would be even higher for continuing
burn-up.
332
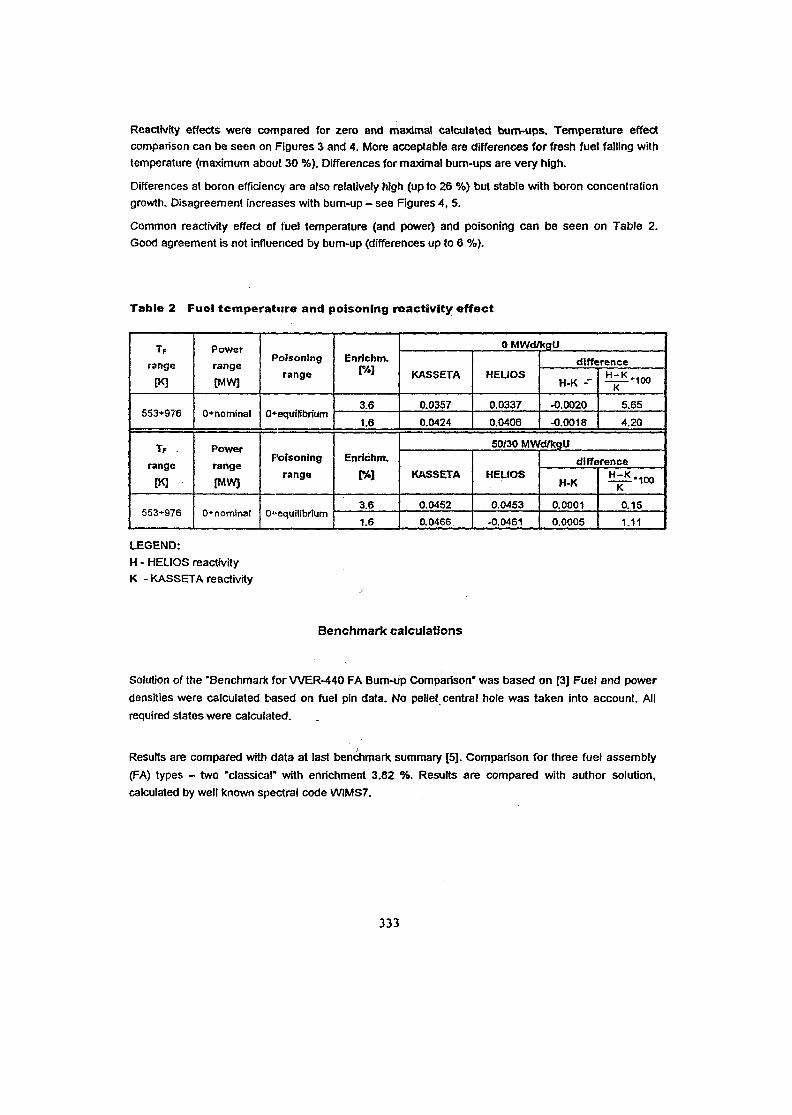
Reactivity effects were compared for zero and maximal calculated bum-ups. Temperature effectcomparison can be seen on Figures 3 and 4. More acceptable are differences for fresh fuel falling withtemperature (maximum about 30 %). Differences for maximal burn-ups are very hfgh.
Differences at boron efficiency are atso relatively high (up to 26 %) but stable with boron concentrationgrowth. Disagreement increases with burn-up - see Figures 4, 5.
Common reactivity effect of fuel temperature (and power) and poisoning can be seen on Table 2.Good agreement is not influenced by bum-up (differences up to 6 %).
Table 2 Fuel temperature and poisoning reactivity effect
TF
range
[K]
553+976
TF .
range
[K]
553+976
Power
range
[MW]
0+nominal
Power
range
[MW]
0+nominat
Poisoning
range
0*equilibrium
Poisoning
range
0->-equifibrium
Enrichm.
3.6
1.6
Enrichm.
r%]
3.6
1.6
0 MWd/kgU
KASSETA
0.0357
0.0424
HELIOS
0.0337
0.0406
difference
H-K - '
-0.0020
-0.0018
H " K M0O
5.65
4.20
50/30 MWdVkgU
KASSETA
0.0452
0.0466
HELIOS
0.0453
-0.0461
difference
H-K
0.0001
0.0005
H~K '10OK
0.15
1.11
LEGEND:H - HELIOS reactivityK - KASSETA reactivity
Benchmark calculations
Solution of the "Benchmark for WER-440 FA Bum-up Comparison" was based on [3J Fuel and power
densities were calculated based on fuel pin data. No pellet central hole was taken into account. All
required states were calculated.
Results are compared with data at last benchmark summary [5]. Comparison for three fuel assembly
(FA) types - two "classical" with enrichment 3.82 %. Results are compared with author solution,
calculated by well known spectral code WIMS7.
333
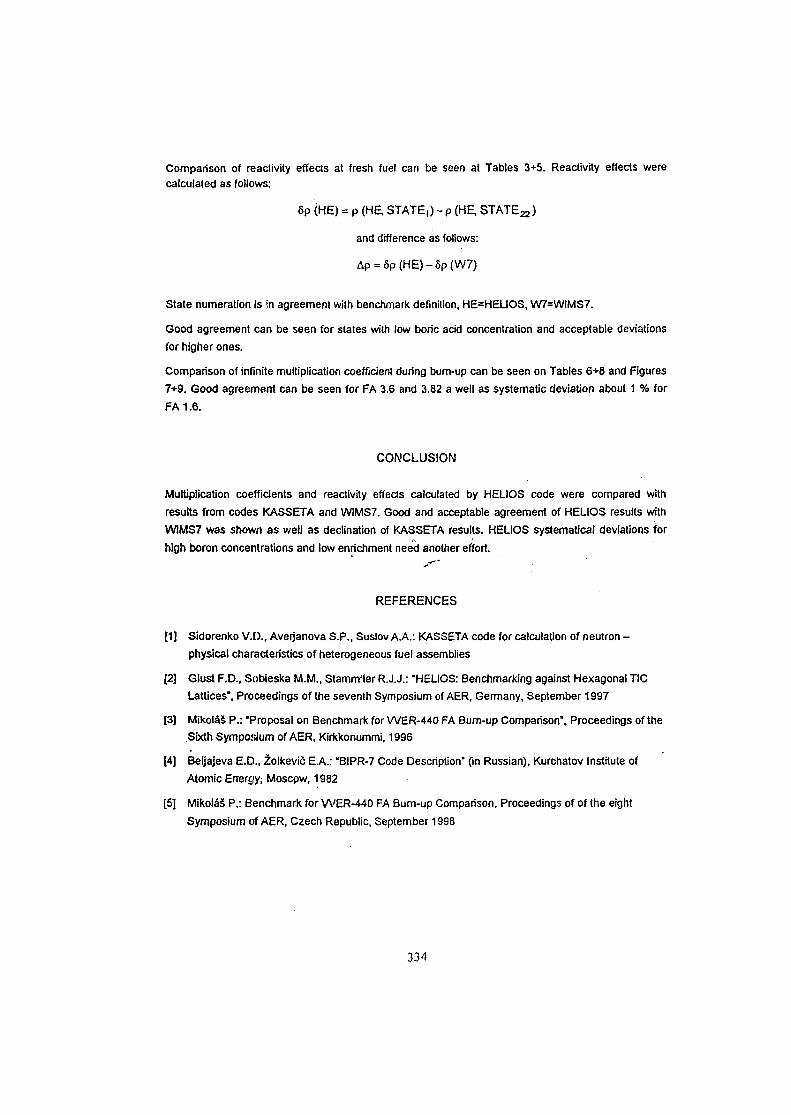
Comparison of reactivity effects at fresh fuel can be seen at Tables 3+5. Reactivity effects werecalculated as follows:
8p (HE) = p (HE, STATE,)-p (HE, STATE^,)
and difference as follows:
Ap = 5p(HE)-8p(W7)
State numeration is in agreement with benchmark definition, HE=HELIOS, W7=WIMS7.
Good agreement can be seen for states with low boric acid concentration and acceptable deviations
for higher ones.
Comparison of infinite multiplication coefficient during burn-up can be seen on Tables 6+8 and Figures
7+9. Good agreement can be seen for FA 3,6 and 3.82 a well as systematic deviation about 1 % for
FA 1.6.
CONCLUSION
Multiplication coefficients and reactivity effects calculated by HELIOS code were compared with
results from codes KASSETA and WIMS7. Good and acceptable agreement of HELIOS results with
WIMS7 was shown as well as declination of KASSETA results. HELIOS systematical deviations for
high boron concentrations and low enrichment need another effort.
REFERENCES
[1] Sidorenko V.[)., Averjanova S.P., Suslov A.A.: KASSETA code for calculation of neutron -
physical characteristics of heterogeneous fuel assemblies
[2] Giust F.D., Sobieska M.M., Stamm'ler R.J.J.: "HELIOS: Benchmarking against Hexagonal TIC
Lattices', Proceedings of the seventh Symposium of AER, Germany, September 1997
13] Mikolas P.: "Proposal on Benchmark for WER-440 FA Burn-up Comparison", Proceedings of theSixth Symposium of AER, Kirkkonummi, 1996
[4] Beljajeva E.D., 2olkevic E.A.: "BIPR-7 Code Description" (in Russian), Kurchatov Institute of
Atomic Energy; Moscow, 1982
[5] MikolaS P.: Benchmark for WER-440 FA Bum-up Comparison, Proceedings of of the eight
Symposium of AER, Czech Republic, September 1998
334
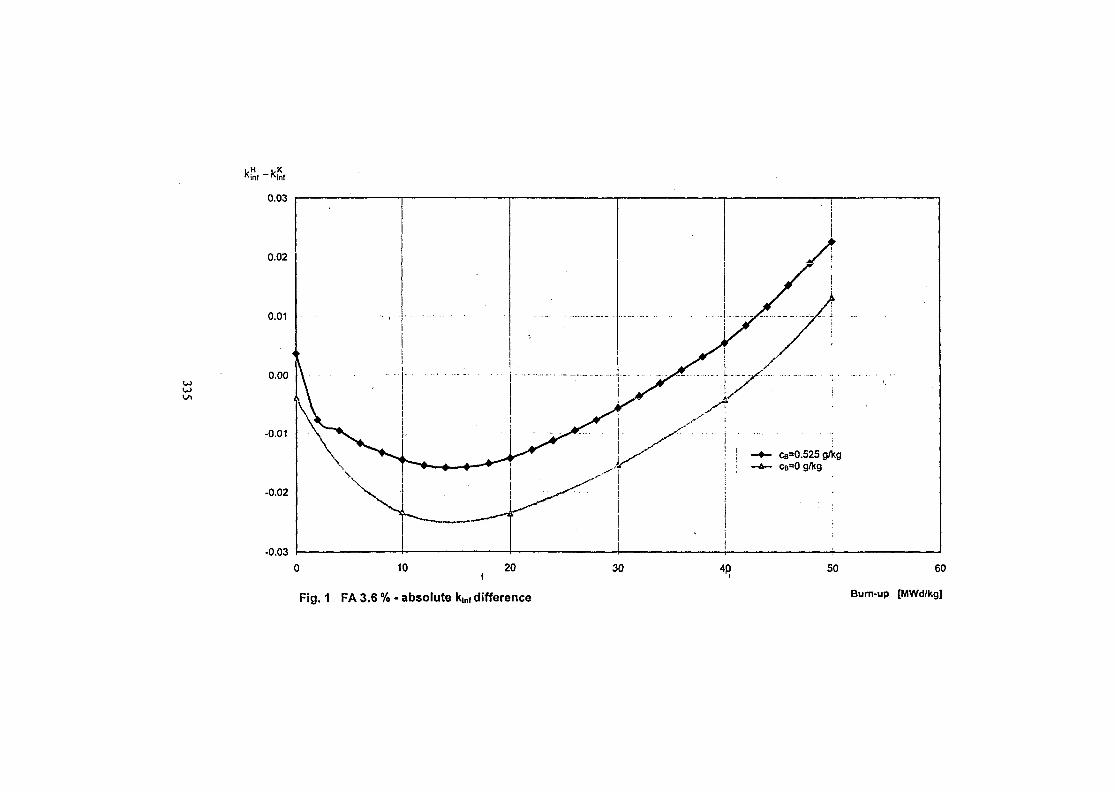
Kinf ~ Kinf
0.03
0.02
0.01
0.00
-0.01
-0.02
-0.03
CB=0.525 g/kgCB=0 g/kg
0 10 20
Fig. 1 FA 3.6 % - absolute k|nt difference
30 40 50 60
Burn-up [MWd/kg]
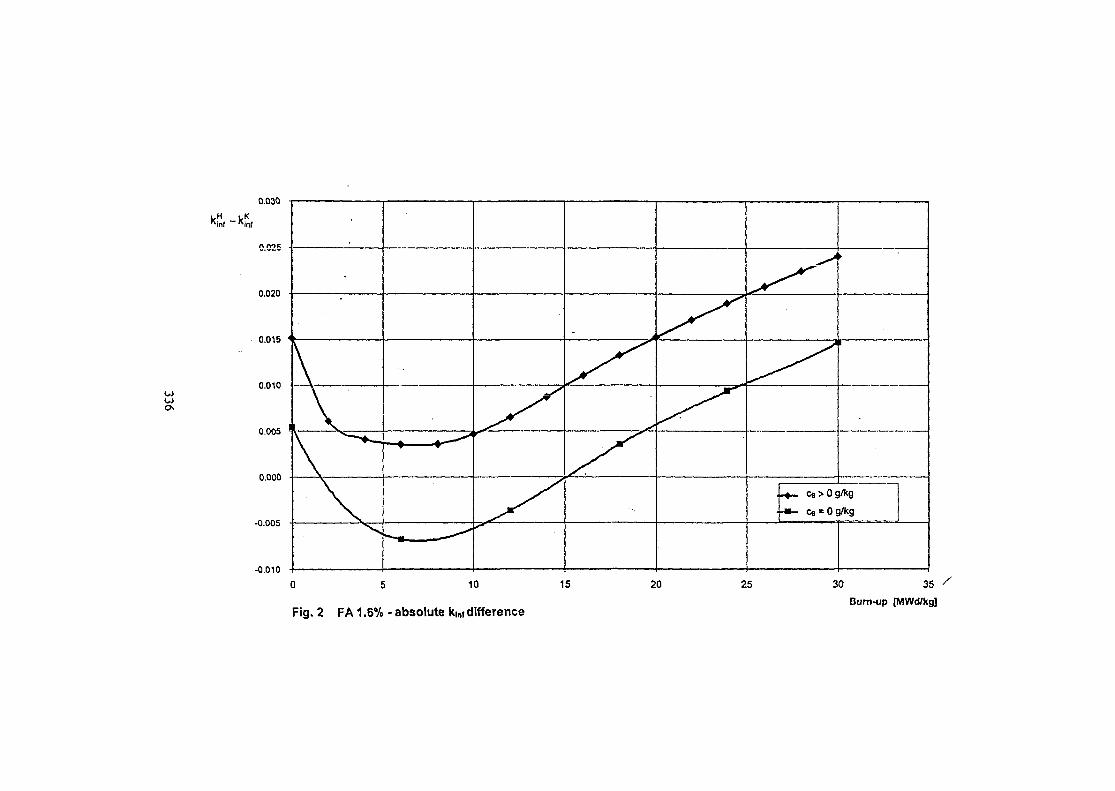
0.030
kH kK
0.02E
0.020
0.015
0.010
0.005
0.000
-0.005
-0.010
\
A\
— -"
A
i
_ ^ _ ce>0g/kg
•m- ce = 0 g/kg
0 5 10 15
Fig. 2 FA 1.6% - absolute kinf difference
20 25 30 35
Burn-up [MWd/kg]
ApldJ
kasseta - 0 MWd/kgU
helios - 0 MWd/kgU
abs. dev. - 0 MW/kgU (H-K)
kasseta - 50 MW/kgU
helios • 50 MW/kgU
abs. dev. - 50 MW/kgU (H-K)
temp coef reak (kassela )
250 300 • 350 400
Fig. 3 FA 3.6% - Isothermal temperature reactivity coefficient
450 500 550 600
temperature [K]
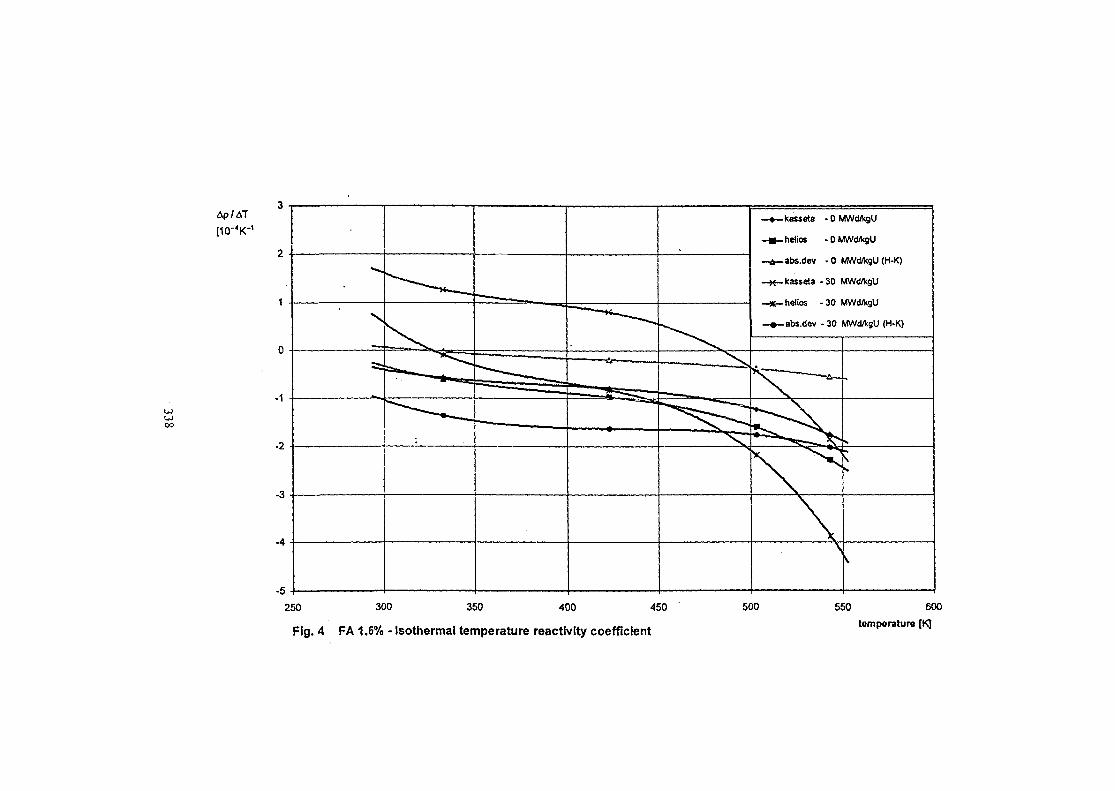
Ap/AT
[10-4K-1—«—kasseta -0 MWd/kgU
-m- helios • 0 MWd/kgU
-ir-abs.dev - 0 MWd/kgU (H-K)
-K-kasseta -30 MWdA;gU
- * _ helios -30 MWd/VgU
-•-abs.tlev -30 MWd/kgU (H-K)
250 300 350 400 450
Fig. 4 FA 1.6% - Isothermal temperature reactivity coefficient
500 550 600
temperature [K]
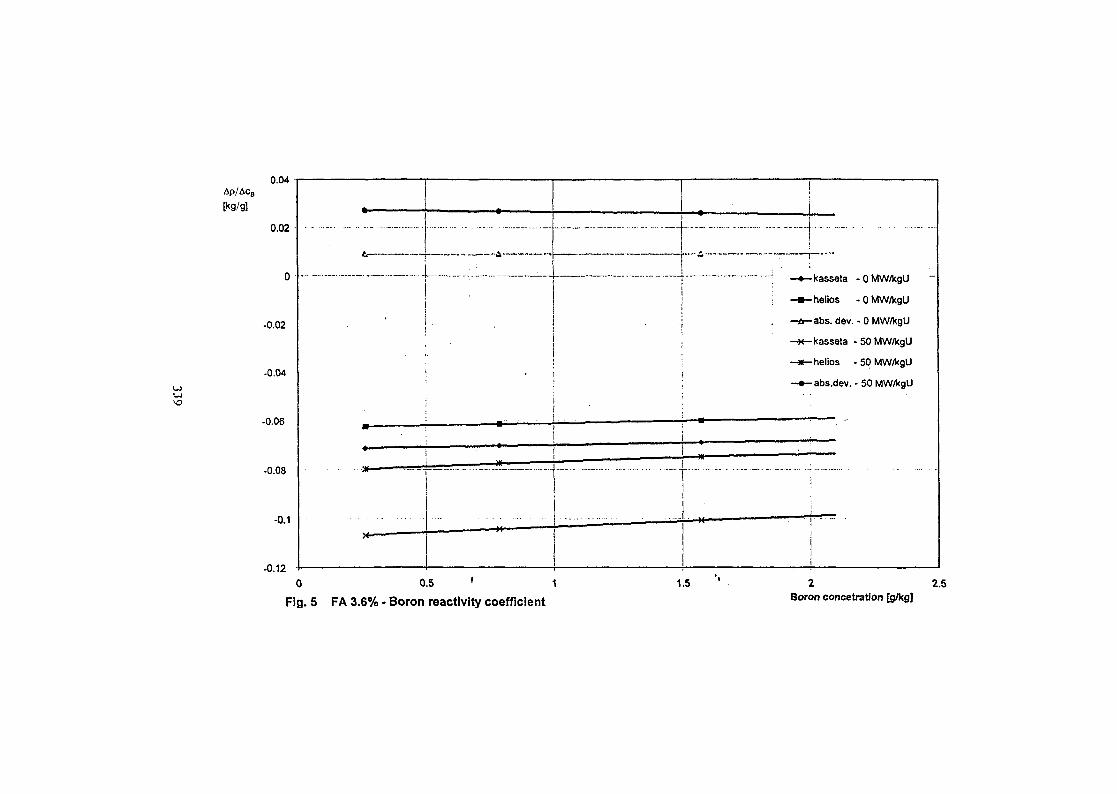
Ap/ACB
0.04
0.02
0 -
-0.02
-0.04
-0.06
-0.08
-0.1
-0.12
" " 1
•
!M •
K—
— * - • "
r ' — ~ • "
. *
' • ' • ; " ^
1
, i—- H
" ; —•-kasseta -OMW/kgll
; -»-hel ios -OMW/kgtl
-tr- abs. dev. - 0 MW/kgU
-H-kasseta - 50 MW/kgU
- * - helios - 50 MW/kgU
-•-abs.dev. - 50 MW/kgU
—to • — — — —
" ~ ~ " ; "
i
i
]
!
0 0.5 • 1
Fig. 5 FA 3.6% - Boron reactivity coefficient
1.5 2 2.5Boron concetration [g/kg]
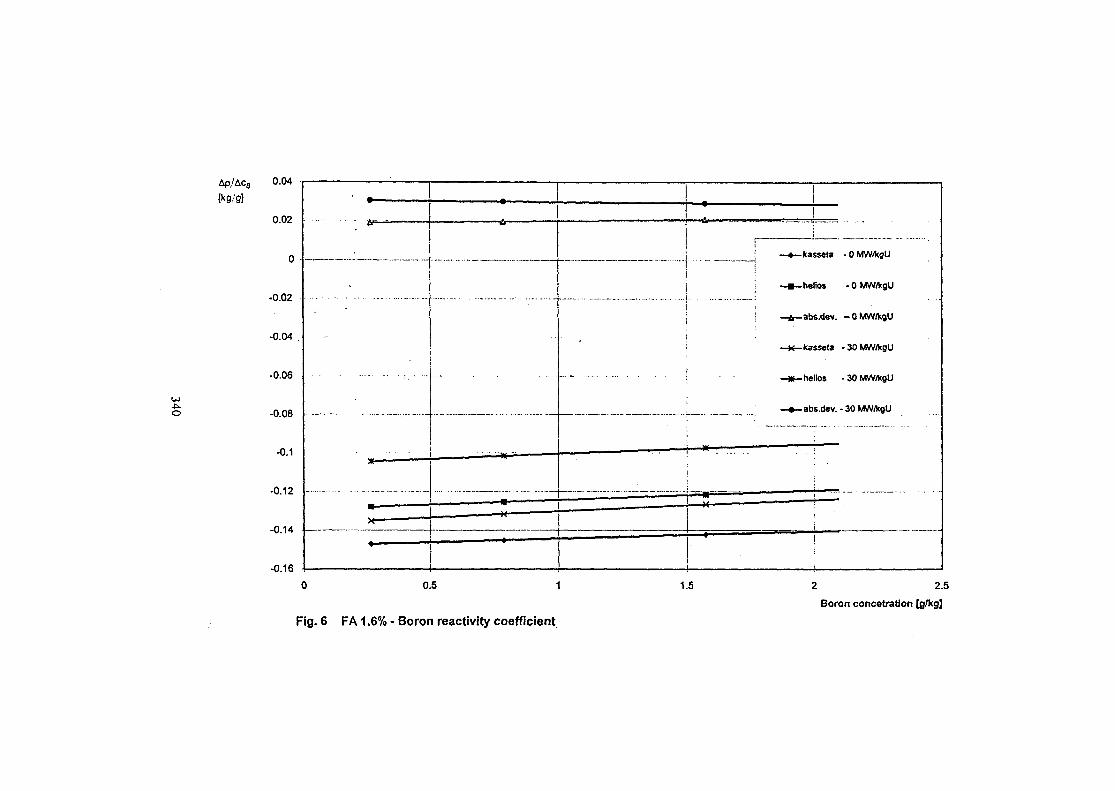
-0.12
-0.14
-0.16
0.5 1.5 2 2.5Boron concetration [g/kg]
Fig. 6 FA 1.6% - Boron reactivity coefficient
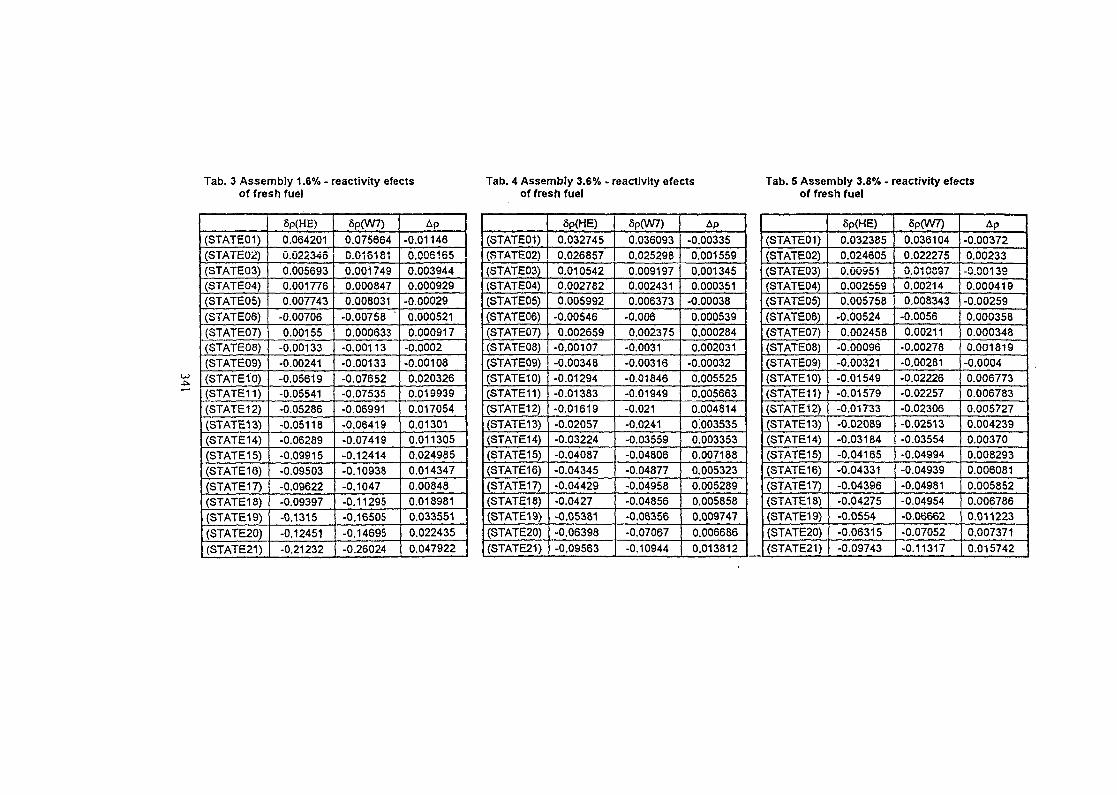
Tab. 3 Assembly 1.6% - reactivity electsof fresh fuel
Tab. 4 Assembly 3.6% - reactivity efectsof fresh fuel
Tab. 5 Assembly 3.8% - reactivity efectsof fresh fuel
-fc.
(STATE01)
(STATE02)
(STATE03)
(STATE04)
(STATE05)
(STATE06)
(STATE07)
(STATE08)
(STATE09)
(STATE 10)
(STATE11)
(STATE 12)
(STATE13)
(STATE14)
(STATE15)
(STATE16)
(STATE17)
(STATE18)
(STATE19)
(STATE20)
(STATE21)
Sp(HE)
0.064201
0.022346
0.005693
0.001776
0.007743
-0.00706
0.00155
-0.00133
-0.00241
-0.05619
-0.05541
-0.05286
-0.05118
-0.06289
-0.09915
-0.09503
-0.09622
-0.09397 j
-0.1315
-0.12451
-0.21232
8p(W7)
0.075664
0.016181
0.001749
0.000847
0.008031
-0.00758 '
0.000633
-0.00113
-0.00133
-0.07652
-0.07535
-0.06991
-0.06419
-0.07419
-0.12414
-0.10938
-0.1047
-0.11295
-0.16505
-0.14695
-0.26024
Ap-0.01146
0.006165
0.003944
0.000929
-0.00029
0.000521
0.000917
-0.0002
-0.00108
0.020326
0.019939
0.017054
0.01301
0.011305
0.024985
0.014347
0.00848
0.018981
0.033551
0.022435
0.047922
(STATE01)
(STATE02)
(STATE03)
(STATE04)
(STATE05)
(STATE06)
(STATE07)
(STATE08)
(STATE09)
(STATE10)
(STATE11)
(STATE12)
(STATE13)
(STATE14)
(STATE15)
(STATE16)
(STATE17)
(STATE18)
(STATE19)
(STATE20)
(STATE21)
5p(HE)
0.032745
0.026857
0.010542
0.002782
0.005992
-0.00546
0.002659
-0.00107
-0.00348
-0.01294
-0.01383
-0.01619
-0.02057
-0.03224
-0.04087
-0.04345
-0.04429
-0.0427
-0.05381
-0.06398
-0.09563
5p(W7)
0.036093
0.025298
0.009197
0.002431
0.006373
-0.006
0.002375
-0.0031
-0.00316
-0.01846
-0.01949
-0.021
-0.0241
-0.03559
-0.04806
-0.04877
-0.04958
-0.04856
-0.06356
-0.07067
-0.10944
Ap-0.00335
0.001559
0.001345
0.000351
-0.00038
0.000539
0.000284
0.002031
-0.00032
0.005525
0.005663
0.004814
0.003535
0.003353
0.007188
0.005323
0.005289
0.005858
0.009747
0.006686
0.013812
(STATE01)
(STATE02)
(STATE03)
(STATE04)
(STATE05)
(STATE06)
(STATE07)
(STATE08)
(STATE09)
(STATE10)
(STATE11)
(STATE12)
(STATE13)
(STATE14)
(STATE15)
(STATE16)
(STATE17)
(STATE18)
(STATE19)
(STATE20)
(STATE21)
Sp(HE)
0.032385
0.024605
0.00S51
0.002559
0.005758
-0.00524
0.002458
-0.00096
-0.00321
-0.01549
-0.01579
-0.01733
-0.02089
-0.03184
-0.04165
-0.04331
-0.04396
-0.04275
-0.0554
-0.06315
-0.09743
8p(W7)
0.036104
0.022275
0.010897
0.00214
0.008343
-0.0056
0.00211
-0.00278
-0.00281
-0.02226
-0.02257
-0.02306
-0.02513
-0.03554
-0.04994
-0.04939
-0.04981
-0.04954
-0.06662
-0.07052
-0.11317
Ap
-0.00372
0.00233
-0.00139
0.000419
-0.00259
0.000358
0.000348
0.001819
-0.0004
0.006773
0.006783
0.005727
0.004239
0.00370
0.008293
0.006081
0.005852
0.006786
0.011223
0.007371
0.015742
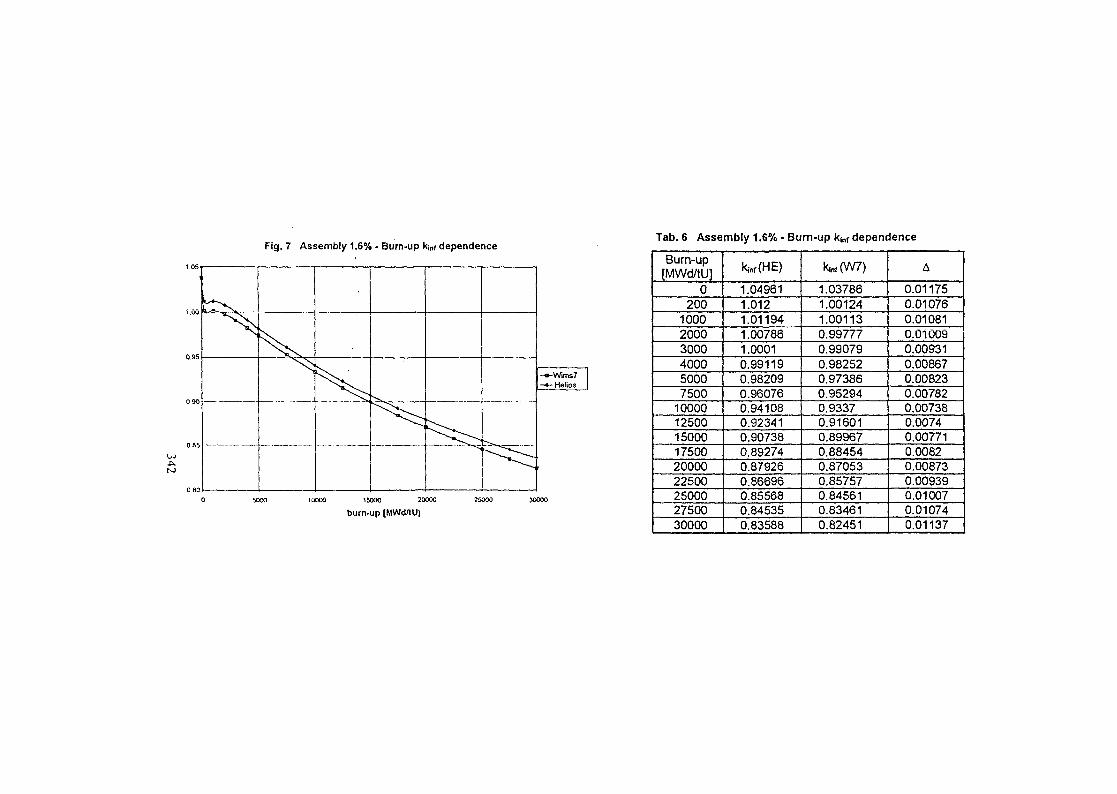
Fig. 7 Assembly 1.6% - Burn-up kw dependenceTab. 6 Assembly 1.6% - Burn-up lew dependence
V_ -«-Wims7
-*- Helios
10000 15000 20000
burn-up [MWd/tU]
Burn-up[MWd7tU]
0200
100020003000400050007500100001250015000175002000022500250002750030000
kw(HE)
1.049611.0121.011941.007861.00010.991190.982090.960760.941080.923410.907380.892740.879260.866960.855680.845350.83588
kw(W7)
1.037861.001241.001130.997770.990790.982520.973860.952940.93370.916010.899670.884540.870530.857570.845610.834610.82451
A
0.011750.010760.010810.010090.009310.008670.008230.007820.007380.00740.007710.00820.008730.009390.010070.010740.01137
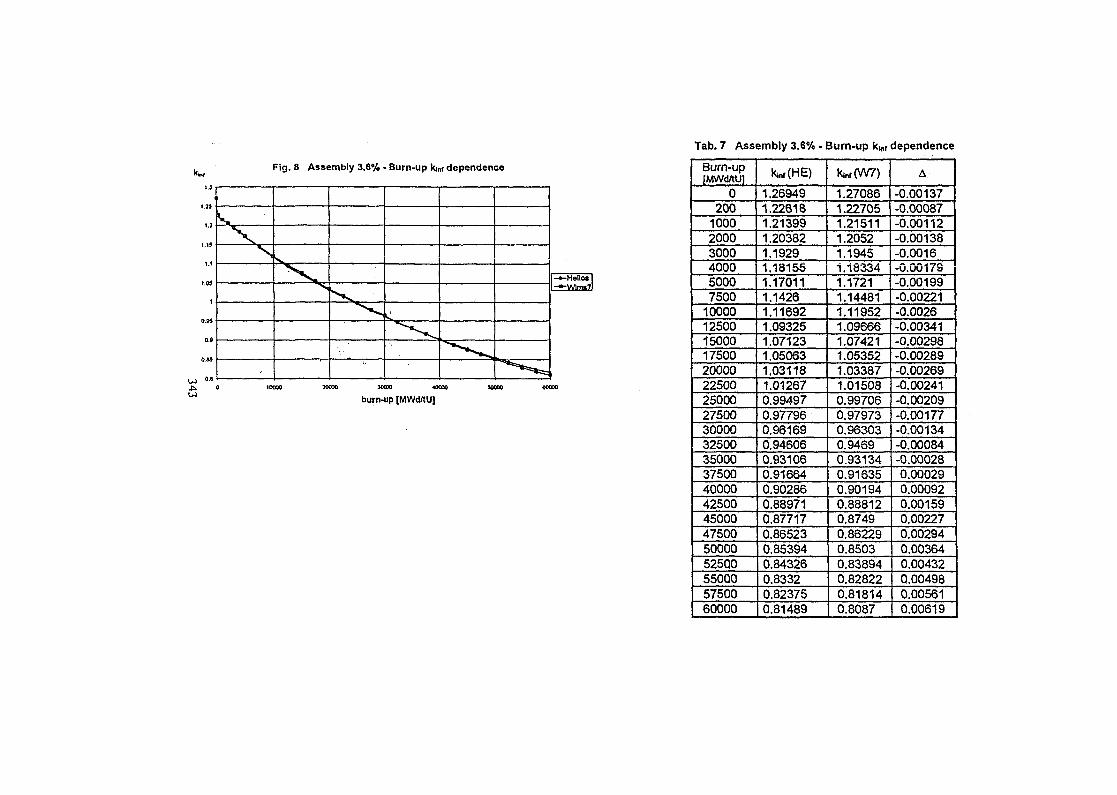
Fig. 8 Assembly 3.6% • Burn-up kmr dependence
MS
1.3
30000 MOW 40000
burn-up [MWd/tU]
Tab. 7 Assembly 3.6% -
Burn-up[MWd/tUJ
02001000200030004000500075001000012500150001750020000225002500027500'300003250035000375004000042500450004750050000525Q0550005750060000
kmi(HE)
1.269491.226181.213991.203821.19291.181551.170111.14261.116921.093251.071231.050631.031181.012670.994970.977960.961690.946060.931060.916640.902860.889710.877170.865230.853940.843260.83320.823750.81489
3um-up k r
k,n,(W7)
1.270861.227051.215111.20521.19451.183341.17211.144811.119521.096661.074211.053521.033871.015080.997060.979730.963030.94690.931340.916350.901940.888120.87490.862290.85030.838940.828220.818140.8087
dependence
A
-0.00137-0.00087-0.00112-0.00138-0.0016-0.00173-0.00199-0.00221-0.0026-0.00341-0.00298-0.00289-0.00269-0.00241-0.00209-0.00177-0.00134-0.00084-0.000280.000290.000920.001590.002270.002940.003640.004320.004980.005610.00619
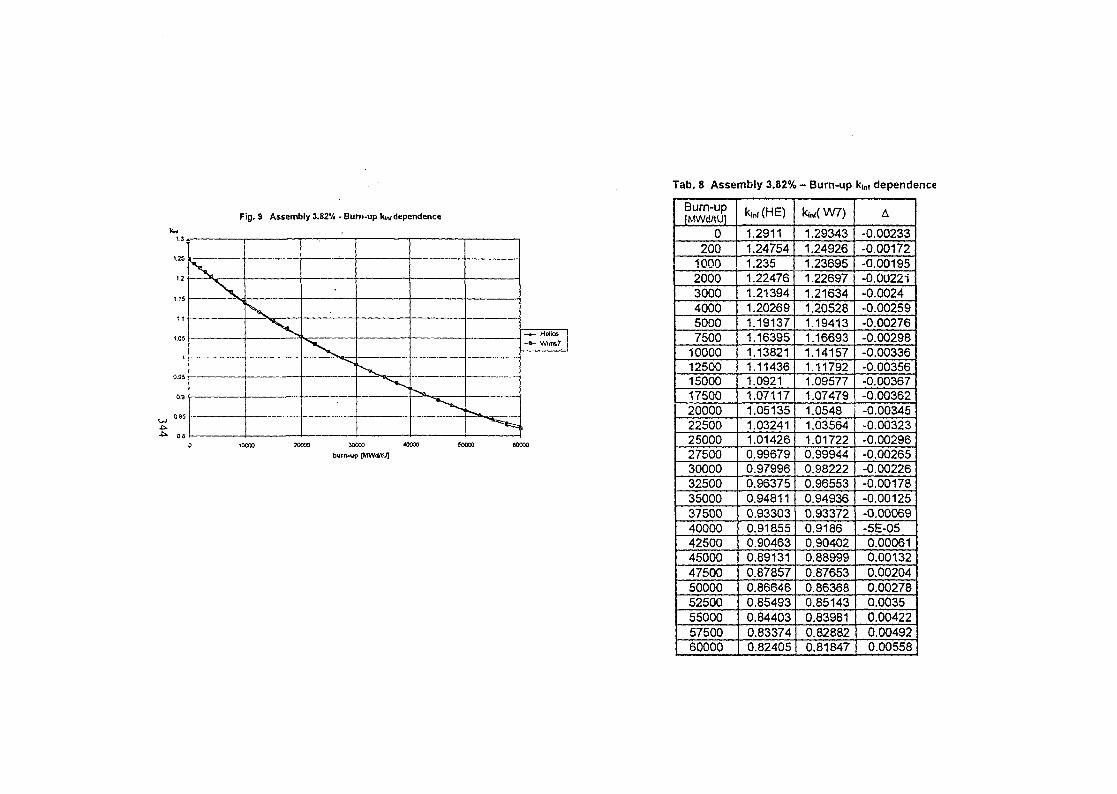
Tab. 8 Assembly 3.82% - Burn-up kta, dependence
Fig. 9 Assennbly 3.82% - Burn-up kw dependence
1.25
1.2
1.15
1.05
0.95
0.9
>
^ ^
30000 «M00
burn-up [MWd/tUJ
Burn-up[MWd/tU]
0200100020003000400050007500100001250015000175002000022500250002750030000325003500037500400004250045000475005000052500550005750060000
kw(HE)1.29111.247541.2351.224761.213941.202691.191371.163951.138211.114361.09211.071171.051351.032411.014260.996790.979960.963750.948110.933030.918550.904630.891310.878570.866460.854930.844030.833740.82405
M W7)1.293431249261.236951.226971.216341.205281.194131.166931.141571.117921.095771.074791.05481.035641.017220.999440.982220.965530.949360.933720.91860.904020.889990.876530.863680.851430.839810.828820.81847
A
-0.00233-0.00172-0.00195-0.00221-0.0024-0.00259-0.00276-0.00298-0.00336-0.00356-0.00367-0.00362-0.00345-0.00323-0.00296-0.00265-0.00226-0.00178-0.00125-0.00069-5E-050.000610.001320.002040.002780.00350.004220.004920.00558
SK01ST096
NEUTRON FLUX UNCERTAINTY AND COVARIANCES FORSPECTRUM ADJUSTMENT AND ESTIMATION OF
VVER-1000 PRESSURE VESSEL FLUENCES
Bertram BohmerForschungszentrum, Rossendorf e.V.,
POB 510119, D-01314 Dresden, Germany
Gennadie N. ManturovInstitute of Physics and Power Engineering,
Bondarenko Sq. 1, 249030 Obninsk, Kaluga Region, Russian Federation
ABSTRACT
Results of estimation of the covariance matrix of the neutron spectrum in the WER-1000 reactorcavity and pressure vessel positions are presented. Two-dimensional calculations with the discreteordinates transport code DORT in r-theta and r-z-geometry used to determine the neutrongroup spectrum covariances including cross-correlations between interesting positions. Thenew Russian ABBN-93 data set and CONSYST code used to supply all transport calculations withgroup neutron data. All possible sources of uncertainties namely caused by the neutron crosssections, fission sources, geometrical dimensions and material densities considered, whereasthe uncertainty of the calculation method was considered negligible in view of the availableprecision of Monte Carlo simulation used for more precise evaluation of the neutron fluence.
INTRODUCTION
The assessment of the uncertainties of neutron transport calculation results caused byuncertainties of the input data is very important as for the direct use of the calculated fluxesand their spectra so for the further data improvement by spectrum adjustment on the basis ofexperimental results obtained in reactor dosimetry activation measurements. The exact calculationof the flux spectrum covariances is more difficult and expensive than the calculation of the spectrumitself It includes the calculation of sensitivity coefficients relatively to all input parameters of thetransport calculation, lit requires the availability of uncertainties of all input parameters andknowledge of their mutual correlations. A former work of the authors has approached this topicfirst for WER-1000 using a ID reactor model and applying spectrum adjustment in a singlespectrum approximation. Previous paper' presented an estimation of the flux covariance matrixfor the Balakovo-3 reactor with help of ID transport code AMSN. In the present work 2D/1D-SN-synthesis calculations using the two-dimensional discrete ordinates transport code DORT2
have been used to determine the neutron group spectrum uncertainties and covariance matrix
345
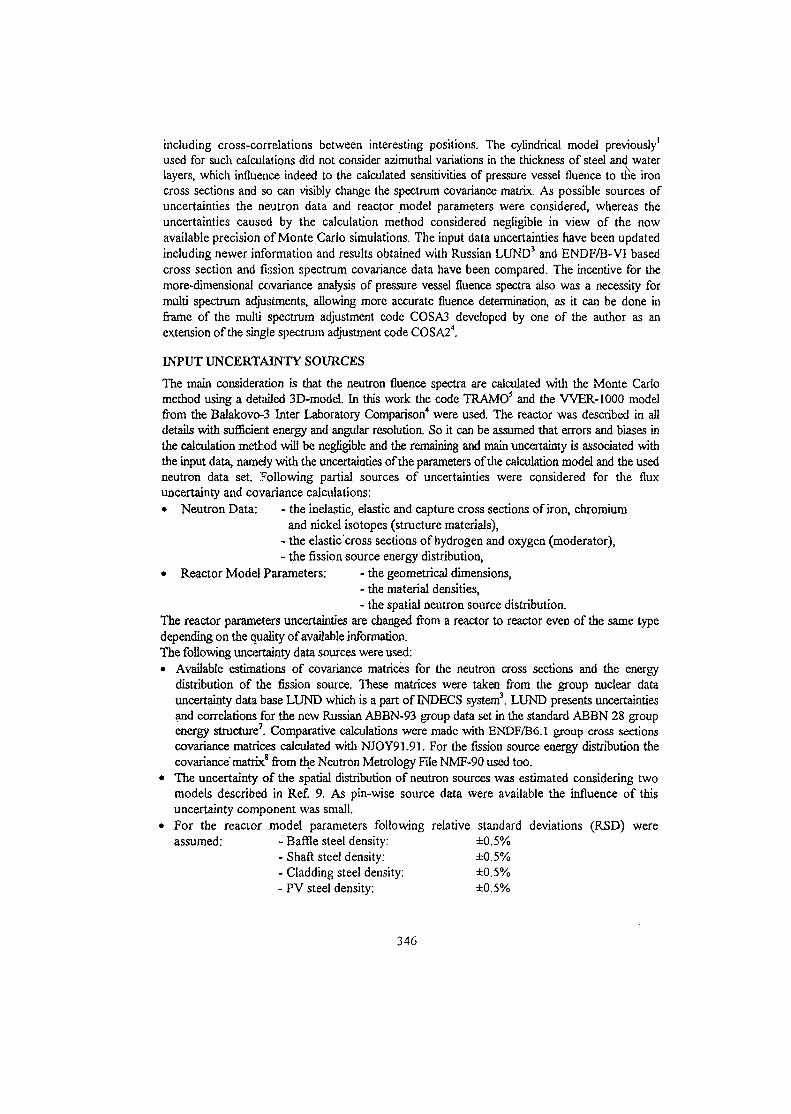
including cross-correlations between interesting positions. The cylindrical model previously1
used for such calculations did not consider azimuthal variations in the thickness of steel and waterlayers, which influence indeed to the calculated sensitivities of pressure vessel fluence to the ironcross sections and so can visibly change the spectrum covariance matrix. As possible sources ofuncertainties the neutron data and reactor model parameters were considered, whereas theuncertainties caused by the calculation method considered negligible in view of the nowavailable precision of Monte Carlo simulations. The input data uncertainties have been updatedincluding newer information and results obtained with Russian LUND3 and ENDF/B-V1 basedcross section and fission spectrum covariance data have been compared. The incentive for themore-dimensional covariance analysis of pressure vessel fluence spectra also was a necessity formulti spectrum adjustments, allowing more accurate fluence determination, as it can be done inframe of the multi spectrum adjustment code COSA3 developed by one of the author as anextension of the single spectrum adjustment code COSA24.
INPUT UNCERTAINTY SOURCES
The main consideration is that the neutron fluence spectra are calculated with the Monte Carlomethod using a detailed 3D-modeI. In this work the code TRAMO5 and the WER-1000 modelfrom the Balakovo-3 Inter Laboratory Comparison4 were used. The reactor was described in alldetails with sufficient energy and angular resolution. So it can be assumed that errors and biases inthe calculation method will be negligible and the remaining and main uncertainty is associated withthe input data, namely with the uncertainties of the parameters of the calculation model and the usedneutron data set. Following partial sources of uncertainties were considered for the fluxuncertainty and covariance calculations:• Neutron Data: - the inelastic, elastic and capture cross sections of iron, chromium
and nickel isotopes (structure materials),- the elastic cross sections of hydrogen and oxygen (moderator),- the fission source energy distribution,
• Reactor Model Parameters: - the geometrical dimensions,- the material densities,- the spatial neutron source distribution.
The reactor parameters uncertainties are changed from a reactor to reactor even of the same typedepending on the quality of available information.The following uncertainty data sources were used:• Available estimations of covariance matrices for the neutron cross sections and the energy
distribution of the fission source. These matrices were taken from the group nuclear datauncertainty data base LUND which is a part of INDECS system3. LUND presents uncertaintiesand correlations for the new Russian ABBN-93 group data set in the standard ABBN 28 groupenergy structure7. Comparative calculations were made with ENDF/B6.1 group cross sectionscovariance matrices calculated with NJOY91.91. For the fission source energy distribution thecovariance" matrix8 from the Neutron Metrology File NMF-90 used too.
• The uncertainty of the spatial distribution of neutron sources was estimated considering twomodels described in Ref. 9. As pin-wise source data were available the influence of thisuncertainty component was small.
• For the reactor model parameters following relative standard deviations (RSD) wereassumed: - Baffle steel density: ±0.5%
- Shaft steel density: ±0.5%- Cladding steel density: ±0.5%- PV steel density: ±0.5%
346
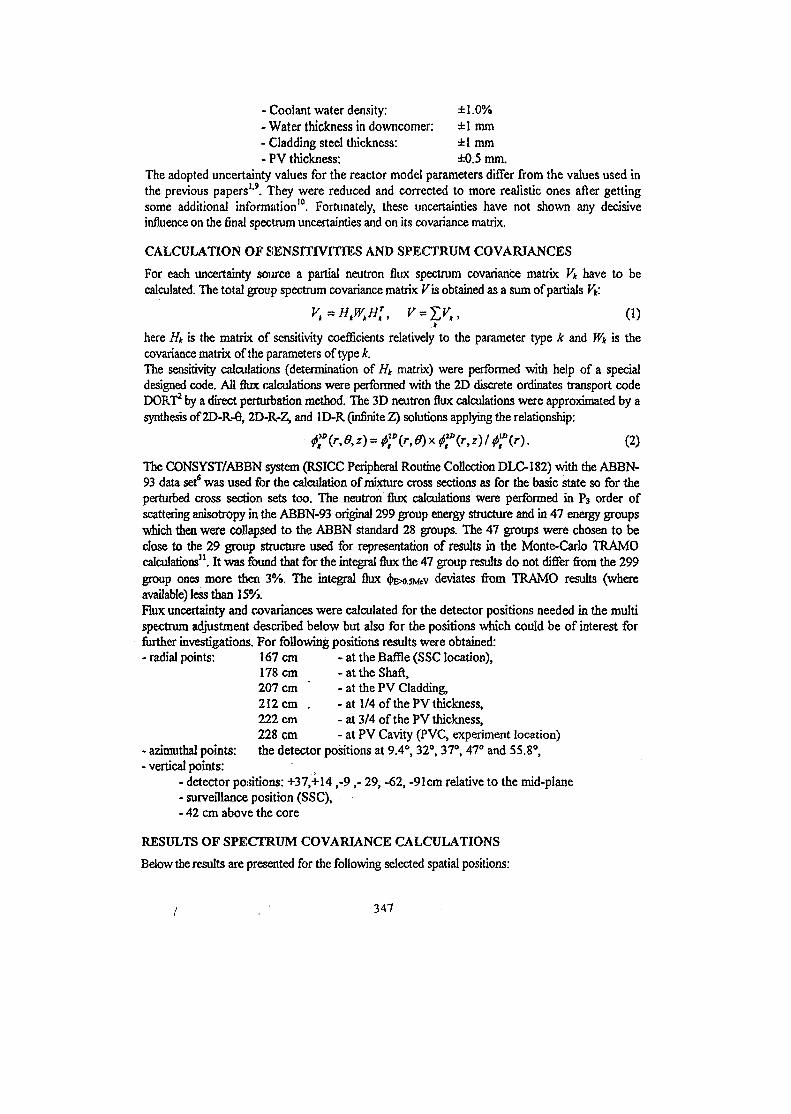
- Coolant water density: ± 1.0%- Water thickness in downcomer: ±1 mm- Cladding steel thickness: ±1 mm- PV thickness: ±0.5 mm.
The adopted uncertainty values for the reactor model parameters differ from the values used inthe previous papers1'9. They were reduced and corrected to more realistic ones after gettingsome additional information10. Fortunately, these uncertainties have not shown any decisiveinfluence on the final spectrum uncertainties and on its covariance matrix.
CALCULATION OF SENSITIVITIES AND SPECTRUM COVARIANCES
For each uncertainty source a partial neutron flux spectrum covariance matrix Vy have to becalculated. The total group spectrum covariance matrix Fis obtained as a sum of partials Vy.
Vk=HkWtHT
t, F = 2 X , (1)
here Hy is the matrix of sensitivity coefficients relatively to the parameter type k and Wy is thecovariance matrix of the parameters of type k.The sensitivity calculations (determination of Hy matrix) were performed with help of a specialdesigned code. All flux calculations were performed with the 2D discrete ordinates transport codeDORT2 by a direct perturbation method. The 3D neutron flux calculations were approximated by asynthesis of 2D-R-Q, 2D-R-Z, and 1D-R (infinite Z) solutions applying the relationship:
f?{rA*) = tlD(r,0)x ftD{r,z)l<t>\\r). (2)
The CONSYST/ABBN system (RSICC Peripheral Routine Collection DLC-182) with the ABBN-93 data set* was used for the calculation of mixture cross sections as for the basic state so for theperturbed cross section sets too. The neutron flux calculations were performed in P3 order ofscattering anisotropy in the ABBN-93 original 299 group energy structure and in 47 energy groupswhich then were collapsed to the ABBN standard 28 groups. The 47 groups were chosen to beclose to the 29 group structure used for representation of results in the Monte-Carlo TRAMOcalculations'1. It was found that for the integral flux the 47 group results do not differ from the 299group ones more then 3%. The integral flux <j>Ex>.5MeV deviates from TRAMO results (whereavailable) less than 15%.Flux uncertainty and covariances were calculated for the detector positions needed in the multispectrum adjustment described below but also for the positions which could be of interest forfurther investigations. For following positions results were obtained:- radial points: 167 cm
178 cm207 cm212 cm .222 cm228 cm
- at the Baffle (SSC location),- at the Shaft,- at the PV Cladding,- at 1/4 of the PV thickness,- at 3/4 of the PV thickness,- at PV Cavity (PVC, experiment location)
- azimuthal points: the detector positions at 9.4°, 32°, 37°, 47° and 55.8°,-vertical points:
- detector positions: +37,+14- surveillance position (SSC),- 42 cm above the core
,-9,- 29, -62, -91cm relative to the mid-plane
RESULTS OF SPECTRUM COVARIANCE CALCULATIONS
Below the results are presented for the following selected spatial positions:
347
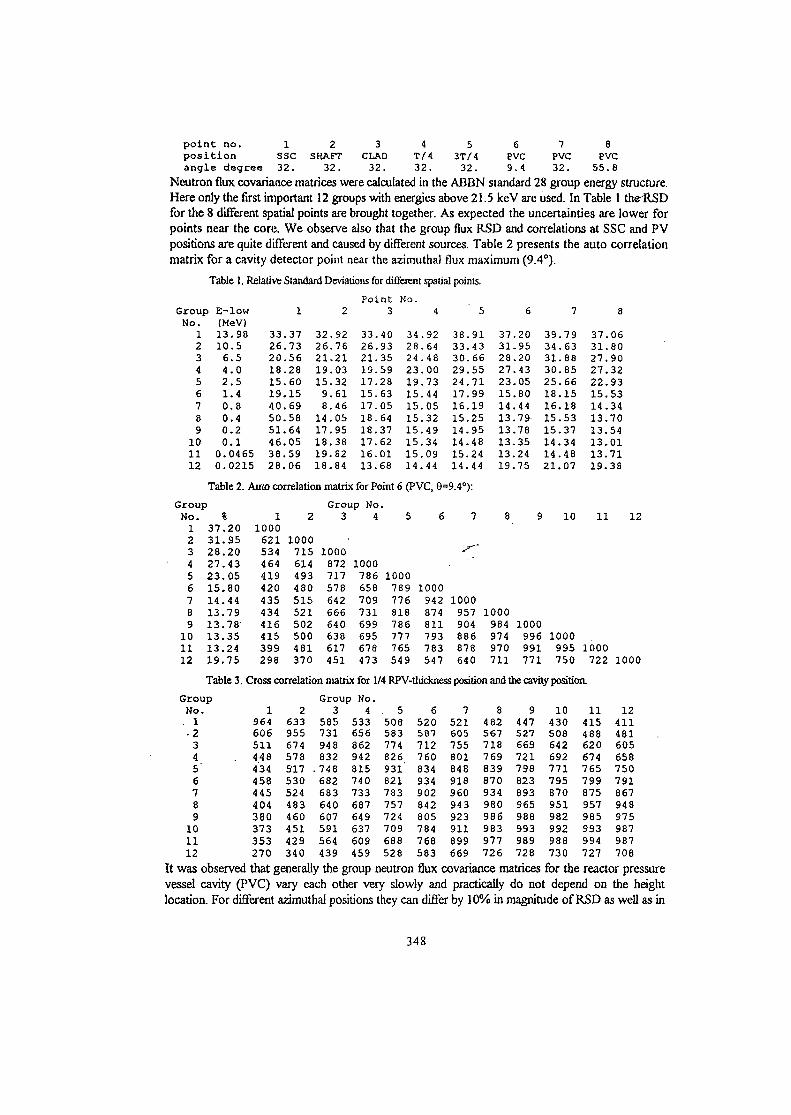
point no. 1 2 3 4 5 6 7 8position SSC SHAFT CLAD T/4 3T/4 PVC PVC PVCangle degree 32. 32. 32. 32. 32. 9.4 32. 55.8
Neutron flux covariance matrices were calculated in the ABBN standard 28 group energy structure.Here only the first important 12 groups with energies above 21.5 keV are used. In Table 1 the-RSDfor the 8 different spatial points are brought together. As expected the uncertainties are lower forpoints near the core. We observe also that the group flux RSD and correlations at SSC and PVpositions are quite different and caused by different sources. Table 2 presents the auto correlationmatrix for a cavity detector point near the azimuthal flux maximum (9.4°).
Table 1. Relative Standard Deviations for different spatial points.
Group E-lowNo.
123456789
101112
(MeV)13.9810.5
00
6 . 54 . 02 . 51.40 . 80 . 40 . 20 . 1
33262018151940505146
.0465 38
.0215 28
Table 2. <
GroupNo.
123456789
101112
373128272 315141313131319
%. 2 0. 9 5. 2 0. 4 3. 0 5. 8 0.44. 7 9. 7 8. 3 5.24. 7 5
1
. 3 7
. 7 3
. 5 6
. 2 8
. 6 0
. 1 5
.69
. 5 8
.64
. 0 5
. 5 9
. 0 6
2
32.9226.7621.2119.0315.32
9.618.46
14.0517.9518.3819.8218.84
Point No.
3 3 .2 6 .2 1 .19 .1 7 .1 5 .1 7 .1 8 .1 8 .1 7 .1 6 .1 3 .
3
409335592863056437620168
4
34.9228.6424.4823.0019.7315.4415.0515.3215.4915.3415.0914.44
3 8 .3 3 .3 0 .2 9 .2 4 .1 7 .1 6 .1 5 .1 4 .1 4 .1 5 .1 4 .
5
91 3743 3166 2855 2771 2399 1519 1425 1395 1348 1324 1344 19
kuto correlation matrix for Point 6 (PVC, 8=9.4"):
11000
6215344 64419420435434416415399298
2
1000715614493480515521502500481370
Group No3
1000872717578642666640638617451
4
1000786658709731699695678473
5 6
1000789 1000776 942818 874786 811777 793765 783549 547
7 8
1000957 1000904 984886 974878 970640 711
6
.20
. 9 5
.20
. 4 3
. 0 5
. 8 0
.44
.79
.78
. 3 5
.24
. 7 5
9
1000996991771
7
39.7934.6331.8830.8525.6618.1516.1815.5315.3714.3414.4821.07
10
1000995750
3 7 .3 1 .2 7 .2 7 .2 2 .1 5 .1 4 .1 3 .1 3 .1 3 .1 3 .1 9 .
11
1000722
Table 3. Cross correlation matrix for 1/4 RPV-thickness position and the cavity positioa
GroupNo.. 1-2
345"6789
101112
1964606511448434458445404380373353270
2633955674578517 .530524483460451429340
Group3
585731948832
. 748682683640607591564439
> No.4
53365686294281574073368764 9637609459
. 5508583774826931821783757724709688528
6520587712760834934902842805784768583
7521605755801848918960943923911899669
84 82567718769839870934980986983977726
9447527669721798823893965988993989728
10430508642692771795870951982992988730
11415488620674765799875957985993994727
8
068090329353347054017138
1
100
12411481605658750791867948975987987708
It was observed, that generally the group neutron flux covariance matrices for the reactor pressurevessel cavity (PVC) vary each other very slowly and practically do not depend on the heightlocation. For different azimuthal positions they can differ by 10% in magnitude of RSD as well as in
348
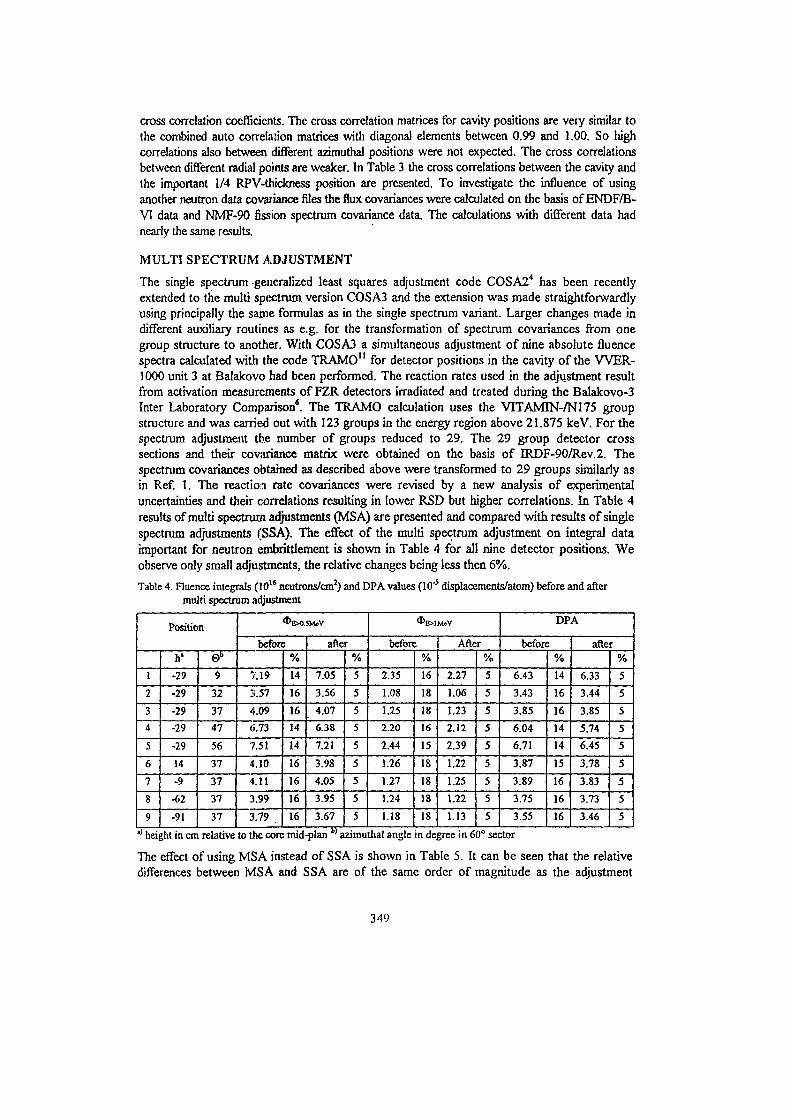
cross correlation coefficients. The cross correlation matrices for cavity positions are very similar tothe combined auto correlation matrices with diagonal elements between 0.99 and 1.00. So highcorrelations also between different azimuthal positions were not expected. The cross correlationsbetween different radial points are weaker. In Table 3 the cross correlations between the cavity andthe important 1/4 RPV-thickness position are presented. To investigate the influence of usinganother neutron data covariance files the flux covariances were calculated on the basis of ENDF/B-VI data and NMF-90 fission spectrum covariance data. The calculations with different data hadnearly the same results.
MULTI SPECTRUM ADJUSTMENT
The single spectrum generalized least squares adjustment code COSA24 has been recentlyextended to the multi spectrum version COSA3 and the extension was made straightforwardlyusing principally the same formulas as in the single spectrum variant. Larger changes made indifferent auxiliary routines as e.g. for the transformation of spectrum covariances from onegroup structure to another. With COSA3 a simultaneous adjustment of nine absolute fluencespectra calculated with the code TRAMO" for detector positions in the cavity of the W E R -1000 unit 3 at Balakovo had been performed. The reaction rates used in the adjustment resultfrom activation measurements of FZR detectors irradiated and treated during the Balakovo-3Inter Laboratory Comparison*. The TRAMO calculation uses the VITAMTN-/N175 groupstructure and was carried out with 123 groups in the energy region above 21.875 keV. For thespectrum adjustment the number of groups reduced to 29. The 29 group detector crosssections and their covariance matrix were obtained on the basis of IRDF-90/Rev.2. Thespectrum covariances obtained as described above were transformed to 29 groups similarly asin Ref. 1. The reaction rate covariances were revised by a new analysis of experimentaluncertainties and their correlations resulting in lower RSD but higher correlations. In Table 4results of multi spectrum adjustments (MSA) are presented and compared with results of singlespectrum adjustments (SSA). The effect of the multi spectrum adjustment on integral dataimportant for neutron embrittlement is shown in Table 4 for all nine detector positions. Weobserve only small adjustments, the relative changes being less then 6%.
Table 4. Fluence integrals (1016 neutrons/cm2) and DPA values (10'5 displacements/atom) before and aftermulti spectrum adjustment
Position
1
2
3
4
5
6
7
8
9
h'
-29
-29
-29
-29
-29
14
-9
-62
-91
0b
9
32
37
47
56
37
37
37
37
<I>E>O.SM»V
befon
7.19
3.57
4.09
6.73
7.51
4.10
4.11
3.99
3.79
•%
14
16
16
14
14
16
16
16
16
after
7.05
3.56
4.07
6.38
7.21
3.98
4.05
3.95
3.67
%
5
5
55
5
5
5
5
5
befon
2.35
1.08
1.25
2.20
2.44
1.26
1.27
1.24
1.18
%
16
18
18
16
15
18
18
18
18
After
2.27
1.06
1.23
2.12
2.39
1.22
1.25
1.22
1.13
%
5
5
5
5
5
5
5
5
5
DPA
befon
6.43
3.43
3.85
6.04
6.71
3.87
3.89
3.75
3.55
%
14
16
16
14
14
15
16
16
16
after
6.33
3.44
3.85
5.74
6.45
3.78
3.83
3.73
3.46
%
5
5
5
5
5
5
5
5
5
*' height in cm relative to the core mid-plan b) azimuthal angle in degree in 60" sector
The effect of using MSA instead of SSA is shown in Table 5. It can be seen that the relativedifferences between MSA and SSA are of the same order of magnitude as the adjustment
349
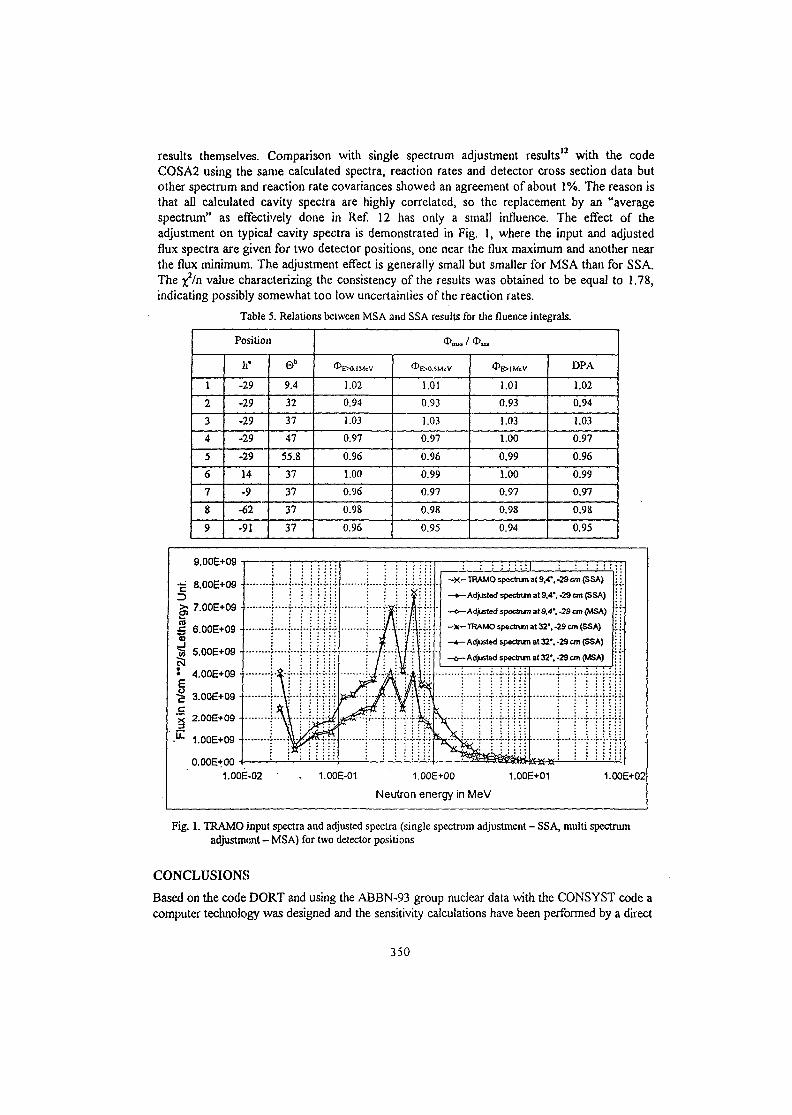
results themselves. Comparison with single spectrum adjustment results12 with the codeCOSA2 using the same calculated spectra, reaction rates and detector cross section data butother spectrum and reaction rate covariances showed an agreement of about 1%. The reason isthat all calculated cavity spectra are highly correlated, so the replacement by an "averagespectrum" as effectively done in Ref. 12 has only a small influence. The effect of theadjustment on typicaJ cavity spectra is demonstrated in Fig. 1, where the input and adjustedflux spectra are given for two detector positions, one near the flux maximum and another nearthe flux minimum. The adjustment effect is generally small but smaller for MSA than for SSA.The %2/n value characterizing the consistency of the results was obtained to be equal to 1.78,indicating possibly somewhat too low uncertainties of the reaction rates.
Table 5. Relations between MSA and SSA results for the fluence integrals.
Position
1
2
3
4
5
6
7
8
9
h'
-29
-29
-29
-29
-29
14
•9
•62
-91
©"
9.4
32
37
47
55.8
37
37
37
37
1.02
0.94
1.03
0.97
0.96
1.00
0.96
0.98
0.96
^EXXSMeV
1.01
0.93
1.03
0.97
0.96
0.99
0.97
0.98
0.95
1.01
0.93
1.03
1.00
0,99
1.00
0.97
0.98
0.94
DPA
1.02
0.94
1.03
0.97
0.96
0.99
0.97
0.98
0.95
9.00E+09
•g 8.00E+09
>; 7.00E+09
J 6.00E+09 •
^ S.OOE+09 -
* 4.00E+09 -
•g 3.00E+09 -cx 2.00E+09 -
^ 1.00E+09 •
\
A1 p*-r
•A ?*"
'•'/ s*t&
iI
•A
A
A
•
y
!H1:ii
: : : : : : : : I : : : : : :- X - TRAMO spectun at 9,4*. -29 cm (SSA)
~*~ Adjusted spectrum at 3,4*. -29 cm (SSA)
—o— Adjusted spectrun at 9,4*. -29 cm (MSA)
. -*-TRAMOspeclnjnat32*,-29cm(SSA)
- * - Adjusted spectnm at 32*, -29 cm (SS A)—^—Adjusted spectrur at 32', 29 ctTiff»tsA)
—rr1
1.00E-02 • . 1.00E-01 1.00E+00 1.00E+01 1.00E+02
Neutron energy in MeV
Fig. 1. TRAMO input spectra and adjusted spectra (single spectrum adjustment - SSA, multi spectrumadjustment - MSA) for two detector positions
CONCLUSIONS
Based on the code DORT and using the ABBN-93 group nuclear data with the CONSYST code acomputer technology was designed and the sensitivity calculations have been performed by a direct
350
perturbation method. 3D neutron flux calculations were approximated by a synthesis of 2D-R8, 2D-RZ, and 1D-R (infinite Z) results. Flux spectrum covariance matrices have been estimated for arepresentative set of points of interest for pressure vessel dosimetry purposes. Ail of input datauncertainty sources have been investigated and taking into account. Spectrum uncertainties inthe pressure vessel cavity were found to be nearly 100% correlated. Correlations between 1/4RPV thickness and cavity points are lower but sufficiently high to be adjusted together with thecavity positions what will be an aim of further works. Multi spectrum adjustment was shown toresult in different and generally smaller adjustments as single spectrum adjustment.
ACKNOWLEDGMENTS
The authors are very grateful to Dr. G. Borodkin (SEC GAN, Moscow) for the help inconstructing of the 2D-RZ and R 0 Balakovo-3 reactor models and the source distribution forDORT calculations.
REFERENCES
1. B. Boehmer and G. Manturov, Neutron Spectrum Covariances and Their Influence on Results ofPressure Vessel Neutron Spectrum Adjustments, Proc. Intern, Conf., Praque, 1996. •
2. W.A. Rhoades, R.L. Childs, The DORT Two-Dimensional Discrete Ordinates Transport Code,Nucl. Sci. & Engn. 99, 1, 88 (1988)
3. G.N. Manturov, "Influence of Neutron Data Uncertainties on the Accuracy of Prediction ofAdvanced Reactor Characteristics", Proc. of Intern. Conf. on Nuclear Data for Science &Technology, Gatlinburg, Tennessee, USA, 1994, Vol.2, p.993.
4. B.Boehmer, COSA2 - Ein Spektrumsjustierungsprogramm zur Auswertung von Aktivierungs-messungen auf der Basis der verallgemeinerten Methode der kleinsten Quadrate, ZFK-735,Rossendorf, 1991.
5. H.-U. Barz, TRAMO - a Flexible MuWgroup Neutron Transport Code on the Basis of the MonteCarlo Method for Fhrx Calculations, ZFK-705, RosSendorf, 1990.
6. G. I. Borodkin and 0. M. Kovalevich, "Inter Laboratory WER-1000 Ex-vessel Experiment atBalakovo-3 NPP", Proc. of the 9th Intern. Symp. on Reactor Dosimetry, Sept. 2-6, 1996, Prague,Czech Republic. Hamid AH Abderrahim et al. Eds., World Scientific Publishing Co. Pte. Ltd.,1998. pp.431-438.
7. G.N. Manturov, M.N. Nikolaev, A.M. Tsiboulia, ABBN-93 Group Data Library. Part 1: NuclearData for the Calculation of Neutron and Photon Radiation Fields, INDC(CCP)-409/L, 1997, p.65.
8. E. Szondi, Technical University of Budapest, Hungary, private communication.9. B. Boehmer, G. Manturov, Neutron Spectrum Covariances and their Influence on Results of
Pressure Vessel Neutron Spectrum Adjustments, Voprosy Atomnoi Naufct i Techniki, SeriyaJadernye Konstanty, 1998, Vypusk 1, p. 28-34, Ed. ZNIIatominform, Moscow (in Russian).
10. V.I. Tsofin, Uncertainties of Reactor Design Parameters, Contribution to the Intern. Workshop ontheBalakovo-3 Interlaboratory Pressure Vessel Dosimetry Experiment, Rossendorf, Sept. 1997.
11. H.-U. Barz, B. Boehmer, J. Konheiser, I. Stephan, High-Precision Monte Carlo Calculations,Experimental Verification and Adjustment of Fluences in the Pressure Vessel Cavity of a W E R -1000, Proc. 1998 ANS Radiation Protection and Shielding Division Topical ConferenceTechnologies for the New Century, April 19-23,1998, Nashville, Tennessee, USA, Vol. 1, p. 447.
12. H.-U. Barz, B. Boehmer, I. Konheiser, I. Stephan, Monte Carlo Calculations of Neutron FTuenceSpectra, Activation Measurements, Uncertainty Analysis and Spectrum Adjustment for theK0RPUS Dosimetry Benchmark, Contribution to Symp. on Reactor Dosimetry, ASTM STP 1398,American Society for Testing and Materials, West Conshohoken, PA, 2000.
351
SK01ST097
THE USE OF THE CODES FROM MCU FAMILY FORCALCULATIONS OF VVER TYPE REACTORS
Abagjan L.P., AlexeyevN.L, Bryzgalov V.I., Gomin E.A., Glushkov A.E., Gorodkov S.S.,Gurevich M.I., Kalugin M.A., Marin S.V., Shkarovsky D.A., Yudkevich M.S.
Russian Research Center "Kurchatov Institute"
ABSTRACT
The MCU-RFFI/A and MCU-REA codes developed within the framework of the long-term MCU project are widely used for calculations of neutron physic characteristics of W E Rtype reactors. Complete descriptions of the codes are available in both Russian and English.The codes are verified and validated by means of the comparison of calculated results withexperimental data and mathematical benchmarks. The codes are licensed by Russian Nuclearand Criticality Safety Regulatory Body /Gosatomnadzor RF/ (Code Passports: N 61 of17.10.1996 and Nl 15 of 02.03.2000 accordingly).
The codes of the MCU family are used for:
• evaluation of the quality of experiments (including experimental facilities P and LR-0) ;
• verification of the design codes for nuclear reactors calculations;
• calculations of neutron multiplication factor for nuclear safety assessment of criticalfacilities, nuclear materials storages and shipping casks;
• design calculations of neutron physic characteristics of W E R type reactors consideringthe change of the materials' isotopic composition during burnup without anysimplifications in geometry and using the most precise models of neutron interactions withmatter,
• calculations of parameters and effects that cannot be calculated with necessary precision bymeans of design codes and measured in critical experiments.
The report gives examples of W E R reactor physic tasks important for practice solvedusing the codes from the MCU family. Some calculational results are given too.
353
THE USE OF THE CODES FROM MCU FAMILY FORCALCULATIONS OF VVER TYPE REACTORS
Abagjan L.P., Alexeyev N.I., Bryzgalov V.I., Gomin E.A., Glushkov A.E., Gorodkov S.S.,Gurevich M.I., Kalugin M.A., Marin S.V., Shkarovsky D.A., Yudkevich M.S.
Russian Research Center "Kurchatov Institute"
The MCU-RFFI/A [1,2] and MCU-REA [3-5] codes developed within the framework ofthe long-term MCU project are widely used for calculations of neutron physic characteristicsof VVER type reactors. Complete descriptions of the codes are available in both Russian andEnglish. The codes are verified and validated (v&v) by means of the comparison of calculatedresults with experimental data and mathematical benchmarks. The codes are licensed by Rus-sian Nuclear and Criticality Safety Regulatory Body /Gosatomnadzor RF/ (Code Passports: N61 of 17.10.1996 and N115 of 02.03.2000 accordingly).
The MCU-RFFI/A code with the DLC/MCUDAT-1.0 neutron data library is intended formathematical modeling of neutron multiplying systems with fast, intermediate, and thermalneutron spectrum, and practically arbitrary geometry including W E R type reactors, nuclearmaterials storages and shipping casks, wide class of critical assemblies.
Detailed description of the geometry and material composition of a system defines itsstate. Each of the materials of the system being modeled may be any mixture of isotopesavailable at the DLC/MCUDAT-1.0 data library, which is a part of the code. It contains neu-tron physic constants for 131 isotopes. 211 experimental configurations are considered in v&vreport.
The MCU-REA code with DLCMCUDA T-2.1 data library is a development of the MCU-RFFI/A code. It is intended for calculations of neutron physic characteristics of W E R typereactors during burnup taking into account the depletion of the fuel and burnable absorbers.
The DLC/MCUDAT-2.1 neutron physic data library provides information for 282 isotopes(data for 131 isotopes of DLC/MCUDAT-1.0 were revised). The library contains a new entrycalled MULTIC that - besides other data - contains data on temperature dependence for sub-group parameters in the unresolved resonance region. The geometry module of the code in-cludes the submodule that uses the Woodcock method. This removes practically any restric-tions on the geometry description of a system and, for example, allows modeling of bent fuelassemblies of the WER-1000 reactor. The total amount of the experiments considered in they&v report is 315. These are mostly benchmark experiments adopted by the ICSBEP [7]group.
The results.of the MCU-REA v&v (see [6]) are summarized in Table 1.
Figure 1 presents the results of calculations (see [8] also) of 153 experimental configura-tions of ZR-6 (CBFI, Budapest, Hungary) [9]. The descriptions of the configurations are takenfrom [7]. The precision of the two dimensional descriptions of these configurations with axialleakage given by experimental buckling value has been analyzed. The usability of such an ap-proach for design codes verification has been shown.
354
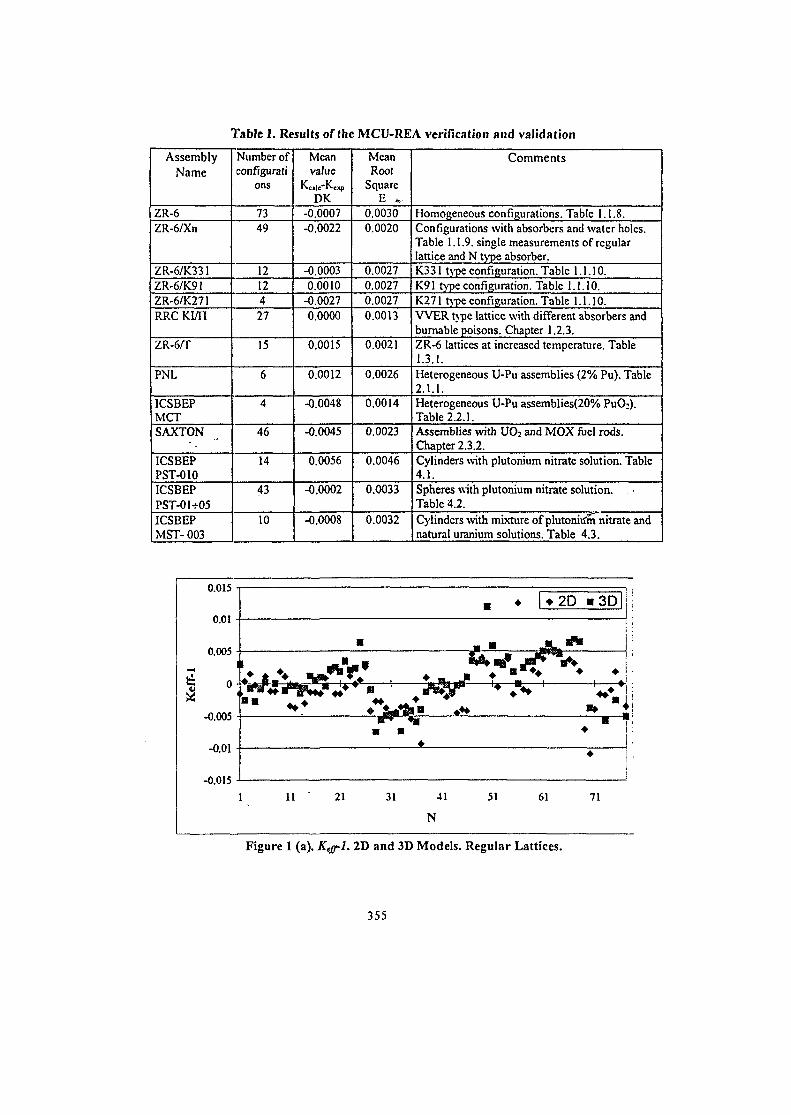
Table 1. Results of the MCU-REA verification and validation
AssemblyName
ZR-6ZR-6/Xn
ZR-6/K331ZR-6/K91ZR-6/K271RRCKI/n
ZR-6/T
PNL
ICSBEPMCTSAXTON
ICSBEPPST-010ICSBEPPST-01-f05ICSBEPMST- 003
Number ofconfigurati
ons
7349
12124
27
15
6
4
46
14
43
10
Meanvalue
DK-0.0007-0.0022
-0.00030.0010
-0.00270.0000
0.0015
0.0012
-0.0048
-0.0045
0.0056
-0.0002
-0.0008
MeanRoot
SquareE »,
0.00300.0020
0.00270.00270.00270.0013
0.0021
0.0026
0.0014
0.0023
0.0046
0.0033
0.0032
Comments
Homogeneous configurations. Table 1.1.8.Configurations with absorbers and water holes.Table 1.1.9. single measurements of regularlattice and N type absorber.K331 type configuration. Table 1.1.10.K91 type configuration. Table 1.1.10.K271 type configuration. Table 1.1.10.W E R t\pe lattice with different absorbers andburnable poisons. Chapter 1.2.3.ZR-6 lattices at increased temperature. Table1.3.1.Heterogeneous U-Pu assemblies (2% Pu). Table2.1.1.Heterogeneous U-Pu assemblies(20% PuO->).Table 2.2.1.Assemblies with UO2 and MOX fuel rods.Chapter 2.3.2.Cylinders with plutonium nitrate solution. Table4.1.Spheres with plutonium nitrate solution.Table 4.2.Cylinders with mixture of plutonivfm nitrate andnatural uranium solutions. Table 4.3.
0.015
0.01
0.005
11 ' 21 31 41 51 61 71
-0.015
Figure 1 (a). Keff-1. 2D and 3D Models. Regular Lattices.
355
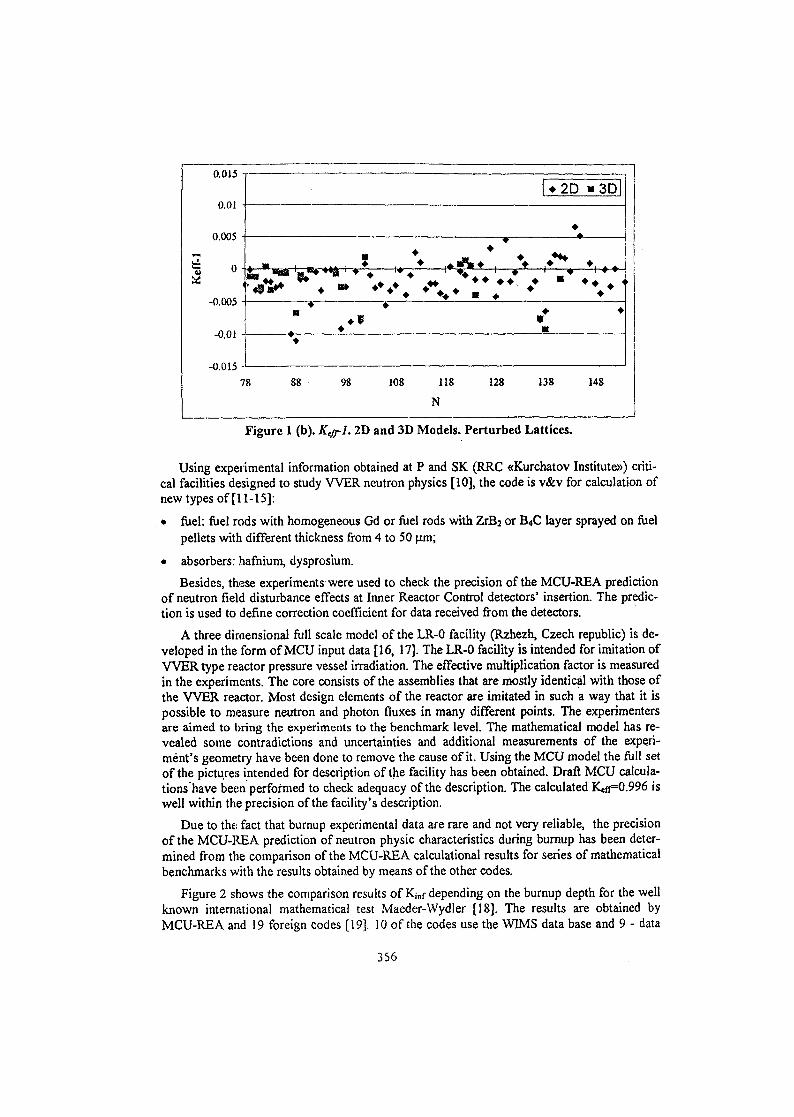
0.0)5
0.01
0.005 -
0
-0.005 -
-0.01
-0.015
H
*•• *
• +
•
• 2D »3D
f * 1 • •
• •
78 88 98 108 118 12S 138 148
N
Figure 1 (b). Kejrl. 2D and 3D Models. Perturbed Lattices.
Using experimental information obtained at P and SK (RRC «Kurchatov Institute))) criti-cal facilities designed to study W E R neutron physics [10], the code is v&v for calculation ofnew types of [11-15]:
• fuel: fuel rods with homogeneous Gd or fuel rods with ZrB2 or B4C layer sprayed on fuelpellets with different thickness from 4 to 50 urn;
• absorbers: hafnium, dysprosium.
Besides, these experiments were used to check the precision of the MCU-REA predictionof neutron field disturbance effects at Inner Reactor Control detectors' insertion. The predic-tion is used to define correction coefficient for data received from the detectors.
A three dimensional full scale model of the LR-0 facility (Rzhezh, Czech republic) is de-veloped in the form of MCU input data [16, 17]. The LR-0 facility is intended for imitation ofW E R type reactor pressure vessel irradiation. The effective multiplication factor is measuredin the experiments. The core consists of the assemblies that are mostly identical with those ofthe W E R reactor. Most design elements of the reactor are imitated in such a way that it ispossible to measure neutron and photon fluxes in many different points. The experimentersare aimed to bring the experiments to the benchmark level. The mathematical model has re-vealed some contradictions and uncertainties and additional measurements of the experi-ment's geometry have been done to remove the cause of it. Using the MCU model the full setof the pictures intended for description of the facility has been obtained. Draft MCU calcula-tions have been performed to check adequacy of the description. The calculated K«ff=0.996 iswell within the precision of the facility's description.
Due to the fact that burnup experimental data are rare and not very reliable, the precisionof the MCU-REA prediction of neutron physic characteristics during burnup has been deter-mined from the comparison of the MCU-REA calculational results for series of mathematicalbenchmarks with the results obtained by means of the other codes.
Figure 2 shows the comparison results of Kinf depending on the burnup depth for the wellknown international mathematical test Maeder-Wydler [18]. The results are obtained byMCU-REA and 19 foreign codes [19]. 10 of the codes use the WIMS data base and 9 - data
356
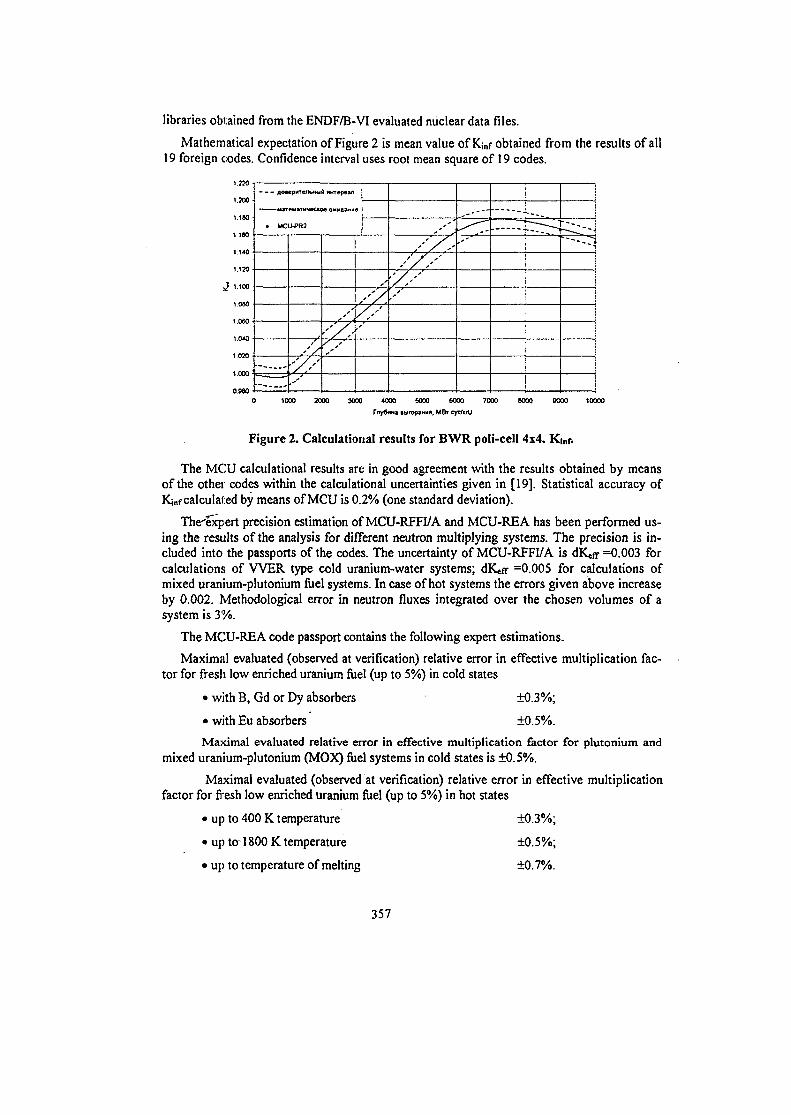
libraries obtained from the ENDF/B-VI evaluated nuclear data files.
Mathematical expectation of Figure 2 is mean value of Kinf obtained from the results of all19 foreign codes. Confidence interval uses root mean square of 19 codes.
1.220
1200
1 180
1 160
A°»
«r
• MC
eptrrenbHbiA MKTepean
LJ-PR2
/ /
' y
/
;i
4000 5000 6000 7000
Figure 2. Calculational results for BWR poli-cell 4x4. Ktor.
The MCU calculational results are in good agreement with the results obtained by meansof the other codes within the calculational uncertainties given in [19]. Statistical accuracy ofIQnf calculated by means of MCU is 0.2% (one standard deviation).
The'expert precision estimation of MCU-RFFI/A and MCU-REA has been performed us-ing the results of the analysis for different neutron multiplying systems. The precision is in-cluded into the passports of the codes. The uncertainty of MCU-RFFI/A is dKtff =0.003 forcalculations of W E R type cold uranium-water systems; dK«ff =0.005 for calculations ofmixed uranium-plutonium fuel systems. In case of hot systems the errors given above increaseby 0.002. Methodological error in neutron fluxes integrated over the chosen volumes of asystem is 3%.
The MCU-REA code passport contains the following expert estimations.
Maximal evaluated (observed at verification) relative error in effective multiplication fac-tor for fresh low enriched uranium fuel (up to 5%) in cold states
• with B, Gd or Dy absorbers
• with Eu absorbers
±0.3%;
±0.5%.
Maximal evaluated relative error in effective multiplication factor for plutonium andmixed uranium-plutonium (MOX) fuel systems in cold states is ±0.5%.
Maximal evaluated (observed at verification) relative error in effective multiplicationfactor for fresh low enriched uranium fuel (up to 5%) in hot states
• up to 400 K temperature
• up to 1800 K temperature
• up to temperature of melting
±0.3%;
±0.5%;
±0.7%.
357
Maximal evaluated relative error in effective multiplication factor for plutonium andmixed uranium-plutonium (MOX) fuel systems in hot states is ±0.7%.
Maximal evaluated relative error in calculation of pin by pin distribution of 235U fissionrate in fresh fuel
• with B, Gd or Dy absorbers ±3%;
• with Eu absorbers ±5%.
Maximal evaluated relative error in calculation of pin by pin distribution of 239Pu fissionrate in fresh fuel is ±5%.
Maximal evaluated relative deviations of calculated concentrations at burnup from avail-able experimental data and results of international calculational benchmarks:
• 235U ±5%;
• 239Pu ±5%;
• 155Gd and 157Gd ±10%.
Maximal error in reactivity loss at the burnups up to 60 MWD/kg (deviation from theresults of independent calculations) +0.02 (absolute).
If summarize briefly the characteristic features of the MCU codes we may note thefollowing.
1. They has modular structure.
2. For neutron-nuclear interaction modeling the codes permit to take into account:
• the laws of inelastic scattering from evaluated nuclear data files;
• cross section temperature dependence in unresolved resonance region in subgroup ap-proximation;
• Doppler broadening of resonance curve in resolved resonance region using infinitenumber of energetic points;
• temperature dependence of scattering law S(cc,P) calculated for necessary temperature.
3. Geometric possibilities of the codes are supported by the union of the combinatorial andWoodcock methods supplemented by special algorithm for microfuel modeling.
4. The criticals with the neutron leakage given by the buckling vector may be calculated.
5. All few group constants including the diffusion coefficient for design codes are calcu-lated.
6. More than 300 three dimensional experimental benchmarks published in InternationalHandbook of Evaluated Criticality Safety Benchmark Experiments [7] have been calculated.The discrepancy between calculation and experiment results lies inside the evaluated experi-mental errors.
Besides these two codes licensed by Russian Nuclear and Criticality Safety RegulatoryBody (Gosatomnadzor RF), codes-interfaces MCU-EGS4 and MCU-ORIGEN have been de-veloped and are being tested and verified.
The MCU-EGS4 interface is intended for Monte-Carlo modeling of neutron, photon elec-tron and positron transport in complicated geometry. The modeling is performed with mini-mal possible approximations in physics of particles' interaction with matter, geometry and
358
material composition of the matter. The EGS4 (Electron-Gamma Shower) [20], which is freeavailable, is initially intended for maximum precision in description of photon, electron andpositron interaction with chemical elements and their compounds or mixtures and bases on itsown data library with pointwise representation of cross sections in the energy region down to-10 keV. The geometry and particles source description and tallying of events are done bycorresponding MCU modules.
The MCU-ORIGEN interface is intended for calculations of reactor's neutron physiccharacteristics versus burnup. The ORIGENS code belongs to the SCALE system [21] andconsiders all nucleus transformation chains without approximation. Introduction of ORIGENSinto the MCU code allows evaluation of spent fuel radioactivity characteristics in addition tothe burnup calculations.
The MCU codes named are used for:
• quality evaluations of experiments (P and LR-0 facilities in particular);
• verification of design codes intended for calculations of nuclear reactors;
• calculations of effective multiplication factor for verification of-nuclear safety ofcritical facilities, nuclear materials storages and shipping casks;
• design calculations of W E R type reactors' neutron physic characteristics takinginto account isotopic changes of materials during burnup, using the most precisemodels of neutron with matter interactions that cannot be calculated by means ofdesign codes and measured in critical experiments.
The codes described have been used to solve, in particular, the following tasks.
A representative set of mathematical benchmarks has been developed and calculated. Theset also includes some international tests, [22, 23] for verification of design spectrum codesTVS-M [24] and SAPFER. [25] (Russia), and the HELIOS code [26]. The precision of the de-sign codes is determined from the comparison of their calculational results with the resultsobtained by means of MCU. The set of the tasks for quality assurance of coarse and fine meshreactor codes intended for W E R calculations is under development.
Within the framework of the international working groups WPPR (Working Party on thePhysics of Plutonium Fuels) and TFRPD (Task Force on Reactor-based Plutonium Disposi-tion) NEA/OECD the following works were performed:
• Critical experiments VENUS-2 [27] and KRITZ-2 [28] are calculated.
• International calculational benchmark WER-MOX [29] was formulated. It wascalculated. Comparison with different codes is being performed.
Within the framework of-the international working group: Research Group of the PhysicalProblems on Spent Fuel, Radwaste and Decommissioning of NPP, Atomic Energy Research,CB2 [30] benchmark was calculated.
In the WER-1000 fuel rods the fission rates distributions were calculated under condi-tions simulating reactivity initiated accidents. This work was a part of the large program ofthe determination of failure thresholds of fuel rods as a function of the burn-up and determi-nation of failure mechanism. Results of this work were used in database NUREG/IA-0156[31,32].
The full scale three dimensional model of the VVER-1000 reactor in 60 degree symmetrysector is elaborated and used to estimate reactor's parameters, e.g. space power distribution(by pins and by assemblies), and to verify the design codes [33], The developed mathematical
359
model of the reactor allows studying of the impact of the following causes on criticality:movement or removal of absorbers; insertion of new and non-standard materials and devicesinto the core; appearance of local fluctuations in water density in the core, in boric acid con-tent, in removal of rods or their replacement by other materials; insertion of different devicesinto the reflector. In particular, the weight of the 10-th absorber group has been estimated tobe (O.33±O. 1)% when the total weight of all rods is (7.0±0.1)%.
The quality assessment has been performed for a spent fuel dry storage design developedby the American, Company Duke Engineering & Services for Zaporozhskaya NPP [34]. Nu-clear regulations are stronger at the territory of the former USSR than in the USA. The ex-amination was necessary for the design to satisfy the local requirements. The calculationsshowed that the design meets the local requirements in case of the normal operation, but incase of complicated events, e.g. filling of the storage's basket with pure water, the suggesteddesign does not satisfy the local safety requirements. Thus, additional work on the project isnecessary, or regulating base should be reconsidered.
Nuclear safety assessment has been performed for designs of nuclear fuel storages andtransport means intended for NPP's with WER-640 [35] and Kudankulam (India) [36].
The methodology of taking into account the changes of the gap between assemblies hasbeen developed using two dimensional model. The methodology is intended for revision ofthe power density peaks in the fuel caused by deformations of fuel assemblies in the WER-1000 reactor. The local peaks of power density have been estimated using this methodology[37].
The effects related to the neutron field perturbation near the joint of reactor control assem-bly in the WER-440 reactor [38] have been studied.
The calculations of the transient function of intra-reactor neutron beta-emissiorj.detector[39] have been performed. The factors of the intra-reactor detectors sensitivity [40] were cal-culated. The analysis of the calculational results showed the necessity to correct the results ofthe design neutron physic codes and the significant dependence of the detector's current onthe used spectrum of electrons being generated inside the emitter. There are grounds to be-lieve that more studies will make it possible to develop a better description of the dependenceof transient factors on local characteristics of the core, i.e. burnup, poisoning, coolant density,etc.
The MCU code is used in the project that studies the ability to use MOX fuel in VEER-1000 type reactors within the framework of the international program on weapon grade pluto-nium disposition [41].
MCU is used for development of fuel assemblies design for future reactors, including oneswith spectrum regulating [42].
The MCU-RFFI code [43] has been developed for educational and scientific-research pur-poses. The distribution of the code is free.
360
REFERENCES
1. Gomin E.A., Maiorov L.V., Yudkevich M.S. Some Aspects of Monte Carlo MethodApplication to Nuclear Reactor Analysis. Progress in Nuclear Science. Vol. 24, NN 1-3,1990.
2. MCU-RFFI/A Code. RRC KI Report N32/1-14-298, M., 1998.
3. Verification of the MCU-RFFI/A code. RRC KI report N36/1-133-96, Moscow, 1996.
4. Abagan L.P., Alexeyev N.I., Gomin E.A. and others. The MCU-REA code withDLC/MCUDAT-2.1 nuclear data library. RRC KI report N36/7-98, Moscow, 1998.
5. Gomin E.A., Maiorov L.V. The MCU Monte Carlo Code for 3D Depletion Calculation.Proceedings of International Conference on Mathematics and Computation, ReactorPhysics, and Environmental Analyses in Nuclear Applications, September 27-30 1999,vol.2 pp. 997-1006, Madrid, Spain,.
6. Abagan L.P., Alexeyev N.I., Gomin E.A. and others. Verification of the MCU-REA code.RRC KI report N36/8-98, Moscow, 1998.
7. International Handbook of Evaluated Criticality Safety Benchmark Experiments.NEA/NSC/DOC(95)03 OECD, Paris, 1995.
8. AJexeyev N.I., Gomin E.A., Gurevich M.I. et.al. Modeling of Benchmark ExperimentsPerformed, at ZR-6 Critical Facility and Validation of the MCU-REA Code. Proceedingsof the ANS International Topical Meeting on Advances in Reactor Physics and Mathe-matics ami Computation into the Next Millennium PHYSOR -2000. May 7-12 2000, p.XI.D.l, Pittsburg, Pen., USA.
9. Experimental investigations of physics of W E R lattices, Akademiai Kiado, Budapest,Vol. 1 - 1984, Vol.3 - 1991.
10. Andrianov G.Y., Ionov V.S., Kraynov Yu.A, et.al. Calculational and experimental datafor critical experiments at core with hexagonal water ring. Proc. Of the Int. Conf. OnW E R Safety. Prague (Czech Republic). Sept. 21-23 1995, pp. 223-225.
11. Alexeyev N.I., Andrianov G.Ya., Bolobov P.A. and others. Analysis of nuclear safety ofWER-1000 storage pool at coolant density decrease. Atomic Energy. V. 81. Rel. 4. 1996p.243-249
12. Andrianov G.Ya., Ionov V.S., Krainov Yu. A., etal. Analysis of Critical Experiment Datafor W E R Safety. Transactions of the ANS 1997 Winter Meeting. Albuquerque. NewMexico. Vol. 77. 1-560 (1997) ISSN: 0003-018X, pp. 378-380.
13. Alexeyev N.I., Ananenkov V.V., Epanchenkov Y.A. and others. Experimental and calcu-lational studies of W E R type fuel lattices containing fuel rods with gadolinium and ex-perimental fuel rods with ZrB2 or B4C layers. RRC KI report N32/1-261-97, Moscow,1997.
14. Andrianov G.Ya., Klochkov A.D., Kraynov Y.A. and others. The P critical facility in-tended for W E R physic study (description,, criticality experiments and 3-D calculationalmodels). RRC KI INR N6033/4. Moscow, 1997.
15. Alexeyev N.I., Andrianov G.Ya., Ionov V.S. and others. Hf, B4C and Dy absorbers inVVER type lattices. Experiments and calculations. Thesis's of the reports at 9-th seminar
361
on reactor physics: Safety of nuclear facilities. MlPhI, Vol.1 p. 163-165, Vol.2 p. 20-22,Moscow, 1995.
16. Zaritsky S. Gurevich M, Osmera B.Mikus J.Kam F.B. Check and Visualizations of theInput Data Using the Geometrical Module of the Monte-Carlo Code MCU: WWER-440Pressure Vessel Dosymetry Benchmarks. Proceedings of the 1198 ANS Radiation Protec-tion and Shielding Division Topical Conference April 19-23,1998 Nashville, TennesseeUSA. Vol. 2, p. 325-330
17. Zaritsky S. Osmera B. Gurevich M. Mikus J. Database for WWER-1000 Reactor PressureVessel. IAEA TP Project RER/4/017. December 1998. Nuclear Research Institute, Rez,Czech Republic
18. Maeder, P. Wydler. International Calculations for a BWR Lattice with Adjacent Gadolin-ium Pins, EIR-Bericht Nr.532 NEACRP-L-271, Wurenlingen, 1984.
19. Safe core management with burnable absorbers in WWERs. IAEA-TECDOC-858.
20. Nelson W. R., Hirayama H. and Rogers D. W. 0. The EGS4 code System. SLAC Report265.
21.ORIGEN-S: SCALE system module to calculate fuel depletion, actinide transmutation,fission product buildup and decay, and associated radiation source terms.NUREG/CR-0200, Revision 5, Volume 2, Section F7, ORNL/NUREG/CSD-2/V2/R5,RSIC code package CCC-545, Oak Ridge National Laboratory, Oak Ridge, TN (Septem-ber 1995).
22. M. A. Kalugin, A. P. Lazarenko, A. G. Kalashnikov, J. C. Gehin. WER-1000 Weapons-Grade MOX Computational Benchmark Analysis. II.B.-l. In Proc. of PHYSOR 2000,ANS International Topical Meeting On Advances in Reactor Physics and Mathematicsand Computation into the Next Millennium. May 7-12, 2000, Pittsburgh, Pennsylvania,USA. Published by the ANS, Inc. 555 North Kenssington Avenue, La Grange Park, IL60526, USA. ISBN: 0-89448-655-1; ANS Order No. 2700281.
23. Lazarenko, M. Kalugin, Bychkov, A. Kalashnikov, A. Tsyboulia, W. Zwermann,S. Langenbuch, W. Stach, G. Schlosser, M. Delpech and F. Dolci, P. Girieud and M.L.Vergain Benchmark calculations for WER-1000 fuel assemblies using uranium or MOXfuel. II.B.-2. In Proc. of PHYSOR 2000, ANS International Topical Meeting On Ad-vances in Reactor Physics and Mathematics and Computation into the Next Millennium.May 7-12, 2000, Pittsburgh, Pennsylvania, USA. Published by the ANS, Inc. 555 NorthKenssington Avenue, La Grange Park, EL 60526, USA. ISBN: 0-89448-655-1; ANS Or-der No. 2700281.
24. V.D. Sidorenko et. al. Spectral Code TVS-M for Calculation of Characteristics of Cells,Supercells and Fuel Assemblies of WER-Type Reactors. 5-th Symposium of the AER,Dobogoko, Hungary, Octoder 15-20, 1995.
25. V.G. Artemov et al. A system of tests ands verification experience for the SAPFIR_WR-RC set of codes for neutron physic calculations of different types of reactors. In Proc. Of9-th seminar on reactor reactor physics, V. 1, p. 126, Moscow, MEPhl, 1995.
26. J.J. Casal, et al., HELIOS: Geometric Capabilities of a new Fuel-Assembly Program, Pro-ceedings International Topical Meeting Advances in Mathematics, Computation, and Re-actor Physics, April 28-May, 19991, p. 10.2 1-1.
27. E. Gomin, M. Kalugin, D. Shkarovsky. MCU Results for the Benchmark on the VENUS-2 Core Measurements. 3rd TFRPD Meeting, OECD/Nuclear Energy Agency, France 14-
362
16 June 2000.
28. E. Gomin, M. Kalugin, D. Shkarovsky. KRITZ-2 Experimental Benchmark PreliminaryAnalysis. 3rd TFRPD Meeting, OECD/Nuclear Energy Agency, France 14-16 June 2000.
29. S. Bychkov, M. Kalugin, A. Lazarenko, D. Shkarovsky. International CalculationalBenchmark VVER-1000 Assembly With Burnable Absorbers. Comparison of results ob-tained with various codes. Joint Technical Meeting on MOX Fuel Disposition in VVER-1000. Moscow 24-28 July 2000.
30. Gomin, M. Kalugin, L. Maiorov, M. Yudkevich. Calculational Burnup Credit Benchmarkno.2 (CB2 ). MCU results. Published in: L. Markova. Final Evaluation of CB2 results andPreliminary Evaluation of CB3 results (VVER-440 Burnup Credit Benchmark). 5 thMeeting of AER Working Group E on Physical Problems on Spent Fuel, Radwaste andDecommissioning of Nuclear Power Plants, Rez, Czech Republic, April 11-12, 2000
31. Egorova L.A., .Maiorov L.V. et al. Data Base on the Behavior of High Burnup Fuel Rodswith Zr-l%Nb Cladding and UO2 Fuel (VVER Type) under Reactivity Accident Condi-tions. Description of Test Procedures and Analytical Methods. International AgreementReport. NUREG/IA-0156 ,NSI RRC 2179. Published by U.S. Nuclear "Regulatory Com-mision. Washington, 1999. V.2, p. 1-241.
32. L. Egorova, M. Kalugin et al. Data Base on the Behavior of High Burnup Fuel Rods withZr-l%Nb Cladding and UO2 Fuel (WER Type) under Reactivity Accident Conditions.Test and Calculation Results. International Agreement Report. NUREG/IA-0156 ,NSIRRC 2179. Published by U.S. Nuclear Regulatory Commision. Washington, 1999. V.3, p.1-754.
33. Alexeev N.I. Astachov S.A. , Gurevich M.I., Molotkova N.V. The 3-D Model of theWWER-1000 for the Investigation of the Reactive Effects by the Monte-Carlo Code.Proceedings of the international conference on W E R reactors safety. Prague, 1995,p. 125-127.
34. Alexeyev N.I., Astakhov S.A,, Gomin E.A. et. al. Nuclear Safety Analysis of Project ofZaporozhskaya NPP Dry Spent Fuel Storage System Using the MCU Code. Proceedingsof the 1996 Topical Meeting: Radiation Protection & Shielding, April 2 1 - 2 5 1996, pp.930-937, No. Falouth, Massachusetts, USA.
35. Alexeyev N.I., Astahov S.A., Ponomarenko G.L. and others. Calculational studies to pro-vide fuel storage safety for NPP with WER-640. Stagesl-3. RRC KI report NN 32/1-19-97, 32/1-90-97, 32/1-223-97, Moscow, 1997.
36. Osadchy A.I., Gomin E.A., Tebin V.V. and others. Safety verification of fresh and spentfuel storage at NPP Kudankulam for normal operation. RRC KI report, Moscow, 2000.
37. Gomin E.A., Marin S.V., Nosovsky I.V., Zygankov E.A. Development of methodologyfor taking into account the gap between assemblies calculating power density and reevalu-ation of power density peaks in fuel caused by assemblies' deformations using this meth-odology. 32/1-61-398, Moscow, 1998.
38. Osadchy A.I., Tebin V.V., Alekseyev N.I., Gurevich M.I. Optimization of absorber's dis-tribution in the region of reactor control rod joint (design MSZ-RRC KI) within the frag-ment of the WER-440 core. RRC KI report N 32-1-67-498, Moscow, 1998.
39. Gomin E.A., Marin S.V., Zymbalov S.A. The MCU code. Calculation of transient func-tion of neutron beta-emission detector. RRC KI INR N 5755/5, Moscow, 1994.
40. S.S.Gorodkov, S.V.Marin, S.A.Zymbalov. Calculation of sensitivity factors of itra-reactor
363

control detectors by means of the MCU4 and EGS4 codes. Report at this conference.
41. Yudkevich, G.N. Manturov, R.T. Primm. Validation of MCU and KENO Monte Carlocodes for Application to VVER/PWR Reactors with MOX fuel Loading. Trans.Am. Nucl.Soc, 79,287 (1998).
42. Duhovensky A.S., Kobzar L.L, Marin S.V., Yudkevich M.S. Fual assembly conceptionfor VVER-1500. Report at this conference.
43. Gomin E.A., Maiorov L.V. The MCU-RFFI Monte Carlo Code for Reactor Design Appli-cations. Proceedings of International Conference on Mathematics and Computation, Re-actor Physics, and Environmental Analyses, April 30 - May 4 1995, vol.2 pp. 1136-1141,Portland, Or, USA.
364
SK01ST098
PIN-BY-PIN MODELING OF FUEL CYCLE AND REACTIVITY INITIATEDACCIDENTS IN LWR
A.Avvakumov, V.Malofeev, V.SidorovRRC "Kurchatov Institute", Nuclear Safety Institute, Russia
[email protected], [email protected], [email protected]
ABSTRACT
This study deals with validation results for pin-by-pin methods to model fuel cycle andreactivity initiated accidents (RIAs) in LWR. Both methods are based on a heterogeneous pin-by-pin reactor model, realized in the BARS code. Validation results are presented for separatesteps of W E R fuel cycle modeling. Features and advantages of a pin-by-pin approach formodeling of LWR RIA shown on. the basis of calculations of control rod ejection accidents(REAs) in South Ukrainian NPP Unit 1 WER-1000 and Three Mile Island Unit 1 (TMI-1)PWR at the end of cycles. Calculations were performed using the coupled RELAP-BARScode. Effects of pin-by-pin power and burnup distribution on estimation of the accidentconsequences are considered.
1. INTRODUCTION
In LWR safety analysis with respect to reactivity initiated accidents, such as control rodejection, main steam line break or boron dilution, a detailed description of the powerdistribution over the reactor core plays an important role. Numerous neutronic and thermal-hydraulic phenomena occurring in the reactor core during the plant operation and transienthave influence on key factors (for instance, peak local fuel enthalpy) in safety analysis of RIAconsequences, especially in a LWR with a high bumup core.
Usually, such an analysis is carried out by widely used 3D assembly-by-assembly neutroniccodes that calculate assembly average power distribution. These codes, which are known as"best-estimate", are based, as a rule, on a two-group nodal diffusion model and coupled withmodern thermal-hydraulic codes, such as TRAC, RELAP, etc. Thus, estimation of the localparameters (for example, fuel rod enthalpy) may be done only by using additional procedureof a power reconstruction within selected fuel assembly with peak power. But the hottest fuelrod does not necessarily belong to this fuel assembly [1]. Another problem is reliability of apower reconstruction model under the transient conditions, especially, for assemblies locatednear the core reflector.
365
A pin-by-pin model allows taking into account the intra-assembly effects directly without anypower reconstruction procedure. Such a detailed NPP dynamic model has been developed inNuclear Safety Institute of Russian Research Centre "Kurchatov Institute" for VVER andPWR R1A analysis [2]. The model is based on a coupling of the RELAP5/MOD3.2 thermal-hydraulic code [3] with the BARS neutronic code [4]. The 3D pin-by-pin heterogeneousmodel (up to 80,000 pins) is used for the core neutronics, and a multi-channel assembly-by-assembly model describes the core thermal-hydraulics. An individual thermal-hydraulicchannel corresponds to each fuel assembly with few fuel rods simulated by individual thermalstructures. To provide the data exchange between RELAP and BARS, the COTT interfacecode is used. Besides, the COTT code contains simplified thermal-hydraulic option based onID single- or two-phase homogeneous flow with a slip ratio.
Validation calculations carried out for various numerical and experimental benchmarks showthat the BARS code meets accuracy criteria for LWR analysis and coupled RELAP-BARScode can be successfully used for RIA modeling [5-7].
Based on the pin-by-pin heterogeneous approach [8], a method for LWR fuel cycle modelinghas been developed. This method includes two stages: database generation within a single fuelassembly model and fuel cycle calculation. Results of validation for VVER fuel cycleparameters, such as nuclide composition and duration of fuel cycles demonstrate capability ofthe pin-by-pin fuel cycle method to predict these parameters with reasonable accuracy [9].
2. VALIDATION RESULTS FOR FUEL CYCLE MODELING IN WER-1000
LWR fuel cycle modeling is one of the most important problems of the LWR core operationand fuel management. Keeping in mind numerous neutronic and thermal-hydraulic processesin the reactor core and other plant systems, the solution of this problem in details seems to berather problematic. Presented in this paper pin-by-pin approach allows LWR fuel cyclemodeling in more realistic manner in comparison with widely spread assembly-by-assemblymodel.
The fuel cycle model implemented in BARS consists in two separate stages:1) calculation of nuclide composition for fuel rods and burnable absorbers and generation of
global database for the BARS code by the TRIFON code [10];2) calculation of the fuel cycle itself by BARS with the database calculated in advance.
There are 3 codes.used within the fuel cycle model: BARS, TRIFON and the burnup interfacecode, which solves depletion equations. This interface code uses generally used scheme ofnuclide transformation taking into account 24 heavy nuclides, 50 explicit fission products and4 lumped fission products [11].
A validation procedure was split into two steps; each of them may be considered as separateprocedure and corresponding validation results may be of interest in other areas (for instance,a prediction of the nuclide composition in the high burnup fuel).
366
First step of the validation procedure dealt with the prediction of nuclide composition inVVER fuel rods under various operational conditions including geometrical and thermal-hydraulic effects on neutron spectrum in the fuel irradiated up to 60 MWd/kgU.
Second step involves VVER-1000 fuel cycle modeling by BARS using a neutron databaseprepared by the TRIFON code. The BARS input deck includes available operationalinformation on the fuel reloading scheme, soluble boron concentrations in the moderatorduring the fuel cycle, the reactor power history, axial positions of regulating banks of controlrods, etc.
2.1. Validation of Calculational Model to Predict Nuclide Composition in W E R Fuel
Unfortunately, detailed experimental data on VVER spent fuel nuclide composition availablein literature are rather poor. As a rule, they include the data only for major actinides withoutany information on fission products playing an important role in the fuel cycle. Thus, thesedata do not allow validating a depletion code as a whole. In this case it is worth to usecalculational benchmarks aimed to compare capabilities of different .depletion codes withvarious neutron data libraries. Another reason to use them is a possibility to analyzeuncertainties due to different factors: neutronic and depletion models, libraries, etc.
As a result, it has been chosen the following validation database:• WER-440 bumup credit calculational benchmark CB2 [12];• a set of measured data for the nuclide composition of the high bumup spent fuel for
VVER-440 and WER-1000 reactors [13 and 14].
CB2 calculational benchmark has been prepared in 1997 in the collaboration with theOECD/NEA/NSC Burnup Credit Criticality Benchmarks Working Group. A detailedspecification of this benchmark and contains 10 calculational sets obtained from 9 institutes of7 countries are given in [12]. These data were calculated using modern depletion codes, suchas CASMO-4, SCALE 4.3, WIMS7, HELIOS, etc. Depletion calculations for WER-440 fuelrod cell were carried out for two burnup values: 30 and 40 MWd/kgU. Total number ofnuclides which concentrations are given is 26 including 15 fission products.
In our study the calculational set obtained by the HELIOS, (version 1.5) code was chosen as areference one for validation because of the neutron library used by HELIOS was based on thesame ENDF/B-VI file used also in the TRIFON code library. This fact allowed us to minimizethe calculational uncertainty due to differences in the neutron libraries used by both codes.
The BARS-TRIFON code calculated the nuclide composition for each fuel rod within the fuelassembly and then the averaged data for selected nuclides were compared with the HELIOSresults. The averaged results and the relative deviations (e) are presented in Table 1. It shouldbe noted that the BARS-TRIFON calculated data differs to some extent from those presentedin [9] after last revision of chain yields.
367
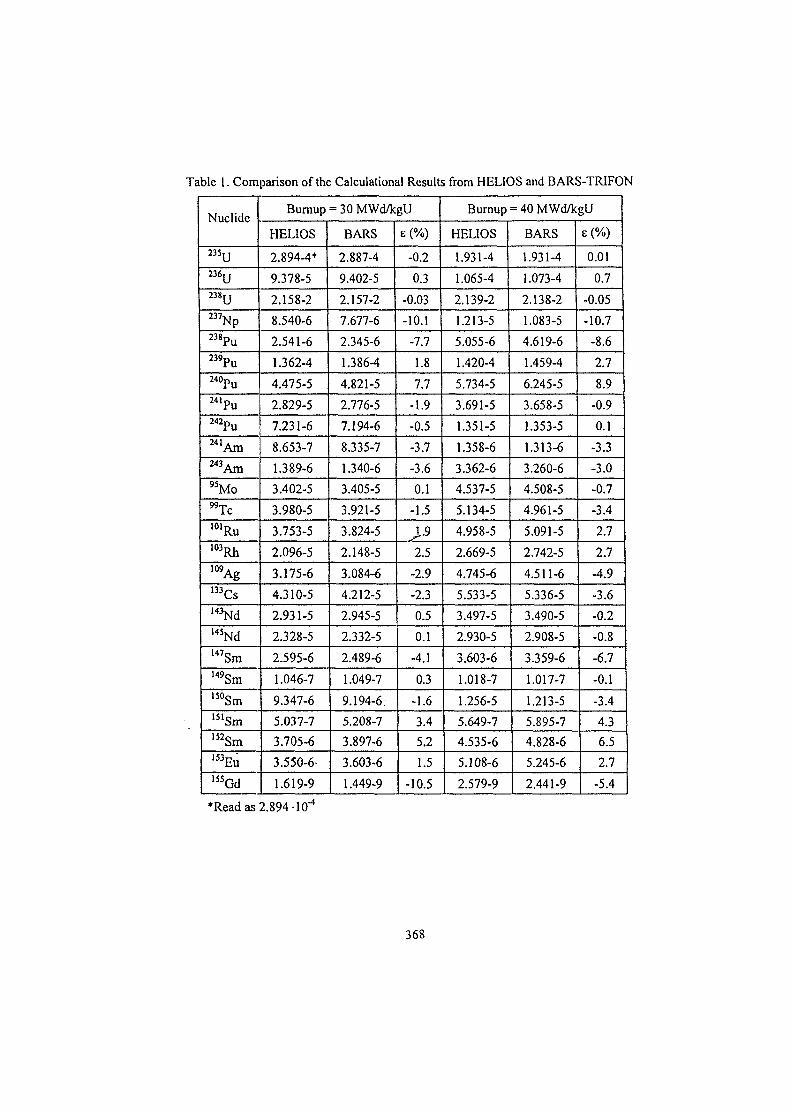
Table 1. Comparison of the Calculational Results from HELIOS and BARS-TRIFON
Nuclide
235U236U238U237Np238pu
M 9 Pu240Pu2 4 1Pu242Pu2 4 1 Am243Am95Mo
"Tc10lRu103Rh109Ag133Cs143Nd145Ndl 4 7 Sm149Sm150Sm151Sml 5 2 Sm153Eu155Gd
Burnup = 30 MWd/kgU
HELIOS
2.894-4*
9.378-5
2.158-2
8.540-6
2.541-6
1.362-4
4.475-5
2.829-5
7.231-6
8.653-7
1.389-6
3.402-5
3.980-5
3.753-5
2.096-5
3.175-6
4.310-5
2.931-5
2.328-5
2.595-6
1.046-7
9.347-6
5.037-7
3.705-6
3.550-6-
1.619-9
BARS
2.887-4
9.402-5
2.157-2
7.677-6
2.345-6
1.386-4
4.821-5
2.776-5
7.194-6
8.335-7
1.340-6
3.405-5
3.921-5
3.824-5
2.148-5
3.084-6
4.212-5
2.945-5
2.332-5
2.489-6
1.049-7
9.194-6.
5.208-7
3.897-6
3.603-6
1.449-9
e(%)
-0.2
0.3
-0.03
-10.1
-7.7
1.8
7.7
-1.9
-0.5
-3.7
-3.6
0.1
-1.5
>9
2.5
-2.9
-2.3
0.5
0.1
-4.1
0.3
-1.6
3.4
5.2
1.5
-10.5
Burnup = 40 MWd/kgU
HELIOS
1.931-4
1.065-4
2.139-2
1.213-5
5.055-6
1.420-4
5.734-5
3.691-5
1.351-5
1.358-6
3.362-6
4.537-5
5.134-5
4.958-5
2.669-5
4.745-6
5.533-5
3.497-5
2.930-5
3.603-6
1.018-7
1.256-5
5.649-7
4.535-6
5.108-6
2.579-9
BARS
1.931-4
1.073-4
2.138-2
1.083-5
4.619-6
1.459-4
6.245-5
3.658-5
1.353-5
1.313-6
3.260-6
4.508-5
4.961-5
5.091-5
2.742-5
4.511-6
5.336-5
3.490-5
2.908-5
3.359-6
1.017-7
1.213-5
5.895-7
4.828-6
5.245-6
2.441-9
E(%)
0.01
0.7
-0.05
-10.7
-8.6
2.7
8.9
-0.9
0.1
-3.3
-3.0
-0.7
-3.4
2.7
2.7
-4.9
-3.6
-0.2
-0.8
-6.7
-0.1
-3.4
4.3
6.5
2.7
-5.4
•Read as 2.894 •10-'
368
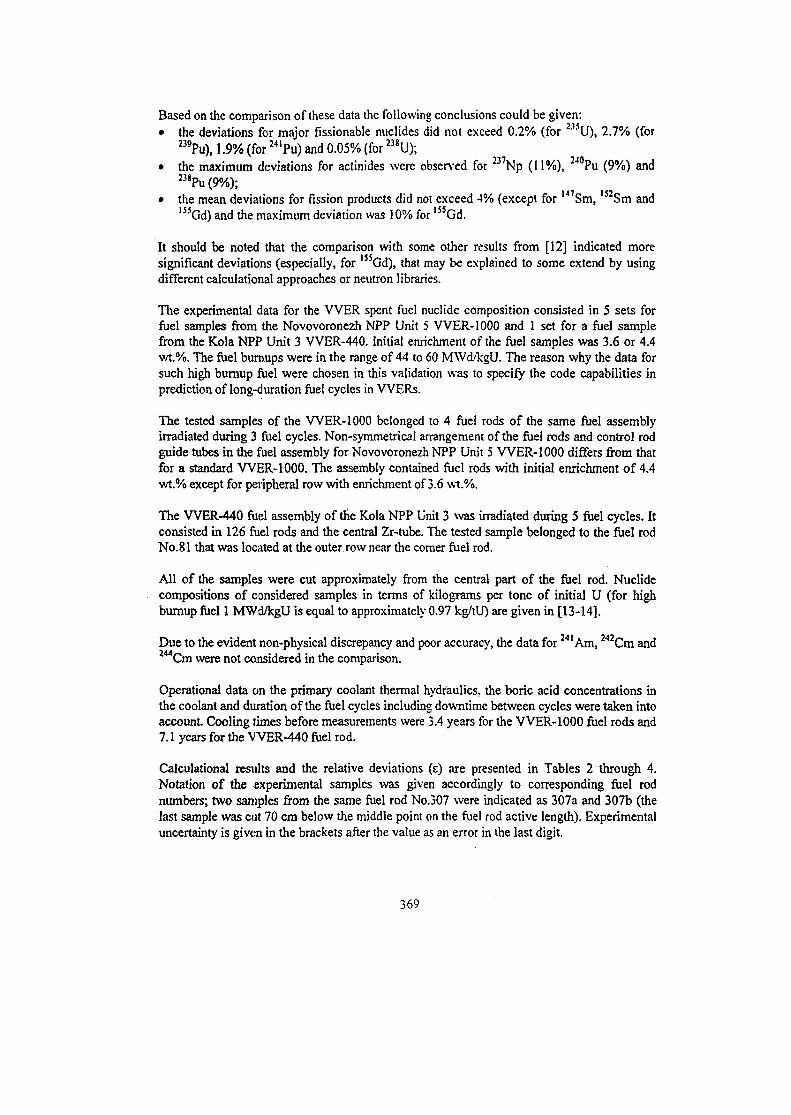
Based on the comparison of these data the following conclusions could be given:• the deviations for major fissionable nuclides did not exceed 0.2% (for 235U), 2.7% (for
239Pu), 1.9% (for 24IPu) and 0.05% (for 238U);• the maximum deviations for actinides were observed for 237Np (11%), 240Pu (9%) and
238Pu (9%);• the mean deviations for fission products did not exceed 4% (except for l47Sm, 152Sm and
155Gd) and the maximum deviation was 10% for I55Gd.
It should be noted that the comparison with some other results from [12] indicated moresignificant deviations (especially, for 155Gd), that may be explained to some extend by usingdifferent calculational approaches or neutron libraries.
The experimental data for the VVER spent fuel nuclide composition consisted in 5 sets forfuel samples from the Novovoronezh NPP Unit 5 VVER-1000 and 1 set for a fuel samplefrom the Kola NPP Unit 3 VVER-440. Initial enrichment of the fuel samples was 3.6 or 4.4wt.%. The fuel burnups were in the range of 44 to 60 MWd/kgU. The reason why the data forsuch high burnup fuel were chosen in this validation was to specify the code capabilities inprediction of long-duration fuel cycles in VVERs.
The tested samples of the WER-1000 belonged to 4 fuel rods of the same fuel assemblyirradiated during 3 fuel cycles. Non-symmetrical arrangement of the fuel rods and control rodguide tubes in the fuel assembly for Novovoronezh NPP Unit 5 VVER-1000 differs from thatfor a standard VVER-1000. The assembly contained fuel rods with initial enrichment of 4.4wt.% except for peripheral row with enrichment of 3.6 wt.%.
The WER-440 fuel assembly of the Kola NPP Unit 3 was irradiated during 5 fuel cycles. Itconsisted in 126 fuel rods and the central Zr-tube. The tested sample belonged to the fuel rodNo.81 that was located at the outer row near the corner fuel rod.
All of the samples were cut approximately from the central part of the fuel rod. Nuclidecompositions of considered samples in terms of kilograms per tone of initial U (for highburnup fuel 1 MWd/kgU is equal to approximately 0.97 kg/tU) are given in [13-14].
Due to the evident non-physical discrepancy and poor accuracy, the data for 24lAm, 242Cm and244Cm were not considered in the comparison.
Operational data on the primary coolant thermal hydraulics, the boric acid concentrations inthe coolant and duration of the fuel cycles including downtime between cycles were taken intoaccount Cooling times before measurements were 3.4 years for the VVER-1000 fuel rods and7.1 years for the WER-440 fuel rod.
Calculational results and the relative deviations (s) are presented in Tables 2 through 4.Notation of the experimental samples was given accordingly to corresponding fuel rodnumbers; two samples from the same fuel rod No.307 were indicated as 307a and 307b (thelast sample was cut 70 cm below the middle point on the fuel rod active length). Experimentaluncertainty is given in the brackets after the value as an error in the last digit.
369
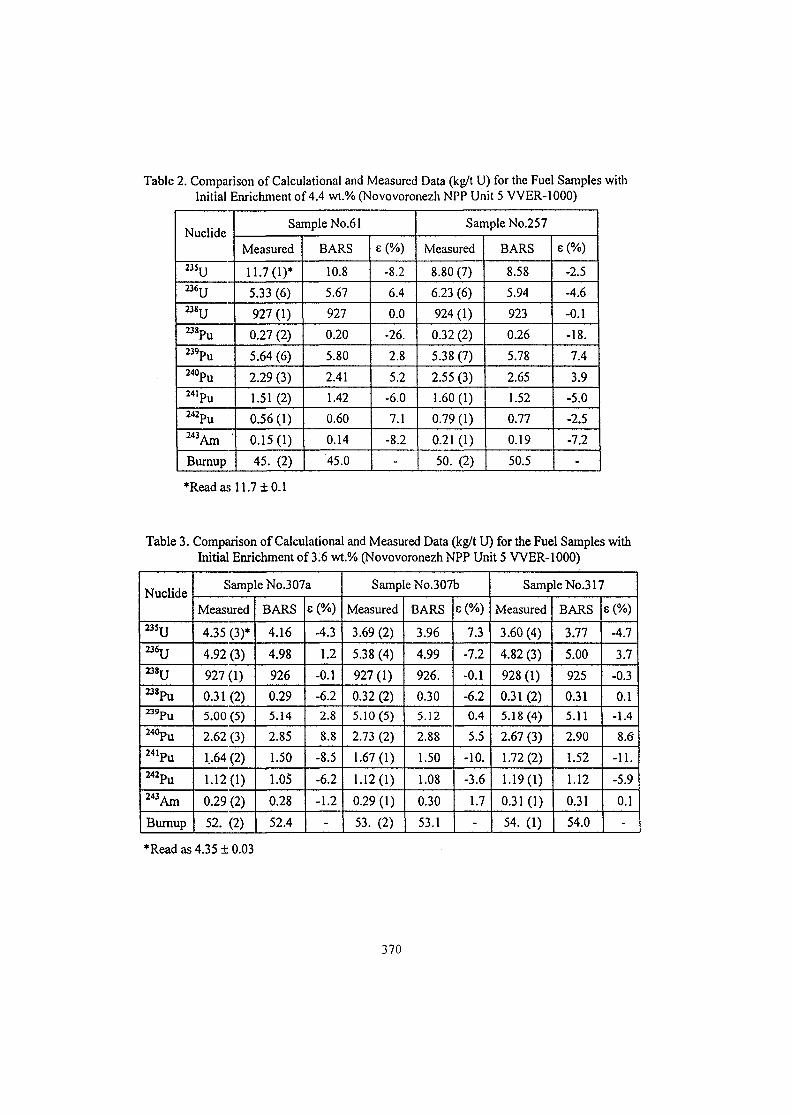
Table 2. Comparison of Calculational and Measured Data (kg/t U) for the Fuel Samples withInitial Enrichment of 4.4 wt.% (Novovoronezh NPP Unit 5 VVER-1000)
Nuclide
235U2 3 6 U2 3 8 U238pu
2 3 9 Pu240pu
24!pu
242Pu243Am •
Burnup
Sample No.61
Measured
11.7(1)*
5.33 (6)
927 (1)
0.27 (2)
5.64 (6)
2.29 (3)
1.51 (2)
0.56 (1)
0.15(1)
45. (2)
BARS
10.8
5.67
927
0.20
5.80
2.41
1.42
0.60
0.14
45.0
E (%)
-8.2
6.4
0.0
-26.
2.8
5.2
-6.0
7.1
-8.2
-
Sample No.257
Measured
8.80 (7)
6.23 (6)
924 (1)
0.32 (2)
5.38 (7)
2.55 (3)
1.60(1)
0.79(1)
0.21 (1)
50. (2)
BARS
8.58
5.94
923
0.26
5.78
2.65
1.52
0.77
0.19
50.5
e(%)
-2.5
-4.6
-0.1
-18.
7.4
3.9
-5.0
-2.5
-7.2
-
"Read as 11.7 ±0.1
Table 3. Comparison of CalculationalInitial, Enrichment of 3.6 wt
and Measured Data (kg/t U) for the Fuel Samples% (Novovoronezh NPP Unit 5 VVER-1000)
with
Nuclide
23 5 u
23 8 u
^ P u239p u
240Pu241Pu242Pu243Am
Burnup
Sample No.307a
Measured
4.35 (3)*
4.92 (3)
927 (1)
0.31 (2)
5.00 (5)
2.62 (3)
1.64 (2)
1.12(1)
0.29 (2)
52. (2)
BARS
4.16
4.98
926
0.29
5.14
2.85
1.50
1.05
0.28
52.4
e(%)
-4.3
1.2
-0.1
-6.2
2.8
8.8
-8.5
-6.2
-1.2
-
Sample No.307b
Measured
3.69 (2)
5.38 (4)
927 (1)
0.32 (2)
5.10(5)
2.73 (2)
1.67.(1)
1.12(1)
0.29 (1)
53. (2)
BARS
3.96
4.99
926.
0.30
5.12
2.88
1.50
1.08
0.30
53.1
e(%)
7.3
-7.2
-0.1
-6.2
0.4
5.5
-10.
-3.6
1.7
-
Sample No.317
Measured
3.60 (4)
4.82 (3)
928 (1)
0.31 (2)
5.18(4)
2.67 (3)
1.72(2)
1.19(1)
0.31 (1)
54. (1)
BARS
3.77
5.00
925
0.31
5.11
2.90
1.52
1.12
0.31
54.0
s(%)
-4.7
3.7
-0.3
0.1-1.4
8.6
-11.
-5.9
0.1
-
"Read as 4.35 ± 0.03
370
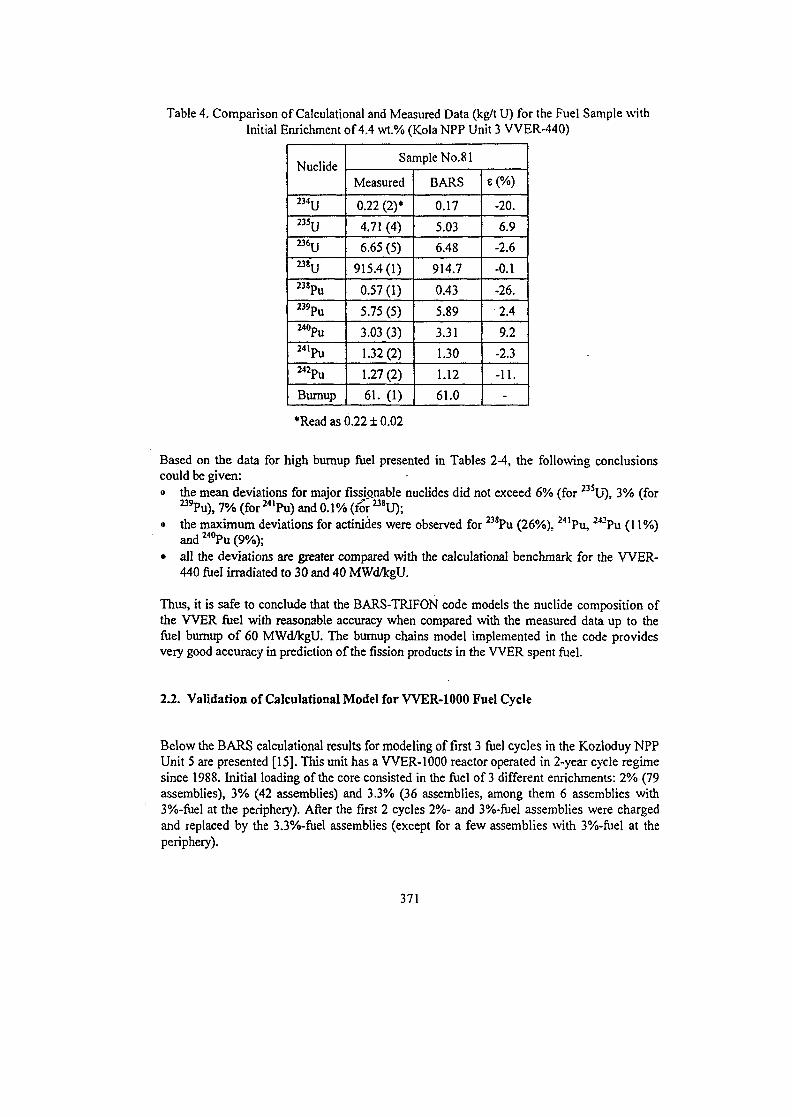
Table 4. Comparison of Calculational and Measured Data (kg/t U) for the Fuel Sample withInitial Enrichment of 4.4 wt.% (Kola NPP Unit 3 VVER-440)
Nuclide
234U235U
mv2 3 8 p u
M9Pu240Pu241Pu242Pu
Bumup
Sample No.81
Measured
0.22 (2)*
4.71 (4)
6.65 (5)
915.4(1)
0.57(1)
5.75 (5)
3.03 (3)
1.32(2)
1.27(2)
61. (1)
BARS
0.17
5.03
6.48
914.7
0.43
5.89
3.31
1.30
1.12
61.0
e(%)
-20.
6.9
-2.6
-0.1
-26.
2.4
9.2
-2.3
-11.
-
•Read as 0.22 ±0.02
Based on the data for high bumup fuel presented in Tables 2-4, the following conclusionscould be given:» the mean deviations for major fissiojiable nuclides did not exceed 6% (for 235U), 3% (for
" 'Pu) , 7% (for 241Pu) and 0.1% (lor mU);• the maximum deviations for actinides were observed for 238Pu (26%), 24lPu, 24"Pu (11%)
and 240Pu (9%);• all the deviations are greater compared with the calculational benchmark for the W E R -
440 fuel irradiated to 30 and 40 MWd/kgU.
Thus, it is safe to conclude that the BARS-TRIFON code models the nuclide composition ofthe W E R fuel with reasonable accuracy when compared with the measured data up to thefuel bumup of 60 MWd/kgU. The burnup chains model implemented in the code providesvery good accuracy in prediction of the fission products in the W E R spent fuel.
2.2. Validation of Calculational Model for WER-1000 Fuel Cycle
Below the BARS calculational results for modeling of first 3 fuel cycles in the Kozloduy NPPUnit 5 are presented [15]. This unit has a WER-1000 reactor operated in 2-year cycle regimesince 1988. Initial loading of the core consisted in the fuel of 3 different enrichments: 2% (79assemblies), 3% (42 assemblies) and 3.3% (36 assemblies, among them 6 assemblies with3%-fuel at the periphery). After the first 2 cycles 2%- and 3%-fuel assemblies were chargedand replaced by the 3.3%-fuel assemblies (except for a few assemblies with 3%-fuel at theperiphery).
371
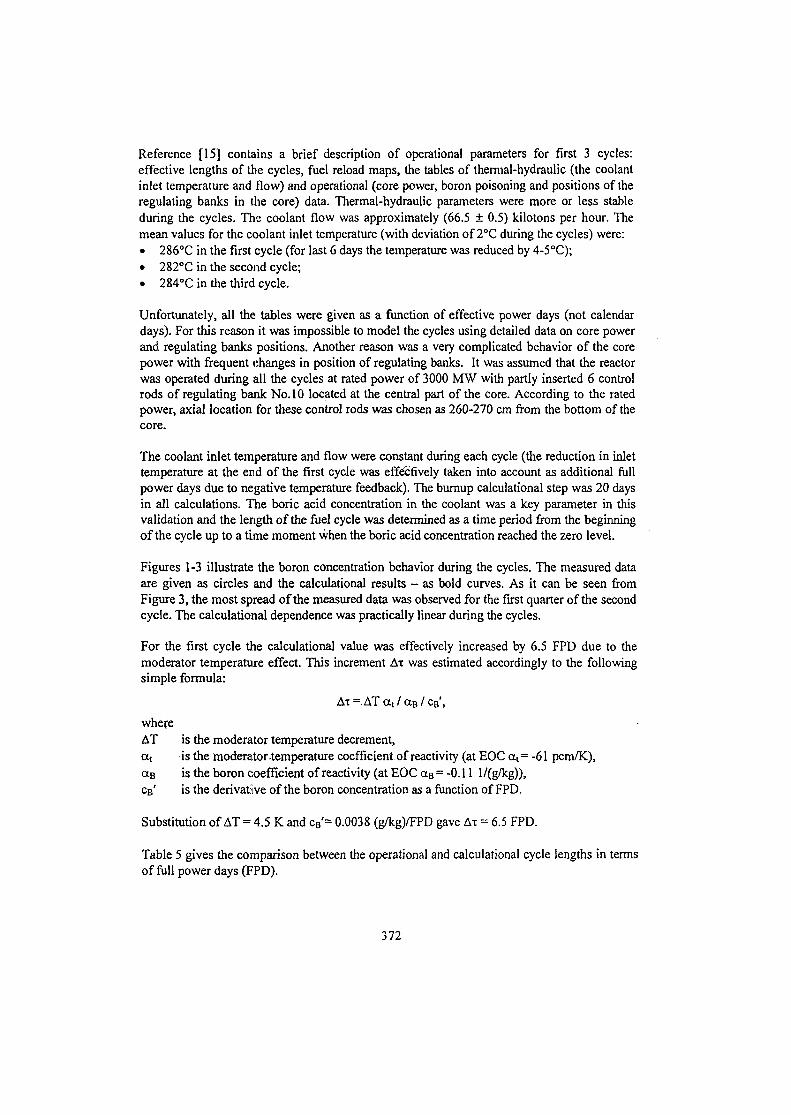
Reference [15] contains a brief description of operational parameters for first 3 cycles:effective lengths of the cycles, fuel reload maps, the tables of thermal-hydraulic (the coolantinlet temperature and flow) and operational (core power, boron poisoning and positions of theregulating banks in the core) data. Thermal-hydraulic parameters were more or less stableduring the cycles. The coolant flow was approximately (66.5 ± 0.5) kilotons per hour. Themean values for the coolant inlet temperature (with deviation of 2°C during the cycles) were:• 286°C in the first cycle (for last 6 days the temperature was reduced by 4-5°C);• 282CC in the second cycle;• 284°C in the third cycle.
Unfortunately, all the tables were given as a function of effective power days (not calendardays). For this reason it was impossible to model the cycles using detailed data on core powerand regulating banks positions. Another reason was a very complicated behavior of the corepower with frequent changes in position of regulating banks. It was assumed that the reactorwas operated during all the cycles at rated power of 3000 MW with partly inserted 6 controlrods of regulating bank No. 10 located at the central part of the core. According to the ratedpower, axial location for these control rods was chosen as 260-270 cm from the bottom of thecore.
The coolant inlet temperature and flow were constant during each cycle (the reduction in inlettemperature at the end of the first cycle was effectively taken into account as additional fullpower days due to negative temperature feedback). The burnup calculational step was 20 daysin all calculations. The boric acid concentration in the coolant was a key parameter in thisvalidation and the length of the fuel cycle was determined as a time period from the beginningof the cycle up to a time moment when the boric acid concentration reached the zero level.
Figures 1-3 illustrate the boron concentration behavior during the cycles. The measured dataare given as circles and the calculational results - as bold curves. As it can be seen fromFigure 3, the most spread of the measured data was observed for the first quarter of the secondcycle. The calculational dependence was practically linear during the cycles.
For the first cycle the calculational value was effectively increased by 6.5 FPD due to themoderator temperature effect. This increment AT was estimated accordingly to the followingsimple formula:
A-r = AT a t / aa / CB',
whereAT is the moderator temperature decrement,ctt is the moderator-temperature coefficient of reactivity (at EOC a t = -61 pcm/K),OCB is the b o r o n coefficient o f reactivity (at E O C OCB = -0.11 1 / (g/kg)) ,CB' is the derivative of the boron concentration as a function of FPD.
Substitution of AT = 4.5 K and cB'= 0.0038 (g/kg)/FPD gave Ax = 6.5 FPD.
Table 5 gives the comparison between the operational and calculational cycle lengths in termsof full power days (FPD).
372
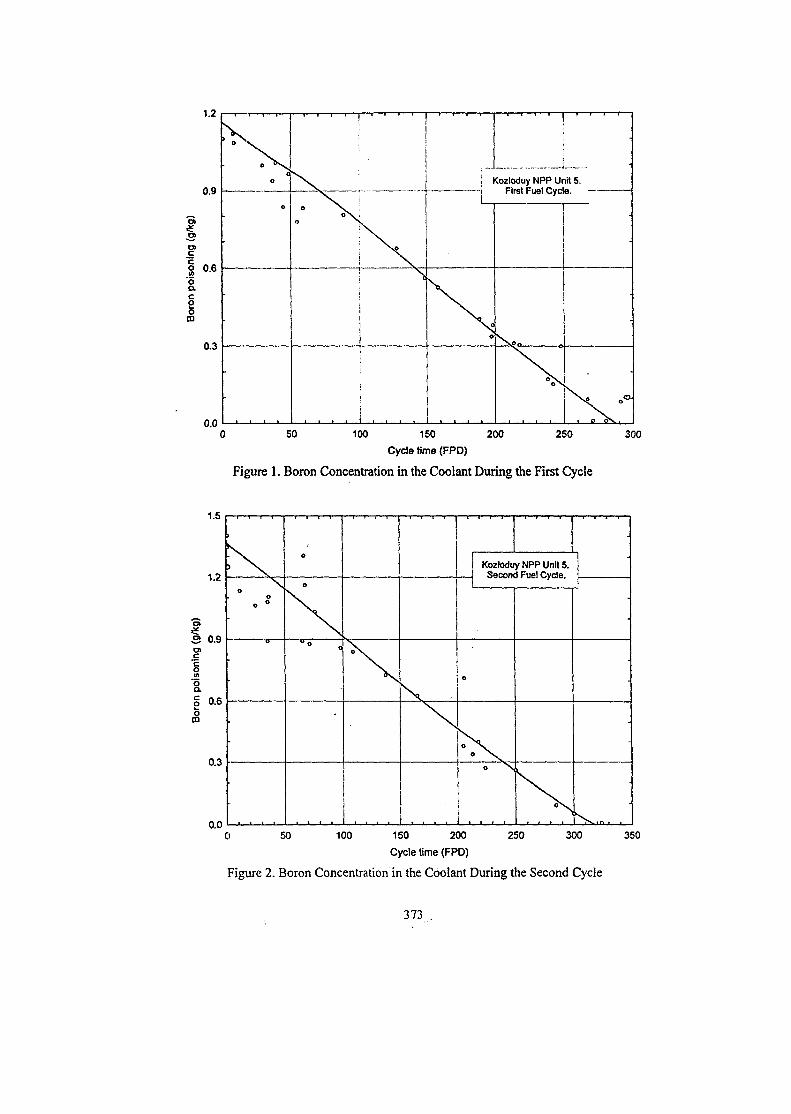
, Kozloduy NPP Unit 5i First Fuel Cycle.
0.0100 150 200 250
Cycle time <FPD)
Figure 1. Boron Concentration in the Coolant During the First Cycle
300
1.5
1.2 -
3 0.9
0.6 -|oin
0.3
0.0
oo
0 °
•
•
•
•
o
o
u \
V
1
i
N
\
. . . .
•
"1Kozloduy NPP Unit 5. |Spprairl Fnol r.urlo 1
!
o
^ \
•
•
•
50 300100 150 200 250
Cycle time (FPD)
Figure 2. Boron Concentration in the Coolant During the Second Cycle
350
373 .
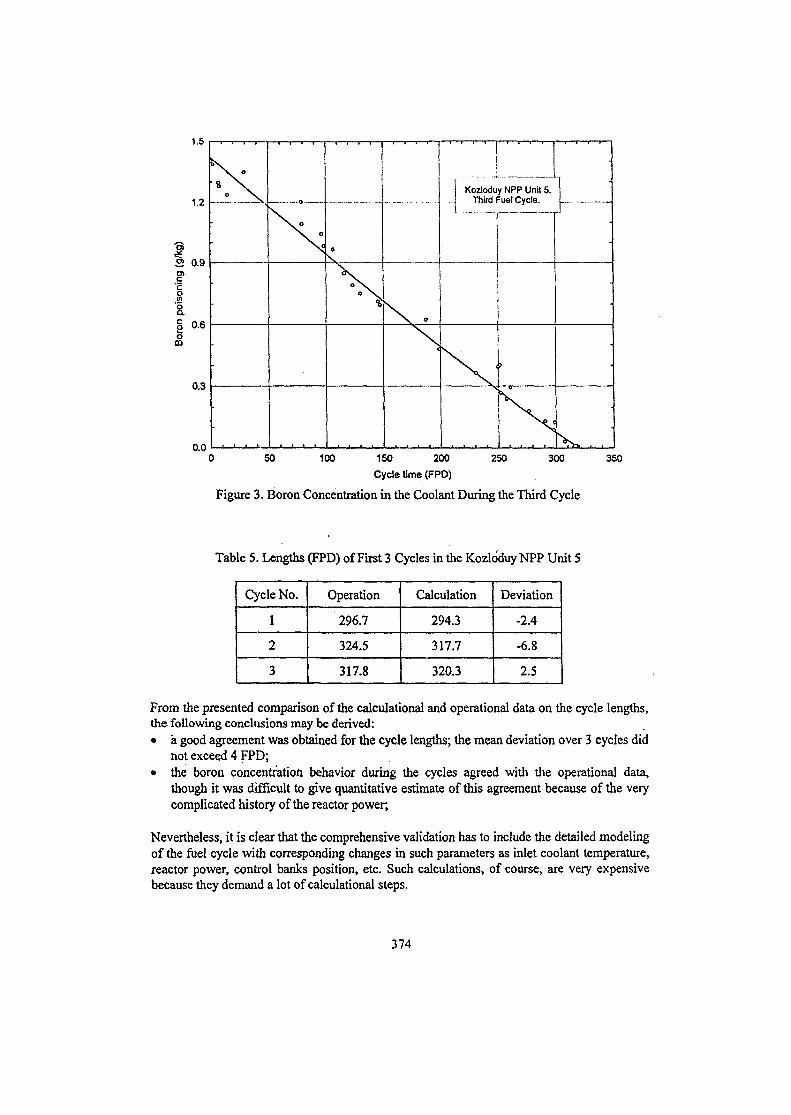
1.5
1.2 -
•a
3 0.9
aI
CO
0.3
0.0
- • i —r—r—i—
% N.
•
•
•
o _
X. o
—i—i i i—
o\
\
N
• i i •?
-
Kozloduy NPP Unit 5.Third Fuel Cycle.
\
•
-
50 100 250 300150 200
Cycle time (FPD)
Figure 3. Boron Concentration in the Coolant During the Third Cycle
350
Table 5. Lengths (FPD) of First 3 Cycles in the Kozldduy NPP Unit 5
Cycle No.
1
2
3
Operation
296.7
324.5
317.8
Calculation
294.3
317.7
320.3
Deviation
-2.4
-6.8
2.5
From the presented comparison of the calculational and operational data on the cycle lengths,the following conclusions may be derived:• a good agreement was obtained for the cycle lengths; the mean deviation over 3 cycles did
not exceed 4 FPD;• the boron concentration behavior during the cycles agreed with the operational data,
though it was difficult to give quantitative estimate of this agreement because of the verycomplicated history of the reactor power;
Nevertheless, it is clear that the comprehensive validation has to include the detailed modelingof the fuel cycle with corresponding changes in such parameters as inlet coolant temperature,reactor power, control banks position, etc. Such calculations, of course, are very expensivebecause they demand a lot of calculational steps.
374
3. CALCULATION OF REA IN A VVER-1000. EFFECT OF PIN-BY-PIN FUELPOWER AND BURNUP REPRESENTATION
In recent calculational studies of power excursions in VVER-1000 core containing only freshfuel, a number of interesting results was found [1]. Among them the following ones may bepointed out:• ejection of a peripheral control rod resulted in a very complicated pin-by-pin power
distribution in assemblies directly adjacent to the accident one;• the hottest fuel rod did not necessarily belong to assembly with peak power;• fuel assemblies, adjacent to the accident one from the one side and to the reflector from
the other, with relatively low power contained fuel rods with power exceeded maximumvalue for fuel rods in assembly with peak power.
This Section describes an analogous study of REA in a VVER-1000 but with burnup core.Two comparative calculations were carried out by the RELAP5-BARS coupled code for theSouth Ukrainian NPP Unit 1 VVER-1000 at the end of the third fuel cycle. The maindifference between these calculations was in fuel bumup representation. Two types of the corewere considered: one with pin-by-pin burnup distribution and another - with assemblyaveraged burnup when all nodes of any axial layer within any fuel assembly were of the sameburnup.
The South Ukrainian NPP Unit 1 was operated in 2-year cycle regime without any burnablepoison rods in the core. Calculational procedure and main results for the first 3 cycles wereidentical to those described in previous Section. Calculational average burnup of the core atthe end of the cycle was 21 MWd/kgU with peak burnup of 37.5 MWd/kgU for thecalculational node in the central part of the core.
The initial thermal-hydraulic conditions in the reactor corresponded to hot zero power (HZP)startup. The reactor power was 10"* of the rated power, and the coolant inlet temperature andflow rate were 287°C and 17 t/s respectively.
A key factor in REA analysis is the worth of ejected control rod. At normal operationalconditions the worth of any rod does not exceed 1 p. Because the goal of this study was toanalyze consequences of a REA at conservative initial reactor conditions with the ejectedcontrol rod worth of 1.2p, the initial control rod pattern was changed. There are 61 controlrods grouped in 10 different banks in the VVER-1000 core. In this study it was assumed that18 control rods of 3 banks in the central part of the core and 18 control rods (including theaccident rod) of 3 peripheral banks were fully inserted. Figure 4 presents location of insertedcontrol rods before the accident. As shown in the figure, the control rod pattern was non-symmetrical because one control rod located near the ejected one was assumed as stuck out.This asymmetry resulted in required worth of the ejected control rod. It should be mentionedthat such an approach is more realistic compared with artificial adjustment of neutron crosssections for this region to reach the desired value of the control rod worth.
As it was above mentioned, two identical calculations were done. Case 1 - with the pin-by-pinburnup distribution and Case 2 - with the assembly averaged one. Thus, the RELAP-BARSinput decks for both cases differ only by the initial burnup distributions.
375
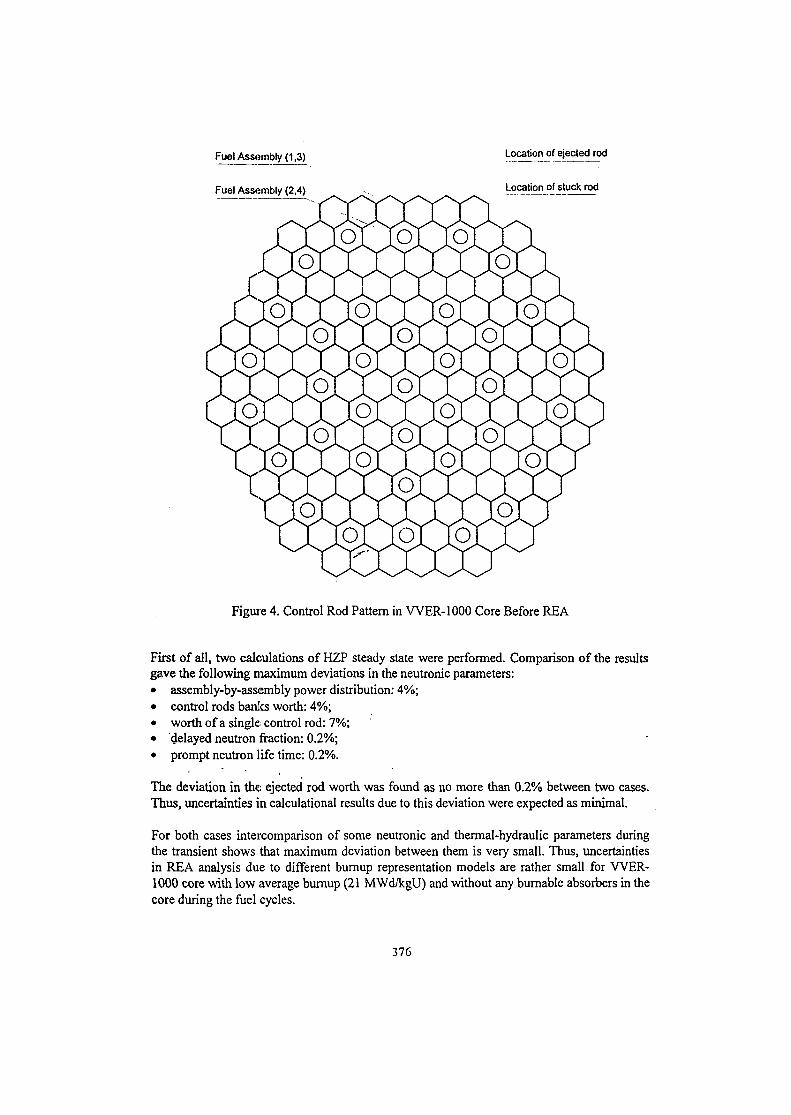
Fuel Assembly (1,3)
Fuel Assembly (2,4)
Location of ejected rod
Location of stuck rod
Figure 4. Control Rod Pattern in VVER-1000 Core Before REA
First of all, two calculations of HZP steady state were performed. Comparison of the resultsgave the following maximum deviations in the neutronic parameters:
assembly-by-assembly power distribution: 4%;control rods banks worth: 4%;worth of a single control rod: 7%;delayed neutron fraction: 0.2%;prompt neutron life time: 0.2%.
The deviation in the ejected rod worth was found as no more than 0.2% between two cases.Thus, uncertainties in calculational results due to this deviation were expected as minimal.
For both cases intercomparison of some neutronic and thermal-hydraulic parameters duringthe transient shows that maximum deviation between them is very small. Thus, uncertaintiesin REA analysis due to different bumup representation models are rather small for WER-1000 core with low average burnup (21 MWd/kgU) and without any burnable absorbers in thecore during the fuel cycles.
376
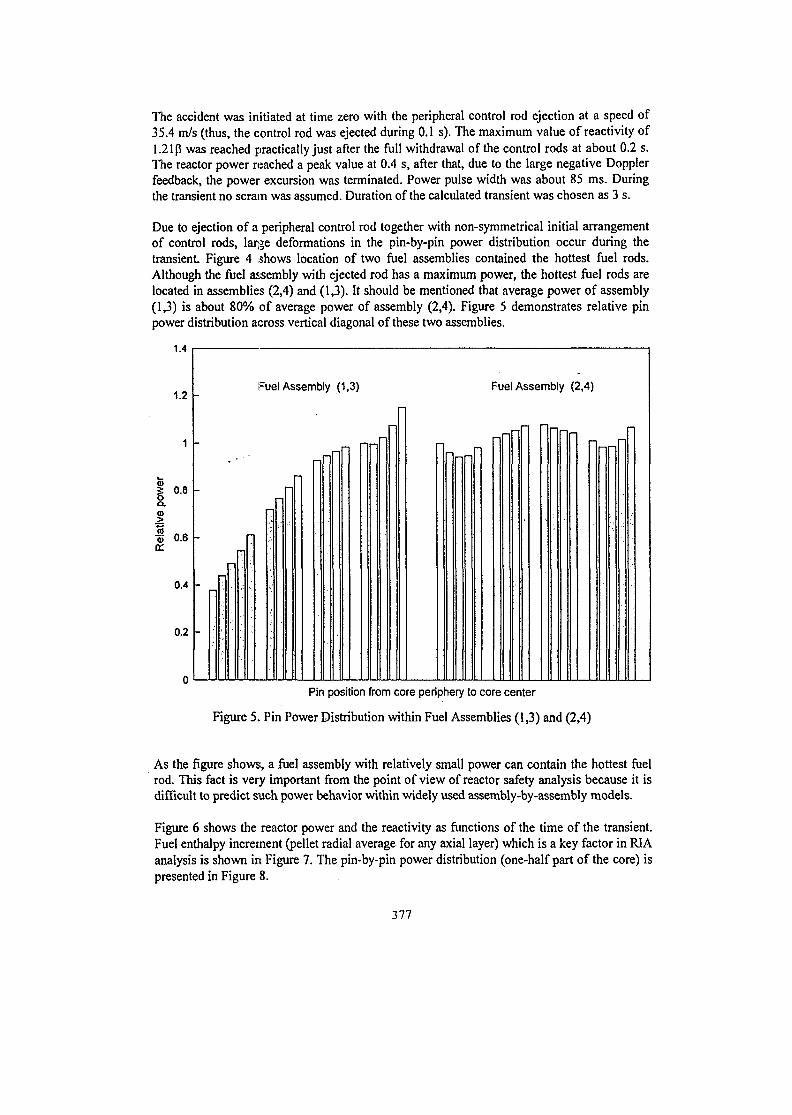
The accident was initiated at time zero with the peripheral control rod ejection at a speed of35.4 m/s (thus, the control rod was ejected during 0.1 s). The maximum value of reactivity of1.21 (5 was reached practically just after the full withdrawal of the control rods at about 0.2 s.The reactor power reached a peak value at 0.4 s, after that, due to the large negative Dopplerfeedback, the power excursion was terminated. Power pulse width was about 85 ms. Duringthe transient no scram was assumed. Duration of the calculated transient was chosen as 3 s.
Due to ejection of a peripheral control rod together with non-symmetrical initial arrangementof control rods, large deformations in the pin-by-pin power distribution occur during thetransient Figure 4 shows location of two fuel assemblies contained the hottest fuel rods.Although the fuel assembly with ejected rod has a maximum power, the hottest fuel rods arelocated in assemblies (2,4) and (1,3). It should be mentioned that average power of assembly(1,3) is about 80% of average power of assembly (2,4). Figure 5 demonstrates relative pinpower distribution across vertical diagonal of these two assemblies.
1.2
1
<u5 0.8o
Rel
ativ
e p
o
0.4
0.2
n
Fuel Assembly (1,3)
-
-
-
n
n nn
Fuel Assembly (2,4)
I n nf—lj I ~ J r
Pin position from core periphery to core center
Figure 5. Pin Power Distribution within Fuel Assemblies (1,3) and (2,4)
As the figure shows, a fuel assembly with relatively small power can contain the hottest fuelrod. This fact is very important from the point of view of reactor safety analysis because it isdifficult to predict such power behavior within widely used assembly-by-assembly models.
Figure 6 shows the reactor power and the reactivity as functions of the time of the transient.Fuel enthalpy increment (pellet radial average for any axial layer) which is a key factor in RIAanalysis is shown in Figure 7. The pin-by-pin power distribution (one-half part of the core) ispresented in Figure 8.
377
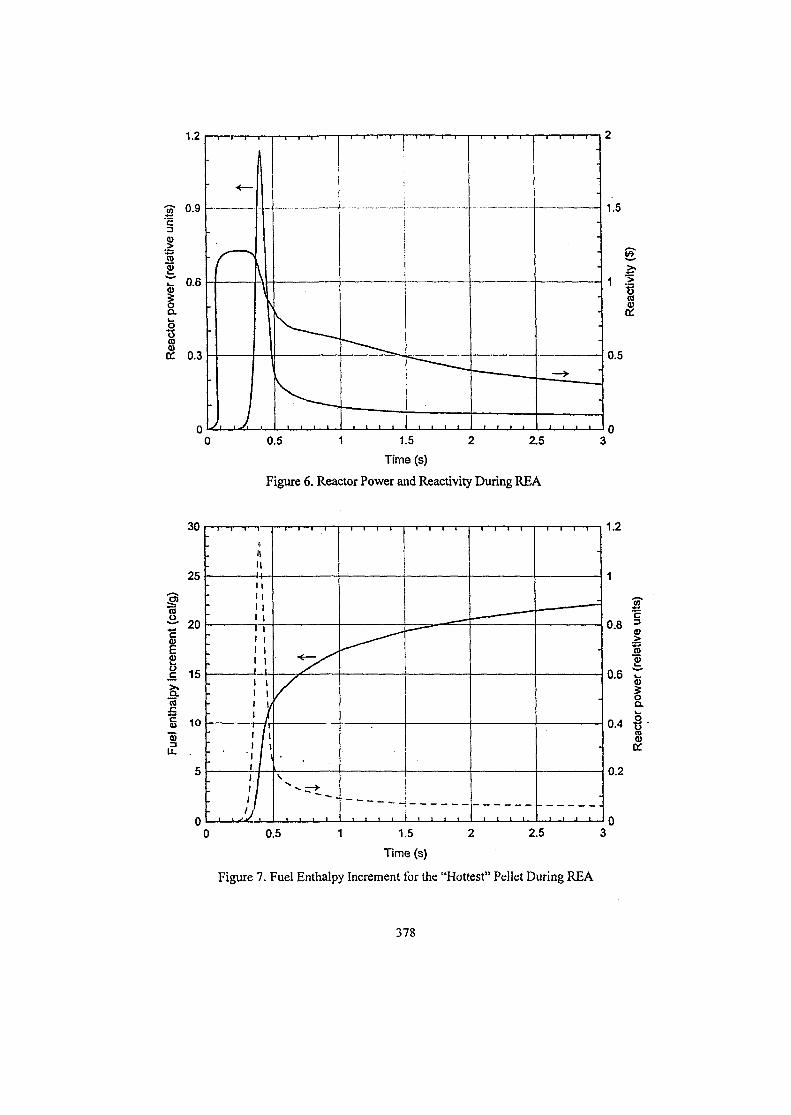
I•S3TO
1.2
0.9
0.6
CO
a! 0.3
-
•
J
\—1—I—
1\1J
—1—1—~l—1—
Lt i i i
—T 1 1—'T11
• i t i
i • i •• i - i —
. . . .
—I—r—r—i -
" — _
i i i t
1 1 1 F ~"
-
•
1 1 1 1
0.5 2.51 1.5 2
Time (s)
Figure 6. Reactor Power and Reactivity During REA
1.5
i1 ICO
&
0.5
30
25
en
i£
iCO
15
g 10
1u. .
4
H
11
•*
•
111
1111
1 11 I1 1/
1 /I1 / l
• ' ' I '
1 /I.II 1/ I
• , , JJ .
/
\
*^ -
i . i i
1
!
1
r
, "
' — w. '
. i . . 1 i i i i
_ _ — • '
i t i i
_ • •
•
-
•
i i t i
1.2
0.5 1
0-8
0.4
I2
Iot>"%
0.2
2.51.5 2
Time (s)
Figure 7. Fuel Enthalpy Increment for the "Hottest" Pellet During REA
378
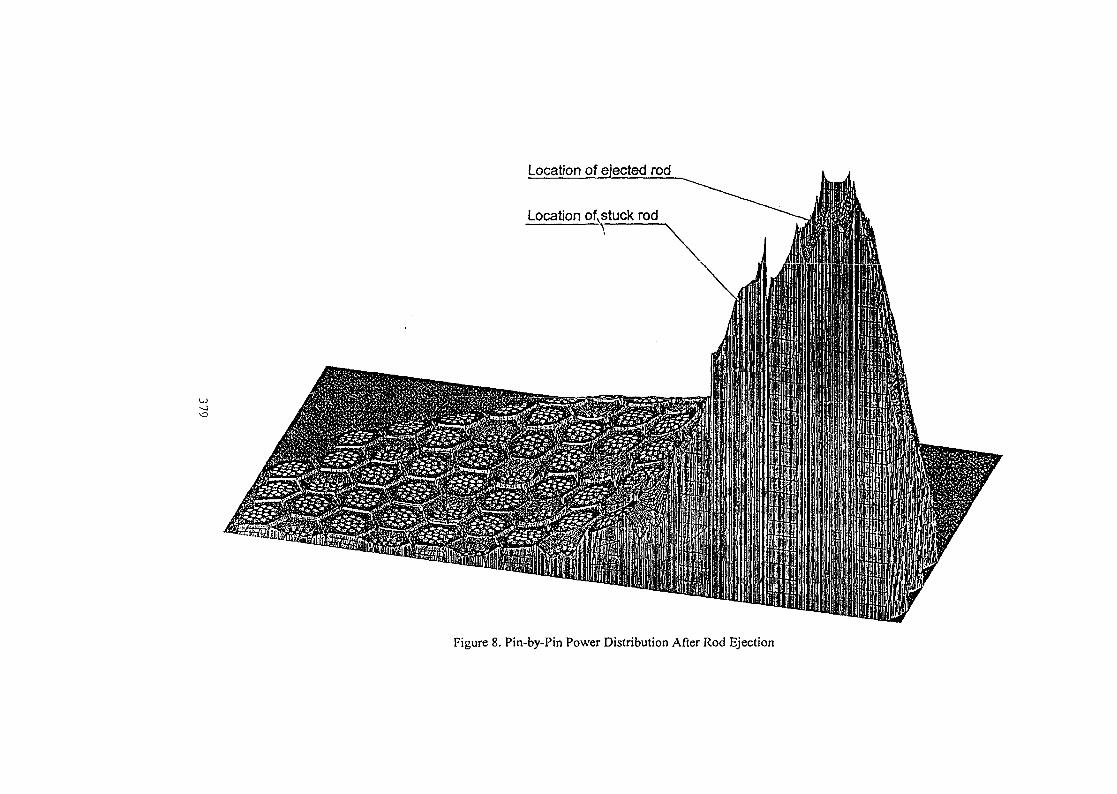
Location of ejected rod
Location of. stuck rod
mmFigure 8. Pin-by-Pin Power Distribution After Rod Ejection
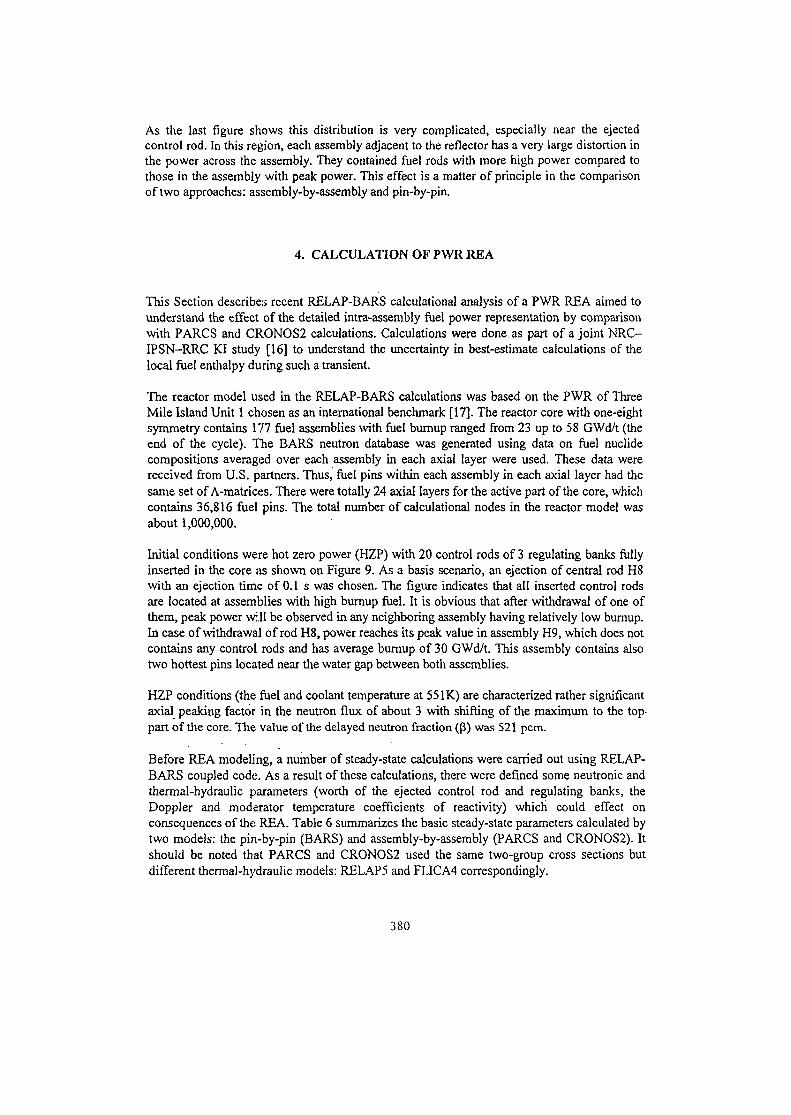
As the last figure shows this distribution is very complicated, especially near the ejectedcontrol rod. In this region, each assembly adjacent to the reflector has a very large distortion inthe power across the assembly. They contained fuel rods with more high power compared tothose in the assembly with peak power. This effect is a matter of principle in the comparisonof two approaches: assembly-by-assembly and pin-by-pin.
4. CALCULATION OF PWR REA
This Section describes recent RELAP-BARS calculational analysis of a PWR REA aimed tounderstand the effect of the detailed intra-assembly fuel power representation by comparisonwith PARCS and CRONOS2 calculations. Calculations were done as part of a joint NRC-IPSN-RRC KI study [16] to understand the uncertainty in best-estimate calculations of thelocal fuel enthalpy during such a transient.
The reactor model used in the RELAP-BARS calculations was based on the PWR of ThreeMile Island Unit 1 chosen as an international benchmark [17]. The reactor core with one-eightsymmetry contains 177 fuel assemblies with fuel burnup ranged from 23 up to 58 GWd/t (theend of the cycle). The BARS neutron database was generated using data on fuel nuclidecompositions averaged over each assembly in each axial layer were used. These data werereceived from U.S. partners. Thus, fuel pins within each assembly in each axial layer had thesame set of A-matrices. There were totally 24 axial layers for the active part of the core, whichcontains 36,816 fuel pins. The total number of calculational nodes in the reactor model wasabout 1,000,000.
Initial conditions were hot zero power (HZP) with 20 control rods of 3 regulating banks fullyinserted in the core as shown on Figure 9. As a basis scenario, an ejection of central rod H8with an ejection time of 0.1 s was chosen. The figure indicates that all inserted control rodsare located at assemblies with high burnup fuel. It is obvious that after withdrawal of one ofthem, peak power will be observed in any neighboring assembly having relatively low burnup.In case of withdrawal of rod H8, power reaches its peak value in assembly H9, which does notcontains any control rods and has average burnup of 30 GWd/t. This assembly contains alsotwo hottest pins located near the water gap between both assemblies.
HZP conditions (the fuel and coolant temperature at 55IK) are characterized rather significantaxial peaking factor in the neutron flux of about 3 with shifting of the maximum to the top-part of the core. The value of the delayed neutron fraction ((J) was 521 pcm.
Before REA modeling, a number of steady-state calculations were carried out using RELAP-BARS coupled code. As a result of these calculations, there were defined some neutronic andthermal-hydraulic parameters (worth of the ejected control rod and regulating banks, theDoppler and moderator temperature coefficients of reactivity) which could effect onconsequences of the REA. Table 6 summarizes the basic steady-state parameters calculated bytwo models: the pin-by-pin (BARS) and assembly-by-assembly (PARCS and CRONOS2). Itshould be noted that PARCS and CRONOS2 used the same two-group cross sections butdifferent thermal-hydraulic models: RELAP5 and FLICA4 correspondingly.
380
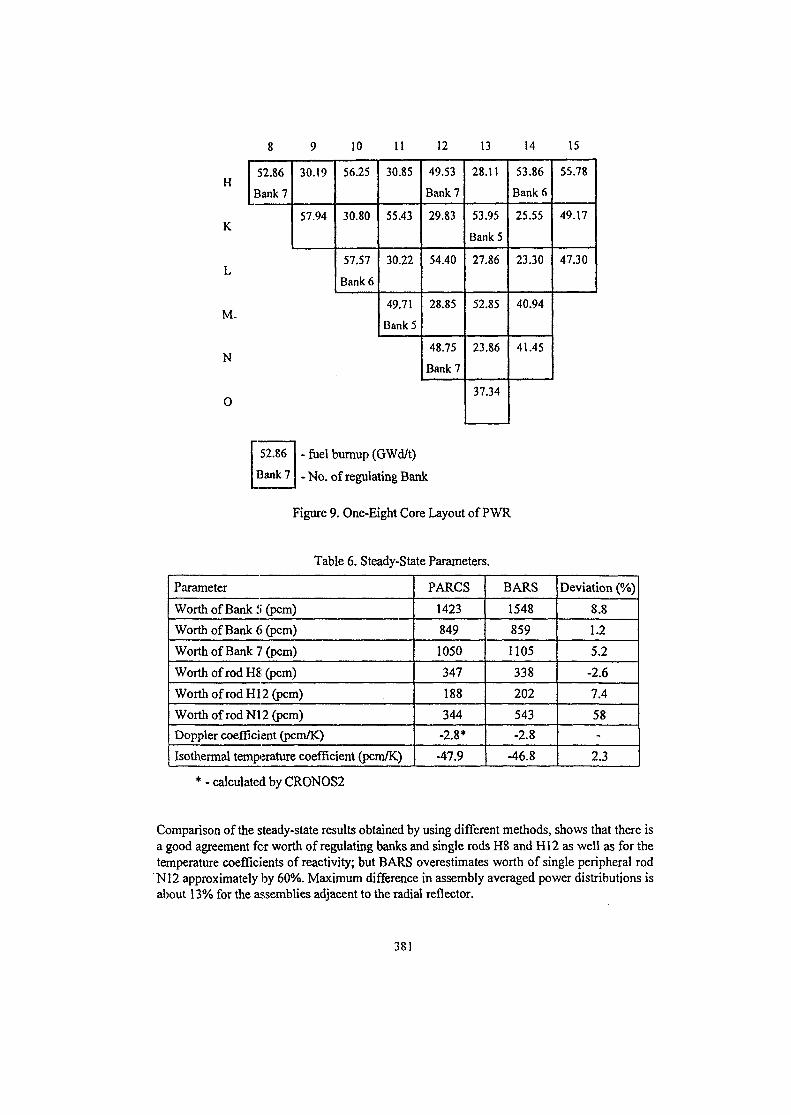
8
H I 5 2 8 6| Bank 7
K
L
M.
N
0
9
30.19
57.94
10
56.25
30.80
57.57
Bank 6
11
30.85
55.43
30.22
49.71
Bank5
12
49.53
Bank 7
29.83
54.40
28.85
48.75
Bank 7
t3
28.11
53.95
Bank 5
27.86
52.85
23.86
37.34
14
53.86
Bank 6
25.55
23.30
40.94
41.45
15
55.78
49.17
47.30
52.86
Bank 7
- fuel burnup (GWd/t)
- No. of regulating Bank
Figure 9. One-Eight Core Layout of PWR
Table 6. Steady-State Parameters.
Parameter
Worth of Bank 5 (pern)
Worth of Bank 6 (pem)
Worth of Bank 7 (pem)
Worth of rod H8 (pem)
Worth of rod H12 (pem)
Worth of rod N12 (pem)
Doppler coefficient (pcm/K)
Isothermal temperature coefficient (pcm/K)
PARCS
1423
849
1050
347
188
344
-2.8*
-47.9
BARS
1548
859
1105
338
202
543
-2.8
-46.8
Deviation (%)
8.8
1.2
5.2
-2.6
7.4
58-
2.3
- calculated by CRONOS2
Comparison of the steady-state results obtained by using different methods, shows that there isa good agreement for worth of regulating banks and single rods H8 and H12 as well as for thetemperature coefficients of reactivity; but BARS overestimates worth of single peripheral rodN12 approximately by 60%. Maximum difference in assembly averaged power distributions isabout 13% for the assemblies adjacent to the radial reflector.
381
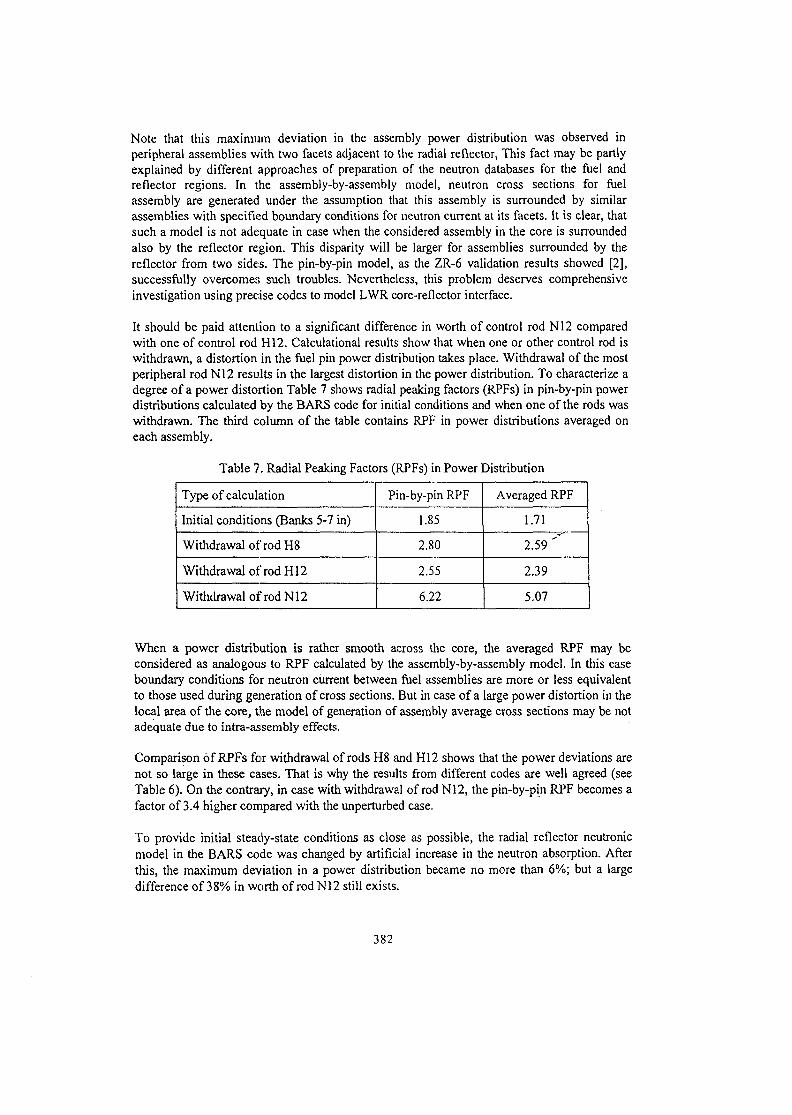
Note that this maximum deviation in the assembly power distribution was observed inperipheral assemblies with two facets adjacent to the radial reflector, This fact may be partlyexplained by different approaches of preparation of the neutron databases for the fuel andreflector regions. In the assembly-by-assembly model, neutron cross sections for fuelassembly are generated under the assumption that this assembly is surrounded by similarassemblies with specified boundary conditions for neutron current at its facets. It is clear, thatsuch a model is not adequate in case when the considered assembly in the core is surroundedalso by the reflector region. This disparity will be larger for assemblies surrounded by thereflector from two sides. The pin-by-pin model, as the ZR-6 validation results showed [2],successfully overcomes such troubles. Nevertheless, this problem deserves comprehensiveinvestigation using precise codes to model LWR core-reflector interface.
It should be paid attention to a significant difference in worth of control rod N12 comparedwith one of control rod HI2. Calculational results show that when one or other control rod iswithdrawn, a distortion in the fuel pin power distribution takes place. Withdrawal of the mostperipheral rod N12 results in the largest distortion in the power distribution. To characterize adegree of a power distortion Table 7 shows radial peaking factors (RPFs) in pin-by-pin powerdistributions calculated by the BARS code for initial conditions and when one of the rods waswithdrawn. The third column of the table contains RPF in power distributions averaged oneach assembly.
Table 7. Radial Peaking Factors (RPFs) in Power Distribution
Type of calculation
Initial conditions (Banks 5-7 in)
Withdrawal of rod H8
Withdrawal of rod H12
Withdrawal of rod N12
Pin-by-pin RPF
1.85
2.80
2.55
6.22
Averaged RPF
1.71
2 .59 '
2.39
5.07
When a power distribution is rather smooth across the core, the averaged RPF may beconsidered as analogous to RPF calculated by the assembly-by-assembly model. In this caseboundary conditions for neutron current between fuel assemblies are more or less equivalentto those used during generation of cross sections. But in case of a large power distortion in thelocal area of the core, the model of generation of assembly average cross sections may be notadequate due to intra-assembly effects.
Comparison of RPFs for withdrawal of rods H8 and H12 shows that the power deviations arenot so large in these cases. That is why the results from different codes are well agreed (seeTable 6). On the contrary, in case with withdrawal of rod N12, the pin-by-pin RPF becomes afactor of 3.4 higher compared with the unperturbed case.
To provide initial steady-state conditions as close as possible, the radial reflector neutronicmodel in the BARS code was changed by artificial increase in the neutron absorption. Afterthis, the maximum deviation in a power distribution became no more than 6%; but a largedifference of 38% in worth of rod N12 still exists.
382
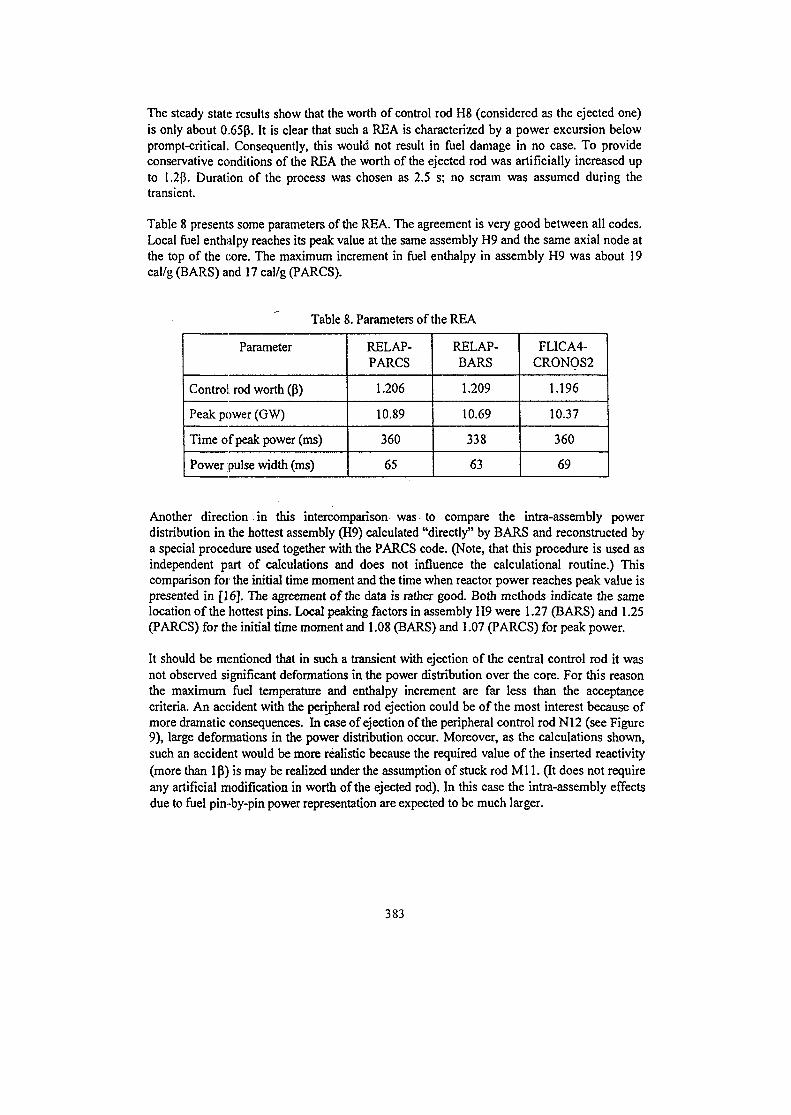
The steady state results show that the worth of control rod H8 (considered as the ejected one)is only about 0.65(3. It is clear that such a REA is characterized by a power excursion belowprompt-critical. Consequently, this would not result in fuel damage in no case. To provideconservative conditions of the REA the worth of the ejected rod was artificially increased upto 1.2p. Duration of the process was chosen as 2.5 s; no scram was assumed during thetransient.
Table 8 presents some parameters of the REA. The agreement is very good between all codes.Local fuel enthalpy reaches its peak value at the same assembly H9 and the same axial node atthe top of the core. The maximum increment in fuel enthalpy in assembly H9 was about 19cal/g (BARS) and 17 cal/g (PARCS).
Table 8. Parameters of the REA
Parameter
Control rod worth (fi)
Peak power (GW)
Time of peak power (ms)
Power pulse width (ms)
RELAP-PARCS
1.206
10.89
360
65
RELAP-BARS
1.209
10.69
338
63
FLICA4-CRONOS2
1.196
10.37
360
69
Another direction in this intercomparison was to compare the intra-assembly powerdistribution in the hottest assembly (H9) calculated "directly" by BARS and reconstructed bya special procedure used together with the PARCS code. (Note, that this procedure is used asindependent part of calculations and does not influence the calculational routine.) Thiscomparison for the initial time moment and the time when reactor power reaches peak value ispresented in [16]. The agreement of the data is rather good. Both methods indicate the samelocation of the hottest pins. Local peaking factors in assembly H9 were 1.27 (BARS) and 1.25(PARCS) for the initial time moment and 1.08 (BARS) and 1.07 (PARCS) for peak power.
It should be mentioned that in such a transient with ejection of the central control rod it wasnot observed significant deformations in the power distribution over the core. For this reasonthe maximum fuel temperature and enthalpy increment are far less than the acceptancecriteria. An accident with the peripheral rod ejection could be of the most interest because ofmore dramatic consequences. In case of ejection of the peripheral control rod N12 (see Figure9), large deformations in the power distribution occur. Moreover, as the calculations shown,such an accident would be more realistic because the required value of the inserted reactivity(more than 1 (3) is may be realized under the assumption of stuck rod Ml 1. (It does not requireany artificial modification in worth of the ejected rod). In this case the intra-assembly effectsdue to fuel pin-by-pin power representation are expected to be much larger.
383
5. CONCLUSIONS
The goal of this study was to present methodology, validation and intercomparison results forpin-by-pin modeling of fuel cycles and reactivity initiated accidents in LWRs. The pin-by-pinmodel based on the heterogeneous reactor theory was implemented in the BARS code, whichwas coupled with the thermal-hydraulic code RELAP5/MOD3.2. The RELAP-BARS coupledcode allows solving numerous neutronic and thermal-hydraulic problems in LWR safetyanalysis. Among them, such problems as fuel cycle modeling and analysis of RIA are of greatinterest.
Unlike widely spread neutronic nodal diffusion codes based on assembly-by-assemblyrepresentation of the core neutronic model, the pin-by-pin model realized in BARS allows indetails to take into account complicated intra-assembly effects of fuel power, burnup andtemperature in LWR analysis.
Validation results for different stages of VVER fuel cycle modeling clearly demonstratecapability of the BARS pin-by-pin fuel cycle method in prediction of nuclide composition offuel and duration of cycles.
Calculational studies of the peripheral rod ejection accident in South Ukrainian WER-1000and intercomparison of results for the central rod ejection in TMI-1 PWR allow to concludethat there are many Eispects of interest from the point of view of LWR safety analysis. Amongthem: very complicated pin-by-pin power distribution in fuel assemblies near the accident oneand core-reflector interface, presence of the hottest fuel rods in assemblies with relatively lowpower, etc. Besides., it was found that the hottest fuel rod does not necessarily belong toassembly with maximum power. The latter fact makes the applicability of neutron fluxreconstruction methods as rather questionable, especially in case of large distortions in pin-by-pin flux distribution. It is obvious that comprehensive analysis of intra-assembly effects due topin-by-pin power representation is possible only in the frame of the pin-by-pin approach.
REFERENCE
1. A. Awakumov, et al., "3 D Pin-by-Pin Modeling of Rod Ejection RIA in VVER-1000,"Report No. 90-12/1-33-97, Nuclear Safety Institute of Russian Research Centre"Kurchatov Institute", 1997.
2. A.-Awakumov and V. Malofeev, "An Advanced 3 D Pin-by-Pin Neutronic Model for theLWR RIA Analysis: Features, Advantages and Validation," Report No. 90-12/1-8-97,Nuclear Safety Institute of Russian Research Centre "Kurchatov Institute", 1997.
3. "RELAP5/MOD3.2 Code Manual," NUREG/CR-5535, INEL-95/0174, 1995.
4. A. Awakumov and V. Malofeev, "Three-Dimensional Simulation of Delayed NeutronTransients in a Heterogeneous Reactor," At. Energy, 70 (1), 1991.
384
5. A. Awakumov, et a!., "Validation of the BARS Code Package with ENDF/B Based DataLibrary," Report No. 90-12/1-4-98, Nuclear Safety Institute of Russian Research Centre"Kurchatov Institute", 1998.
6. A. Avvakumov and V. Malofeev, "Validation of an Advanced Heterogeneous Model forLWR Detailed Pin-by-Pin Calculations," Proceedings of the International Conference onthe Physics of Nuclear Science and Technology, Long Island, NY, October 1998.
7. A. Awakumov and V. Malofeev, "Validation of a Pin-by-Pin Neutron Kinetics Methodfor LWRs," Proceedings of the International Twenty-Sixth Water Reactor SafetyInformation Meeting, Bethesda, Maryland, October 1998.
8. B. Kochurov and V. Malofeev, "A Difference Approach to the Solution of HeterogeneousReactor Equations," Annals of Nuclear Energy, 4,21,1977.
9. A. Awakumov, V. Malofeev and V. Sidorov, "Analysis of Pin-by-Pin Effects for LWRRod Ejection Accident," NUREG/IA-0175, NSIRRC KI 90-12/1-3-00, IPSN/00-13,2000.
10. A. Kwaratzhely and B. Kochurov, "A Method for Calculation of Neutronic Parameters ina Heterogeneous Reactor Cell," At. Energy, 58 (2), 1985.
11. A.D. Galanin, "Revision of Scheme for the Major Fission Products with Weak EffectiveFission Product," Preprint ITEP-135,1989 (Rus).
12. L. Markova, 'CB2 Result Evaluation (VVER-440 Burnup Credit Benchmark)," 9th AERSymposium on W E R Reactor Physics and Reactor Safety, Slovakia, October 4-8,1999.
13. "Post-Irradiation Examinations of Fuel Assembly No. 4436001114 Irradiated at NV NPPUnit 5 During 3 Fuel Cycles up to Burnup of 44fT MWd/kgU," O-4011, RIAR,Dimitrovgrad,, 1991 (Rus).
14. "Post-Irradiation Examinations of Fuel Assemblies Nos. 14422198 and 14422222Irradiated at Kola NPP Unit 3 up to Burnups of 46.22 and 48.18 MWd/kgU," 0-4326,RIAR, Dimitrovgrad, 1994 (Rus).
15. "In-Core Fuel Management Code Package Validation for WWERs," IAEA-TECDOC-847, November, 1995.
16. D.J. Diamond, et al., "Intercomparison of Results for a PWR Rod Ejection Accident,"Proceedings of the International Twenty-Seventh Water Reactor Safety InformationMeeting, Bethesda, Maryland, October 1999.
17. K.N. Ivanov et al., "Pressurized water Reactor Main Steam Line Break (MSLB)Benchmark; Volume I: Final Specifications," NEA/NSC/DOC(99)8, U.S. NuclearRegulatory Commission and OECD Nuclear Energy Agency, April 1999.
385
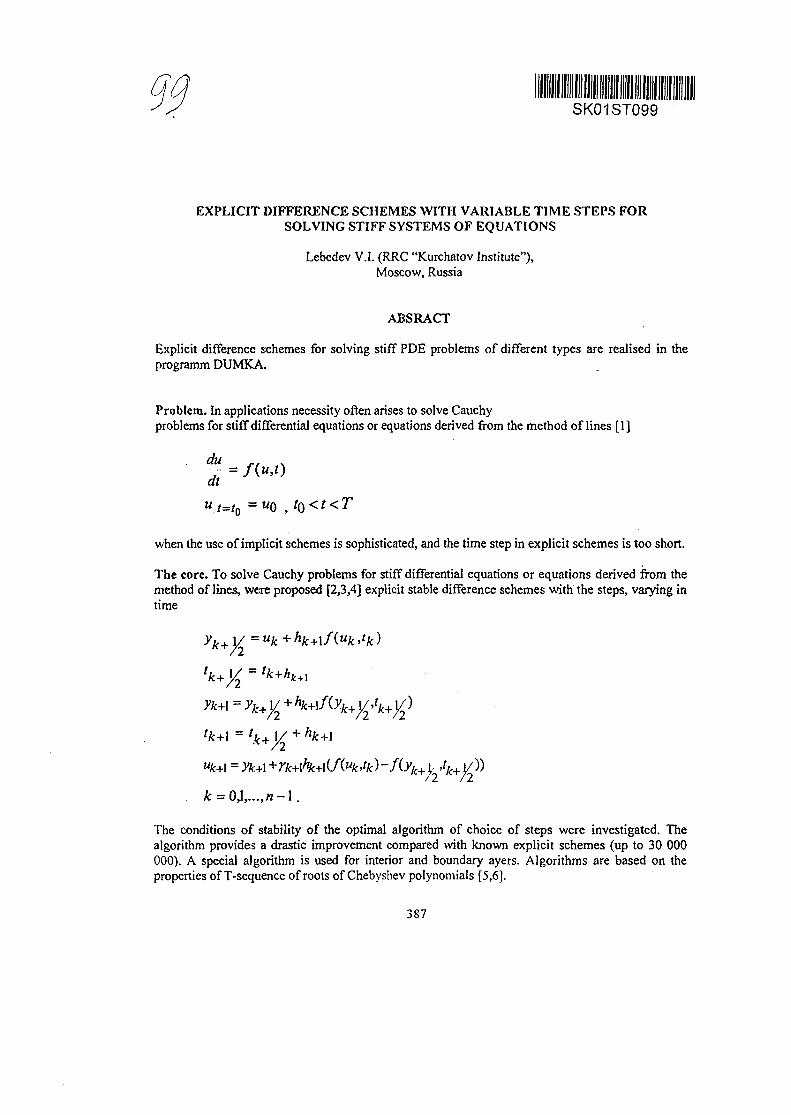
SK01ST099
EXPLICIT DIFFERENCE SCHEMES WITH VARIABLE TIME STEPS FORSOLVING STIFF SYSTEMS OF EQUATIONS
Lebedev V.I. (RRC "Kurchatov Institute"),Moscow, Russia
ABSRACT
Explicit difference schemes for solving stiff PDE problems of different types are realised in theprogramm DUMKA.
Problem. In applications necessity often arises to solve Cauchyproblems for stiff differential equations or equations derived from the method of lines [1]
dl J v "
"/=/„ =«0 , to<t<T
when the use of implicit schemes is sophisticated, and the time step in explicit schemes is too short.
The core. To solve Cauchy problems for stiff differential equations or equations derived from themethod of lines, were proposed [2,3,4] explicit stable difference schemes with the steps, varying intime
=-uk+hk+lf(uk,tk)
yk+y2 +lk+\ - tfc+y
\. 4+1/))
The conditions of stability of the optimal algorithm of choice of steps were investigated. Thealgorithm provides a drastic improvement compared with known explicit schemes (up to 30 000000). A special algorithm is used for interior and boundary ayers. Algorithms are based on theproperties of T-sequence of roots of Chebyshev polynomials [5,6].
387
The advantages of the proposed method. The methods are convenient to implement on paralleland pipeline computers, are suitable to solve highly multidimensional problems, problems withnonlinear,nonsymmetric, nondefinite operators, for unconstrained optimization. The use of explicit stabledifference schemes gives us a possibility to almost absolutely parallelize and vectorizecomputations.
The code. The method is used in FORTRAN code DUMKA. Computations were conducted onCONVEX, CYBER, ELBRUS, BESM and different PCs.
The method is quite flexible. The use in applications is simple, as DUMKA user should just towrite a subroutine for the right-hand side of equations and a subroutine, estimating the greatest inmodulus negative eigenvalue of Jacobean. The method requires the storage of only three arrays ofvariables.
TESTING OF THE CODE.
To test and analyze the code the standard testing set was used [10,11]. The problems were dividedinto six groups by the sort of spectrum (real, complex), and the sort of equations (linear, nonlinear).12 stiff test problems from [12] were solved by DUMKA. Time of solution and accuracy werecompared with those of solvers: RKC, RADAU5, LSODE, EPISODE, DOPRI8(5), SDIRK4,SEVLEX, SODEX, ROS4, RODAS, STRIDE. The results of testing confirmed the perspectivityof using DUMKA for integration of stiff systems.
Additionally some problems,not included into the sets [10,11,12] were solved, but of interest ininvestigation of the ability of the code to solve neutron transport problems, and also some problemsfrom [4] (linear heat transfer equation for three-dimensional domain with a large number of nodes,a system of multigroup, one-dimensional kinetic equations with delayed neutronsf 16]. These resultsconfirmed the assumptions about the method's features and advantages of the code in solution ofstiff systems.
The work was supported by Russian Foundation for the Basic Research (99-01 -00141).
References.
1. Lebedev V.I. Equations and convergence of the differential difference method (the method oflines). Vestnik MGU, No. 10, pp.47-57, 1955 (in Russian).
2. Lebedev V.I. Explicit difference schemes with time-variable steps for solution of stiff systems ofequations. Preprint DNM AS USSR No. 177,1987.
3. Lebedev V.I. Explicit difference schemes with time-variable steps for solution of stiff systems ofequations. Sov. J. Numer. Anal. Math. Modelling. Vol.4, No.2, pp.111-135, 1989.
4. Lebedev V.I. How to solve stiff systems of equations by explicit difference schemes. Numericalmethods and applications, Ed. G.I.Marchuk, CRC Press, Boca Raton, Ann Arbor, London,Tokyo, pp.45-80, 1994.
5. Lebedev V.I., Finogenov S.A. On the utilization of ordered Chebyshev parameters in iterativemethods. Zh. Vychisl. Mat. Mat. Phys, Vol.16, No.4, pp.895-907, 1976 (in Russian).
6. Lebedev V.I. An Introduction to Functional Analysis and Computational Mathematics. Birkh,Boston, Basel, Berlin, 1996.
388
7. Lebedev V.I. Zototarev polynomials and extremum problems. Russ. J. Numer. Anal. Math.Modelling, Vol.9, No,3, pp.231—263, 1994.
8. Medovikov A.A. Third order explicit method for the stiff ordinary differential equations. LectureNotes in Computer Science 1196. Numerical Analysis and Its Applications. Springer, pp.327-334. 1997.
9. Lebedev V.I. Explicit difference schemes with variable time steps for solving stiff systems ofequations. Lecture Notes in Computer Science 1196. Numerical Analysis and Its Applications.Springer, pp.274-283. 1997.
10.Enright W.H.,Pryce J.D. Two FORTRAN Packages for Assessing Initial Value Methods. ACMTrans. Math. Soft., Vol.13, No.l, pp. 1-27,1987.
11.Byrne G.D.,Hindmarsh A.C. Stiff ODE Solvers: A Review of Current and Coming Attractions.J. of Comp. Physics. Vol.70, pp.1—62,1987.
12.E. Hairer, G. Wanner. Solving Ordinary Differential Equations II. Second Revised Edition,Springer- Verlag, 1996.
13. V.I. Lebedev, Explicit difference schemes for solving stiff systems of ODEs and PDEs withcomlex spectrum. Russian^. Num. Math. Math. Modelling N2, 1998, pp. 107-116
14.A.A. Medovikov, High order explicit methods for parabolic equations. BIT Vol.38, No2., 1998,pp. 372-390.
15.Lebedev V.I., Medovokov A.A. Explicit method of the 2 order of accuracyfor the solution ofstiff systems of differential quations. Izvestija VUZov, mathematica N9 (436), 1998, pp.55-63.
16. V.I. Lebedev, V,S.Vlaqimirov. The nuclear power and mathematics. Russian J. Num. Math.Math. Modelling v 15 N3-4,2000, p. 257-283.
389
SK01ST106
KFKI Atomic Energy Research Institute
THE SOLUTION OF THE LEU AND MOXWER-1000 CALCULATION BENCHMARKWITH THE KARATE-MULTICELL CODE
G. Hord6sy, Cs. Mar&czyKFKI Atomic Energy Research Institute
P.O.Box 49Budapest, Hungary H-1525
Phone: +36 1 392-2222 ext. 14-99Fax: +361395-9293
E-mail: [email protected]
INTRODUCTION
• Preparations for disposition of weapons grade plutonium in WER-1000 reactors are in progress.
• Benchmark: Defined by the Kurchatov Institute (S.Bychkov,M.Kalugin, A.Lazarenko) to assess the applicability of computer codesfor weapons grade MOX assembly calculations
• Framework : "Task Force on Reactor-Based Plutonium Disposition"of OECD Nuclear Energy Agency .
391
KFKI Atomic Energy Research Institute
BENCHMARK PROBLEM
Burnup calculation of two WER-1000 assemblies:
• Uniformly enriched LEU fuel assembly with 12 U-Gd integratedburnable absorber rods
• Profiled weapon grade MOX fuel assembly with 12 U-Gd integratedburnable absorber rods
States to be calculated:
• Burnup calculation at nominal parameters up to 40 [MWd/kgHM]
• States at 0., 20. and 40 [MWd/kgHM]:
51 Operating poisoned state52 Operating non-poisoned state53 Hot state54 Hot state without boric acid55 Cold state
392
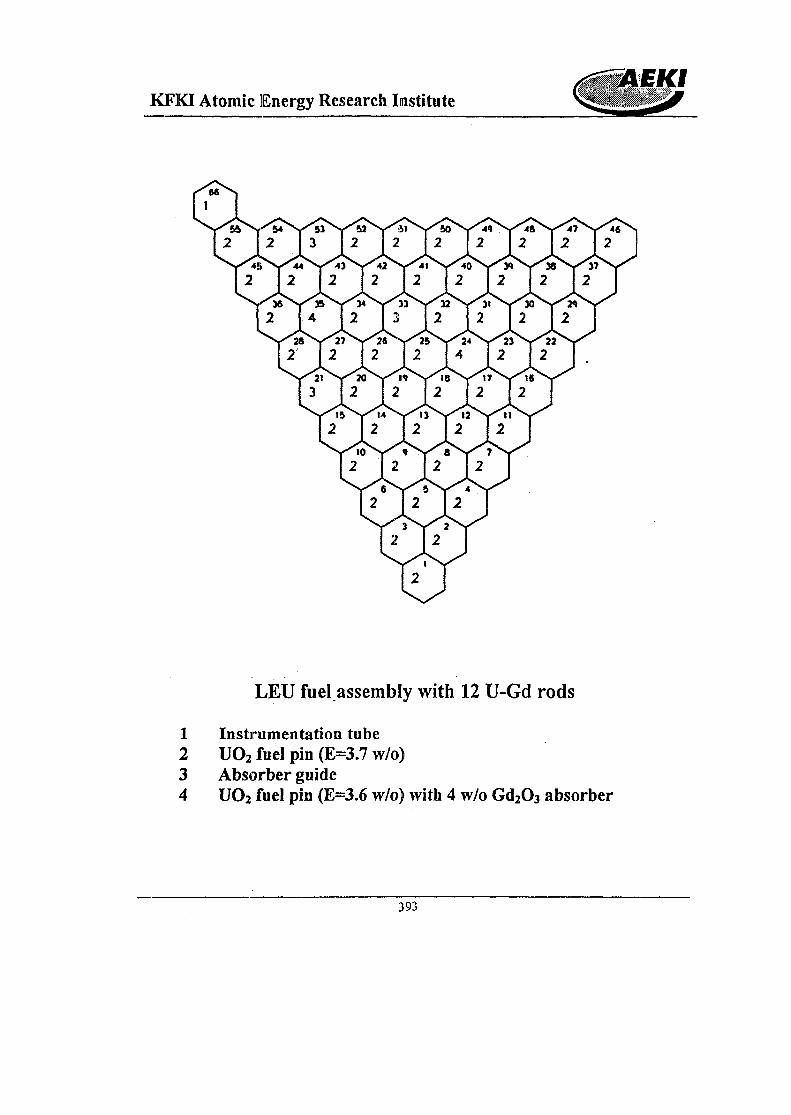
KFKI Atomic Energy Research InstituteEKI
2 4 2 3 2 2 2 2
LEU fuel assembly with 12 U-Gd rods
1 Instrumentation tube2 UO2 fuel pin (E=3.7 w/o)3 Absorber guide4 UO2 fuel pin (E=3.6 w/o) with 4 w/o Gd2C>3 absorber
393
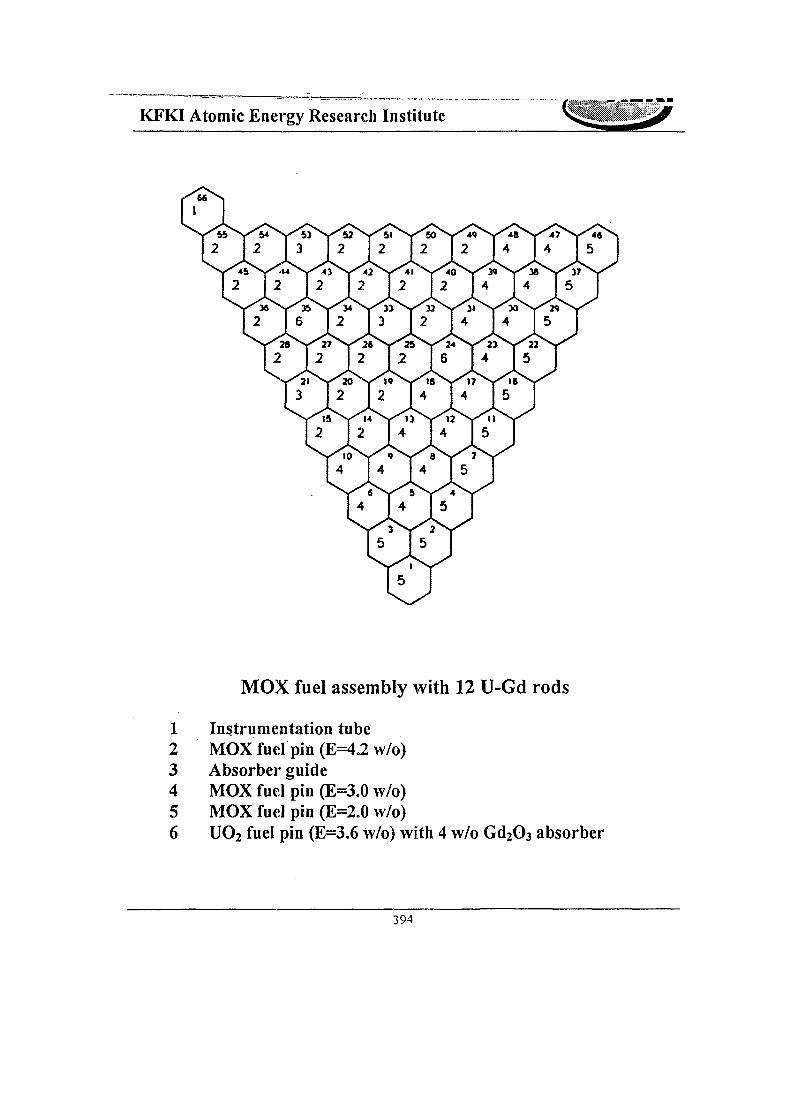
KFKI Atomic Energy Research Institute
MOX fuel assembly with 12 U-Gd rods
1 Instrumentation tube2 MOX fuel pin (E=4.2 w/o)3 Absorber guide4 MOX fuel pin (E=3.0 w/o)5 MOX fuel pin (E=2.0 w/o)6 UO2 fuel pin (E=3.6 w/o) with 4 w/o Gd2O3 absorber
394
KFKI Atomic Energy Research Institute
THE KARATE-MULTICELL CODE
• KARATE code system: Calculation of neutron physical and thermahydraulic processes in the WER-440 core
• Assembly transport calculations: MULTICELL code (tested againsmeasurements on the ZR-6 critical assembly)
• Multigroup calculations: 35 epithermal and 35 thermal energy group!,thermal cut-off: 1.84eV.
• Nuclear data: based on ENDF/B-VI library, processed by NJOY ancPEACO
• Resonance isotopes: U-235, U-238, Pu-239 (equivalence theory) Pu-240 : Explicit treatment in the thermal region witfi Doppleibroadening.
• Collision probabilities: Combination of cell transmission, escapiprobabilities and the collision probabilities inside the cylindrical cellsPeriodic boundary condition.
• Burnup calculations: 18 actinide and 145 fission product isotopes
395
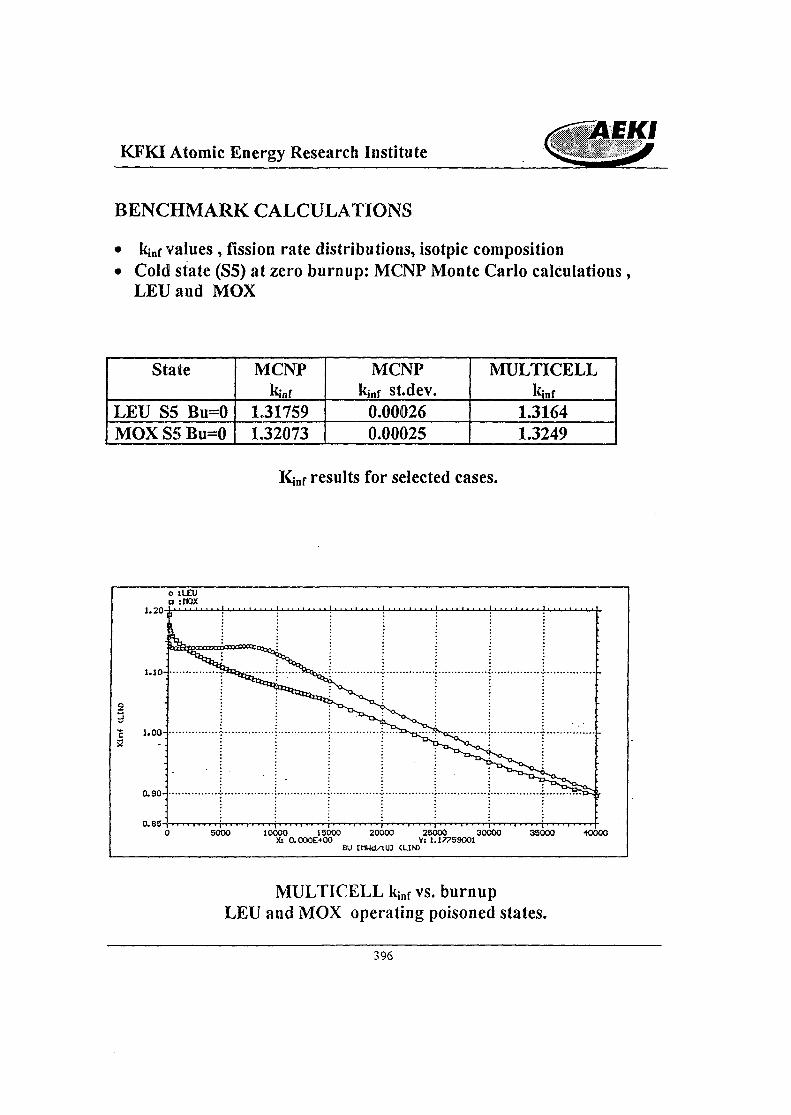
KFKI Atomic Energy Research InstituteAEKI
BENCHMARK CALCULATIONS
• kjnf values , fission rate distributions, isotpic composition• Cold state (S5) at zero burnup: MCNP Monte Carlo calculations,
LEU and MOX
State
LEU S5 Bu=0MOX S5 Bu=0
MCNPkinf
131759L32073
MCNPk,nf st.dev.
0.000260.00025
MULTICELLkinf
1.31641.3249
results for selected cases.
1.10-
23c 1.00-S2 - .
0.90-j
G
o sLEU• tflOX
I
Jfew
6000 10O00 15000 20000 25000 30000 35000 •VXX: 0.000E+0O V: 1.17759001
BU CMHd/ UJ <LIN)
00
MULTICELL kjnf vs. burnupLEU and MOX operating poisoned states.
396
KFKI Atomic Energy Research Institute
REFERENCES
1. S.Bychkov, M.KaIugin, AXazarenko, "Proposal for LEU and MOX W E RCalculational Benchmarks", Russian Research Center "Kurchatov Institute"
2. Gad6 et alM "KARATE - A Code for WER-440 Core Calculation", Transactionsof ANS Winter Meeting, Washington DC, November 13-17,1994, p. 485, Vol. 71.
3. Gy. Hegyi et al., "Benchmark on Integral Parameters and Pin-Wise EnergyDistributions of Heterogeneous Lattices", Proc of the third Symposium of AER,Piestany, Slovakia, 27 September- 1 October 1993, p. 241
4. MacFarlane, D. W. Muir, The NJOY Nuclear Data Processing System, LA-12740-M, 1994
5. YJshiguro, H. Takano, PEACO - A Code for Calculation of Group Constants ofResonance Energy Region in Heterogeneous Systems, JAERI 1219 report, 1971.
397
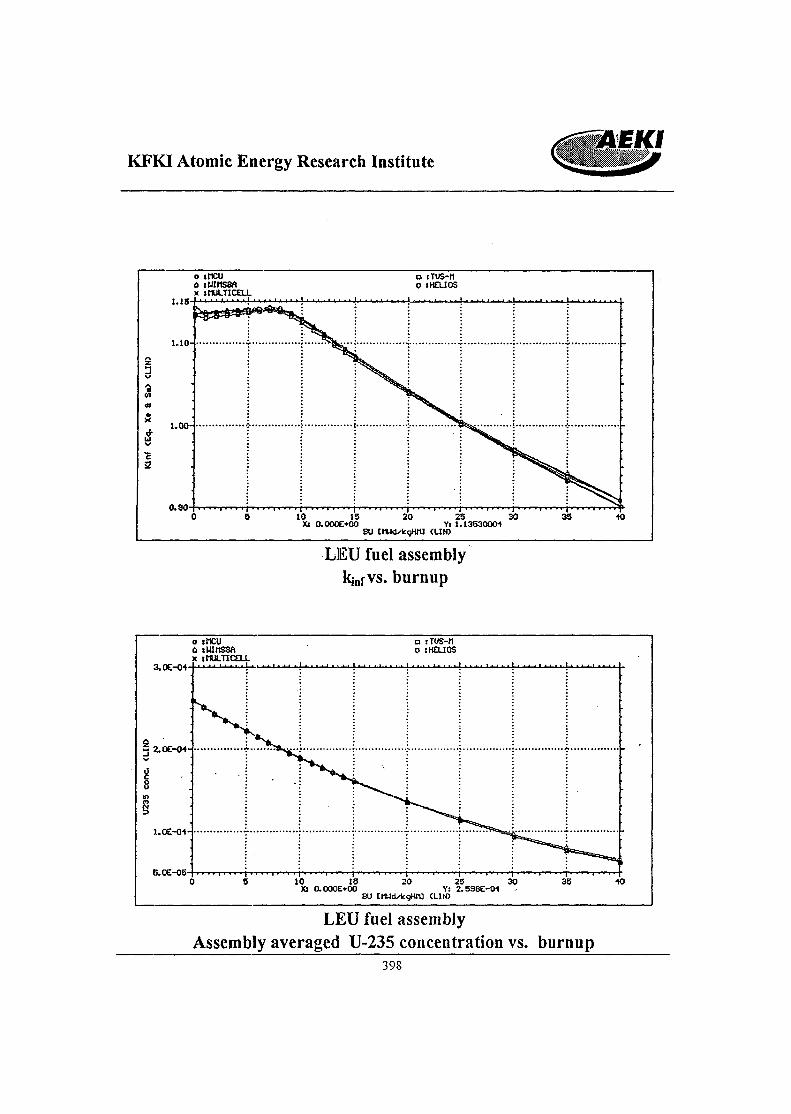
KFKI Atomic Energy Research Institute
LID-
S'
3«* 1.00-
82
c
o «ncu a iTus-n0 iUiriS8A p :HELIOSx tnULTICELL
• N
V
> 5 10 15 20 25 30 35 *Xs O.OOOE+00 Yl 1.1353000-t
BU tnUdxkgHrtl (LIN)
-
3
LEU fuel assembly. burnup
3.0E-04
o :MCUd iUinS8AX jdULTICOX
a iTVS-rtD xHOJOS
10 ISXl O.OOOE+00
20
BU
25 30Ys 2.598E-0* ,
(UN)
5.0E-05- ! •• . |35 •K)
LEU fuel assemblyAssembly averaged U-235 concentration vs. burnup
398
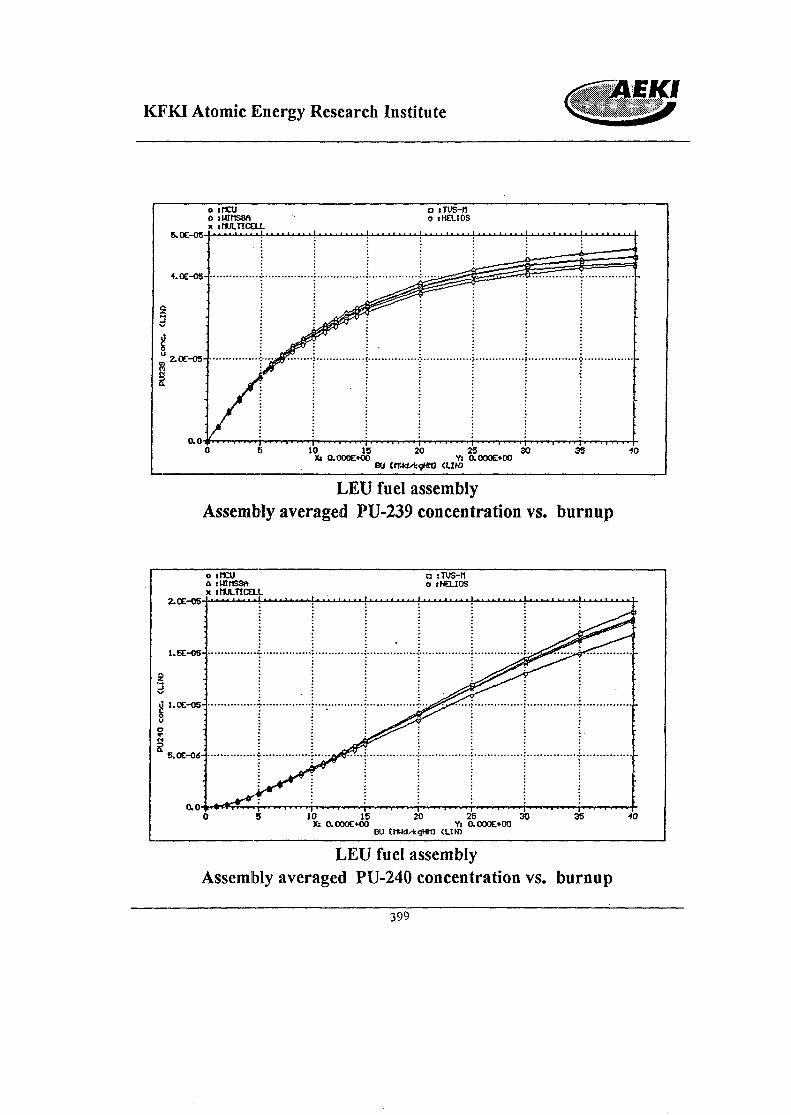
EKlKFKI Atomic Energy Research Institute
4.0G-O5-
2.0E-O3-
ao-i
o iMCU
x inoLncnx
Ar
a iTUS-tio iHELIOS
10 15x> o.oooe+00
20
BOvi
25 30aoooe+oo
35 -K>
LEU fuel assemblyAssembly averaged PU-239 concentration vs. burnup
2.0E-05-
1.5E-0S-
1.0E-05-
5.0E-04-
10 15Xs O.OOOE+00
20
BU
25 30Y: O.OOOE+00
<LIN>•to
LEU fuel assemblyAssembly averaged PU-240 concentration vs. burnup
399
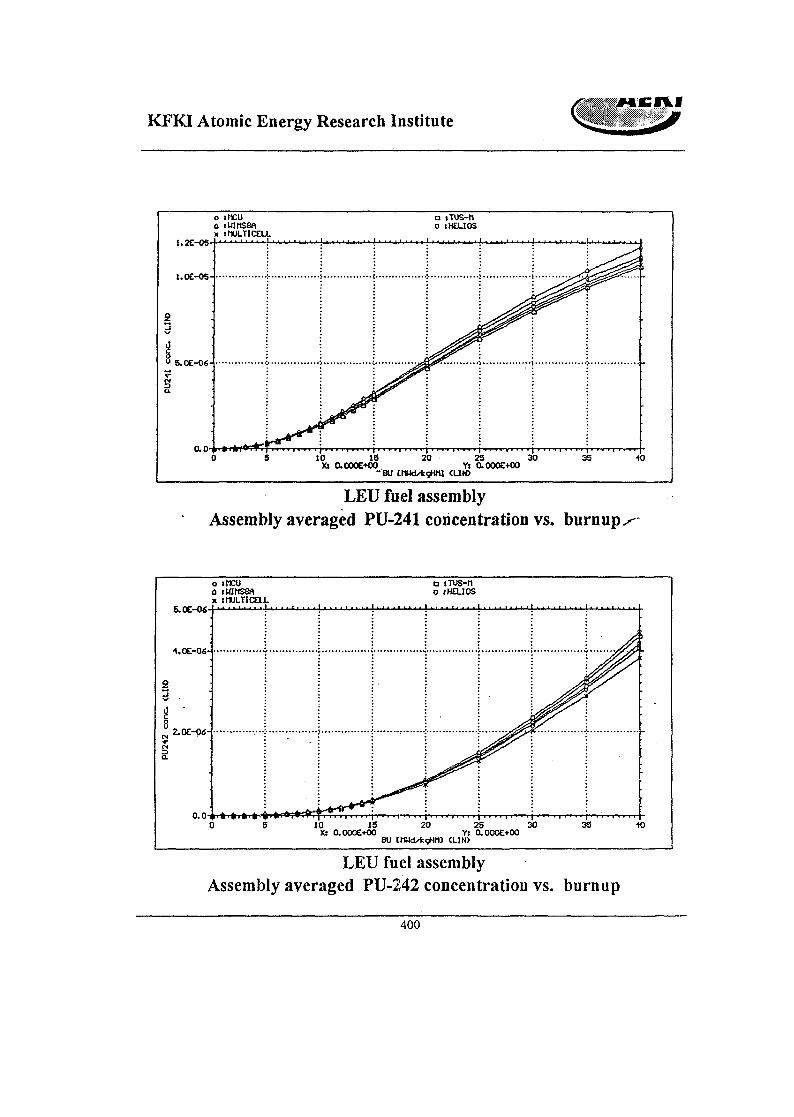
KFKI Atomic Energy Research Institute
1.2E-O5-
o iMCUa iUiriS8Ax iMULTICEU.
1.0E-05
5.0E-0S-
0.0-10 15 20 25 30 35& aoooe+oo YI aoooe+oo
-BU tHUtMcaWO <UIO
•to
LEU fuel assemblyAssembly averaged PU-241 concentration vs. burnup.
o incu0 lUMSSrt
5.X-06-
4.0E-0S-
, 2.0E-06-
0.0 » . » . » i > . » ^0 5 10 IS
X: O.OOOE+00 BU
2 5 30Y: O.OOOE+00
CLIN>
35
LEU fuel assemblyAssembly averaged PU-242 concentration vs. burnup
400
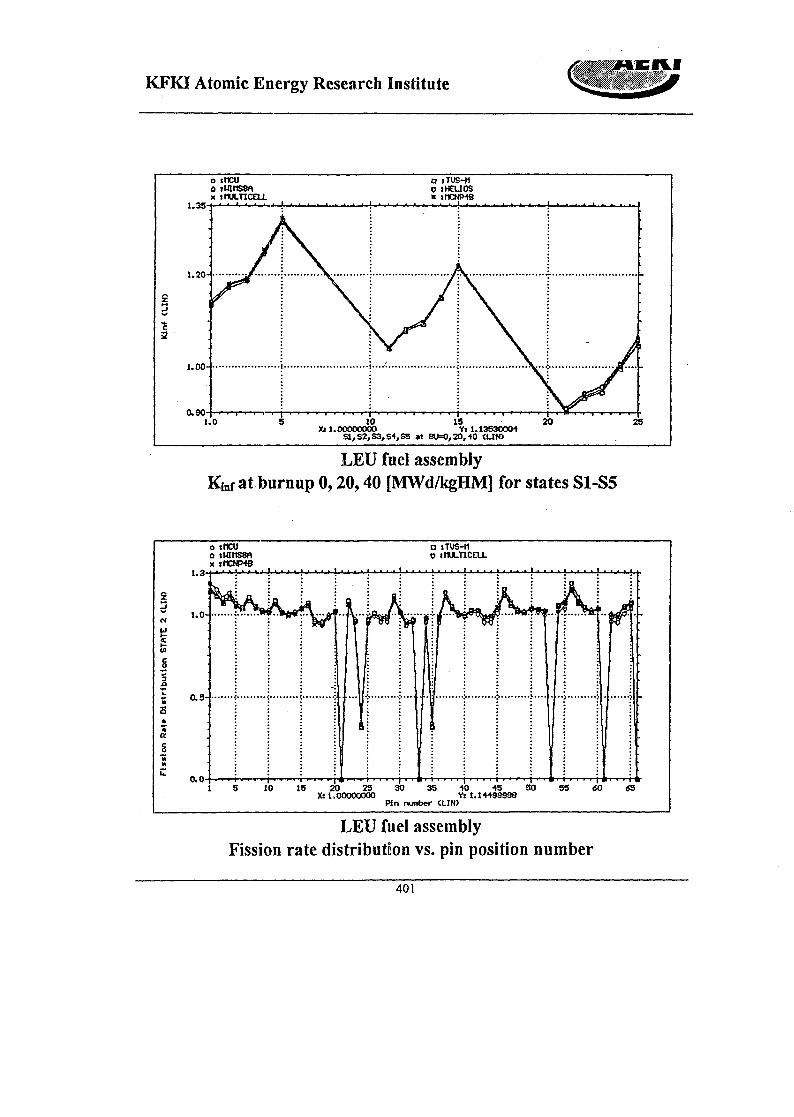
KFKI Atomic Energy Research Institute
1.35-
1.20-
1.00-
0.90-1.0 5 10 15 20
X« 1. 00000000 YJ 1.135300CMS1,S2,S3,S4,S5 »t BU=0,20,-«J <UN>
25
LEU fuel assemblyKinf at burnup 0,20,40 [MWd/kgHM] for states S1-S5
1.3-
g
i *•«-I01
s5
S 0.5-
s*
|
C 0.0
o «MCU a tTUS-tto ttanssA o SHULTICELLX itKNMB
Vfti
1\ 1
1
-
5 10 25 20 25 30 35 -tO -*5 50 55 60 <55X: 1.00000000 Yj 1.M49S998
Pin number <UN>
LEU fuel assemblyFission rate distribution vs. pin position number
401
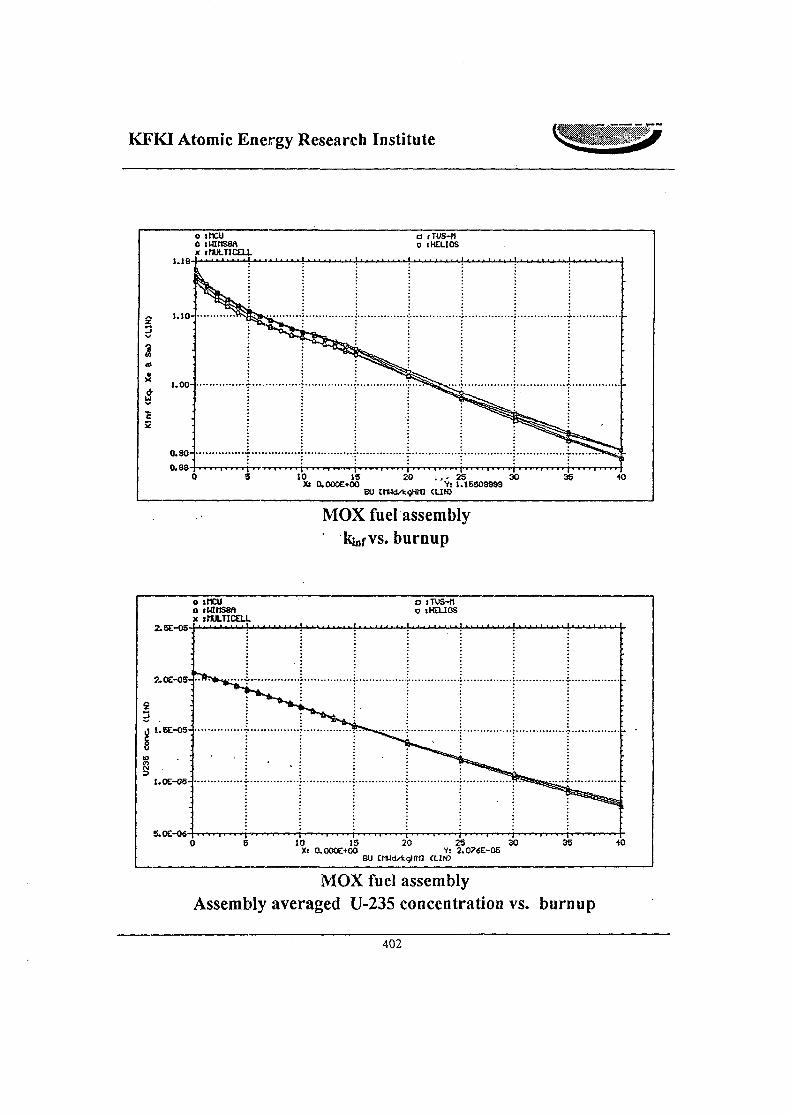
KFKI Atomic Energy Research Institute
2 '•">-3
3 ;a*
X l.OO-
1 :c2
0.90-
c
o iMCU a tTUS-fiD :UIttS8A o i HELIOSx :nULTIC£U.
»>__
* * * * *
» r » i | , . . - . , . . . , , | j | . . . . ( . . . . | . , . . , . . . .5 10 IS 20 . , - 25 30 35 +
Xs O.OOOE+00 V: 1.15509939BO trwd^gHra <UH>
0
MOX fuel assemblys. burnup
o >ncua tutttssftx lOULTICOi.
2.SE-05-
10 IS 20 25 30Xs 0.000E+00 Y: 2.07SE-05
BU CMUd/'fcgHMJ <LIN)
35 +0
MOX fuel assemblyAssembly averaged U-235 concentration vs. burnup
402
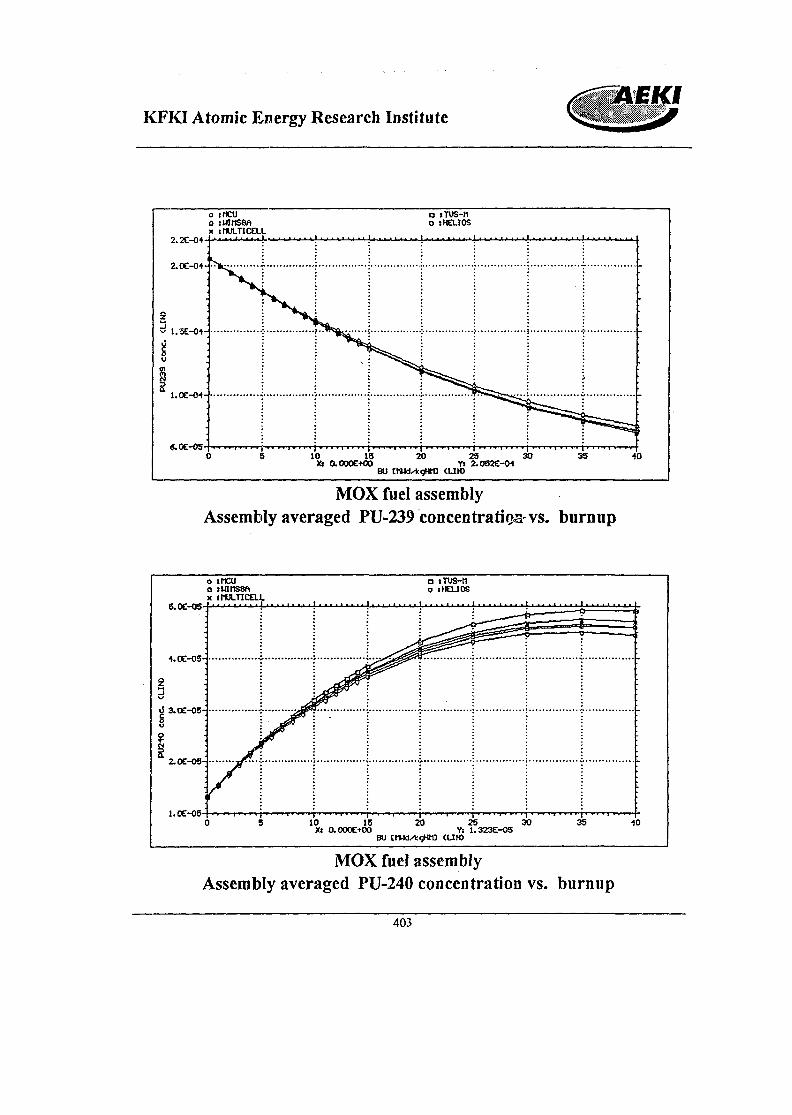
KFKI Atomic Energy Research InstituteAEKI
2.OE-O4-
g~ 1.5E-01-
u
a1.0C-<M-
(
o tncu o »Tus-riD jUIfiSSA o ! HELIOSx tnULTICELL
V
\
^ ^
3 !5 10 15 20 23 30 35 4XS aO00E+OO Yi 2.0S2E-04
BU CMMxkqmt) OIN>
D
MOX fuel assemblyAssembly averaged PU-239concentratios-vs. burnup
4.0E-05-
3.0E-05-
2.0E-05-
1.0C-05-
o thCUa tuirtssfix muuicax
f
j^
r
- . - .
D tTWS-H0 :HEL10S
l ^ ^ ^ S r 15 = <
-
10 15 20 25 30Xt a000E+00 Y: 1.323E-0S
BU CMMdAgHra CLIN)
35 40
MOX fuel assemblyAssembly averaged PU-240 concentration vs. burnup
403
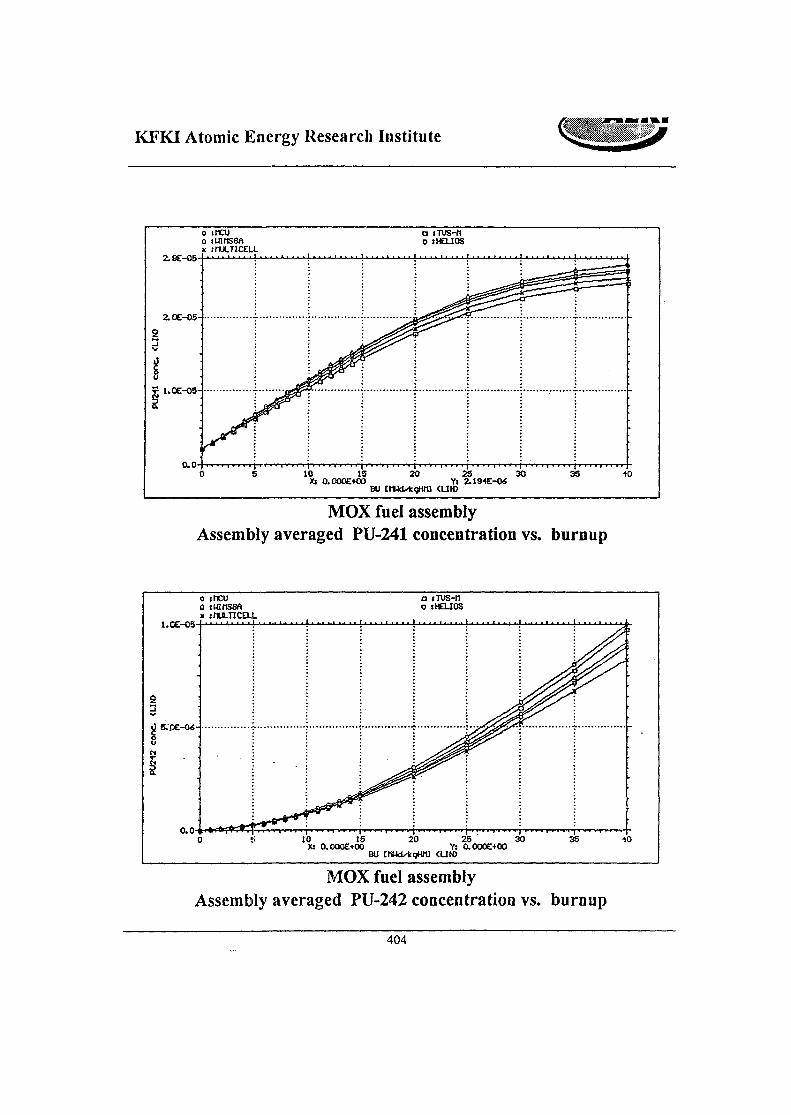
KFKI Atomic Energy Research Institute
2.8E-05-
2.0E-05-
? l.OE-05-
0.0| , . -0 S 10 15 20 25 30 35 -10
Xt O.OOOE+00 Yi 2.194E-WBU CMUtMsgHH] <UIO
MOX fuel assemblyAssembly averaged PU-241 concentration vs. burnup
o trcuox snu.nca.L
KOC-05 1 •' " "
a iTUS-tig :HOiOS
I 5.DE-0S-
0.010 15
Xi 0.O00E+O0 BU
20 25 30V: a000E+00
<UN>
35 -K)
MOX fuel assemblyAssembly averaged PU-242 concentration vs. burnup
404
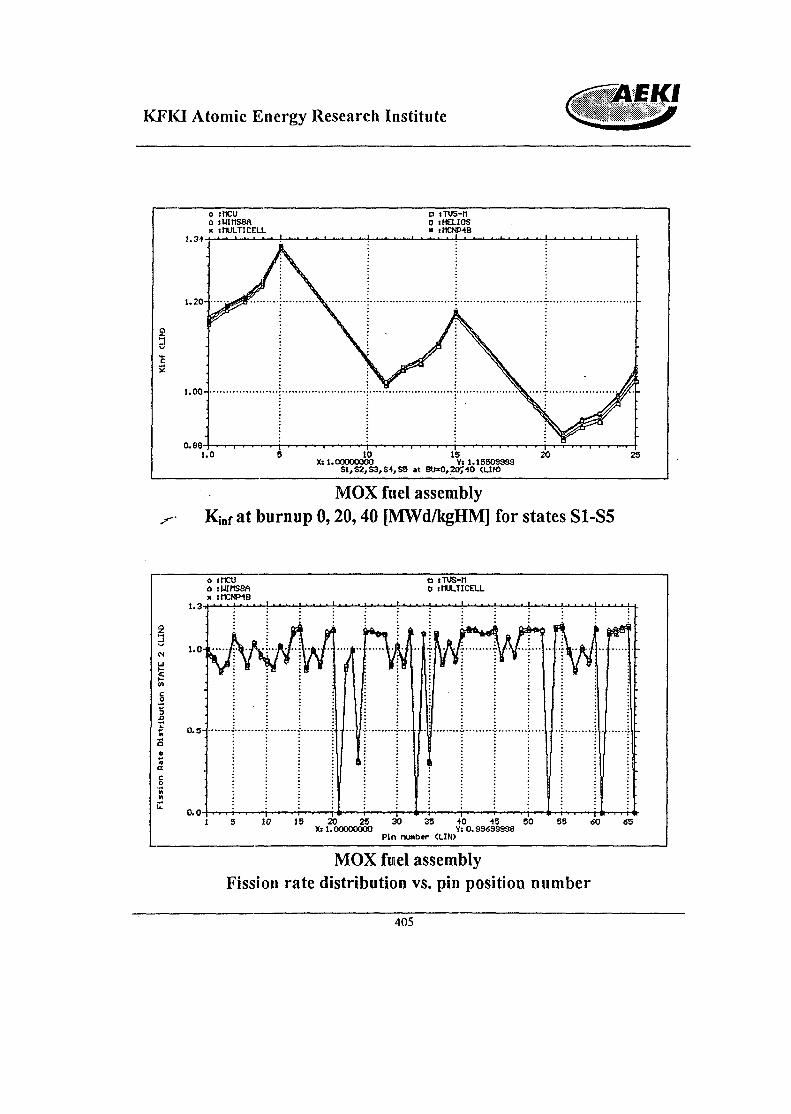
AEKIKFKI Atomic Energy Research Institute
o incua 1WIMS8Ax itiULTICEU.
0.88-10 IS 20
X: 1.00000000 Vl 1.15509S99S1,S2,S3,S-»,S5 at BU-0,20^40 (UN)
25
MOX fuel assemblyK,nf at burnup 0,20,40 [MWd/kgHM] for states S1-S5
o iMCU o :TUS-t10 tWtiSSfit p iMUUTICOJ-x iMCNFMB
23t
\
•< ' 4 u ij
:
; 0.5-
.... Js; Jif*
[J b,w
Iw
-
5 10 15 20 25 30 35 10 15 50 55 60 65X: 1.00000000 Yt 0.99«93S98
Pin number <UN>
MOX fuel assemblyFission rate distribution vs. pin position number
405
SK01ST100
CALCULATION OF ACCURATE ALBEDO BOUNDARY CONDITIONS FORTHREE-DIMENSIONAL NODAL DIFFUSION CODES BY THE METHOD OF
CHARACTERISTICS
Petko T. PetkovInstitute for Nuclear Research and Nuclear Energy, Sofia, Bulgaria
e-mail: [email protected]
ABSTRACT
Most of the few-group three-dimensional nodal diffusion codes used for neutronicscalculations of the WWER reactors use albedo type boundary conditions on the core-reflector boundary. The conventional albedoes are group-to-group reflection probabilities,defined on each outer node face. The method of characteristics is used to calculate accu-rate albedoes by the following procedure. A many-group two-dimensional heterogeneouscore-reflector problem, including a sufficient part of the core and detailed description ofthe adjacent reflector, is solved first. From this solution the angular flux on the core-reflector boundary is calculated in all groups for all traced neutron directions. In orderto calculate the albedoes from macro-group g to all macro-groups, an inhomogeneousboundary value problem for the reflector only is solved with the incoming angular fluxeson the core-reflector boundary taken from the global solution for the transport groupswithin macro-group g and set to zero for all other transport groups. From this solutionthe partial in- and out-currents on all assembly faces on the core-reflector boundary andfor all macro-groups; are calculated, from which the albedo coefficients from macro-groupg to all macro-groups for each assembly face are calculated. The method is exact as faras the two-dimensional heterogeneous solution by the method of characteristics is exact.
The group-to-group albedoes, however, depend strongly on the core loading, because asignificant part of the neutrons entering a particular assembly face come from the neighborfaces. The above described procedure can be modified to calculate a new type of albedoes,the reflection probabilities of neutrons leaving the core through face j in macro-group hto return back through face i in group g. These new albedoes depend on the core loadingmore than 10 times less than the conventional ones and are practically invariant withrespect to the core loading. If the assembly faces are too wide, they can be divided intosegments.
Accurate boundary conditions can be calculated for the radial, top and bottom reflec-tors as well as for the absorber part of the WWER-440 control assemblies. The algorithmcan be used to estimate also albedoes, coupling outer node faces on the radial reflector inthe axial direction. Numerical results for the WWER-440 reactor are presented.
407
Introduction
In the old 1995-vcrsion of the two-group three-dimensional nodal diffusion code SPPS-1.6(1] the absorber part of the control assembly and the radial, top, and bottom reflectorsare described by the conventional albedo boundary conditions, which can be stated in thefollowing form:
where j * is the partial current in group g from the fuel assembly to the reflector, j ~ isthe partial current in group g from the reflector to the fuel assembly, and ah^g is thealbedo from group g to group h, i.e. the probability that a neutron in group g passingfrom the fuel assembly to the reflector will return back as neutron of group h. Suchboundary conditions are widely used in three-dimensional nodal codes. The coefficientsocht-g are different on all outer assembly faces on the radial core boundary. Different otk*-g
are used for three axial zones of the absorber part of the control rod. Separate a/n_j areused for the upper and lower reflector and for the top end of the fuel part of the controlassembly. In fact the so-called 7-matrices are used in SPPS-1.6, but there is one-to-onecorrespondence between the or- and 7-matrices.
In principal these albedos are adequate provided they can be calculated exactly. Theold procedure for generation of albedo boundary conditions was based on the WIMSD4code[2, 3], used for calculation of macroscopic cross sections, and the one-dimensionalSAT transport code ANISN[4], used to solve the neutron transport equation. Cylindrical
geometry was used for the absorber and plane geometry for aH other reflectors. A singlecalculation with ANISN yields a set of out-going and in-coming partial currents "whichform two equations, but the unknown coefficients are four. The missing two equations areobtained by solving another problem with different fuel assemblies (e.g., with differentenrichment). Because the radial core boundary is quite different from one-dimensionalplane geometry, manual fitting was applied for the outer assembly faces. This procedurefor generation of boundary conditions was the best choice in 1995, when the code's librarywas generated.
From general considerations it follows that the boundary conditions on the radialreflector should depend on the fuel loading. If they do, however, the nodal code cannotbe run independently and its application would be too complicated. Therefore, it isdesirable that the boundary conditions will be invariant with respect to the core loading.
' The method of characteristics is probably the only method which can be used for cal-culation of accurate albedo boundary conditions. In this method the neutron transportequation is solved for the generic angular neutron flux in selected directions of neutron mo-tion and for each direction in equidistant parallel tracks, covering the domain of solution.The accuracy of the solution depends on the number and choice of the traced directionsand on the track separation. The present day computers allow accurate solution of theneutron transport equation in two-dimensional real geometry.
The current work is based on the MARIKO code[5, 6, 7], which solves the multi-group neutron transport equation in general two-dimensional geometry by the method ofcharacteristics. The domain of solution can be either a rectangle or a right hexagon withthe most general periodic boundary conditions. Any mirror or rotational symmetry insidethe domain is fully accounted for. There are three levels of geometric structures—regions,cells, and macro-cells. The domain of solution is divided into macro-cells, the macro-cells
408
are divided into cells, and the cells are divided into regions. The outer boundary of amacro-cell and cell can be any polygon. The outer boundary of a region can be practicallyany combination of straight line and circular arc segments. A fuel assembly should bedescribed as a separate macro-cell.
The MARIKO code accounts for Pl-scattering and the neutron source within a regioncan be represented as linear function of the spatial coordinates. The code has been verifiedby comparison with accurate Monte Carlo calculations for difficult transport problems.
In the following section the algorithm of calculating albedo boundary conditions ispresented. Then in the next section some aspects of its implementation are discussed.Numerical results for the WWER-440 absorber and radial reflector are presented in thethird section. The procedure of using the face-group to face group albedoes in SPPS-1.6is outlined in the next section. Finally, some conclusions are drawn.
Method of calculationLet us consider the problem of calculating albedo boundary conditions for radial faces ofthe absorber part of the WWER-440 control assembly. The neutron transport equationmust be solved for a two-dimensional hexagonal domain with lattice pitch 3 times greaterthan the assembly lattice pitch and with periodic boundary conditions on its outer bound-ary. The absorber itself is at the centre of the domain. A 30-degree sector of the domainis presented on Fig. 1 in macro-cell level and on Fig. 2 in region level.
Let us assume that the transport equation has been solved for the whole domain in anumber of transport groups and the transport solution is available. From this transportsolution the angular neutron flux at all points, where the tracks enter the absorber, andin all traced directions and all transport groups can be calwsfated. In the method ofcharacteristics the neutron travel is accounted for only along the tracks and neutronsmay enter the absorber only along the tracks. Therefore, an inhomogeneous boundaryvalue problem can be stated within the absorber only using the same tracks with thein-coming angular fluxes on the outer absorber boundary taken from the global solution.The solution of this problem must coincide with the global solution within the absorber.This fact does not help much except that it gives a clue for testing the algorithm forsolving the inhomogeneous boundary value problem and its implementation.
Now let us consider another problem. The in-coming angular fluxes on the outerabsorber boundary are kept the same as for the global solution in all transport groupscorresponding to the fast diffusion group, but are set to zero for all thermal transportgroups. For this problem the in-coming (to the absorber) partial currents in the fasttransport groups are the same as for the global solution and those in the thermal groupsare zero. Solving this new problem the out-going partial currents can be calculated andusing the basic albedo equation the coefficients «/<-/ and att~/ can be calculated.
By analogy, setting to zero the in-coming angular fluxes in all fast groups and retainingthe global incoming angular fluxes in all thermal groups, a new inhomogeneous boundaryvalue problem can be stated. From its solution the remaining coefficients a/<_( and ati-t
can be calculated. It would be cheaper to use the partial currents from the global solutionto form the two additional equations for the four albedo coefficients.
The above described method is applicable for any number of diffusion groups. More-over, with a little modifications it can be used to calculate group to group and face to facealbedoes. Considering the outer assembly faces on the radial boundary, the in-coming (to
409
the fuel assembly) partial current on face ; in group g can be presented as
Jig — Z^Ctigi-jhJjw3*
where j^g and jjjj are the partial currents on face i in group g and aig^jh is the probabilitythat a neutron, which has left the core through face j in group h will return back tothe core through face t in group g. In order to determine the coefficients ais<_,j, from aparticular pair of face j and group h to all i and g, the in-coming (to the reflector) angularfluxes must be set to zero on all faces and in all groups except on face j and in grouph (in group h means all transport groups corresponding to macro-group h). In this caseonly one term will be none-zero on the right hand side of the above equation.
Implementation
The MARIKO code has been equipped with modules for automatic generation of thegeometry structure of the WWER-440 fuel assemblies, reflector, and absorber. A fuel as-sembly may consist of any number of adjacent 30-degree sectors, thus covering practicallyall possible variants of a fuel assembly. The reflector region is described as a number ofassembly like macro-cells, each one consisting of any number of adjacent 30-degree sec-tors. The reflector macro-cells are divided into cells like the cells in a fuel assembly, butwithout fuel pins. Given the standard rectangular coordinates of the macro-cell, the codeautomatically overlays the core shroud, basket, shaft, the stainless steel cylindrical bodiesin the dummy assemblies, etc. Minimum number of human input data are supplied bythe user. A separate subroutine models the absorber, because finer spatial discretizationis required around the boron steel inserts.
A preliminary step in calculating boundary conditions is the solution of the globaleigenvalue problem and recording the final results to a disk file. It is performed by thestandard calculation path in MARIKO.
In order to calculate boundary conditions the 'reflector' region must be specified first.The implementation is very simple—the user specifies which macro-cells form the 'reflec-tor'. A macro-cell in the 'reflector' must not contain fuel, but not all none-fuel macro-cellshave to be included in the 'reflector'. Thus, boundary conditions can be calculated notonly on the outer fuel assembly faces, but further in the reflector, which is necessary for thefine-mesh diffusion codes and some nodal diffusion codes. Since the reflector macro-cellscan be constructed from any number of 30-degree sectors, the 'reflector' can be defines ina flexible way.
The next part of the algorithm identifies the points where the tracks enter and leave .the 'reflector', together with additional information, such as which macro-cell side isintersected. In solving the inhomogeneous boundary value problem the ray tracing startsat the point where the track enters the 'reflector' with a known value of the angular fluxat this point and continues until the track leaves the 'reflector'. Therefore, two new raytracing procedures are required. The first one is almost the same as the standard raytracing procedure in solving the eigenvalue problem. It passes all the tracks for the entireproblem and does the usual integration to calculate the scalar flux, current, escape andtransmission probabilities. In addition it saves the in-coming (to the 'reflector') angularfluxes. This procedure is performed once before the actual solution of the inhomogeneousboundary value problem or problems has started. It does not require user input.
In order to state the inhomogeneous boundary value problem the user must specifywhat kind of boundary conditions are to be calculated—a value of -2 of a control variable
410
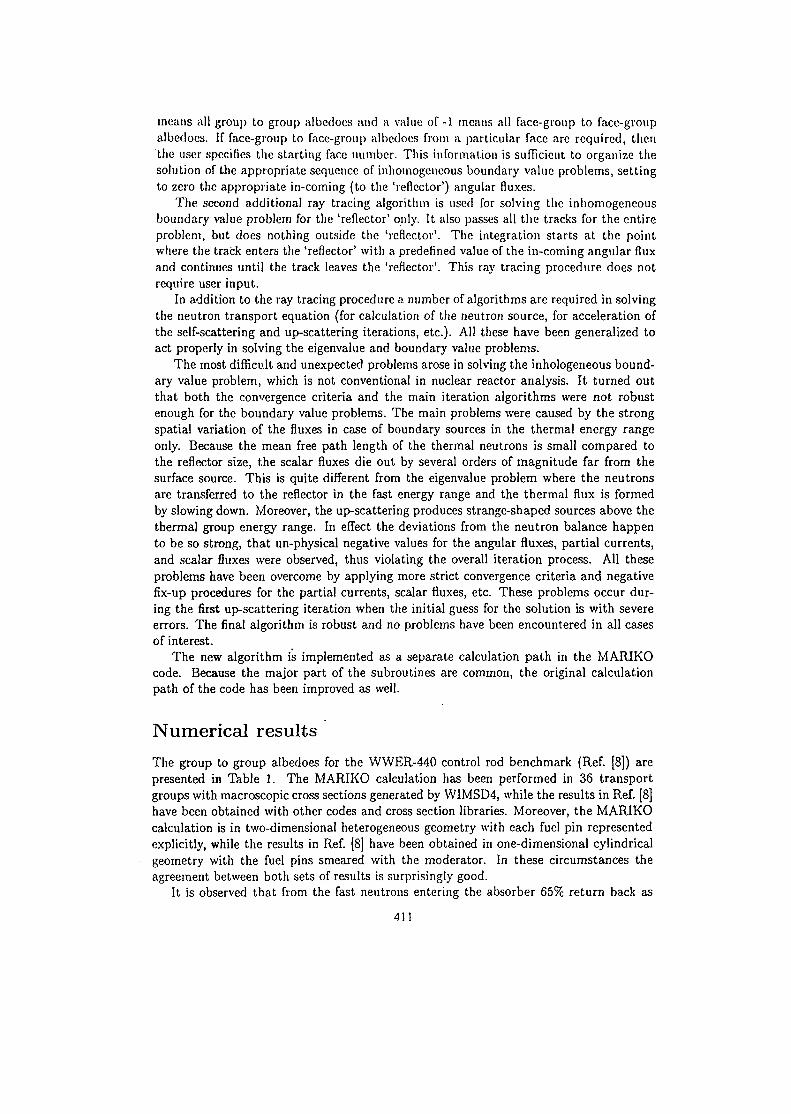
means all group to group albcdoes and a value ol'-l means all face-group to face-groupalbedoes. If face-group to face-group albcdocs from a particular face are required, thenthe user specifies the starting face number. This information is sufficient to organize thesolution of the appropriate sequence of inhomogeneous boundary value problems, settingto zero the appropriate in-coming (to the 'reflector') angular fluxes.
The second additional ray tracing algorithm is used for solving the inhomogeneousboundary value problem for the 'reflector' only. It also passes all the tracks for the entireproblem, but does nothing outside the 'reflector'. The integration starts at the pointwhere the track enters the 'reflector' with a predefined value of the in-coming angular fluxand continues until the track leaves the 'reflector'. This ray tracing procedure does notrequire user input.
In addition to the ray tracing procedure a number of algorithms are required in solvingthe neutron transport equation (for calculation of the neutron source, for acceleration ofthe self-scattering and up-scattering iterations, etc.). All these have been generalized toact properly in solving the eigenvalue and boundary value problems.
The most difficult and unexpected problems arose in solving the inhologeneous bound-ary value problem, which is not conventional in nuclear reactor analysis. It turned outthat both the convergence criteria and the main iteration algorithms were not robustenough for the boundary value problems. The main problems were caused by the strongspatial variation of the fluxes in case of boundary sources in the thermal energy rangeonly. Because the mean free path length of the thermal neutrons is small compared tothe reflector size, the scalar fluxes die out by several orders of magnitude far from thesurface source. This is quite different from the eigenvalue problem where the neutronsare transferred to the reflector in the fast energy range and the thermal flux is formedby slowing down. Moreover, the up-scattering produces strange-shaped sources above thethermal group energy range. In effect the deviations from the neutron balance happento be so strong, that un-physical negative values for the angular fluxes, partial currents,and scalar fluxes were observed, thus violating the overall iteration process. All theseproblems have been overcome by applying more strict convergence criteria and negativefix-up procedures for the partial currents, scalar fluxes, etc. These problems occur dur-ing the first up-scattering iteration when the initial guess for the solution is with severeerrors. The final algorithm is robust and no problems have been encountered in all casesof interest.
The new algorithm is implemented as a separate calculation path in the MARIKOcode. Because the major part of the subroutines are common, the original calculationpath of the code has been improved as well.
Numerical results
The group to group albedoes for the WWER-440 control rod benchmark (Ref. [8]) arepresented in Table 1. The MARIKO calculation has been performed in 36 transportgroups with macroscopic cross sections generated by WIMSD4. while the results in Ref. [8]have been obtained with other codes and cross section libraries. Moreover, the MARIKOcalculation is in two-dimensional heterogeneous geometry with each fuel pin representedexplicitly, while the results in Ref. [8] have been obtained in one-dimensional cylindricalgeometry with the fuel pins smeared with the moderator. In these circumstances theagreement between both sets of results is surprisingly good.
It is observed that from the fast neutrons entering the absorber 65% return back as
411
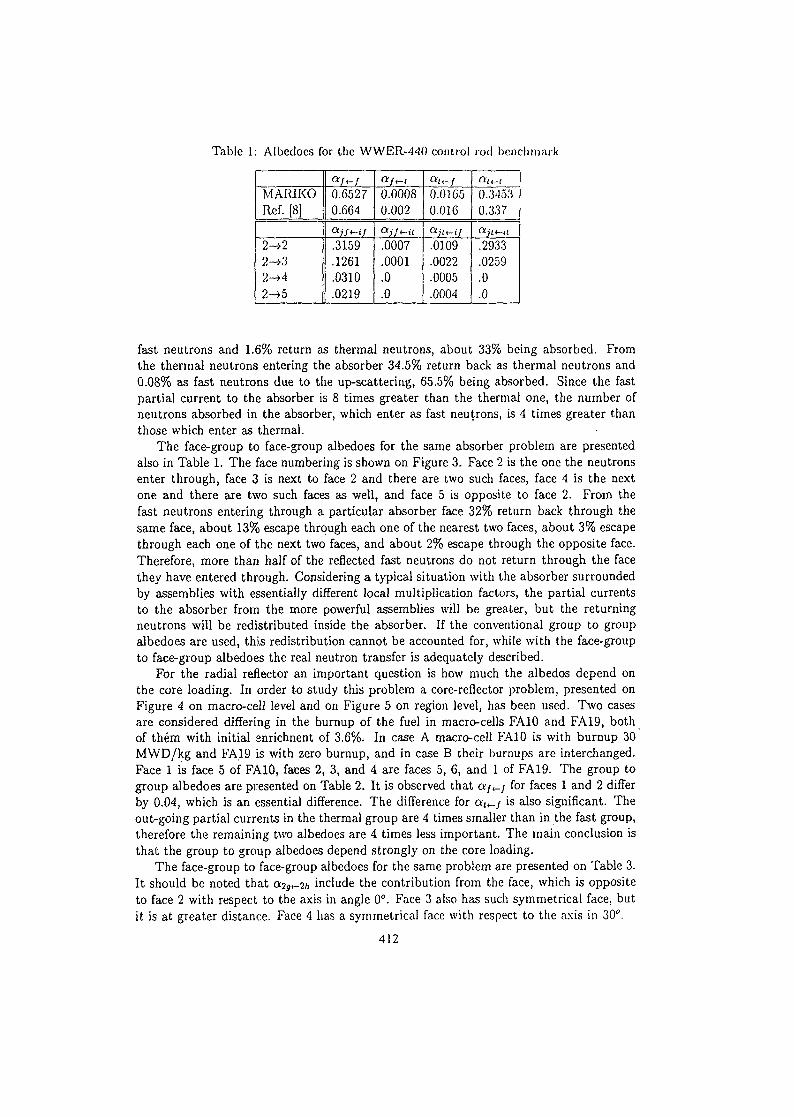
Table 1: Albedoes for the WWER-440 control rod benchmark
MARIKOlief. [8J
2->22->32->42->5
0.65270.664
.3159
.1261
.0310
.0219
0.00080.002
.0007
.0001
.0
.0
C*H-f
0.01G50.016
Ojti-if
.0109
.0022
.0005
.0004
0.34530.337
.2933
.0259
.0
.0
fast neutrons and 1.6% return as thermal neutrons, about 33% being absorbed. Fromthe thermal neutrons entering the absorber 34.5% return back as thermal neutrons and0.08% as fast neutrons due to the up-scattering, 65.5% being absorbed. Since the fastpartial current to the absorber is 8 times greater than the thermal one, the number ofneutrons absorbed in the absorber, which enter as fast neutrons, is 4 times greater thanthose which enter as thermal.
The face-group to face-group albedoes for the same absorber problem are presentedalso in Table 1. The face numbering is shown on Figure 3. Face 2 is the one the neutronsenter through, face 3 is next to face 2 and there are two such faces, face 4 is the nextone and there are two such faces as well, and face 5 is opposite to face 2. From thefast neutrons entering through a particular absorber face 32% return back through thesame face, about 13% escape through each one of the nearest two faces, about 3% escapethrough each one of the next two faces, and about 2% escape through the opposite face.Therefore, more than half of the reflected fast neutrons do not return through the facethey have entered through. Considering a typical situation with the absorber surroundedby assemblies with essentially different local multiplication factors, the partial currentsto the absorber from the more powerful assemblies will be greater, but the returningneutrons will be redistributed inside the absorber. If the conventional group to groupalbedoes are used, this redistribution cannot be accounted for, while with the face-groupto face-group albedoes the real neutron transfer is adequately described.
For the radial reflector an important question is how much the albedos depend onthe core loading. In order to study this problem a core-reflector problem, presented onFigure 4 on macro-cell level and on Figure 5 on region level, has been used. Two casesare considered differing in the burnup of the fuel in macro-cells FA10 and FA19, bothof them with initial enrichnent of 3.6%. In case A macro-cell FA10 is with burnup 30MWD/kg and FA19 is with zero burnup, and in case B their burnups are interchanged.Face 1 is face 5 of FAlO, faces 2, 3, and 4 are faces 5, 6, and 1 of FA19. The group togroup albedoes are presented on Table 2. It is observed that a/,-/ for faces 1 and 2 differby 0.04, which is an essential difference. The difference for ort«_/ is also significant. Theout-going partial currents in the thermal group are 4 times smaller than in the fast group,therefore the remaining two albedoes are 4 times less important. The main conclusion isthat the group to group albedoes depend strongly on the core loading.
The face-group to face-group albedoes for the same problem are presented on Table 3.It should be noted that c*2j<-2/» include the contribution from the face, which is oppositeto face 2 with respect to the axis in angle 0°. Face 3 also has such symmetrical face, butit is at greater distance. Face 4 has a symmetrical face with respect to the axis in 30".
412
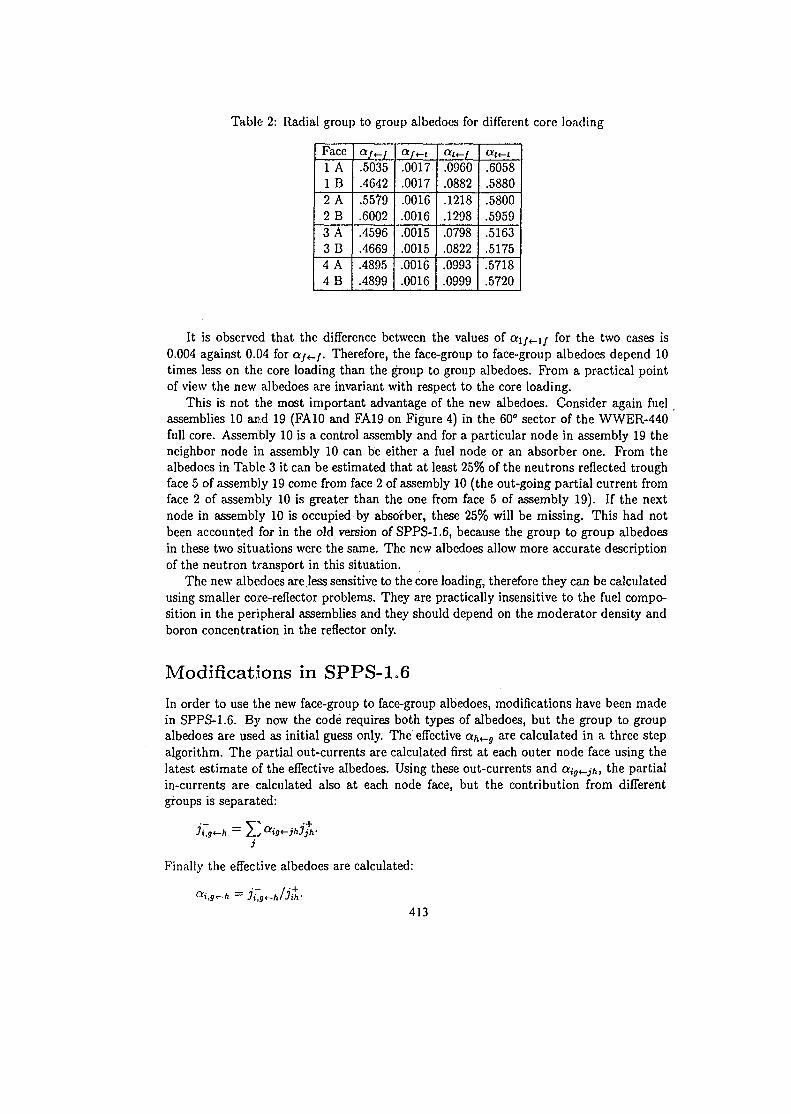
Table 2: Radial group to group albedocs for different core loading
Face1 A1 B2 A2B3 A3B4 A4B
.5035
.4642
.5579
.6002
.4596
.4669
.4895
.4899
.0017
.0017
.0016
.0016
.0015
.0015
.0016
.0016
«*<-/.0960.0882.1218.1298.0798.0822.0993.0999
.6058
.5880
.5800
.5959
.5163
.5175
.5718
.5720
It is observed that the difference between the values of ai/*-i/ for the two cases is0.004 against 0.04 for <*/<_/. Therefore, the face-group to face-group albedoes depend 10times less on the core loading than the group to group albedoes. From a practical pointof view the new albedoes are invariant with respect to the core loading.
This is not the most important advantage of the new albedoes. Consider again fuelassemblies 10 and 19 (FA10 and FA19 on Figure 4) in the 60° sector of the WWER-440full core. Assembly 10 is a control assembly and for a particular node in assembly 19 theneighbor node in assembly 10 can be either a fuel node or an absorber one. From thealbedoes in Table 3 it can be estimated that at least 25% of the neutrons reflected troughface 5 of assembly 19 come from face 2 of assembly 10 (the out-going partial current fromface 2 of assembly 10 is greater than the one from face 5 of assembly 19). If the nextnode in assembly 10 is occupied by absorber, these 25% will be missing. This had notbeen accounted for in the old version of SPPS-1.6, because the group to group albedoesin these two situations were the same. The new albedoes allow more accurate descriptionof the neutron transport in this situation.
The new albedoes are less sensitive to the core loading, therefore they can be calculatedusing smaller core-reflector problems. They are practically insensitive to the fuel compo-sition in the peripheral assemblies and they should depend on the moderator density andboron concentration in the reflector only.
Modifications in SPPS-1.6In order to use the new face-group to face-group albedoes, modifications have been madein SPPS-1.6. By now the code requires both types of albedoes, but the group to groupalbedoes are used as initial guess only. The effective a/,<_s are calculated in a three stepalgorithm. The partial out-currents are calculated first at each outer node face using thelatest estimate of the effective albedoes. Using these out-currents and otigi-.jh, the partialin-currents are calculated also at each node face, but the contribution from differentgroups is separated:
Finally the effective albedoes are calculated:
"'.J^fl Ji,gi~hlJih'
413
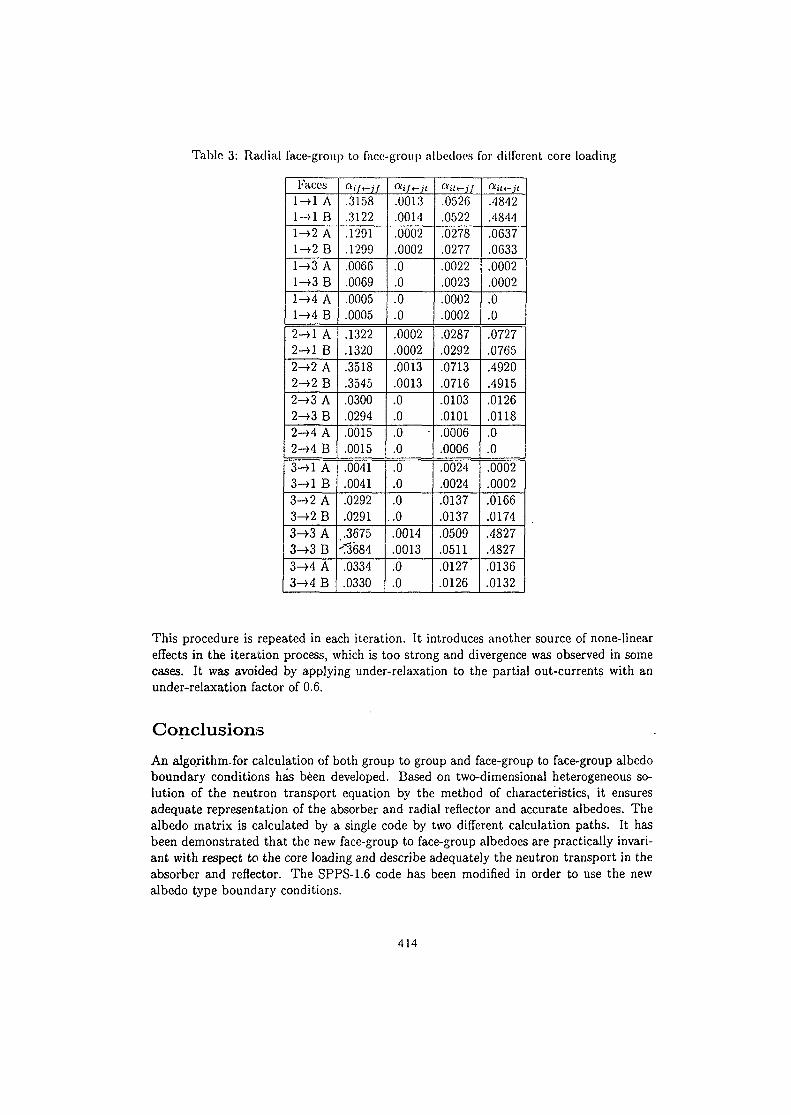
Table 3: Radial face-group to face-group albedoes for different core loading
Faces1->1 A1->1 Bl->2 AH2Bl->3 A1-+3BH4Al->4 B
2->l A2-+1 B2-42A2->2B2->3 A2->3B2->4A2->4B
3->l A3->l B3-»2A3-J-2 B3->3A3-+3B3->4 A3->4B
°'7<-j/.3158.3122.1291.1299.0066.0069.0005.0005
.1322
.1320
.3518
.3545
.0300
.0294
.0015
.0015
.0041
.0041
.0292
.0291
.3675<3'684.0334.0330
.0013
.0014
.0002
.0002
.0
.0
.0
.0
.0002
.0002
.0013
.0013
.0
.0
.0
.0
.0
.0
.0
.0
.0014
.0013
.0
.0
Citt-jf
.0526
.0522
.0278
.0277
.0022
.0023
.0002
.0002
.0287
.0292
.0713
.0716
.0103
.0101
.0006
.0006
.0024
.0024
.0137
.0137
.0509
.0511
.0127
.0126
.4842
.4844
.0637
.0633
.0002
.0002
.0
.0
.0727
.0765
.4920
.4915
.0126
.0118
.0
.0
.0002
.0002
.0166
.0174
.4827
.4827
.0136
.0132
This procedure is repeated in each iteration. It introduces another source of none-lineareffects in the iteration process, which is too strong and divergence was observed in somecases. It was avoided by applying under-relaxation to the partial out-currents with anunder-relaxation factor of 0.6.
Conclusions
An algorithm, for calculation of both group to group and face-group to face-group albedoboundary conditions has been developed. Based on two-dimensional heterogeneous so-lution of the neutron transport equation by the method of characteristics, it ensuresadequate representation of the absorber and radial reflector and accurate albedoes. Thealbedo matrix is calculated by a single code by two different calculation paths. It hasbeen demonstrated that the new face-group to face-group albedoes are practically invari-ant with respect to the core loading and describe adequately the neutron transport in theabsorber and reflector. The SPPS-1.6 code has been modified in order to use the newalbedo type boundary conditions.
414
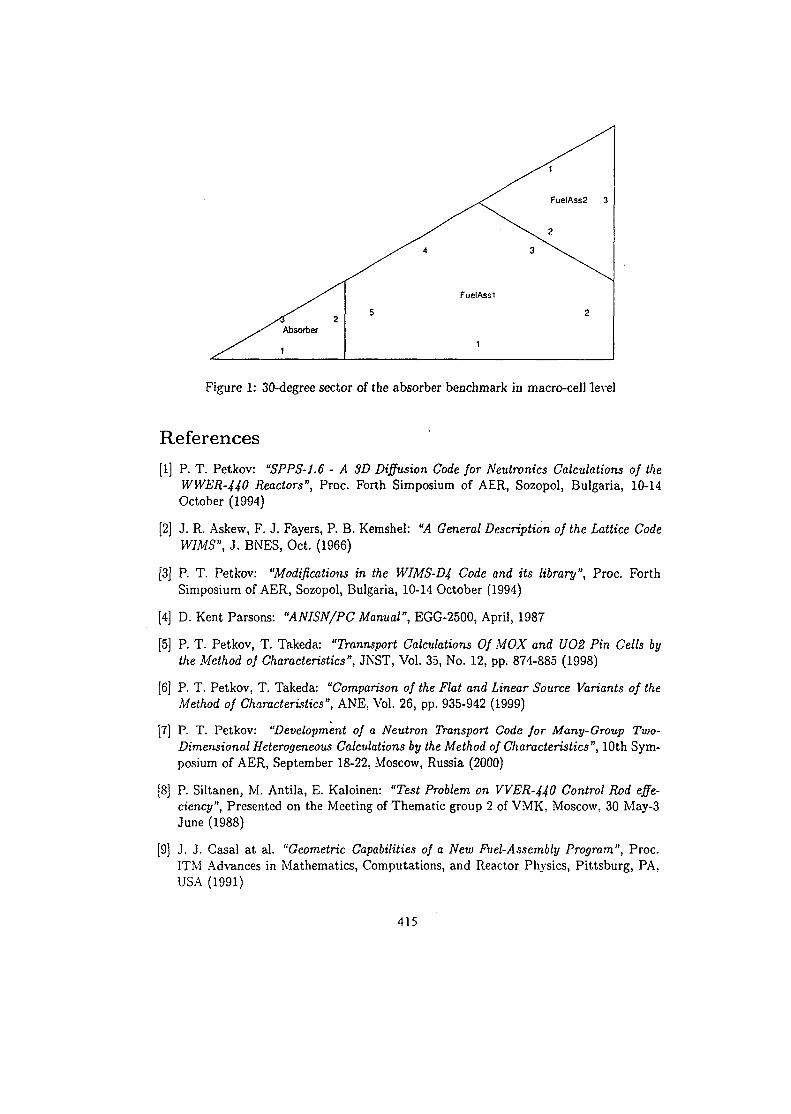
Figure 1: 30-degree sector of the absorber benchmark in macro-cell level
References[1] P. T. Petkov: "SPPS-1.6 - A 3D Diffusion Code for Neutronics Calculations of the
WWER-440 Reactors", Proc. Forth Simposium of AER, Sozopol, Bulgaria, 10-14October (1994)
[2] J. R. Askew, F. J. Fayers, P. B. Kemshel: "A General Description of the Lattice CodeWIMS", J. BNES, Oct. (1966)
[3] P. T. Petkov: "Modifications in the WIMS-D4 Code and its library", Proc. ForthSimposium of AER, Sozopol, Bulgaria, 10-14 October (1994)
[4] D. Kent Parsons: "ANISN/PC Manual", EGG-2500, April, 1987
[5] P. T. Petkov, T. Takeda: "Trannsport Calculations Of MOX and UO2 Pin Cells bythe Method of Characteristics", JNST, Vol. 35, No. 12, pp. 874-885 (1998)
[6] P. T. Petkov, T. Takeda: "Comparison of the Flat and Linear Source Variants of theMethod of Characteristics", ANE, Vol. 26, pp. 935-942 (1999)
[7] P. T. Petkov: "Development of a Neutron Transport Code for Many-Group Two-Dimensional Heterogeneous Calculations by the Method of Characteristics", 10th Sym-posium of AER, September 18-22. Moscow, Russia (2000)
[8] P. Siltanen, M. Antila, E. Kaloinen: "Test Problem on VVER-440 Control Rod effe-ciency", Presented on the Meeting of Thematic group 2 of VMK, Moscow. 30 May-3June (1988)
[9] J. J. Casal at al. "Geometric Capabilities of a New Fuel-Assembly Program", Proc.ITM Advances in Mathematics, Computations, and Reactor Physics, Pittsburg, PA.USA (1991)
415
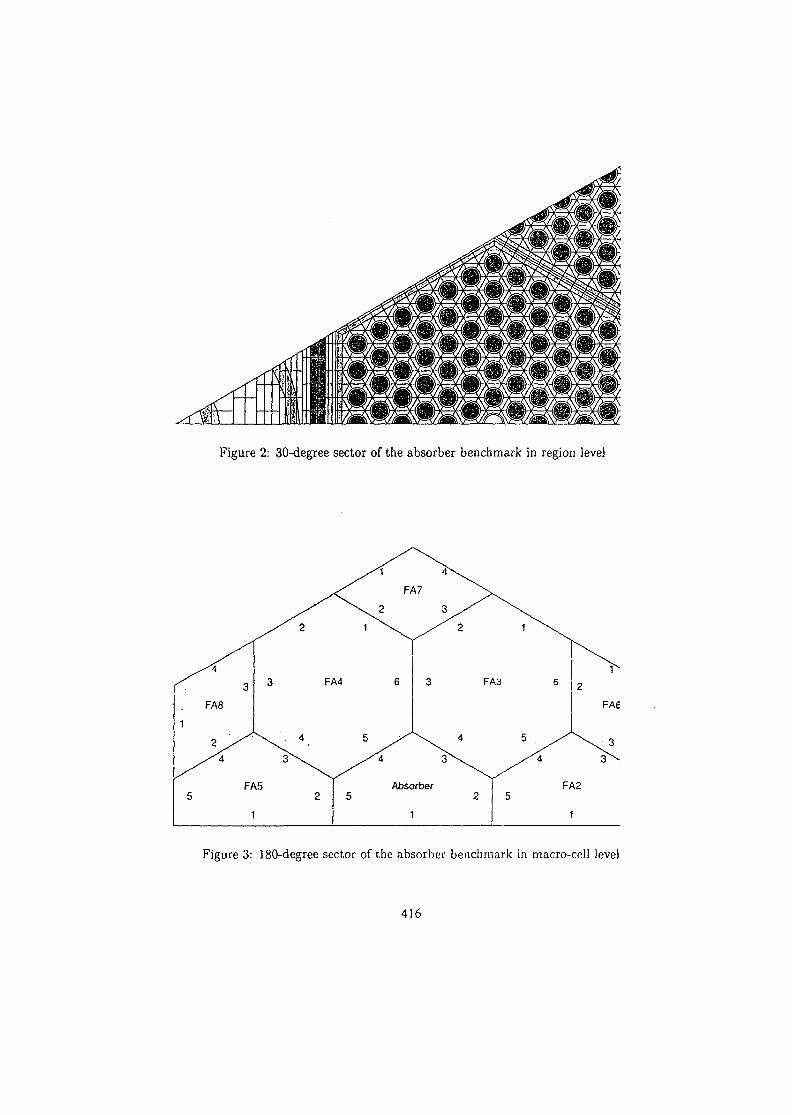
Figure 2: 30-degree sector of the absorber benchmark in region level
Figure 3: 180-degree sector of the absorber benchmark in macro-cell level
416
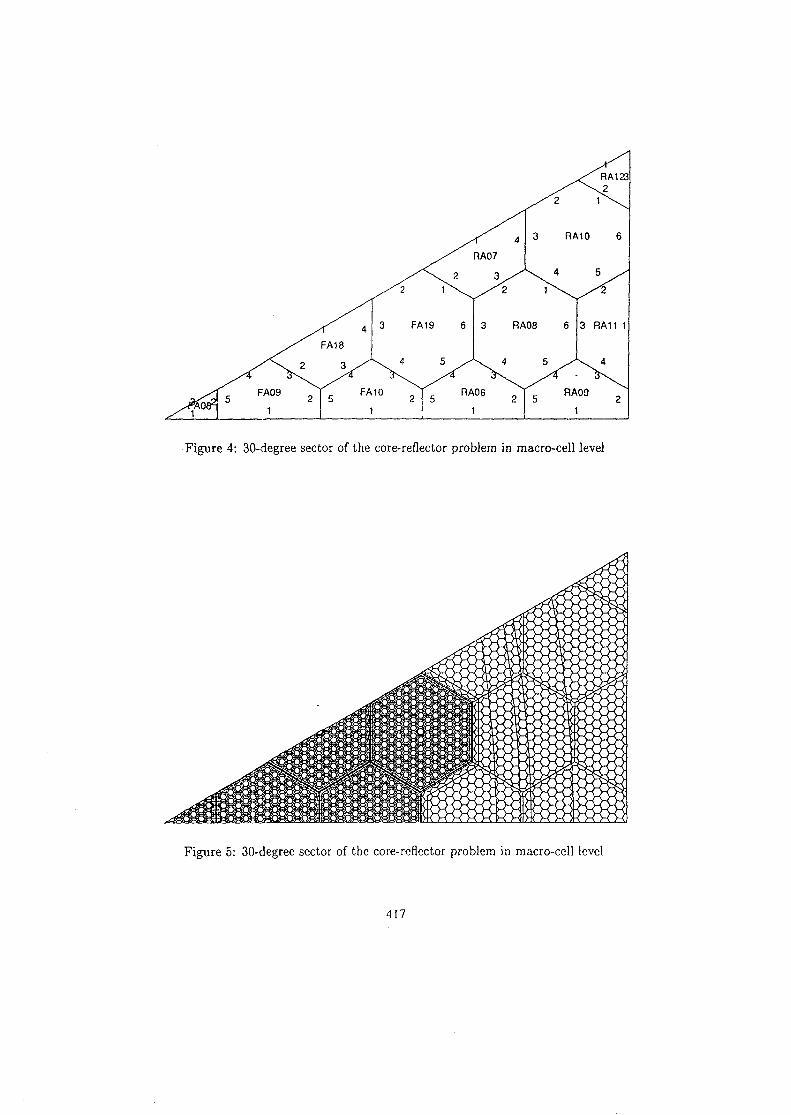
Figure 4: 30-degree sector of the core-reflector problem in macro-cell level
Figure 5: 30-degree sector of the core-reflector problem in macro-cell level
417
SK01ST101
CALCULATIONS OF VVER CELLS AND ASSEMBLIES BY WIMS-7B CODE
N.I.Laletin, N.V.SultanovRRC "Kurchatov institute"
Moscow, RUSSIA
ABSTRACT
A study of the nuclear data libraries of the WIMS7B code have been performed incalculations of computational benchmark problems. The benchmarks cover pin cell, singlefuel assembly with several different fuel types, moderator densities.-Fuel depletion isperformed to a burnup of 60 MWd/kgNM in the VVER-1000 pin celLThe results of theanalysis of the benchmark with different code systems have been compared and indicatedgood agreement among the different methods and data.
1. INTRODUCTION
Our aim in this report is to compare of calculation results, obtained with the use of differentlibraries, which are in the variant of the WIMS7B code. We wanted also to have a someacquiantance with the new option of WIMS-7B - CACTUS. The variant of WIMS-7B wasplaced at our disposal by the codes authors for a temporal use for 9 months. It was natural tomake at comparisons with analogous values of TVS-M, HELIOUS codes, where the otherdifferent libraries were used. In accordance with our aims the calculations of pin cells studiedin Ref/1/ were carried out. Amongst these cells the ones with UO2, MOX-fuel with differentpart Pu and one cell with Pu-241 were studied. The last cell was taken for a check-up ofmicrosections of separate nuclides Pu. Except this cell the results of WIMS-7B do notstrongly differ from the ones of other codes. For the cell with Pu-241 WIMS-7B give resultsclose to HELIOUS (the library have as the basis the ENDFB-VI files) but differ very visiblefrom the TVS-M result. After then the calculations of nonuniform lattice VVER assemblieswere carried out by the option CACTUS. This option provide calculations by thecharacteristics method. The calculation results are compared with values obtained by othercodes: MCU, TVS-M, HELIOS, Apollo-II. The conclusion from this analysis is such: themethodical parts of errors of these codes have nearly the same values. Spacing for K rr values
419
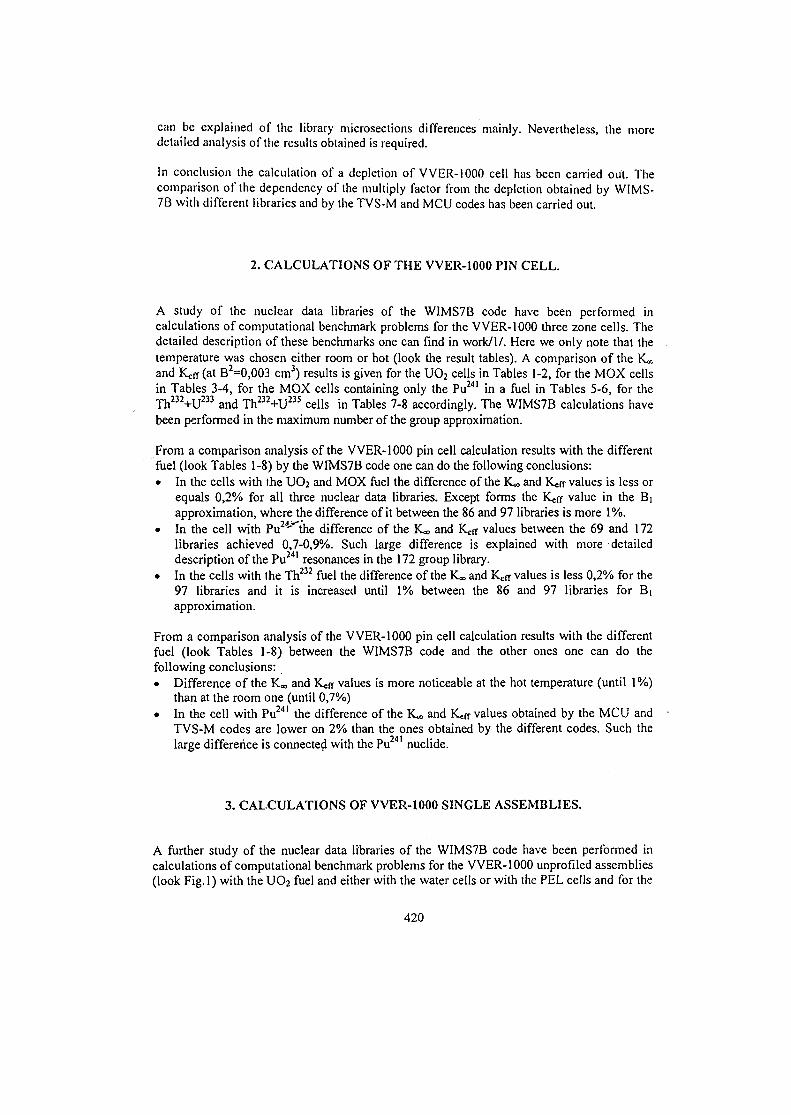
can be explained of the library microsections differences mainly. Nevertheless, the moredetailed analysis of the results obtained is required.
In conclusion the calculation of a depletion of VVER-1000 cell has been carried out. Thecomparison of the dependency of the multiply factor from the depletion obtained by WIMS-7B with different libraries and by the TVS-M and MCU codes has been carried out.
2. CALCULATIONS OF THE VVER-1000 PIN CELL.
A study of the nuclear data libraries of the WIMS7B code have been performed incalculations of computational benchmark problems for the VVER-1000 three zone cells. Thedetailed description of these benchmarks one can find in work/1/. Here we only note that thetemperature was chosen either room or hot (look the result tables). A comparison of the Kx
and K ^ a t B2=0,003 cm3) results is given for the UO2 cells in Tables 1-2, for the MOX cellsin Tables 3-4, for the MOX cells containing only the Pu241 in a fuel in Tables 5-6, for theTh232+U233 and Th232+U235 cells in Tables 7-8 accordingly. The WIMS7B calculations havebeen performed in the maximum number of the group approximation.
From a comparison analysis of the VVER-1000 pin cell calculation results with the differentfuel (look Tables 1-8) by the WIMS7B code one can do the following conclusions:• In the cells with the UO2 and MOX fuel the difference of the K«, and K*fr values is less or
equals 0,2% for all three nuclear data libraries. Except forms the K*fr value in the Biapproximation, where the difference of it between the 86 and 97 libraries is more 1%.
• In the cell with Pu24<the difference of the K« and K^ values between the 69 and 172libraries achieved 0,7-0,9%. Such large difference is explained with more detaileddescription of the Pu241 resonances in the 172 group library.
• In the cells with the Th232 fuel the difference of the K*, and K fr values is less 0,2% for the97 libraries and it is increased until 1% between the 86 and 97 libraries for B(
approximation.
From a comparison analysis of the VVER-1000 pin cell calculation results with the differentfuel (look Tables 1-8) between the WIMS7B code and the other ones one can do thefollowing conclusions:• Difference of the ICo and Kcfr values is more noticeable at the hot temperature (until 1%)
than at the room one (until 0,7%)• In the cell with Pu241 the difference of the K* and Y^n values obtained by the MCU and
TVS-M codes are lower on 2% than the ones obtained by the different codes. Such thelarge difference is connected with the Pu241 nuclide.
3. CALCULATIONS OF VVER-1000 SINGLE ASSEMBLIES.
A further study of the nuclear data libraries of the WIMS7B code have been performed incalculations of computational benchmark problems for the VVER-1000 unprofiled assemblies(look Fig.l) with the UO2 fuel and either with the water cells or with the PEL cells and for the
420
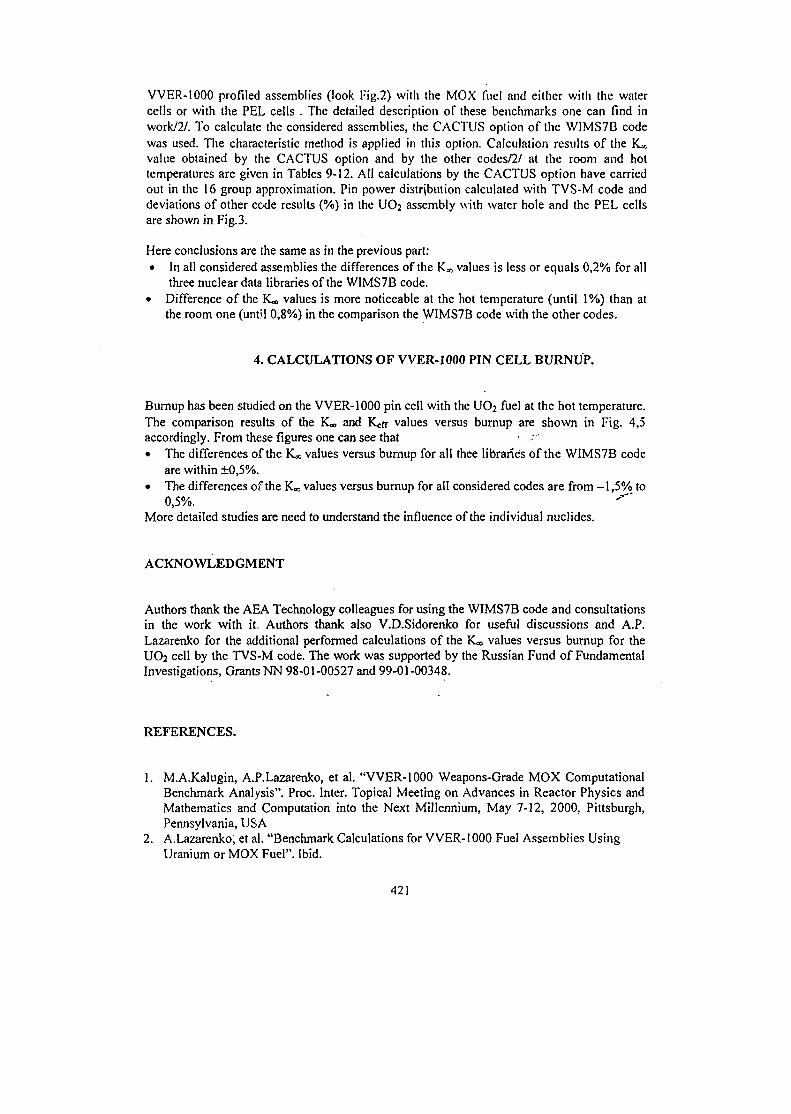
VVER-1000 profiled assemblies (look Fig.2) with the MOX fuel and either with the watercells or with the PEL cells . The detailed description of these benchmarks one can find inwork/2/. To calculate the considered assemblies, the CACTUS option of the WIMS7B codewas used. The characteristic method is applied in this option. Calculation results of the K*value obtained by the CACTUS option and by the other codes/2/ at the room and hottemperatures are given in Tables 9-12. All calculations by the CACTUS option have carriedout in the 16 group approximation. Pin power distribution calculated with TVS-M code anddeviations of other code results (%) in the UO2 assembly with water hole and the PEL cellsare shown in Fig.3.
Here conclusions are the same as in the previous part:• In all considered assemblies the differences of the 1C«> values is less or equals 0,2% for all
three nuclear data libraries of the WIMS7B code.• Difference of the K«, values is more noticeable at the hot temperature (until 1%) than at
the room one (until 0,8%) in the comparison the WIMS7B code with the other codes.
4. CALCULATIONS OF VVER-1000 PIN CELL BURNUP.
Burnup has been studied on the VVER-1000 pin cell with the UO2 fuel at the hot temperature.The comparison results of the K« and K<fr values versus burnup are shown in Fig. 4,5accordingly. From these figures one can see that • •"• The differences of the ICc values versus burnup for all thee libraries of the WIMS7B code
are within ±0,5%.• The differences of the K« values versus burnup for all considered codes are from -1,5% to
0,5%. "*"More detailed studies are need to understand the influence of the individual nuclides.
ACKNOWLEDGMENT
Authors thank the AEA Technology colleagues for using the WIMS7B code and consultationsin the work with it. Authors thank also V.D.Sidorenko for useful discussions and A.P.Lazarenko for the additional performed calculations of the K« values versus burnup for theUO2 cell by the TVS-M code. The work was supported by the Russian Fund of FundamentalInvestigations, Grants NN 98-01-00527 and 99-01-00348.
REFERENCES.
1. M.A.Kalugin, A.P.Lazarenko, et al. "VVER-1000 Weapons-Grade MOX ComputationalBenchmark Analysis". Proc. Inter. Topical Meeting on Advances in Reactor Physics andMathematics and Computation into the Next Millennium, May 7-12, 2000, Pittsburgh,Pennsylvania, USA
2. A.Lazarenko, et al. "Benchmark Calculations for VVER-1000 Fuel Assemblies UsingUranium or MOX Fuel". Ibid.
421
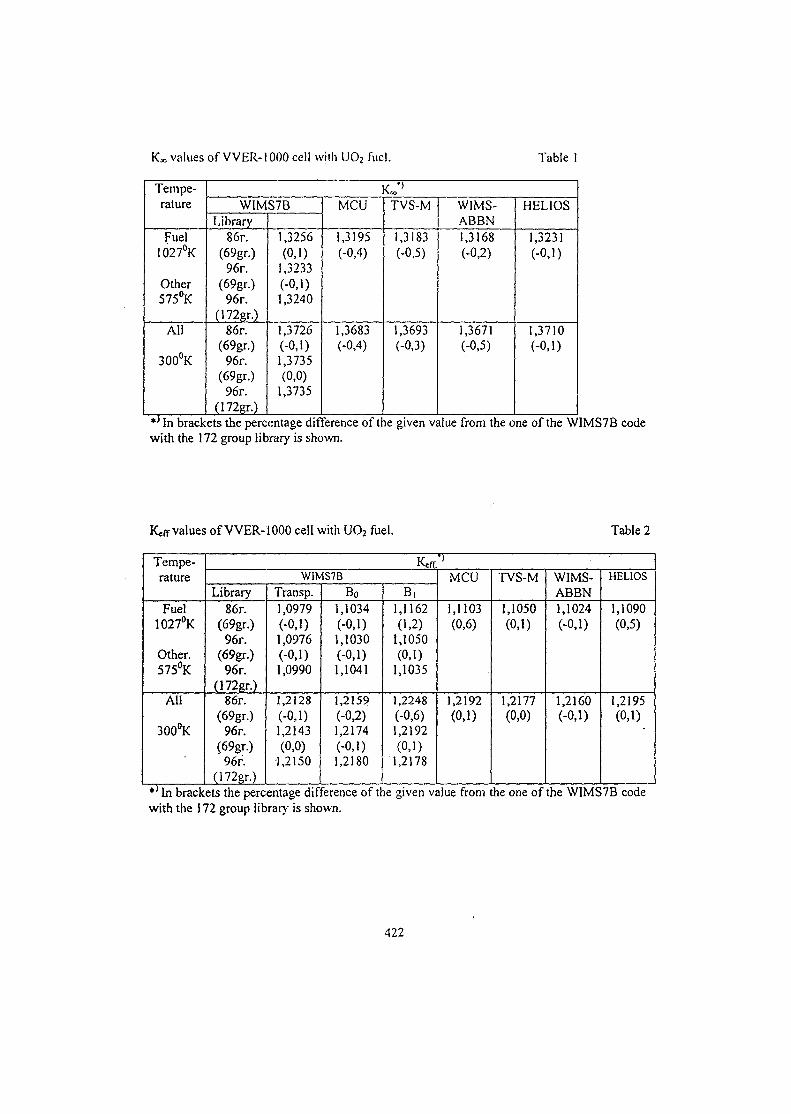
FC values of VVER-1000 cell with U02 fuel. Table 1
Tempe-rature
Fuel1027°K
Other575°K
Ail
300°K
K *'WIMS7B
Library86r.
(69gr.)96r.
(69gr.)96r.
(172gr.)86r.
(69gr.)96r.
(69gr.)96r.
(172gr.)
1,3256(0,1)
1,3233(-0,1)1,3240
1,3726(-0,1)1,3735(0,0)
1,3735
MCU
1,3195(-0,4)
1,3683(-0,4)
TVS-M
1,3183(-0,5)
1,3693(-0,3)
W1MS-ABBN1,3168(-0,2)
1,3671(-0,5)
HELIOS
1,3231(-0,1)
1,3710(-0,1)
*J In brackets the percentage difference of the given value from the one of the WIMS7B codewith the 172 group library is shown.
Kefr values of VVER-1000 cell with UO2 fuel. Table 2
Tempe-rature
Fuel1027°K
Other.575°K
All
300°K
Kcr.'*W1MS7B
Library86r.
(69gr.)96r.
(69gr.)96r.
(172gr.)86r.
(69gr.)96r.
(69gr.)96r.
(172gr.)
Transp.1,0979(-0,1)1,0976(-0,1)1,0990
1,2128(-0,1)1,2143(0,0)
1,2150
Bo1,1034(-0,1)1,1030(-0,1)1,1041
1,2159(-0,2)1,2174(-0,1)1,2180
B,1,1162(1,2)
1,1050(0,1)
1,1035
1,2248(-0,6)1,2192(0,1)
1,2178
MCU
1,1103(0,6)
1,2192(0,1)
TVS-M
1,1050(0,1)
1,2177(0,0)
WIMS-ABBN1,1024(-0,1)
1,2160(-0,1)
HELIOS
1,1090(0,5)
1,2195(0,1)
-
*' In brackets the percentage difference of the given value from the one of the WIMS7B codewith the 172 group library is shown.
422
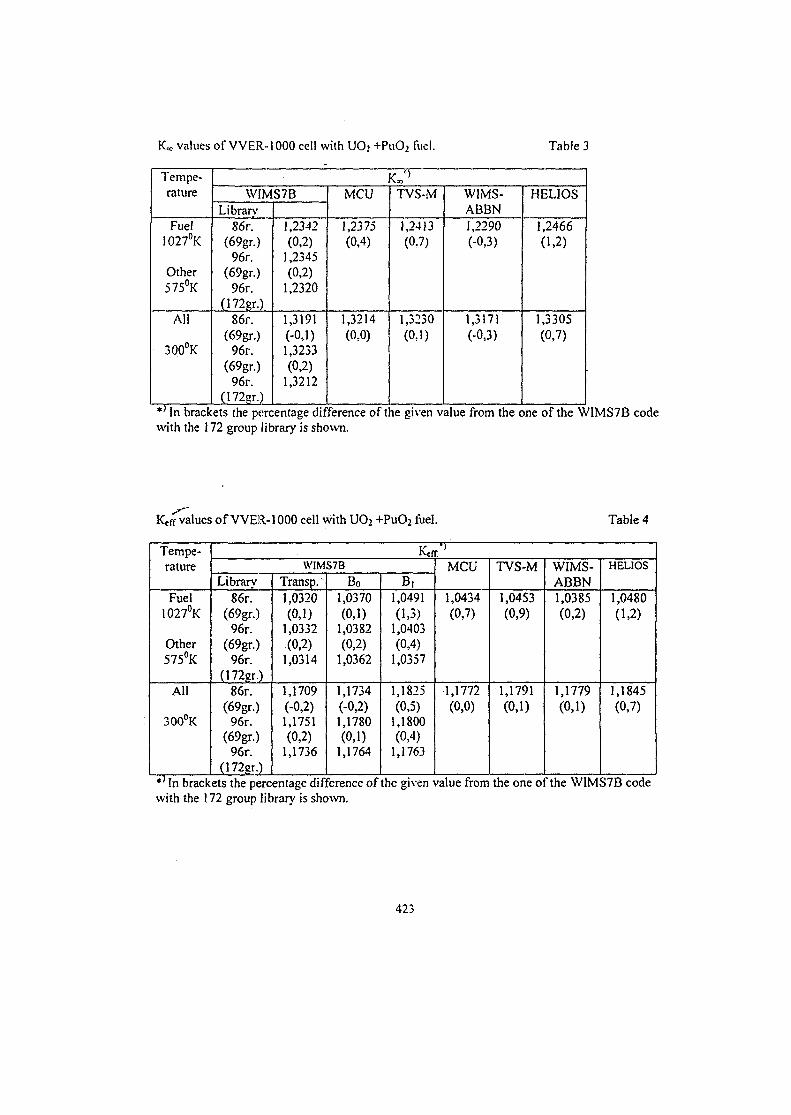
values of VVER-1000 cell with U02 +PuO2 fuel. Table 3
Tempe-rature
Fuel1027°K
Other575°K
All
300°K
WIMS7BLibrary
86r.(69gr.)
96r.(69gr.)
96r.(172gr.)
86r.(69gr.)
96r.(69gr.)
96r.
1,2342(0,2)
1,2345(0,2)
1,2320
1,3191(-0,1)1,3233(0,2)
1,3212
MCU
1,2375(0,4)
1,3214(0,0)
TVS-M
1,2413(0.7)
1,3230(0,1)
WIMS-ABBN1,2290(-0,3)
1,3171(-0,3)
HELIOS
1,2466(1,2)
1,3305(0,7)
*' In brackets the percentage difference of the given value from the one of the WIMS7B codewith the 172 group library is shown.
IQff values of VVER-1000 cell with UO2 +PuO2 fuel. Table 4
Tempe-rature
Fuel1027°K
Other575°K
All
300°K
Keff/'WIMS7B
Librarv86r.
(69gr.)96r.
(69gr.)96r.
(172gr.)86r.
(69gr.)96r.
(69gr.)96r.
(172gr.)
Transp.^1,0320(0,1)
1,0332(0,2)
1,0314
1,1709(-0,2)1,1751(0,2)
1,1736
Bo1,0370(0,1)
1,0382(0,2)
1,0362
1,1734(-0,2)1,1780(0,1)
1,1764
B,1,0491(1,3)
1,0403(0,4)
1,0357
1,1825(0,5)
1,1800(0,4)
1,1763
MCU
1,0434(0,7)
1,1772(0,0)
TVS-M
1,0453(0,9)
1,1791(0,1)
WIMS-ABBN1,0385(0,2)
1,1779(0,1)
HELIOS
1,0480(1,2)
1,1845(0,7)
*' In brackets the percentage difference of the given value from the one of the WIMS7B codewith the 172 group library is shown.
423
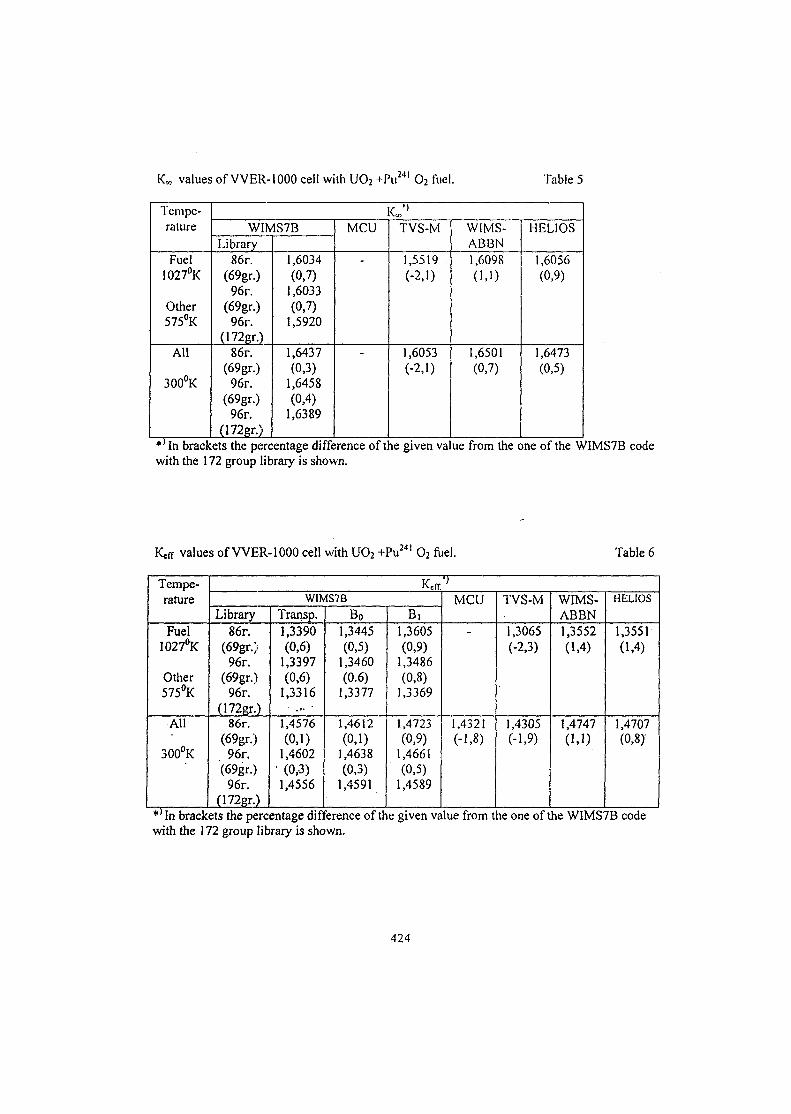
241KM values of VVER-1000 cell with UO2 +Pu*" 0 2 fuel. Table 5
Tempe-rature
Fuel1027°K
Other575°K
All
300°K
w 'I
WIMS7BLibrary
86r.(69gr.)
96r.(69gr.)
96r.(172gr.)
86r.(69gr.)
96r.(69gr.)
96r.(172gr.)
1,6034(0,7)
1,6033(0,7)
1,5920
1,6437(0,3)
1,6458(0,4)
1,6389
MCU
-
TVS-M
1,5519(-2,1)
1,6053(-2,1)
W1MS-ABBN1,60980,1)
1,6501(0,7)
HELIOS
1,6056(0,9)
1,6473(0,5)
*} In brackets the percentage difference of the given value from the one of the WIMS7B codewith the 172 group library is shown.
values of VVER-1000 cell with UO2 0 2 fuel. Table 6
Tempe-rature
Fuel1027°K
Other575°K
All
300°K
W1MS7B
Library86r.
(69gr.)96r.
(69gr.)96r.
(172gr.)86r.
(69gr.)96r.
(69gr.)96r.
(172gr.)
Transp.1,3390(0,6)
1,3397(0,6)
1,3316• . . . •
1,4576(0,1)
1,4602• (0,3)1,4556
Bo1,3445(0,5)
1,3460(0.6)
1,3377
1,4612(0,1)
1,4638(0,3)
1,4591
B,1,3605(0,9)
1,3486(0,8)
1,3369
1,4723(0,9)
1,4661(0,5)
1,4589
MCU
-
1,4321(-1,8)
TVS-M
1,3065(-2,3)
1,4305(-1,9)
WIMS-ABBN1,3552(1,4)
1,4747(1,1)
HELIOS
1,3551(1,4)
1,4707(0,8)"
'"'in brackets the percentage difference of the given value from the one of the WIMS7B codewith the 172 group library is shown.
424
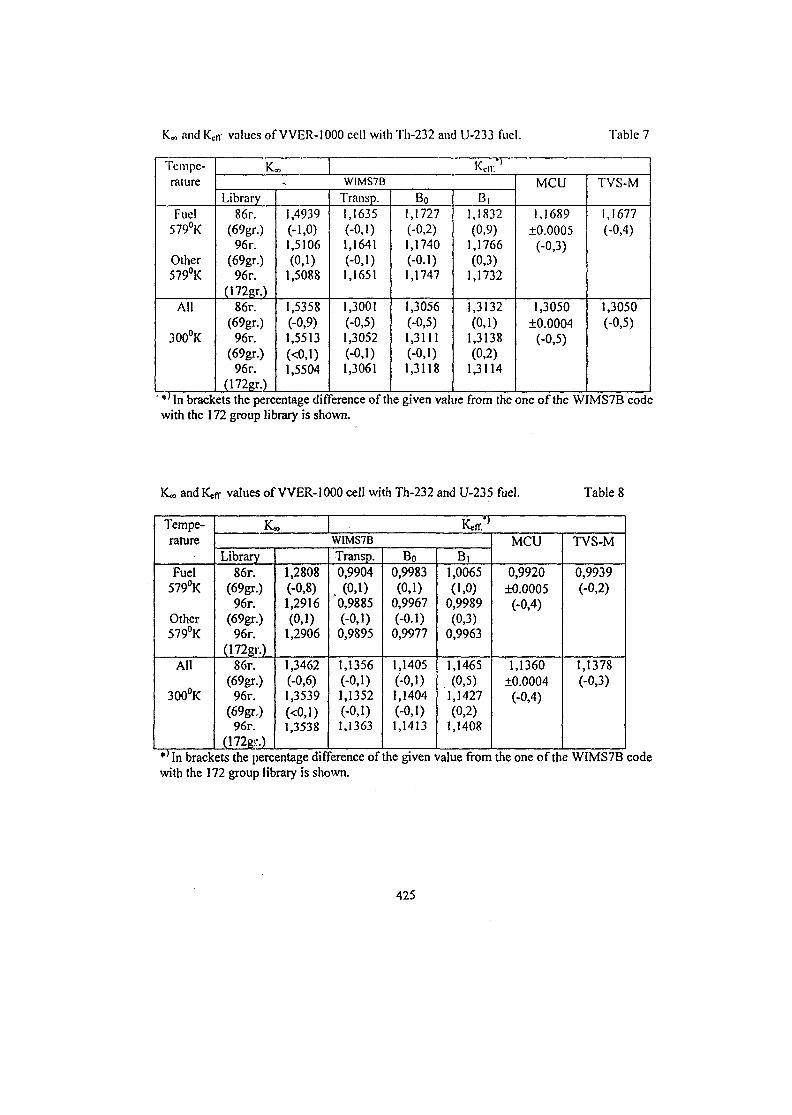
KM and Ketr values of VVER-IOOO cell with Th-232 and U-233 fuel. Table 7
Tempe-rature
Fuel579°K
Other579°K
All
300°K
K»WIMS7B
Library86r.
(69gr.)96r.
(69gr.)96r.
(172gr.)86r.
(69gr.)96r.
(69gr.)96r.
(172gr.)
1,4939(-1,0)1,5106(0,1)
1,5088
1,5358(-0,9)1,5513(<0,l)1,5504
Transp.1,1635(-0,1)1,1641(-0,1)1,1651
1,3001(-0,5)1,3052(-0,1)1,3061
Bo1,1727(-0,2)1,1740(-o.i)1,1747
1,3056(-0,5)1,3111(-0,1)1,3118
B,1,1832(0,9)
1,1766(0,3)
1,1732
1,3132(0,1)
1,3138(0,2)
1,3114
MCU
1,1689±0.0005
(-0,3)
1,3050±0.0004
(-0,5)
TVS-M
1,1677(-0,4)
1,3050(-0,5)
*' In brackets the percentage difference of the given value from the one of the WIMS7B codewith the 172 group library is shown.
K« andlQfr values of VVER-1000 cell with Th-232 and U-235 fuel. Table 8
Tempe-rature
Fuel579°K
Other579°K
All
300°K
Keft''W1MS7B
Library86r.
(69gr.)96r.
(69gr.)96r.
(172gr.)86r.
(69gr.)96r.
(69gr.)96r.
1,2808(-0,8)1,2916(0,1)
1,2906
1,3462(-0,6)1,3539(<0,l)1,3538
Transp.0,9904
, (0,1)0,9885(-0,1)0,9895
1,1356(-0,1)1,1352(-0,1)1,1363
Bo0,9983(0,1)
0,9967(-0.1)0,9977
1,1405(-0,1)1,1404(-0,1)1,1413
B,1,0065(1,0)
0,9989(0,3)
0,9963
1,1465(0,5)
1,1427(0,2)
1,1408
MCU
0,9920±0.0005
(-0,4)
1,1360±0.0004
(-0,4)
TVS-M
0,9939(-0,2)
1,1378(-0,3)
i brackets the jwrcentage difference of the given value from the one of the WIMS7B codewith the 172 group library is shown.
425
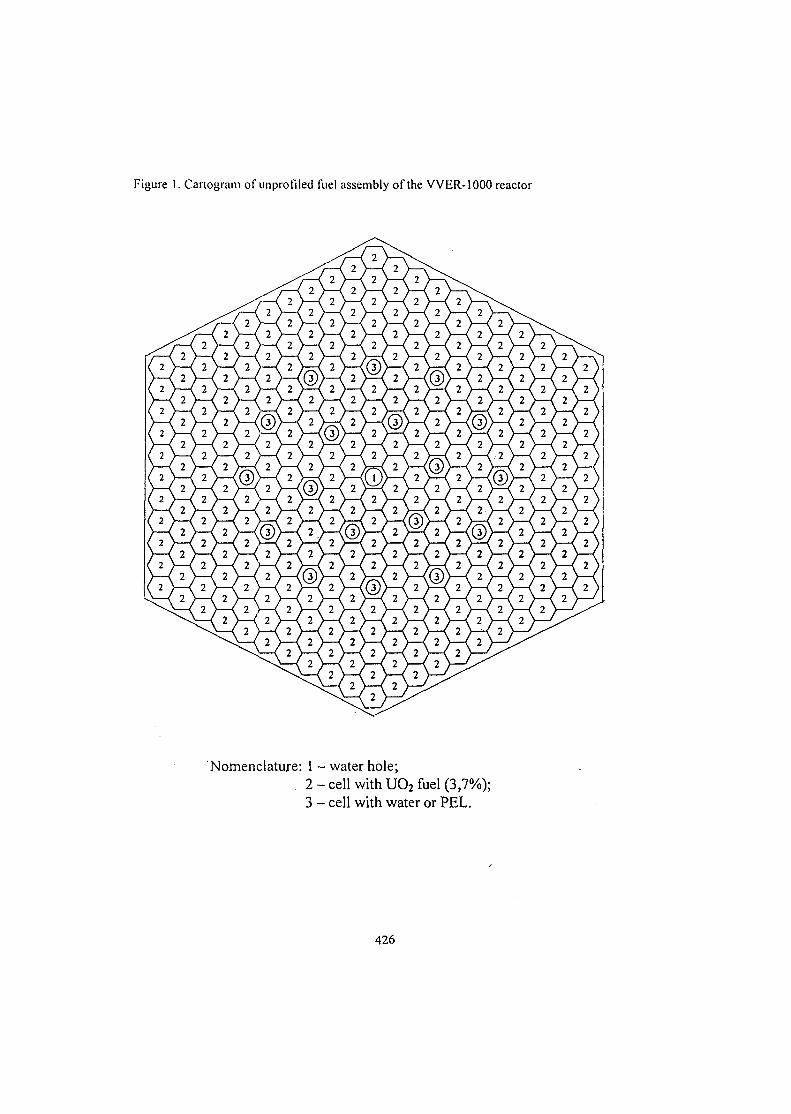
Figure 1. Cartogram of unprofiled fuel assembly of the VVER-1000 reactor
Nomenclature: 1 —water hole;2-cell with UO2 fuel (3,7%);3 - cell with water or PEL.
426
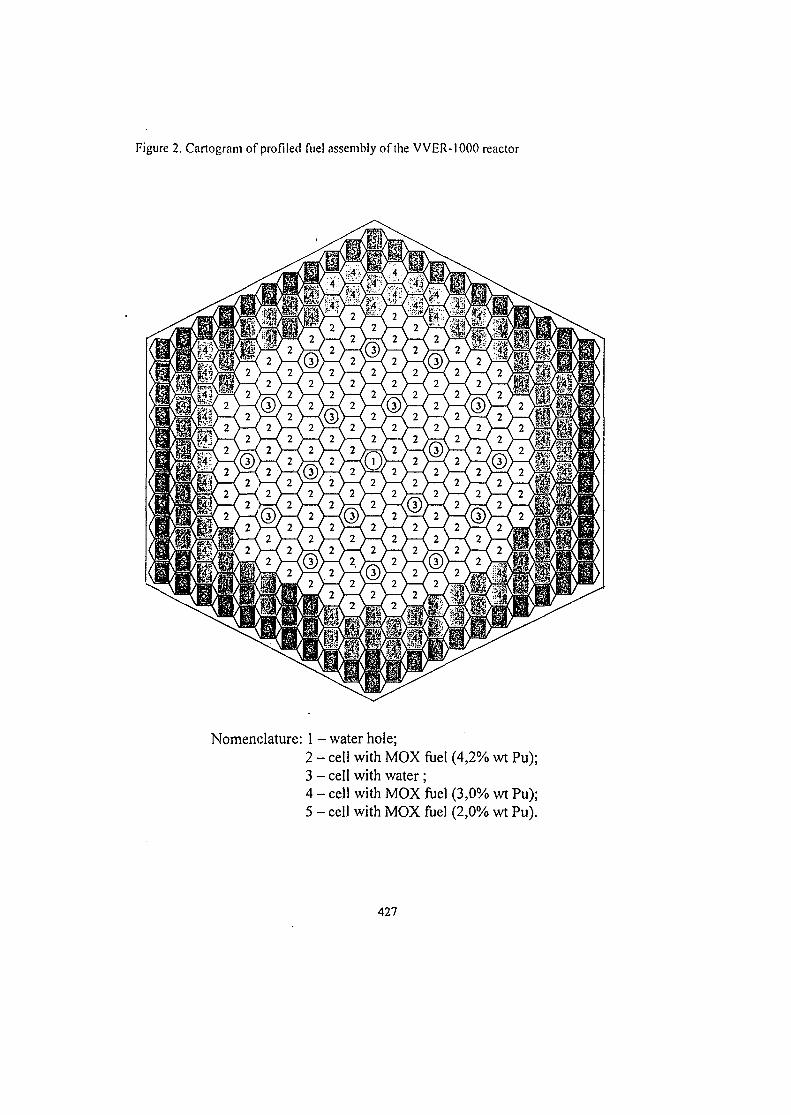
Figure 2. Cartogram of profiled fuel assembly of the VVER-1000 reactor
Nomenclature: 1 - water hole;2 - cell with MOX fuel (4,2% wt Pu);3 - cell with water ;4 - cell with MOX fuel (3,0% wt Pu);5 - cell with MOX fuel (2,0% wt Pu).
427
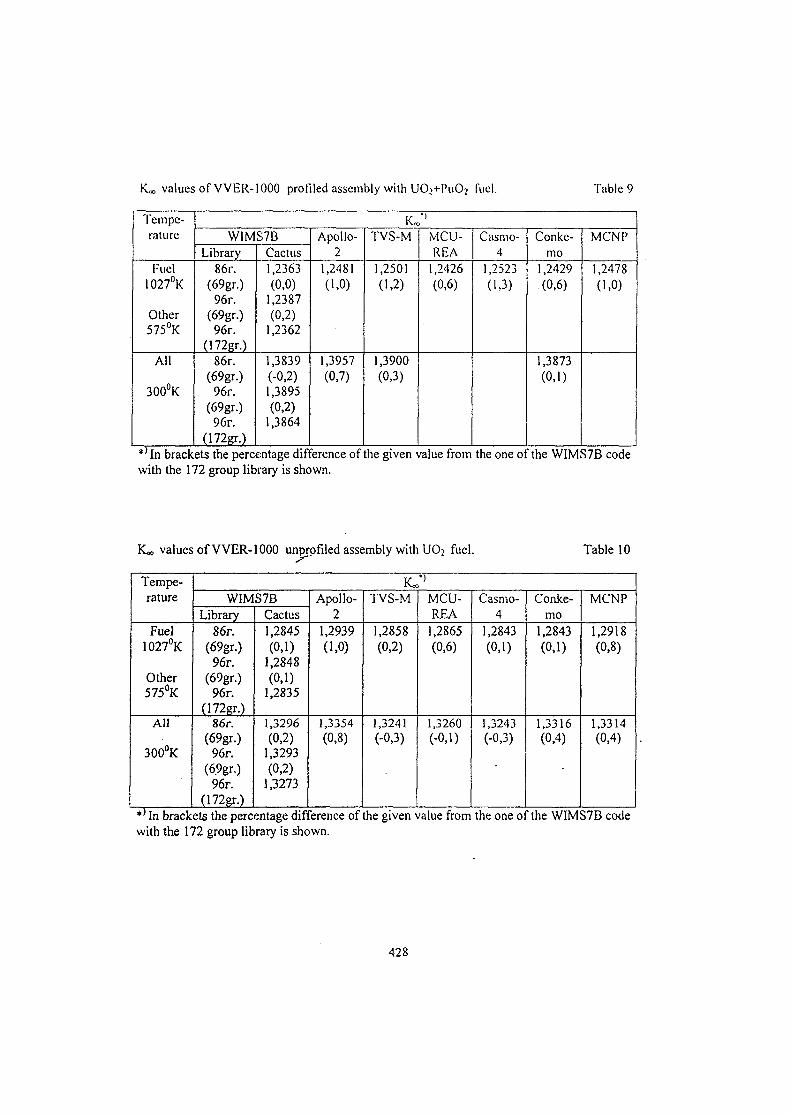
«.„ values of VVER-1000 profiled assembly with UO.+PuOj fuel. Table 9
Tempe-rature
Fuel1027°K
Other575°K
All
300°K
WIMS7BLibrary
86r.(69gr.)
96r.(69gr.)
96r.(172gr.)
86r.(69gr.)
96r.(69gr.)
96r.(172gr.)
Cactus1,2363(0,0)
1,2387(0,2)
1,2362
1,3839(-0,2)1,3895(0,2)
1,3864
Apollo-2
1,2481(1,0)
1,3957(0,7)
TVS-M
1,2501(1,2)
1,3900(0,3)
MCU-REA
1,2426(0,6)
Casmo-4
1,2523(U3)
Conke-mo
1,2429(0,6)
1,3873(0,1)
MCNP
1,2478(1,0)
*'ln brackets the percentage difference of the given value from the one of the WIMS7B codewith the 172 group library is shown.
K« values of VVER-1000 unprpfiled assembly with UO2 fuel. Table 10
Tempe-rature
Fuel1027°K
Other575°K
All
300°K
WIMS7BLibrary
86r.(69gr.)
96r.(69gr.)
96r.(172gr.)
86r.(69gr.)
96r.(6.9gr.)
96r.(172gr.)
Cactus1,2845(0,1)
1,2848(0,1)
1,2835
1,3296(0,2)
1,3293(0,2)
1,3273
Apollo-2
1,2939(1,0)
1,3354(0,8)
TVS-M
1,2858(0,2)
1,3241(-0,3)
MCU-REA1,2865(0,6)
1,3260(-0,1)
Casmo-4
1,2843(0,1)
1,3243(-0,3)
Conke-rao
1,2843(0,1)
1,3316(0,4)
-
MCNP
1,2918(0,8)
1,3314(0,4)
*' In brackets the percentage difference of the given value from the one of the WIMS7B codewith the 172 group library is shown.
428
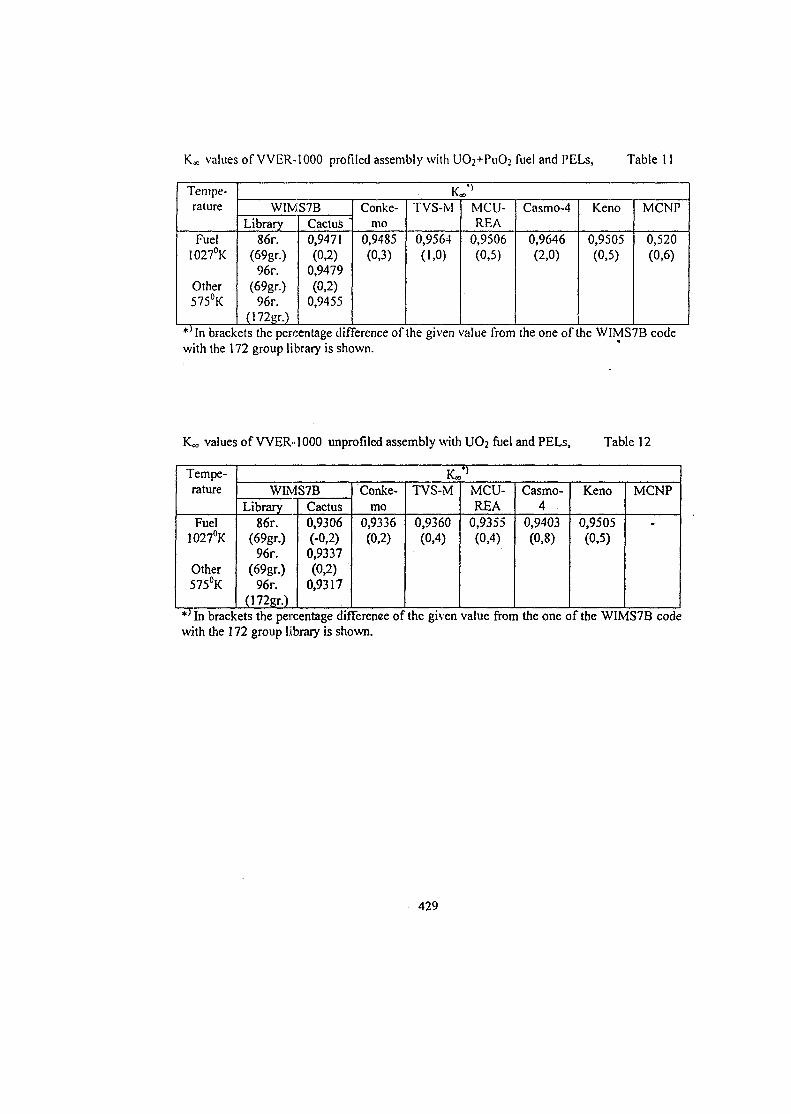
Kx values of VVER-1000 profiled assembly with UO2+PuO2 fuel and PELs, Table 11
Tempe-rature
Fuel1027°K
Other575°K
WIMS7BLibrary
86r.(69gr.)
96r.(69gr.)
96r.(172gr.)
Cactus0,9471(0,2)
0,9479(0,2)
0,9455
Conke-mo
0,9485(0,3)
KTVS-M
0,9564(1,0)
*)JO
MCU-REA
0,9506(0,5)
Casmo-4
0,9646(2,0)
Keno
0,9505(0,5)
MCNP
0,520(0,6)
*} In brackets the percentage difference of the given value from the one of the WIMS7B codewith the 172 group library is shown.
K» values of VVER-1000 unprofiled assembly with UO2 fuel and PELs, Table 12
Tempe-rature
Fuel1027°K
Other575°K
WIMS7BLibrary
86r.(69gr.)
96r.(69gr.)
96r.(172gr.)
Cactus0,9306(-0,2)
0,9337(0,2)
0,9317
Conke-mo
0,9336(0,2)
TVS-M
0,9360(0,4)
MCU-REA
0,9355(0,4)
Casmo-4 •
0,9403(0,8)
Keno
0,9505(0,5)
MCNP
*J In brackets the percentage difference of the given value from the one of the WIMS7B codewith the 172 group library is shown.
429
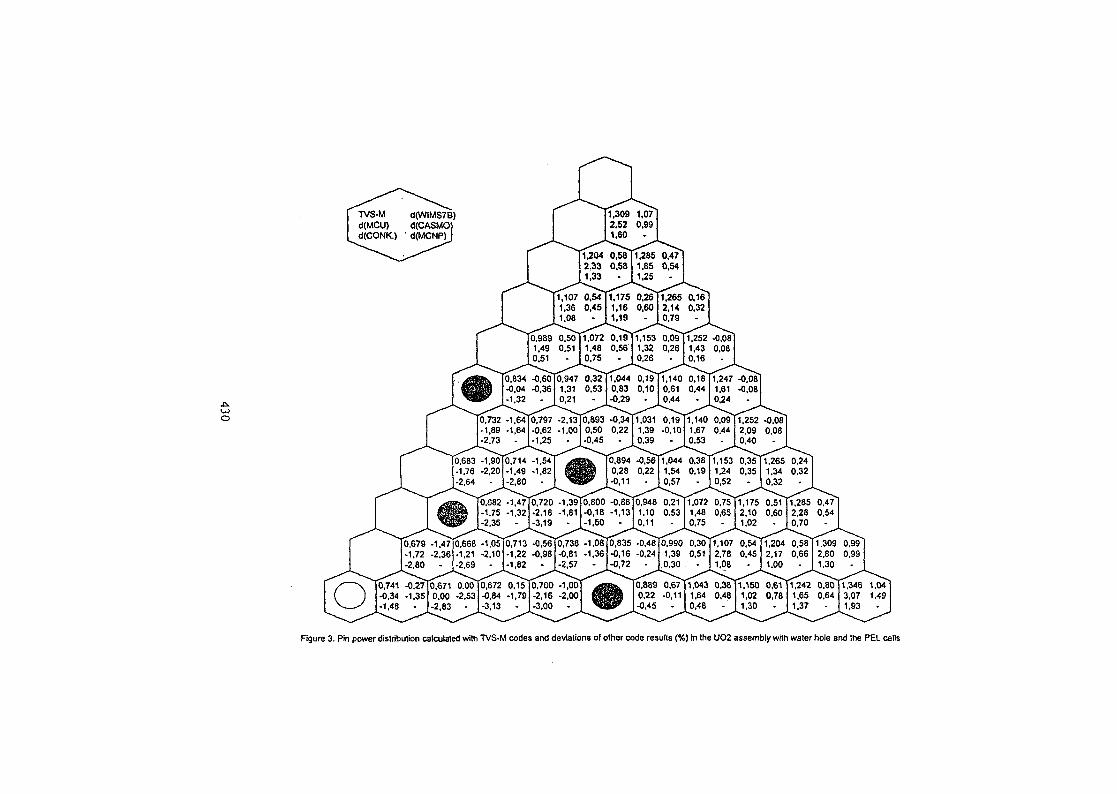
.fc.
O
TVS-M d(WIMS7B)d(MCU) d(CASMOd(CONK.) ' d(MCNP)
1,309 1,072,52 0,991,60 -
1,204 0,58 11,285 0,472.33 0.58 I 1,85 0,541,33 - 1,25 -
1,107 0,54 1.175 0,26 1,265 0.161.36 0,45 1.16 0,60 2,14 0.321,08 - 1,19 - 0.79
0,989 0,50 1.072 0,19 1,153 0,09 1,252 -0,081,49 0,51 1,48 0,56 1.32 0,26 1,43 0.080.51 - 0.75 - 0,26 - 0,16
0,947 0,32 1,044 0,191,31 0,53 0,83 0,100,21 - I -0.29
0,834 -0,60-0,04 -0,36-1,32
1,140 0,180,61 0,440,44
1,247 -0.081.61 -0,080,24 -
0,732 -1,6410,797 -2,13 0,893 -0,34 1,031 0,19 1,140 0,0911,252 -0,08-1,89 -1,64 -0,62 -1,00 0,50 0,22 1.39 -0.10 1,67 0.44 2,09 0,08-2.73 - -1.25 - 1-0,45 - 10,39 - 10.53 - I 0.40
0,683 -1,90 0,714 -1,54 0,894 -0,56 1,044 1,153 0,35 1,265
1,39 0,800-0,88 0,948 0.21 1,072 0,75 1,175 0.511,811-0,18 -1,13 1,10 0.53 1.48 0,65 2,10 0.60
-1,50 - I 0,11 - I 0,75 - I 1,02
1,285 0,472,28 0.540,70
0,682 -1,47 0,720-1,75 -1,32-2,18-2,35 - I -3.19
1,309 0,992.80 0,991,30
0.679 -1,471.72 -2.362,80 -
0,741 -0,27 0.671 0.00 0,672 0,15 0.700 -1,00-0.34 -1,35 0,00 -2,53-0,84 -1,79-2,16 -2,00-1,48 - -2.83 - 1-3.13 - 1-3,00
0,889 0,67 1.043 0.38 1,150 0,610,22 -0,11 1,64 0,48 1,02 0.78-0,45 - 0.48 - 1,30
0,80 1,346 1,040,64 3,07 1.49
1.93
Figure 3. Pin power distribution calculated with TVS-M code$ and deviations of other code results (%} in the UO2 assembly with water hole and the PEL cells
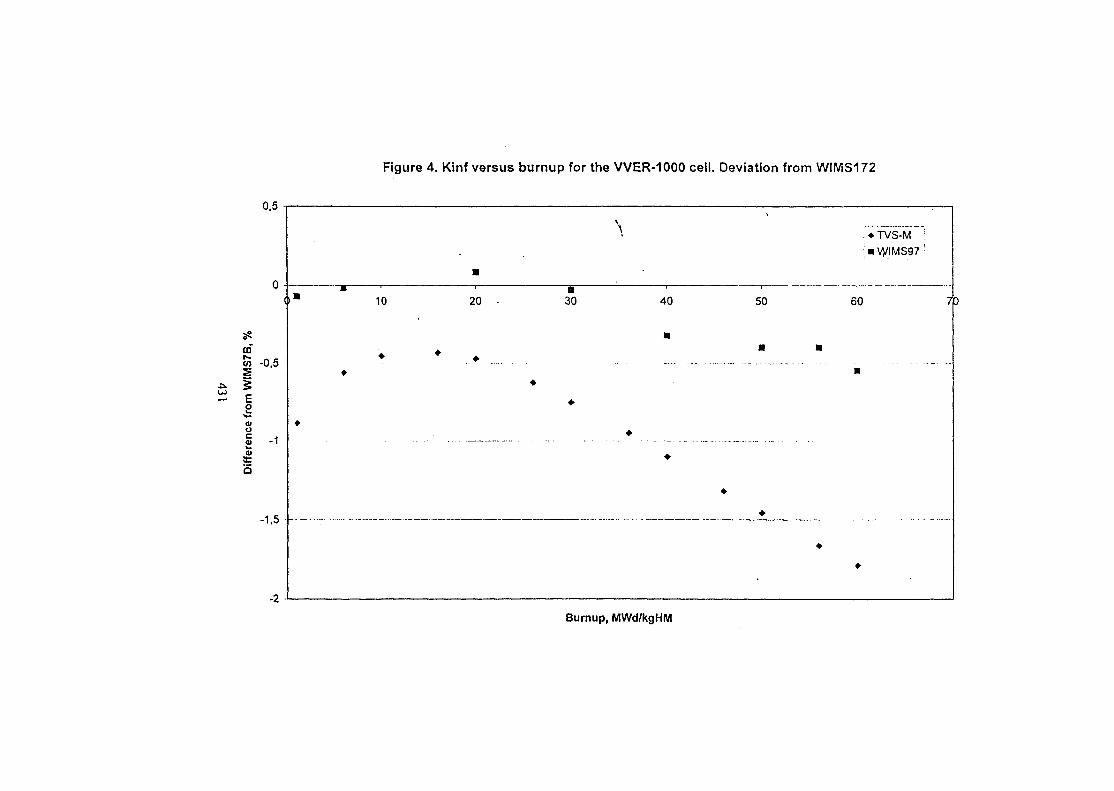
0,5
Figure 4. Kinf versus burnup for the VVER-1000 cell. Deviation from WIMS172
: • TVS-M ;
| • VVIMS97 ''
10 20 30 40 50 60
-0,5
§Eo
oS -1
15
-1,5
-2
Burnup, MWd/kgHM
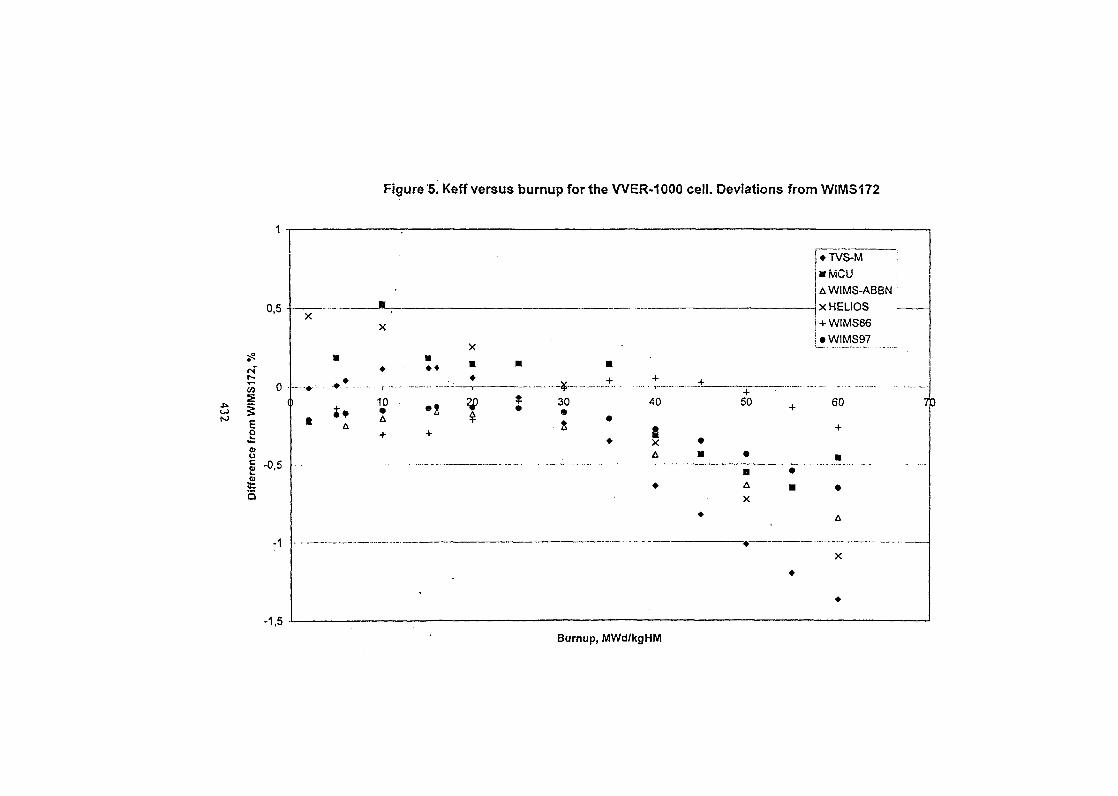
Figure 5. Keff versus burnup for the WER-1000 cell. Deviations from WIMS172
0,5
s5
ICDO
S -0,5
I
A
-1,5
. * :
10
• •
•2t
--¥--30 40
8X
• TVS-MmbACu
IAWIMS-ABBN
X HELIOS( + WIMS66! • WIMS97
50 60
•
X• •
7D
Burnup, MWd/kgHM
SK01ST102
DEVELOPMENT OF CODES FOR PHYSICAL CALCULATIONS OF VVER
A.N.NovikovRussian Research Centre "Kurchatov Institute", Moscow,
Russia
ABSTRACT
A package of codes for physical calculations of VVER reactors, used at the RRC"Kurchatov Institute" is discussed including the purpose of these codes, approximations used,degree of data verification, possibilities of automation of calculations and presentation ofresults, trends of further development of the codes.
INTRODUCTION
The works on modernization of the W E R fuel cycles necessitated an accelerateddevelopment of codes for physical calculations of these reactors. Recently the package of suchcodes used at the RRC "Kurchatov Institute" was essentially updated and expanded. Belowthe codes entering this package, their purpose, approximations used, degree of verification,possibilities of automation of calculations and presentation of results, trends of furtherdevelopment of the codes are briefly discussed.
All the codes discussed were created at the RRC "Kurchatov Institute".
PACKAGE OF CODES FOR PHYSICAL CALCULATIONS OF W E R REACTORS,USED AT THE RRC "KURCHATOV INSTITUTE"
MCU-RFFI/A Code
PurposeThe code is designed for solution of problems of 10 MeV-10'5 eVneutron transport by the Monte Carlo method. The code gives thepossibility to solve both uniform (on criticality) and nonuniform (withthe given source) problems for systems with an arbitrarily complicatedthree-dimensional geometry. The admissible boundary conditions -leakage through the external surface, white and mirror reflections,translational symmetry.
433
Mainapplications
Approximationsused
- verification of engineering codes for physical calculations of nuclearreactors;- verification of neutron cross sections on the basis of calculationtreatment of experimental results;- precision calculations of multiplying systems with a complicatedspatial-energy distributions of neutrons.
Geometry of the calculated system, its material and registration zones isdescribed as a Bulev combination of a set of simple bodies (cylinders,cones, balls, parallelepipeds, etc.). The code simulates the processes ofneutron-nucleus collisions taking into account the energy changedependence on the scattering angle. Both the use of step-by-step andcontinuous forms of nuclear cross sections dependence vs energy ispermissible. The difference in the fission spectra for prompt anddelayed neutrons can be taken into account.In the region of unresolved resonances the neutron cross sections ofnuclei are calculated by the subgroup parameters or using theBondarenko f-factors. For the region of resolved resonances both thesubgroup and point-by-point descriptions of cross sections areadmitted. The cross sections of most important nuclides are calculatedby the resonance parameters with allowance for their Dopplerbroadening. Modeling of collisions in the region of neutronthermolization can be made in the multigroup approximation or basingon the model of continuous energy variation. In both cases the thermalmotion of nuclei, effect of chemical binding and coherent effects ofelastic scattering are taken into account.Code MCU-RFFI/A has an independent bank of evaluated nuclear data,DLC/MCUDAT, which incorporates:BNAB/MCU -extended and updated version of 26-group nuclear data
library BNAB-78;LIPAR -library of resonance parameters for the region of
resolved resonances;TEPKON -library of multigroup cross sections for the region of
neutron thermalization;VESTA -library of tables of probabilities for modeling
neutron-nucleus collisions in the thermalization region,obtained from the S(a,P) scattering laws for modelingneutron-nucleus collisions in the region ofthermalization.
Bank DLC/MCUDAT is verified by the data from more than 300integral experiments; it insures the accuracy of calculations of W E R -type critical assemblies nearly equal to that obtained by MCNP codewith the use of library ENDF/B-V (0.3-0.4% in KefT).
434
Inputinformation
Outputinformation
Codefeasibilities
Applicationexperience
Code versionsavailable and inprogress
Purpose
Approximationsused
Geometry of the system, composition and temperature of materialzones and objects, boundary energies of neutron groups registered,requirements to the list and statistical accuracy of functionalscalculated.
The code gives the possibility to calculate the distributions of neutronflux, reaction rates and spectral indices, few-group neutron crosssections of materials and particular nuclides, multiplication factor andparameters of point kinetics of the system, average neutron fluxes andcurrents on the cell surfaces. For the uniform heterogeneous fuellattices with a specified buckling vector the neutron diffusioncoefficients can be obtained in the determinations of Benoist andBonalumi.
Code feasibilities are determined in many respects by the computerproductivity. The code does not impose any special requirements on the 'memory.
The code is verified and has RF Gosatomnadzor's license to be used forsolution of reactor problems.
On the basis of MCU-RFFI/A the code package MCU-REA wasdeveloped for performance of accurate calculations of bumup ofuniform fuel lattices, FAs and core fragments.
KASSETA-2 Code
Preparation and approximation multiparametric dependencies of few-group neutron cross sections for FAs and for cells of fuel rods, absorberrods, burnable absorber rods and for other cells included in these FAsas well as derivatives of these cross sections as functions of reactorstate and fuel bumup, required for the BIPR and PERMAK codes (seebelow).
Calculation of spatial-energy distribution of neutrons in the FA crosssection symmetry sector is performed with a fine (pin-by-pin) mesh bythe finite difference method with the use of four groups of neutrons.The boundary energies of groups are: 10MeV-0.8MeV-5.5keV-0.625eV-0. Macroscopic group cross sections of non-fuel cells andmaterials as well as group macroscopic cross sections of heavy nuclides
435
Inputinformation
Outputinformation
Code feasibility
and fission products in the fuel rod cells are prepared for all thespecified reactor states and for the chosen range of fuel burnups bymultigroup module UNIRASOS. The microscopic cross sections ofnuclides for two upper groups of neutrons, used in this module, areobtained by generalizing the results of multigroup calculations ofneutron spectra of typical uranium-water lattices. The nuclide crosssections for the resonance neutron group are determined bysemiempirical formulas approximating the results of multigroupcalculations and measurement data. Neutron spectra, reaction rates andnuclear neutron cross sections in the thermal energy region arecalculated using N.I. Laletin's differential model of neutronthermalization. For accounting the cell heterogeneity the first collisionprobability method is used.
Calculations of neutrons distribution in FA are performed iterativelywith refinement of the neutron leakage in the groups determined byprovision of FA criticality conditions. The determination ofdependencies of averaged few-group neutron cross sections of FA isperformed by cycles: calculation of neutron distribution in FA, reactionspeeds, averaged cross sections and their derivatives being performedsuccessively for each of specified reactor states, then a step on bumupof FA in the working state, and again the calculations for all thespecified states of FA and so on. The fuel burnup calculations areperformed pin by pin. During these calculations variations in theconcentrations of 19 heavy nuclides, six fission products and onefission pseudoproduct in the fuel are taken into account in explicitform. The approximation of found dependencies of group neutron crosssections of FA and its separate cells is reduced to the determination ofcoefficients of polynomials used by codes BIPR and PERMAK.
Geometry and materials of FA, types and location of fuel rods, absorberrods, burnable absorber rods in FA, guiding and measurement tubes,parameters of specified states (coolant temperature and density, boronconcentration in the coolant, fuel temperature, presence/absence ofxenon/samarium in the fuel, fuel bumup variation range), requiredcalculation results.
Dependencies of few-group effective neutron cross sections of FA, itscells, derivatives of these cross sections and fractions of delayedneutrons vs reactor state and fuel burnup. Coefficients of approximationof these dependencies for the BIPR and PERMAK codes. Variations ofpin by pin power distribution, fuel burnup and isotope composition,burnable absorber concentration, FA multiplying properties in theprocess of FA operation.
Specified parameters of FA state shall be limited by the values takingplace under normal operation conditions of VVER. Geometry and
436
Applicationexperience
Codes versionsavailable and inprogressof the code
Purpose
Approximationsused
materials of FA shall be close to those used in VVER-440 and VVER-1000 reactors.
Code is verified and has the RF Gosatomnadzor license forperformance of design and operational physical calculations of VVER.
KASSETA-TVEG, a version of the KASSETA-2 code makes itpossible to perform calculations for FA bundle IFBA (based on Gd2O3
and ZrB2). The code permits the calculations with the use of six groupsof neutrons (three subgroups of thermal neutrons) to be carried out.
TVS-M Code
As for the KASSETA-2 code
Code uses the nuclear data library used in the MCU-RPFI code (seeabove). For the region of slowing - down neutrons 10.5MeV>E>4.65keV (.1-12 groups of BNAB) this library, in addition to group values ofneutron cross sections of nuclides, includes their subgroup parametersand corresponding temperature dependencies, prompt and delayedneutron spectra, average energies, output fractions and constants ofdecay of the sources of six groups of delayed neutrons. For the energyregion of resolved resonances 4.65keV>E>0.625 eV (13-24 groups ofBNAB with some modification of the data for group 24) the library, inaddition to neutron cross sections of nuclides in groups and theirsubgroup parameters, contains the information on the parameters of themost important resolved resonances. For the thermal region of neutronenergies EO.625 eV the library offers the neutron cross sections asapplied to 24 energy groups. The library also includes scatteringmatrixes for oxygen and carbon, obtained in terms of gas model fortemperatures 300, 373, 473, 558 and 623°K as well as those forhydrogen in water at the same temperatures, based on Kopell-Youngmodel.
The code runs by cycles which include the following typical steps(preparing the constant library for BIPR and PERMAK codes thecontents of steps are somewhat different):- detailed multigroup transport calculations of neutron spectra for allkinds of FA cells (fuel rod, absorber rod, burnable absorber rods etc.)for their specified states, yielding 48-group neutron cross sections ofcells and cell materials and nuclides as well as nodal functionals ofcells;- 48-group diffusion fine (pin-by-pin) mesh nodal calculations ofspatial-energy distribution of neutrons in the specified FA states,
437
yielding few-group (one, two and four-groups) as well as six-group(when using three subgroups of thermal neutrons) fluxes, values andneutron cross sections of FA, cells and their materials and nuclides,corresponding to the condition of FA criticality;- fine (pin-by-pin) mesh calculation of fuel burnup in the criticalworking state of FA (burnup step is ~ 2MW.day/kg).Multiparametric dependencies of few-group neutron cross sections andof other FA characteristics and its cells, resulting from multiple cyclicrepetition of above calculation steps, are approximated. The libraries ofapproximation coefficients are given in formats used by BIPR andPERMAK codes.Detailed multigroup transport calculations of neutron spectrum in"background" fuel cells and supercells (see below) are performed forthe region of slowing - down neutrons with dividing each of twelvegroups into 10-30 intervals equal in lethargy. The slowing down ofneutrons in elastic collisions can be calculated with allowance for alinear term by the cosine of scattering angle in the center of inertiasystem. In inelastic collisions the slowing - down of neutrons iscalculated using matrixes of inelastic transitions assuming thedistribution of neutrons, slowed down to the given'group, be uniform inenergy. For nuclides with subgroup description of cross sections theheterogeneous subgroup calculation of their microsections isperformed.
Spatial distribution of neutrons in the cells and supercells is determined(with their division into an arbitrary series of concentric material zones)using the passing - through probability method. This method is basedon the use of probabilities, operatively calculated and depending onlyon the size and properties of the probability zone considered forneutrons, born in the zone as well as for those dropping to its boundary,to escape from this zone or to have there the first collision. The sourcesof neutron birth in the zones are supposed to be uniform and isotropic.The angular distribution of neutrons dropping to the zone boundary isdescribed in the P-3 approximation. On the external boundaries of cellsand supercells the conditions of mirror reflection of neutrons are used.The supercell model is used for calculations of detail neutron spectra innon-fuel cells and in "non-background" fuel cells (e.g., in the "tveg"cell containing Gd2O, in the fuel). These cells are considered as acentral region of supercell whose peripheral part is a medium ofhomogenized "background" fuel cells.
Detailed calculations of neutron spectrum in the cells for the region ofresolved resonances are performed in the similar manner but with amuch more increased number of energy intervals (up to 500 in groups16-18), considered in the groups. Calculations of neutron cross sectionsfor each required energy are performed basing on the parameters ofnuclear resonances with the use of modulus CROSS of the MCU-RFFI/A code , which permits the effects of Doppler broadening oflevels, resonance overlapping, interference of potential and resonancescatterings, etc. to be accounted in detail.
438
Inputinformation
Outputinformation
Calculations of neutron spectra in cells and supercells for the region ofthermal neutrons are performed traditionally, using 24 groups ofneutrons and scattering matrixes described above.The libraries of 48-group cell characteristics, being prepared, contain,along with neutron cross sections of cells and their materials andindividual nuclides, group nodal functionals of the cells, in particular,the transverse and longitudinal diffusion coefficients calculated bysomewhat modified Benuoist's method. Nodal functionals effectivelyaccount for the internal cell's heterogeneity.Fine mesh 48-group diffusion calculations of neutron distribution in FAare carried out by solving the system of nodal equations of neutronbalance in the cells using cycles of internal and external iterations andcorresponding methods of their acceleration. The neutron balanceequations are based on the possibility of presenting the solution insidethe cells as a linear combination of symmetrical and antisymmetricaleigenrunctions. Spatial-energy distributions of neutrons for thespecified FA states, obtained in the calculations, depend on thedirection of neutron leakage vector (along or across FA).Burnup calculations are performed rod-by-rod within FA in the criticalworking state. The variations in the concentrations of heavy nuclides(from Th-232 to Cm-244), 96 fission products (from Kr-82 to Dy-163)in the fuel, the concentration and isotope composition of burnableabsorber in burnable absorber rod and tveg cells are taken into accountin explicit form. It is possible to obtain the information about changesin the nuclide compositions of both for the cells on the average and forindividual geometrical zones identified in these cells. The code allowsthe influence of FA powerless outage time (at refuelings and storage ofirradiated FA in the fuel pond) on the isotope composition of fuel andmultiplying properties of FA to be taken into account. The code makesit possible to calculate the changes in the ratio of Rh detectors signal toFA power during their operation. Using the neutron spectra andreaction speeds, obtained in the calculations for specified states ofneutron distributions in FA and its cells, the multiparametricdependencies of two-group neutron cross sections and diffusioncoefficients of FA for the BIPR codes and 4-6 group neutron crosssections and nodal functionals of the cells for the PERMAK codes ,needed for the calculation of the reactor as a whole, can be determinedby averaging and approximated.
Geometry and materials of FA, types, characteristics and location of FAcells, parameters of the specified states of FA, requirements to the usedapproximations, problems to be solved, content and formats of thepresentation of calculation results.
Coefficients of approximation of multiparametric dependencies of few-group neutron cross sections as well as of other characteristics of FA
439
Codefeasibility
Applicationexperience
Code versionsavailable and inprogress
Purpose
Approximationsused
Inputinformation
and their cells in the formats of the BIPR and PERMAK codes , changein the isotope composition of fuel and burnable poison in the process ofFA operation, , results of additional calculations performed on theuser's requests.
Geometry, materials and parameters of FA state shall be close to thoseused in the VVER reactors under normal operational conditions.
The code is verified and has the RF Gosatomnadzor license to be usedfor design and operational physical calculations of VVER.
Additional calculation modules are being developed to extend thecomposition and to increase the detalization of the results obtained.
BIPR-7 Code
Calculations of the criticality parameters, reactivity effects andcoefficients, differential and integral control rod worths, three-dimensional power distributions in the VVER-440 and VVER-1000cores, calculation modeling of burnup and refuelings processes, xenon-135 and samarium-149 transients.
Two-group diffusion approximation is used. The system of neutronbalance equations is solved using a coarse, three-dimensional, meshhexagonal in plan mesh whose nodal points coincide with the FAcenters. The neutron balance equation uses effectively seven flux pointsin the FA cross section (in its center and by angles). Accounting ofthermal neutron leakage is made in the approximation of two half-spaces. Calculation of the reactivity coefficients and other parametersof points kinetics is performed on the basis of perturbation theory inone-group approximation.
Geometry of the core, reactor thermal power, inlet coolant temperature,density and flow rate, size, type and locations of fixed FA and CR fuelfollowers in the core, fuel burnup distribution as well as theconcentrations of promethium and samarium along the height of fixedFA and CR fuel followers, distribution of CRs by the withdrawalpriority groups, location of CR in the core height, libraries ofcoefficients of approximation of multiparameteric dependencies of two-group neutron cross sections, diffusion coefficients of FA, boundaryconditions for CR absorbers, radial and axial blankets, the symmetrysector of the reactor used in the calculations, the amount of calculation
440
Outputinformation
Feasibilityof the code
Applicationexperience
Code versionsavailable and inprogress
Purpose
Approximationsused
layers in the core height, the number of the calculation layer forperformance of pin-by-pin calculations of fuel burnup by thePERMAK-360B code (see below), the type of the problem to besolved, format of printing results etc.
The resulting information corresponds generally to the informationspecified above in the item "Purpose". By the extension of the sourceinformation the code can be used for the comparison of the calculationswith the data on startups and fuel load operation, determination of therepeated criticality temperature at the end of fuel load performance,simulation of core life prolongation, etc. To carry out PERMAK-360Bcalculations the information is given on the variation of boronconcentration in the coolant during the fuel load bumup, power of thecalculating layer, coolant temperatures and axial components ofneutron flux buckling in each FA for this layer.
The code gives a possibility to perform calculations for the coresymmetry sectors 30, 60, 120, 180 and 360 degrees. The code isprovided with an archive which offers the possibility to continue therun upon interruption and cyclic performance of burnup calculations fora series of fuel loads.
The code is verified and has RF Gosatomnadzor's license to be usedfor design and operational physical calculations of VVER reactors.
The BIPR-7A code is the version of the BIPR-7 code, which isincluded in code package KASKAD (see below).
BIPR-8 Code
It is similar to that of the BEPR-7 code but with achieving a higheraccuracy of calculations.
Code BIPR-8 is a nodal three-dimensional two-group diffusionphysical model of VVER. The core is represented as a system ofequivalent regular hexagonal prisms (nodes) formed mentally bydividing the FAs in height by horizontal planes. Along with the propercore, the calculation region may be added with nodes of the side, topand bottom reflectors as well as (for the VVER-440) with CRabsorbers. The node properties are characterized by their averagedgroup neutron cross sections. Two groups of neutrons are considered:slowing - down (1) and thermal (2). It is assumed that the neutron
441
distributions inside the nodes can be represented as the sum ofasymptotic <l>,s(p,(p,z) and transient Ot components:
O| = Oas + p<t>, <I>2 = r<I>as + OtHere p,<p,z - are the local coordinates connected with the node centers(taking into account the hexagonal form of nodes the range of pvariation is a function of (p)
14
®x = lO°lge"AE/L. where
O°,g. is the average value of transient solution on the g surface of node(g=l...G, G=14 due to account for the contributions of each of halvesof the side bounds of the node to the transient solution);Ag is the shortest distance from the considered point of node to itssurface g;L- is the length of thermal neutron diffusion in the node.It is supposed that the asymptotic components of the solution in thenodes permit separation of the variables
fl>M-R{p,<p)Z(z)where both R and Z can be represented by the sum of theirsymmetric (s) and asymmetric (a) components:
R=ARs(p) + Ra(p,<p) Z = Zs(z) + BZa, where
Rs = J0(B,p) Ra = I bJUBrp) cos (mcp + 8m) for Br2 > 0 and
Rs = Io(Brp) R, = Z bmIm(Brp) cos (m<p + 5m) for Br2< 0, and
Zj = cos (Bzz) Z, = sin(Bzz) for B ^ O , andZ« = ch(Bzz) Z, = sh(Bzz) for Bz
2 < 0
Here Jm and Im - are the Bessel functions of the real and imaginaryarguments;Br and Bz
2 - are the buclings of radial and axial distributions of theasymptotic component of the neutron flux in the nodeBr + Bz
2 = je20 ae2
0 = (Ko/Keff - 1)/Mo2, andae2
0 , Ko and Mo2 - are the asymptotic values of the material buckling,multiplication factor and squared length of neutron migration in thenode.At the above approximations the system of node neutron balanceequations, based on the use of the conditions of sewing the averagedgroup fluxes and currents on the boundary surfaces common for'neighbor nodes permits the eigenvalue of the problem to be iterativelyfound, and the values of group neutron fluxes Fi and F2, average overthe node volume, to be determined. Cycles of inner and outer iterationsare used with corresponding procedures of their acceleration.In the course of iterations the values of A,B,bm, 8m,cl)otgi Br
2, B z \ r, p, Fi,F2 and K«ff are successively refined. The feedback effects are consideredat the stage of outer iterations. The principles of determination ofcriticality parameters, reactivity effects, control rod worths, simulationof burnup and refueling processes as well as of Xe-135 and Sm-149
442
Inputinformation
Outputinformation
Codefeasibility
Applicationexperience
Code versionsavailable and inprogress
Purpose
transients are similar to those used in the 13IPR-7 code . The calculationof reactivity coefficients and other parameters of point kinetics of thereactor is performed on the basis of perturbation theory in the two-group approximation. The BIPR-8 code ensures a higher accuracy ofcalculations (comparing with the BIPR-7 calculations the errors in K,,rvalues and in the description of power distributions are reduced byabout an order of magnitude)
The input information is similar to that for the BIPR-7 code . When theCR absorbers and reflectors are introduced into the calculation region,the two-group neutron cross sections of the corresponding nodes shallbe specified.
The output information is similar to that for the BIPR-7 code. Apossibility is given to output an additional information on the averagevalues of group neutron fluxes and currents on the external nodesurfaces and on power distributions inside the nodes.
As for the BIPR-7 code
The code is verified and has the RF Gosatomnadzor's license to be usedfor design and operational physical calculations of VVER reactors.
BEPR-8KN is a version of the BIPR-8 code offering the possibility toanalyze the effects of three-dimensional space-time kinetics of powerdistributions in the VVER cores with allowance for six groups ofdelayed neutrons. Together with the ATHLET code developed by GRSspecialists (Germany) this code forms a physical and thermal-hydraulicpackage of code for the analysis of VVER reactivity accidents. Aversion of this code package was created where the ATHLET code isreplaced by the.Russian code RASNAR-2.
PERMAK-360B Code
Comparison of the calculation results with the measurement dataobtained on the critical facilities. Preparation of boundary conditionsfor the side reflector, used in the BIPR-7 code. Performance of two-dimensional pin-by-pin calculations of VVER fuel load bumup in thespecified core cross section.
443
Approximationsused
Inputinformation
Outputinformation
The four-group diffusion approximation is used. The system of cellneutron balance equations is solved by the finite difference method ontwo-dimensional hexagonal mesh whose nodal point's coincide with thecenters of FA fuel rods. The calculation region, in addition to FA cells,includes the cells of the reactor side reflectors. In the comparison ofcalculations with the measurements on the critical fapilities the neutronleakage along the assembly height is expressed through the value of FAheight buckling. Preparation of boundary conditions for the BIPR-7code is performed by the calculation of group values of neutron fluxesand currents averaged over the peripheral faces of peripheral FAs. Thetwo-dimensional pin-by-pin fuel burnup calculations are performedwith effective allowance for the three-dimensionality of the reactor. Forthis purpose, in addition to multiparametric dependencies of cell few-group neutron cross sections, the information obtained from thepreliminary BIPR-7 calculations on changes during the FA operation,in the boron concentration in the coolant, calculated layer power and,(individually for each FA in the layer) local (for this layer) values ofheight bucklings and coolant temperatures are used.
The input information depends on the type of the problem to be solved.In the comparison of the calculation results with the data ofmeasurements on the critical facility it is needed to have the descriptionof its structure and four-group neutron cross sections for all itscalculation cells. In the preparation of boundary conditions for the sidereflector of the reactor, required by the BIPR-7 code for the coresconsisting of several types of FA, the necessary information can bespecified in FA - by FA mode. In performance of pin-by-pincalculations of fuel load it is necessary to have:- charts of FAs location (by their types) in the core;- libraries of approximation coefficients for multiparametricdependencies of cell four-group neutron cross sections for these FAsand for side reflector;- results of BEPR-7 calculations of fuel load burnup, required by thiscode (see above);- results of pin-by-pin burnup calculations by the PERMAK code ofprevious fuel load of the core.
The code gives the possibility to obtain from the calculations:- calculation values of K^-of the critical facility as well as distributionsof group neutron fluxes, reaction rates and spectral indices in its cross-section;- two-group boundary conditions for the external faces of peripheralFA, required by the BIPR-7 code;
444
Code feasibility
Applicationexperience
Code versionsavailable andin progress
Purpose
Approximationsused
- changes in pin-by-pin power distribution and FA fuel burnup duringthe fuel load operation, with indication of the highest powered fuel rodlocations and fuel burnups.
The code admits the possibility to perform calculations for coresymmetry sectors 30, 60, 120, 180 and 360 degrees. This allows theeffects due to transfer of FA with asymmetrical properties to theopposite sector of core symmetry to be analyzed. The code has a specialcalculation module for obtaining the values of group neutron fluxes andcurrents averaged over FA faces, and for determining one- and two-group neutron cross-sections and other FA characteristics, in particular,changes of multiplication factors of FAs during their operation.
The code is verified and has the RF Gosatomnadzor's license to be usedfor design and operational physical calculations of VVER.
PERMAK-A is a multilayer version of the PERMAK-360B codeincluded in the code package KASKAD (see below).PERMAK-3D is a three-dimensional fine (pin-by-pin in plan) meshfour-group diffusion code for analysis of the features of powerdistributions in the W E R cores with sharp changes in the neutronspectrum (near the compound section of absorber - CR fuel follower ofWER-440, near the lower part of absorber cluster of VVER IOOO, inthe area of CR fuel follower insertion to the lower supporting plate ofWER-440, etc.)
KASKAD Code package
The increase in the detalization and extension of the nomenclature ofW E R physical calculations. Automation of:- comparison of calculation results with the data on startup andoperation of fuel loads;- performance of calculations of detailed neutronic characteristics offuel loads and presentation of the results (in accordance with thenomenclature of such results, adopted in RF);- checks of correspondence of the calculated characteristics of chosenfuel load to the adopted design restrictions (in particular, fuel bumup-depending restrictions on the linear heat generation rate of fuel rods and"jumps" of these rates during refueling operations, CR movements andreactor power variations).
The code package includes:- codes BIPR-7A, PROROK-A, PERMAK-A and PIR-A (see below);
445
- archive H1PI-A containing the information on the operation history ofpower units of the given NPP (compositions and fuel loading patterns,calculated characteristics as well as the data on startup and operation offuel loads, in-core monitoring system characteristics, etc.);- needed input information and libraries of constants for the abovementioned codes;- requirements and design restrictions for. the development offorthcoming fuel loads;- a control-supervisor code ensuring operative interactions of the abovecodes and their communication with the archive.The three-dimensional coarse mesh two-group diffusion code BIPR-7Ais the basic calculation module of the code package. Theapproximations used are similar to those indicated for the BIPR-7 code.In the calculations of fuel load burriup it prepares the information for allthe core calculation layers (for VVER-440 fuel loads 25 layers arenormally used) required by the PERMAK-A code.The PROROK-A code is used for optimization of rearrangement of FAin the reactor core during the refuelings.The multilayer two-dimensional fine mesh diffusion six-group (usingthree subgroups of thermal neutrons) code PERMAK-A is used forperformance of pin-by-pin calculations of fuel load bumups and forobtaining the information on variations of linear heat generation ratesof fuel rods during CR group movement, reactor power changing andXe-135 transients. The equations of neutron balance in the cells forthree upper neutron groups in this code are based on the finitedifference approximation. For three subgroups of thermal neutrons thenodal balance equations are used. This ensures a higher accuracy ofdescription in calculations of efficiencies of absorber rods and burnableabsorber rods, power distributions in FA fuel bundles and rate ofgadolinium burnup in fuel rods with uranium-gadolinium fuel.The PIR-A code is used in the code package for:
- restoration of power distributions in the core by thermocouplereadings and signals from rhodium (Rh) detectors (with thedetermination of FA powers and power distributions in the FA height);- comparisons of calculated power distributions with restored ones;- comparison of physical core characteristics (criticality parameters,reactivity effects and coefficients, CR worths etc.) measured in thestartups and operation of fuel loads with the calculated ones.The restoration of power distribution in the core is carried out using thecalculation modules of coolant heating in FA and connection of Rh-detector currents with the local FA power. The calculationcharacteristics of fuel load, required for carrying out comparisons, aredetermined using the BIPR-7A code taking into account the features ofreactor state at the time of measurements (effective time of fuel loadperformance, core thermal power values, control rod positions, inletcoolant temperature, boron concentration in the coolant, Xe-135transient effects etc.).
446
Inputinformation
Outputinformation
Code packagefeasibility
Applicationexperience
Code versionsavailable andin progress
Purpose
Approximationused
Input information
The input data and libraries of constants for the B1PR-7A. PERMAK.-Aand PIR-A codes.Information on the core operation history.Requirements and design restrictions for the elaboration andsubstantiation of the forthcoming fuel load.Requirements to the succession and contents of problems to be solved,'formats of results presentation (for the control-supervisor code).
In accordance with the requirements to the control-supervisor code.
The code package made it possible to perform calculations for coresymmetry sectors 30, 60, 120, 180 and 360 degrees. The possibility isgiven to continue running after interruption and cyclic fulfillment ofcalculations for successive series of fuel loads. The code package offersto the user the possibility of visualization of the input data, process ofcalculation performance and results obtained.
The BIPR-7A, PERMAK-A and PIR-A codes included to the packageare verified and have the licenses to be used for design and operationalphysical calculations of W E R reactors.
PERMAK-AT is a version of the PERMAK-A code giving theinformation on the conditions of fuel rod performance in FA(temperatures of fuel, cladding and coolant jets, pressure of fission gasin fuel rods, DNBR, etc.).Development of additional calculation and service modules forextending the code package feasibility is in progress.
IR Code
Calculation modeling and analysis of possibilities of optimization ofpower changing in the VVER-1000 reactors
Similar to those used in the BIPR-7A and PERMAK-A codes.
Similar to those used in the BIPR-7A and PERMAK-A codes.Additionally, the requirements to power changing and the informationon the previous history of reactor operation, necessary for accountingforthe current state of Xenon-135 transient, are specified.
447
Output information
Codefeasibility
Applicationexperience
Code versionsavailable andin progress
Changes of the reactor criticality parameters and power distribution inthe core (in particular, the linear heat generation rate of fuel rods) in theprocess of power changing.The possibility of obtaining the information on the needs in waterexchange.
The code is adjusted for the current non-equilibrium state of the reactor,interactive mode of code running and visualization of the results ofmodeling the power changing on the monitor display.
The code is verified and has the RF Gosatomnadzor license to be usedfor the analysis of the VVER-1000 power changing characteristics. It isimplemented to pilot operation at the Novo-Voronezh, Zaporozhie andRovno NPPs.
The works are in progress on entering the IR co.de to the KASKADcode package and to the software of the normal standard ICIS ofWER-1000 reactor. The IR-440 code is being developed for modelingVVER-440 power changing.
448
SK01ST103
A Preliminary result of Calculation of Extrapolated-to-Zero-Mesh-SizeSolution (EZMSS) of the Second AER Kinetic benchmark with finite -
difference code MAG.
Igor R. Suslov
Institute for Physics and Power Engineering, Obninsk, RussiaTel. +7 0S439 94919. e-mail: [email protected]
ABSTRACT
A preliminary result of calculation of Extrapolated-to-Zero-Mesh-Size Solution (EZMSS) for theSecond AER Kinetic benchmark is presented. Calculation has been made with the code MAG.The standard MCFD (mesh - center finite difference) approximation in A-Z geometry has beenused for space approximation. The mesh refinement technique with h — extrapolation has beenused to calculate EXMSS and to evaluate its accuracy. The preliminary result shows a significantdifference with all known to author solutions generated earlier by nodal codes, in particular withDTft3D reference solution. The only exception is BIPR8 solution that seems to be rather close topreliminary estimation of the EZMSS.
The preliminary estimation for extrapolated values for K^o is in range 0.9979-0.9981 and forK«ir,i is in range 1.0084-1.0086. That gives control rod reactivity in range 2.09-2.11(3 that issignificantly higher then CR reactivity in reference DIF3D solution. An extrapolation of time-dependent calculations with 24x10 and 54x10 grids predicts peak power significantly higher thenin reference DIF3D solution.
1. INTRODUCTION
Several AER kinetics benchmarks have been proposed and investigated since 1990 to evaluate anumerical component of inaccuracy in the nodal codes used for VVER safety analyses. Theaccurate solution of that problem demands generation of High Accuracy Solution (HAS) withaccuracy much higher (something like 10 times higher) then accuracy of the nodal codes. Suchsolution can be generated as an Extrapolated-to-Zero-Mesh-Size Solution (EZMSS) from set offinite difference or finite element solutions on refined mesh grids by extrapolation technique.The main problem is that a generation of the EZMSS is numerically very expansive and itdemands very significant time and efforts to generate solution on sufficient fine mesh grids withtight criteria for iterative solver of linear algebra problem.
In this paper preliminary result of EZMSS generation for Second AER Kinetic benchmark[U.Grundmann, U.Rohde, 1993] is presented. The Second AER Kinetic benchmark models aVVER-440 reactor core with 180 grads reflective symmetry. Rod Bank 6 including the rod to beejected is inserted 200 cm in core. The radial and axial reflectors are modeled by albedoboundary conditions. The transient is initiated by eccentric rod ejection during 0.16 sec. Duringthe transient the fission cross section is temperature dependent. The feedback mechanism isbased on adiabatic increase of fuel temperature. No heat is transferred from fuel to coolant.
449
The remainder of paper is organized as follows. In Section 1 all components of numerical errorare formulated, in Section 2 (his components are be given in details for the MAG [I.R.Suslov,
, 1996] code used in this paper. Though considered problem is time dependent, very importantinformation about solution can be received with A'rll calculations for initial {ktJf(>) and "rod
ejected" (kr / l,) states. In Section 3 a preliminary result of calculation of EZMSS for kcj/ 0 , k^ ,
and initial power distribution is presented. The results of time - dependent calculation withMAG for 24x10 and 54x10 mesh grids are presented also. Some, very preliminary conclusionsand future works are presented in Section 4.
1. COMPONENTS OF NUMERICAL ERROR OF SOLUTION FOR SECOND AERKINETIC BENCHMARK
Before a discussion of the components of numerical error it should be mentioned that acceptedadiabatic model of heat transfer leads to both initial and final states of transient rigorouslyspeaking are not the steady state. Still further we will ignore that effect due to its negligible valuefor considered time interval.
The error of numerical solution consists of the following components:• Component of space approximation for diffusion equation. The finiteness of mesh grid in
diffusion operator approximation leads to error that can be arbitrary reduced with meshrefining. If the numerical convergence rate is known, the extrapolation technique can beused to improve and to evaluate the space approximation component of the error.
• Component of iterative method of solution. The solution on fine grids can be generatedonly with use of iterative method for linear algebra solver. Theoretically this error can bereduced by use of tight convergence criteria if arithmetic is exact. But practically aconvergence can not be differentiating from stagnation for iterative methods with slowlyconvergence that is often the case for fine mesh calculations. To evaluate this component oferror can be used both the calculations with several improving convergence criteria andcomparison of calculation with ordinary and double precision arithmetic. It should bementioned that, if a two-level iterative method is used then inner (one energy group) andouter (fission source) iterations must be analyzed both.
» Time approximation component. When space approximation is choused then originalproblem is reduced to solution of ordinary differential equation (ODE) system. To solve thesystem the method for approximate solution of ODE are to be applied. An accuracy ofapproximate solution depends on the time integration step. The error due to size of timeintegration step has very similar numerical features as considered above space-approximation error and can be investigated and arbitrary reduced by similar techniques(decreasing of time integration step and extrapolation) applied to time integration method.
• Component connected.with an approximation of fuel temperature distribution. Theoriginal formulation of the Second AER Kinetic benchmark involves point-wise fueltemperature distribution, though nodal codes use only assemble-wise fuel distribution. Theerror due to that approximation is reduced with space mesh grid refinement if averagingwithin assembly is not involved and code able to use point-wise cross-sections.
The presented list of components shows that generation of EZMSS is extremely complicatedproblem demanding huge number of runs with different approximation parameters to evaluateall errors. A comparison of the EZMS solutions generated by at least two different codes seemsto be absolutely necessary to receive a reliable solution of the problem.
450
2. ANALYSES OF COMPONENTS OF NUMERICAL ERROR FOR SOLUTIONCALCULATED WITH CODE MAG
The code MAG [I.R.Suslov, 1996] solves the multigroup diffusion equation in arbitrarygeometry. The last ability is provided by usage of general sparse matrix technique. Only A-Zgeometry option has been used in presented calculations. To use as fine mesh grids as possiblethe 30 grad symmetry has been used for the initial state when only 180 grad reflective symmetryhas been used for the "rod ejected" state and for time dependent calculations.
2.1 "Space approximation for diffusion equation" component. This component influencedmost significantly the results. The standard mesh-centered finite - difference scheme has beenimplemented in code MAG for space approximation. Numerically the scheme usually exhibitsquadratic convergence both in radial and Z directions, so following technique has been used tocalculate the EZMS values.
Let a starting mesh grid is defined. The index (0,0) will be used for values calculated on that"starting grid", for example k^J. Keeping number of meshes in Z - direction the mesh in plane
is refined increasing number of triangles per hexagon (tph) N'& . When values for grids with
N'I and N'*' are calculated the "A-extrapolated" value, for example k^0, for pair ( N'^, N£')
can be calculated with standard quadratic extrapolation• x 0 t ' 0 it 2 0
where
i i( i i
The difference in "A-extrapolated" values calculated with pairs (N'^. \''") and (N'*', N'^2) can
be used to evaluate achieved accuracy in k*f.
Applying the same technique in Z-direction (keeping number of tph and increasing number of z-intervals) the "Z -extrapolated" value ^ a n d its achieved accuracy can be evaluated. Finally the
"A, Z-extrapolated" value k^° (for given "starting" mesh grid!) can be calculated as
or
whereAk1 = £ * 0 -kOfi
Ak: =it°M -kOfi
The process should be repeated with more fine "starting" grid to evaluate achieved accuracy ink"f (of course, achieved accuracy in k^f and k*f should be taken into account).
Though this process "extrapolation with control of achieved accuracy" demands rather manyruns, it has an advance that the most expensive calculations with simultaneously fine grids in Aand Z directions can be avoided and the components of accuracy is well controlled on each step.
451
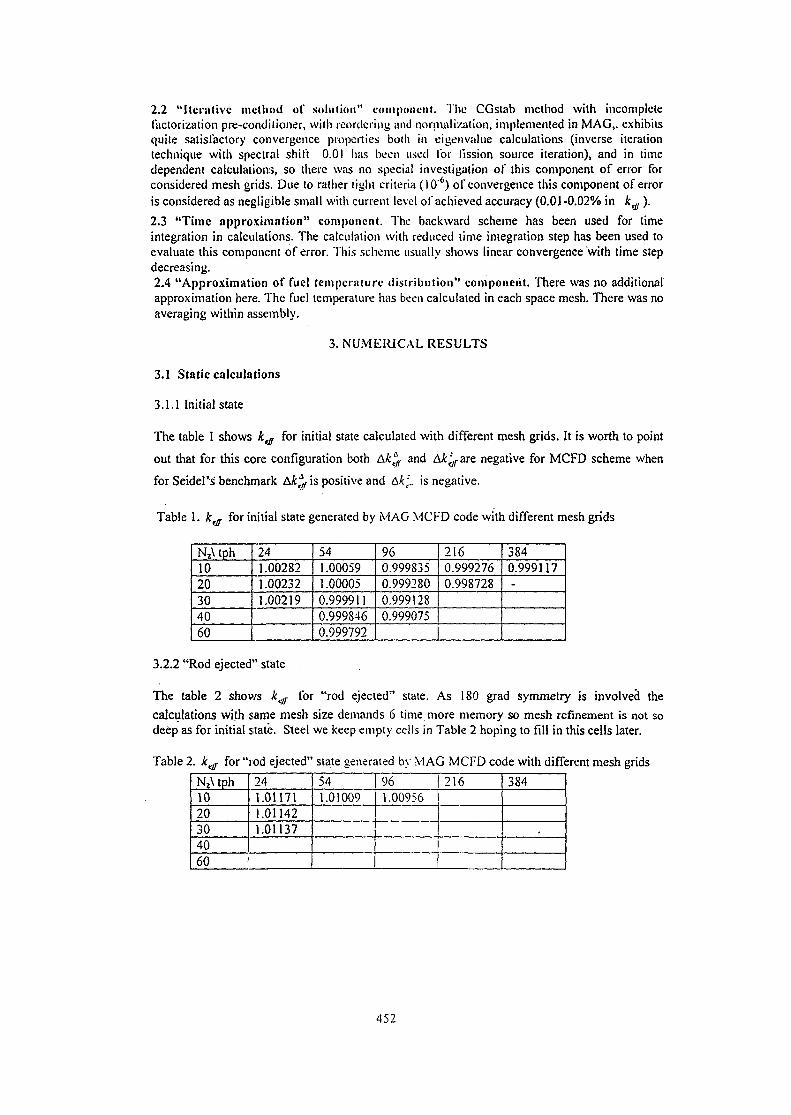
2.2 "Iterative method of .solution" component. The CGslab method with incompletefactorization pre-condilioner, with reordering and nomialization, implemented in MAG,, exhibitsquite satisfactory convergence properties both in eigenvalue calculations (inverse iterationtechnique with spectral shift 0.01 has been used for fission source iteration), and in timedependent calculations, so there was no special investigation of this component of error forconsidered mesh grids. Due to rather light criteria (10'6) of convergence this component of erroris considered as negligible small with current level of achieved accuracy (0.01-0.02% in keJ/).
2.3 "Time approximation" component. The backward scheme has been used for timeintegration in calculations. The calculation with reduced time integration step has been used toevaluate this component of error. This scheme usually shows linear convergence with time stepdecreasing.2.4 "Approximation of fuel temperature distribution" component. There was no additionalapproximation here. The fuel temperature has been calculated in each space mesh. There was noaveraging within assembly.
3. NUMERICAL RESULTS
3.1 Static calculations
3.1.1 Initial state
The table I shows kejr for initial state calculated with different mesh grids. It is worth to point
out that for this core configuration both AAj), and A ^ a r e negative for MCFD scheme when
for Seidel's benchmark Ak^ is positive and A&;',. is negative.
Table 1. k€ff for initial state generated by MAG MCFD code with different mesh grids
Nz\ tph1020304060
241.002821.002321.00219
541.000591.00005 j0.9999110.9998460.999792
960.999S350.9992800.9991280.999075
2160.9992760.998728
3840.999117-
3.2.2 "Rod ejected" state
The table 2 shov/s kejr for "rod ejected" state. As 180 grad symmetry is involved the
calculations wi.th same mesh size demands 6 time more memory so mesh refinement is not sodeep as for initial state. Steel we keep empty cells in Table 2 hoping to fill in this cells later.
Table 2. ktff for "rod ejected" state generated by MAG MCFD code with different mesh grids
Nz\ tph1020304060
241.011711.011421.01137
541.01009
96 |2161.00956
384
452
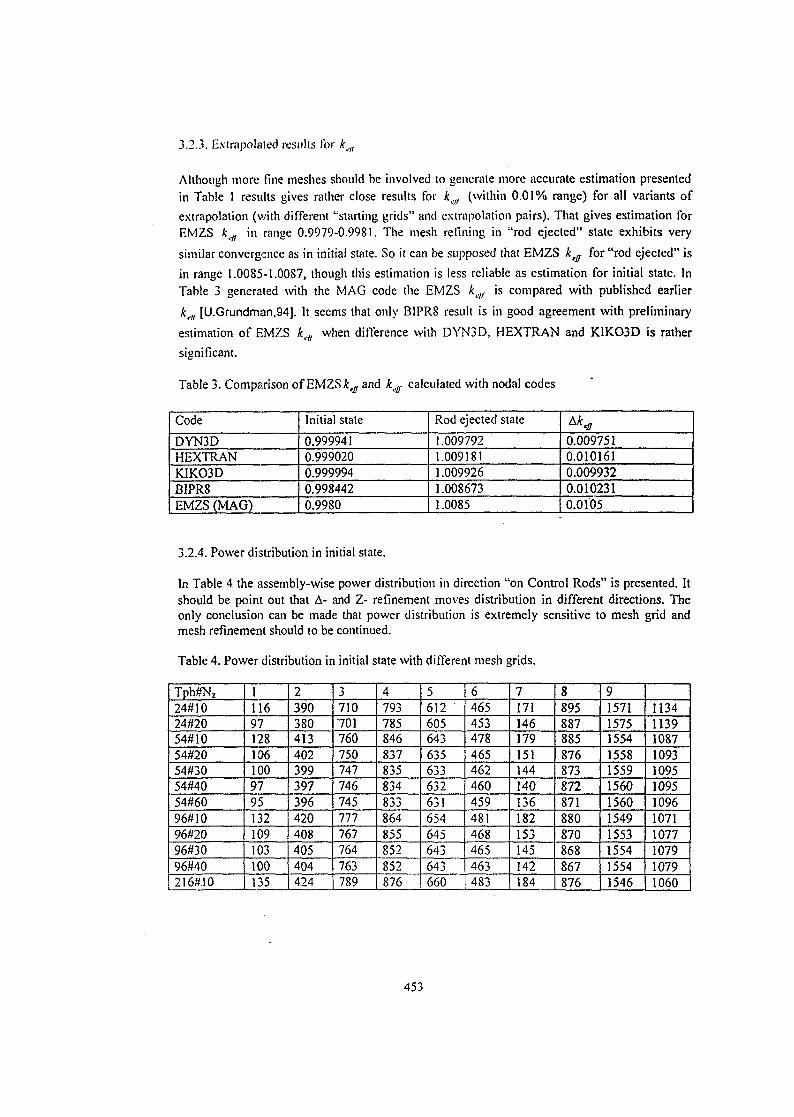
3.2.3. Extrapolated results for kcll
Although more fine meshes should be involved to generate more accurate estimation presentedin Table 1 results gives rather close results for kc// (within 0.01% range) for all variants ofextrapolation (with different "starting grids" and extrapolation pairs). That gives estimation forEMZS ktff in range 0.9979-0.9981. The mesh refining in "rod ejected" state exhibits very
similar convergence as in initial state. So it can be supposed (hat EMZS keff for "rod ejected" isin range 1.0085-1.0087, though this estimation is less reliable as estimation for initial state. InTable 3 generated with the MAG code the EMZS kvir is compared with published earlier
ktll fU.Grundman,94]. It seems that only BIPR8 result is in good agreement with preliminary
estimation of EMZS kcll when difference with DYN3D, HEXTRAN and KIKO3D is rather
significant.
Table 3. Comparison of EMZS klff and kelf calculated with nodal codes
Code
DYN3DHEXTRANKIKO3DBIPR8EMZS (MAG)
Initial state
0.9999410.9990200.9999940.9984420.9980
Rod ejected state
1.0097921.0091811.0099261.0086731.0085
Akejr
0.0097510.0101610.0099320.0102310.0105
3.2.4. Power distribution in initial state.
In Table 4 the assembly-wise power distribution in direction "on Control Rods" is presented. Itshould be point out that A- and Z- refinement moves distribution in different directions. Theonly conclusion can be made that power distribution is extremely sensitive to mesh grid andmesh refinement should to be continued.
Table 4. Power distribution in initial state with different mesh grids.
Tph#N224#1024#2054#1054#2054#3054#4054#6096#1096#2096#3096#40216#10
1116971281061009795132109103
J00135
2390380413402399397396420408405404424
3710701760750747746745777767764763789
4793785846837835834833864855852852876
5612605643635633632631654645643643660
6465453478465462460459481468465463483
7171146179151144140136182153145142184
8895887885876873872871880870868867876
9157115751554155815591560156015491553155415541546
113411391087109310951095109610711077107910791060
453
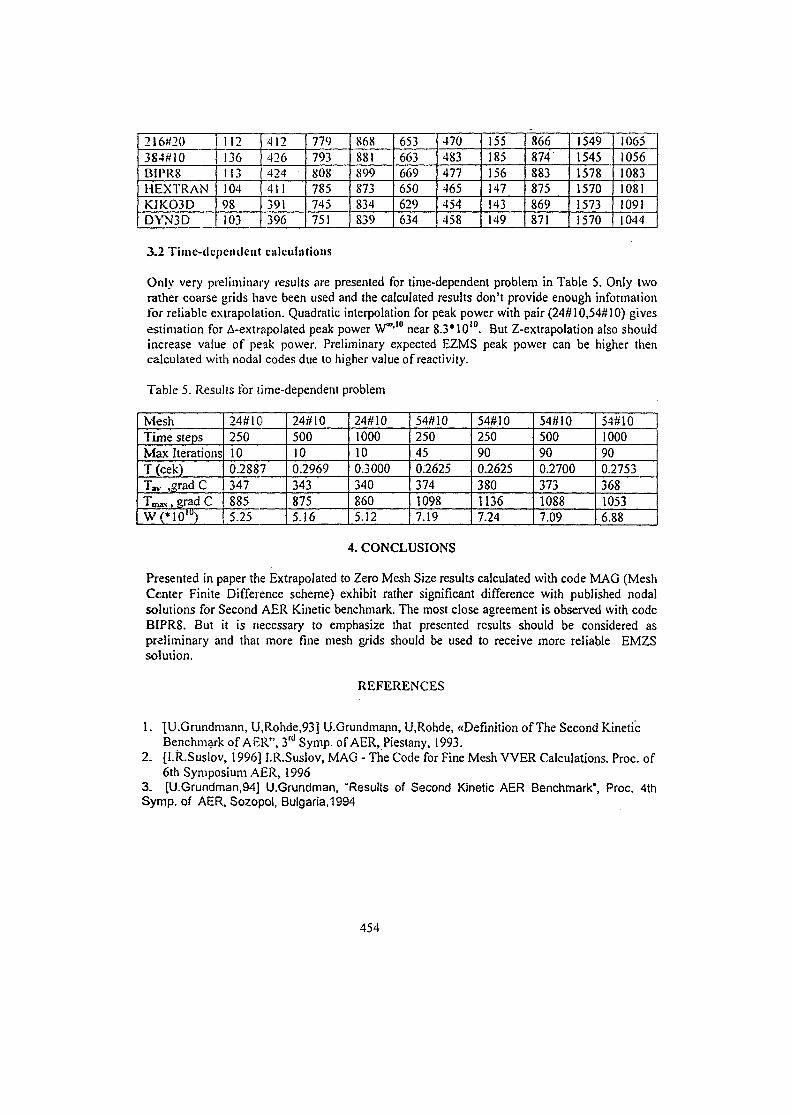
2163203S4#10BIPR8HEXTRANKJKO3DDYN3D
11213611310498103
412426424411391396
779793808785745751
868881899873834839
653663669650629634
470483477465454458
155185156147143149
866874883875869871
154915451578157015731570
106510561083108110911044
3.2 Time-dependent calculations
Only very preliminary results are presented for time-dependent problem in Table 5. Only tworather coarse grids have been used and the calculated results don't provide enough informationfor reliable extrapolation. Quadratic interpolation for peak power with pair (24#10,54#10) givesestimation for A-extrapolated peak power W°°>10 near 8.3* 1010. But Z-extrapoIation also shouldincrease value of peak power. Preliminary expected EZMS peak power can be higher thencalculated with nodal codes due to higher value of reactivity.
Table 5. Results for time-dependent problem
MeshTime stepsM a x IterationsT(cek)T*. ,grad CTmax, grad CW(*10lu)
24#10250100.28873478855.25
24#10500100.29693438755.16
24#101000100.30003408605.12
54#10250450.262537410987.19
54#10250900.262538011367.24
54#10500900.270037310887.09
54#101000900.275336810536.88
4. CONCLUSIONS
Presented in paper the Extrapolated to Zero Mesh Size results calculated with code MAG (MeshCenter Finite Difference scheme) exhibit rather significant difference with published nodalsolutions for Second AER Kinetic benchmark. The most close agreement is observed with codeBIPR8. But it is necessary to emphasize that presented results should be considered aspreliminary and that more fine mesh grids should be used to receive more reliable EMZSsolution.
REFERENCES
1. "[U.Grundmann, U,Rohde,93] U.Grundmann, U.Rohde, «Definition of The Second KineticBenchmark of AER", 3rd Symp. of AER, Piestany, 1993.
2. [I.R.Suslov, 1996] I.R.Suslov, MAG - The Code for Fine Mesh VVER Calculations. Proc. of6th Symposium AER, 1996
3. [U.Grundman,94] U.Grundman, "Results of Second Kinetic AER Benchmark", Proc. 4thSymp. of AER, Sozopol, Bulgaria,1994
454
SK01ST104
RADIATION EMBRITTLEMENT OF WWER-440 AND WWER-1000PRESSURE VESSELS AND URGENT TASKS OF REACTOR DOSIMETRY
Zaritsky S.M., Platonov P.A., Brodkin E.B., Egorov A.L.,Kryukov A.M., Nikolaev Yu.A., Shtrombakh Ya.I.
RRC "Kurchatov Institute", 123182 Moscow, [email protected]
ABSTRACT
The peculiarities of surveillance programs and some features of irradiation embrittlement ofWWER pressure vessel materials are discussed. Taking into account these peculiarities andfeatures it is concluded that there are serious reasons for improvement of WWER dosimetry.
INTRODUCTION
The safety of WWER and PWR type NPP is strongly depends on integrity of reactor pressurevessel (RPV), and the problem of radiation embrittlement of RPV is urgent for all water-waterreactors. That's why the main task of reactor dosimetry for those reactors is to ensure thereliable assessment of the level of embrittlement and the prediction of the safety life-time ofRPV.
It means that the following parameters must be evaluated reliably:- a radiation damage and irradiation conditions for RPV (actual and prognosis), taking into
account possible or planned changes of fuel cycles,- a radiation damage and irradiation conditions for experimental specimens (ES), which are
used for investigation of materials embrittlement,- a radiation damage and irradiation conditions for surveillance specimens (SS), which are
irradiated inside RPV during NPP operation and are used for making prognosis of RPVembrittlemeht.
All conditions, which can have an influence on irradiation embrittlement kinetics, must betaken into account.
1. STANDARD MODEL OF RADIATION EMBRITTLEMENT
In accordance with Russian standard the shift AT of the ductile-brittle transient temperaturecaused by material irradiation depends on the fast (E>0.5 MeV) neutron fluence and isdescribed by formula
455
where
A(pl,t)=Ao(0^(p0 - radiation embrittlement coefficient,p, - concentration of main impurities in material,( - irradiation temperature,0o.s - neutron fluence above 0.5 MeV,a = 1/3.
The similar relationships are included in foreign standards (where <P(E>1.0 MeV) is usedinstead of <P(E>0.5 MeV), and another values for a, Ao and K are accepted).
So the first task of reactor dosimetry is to determine the fluence &0.s on RPV, ES and SS withthe necessary accuracy. As it was demonstrated in [1] the statistical accuracy ±15% of RPVfluence determination could be acceptable if:- t he standard model (1) is valid, A and a are grounded on reliable and representative
experimental data, concentrations of impurities are small, and a£ 1/3,- annealing had not been carried out,- the level of embrittlement is considerably lower than safety limit (RPV is far from the end
of the designed life-time),- a representative surveillance program exists, irradiation conditions of SS arid RPV are
identical, ;
-.the systematic biases in fluence determination on SS and RPV are exclude usingrepresentative benchmark experiments.
• But it became clear after the latest investigations that actually these conditions are not valid inmany cases and as a result the reactor dosimetry must solve now manifold tasks, which aremore complicated than it could be evident from law (1).
2. WWER-440 REACTORS
A most of WWER-440 reactors are closed to design operation life-time, but problems of theirRPV embrittlement and - therefore - dosimetry keep on very important due to:- the necessity of prolongation of NPPs operation time over design limits is evident,r the information concerning the kinetics of welds embrittlement is insufficient, especially
after annealing,- t he surveillance programs are not exist on WWER-440 series V-230 reactors and
insufficiently reliable on the reactors series V-213.
The materials of V-230 RPVs have an accelerated embrittlement (in comparison withpredicted -embrittlement) due to relatively high phosphorus and copper concentrations. Allthese RPVs are annealed up to date. The steel shielding assemblies are loaded at coreperiphery in some of WWER-440s (for decreasing the RPV fluence).
The representativeness and reliability of WWER-440 surveillance program are insufficientdue to following reasons: .- the SS are located on the barrel surface and there is water downcomer between specimens
and RPV; as a result the lead factor (ratio of fluence rate at specimens and RPV) is too high
456
- the orientation of specimen capsules has not been fixed during irradiation and it can lead to±(20-30)% fluence rate variations;
- the local neutron field in the specimens region is influenced by control rods movement, andthis fact embarrasses the reliable fluence evaluation;
- the irradiation conditions for RPV and SS are considerably different (see Table 1).
Some experimental data on WWER-440 RPV embrittlement, which were obtained during lastyears, don't correspond with standard model (1); especially it concerns the secondaryembrittlement (after annealing).
Let's consider some of those data.
2.1. PRIMARY EMBRITTLEMENT (BEFORE ANNEALING).
The dependence of weld material embrittlement on fluence is shown on the Fig.l for differentneutron flux densities - in SS positions of Rovno-1 NPP (core with shielding assemblies) andin SS positions of Armenian NPP (standard core) [2]. The difference of AT between twocurves reaches 40-50°C at fluence (1-1.5)-1020 n/cm2. The estimations show" [2] that suchdifference only partially (approximately in 30-40%) can be explained by higher irradiationtemperature in Armenian NPP.
The Table, which accompanies the Fig. 1, shows that not only neutron flux densities (fluencerates) are different in those cases, but also the fast neutron spectrum and gamma flux density.Possibly the obsesrvable difference of embrittlement kinetics is a result of differences of theseirradiation conditions.
. Evidently these factors (not only fluence) must be taken into account when analyzing andusing the results of specimens testing. It should be necessary to investigate by specialexperiments the influence of gamma flux density and fluence rate (neutron flux density), andto provide the retrodosimetry of specimen irradiations, which were done before (including thedetermination of neutron and gamma flux densities).
It issues the new challenges for dosimetry, at first hand it is necessary to increase the accuracyof determination of gamma field characteristics. This accuracy is unsatisfactory today [3].
Improved accuracy of dosimetry is necessary also for analysis of possible various stages ofembrittlemenf. As it is shown in Fig.2 the embrittlement can accelerate - in comparison withthe standard law (1) - after accumulation of certain fluence [2]. Sometimes the slowing downof embrittlement can be observed after stage of acceleration - see Fig.3 [2]. It is clear that theshape of embrittlement curve in this region depends on accuracy of the fluence determination.For example, if we move the -points 3 and 4 in Fig.3 accordingly left and right by 15%, theembrittlement curve gets the "standard" shape.
Thus the accuracy of the fluence determination must be noticeably better than ±15% foranalysis of possible stages of embrittlement, development of appropriate embrittlementmodels and taking into account this phenomena in practice.
2.2. SECONDARY EMBRITTLEMENT (AFTER ANNEALING)
The influence if irradiation conditions (besides fast neutron fluence) at post-annealingirradiation is evident. Probably the other mechanism of embrittlement works in this case and
457
other laws are valid [4]. Therefore the other character of intluence ot irradiation conditions ispossible here - In comparison with the primary embrittlement.
Fig.4 demonstrates the results of testing of samples (templates), which were cut out from theweld of annealed RPV of Kozloduy-1 NPP and then reirradiated in the surveillance channelsof Rovno-1 NPP (core with shielding assemblies) [2]. Point 1 was obtained after testing ofsamples, which were cut out from weld just after annealing. Templates for point 2 were cutout and tested after further operation of NPP. Then the templates from the second series wereirradiated in the channels of SS of Rovno-1. Point 3 shows the results of testing of thosetemplates. One can see that in this case- in contrary with Fig.l - the embrittlement rate isconsiderably smaller at irradiation in lower neutron flux - on the RPV. However the fastneutron spectrum is noticeably harder and the ratio of gamma to fast neutron flux isconsiderably higher on the RPV.
The similar (though far less pronounced) data are shown in Fig.5. Templates were cut outfrom weld of Novo-Voronezh-3 NPP and reirradiated in surveillance channels of Kola-4 NPP(standard core) [4]. Possibly the effect is far less pronounced in this case because theirradiations were at much higher levels of neutron and gamma fluxes.
In any case these data show that the level of embrittlement depends not only on fast neutronfluence.
The influence of gamma irradiation is discussed last years. The available data show thatgamma-irradiation can lead to increase [5,6] as well as to decrease [7] of embrittlement.Possibly it depends on gamma spectrum, concentration of impurities in a metal, status of ametal (before or after annealing), other irradiation conditions (fast neutron flux density andspectrum etc.).
The embrittlement coefficients A for the secondary embrittlement are shown in Fig.6 [4];these data were obtained after irradiation of samples in different conditions. One can see thatA is sufficiently higher in cases, where the level of gamma irradiation is lower (gammairradiation was weakened by steel shielding assemblies in Rovno-1 and lead shielding inKORPUS facility [8]).
These results are systematized in Fig.7 depending on gamma flux density [4]. One can seethat the main part of results can be described by one curve, and relative embrittlementcoefficient A/K sharply falls at gamma flux density increasing and reaches the asymptoticlevel at gamma flux density more than 5-10u y/cm2s. But results of testing of Kozloduy-1templates don't agree with this curve. Obviously some other irradiation conditions (whichhaven't been taken into consideration) are important in this case.
It is clear that further analysis must be started from the specification of all irradiationconditions. This is a new challenge for reactor dosimetry. And the first task is analysis ofgamma field. As it was mentioned above the state-of-the-art accuracy of determination ofgamma field parameters is insufficient now [3]. For solving this problem it is necessary in thefirst place to provide the detail measurements of gamma field in different regions of theunique full-scale mock-ups of WWERs on the LR-0 reactor in NRI Rez, Czech Republic[11,12].
458

3. WWER-1000 REACTORS
The RPV of WV/ER-1000s are relatively far from designed life-time, but the problem of theirirradiation embrittlement is urgent just today, because the operation of those RP Vs showedthat:- the accelerated (in comparison with standard model) embrittlement takes place for RPVs
with high nickel contents [9],- the surveillance program is insufficiently representative.
The accelerated embrittlement makes the higher demands to the accuracy of fluencedetermination [1,2]. The higher demands to the dosimetry follow also from the peculiarities ofthe surveillance program.
The insufficient representativeness of W\VER-1000 surveillance program is caused by thefollowing reasons:- SS are located on the baffle, higher than upper edge of the core, in the region of high
gradients of neutron field; the lead factors for different samples are in the interval fromvalue <1 to 5-6;
- the irradiation conditions of SS are differed from irradiation conditions of RPVs;- SS are located in the "heat" coolant region, and as a result their temperature is probably
higher than the temperature of RPV.
The calculation of neutron field in the surveillance assemblies is very complicated and couldnot be carried out with necessary accuracy in a moment of SS program designing. Theapproximate calculation data obtained in that time were used later in an interpretation ofresults of SS testing; the kinetics of RPV embrittlement during operation was determined onthe base of those testing. It should be reminded that 10-12 Charpy specimens must be tested atdifferent temperatures for obtaining the curve of ductile-brittle transient and corresponding ATat fixed 00.5- In all these specimens fluence &o.s must be approximately the same (in thelimits of acceptable scatter).
Several years ago the fluences at all SS, which were unloaded from all WWER- 1000s, werereevaluated using more adequate three-dimensional calculations, new nuclear data library andmeasured activties of MMn, which is generated in a SS material in reaction 54Fe(n,p)54Mn[10]. After that SS for each reactor were combined in new groups with approximately equalfluence at every specimen (in limits of ±15%) and new evaluation of fwas carried out
Some results of AT reevaluation are demonstrated in Fig.8 [2]. One can see that theinterpretation of the same results of SS mechanical testing can be essentially differentdepending on dosimetry data. Of course, it leads to changes in obtained embrittlement kineticsand in evaluations of RPV life-time.
It's necessary to solve two problems now.
First of all the accuracy of mentioned new calculations is unknown, their results can containsystematic biases. The detail benchmark experiments are necessary; such experiments must becarried out on the reactor LR-0 [11].
Secondly, "manganese" meth'od of SS fluence determination strictly speaking cannot be usedin the cases when SS are irradiated in reactor during too long time. The value of Ti« for 34Mn
459
is equal to 312 days, so iron doesn't "remember" the local history of SS irradiation outside theseveral Ti.j, and extrapolation is necessary.
Nevertheless we were forced to use this monitor reaction even in the case of very longirradiations. Actually in all analyzed cases the in-reactor time was too long even for the firstSS unloading. The problem can be solved only by measuring the activity of niobium, whichcould be extracted from materials of SS or SS containers (the TKZ of WmNb, which is producedin the reaction 93Nb(n,n'), is equal to -18 years).
After solving the two mentioned problems the retrodosimetry of WWER-1000 surveillancecapsules and reevaluation of SS testing results are urgently necessary. The interpretation andanalysis of tests of SS, which will be unloaded in the future, are impossible without solvingthese two problems.
CONCLUSIONS
The necessity of reliable evaluation and prolongation of WWER RPV lifetime as well as theneed of development of improved radiation embrittlement models make high demands ofreactor dosimetry, first of all due to peculiarities of the surveillance programs and newexperimental facts briefly discussed in the report.
The top-priority tasks are:- "multifactor" dosimetry and retrodosimetry of experimental and surveillance programs and
RPVs; besides the fast neutron fluence, other parameters of neutron and-especially -gamma fields should be taken into account;
- improvement and validation of calculation and experimental methods and nuclear data fornphieving the necessary accuracy of neutron and gamma fields dosimetry;
- special benchmark experiments, first of all full-scale mock-up experiments on the LR-0reactor, for elimination of systematic biases in the determination of neutron and gammafields parameters;
- improvement of WWER-1000 surveillance program: specification and benchmarking thecalculations of neutron and gamma field in the surveillance assemblies, and developmentof the calculation-experimental method of fluence determination using the measurements ofthe activity of niobium extracted from SS or SS container materials.
The experimental validation of "multifactor" dosimetry methods - especially methods ofgamma flux density and gamma spectrum calculations - must necessarily include the full-scale WWER mock-up experiments on the LR-0 reactor.
REFERENCES
1. Gerard R. and Zaritsky S.M., What do We Need Dosimetry for? Reactor Dosimetry,ASTM STP 1398, John G. Williams, David W. Vehar, Frank H. Ruddy and David M.Gilliam, Eds, American Society for Testing and Materials, West Conshohoken, PA, 2000.
2. Zaritsky S.M., Platonov'P.A., Nikolaev Yu.A., Osmera B., Valenta V., Review ofProblems and Requirements in WER Reactor-Type Pressure Vessel Dosimetry. ReactorDosimetry, ASTM STP 1398, John G. Williams, David W. Vehar, Frank H. Ruddy and
460
David M. Gilliam, Eds, American Society for Testing and Materials, West Conshohoken,PA, 2000.
3. Gold R., A Challenge to the International Reactor Dosimetry Community: QuantifyGamma-Ray Spectra. Proceedings of the 9th Internationa! Symposium on ReactorDosimetry, Prague, Czech Republic, September 2-6, 1996, pp. 565-575.
4. Platonov P.A., Shtrombakh Ya.I., Kryukov A.M., Nikolaev Yu.A., Zaritsky S.M, TheEvaluation of WWER-440 RPV Material Status and Possibilities of Their Life-TimeProlongation, The Int. Conference on Material Science Problems at Design and Operationof NPP Equipment, StJPetersburg, June 19-23, 2000 (in Russian).
5. Remec I., Wang J.A., Kam F.B.K., Farrel K., Effects of Gamma-Induced Displacementson HFIR Pressure Vessel Materials. Journal of Nuclear Materials, v. 217, 1994, pp.258-268.
6. Alexander D.E., Rehn L.E., The Role of Gamma-Rays and Freely-Migrating Defects inReactor Pressure Vessel Embrittlement, Proceedings of the 9* International Symposiumon Reactor Dosimetry, Prague, Czech Republic, September 2-6,1996, pp. 508-515.
7. Amaev A.D., Karpukhin V.I., Korolyov Yu.N., Krasikov E.A., Kuznetsov V.N., LebedevL.M. Nikolaenko V.A., Gamma Irradiation Annealing of WWER RPV. Steel, AtomnaiaEnergia, v.82, No.5,1997, pp. 351-354 (in Russian).
Nikolaenko V.A., Karpukhin V.I., Krasikov E.A., Amaev A.D., Zantsky S.M., KuznetsovV.N., Gamma Irradiation as One of the Main Factors of Influence of Reactor Radiationon the Characteristics of Materials, Metals, No.2, 1998, pp. 112-117 (in Russian).
8. Brodkin E.B., Egorov A.L., Golovanov V.N., Markina N.V., Raetsky V.M., SulaberidzeV.S., Tsikanov V.A., Zaritsky S.M., The Irradiation Facility KORPUSfor Irradiation ofthe Reactor Structure Materials, Reactor Dosimetry, ASTM STP 1228,1994, pp.480-489.
Mariana N., Ryazanov D., Tellin A., Lichadeev V., PavlcvV., Tsikanov V., AitAbderrahim H., Vanmechelen P., Paardekoper A., Voorbraak W., Nolthenius H., SerenT., Stephan I , Zaritsky S., International Neutron Dosimetry Characterization atKORPUSFacility: Inter-Laboratory Dosimetry Calibration Results, 1998 ANS Radiation Protectionand Shielding Division Topical Conference Technologies for the New Century, April 19-23, 1998, Nashville, Tennessee, USA, vol.1, pp.316-323.
9. Kryukov AM., Nikolaev Yu.A., and Nikolaeva A. V. Behaviour of Mechanical Propertiesof Nickel-Alloyed Reactor Pressure Vessel Steel under Neutron Irradiation and Post-Irradiatidn Annealing, Nuclear Engineering and Design, Vol.186, 1998, pp.353-359.
10. Brodkin E.B., Egorov A.L., Vikhrov V.I., and Zaritsky S.M. The Determination of theWER-1000 Surveillance Neutron Fluence Using the 54Mn Activity Measurements andTORT Neutron Spectra Calculations, Proceedings of the 1996 Topical Meeting RadiationProtection and Shielding, No. Falmouth, Massachusetts, April 21-25, 1996, Vol.1, pp.43-47.
11. Zaritsky S.M., Osmera B., Review of Theoretical and Experimental Investigations ofWER Pressure Vessel Radiation Damage in Engineering Benchmarks, Proc. ofInternational Conference on Reactor Physics and Reactor Computations, Tel Aviv,January 23-26, 1994, pp.757-764.
12. Hort M., Konecna A., Smutny V., Gamma-Ray Spectrometry in Mixed Radiation FieldsUsing Stilbene Scintillalor, Proceedings of the 9 International Symposium on ReactorDosimetry, Prague, Czech Republic, September 2-6, 1996, pp. 101 -109
461
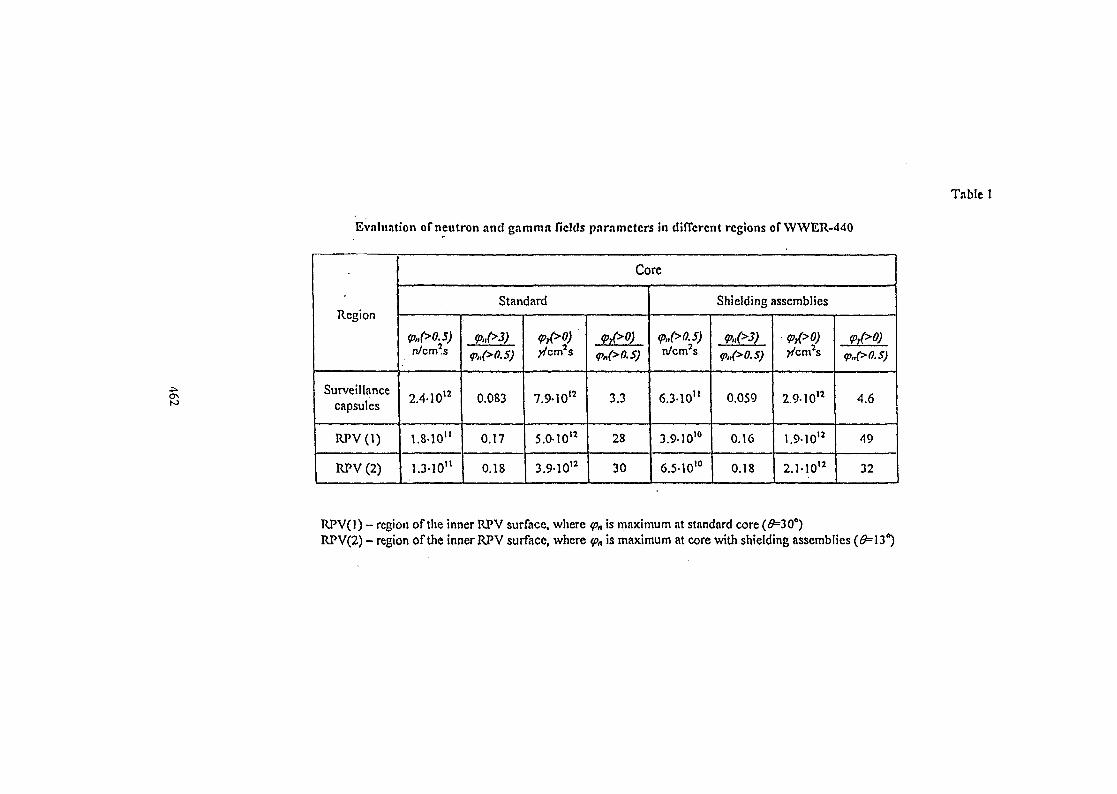
Table 1
Evaluation of neutron and gamma fields parameters in different regions of WWER-440
Region
Surveillancecapsules
RPV(l)
RPV (2)
Core
Standard
<P»(>O.S)n/cm's
2.4-10"
1.8-10"
1.3-10"
Pn(>3)
<P,,(>0.5)
0.083
0.17
0.18
<Prt>0)?/cm2s
7.9-10"
5.0-10"
3.9-10"
<P«(>0.S)
3.3
28
30
Shielding assemblies
<p,,(>0.S)n/cm2s
6.3-10"
3.9-10'°
6.5-10'°
<p,,(>3)
p,,(>0.S)
0.059
0.16
0.18
<Pr(>0)>/cm2s
2.9-10"
1.9-10"
2.1-10"
<p.,(>0.S)
4.6
49
32
RPV(l) - region of the inner RPV surface, where <pn is maximum at standard core (0=30°)RPV(2) - region of the inner RPV surface, where <pn is maximum at core with shielding assemblies (#=13°)
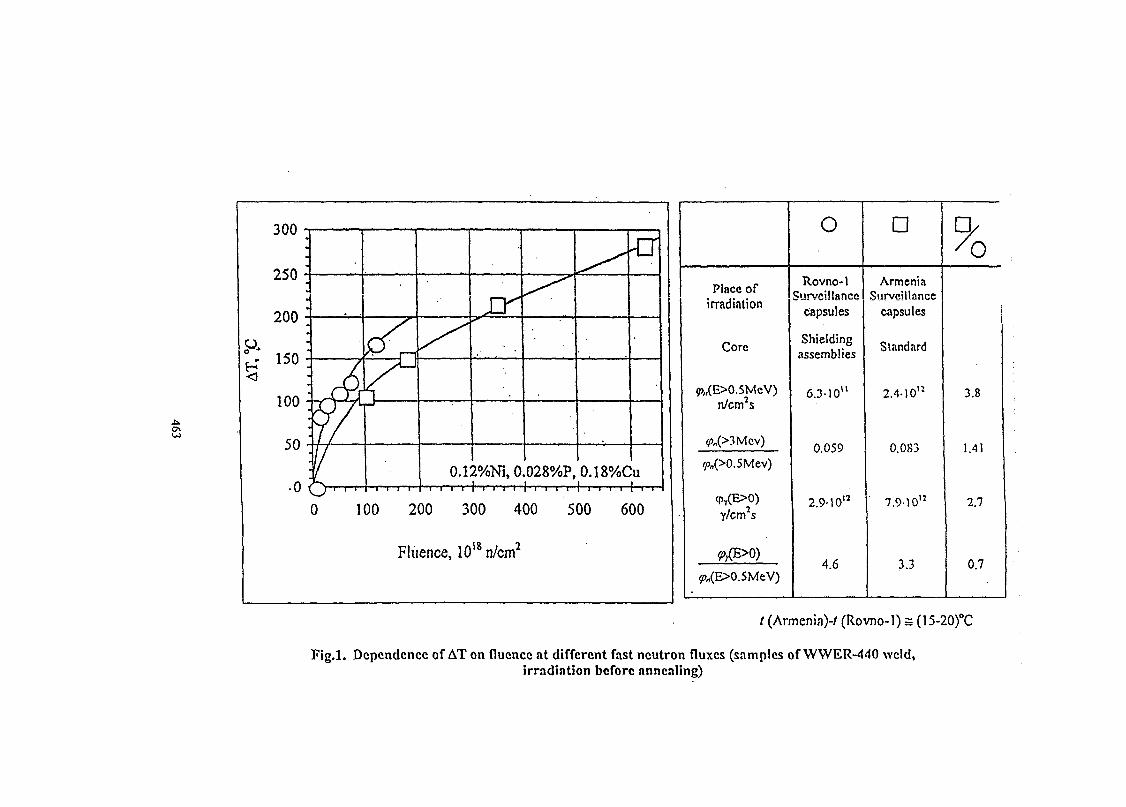
300
250
13
• 0
u
0.12%Ni, 0.028%P, 0.18%Cu
0 100 200 300 400 500 600
Fluence, 1018n/cm2
Place ofirradiation
Core
^,(E>0.5McV)n/cm2s
9>n(>3Mcv)
f/?n(>0.5Mev)
cpY(E>0)
y/cm2s
9>n(E>O.5MeV)
o
Rovno-1SurveiilanGe
capsules
Shieldingassemblies
6.3-10"
0.059
2.9-10n
4.6
D
ArmeniaSurveillance
capsules
Standard
2.4-1012
0.083
7.9-1012
3.3
9
3.8
1.41
2.7
0.7
/ (Armenia)-/ (Rovno-1) s (15-20)°C
Fig.l. Dependence of AT on fluence at different fast neutron fluxes (samples of WWER-440 weld,irradiation before annealing)
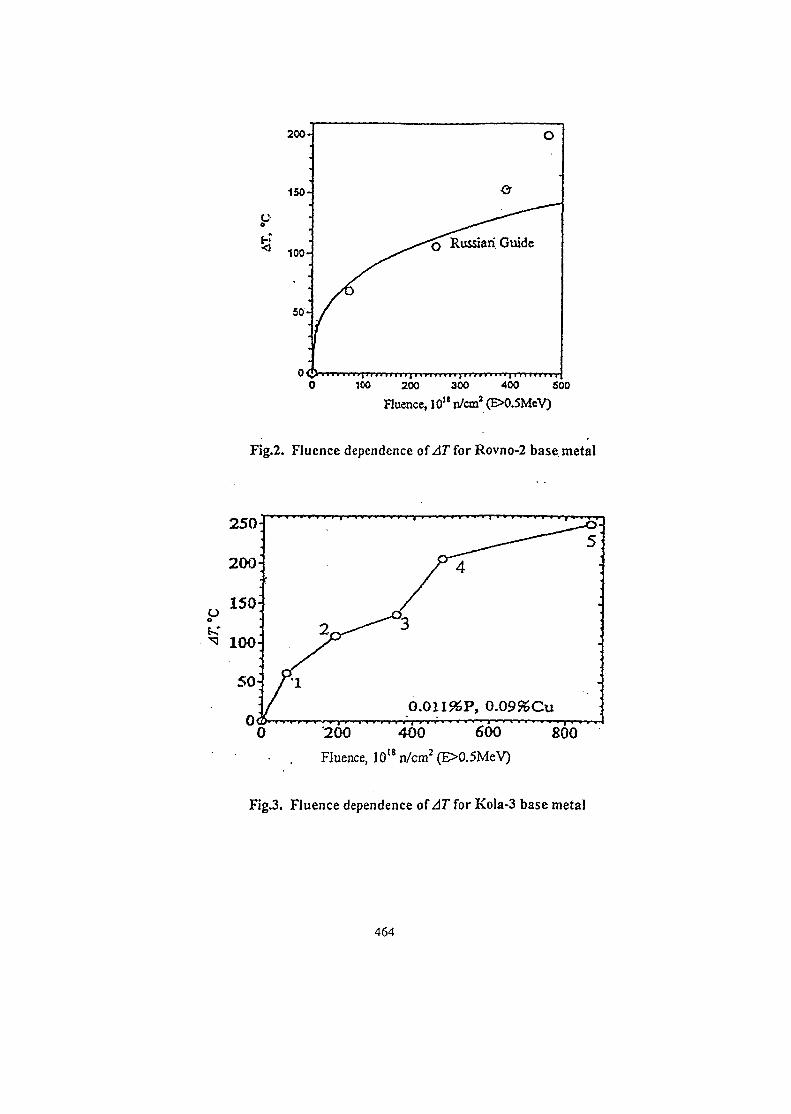
200
150
1CO 200 300 400 500
Fluence, I0u n/cm2 (E>0.5MeV)
Fig.2. Fluence dependence of AT for Rovno-2 base metal
0.011 % P , 0 .09%Cu
200 400 600
Fluence, 10t8n/cm2(E>0.5MeV)
800
Fig.3. Fluence dependence of AT for Kola-3 base metal
464
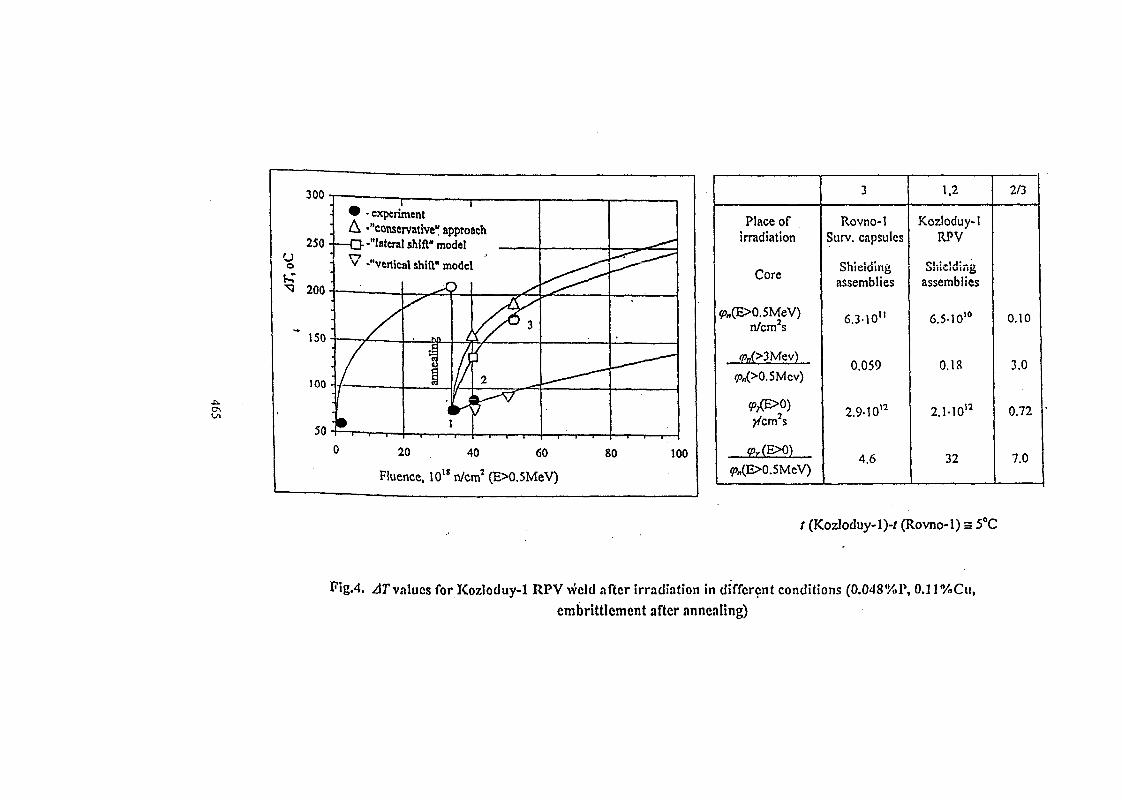
experimentA -"conservative" approach
"lateral shift" model
vertical shift" model
Fluence, 1018 n/cm2 (E>0.5MeV)
Place ofirradiation
Core
^)«(E>0.5MeV)n/cm2s
cpn(>3Mev)
tPniP'0.5 M Cv)
<pv(E>0)
pn(E>0.5MeV)
3
Rovno-1Surv. capsules
Shieldingassemblies
6.3-10"
0.059
2.9-1012
4.6
1.2
Kozloduy-1RPV
Shieldingassemblies
6.5-1O10
0.18
2.1-1012
32
2/3
0.10
3.0
0.72
7.0
/ (Kozloduy-1)-/ (Rovno-1) s 5°C
Fig.4. ^rvalues for Kozloduy-1 RPV weld after irradiation in different conditions (0.048%P, 0.1 l%Cu,
embrittlement after annealing)
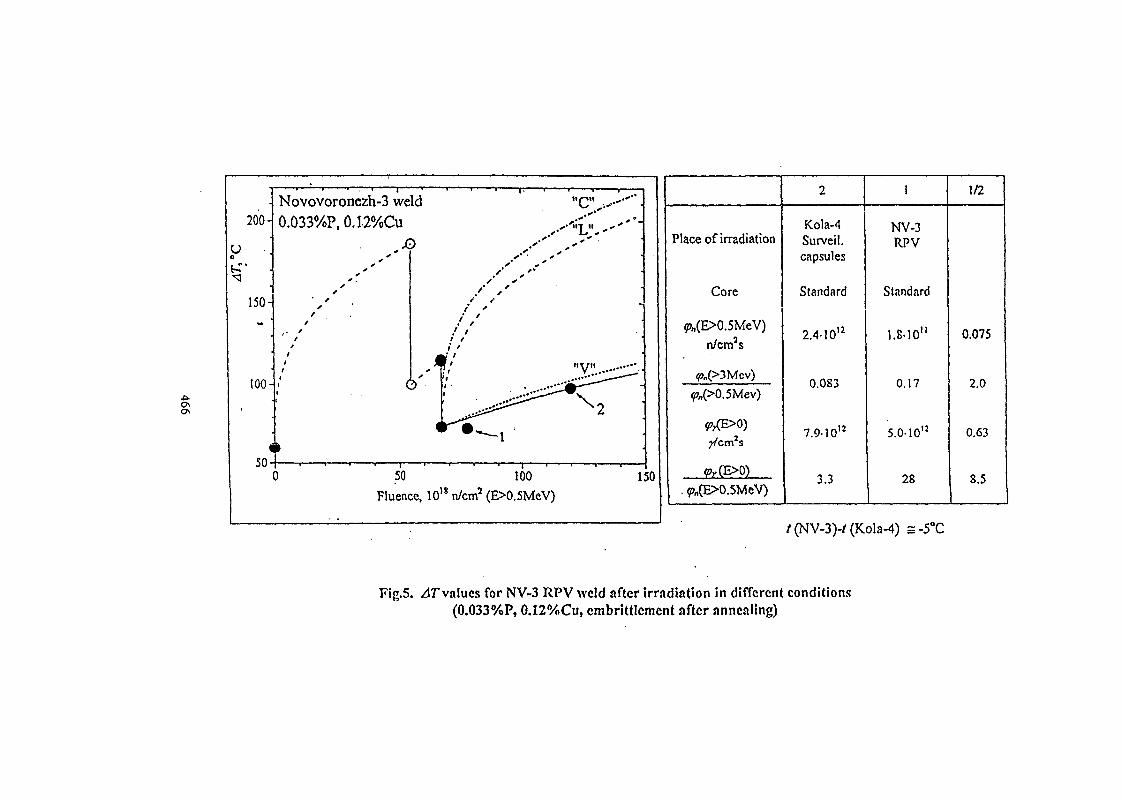
ONO
V
200-
t
150-vt.
100-
1
50-
Novovoronezh-3 weld0.033%P,0.12°/oCu
•* •
//
, . //
y/
II
c
)
/ // /
1 // '
, '
%w
y/ ,
/ *
/
" * - ~ - l
• ' " i 'i i
-
"V"
^ 2 ;
50 100
Fluence, 1018 n/cm2 (E>0.5MeV)150
Place of irradiation
Core
f«(E>0.5MeV)
n/cm2s
fern's
. ?>n(E>0.5MeV)
Ko!a-4Surveil.capsules
Standard
2.4-1012
0.083
7.9-1012
3.3
NV-3RPV
Standard
1,8-10"
0.17
5.0-1012
28
1/2
0.075
2.0
0.63
8.5
t (NV-3)-/ (Kola-4) s-5°C
Fig.5. ^rvalues for NV-3 RPV weld after irradiation in different conditions(0.033%P, 0.12%Cu, embrittlcmcnt after annealing)
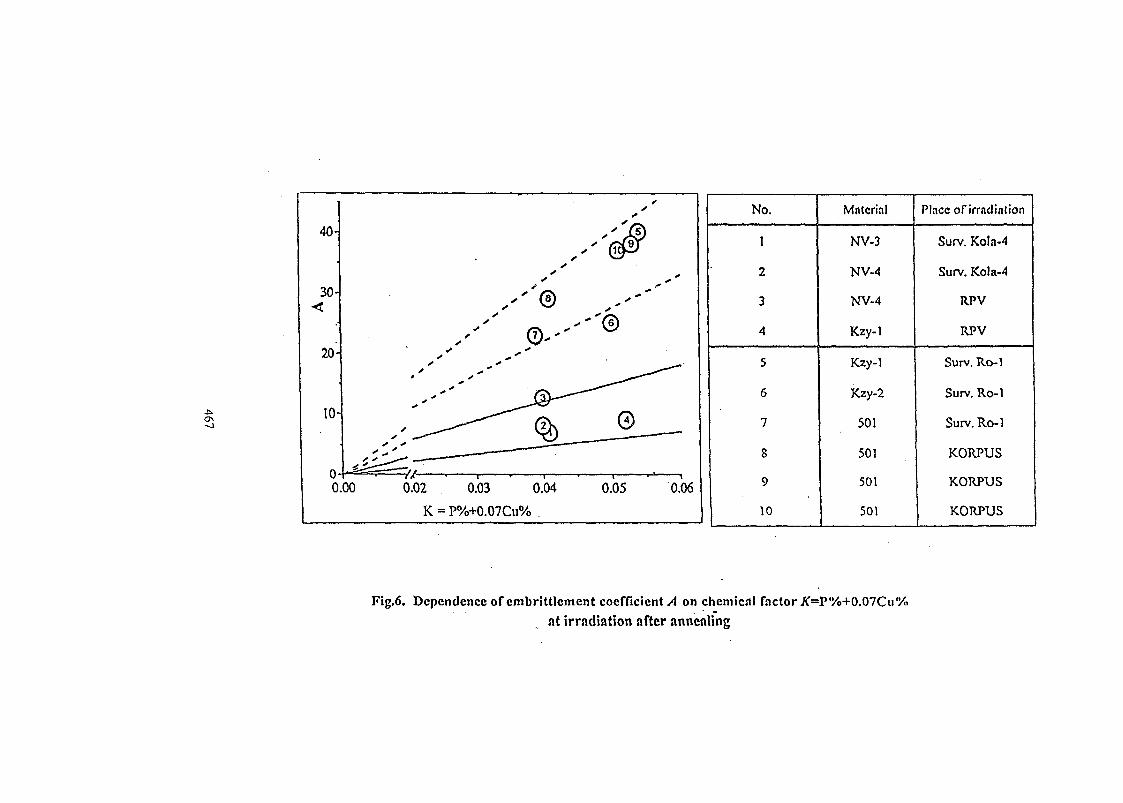
-fc.
J
0.02 0.03 0.04
K = P%+0.07Cu% .
0.05 0.06
No.
1
2
3
4
5
6
7
8
9
10
Material
NV-3
NV-4
NV-4
Kzy-1
Kzy-1
Kzy-2
501
501
501
501
Place of irradintion
Surv. Kola-4
Surv. Ko!a-4
RPV
RPV
Surv. Ro-1
Surv. Ro-1
Surv. Ro-1
KORPUS
KORPUS
KORPUS
Fig.6. Dependence of cmbrittlement coefficient A on chemical fnctor Jf=P%+0.07Cu%at irradiation after annealing
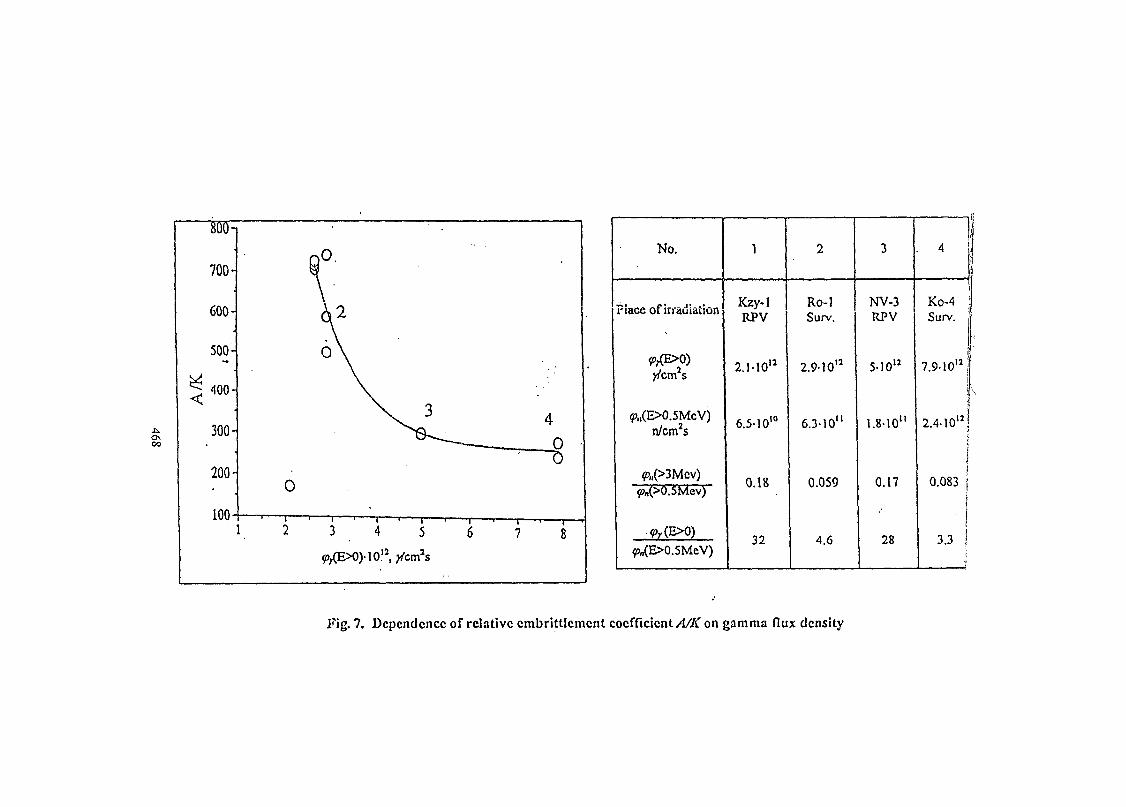
oo
A/K
8001
700-
600-
500-
400-
300-
200-
100-
0
I 2
tA2
o\\
3
\
i
4
)-1012,
5
>/cm2s
—-—~_
—i 1
6
4
——8 'u
1 • 1 r
7 8
No.
Fiace of irradiation
97,,(E>O.5MeV)n/cm2s
fn(>3Mcv)^n(>0.5Mev)
.^(E>0)^n(E>0.5MeV)
1
Kzy-1RPV
2.I-1012
6.5-1010
0.18
32
2
Ro-1Surv.
2.9-1012
6.3-10"
0.059
4.6
3
NV-3RPV
5-1012
1.8-10"
0.17
28
4
Ko-4 !Surv.
7.9-1012
:
2.4-1012}jij,;
0 083}
J
3.3 1
Fig. 7. Dependence of relative cmbrittlcmcnt coefficient A/K on gamma flux density
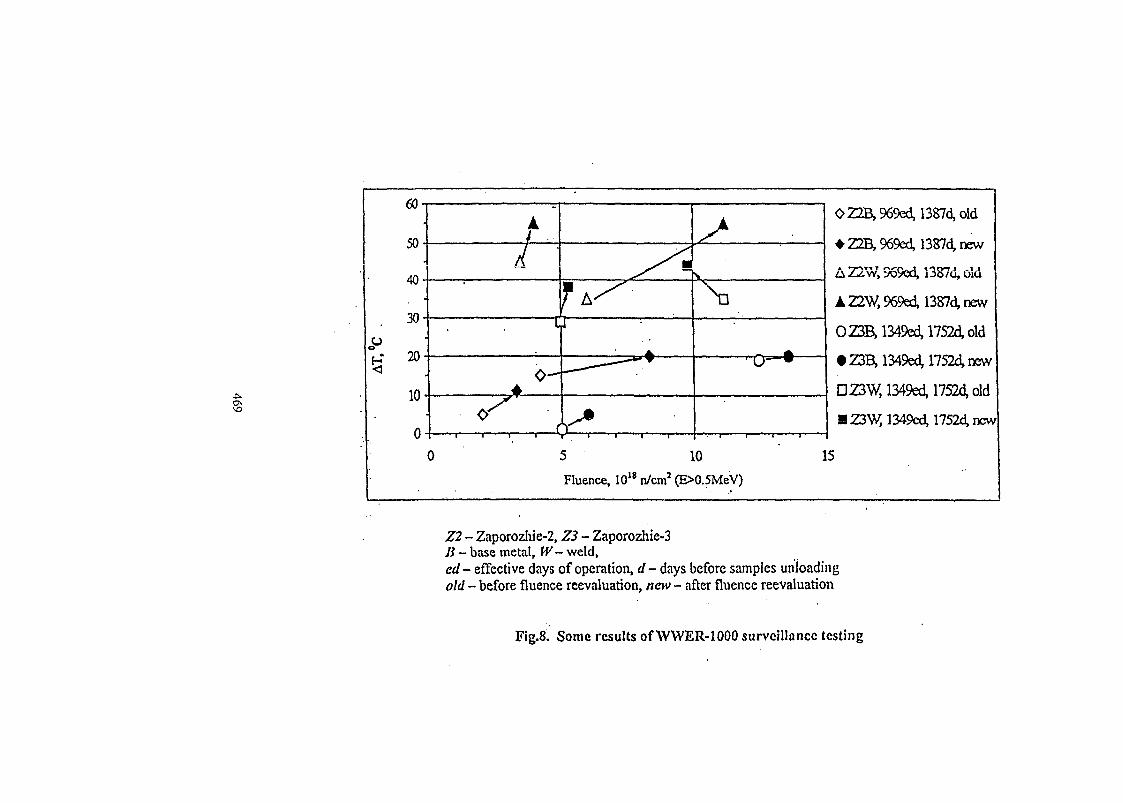
m
50
40
30
20
10
0
0
A
J i 1•
L
(u
\ 3
- i i i. ft
5 10
Fluence, 1018 n/cm2 (E>0.5MeV)
O22B,96^d,1387d,old
• ZZa 969ed, 1387d, new
AZ2V^969ed,1387d,old
AZ2W,969ed,1387d,new
OZ3B,1349ed,1752d,old
• Z3B>1349ed,1752d,new
DZ3W,1349ed,1752d,o]d
SZ3W, 1349ed,1752d,ncw
15
Z2 - Zaporozlaie-2, Z3 - Zaporozhie-3Ji - base metal, W- weld,ed- effective days of operation, d- days before samples unloadingold - before fluence reevaluation, new - after fluence reevaluation
Fig.8. Some results of WWER-1000 surveillance testing
SK01ST105
CALCULATION AND EXPERIMENTAL STUDIES OF POWER DISTRIBUTION INTHE VICINITY OF THE NORMAL AND MODERNIZED CR OF THE VVER-440
REACTOR
Aborina I., Bolobov P., Krainov Yu.Institute of Nuclear Reactors, RRC "Kurchatov Institute", Moscow
ABSTRACT
The implementation of fuel cycles with higher fuel burnups at the NPP with W E R -440 made it necessary to introduce some additional design restrictions connected with thepermissible limits of ramps of the linear heat generation rate to fuel pins. - This and theprospects for the use of load-following regimes of reactor operation lead to the need for themodernization of the design of the control rod (CR) fuel follower in the area of it joint withthe absorber rod.
As shown by the measurements carried out on the RRC "Kurchatov Institute" testfacility, the burst of fixed fuel assembly (FA) power in the vicinity of the CR joint can beessentially reduced by means of hafnium plates attached to the CR fuel follower shroud tube.
One of the results of experimental studies of power distribution in the area of the CRjoint is the conclusion that the adequate analysis of pin-by-pin power distribution in thevicinity of the joint can be only made using a three-dimensional calculation model.
A three-dimensional model of critical facility containing 18 FA of the WER-440reactor and one CF, located in the center of critical facility is described, and the results ofsome calculations and measurements are given.
CRITICAL FACILITIES CONSISTING OF WER-440 FUEL ASSEMBLIES
On the "P" critical test facility of RRC "Kurchatov Institute" the measurements of thepower distribution fields near the joint between the absorber rod and fuel follower of the CRof WER-440 as well as near the lower reflector were carried out. The critical facilityconsisted of 18 FA with fuel enrichment 3.6 mass %, three of which were dismountable (FAp)and one, also dismountable, CR with fuel follower enrichment 2.4 mass % located in thecenter of the critical facility (Fig. 1). Several groups of measurements were performed on thiscritical facility, of which two group will be considered here.
The first group of measurements was carried out with the normal fuel follower. Thefollowing composition of fuel assemblies was used:
• all the FA contained the fuel pins with enrichment 3.6 mass %
• the CR contained normal fuel follower with enrichment 2.4 mass %.
Before the installation to the critical facility the central fuel pin of external row of oneof the dismountable FA was replaced by a dismountable fuel pin of the same fuel enrichmentand design.
In this group of measurement the influence of the CR joint on the axial-radial powerdistribution in the FA fuel pins, neighboring the joint, as well as the effect of hafnium plates
471
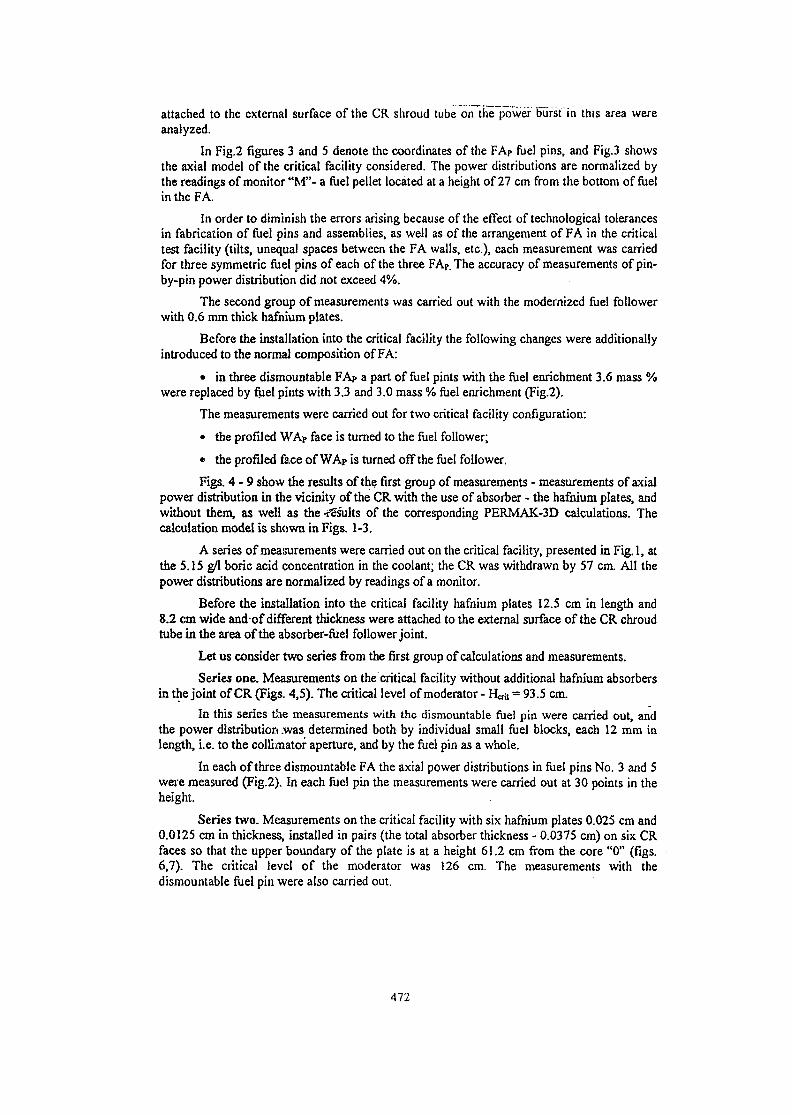
attached to the external surface of the CR shroud tube on the power burst in this area wereanalyzed.
In Fig.2 figures 3 and 5 denote the coordinates of the FAp fuel pins, and Fig.3 showsthe axial model of the critical facility considered. The power distributions are normalized bythe readings of monitor "M"- a fuel pellet located at a height of 27 cm from the bottom of fuelin the FA.
In order to diminish the errors arising because of the effect of technological tolerancesin fabrication of fuel pins and assemblies, as well as of the arrangement of FA in the criticaltest facility (tilts, unequal spaces between the FA walls, etc.), each measurement was carriedfor three symmetric fuel pins of each of the three FAp. The accuracy of measurements of pin-by-pin power distribution did not exceed 4%.
The second group of measurements was carried out with the modernized fuel followerwith 0.6 mm thick hafnium plates.
Before the installation into the critical facility the following changes were additionallyintroduced to the normal composition of FA:
• in three dismountable FAp a part of fuel pints with the fuel enrichment 3.6 mass %were replaced by fuel pints with 3.3 and 3.0 mass % fuel enrichment (Fig.2).
The measurements were carried out for two critical facility configuration:
• the profiled WAp face is turned to the fuel follower;
• the profiled face of WAp is turned off the fuel follower.
Figs. 4 - 9 show the results of the first group of measurements - measurements of axialpower distribution in the vicinity of the CR with the use of absorber - the hafnium plates, andwithout them, as well as the -sfSsults of the corresponding PERMAK-3D calculations. Thecalculation model is shown in Figs. 1-3.
A series of measurements were carried out on the critical facility, presented in Fig. 1, atthe 5.15 g/1 boric acid concentration in the coolant; the CR was withdrawn by 57 cm. All thepower distributions are normalized by readings of a monitor.
Before the installation into the critical facility hafnium plates 12.5 cm in length and8.2 cm wide and of different thickness were attached to the external surface of the CR chroudtube in the area of the absorber-fuel follower joint.
Let us consider two series from the first group of calculations and measurements.
Series one. Measurements on the critical facility without additional hafnium absorbersin the joint of CR (Figs. 4,5). The critical level of moderator - H^t - 93.5 cm.
In this series the measurements with the dismountable fuel pin were carried out, andthe power distribution .was determined both by individual small fuel blocks, each 12 mm inlength, i.e. to the collimator aperture, and by the fuel pin as a whole.
In each of three dismountable FA the axial power distributions in fuel pins No. 3 and 5were measured (Fig.2). In each fuel pin the measurements were carried out at 30 points in theheight.
Series two. Measurements on the critical facility with six hafnium plates 0.025 cm and0.0125 cm in thickness, installed in pairs (the total absorber thickness - 0.0375 cm) on six CRfaces so that the upper boundary of the plate is at a height 61.2 cm from the core "0" (figs.6,7). The critical level of the moderator was 126 cm. The measurements with thedismountable fuel pin were also carried out.
472
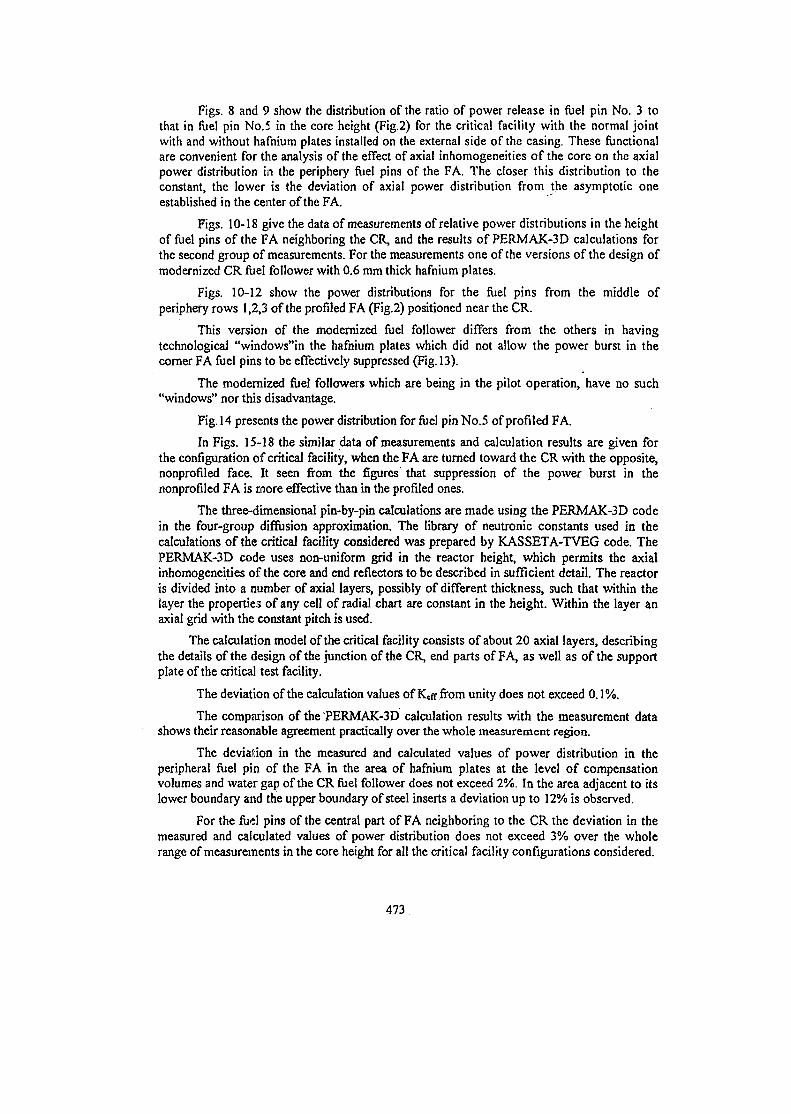
Figs. 8 and 9 show the distribution of the ratio of power release in fuel pin No. 3 tothat in fuel pin No.5 in the core height (Fig.2) for the critical facility with the normal jointwith and without hafnium plates installed on the external side of the casing. These functionalare convenient for the analysis of the effect of axial inhomogeneities of the core on the axialpower distribution in the periphery fuel pins of the FA. The closer this distribution to theconstant, the lower is the deviation of axial power distribution from the asymptotic oneestablished in the center of the FA.
Figs. 10-18 give the data of measurements of relative power distributions in the heightof fuel pins of the FA neighboring the CR, and the results of PERMAK-3D calculations forthe second group of measurements. For the measurements one of the versions of the design ofmodernized CR fuel follower with 0.6 mm thick hafnium plates.
Figs. 10-12 show the power distributions for the fuel pins from the middle ofperiphery rows 1,2,3 of the profiled FA (Fig.2) positioned near the CR.
This version of the modernized fuel follower differs from the others in havingtechnological "windows"in the hafnium plates which did not allow the power burst in thecorner FA fuel pins to be effectively suppressed (Fig. 13).
The modernized fuel followers which are being in the pilot operation, have no such"windows" nor this disadvantage.
Fig. 14 presents the power distribution for fuel pin No.5 of profiled FA.
In Figs. 15-18 the similar data of measurements and calculation results are given forthe configuration of critical facility, when the FA are turned toward the CR with the opposite,nonprofiled face. It seen from the figures that suppression of the power burst in thenonprofiled FA is more effective than in the profiled ones.
The three-dimensional pin-by-pin calculations are made using the PERMAK-3D codein the four-group diffusion approximation. The library of neutronic constants used in thecalculations of the critical facility considered was prepared by KASSETA-TVEG code. ThePERMAK-3D code uses non-uniform grid in the reactor height, which permits the axialinhomogeneities of the core and end reflectors to be described in sufficient detail. The reactoris divided into a number of axial layers, possibly of different thickness, such that within thelayer the properties of any cell of radial chart are constant in the height. Within the layer anaxial grid with the constant pitch is used.
The calculation model of the critical facility consists of about 20 axial layers, describingthe details of the design of the junction of the CR, end parts of FA, as well as of the supportplate of the critical test facility.
The deviation of the calculation values of K«ff from unity does not exceed 0.1%.
The comparison of the"PERMAK-3D calculation results with the measurement datashows their reasonable agreement practically over the whole measurement region.
The deviation in the measured and calculated values of power distribution in theperipheral fuel pin of the FA in the area of hafnium plates at the level of compensationvolumes and water gap of the CR fuel follower does not exceed 2%. In the area adjacent to itslower boundary and the upper boundary of steel inserts a deviation up to 12% is observed.
For the fuel pins of the central part of FA neighboring to the CR the deviation in themeasured and calculated values of power distribution does not exceed 3% over the wholerange of measurements in the core height for all the critical facility configurations considered.
473
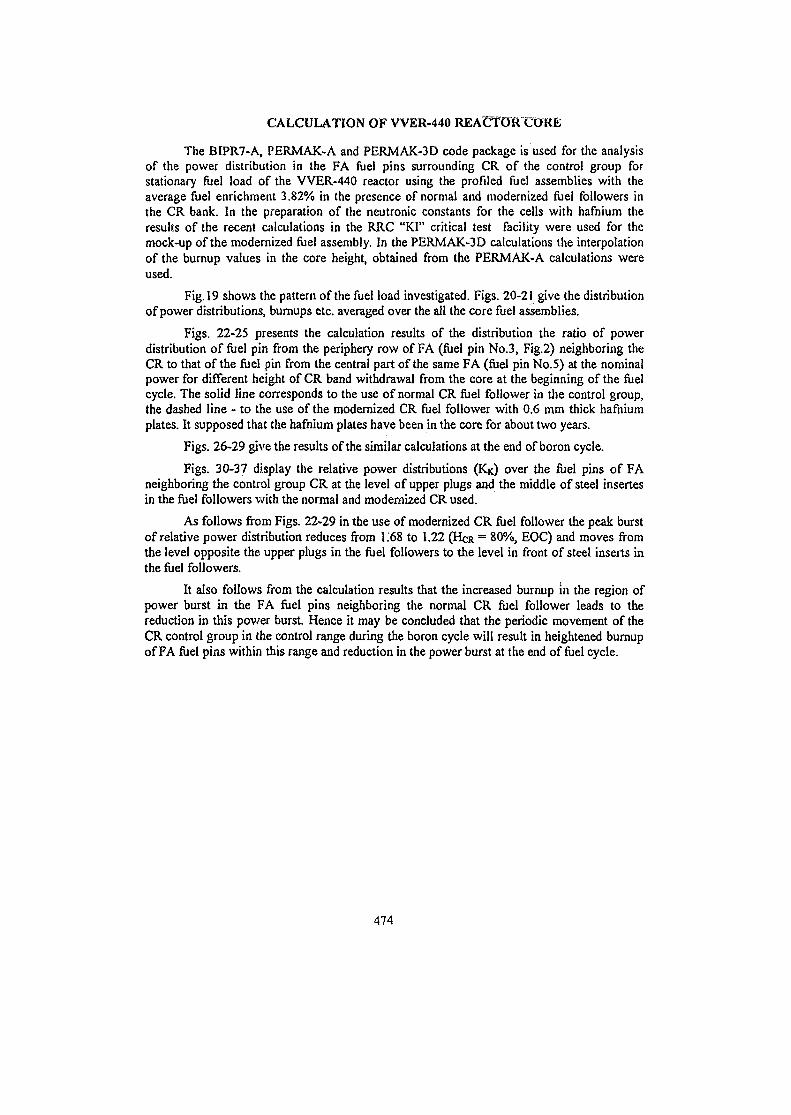
CALCULATION OF VVER-440 REACTOR COR£
The BIPR7-A, PERMAK-A and PERMAK-3D code package is used for the analysisof the power distribution in the FA fuel pins surrounding CR of the control group forstationary fuel load of the VVER-440 reactor using the profiled fuel assemblies with theaverage fuel enrichment 3.82% in the presence of normal and modernized fuel followers inthe CR bank. In the preparation of the neutronic constants for the cells with hafnium theresults of the recent calculations in the RRC "KI" critical test facility were used for themock-up of the modernized fuel assembly. In the PERMAK-3D calculations the interpolationof the burnup values in the core height, obtained from the PERMAK-A calculations wereused.
Fig. 19 shows the pattern of the fuel load investigated. Figs. 20-21 give the distributionof power distributions, burnups etc. averaged over the all the core fuel assemblies.
Figs. 22-25 presents the calculation results of the distribution the ratio of powerdistribution of fuel pin from the periphery row of FA (fuel pin No.3, Fig.2) neighboring theCR to that of the fuel pin from the central part of the same FA (fuel pin No.5) at the nominalpower for different height of CR band withdrawal from the core at the beginning of the fuelcycle. The solid line corresponds to the use of normal CR fuel follower in the control group,the dashed line - to the use of the modernized CR fuel follower with 0.6 mm thick hafniumplates. It supposed that the hafnium plates have been in the core for about two years.
Figs. 26-29 give the results of the similar calculations at the end of boron cycle.
Figs. 30-37 display the relative power distributions (KK) over the fuel pins of FAneighboring the control group CR at the level of upper plugs and the middle of steel insertesin the fuel followers with the normal and modernized CR used.
As follows from Figs. 22-29 in the use of modernized CR fuel follower the peak burstof relative power distribution reduces from 1.68 to 1.22 (HCR = 80%, EOC) and moves fromthe level opposite the upper plugs in the fuel followers to the level in front of steel inserts inthe fuel followers.
It also follows from the calculation results that the increased burnup in the region ofpower burst in the FA fuel pins neighboring the normal CR fuel follower leads to thereduction in this power burst Hence it may be concluded that the periodic movement of theCR control group in the control range during the boron cycle will result in heightened burnupof FA fuel pins within this range and reduction in the power burst at the end of fuel cycle.
474
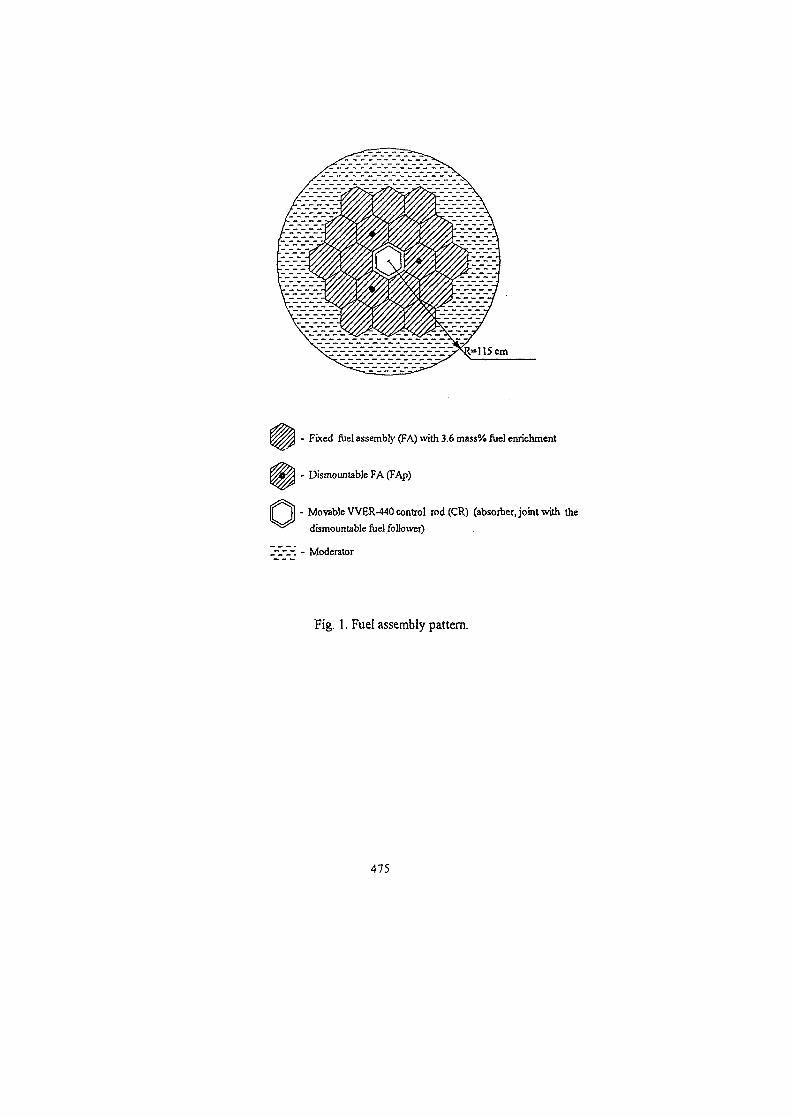
- Fixed fuel assembly (FA) with 3.6 mass% fuel enrichment
- Dismountable FA (FAp)
- Movable VVER-440 control rod (CR) (absorber, joint with the
dismountable fuel follower)
I-I-I-; - Moderator
Fig. 1. Fuel assembly pattern.
475
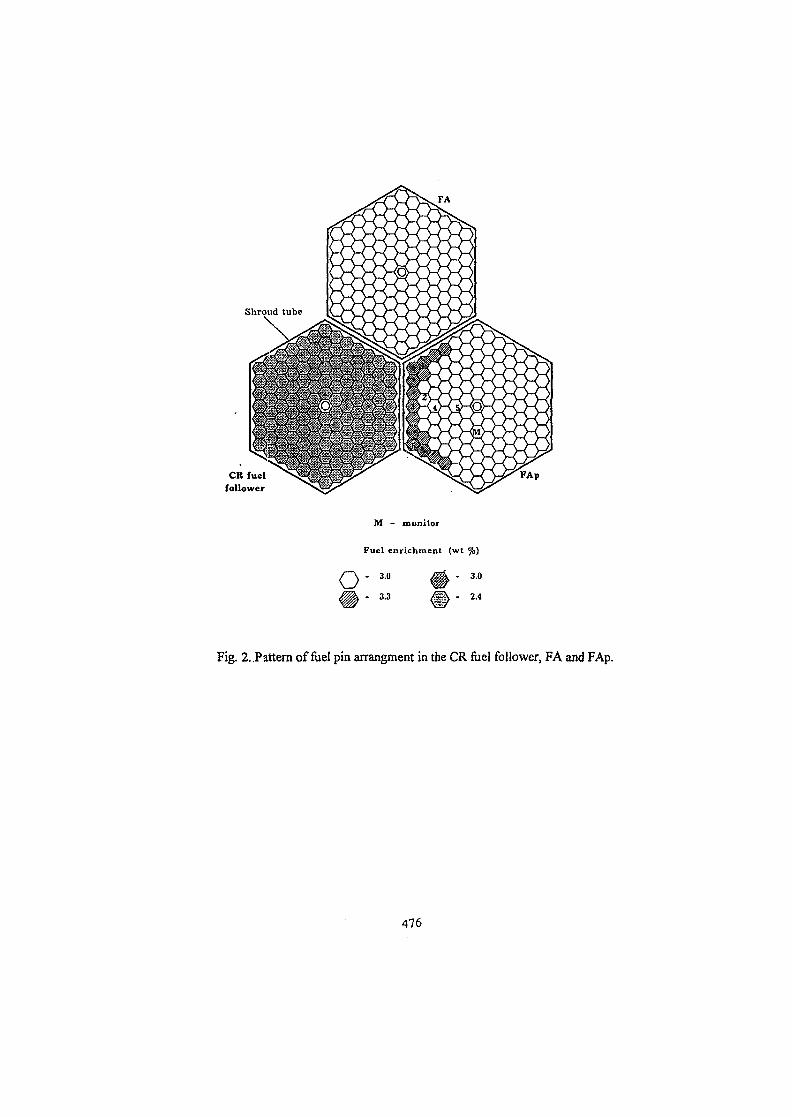
M - monitor
Fuel enrichment (wt
o - 3 - 6< ^ - 3.3
- 3.0
- 2.4
Fig. 2. Pattern of fuel pin arrangment in the CR fuel follower, FA and FAp.
476
co
'6COco
o
FA FA FA FA
zone "0"
1 - Steel inserts in CR pins above the fuel2 - Compensation volumes in CR pins3 - Upper plug in CR pins (Zr+H2O)4-Water gap in CRS - Steel
6 - Absorber in CR absorber rod7 - Water gap between CR fuel follower and FA8 - Water gap between FA and FA9 - lower plug and support grid of FA pins
Fig. 3. Calculation model of critical facility, consisting of VVER-440 fuel assemblies.
477
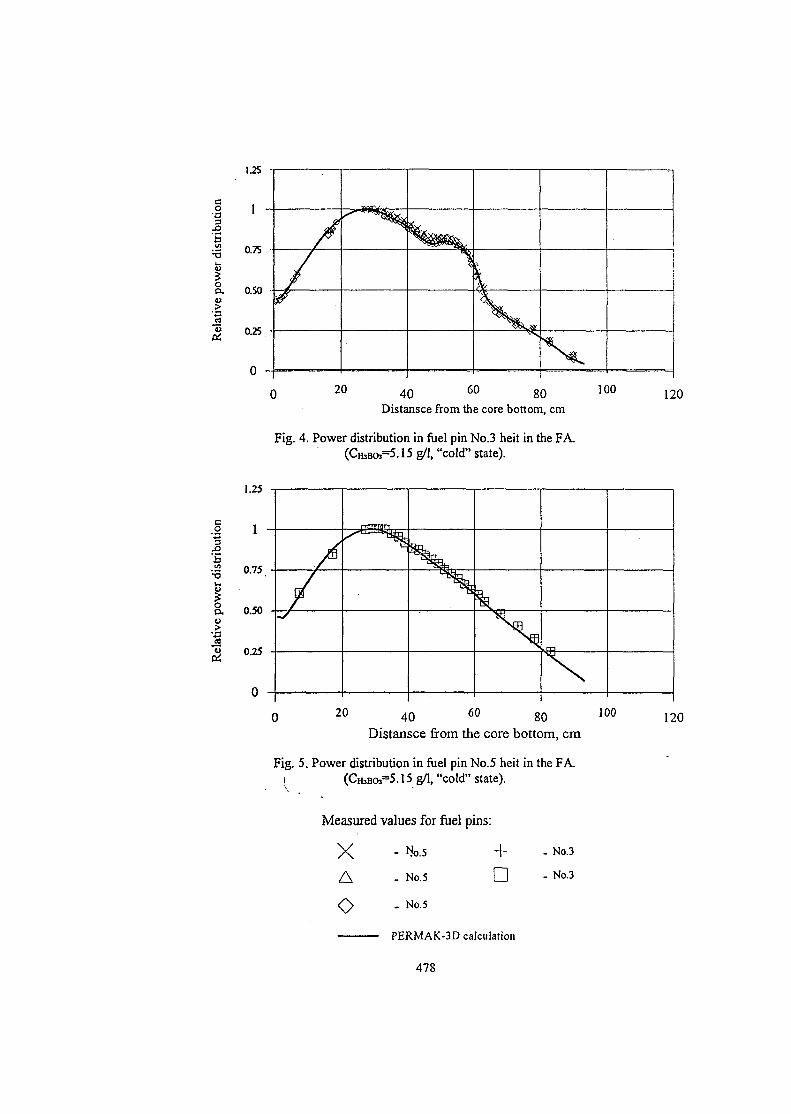
co•a
S3oa,
IisPi
Distansce from the core bottom, cm
Fig. 4. Power distribution in fuel pin No.3 heit in the FA.lS g/1, "cold" state).
1.25
co'^p'S•3
o
0.75
0.50
0.25
Distansce from the core bottom, cm
Fig. 5. Power distribution in fuel pin No.5 heit in the FA.i (CH3BOJ=5 .15 g/1, "cold" state).
Measured
XA
o
values for fuel
- N 0 . 5
. No.5
. No.5
PERMAK-3D
473
pins:
+•
calculation
- No.3
. No.3
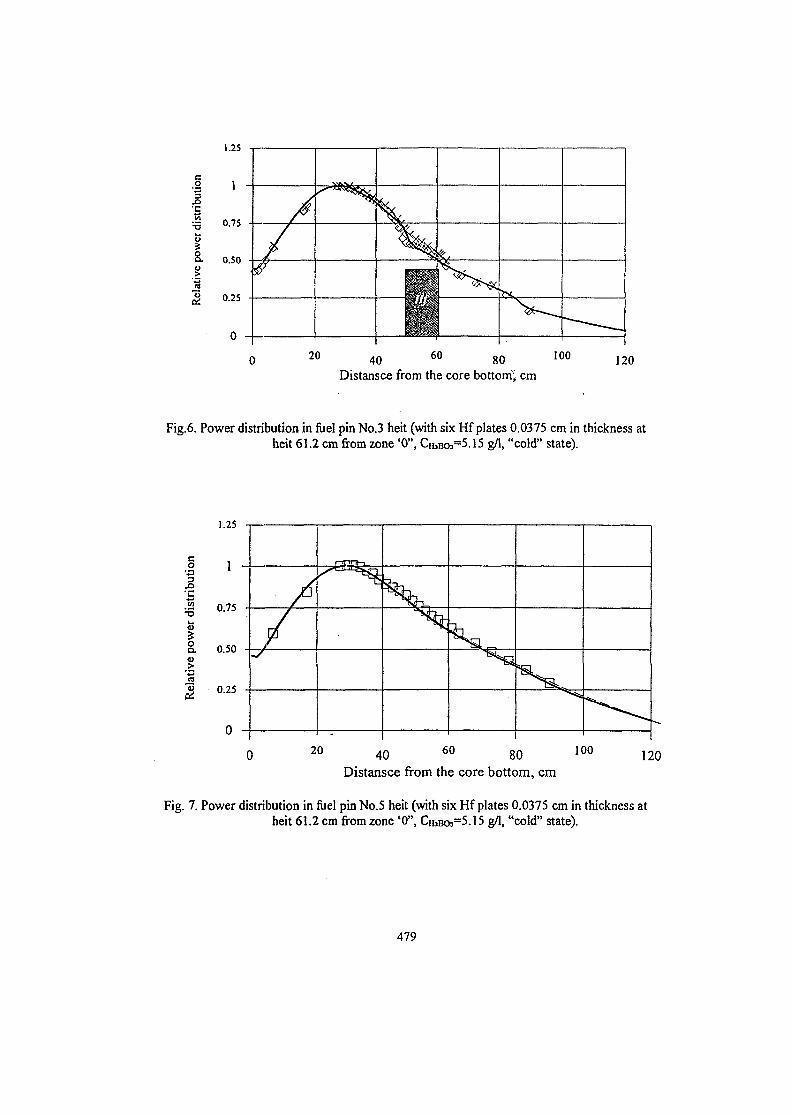
1.25
•s•3>_
8.o>
u
0.75
0.50
0.25
40 60 80 100 120Distansce from the core bottom; cm
Fig.6. Power distribution in fuel pin No.3 heit (with six Hf plates 0.0375 cm in thickness atheit 61.2 cm from zone '0", CK,BO3=5.15 g/1, "cold" state).
1.25
§
'Sin'•3
oD.
0.75
0.50
0-25
20
Distansce from the core bottom, cm
Fig. 7. Power distribution in fuel pin No.5 heit (with six Hf plates 0.0375 cm in thickness atheit 61.2 cm from zone '0", CRJBCV^.IS g/1, "cold" state).
479
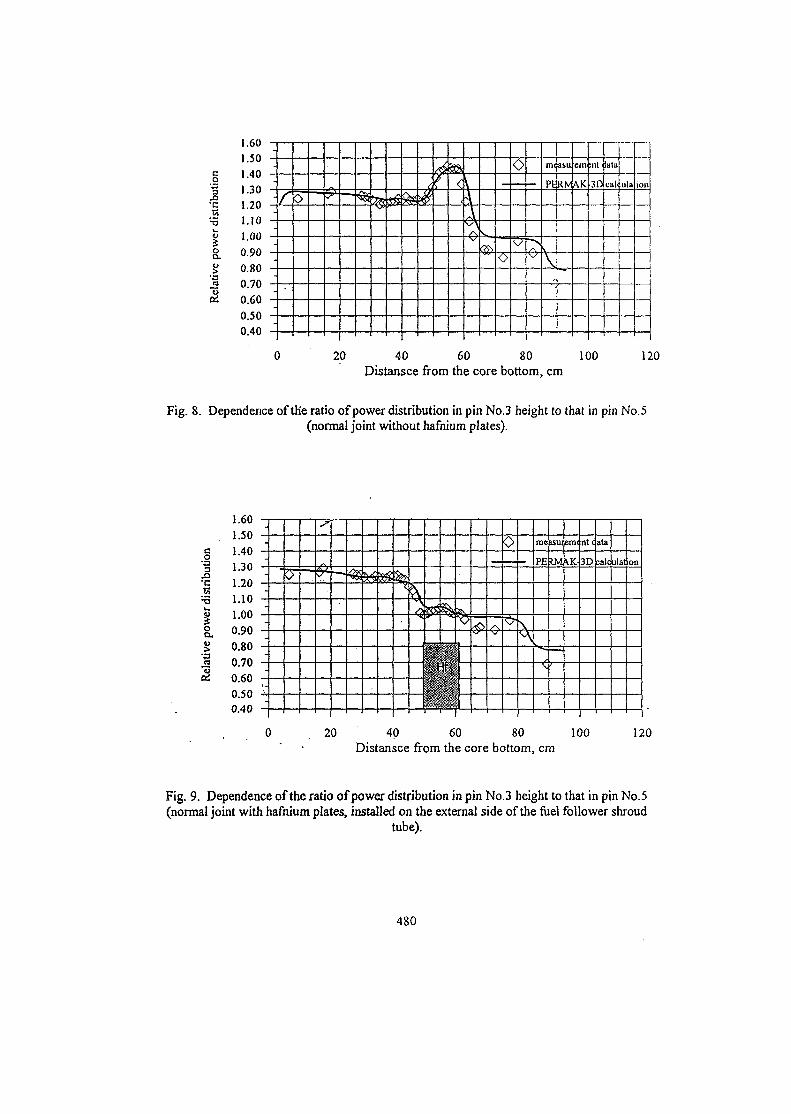
a
1.601.501.401.301.201.101.000.900.800.700.600.500.40
----
-1-1-1-
•>
•
•i
r 0<4/
to<<A
YN
O
O in^asu
PERN1
)
1
em
AK
; iU
3D
lata
ula ion
20 40 60 80 100Distansce from the core bottom, cm
120
Fig. 8. Dependence of the ratio of power distribution in pin No.3 height to that in pin No.5(normal joint without hafnium plates).
a
1.601.501.401.301.201.101.000.900.800.700.600.500.40
\
k>
^
me
PF.
*"•::
1lsuijemi nt<
3D
ata
:al( ulal on
20 40 60 80 100Distansce from the core bottom, cm
120
Fig. 9. Dependence of the ratio of power distribution in pin No.3 height to that in pin No.5(normal joint with hafnium plates, installed on the external side of the fuel follower shroud
tube).
480
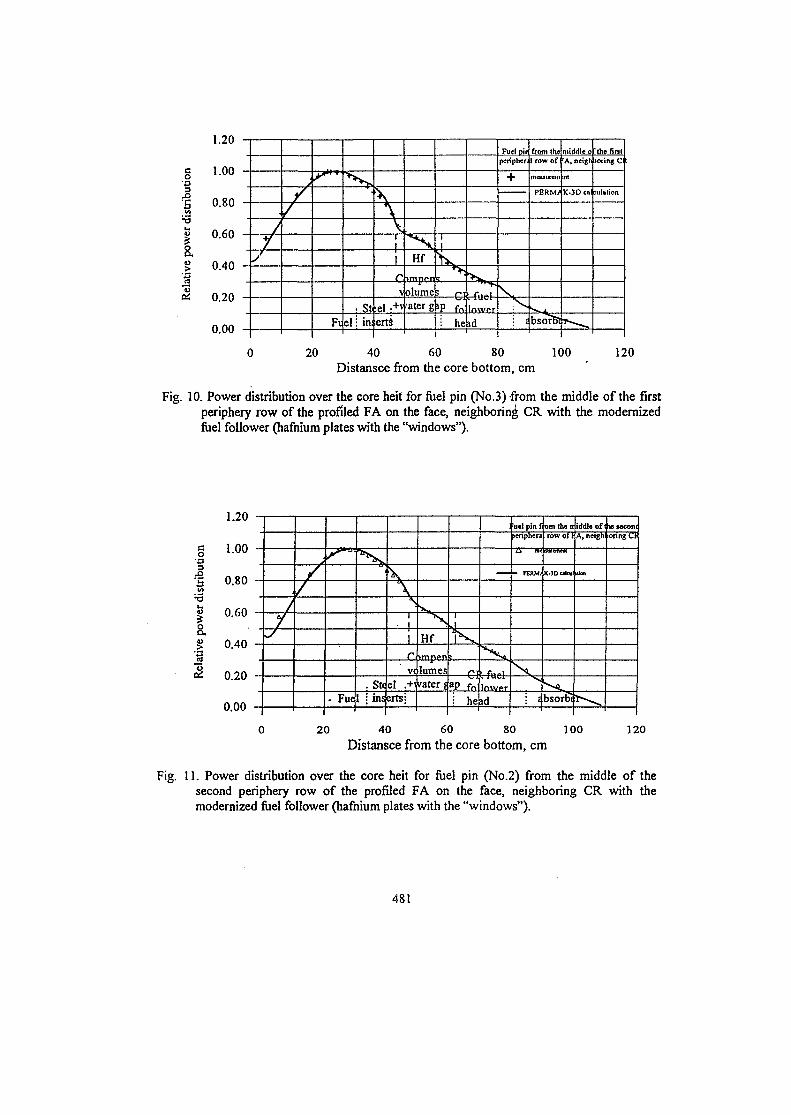
I1-3
I"8
1.20
1.00
0.80
0.60
0.40
0.20
0.00
iy
//
Fi
* %
el i in:
\A\i
iir
el ^erti
Hf
olume'ater g
1
^ ^
s Ct>P fni he
<. fuelInwprbd
Fuel pirpcriphcr
+
• i
from theI row of
inouuran
PERM/
bsorBl
middle orA, neigl
K-3D ca
the firsttoring C
rulation
20 40 60 80 100 120Distansce from the core bottom, cm
Fig. 10. Power distribution over the core heit for fuel pin (No.3) from the middle of the firstperiphery row of the profiled FA on the face, neighboring CR with the modernizedfuel follower (hafnium plates with the "windows").
1.20 -
co•a3
X>
'S^ 1
wer
e
oo.?
1.00 -
0.80 -
0.60 -
0.40 -
0.20
0.00 -
i
//
- Fue
\
. Stt: ins
\\
\i
• 1
|
rvc
el .+\ertsi
sHf
lumesvater t
KCl
aP fni he
' fuel
ad
uel pin J>enphcra
- PERM.
s; i
om the ir
row ol t
"""""
K-JDeital
!>sor6(
iddle ofA, neigh
Ikn
KteconcoringCI
20 40 60 80 100Distansce from the core bottom, cm
120
Fig. 11. Power distribution over the core heit for fuel pin (No.2) from the middle of thesecond periphery row of the profiled FA on the face, neighboring CR with themodernized fuel follower (hafnium plates with the "windows").
481
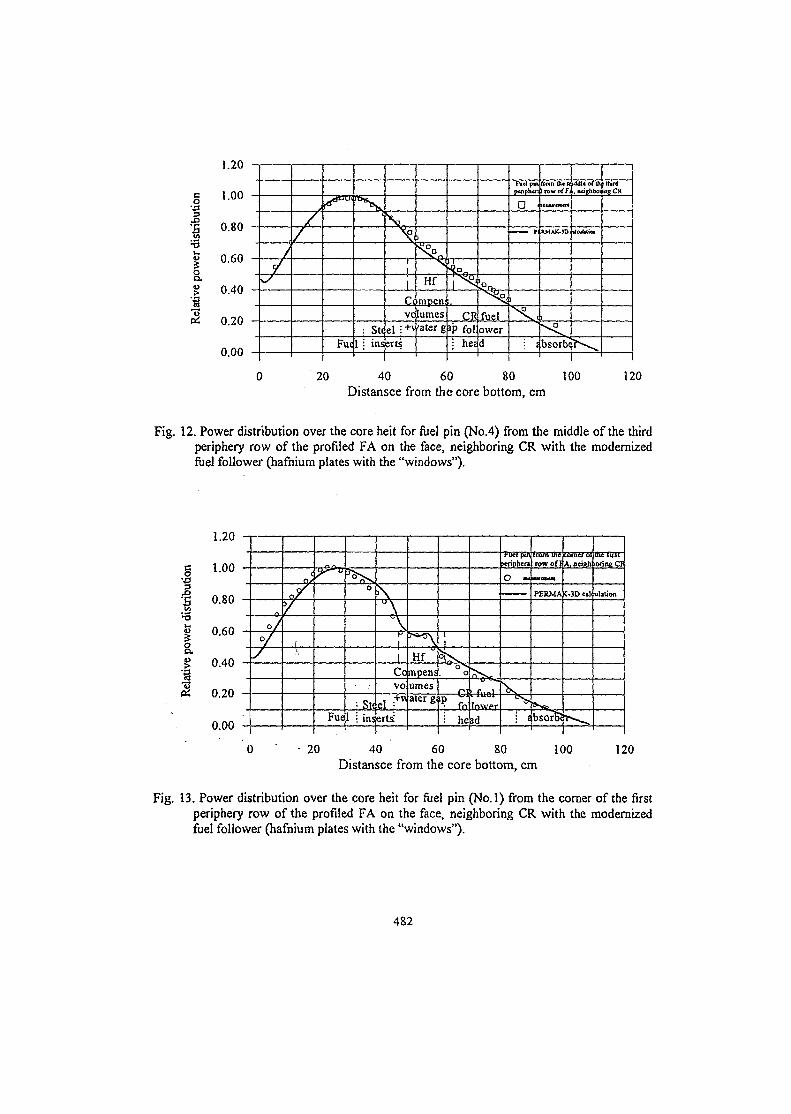
co•0
XI
1•3
1a>lat
i-
1.20
1.00
0.80
0.60
0.40
0.20
0.00 —
//
i
/
/
Fue
i
: SUI i ins
\
I
1
|
vce l l + *zns
NHf
mpenlumcsfater g
«4pf^i
CR»P foli he«
f»elowerd
Fvidpin
a •——• n
^ ^ t
:• ;
fVcm the nrowrfF
K M A K - J O
bsorb«f^^
Hid»gC»
1
20 40 60 80 100Distansce from the core bottom, cm
120
Fig. 12. Power distribution over the core heit for fuel pin (No.4) from the middle of the thirdperiphery row of the profiled FA on the face, neighboring CR with the modernizedfuel follower (hafnium plates with the "windows").
g1
a
1.20
1.00
0.80
0.60
0.40
0.20
0.00
°/y
Fue
o
= StJ
•\
\||
Covo
el : w
1 • inserts;I
Hfmpensumesater g
|
o
Cl
i he
1 furl
Id
I'M pin>eriphera
O »<
V
tromlhcrow of}
SWOBMt
PERMA
bsorSi
;omtl 61A, BtifOi
COD Ml
[htTu-ttorin«CI
ulation
0 - 2 0 40 60 80 100 120Distansce from the core bottom, cm
Fig. 13. Power distribution over the core heit for fuel pin (No.l) from the corner of the firstperiphery row of the profiled FA on the face, neighboring CR with the modernizedfuel follower (hafnium plates with the "windows").
482
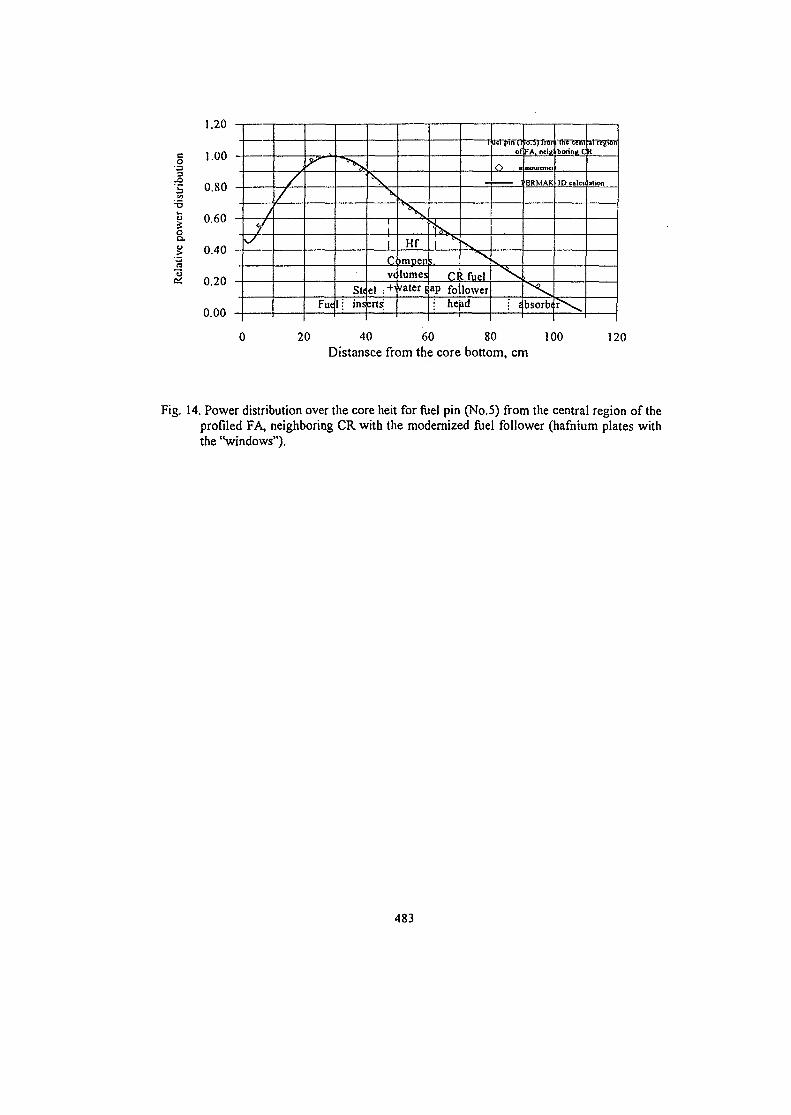
1.20
§ 100•a3
I 0.80it
'-5§ 0.60
>"a
0.40
0.20
0.00
//
//
y
FueSt<
!; ins
\\
i|
1cV(
el -+\ens
Hf
jmpenlumesvater (
j_3
CF.fuelaP follower; head
of
O ,J
: £
FA. neiit
ERMAK
bsorbt
borinit C
3D calcu
3T7egf5fiil
at ion
20 40 60 80 100 120Distansce from the core bottom, cm
Fig. 14. Power distribution over the core heit for fuel pin (No.5) from the central region of theprofiled FA, neighboring CR with the modernized fuel follower (hafnium plates withthe "windows").
483
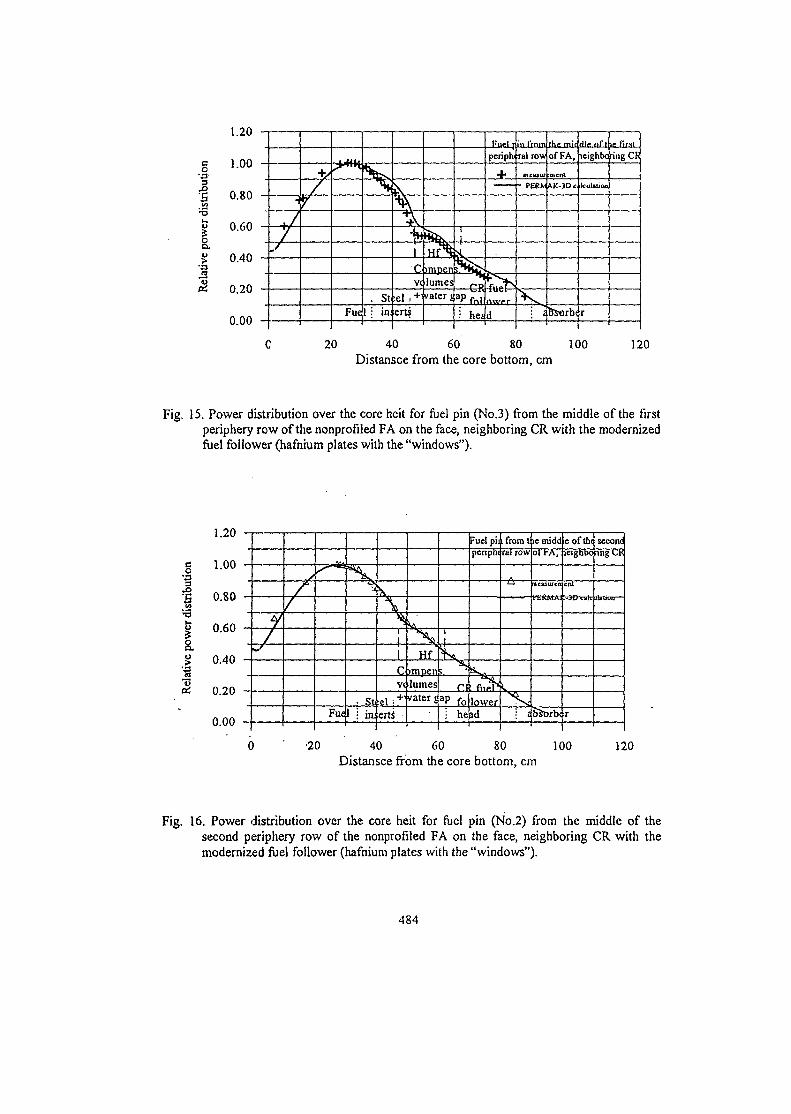
20 40 60 80 100Distansce from the core bottom, cm
120
Fig. 15. Power distribution over the core heit for fuel pin (No.3) from the middle of the firstperiphery row of the nonprofiled FA on the face, neighboring CR with the modernizedfuel follower (hafnium plates with the "windows").
|
a
2
1.20
0.80
0.60
0.40
0.20
0.00
i•j
-A
Fue
'ii
1 i in
V\tI1cV(
er«
Hfsmpenlumesvater {
|
naP fo! he
Fuel piipenptu
flirt"lowerad
. from tral row
s
• i
ic midd01 KA,
Tteasuren
PERMAi
BSt>rb<
eofth(leigtibo
ent
-3D tali.
r
seconding UK
Itiliuil -
•20 40 60 80 100 120Distansce from the core bottom, cm
Fig. 16. Power distribution over the core heit for fuel pin (No.2) from the middle of thesecond periphery row of the nonprofiled FA on the face, neighboring CR with themodernized fuel follower (hafnium plates with the "windows").
484
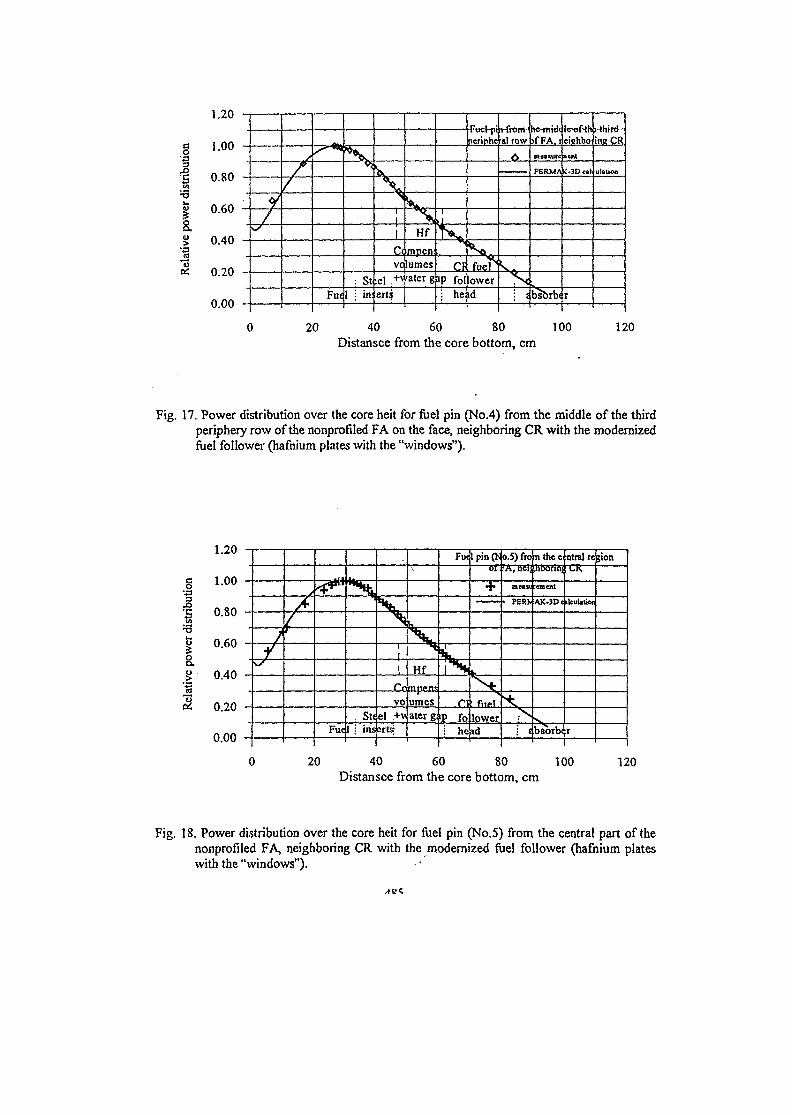
§•a3
wer
a
1.20
1.00
0.80
0.60
0.40
y
r
Fue
1
: St1 : in:
*y
\ >
IIC«jvo
el .+»erts
wHf
mpentumes'ater g
d
CRap fol! he.
rFuehiiperiphe
fuel]ower
id
Hronrat row
k.• i
he-mt<l<>fFA. r
mctiure
PBRMA
bsbrbi
le-oflheishbonent
r
Hhifd-ineCR
uifttion
0.00
0 20 40 60 80 100 120Distansce from the core bottom, cm
Fig. 17. Power distribution over the core heit for fuel pin (No.4) from the middle of the thirdperiphery row of the nonprofiled FA on the face, neighboring CR with the modernizedfuel follower (hafnium plates with the "windows").
§• • p
tive
pow
er d
i;R
ela
1.20
1.00
0.80
0.60
0.40
0.20
0.00
i
A/T
-ji
Fue; S ^
1 : ins
V
11
Cr
VO
el +verts
VHf
umesater g;
Fu<
j
1^1
nP foI he
lpin(l-
of
+
fuMlowerid
o.5) fro•A, nel(
new
• PERk
• i
nthec
hborinc
ement
AK-3D<
bsorbi
ntral re
ilculatiot
r
;ion
20 40 60 80 100Distansce from the core bottom, cm
120
Fig. 18. Power distribution over the core heit for fuel pin (No.5) from the central part of thenonprofiled FA, neighboring CR with the modernized fuel follower (hafnium plateswith the "windows").
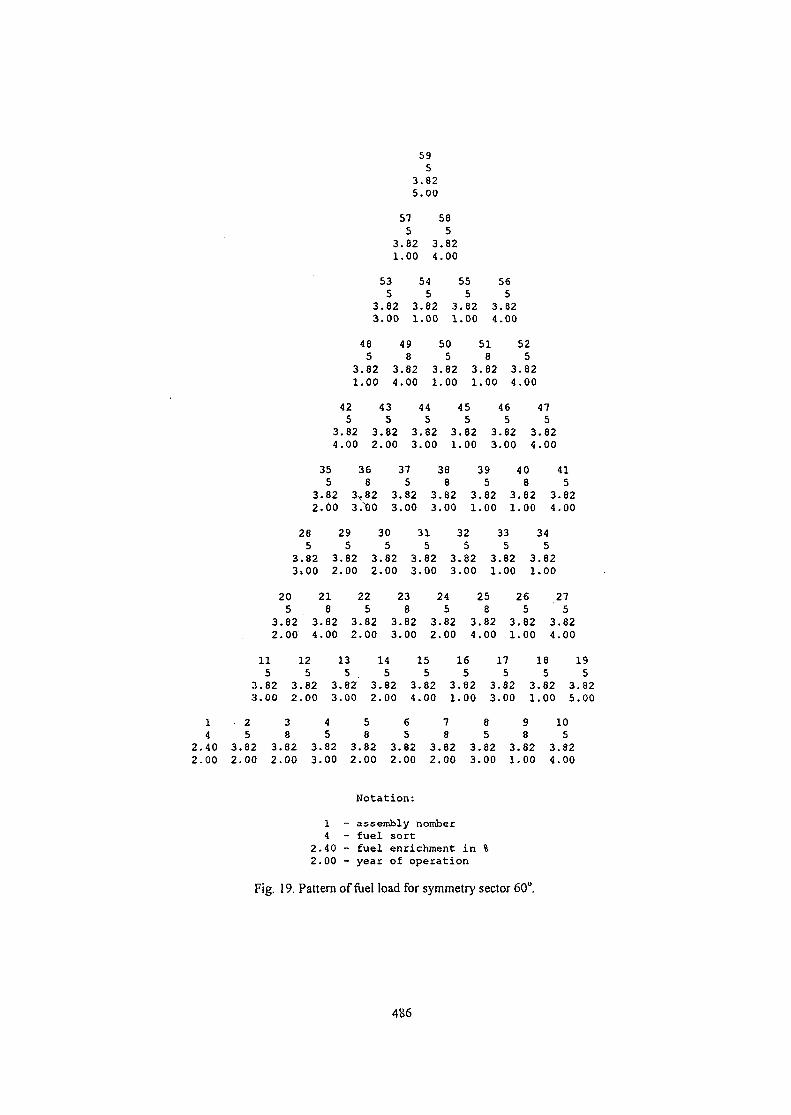
595
3.825.00
57 585 5
3.82 3.821.00 4.00
53 54 55 565 5 5 5
3.82 3.82 3.82 3.823.00 1.00 1.00 4.00
48 49 50 51 525 8 5 8 5
3.82 3.82 3.82 3.82 3.821.00 4.00 1.00 1.00 4.00
42 43 44 45 46 475 5 5 5 5 5
3.82 3.82 3.82 3.82 3.82 3.824.00 2.00 3.00 1.00 3.00 4.00
35 36 37 38 39 40 415 8 5 8 5 8 5
3.82 3^82 3.82 3.82 3.82 3.82 3.822.00 3.00 3.00 3.00 1.00 1.00 4.00
28 29 30 31 32 33 345 5 5 5 5 5 5
3.82 3.82 3.82 3.82 3.82 3.82 3.823»00 2.00 2.00 3,00 3.00 1.00 1.00
20 21 22 23 24 25 26 275 8 5 8 5 8 5 5
3.82 3.82 3.82 3.82 3.82 3.82 3.82 3.822.00 4.00 2.00 3.00 2.00 4.00 1.00 4.00
11 12 13 14 15 16 17 18 195 5 5 . 5 5 5 5 5 5
3.82 3.82 3.82 3.82 3.82 3.82 3.82 3.82 3.823.0.0 2.00 3.00 2.00 4.00 1.00 3.00 1.00 5.00
1 2 3 4 5 6 7 8 9 104 5 8 5 8 5 8 5 8 5
2 . 4 0 3 . 8 2 3 . 8 2 3 . 8 2 3 . 8 2 3 . 8 2 3 . 8 2 3 . 8 2 3 . 8 2 3 . 8 22 . 0 0 2 . 0 0 2 . 0 0 3 . 0 0 2 . 0 0 2 . 0 0 2 . 0 0 3 . 0 0 1 .00 4 . 0 0
N o t a t i o n :
1 - assembly nomber4 - fuel sort
2.40 - fuel enrichment in %2.00 - year of operation
Fig. 19. Pattern of fuel load for symmetry sector 60°
486
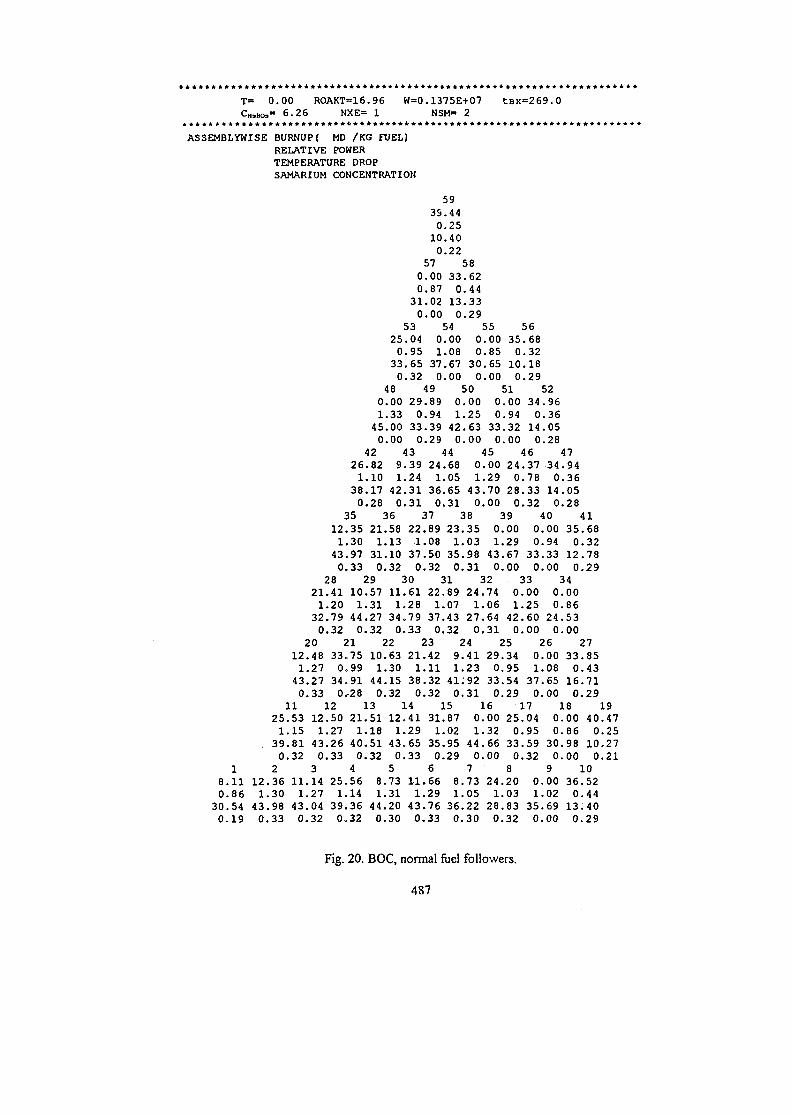
0.00 ROAKT=16.96,= 6.26 NXE= 1
W=0.1375E+07NSM= 2
t B X = 2 6 9 . 0
ASSEMBLYWISE BURNOP( MD /KG FUEL)RELATIVE POWERTEMPERATURE DROPSAMARIUM CONCENTRATION
18.110.8630.540.19
121
430
2513902.36.30.98.33
121430
11.53.15.81.32
111430
211320
20.48.27.27.33
1214303.14.27.04.32
121430
28.41.20.79.32
330340
12.50.27.26.33
251390
261380
35.35.30.97.33
101440
21.75.99.91,28
2114004.56.14.36.32
250330
480.001.3345.000.00
42.82 9.10 1.17 42.28 0
3621.581.1331.100.32
29.57 11.31 1.27 34.32 0
2210.631.3044.150.32
13.51 12.18 1.51 43.32 0
58.731.3144.200.30
5935.440.2510.400.22
57 580.00 33.620.87 0.4431.02 13.330.00 0.29
53 54 55 56.04 0.00 0.00 35.68.95 1.08 0.85 0.32.65 37.67 30.65 10.18.32 0.00 0.00 0.29
49 50 51 5229.89 0.00 0.00 34.960.94 1.25 0.94 0.3633.39 42.63 33.32 14.050.29 0.00 0.00 0.28
43 44 45 46 47.39 24.68 0.00 24.37 34..24 1.05 1.29 0.78 0..31 36.65 43.70 28.33 14..31 0.31 0.00 0.32 0.
37 38 39 4022.89 23.35 0.00 0.001.08 1.03 1.29 0.9437.50 35.98 43.67 33.330.32 0-31 0.00 0.00
94360528
350120
30 31 32 33 34.61 22.89 24.74 0.00 0..28 1.07 1.06 1.25 0..79 37.43 27.64 42.60 24..33 0.32 0.31 0.00 0.
23 24 25 2621.42 9.41 29.34 0.001.11 1.23 0.95 1.0838.32 4l;92 33.54 37.650.32 0.31 0.29 0.00
00865300
330160
14 15 16 17 18.41 31.87 0.00 25.04 0..29 1.02 1.32 0.95 0..65 35.95 44.66 33.59 30..33 0.29 0.00 0.32 0.
6 7 8 911.66 8.73 24.20 0.001.29 1.05 1.03 1.0243.76 36.22 28.83 35.690.33 0.30 0.32 0.00
00869800
360130
41.68.32.78.29
27.85.43.71.29
400100
10.52.44.40.29
19.47.25.27.21
Fig. 20. BOC, normal fuel followers.
487
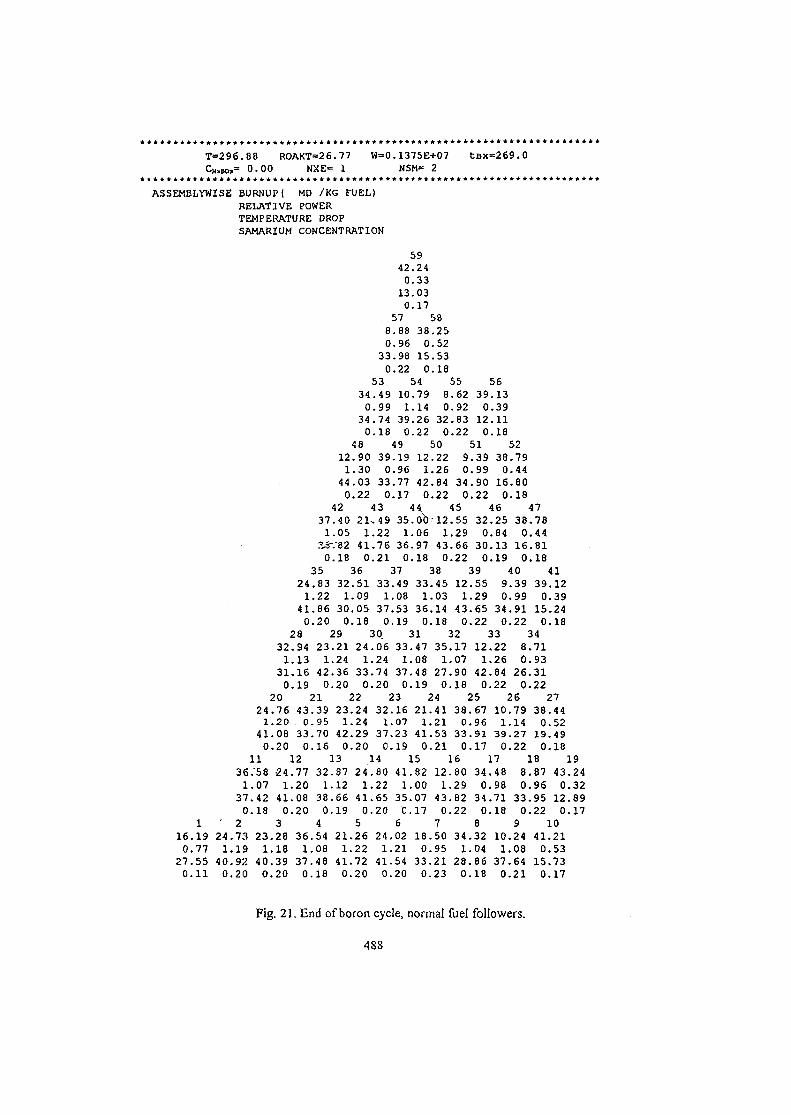
T=296.88 ROAKT=26.77CH3»03= 0.00 NXE= 1
W=0.137SE+07NSM= 2
tBX=269.0
ASSEMBLYWISE BURNUP{ MD /KG FUEL)RELATIVE POWERTEMPERATURE DROPSAMARIUM CONCENTRATION
5942.240.3313.03
340
4812.901.3044.030.22
42
0578.880.9633.980.22
5334.490.9974
1758
38.250.5215.530.18
54 5510.79 8.621.14 0.9239.26 32.83 12
22 0519
0.96 1.26 033.77 42.84 34
0.22 0.22
.18 0.22 0.49 50
39.19 12.22
5639.130.391118
0.1743 44 45
5239 38.7999 0.4490 16.80
0.1846 47
37.40 21.49 3 5 . 0 0 1 2 . 5 5 32.25 38.781.05 1.22 1.06 1.29 0.84 0.44
. 3-/82 41.76 36.97 43.66 30.13 16.810.18 0.21 0.18 0.22 0.19 0.18
36 37 38 39 40 413524.83
.22
.86
32.51 33.49 33.45 12.551.
41.1.09
30.050.18
131
020
24.761.20
41.080.20 0
11 1236.58 -24.77
2029
23.211.24 1
42.36 330
321.07 1.20 1
37.42 41.08 380.18 0.20 0
1 ' 2 3 416.19 24.73 23.28 36.540.77 1.19 1.18 1.08
27.55 40.92 40.39
028
32.9413161921
43.390.9533.70
161387126619
521.26
1.2237.48 41.72
1.0837.530.19
1.03 1.2936.14 43.65 340.18 0.22 0
30. 3124.06 33.47
3235.17
1.08 1.07.90.18
2474 37.48 27
20 0.20 0.19 022 23 24
23.24 32.16 21.411.24 1.07 1.21
41.53 330.21 0
15 1641.82135060221
3312.221420
9.39 39.120.99 0.3991 15.2422 0.18348.71
26 0.84 26.22 0.
.93
.31
.2226 2725
38.67 10.79 38.440.96 1.14 0.52
39.270
.9117
0.11 0.20 0.20 0.18 0.20
24 1.0742.29 37.230.20 0.19
1424.80
1.227118
924.02 18.50 34.32 10.24
1.21 0.95 1.04 1.0841.54 33.21 28.86 37.64 15.730.20 0.23 0.18 0.21 0.17
41.650.20
.00
.07
.17
1780 34.4829 0.9882 34
0
121
430.22
7 850 34.32
1
19.4922 0.18
18 198.87 43.240.96 0.
33.95 12.0.22 0.
1041.21
0.53
.32,89,17
Fig. 21. End of boron cycle, normal fuel followers.
488
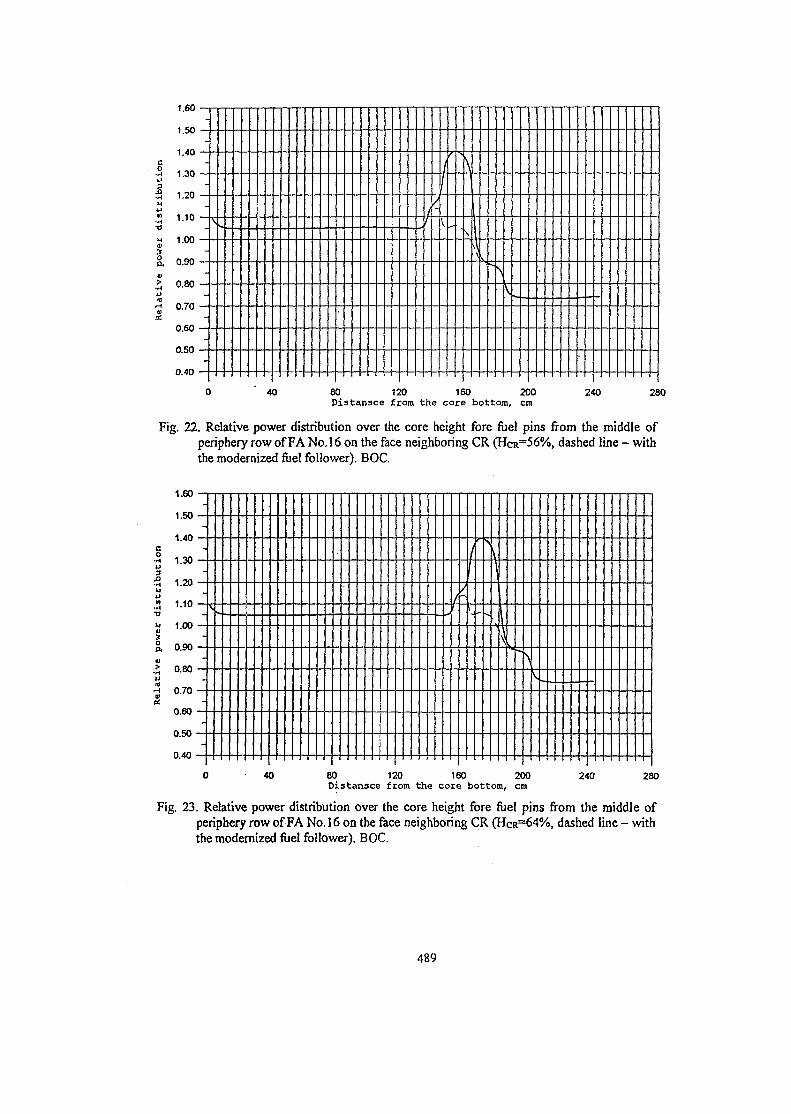
1.60
1.50
1.40
1.30
1.20
1.10
1.00
0.90
0.80
0.70
0.60
0.50
0.40
-
-
-
-
-
-
I1
f1V- •
\
Av\\
•
40 80 120 160 200Distansce from the core bottom, cm
240 280
Fig. 22. Relative power distribution over the core height fore fuel pins from the middle ofperiphery row of FA No. 16 on the face neighboring CR (HCR=56%, dashed line - withthe modernized fuel follower). BOC.
1.60
1.50
1.40
1.30
1.20
1.10
1.00
0.90
0.80
0.70
0.60
0.50
0.40
-
-
-
-
-
-
-
-
-
-
-
1
1
1J•
\
\
40 80 120 160 200Distansce from the core bottom, cm
240 280
Fig. 23. Relative power distribution over the core height fore fuel pins from the middle ofperiphery row of FA No. 16 on the face neighboring CR (HCR=64%, dashed line - withthe modernized fuel follower). BOC.
489
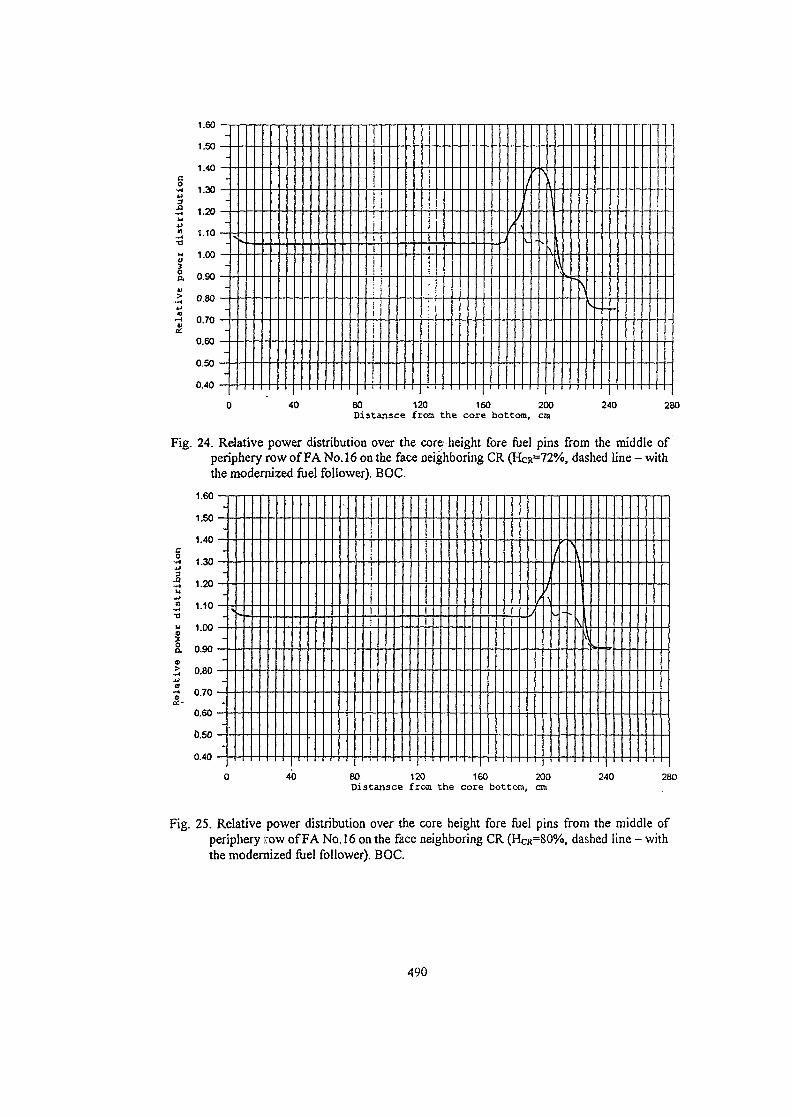
3o
0.40 —
: II1•
•
|
i
!1
I1
f /
(
1
\
40 80 120 160 200Distansce froa the core bottom, cm
240 280
Fig. 24. Relative power distribution over the core,- height fore fuel pins from the middle ofperiphery row of FA No. 16 on the face neighboring CR (HCR=72%, dashed line - withthe modernized fuel follower). BOC.
3Mn
i.ou —
4 Aft
4 on
n Rn
h in
ji
f
!
i
|
j/
i\)i
-
J1IsI
40 80 120 160 200Distansce from the core bottom, cm
240 280
Fig. 25. Relative power distribution over the core height fore fuel pins from the middle ofperiphery row of FA No. 16 on the face neighboring CR (HCR=80%, dashed line - withthe modernized fuel follower). BOC.
490
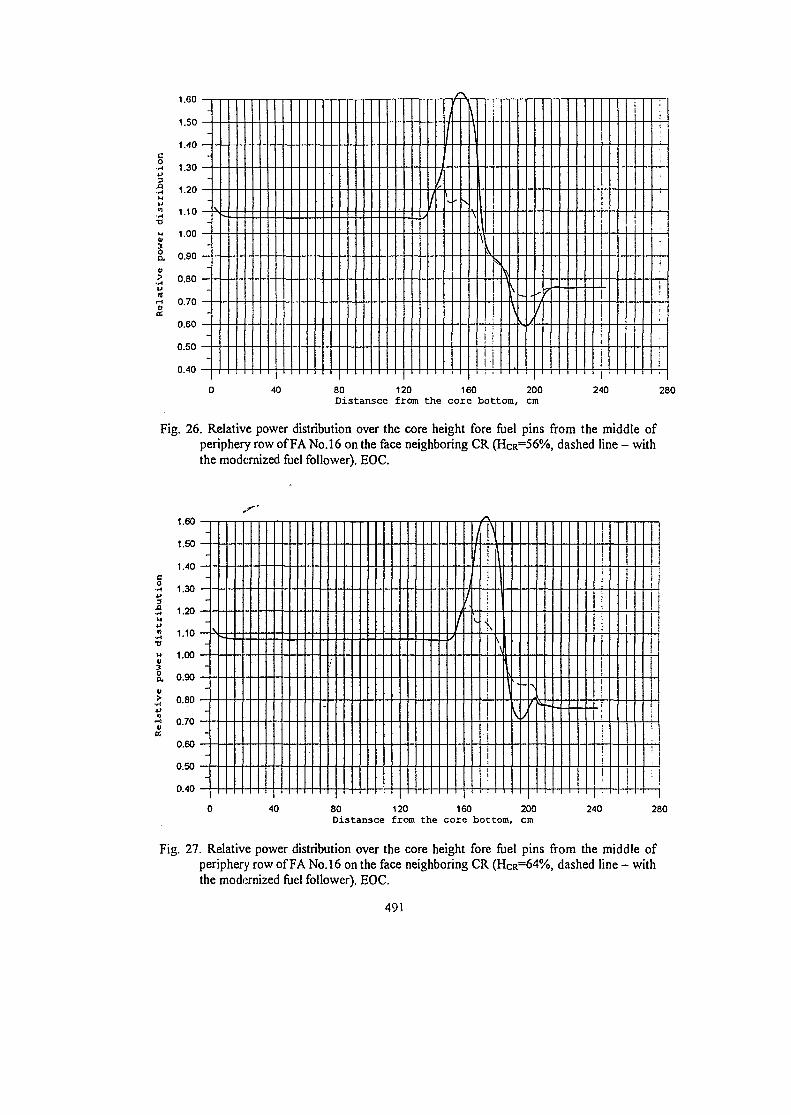
Ill
o
a.o
1.60 —i
1 Afi
1 10 —
A on
/
1/1//
i
• s
|
1
I\
<|
v
\ /7
\
40 80 120 160 200Distansce from the core bottom, cm
240 280
Fig. 26. Relative power distribution over the core height fore fuel pins from the middle ofperiphery row of FA No. 16 on the face neighboring CR (HCR=56%, dashed line - withthe modernized fuel follower). EOC.
1.60
1.50
1.40
1.30
1.20
1.10
1.00
0.90
0.80
0.70
0.60
0.50
0.40
-
-
-
-
-
-
-
-
-
-
-
-
\
•
1
\j|I/
| \
\
|1j11i
1
-1
1
1
|
:
40 80 120 160 200Distansce from the core bottom, cm
240 280
Fig. 27. Relative power distribution over the core height fore fuel pins from the middle ofperiphery row of FA No. 16 on the face neighboring CR (HCR=64%, dashed line - withthe modernized fuel follower). EOC.
491
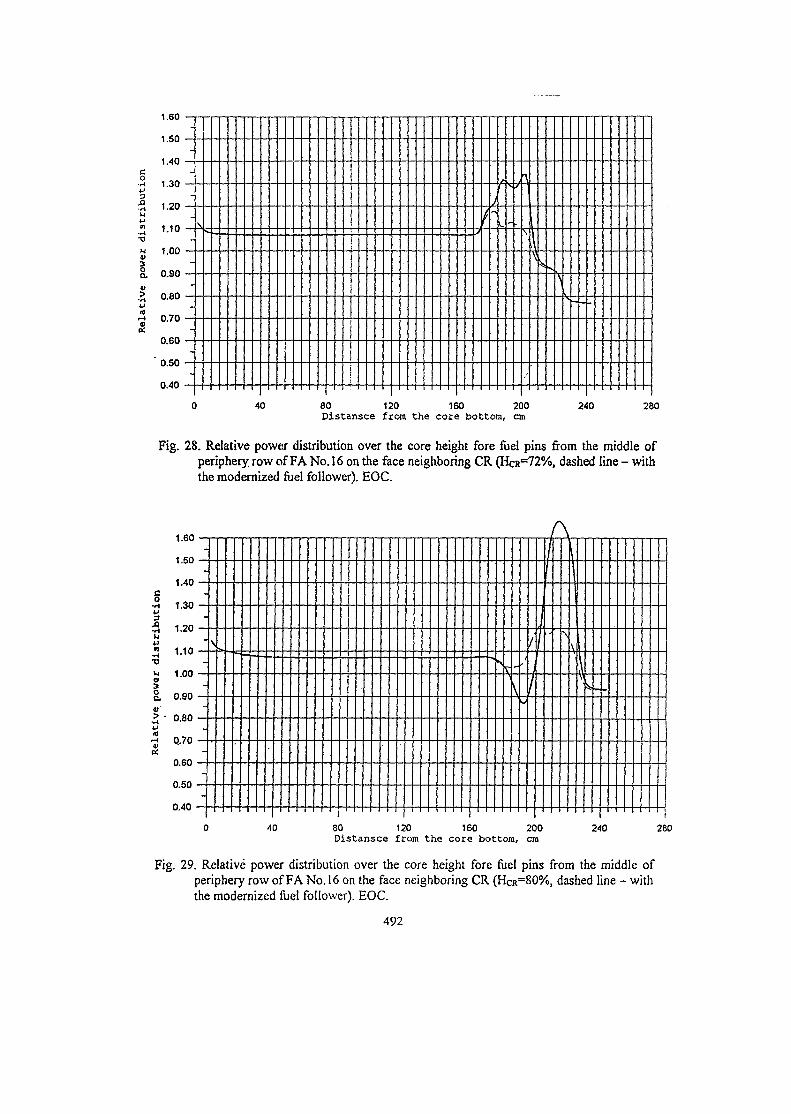
u3oa
s.
1.60
1.50
1.40
1.30
1.20
1.10
1.00
0.90
0.80
0.70
0.60
' 0.50
0.40
-
-
-
-
-
-
-
--
-
-
- s
fJ
**•
f
\
/
•v
40 80 120Distansce from the
160 200core bottom, cm
240 280
Fig. 28. Relative power distribution over the core height fore fuel pins from the middle ofperiphery row of FA No. 16 on the face neighboring CR (HCR=72%, dashed line - withthe modernized fuel follower). EOC.
•H
u
U
oa,
1.60 I I I | I I
< r.n .,_ _ ,,.. ,_ ._
1 40 —- - • - •
" \1 10 - * - - -
o on .._ , ..
ft an _ _ . - - - .J
n yn
A an „
Q 5 Q
0 4 0 - - - •-..- -
\
I ]
I
I
1II\l
40 80 120 160 200Distansce from the core bottom, cm
240 280
Fig. 29. Relative power distribution over the core height fore fuel pins from the middle ofperiphery row of FA No. 16 on the face neighboring CR (HCR=80%, dashed line - withthe modernized fuel follower). EOC.
492
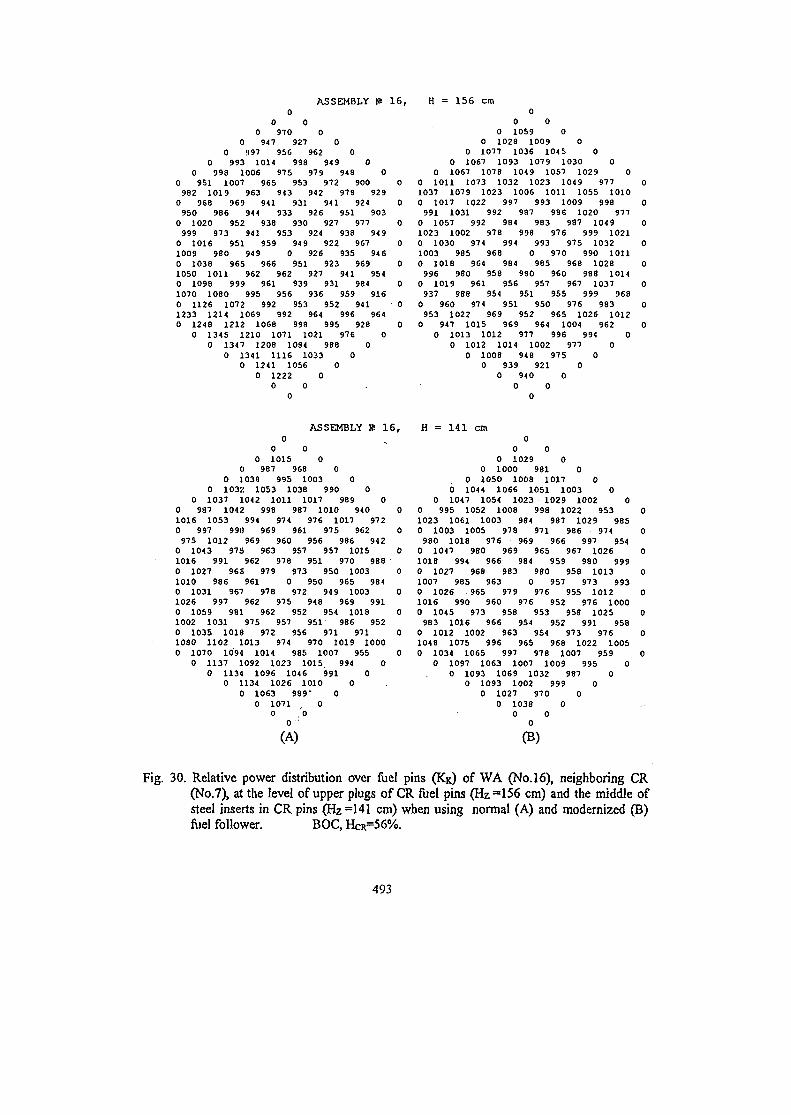
ASSEMBLY IP 16,0
0 00 970 0
0 947 927 00 997 956 962 0
0 993 1014 998 949 00 998 1006 975 979 948 0
0 951 1007 965 953 972 900 0982 1019 963 943 942 978 9290 968 969 941 931 941 924 0950 986 944 933 926 951 903
0 1020 952 938 930 927 977 0999 973 941 953 924 938 9490 1016 951 959 949 922 967 01009 980 949 0 926 935 9460 1038 965 966 951 923 969 01050 1011 962 962 927 941 9540 1098 999 961 939 931 984 01070 1080 995 956 936 9S9 9160 1126 1072 992 953 952 941 01233 1214 1069 992 964 996 9640 1248 1212 1068 998 995 928 0
0 1345 1210 1071 1021 976 00 1347 1208 1084 988 0
0 1341 1116 1033 00 1241 1056 0
0 1222 00 0
0
H = 156 cm0
0 00 1059 0
0 1028 1009 00 1077 1036 1045 0
0 1067 1093 1079 1030 00 1067 1078 1049 1057 1029 0
0 1011 1073 1032 1023 1049 977 01037 1079 1023 1006 1011 1055 10100 1017 1022 997 993 1009 998 0991 1031 992 987 986 1020 977
0 1057 992 984 983 987 1049 01023 1002 978 998 976 999 10210 1030 974 994 993 975 1032 01003 985 968 0 970 990 10110 1018 964 984 985 968 1028 0996 980 958 980 960 988 1014
0 1019 961 956 957 967 1037 0937 988 954 951 955 999 9680 960 974 951 950 976 983 0953 1022 969 952 965 1026 10120 947 1015 969 964 1004 962 0
0 1013 1012 977 996 994 00 1012 1014 1002 977 0
0 1008 948 975 00 939 921 0
0 940 00 0
0
ASSEMBLY » 16,0
0 00 1015 0
0 987 968 00 1038 995 1003 0
0 1032 1053 1038 990 00 1037 1042 1011 1017 989 0
0 987 1042 998 987 1010 940 01016 1053 994 974 976 1017 9720 997 998 969 961 975 962 0975 1012 969 960 956 986 942
0 1043 975 963 957 957 1015 01016 991 962 978 951 970 9880 1027 96S 979 973 950 1003 01010 986 961 0 950 965 9840 1031 967 978 972 94 9 1003 01026 997 962 975 948 969 9910 1059 981 962 952 954 1018 01002 1031 975 957 951 986 9520 1035 1018 972 956 971 971 01080 1102 1013 974 970 1019 10000 1070 1094 1014 985 1007 955 0
0 1137 1092 1023 1015 994 00 1134 1096 1046 991 0
0 1134 1026 1010 00 1063 989' 0
0 1071 0O 0
0 '
H = 141 cm0
0 00 1029 0
0 1000 981 00 1050 1008 1017 0
0 1044 1066 1051 1003 00 1047 1054 1023 1029 1002 0
0 995 1052 1008 998 1022 953 01023 1061 1003 984 987 1029 9850 1003 1005 978 971 986 974 0980 1018 976 969 966 997 9540 1047 980 969 965 967 1026 01018 994 966 984 959 980 9990 1027 968 983 980 958 1013 01007 985 963 0 957 973 9930 1026 965 979 976 955 1012 01016 990 960 976 952 976 10000 1045 973 958 953 958 1025 0983 1016 966 954 952 991 958
0 1012 1002 963 954 973 976 01048 1075 996 965 968 1022 10050 1034 106S 997 978 1007 959 0
0 1097 1063 1007 1009 995 00 1093 1069 1032 987 0
0 1093 1002 999 00 1027 970 0
0 1038 00 0
0
(A) (B)
Fig. 30. Relative power distribution over fuel pins (KK) of WA (No. 16), neighboring CR(No.7), at the level of upper plugs of CR fuel pins (Hz =156 cm) and the middle ofsteel inserts in CR pins (Hz =141 cm) when using normal (A) and modernized (B)fuel follower. BOC, HCR=56%.
493
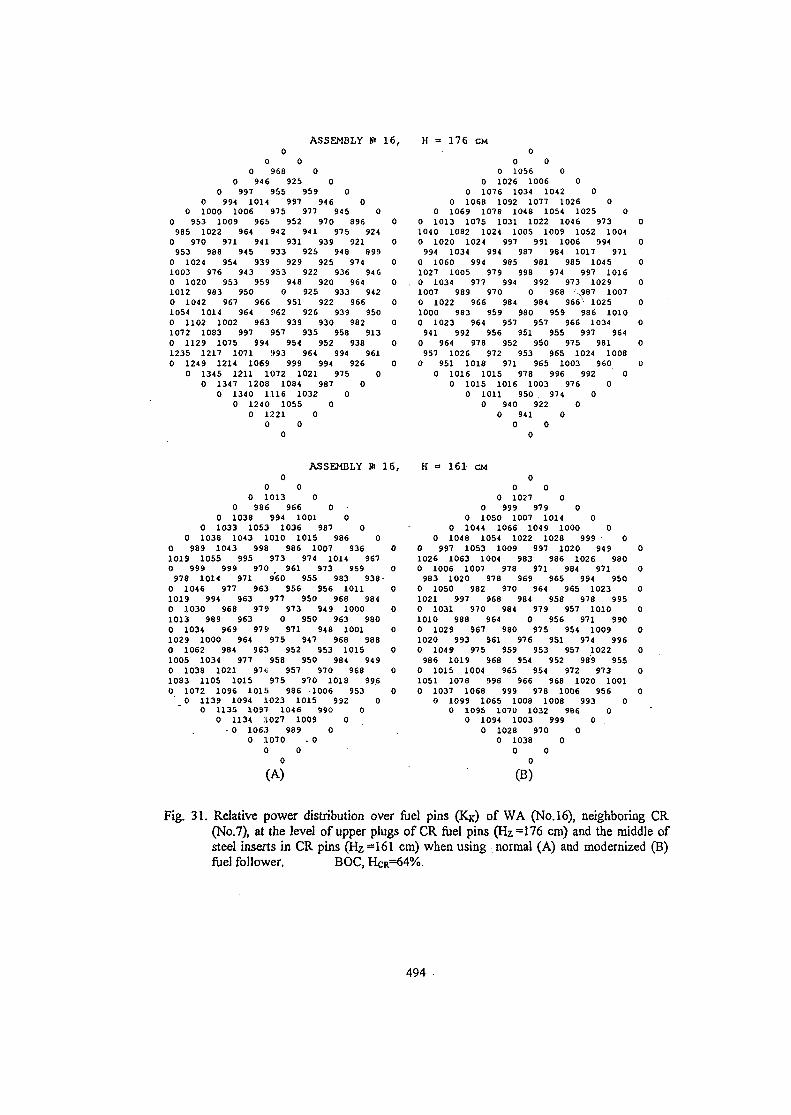
ASSEMBLY » 16,0
0 00 968 0
0 946 925 00 997 955 959 0
0 994 1014 997 946 00 1000 1006 975 977 945 0
0 953 1009 965 952 970 896 0965 1022 964 942 941 975 924
0 970 971 941 931 939 921 0953 988 945 933 925 948 899
0 1024 954 939 929 925 974 01003 976 943 953 922 936 9460 1020 953 959 948 920 964 01012 983 950 0 925 933 9420 1042 967 966 951 922 966 01054 1014 964 962 926 939 9500 1102 1002 963 939 930 982 01072 1083 997 957 935 958 9130 1129 1075 994 954 952 938 01235 1217 1071 993 964 994 9610 1249 1214 1069 999 994 926 0
0 1345 1211 1072 1021 975 00 1347 1208 1084 987 0
0 1340 1.116 1032 00 1240 1055 0
0 1221 00 0
0
H = 176 CM0
0 00 1056 0
0 1026 1006 00 1076 1034 1042 0
0 1068 1092 1077 1026 00 1069 1078 1048 1054 1025 0
0 1013 1075 1031 1022 1046 9731040 1082 1024 100S 1009 1052 10040 1020 1024 997 991 1006 994994 1034 994 987 984 1017 9710 1060 994 985 981 985 10451027 1005 979 998 974 997 10160 1034 977 994 992 973 10291007 989 970 0 968 -N987 10070 1022 966 984 984 966V 10251000 983 959 980 959 986 10100 1023 964 957 957 966 1034941 992 956 951 955 997 9640 964 978 952 950 975 981957 1026 972 953 965 1024 10080 951 1018 971 965 1003 960
0 1016 1015 978 996 992 00 1015 1016 1003 976 0
0 1011 950 974 00 940 922 0
0 941 00 0
0
ASSEMBLY » 16,0
. 0 00 1013 0
0 986 966 00 1038 994 1001 0
0 1033 1053 1036 987 00 1038 1043 1010 1015 986 0
0 989 1043 998 986 1007 936 01019 1055 995 973 974 1014 9670 999 999 970 961 973 959 0978 1014 971 960 955 983 938-0 1046 977 963 956 956 1011 01019 994 963 977 950 968 9840 1030 968 979 973 949 1000 01013 989 963 0 950 963 9800 X034 969 979 971 948 1001 01029 1000 964 975 947 968 9880 1062 984 963 952 953 1015 01005 1034 977 958 950 984 9490 1038 1021 97« 957 970 968 01083 1105 1015 975 970 1018 9960 1072 1096 1015 986 1006 953 0
0 1139 1094 1023 1015 992 00 113S 1097 1046 990 0
0 1134 1027 1009 0• 0 1063 989 0
0 1070 . 00 0
0
(A)
H = 161 CMo
0 00 1027 0
0 999 979 00 1050 1007 1014 0
0 1044 1066 1049 1000 00 1048 1054 1022 1028 999 0
0 997 1053 1009 997 1020 949 01026 1063 1004 983 986 1026 9800 1006 1007 978 971 984 971 0983 1020 978 969 965 994 950
0 1050 982 970 964 965 1023 01021 997 968 984 958 978 9950 1031 970 984 979 957 1010 01010 988 964 0 956 971 9900 1029 967 980 975 954 1009 01020 993 961 976 951 974 9960 104 9 975 959 953 957 1022 0986 1019 968 S54 952 989 955
0 1015 1004 965 954 972 973 01051 1078 998 966 968 1020 10010 1037 1068 999 978 1006 956 0
0 1099 1065 1008 1008 993 00 1095 1070 1032 986 0
0 1094 1003 999 00 1028 970 0
0 1038 00 0
0
(B)
Fig. 31. Relative power distribution over fuel pins (KK) of WA (No. 16), neighboring CR(No.7), at the level of upper plugs of CR fuel pins (Hz =176 cm) and the middle ofsteel inserts in CR pins (Hz =161 cm) when using normal (A) and modernized (B)fuel follower. BOC, HCR=64%.
494
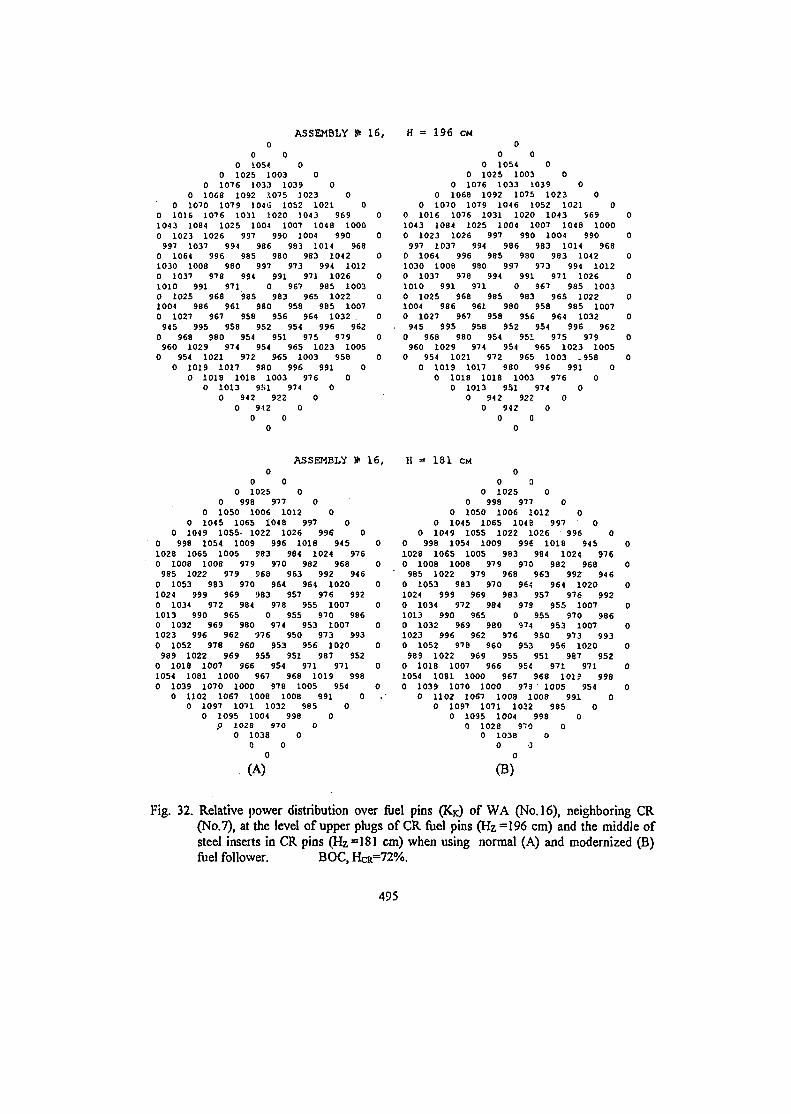
ASSEMBLY If 16 ,o
o oo ios« o
O 1025 1003 00 1076 1033 1039 0
0 1068 1092 1075 1023 00 1070 1079 1046 1052 1021 0
0 1016 1076 1031 1020 1043 969 01043 1084 1025 1004 1007 1048 10000 1023 1026 997 990 1004 990 0997 1037 994 986 983 1014 968
0 1064 996 985 980 963 1042 01030 1008 980 997 973 994 10120 1037 978 994 991 971 1026 01010 991 971 0 967 985 10030 102S 968 985 983 965 1022 01004 986 961 980 958 985 10070 1027 967 958 956 964 1032 0945 995 958 952 954 996 962
0 968 980 954 951 975 979 0960 1029 974 954 965 1023 1005
0 9S< 1021 972 965 1003 958 00 1019 1017 980 996 991 0
0 1018 1018 1003 976 00 1013 9S1 974 0
0 942 922 00 942 0
0 00
H = 196 CM0
0 00 1054 0
0 1025 1003 00 1076 1033 1039 0
0 1068 1092 1075 1023 00 1070 1079 1046 1052 1021 0
0 1016 1076 1031 1020 1043 969 01043 1084 1025 1004 1007 1048 10000 1023 1026 997 990 1004 990 0997 1037 994 986 983 1014 9680 1064 996 985 980 983 1042 01030 1008 980 997 973 994 10120 1037 978 994 991 971 1026 01010 991 971 0 967 985 10030 1025 968 985 983 965 1022 01004 986 961 980 958 985 10070 1027 967 958 956 964 1032 0945 995 958 952 954 996 962
0 968 980 954 951 975 979 0960 1029 974 954 965 1023 1005
0 954 1021 972 965 1003 .958 00 1019 1017 980 996 991 0
0 1018 1018 1003 976 00 1013 951 974 0
0 942 922 00 942 0
0 00
ASSEMBLY » 16,0
0 o0 1025 0
0 998 977 00 1050 1006 1012 0
0 1045 1065 1048 997 00 1049 1055- 1022 1026 996 0
0 998 1054 1009 996 1018 945 01028 1065 1005 983 984 1024 9760 1008 1008 979 970 982 968 0985 1022 979 968 963 992 946
0 1053 983 970 964 964 1020 01024 999 969 983 957 976 9920 1034 972 984 978 955 1007 01013 990 965 0 955 970 9860 1032 969 980 974 9S3 1007 01023 996 962 976 950 973 9930 1052 978 960 953 956 1020 0
989 1022 969 955 951 987 9520 1018 1007 966 954 971 971 01054 1081 1000 967 968 1019 9980 1039 1070 1000 978 1005 954 0
0 1102 1067 1008 1008 9.91 00 1097 1071 1032 985 0
0 1095 1004 998 0p 1028 970 0
0 1038 00 0
0
H = 181 CM0
0 Q0 1025 0
0 998 977 00 1050 1006 1012 0
0 1045 1065 1049 997 00 1049 1055 1022 1026 996 0
0 998 1054 1009 996 1018 945 01028 1065 1005 983 984 1024 9760 1008 1008 979 970 982 968 0
' 985 1022 979 968 963 992 9460 1053 983 970 964 964 1020 01024 999 969 963 957 976 9920 1034 972 984 979 955 1007 01013 990 965 0 955 970 9860 1032 969 980 974 953 1007 01023 996 962 976 950 973 9930 1052 978 960 953 956 1020 0
989 1022 969 955 951 987 9520 1018 1007 966 954 971 971 01054 1081 1000 967 968 1019 9980 1039 1070 1000 973 1005 954 0
0 1102 1067 1008 1008 991 00 1097 1071 1032 985 0
0 1095 1004 998 00 1028 970 0
0 1038 O0 0
0
(A) (B)
Fig. 32. Relative power distribution over fuel pins (KR) of WA (NO. 16), neighboring CR(No.7), at the level of upper plugs of CR fuel pins (Hz =196 cm) and the middle ofsteel inserts in CR pins (Hz =181 cm) when using normal (A) and modernized (B)fuel follower. BOC, HCR=72%.
495
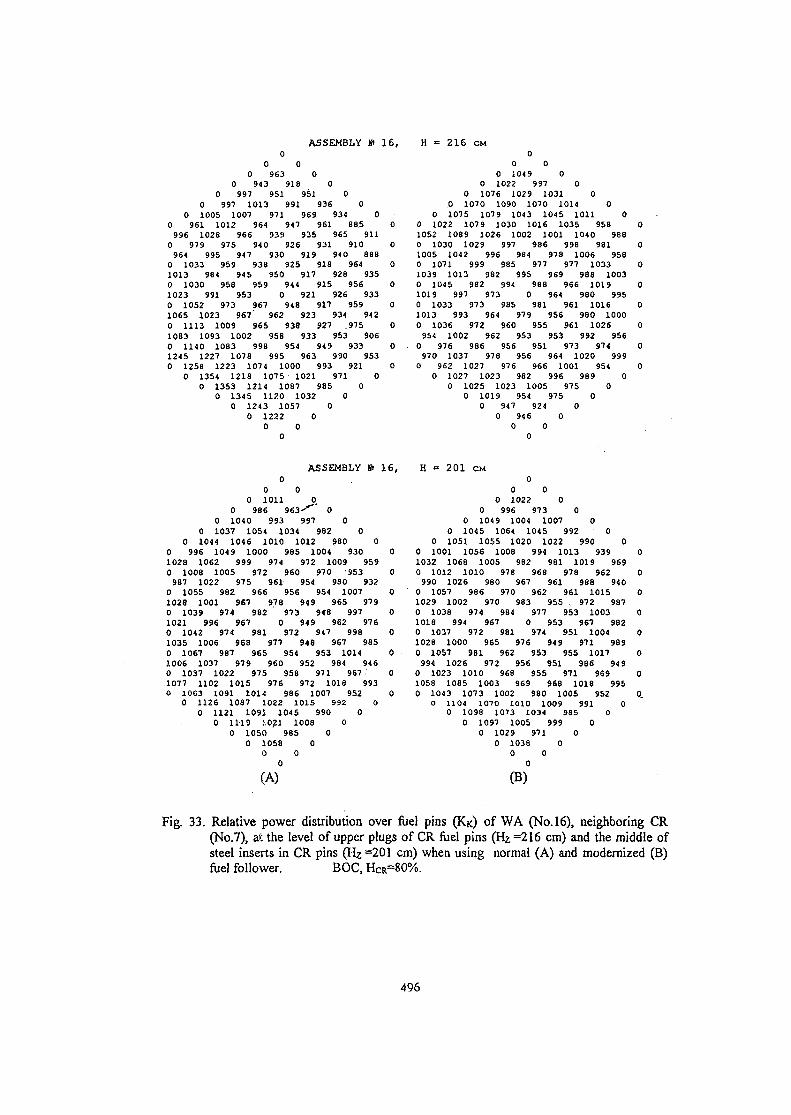
ASSEMBLY & 16,0
0 00 963 0
0 943 918 00 997 951 951 0
0 997 1013 991 936 00 1005 1007 971 969 934 0
0 961 1012 964 947 961 885 0996 1028 966 939 935 965 911
0 979 97S 940 926 931 910 0964 995 947 930 919 940 6880 1033 959 938 925 918 964 01013 984 945 950 917 928 9350 1030 9S8 959 944 91S 956 01023 991 953 0 921 926 9330 1052 973 967 948 917 959 01065 1023 967' 962 923 934 9420 1113 1009 965 938 927 .975 01083 1093 1002 958 933 953 9060 1140 1083 998 954 949 933 01245 1227 1078 995 963 990 9530 1258 1223 1074 1000 993 921 0
0 1354 1218 1075 1021 971 00 1353 1214 1087 98S 0
0 1345 1120 1032 00 1243 1057 0
0 1222 00 0
0
H = 216 CM0
0 00 1049 0
0 1022 997 00 1076 1029 1031 0
0 1070 1090 1070 1014 00 1075 1079 1043 1045 1011 0
0 1022 1079 1030 1016 1035 958 01052 1089 1026 1002 1001 1040 9880 1030 1029 997 986 998 981 01005 1042 996 984 978 1006 9580 1071 999 985 977 977 1033 01039 1013 982 995 969 988 10030 1045 982 994 988 966 1019 01019 997 973 0 964 980 9950 1033 973 985 981 961 1016 01013 993 964 979 956 980 10000 1036 972 960 955 961 1026 0
954 1002 962 953 953 992 9560 976 986 956 951 973 974 0970 1037 978 956 964 1020 999
0 962 1027 976 966 1001 954 00 1027 1023 982 996 969 0
0 1025 1023 1005 975 00 1019 954 975 0
0 947 924 00 946 0
0 00
ASSEMBLY » 16,0
0 00 1011 0.
0 986 963-"" 00 1040 993 997 0
0 1037 1054 1034 982 00 1044 1046 1010 1012 980 0
0 996 1049 1000 985 1004 930 01028 1062 999 974 972 1009 9590 1008 1005 972 960 970 9S3 0987 1022 975 961 954 980 932
0 1055 982 966 956 954 1007 01028 1001 967 978 949 965 9790 1039 974 982 973 94 8 997 01021 996 967 0 949 962 9760 1042 974 981 972 947 998 01035 1006 968 977 948 967 9850 1067 987 965 954 953 1014 01006 1037 979 960 952 984 9460 1037 1022 975 958 971 967 01077 1102 1015 976 972 1018 9930 1063 1091 1014 986 1007 952 0
0 1126 1087 1022 1015 992 00 1121 1091 1045 990 0
0 1119 1021 1008 00 1050 985 0
0 1058 00 0
0
H = 201 CM0
0 00 1022 0
0 996 973 00 1049 1004 1007 0
0 1045 1064 1045 992 00 1051 1055 1020 1022 990 0
0 1001 1056 1008 994 1013 939 01032 1068 1005 982 981 1019 9690 1012 1010 978 968 978 962 0990 1026 980 967 961 988 940
0 1057 986 970 962 961 1015 01029 1002 970 983 955 . 972 9870 1038 974 984 977 953 1003 01018 994 967 0 953 967 9820 1037 972 981 974 951 1004 01028 1000 965 976 94 9 971 9890 1057 981 962 953 955 1017 0994 1026 972 956 951 986 949
0 1023 1010 968 955 971 969 01058 1085 1003 969 968 1018 9950 1043 1073 1002 980 1005 952 0.
0 1104 1070 1010 1009 991 00 1098 1073 1034 985 0
0 1097 1005 999 00 1029 971 0
0 1038 00 0
(A) (B)
Fig. 33. Relative power distribution over fuel pins (KK) of WA (No. 16), neighboring CR(No.7), at the level of upper plugs of CR fuel pins (Hz =216 cm) and the middle ofsteel inserts in CR pins (Hz =201 cm) when using normal (A) and modernized (B)fuel follower. BOC, HCR=80%.
496
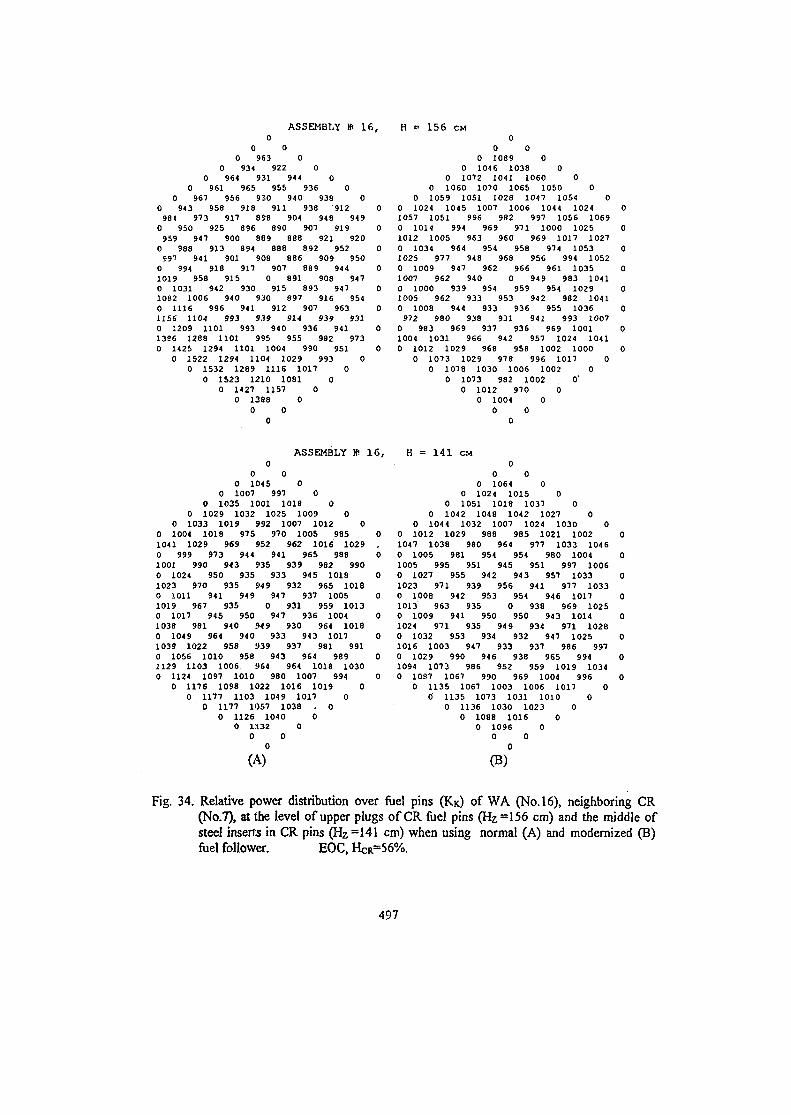
ASSEMBLY » 16,0
0 00 963 0
0 934 922 00 964 931 944 0
0 961 965 955 936 00 961 956 930 940 938 0
0 943 958 918 911 938 912 0984 973 917 898 904 948 9490 950 925 896 890 907 919 0959 947 900 B89 888 921 9200 988 913 894 888 892 952 0997 941 901 908 886 909 9500 994 918 917 907 889 944 01019 958 915 0 891 908 9470 1031 942 930 915 893 947 01082 1006 940 930 897 916 9540 1116 996 941 912 907 963 01156 1104 993 939 914 939 9310 1209 1101 993 940 936 941 01386 1288 1101 99S 955 982 9730 1425 1294 1101 1004 990 951 0
0 1522 1294 1104 1029 993 00 1532 1289 1116 1017 0
0 1523 1210 1081 00 1427 1157 0
0 1388 00 0
0
H = 156 CM0
0 00 1089 0
0 1046 1038 00 1072 1041 1060 0
0 1060 1070 1065 1050 00 10S9 1051 1028 1047 1054 0
0 1024 104S 1007 1006 1044 10241057 1051 996 982 997 1056 10690 1014 994 969 971 1000 10251012 1005 963 960 969 1017 10270 1034 964 954 958 974 10531025 977 948 968 956 994 10520 1009 947 962 966 961 10351007 962 940 0 949 983 10410 1000 939 954 959 954 10291005 962 933 953 942 982 10410 1008 944 933 936 955 1036972 980 938 931 941 993 1007
0 983 969 937 936 969 10011004 1031 966 942 957 1024 10410 1012 1029 968 958 1002 1000
0 1073 1029 978 996 1017 00 1078 1030 1006 1002 0
0 1073 982 1002 0'0 1012 970 0
0 1004 00 0
0
ASSEMBLY » 16,0
0 00 1045 0
0 1007 997 00 1035 1001 1018 0
0 1029 1032 1025 1009 00 1033 1019 992 1007 1012 0
0 1004 1018 975 .970 1005 985 01041 1029 969 952 962 1016 1029 .0 999 973 944 941 965 988 01001 990 943 935 939 982 9900 1024 950 935 933 945 1018 01023 970 935 949 932 965 10180 1011 941 949 947 937 1005 01019 967 935 0 931 959 10130 1017 945 950 947 936 1004 01038 981 940 949 930 964 10180 1049 964 940 933 943 1017 01039 1022 958 939 937 981 9910 1056 1010 958 943 964 989 01129 1103 1006. 964 964 1018 10300 1124 1097 1010 980 1007 994 0
0 1176 1098 1022 1016 1019 00 1177 1103 1049 1017 0
0 1177 1057 1038 . 00 1126 1040 0
O 1.132 00 0
H = 141 CM0
0 00 1064 0
0 1024 1015 00 1051 1018 1037 0
0 1042 1048 1042 1027 00 1044 1032 1007 1024 1030 0
0 1012 1029 988 985 1021 10021047 1038 980 964 977 1033 10460 1005 981 954 954 980 10041005 995 951 945 951 997 10060 1027 955 942 943 957 1033
1023 971 939 956 941 977 10330 1008 942 953 954 946 10171013 963 935 0 938 969 10250 1009 941 950 950 943 10141024 971 935 949 934 971 10280 1032 953 934 932 947 10251016 1003 947 933 937 986 9970 1029 990 946 938 965 9941094 1073 986 952 9S9 1019 10340 1087 1067 990 969 1004 996
0 1135 1067 1003 1006 1017 00 1135 1073 1031 1010 0
0 1136 1030 1023 00 1088 1016 0
0 1096 00 0
(A) (B)
Fig. 34. Relative power distribution over fuel pins (KK) of WA (No. 16), neighboring CR(No.7), at the level of upper plugs of CR fuel pins (Hz =156 cm) and the middle ofsteel inserts in CR pins (Hz =141 cm) when using normal (A) and modernized (B)fuel follower. EOC, HCR=56%.
497
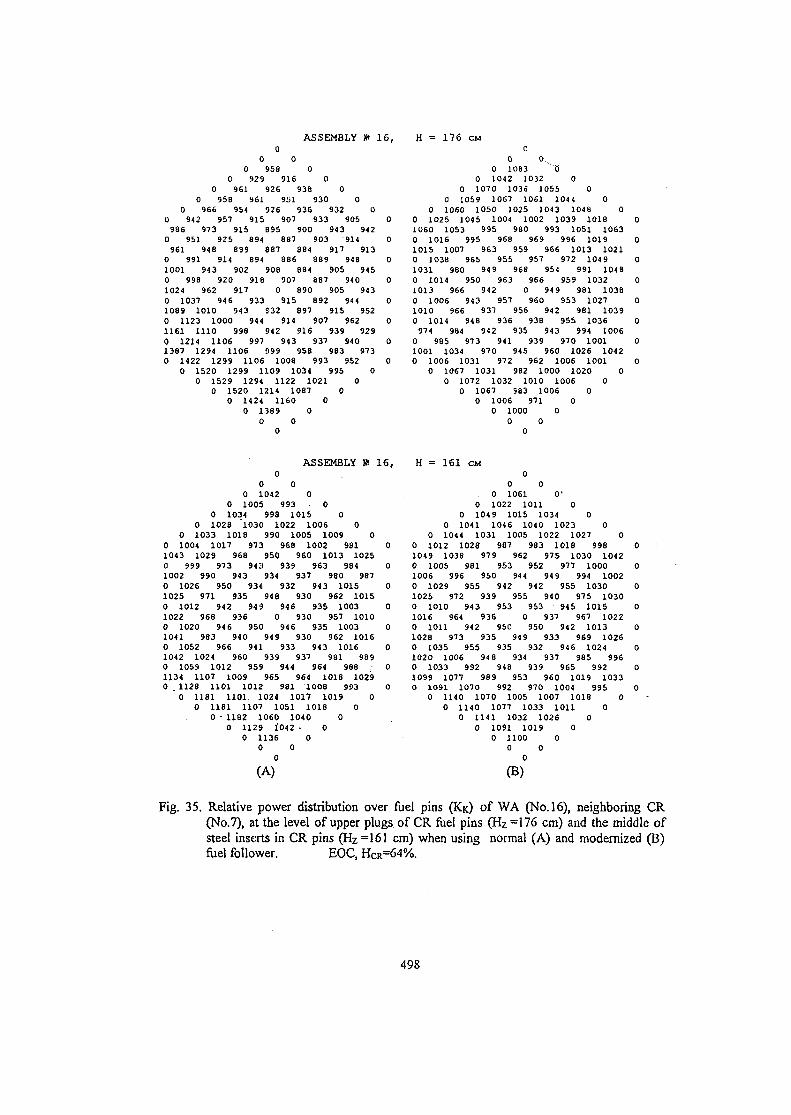
ASSEMBLY » 16,0
o o0 9S8 0
0 929 916 00 961 926 938 0
0 958 961 951 930 00 966 954 926 936 932 0
0 942 957 915 907 933 905 0986 973 915 895 900 943 942
0 951 925 694 887 903 914 0961 948 899 887 884 911 913
0 991 914 894 886 889 948 01001 943 902 908 884 905 9450 998 920 918 907 887 940 01024 962 917 0 890 90S 9430 1037 946 933 915 892 944 01089 1010 943 932 897 915 9520 1123 1000 944 914 907 962 01161 1110 998 942 916 939 9290 1214 1106 997 943 937 940 01387 1294 1106 999 958 983 9730 1422 1299 1106 1008 993 952 0
0 1520 1299 1109 1.034 995 00 1529 1294 1122 1021 0
0 1520 1214 1087 00 1424 1160 0
0 1389 00 0
0
H = 176 CM0
0 0.0 1083 B
0 1042 1032 00 1070 1036 1055 0
0 1059 1067 1061 1044 00 1060 1050 1025 1043 1048 0
0 1025 1045 1004 1002 1039 10181060 1053 995 980 993 1051 10630 1016 995 968 969 996 10191015 1007 963 959 966 1013 10210 1038 965 955 957 972 10491031 980 949 968 954 991 10480 1014 950 963 966 959 10321013 966 942 0 949 981 10380 1006 943 957 960 953 10271010 966 937 956 942 981 1039
1014 948 936 938 955 1036974 984 942 935 943 994 1006
0 985 973 941 939 970 10011001 1034 970 945 960 1026 10420 1006 1031 972 962 1006 1001
0 1067 1031 982 1000 1020 00 1072 1032 1010 1006 0
0 1067 983 1006 00 1006 971 0
0 1000 00 0
0
ASSEMBLY IB 16,0
0 00 1042 0
0 1005 993 00 1034 998 1015 0
0 1028 1030 1022 1006 00 1033 1018 990 1005 1009 0
0 1004 1017 973 968 1002 981 01043 1029 968 950 960 1013 10250 999 973 94? 939 963 984 01002 990 943 934 937 980 9870 1026 950 934 932 943 1015 01025 971 935 948 930 962 10150 1012 942 94 9 946 935 1003 01022 968 936 930 957 10100 1020 946 950 946 935 10031041 983 940 949 930 962 10160 1052 966 941 933 943 10161042 1024 960 939 937 981 9890 1059 1012 S59 944 964 988 .1134 1107 1009 965 964 1018 10290 . 1128 1101 1012 981 1008 993
0 1181 1101. 1024 1017 1019 00 1181 1107 1051 1018 0
0 • 1182 1060 1040 00 1129 i042 • 0
0 1136 00 0
(A)
H = 161 CM0
0 0. 0 1061 0-
0 1022 1011 00 1049 1015 1034 0
0 1041 1046 1040 1023 00 1044 1031 1005 1022 1027 0
0 1012 1028 987 983 1018 9981049 1038 979 962 975 1030 10420 1005 981 953 952 977 10001006 996 950 944 949 994 10020 1029 955 942 942 955 10301025 972 939 955 940 975 10300 1010 943 953 953 945 10151016 964 936 0 937 967 10220 1011 942 950 950 942 10131028 973 935 S49 933 969 10260 1035 955 935 932 946 10241020 1006 948 534 937 985 9960 1033 992 948 939 965 992 01099 1077 989 953 960 1019 10330 1091 1070 992 970 1004 995 0
0 1140 1070 1005 1007 1018 00 1140 1077 1033 1011 0
0 1141 1032 1026 00 1091 1019 0
0 1100 00 0
(B)
Fig. 35. Relative power distribution over fuel pins (KK) of WA (No. 16), neighboring CR(No.7), at the level of upper plugs, of CR fuel pins (Hz =176 cm) and the middle ofsteel inserts in CR pins (Hz =161 cm) when using normal (A) and modernized (B)fuel follower. EOC, HCR=64%.
498
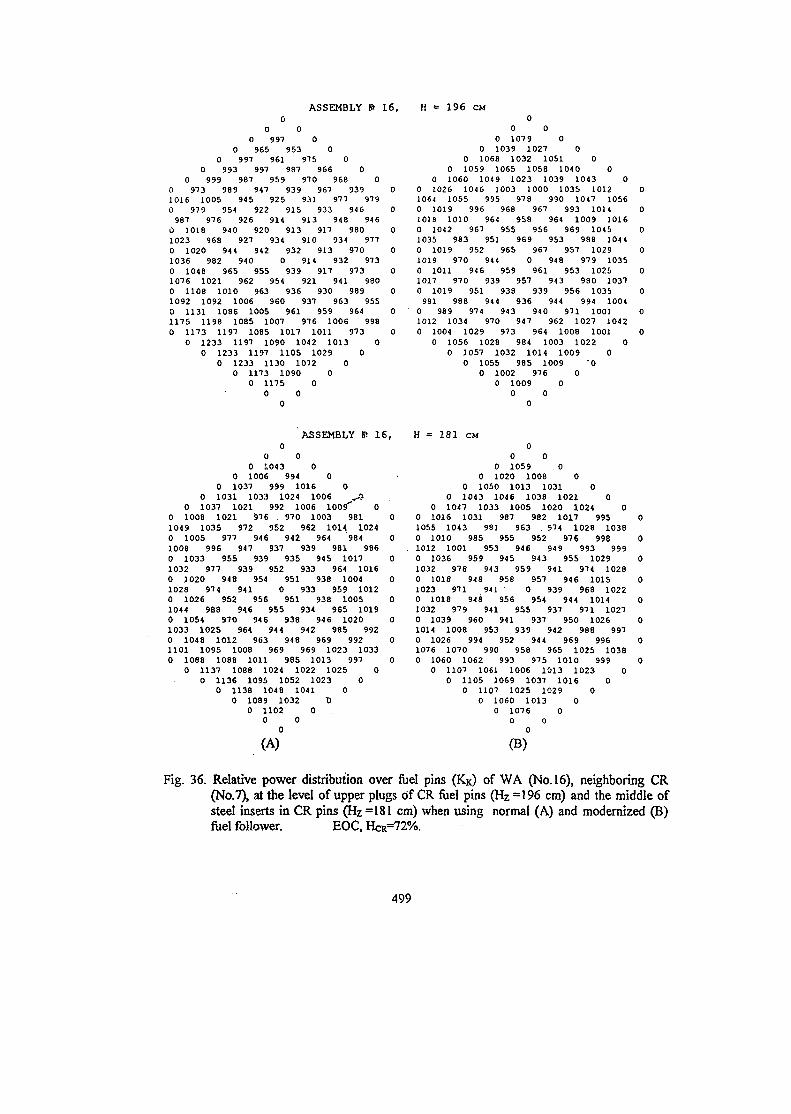
ASSEMBLY » 16,0
o 00 997 0
0 965 953 00 997 961 915 0
0 993 997 987 966 00 999 987 959 970 968 0
0 973 989 947 939 967 939 01016 1005 945 925 931 977 9790 979 954 922 915 933 946 0987 976 926 914 913 948 946
0 1018 940 920 913 917 980 01023 968 927 934 910 934 9770 1020 944 942 932 913 970 01036 982 940 0 914 932 9730 1048 965 955 939 917 973 01076 1021 962 954 921 941 9800 1108 1010 963 936 930 989 01092 1092 1006 960 937 963 9S50 1131 1086 1005 961 959 964 01175 1198 1085 1007 976 1006 9980 1173 1197 1085 101T 1011 973 0
0 1233 1197 1090 1042 1013 00 1233 1197 1105 1029 0
0 1233 1130 1072 00 1173 1090 0
0 1175 00 0
0
H = 196 CM0
0 00 1079 0
0 1039 1027 00 1068 1032 1051 0
0 1059 1065 1058 1040 00 1060 1049 1023 1039 1043 0
0 1026 1046 1003 1000 1035 1012 01064 1055 995 978 990 1047 10560 1019 996 968 967 993 1014 01016 1010 964 958 964 1009 10160 1042 967 955 956 969 1045 01035 983 951 969 953 988 10440 1019 952 965 967 957 1029 01019 970 944 0 948 979 10350 1011 946 959 961 953 1025 01017 970 939 957 943 980 10370 1019 951 938 939 956 1035 0981 988 944 936 944 994 1004
0 989 974 943 940 971 1001 01012 1034 970 947 962 1027 10420 1004 1029 973 964 1008 1001 0
0 1056 1028 984 1003 1022 00 1057 1032 1014 1009 0
0 10S5 985 1009 -00 1002 976 0
0 1009 00 0
0
ASSEMBLY H* 16,0
o o0 1043 0
0 1006 994 00 1037 999 1016 0
0 1031 1033 1024 1006 ,-50 1037 1021 992 1006 1009' 0
0 1008 1021 976 . 970 1003 981 01049 1035 972 952 962 1011 1 O 2 4
0 1005 977 946 942 964 984 01008 996 947 937 939 981 9860 1033 955 939 935 945 1017 01032 977 939 952 933 964 10160 1020 948 954 951 938 1004 01028 974 941 0 933 959 10120 1026 952 956 951 938 1005 01044 988 946 955 934 965 10190 1054 970 946 938 946 1020 01033 1025 964 944 942 985 9920 1048 1012 963 948 969 992 01101 1095 1008 969 969 1023 10330 1088 1088 1011 985 1013 997 0
0 1137 1088 1024 1022 1025 00 1136 1095 1052 1023 0
0 1138 1048 1041 00 1089 1032 T>
0 1102 00 0
0
H = 181 CM0
0 00 1059 0
0 1020 1008 00 1050 1013 1031 0
0 1043 1046 1038 1021 00 1047 1033 1005 1020 1024 0
0 1016 1031 987 982 1017 995 01055 1043 981 963 974 1028 10380 1010 985 9SS 952 976 998 01012 1001 953 94 6 94 9 993 9990 1036 959 945 943 955 1029 01032 978 943 959 541 974 10280 1018 948 958 957 946 1015 01023 971 941 0 939 968 10220 1018 948 9S6 954 944 1014 01032 979 941 955 937 971 10270 1039 960 941 937 950 1026 01014 1008 953 939 942 988 9970 1026 994 952 944 969 996 01076 1070 990 958 965 102S 10380 1060 1062 993 975 1010 999 0
0 1107 1061 1006 1013 1023 00 1105 1069 1037 1016 0
0 1107 1025 1029 00 1060 1013 0
0 1076 00 0
(A) (B)
Fig. 36. Relative power distribution over fuel pins (KK) of WA (No. 16), neighboring CR(No.7), at the level of upper plugs of CR fuel pins (Hz =196 cm) and the middle ofsteel inserts in CR pins (Hz =181 cm) when using normal (A) and modernized (B)fuel follower. EOC, HCR=72%.
499
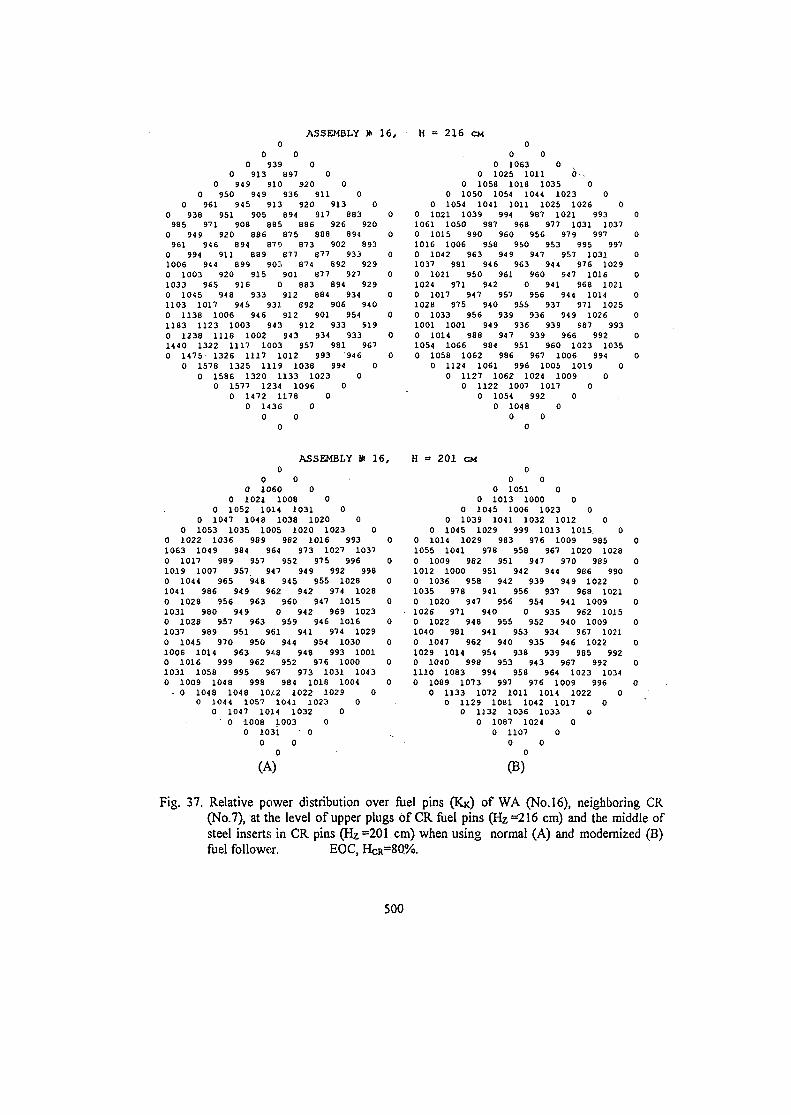
ASSEMBLY » 16,0
0 00 939 0
0 913 897 00 949 910 920 0
0 950 949 936 911 00 961 945 913 920 913 0
0 938 951 905 894 917 883 0985 971 908 885 886 926 920
0 949 920 886 875 888 894 0961 946 894 879 873 902 893
0 994 911 889 877 877 933 01006 944 899 903 874 892 9290 1003 920 915 901 877 927 01033 965 916 0 883 894 9290 1045 948 933 912 884 934 01103 1017 94S 931 892 906 9400 1138 1006 946 912 901 954 01183 1123 1003 943 912 933 9190 1238 1118 1002 943 934 933 01440 1322 1117 1003 957 981 9670 1475 1326 1117 1012 993 946 0
0 1578 1325 1119 1038 994 00 1586 1320 1133 1023 0
0 1577 1234 1096 00 1472 1178 0
0 1436 00 0
0
H = 2X6 CM0
0 00 1063 0 ,
0 1025 1011 0-.0 1058 1018 1035 0
0 1050 1054 1044 1023 00 1054 1041 1011 1025 1026 0
0 1021 1039 994 987 1021 993 01061 1050 987 968 977 1031 10370 1015 990 960 956 979 997 01016 1006 958 950 953 995 9970 1042 963 949 947 957 1031 01037 981 946 963 944 976 10290 1021 950 961 960 947 1016 01024 971 942 0 941 968 10210 1017 947 957 956 944 1014 01028 975 940 955 937 971 10250 1033 956 939 936 949 1026 01001 1001 94 9 936 939 987 9930 1014 988 947 939 966 992 01054 1066 984 951 960 1023 10350 1058 1062 986 967 1006 994 0
0 1124 1061 996 1005 1019 00 1127 1062 1024 1009 0
0 1122 1007 1017 00 1054 992 0
0 1048 00 0
0
ASSEMBLY & 16,0
0 0O 1060 0
0 1021 1008 00 1052 1014 1031 0
0 1047 1048 1038 1020 00 1053 1035 1005 1020 1023 0
0 1022 1036 989 982 1016 993 01063 1049 984 964 973 1027 10370 1017 989 957 952 975 996 01019 1007 957 947 949 992 9980 1044 965 948 945 955 1028 01041 986 949 962 942 974 10280 1028 956 963 960 947 1015 01031 980 949 0 942 969 10230 1028 957 963 959 946 1016 01037 989 951 961 941 974 10290 1045 970 950 944 954 1030 01006 1014 963 948 948 993 10010 1016 999 962 952 976 1000 01031 1058 995 967 973 1031 10430 1009 1048 998 984 1018 1004 0- 0 1048 1048 10.12 1022 1029 0
0 1044 1057 1041 1023 00 1047 10.14 1032 0' 0 1008 1003 0
0 1031 ' 00 0
H = 201 CM0
0 00 1051 0
0 1013 1000 00 1045 1006 1023 0
0 1039 1041 1032 1012 00 1045 1029 999 1013 1015 0
0 1014 1029 983 976 1009 985 01055 1041 978 958 967 1020 10280 1009 982 951 947 970 989 01012 1000 951 942 944 986 9900 1036 958 942 939 949 1022 01035 978 941 956 937 968 10210 1020 947 956 954 941 1009 01026 971 940 0 935 962 10150 1022 948 955 952 940 1009 01040 981 941 953 934 967 10210 1047 962 940 935 946 1022 01029 1014 954 938 939 985 9920 1040 998 953 943 967 992 01110 1083 994 958 964 1023 10340 1089 1073 997 976 1009 996 0
0 1133 1072 1011 1014 1022 00 1129 1081 1042 1017 0
0 1132 1036 1033 00 1087 1024 0
0 1107 00 0
(A) (B)
Fig. 37. Relative power distribution over fuel pins (KK) of WA (No. 16), neighboring CR(No.7), at the level of upper plugs of CR fuel pins (Hz =216 cm) and the middle ofsteel inserts in CR pins (Hz =201 cm) when using normal (A) and modernized (B)fuel follower. EOC, HCR=80%.
500

Spectral and Core Calculation Methods
In the paper of p. Darilek and C. Strmensky the results of HELIOS and KASSETA-TWEG bum-up calculations are compared. Differences of reactivity effects arediscussed.
In his second talk G. Manturov spoke on the details of estimating the reactor vesseland probe sample fluence. He reported results of estimating covariance matrix of theneutron spectrum at the core barrel of the VVER-1000 reactor, as well as at thereactor vessel. Russian ABBN-93 library of nuclear data was used in the transportcalculations to determine the neutron source at the core boundary. Their effect onuncertainties in the cross-sections, fission sources nuclear densities and geometricaldimensions was also discussed: {••,
. ? K - i b ';•',•: r . ? h c - \ \ K < > ; ; : • [ • • • . . •,
E. Gomin presented a large amount of results obtained by the Monte Carlo codeMCU, which has been licensed by the Russian regulatory body Gosatomnadzor. Thecalculations aimed at estimating the accuracy of MCU for a variety of cores includingthe W E R cores. The MCU is applicable to burnup and criticality problems as well andis widely used in verification and validation of Russian design codes, such as TVS-M.
The paper of A. Awakumov et al. is dedicated to the validation of the code based onpin-by-pin reactor calculation to model reactivity initiated accidents (RIA). Thereference units are VYER-1000 power unit and TMI, Unit 1.
In the paper of V. Lebedev purely mathematical problems of solving finite-differenceequations by means of varying the time step were considered.
«TThe paper of Cs. Maraczy was devoted to the solution of the benchmark problem onMOX-fuel burnup using the uranium-gadolinium absorber.
In the paper of P. Petkov the calculation of accurate albedo boundary conditions for3D nodal diffusion codes by the method of characteristics is discussed.• •'.' ';.i h ^ ' i A ' . - > • '..-: ><• - : y , ' r : • ,' •
The paper flf ILXaJetin presents a study of the nuclear data libraries of WIMS7B code.Fuel depletion is performed to a burn-up of 60 MWd/kgNM in the WER-1000 fuelpin cell.; • • n - ; ; : : c t * h-S .,\r. I.:' •
The paper of A. Novikov gives a detailed description of a neutronic code package usedin W E R designing in Russia. ;
In the paper of I. Suslov the influence of finite-difference mesh step on the results ofsecond AER kinetic benchmark is discussed. It is noted that the results obtained inreducing the mesh step differ from those presented by some authors. The exception isthe results from the BIPR-8 code calculations.
The main, problems, of VyER reactor pressure vessel (RPV) dosimetry were reviewedtaking into account the RPV metal characteristics, the features of surveillanceprograms and some features of irradiation embrittlement of WER-440 and WER-1000 RPV materials. This presentation was made by S. Zaritski.

The calculation and experimental studies of power distribution in the vicinity of thenormal and modernized control rod of the WER-440 reactor are described in thepresentation of P. Bolobov. It is shown that the power burst in the vicinity of the CRjoint can be essentially reduced by means of hafnium plates attached to the CR fuelfollower shroud tube.
Session 2. SPECTRAL AND CORE CALCULATION
J. Svarny (Skoda) presented his paper "Information of AER working group A onimprovement, extension and validation of parameterized few-group libraries; forWER-440 and WER-1000" . . .-re .S\.&i-rv.:• >.k>^ [,-n
• ! • : • • . . • • • • v,U ( i : - . l i i , . f ' . - . ' y ; ^ ft>?ii.-;:.-i--
A. Lazarenko presented the paper "Verification of third generation code package forW E R physical calculations" by S.S. Aleshin, P.A. Bolobov.S.N.iBolshagin, A.P.Lazarenko, A.V. Markov, V.V. Morozov, V.D. Sidorenko,1 A.A. Suslov.x V.M.Tsvetkov (RRC KI). The main difference between the 3diand 2™1 generation codepackages consists in the lattice codes, but their accuracies are close.
V. Malofeev presented the paper "BARS - a heterogeneous code fdr 3d pin-by-pinLWR steady-state and transient calculations" by A.V. Awakumov;; V.M.: Malofeev(RRC KI). The results for reactivity coefficients and pin-by-pin distribution'werepresented. '• '-'vvi'-- n i i > s » - . ; n>b'••- ~."
Z. Szecsenyi's presentation was devoted to a mathematically exact statistical methodfor determination of uncertainties of limitation system including reactor uncertainties(fabrication uncertainties) and those of reactor physical models used, developed atNPP Paks. Application on limitations of new fuel was given.
P. Petkov reported on the development of a library of two-group diffusion parametersfor SPPS-1.6 by HELIOS. The presented analysis of CCCP method showed thatHELIOS algorithm is accurate enough for assembly calculation, "but inadequate forabsorber and core-reflector problems. The new HELIOS library was" tested byLOVnSA operational data and compared to another one generated by WIMS-D4 andno significant difference was found. "; ••,:• ••.•t»;;>>".*i V.> x - f ^ j » J j «•;(
The new code MARICO based on method of characteristics was prepared in INRNE,Sofia (P. Petkov). The first experience with this code was shown and iteration strategyincluding sensitivity of the result to various parameter^ was presented.'-''*'1'}*^ k-j i
The paper by P. Mikolas dealt with burnable poison inserted into fuel assemblies andpresented a series of calculations for various geometries of WER-440 fuel assemblieswith Gd2O3 pins. . •Uhi-.i ^ V ^an^pfr /iSVY irt
The paper by A. Tanskanen was devoted to a hovel auxiliary code called DIMER. In anumber of methods, including Monte Carlo and''collision probability methods,specification of geometry requires a large amount of labor. DIMER reducies that laborby offering the user automated mesh generation features. ' '
The paper by N. Laletin introduced applications of the surface harmonics method(SHM). The presented results corroborate the effectiveness and high accuracy of theSHM.