prism johnson ltd
TRANSCRIPT

Prism Johnson Ltd.
1
Lorem ipsum dolor sit amet, consectetuer adipiscing elit, sed diam nonummy nibh euismod tincidunt ut laoreet dolore magna aliquam erat volutpat. Ut wisi enim ad minim veniam, quis nostrud exerci tation ullamcorper suscipit lobortis nisl ut aliquip ex ea commodo consequat. Duis autem vel eum iriure dolor in hendrerit in vulputate velit esse molestie consequat, vel illum dolore eu feugiat nulla
▪ Lorem ipsum dolor sit amet, consectetuer adipiscing elit, sed diam nonummy
nibh euismod tincidunt ut laoreet dolore magna aliquam erat volutpat. Ut wisi enim ad minim veniam,
▪ quis nostrud exerci tation ullamcorper suscipit lobortis nisl ut aliquip ex ea commodo consequat. Duis autem vel eum iriure dolor in hendrerit in vulputate velit esse molestie consequat,
▪ vel illum dolore eu feugiat nulla facilisis at vero eros et accumsan et iusto odio dignissim qui blandit praesent luptatum zzril delenit augue duis dolore te feugait nulla facilisi. et iusto odio dignissim qui blandit praesent luptatum zzril delenit
Initiating Coverage
Prism Johnson Ltd. 11-June-2021
Prism Johnson Ltd.
2
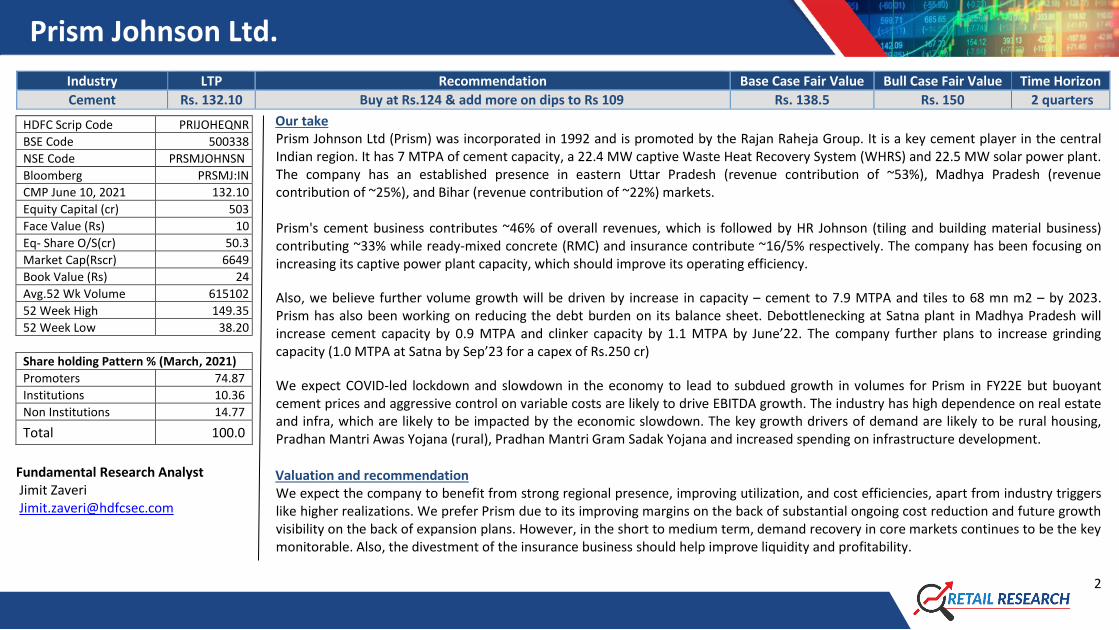
Industry LTP Recommendation Base Case Fair Value Bull Case Fair Value Time Horizon
Cement Rs. 132.10 Buy at Rs.124 & add more on dips to Rs 109 Rs. 138.5 Rs. 150 2 quarters
Our take Prism Johnson Ltd (Prism) was incorporated in 1992 and is promoted by the Rajan Raheja Group. It is a key cement player in the central Indian region. It has 7 MTPA of cement capacity, a 22.4 MW captive Waste Heat Recovery System (WHRS) and 22.5 MW solar power plant. The company has an established presence in eastern Uttar Pradesh (revenue contribution of ~53%), Madhya Pradesh (revenue contribution of ~25%), and Bihar (revenue contribution of ~22%) markets. Prism's cement business contributes ~46% of overall revenues, which is followed by HR Johnson (tiling and building material business) contributing ~33% while ready-mixed concrete (RMC) and insurance contribute ~16/5% respectively. The company has been focusing on increasing its captive power plant capacity, which should improve its operating efficiency.
Also, we believe further volume growth will be driven by increase in capacity – cement to 7.9 MTPA and tiles to 68 mn m2 – by 2023. Prism has also been working on reducing the debt burden on its balance sheet. Debottlenecking at Satna plant in Madhya Pradesh will increase cement capacity by 0.9 MTPA and clinker capacity by 1.1 MTPA by June’22. The company further plans to increase grinding capacity (1.0 MTPA at Satna by Sep’23 for a capex of Rs.250 cr)
We expect COVID-led lockdown and slowdown in the economy to lead to subdued growth in volumes for Prism in FY22E but buoyant cement prices and aggressive control on variable costs are likely to drive EBITDA growth. The industry has high dependence on real estate and infra, which are likely to be impacted by the economic slowdown. The key growth drivers of demand are likely to be rural housing, Pradhan Mantri Awas Yojana (rural), Pradhan Mantri Gram Sadak Yojana and increased spending on infrastructure development.
Valuation and recommendation We expect the company to benefit from strong regional presence, improving utilization, and cost efficiencies, apart from industry triggers like higher realizations. We prefer Prism due to its improving margins on the back of substantial ongoing cost reduction and future growth visibility on the back of expansion plans. However, in the short to medium term, demand recovery in core markets continues to be the key monitorable. Also, the divestment of the insurance business should help improve liquidity and profitability.
HDFC Scrip Code PRIJOHEQNR
BSE Code 500338
NSE Code PRSMJOHNSN
Bloomberg PRSMJ:IN
CMP June 10, 2021 132.10
Equity Capital (cr) 503
Face Value (Rs) 10
Eq- Share O/S(cr) 50.3
Market Cap(Rscr) 6649
Book Value (Rs) 24
Avg.52 Wk Volume 615102
52 Week High 149.35
52 Week Low 38.20
Share holding Pattern % (March, 2021)
Promoters 74.87
Institutions 10.36
Non Institutions 14.77
Total 100.0
Fundamental Research Analyst Jimit Zaveri [email protected]
Prism Johnson Ltd.
3
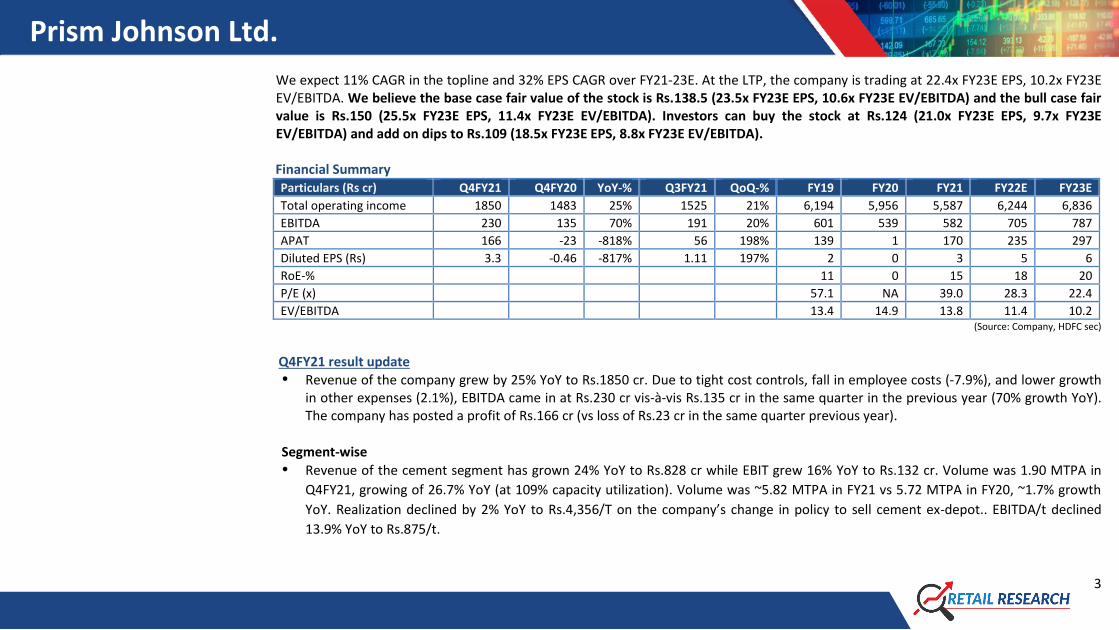
We expect 11% CAGR in the topline and 32% EPS CAGR over FY21-23E. At the LTP, the company is trading at 22.4x FY23E EPS, 10.2x FY23E EV/EBITDA. We believe the base case fair value of the stock is Rs.138.5 (23.5x FY23E EPS, 10.6x FY23E EV/EBITDA) and the bull case fair value is Rs.150 (25.5x FY23E EPS, 11.4x FY23E EV/EBITDA). Investors can buy the stock at Rs.124 (21.0x FY23E EPS, 9.7x FY23E EV/EBITDA) and add on dips to Rs.109 (18.5x FY23E EPS, 8.8x FY23E EV/EBITDA). Financial Summary Particulars (Rs cr) Q4FY21 Q4FY20 YoY-% Q3FY21 QoQ-% FY19 FY20 FY21 FY22E FY23E
Total operating income 1850 1483 25% 1525 21% 6,194 5,956 5,587 6,244 6,836
EBITDA 230 135 70% 191 20% 601 539 582 705 787
APAT 166 -23 -818% 56 198% 139 1 170 235 297
Diluted EPS (Rs) 3.3 -0.46 -817% 1.11 197% 2 0 3 5 6
RoE-% 11 0 15 18 20
P/E (x) 57.1 NA 39.0 28.3 22.4
EV/EBITDA 13.4 14.9 13.8 11.4 10.2 (Source: Company, HDFC sec)
Q4FY21 result update Revenue of the company grew by 25% YoY to Rs.1850 cr. Due to tight cost controls, fall in employee costs (-7.9%), and lower growth
in other expenses (2.1%), EBITDA came in at Rs.230 cr vis-à-vis Rs.135 cr in the same quarter in the previous year (70% growth YoY). The company has posted a profit of Rs.166 cr (vs loss of Rs.23 cr in the same quarter previous year).
Segment-wise
Revenue of the cement segment has grown 24% YoY to Rs.828 cr while EBIT grew 16% YoY to Rs.132 cr. Volume was 1.90 MTPA in
Q4FY21, growing of 26.7% YoY (at 109% capacity utilization). Volume was ~5.82 MTPA in FY21 vs 5.72 MTPA in FY20, ~1.7% growth
YoY. Realization declined by 2% YoY to Rs.4,356/T on the company’s change in policy to sell cement ex-depot.. EBITDA/t declined
13.9% YoY to Rs.875/t.
Prism Johnson Ltd.
4
Revenue of HRJ segment posted 45% YoY growth to Rs.614 cr and EBIT of this segment posted profit (vs loss earlier) to Rs.28 cr.
Revenue from sanitary ware & bath fittings grew 11.9% YoY in FY21. Tile exports revenue grew 54.1% YoY in FY21.
Revenue of RMC segment has posted 6% YoY degrowth to Rs.332 cr and EBIT of this segment has posted profit from loss to Rs.46 cr.
The company is focusing on improving plant utilization levels, increasing the sales of value-added products and IHB (Individual home
builders) segment.
Revenue of insurance segment has posted 60% YoY growth to Rs.87 cr and EBIT of this segment is a flat loss of Rs.14 cr. It has
launched products including Group Premier Personal Accident Insurance and Saral Suraksha Bima – Raheja QBE General Insurance
(Standard Personal Accident Insurance) during Q4FY21. RQBE has added 213 partners in Q4FY21, taking the number of total partners
to 2,690, including agents, brokers, POSP, IMF, MISP and web aggregators. Gross written premium: Rs.104 cr, growth of 57% over
Q4FY20.
The cement division’s volume and the RMC’s EBIT were the highest ever in Q4FY21.
Prism Johnson Ltd.
5
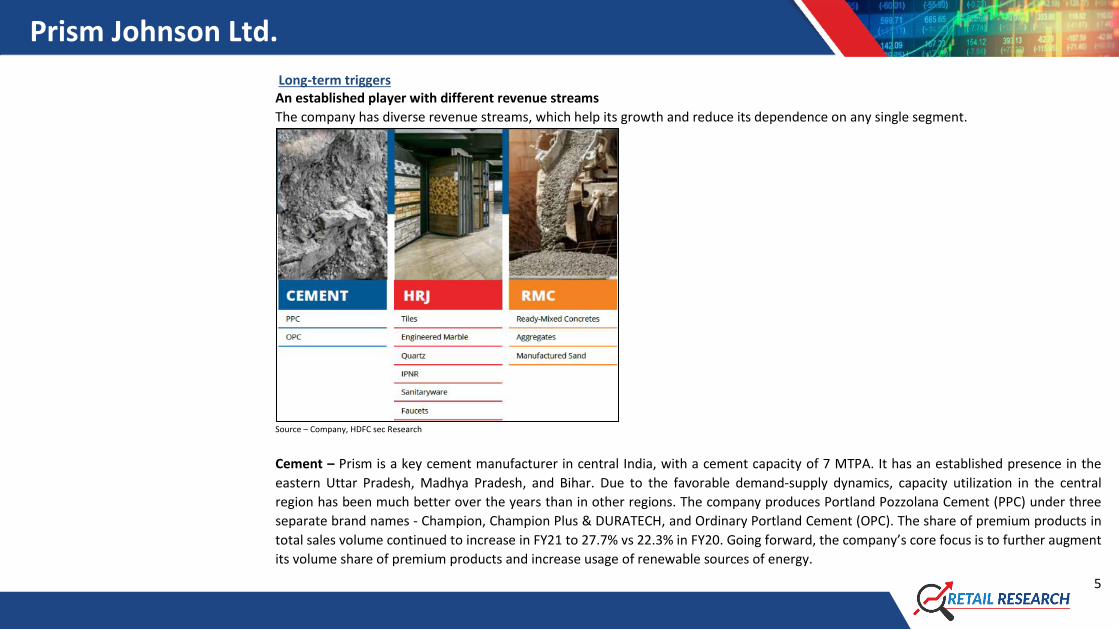
Long-term triggers An established player with different revenue streams
The company has diverse revenue streams, which help its growth and reduce its dependence on any single segment.
Source – Company, HDFC sec Research
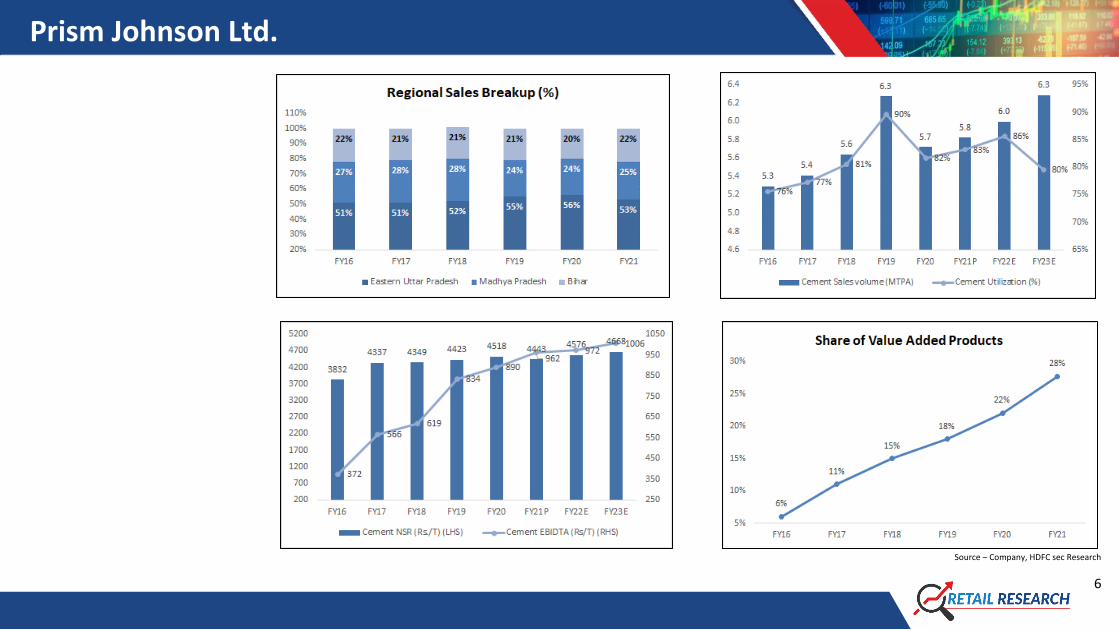
Cement – Prism is a key cement manufacturer in central India, with a cement capacity of 7 MTPA. It has an established presence in the
eastern Uttar Pradesh, Madhya Pradesh, and Bihar. Due to the favorable demand-supply dynamics, capacity utilization in the central
region has been much better over the years than in other regions. The company produces Portland Pozzolana Cement (PPC) under three
separate brand names - Champion, Champion Plus & DURATECH, and Ordinary Portland Cement (OPC). The share of premium products in
total sales volume continued to increase in FY21 to 27.7% vs 22.3% in FY20. Going forward, the company’s core focus is to further augment
its volume share of premium products and increase usage of renewable sources of energy.
Prism Johnson Ltd.
6
Source – Company, HDFC sec Research
Prism Johnson Ltd.
7
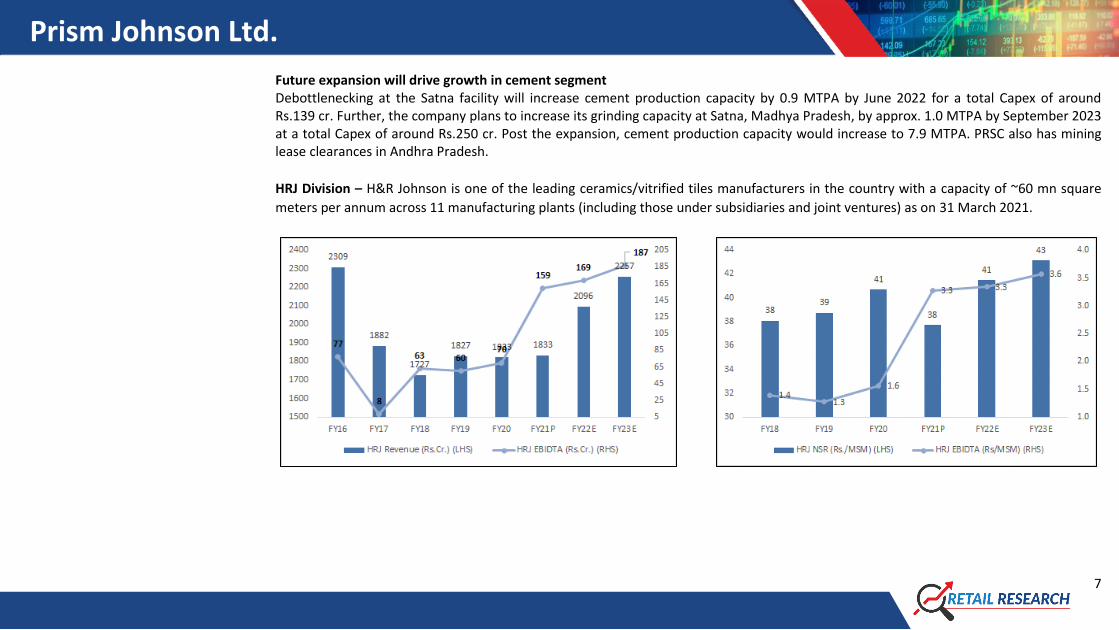
Future expansion will drive growth in cement segment Debottlenecking at the Satna facility will increase cement production capacity by 0.9 MTPA by June 2022 for a total Capex of around Rs.139 cr. Further, the company plans to increase its grinding capacity at Satna, Madhya Pradesh, by approx. 1.0 MTPA by September 2023 at a total Capex of around Rs.250 cr. Post the expansion, cement production capacity would increase to 7.9 MTPA. PRSC also has mining lease clearances in Andhra Pradesh.
HRJ Division – H&R Johnson is one of the leading ceramics/vitrified tiles manufacturers in the country with a capacity of ~60 mn square
meters per annum across 11 manufacturing plants (including those under subsidiaries and joint ventures) as on 31 March 2021.
Prism Johnson Ltd.
8
Source – Company, HDFC sec Research
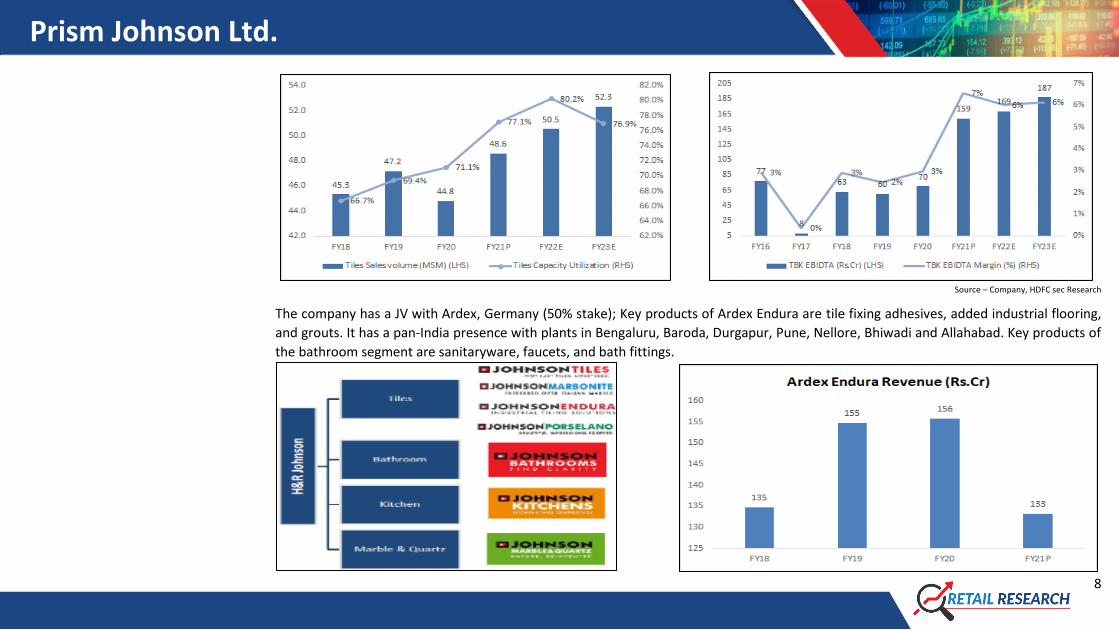
The company has a JV with Ardex, Germany (50% stake); Key products of Ardex Endura are tile fixing adhesives, added industrial flooring,
and grouts. It has a pan-India presence with plants in Bengaluru, Baroda, Durgapur, Pune, Nellore, Bhiwadi and Allahabad. Key products of
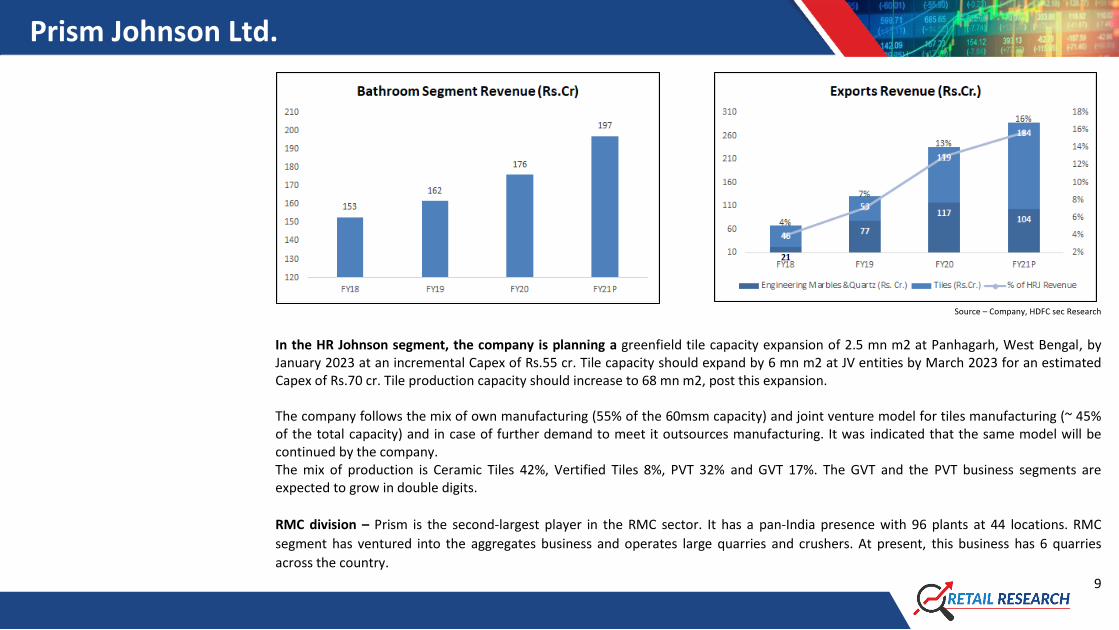
the bathroom segment are sanitaryware, faucets, and bath fittings.
Prism Johnson Ltd.
9
Source – Company, HDFC sec Research
In the HR Johnson segment, the company is planning a greenfield tile capacity expansion of 2.5 mn m2 at Panhagarh, West Bengal, by January 2023 at an incremental Capex of Rs.55 cr. Tile capacity should expand by 6 mn m2 at JV entities by March 2023 for an estimated Capex of Rs.70 cr. Tile production capacity should increase to 68 mn m2, post this expansion. The company follows the mix of own manufacturing (55% of the 60msm capacity) and joint venture model for tiles manufacturing (~ 45% of the total capacity) and in case of further demand to meet it outsources manufacturing. It was indicated that the same model will be continued by the company. The mix of production is Ceramic Tiles 42%, Vertified Tiles 8%, PVT 32% and GVT 17%. The GVT and the PVT business segments are expected to grow in double digits.
RMC division – Prism is the second-largest player in the RMC sector. It has a pan-India presence with 96 plants at 44 locations. RMC
segment has ventured into the aggregates business and operates large quarries and crushers. At present, this business has 6 quarries
across the country.
Prism Johnson Ltd.
10
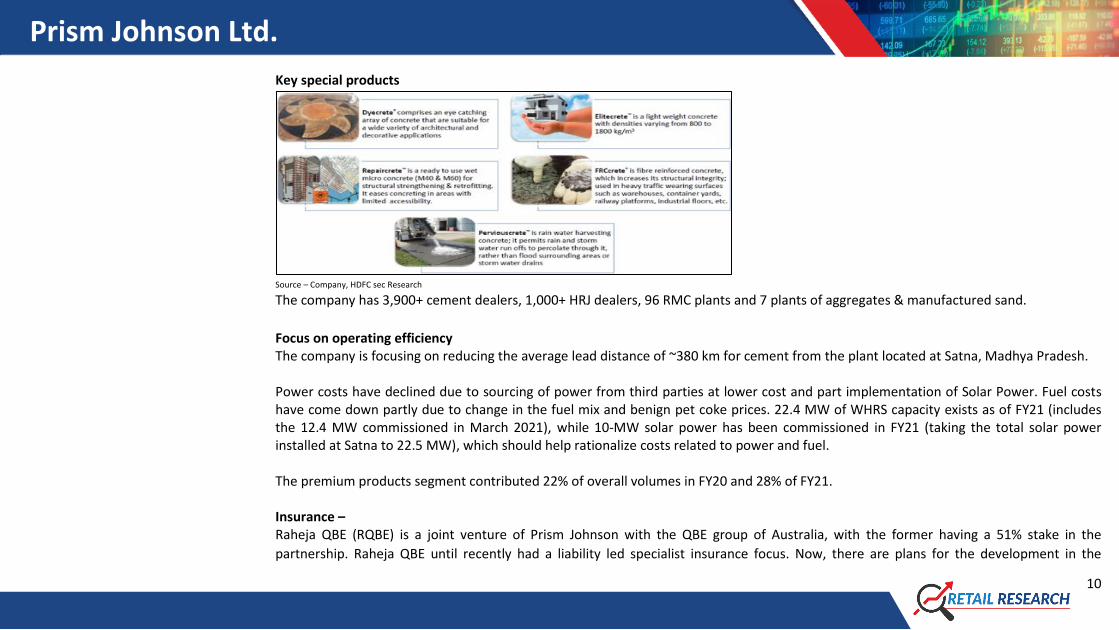
Key special products
Source – Company, HDFC sec Research The company has 3,900+ cement dealers, 1,000+ HRJ dealers, 96 RMC plants and 7 plants of aggregates & manufactured sand.
Focus on operating efficiency The company is focusing on reducing the average lead distance of ~380 km for cement from the plant located at Satna, Madhya Pradesh. Power costs have declined due to sourcing of power from third parties at lower cost and part implementation of Solar Power. Fuel costs have come down partly due to change in the fuel mix and benign pet coke prices. 22.4 MW of WHRS capacity exists as of FY21 (includes the 12.4 MW commissioned in March 2021), while 10-MW solar power has been commissioned in FY21 (taking the total solar power installed at Satna to 22.5 MW), which should help rationalize costs related to power and fuel. The premium products segment contributed 22% of overall volumes in FY20 and 28% of FY21. Insurance – Raheja QBE (RQBE) is a joint venture of Prism Johnson with the QBE group of Australia, with the former having a 51% stake in the
partnership. Raheja QBE until recently had a liability led specialist insurance focus. Now, there are plans for the development in the
Prism Johnson Ltd.
11
personal space through expanding product offerings to health and motor insurance. Products that have been approved by the regulator:
Private Car Bundled Policy, Private Car Addon Covers – Annual, Group Hospital Daily Cash, Pravasi Bhartiya Bima Yojana, Arogya
Sanjeevani, Health Qube.
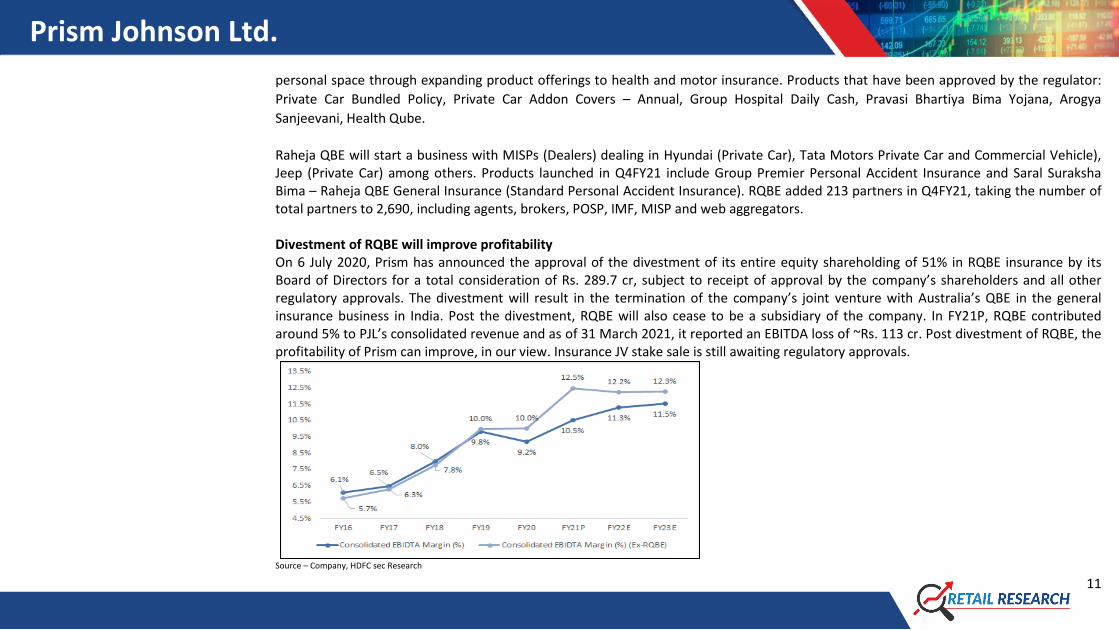
Raheja QBE will start a business with MISPs (Dealers) dealing in Hyundai (Private Car), Tata Motors Private Car and Commercial Vehicle), Jeep (Private Car) among others. Products launched in Q4FY21 include Group Premier Personal Accident Insurance and Saral Suraksha Bima – Raheja QBE General Insurance (Standard Personal Accident Insurance). RQBE added 213 partners in Q4FY21, taking the number of total partners to 2,690, including agents, brokers, POSP, IMF, MISP and web aggregators. Divestment of RQBE will improve profitability On 6 July 2020, Prism has announced the approval of the divestment of its entire equity shareholding of 51% in RQBE insurance by its Board of Directors for a total consideration of Rs. 289.7 cr, subject to receipt of approval by the company’s shareholders and all other regulatory approvals. The divestment will result in the termination of the company’s joint venture with Australia’s QBE in the general insurance business in India. Post the divestment, RQBE will also cease to be a subsidiary of the company. In FY21P, RQBE contributed around 5% to PJL’s consolidated revenue and as of 31 March 2021, it reported an EBITDA loss of ~Rs. 113 cr. Post divestment of RQBE, the profitability of Prism can improve, in our view. Insurance JV stake sale is still awaiting regulatory approvals.
Source – Company, HDFC sec Research
Prism Johnson Ltd.
12
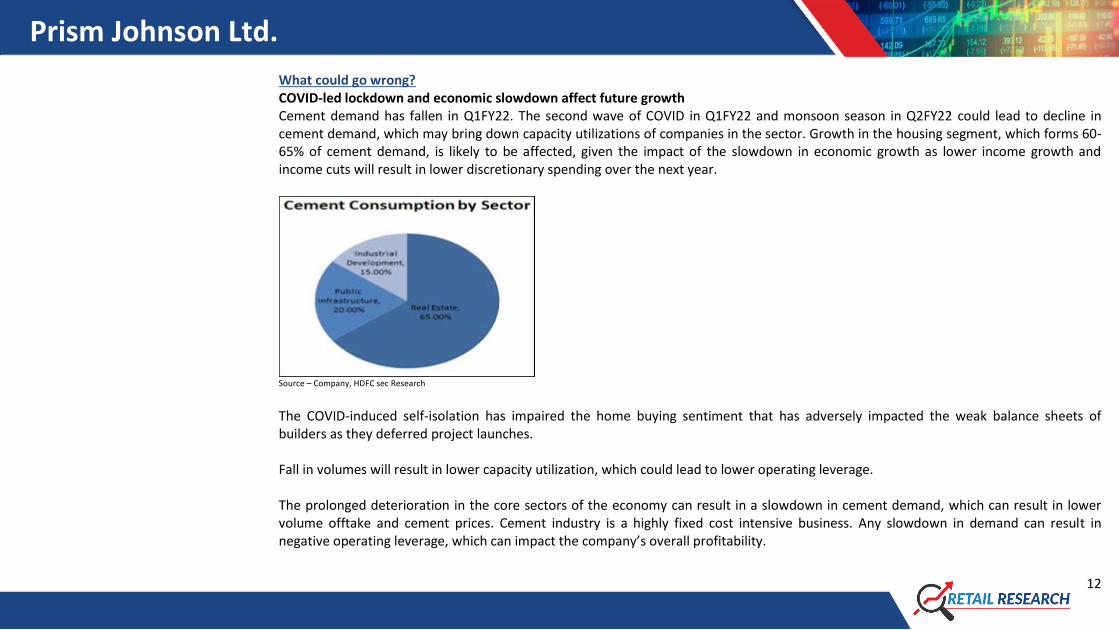
What could go wrong? COVID-led lockdown and economic slowdown affect future growth Cement demand has fallen in Q1FY22. The second wave of COVID in Q1FY22 and monsoon season in Q2FY22 could lead to decline in cement demand, which may bring down capacity utilizations of companies in the sector. Growth in the housing segment, which forms 60-65% of cement demand, is likely to be affected, given the impact of the slowdown in economic growth as lower income growth and income cuts will result in lower discretionary spending over the next year.
Source – Company, HDFC sec Research The COVID-induced self-isolation has impaired the home buying sentiment that has adversely impacted the weak balance sheets of builders as they deferred project launches. Fall in volumes will result in lower capacity utilization, which could lead to lower operating leverage. The prolonged deterioration in the core sectors of the economy can result in a slowdown in cement demand, which can result in lower volume offtake and cement prices. Cement industry is a highly fixed cost intensive business. Any slowdown in demand can result in negative operating leverage, which can impact the company’s overall profitability.
Prism Johnson Ltd.
13
Cost increase in H2FY21 and Q1FY22 could stress margins
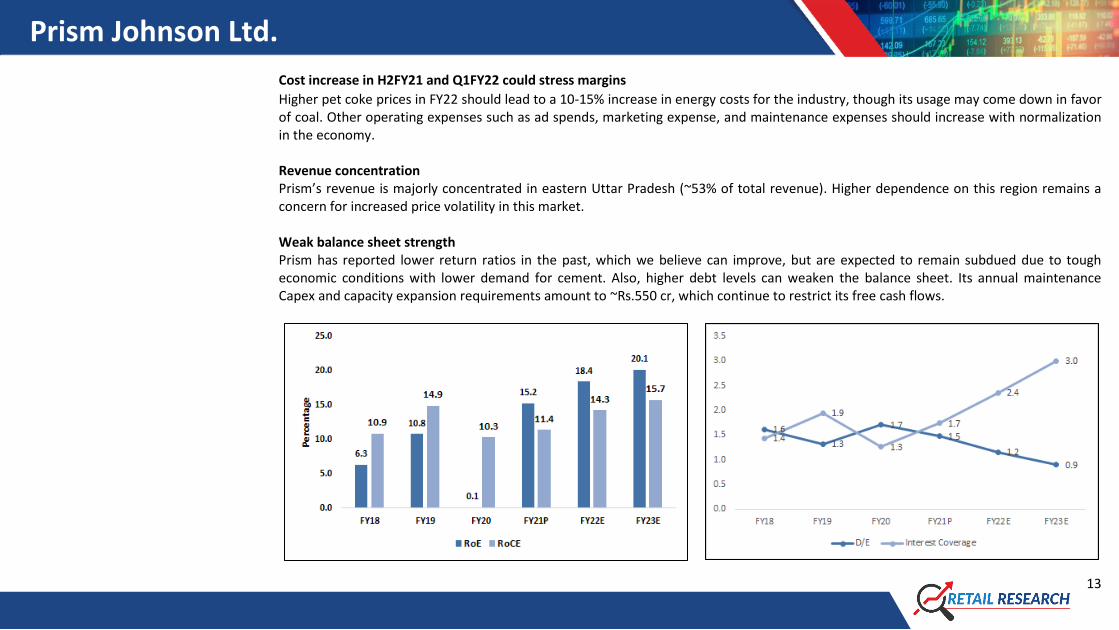
Higher pet coke prices in FY22 should lead to a 10-15% increase in energy costs for the industry, though its usage may come down in favor of coal. Other operating expenses such as ad spends, marketing expense, and maintenance expenses should increase with normalization in the economy. Revenue concentration Prism’s revenue is majorly concentrated in eastern Uttar Pradesh (~53% of total revenue). Higher dependence on this region remains a concern for increased price volatility in this market. Weak balance sheet strength Prism has reported lower return ratios in the past, which we believe can improve, but are expected to remain subdued due to tough economic conditions with lower demand for cement. Also, higher debt levels can weaken the balance sheet. Its annual maintenance Capex and capacity expansion requirements amount to ~Rs.550 cr, which continue to restrict its free cash flows.
Prism Johnson Ltd.
14
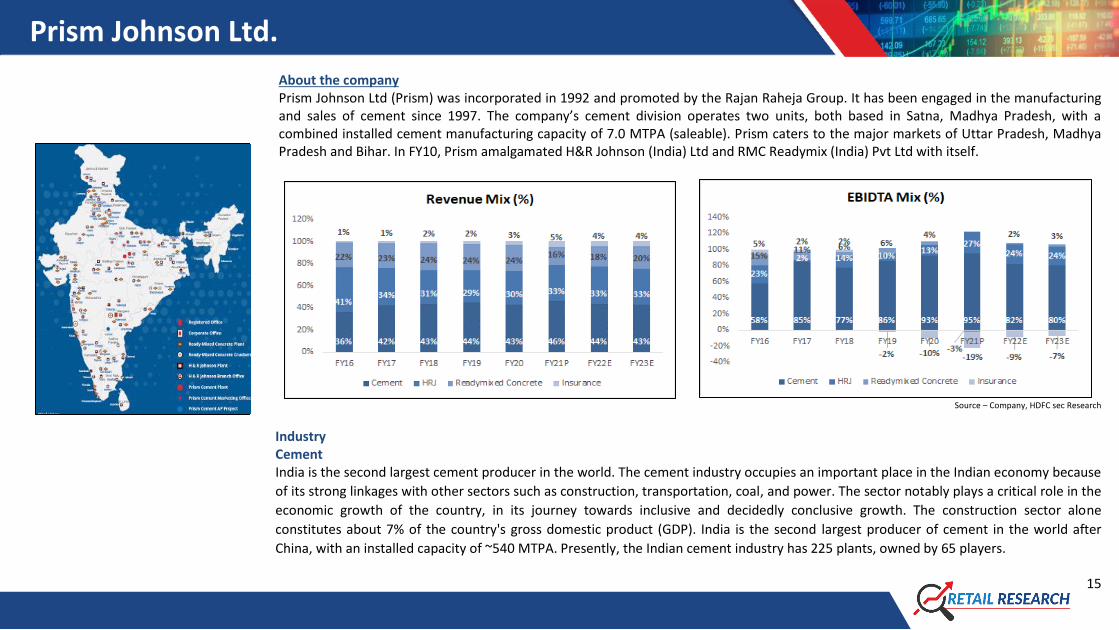
Source – Company, HDFC sec Research The weak performance of HRJ and RMC divisions The tiles segment is highly competitive with several prominent organised players and a large number of unorganised players. Its capacity utilization remained low owing to subdued demand for its products, as it had lost market share to competitors. The replacement demand is also expected to remain muted due to weak consumer sentiment.
Source – Company, HDFC sec Research
Prism Johnson Ltd.
15
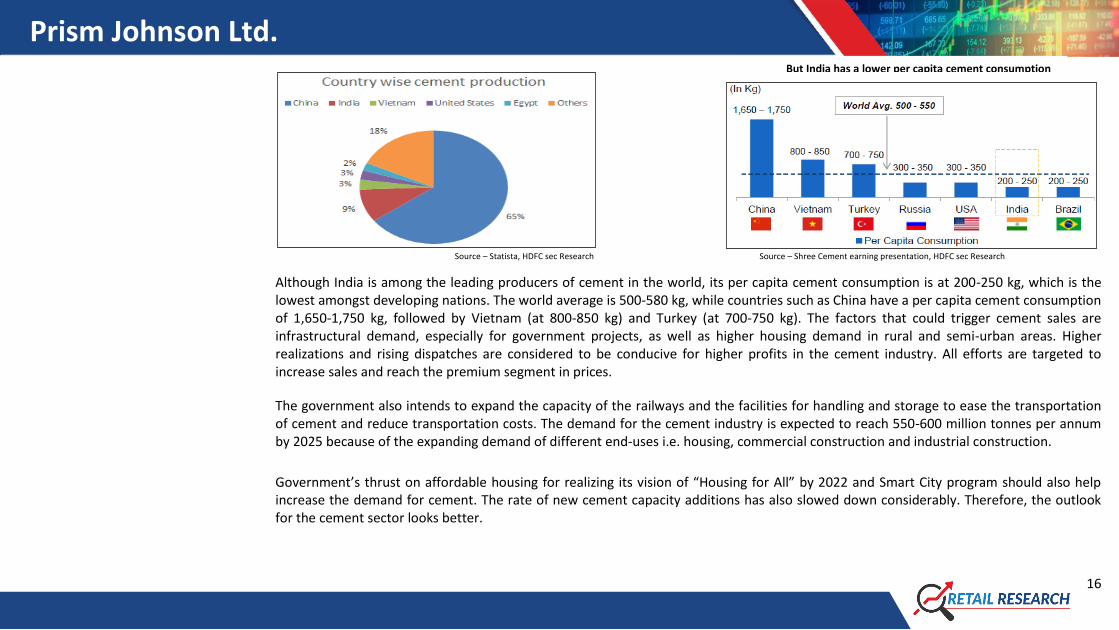
About the company Prism Johnson Ltd (Prism) was incorporated in 1992 and promoted by the Rajan Raheja Group. It has been engaged in the manufacturing and sales of cement since 1997. The company’s cement division operates two units, both based in Satna, Madhya Pradesh, with a combined installed cement manufacturing capacity of 7.0 MTPA (saleable). Prism caters to the major markets of Uttar Pradesh, Madhya Pradesh and Bihar. In FY10, Prism amalgamated H&R Johnson (India) Ltd and RMC Readymix (India) Pvt Ltd with itself.
Source – Company, HDFC sec Research
Industry Cement India is the second largest cement producer in the world. The cement industry occupies an important place in the Indian economy because
of its strong linkages with other sectors such as construction, transportation, coal, and power. The sector notably plays a critical role in the
economic growth of the country, in its journey towards inclusive and decidedly conclusive growth. The construction sector alone
constitutes about 7% of the country's gross domestic product (GDP). India is the second largest producer of cement in the world after
China, with an installed capacity of ~540 MTPA. Presently, the Indian cement industry has 225 plants, owned by 65 players.
Prism Johnson Ltd.
16
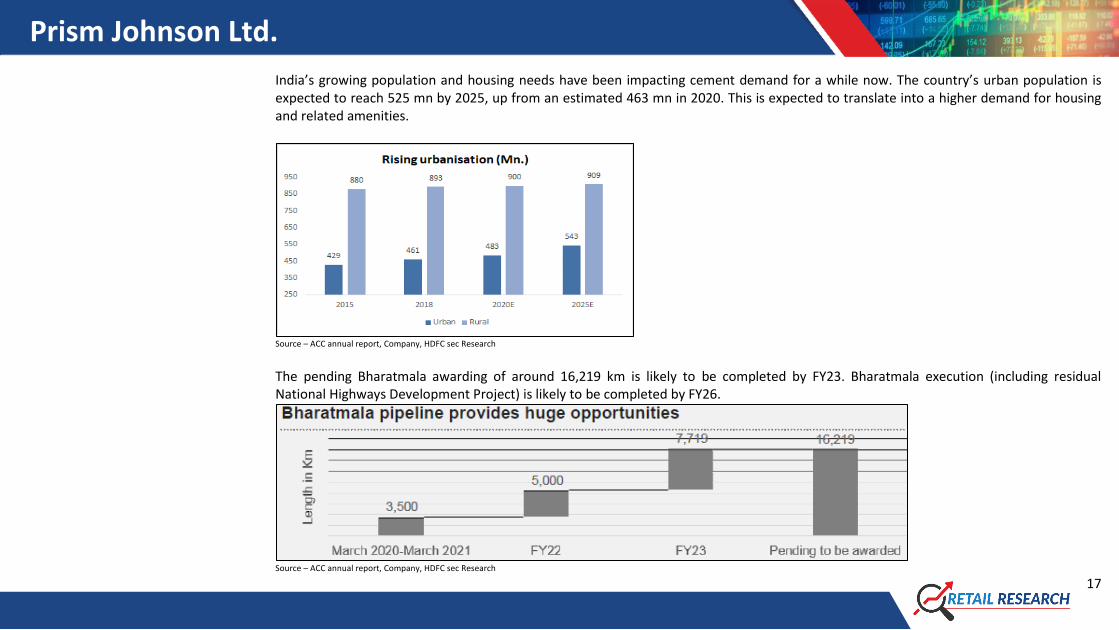
Source – Statista, HDFC sec Research Source – Shree Cement earning presentation, HDFC sec Research
Although India is among the leading producers of cement in the world, its per capita cement consumption is at 200-250 kg, which is the lowest amongst developing nations. The world average is 500-580 kg, while countries such as China have a per capita cement consumption of 1,650-1,750 kg, followed by Vietnam (at 800-850 kg) and Turkey (at 700-750 kg). The factors that could trigger cement sales are infrastructural demand, especially for government projects, as well as higher housing demand in rural and semi-urban areas. Higher realizations and rising dispatches are considered to be conducive for higher profits in the cement industry. All efforts are targeted to increase sales and reach the premium segment in prices.
The government also intends to expand the capacity of the railways and the facilities for handling and storage to ease the transportation of cement and reduce transportation costs. The demand for the cement industry is expected to reach 550-600 million tonnes per annum by 2025 because of the expanding demand of different end-uses i.e. housing, commercial construction and industrial construction.
Government’s thrust on affordable housing for realizing its vision of “Housing for All” by 2022 and Smart City program should also help increase the demand for cement. The rate of new cement capacity additions has also slowed down considerably. Therefore, the outlook for the cement sector looks better.
But India has a lower per capita cement consumption
Prism Johnson Ltd.
17
India’s growing population and housing needs have been impacting cement demand for a while now. The country’s urban population is expected to reach 525 mn by 2025, up from an estimated 463 mn in 2020. This is expected to translate into a higher demand for housing and related amenities.
Source – ACC annual report, Company, HDFC sec Research
The pending Bharatmala awarding of around 16,219 km is likely to be completed by FY23. Bharatmala execution (including residual National Highways Development Project) is likely to be completed by FY26.
Source – ACC annual report, Company, HDFC sec Research
Prism Johnson Ltd.
18
Cement, being a bulk commodity, is in a freight intensive industry, for which long-distance transportation can prove uneconomical. This has
led to cement being largely a regional play with the industry being divided into five main regions viz. north, south, west, east and the central
region. Cement is relatively a highly concentrated industry in India with: (1) the top 10 companies constituting> 60% of the market; (2) the
top 5 companies enjoying a market share of around > 48%, and (3) the top 2 cement groups (LafargeHolcim and Aditya Birla Group) enjoying
a market share of ~38%.
Tiles Ceramic tiles are widely applicable in residential and commercial buildings, owing to their durability and crack resistance nature. Protective
coatings on ceramic tiles offer high water resistance, stain protection, and clean-up. Ceramic tiles have intact glazing, which provides
protection from dust.
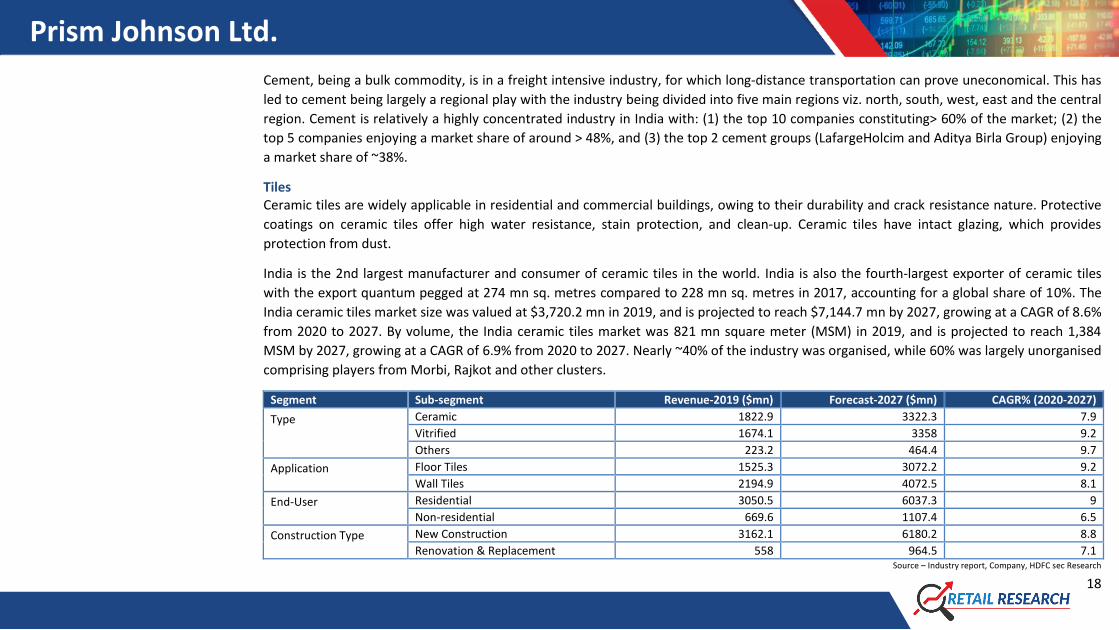
India is the 2nd largest manufacturer and consumer of ceramic tiles in the world. India is also the fourth-largest exporter of ceramic tiles
with the export quantum pegged at 274 mn sq. metres compared to 228 mn sq. metres in 2017, accounting for a global share of 10%. The
India ceramic tiles market size was valued at $3,720.2 mn in 2019, and is projected to reach $7,144.7 mn by 2027, growing at a CAGR of 8.6%
from 2020 to 2027. By volume, the India ceramic tiles market was 821 mn square meter (MSM) in 2019, and is projected to reach 1,384
MSM by 2027, growing at a CAGR of 6.9% from 2020 to 2027. Nearly ~40% of the industry was organised, while 60% was largely unorganised
comprising players from Morbi, Rajkot and other clusters.
Segment Sub-segment Revenue-2019 ($mn) Forecast-2027 ($mn) CAGR% (2020-2027)
Type
Ceramic 1822.9 3322.3 7.9
Vitrified 1674.1 3358 9.2
Others 223.2 464.4 9.7
Application
Floor Tiles 1525.3 3072.2 9.2
Wall Tiles 2194.9 4072.5 8.1
End-User
Residential 3050.5 6037.3 9
Non-residential 669.6 1107.4 6.5
Construction Type
New Construction 3162.1 6180.2 8.8
Renovation & Replacement 558 964.5 7.1 Source – Industry report, Company, HDFC sec Research
Prism Johnson Ltd.
19
The Government of India has launched several programs which are helping tile industry to grow and flourish. The government has built 110
mn+ toilets in the last few years to eliminate the open defecation in the country. Moreover, programs such as Swachh Bharat Mission (SBM)
in urban and rural areas has successfully boost the ceramic tile industry, owing to the growing demand of small size tiles.
India is an emerging economy, where real estate market is growing, owing to increased infrastructure development projects. Economic
recovery and growth in construction demand are significantly driving the ceramic tiles market growth. Western part of India is the major
revenue contributor in the country.
Digital tile printing offers manufacturers limitless and variety of designs for wall and floor. In addition, the advanced digital printing
technology for ceramic tiles has an immense impact on major wall and flooring tiles categories, owing to its ability to print unique designs,
patterns, and vibrant colors on tiles.
Increase in adoption of ceramic tiles in commercial buildings boost the growth of the market, as many developers, contractors, as well
companies have invested or plan to invest in plants for construction of commercial buildings. India is set to >65 mn sq ft of new mall spaces
by the end of 2022, of which the top 7 cities comprise 72% share and the remaining 28% or 18.2 mn sq ft is slated to come up in Tier 2 and 3
cities. This could widen the ceramic tile and sanitaryware market in the near future.
The Morbi cluster, looked beyond the Indian shores. They exported their output to the Middle East and Europe. Moreover, the imposition of
duty by the US on import of ceramic products from China, opened a big opportunity for the Indian players – as such their exports have been
surging.
Ceramic tiles are expected to play an important role in ‘Green’ construction in the future. Products such as cool roof tiles help reflect solar
energy, which keeps interiors cooler, reducing the inside temperature by ~10 to 20 degree Celsius.
Prism Johnson Ltd.
20
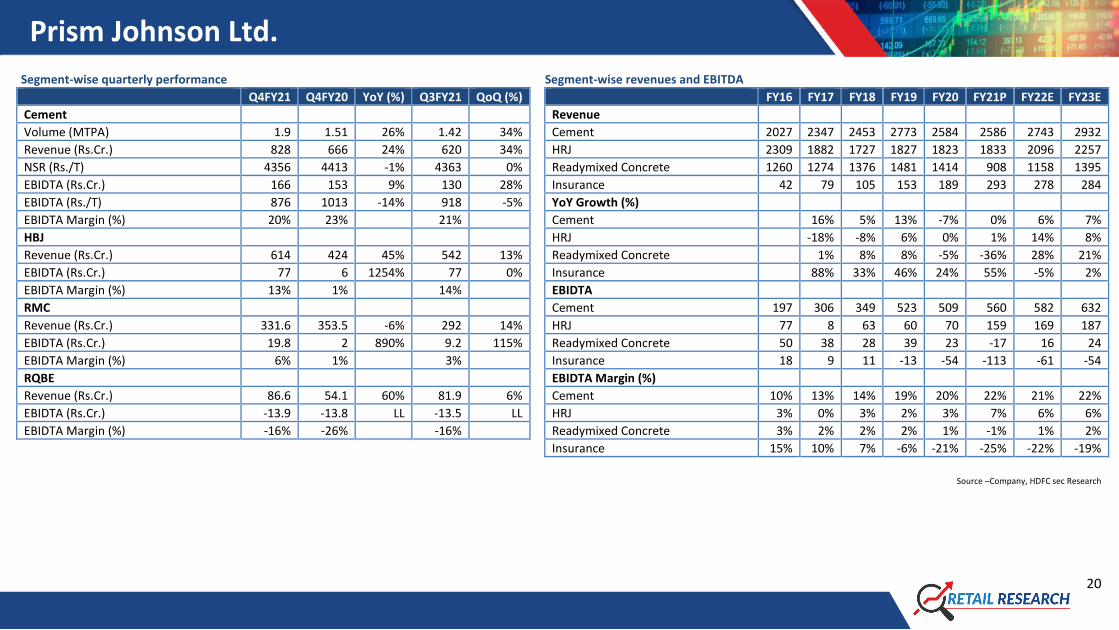
Segment-wise quarterly performance Segment-wise revenues and EBITDA Q4FY21 Q4FY20 YoY (%) Q3FY21 QoQ (%) FY16 FY17 FY18 FY19 FY20 FY21P FY22E FY23E
Cement Revenue
Volume (MTPA) 1.9 1.51 26% 1.42 34% Cement 2027 2347 2453 2773 2584 2586 2743 2932
Revenue (Rs.Cr.) 828 666 24% 620 34% HRJ 2309 1882 1727 1827 1823 1833 2096 2257
NSR (Rs./T) 4356 4413 -1% 4363 0% Readymixed Concrete 1260 1274 1376 1481 1414 908 1158 1395
EBIDTA (Rs.Cr.) 166 153 9% 130 28% Insurance 42 79 105 153 189 293 278 284
EBIDTA (Rs./T) 876 1013 -14% 918 -5% YoY Growth (%)
EBIDTA Margin (%) 20% 23% 21% Cement 16% 5% 13% -7% 0% 6% 7%
HBJ HRJ -18% -8% 6% 0% 1% 14% 8%
Revenue (Rs.Cr.) 614 424 45% 542 13% Readymixed Concrete 1% 8% 8% -5% -36% 28% 21%
EBIDTA (Rs.Cr.) 77 6 1254% 77 0% Insurance 88% 33% 46% 24% 55% -5% 2%
EBIDTA Margin (%) 13% 1% 14% EBIDTA
RMC Cement 197 306 349 523 509 560 582 632
Revenue (Rs.Cr.) 331.6 353.5 -6% 292 14% HRJ 77 8 63 60 70 159 169 187
EBIDTA (Rs.Cr.) 19.8 2 890% 9.2 115% Readymixed Concrete 50 38 28 39 23 -17 16 24
EBIDTA Margin (%) 6% 1% 3% Insurance 18 9 11 -13 -54 -113 -61 -54
RQBE EBIDTA Margin (%)
Revenue (Rs.Cr.) 86.6 54.1 60% 81.9 6% Cement 10% 13% 14% 19% 20% 22% 21% 22%
EBIDTA (Rs.Cr.) -13.9 -13.8 LL -13.5 LL HRJ 3% 0% 3% 2% 3% 7% 6% 6%
EBIDTA Margin (%) -16% -26% -16% Readymixed Concrete 3% 2% 2% 2% 1% -1% 1% 2%
Insurance 15% 10% 7% -6% -21% -25% -22% -19%
Source –Company, HDFC sec Research
Prism Johnson Ltd.
21
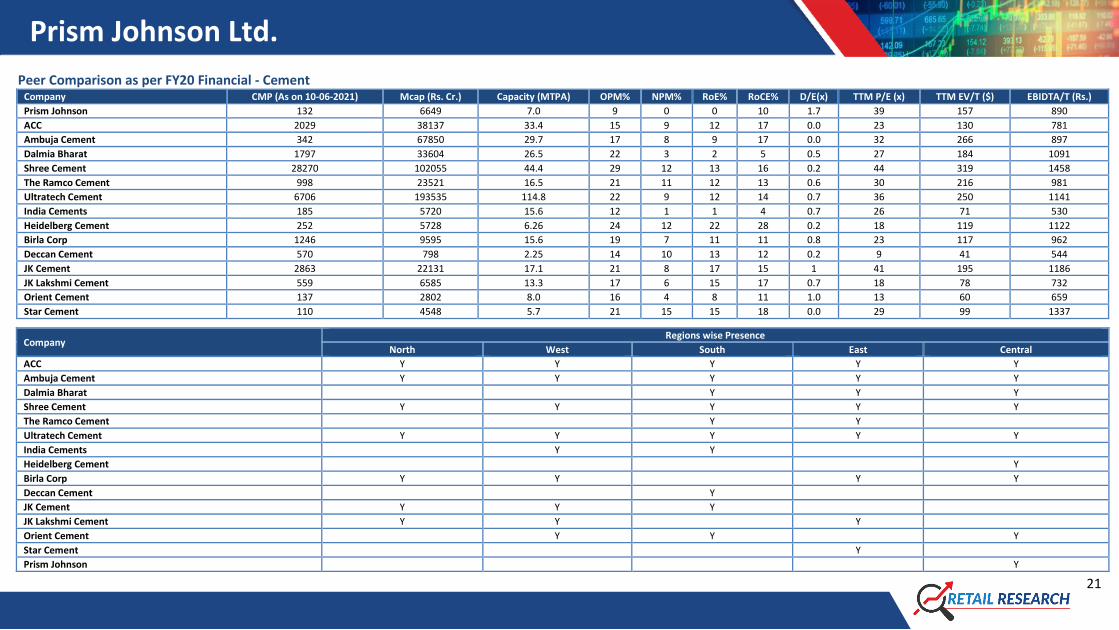
Peer Comparison as per FY20 Financial - Cement Company CMP (As on 10-06-2021) Mcap (Rs. Cr.) Capacity (MTPA) OPM% NPM% RoE% RoCE% D/E(x) TTM P/E (x) TTM EV/T ($) EBIDTA/T (Rs.)
Prism Johnson 132 6649 7.0 9 0 0 10 1.7 39 157 890
ACC 2029 38137 33.4 15 9 12 17 0.0 23 130 781
Ambuja Cement 342 67850 29.7 17 8 9 17 0.0 32 266 897
Dalmia Bharat 1797 33604 26.5 22 3 2 5 0.5 27 184 1091
Shree Cement 28270 102055 44.4 29 12 13 16 0.2 44 319 1458
The Ramco Cement 998 23521 16.5 21 11 12 13 0.6 30 216 981
Ultratech Cement 6706 193535 114.8 22 9 12 14 0.7 36 250 1141
India Cements 185 5720 15.6 12 1 1 4 0.7 26 71 530
Heidelberg Cement 252 5728 6.26 24 12 22 28 0.2 18 119 1122
Birla Corp 1246 9595 15.6 19 7 11 11 0.8 23 117 962
Deccan Cement 570 798 2.25 14 10 13 12 0.2 9 41 544
JK Cement 2863 22131 17.1 21 8 17 15 1 41 195 1186
JK Lakshmi Cement 559 6585 13.3 17 6 15 17 0.7 18 78 732
Orient Cement 137 2802 8.0 16 4 8 11 1.0 13 60 659
Star Cement 110 4548 5.7 21 15 15 18 0.0 29 99 1337
Company Regions wise Presence
North West South East Central
ACC Y Y Y Y Y
Ambuja Cement Y Y Y Y Y
Dalmia Bharat Y Y Y
Shree Cement Y Y Y Y Y
The Ramco Cement Y Y
Ultratech Cement Y Y Y Y Y
India Cements Y Y
Heidelberg Cement Y
Birla Corp Y Y Y Y
Deccan Cement Y
JK Cement Y Y Y
JK Lakshmi Cement Y Y Y
Orient Cement Y Y Y
Star Cement Y
Prism Johnson Y
Prism Johnson Ltd.
22
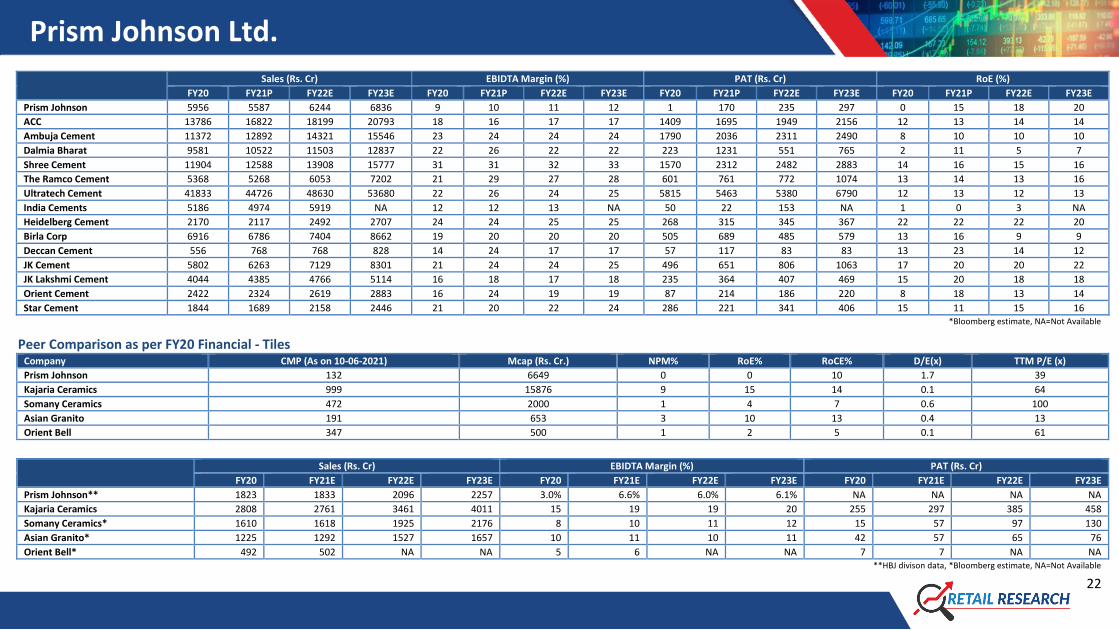
Sales (Rs. Cr) EBIDTA Margin (%) PAT (Rs. Cr) RoE (%)
FY20 FY21P FY22E FY23E FY20 FY21P FY22E FY23E FY20 FY21P FY22E FY23E FY20 FY21P FY22E FY23E
Prism Johnson 5956 5587 6244 6836 9 10 11 12 1 170 235 297 0 15 18 20
ACC 13786 16822 18199 20793 18 16 17 17 1409 1695 1949 2156 12 13 14 14
Ambuja Cement 11372 12892 14321 15546 23 24 24 24 1790 2036 2311 2490 8 10 10 10
Dalmia Bharat 9581 10522 11503 12837 22 26 22 22 223 1231 551 765 2 11 5 7
Shree Cement 11904 12588 13908 15777 31 31 32 33 1570 2312 2482 2883 14 16 15 16
The Ramco Cement 5368 5268 6053 7202 21 29 27 28 601 761 772 1074 13 14 13 16
Ultratech Cement 41833 44726 48630 53680 22 26 24 25 5815 5463 5380 6790 12 13 12 13
India Cements 5186 4974 5919 NA 12 12 13 NA 50 22 153 NA 1 0 3 NA
Heidelberg Cement 2170 2117 2492 2707 24 24 25 25 268 315 345 367 22 22 22 20
Birla Corp 6916 6786 7404 8662 19 20 20 20 505 689 485 579 13 16 9 9
Deccan Cement 556 768 768 828 14 24 17 17 57 117 83 83 13 23 14 12
JK Cement 5802 6263 7129 8301 21 24 24 25 496 651 806 1063 17 20 20 22
JK Lakshmi Cement 4044 4385 4766 5114 16 18 17 18 235 364 407 469 15 20 18 18
Orient Cement 2422 2324 2619 2883 16 24 19 19 87 214 186 220 8 18 13 14
Star Cement 1844 1689 2158 2446 21 20 22 24 286 221 341 406 15 11 15 16 *Bloomberg estimate, NA=Not Available
Peer Comparison as per FY20 Financial - Tiles Company CMP (As on 10-06-2021) Mcap (Rs. Cr.) NPM% RoE% RoCE% D/E(x) TTM P/E (x)
Prism Johnson 132 6649 0 0 10 1.7 39
Kajaria Ceramics 999 15876 9 15 14 0.1 64
Somany Ceramics 472 2000 1 4 7 0.6 100
Asian Granito 191 653 3 10 13 0.4 13
Orient Bell 347 500 1 2 5 0.1 61
Sales (Rs. Cr) EBIDTA Margin (%) PAT (Rs. Cr)
FY20 FY21E FY22E FY23E FY20 FY21E FY22E FY23E FY20 FY21E FY22E FY23E
Prism Johnson** 1823 1833 2096 2257 3.0% 6.6% 6.0% 6.1% NA NA NA NA
Kajaria Ceramics 2808 2761 3461 4011 15 19 19 20 255 297 385 458
Somany Ceramics* 1610 1618 1925 2176 8 10 11 12 15 57 97 130
Asian Granito* 1225 1292 1527 1657 10 11 10 11 42 57 65 76
Orient Bell* 492 502 NA NA 5 6 NA NA 7 7 NA NA **HBJ divison data, *Bloomberg estimate, NA=Not Available
Prism Johnson Ltd.
23
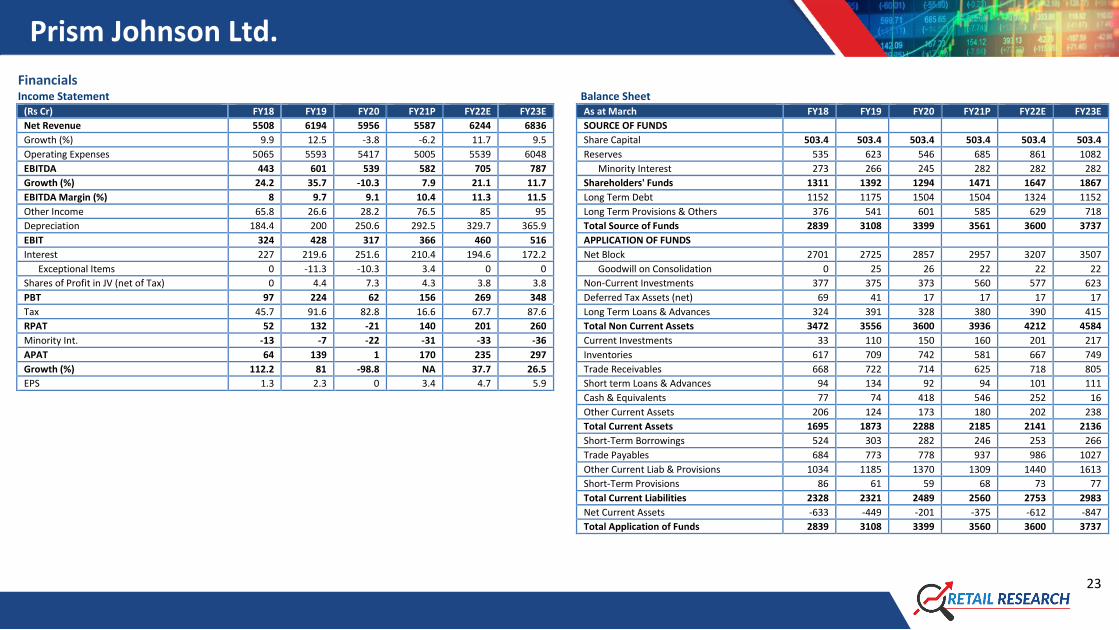
Financials Income Statement Balance Sheet
(Rs Cr) FY18 FY19 FY20 FY21P FY22E FY23E As at March FY18 FY19 FY20 FY21P FY22E FY23E
Net Revenue 5508 6194 5956 5587 6244 6836 SOURCE OF FUNDS
Growth (%) 9.9 12.5 -3.8 -6.2 11.7 9.5 Share Capital 503.4 503.4 503.4 503.4 503.4 503.4
Operating Expenses 5065 5593 5417 5005 5539 6048 Reserves 535 623 546 685 861 1082
EBITDA 443 601 539 582 705 787 Minority Interest 273 266 245 282 282 282
Growth (%) 24.2 35.7 -10.3 7.9 21.1 11.7 Shareholders' Funds 1311 1392 1294 1471 1647 1867
EBITDA Margin (%) 8 9.7 9.1 10.4 11.3 11.5 Long Term Debt 1152 1175 1504 1504 1324 1152
Other Income 65.8 26.6 28.2 76.5 85 95 Long Term Provisions & Others 376 541 601 585 629 718
Depreciation 184.4 200 250.6 292.5 329.7 365.9 Total Source of Funds 2839 3108 3399 3561 3600 3737
EBIT 324 428 317 366 460 516 APPLICATION OF FUNDS
Interest 227 219.6 251.6 210.4 194.6 172.2 Net Block 2701 2725 2857 2957 3207 3507
Exceptional Items 0 -11.3 -10.3 3.4 0 0 Goodwill on Consolidation 0 25 26 22 22 22
Shares of Profit in JV (net of Tax) 0 4.4 7.3 4.3 3.8 3.8 Non-Current Investments 377 375 373 560 577 623
PBT 97 224 62 156 269 348 Deferred Tax Assets (net) 69 41 17 17 17 17
Tax 45.7 91.6 82.8 16.6 67.7 87.6 Long Term Loans & Advances 324 391 328 380 390 415
RPAT 52 132 -21 140 201 260 Total Non Current Assets 3472 3556 3600 3936 4212 4584
Minority Int. -13 -7 -22 -31 -33 -36 Current Investments 33 110 150 160 201 217
APAT 64 139 1 170 235 297 Inventories 617 709 742 581 667 749
Growth (%) 112.2 81 -98.8 NA 37.7 26.5 Trade Receivables 668 722 714 625 718 805
EPS 1.3 2.3 0 3.4 4.7 5.9 Short term Loans & Advances 94 134 92 94 101 111
Cash & Equivalents 77 74 418 546 252 16 Other Current Assets 206 124 173 180 202 238 Total Current Assets 1695 1873 2288 2185 2141 2136 Short-Term Borrowings 524 303 282 246 253 266 Trade Payables 684 773 778 937 986 1027 Other Current Liab & Provisions 1034 1185 1370 1309 1440 1613 Short-Term Provisions 86 61 59 68 73 77
Total Current Liabilities 2328 2321 2489 2560 2753 2983
Net Current Assets -633 -449 -201 -375 -612 -847
Total Application of Funds 2839 3108 3399 3560 3600 3737
Prism Johnson Ltd.
24
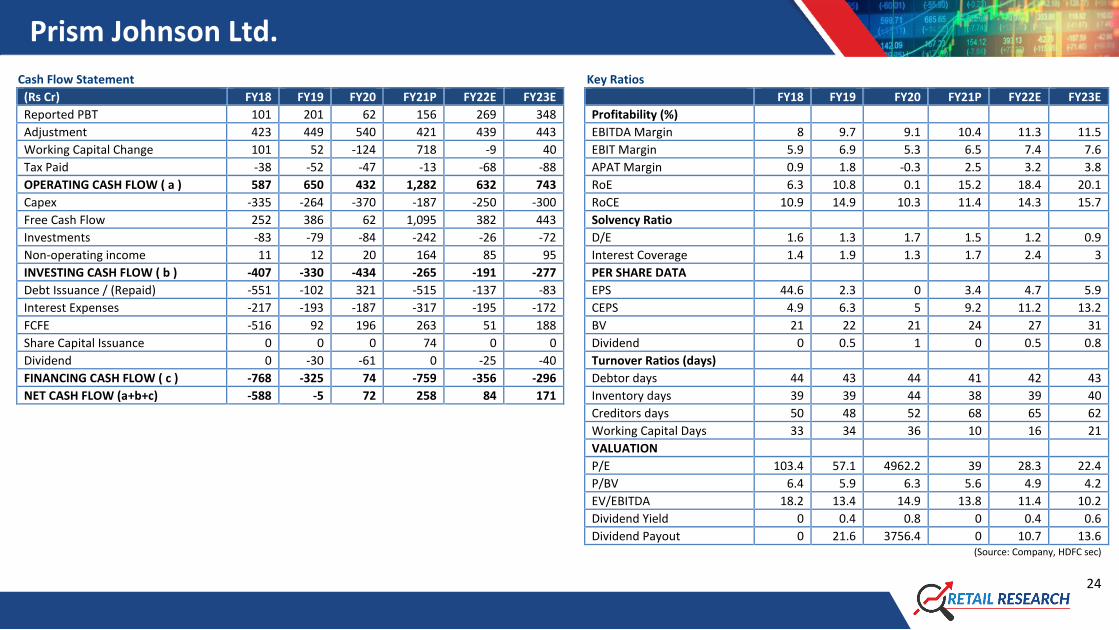
Cash Flow Statement
Key Ratios
(Rs Cr) FY18 FY19 FY20 FY21P FY22E FY23E FY18 FY19 FY20 FY21P FY22E FY23E
Reported PBT 101 201 62 156 269 348 Profitability (%)
Adjustment 423 449 540 421 439 443 EBITDA Margin 8 9.7 9.1 10.4 11.3 11.5
Working Capital Change 101 52 -124 718 -9 40 EBIT Margin 5.9 6.9 5.3 6.5 7.4 7.6
Tax Paid -38 -52 -47 -13 -68 -88 APAT Margin 0.9 1.8 -0.3 2.5 3.2 3.8
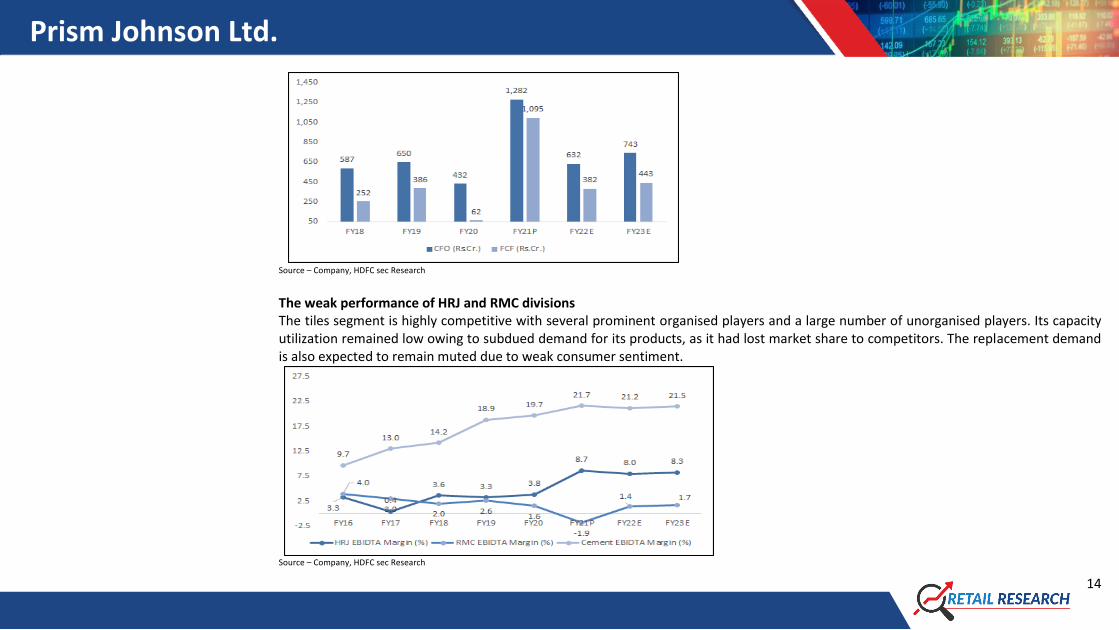
OPERATING CASH FLOW ( a ) 587 650 432 1,282 632 743 RoE 6.3 10.8 0.1 15.2 18.4 20.1
Capex -335 -264 -370 -187 -250 -300 RoCE 10.9 14.9 10.3 11.4 14.3 15.7
Free Cash Flow 252 386 62 1,095 382 443 Solvency Ratio
Investments -83 -79 -84 -242 -26 -72 D/E 1.6 1.3 1.7 1.5 1.2 0.9
Non-operating income 11 12 20 164 85 95 Interest Coverage 1.4 1.9 1.3 1.7 2.4 3
INVESTING CASH FLOW ( b ) -407 -330 -434 -265 -191 -277 PER SHARE DATA
Debt Issuance / (Repaid) -551 -102 321 -515 -137 -83 EPS 44.6 2.3 0 3.4 4.7 5.9
Interest Expenses -217 -193 -187 -317 -195 -172 CEPS 4.9 6.3 5 9.2 11.2 13.2
FCFE -516 92 196 263 51 188 BV 21 22 21 24 27 31
Share Capital Issuance 0 0 0 74 0 0 Dividend 0 0.5 1 0 0.5 0.8
Dividend 0 -30 -61 0 -25 -40 Turnover Ratios (days)
FINANCING CASH FLOW ( c ) -768 -325 74 -759 -356 -296 Debtor days 44 43 44 41 42 43
NET CASH FLOW (a+b+c) -588 -5 72 258 84 171 Inventory days 39 39 44 38 39 40
Creditors days 50 48 52 68 65 62
Working Capital Days 33 34 36 10 16 21
VALUATION P/E 103.4 57.1 4962.2 39 28.3 22.4
P/BV 6.4 5.9 6.3 5.6 4.9 4.2
EV/EBITDA 18.2 13.4 14.9 13.8 11.4 10.2 Dividend Yield 0 0.4 0.8 0 0.4 0.6 Dividend Payout 0 21.6 3756.4 0 10.7 13.6
(Source: Company, HDFC sec)
Prism Johnson Ltd.
25
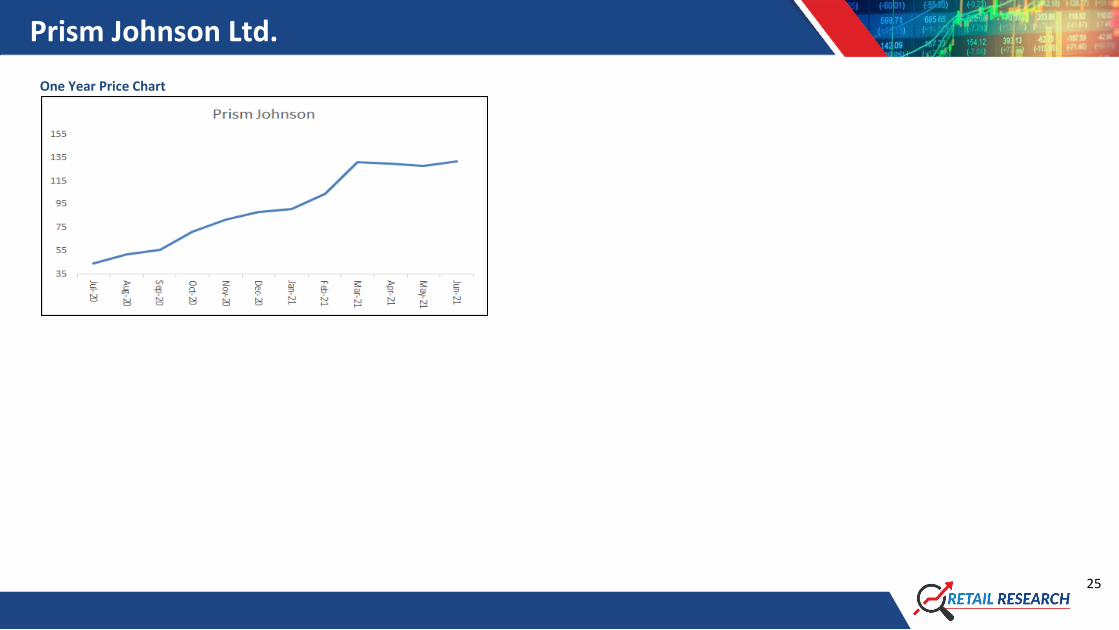
One Year Price Chart
Prism Johnson Ltd.
26
Disclosure: I, Jimit Zaveri, (MBA - Finance), authors and the names subscribed to this report, hereby certify that all of the views expressed in this research report accurately reflect our views about the subject issuer(s) or securities. HSL has no material adverse disciplinary history as on the date of
publication of this report. We also certify that no part of our compensation was, is, or will be directly or indirectly related to the specific recommendation(s) or view(s) in this report.
Research Analyst or his relative or HDFC Securities Ltd. does not have any financial interest in the subject company. Also Research Analyst or his relative or HDFC Securities Ltd. or its Associate may have beneficial ownership of 1% or more in the subject company at the end of the month
immediately preceding the date of publication of the Research Report. Further Research Analyst or his relative or HDFC Securities Ltd. or its associate does not have any material conflict of interest.
Any holding in stock – No
HDFC Securities Limited (HSL) is a SEBI Registered Research Analyst having registration no. INH000002475.
Disclaimer:
This report has been prepared by HDFC Securities Ltd and is meant for sole use by the recipient and not for circulation. The information and opinions contained herein have been compiled or arrived at, based upon information obtained in good faith from sources believed to be reliable.
Such information has not been independently verified and no guaranty, representation of warranty, express or implied, is made as to its accuracy, completeness or correctness. All such information and opinions are subject to change without notice. This document is for information
purposes only. Descriptions of any company or companies or their securities mentioned herein are not intended to be complete and this document is not, and should not be construed as an offer or solicitation of an offer, to buy or sell any securities or other financial instruments.
This report is not directed to, or intended for display, downloading, printing, reproducing or for distribution to or use by, any person or entity who is a citizen or resident or located in any locality, state, country or other jurisdiction where such distribution, publication, reproduction,
availability or use would be contrary to law or regulation or what would subject HSL or its affiliates to any registration or licensing requirement within such jurisdiction.
If this report is inadvertently sent or has reached any person in such country, especially, United States of America, the same should be ignored and brought to the attention of the sender. This document may not be reproduced, distributed or published in whole or in part, directly or
indirectly, for any purposes or in any manner.
Foreign currencies denominated securities, wherever mentioned, are subject to exchange rate fluctuations, which could have an adverse effect on their value or price, or the income derived from them. In addition, investors in securities such as ADRs, the values of which are influenced
by foreign currencies effectively assume currency risk.
It should not be considered to be taken as an offer to sell or a solicitation to buy any security. HSL may from time to time solicit from, or perform broking, or other services for, any company mentioned in this mail and/or its attachments.
HSL and its affiliated company(ies), their directors and employees may; (a) from time to time, have a long or short position in, and buy or sell the securities of the company(ies) mentioned herein or (b) be engaged in any other transaction involving such securities and earn brokerage or
other compensation or act as a market maker in the financial instruments of the company(ies) discussed herein or act as an advisor or lender/borrower to such company(ies) or may have any other potential conflict of interests with respect to any recommendation and other related
information and opinions.
HSL, its directors, analysts or employees do not take any responsibility, financial or otherwise, of the losses or the damages sustained due to the investments made or any action taken on basis of this report, including but not restricted to, fluctuation in the prices of shares and bonds,
changes in the currency rates, diminution in the NAVs, reduction in the dividend or income, etc.
HSL and other group companies, its directors, associates, employees may have various positions in any of the stocks, securities and financial instruments dealt in the report, or may make sell or purchase or other deals in these securities from time to time or may deal in other securities
of the companies / organizations described in this report.
HSL or its associates might have managed or co-managed public offering of securities for the subject company or might have been mandated by the subject company for any other assignment in the past twelve months.
HSL or its associates might have received any compensation from the companies mentioned in the report during the period preceding twelve months from t date of this report for services in respect of managing or co-managing public offerings, corporate finance, investment banking or
merchant banking, brokerage services or other advisory service in a merger or specific transaction in the normal course of business.
HSL or its analysts did not receive any compensation or other benefits from the companies mentioned in the report or third party in connection with preparation of the research report. Accordingly, neither HSL nor Research Analysts have any material conflict of interest at the time of
publication of this report. Compensation of our Research Analysts is not based on any specific merchant banking, investment b anking or brokerage service transactions. HSL may have issued other reports that are inconsistent with and reach different conclusion from the information
presented in this report.
Research entity has not been engaged in market making activity for the subject company. Research analyst has not served as an officer, director or employee of the subject company. We have not received any compensation/benefits from the subject company or third party in
connection with the Research Report.
HDFC securities Limited, I Think Techno Campus, Building - B, "Alpha", Office Floor 8, Near Kanjurmarg Station, Opp. Crompton Greaves, Kanjurmarg (East), Mumbai 400 042 Phone: (022) 3075 3400 Fax: (022) 2496 5066
Compliance Officer: Binkle R. Oza Email: [email protected] Phone: (022) 3045 3600
HDFC Securities Limited, SEBI Reg. No.: NSE, BSE, MSEI, MCX: INZ000186937; AMFI Reg. No. ARN: 13549; PFRDA Reg. No. POP: 11092018; IRDA Corporate Agent License No.: CA0062; SEBI Research Analyst Reg. No.: INH000002475; SEBI Investment Adviser Reg. No.: INA000011538; CIN -
U67120MH2000PLC152193
Mutual Funds Investments are subject to market risk. Please read the offer and scheme related documents carefully before investing.