accounts - johnson matthey
TRANSCRIPT

AccountsThe Accounts include the consolidated and parent company accounts and related notes,
prepared in accordance with International Financial Reporting Standards, as well as the
independent auditor’s report.
Johnson Matthey
Annual Report and Accounts 2019156
Accounts

Notes on the accounts continuedfor the year ended 31st March 2019
158 Consolidated Income Statement 158 Consolidated Statement of Total Comprehensive Income 159 Consolidated and Parent Company Balance Sheets 160 Consolidated Cash Flow Statement 161 Consolidated Statement of Changes in Equity 162 Parent Company Statement of Changes in Equity 163 Accounting policies 173 Notes on the accounts 223 Independent auditor’s report
ContentsA
cco
un
ts
Johnson Matthey
Annual Report and Accounts 2019 157
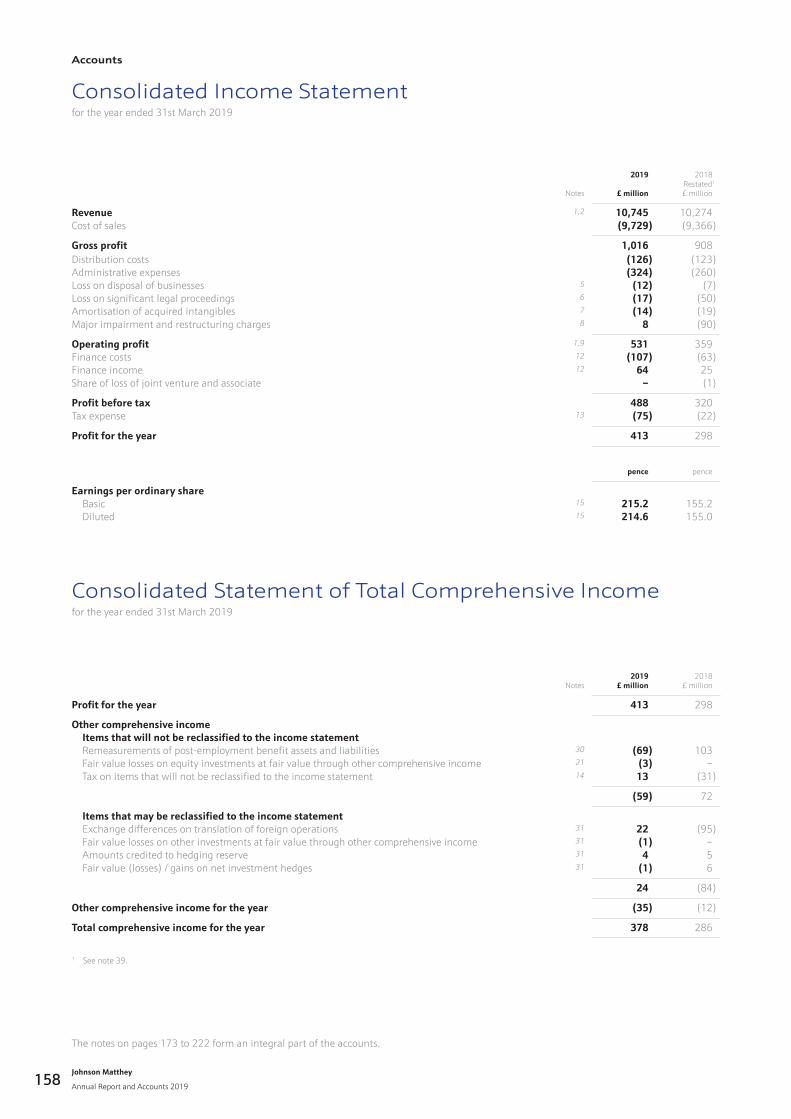
Consolidated Income Statementfor the year ended 31st March 2019
Notes
2019
£ million
2018Restated1
£ million
Revenue 1,2 10,745 10,274Cost of sales (9,729) (9,366)
Gross profit 1,016 908Distribution costs (126) (123)Administrative expenses (324) (260)Loss on disposal of businesses 5 (12) (7)Loss on significant legal proceedings 6 (17) (50)Amortisation of acquired intangibles 7 (14) (19)Major impairment and restructuring charges 8 8 (90)
Operating profit 1,9 531 359Finance costs 12 (107) (63)Finance income 12 64 25Share of loss of joint venture and associate – (1)
Profit before tax 488 320Tax expense 13 (75) (22)
Profit for the year 413 298
pence pence
Earnings per ordinary share Basic 15 215.2 155.2 Diluted 15 214.6 155.0
Consolidated Statement of Total Comprehensive Incomefor the year ended 31st March 2019
Notes2019
£ million2018
£ million
Profit for the year 413 298
Other comprehensive income Items that will not be reclassified to the income statement Remeasurements of post-employment benefit assets and liabilities 30 (69) 103 Fair value losses on equity investments at fair value through other comprehensive income 21 (3) – Tax on items that will not be reclassified to the income statement 14 13 (31)
(59) 72
Items that may be reclassified to the income statement Exchange differences on translation of foreign operations 31 22 (95) Fair value losses on other investments at fair value through other comprehensive income 31 (1) – Amounts credited to hedging reserve 31 4 5 Fair value (losses) / gains on net investment hedges 31 (1) 6
24 (84)
Other comprehensive income for the year (35) (12)
Total comprehensive income for the year 378 286
1 See note 39.
The notes on pages 173 to 222 form an integral part of the accounts.
Johnson Matthey
Annual Report and Accounts 2019
Accounts
158
Group Parent company
Notes
2019
£ million
2018Restated1
£ million
2019
£ million
2018Restated1
£ million
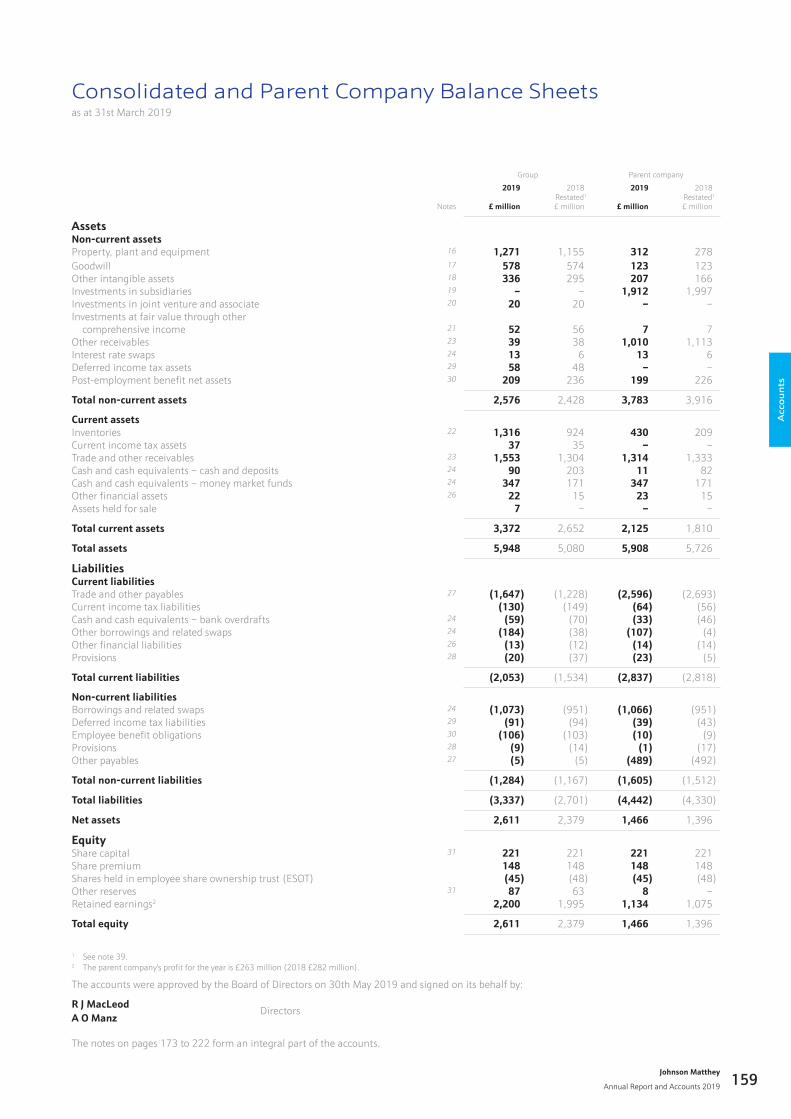
AssetsNon-current assetsProperty, plant and equipment 16 1,271 1,155 312 278Goodwill 17 578 574 123 123Other intangible assets 18 336 295 207 166Investments in subsidiaries 19 – – 1,912 1,997Investments in joint venture and associate 20 20 20 – –Investments at fair value through other comprehensive income 21 52 56 7 7Other receivables 23 39 38 1,010 1,113Interest rate swaps 24 13 6 13 6Deferred income tax assets 29 58 48 – –Post-employment benefit net assets 30 209 236 199 226
Total non-current assets 2,576 2,428 3,783 3,916
Current assetsInventories 22 1,316 924 430 209Current income tax assets 37 35 – –Trade and other receivables 23 1,553 1,304 1,314 1,333Cash and cash equivalents – cash and deposits 24 90 203 11 82Cash and cash equivalents – money market funds 24 347 171 347 171Other financial assets 26 22 15 23 15Assets held for sale 7 – – –
Total current assets 3,372 2,652 2,125 1,810
Total assets 5,948 5,080 5,908 5,726
LiabilitiesCurrent liabilitiesTrade and other payables 27 (1,647) (1,228) (2,596) (2,693)Current income tax liabilities (130) (149) (64) (56)Cash and cash equivalents – bank overdrafts 24 (59) (70) (33) (46)Other borrowings and related swaps 24 (184) (38) (107) (4)Other financial liabilities 26 (13) (12) (14) (14)Provisions 28 (20) (37) (23) (5)
Total current liabilities (2,053) (1,534) (2,837) (2,818)
Non-current liabilitiesBorrowings and related swaps 24 (1,073) (951) (1,066) (951)Deferred income tax liabilities 29 (91) (94) (39) (43)Employee benefit obligations 30 (106) (103) (10) (9)Provisions 28 (9) (14) (1) (17)Other payables 27 (5) (5) (489) (492)
Total non-current liabilities (1,284) (1,167) (1,605) (1,512)
Total liabilities (3,337) (2,701) (4,442) (4,330)
Net assets 2,611 2,379 1,466 1,396
EquityShare capital 31 221 221 221 221Share premium 148 148 148 148Shares held in employee share ownership trust (ESOT) (45) (48) (45) (48)Other reserves 31 87 63 8 –Retained earnings2 2,200 1,995 1,134 1,075
Total equity 2,611 2,379 1,466 1,396
1 See note 39.2 The parent company’s profit for the year is £263 million (2018 £282 million).
The accounts were approved by the Board of Directors on 30th May 2019 and signed on its behalf by:
R J MacLeod Directors
A O Manz
Consolidated and Parent Company Balance Sheetsas at 31st March 2019
The notes on pages 173 to 222 form an integral part of the accounts.
Acc
ou
nts
Johnson Matthey
Annual Report and Accounts 2019 159
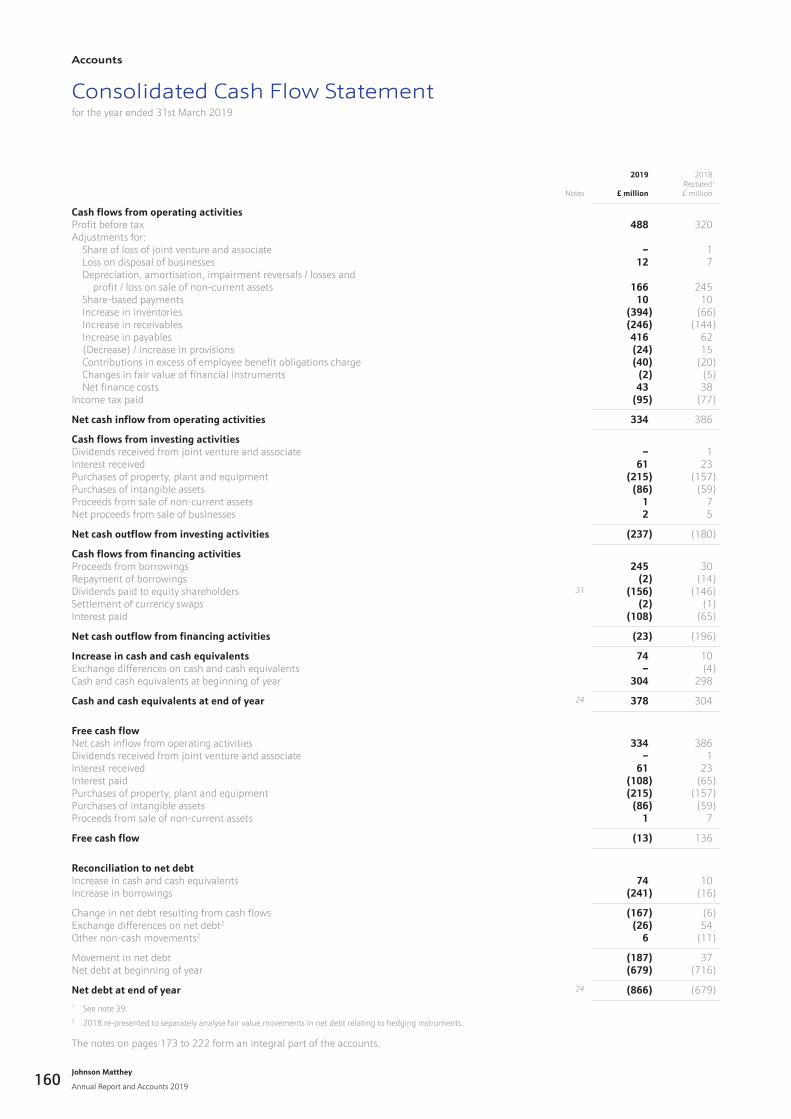
Consolidated Cash Flow Statementfor the year ended 31st March 2019
Notes
2019
£ million
2018Restated1
£ million
Cash flows from operating activitiesProfit before tax 488 320Adjustments for: Share of loss of joint venture and associate – 1 Loss on disposal of businesses 12 7 Depreciation, amortisation, impairment reversals / losses and profit / loss on sale of non-current assets 166 245 Share-based payments 10 10 Increase in inventories (394) (66) Increase in receivables (246) (144) Increase in payables 416 62 (Decrease) / increase in provisions (24) 15 Contributions in excess of employee benefit obligations charge (40) (20) Changes in fair value of financial instruments (2) (5) Net finance costs 43 38Income tax paid (95) (77)
Net cash inflow from operating activities 334 386
Cash flows from investing activitiesDividends received from joint venture and associate – 1Interest received 61 23Purchases of property, plant and equipment (215) (157)Purchases of intangible assets (86) (59)Proceeds from sale of non-current assets 1 7Net proceeds from sale of businesses 2 5
Net cash outflow from investing activities (237) (180)
Cash flows from financing activitiesProceeds from borrowings 245 30Repayment of borrowings (2) (14)Dividends paid to equity shareholders 31 (156) (146)Settlement of currency swaps (2) (1)Interest paid (108) (65)
Net cash outflow from financing activities (23) (196)
Increase in cash and cash equivalents 74 10Exchange differences on cash and cash equivalents – (4)Cash and cash equivalents at beginning of year 304 298
Cash and cash equivalents at end of year 24 378 304
Free cash flowNet cash inflow from operating activities 334 386Dividends received from joint venture and associate – 1Interest received 61 23Interest paid (108) (65)Purchases of property, plant and equipment (215) (157)Purchases of intangible assets (86) (59)Proceeds from sale of non-current assets 1 7
Free cash flow (13) 136
Reconciliation to net debtIncrease in cash and cash equivalents 74 10Increase in borrowings (241) (16)
Change in net debt resulting from cash flows (167) (6)Exchange differences on net debt2 (26) 54Other non-cash movements2 6 (11)
Movement in net debt (187) 37Net debt at beginning of year (679) (716)
Net debt at end of year 24 (866) (679)1 See note 39.2 2018 re-presented to separately analyse fair value movements in net debt relating to hedging instruments.
The notes on pages 173 to 222 form an integral part of the accounts.
Johnson Matthey
Annual Report and Accounts 2019
Accounts
160
Share capital
£ million
Share premium
account £ million
Shares held in
ESOT £ million
Other reserves
(note 31) £ million
Retained earnings £ million
Total attributable
to equity holders
£ million
Non- controlling
interests £ million
Total equity
£ million
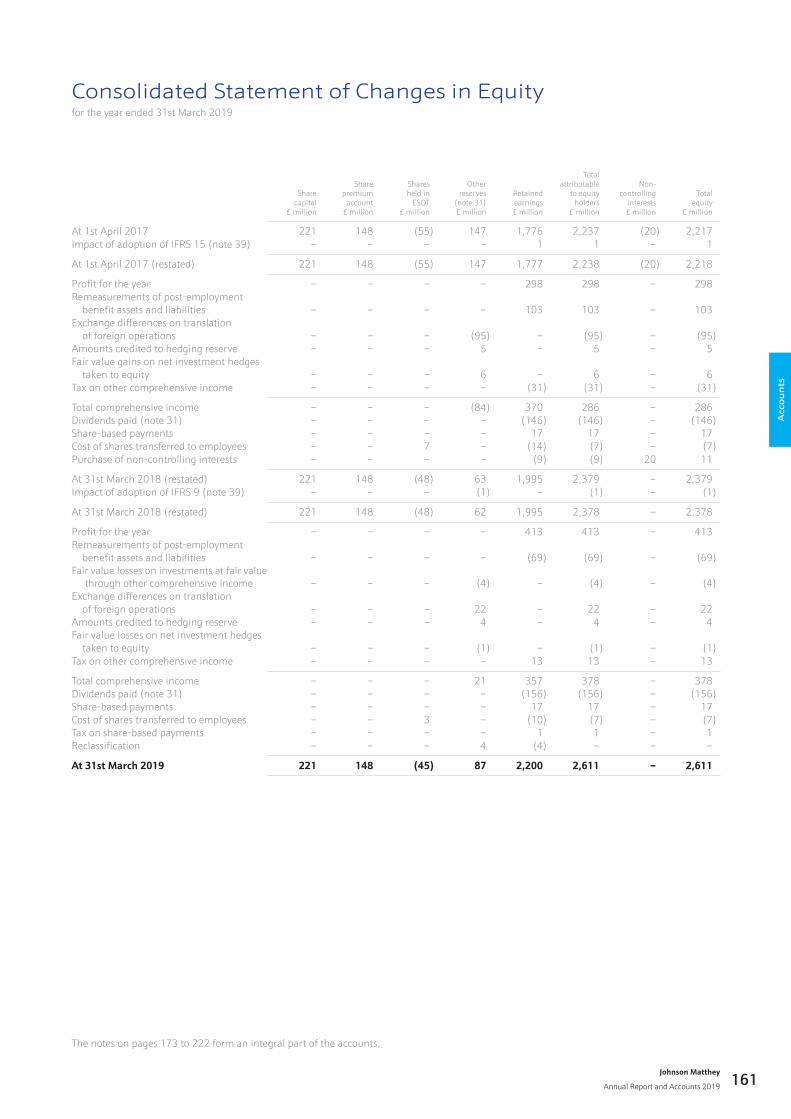
At 1st April 2017 221 148 (55) 147 1,776 2,237 (20) 2,217Impact of adoption of IFRS 15 (note 39) – – – – 1 1 – 1
At 1st April 2017 (restated) 221 148 (55) 147 1,777 2,238 (20) 2,218
Profit for the year – – – – 298 298 – 298Remeasurements of post-employment benefit assets and liabilities – – – – 103 103 – 103Exchange differences on translation of foreign operations – – – (95) – (95) – (95)Amounts credited to hedging reserve – – – 5 – 5 – 5Fair value gains on net investment hedges taken to equity – – – 6 – 6 – 6Tax on other comprehensive income – – – – (31) (31) – (31)
Total comprehensive income – – – (84) 370 286 – 286Dividends paid (note 31) – – – – (146) (146) – (146)Share-based payments – – – – 17 17 – 17Cost of shares transferred to employees – – 7 – (14) (7) – (7)Purchase of non-controlling interests – – – – (9) (9) 20 11
At 31st March 2018 (restated) 221 148 (48) 63 1,995 2,379 – 2,379Impact of adoption of IFRS 9 (note 39) – – – (1) – (1) – (1)
At 31st March 2018 (restated) 221 148 (48) 62 1,995 2,378 – 2,378
Profit for the year – – – – 413 413 – 413Remeasurements of post-employment benefit assets and liabilities – – – – (69) (69) – (69)Fair value losses on investments at fair value through other comprehensive income – – – (4) – (4) – (4)Exchange differences on translation of foreign operations – – – 22 – 22 – 22Amounts credited to hedging reserve – – – 4 – 4 – 4Fair value losses on net investment hedges taken to equity – – – (1) – (1) – (1)Tax on other comprehensive income – – – – 13 13 – 13
Total comprehensive income – – – 21 357 378 – 378Dividends paid (note 31) – – – – (156) (156) – (156)Share-based payments – – – – 17 17 – 17Cost of shares transferred to employees – – 3 – (10) (7) – (7)Tax on share-based payments – – – – 1 1 – 1Reclassification – – – 4 (4) – – –
At 31st March 2019 221 148 (45) 87 2,200 2,611 – 2,611
Consolidated Statement of Changes in Equityfor the year ended 31st March 2019
The notes on pages 173 to 222 form an integral part of the accounts.
Acc
ou
nts
Johnson Matthey
Annual Report and Accounts 2019 161
Share capital
£ million
Share premium
account £ million
Shares held in
ESOT £ million
Other reserves
(note 31) £ million
Retained earnings £ million
Total equity
£ million
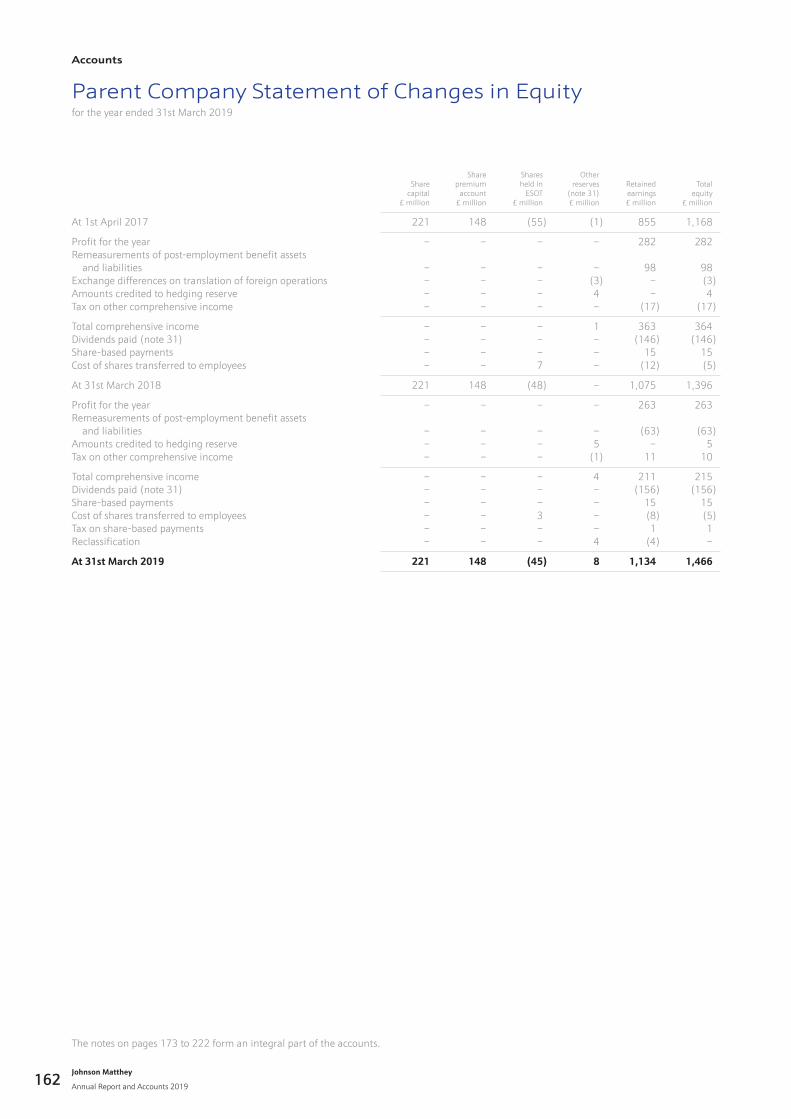
At 1st April 2017 221 148 (55) (1) 855 1,168
Profit for the year – – – – 282 282Remeasurements of post-employment benefit assets and liabilities – – – – 98 98Exchange differences on translation of foreign operations – – – (3) – (3)Amounts credited to hedging reserve – – – 4 – 4Tax on other comprehensive income – – – – (17) (17)
Total comprehensive income – – – 1 363 364Dividends paid (note 31) – – – – (146) (146)Share-based payments – – – – 15 15Cost of shares transferred to employees – – 7 – (12) (5)
At 31st March 2018 221 148 (48) – 1,075 1,396
Profit for the year – – – – 263 263Remeasurements of post-employment benefit assets and liabilities – – – – (63) (63)Amounts credited to hedging reserve – – – 5 – 5Tax on other comprehensive income – – – (1) 11 10
Total comprehensive income – – – 4 211 215Dividends paid (note 31) – – – – (156) (156)Share-based payments – – – – 15 15Cost of shares transferred to employees – – 3 – (8) (5)Tax on share-based payments – – – – 1 1Reclassification – – – 4 (4) –
At 31st March 2019 221 148 (45) 8 1,134 1,466
Parent Company Statement of Changes in Equityfor the year ended 31st March 2019
The notes on pages 173 to 222 form an integral part of the accounts.
Johnson Matthey
Annual Report and Accounts 2019
Accounts
162
Accounting policiesfor the year ended 31st March 2019
Basis of accounting and preparation – groupThe accounts are prepared on a going concern basis in accordance with International Financial Reporting Standards (IFRS) issued by the International Accounting Standards Board (IASB) and interpretations issued by the International Financial Reporting Interpretations Committee (IFRIC) or the Standing Interpretations Committee (SIC) as adopted by the European Union (EU).
The accounts are prepared on the historical cost basis, except for certain assets and liabilities which are measured at fair value as explained below.
The group accounts comprise the accounts of the parent company and its subsidiaries, including the employee share ownership trust, and include the group’s interest in joint ventures and associates. Entities the group controls are accounted for as subsidiaries. Entities that are joint ventures or associates are accounted for using the equity method of accounting. Transactions and balances between group companies are eliminated. No profit is recognised on transactions between group companies.
The results of businesses acquired or disposed of in the year are consolidated from or up to the effective date of acquisition or disposal, respectively. The net assets of businesses acquired are recognised in the consolidated accounts at their fair values at the date of acquisition.
Basis of accounting and preparation – parent companyThe accounts are prepared on a going concern basis in accordance with Financial Reporting Standard (FRS) 101, Reduced Disclosure Framework, issued in September 2015. The parent company applies the recognition, measurement and disclosure requirements of IFRS as adopted by the EU, but makes amendments where necessary to comply with the Companies Act 2006 and has set out below the FRS 101 disclosure exemptions available to the Company:
• the requirements of paragraphs 45(b) and 46 to 52 of IFRS 2, Share-based Payment;
• the requirements of paragraphs 62, B64(d), B64(e), B64(g), B64(h), B64(j) to B64(m), B64(n)(ii), B64(o)(ii), B64(p), B64(q)(ii), B66 and B67 of IFRS 3, Business Combinations;
• the requirements of paragraph 33(c) of IFRS 5, Non-current Assets Held for Sale and Discontinued Operations;
• the requirements of IFRS 7, Financial Instruments: Disclosures;
• the requirements of paragraphs 91 to 99 of IFRS 13, Fair Value Measurement;
• the requirements of the second sentence of paragraph 110 and paragraphs 113(a), 114, 115, 118, 119(a) to (c), 120 to 127 and 129 of IFRS 15, Revenue from Contracts with Customers;
• the requirement in paragraph 38 of IAS 1, Presentation of Financial Statements, to present comparative information in respect of: paragraph 79(a)(iv) of IAS 1; paragraph 73(e) of IAS 16, Property, Plant and Equipment; paragraph 118(e) of IAS 38, Intangible Assets; and paragraphs 76 and 79(d) of IAS 40, Investment Property;
• the requirements of paragraphs 10(d), 10(f), 16, 38A, 38B, 38C, 38D, 40A, 40B, 40C, 40D, 111 and 134 to 136 of IAS 1, Presentation of Financial Statements;
• the requirements of IAS 7, Statement of Cash Flows;
• the requirements of paragraphs 30 and 31 of IAS 8, Accounting Policies, Changes in Accounting Estimates and Errors;
• the requirements of paragraphs 17 and 18A of IAS 24, Related Party Disclosures;
• the requirements in IAS 24, Related Party Disclosures, to disclose related party transactions entered into between two or more members of a group, provided that any subsidiary which is a party to the transaction is wholly owned by such a member; and
• the requirements of paragraphs 130(f)(ii), 130(f)(iii), 134(d) to 134(f) and 135(c) to 135(e) of IAS 36, Impairment of Assets.
The parent company has not presented its own income statement, statement of total comprehensive income and related notes as permitted by Section 408(3) of the Companies Act 2006. Profit for the year is disclosed in the parent company balance sheet and statement of changes in equity.
In the parent company balance sheet, businesses acquired from other group companies are recognised at book value at the date of acquisition. The difference between the consideration paid and the book value of the net assets acquired is reflected in retained earnings.
Acc
ou
nts
Johnson Matthey
Annual Report and Accounts 2019 163
Significant accounting policiesThe group’s and parent company’s significant accounting policies are:
Foreign currencies
Foreign currency transactions are recorded in the functional currency of the relevant subsidiary, joint venture, associate or branch at the exchange rate at the date of the transaction. Foreign currency monetary assets and liabilities are retranslated into the relevant functional currency at the exchange rate at the balance sheet date.
Income statements and cash flows of overseas subsidiaries, joint ventures, associates and branches are translated into sterling at the average rates for the year. Balance sheets of overseas subsidiaries, joint ventures, associates and branches, including any fair value adjustments and related goodwill, are translated into sterling at the exchange rates at the balance sheet date.
Exchange differences arising on the translation of the net investment in overseas subsidiaries, joint ventures, associates and branches, less exchange differences arising on related foreign currency financial instruments which hedge the group’s net investment in these operations, are taken to other comprehensive income. On disposal of the net investment, the cumulative exchange difference is reclassified from equity to operating profit. The group has taken advantage of the exemption allowed in IFRS 1, First-time Adoption of International Reporting Standards, to deem the cumulative translation difference for all overseas subsidiaries and branches to be zero at 1st April 2004.
Other exchange differences are recognised in operating profit.
Revenue
Revenue represents income derived from contracts for the provision of goods and services by the parent company and its subsidiaries to customers in exchange for consideration in the ordinary course of the group’s activities.
Performance obligations
Upon approval by the parties to a contract, the contract is assessed to identify each promise to transfer either a distinct good or service or a series of distinct goods or services that are substantially the same and have the same pattern of transfer to the customer. Goods and services are distinct and accounted for as separate performance obligations in the contract if the customer can benefit from them either on their own or together with other resources that are readily available to the customer and they are separately identifiable in the contract.
The group typically sells licences to its intellectual property together with other goods and services and, since these licences are not generally distinct in the context of the contract, revenue recognition is considered at the level of the performance obligation of which the licence forms part. Revenue in respect of performance obligations containing bundles of goods and services in which a licence with a sales or usage-based royalty is the predominant item is recognised when sales or usage occur.
Transaction price
At the start of the contract, the total transaction price is estimated as the amount of consideration to which the group expects to be entitled in exchange for transferring the promised goods and services to the customer, excluding sales taxes. Variable consideration, such as trade discounts, is included based on the expected value or most likely amount only to the extent that it is highly probable that there will not be a reversal in the amount of cumulative revenue recognised. The transaction price does not include estimates of consideration resulting from contract modifications until they have been approved by the parties to the contract. The total transaction price is allocated to the performance obligations identified in the contract in proportion to their relative stand-alone selling prices. Many of the group’s and parent company’s products and services are bespoke in nature and, therefore, stand-alone selling prices are estimated based on cost plus margin or by reference to market data for similar products and services.
Accounting policies continuedfor the year ended 31st March 2019
Johnson Matthey
Annual Report and Accounts 2019
Accounts
164
Significant accounting policies (continued)
Revenue (continued)
Revenue recognition
Revenue is recognised as performance obligations are satisfied as control of the goods and services is transferred to the customer.
For each performance obligation within a contract, the group and parent company determine whether it is satisfied over time or at a point in time. Performance obligations are satisfied over time if one of the following criteria is satisfied:
• the customer simultaneously receives and consumes the benefits provided by the group’s and parent company’s performance as they perform;
• the group’s and parent company’s performance creates or enhances an asset that the customer controls as the asset is created or enhanced;
• the group’s and parent company’s performance does not create an asset with an alternative use to the group and parent company and they have an enforceable right to payment for performance completed to date.
If the over time criteria are met, revenue is recognised using an input method based on costs incurred to date as a proportion of estimated total contract costs. When it is probable that total contract costs will exceed total contract revenue, the expected loss is recognised immediately as an expense.
The majority of the metal processed by the group’s and parent company’s refining businesses is owned by customers and, therefore, revenue is recognised over time on the basis that the group and parent company are enhancing an asset controlled by the customer.
If the over time criteria for revenue recognition are not met, revenue is recognised at the point in time that control is transferred to the customer, which is usually when legal title passes to the customer and the business has the right to payment, for example, when the goods are despatched or delivered in line with the International Chamber of Commerce’s International Commercial Terms (Incoterms®) as detailed in the relevant contract or on notification that the goods have been used when they are consignment products located at customers’ premises. Most of the group’s and parent company’s contracts satisfy the point in time criteria.
In the event that the group and parent company enter into bill-and-hold transactions at the specific request of customers, revenue is recognised when the goods are ready for transfer to the customer and when the group and parent company are no longer capable of directing those goods to another use.
Revenue includes sales of precious metal to customers and the precious metal content of products sold to customers.
Linked contracts under which the group and parent company sell or buy precious metal and commit to repurchase or sell the metal in the future are accounted for as finance transactions and no revenue is recognised in respect of the sale leg.
No revenue is recognised by the group or parent company in respect of non-monetary exchanges of precious metal on the basis that the counterparties are in the same line of business.
Consideration payable to customers
Consideration payable to customers in advance of the recognition of revenue in respect of the goods and services to which it relates is capitalised and recognised as a deduction to the revenue recognised upon transfer of the goods and services to the customer.
Costs to fulfil a contract
Contract fulfilment costs in respect of over time contracts are expensed as incurred. Contract fulfilment costs in respect of point in time contracts are accounted for under IAS 2, Inventories.
Contract receivables
Contract receivables represent amounts for which the group and parent company have an unconditional right to consideration in respect of unbilled revenue recognised at the balance sheet date.
Contract liabilities
Contract liabilities represent the obligation to transfer goods or services to a customer for which consideration has been received, or consideration is due, from the customer.
Accounting policies continuedfor the year ended 31st March 2019
Acc
ou
nts
Johnson Matthey
Annual Report and Accounts 2019 165
Significant accounting policies (continued)
Finance costs and finance income
Finance costs that are directly attributable to the construction of an asset that necessarily takes a substantial period of time to get ready for its intended use are capitalised as part of the cost of that asset. Other finance costs and finance income are recognised in the income statement in the year incurred.
Grants
Grants related to assets are included in deferred income and released to the income statement in equal instalments over the expected useful lives of the related assets. Grants related to income are deducted in reporting the related expense.
Research and development
Research expenditure is charged to the income statement in the year incurred. Development expenditure is charged to the income statement in the year incurred unless it meets the recognition criteria for capitalisation. When the recognition criteria have been met, any further development expenditure is capitalised as an intangible asset.
Property, plant and equipment
Property, plant and equipment is stated at cost less accumulated depreciation and any provisions for impairment. Depreciation is provided at rates calculated to write-off the cost less estimated residual value of each asset over its useful life. Certain freehold buildings and plant and equipment are depreciated using the units of production method as this more closely reflects their expected consumption. All other assets are depreciated using the straight-line method. The useful lives vary according to the class of the asset, but are typically:
• leasehold property – 30 years (or the life of the lease if shorter);
• freehold buildings – 30 years; and
• plant and equipment – 4 to 10 years.
Freehold land is not depreciated.
Goodwill and other intangible assets
Goodwill arises on the acquisition of a business when the fair value of the consideration exceeds the fair value attributed to the net assets acquired (including contingent liabilities). It is subject to annual impairment reviews. Acquisition-related costs are charged to the income statement as incurred. The group and parent company have taken advantage of the exemption allowed under IFRS 1 and, therefore, goodwill arising on acquisitions made before 1st April 2004 is included at the carrying amount at that date less any subsequent impairments.
Other intangible assets are stated at cost less accumulated amortisation and any provisions for impairment. Customer contracts are amortised when the relevant income stream occurs. All other intangible assets are amortised by using the straight-line method over the useful lives from the time they are first available for use. The estimated useful lives vary according to the specific asset, but are typically:
• customer contracts and relationships – 1 to 15 years;
• capitalised computer software – 3 to 10 years;
• patents, trademarks and licences – 3 to 20 years;
• acquired research and technology – 4 to 10 years; and
• capitalised development currently being amortised – 3 to 8 years.
Intangible assets which are not yet being amortised are subject to annual impairment reviews.
Accounting policies continuedfor the year ended 31st March 2019
Johnson Matthey
Annual Report and Accounts 2019
Accounts
166
Significant accounting policies (continued)
Investments in subsidiaries
Investments in subsidiaries are stated in the parent company’s balance sheet at cost less any provisions for impairment. If a distribution is received from a subsidiary, the investment in that subsidiary is assessed for an indication of impairment.
Leases
Leases are classified as finance leases whenever they transfer substantially all the risks and rewards of ownership to the group. The assets are included in property, plant and equipment and the capital elements of the leasing commitments are shown as obligations under finance leases. The assets are depreciated on a basis consistent with similar owned assets or the lease term if shorter. The interest element of the lease rental is included in the income statement.
The group leases, rather than purchases, precious metals to fund temporary peaks in metal requirements provided market conditions allow. These leases are from banks for specified periods (typically a few months) and the group pays a fee which is expensed on a straight-line basis over the lease term in finance costs. The group holds sufficient precious metal inventories to meet all the obligations under these lease arrangements as they fall due.
All other leases are classified as operating leases and the lease costs are expensed on a straight-line basis over the lease term in operating profit.
Precious metal inventories
Inventories of gold, silver and platinum group metals are valued according to the source from which the metal is obtained. Metal which has been purchased and committed to future sales to customers is valued at the price at which it is contractually committed. Other precious metal inventories owned by the group, which are unhedged, are valued at the lower of cost and net realisable value using the weighted average cost formula.
Other inventories
Non-precious metal inventories are valued at the lower of cost, including attributable overheads, and net realisable value. Except where costs are specifically identified, the first-in, first-out cost formula is used to value inventories.
Cash and cash equivalents
Cash and deposits comprise cash at bank and in hand and short-term deposits with a maturity date of three months or less from the date of acquisition. Money market funds comprise investments in funds that are subject to an insignificant risk of changes in fair value. The group and parent company routinely use short-term bank overdraft facilities, which are repayable on demand, as an integral part of their cash management policies and, therefore, cash and cash equivalents include cash and deposits, money market funds and bank overdrafts. Offset arrangements across group businesses have been applied to arrive at the net cash and overdraft figures.
Financial instruments – accounting policies applied since 1st April 2018
Investments and other financial assets
The group and parent company classify their financial assets in the following measurement categories:
• those measured at fair value either through other comprehensive income or through profit or loss; and
• those measured at amortised cost.
At initial recognition, the group and parent company measure financial assets at fair value plus, in the case of financial assets not measured at fair value through profit or loss, transaction costs that are directly attributable to their acquisition.
The group and parent company subsequently measure equity investments at fair value and have elected to present fair value gains and losses on equity investments in other comprehensive income. There is, therefore, no subsequent reclassification of cumulative fair value gains and losses to profit or loss following disposal of the investments.
The group and parent company subsequently measure trade and other receivables and contract receivables at amortised cost, with the exception of trade receivables that have been designated as at fair value through other comprehensive income because the group has certain operations with business models to hold trade receivables for collection or sale. All other financial assets, including short-term receivables, are measured at amortised cost less any impairment provision.
For trade and contract receivables, the group and parent company apply the simplified approach permitted by IFRS 9, Financial Instruments, which requires expected lifetime losses to be recognised from initial recognition.
Accounting policies continuedfor the year ended 31st March 2019
Acc
ou
nts
Johnson Matthey
Annual Report and Accounts 2019 167
Significant accounting policies (continued)
Financial instruments – accounting policies applied since 1st April 2018 (continued)
Derivative financial instruments
The group and parent company use derivative financial instruments, in particular forward currency contracts, currency swaps and interest rate swaps to manage the financial risks associated with their underlying business activities and the financing of those activities. The group and parent company do not undertake any speculative trading activity in derivative financial instruments.
Derivative financial instruments are measured at their fair value. Derivative financial instruments may be designated at inception as fair value hedges, cash flow hedges or net investment hedges if appropriate. For currency swaps designated as instruments in cash flow or net investment hedging relationships, the impact from currency basis spreads is included in the hedge relationship and may be a source of ineffectiveness recognised in the income statement. Derivative financial instruments which are not designated as hedging instruments are classified as at fair value through profit or loss, but are used to manage financial risk. Changes in the fair value of any derivative financial instruments that are not designated as, or are not determined to be, effective hedges are recognised immediately in the income statement. The vast majority of forward precious metal price contracts are entered into and held for the receipt or delivery of precious metal and, therefore, are not recorded at fair value.
Cash flow hedges
Changes in the fair value of derivative financial instruments designated as cash flow hedges are recognised in other comprehensive income to the extent that the hedges are effective. Ineffective portions are recognised in the income statement immediately. If the hedged item results in the recognition of a non-financial asset or liability, the amount previously recognised in other comprehensive income is transferred out of equity and included in the initial carrying amount of the asset or liability. Otherwise, the amount previously recognised in other comprehensive income is transferred to the income statement in the same period that the hedged item is recognised in the income statement. If the hedging instrument expires or is sold, terminated or exercised, the hedge no longer meets the criteria for hedge accounting or the designation is revoked, amounts previously recognised in other comprehensive income remain in equity until the forecast transaction occurs. If a forecast transaction is no longer expected to occur, the amounts previously recognised in other comprehensive income are transferred to the income statement. If a forward precious metal price contract will be settled net in cash, it is designated and accounted for as a cash flow hedge.
Fair value hedges
Changes in the fair value of derivative financial instruments designated as fair value hedges are recognised in the income statement, together with the related changes in the fair value of the hedged asset or liability. Fair value hedge accounting is discontinued if the hedging instrument expires or is sold, terminated or exercised, the hedge no longer meets the criteria for hedge accounting or the designation is revoked.
Net investment hedges
For hedges of net investments in foreign operations, the effective portion of the gain or loss on the hedging instrument is recognised in other comprehensive income, while the ineffective portion is recognised in the income statement. Amounts taken to other comprehensive income are reclassified from equity to the income statement when the foreign operations are sold or liquidated.
Financial liabilities
Borrowings are measured at amortised cost unless they are designated as being fair value hedged, in which case they are remeasured for the fair value changes in respect of the hedged risk with these changes recognised in the income statement. All other financial liabilities, including short-term payables, are measured at amortised cost.
Precious metal sale and repurchase agreements
The group and parent company undertake linked contracts to sell or buy precious metal and commit to repurchase or sell the metal in the future. An asset representing the metal which the group and parent company have committed to sell or a liability representing the obligation to repurchase the metal are recognised in trade and other receivables or trade and other payables, respectively.
Accounting policies continuedfor the year ended 31st March 2019
Johnson Matthey
Annual Report and Accounts 2019
Accounts
168
Significant accounting policies (continued)
Financial instruments – accounting policies applied until 31st March 2018
Derivative financial instruments
The group and parent company use derivative financial instruments, in particular forward currency contracts and currency swaps, to manage the financial risks associated with their underlying business activities and the financing of those activities. The group and parent company do not undertake any speculative trading activity in derivative financial instruments.
Derivative financial instruments are measured at their fair value. Derivative financial instruments may be designated at inception as fair value hedges, cash flow hedges or net investment hedges if appropriate. Derivative financial instruments which are not designated as hedging instruments are classified as held for trading, but are used to manage financial risk.
The vast majority of forward precious metal price contracts are entered into and held for the receipt or delivery of precious metal and, therefore, are not recorded at fair value. If a forward precious metal price contract will be settled net in cash then it is designated and accounted for as a cash flow hedge.
Changes in the fair value of any derivative financial instruments that are not designated as, or are not determined to be, effective hedges are recognised immediately in the income statement.
Changes in the fair value of derivative financial instruments designated as fair value hedges are recognised in the income statement, together with the related changes in the fair value of the hedged asset or liability. Fair value hedge accounting is discontinued if the hedging instrument expires or is sold, terminated or exercised, the hedge no longer meets the criteria for hedge accounting or the designation is revoked.
Changes in the fair value of derivative financial instruments designated as cash flow hedges are recognised in other comprehensive income to the extent that the hedges are effective. Ineffective portions are recognised in the income statement immediately. If the hedged item results in the recognition of a non-financial asset or liability, the amount previously recognised in other comprehensive income is transferred out of equity and included in the initial carrying amount of the asset or liability. Otherwise, the amount previously recognised in other comprehensive income is transferred to the income statement in the same period that the hedged item is recognised in the income statement. If the hedging instrument expires or is sold, terminated or exercised, the hedge no longer meets the criteria for hedge accounting or the designation is revoked, amounts previously recognised in other comprehensive income remain in equity until the forecast transaction occurs. If a forecast transaction is no longer expected to occur, the amounts previously recognised in other comprehensive income are transferred to the income statement.
For hedges of net investments in foreign operations, the effective portion of the gain or loss on the hedging instrument is recognised in other comprehensive income, while the ineffective portion is recognised in the income statement. Amounts taken to other comprehensive income are reclassified from equity to the income statement when the foreign operations are sold or liquidated.
Other financial instruments
All other financial instruments are initially recognised at fair value plus transaction costs. Subsequent measurement is as follows:
• Borrowings are measured at amortised cost unless they are designated as being fair value hedged, in which case they are remeasured for the fair value changes in respect of the hedged risk with these changes recognised in the income statement.
• Available-for-sale investments which are investments in equity instruments that have a quoted market price in an active market are fair valued at that price with the gain or loss recognised in other comprehensive income. Investments in equity instruments that do not have a quoted market price in an active market are valued at fair value if it can be measured reliably with the gain or loss recognised in other comprehensive income. If the fair value cannot be measured reliably, they are measured at cost.
• Other available-for-sale investments are measured at fair value with interest calculated using the effective interest method recognised in finance income and the remaining gain or loss recognised in other comprehensive income until the investment is derecognised. At that time, the cumulative gain or loss recognised in other comprehensive income will be transferred to the income statement.
• All other financial assets and liabilities, including short-term receivables and payables, are measured at amortised cost less any impairment provision.
Taxation
Current and deferred tax are recognised in the income statement, except when they relate to items recognised directly in equity, in which case the related tax is also recognised in equity.
Current tax is the amount of income tax expected to be paid in respect of taxable profits using the tax rates that have been enacted or substantively enacted at the balance sheet date.
Deferred tax is provided in full, using the liability method, on temporary differences arising between the tax bases of assets and liabilities and their carrying amounts in the balance sheet. It is provided using the tax rates that are expected to apply in the period when the asset or liability is settled, based on tax rates that have been enacted or substantively enacted at the balance sheet date.
Deferred tax assets are recognised to the extent that it is probable that future taxable profits will be available against which the temporary differences can be utilised. No deferred tax asset or liability is recognised in respect of temporary differences associated with investments in subsidiaries and branches where the group is able to control the timing of the reversal of the temporary difference and it is probable that the temporary difference will not reverse in the foreseeable future.
Accounting policies continuedfor the year ended 31st March 2019
Acc
ou
nts
Johnson Matthey
Annual Report and Accounts 2019 169
Significant accounting policies (continued)
Provisions and contingencies
Provisions are recognised when the group has a present obligation as a result of a past event and a reliable estimate can be made of a probable adverse outcome, for example warranties, environmental claims and restructuring. Otherwise, material contingent liabilities are disclosed unless the probability of the transfer of economic benefits is remote. Contingent assets are only disclosed if an inflow of economic benefits is probable.
The parent company considers financial guarantees of its subsidiaries’ borrowings and precious metal leases to be insurance contracts.
Share-based payments and employee share ownership trust (ESOT)
The fair value of shares awarded to employees under the performance share plan, restricted share plan, long term incentive plan and deferred bonus plan is calculated by adjusting the share price on the date of allocation for the present value of the expected dividends that will not be received. The resulting cost is charged to the income statement over the relevant performance periods, adjusted to reflect actual and expected levels of vesting where appropriate.
The group and parent company provide finance to the ESOT to purchase company shares in the open market. Costs of running the ESOT are charged to the income statement. The cost of shares held by the ESOT is deducted in arriving at equity until they vest unconditionally with employees.
Post-employment benefits
The costs of defined contribution plans are charged to the income statement as they fall due.
For defined benefit plans, the group and parent company recognise the net assets or liabilities of the plans in their balance sheets. Assets are measured at their fair value at the balance sheet date. Liabilities are measured at present value using the projected unit credit method and a discount rate reflecting yields on high quality corporate bonds. The changes in plan assets and liabilities, based on actuarial advice, are recognised as follows:
• The current service cost is deducted in arriving at operating profit.
• The net interest cost, based on the discount rate at the beginning of the year, contributions paid in and the present value of the net defined benefit liabilities during the year, is included in finance costs.
• Past service costs and curtailment gains and losses are recognised in operating profit at the earlier of when the plan amendment or curtailment occurs and when any related restructuring costs or termination benefits are recognised.
• Gains or losses arising from settlements are included in operating profit when the settlement occurs.
• Remeasurements, representing returns on plan assets, excluding amounts included in interest, and actuarial gains and losses arising from changes in financial and demographic assumptions, are recognised in other comprehensive income.
Sources of estimation uncertaintyDetermining the carrying amounts of certain assets and liabilities at the balance sheet date requires estimation of the effects of uncertain future events. In the event that actual outcomes differ from those estimated, there may be an adjustment to the carrying amounts of those assets and liabilities within the next financial year. The significant risks of material adjustment to the group’s and parent company’s financial position during the year ending 31st March 2020 relate to the valuation of the liabilities of the defined benefit pension plans and tax provisions. The group and parent company have considered other estimates that, whilst not deemed to represent a significant risk of material adjustment to the group’s and parent company’s financial position during the year ending 31st March 2020, represent important accounting estimates.
Post-employment benefits
The group’s and parent company’s defined benefit plans are assessed annually by qualified independent actuaries. The estimate of the liabilities of the plans is based on a number of actuarial assumptions.
There is a range of possible values for each actuarial assumption and the point within that range is estimated to most appropriately reflect the group’s and parent company’s circumstances. Small changes in these assumptions can have a significant impact on the estimate of the liabilities of the plans. A description of those discount rate and inflation assumptions, together with sensitivity analysis, is set out in note 30 to the group and parent company accounts.
Accounting policies continuedfor the year ended 31st March 2019
Johnson Matthey
Annual Report and Accounts 2019
Accounts
170
Accounting policies continuedfor the year ended 31st March 2019
Sources of estimation uncertainty (continued)
Tax provisions
Tax provisions are determined based on the tax laws and regulations that apply in each of the jurisdictions in which the group operates. Tax provisions are recognised where the impact of those laws and regulations is unclear and it is probable that there will be a tax adjustment representing a future outflow of funds to a tax authority or a consequent adjustment to the carrying value of a tax asset.
Provisions are measured using the best estimate of the most likely amount, being the most likely amount in a range of possible outcomes. The resolution of tax positions taken by the group can take a considerable period of time to conclude and, in some cases, it is difficult to predict the outcome. Group current income tax liabilities at 31st March 2019 of £130 million (2018: £149 million) include tax provisions of £102 million (2018: £86 million) and the estimation of the range of possible outcomes is an increase in those liabilities by £60 million (2018: £61 million) to a decrease of £61 million (2018: £50 million). The estimates made reflect where the group: faces routine tax audits or is in ongoing disputes with tax authorities; has identified potential tax exposures relating to transfer pricing; or is contesting the tax deductibility of certain business costs.
Goodwill and other intangible assets
The group and parent company have significant intangible assets from both business acquisitions and investments in new products and technologies. Some of those acquisitions and investments are at an early stage of commercial development and, therefore, carry a greater risk that they will not be commercially viable. Goodwill and intangible assets not yet ready for use are not amortised, but are subject to annual impairment reviews. Other intangible assets are amortised from the time they are first ready for use and are assessed for impairment when there is a triggering event that provides evidence that they are impaired.
The impairment reviews require the use of estimates of future profit and cash generation based on financial budgets and plans approved by management, generally covering a three-year period, and the pre-tax discount rates used in discounting projected cash flows.
Refining process
The group’s and parent company’s refining businesses process significant quantities of precious metal and there are uncertainties regarding the actual amount of metal in the refining system at any one time. The group’s refining businesses process over four million ounces of platinum group metals per annum with a market value of around £3.7 billion. The majority of metal processed is owned by customers and the group and parent company must return pre-agreed quantities of refined metal based on assays of starting materials and other contractual arrangements, such as the timing of the return of metal. The group and parent company calculate the profits or losses of their refining operations based on estimates, including the extent to which process losses are expected during refining. The risk of process losses or gains depends on the nature of the starting material being refined, the specific refining processes applied, the efficiency of those processes and the contractual arrangements.
Stocktakes are performed to determine the volume and value of metal within the refining system compared with the calculated estimates, with the variance being a profit or a loss. Stocktakes are, therefore, a key control in the assessment of the accuracy of the profit or loss of refining operations. Whilst refining is a complex, large-scale industrial process, the group and parent company have appropriate processes and controls over the movement of material in their refineries.
Judgements made in applying accounting policiesThe group and parent company use precious metal owned by customers in their production processes. It has been determined that this metal is not controlled by the group or parent company and, therefore, it is not recognised on the balance sheet.
The group and parent company manage precious metal inventories by entering into physically settled forward sales and purchases of metal positions in line with a well established hedging policy. The own use exemption has been adopted for these transactions and, therefore, the group and parent company do not fair value such physically settled contracts.
In the course of preparing the accounts, no other judgements have been made in the process of applying the group’s and parent company’s accounting policies, other than those involving estimations, that have had a significant effect on the amounts recognised in the accounts.
Acc
ou
nts
Johnson Matthey
Annual Report and Accounts 2019 171
Accounting policies continuedfor the year ended 31st March 2019
Changes in accounting policiesStandards effective from 1st April 2018
IFRS 9, Financial Instruments, and IFRS 15, Revenue from Contracts with Customers, became effective from 1st April 2018. The impact of adoption is set out in note 39.
Standards effective from 1st April 2019
IFRS 16, Leases
IFRS 16 is effective from 1st April 2019. Whilst lessor accounting is similar to IAS 17, lessee accounting is significantly different. Under IFRS 16, the group and parent company will recognise on the balance sheet a right-of-use asset and a lease liability for future lease payments in respect of all leases unless the underlying assets are of low value or the lease term is 12 months or less. In the income statement, rental expense on the impacted leases will be replaced with depreciation on the right-of-use asset and interest expense on the lease liability. The new standard will primarily impact the accounting for the group’s and parent company’s operating leases as their activities as a lessor are not significant.
The group and parent company will apply the simplified transition approach and will not restate comparative amounts for the year ended 31st March 2019. All right-of-use assets will be measured at the amount of the lease liability on adoption (adjusted for any prepaid or accrued lease expenses).
As at 31st March 2019, the group has non-cancellable operating lease commitments of £76 million (see note 35), of which approximately £2 million relates to short-term leases which will be recognised in the income statement on a straight-line basis under IFRS 16.
For the remaining lease commitments, the group expects to recognise right-of-use assets and lease liabilities of approximately £75 million on 1st April 2019. The discounted lease liabilities include cancellable lease term extension options which are not included in the operating lease commitments note, but are expected to be exercised. The group estimates that profit before tax will be reduced by approximately £1 million in the year ending 31st March 2020 as a result of adopting IFRS 16.
It is unclear whether contracts entered into by the group and parent company to lease metal from third parties constitute leases as defined by IFRS 16. Specifically, it is not clear whether the leased metal represents a defined asset given its fungible nature. However, on the basis that there is no alternative accounting standard applicable to these transactions, the group and parent company will continue to recognise the expense in the income statement on a straight-line basis, with no recognition on the balance sheet.
IFRIC 23, Uncertainty over Income Tax Treatments
IFRIC 23 is effective from 1st April 2019. The interpretation clarifies how to recognise and measure current and deferred income tax assets and liabilities where there is uncertainty over a tax treatment. The group does not expect IFRIC 23 to have a material impact on its reported results or net assets.
The group does not consider that any other standards or interpretations issued, but not yet effective, will have a significant impact on its reported results or net assets.
Non-GAAP measures
The group uses various measures to manage its business which are not defined by generally accepted accounting principles (GAAP). The group’s management believes these measures provide valuable additional information to users of the accounts in understanding the group’s performance. The principal non-GAAP measures are as follows:
• Sales – note 1
• Underlying operating profit – note 1
• Working capital days (excluding precious metals) – note 22
• Net debt – note 24
• Return on invested capital (ROIC) – note 31
• Net debt (including post tax pension deficits) to underlying EBITDA (Earnings Before Interest, Tax, Depreciation and Amortisation) – note 31
Johnson Matthey
Annual Report and Accounts 2019
Accounts
172
Notes on the accountsfor the year ended 31st March 2019
1 Segmental informationThe group has four operating sectors, Clean Air, Efficient Natural Resources, Health and New Markets, and a corporate headquarters that retains certain costs that have not been allocated to the operating sectors. The Group Management Committee (the chief operating decision maker as defined by IFRS 8, Operating Segments) monitors the results of these operating sectors to assess performance and make decisions about the allocation of resources. Each operating sector is represented by a member of the Group Management Committee. These operating sectors represent the group’s reportable segments. Their principal activities are described on pages 78 to 85. The performance of the operating sectors is assessed on sales and underlying operating profit.
Sales
Definition: Revenue excluding sales of precious metals to customers and the precious metal content of products sold to customers.
Purpose: The group believes that sales is a better measure of the growth of the group than revenue. Total revenue can be heavily distorted by year on year fluctuations in the market prices of precious metals and, in many cases, the value of precious metals is passed directly on to customers.
Underlying operating profit
Definition: Operating profit excluding profit or loss on disposal of businesses (note 5), gain or loss on significant legal proceedings, together with associated legal costs (note 6), amortisation of acquired intangibles (note 7) and major impairment and restructuring charges (note 8).
Purpose: The group believes that underlying operating profit provides a better guide to the underlying performance of the group.
Sales between segments are made at market prices, taking into account the volumes involved.
Revenue, sales and underlying operating profit by segment
The group did not receive revenue from any individual external customer which represents more than 10% of the group’s total revenue from external customers during the year ended 31st March 2019. Following the restatement of the prior year comparative for revenue (see note 39), no individual customer represented more than 10% of revenue during the year ended 31st March 2018.
Year ended 31st March 2019
Clean Air£ million
Efficient Natural
Resources£ million
Health£ million
New Markets£ million
Corporate£ million
Eliminations£ million
Total£ million
Revenue from external customers 4,948 5,074 259 464 – – 10,745Inter-segment revenue 210 2,608 – 9 – (2,827) –
Revenue 5,158 7,682 259 473 – (2,827) 10,745
External sales 2,719 880 256 359 – – 4,214Inter-segment sales 1 111 1 3 – (116) –
Sales 2,720 991 257 362 – (116) 4,214
Underlying operating profit (note 4) 393 181 43 2 (53) – 566
Year ended 31st March 2018
Clean Air
£ million
Efficient Natural
ResourcesRestated1
£ million
Health
£ million
New Markets
£ million
Corporate
£ million
Eliminations
£ million
TotalRestated1
£ million
Revenue from external customers 4,248 5,389 252 385 – – 10,274Inter-segment revenue 260 2,342 – 18 – (2,620) –
Revenue 4,508 7,731 252 403 – (2,620) 10,274
External sales 2,454 845 247 300 – – 3,846Inter-segment sales – 111 – 12 – (123) –
Sales 2,454 956 247 312 – (123) 3,846
Underlying operating profit (note 4) 349 158 44 17 (43) – 525
1 See note 39.
Acc
ou
nts
Johnson Matthey
Annual Report and Accounts 2019 173
Notes on the accounts continuedfor the year ended 31st March 2019
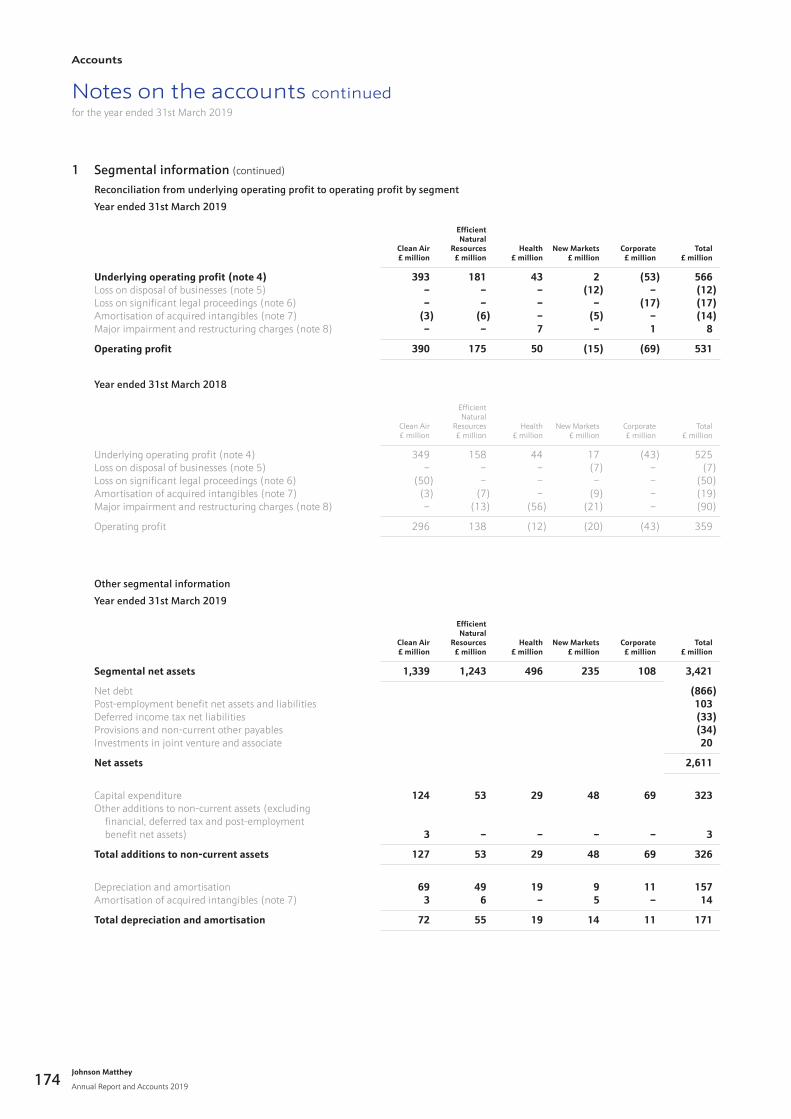
1 Segmental information (continued)
Reconciliation from underlying operating profit to operating profit by segment
Year ended 31st March 2019
Clean Air£ million
Efficient Natural
Resources£ million
Health£ million
New Markets£ million
Corporate£ million
Total£ million
Underlying operating profit (note 4) 393 181 43 2 (53) 566Loss on disposal of businesses (note 5) – – – (12) – (12)Loss on significant legal proceedings (note 6) – – – – (17) (17)Amortisation of acquired intangibles (note 7) (3) (6) – (5) – (14)Major impairment and restructuring charges (note 8) – – 7 – 1 8
Operating profit 390 175 50 (15) (69) 531
Year ended 31st March 2018
Clean Air£ million
Efficient Natural
Resources£ million
Health£ million
New Markets£ million
Corporate£ million
Total£ million
Underlying operating profit (note 4) 349 158 44 17 (43) 525Loss on disposal of businesses (note 5) – – – (7) – (7)Loss on significant legal proceedings (note 6) (50) – – – – (50)Amortisation of acquired intangibles (note 7) (3) (7) – (9) – (19)Major impairment and restructuring charges (note 8) – (13) (56) (21) – (90)
Operating profit 296 138 (12) (20) (43) 359
Other segmental information
Year ended 31st March 2019
Clean Air£ million
Efficient Natural
Resources£ million
Health£ million
New Markets£ million
Corporate£ million
Total£ million
Segmental net assets 1,339 1,243 496 235 108 3,421
Net debt (866)Post-employment benefit net assets and liabilities 103Deferred income tax net liabilities (33)Provisions and non-current other payables (34)Investments in joint venture and associate 20
Net assets 2,611
Capital expenditure 124 53 29 48 69 323Other additions to non-current assets (excluding financial, deferred tax and post-employment benefit net assets) 3 – – – – 3
Total additions to non-current assets 127 53 29 48 69 326
Depreciation and amortisation 69 49 19 9 11 157Amortisation of acquired intangibles (note 7) 3 6 – 5 – 14
Total depreciation and amortisation 72 55 19 14 11 171
Johnson Matthey
Annual Report and Accounts 2019
Accounts
174
Notes on the accounts continuedfor the year ended 31st March 2019
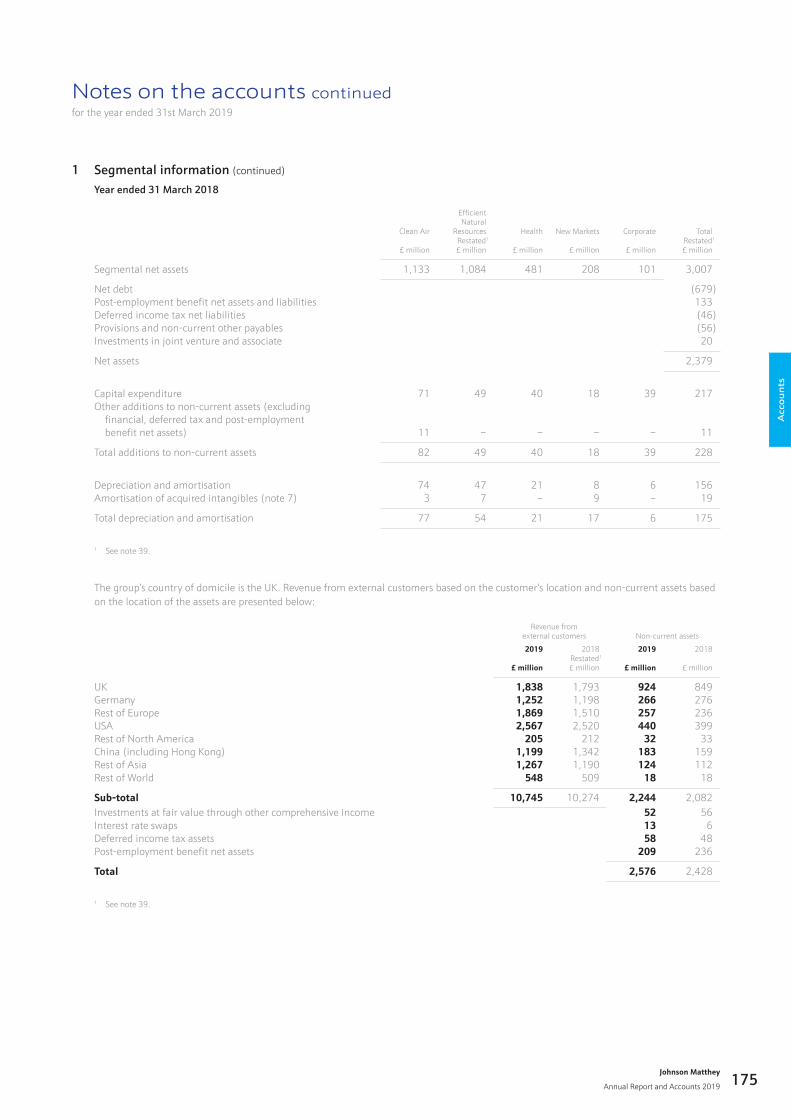
1 Segmental information (continued)
Year ended 31 March 2018
Clean Air
£ million
Efficient Natural
ResourcesRestated1
£ million
Health
£ million
New Markets
£ million
Corporate
£ million
TotalRestated1
£ million
Segmental net assets 1,133 1,084 481 208 101 3,007
Net debt (679)Post-employment benefit net assets and liabilities 133Deferred income tax net liabilities (46)Provisions and non-current other payables (56)Investments in joint venture and associate 20
Net assets 2,379
Capital expenditure 71 49 40 18 39 217Other additions to non-current assets (excluding financial, deferred tax and post-employment benefit net assets) 11 – – – – 11
Total additions to non-current assets 82 49 40 18 39 228
Depreciation and amortisation 74 47 21 8 6 156Amortisation of acquired intangibles (note 7) 3 7 – 9 – 19
Total depreciation and amortisation 77 54 21 17 6 175
1 See note 39.
The group’s country of domicile is the UK. Revenue from external customers based on the customer’s location and non-current assets based on the location of the assets are presented below:
Revenue from external customers Non-current assets
2019
£ million
2018Restated1
£ million
2019
£ million
2018
£ million
UK 1,838 1,793 924 849Germany 1,252 1,198 266 276Rest of Europe 1,869 1,510 257 236USA 2,567 2,520 440 399Rest of North America 205 212 32 33China (including Hong Kong) 1,199 1,342 183 159Rest of Asia 1,267 1,190 124 112Rest of World 548 509 18 18
Sub-total 10,745 10,274 2,244 2,082Investments at fair value through other comprehensive income 52 56Interest rate swaps 13 6Deferred income tax assets 58 48Post-employment benefit net assets 209 236
Total 2,576 2,428
1 See note 39.
Acc
ou
nts
Johnson Matthey
Annual Report and Accounts 2019 175
Notes on the accounts continuedfor the year ended 31st March 2019
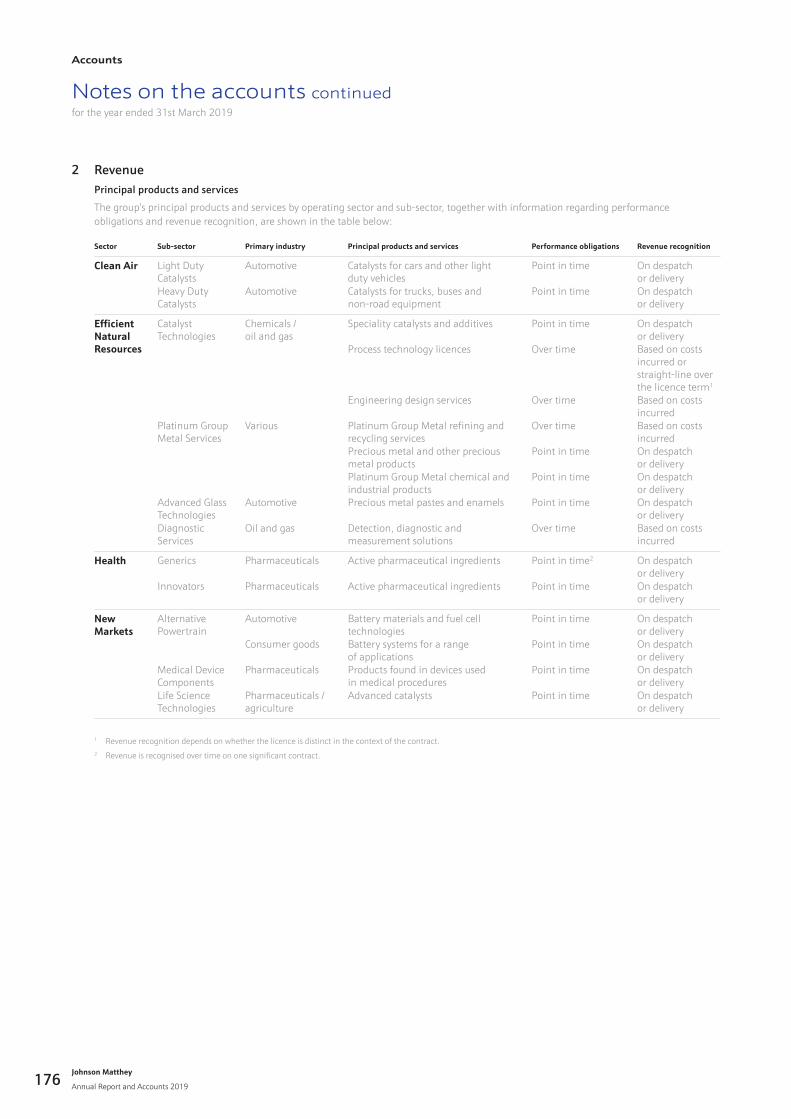
2 Revenue Principal products and services
The group’s principal products and services by operating sector and sub-sector, together with information regarding performance obligations and revenue recognition, are shown in the table below:
Sector Sub-sector Primary industry Principal products and services Performance obligations Revenue recognition
Clean Air Light Duty Catalysts
Automotive Catalysts for cars and other light duty vehicles
Point in time On despatch or delivery
Heavy Duty Catalysts
Automotive Catalysts for trucks, buses and non-road equipment
Point in time On despatch or delivery
Efficient Natural Resources
Catalyst Technologies
Chemicals / oil and gas
Speciality catalysts and additives Point in time On despatch or delivery
Process technology licences Over time Based on costs incurred or straight-line over the licence term1
Engineering design services Over time Based on costs incurred
Platinum Group Metal Services
Various Platinum Group Metal refining and recycling services
Over time Based on costs incurred
Precious metal and other precious metal products
Point in time On despatch or delivery
Platinum Group Metal chemical and industrial products
Point in time On despatch or delivery
Advanced Glass Technologies
Automotive Precious metal pastes and enamels Point in time On despatch or delivery
Diagnostic Services
Oil and gas Detection, diagnostic and measurement solutions
Over time Based on costs incurred
Health Generics Pharmaceuticals Active pharmaceutical ingredients Point in time2 On despatch or delivery
Innovators Pharmaceuticals Active pharmaceutical ingredients Point in time On despatch or delivery
New Markets
Alternative Powertrain
Automotive Battery materials and fuel cell technologies
Point in time On despatch or delivery
Consumer goods Battery systems for a range of applications
Point in time On despatch or delivery
Medical Device Components
Pharmaceuticals Products found in devices used in medical procedures
Point in time On despatch or delivery
Life Science Technologies
Pharmaceuticals / agriculture
Advanced catalysts Point in time On despatch or delivery
1 Revenue recognition depends on whether the licence is distinct in the context of the contract.2 Revenue is recognised over time on one significant contract.
Johnson Matthey
Annual Report and Accounts 2019
Accounts
176
Notes on the accounts continuedfor the year ended 31st March 2019
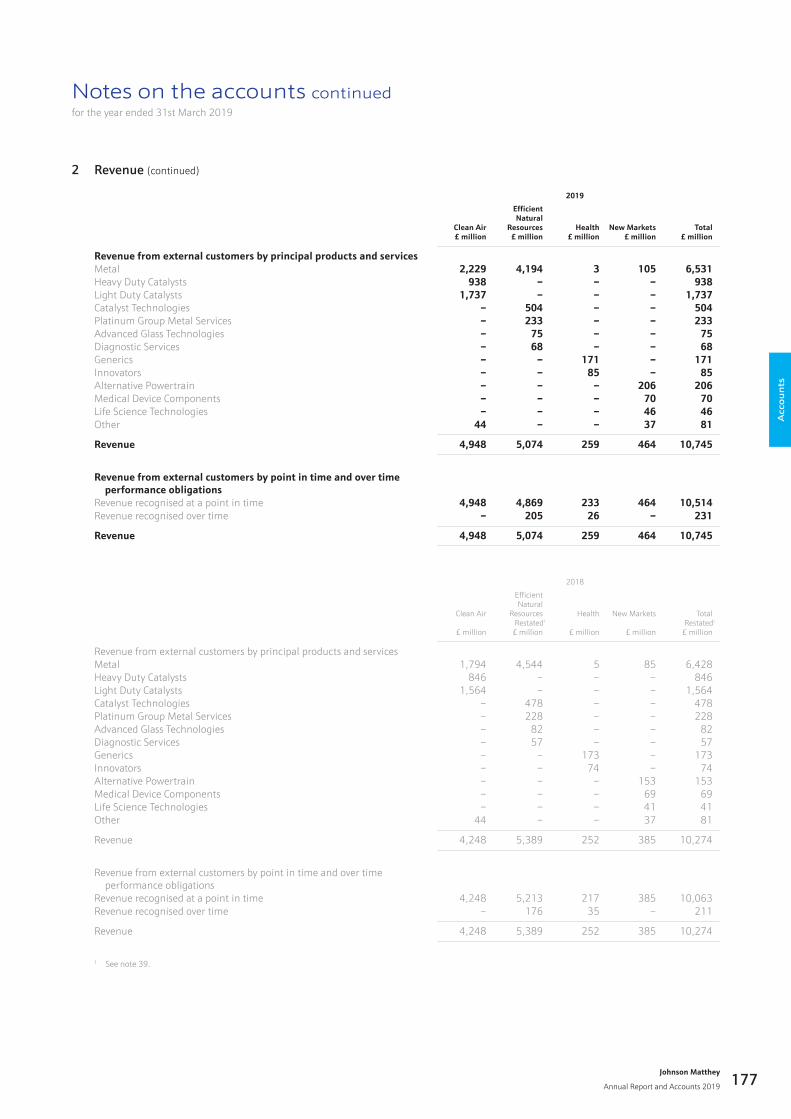
2 Revenue (continued)
2019
Clean Air £ million
EfficientNatural
Resources£ million
Health£ million
New Markets£ million
Total£ million
Revenue from external customers by principal products and servicesMetal 2,229 4,194 3 105 6,531Heavy Duty Catalysts 938 – – – 938Light Duty Catalysts 1,737 – – – 1,737Catalyst Technologies – 504 – – 504Platinum Group Metal Services – 233 – – 233Advanced Glass Technologies – 75 – – 75Diagnostic Services – 68 – – 68Generics – – 171 – 171Innovators – – 85 – 85Alternative Powertrain – – – 206 206Medical Device Components – – – 70 70Life Science Technologies – – – 46 46Other 44 – – 37 81
Revenue 4,948 5,074 259 464 10,745
Revenue from external customers by point in time and over time performance obligationsRevenue recognised at a point in time 4,948 4,869 233 464 10,514Revenue recognised over time – 205 26 – 231
Revenue 4,948 5,074 259 464 10,745
2018
Clean Air
£ million
EfficientNatural
ResourcesRestated!
£ million
Health
£ million
New Markets
£ million
TotalRestated!
£ million
Revenue from external customers by principal products and servicesMetal 1,794 4,544 5 85 6,428Heavy Duty Catalysts 846 – – – 846Light Duty Catalysts 1,564 – – – 1,564Catalyst Technologies – 478 – – 478Platinum Group Metal Services – 228 – – 228Advanced Glass Technologies – 82 – – 82Diagnostic Services – 57 – – 57Generics – – 173 – 173Innovators – – 74 – 74Alternative Powertrain – – – 153 153Medical Device Components – – – 69 69Life Science Technologies – – – 41 41Other 44 – – 37 81
Revenue 4,248 5,389 252 385 10,274
Revenue from external customers by point in time and over time performance obligationsRevenue recognised at a point in time 4,248 5,213 217 385 10,063Revenue recognised over time – 176 35 – 211
Revenue 4,248 5,389 252 385 10,274
1 See note 39.
Acc
ou
nts
Johnson Matthey
Annual Report and Accounts 2019 177
Notes on the accounts continuedfor the year ended 31st March 2019
2 Revenue (continued)
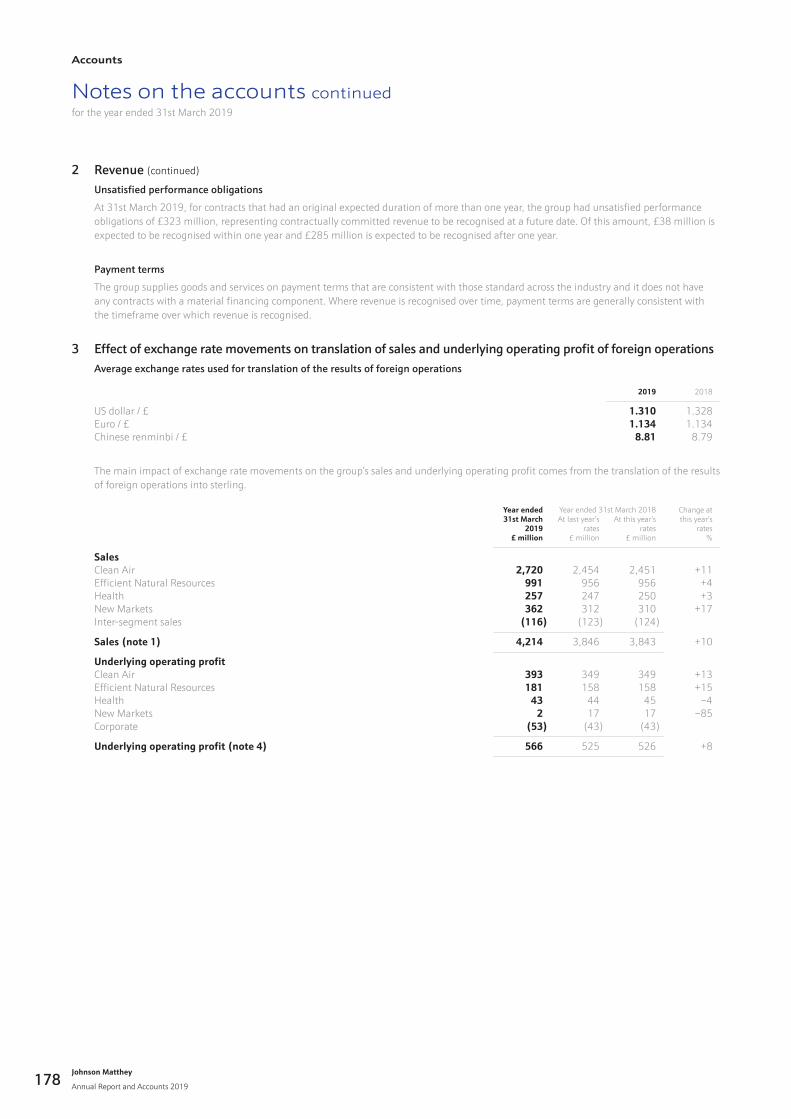
Unsatisfied performance obligations
At 31st March 2019, for contracts that had an original expected duration of more than one year, the group had unsatisfied performance obligations of £323 million, representing contractually committed revenue to be recognised at a future date. Of this amount, £38 million is expected to be recognised within one year and £285 million is expected to be recognised after one year.
Payment terms
The group supplies goods and services on payment terms that are consistent with those standard across the industry and it does not have any contracts with a material financing component. Where revenue is recognised over time, payment terms are generally consistent with the timeframe over which revenue is recognised.
3 Effect of exchange rate movements on translation of sales and underlying operating profit of foreign operations Average exchange rates used for translation of the results of foreign operations
2019 2018
US dollar / £ 1.310 1.328Euro / £ 1.134 1.134Chinese renminbi / £ 8.81 8.79
The main impact of exchange rate movements on the group’s sales and underlying operating profit comes from the translation of the results of foreign operations into sterling.
Year ended31st March
2019£ million
Year ended 31st March 2018 Change atthis year’s
rates%
At last year’srates
£ million
At this year’srates
£ million
SalesClean Air 2,720 2,454 2,451 +11Efficient Natural Resources 991 956 956 +4Health 257 247 250 +3New Markets 362 312 310 +17Inter-segment sales (116) (123) (124)
Sales (note 1) 4,214 3,846 3,843 +10
Underlying operating profitClean Air 393 349 349 +13Efficient Natural Resources 181 158 158 +15Health 43 44 45 –4New Markets 2 17 17 –85Corporate (53) (43) (43)
Underlying operating profit (note 4) 566 525 526 +8
Johnson Matthey
Annual Report and Accounts 2019
Accounts
178
Notes on the accounts continuedfor the year ended 31st March 2019
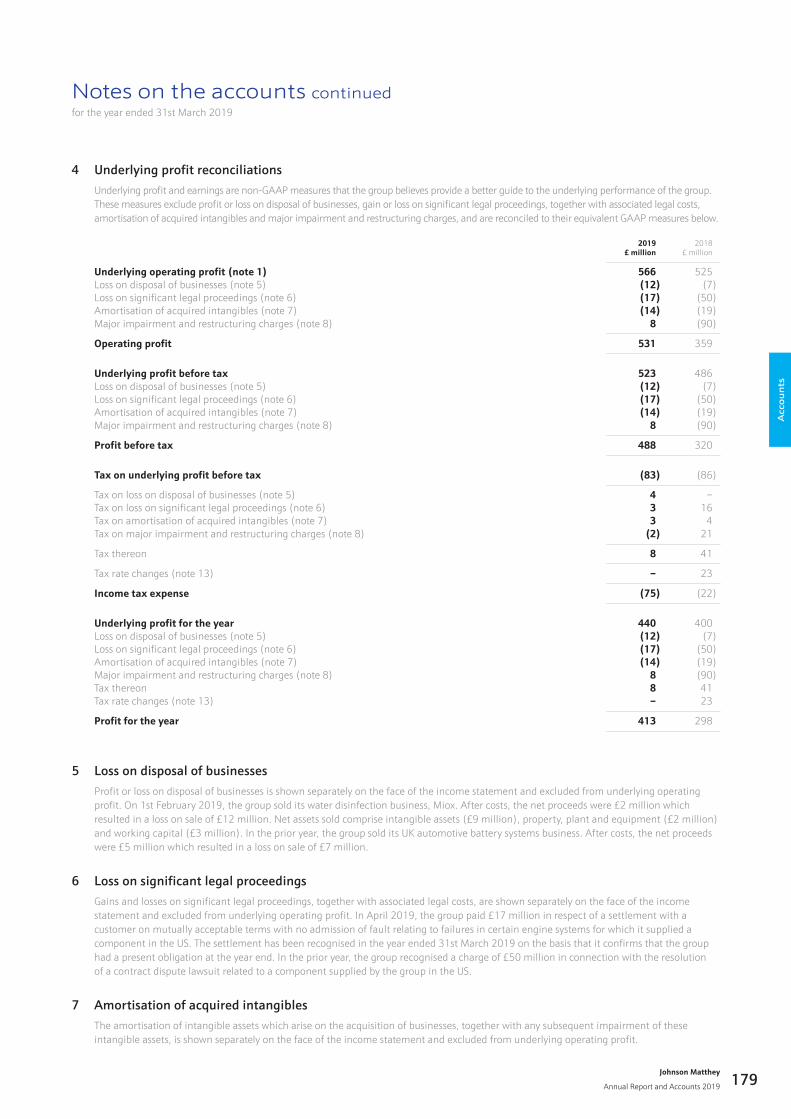
4 Underlying profit reconciliationsUnderlying profit and earnings are non-GAAP measures that the group believes provide a better guide to the underlying performance of the group. These measures exclude profit or loss on disposal of businesses, gain or loss on significant legal proceedings, together with associated legal costs, amortisation of acquired intangibles and major impairment and restructuring charges, and are reconciled to their equivalent GAAP measures below.
2019£ million
2018£ million
Underlying operating profit (note 1) 566 525Loss on disposal of businesses (note 5) (12) (7)Loss on significant legal proceedings (note 6) (17) (50)Amortisation of acquired intangibles (note 7) (14) (19)Major impairment and restructuring charges (note 8) 8 (90)
Operating profit 531 359
Underlying profit before tax 523 486Loss on disposal of businesses (note 5) (12) (7)Loss on significant legal proceedings (note 6) (17) (50)Amortisation of acquired intangibles (note 7) (14) (19)Major impairment and restructuring charges (note 8) 8 (90)
Profit before tax 488 320
Tax on underlying profit before tax (83) (86)
Tax on loss on disposal of businesses (note 5) 4 –Tax on loss on significant legal proceedings (note 6) 3 16Tax on amortisation of acquired intangibles (note 7) 3 4Tax on major impairment and restructuring charges (note 8) (2) 21
Tax thereon 8 41
Tax rate changes (note 13) – 23
Income tax expense (75) (22)
Underlying profit for the year 440 400Loss on disposal of businesses (note 5) (12) (7)Loss on significant legal proceedings (note 6) (17) (50)Amortisation of acquired intangibles (note 7) (14) (19)Major impairment and restructuring charges (note 8) 8 (90)Tax thereon 8 41Tax rate changes (note 13) – 23
Profit for the year 413 298
5 Loss on disposal of businessesProfit or loss on disposal of businesses is shown separately on the face of the income statement and excluded from underlying operating profit. On 1st February 2019, the group sold its water disinfection business, Miox. After costs, the net proceeds were £2 million which resulted in a loss on sale of £12 million. Net assets sold comprise intangible assets (£9 million), property, plant and equipment (£2 million) and working capital (£3 million). In the prior year, the group sold its UK automotive battery systems business. After costs, the net proceeds were £5 million which resulted in a loss on sale of £7 million.
6 Loss on significant legal proceedingsGains and losses on significant legal proceedings, together with associated legal costs, are shown separately on the face of the income statement and excluded from underlying operating profit. In April 2019, the group paid £17 million in respect of a settlement with a customer on mutually acceptable terms with no admission of fault relating to failures in certain engine systems for which it supplied a component in the US. The settlement has been recognised in the year ended 31st March 2019 on the basis that it confirms that the group had a present obligation at the year end. In the prior year, the group recognised a charge of £50 million in connection with the resolution of a contract dispute lawsuit related to a component supplied by the group in the US.
7 Amortisation of acquired intangiblesThe amortisation of intangible assets which arise on the acquisition of businesses, together with any subsequent impairment of these intangible assets, is shown separately on the face of the income statement and excluded from underlying operating profit.
Acc
ou
nts
Johnson Matthey
Annual Report and Accounts 2019 179
Notes on the accounts continuedfor the year ended 31st March 2019
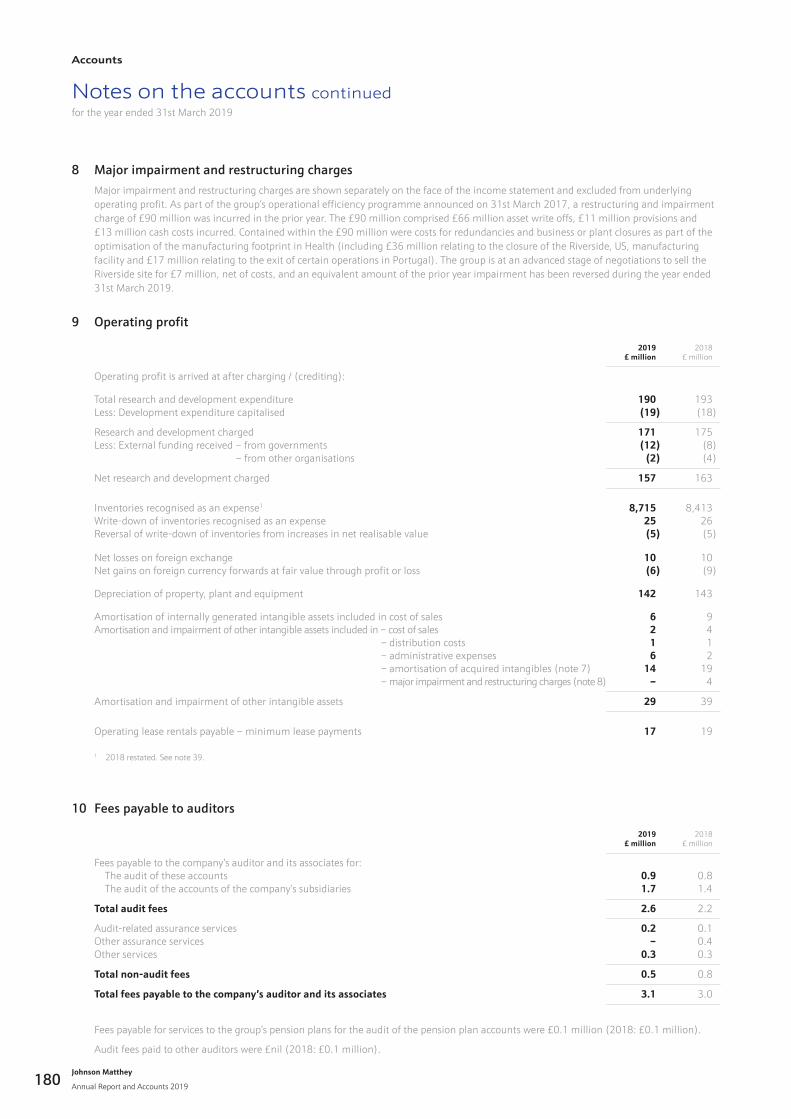
8 Major impairment and restructuring chargesMajor impairment and restructuring charges are shown separately on the face of the income statement and excluded from underlying operating profit. As part of the group’s operational efficiency programme announced on 31st March 2017, a restructuring and impairment charge of £90 million was incurred in the prior year. The £90 million comprised £66 million asset write offs, £11 million provisions and £13 million cash costs incurred. Contained within the £90 million were costs for redundancies and business or plant closures as part of the optimisation of the manufacturing footprint in Health (including £36 million relating to the closure of the Riverside, US, manufacturing facility and £17 million relating to the exit of certain operations in Portugal). The group is at an advanced stage of negotiations to sell the Riverside site for £7 million, net of costs, and an equivalent amount of the prior year impairment has been reversed during the year ended 31st March 2019.
9 Operating profit
2019£ million
2018£ million
Operating profit is arrived at after charging / (crediting):
Total research and development expenditure 190 193Less: Development expenditure capitalised (19) (18)
Research and development charged 171 175Less: External funding received – from governments (12) (8)
– from other organisations (2) (4)
Net research and development charged 157 163
Inventories recognised as an expense1 8,715 8,413Write-down of inventories recognised as an expense 25 26Reversal of write-down of inventories from increases in net realisable value (5) (5)
Net losses on foreign exchange 10 10Net gains on foreign currency forwards at fair value through profit or loss (6) (9)
Depreciation of property, plant and equipment 142 143
Amortisation of internally generated intangible assets included in cost of sales 6 9Amortisation and impairment of other intangible assets included in – cost of sales 2 4
– distribution costs 1 1– administrative expenses 6 2– amortisation of acquired intangibles (note 7) 14 19– major impairment and restructuring charges (note 8) – 4
Amortisation and impairment of other intangible assets 29 39
Operating lease rentals payable – minimum lease payments 17 19
1 2018 restated. See note 39.
10 Fees payable to auditors
2019£ million
2018£ million
Fees payable to the company’s auditor and its associates for: The audit of these accounts 0.9 0.8 The audit of the accounts of the company’s subsidiaries 1.7 1.4
Total audit fees 2.6 2.2
Audit-related assurance services 0.2 0.1Other assurance services – 0.4Other services 0.3 0.3
Total non-audit fees 0.5 0.8
Total fees payable to the company’s auditor and its associates 3.1 3.0
Fees payable for services to the group’s pension plans for the audit of the pension plan accounts were £0.1 million (2018: £0.1 million).
Audit fees paid to other auditors were £nil (2018: £0.1 million).
Johnson Matthey
Annual Report and Accounts 2019
Accounts
180
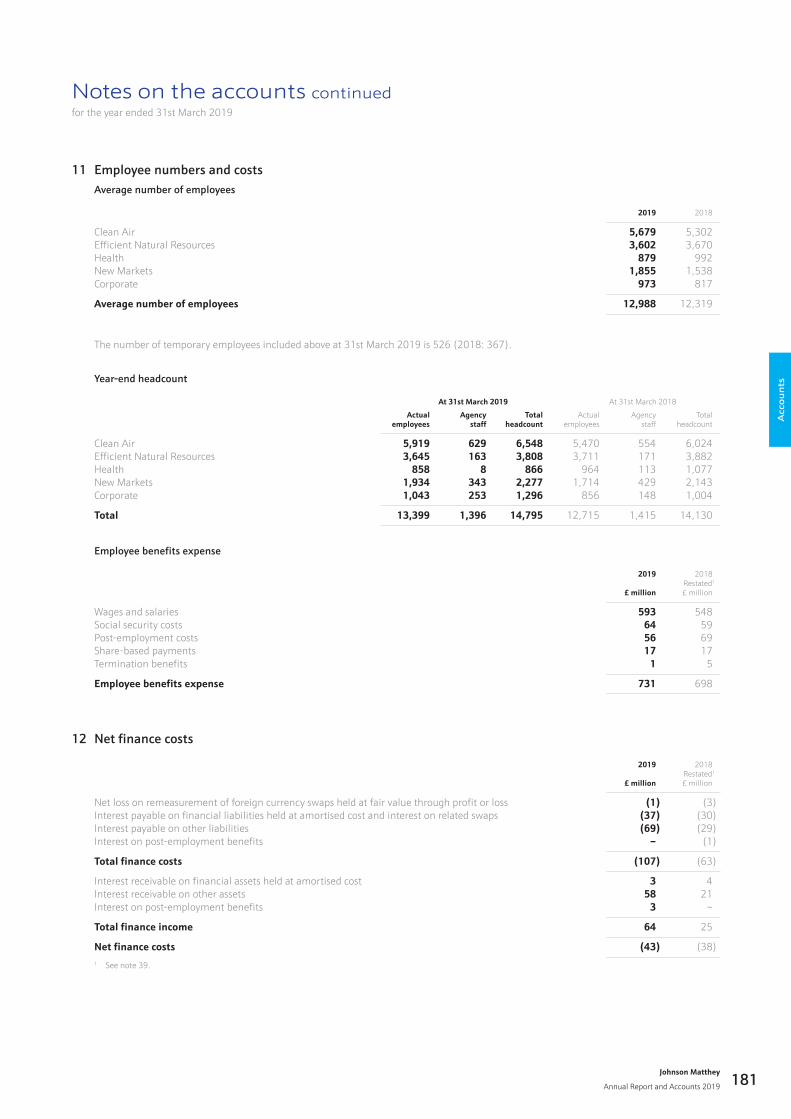
Notes on the accounts continuedfor the year ended 31st March 2019
11 Employee numbers and costs Average number of employees
2019 2018
Clean Air 5,679 5,302Efficient Natural Resources 3,602 3,670Health 879 992New Markets 1,855 1,538Corporate 973 817
Average number of employees 12,988 12,319
The number of temporary employees included above at 31st March 2019 is 526 (2018: 367).
Year-end headcount
At 31st March 2019 At 31st March 2018
Actualemployees
Agencystaff
Totalheadcount
Actualemployees
Agencystaff
Totalheadcount
Clean Air 5,919 629 6,548 5,470 554 6,024Efficient Natural Resources 3,645 163 3,808 3,711 171 3,882Health 858 8 866 964 113 1,077New Markets 1,934 343 2,277 1,714 429 2,143Corporate 1,043 253 1,296 856 148 1,004
Total 13,399 1,396 14,795 12,715 1,415 14,130
Employee benefits expense
2019
£ million
2018Restated1
£ million
Wages and salaries 593 548Social security costs 64 59Post-employment costs 56 69Share-based payments 17 17Termination benefits 1 5
Employee benefits expense 731 698
12 Net finance costs
2019
£ million
2018Restated1
£ million
Net loss on remeasurement of foreign currency swaps held at fair value through profit or loss (1) (3)Interest payable on financial liabilities held at amortised cost and interest on related swaps (37) (30)Interest payable on other liabilities (69) (29)Interest on post-employment benefits – (1)
Total finance costs (107) (63)
Interest receivable on financial assets held at amortised cost 3 4Interest receivable on other assets 58 21Interest on post-employment benefits 3 –
Total finance income 64 25
Net finance costs (43) (38)1 See note 39.
Acc
ou
nts
Johnson Matthey
Annual Report and Accounts 2019 181
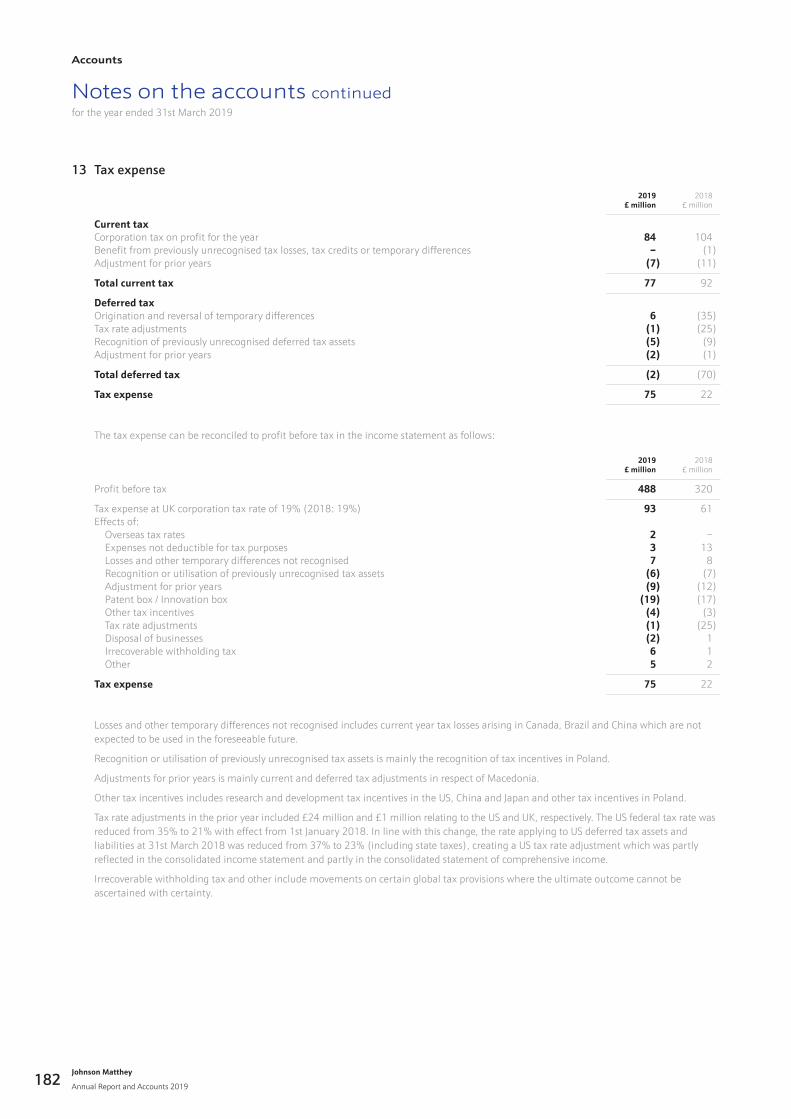
Notes on the accounts continuedfor the year ended 31st March 2019
13 Tax expense
2019£ million
2018£ million
Current taxCorporation tax on profit for the year 84 104Benefit from previously unrecognised tax losses, tax credits or temporary differences – (1)Adjustment for prior years (7) (11)
Total current tax 77 92
Deferred taxOrigination and reversal of temporary differences 6 (35)Tax rate adjustments (1) (25)Recognition of previously unrecognised deferred tax assets (5) (9)Adjustment for prior years (2) (1)
Total deferred tax (2) (70)
Tax expense 75 22
The tax expense can be reconciled to profit before tax in the income statement as follows:
2019£ million
2018£ million
Profit before tax 488 320
Tax expense at UK corporation tax rate of 19% (2018: 19%) 93 61Effects of: Overseas tax rates 2 – Expenses not deductible for tax purposes 3 13 Losses and other temporary differences not recognised 7 8 Recognition or utilisation of previously unrecognised tax assets (6) (7) Adjustment for prior years (9) (12) Patent box / Innovation box (19) (17) Other tax incentives (4) (3) Tax rate adjustments (1) (25) Disposal of businesses (2) 1 Irrecoverable withholding tax 6 1 Other 5 2
Tax expense 75 22
Losses and other temporary differences not recognised includes current year tax losses arising in Canada, Brazil and China which are not expected to be used in the foreseeable future.
Recognition or utilisation of previously unrecognised tax assets is mainly the recognition of tax incentives in Poland.
Adjustments for prior years is mainly current and deferred tax adjustments in respect of Macedonia.
Other tax incentives includes research and development tax incentives in the US, China and Japan and other tax incentives in Poland.
Tax rate adjustments in the prior year included £24 million and £1 million relating to the US and UK, respectively. The US federal tax rate was reduced from 35% to 21% with effect from 1st January 2018. In line with this change, the rate applying to US deferred tax assets and liabilities at 31st March 2018 was reduced from 37% to 23% (including state taxes), creating a US tax rate adjustment which was partly reflected in the consolidated income statement and partly in the consolidated statement of comprehensive income.
Irrecoverable withholding tax and other include movements on certain global tax provisions where the ultimate outcome cannot be ascertained with certainty.
Johnson Matthey
Annual Report and Accounts 2019
Accounts
182
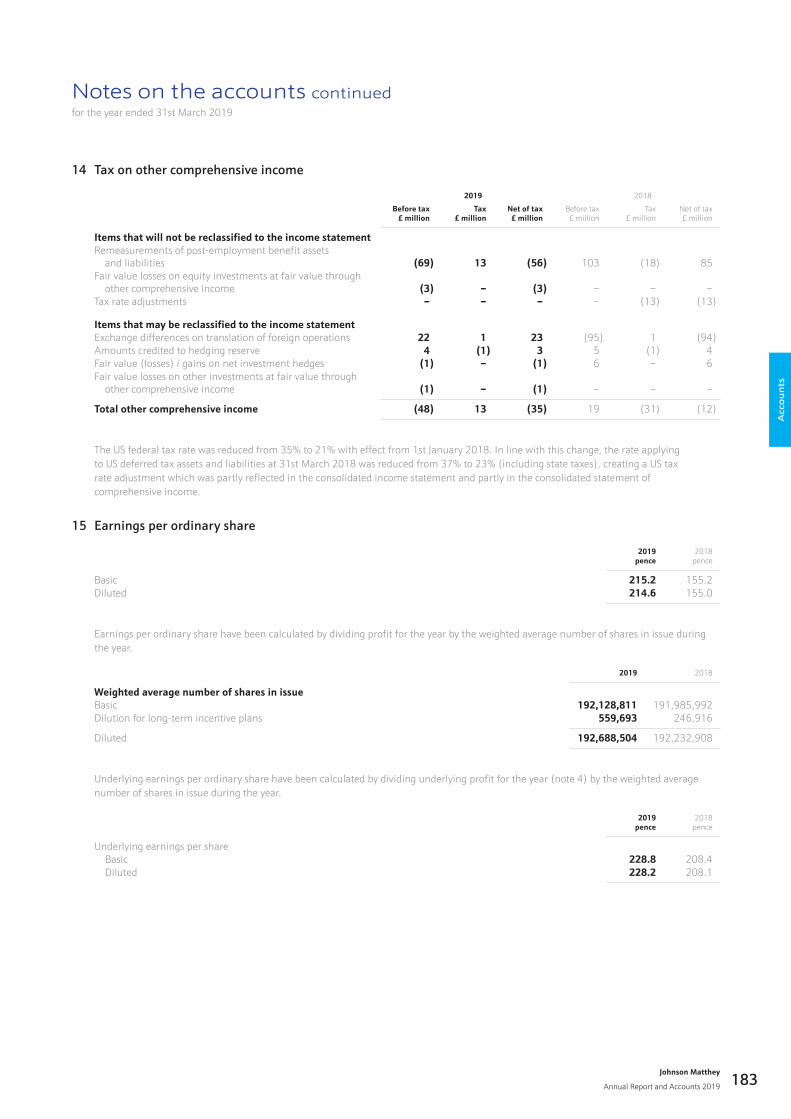
Notes on the accounts continuedfor the year ended 31st March 2019
14 Tax on other comprehensive income
2019 2018
Before tax£ million
Tax£ million
Net of tax£ million
Before tax£ million
Tax£ million
Net of tax£ million
Items that will not be reclassified to the income statementRemeasurements of post-employment benefit assets and liabilities (69) 13 (56) 103 (18) 85Fair value losses on equity investments at fair value through other comprehensive income (3) – (3) – – –Tax rate adjustments – – – – (13) (13)
Items that may be reclassified to the income statementExchange differences on translation of foreign operations 22 1 23 (95) 1 (94)Amounts credited to hedging reserve 4 (1) 3 5 (1) 4Fair value (losses) / gains on net investment hedges (1) – (1) 6 – 6Fair value losses on other investments at fair value through other comprehensive income (1) – (1) – – –
Total other comprehensive income (48) 13 (35) 19 (31) (12)
The US federal tax rate was reduced from 35% to 21% with effect from 1st January 2018. In line with this change, the rate applying to US deferred tax assets and liabilities at 31st March 2018 was reduced from 37% to 23% (including state taxes), creating a US tax rate adjustment which was partly reflected in the consolidated income statement and partly in the consolidated statement of comprehensive income.
15 Earnings per ordinary share
2019pence
2018pence
Basic 215.2 155.2Diluted 214.6 155.0
Earnings per ordinary share have been calculated by dividing profit for the year by the weighted average number of shares in issue during the year.
2019 2018
Weighted average number of shares in issueBasic 192,128,811 191,985,992Dilution for long-term incentive plans 559,693 246,916
Diluted 192,688,504 192,232,908
Underlying earnings per ordinary share have been calculated by dividing underlying profit for the year (note 4) by the weighted average number of shares in issue during the year.
2019pence
2018pence
Underlying earnings per share Basic 228.8 208.4 Diluted 228.2 208.1
Acc
ou
nts
Johnson Matthey
Annual Report and Accounts 2019 183
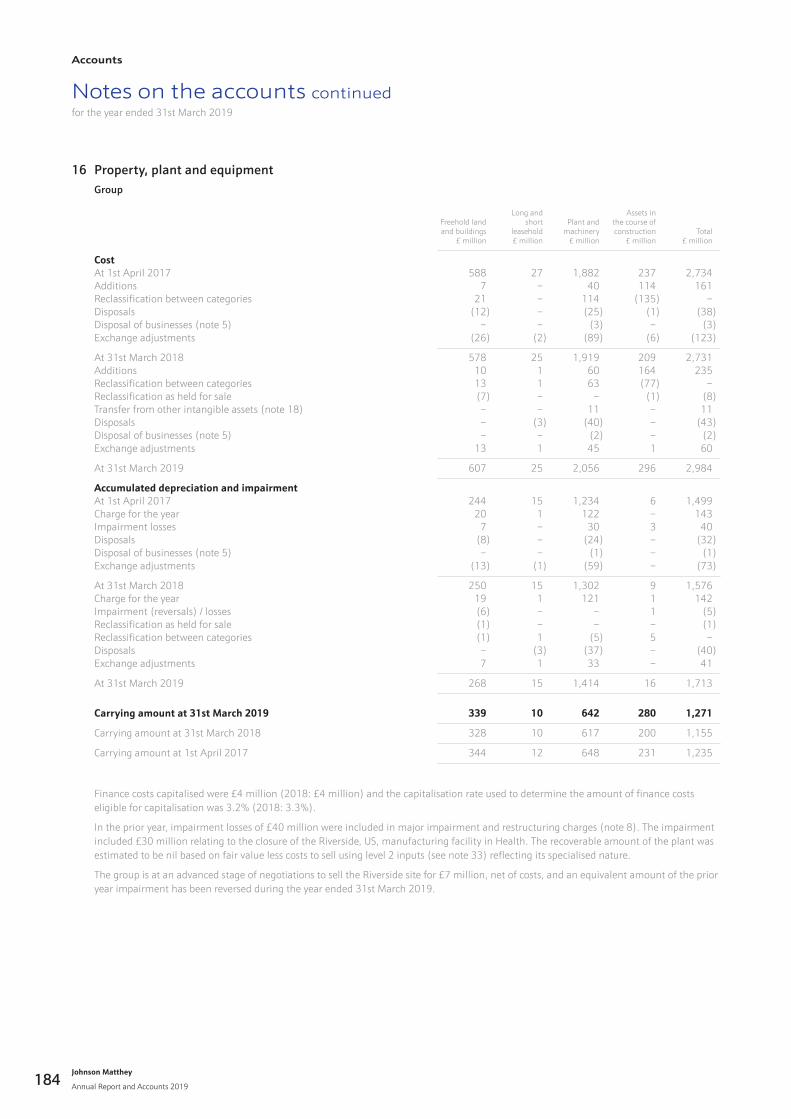
Notes on the accounts continuedfor the year ended 31st March 2019
16 Property, plant and equipment Group
Freehold landand buildings
£ million
Long and short
leasehold£ million
Plant andmachinery
£ million
Assets inthe course ofconstruction
£ millionTotal
£ million
CostAt 1st April 2017 588 27 1,882 237 2,734Additions 7 – 40 114 161Reclassification between categories 21 – 114 (135) –Disposals (12) – (25) (1) (38)Disposal of businesses (note 5) – – (3) – (3)Exchange adjustments (26) (2) (89) (6) (123)
At 31st March 2018 578 25 1,919 209 2,731Additions 10 1 60 164 235Reclassification between categories 13 1 63 (77) –Reclassification as held for sale (7) – – (1) (8)Transfer from other intangible assets (note 18) – – 11 – 11Disposals – (3) (40) – (43)Disposal of businesses (note 5) – – (2) – (2)Exchange adjustments 13 1 45 1 60
At 31st March 2019 607 25 2,056 296 2,984
Accumulated depreciation and impairmentAt 1st April 2017 244 15 1,234 6 1,499Charge for the year 20 1 122 – 143Impairment losses 7 – 30 3 40Disposals (8) – (24) – (32)Disposal of businesses (note 5) – – (1) – (1)Exchange adjustments (13) (1) (59) – (73)
At 31st March 2018 250 15 1,302 9 1,576Charge for the year 19 1 121 1 142Impairment (reversals) / losses (6) – – 1 (5)Reclassification as held for sale (1) – – – (1)Reclassification between categories (1) 1 (5) 5 –Disposals – (3) (37) – (40)Exchange adjustments 7 1 33 – 41
At 31st March 2019 268 15 1,414 16 1,713
Carrying amount at 31st March 2019 339 10 642 280 1,271
Carrying amount at 31st March 2018 328 10 617 200 1,155
Carrying amount at 1st April 2017 344 12 648 231 1,235
Finance costs capitalised were £4 million (2018: £4 million) and the capitalisation rate used to determine the amount of finance costs eligible for capitalisation was 3.2% (2018: 3.3%).
In the prior year, impairment losses of £40 million were included in major impairment and restructuring charges (note 8). The impairment included £30 million relating to the closure of the Riverside, US, manufacturing facility in Health. The recoverable amount of the plant was estimated to be nil based on fair value less costs to sell using level 2 inputs (see note 33) reflecting its specialised nature.
The group is at an advanced stage of negotiations to sell the Riverside site for £7 million, net of costs, and an equivalent amount of the prior year impairment has been reversed during the year ended 31st March 2019.
Johnson Matthey
Annual Report and Accounts 2019
Accounts
184
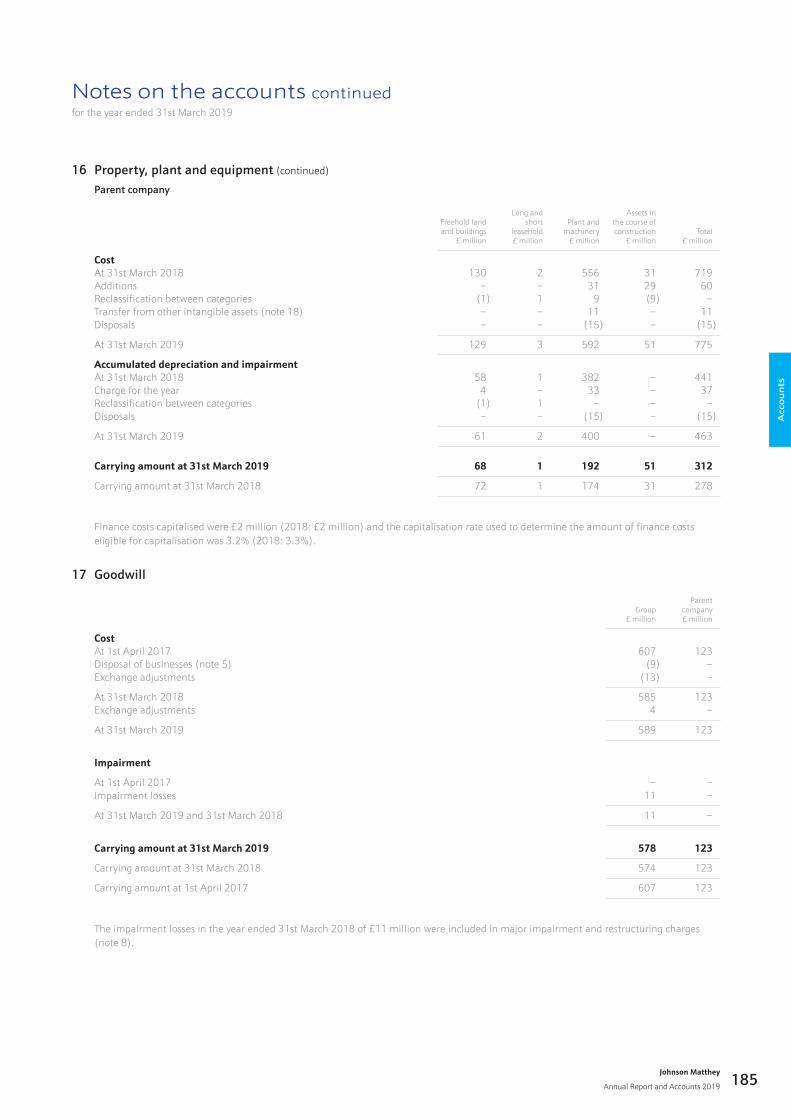
Notes on the accounts continuedfor the year ended 31st March 2019
16 Property, plant and equipment (continued)
Parent company
Freehold landand buildings
£ million
Long and short
leasehold£ million
Plant andmachinery
£ million
Assets inthe course ofconstruction
£ millionTotal
£ million
CostAt 31st March 2018 130 2 556 31 719Additions – – 31 29 60Reclassification between categories (1) 1 9 (9) –Transfer from other intangible assets (note 18) – – 11 – 11Disposals – – (15) – (15)
At 31st March 2019 129 3 592 51 775
Accumulated depreciation and impairmentAt 31st March 2018 58 1 382 – 441Charge for the year 4 – 33 – 37Reclassification between categories (1) 1 – – –Disposals – – (15) – (15)
At 31st March 2019 61 2 400 – 463
Carrying amount at 31st March 2019 68 1 192 51 312
Carrying amount at 31st March 2018 72 1 174 31 278
Finance costs capitalised were £2 million (2018: £2 million) and the capitalisation rate used to determine the amount of finance costs eligible for capitalisation was 3.2% (2018: 3.3%).
17 Goodwill
Group£ million
Parentcompany£ million
CostAt 1st April 2017 607 123Disposal of businesses (note 5) (9) –Exchange adjustments (13) –
At 31st March 2018 585 123Exchange adjustments 4 –
At 31st March 2019 589 123
Impairment
At 1st April 2017 – –Impairment losses 11 –
At 31st March 2019 and 31st March 2018 11 –
Carrying amount at 31st March 2019 578 123
Carrying amount at 31st March 2018 574 123
Carrying amount at 1st April 2017 607 123
The impairment losses in the year ended 31st March 2018 of £11 million were included in major impairment and restructuring charges (note 8).
Acc
ou
nts
Johnson Matthey
Annual Report and Accounts 2019 185
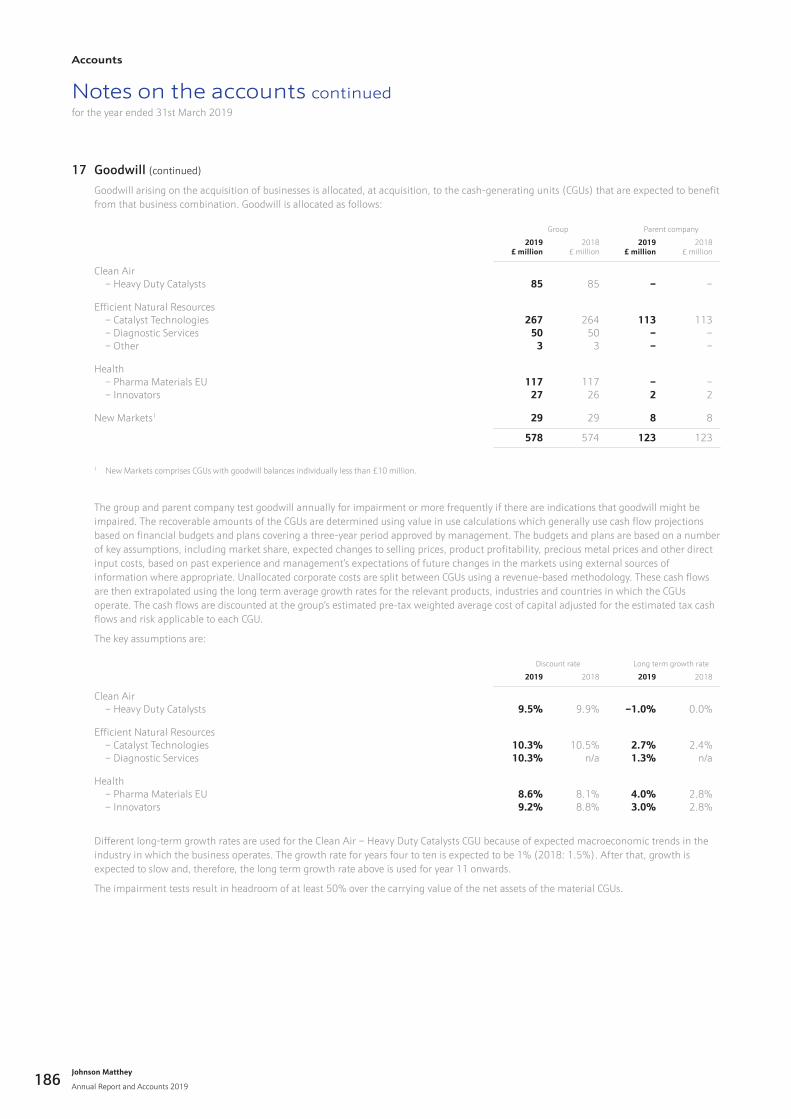
Notes on the accounts continuedfor the year ended 31st March 2019
17 Goodwill (continued)
Goodwill arising on the acquisition of businesses is allocated, at acquisition, to the cash-generating units (CGUs) that are expected to benefit from that business combination. Goodwill is allocated as follows:
Group Parent company
2019£ million
2018£ million
2019£ million
2018£ million
Clean Air – Heavy Duty Catalysts 85 85 – –
Efficient Natural Resources – Catalyst Technologies 267 264 113 113 – Diagnostic Services 50 50 – – – Other 3 3 – –
Health – Pharma Materials EU 117 117 – – – Innovators 27 26 2 2
New Markets1 29 29 8 8
578 574 123 123
1 New Markets comprises CGUs with goodwill balances individually less than £10 million.
The group and parent company test goodwill annually for impairment or more frequently if there are indications that goodwill might be impaired. The recoverable amounts of the CGUs are determined using value in use calculations which generally use cash flow projections based on financial budgets and plans covering a three-year period approved by management. The budgets and plans are based on a number of key assumptions, including market share, expected changes to selling prices, product profitability, precious metal prices and other direct input costs, based on past experience and management’s expectations of future changes in the markets using external sources of information where appropriate. Unallocated corporate costs are split between CGUs using a revenue-based methodology. These cash flows are then extrapolated using the long term average growth rates for the relevant products, industries and countries in which the CGUs operate. The cash flows are discounted at the group’s estimated pre-tax weighted average cost of capital adjusted for the estimated tax cash flows and risk applicable to each CGU.
The key assumptions are:
Discount rate Long term growth rate
2019 2018 2019 2018
Clean Air – Heavy Duty Catalysts 9.5% 9.9% –1.0% 0.0%
Efficient Natural Resources – Catalyst Technologies 10.3% 10.5% 2.7% 2.4% – Diagnostic Services 10.3% n/a 1.3% n/a
Health – Pharma Materials EU 8.6% 8.1% 4.0% 2.8% – Innovators 9.2% 8.8% 3.0% 2.8%
Different long-term growth rates are used for the Clean Air – Heavy Duty Catalysts CGU because of expected macroeconomic trends in the industry in which the business operates. The growth rate for years four to ten is expected to be 1% (2018: 1.5%). After that, growth is expected to slow and, therefore, the long term growth rate above is used for year 11 onwards.
The impairment tests result in headroom of at least 50% over the carrying value of the net assets of the material CGUs.
Johnson Matthey
Annual Report and Accounts 2019
Accounts
186
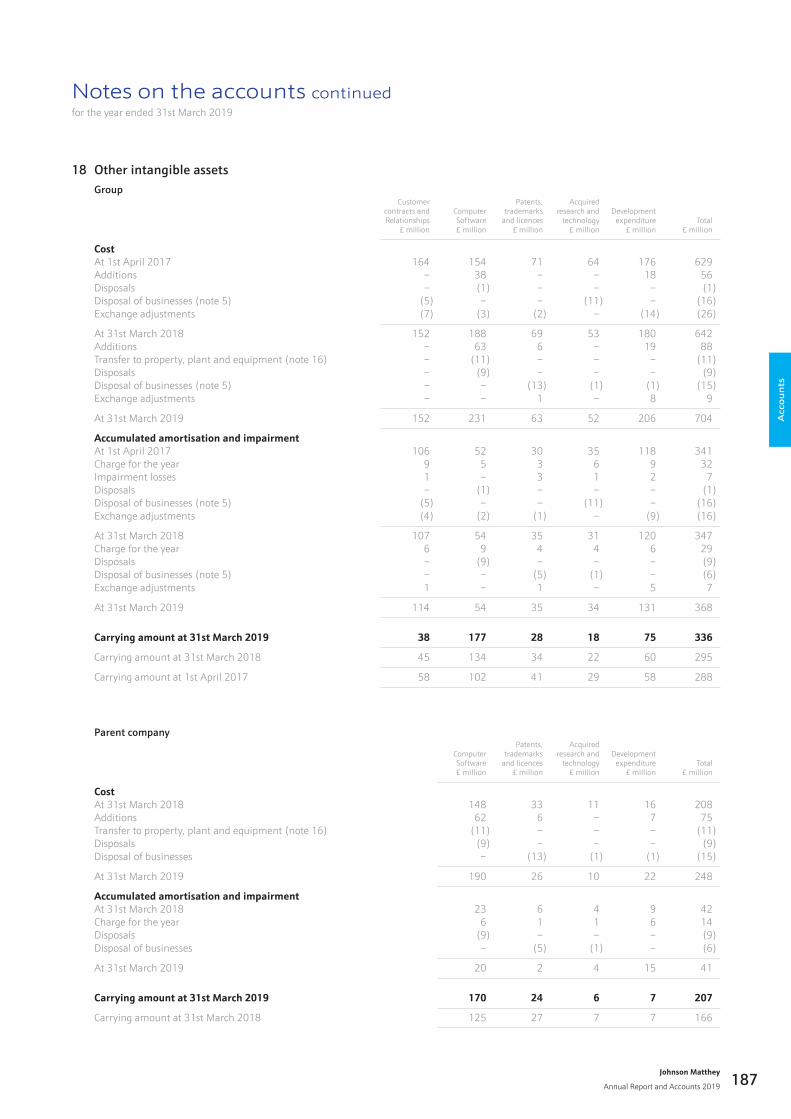
Notes on the accounts continuedfor the year ended 31st March 2019
18 Other intangible assets Group
Customercontracts andRelationships
£ million
ComputerSoftware£ million
Patents,trademarks
and licences£ million
Acquiredresearch and
technology£ million
Developmentexpenditure
£ millionTotal
£ million
CostAt 1st April 2017 164 154 71 64 176 629Additions – 38 – – 18 56Disposals – (1) – – – (1)Disposal of businesses (note 5) (5) – – (11) – (16)Exchange adjustments (7) (3) (2) – (14) (26)
At 31st March 2018 152 188 69 53 180 642Additions – 63 6 – 19 88Transfer to property, plant and equipment (note 16) – (11) – – – (11)Disposals – (9) – – – (9)Disposal of businesses (note 5) – – (13) (1) (1) (15)Exchange adjustments – – 1 – 8 9
At 31st March 2019 152 231 63 52 206 704
Accumulated amortisation and impairmentAt 1st April 2017 106 52 30 35 118 341Charge for the year 9 5 3 6 9 32Impairment losses 1 – 3 1 2 7Disposals – (1) – – – (1)Disposal of businesses (note 5) (5) – – (11) – (16)Exchange adjustments (4) (2) (1) – (9) (16)
At 31st March 2018 107 54 35 31 120 347Charge for the year 6 9 4 4 6 29Disposals – (9) – – – (9)Disposal of businesses (note 5) – – (5) (1) – (6)Exchange adjustments 1 – 1 – 5 7
At 31st March 2019 114 54 35 34 131 368
Carrying amount at 31st March 2019 38 177 28 18 75 336
Carrying amount at 31st March 2018 45 134 34 22 60 295
Carrying amount at 1st April 2017 58 102 41 29 58 288
Parent company
ComputerSoftware£ million
Patents,trademarks
and licences£ million
Acquiredresearch and
technology£ million
Developmentexpenditure
£ millionTotal
£ million
CostAt 31st March 2018 148 33 11 16 208Additions 62 6 – 7 75Transfer to property, plant and equipment (note 16) (11) – – – (11)Disposals (9) – – – (9)Disposal of businesses – (13) (1) (1) (15)
At 31st March 2019 190 26 10 22 248
Accumulated amortisation and impairmentAt 31st March 2018 23 6 4 9 42Charge for the year 6 1 1 6 14Disposals (9) – – – (9)Disposal of businesses – (5) (1) – (6)
At 31st March 2019 20 2 4 15 41
Carrying amount at 31st March 2019 170 24 6 7 207
Carrying amount at 31st March 2018 125 27 7 7 166
Acc
ou
nts
Johnson Matthey
Annual Report and Accounts 2019 187
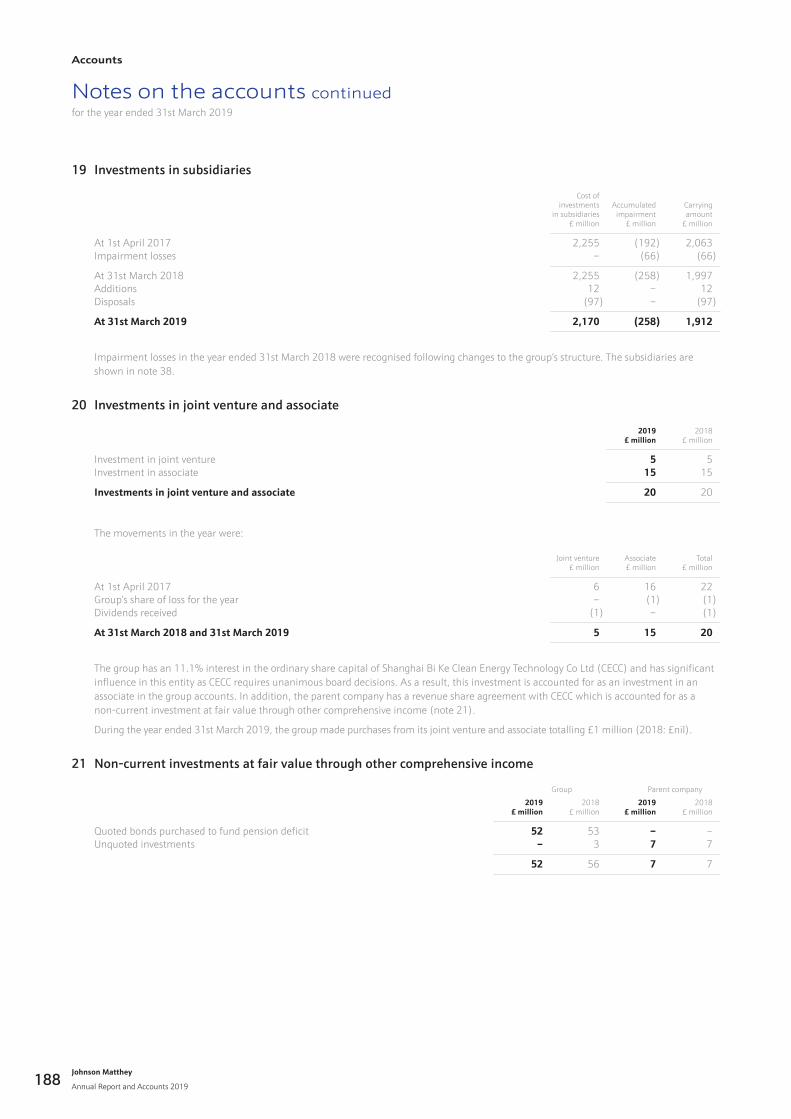
Notes on the accounts continuedfor the year ended 31st March 2019
19 Investments in subsidiaries
Cost ofinvestments
in subsidiaries£ million
Accumulatedimpairment
£ million
Carryingamount
£ million
At 1st April 2017 2,255 (192) 2,063Impairment losses – (66) (66)
At 31st March 2018 2,255 (258) 1,997Additions 12 – 12Disposals (97) – (97)
At 31st March 2019 2,170 (258) 1,912
Impairment losses in the year ended 31st March 2018 were recognised following changes to the group’s structure. The subsidiaries are shown in note 38.
20 Investments in joint venture and associate
2019£ million
2018£ million
Investment in joint venture 5 5Investment in associate 15 15
Investments in joint venture and associate 20 20
The movements in the year were:
Joint venture£ million
Associate£ million
Total£ million
At 1st April 2017 6 16 22Group’s share of loss for the year – (1) (1)Dividends received (1) – (1)
At 31st March 2018 and 31st March 2019 5 15 20
The group has an 11.1% interest in the ordinary share capital of Shanghai Bi Ke Clean Energy Technology Co Ltd (CECC) and has significant influence in this entity as CECC requires unanimous board decisions. As a result, this investment is accounted for as an investment in an associate in the group accounts. In addition, the parent company has a revenue share agreement with CECC which is accounted for as a non-current investment at fair value through other comprehensive income (note 21).
During the year ended 31st March 2019, the group made purchases from its joint venture and associate totalling £1 million (2018: £nil).
21 Non-current investments at fair value through other comprehensive income
Group Parent company
2019£ million
2018£ million
2019£ million
2018£ million
Quoted bonds purchased to fund pension deficit 52 53 – –Unquoted investments – 3 7 7
52 56 7 7
Johnson Matthey
Annual Report and Accounts 2019
Accounts
188
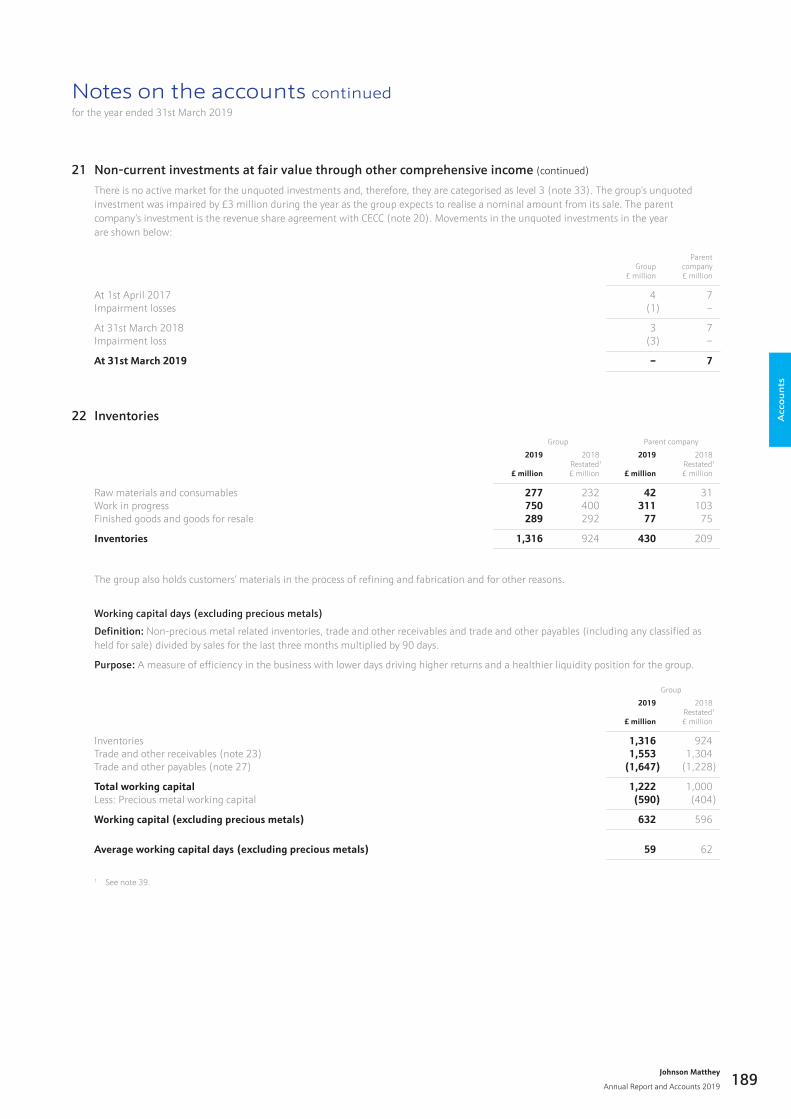
Notes on the accounts continuedfor the year ended 31st March 2019
21 Non-current investments at fair value through other comprehensive income (continued)
There is no active market for the unquoted investments and, therefore, they are categorised as level 3 (note 33). The group’s unquoted investment was impaired by £3 million during the year as the group expects to realise a nominal amount from its sale. The parent company’s investment is the revenue share agreement with CECC (note 20). Movements in the unquoted investments in the year are shown below:
Group£ million
Parentcompany£ million
At 1st April 2017 4 7Impairment losses (1) –
At 31st March 2018 3 7Impairment loss (3) –
At 31st March 2019 – 7
22 Inventories
Group Parent company
2019
£ million
2018Restated1
£ million
2019
£ million
2018Restated1
£ million
Raw materials and consumables 277 232 42 31Work in progress 750 400 311 103Finished goods and goods for resale 289 292 77 75
Inventories 1,316 924 430 209
The group also holds customers’ materials in the process of refining and fabrication and for other reasons.
Working capital days (excluding precious metals)
Definition: Non-precious metal related inventories, trade and other receivables and trade and other payables (including any classified as held for sale) divided by sales for the last three months multiplied by 90 days.
Purpose: A measure of efficiency in the business with lower days driving higher returns and a healthier liquidity position for the group.
Group
2019
£ million
2018Restated1
£ million
Inventories 1,316 924Trade and other receivables (note 23) 1,553 1,304Trade and other payables (note 27) (1,647) (1,228)
Total working capital 1,222 1,000Less: Precious metal working capital (590) (404)
Working capital (excluding precious metals) 632 596
Average working capital days (excluding precious metals) 59 62
1 See note 39.
Acc
ou
nts
Johnson Matthey
Annual Report and Accounts 2019 189
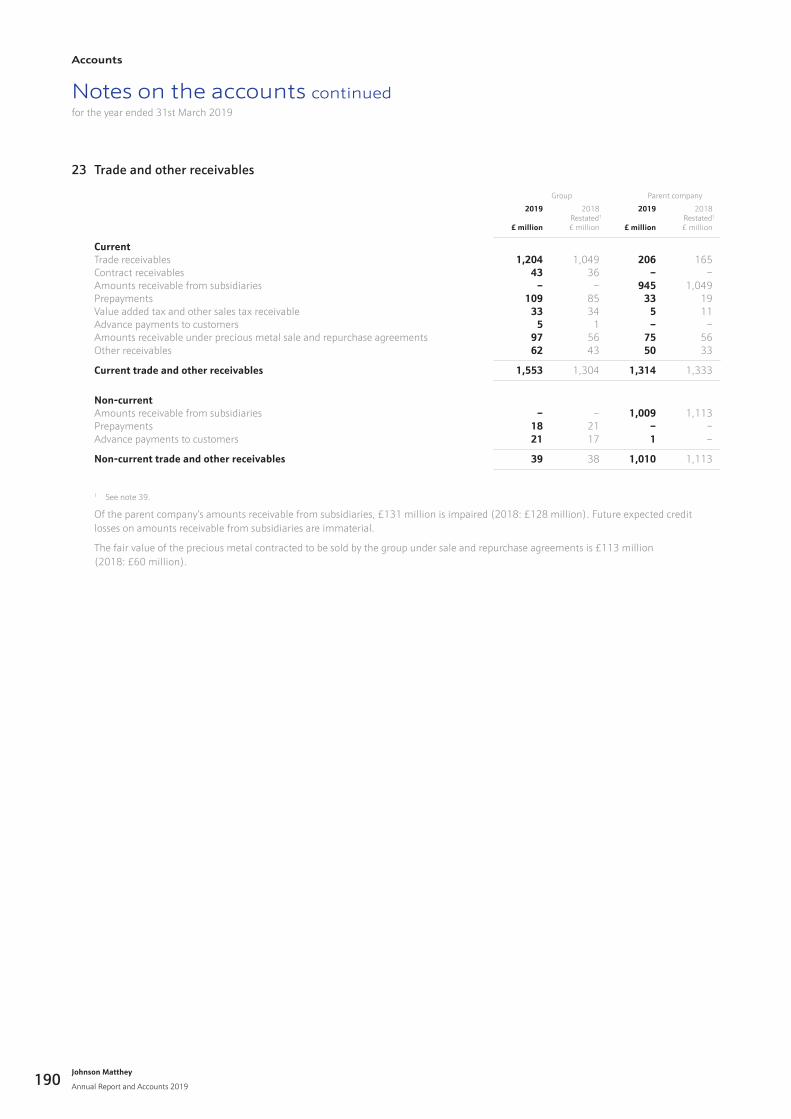
Notes on the accounts continuedfor the year ended 31st March 2019
23 Trade and other receivables
Group Parent company
2019
£ million
2018Restated1
£ million
2019
£ million
2018Restated1
£ million
CurrentTrade receivables 1,204 1,049 206 165Contract receivables 43 36 – –Amounts receivable from subsidiaries – – 945 1,049Prepayments 109 85 33 19Value added tax and other sales tax receivable 33 34 5 11Advance payments to customers 5 1 – –Amounts receivable under precious metal sale and repurchase agreements 97 56 75 56Other receivables 62 43 50 33
Current trade and other receivables 1,553 1,304 1,314 1,333
Non-currentAmounts receivable from subsidiaries – – 1,009 1,113Prepayments 18 21 – –Advance payments to customers 21 17 1 –
Non-current trade and other receivables 39 38 1,010 1,113
1 See note 39.
Of the parent company’s amounts receivable from subsidiaries, £131 million is impaired (2018: £128 million). Future expected credit losses on amounts receivable from subsidiaries are immaterial.
The fair value of the precious metal contracted to be sold by the group under sale and repurchase agreements is £113 million (2018: £60 million).
Johnson Matthey
Annual Report and Accounts 2019
Accounts
190
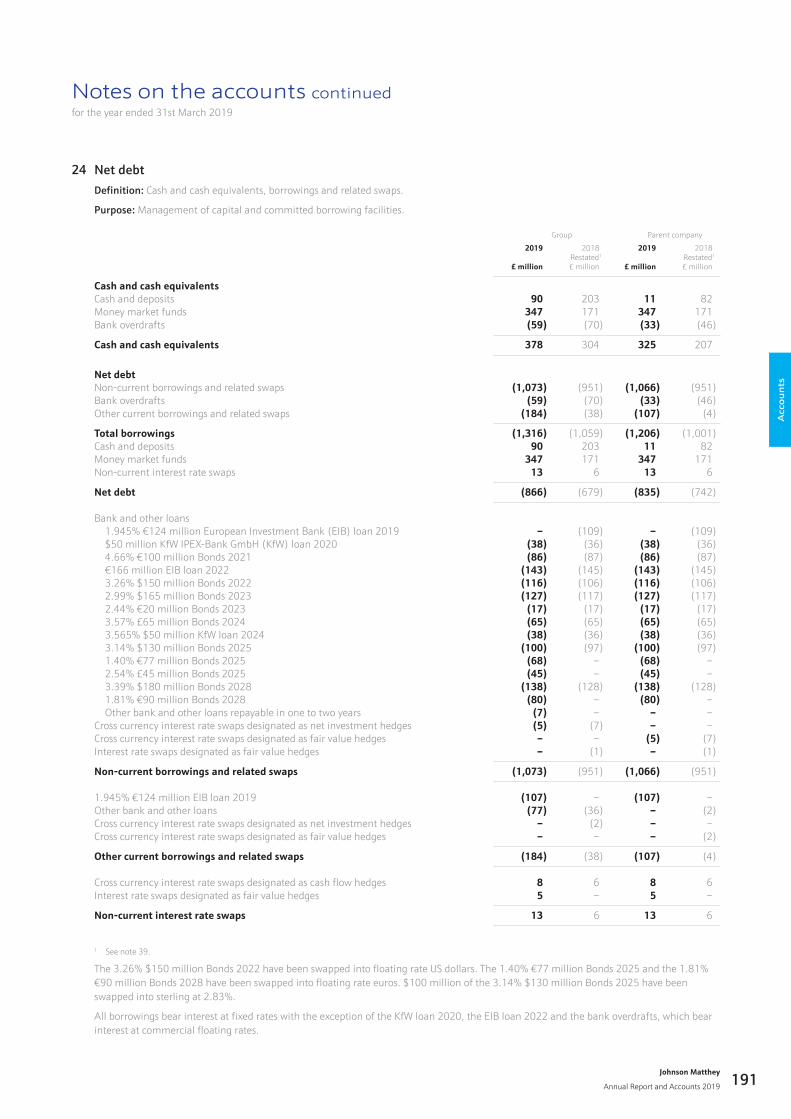
Notes on the accounts continuedfor the year ended 31st March 2019
24 Net debtDefinition: Cash and cash equivalents, borrowings and related swaps.
Purpose: Management of capital and committed borrowing facilities.
Group Parent company
2019
£ million
2018Restated1
£ million
2019
£ million
2018Restated1
£ million
Cash and cash equivalentsCash and deposits 90 203 11 82Money market funds 347 171 347 171Bank overdrafts (59) (70) (33) (46)
Cash and cash equivalents 378 304 325 207
Net debtNon-current borrowings and related swaps (1,073) (951) (1,066) (951)Bank overdrafts (59) (70) (33) (46)Other current borrowings and related swaps (184) (38) (107) (4)
Total borrowings (1,316) (1,059) (1,206) (1,001)Cash and deposits 90 203 11 82Money market funds 347 171 347 171Non-current interest rate swaps 13 6 13 6
Net debt (866) (679) (835) (742)
Bank and other loans 1.945% €124 million European Investment Bank (EIB) loan 2019 – (109) – (109) $50 million KfW IPEX-Bank GmbH (KfW) loan 2020 (38) (36) (38) (36) 4.66% €100 million Bonds 2021 (86) (87) (86) (87) €166 million EIB loan 2022 (143) (145) (143) (145) 3.26% $150 million Bonds 2022 (116) (106) (116) (106) 2.99% $165 million Bonds 2023 (127) (117) (127) (117) 2.44% €20 million Bonds 2023 (17) (17) (17) (17) 3.57% £65 million Bonds 2024 (65) (65) (65) (65) 3.565% $50 million KfW loan 2024 (38) (36) (38) (36) 3.14% $130 million Bonds 2025 (100) (97) (100) (97) 1.40% €77 million Bonds 2025 (68) – (68) – 2.54% £45 million Bonds 2025 (45) – (45) – 3.39% $180 million Bonds 2028 (138) (128) (138) (128) 1.81% €90 million Bonds 2028 (80) – (80) – Other bank and other loans repayable in one to two years (7) – – –Cross currency interest rate swaps designated as net investment hedges (5) (7) – –Cross currency interest rate swaps designated as fair value hedges – – (5) (7)Interest rate swaps designated as fair value hedges – (1) – (1)
Non-current borrowings and related swaps (1,073) (951) (1,066) (951)
1.945% €124 million EIB loan 2019 (107) – (107) –Other bank and other loans (77) (36) – (2)Cross currency interest rate swaps designated as net investment hedges – (2) – –Cross currency interest rate swaps designated as fair value hedges – – – (2)
Other current borrowings and related swaps (184) (38) (107) (4)
Cross currency interest rate swaps designated as cash flow hedges 8 6 8 6Interest rate swaps designated as fair value hedges 5 – 5 –
Non-current interest rate swaps 13 6 13 6
1 See note 39.
The 3.26% $150 million Bonds 2022 have been swapped into floating rate US dollars. The 1.40% €77 million Bonds 2025 and the 1.81% €90 million Bonds 2028 have been swapped into floating rate euros. $100 million of the 3.14% $130 million Bonds 2025 have been swapped into sterling at 2.83%.
All borrowings bear interest at fixed rates with the exception of the KfW loan 2020, the EIB loan 2022 and the bank overdrafts, which bear interest at commercial floating rates.
Acc
ou
nts
Johnson Matthey
Annual Report and Accounts 2019 191
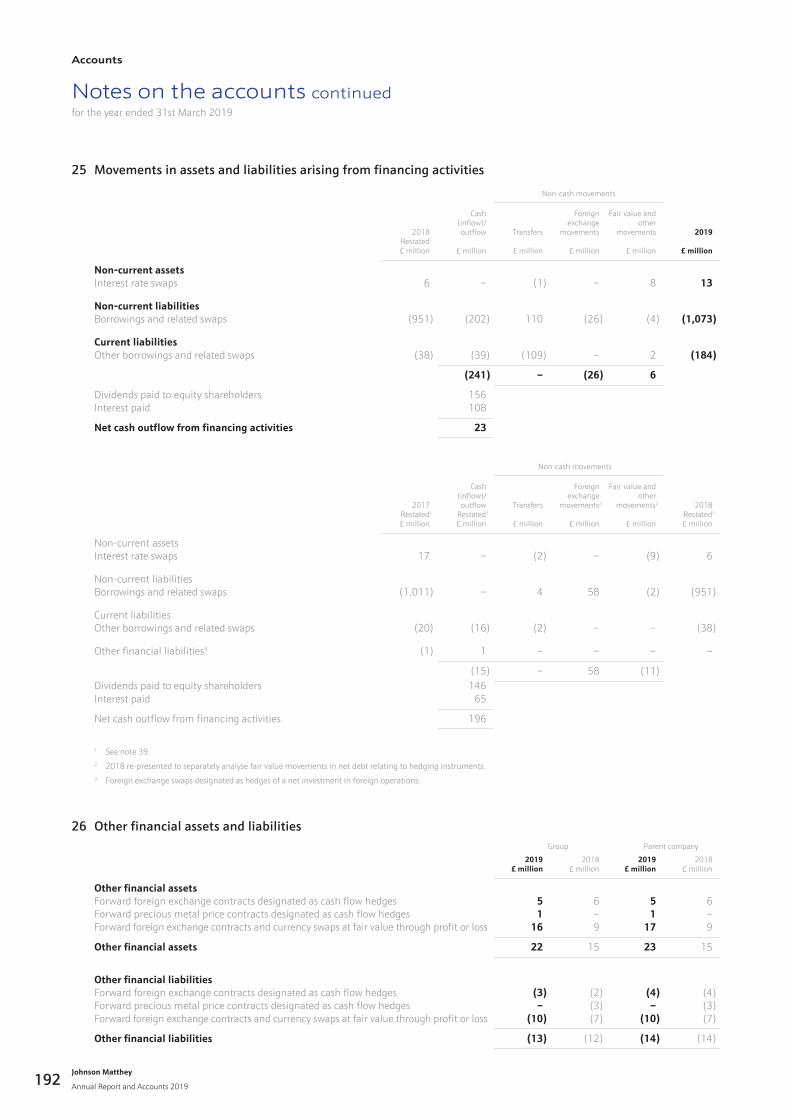
Notes on the accounts continuedfor the year ended 31st March 2019
25 Movements in assets and liabilities arising from financing activities
Non-cash movements
2018Restated1
£ million
Cash (inflow)/outflow
£ million
Transfers
£ million
Foreign exchange
movements
£ million
Fair value and other
movements
£ million
2019
£ million
Non-current assetsInterest rate swaps 6 – (1) – 8 13
Non-current liabilitiesBorrowings and related swaps (951) (202) 110 (26) (4) (1,073)
Current liabilitiesOther borrowings and related swaps (38) (39) (109) – 2 (184)
(241) – (26) 6
Dividends paid to equity shareholders 156Interest paid 108
Net cash outflow from financing activities 23
Non-cash movements
2017Restated1
£ million
Cash (inflow)/outflow
Restated1
£ million
Transfers
£ million
Foreign exchange
movements2
£ million
Fair value and other
movements2
£ million
2018Restated1
£ million
Non-current assetsInterest rate swaps 17 – (2) – (9) 6
Non-current liabilitiesBorrowings and related swaps (1,011) – 4 58 (2) (951)
Current liabilitiesOther borrowings and related swaps (20) (16) (2) – – (38)
Other financial liabilities3 (1) 1 – – – –
(15) – 58 (11)Dividends paid to equity shareholders 146Interest paid 65
Net cash outflow from financing activities 196
1 See note 39.2 2018 re-presented to separately analyse fair value movements in net debt relating to hedging instruments.3 Foreign exchange swaps designated as hedges of a net investment in foreign operations.
26 Other financial assets and liabilitiesGroup Parent company
2019£ million
2018£ million
2019£ million
2018£ million
Other financial assetsForward foreign exchange contracts designated as cash flow hedges 5 6 5 6Forward precious metal price contracts designated as cash flow hedges 1 – 1 –Forward foreign exchange contracts and currency swaps at fair value through profit or loss 16 9 17 9
Other financial assets 22 15 23 15
Other financial liabilitiesForward foreign exchange contracts designated as cash flow hedges (3) (2) (4) (4)Forward precious metal price contracts designated as cash flow hedges – (3) – (3)Forward foreign exchange contracts and currency swaps at fair value through profit or loss (10) (7) (10) (7)
Other financial liabilities (13) (12) (14) (14)
Johnson Matthey
Annual Report and Accounts 2019
Accounts
192
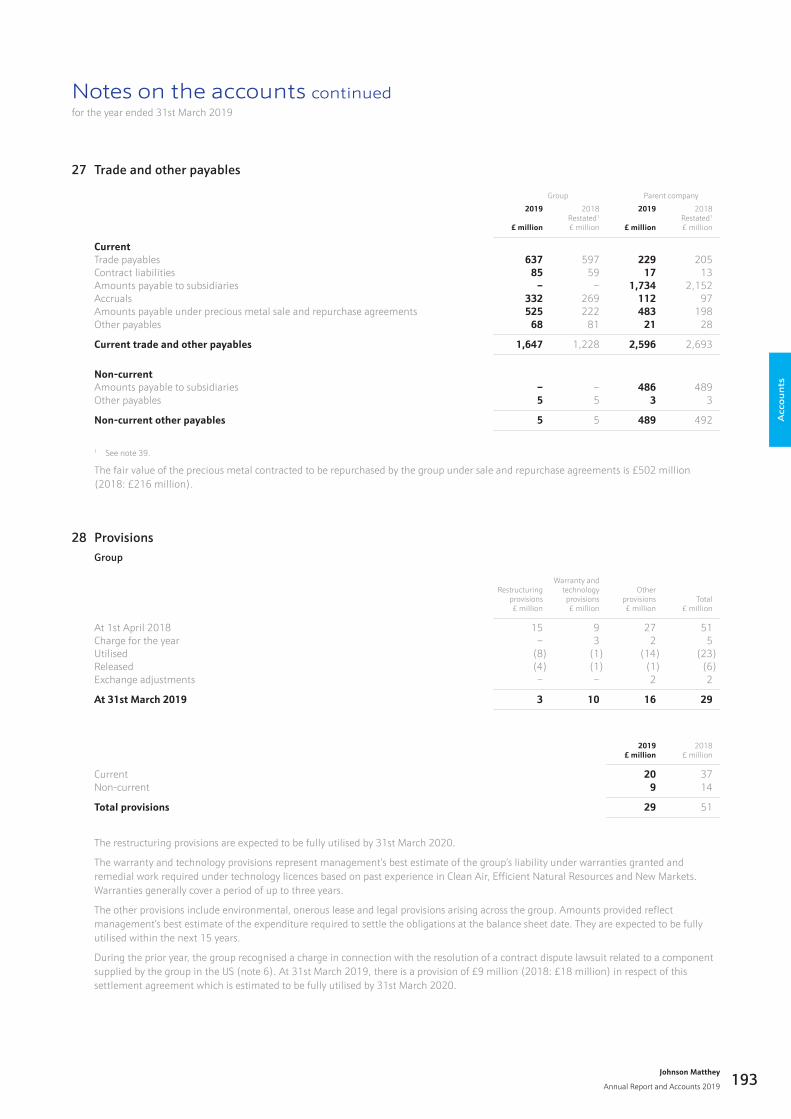
Notes on the accounts continuedfor the year ended 31st March 2019
27 Trade and other payables
Group Parent company
2019
£ million
2018 Restated1
£ million
2019
£ million
2018Restated1
£ million
CurrentTrade payables 637 597 229 205Contract liabilities 85 59 17 13Amounts payable to subsidiaries – – 1,734 2,152Accruals 332 269 112 97Amounts payable under precious metal sale and repurchase agreements 525 222 483 198Other payables 68 81 21 28
Current trade and other payables 1,647 1,228 2,596 2,693
Non-currentAmounts payable to subsidiaries – – 486 489Other payables 5 5 3 3
Non-current other payables 5 5 489 492
1 See note 39.
The fair value of the precious metal contracted to be repurchased by the group under sale and repurchase agreements is £502 million (2018: £216 million).
28 Provisions Group
Restructuringprovisions£ million
Warranty andtechnologyprovisions£ million
Otherprovisions£ million
Total£ million
At 1st April 2018 15 9 27 51Charge for the year – 3 2 5Utilised (8) (1) (14) (23)Released (4) (1) (1) (6)Exchange adjustments – – 2 2
At 31st March 2019 3 10 16 29
2019£ million
2018£ million
Current 20 37Non-current 9 14
Total provisions 29 51
The restructuring provisions are expected to be fully utilised by 31st March 2020.
The warranty and technology provisions represent management’s best estimate of the group’s liability under warranties granted and remedial work required under technology licences based on past experience in Clean Air, Efficient Natural Resources and New Markets. Warranties generally cover a period of up to three years.
The other provisions include environmental, onerous lease and legal provisions arising across the group. Amounts provided reflect management’s best estimate of the expenditure required to settle the obligations at the balance sheet date. They are expected to be fully utilised within the next 15 years.
During the prior year, the group recognised a charge in connection with the resolution of a contract dispute lawsuit related to a component supplied by the group in the US (note 6). At 31st March 2019, there is a provision of £9 million (2018: £18 million) in respect of this settlement agreement which is estimated to be fully utilised by 31st March 2020.
Acc
ou
nts
Johnson Matthey
Annual Report and Accounts 2019 193
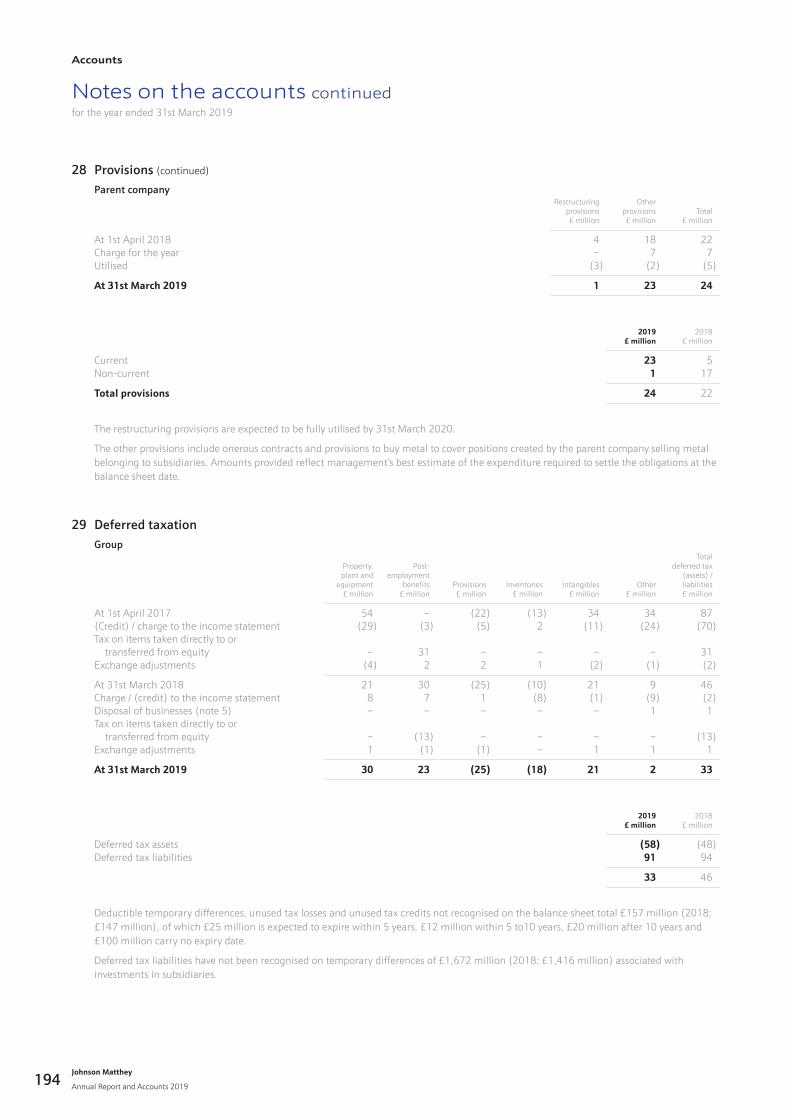
Notes on the accounts continuedfor the year ended 31st March 2019
28 Provisions (continued)
Parent companyRestructuring
provisions£ million
Otherprovisions£ million
Total£ million
At 1st April 2018 4 18 22Charge for the year – 7 7Utilised (3) (2) (5)
At 31st March 2019 1 23 24
2019£ million
2018£ million
Current 23 5Non-current 1 17
Total provisions 24 22
The restructuring provisions are expected to be fully utilised by 31st March 2020.
The other provisions include onerous contracts and provisions to buy metal to cover positions created by the parent company selling metal belonging to subsidiaries. Amounts provided reflect management’s best estimate of the expenditure required to settle the obligations at the balance sheet date.
29 Deferred taxation Group
Property,plant and
equipment£ million
Post-employment
benefits£ million
Provisions£ million
Inventories£ million
Intangibles£ million
Other£ million
Totaldeferred tax
(assets) /liabilities£ million
At 1st April 2017 54 – (22) (13) 34 34 87(Credit) / charge to the income statement (29) (3) (5) 2 (11) (24) (70)Tax on items taken directly to or transferred from equity – 31 – – – – 31Exchange adjustments (4) 2 2 1 (2) (1) (2)
At 31st March 2018 21 30 (25) (10) 21 9 46Charge / (credit) to the income statement 8 7 1 (8) (1) (9) (2)Disposal of businesses (note 5) – – – – – 1 1Tax on items taken directly to or transferred from equity – (13) – – – – (13)Exchange adjustments 1 (1) (1) – 1 1 1
At 31st March 2019 30 23 (25) (18) 21 2 33
2019£ million
2018£ million
Deferred tax assets (58) (48)Deferred tax liabilities 91 94
33 46
Deductible temporary differences, unused tax losses and unused tax credits not recognised on the balance sheet total £157 million (2018: £147 million), of which £25 million is expected to expire within 5 years, £12 million within 5 to10 years, £20 million after 10 years and £100 million carry no expiry date.
Deferred tax liabilities have not been recognised on temporary differences of £1,672 million (2018: £1,416 million) associated with investments in subsidiaries.
Johnson Matthey
Annual Report and Accounts 2019
Accounts
194
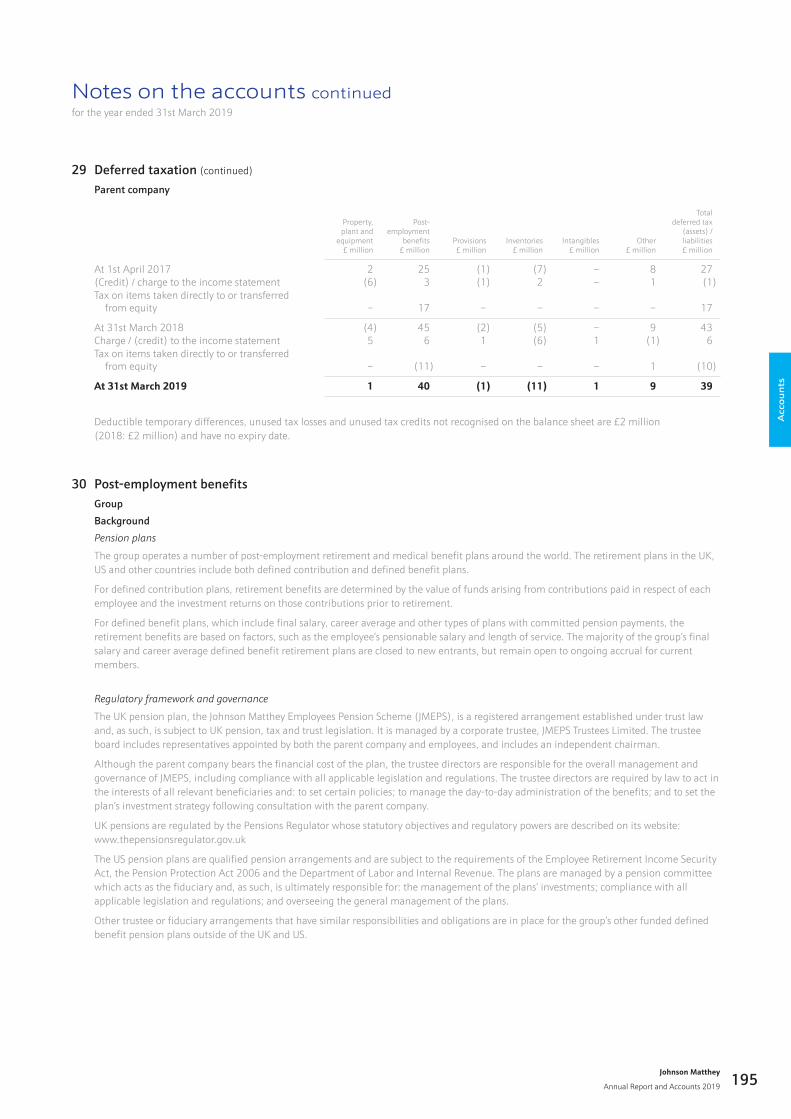
Notes on the accounts continuedfor the year ended 31st March 2019
29 Deferred taxation (continued)
Parent company
Property,plant and
equipment£ million
Post-employment
benefits£ million
Provisions£ million
Inventories£ million
Intangibles£ million
Other£ million
Totaldeferred tax
(assets) /liabilities£ million
At 1st April 2017 2 25 (1) (7) – 8 27(Credit) / charge to the income statement (6) 3 (1) 2 – 1 (1)Tax on items taken directly to or transferred from equity – 17 – – – – 17
At 31st March 2018 (4) 45 (2) (5) – 9 43Charge / (credit) to the income statement 5 6 1 (6) 1 (1) 6Tax on items taken directly to or transferred from equity – (11) – – – 1 (10)
At 31st March 2019 1 40 (1) (11) 1 9 39
Deductible temporary differences, unused tax losses and unused tax credits not recognised on the balance sheet are £2 million (2018: £2 million) and have no expiry date.
30 Post-employment benefits Group
Background
Pension plans
The group operates a number of post-employment retirement and medical benefit plans around the world. The retirement plans in the UK, US and other countries include both defined contribution and defined benefit plans.
For defined contribution plans, retirement benefits are determined by the value of funds arising from contributions paid in respect of each employee and the investment returns on those contributions prior to retirement.
For defined benefit plans, which include final salary, career average and other types of plans with committed pension payments, the retirement benefits are based on factors, such as the employee’s pensionable salary and length of service. The majority of the group’s final salary and career average defined benefit retirement plans are closed to new entrants, but remain open to ongoing accrual for current members.
Regulatory framework and governance
The UK pension plan, the Johnson Matthey Employees Pension Scheme (JMEPS), is a registered arrangement established under trust law and, as such, is subject to UK pension, tax and trust legislation. It is managed by a corporate trustee, JMEPS Trustees Limited. The trustee board includes representatives appointed by both the parent company and employees, and includes an independent chairman.
Although the parent company bears the financial cost of the plan, the trustee directors are responsible for the overall management and governance of JMEPS, including compliance with all applicable legislation and regulations. The trustee directors are required by law to act in the interests of all relevant beneficiaries and: to set certain policies; to manage the day-to-day administration of the benefits; and to set the plan’s investment strategy following consultation with the parent company.
UK pensions are regulated by the Pensions Regulator whose statutory objectives and regulatory powers are described on its website: www.thepensionsregulator.gov.uk
The US pension plans are qualified pension arrangements and are subject to the requirements of the Employee Retirement Income Security Act, the Pension Protection Act 2006 and the Department of Labor and Internal Revenue. The plans are managed by a pension committee which acts as the fiduciary and, as such, is ultimately responsible for: the management of the plans’ investments; compliance with all applicable legislation and regulations; and overseeing the general management of the plans.
Other trustee or fiduciary arrangements that have similar responsibilities and obligations are in place for the group’s other funded defined benefit pension plans outside of the UK and US.
Acc
ou
nts
Johnson Matthey
Annual Report and Accounts 2019 195
Notes on the accounts continuedfor the year ended 31st March 2019
30 Post-employment benefits (continued)
Group (continued)
Background (continued)
Benefits
The UK defined benefit pension plan is segregated into two sections – a legacy section which provides final salary and career average pension benefits and a cash balance section.
The legacy section provides benefits to members in the form of a set level of pension payable for life based on the member’s length of service and final pensionable salary at retirement or averaged over their career with the company. The majority of the benefits attract inflation-related increases both before and after retirement. The final salary element of the legacy section was closed to future accrual of benefits from 1st April 2010 and the career average element of the legacy section was closed to new entrants on 1st October 2012, but remains open to future accrual for existing members.
The cash balance section provides benefits to members at the point of retirement in the form of a cash lump sum. The benefits attract inflation-related increases before retirement but, following the payment of the retirement lump sum benefit, the plan has no obligation to pay any further benefits to the member. All new employees join the cash balance section of the plan.
During the year, employees in the career average element of the legacy section were given the option of switching to the cash balance section, with 57% electing to switch.
The group operates two defined benefit pension plans in the US. The hourly pension plan is for unionised employees and provides a fixed retirement benefit for life based upon years of service. The salaried pension plan provides retirement benefits for life based on the member’s length of service and final pensionable salary (averaged over the last five years). The salaried plan benefits attract inflation-related increases before leaving, but are non-increasing thereafter. On retirement, members in either plan have the option to take the cash value of their benefit instead of a lifetime annuity in which case the plan has no obligation to pay any further benefits to the member.
The US salaried pension plan was closed to new entrants on 1st September 2013, but remains open to future accrual for existing members. All new non-unionised US employees now join a defined contribution plan.
Otherpost-employmentbenefits
The group’s principal post-employment medical plans are in the UK and US, and are unfunded arrangements that have been closed to new entrants for over ten years.
Maturityprofile
The estimated weighted average durations of the defined benefit obligations of the main plans as at 31st March 2019 are:
Weighted average
durationYears
Pensions: UK 20 US 12Post-retirement medical benefits: UK 12 US 14
Funding
Introduction
The group’s principal defined benefit retirement plans are funded through separate fiduciary or trustee administered funds that are independent of the sponsoring company. The contributions paid to these arrangements are jointly agreed by the sponsoring company and the relevant trustee or fiduciary body after each funding valuation and in consultation with independent qualified actuaries. The plans’ assets, together with the agreed funding contributions, should be sufficient to meet the plans’ future pension obligations.
Johnson Matthey
Annual Report and Accounts 2019
Accounts
196
Notes on the accounts continuedfor the year ended 31st March 2019
30 Post-employment benefits (continued)
Group (continued)
Funding (continued)
UK valuations
UK legislation requires that pension plans are funded prudently and that, when undertaking a funding valuation (every three years), assets are taken at their market value and liabilities are determined based on a set of prudent assumptions set by the trustee following consultation with their appointed actuary. The assumptions used for funding valuations may, therefore, differ to the actuarial assumptions used for IAS 19, Employee Benefits, accounting purposes.
In January 2013, a special purpose vehicle (SPV), Johnson Matthey (Scotland) Limited Partnership, was set up to provide deficit reduction contributions and greater security to the trustee. The group invested £50 million in a bond portfolio which is beneficially held by the SPV. The income generated by the SPV is used to make annual distributions of £3.5 million to JMEPS for a period of up to 25 years. These annual distributions are only payable if the legacy section of JMEPS continues to be in deficit on a funding basis. This bond portfolio is held as a non-current investment at fair value through other comprehensive income (note 21) and the group’s liability to pay the income to the plan is not a plan asset under IAS 19, although it is for actuarial funding valuation purposes. The SPV is exempt from the requirement to prepare audited annual accounts as it is included on a consolidated basis in these accounts.
A funding valuation of JMEPS was carried out as at 1st April 2018 and showed that there was a deficit of £34 million in the legacy section of the plan. To address this deficit, the parent company agreed to make a contribution of £23 million prior to 31st December 2019, of which £6 million was paid during the year ended 31st March 2019. At 31st March 2018, £43 million remained available within the SPV for future distribution which created an overall surplus of £9 million in the legacy section of the plan at that date. The valuation also showed a surplus in the cash balance section of the plan.
In accordance with the governing documentation of JMEPS, any future plan surplus would be returned to the parent company by way of a refund assuming gradual settlement of the liabilities over the lifetime of the plan. As such, there are no adjustments required in respect of IFRIC 14, IAS 19 – The Limit on a Defined Benefit Asset, Minimum Funding Requirements and their Interaction.
US valuations
The last annual review of the US defined benefit pension plans was carried out by a qualified actuary as at 1st July 2018 and showed that there was a deficit of $3 million on the projected funding basis. To address this deficit, the parent company made a contribution of $3 million in November 2018. The assumptions used for funding valuations may differ to the actuarial assumptions used for IAS 19 accounting purposes.
Other valuations
Similar funding valuations are undertaken on the group’s other defined benefit pension plans outside of the UK and US in accordance with prevailing local legislation.
Acc
ou
nts
Johnson Matthey
Annual Report and Accounts 2019 197

Notes on the accounts continuedfor the year ended 31st March 2019
30 Post-employment benefits (continued)
Group (continued)
Funding (continued)
Risk management
The group is exposed to a number of risks relating to its post-retirement pension plans, the most significant of which are:
Risk Mitigation
Market (investment) risk
Asset returns may not move in line with the liabilities and may be subject to volatility.
The group’s various plans have highly diversified investment portfolios, investing in a wide range of assets that provide reasonable assurance that no single security or type of security could have a material adverse impact on the plan.
A de-risking strategy is in place to reduce volatility in the plans as a result of the mismatch between the assets and liabilities. As the funding level of the plans improve and hit pre-agreed triggers, plan investments are switched from return-seeking assets to liability-matching assets.
The plans implement partial currency hedging on their overseas assets to mitigate currency risk.
Interest (discount) rate risk
Liabilities are sensitive to movements in bond yields (interest rates), with lower interest rates leading to an increase in the valuation of liabilities, albeit the impact on the plan’s funding level will be partially offset by an increase in the value of its bond holdings.
The group’s defined benefit plans hold a high proportion of their assets in government or corporate bonds, which provide a natural hedge against falling interest rates.
In the UK, this interest rate hedge is extended by the use of interest rate swaps, such that approximately 70% of the plan’s interest rate risk is currently hedged. The swaps are held with several banks to reduce counterparty risk.
Inflation risk
Liabilities are sensitive to movements in inflation, with higher inflation leading to an increase in the valuation of liabilities.
Where plan benefits provide inflation-related increases, the plan holds some inflation-linked assets which provide a natural hedge against higher than expected inflation increases.
In the UK, this inflation hedge is extended by the use of inflation swaps, such that approximately 70% of the plan’s inflation risk is currently hedged. The swaps are held with several banks to reduce counterparty risk.
Longevity risk
The majority of the group’s defined benefit plans provide benefits for the life of the member, so the liabilities are sensitive to life expectancy, with increases in life expectancy leading to an increase in the valuation of liabilities.
The group has closed most of its defined benefit pension plans to new entrants, replacing them with either a cash balance plan or defined contribution plans, both of which are unaffected by life expectancy. During the year ended 31st March 2019, 57% of the members of the career average element of the legacy section of JMEPS elected to switch to the cash balance section as part of a pension plan review.
For the plans where a benefit for life continues to be payable, prudent mortality assumptions are used that appropriately allow for a future improvement in life expectancy. These assumptions are reviewed on a regular basis.
Contributions
During the year, total contributions to the group’s post-employment defined benefit plans were £75 million (2018: £69 million), including deficit contributions of £23 million (2018: £23 million) in respect of JMEPS.
It is estimated that the group will contribute approximately £67 million to the post-employment defined benefit plans during the year ending 31st March 2020.
IAS 19 accounting
Principal actuarial assumptions
Qualified independent actuaries have updated the IAS 19 valuations of the group’s major defined benefit plans to 31st March 2019. The assumptions used are chosen from a range of possible actuarial assumptions which, due to the long-term nature of the plans, may not necessarily be borne out in practice.
Johnson Matthey
Annual Report and Accounts 2019
Accounts
198
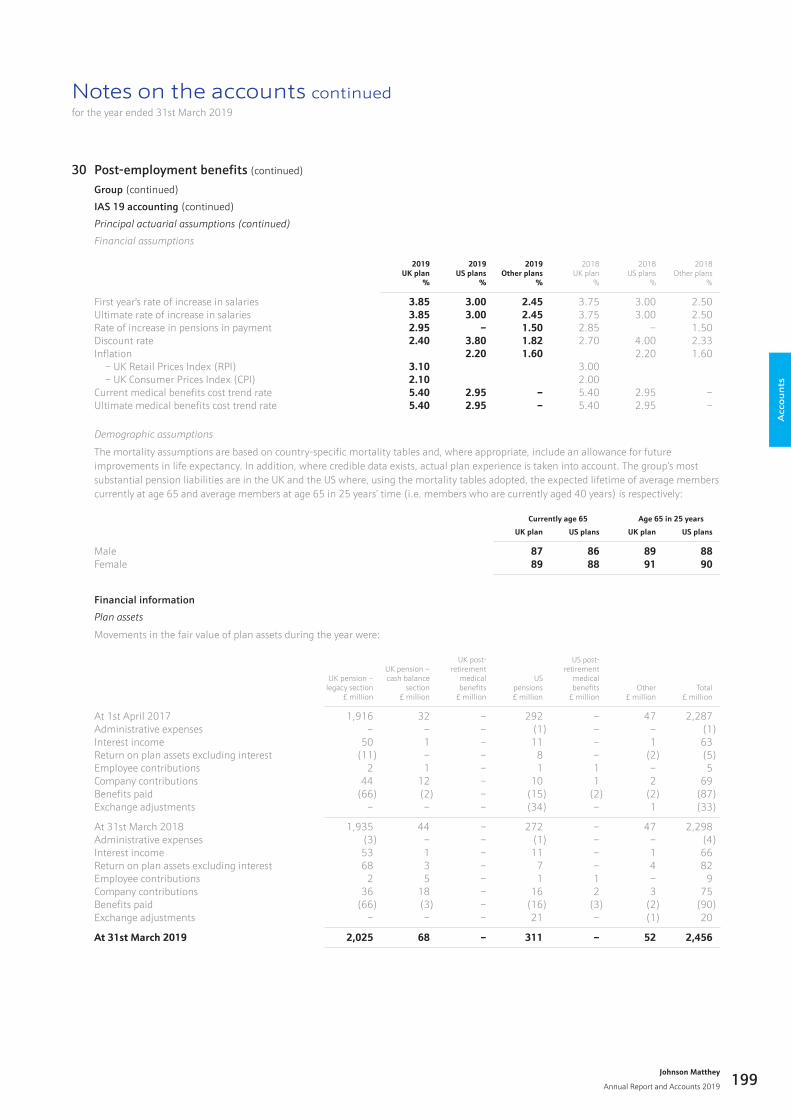
Notes on the accounts continuedfor the year ended 31st March 2019
30 Post-employment benefits (continued)
Group (continued)
IAS 19 accounting (continued)
Principal actuarial assumptions (continued)
Financial assumptions
2019UK plan
%
2019US plans
%
2019Other plans
%
2018UK plan
%
2018US plans
%
2018Other plans
%
First year's rate of increase in salaries 3.85 3.00 2.45 3.75 3.00 2.50Ultimate rate of increase in salaries 3.85 3.00 2.45 3.75 3.00 2.50Rate of increase in pensions in payment 2.95 – 1.50 2.85 – 1.50Discount rate 2.40 3.80 1.82 2.70 4.00 2.33Inflation 2.20 1.60 2.20 1.60 – UK Retail Prices Index (RPI) 3.10 3.00 – UK Consumer Prices Index (CPI) 2.10 2.00Current medical benefits cost trend rate 5.40 2.95 – 5.40 2.95 –Ultimate medical benefits cost trend rate 5.40 2.95 – 5.40 2.95 –
Demographic assumptions
The mortality assumptions are based on country-specific mortality tables and, where appropriate, include an allowance for future improvements in life expectancy. In addition, where credible data exists, actual plan experience is taken into account. The group’s most substantial pension liabilities are in the UK and the US where, using the mortality tables adopted, the expected lifetime of average members currently at age 65 and average members at age 65 in 25 years’ time (i.e. members who are currently aged 40 years) is respectively:
Currently age 65 Age 65 in 25 years
UK plan US plans UK plan US plans
Male 87 86 89 88Female 89 88 91 90
Financial information
Plan assets
Movements in the fair value of plan assets during the year were:
UK pension –legacy section
£ million
UK pension –cash balance
section£ million
UK post-retirement
medicalbenefits
£ million
USpensions£ million
US post-retirement
medicalbenefits
£ millionOther
£ millionTotal
£ million
At 1st April 2017 1,916 32 – 292 – 47 2,287Administrative expenses – – – (1) – – (1)Interest income 50 1 – 11 – 1 63Return on plan assets excluding interest (11) – – 8 – (2) (5)Employee contributions 2 1 – 1 1 – 5Company contributions 44 12 – 10 1 2 69Benefits paid (66) (2) – (15) (2) (2) (87)Exchange adjustments – – – (34) – 1 (33)
At 31st March 2018 1,935 44 – 272 – 47 2,298Administrative expenses (3) – – (1) – – (4)Interest income 53 1 – 11 – 1 66Return on plan assets excluding interest 68 3 – 7 – 4 82Employee contributions 2 5 – 1 1 – 9Company contributions 36 18 – 16 2 3 75Benefits paid (66) (3) – (16) (3) (2) (90)Exchange adjustments – – – 21 – (1) 20
At 31st March 2019 2,025 68 – 311 – 52 2,456
Acc
ou
nts
Johnson Matthey
Annual Report and Accounts 2019 199
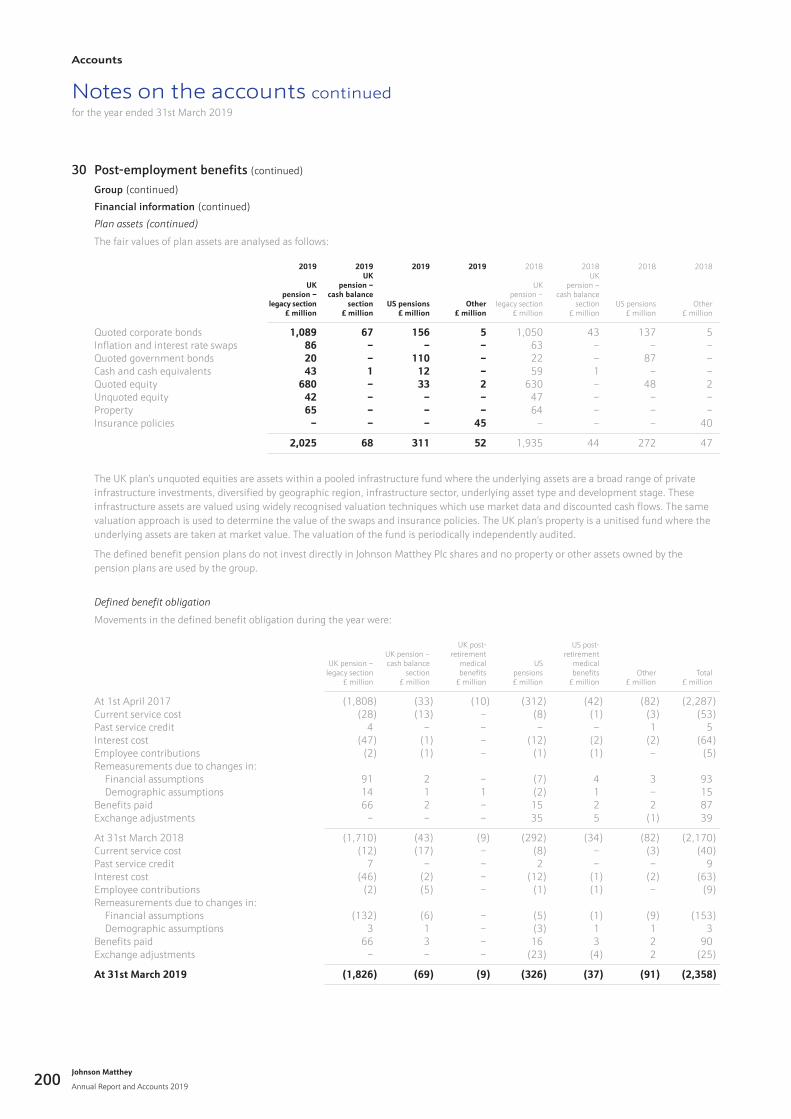
Notes on the accounts continuedfor the year ended 31st March 2019
30 Post-employment benefits (continued)
Group (continued)
Financial information (continued)
Plan assets (continued)
The fair values of plan assets are analysed as follows:
2019
UKpension –
legacy section£ million
2019UK
pension –cash balance
section£ million
2019
US pensions£ million
2019
Other£ million
2018
UKpension –
legacy section£ million
2018UK
pension –cash balance
section£ million
2018
US pensions£ million
2018
Other£ million
Quoted corporate bonds 1,089 67 156 5 1,050 43 137 5Inflation and interest rate swaps 86 – – – 63 – – –Quoted government bonds 20 – 110 – 22 – 87 –Cash and cash equivalents 43 1 12 – 59 1 – –Quoted equity 680 – 33 2 630 – 48 2Unquoted equity 42 – – – 47 – – –Property 65 – – – 64 – – –Insurance policies – – – 45 – – – 40
2,025 68 311 52 1,935 44 272 47
The UK plan’s unquoted equities are assets within a pooled infrastructure fund where the underlying assets are a broad range of private infrastructure investments, diversified by geographic region, infrastructure sector, underlying asset type and development stage. These infrastructure assets are valued using widely recognised valuation techniques which use market data and discounted cash flows. The same valuation approach is used to determine the value of the swaps and insurance policies. The UK plan’s property is a unitised fund where the underlying assets are taken at market value. The valuation of the fund is periodically independently audited.
The defined benefit pension plans do not invest directly in Johnson Matthey Plc shares and no property or other assets owned by the pension plans are used by the group.
Definedbenefitobligation
Movements in the defined benefit obligation during the year were:
UK pension –legacy section
£ million
UK pension –cash balance
section£ million
UK post-retirement
medicalbenefits
£ million
USpensions£ million
US post-retirement
medicalbenefits
£ millionOther
£ millionTotal
£ million
At 1st April 2017 (1,808) (33) (10) (312) (42) (82) (2,287)Current service cost (28) (13) – (8) (1) (3) (53)Past service credit 4 – – – – 1 5Interest cost (47) (1) – (12) (2) (2) (64)Employee contributions (2) (1) – (1) (1) – (5)Remeasurements due to changes in: Financial assumptions 91 2 – (7) 4 3 93 Demographic assumptions 14 1 1 (2) 1 – 15Benefits paid 66 2 – 15 2 2 87Exchange adjustments – – – 35 5 (1) 39
At 31st March 2018 (1,710) (43) (9) (292) (34) (82) (2,170)Current service cost (12) (17) – (8) – (3) (40)Past service credit 7 – – 2 – – 9Interest cost (46) (2) – (12) (1) (2) (63)Employee contributions (2) (5) – (1) (1) – (9)Remeasurements due to changes in: Financial assumptions (132) (6) – (5) (1) (9) (153) Demographic assumptions 3 1 – (3) 1 1 3Benefits paid 66 3 – 16 3 2 90Exchange adjustments – – – (23) (4) 2 (25)
At 31st March 2019 (1,826) (69) (9) (326) (37) (91) (2,358)
Johnson Matthey
Annual Report and Accounts 2019
Accounts
200
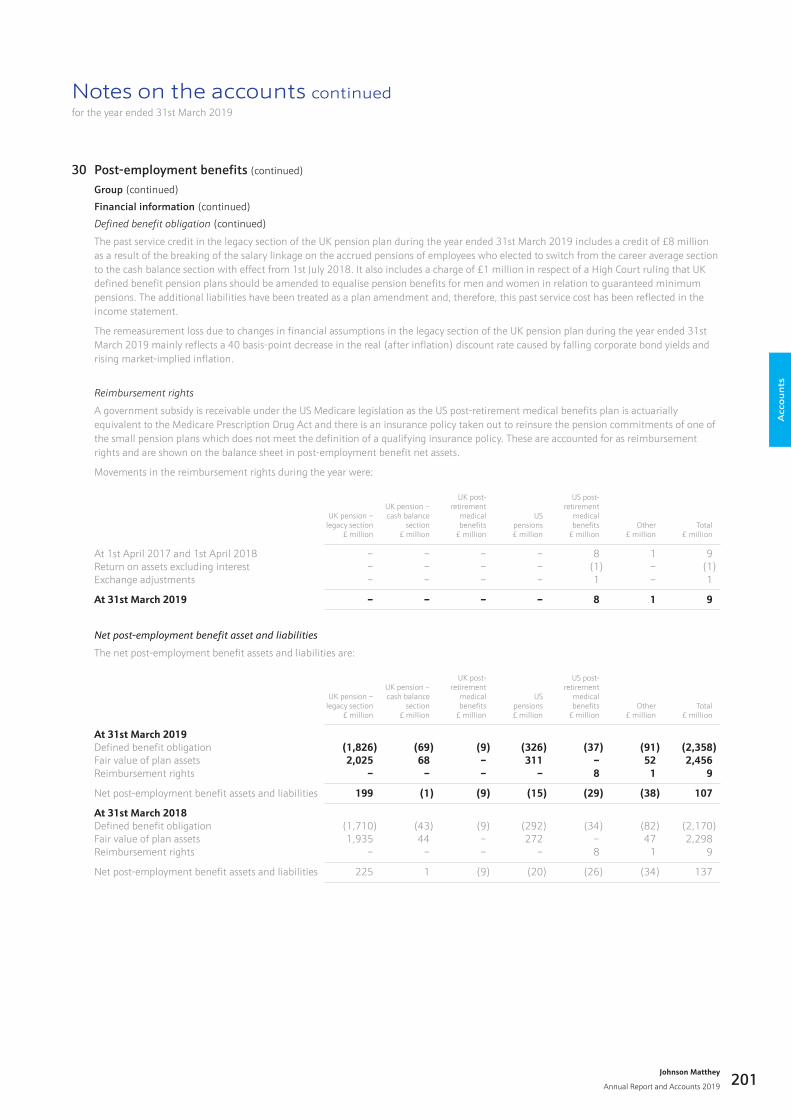
Notes on the accounts continuedfor the year ended 31st March 2019
30 Post-employment benefits (continued)
Group (continued)
Financial information (continued)
Definedbenefitobligation (continued)
The past service credit in the legacy section of the UK pension plan during the year ended 31st March 2019 includes a credit of £8 million as a result of the breaking of the salary linkage on the accrued pensions of employees who elected to switch from the career average section to the cash balance section with effect from 1st July 2018. It also includes a charge of £1 million in respect of a High Court ruling that UK defined benefit pension plans should be amended to equalise pension benefits for men and women in relation to guaranteed minimum pensions. The additional liabilities have been treated as a plan amendment and, therefore, this past service cost has been reflected in the income statement.
The remeasurement loss due to changes in financial assumptions in the legacy section of the UK pension plan during the year ended 31st March 2019 mainly reflects a 40 basis-point decrease in the real (after inflation) discount rate caused by falling corporate bond yields and rising market-implied inflation.
Reimbursement rights
A government subsidy is receivable under the US Medicare legislation as the US post-retirement medical benefits plan is actuarially equivalent to the Medicare Prescription Drug Act and there is an insurance policy taken out to reinsure the pension commitments of one of the small pension plans which does not meet the definition of a qualifying insurance policy. These are accounted for as reimbursement rights and are shown on the balance sheet in post-employment benefit net assets.
Movements in the reimbursement rights during the year were:
UK pension –legacy section
£ million
UK pension –cash balance
section£ million
UK post-retirement
medicalbenefits
£ million
USpensions£ million
US post-retirement
medicalbenefits
£ millionOther
£ millionTotal
£ million
At 1st April 2017 and 1st April 2018 – – – – 8 1 9Return on assets excluding interest – – – – (1) – (1)Exchange adjustments – – – – 1 – 1
At 31st March 2019 – – – – 8 1 9
Netpost-employmentbenefitassetandliabilities
The net post-employment benefit assets and liabilities are:
UK pension –legacy section
£ million
UK pension –cash balance
section£ million
UK post-retirement
medicalbenefits
£ million
USpensions£ million
US post-retirement
medicalbenefits
£ millionOther
£ millionTotal
£ million
At 31st March 2019Defined benefit obligation (1,826) (69) (9) (326) (37) (91) (2,358)Fair value of plan assets 2,025 68 – 311 – 52 2,456Reimbursement rights – – – – 8 1 9
Net post-employment benefit assets and liabilities 199 (1) (9) (15) (29) (38) 107
At 31st March 2018Defined benefit obligation (1,710) (43) (9) (292) (34) (82) (2,170)Fair value of plan assets 1,935 44 – 272 – 47 2,298Reimbursement rights – – – – 8 1 9
Net post-employment benefit assets and liabilities 225 1 (9) (20) (26) (34) 137
Acc
ou
nts
Johnson Matthey
Annual Report and Accounts 2019 201
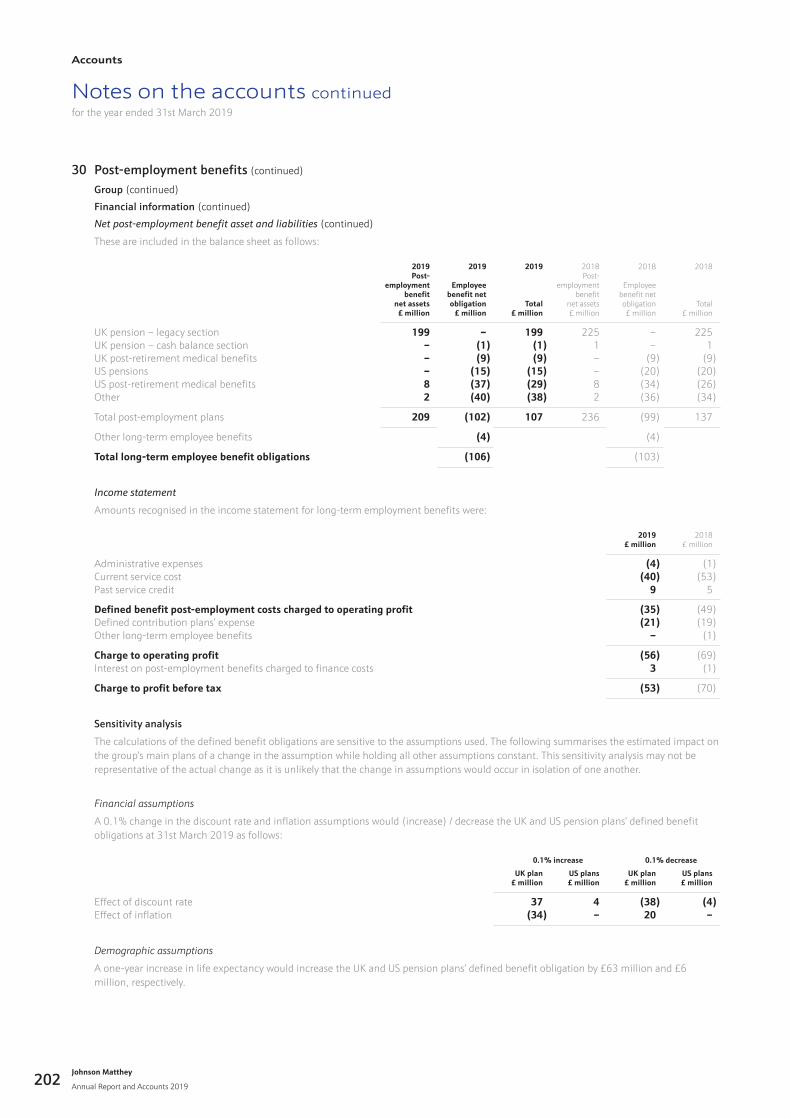
Notes on the accounts continuedfor the year ended 31st March 2019
30 Post-employment benefits (continued)
Group (continued)
Financial information (continued)
Netpost-employmentbenefitassetandliabilities (continued)
These are included in the balance sheet as follows:
2019Post-
employmentbenefit
net assets£ million
2019
Employeebenefit net obligation
£ million
2019
Total£ million
2018Post-
employmentbenefit
net assets£ million
2018
Employeebenefit net obligation£ million
2018
Total£ million
UK pension – legacy section 199 – 199 225 – 225UK pension – cash balance section – (1) (1) 1 – 1UK post-retirement medical benefits – (9) (9) – (9) (9)US pensions – (15) (15) – (20) (20)US post-retirement medical benefits 8 (37) (29) 8 (34) (26)Other 2 (40) (38) 2 (36) (34)
Total post-employment plans 209 (102) 107 236 (99) 137
Other long-term employee benefits (4) (4)
Total long-term employee benefit obligations (106) (103)
Incomestatement
Amounts recognised in the income statement for long-term employment benefits were:
2019£ million
2018£ million
Administrative expenses (4) (1)Current service cost (40) (53)Past service credit 9 5
Defined benefit post-employment costs charged to operating profit (35) (49)Defined contribution plans’ expense (21) (19)Other long-term employee benefits – (1)
Charge to operating profit (56) (69)Interest on post-employment benefits charged to finance costs 3 (1)
Charge to profit before tax (53) (70)
Sensitivity analysis
The calculations of the defined benefit obligations are sensitive to the assumptions used. The following summarises the estimated impact on the group’s main plans of a change in the assumption while holding all other assumptions constant. This sensitivity analysis may not be representative of the actual change as it is unlikely that the change in assumptions would occur in isolation of one another.
Financial assumptions
A 0.1% change in the discount rate and inflation assumptions would (increase) / decrease the UK and US pension plans’ defined benefit obligations at 31st March 2019 as follows:
0.1% increase 0.1% decrease
UK plan£ million
US plans£ million
UK plan£ million
US plans£ million
Effect of discount rate 37 4 (38) (4)Effect of inflation (34) – 20 –
Demographic assumptions
A one-year increase in life expectancy would increase the UK and US pension plans’ defined benefit obligation by £63 million and £6 million, respectively.
Johnson Matthey
Annual Report and Accounts 2019
Accounts
202
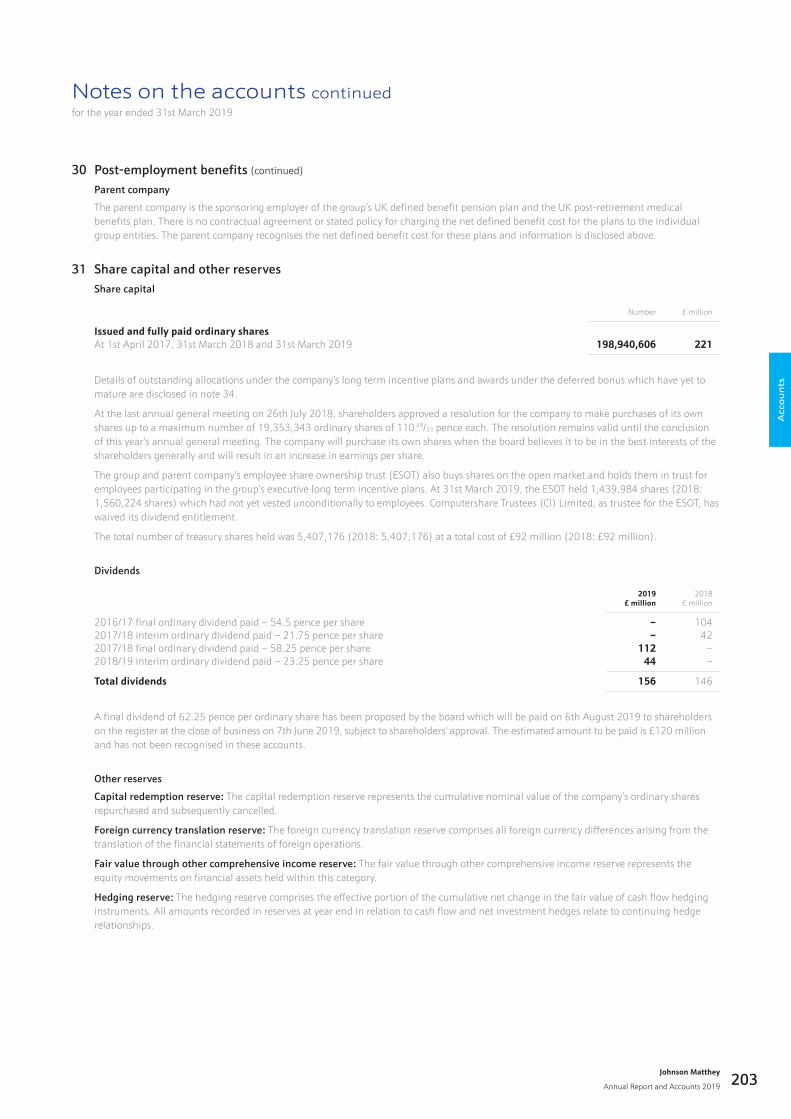
Notes on the accounts continuedfor the year ended 31st March 2019
30 Post-employment benefits (continued)
Parent company
The parent company is the sponsoring employer of the group’s UK defined benefit pension plan and the UK post-retirement medical benefits plan. There is no contractual agreement or stated policy for charging the net defined benefit cost for the plans to the individual group entities. The parent company recognises the net defined benefit cost for these plans and information is disclosed above.
31 Share capital and other reserves Share capital
Number £ million
Issued and fully paid ordinary sharesAt 1st April 2017, 31st March 2018 and 31st March 2019 198,940,606 221
Details of outstanding allocations under the company’s long term incentive plans and awards under the deferred bonus which have yet to mature are disclosed in note 34.
At the last annual general meeting on 26th July 2018, shareholders approved a resolution for the company to make purchases of its own shares up to a maximum number of 19,353,343 ordinary shares of 110 49/53 pence each. The resolution remains valid until the conclusion of this year’s annual general meeting. The company will purchase its own shares when the board believes it to be in the best interests of the shareholders generally and will result in an increase in earnings per share.
The group and parent company’s employee share ownership trust (ESOT) also buys shares on the open market and holds them in trust for employees participating in the group’s executive long term incentive plans. At 31st March 2019, the ESOT held 1,439,984 shares (2018: 1,560,224 shares) which had not yet vested unconditionally to employees. Computershare Trustees (CI) Limited, as trustee for the ESOT, has waived its dividend entitlement.
The total number of treasury shares held was 5,407,176 (2018: 5,407,176) at a total cost of £92 million (2018: £92 million).
Dividends
2019£ million
2018£ million
2016/17 final ordinary dividend paid – 54.5 pence per share – 1042017/18 interim ordinary dividend paid – 21.75 pence per share – 422017/18 final ordinary dividend paid – 58.25 pence per share 112 –2018/19 interim ordinary dividend paid – 23.25 pence per share 44 –
Total dividends 156 146
A final dividend of 62.25 pence per ordinary share has been proposed by the board which will be paid on 6th August 2019 to shareholders on the register at the close of business on 7th June 2019, subject to shareholders’ approval. The estimated amount to be paid is £120 million and has not been recognised in these accounts.
Other reserves
Capital redemption reserve: The capital redemption reserve represents the cumulative nominal value of the company’s ordinary shares repurchased and subsequently cancelled.
Foreign currency translation reserve: The foreign currency translation reserve comprises all foreign currency differences arising from the translation of the financial statements of foreign operations.
Fair value through other comprehensive income reserve: The fair value through other comprehensive income reserve represents the equity movements on financial assets held within this category.
Hedging reserve: The hedging reserve comprises the effective portion of the cumulative net change in the fair value of cash flow hedging instruments. All amounts recorded in reserves at year end in relation to cash flow and net investment hedges relate to continuing hedge relationships.
Acc
ou
nts
Johnson Matthey
Annual Report and Accounts 2019 203
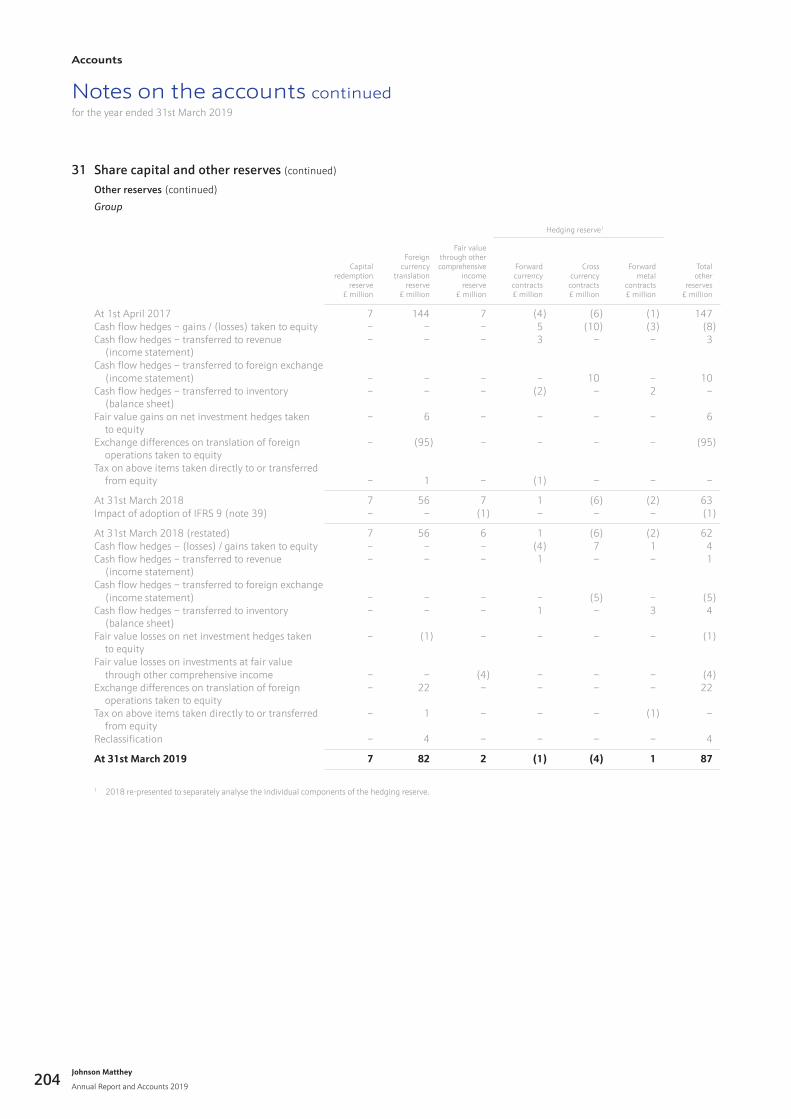
Notes on the accounts continuedfor the year ended 31st March 2019
31 Share capital and other reserves (continued)
Other reserves (continued)
Group
Hedging reserve1
Capitalredemption
reserve£ million
Foreigncurrency
translation reserve
£ million
Fair value through other comprehensive
income reserve
£ million
Forwardcurrency
contracts£ million
Crosscurrency
contracts£ million
Forwardmetal
contracts£ million
Totalother
reserves£ million
At 1st April 2017 7 144 7 (4) (6) (1) 147Cash flow hedges – gains / (losses) taken to equity – – – 5 (10) (3) (8)Cash flow hedges – transferred to revenue (income statement)
– – – 3 – – 3
Cash flow hedges – transferred to foreign exchange (income statement) – – – – 10 – 10Cash flow hedges – transferred to inventory (balance sheet)
– – – (2) – 2 –
Fair value gains on net investment hedges taken to equity
– 6 – – – – 6
Exchange differences on translation of foreign operations taken to equity
– (95) – – – – (95)
Tax on above items taken directly to or transferred from equity – 1 – (1) – – –
At 31st March 2018 7 56 7 1 (6) (2) 63Impact of adoption of IFRS 9 (note 39) – – (1) – – – (1)
At 31st March 2018 (restated) 7 56 6 1 (6) (2) 62Cash flow hedges – (losses) / gains taken to equity – – – (4) 7 1 4Cash flow hedges – transferred to revenue (income statement)
– – – 1 – – 1
Cash flow hedges – transferred to foreign exchange (income statement) – – – – (5) – (5)Cash flow hedges – transferred to inventory (balance sheet)
– – – 1 – 3 4
Fair value losses on net investment hedges taken to equity
– (1) – – – – (1)
Fair value losses on investments at fair value through other comprehensive income – – (4) – – – (4)Exchange differences on translation of foreign operations taken to equity
– 22 – – – – 22
Tax on above items taken directly to or transferred from equity
– 1 – – – (1) –
Reclassification – 4 – – – – 4
At 31st March 2019 7 82 2 (1) (4) 1 87
1 2018 re-presented to separately analyse the individual components of the hedging reserve.
Johnson Matthey
Annual Report and Accounts 2019
Accounts
204
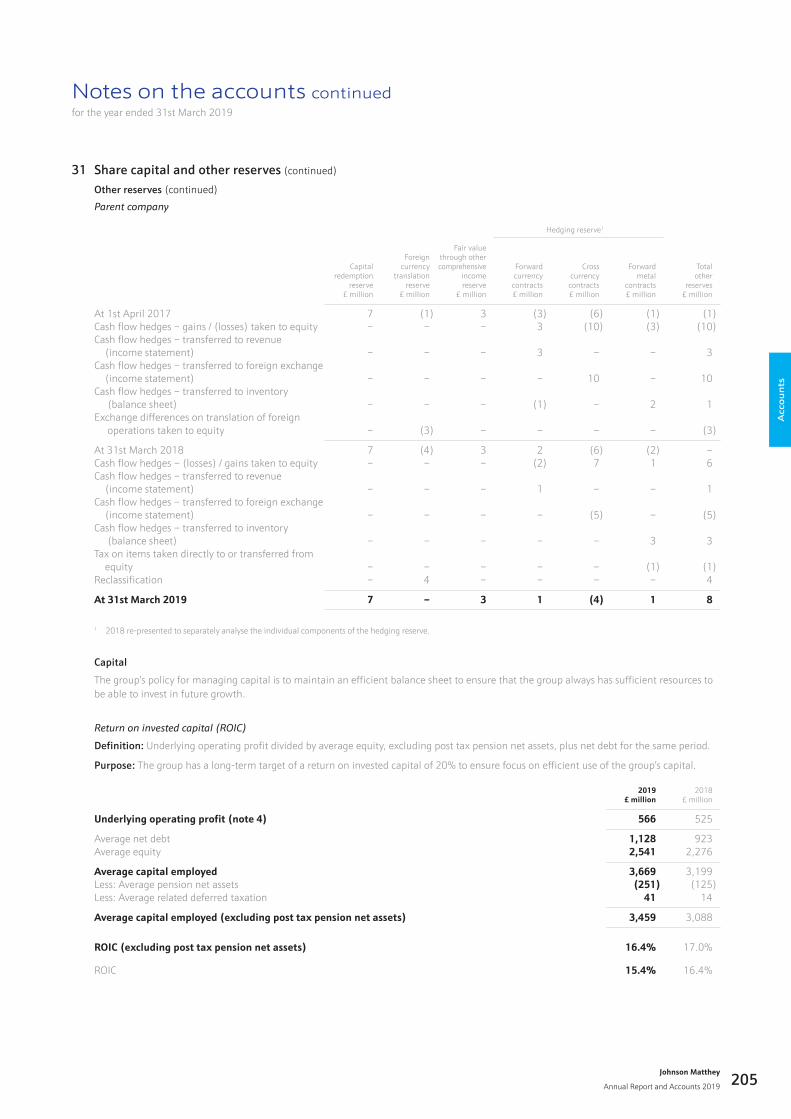
Notes on the accounts continuedfor the year ended 31st March 2019
31 Share capital and other reserves (continued)
Other reserves (continued)
Parentcompany
Hedging reserve1
Capitalredemption
reserve£ million
Foreigncurrency
translationreserve
£ million
Fair value through other comprehensive
income reserve
£ million
Forwardcurrency
contracts£ million
Crosscurrency
contracts£ million
Forwardmetal
contracts£ million
Totalother
reserves£ million
At 1st April 2017 7 (1) 3 (3) (6) (1) (1)Cash flow hedges – gains / (losses) taken to equity – – – 3 (10) (3) (10)Cash flow hedges – transferred to revenue (income statement) – – – 3 – – 3Cash flow hedges – transferred to foreign exchange (income statement) – – – – 10 – 10Cash flow hedges – transferred to inventory (balance sheet) – – – (1) – 2 1Exchange differences on translation of foreign operations taken to equity – (3) – – – – (3)
At 31st March 2018 7 (4) 3 2 (6) (2) –Cash flow hedges – (losses) / gains taken to equity – – – (2) 7 1 6Cash flow hedges – transferred to revenue (income statement) – – – 1 – – 1Cash flow hedges – transferred to foreign exchange (income statement) – – – – (5) – (5)Cash flow hedges – transferred to inventory (balance sheet) – – – – – 3 3Tax on items taken directly to or transferred from equity – – – – – (1) (1)Reclassification – 4 – – – – 4
At 31st March 2019 7 – 3 1 (4) 1 8
1 2018 re-presented to separately analyse the individual components of the hedging reserve.
Capital
The group’s policy for managing capital is to maintain an efficient balance sheet to ensure that the group always has sufficient resources to be able to invest in future growth.
Returnoninvestedcapital(ROIC)
Definition: Underlying operating profit divided by average equity, excluding post tax pension net assets, plus net debt for the same period.
Purpose: The group has a long-term target of a return on invested capital of 20% to ensure focus on efficient use of the group’s capital.
2019£ million
2018£ million
Underlying operating profit (note 4) 566 525
Average net debt 1,128 923Average equity 2,541 2,276
Average capital employed 3,669 3,199Less: Average pension net assets (251) (125)Less: Average related deferred taxation 41 14
Average capital employed (excluding post tax pension net assets) 3,459 3,088
ROIC (excluding post tax pension net assets) 16.4% 17.0%
ROIC 15.4% 16.4%
Acc
ou
nts
Johnson Matthey
Annual Report and Accounts 2019 205
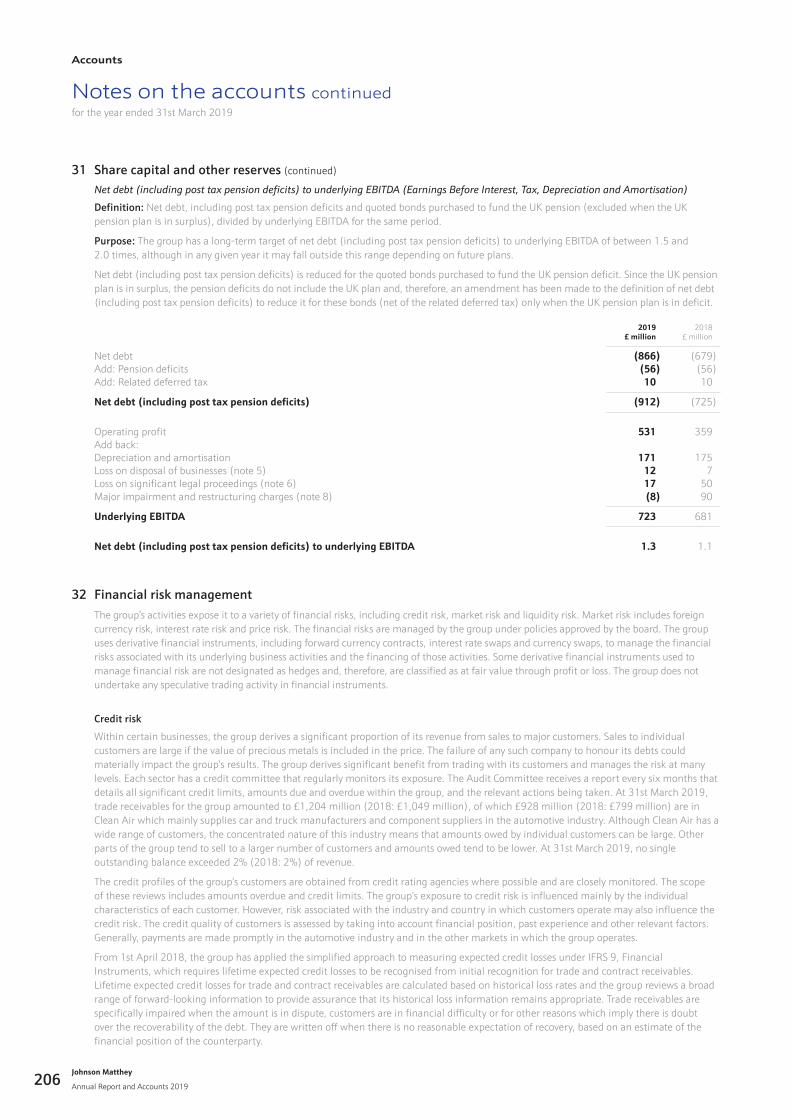
Notes on the accounts continuedfor the year ended 31st March 2019
31 Share capital and other reserves (continued)
Netdebt(includingposttaxpensiondeficits)tounderlyingEBITDA(EarningsBeforeInterest,Tax,DepreciationandAmortisation)
Definition: Net debt, including post tax pension deficits and quoted bonds purchased to fund the UK pension (excluded when the UK pension plan is in surplus), divided by underlying EBITDA for the same period.
Purpose: The group has a long-term target of net debt (including post tax pension deficits) to underlying EBITDA of between 1.5 and 2.0 times, although in any given year it may fall outside this range depending on future plans.
Net debt (including post tax pension deficits) is reduced for the quoted bonds purchased to fund the UK pension deficit. Since the UK pension plan is in surplus, the pension deficits do not include the UK plan and, therefore, an amendment has been made to the definition of net debt (including post tax pension deficits) to reduce it for these bonds (net of the related deferred tax) only when the UK pension plan is in deficit.
2019£ million
2018£ million
Net debt (866) (679)Add: Pension deficits (56) (56)Add: Related deferred tax 10 10
Net debt (including post tax pension deficits) (912) (725)
Operating profit 531 359Add back:Depreciation and amortisation 171 175Loss on disposal of businesses (note 5) 12 7Loss on significant legal proceedings (note 6) 17 50Major impairment and restructuring charges (note 8) (8) 90
Underlying EBITDA 723 681
Net debt (including post tax pension deficits) to underlying EBITDA 1.3 1.1
32 Financial risk managementThe group’s activities expose it to a variety of financial risks, including credit risk, market risk and liquidity risk. Market risk includes foreign currency risk, interest rate risk and price risk. The financial risks are managed by the group under policies approved by the board. The group uses derivative financial instruments, including forward currency contracts, interest rate swaps and currency swaps, to manage the financial risks associated with its underlying business activities and the financing of those activities. Some derivative financial instruments used to manage financial risk are not designated as hedges and, therefore, are classified as at fair value through profit or loss. The group does not undertake any speculative trading activity in financial instruments.
Credit risk
Within certain businesses, the group derives a significant proportion of its revenue from sales to major customers. Sales to individual customers are large if the value of precious metals is included in the price. The failure of any such company to honour its debts could materially impact the group’s results. The group derives significant benefit from trading with its customers and manages the risk at many levels. Each sector has a credit committee that regularly monitors its exposure. The Audit Committee receives a report every six months that details all significant credit limits, amounts due and overdue within the group, and the relevant actions being taken. At 31st March 2019, trade receivables for the group amounted to £1,204 million (2018: £1,049 million), of which £928 million (2018: £799 million) are in Clean Air which mainly supplies car and truck manufacturers and component suppliers in the automotive industry. Although Clean Air has a wide range of customers, the concentrated nature of this industry means that amounts owed by individual customers can be large. Other parts of the group tend to sell to a larger number of customers and amounts owed tend to be lower. At 31st March 2019, no single outstanding balance exceeded 2% (2018: 2%) of revenue.
The credit profiles of the group’s customers are obtained from credit rating agencies where possible and are closely monitored. The scope of these reviews includes amounts overdue and credit limits. The group’s exposure to credit risk is influenced mainly by the individual characteristics of each customer. However, risk associated with the industry and country in which customers operate may also influence the credit risk. The credit quality of customers is assessed by taking into account financial position, past experience and other relevant factors. Generally, payments are made promptly in the automotive industry and in the other markets in which the group operates.
From 1st April 2018, the group has applied the simplified approach to measuring expected credit losses under IFRS 9, Financial Instruments, which requires lifetime expected credit losses to be recognised from initial recognition for trade and contract receivables. Lifetime expected credit losses for trade and contract receivables are calculated based on historical loss rates and the group reviews a broad range of forward-looking information to provide assurance that its historical loss information remains appropriate. Trade receivables are specifically impaired when the amount is in dispute, customers are in financial difficulty or for other reasons which imply there is doubt over the recoverability of the debt. They are written off when there is no reasonable expectation of recovery, based on an estimate of the financial position of the counterparty.
Johnson Matthey
Annual Report and Accounts 2019
Accounts
206
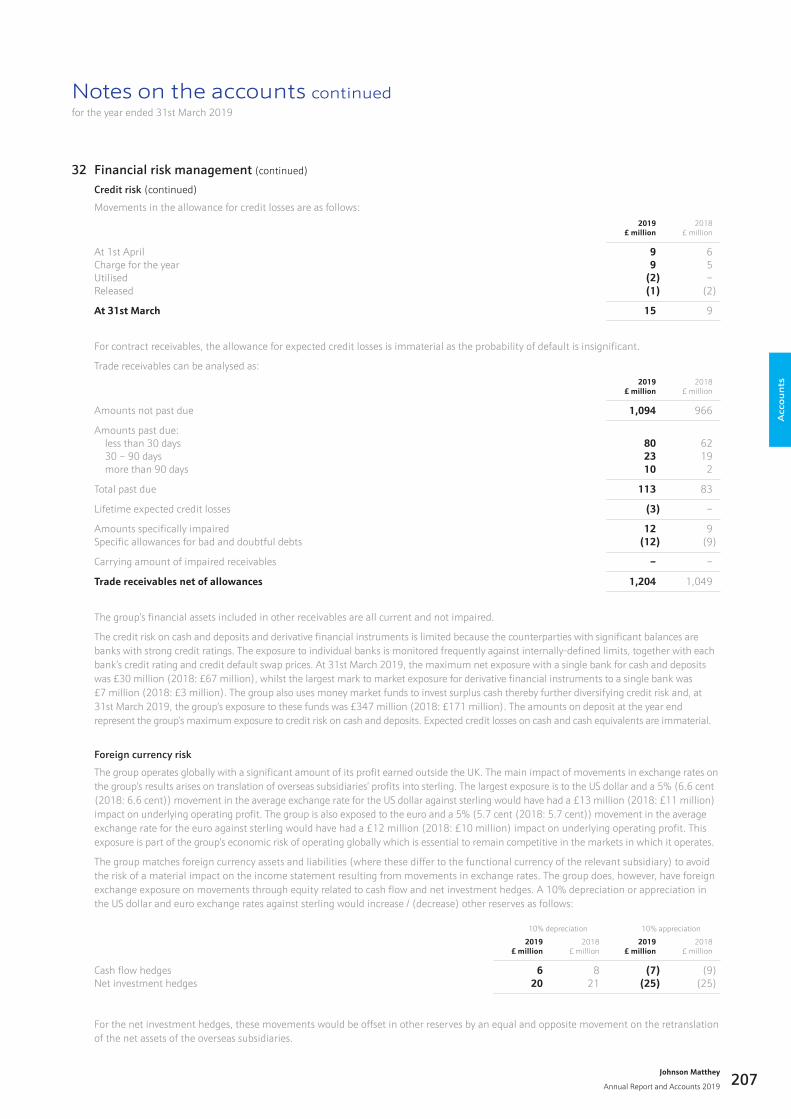
Notes on the accounts continuedfor the year ended 31st March 2019
32 Financial risk management (continued)
Credit risk (continued)
Movements in the allowance for credit losses are as follows:2019
£ million2018
£ million
At 1st April 9 6Charge for the year 9 5Utilised (2) –Released (1) (2)
At 31st March 15 9
For contract receivables, the allowance for expected credit losses is immaterial as the probability of default is insignificant.
Trade receivables can be analysed as:2019
£ million2018
£ million
Amounts not past due 1,094 966
Amounts past due: less than 30 days 80 62 30 – 90 days 23 19 more than 90 days 10 2
Total past due 113 83
Lifetime expected credit losses (3) –
Amounts specifically impaired 12 9Specific allowances for bad and doubtful debts (12) (9)
Carrying amount of impaired receivables – –
Trade receivables net of allowances 1,204 1,049
The group’s financial assets included in other receivables are all current and not impaired.
The credit risk on cash and deposits and derivative financial instruments is limited because the counterparties with significant balances are banks with strong credit ratings. The exposure to individual banks is monitored frequently against internally-defined limits, together with each bank’s credit rating and credit default swap prices. At 31st March 2019, the maximum net exposure with a single bank for cash and deposits was £30 million (2018: £67 million), whilst the largest mark to market exposure for derivative financial instruments to a single bank was £7 million (2018: £3 million). The group also uses money market funds to invest surplus cash thereby further diversifying credit risk and, at 31st March 2019, the group’s exposure to these funds was £347 million (2018: £171 million). The amounts on deposit at the year end represent the group’s maximum exposure to credit risk on cash and deposits. Expected credit losses on cash and cash equivalents are immaterial.
Foreign currency risk
The group operates globally with a significant amount of its profit earned outside the UK. The main impact of movements in exchange rates on the group’s results arises on translation of overseas subsidiaries’ profits into sterling. The largest exposure is to the US dollar and a 5% (6.6 cent (2018: 6.6 cent)) movement in the average exchange rate for the US dollar against sterling would have had a £13 million (2018: £11 million) impact on underlying operating profit. The group is also exposed to the euro and a 5% (5.7 cent (2018: 5.7 cent)) movement in the average exchange rate for the euro against sterling would have had a £12 million (2018: £10 million) impact on underlying operating profit. This exposure is part of the group’s economic risk of operating globally which is essential to remain competitive in the markets in which it operates.
The group matches foreign currency assets and liabilities (where these differ to the functional currency of the relevant subsidiary) to avoid the risk of a material impact on the income statement resulting from movements in exchange rates. The group does, however, have foreign exchange exposure on movements through equity related to cash flow and net investment hedges. A 10% depreciation or appreciation in the US dollar and euro exchange rates against sterling would increase / (decrease) other reserves as follows:
10% depreciation 10% appreciation
2019£ million
2018£ million
2019£ million
2018£ million
Cash flow hedges 6 8 (7) (9)Net investment hedges 20 21 (25) (25)
For the net investment hedges, these movements would be offset in other reserves by an equal and opposite movement on the retranslation of the net assets of the overseas subsidiaries.
Acc
ou
nts
Johnson Matthey
Annual Report and Accounts 2019 207
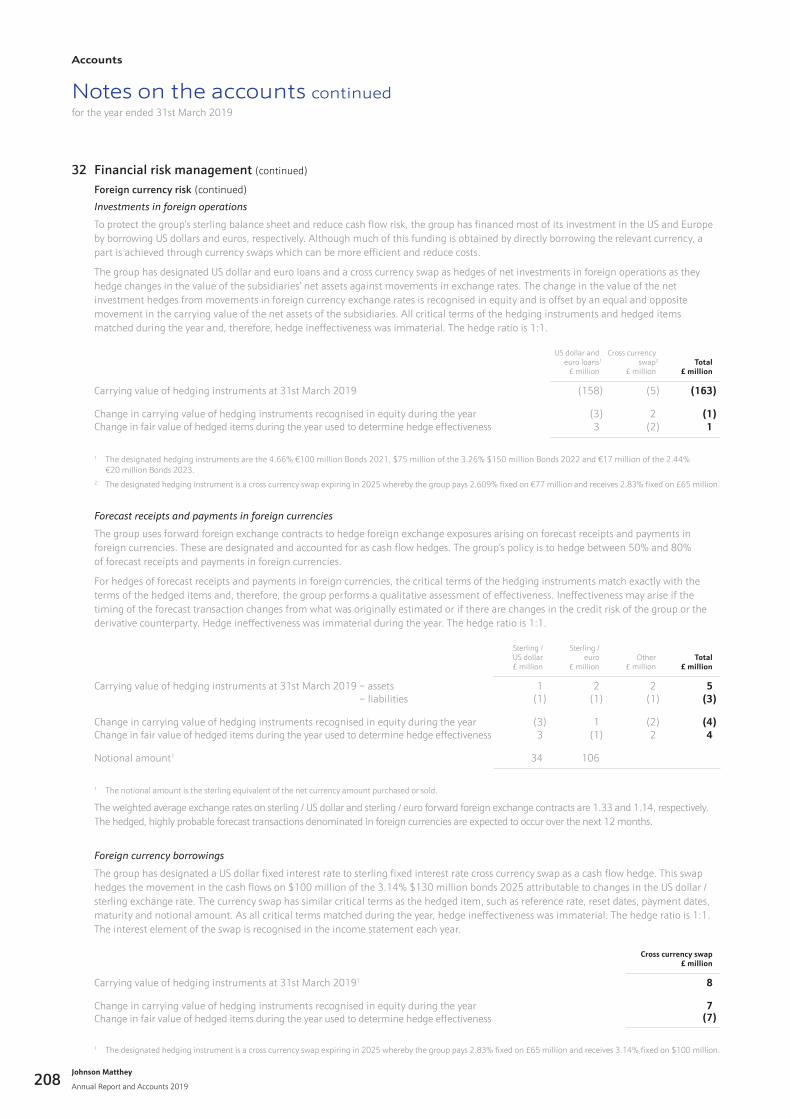
Notes on the accounts continuedfor the year ended 31st March 2019
32 Financial risk management (continued)
Foreign currency risk (continued)
Investmentsinforeignoperations
To protect the group’s sterling balance sheet and reduce cash flow risk, the group has financed most of its investment in the US and Europe by borrowing US dollars and euros, respectively. Although much of this funding is obtained by directly borrowing the relevant currency, a part is achieved through currency swaps which can be more efficient and reduce costs.
The group has designated US dollar and euro loans and a cross currency swap as hedges of net investments in foreign operations as they hedge changes in the value of the subsidiaries’ net assets against movements in exchange rates. The change in the value of the net investment hedges from movements in foreign currency exchange rates is recognised in equity and is offset by an equal and opposite movement in the carrying value of the net assets of the subsidiaries. All critical terms of the hedging instruments and hedged items matched during the year and, therefore, hedge ineffectiveness was immaterial. The hedge ratio is 1:1.
US dollar andeuro loans1
£ million
Cross currencyswap2
£ millionTotal
£ million
Carrying value of hedging instruments at 31st March 2019 (158) (5) (163)
Change in carrying value of hedging instruments recognised in equity during the year (3) 2 (1)Change in fair value of hedged items during the year used to determine hedge effectiveness 3 (2) 1
1 The designated hedging instruments are the 4.66% €100 million Bonds 2021, $75 million of the 3.26% $150 million Bonds 2022 and €17 million of the 2.44% €20 million Bonds 2023.
2 The designated hedging instrument is a cross currency swap expiring in 2025 whereby the group pays 2.609% fixed on €77 million and receives 2.83% fixed on £65 million.
Forecastreceiptsandpaymentsinforeigncurrencies
The group uses forward foreign exchange contracts to hedge foreign exchange exposures arising on forecast receipts and payments in foreign currencies. These are designated and accounted for as cash flow hedges. The group’s policy is to hedge between 50% and 80% of forecast receipts and payments in foreign currencies.
For hedges of forecast receipts and payments in foreign currencies, the critical terms of the hedging instruments match exactly with the terms of the hedged items and, therefore, the group performs a qualitative assessment of effectiveness. Ineffectiveness may arise if the timing of the forecast transaction changes from what was originally estimated or if there are changes in the credit risk of the group or the derivative counterparty. Hedge ineffectiveness was immaterial during the year. The hedge ratio is 1:1.
Sterling / US dollar£ million
Sterling / euro
£ millionOther
£ millionTotal
£ million
Carrying value of hedging instruments at 31st March 2019 – assets 1 2 2 5– liabilities (1) (1) (1) (3)
Change in carrying value of hedging instruments recognised in equity during the year (3) 1 (2) (4)Change in fair value of hedged items during the year used to determine hedge effectiveness 3 (1) 2 4
Notional amount1 34 106
1 The notional amount is the sterling equivalent of the net currency amount purchased or sold.
The weighted average exchange rates on sterling / US dollar and sterling / euro forward foreign exchange contracts are 1.33 and 1.14, respectively. The hedged, highly probable forecast transactions denominated in foreign currencies are expected to occur over the next 12 months.
Foreigncurrencyborrowings
The group has designated a US dollar fixed interest rate to sterling fixed interest rate cross currency swap as a cash flow hedge. This swap hedges the movement in the cash flows on $100 million of the 3.14% $130 million bonds 2025 attributable to changes in the US dollar / sterling exchange rate. The currency swap has similar critical terms as the hedged item, such as reference rate, reset dates, payment dates, maturity and notional amount. As all critical terms matched during the year, hedge ineffectiveness was immaterial. The hedge ratio is 1:1. The interest element of the swap is recognised in the income statement each year.
Cross currency swap£ million
Carrying value of hedging instruments at 31st March 20191 8
Change in carrying value of hedging instruments recognised in equity during the year 7Change in fair value of hedged items during the year used to determine hedge effectiveness (7)
1 The designated hedging instrument is a cross currency swap expiring in 2025 whereby the group pays 2.83% fixed on £65 million and receives 3.14% fixed on $100 million.
Johnson Matthey
Annual Report and Accounts 2019
Accounts
208
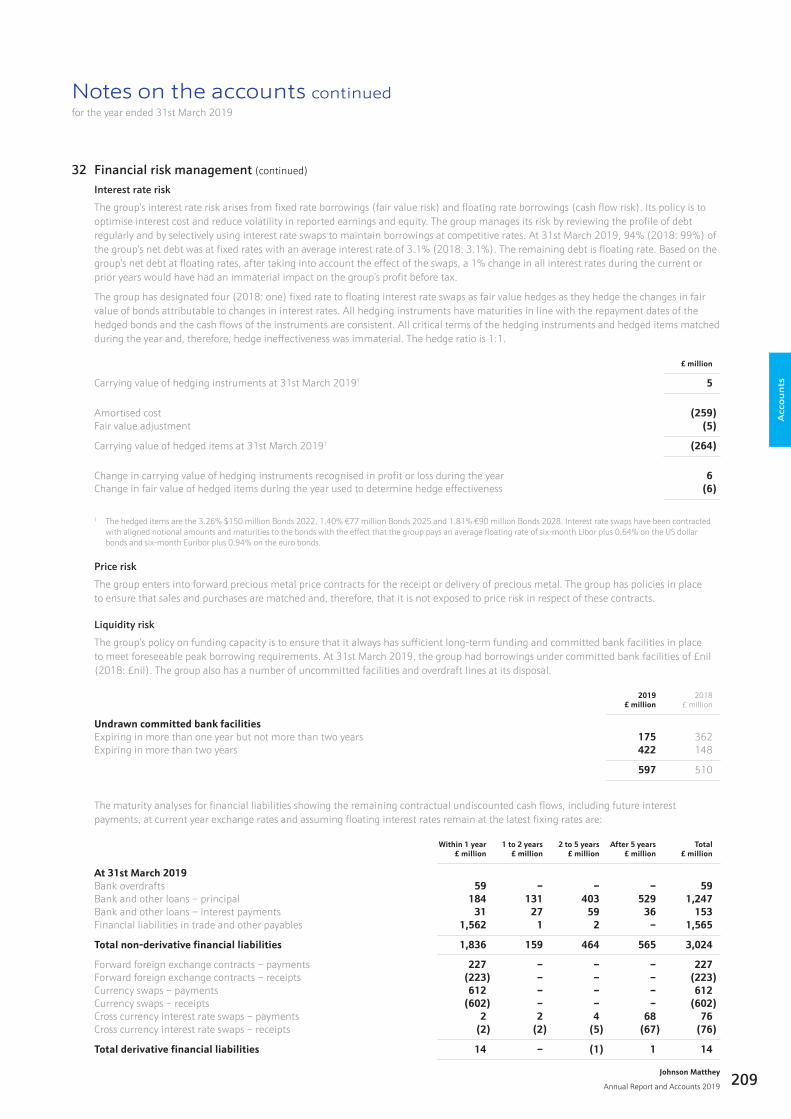
Notes on the accounts continuedfor the year ended 31st March 2019
32 Financial risk management (continued)
Interest rate risk
The group’s interest rate risk arises from fixed rate borrowings (fair value risk) and floating rate borrowings (cash flow risk). Its policy is to optimise interest cost and reduce volatility in reported earnings and equity. The group manages its risk by reviewing the profile of debt regularly and by selectively using interest rate swaps to maintain borrowings at competitive rates. At 31st March 2019, 94% (2018: 99%) of the group’s net debt was at fixed rates with an average interest rate of 3.1% (2018: 3.1%). The remaining debt is floating rate. Based on the group’s net debt at floating rates, after taking into account the effect of the swaps, a 1% change in all interest rates during the current or prior years would have had an immaterial impact on the group’s profit before tax.
The group has designated four (2018: one) fixed rate to floating interest rate swaps as fair value hedges as they hedge the changes in fair value of bonds attributable to changes in interest rates. All hedging instruments have maturities in line with the repayment dates of the hedged bonds and the cash flows of the instruments are consistent. All critical terms of the hedging instruments and hedged items matched during the year and, therefore, hedge ineffectiveness was immaterial. The hedge ratio is 1:1.
£ million
Carrying value of hedging instruments at 31st March 20191 5
Amortised cost (259)Fair value adjustment (5)
Carrying value of hedged items at 31st March 20191 (264)
Change in carrying value of hedging instruments recognised in profit or loss during the year 6Change in fair value of hedged items during the year used to determine hedge effectiveness (6)
1 The hedged items are the 3.26% $150 million Bonds 2022, 1.40% €77 million Bonds 2025 and 1.81% €90 million Bonds 2028. Interest rate swaps have been contracted with aligned notional amounts and maturities to the bonds with the effect that the group pays an average floating rate of six-month Libor plus 0.64% on the US dollar bonds and six-month Euribor plus 0.94% on the euro bonds.
Price risk
The group enters into forward precious metal price contracts for the receipt or delivery of precious metal. The group has policies in place to ensure that sales and purchases are matched and, therefore, that it is not exposed to price risk in respect of these contracts.
Liquidity risk
The group’s policy on funding capacity is to ensure that it always has sufficient long-term funding and committed bank facilities in place to meet foreseeable peak borrowing requirements. At 31st March 2019, the group had borrowings under committed bank facilities of £nil (2018: £nil). The group also has a number of uncommitted facilities and overdraft lines at its disposal.
2019£ million
2018£ million
Undrawn committed bank facilitiesExpiring in more than one year but not more than two years 175 362Expiring in more than two years 422 148
597 510
The maturity analyses for financial liabilities showing the remaining contractual undiscounted cash flows, including future interest payments, at current year exchange rates and assuming floating interest rates remain at the latest fixing rates are:
Within 1 year£ million
1 to 2 years£ million
2 to 5 years£ million
After 5 years£ million
Total£ million
At 31st March 2019Bank overdrafts 59 – – – 59Bank and other loans – principal 184 131 403 529 1,247Bank and other loans – interest payments 31 27 59 36 153Financial liabilities in trade and other payables 1,562 1 2 – 1,565
Total non-derivative financial liabilities 1,836 159 464 565 3,024
Forward foreign exchange contracts – payments 227 – – – 227Forward foreign exchange contracts – receipts (223) – – – (223)Currency swaps – payments 612 – – – 612Currency swaps – receipts (602) – – – (602)Cross currency interest rate swaps – payments 2 2 4 68 76Cross currency interest rate swaps – receipts (2) (2) (5) (67) (76)
Total derivative financial liabilities 14 – (1) 1 14
Acc
ou
nts
Johnson Matthey
Annual Report and Accounts 2019 209
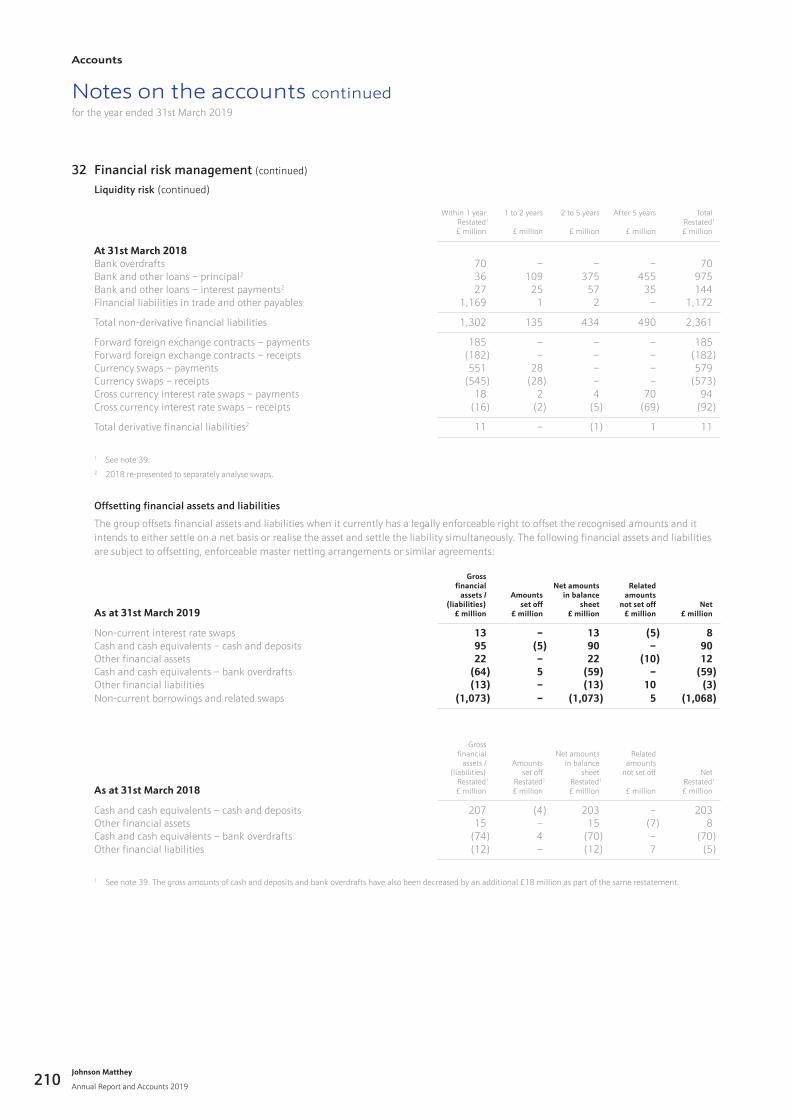
Notes on the accounts continuedfor the year ended 31st March 2019
32 Financial risk management (continued)
Liquidity risk (continued)
Within 1 yearRestated1
£ million
1 to 2 years
£ million
2 to 5 years
£ million
After 5 years
£ million
TotalRestated1
£ million
At 31st March 2018Bank overdrafts 70 – – – 70Bank and other loans – principal2 36 109 375 455 975Bank and other loans – interest payments2 27 25 57 35 144Financial liabilities in trade and other payables 1,169 1 2 – 1,172
Total non-derivative financial liabilities 1,302 135 434 490 2,361
Forward foreign exchange contracts – payments 185 – – – 185Forward foreign exchange contracts – receipts (182) – – – (182)Currency swaps – payments 551 28 – – 579Currency swaps – receipts (545) (28) – – (573)Cross currency interest rate swaps – payments 18 2 4 70 94Cross currency interest rate swaps – receipts (16) (2) (5) (69) (92)
Total derivative financial liabilities2 11 – (1) 1 11
1 See note 39.2 2018 re-presented to separately analyse swaps.
Offsetting financial assets and liabilities
The group offsets financial assets and liabilities when it currently has a legally enforceable right to offset the recognised amounts and it intends to either settle on a net basis or realise the asset and settle the liability simultaneously. The following financial assets and liabilities are subject to offsetting, enforceable master netting arrangements or similar agreements:
As at 31st March 2019
Grossfinancial
assets /(liabilities)
£ million
Amountsset off
£ million
Net amountsin balance
sheet£ million
Relatedamounts
not set off£ million
Net£ million
Non-current interest rate swaps 13 – 13 (5) 8Cash and cash equivalents – cash and deposits 95 (5) 90 – 90Other financial assets 22 – 22 (10) 12Cash and cash equivalents – bank overdrafts (64) 5 (59) – (59)Other financial liabilities (13) – (13) 10 (3)Non-current borrowings and related swaps (1,073) – (1,073) 5 (1,068)
As at 31st March 2018
Grossfinancial
assets /(liabilities)
Restated1
£ million
Amountsset off
Restated1
£ million
Net amountsin balance
sheetRestated1
£ million
Relatedamounts
not set off
£ million
NetRestated1
£ million
Cash and cash equivalents – cash and deposits 207 (4) 203 – 203Other financial assets 15 – 15 (7) 8Cash and cash equivalents – bank overdrafts (74) 4 (70) – (70)Other financial liabilities (12) – (12) 7 (5)
1 See note 39. The gross amounts of cash and deposits and bank overdrafts have also been decreased by an additional £18 million as part of the same restatement.
Johnson Matthey
Annual Report and Accounts 2019
Accounts
210
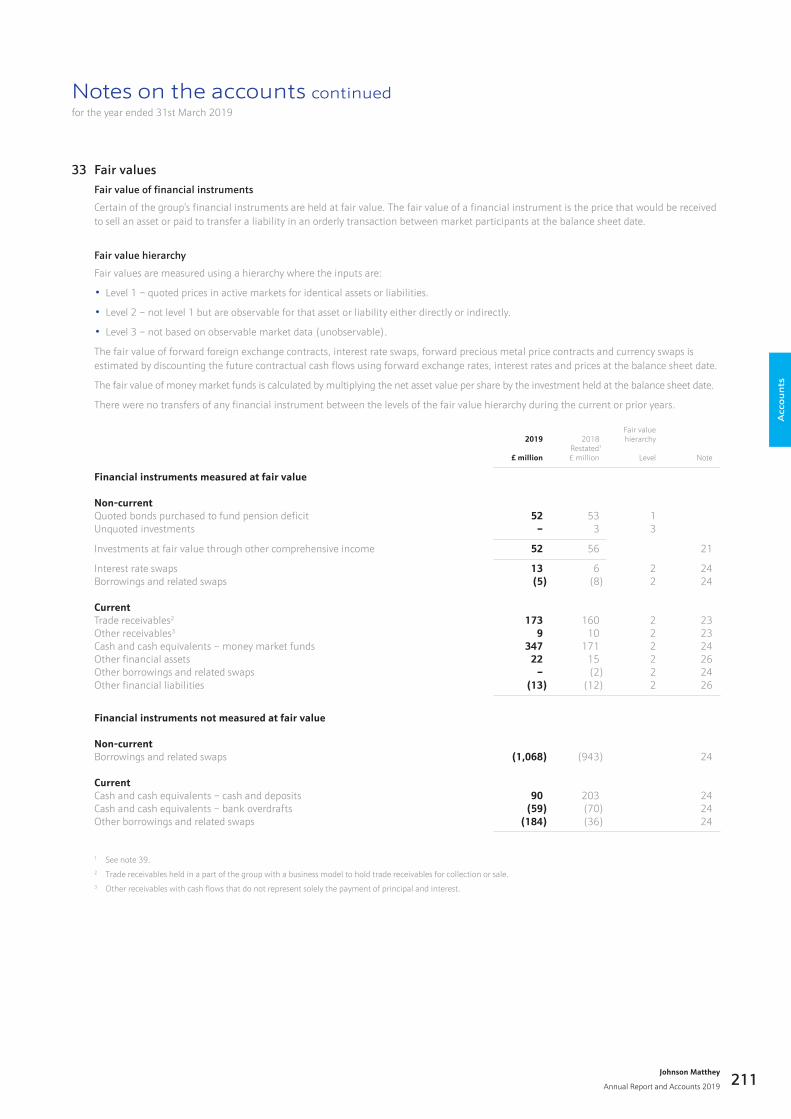
Notes on the accounts continuedfor the year ended 31st March 2019
33 Fair values Fair value of financial instruments
Certain of the group’s financial instruments are held at fair value. The fair value of a financial instrument is the price that would be received to sell an asset or paid to transfer a liability in an orderly transaction between market participants at the balance sheet date.
Fair value hierarchy
Fair values are measured using a hierarchy where the inputs are:
• Level 1 – quoted prices in active markets for identical assets or liabilities.
• Level 2 – not level 1 but are observable for that asset or liability either directly or indirectly.
• Level 3 – not based on observable market data (unobservable).
The fair value of forward foreign exchange contracts, interest rate swaps, forward precious metal price contracts and currency swaps is estimated by discounting the future contractual cash flows using forward exchange rates, interest rates and prices at the balance sheet date.
The fair value of money market funds is calculated by multiplying the net asset value per share by the investment held at the balance sheet date.
There were no transfers of any financial instrument between the levels of the fair value hierarchy during the current or prior years.
2019
£ million
2018Restated1
£ million
Fair valuehierarchy
Level Note
Financial instruments measured at fair value
Non-currentQuoted bonds purchased to fund pension deficit 52 53 1Unquoted investments – 3 3
Investments at fair value through other comprehensive income 52 56 21
Interest rate swaps 13 6 2 24Borrowings and related swaps (5) (8) 2 24
CurrentTrade receivables2 173 160 2 23Other receivables3 9 10 2 23Cash and cash equivalents – money market funds 347 171 2 24Other financial assets 22 15 2 26Other borrowings and related swaps – (2) 2 24Other financial liabilities (13) (12) 2 26
Financial instruments not measured at fair value
Non-currentBorrowings and related swaps (1,068) (943) 24
CurrentCash and cash equivalents – cash and deposits 90 203 24Cash and cash equivalents – bank overdrafts (59) (70) 24Other borrowings and related swaps (184) (36) 24
1 See note 39.2 Trade receivables held in a part of the group with a business model to hold trade receivables for collection or sale.3 Other receivables with cash flows that do not represent solely the payment of principal and interest.
Acc
ou
nts
Johnson Matthey
Annual Report and Accounts 2019 211
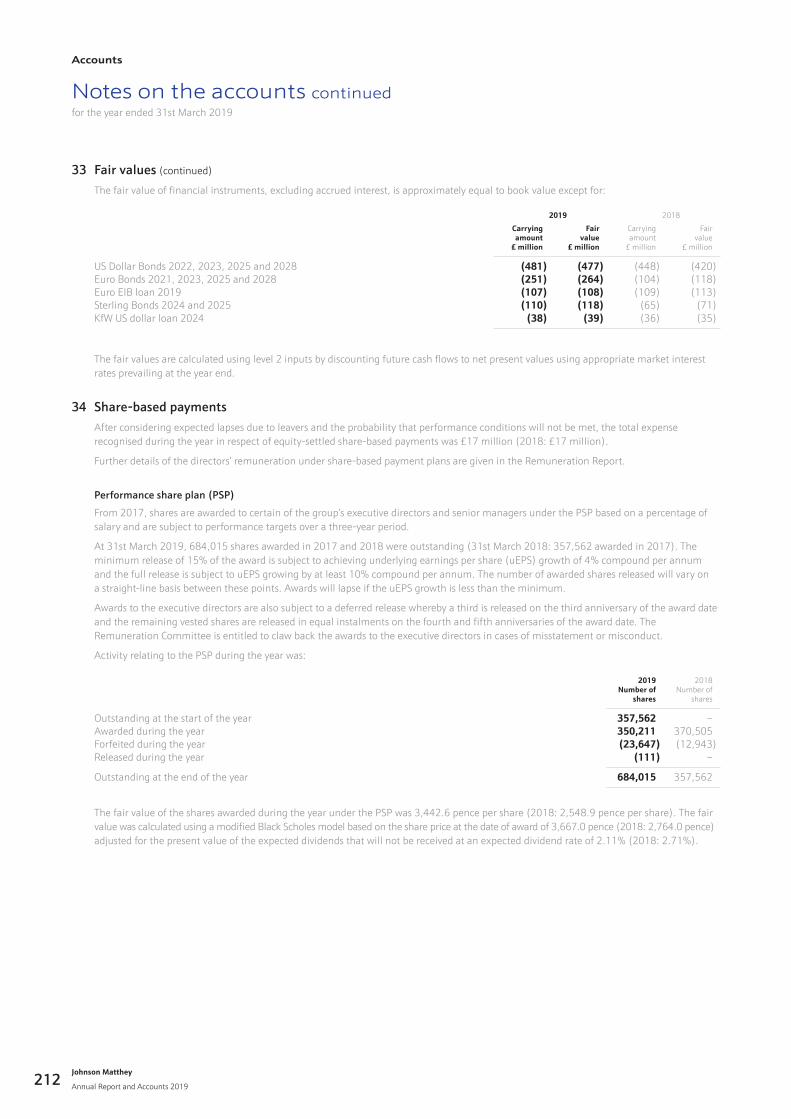
Notes on the accounts continuedfor the year ended 31st March 2019
33 Fair values (continued)
The fair value of financial instruments, excluding accrued interest, is approximately equal to book value except for:
2019 2018
Carryingamount
£ million
Fairvalue
£ million
Carryingamount
£ million
Fairvalue
£ million
US Dollar Bonds 2022, 2023, 2025 and 2028 (481) (477) (448) (420)Euro Bonds 2021, 2023, 2025 and 2028 (251) (264) (104) (118)Euro EIB loan 2019 (107) (108) (109) (113)Sterling Bonds 2024 and 2025 (110) (118) (65) (71)KfW US dollar loan 2024 (38) (39) (36) (35)
The fair values are calculated using level 2 inputs by discounting future cash flows to net present values using appropriate market interest rates prevailing at the year end.
34 Share-based paymentsAfter considering expected lapses due to leavers and the probability that performance conditions will not be met, the total expense recognised during the year in respect of equity-settled share-based payments was £17 million (2018: £17 million).
Further details of the directors’ remuneration under share-based payment plans are given in the Remuneration Report.
Performance share plan (PSP)
From 2017, shares are awarded to certain of the group’s executive directors and senior managers under the PSP based on a percentage of salary and are subject to performance targets over a three-year period.
At 31st March 2019, 684,015 shares awarded in 2017 and 2018 were outstanding (31st March 2018: 357,562 awarded in 2017). The minimum release of 15% of the award is subject to achieving underlying earnings per share (uEPS) growth of 4% compound per annum and the full release is subject to uEPS growing by at least 10% compound per annum. The number of awarded shares released will vary on a straight-line basis between these points. Awards will lapse if the uEPS growth is less than the minimum.
Awards to the executive directors are also subject to a deferred release whereby a third is released on the third anniversary of the award date and the remaining vested shares are released in equal instalments on the fourth and fifth anniversaries of the award date. The Remuneration Committee is entitled to claw back the awards to the executive directors in cases of misstatement or misconduct.
Activity relating to the PSP during the year was:
2019Number of
shares
2018Number of
shares
Outstanding at the start of the year 357,562 –Awarded during the year 350,211 370,505Forfeited during the year (23,647) (12,943)Released during the year (111) –
Outstanding at the end of the year 684,015 357,562
The fair value of the shares awarded during the year under the PSP was 3,442.6 pence per share (2018: 2,548.9 pence per share). The fair value was calculated using a modified Black Scholes model based on the share price at the date of award of 3,667.0 pence (2018: 2,764.0 pence) adjusted for the present value of the expected dividends that will not be received at an expected dividend rate of 2.11% (2018: 2.71%).
Johnson Matthey
Annual Report and Accounts 2019
Accounts
212
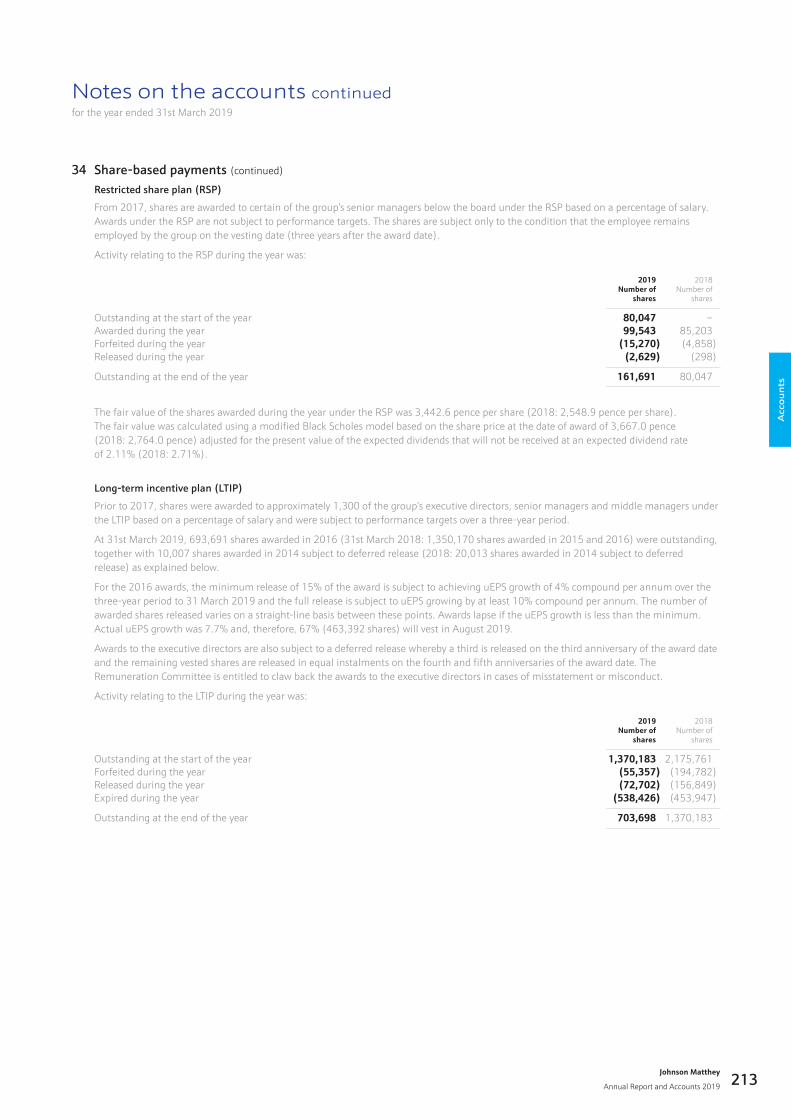
Notes on the accounts continuedfor the year ended 31st March 2019
34 Share-based payments (continued)
Restricted share plan (RSP)
From 2017, shares are awarded to certain of the group’s senior managers below the board under the RSP based on a percentage of salary. Awards under the RSP are not subject to performance targets. The shares are subject only to the condition that the employee remains employed by the group on the vesting date (three years after the award date).
Activity relating to the RSP during the year was:
2019Number of
shares
2018Number of
shares
Outstanding at the start of the year 80,047 –Awarded during the year 99,543 85,203Forfeited during the year (15,270) (4,858)Released during the year (2,629) (298)
Outstanding at the end of the year 161,691 80,047
The fair value of the shares awarded during the year under the RSP was 3,442.6 pence per share (2018: 2,548.9 pence per share). The fair value was calculated using a modified Black Scholes model based on the share price at the date of award of 3,667.0 pence (2018: 2,764.0 pence) adjusted for the present value of the expected dividends that will not be received at an expected dividend rate of 2.11% (2018: 2.71%).
Long-term incentive plan (LTIP)
Prior to 2017, shares were awarded to approximately 1,300 of the group’s executive directors, senior managers and middle managers under the LTIP based on a percentage of salary and were subject to performance targets over a three-year period.
At 31st March 2019, 693,691 shares awarded in 2016 (31st March 2018: 1,350,170 shares awarded in 2015 and 2016) were outstanding, together with 10,007 shares awarded in 2014 subject to deferred release (2018: 20,013 shares awarded in 2014 subject to deferred release) as explained below.
For the 2016 awards, the minimum release of 15% of the award is subject to achieving uEPS growth of 4% compound per annum over the three-year period to 31 March 2019 and the full release is subject to uEPS growing by at least 10% compound per annum. The number of awarded shares released varies on a straight-line basis between these points. Awards lapse if the uEPS growth is less than the minimum. Actual uEPS growth was 7.7% and, therefore, 67% (463,392 shares) will vest in August 2019.
Awards to the executive directors are also subject to a deferred release whereby a third is released on the third anniversary of the award date and the remaining vested shares are released in equal instalments on the fourth and fifth anniversaries of the award date. The Remuneration Committee is entitled to claw back the awards to the executive directors in cases of misstatement or misconduct.
Activity relating to the LTIP during the year was:
2019Number of
shares
2018Number of
shares
Outstanding at the start of the year 1,370,183 2,175,761Forfeited during the year (55,357) (194,782)Released during the year (72,702) (156,849)Expired during the year (538,426) (453,947)
Outstanding at the end of the year 703,698 1,370,183
Acc
ou
nts
Johnson Matthey
Annual Report and Accounts 2019 213
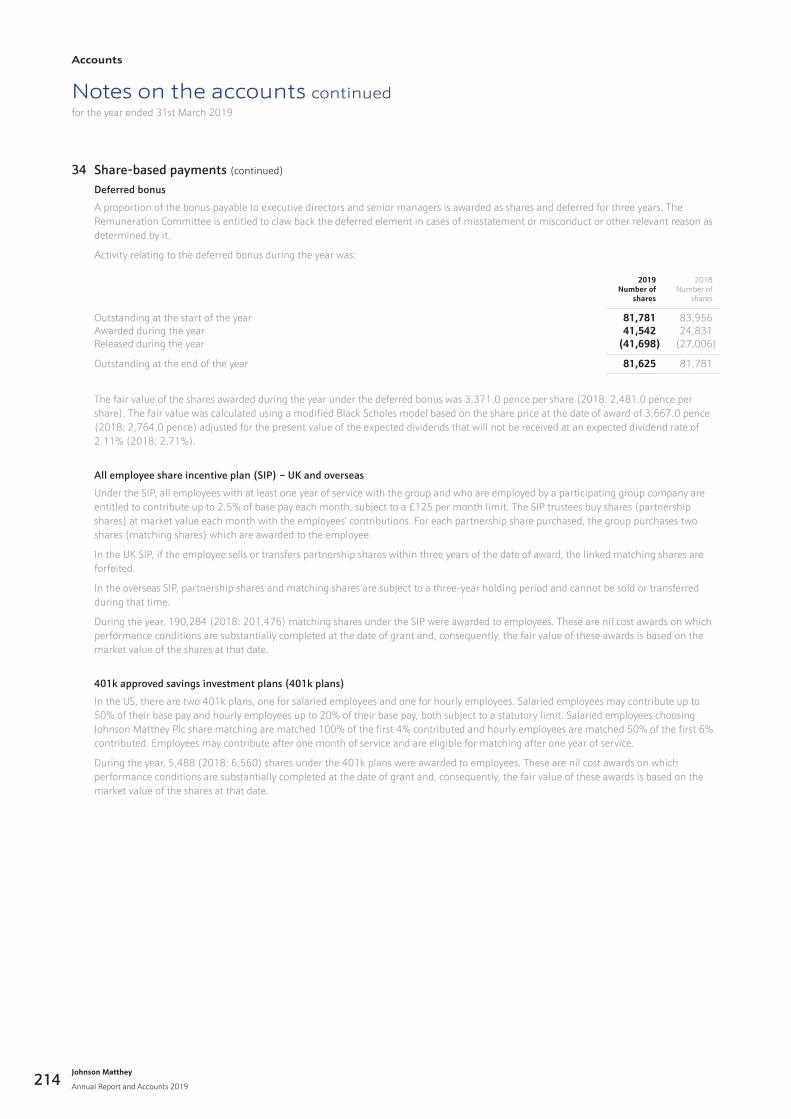
Notes on the accounts continuedfor the year ended 31st March 2019
34 Share-based payments (continued)
Deferred bonus
A proportion of the bonus payable to executive directors and senior managers is awarded as shares and deferred for three years. The Remuneration Committee is entitled to claw back the deferred element in cases of misstatement or misconduct or other relevant reason as determined by it.
Activity relating to the deferred bonus during the year was:
2019Number of
shares
2018Number of
shares
Outstanding at the start of the year 81,781 83,956Awarded during the year 41,542 24,831Released during the year (41,698) (27,006)
Outstanding at the end of the year 81,625 81,781
The fair value of the shares awarded during the year under the deferred bonus was 3,371.0 pence per share (2018: 2,481.0 pence per share). The fair value was calculated using a modified Black Scholes model based on the share price at the date of award of 3,667.0 pence (2018: 2,764.0 pence) adjusted for the present value of the expected dividends that will not be received at an expected dividend rate of 2.11% (2018: 2.71%).
All employee share incentive plan (SIP) – UK and overseas
Under the SIP, all employees with at least one year of service with the group and who are employed by a participating group company are entitled to contribute up to 2.5% of base pay each month, subject to a £125 per month limit. The SIP trustees buy shares (partnership shares) at market value each month with the employees’ contributions. For each partnership share purchased, the group purchases two shares (matching shares) which are awarded to the employee.
In the UK SIP, if the employee sells or transfers partnership shares within three years of the date of award, the linked matching shares are forfeited.
In the overseas SIP, partnership shares and matching shares are subject to a three-year holding period and cannot be sold or transferred during that time.
During the year, 190,284 (2018: 201,476) matching shares under the SIP were awarded to employees. These are nil cost awards on which performance conditions are substantially completed at the date of grant and, consequently, the fair value of these awards is based on the market value of the shares at that date.
401k approved savings investment plans (401k plans)
In the US, there are two 401k plans, one for salaried employees and one for hourly employees. Salaried employees may contribute up to 50% of their base pay and hourly employees up to 20% of their base pay, both subject to a statutory limit. Salaried employees choosing Johnson Matthey Plc share matching are matched 100% of the first 4% contributed and hourly employees are matched 50% of the first 6% contributed. Employees may contribute after one month of service and are eligible for matching after one year of service.
During the year, 5,488 (2018: 6,560) shares under the 401k plans were awarded to employees. These are nil cost awards on which performance conditions are substantially completed at the date of grant and, consequently, the fair value of these awards is based on the market value of the shares at that date.
Johnson Matthey
Annual Report and Accounts 2019
Accounts
214
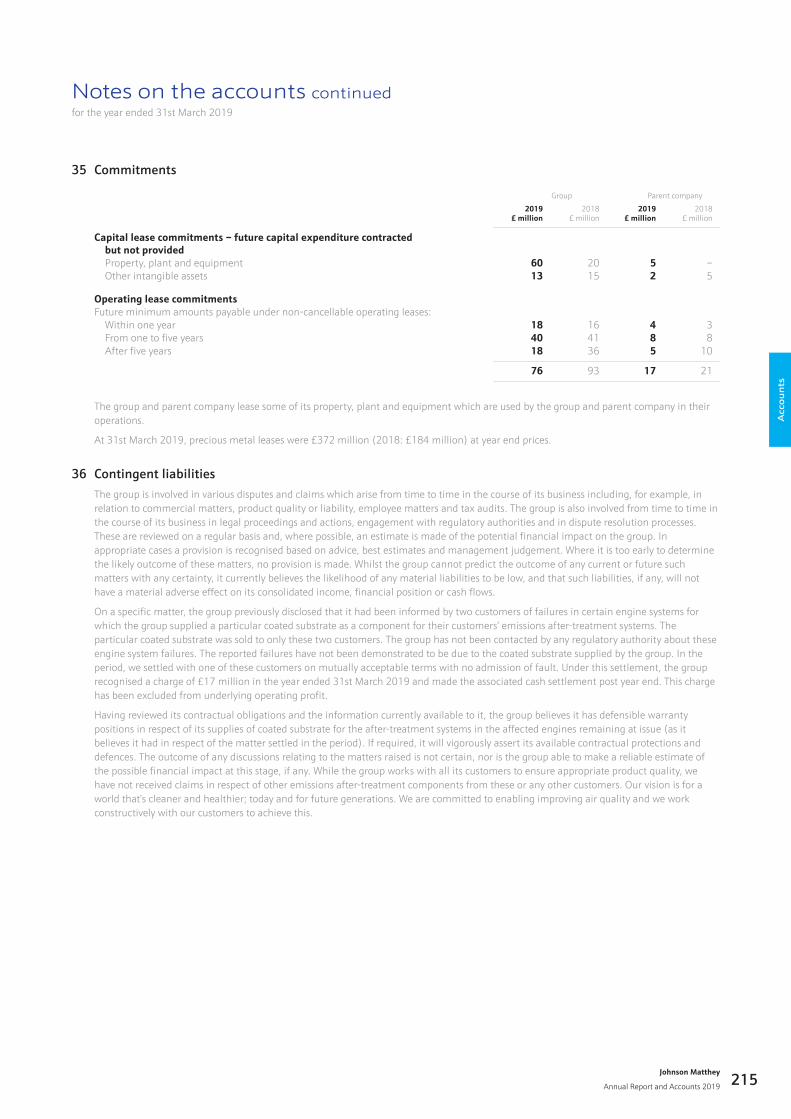
Notes on the accounts continuedfor the year ended 31st March 2019
35 Commitments
Group Parent company
2019£ million
2018£ million
2019£ million
2018£ million
Capital lease commitments – future capital expenditure contracted but not provided Property, plant and equipment 60 20 5 – Other intangible assets 13 15 2 5
Operating lease commitmentsFuture minimum amounts payable under non-cancellable operating leases: Within one year 18 16 4 3 From one to five years 40 41 8 8 After five years 18 36 5 10
76 93 17 21
The group and parent company lease some of its property, plant and equipment which are used by the group and parent company in their operations.
At 31st March 2019, precious metal leases were £372 million (2018: £184 million) at year end prices.
36 Contingent liabilitiesThe group is involved in various disputes and claims which arise from time to time in the course of its business including, for example, in relation to commercial matters, product quality or liability, employee matters and tax audits. The group is also involved from time to time in the course of its business in legal proceedings and actions, engagement with regulatory authorities and in dispute resolution processes. These are reviewed on a regular basis and, where possible, an estimate is made of the potential financial impact on the group. In appropriate cases a provision is recognised based on advice, best estimates and management judgement. Where it is too early to determine the likely outcome of these matters, no provision is made. Whilst the group cannot predict the outcome of any current or future such matters with any certainty, it currently believes the likelihood of any material liabilities to be low, and that such liabilities, if any, will not have a material adverse effect on its consolidated income, financial position or cash flows.
On a specific matter, the group previously disclosed that it had been informed by two customers of failures in certain engine systems for which the group supplied a particular coated substrate as a component for their customers’ emissions after-treatment systems. The particular coated substrate was sold to only these two customers. The group has not been contacted by any regulatory authority about these engine system failures. The reported failures have not been demonstrated to be due to the coated substrate supplied by the group. In the period, we settled with one of these customers on mutually acceptable terms with no admission of fault. Under this settlement, the group recognised a charge of £17 million in the year ended 31st March 2019 and made the associated cash settlement post year end. This charge has been excluded from underlying operating profit.
Having reviewed its contractual obligations and the information currently available to it, the group believes it has defensible warranty positions in respect of its supplies of coated substrate for the after-treatment systems in the affected engines remaining at issue (as it believes it had in respect of the matter settled in the period). If required, it will vigorously assert its available contractual protections and defences. The outcome of any discussions relating to the matters raised is not certain, nor is the group able to make a reliable estimate of the possible financial impact at this stage, if any. While the group works with all its customers to ensure appropriate product quality, we have not received claims in respect of other emissions after-treatment components from these or any other customers. Our vision is for a world that’s cleaner and healthier; today and for future generations. We are committed to enabling improving air quality and we work constructively with our customers to achieve this.
Acc
ou
nts
Johnson Matthey
Annual Report and Accounts 2019 215
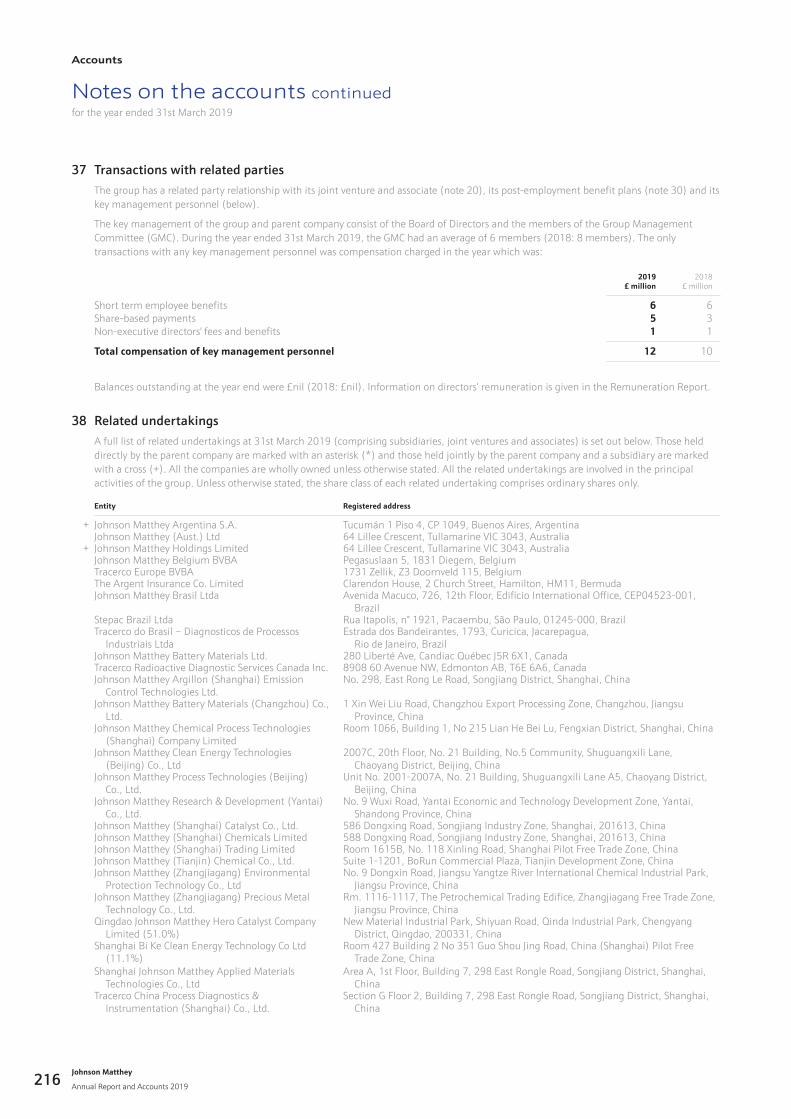
Notes on the accounts continuedfor the year ended 31st March 2019
37 Transactions with related partiesThe group has a related party relationship with its joint venture and associate (note 20), its post-employment benefit plans (note 30) and its key management personnel (below).
The key management of the group and parent company consist of the Board of Directors and the members of the Group Management Committee (GMC). During the year ended 31st March 2019, the GMC had an average of 6 members (2018: 8 members). The only transactions with any key management personnel was compensation charged in the year which was:
2019£ million
2018£ million
Short term employee benefits 6 6Share-based payments 5 3Non-executive directors' fees and benefits 1 1
Total compensation of key management personnel 12 10
Balances outstanding at the year end were £nil (2018: £nil). Information on directors’ remuneration is given in the Remuneration Report.
38 Related undertakingsA full list of related undertakings at 31st March 2019 (comprising subsidiaries, joint ventures and associates) is set out below. Those held directly by the parent company are marked with an asterisk (*) and those held jointly by the parent company and a subsidiary are marked with a cross (+). All the companies are wholly owned unless otherwise stated. All the related undertakings are involved in the principal activities of the group. Unless otherwise stated, the share class of each related undertaking comprises ordinary shares only.
Entity Registered address
+ Johnson Matthey Argentina S.A. Tucumán 1 Piso 4, CP 1049, Buenos Aires, ArgentinaJohnson Matthey (Aust.) Ltd 64 Lillee Crescent, Tullamarine VIC 3043, Australia
+ Johnson Matthey Holdings Limited 64 Lillee Crescent, Tullamarine VIC 3043, AustraliaJohnson Matthey Belgium BVBA Pegasuslaan 5, 1831 Diegem, BelgiumTracerco Europe BVBA 1731 Zellik, Z3 Doornveld 115, BelgiumThe Argent Insurance Co. Limited Clarendon House, 2 Church Street, Hamilton, HM11, BermudaJohnson Matthey Brasil Ltda Avenida Macuco, 726, 12th Floor, Edifício International Office, CEP04523-001,
BrazilStepac Brazil Ltda Rua Itapolis, n° 1921, Pacaembu, São Paulo, 01245-000, BrazilTracerco do Brasil – Diagnosticos de Processos
Industriais LtdaEstrada dos Bandeirantes, 1793, Curicica, Jacarepagua,
Rio de Janeiro, BrazilJohnson Matthey Battery Materials Ltd. 280 Liberté Ave, Candiac Québec J5R 6X1, CanadaTracerco Radioactive Diagnostic Services Canada Inc. 8908 60 Avenue NW, Edmonton AB, T6E 6A6, CanadaJohnson Matthey Argillon (Shanghai) Emission
Control Technologies Ltd.No. 298, East Rong Le Road, Songjiang District, Shanghai, China
Johnson Matthey Battery Materials (Changzhou) Co., Ltd.
1 Xin Wei Liu Road, Changzhou Export Processing Zone, Changzhou, Jiangsu Province, China
Johnson Matthey Chemical Process Technologies (Shanghai) Company Limited
Room 1066, Building 1, No 215 Lian He Bei Lu, Fengxian District, Shanghai, China
Johnson Matthey Clean Energy Technologies (Beijing) Co., Ltd
2007C, 20th Floor, No. 21 Building, No.5 Community, Shuguangxili Lane, Chaoyang District, Beijing, China
Johnson Matthey Process Technologies (Beijing) Co., Ltd.
Unit No. 2001-2007A, No. 21 Building, Shuguangxili Lane A5, Chaoyang District, Beijing, China
Johnson Matthey Research & Development (Yantai) Co., Ltd.
No. 9 Wuxi Road, Yantai Economic and Technology Development Zone, Yantai, Shandong Province, China
Johnson Matthey (Shanghai) Catalyst Co., Ltd. 586 Dongxing Road, Songjiang Industry Zone, Shanghai, 201613, ChinaJohnson Matthey (Shanghai) Chemicals Limited 588 Dongxing Road, Songjiang Industry Zone, Shanghai, 201613, ChinaJohnson Matthey (Shanghai) Trading Limited Room 1615B, No. 118 Xinling Road, Shanghai Pilot Free Trade Zone, ChinaJohnson Matthey (Tianjin) Chemical Co., Ltd. Suite 1-1201, BoRun Commercial Plaza, Tianjin Development Zone, ChinaJohnson Matthey (Zhangjiagang) Environmental
Protection Technology Co., LtdNo. 9 Dongxin Road, Jiangsu Yangtze River International Chemical Industrial Park,
Jiangsu Province, ChinaJohnson Matthey (Zhangjiagang) Precious Metal
Technology Co., Ltd.Rm. 1116-1117, The Petrochemical Trading Edifice, Zhangjiagang Free Trade Zone,
Jiangsu Province, ChinaQingdao Johnson Matthey Hero Catalyst Company
Limited (51.0%)New Material Industrial Park, Shiyuan Road, Qinda Industrial Park, Chengyang
District, Qingdao, 200331, ChinaShanghai Bi Ke Clean Energy Technology Co Ltd
(11.1%)Room 427 Building 2 No 351 Guo Shou Jing Road, China (Shanghai) Pilot Free
Trade Zone, ChinaShanghai Johnson Matthey Applied Materials
Technologies Co., LtdArea A, 1st Floor, Building 7, 298 East Rongle Road, Songjiang District, Shanghai,
ChinaTracerco China Process Diagnostics &
Instrumentation (Shanghai) Co., Ltd.Section G Floor 2, Building 7, 298 East Rongle Road, Songjiang District, Shanghai,
China
Johnson Matthey
Annual Report and Accounts 2019
Accounts
216
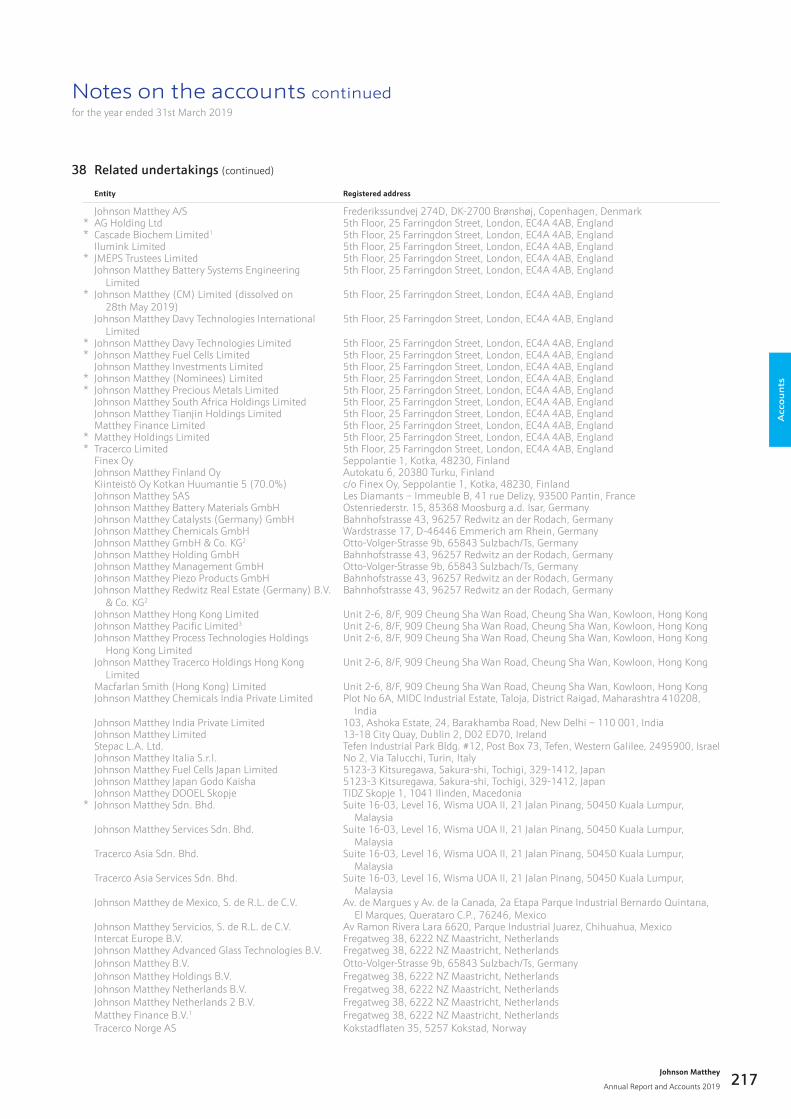
Notes on the accounts continuedfor the year ended 31st March 2019
38 Related undertakings (continued)
Entity Registered address
Johnson Matthey A/S Frederikssundvej 274D, DK-2700 Brønshøj, Copenhagen, Denmark* AG Holding Ltd 5th Floor, 25 Farringdon Street, London, EC4A 4AB, England* Cascade Biochem Limited1 5th Floor, 25 Farringdon Street, London, EC4A 4AB, England
Ilumink Limited 5th Floor, 25 Farringdon Street, London, EC4A 4AB, England* JMEPS Trustees Limited 5th Floor, 25 Farringdon Street, London, EC4A 4AB, England
Johnson Matthey Battery Systems Engineering Limited
5th Floor, 25 Farringdon Street, London, EC4A 4AB, England
* Johnson Matthey (CM) Limited (dissolved on 28th May 2019)
5th Floor, 25 Farringdon Street, London, EC4A 4AB, England
Johnson Matthey Davy Technologies International Limited
5th Floor, 25 Farringdon Street, London, EC4A 4AB, England
* Johnson Matthey Davy Technologies Limited 5th Floor, 25 Farringdon Street, London, EC4A 4AB, England* Johnson Matthey Fuel Cells Limited 5th Floor, 25 Farringdon Street, London, EC4A 4AB, England
Johnson Matthey Investments Limited 5th Floor, 25 Farringdon Street, London, EC4A 4AB, England* Johnson Matthey (Nominees) Limited 5th Floor, 25 Farringdon Street, London, EC4A 4AB, England* Johnson Matthey Precious Metals Limited 5th Floor, 25 Farringdon Street, London, EC4A 4AB, England
Johnson Matthey South Africa Holdings Limited 5th Floor, 25 Farringdon Street, London, EC4A 4AB, EnglandJohnson Matthey Tianjin Holdings Limited 5th Floor, 25 Farringdon Street, London, EC4A 4AB, EnglandMatthey Finance Limited 5th Floor, 25 Farringdon Street, London, EC4A 4AB, England
* Matthey Holdings Limited 5th Floor, 25 Farringdon Street, London, EC4A 4AB, England* Tracerco Limited 5th Floor, 25 Farringdon Street, London, EC4A 4AB, England
Finex Oy Seppolantie 1, Kotka, 48230, FinlandJohnson Matthey Finland Oy Autokatu 6, 20380 Turku, FinlandKiinteistö Oy Kotkan Huumantie 5 (70.0%) c/o Finex Oy, Seppolantie 1, Kotka, 48230, FinlandJohnson Matthey SAS Les Diamants – Immeuble B, 41 rue Delizy, 93500 Pantin, FranceJohnson Matthey Battery Materials GmbH Ostenriederstr. 15, 85368 Moosburg a.d. Isar, GermanyJohnson Matthey Catalysts (Germany) GmbH Bahnhofstrasse 43, 96257 Redwitz an der Rodach, GermanyJohnson Matthey Chemicals GmbH Wardstrasse 17, D-46446 Emmerich am Rhein, GermanyJohnson Matthey GmbH & Co. KG2 Otto-Volger-Strasse 9b, 65843 Sulzbach/Ts, GermanyJohnson Matthey Holding GmbH Bahnhofstrasse 43, 96257 Redwitz an der Rodach, GermanyJohnson Matthey Management GmbH Otto-Volger-Strasse 9b, 65843 Sulzbach/Ts, GermanyJohnson Matthey Piezo Products GmbH Bahnhofstrasse 43, 96257 Redwitz an der Rodach, GermanyJohnson Matthey Redwitz Real Estate (Germany) B.V.
& Co. KG2Bahnhofstrasse 43, 96257 Redwitz an der Rodach, Germany
Johnson Matthey Hong Kong Limited Unit 2-6, 8/F, 909 Cheung Sha Wan Road, Cheung Sha Wan, Kowloon, Hong KongJohnson Matthey Pacific Limited3 Unit 2-6, 8/F, 909 Cheung Sha Wan Road, Cheung Sha Wan, Kowloon, Hong KongJohnson Matthey Process Technologies Holdings
Hong Kong LimitedUnit 2-6, 8/F, 909 Cheung Sha Wan Road, Cheung Sha Wan, Kowloon, Hong Kong
Johnson Matthey Tracerco Holdings Hong Kong Limited
Unit 2-6, 8/F, 909 Cheung Sha Wan Road, Cheung Sha Wan, Kowloon, Hong Kong
Macfarlan Smith (Hong Kong) Limited Unit 2-6, 8/F, 909 Cheung Sha Wan Road, Cheung Sha Wan, Kowloon, Hong KongJohnson Matthey Chemicals India Private Limited Plot No 6A, MIDC Industrial Estate, Taloja, District Raigad, Maharashtra 410208,
IndiaJohnson Matthey India Private Limited 103, Ashoka Estate, 24, Barakhamba Road, New Delhi – 110 001, IndiaJohnson Matthey Limited 13-18 City Quay, Dublin 2, D02 ED70, IrelandStepac L.A. Ltd. Tefen Industrial Park Bldg. #12, Post Box 73, Tefen, Western Galilee, 2495900, IsraelJohnson Matthey Italia S.r.l. No 2, Via Talucchi, Turin, ItalyJohnson Matthey Fuel Cells Japan Limited 5123-3 Kitsuregawa, Sakura-shi, Tochigi, 329-1412, JapanJohnson Matthey Japan Godo Kaisha 5123-3 Kitsuregawa, Sakura-shi, Tochigi, 329-1412, JapanJohnson Matthey DOOEL Skopje TIDZ Skopje 1, 1041 Ilinden, Macedonia
* Johnson Matthey Sdn. Bhd. Suite 16-03, Level 16, Wisma UOA II, 21 Jalan Pinang, 50450 Kuala Lumpur, Malaysia
Johnson Matthey Services Sdn. Bhd. Suite 16-03, Level 16, Wisma UOA II, 21 Jalan Pinang, 50450 Kuala Lumpur, Malaysia
Tracerco Asia Sdn. Bhd. Suite 16-03, Level 16, Wisma UOA II, 21 Jalan Pinang, 50450 Kuala Lumpur, Malaysia
Tracerco Asia Services Sdn. Bhd. Suite 16-03, Level 16, Wisma UOA II, 21 Jalan Pinang, 50450 Kuala Lumpur, Malaysia
Johnson Matthey de Mexico, S. de R.L. de C.V. Av. de Margues y Av. de la Canada, 2a Etapa Parque Industrial Bernardo Quintana, El Marques, Querataro C.P., 76246, Mexico
Johnson Matthey Servicios, S. de R.L. de C.V. Av Ramon Rivera Lara 6620, Parque Industrial Juarez, Chihuahua, MexicoIntercat Europe B.V. Fregatweg 38, 6222 NZ Maastricht, NetherlandsJohnson Matthey Advanced Glass Technologies B.V. Fregatweg 38, 6222 NZ Maastricht, NetherlandsJohnson Matthey B.V. Otto-Volger-Strasse 9b, 65843 Sulzbach/Ts, GermanyJohnson Matthey Holdings B.V. Fregatweg 38, 6222 NZ Maastricht, NetherlandsJohnson Matthey Netherlands B.V. Fregatweg 38, 6222 NZ Maastricht, NetherlandsJohnson Matthey Netherlands 2 B.V. Fregatweg 38, 6222 NZ Maastricht, NetherlandsMatthey Finance B.V.1 Fregatweg 38, 6222 NZ Maastricht, NetherlandsTracerco Norge AS Kokstadflaten 35, 5257 Kokstad, Norway
Acc
ou
nts
Johnson Matthey
Annual Report and Accounts 2019 217
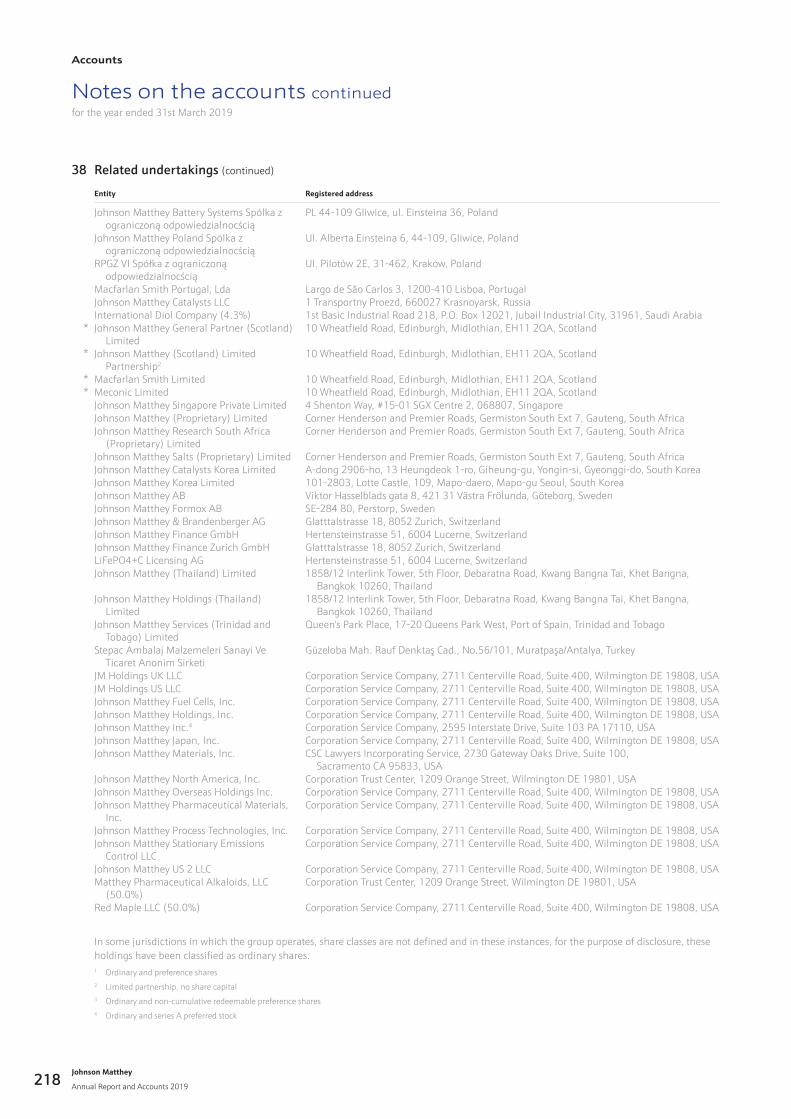
Notes on the accounts continuedfor the year ended 31st March 2019
38 Related undertakings (continued)
Entity Registered address
Johnson Matthey Battery Systems Spólka z ograniczoną odpowiedzialnocścią
PL 44-109 Gliwice, ul. Einsteina 36, Poland
Johnson Matthey Poland Spólka z ograniczoną odpowiedzialnocścią
Ul. Alberta Einsteina 6, 44-109, Gliwice, Poland
RPGZ VI Spółka z ograniczoną odpowiedzialnocścią
Ul. Pilotów 2E, 31-462, Krakow, Poland
Macfarlan Smith Portugal, Lda Largo de São Carlos 3, 1200-410 Lisboa, PortugalJohnson Matthey Catalysts LLC 1 Transportny Proezd, 660027 Krasnoyarsk, RussiaInternational Diol Company (4.3%) 1st Basic Industrial Road 218, P.O. Box 12021, Jubail Industrial City, 31961, Saudi Arabia
* Johnson Matthey General Partner (Scotland) Limited
10 Wheatfield Road, Edinburgh, Midlothian, EH11 2QA, Scotland
* Johnson Matthey (Scotland) Limited Partnership2
10 Wheatfield Road, Edinburgh, Midlothian, EH11 2QA, Scotland
* Macfarlan Smith Limited 10 Wheatfield Road, Edinburgh, Midlothian, EH11 2QA, Scotland* Meconic Limited 10 Wheatfield Road, Edinburgh, Midlothian, EH11 2QA, Scotland
Johnson Matthey Singapore Private Limited 4 Shenton Way, #15-01 SGX Centre 2, 068807, SingaporeJohnson Matthey (Proprietary) Limited Corner Henderson and Premier Roads, Germiston South Ext 7, Gauteng, South AfricaJohnson Matthey Research South Africa
(Proprietary) LimitedCorner Henderson and Premier Roads, Germiston South Ext 7, Gauteng, South Africa
Johnson Matthey Salts (Proprietary) Limited Corner Henderson and Premier Roads, Germiston South Ext 7, Gauteng, South AfricaJohnson Matthey Catalysts Korea Limited A-dong 2906-ho, 13 Heungdeok 1-ro, Giheung-gu, Yongin-si, Gyeonggi-do, South KoreaJohnson Matthey Korea Limited 101-2803, Lotte Castle, 109, Mapo-daero, Mapo-gu Seoul, South KoreaJohnson Matthey AB Viktor Hasselblads gata 8, 421 31 Västra Frölunda, Göteborg, SwedenJohnson Matthey Formox AB SE-284 80, Perstorp, SwedenJohnson Matthey & Brandenberger AG Glatttalstrasse 18, 8052 Zurich, SwitzerlandJohnson Matthey Finance GmbH Hertensteinstrasse 51, 6004 Lucerne, SwitzerlandJohnson Matthey Finance Zurich GmbH Glatttalstrasse 18, 8052 Zurich, SwitzerlandLiFePO4+C Licensing AG Hertensteinstrasse 51, 6004 Lucerne, SwitzerlandJohnson Matthey (Thailand) Limited 1858/12 Interlink Tower, 5th Floor, Debaratna Road, Kwang Bangna Tai, Khet Bangna,
Bangkok 10260, ThailandJohnson Matthey Holdings (Thailand)
Limited1858/12 Interlink Tower, 5th Floor, Debaratna Road, Kwang Bangna Tai, Khet Bangna,
Bangkok 10260, ThailandJohnson Matthey Services (Trinidad and
Tobago) LimitedQueen's Park Place, 17-20 Queens Park West, Port of Spain, Trinidad and Tobago
Stepac Ambalaj Malzemeleri Sanayi Ve Ticaret Anonim Sirketi
Güzeloba Mah. Rauf Denktaş Cad., No.56/101, Muratpaşa/Antalya, Turkey
JM Holdings UK LLC Corporation Service Company, 2711 Centerville Road, Suite 400, Wilmington DE 19808, USAJM Holdings US LLC Corporation Service Company, 2711 Centerville Road, Suite 400, Wilmington DE 19808, USAJohnson Matthey Fuel Cells, Inc. Corporation Service Company, 2711 Centerville Road, Suite 400, Wilmington DE 19808, USAJohnson Matthey Holdings, Inc. Corporation Service Company, 2711 Centerville Road, Suite 400, Wilmington DE 19808, USAJohnson Matthey Inc.4 Corporation Service Company, 2595 Interstate Drive, Suite 103 PA 17110, USAJohnson Matthey Japan, Inc. Corporation Service Company, 2711 Centerville Road, Suite 400, Wilmington DE 19808, USAJohnson Matthey Materials, Inc. CSC Lawyers Incorporating Service, 2730 Gateway Oaks Drive, Suite 100,
Sacramento CA 95833, USAJohnson Matthey North America, Inc. Corporation Trust Center, 1209 Orange Street, Wilmington DE 19801, USAJohnson Matthey Overseas Holdings Inc. Corporation Service Company, 2711 Centerville Road, Suite 400, Wilmington DE 19808, USAJohnson Matthey Pharmaceutical Materials,
Inc.Corporation Service Company, 2711 Centerville Road, Suite 400, Wilmington DE 19808, USA
Johnson Matthey Process Technologies, Inc. Corporation Service Company, 2711 Centerville Road, Suite 400, Wilmington DE 19808, USAJohnson Matthey Stationary Emissions
Control LLCCorporation Service Company, 2711 Centerville Road, Suite 400, Wilmington DE 19808, USA
Johnson Matthey US 2 LLC Corporation Service Company, 2711 Centerville Road, Suite 400, Wilmington DE 19808, USAMatthey Pharmaceutical Alkaloids, LLC
(50.0%)Corporation Trust Center, 1209 Orange Street, Wilmington DE 19801, USA
Red Maple LLC (50.0%) Corporation Service Company, 2711 Centerville Road, Suite 400, Wilmington DE 19808, USA
In some jurisdictions in which the group operates, share classes are not defined and in these instances, for the purpose of disclosure, these holdings have been classified as ordinary shares.1 Ordinary and preference shares2 Limited partnership, no share capital3 Ordinary and non-cumulative redeemable preference shares4 Ordinary and series A preferred stock
Johnson Matthey
Annual Report and Accounts 2019
Accounts
218
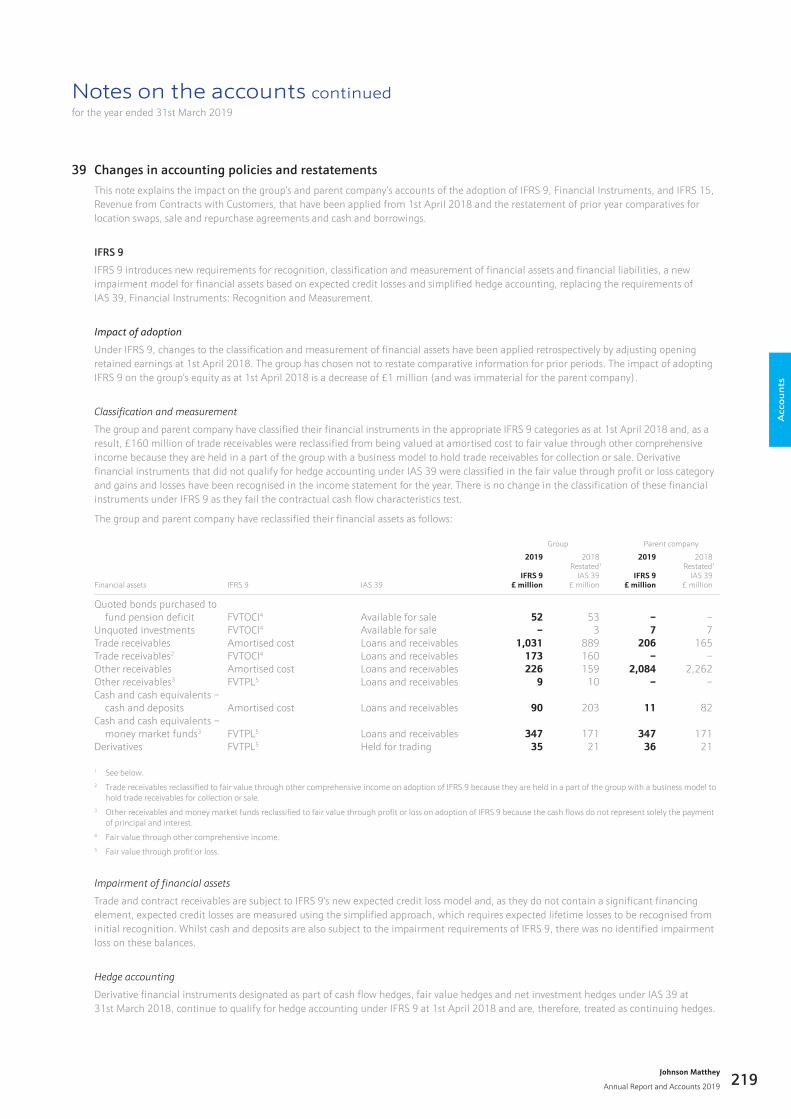
Notes on the accounts continuedfor the year ended 31st March 2019
39 Changes in accounting policies and restatementsThis note explains the impact on the group’s and parent company’s accounts of the adoption of IFRS 9, Financial Instruments, and IFRS 15, Revenue from Contracts with Customers, that have been applied from 1st April 2018 and the restatement of prior year comparatives for location swaps, sale and repurchase agreements and cash and borrowings.
IFRS 9
IFRS 9 introduces new requirements for recognition, classification and measurement of financial assets and financial liabilities, a new impairment model for financial assets based on expected credit losses and simplified hedge accounting, replacing the requirements of IAS 39, Financial Instruments: Recognition and Measurement.
Impactofadoption
Under IFRS 9, changes to the classification and measurement of financial assets have been applied retrospectively by adjusting opening retained earnings at 1st April 2018. The group has chosen not to restate comparative information for prior periods. The impact of adopting IFRS 9 on the group’s equity as at 1st April 2018 is a decrease of £1 million (and was immaterial for the parent company).
Classificationandmeasurement
The group and parent company have classified their financial instruments in the appropriate IFRS 9 categories as at 1st April 2018 and, as a result, £160 million of trade receivables were reclassified from being valued at amortised cost to fair value through other comprehensive income because they are held in a part of the group with a business model to hold trade receivables for collection or sale. Derivative financial instruments that did not qualify for hedge accounting under IAS 39 were classified in the fair value through profit or loss category and gains and losses have been recognised in the income statement for the year. There is no change in the classification of these financial instruments under IFRS 9 as they fail the contractual cash flow characteristics test.
The group and parent company have reclassified their financial assets as follows:
Group Parent company
Financial assets IFRS 9 IAS 39
2019
IFRS 9£ million
2018Restated1
IAS 39£ million
2019
IFRS 9£ million
2018Restated1
IAS 39£ million
Quoted bonds purchased to fund pension deficit FVTOCI4 Available for sale 52 53 – –Unquoted investments FVTOCI4 Available for sale – 3 7 7Trade receivables Amortised cost Loans and receivables 1,031 889 206 165Trade receivables2 FVTOCI4 Loans and receivables 173 160 – –Other receivables Amortised cost Loans and receivables 226 159 2,084 2,262Other receivables3 FVTPL5 Loans and receivables 9 10 – –Cash and cash equivalents – cash and deposits Amortised cost Loans and receivables 90 203 11 82Cash and cash equivalents – money market funds3 FVTPL5 Loans and receivables 347 171 347 171Derivatives FVTPL5 Held for trading 35 21 36 21
1 See below.2 Trade receivables reclassified to fair value through other comprehensive income on adoption of IFRS 9 because they are held in a part of the group with a business model to
hold trade receivables for collection or sale.3 Other receivables and money market funds reclassified to fair value through profit or loss on adoption of IFRS 9 because the cash flows do not represent solely the payment
of principal and interest.4 Fair value through other comprehensive income.5 Fair value through profit or loss.
Impairmentoffinancialassets
Trade and contract receivables are subject to IFRS 9’s new expected credit loss model and, as they do not contain a significant financing element, expected credit losses are measured using the simplified approach, which requires expected lifetime losses to be recognised from initial recognition. Whilst cash and deposits are also subject to the impairment requirements of IFRS 9, there was no identified impairment loss on these balances.
Hedge accounting
Derivative financial instruments designated as part of cash flow hedges, fair value hedges and net investment hedges under IAS 39 at 31st March 2018, continue to qualify for hedge accounting under IFRS 9 at 1st April 2018 and are, therefore, treated as continuing hedges.
Acc
ou
nts
Johnson Matthey
Annual Report and Accounts 2019 219
Notes on the accounts continuedfor the year ended 31st March 2019
39 Changes in accounting policies and restatements (continued)
IFRS 15
IFRS 15 supersedes all revenue standards and interpretations in IFRS. It provides a principles-based approach for revenue recognition and requires that revenue is recognised as the distinct performance obligations promised within a contract are satisfied either at a point in time or over time. Following the detailed review of the transactions performed in the year ended 31st March 2018, the group has concluded that all swaps (location and form) and sale and repurchase agreements will be excluded from revenue under IFRS 15.
The impact on the financial statements as a result of the move to IFRS 15 has led the group to conclude that the group and parent company should apply IFRS 15 on a fully retrospective basis, which means that the comparative information for the year ended 31st March 2018 has been restated. The following expedients have been used in accordance with paragraph C5:
• revenue in respect of completed contracts with variable consideration reflects the transaction price at the date the contracts were completed; and
• the transaction price allocated to unsatisfied and partially unsatisfied performance obligations as at 31st March 2018 is not disclosed.
The group and parent company have not shown the amount of the adjustments relating to periods before those presented on the basis that it is not practicable to do so. Movements in inventories, receivables and payables in the consolidated cash flow statement for the year ended 31st March 2018 have not been restated on the same basis. The overall impact on equity is less than £5 million as a result of the re-presentation of the financial statements as at 31st March 2018 and there is no impact on sales excluding precious metals, profit, working capital, net debt or net assets. We have taken the same approach to the parent company accounts and restated those accordingly.
Impactofadoption
The group has noted that the presentation of sales and purchases of certain commodity forward contracts varies across its industry peer group. In conjunction with its adoption of IFRS 15, the group has reviewed its accounting for a number of such contracts held by the Platinum Group Metal Services business. The group regularly enters into contracts whereby metal is transferred with a separate agreement to buy back the metal, either in a different location and/or in a different form. IFRS 15 requires the presentation of swap transactions (regardless of whether they are a location or form swap) with counterparties of a similar nature to the group to be excluded from revenue. It further clarifies that transactions with a linked sale and future repurchase (sale and repurchase agreements) are excluded from revenue and treated as finance transactions.
The impact of applying this presentation of form and location swaps to the financial statements is to reduce revenue and cost of sales for the year ended 31st March 2018 by £840 million with no impact on sales excluding precious metals, profit, working capital, net debt or net assets. This change has also decreased inventories by £2 million and increased receivables by £2 million as at 31st March 2018. Location swaps are also non-revenue transactions under IAS 18. Had the group not restated under IFRS 15, the financial impact of restating location swaps and other, smaller errors identified during the process, would be to decrease revenue and cost of sales by £621 million, with no impact on reported profit, net assets or net debt.
IFRS 15 provides new guidance in respect of principal versus agent considerations which is relevant to the sale of metal and substrate in Clean Air and to the sale of metal in Efficient Natural Resources. Revenue from refining metal owned by customers in Efficient Natural Resources continues to be recognised over time on the basis that the group is enhancing an asset controlled by the customer. Revenue in respect of the sale of the company’s metal and substrate continues to be recognised on a gross basis reflecting the fact that the group is the principal. Where the group refines metal owned by customers and control of the metal remains with the customer during the process, the revenue recognised does not include the value of the metal controlled by the customer. The impact on the group’s income statement is to increase revenue and cost of sales by £2 million, with no net impact on profit. The impact on the group’s balance sheet is to reduce inventory by £18 million, increase contract receivables £20 million, increase accruals £2 million, decrease contract liabilities £1 million and increase opening retained earnings £1 million. There is no impact on the parent company accounts.
Restatements
Saleandrepurchaseagreements
The group has restated the financial statements to exclude revenue and cost of sales derived from sale and repurchase agreements and account for these as finance transactions. Application of this change in presentation to the financial statements for the year ended 31st March 2018 reduces revenue and cost of sales by £3,010 million. This change has also increased inventories by £161 million, creditors by £215 million and receivables by £54 million as at 31st March 2018. This change also increased finance costs and finance income by £20 million, respectively.
The re-presentation of the financial statements has no impact on sales excluding precious metals, profit, working capital, net debt or net assets and, therefore, historic business performance measures communicated by the group are unchanged.
Cashandborrowings
The group’s consolidated balance sheet and cash flow statement have been restated to increase cash and deposits by £45 million, bank overdrafts by £17 million and other current borrowings and related swaps by £28 million at 31st March 2018 to better reflect the group’s cash pooling arrangements. In addition, money market funds of £171 million have been shown separately from cash and deposits. The parent company balance sheet has also been restated to increase cash and deposits by £35 million and bank overdrafts by £35 million at 31st March 2018.
Johnson Matthey
Annual Report and Accounts 2019
Accounts
220
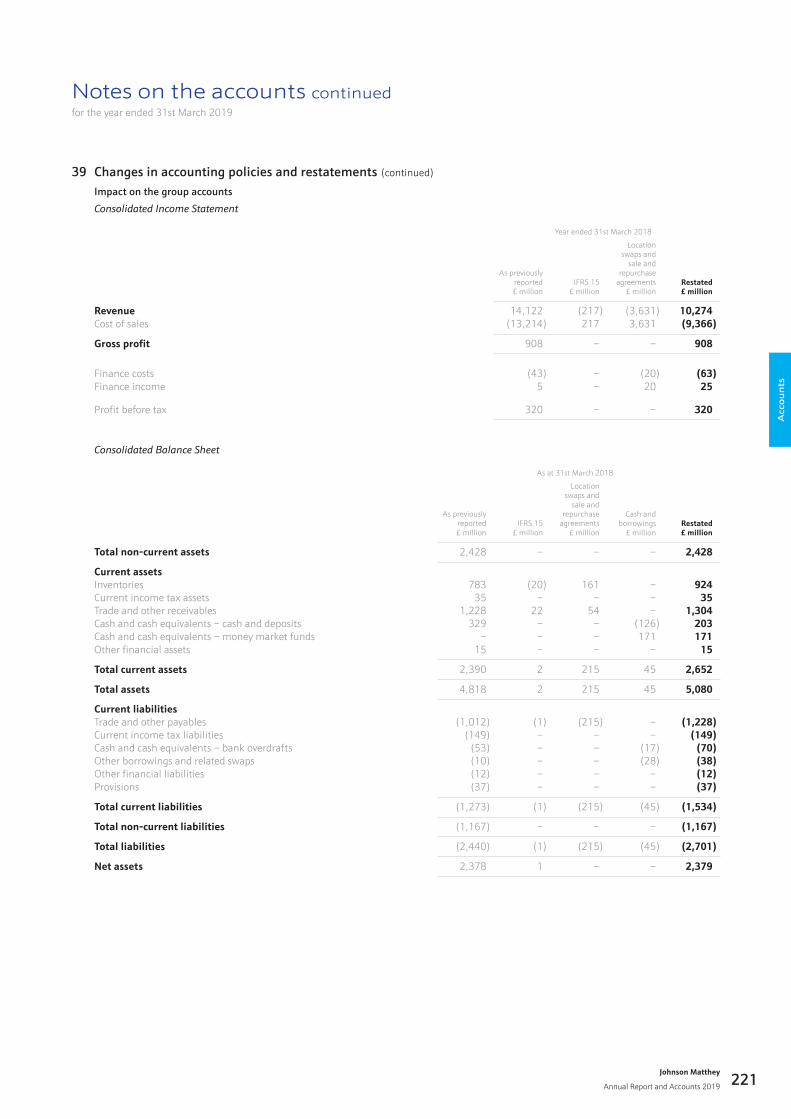
Notes on the accounts continuedfor the year ended 31st March 2019
39 Changes in accounting policies and restatements (continued)
Impact on the group accounts
ConsolidatedIncomeStatement
Year ended 31st March 2018
As previouslyreported£ million
IFRS 15£ million
Location swaps and
sale and repurchase
agreements £ million
Restated£ million
Revenue 14,122 (217) (3,631) 10,274Cost of sales (13,214) 217 3,631 (9,366)
Gross profit 908 – – 908
Finance costs (43) – (20) (63)Finance income 5 – 20 25
Profit before tax 320 – – 320
ConsolidatedBalanceSheet
As at 31st March 2018
As previouslyreported£ million
IFRS 15£ million
Location swaps and
sale and repurchase
agreements£ million
Cash andborrowings
£ millionRestated£ million
Total non-current assets 2,428 – – – 2,428
Current assetsInventories 783 (20) 161 – 924Current income tax assets 35 – – – 35Trade and other receivables 1,228 22 54 – 1,304Cash and cash equivalents – cash and deposits 329 – – (126) 203Cash and cash equivalents – money market funds – – – 171 171Other financial assets 15 – – – 15
Total current assets 2,390 2 215 45 2,652
Total assets 4,818 2 215 45 5,080
Current liabilitiesTrade and other payables (1,012) (1) (215) – (1,228)Current income tax liabilities (149) – – – (149)Cash and cash equivalents – bank overdrafts (53) – – (17) (70)Other borrowings and related swaps (10) – – (28) (38)Other financial liabilities (12) – – – (12)Provisions (37) – – – (37)
Total current liabilities (1,273) (1) (215) (45) (1,534)
Total non-current liabilities (1,167) – – – (1,167)
Total liabilities (2,440) (1) (215) (45) (2,701)
Net assets 2,378 1 – – 2,379
Acc
ou
nts
Johnson Matthey
Annual Report and Accounts 2019 221
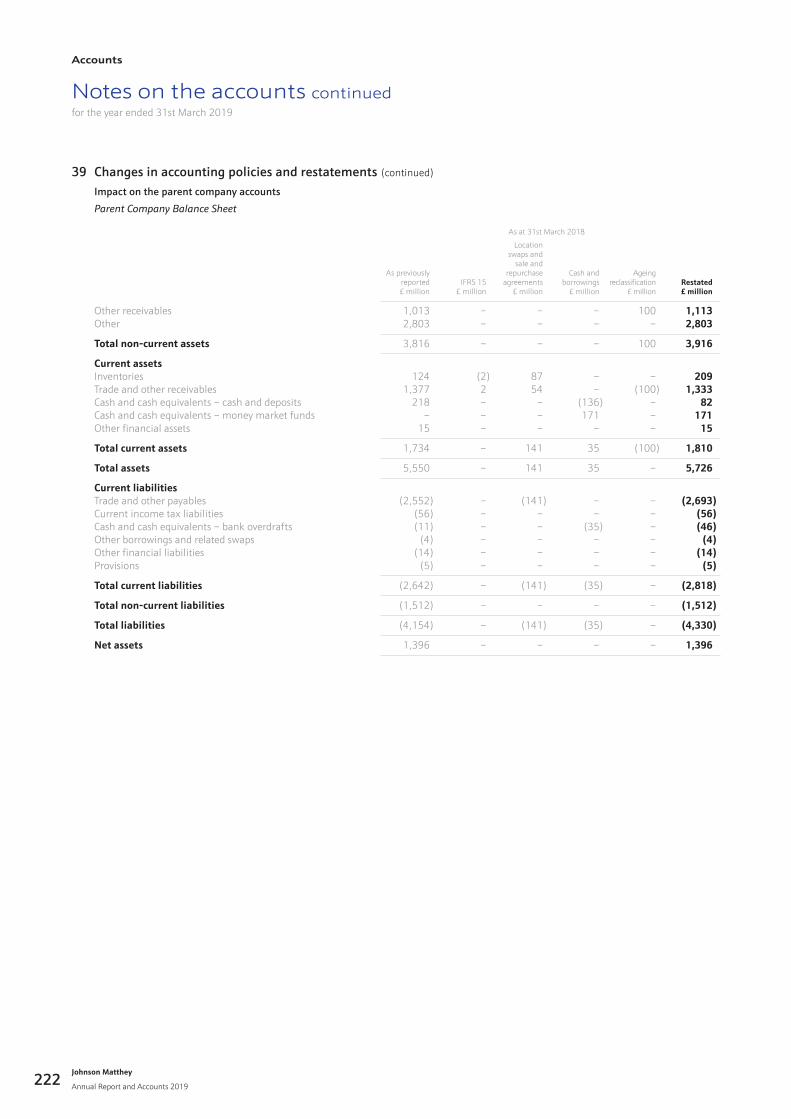
Notes on the accounts continuedfor the year ended 31st March 2019
39 Changes in accounting policies and restatements (continued) Impact on the parent company accounts
ParentCompanyBalanceSheet
As at 31st March 2018
As previouslyreported£ million
IFRS 15£ million
Location swaps and
sale and repurchase
agreements£ million
Cash andborrowings
£ million
Ageingreclassification
£ millionRestated£ million
Other receivables 1,013 – – – 100 1,113Other 2,803 – – – – 2,803
Total non-current assets 3,816 – – – 100 3,916
Current assetsInventories 124 (2) 87 – – 209Trade and other receivables 1,377 2 54 – (100) 1,333Cash and cash equivalents – cash and deposits 218 – – (136) – 82Cash and cash equivalents – money market funds – – – 171 – 171Other financial assets 15 – – – – 15
Total current assets 1,734 – 141 35 (100) 1,810
Total assets 5,550 – 141 35 – 5,726
Current liabilitiesTrade and other payables (2,552) – (141) – – (2,693)Current income tax liabilities (56) – – – – (56)Cash and cash equivalents – bank overdrafts (11) – – (35) – (46)Other borrowings and related swaps (4) – – – – (4)Other financial liabilities (14) – – – – (14)Provisions (5) – – – – (5)
Total current liabilities (2,642) – (141) (35) – (2,818)
Total non-current liabilities (1,512) – – – – (1,512)
Total liabilities (4,154) – (141) (35) – (4,330)
Net assets 1,396 – – – – 1,396
Johnson Matthey
Annual Report and Accounts 2019
Accounts
222
Independent auditor’s reportto the members of Johnson Matthey Plc
Report on the audit of the financial statements
OpinionIn our opinion:
• Johnson Matthey Plc’s Group financial statements and parent company financial statements (the “financial statements”) give a true and fair view of the state of the Group’s and of the parent company’s affairs as at 31 March 2019 and of the Group’s profit and cash flows for the year then ended;
• the Group financial statements have been properly prepared in accordance with International Financial Reporting Standards (IFRSs) as adopted by the European Union;
• the parent company financial statements have been properly prepared in accordance with United Kingdom Generally Accepted Accounting Practice (United Kingdom Accounting Standards, comprising FRS 101 “Reduced Disclosure Framework”, and applicable law); and
• the financial statements have been prepared in accordance with the requirements of the Companies Act 2006 and, as regards the Group financial statements, Article 4 of the IAS Regulation.
We have audited the financial statements, included within the Annual Report, which comprise: the consolidated and parent company balance sheets as at 31 March 2019; the consolidated income statement and consolidated statement of total comprehensive income; the consolidated cash flow statement; the consolidated and parent company statement of changes in equity for the year then ended; and the notes to the financial statements, including the Accounting Policies.
Our opinion is consistent with our reporting to the Audit Committee.
Basis for opinionWe conducted our audit in accordance with International Standards on Auditing (UK) (“ISAs (UK)”) and applicable law. Our responsibilities under ISAs (UK) are further described in the Auditors’ responsibilities for the audit of the financial statements section of our report. We believe that the audit evidence we have obtained is sufficient and appropriate to provide a basis for our opinion.
Independence
We remained independent of the Group in accordance with the ethical requirements that are relevant to our audit of the financial statements in the UK, which includes the FRC’s Ethical Standard, as applicable to listed public interest entities, and we have fulfilled our other ethical responsibilities in accordance with these requirements.
To the best of our knowledge and belief, we declare that non-audit services prohibited by the FRC’s Ethical Standard were not provided to the Group or the parent company.
Other than those disclosed in note 10 to the financial statements, we have provided no non-audit services to the Group or the parent company in the period from 1 April 2018 to 31 March 2019.
Acc
ou
nts
Johnson Matthey
Annual Report and Accounts 2019 223
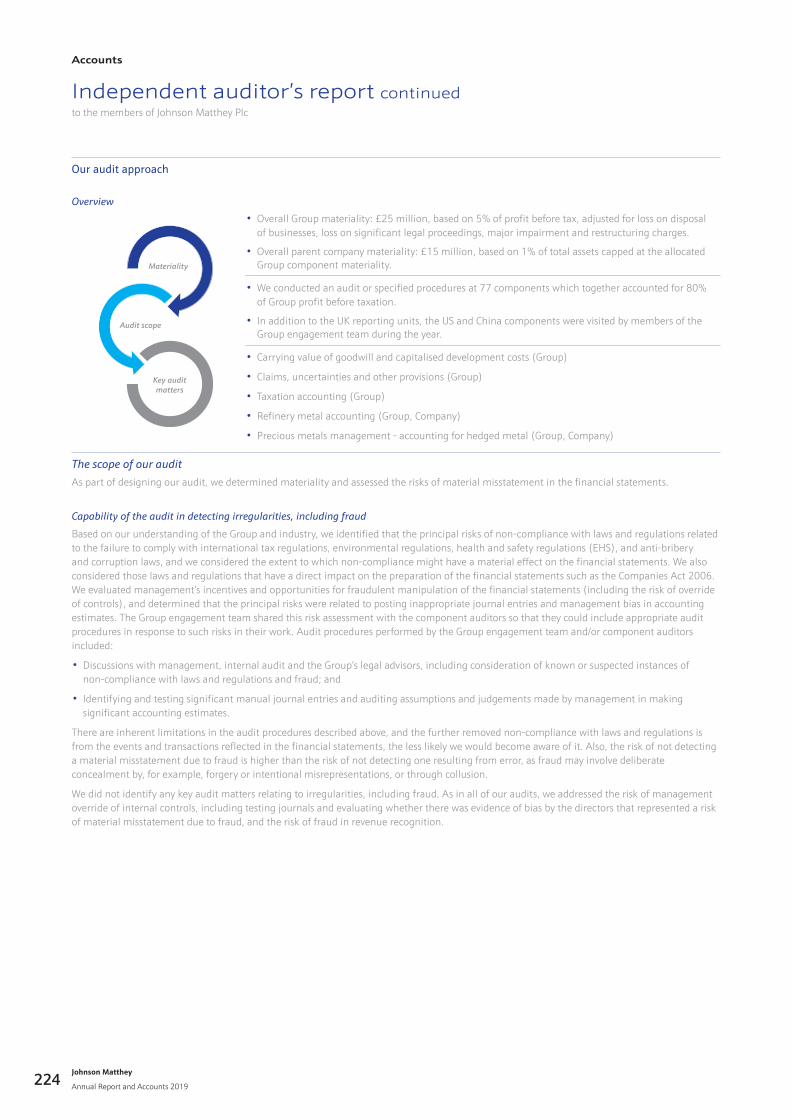
Our audit approach
Overview
• Overall Group materiality: £25 million, based on 5% of profit before tax, adjusted for loss on disposal of businesses, loss on significant legal proceedings, major impairment and restructuring charges.
• Overall parent company materiality: £15 million, based on 1% of total assets capped at the allocated Group component materiality.
• We conducted an audit or specified procedures at 77 components which together accounted for 80% of Group profit before taxation.
• In addition to the UK reporting units, the US and China components were visited by members of the Group engagement team during the year.
• Carrying value of goodwill and capitalised development costs (Group)
• Claims, uncertainties and other provisions (Group)
• Taxation accounting (Group)
• Refinery metal accounting (Group, Company)
• Precious metals management - accounting for hedged metal (Group, Company)
ThescopeofourauditAs part of designing our audit, we determined materiality and assessed the risks of material misstatement in the financial statements.
Capabilityoftheauditindetectingirregularities,includingfraud
Based on our understanding of the Group and industry, we identified that the principal risks of non-compliance with laws and regulations related to the failure to comply with international tax regulations, environmental regulations, health and safety regulations (EHS), and anti-bribery and corruption laws, and we considered the extent to which non-compliance might have a material effect on the financial statements. We also considered those laws and regulations that have a direct impact on the preparation of the financial statements such as the Companies Act 2006. We evaluated management’s incentives and opportunities for fraudulent manipulation of the financial statements (including the risk of override of controls), and determined that the principal risks were related to posting inappropriate journal entries and management bias in accounting estimates. The Group engagement team shared this risk assessment with the component auditors so that they could include appropriate audit procedures in response to such risks in their work. Audit procedures performed by the Group engagement team and/or component auditors included:
• Discussions with management, internal audit and the Group’s legal advisors, including consideration of known or suspected instances of non-compliance with laws and regulations and fraud; and
• Identifying and testing significant manual journal entries and auditing assumptions and judgements made by management in making significant accounting estimates.
There are inherent limitations in the audit procedures described above, and the further removed non-compliance with laws and regulations is from the events and transactions reflected in the financial statements, the less likely we would become aware of it. Also, the risk of not detecting a material misstatement due to fraud is higher than the risk of not detecting one resulting from error, as fraud may involve deliberate concealment by, for example, forgery or intentional misrepresentations, or through collusion.
We did not identify any key audit matters relating to irregularities, including fraud. As in all of our audits, we addressed the risk of management override of internal controls, including testing journals and evaluating whether there was evidence of bias by the directors that represented a risk of material misstatement due to fraud, and the risk of fraud in revenue recognition.
Independent auditor’s report continuedto the members of Johnson Matthey Plc
Materiality
Audit scope
Key auditmatters
Johnson Matthey
Annual Report and Accounts 2019
Accounts
224
Independent auditor’s report continuedto the members of Johnson Matthey Plc
Keyauditmatters
Key audit matters are those matters that, in the auditors’ professional judgement, were of most significance in the audit of the financial statements of the current period and include the most significant assessed risks of material misstatement (whether or not due to fraud) identified by the auditors, including those which had the greatest effect on: the overall audit strategy; the allocation of resources in the audit; and directing the efforts of the engagement team. These matters, and any comments we make on the results of our procedures thereon, were addressed in the context of our audit of the financial statements as a whole, and in forming our opinion thereon, and we do not provide a separate opinion on these matters. This is not a complete list of all risks identified by our audit.
Key audit matter How our audit addressed the key audit matter
Carryingvalueofgoodwillandcapitaliseddevelopmentcosts
Refer to the Significant issues considered by the Audit Committee on page 127 and notes 17 and 18 to the financial statements.
The Group holds goodwill of £578 million (2018: £574 million) and capitalised development costs of £75 million (2018: £60 million) at 31 March 2019.
The Group has significant goodwill arising from the acquisition of businesses and investments in new products and technologies.
The Group also has significant capitalised development costs which are at an early stage of their commercial life cycle and as such, carry a greater risk that they will not be commercially viable.
The impairment reviews performed by management contain a number of significant judgements and estimates. Changes in these assumptions can result in materially different impairment charges or available headroom. Certain assets are subject to annual impairment assessment, while others with a finite life are reviewed if a triggering event has been identified.
We obtained management’s value in use goodwill impairment models and tested and evaluated the reasonableness of key assumptions, including CGU identification, operating cash flow forecasts and key inputs to these forecasts, long term growth rates, and discount rates.
We obtained the impairment trigger assessment and value in use impairment models over generic drug development performed by management to assess the key assumptions considered, including operating cash flow forecasts and key inputs to these forecasts, perpetuity growth rates, and discount rates.
We tested the mathematical integrity of the forecasts and carrying values in management’s impairment models and confirmed that management’s estimate of each CGU’s recoverable amount is appropriately based on the higher of fair value less costs of disposal and value in use.
We agreed the forecast cash flows to management’s approved budget, assessed how these budgets are compiled and understood key related judgements and estimates, including short-term growth rates and cost allocations. For each material CGU we either performed independent testing of the assumptions (as explained below) or corroborated them to supporting evidence. We have assessed the reasonableness of cash flow forecasts in the context of the individual impairment analyses.
We engaged our valuations experts where necessary to assess the long term growth rate and discount rate for each CGU by comparison with third party information, past performance and relevant risk factors.
We performed our own independent sensitivity analysis to assess whether a reasonable downside change in the key assumptions could give rise to a material impairment.
We assessed management’s historical forecasting accuracy by comparing the prior year forecasts with actual results. This informed the assumptions applied to our independent sensitivity analysis.
As a result of our work, we agreed with management’s conclusions on the recoverability of the goodwill and capitalised development costs. We have assessed management’s disclosures in light of the impairment testing performed and we considered the disclosures made to be reasonable.
Acc
ou
nts
Johnson Matthey
Annual Report and Accounts 2019 225
Independent auditor’s report continuedto the members of Johnson Matthey Plc
Key audit matter How our audit addressed the key audit matter
Claims,uncertaintiesandotherprovisions
Refer to the Significant issues considered by the Audit Committee on page 127 and notes 28 and 36 to the financial statements
This risk covers product liability issues and other litigious matters across the Group.
Due to the complex nature of the products offered by Johnson Matthey, the Group at any point in time may be exposed to product liability issues including claims for damages or compensation. The assumptions underpinning these claims and the identification of when such claims arise are inherently judgemental. Careful consideration needs to be given as to how they are estimated and subsequently accounted for.
The Group is also involved in various legal proceedings, including actual or threatened litigation and regulatory investigations.
The Group discloses such risks as contingent liabilities where it is unable to make a reliable estimate of potential exposures or where it believes a possible obligation is not probable. If the Group is unable to defend against such claims, these risks could give rise to a future liability.
For litigation provisions, we read the summary of major litigation matters provided by management and held discussions with the Group’s general counsel. For a sample of matters, we obtained and reviewed correspondence with external legal counsel with respect to matters included in the summary.
We have circularised external legal counsel to independently assess legal exposures and expected outcome for material cases across the Group.
We reviewed board minutes and made inquiries of management to address the risk of undisclosed claims and uncertainties. We performed audit procedures to identify any third party legal counsel used by management and as appropriate included them in our circularisation.
We have assessed the underlying assumptions underpinning product liability claims by considering past history in settlement of such claims as evidence of likely settlement of open matters. We applied professional scepticism in auditing both the likely outcome and quantification of claims, including performing audit procedures over claims management determined to be immaterial and requesting management provide further support.
We have assessed the level of provisioning and contingent liability disclosures, where relevant, in response to known claims.
Based on the procedures outlined, we are satisfied that management’s provisioning estimates were adequately supported and appropriate disclosures have been provided.
Taxationaccounting
Refer to the Significant issues considered by the Audit Committee on page 127 and to the Accounting Policies in the financial statements
The Group holds tax provisions of £102 million (2018: £86 million).
The Group operates in a number of international jurisdictions, and as a result there is risk of uncertain tax exposures around the Group and heightened risk around estimates in determining the tax effect of cross border transactions including transfer pricing arrangements.
Where the precise impact of the tax laws and regulations on taxes payable on profit arising in those jurisdictions is unclear, the Group seeks to make reasonable estimates to determine the tax charges that may arise.
We engaged our tax specialists in support of our audit of tax and obtained an understanding of the Group’s tax strategy and risks. We recalculated the Group’s tax provisions and determined whether the treatments adopted were in line with the Group’s tax policies and had been applied consistently.
We evaluated the key underlying assumptions and judgements, including considering the status of tax authority audits and enquiries through examining the latest correspondence and enquiring of management. We considered the basis and support in particular for provisions not subject to tax audit in comparison with our experience for similar situations.
We evaluated the consistency of management’s approach to identifying triggering events to reassess or record a provision for an exposure.
We also evaluated the consistency of management’s approach to establishing or changing prior provision estimates and validated that changes in prior provisions reflected a change in facts and circumstances.
Our in-scope components performed audit work on the local tax expense and completeness of the corresponding liability or asset position and we performed analytical procedures at a Group level on any large markets that were out of scope.
We also considered the adequacy of the Group’s disclosures in respect of tax and uncertain tax positions.
We are satisfied that management’s provisions with respect to uncertain tax matters have been prepared on a reasonable basis that represent management’s current best estimate of the most likely outcome. We consider management’s disclosures with respect to tax matters to be appropriate.
Johnson Matthey
Annual Report and Accounts 2019
Accounts
226
Independent auditor’s report continuedto the members of Johnson Matthey Plc
Key audit matter How our audit addressed the key audit matter
Refinerymetalaccounting
Refer to the Significant issues considered by the Audit Committee on page 126 and to the Accounting Policies in the financial statements
The Group refines a significant amount of metal. Complex estimates are applied in determining the year-end inventory balances including:
(i) Estimation of the level of metal contained in the carrier material entering the refining process, and the refined metal that leaves the refining process;
(ii) Estimates of the metal at the refineries at the time of stock takes, and the subsequent sampling and assaying to assess the precious metal content on stock take date;
(iii) Estimates of the process losses of precious metals that may be lost during the refining and fabrication process, and the adequacy of these provisions at year-end; and
(iv) Estimates of the net realisable value of unhedged metal held at year-end.
As part of its refining activities, the Group processes material on behalf of third parties, whereby the Group must return pre-agreed recoverable quantities of refined metal to those parties at an agreed date. As such, the Group’s year-end metal inventory is reduced or increased dependent on its ability to recover metal as part of its refining operations.
The majority of metal processed at refineries is owned by customers and is not held on the financial balance sheet of Group. As such, the Group performs a metal balance sheet reconciliation to ensure quantities of precious metals held at year-end are appropriately understood, classified and reconciled. This ensures that only the Group owned inventory is recorded on the balance sheet, and that the price allocated to this owned inventory is at the lower of cost and net realisable value.
The refining process and its associated estimates are deemed a significant risk, as a small variation in underlying estimates or classification could result in a material change to the quantity or valuation of inventory.
We evaluated the design and operation of key controls at the main refining locations over stock takes, and metal assaying procedures.
We tested that the metal balance sheet was prepared and reviewed on a monthly basis.
We tested the classification of precious metals at year-end on the metal balance sheet, to determine if metal was owned by the Group or the customer. Our procedures included sending confirmations to customers, and testing the customer metal that was in the refining process, but not contractually due.
We assessed management’s policy for recognising stock take gains and losses arising from the stock takes that occurred during the year. We performed site visits and attended physical stock counts at sites to verify existence of stock and adherence to the Group’s stock take processes, and the reasonableness of stock take gains and losses that have been recorded.
We assessed provisions for inventory process loss compared to historical trends and stock take results to assess the likelihood and quantum of processing loss (if any) of metal between the date of the stock take and the year-end date.
We tested that all unhedged metal was being held at the lower of cost and net realisable value, on an individual metal by metal methodology, with reference to external metal price data.
We considered the adequacy of the Group’s disclosures about the degree of estimation involved in arriving at the measured inventory.
We are satisfied with the quantity and valuation of inventory, and that such balances were adequately supported and in line with relevant Group accounting policies.
Preciousmetalsmanagement–accountingforhedgedmetal
Refer to the Significant issues considered by the Audit Committee on page 126 and note 39 in the financial statements
The Group operates a Precious Metals Management (“PMM”) division that is responsible for sourcing precious metal and managing price exposures and inventory levels of the significant quantities of precious metals that are processed and converted into manufactured goods.
Whilst PMM sources metal on the Group’s account and sells this to customers, it also obtains metal by entering into metal leasing contracts with financial institutions and manages significant quantities of customer owned metal. To execute its strategy and comply with the Group’s risk management policies, PMM operates a number of trading desks that enter into spot, forward and swap transactions with customers, suppliers and financial institutions. PMM is not mandated to enter into speculative trades for the purpose of making a profit.
The accounting for these transactions is complex and as part of the Group’s adoption of IFRS 15 – Revenue from Contracts with Customers (“IFRS 15”) together with management we have performed a detailed review of the activities of PMM and reassessed the required accounting for these transactions, under both IAS 18 – Revenue (“IAS 18”) and IFRS 15. This review has concluded that certain commodity contracts (principally swaps and sale and repurchase agreements) should not be included within revenue in the current year or the prior year.
The prior year financial statements have therefore been restated, and the impact of both the adoption of IFRS 15 and other prior year items requiring restatement have been separately disclosed.
As PMM uses a number of different commodity contracts we gained an understanding of each type and evaluated how these were accounted for, including consideration of:
• the application of the ‘own use’ exemption for valuing financial instruments, and how metal inventory was recorded and valued at year-end; and
• how ‘sale and repurchase’ and ‘swap’ transactions are accounted for under the Group’s accounting policies, IAS 18 and IFRS 15.
We reviewed management’s exercise to disaggregate the commodity contracts and identify whether or not such transactions should be included within revenue in both the current and prior year.
We agreed a sample of trades to external evidence to provide support that the trades had occurred, were accurately recorded and were correctly classified.
We considered management’s allocation of adjustments between those arising from the implementation of IFRS 15 and from other restatements, and the associated disclosures made in the financial statements. We believe the allocation of the adjustments and associated disclosures is appropriate.
Acc
ou
nts
Johnson Matthey
Annual Report and Accounts 2019 227
Independent auditor’s report continuedto the members of Johnson Matthey Plc
Howwetailoredtheauditscope
We tailored the scope of our audit to ensure that we performed enough work to be able to give an opinion on the financial statements as a whole, taking into account the structure of the Group and the parent company, the accounting processes and controls, and the industry in which they operate.
The Group is structured across four sectors, Clean Air, Efficient Natural Resources, Health, and New Markets, as well as the Corporate central unit. The financial statements are a consolidation of approximately 315 Business Units. We have identified each individual Business Unit as a component, or a series of Business Units where they map to one legal statutory entity. These components comprise the Group’s operating businesses and holding companies across the four sectors and Corporate.
Based on our risk and materiality assessments, we determined which components required an audit of their complete financial information having considered the relative significance of each entity to the Group, locations with significant inherent risks and the overall coverage obtained over each material line item in the consolidated financial statements. We identified one component which, in our view, required an audit of its complete financial information, due to its size or its risk characteristics. We performed audits of complete financial information at a further 60 components.
In addition to those full scope components, we performed specified procedures at 16 components over specific financial statement line items including revenue, trade and other receivables and deferred income, cash, intangibles, inventory, metal inventory, accruals, fixed assets and depreciation, cost of sales and operating expenses. This ensured that appropriate audit procedures were performed to achieve sufficient coverage over these financial statement line items.
The total 77 in-scope components are located in numerous countries around the world. We used local teams in these countries to perform the relevant audit procedures. Of these, one component has been determined to be financially significant based on its contribution to the Group. This financially significant component is located in the UK.
The Group consolidation, financial statement disclosures and corporate functions were audited by the Group audit team. This included our work over consolidation, litigation provisions, taxation, goodwill, post-retirement benefits, earnings per share and treasury related balances.
This scope of work, together with additional procedures performed at the Group level, accounted for 84% of Group revenue and 80% of Group profit before taxation. This provided the evidence we needed for our opinion on the consolidated financial statements taken as a whole. This was before considering the contribution to our audit evidence from performing audit work at the Group level, including disaggregated analytical review procedures, which covers certain of the Group’s smaller and lower risk components that were not directly included in our Group audit scope.
We issued formal written instructions to all component auditors setting out the audit work to be performed by each of them. The Group audit team visited reporting units in the UK, US, and China during the course of the year in order to attend local management meetings. Throughout the year, the Group audit team held regular meetings with all reporting units at all stages of the audit to direct and supervise the work of these local teams and to ensure that we had a full and comprehensive understanding of the results of their work – particularly insofar as it related to the identified areas of focus. The Group engagement team also reviewed selected audit working papers for certain component teams.
Johnson Matthey
Annual Report and Accounts 2019
Accounts
228
Materiality
The scope of our audit was influenced by our application of materiality. We set certain quantitative thresholds for materiality. These, together with qualitative considerations, helped us to determine the scope of our audit and the nature, timing and extent of our audit procedures on the individual financial statement line items and disclosures and in evaluating the effect of misstatements, both individually and in aggregate on the financial statements as a whole.
Based on our professional judgement, we determined materiality for the financial statements as a whole as follows:
Group financial statements Parent company financial statements
Overallmateriality
£25 million £15 million
Howwe determinedit
5% of profit before tax, adjusted for loss on disposal of businesses, loss on significant legal proceedings and major impairment and restructuring charges.
1% of total assets but materiality level is capped based on an allocated Group component materiality.
Rationaleforbenchmarkapplied
Adjusted (underlying) profit before tax is used as the materiality benchmark excluding amortisation of acquired intangibles. Management uses this measure as it believes that it reflects the underlying performance of the Group and this is how the directors are measured on their performance. We did not adjust profit before tax to add back amortisation of acquired intangibles as in our view this is a recurring item.
We considered total assets to be an appropriate benchmark for the parent company given that, whilst it does have trading businesses it is the ultimate holding company, holds material investments in subsidiary undertakings, incurs corporate costs and enters into financing on behalf of the Group. The materiality level was capped at £15 million given the overall Group materiality level.
For each component in the scope of our Group audit, we allocated a materiality that is less than our overall Group materiality. The range of materiality allocated across components was between £1 million and £15 million. Certain components were audited to a local statutory audit materiality that was also less than our overall Group materiality.
We agreed with the Audit Committee that we would report to them misstatements identified during our audit above £1.26 million, for both the Group and parent company audits, as well as misstatements below those amounts that, in our view, warranted reporting for qualitative reasons.
Goingconcern
In accordance with ISAs (UK) we report as follows:
Reporting obligation Outcome
We are required to report if we have anything material to add or draw attention to in respect of the directors’ statement in the financial statements about whether the directors considered it appropriate to adopt the going concern basis of accounting in preparing the financial statements and the directors’ identification of any material uncertainties to the Group’s and the parent company’s ability to continue as a going concern over a period of at least twelve months from the date of approval of the financial statements.
We have nothing material to add or to draw attention to. However, because not all future events or conditions can be predicted, this statement is not a guarantee as to the Group’s and the parent company’s ability to continue as a going concern. For example, the terms on which the United Kingdom may withdraw from the European Union are not clear, and it is difficult to evaluate all of the potential implications on the Group’s and the parent company’s trade, customers, suppliers and the wider economy.
We are required to report if the directors’ statement relating to Going Concern in accordance with Listing Rule 9.8.6R(3) is materially inconsistent with our knowledge obtained in the audit.
We have nothing to report.
Reporting on other informationThe other information comprises all of the information in the Annual Report other than the financial statements and our auditors’ report thereon. The directors are responsible for the other information. Our opinion on the financial statements does not cover the other information and, accordingly, we do not express an audit opinion or, except to the extent otherwise explicitly stated in this report, any form of assurance thereon.
In connection with our audit of the financial statements, our responsibility is to read the other information and, in doing so, consider whether the other information is materially inconsistent with the financial statements or our knowledge obtained in the audit, or otherwise appears to be materially misstated. If we identify an apparent material inconsistency or material misstatement, we are required to perform procedures to conclude whether there is a material misstatement of the financial statements or a material misstatement of the other information. If, based on the work we have performed, we conclude that there is a material misstatement of this other information, we are required to report that fact. We have nothing to report based on these responsibilities.
Independent auditor’s report continuedto the members of Johnson Matthey Plc
Acc
ou
nts
Johnson Matthey
Annual Report and Accounts 2019 229
Independent auditor’s report continuedto the members of Johnson Matthey Plc
Reporting on other information (continued)
With respect to the Strategic Report and Directors’ Report, we also considered whether the disclosures required by the UK Companies Act 2006 have been included.
Based on the responsibilities described above and our work undertaken in the course of the audit, the Companies Act 2006 (CA06), ISAs (UK) and the Listing Rules of the Financial Conduct Authority (FCA) require us also to report certain opinions and matters as described below (required by ISAs (UK) unless otherwise stated).
StrategicReportandDirectors’Report
In our opinion, based on the work undertaken in the course of the audit, the information given in the Strategic Report and Directors’ Report for the year-ended 31 March 2019 is consistent with the financial statements and has been prepared in accordance with applicable legal requirements. (CA06)
In light of the knowledge and understanding of the Group and parent company and their environment obtained in the course of the audit, we did not identify any material misstatements in the Strategic Report and Directors’ Report. (CA06)
Thedirectors’assessmentoftheprospectsoftheGroupandoftheprincipalrisksthatwouldthreatenthesolvencyorliquidityoftheGroup
We have nothing material to add or draw attention to regarding:
• The directors’ confirmation on page 91 of the Annual Report that they have carried out a robust assessment of the principal risks facing the Group, including those that would threaten its business model, future performance, solvency or liquidity.
• The disclosures in the Annual Report that describe those risks and explain how they are being managed or mitigated.
• The directors’ explanation on page 97 of the Annual Report as to how they have assessed the prospects of the Group, over what period they have done so and why they consider that period to be appropriate, and their statement as to whether they have a reasonable expectation that the Group will be able to continue in operation and meet its liabilities as they fall due over the period of their assessment, including any related disclosures drawing attention to any necessary qualifications or assumptions.
We have nothing to report having performed a review of the directors’ statement that they have carried out a robust assessment of the principal risks facing the Group and statement in relation to the longer-term viability of the Group. Our review was substantially less in scope than an audit and only consisted of making inquiries and considering the directors’ process supporting their statements; checking that the statements are in alignment with the relevant provisions of the UK Corporate Governance Code (the “Code”); and considering whether the statements are consistent with the knowledge and understanding of the Group and parent company and their environment obtained in the course of the audit. (Listing Rules)
OtherCodeProvisions
We have nothing to report in respect of our responsibility to report when:
• The statement given by the directors, on page 115, that they consider the Annual Report taken as a whole to be fair, balanced and understandable, and provides the information necessary for the members to assess the Group’s and parent company’s position and performance, business model and strategy is materially inconsistent with our knowledge of the Group and parent company obtained in the course of performing our audit.
• The section of the Annual Report on pages 123 to 131 describing the work of the Audit Committee does not appropriately address matters communicated by us to the Audit Committee.
• The directors’ statement relating to the parent company’s compliance with the Code does not properly disclose a departure from a relevant provision of the Code specified, under the Listing Rules, for review by the auditors.
Directors’Remuneration
In our opinion, the part of the Directors’ Remuneration Report to be audited has been properly prepared in accordance with the Companies Act 2006. (CA06)
Responsibilities for the financial statements and the auditResponsibilitiesofthedirectorsforthefinancialstatements
As explained more fully in the Responsibility of Directors, the directors are responsible for the preparation of the financial statements in accordance with the applicable framework and for being satisfied that they give a true and fair view. The directors are also responsible for such internal control as they determine is necessary to enable the preparation of financial statements that are free from material misstatement, whether due to fraud or error.
In preparing the financial statements, the directors are responsible for assessing the Group’s and the parent company’s ability to continue as a going concern, disclosing as applicable, matters related to going concern and using the going concern basis of accounting unless the directors either intend to liquidate the Group or the parent company or to cease operations, or have no realistic alternative but to do so.
Johnson Matthey
Annual Report and Accounts 2019
Accounts
230
Auditors’responsibilitiesfortheauditofthefinancialstatements
Our objectives are to obtain reasonable assurance about whether the financial statements as a whole are free from material misstatement, whether due to fraud or error, and to issue an auditors’ report that includes our opinion. Reasonable assurance is a high level of assurance, but is not a guarantee that an audit conducted in accordance with ISAs (UK) will always detect a material misstatement when it exists. Misstatements can arise from fraud or error and are considered material if, individually or in the aggregate, they could reasonably be expected to influence the economic decisions of users taken on the basis of these financial statements.
A further description of our responsibilities for the audit of the financial statements is located on the FRC’s website at: www.frc.org.uk/auditorsresponsibilities. This description forms part of our auditors’ report.
Useofthisreport
This report, including the opinions, has been prepared for and only for the parent company’s members as a body in accordance with Chapter 3 of Part 16 of the Companies Act 2006 and for no other purpose. We do not, in giving these opinions, accept or assume responsibility for any other purpose or to any other person to whom this report is shown or into whose hands it may come save where expressly agreed by our prior consent in writing.
Other required reporting
Companies Act 2006 exception reportingUnder the Companies Act 2006 we are required to report to you if, in our opinion:
• we have not received all the information and explanations we require for our audit; or
• adequate accounting records have not been kept by the parent company, or returns adequate for our audit have not been received from branches not visited by us; or
• certain disclosures of directors’ remuneration specified by law are not made; or
• the parent company financial statements and the part of the Directors’ Remuneration Report to be audited are not in agreement with the accounting records and returns.
We have no exceptions to report arising from this responsibility.
AppointmentFollowing the recommendation of the Audit Committee, we were appointed by the directors on 26 July 2018 to audit the financial statements for the year-ended 31 March 2019 and subsequent financial periods. This is therefore our first year of uninterrupted engagement.
Mark Gill (Senior Statutory Auditor)for and on behalf of PricewaterhouseCoopers LLPChartered Accountants and Statutory AuditorsLondon
30 May 2019
Independent auditor’s report continuedto the members of Johnson Matthey Plc
Acc
ou
nts
Johnson Matthey
Annual Report and Accounts 2019 231