price discovery in agricultural commodities: the shifting relationship between spot and future...
TRANSCRIPT

Price discovery in agricultural commodities: the shifting relationship
between spot and futures prices
LUCIA BALDI*, MASSIMO PERI, DANIELA VANDONE
*Department of Agricultural, Food and Environmental Economics
Università degli Studi di Milano - Italy
Paper prepared for presentation at the EAAE 2011 Congress
Change and Uncertainty Challenges for Agriculture,
Food and Natural Resources
August 30 to September 2, 2011 ETH Zurich, Zurich, Switzerland
Copyright 2011 by Baldi, Peri, Vandone. All rights reserved. Readers may make
verbatim copies of this document for non-commercial purposes by any means, provided
that this copyright notice appears on all such copies.

1
Price discovery in agricultural commodities: the shifting relationship between spot and futures prices
LUCIA BALDI , MASSIMO PERI AND DANIELA VANDONE
1. Introduction Over the last few years commodity prices have undergone strong fluctuations as a consequence of economic, political and financial issues that have reshaped the global economic equilibrium. Most of the anomalies recorded during this period were attributed to the growing role played by financial instruments, specifically derivatives. In fact, although it is well known that derivatives provide economic benefits, such as information dissemination, price discovery and efficient allocation of resources (Chan 1992, Schwarz, Szakmary 1994), the tightened cross-market linkages that result from derivatives trading also fuel a common public and regulatory perception that derivatives generate or exacerbate volatility in the underlying asset markets, since they represent not only an important tool for managing risk exposure, but also an opportunity for trading and speculation. In particular, the low cost of futures trading may induce excessive speculation which, in turn, may cause commodity prices to vary excessively, with destabilizing effects in the markets. In this regard, the study of the dynamics of futures and spot prices for agricultural commodities assumes particular importance, especially within the framework of the recent global food balances crisis, where concerns have been raised about the possible role of futures and speculation in increasing the price of some agricultural commodities. Some interesting studies have already analyzed the role of “financialization” of commodities futures and spot market; however many authors (Headey and Fan, 2008; Fortenbery, 2009; Romano, 2009; Irwin et al. 2011) have highlighted the need to deepen empirical evidence to better identify the relationship between spot and futures prices utilizing appropriate methodological instruments. We intend to fill this gap by applying cointegration methodology in the presence of potentially unknown structural breaks in the prices of corn and soybean, using a recent methodology proposed by Keiryval and Perron (2009). We then study the causality relationships between spot and futures prices within each specific sub-period identified, using the procedure developed in Toda and Yamamoto (1995), in order to analyze where changes in spot and futures price originate and how they spread. We focus on corn and soybeans, two of the most significant food commodities traded in global financial markets, that have particularly suffered the combined effect of crisis and biofuel demand growth (Headey and Fan, 2008). We use weekly data of spot and future prices from January 2004 to September 2010. This work offers two new insights. Firstly, from a methodological point of view, while previous studies analyzed the long-run equilibrium relationship between spot and futures prices using conventional cointegration analysis, we use a refined methodology to analyze the existence of a potential structural break in the cointegration vector in order to gather the time dynamic of the relationship, which is important in a period of high price movements. To the authors’ knowledge this procedure has never been applied to investigate the long-term dynamics between spot and futures prices in the corn and soybean markets. Secondly, we specifically focus on the price discovery role of spot and future markets during the recent food price crises with the aim to contribute to the debate on the role of financial markets speculation in food price increases. The paper is organized as follows: Section 2 describes the theoretical framework. Section 3 presents the dataset used for the purpose of the study and a brief analysis of spot and futures price trend. Section 4 proposes the econometric methodology and section 5 develops the empirical results. Section 6 includes the discussion and final remarks. 2. Theoretical framework 2.1 The debate Financial explanations of agricultural prices pattern obtained shifting support over the last 40 years and returned very fashionable during the recent price rose in 2005-2008 (Cooper and Lewrence,

2
1975; Bordo, 1980; Chamber and Just, 1982; Taylor, 1995; Awokuse, T. O., 2005). Gilbert (2010) for instance highlight that this agricultural price boom took place not only with booms in others commodity prices but also with booms in equity and real estate prices; he suggests that, in an environment in which central banks were controlling goods prices, monetary growth may have spilt over into asset prices. Agricultural futures markets should provided a possible route through which this transmission may have taken place. In recent years an heated debate developed over the role of “financialization” of commodity futures and spot markets, that have important consequences from a policy perspective as well as practical implications for the efficient pricing of commodities. In particular some economists and policy-makers assert that the dramatic rise and fall of world food prices in 2007-08 was largely a result of speculative activity in global commodity market and that a “bubble” was generated forcing commodity futures prices well above “fundamental values”. On the other side, other authors have expressed scepticism about the bubble argument arguing that commodity markets in the same period were driven by fundamental supply and demand factors, like increased use of biofuel, growth in demand from China and India, decline of stocks, increased oil prices and Dollar depreciation (see Irwin and Sanders, 2011 for an exhaustive review). A third group of authors argues that many factors have intervened in the recent crisis and therefore we can not identify a single reason. The “probubble” side was fueled initially by Masters (2008) and later by Cooke and Robles (2009) who use an empirical analysis to provides evidences that financial activity in futures markets and proxies for speculation can explain the observed change in food prices and that excess price surge caused by speculation could boost poverty and result in long term, irreversible nutritional damage. In line with these considerations arises Ghosh (2010) that argues that the financial crisis also directly operates to increase food insecurity by imposing constraints on fiscal policies and food imports in balance-of-payments constrained developing countries, causing exchange rate devaluation through capital flight and adversely affecting employment, thereby reducing the ability of vulnerable groups to purchase food. Gilbert (2010) investigates the factors driving the recent increase in food prices and concludes the demand for grains and oilseeds as biofuel feedstocks has been cited as the main cause of price rise but there is little direct evidence for this contention whereas index-based investment in agricultural futures markets is seen as the major channel through which macroeconomic and monetary factors generate the food prices crisis. At last, Tang and Xiong’s analysis (Tang and Xiong, 2010) appears to provide concrete evidence of a linkage between futures price movements and commodity index investment and conclude that the increasing presence of index investors in commodities markets precipitated a fundamental process of financialization amongst the commodities markets, through which commodity prices now become more correlated with the prices of financial asset and each others. On the other side, some economists argue that commodity price increases have been mainly determined by market supply and demand and that futures markets form the mechanism by which information about fundamentals becomes incorporated in market prices. In an early work Headey and Fan (2008) argue that although futures markets could have exacerbated the volatility in agricultural market, they are unlikely to be a lending cause of the overall price surge. In particular for corn and soybean they suppose increased biofuels production offers a strong explanation of rapidly increasing prices and, for the others goods, also rising oil prices, the depreciation of US dollar, and some commodity-specific explanations. A large number of papers (among them Stoll and Whaley, 2010; Irwin and Sanders, 2009, 2011; Sanders and Irwin, 2010) have focused on the issues of index fund investment strongly soared over the last decade. In these works authors carry out empirical evidences demonstrating that very limited traces of linkage are visible between the level of commodities prices and market positions of index funds. They argue that possible limits on speculation would not be justified and could do substantial harm to the efficient functioning of these markets. Finally, some authors do not focalize their attention to indentify a specific factor that triggered the crisis considering that many causes above mentioned are complementary (Vaciago, 2008; Romano, 2009; Gutierrez 2010). Lang (2010) at last highlights the need to reflect on the adequacy of food

3
policy to respond to the squeeze on land, people, health and environment, claiming that the crisis is just a sign of system failure. Fonterbery (2009) highlight also the risk that the recent introduction of regulatory “reforms” may actually reduce the overall efficiency of market to discover price and transfer risk. Price discovery issues undoubtedly remains one of the most concrete problems to be addressed to assess the ability of agricultural futures markets to assimilate and transmit information and to transfer risk. Findings generally indicate that in well-designed futures contracts prices respond rapidly to new information, provide unbiased if imprecise forecasts of subsequent cash prices, and transmit information quickly throughout the marketing system (Carter 1999; Williams 2001; Garcia and Leuthold 2004). With regards to managing risk, the potential benefits of using futures contracts to hedge price risk have been identified for a variety of contracts and market situations (e.g., Tomek and Peterson 2001; Lien and Tse 2002). We enter this debate with a specific perspective, that is to analyse the causal relationship between spot and futures prices to study where changes in spot and futures prices originate and how they spreads (cd price discovery). This will not disentangle the discussion, but provide a further empirical evidence based on an advanced econometric approach. 2.2 The price discovery Theoretically, the relationship between spot and futures prices can be derived from the spot-future parity, which implies that spot and futures prices should move together across time to avoid constant arbitrage opportunities based on the spot-futures relationship (Hull, 1997). Intuitively, since spot and futures prices for any commodity are driven by the same underlying information, they should be closely related; the exact nature of this relationship depends on many factors, among which seasonal effects, the nature of the commodity (storable or non-storable) and market expectations. The theoretical equilibrium relationship between spot and future prices is a long-run, rather than a short-run, connection, and can be tested by examining whether spot and futures prices are cointegrated. There already exists a vast literature that highlights the long-run equilibrium relationship between commodities spot and futures prices (among others, Martin and Garcia 1981, Hokkio and Rush 1989, Wahab and Lashgari 1993, Giot 2003, Garcia and Leuthold 2004, Hernandez and Torero 2010), but only a few studies examine the time dynamic of such a relationship, i.e. the existence of a potential structural break in the cointegration vector (Dawson et al.. 2010; Maslyuk and Smyth 2009). Such a methodological refinement is important. In conventional cointegration analysis, cointegration vectors are assumed to be time invariant; however, in the long-run, the relationship between the series may change due to a break, and the time-invariant formulation of the cointegrating vector will no longer be appropriate (Hansen 1992). Since commodities have experienced in recent years sizeable and long-lasting price changes (see Figure 1 in Section 3), it is likely that this methodology is able to capture more accurately the relationship between spot and futures prices, and, specifically, to properly analyze their causal relationship. The study of the causal relationship between spot and futures prices is functional to the analysis of the “price discovery” role of spot and futures markets, defined as the lead-lag relationship and information flows between spot and futures markets (Schroeder and Goodwin 1991, Yang et al.. 2001, Brooks et al.. 2001). Accordingly, a market that reflecting new information more rapidly is said to have a price discovery function. The issue of price discovery is significant in the light of the debate about the relation between the diffusion of financial instruments and an increase in food commodities prices. In fact, although it is common knowledge that derivatives provide economic benefits, such as information dissemination, price discovery and efficient allocation of resources, there is a widespread public and regulatory perception that such financial instruments generate or exacerbate excessive speculation which, in turn, forces prices away from their fundamental value, with destabilizing effects on real markets (Gerety, Mulherin 1991, Fleming, Ostdiek 1999).
4
However, it is important to correctly understand the meaning of the causal relationship between spot and futures prices, since, sometimes, the notion of price discovery is improperly used to evaluate hypothesis about the role of speculation in commodities price increase and decrease: when changes in prices appear first in the futures market, speculation may be an important determinant, vice-versa if changes in prices appear first in the spot market, they are caused by changes in market fundamentals that affect the supply/demand balance for the commodity (Kaufmann and Ullman 2009). This way of interpreting the causal relationship between spot and futures prices is conceptually misleading, since price discovery does not necessarily reflect the existence of speculation, but the way prices echo new or unexpected information and spread this information through markets. See Irwin et al.. (2009) for a comprehensive explanation about the misunderstanding of the role of speculation in commodities price boom. Empirical findings generally support the price discovery role of futures markets, i.e. spot prices are usually discovered in the future markets. Indeed, spot and futures prices on the same commodity have the same fundamentals and change if new information emerges that causes market participants to revise their estimates of physical supply and/or demand. Since contracts sold on futures markets generally do not require the delivery of the commodity but can be implemented immediately with little up-front cash, futures markets generally react more quickly than spot markets (Silvapulle and Moosa 1999). In particular, Garbade and Silber (1983) analyze the price discovery for four storable commodities including corn and soybean and conclude that futures markets generally dominate spot markets in registering and transmitting information. Crain and Lee (1996) also find that changes in wheat futures prices lead changes in spot prices, confirming that futures markets dominate spot markets in the price discovery process. In more recent years, Yang et al.. (2001) confirmed that futures markets play the dominant role in the price discovery process for storable commodities. Similarly, Henandez and Torero (2010), who analyzed spot and futures prices for wheat, corn and soybeans, find evidence that future prices Granger-cause spot prices more often than the reverse - particularly for corn and wheat. They also find that the causal relationship is remarkably stronger than in the past and adduce this result to the increasing importance of electronic trading of futures contracts, which results in more transparent and widely accessible prices. Other studies, however, have undermined these results and find that spot prices lead futures prices (Quan 1992, Kuiper et al. 2002, Mohan and Love, 2004) The present analysis intends to extend these previous studies by examining and interpreting, across the recent food crises, the causal relationships in spot and futures markets within the sub-periods identified by structural breaks. 3. Data issues In our analysis we focalized the attention in weekly spot and futures prices. The specific spot prices considered are corn U.S. No.2 yellow FOB U.S. Gulf and soybeans No.1 FOB U.S. Gulf. These quotations are the leading benchmark price for international trade and are considered as reported by the USDA on Friday of each week. Future prices are collected from DataStream and are from CBOT. Futures prices are those from the nearby contract, but contracts are rolled over to the next contract on the first business day of the contract month; this is the standard procedure in the literature since the nearby futures contract is highly liquid and the most active (Yang et al.. 2001). The sample period comes from January 2004 to September 2010. All prices are in U.S. dollars per metric ton (US$/MT). Futures prices are denoted in U.S. cents per bushel, which were subsequently converted into US$/MT for comparison purposes with spot prices. As we are interested in longer-term price movements, we use weekly values instead of daily observations (Kaufmann, Ullman 2009). This change reduces the likelihood of finding a causal relationship (Schwarz, Szakmary 1994). Additionally, there is no evidence that the use of weekly data affects our results and conclusions, since they are substantially unaffected when we repeat the analysis using daily data.
5
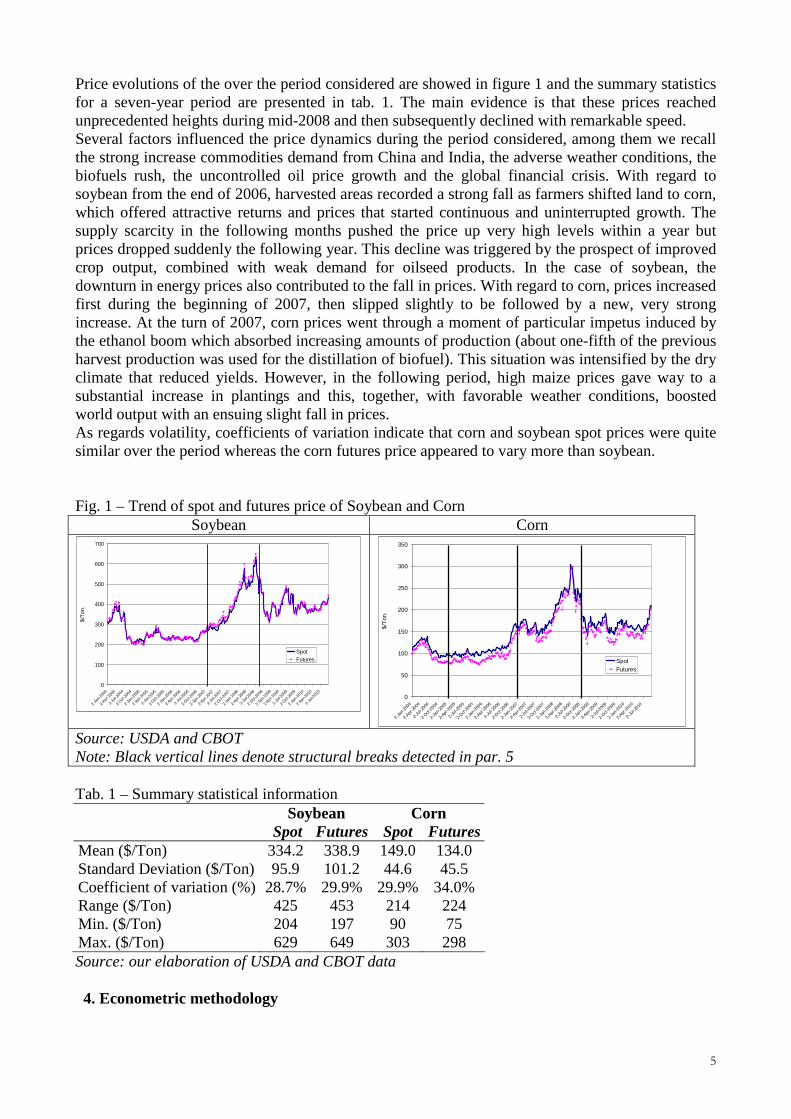
Price evolutions of the over the period considered are showed in figure 1 and the summary statistics for a seven-year period are presented in tab. 1. The main evidence is that these prices reached unprecedented heights during mid-2008 and then subsequently declined with remarkable speed. Several factors influenced the price dynamics during the period considered, among them we recall the strong increase commodities demand from China and India, the adverse weather conditions, the biofuels rush, the uncontrolled oil price growth and the global financial crisis. With regard to soybean from the end of 2006, harvested areas recorded a strong fall as farmers shifted land to corn, which offered attractive returns and prices that started continuous and uninterrupted growth. The supply scarcity in the following months pushed the price up very high levels within a year but prices dropped suddenly the following year. This decline was triggered by the prospect of improved crop output, combined with weak demand for oilseed products. In the case of soybean, the downturn in energy prices also contributed to the fall in prices. With regard to corn, prices increased first during the beginning of 2007, then slipped slightly to be followed by a new, very strong increase. At the turn of 2007, corn prices went through a moment of particular impetus induced by the ethanol boom which absorbed increasing amounts of production (about one-fifth of the previous harvest production was used for the distillation of biofuel). This situation was intensified by the dry climate that reduced yields. However, in the following period, high maize prices gave way to a substantial increase in plantings and this, together, with favorable weather conditions, boosted world output with an ensuing slight fall in prices. As regards volatility, coefficients of variation indicate that corn and soybean spot prices were quite similar over the period whereas the corn futures price appeared to vary more than soybean. Fig. 1 – Trend of spot and futures price of Soybean and Corn
Soybean Corn
0
100
200
300
400
500
600
700
2-Ja
n-20
04
2-Apr
-200
4
2-Ju
l-200
4
2-Oct-
2004
2-Ja
n-20
05
2-Apr
-200
5
2-Ju
l-200
5
2-Oct-
2005
2-Ja
n-20
06
2-Apr-2
006
2-Ju
l-200
6
2-Oct-
2006
2-Ja
n-20
07
2-Apr
-200
7
2-Ju
l-200
7
2-Oct-
2007
2-Ja
n-20
08
2-Apr
-200
8
2-Ju
l-200
8
2-Oct-
2008
2-Ja
n-20
09
2-Apr
-200
9
2-Ju
l-200
9
2-Oct-
2009
2-Ja
n-20
10
2-Apr
-201
0
2-Ju
l-201
0
$/T
on.
SpotFutures
0
50
100
150
200
250
300
350
2-Ja
n-20
04
2-Apr
-200
4
2-Ju
l-200
4
2-Oct-
2004
2-Ja
n-20
05
2-Apr
-200
5
2-Ju
l-200
5
2-Oct-
2005
2-Ja
n-20
06
2-Apr
-200
6
2-Ju
l-200
6
2-Oct-
2006
2-Ja
n-20
07
2-Apr
-200
7
2-Ju
l-200
7
2-Oct-
2007
2-Ja
n-20
08
2-Apr
-200
8
2-Ju
l-200
8
2-Oct-
2008
2-Ja
n-20
09
2-Apr
-200
9
2-Ju
l-200
9
2-Oct-
2009
2-Ja
n-20
10
2-Apr
-201
0
2-Ju
l-201
0
$/T
on.
SpotFutures
Source: USDA and CBOT Note: Black vertical lines denote structural breaks detected in par. 5 Tab. 1 – Summary statistical information
Soybean Corn Spot Futures Spot Futures Mean ($/Ton) 334.2 338.9 149.0 134.0 Standard Deviation ($/Ton) 95.9 101.2 44.6 45.5 Coefficient of variation (%) 28.7% 29.9% 29.9% 34.0% Range ($/Ton) 425 453 214 224 Min. ($/Ton) 204 197 90 75 Max. ($/Ton) 629 649 303 298 Source: our elaboration of USDA and CBOT data 4. Econometric methodology

6
In our study, we analyze the long-run relationship between spot and future prices of corn and soybean during a period when evident breaks occurred, as fig. 1 highlights. Considering that, traditionally, spot and the relative nearby future contracts are cointegrated and considering moreover the significant changing dynamics recorded by the series during the period considered, in this study we search for a cointegration relationship that accounts also for structural breaks. Subsequently, for the sub period detected from the procedure utilized, we investigate the price discovery process using the Granger causality approach. Specifically, to address the research question of this paper, the approach starts by investigating the order of integration of the variables. With this objective in mind, considering that testing for unit root of a series in presence of structural break using a traditional augmented Dickey-Fuller (1979) technique provides biased results (Perron, 1989), the order of integration of the variables is tested using also an alternative methodology. The first test used is the GLS augmented Dickey-Fuller (ADF-GLS) test of Elliot et al.. (1996) and the second is the Zivot and Andrews (1992). The ADF-GLS has a unit root under the null hypothesis and does not assume the presences of structural breaks. On the other hand, the Zivot and Andrews (1992) test is a sequential test that allows the existence of one endogenous break, where the null hypothesis is that the series is integrated without exogenous structural break. Once the series are found to be of the same order of integration, we test for cointegrating relationship allowing the presences of multiple structural breaks. The literature presents several different approaches for the analysis of structural breaks. These differ on the estimation and inference about break dates, the inclusion of tests for structural changes, tests for unit root in presence of structural changes in the trend function, as well as tests for cointegration allowing for structural changes (see Perron 2005 for a exhaustive review). One of the most important issues concerns the possibility to manage multiple structural breaks when series are related to each other. Bai and Perron (1998) first dealt with these issues proposing a methodology limited to I(0) series. However, to fit within the purpose of this paper, focused on the analysis of the changing dynamics between spot and future price of corn and soybean during the recently financial crisis, Kejriwal and Perron's (2009) approach was utilized to estimate, test and compute multiple endogenous breaks dates in conintegrated regressor. From the econometric point of view, the Kejriwal and Perron (2009) model is an extension of the Bai and Perron (1998) procedure to a more general model allowing for the possibility of both I(0) and I(1) variables in the regression. The Kejriwal and Perron (2009) model is based on the following linear regression with m breaks and (m+1) regimes:
tbjbtfftbjbtfftjt uxxzzcy +′+′+′+′+= ββθθ jj TTt ,...,11 += − (1)
where yt is the I(1) dependent variable at time t, zft ( 1×fq ) and zbt ( 1×bq ) are vectors of unit root
variables, while xft ( 1×fp ) and xbt ( 1×bp ) are vectors of stationary variables. The symbols θf, θbj,
βf and βbj (j = 1, ..., m+1) are coefficients of these vectors, while ut is the stochastic disturbance at time t. The subscripts f and b respectively represent the regressor that are fixed or change across the regimes. Conventionally, T0=0 and Tm+1=T. The purpose of the Kejriwal and Perron (2009) model is to estimate the unknown break points (T1,...,Tm) together with the regression coefficients allowing for both a partial or a pure structural change model. In the partial structural change model, only a subset of coefficient changes across the j regimes; when pf = qf = 0, the model is referred to a pure structural change model, where all coefficients in the equation change across regimes. Asymptotic critical values for these tests can be found in Kejriwal and Perron (2009). For both commodities considered and for each of the sub-periods detected by the breaks in the spot and futures prices relationship we then investigate the Granger causality.

7
Considering that when the series are integrated the conventional Granger non-causality test is not valid as the test does not have a standard distribution(Toda and Yamamoto, 1995), we apply the Toda and Yamamoto (1995) procedure following the Rambaldi and Doran (1996) approach. It is firstly necessary to select the maximum order of integration (dmax) of the variable considered (in our case, it is one), next it is necessary to determine the optimal lag (k) of the VAR model using information criteria, the preferred lag value being selected on the basis of AIC, HQIC and SBIC statistics. Then a VAR(k+dmax) has to be estimated in a Seemingly Unrelated Regression (SUR) framework, lastly the hypothesis is tested using a Wald statistic test (MWALD) which has an asymptotic chi-square distribution. In our case, considering the relationship between spot (S) and futures (F) prices the VAR assumes the following specification:
∑ ∑ ∑∑+
+= =
+
+=−−−
=− +++++=
max max
1 1 112112
1110
dk
kj
k
i
dk
kjtjtjtijtj
k
itit FFSSS εδδγγγ (3)
∑ ∑ ∑∑+
+= =
+
+=−−−
=− +++++=
max max
1 1 122112
1110
dk
kj
k
i
dk
kjtjtjtijtj
k
itit SSFFF εββααα (4)
The null hypothesis that spot price does not Granger cause futures price is formulated as β11=β12=…= β1k=0, while when futures does not Granger cause spot prices the null is: δ11=δ12=…= δ1k=0. 5. Empirical results The degree of integration of the variables was tested using the ADF-GLS test and the Zivot and Andrews (1992) test (ZA) that permits the presence of structural changes. Table 2 shows the results of the tests using different alternatives: with level shift, with trend and with level and time trend shift. The tests indicate that all series are I(1) in all the cases considered and are stationary in the first differences. In particular the ZA test highlights the presence of unit root when breaks are considered.
Table 2 - Results of the Unit root tests ADF-GLS ZA
Trend Level Trend
Level Trend Level Trend
Spot-Soy -1.175 -1.546 -3.416 -2.545 -3.254 Futures-Soy -1.190 -1.473 -3.424 -2.692 -3.347 Spot-Corn -0.629 -1.851 -3.701 -2.838 -3.361 Futures -Corn -0.646 -1.672 -3.705 -2.852 -3.633 Critical Value
1% -2.572 -3.475 -5.43 -4.93 -5.57 5% -1.942 -2.900 -4.80 -4.42 -5.08 10% -1.616 -2.588
Provided that series are integrated of the same order, we can analyze the cointegration between them. To investigate the presence of multiple breaks and estimate the data of the breaks in a cointegrating framework we then adopt the Kejriwal and Perron (2009) procedure. In tables 3 and 4 we report the specification of the model utilized and the results of these estimates where we can conclude that two breaks occur for soybean and three for corn. In particular, as regards corn, the first break is detected at the beginning of 2005. This break can be attributed to the 2005 Energy Policy Act, which fixed a biofuel obligatory mandate for ethanol use with a first step of 15 billions of litres for 2006. Since corn is the raw material to produce ethanol, it is likely that the biofuel policy heavily influenced new pressures on the demand side of corn.

8
Two remarkable breaks are then detected, both for corn and soybean, during the recent economic and financial crisis. Specifically, for corn the first of these two breaks is detected in December 2006, during the first rise of prices due to the strong demand for feed use, in particular from developing countries like China, and for ethanol production. For soybean, the first break is detected a few months later, at the beginning of 2007. This break can be attributed to several factors, among which the constant rise in the demand of soybean during a period where some external factors, such as weather, weakened the total production, leading to a gradual tightening in global stocks. Furthermore, steadily growing biodiesel requirements led to increased demand for vegetable oil, notably soybean in the U.S., rapeseed in Europe. Finally, the last break is detected, for corn and soybean, in Autumn 2008. This break coincides with the bursting of the commodities price bubble. In this period, international prices of all coarse grains declined sharply due to favorable global crop prospects and ample supplies in world markets. The downturn was further aggravated by the market expectation that a global economic slowdown could lower demand for coarse grains and that the steep drop in crude oil prices could also depress demand (for corn in particular) from the ethanol sector. Not to be overlooked, moreover, was the simultaneous collapse of the U.S. financial system, which then extended to the rest of the world economy, and the concurrent lack of liquidity and trading volume that limited the ability of the futures market to transmit price information to spot markets effectively.
Table 3 - Kejriwal and Perron (2009) tests of multiple structural breaks - Soy Specifications
zt={futures-soy}
q=1 M=5 ε=0.15 h=52 xt={0} p=0
Tests SupFT(1) 61.942**
SupFT(2) 171.546**
SupFT(3) 132.028**
SupFT(4) 102.839**
SupFT(5) 80.405**
UD max 171.546**
SupFT(2|1) 233.088**
SupFT(3|2) 7.510
SupFT(4|3) 3.706
Dates and confidences interval with four breaks
^
1T 02/02/07
(01/26/07 - 02/23/07)
^
2T 08/15/08
(08/01/08 - 08/29/08)
Notes: The supFT(k) tests and the standard errors use the following specifications: no serial correlation in the errors, different variances of errors and different distribution for the data across segments. The confidence intervals are reported in parenthesis. ** denote significance at the 1% level. Critical values are obtained from table 1 and 3 of Kejriwal and Perron (2009).
Table 4 - Kejriwal and Perron (2009) tests of multiple structural breaks - Corn Specifications
zt={futures-corn}
q=1 M=5 ε=0.15 h=52 xt={0} p=0
Tests SupFT(1)
136.431** SupFT(2) 91.600**
SupFT(3) 74.978**
SupFT(4) 58.661**
SupFT(5) 47.018**
UD max 136.431**
SupFT(2|1) 34.828**
SupFT(3|2) 22.656**
SupFT(4|3) 8.834
Dates and confidences interval with four breaks
^
1T ^
2T ^
3T Invertire date per inglese
9
01/14/05 (11/12/04 - 03/04/05)
12/15/06 (12/01/06 - 01/12/07)
10/10/08 (05/16/08 - 01/16/09)
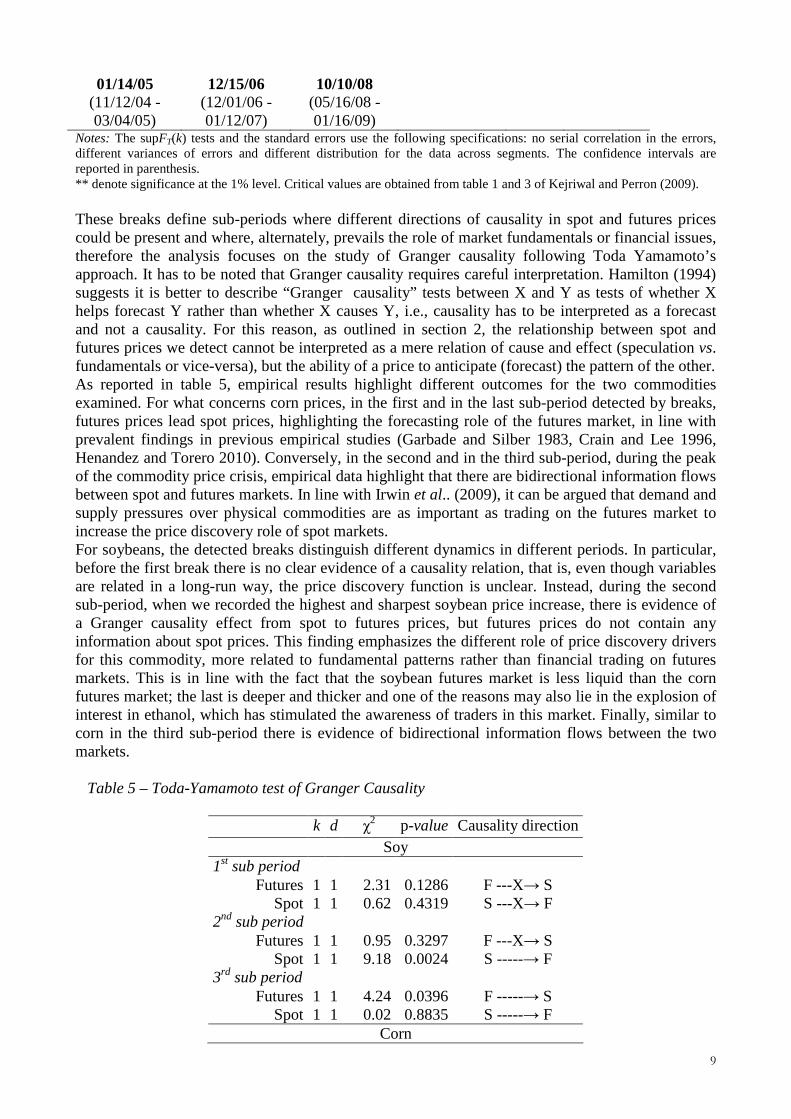
Notes: The supFT(k) tests and the standard errors use the following specifications: no serial correlation in the errors, different variances of errors and different distribution for the data across segments. The confidence intervals are reported in parenthesis. ** denote significance at the 1% level. Critical values are obtained from table 1 and 3 of Kejriwal and Perron (2009). These breaks define sub-periods where different directions of causality in spot and futures prices could be present and where, alternately, prevails the role of market fundamentals or financial issues, therefore the analysis focuses on the study of Granger causality following Toda Yamamoto’s approach. It has to be noted that Granger causality requires careful interpretation. Hamilton (1994) suggests it is better to describe “Granger causality” tests between X and Y as tests of whether X helps forecast Y rather than whether X causes Y, i.e., causality has to be interpreted as a forecast and not a causality. For this reason, as outlined in section 2, the relationship between spot and futures prices we detect cannot be interpreted as a mere relation of cause and effect (speculation vs. fundamentals or vice-versa), but the ability of a price to anticipate (forecast) the pattern of the other. As reported in table 5, empirical results highlight different outcomes for the two commodities examined. For what concerns corn prices, in the first and in the last sub-period detected by breaks, futures prices lead spot prices, highlighting the forecasting role of the futures market, in line with prevalent findings in previous empirical studies (Garbade and Silber 1983, Crain and Lee 1996, Henandez and Torero 2010). Conversely, in the second and in the third sub-period, during the peak of the commodity price crisis, empirical data highlight that there are bidirectional information flows between spot and futures markets. In line with Irwin et al.. (2009), it can be argued that demand and supply pressures over physical commodities are as important as trading on the futures market to increase the price discovery role of spot markets. For soybeans, the detected breaks distinguish different dynamics in different periods. In particular, before the first break there is no clear evidence of a causality relation, that is, even though variables are related in a long-run way, the price discovery function is unclear. Instead, during the second sub-period, when we recorded the highest and sharpest soybean price increase, there is evidence of a Granger causality effect from spot to futures prices, but futures prices do not contain any information about spot prices. This finding emphasizes the different role of price discovery drivers for this commodity, more related to fundamental patterns rather than financial trading on futures markets. This is in line with the fact that the soybean futures market is less liquid than the corn futures market; the last is deeper and thicker and one of the reasons may also lie in the explosion of interest in ethanol, which has stimulated the awareness of traders in this market. Finally, similar to corn in the third sub-period there is evidence of bidirectional information flows between the two markets.
Table 5 – Toda-Yamamoto test of Granger Causality
k d χ2 p-value Causality direction
Soy 1st sub period
Futures 1 1 2.31 0.1286 F ---X→ S Spot 1 1 0.62 0.4319 S ---X→ F
2nd sub period Futures 1 1 0.95 0.3297 F ---X→ S
Spot 1 1 9.18 0.0024 S -----→ F 3rd sub period
Futures 1 1 4.24 0.0396 F -----→ S Spot 1 1 0.02 0.8835 S -----→ F
Corn

10
1st sub period Futures 2 1 23.69 0.0000 F -----→ S
Spot 2 1 3.07 0.2157 S ---X→ F 2nd sub period
Futures 2 1 67.39 0.0000 F -----→ S Spot 2 1 7.84 0.0199 S -----→ F
3rd sub period Futures 2 1 71.64 0.0000 F -----→ S
Spot 2 1 6.93 0.0313 S -----→ F 4th sub period
Futures 2 1 122.84 0.0000 F -----→ S Spot 2 1 0.47 0.7898 S ---X→ F
Notes: See table A and B, respectively for soy and corn, for definition of the sub period detected by the breaks. In the last column F and S indicate Futures and Spot prices while the symbol -----→ and ---X→ respectively indicate Granger cause and does not Granger cause. Since the different IC utilized to detected the optimal lag length provide different results for the corn series, spanning from 2 to 3 lags, we also test for k=3, without detecting any relevant differences in respect to 2 lags. 6. Conclusion The exceptional price rises recorded in the last few years has destabilized the world economic scenario and has lowered the level of world agricultural stocks to levels unseen for 25 years. Among the main causes we can find firstly, the strong increase in the demand for commodities from China and India, countries with increasingly higher standards of living and the surge in energy demands that this entails. The rush to biofuels, initially considered as the main cause of this inflationary pressure, is another major factor: increasingly significant quantities of agricultural products are, in fact, being diverted away from their traditional food markets. The uncontrolled increase in the oil price, has had repercussions throughout the economy and has had in particular a crucial impact on the fertilizer market and transport. Last but not least, financial speculation, which caused considerable price volatility and prevented the planning of supply in many countries, contributed to creating a situation of marked instability. Over the period January 2004 – September 2010 we apply an econometric methodology (Kejriwal and Perron, 2009) allowing us to test for multiple structural changes in the cointegrated system between spot and futures prices of corn and soybean; we then utilize a specific approach (Toda and Yamamoto, 1995) to investigate their causal linkages. Results show that breaks were detected at specific stages in the food commodity markets and relate to events that have significantly affected the supply and demand of corn and soybeans for food and energy purposes. The sub-periods consequently identified express different dynamics in the causal relationship between spot and futures prices. In line with the main findings that emerge in the literature investigating the spot-futures price relationship in food commodity markets, futures prices play a major role in price discovery, that is in registering and transmitting information from the related real market; due to the greater transparency and, often, greater liquidity of commodity futures over physical commodities, futures markets react more quickly to new or unexpected information than the underlying spot market. However, in times of crisis and in particular in phases of strong price increase, the cash market also becomes an important actor in the price discovery process. Specifically, as regards soybean, our findings emphasize that price discovery is more related to fundamental patterns rather than financial trading on futures markets, in line with the fact that the soybean futures market is less deeper and thicker than the corn futures market. Overall, changes in supply and demand fundamentals are important in explaining the recent drastic increase in food prices, although it is likely that other reasons, such as rising expectations, speculation and hysteria also played a role in the increasing level and volatility of food prices (Robles et al., 2009).

11
Within the contest of the price relationship between the two commodities considered, the study offers new insights into how corn and soy markets relate at an industry level. The findings may also be important for producers, in order to better manage price risk, and for traders, in order to exploit speculative and/or arbitrage opportunities. References Awokuse, T. O. (2005), Impact of macroeconomic policies on agriculture, Agricultural and
Resource Economics Review, Vol. 34, pp. 226–237. Bai J., Perron P. (2003), Computation and analysis of multiple structural change models, Journal of
Applied Econometrics, Vol. 18, (2003) pp. 1-22. Bai J., Perron P. (1998), Estimating and testing linear models with multiple structural changes,
Econometrica, Vol. 66, pp. 47-78. Bordo, M. D. ‘The effect of monetary change on relative commodity prices and the role of long term contracts’, Journal of Political Economy, Vol. 88, (1980) pp. 1088–1109. Brooks C., Rew A.G., Ritson S. (2001), A trading strategy based on the lead-lag relationship
between the spot index and futures contract for the FTSE 100, International Journal of Forecasting, 17, 31-44.
Chambers, R. G. and Just, R. E. ‘An investigation of the effects of monetary factors on agriculture’, Journal of Monetary Economics, Vol. 9, (1982) pp. 235–247. Chan, K. (1992), A Further Analysis of the Lead-lag Relationship Between the Cash Market and
Stock Index Futures Market, Review of Financial Studies, 5(1): 123-152. Cooke, B., Robles M. (2009), Recent Food Prices Movements, A time series Analysis, International
Food Policy Research Institute, Discussion Paper n. 00942. Cooper, R. N. and Lawrence, R. Z. ‘The 1972–75 commodity boom’, Brookings Papers on Economic Activity, Vol. 1975, (1975) pp. 481–490. Crain, S. J. & Lee, J. H. (1996), Volatility in wheat spot and futures markets, 1950–1993:
government farm programs, seasonality, and causality, Journal of Finance, 51, 325–44. Dawson P.J., Sanjuan A.I., White B. (2010), Structural breaks and the relationship between barley
and wheat futures prices on the London International Financial Futures Exchange, Review of Agricultural Economics, 28, pp. 585-594.
Dickey, D.A., Fuller, W.A (1979), Distribution of the estimators for autoregressive time Series with a unit Root, Journal of the American Statistical Association, Vol. 74, (1979) pp. 427-431.
Elliot, G., Rothenberg, T. and Stock, J. (1996), Efficient tests for an autoregressive unit root, Econometrica, Vol. 64 (4), pp. 813-836.
Fleming, J., Ostdiek, B. (1999), The impact of energy derivatives on the crude oil market, Energy Economics, 1 (2), pp. 135–167.
Garbade, K. D., Silber, W.L. (1983), Price movements and price discovery in futures and cash markets, The Review of Economics and Statistics, 65, 289-297.
Garcia, P. Leuthold R. (2004), A selected review of agricultural commodity futures and options markets, European Review of Agricultural Economics, 31, 235-272.
Gerety M.S. and Mulherin J.H. (1991), Patterns in Intraday Stock Market Volatility, Past and Present, Financial Analysts Journal, 71-79
Gilbert C. L. (2010), How to Understand High Food Prices, Journal of Agricultural Economics, vol. 61, no. 2, pp. 398-425.
Giot P. (2003), The information content of implied volatility in agricultural commodity markets, Journal of Futures Markets, 23, 441-454.
Ghosh J. (2010), The Unnatural Coupling: Food and Global Finance, Journal of Agrarian Change, vol 10, issue 1, pp. 72-86.
Hamilton J. D. (1994), Time Series Analysis, Princeton Univ. Press; Princeton, NJ. Hansen B.E. (1992), Tests for parameter instability in regressions with I(1) processes, Journal of
Business and Economics Statistics, 10, 321-335.
12
Headey D., Fan S. (2008), Anatomy of a crisis: the cause and consequences of surging food prices, Agricultural Economics, n. 39, pp. 375-391.
Hernandez M., Torero M. (2010), Examining the Dynamic Relationship between spot and future prices of agricultural commodities, International Food Policy Research Institute, Discussion Paper 00988.
Hokkio C., Rush M. (1989), Market efficiency and cointegration: an application to Sterling and Deutschmark exchange rates, Journal of International Money and Finance, 8, 75-88.
Hull J.C. (1997), Options, futures and other derivatives. Prentice Hall, New York. Irwin S., Garcia P., Good D. L., Kunda L. (2011), Spreads and Non-Convergence....” Forthcoming
in Applied Economics Perspectives and Policy Irwin, S.H., Sanders D.R., Merrin and R.P. (2009), Devil or Angel? The Role of Speculation in the
Recent Commodity Price Boom (and Bust), Journal of Agricultural and Applied Economics, 41, 377-391.
Irwin S. H., Sanders D. R. (2011), Index Funds, Financialization, and commodity futures markets, Applied economic perspective and policy, pp.1-31
Irwin, S. H., Garcia P., Good D. L., Kunda E. L. (2011), Spreads and Non-Convergence in CBOT Corn, Soybean, and Wheat Futures: Are Index Funds to Blame? Forthcoming: Applied Economics Perspectives and Policy.
Kaufmann R.K., Ullman B. (2009), Oil prices, speculation, and fundamentals: interpreting causal relations among spot and future prices, Energy Economics, 31, 550-558.
Kejrywal, M., Perron, P. (2009), Testing for Multiple Structural Changes in Cointegrated Regression Models, Journal of Business and Economic Statistics, In press (doi:10.1198/jbes.2009.07220).
Kuiper W.E., Pennings J.M.E., Meulenberg M.T.G. (2002), Identification by full adjustment: evidence from the relationship between futures and spots prices, European Review of Agricultural Economics,29, 67-84.
Martin L., Garcia P. (1981), The price-forecasting performance of futures markets for live cattle and hogs: a disaggregated analysis, American Journal of Agricultural Economics, 63, 209-215.
Maslyuk S., Smyth R. (2009), Cointegration between opil spot and future prices of the same and different grades in the presence of structural changes, Energy Policy, 37, 1687-1693.
Masters M. W. (2008), Testimony before the Committee on Homeland Security and Goverment Affairs, U.S. Senate. Accessed April 2009.
Mohan S., Love J. (2004), Coffee futures: role in reducing coffee producers’ price risk, Journal of International Development, 16, 983-1002.
Naylor R. L., Falcon W. P. (2010), Food Security in an Era of Economic Volatility, Population and Development Review, vol 36, issue 4, pp. 693-723.
Perron, P. (2005), Dealing with Structural Breaks, in “Palgrave Handbook of Econometrics”, Vol. 1: Econometric Theory, K. Patterson and T.C. Mills (eds.), Palgrave Macmillan, (2005), pp. 278-352.
Perron, P. (1989), The great crash, the oil price shock and the unit root hypothesis, Econometrica , Vol. 57, 1361-1401.
Quan J. (1992), Two-step testing procedure for price-discovery role of futures prices, Journal of Futures Markets, 12, 139-149.
Rambaldi, A.N., Doran H.E. (1996), Testing for Granger non-causality in cointegrated system made easy, working papers in econometrics and applied statistics, no. 88, Department of Econometrics, University of New England.
Robles, M., Torero, M., von Braun, J. (2009), When speculation matters, International Food Policy Research Institute, Issue Brief 57.
Romano D (2009), Bolla o non bolla: il ruolo della speculazione nella dinamica dei prezzi delle materie prime agricole, AGRIREGIONIEUROPA, 5, 18. Sander, Irwin (2010), A Speculative Bubble in Commodity Futures Prices? Cross-Sectional Evidence, Agricultural Economics 41(1): 25–32.
13
Schroeder T.C., Goodwin B.K. (1991), Price discovery and cointegration for live hogs, Journal of
Futures Markets, 11, 685-696. Schwarz, T.V., Szakmary A.C. (1994), Price Discovery in Petroleum Markets: Arbitrage,
Cointegration, and the Time Interval of Analysis, Journal of Futures Markets, 14 (1994), pp. 147–167.
Silvapulle, P. and Moosa, I. A. (1999), The relationship between spot and futures prices: Evidence from the crude oil market, Journal of Futures Markets, 19: 175–193.
Stoll H. R., Whaley R. E. (2010), Commodity Index Investing and Commodity Futures Prices, Journal of Applied Finance, 20(1), pp. 7-46.
Tang K. Xiong W. (2010), Index Investment and Financialization of Commodities, Working PaperAvailable at SSRN: http://ssrn.com/abstract=1455724 Taylor, J. B. ‘The monetary transmission mechanism: An empirical framework’, Journal of Economic Perspectives, Vol. 9, (1995) pp. 11–26. Toda, H.Y and Yamamoto, T. (1995), Statistical Inference in Vector Autoregressions with Possibly
integrated Processes, Journal of Econometrics, 66, 225-250. Vaciago G. (2010), Dalla crisi della finanza alla crisi economica: come ne usciamo? In “Crisi
economica e agricoltura, Quaderni Gruppo 2013. Wahab M., Lashgari M. (1993), Price dynamics and error correction in stock index and stock index
futures markets: a cointegration approach, Journal of Futures Markets, 13, 711-742. Yang J., Bessler D.A., Leatham D.J. (2001), Asset storability and price discovery in commodity
futures markets: a new look, Journal of futures markets, 21, 279-300. Zivot, E., Andrews, D.W.K. (1992), Further evidence on the great crash, the oil price shock and the
unit root hypothesis, Journal of Business and Economic Statistics, Vol. 10, (1992) pp. 251-270.