prevalence of and factors related to the use of antidepressants and benzodiazepines: results from...
TRANSCRIPT
Subramaniam et al. BMC Psychiatry 2013, 13:231http://www.biomedcentral.com/1471-244X/13/231
RESEARCH ARTICLE Open Access
Prevalence of and factors related to the use ofantidepressants and benzodiazepines: resultsfrom the Singapore Mental Health StudyMythily Subramaniam1*, Vincent YF He2, Janhavi A Vaingankar2, Edimansyah Abdin2 and Siow Ann Chong2
Abstract
Background: Prescription and use of antidepressants and benzodiazepines are common in the general population.Prescription of psychotropic drugs is a complex process: patient, physician and healthcare characteristics mediate,interact and influence it. The current study aimed to establish the prevalence and factors associated with the use ofantidepressants (ADs) and benzodiazepines (BZDs) in Singapore.
Methods: The Singapore Mental Health Study (SMHS) was a nationally representative survey of Singapore Residentsaged 18 years and above. Face-to-face interviews were conducted from December 2009 to December 2010. Thediagnoses of mental disorders were established using the Composite International Diagnostic Interview version 3.0(CIDI-3.0). The pharmacoepidemiology section was used to collect information on medication use.
Results: The overall prevalence estimates for ADs and BZDs use during the 12 months prior to the interview were1.1% and 1.2% respectively. In all, 2.0% had used ADs and/or BZDs. ‘Help seeking for emotional or mental healthproblems’ was the most important predictor for the use of ADs and BZDs—help seekers were much more likely touse ADs (adjusted OR: 31.62, 95% CI: 13.36–74.83) and more likely to use BZDs than non-help seekers in theprevious 12 months (adjusted OR: 34.38, 95% CI: 12.97–91.16). Only 27.6% of those with 12-month major depressivedisorder (MDD) had sought formal medical help for their problems and ADs were being used by just over a quarterof this ‘help-seeking group’ (26.3%).
Conclusions: We found that the use of ADs and BZDs in our population was relatively low, and ‘help-seeking’ wasthe most important predictor of the use of ADs and BZDs. In concordance with research from other Westerncountries, use of ADs was low among those with 12-month MDD.
Keywords: Antidepressant, Benzodiazepine, Major depressive disorder, Alcohol use disorder, Survey
BackgroundPopulation based surveys from Europe and North Americahave suggested that prescription rates of psychotropicdrugs range from 10 to 15% in the population [1-3], withthe most common being the prescription and use of anti-depressants (ADs) and benzodiazepines (BZDs). A studyof six countries across Europe found that 4.38% and 9.17%of the total sample reported the use of ADs and BZDs inthe past 12-months [4].
* Correspondence: [email protected] Division, Institute of Mental Health, Buangkok Green Medical Park,10 Buangkok View, Singapore 539747, SingaporeFull list of author information is available at the end of the article
© 2013 Subramaniam et al.; licensee BioMed CCreative Commons Attribution License (http:/distribution, and reproduction in any medium
Prescription of psychotropic drugs is a complex process:patient, physician and healthcare characteristics mediate,interact and influence it. It has been consistently reportedthat the consumption of psychotropic medications in-creases with age [5-8], is higher among women [5,7,9],among those with lower education [4,5,8] and the un-employed [10,11]. Mojtabai [12] showed that patientsseeking help for depression and anxiety disorders frompsychiatrists received ADs more frequently than if theywere seeing primary care physicians. The nature andsetting of the healthcare service such as primary versustertiary healthcare setting, public versus private insti-tutions, medical insurance systems, also influence
entral Ltd. This is an Open Access article distributed under the terms of the/creativecommons.org/licenses/by/2.0), which permits unrestricted use,, provided the original work is properly cited.
Subramaniam et al. BMC Psychiatry 2013, 13:231 Page 2 of 10http://www.biomedcentral.com/1471-244X/13/231
prescription patterns. These factors may interact andfurther influence the prescription and use of thesemedications for example, Bellantuono et al. [13] found theperception of a social problem by a General Practitioner(GP) doubled the probability of a psychotropic drug beingprescribed in women but not men; Taggart et al. [14]found that male physicians prescribed psychotropic drugsat a significantly higher rate for female patients as com-pared to female physicians.The growing phenomenon of the pervasive use of ADs
has given rise to questions regarding the appropriatenessof their prescription as well as the rising costs. On theother hand, epidemiological surveys have uncoveredlarge treatment gaps among those with major depressivedisorder (MDD). Results from the European Study of theEpidemiology of Mental Disorders (ESEMeD) [15] showedthat 63.5% of those with 12-month diagnosis of any mooddisorder did not consult any formal health services, andamong those who sought help, only 71% were prescribed amedication. The Singapore Mental Health Study (SMHS)showed that the treatment gap for those with lifetimeMDD was 59.6% while that of dysthymia was 46.8% [16].However, little is known in Singapore about the prevalenceof AD use in the community. Previous studies on the pre-scription of psychotropic medications in Singapore werelargely limited to populations undergoing psychiatrictreatment in specialized clinical settings [17,18].Singapore is a city-state in South-East Asia with a multi-
ethnic population that totals 5 million. A principal featureof Singapore’s healthcare philosophy is the emphasis onindividual responsibility and the need for co-payment forservices provided. It has a dual healthcare system with apublic and private sector where affordability of healthcareis ensured with the 3 Ms: Medisave, a national mandatoryhealthcare saving plan; Medishield, a national low costmedical insurance; and Medifund, where subsidies areprovided for the needy through a national fund. Patientsseeking treatment in public hospitals may apply for arange of subsidies on their total bill; the extent of subsidyreceived is subjected to guidelines set by the governmentto allocate limited resources to those who need themmost. Mental health services are provided mainly bypsychiatrists and primary care doctors. GPs provide 80%of the primary healthcare services, and doctors in govern-ment polyclinics provide the remaining 20%. Public hospi-tals (referred to as restructured hospitals) provide about80% of the tertiary care in Singapore, while the remainingare provided by private hospitals.The main objectives of this study were to establish
the prevalence of AD and BZD use and their associatedfactors in Singapore. We examined the effect of socio-demographic factors, diagnosis of mood, anxiety or al-cohol use disorders, disability due to mental disorders,help-seeking as well as the presence of comorbid
chronic physical condition on the use of ADs andBZDs across a national sample in Singapore.
MethodsSampleThe Singapore Mental Health Study (SMHS) was a na-tionally representative survey of Singapore Residentsaged 18 years and above. A disproportionate stratifiedsampling was used where the 3 main ethnic groups(Chinese, Malays, and Indians) were sampled in equiva-lent proportion of about 30% each and the remaining 10%belonged to ‘Other’ ethnic groups. This was to address thepossibility of not getting an adequate sample in minorityethnic groups to accurately establish the prevalence of anuncommon disorder. The sample size was derived from astatistical power calculation for binary proportions usingpreviously established prevalence rates of mental disordersin Singapore. We found the margin of error using thissample distribution for the overall prevalence estimatewas between 1.5%—3.0%, while the margin of error for thestrata defined by age and ethnic groups was 1.0—3.5%. Asthe margin of error (or precision) of a binary proportiondepends on the estimate, we also computed the relativestandard error (RSE), which was below 30%.The respondents were randomly selected from a National
registry and approached at the household address providedby the registry. The study was approved by the relevantinstitutional ethics committee (National Healthcare GroupDomain Specific Review Board) and written informed con-sent was obtained from all respondents. Face-to-face inter-views were conducted by trained lay interviewers, and thehousehold survey was conducted from December 2009 toDecember 2010. 6,616 respondents completed the inter-view, giving a survey response rate of 75.9%. The studymethodology is described in detail in an earlier article [19].
AssessmentsThe diagnoses of mental disorders were established usingthe Composite International Diagnostic Interview version3.0 (CIDI-3.0) [20]. We used the Computer AssistedPersonal Interviewing (CAPI) version of the CIDI 3.0 inEnglish and Chinese, and the paper and pencil interview(PAPI) version of the Malay CIDI. Diagnostic modules forlifetime and 12-month prevalence of mood disorders(MDD and Dysthymia), anxiety disorders (generalizedanxiety disorder (GAD), and obsessive compulsive dis-order (OCD)) and alcohol use disorders (alcohol abuseand alcohol dependence) were included in the survey.Diagnostic hierarchy rules and organic exclusion criteriawere applied to all diagnoses. Help-seeking was assessedby analyzing the services module; help-seekers for thepurposes of this study were defined as those who hadconsulted with any formal healthcare provider (i.e. psych-iatrist, GP or any other medical doctor as only these
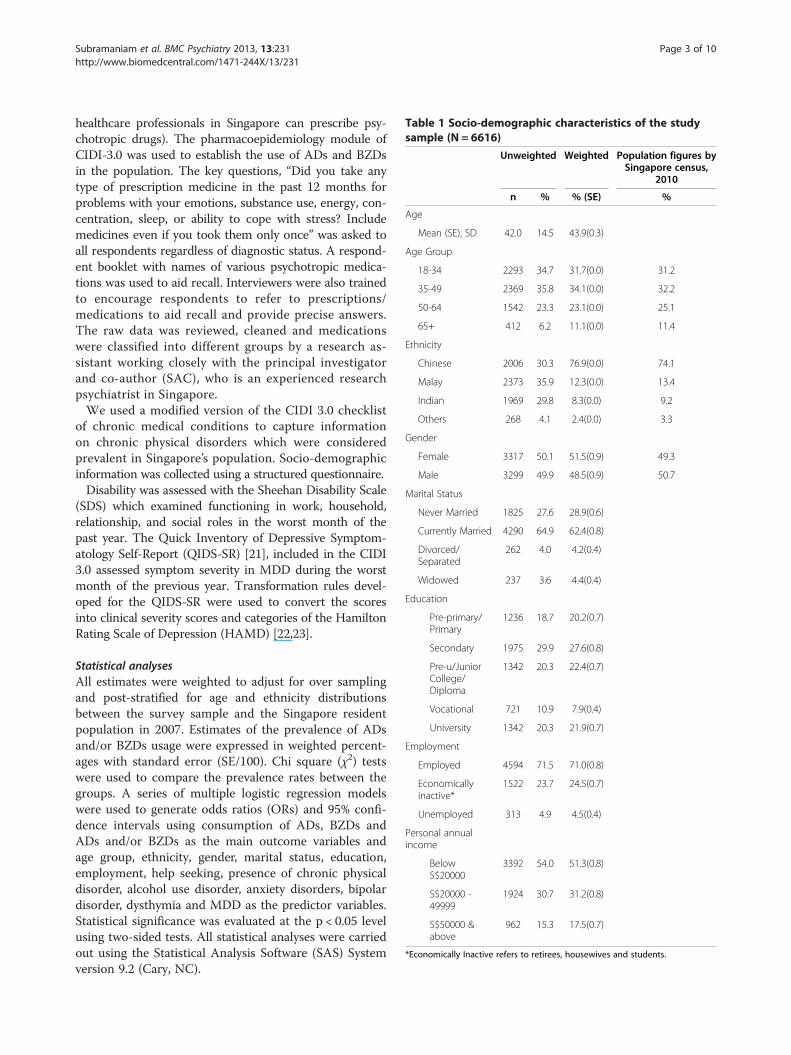
Table 1 Socio-demographic characteristics of the studysample (N = 6616)
Unweighted Weighted Population figures bySingapore census,
2010
n % % (SE) %
Age
Mean (SE), SD 42.0 14.5 43.9(0.3)
Age Group
18-34 2293 34.7 31.7(0.0) 31.2
35-49 2369 35.8 34.1(0.0) 32.2
50-64 1542 23.3 23.1(0.0) 25.1
65+ 412 6.2 11.1(0.0) 11.4
Ethnicity
Chinese 2006 30.3 76.9(0.0) 74.1
Malay 2373 35.9 12.3(0.0) 13.4
Indian 1969 29.8 8.3(0.0) 9.2
Others 268 4.1 2.4(0.0) 3.3
Gender
Female 3317 50.1 51.5(0.9) 49.3
Male 3299 49.9 48.5(0.9) 50.7
Marital Status
Never Married 1825 27.6 28.9(0.6)
Currently Married 4290 64.9 62.4(0.8)
Divorced/Separated
262 4.0 4.2(0.4)
Widowed 237 3.6 4.4(0.4)
Education
Pre-primary/Primary
1236 18.7 20.2(0.7)
Secondary 1975 29.9 27.6(0.8)
Pre-u/JuniorCollege/Diploma
1342 20.3 22.4(0.7)
Vocational 721 10.9 7.9(0.4)
University 1342 20.3 21.9(0.7)
Employment
Employed 4594 71.5 71.0(0.8)
Economicallyinactive*
1522 23.7 24.5(0.7)
Unemployed 313 4.9 4.5(0.4)
Personal annualincome
BelowS$20000
3392 54.0 51.3(0.8)
S$20000 -49999
1924 30.7 31.2(0.8)
S$50000 &above
962 15.3 17.5(0.7)
*Economically Inactive refers to retirees, housewives and students.
Subramaniam et al. BMC Psychiatry 2013, 13:231 Page 3 of 10http://www.biomedcentral.com/1471-244X/13/231
healthcare professionals in Singapore can prescribe psy-chotropic drugs). The pharmacoepidemiology module ofCIDI-3.0 was used to establish the use of ADs and BZDsin the population. The key questions, “Did you take anytype of prescription medicine in the past 12 months forproblems with your emotions, substance use, energy, con-centration, sleep, or ability to cope with stress? Includemedicines even if you took them only once” was asked toall respondents regardless of diagnostic status. A respond-ent booklet with names of various psychotropic medica-tions was used to aid recall. Interviewers were also trainedto encourage respondents to refer to prescriptions/medications to aid recall and provide precise answers.The raw data was reviewed, cleaned and medicationswere classified into different groups by a research as-sistant working closely with the principal investigatorand co-author (SAC), who is an experienced researchpsychiatrist in Singapore.We used a modified version of the CIDI 3.0 checklist
of chronic medical conditions to capture informationon chronic physical disorders which were consideredprevalent in Singapore’s population. Socio-demographicinformation was collected using a structured questionnaire.Disability was assessed with the Sheehan Disability Scale
(SDS) which examined functioning in work, household,relationship, and social roles in the worst month of thepast year. The Quick Inventory of Depressive Symptom-atology Self-Report (QIDS-SR) [21], included in the CIDI3.0 assessed symptom severity in MDD during the worstmonth of the previous year. Transformation rules devel-oped for the QIDS-SR were used to convert the scoresinto clinical severity scores and categories of the HamiltonRating Scale of Depression (HAMD) [22,23].
Statistical analysesAll estimates were weighted to adjust for over samplingand post-stratified for age and ethnicity distributionsbetween the survey sample and the Singapore residentpopulation in 2007. Estimates of the prevalence of ADsand/or BZDs usage were expressed in weighted percent-ages with standard error (SE/100). Chi square (χ2) testswere used to compare the prevalence rates between thegroups. A series of multiple logistic regression modelswere used to generate odds ratios (ORs) and 95% confi-dence intervals using consumption of ADs, BZDs andADs and/or BZDs as the main outcome variables andage group, ethnicity, gender, marital status, education,employment, help seeking, presence of chronic physicaldisorder, alcohol use disorder, anxiety disorders, bipolardisorder, dysthymia and MDD as the predictor variables.Statistical significance was evaluated at the p < 0.05 levelusing two-sided tests. All statistical analyses were carriedout using the Statistical Analysis Software (SAS) Systemversion 9.2 (Cary, NC).
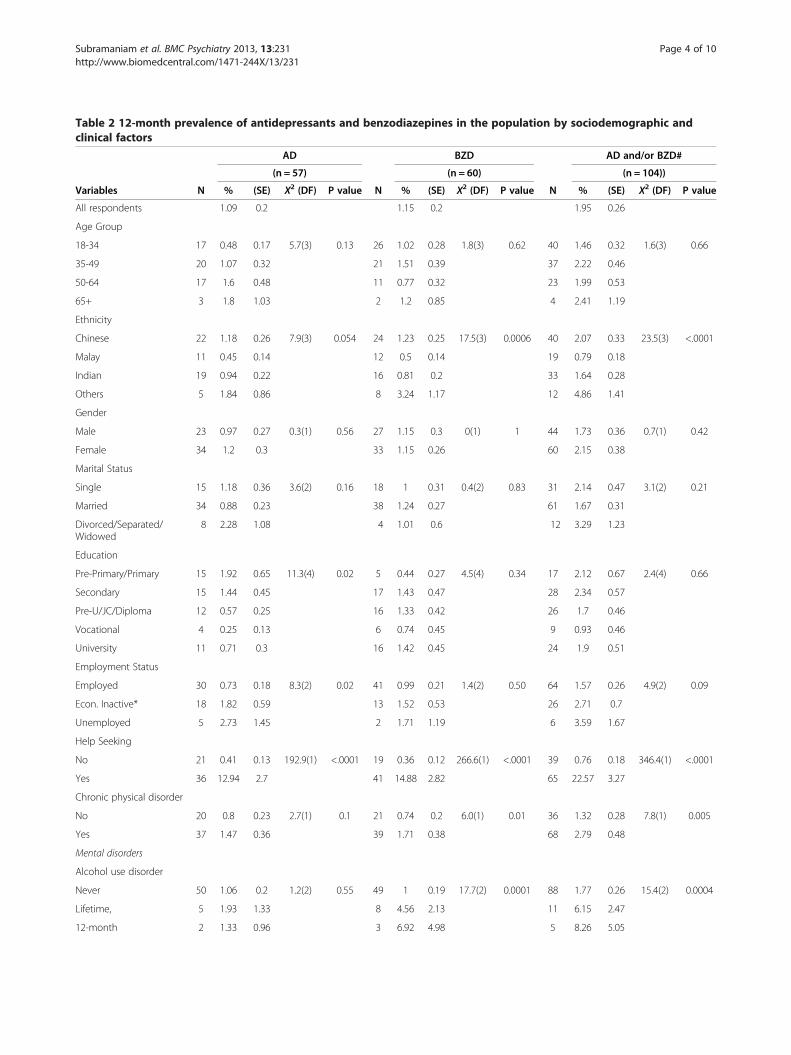
Table 2 12-month prevalence of antidepressants and benzodiazepines in the population by sociodemographic andclinical factors
AD BZD AD and/or BZD#
(n = 57) (n = 60) (n = 104))
Variables N % (SE) X2 (DF) P value N % (SE) X2 (DF) P value N % (SE) X2 (DF) P value
All respondents 1.09 0.2 1.15 0.2 1.95 0.26
Age Group
18-34 17 0.48 0.17 5.7(3) 0.13 26 1.02 0.28 1.8(3) 0.62 40 1.46 0.32 1.6(3) 0.66
35-49 20 1.07 0.32 21 1.51 0.39 37 2.22 0.46
50-64 17 1.6 0.48 11 0.77 0.32 23 1.99 0.53
65+ 3 1.8 1.03 2 1.2 0.85 4 2.41 1.19
Ethnicity
Chinese 22 1.18 0.26 7.9(3) 0.054 24 1.23 0.25 17.5(3) 0.0006 40 2.07 0.33 23.5(3) <.0001
Malay 11 0.45 0.14 12 0.5 0.14 19 0.79 0.18
Indian 19 0.94 0.22 16 0.81 0.2 33 1.64 0.28
Others 5 1.84 0.86 8 3.24 1.17 12 4.86 1.41
Gender
Male 23 0.97 0.27 0.3(1) 0.56 27 1.15 0.3 0(1) 1 44 1.73 0.36 0.7(1) 0.42
Female 34 1.2 0.3 33 1.15 0.26 60 2.15 0.38
Marital Status
Single 15 1.18 0.36 3.6(2) 0.16 18 1 0.31 0.4(2) 0.83 31 2.14 0.47 3.1(2) 0.21
Married 34 0.88 0.23 38 1.24 0.27 61 1.67 0.31
Divorced/Separated/Widowed
8 2.28 1.08 4 1.01 0.6 12 3.29 1.23
Education
Pre-Primary/Primary 15 1.92 0.65 11.3(4) 0.02 5 0.44 0.27 4.5(4) 0.34 17 2.12 0.67 2.4(4) 0.66
Secondary 15 1.44 0.45 17 1.43 0.47 28 2.34 0.57
Pre-U/JC/Diploma 12 0.57 0.25 16 1.33 0.42 26 1.7 0.46
Vocational 4 0.25 0.13 6 0.74 0.45 9 0.93 0.46
University 11 0.71 0.3 16 1.42 0.45 24 1.9 0.51
Employment Status
Employed 30 0.73 0.18 8.3(2) 0.02 41 0.99 0.21 1.4(2) 0.50 64 1.57 0.26 4.9(2) 0.09
Econ. Inactive* 18 1.82 0.59 13 1.52 0.53 26 2.71 0.7
Unemployed 5 2.73 1.45 2 1.71 1.19 6 3.59 1.67
Help Seeking
No 21 0.41 0.13 192.9(1) <.0001 19 0.36 0.12 266.6(1) <.0001 39 0.76 0.18 346.4(1) <.0001
Yes 36 12.94 2.7 41 14.88 2.82 65 22.57 3.27
Chronic physical disorder
No 20 0.8 0.23 2.7(1) 0.1 21 0.74 0.2 6.0(1) 0.01 36 1.32 0.28 7.8(1) 0.005
Yes 37 1.47 0.36 39 1.71 0.38 68 2.79 0.48
Mental disorders
Alcohol use disorder
Never 50 1.06 0.2 1.2(2) 0.55 49 1 0.19 17.7(2) 0.0001 88 1.77 0.26 15.4(2) 0.0004
Lifetime, 5 1.93 1.33 8 4.56 2.13 11 6.15 2.47
12-month 2 1.33 0.96 3 6.92 4.98 5 8.26 5.05
Subramaniam et al. BMC Psychiatry 2013, 13:231 Page 4 of 10http://www.biomedcentral.com/1471-244X/13/231
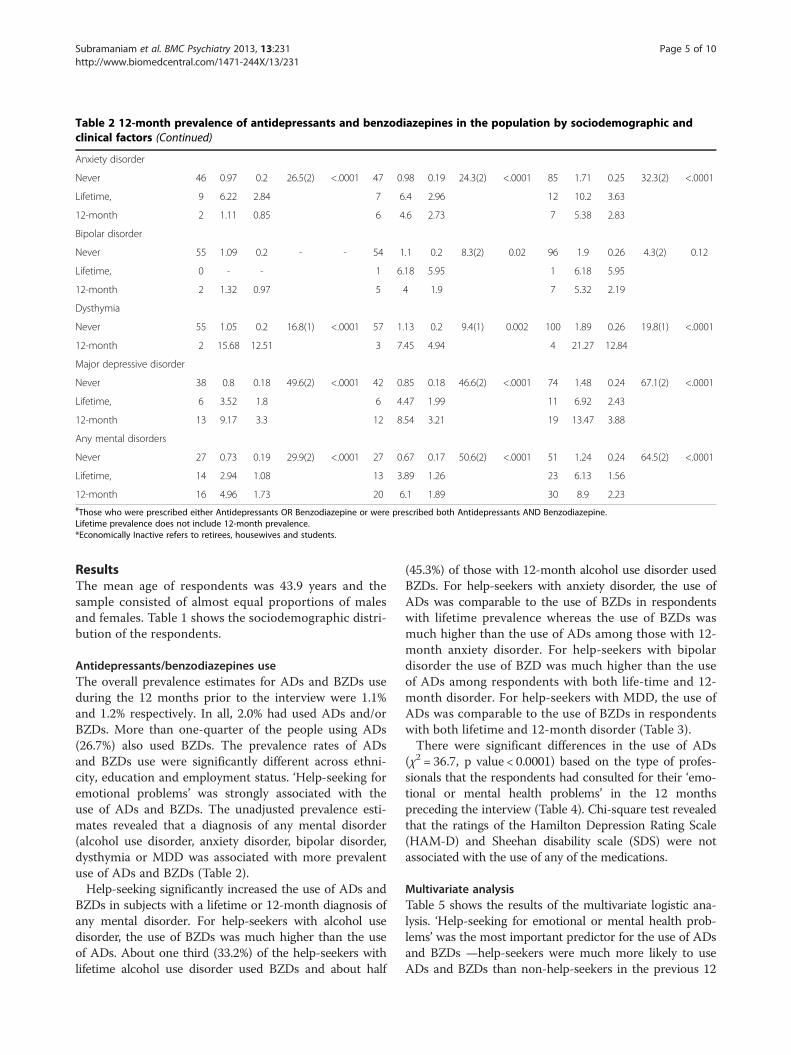
Table 2 12-month prevalence of antidepressants and benzodiazepines in the population by sociodemographic andclinical factors (Continued)
Anxiety disorder
Never 46 0.97 0.2 26.5(2) <.0001 47 0.98 0.19 24.3(2) <.0001 85 1.71 0.25 32.3(2) <.0001
Lifetime, 9 6.22 2.84 7 6.4 2.96 12 10.2 3.63
12-month 2 1.11 0.85 6 4.6 2.73 7 5.38 2.83
Bipolar disorder
Never 55 1.09 0.2 - - 54 1.1 0.2 8.3(2) 0.02 96 1.9 0.26 4.3(2) 0.12
Lifetime, 0 - - 1 6.18 5.95 1 6.18 5.95
12-month 2 1.32 0.97 5 4 1.9 7 5.32 2.19
Dysthymia
Never 55 1.05 0.2 16.8(1) <.0001 57 1.13 0.2 9.4(1) 0.002 100 1.89 0.26 19.8(1) <.0001
12-month 2 15.68 12.51 3 7.45 4.94 4 21.27 12.84
Major depressive disorder
Never 38 0.8 0.18 49.6(2) <.0001 42 0.85 0.18 46.6(2) <.0001 74 1.48 0.24 67.1(2) <.0001
Lifetime, 6 3.52 1.8 6 4.47 1.99 11 6.92 2.43
12-month 13 9.17 3.3 12 8.54 3.21 19 13.47 3.88
Any mental disorders
Never 27 0.73 0.19 29.9(2) <.0001 27 0.67 0.17 50.6(2) <.0001 51 1.24 0.24 64.5(2) <.0001
Lifetime, 14 2.94 1.08 13 3.89 1.26 23 6.13 1.56
12-month 16 4.96 1.73 20 6.1 1.89 30 8.9 2.23#Those who were prescribed either Antidepressants OR Benzodiazepine or were prescribed both Antidepressants AND Benzodiazepine.Lifetime prevalence does not include 12-month prevalence.*Economically Inactive refers to retirees, housewives and students.
Subramaniam et al. BMC Psychiatry 2013, 13:231 Page 5 of 10http://www.biomedcentral.com/1471-244X/13/231
ResultsThe mean age of respondents was 43.9 years and thesample consisted of almost equal proportions of malesand females. Table 1 shows the sociodemographic distri-bution of the respondents.
Antidepressants/benzodiazepines useThe overall prevalence estimates for ADs and BZDs useduring the 12 months prior to the interview were 1.1%and 1.2% respectively. In all, 2.0% had used ADs and/orBZDs. More than one-quarter of the people using ADs(26.7%) also used BZDs. The prevalence rates of ADsand BZDs use were significantly different across ethni-city, education and employment status. ‘Help-seeking foremotional problems’ was strongly associated with theuse of ADs and BZDs. The unadjusted prevalence esti-mates revealed that a diagnosis of any mental disorder(alcohol use disorder, anxiety disorder, bipolar disorder,dysthymia or MDD was associated with more prevalentuse of ADs and BZDs (Table 2).Help-seeking significantly increased the use of ADs and
BZDs in subjects with a lifetime or 12-month diagnosis ofany mental disorder. For help-seekers with alcohol usedisorder, the use of BZDs was much higher than the useof ADs. About one third (33.2%) of the help-seekers withlifetime alcohol use disorder used BZDs and about half
(45.3%) of those with 12-month alcohol use disorder usedBZDs. For help-seekers with anxiety disorder, the use ofADs was comparable to the use of BZDs in respondentswith lifetime prevalence whereas the use of BZDs wasmuch higher than the use of ADs among those with 12-month anxiety disorder. For help-seekers with bipolardisorder the use of BZD was much higher than the useof ADs among respondents with both life-time and 12-month disorder. For help-seekers with MDD, the use ofADs was comparable to the use of BZDs in respondentswith both lifetime and 12-month disorder (Table 3).There were significant differences in the use of ADs
(χ2 = 36.7, p value < 0.0001) based on the type of profes-sionals that the respondents had consulted for their ‘emo-tional or mental health problems’ in the 12 monthspreceding the interview (Table 4). Chi-square test revealedthat the ratings of the Hamilton Depression Rating Scale(HAM-D) and Sheehan disability scale (SDS) were notassociated with the use of any of the medications.
Multivariate analysisTable 5 shows the results of the multivariate logistic ana-lysis. ‘Help-seeking for emotional or mental health prob-lems’ was the most important predictor for the use of ADsand BZDs —help-seekers were much more likely to useADs and BZDs than non-help-seekers in the previous 12
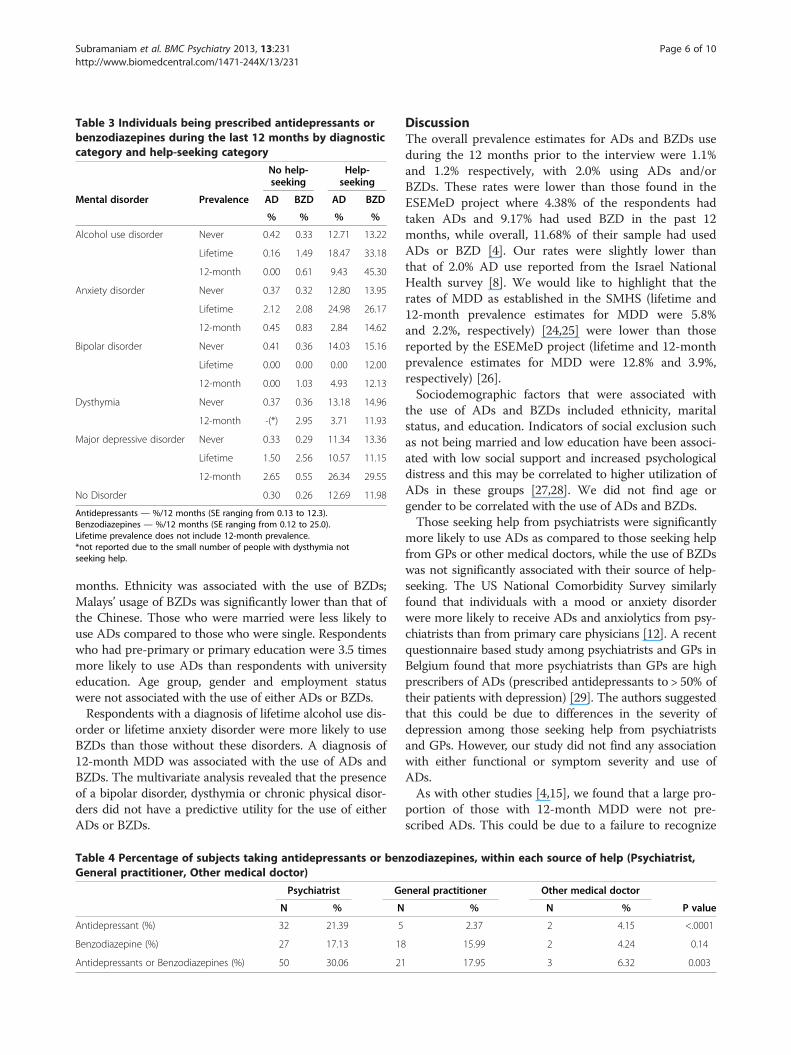
Table 3 Individuals being prescribed antidepressants orbenzodiazepines during the last 12 months by diagnosticcategory and help-seeking category
No help-seeking
Help-seeking
Mental disorder Prevalence AD BZD AD BZD
% % % %
Alcohol use disorder Never 0.42 0.33 12.71 13.22
Lifetime 0.16 1.49 18.47 33.18
12-month 0.00 0.61 9.43 45.30
Anxiety disorder Never 0.37 0.32 12.80 13.95
Lifetime 2.12 2.08 24.98 26.17
12-month 0.45 0.83 2.84 14.62
Bipolar disorder Never 0.41 0.36 14.03 15.16
Lifetime 0.00 0.00 0.00 12.00
12-month 0.00 1.03 4.93 12.13
Dysthymia Never 0.37 0.36 13.18 14.96
12-month -(*) 2.95 3.71 11.93
Major depressive disorder Never 0.33 0.29 11.34 13.36
Lifetime 1.50 2.56 10.57 11.15
12-month 2.65 0.55 26.34 29.55
No Disorder 0.30 0.26 12.69 11.98
Antidepressants — %/12 months (SE ranging from 0.13 to 12.3).Benzodiazepines — %/12 months (SE ranging from 0.12 to 25.0).Lifetime prevalence does not include 12-month prevalence.*not reported due to the small number of people with dysthymia notseeking help.
Subramaniam et al. BMC Psychiatry 2013, 13:231 Page 6 of 10http://www.biomedcentral.com/1471-244X/13/231
months. Ethnicity was associated with the use of BZDs;Malays’ usage of BZDs was significantly lower than that ofthe Chinese. Those who were married were less likely touse ADs compared to those who were single. Respondentswho had pre-primary or primary education were 3.5 timesmore likely to use ADs than respondents with universityeducation. Age group, gender and employment statuswere not associated with the use of either ADs or BZDs.Respondents with a diagnosis of lifetime alcohol use dis-
order or lifetime anxiety disorder were more likely to useBZDs than those without these disorders. A diagnosis of12-month MDD was associated with the use of ADs andBZDs. The multivariate analysis revealed that the presenceof a bipolar disorder, dysthymia or chronic physical disor-ders did not have a predictive utility for the use of eitherADs or BZDs.
Table 4 Percentage of subjects taking antidepressants or benGeneral practitioner, Other medical doctor)
Psychiatrist Ge
N % N
Antidepressant (%) 32 21.39 5
Benzodiazepine (%) 27 17.13 18
Antidepressants or Benzodiazepines (%) 50 30.06 21
DiscussionThe overall prevalence estimates for ADs and BZDs useduring the 12 months prior to the interview were 1.1%and 1.2% respectively, with 2.0% using ADs and/orBZDs. These rates were lower than those found in theESEMeD project where 4.38% of the respondents hadtaken ADs and 9.17% had used BZD in the past 12months, while overall, 11.68% of their sample had usedADs or BZD [4]. Our rates were slightly lower thanthat of 2.0% AD use reported from the Israel NationalHealth survey [8]. We would like to highlight that therates of MDD as established in the SMHS (lifetime and12-month prevalence estimates for MDD were 5.8%and 2.2%, respectively) [24,25] were lower than thosereported by the ESEMeD project (lifetime and 12-monthprevalence estimates for MDD were 12.8% and 3.9%,respectively) [26].Sociodemographic factors that were associated with
the use of ADs and BZDs included ethnicity, maritalstatus, and education. Indicators of social exclusion suchas not being married and low education have been associ-ated with low social support and increased psychologicaldistress and this may be correlated to higher utilization ofADs in these groups [27,28]. We did not find age orgender to be correlated with the use of ADs and BZDs.Those seeking help from psychiatrists were significantly
more likely to use ADs as compared to those seeking helpfrom GPs or other medical doctors, while the use of BZDswas not significantly associated with their source of help-seeking. The US National Comorbidity Survey similarlyfound that individuals with a mood or anxiety disorderwere more likely to receive ADs and anxiolytics from psy-chiatrists than from primary care physicians [12]. A recentquestionnaire based study among psychiatrists and GPs inBelgium found that more psychiatrists than GPs are highprescribers of ADs (prescribed antidepressants to > 50% oftheir patients with depression) [29]. The authors suggestedthat this could be due to differences in the severity ofdepression among those seeking help from psychiatristsand GPs. However, our study did not find any associationwith either functional or symptom severity and use ofADs.As with other studies [4,15], we found that a large pro-
portion of those with 12-month MDD were not pre-scribed ADs. This could be due to a failure to recognize
zodiazepines, within each source of help (Psychiatrist,
neral practitioner Other medical doctor
% N % P value
2.37 2 4.15 <.0001
15.99 2 4.24 0.14
17.95 3 6.32 0.003
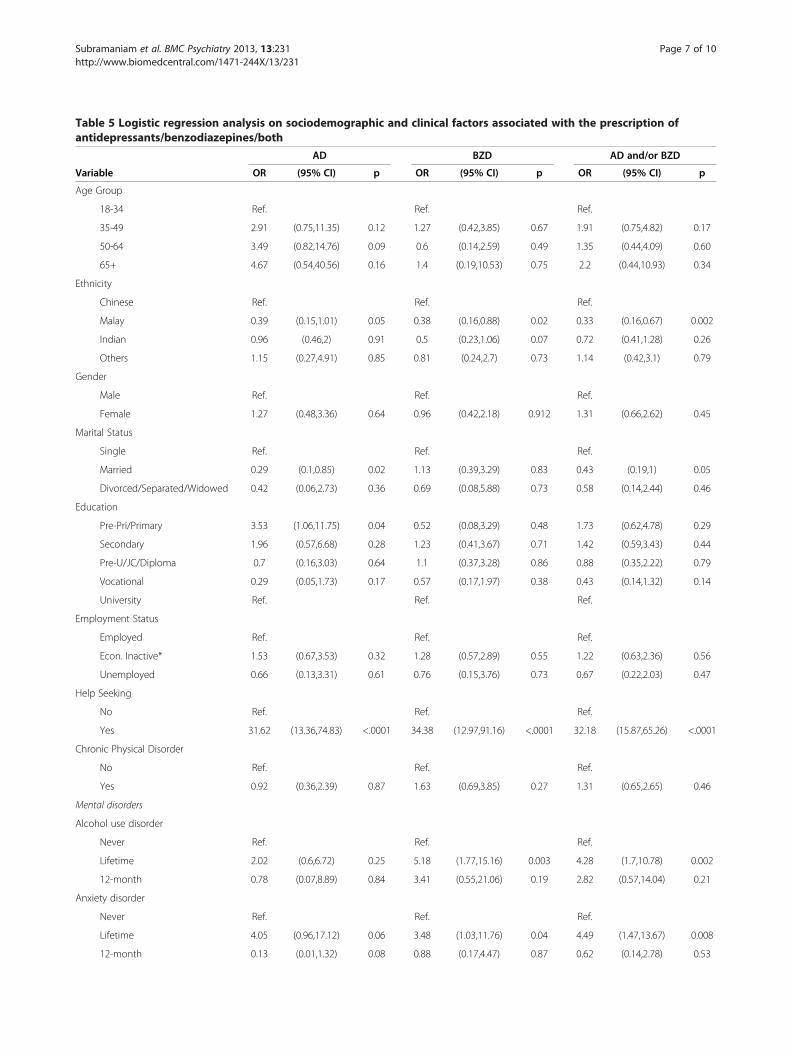
Table 5 Logistic regression analysis on sociodemographic and clinical factors associated with the prescription ofantidepressants/benzodiazepines/both
AD BZD AD and/or BZD
Variable OR (95% CI) p OR (95% CI) p OR (95% CI) p
Age Group
18-34 Ref. Ref. Ref.
35-49 2.91 (0.75,11.35) 0.12 1.27 (0.42,3.85) 0.67 1.91 (0.75,4.82) 0.17
50-64 3.49 (0.82,14.76) 0.09 0.6 (0.14,2.59) 0.49 1.35 (0.44,4.09) 0.60
65+ 4.67 (0.54,40.56) 0.16 1.4 (0.19,10.53) 0.75 2.2 (0.44,10.93) 0.34
Ethnicity
Chinese Ref. Ref. Ref.
Malay 0.39 (0.15,1.01) 0.05 0.38 (0.16,0.88) 0.02 0.33 (0.16,0.67) 0.002
Indian 0.96 (0.46,2) 0.91 0.5 (0.23,1.06) 0.07 0.72 (0.41,1.28) 0.26
Others 1.15 (0.27,4.91) 0.85 0.81 (0.24,2.7) 0.73 1.14 (0.42,3.1) 0.79
Gender
Male Ref. Ref. Ref.
Female 1.27 (0.48,3.36) 0.64 0.96 (0.42,2.18) 0.912 1.31 (0.66,2.62) 0.45
Marital Status
Single Ref. Ref. Ref.
Married 0.29 (0.1,0.85) 0.02 1.13 (0.39,3.29) 0.83 0.43 (0.19,1) 0.05
Divorced/Separated/Widowed 0.42 (0.06,2.73) 0.36 0.69 (0.08,5.88) 0.73 0.58 (0.14,2.44) 0.46
Education
Pre-Pri/Primary 3.53 (1.06,11.75) 0.04 0.52 (0.08,3.29) 0.48 1.73 (0.62,4.78) 0.29
Secondary 1.96 (0.57,6.68) 0.28 1.23 (0.41,3.67) 0.71 1.42 (0.59,3.43) 0.44
Pre-U/JC/Diploma 0.7 (0.16,3.03) 0.64 1.1 (0.37,3.28) 0.86 0.88 (0.35,2.22) 0.79
Vocational 0.29 (0.05,1.73) 0.17 0.57 (0.17,1.97) 0.38 0.43 (0.14,1.32) 0.14
University Ref. Ref. Ref.
Employment Status
Employed Ref. Ref. Ref.
Econ. Inactive* 1.53 (0.67,3.53) 0.32 1.28 (0.57,2.89) 0.55 1.22 (0.63,2.36) 0.56
Unemployed 0.66 (0.13,3.31) 0.61 0.76 (0.15,3.76) 0.73 0.67 (0.22,2.03) 0.47
Help Seeking
No Ref. Ref. Ref.
Yes 31.62 (13.36,74.83) <.0001 34.38 (12.97,91.16) <.0001 32.18 (15.87,65.26) <.0001
Chronic Physical Disorder
No Ref. Ref. Ref.
Yes 0.92 (0.36,2.39) 0.87 1.63 (0.69,3.85) 0.27 1.31 (0.65,2.65) 0.46
Mental disorders
Alcohol use disorder
Never Ref. Ref. Ref.
Lifetime 2.02 (0.6,6.72) 0.25 5.18 (1.77,15.16) 0.003 4.28 (1.7,10.78) 0.002
12-month 0.78 (0.07,8.89) 0.84 3.41 (0.55,21.06) 0.19 2.82 (0.57,14.04) 0.21
Anxiety disorder
Never Ref. Ref. Ref.
Lifetime 4.05 (0.96,17.12) 0.06 3.48 (1.03,11.76) 0.04 4.49 (1.47,13.67) 0.008
12-month 0.13 (0.01,1.32) 0.08 0.88 (0.17,4.47) 0.87 0.62 (0.14,2.78) 0.53
Subramaniam et al. BMC Psychiatry 2013, 13:231 Page 7 of 10http://www.biomedcentral.com/1471-244X/13/231
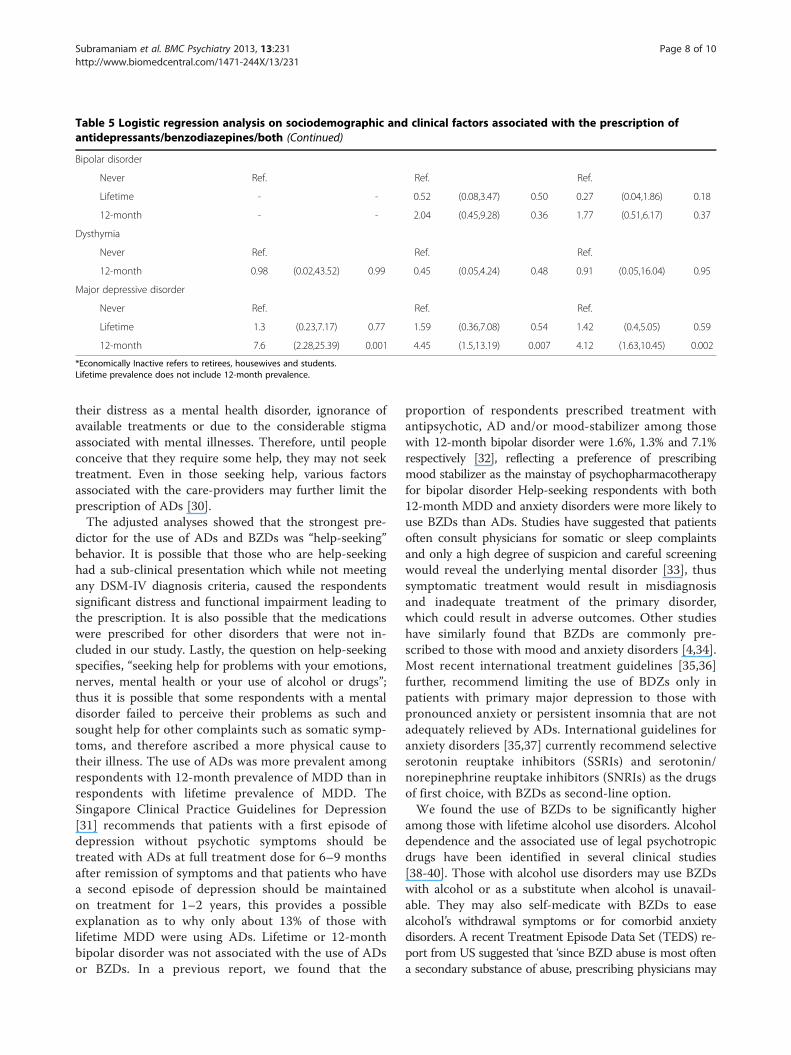
Table 5 Logistic regression analysis on sociodemographic and clinical factors associated with the prescription ofantidepressants/benzodiazepines/both (Continued)
Bipolar disorder
Never Ref. Ref. Ref.
Lifetime - - 0.52 (0.08,3.47) 0.50 0.27 (0.04,1.86) 0.18
12-month - - 2.04 (0.45,9.28) 0.36 1.77 (0.51,6.17) 0.37
Dysthymia
Never Ref. Ref. Ref.
12-month 0.98 (0.02,43.52) 0.99 0.45 (0.05,4.24) 0.48 0.91 (0.05,16.04) 0.95
Major depressive disorder
Never Ref. Ref. Ref.
Lifetime 1.3 (0.23,7.17) 0.77 1.59 (0.36,7.08) 0.54 1.42 (0.4,5.05) 0.59
12-month 7.6 (2.28,25.39) 0.001 4.45 (1.5,13.19) 0.007 4.12 (1.63,10.45) 0.002
*Economically Inactive refers to retirees, housewives and students.Lifetime prevalence does not include 12-month prevalence.
Subramaniam et al. BMC Psychiatry 2013, 13:231 Page 8 of 10http://www.biomedcentral.com/1471-244X/13/231
their distress as a mental health disorder, ignorance ofavailable treatments or due to the considerable stigmaassociated with mental illnesses. Therefore, until peopleconceive that they require some help, they may not seektreatment. Even in those seeking help, various factorsassociated with the care-providers may further limit theprescription of ADs [30].The adjusted analyses showed that the strongest pre-
dictor for the use of ADs and BZDs was “help-seeking”behavior. It is possible that those who are help-seekinghad a sub-clinical presentation which while not meetingany DSM-IV diagnosis criteria, caused the respondentssignificant distress and functional impairment leading tothe prescription. It is also possible that the medicationswere prescribed for other disorders that were not in-cluded in our study. Lastly, the question on help-seekingspecifies, “seeking help for problems with your emotions,nerves, mental health or your use of alcohol or drugs”;thus it is possible that some respondents with a mentaldisorder failed to perceive their problems as such andsought help for other complaints such as somatic symp-toms, and therefore ascribed a more physical cause totheir illness. The use of ADs was more prevalent amongrespondents with 12-month prevalence of MDD than inrespondents with lifetime prevalence of MDD. TheSingapore Clinical Practice Guidelines for Depression[31] recommends that patients with a first episode ofdepression without psychotic symptoms should betreated with ADs at full treatment dose for 6–9 monthsafter remission of symptoms and that patients who havea second episode of depression should be maintainedon treatment for 1–2 years, this provides a possibleexplanation as to why only about 13% of those withlifetime MDD were using ADs. Lifetime or 12-monthbipolar disorder was not associated with the use of ADsor BZDs. In a previous report, we found that the
proportion of respondents prescribed treatment withantipsychotic, AD and/or mood-stabilizer among thosewith 12-month bipolar disorder were 1.6%, 1.3% and 7.1%respectively [32], reflecting a preference of prescribingmood stabilizer as the mainstay of psychopharmacotherapyfor bipolar disorder Help-seeking respondents with both12-month MDD and anxiety disorders were more likely touse BZDs than ADs. Studies have suggested that patientsoften consult physicians for somatic or sleep complaintsand only a high degree of suspicion and careful screeningwould reveal the underlying mental disorder [33], thussymptomatic treatment would result in misdiagnosisand inadequate treatment of the primary disorder,which could result in adverse outcomes. Other studieshave similarly found that BZDs are commonly pre-scribed to those with mood and anxiety disorders [4,34].Most recent international treatment guidelines [35,36]further, recommend limiting the use of BDZs only inpatients with primary major depression to those withpronounced anxiety or persistent insomnia that are notadequately relieved by ADs. International guidelines foranxiety disorders [35,37] currently recommend selectiveserotonin reuptake inhibitors (SSRIs) and serotonin/norepinephrine reuptake inhibitors (SNRIs) as the drugsof first choice, with BZDs as second-line option.We found the use of BZDs to be significantly higher
among those with lifetime alcohol use disorders. Alcoholdependence and the associated use of legal psychotropicdrugs have been identified in several clinical studies[38-40]. Those with alcohol use disorders may use BZDswith alcohol or as a substitute when alcohol is unavail-able. They may also self-medicate with BZDs to easealcohol’s withdrawal symptoms or for comorbid anxietydisorders. A recent Treatment Episode Data Set (TEDS) re-port from US suggested that ‘since BZD abuse is most oftena secondary substance of abuse, prescribing physicians may
Subramaniam et al. BMC Psychiatry 2013, 13:231 Page 9 of 10http://www.biomedcentral.com/1471-244X/13/231
wish to screen for alcohol and other drugs of abuse andmonitor patients more closely’ [41].The limitations of our study include the fact that the
data were entirely based on self-report and the willingnessof the respondents to disclose the use of medications, thusour rates are possibly underestimates. Studies have dem-onstrated that there is good concordance between self-reported psychotropic medication use and informationobtained from official prescription databases for mostpsychotropic drugs [42]. Our study did not establish non-pharmacological treatments, thus it may be possible thatthose with anxiety or mood disorder were receiving behav-ioral interventions which may have resulted in some ofour findings. As this was a household study, we excludedthose who were in institutions such as hospitals/nursinghomes and prisons during the field period of the study andthese populations may have a higher use of psychotropicmedications.The strengths of our study are the use of a structured
standardized instrument and well trained interviewers whocaptured the information systematically and accurately. Wealso achieved a relatively high response rate of 75.9% whichmakes the findings generalizable to the resident population.
ConclusionsIn conclusion, we found that use of ADs and BZDs in ourpopulation was relatively low and that ‘help-seeking’ wasthe most important predictor of the use of ADs and BZDs.What needs to be further investigated is the appropriate-ness of the use of these psychotropic medications – aquestion which was beyond the scope of this study. How-ever, it would seem there might be an underutilization ofADs among those with 12-month MDD (although wecould not establish whether these respondents have re-ceived any form of psychotherapy), as well as a relativelyhigh rate of BZDs use among those with alcohol usedisorders. However, these findings need to be furtherresearched in this population.
Competing interestsThe authors report no other financial or other relationship relevant to thesubject of this article.
Authors’ contributionsMS wrote the first draft of the article and was involved in study design andprotocol writing. VYFH conducted the statistical analyses. JAV helped instudy design, protocol writing and gave inputs into the article. EA helped instudy design, protocol writing and gave inputs into the article. SA helped instudy design, protocol writing and gave inputs into the article. All authorsread and approved the final manuscript.
FundingThis study was supported by funding from the Singapore MillenniumFoundation and the Ministry of Health, Singapore.
Author details1Research Division, Institute of Mental Health, Buangkok Green Medical Park,10 Buangkok View, Singapore 539747, Singapore. 2Research Division, Instituteof Mental Health, Singapore, Singapore.
Received: 15 January 2013 Accepted: 18 September 2013Published: 23 September 2013
References1. Ustün TB, von Korff M: Primary mental health services: access and
provision of care. In Mental illness in general health care. Edited by UstünTB, Sartorius N. Chichester: John Wiley; 1995:347–360.
2. Ohayon MM, Caulet M: Psychotropic medication and insomniacomplaints in two epidemiological studies. Can J Psychiatry 1996,41(7):457–464.
3. The ESEMeD⁄MHEDEA 2000 investigators: Psychotropic drug utilization inEurope: results from the European Study of the Epidemiology of MentalDisorders (ESEMeD) project. Acta Psychiatr Scand 2004,109(suppl 420):55–64.
4. Demyttenaere K, Bonnewyn A, Bruffaerts R, De Girolamo G, Gasquet I,Kovess V, Haro JM, Alonso J: Clinical factors influencing the prescription ofantidepressants and benzodiazepines: results from the European studyof the epidemiology of mental disorders (ESEMeD). J Affect Disord 2008,110(1–2):84–93.
5. Kisely S, Linden M, Bellantuono C, Simon G, Jones J: Why are patientsprescribed psychotropic drugs by general practitioners? Results of aninternational study. Psychol Med 2000, 30(5):1217–1225.
6. Nielsen MW, Hansen EH, Rasmussen NK: Patterns of psychotropicmedicine use and related diseases across educational groups: nationalcross-sectional survey. Eur J Clin Pharmacol 2004, 60(3):199–204.
7. Paulose-Ram R, Jonas BS, Orwig D, Safran MA: Prescription psychotropicmedication use among the U.S. Adult population: results from the thirdnational health and nutrition examination survey, 1988–1994. J ClinEpidemiol 2004, 57(3):309–317.
8. Grinshpoon A, Marom E, Weizman A, Ponizovsky AM: Psychotropic druguse in Israel: results from the national health survey. Prim CareCompanion. J Clin Psychiatry 2007, 9(5):356–363.
9. Ohayon MM, Lader MH: Use of psychotropic medication in the generalpopulation of France, Germany, Italy, and the United Kingdom. J ClinPsychiatry 2002, 63(9):817–825.
10. Blennow G, Romelsjö A, Leifman H, Leifman A, Karlsson G: Sedatives andhypnotics in Stockholm: social factors and kinds of use. Am J PublicHealth 1994, 84(2):242–246.
11. Magrini N, Vaccheri A, Parma E, D’Alessandro R, Bottoni A, Occhionero M,Montanaro N: Use of benzodiazepines in the Italian general population:prevalence, pattern of use and risk factors for use. Eur J Clin Pharmacol1996, 50(1–2):19–25.
12. Mojtabai R: Datapoints: prescription patterns for mood and anxietydisorders in a community sample. Psychiatr Serv 1999, 50(12):1557.
13. Bellantuono C, Arreghini E, Adami M, Bodini F, Gastaldo M, Micciolo R:Psychotropic drug prescription in Italy. A survey in general practice. SocPsychiatry Psychiatr Epidemiol 1989, 24(4):212–218.
14. Taggart LAP, Mc Cammon SL, Allred LJ, Horner RD, Harold MJ: Effect ofpatient and physician gender on prescriptions for psychotropic drugs.J Womens Health 1993, 2(4):353–357.
15. Alonso J, Angermeyer MC, Bernert S, Bruffaerts R, Brugha TS, Bryson H, deGirolamo G, Graaf R, Demyttenaere K, Gasquet I, Haro JM, Katz SJ, KesslerRC, Kovess V, Lépine JP, Ormel J, Polidori G, Russo LJ, Vilagut G, Almansa J,Arbabzadeh-Bouchez S, Autonell J, Bernal M, Buist-Bouwman MA, CodonyM, Domingo-Salvany A, Ferrer M, Joo SS, Martínez-Alonso M, Matschinger H,et al: Use of mental health services in Europe: results from the EuropeanStudy of the Epidemiology of Mental Disorders (ESEMeD) project. ActaPsychiatr Scand 2004, 109(suppl 420):47–54.
16. Chong SA, Abdin E, Sherbourne C, Vaingankar J, Heng D, Yap M,Subramaniam M: Treatment gap in common mental disorders: theSingapore perspective. Epidemiol Psychiatric Sci 2012, 21(2):195–202.
17. Uchida N, Chong MY, Tan CH, Nagai H, Tanaka M, Lee MS, Fujii S, Yang SY,Si T, Sim K, Wei H, Ling HY, Nishimura R, Kawaguchi Y, Edwards G, SartoriusN, Shinfuku N: International study on antidepressant prescription patternat 20 teaching hospitals and major psychiatric institutions in East Asia:analysis of 1898 cases from China, Japan, Korea, Singapore and Taiwan.Psychiatry Clin Neurosci 2007, 61(5):522–528.
18. Xie F, Tan CH, Li SC: Are they being used safely? A retrospective cross-sectional tertiary health care survey of selective serotonin reuptakeinhibitors prescribing practice in Singapore. Hum Psychopharmacol 2005,20(7):459–465.
Subramaniam et al. BMC Psychiatry 2013, 13:231 Page 10 of 10http://www.biomedcentral.com/1471-244X/13/231
19. Subramaniam M, Vaingankar J, Heng D, Kwok KW, Lim YW, Yap M, ChongSA: The Singapore mental health study: an overview of themethodology. Inter J Methods Psychiatry 2012, 21(2):149–157.
20. Kessler RC, Ustun TB: The world mental health (WMH) survey initiativeversion of the World Health Organization (WHO) CompositeInternational Diagnostic Interview (CIDI). Int J Methods Psychiatr Res 2004,13:93–121.
21. Rush AJ, Carmody T, Relmiz PE: The Inventory of DepressiveSymptomatology (IDS). Int J Methods Psychiatr Res 2000, 9:45–59.
22. Hamilton M: A rating scale for depression. J Neurol Neurosurg Psychiatry1960, 23:56–62.
23. Rush AJ, Trivedi MH, Ibrahim HM, Carmody TJ, Arnow B, Klein DN,Markowitz JC, Ninan PT, Kornstein S, Manber R, Thase ME, Kocsis JH, KellerMB: The 16 item Quick Inventory of Depressive Symptomatology (QIDS)Clinician Rating (QIDS-C) and Self-Report (QIDS-SR). Biol Psychiatry 2003,54(5):573–583.
24. Chong SA, Vaingankar J, Abdin E, Subramaniam M: The prevalence andimpact of major depressive disorder among Chinese, Malays and Indiansin an Asian multi-racial population. J Affect Disord 2012, 138(1–2):128–136.
25. Chong SA, Abdin E, Vaingankar JA, Heng D, Sherbourne C, Yap M, Lim YW,Wong HB, Ghosh-Dastidar B, Kwok KW, Subramaniam M: A population-based survey of mental disorders in Singapore. Ann Acad Med Singapore2012, 41:49–66.
26. Alonso J, Angermeyer MC, Bernert S, Bruffaerts R, Brugha TS, Bryson H, deGirolamo G, Graaf R, Demyttenaere K, Gasquet I, Haro JM, Katz SJ, KesslerRC, Kovess V, Lépine JP, Ormel J, Polidori G, Russo LJ, Vilagut G, Almansa J,Arbabzadeh-Bouchez S, Autonell J, Bernal M, Buist-Bouwman MA, CodonyM, Domingo-Salvany A, Ferrer M, Joo SS, Martínez-Alonso M, Matschinger H,et al: European Study of the Epidemiology of Mental Disorders (ESEMeD)Project. Prevalence of mental disorders in Europe: results from theEuropean Study of the Epidemiology of Mental Disorders (ESEMeD)project. Acta Psychiatr Scand 2004, 109(suppl 420):21–27.
27. Hjern A, Wicks S, Dalman C: Social adversity contributes to high morbidityin psychoses in immigrants – a national cohort study in two generationsof Swedish residents. Psychol Med 2004, 34(6):1025–1033.
28. Morgan C, Burns T, Fitzpatrick R, Pinforld V, Priebe S: Social exclusion andmental health: conceptual and methodological review. Br J Psychiatry2007, 191:477–483.
29. Demyttenaere K, Ansseau M, Constant E, Albert A, Van Gassen G, vanHeeringen K: Do general practitioners and psychiatrists agree aboutdefining cure from depression? The DEsCRIBE™ survey. BMC Psychiatry2011, 11:169.
30. Mendlewicz J: Optimising antidepressant use in clinical practice: towardscriteria for antidepressant selection. Br J Psychiatry Suppl 2001, 42:S1–S3.
31. Chua HC, Chan LL, Chee KS, Chen YH, Chin SA, Chua PL, Fones SL, Fung D,Khoo CL, Kwek SK, Lim EC, Ling J, Poh P, Sim K, Tan BL, Tan CH, Tan LL, Tan YH,Tay WK, Yeo C, Su HC, Singapore Ministry of Health: Ministry of health clinicalpractice guidelines: depression. Singapore Med J 2012, 53(2):137–143.
32. Subramaniam M, Abdin E, Vaingankar J, Chong SA: Prevalence, correlates,comorbidity and severity of bipolar disorder: results from the Singaporemental health study. J Affect Disord 2013, 146(2):189–196.
33. Wittchen HU, Lieb R, Wunderlich U, Schuster P: Comorbidity in primarycare: presentation and consequences. J Clin Psychiatry 1999,60(suppl 7):29–36.
34. Lagnaoui R, Depont F, Fourrier A, Abouelfath A, Bégaud B, Verdoux H,Moore N: Patterns and correlates of benzodiazepine use in the Frenchgeneral population. Eur J Clin Pharmacol 2004, 60(7):523–529.
35. Kennedy SH, Lam RW, Parikh SV, Patten SB, Ravindran AV: CanadianNetwork for Mood and Anxiety Treatments (CANMAT) clinical guidelinesfor the management of major depressive disorder in adults. J AffectDisord 2009, 117(suppl 1):S1–S2.
36. American Psychiatric Association: Practice guideline for the treatment ofpatients with major depressive disorder, third edition. Washington DC:Arlington (VA); 2010:152.
37. Davidson JR, Zhang W, Connor KM, Ji J, Jobson K, Lecrubier Y, McFarlaneAC, Newport DJ, Nutt DJ, Osser DN, Stein DJ, Stowe ZN, Tajima O, VersianiM: A psychopharmacological treatment algorithm for generalisedanxiety disorder (GAD). J Psychopharmacol 2010, 24(1):3–26.
38. Ashley MJ, le Riche WH, Hatcher J, Kornaczewski A, Schmidt W, Rankin JG:‘Mixed’ (Drug abusing) and ‘pure’ alcoholics: a socio-medicalcomparison. Br J Addict 1978, 73(1):19–34.
39. Busto U, Simpkins J, Sellers EM, Sisson B, Segal R: Objective determinationof benzodiazepine use and abuse in alcoholics. Br J Addic 1983,78(4):429–435.
40. Ross HE: Benzodiazepine use and anxiolytic abuse and dependence intreated alcoholics. Addiction 1993, 88(2):209–218.
41. Substance Abuse and Mental Health Services Administration, Center forBehavioral Health Statistics and Quality: Substance abuse treatmentadmissions for abuse of benzodiazepines. Rockville, MD: The TEDS Report;2011.
42. Haukka J, Suvisaari J, Tuulio-Henriksson A, Lönnqvist J: High concordancebetween self-reported medication and official prescription databaseinformation. Eur J Clin Pharmacol 2007, 63(11):1069–1074.
doi:10.1186/1471-244X-13-231Cite this article as: Subramaniam et al.: Prevalence of and factors relatedto the use of antidepressants and benzodiazepines: results from theSingapore Mental Health Study. BMC Psychiatry 2013 13:231.
Submit your next manuscript to BioMed Centraland take full advantage of:
• Convenient online submission
• Thorough peer review
• No space constraints or color figure charges
• Immediate publication on acceptance
• Inclusion in PubMed, CAS, Scopus and Google Scholar
• Research which is freely available for redistribution
Submit your manuscript at www.biomedcentral.com/submit