preparation and characterization of solid dispersions - mdpi
TRANSCRIPT
pharmaceuticals
Article
Preparation and Characterization of Solid DispersionsComposed of Curcumin, Hydroxypropyl Celluloseand/or Sodium Dodecyl Sulfate by Grinding withVibrational Ball Milling
Nguyen Ngoc Sao Mai, Yuta Otsuka , Yayoi Kawano * and Takehisa Hanawa *
Department of Pharmaceutical Sciences, Faculty of Pharmaceutical Sciences, Tokyo University of Science,2641 Yamazaki, Noda, Chiba 278-8510, Japan; [email protected] (N.N.S.M.); [email protected] (Y.O.)* Correspondence: [email protected] (Y.K.); [email protected] (T.H.); Tel.: +81-4-7121-4003 (Y.K.);
+81-4-7121-3654 (T.H.)
Received: 16 September 2020; Accepted: 6 November 2020; Published: 12 November 2020 �����������������
Abstract: Solubility is an important physicochemical property affecting drug bioavailability.One approach to improve drug solubility is using amorphous formulations, which can improvesolubility by up to a 1000-fold. Herein, amorphous curcumin (CUR) and amorphous solid dispersions(SDs) consisting of CUR, hydroxypropyl cellulose (HPC) and/or sodium dodecyl sulfate (SDS) weredeveloped using vibrational ball milling. The resulting ground mixtures (GMs) were characterizedusing powder X-ray diffractometry, Fourier transform infrared spectroscopy, differential scanningcalorimetry and a dissolution test. The 60-min GM containing 90% HPC significantly increased thedrug solubility. Presence of SDS in the GMs containing 90% HPC reduced the grinding durationfrom 60 min to 30 min in forming a ground SD that significantly increased the CUR dissolution rate.This amorphous state was stable for 30 days when stored at 40 ◦C/RH 75%.
Keywords: amorphous solid dispersion; solubility; stability; poorly water-soluble drug; vibrationalball milling; Fourier transform infrared spectroscopy; X-ray powder diffraction; differential scanningcalorimetry; dissolution
1. Introduction
Solubility is one of the most important physicochemical properties affecting drug bioavailability.It is estimated that approximately 70% of the current new drug candidates have poor solubility [1].One methodology that can enhance the solubility of poorly water-soluble drugs and their bioavailabilityis amorphization [2–5]. Indeed, the solubility of amorphous drugs can be up to a 1000-fold higherthan that of their crystalline forms [6–9]. Amorphous substances can be classified into two categories:molecularly pure drugs and solid dispersions (SDs), where the active pharmaceutical ingredient (API) isdispersed within a carrier(s). Vo et al. have demonstrated that SDs can be categorized into four distinctsubcategories [10]: (1) SDs that use a crystalline carrier, such as urea [11–13] or sugar [11]; (2) SDs thatuse a polymeric carrier, such as povidone [14], polyethylene glycol [15], hydroxypropyl cellulose [16] orcyclodextrin [17–21]; (3) SDs that use a carrier with surface activity, such as surfactant(s) or a mixture ofpolymers and surfactants [22]; and (4) controlled release SDs or SDs that use swellable/water insolublepolymers, such as Eudragit® [23] and Carbopol® [23].
In this study, we focused on curcumin (CUR) as a model of a poorly water-soluble API. CURis a diarylheptanoid consisting of two aromatic rings joined by a seven-carbon chain. CUR exhibitsvarious pharmacological properties, such as analgesic, anti-inflammatory, anti-oxidant, anti-malarialand insect repellant activities [24–29]. CUR has a low aqueous solubility (~28.9 ng/mL) and is
Pharmaceuticals 2020, 13, 383; doi:10.3390/ph13110383 www.mdpi.com/journal/pharmaceuticals
Pharmaceuticals 2020, 13, 383 2 of 15
dramatically metabolized through the first pass in the liver (maximum serum concentration at 1 h:0.006 ± 0.005 µg/mL) [30]. Particularly, CUR has been used in accelerating the wound healing process.Kulac et al. described CUR as a wound dressing agent that protected wound tissue from microbialinfection, reduced inflammation and stimulated cell proliferation to re-build damaged tissue [31].Cianfruglia et al. reported that CUR at a high concentration (≥20 µM) reduced the cell viability ofhuman dermal fibroblasts (HDFs) with regard to the control by 57% [32]. The protective effect on HDFfrom ultraviolet A (UVA) was recorded at 5 µM CUR pretreated for 2 h prior to 10 J/m2 UVA irradiationexposure [33].
Hydroxypropyl cellulose (HPC) is used in SD formation to improve drug solubility. Yamada etal. demonstrated that the co-ground mixtures (consisting of 3, 9-bis(N, N-dimethylcarbamoyloxy)-5H-benzofuro (3, 2-c)quinoline-6-one and HPC) increased the dissolution rate and maintained thehigh drug solubility by increasing the particles’ surface area and forming an amorphous state [34].Sugimoto et al. reported that co-ground phenytoin with L-HPC using ultra-cryo milling exhibited adissolution rate of approximately 90% over 60 min [35]. Sodium dodecyl sulfate (SDS) is an anionicsurfactant widely used to improve drug wettability, solubility and dissolution rate of poorly solubleAPIs. Madelung et al. reported that felodipine and griseofulvin solubility linearly increased asthe amount of SDS increased [36]. A small addition of SDS resulted in a significant increase in thedissolution rate of fenofibrate samples obtained by salt-assisted milling [37]. For prolonged contactwith human skin, the SDS concentrations should not exceed 1% to avoid irritation [38].
For decades, to enhance CUR solubility, numerous methodologies forming CUR SDs withpolymers have been accessed. Li et al. ameliorated CUR solubility by forming spray-dried SDs ofCUR in cellulose derivative matrices (hydroxypropyl methylcellulose acetate succinate-HPMC AS,carboxymethylcellulose acetate butyrate and cellulose acetate adipate propionate) [39]. Seo et al.reported that an SD of CUR and polyethylene glycol-15-hydroxystearate obtained by the conventionalsolvent evaporation method significantly increased the drug solubility at physiological pH [40].Satomi et al. developed CUR SDs with HPC-SL and HPMC AS using wet milling and freeze-dryingmethods [41]. Wiegel et al. investigated CUR amorphous SDs with polyvinyl pyrrolidone, EudragitE100, carboxymethyl cellulose acetate butyrate, HPMC and HPMC AS using spin coating, rotaryevaporation and cryo-milling [42].
We considered vibrational ball milling, a dry milling method to develop ground and co-groundCUR. In addition, it is applicable not only in laboratory research but also in pilot- and industrial-scalestudies [43]. During the grinding process, various parameters can influence the efficiency of grinding,such as the frequency of the vibration, type of grinding jar (volume and material), type of media(quantity, material and diameter), amount of powder filling, percentage of components and grindingduration. Design of experiment (DoE) is an approach that can determine cause and effect relationshipsby introducing all possible inputs/factors acting on the process and all output(s)/response(s) basedon the aims and statistical tests performed. Then, the experimental resources are optimized whileconsidering all the restrictions and limitations of the resources.
This study focuses on the effects of grinding duration, HPC and SDS in solubility enhancement ofground and co-ground CUR using vibrational ball milling. Here, the amorphization was observedin a molecularly pure drug, SDs that consist of a drug and a polymer and SDs that consist of a drug,polymer and surfactant. The interactions between CUR–CUR and CUR–HPC after the grinding wasevaluated. The CUR formulations that significantly improved the drug dissolution rate were detected.
2. Results and Discussion
2.1. Power X-ray Diffraction (PXRD) Patterns
The PXRD patterns of 60 different samples were examined. The CUR crystals showed characteristicpeaks at 2θ = 8.86, 12.28, 14.52 and 17.24◦, which represented their crystalline nature (data are notshown). The PXRD pattern of HPC was observed as an amorphous form, whereas that of SDS showed
Pharmaceuticals 2020, 13, 383 3 of 15
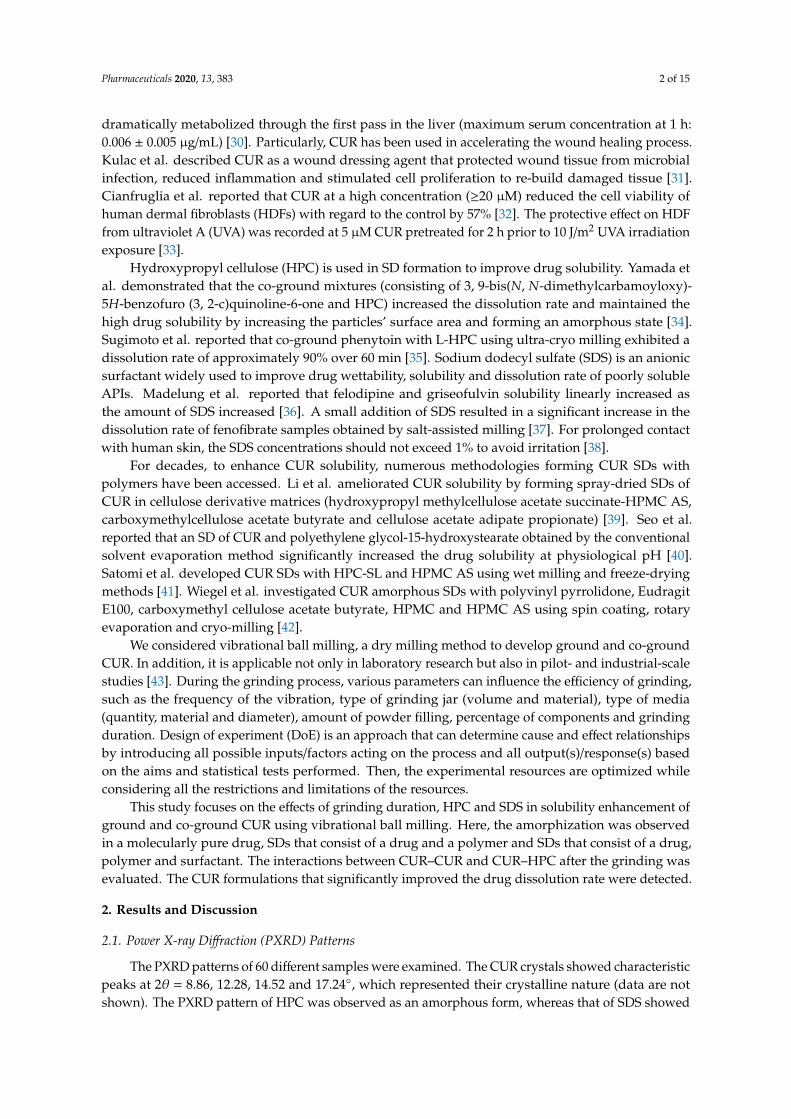
a prominent peak at 6.8◦ (data are not shown). Figure 1 displays the PXRD patterns of ground CUR,ground mixtures (GMs) containing CUR and 50% HPC, GMs containing CUR and 75% HPC, and GMscontaining CUR and SDS.
Pharmaceuticals 2020, 13, x FOR PEER REVIEW 3 of 15
2. Results and Discussion
2.1. Power X-ray Diffraction (PXRD) Patterns
The PXRD patterns of 60 different samples were examined. The CUR crystals showed characteristic peaks at 2θ = 8.86, 12.28, 14.52 and 17.24°, which represented their crystalline nature (data are not shown). The PXRD pattern of HPC was observed as an amorphous form, whereas that of SDS showed a prominent peak at 6.8° (data are not shown). Figure 1 displays the PXRD patterns of ground CUR, ground mixtures(GMs) containing CUR and 50% HPC, GMs containing CUR and 75% HPC, and GMs containing CUR and SDS.
The CUR characteristic peaks could be observed irrespective of the grinding duration, but the peak intensity was decreased (Figure 1A). Colombo et al. [43] described that solid materials being processed in a mill received mechanical energy in a pulse form whenever they were entrapped between the media and mill wall. The transfer of mechanical energy through means of normal and shear stresses acting on the solid material surfaces created growth of a strain field in the solid bulk. The strain field-manifested atoms shift from the equilibrium stable positions at the lattice nodes or lattice collapse. Hence, the crystal transformation to an amorphous phase could be explained and the reduction in the peak intensity was greater as the grinding time was prolonged.
Figure 1. PXRD patterns of (A) ground curcumin (CUR) crystals; (B) ground mixtures (GMs) containing CUR and 50% hydroxypropyl cellulose (HPC); (C) GMs containing CUR and 75% HPC; and (D) GMs containing CUR and sodium dodecyl sulfate.
In binary ground mixtures (GMs) containing CUR and HPC (10, 25 and 50%), the characteristic peaks of CUR were visible but the reduction in the peak intensity clearly corresponded to the grinding duration (Figure 1B). An SD formation was observed in these GMs, but the CUR was not totally dispersed in HPC and reduced its crystallinity. In GMs containing CUR and 75% HPC, some prominent peaks were observed at 2θ = 17.24 and 24.76° for the 15-min and 30-min GMs. However, these peaks disappeared in the 45-min and 60-min GMs (Figure 1C). In the GMs containing CUR and
Figure 1. PXRD patterns of (A) ground curcumin (CUR) crystals; (B) ground mixtures (GMs) containingCUR and 50% hydroxypropyl cellulose (HPC); (C) GMs containing CUR and 75% HPC; and (D) GMscontaining CUR and sodium dodecyl sulfate.
The CUR characteristic peaks could be observed irrespective of the grinding duration, but thepeak intensity was decreased (Figure 1A). Colombo et al. [43] described that solid materials beingprocessed in a mill received mechanical energy in a pulse form whenever they were entrapped betweenthe media and mill wall. The transfer of mechanical energy through means of normal and shearstresses acting on the solid material surfaces created growth of a strain field in the solid bulk. The strainfield-manifested atoms shift from the equilibrium stable positions at the lattice nodes or lattice collapse.Hence, the crystal transformation to an amorphous phase could be explained and the reduction in thepeak intensity was greater as the grinding time was prolonged.
In binary ground mixtures (GMs) containing CUR and HPC (10, 25 and 50%), the characteristicpeaks of CUR were visible but the reduction in the peak intensity clearly corresponded to the grindingduration (Figure 1B). An SD formation was observed in these GMs, but the CUR was not totallydispersed in HPC and reduced its crystallinity. In GMs containing CUR and 75% HPC, some prominentpeaks were observed at 2θ = 17.24 and 24.76◦ for the 15-min and 30-min GMs. However, these peaksdisappeared in the 45-min and 60-min GMs (Figure 1C). In the GMs containing CUR and 90% HPC,the characteristic peaks of CUR disappeared following 15 min of grinding (Figure S1F). The totaltransformation into an amorphous nature of the GMs showed that CUR was well dispersed within thematrix of the HPC as the amount of HPC was triple that of CUR.
In ternary physical mixtures (PMs) (containing CUR, HPC and SDS), regardless of the HPCamount, the prominent peak of SDS at 6.8◦ was observed (Figure 1D). However, this peak disappearedin all GMs (Figure S1D–L). Since the SDS amount in the mixtures was very small, its dispersion waseasily attained. In other words, the presence of SDS did not clearly influence the crystallinity of the
Pharmaceuticals 2020, 13, 383 4 of 15
CUR in the GMs. As a result, the crystallinity transformation behavior of the ternary GMs was similarto that of the binary GMs.
2.2. Fourier Transform Infrared (FTIR) Spectroscopy
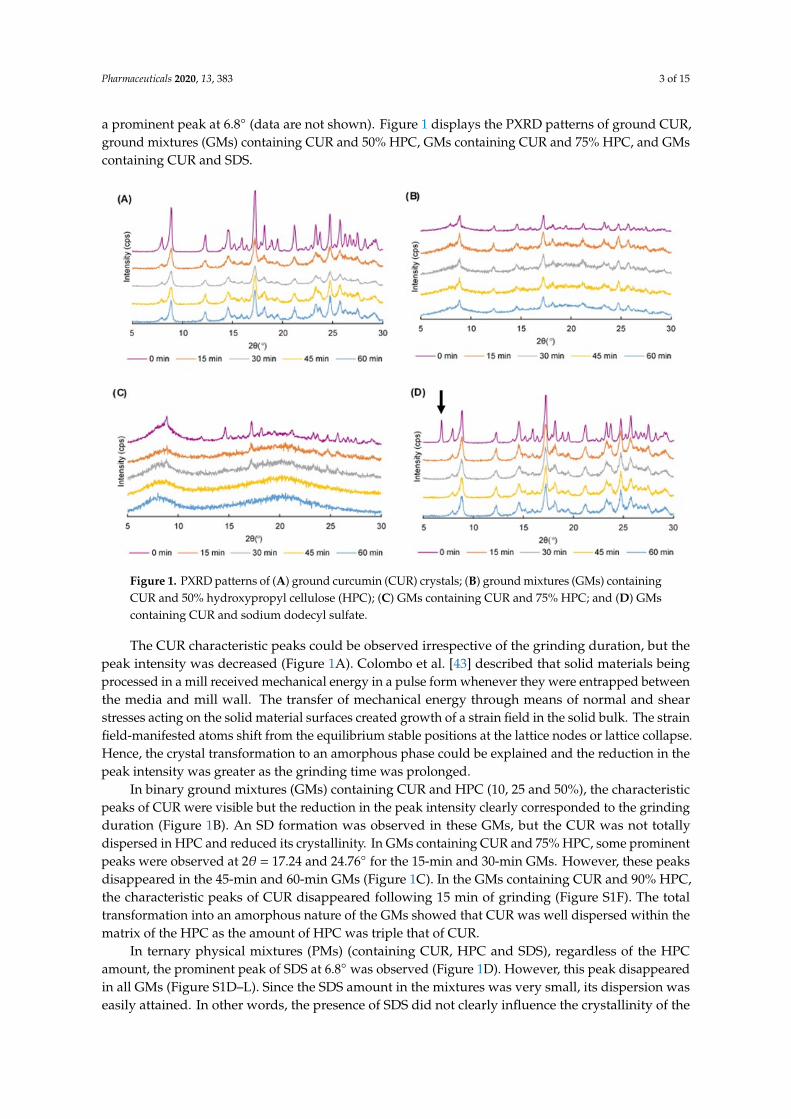
The FTIR spectra of the 60 samples were examined. The prominent peaks observed in CUR wereas follows [44]: (1) 3502 cm−1 for the phenolic (-OH) vibrations; (2) 3017 cm−1 for the aromatic C–Hstretching vibrations; (3) 1626 cm−1 for the conjugated alkene (C = C) stretching; (4) 1602 cm−1 for thestretching vibration of the benzene ring skeleton; (5) 1506 cm−1 for the mixed (C = O) and (C = C)vibrations; and (6) 1274 cm−1 for the methyl aryl ether (C–O) stretching vibrations (data are not shown).Figure 2 exhibits the FTIR spectra of ground CUR, ground mixtures (GMs) containing CUR and 50%HPC, GMs containing CUR and 75% HPC, and GMs containing CUR and SDS.
Pharmaceuticals 2020, 13, x FOR PEER REVIEW 4 of 15
90% HPC, the characteristic peaks of CUR disappeared following 15 min of grinding (Figure S1F). The total transformation into an amorphous nature of the GMs showed that CUR was well dispersed within the matrix of the HPC as the amount of HPC was triple that of CUR.
In ternary physical mixtures (PMs) (containing CUR, HPC and SDS), regardless of the HPC amount, the prominent peak of SDS at 6.8° was observed (Figure 1D). However, this peak disappeared in all GMs (Figure S1D–L). Since the SDS amount in the mixtures was very small, its dispersion was easily attained. In other words, the presence of SDS did not clearly influence the crystallinity of the CUR in the GMs. As a result, the crystallinity transformation behavior of the ternary GMs was similar to that of the binary GMs.
2.2. Fourier Transform Infrared (FTIR) Spectroscopy
The FTIR spectra of the 60 samples were examined. The prominent peaks observed in CUR were as follows [44]: (1) 3502 cm−1 for the phenolic (-OH) vibrations; (2) 3017 cm−1 for the aromatic C–H stretching vibrations; (3) 1626 cm−1 for the conjugated alkene (C = C) stretching; (4) 1602 cm−1 for the stretching vibration of the benzene ring skeleton; (5) 1506 cm−1 for the mixed (C = O) and (C = C) vibrations; and (6) 1274 cm−1 for the methyl aryl ether (C–O) stretching vibrations (data are not shown). Figure 2 exhibits the FTIR spectra of ground CUR, ground mixtures(GMs) containing CUR and 50% HPC, GMs containing CUR and 75% HPC, and GMs containing CUR and SDS.
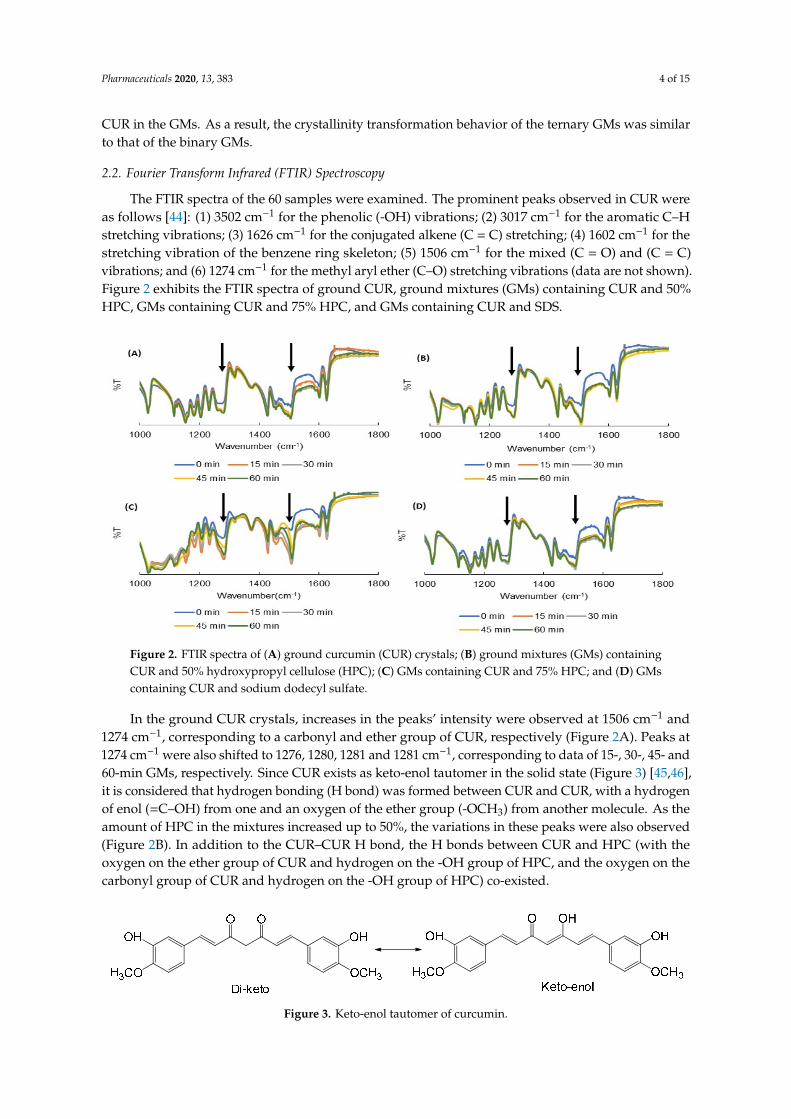
In the ground CUR crystals, increases in the peaks’ intensity were observed at 1506 cm−1 and 1274 cm−1, corresponding to a carbonyl and ether group of CUR, respectively (Figure 2A). Peaks at 1274 cm−1 were also shifted to 1276, 1280, 1281 and 1281 cm−1, corresponding to data of 15-, 30-, 45- and 60-min GMs, respectively. Since CUR exists as keto-enol tautomer in the solid state (Figure 3) [45,46], it is considered that hydrogen bonding (H bond) was formed between CUR and CUR, with a hydrogen of enol (=C–OH) from one and an oxygen of the ether group (-OCH3) from another molecule. As the amount of HPC in the mixtures increased up to 50%, the variations in these peaks were also observed (Figure 2B). In addition to the CUR–CUR H bond, the H bonds between CUR and HPC (with the oxygen on the ether group of CUR and hydrogen on the -OH group of HPC, and the oxygen on the carbonyl group of CUR and hydrogen on the -OH group of HPC) co-existed.
Figure 2. FTIR spectra of (A) ground curcumin (CUR) crystals; (B) ground mixtures (GMs) containing CUR and 50% hydroxypropyl cellulose (HPC); (C) GMs containing CUR and 75% HPC; and (D) GMs containing CUR and sodium dodecyl sulfate.
Figure 2. FTIR spectra of (A) ground curcumin (CUR) crystals; (B) ground mixtures (GMs) containingCUR and 50% hydroxypropyl cellulose (HPC); (C) GMs containing CUR and 75% HPC; and (D) GMscontaining CUR and sodium dodecyl sulfate.
In the ground CUR crystals, increases in the peaks’ intensity were observed at 1506 cm−1 and1274 cm−1, corresponding to a carbonyl and ether group of CUR, respectively (Figure 2A). Peaks at1274 cm−1 were also shifted to 1276, 1280, 1281 and 1281 cm−1, corresponding to data of 15-, 30-, 45- and60-min GMs, respectively. Since CUR exists as keto-enol tautomer in the solid state (Figure 3) [45,46],it is considered that hydrogen bonding (H bond) was formed between CUR and CUR, with a hydrogenof enol (=C–OH) from one and an oxygen of the ether group (-OCH3) from another molecule. As theamount of HPC in the mixtures increased up to 50%, the variations in these peaks were also observed(Figure 2B). In addition to the CUR–CUR H bond, the H bonds between CUR and HPC (with theoxygen on the ether group of CUR and hydrogen on the -OH group of HPC, and the oxygen on thecarbonyl group of CUR and hydrogen on the -OH group of HPC) co-existed.
Pharmaceuticals 2020, 13, x FOR PEER REVIEW 5 of 15
Figure 3. Keto-enol tautomer of curcumin.
Particularly, in GMs containing over 75% HPC (Figure 2C), new peaks at 1507 cm−1 and 1275 cm−1 were observed and became more intensive when the grinding duration increased. This suggests that the drug was thoroughly dispersed in the HPC and the only hydrogen bond between CUR and HPC was formed. In other words, the hydrogen bond between CUR and CUR did not exist. The SDS in both the ternary PMs and GMs did not influence the FTIR spectra of these GMs (Figure 2D and Figure S2D–L) because of its small amount and being over-imposed by the spectra of CUR and HPC.
2.3. Differential Scanning Calorimetry (DSC) Curves
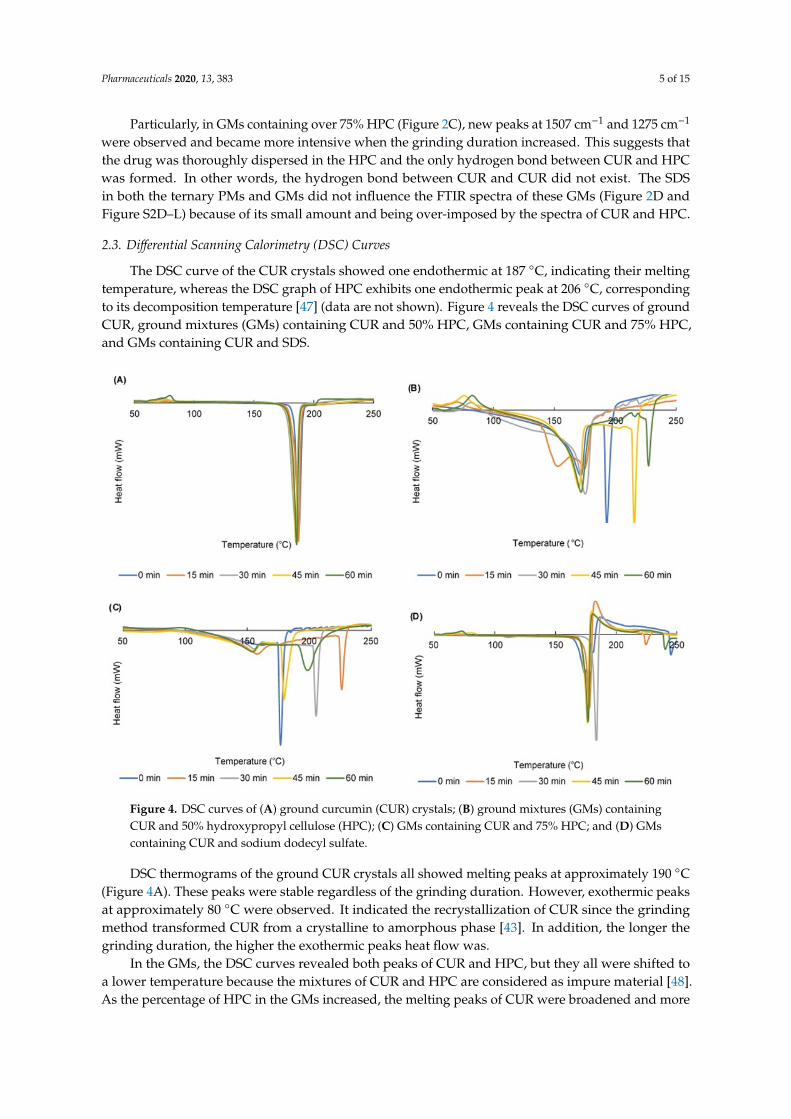
The DSC curve of the CUR crystals showed one endothermic at 187 °C, indicating their melting temperature, whereas the DSC graph of HPC exhibits one endothermic peak at 206 °C, corresponding to its decomposition temperature [47] (data are not shown). Figure 4 reveals the DSC curves of ground CUR, ground mixtures(GMs) containing CUR and 50% HPC, GMs containing CUR and 75% HPC, and GMs containing CUR and SDS.
Figure 4. DSC curves of (A) ground curcumin (CUR) crystals; (B) ground mixtures (GMs) containing CUR and 50% hydroxypropyl cellulose (HPC); (C) GMs containing CUR and 75% HPC; and (D) GMs containing CUR and sodium dodecyl sulfate.
Figure 3. Keto-enol tautomer of curcumin.
Pharmaceuticals 2020, 13, 383 5 of 15
Particularly, in GMs containing over 75% HPC (Figure 2C), new peaks at 1507 cm−1 and 1275 cm−1
were observed and became more intensive when the grinding duration increased. This suggests thatthe drug was thoroughly dispersed in the HPC and the only hydrogen bond between CUR and HPCwas formed. In other words, the hydrogen bond between CUR and CUR did not exist. The SDSin both the ternary PMs and GMs did not influence the FTIR spectra of these GMs (Figure 2D andFigure S2D–L) because of its small amount and being over-imposed by the spectra of CUR and HPC.
2.3. Differential Scanning Calorimetry (DSC) Curves
The DSC curve of the CUR crystals showed one endothermic at 187 ◦C, indicating their meltingtemperature, whereas the DSC graph of HPC exhibits one endothermic peak at 206 ◦C, correspondingto its decomposition temperature [47] (data are not shown). Figure 4 reveals the DSC curves of groundCUR, ground mixtures (GMs) containing CUR and 50% HPC, GMs containing CUR and 75% HPC,and GMs containing CUR and SDS.
Pharmaceuticals 2020, 13, x FOR PEER REVIEW 5 of 15
Figure 3. Keto-enol tautomer of curcumin.
Particularly, in GMs containing over 75% HPC (Figure 2C), new peaks at 1507 cm−1 and 1275 cm−1 were observed and became more intensive when the grinding duration increased. This suggests that the drug was thoroughly dispersed in the HPC and the only hydrogen bond between CUR and HPC was formed. In other words, the hydrogen bond between CUR and CUR did not exist. The SDS in both the ternary PMs and GMs did not influence the FTIR spectra of these GMs (Figure 2D and Figure S2D–L) because of its small amount and being over-imposed by the spectra of CUR and HPC.
2.3. Differential Scanning Calorimetry (DSC) Curves
The DSC curve of the CUR crystals showed one endothermic at 187 °C, indicating their melting temperature, whereas the DSC graph of HPC exhibits one endothermic peak at 206 °C, corresponding to its decomposition temperature [47] (data are not shown). Figure 4 reveals the DSC curves of ground CUR, ground mixtures(GMs) containing CUR and 50% HPC, GMs containing CUR and 75% HPC, and GMs containing CUR and SDS.
Figure 4. DSC curves of (A) ground curcumin (CUR) crystals; (B) ground mixtures (GMs) containing CUR and 50% hydroxypropyl cellulose (HPC); (C) GMs containing CUR and 75% HPC; and (D) GMs containing CUR and sodium dodecyl sulfate.
Figure 4. DSC curves of (A) ground curcumin (CUR) crystals; (B) ground mixtures (GMs) containingCUR and 50% hydroxypropyl cellulose (HPC); (C) GMs containing CUR and 75% HPC; and (D) GMscontaining CUR and sodium dodecyl sulfate.
DSC thermograms of the ground CUR crystals all showed melting peaks at approximately 190 ◦C(Figure 4A). These peaks were stable regardless of the grinding duration. However, exothermic peaksat approximately 80 ◦C were observed. It indicated the recrystallization of CUR since the grindingmethod transformed CUR from a crystalline to amorphous phase [43]. In addition, the longer thegrinding duration, the higher the exothermic peaks heat flow was.
In the GMs, the DSC curves revealed both peaks of CUR and HPC, but they all were shifted toa lower temperature because the mixtures of CUR and HPC are considered as impure material [48].As the percentage of HPC in the GMs increased, the melting peaks of CUR were broadened and more
Pharmaceuticals 2020, 13, 383 6 of 15
shifted to a lower temperature (Figure 4B,C). The recrystallization peaks could be observed in GMscontaining up to 50% HPC.
In case of ternary GMs, the presence of SDS raised the right shoulders and un-stabilized the CURmelting peaks (Figure 4D). However, the recrystallization phenomenon of the ground CUR was similarto that of the binary GMs. In other words, the CUR recrystallization was prevented as the HPC amountin the GMs was over 75%.
2.4. Dissolution Profiles
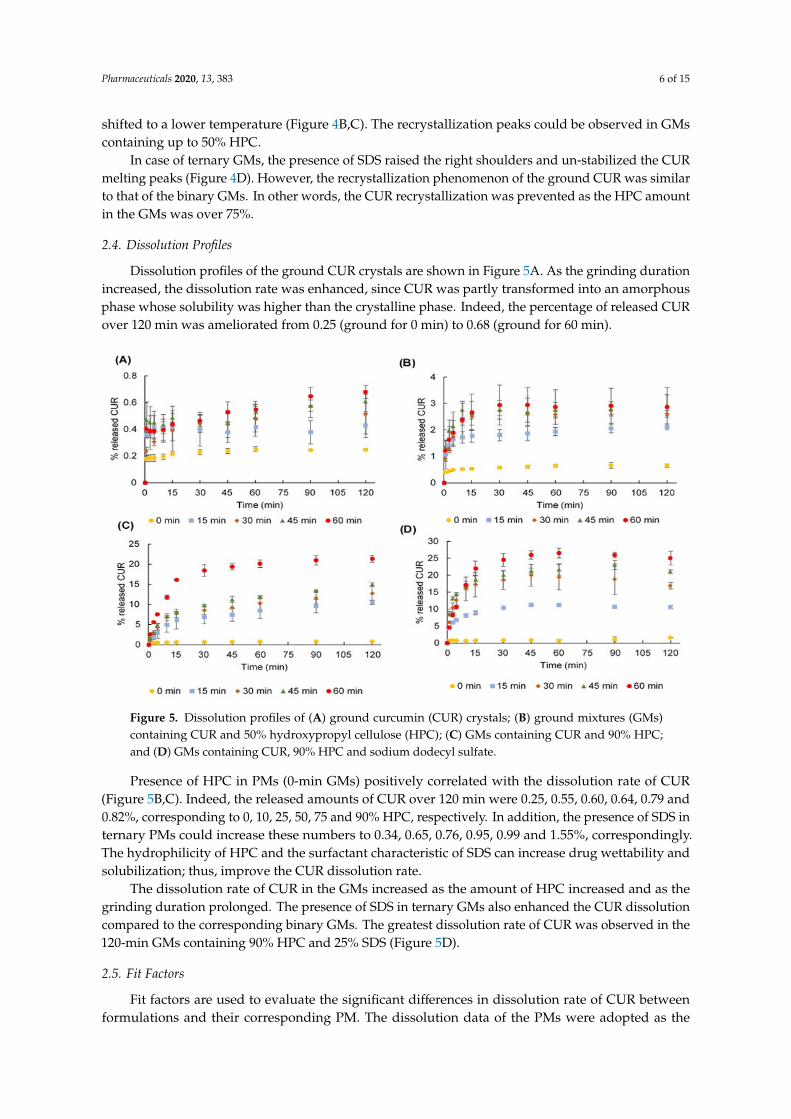
Dissolution profiles of the ground CUR crystals are shown in Figure 5A. As the grinding durationincreased, the dissolution rate was enhanced, since CUR was partly transformed into an amorphousphase whose solubility was higher than the crystalline phase. Indeed, the percentage of released CURover 120 min was ameliorated from 0.25 (ground for 0 min) to 0.68 (ground for 60 min).
Pharmaceuticals 2020, 13, x FOR PEER REVIEW 6 of 15
DSC thermograms of the ground CUR crystals all showed melting peaks at approximately 190 °C (Figure 4A). These peaks were stable regardless of the grinding duration. However, exothermic peaks at approximately 80 °C were observed. It indicated the recrystallization of CUR since the grinding method transformed CUR from a crystalline to amorphous phase [43]. In addition, the longer the grinding duration, the higher the exothermic peaks heat flow was.
In the GMs, the DSC curves revealed both peaks of CUR and HPC, but they all were shifted to a lower temperature because the mixtures of CUR and HPC are considered as impure material [48]. As the percentage of HPC in the GMs increased, the melting peaks of CUR were broadened and more shifted to a lower temperature (Figure 4B,C). The recrystallization peaks could be observed in GMs containing up to 50% HPC.
In case of ternary GMs, the presence of SDS raised the right shoulders and un-stabilized the CUR melting peaks (Figure 4D). However, the recrystallization phenomenon of the ground CUR was similar to that of the binary GMs. In other words, the CUR recrystallization was prevented as the HPC amount in the GMs was over 75%.
2.4. Dissolution Profiles
Dissolution profiles of the ground CUR crystals are shown in Figure 5A. As the grinding duration increased, the dissolution rate was enhanced, since CUR was partly transformed into an amorphous phase whose solubility was higher than the crystalline phase. Indeed, the percentage of released CUR over 120 min was ameliorated from 0.25 (ground for 0 min) to 0.68 (ground for 60 min).
Presence of HPC in PMs (0-min GMs) positively correlated with the dissolution rate of CUR (Figure 5B,C). Indeed, the released amounts of CUR over 120 min were 0.25, 0.55, 0.60, 0.64, 0.79 and 0.82%, corresponding to 0, 10, 25, 50, 75 and 90% HPC, respectively. In addition, the presence of SDS in ternary PMs could increase these numbers to 0.34, 0.65, 0.76, 0.95, 0.99 and 1.55%, correspondingly. The hydrophilicity of HPC and the surfactant characteristic of SDS can increase drug wettability and solubilization; thus, improve the CUR dissolution rate.
Figure 5. Dissolution profiles of (A) ground curcumin (CUR) crystals; (B) ground mixtures (GMs) containing CUR and 50% hydroxypropyl cellulose (HPC); (C) GMs containing CUR and 90% HPC; and (D) GMs containing CUR, 90% HPC and sodium dodecyl sulfate.
Figure 5. Dissolution profiles of (A) ground curcumin (CUR) crystals; (B) ground mixtures (GMs)containing CUR and 50% hydroxypropyl cellulose (HPC); (C) GMs containing CUR and 90% HPC;and (D) GMs containing CUR, 90% HPC and sodium dodecyl sulfate.
Presence of HPC in PMs (0-min GMs) positively correlated with the dissolution rate of CUR(Figure 5B,C). Indeed, the released amounts of CUR over 120 min were 0.25, 0.55, 0.60, 0.64, 0.79 and0.82%, corresponding to 0, 10, 25, 50, 75 and 90% HPC, respectively. In addition, the presence of SDS internary PMs could increase these numbers to 0.34, 0.65, 0.76, 0.95, 0.99 and 1.55%, correspondingly.The hydrophilicity of HPC and the surfactant characteristic of SDS can increase drug wettability andsolubilization; thus, improve the CUR dissolution rate.
The dissolution rate of CUR in the GMs increased as the amount of HPC increased and as thegrinding duration prolonged. The presence of SDS in ternary GMs also enhanced the CUR dissolutioncompared to the corresponding binary GMs. The greatest dissolution rate of CUR was observed in the120-min GMs containing 90% HPC and 25% SDS (Figure 5D).
2.5. Fit Factors
Fit factors are used to evaluate the significant differences in dissolution rate of CUR betweenformulations and their corresponding PM. The dissolution data of the PMs were adopted as the
Pharmaceuticals 2020, 13, 383 7 of 15
reference during samples testing, which have the same amount of HPC and SDS. The difference factor(f1) and similarity factor (f2) values were calculated and are shown in Table 1. All samples had f1
values >15, indicating that the ground samples and presence of HPC and/or SDS in the samples ledto a noticeable difference in CUR dissolution rate. In addition, an f2 value of <50 was observed infour GMs, namely, the 60-min binary GM containing 90% HPC (40.6) as well as the 30-min, 45-minand 60-min ternary GMs containing 90% HPC (corresponding to 40.4, 37.5 and 34.9, respectively).There were significant differences in the dissolution rate of these GMs. Therefore, the presence ofSDS helped reduce the grinding duration from 60 min to 30 min in order to develop a ground SD,which significantly enhanced the drug solubility.
Table 1. Fit factors.
Without SDS
GrindingTime (min)
HPC 0% HPC 10% HPC 25% HPC 50% HPC 75% HPC 90%
f1 f2 f1 f2 f1 f2 f1 f2 f1 f2 f1 f2
15 min 54.8 99.6 48.4 99.1 70.8 93.7 77.2 88.5 81.7 82.3 91.9 59.830 min 56.6 99.5 58.3 98.2 66.0 92.3 82.0 83.3 90.3 68.2 93.5 54.945 min 63.5 99.2 59.8 97.8 72.9 92.6 84.0 81.3 93.1 59.9 94.3 51.860 min 63.2 99.2 81.6 87.7 84.8 82.2 83.7 81.5 93.8 57.0 96.6 40.6
With SDS
Grindingtime (min)
HPC 0% HPC 10% HPC 25% HPC 50% HPC 75% HPC 90%
f1 f2 f1 f2 f1 f2 f1 f2 f1 f2 f1 f2
15 min 59.1 98.8 54.8 98.3 47.8 97.6 78.2 81.8 66.2 65.9 92.0 53.530 min 67.4 97.7 55.1 98.2 54.9 96.4 78.9 80.9 71.1 60.8 95.5 40.445 min 73.2 96.8 63.4 96.8 54.5 96.5 79.0 80.8 75.7 54.7 96.1 37.560 min 74.0 96.5 82.5 86.8 78.1 84.5 90.8 61.5 76.4 53.4 96.3 34.9
SDS, Sodium dodecyl sulfate; HPC, Hydroxypropyl cellulose; f1, Difference factor; f2, Similarity factor.
2.6. Dissolution Efficiency (DE)
DE (%) is a parameter reflecting the area under the dissolution curves. The DEs of the 60 sampleswere calculated and are shown in Table S1; the values were in the ranged between 0.23 and 23.97;the smallest value corresponded to the DE of CUR crystals, and the highest value corresponded tothe DE of 60-min GM containing 90% HPC and SDS. Hence, the DE value of the later formulationincreased 104 times as compared to the DE value of the CUR crystals.
In addition, because the DEs are comparative parameters to evaluate the differences amongformulations, they were submitted into DoE as output data whereas the inputs were A-HPC (amountof HPC, %), B-grinding time (min) and C-presence of SDS. Following this, an analysis of variation wasaccessed to estimate the significance of the DoE model.
2.7. Analysis of DoE
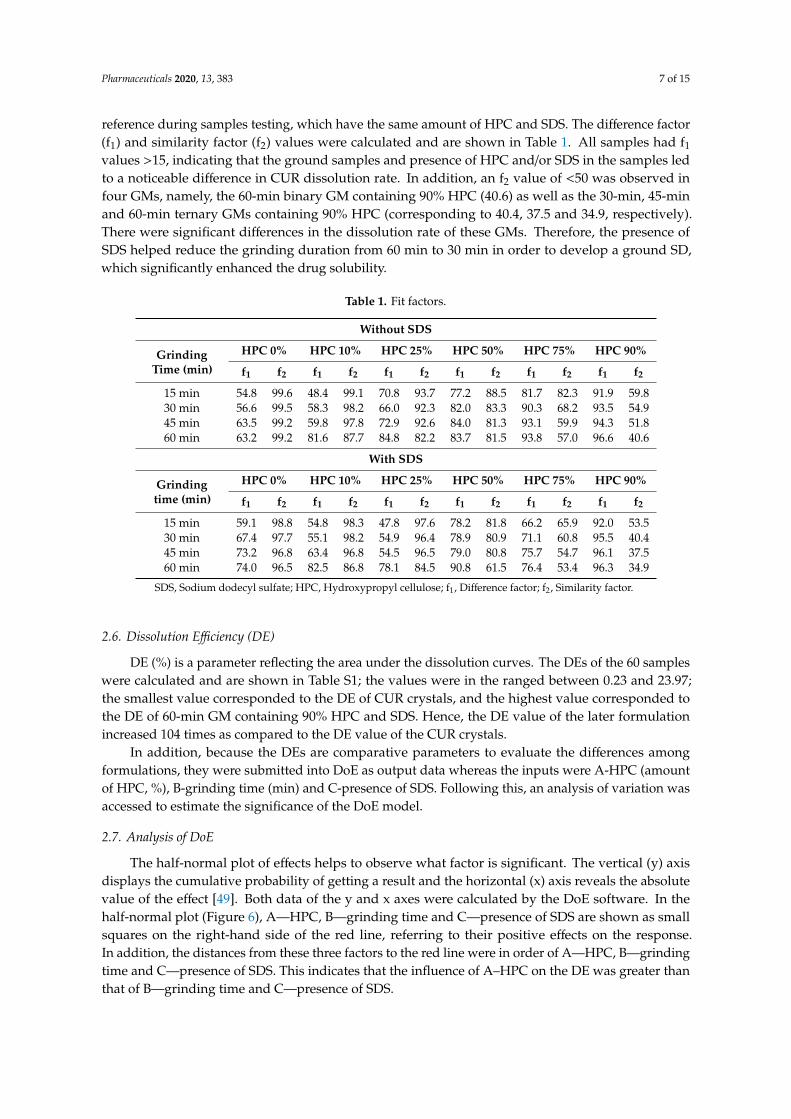
The half-normal plot of effects helps to observe what factor is significant. The vertical (y) axisdisplays the cumulative probability of getting a result and the horizontal (x) axis reveals the absolutevalue of the effect [49]. Both data of the y and x axes were calculated by the DoE software. In thehalf-normal plot (Figure 6), A—HPC, B—grinding time and C—presence of SDS are shown as smallsquares on the right-hand side of the red line, referring to their positive effects on the response.In addition, the distances from these three factors to the red line were in order of A—HPC, B—grindingtime and C—presence of SDS. This indicates that the influence of A–HPC on the DE was greater thanthat of B—grinding time and C—presence of SDS.
Pharmaceuticals 2020, 13, 383 8 of 15
Pharmaceuticals 2020, 13, x FOR PEER REVIEW 8 of 15
value of the effect [49]. Both data of the y and x axes were calculated by the DoE software. In the half-normal plot (Figure 6), A—HPC, B—grinding time and C—presence of SDS are shown as small squares on the right-hand side of the red line, referring to their positive effects on the response. In addition, the distances from these three factors to the red line were in order of A—HPC, B—grinding time and C—presence of SDS. This indicates that the influence of A–HPC on the DE was greater than that of B—grinding time and C—presence of SDS.
Figure 6. Half-normal plot of analysis. HPC, Hydroxypropyl cellulose; SDS, Sodium dodecyl sulfate.
A model F-value of 13.77 implies model significance; there was only a 0.01% chance that an F-value this large could occur due to noise (Table 2). Because p-values > 0.05 indicate that the model terms are significant, A—HPC, B—grinding time and C—presence of SDS were significant model terms whose p-values were <0.0001, 0.0002 and 0.0465, respectively. In other words, A—HPC, B—grinding time and C—presence of SDS factors significantly influenced the DE. The smaller the p-value is, the greater is the influence of the factor on DE. This fact illustrated the mentioned analysis observed from the half-normal plot.
Table 2. Result of the analysis of variation.
Source Sum of Squares df Mean Square F-Value p-Value Model 1314.82 10 131.48 13.77 <0.0001 significant
A—HPC 1008.40 5 201.68 21.12 <0.0001 B—Grinding time 266.59 4 66.65 6.98 0.0002
C—Presence of SDS 39.84 1 39.84 4.17 0.0465 df, Degrees of freedom; HPC, Hydroxypropyl cellulose; SDS, Sodium dodecyl sulfate.
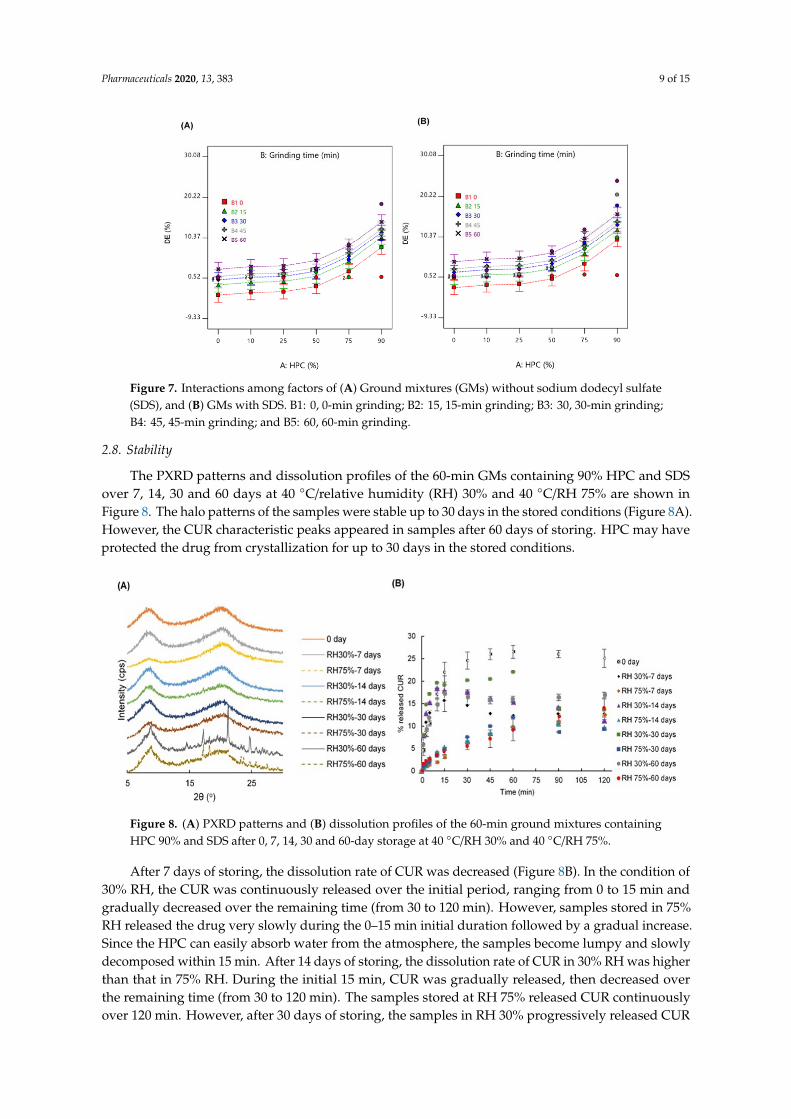
The interactions of the three factors are shown in Figure 7. Samples ground for a longer duration expressed higher DE while samples containing a larger amount of HPC showed better DE. Moreover, the presence of SDS in the GMs significantly increased DE compared to GMs in the absence of SDS (p-value < 0.05).
Figure 6. Half-normal plot of analysis. HPC, Hydroxypropyl cellulose; SDS, Sodium dodecyl sulfate.
A model F-value of 13.77 implies model significance; there was only a 0.01% chance that an F-valuethis large could occur due to noise (Table 2). Because p-values > 0.05 indicate that the model terms aresignificant, A—HPC, B—grinding time and C—presence of SDS were significant model terms whosep-values were <0.0001, 0.0002 and 0.0465, respectively. In other words, A—HPC, B—grinding timeand C—presence of SDS factors significantly influenced the DE. The smaller the p-value is, the greateris the influence of the factor on DE. This fact illustrated the mentioned analysis observed from thehalf-normal plot.
Table 2. Result of the analysis of variation.
Source Sum of Squares df Mean Square F-Value p-Value
Model 1314.82 10 131.48 13.77 <0.0001 significantA—HPC 1008.40 5 201.68 21.12 <0.0001
B—Grinding time 266.59 4 66.65 6.98 0.0002C—Presence of SDS 39.84 1 39.84 4.17 0.0465
df, Degrees of freedom; HPC, Hydroxypropyl cellulose; SDS, Sodium dodecyl sulfate.
The interactions of the three factors are shown in Figure 7. Samples ground for a longer durationexpressed higher DE while samples containing a larger amount of HPC showed better DE. Moreover,the presence of SDS in the GMs significantly increased DE compared to GMs in the absence of SDS(p-value < 0.05).
Pharmaceuticals 2020, 13, 383 9 of 15
Pharmaceuticals 2020, 13, x FOR PEER REVIEW 9 of 15
the presence of SDS in the GMs significantly increased DE compared to GMs in the absence of SDS
(p‐value < 0.05).
2.8. Stability
The PXRD patterns and dissolution profiles of the 60‐min GMs containing 90% HPC and SDS
over 7, 14, 30 and 60 days at 40 °C/relative humidity (RH) 30% and 40 °C/RH 75% are shown in Figure
8. The halo patterns of the samples were stable up to 30 days in the stored conditions (Figure 8A).
However, the CUR characteristic peaks appeared in samples after 60 days of storing. HPC may have
protected the drug from crystallization for up to 30 days in the stored conditions.
Figure 7. Interactions among factors of (A) Ground mixtures (GMs) without sodium dodecyl
sulfate (SDS), and (B) GMs with SDS. B1: 0, 0‐min grinding; B2: 15, 15‐min grinding; B3: 30, 30‐min
grinding; B4: 45, 45‐min grinding; and B5: 60, 60‐min grinding
Figure 8. (A) PXRD patterns and (B) dissolution profiles of the 60‐min ground mixtures
containing HPC 90% and SDS after 0, 7, 14, 30 and 60‐day storage at 40 °C/RH 30% and 40 °C/RH
75%.
Figure 7. Interactions among factors of (A) Ground mixtures (GMs) without sodium dodecyl sulfate(SDS), and (B) GMs with SDS. B1: 0, 0-min grinding; B2: 15, 15-min grinding; B3: 30, 30-min grinding;B4: 45, 45-min grinding; and B5: 60, 60-min grinding.
2.8. Stability
The PXRD patterns and dissolution profiles of the 60-min GMs containing 90% HPC and SDSover 7, 14, 30 and 60 days at 40 ◦C/relative humidity (RH) 30% and 40 ◦C/RH 75% are shown inFigure 8. The halo patterns of the samples were stable up to 30 days in the stored conditions (Figure 8A).However, the CUR characteristic peaks appeared in samples after 60 days of storing. HPC may haveprotected the drug from crystallization for up to 30 days in the stored conditions.
Pharmaceuticals 2020, 13, x FOR PEER REVIEW 9 of 15
Figure 7. Interactions among factors of (A) Ground mixtures (GMs) without sodium dodecyl sulfate (SDS), and (B) GMs with SDS. B1: 0, 0-min grinding; B2: 15, 15-min grinding; B3: 30, 30-min grinding; B4: 45, 45-min grinding; and B5: 60, 60-min grinding.
2.8. Stability
The PXRD patterns and dissolution profiles of the 60-min GMs containing 90% HPC and SDS over 7, 14, 30 and 60 days at 40 °C/relative humidity (RH) 30% and 40 °C/RH 75% are shown in Figure 8. The halo patterns of the samples were stable up to 30 days in the stored conditions (Figure 8A). However, the CUR characteristic peaks appeared in samples after 60 days of storing. HPC may have protected the drug from crystallization for up to 30 days in the stored conditions.
Figure 8. (A) PXRD patterns and (B) dissolution profiles of the 60-min ground mixtures containing HPC 90% and SDS after 0, 7, 14, 30 and 60-day storage at 40 °C/RH 30% and 40 °C/RH 75%.
After 7 days of storing, the dissolution rate of CUR was decreased (Figure 8B). In the condition of 30% RH, the CUR was continuously released over the initial period, ranging from 0 to 15 min and gradually decreased over the remaining time (from 30 to 120 min). However, samples stored in 75% RH released the drug very slowly during the 0–15 min initial duration followed by a gradual increase. Since the HPC can easily absorb water from the atmosphere, the samples become lumpy and slowly
Figure 8. (A) PXRD patterns and (B) dissolution profiles of the 60-min ground mixtures containingHPC 90% and SDS after 0, 7, 14, 30 and 60-day storage at 40 ◦C/RH 30% and 40 ◦C/RH 75%.
After 7 days of storing, the dissolution rate of CUR was decreased (Figure 8B). In the condition of30% RH, the CUR was continuously released over the initial period, ranging from 0 to 15 min andgradually decreased over the remaining time (from 30 to 120 min). However, samples stored in 75%RH released the drug very slowly during the 0–15 min initial duration followed by a gradual increase.Since the HPC can easily absorb water from the atmosphere, the samples become lumpy and slowlydecomposed within 15 min. After 14 days of storing, the dissolution rate of CUR in 30% RH was higherthan that in 75% RH. During the initial 15 min, CUR was gradually released, then decreased overthe remaining time (from 30 to 120 min). The samples stored at RH 75% released CUR continuouslyover 120 min. However, after 30 days of storing, the samples in RH 30% progressively released CUR
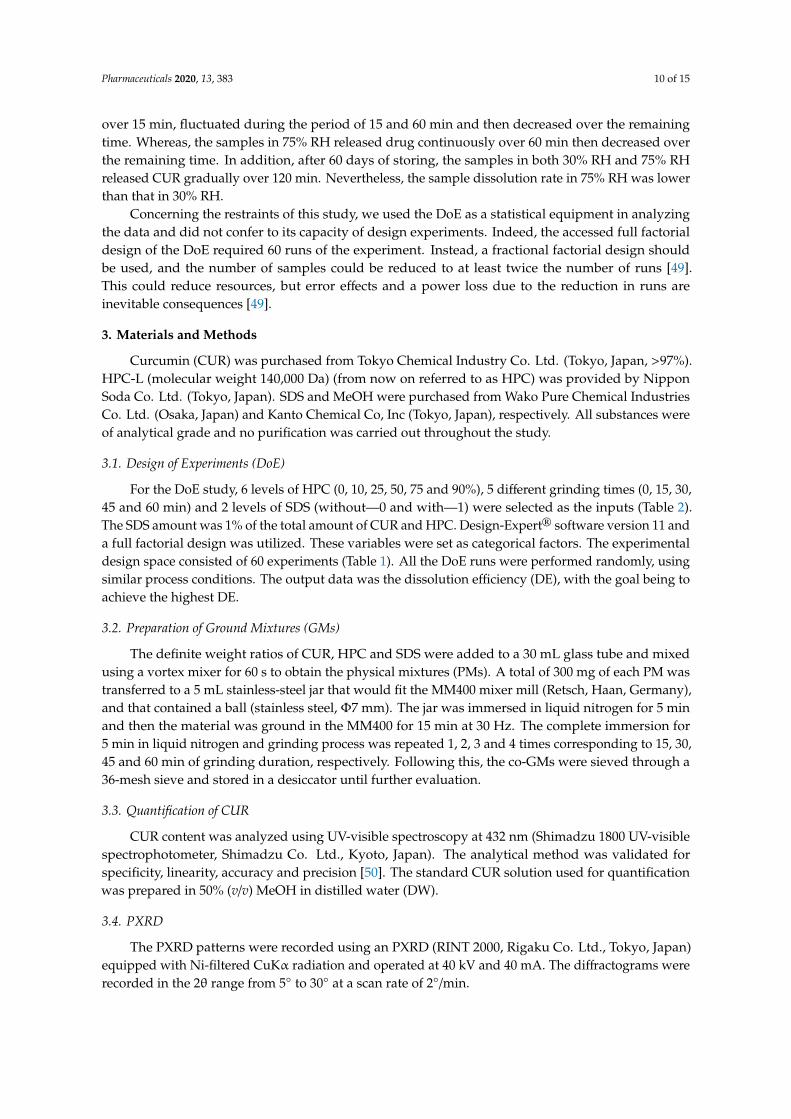
Pharmaceuticals 2020, 13, 383 10 of 15
over 15 min, fluctuated during the period of 15 and 60 min and then decreased over the remainingtime. Whereas, the samples in 75% RH released drug continuously over 60 min then decreased overthe remaining time. In addition, after 60 days of storing, the samples in both 30% RH and 75% RHreleased CUR gradually over 120 min. Nevertheless, the sample dissolution rate in 75% RH was lowerthan that in 30% RH.
Concerning the restraints of this study, we used the DoE as a statistical equipment in analyzingthe data and did not confer to its capacity of design experiments. Indeed, the accessed full factorialdesign of the DoE required 60 runs of the experiment. Instead, a fractional factorial design shouldbe used, and the number of samples could be reduced to at least twice the number of runs [49].This could reduce resources, but error effects and a power loss due to the reduction in runs areinevitable consequences [49].
3. Materials and Methods
Curcumin (CUR) was purchased from Tokyo Chemical Industry Co. Ltd. (Tokyo, Japan, >97%).HPC-L (molecular weight 140,000 Da) (from now on referred to as HPC) was provided by NipponSoda Co. Ltd. (Tokyo, Japan). SDS and MeOH were purchased from Wako Pure Chemical IndustriesCo. Ltd. (Osaka, Japan) and Kanto Chemical Co, Inc (Tokyo, Japan), respectively. All substances wereof analytical grade and no purification was carried out throughout the study.
3.1. Design of Experiments (DoE)
For the DoE study, 6 levels of HPC (0, 10, 25, 50, 75 and 90%), 5 different grinding times (0, 15, 30,45 and 60 min) and 2 levels of SDS (without—0 and with—1) were selected as the inputs (Table 2).The SDS amount was 1% of the total amount of CUR and HPC. Design-Expert® software version 11 anda full factorial design was utilized. These variables were set as categorical factors. The experimentaldesign space consisted of 60 experiments (Table 1). All the DoE runs were performed randomly, usingsimilar process conditions. The output data was the dissolution efficiency (DE), with the goal being toachieve the highest DE.
3.2. Preparation of Ground Mixtures (GMs)
The definite weight ratios of CUR, HPC and SDS were added to a 30 mL glass tube and mixedusing a vortex mixer for 60 s to obtain the physical mixtures (PMs). A total of 300 mg of each PM wastransferred to a 5 mL stainless-steel jar that would fit the MM400 mixer mill (Retsch, Haan, Germany),and that contained a ball (stainless steel, Φ7 mm). The jar was immersed in liquid nitrogen for 5 minand then the material was ground in the MM400 for 15 min at 30 Hz. The complete immersion for5 min in liquid nitrogen and grinding process was repeated 1, 2, 3 and 4 times corresponding to 15, 30,45 and 60 min of grinding duration, respectively. Following this, the co-GMs were sieved through a36-mesh sieve and stored in a desiccator until further evaluation.
3.3. Quantification of CUR
CUR content was analyzed using UV-visible spectroscopy at 432 nm (Shimadzu 1800 UV-visiblespectrophotometer, Shimadzu Co. Ltd., Kyoto, Japan). The analytical method was validated forspecificity, linearity, accuracy and precision [50]. The standard CUR solution used for quantificationwas prepared in 50% (v/v) MeOH in distilled water (DW).
3.4. PXRD
The PXRD patterns were recorded using an PXRD (RINT 2000, Rigaku Co. Ltd., Tokyo, Japan)equipped with Ni-filtered CuKα radiation and operated at 40 kV and 40 mA. The diffractograms wererecorded in the 2θ range from 5◦ to 30◦ at a scan rate of 2◦/min.
Pharmaceuticals 2020, 13, 383 11 of 15
3.5. FTIR
The attenuated total reflection method was used and FTIR spectra were recorded on a FTIRspectrometer Frontier(T)-UATR (DiKRS5) (Perkin-Elmer Inc., Shelton, CT, USA). The scanning rangewas 4000–500 cm−1 with 16 times the accumulation count, a 1 mm sample thickness and a resolutionset at 1 cm−1. The obtained spectra were normalized using the SNV method [51].
3.6. DSC
DSC measurements were obtained using a DSC-60 Plus Differential Scanning Calorimeter(Shimadzu Co. Ltd., Kyoto, Japan) connected to a TA-60WS thermal analyzer (Shimadzu Co. Ltd.,Kyoto, Japan) and an FC-60A flow controller (Shimadzu Co. Ltd., Kyoto, Japan). Approximately3–5 mg of samples was weighed in aluminum pans and were sealed. An empty pan was used as thereference. The samples were scanned at 10 ◦C/min from 25 ◦C to 250 ◦C under N2 gas with a flow rateof 50 mL/min. The obtained spectra were normalized by the SNV method.
3.7. Dissolution Studies
The dissolution profiles of CUR in the GMs were evaluated using the dissolution apparatus asspecified in the 17th Japanese Pharmacopoeia. GMs containing 5 mg of CUR were accurately weighedand placed in a vessel containing 500 mL of distilled water (DW). The temperature was controlledat 37 ± 0.5 ◦C and the rotating paddle speed was set at 100 rpm throughout this study. At definedtime intervals (1, 3, 5, 10, 15, 30, 45, 60, 90 and 120 min), 5 mL aliquots were withdrawn, and an equalvolume of fresh DW was added. The sample solutions were filtered through a 0.45-µm membranefilter and assayed for CUR content using UV-visible spectroscopy at 432 nm as described in the section“Quantification of CUR”. The release profiles of CUR were evaluated for the comparison. Each samplewas carried out in triplicate.
3.8. Fit Factors
Moore and Flanner proposed procedures including a different factor and similar factor to comparethe dissolution profiles in a pairwise fashion [52]. The difference factor (f1) measures the percenterror between two curves over all time points (Equation (1)). The similarity factor (f2) is a logarithmictransformation of the sum-squared error of differences between the test Tt and reference samples Rt
over all time points (Equation (2)).
f1 =
∑nt=1|Rt − Tt|∑n
t=1 Rt(1)
f2 = 50× log
100√(1 + 1
n∑(Rt − Tt)
2) (2)
where n: number of time points; Rt: the mean dissolution value (%) for the reference product at time t;and Tt: the mean dissolution value (%) for the test product at the same time t.
The different factor f1 is 0 when the test and reference profiles are identical and increaseproportionally with the dissimilarity between two dissolution profiles. The similar factor f2 fits theresult between 0 and 100. It is 100 when the test and the reference profiles are identical and tends to0 as the dissimilarity increases. In general, f1 values lower than 15 (0–15) and f2 values higher than50 (50–100) show the similarity of the dissolution profiles [53].
In this study, to identify the formulations and conditions of the grinding method that cansignificantly enhance the kinetic solubility of drug, the f1 and f2 should represent the dissimilarity of thedissolution profiles. In other words, an f1 value higher than 15 and f2 values lower than 50 are noticed.
Pharmaceuticals 2020, 13, 383 12 of 15
3.9. DE
Khan and Rhodes suggested DE as a suitable parameter for the evaluation of in vitrodissolution [54]. The term DE for a pharmaceutical dosage form is defined as the area underthe dissolution curve up to a certain time t, expressed as a percentage of the area of the rectangledescribed by 100% dissolution at the same time. It can be calculated using the following Equation (3):
DE(%) =
∫ t0 y× dt
y100 × t× 100 (3)
where y is the drug percent dissolved at time t.Here, we considered both the shape of the dissolution curve and the rate of dissolution, rather than
the latter parameter only. The DE summarizes the drug release data into a single figure that is readyto make a comparison between a large number of formulations [54]. The resulting DE values weresubmitted to the DoE in order to detect the existence of significant differences between the formulations.
3.10. Stability Study
To evaluate stability, the 60-min GM containing 90% HPC and SDS was stored for 60 days at40 ◦C/30% RH and 40 ◦C/75% RH. The PXRD and dissolution profiles were examined at predeterminedtime intervals over this period (0, 7, 14, 30 and 60 days).
4. Conclusions
In this study, amorphization of CUR and CUR SDs consisting of CUR, HPC and/or SDS weredeveloped by vibrational ball milling. The resulting ground samples were characterized using PXRD,FTIR, DSC and a dissolution test. The 60-min GM containing 90% HPC significantly increased the CURsolubility. Presence of SDS in GMs containing 90% HPC reduced the grinding duration from 60 min to30 min in forming a ground SD that significantly increased the drug dissolution rate. This amorphousstate was stable for 30 days when stored at 40 ◦C/RH 75%.
Supplementary Materials: The following are available online at http://www.mdpi.com/1424-8247/13/11/383/s1,Figure S1. PXRD patterns of 60 samples, Figure S2. FTIR spectra of 60 samples, Figure S3. DSC curves of 60 samples,Figure S4. Dissolution behaviors of 60 samples, Table S1. Inputs and output data of design of experiment.
Author Contributions: All experiments were supervised by T.H.; conception, design, realization, acquisition,analysis, interpretation of data, writing and editing, N.N.S.M., T.H., Y.O. and Y.K.; reviewed the writing, T.H.All authors have read and agreed to the published version of the manuscript.
Funding: This research did not receive any specific grant from funding agencies in the public, commercial,or not-for-profit sectors.
Acknowledgments: The first author is grateful to the Ministry of Education, Culture, Sport, Science and TechnologyJapan for a PhD scholarship.
Conflicts of Interest: The authors declare no conflict of interest. The authors alone are responsible for the contentand writing of this article.
References
1. Rams-Baron, M.; Jachowicz, R.; Boldyreva, E.; Zhou, D.; Jamroz, W.; Paluch, M. Amorphous drug solubilityand absorption enhancement. In Amorphous Drugs; Springer International Publishing Co.: Cham, Switzerland,2018; pp. 41–68.
2. Ngono, F.; Willart, J.F.; Cuello, G.J.; Jimenez-Ruiz, M.; Yelles, C.H.; Affouard, F. Impact of amorphizationmethods on the physico-chemical properties of amorphous lactulose. Mol. Pharm. 2020, 17, 1–9. [CrossRef]
3. Zeng, Y.; Alzate-Vargas, L.; Li, C.; Graves, R.; Brum, J.; Strachan, A.; Koslowski, M. Mechanically inducedamorphization of small molecule organic crystals. Model. Simul. Mater. Sci. Eng. 2019, 27, 1–19. [CrossRef]
Pharmaceuticals 2020, 13, 383 13 of 15
4. Shen, W.; Wang, X.; Jia, F.; Tong, Z.; Sun, H.; Wang, X.; Song, F.; Ai, Z.; Zhang, L.; Chai, B. Amorphizationenables highly efficient anaerobic thiamphenicol reduction by zero-valent iron. Appl. Catal. B 2020,264, 118550. [CrossRef]
5. Nuno, F.C.; João, F.P.; Ana, I.F. Co-amorphization of olanzapine for solubility enhancement. Ann. Med. 2019,51, 87.
6. Zhang, W.; Zhao, Y.; Xu, L.; Song, X.; Yuan, X.; Sun, J.; Zhang, J. Superfine grinding induced amorphizationand increased solubility of α-chitin. Carbohydr. Polym. 2020, 237, 116145. [CrossRef]
7. Brough, C.; Williams, R.O., 3rd. Amorphous solid dispersions and nano-crystal technologies for poorlywater-soluble drug delivery. Int. J. Pharm. 2013, 453, 157–166. [CrossRef]
8. DiNunzio, J.C.; Miller, D.A.; Yang, W.; McGinity, J.W.; Williams, R.O., 3rd. Amorphous compositions usingconcentration enhancing polymers for improved bioavailability of itraconazole. Mol. Pharm. 2008, 5, 968–980.[CrossRef]
9. Hancock, B.C.; Parks, M. What is the true solubility advantage for amorphous pharmaceuticals? Pharm. Res.2000, 17, 397–404. [CrossRef]
10. Vo, C.L.N.; Park, C.; Lee, B.J. Current Trends and future perspectives of solid dispersions containing poorlywater-soluble drugs. Eur. J. Pharm. Biopharm. 2013, 85, 799–813. [CrossRef]
11. Shaikh, A.; Bhide, P.; Nachinolkar, R. Solubility enhancement of celecoxib by solid dispersion technique andincorporation into topical gel. Asian J. Pharm. Clin. Res. 2019, 12, 294–300. [CrossRef]
12. Palanisamy, V.; Sanphui, P.; Prakash, M.; Chernyshev, V. Multicomponent solid forms of the uric acidreabsorption inhibitor lesinurad and cocrystal polymorphs with urea: DFT simulation and solubility study.Acta Crystallogr. Sect. C 2019, 75, 1102–1117. [CrossRef] [PubMed]
13. Das, S.; Mandal, P. Design, formulation, and evaluation of solid dispersion tablets of poorly water-solubleantidiabetic drug using natural polymer. Asian J. Pharm. Clin. Res. 2019, 12, 195–207.
14. Kapourani, A.; Vardaka, E.; Katopodis, K.; Kachrimanis, K.; Barmpalexis, P. Crystallization tendency of APIspossessing different thermal and glass related properties in amorphous solid dispersions. Int. J. Pharm. 2020,579, 119149. [CrossRef]
15. Thais, F.R.A.; Cecília, T.B.; Denicezar, B.; Venâncio, A.A.; Mirella, S.; Carolina, S.; Patrícia, S.; Marco, V.C.Preparation, characterization and ex vivo intestinal permeability studies of ibuprofen solid dispersion.J. Disper. Sci. Technol. 2019, 40, 546–554.
16. Uchiyama, H.; Wada, Y.; Hatanaka, Y.; Hirata, Y.; Taniguchi, M.; Kadota, K.; Tozuka, Y. Solubility andpermeability improvement of quercetin by an interaction between α-glucosyl stevia nano-aggregates andhydrophilic polymer. J. Pharm. Sci. 2019, 108, 2033–2040. [CrossRef]
17. Trapani, A.; Catalano, A.; Carocci, A.; Carrieri, A.; Mercurio, A.; Rosato, A.; Mandracchia, D.; Tripodo, G.;Schiavone, B.I.P.; Franchini, C.; et al. Effect of methyl-β-cyclodextrin on the antimicrobial activity of a newseries of poorly water-soluble benzothiazoles. Carbohydr. Polym. 2019, 207, 720–728. [CrossRef]
18. Curcuma longa in India Materia. In Indian Materia Medica; Nadkarni, K.M. (Ed.) Popular Prakashan Co.:Mumbai, India, 1976; pp. 414–418.
19. Narayanacharyulu, R.; Krishna, S.C.; Mudit, D. Design and development of sustained release tablets usingsolid dispersion of beclomethasone dipropionate. Res. Rev. J. Drug Formulation Dev. Prod. 2015, 2, 30–41.
20. Niederau, C.; Göpfert, E. The effect of chelidonium- and turmeric root extract on upper abdominal pain dueto functional disorders of the biliary system. Results from a placebo-controlled double-blind study. Med. Klin1999, 94, 425–430. [CrossRef]
21. Abouhussein, D.M.N.; El Nabarawi, M.A.E.; Shalaby, S.H.; El-Bary, A.A. Sertraline-cyclodextrin complexorodispersible sublingual tablet: Optimization, stability, and pharmacokinetics. J. Pharm. Innov. 2019, 1–14.[CrossRef]
22. Vasconcelos, T.; Sarmento, B.; Costa, P. Solid dispersions as strategy to improve oral bioavailability of poorwater-soluble drugs. Drug Discov. Today 2007, 12, 1068–1075. [CrossRef]
23. Abd El-Bary, A.; Kamal, I.H.; Haza’a, B.S.; Al Sharabi, I. Formulation of sustained release bioadhesiveminitablets containing solid dispersion of levofloxacin for once daily ocular use. Pharm. Dev. Technol. 2019,24, 824–838. [CrossRef]
24. Duke, J.A.; Bogenschutz-Godwin, M.J.; duCellier, J.; Duke, P.K. CRC Handbook of Medicinal Spices, 1st ed.;CRC Press LLC: Boca Raton, FL, USA, 2002; pp. 137–144.
Pharmaceuticals 2020, 13, 383 14 of 15
25. Li, C.; Li, L.; Luo, J.; Huang, N. Effect of turmeric volatile oil on the respiratory tract. Zhongguo Zhong Yao Za Zhi1998, 23, 624–625.
26. Curcuma longa (turmeric). Monograph. Altern. Med. Rev. 2001, 6, S62–S66.27. Shoba, G.; Joy, D.; Joseph, T.; Majeed, M.; Rajendran, R.; Srinivas, P.S. Influence of piperine on the
pharmacokinetics of curcumin in animals and human volunteers. Planta Med. 1998, 64, 353–356. [CrossRef]28. Bouvier, G.; Hergenhahn, M.; Polack, A.; Bornkamm, G.W.; Bartsch, H. Validation of two test systems for
detecting tumor promoters and EBV inducers: Comparative responses of several agents in DR-CAT Rajicells and in human granulocytes. Carcinogenesis 1993, 14, 1573–1578. [CrossRef]
29. Saikia, A.P.; Ryakala, V.K.; Sharma, P.; Goswami, P.; Bora, U. Ethnobotany of medicinal plants used byAssamese people for various skin ailments and cosmetics. J. Ethnopharmacol. 2006, 106, 149–157. [CrossRef]
30. Sharma, R.A.; Steward, W.P.; Gescher, A.J. Pharmacokinetics and pharmacodynamics of curcumin.Adv. Exp. Med. Biol. 2007, 595, 453–470.
31. Kulac, M.; Aktas, C.; Tulubas, F.; Uygur, R.; Kanter, M.; Erboga, M.; Ozen, O.A. The effects of topical treatmentwith curcumin on burn wound healing in rats. J. Mol. Histol. 2012, 44, 83–90. [CrossRef]
32. Cianfruglia, L.; Minnelli, C.; Laudadio, E.; Scirè, A.; Armeni, T. Side effects of curcumin: Epigenetic andantiproliferative implications for normal dermal fibroblast and breast cancer cells. Antioxidants 2019, 8, 382.[CrossRef]
33. Liu, X.; Zhang, R.; Shi, H.; Li, X.; Li, Y.; Taha, A.; Xu, C. Protective effect of curcumin against ultraviolet Airradiation-induced photoaging in human dermal fibroblasts. Mol. Med. Rep. 2018, 17, 7227–7237. [CrossRef]
34. Yamada, T.; Saito, N.; Imai, T.; Otagiri, M. Effect of Grinding with Hydroxypropyl Cellulose on the Dissolutionand Particle Size of a Poorly Water-Soluble Drug. Chem. Pharm. Bull. 1999, 47, 1311–1313. [CrossRef]
35. Sugimoto, S.; Niwa, T.; Nakanishi, Y.; Danjo, K. Novel ultra-cryo milling and co-grinding technique in liquidnitrogen to produce dissolution-enhanced nanoparticles for poorly water-Soluble drugs. Chem. Pharm. Bull.2012, 60, 325–333. [CrossRef] [PubMed]
36. Madelung, P.; Østergaard, J.; Bertelsen, P.; Jørgensen, E.V.; Jacobsen, J.; Müllertz, A. Impact of sodium dodecylsulphate on the dissolution of poorly soluble drug into biorelevant medium from drug-surfactant discs.Int. J. Pharm. 2014, 467, 1–8. [CrossRef] [PubMed]
37. Mochalin, V.N.; Sagar, A.; Gour, S.; Gogotsi, Y. Manufacturing nanosized fenofibrate by salt assisted milling.Pharm. Res. 2009, 26, 1365–1370. [CrossRef] [PubMed]
38. Elder, R.L. Final report on the safety assessment of sodium lauryl sulfate and ammonium lauryl sulfate.J. Am. Coll. Toxicol. 1983, 2, 127–181.
39. Li, B.; Konecke, S.; Wegiel, L.A.; Taylor, L.S.; Edgar, K.J. Both solubility and chemical stability of curcuminare enhanced by solid dispersion in cellulose derivative matrices. Carbohyd. Polym. 2013, 98, 1108–1116.[CrossRef]
40. Seo, S.-W.; Han, H.-K.; Chun, M.-K.; Choi, H.-K. Preparation and pharmacokinetic evaluation of curcuminsolid dispersion using Solutol® HS15 as a carrier. Int. J. Pharm. 2012, 424, 18–25. [CrossRef]
41. Satomi, O.; Takahashi, H.; Kawabata, Y.; Seto, Y.; Hatanaka, J.; Timmermann, B.; Yamada, S. Formulationdesign and photochemical studies on nanocrystal solid dispersion of curcumin with improved oralbioavailability. J. Pharm. Sci. 2010, 99, 1871–1881.
42. Wegiel, L.A.; Zhao, Y.; Mauer, L.J.; Edgar, K.J.; Taylor, L.S. Curcumin amorphous solid dispersions:The influence of intra and intermolecular bonding on physical stability. Pharm. Dev. Technol. 2013,19, 976–986. [CrossRef]
43. Colombo, I.; Grassi, G.; Grassi, M. Drug mechanochemical activation. J. Pharm. Sci. 2009, 98, 3961–3986.[CrossRef]
44. Kolev, T.M.; Velcheva, E.A.; Stamboliyska, B.A.; Spiteller, M. DFT and experimental studies of the structureand vibrational spectra of curcumin. Int. J. Quantum Chem. 2005, 102, 1069–1079. [CrossRef]
45. Tønnesen, H.H.; Karlsen, J.; Mostad, A. Structural studies of curcuminoids. I. The crystal structure ofcurcumin. Acta Chem. Scand. Ser. B 1982, 36, 475–479. [CrossRef]
46. Mague, J.T.; Alworth, W.T.; Payton, F.L. Curcumin and derivatives. Acta Cryst. 2004, 60, 608–610. [CrossRef]47. Kararli, T.T.; Hurlbut, J.B.; Needham, T.E. Glass–rubber transitions of cellulosic polymers by dynamic
mechanical analysis. J. Pharm. Sci. 1990, 79, 845–848. [CrossRef] [PubMed]48. Allen, E. The melting point of impure organic compounds. J. Chem. Educ. 1942, 19, 278. [CrossRef]49. Mark, J.A.; Patrick, J.W. DoE Simplified, 3rd ed.; CRC Press: Boca Raton, FL, USA, 2015.
Pharmaceuticals 2020, 13, 383 15 of 15
50. Center for drug evaluation and research. Q2 (R1) Validation of Analytical Procedures: Text and Methodology;FDA: Beltsville, MD, USA, 1995.
51. Dhanoa, M.S.; Lister, S.J.; Sanderson, R.; Barnes, R.J. The link between multiplicative scatter correction (MSC)and standard normal variate (SNV) transformations of NIR spectra. J. Near Infrared Spec. 1994, 2, 43–47.[CrossRef]
52. Moore, W.; Flanner, H.H. Mathematical comparison of curves with an emphasis on in vitro dissolutionprofiles. Pharm. Technol. 1996, 20, 64–74.
53. Polli, J.E.; Rekhi, G.S.; Augsburger, L.L.; Shah, V.P. Methods to compare dissolution profiles and a rationalefor wide dissolution specifications for metoprolol tartarate tablets. J. Pharm. Sci. 1997, 86, 690–700. [CrossRef]
54. Khan, K.A.; Rhodes, C.T. Effect of compaction pressure on the dissolution efficiency of some direct compressionsystems. Pharm. Acta Helv. 1972, 47, 594–700.
Publisher’s Note: MDPI stays neutral with regard to jurisdictional claims in published maps and institutionalaffiliations.
© 2020 by the authors. Licensee MDPI, Basel, Switzerland. This article is an open accessarticle distributed under the terms and conditions of the Creative Commons Attribution(CC BY) license (http://creativecommons.org/licenses/by/4.0/).