prediction of knock limited operating conditions of a natural gas engine
TRANSCRIPT
Energy Conversion and Management 46 (2005) 121–138www.elsevier.com/locate/enconman
Prediction of knock limited operating conditionsof a natural gas engine
Seref Soylu *
Department of Automotive Education, Teknik Egitim Fakultesi, Sakarya University, 54187 Sakarya, Turkey
Received 9 December 2003; received in revised form 9 December 2003; accepted 22 February 2004
Available online 19 March 2004
Abstract
Computer models of engine processes are valuable tools for predicting and analyzing engine performance
and allow exploration of many engine design alternatives in an inexpensive fashion. In the present work, a
zero-dimensional, two zone thermodynamic model was used to determine the knock limited operating
conditions of a natural gas engine. Experimentally based burning rate models were used for flame initiation
and propagation calculations. A knock model was incorporated with the zero-dimensional model. Com-
parison of the measured and calculated cylinder pressure data indicated that the model is able to match the
measured cylinder pressure data with less than 8% error in magnitudes if the computations are started at the
experimental spark timing. The knock predictions agreed with the measurements also. With the establishedknock model, it is possible not only to investigate whether knock is observed with changing operating and
design parameters, but also to evaluate their effects on the maximum possible knock intensity.
� 2004 Elsevier Ltd. All rights reserved.
Keywords: Engine knock; Autoignition; Natural gas; Engine modeling; Zero-D model
1. Introduction
Since the invention of Otto’s first four stroke engine, development of the spark ignition (SI)engine has achieved a high level of success. In the early years, increasing engine power and engineworking reliability were the most important goals for engine designers. Within the past threedecades, however, the regulation of exhaust emissions and the inevitable decline of petroleumresources have brought increased attention to development of advanced combustions systems andalternative fuels.
* Tel.: +90-264-3460090x609; fax: +90-264-3460262.
E-mail address: [email protected] (S. Soylu).
0196-8904/$ - see front matter � 2004 Elsevier Ltd. All rights reserved.
doi:10.1016/j.enconman.2004.02.014
Nomenclature
CA crank angleEGR exhaust gas re-circulationER equivalence ratioPR propane ratioFIP flame initiation periodFPP flame propagation periodFTP flame termination periodKOCA knock occurrence crank angleKI knock intensityM massP pressureR universal gas constantT temperatureTDC top dead centerV volumeX mass fractionZero-D zero-dimensionalh enthalpyu internal energyh crank angles characteristic conversion time
Subscriptsb burnedu unburned
122 S. Soylu / Energy Conversion and Management 46 (2005) 121–138
In order to be accepted as an alternative fuel, an engine using the fuel must have power andefficiency at least close to that of traditionally fueled engines and have lower emissions. Currently,lean burn natural gas engines are attracting increasing attention as a desirable alternative, espe-cially for stationary applications. In-cylinder pollution formation in these engines is significantlylower than that of Diesel engines. The higher octane number of methane, which is the dominantcomponent of natural gas, allows the engines to be turbocharged and have higher compressionratios than conventional spark ignition engines. This provides the thermal efficiency and torqueneeded for acceptance as an alternative to conventional engines. However, engine design andoperating parameters such as compression ratio, inlet pressure and temperature, spark timing,equivalence ratio and exhaust gas re-circulation must be optimized for the best performance andefficiency. The seasonal and regional variations in natural gas composition [1], which causesnatural gas to have a lower octane number is another variable to be considered. Under theseconditions, building a competitive natural gas engine may not be possible with conventionalmethods and may require costly engine tests. Therefore, engine modeling codes are generally
S. Soylu / Energy Conversion and Management 46 (2005) 121–138 123
preferred for the initial designs. Computer models of engine processes are valuable tools foranalyzing and optimizing engine performance and allow exploration of many engine designalternatives in an inexpensive fashion. For any given engine design and operating condition thepressure–time, temperature–time traces can be predicted. Since the burned and unburned zonethermodynamic states can be computed, the knock limits can be predicted.
Modeling the performance of internal combustion engines has been a continuing effort over theyears and many models have been developed to predict engine performance parameters. Some ofthe models generally employ assumptions to simplify the flow and combustion process [2–5].Others use multi-dimensional reactive flow codes for detailed modeling of engine flow andcombustion processes that are very sophisticated [6–11]. These models incorporate knock sub-models to predict the knock limited operating conditions of the engines. The knock models can beclassified as: empirical ignition delay correlations, detailed chemical kinetic models and reducedmodels.
The ignition delay correlations are the most basic approach to predicting end gas autoignitionin SI engines. It is also known as the knock integral approach. In this technique, the details of thereactions are not examined. An empirical correlation is derived by matching an Arrheniusfunction to measured test data for the induction period over the relevant end gas pressure andtemperature ranges. Liwengood and Wu [12] developed the first published ignition delay corre-lation for SI engines. The pressure and temperature histories of a fired engine were used todetermine knock onset. N-heptane and iso-octane mixtures were used as fuels. A wide range ofoperating conditions was covered, and a good correlation between the predicted and measuredtimes of knock was observed. Douad and Eyzat [13] proposed a method (Four Octane NumberMethod) to determine the knock resistance of fuels based on the ignition delay concept. The pre-exponential parameter was based on the octane number of the fuel and the end gas temperature.The model’s prediction were claimed to be within an average accuracy of 0.5 octane points. Byet al. [14] tested four different ignition delay correlations to predict knock onset. Both two zoneand three zone models were used to estimate the temperature of the end gas from the measuredpressure data. The results for the two zone model are best for the primary reference fuel (PRF)with an octane number (ON) of 81.4, while the three zone model results are best for the PRF with100 ON.
Detailed chemical kinetic models are based on the elementary reactions that occur duringcombustion. The models often include several hundred reactions and capture all the detailedreactions leading up to autoignition and through the combustion process to final products for-mation. Lund [15] developed a general computer program for calculating time dependent phe-nomena involving one dimensional hydrodynamic, transport and detailed chemical kinetics. Thecode has been used widely for detailed analysis and understanding of autoignition phenomena inhydrocarbon fuels [16–20].
The detailed chemical kinetic models have many advantages in terms of capturing all thereactions leading up to autoignition and through the combustion process to the final products,however, performing calculations for hundreds of reactions and species require extensive com-putation time and very powerful computers. In addition, engine designers may need model pre-dictions at several initial conditions, which require substantial computational time. Therefore,reduced models that capture only the rate limiting reactions leading up to autoignition are pre-ferred in application. Cowart et al. [17,18] applied both a reduced and a detailed model for the
124 S. Soylu / Energy Conversion and Management 46 (2005) 121–138
prediction of knock onset and knock intensity. The knock onset predictions match the mea-surements to within about 3� CA without any adjustment of the reaction constants. It was alsopointed out that predicting knock intensity along with knock onset is crucial. The detailed model’spredicted carbon monoxide concentration change at 1100 K with time revealed that a linearcorrelation exists with the knock intensity. The reduced model shows a similar correlation be-tween the rate of change of temperature (dT=dt) and the knock intensity, but the dependence onthe intensity is much weaker than that observed with the detailed model. Konig and Sheppard [21]observed that the knock intensity correlates with the knock occurrence crank angle.
The autoignition model that is employed in the present study is a relatively new model that wasdeveloped based on the knock integral approach. The model was validated with data collectedfrom a SI natural gas engine utilizing natural gas with propane added up to 15% by mass. Theautoignition model was incorporated with the zero-dimensional (Zero-D) model that wasdeveloped by Soylu and Van Gerpen [22–25]. Using the Zero-D model, a parametric study wasperformed to determine the knock limited operating conditions of the SI natural gas engine.Comparison of the measured and predicted cylinder pressure data indicated that the Zero-Dmodel is able to match the measured cylinder pressure data with less than 8% error in magnitude ifthe computations are started at the experimental spark timing. The knock predictions agreed withthe measurements also.
2. Experimental setup
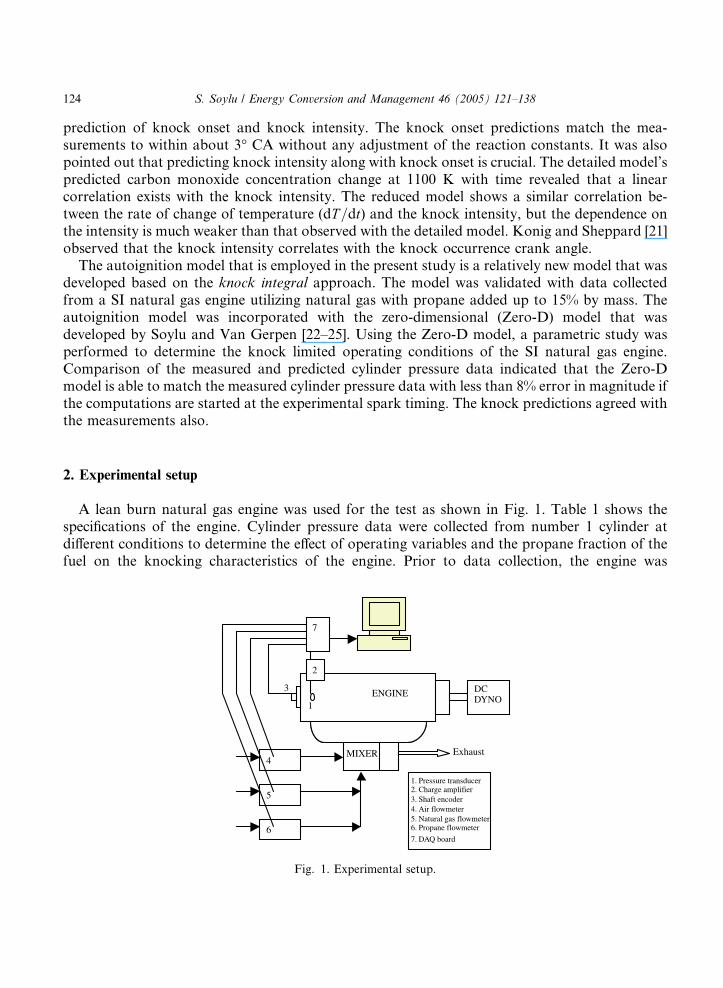
A lean burn natural gas engine was used for the test as shown in Fig. 1. Table 1 shows thespecifications of the engine. Cylinder pressure data were collected from number 1 cylinder atdifferent conditions to determine the effect of operating variables and the propane fraction of thefuel on the knocking characteristics of the engine. Prior to data collection, the engine was
ENGINE1
MIXER4
5
6
DC DYNO
Exhaust
7
3
2
1. Pressure transducer2. Charge amplifier3. Shaft encoder4. Air flowmeter5. Natural gas flowmeter6. Propane flowmeter
7. DAQ board
Fig. 1. Experimental setup.
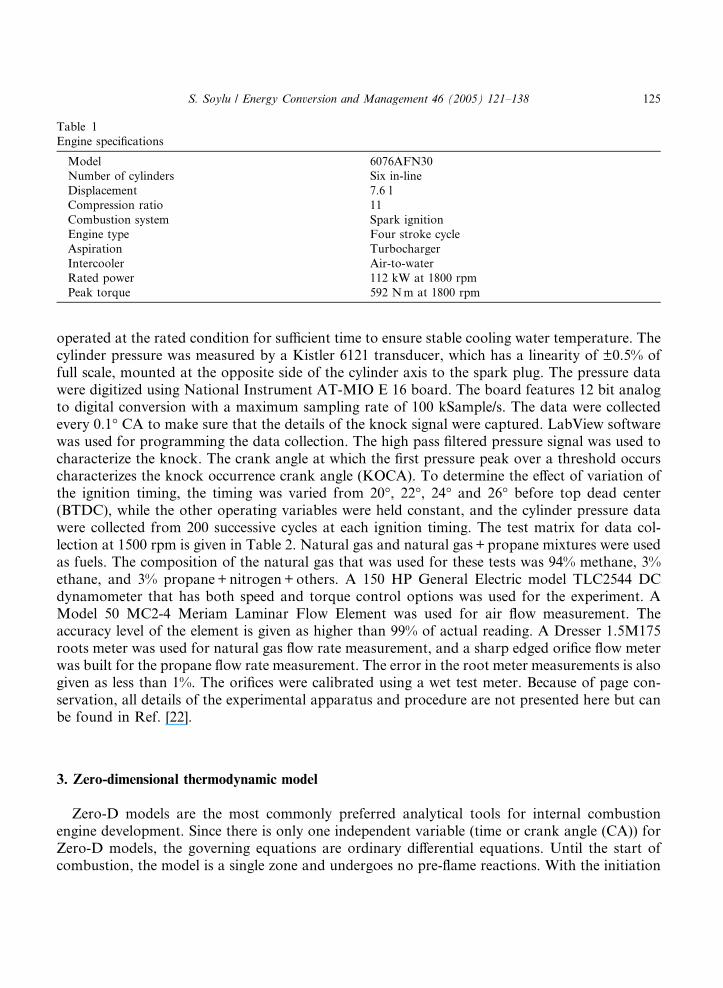
Table 1
Engine specifications
Model 6076AFN30
Number of cylinders Six in-line
Displacement 7.6 l
Compression ratio 11
Combustion system Spark ignition
Engine type Four stroke cycle
Aspiration Turbocharger
Intercooler Air-to-water
Rated power 112 kW at 1800 rpm
Peak torque 592 Nm at 1800 rpm
S. Soylu / Energy Conversion and Management 46 (2005) 121–138 125
operated at the rated condition for sufficient time to ensure stable cooling water temperature. Thecylinder pressure was measured by a Kistler 6121 transducer, which has a linearity of ±0.5% offull scale, mounted at the opposite side of the cylinder axis to the spark plug. The pressure datawere digitized using National Instrument AT-MIO E 16 board. The board features 12 bit analogto digital conversion with a maximum sampling rate of 100 kSample/s. The data were collectedevery 0.1� CA to make sure that the details of the knock signal were captured. LabView softwarewas used for programming the data collection. The high pass filtered pressure signal was used tocharacterize the knock. The crank angle at which the first pressure peak over a threshold occurscharacterizes the knock occurrence crank angle (KOCA). To determine the effect of variation ofthe ignition timing, the timing was varied from 20�, 22�, 24� and 26� before top dead center(BTDC), while the other operating variables were held constant, and the cylinder pressure datawere collected from 200 successive cycles at each ignition timing. The test matrix for data col-lection at 1500 rpm is given in Table 2. Natural gas and natural gas + propane mixtures were usedas fuels. The composition of the natural gas that was used for these tests was 94% methane, 3%ethane, and 3% propane+nitrogen+others. A 150 HP General Electric model TLC2544 DCdynamometer that has both speed and torque control options was used for the experiment. AModel 50 MC2-4 Meriam Laminar Flow Element was used for air flow measurement. Theaccuracy level of the element is given as higher than 99% of actual reading. A Dresser 1.5M175roots meter was used for natural gas flow rate measurement, and a sharp edged orifice flow meterwas built for the propane flow rate measurement. The error in the root meter measurements is alsogiven as less than 1%. The orifices were calibrated using a wet test meter. Because of page con-servation, all details of the experimental apparatus and procedure are not presented here but canbe found in Ref. [22].
3. Zero-dimensional thermodynamic model
Zero-D models are the most commonly preferred analytical tools for internal combustionengine development. Since there is only one independent variable (time or crank angle (CA)) forZero-D models, the governing equations are ordinary differential equations. Until the start ofcombustion, the model is a single zone and undergoes no pre-flame reactions. With the initiation
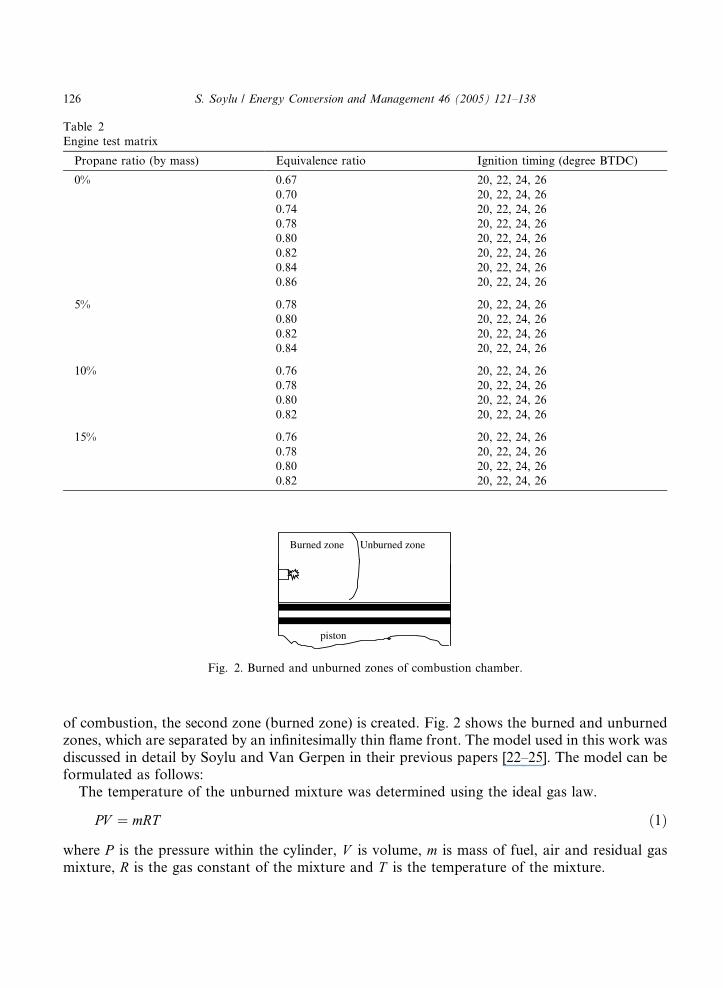
Table 2
Engine test matrix
Propane ratio (by mass) Equivalence ratio Ignition timing (degree BTDC)
0% 0.67 20, 22, 24, 26
0.70 20, 22, 24, 26
0.74 20, 22, 24, 26
0.78 20, 22, 24, 26
0.80 20, 22, 24, 26
0.82 20, 22, 24, 26
0.84 20, 22, 24, 26
0.86 20, 22, 24, 26
5% 0.78 20, 22, 24, 26
0.80 20, 22, 24, 26
0.82 20, 22, 24, 26
0.84 20, 22, 24, 26
10% 0.76 20, 22, 24, 26
0.78 20, 22, 24, 26
0.80 20, 22, 24, 26
0.82 20, 22, 24, 26
15% 0.76 20, 22, 24, 26
0.78 20, 22, 24, 26
0.80 20, 22, 24, 26
0.82 20, 22, 24, 26
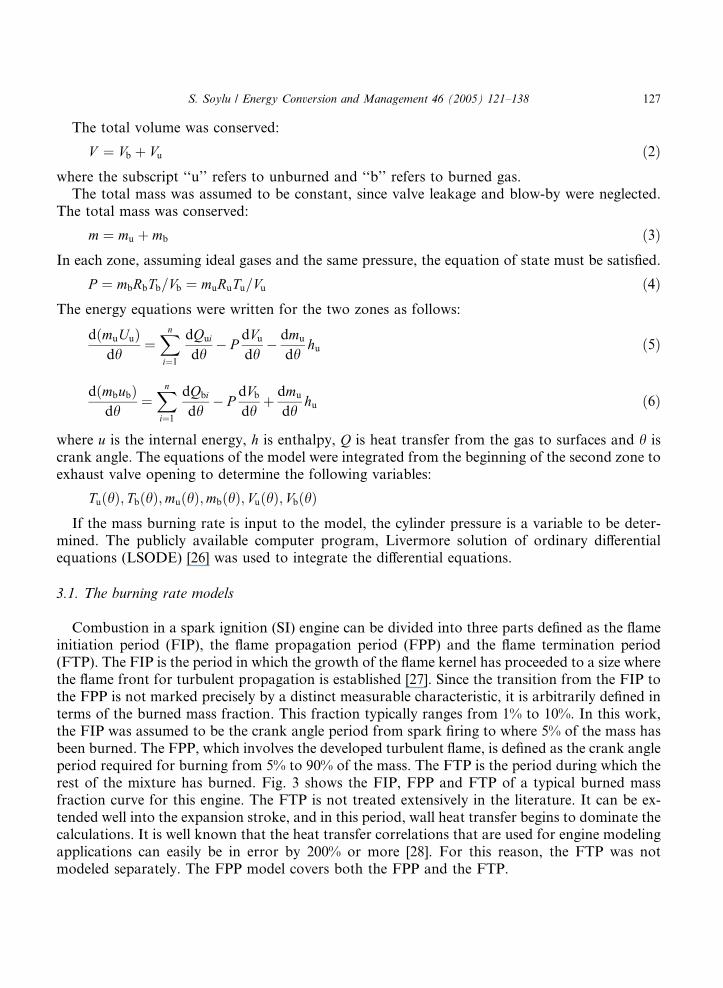
Burned zone Unburned zone
piston
Fig. 2. Burned and unburned zones of combustion chamber.
126 S. Soylu / Energy Conversion and Management 46 (2005) 121–138
of combustion, the second zone (burned zone) is created. Fig. 2 shows the burned and unburnedzones, which are separated by an infinitesimally thin flame front. The model used in this work wasdiscussed in detail by Soylu and Van Gerpen in their previous papers [22–25]. The model can beformulated as follows:
The temperature of the unburned mixture was determined using the ideal gas law.
PV ¼ mRT ð1Þ
where P is the pressure within the cylinder, V is volume, m is mass of fuel, air and residual gasmixture, R is the gas constant of the mixture and T is the temperature of the mixture.
S. Soylu / Energy Conversion and Management 46 (2005) 121–138 127
The total volume was conserved:
V ¼ Vb þ Vu ð2Þ
where the subscript ‘‘u’’ refers to unburned and ‘‘b’’ refers to burned gas.The total mass was assumed to be constant, since valve leakage and blow-by were neglected.The total mass was conserved:
m ¼ mu þ mb ð3Þ
In each zone, assuming ideal gases and the same pressure, the equation of state must be satisfied.P ¼ mbRbTb=Vb ¼ muRuTu=Vu ð4Þ
The energy equations were written for the two zones as follows:dðmuUuÞdh
¼Xn
i¼1
dQui
dh� P
dVudh
� dmu
dhhu ð5Þ
dðmbubÞdh
¼Xn
i¼1
dQbi
dh� P
dVbdh
þ dmu
dhhu ð6Þ
where u is the internal energy, h is enthalpy, Q is heat transfer from the gas to surfaces and h iscrank angle. The equations of the model were integrated from the beginning of the second zone toexhaust valve opening to determine the following variables:
TuðhÞ; TbðhÞ;muðhÞ;mbðhÞ; VuðhÞ; VbðhÞ
If the mass burning rate is input to the model, the cylinder pressure is a variable to be deter-mined. The publicly available computer program, Livermore solution of ordinary differentialequations (LSODE) [26] was used to integrate the differential equations.
3.1. The burning rate models
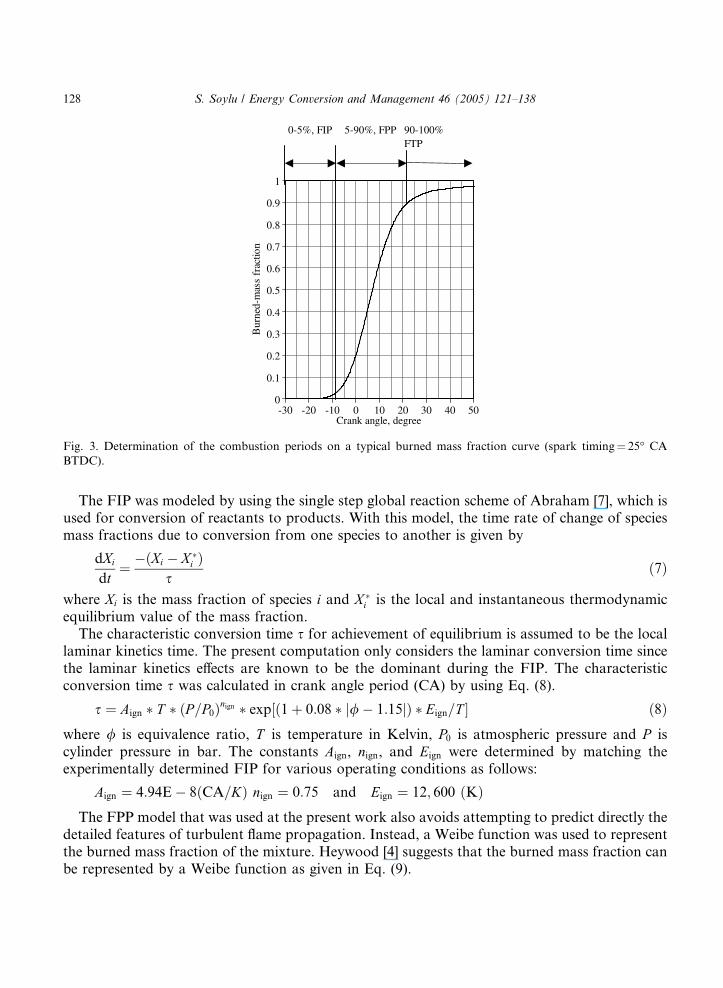
Combustion in a spark ignition (SI) engine can be divided into three parts defined as the flameinitiation period (FIP), the flame propagation period (FPP) and the flame termination period(FTP). The FIP is the period in which the growth of the flame kernel has proceeded to a size wherethe flame front for turbulent propagation is established [27]. Since the transition from the FIP tothe FPP is not marked precisely by a distinct measurable characteristic, it is arbitrarily defined interms of the burned mass fraction. This fraction typically ranges from 1% to 10%. In this work,the FIP was assumed to be the crank angle period from spark firing to where 5% of the mass hasbeen burned. The FPP, which involves the developed turbulent flame, is defined as the crank angleperiod required for burning from 5% to 90% of the mass. The FTP is the period during which therest of the mixture has burned. Fig. 3 shows the FIP, FPP and FTP of a typical burned massfraction curve for this engine. The FTP is not treated extensively in the literature. It can be ex-tended well into the expansion stroke, and in this period, wall heat transfer begins to dominate thecalculations. It is well known that the heat transfer correlations that are used for engine modelingapplications can easily be in error by 200% or more [28]. For this reason, the FTP was notmodeled separately. The FPP model covers both the FPP and the FTP.
0
0.1
0.2
0.3
0.4
0.5
0.6
0.7
0.8
0.9
1
-30 -20 -10 0 10 20 30 40 50Crank angle, degree
Bur
ned-
mas
s fr
actio
n
0-5%, FIP 5-90%, FPP 90-100%FTP
Fig. 3. Determination of the combustion periods on a typical burned mass fraction curve (spark timing¼ 25� CA
BTDC).
128 S. Soylu / Energy Conversion and Management 46 (2005) 121–138
The FIP was modeled by using the single step global reaction scheme of Abraham [7], which isused for conversion of reactants to products. With this model, the time rate of change of speciesmass fractions due to conversion from one species to another is given by
dXi
dt¼ �ðXi � X �
i Þs
ð7Þ
where Xi is the mass fraction of species i and X �i is the local and instantaneous thermodynamic
equilibrium value of the mass fraction.The characteristic conversion time s for achievement of equilibrium is assumed to be the local
laminar kinetics time. The present computation only considers the laminar conversion time sincethe laminar kinetics effects are known to be the dominant during the FIP. The characteristicconversion time s was calculated in crank angle period (CA) by using Eq. (8).
s ¼ Aign � T � ðP=P0Þnign � exp½ð1þ 0:08 � j/� 1:15jÞ � Eign=T � ð8Þ
where / is equivalence ratio, T is temperature in Kelvin, P0 is atmospheric pressure and P iscylinder pressure in bar. The constants Aign, nign, and Eign were determined by matching theexperimentally determined FIP for various operating conditions as follows:Aign ¼ 4:94E� 8ðCA=KÞ nign ¼ 0:75 and Eign ¼ 12; 600 ðKÞ
The FPP model that was used at the present work also avoids attempting to predict directly thedetailed features of turbulent flame propagation. Instead, a Weibe function was used to representthe burned mass fraction of the mixture. Heywood [4] suggests that the burned mass fraction canbe represented by a Weibe function as given in Eq. (9).
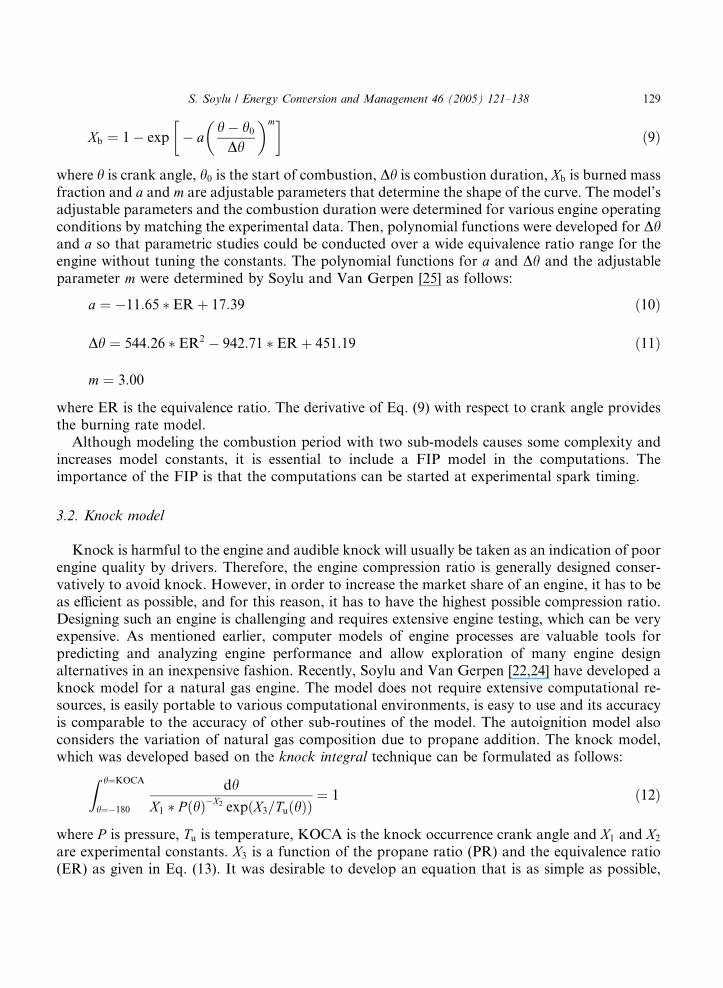
S. Soylu / Energy Conversion and Management 46 (2005) 121–138 129
Xb ¼ 1� exp
�� a
h� h0Dh
� �m�ð9Þ
where h is crank angle, h0 is the start of combustion, Dh is combustion duration, Xb is burned massfraction and a and m are adjustable parameters that determine the shape of the curve. The model’sadjustable parameters and the combustion duration were determined for various engine operatingconditions by matching the experimental data. Then, polynomial functions were developed for Dhand a so that parametric studies could be conducted over a wide equivalence ratio range for theengine without tuning the constants. The polynomial functions for a and Dh and the adjustableparameter m were determined by Soylu and Van Gerpen [25] as follows:
a ¼ �11:65 � ERþ 17:39 ð10Þ
Dh ¼ 544:26 � ER2 � 942:71 � ERþ 451:19 ð11Þ
m ¼ 3:00
where ER is the equivalence ratio. The derivative of Eq. (9) with respect to crank angle providesthe burning rate model.
Although modeling the combustion period with two sub-models causes some complexity andincreases model constants, it is essential to include a FIP model in the computations. Theimportance of the FIP is that the computations can be started at experimental spark timing.
3.2. Knock model
Knock is harmful to the engine and audible knock will usually be taken as an indication of poorengine quality by drivers. Therefore, the engine compression ratio is generally designed conser-vatively to avoid knock. However, in order to increase the market share of an engine, it has to beas efficient as possible, and for this reason, it has to have the highest possible compression ratio.Designing such an engine is challenging and requires extensive engine testing, which can be veryexpensive. As mentioned earlier, computer models of engine processes are valuable tools forpredicting and analyzing engine performance and allow exploration of many engine designalternatives in an inexpensive fashion. Recently, Soylu and Van Gerpen [22,24] have developed aknock model for a natural gas engine. The model does not require extensive computational re-sources, is easily portable to various computational environments, is easy to use and its accuracyis comparable to the accuracy of other sub-routines of the model. The autoignition model alsoconsiders the variation of natural gas composition due to propane addition. The knock model,which was developed based on the knock integral technique can be formulated as follows:
Z h¼KOCA
h¼�180
dh
X1 � P ðhÞ�X2 expðX3=TuðhÞÞ¼ 1 ð12Þ
where P is pressure, Tu is temperature, KOCA is the knock occurrence crank angle and X1 and X2
are experimental constants. X3 is a function of the propane ratio (PR) and the equivalence ratio(ER) as given in Eq. (13). It was desirable to develop an equation that is as simple as possible,
130 S. Soylu / Energy Conversion and Management 46 (2005) 121–138
however, slight variations in X3 cause significant variation in the predictions of KOCA because ofthe exponent term in the model. Therefore, the flexibility provided by Eq. (13) was preferred.
X1 ¼ 0:985; X2 ¼ 0:887
X3 ¼ ð�0:575þ ð10:058 � PR� 54:053 � PR2ÞÞ � ERþ ð1:456þ ð�8:703 � PRþ 43:615 � PR2ÞÞ � 7000 K
ð13Þ
4. Results and discussion
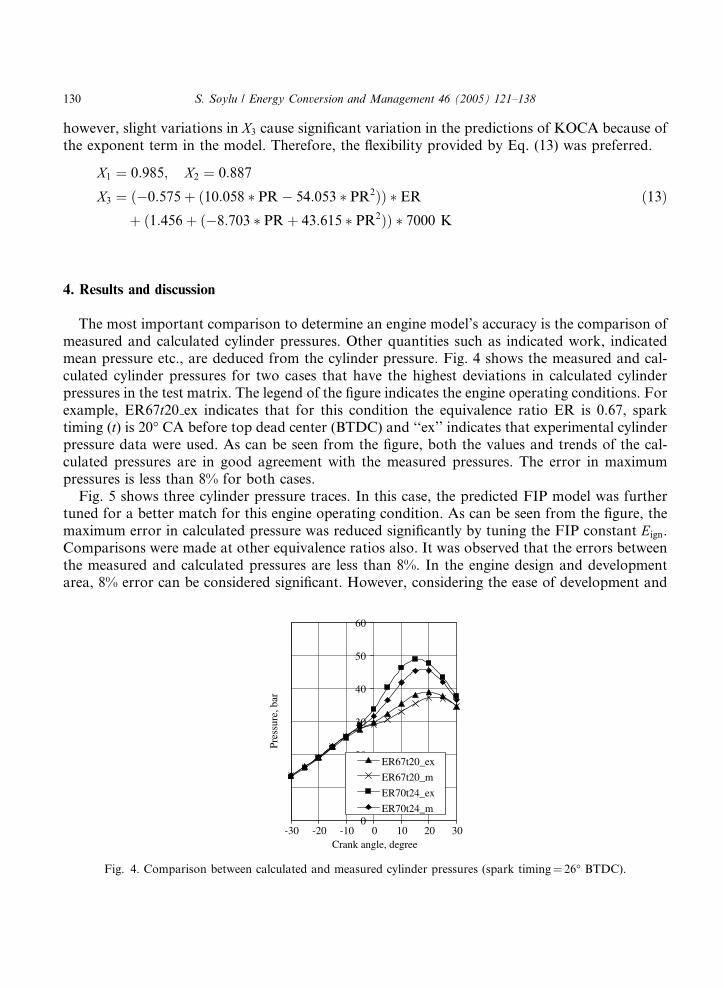
The most important comparison to determine an engine model’s accuracy is the comparison ofmeasured and calculated cylinder pressures. Other quantities such as indicated work, indicatedmean pressure etc., are deduced from the cylinder pressure. Fig. 4 shows the measured and cal-culated cylinder pressures for two cases that have the highest deviations in calculated cylinderpressures in the test matrix. The legend of the figure indicates the engine operating conditions. Forexample, ER67t20 ex indicates that for this condition the equivalence ratio ER is 0.67, sparktiming (t) is 20� CA before top dead center (BTDC) and ‘‘ex’’ indicates that experimental cylinderpressure data were used. As can be seen from the figure, both the values and trends of the cal-culated pressures are in good agreement with the measured pressures. The error in maximumpressures is less than 8% for both cases.
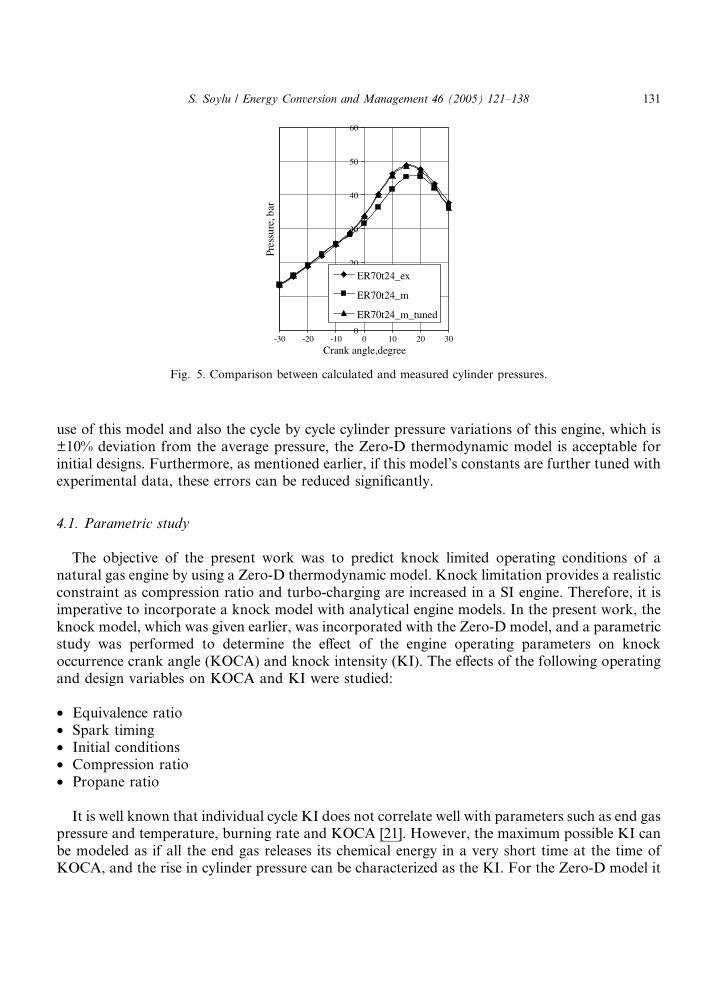
Fig. 5 shows three cylinder pressure traces. In this case, the predicted FIP model was furthertuned for a better match for this engine operating condition. As can be seen from the figure, themaximum error in calculated pressure was reduced significantly by tuning the FIP constant Eign.Comparisons were made at other equivalence ratios also. It was observed that the errors betweenthe measured and calculated pressures are less than 8%. In the engine design and developmentarea, 8% error can be considered significant. However, considering the ease of development and
0
10
20
30
40
50
60
-30 -20 -10 0 10 20 30Crank angle, degree
Pres
sure
, bar
ER67t20_ex
ER67t20_m
ER70t24_ex
ER70t24_m
Fig. 4. Comparison between calculated and measured cylinder pressures (spark timing¼ 26� BTDC).
0
10
20
30
40
50
60
-30 -20 -10 0 10 20 30
Crank angle,degree
Pres
sure
, bar
ER70t24_ex
ER70t24_m
ER70t24_m_tuned
Fig. 5. Comparison between calculated and measured cylinder pressures.
S. Soylu / Energy Conversion and Management 46 (2005) 121–138 131
use of this model and also the cycle by cycle cylinder pressure variations of this engine, which is±10% deviation from the average pressure, the Zero-D thermodynamic model is acceptable forinitial designs. Furthermore, as mentioned earlier, if this model’s constants are further tuned withexperimental data, these errors can be reduced significantly.
4.1. Parametric study
The objective of the present work was to predict knock limited operating conditions of anatural gas engine by using a Zero-D thermodynamic model. Knock limitation provides a realisticconstraint as compression ratio and turbo-charging are increased in a SI engine. Therefore, it isimperative to incorporate a knock model with analytical engine models. In the present work, theknock model, which was given earlier, was incorporated with the Zero-D model, and a parametricstudy was performed to determine the effect of the engine operating parameters on knockoccurrence crank angle (KOCA) and knock intensity (KI). The effects of the following operatingand design variables on KOCA and KI were studied:
• Equivalence ratio• Spark timing• Initial conditions• Compression ratio• Propane ratio
It is well known that individual cycle KI does not correlate well with parameters such as end gaspressure and temperature, burning rate and KOCA [21]. However, the maximum possible KI canbe modeled as if all the end gas releases its chemical energy in a very short time at the time ofKOCA, and the rise in cylinder pressure can be characterized as the KI. For the Zero-D model it
132 S. Soylu / Energy Conversion and Management 46 (2005) 121–138
is assumed that the end gas is standard air and all the end gas energy is released at constantvolume. The KI model is formulated as follows:
Qauto ¼ mend-gascvðTb � TuÞ ð14Þ
Pb ¼TbTu
Pu ð15Þ
where Qauto is energy released from the end gas, mend-gas is mass of the end gas, cv is specific heat atconstant volume, Tb is mixture temperature after autoignition, Tu is end gas temperature beforeautoignition and Pb is pressure after autoignition. The pressure rise after autoignition was char-acterized as knock intensity (KI). This method is a very simple way to model KI, and cylinderpressure traces can be significantly different from real cylinder pressures during the knock.However, the trends in the maximum possible KI with variations of engine operating conditionscan be observed, which provide some useful information to engine designers.
With the established KOCA and KI model, it is possible not only to investigate whether knockis observed with changing operating and design parameters but also to evaluate their effects on theKI. It may also show how much various individual operating and design parameters can beadjusted to reduce the engine autoignition tendency. In addition, the present model can be used insearching for better combinations of engine operating and design variables beyond the availabilityof experimental data. Manipulating changes in the operating and design parameters to avoidknock while enhancing engine performance is a reality with the present work without performingextensive experimental engine testing.
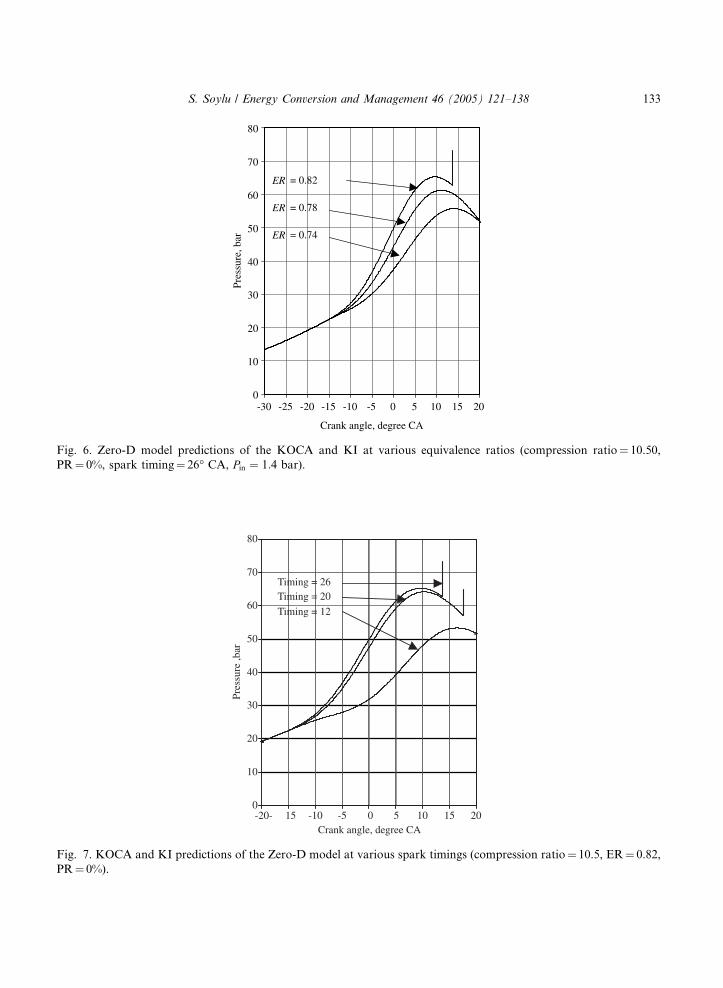
Fig. 6 shows the Zero-D model predictions for KOCA and KI with variations in equivalenceratio. As can be seen from the figure, end gas autoignition depends strongly on equivalence ratio.It is confirmed by measured cylinder pressure data that if the equivalence ratio is 0.74, autoig-nition is not observed at this operating condition of the engine. It is also observed from measuredcylinder pressure data that if the equivalence ratio is 0.82, the average autoignition for 200consecutive cycles is observed at 13� CA after TDC. As can be seen from the figure, the KOCAprediction of the model is 13.8� CA after TDC if the equivalence ratio is 0.82, which is only a 0.8�CA deviation from the measured data.
Spark timing is one of the important engine operating parameters for the designer. The end gastemperature is strongly dependent on timing, and therefore, any retardation in timing decreasesthe end gas temperature. Knock control systems generally retard the spark timing to preventheavy knock. Fig. 7 shows the model predictions for KOCA and KI at various spark timings. Ascan be seen from the figure, KI is reduced with retarded timings. The KOCA prediction of themodel at 26� CA timing is very accurate with a deviation of 0.5� CA. However, at 20� CA, thereshould not be an autoignition. The reason for this could be the inaccuracy of determination of theend gas temperature at retarded timings. During the optimization process of the autoignitionmodel, it was assumed that the unburned zone compression is adiabatic.
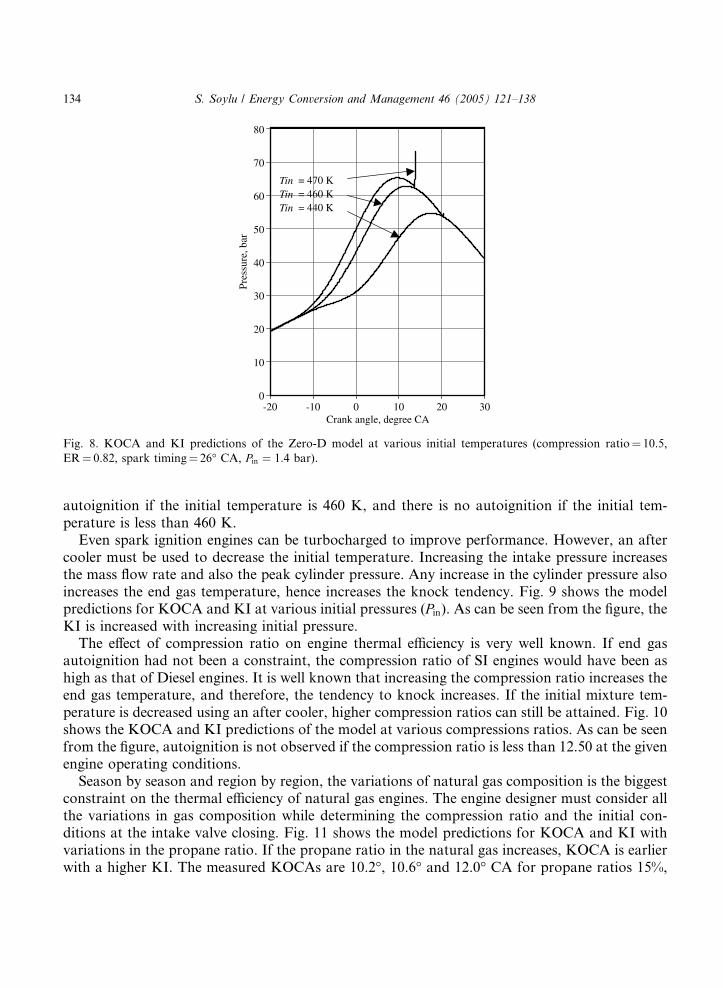
The initial mixture temperature is another important operating parameter that influences theonset of knock. If the initial temperature is increased, the reaction rate in the end gas increases,which leads to earlier autoignition with higher KI. Fig. 8 shows the model predictions for KOCAand KI at various initial temperature (Tin). As can be seen from the figures, there is a light
0
10
20
30
40
50
60
70
80
-30 -25 -20 -15 -10 -5 0 5 10 15 20
Crank angle, degree CA
Pres
sure
, bar
ER = 0.82
ER = 0.78
ER = 0.74
Fig. 6. Zero-D model predictions of the KOCA and KI at various equivalence ratios (compression ratio¼ 10.50,
PR¼ 0%, spark timing¼ 26� CA, Pin ¼ 1:4 bar).
0
10
20
30
40
50
60
70
80
-20- 15 -10 -5 0 5 10 15 20Crank angle, degree CA
Pres
sure
,bar
Timing = 26 Timing = 20
Timing = 12
Fig. 7. KOCA and KI predictions of the Zero-D model at various spark timings (compression ratio¼ 10.5, ER¼ 0.82,
PR¼ 0%).
S. Soylu / Energy Conversion and Management 46 (2005) 121–138 133
0
10
20
30
40
50
60
70
80
-20 -10 0 10 20 30Crank angle, degree CA
Pres
sure
, bar
Tin = 470 KTin = 460 KTin = 440 K
Fig. 8. KOCA and KI predictions of the Zero-D model at various initial temperatures (compression ratio¼ 10.5,
ER¼ 0.82, spark timing¼ 26� CA, Pin ¼ 1:4 bar).
134 S. Soylu / Energy Conversion and Management 46 (2005) 121–138
autoignition if the initial temperature is 460 K, and there is no autoignition if the initial tem-perature is less than 460 K.
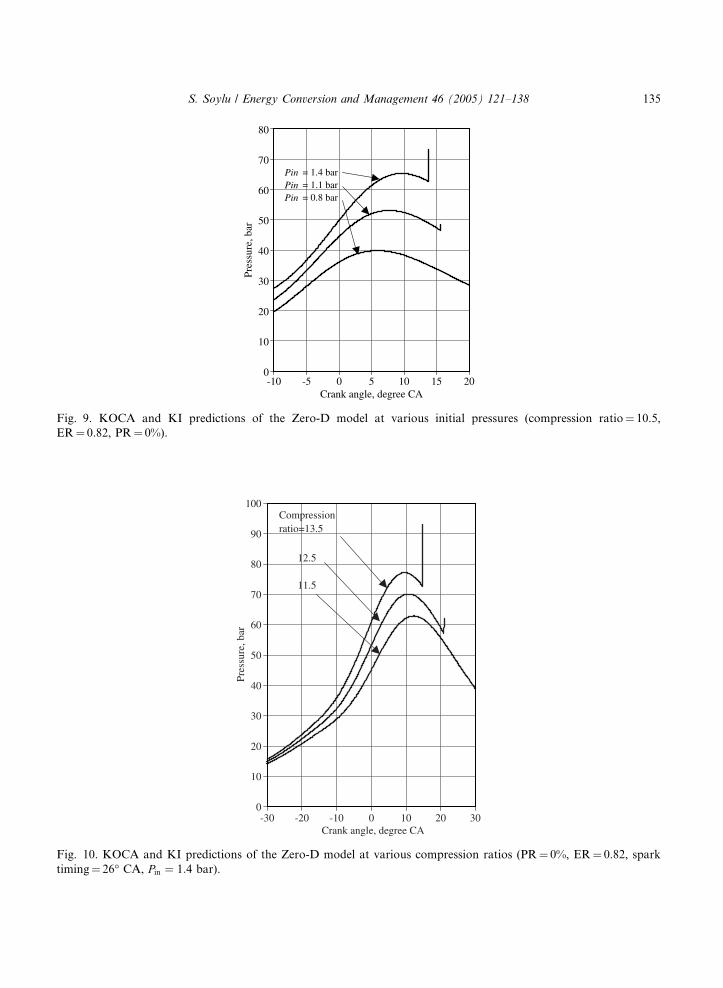
Even spark ignition engines can be turbocharged to improve performance. However, an aftercooler must be used to decrease the initial temperature. Increasing the intake pressure increasesthe mass flow rate and also the peak cylinder pressure. Any increase in the cylinder pressure alsoincreases the end gas temperature, hence increases the knock tendency. Fig. 9 shows the modelpredictions for KOCA and KI at various initial pressures (Pin). As can be seen from the figure, theKI is increased with increasing initial pressure.
The effect of compression ratio on engine thermal efficiency is very well known. If end gasautoignition had not been a constraint, the compression ratio of SI engines would have been ashigh as that of Diesel engines. It is well known that increasing the compression ratio increases theend gas temperature, and therefore, the tendency to knock increases. If the initial mixture tem-perature is decreased using an after cooler, higher compression ratios can still be attained. Fig. 10shows the KOCA and KI predictions of the model at various compressions ratios. As can be seenfrom the figure, autoignition is not observed if the compression ratio is less than 12.50 at the givenengine operating conditions.
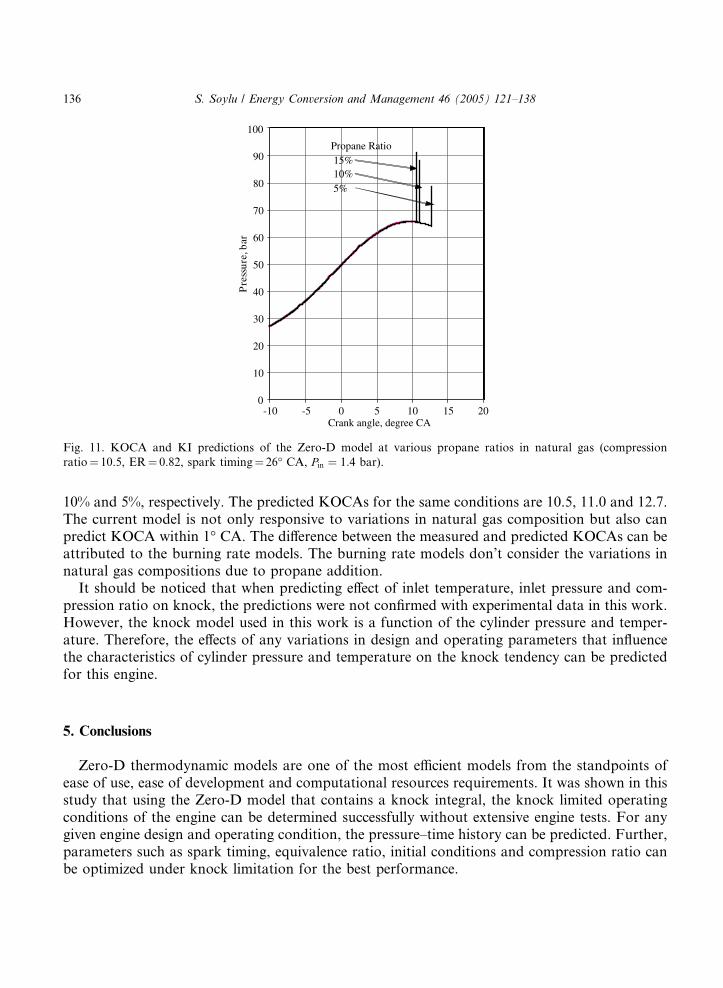
Season by season and region by region, the variations of natural gas composition is the biggestconstraint on the thermal efficiency of natural gas engines. The engine designer must consider allthe variations in gas composition while determining the compression ratio and the initial con-ditions at the intake valve closing. Fig. 11 shows the model predictions for KOCA and KI withvariations in the propane ratio. If the propane ratio in the natural gas increases, KOCA is earlierwith a higher KI. The measured KOCAs are 10.2�, 10.6� and 12.0� CA for propane ratios 15%,
0
10
20
30
40
50
60
70
80
-10 -5 0 5 10 15 20Crank angle, degree CA
Pres
sure
, bar
Pin = 1.4 barPin = 1.1 barPin = 0.8 bar
Fig. 9. KOCA and KI predictions of the Zero-D model at various initial pressures (compression ratio¼ 10.5,
ER¼ 0.82, PR¼ 0%).
0
10
20
30
40
50
60
70
80
90
100
-30 -20 -10 0 10 20 30Crank angle, degree CA
Pres
sure
, bar
Compression ratio=13.5
12.5
11.5
Fig. 10. KOCA and KI predictions of the Zero-D model at various compression ratios (PR¼ 0%, ER¼ 0.82, spark
timing¼ 26� CA, Pin ¼ 1:4 bar).
S. Soylu / Energy Conversion and Management 46 (2005) 121–138 135
0
10
20
30
40
50
60
70
80
90
100
-10 -5 0 5 10 15 20Crank angle, degree CA
Pre
ssur
e, b
ar
Propane Ratio 15% 10% 5%
Fig. 11. KOCA and KI predictions of the Zero-D model at various propane ratios in natural gas (compression
ratio¼ 10.5, ER¼ 0.82, spark timing¼ 26� CA, Pin ¼ 1:4 bar).
136 S. Soylu / Energy Conversion and Management 46 (2005) 121–138
10% and 5%, respectively. The predicted KOCAs for the same conditions are 10.5, 11.0 and 12.7.The current model is not only responsive to variations in natural gas composition but also canpredict KOCA within 1� CA. The difference between the measured and predicted KOCAs can beattributed to the burning rate models. The burning rate models don’t consider the variations innatural gas compositions due to propane addition.
It should be noticed that when predicting effect of inlet temperature, inlet pressure and com-pression ratio on knock, the predictions were not confirmed with experimental data in this work.However, the knock model used in this work is a function of the cylinder pressure and temper-ature. Therefore, the effects of any variations in design and operating parameters that influencethe characteristics of cylinder pressure and temperature on the knock tendency can be predictedfor this engine.
5. Conclusions
Zero-D thermodynamic models are one of the most efficient models from the standpoints ofease of use, ease of development and computational resources requirements. It was shown in thisstudy that using the Zero-D model that contains a knock integral, the knock limited operatingconditions of the engine can be determined successfully without extensive engine tests. For anygiven engine design and operating condition, the pressure–time history can be predicted. Further,parameters such as spark timing, equivalence ratio, initial conditions and compression ratio canbe optimized under knock limitation for the best performance.
S. Soylu / Energy Conversion and Management 46 (2005) 121–138 137
With the established KOCA and KI model, it is possible not only to investigate whether knockwill be observed with changing operating and design parameters but also to evaluate their effectson the KI. It may also show how much various individual operating and design parameters can beadjusted to reduce the engine autoignition tendency.
Engine knock provides a realistic constraint as operating and design variables are optimized ina spark ignition engine. Therefore, it is imperative to incorporate a knock model with the zero-dimensional model. The knock model used in this work is a function of the cylinder pressure andtemperature. Therefore, the knock tendency of any variations in design and operating parametersthat influence characteristics of the cylinder pressure and temperature can be predicted success-fully for this engine.
Since the burning rate and knock models are empirical, they can be used conveniently in theoperation range where they were developed. Outside of the range in which they were developed,the models should be used with great care.
Acknowledgements
This work has, in part, been supported by the John Deere Product Engineering Center.
References
[1] Liss WE. Natural gas as a stationary engine and vehicle fuel. SAE Paper no. 912364, 1991.
[2] Krieger RB, Borman GL. The computation of apparent heat release for internal combustion engines. ASME Paper
no. 66-WA/DGP-4, 1966.
[3] Blumberg PN, Kummer JT. Prediction of NO formation in spark ignited engines––an analysis of methods of
control. Combust Sci Technol 1971;4:73–95.
[4] Heywood JB. Internal combustion engines fundamentals. New York: McGraw-Hill; 1988.
[5] Soylu S. Simple modeling of combustion for a natural gas engine. SAE Paper no. 2002-01-2733, 2002.
[6] Karim GA, Gao J. Prediction of the performance of spark ignition gas engines including knock. SAE Paper no.
932823, 1993.
[7] Abraham J, Bracco FV. Comparison of computed and measured premixed charge engine combustion. Combust
Flame 1985;60:309–22.
[8] Anthony AA. A block structured KIVA program for engines with vertical and canted valves. New Mexico: Los
Alamos National Laboratory; 1999.
[9] Kong SC, Ayoub N, Reitz RD. Modeling combustion in compression ignition homogenous charge engines. SAE
Technical Paper. Paper no. 920512, 1992.
[10] Kong SC, Reitz RD. Use of detailed chemical kinetics to study HCCI engine combustion with consideration of
turbulent mixing effects. ASME ICE Division Fall 2000 Technical meeting.
[11] Yavuz I, Celik I, McMillian MH. Knock prediction in reciprocating gas-engines using detailed chemical kinetics.
SAE Paper no. 2001-01-1012.
[12] Livengood JC, Wu PC. Correlation of autoignition phenomena in internal combustion engines and rapid
compression machines. In: Fifth Symposium (International) on Combustion, 1955. p. 347–356.
[13] Douaud AM, Eyzat P. Four-octane-number-method for predicting the antiknock behaviour of fuels and engines.
SAE Paper no. 780080, 1978.
[14] By A, Kempinsky B, Rife JM. Knock in spark ignition engines. SAE Paper no. 810147, 1981.
138 S. Soylu / Energy Conversion and Management 46 (2005) 121–138
[15] Lund CM. HCT––a general computer program for calculating time-dependent phenomena involving one-
dimensional hydrodynamics, transport, and detailed chemical kinetics. Lawrence Livermore National Laboratory
Report UCRL-52504.
[16] Aceves SM, Flowers DL, Westbrook CK, Ray Smith J, Pitz WJ. A multi-zone model for prediction of HCCI
combustion and emissions. SAE Paper no. 2000-01-0327.
[17] Cowart JS, Haghgooie M, Newman CE, Davis GC, Pitz WJ, Westbrook CK. The intensity of knock in an internal
combustion engine: an experimental and modeling study. SAE Paper no. 922327, 1993.
[18] Cowart JS, Keck JC, Heywood JB, Westbrook CK, Pitz WJ. Engine knock predictions using a fully-detailed and a
reduced chemical kinetic mechanism. In: Twenty-Third Symposium on Combustion, 1990. p. 1055–62.
[19] Wilk RD, Green RM, Pitz WJ, Westbrook CK, Cernansky NP. An experimental and kinetic modeling study of the
combustion on n-butane and isobutane in an internal combustion engine. SAE Paper No. 900028, 1990.
[20] Westbrook CK, Pitz WJ, Leppard WR. The autoignition chemistry of paraffinic fuels and pro-knock and anti-
knock additives: a detailed chemical kinetic study. SAE Paper no. 912314, 1991.
[21] Konig G, Sheppard GW. End-gas autoignition and knock in a spark ignition engine. SAE Paper no. 902135, 1990.
[22] Soylu S. Autoignition modeling of natural gas for engine modeling programs: an experimental and modeling study.
PhD thesis, Iowa State University, IA, USA. 2001.
[23] Soylu S. Combustion analysis of a natural gas engine. ICES2003-563, 2003 Spring Tech Conf of the ASME,
Salzburg, Austria. May 11–14, 2003.
[24] Soylu S, Van Gerpen J. Development of an autoignition submodel for natural gas engines. J Fuel 2003;82:1699–
707.
[25] Soylu S, Van Gerpen J. Development of empirically based burning rate sub-models for a natural gas engine. Energy
Convers Manage 2003;45/14:467–81.
[26] Hindmarsh AC. LSODE and LSODI, two new initial value ordinary differential equation solvers. ACM-SIGNUM
Newslett 1980;15(4):10–1, Livermore, CA.
[27] Amann CA. Cylinder-pressure measurement and its use in engine research, SAE Paper no. 852067, 1985.
[28] Borman GL. Modeling flame propagation and heat transfer in engines––an introductory overview. In: Mattavi JN,
Amann CA, editors. Combustion modeling in reciprocating engines. Plenum; 1980.