prediction of formation of gas-phase bubbles correlated by vortices in the fuel reactor of chemical...
TRANSCRIPT
Fuel Processing Technology 130 (2015) 235–244
Contents lists available at ScienceDirect
Fuel Processing Technology
j ourna l homepage: www.e lsev ie r .com/ locate / fuproc
Prediction of formation of gas-phase bubbles correlated by vortices in thefuel reactor of chemical looping combustion
Luming Chen a, Xiaogang Yang a,⁎, Xia Li b, Guang Li a, Colin Snape b
a International Doctoral Innovation Centre (IDIC), The University of Nottingham Ningbo, University Park, Ningbo 315100, PR Chinab Faculty of Engineering, The University of Nottingham, University Park, Nottingham NG7 2RD, UK
⁎ Corresponding author. Tel.: +86 574 88182419.E-mail address: [email protected] (X
http://dx.doi.org/10.1016/j.fuproc.2014.10.0290378-3820/© 2014 Elsevier B.V. All rights reserved.
a b s t r a c t
a r t i c l e i n f oArticle history:Received 5 August 2014Received in revised form 12 October 2014Accepted 20 October 2014Available online xxxx
Keywords:Chemical looping combustionFuel reactorCFDFluidised bed
Chemical looping combustion (CLC) as a potential CO2 capture technology has been considered as a promisingand likely alternative to traditional combustion technology to mitigate the CO2 emission due to its prosecutionof CO2 sequestration at a low cost. Although a number of studies on the hydrodynamic behaviours of the CLC pro-cess in fuel reactor have been documented in the open literature, there have been rare studies on the correlationbetween the bubble formation and the local particulate volume fraction. This paper aims to investigate the CLCprocess in a fuel reactor using the CFDmodelling, coupled with the heterogeneous reactions, the hydrodynamicsand reaction kinetics occurring in the fuel reactor. A parameter correlating the occurrence of bubble and dynamicproperties is proposed. The parameter may be acted as an indicator of time-dependent bubble evolution with apotential to be adopted in the CLC for controlling the bubbling phenomena since the occurrence of the bubbles atspecific positions is highly correlated with the local large eddies embedded in the flow. The results obtainedclearly indicate that the CFD model developed in the current study reasonably forecasts the hydrodynamic be-haviours and important phenomena observed in the fuel reactor.
© 2014 Elsevier B.V. All rights reserved.
1. Introduction
Chemical looping combustion (CLC) has been considered as apromising alternative to traditional combustion technology to mitigatethe CO2 emission due to the potential of CO2 sequestration at a verylow cost. According to the estimation, a coal-fired power plant needsto consume around 20% of the total electricity generated to separateand compress the produced CO2 in the combustion while CO2
separation process is responsible for almost three-fourths of the wholeenergy consumed in the process [1,2]. In addition, coal combustioncauses enormous environmental problems. Thus, the application ofthe CLC may partially resolve the problem. In a CLC, solid oxygencarriers, usually highly-reactive metal particles, are introduced totransfer the oxygen necessary for the combustion from air through theinitial oxidation in air reactor and to subsequently realize the reductionin fuel reactor. Until very recently, most of the adopted CLC reactors arebased on fluidised bed technology due to its distinct benefits ofuniformed particle mixing and temperature gradients together withthe continuous operationmode in the fluidised bed reactor. Meanwhile,the bubbling fluidised bed is usually acted as the fuel reactor due to thebenefits of controllable handling of particles, high heat flow andrelatively high rate of gas–solid reaction due to the large gas–solid con-tact area [3]. So far, themost common type of CLC reactor is composed of
. Yang).
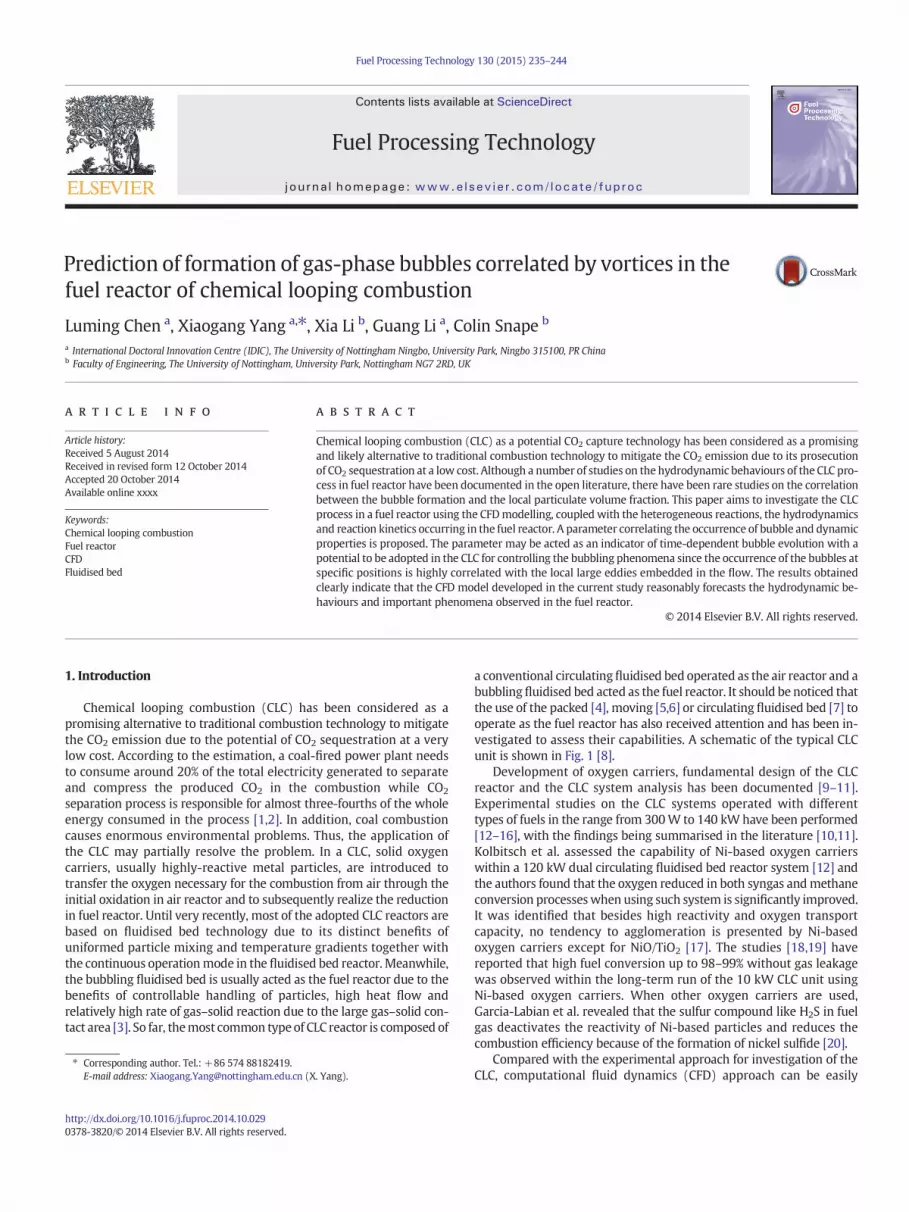
a conventional circulatingfluidised bed operated as the air reactor and abubbling fluidised bed acted as the fuel reactor. It should be noticed thatthe use of the packed [4], moving [5,6] or circulating fluidised bed [7] tooperate as the fuel reactor has also received attention and has been in-vestigated to assess their capabilities. A schematic of the typical CLCunit is shown in Fig. 1 [8].
Development of oxygen carriers, fundamental design of the CLCreactor and the CLC system analysis has been documented [9–11].Experimental studies on the CLC systems operated with differenttypes of fuels in the range from 300W to 140 kWhave been performed[12–16], with the findings being summarised in the literature [10,11].Kolbitsch et al. assessed the capability of Ni-based oxygen carrierswithin a 120 kW dual circulating fluidised bed reactor system [12] andthe authors found that the oxygen reduced in both syngas andmethaneconversion processeswhen using such system is significantly improved.It was identified that besides high reactivity and oxygen transportcapacity, no tendency to agglomeration is presented by Ni-basedoxygen carriers except for NiO/TiO2 [17]. The studies [18,19] havereported that high fuel conversion up to 98–99% without gas leakagewas observed within the long-term run of the 10 kW CLC unit usingNi-based oxygen carriers. When other oxygen carriers are used,Garcia-Labian et al. revealed that the sulfur compound like H2S in fuelgas deactivates the reactivity of Ni-based particles and reduces thecombustion efficiency because of the formation of nickel sulfide [20].
Compared with the experimental approach for investigation of theCLC, computational fluid dynamics (CFD) approach can be easily
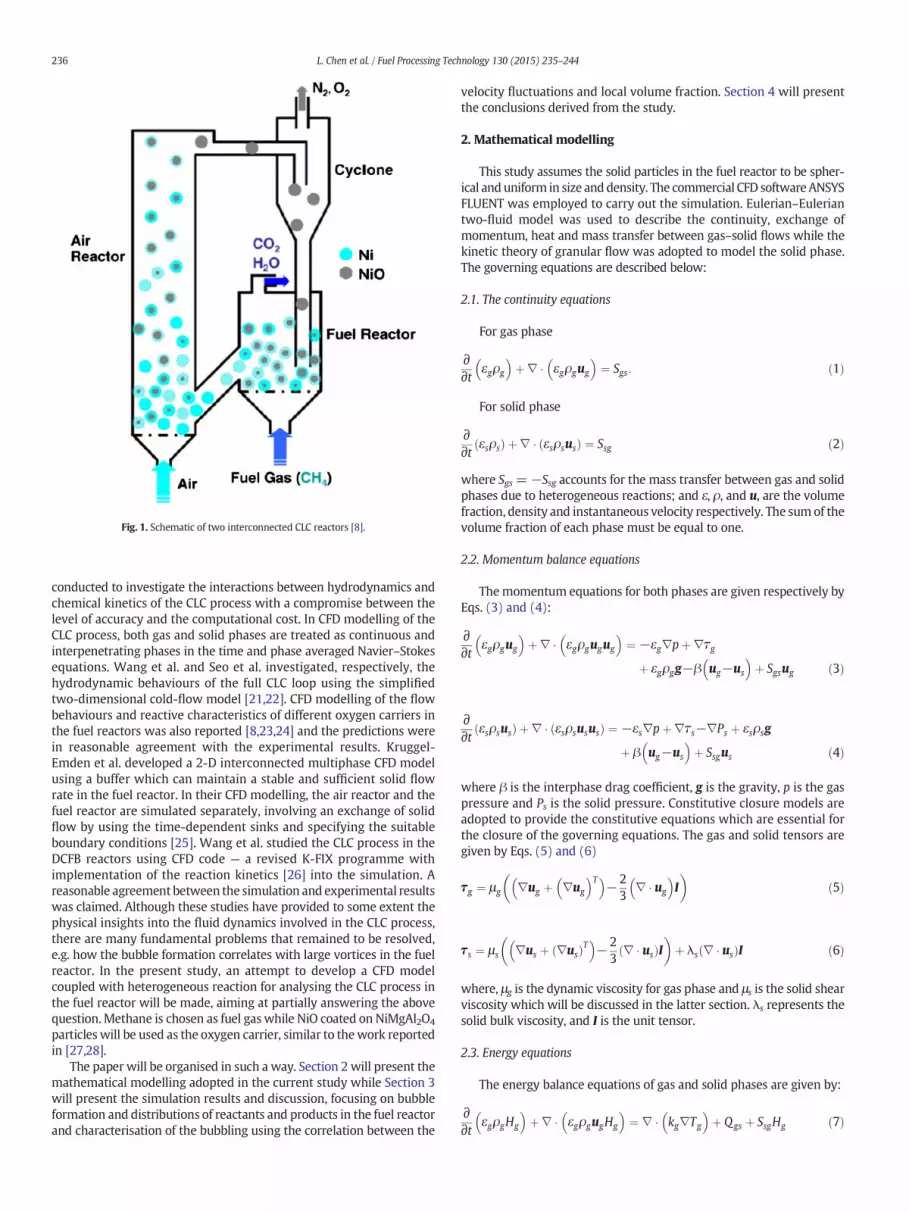
Fig. 1. Schematic of two interconnected CLC reactors [8].
236 L. Chen et al. / Fuel Processing Technology 130 (2015) 235–244
conducted to investigate the interactions between hydrodynamics andchemical kinetics of the CLC process with a compromise between thelevel of accuracy and the computational cost. In CFD modelling of theCLC process, both gas and solid phases are treated as continuous andinterpenetrating phases in the time and phase averaged Navier–Stokesequations. Wang et al. and Seo et al. investigated, respectively, thehydrodynamic behaviours of the full CLC loop using the simplifiedtwo-dimensional cold-flow model [21,22]. CFD modelling of the flowbehaviours and reactive characteristics of different oxygen carriers inthe fuel reactors was also reported [8,23,24] and the predictions werein reasonable agreement with the experimental results. Kruggel-Emden et al. developed a 2-D interconnected multiphase CFD modelusing a buffer which can maintain a stable and sufficient solid flowrate in the fuel reactor. In their CFD modelling, the air reactor and thefuel reactor are simulated separately, involving an exchange of solidflow by using the time-dependent sinks and specifying the suitableboundary conditions [25]. Wang et al. studied the CLC process in theDCFB reactors using CFD code — a revised K-FIX programme withimplementation of the reaction kinetics [26] into the simulation. Areasonable agreement between the simulation and experimental resultswas claimed. Although these studies have provided to some extent thephysical insights into the fluid dynamics involved in the CLC process,there are many fundamental problems that remained to be resolved,e.g. how the bubble formation correlates with large vortices in the fuelreactor. In the present study, an attempt to develop a CFD modelcoupled with heterogeneous reaction for analysing the CLC process inthe fuel reactor will be made, aiming at partially answering the abovequestion. Methane is chosen as fuel gas while NiO coated on NiMgAl2O4
particles will be used as the oxygen carrier, similar to thework reportedin [27,28].
The paper will be organised in such a way. Section 2 will present themathematical modelling adopted in the current study while Section 3will present the simulation results and discussion, focusing on bubbleformation and distributions of reactants and products in the fuel reactorand characterisation of the bubbling using the correlation between the
velocity fluctuations and local volume fraction. Section 4 will presentthe conclusions derived from the study.
2. Mathematical modelling
This study assumes the solid particles in the fuel reactor to be spher-ical and uniform in size and density. The commercial CFD softwareANSYSFLUENT was employed to carry out the simulation. Eulerian–Euleriantwo-fluid model was used to describe the continuity, exchange ofmomentum, heat and mass transfer between gas–solid flows while thekinetic theory of granular flow was adopted to model the solid phase.The governing equations are described below:
2.1. The continuity equations
For gas phase
∂∂t εgρg
� �þ∇ � εgρgug
� �¼ Sgs: ð1Þ
For solid phase
∂∂t εsρsð Þ þ∇ � εsρsusð Þ ¼ Ssg ð2Þ
where Sgs =−Ssg accounts for the mass transfer between gas and solidphases due to heterogeneous reactions; and ε, ρ, and u, are the volumefraction, density and instantaneous velocity respectively. The sum of thevolume fraction of each phase must be equal to one.
2.2. Momentum balance equations
Themomentum equations for both phases are given respectively byEqs. (3) and (4):
∂∂t εgρgug
� �þ∇ � εgρgugug
� �¼ −εg∇pþ∇τg
þ εgρgg−β ug−us
� �þ Sgsug ð3Þ
∂∂t εsρsusð Þ þ∇ � εsρsususð Þ ¼ −εs∇pþ∇τs−∇Ps þ εsρsg
þ β ug−us
� �þ Ssgus ð4Þ
where β is the interphase drag coefficient, g is the gravity, p is the gaspressure and Ps is the solid pressure. Constitutive closure models areadopted to provide the constitutive equations which are essential forthe closure of the governing equations. The gas and solid tensors aregiven by Eqs. (5) and (6)
τg ¼ μg ∇ug þ ∇ug
� �T� �−2
3∇ � ug
� �I
� �ð5Þ
τs ¼ μs ∇us þ ∇usð ÞT� �
−23
∇ � usð ÞI� �
þ λs ∇ � usð ÞI ð6Þ
where, μg is the dynamic viscosity for gas phase and μs is the solid shearviscosity which will be discussed in the latter section. λs represents thesolid bulk viscosity, and I is the unit tensor.
2.3. Energy equations
The energy balance equations of gas and solid phases are given by:
∂∂t εgρgHg
� �þ∇ � εgρgugHg
� �¼ ∇ � kg∇Tg
� �þ Qgs þ SsgHg ð7Þ

237L. Chen et al. / Fuel Processing Technology 130 (2015) 235–244
∂∂t εsρsHsð Þ þ∇ � εsρsusHsð Þ ¼ ∇ � ks∇Tsð Þ þ Qsg þ SgsHs ð8Þ
where H and k represent the enthalpy, and thermal conductivity,respectively. Qgs = −Qsg accounts for the inter-phase heat transfer.The heat exchange Qsg can be calculated based on Eq. (9):
Qsg ¼ hsg Tg−TS
� �ð9Þ
where hsg is the heat transfer coefficient between gas and solid phaseand is given by Eq. (10)
hsg ¼ 6kgεsεgNu
d2S: ð10Þ
The Nusselt number Nu in Eq. (10) can be calculated based on theempirical relationships as suggested in [29]:
Nu ¼ 7:0−10:0εg þ 5:0ε2g� �
1:0þ 0:7R0:2e Pr1=3
� �þ 1:33−2:4εg þ 1:2ε2g� �
Re0:7Pr1=3 ð11Þ
with the given Prandtl number Pr, the particle Renolds number Rep andthe particle diameter dp.
2.4. Species transport equations
The conservation equations of species j, which are used to describethe chemical reactions in the fuel reactor are given by
∂∂t εiρiYi; j
� �þ∇ � εiρiuiYi; j
� �¼ −∇ � εi Ji; j
� �þ Rhe ð12Þ
where Yi,j denotes themass fraction of species j in phase i, Ji,j denotes thediffusive mass flux and Rhe denotes the heterogeneous reaction rate.
2.5. Drag model
Several drag models for gas–solid bubbling fluidised bed (theWen-Yu, Syamlal-O'Brien and Gidaspow drag models) have beenproposed to illustrate the inter-phase momentum exchange betweenphases [30]. However, Gidaspow drag model was employed in thecurrent study because it has been widely accepted and utilised in thesimulation of fluidised beds at commercial scale [31].
βsg ¼ 150ε2s μg
εgd2pþ 1:75εs
εgdp
ug−us
��� ��� εgb0:8� �
ð13Þ
βsg ¼ 0:75εgρgCD0ε−2:65g
1−εg� �
dpug−us
��� ��� εg≥0:8� � ð14Þ
where CD0 is the standard drag coefficient.
CD0 ¼ 0:44 RepN1000� �
;CD0 ¼ 24Rep
1þ 0:15Re0:687p
� �Rep≤1000� �
ð15Þ
with the particle Reynolds number Rep ¼ ρgdp ug−upj jεgμg
.
2.6. Kinetic theory of granular flow (KTGF)
The kinetic theory of granular flow (KTGF) is basically an extensionof the classical kinetic gas theory and it has been utilised to interpretthe random granular motion of particle collision in fluidised bed. Inthe KTGF, the rheology of fluidised particles is dominated by thefluctuatingmotion and local concentration of solids. TheKTGF expresses
the particle collision using two parameters, the solid phase stresses andviscosities which are represented as a function of granular flowtemperature, respectively. This study adopts the equation as describedin [32,33].
32
∂∂t εsρsΘð Þ þ∇ � εsρsugΘ
� �� �¼ −∇PsI þ τsð Þ
: ∇us þ∇ � ks∇Θð Þ−γs þΦs þ Dgs ð16Þ
In Eq. (16), the two terms on the left hand side account for the accu-mulation and convection of kinetic fluctuation energy separately. Thefirst term on the right hand side depicts the production of kinetic fluctu-ation energy due to irreversible deformation of the solid phase velocityfield, while the conductive transport of kinetic fluctuation energy is de-scribed by the second term. The third term is used tomodel the dissipa-tion of the fluctuation energy resulting from the inelastic inter-particleinteractions. The fourth term indicates the exchange of the fluctuationenergy owing to the interphase momentum transport. The interactionbetween thefluctuating gas velocity and thefluctuatingparticle velocityrepresented by the last term is usually neglected due to the completesuppression of gas phase turbulence in bubbling gas–solid fluidisedbeds [32].
The diffusion of fluctuation energy ks can be defined based on thework reported in [34]:
ks ¼ kdenses þ kthins ð17Þ
kdenses ¼ 15ρsdsεsffiffiffiffiffiffiffiffiΘsπ
p4 41−33ηð Þ 1þ 12
5η 4η−3ð Þ þ 16
15π41−33ηð Þ
� �ηεsg0
� �ð18Þ
kthins ¼ 25ρsdsffiffiffiffiffiffiffiffiΘsπ
p16g0η 41−33ηð Þ 1þ 12
5η2 4η−3ð Þεsg0
� �ð19Þ
η ¼ 0:5 1:0þ eð Þ ð20Þ
with the given coefficient of restitution e. The estimation of thedissipation of the fluctuation energy due to particle collision following[34] is given by
γs ¼ 12:0 1−e2� �
ε2s ρs
ffiffiffiffiffiffiffiffiΘ3s
πd2p
vuut : ð21Þ
The exchange of the fluctuation energy owing to the interphasemomentum transport can be defined by [33]:
Φs ¼ −3βΘs: ð22Þ
The solid pressure Ps can be defined as [34]:
Ps ¼ ½1þ 2 1þ eð ÞεsρsΘs ð23Þ
where g0 is the radial distribution function as proposed by Ding andGidaspow [33]
g0 ¼ 35
1− εsεs;max
!1=3" #−1
: ð24Þ
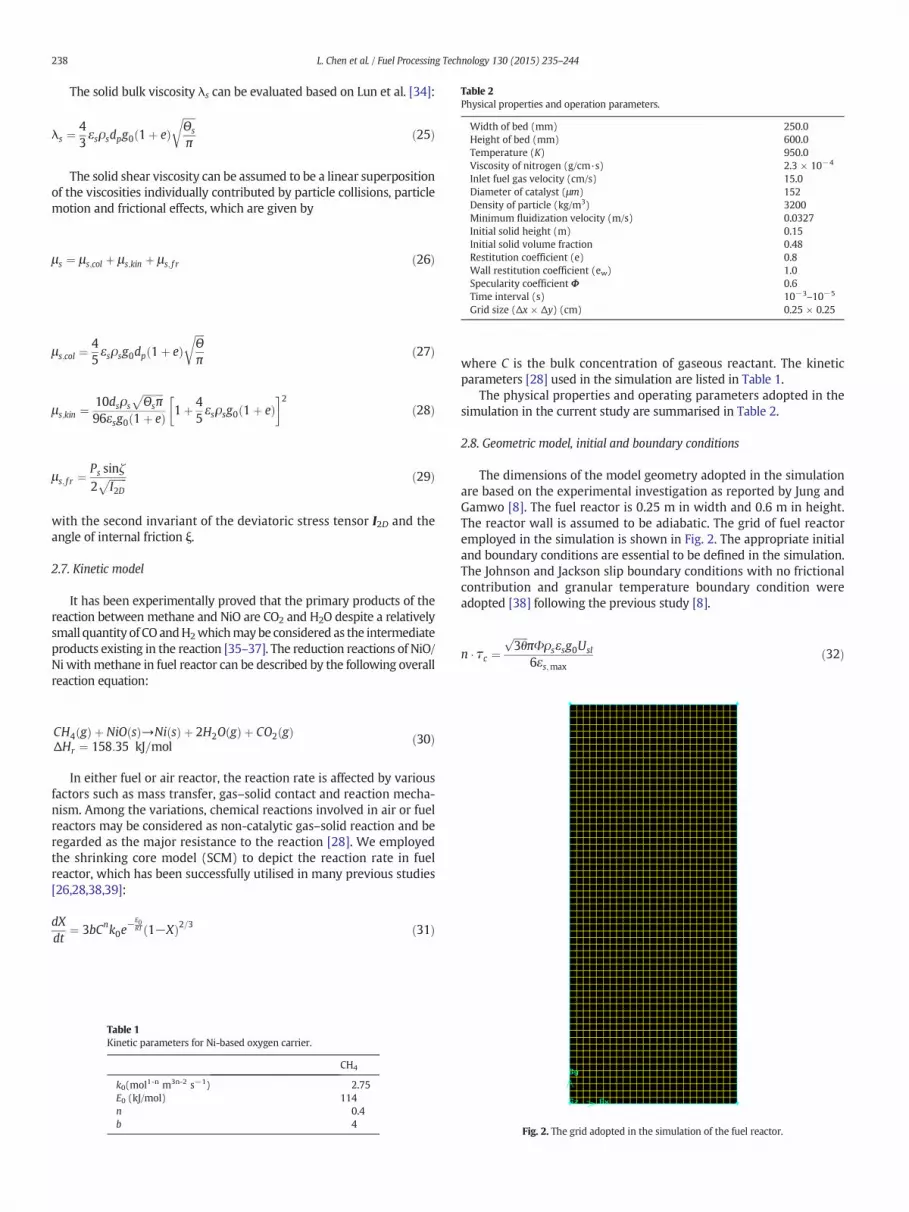
Table 2Physical properties and operation parameters.
Width of bed (mm) 250.0Height of bed (mm) 600.0Temperature (K) 950.0Viscosity of nitrogen (g/cm·s) 2.3 × 10⁻⁴
Inlet fuel gas velocity (cm/s) 15.0Diameter of catalyst (μm) 152Density of particle (kg/m3) 3200Minimum fluidization velocity (m/s) 0.0327Initial solid height (m) 0.15Initial solid volume fraction 0.48Restitution coefficient (e) 0.8Wall restitution coefficient (ew) 1.0Specularity coefficient Φ 0.6Time interval (s) 10−3–10−5
Grid size (Δx × Δy) (cm) 0.25 × 0.25
238 L. Chen et al. / Fuel Processing Technology 130 (2015) 235–244
The solid bulk viscosity λs can be evaluated based on Lun et al. [34]:
λs ¼43εsρsdpg0 1þ eð Þ
ffiffiffiffiffiΘs
π
rð25Þ
The solid shear viscosity can be assumed to be a linear superpositionof the viscosities individually contributed by particle collisions, particlemotion and frictional effects, which are given by
μs ¼ μs;col þ μs;kin þ μs; f r ð26Þ
μs;col ¼45εsρsg0dp 1þ eð Þ
ffiffiffiffiΘπ
rð27Þ
μs;kin ¼ 10dsρs
ffiffiffiffiffiffiffiffiΘsπ
p96εsg0 1þ eð Þ 1þ 4
5εsρsg0 1þ eð Þ
� �2ð28Þ
μs; f r ¼Ps sinζ2
ffiffiffiffiffiffiffiI2D
p ð29Þ
with the second invariant of the deviatoric stress tensor I2D and theangle of internal friction ξ.
2.7. Kinetic model
It has been experimentally proved that the primary products of thereaction between methane and NiO are CO2 and H2O despite a relativelysmall quantity of COandH2whichmaybe considered as the intermediateproducts existing in the reaction [35–37]. The reduction reactions of NiO/Ni withmethane in fuel reactor can be described by the following overallreaction equation:
CH4 gð Þ þ NiO sð Þ→Ni sð Þ þ 2H2O gð Þ þ CO2 gð ÞΔHr ¼ 158:35 kJ=mol ð30Þ
In either fuel or air reactor, the reaction rate is affected by variousfactors such as mass transfer, gas–solid contact and reaction mecha-nism. Among the variations, chemical reactions involved in air or fuelreactors may be considered as non-catalytic gas–solid reaction and beregarded as the major resistance to the reaction [28]. We employedthe shrinking core model (SCM) to depict the reaction rate in fuelreactor, which has been successfully utilised in many previous studies[26,28,38,39]:
dXdt
¼ 3bCnk0e−E0
RT 1−Xð Þ2=3 ð31Þ
Table 1Kinetic parameters for Ni-based oxygen carrier.
CH4
k0(mol1-n m3n-2 s−1) 2.75E0 (kJ/mol) 114n 0.4b 4
where C is the bulk concentration of gaseous reactant. The kineticparameters [28] used in the simulation are listed in Table 1.
The physical properties and operating parameters adopted in thesimulation in the current study are summarised in Table 2.
2.8. Geometric model, initial and boundary conditions
The dimensions of the model geometry adopted in the simulationare based on the experimental investigation as reported by Jung andGamwo [8]. The fuel reactor is 0.25 m in width and 0.6 m in height.The reactor wall is assumed to be adiabatic. The grid of fuel reactoremployed in the simulation is shown in Fig. 2. The appropriate initialand boundary conditions are essential to be defined in the simulation.The Johnson and Jackson slip boundary conditions with no frictionalcontribution and granular temperature boundary condition wereadopted [38] following the previous study [8].
n � τc ¼ffiffiffiffiffiffi3θ
pπΦρsεsg0Usl
6εs;maxð32Þ
Fig. 2. The grid adopted in the simulation of the fuel reactor.

239L. Chen et al. / Fuel Processing Technology 130 (2015) 235–244
−n � q ¼ffiffiffiffiffiffi3θ
pπΦρsεsg0 Uslj j2 þ
ffiffiffi3
pπρsεsg0 1−e2w
� �θ3=2
ð33Þ
Fig. 4. Instantaneous volume fraction contours (a) work by Chalermsinsuwan et al.;(b) current work.
6εs;max 4εs;max
The simulation was initialised by assuming the fuel reactor to bepartly loaded with the oxygen carriers consisting of NiO (60 wt.%)supported on NiMgAl2O4 (40 wt.%), where the initial solid volumefraction is 0.48 and the static bed height is 0.15 m. The porosity of theoxygen carrier is 0.36%. Pressure outlet boundary condition at the exitis imposed with the approximation that the reactive flow is welldeveloped. The commercial CFD code ANSYS FLUENT has been adoptedin the simulation. The case of heterogeneous reaction was considered.The time step of 0.0001 s is chosen for the temporal discretisation and30 iterations per time step are carried out. A convergence criterion of10−3 was selected to specify the maximum residuals between twosuccessive iterations for all concerned parameters. The phase coupledSIMPLE algorithm was employed to describe the pressure–velocitycoupling of both gas and solid phases. The second order QUICK schemeis employed to evaluate the convective terms. In the simulation, gridindependence test has been undertaken and it was found that therefinedmesh with 0.125 × 0.125 cmhasminor impact on the predictedflowbehaviours and concentrations of both gas and solid phases. Thus, agrid of 0.25 × 0.25 cm has been employed throughout the simulation.
2.9. Hydrodynamic model validation
To ensure that the CFD model employed in this paper was able toeffectively capture the actual bubbling features, a validation simulationfor an independent case of gas–solid bubbling fluidised bed as reportedin the open literature [40] was conducted before the CFD model wasapplied to the simulation of the fuel reactor. The reason for the selectionof the gas–solid bubbling fluidised bed is that its configuration and flowcharacteristics are similar to those in the fuel reactor if the reactions arenot concerned. A quantitative comparison of bed expansion ratiobetween the numerical calculation results obtained by using the CFDmodel used in the current study and the previously published experi-mental results [40] is shown in Fig. 3. In the experimental work ofChalermsinsuwan et al. [40], a scale factor “C” was used to representthe effects of experimental conditions on the interphase exchangecoefficient model for the purpose of accurate prediction of bedexpansion. It can be seen clearly from Fig. 3 that the bed expansionratios predicted using our CFDmodel are consistentwith those reportedby Chalermsinsuwan et al. [40]. The bed expansion ratios obtained fromthe experiments for conditions of the superficial velocity of 0.28m/s and0.35 m/s are in good agreement with the simulation results with thescale factor of 0.15, while the expansion ratio for condition of thesuperficial velocity of 0.25 m/s can be predicted properly with a scalefactor of 0.1. Fig. 4 depicts the comparison of the instantaneous volume
1.25
1.27
1.29
1.31
1.33
1.35
1.37
1.39
0.2 0.3 0.4
Bed
Exp
ansi
on R
atio
Superficial Velocity (m/s)
Experimental data(Chalermsinsuwan et al.2011)
C=0.15(Chalermsinsuwan et al.2011)
C=0.10(Chalermsinsuwan et al.2011)
C=0.15
C=0.10
Fig. 3. Comparisons of bed expansion ratios between the experimental and simulationresults.
fraction distribution between our simulation and that reported byChalermsinsuwan et al. The features of bubble formation, rise andburst in the bubbling fluidised bedwere successfully captured. It shouldbe noted that it is unclear what type of non-uniformed parabola inletvelocity profile was employed by Chalermsinsuwan et al. in theirsimulation. We have assumed a one seventh power law inlet velocityprofile used for inlet velocity. Thus, minor differences in the volumefraction contours can be spotted from Fig. 4. Also, the differentdiscretisation scheme (second order upwind scheme) was adopted inthe current work while the discretisation scheme employed in theliterature [40] was not clarified, which may lead to some inconsis-tencies. It seems that our CFD model is able to properly capture thehydrodynamics of the bubbling fluidised bed. With confidence andsome reservations, we employ the CFD model proposed in this paperfor modelling the hydrodynamics in the fuel rector.
3. Results and discussion
3.1. Bubble formation and distributions of reactants and products in the fuelreactor
To examine the bubble formation, the transient simulations havebeen performed over a period of 12 s. The trial simulation has indicatedthat after t = 10.0 s, it seems that the flow in the fuel reactor hasachieved a quasi-steady status. At the beginning of the simulation, thesolid oxygen carriers (NiO particles) were assumed to suspend by theinert gas introduced from the bottom of the fuel reactor. The gaseousfuel consisting of 12.5 wt.% of methane (CH4) and 87.5 wt.% of nitrogen(N2) was fed into the fuel reactor after the simulation reached 5 s.Simulation results indicate that the solid particles and gaseous fuel arehighly mixed due to the formation of upward gas bubble. Meanwhile,the methane is oxidised by the oxygen within the solid carriers andconverted to two main products, H2O and CO2.
The instantaneous changes of different parameters and properties ofthe flow and reaction can be observed from the simulation. Fig. 5 showsthe distributions of the volume fraction of solid particles, the massfraction of methane, the mass fraction of H2O and the mass fraction ofCO2 along with the time evolution from 5.0 s to 12.0 s. It can be seenfrom the contour plot of particle volume fraction that the importantcharacteristics of the bubbles in the fuel reactor are reasonably
5.0s 8.0s 9.0s 10.0s 11.0s
11.2s 11.4s 11.6s 11.8s 12.0s
(a)
5.0s 8.0s 9.0s 10.0s 11.0s
11.2s 11.4s 11.6s 11.8s 12.0s
(b)
5.0s 8.0s 9.0s 10.0s 11.0s
11.2s 11.4s 11.6s 11.8s 12.0s
(c)
5.0s 8.0s 9.0s 10.0s 11.0s
11.2s 11.4s 11.6s 11.8s 12.0s
(d)
Fig. 5. Instantaneous contours of the volume fractions of solid particles and themass fractions of the reactants and products in the fuel reactorwith time evolution. (a) The volume fractionof solid particles; (b) the mass fraction of methane; c) the mass fraction of H2O; d) the mass fraction of CO2.
240 L. Chen et al. / Fuel Processing Technology 130 (2015) 235–244
captured, including the formation of bubbles, rise and burst of bubbles.As the fast rising bubbles would result in a poor mixing between solidparticles and gas phase species so that the conversion of methane isreduced significantly, it is essential to monitor and control bubbleformation, which will assist the conversion of the fuel gas so as toimprove the conversion efficiency. This will be further discussed.
As mentioned above, the simulation revealed that the flow in thefuel reactor roughly achieved the quasi-steady status at t = 10.0 s. Itcan be seen from Fig. 5b that the mass fraction of CH4 decreasesgradually along the height of the fuel reactor from the distributor tothe outlet while the reverse behaviour for the distributions of H2O andCO2 is observed from Fig. 5c and d. This result is qualitatively consistentwith the reality as can be seen qualitatively from the overall reaction
Eq. (30). Because H2O and CO2 are the reaction products, it is expectedthat with the consumption of CH4 along the bed height, production ofH2O and CO2 in the reduction process should increase. Adanez et al.[10] indicated that the mass fraction of methane in longitudinaldirection predicted by using the shrinking coremodel decreases linearlyalong the bed heightwhen referencing from the bottom. The results ob-tained by Jung et al. [8] and Deng et al. [8,24] figured out that the bubblephase presented a high concentration of CH4 indicating the bypassing ofbubble in the fuel reactor would result in a poor conversion rate due toincomplete combustion. This is consistent with the results obtainedfrom the current simulations. Thus, the bubble fraction contoursshown in Fig. 5a and b clearly indicate that the formedbubbles, especial-ly near the wall have higher concentration of CH4 than that of adjacent

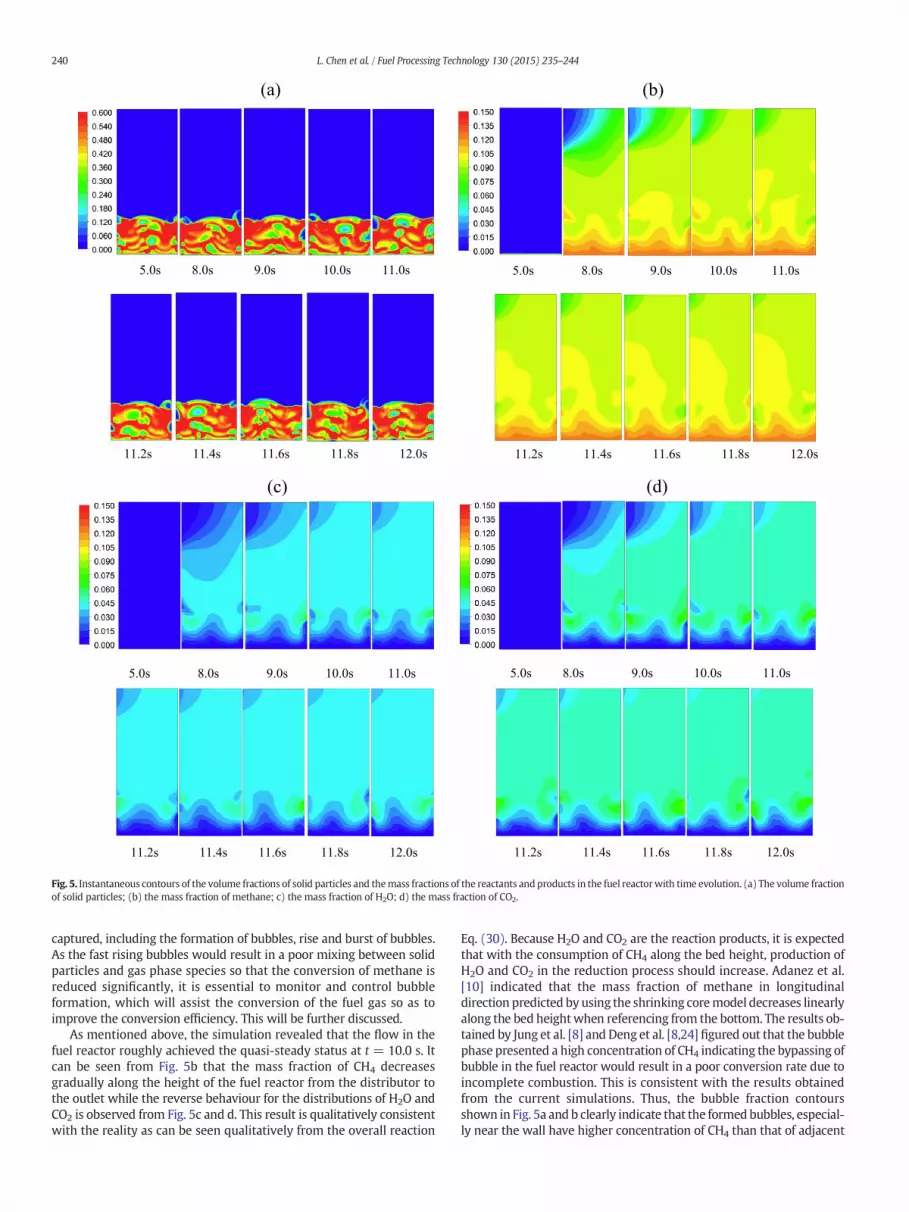
Fig. 6. Instantaneous contours of the volume fraction, the velocity vector and the vortex of gas phase at 11.2 s. (a) The volume fraction of gas phase; (b) the y-velocity vector of gas phasewith a scale factor 2; (c) the vortex magnitude of gas phase correlated with the mass fraction of methane.
241L. Chen et al. / Fuel Processing Technology 130 (2015) 235–244
section. Meanwhile, higher concentrations of products such as H2O andCO2 are found where the solid phase concentration is higher as can beseen from Fig. 5a, c and d.
Asmentioned above, the gas bubbles formed in the dense bed regionis proposed to have a strong relationship with the local eddies. Fig. 6presents the instantaneous contours of the volume fraction, they-velocity vector and the vortex of gas phase correlated with the massfraction of methane at 11.2 s respectively. It is identified that vorticesare formed where the concentration of gas phase is high and theirmagnitudes increase along with the volume fraction. Meanwhile, italso indicates the incomplete combustion of methane due to its highconcentration in bubble phase.
3.2. Redistributions of reactants and products and dynamic parametervariations in fuel reactor
The time evolution of mass fractions of gaseous reactant andproducts in the dense bed region was captured and recorded, startingat t = 5 s after the simulation was run, as shown in Fig. 7. When t =6 s, the time oscillation of the methane mass fraction seems to enterthe quasi-steady status, where the bubble bypassing and the reductionmay dictate the involved phenomena observed in the fuel reactor.From Fig. 7, it is obvious that a rapid increase in the mass fraction of
0.00
0.02
0.04
0.06
0.08
0.10
0.12
0.14
0.0 2.0 4.0 6.0 8.0 10.0 12.0 14.0
Mas
s fr
acti
on
Time(t)
CH4
H2O
CO2
Fig. 7. Time evolution of mass fraction of gaseous reactant and products at x = 0.125 m,y = 0.05 m in dense bed region.
methane is occurring during the period from t = 5 to 5.6 s. This maybe attributed to the insufficient reduction because of the redundantCH4 fed in. Thereafter the reduction gradually reaches the quasi-steady state and the mass fraction of methane oscillated around 0.115.The tendency of the oscillations of CO2 mass fraction is very similar tothat of thewater. Themass fraction of CO2 sustains a frequent oscillationaround 0.018 after 6 s, while 0.015 for that of H2O. This time oscillationmay also indicate that the reduction has reached quasi-equilibrium inthe dense bed after 6 s for the fuel reactor adopted in the current study.
Fig. 8 shows the variations of the mass fraction of gaseous reactantand products in free board region with the time change. The methanerapidly accumulated in the free board region during the period fromt = 6.5 s to 9.2 s and the rate decreases gradually afterwards. Thelarge fast-rising bubbles formed consisting of high-concentrationmethane in the dense bed region are the major factor responsible forthe rapid increase, while ineffective combustion of methane becauseof insufficient reduction rate also contributes to the rapid increase inmethane mass fraction in the free board region. Similar tends of themass fraction of CO2 and H2O are observed in Fig. 8. Lower oxygen car-rier concentration in the reactor may be the reason for the reduced pro-ducing rate of H2O and CO2.
-0.02
0.00
0.02
0.04
0.06
0.08
0.10
0.12
0.0 2.0 4.0 6.0 8.0 10.0 12.0 14.0
Mas
s fr
acti
on
Time (t)
CH4
H2O
CO2
Fig. 8. Time evolution of mass fraction of gaseous reactant and products at x = 0.125 m,y = 0.50 m in free board region.
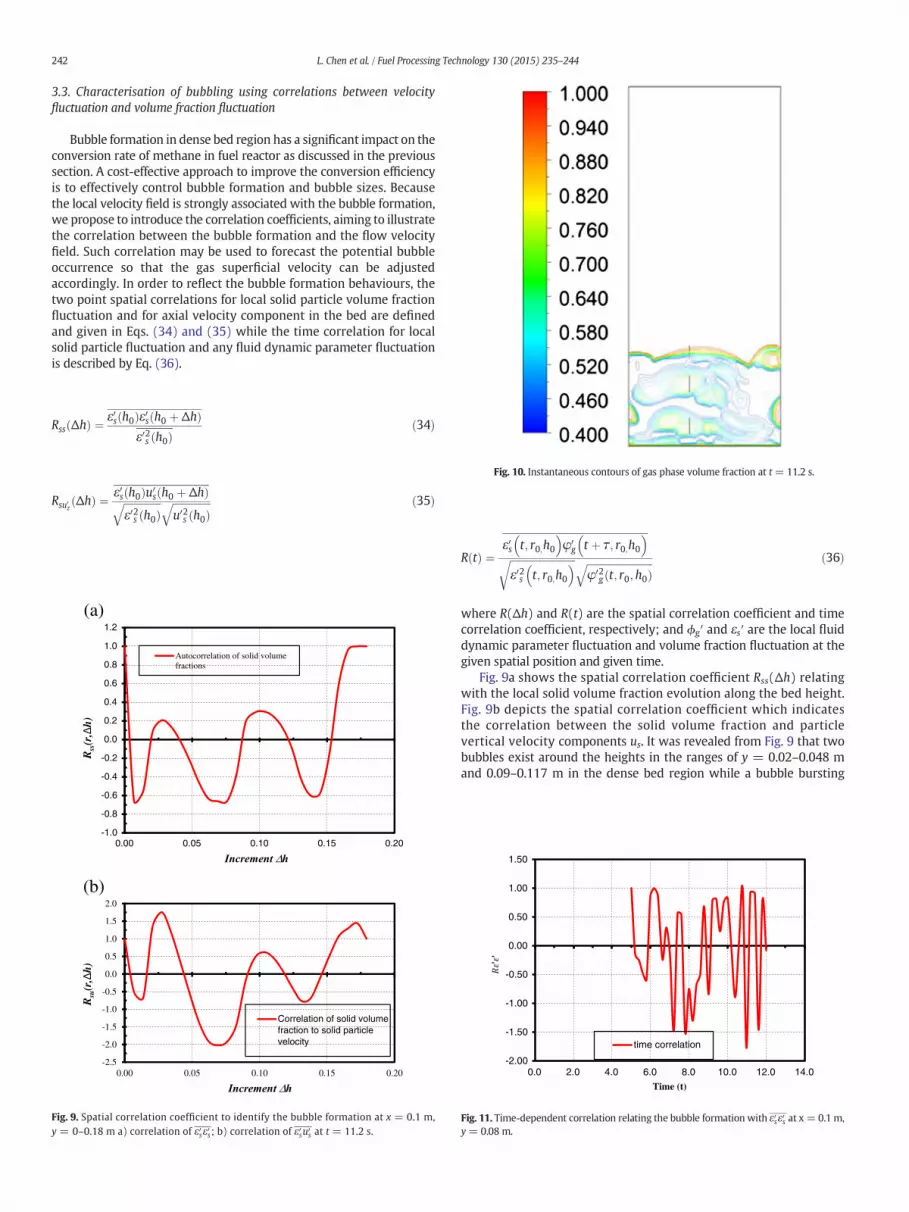
Fig. 10. Instantaneous contours of gas phase volume fraction at t = 11.2 s.
242 L. Chen et al. / Fuel Processing Technology 130 (2015) 235–244
3.3. Characterisation of bubbling using correlations between velocityfluctuation and volume fraction fluctuation
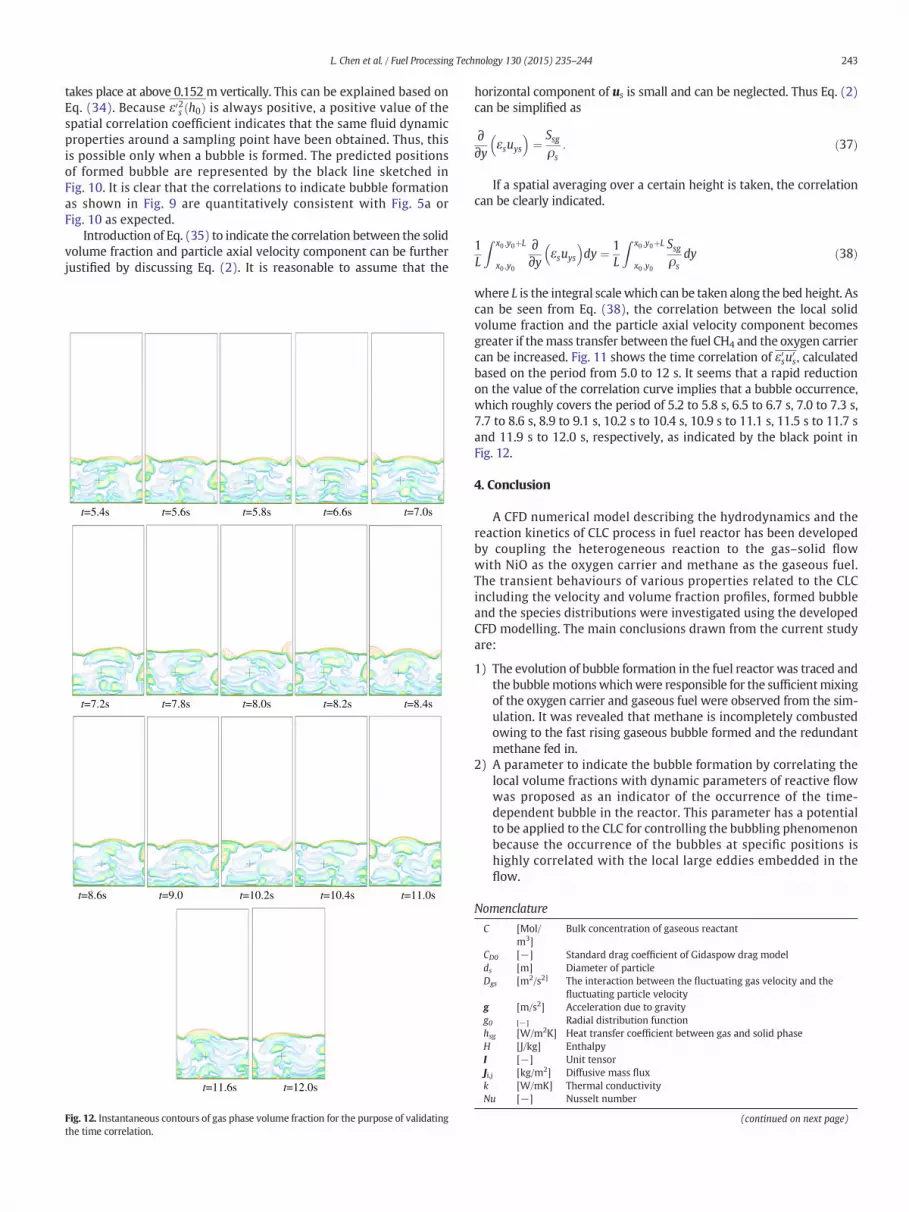
Bubble formation in dense bed region has a significant impact on theconversion rate of methane in fuel reactor as discussed in the previoussection. A cost-effective approach to improve the conversion efficiencyis to effectively control bubble formation and bubble sizes. Becausethe local velocity field is strongly associated with the bubble formation,we propose to introduce the correlation coefficients, aiming to illustratethe correlation between the bubble formation and the flow velocityfield. Such correlation may be used to forecast the potential bubbleoccurrence so that the gas superficial velocity can be adjustedaccordingly. In order to reflect the bubble formation behaviours, thetwo point spatial correlations for local solid particle volume fractionfluctuation and for axial velocity component in the bed are definedand given in Eqs. (34) and (35) while the time correlation for localsolid particle fluctuation and any fluid dynamic parameter fluctuationis described by Eq. (36).
Rss Δhð Þ ¼ ε0s h0ð Þε0s h0 þ Δhð Þε02s h0ð Þ
ð34Þ
Rsu0z Δhð Þ ¼ ε0s h0ð Þu0s h0 þ Δhð Þffiffiffiffiffiffiffiffiffiffiffiffiffiffiffi
ε02s h0ð Þq ffiffiffiffiffiffiffiffiffiffiffiffiffiffiffi
u02s h0ð Þ
q ð35Þ
(a)
(b)
-1.0
-0.8
-0.6
-0.4
-0.2
0.0
0.2
0.4
0.6
0.8
1.0
1.2
0.00 0.05 0.10 0.15 0.20
Autocorrelation of solid volumefractions
-2.5
-2.0
-1.5
-1.0
-0.5
0.0
0.5
1.0
1.5
2.0
0.00 0.05 0.10 0.15 0.20
Correlation of solid volumefraction to solid particlevelocity
Fig. 9. Spatial correlation coefficient to identify the bubble formation at x = 0.1 m,y = 0–0.18 m a) correlation of ε0sε0s; b) correlation of ε0su0
s at t = 11.2 s.
R tð Þ ¼ε0s t; r0;h0� �
φ0g t þ τ; r0;h0� �
ffiffiffiffiffiffiffiffiffiffiffiffiffiffiffiffiffiffiffiffiffiffiffiffiffiffiε02s t; r0;h0� �r ffiffiffiffiffiffiffiffiffiffiffiffiffiffiffiffiffiffiffiffiffiffiffiffiffiffi
φ02g t; r0; h0ð Þ
q ð36Þ
where R(Δh) and R(t) are the spatial correlation coefficient and timecorrelation coefficient, respectively; and ϕg′ and εs′ are the local fluiddynamic parameter fluctuation and volume fraction fluctuation at thegiven spatial position and given time.
Fig. 9a shows the spatial correlation coefficient Rss(Δh) relatingwith the local solid volume fraction evolution along the bed height.Fig. 9b depicts the spatial correlation coefficient which indicatesthe correlation between the solid volume fraction and particlevertical velocity components us. It was revealed from Fig. 9 that twobubbles exist around the heights in the ranges of y = 0.02–0.048 mand 0.09–0.117 m in the dense bed region while a bubble bursting
-2.00
-1.50
-1.00
-0.50
0.00
0.50
1.00
1.50
0.0 2.0 4.0 6.0 8.0 10.0 12.0 14.0
Time (t)
time correlation
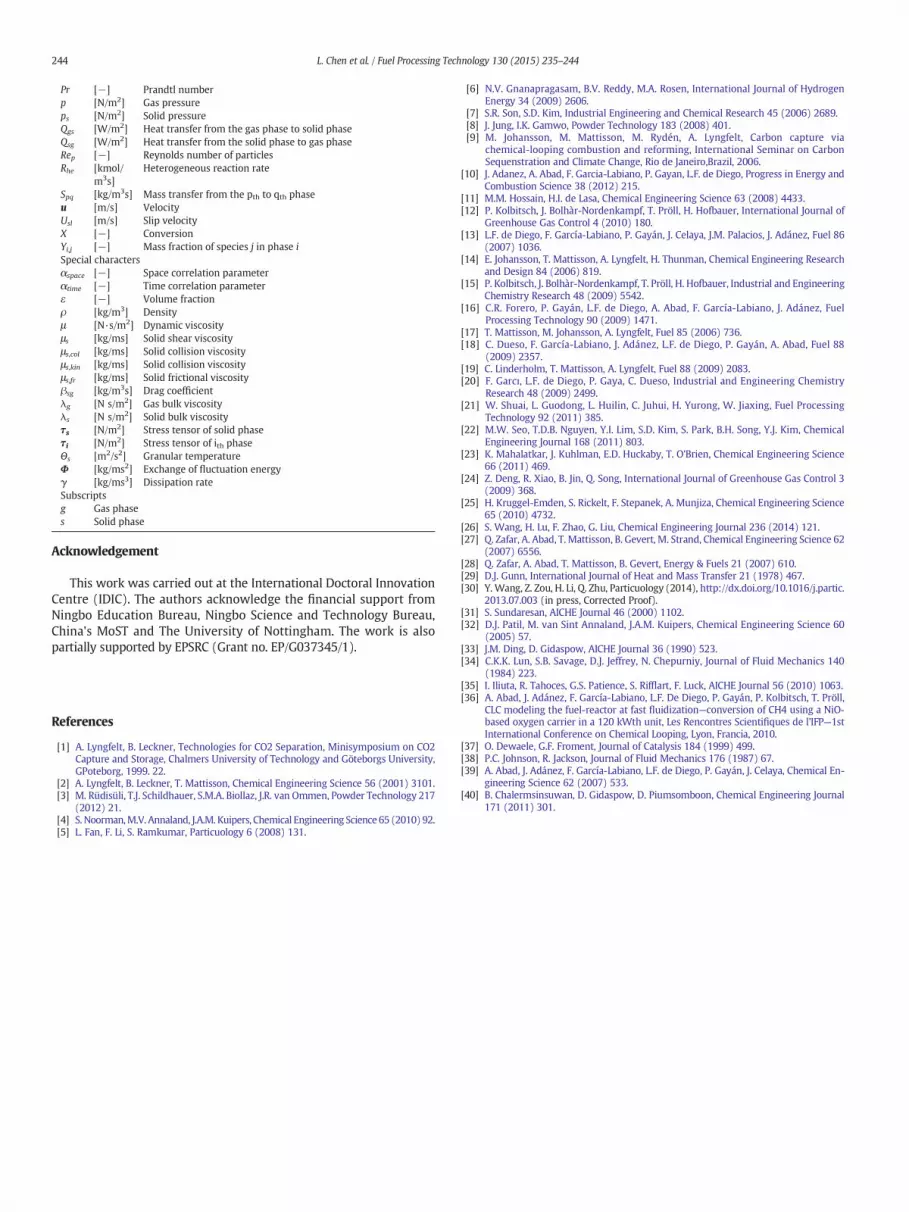
Fig. 11. Time-dependent correlation relating the bubble formation with ε0sε0s at x = 0.1 m,y = 0.08 m.
243L. Chen et al. / Fuel Processing Technology 130 (2015) 235–244
takes place at above 0.152 m vertically. This can be explained based onEq. (34). Because ε02s h0ð Þ is always positive, a positive value of thespatial correlation coefficient indicates that the same fluid dynamicproperties around a sampling point have been obtained. Thus, thisis possible only when a bubble is formed. The predicted positionsof formed bubble are represented by the black line sketched inFig. 10. It is clear that the correlations to indicate bubble formationas shown in Fig. 9 are quantitatively consistent with Fig. 5a orFig. 10 as expected.
Introduction of Eq. (35) to indicate the correlation between the solidvolume fraction and particle axial velocity component can be furtherjustified by discussing Eq. (2). It is reasonable to assume that the
t=5.4s t=5.6s t=5.8s t=6.6s t=7.0s
t=7.2s t=7.8s t=8.0s t=8.2s t=8.4s
t=8.6s t=9.0 t=10.2s t=10.4s t=11.0s
t=11.6s t=12.0s
Fig. 12. Instantaneous contours of gas phase volume fraction for the purpose of validatingthe time correlation.
horizontal component of us is small and can be neglected. Thus Eq. (2)can be simplified as
∂∂y εsuys
� �¼ Ssg
ρs: ð37Þ
If a spatial averaging over a certain height is taken, the correlationcan be clearly indicated.
1L
Z x0 ;y0þL
x0 ;y0
∂∂y εsuys
� �dy ¼ 1
L
Z x0 ;y0þL
x0 ;y0
Ssgρs
dy ð38Þ
where L is the integral scale which can be taken along the bed height. Ascan be seen from Eq. (38), the correlation between the local solidvolume fraction and the particle axial velocity component becomesgreater if themass transfer between the fuel CH4 and the oxygen carriercan be increased. Fig. 11 shows the time correlation of ε0su
0s, calculated
based on the period from 5.0 to 12 s. It seems that a rapid reductionon the value of the correlation curve implies that a bubble occurrence,which roughly covers the period of 5.2 to 5.8 s, 6.5 to 6.7 s, 7.0 to 7.3 s,7.7 to 8.6 s, 8.9 to 9.1 s, 10.2 s to 10.4 s, 10.9 s to 11.1 s, 11.5 s to 11.7 sand 11.9 s to 12.0 s, respectively, as indicated by the black point inFig. 12.
4. Conclusion
A CFD numerical model describing the hydrodynamics and thereaction kinetics of CLC process in fuel reactor has been developedby coupling the heterogeneous reaction to the gas–solid flowwith NiO as the oxygen carrier and methane as the gaseous fuel.The transient behaviours of various properties related to the CLCincluding the velocity and volume fraction profiles, formed bubbleand the species distributions were investigated using the developedCFD modelling. The main conclusions drawn from the current studyare:
1) The evolution of bubble formation in the fuel reactor was traced andthe bubblemotionswhichwere responsible for the sufficientmixingof the oxygen carrier and gaseous fuel were observed from the sim-ulation. It was revealed that methane is incompletely combustedowing to the fast rising gaseous bubble formed and the redundantmethane fed in.
2) A parameter to indicate the bubble formation by correlating thelocal volume fractions with dynamic parameters of reactive flowwas proposed as an indicator of the occurrence of the time-dependent bubble in the reactor. This parameter has a potentialto be applied to the CLC for controlling the bubbling phenomenonbecause the occurrence of the bubbles at specific positions ishighly correlated with the local large eddies embedded in theflow.
Nomenclature
C
[Mol/m3]Bulk concentration of gaseous reactant
CD0
[−] Standard drag coefficient of Gidaspow drag model ds [m] Diameter of particle Dgs [m2/s2] The interaction between the fluctuating gas velocity and thefluctuating particle velocity
g [m/s2] Acceleration due to gravity g0 [−] Radial distribution function hsg [W/m2K] Heat transfer coefficient between gas and solid phase H [J/kg] Enthalpy I [−] Unit tensor Ji,j [kg/m2] Diffusive mass flux k [W/mK] Thermal conductivity Nu [−] Nusselt number(continued on next page)
A
244 L. Chen et al. / Fuel Processing Technology 130 (2015) 235–244
Pr
cknow
[−]
ledgem
Prandtl number
p [N/m2] Gas pressure ps [N/m2] Solid pressure Qgs [W/m2] Heat transfer from the gas phase to solid phase Qsg [W/m2] Heat transfer from the solid phase to gas phase Rep [−] Reynolds number of particles Rhe [kmol/m3s]
Heterogeneous reaction rateSpq
[kg/m3s] Mass transfer from the pth to qth phase u [m/s] Velocity Usl [m/s] Slip velocity X [−] Conversion Yi,j [−] Mass fraction of species j in phase i Special characters αspace [−] Space correlation parameter αtime [−] Time correlation parameter ε [−] Volume fraction ρ [kg/m3] Density μ [N·s/m2] Dynamic viscosity μs [kg/ms] Solid shear viscosity μs,col [kg/ms] Solid collision viscosity μs,kin [kg/ms] Solid collision viscosity μs,fr [kg/ms] Solid frictional viscosity βsg [kg/m3s] Drag coefficient λg [N s/m2] Gas bulk viscosity λs [N s/m2] Solid bulk viscosity τs [N/m2] Stress tensor of solid phase τi [N/m2] Stress tensor of ith phase Θs [m2/s2] Granular temperature Φ [kg/ms2] Exchange of fluctuation energy γ [kg/ms3] Dissipation rate Subscripts g Gas phase s Solid phaseent
This work was carried out at the International Doctoral InnovationCentre (IDIC). The authors acknowledge the financial support fromNingbo Education Bureau, Ningbo Science and Technology Bureau,China's MoST and The University of Nottingham. The work is alsopartially supported by EPSRC (Grant no. EP/G037345/1).
References
[1] A. Lyngfelt, B. Leckner, Technologies for CO2 Separation, Minisymposium on CO2Capture and Storage, Chalmers University of Technology and Göteborgs University,GPoteborg, 1999. 22.
[2] A. Lyngfelt, B. Leckner, T. Mattisson, Chemical Engineering Science 56 (2001) 3101.[3] M. Rüdisüli, T.J. Schildhauer, S.M.A. Biollaz, J.R. van Ommen, Powder Technology 217
(2012) 21.[4] S. Noorman,M.V. Annaland, J.A.M. Kuipers, Chemical Engineering Science 65 (2010) 92.[5] L. Fan, F. Li, S. Ramkumar, Particuology 6 (2008) 131.
[6] N.V. Gnanapragasam, B.V. Reddy, M.A. Rosen, International Journal of HydrogenEnergy 34 (2009) 2606.
[7] S.R. Son, S.D. Kim, Industrial Engineering and Chemical Research 45 (2006) 2689.[8] J. Jung, I.K. Gamwo, Powder Technology 183 (2008) 401.[9] M. Johansson, M. Mattisson, M. Rydén, A. Lyngfelt, Carbon capture via
chemical-looping combustion and reforming, International Seminar on CarbonSequenstration and Climate Change, Rio de Janeiro,Brazil, 2006.
[10] J. Adanez, A. Abad, F. Garcia-Labiano, P. Gayan, L.F. de Diego, Progress in Energy andCombustion Science 38 (2012) 215.
[11] M.M. Hossain, H.I. de Lasa, Chemical Engineering Science 63 (2008) 4433.[12] P. Kolbitsch, J. Bolhàr-Nordenkampf, T. Pröll, H. Hofbauer, International Journal of
Greenhouse Gas Control 4 (2010) 180.[13] L.F. de Diego, F. García-Labiano, P. Gayán, J. Celaya, J.M. Palacios, J. Adánez, Fuel 86
(2007) 1036.[14] E. Johansson, T. Mattisson, A. Lyngfelt, H. Thunman, Chemical Engineering Research
and Design 84 (2006) 819.[15] P. Kolbitsch, J. Bolhàr-Nordenkampf, T. Pröll, H. Hofbauer, Industrial and Engineering
Chemistry Research 48 (2009) 5542.[16] C.R. Forero, P. Gayán, L.F. de Diego, A. Abad, F. García-Labiano, J. Adánez, Fuel
Processing Technology 90 (2009) 1471.[17] T. Mattisson, M. Johansson, A. Lyngfelt, Fuel 85 (2006) 736.[18] C. Dueso, F. García-Labiano, J. Adánez, L.F. de Diego, P. Gayán, A. Abad, Fuel 88
(2009) 2357.[19] C. Linderholm, T. Mattisson, A. Lyngfelt, Fuel 88 (2009) 2083.[20] F. Garcı, L.F. de Diego, P. Gaya, C. Dueso, Industrial and Engineering Chemistry
Research 48 (2009) 2499.[21] W. Shuai, L. Guodong, L. Huilin, C. Juhui, H. Yurong, W. Jiaxing, Fuel Processing
Technology 92 (2011) 385.[22] M.W. Seo, T.D.B. Nguyen, Y.I. Lim, S.D. Kim, S. Park, B.H. Song, Y.J. Kim, Chemical
Engineering Journal 168 (2011) 803.[23] K. Mahalatkar, J. Kuhlman, E.D. Huckaby, T. O'Brien, Chemical Engineering Science
66 (2011) 469.[24] Z. Deng, R. Xiao, B. Jin, Q. Song, International Journal of Greenhouse Gas Control 3
(2009) 368.[25] H. Kruggel-Emden, S. Rickelt, F. Stepanek, A. Munjiza, Chemical Engineering Science
65 (2010) 4732.[26] S. Wang, H. Lu, F. Zhao, G. Liu, Chemical Engineering Journal 236 (2014) 121.[27] Q. Zafar, A. Abad, T. Mattisson, B. Gevert, M. Strand, Chemical Engineering Science 62
(2007) 6556.[28] Q. Zafar, A. Abad, T. Mattisson, B. Gevert, Energy & Fuels 21 (2007) 610.[29] D.J. Gunn, International Journal of Heat and Mass Transfer 21 (1978) 467.[30] Y. Wang, Z. Zou, H. Li, Q. Zhu, Particuology (2014), http://dx.doi.org/10.1016/j.partic.
2013.07.003 (in press, Corrected Proof).[31] S. Sundaresan, AICHE Journal 46 (2000) 1102.[32] D.J. Patil, M. van Sint Annaland, J.A.M. Kuipers, Chemical Engineering Science 60
(2005) 57.[33] J.M. Ding, D. Gidaspow, AICHE Journal 36 (1990) 523.[34] C.K.K. Lun, S.B. Savage, D.J. Jeffrey, N. Chepurniy, Journal of Fluid Mechanics 140
(1984) 223.[35] I. Iliuta, R. Tahoces, G.S. Patience, S. Rifflart, F. Luck, AICHE Journal 56 (2010) 1063.[36] A. Abad, J. Adánez, F. García-Labiano, L.F. De Diego, P. Gayán, P. Kolbitsch, T. Pröll,
CLC modeling the fuel-reactor at fast fluidization—conversion of CH4 using a NiO-based oxygen carrier in a 120 kWth unit, Les Rencontres Scientifiques de l'IFP—1stInternational Conference on Chemical Looping, Lyon, Francia, 2010.
[37] O. Dewaele, G.F. Froment, Journal of Catalysis 184 (1999) 499.[38] P.C. Johnson, R. Jackson, Journal of Fluid Mechanics 176 (1987) 67.[39] A. Abad, J. Adánez, F. García-Labiano, L.F. de Diego, P. Gayán, J. Celaya, Chemical En-
gineering Science 62 (2007) 533.[40] B. Chalermsinsuwan, D. Gidaspow, D. Piumsomboon, Chemical Engineering Journal
171 (2011) 301.