capture and inception of bubbles near line vortices
TRANSCRIPT

Capture and inception of bubbles near line vorticesG. F. OweisUniversity of Michigan, Ann Arbor, Michigan 48109-2121
I. E. van der HoutDelft University of Technology, The Netherlands
C. IyerThe Ford Motor Company, Dearborn, Michigan 48126-2798
G. TryggvasonWorcester Polytechnic Institute, Worcester, Massachusetts 01609-2280
S. L. Ceccioa!
University of Michigan, Ann Arbor, Michigan 48109-2121
sReceived 15 July 2003; accepted 26 October 2004; published online 13 January 2005d
Motivated by the need to predict vortex cavitation inception, a study has been conducted toinvestigate bubble capture by a concentrated line vortex of core sizerc and circulationG0 undernoncavitating and cavitating conditions. Direct numerical simulations that solve simultaneously forthe two phase flow field, as well as a simpler one-way coupled point-particle-tracking modelsPTMdwere used to investigate the capture process. The capture times were compared to experimentalobservations. It was found that the point-particle-tracking model can successfully predict the captureof noncavitating small nuclei by a line vortex released far from the vortex axis. The nucleus growsvery slowly during capture until the late stages of the process, where bubble/vortex interaction andbubble deformation become important. Consequently, PTM can be used to study the capture ofcavitating nuclei by dividing the process into the noncavitating capture of the nucleus, and then thegrowth of the nucleus in the low-pressure core region. Bubble growth and deformation act to speedup the capture process. ©2005 American Institute of Physics. fDOI: 10.1063/1.1834916g
I. BACKGROUND
Hydrodynamic lifting surfaces associated with propul-sion and control systems often develop concentrated trailingvortices. Small bubblessor nucleid present in the free streamnear the concentrated vortex will be drawn toward the axis offlow rotation, and if the vortex core pressure falls below theliquid vapor pressure, these small bubbles can act as nucle-ation sites for cavitation inception. Vortex cavitation can alsooccur in unsteady vortices such as those found in shear layersand jets. Arndt1 has recently reviewed the subject of vortexcavitation.
Early vortex cavitation inception events often happendiscretely in time, and this is because two conditions must bemet concurrently:sid a cavitation nucleussa bubbled must bepresent in the low-pressure region of the vortexsthe coredand sii d the vortex core pressure should be low enough forthis nucleus to grow explosively, or cavitate. If a nucleusalready exists in the vortex core, then cavitation inception iscontrolled by the pressure field generated by the vortex.Transient pressure drops in the vortex core due to unsteadyflow phenomenase.g., vortex stretchingd can produce the lowpressures required for the explosive growth of the nucleus. Ifthe nucleus exists outside the core region, it can move to-ward the vortex axis and be “captured” by the low-pressureregion of the vortex. The time it takes the nucleus to move
near the vortex axis is the capture time. If the time scaleassociated with the transient pressure drop in the vortex coreis known si.e., how long an unsteady vortex will sustain acertain level of pressure reductiond, then one needs to knowthe capture time to identify which nuclei surrounding an un-steady vortex will lead to discrete vortex cavitation eventsfirst. The likelihood of cavitation inception in the vortex coreis related s1d to the probability of the nuclei’s presencewithin or near the vortex core ands2d to the probability thatthe nuclei will migrate towards the vortex axissbe capturedby the vortexd in time while the transient vortex core pres-sure is still low enough for explosive bubble growth. Thefirst condition is related to the concentration and size distri-bution of the free-stream nucleisi.e., the nuclei number dis-tributiond, while the second condition is governed by thecapture time.
The vortex-induced capture, interaction, and growth ofsmall bubbles have been studied by several researchers ex-perimentally and numerically using spherical bubble as-sumptions and also high fidelity simulation of the two phaseflow field with resolved bubble shape computations. Sridharand Katz2 studied an entrained bubble in a vortex ring usingparticle image velocimetry and showed that in certain casesthe entrained bubble can substantially change the structure ofthe vortex. Hsiao and Pauley3 examined the capture of acavitation nucleus by a tip vortex employing a Reynolds av-eraged Navier StokessRANSd model of the noncavitatingflow along with a point-particle tracking modelsPTMd toadAuthor to whom correspondence should be addressed.
PHYSICS OF FLUIDS17, 022105s2005d
1070-6631/2005/17~2!/022105/14/$22.50 © 2005 American Institute of Physics17, 022105-1
Downloaded 27 Aug 2010 to 131.180.130.114. Redistribution subject to AIP license or copyright; see http://pof.aip.org/about/rights_and_permissions

describe the spherical dynamics of the nucleus. More de-tailed computations have been attempted by other research-ers. For instance, Chahine and co-workers have used bothRANS and boundary integral methods to study vortex bubbleinteraction.4–7 They have shown how captured bubbles cansignificantly deform as they are captured by the vortex, growand collapse.
In models of bubbles in liquid flows that employ one-way coupling between the carrier flow and the bubble, it isassumed that the presence of the bubble does not signifi-cantly alter the carrier flow field. An equation of motion forthe trajectory of the bubble is solved using a force balance onthe bubble. For cavitating flows, the Rayleigh-Plesset equa-tion is employed to describe the dynamics of the cavitatingbubble. Such PTM techniques often assume that the bubblesremain spherical during the bubble capture, growth, and col-lapse. However, as the volume of a bubble increases, thepressure and flow gradients near the vortex can cause thebubble to deform and can lead to significant modification ofthe forces on the bubble. Higher fidelity simulations of thebubble-flow interactions are possible, but can be computa-tionally intensive. It would be preferable if the one-waycoupled PTM can be used to yield an accurate estimate of thebubble capture times.
In the present work, we will examine the capture of abubble by a steady line vortex for both noncavitating andcavitating conditions. We will use one-way coupled PTMcomputations, and also higher fidelity, fully resolved directnumerical simulationsDNSd of the two phase flow field. TheDNS does not employ the one-way coupling assumption, andthus details of the bubble shape distortions and modificationsto the liquid flow field can be revealed. Experimental obser-vations of bubble capture are then compared with the pre-dicted results of the PTM. These data are used to explore theaccuracy and limitations of the one-way coupled PTM. Incomparisons involving the PTM and DNS models, the sameDNS flow, fluid properties, and bubble/fluid density ratio areused in the PTM. Similarly, in comparisons involving thePTM and experimental results, the experimental flow andfluid properties are used in the PTM.
II. ONE-WAY COUPLED POINT-PARTICLE TRACKINGMODEL OF BUBBLE CAPTURE
The dynamics of small bubbles in a flow can be calcu-lated assuming that their presence does not significantly alterthe flow. The effect of the flow on a bubble can be deter-mined through the equation of motion for a point particle:8–10
rBVBduB
dt= VBsrB − r fdg − VB = p +
1
2r fVBSDu
Dt−
duB
dtD
+ FD + FL + FB + FV, s1d
whererB is the bubble density,rF is the fluid density,VB isthe volume of the bubble,uB is the bubble velocity,u is thefluid velocity in the absence of the bubble at the center of thebubble sunperturbed velocityd. FD is the drag force,FL isthe lift force, FB is the Basset history force, andFV is theforce due to volume changes. In the present analysis, thedrag force is given by
FD = CD12r fABuu − uBusu − uBd, s2d
where
CD =24
ReBs1 + 0.197 ReB
0.63+ 2.6s10−4dReB1.38d s3d
and ReB=2Ruu−uBu /n f is the bubble Reynolds number basedon the bubble radiusR and its slip velocity.11 We will neglectthe Basset force term, as the bubble relative acceleration isexpected to be smallsa detailed discussion of the relativesize of the Basset term is found in Maxey and Riley8d. Theforce due to the bubble volume variation is given by Johnsonand Hsieh12 as
FV = 2pR2rsu − uBddR
dt. s4d
The buoyancy, pressure gradient, and added mass terms alsoappear in Eq.s1d, with an added mass coefficient of 1/2 forspherical bubbles. We will ignore the buoyancy force, theBasset force, and the bubble volume variation term in thePTM computations. The lift force on the bubble is related tothe slip velocity and the circulation of the unperturbed fluidat the center of the bubble
FL = CL1
2r fABuu − uBusu − uBd =
3
8r fVBCL
su − uBd 3 v
a,
s5d
wherea= uvuR/ uu−uBu is the dimensionless shear rate andvis the fluid vorticity of the undisturbed flow at the center ofthe bubble. The lift coefficient is a function of both the shearand vorticity. Auton13 and Auton, Hunt, and Prud’homme14
showed that for weak shearsa!1d the lift coefficient isgiven by
CL,A = 43a. s6d
Saffman15 showed that, for low Reynolds numberssReB
,20d,
CL,S= 5.82 ReB−0.5a0.5. s7d
For higher Reynolds numbers, Dandy and Dwyer16 used nu-merical analysis to show that for 0.0005,a,0.4 and ReB.20,
CL,D < 0.3a. s8d
Finally, Sridhar and Katz17 experimentally determined thelift coefficient on bubbles with diameters between 500 and800 mm and 20,ReB,80, and found relatively high liftcoefficients
CL,SK = 0.59a0.25. s9d
In the present work, we will compare results produced usingthese different formulations.
To determine the volume variation for a cavitatingspherical bubble, the Rayleigh-Plesset equation given is usedto determine the time-varying bubble radius,Rstd:
022105-2 Oweis et al. Phys. Fluids 17, 022105 ~2005!
Downloaded 27 Aug 2010 to 131.180.130.114. Redistribution subject to AIP license or copyright; see http://pof.aip.org/about/rights_and_permissions

Rd2R
dt2+
3
2SdR
dtD2
=1
r fSpV + pGISRO
RD3k
− pB −2s
R
−4m f
R
dR
dtD . s10d
This relation is derived for a spherical bubble in an un-bounded fluid, andpB is the pressure far away from thebubble, pGI is the pressure of the noncondensable gas ini-tially in the bubble when its radius isR0, k is the polytropicexponent for the noncondensable gas within the bubble, ands is the surface tension. For the point-particle-trackingmodel, pB is taken as the local fluid static pressure at thelocation of the bubble center. If the bubble is small and thepressure gradients near the bubble are mild, then=p·R/p!1 at the bubble center, and we may modelpB<p.
III. GAUSSIAN VORTEX MODEL
We will consider the capture of bubbles by a Gaussianvortex of total circulationGO and core radiusrC. Also knownas Lamb-Oseen vortex, the tangential velocity as a functionof the radial distance from the axisr is given by
uusrd =GO
2prs1 − e−h1sr/rCd2d s11d
and the maximum tangential velocityuC occurs atrC and isgiven by
uC = h2GO
2prC, s12d
whereh1=1.255 andh2=0.715. The pressure depression atthe vortex centerliner =0 is given by
psrd − p` = Eu
−r fuu
2srdr
dr = − r fS GO
2prCD2
fS r
rCD , s13d
where
fS r
rCD = S − 1
2sr/rCd2D3− 1 + 2e−asr/rCd2 − e−2asr/rCd2
− 2asr/rCd2Eifasr/rCd2g+ 2asr/rCd2Eif2asr/rCd2g
4 . s14d
At the vortex core,
pC − p` = − r fS GO
2prCD2
fs0d = − h3r fS GO
2prCD2
, s15d
whereh3= fs0d=0.870.18 Here, we are neglecting the possi-bility that there may be nonuniform flow along the vortexaxis.
The vortex Reynolds number is
ReC =uCrC
v f. s16d
The Weber number of a bubble with radiusRO is
We =r fROuC
2
2s. s17d
The vortex cavitation number is defined as
s` =p` − pV
1
2r fuC
2
. s18d
IV. DIRECT NUMERICAL SIMULATIONS OF BUBBLEDYNAMICS
It is possible to classify the numerical methods used tosolve for cavitating flows into three categories: mixed-fluidmethods, discontinuous interface methods, and finite thick-ness interface methods. The mixed-fluid approach treats wa-ter and vapor as two different fluids and employs an addi-tional equation for void fraction. This method does notresolve the individual bubbles, and an example is found inKubota, Kato, and Yamaguchi.19 Discontinuous interfacemodels describe the system as two different flows separatedby the interface, and the method can be modified to examineindividual bubblesssee Deshpande, Feng, and Merkle20d.The front tracking method used in this study falls under thethird category. Front tracking works for multifluid, incom-pressible flows, and in this method the thin density interfacebetween fluids is tracked explicitly by advancing the densityfield with a separate transport equation superimposed uponthe Navier-Stokes equation. The DNS front-tracking methodused in this study was developed by Unverdi andTryggvason21 and improved by Esmaeeli andTryggvason.22,23 A single Navier-Stokes equation with vari-able density and viscosity is solved for the entire domain,and the surface tension is added as a body force concentratedat the fluid interfaces. The fluids inside and outside thebubbles are taken to be Newtonian, and the flow is incom-pressible and isothermal, so that the densities and viscositiesare constant within each phase. The unsteady, viscous, in-compressible Navier-Stokes equations are solved on a fixedstaggered grid, while the interface between the bubble andliquid is explicitly represented by a separate, unstructuredgrid that moves through the stationary one. The frontsinter-faced keeps the density and viscosity discontinuities sharpand also provides a way to calculate the surface tension. Thenumerical scheme used is a conservative second-order accu-rate, centered difference scheme for spatial variables, andexplicit second-order time integration. For the cavitatingbubbles the interior pressure is specified and replaces theincompressibility condition there. Yu, Ceccio, andTryggvason24 used this front tracking method to examine thecollapse of bubbles in shear flow, and developed the modelused here. Resolution and accuracy studies for the cavitationmodels were reported in that study. For an extensive reviewof the basic method, see Tryggvasonet al.25
V. EXPERIMENTAL SETUP
Single cavitation bubbles were created by focusing apulsed infrared laser beam near a steady line vortex emanat-ing from the tip of a hydrofoil. The facility used in this studyis the University of Michigan 9-Inch Cavitation Tunnel. Thewater tunnel has a circular contraction downstream of a se-ries of flow management screens with contraction area ratioof 6.4:1. The test section has a 22.9 cm diameter round inlet
022105-3 Capture and inception of bubbles near line vortices Phys. Fluids 17, 022105 ~2005!
Downloaded 27 Aug 2010 to 131.180.130.114. Redistribution subject to AIP license or copyright; see http://pof.aip.org/about/rights_and_permissions

that is then faired into a rectangular test section with widelyrounded corners. Four acrylic windowss93.9 by 10.0 cm2
viewing aread permit optical access to the test section flow.The flow in the test section can be operated at pressures fromvapor pressure to<200 kPa. The average velocity in the testsection is variable up to 18 m/s. A deaeration system wasused to vary the dissolved gas content of the flow, and theinlet tunnel water is filtered to 1mm. Details of the experi-mental setup and the laser bubble generation in the vortexcan be found in Oweiset al.18
A vortical flow was created using a cambered hydrofoilmounted to a side window of the test section. The hydrofoilhad a rectangular platform of 9.5 cm span and 16.8 cmchord. The tip of the hydrofoil was truncated with sharpedges. The hydrofoil mount allowed continuous changes ofthe incident flow angle. A series of tip and trailing edgevortices were shed near the tip, and these vortices merged toform a single vortex within one-half chord length down-stream of the trailing edge. Measurements of the bubble/vortex interactions were taken at a free-stream velocity of10 m/s and a variety of pressures. The dissolved oxygencontent was measured with an Orion Model 810 oxygenmeter. In order to reduce the number of free-stream nuclei,the free-stream gas content was reduced to below 1.5 ppmduring the measurements. Natural hydrodynamic cavitationoccurred at various locations along the vortex axis down-stream of the location of vortex roll up. However, at suchlow air content, the event rate of this type of cavitation wasrelatively lows,0.1 event per secondd, and did not affect theconduct of the experiment.
Planar particle imaging velocimetrysPIVd was used tomeasure the vortical flow field at a station 9.0 cm down-stream of the trailing edge. A double-pulsed light sheet 9 mmthick was created perpendicular to the mean flow directionusing two pulsed Nd:YAGsYAG—yttrium aluminum garnetdlasers sSpectra Physics model Pro-250 Seriesd. 15.3mmaverage diameter silver coated glass spheres were used toseed the flow. An acrylic prism was optically mounted to awindow of the test section for viewing the light sheet withreduced optical distortion. Double-pulsed images of the lightsheet were acquired with a LaVision Inc. cross correlationdigital camera with 128031024 pixels. Optical distortion ofthe planar light sheet image was corrected through a calibra-tion procedure that employed the imaging of a regular grid inthe location of the light sheet plane. Velocity vectors wereproduced from the double-pulsed images using the imageanalysis softwareDAVIS6.0.4. Multipass vector extractionscheme with a final window size of 32332 pixels and 12%window overlap was used to produce 41327 in plane veloc-ity vectors at 0.62 mm spacing. Since the camera-imagingplane was not parallel to the light sheet and it had an angularshift of 45° with the horizontal direction, this velocity com-ponent was corrected by knowledge of the camera angle andthe tunnel free-stream velocity. Image sequences of bubblesinside the vortex core indicated the axial velocity in the vor-tex core was nearly uniform and close to the free-streamspeed.
A Gaussian vortex velocity profile was fitted to the PIVmeasurements, and the fitted vortex core radius wasrC
=5.6 mm and its strength wasGO=0.290 m2/s ssee Oweisetal.18 for additional detailsd. Examination of the instantaneousimages indicated that the vortex core did not wander signifi-cantly. The amplitude of wandering was consistently lessthan 10% ofrC. Consequently, no correction for vortex wan-dering was needed, as discussed by Boulonet al.26 andOweis and Ceccio.27
Optically stimulated cavitation bubbles were creatednear the vortex core. The infrared beam from a pulsed Nd-YAG laser sQuanta Ray PRO-250d was expanded through aset of spherical lenses to a diameter of<75 mm, and thenfocused into a very thin focal volume in the water tunnel testsection. The 10 ns laser pulse had a wavelength of 1064 nmand maximum energy of 280 mJ. An inertial vapor bubblegrows explosively at the laser focal point to a maximumvolume, and then collapses violently. The bubble may re-bound after its initial collapse, and bubble fragmentation andcoalescence may also result after collapse. The time span ofthe inertial vapor bubble from the instance the laser is intro-duced until its violent collapse is very short and is on theorder of 100–200ms. The resulting stabilized bubble afterthe initial stages of violent growth and collapse is then usedfor the bubble/vortex capture studies. By adjusting the lenssystem, the bubble could be introduced at varying locationsrelative to the vortex axis. By varying the free-stream pres-sure and laser energy, the size of the laser-induced bubblecould be coarsely controlled. Images of the bubble were ob-served with a Cooke Corp. “FlashCam” digital camera. Thecamera had an effective resolution of 7503240 pixels andcould record up to ten consecutive exposures on the sameframe, with controllable exposure times and interexposuredelays. A pulse delay generatorsSRS model DG535d wasused to trigger the camera at varying time delays from thelaser light pulse.
Figures 1sad and 1sbd show multiple exposures of twolaser induced bubbles as they are captured by the steady linevortex. The bubbles are introduced at the outer edge of the
FIG. 1. sad Eight images of a laser-induced bubble as it is captured by thevortex for cavitation number,s`=3.0. The release position of the bubble,rx/ rc=1. The delay between each image is 350ms. The capture time,t*=1.25. The bubble size,rc/R0=6. sbd Same assad but with the capture timet* =0.9 and bubble sizerc/R0=10.
022105-4 Oweis et al. Phys. Fluids 17, 022105 ~2005!
Downloaded 27 Aug 2010 to 131.180.130.114. Redistribution subject to AIP license or copyright; see http://pof.aip.org/about/rights_and_permissions
vortex core, and are then forced by the vortex field to mi-grate towards the center of rotation as they are captured.
VI. NONCAVITATING BUBBLE CAPTURE PREDICTEDWITH THE POINT-PARTICLE-TRACKING MODEL
The one-way coupled PTM was used to predict the timeof capture for spherical bubbles by a Gaussian vortex,tC
*
= tCuC/ rC. An Euler integration scheme with time steppingwas used to solve the horizontal and vertical components ofEq. s1d. The case of noncavitating bubbles was first consid-ered. Bubbles of varying sizes were released at different ra-dial positions from the vortex axisrX with an initial velocityequal to that of the fluid at the bubble center. A bubble wasconsidered captured when it intersected the annulus definedby 1/4 of the core radius, which approximately correspondedto the region of lowest core pressure. In these simulations,the bubble remained sphericalsequivalent to We!1.d
For bubbles far away from the vortex, we can assumethat the bubble accelerations and lift forces are negligibleand that there exists a balance between the pressure gradientinduced force and the drag force on the bubble,VB= P<FD. If the largest component of the bubble velocity is inthe radial directionuB,r, then the force balance far from thevortex axis becomes
− uu2srdr
r f4
3pRO
3 <1
2r fCDpRO
2 uB,r2 , s19d
where uusrd<uCrC/h2r and CD<12n f /ROuB,r. The bubblevelocity becomes
uB,r < −2suCrCROd2
9h22n f
1
r3 . s20d
This expression can be integrated to yield the approximatecapture time for bubbles far from the vortex core,rX/ rC@1:
tC* < suC/rCdE
rX
0 1
uB,rsrddr =
9h22
8 ReCS rC
ROD2S rX
rCD4
. s21d
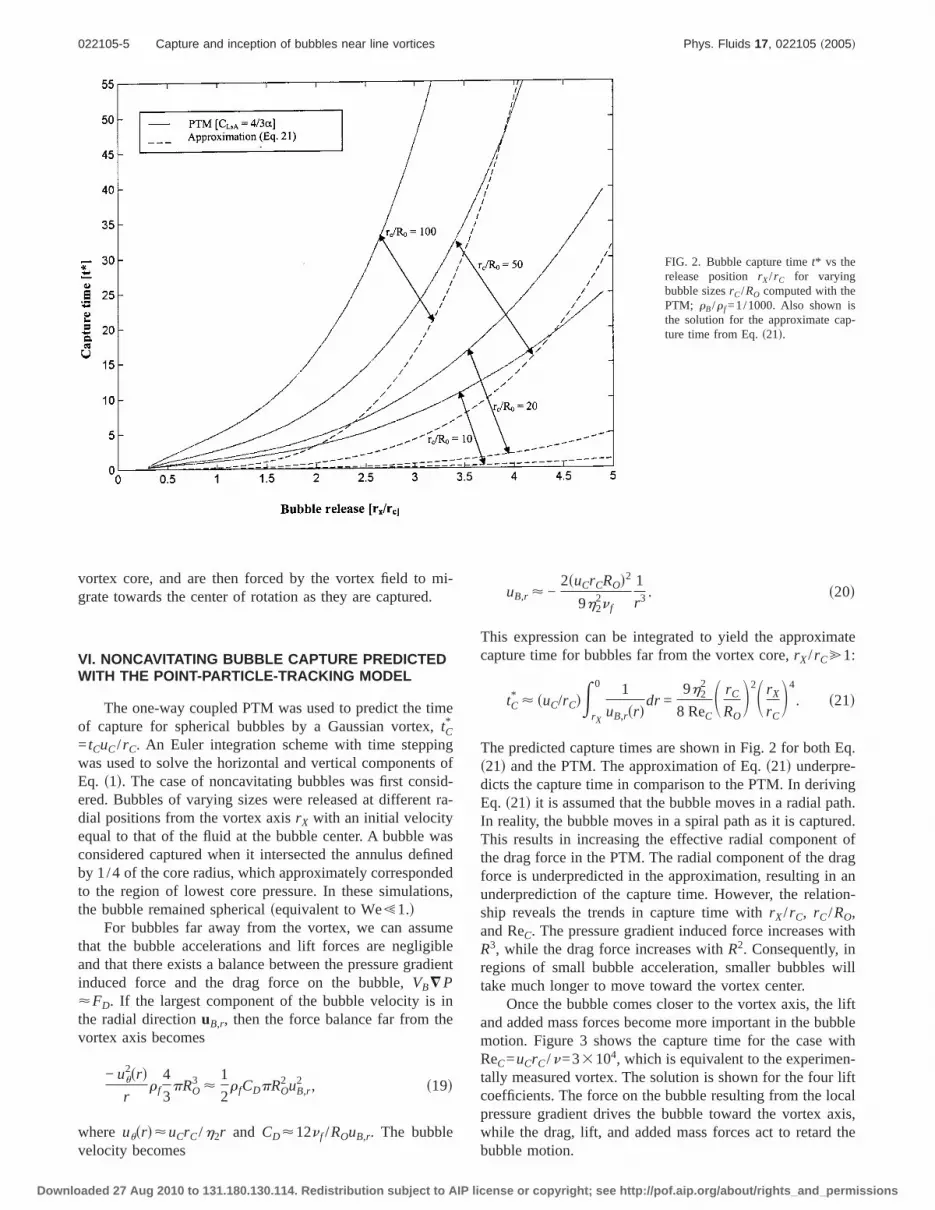
The predicted capture times are shown in Fig. 2 for both Eq.s21d and the PTM. The approximation of Eq.s21d underpre-dicts the capture time in comparison to the PTM. In derivingEq. s21d it is assumed that the bubble moves in a radial path.In reality, the bubble moves in a spiral path as it is captured.This results in increasing the effective radial component ofthe drag force in the PTM. The radial component of the dragforce is underpredicted in the approximation, resulting in anunderprediction of the capture time. However, the relation-ship reveals the trends in capture time withrX/ rC, rC/RO,and ReC. The pressure gradient induced force increases withR3, while the drag force increases withR2. Consequently, inregions of small bubble acceleration, smaller bubbles willtake much longer to move toward the vortex center.
Once the bubble comes closer to the vortex axis, the liftand added mass forces become more important in the bubblemotion. Figure 3 shows the capture time for the case withReC=uCrC/n=33104, which is equivalent to the experimen-tally measured vortex. The solution is shown for the four liftcoefficients. The force on the bubble resulting from the localpressure gradient drives the bubble toward the vortex axis,while the drag, lift, and added mass forces act to retard thebubble motion.
FIG. 2. Bubble capture timet* vs therelease positionrX/ rC for varyingbubble sizesrC/RO computed with thePTM; rB/r f =1/1000. Also shown isthe solution for the approximate cap-ture time from Eq.s21d.
022105-5 Capture and inception of bubbles near line vortices Phys. Fluids 17, 022105 ~2005!
Downloaded 27 Aug 2010 to 131.180.130.114. Redistribution subject to AIP license or copyright; see http://pof.aip.org/about/rights_and_permissions

Variation in the lift coefficient leads to some change inthe capture time, although the effect is secondary. We canscale the average bubble Reynolds number as
ReB ,rX
tC
RO
n f= ReC
1
tC*
RO
rC
rX
rC. s22d
Here,rX/ rC is on the order of 1,tC* is on the order of 10, and
ReC is on the order of 104. Then the bubble Reynolds numberReB will be on the order of 10sRO/ rCd−1, and the bubbleReynolds number will decrease with increasing capture timeand decreasing bubble size. The lift coefficients proposed bySaffman fEq. s7dg is valid for ReB,20, and the largestbubbles approach this limit. The relationships proposed byDandy and DwyerfEq. s8dg and Sridhar and KatzfEq. s9dgare valid for somewhat higher bubble Reynolds numbers upto <100. The highest ReB will occur in the last stages ofcapture.
The highest levels of vorticity occur forr / rC,2, alongwith the highest bubbles slip velocities. The capture timewhen the bubble is withinr / rC,2 is on the order of unity,making the relative velocity on the order ofuC. The nondi-mensional shear in the coreaC can then be scaled as
aC =uvCuRO
uu − uBu,
2uCRO
rC
1
uC=
2RO
rC. s23d
The highest local values ofaC occur within the vortex core,however. For the smallest bubbles considered here,aC!1.For the largest bubbles considered here,aC is between 0.1and 1. The lift coefficients proposed by AutonfEq. s6dg andDandy and DwyerfEq. s8dg are for the case ofa,1, makingthem less appropriate for the final portion of the capture pro-cess of larger bubbles. Figure 4 shows the variation of thecapture time with the vortex Reynolds number for the case of
rC/RO=50, using the lift coefficient of AutonfEq. s6dg. Asexpected, the time for bubble capture increases with increas-ing fluid viscosity and decreases approximately as 1/ReC.
VII. DIRECT NUMERICAL SIMULATIONS OFNONCAVITATING BUBBLE CAPTURE
The PTM model does not account for bubble deforma-tion and bubble-flow interaction that may occur during thefinal stages of collapse. It is expected that these effects aremost important for relatively large bubbles as they near thevortex core. To examine this process, bubbles withrC/RO onthe order of 10 were computed using DNS for various Weberand cavitation numbers. In these simulations, the effectivevortex maximum tangential velocity and core size areuC
=5 m/s andrC=2.5 mm, respectively. The length of thecomputational domain is four core radii, or 10 mm. The vor-tex Reynolds number ReC=250, is about 50 times lower thanthe experimentally examined vortex. However, even at thelower Reynolds number, the amount of vortex diffusion dur-ing the computation was relatively small, with the coregrowing less than 5% over the duration of the computation.The kinematic viscosity and density of the gas phase were1/10 that of the fluid. This ratio was chosen to improve thecomputational efficiency. The initial bubble radius was madea proportion of the core radius, and the release position ofthe bubble was varied along the radius. Again, the bubblewas given an initial velocity equal to the mean of the sur-rounding fluid. Bubbles were released aty/L=0.5 and vary-ing x/L, with the vortex axis atx/L=y/L=0.5. A grid reso-lution study was performed for the capture of a noncavitatingbubble with rC/RO=8 and We=0.13. The bubble was re-leased atrX/ rC=0.5, a region of large flow gradients. Simu-lations with resolutions of 963, 1283, 1603 were compared,
FIG. 3. Bubble capture timet* vs therelease positionrX/ rC using the fourdifferent lift coefficientsCl for varyingbubble sizesrC/RO computed with thePTM; rB/r f =1/1000.
022105-6 Oweis et al. Phys. Fluids 17, 022105 ~2005!
Downloaded 27 Aug 2010 to 131.180.130.114. Redistribution subject to AIP license or copyright; see http://pof.aip.org/about/rights_and_permissions

and bubble center positions at nondimensional timet*=1.77 were within 1% of the domain length. It was con-cluded that a resolution of 1283 would be sufficient. The timestep was subject to restrictions due to the diffusion terms aswell as the centered differencing used for the advectionterms. These restrictions areDtn /Dx2ø1/8; fDtsuUxu+ uUyu+ uUzud2g /nø8. The minimum time step from the two rela-tions was used in the simulations.
Figure 5sad shows the trajectory of a noncavitatingbubble withrC/RO=8 and We=0.13 forrX/ rC=1.0, and Fig.5sbd shows the vorticity in thex-y plane. It is clear that thebubble locally modifies the flow, and a wake develops behindthe bubble. Figure 6 shows the trajectory of three bubblesreleased atrX/ rC=1.5, 1.0, and 0.5 along with the predictionof the PTM. The Weber number in the DNS computations is0.13, andrc/R0=8. Again, the bubble is considered capturedwhen the bubble interface crossesrC/4. The capture timespredicted with the DNS for the three bubbles aret* =4.61,2.22, and 0.74. These are compared witht* =4.51, 2.74, and0.85 for the PTM. Here, the density ratio and vortex proper-ties of the DNS calculation were used in the PTM, and thelift coefficient of Auton was used. The low Weber number inthe DNS calculations leads to relatively little bubble defor-mation, and the capture times are within 20% of those fromthe PTM. This variation is on the order of the changes in thePTM prediction that result from the use of the different liftcoefficients.
Table I presents a summary of the simulations and thecapture times. The PTM both overpredicts and underpredictsthe capture time compared to the DNS. The differences rangebetween ±20% on average. When the bubbles start fartherfrom the vortex, the PTM predicts a shorter capture time.But, when the bubbles start closest to the vortex, the PTM
predicts a longer capture time. Moreover, these differencesare more pronounced as the We increases. This suggests thatthe capture time is influenced by bubble deformations andbubble-flow interactions during the last stages of capture.
Figure 7 shows the trajectories and capture times for abubble with rc/R0=8 for two different Weber numbers re-leased atrX/ rC=1.5. The capture time decreases with in-creasing Weber number, implying that increased bubble de-formation leads to faster bubble capture. The capture timescomputed with the PTM and the DNS forrX/ rC=1.0 sTableId are similar. But the PTM underpredicts the capture timesfor bubbles released atrX/ rC=1.5, suggesting the accumu-lated effect of varying lift coefficient on the final capturetime. Figure 8 shows the capture of a bubble withrC/RO
=12, We=0.1, andrX/ rC=1.5. The trajectory of this bubblecan be compared to the trajectory of the larger bubblesrC/RO=8d shown in Fig. 6 for similar We andrX/ rC. Thesmaller bubble requires more turns to get captured, its trajec-tory better approaches the circular shape, and its capture timeis longer than that for the large bubblessee also Table Id.However, the PTM underpredicts the capture time for bothbubble sizes, suggesting that the lift and drag coefficients ofthe PTM are too small when the bubble is close to capture,even though the lift coefficient used is the largest of the fourconsidered.
VIII. THE CAPTURE OF CAVITATING NUCLEI
The capture of potentially cavitating nuclei is now con-sidered. As the gas bubble experiences reduced pressure, itsvolume will increase isothermally. Bubbles far from the low-pressure region will grow quasistatically and isothermallysk=1d until psrdøpV, with the radius satisfying the equation
FIG. 4. Bubble capture timet* vs therelease positionrX/ rC for varying Rey-nolds number Re computed with thePTM; rB/r f =1/1000.
022105-7 Capture and inception of bubbles near line vortices Phys. Fluids 17, 022105 ~2005!
Downloaded 27 Aug 2010 to 131.180.130.114. Redistribution subject to AIP license or copyright; see http://pof.aip.org/about/rights_and_permissions

pV − psrd + pGIS RO
RsrdD3
−2s
RO
RO
Rsrd= 0. s24d
As the pressure is decreased further, the bubble can begin togrow rapidly. A stability analysis of Eq.s10d yields the criti-cal radiusRisrd above which bubbles will grow explosivelyfor a given liquid tensionssee Brennen28 for a complete dis-cussiond:
Risrd ù4s
3fpV − psrdg. s25d
Vaporous cavitation can occur when the pressure at the vor-tex axis is less than or equal to the vapor pressurepCøpV.From the relationship for the core pressurefEq. s15dg and ourdefinition ofs` fEq. s18dg, this is equivalent to the conditions`ø2h3/h2
2=si =3.40, wheresi is the cavitation inceptionindex which is a property of the Gaussian vortex.
The static equilibrium radius can then be rewritten interms of the cavitation and Weber numbers:
− s` + Ss` +2
WeDS RO
RsrdD3
−2
WeS RO
RsrdD +
2fsr/rCdh2
2 = 0.
s26d
This expression is valid forpsrdùpV or equivalently,
− s` −2fsr/rCd
h22 . 0. s27d
The critical radiusfEq. s25dg can also be reformulated interms of the Weber and the cavitation numbers:
RisrdRO
siWe
4= S 1
fsr/rCd/h3 − s`/siD . s28d
Small bubbles are expected to move toward the vortex axis,quasistatically changing volume until they reach a radial po-sition r i where Risr id=Rsr id when unstable bubble growthwill occur.
Consequently, the parameters for nuclei capture arerC,uC, ReC, rX, RO, We, ands`. We will consider in the follow-ing theoretical analysis the bubble capture for the experimen-tally examined vortex, thus setting the first three parameters.
FIG. 5. sad The DNS simulation of a noncavitating bubble being captured bya line vortex.rc/R0=8, We=0.13, and released atrx/ rc=1. sbd The DNSsimulation of the vorticity contours and the streamlines att* =0.85 with thesame conditions as insad, rB/r f =1/10.
FIG. 6. The trajectory of a noncavitating bubble for three release positions,rX/ rC, computed with the PTM and DNSscases 1, 2, and 3 of Table Id.rB/r f =1/10 for the PTM andDNS. The capture time criterion is 0.25rC.
022105-8 Oweis et al. Phys. Fluids 17, 022105 ~2005!
Downloaded 27 Aug 2010 to 131.180.130.114. Redistribution subject to AIP license or copyright; see http://pof.aip.org/about/rights_and_permissions

The nuclei to be considered arerC/RO=50, 200, 500, and1000 corresponding to bubbles of 110, 28, 11, and 6mmradii. This corresponds to We=26, 6.5, 2.6, and 1.3 for airbubbles in clean water. We will consider free-stream cavita-
tion numbers ranging froms` /si =1, 7/8, 3/4, 1/2, to 1/4.It should be noted that, in practice, it is difficult to sustainlarge tensions in the vortex core for steady line vortices.When the tension is sufficiently high, even the smallest nu-
FIG. 7. The trajectory of a noncavitat-ing bubble for varying Weber numberWe computed with the PTM and DNS.rB/r f =1/10 for the PTM and DNSfcases 4sad, and 4sbd of Table Ig. Thecapture time criterion is 0.25rC.
TABLE I. A summary of the computed bubble capture cases using PTM and DNS. The bubble to fluid densityratio and kinematic viscosity ratio are 1/10 for the DNS and PTM.
Case Method rX/ rC rC/R0 We t*% ofPTM
1 DNS 0.5 8 0.13 0.74 79
PTM 0.5 8 ¯ 0.94
2 DNS 1.0 8 0.13 2.22 95
PTM 1.0 8 ¯ 2.34
3 DNS 1.5 8 0.13 4.61 105
PTM 1.5 8 ¯ 4.40
4a DNS 1.5 8 0.1 4.86 110
4b DNS 1.5 8 0.01 5.84 133
PTM 1.5 8 ¯ 4.40
5 DNS 1.5 12 0.1 10.3 144
PTM 1.5 12 ¯ 7.13
6a DNS 1 8 1 1.91 82
6b DNS 1 8 0.1 2.33 100
6c DNS 1 8 0.01 2.51 107
PTM 1 8 ¯ 2.34
022105-9 Capture and inception of bubbles near line vortices Phys. Fluids 17, 022105 ~2005!
Downloaded 27 Aug 2010 to 131.180.130.114. Redistribution subject to AIP license or copyright; see http://pof.aip.org/about/rights_and_permissions

clei will cavitate and the vortex core will fill with an annulusof vapor.
Solutions forRisr / rCd and Rsr / rCd were computed forthe four conditions described above. The vertical dashed lineis the radial position when the fluid pressure reaches the
vapor pressure. Figure 9 shows the case ofrC/RO=50, thelargest bubbles. As the bubbles come closer to the core, theequilibrium radius changes by a factor of up to 3 beforeinception. All of these bubbles are initially large enough tocavitate when they pass into the flow with pressure below
FIG. 8. The trajectory of a noncavitat-ing bubble computed with the PTMand DNS. rB/r f =1/10 for the PTMand DNSscase 5 of Table Id. The cap-ture time criterion is 0.25rC.
FIG. 9. The quasistatic growth of the bubble radius as afunction of distance from the vortex axis for a bubblewith an initial sizerc/R0=50, We=26 for varying vor-tex cavitation numbersssolid linesd. Also plotted is thesolution of Eq. s29d sdashed linesd, which yields thecritical radiusRi for rapid bubble growth as a functionof rx/ rc for varying cavitation numbers. The verticaldotted lines occur whenpsrd=pv for a givens`. Thepressure field is equivalent to that of the experimentalvortex.
022105-10 Oweis et al. Phys. Fluids 17, 022105 ~2005!
Downloaded 27 Aug 2010 to 131.180.130.114. Redistribution subject to AIP license or copyright; see http://pof.aip.org/about/rights_and_permissions
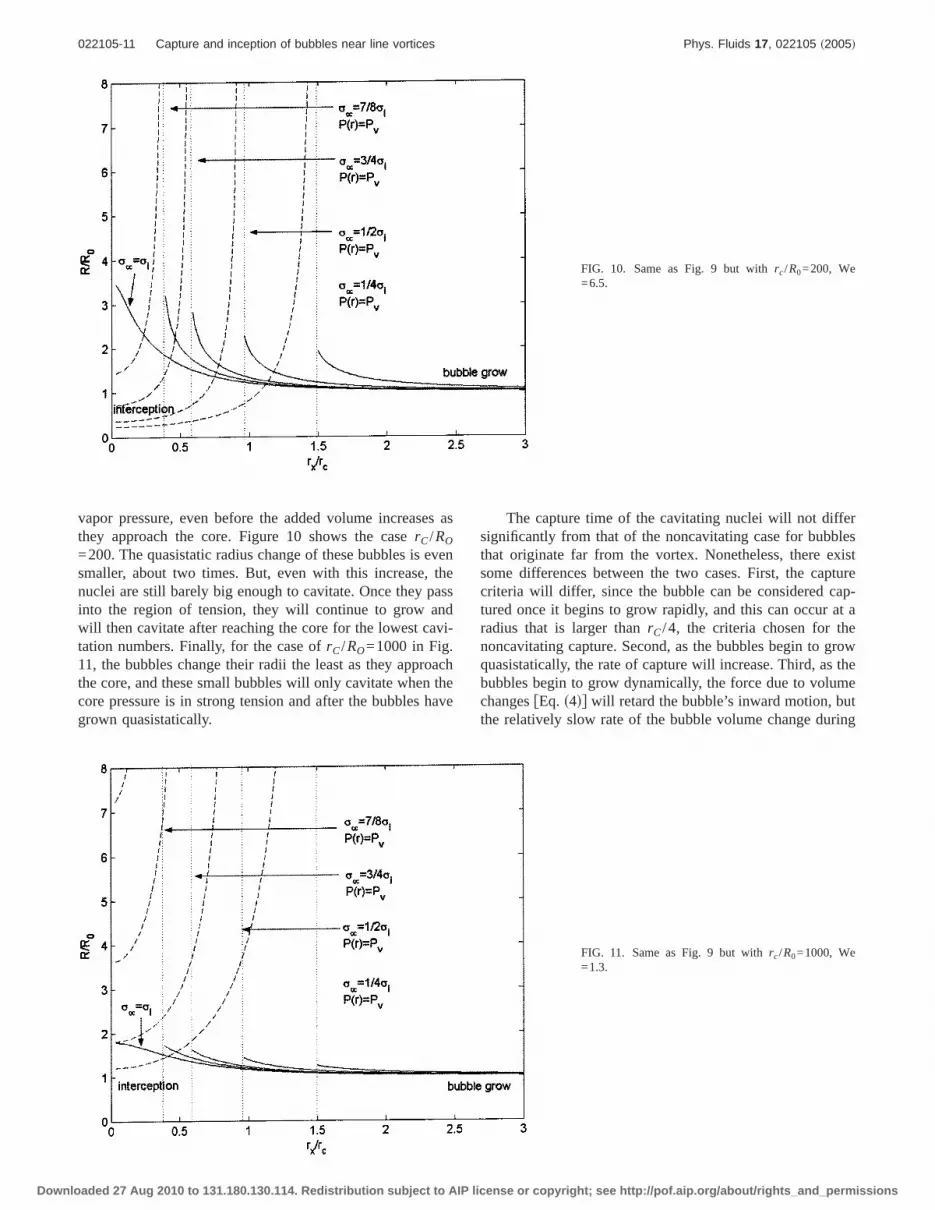
vapor pressure, even before the added volume increases asthey approach the core. Figure 10 shows the caserC/RO
=200. The quasistatic radius change of these bubbles is evensmaller, about two times. But, even with this increase, thenuclei are still barely big enough to cavitate. Once they passinto the region of tension, they will continue to grow andwill then cavitate after reaching the core for the lowest cavi-tation numbers. Finally, for the case ofrC/RO=1000 in Fig.11, the bubbles change their radii the least as they approachthe core, and these small bubbles will only cavitate when thecore pressure is in strong tension and after the bubbles havegrown quasistatically.
The capture time of the cavitating nuclei will not differsignificantly from that of the noncavitating case for bubblesthat originate far from the vortex. Nonetheless, there existsome differences between the two cases. First, the capturecriteria will differ, since the bubble can be considered cap-tured once it begins to grow rapidly, and this can occur at aradius that is larger thanrC/4, the criteria chosen for thenoncavitating capture. Second, as the bubbles begin to growquasistatically, the rate of capture will increase. Third, as thebubbles begin to grow dynamically, the force due to volumechangesfEq. s4dg will retard the bubble’s inward motion, butthe relatively slow rate of the bubble volume change during
FIG. 10. Same as Fig. 9 but withrc/R0=200, We=6.5.
FIG. 11. Same as Fig. 9 but withrc/R0=1000, We=1.3.
022105-11 Capture and inception of bubbles near line vortices Phys. Fluids 17, 022105 ~2005!
Downloaded 27 Aug 2010 to 131.180.130.114. Redistribution subject to AIP license or copyright; see http://pof.aip.org/about/rights_and_permissions
the quasistatic growth of the bubble makes this term negli-gible up until the rapid bubble growth. All of these effectsare relatively small, but they lead to a decrease in the capturetime DtC
* on the order of 1 for the larger bubbles. Otherwise,the capture time for the smaller bubbles is not substantiallydifferent between the cavitating and noncavitating cases, es-pecially for bubbles starting far from the vortex core.
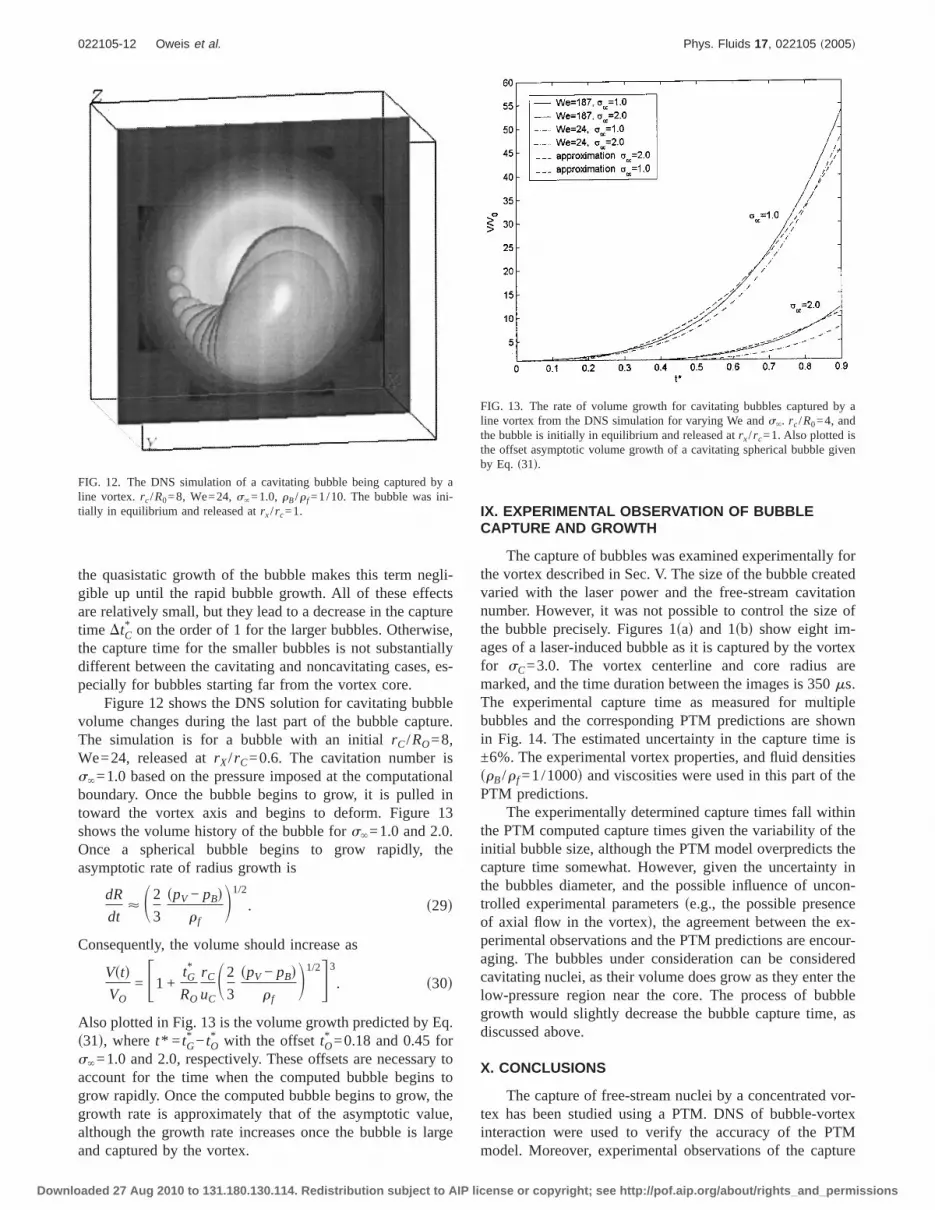
Figure 12 shows the DNS solution for cavitating bubblevolume changes during the last part of the bubble capture.The simulation is for a bubble with an initialrC/RO=8,We=24, released atrX/ rC=0.6. The cavitation number iss`=1.0 based on the pressure imposed at the computationalboundary. Once the bubble begins to grow, it is pulled intoward the vortex axis and begins to deform. Figure 13shows the volume history of the bubble fors`=1.0 and 2.0.Once a spherical bubble begins to grow rapidly, theasymptotic rate of radius growth is
dR
dt< S2
3
spV − pBdr f
D1/2
. s29d
Consequently, the volume should increase as
VstdVO
= F1 +tG*
RO
rC
uCS2
3
spV − pBdr f
D1/2G3
. s30d
Also plotted in Fig. 13 is the volume growth predicted by Eq.s31d, wheret* = tG
* − tO* with the offsettO
* =0.18 and 0.45 fors`=1.0 and 2.0, respectively. These offsets are necessary toaccount for the time when the computed bubble begins togrow rapidly. Once the computed bubble begins to grow, thegrowth rate is approximately that of the asymptotic value,although the growth rate increases once the bubble is largeand captured by the vortex.
IX. EXPERIMENTAL OBSERVATION OF BUBBLECAPTURE AND GROWTH
The capture of bubbles was examined experimentally forthe vortex described in Sec. V. The size of the bubble createdvaried with the laser power and the free-stream cavitationnumber. However, it was not possible to control the size ofthe bubble precisely. Figures 1sad and 1sbd show eight im-ages of a laser-induced bubble as it is captured by the vortexfor sC=3.0. The vortex centerline and core radius aremarked, and the time duration between the images is 350ms.The experimental capture time as measured for multiplebubbles and the corresponding PTM predictions are shownin Fig. 14. The estimated uncertainty in the capture time is±6%. The experimental vortex properties, and fluid densitiessrB/r f =1/1000d and viscosities were used in this part of thePTM predictions.
The experimentally determined capture times fall withinthe PTM computed capture times given the variability of theinitial bubble size, although the PTM model overpredicts thecapture time somewhat. However, given the uncertainty inthe bubbles diameter, and the possible influence of uncon-trolled experimental parametersse.g., the possible presenceof axial flow in the vortexd, the agreement between the ex-perimental observations and the PTM predictions are encour-aging. The bubbles under consideration can be consideredcavitating nuclei, as their volume does grow as they enter thelow-pressure region near the core. The process of bubblegrowth would slightly decrease the bubble capture time, asdiscussed above.
X. CONCLUSIONS
The capture of free-stream nuclei by a concentrated vor-tex has been studied using a PTM. DNS of bubble-vortexinteraction were used to verify the accuracy of the PTMmodel. Moreover, experimental observations of the capture
FIG. 12. The DNS simulation of a cavitating bubble being captured by aline vortex. rc/R0=8, We=24,s`=1.0, rB/r f =1/10. The bubble was ini-tially in equilibrium and released atrx/ rc=1.
FIG. 13. The rate of volume growth for cavitating bubbles captured by aline vortex from the DNS simulation for varying We ands`. rc/R0=4, andthe bubble is initially in equilibrium and released atrx/ rc=1. Also plotted isthe offset asymptotic volume growth of a cavitating spherical bubble givenby Eq. s31d.
022105-12 Oweis et al. Phys. Fluids 17, 022105 ~2005!
Downloaded 27 Aug 2010 to 131.180.130.114. Redistribution subject to AIP license or copyright; see http://pof.aip.org/about/rights_and_permissions

of laser induced bubbles by a concentrated vortex were usedto assess the validity of the PTM model under like condi-tions. The conclusions of this study are as follows:
s1d The point-particle-tracking model can successfullypredict the capture time for small bubbles starting far from aline vortex. The accuracy of the measured capture time de-creases with decreasing release distance from the vortex axis.The DNS computations suggest that the PTM will underpre-dict the capture time in the final stages of capture whenbubble deformations and bubble volume growth can becomeimportant.
s2d Varying the lift coefficient in the PTM produced littleeffect on the capture times.
s3d Smaller bubbles can orbit the vortex many times be-fore being captured and thus take a longer time to migratetowards the vortex center. Their trajectories approach a cir-cular shape.
s4d The capture time for a given bubble decreases withincreasing the vortex-based Reynolds number.
s5d Bubble volume growth is very slow until the laststages of capture, which makes it useful to separate the pro-cess of cavitating nuclei capture into two steps; first the non-cavitating capture of the nucleus and then the growth of thenucleus in the low-pressure core region. Thus, a noncavitat-ing PTM model can be used to successfully predict the tra-jectory of cavitation nuclei up to the final staged of capture.
ACKNOWLEDGMENTS
This work was supported by the Office of Naval Re-search under Contract No. N00014-99-1-0307 with Dr. Ki-Han Kim, technical monitor. The DNS computations were
conducted with the computational resources of the MauiHigh Performance Computing Center.
1R. E. A. Arndt, “Cavitation in vortical flows,” Annu. Rev. Fluid Mech.34,143 s2002d.
2G. Sridhar and J. Katz, “Effect of entrained bubbles on the structure ofvortex rings,” J. Fluid Mech.397, 171 s1999d.
3C. T. Hsiao and L. L. Pauley, “Study of tip vortex cavitation inceptionusing Navier-Stokes computation and bubble dynamics model,” J. FluidsEng. 121, 198 s1999d.
4G. L. Chahine, “Non-spherical bubble dynamics in a line vortex,”Pro-ceedings of the ASME FED Cavitation and Multiphase Flow Forum, Tor-onto, edited by O. FuruyasKluwer Academic, Dordrecht, 1990d, Vol. 98,p. 121.
5G. L. Chahine, “Strong interactions bubble/bubble and bubble/flow,”Bubble Dynamics and Interface Phenomena, edited by J. R. Blake, J. M.Boulton-Stone, and N. H. ThomassKluwer Academic, Dordrecht, 1994d,p. 195.
6C. T. Hsiao and G. L. Chahine, “Numerical simulation of bubble dynamicsin a vortex flow using Navier-Stokes computations and moving chimeragrid scheme,” Proceedings of 4th International Symposium on Cavitation,California Institute of Technology, Pasadena, CA, June 20–23, 2001.
7G. L. Chahine and C.-T. Hsiao, “Prediction of vortex cavitation inceptionusing coupled spherical and non-spherical models,” Proceedings of 24thSymposium of Naval Hydrodynamics, Fukuoka, Japan, July 8–13, 2002.
8M. R. Maxey and J. J. Riley, “Equation of motion for a small rigid spherein a non-uniform flow,” Phys. Fluids26, 883 s1983d.
9J. Magnaudet and I. Eames, “The motion of high-Reynolds numberbubbles in inhomogeneous flows,” Annu. Rev. Fluid Mech.32, 659s2000d.
10N. Raju and E. Meiburg, “Dynamics of spherical particles in vortical andstagnation point flow fields,” Phys. Fluids9, 299 s1997d.
11W. L. Haberman and R. K. Morton, “An experimental investigation of thedrag and shape of air bubbles rising in various liquids,” DTMB Report No.802, 1953.
12V. E. Johnson and T. Hsieh, “The influence of the trajectories of gas nucleion cavitation inception,”Proceedings of the Sixth Symposium on NavalHydrodynamicssOffice of Naval Research, Washington, DC, 1966d, p.163.
13T. R. Auton, “The lift on a spherical body in a rotational flow,” J. Fluid
FIG. 14. Bubble capture timet* vs therelease positionrX/ rC for varyingbubble sizesrC/RO computed with thePTM with rB/r f =1/1000. Also shownis the experimental data for varyingthe release positionrX/ rC.
022105-13 Capture and inception of bubbles near line vortices Phys. Fluids 17, 022105 ~2005!
Downloaded 27 Aug 2010 to 131.180.130.114. Redistribution subject to AIP license or copyright; see http://pof.aip.org/about/rights_and_permissions

Mech. 183, 199 s1987d.14T. R. Auton, J. C. R. Hunt, and M. Prud’homme, “The force exerted on a
body moving in an inviscid unsteady non-uniform rotational flow,” J.Fluid Mech. 183, 241 s1988d.
15P. G. Saffman, “The lift on a small sphere in a slow shear flow,” J. FluidMech. 22, 385 s1965d.
16D. S. Dandy and H. A. Dwyer, “A sphere in shear flow at finite Reynoldsnumber: Effect of shear on particle lift, drag, and heat transfer,” J. FluidMech. 216, 381 s1990d.
17G. Sridhar and J. Katz, “Lift and drag forces on microscopic bubblesentrained by a vortex,” Phys. Fluids7, 389 s1995d.
18G. F. Oweis, J. Choi, and S. L. Ceccio, “Dynamics and noise emission oflaser induced cavitation bubbles in a vortical flow field,” J. Acoust. Soc.Am. 115, 1049s2004d.
19A. Kubota, H. Kato, and H. Yamaguchi, “A new modeling of cavitatingflows; a numerical study of unsteady cavitation on a hydrofoil section,” J.Fluid Mech. 240, 59 s1992d.
20M. Deshpande, J. Feng, and C. Merkle, “Numerical modeling of thermo-dynamic effects of cavitation,” ASME J. Fluids Eng.119, 420 s1997d.
21S. O. Unverdi and G. Tryggvason, “A front-tracking method for viscous,
incompressible, multi-fluid flows,” J. Comput. Phys.100, 23 s1992d.22A. Esmaeeli and G. Tryggvason, “Direct numerical simulations of bubbly
flows. Part 1. Low Reynolds number arrays,” J. Fluid Mech.377, 313s1998d.
23A. Esmaeeli and G. Tryggvason, “Direct numerical simulations of bubblyflows. Part 2. Moderate Reynolds number arrays,” J. Fluid Mech.385,325 s1999d.
24P. W. Yu, S. L. Ceccio, and G. Tryggvason, “The collapse of a cavitationbubble in shear flows—A numerical study,” Phys. Fluids7, 2608s1995d.
25G. Trggvason, B. Bunner, A. Esmaeeli, D. Juric, N. Al-Rawahi, W.Tauber, J. Han, S. Nas, and Y.-J. Jan, “A front tracking method for thecomputations of multiphase flow,” J. Comput. Phys.169, 708 s2001d.
26O. Boulon, M. Callenaere, J.-P. Franc, and J.-M. Michel, “An experimen-tal insight into the effect of confinement on tip vortex cavitation of anelliptical hydrofoil,” J. Fluid Mech.390, 1 s1999d.
27G. F. Oweis and S. L. Ceccio, “Instantaneous and time averaged flowfields of multiple vortices in the tip region of a ducted propulsor,” Exp.Fluids sto be publishedd.
28C. E. Brennen,Cavitation and Bubble DynamicssOxford UniversityPress, New York, 1995d.
022105-14 Oweis et al. Phys. Fluids 17, 022105 ~2005!
Downloaded 27 Aug 2010 to 131.180.130.114. Redistribution subject to AIP license or copyright; see http://pof.aip.org/about/rights_and_permissions