preclinical roc studies of digital stereomammography
TRANSCRIPT
318 IEEE TRANSACTIONS ON MEDICAL IMAGING, VOL. 14, NO. 2, JUNE 1995Pre-Clinical ROC Studies of DigitalStereomammographyJean Hsu, David M. Chelberg, Charles F. Babbs, Zygmunt Pizlo, and Edward J. DelpAbstract| This paper reports the diagnostic perfor-mance of observers in detecting abnormalities in computer-generated mammogram-like images. A mathematical modelof the human breast is de�ned in which breast tissues aresimulated by spheres of di�erent sizes and densities. Im-ages are generated by casting rays from a speci�ed source,through the model, and onto an image plane. Observer per-formance when using two viewing modalities (stereo versusmono) is compared. In the stereo viewing mode, imagesare presented to the observer (wearing liquid-crystal displayglasses), such that the left eye sees the left image only andthe right eye sees the right image only. In this way, the im-ages can be fused by the observer to obtain a sense of depth.In the mono viewing mode, identical images are presentedto the left and right eyes so that no binocular disparitieswill be prodiced by the images. Observer response dataare evaluated using receiver operating characteristic (ROC)analysis to characterize any di�erence in detectability of ab-normalities (in either the density or the arrangement of sim-ulated tissue densities) using the two viewing modes. Ourexperimental results indicate the clear superiority of stereoviewing for detection of arrangement abnormalities. For de-tection of density abnormalities, the performance of the twoviewing modes is similar. These preliminary results suggestthat stereomammography may permit easier detection ofcertain tissue abnormalities, perhaps providing a route toearlier tumor detection in cases of breast cancer.Keywords| diagnostic radiology; digital mammography;receiver operating characteristic (ROC) analysis; stereoimaging. I. IntroductionThe breast is the most frequent site of incidence of cancerin American women, accounting for 32% of incident can-cers [1]. The disease is now projected to a�ect one womanin nine [2] and has been targeted by the National Institutesof Health (NIH) and by society in general for intensive re-search [3]. Prior to metastatic spread, breast cancer is aregional disease which can often be cured by surgery orradiation. After metastatic spread, however, it becomesa generalized disease that is resistant to aggressive regi-mens of chemotherapy. The probability of metastasis isdirectly related to the size of the primary lesion. Hence, ahighly e�ective means to diminish breast cancer mortalityis earlier diagnosis [4], leading to a reduction in average tu-mor size at initial treatment. The Health Insurance Plan(HIP) study which began in 1963, after eighteen years ofJean Hsu, David M. Chelberg, and Edward J. Delp are with theSchool of Electrical Engineering, Purdue University, West Lafayette,IN 47907.Charles F. Babbs is with the Hillenbrand Biomedical EngineeringCenter, Purdue University, West Lafayette, IN 47907.Zygmunt Pizlo is with the Department of Psychological Sciences,Purdue University, West Lafayette, IN 47907.This work was supported in part by the Purdue University TRASKfund and by a Digital Equipment Corporation Faculty Incentives forExcellence Grant.
follow-up, has clearly demonstrated that the screening ofpresumably well women, with the possibility of early tu-mor detection, can result in a substantial (25%) reductionin mortality from breast cancer [5]. Early tumor detectionhas also been identi�ed by the National Cancer Instituteas a major priority for the decade of the 1990's, and re-cent NIH announcements have pointed out the need forimproved screening technologies for the detection of breastcancer [3].Mammography is the standard for diagnosis of localizedbreast cancer. It is well known to be more e�ective thanphysical examination, sonography, thermography and di-aphanography [5], [6], [7]. Despite their utility, mammo-graphic images are complex. Abnormalities in mammo-grams, when present, may be small or subtle. Any diag-nostic technique that improves the sensitivity or speci�cityof breast cancer detection would be highly valued. Giventhat the estimated number of new breast cancer cases in theUnited States for 1993 is 183,000 [1], even a slight improve-ment in the diagnostic accuracy of mammography wouldbene�t thousands of women.In this paper, we report a study on the use of stereo per-ception as an adjunct to mammographic screening. Thework is based on the hypothesis that recognition of sub-tle abnormalities in a complex three-dimensional object,such as the matrix of glandular and fatty tissues of thebreast, can be enhanced when the scene is viewed in stereo.The depth information provided by stereo display may al-low better radiographic de�nition of abnormal masses fromsimilar surrounding normal tissues, thereby increasing theobserver's ability to distinguish and characterize abnormalmasses. Stereo viewing requires views of the same scenefrom two slightly di�erent perspectives. Traditional mam-mographic screenings also require two views (medio-lateraland cranio-caudal). Hence, to achieve stereo viewing, noadditional radiation exposure is necessary. To systemati-cally investigate the e�ectiveness of stereo imaging in aid-ing the detection of abnormalities in computer-simulatedmammograms, psychophysical experiments have been de-signed. A preliminary study involving fewer subjects hasbeen reported [8]. We have since then extended our workto include more subjects, as reported here.Section II contains an introduction to the basic conceptsof stereo perception and discusses the potential bene�ts ofstereo viewing for mammographic screening. Section IIIpresents an overview of the experiments. Our image gener-ation process, the advantages of using computer-simulatedimages, our mathematical model of the human breast andthe types of abnormalities which are de�ned are also de-scribed in section III. Section IV contains a description of
HSU ET AL.:PRE-CLINICAL ROC STUDIES OF DIGITAL STEREOMAMMOGRAPHY 319the design of the experiments and the experimental equip-ment used. Section V is the data analysis section. It isfollowed by a report of the experimental results in sectionVI. A discussion of the results and the conclusion can befound in sections VII and VIII respectively.II. STEREO PERCEPTIONBy alternately opening and closing one eye, we note thatour left and right eyes observe slightly di�erent views of ascene. The left and right images, when combined or fusedby the brain, produce stereo perception or stereo visionin humans [9]. The fact that humans can see well withonly one eye indicates that monocular cues such as linearperspective, occultation, shading, shadow, and texture canalso provide a sense of depth [10], [11], [12], [13]. However,in the domain of x-ray imaging, radiologists have minimalmonocular depth cues. In mammography, in particular,the observer may not know the exact shape of a possibletumor. Binocular stereo vision could be of great bene�t insuch applications since it is the most powerful depth cuefor scenes viewed close at hand and it is su�cient for per-ception of objects even in the absence of other cues such ascolor and contour [14]. Stereo vision can help in resolvingambiguities by revealing position, form, and structure ofobjects. Intriguingly, as indicated in [15], stereopsis mayaccess specialized brain centers that allow an observer tolook through the clutter of insigni�cant depth planes toconcentrate visual attention on a triangulated target. Vi-sual information processing in the brain is organized withrelatively large areas devoted to binocular stereopsis andthe analysis of depth cues. By using stereo viewing, ob-servers may utilized these areas of the brain to attain betteraccuracy in mammographic screening.Stereo techniques have been available to radiologists fordecades [16]. In 1898, just three years after the discoveryof x-rays, Davidson used the stereoscopic method in x-rayimaging [17]. However, the poor quality of stereo displaydevices in the past, and more recently, the availability andinterest in computed tomography (CT) and magnetic res-onance imaging (MRI), have led to the neglect of stereo x-ray research. The particular clinical requirements of mam-mographic screening for breast cancer, however, create aspecial situation in which CT and MRI may not be appro-priate for routine use. Recent American Cancer Societyguidelines call for baseline mammography in women 35-40years of age, and yearly mammography in women over 50years of age [18]. The large number of women who mustbe screened on a repeated basis, the relatively high radia-tion dose of CT and the relatively high cost of MRI (about$1000 for MRI versus $60 for mammography), make theseimaging approaches inappropriate for widespread applica-tion to breast cancer screening. Furthermore, recent im-provements in computer and video technology [19], [20],[21] have made realistic high-quality three-dimensional x-ray imaging possible. For initial diagnostic screening, stere-oradiographic approaches may well �ll a technological nicheof considerable public health importance.
III. OVERVIEW OF THE EXPERIMENT ANDIMAGE GENERATIONTo determine if stereo viewing a�ects the accuracy of ab-normality detection, we have designed experiments to sys-tematically investigate the e�ectiveness of stereo viewingfor detection of abnormalities in the density and arrange-ment of simulated tissue densities. Twenty two subjectshave participated in the experiments. Subjects include theauthors, some graduate students and some undergraduatestudents. The perceptual tasks that are required in theexperiments are similar to those required of radiologistsin the diagnosis of breast diseases, but do not require ra-diological training. In addition, it is commonly acceptedin the �eld of psychology that visual perception, includingstereo vision, is an inate ability [22]. The use of lay sub-jects as experimental participants is therefore appropriate.The accuracy and precision with which lay subjects can de-tect abnormalities using stereo versus mono viewing modewill de�ne in a fundamental sense the potential diagnos-tic bene�ts of depth information provided by digital stereodisplays.Computational models are used to create computer-simulated images [23]. In this way, fundamental questionsrelating to the virtue of stereo displays as an aid to humanperception can be answered without exposing any humansubjects to radiation. Also, the cost of obtaining images foranalysis is minimal. Other advantages of using computer-simulated images include:1. \ground truth" about the images is known exactly,since the abnormalities are deliberately created andmathematically de�ned;2. the number of possible abnormalities is unlimited, andthe nature, background, and context of the abnormal-ities can be systematically varied to determine underwhat circumstances perception and diagnostic perfor-mance are most and least in uenced by stereo displaytechniques;3. a computational model of the breast can be mademore anatomically realistic and more complex thanphysical models (phantoms), such as those constructedfrom resin;4. a computational model is exactly reproducible; and5. full control over the image formation process is possi-ble.Our mathematical model of a breast consists of a large,truncated hemisphere with a small sphere at its apex as thenipple. \Truncation" is used to simulate attening of thebreast between compression plates during mammographicexamination. Spherical densities are distributed beneaththe \skin" of the breast-like hemisphere to represent theglandular and connective tissue elements of the breast. Thenumber of spherical densities has a Gaussian distributionwith mean 70 and standard deviation 5. The embeddedspheres have a Gaussian distribution of size, density, andcenter coordinates within the model. Limited random vari-ations in sphere size and density are included to mimic nor-mal biological variations, from which \abnormal" featureshave to be distinguished. A diagram illustrating our math-
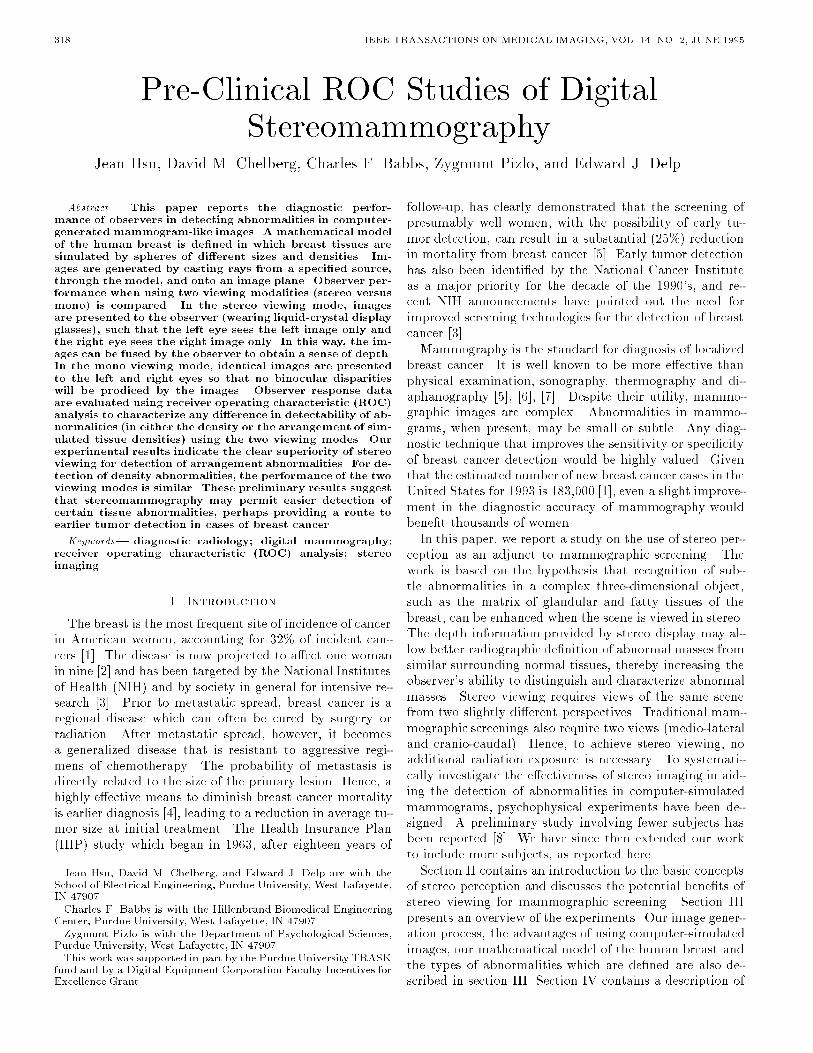
320 IEEE TRANSACTIONS ON MEDICAL IMAGING, VOL. 14, NO. 2, JUNE 1995ematical breast model is shown in Figure 1. Table I liststhe values of the parameters used.x-ray source
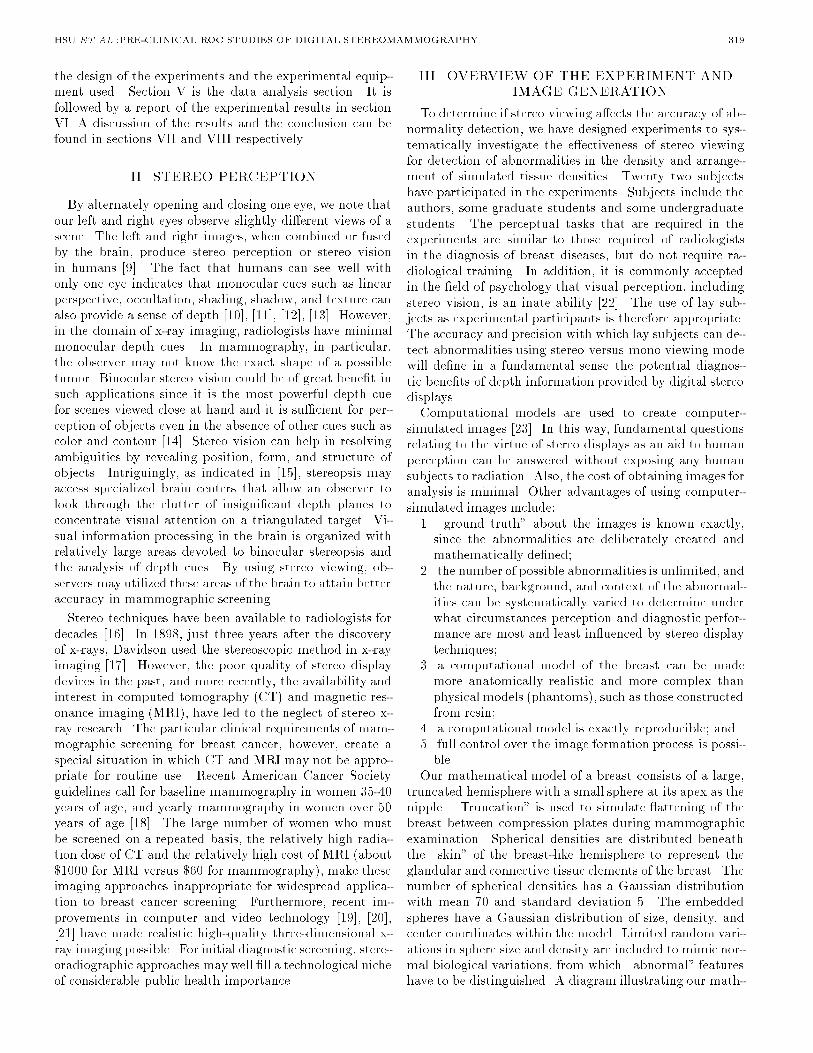
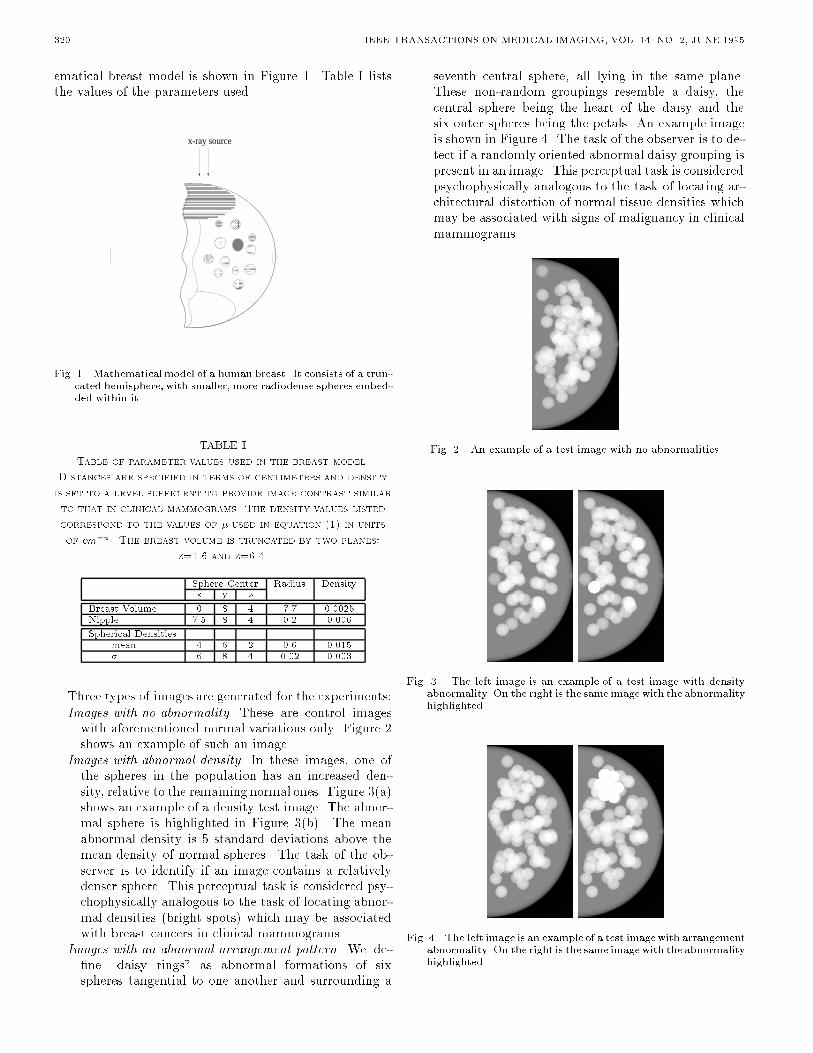
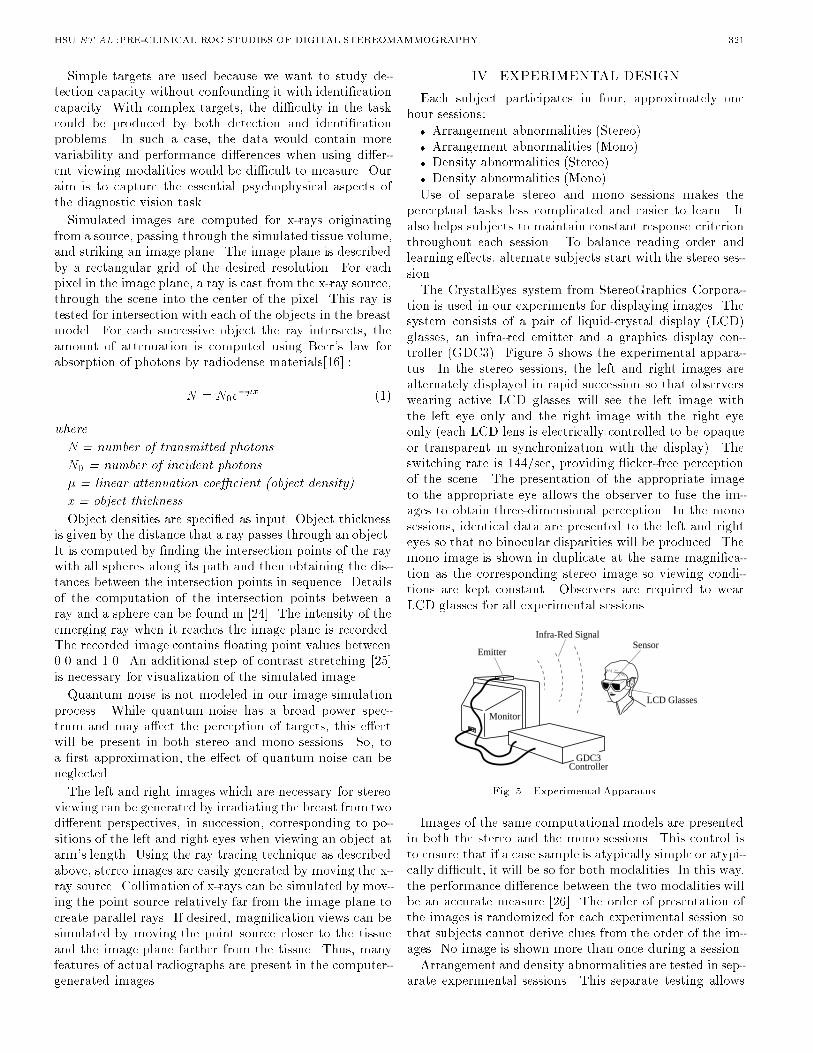
Fig. 1. Mathematical model of a human breast. It consists of a trun-cated hemisphere, with smaller, more radiodense spheres embed-ded within it. TABLE ITable of parameter values used in the breast model.Distances are specified in terms of centimeters and densityis set to a level sufficient to provide image contrast similarto that in clinical mammograms. The density values listedcorrespond to the values of � used in equation (1) in unitsof cm�1. The breast volume is truncated by two planes:z=1.6 and z=6.4.Sphere Center Radius Densityx y zBreast Volume 0 8 4 7.7 0.0025Nipple 7.5 8 4 0.2 0.006Spherical Densitiesmean 4 6 2 0.6 0.015� 6 8 4 0.02 0.003Three types of images are generated for the experiments:Images with no abnormality. These are control imageswith aforementioned normal variations only. Figure 2shows an example of such an image.Images with abnormal density. In these images, one ofthe spheres in the population has an increased den-sity, relative to the remaining normal ones. Figure 3(a)shows an example of a density test image. The abnor-mal sphere is highlighted in Figure 3(b). The meanabnormal density is 5 standard deviations above themean density of normal spheres. The task of the ob-server is to identify if an image contains a relativelydenser sphere. This perceptual task is considered psy-chophysically analogous to the task of locating abnor-mal densities (bright spots) which may be associatedwith breast cancers in clinical mammograms.Images with an abnormal arrangement pattern. We de-�ne \daisy rings" as abnormal formations of sixspheres tangential to one another and surrounding a
seventh central sphere, all lying in the same plane.These non-random groupings resemble a daisy, thecentral sphere being the heart of the daisy and thesix outer spheres being the petals. An example imageis shown in Figure 4. The task of the observer is to de-tect if a randomly oriented abnormal daisy grouping ispresent in an image. This perceptual task is consideredpsychophysically analogous to the task of locating ar-chitectural distortion of normal tissue densities whichmay be associated with signs of malignancy in clinicalmammograms.Fig. 2. An example of a test image with no abnormalities.
Fig. 3. The left image is an example of a test image with densityabnormality. On the right is the same image with the abnormalityhighlighted.Fig. 4. The left image is an example of a test imagewith arrangementabnormality. On the right is the same image with the abnormalityhighlighted.
HSU ET AL.:PRE-CLINICAL ROC STUDIES OF DIGITAL STEREOMAMMOGRAPHY 321Simple targets are used because we want to study de-tection capacity without confounding it with identi�cationcapacity. With complex targets, the di�culty in the taskcould be produced by both detection and identi�cationproblems. In such a case, the data would contain morevariability and performance di�erences when using di�er-ent viewing modalities would be di�cult to measure. Ouraim is to capture the essential psychophysical aspects ofthe diagnostic vision task.Simulated images are computed for x-rays originatingfrom a source, passing through the simulated tissue volume,and striking an image plane. The image plane is describedby a rectangular grid of the desired resolution. For eachpixel in the image plane, a ray is cast from the x-ray source,through the scene into the center of the pixel. This ray istested for intersection with each of the objects in the breastmodel. For each successive object the ray intersects, theamount of attenuation is computed using Beer's law forabsorption of photons by radiodense materials[16] :N = N0e��x (1)whereN = number of transmitted photonsN0 = number of incident photons� = linear attenuation coe�cient (object density)x = object thickness.Object densities are speci�ed as input. Object thicknessis given by the distance that a ray passes through an object.It is computed by �nding the intersection points of the raywith all spheres along its path and then obtaining the dis-tances between the intersection points in sequence. Detailsof the computation of the intersection points between aray and a sphere can be found in [24]. The intensity of theemerging ray when it reaches the image plane is recorded.The recorded image contains oating point values between0.0 and 1.0. An additional step of contrast stretching [25]is necessary for visualization of the simulated image.Quantum noise is not modeled in our image simulationprocess. While quantum noise has a broad power spec-trum and may a�ect the perception of targets, this e�ectwill be present in both stereo and mono sessions. So, toa �rst approximation, the e�ect of quantum noise can beneglected.The left and right images which are necessary for stereoviewing can be generated by irradiating the breast from twodi�erent perspectives, in succession, corresponding to po-sitions of the left and right eyes when viewing an object atarm's length. Using the ray tracing technique as describedabove, stereo images are easily generated by moving the x-ray source. Collimation of x-rays can be simulated by mov-ing the point source relatively far from the image plane tocreate parallel rays. If desired, magni�cation views can besimulated by moving the point source closer to the tissueand the image plane farther from the tissue. Thus, manyfeatures of actual radiographs are present in the computer-generated images.
IV. EXPERIMENTAL DESIGNEach subject participates in four, approximately onehour sessions:� Arrangement abnormalities (Stereo)� Arrangement abnormalities (Mono)� Density abnormalities (Stereo)� Density abnormalities (Mono)Use of separate stereo and mono sessions makes theperceptual tasks less complicated and easier to learn. Italso helps subjects to maintain constant response criterionthroughout each session. To balance reading order andlearning e�ects, alternate subjects start with the stereo ses-sion.The CrystalEyes system from StereoGraphics Corpora-tion is used in our experiments for displaying images. Thesystem consists of a pair of liquid-crystal display (LCD)glasses, an infra-red emitter and a graphics display con-troller (GDC3). Figure 5 shows the experimental appara-tus. In the stereo sessions, the left and right images arealternately displayed in rapid succession so that observerswearing active LCD glasses will see the left image withthe left eye only and the right image with the right eyeonly (each LCD lens is electrically controlled to be opaqueor transparent in synchronization with the display). Theswitching rate is 144/sec, providing icker-free perceptionof the scene. The presentation of the appropriate imageto the appropriate eye allows the observer to fuse the im-ages to obtain three-dimensional perception. In the monosessions, identical data are presented to the left and righteyes so that no binocular disparities will be produced. Themono image is shown in duplicate at the same magni�ca-tion as the corresponding stereo image so viewing condi-tions are kept constant. Observers are required to wearLCD glasses for all experimental sessions.LCD Glasses
SensorInfra-Red Signal
GDC3Controller
Monitor
EmitterFig. 5. Experimental Apparatus.Images of the same computational models are presentedin both the stereo and the mono sessions. This control isto ensure that if a case sample is atypically simple or atypi-cally di�cult, it will be so for both modalities. In this way,the performance di�erence between the two modalities willbe an accurate measure [26]. The order of presentation ofthe images is randomized for each experimental session sothat subjects cannot derive clues from the order of the im-ages. No image is shown more than once during a session.Arrangement and density abnormalities are tested in sep-arate experimental sessions. This separate testing allows

322 IEEE TRANSACTIONS ON MEDICAL IMAGING, VOL. 14, NO. 2, JUNE 1995independent analysis of the performance of stereo versusmono viewing for detection of each type of abnormality.There is at most one abnormality present in each image.The experimental sessions are fully automated. Stan-dardized lighting and viewing distance are also maintained.An introduction to the experiment and instructions for re-sponding are presented on-screen. Training images, giv-ing examples of the types of abnormalities to be searchedfor, are displayed as part of the subject training sequence.These training images serve to acquaint the subject withthe visual display and the nature of abnormalities (eitherdensities or daisy rings) to be identi�ed in a given session.In the training session, feedback is provided to the subject[27]. The system highlights the abnormal object (see Fig-ure 3(b) and Figure 4(b)) when the subject presses a keyto indicate that he or she is ready to see the answer.The actual experimental session begins immediately af-ter the training session is completed. In the experimentalsession, test images are displayed and keystrokes, indicat-ing the subjects' responses, are recorded by the computersystem. Depending on whether the subject is participatingin the stereo or the mono session, appropriately formattedimages are shown, one at a time, on the video display. Thesubject is allowed to view each image for a maximum of 30seconds. This time limit is set to simulate the fact that ra-diologists have limited time to examine each mammogram;it also limits the variability in subject's response time. Ifdesired, subjects can respond in less than 30 seconds bypressing the n-key for \next".After viewing each image, subjects are asked to rate theimage for abnormality on a graded scale of 1 to 5.A response of 1 indicates de�nitely no abnormality is present.A response of 2 indicates probably no abnormality is present.A response of 3 is an equivocal response i.e. possible abnormality.A response of 4 indicates an abnormality is probably present.A response of 5 indicates an abnormality is de�nitely present.The rating scale is displayed whenever responses are ex-pected from the subject. In this way, the subject doesnot have to memorize the scale. This display also helpsto reduce errors due to misunderstanding of the meaningof the numeric scale. Subjects are given feedback aftereach response. Providing feedback is a standard element inpsychophysical experiments. Without feedback, subjects'prior experiences, which are not under the experimenter'scontrol, may have an e�ect on the experiment [28]. Theuse of feedback increases the reliability of the experimentalresults. To avoid cluttering the screen with too much infor-mation, audio feedback is used in our experimental sessions.A tone is automatically sounded if the image that has justbeen rated contains an abnormality. In each session sub-jects evaluate 60 images, with the knowledge that exactlyhalf of the images contained a particular abnormality.V. DATA ANALYSISReceiver operating characteristic (ROC) analysis hasbeen accepted as the most rigorous and objective means ofcomparing diagnostic imaging modalities in radiology [26],[29], [30]. In mammography-related research, ROC analy-
sis has been used to characterize the accuracy of mammog-raphy [31], to compare the performance of mammographyand palpation [7] and to characterize the spatial resolu-tion requirement and the e�ect of unsharp-mask �lteringon the detectability of subtle micro-calci�cations in digitalmammography [32]. ROC analysis has also been utilized ina study on the e�ect of attention-cueing on breast cancerdetection performance [33], [34].According to the ROC model, a radiologist or an ob-server decides to render a positive or negative diagnosisby comparing his or her con�dence concerning each imagewith an internal con�dence criterion. If con�dence in apositive diagnosis exceeds this con�dence criterion, the im-age is read as positive and vice versa. If the observer iskeen to make a positive diagnosis and desires to minimizefalse negative readings, then the false positive fraction willbe increased. This mind-set is appropriate in breast can-cer screening, in which a radiologist generally prefers highsensitivity (true positive fraction), even at the expense ofa high false positive fraction, because of the great impor-tance of detecting early breast cancers. The penalty to thepatient for a false positive diagnosis (a negative biopsy) ismuch less than the penalty for a false negative one (a con-tinuing malignancy). In current clinical mammography,the false positive fraction is in the range of 30% to 60% [7],[31].To compare the performance of observers using a modi-�ed or innovative technology with the performance of thesame observers using conventional technology, it is neces-sary to gather performance data for a series of images inwhich diagnostic truth is known and then to construct theROC curves (see Figure 6) [26], [35]. In the domain of med-ical imaging, ROC curves are most commonly assumed tohave the binormal functional form [29]. The two adjustableparameters of binormal ROC curves can be �tted from theROC data by using the maximum likelihood parameter es-timation scheme [30]. If for the same observers, the curvefor the new technology lies above the curve for the conven-tional technology, there is objective evidence that the newtechnology permits a greater fraction of correct diagnoses,regardless of variability in observers' bias for or againstmaking a false positive diagnosis.0 0.2 0.4 0.6 0.8 1
FPF
#1
0.2
0.4
0.6
0.8
1TPF
0 0.2 0.4 0.6 0.8 1FPF
#19
0.2
0.4
0.6
0.8
1TPF
Fig. 6. Typical ROC curves with data points and corresponding95% con�dence limits [36] (Subject #1 and Subject #19, Ar-rangement Experiment). Legend : thick lines, black diamonds(stereo viewing); thin lines, crosses (mono viewing).

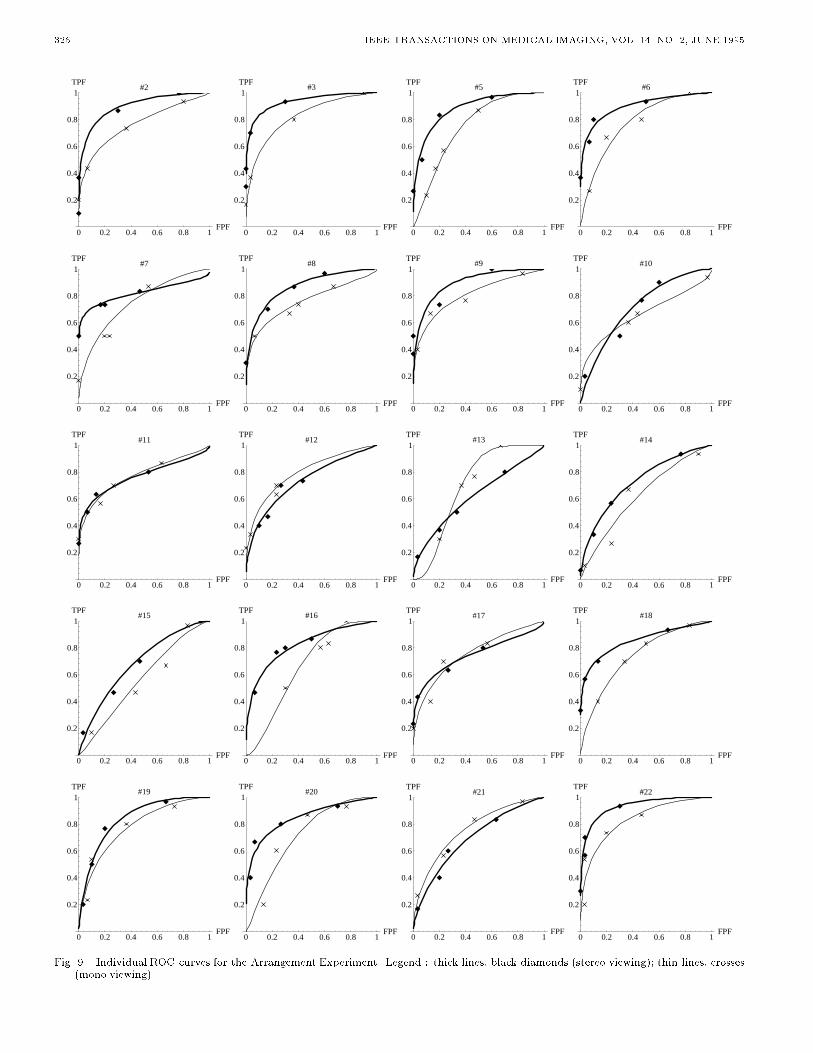
HSU ET AL.:PRE-CLINICAL ROC STUDIES OF DIGITAL STEREOMAMMOGRAPHY 323A problem which may occur with ROC curve �tting is adegenerate data set. The most common degeneracy occurswhen the observer does not distribute his or her responsesmore or less uniformly over all the possible rating cate-gories. One of the subjects in our experiment did not usecategories 1 and 3 in his responses. Another subject usedcategory 3 most of the time. These idiosyncrasies resultedin degenerate data sets which have to be discarded [26].To minimize occurrences of degenerate data sets, subjectsare instructed to use all categories and to distribute theirresponses uniformly over the rating scale. Although suchinstructions may a�ect subjects' responses, no conclusiveresults have been reported in the existing literature [27],[37]. There is also no reason to believe that any such e�ectwill upset the di�erential between mono and stereo viewingperformance. In addition, if subjects were not instructed todistribute their responses uniformly, the data sets obtainedmay not be analyzable and hence may be useless.For our experiments, observer response data are evalu-ated by ROC analysis using standard techniques for �vecategory ratings as described by Metz [29]. A maximumlikelihood curve �t for data from each subject is computed.For non-degenerate data sets, individual ROC curves aregenerated from the two �tted parameters, correspondingto the slope and y-intercept of ROC curves in normal de-viate axes. To generate ROC curves with TPF and FPFin linear probability coordinates, the normal deviate axesare transformed using the following function [38]:F (x) = 1p2� Z x�1 e�t2=2dtStudent-t tests of paired di�erences in the stereo andmono summary index, Az (area under the ROC curve),are performed to determine signi�cance. Paired t-tests areperformed instead of non-paired t-tests to minimize thee�ects of inter-observer di�erences such as di�erences inobserver's skill and experience. For example, the signi�-cance of the results may be obscured by the tendency ofbetter skilled and experienced observers to perform bet-ter and the tendency of others to perform poorly. Thisdi�erence in performance increases the apparent varianceand thus decreases the signi�cance of any di�erence in theperformance of the two modalities if a non-paired t-test isused. In order to visualize the overall performance of allsubjects, combined ROC curves are plotted (in the samemanner as described above) using the average parametervalues for all subjects. This is the recommended methodto use when a heterogeneous observer population is studied[30]. VI. RESULTSA. Arrangement ExperimentOf the 22 result sets from the arrangement experiment,one degenerate data set had to be discarded (see discussionin section V). Table II lists the individual Az indices andthe corresponding standard errors for both the stereo andmono sessions of the arrangement experiment. The � listed
for the average case is the standard error of the averageof the Az values, not the average of the standard errors.Figure 6 and Figure 9 show the individual ROC curveswhile Figure 7 shows the overall performance of the 21subjects who participated in the arrangement experiment.The shape of the composite ROC curves is typical for a vi-sual detection experiment in radiology [29], [32], indicatingthat an appropriate perceptual task is required of the sub-jects, neither too trivial nor too di�cult. In comparing thetwo modalities, the TPF for any given FPF in Figure 7 isclearly greater for stereo than for mono views. The di�er-ence in the Az index (describing the area under the ROCcurve) is statistically signi�cant (t=4.49, p=0.00023) usinga 2-tailed paired t-test. Hence, there is clear and signi�cantbene�t in using the stereo modality.TABLE IITable of individual Az (area under the ROC curve) indicesand the associated standard errors for the arrangementexperiment. Average is the mean of the indicated Az valuesand the associated standard error of the mean.Subject Stereo Session Mono SessionAz � Az �1 0.94 0.034 0.84 0.0522 0.90 0.035 0.77 0.0633 0.94 0.035 0.82 0.0575 0.88 0.044 0.74 0.0666 0.90 0.042 0.78 0.0617 0.82 0.065 0.75 0.0668 0.87 0.048 0.76 0.0669 0.90 0.042 0.81 0.05810 0.72 0.068 0.66 0.07911 0.77 0.069 0.77 0.06412 0.73 0.072 0.79 0.07613 0.62 0.075 0.70 0.07414 0.73 0.068 0.63 0.07415 0.69 0.072 0.57 0.07516 0.82 0.057 0.66 0.08017 0.75 0.070 0.76 0.06518 0.85 0.053 0.74 0.06619 0.84 0.053 0.78 0.06020 0.85 0.052 0.72 0.06821 0.69 0.070 0.76 0.06322 0.93 0.034 0.83 0.054Average 0.82 0.094 0.74 0.0680 0.2 0.4 0.6 0.8 1
FPF
Arrangement Experiment
0.2
0.4
0.6
0.8
1TPF
Fig. 7. Combined ROC curves for ArrangementExperiment. Legend: thick lines (stereo viewing); thin lines (mono viewing). Thesecurves are generated using the average �tted parameter valuesfor all subjects. The data for individual subjects can be found inFigures 6 and 9.

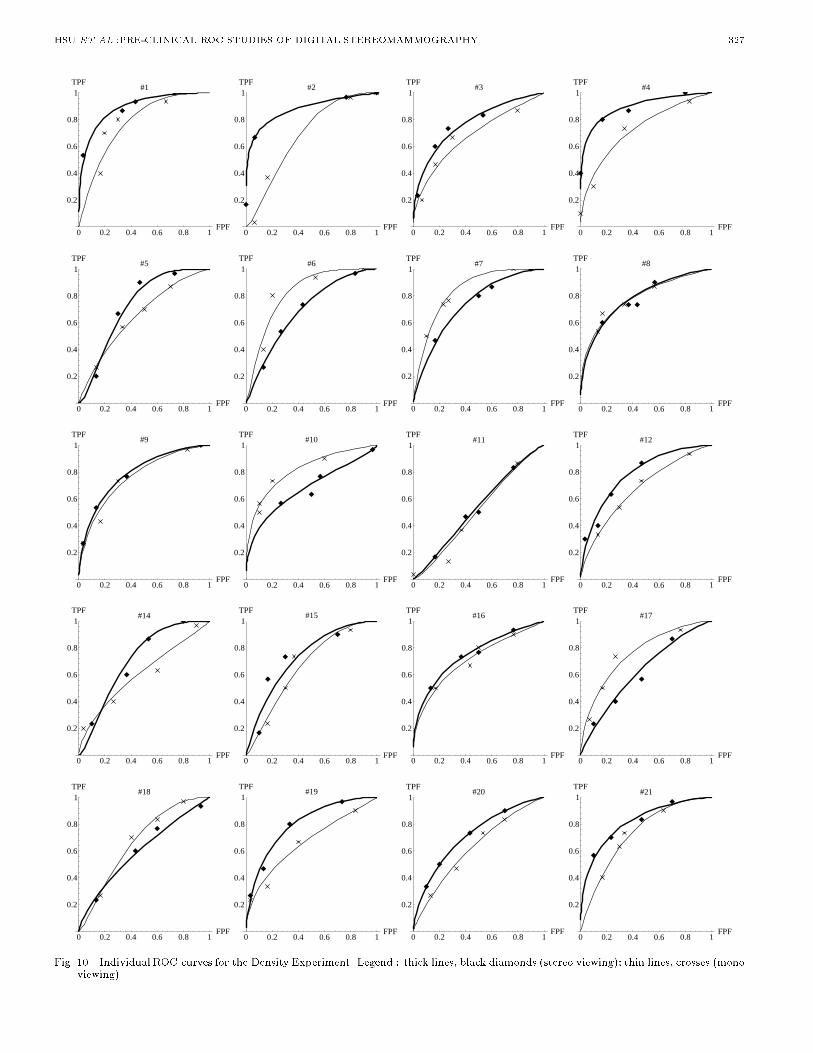
324 IEEE TRANSACTIONS ON MEDICAL IMAGING, VOL. 14, NO. 2, JUNE 1995B. Density ExperimentOf the 22 participants of the experiment, two had de-generate data sets, leaving 20 analyzable data sets (see Ta-ble III and Figure 10). Once again, the � listed for theaverage case in Table III is the standard error of the meanAz's. The overall performance of the 20 subjects is shownin Figure 8. There is a slight di�erence between the com-posite ROC curves for the two modalities, with the stereoROC curve lying above the mono ROC curve. However,using a 2-tailed paired t-test, the di�erence in area underthe ROC curve, Az, is not statistically signi�cant (t=1.63,p=0.12). TABLE IIITable of individual Az (area under the ROC curve) indicesand the associated standard errors for the densityexperiment. Average is the mean of the indicated Az valuesand the associated standard error of the mean.Subject Stereo Session Mono SessionAz � Az �1 0.89 0.044 0.77 0.0632 0.88 0.051 0.68 0.0783 0.77 0.063 0.68 0.0704 0.90 0.043 0.73 0.0675 0.73 0.068 0.65 0.0736 0.69 0.070 0.82 0.0587 0.73 0.068 0.84 0.0558 0.78 0.063 0.78 0.0629 0.79 0.061 0.76 0.06310 0.68 0.076 0.82 0.05711 0.53 0.077 0.51 0.07812 0.79 0.061 0.68 0.07114 0.71 0.069 0.61 0.07415 0.73 0.066 0.66 0.07216 0.75 0.065 0.71 0.06917 0.62 0.074 0.76 0.06318 0.60 0.075 0.67 0.07219 0.80 0.058 0.66 0.07220 0.72 0.067 0.62 0.07421 0.82 0.056 0.73 0.068Average 0.75 0.095 0.71 0.0820 0.2 0.4 0.6 0.8 1
FPF
Density Experiment
0.2
0.4
0.6
0.8
1TPF
Fig. 8. Combined ROC curves for Density Experiment. Legend :thick lines (stereo viewing); thin lines (mono viewing). Thesecurves are generated using the average �tted parameter valuesfor all subjects. The data for individual subjects can be found inFigure 10. VII. DISCUSSIONThe purpose of our experiments is to determine whichviewing modality (stereo or mono) leads to better diag-
nostic performance. Our aim is not to measure the abso-lute detectabilities of abnormalities using the two viewingmodes. In order to achieve our purpose, real-world view-ing conditions are simulated as closely as possible in thedesign of the experiments. To simulate time constraintsof practicing radiologists, a maximum time limit is set forviewing images. A relatively large group of subjects wasused so that the general utility of depth perception in clin-ical practice can be accessed.The choice of which images should be included in anROC experiment is not easy, but an appropriate choice isvery important. If the abnormalities to be detected are tooconspicuous, subjects will perform well regardless of themodality used. Similarly, if the abnormalities are chosento be too subtle, poor performance will be recorded for allmodalities. A rule of thumb which has been suggested fordetermining the most appropriate level of case di�culty isthat the average Az of two modalities under considerationshould lie near the range 0.75 to 0.8 [26]. For our study, theaverage Az index for the arrangement experiment is 0.78and that for the density experiment is 0.73, indicating thatthe di�culty levels of our experiments are appropriate.The experimental results allow us to conclude con�dentlythat stereo viewing provides higher detectability of ar-rangement abnormalities. This �nding is consistent withexpectations since stereo viewing increases detectability ofshapes and structures. Also, after the experimental ses-sions, when asked about their preferences of the two modal-ities, all subjects except one preferred the stereo sessionsover the mono sessions.Our experimental results also show that stereo viewinghas an advantage over mono viewing for detection of den-sity di�erences. However, the performance di�erence be-tween the viewing modalities is not statistically signi�cant.In our earlier work with fewer subjects [8], a low signif-icant di�erence (at 4% signi�cance level) is found in theperformance of the two modalities { with stereo mode out-performing mono mode.The following details about our experiments should benoted. A basic assumption which was made in the studyis that any given observer is equally skilled with the twoviewing modalities in question. This may not be true ingeneral but any di�erences in skill of stereo versus monoviewing modalities are minimized by the compulsory train-ing session given before the actual experimental sessionsbegin. Another noteworthy factor is that the screen phos-phor decay and retinal sensitivity to the persisting imagecan result in some ghosting when stereo viewing is used. Ifnew stereo display technology which overcomes these prob-lems becomes available, the performance of stereo viewingmay be even better.VIII. CONCLUSIONWe have applied modern stereo display technology todiagnostic mammography. The utilization of computer-simulated x-ray images for testing new imaging technolo-gies is e�cient and cost e�ective. To our knowledge thisis the �rst scienti�c evaluation of stereo versus mono med-

HSU ET AL.:PRE-CLINICAL ROC STUDIES OF DIGITAL STEREOMAMMOGRAPHY 325ical imaging using ROC curve analysis. This paper re-ports fundamental results on the contribution provided bystereo viewing to diagnostic performance and demonstratesthe potential of stereo mammography for early detection ofbreast cancer. References[1] Catherine C. Boring, Teresa S. Squires, and Tony Tong, \Cancerstatistics, 1993", CA: A Cancer Journal for Clinicians, vol. 43,pp. 7{26, 1993.[2] \Cancer facts and �gures", American Cancer Society, 1992.[3] \Digitalmammographydevelopmentgroup (National Cancer In-stitute) PA-92-57", NIH Guide, vol. 21, March 27 1992.[4] E. R. Fisher and J. D. Paulson, \Identi�cation of early changesin breast cancer", in E. Grundmann and L. Beck, editors, EarlyDiagnosis of Breast Cancer, pp. 65{73. Fischer, New York, 1982.[5] Philip Strax, Make Sure You Do Not Have Breast Cancer, St.Martin's Press, New York, 1989.[6] Tim B. Hunter and Laurie L. Fajardo, \Digital genitoruniary,gastrointestinal, and breast radiology", in John D. Newell andCharles A. Kelsey, editors, Digital Imaging in Diagnostic Radi-ology, pp. 43{70. Churchill Livingstone, New York, 1990.[7] John K. Gohagan, Edward L. Spitznagel, Martha McCrate, andThomas B. Frank, \ROC analysis of mammography and palpa-tion for breast screening", Investigative Radiology, vol. 19, pp.587{592, 1984.[8] J. Hsu, C. F. Babbs, D. M. Chelberg, Z. Pizlo, and E. J. Delp,\A study of the e�ectiveness of stereo imaging with applicationsin mammography", in Proceedings of the SPIE Conference onHuman Vision, Visual Processing, and Digital Display IV, vol.1913, pp. 154{165, Feburary 1993.[9] Peter C. Dodwell, \Binocular vision and pattern coding", inVisual Pattern Recognition, pp. 120{136. Holt, Rinehart andWinston, New York, 1970.[10] Margret Livingstone and David Hubel, \Segregation of form,color, movement, and depth: anatomy, physiology, and percep-tion", Science, vol. 240, pp. 740{749, May 1988.[11] James T. Todd and Robin A. Akerstrom, \Perception of three-dimensional form from patterns of optical texture", Journal ofExperimental Psychology, vol. 13, pp. 242{255, 1987.[12] Tom Troscianko, Rachel Montagnon, Jacques LeClerc, Em-manuelle Malbert, and Pierre-Louis Chanteau, \The role ofcolour as a monocular depth cue", Vision Research, vol. 31,pp. 1923{1930, 1991.[13] Zygmunt Pizlo and Azriel Rosenfeld, \Recognition of planarshapes from perspective images using contour-based invariants",Computer Vision, Graphics and Image Processing : Image Un-derstanding, vol. 56, pp. 330{350, November 1992.[14] Bela Julesz, Foundations of Cyclopean Perception, Universityof Chicago Press, Chicago, 1971.[15] W. Carter, \The advantage of single lens stereopsis", in Pro-ceedings of the SPIE Conference on Stereoscopic Displays andApplications III, vol. 1669, pp. 204{214, Feburary 1992.[16] Edward E. Christensen, Thomas S. Curry, and James Nunnally,An Introduction to the Physics of Diagnostic Radiology, Lee &Febiger, Philadelphia, 1972.[17] Jas Mackenzie Davidson, \Remarks on the value of stereoscopicphotographyand skiagraphy: records of clinical and pathologicalappearances", British Medical Journal, pp. 1669{1671, Decem-ber 1898.[18] Gerald D. Dodd, \American cancer society guidelines on screen-ing for breast cancer: an overview", CA: A Cancer Journal forClinicians, vol. 42, pp. 177{180, 1992.[19] Sen Zhang, Paul H. King, and Xiaodong Pang, \Recent progressin x-ray stereoscopes", Medical Physics, vol. 10, pp. 574{578,September/October 1983.[20] Lenny Lipton, The CrystalEyes Handbook, StereoGraphics Cor-poration, 1991.[21] Andrew Woods, Tom Docherty, and Rolf Koch, \The use of icker-free television products for stereoscopic display applica-tions", in Proceesings of the SPIE conference on StereoscopicDisplays and Applications II, vol. 1457, pp. 322{326, 1991.[22] R. D. Walk and E. J. Gibson, \A comparative and analyticalstudy of visual depth perception", Psychological Monographs,vol. 75, 1961.
[23] Jean Hsu and David M. Chelberg, \Visible light and x-ray raytracing of generalized cylinders", Computer Vision, Graphics,and Image Processing: Graphical Models and Image Processing,vol. 56, pp. 392{401, September 1994, A version is also availableas TR-EE-93-43, Purdue Univeristy, November 1993.[24] Andrew S. Glassner, An Introduction to Ray Tracing, AcademicPress, London; San Diego, 1989.[25] Rafael C. Gonzalez and Richard E. Woods, Digital Image Pro-cessing, Addison Wesley, 1992.[26] Charles E. Metz, \Some practical issues of experimental designand data analysis in radiological ROC studies", InvestigativeRadiology, vol. 24, pp. 234{245, 1989.[27] William H. Straub, Howard Rockette, Jill L. King, Nancy A.Obuchowski, Walter F. Good, John H. Feist, Barbara C. Good,and Charles E. Metz, \Training observers for receiver operat-ing characteristic (ROC) studies", in Proceedings of the SPIEConference on Medical Imaging IV: PACS System Design andEvaluation, vol. 1234, pp. 126{130, 1990.[28] George Sperling, Barbara A. Dosher, and Michael S. Landy,\How to study the kinetic depth e�ect experimentally", Jour-nal of Experimental Psychology: Human Perception and Per-formance, vol. 16, pp. 445{450, 1990.[29] Charles E. Metz, \ROC methodology in radiologic imaging",Investigative Radiology, vol. 21, pp. 720{733, 1986.[30] John A. Swets and Ronald M. Pickett, Evaluation of DiagnosticSystems : Methods from Signal Detection Theory, AcademicPress, 1982.[31] James E. Goin, JoAnn D. Haberman, Martha K. Linder, andPerry A. Lambird, \Analysis of mammography: A blind in-terpretation of BCDDP radiographs", Radiology, vol. 148, pp.393{396, August 1983.[32] Heang Ping Chan, Carl J. Vyborny, Herber MacMahon,Charles E. Metz, Kunio Doi, and Edward A. Sickles, \Digitalmammography: ROC studies of the e�ects of pixel size and un-sharp mask �ltering on detection of subtle microcalci�cations",Investigative Radiology, vol. 22, 1987.[33] Susan M. Astley and Christopher J. Taylor, \Combiningcues for mammographic abnormalities", in Proceedings of theFirst British Machine Vision Conference, pp. 253{258, Oxford,September 1990.[34] Sue Astley, Ian Hutt, Stephen Adamson, Peter Miller, PeterRose, Caroline Boggis, Chris Taylor, TimValentine, Jack Davies,and Janette Armstrong, \Automation in mammography : Com-puter vision and human perception", in Proceedings of the SPIEConference on Biomedical Image Processing, vol. 1905, 1993.[35] John A. Swets, \ROC analysis applied to the evaluation of med-ical imaging techniques", Investigative Radiology, vol. 14, pp.109{121, 1979.[36] Richard Stevens Burington and Donald Curtis May, Handbookof Probability and Statistics with Tables, pp. 247{248, McGraw-Hill Book Company, 1970.[37] R. M. Dawood, A. Todd-Pokropek, J. O. M. C. Craig, J. H.Highman, and A. W. Porter, \The optimal use of rating scalesin ROC analysis", in Proceedings of the SPIE Conference onMedical Imaging IV: PACS System Design and Evaluation, vol.1234, pp. 952{956, 1990.[38] James P. Egan, Signal Detection Theory and ROC Analysis, pp.68{69, Academic Press, New York, 1975.
326 IEEE TRANSACTIONS ON MEDICAL IMAGING, VOL. 14, NO. 2, JUNE 19950 0.2 0.4 0.6 0.8 1
FPF
#2
0.2
0.4
0.6
0.8
1TPF
0 0.2 0.4 0.6 0.8 1FPF
#3
0.2
0.4
0.6
0.8
1TPF
0 0.2 0.4 0.6 0.8 1FPF
#5
0.2
0.4
0.6
0.8
1TPF
0 0.2 0.4 0.6 0.8 1FPF
#6
0.2
0.4
0.6
0.8
1TPF
0 0.2 0.4 0.6 0.8 1FPF
#7
0.2
0.4
0.6
0.8
1TPF
0 0.2 0.4 0.6 0.8 1FPF
#8
0.2
0.4
0.6
0.8
1TPF
0 0.2 0.4 0.6 0.8 1FPF
#9
0.2
0.4
0.6
0.8
1TPF
0 0.2 0.4 0.6 0.8 1FPF
#10
0.2
0.4
0.6
0.8
1TPF
0 0.2 0.4 0.6 0.8 1FPF
#11
0.2
0.4
0.6
0.8
1TPF
0 0.2 0.4 0.6 0.8 1FPF
#12
0.2
0.4
0.6
0.8
1TPF
0 0.2 0.4 0.6 0.8 1FPF
#13
0.2
0.4
0.6
0.8
1TPF
0 0.2 0.4 0.6 0.8 1FPF
#14
0.2
0.4
0.6
0.8
1TPF
0 0.2 0.4 0.6 0.8 1FPF
#15
0.2
0.4
0.6
0.8
1TPF
0 0.2 0.4 0.6 0.8 1FPF
#16
0.2
0.4
0.6
0.8
1TPF
0 0.2 0.4 0.6 0.8 1FPF
#17
0.2
0.4
0.6
0.8
1TPF
0 0.2 0.4 0.6 0.8 1FPF
#18
0.2
0.4
0.6
0.8
1TPF
0 0.2 0.4 0.6 0.8 1FPF
#19
0.2
0.4
0.6
0.8
1TPF
0 0.2 0.4 0.6 0.8 1FPF
#20
0.2
0.4
0.6
0.8
1TPF
0 0.2 0.4 0.6 0.8 1FPF
#21
0.2
0.4
0.6
0.8
1TPF
0 0.2 0.4 0.6 0.8 1FPF
#22
0.2
0.4
0.6
0.8
1TPF
Fig. 9. Individual ROC curves for the Arrangement Experiment. Legend : thick lines, black diamonds (stereo viewing); thin lines, crosses(mono viewing).
HSU ET AL.:PRE-CLINICAL ROC STUDIES OF DIGITAL STEREOMAMMOGRAPHY 3270 0.2 0.4 0.6 0.8 1
FPF
#1
0.2
0.4
0.6
0.8
1TPF
0 0.2 0.4 0.6 0.8 1FPF
#2
0.2
0.4
0.6
0.8
1TPF
0 0.2 0.4 0.6 0.8 1FPF
#3
0.2
0.4
0.6
0.8
1TPF
0 0.2 0.4 0.6 0.8 1FPF
#4
0.2
0.4
0.6
0.8
1TPF
0 0.2 0.4 0.6 0.8 1FPF
#5
0.2
0.4
0.6
0.8
1TPF
0 0.2 0.4 0.6 0.8 1FPF
#6
0.2
0.4
0.6
0.8
1TPF
0 0.2 0.4 0.6 0.8 1FPF
#7
0.2
0.4
0.6
0.8
1TPF
0 0.2 0.4 0.6 0.8 1FPF
#8
0.2
0.4
0.6
0.8
1TPF
0 0.2 0.4 0.6 0.8 1FPF
#9
0.2
0.4
0.6
0.8
1TPF
0 0.2 0.4 0.6 0.8 1FPF
#10
0.2
0.4
0.6
0.8
1TPF
0 0.2 0.4 0.6 0.8 1FPF
#11
0.2
0.4
0.6
0.8
1TPF
0 0.2 0.4 0.6 0.8 1FPF
#12
0.2
0.4
0.6
0.8
1TPF
0 0.2 0.4 0.6 0.8 1FPF
#14
0.2
0.4
0.6
0.8
1TPF
0 0.2 0.4 0.6 0.8 1FPF
#15
0.2
0.4
0.6
0.8
1TPF
0 0.2 0.4 0.6 0.8 1FPF
#16
0.2
0.4
0.6
0.8
1TPF
0 0.2 0.4 0.6 0.8 1FPF
#17
0.2
0.4
0.6
0.8
1TPF
0 0.2 0.4 0.6 0.8 1FPF
#18
0.2
0.4
0.6
0.8
1TPF
0 0.2 0.4 0.6 0.8 1FPF
#19
0.2
0.4
0.6
0.8
1TPF
0 0.2 0.4 0.6 0.8 1FPF
#20
0.2
0.4
0.6
0.8
1TPF
0 0.2 0.4 0.6 0.8 1FPF
#21
0.2
0.4
0.6
0.8
1TPF
Fig. 10. Individual ROC curves for the Density Experiment. Legend : thick lines, black diamonds (stereo viewing); thin lines, crosses (monoviewing).