practical applications of portable xrf in mineral exploration
TRANSCRIPT
Practical Applications of Portable XRF in Mineral Exploration:Confessions of a Geochemist
Dennis ArnePrincipal Consultant ‐ Geochemistry
www.csaglobal.com 1Denver X‐ray Conference, August 3, 2017
• Introduction to analytical approaches• Case study of what not to do• Public reporting codes• Sampling is the key• Analytical aspects to getting it right
www.csaglobal.com 2Denver X‐ray Conference, August 3, 2017
Outline
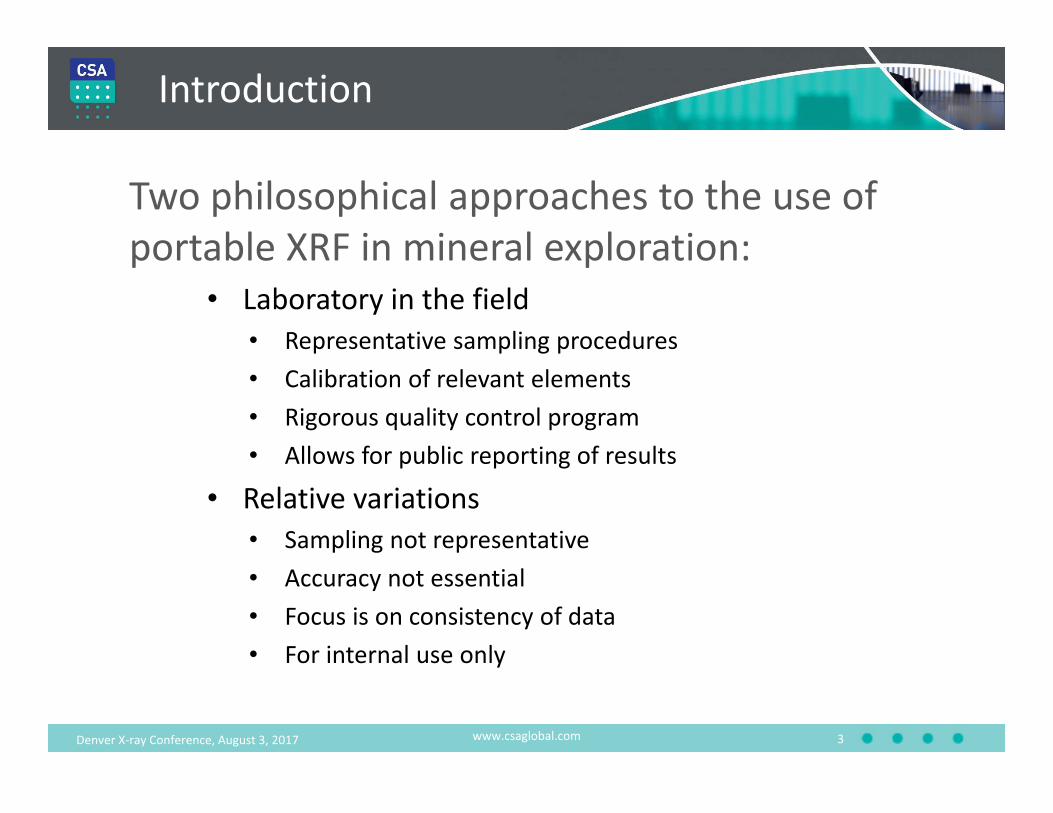
Two philosophical approaches to the use of portable XRF in mineral exploration:
• Laboratory in the field• Representative sampling procedures• Calibration of relevant elements
• Rigorous quality control program• Allows for public reporting of results
• Relative variations• Sampling not representative• Accuracy not essential• Focus is on consistency of data• For internal use only
Introduction
www.csaglobal.com 3Denver X‐ray Conference, August 3, 2017
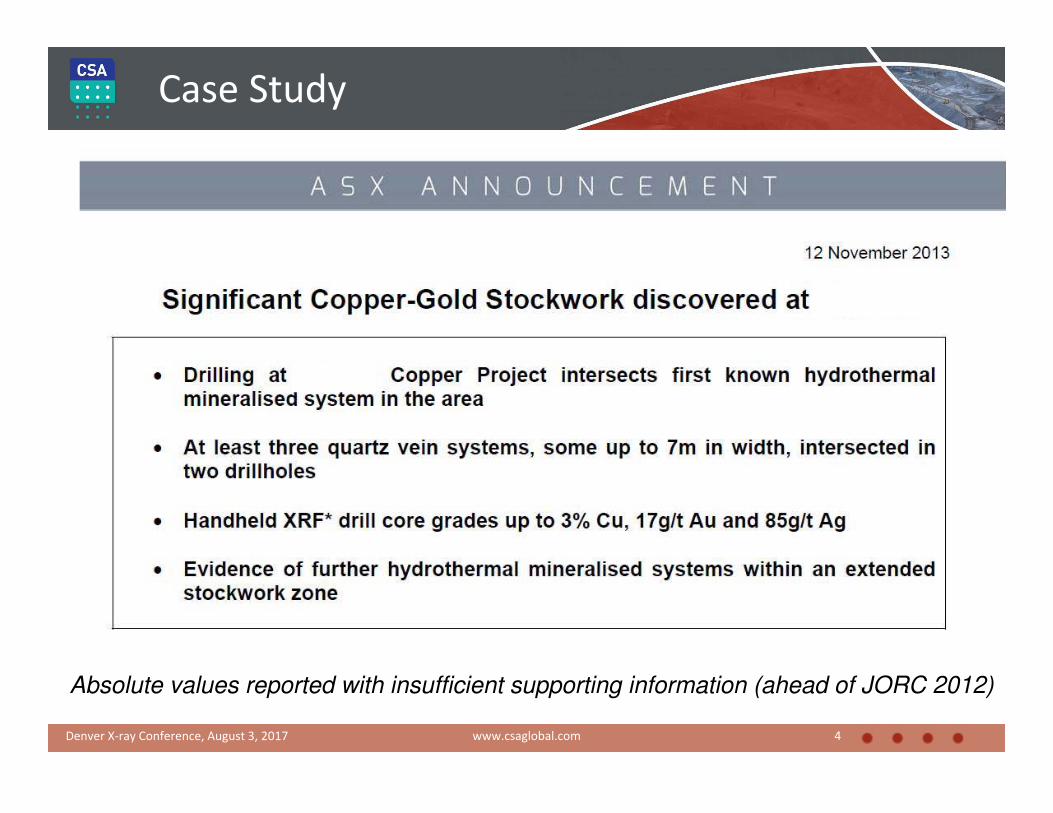
Case Study
www.csaglobal.com
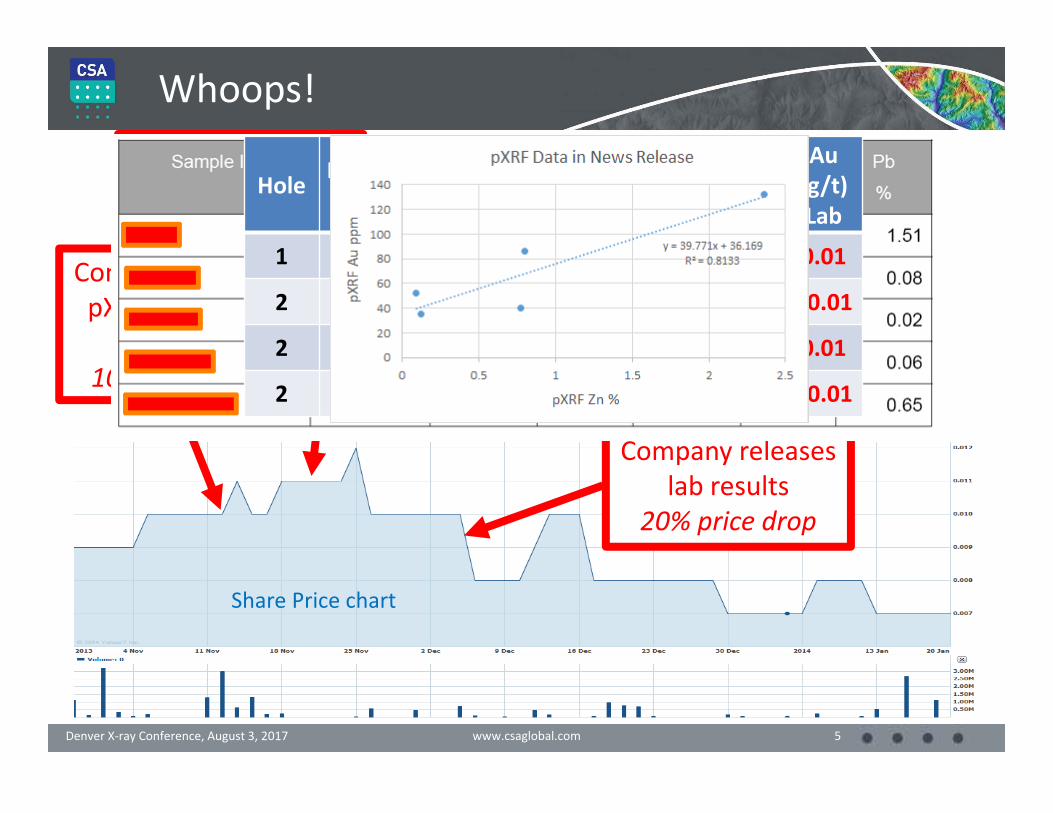
Absolute values reported with insufficient supporting information (ahead of JORC 2012)
4Denver X‐ray Conference, August 3, 2017
www.csaglobal.com
Share Price chart
HoleDepth
(m)
Cu (%)
pXRF
Ag (g/t)
pXRF
Au (g/t) pXRF
1 26‐27 3.1 85 10.1
2 12‐13 2.3 82 14.0
2 13‐14 0.4 32 9.1
2 18‐19 0.5 8 10.0
Company releases lab results
20% price drop
Company releases pXRF Cu, Au, Ag
results
10% price jump
Company retracts Au & AgHole
Depth
(m)
Cu (%)
pXRF
Cu (%) Lab
Ag (g/t)
pXRF
Ag (g/t) Lab
Au (g/t) pXRF
Au (g/t) Lab
1 26‐27 3.1 1.02 85 23 10.1 0.01
2 12‐13 2.3 1.26 82 63 14.0 <0.01
2 13‐14 0.4 0.45 32 36 9.1 0.01
2 18‐19 0.5 0.22 8 9 10.0 <0.01
Whoops!
5Denver X‐ray Conference, August 3, 2017

“Nature and quality of sampling (eg cut channels, random chips, or specific specialised industry standard measurement tools appropriate to the minerals under investigation, such as down hole gamma sondes, or handheld XRF instruments, etc).”
“For geophysical tools, spectrometers, handheld XRF instruments, etc, the parameters used in determining the analysis including instrument make and model, reading times, calibration factors applied and their derivation, etc.”
JORC 2012 Table 1
www.csaglobal.com 6Denver X‐ray Conference, August 3, 2017
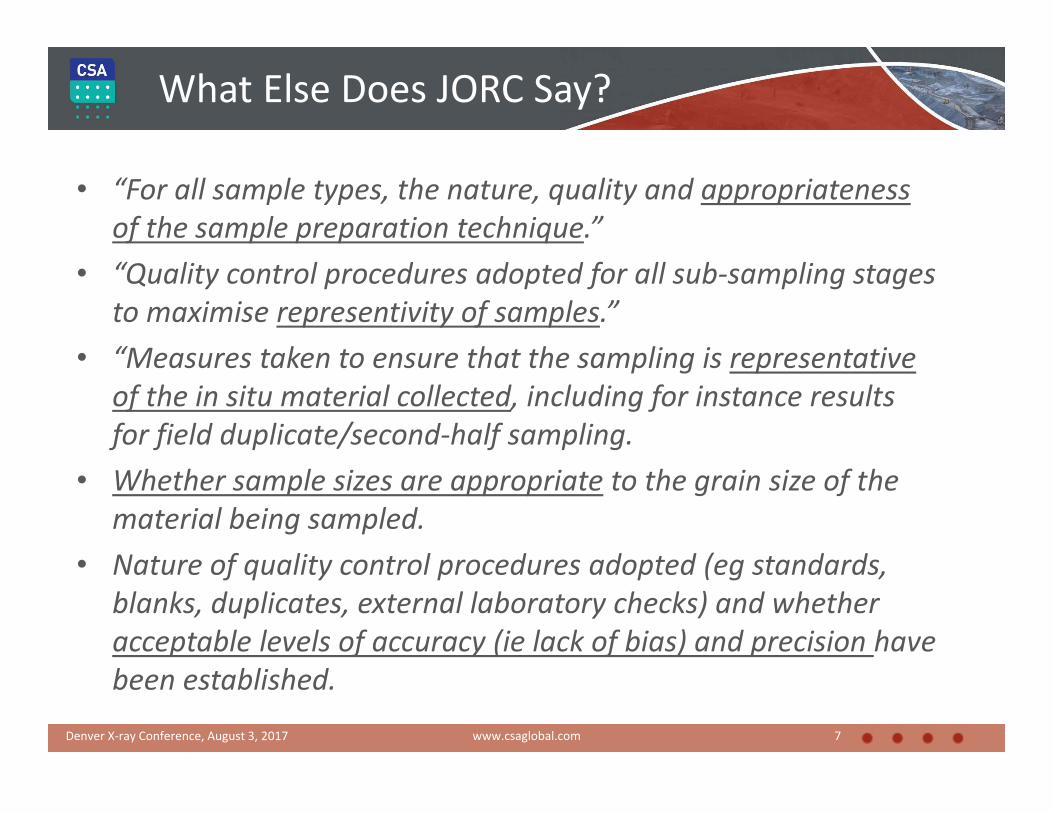
What Else Does JORC Say?
www.csaglobal.com
• “For all sample types, the nature, quality and appropriatenessof the sample preparation technique.”
• “Quality control procedures adopted for all sub‐sampling stages to maximise representivity of samples.”
• “Measures taken to ensure that the sampling is representativeof the in situ material collected, including for instance results for field duplicate/second‐half sampling.
• Whether sample sizes are appropriate to the grain size of the material being sampled.
• Nature of quality control procedures adopted (eg standards, blanks, duplicates, external laboratory checks) and whether acceptable levels of accuracy (ie lack of bias) and precision have been established.
7Denver X‐ray Conference, August 3, 2017
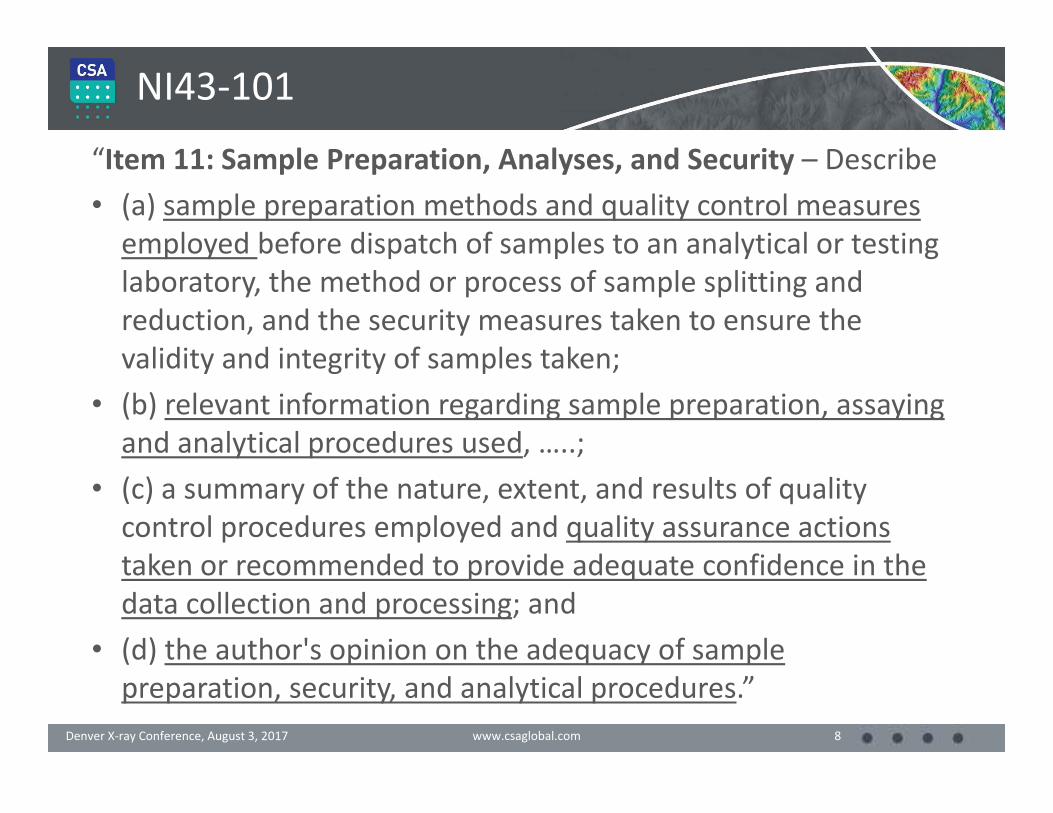
“Item 11: Sample Preparation, Analyses, and Security – Describe• (a) sample preparation methods and quality control measures employed before dispatch of samples to an analytical or testing laboratory, the method or process of sample splitting and reduction, and the security measures taken to ensure the validity and integrity of samples taken;
• (b) relevant information regarding sample preparation, assaying and analytical procedures used, …..;
• (c) a summary of the nature, extent, and results of quality control procedures employed and quality assurance actions taken or recommended to provide adequate confidence in the data collection and processing; and
• (d) the author's opinion on the adequacy of sample preparation, security, and analytical procedures.”
www.csaglobal.com
NI43‐101
8Denver X‐ray Conference, August 3, 2017
Sampling
www.csaglobal.com 9
www.csaglobal.com
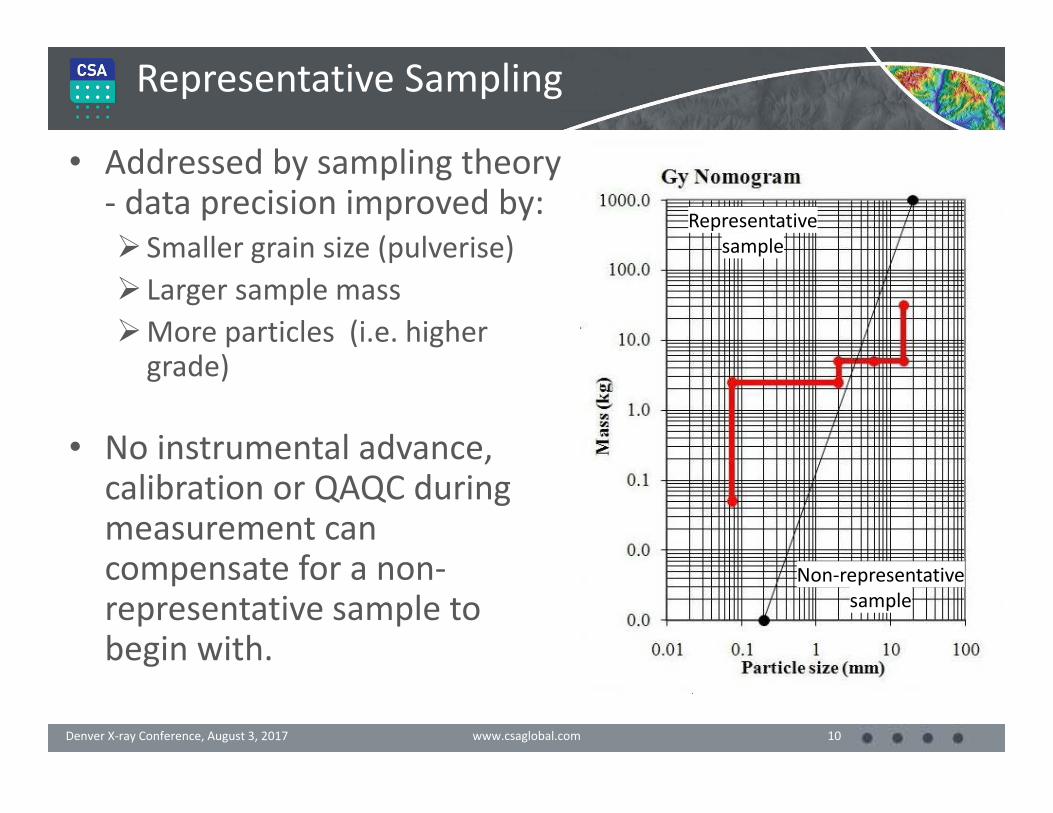
Representative Sampling
• Addressed by sampling theory ‐ data precision improved by: Smaller grain size (pulverise) Larger sample mass
More particles (i.e. higher grade)
• No instrumental advance, calibration or QAQC during measurement can compensate for a non‐representative sample to begin with.
10Denver X‐ray Conference, August 3, 2017
Representative
sample
Non‐representativesample
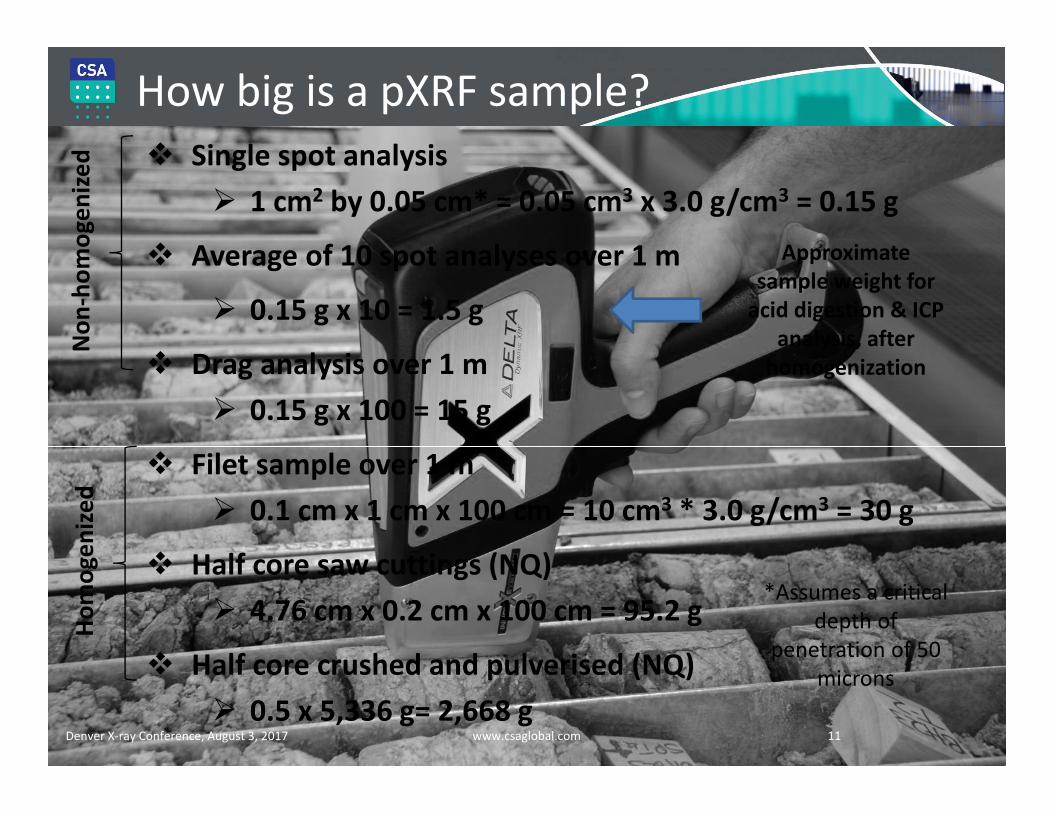
Single spot analysis 1 cm2 by 0.05 cm* = 0.05 cm3 x 3.0 g/cm3 = 0.15 g
Average of 10 spot analyses over 1 m
0.15 g x 10 = 1.5 g
Drag analysis over 1 m 0.15 g x 100 = 15 g
Filet sample over 1 m 0.1 cm x 1 cm x 100 cm = 10 cm3 * 3.0 g/cm3 = 30 g
Half core saw cuttings (NQ) 4.76 cm x 0.2 cm x 100 cm = 95.2 g
Half core crushed and pulverised (NQ) 0.5 x 5,336 g= 2,668 g
How big is a pXRF sample?
www.csaglobal.com 11
Approximate sample weight for acid digestion & ICP
analysis, after homogenization
Denver X‐ray Conference, August 3, 2017
*Assumes a critical depth of
penetration of 50 microns
Homogenized
Non
‐homogenized
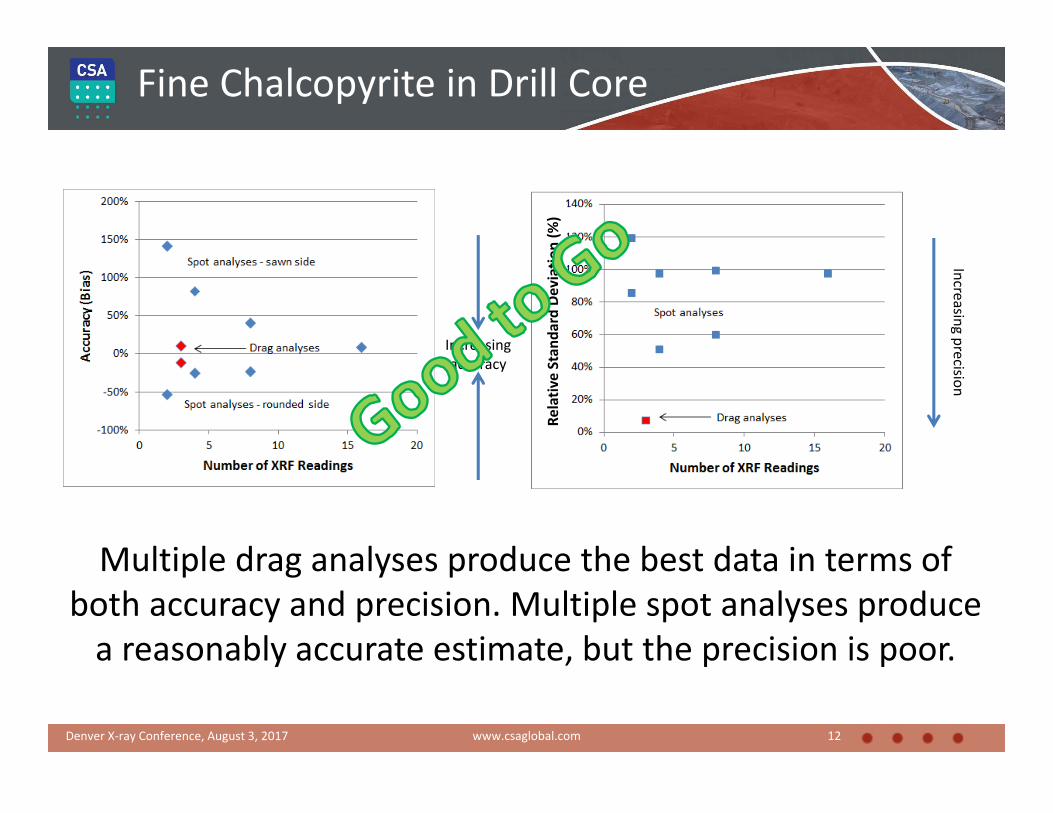
Fine Chalcopyrite in Drill Core
www.csaglobal.com
Increasing
accuracy
Multiple drag analyses produce the best data in terms of both accuracy and precision. Multiple spot analyses produce a reasonably accurate estimate, but the precision is poor.
12Denver X‐ray Conference, August 3, 2017
Incre
asin
g precisio
n
Relative
Standard
Deviation
(%)
Incre
asin
g precisio
n
Relative
Standard
Deviation
(%)
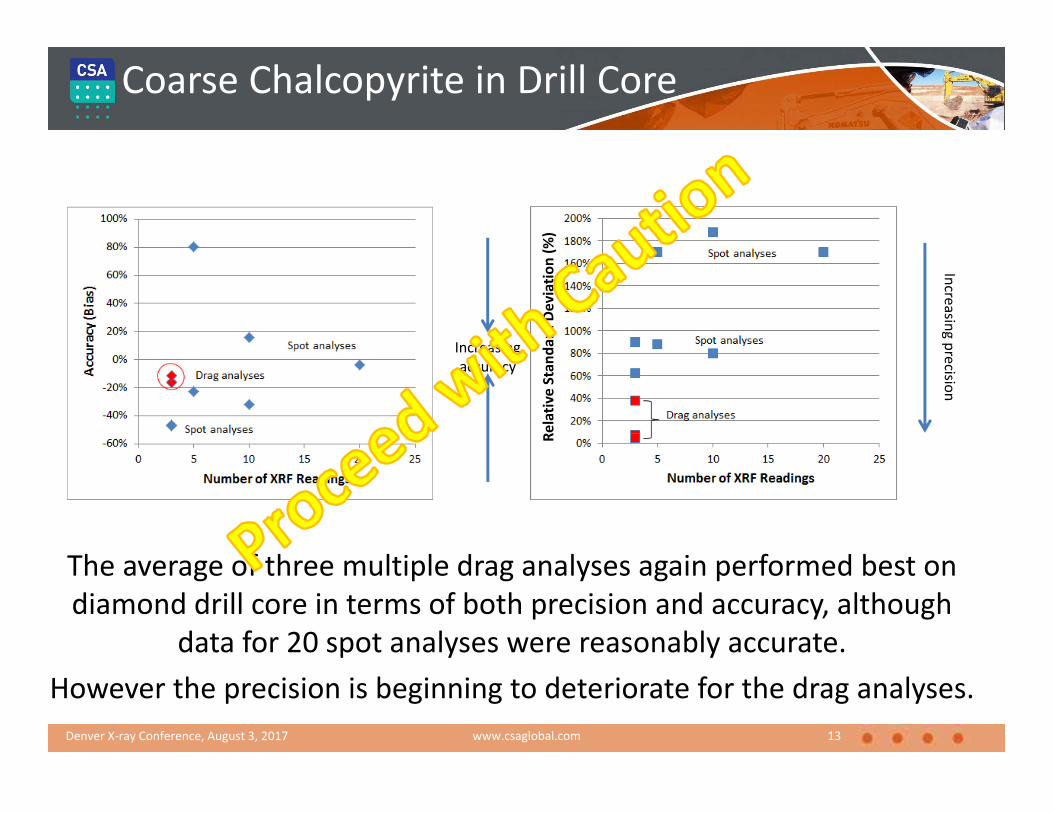
Coarse Chalcopyrite in Drill Core
www.csaglobal.com
Increasing
accuracy
The average of three multiple drag analyses again performed best on diamond drill core in terms of both precision and accuracy, although
data for 20 spot analyses were reasonably accurate.However the precision is beginning to deteriorate for the drag analyses.
13Denver X‐ray Conference, August 3, 2017
Spot analyses
Drag analyses
Relative Standard Deviation
Relative
Standard
Deviation
(%)/Bias (%)
Bias
www.csaglobal.com
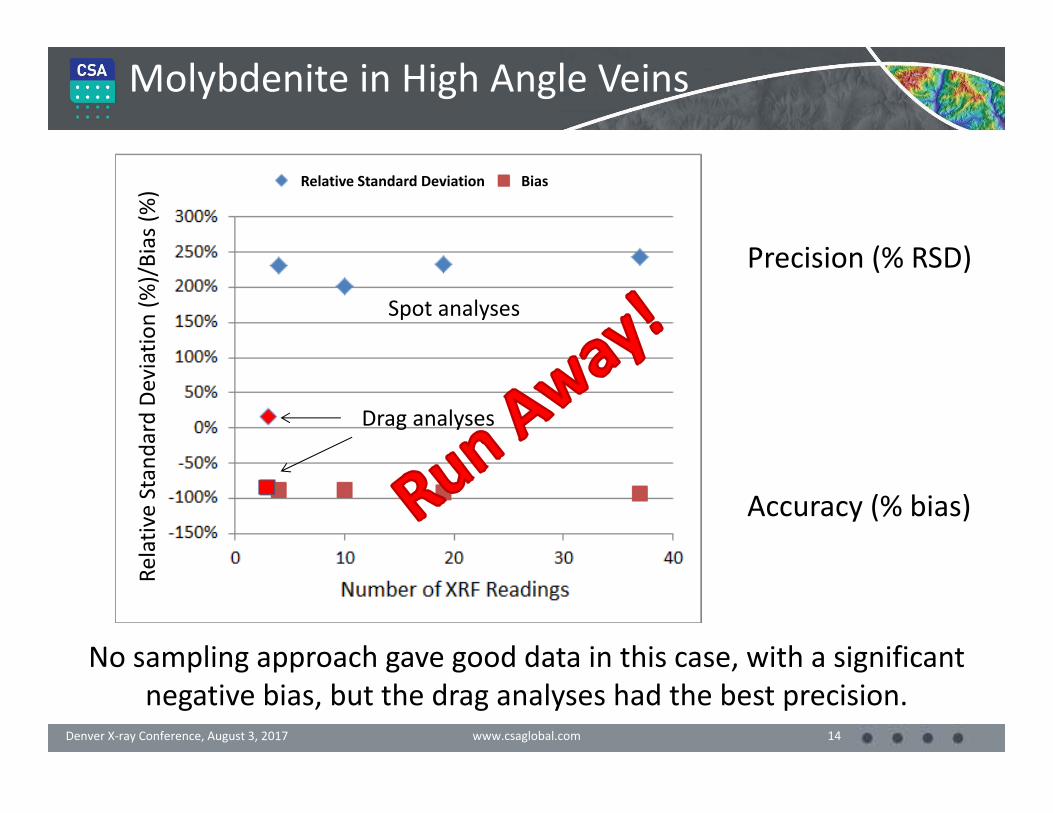
Molybdenite in High Angle Veins
Accuracy (% bias)
Precision (% RSD)
No sampling approach gave good data in this case, with a significant negative bias, but the drag analyses had the best precision.
14Denver X‐ray Conference, August 3, 2017
www.csaglobal.com 15
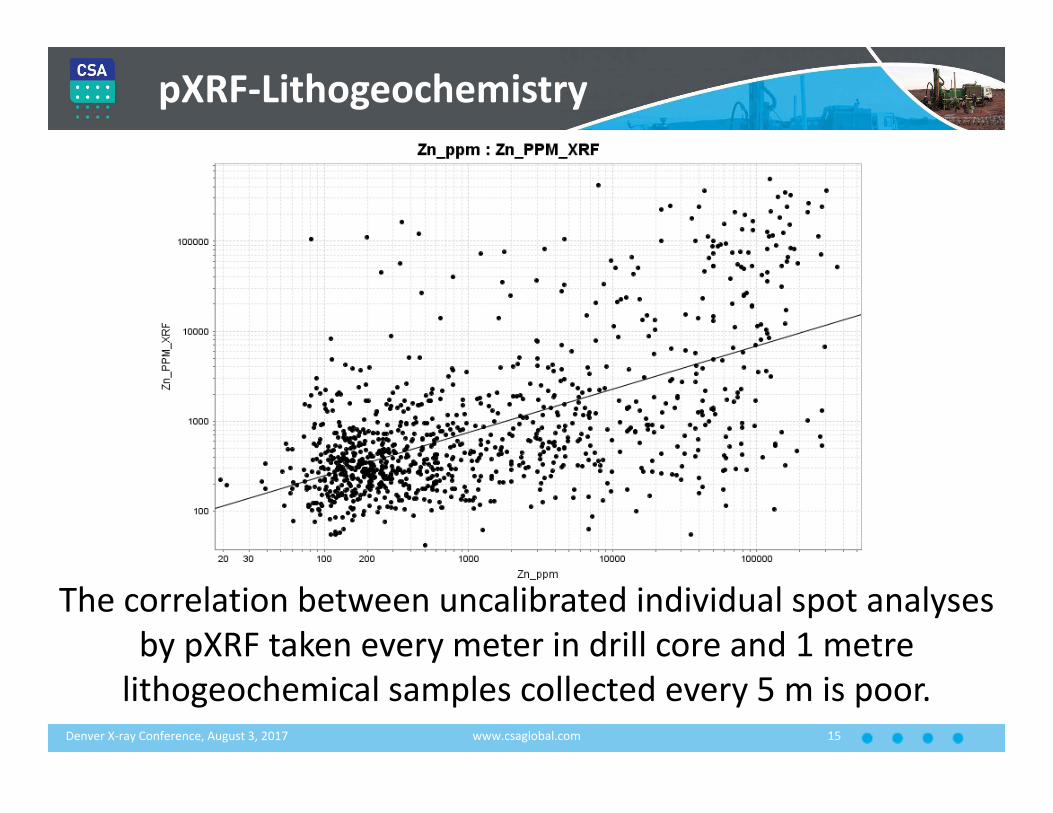
pXRF‐Lithogeochemistry
The correlation between uncalibrated individual spot analyses by pXRF taken every meter in drill core and 1 metre lithogeochemical samples collected every 5 m is poor.
Denver X‐ray Conference, August 3, 2017

However, comparison of portable XRF spot analyses every metre down‐hole versus 1 m lithogeochemical
sample every 5 m down‐hole is informative.
Down‐hole Plots
www.csaglobal.com 16Denver X‐ray Conference, August 3, 2017
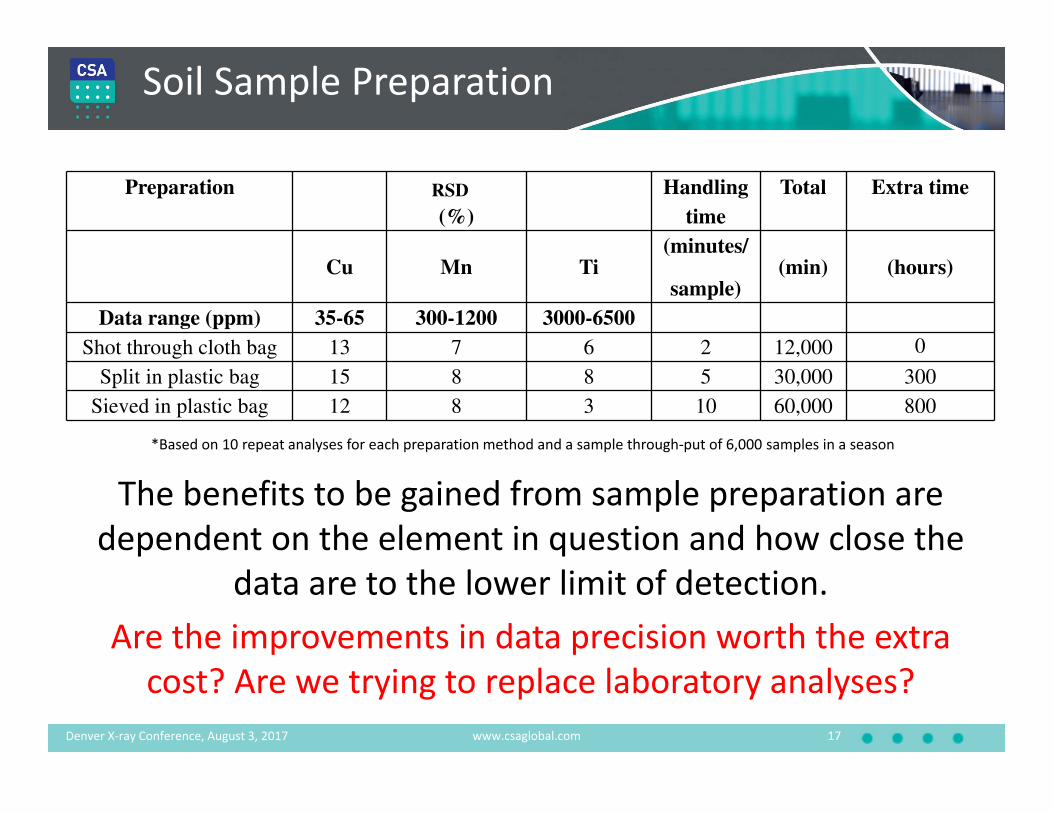
The benefits to be gained from sample preparation are dependent on the element in question and how close the
data are to the lower limit of detection.Are the improvements in data precision worth the extra cost? Are we trying to replace laboratory analyses?
Soil Sample Preparation
www.csaglobal.com 17
Preparation RMS CV
(%)
Handling
time
Total Extra time
Cu Mn Ti(minutes/
sample)(min) (hours)
Data range (ppm) 35-65 300-1200 3000-6500
Shot through cloth bag 13 7 6 2 12,000 0
Split in plastic bag 15 8 8 5 30,000 300
Sieved in plastic bag 12 8 3 10 60,000 800
*Based on 10 repeat analyses for each preparation method and a sample through‐put of 6,000 samples in a season
Denver X‐ray Conference, August 3, 2017
RSD
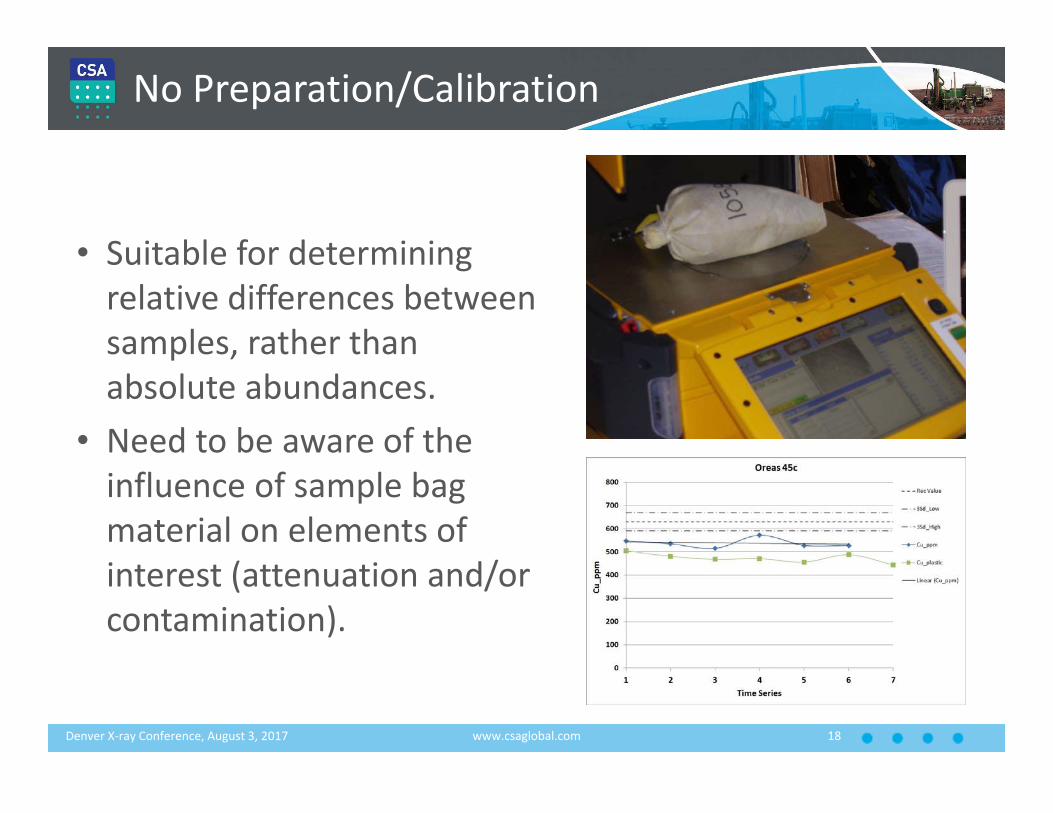
No Preparation/Calibration
www.csaglobal.com
• Suitable for determining relative differences between samples, rather than absolute abundances.
• Need to be aware of the influence of sample bag material on elements of interest (attenuation and/or contamination).
18Denver X‐ray Conference, August 3, 2017
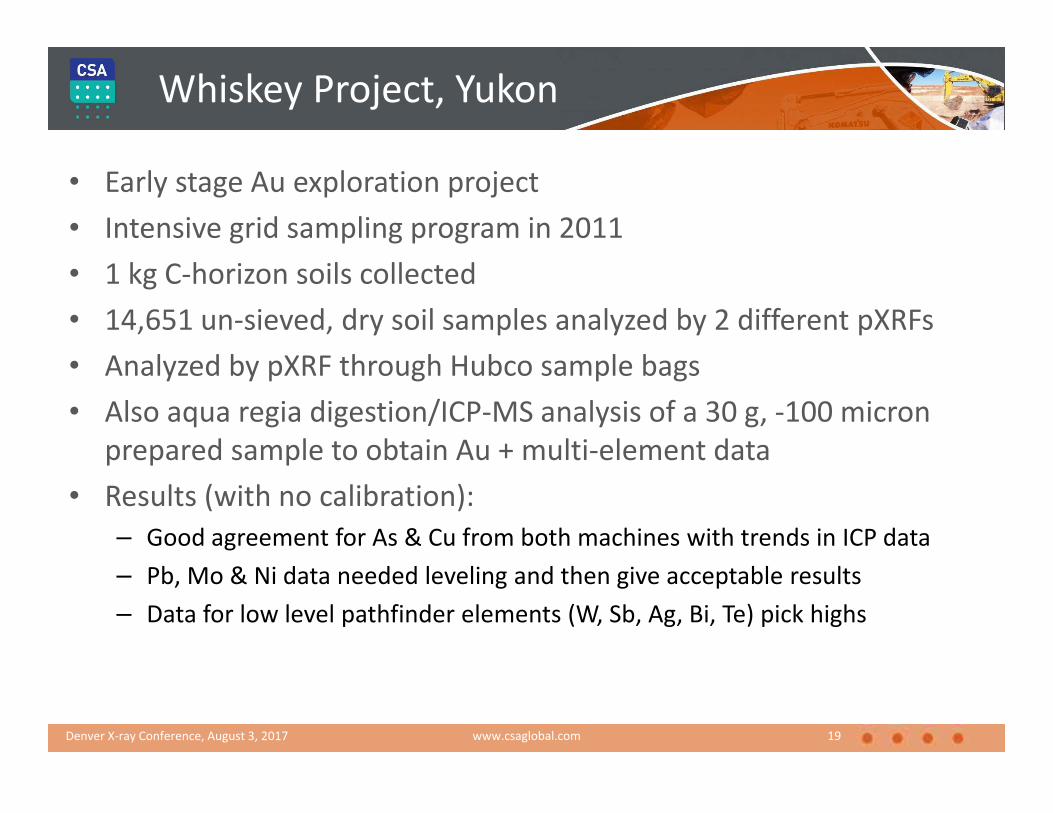
• Early stage Au exploration project• Intensive grid sampling program in 2011• 1 kg C‐horizon soils collected• 14,651 un‐sieved, dry soil samples analyzed by 2 different pXRFs• Analyzed by pXRF through Hubco sample bags• Also aqua regia digestion/ICP‐MS analysis of a 30 g, ‐100 micron
prepared sample to obtain Au + multi‐element data• Results (with no calibration):
– Good agreement for As & Cu from both machines with trends in ICP data– Pb, Mo & Ni data needed leveling and then give acceptable results– Data for low level pathfinder elements (W, Sb, Ag, Bi, Te) pick highs
Whiskey Project, Yukon
www.csaglobal.com 19Denver X‐ray Conference, August 3, 2017
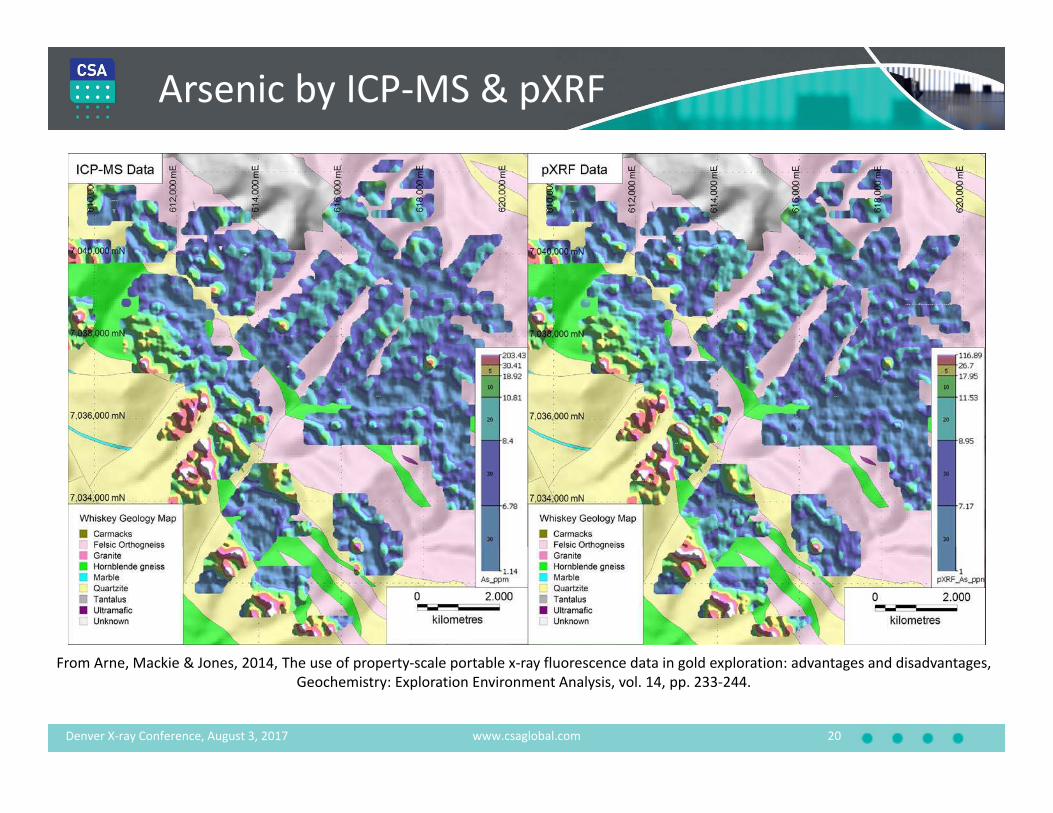
Arsenic by ICP‐MS & pXRF
www.csaglobal.com
From Arne, Mackie & Jones, 2014, The use of property‐scale portable x‐ray fluorescence data in gold exploration: advantages and disadvantages,Geochemistry: Exploration Environment Analysis, vol. 14, pp. 233‐244.
20Denver X‐ray Conference, August 3, 2017
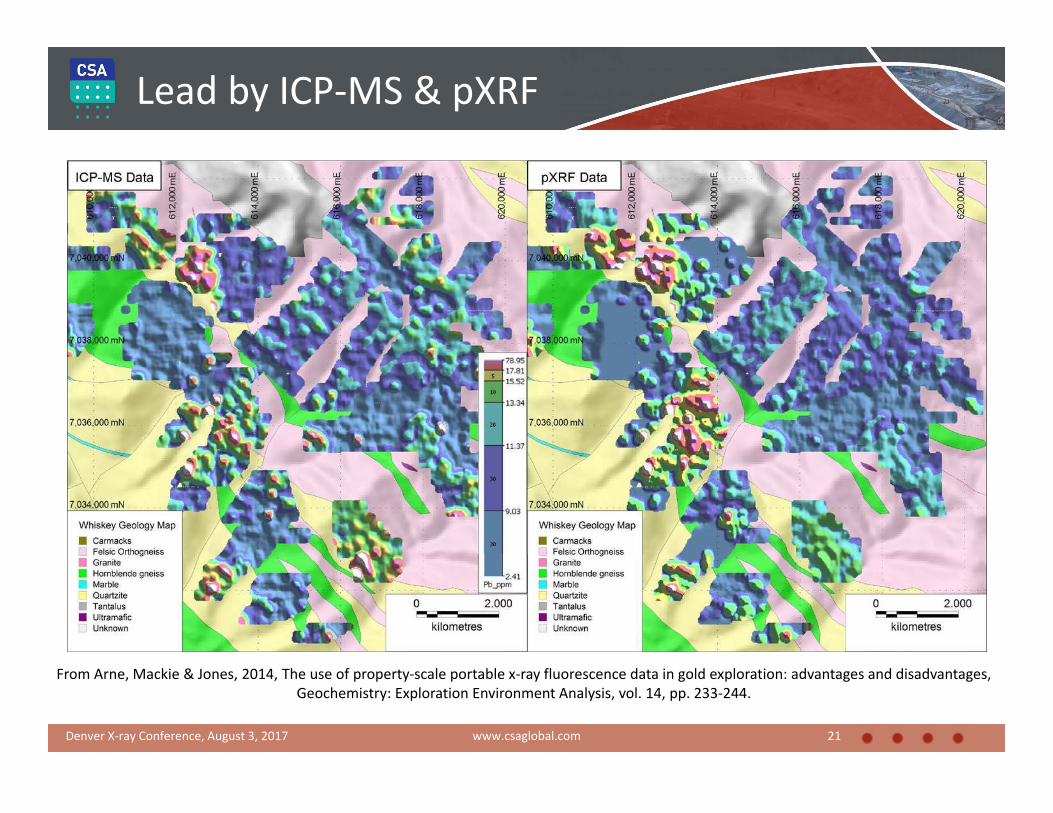
Lead by ICP‐MS & pXRF
www.csaglobal.com 21
From Arne, Mackie & Jones, 2014, The use of property‐scale portable x‐ray fluorescence data in gold exploration: advantages and disadvantages,Geochemistry: Exploration Environment Analysis, vol. 14, pp. 233‐244.
Denver X‐ray Conference, August 3, 2017
www.csaglobal.com 22
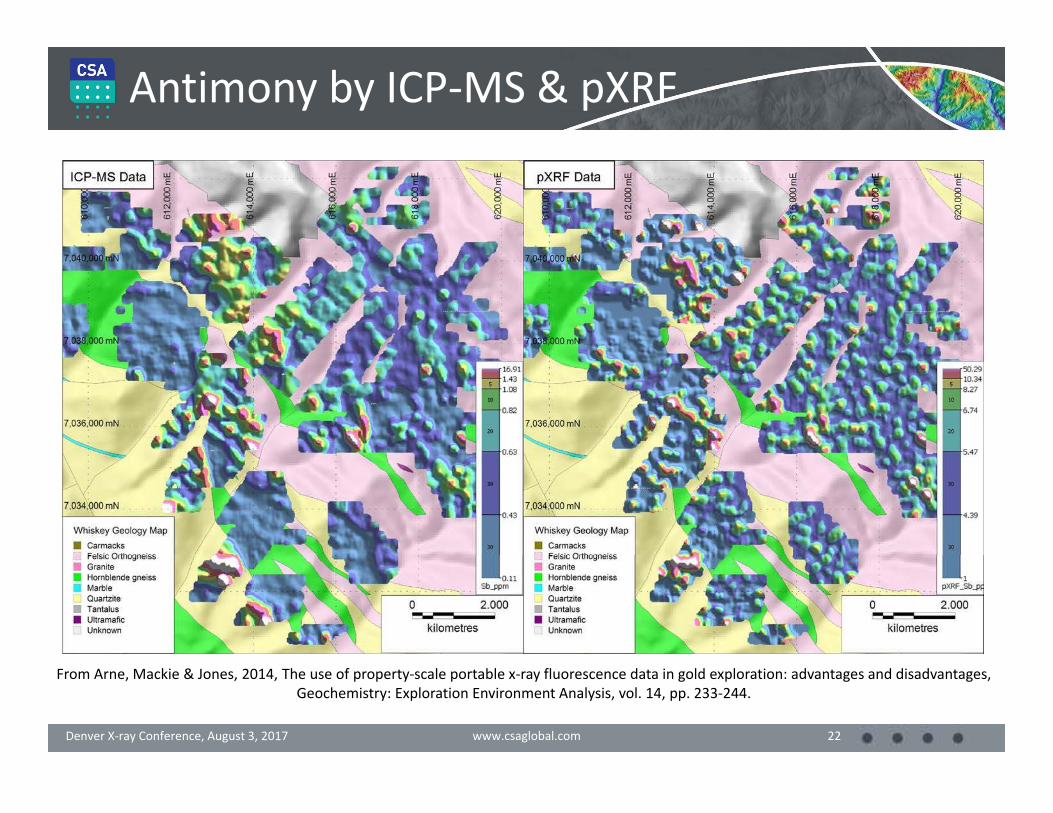
Antimony by ICP‐MS & pXRF
From Arne, Mackie & Jones, 2014, The use of property‐scale portable x‐ray fluorescence data in gold exploration: advantages and disadvantages,Geochemistry: Exploration Environment Analysis, vol. 14, pp. 233‐244.
Denver X‐ray Conference, August 3, 2017
Analytical Aspects
www.csaglobal.com 23
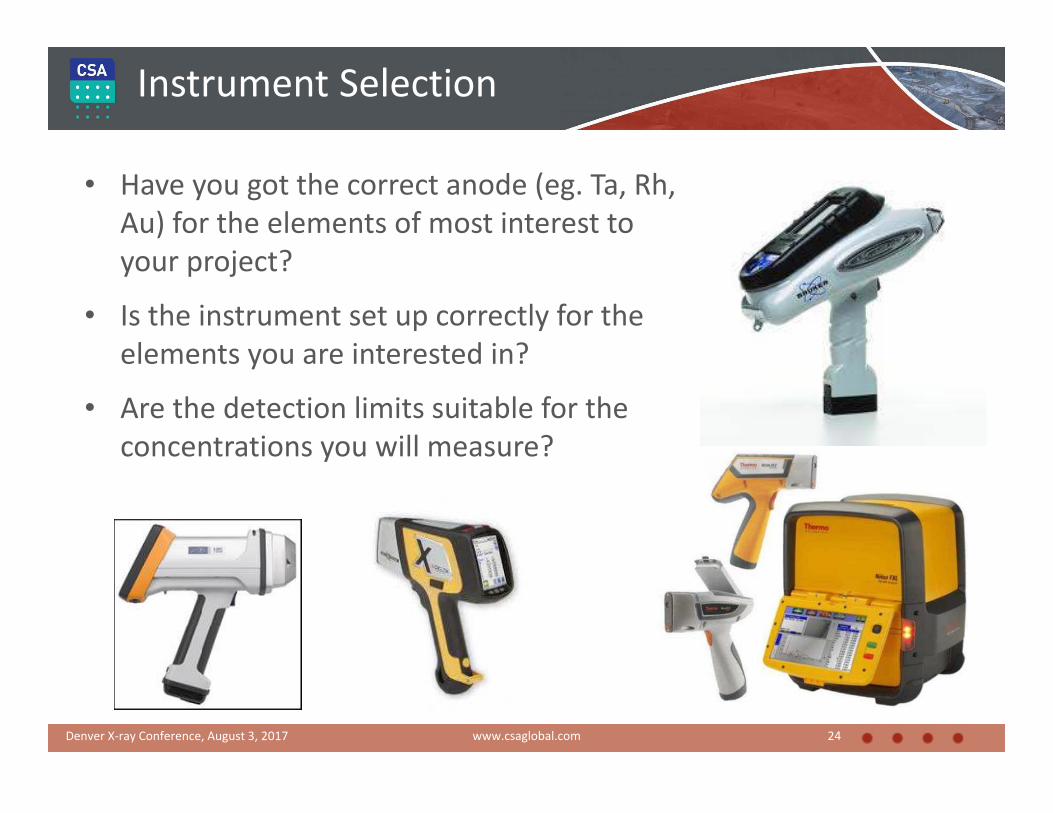
Instrument Selection
www.csaglobal.com
• Have you got the correct anode (eg. Ta, Rh, Au) for the elements of most interest to your project?
• Is the instrument set up correctly for the elements you are interested in?
• Are the detection limits suitable for the concentrations you will measure?
24Denver X‐ray Conference, August 3, 2017
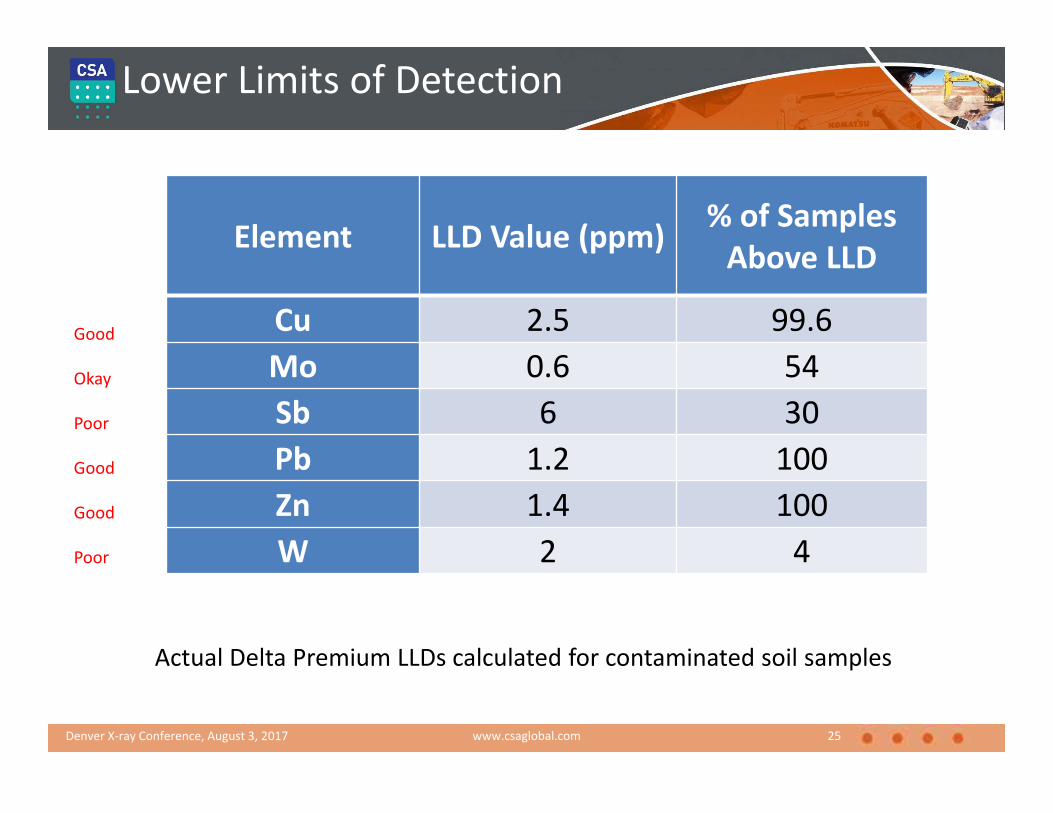
Lower Limits of Detection
www.csaglobal.com
Limits o
f Detection
(ppm)
Element LLD Value (ppm)% of Samples Above LLD
Cu 2.5 99.6
Mo 0.6 54
Sb 6 30
Pb 1.2 100
Zn 1.4 100
W 2 4
Good
Okay
Poor
Good
Good
Poor
Actual Delta Premium LLDs calculated for contaminated soil samples
25Denver X‐ray Conference, August 3, 2017
www.csaglobal.com
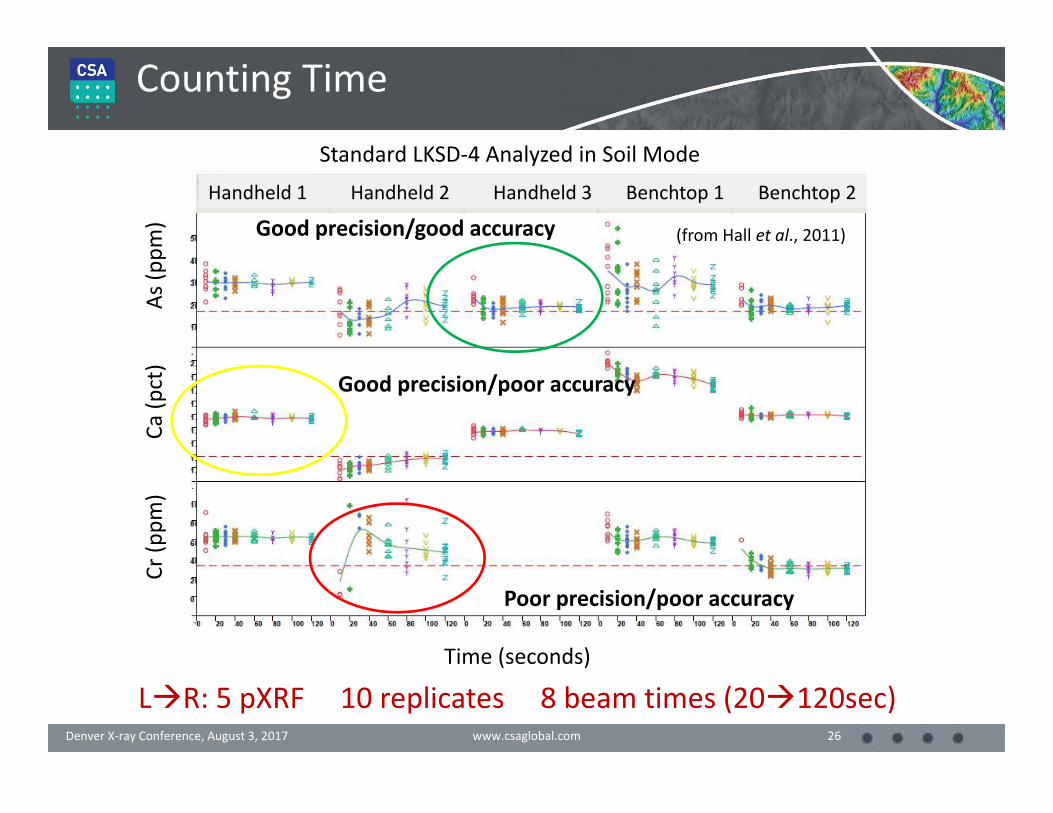
Counting Time
26
Standard LKSD‐4 Analyzed in Soil Mode
Handheld 1 Handheld 2 Handheld 3 Benchtop 1 Benchtop 2
Time (seconds)
Cr (ppm)
Ca
(pct)
As (ppm)
Poor precision/poor accuracy
Good precision/poor accuracy
Good precision/good accuracy (from Hall et al., 2011)
LR: 5 pXRF 10 replicates 8 beam times (20120sec)Denver X‐ray Conference, August 3, 2017

Accuracy
www.csaglobal.com
• Certified reference materials (CRM) should be matrix‐appropriate.
• CRM should span a range of expected values.
• CRM data should be collected on a regular basis to monitor drift.
• Calibrate with either matrix‐appropriate CRM or project‐specific samples analyzed by appropriate methods.
27Denver X‐ray Conference, August 3, 2017

Summary
• Sampling is one of the most important aspects of using portable XRF data in mineral exploration.• Must be representative if data are to used quantitatively• Non‐representative samples can also be used qualitatively
• The collection of quantitative data requires appropriate choice of instrument, adequate count times and calibration for the elements of interest.• However, even inaccurate and imprecise data may be useful
to reveal relative differences (just not publicly reported!)www.csaglobal.com 28Denver X‐ray Conference, August 3, 2017