polyaniline synthesized by different dopants for fluorene
TRANSCRIPT
materials
Article
Polyaniline Synthesized by Different Dopants for FluoreneDetection via Photoluminescence Spectroscopy
Mahnoush Beygisangchin 1,2, Suraya Abdul Rashid 1,* , Suhaidi Shafie 2,3,* and Amir Reza Sadrolhosseini 4
Citation: Beygisangchin, M.; Abdul
Rashid, S.; Shafie, S.; Sadrolhosseini,
A.R. Polyaniline Synthesized by
Different Dopants for Fluorene
Detection via Photoluminescence
Spectroscopy. Materials 2021, 14, 7382.
https://doi.org/10.3390/ma14237382
Academic Editor: Mario Culebras Rubio
Received: 14 October 2021
Accepted: 26 November 2021
Published: 2 December 2021
Publisher’s Note: MDPI stays neutral
with regard to jurisdictional claims in
published maps and institutional affil-
iations.
Copyright: © 2021 by the authors.
Licensee MDPI, Basel, Switzerland.
This article is an open access article
distributed under the terms and
conditions of the Creative Commons
Attribution (CC BY) license (https://
creativecommons.org/licenses/by/
4.0/).
1 Nanomaterials Processing and Technology Laboratory, Institute of Nanoscience and Nanotechnology,University Putra Malaysia, Serdang 43400, Malaysia; [email protected]
2 Functional Nanotechnology Devices Laboratory, Institute of Nanoscience and Nanotechnology,University Putra Malaysia, Serdang 43400, Malaysia
3 Faculty of Engineering, University Putra Malaysia, Serdang 43400, Malaysia4 Magneto-Plasmonic Laboratory, Laser and Plasma Research Institute, Shahid Beheshti University,
Tehran 1983969411, Iran; [email protected]* Correspondence: [email protected] (S.A.R.); [email protected] (S.S.);
Tel.: +603-9769-7538 (S.A.R.); +603-9769-6307 (S.S.)
Abstract: The effects of different dopants on the synthesis, optical, electrical and thermal features ofpolyaniline were investigated. Polyaniline (PANI) doped with p-toluene sulfonic acid (PANI-PTSA),camphor sulphonic acid (PANI-CSA), acetic acid (PANI-acetic acid) and hydrochloric acid (PANI-HCl)was synthesized through the oxidative chemical polymerization of aniline under acidic conditions atambient temperature. Fourier transform infrared light, X-ray diffraction, UV-visible spectroscopy,field emission scanning electron microscopy, photoluminescence spectroscopy and electrical analysiswere used to define physical and structural features, bandgap values, electrical conductivity andtype and degree of doping, respectively. Tauc calculation reveals the optical band gaps of PANI-PTSA, PANI-CSA, PANI-acetic acid and PANI-HCl at 3.1, 3.5, 3.6 and 3.9 eV, respectively. Withthe increase in dopant size, crystallinity is reduced, and interchain separations and d-spacing arestrengthened. The estimated conductivity values of PANI-PTSA, PANI-CSA, PANI-acetic acid andPANI-HCl are 3.84 × 101, 2.92 × 101, 2.50 × 10⁻², and 2.44 × 10⁻² S·m−1, respectively. Particularly,PANI-PTSA shows high PL intensity because of its orderly arranged benzenoid and quinoid units.Owing to its excellent synthesis, low bandgap, high photoluminescence intensity and high electricalfeatures, PANI-PTSA is a suitable candidate to improve PANI properties and electron provider forfluorene-detecting sensors with a linear range of 0.001–10 µM and detection limit of 0.26 nM.
Keywords: polyaniline; PANI; fluorene; dopant; PTSA; CSA; acetic acid; HCl; XRD; conductivity;four-point probe; sensor; photoluminescence
1. Introduction
Fluorene is a polycyclic aromatic hydrocarbon (PAH) that poses risks to humans andthe environment [1]. Several techniques have been developed for PAH detection, such asFourier Transform Infrared spectroscopy, Raman spectroscopy, mass spectrometry (MS),gas chromatography (GC) and high-performance liquid chromatography [2]. Althoughthese methods are sensitive and give reliable measurement, they are costly and requirea long sample preparation time (non-real-time), bulky tabletop equipment and qualifiedoperators. Others also suffer from low detection limits and necessitate a large amount ofsample volume and solvent for separation and extraction.
Novel sensors for onsite fluorene detection, quantification and constant monitoringare vital to maintaining a healthy, non-polluted and sustainable environment. Techno-logical growth in the field of sensors is driven by concerns about the safety and healthof humanity [3]. Sensor devices are generally based on metal oxides operating at hightemperatures. Hence, novel materials that can overcome the limitations of metal oxides arebeing explored.
Materials 2021, 14, 7382. https://doi.org/10.3390/ma14237382 https://www.mdpi.com/journal/materials

Materials 2021, 14, 7382 2 of 19
Polymer systems provide a new avenue to synthesize novel materials with highthermal, electrical and optical features. Conducting polymers have remarkably attractedinterest in the fields of nanoscience and nanotechnology due to their exceptional con-ductivity and redox performance [4]. A conductive polymer is a polymer that exhibitssemiconductor or even conductor properties by chemically or electrochemically doping itsbackbone with a conjugated double bond [5,6]. The main conductive polymers, such asp-phenylenevinylene (PPV), polypyrrole (PPy) and polyaniline (PANI), are being appliedin many areas, including photothermal therapy, electromagnetic interference shielding,photovoltaic cell, storage battery, membrane gas separation, microwave absorption, chemi-cal sensors and anti-corrosion coating [7–10]. Some of their advantages include improvedinterface qualities, suitability for the production of lightweight devices, affordability andhigh productivity [10,11]. In polymerization, a plain organic synthesis technique must beapplied to achieve a repeatable macromolecular design.
PANI is a singular conducting polymer compound with unique electrical and opticalproperties [10] and has the advantages of simple synthesis, environmental stability, afford-ability and flexible control of electrical features with charge-transfer doping and protona-tion [10,12,13]. Owing to its extraordinary properties, this compound can be used in variousfields, such as electrochromic glasses [14], solar cells [15], electroluminescent machines [10],sensors [16], biosensors [17], supercapacitors [18], neural prosthesis/biotic–abiotic inter-faces [10], scaffolding [19], delivery systems [20], anti-corrosion materials [21], membranegas separation [8] and solar cells [22]. During the polymerization of aniline monomer,PANI transforms into one of the three states of normalized oxidation: (a) leucoemeraldine(white/clear), (b) pernigraniline (blue/violet) and (c) emeraldine (salt- green/base-blue).Pernigraniline is a completely oxidized PANI, emeraldine is half evenly oxidized and halfdecreased PANI, and leucomeraldine is completely decreased PANI [23]. The most con-ductive and consistent state is emeraldine with the conductivity of less than 10−10 s cm−1
created by its salt form. The synthesis method affects the conductivity of PANI, whichcan be controlled by immersing the emeraldine base in an aqueous acidic solution. PANIgenerally assumes a dark green solid-state after being formed through oxidative chemicalpolymerization inside an acidic aqueous average [10,24] in a solution of phosphoric acid,picric acid or camphor sulfonic acid [25–28].
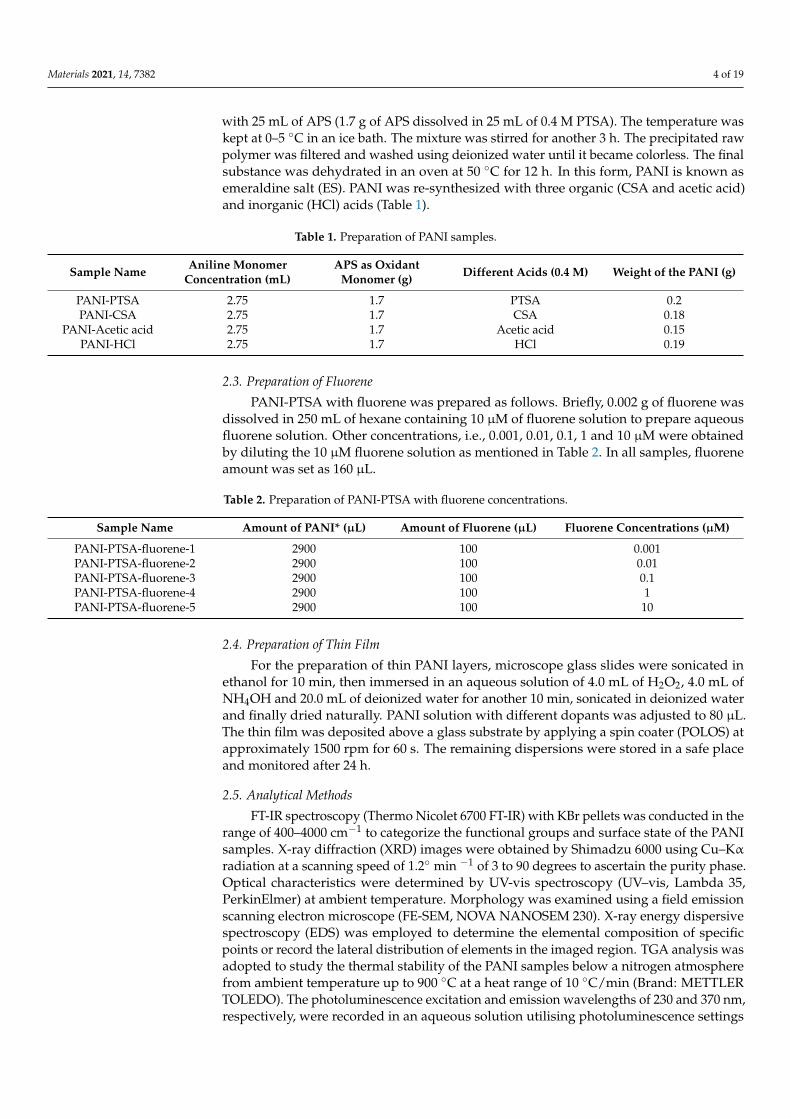
In the presence of an acid, PANI synthesis initially occurs through bipolar formation,followed by the development of a polar shape (Figure 1) [29–33]. The formation of apolaron structure leads to PANI-ES using protonation. Electrification of a conductingpolymer causes the dopant to begin moving along the polymer; this phenomenon leadsto the steady-state impairment because polarons can move along the polymer chains toenable electrical conductivity [34]. Doping either removes the electrons from the valenceband molecular orbital or transfers them to the last empty transmission band molecularorbital. This process produces charge carriers, including polar and bipolar, inside thepolymer [35,36]. The charge carriers of the polaron generate energy inside the dopant-restricted energy band to enable electron transfer from the valence to the conductionband.
PANI has a high potential to capture PAHs, such as fluorene that contains aromaticrings and a carboxyl functional group that can interact with PANI [37]. This compound alsohas promising chemical and physical properties such as high conductivity, environmentalstability, corrosion resistance and homogenous microstructure. Additionally, PANI hasfunctional groups such as sulfonated poly (aniline-co-o-aminophenol) and s-copolymerand can be prepared using oxidative chemical methods and doped with different acids [38].Therefore, PANI is a suitable conductive polymer for PAH detection. Investigating theinteraction of PANI with PAHs can help improve the fundamental understanding andapplication of PANI in sensors.
Materials 2021, 14, 7382 3 of 19
Materials 2021, 14, x FOR PEER REVIEW 3 of 19
In this study, the effects of different acids as dopants on the physical properties and thermal, optical and electrical qualities of PANI were investigated. PANI was prepared through oxidative polymerization and doped using four types of acid, namely, organic acids such as toluene-4-sulfonic acid monohydrate (PTSA), camphor sulfonic acid (CSA) and acetic acid and inorganic acids such as hydrochloric acid (HCl). The prepared samples were examined by Fourier transform infrared (FT-IR) spectroscopy, X-ray diffraction (XRD), UV-visible spectroscopy (UV-vis), field emission scanning electron microscopy (FE-SEM), energy dispersive X-ray spectrometry (EDS), thermal gravity analysis (TGA) and photoluminescence (PL). The four-point probe method was used to investigate elec-trical behavior, and photoluminescence spectroscopy was applied to detect fluorescence properties. The application of PANI with excellent synthesis, features and high PL inten-sity to detect low fluorene concentration was also evaluated.
Figure 1. Synthesis of PANI by using different acids as dopants.
2. Materials and Methods 2.1. Materials
PTSA, aniline monomer (aniline 99%), CSA, hexane and fluorene were purchased from Merck KGaA, Darmstadt, Germany. N-Methyl-2-pyrrolidone, ammonium persul-fate (APS 98%), acetic acid, HCl, ammonia solution (NH4OH) and H2O2 were provided by Avanti Chemicals of Merck KGaA, Darmstadt, Germany. Microscope glass slides were acquired from Jiangsu Huida Medical Instruments Co., Ltd. (Yancheng, Jiangsu, China). All chemicals were of analytical grade. Distilled water was used for aniline synthesis.
2.2. Preparation of PANI PANI was synthesized as previously described [39]. Briefly, 2.75 mL of aniline was
dissolved in 150 mL of 0.4 M PTSA, constantly stirred for 1 h, cooled and dropwise added with 25 mL of APS (1.7 g of APS dissolved in 25 mL of 0.4 M PTSA). The temperature was kept at 0–5 °C in an ice bath. The mixture was stirred for another 3 h. The precipitated raw polymer was filtered and washed using deionized water until it became colorless. The final substance was dehydrated in an oven at 50 °C for 12 h. In this form, PANI is known
Figure 1. Synthesis of PANI by using different acids as dopants.
In this study, the effects of different acids as dopants on the physical properties andthermal, optical and electrical qualities of PANI were investigated. PANI was preparedthrough oxidative polymerization and doped using four types of acid, namely, organicacids such as toluene-4-sulfonic acid monohydrate (PTSA), camphor sulfonic acid (CSA)and acetic acid and inorganic acids such as hydrochloric acid (HCl). The prepared sampleswere examined by Fourier transform infrared (FT-IR) spectroscopy, X-ray diffraction (XRD),UV-visible spectroscopy (UV-vis), field emission scanning electron microscopy (FE-SEM),energy dispersive X-ray spectrometry (EDS), thermal gravity analysis (TGA) and photolu-minescence (PL). The four-point probe method was used to investigate electrical behavior,and photoluminescence spectroscopy was applied to detect fluorescence properties. Theapplication of PANI with excellent synthesis, features and high PL intensity to detect lowfluorene concentration was also evaluated.
2. Materials and Methods2.1. Materials
PTSA, aniline monomer (aniline 99%), CSA, hexane and fluorene were purchasedfrom Merck KGaA, Darmstadt, Germany. N-Methyl-2-pyrrolidone, ammonium persulfate(APS 98%), acetic acid, HCl, ammonia solution (NH4OH) and H2O2 were provided byAvanti Chemicals of Merck KGaA, Darmstadt, Germany. Microscope glass slides wereacquired from Jiangsu Huida Medical Instruments Co., Ltd. (Yancheng, Jiangsu, China).All chemicals were of analytical grade. Distilled water was used for aniline synthesis.
2.2. Preparation of PANI
PANI was synthesized as previously described [39]. Briefly, 2.75 mL of aniline wasdissolved in 150 mL of 0.4 M PTSA, constantly stirred for 1 h, cooled and dropwise added
Materials 2021, 14, 7382 4 of 19
with 25 mL of APS (1.7 g of APS dissolved in 25 mL of 0.4 M PTSA). The temperature waskept at 0–5 C in an ice bath. The mixture was stirred for another 3 h. The precipitated rawpolymer was filtered and washed using deionized water until it became colorless. The finalsubstance was dehydrated in an oven at 50 C for 12 h. In this form, PANI is known asemeraldine salt (ES). PANI was re-synthesized with three organic (CSA and acetic acid)and inorganic (HCl) acids (Table 1).
Table 1. Preparation of PANI samples.
Sample Name Aniline MonomerConcentration (mL)
APS as OxidantMonomer (g) Different Acids (0.4 M) Weight of the PANI (g)
PANI-PTSA 2.75 1.7 PTSA 0.2PANI-CSA 2.75 1.7 CSA 0.18
PANI-Acetic acid 2.75 1.7 Acetic acid 0.15PANI-HCl 2.75 1.7 HCl 0.19
2.3. Preparation of Fluorene
PANI-PTSA with fluorene was prepared as follows. Briefly, 0.002 g of fluorene wasdissolved in 250 mL of hexane containing 10 µM of fluorene solution to prepare aqueousfluorene solution. Other concentrations, i.e., 0.001, 0.01, 0.1, 1 and 10 µM were obtainedby diluting the 10 µM fluorene solution as mentioned in Table 2. In all samples, fluoreneamount was set as 160 µL.
Table 2. Preparation of PANI-PTSA with fluorene concentrations.
Sample Name Amount of PANI* (µL) Amount of Fluorene (µL) Fluorene Concentrations (µM)
PANI-PTSA-fluorene-1 2900 100 0.001PANI-PTSA-fluorene-2 2900 100 0.01PANI-PTSA-fluorene-3 2900 100 0.1PANI-PTSA-fluorene-4 2900 100 1PANI-PTSA-fluorene-5 2900 100 10
2.4. Preparation of Thin Film
For the preparation of thin PANI layers, microscope glass slides were sonicated inethanol for 10 min, then immersed in an aqueous solution of 4.0 mL of H2O2, 4.0 mL ofNH4OH and 20.0 mL of deionized water for another 10 min, sonicated in deionized waterand finally dried naturally. PANI solution with different dopants was adjusted to 80 µL.The thin film was deposited above a glass substrate by applying a spin coater (POLOS) atapproximately 1500 rpm for 60 s. The remaining dispersions were stored in a safe placeand monitored after 24 h.
2.5. Analytical Methods
FT-IR spectroscopy (Thermo Nicolet 6700 FT-IR) with KBr pellets was conducted in therange of 400–4000 cm−1 to categorize the functional groups and surface state of the PANIsamples. X-ray diffraction (XRD) images were obtained by Shimadzu 6000 using Cu–Kα
radiation at a scanning speed of 1.2 min −1 of 3 to 90 degrees to ascertain the purity phase.Optical characteristics were determined by UV-vis spectroscopy (UV–vis, Lambda 35,PerkinElmer) at ambient temperature. Morphology was examined using a field emissionscanning electron microscope (FE-SEM, NOVA NANOSEM 230). X-ray energy dispersivespectroscopy (EDS) was employed to determine the elemental composition of specificpoints or record the lateral distribution of elements in the imaged region. TGA analysis wasadopted to study the thermal stability of the PANI samples below a nitrogen atmospherefrom ambient temperature up to 900 C at a heat range of 10 C/min (Brand: METTLERTOLEDO). The photoluminescence excitation and emission wavelengths of 230 and 370 nm,respectively, were recorded in an aqueous solution utilising photoluminescence settings
Materials 2021, 14, 7382 5 of 19
(PL, PerkinElmer, and LS 55). Electrical conductivity was measured using a four-terminalprobe from Mitsubishi Chemical Analytech (MCCAT) Measuring Systems.
3. Result and Discussion3.1. FT-IR Characterization
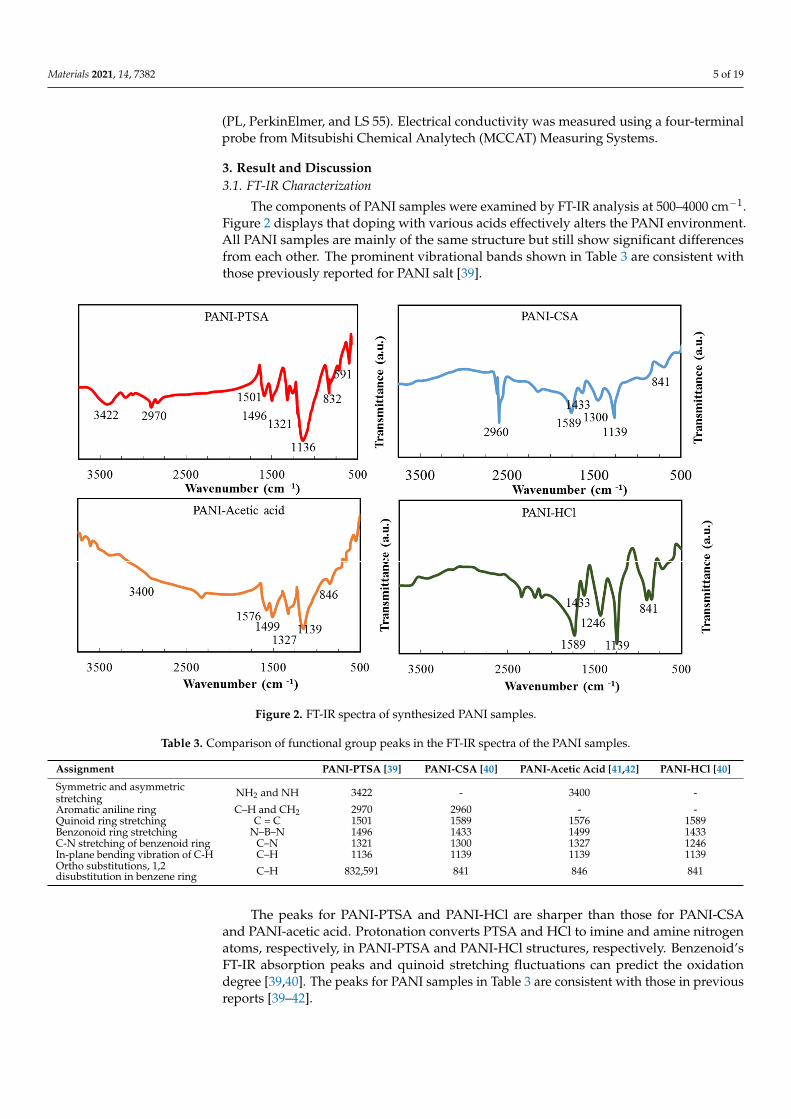
The components of PANI samples were examined by FT-IR analysis at 500–4000 cm−1.Figure 2 displays that doping with various acids effectively alters the PANI environment.All PANI samples are mainly of the same structure but still show significant differencesfrom each other. The prominent vibrational bands shown in Table 3 are consistent withthose previously reported for PANI salt [39].
Materials 2021, 14, x FOR PEER REVIEW 5 of 19
a four-terminal probe from Mitsubishi Chemical Analytech (MCCAT) Measuring Sys-tems.
3. Result and Discussion 3.1. FT-IR Characterization
The components of PANI samples were examined by FT-IR analysis at 500–4000 cm−1. Figure 2 displays that doping with various acids effectively alters the PANI environment. All PANI samples are mainly of the same structure but still show significant differences from each other. The prominent vibrational bands shown in Table 3 are consistent with those previously reported for PANI salt [39].
Figure 2. FT-IR spectra of synthesized PANI samples.
Table 3. Comparison of functional group peaks in the FT-IR spectra of the PANI samples.
Assignment PANI-PTSA [39]
PANI-CSA [40]
PANI-Acetic acid [41,42]
PANI-HCl [40]
Symmetric and asymmetric stretching NH2 and NH 3422 - 3400 - Aromatic aniline ring C–H and CH2 2970 2960 - - Quinoid ring stretching C = C 1501 1589 1576 1589 Benzonoid ring stretching N–B–N 1496 1433 1499 1433 C-N stretching of benzenoid ring C–N 1321 1300 1327 1246 In-plane bending vibration of C-H C–H 1136 1139 1139 1139 Ortho substitutions, 1,2 disubstitution in benzene ring
C–H 832,591 841 846 841
The peaks for PANI-PTSA and PANI-HCl are sharper than those for PANI-CSA and PANI-acetic acid. Protonation converts PTSA and HCl to imine and amine nitrogen atoms, respectively, in PANI-PTSA and PANI-HCl structures, respectively. Benzenoid’s FT-IR absorption peaks and quinoid stretching fluctuations can predict the oxidation degree
Figure 2. FT-IR spectra of synthesized PANI samples.
Table 3. Comparison of functional group peaks in the FT-IR spectra of the PANI samples.
Assignment PANI-PTSA [39] PANI-CSA [40] PANI-Acetic Acid [41,42] PANI-HCl [40]
Symmetric and asymmetricstretching NH2 and NH 3422 - 3400 -
Aromatic aniline ring C–H and CH2 2970 2960 - -Quinoid ring stretching C = C 1501 1589 1576 1589Benzonoid ring stretching N–B–N 1496 1433 1499 1433C-N stretching of benzenoid ring C–N 1321 1300 1327 1246In-plane bending vibration of C-H C–H 1136 1139 1139 1139Ortho substitutions, 1,2disubstitution in benzene ring C–H 832,591 841 846 841
The peaks for PANI-PTSA and PANI-HCl are sharper than those for PANI-CSAand PANI-acetic acid. Protonation converts PTSA and HCl to imine and amine nitrogenatoms, respectively, in PANI-PTSA and PANI-HCl structures, respectively. Benzenoid’sFT-IR absorption peaks and quinoid stretching fluctuations can predict the oxidationdegree [39,40]. The peaks for PANI samples in Table 3 are consistent with those in previousreports [39–42].
Materials 2021, 14, 7382 6 of 19
In PANI-CSA and PANI-PTSA, the peaks at 2960 and 2970 cm−1 are associated withC-H stretching. These bands are not affected by doping, indicating that an aromatic ring ispreserved inside the polymer [40].
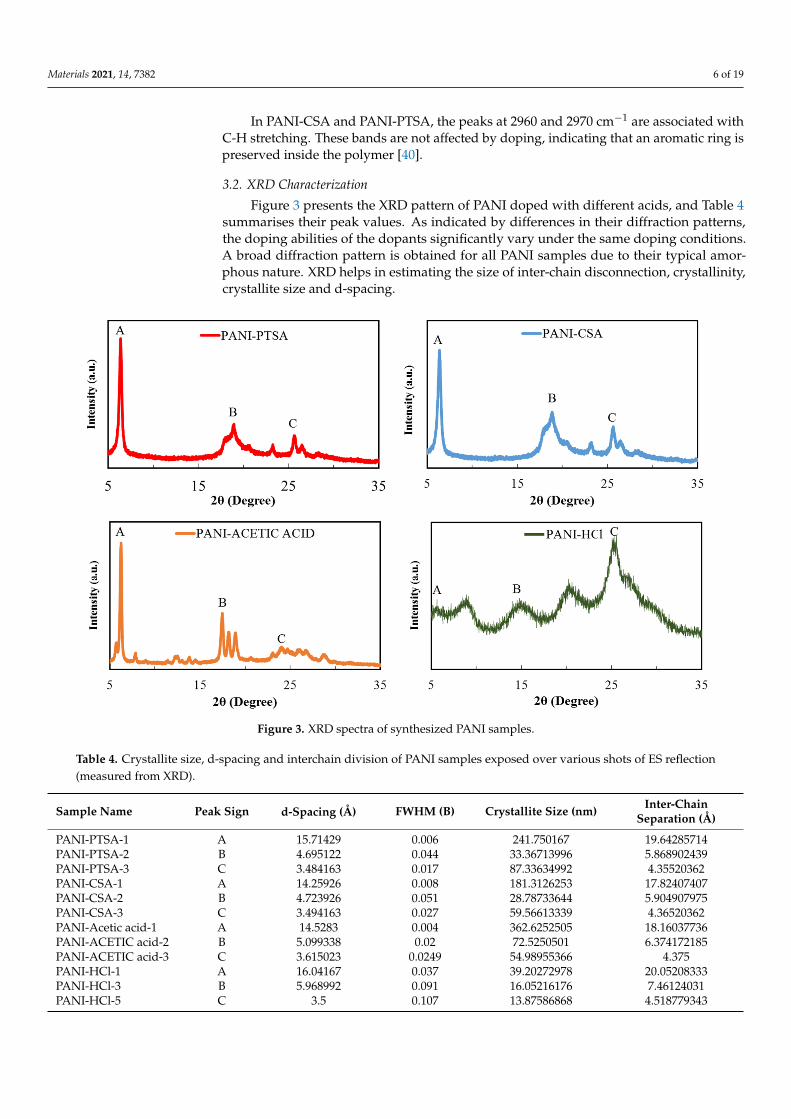
3.2. XRD Characterization
Figure 3 presents the XRD pattern of PANI doped with different acids, and Table 4summarises their peak values. As indicated by differences in their diffraction patterns,the doping abilities of the dopants significantly vary under the same doping conditions.A broad diffraction pattern is obtained for all PANI samples due to their typical amor-phous nature. XRD helps in estimating the size of inter-chain disconnection, crystallinity,crystallite size and d-spacing.
Materials 2021, 14, x FOR PEER REVIEW 7 of 19
PTSA > PANI-CSA > PANI-acetic acid > PANI-HCl. The actual quantity of inter-chain separation and d-spacing is the exact opposite of the theoretical quantity. Hence, conduc-tivity decreases in the following order: PANI-PTSA > PANI-CSA > PANI-acetic acid > PANI-HCl. Nonetheless, the large acid exerts great force against the ordering and closing of polymer chains, resulting in low crystallinity, great inter-chain spacing and d-spacing and reduced conductivity.
Figure 3. XRD spectra of synthesized PANI samples.
Table 4. Crystallite size, d-spacing and interchain division of PANI samples exposed over various shots of ES reflection (measured from XRD).
Sample Name Peak Sign d-Spacing (Å) FWHM (B) Crystallite Size (nm) Inter-Chain Separation (Å) PANI-PTSA-1 A 15.71429 0.006 241.750167 19.64285714 PANI-PTSA-2 B 4.695122 0.044 33.36713996 5.868902439 PANI-PTSA-3 C 3.484163 0.017 87.33634992 4.35520362 PANI-CSA-1 A 14.25926 0.008 181.3126253 17.82407407 PANI-CSA-2 B 4.723926 0.051 28.78733644 5.904907975 PANI-CSA-3 C 3.494163 0.027 59.56613339 4.36520362 PANI-Acetic acid-1 A 14.5283 0.004 362.6252505 18.16037736 PANI-ACETIC acid-2 B 5.099338 0.02 72.5250501 6.374172185 PANI-ACETIC acid-3 C 3.615023 0.0249 54.98955366 4.375 PANI-HCl-1 A 16.04167 0.037 39.20272978 20.05208333 PANI-HCl-3 B 5.968992 0.091 16.05216176 7.46124031 PANI-HCl-5 C 3.5 0.107 13.87586868 4.518779343
Figure 3. XRD spectra of synthesized PANI samples.
Table 4. Crystallite size, d-spacing and interchain division of PANI samples exposed over various shots of ES reflection(measured from XRD).
Sample Name Peak Sign d-Spacing (Å) FWHM (B) Crystallite Size (nm) Inter-ChainSeparation (Å)
PANI-PTSA-1 A 15.71429 0.006 241.750167 19.64285714PANI-PTSA-2 B 4.695122 0.044 33.36713996 5.868902439PANI-PTSA-3 C 3.484163 0.017 87.33634992 4.35520362PANI-CSA-1 A 14.25926 0.008 181.3126253 17.82407407PANI-CSA-2 B 4.723926 0.051 28.78733644 5.904907975PANI-CSA-3 C 3.494163 0.027 59.56613339 4.36520362PANI-Acetic acid-1 A 14.5283 0.004 362.6252505 18.16037736PANI-ACETIC acid-2 B 5.099338 0.02 72.5250501 6.374172185PANI-ACETIC acid-3 C 3.615023 0.0249 54.98955366 4.375PANI-HCl-1 A 16.04167 0.037 39.20272978 20.05208333PANI-HCl-3 B 5.968992 0.091 16.05216176 7.46124031PANI-HCl-5 C 3.5 0.107 13.87586868 4.518779343
Materials 2021, 14, 7382 7 of 19
For all samples, d-spacing was delimited using Debye–Scherrer (powder) methodutilizing the Bragg relation (Equation (1)) [43].
nλ = 2d sin θ, (1)
where n is an integer; λ is the wavelength of X-ray, which for the Cu target is 1.54 Å; d,named as d-spacing, is the distance among the planes; and θ is the angle between the pathof the beam and the planes.
Crystallite quantity was measured using the Scherrer relation (Equation (2)) [44];
t =kλ
B cos θ, (2)
where t is the crystallite quantity, K is the ordinary crystallite (∼0.9) the shape factor and Bis the entire diameter at crystalline peak’s half maximum in radians [45].
Inter-chain separation was determined using the relation given by Klug and Alexander(Equation (3)):
R =5λ
8 sin θ, (3)
where R is the inter-chain division.The XRD profile for the PANI-PTSA pattern includes broad peaks at 6.4 and 18.97
and a sharp peak at 25.64. The peak at 18.97 indicates the inter-chain distance betweenadjoining benzene rings in PANI, and the peak at 25.64 is attributed to the dispersionof PANI chains at an interplanar distance. On the basis of this microstructural analysis,PANI is in the verified form of ES [46]. PANI-CSA also shows similar peaks at 6.35 and18.86 and a sharp peak at 25.61 [40]. PANI-acetic acid shows sharp, intense peaks at 6.26,17.49 and 24.72 attributed to the arrangement of the acetic acid molecules in the tunnelsbetween the PANI chains [47]. Finally, PANI-HCl shows five peaks at 5.65, 9.05, 14.92,20.62 and 25.55 [48,49]. Given its long alkyl tails, PTSA can penetrate the crystal planesof PANI deeper than other acids with bulky cycloaliphatic rings such as CSA, acetic acidand HCl.
As shown in Table 4, all PANI samples have three crystalline peaks at 6, 18 and25. Conductivity increases with the increasing crystallinity and decreasing inter-chainspacing and d-spacing. Table 5 describes the main properties of PANI samples obtainedfrom the peak at 25 in the XRD characterization and their comparison with those fromother research. A high grade of balance in the organization or order of polymer chainsimplies great crystallinity. Balance and ordered construction, defined as crystallinity, isa desirable factor, particularly for the intra-molecular movement of charged varietiestowards the chain and to any degree for inter-molecular jumps due to dense and goodpacking. Therefore, an increase in crystallinity also increases conductivity. When theinter-chain spacing and d-spacing decrease, the possibility of inter-chain jumps increases,and conductivity simultaneously increases. Net conductivity is attributed to the intra-chainand inter-chain mobility of the electrons and holes [50,51]. Crystallinity reduction is in theorder of PANI-PTSA > PANI-CSA > PANI-acetic acid > PANI-HCl. The actual quantity ofinter-chain separation and d-spacing is the exact opposite of the theoretical quantity. Hence,conductivity decreases in the following order: PANI-PTSA > PANI-CSA > PANI-acetic acid> PANI-HCl. Nonetheless, the large acid exerts great force against the ordering and closingof polymer chains, resulting in low crystallinity, great inter-chain spacing and d-spacingand reduced conductivity.
Materials 2021, 14, 7382 8 of 19
Table 5. Features of synthesized PANI samples and comparison with other research.
Sample Name Crystallite Size(nm) d-Spacing (Å)
Inter-ChainSeparation (Å) Bandgap Conductivity
(S·cm−1)References
PANI-PTSA
47 3.50 4.37 4.50 4.8 × 10⁻² [30]13.8 3.51 4.39 4.196 1 × 10⁻² [50]29 4.6 - - 12 × 10−2 [46]87 3.48 4.35 3.1 3.84 × 101 Current study
PANI-CSA
- 3.52 - 3.8 11 × 10−2 [52]65 4.9 - - 21 × 10−2 [46]56 - - - 2.7× 101 [40]59 3.49 4.36 3.5 2.92 × 101 Current study
PANI-Aceticacid
49 - - - 6.5× 10⁻² [53]- - - - 4.21 × 10⁻² [32]- - - - 6.5 × 10⁻⁵ [54]
55 3.6 4.37 3.6 2.50 × 10⁻² Current study
PANI-HCl
59 3.49 4.36 4.48 1.6 × 10⁻¹ [30]- - - 2.40 54 × 10−2 [55]
38.3 3.9 - 3.85 - [56]14 3.5 4.5 3.9 2.44 × 10⁻² Current study
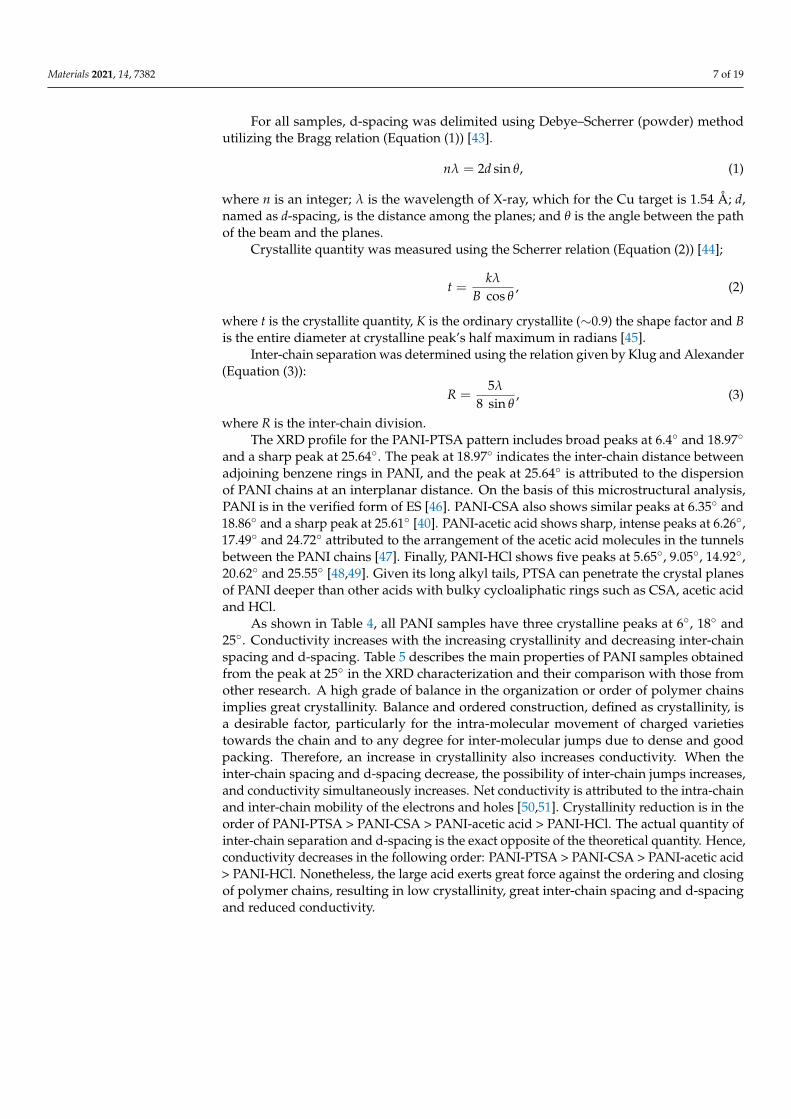
3.3. UV-Vis Characterization
Figure 4 shows the UV-vis spectra of PANI samples. The absorption peaks of PANIsamples depend on the doping level, conjugation extent and solvent type [57]. Valance andconduction bands are formed by the π and π* orbital, respectively.
Materials 2021, 14, x FOR PEER REVIEW 8 of 19
Table 5. Features of synthesized PANI samples and comparison with other research.
Sample Name Crystallite Size (nm)
d-Spacing (Å)
Inter-Chain Separation (A˚) Bandgap
Conductivity (S.cm−1) References
PANI-PTSA
47 3.50 4.37 4.50 4.8 × 10⁻² [30] 13.8 3.51 4.39 4.196 1 × 10⁻² [50] 29 4.6 - - 12 × 10−2 [46] 87 3.48 4.35 3.1 3.84 × 101 Current study
PANI-CSA
- 3.52 - 3.8 11 × 10−2 [52] 65 4.9 - - 21 × 10−2 [46] 56 - - - 2.7× 101 [40] 59 3.49 4.36 3.5 2.92 × 101 Current study
PANI-Acetic acid
49 - - - 6.5× 10⁻² [53] - - - - 4.21 × 10⁻² [32] - - - - 6.5 × 10⁻⁵ [54]
55 3.6 4.37 3.6 2.50 × 10⁻² Current study
PANI-HCl
59 3.49 4.36 4.48 1.6 × 10⁻¹ [30] - - - 2.40 54 × 10−2 [55]
38.3 3.9 - 3.85 - [56] 14 3.5 4.5 3.9 2.44 × 10⁻² Current study
3.3. UV-Vis Characterization Figure 4 shows the UV-vis spectra of PANI samples. The absorption peaks of PANI
samples depend on the doping level, conjugation extent and solvent type [57]. Valance and conduction bands are formed by the π and π* orbital, respectively.
Figure 4. UV-vis spectra of synthesized PANI samples.
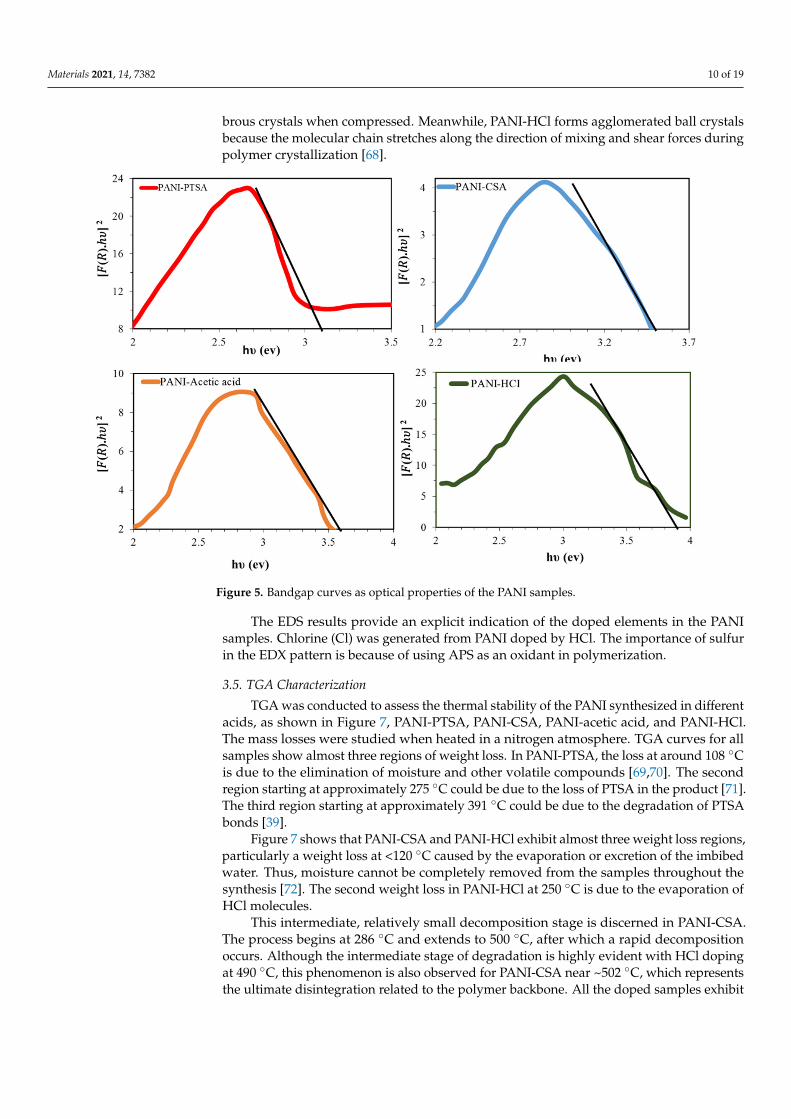
Bandgaps are energy variations between two bands and are used to determine the optical properties of semiconducting polymers. Low bandgap energy implies smooth π–π* electronic transformation and increased conductivity [58]. The UV spectra of PANI samples exhibit three specific absorption bands across the wavelength regions of 250–320, 320–450 and 450–800 nm. Nitrogen excitation in the benzenoid segments (π–π* transition) causes the first absorption, and the shift from polaron to π* band and from π to polaron band of the doped PANI chains causes the second and third absorptions, respectively [53,58–60]. Table 6 shows the comparison of absorption rates from the UV-vis spectra of PANI samples. A decrease in absorption band at 578, 579 and 630 nm occurs for PANI-PTSA, PANI-HCl, and PANI-acetic acid, respectively. This phenomenon indicates that the
Figure 4. UV-vis spectra of synthesized PANI samples.
Bandgaps are energy variations between two bands and are used to determine theoptical properties of semiconducting polymers. Low bandgap energy implies smooth π–π*electronic transformation and increased conductivity [58]. The UV spectra of PANI samplesexhibit three specific absorption bands across the wavelength regions of 250–320, 320–450and 450–800 nm. Nitrogen excitation in the benzenoid segments (π–π* transition) causesthe first absorption, and the shift from polaron to π* band and from π to polaron band ofthe doped PANI chains causes the second and third absorptions, respectively [53,58–60].Table 6 shows the comparison of absorption rates from the UV-vis spectra of PANI samples.A decrease in absorption band at 578, 579 and 630 nm occurs for PANI-PTSA, PANI-HCl,and PANI-acetic acid, respectively. This phenomenon indicates that the quinoid rings and
Materials 2021, 14, 7382 9 of 19
imine nitrogen atoms generated from protonation with PTSA, HCl and acetic acid dopantsare transformed to benzenoid rings. The steric effect of the dopant anions may be thereason for the decrease in the peaks at 570 and 630 nm of the PANI samples [55].
Table 6. Comparison of the absorbance values of the PANI samples.
Π–π* Polaron to π* π to Polaron
PANI-Samples Wavelength (nm) PANI-Samples Wavelength (nm) PANI-Samples Wavelength (nm)
PANI-PTSA 207 PANI-PTSA 321 PANI-PTSA 578PANI-CSA 253 PANI-CSA 338 PANI-CSA 785
PANI-Acetic acid 283 PANI-Acetic acid - PANI-Acetic acid 630PANI-HCl 317 PANI-HCl - PANI-HCl 579
Diffuse reflectance was analyzed to ascertain the energy range and the optical featuresof the PANI samples. Bandgap energies were calculated using the Tauc method, in whichthe energy-dependent absorption coefficient α is obtained using the following Equation (4):
(αhυ)2 = K(hυ − Eg), (4)
where υ is the frequency of the photon, h is Planck’s constant, Eg is the bandgap energy, Kis a constant and α is the diffuse reflectance spectrum calculated from Equation (5):
F(R) =1 − R
2R. (5)
Substituting F(R) in place of α in Equation (1) yields Equation (6):
(F(R).hυ)2 = K(hυ − Eg), (6)
where R is the recognized reflectance inside UV-vis spectra, the crossing position withinthe [F(R). hυ]2 versus hυ (Figure 5) implies that the bandgaps are an optical feature that canbe calculated by extrapolating the straight line at α = 0. Therefore, the calculated opticalbandgaps of PANI-PTSA, PANI-CSA, PANI-acetic acid and PANI-HCl were 3.1, 3.5, 3.6and 3.9 eV, respectively. Laboratory experiment confirmed that the PANI bandgap differssignificantly depending on the doping process. With increasing interaction between PANIand doping anions PTSA, CSA, acetic acid, and HCl and BSA, the conductivity of particlesand the number of charge carriers increase, whereas the amount of bandgap decreases(Table 5).
3.4. FE-SEM and EDS Characterization
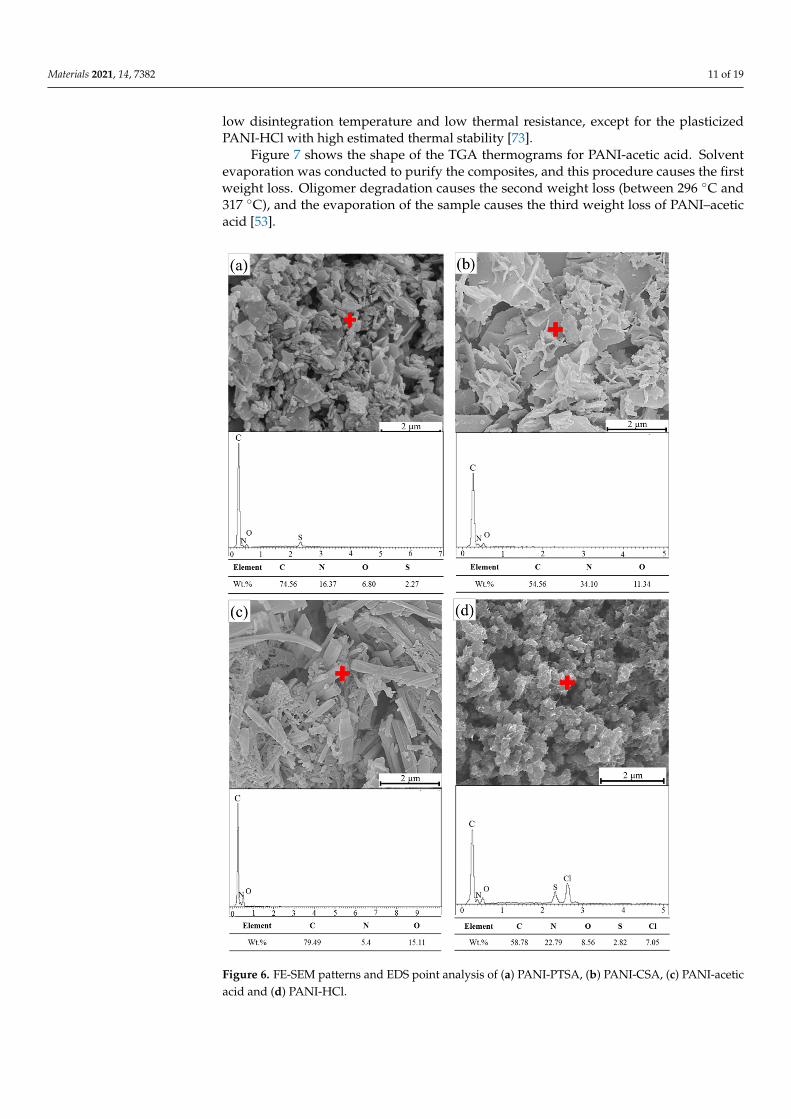
PANI morphology relies on the synthesis method, medium or solvent [61]. Figure 6shows the FE-SEM images and elemental analysis of PANI samples prepared by usingoxidative aniline polymerization techniques in organic and inorganic acid solutions. Highsurface tension is observed, leading to an aggregation tendency and a low specific surfacearea [62]. All the figures present the micrographs of PANI particles at a magnificationof 10,000 with a scale bar of 2 µm. A granular structure (cluster) with micrometer-sizedparticles is found on the PANI surface, thus confirming the formation of ES [62]. By con-trast, large aggregates of PANI particles with up to several microns in size are formedafter drying as shown in FE-SEM images. Nanofibres are generally the fundamentalunits produced during the oxidative chemical polymerization of PANI [63–65]. Owing tosecondary overgrowth, the generated final products become irregularly shaped PANI pow-ders. Although the chemical polymerization of aniline can prevent secondary growth [66],aggregation remains crucial in this case. Agglomeration occurs due to the intra- and inter-molecular ionic interchain interactions triggered by the proto-generated charge carriers(i.e., polarons/bipolarons) [67]. PANI-PTSA, PANI-CSA and PANI-acetic acid exhibit fi-
Materials 2021, 14, 7382 10 of 19
brous crystals when compressed. Meanwhile, PANI-HCl forms agglomerated ball crystalsbecause the molecular chain stretches along the direction of mixing and shear forces duringpolymer crystallization [68].
Materials 2021, 14, x FOR PEER REVIEW 9 of 19
quinoid rings and imine nitrogen atoms generated from protonation with PTSA, HCl and acetic acid dopants are transformed to benzenoid rings. The steric effect of the dopant anions may be the reason for the decrease in the peaks at 570 and 630 nm of the PANI samples [55].
Diffuse reflectance was analyzed to ascertain the energy range and the optical fea-tures of the PANI samples. Bandgap energies were calculated using the Tauc method, in which the energy-dependent absorption coefficient α is obtained using the following Equation (4): (𝛼ℎ𝜐) = 𝐾(ℎ𝜐 𝐸𝑔), (4)
where υ is the frequency of the photon, h is Planck’s constant, Eg is the bandgap energy, K is a constant and α is the diffuse reflectance spectrum calculated from Equation (5): 𝐹(𝑅) = 1 𝑅2𝑅 . (5)
Substituting F(R) in place of α in Equation (1) yields Equation (6): (𝐹(𝑅). ℎ𝜐) = 𝐾(ℎ𝜐 𝐸𝑔), (6)
where R is the recognized reflectance inside UV-vis spectra, the crossing position within the [F(R). hυ]2 versus hυ (Figure 5) implies that the bandgaps are an optical feature that can be calculated by extrapolating the straight line at α = 0. Therefore, the calculated opti-cal bandgaps of PANI-PTSA, PANI-CSA, PANI-acetic acid and PANI-HCl were 3.1, 3.5, 3.6 and 3.9 eV, respectively. Laboratory experiment confirmed that the PANI bandgap differs significantly depending on the doping process. With increasing interaction be-tween PANI and doping anions PTSA, CSA, acetic acid, and HCl and BSA, the conductiv-ity of particles and the number of charge carriers increase, whereas the amount of bandgap decreases (Table 5).
Figure 5. Bandgap curves as optical properties of the PANI samples.
Figure 5. Bandgap curves as optical properties of the PANI samples.
The EDS results provide an explicit indication of the doped elements in the PANIsamples. Chlorine (Cl) was generated from PANI doped by HCl. The importance of sulfurin the EDX pattern is because of using APS as an oxidant in polymerization.
3.5. TGA Characterization
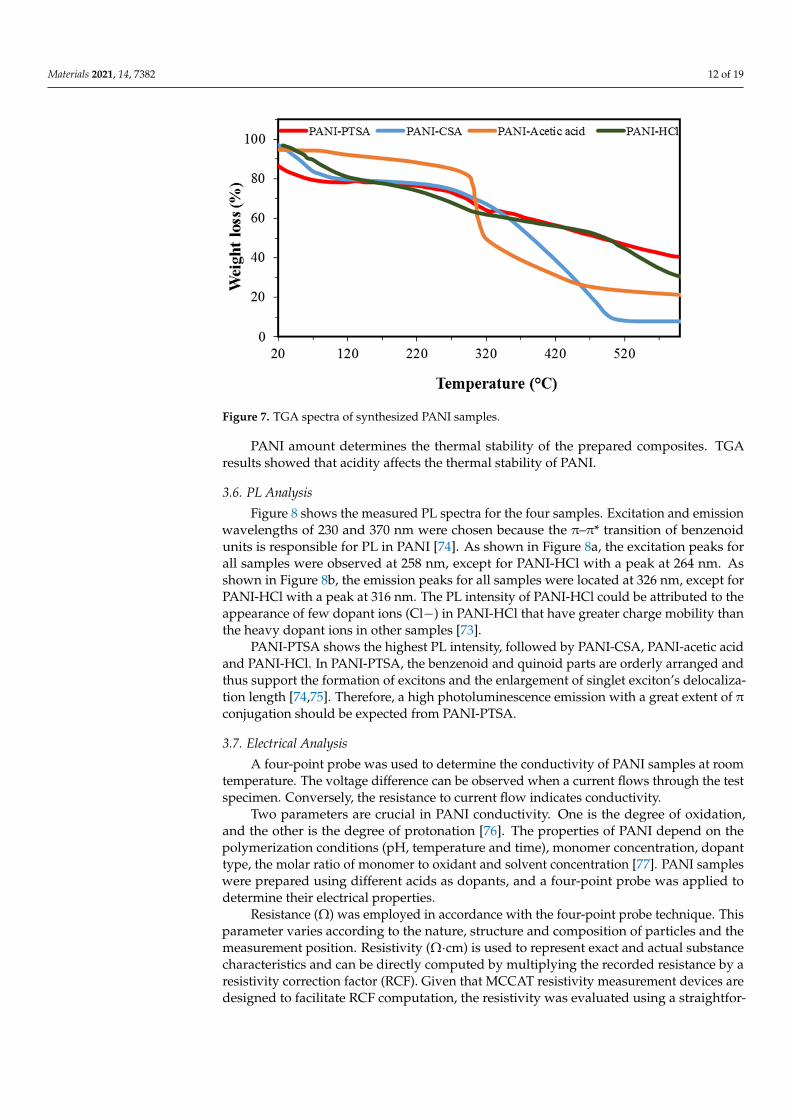
TGA was conducted to assess the thermal stability of the PANI synthesized in differentacids, as shown in Figure 7, PANI-PTSA, PANI-CSA, PANI-acetic acid, and PANI-HCl.The mass losses were studied when heated in a nitrogen atmosphere. TGA curves for allsamples show almost three regions of weight loss. In PANI-PTSA, the loss at around 108 Cis due to the elimination of moisture and other volatile compounds [69,70]. The secondregion starting at approximately 275 C could be due to the loss of PTSA in the product [71].The third region starting at approximately 391 C could be due to the degradation of PTSAbonds [39].
Figure 7 shows that PANI-CSA and PANI-HCl exhibit almost three weight loss regions,particularly a weight loss at <120 C caused by the evaporation or excretion of the imbibedwater. Thus, moisture cannot be completely removed from the samples throughout thesynthesis [72]. The second weight loss in PANI-HCl at 250 C is due to the evaporation ofHCl molecules.
This intermediate, relatively small decomposition stage is discerned in PANI-CSA.The process begins at 286 C and extends to 500 C, after which a rapid decompositionoccurs. Although the intermediate stage of degradation is highly evident with HCl dopingat 490 C, this phenomenon is also observed for PANI-CSA near ~502 C, which representsthe ultimate disintegration related to the polymer backbone. All the doped samples exhibit
Materials 2021, 14, 7382 11 of 19
low disintegration temperature and low thermal resistance, except for the plasticizedPANI-HCl with high estimated thermal stability [73].
Figure 7 shows the shape of the TGA thermograms for PANI-acetic acid. Solventevaporation was conducted to purify the composites, and this procedure causes the firstweight loss. Oligomer degradation causes the second weight loss (between 296 C and317 C), and the evaporation of the sample causes the third weight loss of PANI–aceticacid [53].
Materials 2021, 14, x FOR PEER REVIEW 11 of 19
Figure 6. FE-SEM patterns and EDS point analysis of (a) PANI-PTSA, (b) PANI-CSA, (c) PANI-acetic acid and (d) PANI-HCl.
3.5. TGA Characterization TGA was conducted to assess the thermal stability of the PANI synthesized in differ-
ent acids, as shown in Figure 7, PANI-PTSA, PANI-CSA, PANI-acetic acid, and PANI-HCl. The mass losses were studied when heated in a nitrogen atmosphere. TGA curves for all samples show almost three regions of weight loss. In PANI-PTSA, the loss at around 108 °C is due to the elimination of moisture and other volatile compounds [69,70]. The second region starting at approximately 275 °C could be due to the loss of PTSA in the product [71]. The third region starting at approximately 391 °C could be due to the deg-radation of PTSA bonds [39].
Figure 6. FE-SEM patterns and EDS point analysis of (a) PANI-PTSA, (b) PANI-CSA, (c) PANI-aceticacid and (d) PANI-HCl.
Materials 2021, 14, 7382 12 of 19
Materials 2021, 14, x FOR PEER REVIEW 12 of 19
Figure 7. TGA spectra of synthesized PANI samples.
Figure 7 shows that PANI-CSA and PANI-HCl exhibit almost three weight loss re-gions, particularly a weight loss at <120 °C caused by the evaporation or excretion of the imbibed water. Thus, moisture cannot be completely removed from the samples through-out the synthesis [72]. The second weight loss in PANI-HCl at 250 °C is due to the evapo-ration of HCl molecules.
This intermediate, relatively small decomposition stage is discerned in PANI-CSA. The process begins at 286 °C and extends to 500 °C, after which a rapid decomposition occurs. Although the intermediate stage of degradation is highly evident with HCl doping at 490 °C, this phenomenon is also observed for PANI-CSA near ~502 °C, which represents the ultimate disintegration related to the polymer backbone. All the doped samples ex-hibit low disintegration temperature and low thermal resistance, except for the plasticized PANI-HCl with high estimated thermal stability [73].
Figure 7 shows the shape of the TGA thermograms for PANI-acetic acid. Solvent evaporation was conducted to purify the composites, and this procedure causes the first weight loss. Oligomer degradation causes the second weight loss (between 296 °C and 317 °C), and the evaporation of the sample causes the third weight loss of PANI–acetic acid [53].
PANI amount determines the thermal stability of the prepared composites. TGA re-sults showed that acidity affects the thermal stability of PANI.
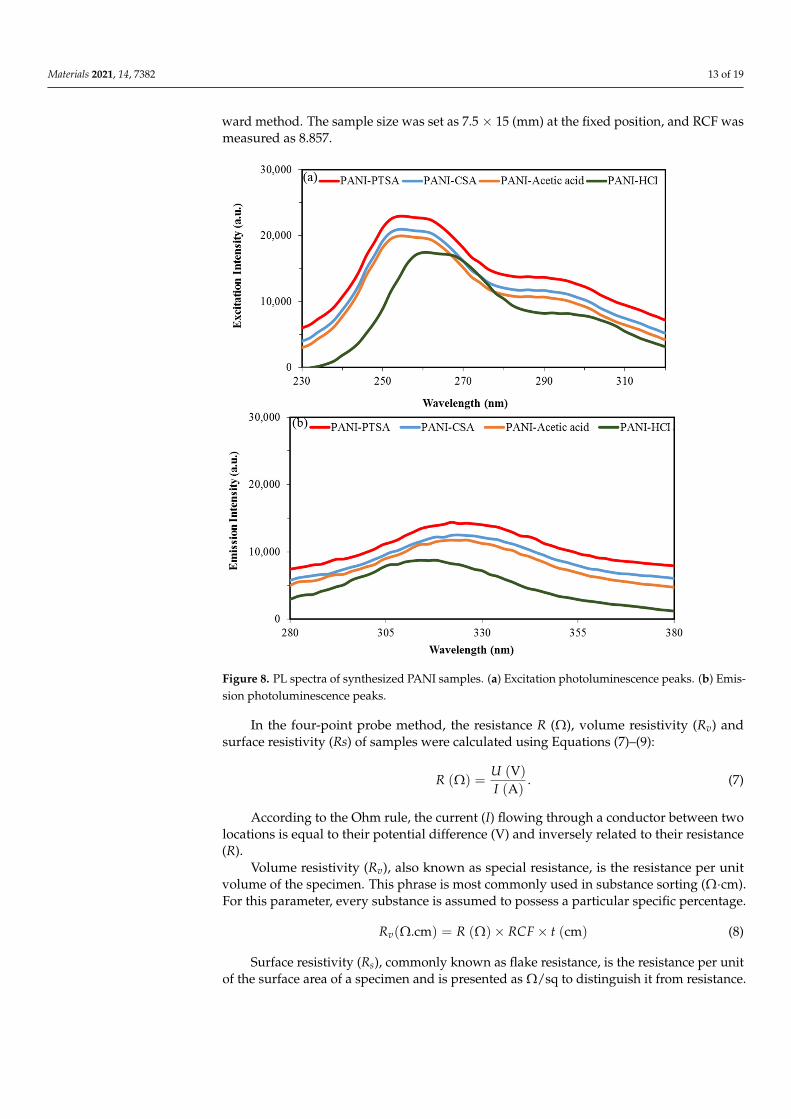
3.6. PL Analysis Figure 8 shows the measured PL spectra for the four samples. Excitation and emis-
sion wavelengths of 230 and 370 nm were chosen because the π–π* transition of benzenoid units is responsible for PL in PANI [74]. As shown in Figure 8a, the excitation peaks for all samples were observed at 258 nm, except for PANI-HCl with a peak at 264 nm. As shown in Figure 8b, the emission peaks for all samples were located at 326 nm, except for PANI-HCl with a peak at 316 nm. The PL intensity of PANI-HCl could be attributed to the appearance of few dopant ions (Cl−) in PANI-HCl that have greater charge mobility than the heavy dopant ions in other samples [73].
Figure 7. TGA spectra of synthesized PANI samples.
PANI amount determines the thermal stability of the prepared composites. TGAresults showed that acidity affects the thermal stability of PANI.
3.6. PL Analysis
Figure 8 shows the measured PL spectra for the four samples. Excitation and emissionwavelengths of 230 and 370 nm were chosen because the π–π* transition of benzenoidunits is responsible for PL in PANI [74]. As shown in Figure 8a, the excitation peaks forall samples were observed at 258 nm, except for PANI-HCl with a peak at 264 nm. Asshown in Figure 8b, the emission peaks for all samples were located at 326 nm, except forPANI-HCl with a peak at 316 nm. The PL intensity of PANI-HCl could be attributed to theappearance of few dopant ions (Cl−) in PANI-HCl that have greater charge mobility thanthe heavy dopant ions in other samples [73].
PANI-PTSA shows the highest PL intensity, followed by PANI-CSA, PANI-acetic acidand PANI-HCl. In PANI-PTSA, the benzenoid and quinoid parts are orderly arranged andthus support the formation of excitons and the enlargement of singlet exciton’s delocaliza-tion length [74,75]. Therefore, a high photoluminescence emission with a great extent of πconjugation should be expected from PANI-PTSA.
3.7. Electrical Analysis
A four-point probe was used to determine the conductivity of PANI samples at roomtemperature. The voltage difference can be observed when a current flows through the testspecimen. Conversely, the resistance to current flow indicates conductivity.
Two parameters are crucial in PANI conductivity. One is the degree of oxidation,and the other is the degree of protonation [76]. The properties of PANI depend on thepolymerization conditions (pH, temperature and time), monomer concentration, dopanttype, the molar ratio of monomer to oxidant and solvent concentration [77]. PANI sampleswere prepared using different acids as dopants, and a four-point probe was applied todetermine their electrical properties.
Resistance (Ω) was employed in accordance with the four-point probe technique. Thisparameter varies according to the nature, structure and composition of particles and themeasurement position. Resistivity (Ω·cm) is used to represent exact and actual substancecharacteristics and can be directly computed by multiplying the recorded resistance by aresistivity correction factor (RCF). Given that MCCAT resistivity measurement devices aredesigned to facilitate RCF computation, the resistivity was evaluated using a straightfor-
Materials 2021, 14, 7382 13 of 19
ward method. The sample size was set as 7.5 × 15 (mm) at the fixed position, and RCF wasmeasured as 8.857.
Materials 2021, 14, x FOR PEER REVIEW 13 of 19
Figure 8. PL spectra of synthesized PANI samples. (a) Excitation photoluminescence peaks. (b) Emission photoluminescence peaks.
PANI-PTSA shows the highest PL intensity, followed by PANI-CSA, PANI-acetic acid and PANI-HCl. In PANI-PTSA, the benzenoid and quinoid parts are orderly ar-ranged and thus support the formation of excitons and the enlargement of singlet exci-ton’s delocalization length [74,75]. Therefore, a high photoluminescence emission with a great extent of π conjugation should be expected from PANI-PTSA.
3.7. Electrical Analysis A four-point probe was used to determine the conductivity of PANI samples at room
temperature. The voltage difference can be observed when a current flows through the test specimen. Conversely, the resistance to current flow indicates conductivity.
Two parameters are crucial in PANI conductivity. One is the degree of oxidation, and the other is the degree of protonation [76]. The properties of PANI depend on the polymer-ization conditions (pH, temperature and time), monomer concentration, dopant type, the molar ratio of monomer to oxidant and solvent concentration [77]. PANI samples were prepared using different acids as dopants, and a four-point probe was applied to deter-mine their electrical properties.
Resistance (Ω) was employed in accordance with the four-point probe technique. This parameter varies according to the nature, structure and composition of particles and the measurement position. Resistivity (Ω∙cm) is used to represent exact and actual sub-stance characteristics and can be directly computed by multiplying the recorded re-sistance by a resistivity correction factor (RCF). Given that MCCAT resistivity measure-ment devices are designed to facilitate RCF computation, the resistivity was evaluated using a straightforward method. The sample size was set as 7.5 × 15 (mm) at the fixed position, and RCF was measured as 8.857.
Figure 8. PL spectra of synthesized PANI samples. (a) Excitation photoluminescence peaks. (b) Emis-sion photoluminescence peaks.
In the four-point probe method, the resistance R (Ω), volume resistivity (Rv) andsurface resistivity (Rs) of samples were calculated using Equations (7)–(9):
R (Ω) =U (V)
I (A). (7)
According to the Ohm rule, the current (I) flowing through a conductor between twolocations is equal to their potential difference (V) and inversely related to their resistance(R).
Volume resistivity (Rv), also known as special resistance, is the resistance per unitvolume of the specimen. This phrase is most commonly used in substance sorting (Ω·cm).For this parameter, every substance is assumed to possess a particular specific percentage.
Rv(Ω.cm) = R (Ω)× RCF × t (cm) (8)
Surface resistivity (Rs), commonly known as flake resistance, is the resistance per unitof the surface area of a specimen and is presented as Ω/sq to distinguish it from resistance.
Materials 2021, 14, 7382 14 of 19
Given that Rs fluctuates with the specimen diameter, most studies assess dye and finecoatings.
Rs(Ω/sq) = R (Ω)× RCF = Rv × t−1, (9)
where R is resistivity (Ω), RCF is resistivity correction factor, and t [cm] is thickness.Thus, the effect of RCF on the resistivity of a specimen depends on measurement location,specimen dimensions and diameter.
Conductivity (σ), also called specific conductivity, is inversely related to volumeresistivity (unit of S/cm or (Ω·cm)−1 and was computed using Equation (10). The obtainedvalues are listed in Tables 5 and 7.
σ (Ω · cm)−1 =1
Rv(10)
Table 7. Electrical data of PANI samples.
Sample Name R (Ω) Rs (Ω/sq) Rv (Ω·cm) Conductivity (Ω·cm)–1
PANI-PTSA 9.98 × 10⁻¹ 8.84 2.61 × 10⁻² 3.84 × 101
PANI-CSA 1.31 × 10⁻¹ 1.16 3.42 × 10⁻² 2.92 × 101
PANI-Acetic acid 1.53 × 10³ 1.36 × 10⁴ 4.00 × 10⁻² 2.50 × 10⁻²
PANI-HCl 1.57 × 10³ 1.39 × 10⁴ 4.10 × 101 2.44 × 10⁻²
Table 7 presents the electrical parameters of PANI samples. Their good conductivityvalues imply the successful production of adequate ES PANI type. The order of conductivityis PANI-PTSA > PANI-HCl > PANI-CSA > PANI-acetic acid. Intensity and charge carriermobility determine the net conductivity of doped PANI and depend on the dopant nature,the structure of the doped PANI and preparation method [50,51,58,78].
3.8. Fluorescence Detection of Fluorene
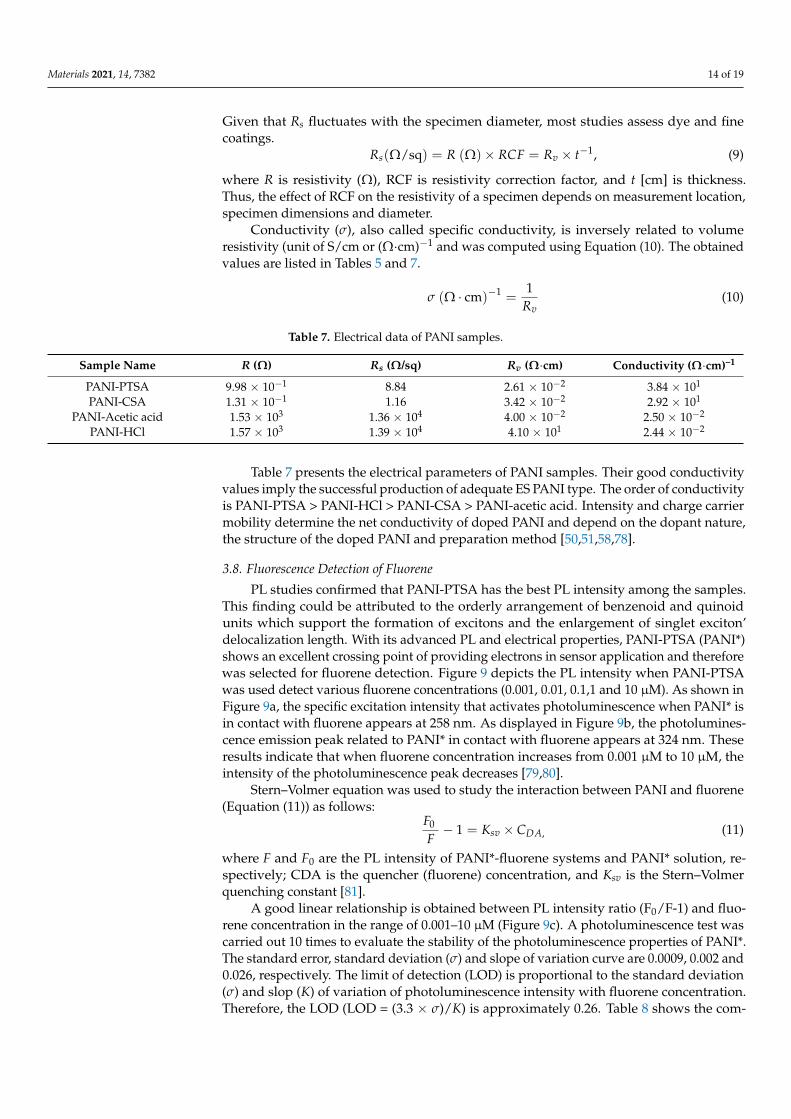
PL studies confirmed that PANI-PTSA has the best PL intensity among the samples.This finding could be attributed to the orderly arrangement of benzenoid and quinoidunits which support the formation of excitons and the enlargement of singlet exciton’delocalization length. With its advanced PL and electrical properties, PANI-PTSA (PANI*)shows an excellent crossing point of providing electrons in sensor application and thereforewas selected for fluorene detection. Figure 9 depicts the PL intensity when PANI-PTSAwas used detect various fluorene concentrations (0.001, 0.01, 0.1,1 and 10 µM). As shown inFigure 9a, the specific excitation intensity that activates photoluminescence when PANI* isin contact with fluorene appears at 258 nm. As displayed in Figure 9b, the photolumines-cence emission peak related to PANI* in contact with fluorene appears at 324 nm. Theseresults indicate that when fluorene concentration increases from 0.001 µM to 10 µM, theintensity of the photoluminescence peak decreases [79,80].
Stern–Volmer equation was used to study the interaction between PANI and fluorene(Equation (11)) as follows:
F0
F− 1 = Ksv × CDA, (11)
where F and F0 are the PL intensity of PANI*-fluorene systems and PANI* solution, re-spectively; CDA is the quencher (fluorene) concentration, and Ksv is the Stern–Volmerquenching constant [81].
A good linear relationship is obtained between PL intensity ratio (F0/F-1) and fluo-rene concentration in the range of 0.001–10 µM (Figure 9c). A photoluminescence test wascarried out 10 times to evaluate the stability of the photoluminescence properties of PANI*.The standard error, standard deviation (σ) and slope of variation curve are 0.0009, 0.002 and0.026, respectively. The limit of detection (LOD) is proportional to the standard deviation(σ) and slop (K) of variation of photoluminescence intensity with fluorene concentration.Therefore, the LOD (LOD = (3.3 × σ)/K) is approximately 0.26. Table 8 shows the com-
Materials 2021, 14, 7382 15 of 19
parison of detection results for fluorene sensors with different fluorescence spectroscopymethods.
Materials 2021, 14, x FOR PEER REVIEW 15 of 19
324 nm. These results indicate that when fluorene concentration increases from 0.001 μM to 10 μM, the intensity of the photoluminescence peak decreases [79,80].
Stern–Volmer equation was used to study the interaction between PANI and fluo-rene (Equation 11) as follows: 𝐹 𝐹 1 = 𝐾 × 𝐶 , (11)
where F and F0 are the PL intensity of PANI*-fluorene systems and PANI* solution, re-spectively; CDA is the quencher (fluorene) concentration, and Ksv is the Stern–Volmer quenching constant [81].
A good linear relationship is obtained between PL intensity ratio (F0/F-1) and fluo-rene concentration in the range of 0.001–10 μM (Figure 9c). A photoluminescence test was carried out 10 times to evaluate the stability of the photoluminescence properties of PANI*. The standard error, standard deviation (σ) and slope of variation curve are 0.0009, 0.002 and 0.026, respectively. The limit of detection (LOD) is proportional to the standard deviation (σ) and slop (K) of variation of photoluminescence intensity with fluorene con-centration. Therefore, the LOD (LOD = (3.3 × σ)/K) is approximately 0.26. Table 8 shows the comparison of detection results for fluorene sensors with different fluorescence spec-troscopy methods.
Figure 9. (a) Excitation photoluminescence peaks. (b) Emission photoluminescence peaks of fluorene in concentrations of 0.001, 0.01, 0.1, 1 and 10 μM upon interaction with PANI*. (c) Variation of intensity peaks when PANI* interacted with fluorene.
Table 8. Comparison of fluorene sensors with different detection techniques according to fluorescence obtained during experimental measurements.
No. Fluorescent Sensor Methods Linear Range (μM) LOD (nM) References 1 Eu(III)-(CCA)2 probe 0.1–1.9 0.43 [82] 2 Thin-layer chromatography (TLC) - 0.5 [83]
3 1,3-bis(cyanomethoxy)-tert-butylcalix[4]arene (CAD) onto CdSe quantum dots (QDs) CAD@CdSe 0–20 0.8 [84]
4 PANI doped PTSA 0.001–10 0.26 Current study
Figure 9. (a) Excitation photoluminescence peaks. (b) Emission photoluminescence peaks of fluorene in concentrationsof 0.001, 0.01, 0.1, 1 and 10 µM upon interaction with PANI*. (c) Variation of intensity peaks when PANI* interacted withfluorene.
Table 8. Comparison of fluorene sensors with different detection techniques according to fluorescence obtained duringexperimental measurements.
No. Fluorescent Sensor Methods Linear Range (µM) LOD (nM) References
1 Eu(III)-(CCA)2 probe 0.1–1.9 0.43 [82]2 Thin-layer chromatography (TLC) - 0.5 [83]
31,3-bis(cyanomethoxy)-tert-butylcalix[4]arene (CAD) onto CdSe quantumdots (QDs) CAD@CdSe
0–20 0.8 [84]
4 PANI doped PTSA 0.001–10 0.26 Current study
4. Conclusions
PANI-PTSA, PANI-CSA, PANI-acetic acid and PANI-HCl were successfully preparedthrough chemical oxidative polymerization. The optical, thermal, and electrical propertiesof PANI rely on the nature and particle quantity of the acid dopant. UV-vis and FT-IRspectra showed that doping creates fundamental varieties inside PANI chains. PANI-PTSA,PANI-CSA and PANI-acetic acid appear as fibrous crystals when compressed. PANI–HCl presents as agglomerated ball crystals because the molecular chain stretches alongthe direction of mixing and shear forces during polymer crystallization. An XRD studyrevealed that the chain length grows with the increasing acidity. When the dopant quantityincreases, crystallinity decreases, and inter-chain separation and d-spacing increase. As aresult, the mobility of load carriers along with a polymer chain and over chains decreases,and conductivity declines. PANI-PTSA exhibits the highest conductivity among the PANIsamples. Additionally, TGA results implied that acidity affects the thermal stability of PANI.PL studies confirmed that among the samples, PANI-PTSA has the best PL intensity because
Materials 2021, 14, 7382 16 of 19
of the orderly arrangement of benzenoid and quinoid units that support the formation ofexcitons and the enlargement of singlet exciton’ delocalization length. Therefore, PANI-PTSA (PANI*) with advanced PL and 0.26 nM detection limit shows a good balance ofproviding an electron and detecting fluorene in sensor applications.
Author Contributions: Conceptualization, M.B. and A.R.S.; Formal analysis, M.B.; Investigation,M.B.; Project administration, S.S. and A.R.S.; Supervision, S.A.R. and S.S.; Visualization, M.B.;Writing—original draft, M.B.; Writing—review and editing, S.A.R., S.S. and A.R.S. All authors haveread and agreed to the published version of the manuscript.
Funding: This research was funded by the Universiti Putra Malaysia via Geran Universiti PutraMalaysia Inisiatif Putra Berimpak 9674700.
Institutional Review Board Statement: Not applicable.
Informed Consent Statement: Not applicable.
Data Availability Statement: The data presented in this study are available on request from thecorresponding author.
Acknowledgments: The authors would like to thank the Universiti Putra Malaysia for its financialsupport.
Conflicts of Interest: The authors declare no conflict of interest. The funders had no role in the designof the study; in the collection, analyses, or interpretation of data; in the writing of the manuscript, orin the decision to publish the results.
References1. Kapp, R. Fluorine. In Encyclopedia of Toxicology; Elsevier: Amsterdam, The Netherlands, 2005; pp. 343–346.2. Yang, L.; Watts, D.J. Particle surface characteristics may play an important role in phytotoxicity of alumina nanoparticles. Toxicol.
Lett. 2005, 158, 122–132. [CrossRef] [PubMed]3. Alfano, B.; Massera, E.; De Maria, A.; De Girolamo, A.; Di Francia, G.; Delli Veneri, P.; Napolitano, T.; Borriello, A. Polyaniline
proton doping for sensor application. In Proceedings of the 2015 XVIII AISEM Annual Conference, Trento, Italy, 3–5 February2015; IEEE: Piscataway, NJ, USA, 2015; pp. 1–4.
4. Quijada, C. Special Issue: Conductive Polymers: Materials and Applications. Materials 2020, 13, 2344. [CrossRef]5. Abdolahi, A.; Hamzah, E.; Ibrahim, Z.; Hashim, S. Synthesis of uniform polyaniline nanofibers through interfacial polymerization.
Materials 2012, 5, 1487–1494. [CrossRef]6. Namsheer, K.; Rout, C.S. Conducting polymers: A comprehensive review on recent advances in synthesis, properties and
applications. RSC Adv. 2021, 11, 5659–5697. [CrossRef]7. Chen, S.; Li, B.; Xiao, R.; Luo, H.; Yu, S.; He, J.; Liao, X. Design an Epoxy Coating with TiO2/GO/PANI Nanocomposites for
Enhancing Corrosion Resistance of Q235 Carbon Steel. Materials 2021, 14, 2629. [CrossRef] [PubMed]8. Yuan, Y.; Wu, H.; Bu, X.; Wu, Q.; Wang, X.; Han, C.; Li, X.; Wang, X.; Liu, W. Improving Ammonia Detecting Performance of
Polyaniline Decorated rGO Composite Membrane with GO Doping. Materials 2021, 14, 2829. [CrossRef] [PubMed]9. Liu, S.; Liu, L.; Meng, F.; Li, Y.; Wang, F. Protective Performance of Polyaniline-Sulfosalicylic Acid/Epoxy Coating for 5083
Aluminum. Materials 2018, 11, 292. [CrossRef]10. Beygisangchin, M.; Abdul Rashid, S.; Shafie, S.; Sadrolhosseini, A.R.; Lim, H.N. Preparations, Properties, and Applications of
Polyaniline and Polyaniline Thin Films—A Review. Polymers 2021, 13, 2003. [CrossRef]11. Lin, Y.-C.; Zhong, X.-X.; Huang, H.-X.; Wang, H.-Q.; Feng, Q.-P.; Li, Q.-Y. Preparation and Application of Polyaniline Doped with
Different Sulfonic Acids for Supercapacitor. Acta Phys. Chim. Sin. 2016, 32, 474–480. [CrossRef]12. Li, Z.; Gong, L. Research Progress on Applications of Polyaniline (PANI) for Electrochemical Energy Storage and Conversion.
Materials 2020, 13, 548. [CrossRef] [PubMed]13. Brachetti-Sibaja, S.B.; Palma-Ramírez, D.; Torres-Huerta, A.M.; Domínguez-Crespo, M.A.; Dorantes-Rosales, H.J.; Rodríguez-
Salazar, A.E.; Ramírez-Meneses, E. Cvd conditions for mwcnts production and their effects on the optical and electrical propertiesof ppy/mwcnts, pani/mwcnts nanocomposites by in situ electropolymerization. Polymers 2021, 13, 351. [CrossRef] [PubMed]
14. Lyu, H. Triple layer tungsten trioxide, graphene, and polyaniline composite films for combined energy storage and electrochromicapplications. Polymers 2020, 12, 49. [CrossRef] [PubMed]
15. Silakhori, M.; Naghavi, M.; Metselaar, H.; Mahlia, T.; Fauzi, H.; Mehrali, M. Accelerated Thermal Cycling Test of Microencap-sulated Paraffin Wax/Polyaniline Made by Simple Preparation Method for Solar Thermal Energy Storage. Materials 2013, 6,1608–1620. [CrossRef] [PubMed]
16. Jang, C.; Park, J.-K.; Yun, G.-H.; Choi, H.H.; Lee, H.-J.; Yook, J.-G. Radio-Frequency/Microwave Gas Sensors Using ConductingPolymer. Materials 2020, 13, 2859. [CrossRef] [PubMed]
Materials 2021, 14, 7382 17 of 19
17. Ramanavicius, S.; Ramanavicius, A. Conducting polymers in the design of biosensors and biofuel cells. Polymers 2021, 13, 49.[CrossRef]
18. Zarach, Z.; Trzcinski, K.; Łapinski, M.; Lisowska-Oleksiak, A.; Szkoda, M. Improving the Performance of a GraphiteFoil/Polyaniline Electrode Material by a Thin PEDOT:PSS Layer for Application in Flexible, High Power Supercapacitors.Materials 2020, 13, 5791. [CrossRef]
19. Ghorbani, F.; Zamanian, A.; Aidun, A. Conductive electrospun polyurethane-polyaniline scaffolds coated with poly(vinylalcohol)-GPTMS under oxygen plasma surface modification. Mater. Today Commun. 2020, 22, 100752. [CrossRef]
20. Llorens, E.; Armelin, E.; del Mar Pérez-Madrigal, M.; del Valle, L.; Alemán, C.; Puiggalí, J. Nanomembranes and Nanofibers fromBiodegradable Conducting Polymers. Polymers 2013, 5, 1115–1157. [CrossRef]
21. Ahmed, M.; Shahid, M.; Khan, Z.; Ammar, A.; Saboor, A.; Khalid, A.; Hayat, A.; Saeed, A.; Koohgilani, M. ElectrochemicalComparison of SAN/PANI/FLG and ZnO/GO Coated Cast Iron Subject to Corrosive Environments. Materials 2018, 11, 2239.[CrossRef]
22. Mohseni, H.R.; Dehghanipour, M.; Dehghan, N.; Tamaddon, F.; Ahmadi, M.; Sabet, M.; Behjat, A. Enhancement of the photovoltaicperformance and the stability of perovskite solar cells via the modification of electron transport layers with reduced grapheneoxide/polyaniline composite. Sol. Energy 2021, 213, 59–66. [CrossRef]
23. Zhou, D.D.; Cui, X.T.; Hines, A.; Greenberg, R.J. Conducting polymers in neural stimulation applications. In Implantable NeuralProstheses 2; Springer: Berlin/Heidelberg, Germany, 2009; pp. 217–252.
24. Gospodinova, N.; Terlemezyan, L. Conducting polymers prepared by oxidative polymerization: Polyaniline. Prog. Polym. Sci.1998, 23, 1443–1484. [CrossRef]
25. Bhadra, S.; Khastgir, D.; Singha, N.K.; Lee, J.H. Progress in preparation, processing and applications of polyaniline. Prog. Polym.Sci. 2009, 34, 783–810. [CrossRef]
26. Yan, H.; Sada, N.; Toshima, N. Thermal transporting properties of electrically conductive polyaniline films as organic thermoelec-tric materials. J. Therm. Anal. Calorim. 2002, 69, 881–887. [CrossRef]
27. Kulkarni, M.V.; Viswanath, A.K.; Marimuthu, R.; Seth, T. Spectroscopic, transport, and morphological studies of polyanilinedoped with inorganic acids. Polym. Eng. Sci. 2004, 44, 1676–1681. [CrossRef]
28. Borole, D.; Kapadi, U.; Kumbhar, P.; Hundiwale, D. Influence of inorganic and organic supporting electrolytes on the electrochem-ical synthesis of polyaniline, poly(o-toluidine) and their copolymer thin films. Mater. Lett. 2002, 56, 685–691. [CrossRef]
29. Stafström, S.; Brédas, J.L.; Epstein, A.J.; Woo, H.S.; Tanner, D.B.; Huang, W.S.; MacDiarmid, A.G. Polaron lattice in highlyconducting polyaniline: Theoretical and optical studies. Phys. Rev. Lett. 1987, 59, 1464–1467. [CrossRef] [PubMed]
30. Sinha, S.; Bhadra, S.; Khastgir, D. Effect of dopant type on the properties of polyaniline. J. Appl. Polym. Sci. 2009, 112, 3135–3140.[CrossRef]
31. Abdiryim, T.; Jamal, R.; Nurulla, I. Doping effect of organic sulphonic acids on the solid-state synthesized polyaniline. J. Appl.Polym. Sci. 2007, 105, 576–584. [CrossRef]
32. Kulkarni, M.V.; Viswanath, A.K.; Marimuthu, R.; Seth, T. Synthesis and characterization of polyaniline doped with organic acids.J. Polym. Sci. Part A Polym. Chem. 2004, 42, 2043–2049. [CrossRef]
33. Hatchett, D.W.; Josowicz, M.; Janata, J. Acid Doping of Polyaniline: Spectroscopic and Electrochemical Studies. J. Phys. Chem. B1999, 103, 10992–10998. [CrossRef]
34. Bredas, J.L.; Street, G.B. Polarons, bipolarons, and solitons in conducting polymers. Acc. Chem. Res. 1985, 18, 309–315. [CrossRef]35. Le, T.-H.; Kim, Y.; Yoon, H. Electrical and Electrochemical Properties of Conducting Polymers. Polymers 2017, 9, 150. [CrossRef]36. Cho, S.; Lee, J.S.; Joo, H. Recent Developments of the Solution-Processable and Highly Conductive Polyaniline Composites for
Optical and Electrochemical Applications. Polymers 2019, 11, 1965. [CrossRef]37. Amiri, A.; Baghayeri, M.; Koshki, M.-S. Electrochemical Deposition of Polyaniline on the Stainless Steel Mesh for the Extraction
of Polycyclic Aromatic Hydrocarbons. SSRN Electron. J. 2021, 1, 1–10. [CrossRef]38. Na, W.; Liu, Q.; Sui, B.; Hu, T.; Su, X. Highly sensitive detection of acid phosphatase by using a graphene quantum dots-based
förster resonance energy transfer. Talanta 2016, 161, 469–475. [CrossRef] [PubMed]39. Usman, F.; Dennis, J.O.; Seong, K.C.; Yousif Ahmed, A.; Meriaudeau, F.; Ayodele, O.B.; Tobi, A.R.; Rabih, A.A.S.; Yar, A. Synthesis
and characterisation of a ternary composite of polyaniline, reduced graphene-oxide and chitosan with reduced optical band gapand stable aqueous dispersibility. Results Phys. 2019, 15, 102690. [CrossRef]
40. Saravanan, S.; Joseph Mathai, C.; Anantharaman, M.R.; Venkatachalam, S.; Prabhakaran, P.V. Investigations on the electrical andstructural properties of polyaniline doped with camphor sulphonic acid. J. Phys. Chem. Solids 2006, 67, 1496–1501. [CrossRef]
41. Trchová, M.; Stejskal, J. Polyaniline: The infrared spectroscopy of conducting polymer nanotubes (IUPAC Technical Report). PureAppl. Chem. 2011, 83, 1803–1817. [CrossRef]
42. Chen, S.A.; Lee, H.T. Polyaniline plasticized with 1-methyl-2-pyrrolidone: Structure and doping behavior. Macromolecules 1993,26, 3254–3261. [CrossRef]
43. Han, D.; Chu, Y.; Yang, L.; Liu, Y.; Lv, Z. Reversed micelle polymerization: A new route for the synthesis of DBSA–polyanilinenanoparticles. Colloids Surf. A Physicochem. Eng. Asp. 2005, 259, 179–187. [CrossRef]
44. Cai, L.-T.; Yao, S.-B.; Zhou, S.-M. Effects of the magnetic field on the polyaniline film studied by in situ conductivity measurementsand X-ray diffraction. J. Electroanal. Chem. 1997, 421, 45–48. [CrossRef]
Materials 2021, 14, 7382 18 of 19
45. Bala, P.; Samantaray, B.K.; Srivastava, S.K.; Nando, G.B. Organomodified montmorillonite as filler in natural and synthetic rubber.J. Appl. Polym. Sci. 2004, 92, 3583–3592. [CrossRef]
46. Jayakannan, M.; Annu, S.; Ramalekshmi, S. Structural effects of dopants and polymerization methodologies on the solid-stateordering and morphology of polyaniline. J. Polym. Sci. Part B Polym. Phys. 2005, 43, 1321–1331. [CrossRef]
47. Rathore, B.S.; Chauhan, N.P.S.; Rawal, M.K.; Ameta, S.C.; Ameta, R. Chitosan–polyaniline–copper(II) oxide hybrid composite forthe removal of methyl orange dye. Polym. Bull. 2020, 77, 4833–4850. [CrossRef]
48. Diggikar, R.S.; Deshmukh, S.P.; Thopate, T.S.; Kshirsagar, S.R. Performance of Polyaniline Nanofibers (PANI NFs) as PANINFs-Silver (Ag) Nanocomposites (NCs) for Energy Storage and Antibacterial Applications. ACS Omega 2019, 4, 5741–5749.[CrossRef]
49. Ajekwene, K.K.; Kurian, T. Bulk and nano-structured polyaniline: Synthesis, characterization, thermal behaviour and dcconductivity. Int. J. Res. Advent Technol. 2018, 6, 2321–9637.
50. Bhadra, S.; Singha, N.K.; Khastgir, D. Dual functionality of PTSA as electrolyte and dopant in the electrochemical synthesis ofpolyaniline, and its effect on electrical properties. Polym. Int. 2007, 56, 919–927. [CrossRef]
51. Bhadra, S.; Singha, N.K.; Khastgir, D. Polyaniline by new miniemulsion polymerization and the effect of reducing agent onconductivity. Synth. Met. 2006, 156, 1148–1154. [CrossRef]
52. Geethalakshmi, D.; Muthukumarasamy, N.; Balasundaraprabhu, R. CSA-doped PANI semiconductor nanofilms: Synthesis andcharacterization. J. Mater. Sci. Mater. Electron. 2015, 26, 7797–7803. [CrossRef]
53. Bednarczyk, K.; Matysiak, W.; Tanski, T.; Janeczek, H.; Schab-Balcerzak, E.; Libera, M. Effect of polyaniline content and protonatingdopants on electroconductive composites. Sci. Rep. 2021, 11, 7487. [CrossRef]
54. Bai, X.L.; Mei, J.T.; Bai, Y.; Mu, Z.G. Synthesis and Characterization of Polyaniline Nanotubes Doped with Amino Acetic Acid.Appl. Mech. Mater. 2012, 184–185, 1285–1288. [CrossRef]
55. Karaoglan, N.; Bindal, C. Synthesis and optical characterization of benzene sulfonic acid doped polyaniline. Eng. Sci. Technol. Int.J. 2018, 21, 1152–1158. [CrossRef]
56. Al-Daghman, A.N.J.; Ibrahim, K.; Ahmed, N.M.; Al-Messiere, M.A. Effect of doping by stronger ions salt on the microstructure ofconductive polyaniline-ES: Structure and properties. J. Optoelectron. Biomed. Mater. 2016, 8, 175–183.
57. Swaruparani, H.; Basavaraja, S.; Basavaraja, C.; Huh, D.S.; Venkataraman, A. A new approach to soluble polyaniline and itscopolymers with toluidines. J. Appl. Polym. Sci. 2010, 117, 1350–1360. [CrossRef]
58. Bhadra, S.; Singha, N.K.; Khastgir, D. Electrochemical synthesis of polyaniline and its comparison with chemically synthesizedpolyaniline. J. Appl. Polym. Sci. 2007, 104, 1900–1904. [CrossRef]
59. Li, X.-G.; Li, A.; Huang, M.-R. Facile High-Yield Synthesis of Polyaniline Nanosticks with Intrinsic Stability and ElectricalConductivity. Chem. Eur. J. 2008, 14, 10309–10317. [CrossRef]
60. Neelgund, G.M.; Oki, A. A facile method for the synthesis of polyaniline nanospheres and the effect of doping on their electricalconductivity. Polym. Int. 2011, 60, 1291–1295. [CrossRef] [PubMed]
61. Huang, J.; Virji, S.; Weiller, B.H.; Kaner, R.B. Polyaniline Nanofibers: Facile Synthesis and Chemical Sensors. J. Am. Chem. Soc.2003, 125, 314–315. [CrossRef]
62. Casado, U.M.; Quintanilla, R.M.; Aranguren, M.I.; Marcovich, N.E. Composite films based on shape memory polyurethanes andnanostructured polyaniline or cellulose–polyaniline particles. Synth. Met. 2012, 162, 1654–1664. [CrossRef]
63. Huang, J.; Kaner, R.B. The intrinsic nanofibrillar morphology of polyaniline. Chem. Commun. 2006, 4, 367–376. [CrossRef]64. Banerjee, S.; Kumar, A. Dielectric behavior and charge transport in polyaniline nanofiber reinforced PMMA composites. J. Phys.
Chem. Solids 2010, 71, 381–388. [CrossRef]65. Rahayu, I.; Eddy, D.R.; Novianty, A.R.; Anggreni, A.; Bahti, H.; Hidayat, S. The effect of hydrochloric acid-doped polyaniline to
enhance the conductivity. IOP Conf. Ser. Mater. Sci. Eng. 2019, 509, 012051. [CrossRef]66. Jing, X.; Wang, Y.; Wu, D.; Qiang, J. Sonochemical synthesis of polyaniline nanofibers. Ultrason. Sonochem. 2007, 14, 75–80.
[CrossRef]67. Saini, P.; Arora, M.; Arya, S.K.; Tawale, J.S. Effect of controlled doping on electrical properties and permittivity of PTSA doped
polyanilines and their EMI shielding performance. Indian J. Pure Appl. Phys. 2014, 52, 175–182.68. Yang, L.; Zhang, C. Sen Effect of Dopants on Microstructure and Properties of Polyaniline and Polypyrrole. Adv. Mater. Res. 2011,
328–330, 1576–1579. [CrossRef]69. Kumar, N.A.; Choi, H.J.; Shin, Y.R.; Chang, D.W.; Dai, L.; Baek, J.B. Polyaniline-grafted reduced graphene oxide for efficient
electrochemical supercapacitors. ACS Nano 2012, 6, 1715–1723. [CrossRef] [PubMed]70. Meriga, V.; Valligatla, S.; Sundaresan, S.; Cahill, C.; Dhanak, V.R.; Chakraborty, A.K. Optical, electrical, and electrochemical
properties of graphene based water soluble polyaniline composites. J. Appl. Polym. Sci. 2015, 132. [CrossRef]71. Arora, M.; Arya, S.K.; Barala, S.K.; Saini, P. Magnetic resonance and electrical properties of p-toluene sulphonic acid doped
polyaniline. Appl. Phys. Mater. Sci. AIP Conf. Proc. 2013, 1536, 1235–1236. [CrossRef]72. Yan, F.; Xue, G. Synthesis and characterization of electrically conducting polyaniline in water–oil microemulsion. J. Mater. Chem.
1999, 9, 3035–3039. [CrossRef]73. Babu, V.J.; Vempati, S.; Ramakrishna, S. Conducting Polyaniline-Electrical Charge Transportation. Mater. Sci. Appl. 2013, 4, 1–10.
[CrossRef]
Materials 2021, 14, 7382 19 of 19
74. Shimano, J.Y.; MacDiarmid, A.G. Polyaniline, a dynamic block copolymer: Key to attaining its intrinsic conductivity? Synth. Met.2001, 123, 251–262. [CrossRef]
75. Wohlgenannt, M.; Vardeny, Z. V Spin-dependent exciton formation rates in -conjugated materials. J. Phys. Condens. Matter 2003,15, R83–R107. [CrossRef]
76. Chiang, J.C.; MacDiarmid, A.G. “Polyaniline”: Protonic acid doping of the emeraldine form to the metallic regime. Synth. Met.1986, 13, 193–205. [CrossRef]
77. Cao, Y.; Andreatta, A.; Heeger, A.J.; Smith, P. Influence of chemical polymerization conditions on the properties of polyaniline.Polymer 1989, 30, 2305–2311. [CrossRef]
78. Bhadra, S.; Singha, N.K.; Chattopadhyay, S.; Khastgir, D. Effect of different reaction parameters on the conductivity and dielectricproperties of polyaniline synthesized electrochemically and modeling of conductivity against reaction parameters throughregression analysis. J. Polym. Sci. Part B Polym. Phys. 2007, 45, 2046–2059. [CrossRef]
79. Sui, B.; Kim, B.; Zhang, Y.; Frazer, A.; Belfield, K.D. Highly Selective Fluorescence Turn-On Sensor for Fluoride Detection. ACSAppl. Mater. Interfaces 2013, 5, 2920–2923. [CrossRef]
80. Sadrolhosseini, A.R.; Krishnan, G.; Safie, S.; Beygisangchin, M.; Rashid, S.A.; Harun, S.W. Enhancement of the fluorescenceproperty of carbon quantum dots based on laser ablated gold nanoparticles to evaluate pyrene. Opt. Mater. Express 2020, 10,2227–2241. [CrossRef]
81. Li, Y.; Chen, J.; Wang, Y.; Li, H.; Yin, J.; Li, M.; Wang, L.; Sun, H.; Chen, L. Large-scale direct pyrolysis synthesis of excitation-independent carbon dots and analysis of ferric (III) ion sensing mechanism. Appl. Surf. Sci. 2021, 538, 148151. [CrossRef]
82. Abbas, A.M.; Anwar, Z.M.; Soliman, Y.A.; Abdel-Hadi, M.M.; Kamel, R.M. A turn-off luminescent europium probe for efficientand sensitive detection of some low molecular weight polycyclic aromatic hydrocarbons in seawater. Microchem. J. 2020, 159,105471. [CrossRef]
83. Rau, A. Basic experiments in thin-layer chromatography-fourier transform Raman spectrometry. J. Raman Spectrosc. 1993, 24,251–254. [CrossRef]
84. Kumar, R.; Arora, M.; Jain, A.K.; Babu, J.N. 1,3-Bis(cyanomethoxy)calix[4]arene capped CdSe quantum dots for the fluorogenicsensing of fluorene. RSC Adv. 2017, 7, 14015–14020. [CrossRef]