policy making for broadband adoption and usage in chile through machine learning
TRANSCRIPT
Policy making for broadband adoption and usage in Chile throughmachine learning
Gonzalo A. Ruz∗, Samuel Varas, Marcelo Villena
Facultad de Ingenierıa y Ciencias, Universidad Adolfo Ibanez, Av. Diagonal Las Torres 2640, Penalolen, Santiago,Chile
Abstract
For developing countries, such as Chile, we study the influential factors for adoption and usageof broadband services. In particular, subsidies on the broadband price are analyzed to see if thisinitiative has a significant effect in the broadband penetration. To carry out this study, machinelearning techniques are used to identify different household profiles using the data obtained froma survey on access, use, and users of broadband Internet from Chile. Different policies are pro-posed for each group found, which were then evaluated empirically through Bayesian networks.Results show that an unconditional subsidy for the Internet price does not seem to be very ap-propriate for everyone since it is only significant for some households groups. The evaluationusing Bayesian networks showed that other polices should be considered as well such as theincorporation of computers, Internet applications development, and digital literacy training.
Keywords: Broadband penetration, Policy making, Clustering analysis, Bayesian networks
1. Introduction
Stimulus for broadband adoption and usage can be achieved through policies from the supply-side or the demand-side. Most nations have ongoing programs for broadband roll out and thelack of availability nowadays is not reported as an influential factor in the adoption of broad-band. For example in Rappoport et al. (2002), factors such as the household income and thelevel of education are good predictors for the acquisition of broadband services. In the case ofMexico (Garcıa-Murillo and Rendon, 2009) it has been found that the most important factor isthe household income. For China, factors such as income, education, and penetration of fixedphones are relevant (Nam et al., 2009). The presence of computers in homes is also a key factoras reported in Stanton (2004), and demographic factors such as gender, age, and education levelof the parents as well (Oh et al., 2003).
From a demand-side point of view, recent reviews show that there have been more than 400initiatives, most of these can be grouped in four areas (Hauge and Prieger, 2010): programs tomitigate price, programs to mitigate the lack of computer ownerships, programs to mitigate lackof digital literacy, and programs to mitigate perceived lack of value. For developing countries,such as Chile which presents a heterogeneous socio-economic population, it is not clear how the
∗Corresponding author. Tel.: +56 2 23311200. Email:[email protected] submitted to Expert Systems with Applications May 27, 2013
price factor influences in the acquisition of broadband services and how important is this factor,and if it is relevant for all the population.
Broadband Internet access is still not considered a necessity good in developing countries,although it has become more and more important. Due to this fact, the majority of householdsin these countries will destine most of their monthly income to pay for food, house payments(rents or mortgages), health insurance, childrens schools, etc. There have been recent studieswhich show that the development of Internet services is of great importance to a society dueto its positive effects on economic growth (Katz and Suter, 2009; Crandall et al., 2007) andemployment generation (Katz, 2009).
With this in mind, the governments of developing countries are keen on increasing broadbandpenetration rates. According to the latest OECD Broadband Portal (2012), Chile’s fixed (wired)broadband subscriptions, per 100 inhabitants, is 12.2. Whereas, Chile’s terrestrial mobile wire-less broadband subscriptions, per 100 inhabitants, is 22.4. These rates are one of the highestin Latin America, nevertheless, when compared to countries of the OECD, they are one of thelowest, considering that the OECD has a penetration rate average of 26 for fixed broadband and55 for mobile wireless broadband. This is an important matter since Chile became a member ofthe OECD in 2010, and therefore needs to improve its Internet penetration rate.
A straightforward hypothesis is that an unconditional broadband subsidiary campaign foreveryone, can have a high impact in improving the broadband penetration rate. In this work, wetry to empirically study if this is the right strategy as well as suggest other alternatives, whichcould favorably influence the broadband penetration.
Policy making through the use of machine learning seems to be a promising area, wheredecision-making can be carried out using historical information (data) in a multivariate way. Thisenables policy makers to take into account several aspects simultaneously, rather than designingpolicies based on individual dimensions or factors. Also, the ability to evaluate and predict theimpact of the policies is straight forward through the models generated by machine learningtechniques, as seen further in this paper. Examples of the use of machine learning techniquesfor policy making are as follows. In Kontogianni et al. (2012), Fuzzy Cognitive Mapping areproposed as a supporting tool, for environmental policy makers, in the areas of participatoryenvironmental scenario development, subjective risk analysis, and stated preference approachesin environmental valuation. Argumentation-based decision models were used in Bourguet et al.(2013) for the analysis of food quality in a public health policy. The use of self-organizingmaps for devising future air pollution policies in Taiwan is presented in Li and Shue (2004). InTurkey, Kahraman and Kaya (2010) present a fuzzy multicriteria decision-making methodologyfor the selection among energy policies and Cinar and Kayakutlu (2010) for creating scenariosfor energy policies using Bayesian networks.
The rest of the paper is organized as follows. Section 2 presents a brief description of themachine learning techniques used in the policy making process. Section 3 presents a clusteringanalysis to identify the profiles of households with no Internet in their homes. In section 4, intra-cluster differences with the households that do have Internet in their homes is analyzed. Basedon the results of section 3 and 4, policies are proposed in section 5 to increment the broadbandpenetration rate. The impact of the policies for each cluster is empirically evaluated in section 6.Discussion and final conclusions of this work are presented in section 7 and 8 respectively.
2

2. Background
To conduct this study, two machine learning techniques are used. First, the k-means algo-rithm is used for data clustering, then Bayesian networks for data classification. A description ofthese techniques is given below.
2.1. k-meansThe well-known k-means clustering algorithm is used to discover natural groupings of a data
set. The algorithm is as follows (Tan et al., 2005),
1. Select (randomly) k points as the initial centroids2. repeat3. Form k clusters by assigning all points to the closest centroid.4. Recompute the centroid of each cluster.5. until The centroids do not change.
One of the drawbacks of most clustering techniques, including the k-means, is that the num-ber of clusters k must be specified a priori. To overcome this problem, several methods forselecting automatically the most plausible number of clusters have been developed. In this pa-per, we select k by computing a cluster validity function proposed by Pham et al. (2005). Thisfunction is defined by,
f (k) =
1 if k = 1
S kαkS k−1
if S k−1 , 0,∀k > 11 if S k−1 = 0,∀k > 1
(1)
with
αk =
{1 − 3
4Ndif k = 2 and Nd > 1
αk−1 + 1−αk−16 if k > 2 and Nd > 1
(2)
where S k is the sum of the cluster distortions (i.e., sum of the squared error between eachcenter of the clusters and all the data points of that same cluster) when the number of clusters is k,Nd is the number of variables (i.e., the number of dimensions) and αk is a weight factor. Basically,this function assumes that the data distribution is uniform; therefore, the cluster distortion for kclusters can be estimated with k− 1 clusters. The ratio between these two measures will be closeto one when no dense data regions are found when k is increased. If dense regions are detected,then S k will be less than the estimated value αkS k−1, therefore, f (k) decreases. The idea is to findthe k values that generate the smallest values of f (k), since they can be considered as well-definedclusters.
2.2. Bayesian networksBayesian networks (BN) were introduced by Judea Pearl (Pearl, 1988) they consist of two
parts. A qualitative part that is a direct acyclic graph (DAG) where each node represents a dis-crete random variable and the edges represent probabilistic dependencies. The quantitative partis a conditional probability table, one for each node, which contains the conditional probabilityof the node conditioned to its parent nodes in the DAG. A key feature of a BN is that it satis-fies the Markov condition, which states that every variable is conditionally independent of itsnondescendents, given the set of its parents.
3
By combining both parts, a BN encodes the joint probability distribution. Given a BN of nrandom variables X = (X1, . . . , Xn) the joint probability distribution is computed by
P(X) =
n∏i=1
P(Xi|ΠXi ) (3)
where ΠXi represents the set of parent nodes (variables) in the DAG. One of the difficulties is thatlearning BNs from data is a difficult problem, in fact it has been shown that it is NP-complete(Chickering, 1996), nevertheless, there are many heuristics and approximations which makes thisproblem computationally tractable (Cooper and Herskovits, 1992; Heckerman et al., 1995).
2.2.1. Bayesian networks for classificationIn a classification task, a database with historical data is used to train a classifier to predict
the outcome of a new example. The data consists in a matrix where each column represents anattribute (random variable) and each row a data example. The final column in the matrix containsa class label. The training process consists in using the data matrix to adjust the parameters ofthe classifier in order to reduce the error between the real output (class label) and the output ofthe classifier. There are many classifiers, such as, C4.5 decision tree, artificial neural networks,k-nn, support vector machines, etc.
One approach is using a probabilistic classifier, in this case, the class value for an example isfound such that it maximizes the posterior probability of the class for a given set of assignments tothe attributes. In other words, the class value for the hth example of the dataset, X1 = xh
1, . . . , Xn =
xhn , can be computed as
classvalue(X1 = xh1, . . . , Xn = xh
n) = arg maxk
P(C = k|X1 = xh1, . . . , Xn = xh
n). (4)
The posterior probability can be computed using Bayes’ theorem
P(C = k|X1, . . . , Xn) =P(C = k)P(X1, . . . , Xn|C = k)∑
k′ P(C = k′)P(X1, . . . , Xn|C = k′). (5)
The denominator of the r.h.s. of (5) is constant with respect to the class and can be expressedas 1/α. So we only need to worry about how to compute the numerator, which is in fact thejoint probability distribution of all the attributes and the class variable. This can be carried outusing a BN with certain assumptions. The simplest approach is to consider that each attributeis conditionally independent of every other attribute. This rather ‘naive’ assumption yields thewell-known naive Bayesian classifier (Duda and Hart, 1973),
P(C = k|X1, . . . , Xn) = αP(C)n∏
i=1
P(Xi|C). (6)
Although this classifier has shown to perform rather well considering the strong indepen-dence assumption (Langley et al., 1992), when there are strong correlations amongst the at-tributes the naive Bayes classification performance is affected. To overcome this problem, avariant of the naive Bayes classifier, called the Tree Augmented Naive Bayes classifier (TAN),was introduced by Friedman et al. (1997). In this model, each attribute has as a parent the classvariable C and at the most, one other attribute, yielding tree structures that have n − 1 edges(without counting the edges from C to every attribute).
4
The first step to construct the TAN classifier is to compute the conditional mutual informationbetween pairs of attributes, conditioned by the class variable. This measure is defined by
I(X; Y |Z) =∑x∈X
∑y∈Y
∑z∈Z
P(x, y, z) logP(x, y|z)
P(x|z)P(y|z). (7)
The conditional mutual information measures the information that Y provides about X when thevalue of Z is known.
The following step is to build a complete undirected graph. This is carried out by connect-ing an edge from each node (attribute) to every other node and assigning the weight of the edgethat connects Xi with X j by I(Xi; X j|C). Next, in order to obtain a tree structure, the maxi-mum weighted spanning tree (MWST) is built using any well-known MWST procedure, such asKruskal’s algorithm (Kruskal Jr., 1956). Finally, directions to the edges of the resulting tree canbe added by choosing any attribute as the root and then setting the directions of all the edges tobe pointing outwards from it.
Given that each attribute will have ΠXi = {X j,i,C}, except for the root attribute node that willhave ΠXi = {C}, the TAN classifier can be expressed as
P(C|X1, . . . , Xn) = αP(C)n∏
i=1
P(Xi|ΠXi ). (8)
A summary of the learning algorithm for this type of Bayesian network is as follows.
1. Compute the conditional mutual information I(Xi; X j|C) between each pair of attributesi , j.
2. Build a complete undirected graph using the attributes as nodes and assign the weight ofthe edge that connects Xi to X j by I(Xi; X j|C).
3. Apply the MWST algorithm.4. Choose an attribute to be root and set the directions of all the edges to be outward from it.5. Add a vertex node C and add an edge from C to every other attribute Xi.
3. Characterization of households with no Internet in Chile
During 2009, the Chilean Subsecretary of Telecommunications (Subtel) presented the studySurvey on access, use, and users of broadband Internet in Chile (Subtel, 2009). This workconsisted in carrying out a survey on the households in four regions of the country: Antofagasta,Valparaıso, Biobıo, and Metropolitana. These regions concentrate approximately 65% of thetotal population of Chile. As part of the results from this survey, the following key factors wereidentified as been influential, for the households, in the decision of having or not broadbandInternet in their homes: income level in their homes, presence of children in school, gender, age,level of education, user or not of computers, and user or not of Internet.
With this information, a cluster analysis can be used to identify different profiles of house-holds, which do not have broadband Internet in their homes. There are 888 households with noInternet from the survey, each of them, is characterized by eight variables shown in Table 1.
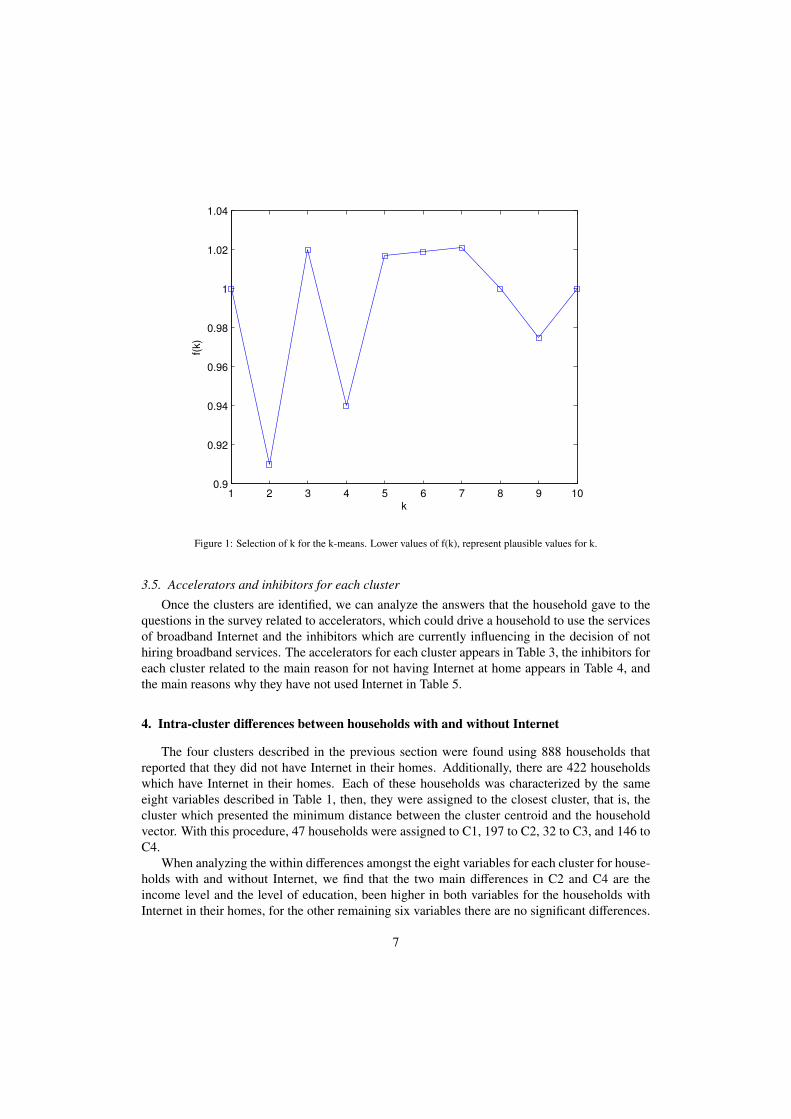
The data mining open source package Weka (Hall et al., 2009) was used to carry out the k-means clustering with k = 1, . . . , 10. For each k, ten independent runs were carried out, recordingthe clustering result with the lowest S k. Then for each k, the f (k) function was computed obtain-ing the results shown in Fig.1.
5

Table 1: Variables used in the clustering process to identify different household profilesName Description TypeFamily number of family members that live in the house Integer
Sex male or female BinaryAge age of household Integer
Education education level (primary, high school, university) IntegerComputer knows how to use a computer BinaryInternet knows how to use the Internet BinaryIncome total income in the house measured as quintiles Integer
Marital status marital status (single, married, divorced) Integer
From Fig.1 we see that the most plausible values for k are 2, 4, and 9 (in that order). Giventhat these groups will be used to design policies, k = 2 partitions the data into two groupswhich are quite general, whereas k = 9 partitions the data into 9 groups which are too specific.Therefore, k = 4 was chosen for this study, which is a good compromise between the two results.The description of each cluster found is as follows.
3.1. Characterization of cluster 1
This group (C1) if formed by 317 female households, which are 55 years old in average andmost of them are married. They have primary school education completed. They do not knowhow to use a computer nor the Internet. The income level in their homes corresponds to thesecond quintile and each home has 3.7 family members in average.
3.2. Characterization of cluster 2
This group (C2) if formed by 180 male households, which are 42 years old in average andmost of them are married. They have high school education completed. They know how to use acomputer and the Internet. The income level in their homes corresponds to the third quintile andeach home has 3.6 family members in average.
3.3. Characterization of cluster 3
This group (C3) if formed by 238 male households, which are 55 years old in average andmost of them are married. They have primary school education completed. They do not knowhow to use a computer nor the Internet. The income level in their homes corresponds to thesecond quintile and each home has 3.5 family members in average.
3.4. Characterization of cluster 4
This group (C4) if formed by 153 female households, which are 40 years old in average andmost of them are married. They have high school education completed. They know how to usea computer and most of them know how to use the Internet. The income level in their homescorresponds to the second quintile and each home has 3.8 family members in average.
A summary of the four clusters appears in Table 2.
6
1 2 3 4 5 6 7 8 9 100.9
0.92
0.94
0.96
0.98
1
1.02
1.04
k
f(k)
Figure 1: Selection of k for the k-means. Lower values of f(k), represent plausible values for k.
3.5. Accelerators and inhibitors for each cluster
Once the clusters are identified, we can analyze the answers that the household gave to thequestions in the survey related to accelerators, which could drive a household to use the servicesof broadband Internet and the inhibitors which are currently influencing in the decision of nothiring broadband services. The accelerators for each cluster appears in Table 3, the inhibitors foreach cluster related to the main reason for not having Internet at home appears in Table 4, andthe main reasons why they have not used Internet in Table 5.
4. Intra-cluster differences between households with and without Internet
The four clusters described in the previous section were found using 888 households thatreported that they did not have Internet in their homes. Additionally, there are 422 householdswhich have Internet in their homes. Each of these households was characterized by the sameeight variables described in Table 1, then, they were assigned to the closest cluster, that is, thecluster which presented the minimum distance between the cluster centroid and the householdvector. With this procedure, 47 households were assigned to C1, 197 to C2, 32 to C3, and 146 toC4.
When analyzing the within differences amongst the eight variables for each cluster for house-holds with and without Internet, we find that the two main differences in C2 and C4 are theincome level and the level of education, been higher in both variables for the households withInternet in their homes, for the other remaining six variables there are no significant differences.
7
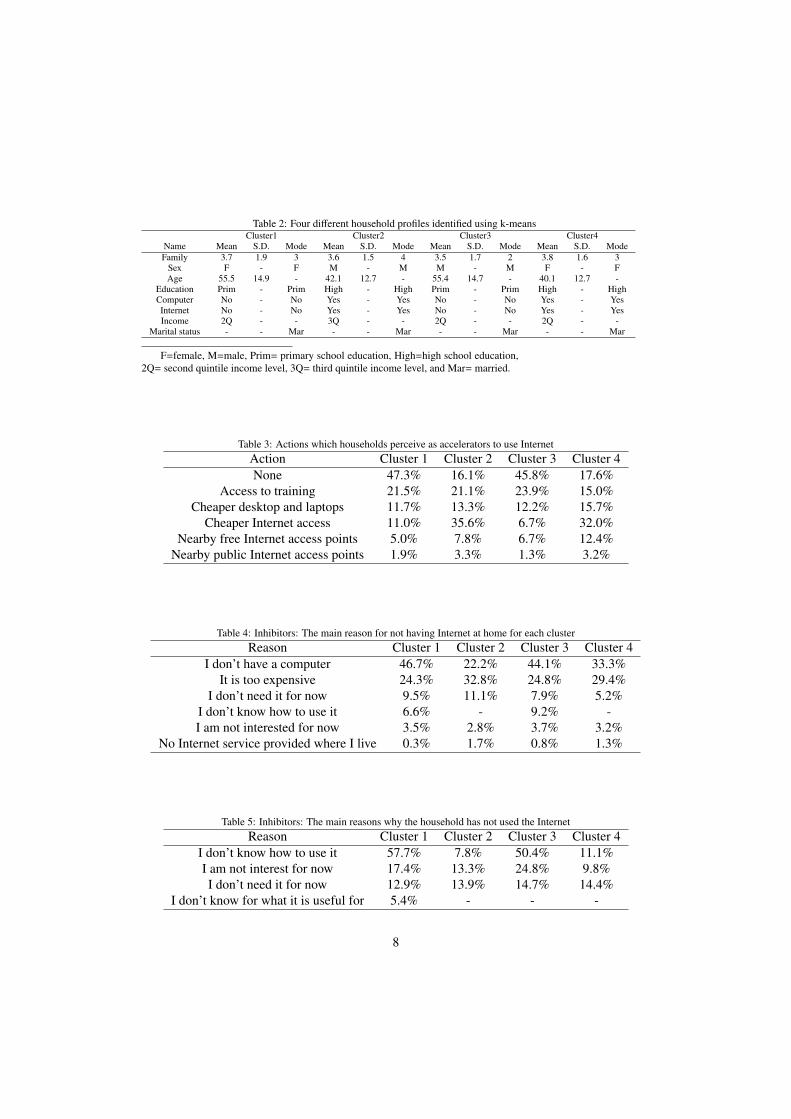
Table 2: Four different household profiles identified using k-meansCluster1 Cluster2 Cluster3 Cluster4
Name Mean S.D. Mode Mean S.D. Mode Mean S.D. Mode Mean S.D. ModeFamily 3.7 1.9 3 3.6 1.5 4 3.5 1.7 2 3.8 1.6 3
Sex F - F M - M M - M F - FAge 55.5 14.9 - 42.1 12.7 - 55.4 14.7 - 40.1 12.7 -
Education Prim - Prim High - High Prim - Prim High - HighComputer No - No Yes - Yes No - No Yes - YesInternet No - No Yes - Yes No - No Yes - YesIncome 2Q - - 3Q - - 2Q - - 2Q - -
Marital status - - Mar - - Mar - - Mar - - Mar
F=female, M=male, Prim= primary school education, High=high school education,2Q= second quintile income level, 3Q= third quintile income level, and Mar= married.
Table 3: Actions which households perceive as accelerators to use InternetAction Cluster 1 Cluster 2 Cluster 3 Cluster 4None 47.3% 16.1% 45.8% 17.6%
Access to training 21.5% 21.1% 23.9% 15.0%Cheaper desktop and laptops 11.7% 13.3% 12.2% 15.7%
Cheaper Internet access 11.0% 35.6% 6.7% 32.0%Nearby free Internet access points 5.0% 7.8% 6.7% 12.4%
Nearby public Internet access points 1.9% 3.3% 1.3% 3.2%
Table 4: Inhibitors: The main reason for not having Internet at home for each clusterReason Cluster 1 Cluster 2 Cluster 3 Cluster 4
I don’t have a computer 46.7% 22.2% 44.1% 33.3%It is too expensive 24.3% 32.8% 24.8% 29.4%
I don’t need it for now 9.5% 11.1% 7.9% 5.2%I don’t know how to use it 6.6% - 9.2% -I am not interested for now 3.5% 2.8% 3.7% 3.2%
No Internet service provided where I live 0.3% 1.7% 0.8% 1.3%
Table 5: Inhibitors: The main reasons why the household has not used the InternetReason Cluster 1 Cluster 2 Cluster 3 Cluster 4
I don’t know how to use it 57.7% 7.8% 50.4% 11.1%I am not interest for now 17.4% 13.3% 24.8% 9.8%I don’t need it for now 12.9% 13.9% 14.7% 14.4%
I don’t know for what it is useful for 5.4% - - -
8

For C1 and C3 the variables that are different are the income level and the number of family mem-bers, again been higher in both variables for households with Internet, for the other remainingsix variables there are no significant differences.
In order to find additional reasons why households in a same cluster have or do not haveInternet in their homes, 41 variables (questions) were selected from the survey (excluding theeight variables used to form the clusters) related to the use of Internet applications, Internet price,and access to technology. The decision tree called J48 (Weka’s implementation of C4.5 algorithm(Quinlan, 1993)) was used to automatically select the most relevant variables to differentiateeach example (household) in one of the two situations (with or without Internet). The identifiedrelevant variables, per cluster, in descending order of importance, are as follows.
4.1. Variables that show intra-cluster differences between households with or without Internetin C1
(i) Do you have a computer desktop at home? (ii) Do you have a fixed line telephone? (iii)Do you have cable TV at home? (iv) How much is the maximum price you are willing to pay forbroadband Internet at your home?
4.2. Variables that show intra-cluster differences between households with or without Internetin C2
Selected variables: (i) Do you use Internet at home or somewhere else? (ii) Do you have acomputer desktop at home? (iii) Do you have a fixed line telephone? (iv) How many children doyou have in scholar age?
4.3. Variables that show intra-cluster differences between households with or without Internetin C3
Selected variables: (i) Do you have a computer desktop at home? (ii) Do you have cable TVat home?
4.4. Variables that show intra-cluster differences between households with or without Internetin C4
Selected variables: (i) Do you have a fixed line telephone? (ii) Do you have a computerdesktop at home? (iii) Do you have a laptop at home? (iv) Do you have cable TV at home? (v)Do you use Internet at home or somewhere else? (vi) How often do you, or someone else foryou, obtain certificates (civil registry, others) via Internet?
5. Proposed policies
To design the policies, the results from section 3 and 4: the accelerators and inhibitors foreach cluster as well as the intra-cluster differences between households with and without Internetwas taken into consideration. With this in mind, four areas have been identified:
1. Promotion of computers (desktops or laptops) incorporation2. Internet price subsidies3. Digital alphabetization and the promotion of usage4. Development of Internet applications
9
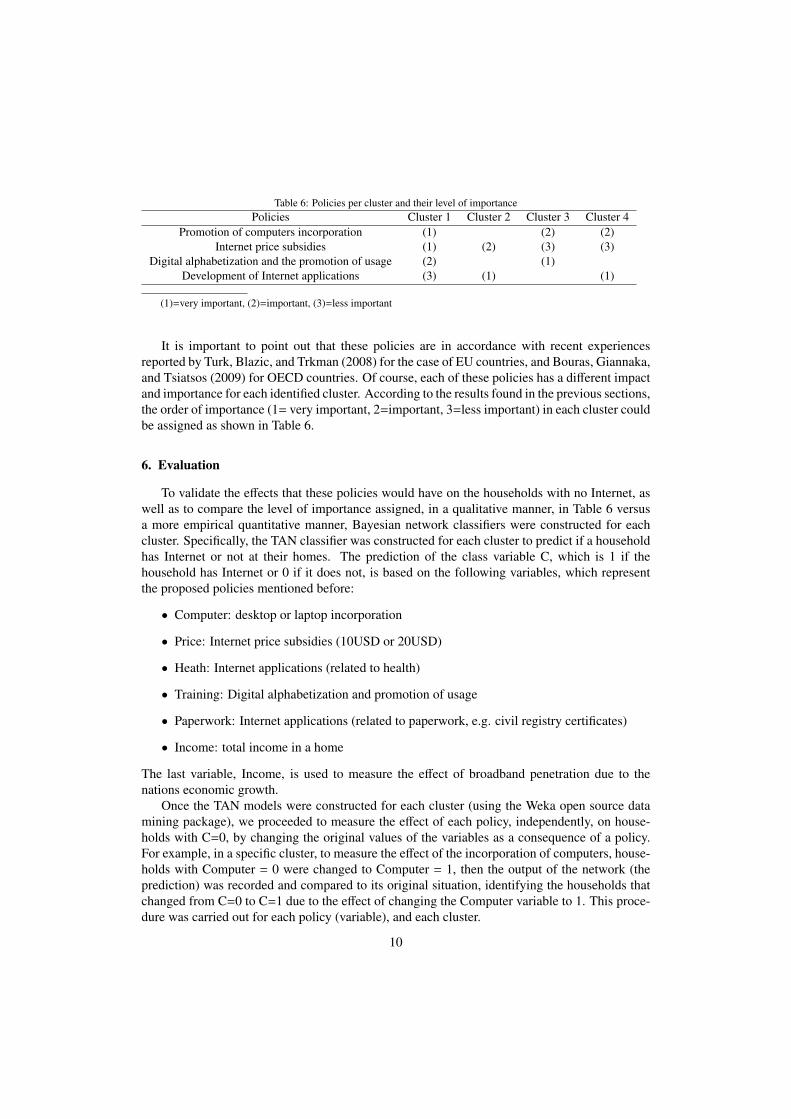
Table 6: Policies per cluster and their level of importancePolicies Cluster 1 Cluster 2 Cluster 3 Cluster 4
Promotion of computers incorporation (1) (2) (2)Internet price subsidies (1) (2) (3) (3)
Digital alphabetization and the promotion of usage (2) (1)Development of Internet applications (3) (1) (1)
(1)=very important, (2)=important, (3)=less important
It is important to point out that these policies are in accordance with recent experiencesreported by Turk, Blazic, and Trkman (2008) for the case of EU countries, and Bouras, Giannaka,and Tsiatsos (2009) for OECD countries. Of course, each of these policies has a different impactand importance for each identified cluster. According to the results found in the previous sections,the order of importance (1= very important, 2=important, 3=less important) in each cluster couldbe assigned as shown in Table 6.
6. Evaluation
To validate the effects that these policies would have on the households with no Internet, aswell as to compare the level of importance assigned, in a qualitative manner, in Table 6 versusa more empirical quantitative manner, Bayesian network classifiers were constructed for eachcluster. Specifically, the TAN classifier was constructed for each cluster to predict if a householdhas Internet or not at their homes. The prediction of the class variable C, which is 1 if thehousehold has Internet or 0 if it does not, is based on the following variables, which representthe proposed policies mentioned before:
• Computer: desktop or laptop incorporation
• Price: Internet price subsidies (10USD or 20USD)
• Heath: Internet applications (related to health)
• Training: Digital alphabetization and promotion of usage
• Paperwork: Internet applications (related to paperwork, e.g. civil registry certificates)
• Income: total income in a home
The last variable, Income, is used to measure the effect of broadband penetration due to thenations economic growth.
Once the TAN models were constructed for each cluster (using the Weka open source datamining package), we proceeded to measure the effect of each policy, independently, on house-holds with C=0, by changing the original values of the variables as a consequence of a policy.For example, in a specific cluster, to measure the effect of the incorporation of computers, house-holds with Computer = 0 were changed to Computer = 1, then the output of the network (theprediction) was recorded and compared to its original situation, identifying the households thatchanged from C=0 to C=1 due to the effect of changing the Computer variable to 1. This proce-dure was carried out for each policy (variable), and each cluster.
10
To measure the performance of the classifiers, n-fold cross validation (Witten et al., 2011)was used. In n-fold cross validation, the original data set is randomly partitioned in n equallysized groups. Then, n − 1 partitions are used to train the classifier, and the remaining partitionis used for testing. This process is repeated n times, so that each partition is used as a test setonce. The correct classification result, on the test set, of each process is averaged to obtain afinal estimation of the performance of the classifier. We use n = 10, as suggested in Witten et al.(2011).
7. Evaluation results and discussions
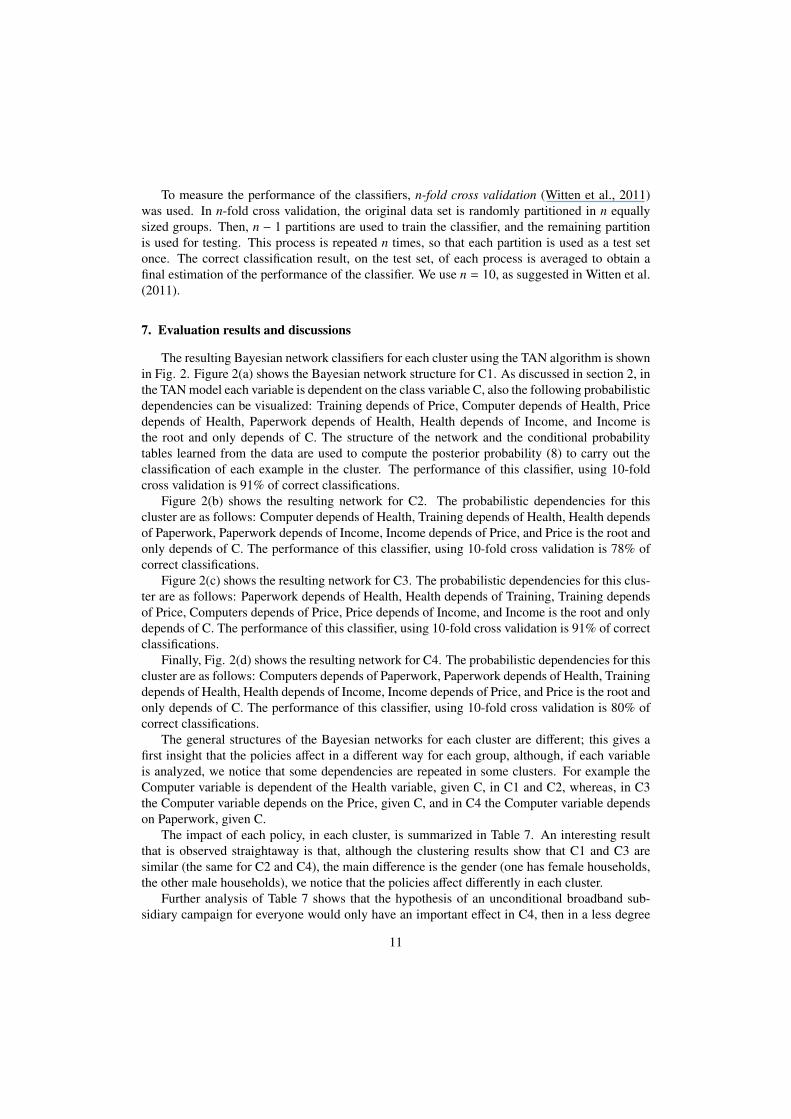
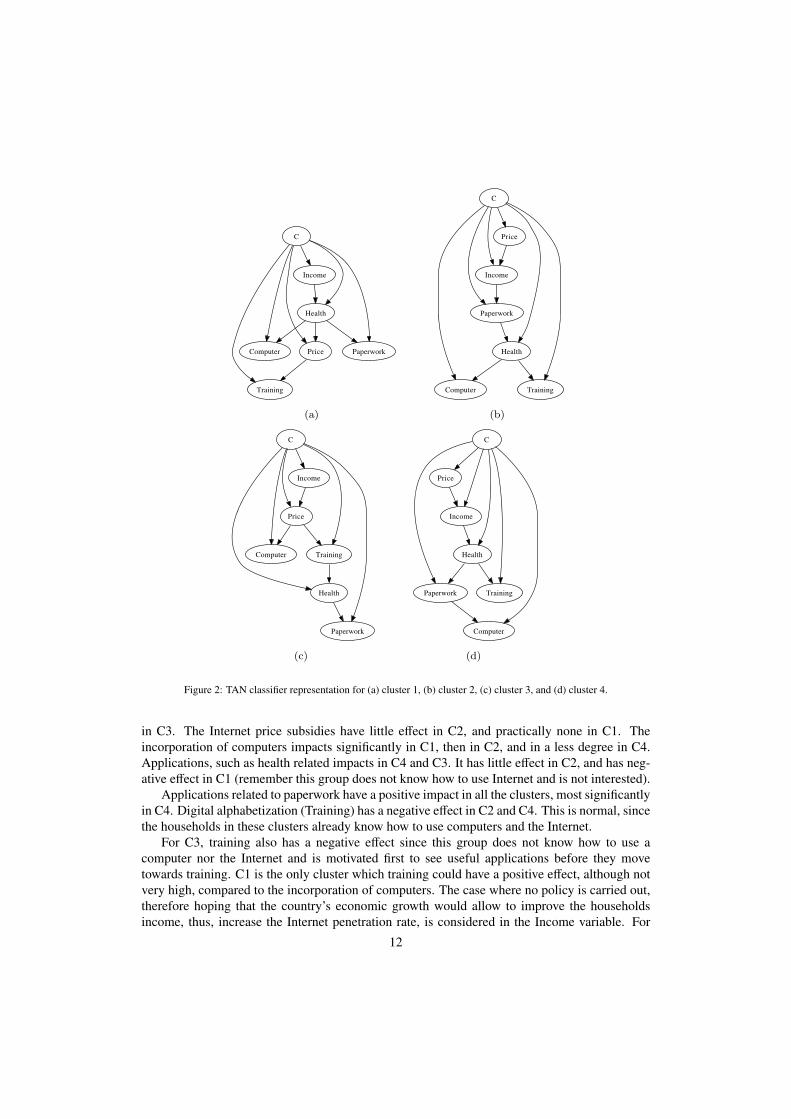
The resulting Bayesian network classifiers for each cluster using the TAN algorithm is shownin Fig. 2. Figure 2(a) shows the Bayesian network structure for C1. As discussed in section 2, inthe TAN model each variable is dependent on the class variable C, also the following probabilisticdependencies can be visualized: Training depends of Price, Computer depends of Health, Pricedepends of Health, Paperwork depends of Health, Health depends of Income, and Income isthe root and only depends of C. The structure of the network and the conditional probabilitytables learned from the data are used to compute the posterior probability (8) to carry out theclassification of each example in the cluster. The performance of this classifier, using 10-foldcross validation is 91% of correct classifications.
Figure 2(b) shows the resulting network for C2. The probabilistic dependencies for thiscluster are as follows: Computer depends of Health, Training depends of Health, Health dependsof Paperwork, Paperwork depends of Income, Income depends of Price, and Price is the root andonly depends of C. The performance of this classifier, using 10-fold cross validation is 78% ofcorrect classifications.
Figure 2(c) shows the resulting network for C3. The probabilistic dependencies for this clus-ter are as follows: Paperwork depends of Health, Health depends of Training, Training dependsof Price, Computers depends of Price, Price depends of Income, and Income is the root and onlydepends of C. The performance of this classifier, using 10-fold cross validation is 91% of correctclassifications.
Finally, Fig. 2(d) shows the resulting network for C4. The probabilistic dependencies for thiscluster are as follows: Computers depends of Paperwork, Paperwork depends of Health, Trainingdepends of Health, Health depends of Income, Income depends of Price, and Price is the root andonly depends of C. The performance of this classifier, using 10-fold cross validation is 80% ofcorrect classifications.
The general structures of the Bayesian networks for each cluster are different; this gives afirst insight that the policies affect in a different way for each group, although, if each variableis analyzed, we notice that some dependencies are repeated in some clusters. For example theComputer variable is dependent of the Health variable, given C, in C1 and C2, whereas, in C3the Computer variable depends on the Price, given C, and in C4 the Computer variable dependson Paperwork, given C.
The impact of each policy, in each cluster, is summarized in Table 7. An interesting resultthat is observed straightaway is that, although the clustering results show that C1 and C3 aresimilar (the same for C2 and C4), the main difference is the gender (one has female households,the other male households), we notice that the policies affect differently in each cluster.
Further analysis of Table 7 shows that the hypothesis of an unconditional broadband sub-sidiary campaign for everyone would only have an important effect in C4, then in a less degree
11
C
Computer
Health
Training
Income
Price Paperwork
(a)
C
Computer
Health
Training
Income
Price
Paperwork
(b)
C
Computer
Health
Training
Income
Price
Paperwork
(c)
C
Computer
Health
Training
Income
Price
Paperwork
(d)
Figure 2: TAN classifier representation for (a) cluster 1, (b) cluster 2, (c) cluster 3, and (d) cluster 4.
in C3. The Internet price subsidies have little effect in C2, and practically none in C1. Theincorporation of computers impacts significantly in C1, then in C2, and in a less degree in C4.Applications, such as health related impacts in C4 and C3. It has little effect in C2, and has neg-ative effect in C1 (remember this group does not know how to use Internet and is not interested).
Applications related to paperwork have a positive impact in all the clusters, most significantlyin C4. Digital alphabetization (Training) has a negative effect in C2 and C4. This is normal, sincethe households in these clusters already know how to use computers and the Internet.
For C3, training also has a negative effect since this group does not know how to use acomputer nor the Internet and is motivated first to see useful applications before they movetowards training. C1 is the only cluster which training could have a positive effect, although notvery high, compared to the incorporation of computers. The case where no policy is carried out,therefore hoping that the country’s economic growth would allow to improve the householdsincome, thus, increase the Internet penetration rate, is considered in the Income variable. For
12
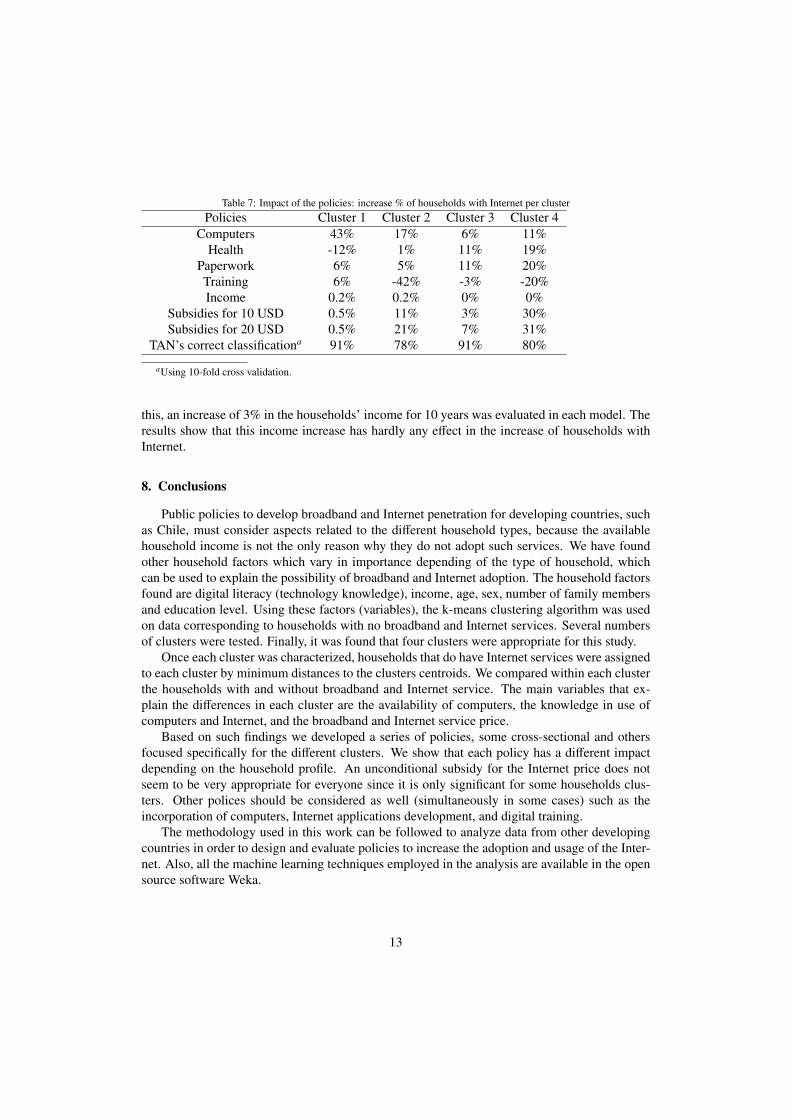
Table 7: Impact of the policies: increase % of households with Internet per clusterPolicies Cluster 1 Cluster 2 Cluster 3 Cluster 4
Computers 43% 17% 6% 11%Health -12% 1% 11% 19%
Paperwork 6% 5% 11% 20%Training 6% -42% -3% -20%Income 0.2% 0.2% 0% 0%
Subsidies for 10 USD 0.5% 11% 3% 30%Subsidies for 20 USD 0.5% 21% 7% 31%
TAN’s correct classificationa 91% 78% 91% 80%
aUsing 10-fold cross validation.
this, an increase of 3% in the households’ income for 10 years was evaluated in each model. Theresults show that this income increase has hardly any effect in the increase of households withInternet.
8. Conclusions
Public policies to develop broadband and Internet penetration for developing countries, suchas Chile, must consider aspects related to the different household types, because the availablehousehold income is not the only reason why they do not adopt such services. We have foundother household factors which vary in importance depending of the type of household, whichcan be used to explain the possibility of broadband and Internet adoption. The household factorsfound are digital literacy (technology knowledge), income, age, sex, number of family membersand education level. Using these factors (variables), the k-means clustering algorithm was usedon data corresponding to households with no broadband and Internet services. Several numbersof clusters were tested. Finally, it was found that four clusters were appropriate for this study.
Once each cluster was characterized, households that do have Internet services were assignedto each cluster by minimum distances to the clusters centroids. We compared within each clusterthe households with and without broadband and Internet service. The main variables that ex-plain the differences in each cluster are the availability of computers, the knowledge in use ofcomputers and Internet, and the broadband and Internet service price.
Based on such findings we developed a series of policies, some cross-sectional and othersfocused specifically for the different clusters. We show that each policy has a different impactdepending on the household profile. An unconditional subsidy for the Internet price does notseem to be very appropriate for everyone since it is only significant for some households clus-ters. Other polices should be considered as well (simultaneously in some cases) such as theincorporation of computers, Internet applications development, and digital training.
The methodology used in this work can be followed to analyze data from other developingcountries in order to design and evaluate policies to increase the adoption and usage of the Inter-net. Also, all the machine learning techniques employed in the analysis are available in the opensource software Weka.
13
Acknowledgements
The authors would like to thank the research assistants Mauricio Valle and Cristobal Giadachfor their contributions to this work and the Chilean Subsecretary of Telecommunications (Subtel)for financially supporting this research.
References
Bourguet, J., Thomopoulos, R., Mugnier, M., Abecassis, J.. An artificial intelligence-based approach to deal withargumentation applied to food quality in a public health policy. Expert Systems with Applications 2013;40:4539–4546.
Chickering, D.M.. Learning bayesian networks is NP-complete. In: Fisher, D., Lenz, A., editors. Learning from data.New York: Springer-Verlag; 1996. p. 121–130.
Cinar, D., Kayakutlu, G.. Scenario analysis using Bayesian networks: A case study in energy sector. Knowledge-BasedSystems 2010;23:267–276.
Cooper, G.F., Herskovits, E.. A Bayesian method for the induction of probabilistic networks from data. MachineLearning 1992;9:309–347.
Crandall, R., Lehr, W., Litan, R.. The effects of broadband deployment on output and employment: A cross-sectionalanalysis of u.s. data. Issues in economic policy (The Brookings Institute) 2007;:1–34.
Duda, R., Hart, P.. Pattern classification and scene analysis. New York: John Wiley & Sons, 1973.Friedman, N., Geiger, D., Goldszmidt, M.. Bayesian network classifiers. Machine Learning 1997;29:131–163.Garcıa-Murillo, M., Rendon, J.. A model of wireless broadband diffusion in latin america. Telematics and Informatics
2009;26:259–269.Hall, M., Frank, E., Holmes, G., Pfahringer, B., Reutemann, P., Witten, I.H.. The WEKA data mining software: An
update. SIGKDD Explorations 2009;11:10–18.Hauge, J., Prieger, J.. Demand-side programs to stimulate adoption of broadband: what works? Review of Network
Economics 2010;9:Article 4.Heckerman, D., Geiger, D., Chickering, D.M.. Learning Bayesian networks: the combination of knowledge and
statistical data. Machine Learning 1995;20:197–243.Kahraman, C., Kaya, I.. A fuzzy multicriteria methodology for selection among energy alternatives. Expert Systems
with Applications 2010;37:6270–6281.Katz, R.. The impact of the broadband policy framework on jobs and the economy. The Parliament 2009;293:2–3.Katz, R., Suter, S.. Estimating the economic impact of the broadband stimulus plan. Working Paper, Columbia Institute
for Tele-Information 2009;.Kontogianni, A.D., Papageorgiou, E.I., Tourkolias, C.. How do you perceive environmental change? fuzzy cognitive
mapping informing stakeholder analysis for environmental policy making and non-market valuation. Applied SoftComputing 2012;12:3725–3735.
Kruskal Jr., J.B.. On the shortest spanning subtree of a graph and the traveling salesman problem. Proceedings of theAmerican Mathematical Society 1956;7:48–50.
Langley, P., Iba, W., Thompson, K.. An analysis of Bayesian classifiers. In: Proceedings of the 10th NationalConference on Artificial Intelligence (AAAI’92). 1992. p. 223–228.
Li, S., Shue, L.. Data mining to aid policy making in air pollution management. Expert Systems with Applications2004;27:331–340.
Nam, C., Kim, S., Lee, H., Duan, B.. Examining the influencing factors and the most efficient point of broadbandadoption in china. Journal of Research and Practice in Information Technology 2009;41:25–38.
OECD Broadband Portal, . Fixed and wireless broadband subscriptions per 100 inhabitants (june 2012)2012;http://www.oecd.org/sti/broadband/oecdbroadbandportal.htm.
Oh, S., Ahn, J., Kim, B.. Adoption of broadband internet in korea: the role of experience in building attitudes. Journalof Information Technology 2003;18:267–280.
Pearl, J.. Probabilistic Reasoning in Intelligent Systems: Networks of Plausible Inference. San Francisco, CA: MorganKaufmann, 1988.
Pham, D.T., Dimov, S.S., Nguyen, C.D.. Selection of k in k-means clustering. Proceedings of the Institution ofMechanical Engineers, Part C: Journal of Mechanical Engineering Science 2005;219:395–412.
Quinlan, J.R.. C4.5: programs for machine learning. Morgan Kaufmann, 1993.Rappoport, P., Kridel, D., Taylor, L., Duffy-Deno, K., Alleman, J.. Residential demand for access to the Internet. The
International Handbook of Telecommunication Economics : Volume II. Cheltenham: Edward Elgar Publishers, 2002.
14

Stanton, L.. Factors influencing the adoption of residential broadband connections to the internet. In: Proc. of the 37thAnnual Hawaii International Conference on System Sciences (HICSS’04). 2004. p. 50128a.
Tan, P., Steinbach, M., Kumar, V.. Introduction to Data Mining. Addison-Wesley, 2005.Witten, I.H., Frank, E., Hall, M.. Data Mining: Practical Machine Learning Tools and Techniques. 3rd ed. Morgan
Kaufmann, 2011.
15