predicting new technology adoption from past technology usage behavior: the case of mobile channel...
TRANSCRIPT
1
PREDICTING NEW TECHNOLOGY ADOPTION FROM PAST TECHNOLOGY USAGE BEHAVIOR: THE CASE OF MOBILE CHANNEL
ADOPTION
Last Revised: February 12, 2014 _____________________________________________________________________________________
ABSTRACT We predict mobile channel adoption by e-marketplace users based on their actual browsing and purchasing behaviors in the e-marketplace before the addition of the mobile channel. Our analysis, based on a large dataset from one of the leading e-marketplaces in South Korea, reveals that access and search behaviors before mobile channel introduction could be important predictors of mobile channel adoption. Specifically, order time dispersion (a behavioral proxy for need for anytime access) is negatively associated with the time it takes to adopt the mobile channel, whereas the proportion of orders based on keyword or category search, the mean number of product categories per order, and the mean display rank of orders (behavioral proxies for need for active search, broad search, and deep search, respectively) are positively associated with the time it takes to adopt the mobile channel. In addition to access and search behaviors, we considered privacy-related behaviors, transaction risk-related behaviors, assurance seeking behaviors, and preferences for transaction time, day, and product categories. Our findings shed new light on adoption research by demonstrating the efficacy of predicting a new technology adoption by individuals, based on their past technology usage behaviors. We also contribute to the emerging literature on mobile commerce by identifying significant predictors for mobile channel adoption. Finally, we suggest a simple scoring rule that can be used by firms to target customers who are most likely to adopt the mobile channel. KEYWORDS: Technology adoption, behavioral proxy, revealed preference, prediction, mobile channel, e-marketplace, access, search, survival analysis _____________________________________________________________________________________
1. INTRODUCTION
Since the seminal works of Davis (1985), Davis (1989), and Davis et al. (1989), who introduced
the technology acceptance model (TAM), one of the most prominent topics in Information
Systems during the past thirty years has been to identify and validate the antecedents of new
information technology adoption (or acceptance) by individuals or organizations. Specifically, IS
researchers have developed adoption theories by incorporating constructs, such as perceived ease
of use, perceived usefulness, subjective norm, and motivation into the model, and many
2
subsequent studies validated the models with self-reported survey data across different contexts.
Research on the technology acceptance model and its variants such as TAM2 (Venkatesh and
Davis, 2000), UTAUT (Venkatesh et al., 2003), and UTAUT2 (Venkatesh et al., 2012) have
greatly advanced our knowledge in the domain.
Despite the popularity and frequent use of TAM and its variants, researchers have raised
concerns about the practicality of using such models. For example, Benbasat and Barki (2007)
state that “we need to identify the antecedents of the beliefs contained in adoption models in
order to benefit practice” (Benbasat and Barki, 2007, p. 215). Although prior studies have
extended TAM by including various factors (e.g., Taylor and Todd, 1995), they have not
improved the practicality of the model much, due to the increase in the complexity of the model.
Furthermore, firms having to decide whether or not to implement a new technology need to
know beforehand how users will perceive the new technology in terms of its ease of use and
usefulness. However, the extant adoption models are not efficient or effective in predicting users’
perceptions and adoption of the new technology, given that users differ in their perceptions about
a new technology. Moreover, identifying potential adopters requires collecting individual-
specific responses through costly and time-consuming surveys. Lastly, as Davis and Kottemann
(1994) point out, the antecedents of technology adoption should be measured beyond perceptions;
specifically, objective measures should be used, wherever possible, to improve the practicality of
a research model. In sum, there has been a call for research that advances technology adoption
research to the next stage (Bagozzi, 2007; Benbasat and Barki, 2007).
In this study, we aim to advance the current state of knowledge in technology adoption
research by predicting a new technology adoption, based on information extracted from an
individual’s past technology usage behaviors. Past behaviors are actual reflections of users’
3
value systems, preferences, and habits; therefore, past usage behavior should contain rich and
valuable information that can predict users’ future behavior. This approach becomes feasible,
reliable and useful as firms accumulate a large amount of users’ detailed behavioral data within
their databases. Moreover, by using pre-existing behavioral data, firms can make predictions for
all customers in their database without conducting additional time-consuming surveys, which are
costly and can only cover a sample of customers.
We demonstrate this approach by investigating mobile channel adoption by users of an e-
marketplace as our research context, and we develop an empirical model to predict mobile
channel adoption based on users’ past e-commerce usage behaviors. Specifically, we use the past
browsing and purchasing behaviors of e-marketplace users through the PC channel to infer users’
latent needs related to access and search. Then, by applying the logic of fit between channel
capabilities and users’ latent needs, we relate these latent needs with the distinctive capabilities
of the current (i.e., PC) and new (i.e., mobile) channels to predict adoption of the new channel.
In addition to providing a context for demonstrating the technique for predicting new
technology adoption based on prior technology usage behavior, understanding the factors that
impact mobile channel adoption is valuable in itself, as the mobile channel has become a
significant conduit for electronic commerce. The mobile gross merchandise volume (GMV) of
eBay, for example, was expected to reach nearly $20 billion in revenue for 2013 (Barr, 2013).
Amazon also announced that mobile devices generated US $3-5 billion in sales, 5-8% of its net
sales in 2012 (Duryee, 2013). Therefore, it is not surprising that both practitioners and
academicians are interested in issues related to the mobile channel, and research in this domain is
gaining momentum (Gebauer et al., 2010; Ghose et al., 2012; Ghose and Han, 2011; Wu and
Wang, 2005). However, despite the increasing significance of the mobile channel, there is a
4
paucity of empirical research employing large datasets to study users’ adoption behavior related
to the mobile channel. There have been a few studies on users’ behaviors in the mobile channel
using large-scale behavioral datasets, which have focused on comparing PC and mobile usage
behavior in terms of digital content creation and consumption (Ghose et al., 2012; Ghose and
Han, 2011), as well as their impact on revenue (Han et al., 2013). Our interest is different from
the above studies, in that we examine e-marketplace users’ search and purchase behaviors before
mobile channel introduction to predict their mobile channel adoption decision.
The mobile channel is of particular interest to this study for two additional reasons. First,
given that most firms offering e-commerce through the mobile channel already offer the PC
channel, information on past behaviors (i.e., usage of the PC channel), which is required by our
empirical technique to predict future behaviors (i.e., mobile channel adoption), is readily
available. Second, since PC and mobile channels are similar in terms of most features (such as
the same product assortment, inability to touch and feel products, and user login credentials), we
can concentrate on a few distinct features of the mobile channel, primarily access capability and
search capability, to construct a simple model that can be used to predict mobile channel
adoption.
To summarize, our study contributes not only to the stream of adoption literature by
demonstrating a novel approach of linking users’ technology adoption with their past technology
usage behaviors, but also to the growing body of research on m-commerce by identifying the
factors affecting e-commerce users’ mobile channel adoption.
The rest of this paper is organized as follows. In the following section, we identify the
distinctive aspects of the PC channel (prior technology) and the mobile channel (new
technology), focusing on the unique technological features and capabilities of the mobile channel.
5
Then, we establish users’ latent needs that may be fulfilled by the distinct features and
capabilities of the mobile channel. We develop behavioral proxies that can capture the
underlying latent needs related to access and search. Employing the proxies and other control
factors that might affect adoption, we build a model, empirically test it, and demonstrate the
predictive power of the model. In addition, we suggest a simple scoring rule that can be used by
firms to target customers who are most likely to adopt the mobile channel. Finally, the paper
concludes with a discussion of the contributions, limitations, and suggestions for future research.
2. CONCEPTUAL BACKGROUND
2.1. Distinct Channel Capabilities of PC versus Mobile Channels
The notion of channel capability (Avery et al., 2012) refers to the enabling characteristics of a
channel that allows consumers to accomplish their shopping goals. Prior research indicates that
the channel capabilities of PC and mobile channels are distinct. Specifically, researchers suggest
that PC and mobile channels differ in terms of two primary capabilities - ubiquity and usability
(Clarke, 2001; Lee and Benbasat, 2003; Venkatesh and Ramesh, 2006; Zhang, 2007).
Compared to a PC, a mobile device is within easy reach of a user throughout the day, due
to its size and portability. Further, given that most of these mobile devices are Internet enabled,
such mobile devices allow users to connect to Internet applications such as e-marketplaces,
regardless of users’ physical locations. Therefore, the mobile channel provides a higher level of
ubiquitous access to such applications vis-à-vis a PC (Bang et al., 2013), which we refer to as the
“ubiquitous access capability” of the mobile channel. However, this benefit of ubiquity comes at
the cost of lower usability.
The small screens of mobile devices and related user interface constraints hamper users’
interactions with these devices, and thus lead to lower levels of usability. Although recent

6
technological advances in mobile devices have addressed some of the usability issues raised in
prior studies (e.g., innovations such as touch screens, specially designed mobile applications,
simple login features, etc.), the mobile channel is still limited in terms of information search-
related usability vis-à-vis the PC channel (Bang et al., 2013). Therefore, we focus on the
information search aspect of usability and refer to it as the “limited information search capability”
of the mobile channel.
In summary, the mobile channel offers ubiquitous access capability, but limited
information search capability, whereas the PC channel offers extensive information search
capability, but constrained access capability. The main technological features of the two
channels and their associated capabilities are presented in Table 1.
----------------------------------------- Insert Table 1 about here
-----------------------------------------
2.2. Users’ Latent Needs and Fit with the Capabilities of the Mobile Channel
In light of the distinct channel capabilities of mobile and PC channels, we conjecture that PC
channel users would find the mobile channel more attractive; thus, they would be early adopters
(or more likely to adopt the channel) if they have a stronger latent need for more ubiquitous
access to the e-marketplace. On the other hand, PC channel users with a stronger latent need for
extensive search capabilities would be relatively slower in adopting (or less likely to adopt) the
mobile channel. Next, we further investigate access and search needs.
7
2.2.1. Access Needs and Fit with the Mobile Channel
E-marketplace users are heterogeneous in terms of their needs for accessing the e-marketplace.
For example, some users prefer to access the e-marketplace only during specific times, whereas
others may want to access it anytime during a given day. Specifically, we identify two
dimensions of access needs—need for frequent access and need for anytime access.
Need for frequent access: We define the need for frequent access in terms of the number
of times a user would like to access the e-marketplace during a given time period. A user who
has a greater need for frequent access would also have the desire to access the e-marketplace
more frequently. Due to the ubiquitous access capability offered by the mobile channel through
the use of specialized applications, users having stronger needs for frequent access would find a
better fit with the mobile channel. Therefore, ceteris paribus, such users would be more likely to
adopt the mobile channel to satisfy their latent needs.
Need for anytime access: We define the need for anytime access as a user's desire for
ubiquitous access to the e-marketplace. For example, a user might want to access the e-
marketplace on her way to work, followed by the unexpected or unplanned need to purchase a
product. Such users with greater needs for anytime access would be able to gain more from the
ubiquitous access capability of the mobile channel, which allows flexible access by making the
time and location of access irrelevant. Thus, their likelihood of mobile channel adoption will be
higher.
2.2.2. Search Needs and Fit with the Mobile Channel
E-marketplace users continue to search for a better product until the marginal cost of search
exceeds the marginal benefit (Hoque and Lohse, 1999). Due to the limited information search
capability (i.e., the marginal search cost in a mobile device is larger than that in a PC),
8
consumers who have the tendency to conduct intensive searches would face significant search
costs on mobile devices. We characterize e-marketplace users’ search needs in terms of their
propensity for active, broad, and deep search.
Need for active search: We define the need for active search as the propensity to engage
in directed search where users have the prior intention to search for a target product. For example,
users could search for a product by typing in keywords if they have a specific product or brand in
mind. On the other hand, there is a segment of users who access an e-marketplace without any
prior intention to purchase a specific product; they purchase products, primarily on impulse, after
being exposed to ads displayed on the e-marketplace. While the former segment of users is
characterized by active, more interactive search (which is associated with planned purchases),
the latter segment is characterized by passive, less interactive search (which is associated with
impulse purchases).
Since current mobile devices fit better with passive search behavior (e.g., touching
displayed ads on a screen) than with active search (e.g., typing in keywords) (Lee and Benbasat,
2003), e-marketplace users who tend to engage in passive search might feel less burdened in
using the mobile channel. On the other hand, due to the limited information search capability of
the mobile channel, e-marketplace users who tend to engage in active search might find the
mobile channel difficult to use. Therefore, e-marketplace users with an active search propensity
would be less likely to adopt the mobile channel, compared to those who exhibit a passive search
propensity.
Need for broad search: We define the need for broad search as a user’s propensity to
search for various product categories before placing an order during a single visit to an e-
marketplace. E-marketplace users having strong needs for broad search might be regarded as big
9
basket shoppers, such as weekend shoppers at Costco, who tend to purchase a variety of things
during a single shopping trip. Due to the limited information search capabilities of the mobile
channel, they would face difficulty in conducting extensive search on the mobile channel.
Therefore, users having greater needs for broad search are likely to experience a lower fit with
the mobile channel, and are thus less likely to adopt it.
Need for deep search: We define the need for deep search as a user’s propensity to search
for various alternatives within a single product category before placing an order while visiting an
e-marketplace. E-marketplace users having strong needs for deep search might be regarded as
deliberate decision-makers who consider various alternatives when purchasing a product. Similar
to the other search dimensions, due to the limited information search capabilities of the mobile
channel, such users would find it difficult to engage in their normal search behavior on the
mobile channel than those who tend to consider only a few alternatives before placing an order.
Therefore, users having greater needs for deep search will experience a lower fit with the mobile
channel, and thus will be less likely to adopt it.
2.3. Developing Behavioral Proxies: Inferring Users’ Latent Needs from Past Behaviors
Because past human behaviors are actual reflections of value systems, preferences and habits, we
can infer valuable information on latent needs and preferences from past behaviors (Bamberg et
al., 2003; Vinson et al., 1977). In addition, this revealed preference approach can be more robust
against social desirability biases or memory errors, compared to stated preference measurements
such as surveys or in-person interviews (Borus, 1966; Fisher, 1993). Finally, behavioral proxies
can be easily created for the entire customer base; thus, this approach would be more scalable
and economical, compared to a survey-based method, which relies on sampling. In this
subsection, we develop behavioral proxies representing the latent needs of e-marketplace users
10
from their access and search behaviors on the PC channel prior to mobile channel introduction.
We propose and empirically show that these behavioral proxies can be good predictors of mobile
channel adoption. Because our goal is to predict users’ mobile channel adoption, based on their
behavior on the PC channel, these behavioral proxies are taken from the period prior to mobile
channel introduction.
Need for frequent access: We measured the need for frequent access as the average
number of orders per day from the day that a user made the first order in the dataset to the day of
mobile channel introduction. We define an order as the act of putting a product into a basket, and
clicking “confirm.” Because a user needs to access an e-marketplace before placing an order, it is
reasonable to assume that order frequencies and access frequencies are highly correlated.1
Therefore, daily order frequency can be a good behavioral proxy for the need for frequent access.
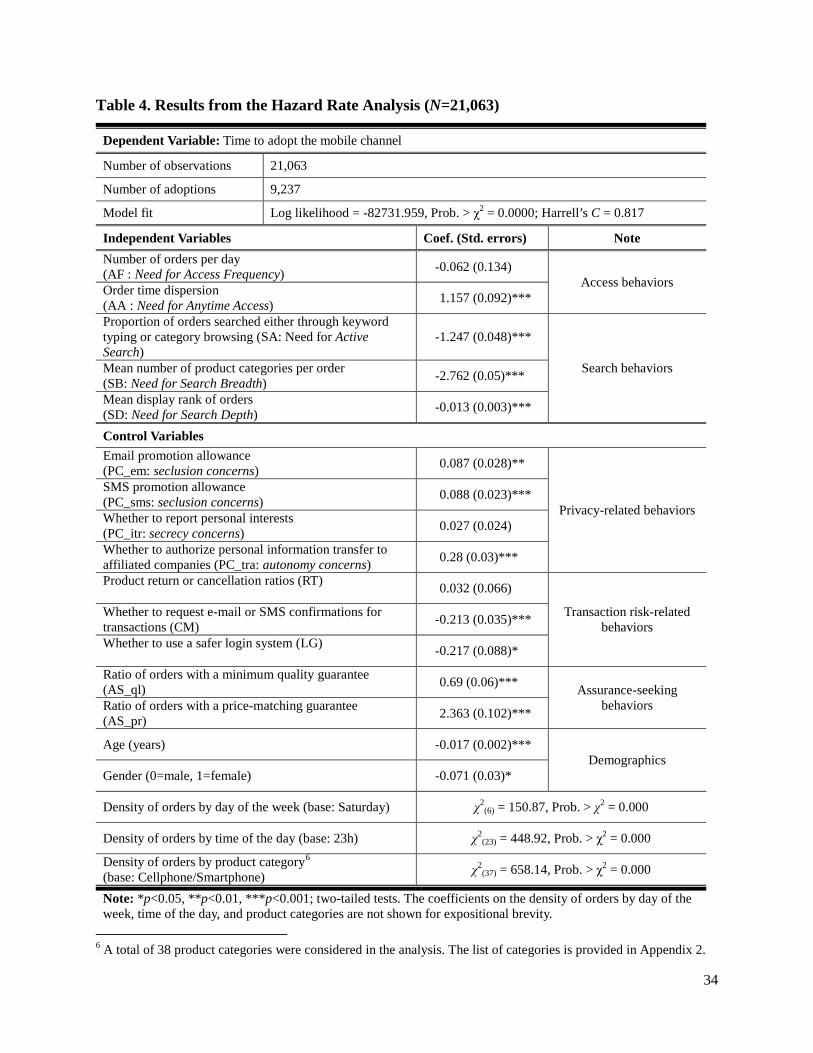
Need for anytime access: We measured the need for anytime access as the dispersion in
time at which orders are placed, before mobile channel introduction. To explain this measure, let
us assume that a user has placed twenty-four orders within a given time period (say a month). On
one extreme, a user may place all of these twenty-four orders around the same time (say 7:00pm),
though on different days (refer to User #2 in Figure 1). Such a user with low order time
dispersion has a low need for anytime access, as her access behavior is concentrated within a
specific time period during which she is likely to be at a specific place. On the other extreme, a
user may place a total of twenty-four orders in a month at different time periods such that no two
orders are placed at the same time of day (refer to User #1 in Figure 1). Such a user with a larger
order time dispersion can be considered to have a greater need for anytime access; therefore,
such a user will a good fit with the ubiquitous mobile channel. As a result, order time dispersion
can be a good behavioral proxy for the need for anytime access. 1 Note that users’ access records are not available in our datasets.
11
----------------------------------------- Insert Figure 1 about here
-----------------------------------------
We calculated order time dispersion with a revised inverse Simpson index, the inverse of
the sum of pair-wise multiplications of shares of order hours, weighted by the inverse of the hour
gap between pairs. The measure is constructed as follows:
𝑇𝐷𝑖 =𝑁
∑ ∑ 𝑠𝑖ℎ𝑚23ℎ𝑛=0 𝑠𝑖ℎ𝑛/(‖ℎ𝑚 − ℎ𝑛‖ + 1)23
ℎ𝑚=0
where ℎ𝑚(ℎ𝑛) is the hour of day, ‖ℎ𝑚 − ℎ𝑛‖ is the hour gap between ℎ𝑚 and ℎ𝑛, e.g., ‖ℎ𝑚 −
ℎ𝑛‖ = 2 if ℎ𝑚=17h, ℎ𝑛=19h or ℎ𝑚=1h, ℎ𝑛=23h, 𝑠𝑖ℎ𝑚(𝑠𝑖ℎ𝑛) represents the fraction of individual
i’s number of orders at ℎ𝑚(ℎ𝑛), and N is a normalizing constant (=0.2201).
The revised index not only captures categorical diversity over hours, such as families of
the Rényi entropy measure, but also takes into account interval diversity at the same time. Figure
1 describes how order time dispersion is calculated.
Need for active search: To measure the need for active search, we focused on actual
search behaviors before placing an order. There are three ways to search for products online: 1)
clicking on display ads; 2) typing in keywords; and 3) browsing categories. Clicking on displays
is less active and much easier than typing in keywords or browsing categories. Further, clicking
on displays may be associated with unplanned purchases, since a user does not know what would
be displayed before visiting the e-marketplace. Following the definition of active search
propensity, we measure it as the proportion of orders that are the result of active search (i.e.,
typing in keywords or browsing categories).
Need for broad search: We measure the need for broad search as the average number of
product categories per order before mobile channel introduction. Since a user needs to search for
products before placing an order, it is reasonable to assume that the number of different product
12
categories per order and the number of searches for different product categories are highly
correlated. Therefore, the average number of different product categories per order can be a good
behavioral proxy for need for broad search.
Need for deep search: The need for deep search is measured as the average display rank
of ordered products. Display rank denotes the display location of an ordered product. If an
ordered product, for example, is listed at the top of the first search result page, then the display
rank of the product is one, whereas if the product is listed at the bottom or on the next search
result page, then the rank will be higher. The average display rank can be a good behavioral
proxy for need for deep search, since e-marketplace users having strong needs for deep search
tend to review products listed not only at the top of the first page, but also at the bottom of the
first page or on the following pages.
It is important to note here that a fundamental assumption underlying the prediction of
users’ future behaviors based on their past behaviors is that users’ behavioral patterns and
inferred needs should be stable, before and after mobile channel introduction. In other words, if
needs were dramatically affected or changed by mobile channel introduction, predicting future
behaviors based on inferred needs before mobile channel introduction would not be possible.
Therefore, as a robustness check, we checked the consistency of access and search behaviors,
before and after mobile channel introduction. These tests confirmed the consistency of access
and search behaviors.
2.4. Dependent and Control Variables
We measured Time to adopt, our dependent variable, as the number of days elapsed from the date
of mobile channel introduction (June 1, 2010) to the date of mobile channel adoption by each
13
user.2 We define the date of mobile channel adoption as the date a user completes his/her first
transaction with mobile devices (smartphones, feature phones, and tablets) through mobile
networks (e.g., Wi-Fi, 3G, 4G networks). This definition allows us to specify Time to adopt in a
clear and objective manner.
To obtain more robust results, in addition to the aforementioned behavioral proxies for
access and search needs, we included the following control variables that might affect mobile
channel adoption. Including a number of control variables helps us not only rule out alternative
explanations, but also alleviates potential biases from omitted variables.
Privacy concerns: The mobile channel allows an e-marketplace to collect additional
personal information about users, such as current location at the time of ordering, etc.
Furthermore, one might expect more unsolicited promotions or pushed ads from an e-
marketplace on the mobile channel. As a result, users with high privacy concerns might hesitate
to adopt the mobile channel. To control for this possibility, we included behavioral proxies for
users’ privacy concerns in the model. Several conceptualizations and dimensions are proposed
for measuring information privacy (e.g., Malhotra et al., 2004; Smith et al., 1996). We employed
two dimensions proposed by Hui and Png (2006)3— seclusion concerns and secrecy concerns—
which are most suitable for this context. Seclusion concerns represent a dimension of privacy
indicating “the right to be left alone” (Hui and Png, 2006). Therefore, e-marketplace users who
have high seclusion concerns would be less likely to adopt the mobile channel, if they expect to
receive more unsolicited promotions or pushed ads after adopting the m-commerce channel. We
employed two dummy variables, whether or not to allow e-mail or SMS promotions from the e-
2 The Cox PH model, which is employed in the study, takes into account those who do not have time to adopt (non-adopters) as the baseline hazard. 3 Our data do not allow us to control for autonomy concerns, which represent “freedom from observation” (Hui and Png, 2006).
14
marketplace before mobile channel introduction, to capture seclusion concerns. Secrecy concerns
represent privacy concerns created by the possession of personal information by others (Hui and
Png, 2006). In the e-marketplace that we examine, users were asked an optional question about
product categories of interest, and some users chose to reveal their preferences. Further, the e-
marketplace asked for permission from users regarding information sharing with an affiliated
company. We used two dummy variables indicating whether or not a user provided personal
interest information to the e-marketplace, and whether or not a user allowed information sharing,
to capture secrecy concerns.
Risk attitude: The transitory nature of using the mobile Internet and the low usability of
mobile devices could hamper mobile users when collecting product information. Limited user
experiences in mobile commerce can aggravate problems of information gathering and
processing. As a result, purchase decisions in the mobile channel might involve greater
uncertainty than in the PC channel. More risk-averse consumers are less likely to purchase under
the same level of uncertainty (Castaño et al., 2008; Peracchio and Tybout, 1996). Therefore, we
control for risk attitudes of e-marketplace users.
We measure the risk attitudes of e-marketplace users from their revealed preferences for
secure transactions and product returns. Two dummy variables were selected to measure
tendencies for secure transactions: (1) whether or not a user requested order confirmations, either
through e-mail or SMS; and (2) whether or not a user used a safer login system. E-marketplace
users who requested confirmation e-mails or SMSes from the e-marketplace can be regarded as
more risk-averse, since they are seeking more secure transactions. The safer login system is a
new way to authenticate user identity designed to reduce the potential risk of identity theft. The
15
use of a safer login system requires an additional add-in installation. Therefore, e-marketplace
users who adopted the safer login system could be regarded as more risk-averse.
Product returns by users are also considered. Purchasing in the mobile channel might
involve greater uncertainty; therefore, e-marketplace users who have more product returns might
be reluctant to adopt the mobile channel because they can be expected to have more returns when
purchasing through the mobile channel. To control for this possibility, we included the product-
return tendencies of e-marketplace users in the model. We measured the tendency as the ratio of
returns to the total number of transactions prior to mobile channel introduction.
Dependence on assurance: Many online vendors offer an assurance on price (“price-
matching guarantee”) or an assurance on quality (“minimum quality guarantee”) for users who
put much weight on value attributes. On the one hand, such assurances could reduce the amount
of information that needs to be processed before making a purchase decision. For example, when
a user chooses from different sellers offering the same product, he/she does not need to compare
prices, if there is a price-matching guarantee. Therefore, e-marketplace users who tend to rely on
assurances might be more likely to adopt the mobile channel, since these assurance-seeking
behaviors would reduce the information burden in the mobile channel. On the other hand,
assurance-seeking behaviors might represent the risk attitudes of e-commerce users, because the
assurances could alleviate users’ concerns about the uncertainty involved in the product quality
and price. In either case, we need to control for users’ tendencies toward assurances. Two
variables—the proportion of orders containing products with price-matching guarantees and the
proportion of orders containing products with minimum quality guarantees—were selected to
measure users’ dependency on assurances.
16
Preference for transaction day and time: In order to account for the possibility that users’
propensity to adopt the mobile channel may vary, depending on which day of the week and
which time of the day they prefer to shop in the e-marketplace, we control for users’ preference
for transaction day of the week and time of the day. We measure users’ preferences for
transaction day and time as their transaction density on each weekday and hour before mobile
channel introduction.
Product category preference: Prior research suggests that products with certain
characteristics (i.e., high time criticality and low information intensity) have a better fit with the
mobile channel, and therefore are more likely to be transacted on the channel (Bang et al., 2013).
This implies that depending on the product categories a user typically purchases on the e-
marketplace, his/her propensity to adopt the mobile channel may vary. Thus, we control for users’
order distribution over product categories. Specifically, we count the number of orders in each
product category normalized by the total number of orders before mobile channel introduction.
Age and gender: In general, demographic variables are known to explain large variances of
outcome variables in many social science studies. We control for the age and gender of e-
marketplace users that are known to be correlated with IT adoption (Venkatesh et al., 2003).
17
3. METHODS
3.1. Data
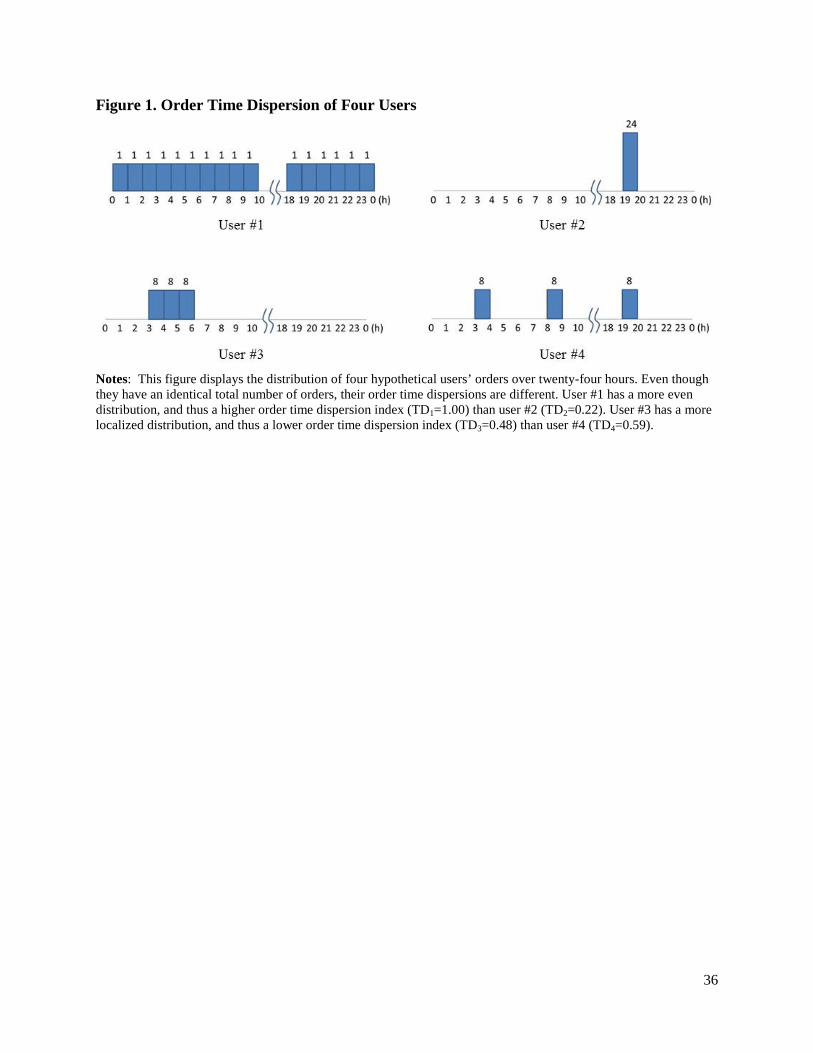
This study uses two large datasets from the database of a large e-marketplace4 in South Korea
that had initially provided the PC channel only and launched the mobile channel later. Each of
the two datasets contains almost all data fields in the original database, including customer
demographics, e-market use settings (e.g., secure login), order/cancellation/return history, and
product information search behaviors before placing orders. Additionally, the datasets cover the
periods before and after the mobile channel launch. The first dataset contains a random sample of
30,000 users who did not adopt the mobile channel until one year after the introduction of the
mobile channel (t2), and their entire 1,454,803 online orders during a period of more than two
years (March 2009-June 2011). The second dataset contains a random sample of 30,000 users
who adopted the mobile channel before t2 and their entire 1,179,159 online orders, and 106,189
mobile orders placed during the same period.
Figure 2 depicts the composition of our datasets. t0 is the beginning of the timespan of the
datasets, t1 is the time when the e-marketplace launched the mobile channel, and t2 is the end
time of the timespan of the datasets. Note that no mobile orders exist between t0 and t1, because
the mobile channel was not available at that time.
----------------------------------------- Insert Figure 2 about here
-----------------------------------------
We randomly resampled 20,000 users without replacement from each dataset, and
merged the two samples into a dataset of 40,000 users for the main analysis (the remaining
samples are used later to check the predictive validity of our model.). Business users (168 users)
4 The e-marketplace ranks third in terms of revenue obtained through the PC channel and first in revenue obtained through the mobile channel in South Korea.
18
were excluded from the dataset, since they show significantly different shopping patterns from
individual consumers in terms of purchasing volume and frequency. We also excluded users who
completed fewer than four transactions before t1 (18,769 users) because their purchasing
behaviors could not be identified due to a lack of sufficient data. Note that because we derive our
behavioral proxies for latent needs and control variables from the data before mobile channel
introduction, we can effectively control for potential endogeneity. Our main sample contains a
total of 21,063 users and their transaction records. Table 2 shows a basic description of the main
sample.
----------------------------------------- Insert Table 2 about here
-----------------------------------------
3.2. Empirical Approach
Our data consist of mobile channel adopters and non-adopters. Adopters vary in terms of
adoption time. To capture the varying adoption time and the existence of non-adopters at the
same time, we employed a survival analysis technique. Specifically, we adopted a Cox
proportional hazard (PH) model to test our predictions (Cox, 1972). Similar to other survival
analysis techniques, the Cox-proportional hazard model focuses on the time to event. While other
parametric hazard models assume a particular shape for the hazard function, such as Weibull or
log-logistic, the Cox PH model has the advantage of placing no restrictions on the shape of the
baseline hazard. The Cox PH model is also known as one of the most general and robust
regression models (Li et al., 2010).
We know the exact time of the mobile channel launch, and our data cover periods both
before and after the mobile channel launch. Our data are right-censored, in that we know the start
time (i.e., all users enter the study at the same time), but we cannot observe the end time (the
time of adoption) for those who adopted the mobile channel after the end of our data collection
19
period, or those who did not adopt the mobile channel at all. None of our observations dropped
out or got lost during the data period. Also, our sample is independently censored data, since our
data period is independent of the event times. Furthermore, mobile channel adoption is a one-
time event, and all of our independent variables, including the control variables, are not time
varying. Thus, we can implement the simplest form of the Cox PH model without concerns about
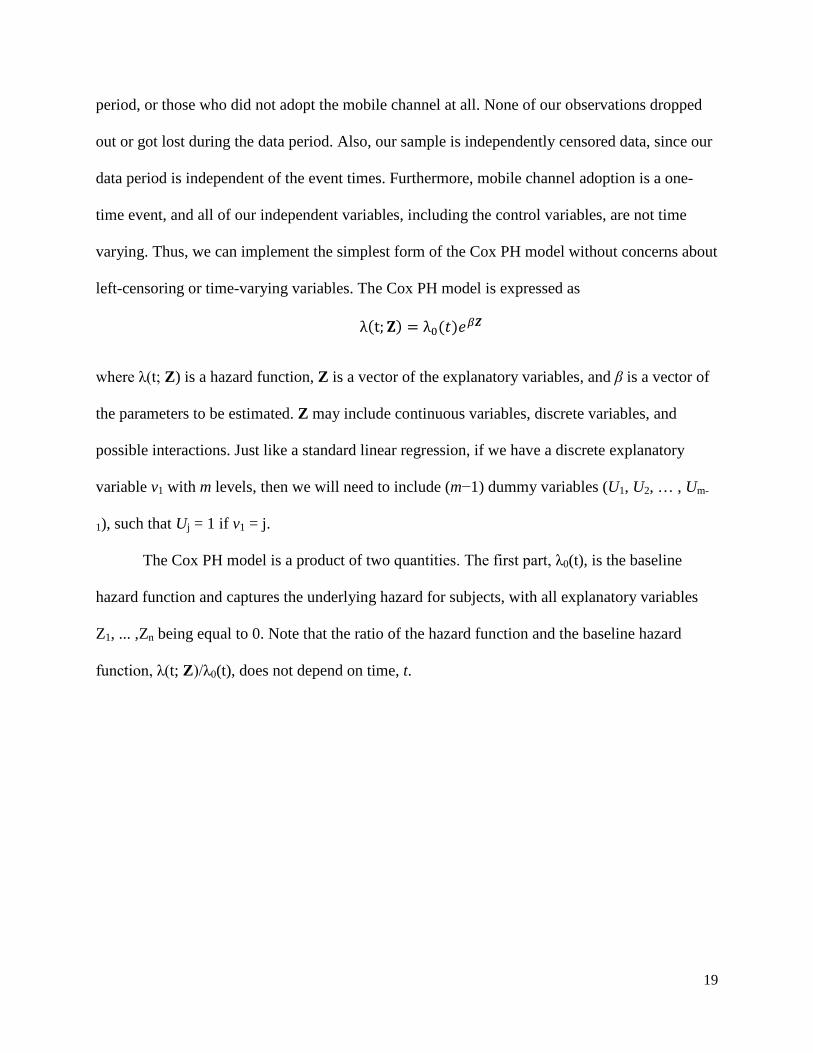
left-censoring or time-varying variables. The Cox PH model is expressed as
λ(t;𝐙) = λ0(𝑡)𝑒𝛽𝒁
where λ(t; Z) is a hazard function, Z is a vector of the explanatory variables, and β is a vector of
the parameters to be estimated. Z may include continuous variables, discrete variables, and
possible interactions. Just like a standard linear regression, if we have a discrete explanatory
variable v1 with m levels, then we will need to include (m−1) dummy variables (U1, U2, … , Um-
1), such that Uj = 1 if v1 = j.
The Cox PH model is a product of two quantities. The first part, λ0(t), is the baseline
hazard function and captures the underlying hazard for subjects, with all explanatory variables
Z1, ... ,Zn being equal to 0. Note that the ratio of the hazard function and the baseline hazard
function, λ(t; Z)/λ0(t), does not depend on time, t.
20
4. RESULTS
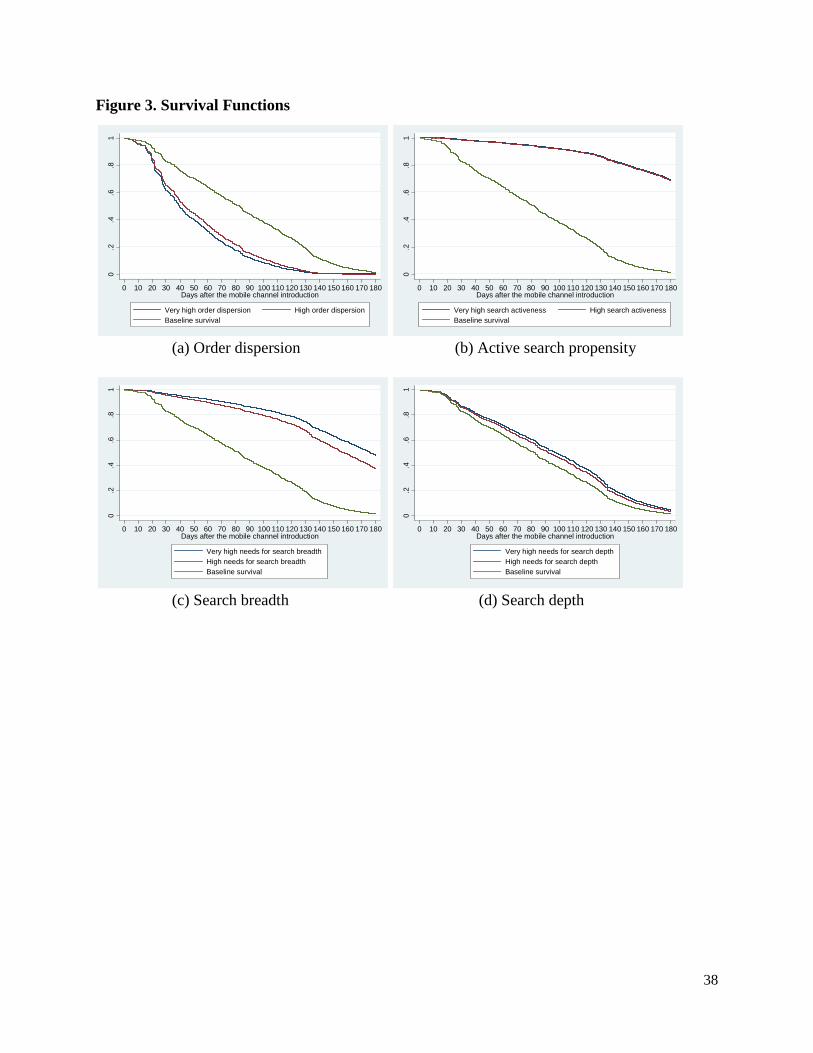
Descriptive statistics and correlations are reported in Tables 3A and 3B. The parameter estimates
for a model that predicts the time to adopt the mobile channel are depicted in Table 4.5 A
likelihood-ratio test between the model containing only the control variables and the main model
confirms that five independent variables collectively increase the overall likelihood significantly
(χ2 (5) = 8595.07, Prob. > χ2 = 0.000). We also evaluated the predictive power of the model by
computing Harrell’s C concordance statistic, which measures the agreement of predictions with
the observed adoption order. Harrell’s C is estimated to be 0.817, indicating that the model
correctly identifies the order of adoption times for pairs of e-commerce users 81.7% of the time.
This suggests that our model has strong predictive power. To further demonstrate the predictive
power of our model, we perform out-of-sample prediction in Section 4.2.
4.1. Impacts of Behavioral Proxies and Control Variables on Mobile Channel Adoption
The effect of the average number of orders per day, which is a behavioral proxy for need for
frequent access, is not significant. This might be due to the channel usage inertia of consumers
(Ansari et al., 2008; Falk et al., 2007). As purchasing experiences accumulate, a channel choice
decision becomes routinized by the learning process, and the habit of using the same channel
might be established. This channel choice inertia could be dominant, especially at the trial stage
of channel choice, due to the complexity and goal uncertainty of the channel choice decision
(Valentini et al., 2011). Therefore, although e-marketplace users having a higher average daily
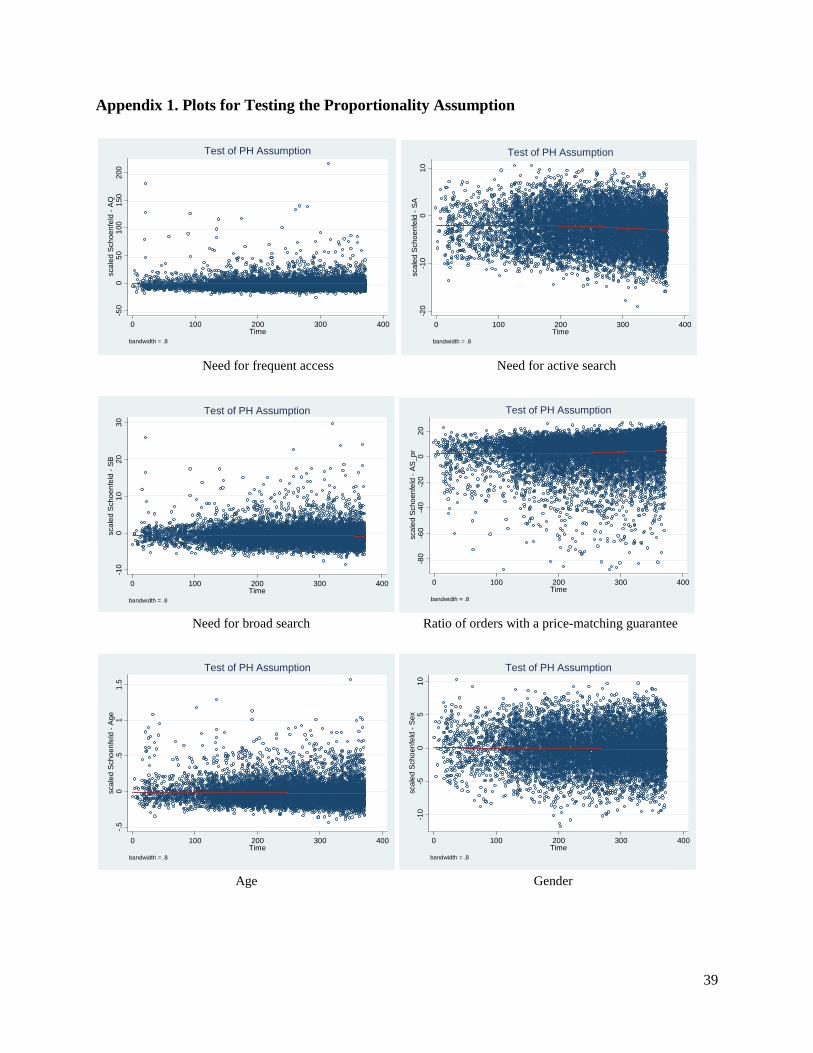
5 Before interpreting the results, the proportional-hazard assumption of the Cox PH model needs to be checked. Either the numerical or graphical method can be employed. A test based on Schoenfeld residuals shows that the null hypothesis of proportionality is rejected for some variables. It is known, however, that no data in practice hold the perfect proportionality, and even a small misalignment could result in the rejection of the null hypothesis when dealing with large data (Klein and Moeschberger, 2003). Therefore, we employed graphical methods for the variables, which seem to violate the assumption (see Appendix 1). Because the plot for active search propensity shows a slight downward trend over time, we re-estimated the main model, including the time-dependent variable, ln t, for active search, and obtained qualitatively similar results.
21
number of orders might have greater access needs, their heavy use of the PC channel could
create inertia and hinder their adoption of the mobile channel.
The effect of order time dispersion, a behavioral proxy for need for anytime access, is
positive and significant. This result confirms that e-marketplace users having a greater need for
anytime access adopt the mobile channel more quickly, since it serves their needs better than the
PC channel. The effects of three search-related behavioral proxies are negative and significant,
indicating that e-marketplace users with fewer needs for active, broad, and deep search tend to
adopt the mobile channel faster, which is consistent with our conjecture.
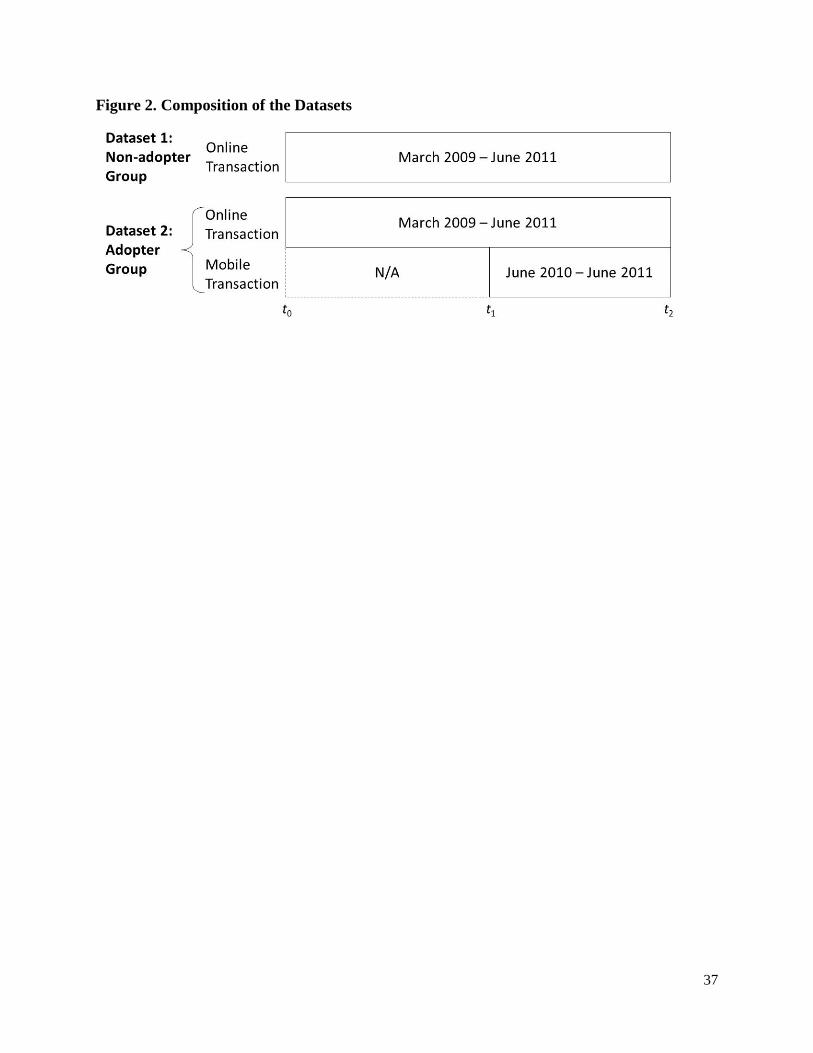
Figure 3 shows the estimated baseline survival function, along with survival curves for
users at a high (75th percentile) and a very high (90th percentile) position in the distribution of
each significant independent variable. The survival rates (i.e., the likelihood of staying as a non-
adopter) for e-marketplace users with higher order time dispersion before mobile channel
introduction drop faster than the baseline after the introduction (see Figure 3-a). On the contrary,
the survival rates for e-marketplace users with higher active search propensity, search breadth,
and search depth before mobile channel introduction drop more slowly than the baseline after the
introduction (see Figure 3-b, 3-c, and 3-d).
Among the control variables, three out of four behavioral proxies for privacy concerns are
significant with the expected signs. E-marketplace users who allow e-mail or SMS promotions
(who have fewer seclusion concerns), and who authorize personal information transfer to an
affiliated company (who have fewer secrecy concerns) tend to adopt the mobile channel faster.
This confirms our conjecture that users with higher privacy concerns will be less likely to adopt
the mobile channel.
Regarding the variables’ ability to capture users’ risk attitudes, the rate of product returns
22
or cancellations is not significant, but two other proxies—whether or not a user requested e-mail
or SMS confirmations for completed transactions and whether or not a user used a safer login
system—are positive and significant. This implies that more risk-averse e-marketplace users are
less likely to adopt the mobile channel, which is consistent with our conjecture.
Users’ dependence on assurance (measured by the proportion of orders with a minimum
quality guarantee and the proportion of orders with a price-matching guarantee) turned out to be
positively related to mobile channel adoption. This confirms our conjecture that assurances can
alleviate users’ information search load, thereby making the limited information search
capability of the mobile channel less of an obstacle for adoption.
Age is negatively correlated with the likelihood to adopt mobile commerce, indicating
that younger users are more likely to adopt the mobile channel. The coefficient on gender is
negative and significant, suggesting that male users are more likely to adopt the mobile channel.
Lastly, we find significant effects of users’ preference for transaction day, transaction
time, and product category. The significance regarding preferences for day, time, and product
categories jointly suggests that mobile channel adoption is influenced not only by user
characteristics, but also by the adoption contexts and tasks (Gebauer et al., 2010).
----------------------------------------- Insert Table 3A about here
----------------------------------------- -----------------------------------------
Insert Table 3B about here ----------------------------------------- -----------------------------------------
Insert Table 4 about here -----------------------------------------
23
----------------------------------------- Insert Figure 3 about here
-----------------------------------------
4.2. Additional Analyses
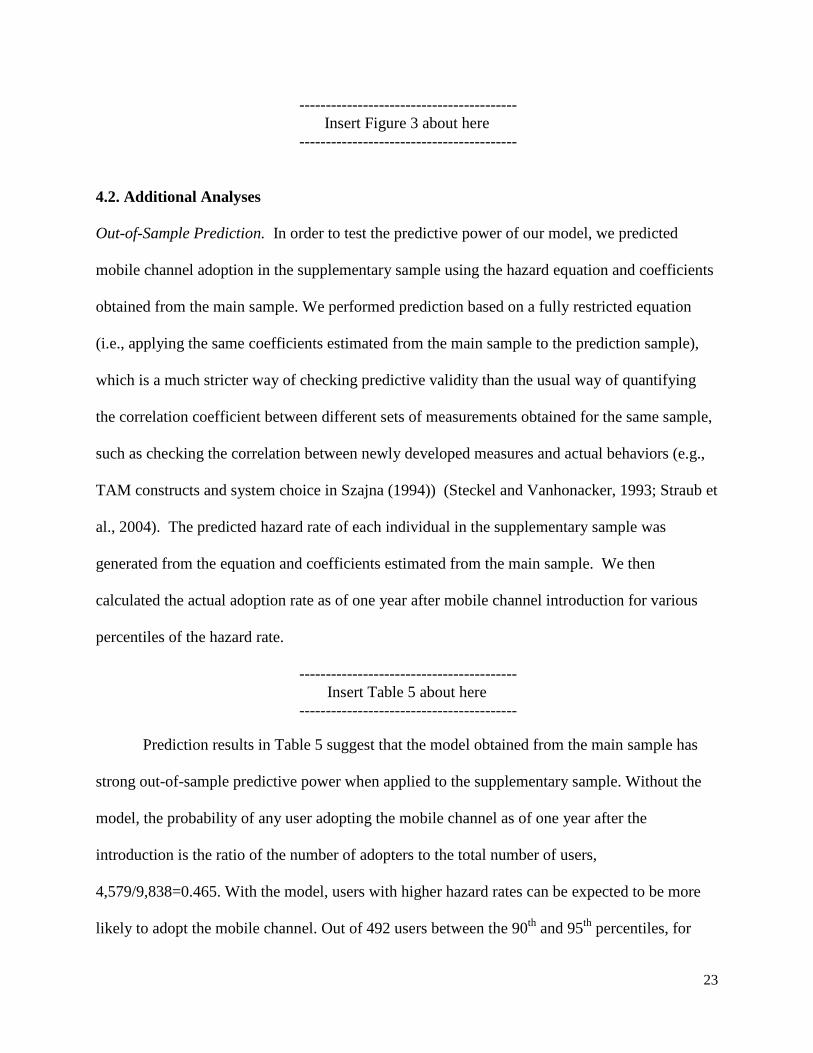
Out-of-Sample Prediction. In order to test the predictive power of our model, we predicted
mobile channel adoption in the supplementary sample using the hazard equation and coefficients
obtained from the main sample. We performed prediction based on a fully restricted equation
(i.e., applying the same coefficients estimated from the main sample to the prediction sample),
which is a much stricter way of checking predictive validity than the usual way of quantifying
the correlation coefficient between different sets of measurements obtained for the same sample,
such as checking the correlation between newly developed measures and actual behaviors (e.g.,
TAM constructs and system choice in Szajna (1994)) (Steckel and Vanhonacker, 1993; Straub et
al., 2004). The predicted hazard rate of each individual in the supplementary sample was
generated from the equation and coefficients estimated from the main sample. We then
calculated the actual adoption rate as of one year after mobile channel introduction for various
percentiles of the hazard rate.
----------------------------------------- Insert Table 5 about here
-----------------------------------------
Prediction results in Table 5 suggest that the model obtained from the main sample has
strong out-of-sample predictive power when applied to the supplementary sample. Without the
model, the probability of any user adopting the mobile channel as of one year after the
introduction is the ratio of the number of adopters to the total number of users,
4,579/9,838=0.465. With the model, users with higher hazard rates can be expected to be more
likely to adopt the mobile channel. Out of 492 users between the 90th and 95th percentiles, for
24
example, 430 users actually adopted the mobile channel within one year after the channel
introduction, indicating an adoption rate of 87.4%, which is much higher than the overall
adoption rate in the supplementary sample, 46.5%. On the contrary, users with lower hazard rates
can be expected to be less likely to adopt the mobile channel. Out of 492 users between the 5th
and 10th percentiles, 412 users actually did not adopt the mobile channel, even one year after the
channel introduction, showing an adoption rate of 16.3%, which is much lower than the overall
adoption rate in the supplementary sample, 53.5%. This prediction exercise adds to the validity
of our model and confidence in our results.
Adoption Scoring Rules. Online retailers or marketplaces that have not yet launched the
mobile channel do not have consumer adoption data to calibrate the prediction model. In order to
provide practical implications to those firms, we develop adoption scoring rules with access and
search variables in our model. Similar heuristic approaches have been used in marketing,
especially for predicting the future purchase behaviors of consumers, or their responses to firm
promotions based on their recency-frequency-monetary (RFM) values (Birant, 2011).
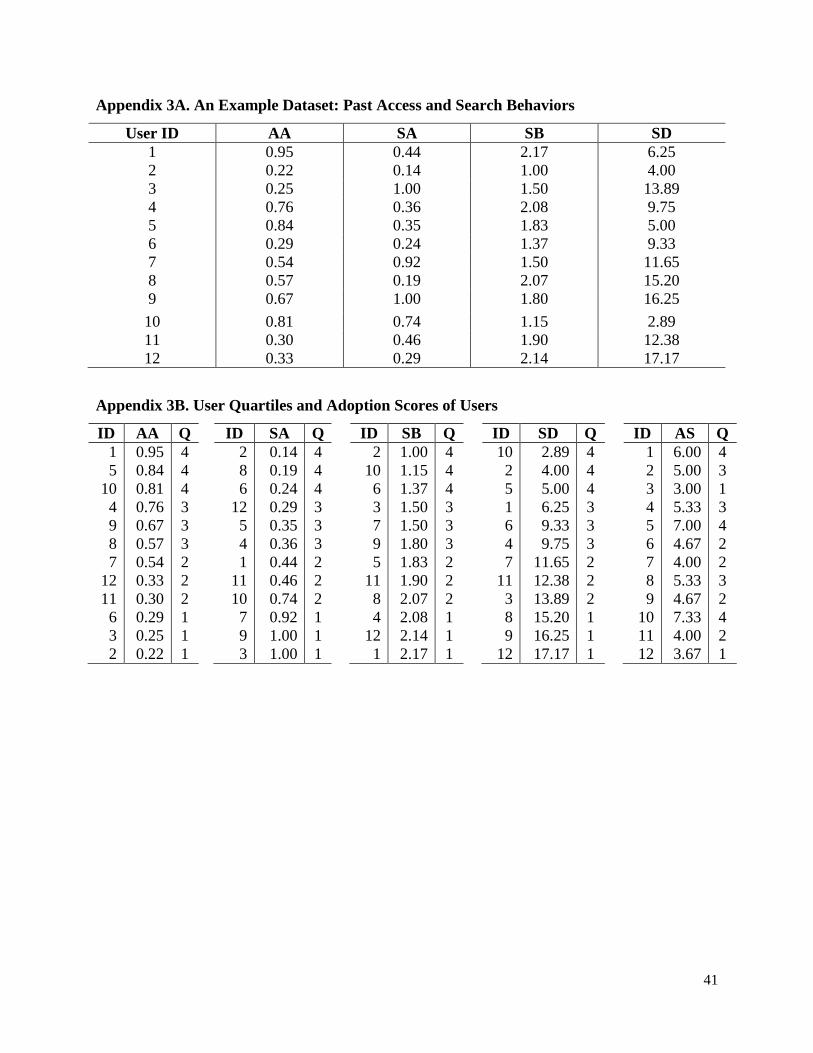
First, we list e-marketplace users in the main sample in descending order of their need for
anytime access (AA), and in ascending order of need for active search (SA), need for broad search
(SB), and need for deep search (SD) (see Appendix 3A and Appendix 3B). Then, we construct an
adoption score of each user by equally weighting the quartiles of the aforementioned access and
search variables (i.e., the sum of the AA quartiles and the average of the SA, SB, and SD
quartiles). Finally, we check the correlation between adoption scores and actual adoptions as of
one year after mobile channel introduction. The correlation between adoption scores and actual
adoptions is 0.35 (p<0.001), meaning that users’ adoption scores, which are computed from their
25
access and search behaviors on the PC channel, can be a good predictor for their mobile channel
adoption.
Table 6 shows the adoption score quartiles and the corresponding number of actual
adopters and non-adopters. Among the top 25% of adoption scores, 69.18% adopted the mobile
channel up to one year after mobile channel introduction, which is much higher than the average
adoption rate of 43.85%. In contrast, among the bottom 25% of adoption scores, only 23.94%
adopted the mobile channel, which is much lower than the average adoption rate. We believe
that this heuristic can be a useful tool for e-commerce companies, helping them assess which
users will be more likely to adopt the mobile channel before deciding to launch one.
----------------------------------------- Insert Table 6 about here
-----------------------------------------
5. DISCUSSION AND CONCLUSION
In this study, we proposed a new approach to explaining and predicting a new technology
adoption, based on prior technology usage behaviors. Specifically, we demonstrated how users’
behavioral patterns, related to access and search, and captured through their actual transactions
on a PC channel of an e-marketplace, could be used to predict their mobile channel adoption. By
identifying the behavioral proxies that represent users’ latent needs for the mobile commerce
channel, we could construct a model that has strong predictive ability. The approach of
predicting a new technology adoption based on objective behavioral measures would become
more feasible, reliable, and useful, as a massive quantity and variety of user data accumulate in
firms’ databases. We believe this empirical approach can complement and extend the current
adoption research by providing an alternative way of measuring the latent needs of users in an
objective and reliable manner.
26
Linking past technology usage behaviors with new technology adoption has several
advantages. First, information on past usage behaviors, which is required to predict future
technology adoption, is readily available in many contexts. Firms can transform such data stored
in their databases into business intelligence by identifying users’ latent needs and predicting the
adoption of a new technology. Second, this approach allows firms to engage in individual-level
targeting for expanding its adopter base. By estimating the propensity to adopt a new technology
for each of their current users, firms can first target the users who are most likely adopt, and can
build their adopter bases effectively. Third, rather than relying on perceptual data, which are
costly to collect and less reliable, drawing business implications from behavioral histories of
users can be done on a large scale in a relatively inexpensive and reliable manner.
Our empirical results on mobile channel adoption also contribute to the burgeoning
research area of mobile commerce. Despite the significance of the mobile channel and many
calls for research, studies on m-commerce are still scant. This study is among the first to examine
mobile channel adoption based on a large dataset. With two datasets of 60,000 e-marketplace
users and over 2.5 million transactions in their online and mobile channels, we empirically show
that m-commerce channel adoption is largely influenced by users’ latent needs for access and
search capabilities.
This study provides several managerial implications for online retailers, which consider
mobile commerce as a new avenue for future growth. The method and findings from this study
could increase retailers’ mobile customer base effectively in the early introduction stage by
focusing on the customer segment, which is more prone to adopt mobile commerce. Specifically,
our results highlight that order time dispersion (a behavioral proxy for need for anytime access),
the proportion of orders followed by keyword or category search, the average number of product
27
categories per order, and the average display rank of orders (behavioral proxies for needs for
active, broad, and deep search, respectively) could be good predictors for mobile channel
adoption. Finally, the adoption scoring rules we proposed can help firms identify and target
potential adopters before they actually launch the mobile channel by computing the access and
search variables.
Our study has a few limitations. First, some of the behavioral measures for access and
search needs are derived based on orders rather than access or search behaviors, due to data
availability. Although they are expected to be highly associated, the measures need to be refined
and validated by future studies. Second, our data do not allow us to consider multi-channel
usage behaviors. For example, e-marketplace users might search for products in the PC channel,
which has extensive information search capability, and then purchase the products in the mobile
channel, which has ubiquitous access capability. Although consumers are likely to purchase at
the moment when they have enough information about the product, consumers could exploit the
benefits of each channel (Han et al., 2013). Collecting data regarding multi-channel usage and
examining the phenomenon of hopping from one channel to another would be an interesting
avenue for future research.
To conclude, our study predicted mobile channel adoption by e-marketplace users, based
on their actual browsing and purchasing behaviors in the e-marketplace, before the addition of
the mobile channel. Our findings show that users’ latent needs concerning access and search,
revealed through their transactions on the PC channel prior to mobile channel introduction, could
be important predictors of their mobile channel adoption. Our conceptual framework, based on
the fit between channel capabilities and users’ latent needs, as well as the behavioral proxies we
developed, will inform future research in this area.
28
REFERENCES Ansari, A., Mela, C.F., and Neslin, S.A., “Customer Channel Migration,” Journal of Marketing Research, 45(1), 2008, pp. 60-76.
Avery, J., Steenburgh, T.J., Deighton, J., and Caravella, M., “Adding Bricks to Clicks: Predicting the Patterns of Cross-Channel Elasticities over Time,” Journal of Marketing, 76(3), 2012, pp. 96-111.
Bagozzi, R.P., “The Legacy of the Technology Acceptance Model and a Proposal for a Paradigm Shift,” Journal of the Association for Information Systems, 8(4), 2007, pp. 3.
Bamberg, S., Ajzen, I., and Schmidt, P., “Choice of Travel Mode in the Theory of Planned Behavior: The Roles of Past Behavior, Habit, and Reasoned Action,” Basic and Applied Social Psychology, 25(3), 2003, pp. 175-187.
Bang, Y., Lee, D.-J., Han, K., Hwang, M., and Ahn, J.-H., “Channel Capabilities, Product Characteristics, and Impacts of Mobile Channel Introduction,” Journal of Management Information Systems, 2013, 30(2), pp. 101-125.
Barr, A., “Ebay Mobile Shopping Almost Doubles This Holiday,” USA Today, December 5, Available at: www.usatoday.com/story/tech/2013/12/05/ebay-mobile-sales-holiday/3880233/.
Benbasat, I. and Barki, H., “Quo Vadis, TAM,” Journal of the Association for Information Systems, 8(4), 2007, pp. 211-218.
Birant, D., “Data Mining Using RFM Analysis,” In K. Funatsu (Ed.), Knowledge-Oriented Applications in Data Mining, InTech, 2011, pp. 91-108.
Borus, M.E., “Response Error in Survey Reports of Earnings Information,” Journal of the American Statistical Association, 61(315), 1966, pp. 729-738.
Castaño, R., Sujan, M., Kacker, M., and Sujan, H., “Managing Uncertainty in the Adoption of New Products: Temporal Distance and Mental Simulation,” Journal of Marketing Research, 45, 2008, pp. 320-336.
Clarke, I., “Emerging Value Propositions for M-Commerce,” Journal of Business Strategies, 18(2), 2001, pp. 133-148.
Cox, D.R. "Regression models and life tables." JR stat soc B, 34(2), 1972, pp. 187-220.
Davis, F.D. 1985. A Technology Acceptance Model for Empirically Testing New End-User Information Systems: Theory and Results. Unpublished PhD thesis, Massachusetts Institute of Technology.
Davis, F.D., “Perceived Usefulness, Perceived Ease of Use, and User Acceptance of Information Technology,” MIS Quarterly, 13(3), 1989, pp. 319-340.
Davis, F.D., Bagozzi, R.P., and Warshaw, P.R., “User Acceptance of Computer Technology: A Comparison of Two Theoretical Models,” Management Science, 35(8), 1989, pp. 982-1003.
Davis, F.D. and Kottemann, J.E., “User Perceptions of Decision Support Effectiveness: Two Production Planning Experiments,” Decision Sciences, 25(1), 1994, pp. 57-76.
Duryee, T., “Eight Percent of Amazon's Sales Are Coming from Mobile,” All Things D, January 4, Available at: allthingsd.com/20130104/eight-percent-of-amazons-sales-are-coming-from-mobile.
29
Falk, T., Schepers, J., Hammerschmidt, M., and Bauer, H.H., “Identifying Cross-Channel Dissynergies for Multichannel Service Providers,” Journal of Service Research, 10(2), 2007, pp. 143-160.
Fisher, R.J., “Social Desirability Bias and the Validity of Indirect Questioning,” Journal of Consumer Research, 20(2), 1993, pp. 303-315.
Gebauer, J., Shaw, M.J., and Gribbins, M.L., “Task-Technology Fit for Mobile Information Systems,” Journal of Information Technology, 25(3), 2010, pp. 259-272.
Ghose, A., Goldfarb, A., and Han, S.P., “How Is the Mobile Internet Different: Search Costs and Local Activities,” Information Systems Research, 2012, forthcoming.
Ghose, A. and Han, S.P., “An Empirical Analysis of User Content Generation and Usage Behavior on the Mobile Internet,” Management Science, 57(9), 2011, pp. 1671-1691.
Han, S.P., Ghose, A., and Xu, K., Mobile Commerce in the New Tablet Economy, Conference on Information Systems and Technology, Minneapolis, Minnesota, 2013.
Hoque, A.Y. and Lohse, G.L., “An Information Search Cost Perspective for Designing Interfaces for Electronic Commerce,” Journal of Marketing Research, 36(3), 1999, pp. 387-394.
Hui, K.-L. and Png, I.P., “The Economics of Privacy,” Handbooks in Information System and Economics, 1, 2006, pp. 471-493.
Klein, J. and Moeschberger, M., Survival Analysis: Statistical Methods for Censored and Truncated Data, 2003.
Lee, Y.E. and Benbasat, I., “Interface Design for Mobile Commerce,” Communications of the ACM, 46(12), 2003, pp. 48-52.
Li, S., Shang, J. and Slaughter, S.A., “Why Do Software Firms Fail? Capabilities, Competitive Actions, and Firm Survival in the Software Industry From 1995 to 2007,” Information Systems Research, 21(3), 2010, pp. 631-654.
Malhotra, N.K., Kim, S.S., and Agarwal, J., “Internet Users' Information Privacy Concerns (Iuipc): The Construct, the Scale, and a Causal Model,” Information Systems Research, 15(4), 2004, pp. 336-355.
Peracchio, L.A. and Tybout, A.M., “The Moderating Role of Prior Knowledge in Schema-Based Product Evaluation,” Journal of Consumer Research, 23(3), 1996, pp. 177-192.
Smith, H.J., Milberg, S.J., and Burke, S.J., “Information Privacy: Measuring Individuals' Concerns About Organizational Practices,” MIS Quarterly, 20(2), 1996, pp. 167-196.
Steckel, J.H. and Vanhonacker, W.R., “Cross-Validating Regression Models in Marketing Research,” Marketing Science, 12(4), 1993, pp. 415-427.
Straub, D., Boudreau, M.-C., and Gefen, D., “Validation Guidelines for Is Positivist Research,” Communications of the Association for Information Systems, 13(24), 2004, pp. 380-427.
Szajna, B., “Software Evaluation and Choice: Predictive Validation of the Technology Acceptance Instrument,” MIS Quarterly, 17(3), 1994, pp. 319-324.
Taylor, S. and Todd, P.A., “Understanding Information Technology Usage: A Test of Competing Models,” Information Systems Research, 6(2), 1995, pp. 144-176.
30
Valentini, S., Montaguti, E., and Neslin, S.A., “Decision Process Evolution in Customer Channel Choice,” Journal of Marketing, 75(6), 2011, pp. 72-86.
Venkatesh, V. and Davis, F.D., “A Theoretical Extension of the Technology Acceptance Model: Four Longitudinal Field Studies,” Management Science, 46(2), 2000, pp. 186-204.
Venkatesh, V., Morris, M.G., Davis, G.B., and Davis, F.D., “User Acceptance of Information Technology: Toward a Unified View,” MIS Quarterly, 27(3), 2003, pp. 425-478.
Venkatesh, V. and Ramesh, V., “Web and Wireless Site Usability: Understanding Differences and Modeling Use,” MIS Quarterly, 30(1), 2006, pp. 181-206.
Venkatesh, V., Thong, J., and Xu, X., “Consumer Acceptance and Use of Information Technology: Extending the Unified Theory of Acceptance and Use of Technology,” MIS Quarterly, 36(1), 2012, pp. 157-178.
Vinson, D.E., Scott, J.E., and Lamont, L.M., “The Role of Personal Values in Marketing and Consumer Behavior,” Journal of Marketing, 41(2), 1977, pp. 44-50.
Wu, J.-H. and Wang, S.-C., “What Drives Mobile Commerce?: An Empirical Evaluation of the Revised Technology Acceptance Model,” Information & Management, 42(5), 2005, pp. 719-729.
Zhang, D., “Web Content Adaptation for Mobile Handheld Devices,” Communications of the ACM, 50(2), 2007, pp. 75-79.
31
Table 1. Distinct Channel Capabilities between PC and Mobile Channels
Technological Features Channel Capabilities
Mobile Channel
Ubiquity of the Internet enabled device/ High portability of devices (e.g., small screens, light weight mobile devices) / Readiness of mobile devices to access the Internet
Ubiquitous access capability
Low input usability of mobile devices (e.g., text input) Limited information search capability
PC Channel
Stationarity of the Internet / Low portability of devices Constrained access capability
High input and output usability (e.g., large screens, keyboards) Extensive information search capability
Table 2. Basic Description of the Main Sample
Total Orders 1,523,563 Before the mobile channel launch (3/01/2009-5/31/2010) Online Orders 646,641
After the mobile channel launch (6/01/2010-6/30/2011)
Online Orders 841,962
Mobile Orders 34,960 Total Users 21,063 Mobile channel Adopters 9,237
Non-adopters 11,826 Gender Female 11,702
Male 9,361 Age 15-20 978
21-25 3,759 26-30 6,163 31-35 5,235 36-40 2,728 41-45 1,199 46-50 489 51- 512
Average membership duration (std.) 1 900.01 (193.85) (Days) Average order prices (std.) 2 34.38 (74.16) (USD) Note: 1 Duration at t2, 2 USD 1 = KRW 1,071.6 as of Nov 11, 2013
32
Table 3A. Descriptive Statistics (N=21,063)
Variable Mean S.D. Min Max 1. AF .059 .129 .009 11.031 2. AA .589 .127 .220 .949 3. SA .684 .293 0 1 4. SB 1.529 .479 1 5.833 5. SD 8.476 4.589 1 88 6. PC_em .769 .422 0 1 7. PC_sm .446 .497 0 1 8. PC_itr .327 .469 0 1 9. PC_tra .842 .364 0 1 10. RT .119 .151 0 1 11. CM .898 .302 0 1 12. LG .988 .111 0 1 13. AS_ql .667 .197 0 1 14. AS_pr .673 .240 0 1 15. Age 31.229 7.783 15 95 16. Gdr .444 .497 0 1 Note: AF=Need for frequent access, AA=Need for anytime access, SA=Need for active search propensity, SB=Need for broad search, SD=Need for deep search depth, PC_em=whether to allow email promotions, PC_sm=whether to allow SMS promotions, PC_itr= whether to give personal information on interests, PC_tra=whether to authorize personal information transfer to other companies, RT=product return or cancellation rates, CM=whether to request e-mail or SMS confirmations for transactions, LG=use of a safer login system, AS_ql=ratio of orders with quality assurance, AS_pr=ratio of orders with a price-matching guarantee, Gdr=gender (0=male, 1=female)
33
Table 3B. Correlations (N=21,063)
Variable AF AA SA SB SD PC_em PC_sm PC_itr PC_tra RT CM LG AS_ql AS_pr Age
AA 0.17
SA 0.04 0.06
SB 0.04 0.04 0.60
SD -0.03 0.00 0.01 0.02
PC_em 0.03 0.04 0.06 0.04 -0.03
PC_sm 0.01 0.02 0.02 0.02 -0.02 0.35
PC_itr -0.03 0.04 0.10 0.07 0.00 -0.01 0.05
PC_tra -0.08 0.22 0.04 0.03 0.03 -0.01 -0.01 0.17
RT 0.02 -0.01 -0.12 -0.10 -0.05 0.00 0.02 -0.03 -0.05
CM -0.05 -0.02 0.05 0.04 -0.01 0.27 0.19 0.02 0.00 -0.01
LG -0.03 -0.03 -0.01 -0.01 0.00 -0.02 -0.03 -0.01 0.01 -0.01 0.02
AS_ql 0.06 0.04 -0.05 -0.05 -0.04 0.02 0.01 -0.07 -0.13 -0.11 -0.01 0.00
AS_pr 0.05 0.00 0.09 0.03 -0.15 0.04 0.06 -0.09 -0.15 0.06 0.01 -0.01 0.12
Age 0.03 0.01 0.01 0.02 0.13 0.01 0.03 0.01 0.04 -0.10 -0.06 0.00 0.01 -0.16
Gdr -0.01 0.01 -0.29 -0.16 0.09 -0.03 -0.05 -0.06 -0.02 -0.04 -0.04 -0.02 -0.04 -0.26 0.11
Note: AF=Need for frequent access, AA=Need for anytime access, SA=Need for active search, SB=Need for broad search, SD=Need for deep search, PC_em=whether to allow email promotions, PC_sm=whether to allow SMS promotions, PC_itr= whether to give personal information on interests, PC_tra=whether to authorize personal information transfer to other companies, RT=product return or cancellation rates, CM=whether to request e-mail or SMS confirmations for transactions, LG=use of a safer login system, AS_ql=ratio of orders with quality assurance, AS_pr=ratio of orders with a price- matching guarantee, Gdr=gender (0=male, 1=female)
34
Table 4. Results from the Hazard Rate Analysis (N=21,063)
Dependent Variable: Time to adopt the mobile channel
Number of observations 21,063
Number of adoptions 9,237
Model fit Log likelihood = -82731.959, Prob. > χ2 = 0.0000; Harrell’s C = 0.817
Independent Variables Coef. (Std. errors) Note Number of orders per day (AF : Need for Access Frequency) -0.062 (0.134)
Access behaviors Order time dispersion (AA : Need for Anytime Access) 1.157 (0.092)***
Proportion of orders searched either through keyword typing or category browsing (SA: Need for Active Search)
-1.247 (0.048)***
Search behaviors Mean number of product categories per order (SB: Need for Search Breadth) -2.762 (0.05)***
Mean display rank of orders (SD: Need for Search Depth) -0.013 (0.003)***
Control Variables Email promotion allowance (PC_em: seclusion concerns) 0.087 (0.028)**
Privacy-related behaviors
SMS promotion allowance (PC_sms: seclusion concerns) 0.088 (0.023)***
Whether to report personal interests (PC_itr: secrecy concerns) 0.027 (0.024)
Whether to authorize personal information transfer to affiliated companies (PC_tra: autonomy concerns) 0.28 (0.03)***
Product return or cancellation ratios (RT) 0.032 (0.066)
Transaction risk-related behaviors
Whether to request e-mail or SMS confirmations for transactions (CM) -0.213 (0.035)***
Whether to use a safer login system (LG) -0.217 (0.088)*
Ratio of orders with a minimum quality guarantee (AS_ql) 0.69 (0.06)*** Assurance-seeking
behaviors Ratio of orders with a price-matching guarantee (AS_pr) 2.363 (0.102)***
Age (years) -0.017 (0.002)*** Demographics
Gender (0=male, 1=female) -0.071 (0.03)*
Density of orders by day of the week (base: Saturday) χ2(6) = 150.87, Prob. > χ2 = 0.000
Density of orders by time of the day (base: 23h) χ2(23) = 448.92, Prob. > χ2 = 0.000
Density of orders by product category6 (base: Cellphone/Smartphone) χ2
(37) = 658.14, Prob. > χ2 = 0.000
Note: *p<0.05, **p<0.01, ***p<0.001; two-tailed tests. The coefficients on the density of orders by day of the week, time of the day, and product categories are not shown for expositional brevity.
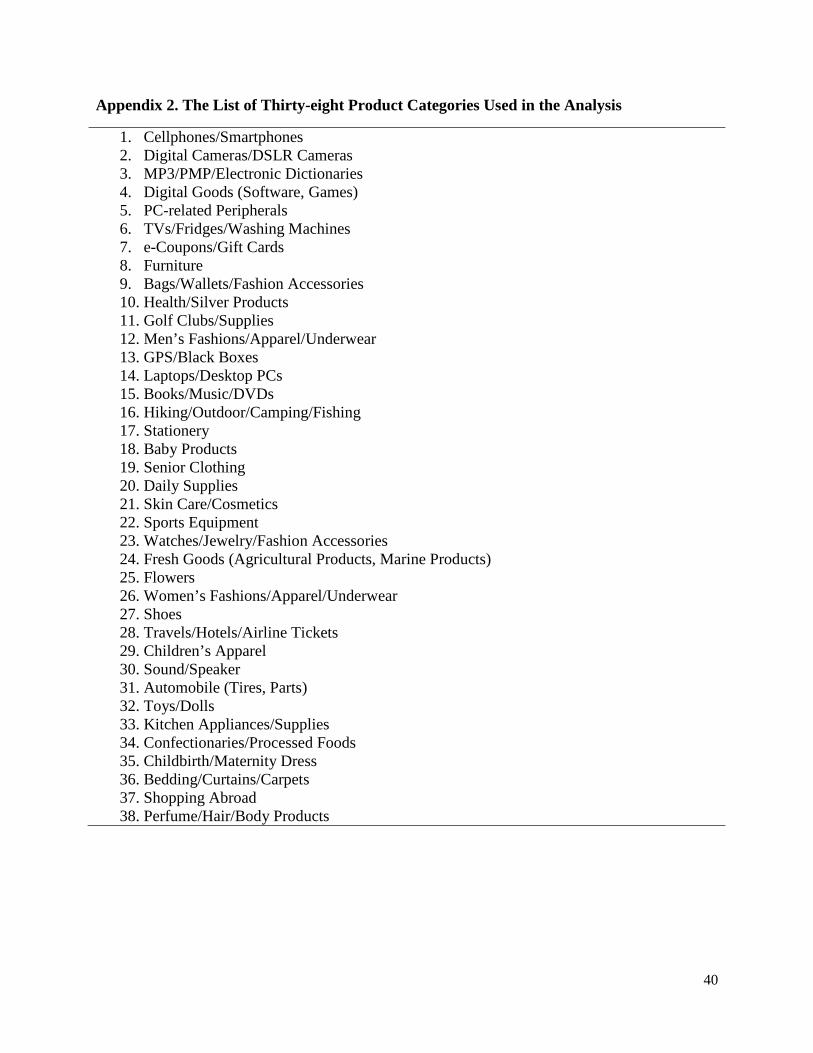
6 A total of 38 product categories were considered in the analysis. The list of categories is provided in Appendix 2.

35
Table 5. Prediction Results on the Supplementary Sample
Hazard Rate Percentile Percentile <1 1-5 5-10 10-25 25-50 50-75 75-90 90-95 95-99 99< Total
No. of Adopters 21 74 80 258 806 1,320 1129 430 362 95 4,575
No. of Non- adopters 78 319 412 1,218 1,653 1,140 347 62 30 4 5,263
Total 99 393 492 1,476 2,459 2,460 1476 492 392 99 9,838
P(A) 0.212 0.188 0.163 0.175 0.328 0.537 0.765 0.874 0.923 0.960 0.465
Note: P(A)=the actual proportion of adopters as of one year after mobile channel introduction.
Table 6. Results of Adoption Scoring Rules
Adoption score quartiles 1 2 3 4 Total
Adopters 1,337 (23.94%)
2,399 (42.47%)
2,497 (45.50%)
3,004 (69.18%)
9,237 (43.85%)
Non-adopters 4,247 (76.06%)
3,250 (57.53%)
2,991 (54.50%)
1,338 (30.82%)
11,826 (56.15%)
Total 5,584 5,649 5,488 4,342 21,063
36
Figure 1. Order Time Dispersion of Four Users
Notes: This figure displays the distribution of four hypothetical users’ orders over twenty-four hours. Even though they have an identical total number of orders, their order time dispersions are different. User #1 has a more even distribution, and thus a higher order time dispersion index (TD1=1.00) than user #2 (TD2=0.22). User #3 has a more localized distribution, and thus a lower order time dispersion index (TD3=0.48) than user #4 (TD4=0.59).
37
Figure 2. Composition of the Datasets
38
Figure 3. Survival Functions
(a) Order dispersion (b) Active search propensity
(c) Search breadth (d) Search depth
0.2
.4.6
.81
0 10 20 30 40 50 60 70 80 90 100 110 120 130 140 150 160 170 180Days after the mobile channel introduction
Very high order dispersion High order dispersionBaseline survival
0.2
.4.6
.81
0 10 20 30 40 50 60 70 80 90 100 110 120 130 140 150 160 170 180Days after the mobile channel introduction
Very high search activeness High search activenessBaseline survival
0.2
.4.6
.81
0 10 20 30 40 50 60 70 80 90 100 110 120 130 140 150 160 170 180Days after the mobile channel introduction
Very high needs for search breadthHigh needs for search breadthBaseline survival
0.2
.4.6
.81
0 10 20 30 40 50 60 70 80 90 100 110 120 130 140 150 160 170 180Days after the mobile channel introduction
Very high needs for search depthHigh needs for search depthBaseline survival
39
Appendix 1. Plots for Testing the Proportionality Assumption
Need for frequent access Need for active search
Need for broad search Ratio of orders with a price-matching guarantee
Age Gender
-50
050
100
150
200
scal
ed S
choe
nfel
d - A
Q
0 100 200 300 400Time
bandwidth = .8
Test of PH Assumption
-20
-10
010
scal
ed S
choe
nfel
d - S
A
0 100 200 300 400Time
bandwidth = .8
Test of PH Assumption
-10
010
2030
scal
ed S
choe
nfel
d - S
B
0 100 200 300 400Time
bandwidth = .8
Test of PH Assumption-8
0-6
0-4
0-2
00
20sc
aled
Sch
oenf
eld
- AS
_pr
0 100 200 300 400Time
bandwidth = .8
Test of PH Assumption
-.50
.51
1.5
scal
ed S
choe
nfel
d - A
ge
0 100 200 300 400Time
bandwidth = .8
Test of PH Assumption
-10
-50
510
scal
ed S
choe
nfel
d - S
ex
0 100 200 300 400Time
bandwidth = .8
Test of PH Assumption
40
Appendix 2. The List of Thirty-eight Product Categories Used in the Analysis
1. Cellphones/Smartphones 2. Digital Cameras/DSLR Cameras 3. MP3/PMP/Electronic Dictionaries 4. Digital Goods (Software, Games) 5. PC-related Peripherals 6. TVs/Fridges/Washing Machines 7. e-Coupons/Gift Cards 8. Furniture 9. Bags/Wallets/Fashion Accessories 10. Health/Silver Products 11. Golf Clubs/Supplies 12. Men’s Fashions/Apparel/Underwear 13. GPS/Black Boxes 14. Laptops/Desktop PCs 15. Books/Music/DVDs 16. Hiking/Outdoor/Camping/Fishing 17. Stationery 18. Baby Products 19. Senior Clothing 20. Daily Supplies 21. Skin Care/Cosmetics 22. Sports Equipment 23. Watches/Jewelry/Fashion Accessories 24. Fresh Goods (Agricultural Products, Marine Products) 25. Flowers 26. Women’s Fashions/Apparel/Underwear 27. Shoes 28. Travels/Hotels/Airline Tickets 29. Children’s Apparel 30. Sound/Speaker 31. Automobile (Tires, Parts) 32. Toys/Dolls 33. Kitchen Appliances/Supplies 34. Confectionaries/Processed Foods 35. Childbirth/Maternity Dress 36. Bedding/Curtains/Carpets 37. Shopping Abroad 38. Perfume/Hair/Body Products
41
Appendix 3A. An Example Dataset: Past Access and Search Behaviors
User ID AA SA SB SD 1 0.95 0.44 2.17 6.25 2 0.22 0.14 1.00 4.00 3 0.25 1.00 1.50 13.89 4 0.76 0.36 2.08 9.75 5 0.84 0.35 1.83 5.00 6 0.29 0.24 1.37 9.33 7 0.54 0.92 1.50 11.65 8 0.57 0.19 2.07 15.20 9 0.67 1.00 1.80 16.25 10 0.81 0.74 1.15 2.89 11 0.30 0.46 1.90 12.38 12 0.33 0.29 2.14 17.17
Appendix 3B. User Quartiles and Adoption Scores of Users
ID AA Q ID SA Q ID SB Q ID SD Q ID AS Q 1 5
10 4 9 8 7
12 11 6 3 2
0.95 0.84 0.81 0.76 0.67 0.57 0.54 0.33 0.30 0.29 0.25 0.22
4 4 4 3 3 3 2 2 2 1 1 1
2 8 6
12 5 4 1
11 10 7 9 3
0.14 0.19 0.24 0.29 0.35 0.36 0.44 0.46 0.74 0.92 1.00 1.00
4 4 4 3 3 3 2 2 2 1 1 1
2 10 6 3 7 9 5
11 8 4
12 1
1.00 1.15 1.37 1.50 1.50 1.80 1.83 1.90 2.07 2.08 2.14 2.17
4 4 4 3 3 3 2 2 2 1 1 1
10 2 5 1 6 4 7
11 3 8 9
12
2.89 4.00 5.00 6.25 9.33 9.75
11.65 12.38 13.89 15.20 16.25 17.17
4 4 4 3 3 3 2 2 2 1 1 1
1 2 3 4 5 6 7 8 9
10 11 12
6.00 5.00 3.00 5.33 7.00 4.67 4.00 5.33 4.67 7.33 4.00 3.67
4 3 1 3 4 2 2 3 2 4 2 1