planning and scheduling operations
TRANSCRIPT
1
Chapter 10Planning and Scheduling Operationspart 1
Sales and Operations Planning
Options and Strategies
Operations Planning in Services
The 11th largest manufacturer. $3.4 Billion.
Focuses on replacement tires.
Key strategies: competitive cost, profit growth,….
2008/10 Reduced production due to supply shortage. No layoffs.
2009/10 Increased capacity by changing to 24/7 operations to meet a growing demand. Hired 200 more employees.
2013/3 Temporarily idled production at its Finlay plant due to high inventories and competition from Chinese‐made tires.
2013/9 Phasing out small tires in favor of bigger tires with better designs. Implementation of new production planning software.
2
2
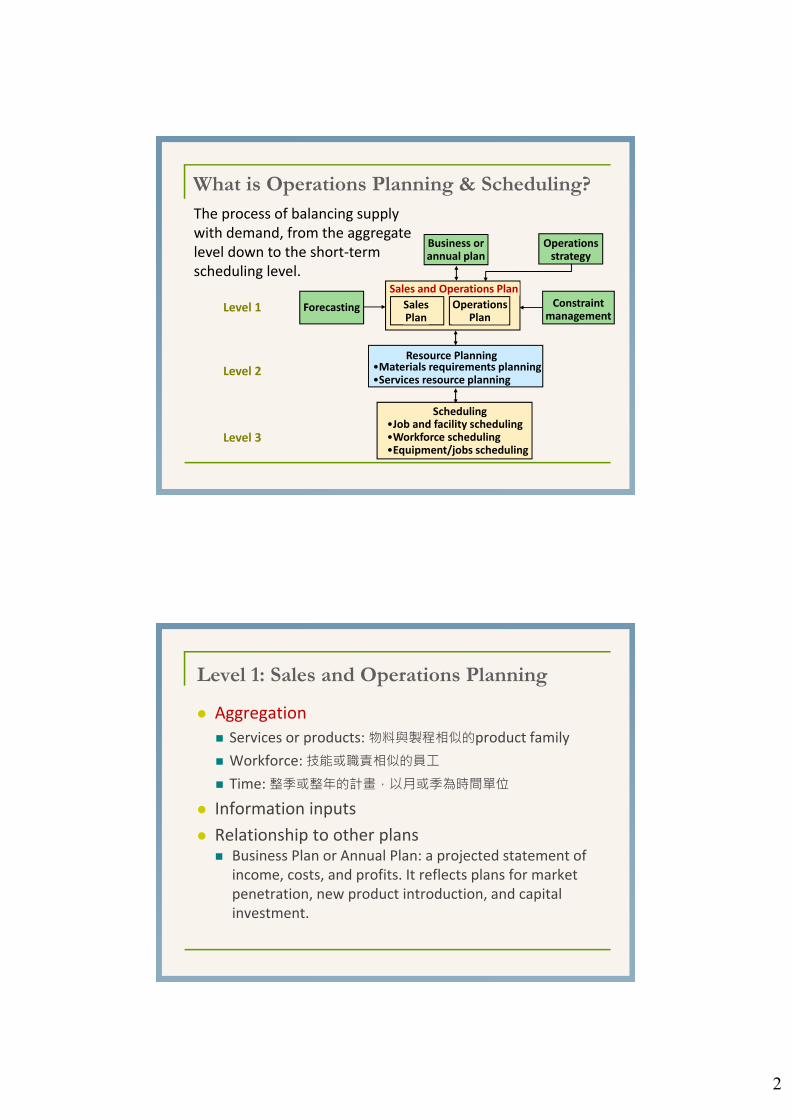
What is Operations Planning & Scheduling?The process of balancing supply with demand, from the aggregate level down to the short‐term scheduling level.
•Job and facility scheduling•Workforce scheduling•Equipment/jobs scheduling
Scheduling
•Materials requirements planning•Services resource planning
Resource Planning
Business orannual plan
SalesPlan
OperationsPlan
Sales and Operations Plan
Forecasting
Operationsstrategy
Constraintmanagement
Level 1
Level 2
Level 3
Level 1: Sales and Operations Planning
Aggregation
Services or products: 物料與製程相似的product family
Workforce: 技能或職責相似的員工
Time:整季或整年的計畫,以月或季為時間單位
Information inputs
Relationship to other plans Business Plan or Annual Plan: a projected statement of
income, costs, and profits. It reflects plans for market penetration, new product introduction, and capital investment.
3
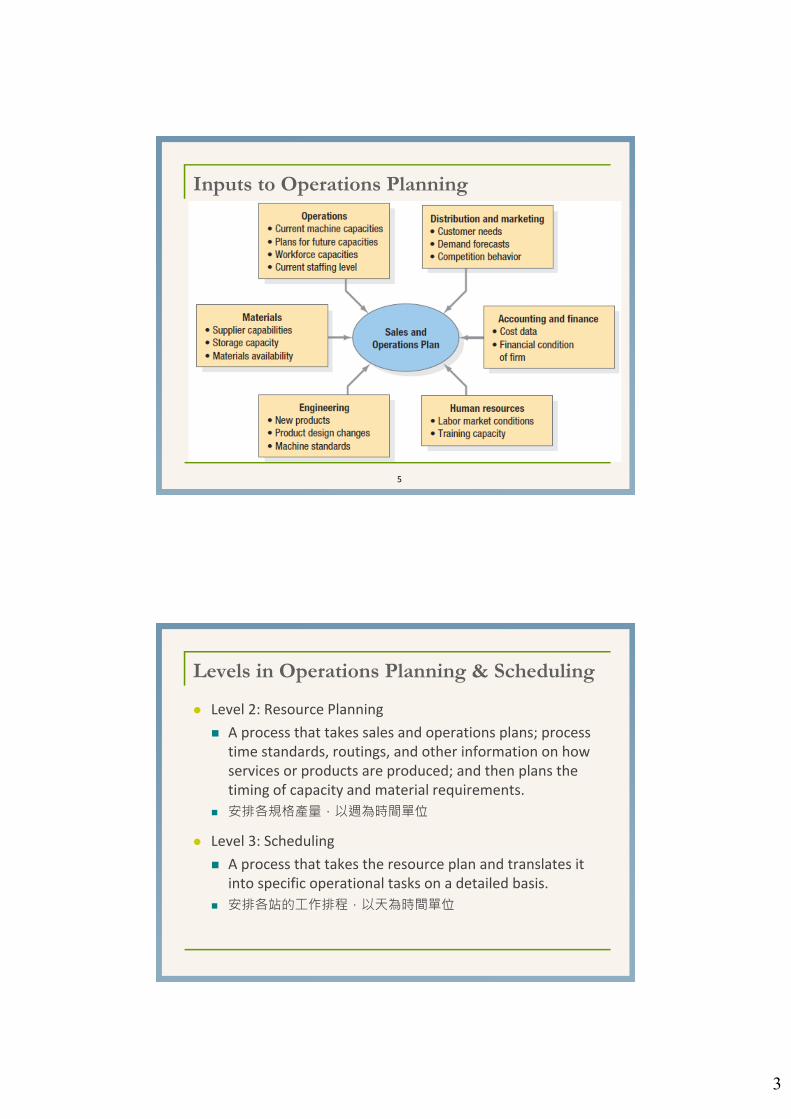
Inputs to Operations Planning
5
Levels in Operations Planning & Scheduling
Level 2: Resource Planning
A process that takes sales and operations plans; process time standards, routings, and other information on how services or products are produced; and then plans the timing of capacity and material requirements.
安排各規格產量,以週為時間單位
Level 3: Scheduling
A process that takes the resource plan and translates it into specific operational tasks on a detailed basis.
安排各站的工作排程,以天為時間單位
4
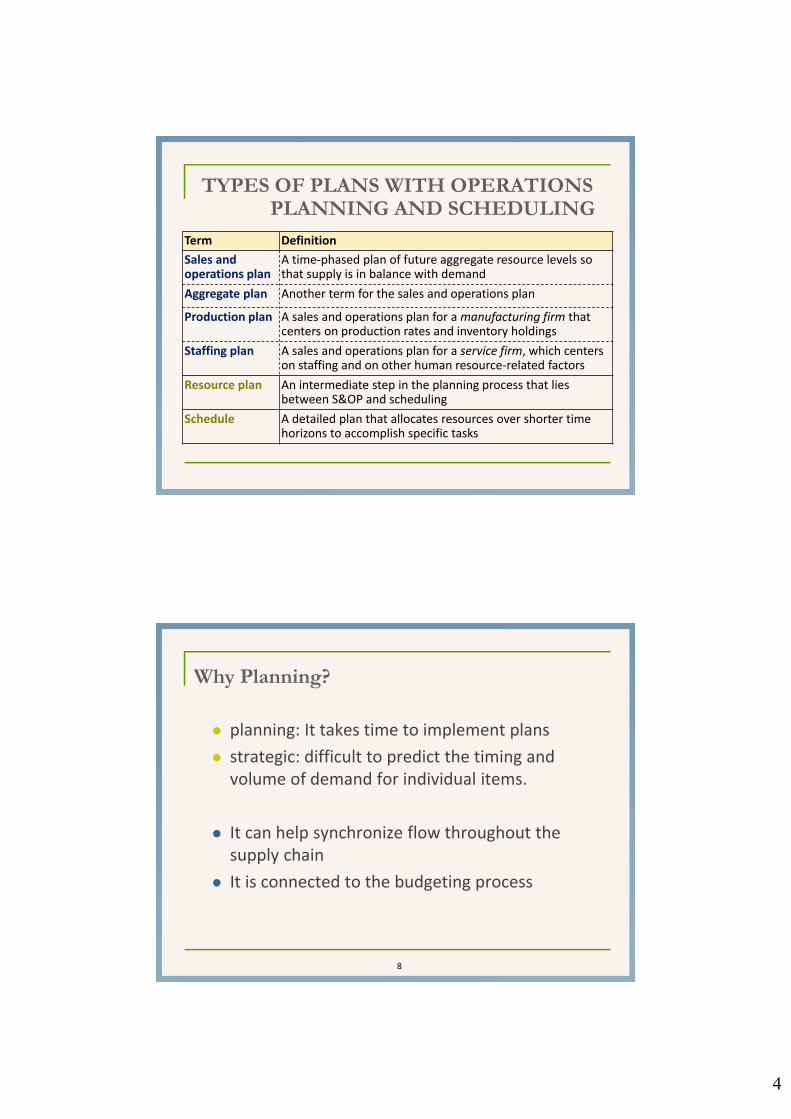
TYPES OF PLANS WITH OPERATIONS PLANNING AND SCHEDULING
Term Definition
Sales and operations plan
A time‐phased plan of future aggregate resource levels so that supply is in balance with demand
Aggregate plan Another term for the sales and operations plan
Production plan A sales and operations plan for a manufacturing firm that centers on production rates and inventory holdings
Staffing plan A sales and operations plan for a service firm, which centers on staffing and on other human resource‐related factors
Resource plan An intermediate step in the planning process that lies between S&OP and scheduling
Schedule A detailed plan that allocates resources over shorter time horizons to accomplish specific tasks
Why Planning?
planning: It takes time to implement plans
strategic: difficult to predict the timing and volume of demand for individual items.
It can help synchronize flow throughout the supply chain
It is connected to the budgeting process
8

5
9
Planning Options and Constraints
Demand Options Pricing/Promotion
Back orders
New demand
Supply Options Workforce Adjustment
Utilization(overtime/slack time)
Part‐time workers
Anticipation Inventory
Subcontractors
Vacation Schedules
Constraints Capacity
Inventory limit/safety stock
Policies
Back orders
Overtime/Subcontracting
Workforce changes
TYPES OF COSTS WITH SALES AND OPERATIONS PLANNING
Cost Definition
Regular time Regular‐time wages plus benefits and pay for vacations
Overtime Wages paid for work beyond the normal workweek exclusive of fringe benefits
Hiring and layoff Cost of advertising jobs, interviews, training programs, scrap caused by inexperienced employees, exit interviews, severance pay, and retraining
Inventory holding Capital, storage and warehousing, pilferage and obsolescence, insurance, and taxes
Backorder and stockout
Costs to expedite past‐due orders, potential cost of losing a customer
6
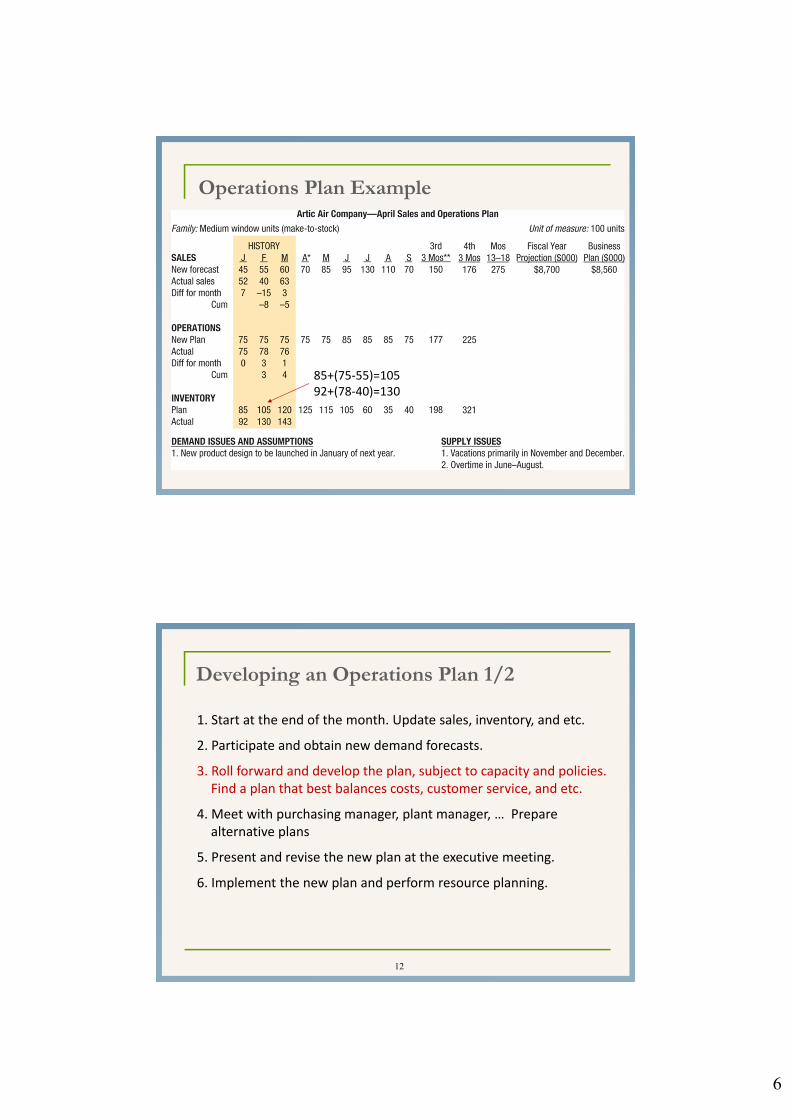
Operations Plan Example
85+(75‐55)=10592+(78‐40)=130
Developing an Operations Plan 1/2
12
1. Start at the end of the month. Update sales, inventory, and etc.
2. Participate and obtain new demand forecasts.
3. Roll forward and develop the plan, subject to capacity and policies. Find a plan that best balances costs, customer service, and etc.
4. Meet with purchasing manager, plant manager, … Prepare alternative plans
5. Present and revise the new plan at the executive meeting.
6. Implement the new plan and perform resource planning.
7
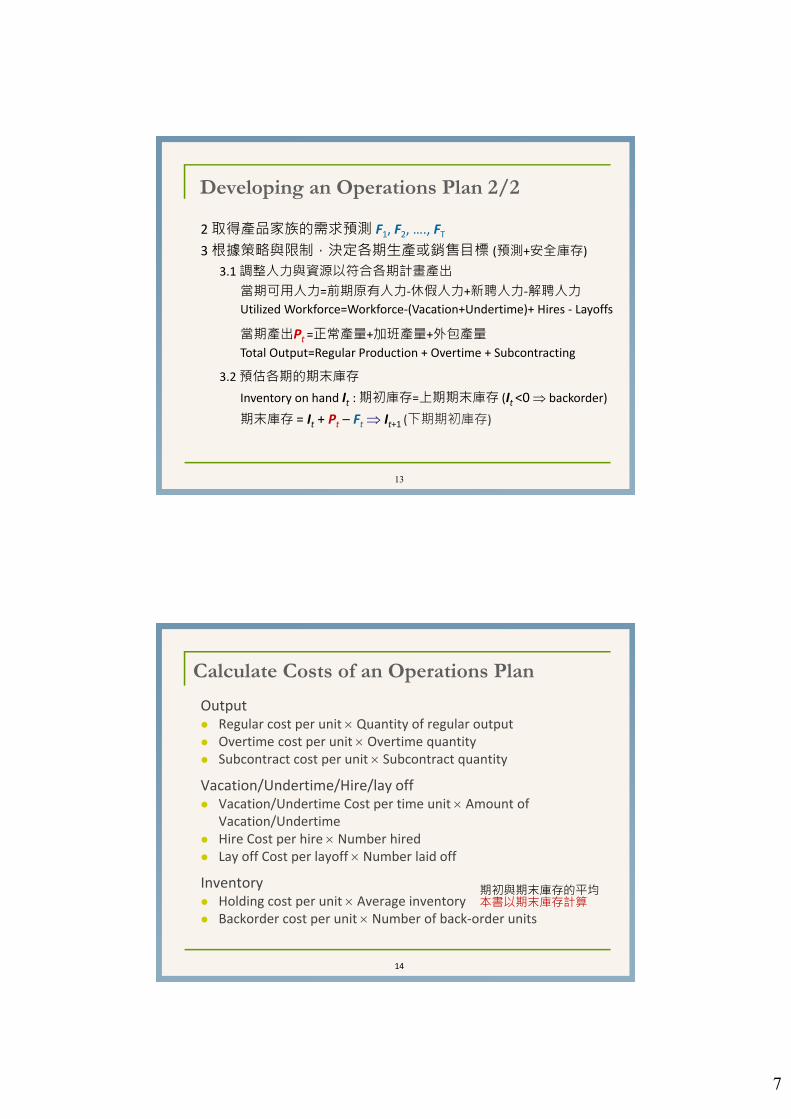
Developing an Operations Plan 2/2
13
2 取得產品家族的需求預測 F1, F2, …., FT3 根據策略與限制,決定各期生產或銷售目標 (預測+安全庫存)
3.1調整人力與資源以符合各期計畫產出當期可用人力=前期原有人力‐休假人力+新聘人力‐解聘人力Utilized Workforce=Workforce‐(Vacation+Undertime)+ Hires ‐ Layoffs
當期產出Pt =正常產量+加班產量+外包產量Total Output=Regular Production + Overtime + Subcontracting
3.2預估各期的期末庫存
Inventory on hand It : 期初庫存=上期期末庫存 (It <0 backorder)
期末庫存 = It + Pt – Ft It+1 (下期期初庫存)
Calculate Costs of an Operations Plan
Output Regular cost per unit Quantity of regular output Overtime cost per unit Overtime quantity Subcontract cost per unit Subcontract quantity
Vacation/Undertime/Hire/lay off Vacation/Undertime Cost per time unit Amount of
Vacation/Undertime Hire Cost per hire Number hired Lay off Cost per layoff Number laid off
Inventory Holding cost per unit Average inventory Backorder cost per unit Number of back‐order units
14
期初與期末庫存的平均本書以期末庫存計算
8
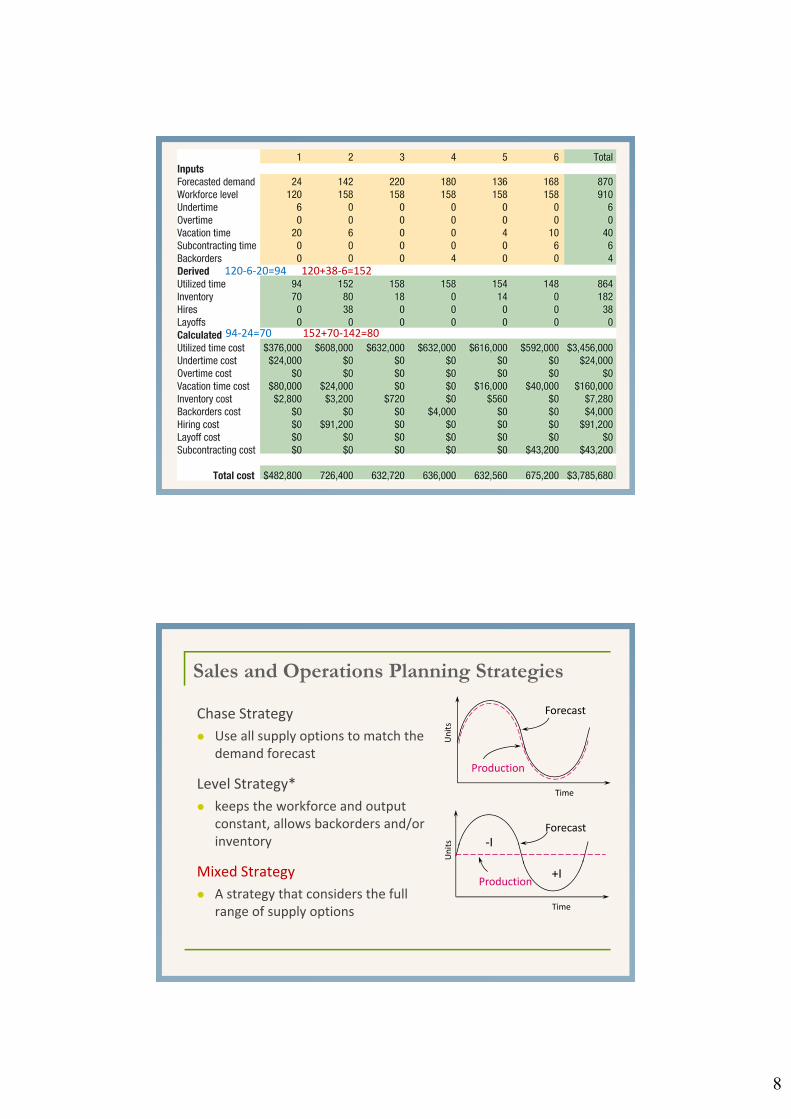
120‐6‐20=94
94‐24=70
120+38‐6=152
152+70‐142=80
Sales and Operations Planning Strategies
Chase Strategy
Use all supply options to match the demand forecast
Level Strategy*
keeps the workforce and output constant, allows backorders and/or inventory
Mixed Strategy
A strategy that considers the full range of supply options
Units
Time
Forecast
Production
‐I
+I
Units
Time
Forecast
Production
9
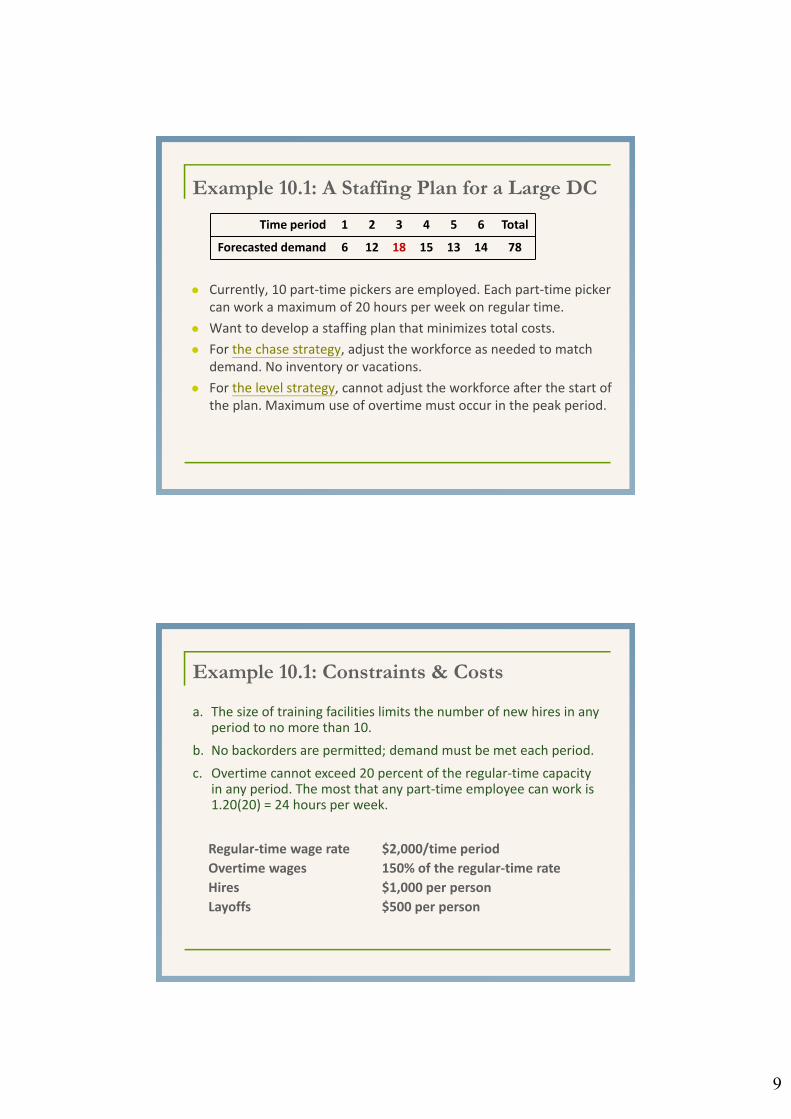
Example 10.1: A Staffing Plan for a Large DC
Currently, 10 part‐time pickers are employed. Each part‐time picker can work a maximum of 20 hours per week on regular time.
Want to develop a staffing plan that minimizes total costs.
For the chase strategy, adjust the workforce as needed to match demand. No inventory or vacations.
For the level strategy, cannot adjust the workforce after the start of the plan. Maximum use of overtime must occur in the peak period.
Time period 1 2 3 4 5 6 Total
Forecasted demand 6 12 18 15 13 14 78
Example 10.1: Constraints & Costs
a. The size of training facilities limits the number of new hires in any period to no more than 10.
b. No backorders are permitted; demand must be met each period.
c. Overtime cannot exceed 20 percent of the regular‐time capacity in any period. The most that any part‐time employee can work is 1.20(20) = 24 hours per week.
Regular‐time wage rate $2,000/time period
Overtime wages 150% of the regular‐time rate
Hires $1,000 per person
Layoffs $500 per person
10
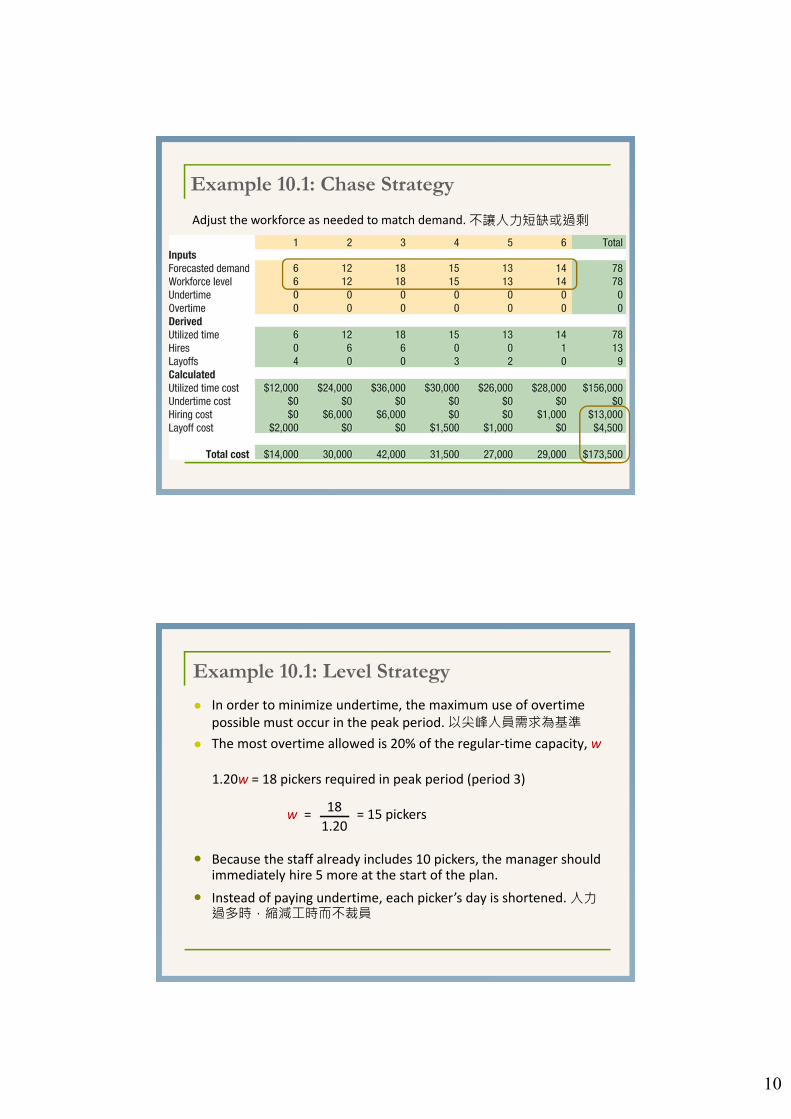
Example 10.1: Chase Strategy
Adjust the workforce as needed to match demand. 不讓人力短缺或過剩
Example 10.1: Level Strategy
In order to minimize undertime, the maximum use of overtime possible must occur in the peak period. 以尖峰人員需求為基準
The most overtime allowed is 20% of the regular‐time capacity, w
Because the staff already includes 10 pickers, the manager should immediately hire 5 more at the start of the plan.
Instead of paying undertime, each picker’s day is shortened. 人力過多時,縮減工時而不裁員
1.20w = 18 pickers required in peak period (period 3)
w = = 15 pickers18
1.20
11
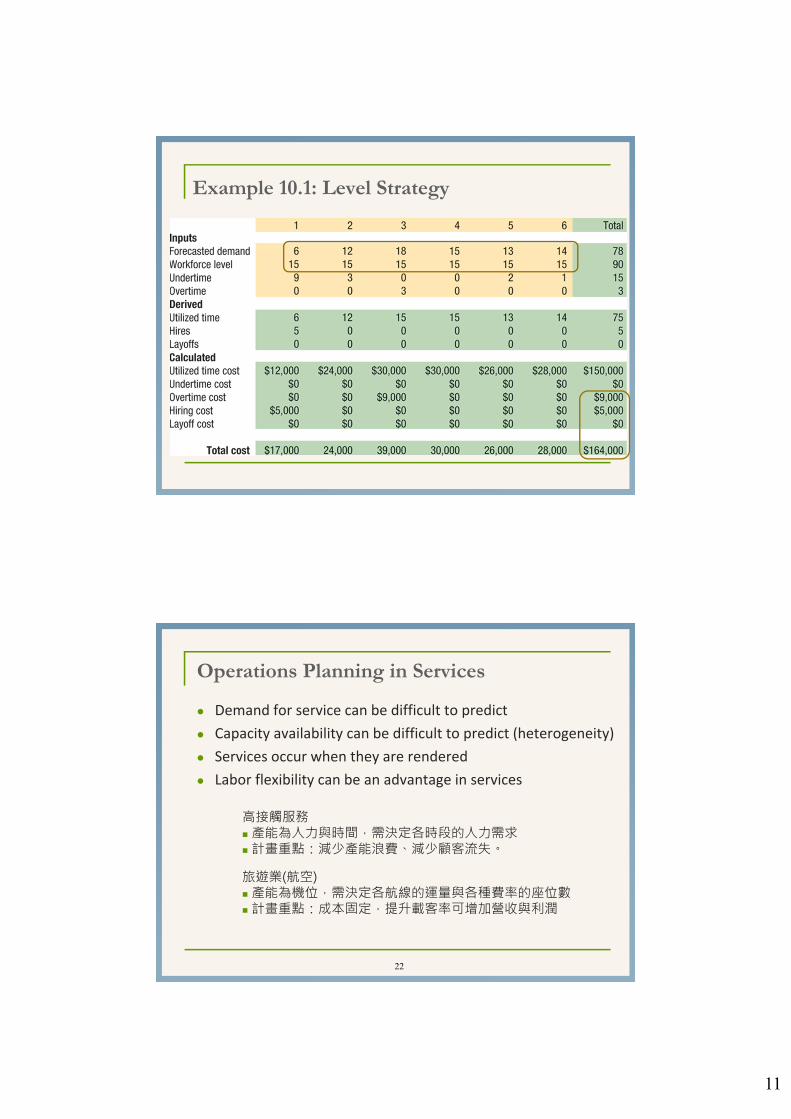
Example 10.1: Level Strategy
Operations Planning in Services
22
高接觸服務產能為人力與時間,需決定各時段的人力需求計畫重點:減少產能浪費、減少顧客流失。
旅遊業(航空)產能為機位,需決定各航線的運量與各種費率的座位數計畫重點:成本固定,提升載客率可增加營收與利潤
Demand for service can be difficult to predict
Capacity availability can be difficult to predict (heterogeneity)
Services occur when they are rendered
Labor flexibility can be an advantage in services
12
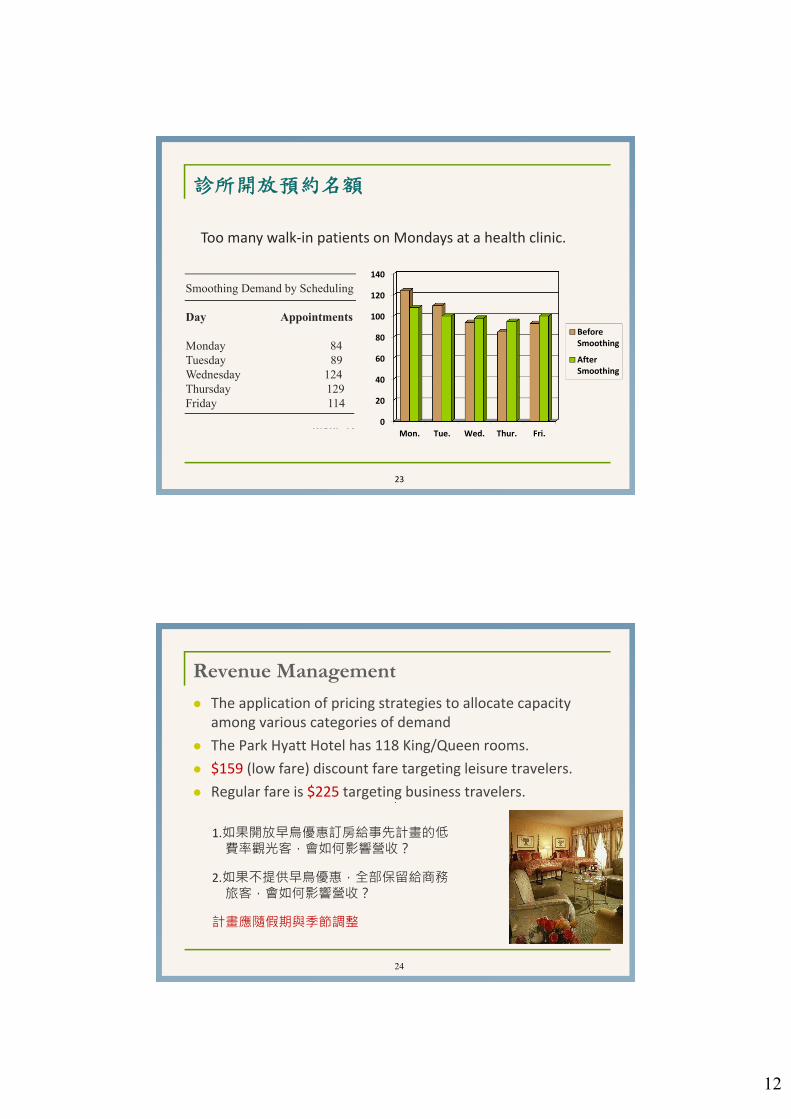
診所開放預約名額
0
20
40
60
80
100
120
140
Mon. Tue. Wed. Thur. Fri.
23
Too many walk‐in patients on Mondays at a health clinic.
0
20
40
60
80
100
120
140
Mon. Tue. Wed. Thur. Fri.
BeforeSmoothing
AfterSmoothing
Smoothing Demand by Scheduling
Day Appointments
Monday 84Tuesday 89Wednesday 124Thursday 129Friday 114
Revenue Management
The application of pricing strategies to allocate capacity among various categories of demand
The Park Hyatt Hotel has 118 King/Queen rooms.
$159 (low fare) discount fare targeting leisure travelers.
Regular fare is $225 targeting business travelers.
24
1.如果開放早鳥優惠訂房給事先計畫的低費率觀光客,會如何影響營收?
2.如果不提供早鳥優惠,全部保留給商務旅客,會如何影響營收?
計畫應隨假期與季節調整