aggregate planning & master production scheduling - e
TRANSCRIPT
Chapter2 1
Aggregate Planning Aggregate Planning & Master Production Scheduling& Master Production Scheduling
Chapter 2
Production Planning Production Planning & Control& Control
Chapter2 2
Aggregate Planning Aggregate Planning & Master Production Scheduling& Master Production Scheduling
1 0
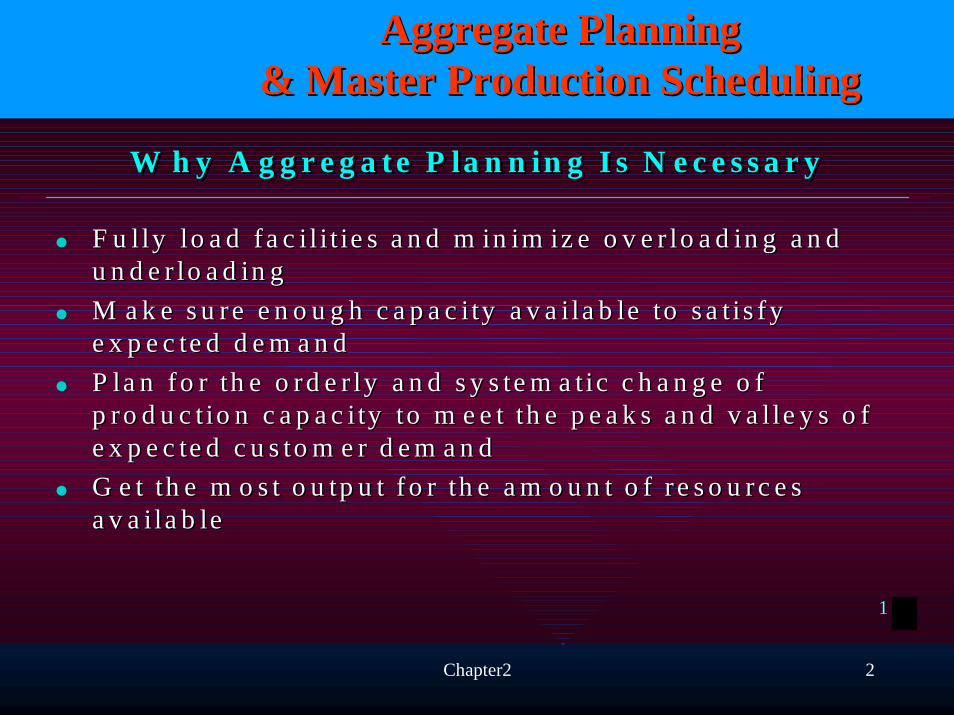
F u l ly lo a d f a c i l i t ie s a n d m in im iz e o v e r lo a d in g a n d F u l ly lo a d f a c i l i t ie s a n d m in im iz e o v e r lo a d in g a n d u n d e r lo a d in gu n d e r lo a d in gM a k e s u re e n o u g h c a p a c i ty a v a i la b le to s a t is fy M a k e s u re e n o u g h c a p a c i ty a v a i la b le to s a t is fy e x p e c te d d e m a n de x p e c te d d e m a n dP la n fo r th e o rd e r ly a n d s y s te m a tic c h a n g e o f P la n fo r th e o rd e r ly a n d s y s te m a tic c h a n g e o f p ro d u c t io n c a p a c i ty to m e e t th e p e a k s a n d v a l le y s o f p ro d u c t io n c a p a c i ty to m e e t th e p e a k s a n d v a l le y s o f e x p e c te d c u s to m e r d e m a n de x p e c te d c u s to m e r d e m a n dG e t th e m o s t o u tp u t fo r th e a m o u n t o f r e s o u rc e s G e t th e m o s t o u tp u t fo r th e a m o u n t o f r e s o u rc e s a v a i la b lea v a i la b le
W h y A g g r e g a t e P la n n in g I s N e c e s s a r yW h y A g g r e g a t e P la n n in g I s N e c e s s a r yW h y A g g r e g a t e P la n n in g I s N e c e s s a r y
Chapter2 3
Aggregate Planning Aggregate Planning & Master Production Scheduling& Master Production Scheduling
3
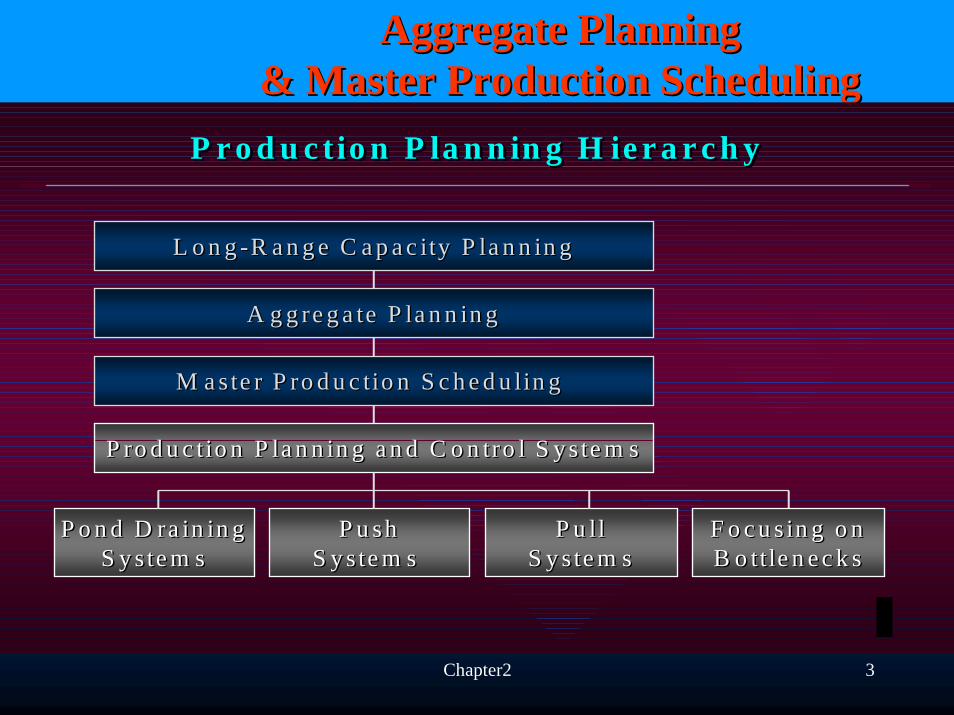
P r o d u c t io n P la n n in g H ie r a r c h yP r o d u c t io n P la n n in g H ie r a r c h yP r o d u c t io n P la n n in g H ie r a r c h y
M a ste r P ro d u c tio n S c h e d u lin g M a s te r P ro d u c tio n S c h e d u lin g
P ro d u c tio n P la n n in g a n d C o n tro l S ys te m sP ro d u c tio n P la n n in g a n d C o n tro l S y s te m s
P o n d D ra in in gP o n d D ra in in gS y s te m sS y s te m s
A g g re g a te P la n n in gA g g re g a te P la n n in g
P u shP u shS y s te m s S y s te m s
P u llP u llS y s te m sS y s te m s
F o c u s in g o nF o c u s in g o nB o ttle n e c k sB o ttle n e c k s
L o n gL o n g -- R a n g e C a p a c ity P la n n in gR a n g e C a p a c ity P la n n in g
Chapter2 4
Aggregate Planning Aggregate Planning & Master Production Scheduling& Master Production Scheduling
4
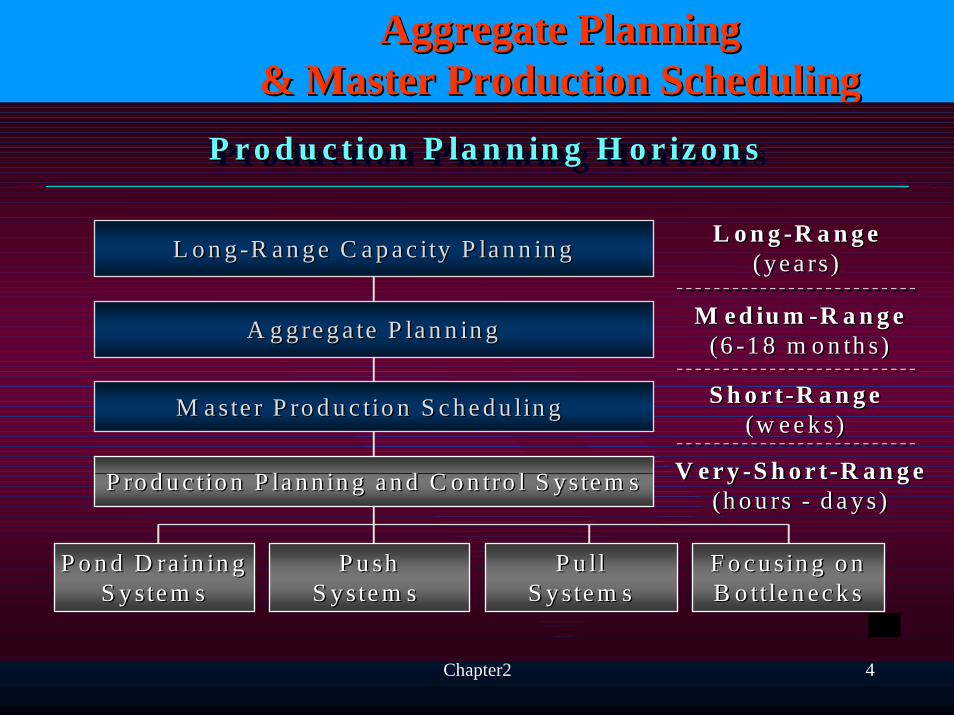
P r o d u c tio n P la n n in g H o r iz o n sP r o d u c tio n P la n n in g H o r iz o n sP r o d u c tio n P la n n in g H o r iz o n s
M a ste r P ro d u c tio n S c h e d u lin g M a ste r P ro d u c tio n S c h e d u lin g
P ro d u c tio n P la n n in g a n d C o n tro l S ys te m sP ro d u c tio n P la n n in g a n d C o n tro l S ys te m s
P o n d D ra in in gP o n d D ra in in gS y ste m sS y ste m s
A g g re g a te P la n n in gA g g re g a te P la n n in g
P u shP u shS y ste m s S y ste m s
P u llP u llS y ste m sS y ste m s
F o c u s in g o nF o c u sin g o nB o ttle n ec k sB o ttle n ec k s
L o n gL o n g -- R a n g e C a p a c ity P la n n in gR a n g e C a p a c ity P la n n in g L o n gL o n g -- R a n g eR a n g e(ye a rs)(ye a rs)
M e d iu mM e d iu m -- R a n g eR a n g e(6(6 -- 1 8 m o n th s)1 8 m o n th s)
S h o r tS h o r t -- R a n g eR a n g e(w e e k s)(w e e k s)
V e r yV e r y -- S h o r tS h o r t -- R a n g eR a n g e(h o u rs (h o u rs -- d a y s)d a y s)
Chapter2 5
Aggregate Planning Aggregate Planning & Master Production Scheduling& Master Production Scheduling
5
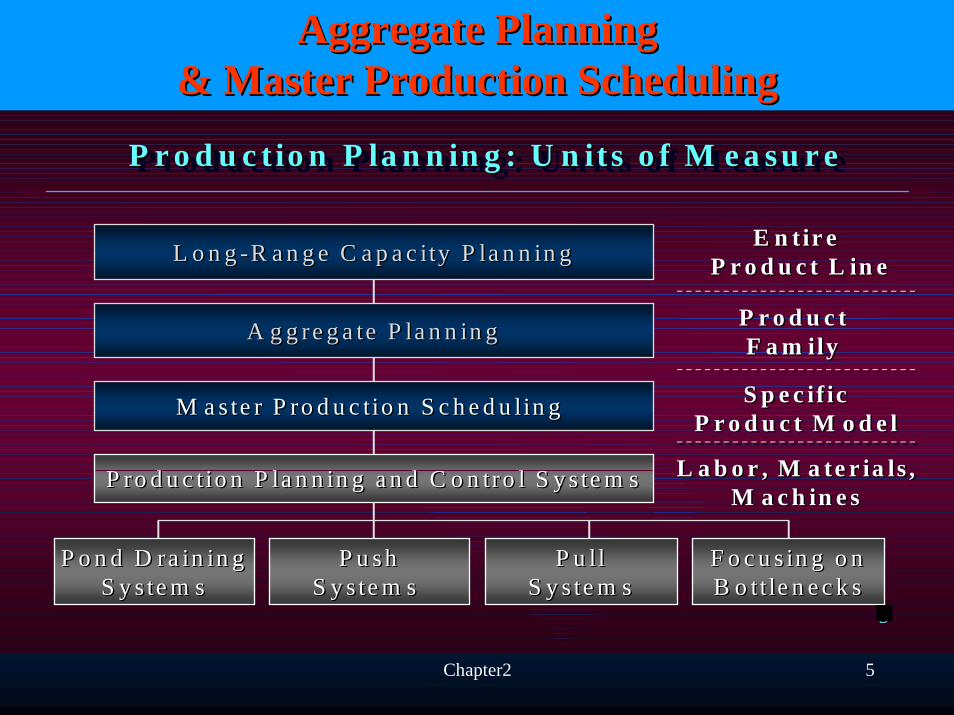
P r o d u c t io n P la n n in g : U n its o f M e a su r eP r o d u c t io n P la n n in g : U n its o f M e a su r eP r o d u c t io n P la n n in g : U n its o f M e a su r e
M a ste r P ro d u c tio n S c h e d u lin gM a s te r P ro d u c tio n S c h e d u lin g
P ro d u c tio n P la n n in g a n d C o n tro l S y s te m sP ro d u c tio n P la n n in g a n d C o n tro l S y s te m s
P o n d D ra in in gP o n d D ra in in gS y s te m sS y s te m s
A g g re g a te P la n n in gA g g re g a te P la n n in g
P u shP u shS y s te m s S y s te m s
P u llP u llS y s te m sS y s te m s
F o c u s in g o nF o c u s in g o nB o tt le n e c k sB o tt le n e c k s
L o n gL o n g -- R a n g e C a p a c ity P la n n in gR a n g e C a p a c ity P la n n in g E n tir e E n t ir e P r o d u c t L in eP r o d u c t L in e
P r o d u c tP r o d u c tF a m ilyF a m ily
S p e c if icS p e c if icP r o d u c t M o d e lP r o d u c t M o d e l
L a b o r , M a te r ia ls ,L a b o r , M a te r ia ls ,M a c h in e sM a c h in e s
Chapter2 6
Aggregate Planning Aggregate Planning & Master Production Scheduling& Master Production Scheduling
6
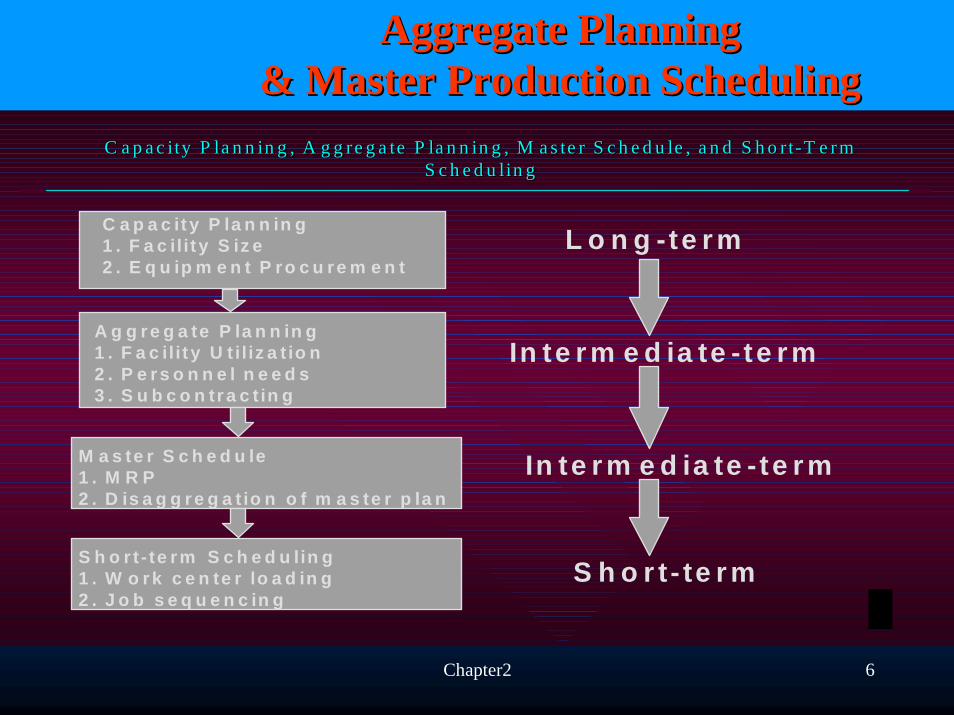
C a p a c ity P la n n in g , A g g re g a te P la n n in g , M a s te r S c h e d u le , a n d S h o rC a p a c ity P la n n in g , A g g re g a te P la n n in g , M a s te r S c h e d u le , a n d S h o r tt -- T e r m T e r m S c h e d u lin gS c h e d u lin g
C a p a c ity P la n n in g1 . F a c il it y S iz e2 . E q u ip m e n t P ro c u re m e n t
A g g re g a te P la n n in g1 . F a c il it y U t il iz a t io n2 . P e rs o n n e l n e e d s3 . S u b c o n tra c t in g
M a s te r S c h e d u le1 . M R P2 . D is a g g re g a t io n o f m a s te r p la n
S h o r t - te rm S c h e d u lin g1 . W o rk c e n te r lo a d in g2 . J o b s e q u e n c in g
L o n g -te rm
In te r m e d ia te -te rm
In te r m e d ia te -te rm
S h o r t- te rm
Chapter2 7
Aggregate Planning Aggregate Planning & Master Production Scheduling& Master Production Scheduling
7
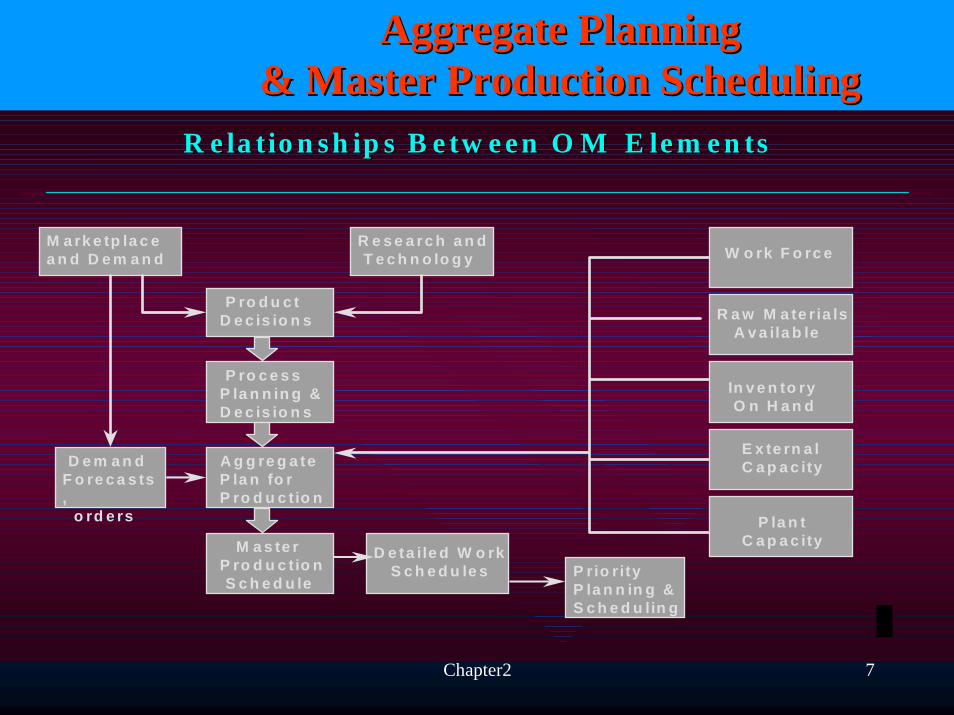
R e la tio n sh ip s B e tw e e n O M E le m e n tsR e la tio n sh ip s B e tw e e n O M E le m e n ts
M a rk e tp la c ea n d D e m a n d
R e s e a rc h a n dT e c h n o lo g y
P ro d u c tD e c is io n s
P ro c e s sP la n n in g &D e c is io n s
A g g re g a teP la n fo rP ro d u c tio n
D e ta ile d W o rkS c h e d u le s
M a s te rP ro d u c tio nS c h e d u le
P rio rityP la n n in g &S c h e d u lin g
D e m a n d F o re c a s ts,
o rd e rs
E x te rn a lC a p a c ity
P la n tC a p a c ity
R a w M a te r ia lsA v a ila b le
In v e n to ryO n H a n d
W o rk F o rc e
Chapter2 8
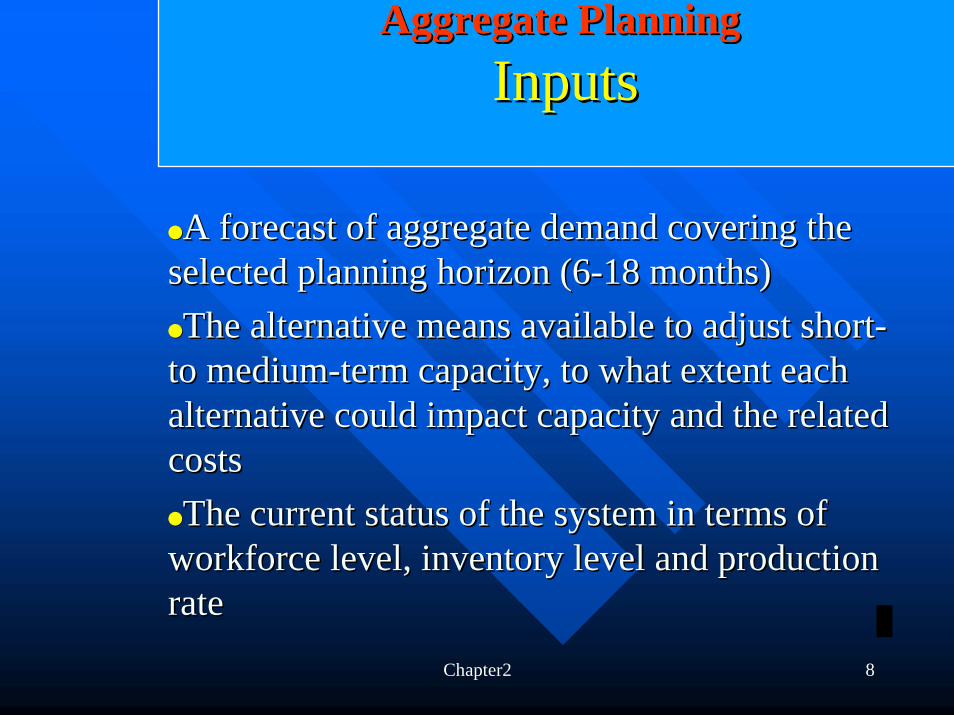
Aggregate Planning Aggregate Planning InputsInputs
A forecast of aggregate demand covering the A forecast of aggregate demand covering the selected planning horizon (6selected planning horizon (6--18 months)18 months)The alternative means available to adjust shortThe alternative means available to adjust short--
to mediumto medium--term capacity, to what extent each term capacity, to what extent each alternative could impact capacity and the related alternative could impact capacity and the related costscostsThe current status of the system in terms of The current status of the system in terms of
workforce level, inventory level and production workforce level, inventory level and production raterate
Chapter2 9
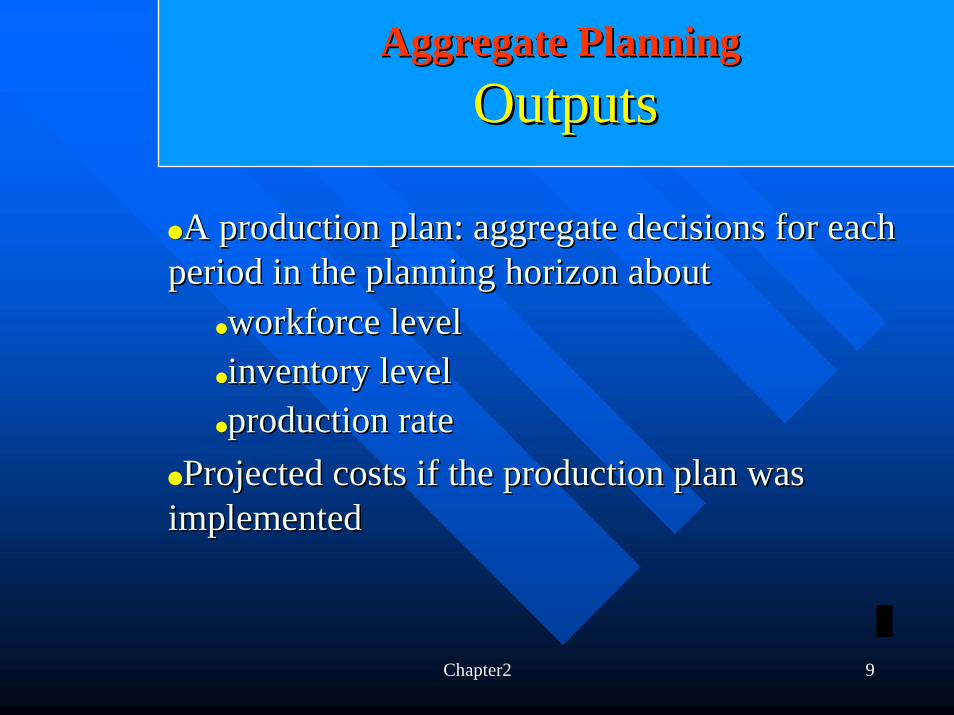
Aggregate Planning Aggregate Planning OutputsOutputs
A production plan: aggregate decisions for each A production plan: aggregate decisions for each period in the planning horizon aboutperiod in the planning horizon about
workforce levelworkforce levelinventory levelinventory levelproduction rateproduction rate
Projected costs if the production plan was Projected costs if the production plan was implementedimplemented
Chapter2 10
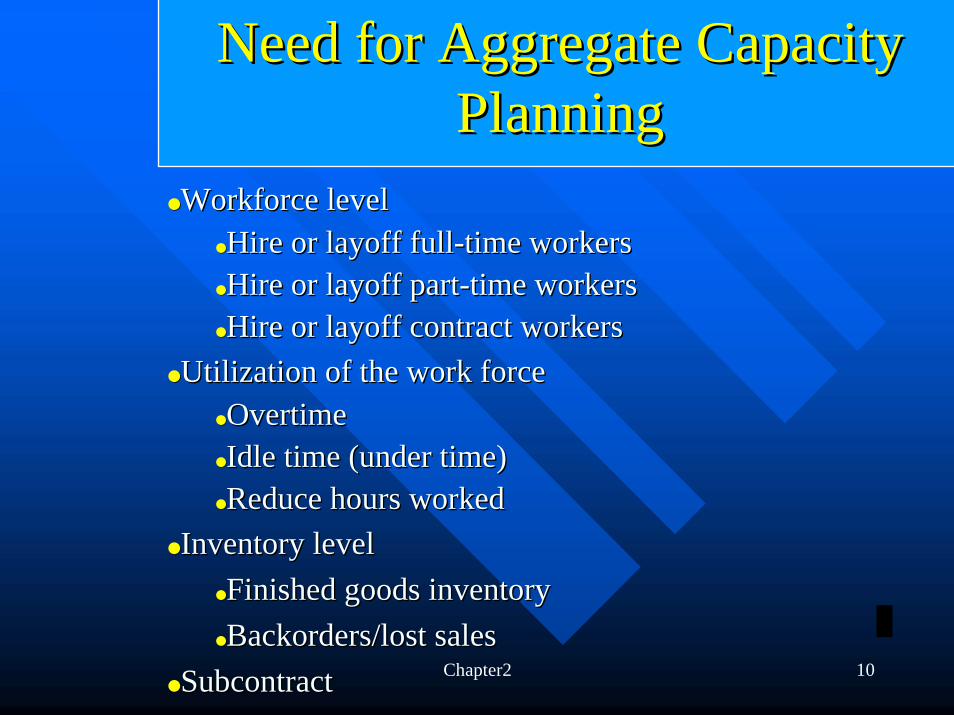
Need for Aggregate Capacity Need for Aggregate Capacity PlanningPlanning
Workforce levelWorkforce levelHire or layoff fullHire or layoff full--time workerstime workersHire or layoff partHire or layoff part--time workerstime workersHire or layoff contract workers Hire or layoff contract workers
Utilization of the work forceUtilization of the work forceOvertimeOvertimeIdle time (under time) Idle time (under time) Reduce hours workedReduce hours worked
Inventory levelInventory levelFinished goods inventoryFinished goods inventoryBackorders/lost salesBackorders/lost sales
SubcontractSubcontract
Chapter2 11
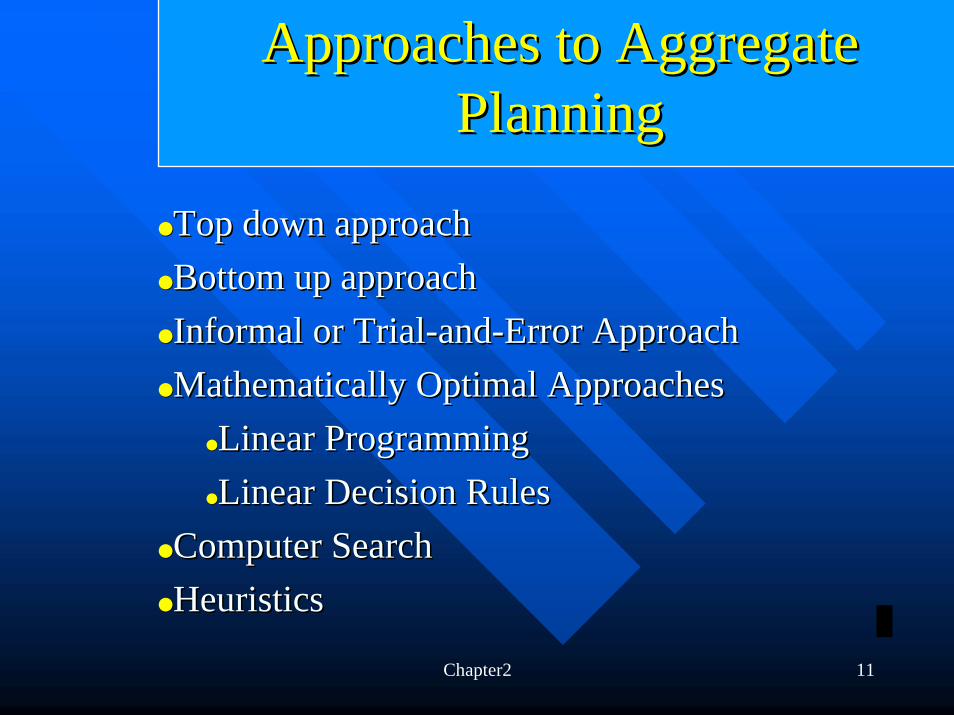
Approaches to Aggregate Approaches to Aggregate PlanningPlanning
Top down approachTop down approachBottom up approachBottom up approachInformal or TrialInformal or Trial--andand--Error ApproachError ApproachMathematically Optimal ApproachesMathematically Optimal Approaches
Linear ProgrammingLinear ProgrammingLinear Decision RulesLinear Decision Rules
Computer SearchComputer SearchHeuristicsHeuristics
Chapter2 12
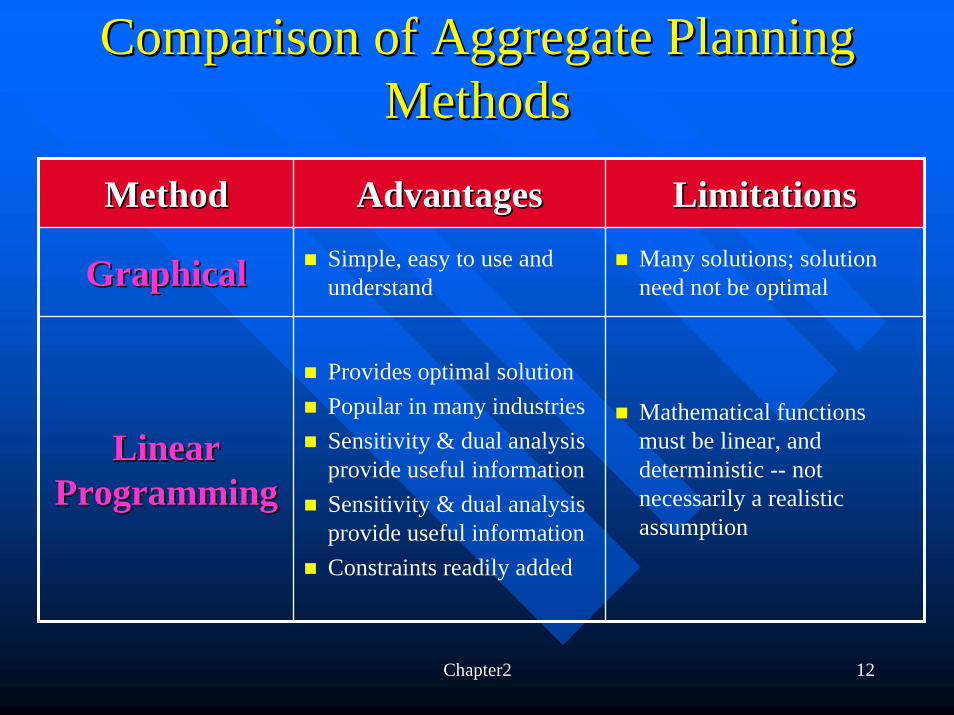
Comparison of Aggregate Planning Comparison of Aggregate Planning MethodsMethods
MethodMethod AdvantagesAdvantages LimitationsLimitations
GraphicalGraphical Simple, easy to use and understand
Provides optimal solutionPopular in many industriesSensitivity & dual analysis provide useful informationSensitivity & dual analysis provide useful informationConstraints readily added
Linear Linear ProgrammingProgramming
Many solutions; solution need not be optimal
Mathematical functions must be linear, and deterministic -- not necessarily a realistic assumption
Chapter2 13
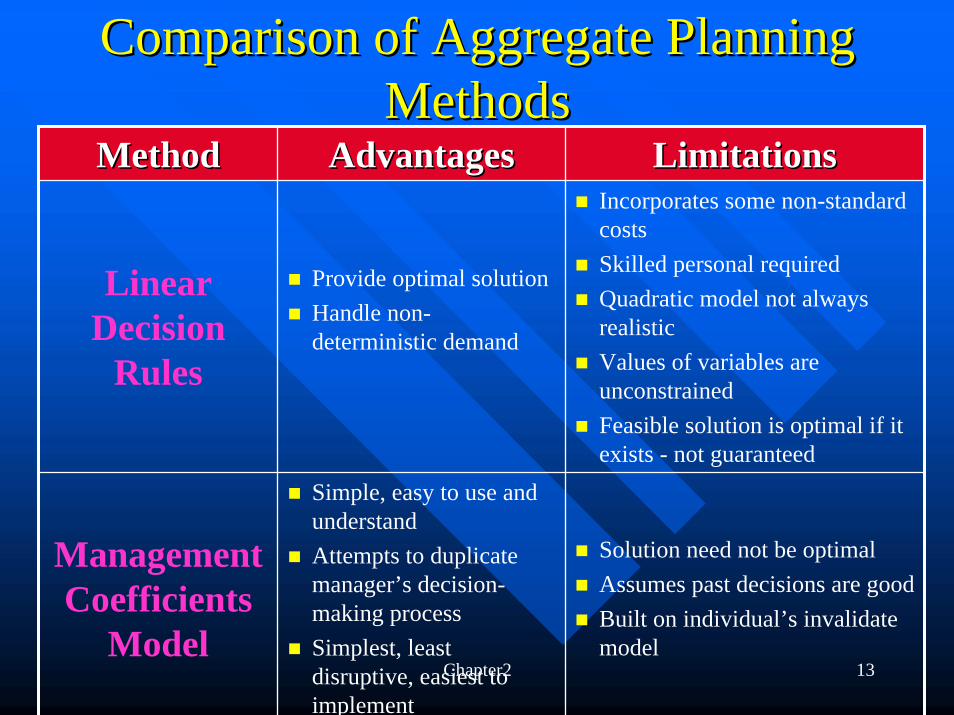
Comparison of Aggregate Planning Comparison of Aggregate Planning MethodsMethods
MethodMethod AdvantagesAdvantages LimitationsLimitations
Linear Decision
Rules
Provide optimal solutionHandle non-deterministic demand
Simple, easy to use and understandAttempts to duplicate manager’s decision-making processSimplest, least disruptive, easiest to implement
Incorporates some non-standard costsSkilled personal requiredQuadratic model not always realisticValues of variables are unconstrainedFeasible solution is optimal if it exists - not guaranteed
Management Coefficients
Model
Solution need not be optimalAssumes past decisions are goodBuilt on individual’s invalidate model
Chapter2 14
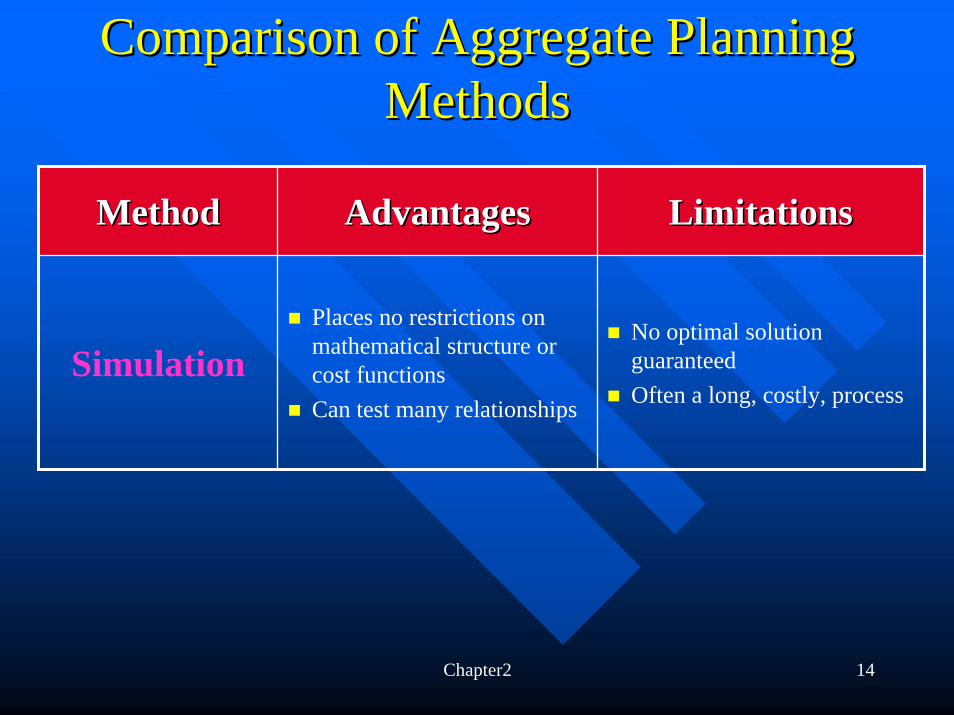
Comparison of Aggregate Planning Comparison of Aggregate Planning MethodsMethods
MethodMethod AdvantagesAdvantages LimitationsLimitations
SimulationPlaces no restrictions on mathematical structure or cost functionsCan test many relationships
No optimal solution guaranteedOften a long, costly, process
Chapter2 15
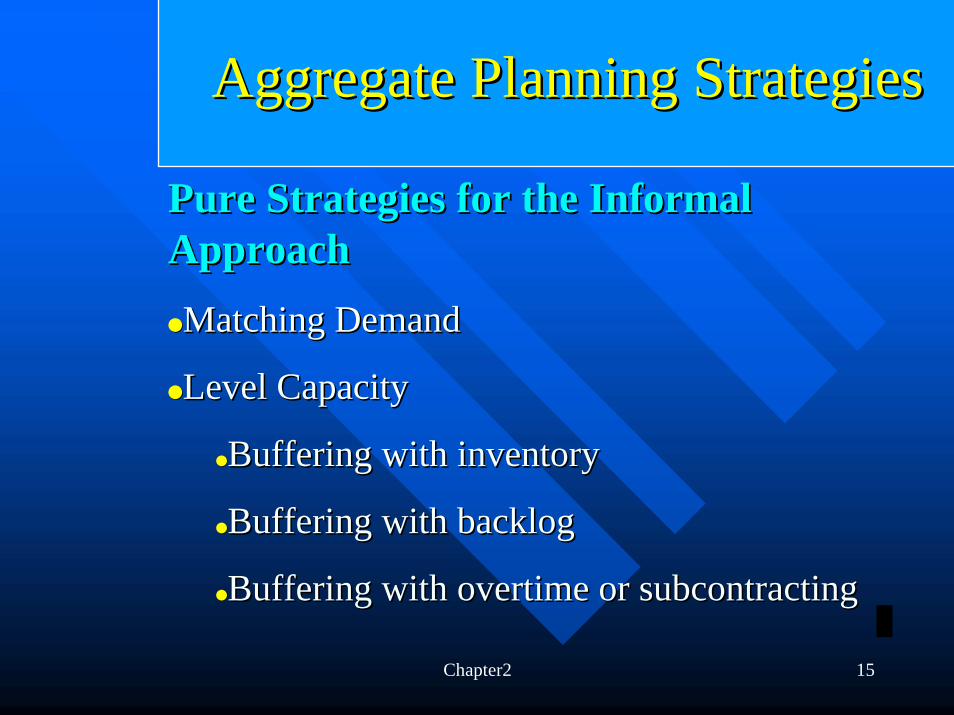
Aggregate Planning StrategiesAggregate Planning Strategies
Pure Strategies for the Informal Pure Strategies for the Informal ApproachApproach
Matching DemandMatching Demand
Level CapacityLevel Capacity
Buffering with inventoryBuffering with inventory
Buffering with backlogBuffering with backlog
Buffering with overtime or subcontractingBuffering with overtime or subcontracting
Chapter2 16
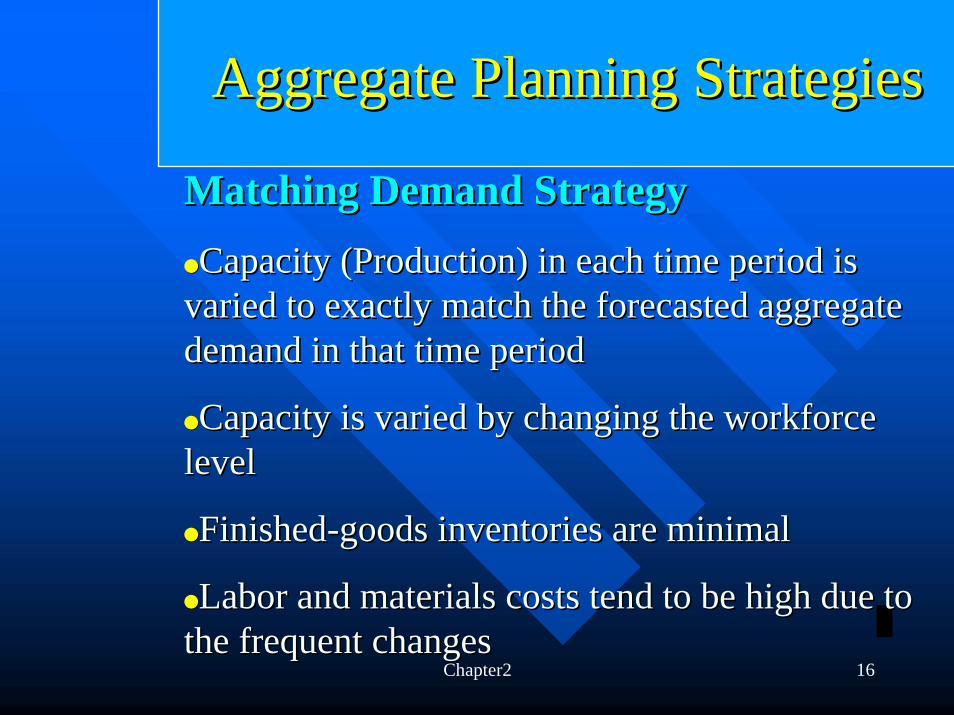
Aggregate Planning StrategiesAggregate Planning Strategies
Matching Demand StrategyMatching Demand Strategy
Capacity (Production) in each time period is Capacity (Production) in each time period is varied to exactly match the forecasted aggregate varied to exactly match the forecasted aggregate demand in that time perioddemand in that time period
Capacity is varied by changing the workforce Capacity is varied by changing the workforce levellevel
FinishedFinished--goods inventories are minimalgoods inventories are minimal
Labor and materials costs tend to be high due to Labor and materials costs tend to be high due to the frequent changesthe frequent changes
Chapter2 17
Developing and EvaluatingDeveloping and Evaluatingthe Matching Production Planthe Matching Production Plan
Production rate is dictated by the forecasted Production rate is dictated by the forecasted aggregate demandaggregate demand
Convert the forecasted aggregate demand into the Convert the forecasted aggregate demand into the required workforce level using production time required workforce level using production time informationinformation
The primary costs of this strategy are the costs of The primary costs of this strategy are the costs of changing workforce levels from period to period, changing workforce levels from period to period, i.e., hiring and layoffsi.e., hiring and layoffs
Chapter2 18
Level Capacity StrategyLevel Capacity Strategy
Capacity (production rate) is held level (constant) Capacity (production rate) is held level (constant) over the planning horizonover the planning horizonThe difference between the constant production The difference between the constant production
rate and the demand rate is made up (buffered) by rate and the demand rate is made up (buffered) by inventory, backlog, overtime, partinventory, backlog, overtime, part--time labor and/or time labor and/or subcontractingsubcontracting
Chapter2 19
Developing and EvaluatingDeveloping and Evaluatingthe Level Production Planthe Level Production Plan
Assume that the amount produced each period is constant, Assume that the amount produced each period is constant, no hiring or layoffsno hiring or layoffsThe gap between the amount planned to be produced and The gap between the amount planned to be produced and
the forecasted demand is filled with either inventory or the forecasted demand is filled with either inventory or backorders, i.e., no overtime, no idle time, no subcontracting backorders, i.e., no overtime, no idle time, no subcontracting The primary costs of this strategy are inventory carrying The primary costs of this strategy are inventory carrying
and backlogging costsand backlogging costsPeriodPeriod--ending inventories or backlogs are determined using ending inventories or backlogs are determined using
the inventory balance equation:the inventory balance equation:EIEItt = EI= EItt--11 + (P+ (Ptt -- DDt t ))
Chapter2 20
Aggregate Plans for ServicesAggregate Plans for Services
For standardized services, aggregate planning may For standardized services, aggregate planning may be simpler than in systems that produce productsbe simpler than in systems that produce productsFor customized services,For customized services,
there may be difficulty in specifying the nature there may be difficulty in specifying the nature and extent of services to be performed for each and extent of services to be performed for each customercustomercustomer may be an integral part of the customer may be an integral part of the
production systemproduction systemAbsence of finishedAbsence of finished--goods inventories as a buffer goods inventories as a buffer
between system capacity and customer demandbetween system capacity and customer demand
Chapter2 21
Rough Cut capacity planningRough Cut capacity planning
This done in conjunction with the tentative master production schedule to test the feasibility in terms of capacity before the master production schedule is finalized
This ensures that a proposed MPS does not overload any key department,work center or machine.
It is typically applied to critical work centers that are most likely to bottleneck
Chapter2 22
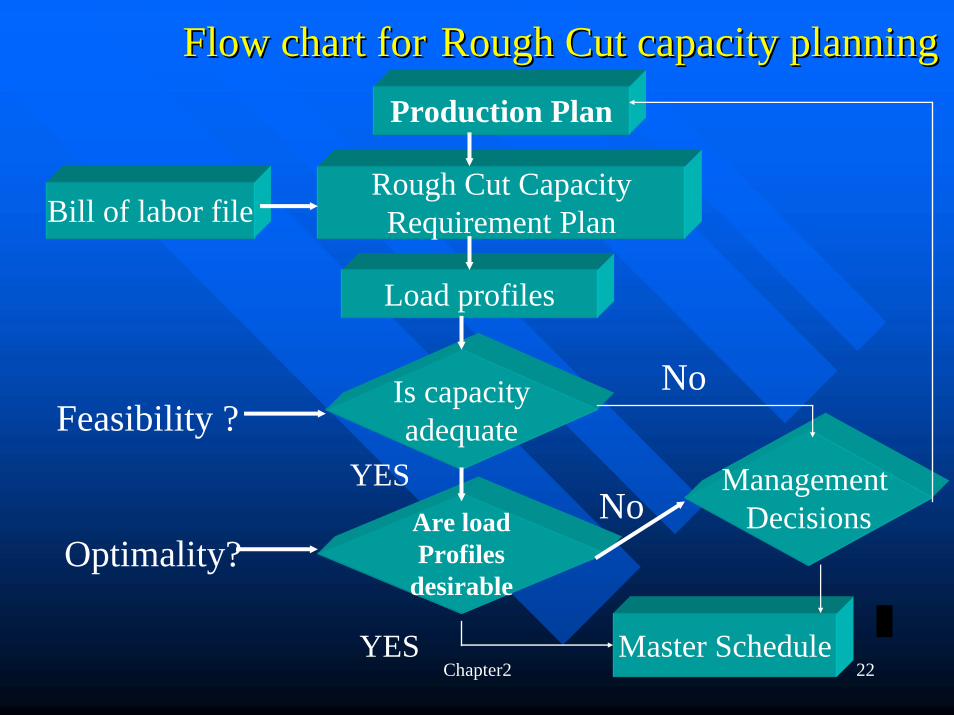
Flow chart forFlow chart for Rough Cut capacity planningRough Cut capacity planningProduction Plan
Load profiles
Rough Cut CapacityRequirement PlanBill of labor file
Master Schedule
Is capacityadequate
Are loadProfiles
desirable
Management Decisions
Feasibility ?
Optimality?
No
NoYES
YES
Chapter2 23
Types of Capacity Types of Capacity
Fixed capacity
Adjustable capacity
Design capacity
Systems capacity
Potential capacity
Immediate capacity
Actual or utilized capacityNormal or rated capacity
Effective capacity
Chapter2 24
Relation between Design , System Relation between Design , System Capacity and actual outputCapacity and actual output
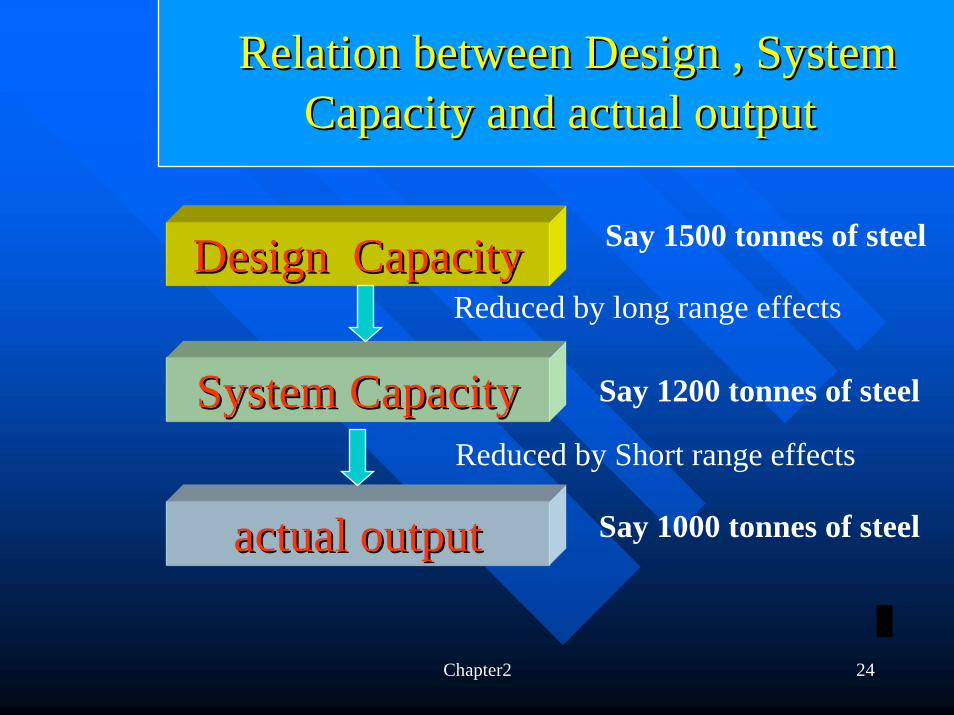
Design CapacityDesign Capacity
actual outputactual output
System CapacitySystem Capacity
Say 1500 tonnes of steel
Reduced by long range effects
Say 1200 tonnes of steel
Say 1000 tonnes of steel
Reduced by Short range effects
Chapter2 25
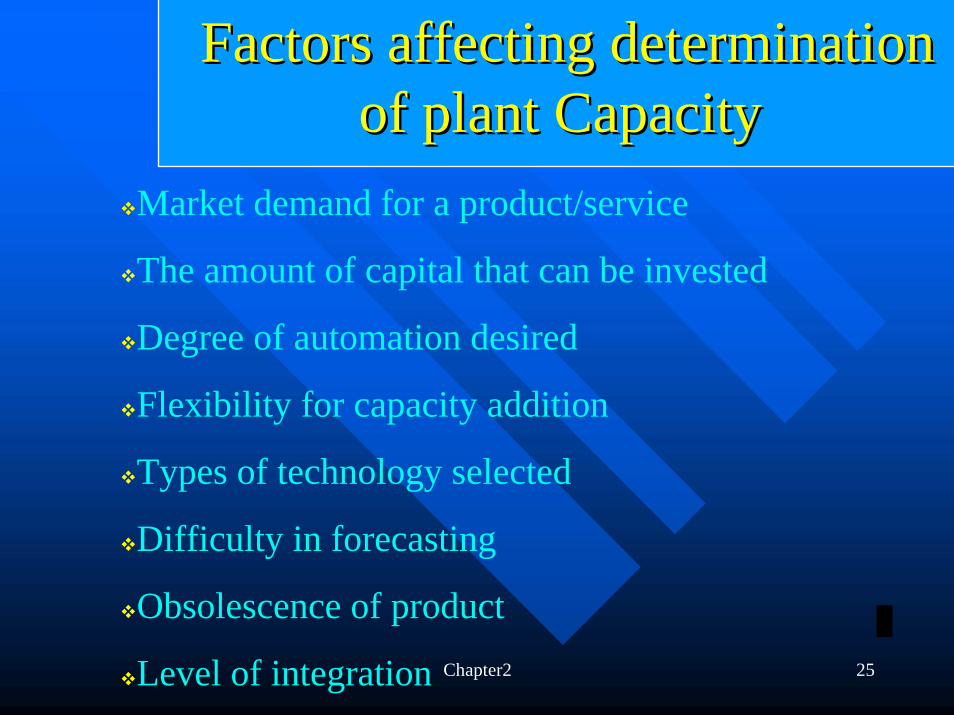
Factors affecting determination Factors affecting determination of plant Capacity of plant Capacity
Market demand for a product/service
The amount of capital that can be invested
Degree of automation desired
Flexibility for capacity addition
Types of technology selected
Difficulty in forecasting
Obsolescence of product
Level of integration
Chapter2 26
Capacity PlanningCapacity Planning
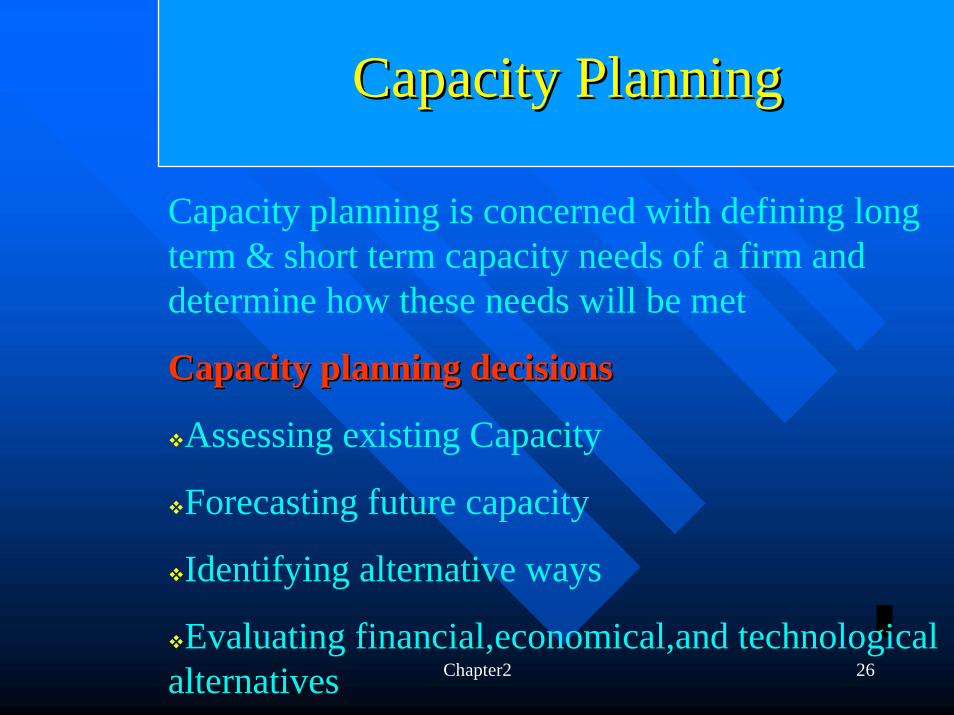
Capacity planning is concerned with defining long term & short term capacity needs of a firm and determine how these needs will be met
Capacity planning decisionsCapacity planning decisions
Assessing existing Capacity
Forecasting future capacity
Identifying alternative ways
Evaluating financial,economical,and technological alternatives
Chapter2 27
The need for Capacity PlanningThe need for Capacity Planning
Capacity planning is necessary when the organization decides to increase its production or introduce new production to the market.
Once the capacity is evaluated and a need for new or expanded facilities is determined ,decisions regarding facility location and process technology selections are taken
Chapter2 28
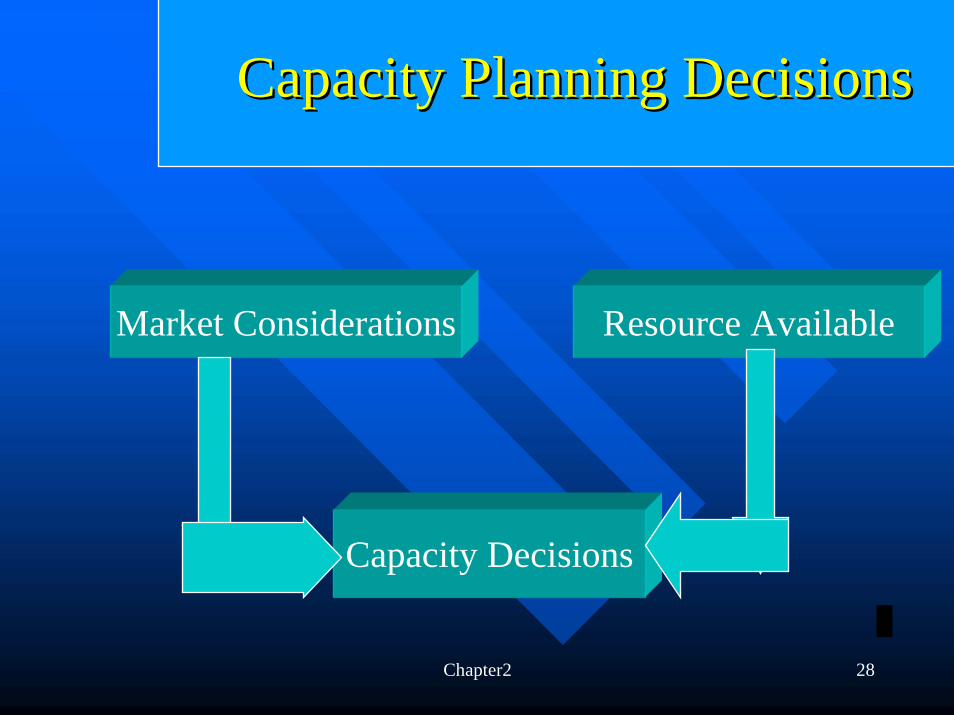
Capacity Planning DecisionsCapacity Planning Decisions
Market Considerations Resource Available
Capacity Decisions
Chapter2 29
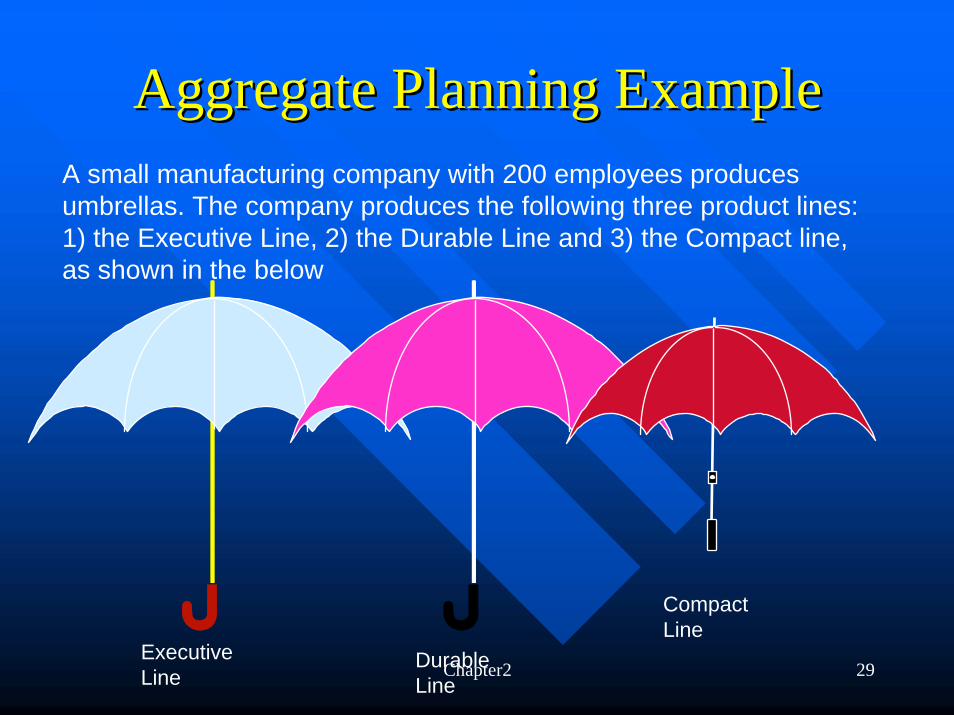
A small manufacturing company with 200 employees produces umbrellas. The company produces the following three product lines: 1) the Executive Line, 2) the Durable Line and 3) the Compact line, as shown in the below
Executive Line
Durable Line
Compact Line
Aggregate Planning ExampleAggregate Planning Example
Chapter2 30
0
2000
4000
6000
8000
10000
J a n Fe b Ma r Apr Ma y J un
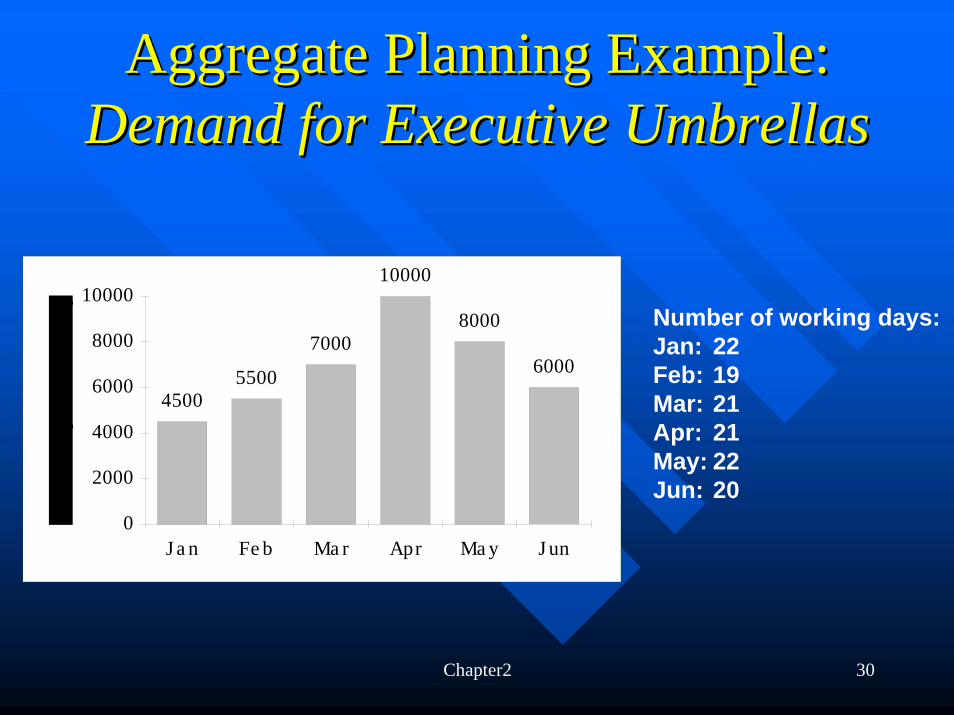
45005500
7000
10000
8000
6000
Number of working days:Jan: 22Feb: 19Mar: 21Apr: 21May: 22Jun: 20
Aggregate Planning Example: Aggregate Planning Example: Demand for Executive UmbrellasDemand for Executive Umbrellas
Chapter2 31
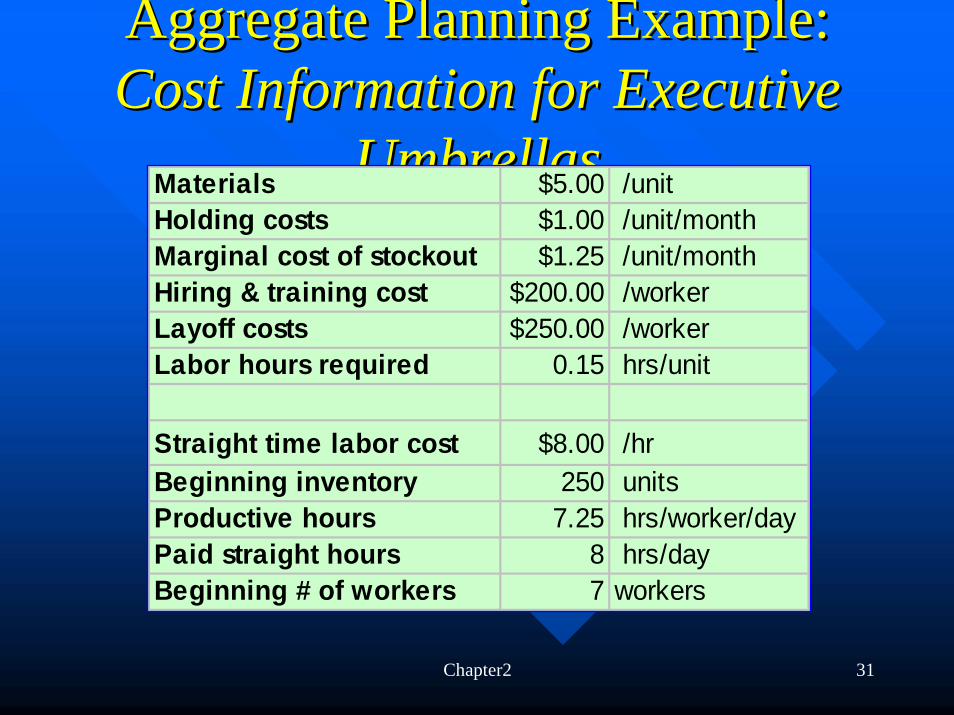
Aggregate Planning Example: Aggregate Planning Example: Cost Information for Executive Cost Information for Executive
UmbrellasUmbrellasMaterials $5.00 /unitHolding costs $1.00 /unit/monthMarginal cost of stockout $1.25 /unit/monthHiring & training cost $200.00 /workerLayoff costs $250.00 /workerLabor hours required 0.15 hrs/unit
Straight time labor cost $8.00 /hrBeginning inventory 250 unitsProductive hours 7.25 hrs/worker/dayPaid straight hours 8 hrs/dayBeginning # of workers 7 workers
Chapter2 32
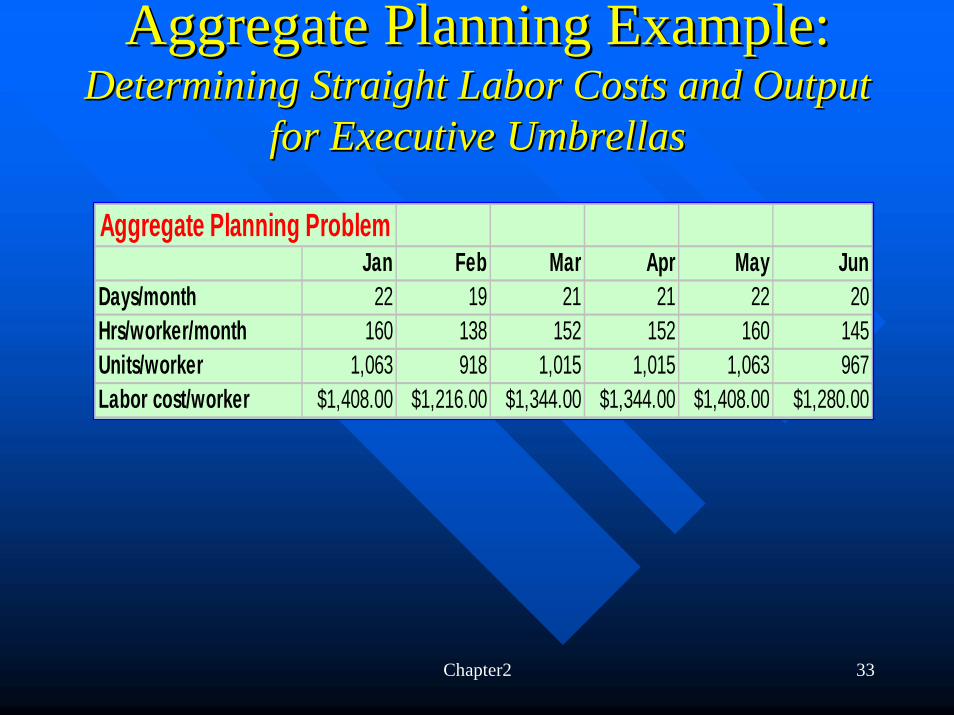
Aggregate Planning Example: Aggregate Planning Example: Determining Straight Labor Costs and Output Determining Straight Labor Costs and Output
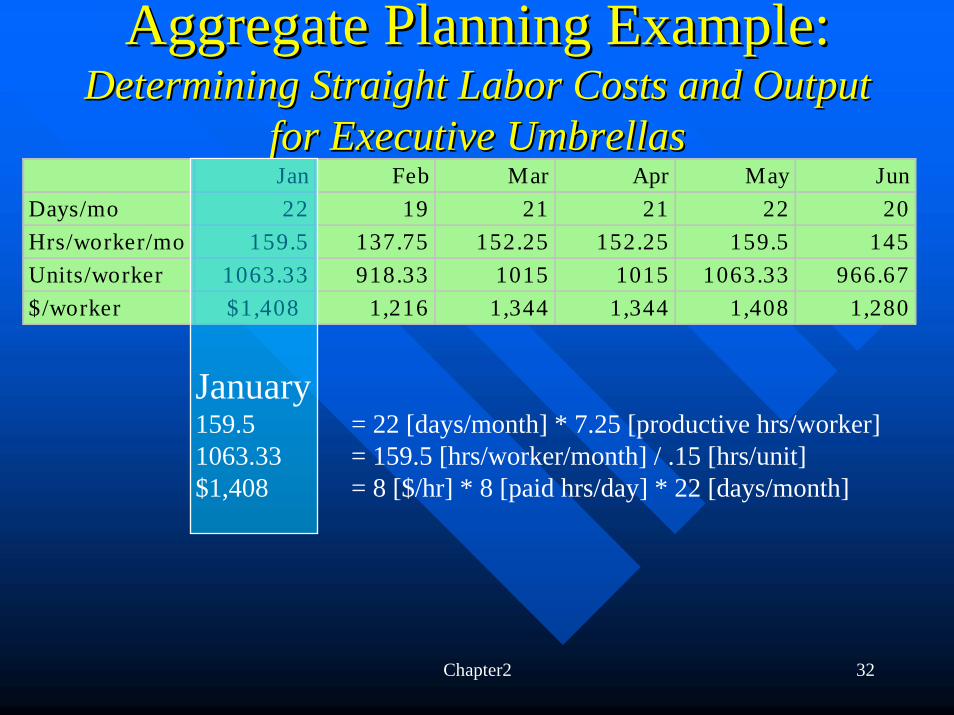
for Executive Umbrellasfor Executive UmbrellasJan Feb Mar Apr May Jun
Days/mo 22 19 21 21 22 20Hrs/worker/mo 159.5 137.75 152.25 152.25 159.5 145Units/worker 1063.33 918.33 1015 1015 1063.33 966.67$/worker $1,408 1,216 1,344 1,344 1,408 1,280
January159.5 = 22 [days/month] * 7.25 [productive hrs/worker]1063.33 = 159.5 [hrs/worker/month] / .15 [hrs/unit]$1,408 = 8 [$/hr] * 8 [paid hrs/day] * 22 [days/month]
Chapter2 33
Aggregate Planning Example: Aggregate Planning Example: Determining Straight Labor Costs and Output Determining Straight Labor Costs and Output
for Executive Umbrellasfor Executive Umbrellas
Aggregate Planning ProblemJan Feb Mar Apr May Jun
Days/month 22 19 21 21 22 20Hrs/worker/month 160 138 152 152 160 145Units/worker 1,063 918 1,015 1,015 1,063 967Labor cost/worker $1,408.00 $1,216.00 $1,344.00 $1,344.00 $1,408.00 $1,280.00
Chapter2 34
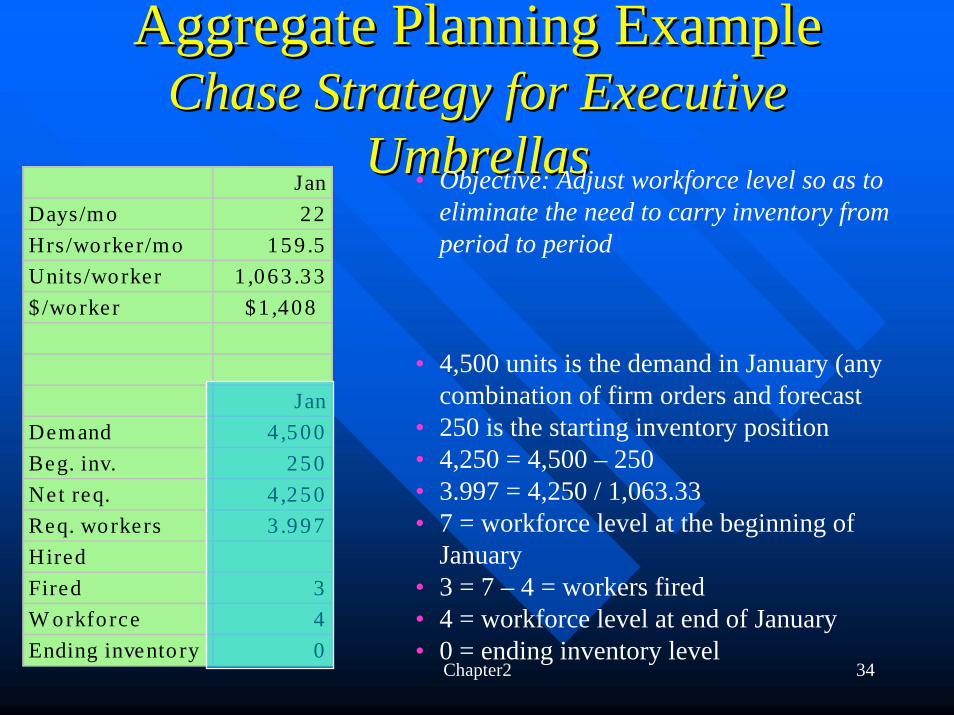
• 4,500 units is the demand in January (any combination of firm orders and forecast
• 250 is the starting inventory position• 4,250 = 4,500 – 250• 3.997 = 4,250 / 1,063.33• 7 = workforce level at the beginning of
January• 3 = 7 – 4 = workers fired• 4 = workforce level at end of January• 0 = ending inventory level
JanDays/mo 22Hrs/worker/mo 159 .5Units/worker 1 ,063 .33$ /worker $1 ,408
JanDemand 4 ,500Beg. inv. 250Net req. 4 ,250Req. workers 3 .997HiredFired 3W orkforce 4Ending invento ry 0
Aggregate Planning ExampleAggregate Planning ExampleChase Strategy for Executive Chase Strategy for Executive
UmbrellasUmbrellas• Objective: Adjust workforce level so as to eliminate the need to carry inventory from period to period
Chapter2 35
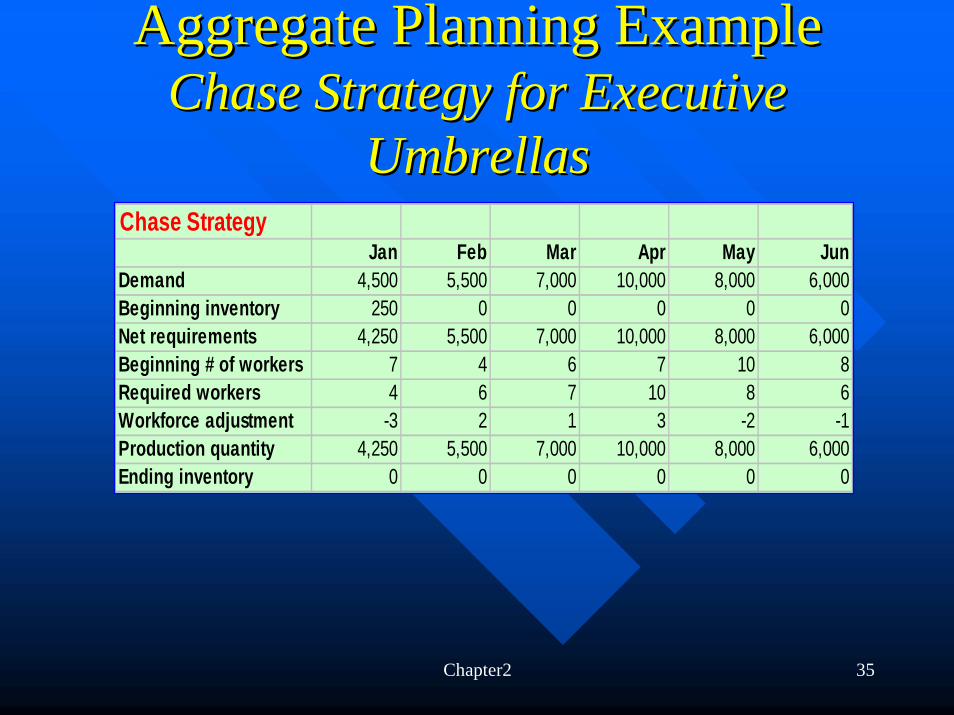
Aggregate Planning ExampleAggregate Planning ExampleChase Strategy for Executive Chase Strategy for Executive
UmbrellasUmbrellasChase Strategy
Jan Feb Mar Apr May JunDemand 4,500 5,500 7,000 10,000 8,000 6,000Beginning inventory 250 0 0 0 0 0Net requirements 4,250 5,500 7,000 10,000 8,000 6,000Beginning # of workers 7 4 6 7 10 8Required workers 4 6 7 10 8 6Workforce adjustment -3 2 1 3 -2 -1Production quantity 4,250 5,500 7,000 10,000 8,000 6,000Ending inventory 0 0 0 0 0 0
Chapter2 36
Aggregate Planning ExampleAggregate Planning ExampleChase Strategy for Executive Chase Strategy for Executive
UmbrellasUmbrellas
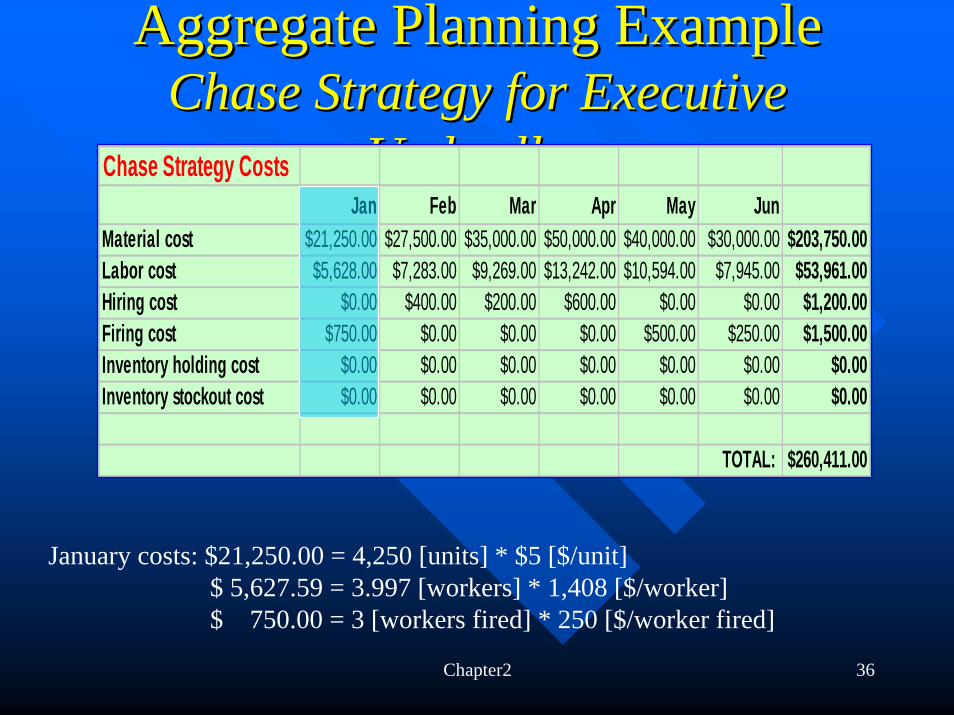
January costs: $21,250.00 = 4,250 [units] * $5 [$/unit]$ 5,627.59 = 3.997 [workers] * 1,408 [$/worker]$ 750.00 = 3 [workers fired] * 250 [$/worker fired]
Chase Strategy CostsJan Feb Mar Apr May Jun
Material cost $21,250.00 $27,500.00 $35,000.00 $50,000.00 $40,000.00 $30,000.00 $203,750.00Labor cost $5,628.00 $7,283.00 $9,269.00 $13,242.00 $10,594.00 $7,945.00 $53,961.00Hiring cost $0.00 $400.00 $200.00 $600.00 $0.00 $0.00 $1,200.00Firing cost $750.00 $0.00 $0.00 $0.00 $500.00 $250.00 $1,500.00Inventory holding cost $0.00 $0.00 $0.00 $0.00 $0.00 $0.00 $0.00Inventory stockout cost $0.00 $0.00 $0.00 $0.00 $0.00 $0.00 $0.00
TOTAL: $260,411.00
Chapter2 37
Aggregate Planning ExampleAggregate Planning ExampleLevel Strategy for Executive UmbrellasLevel Strategy for Executive Umbrellas
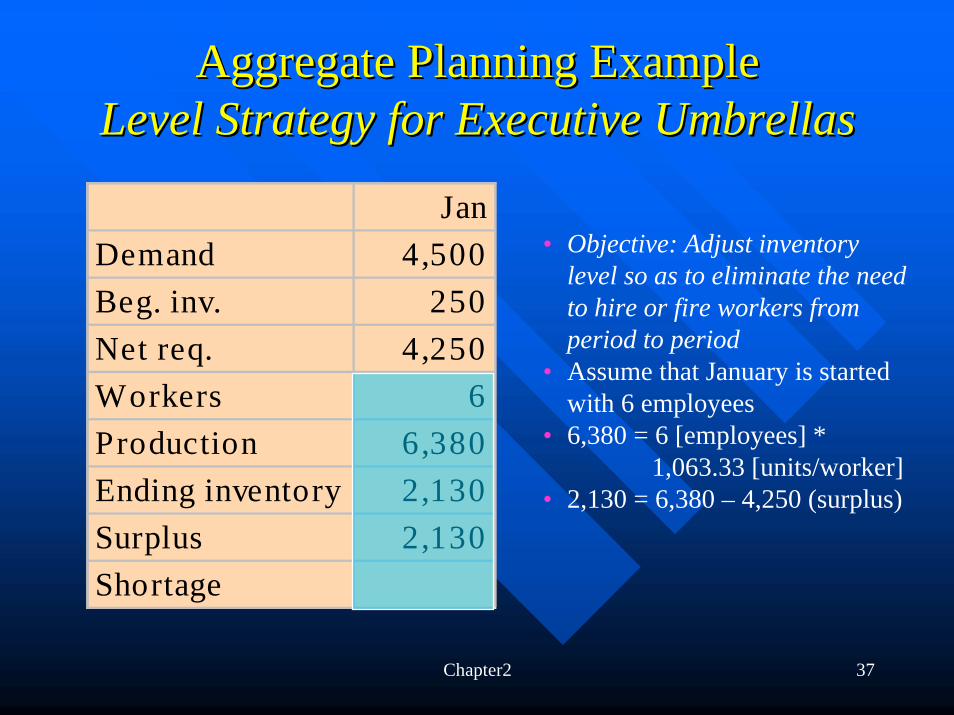
JanDemand 4,500Beg. inv. 250Net req. 4,250Workers 6Production 6,380Ending inventory 2,130Surplus 2,130Shortage
• Objective: Adjust inventory level so as to eliminate the need to hire or fire workers from period to period
• Assume that January is started with 6 employees
• 6,380 = 6 [employees] * 1,063.33 [units/worker]
• 2,130 = 6,380 – 4,250 (surplus)
Chapter2 38
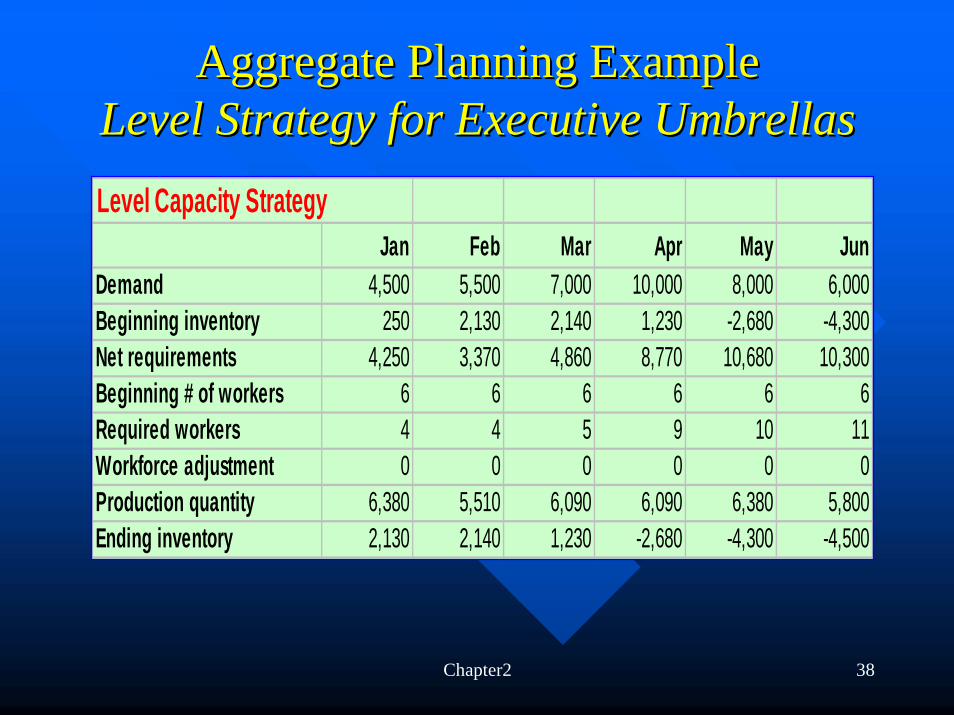
Aggregate Planning ExampleAggregate Planning ExampleLevel Strategy for Executive UmbrellasLevel Strategy for Executive UmbrellasLevel Capacity Strategy
Jan Feb Mar Apr May JunDemand 4,500 5,500 7,000 10,000 8,000 6,000Beginning inventory 250 2,130 2,140 1,230 -2,680 -4,300Net requirements 4,250 3,370 4,860 8,770 10,680 10,300Beginning # of workers 6 6 6 6 6 6Required workers 4 4 5 9 10 11Workforce adjustment 0 0 0 0 0 0Production quantity 6,380 5,510 6,090 6,090 6,380 5,800Ending inventory 2,130 2,140 1,230 -2,680 -4,300 -4,500
Chapter2 39
Aggregate Planning ExampleAggregate Planning ExampleLevel Strategy for Executive UmbrellasLevel Strategy for Executive Umbrellas
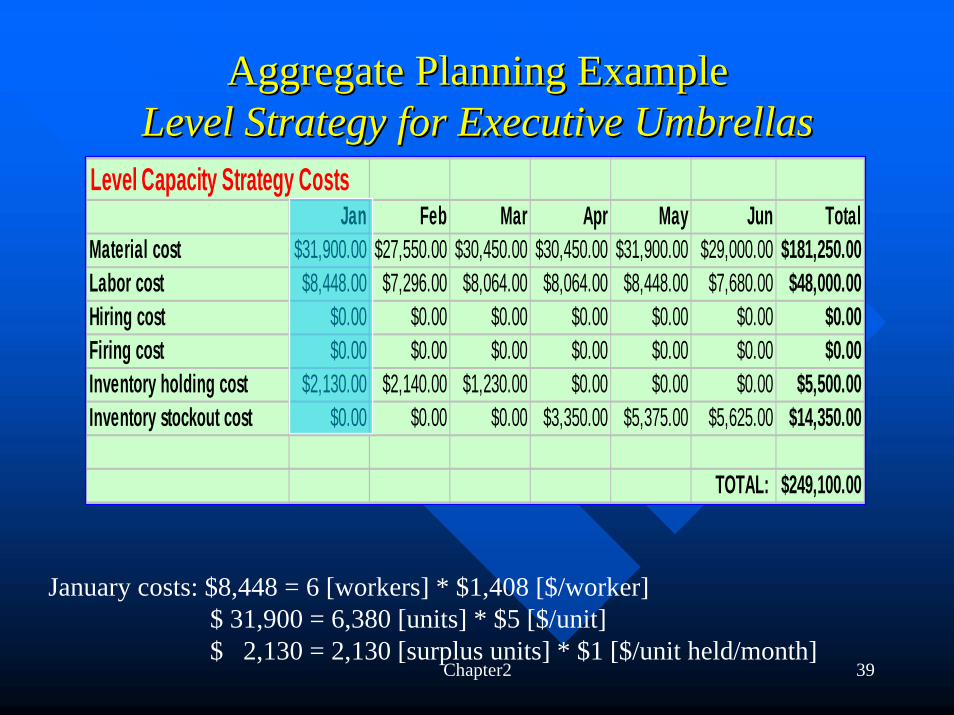
January costs: $8,448 = 6 [workers] * $1,408 [$/worker]$ 31,900 = 6,380 [units] * $5 [$/unit]$ 2,130 = 2,130 [surplus units] * $1 [$/unit held/month]
Level Capacity Strategy CostsJan Feb Mar Apr May Jun Total
Material cost $31,900.00 $27,550.00 $30,450.00 $30,450.00 $31,900.00 $29,000.00 $181,250.00Labor cost $8,448.00 $7,296.00 $8,064.00 $8,064.00 $8,448.00 $7,680.00 $48,000.00Hiring cost $0.00 $0.00 $0.00 $0.00 $0.00 $0.00 $0.00Firing cost $0.00 $0.00 $0.00 $0.00 $0.00 $0.00 $0.00Inventory holding cost $2,130.00 $2,140.00 $1,230.00 $0.00 $0.00 $0.00 $5,500.00Inventory stockout cost $0.00 $0.00 $0.00 $3,350.00 $5,375.00 $5,625.00 $14,350.00
TOTAL: $249,100.00
Chapter2 40
Aggregate Planning ExampleAggregate Planning ExampleWhich Plan is Cheaper?Which Plan is Cheaper?
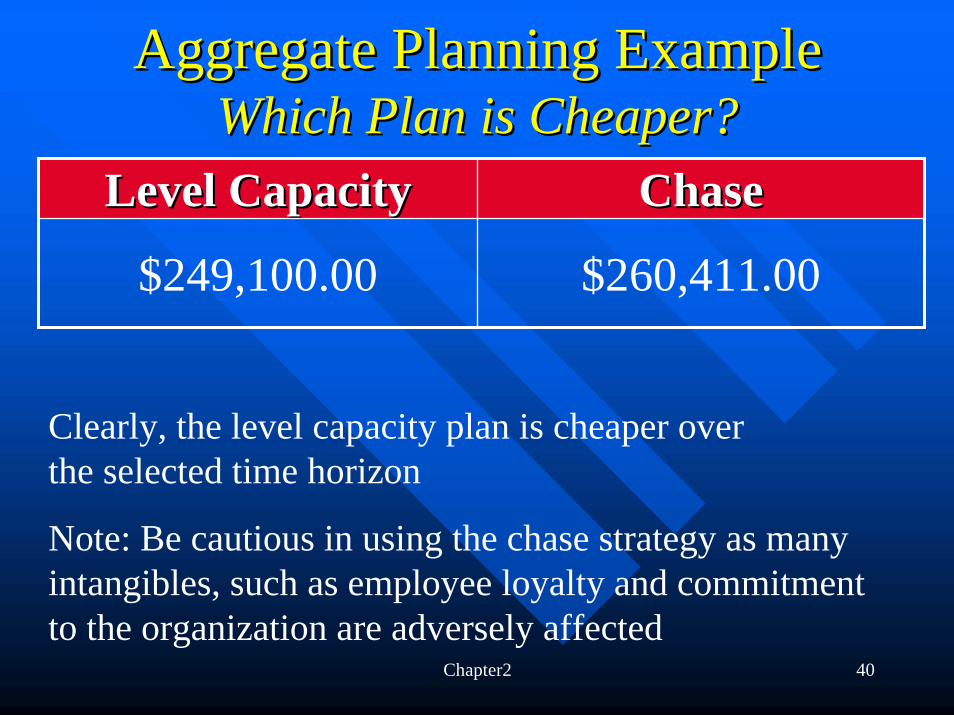
Level CapacityLevel Capacity ChaseChase
$249,100.00 $260,411.00
Clearly, the level capacity plan is cheaper over the selected time horizon
Note: Be cautious in using the chase strategy as many intangibles, such as employee loyalty and commitment to the organization are adversely affected
Chapter2 41
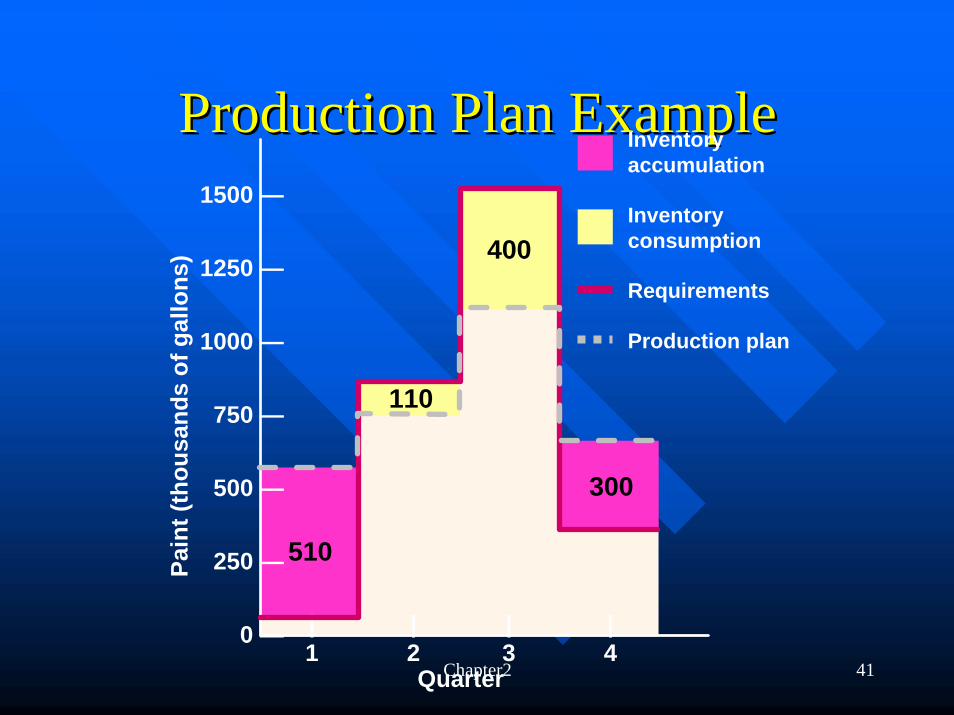
Production Plan ExampleProduction Plan Example
110
400
1500 —
1250 —
1000 —
750 —
500 —
250 —
0 — | | | |1 2 3 4
Quarter
Pain
t (th
ousa
nds
of g
allo
ns)
510
300
Inventoryconsumption
Production plan
Requirements
Inventoryaccumulation
Chapter2 42
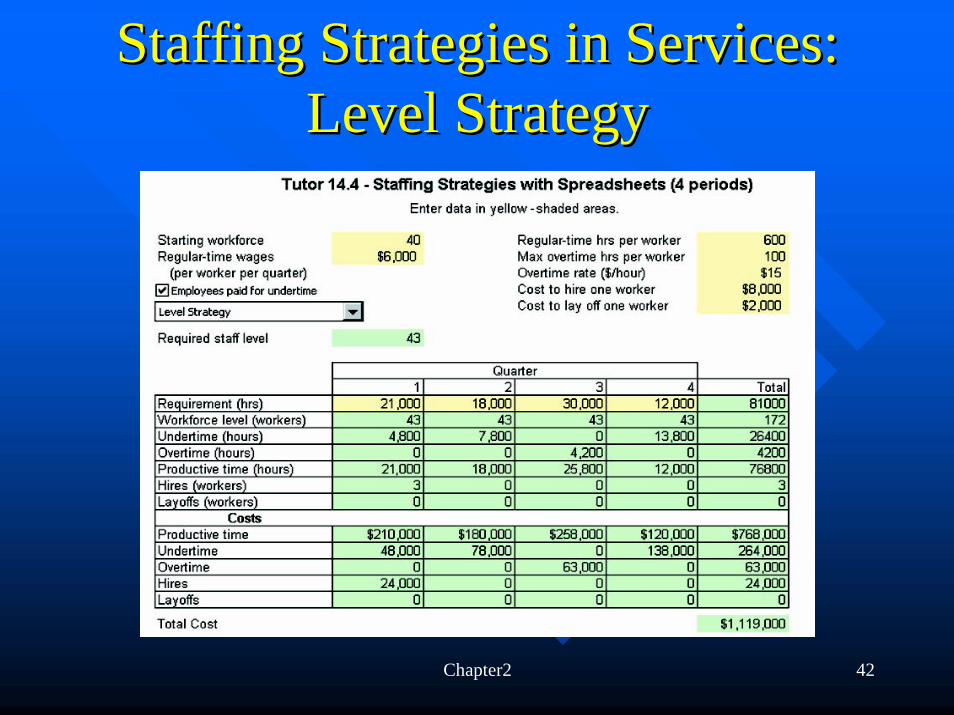
Staffing Strategies in Services: Staffing Strategies in Services: Level StrategyLevel Strategy
Chapter2 43
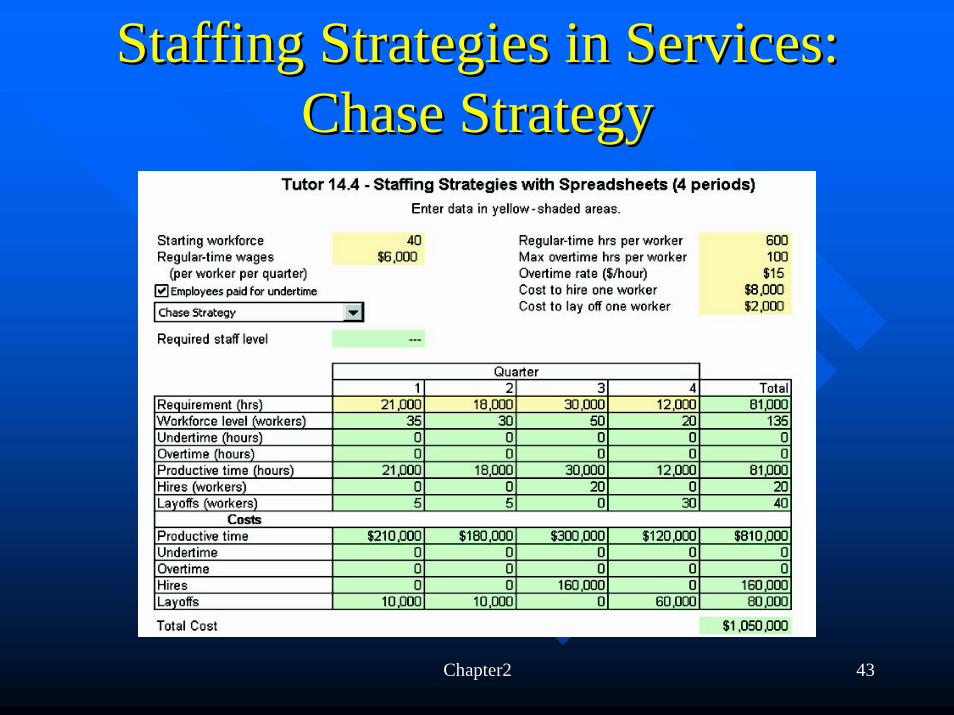
Staffing Strategies in Services: Staffing Strategies in Services: Chase StrategyChase Strategy
Chapter2 44
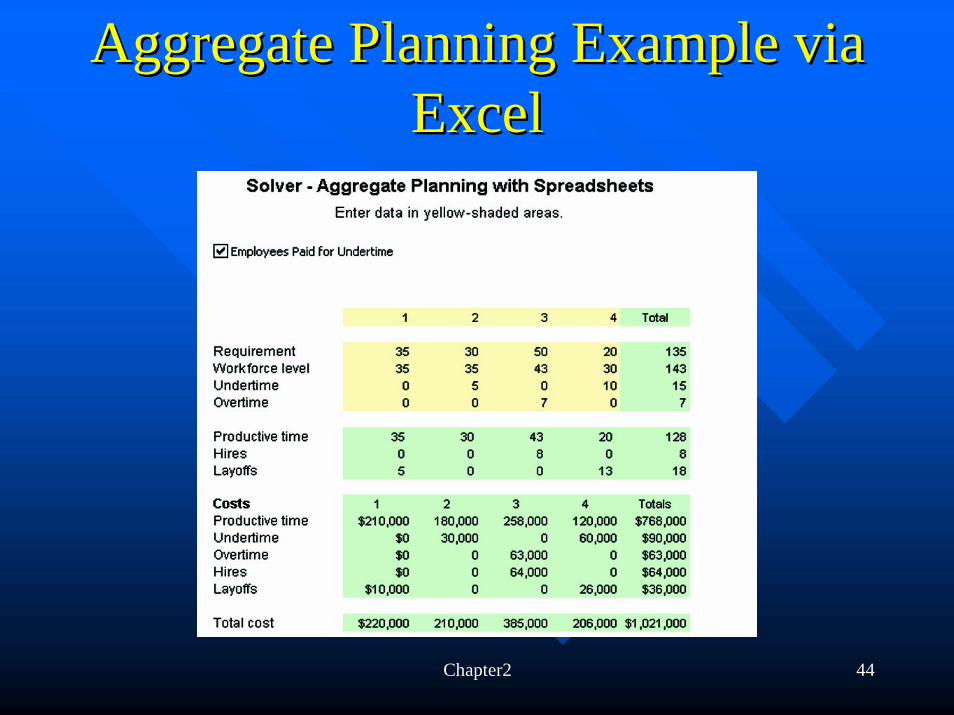
Aggregate Planning Example via Aggregate Planning Example via ExcelExcel
Chapter2 45
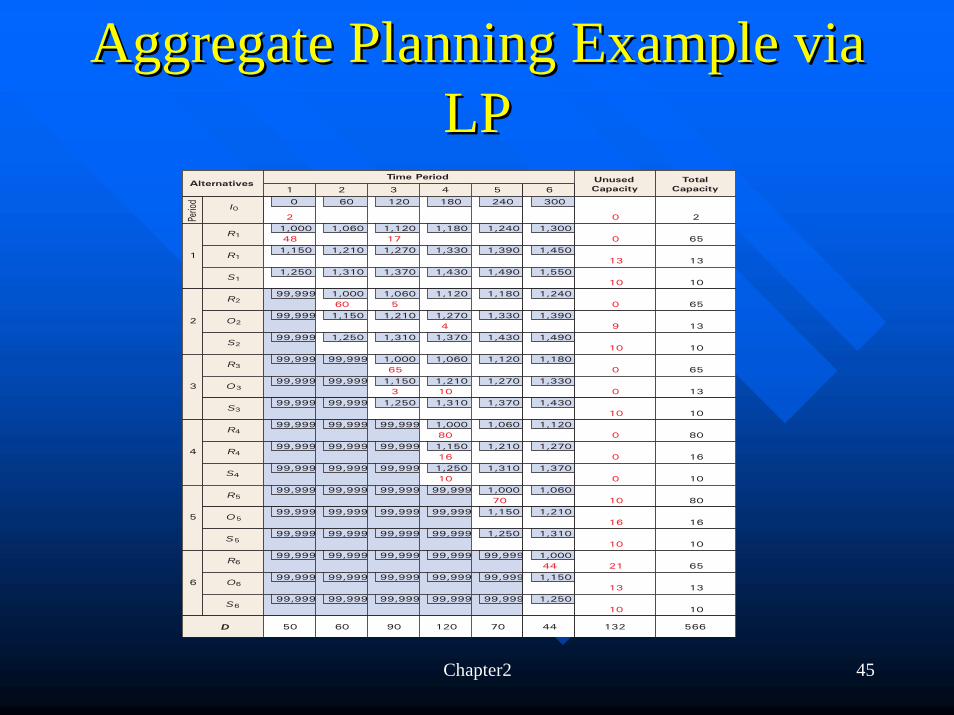
Aggregate Planning Example via Aggregate Planning Example via LPLP
�
Alternatives
I0
1
2
2 3 4 5 6Unused�Capacity
Total�Capacity
Time Period
0 60 120 180 240 300
0 2
R1 48��
� 171,000 1,060 1,120 1,180 1,240 1,300
0 65
R11,150 1,210 1,270 1,330 1,390 1,450
13 13
S11,250 1,310 1,370 1,430 1,490 1,550
10 10
R299,999 1,000 1,060 1,120 1,180 1,240
0 65
O299,999 1,150 1,210 1,270 1,330 1,390
9 13
S299,999 1,250 1,310 1,370 1,430 1,490
10 10
R399,999 99,999 1,000 1,060 1,120 1,180
0 65
O399,999 99,999 1,150 1,210 1,270 1,330
0 13
S399,999 99,999 1,250 1,310 1,370 1,430
10
3
65
560
10
R499,999 99,999 99,999 1,000 1,060 1,120
080
16
10
10
4
80
R499,999 99,999 99,999 1,150 1,210 1,270
0 16
S4 99,999 99,999 99,999 1,250 1,310 1,370
0 10
R599,999 99,999 99,999 99,999 1,000 1,060
1070 80
O599,999 99,999 99,999 99,999 1,150 1,210
16 16
S5 99,999 99,999 99,999 99,999 1,250 1,310
10 10
R699,999 99,999 99,999 99,999 99,999 1,000
2144 65
O6
1
2
3
4
5
699,999 99,999 99,999 99,999 99,999 1,150
13 13
S6 99,999 99,999 99,999 99,999 99,999 1,250
10 10
D 50 60 90 120 70 44 132 566 �
Perio
d
Chapter2 46
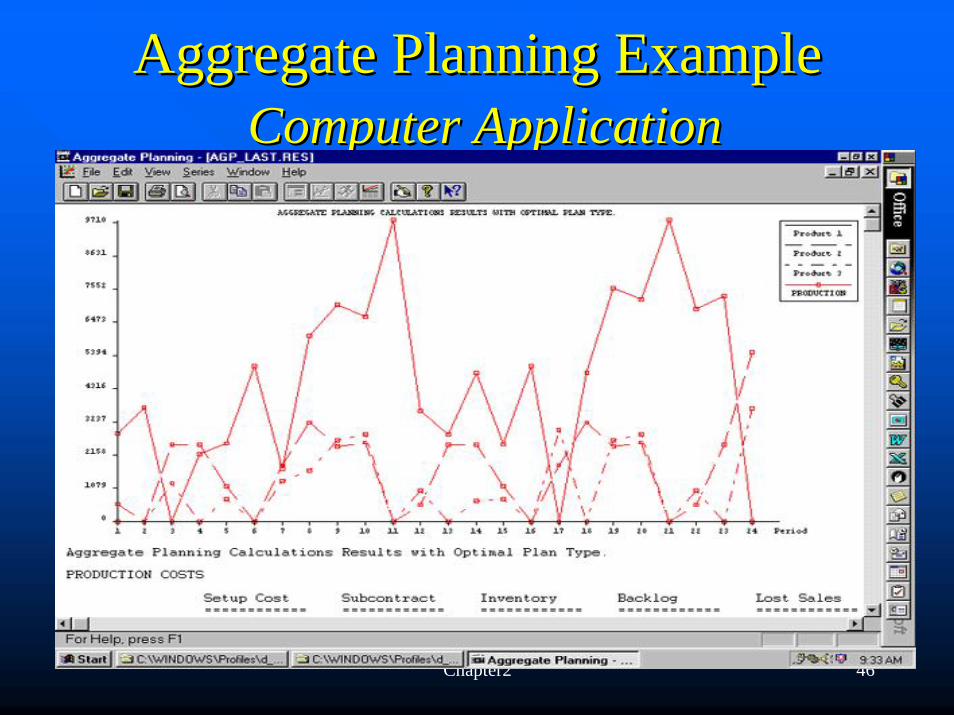
Aggregate Planning ExampleAggregate Planning ExampleComputer ApplicationComputer Application
Chapter2 47
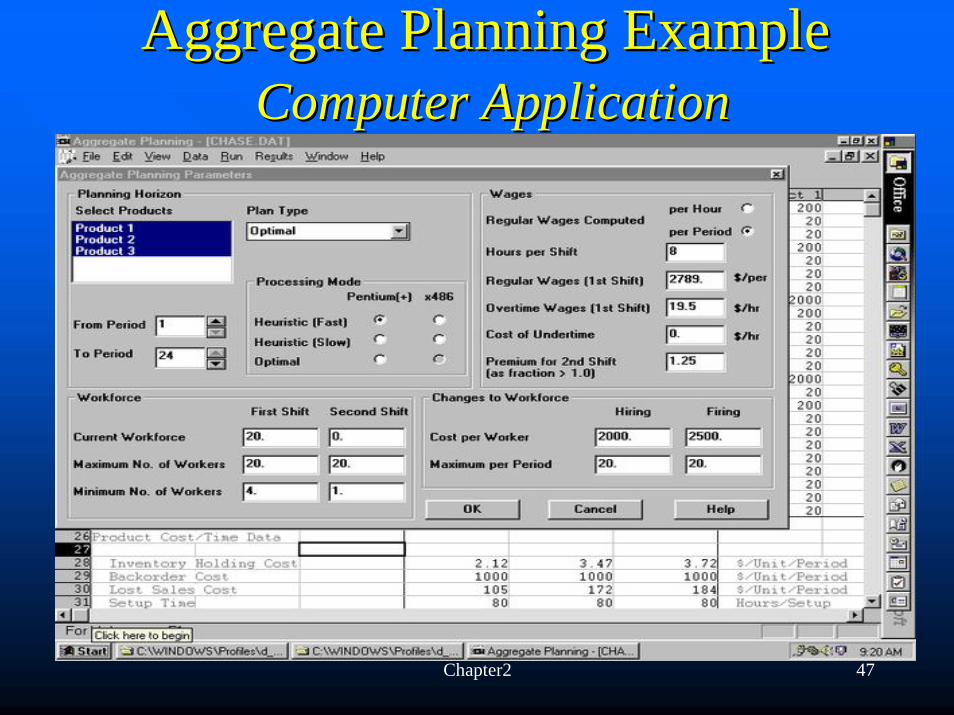
Aggregate Planning ExampleAggregate Planning ExampleComputer ApplicationComputer Application
Chapter2 48
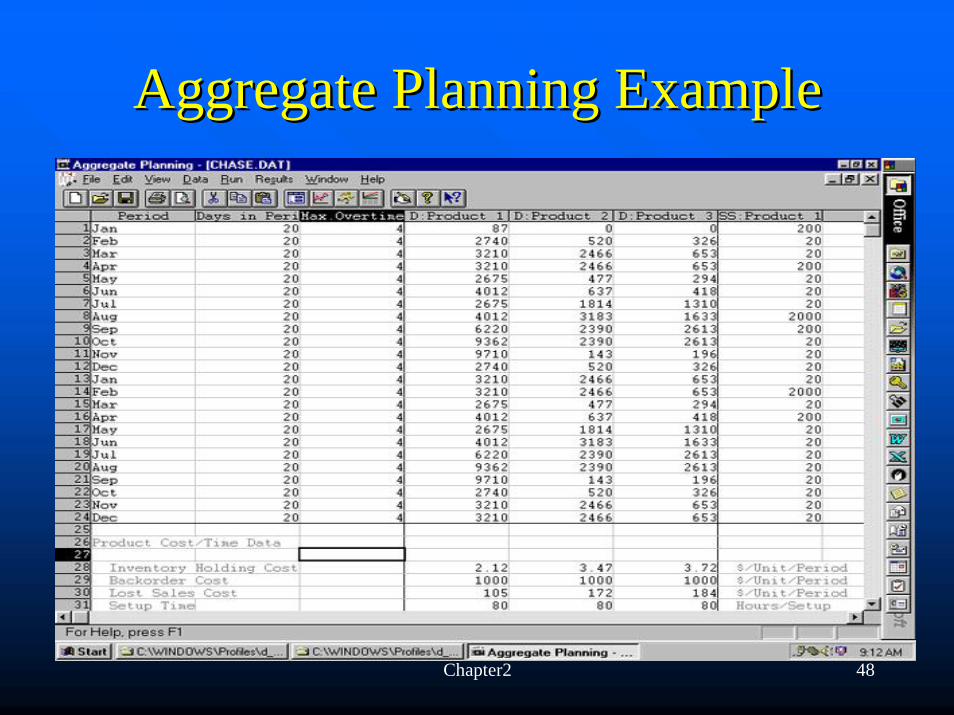
Aggregate Planning ExampleAggregate Planning Example
Chapter2 49
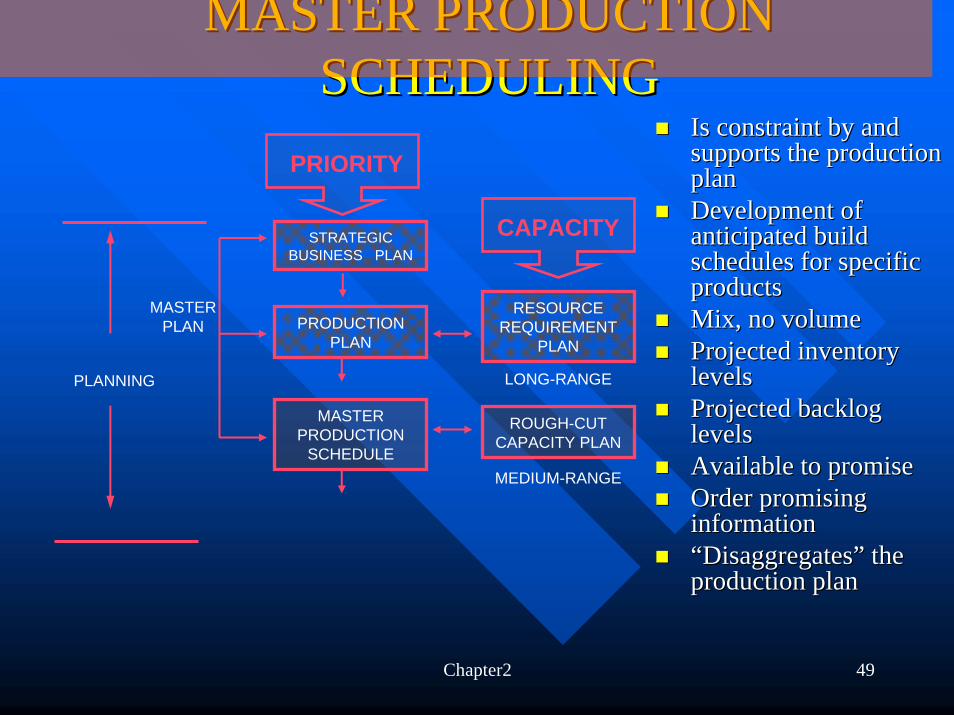
Is constraint by and Is constraint by and supports the production supports the production planplanDevelopment of Development of anticipated build anticipated build schedules for specific schedules for specific productsproductsMix, no volumeMix, no volumeProjected inventory Projected inventory levelslevelsProjected backlog Projected backlog levelslevelsAvailable to promiseAvailable to promiseOrder promising Order promising informationinformation““DisaggregatesDisaggregates”” the the production planproduction plan
MASTER PRODUCTION MASTER PRODUCTION SCHEDULINGSCHEDULING
PLANNING
STRATEGIC BUSINESS PLAN
PRODUCTION PLAN
MASTER PRODUCTION
SCHEDULE
MASTER PLAN
RESOURCE REQUIREMENT
PLAN
ROUGH-CUT CAPACITY PLAN
LONG-RANGE
MEDIUM-RANGE
PRIORITY
CAPACITY
Chapter2 50
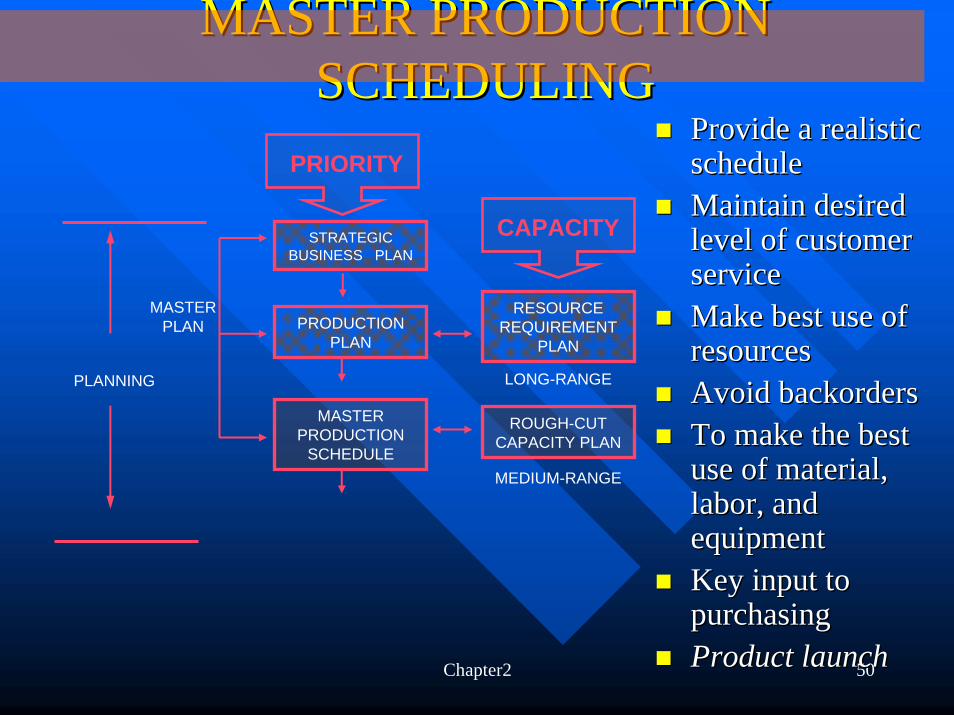
Provide a realistic Provide a realistic schedulescheduleMaintain desired Maintain desired level of customer level of customer serviceserviceMake best use of Make best use of resourcesresourcesAvoid backordersAvoid backordersTo make the best To make the best use of material, use of material, labor, and labor, and equipmentequipmentKey input to Key input to purchasingpurchasingProduct launchProduct launch
MASTER PRODUCTION MASTER PRODUCTION SCHEDULINGSCHEDULING
PLANNING
STRATEGIC BUSINESS PLAN
PRODUCTION PLAN
MASTER PRODUCTION
SCHEDULE
MASTER PLAN
RESOURCE REQUIREMENT
PLAN
ROUGH-CUT CAPACITY PLAN
LONG-RANGE
MEDIUM-RANGE
PRIORITY
CAPACITY
Chapter2 51
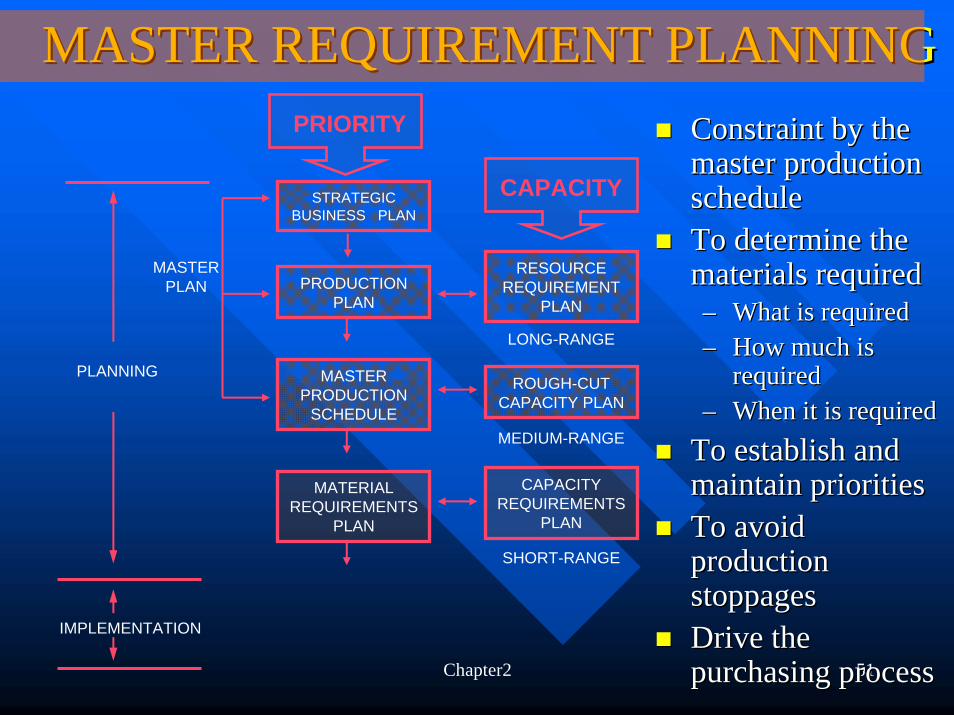
Constraint by the Constraint by the master production master production schedulescheduleTo determine the To determine the materials requiredmaterials required–– What is requiredWhat is required–– How much is How much is
requiredrequired–– When it is requiredWhen it is required
To establish and To establish and maintain prioritiesmaintain prioritiesTo avoid To avoid production production stoppagesstoppagesDrive the Drive the purchasing processpurchasing process
MASTER REQUIREMENT PLANNINGMASTER REQUIREMENT PLANNING
PLANNING
STRATEGIC BUSINESS PLAN
PRODUCTION PLAN
MASTER PRODUCTION
SCHEDULE
MATERIAL REQUIREMENTS
PLAN
MASTER PLAN
RESOURCE REQUIREMENT
PLAN
ROUGH-CUT CAPACITY PLAN
CAPACITY REQUIREMENTS
PLAN
IMPLEMENTATION
LONG-RANGE
MEDIUM-RANGE
SHORT-RANGE
PRIORITY
CAPACITY
Chapter2 52
Guidelines For master SchedulingGuidelines For master Scheduling
1. Work from an aggregate Production plan2. Schedule common Modules when possible3. Load facilities realistically4. Release orders on timely basis5. Monitor inventory levels Closely6. Reschedule as required
Chapter2 53
Guidelines For master SchedulingGuidelines For master Scheduling
Symptoms of a poorly designed MPS
1. Overloaded facilities2. Under loaded facilities3. Excessive inventory levels on some end items
and frequent stock outs on others4. Unrealistic schedules that production
personnoel do not follow5. Excessive expediting or follow up
Chapter2 54
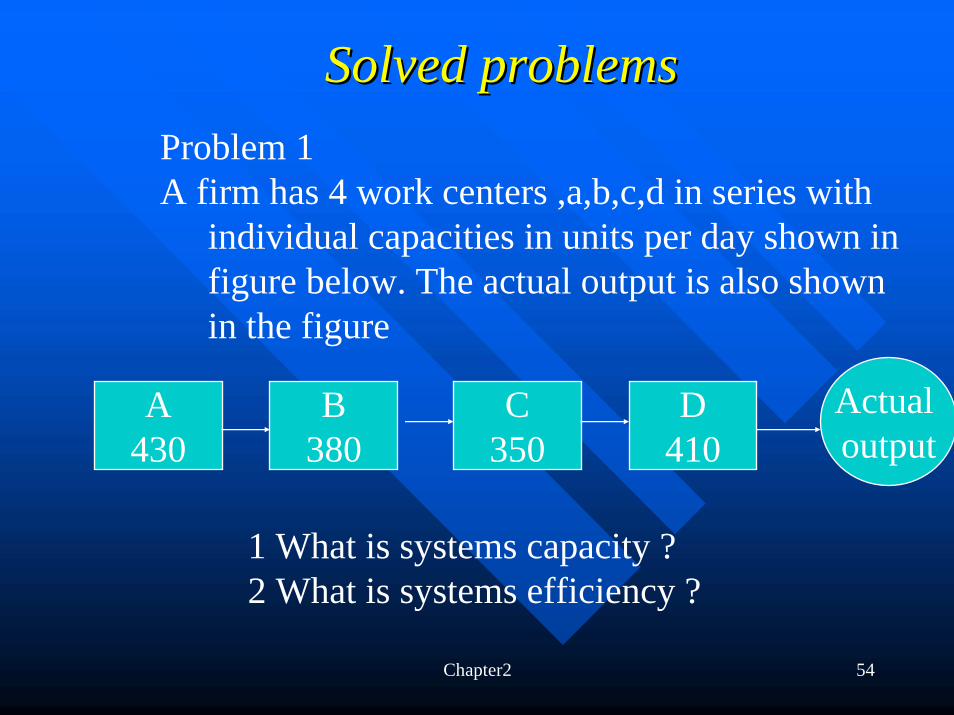
Solved problemsSolved problemsProblem 1A firm has 4 work centers ,a,b,c,d in series with
individual capacities in units per day shown in figure below. The actual output is also shown in the figure
A430
C350
B380
D410
Actual output
1 What is systems capacity ?2 What is systems efficiency ?
Chapter2 55Chapter2 55
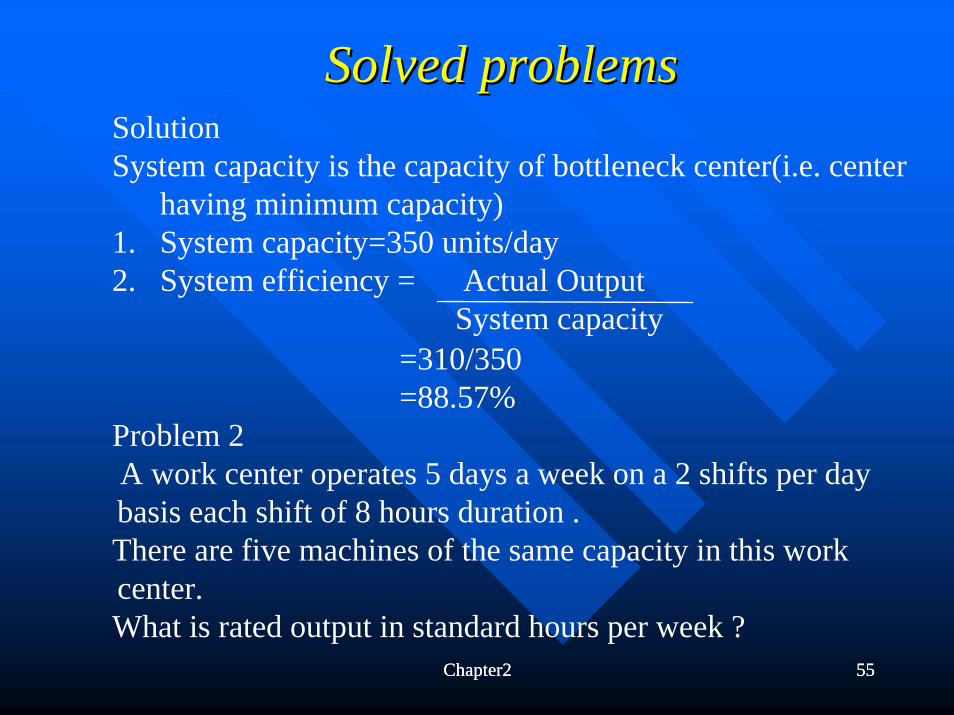
Solved problemsSolved problemsSolutionSystem capacity is the capacity of bottleneck center(i.e. center
having minimum capacity)1. System capacity=350 units/day2. System efficiency = Actual Output
System capacity=310/350=88.57%
Problem 2A work center operates 5 days a week on a 2 shifts per day basis each shift of 8 hours duration .There are five machines of the same capacity in this work center.What is rated output in standard hours per week ?
Chapter2 56Chapter2 56
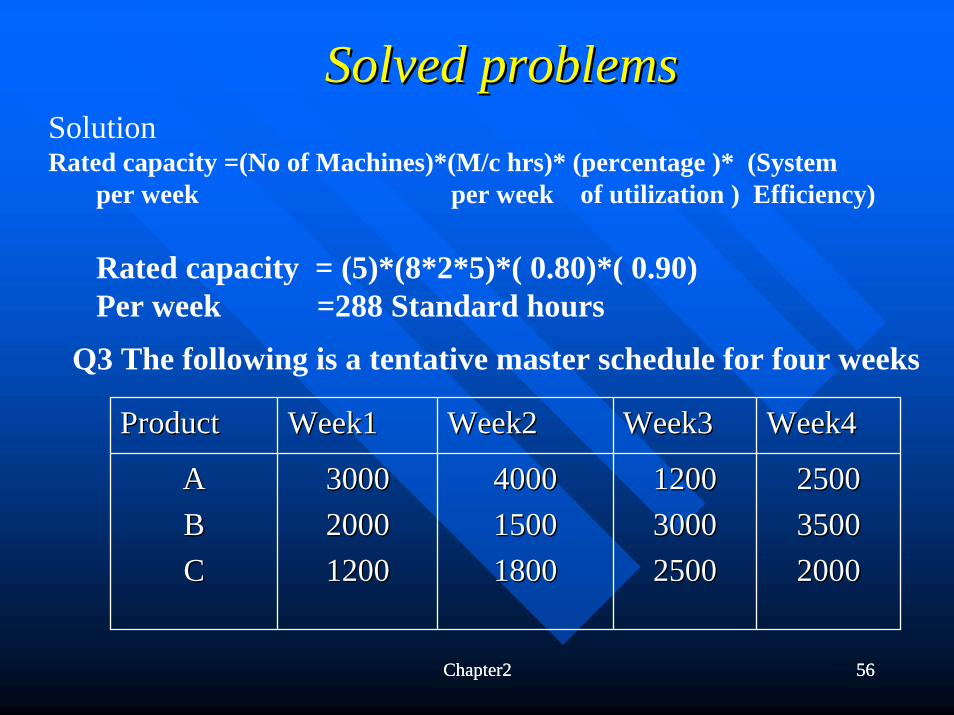
Solved problemsSolved problemsSolutionRated capacity =(No of Machines)*(M/c hrs)* (percentage )* (System
per week per week of utilization ) Efficiency)
Rated capacity = (5)*(8*2*5)*( 0.80)*( 0.90)Per week =288 Standard hours
Q3 The following is a tentative master schedule for four weeks
ProductProduct Week1Week1 Week2Week2 Week3Week3 Week4Week4
AABBCC
300030002000200012001200
400040001500150018001800
120012003000300025002500
250025003500350020002000
Chapter2 57Chapter2 57
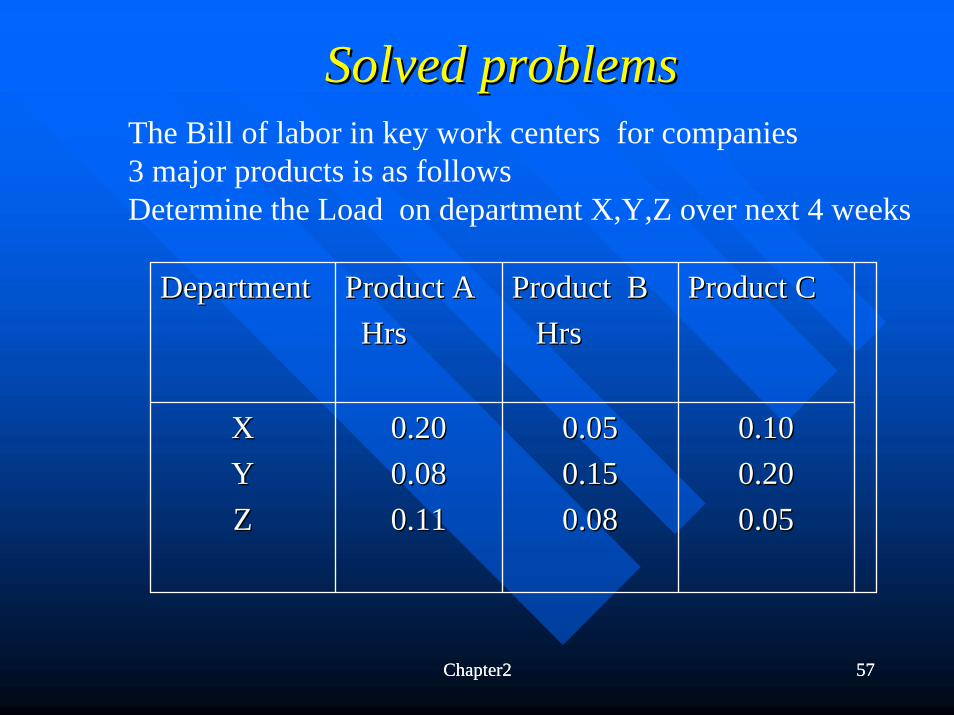
Solved problemsSolved problems
DepartmentDepartment Product AProduct AHrsHrs
Product BProduct BHrsHrs
Product CProduct C
XXYYZZ
0.200.200.080.080.110.11
0.050.050.150.150.080.08
0.100.100.200.200.050.05
The Bill of labor in key work centers for companies 3 major products is as followsDetermine the Load on department X,Y,Z over next 4 weeks
Chapter2 58Chapter2 58
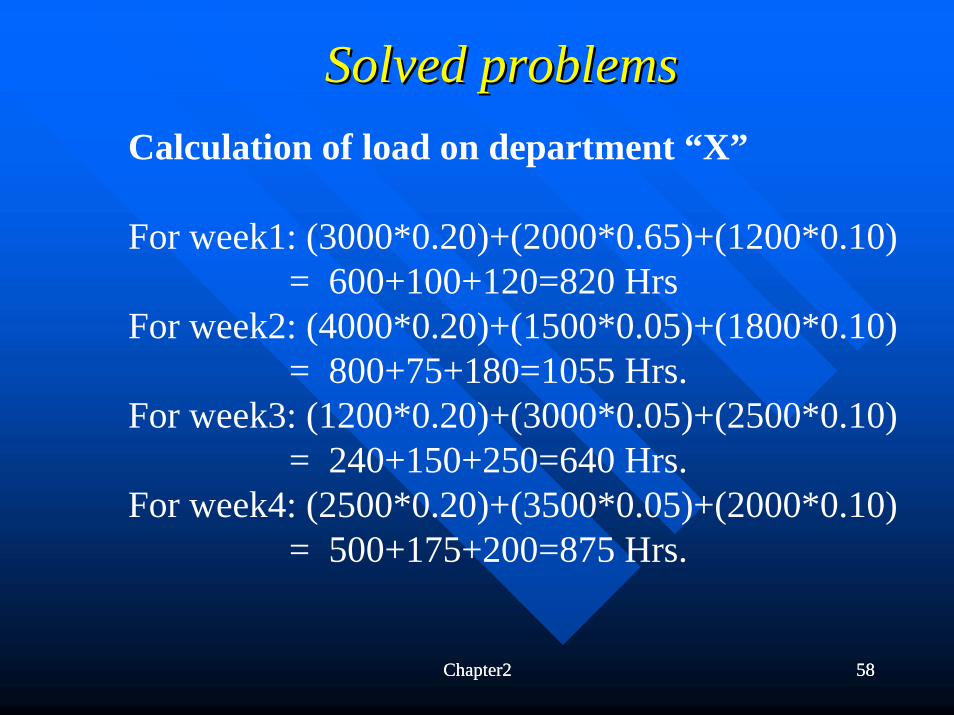
Solved problemsSolved problemsCalculation of load on department “X”
For week1: (3000*0.20)+(2000*0.65)+(1200*0.10)= 600+100+120=820 Hrs
For week2: (4000*0.20)+(1500*0.05)+(1800*0.10)= 800+75+180=1055 Hrs.
For week3: (1200*0.20)+(3000*0.05)+(2500*0.10)= 240+150+250=640 Hrs.
For week4: (2500*0.20)+(3500*0.05)+(2000*0.10)= 500+175+200=875 Hrs.
Chapter2 59Chapter2 59
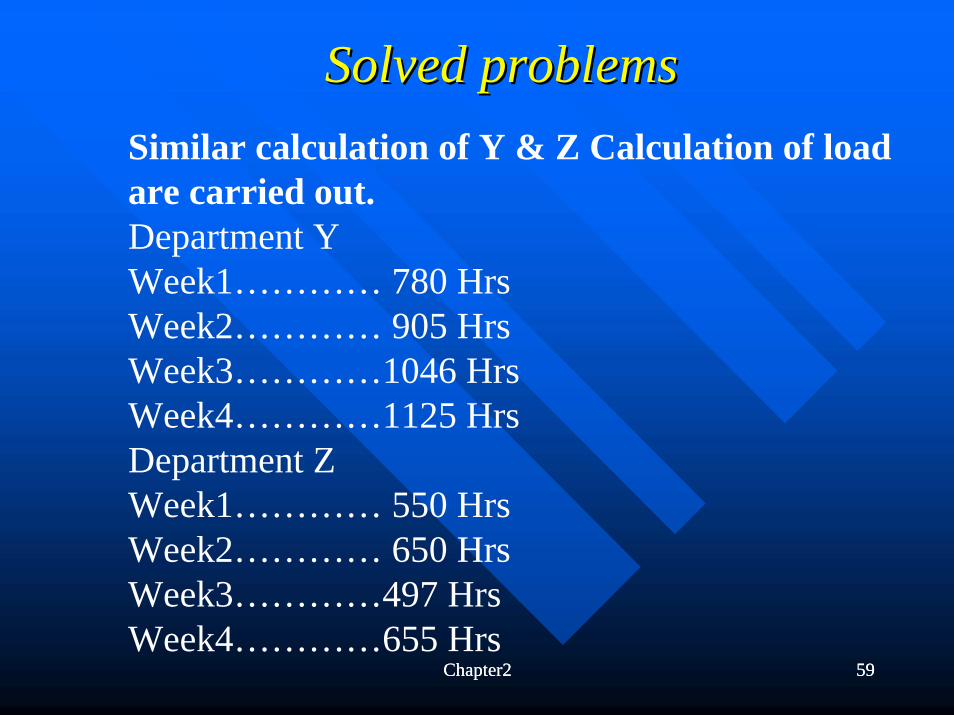
Solved problemsSolved problemsSimilar calculation of Y & Z Calculation of load are carried out.Department YWeek1………… 780 HrsWeek2………… 905 HrsWeek3…………1046 HrsWeek4…………1125 HrsDepartment ZWeek1………… 550 HrsWeek2………… 650 HrsWeek3…………497 HrsWeek4…………655 Hrs
Chapter2 60Chapter2 60
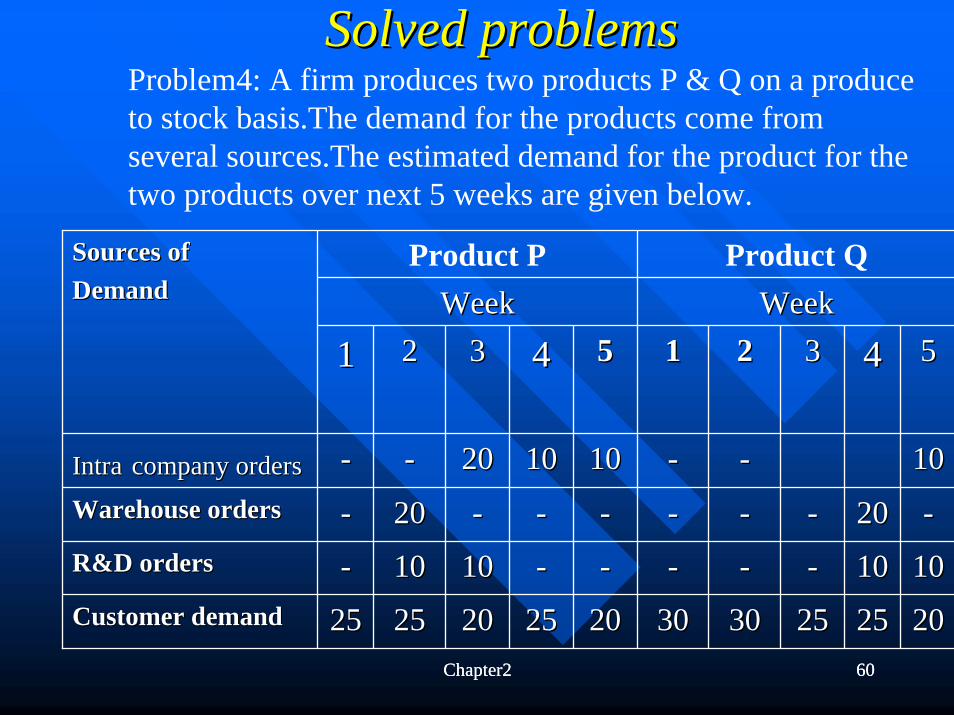
Solved problemsSolved problemsProblem4: A firm produces two products P & Q on a produce to stock basis.The demand for the products come from several sources.The estimated demand for the product for the two products over next 5 weeks are given below.
Product P Product QWeekWeek WeekWeek
11 22 33 44 55 22 33 44 55
1010
--
1010
2525 2020
2020
1010
2525
--
--
2525
--
--
--
3030
1010
--
--
2020
1010
--
--
2020
--
1010
2020
--
2020
1010
2525
11
IntraIntra company orderscompany orders -- --Warehouse ordersWarehouse orders -- --R&D ordersR&D orders -- --Customer demandCustomer demand 2525 3030
Sources ofSources ofDemandDemand
Chapter2 61Chapter2 61
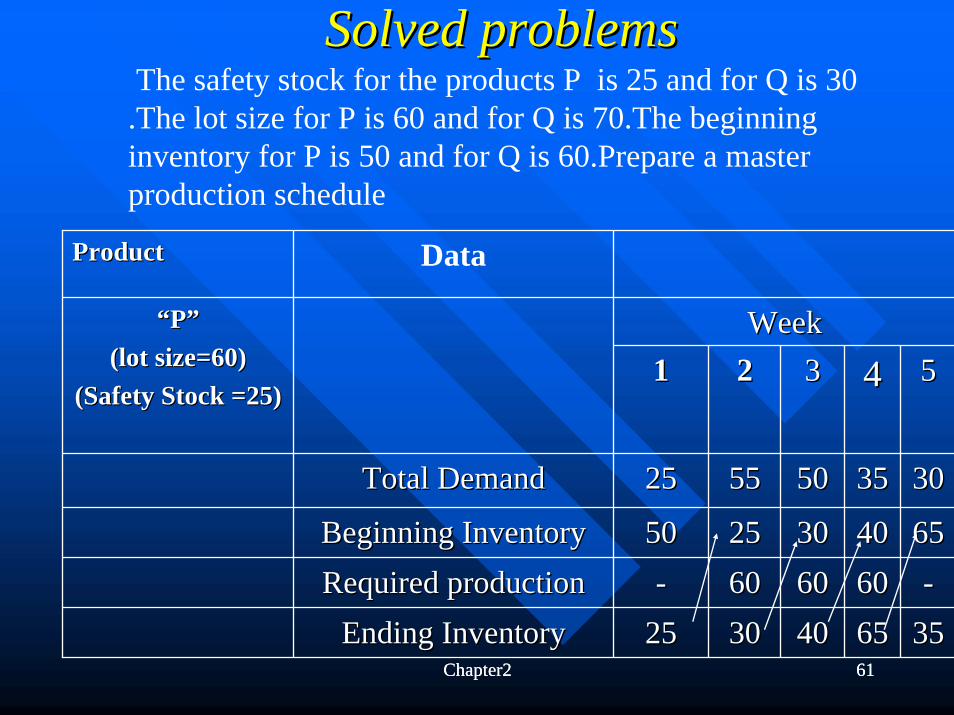
Solved problemsSolved problemsThe safety stock for the products P is 25 and for Q is 30 .The lot size for P is 60 and for Q is 70.The beginning inventory for P is 50 and for Q is 60.Prepare a master production schedule
ProductProduct Data
WeekWeek““PP””(lot size=60)(lot size=60)
(Safety Stock =25)(Safety Stock =25)11 22 33 44 55
3535 3030
6565--
3535
404060606565
5050
303060604040
5555
252560603030
Total DemandTotal Demand 2525
Beginning InventoryBeginning Inventory 5050Required productionRequired production --
Ending InventoryEnding Inventory 2525
Chapter2 62Chapter2 62
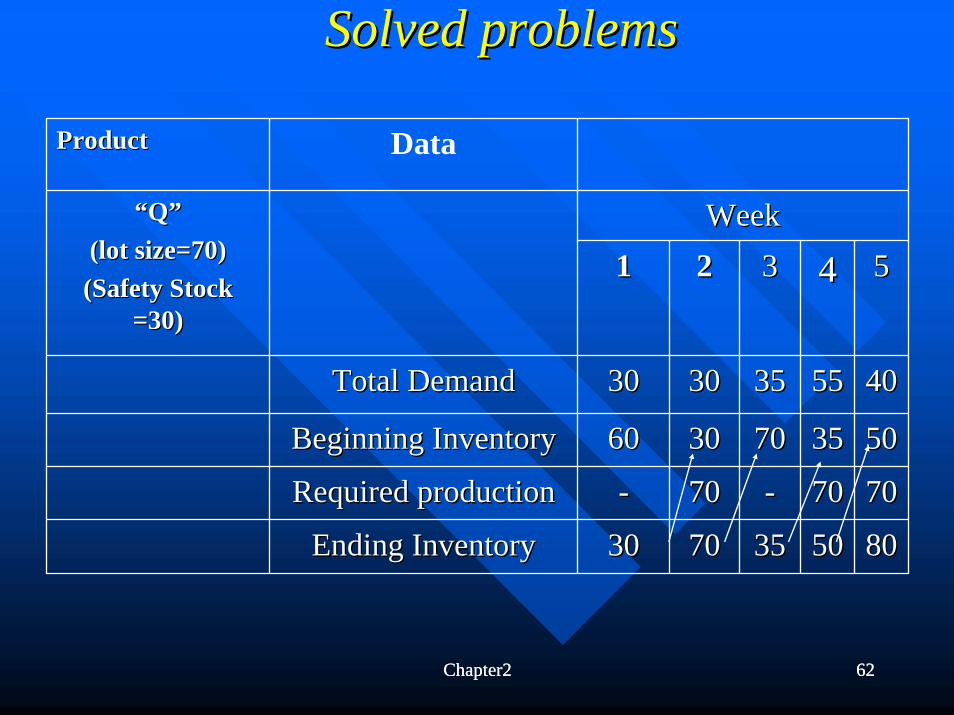
Solved problemsSolved problems
ProductProduct Data
WeekWeek““QQ””(lot size=70)(lot size=70)(Safety Stock (Safety Stock
=30)=30)
11 22 33 44 55
5555 4040
5050
7070
8080
3535
7070
5050
3535
7070
--
3535
3030
3030
7070
7070
Total DemandTotal Demand 3030
Beginning InventoryBeginning Inventory 6060
Required productionRequired production --
Ending InventoryEnding Inventory 3030
Chapter2 63
Aggregate Planning Aggregate Planning & Master Production Scheduling& Master Production Scheduling
End Of
Chapter 2