physiological basis of extreme growth rate differences in the spat of oyster (crassostrea gigas)
TRANSCRIPT
1 3
Mar BiolDOI 10.1007/s00227-014-2447-1
OrIgInal PaPer
Physiological basis of extreme growth rate differences in the spat of oyster (Crassostrea gigas)
David Tamayo · Irrintzi Ibarrola · Iñaki Urrutxurtu · Enrique Navarro
received: 7 november 2013 / accepted: 9 april 2014 © Springer-Verlag Berlin Heidelberg 2014
size-standardization is essential in accounting for observed differences in growth rate. Present results are in accordance with previous reports on other bivalve species on the physi-ological processes underlying endogenous growth differ-ences, suggesting that the same interpretation can be applied to the extremes of these differences.
Introduction
growth rates vary among individuals in natural bivalve populations (Mallet and Haley 1983; Dickie et al. 1984; Brown 1988) even when exposed to similar environmental conditions. This indicates the existence of inter-individual differences in both the capacity to acquire energy and its allocation to growth. Heritability of such inter-individual differences provides scope for improvement of bivalve pro-duction through the implementation of selection programs (newkirk 1980; Sheridan 1997; evans and langdon 2006). Thus, understanding the energetics underlying inter-indi-vidual growth variability is essential in aquaculture.
Many of the early conclusions regarding the physiolog-ical determinants of inter-individual growth differences in bivalves were obtained by performing experiments with specimens sampled from natural populations (garton et al. 1984; gaffney et al. 1990; Hawkins et al. 1989a, b), where local gradients in environmental factors, such as food or oxygen availability, might interact with endoge-nous factors in producing growth differences among indi-viduals. Such interactions are not likely to occur in the case of sibling specimens produced in hatcheries through controlled spawning events and maintained in common culture conditions throughout their lifetime. research performed with specimens of this origin has shown that growth differences (1) are endogenously determined,
Abstract Juvenile oysters (Crassostrea gigas) (produced in november 2009) reared under uniform hatchery condi-tions for 4 months were selected for extreme growth rate differences by repeatedly taking larger and smaller individu-als to achieve weight differences >30× between fast (F) and slow (S) growers. The physiological basis of differential growth was analyzed in experiments in June 2010, where components of energy gain (clearance and ingestion rates and absorption efficiency), energy loss (metabolic rates) and resulting scope for growth (J h−1) were compared for groups of F and S oysters fed three different ration levels (≈0.5, 1.5 and 3.0 mg of total particulate matter l−1). In both F and S oysters, a higher food ration promoted asymp-totic increases in energy gain rates through regulatory adjustments to clearance rates, which maintained similar absorption efficiencies across the food concentrations. no significant differences were found between growth groups in mass-specific physiological rates (i.e., per unit of body mass). However, the scaling of these rates to a common size in both groups using allometric coefficients derived for C. gigas revealed higher energy gain rates coupled with lower metabolic costs of growth in fast growers. Thus, appropriate
Communicated by J. grassle.
D. Tamayo (*) · I. Ibarrola · I. Urrutxurtu · e. navarro Departamento gaFFa (animal Physiology), Facultad de Ciencia y Tecnología, Universidad del País Vasco/euskal Herriko Unibertsitatea, apartado 644, 48080 Bilbao, Spaine-mail: [email protected]
Present Address: D. Tamayo Unité de recherche Physiologie Fonctionnelle des Organismes Marins, laboratoire des Sciences de l´environnement Marin (UMr 65 39 leMar), Ifremer, ZI de la Pointe du Diable, CS 10070, 29280 Plouzané, France
Mar Biol
1 3
meaning that they are not reversed by compensatory over-feeding of slow growers (Tamayo et al. 2011); (2) are evi-dent from the very early larval stages (Pace et al. 2006; Hedgecock et al. 2007; Meyer and Manahan 2010); (3) persist through adulthood and are heritable, thus allowing selection to improve stock production (Bayne 1999, 2000; Bayne et al. 1999b); and (4) have been observed to be linked with physiological characteristics of energy acqui-sition and metabolic output (garton et al. 1984; Hawk-ins et al. 1986, Hawkins and Day 1996; Hawkins 1995; Bayne and Hawkins 1997; Toro and Vergara 1998; Bayne 1999, 2000, 2004; Bayne et al. 1999a, b; Pace et al. 2006; Tamayo et al. 2011, 2013).
Intensive work has analyzed the differences in genotype and/or genetic expression underlying inter-individual dif-ferences in physiological performance. an early genetic approach based on multiple locus heterozygosity analy-sis used by many researchers (Koehn and gaffney 1984; Hawkins et al. 1986; Hawkins 1995; Hedgecock et al. 1995; Bayne and Hawkins 1997; Myrand et al. 2009) recognized an advantageous hybrid vigor: more heterozygous individu-als tended to grow faster due to their diminished metabolic demand (garton et al. 1984; Hawkins 1995) which resulted from more efficient protein turnover (Hawkins et al. 1986, 1989a; Hawkins and Day 1996; Bayne and Hawkins 1997; Morgan et al. 2000). recently, new techniques for massive Dna sequencing have been widely applied to the study of bivalves (Hedgecock et al. 2007; Jenny et al. 2007; Tanguy et al. 2008; Meyer and Manahan 2010; Zhang et al. 2012; Zhao et al. 2012; genard et al. 2013) and can help link physiological performance to quantitative or qualitative dif-ferences in genotype or gene transcription.
Several species of oysters in the family Ostreidae have been the subjects of recent studies on the physiological basis of inter-individual differences in growth rates. Com-parison of the physiological performance of fast versus slow growers has been undertaken in larvae (Pace et al. 2006), juveniles (Toro and Vergara 1998; Pernet et al. 2008) and adults (Toro et al. 1996; Bayne 1999, 2000, 2004; Bayne et al. 1999a, b).
These studies reported significant differences between fast and slow growers in energy acquisition rate (i.e., dif-ferences in filtering activity and, correspondingly, in food ingestion and absorption rates) (Toro and Vergara 1998; Bayne et al. 1999a, b; Bayne 1999, 2000; Pace et al. 2006; Pernet et al. 2008), as well as in the rate of energy loss through respiration (metabolic rate). Following Bayne’s ter-minology (1999), reported differences have been found to fit both the energy allocation model (i.e., different patterns of energy allocation between maintenance and growth, Bayne 1999, 2000; Pernet et al. 2008) and metabolic effi-ciency model (i.e., different energy costs of growth, these defined as the amount of energy expended per unit of tissue
growth: Toro and Vergara 1998; Bayne et al. 1999a, b; Bayne 1999, 2000; Pace et al. 2006; Pernet et al. 2008).
In the present study, spat of the oyster Crassostrea gigas belonging to a single cohort produced in a hatch-ery were subject to successive selection of size extremes to achieve two groups with an ~30× difference in mean size. aims were to compare physiological measurements used in determining scope for growth (SFg), as well as the digestive balance of dietary carbon and nitrogen in these two groups of fast (F) and slow (S) growers, in order to determine the physiological traits underlying these extreme differences in growth rate among individuals. Physiological measurements were performed in a range of dietary conditions to explore the possibility that fast and slow growers respond differently to changes in food availability.
Materials and methods
Oyster (C. gigas) spat were produced in a hatchery (november 2009), the Marine Culture Farm of TIna-MenOr S.l. (Pesués, Cantabria, north Spain) through a massive spawning of some 100 adult oysters collected from a wild population on the rocky shore close to the farm. lar-vae were cultivated at an initial density of 10–20 ml −1 in three larval tanks. Two growth groups were segregated by successive selection of individuals chosen from the extremes of the size range. Feeding conditions consisted of a mixture of the algae Isochrysis galbana (T-ISO clone), Chaetoceros muelleri and Tetraselmis suecica supplied at a ration level representing 5 % of live weight d−1..
Both groups fast (F) and slow (S) growers were deliv-ered on February 25, 2010, and maintained in the labora-tory for 3 months at 17 °C under identical feeding condi-tions, consisting of a mixture of living Isochrysis galbana (T-ISO clone) and Phaeodactylum tricornutum freeze-dried paste (purchased from Fitoplancton Marino) at a ratio of (7:3). no significant mortality (<1 %) was recorded for either F or S oysters during the 3 months of mainte-nance in the laboratory. When physiological experiments were initiated in June, the sizes of F and S clams were 1,955 ± 214.7 and 54 ± 2.6 mg live weight (24.80 ± 0.95 and 6.08 ± 0.90 mm shell length), respectively.
The experimental design included measurements of the physiological components of the energy balance in both groups of oysters maintained with three different food rations (see below). additionally, diet and feces samples corresponding to the medium and high ration were col-lected for CnH analysis in order to compute digestive bal-ances and absorption efficiencies for carbon and nitrogen. Physiological determinations with each diet regime took 6 days and were performed using different specimens.
Mar Biol
1 3
Diet characteristics
Cultures of the alga Isochrysis galbana (T-ISO) had silt particles added to provide diets with an inorganic tracer for absorption efficiency determinations according Cono-ver (1966). Concentrated stocks of these diets were dosed into the feeding tanks at rates set to provide stable particle concentrations and were checked frequently by monitoring particulate volumes (mm3 l−1) using a Coulter Multisizer 3. Target values for the different rations were: 0.5 mm3 l−1 for the low ration, 3.0 mm3 l−1 for the medium ration and 6.0 mm3 l−1 for the high ration.
Characterizing food suspensions involved daily extrac-tion of duplicate water samples from the feeding tanks later filtered through ashed pre-weighted gF/C glass-fiber filters. These filters were subsequently processed to determine concentrations of total particulate matter (TPM: mg l−1) and inorganic and organic particulate matter (PIM and POM: mg l−1). Salts retained in the filters were rinsed out with a solution of ammonium formate sea-water isotonic (0.9 %; w:v), then filters were dried at 110 °C for 24–48 h, weighed, ashed at 450 °C (6 h) and weighed again. TPM and PIM were estimated, respectively, as the dry and ash weight increment of the filters and POM as the weight loss of this filtered material on ashing. Organic content (OC) was estimated as POM/TPM. additionally, three samples of the stock diet taken at different points during the experi-ment were divided into three replicas and each one filtered through pre-ashed (450 °C) gF/C filters for elemental (CnH) analysis. These filters were stored at −20 °C until combustion in a euro ea elemental analyzer (euroVec-tor) which had been calibrated using acetanilide as stand-ard. Dietary characteristics of the three different rations are shown in Table 1.
Physiological determinations
Due to the great size differences between F and S oysters, the number of individuals sample−1 in physiological deter-minations was chosen to achieve a common biomass: from a single individual in F oyster samples to 33 specimens sample−1 in S oysters. Diet treatments proceeded with rep-licated samples disposed in individual chambers suited for
clearance rate (Cr) and absorption efficiency determina-tions: oysters were placed on plastic grids attached to the upper part of inverted conical chambers to allow collection of feces with minimal disturbance (Tamayo et al. 2011, 2013). Water from a feeding tank containing the diet and regulated to 17 °C was re-circulated through the chambers by means of a multichannel peristaltic pump regulated to produce flow rates required to achieve a 15–25 % of reduc-tion in particle concentration inside the chambers while the particulate suspension in the tank was maintained at the tar-get concentration (mm3 l−1) by the addition of an appro-priate amount of particles delivered from a concentrated stock of the diet. a control chamber (without oysters) was used to correct for particle sedimentation. Oysters were allowed to accommodate for 24 h in these chambers which were cleaned prior to the start of measurements.
Clearance rates (Cr: l h−1) of oysters were calculated, according to Crisp (1971) as:
where F is the flow rate (l h−1), n is the number of speci-mens per chamber (n = 1 for F oysters and n = 33 for S oysters) and Ci and Co are the particle concentrations in the outflows of control and experimental chambers, respec-tively. each sample is represented by the average value of 6–7 determinations in a chamber over 48 h and reported values are means of five samples (chamber measurements) for both F and S oysters.
Ingestion rates
Organic ingestion rate (OIr: mg h−1) was computed as the product of Cr and POM concentration (mg POM l−1) in the feeding tanks. Ingestion rates of carbon and nitrogen (IrC and Irn, respectively) were calculated as the product of Cr and particulate organic carbon (POC: mg l−1) and nitrogen (POn: mg l−1), respectively.
absorption efficiencies and absorption rates
Samples of biodeposits collected from the bottoms of chambers were filtered onto ashed pre-weighted gF/C glass-fiber filters and processed for total and organic matter
CR = F/n ∗ ((Ci −Co)/Ci)
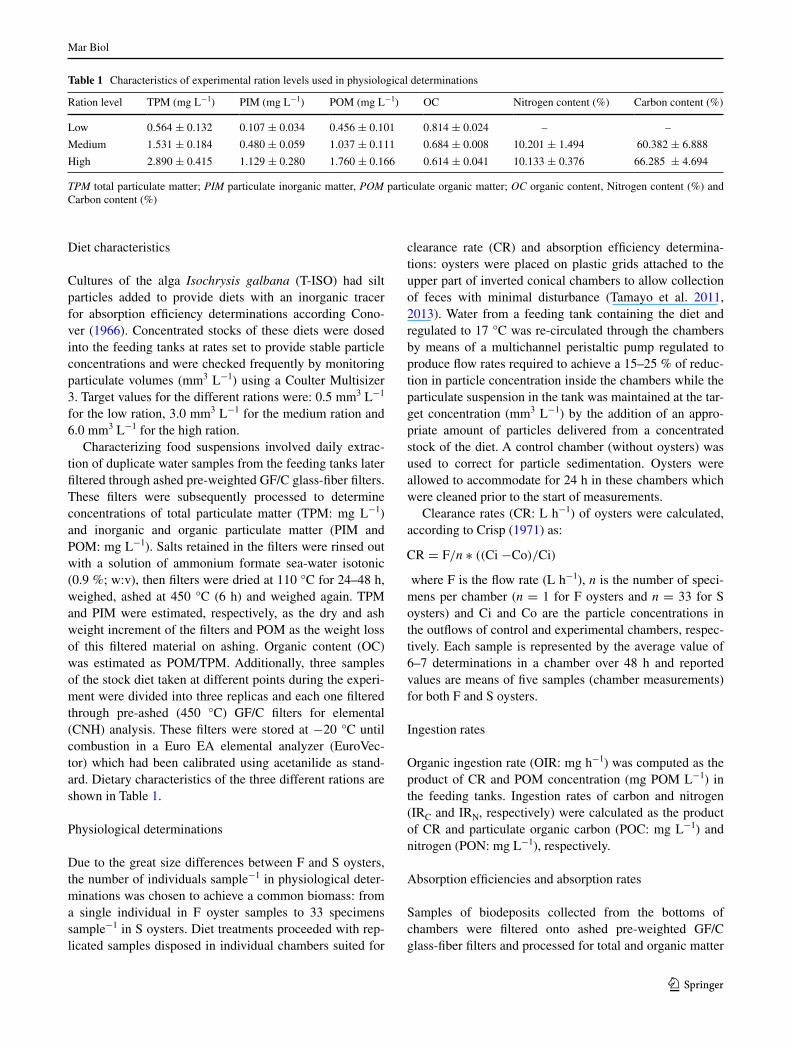
Table 1 Characteristics of experimental ration levels used in physiological determinations
TPM total particulate matter; PIM particulate inorganic matter, POM particulate organic matter; OC organic content, nitrogen content (%) and Carbon content (%)
ration level TPM (mg l−1) PIM (mg l−1) POM (mg l−1) OC nitrogen content (%) Carbon content (%)
low 0.564 ± 0.132 0.107 ± 0.034 0.456 ± 0.101 0.814 ± 0.024 – –
Medium 1.531 ± 0.184 0.480 ± 0.059 1.037 ± 0.111 0.684 ± 0.008 10.201 ± 1.494 60.382 ± 6.888
High 2.890 ± 0.415 1.129 ± 0.280 1.760 ± 0.166 0.614 ± 0.041 10.133 ± 0.376 66.285 ± 4.694
Mar Biol
1 3
as indicated for food samples. In the case of medium and high rations, duplicate samples were filtered onto ashed gF/C filters, stored at −20 °C and processed for elemental (CnH) analysis.
apparent absorption efficiency of organic matter (deci-mal units) was determined following Conover (1966), as:
f and e representing the OCs of food and biodeposits, respectively.
absorption rate (ar: mg h−1) of total organic matter was calculated as the product of OIr and ae. Carbon and nitrogen absorption rates (arC, arn: mg h−1) were calcu-lated as the balance between their ingestion and egestion rates, where the last was computed as total organic egestion rate [Oer = OIr × (1 − ae)] multiplied by the C or n content in the feces.
Carbon and nitrogen ae (aec and aen, respectively) were calculated as the ratio between their absorption and ingestion rates. reported values of ae are based on means of OC or C and n content of biodeposits sampled from five chambers (n = 5) for each growth group. For conversion of OIr and ar to energy units, an energy equivalent of 18.75 J mg POM−1 was applied based on reported data for I. galbana (Whyte 1987).
Metabolic rates (R: J h−1) were derived from measure-ments of oxygen consumption (VO2: ml O2 h
−1) using an oxycaloric coefficient of 20.08 J ml O2
−1 (gnaiger 1983). Oysters were confined in 150-ml chambers (n = 5 for each growth group) sealed with lDO oxygen probes connected to oxymeters (HaTCH HQ40d) and rates of oxygen con-sumption estimated from the decrease in oxygen concentra-tion over time (1–2 h). Controls (chambers without oysters) were used to check the stability of oxygen concentration during the measurement period.
Scope for growth (SFg: J h−1) was computed as the dif-ference between absorption rate and metabolic rate (both in J h−1) which implies, in fact, a slight overestimation of the true SFg, energy losses due to ammonia excretion not hav-ing been considered (see Bayne and newell 1983).
expression of physiological results
Once physiological measurements were completed, individ-uals were processed for determination of tissue dry weight (TDW: mg). Soft tissues of F oysters were dissected and TDW was individually determined after drying the tissues at 80 °C for 48 h. For S oysters, given the elevated number and the difficulty of dissecting small specimens, individual TDWs were estimated from total dry weights (totDW: mg) (obtained after drying at 80 °C for 48 h), using the following equation that was obtained with a group of S oysters broadly covering the size range of experimental S individuals:
AE = (f − e)/(l − e) ∗ f
Following Tamayo et al (2013), physiological rates were expressed as: (1) mass-specific rates (YSPC, rate TDW unit) and (2) size-standardized rate (YSTD). Clearance and meta-bolic rates were standardized to common flesh dry weights (TDWSTD) by using the expression:
where YSTD and YeXP represent the standard and experi-mentally recorded rates, respectively. WeXP represents the weight of the experimental oysters and b the mass-expo-nent that scales physiological rates to body weight in this species (b = 0.439 and 0.8 for Cr and R, respectively, from Bougrier et al. 1995).
Statistical procedures
Physiological measurements were compared for differ-ences between or among treatments (growth categories and ration) by means of multiple factor anOVa(using SPSS 11) after normality was tested (Kolmogorov–Smirnov) and homogeneity of variances evaluated by means of the Bart-lett test (Zar 1984). When necessary, arc-sine transforma-tion of ratios was performed. Slopes of the linear regres-sions for the costs of absorption between F and S oysters were compared using a slope comparison test (Zar 1984).
Results
Mass-specific physiological components of energy balance
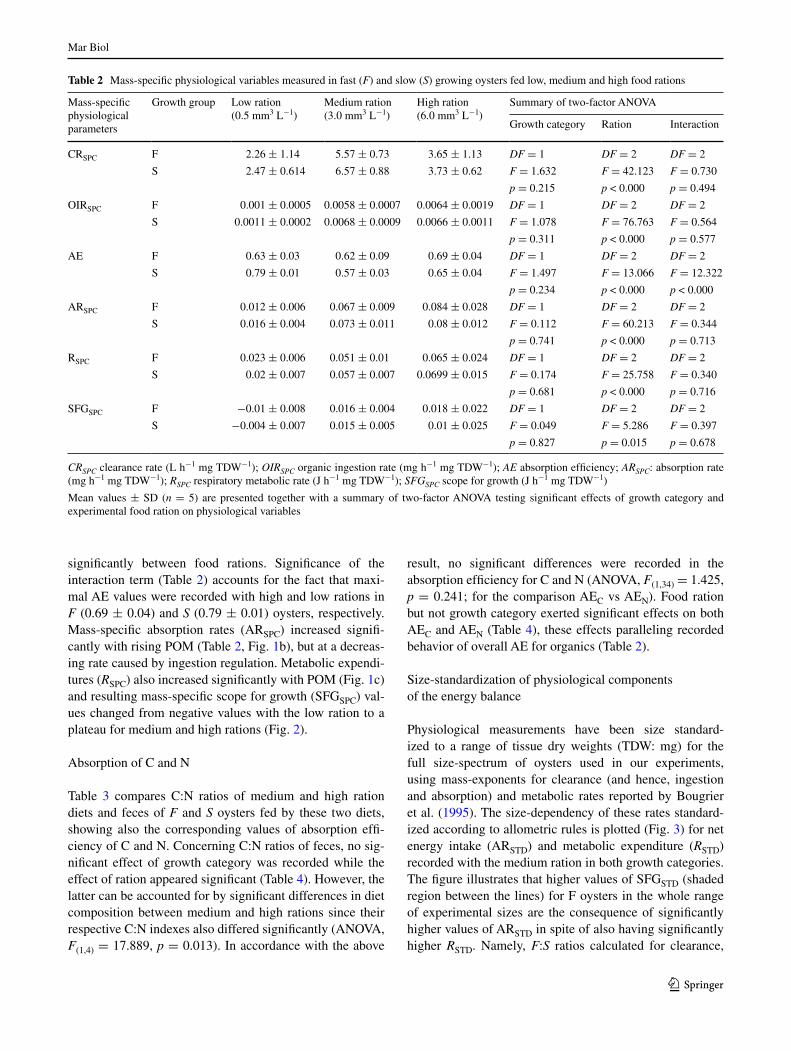
Mass-specific values of Cr (ml h−1 g TDW−1), ingestion rate of organic matter (mg h−1 g TDW−1), absorption rate (J h−1 g TDW−1), metabolic rate (J h−1 g TDW−1) and SFg (J h−1 g TDW−1) recorded for F and S oysters are shown (Table 2), where absorption efficiency (fraction) is also included. The table incorporates a summary of the two-fac-tor anOVa used to test the effect of growth category and food ration.
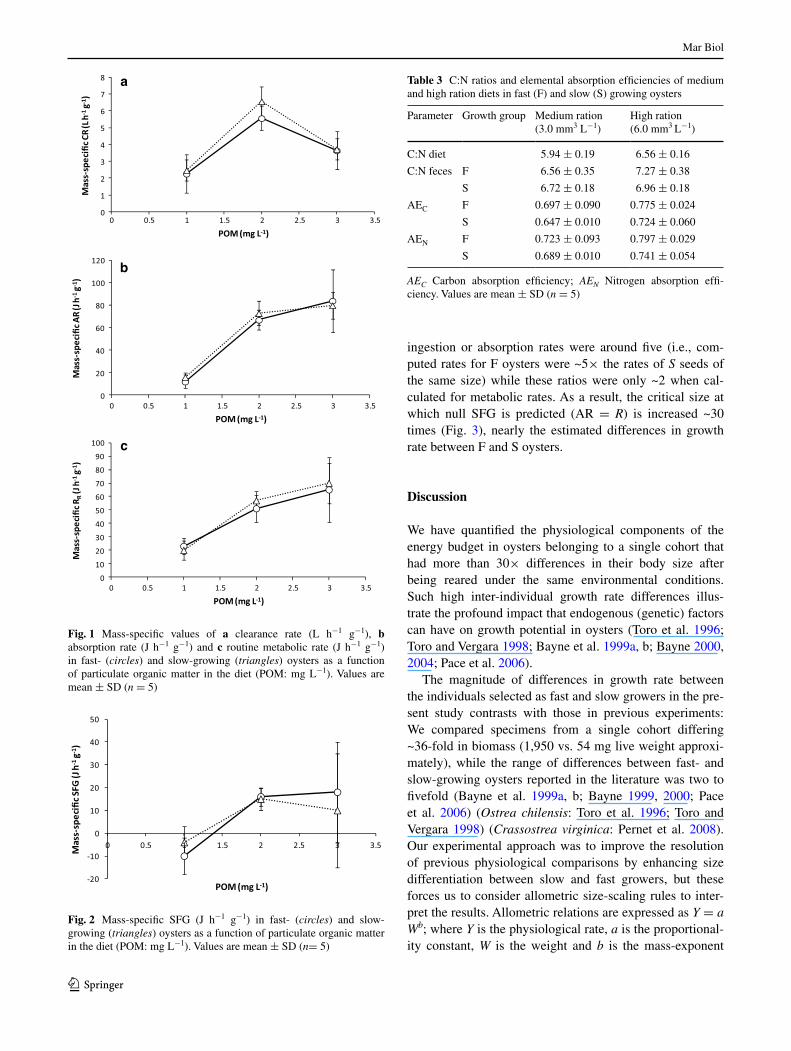
While growth category had no significant effect on mass-specific physiological measurements, food ration had significant effects on all physiological variables: CrSPC increased from low to medium rations but decreased from medium to high rations (Fig. 1a). Since Cr directly deter-mines rates of ingestion, this behavior results in ingestion rate regulation across variable amounts of suspended food. Indeed, data in Table 2 show rates of organic ingestion (OIrSPC) attained a nearly stable value for medium and high rations. Mean values for ae did not differ between F (0.652 ± 0.058) and S (0.676 ± 0.033) oysters but differed
TDW = 0.0747(±0.008) × totDW − 0.0467(±0.391),
r2= 0.8315, F1,20 = 98.713, P < 0.000, n = 22.
YSTD = (TDWSTD/WEXP)b∗ YEXP
Mar Biol
1 3
significantly between food rations. Significance of the interaction term (Table 2) accounts for the fact that maxi-mal ae values were recorded with high and low rations in F (0.69 ± 0.04) and S (0.79 ± 0.01) oysters, respectively. Mass-specific absorption rates (arSPC) increased signifi-cantly with rising POM (Table 2, Fig. 1b), but at a decreas-ing rate caused by ingestion regulation. Metabolic expendi-tures (RSPC) also increased significantly with POM (Fig. 1c) and resulting mass-specific scope for growth (SFgSPC) val-ues changed from negative values with the low ration to a plateau for medium and high rations (Fig. 2).
absorption of C and n
Table 3 compares C:n ratios of medium and high ration diets and feces of F and S oysters fed by these two diets, showing also the corresponding values of absorption effi-ciency of C and n. Concerning C:n ratios of feces, no sig-nificant effect of growth category was recorded while the effect of ration appeared significant (Table 4). However, the latter can be accounted for by significant differences in diet composition between medium and high rations since their respective C:n indexes also differed significantly (anOVa, F(1,4) = 17.889, p = 0.013). In accordance with the above
result, no significant differences were recorded in the absorption efficiency for C and n (anOVa, F(1,34) = 1.425, p = 0.241; for the comparison aeC vs aen). Food ration but not growth category exerted significant effects on both aeC and aen (Table 4), these effects paralleling recorded behavior of overall ae for organics (Table 2).
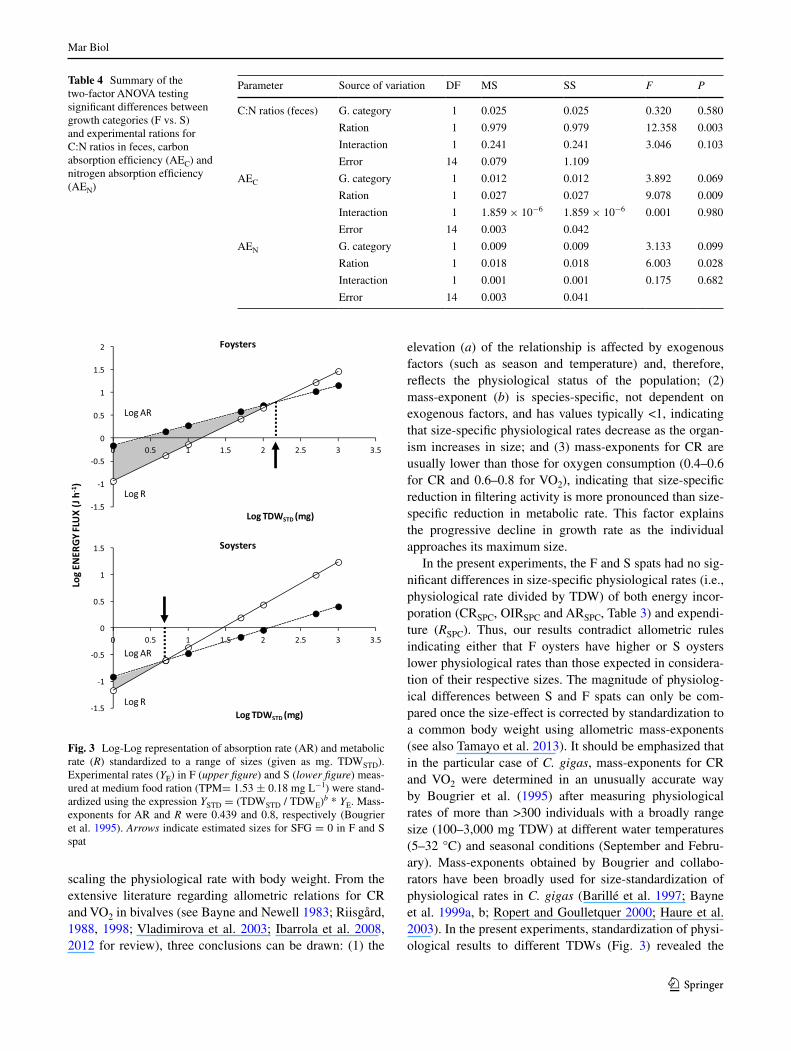
Size-standardization of physiological components of the energy balance
Physiological measurements have been size standard-ized to a range of tissue dry weights (TDW: mg) for the full size-spectrum of oysters used in our experiments, using mass-exponents for clearance (and hence, ingestion and absorption) and metabolic rates reported by Bougrier et al. (1995). The size-dependency of these rates standard-ized according to allometric rules is plotted (Fig. 3) for net energy intake (arSTD) and metabolic expenditure (RSTD) recorded with the medium ration in both growth categories. The figure illustrates that higher values of SFgSTD (shaded region between the lines) for F oysters in the whole range of experimental sizes are the consequence of significantly higher values of arSTD in spite of also having significantly higher RSTD. namely, F:S ratios calculated for clearance,
Table 2 Mass-specific physiological variables measured in fast (F) and slow (S) growing oysters fed low, medium and high food rations
CRSPC clearance rate (l h−1 mg TDW−1); OIRSPC organic ingestion rate (mg h−1 mg TDW−1); AE absorption efficiency; ARSPC: absorption rate (mg h−1 mg TDW−1); RSPC respiratory metabolic rate (J h−1 mg TDW−1); SFGSPC scope for growth (J h−1 mg TDW−1)
Mean values ± SD (n = 5) are presented together with a summary of two-factor anOVa testing significant effects of growth category and experimental food ration on physiological variables
Mass-specific physiological parameters
growth group low ration (0.5 mm3 l−1)
Medium ration (3.0 mm3 l−1)
High ration (6.0 mm3 l−1)
Summary of two-factor anOVa
growth category ration Interaction
CrSPC F 2.26 ± 1.14 5.57 ± 0.73 3.65 ± 1.13 DF = 1 DF = 2 DF = 2
S 2.47 ± 0.614 6.57 ± 0.88 3.73 ± 0.62 F = 1.632 F = 42.123 F = 0.730
p = 0.215 p < 0.000 p = 0.494
OIrSPC F 0.001 ± 0.0005 0.0058 ± 0.0007 0.0064 ± 0.0019 DF = 1 DF = 2 DF = 2
S 0.0011 ± 0.0002 0.0068 ± 0.0009 0.0066 ± 0.0011 F = 1.078 F = 76.763 F = 0.564
p = 0.311 p < 0.000 p = 0.577
ae F 0.63 ± 0.03 0.62 ± 0.09 0.69 ± 0.04 DF = 1 DF = 2 DF = 2
S 0.79 ± 0.01 0.57 ± 0.03 0.65 ± 0.04 F = 1.497 F = 13.066 F = 12.322
p = 0.234 p < 0.000 p < 0.000
arSPC F 0.012 ± 0.006 0.067 ± 0.009 0.084 ± 0.028 DF = 1 DF = 2 DF = 2
S 0.016 ± 0.004 0.073 ± 0.011 0.08 ± 0.012 F = 0.112 F = 60.213 F = 0.344
p = 0.741 p < 0.000 p = 0.713
rSPC F 0.023 ± 0.006 0.051 ± 0.01 0.065 ± 0.024 DF = 1 DF = 2 DF = 2
S 0.02 ± 0.007 0.057 ± 0.007 0.0699 ± 0.015 F = 0.174 F = 25.758 F = 0.340
p = 0.681 p < 0.000 p = 0.716
SFgSPC F −0.01 ± 0.008 0.016 ± 0.004 0.018 ± 0.022 DF = 1 DF = 2 DF = 2
S −0.004 ± 0.007 0.015 ± 0.005 0.01 ± 0.025 F = 0.049 F = 5.286 F = 0.397
p = 0.827 p = 0.015 p = 0.678
Mar Biol
1 3
ingestion or absorption rates were around five (i.e., com-puted rates for F oysters were ~5× the rates of S seeds of the same size) while these ratios were only ~2 when cal-culated for metabolic rates. as a result, the critical size at which null SFg is predicted (ar = R) is increased ~30 times (Fig. 3), nearly the estimated differences in growth rate between F and S oysters.
Discussion
We have quantified the physiological components of the energy budget in oysters belonging to a single cohort that had more than 30× differences in their body size after being reared under the same environmental conditions. Such high inter-individual growth rate differences illus-trate the profound impact that endogenous (genetic) factors can have on growth potential in oysters (Toro et al. 1996; Toro and Vergara 1998; Bayne et al. 1999a, b; Bayne 2000, 2004; Pace et al. 2006).
The magnitude of differences in growth rate between the individuals selected as fast and slow growers in the pre-sent study contrasts with those in previous experiments: We compared specimens from a single cohort differing ~36-fold in biomass (1,950 vs. 54 mg live weight approxi-mately), while the range of differences between fast- and slow-growing oysters reported in the literature was two to fivefold (Bayne et al. 1999a, b; Bayne 1999, 2000; Pace et al. 2006) (Ostrea chilensis: Toro et al. 1996; Toro and Vergara 1998) (Crassostrea virginica: Pernet et al. 2008). Our experimental approach was to improve the resolution of previous physiological comparisons by enhancing size differentiation between slow and fast growers, but these forces us to consider allometric size-scaling rules to inter-pret the results. allometric relations are expressed as Y = a Wb; where Y is the physiological rate, a is the proportional-ity constant, W is the weight and b is the mass-exponent
Fig. 1 Mass-specific values of a clearance rate (l h−1 g−1), b absorption rate (J h−1 g−1) and c routine metabolic rate (J h−1 g−1) in fast- (circles) and slow-growing (triangles) oysters as a function of particulate organic matter in the diet (POM: mg l−1). Values are mean ± SD (n = 5)
Fig. 2 Mass-specific SFg (J h−1 g−1) in fast- (circles) and slow-growing (triangles) oysters as a function of particulate organic matter in the diet (POM: mg l−1). Values are mean ± SD (n= 5)
Table 3 C:n ratios and elemental absorption efficiencies of medium and high ration diets in fast (F) and slow (S) growing oysters
AEC Carbon absorption efficiency; AEN nitrogen absorption effi-ciency. Values are mean ± SD (n = 5)
Parameter growth group Medium ration (3.0 mm3 l−1)
High ration (6.0 mm3 l−1)
C:n diet 5.94 ± 0.19 6.56 ± 0.16
C:n feces F 6.56 ± 0.35 7.27 ± 0.38
S 6.72 ± 0.18 6.96 ± 0.18
aeC F 0.697 ± 0.090 0.775 ± 0.024
S 0.647 ± 0.010 0.724 ± 0.060
aen F 0.723 ± 0.093 0.797 ± 0.029
S 0.689 ± 0.010 0.741 ± 0.054
Mar Biol
1 3
scaling the physiological rate with body weight. From the extensive literature regarding allometric relations for Cr and VO2 in bivalves (see Bayne and newell 1983; riisgård, 1988, 1998; Vladimirova et al. 2003; Ibarrola et al. 2008, 2012 for review), three conclusions can be drawn: (1) the
elevation (a) of the relationship is affected by exogenous factors (such as season and temperature) and, therefore, reflects the physiological status of the population; (2) mass-exponent (b) is species-specific, not dependent on exogenous factors, and has values typically <1, indicating that size-specific physiological rates decrease as the organ-ism increases in size; and (3) mass-exponents for Cr are usually lower than those for oxygen consumption (0.4–0.6 for Cr and 0.6–0.8 for VO2), indicating that size-specific reduction in filtering activity is more pronounced than size-specific reduction in metabolic rate. This factor explains the progressive decline in growth rate as the individual approaches its maximum size.
In the present experiments, the F and S spats had no sig-nificant differences in size-specific physiological rates (i.e., physiological rate divided by TDW) of both energy incor-poration (CrSPC, OIrSPC and arSPC, Table 3) and expendi-ture (RSPC). Thus, our results contradict allometric rules indicating either that F oysters have higher or S oysters lower physiological rates than those expected in considera-tion of their respective sizes. The magnitude of physiolog-ical differences between S and F spats can only be com-pared once the size-effect is corrected by standardization to a common body weight using allometric mass-exponents (see also Tamayo et al. 2013). It should be emphasized that in the particular case of C. gigas, mass-exponents for Cr and VO2 were determined in an unusually accurate way by Bougrier et al. (1995) after measuring physiological rates of more than >300 individuals with a broadly range size (100–3,000 mg TDW) at different water temperatures (5–32 °C) and seasonal conditions (September and Febru-ary). Mass-exponents obtained by Bougrier and collabo-rators have been broadly used for size-standardization of physiological rates in C. gigas (Barillé et al. 1997; Bayne et al. 1999a, b; ropert and goulletquer 2000; Haure et al. 2003). In the present experiments, standardization of physi-ological results to different TDWs (Fig. 3) revealed the
Table 4 Summary of the two-factor anOVa testing significant differences between growth categories (F vs. S) and experimental rations for C:n ratios in feces, carbon absorption efficiency (aeC) and nitrogen absorption efficiency (aen)
Parameter Source of variation DF MS SS F P
C:n ratios (feces) g. category 1 0.025 0.025 0.320 0.580
ration 1 0.979 0.979 12.358 0.003
Interaction 1 0.241 0.241 3.046 0.103
error 14 0.079 1.109
aeC g. category 1 0.012 0.012 3.892 0.069
ration 1 0.027 0.027 9.078 0.009
Interaction 1 1.859 × 10⁻⁶ 1.859 × 10⁻⁶ 0.001 0.980
error 14 0.003 0.042
aen g. category 1 0.009 0.009 3.133 0.099
ration 1 0.018 0.018 6.003 0.028
Interaction 1 0.001 0.001 0.175 0.682
error 14 0.003 0.041
Fig. 3 log-log representation of absorption rate (ar) and metabolic rate (R) standardized to a range of sizes (given as mg. TDWSTD). experimental rates (Ye) in F (upper figure) and S (lower figure) meas-ured at medium food ration (TPM= 1.53 ± 0.18 mg l−1) were stand-ardized using the expression YSTD = (TDWSTD / TDWe)b * Ye. Mass-exponents for ar and R were 0.439 and 0.8, respectively (Bougrier et al. 1995). Arrows indicate estimated sizes for SFg = 0 in F and S spat
Mar Biol
1 3
following: (1) F oysters had a higher energy balance over the whole size range; (2) higher growth potential for F oys-ters is the result of a greater difference between values for arSTD and rSTD; for instance, standardization of rates of F spat to the body size (TDW: mg) of S spat indicates that, after correction for the size-effect, fast growers are able to process five times more food at only twice the metabolic cost. Conversely, for S oysters, standardization of the rates to the equivalent TDW of F oysters indicates that such hypothetical individuals would have higher metabolic rates than ar and, hence, negative SFg. Indeed, results envis-aged by allometric relationships indicates that the energy balance would become negative once the S oysters achieve an equivalent TDW of 5 mg, and this prediction is consist-ent with the lack of growth of S oysters in the laboratory. Therefore, after proper size-standardization of results, it became evident that the higher growth potential displayed by F oysters was based on (1) higher filtering capacity and (2) lower energetic costs per unit of assimilated food than slow-growing oysters.
The coupling of high feeding rates with low costs of growth in faster growing oysters has been previously reported. In a series of studies using controlled crosses of inbred families of C. gigas, growth heterosis in juvenile oysters (Bayne et al. 1999a) and larvae (Pace et al. 2006) was found to be mainly based on the higher feeding rates and growth efficiencies in the hybrids. Indeed, average dif-ferences in growth rate (2–2.5-fold) between inbred lines and hybrids were sustained by Cr differences of 1.2–2.5-fold, this factor explaining 50 % of variance in growth in the case of larvae. On the other hand, lack of signifi-cant differences in size-specific metabolic rates suggested reduced costs of growth in faster growing hybrid larvae and was associated with increased efficiency of protein depo-sition (Pace et al. 2006). Both components of growth dif-ferentiation were also found in comparing adult (17 mo-old) C. gigas from two lines of different parentage where faster growing (5.9 vs. 3.5 mg TDW d−1) resulted from higher feeding rates (×1.56) coupled with a 42 % reduc-tion in costs of growth (Bayne 1999). Quite similar results have been reported for other species in the Ostreidae when comparing physiological behavior in fast-growing individ-uals from selected lines with that of unselected field-caught individuals in the cases of Saccostrea commercialis (Bayne et al. 1999b; Bayne 2000) and C. virginica (Pernet et al. 2008), or between differentially growing cohorts of Ostrea chilensis (Toro et al. 1996; Toro and Vergara 1998). Sig-nificantly, group differences in Crs and costs of growth in our present study exceed those reported earlier, suggesting that the same fundamental physiological factors accounting for inter-individual growth variability would apply to the extremes of the range of such variability.
Considering these factors, it is clear from previous reports that the main contribution to growth differentiation comes from the variable capacity to acquire energy and this raises two questions that, for the moment, have only been poorly investigated. The first one concerns the pos-sible existence of morphological–functional determinants of feeding rate, such as the faster feeding contributing to higher growth rates in clams Ruditapes philippinarum that rely on larger gill areas (Tamayo et al. 2011). genetic causes of differences in gill size are presently unknown. However, variable degrees of gill development among growth groups might be related to the negative correla-tion of growth rate with an aneuploidy index of gill cells reported in both oysters and clams (Thiriot-Quièvreux et al. 1992; Zouros et al., 1996; leitão et al. 2001; Batista et al. 2007; Teixeira de Sousa et al. 2011). This associa-tion between reduced growth and chromosome deletion has been interpreted on the basis that progressive haploidi-zation of somatic cells would cause unmasking of del-eterious recessive genes (Zouros et al. 1996; launey and Hedegecock 2001), which might result in deficient organ development.
no significant differences were found in the responses of S and F oysters to differences in food availability. Higher particle concentrations of high OC resulted in the usual response in continuous feeders (see riisgård et al. 2011 for a recent review): the increase in Cr between the low and medium rations, and reduction in filtration rate at the high particle concentration (6 mm3 l−1), is a regulatory behavior enabling maintenance of ae relatively independent of food concentration in both F and S oysters. However, a small but significant difference was found in the trend exhibited by ae with Cr in both groups: the increase in OIr from the low to medium ration promoted a reduction in ae, which was only significant for S oysters (Table 2). This differential behavior could be indicative of a relatively higher capac-ity for compensatory adjustment at the digestive level in F oysters. new aspects of digestive behavior, including the quantitative assessment of cycles of intracellular digestion, should be studied to answer this question, since in our previ-ous experiments with the clam R. philippinarum (Tamayo et al. 2011), we failed to find significant differences between fast and slow growers either the size of the digestive glands (mg per standard size individual),their protein content (mg protein / mg dry weight) or specific cellulase activity (mg maltose / mg protein) in the digestive gland (unpubl data).
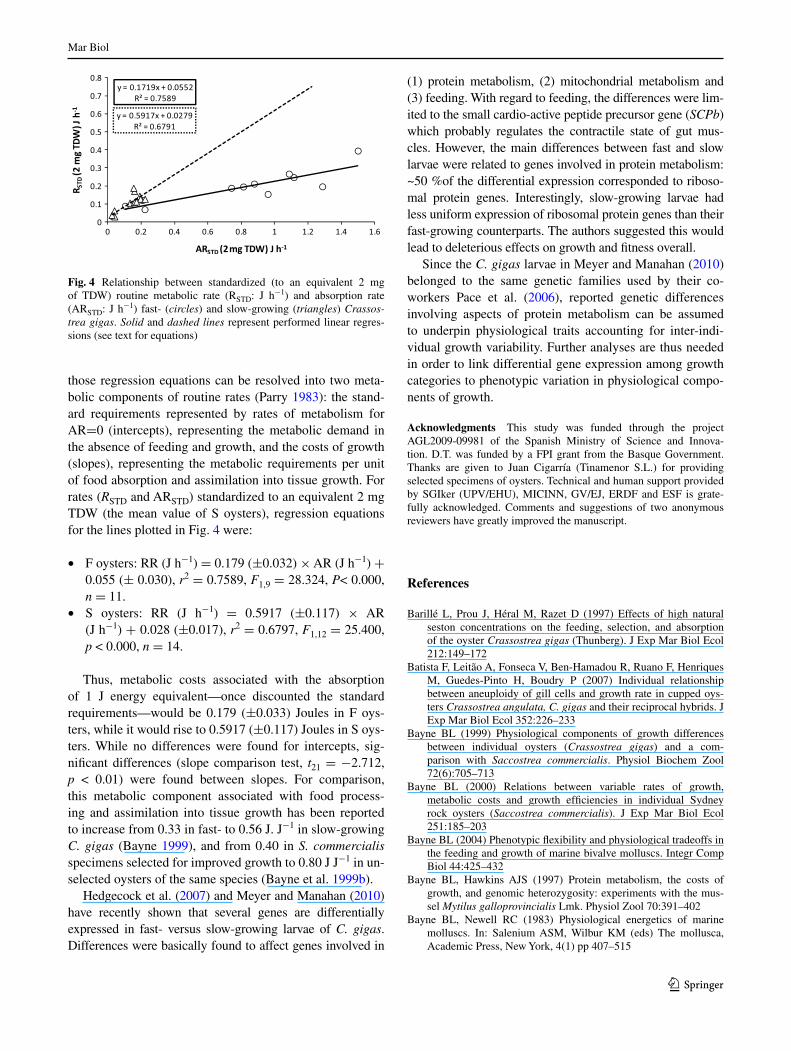
The second component in the physiological tandem accounting for growth differences between F and S oysters is the differential costs of growth. These costs have been estimated from linear regression analyses for routine rates of metabolism (r) versus absorption rates (ar) (Fig. 4). Following Bayne (Bayne et al. 1999b; Bayne 2000),
Mar Biol
1 3
those regression equations can be resolved into two meta-bolic components of routine rates (Parry 1983): the stand-ard requirements represented by rates of metabolism for ar=0 (intercepts), representing the metabolic demand in the absence of feeding and growth, and the costs of growth (slopes), representing the metabolic requirements per unit of food absorption and assimilation into tissue growth. For rates (RSTD and arSTD) standardized to an equivalent 2 mg TDW (the mean value of S oysters), regression equations for the lines plotted in Fig. 4 were:
• F oysters: rr (J h−1) = 0.179 (±0.032) × ar (J h−1) + 0.055 (± 0.030), r2 = 0.7589, F1,9 = 28.324, P< 0.000, n = 11.
• S oysters: rr (J h−1) = 0.5917 (±0.117) × ar (J h−1) + 0.028 (±0.017), r2 = 0.6797, F1,12 = 25.400, p < 0.000, n = 14.
Thus, metabolic costs associated with the absorption of 1 J energy equivalent—once discounted the standard requirements—would be 0.179 (±0.033) Joules in F oys-ters, while it would rise to 0.5917 (±0.117) Joules in S oys-ters. While no differences were found for intercepts, sig-nificant differences (slope comparison test, t21 = −2.712, p < 0.01) were found between slopes. For comparison, this metabolic component associated with food process-ing and assimilation into tissue growth has been reported to increase from 0.33 in fast- to 0.56 J. J−1 in slow-growing C. gigas (Bayne 1999), and from 0.40 in S. commercialis specimens selected for improved growth to 0.80 J J−1 in un-selected oysters of the same species (Bayne et al. 1999b).
Hedgecock et al. (2007) and Meyer and Manahan (2010) have recently shown that several genes are differentially expressed in fast- versus slow-growing larvae of C. gigas. Differences were basically found to affect genes involved in
(1) protein metabolism, (2) mitochondrial metabolism and (3) feeding. With regard to feeding, the differences were lim-ited to the small cardio-active peptide precursor gene (SCPb) which probably regulates the contractile state of gut mus-cles. However, the main differences between fast and slow larvae were related to genes involved in protein metabolism: ~50 %of the differential expression corresponded to riboso-mal protein genes. Interestingly, slow-growing larvae had less uniform expression of ribosomal protein genes than their fast-growing counterparts. The authors suggested this would lead to deleterious effects on growth and fitness overall.
Since the C. gigas larvae in Meyer and Manahan (2010) belonged to the same genetic families used by their co-workers Pace et al. (2006), reported genetic differences involving aspects of protein metabolism can be assumed to underpin physiological traits accounting for inter-indi-vidual growth variability. Further analyses are thus needed in order to link differential gene expression among growth categories to phenotypic variation in physiological compo-nents of growth.
Acknowledgments This study was funded through the project agl2009-09981 of the Spanish Ministry of Science and Innova-tion. D.T. was funded by a FPI grant from the Basque government. Thanks are given to Juan Cigarría (Tinamenor S.l.) for providing selected specimens of oysters. Technical and human support provided by SgIker (UPV/eHU), MICInn, gV/eJ, erDF and eSF is grate-fully acknowledged. Comments and suggestions of two anonymous reviewers have greatly improved the manuscript.
References
Barillé l, Prou J, Héral M, razet D (1997) effects of high natural seston concentrations on the feeding, selection, and absorption of the oyster Crassostrea gigas (Thunberg). J exp Mar Biol ecol 212:149–172
Batista F, leitão a, Fonseca V, Ben-Hamadou r, ruano F, Henriques M, guedes-Pinto H, Boudry P (2007) Individual relationship between aneuploidy of gill cells and growth rate in cupped oys-ters Crassostrea angulata, C. gigas and their reciprocal hybrids. J exp Mar Biol ecol 352:226–233
Bayne Bl (1999) Physiological components of growth differences between individual oysters (Crassostrea gigas) and a com-parison with Saccostrea commercialis. Physiol Biochem Zool 72(6):705–713
Bayne Bl (2000) relations between variable rates of growth, metabolic costs and growth efficiencies in individual Sydney rock oysters (Saccostrea commercialis). J exp Mar Biol ecol 251:185–203
Bayne Bl (2004) Phenotypic flexibility and physiological tradeoffs in the feeding and growth of marine bivalve molluscs. Integr Comp Biol 44:425–432
Bayne Bl, Hawkins aJS (1997) Protein metabolism, the costs of growth, and genomic heterozygosity: experiments with the mus-sel Mytilus galloprovincialis lmk. Physiol Zool 70:391–402
Bayne Bl, newell rC (1983) Physiological energetics of marine molluscs. In: Salenium aSM, Wilbur KM (eds) The mollusca, academic Press, new York, 4(1) pp 407–515
Fig. 4 relationship between standardized (to an equivalent 2 mg of TDW) routine metabolic rate (rSTD: J h−1) and absorption rate (arSTD: J h−1) fast- (circles) and slow-growing (triangles) Crassos-trea gigas. Solid and dashed lines represent performed linear regres-sions (see text for equations)
Mar Biol
1 3
Bayne Bl, Hedgecock D, Mcgoldrick D, rees r (1999a) Feeding behaviour and metabolic efficiency contribute to growth heterosis in Pacific oysters [Crassostrea gigas (Thunberg)]. J exp Mar Biol ecol 233:115–130
Bayne Bl, Svensson S, nell Ja (1999b) The physiological basis for faster growth in the Sydney rock oyster, Saccostrea commercia-lis. Biol Bull 197:377–387
Bougrier S, geairon P, Deslous-Paoli JM, Bacher C, Jonquières g (1995) allometric relationships and effects of temperature on clearance and oxygen consumption rates of Crassostrea gigas (Thunberg). aquaculture 134:143–154
Brown Jr (1988) Multivariate analyses of the role of environmen-tal factors and seasonal and site-related growth variation in the Pacific oyster, Crassostrea gigas. Mar ecol Progr Ser 45:225–236
Conover rJ (1966) assimilation of organic matter by zooplankton. limnol Oceanogr 11:338–354
Crisp DJ (1971) energy flow measurements. In: Holme na, Mc Intyre aD (eds) Methods for the study of marine benthos, (IBP nº 16). Blackwell, Oxford, p 197–323
Dickie lM, Boudreau Pr, Freeman Kr (1984) Influence of stock and site on growth and mortality in the blue mussel (Mytilus edulis). Can J Fish aquat Sci 41:134–140
evans S, langdon C (2006) Direct and indirect responses to selec-tion on individual body weight in the pacific oyster (Crassostrea gigas). aquaculture 261:546–555
gaffney PM, Scott TM, Koehn rK, Diehl WJ (1990) Interrelation-ships of heterozygosity, growth rate and heterozygote deficien-cies in the coot clam, Munilia lateralis. genetics 124:687–699
garton DW, Koehn rK, Scott TM (1984) Multiple-locus heterozy-gosity and the physiological energetics of growth in the coot clam, Mulinia lateralis, from a natural population. genetics 108:445–455
genard B, Miner P, nicolas J-l, Moraga D, Boudry P, Pernet F, Trem-blay r (2013) Integrative study of physiological changes associ-ated with bacterial infection in Pacific oyster larvae. PloS One 8(5):e64534. doi:10.1371/journal.pone.0064534
gnaiger e (1983) Heat dissipation and energetic efficiency in animal anoxibiosis: economy contra power. J exp Zool 228:471–490
Haure J, Huvet a, Palvadeau H, nourry M, Penisson C, Martin JlY, Boudry P (2003) Feeding and respiratory time activities in the cupped oysters Crassostrea gigas, Crassostrea angulata and their hybrids. aquaculture 218:539–551
Hawkins aJS (1995) effects of temperature change on ectotherm metabolism and evolution: metabolic and physiological interrela-tions underlying the superiority of multi-locus heterozygotes in heterogeneous environments. J Therm Biol 2:23–33
Hawkins aJS, Day aJ (1996) The metabolic basis of genetic differ-ences in growth efficiency among marine animals. J exp Mar Biol ecol 203:93–115
Hawkins aJS, Bayne Bl, Day aJ (1986) Protein turnover, physi-ological energetics and heterozygosity in the blue mussel Mytilus edulis: the basis of variable age-specific growth. Proc r Soc lond 229B:161–176
Hawkins aJS, Widdows J, Bayne Bl (1989a) The relevance of whole-body protein metabolism to measured costs of maintenance and growth in Mytilus edulis. Physiol Zool 62:745–763
Hawkins aJS, Bayne Bl, Day aJ, rusin J, Worrall CM (1989b) gen-otype-dependent interrelations between energy metabolism, pro-tein metabolism and fitness. In: ryland JS, Tyler Pa (eds) repro-duction, genetics and distribution of marine organisms. Olsen and Olsen, Fredensborg, pp 283–292
Hedgecock D, Mcgoldrick DJ, Manahan DT, Vavra J, appelmans n, Bayne Bl (1995) Quantitative and molecular genetic analyses of heterosis in bivalve molluscs. J exp Mar Biol ecol 203:49–59
Hedgecock D, lin JZ, DeCola S, Haudenschild CD, Meyer e, Mana-han DT, Bowen B (2007) Transcriptomic analysis of growth
heterosis in larval Pacific oysters (Crassostrea gigas). Proc natl acad Sci USa 104:2313–2318
Ibarrola I, larretxea X, navarro e, Iglesias JIP, Urrutia MB (2008) effects of body-size and season on digestive organ size and the energy balance of cockles fed with a constant diet of phytoplank-ton. J Comp Physiol B 178:501–514
Ibarrola I, arambalza U, navarro JM, Urrutia MB, navarro e (2012) allometric relationships in feeding and digestion in the Chilean mytilids Mytilus chilensis (Hupé), Choromytilus chorus (Molina) and Aulacomya ater (Molina): a comparative study. J exp Mar Biol ecol 426:18–27
Jenny MJ, Chapman rW, annalaura M et al (2007) a cDna micro-array for Crassostrea virginica and C. gigas. Mar Biotech 9:577–591
Koehn rK, gaffney PM (1984) genetic heterozygosity and growth rate in Mytilus edulis. Mar Biol 82:1–7
launey S, Hedegecock D (2001) High genetic load in the Pacific oys-ter Crassostrea gigas. genetics 159:255–265
leitão a, Boudry P, Thiriot-Quiévreux C (2001) negative correlation between aneuploidy and growth in the Pacific oyster Crassostrea gigas: ten years of evidence. aquaculture 193:39–48
Mallet al, Haley lH (1983) growth rate and survival in pure popula-tion mating and crosses of the oyster Crassostrea virginica. Can J Fish aquat Sci 40:948–954
Meyer e, Manahan DT (2010) gene expression profiling of geneti-cally determined growth variation in bivalve larvae (Crassostrea gigas). J exp Biol 213:749–758
Morgan IJ, McCarthy ID, Metcalfe nB (2000) life-history strate-gies and protein metabolism in overwintering juvenile atlantic salmon: growth is enhanced in early migrants through lower pro-tein turnover. J Fish Biol 56:637–647
Myrand B, Tremblay r, Sevigny JM (2009) Decreases in multi-locus het-erozygosity in suspension-cultured mussels (Mytilus edulis) through loss of the more heterozygous individuals. aquac 295:188–194
newkirk gF (1980) review of the genetics and the potential for selective breeding of commercially important bivalves. aquacul-ture 19:209–228
Pace Da, Marsh ag, leong PK, green aJ, Hedgecock D, Manahan DT (2006) Physiological bases of genetically determined varia-tion in growth of marine invertebrate larvae: a study of growth heterosis in the bivalve Crassostrea gigas. J exp Mar Biol ecol 335:188–209
Parry gD (1983) The influence of the costs of growth on ectotherm metabolism. J Theor Biol 101:453–477
Pernet F, Tremblay r, redjah I, Sévigny JM, gionet C (2008) Physio-logical and biochemical traits correlate with differences in growth rate and temperature adaptation among groups of the eastern oys-ter Crassostrea virginica. J exp Biol 211:969–977
riisgård HU (1988) efficiency of particle retention and filtration rate in 6 species of northeast american bivalves. Mar ecol Prog Ser 45:217–223
riisgård HU (1998) no foundation of a “3/4 power scaling law” for respiration in biology. ecol lett 1:71–73
riisgård HU, egede PP, Saavedra IB (2011) Feeding behav-iour of the mussel, Mytilus edulis: new observations, with mini-review of current knowledge. J Mar Biol 2011:1–13. doi:10.1155/2011/312459
ropert M, goulletquer P (2000) Comparative physiological energet-ics of two suspension feeders: polychaete annelid Lanice conchi-lega (Pallas 1766) and Pacific cupped oyster Crassostrea gigas (Thunberg 1795). aquaculture 181:171–189
Sheridan aK (1997) genetic improvement of oyster production—a critique. aquaculture 153:165–179
Tamayo D, Ibarrola I, Urrutia MB, navarro e (2011) The physi-ological basis for inter-individual growth variability in the spat of clams (Ruditapes philippinarum). aquaculture 321:113–120
Mar Biol
1 3
Tamayo D, Ibarrola I, navarro e (2013) Thermal dependence of clearance and metabolic rates in slow- and fast-growing spats of manila clam Ruditapes philippinarum. J Comp Physiol B 183:893–904
Tanguy a, Bierne n, Saavedra C et al (2008) Increasing genomic information in bivalves through new eST collections in four species: development of new genetic markers for environmental studies and genome evolution. gene 408:27–36
Teixeira de Sousa J, Matias D, Joaquim S, Ben-Hamadou r, leitão a (2011) growth variation in bivalves: new insights into growth, physiology and somatic aneuploidy in the carpet shell Ruditapes decussatus. J exp Mar Biol ecol 406:46–53
Thiriot-Quièvreux C, Pogson gH, Zouros e (1992) genetics of growth rate variation in bivalves: aneuploidy and heterozygosity effects in a Crassostrea gigas family. genome 35:39–45
Toro Je, Vergara aM (1998) growth and heterozygosity in a 12-month-old cohort of Ostrea chilensis obtained by mass spawn-ing in laboratory. Mar ecol 19:311–323
Toro Je, Vergara aM, gallegillos r (1996) Multiple-locus heterozy-gosity and growth at two different stages in the life cycle of the Chilean oyster Ostrea chilensis. Mar ecol Prog Ser 134:151–158
Vladimirova Ig, Kleimenov SY, radzinskaya lI (2003) The relation of energy metabolism and body weight in bivalves. Biol Bull 30:392–399
Whyte J (1987) Biochemical composition and energy content of six species of phytoplankton used in mariculture of bivalves. aqua-culture 60:231–241
Zar JH (1984) Bioestatistical analysis, 3rd edn. Prentice-Hall, engle-wood Cliffs
Zhang g, Fang X, guo X et al (2012) The oyster genome reveals stress adaptation and complexity of shell formation. nature 490(7418):49–54
Zhao X, Yu H, Kong l, li Q (2012) Transcriptomic responses to salinity stress in the Pacific oyster Crassostrea gigas. PloS One 7(9):e46244. doi:10.1371/journal.pone.0046244
Zouros e, Thiriot-Quièvreux C, Kotulas g (1996) The negative cor-relation between somatic aneuploidy and growth in the oyster Crassostrea gigas and implications for the effects of induced polyploidization. genet res 68:109–116