a cdna microarray for crassostrea virginica and c. gigas
TRANSCRIPT

Seediscussions,stats,andauthorprofilesforthispublicationat:https://www.researchgate.net/publication/6171577
AcDNAMicroarrayforCrassostreavirginicaandC.gigas.MarBiotechnol9:577-591
ARTICLEinMARINEBIOTECHNOLOGY·OCTOBER2007
ImpactFactor:3.27·DOI:10.1007/s10126-007-9041-1·Source:PubMed
CITATIONS
65
READS
28
22AUTHORS,INCLUDING:
RobertWChapman
SCDNR
92PUBLICATIONS2,522CITATIONS
SEEPROFILE
ArnaudTanguy
StationBiologiquedeRoscoff
72PUBLICATIONS1,910CITATIONS
SEEPROFILE
JonasSAlmeida
StonyBrookUniversityHospital
185PUBLICATIONS5,038CITATIONS
SEEPROFILE
GregoryWWarr
MedicalUniversityofSouthCarolina
147PUBLICATIONS4,986CITATIONS
SEEPROFILE
Allin-textreferencesunderlinedinbluearelinkedtopublicationsonResearchGate,
lettingyouaccessandreadthemimmediately.
Availablefrom:MatthewJJenny
Retrievedon:14January2016
Original Article
A cDNA Microarray for Crassostrea virginica and C. gigas
Matthew J. Jenny,1,2 Robert W. Chapman,1,3 Annalaura Mancia,1,4 Yian A. Chen,5
David J. McKillen,1,4 Hal Trent,1,4 Paul Lang,6 Jean-Michel Escoubas,7 Evelyne Bachere,8
Viviane Boulo,8 Z. John Liu,9 Paul S. Gross,1,4 Charles Cunningham,1,10
Pauline M. Cupit,1,10 Arnaud Tanguy,11 Ximing Guo,12 Dario Moraga,13 Isabelle Boutet,11
Arnaud Huvet,14 Sylvain De Guise,15 Jonas S. Almeida,16 Gregory W. Warr1,4
1Hollings Marine Laboratory, Charleston, SC 29412, USA2Department of Biology, Woods Hole Oceanographic Institution, Woods Hole, MA 02543, USA3South Carolina Department of Natural Resources, Marine Resources Research Institute, Charleston, SC 29412, USA4Department of Biochemistry and Molecular Biology, Medical University of South Carolina, Charleston, SC 29425, USA5Department of Statistics, Texas AM University, College Station, TX 77843, USA6Department of Fisheries and Wildlife, Oregon State University, Corvallis, OR 97331, USA7Ecologie Microbienne des Insectes et Interactions Hote-Pathogene, Universite de Montpellier, 34095, Montpellier, France8IFREMER-CNRS-Universite de Montpellier II, UMR5171—Genome Populations Interactions Adaptation, F-34095, Montpellier cedex 5,France9Department of Fisheries and Allied Aquacultures and Program of Cell and Molecular Biosciences, Auburn University, Auburn, AL36849, USA10Department of Biology, University of New Mexico, Albuquerque, NM 87131, USA11Evolution et Genetique des Populations Marines UMR 7144, Station Biologique, 29682, Roscoff, France12Haskin Shellfish Research Laboratory, Institute of Marine and Coastal Sciences, Rutgers University, Port Norris, NJ 08901, USA13Laboratoire des Sciences de l_Environnement Marin (LEMAR), UMR CNRS 6539, Institut Universitaire Europeen de la Mer,Universite de Bretagne Occidentale, 29280, Plouzane, France14UMR Physiologie et Ecophysiologie des Mollusques Marins, IFREMER Centre de Brest, 29280, Plouzane, France15Department of Pathobiology, University of Connecticut, Storrs, CT 06269, USA16Program in Biomathematics and Biostatistics, University of Texas M.D. Anderson Cancer Center, Houston, TX 77030, USA
Received 30 August 2006 / Accepted 23 March 2007
Abstract
The eastern oyster, Crassostrea virginica, and thePacific oyster, C. gigas, are species of global econo-mic significance as well as important componentsof estuarine ecosystems and models for genetic andenvironmental studies. To enhance the moleculartools available for oyster research, an internationalgroup of collaborators has constructed a 27,496-feature cDNA microarray containing 4460 sequen-ces derived from C. virginica, 2320 from C. gigas,and 16 non-oyster DNAs serving as positive andnegative controls. The performance of the array wasassessed by gene expression profiling using gill anddigestive gland RNA derived from both C. gigas andC. virginica, and digestive gland RNA from C.ariakensis. The utility of the microarray for detec-tion of homologous genes by cross-hybridizationbetween species was also assessed and the correla-tion between hybridization intensity and sequencehomology for selected genes determined. The oyster
cDNA microarray is publicly available to theresearch community on a cost-recovery basis.
Keywords: bivalve — Crassostrea gigas —Crassostrea virginica — heterologous hybridization —microarray — oyster
Introduction
Oysters are members of the Lophotrochozoa, one ofthe three clades of Bilateria and a relatively under-studied group that lacks well developed geneticmodels. The eastern oyster, Crassostrea virginica,and the Pacific oyster, C. gigas, are major compo-nents of a global aquaculture industry; C. gigasalone accounts for an annual production of greaterthan 4 million tons with a value in excess of $3billion. Regular disturbances in the production of C.gigas have been experienced for decades, however,with mortalities reported during summer periods inJapan (Koganezawa 1974), United States (Cheney etal. 2000), and France (Goulletquer et al. 1998;Soletchnik et al. 1999). Oysters are importantCorrespondence to: Matthew Jenny; E-mail: [email protected]
DOI: 10.1007/s10126-007-9041-1 & Volume (&), 1–15 (2007) & * Springer Science + Business Media, LLC 2007

components of the estuarine marine ecosystem (Newell1988), but overharvesting, loss of habitat, declines inenvironmental quality, and increased incidence ofdisease have led to a dramatic reduction in the healthof entire ecosystems, making oysters an importantindicator species of estuarine health. In addition, theoyster has proved a useful model for studying thepopulation biology and genetics of a highly fecundorganism (Hedgecock et al. 2005).
In acknowledgment of the oyster_s commercialand ecological importance, as well as its underuti-lization in mainstream genetics research, the Oys-ter Genome Consortium was formed to advocate forand cooperate in the development of genetic andgenomic tools for oysters. This international com-munity has been instrumental in the constructionof bacterial artificial chromosome (BAC) librariesfor C. gigas and C. virginica (Cunningham et al.2006) and in the adoption, by the CommunitySequencing Program at the Joint Genome Institute,of C. gigas for a preliminary BAC and expressedsequence tag (EST) project. Further, in recent yearsthe availability of oyster DNA sequence informa-tion has been growing, with several groups reportingEST collections for C. gigas and C. virginica (Jennyet al. 2002; Gueguen et al. 2003; Boutet et al. 2004;Huvet et al. 2004; Peatman et al. 2004; Tanguy et al.2004, 2005; David et al. 2005). These collectionshave proven to be invaluable resources for oystergene discovery, as they contain genes whose expres-sion is regulated in response to environmental,chemical, and biological stressors that are thoughtto have contributed to the decline in health ofoyster populations worldwide. To maximize theutility of these collections and to address the needfor microarrays to facilitate functional genomicstudies in oysters, the community of researchers inthis area pooled their EST resources for constructionof a publicly available cDNA microarray. Such amicroarray would have practical uses includingecological monitoring, evaluation of oyster live-stock for selective breeding programs, and under-standing of higher-order gene regulation in oysters.
In this report, we introduce the first publiclyavailable oyster microarray. We describe the contentand design of the array, and we report the degree ofcross-species hybridization between the C. gigasand C. virginica features and include hybridizationinformation about an oyster species not included inthe array (C. ariakensis).
Materials and Methods
Libraries and EST Collections. Clones from8 unmodified cDNA libraries and from 24 suppression
subtractive hybridization (SSH) generated libraries of C.virginica and C. gigas were used to construct themicroarray (Table 1). The details of the construction ofmany of these libraries have been reported elsewhere(Jenny et al. 2002; Gueguen et al. 2003; Boutet et al.2004; Huvet et al. 2004; Peatman et al. 2004; Tanguy etal. 2004, 2005; David et al. 2005). The construction ofcDNA libraries not previously reported is describedbelow. All of the previously unreported C. gigas and C.virginica SSH clone sequences are publicly accessiblein the NCBI dbEST database or at http://www.marinegenomics.org (McKillen et al. 2005).Contig analysis and optimal microarray probeselection was performed on the C. virginica ESTs tominimize redundancy of the clones printed on themicroarray (Chen et al. 2004).
Environmental Challenges and SSH Library
Construction. Adult C. virginica were exposed tometal challenge, hypoxia followed by hyperthermia,and immune stimulation. For metal challenge,oysters were exposed to 0.44 mM cadmium (CdCl2
salt) for 24 h. For the hypoxia/hyperthermiachallenges, oysters were exposed to air for 30 h atroom temperature (23-C) and then placed in abeaker of filtered natural seawater (25 ppt) at 32-Cfor 90 min. Immune challenge was by an injectionof a suspension of heat-killed bacteria and fungiprepared from Vibrio parahemolyticus, Micrococcusluteus, Bacillus subtilus, and Fusarium oxysporum.The final stock concentration of the bacterin/fungalsuspension was created from a pool of 1�109 cfu/mlof each bacterium and 2.5�106 spores/ml of theF. oxysporum, which was heated in boiling water for5 min before aliquoting and storage at –20-C. Theoyster shells were notched opposite the adductormuscle and 100 ml of the suspension were injectedusing tuberculin needles into the adductor muscle.Samples were collected 4 and 24 h after challenge.Hemocytes and/or digestive gland were taken aftereach challenge and homogenized in RLT buffercontaining 0.05% vol/vol b-mercaptoethanol andstored at –20-C until total RNA isolation byRNeasy\ Miniprep kits (Qiagen, Valenica, CA). C.virginica SSH libraries were created using theClontech PCR-Selecti cDNA Subtraction Kit(Clontech Laboratories, Mountain View, CA)according to the manufacturer_s protocols. Forlibrary construction, 2 mg of total RNA fromcontrol and challenged oysters, respectively, wereused for first- and second-strand cDNA synthesis.Hybridization and subtraction steps were carriedout in both the forward and reverse directions. PCRproducts were cloned into the pCR\2.1-TOPOvector as per the manufacturer_s instructions
M. J. JENNY ET AL.: AN OYSTER CDNA MICROARRAY

(TOPO TA Cloning Kit, Invitrogen, Carlsbad, CA).The pCR\2.1-TOPO constructs were transformedinto chemically competent XL1 Blue MRF_ E. colicells. Plasmids were isolated using Qiagen\
Turboprep 96 kits and the Qiagen\ Biorobot 9600,according to the manufacturer_s instructions(Qiagen). Plasmid inserts were sequenced usingstandard M13F and M13R primers.
cDNA Library Construction. The SMARTi cDNALibrary Construction Kit (Clontech Laboratories)was used for construction of the libraries. cDNAwas ligated into a lTriplEx2 vector and packagedusing the Gigapack\ Gold l (Stratagene, LaJolla,CA) packaging system. The cDNA libraries weremass transformed by infecting the BM25.8 strain ofE. coli with the packaged phage at a 1:10 ratio ofphage to bacteria at 31-C for 90 min. Transformedbacteria were selected on LB plates with carbenicillin
(50 mg/ml) and incubated overnight at 31-C. A Qbot(Genetix, New Milton, UK) was used to pick 4608clones from each library. Cultures were incubatedovernight in 96-well plates with LB media andcarbenicillin (50 mg/ml). Expressed 5¶ sequence tagswere generated by sequencing of plasmids using thestandard sequencing primer for pTriplEx2 (ClontechLaboratories). The immune-challenged cDNAlibrary was constructed by mixing equal amounts oftotal RNA from control and immune-stimulatedhemocyte samples. The digestive gland cDNAlibrary was constructed by combining total RNAfrom control, 4 and 24 h immune-stimulated,cadmium-treated, and hypoxia/hyperthermia-treated oysters.
cDNA Microarray Construction. Amplicons weregenerated via polymerase chain reaction (PCR)amplification from bacterial stocks or plasmid
Table 1. Summary of libraries from which clones were derived
Tissue/cell type Library type Challenge/treatment Species
Hemocyte (F & R) SSH 4-h bacterin challenge C. virginicaa
Hemocyte (F & R) SSH 24-h 50 ppb Cd exposure C. virginicaa
Hemocyte (F & R) SSH 24-h hypoxia/hyperthermia C. virginicaa
Digestive gland (F) SSH 4-h bacterin challenge C. virginicaa
Digestive gland (F) SSH 24-h bacterin challenge C. virginicaa
Digestive gland (F) SSH 24-h 50 ppb Cd exposure C. virginicaa
Digestive gland (F) SSH 24-h hypoxia/hyperthermia C. virginicaa
Hemocyte (F & R) SSH Perkinsus marinus challenge C. virginicab
Hemocyte (F & R) SSH Perkinsus marinus challenge C. gigasb
Gill (F & R) SSH Perkinsus marinus challenge C. virginicab
Gill (F & R) SSH Perkinsus marinus challenge C. gigasb
Hemocyte (F & R) SSH Lipopolysaccharide injection C. gigasc
Mantle/gonad (F) SSH BSummer mortality^ resistance C. gigasd
Digestive gland (F & R) SSH Hydrocarbon mixture C. gigase
Digestive gland (F & R) SSH Pesticide exposures C. gigasf
Gill (F & R) SSH Pesticide exposures C. gigasf
Digestive gland (F & R) SSH Hypoxia exposures C. gigasg
Gill (F & R) SSH Hypoxia exposures C. gigasg
Mantle (F & R) SSH Hypoxia exposures C. gigasg
Hemocyte Unmodified Control, 25 ppt natural seawater C. virginicah
Hemocyte Unmodified Control and bacterin injected C. virginicaa
Digestive gland Unmodified Multiple stressors C. virginicaa
D-veliger larvae Unmodified Control, 25 ppt natural seawater C. virginicaf
Gonadal tissue Unmodified Control C. virginicai
Gill Unmodified Control C. virginicai
Hemocyte Unmodified Vibrio spp. injection C. gigasj
Mantle Unmodified Control C. gigask
F, Forward subtracted library; R, reverse subtracted library.aJenny M, http://wwwmarinegenomicsorg.bTanguy et al. (2004) Gene 338, 121–131.cCunningham http://www.marinegenomics.org.dHuvet et al. (2004) Gene 343, 211–220.eBoutet et al. (2004) Gene 329,147–157.fTanguy et al. (2005) FEBS J 272, 390–403.gDavid et al. (2005) FEBS J 272, 5635–5652.hJenny et al. (2002) Mar Biotechnol 4, 81–93.iPeatman et al. (2004) Proc Mar Biotechnol 6, S491–S496.jGueguen et al. (2003) Gene 303,139–145.kCunningham C, unpublished data.
M. J. JENNY ET AL.: AN OYSTER cDNA MICROARRAY
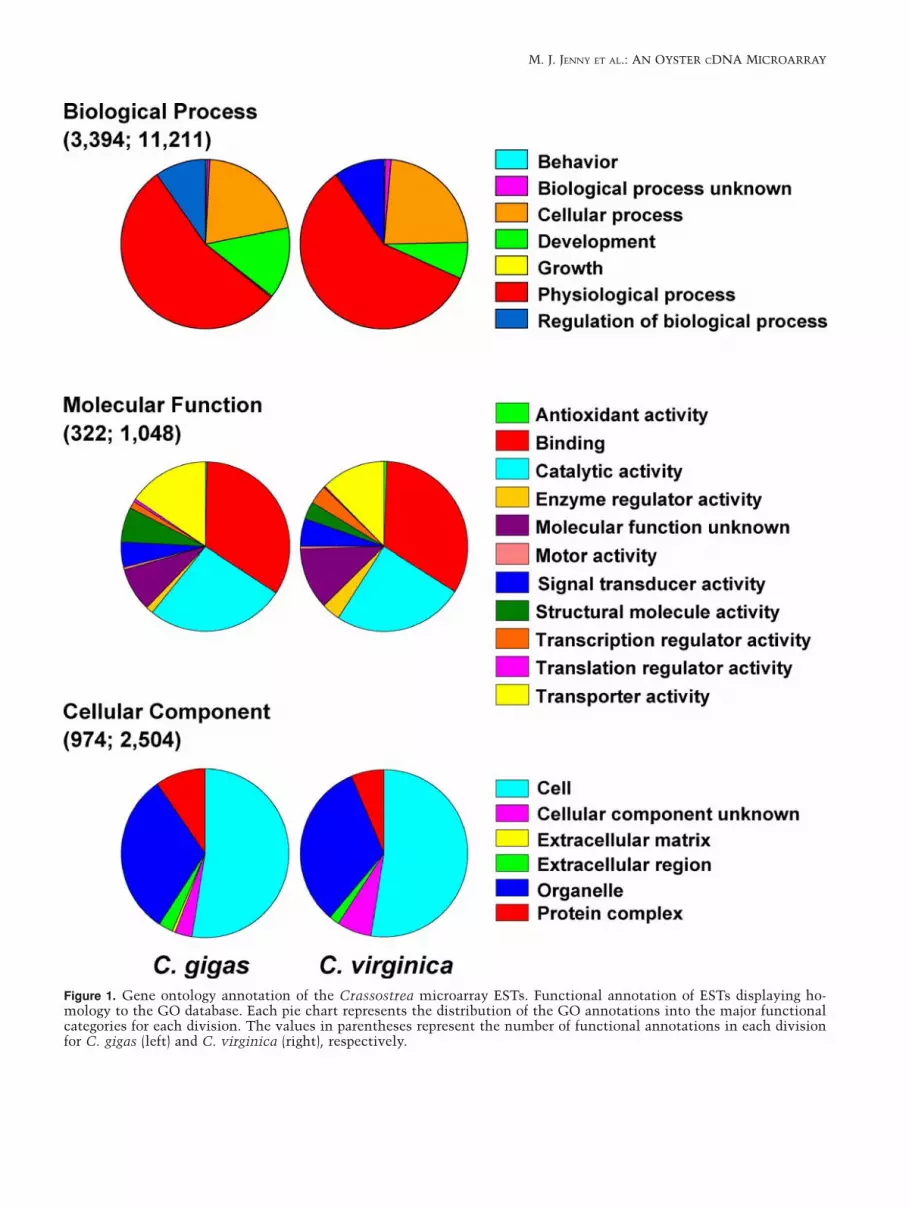
Figure 1. Gene ontology annotation of the Crassostrea microarray ESTs. Functional annotation of ESTs displaying ho-mology to the GO database. Each pie chart represents the distribution of the GO annotations into the major functionalcategories for each division. The values in parentheses represent the number of functional annotations in each divisionfor C. gigas (left) and C. virginica (right), respectively.
M. J. JENNY ET AL.: AN OYSTER CDNA MICROARRAY

DNA preparations using SP6, T7, T3, M13F, M13Rprimers or pTriplEx2. PCR reactions wereperformed in 96-well plates and purified using theQiagen\ Turboprep 96 kits and the Qiagen\
Biorobot 9600 (Qiagen). The success of the PCRamplification and purification was assessed byagarose gel electrophoresis. Purified ampliconswere quantified using a SPECTRAmax PLUSspectrophotometer (Molecular Devices, Sunnyvale,CA), vacuum dried, and resuspended in 30% dimethylsulfoxide to a final concentration of 250 mg/ml. Thearrays were constructed using a Genetix QArrayMaxmicroarray printer (Genetix) fitted with a 24-pinhead, from 12�384-well source plates (Genetix) onGAPS II amino-silane coated slides (Corning,Corning, NY). A 575-feature per subarray patternlayout was used with amplicons printed as side-by-side duplicates. The cDNA microarray slide consistsof two complete, side-by-side arrays, with each arraycontaining a total of 24 subarrays (48 subarrays perslide). Slides were fixed by baking for 2 h at 80-C. Spotmorphology was checked by hybridization with aSpotQC kit using a Cy3TM dye-labeled oligo-nucleotide probe (Integrated DNA Technologies,Coralville, IA).
Experimental Design. To determine tissue-specificgene expression profiles and occurrence of cross-hybridization between species, gill and digestivegland tissue were collected from each of threeindividual C. virginica and C. gigas; and digestivegland was also collected from three C. ariakensis.Tissues from the three individuals of each specieswere pooled together for a total of five separatetissue samples, three from digestive gland and twofrom gill. The tissues were homogenized in RLTbuffer containing 0.05% (vol/vol) b-mercaptoethanoland stored at –20-C. To assess technical replicabilityof the microarray, and to compare gene expressionprofiles of tissues and species, three replicatelabelings and hybridizations were performed foreach RNA sample, for a total of 15 hybidizations.
Microarray Hybridization and Data Collection. TotalRNA was isolated from oyster tissues using theRNeasy\ Miniprep kits (Qiagen) with an on-column DNase treatment. The mRNA used aspositive controls (K. brevis clones) was generatedfrom plasmid templates by in vitro transcriptionusing the MEGAscript\ T7 kit (Ambion, Austin,TX) according to the manufacturer_s protocol. Inbrief, double-stranded DNA template for in vitrotranscription was generated by PCR from plasmidstocks [cloned transcripts include a poly(A) tail] usingstandard T7 and SP6 primers. The PCR products weregel purified using the NucleoTrap\Gel Extract Kit
(Clontech Laboratories) and 1 mg of DNA was used astemplate for the reaction. In vitro transcribed mRNAwas purified using the RNeasy\ Miniprep kits(Qiagen). Antisense RNA (aRNA) was synthesizedfrom 1 mg of oyster total RNA or 1 mg of in vitrotranscribed RNA for each of the positive controlsusing the Amino Allyl MessageAmpi Kit (Ambion)according to the manufacturer_s protocol. A mixtureof Bspiked in^ positive control RNA_s was created sothat 10 ml of the mixture contained four separatecontrol RNAs in a 10-fold serial dilution (100 ng,10 ng, 1 ng, 0.1 ng; 111.1 ng total) to be added to theoyster aRNA. Amino allyl aRNA (mixture of 10 mg ofoyster aRNA and 111.1 ng of control aRNA) wascoupled with an amine-reactive Cy3 dye, columnpurified, and diluted (1:3) in hybridization buffer[50% formamide, 2.4% sodium dodecyl sulfate (SDS),4� SSPE, 2.5� Denhardt_s solution, plus 1 ml ofblocking solution (1 mg Cot-1 DNA and 1 mgpolydATP)]. The probe was then boiled for 1 min andincubated in the dark for 1 h at 50-C. Microarray slideswere prewashed with 0.2% SDS for 2 min, boiled indeionized water for 2 min, rinsed in 70% ethanol for2 min, and then dried. Slides were prehybridized in a
Table 2. Non-oyster genes used for spiked and negativecontrols
NCBI accession no.
Karenia brevis(dinoflagellate, Dinophyceae)Chlorophyll A/B binding protein CO059871Flavodoxin CO065421Photosynthesism core protein CO062297Photolyase CO064781Anas platyrhynchos:(duck, Chordata)IgY heavy chain X65218Litopenaeus vannamei:(shrimp, Arthropoda)Hemocyanin CK572324Ictalurus punctatus:(catfish, Chordata)BOB. 1 M. Lennard et al.
(Fpers com_)Oct-1 AJ000267Oct-2a Y12651Oct-2b Y12652Tursiops truncatus:(dolphin, Chordata)Hemoglobin b chain DT660258IL-1a DT660180IL-8 DT660217White Spot Syndrome Virus:(virus, Nimaviridae)Viral-coat protein 19 Robalino et al. 2005Viral-coat protein 26 CK572418Putative DNA polymerase CK572871
M. J. JENNY ET AL.: AN OYSTER cDNA MICROARRAY

hybridization oven with a prehybridization buffer(33.3% formamide, 1.6% SDS, 2.6 SSPE, 1.6�Denhardt_s solution, and 0.1 mM salmon spermDNA) in the dark for 1 h at 50-C. Slides werehybridized with Cy-3-aaRNA in the dark for 16 h at50-C. After the hybridization, slides were rinsed in 2�saline sodium citrate (SSC), 0.1% SDS and soaked in0.2� SSC, 0.1% SDS for 15 min in the dark at roomtemperature, followed by a rinse in 0.2� SSC, soakingin 0.2� SSC for 15 min, 0.1� SSC for 15 min, andfinally deionized water for 5 min in the dark to removeresidual SDS. The microarrays were then dried andimmediately scanned.
Microarray Data Analysis. The microarray slideswere scanned using a ScanArray Express microarrayscanner at 75% photomultiplier tube (PMT) gain and90% laser power in conjunction with the SpotArraysoftware package (Perkin Elmer, Boston, MA).Hybridization data were obtained by determining spotintensity, background, and QA/QC features with theQuantArray Histogram method (Perkin Elmer). Themicroarray hybridization data and the MIAMEprotocols have been deposited at the GEO site (Seriesno. GSE5293; Accession nos. GSM119921 toGSM119935; www.ncbi.nlm.nih.gov/geo/) and atwww.marinegenomics.org.
Figure 2. Boxplots of hybridization intensity before and after normalization. The top chart represents the array data thathave been log transformed. The bottom chart represents the array data after normalization using the variance stabilizedtransformation (VSN). Each boxplot represents a single array (Dig Gl = digestive gland). The red crosses represent extremevalues exceeding the interquartile range by a factor of 1.5.
M. J. JENNY ET AL.: AN OYSTER CDNA MICROARRAY

A robust generalized log transformation, vari-ance stabilized normalization (VSN) method (Huberet al. 2002), was used to normalize the data beforeour analyses to eliminate observed variance-versus-mean dependence in the intensity signals. A two-way ANOVA (Kleinbaum et al. 1998) was then usedto assess differential gene expression between tis-
sues and among species for all of the oyster cloneson the array. We estimated q values using thesoftware Q-value (Storey 2002; Storey and Tibshirani2003) to decide significant features on the arraysfor multiple-hypothesis testing. This approachadjusting for multiple-hypothesis testing based oncontrolling the false discovery rate (Benjamini and
Figure 3. Variance stabilization after normalization. Variance-versus-mean dependence is apparent in the top chart, wherethe standard deviation (SD) of raw intensity values (after background subtraction) increases dramatically as the rankedmean intensity increases. The bottom chart illustrates the stabilization of the variance after VSN transformation. Moredetails can be found in Huber et al. (2002).
M. J. JENNY ET AL.: AN OYSTER cDNA MICROARRAY
Holchberg 1995) has become popular for genome-wide and high-throughput studies. The proportion oftruly null features, nondifferential expressed genesamong species and between tissues, was estimated,respectively. Differential expression between speciesfor large numbers of genes was apparent duringpreliminary examination, and therefore, a morestringent false discovery rate method was chosenfor evaluating the effect of species as compared tothat of tissue. The Euclidean distance betweennormalized expression values was calculated andaverage linkage method was used for hierarchicalcluster analysis (Statistical Toolbox of MATLABi).Clustergrams (combination of expression heat mapand dendrogram) were used to visualize the relation-
ships of differential gene expression between tissuesand among species (Martinez and Martinez 2002).Pairwise Spearman rank correlation coefficients werecalculated using mean expression values of the fourreplicate spots for all genes on the microarray toestimate the technical reproducibility of the oystermicroarrays.
Results
The Oyster Microarray EST Collection. Acombination of unmodified cDNA libraries,representing unbiased sampling of the transcriptomeof diverse tissues and developmental stages, and SSH
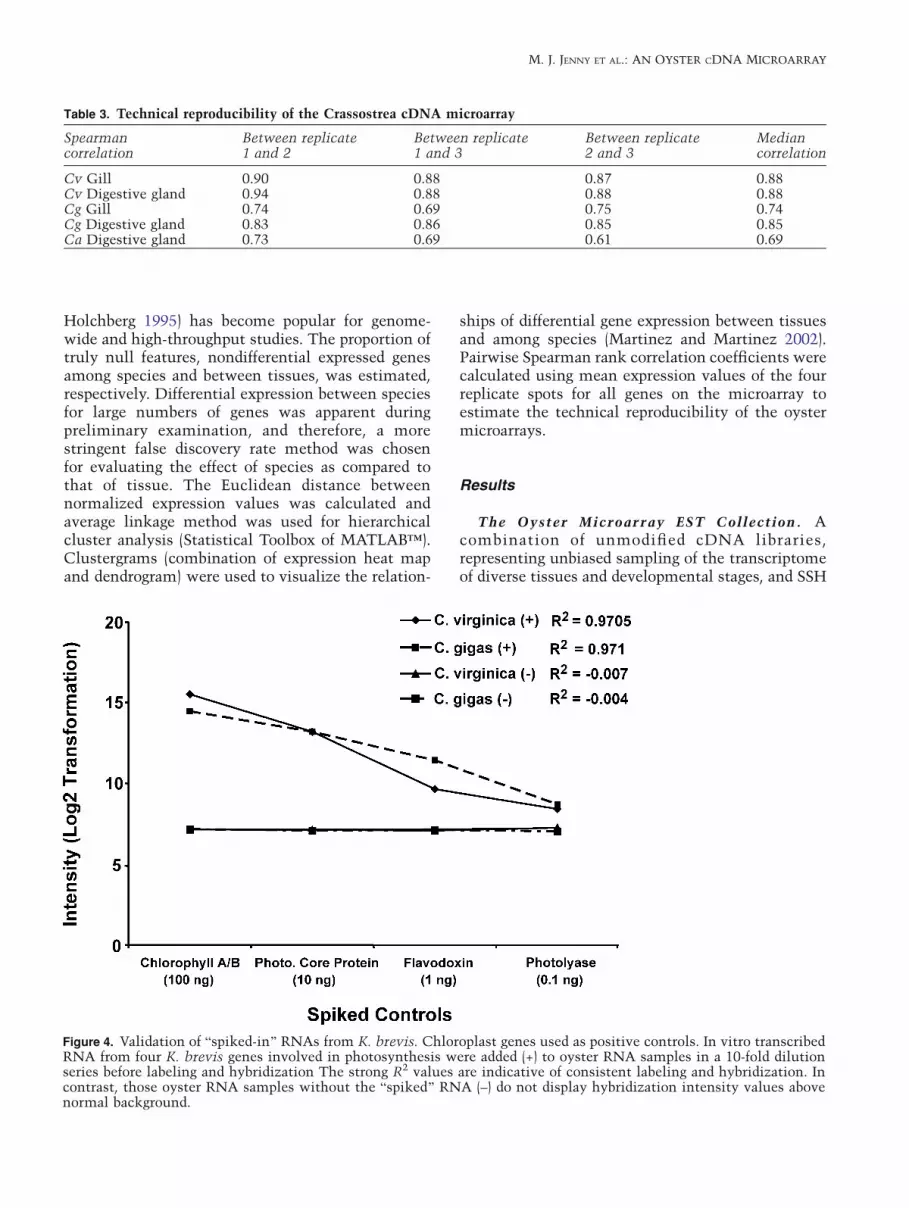
Figure 4. Validation of Bspiked-in^ RNAs from K. brevis. Chloroplast genes used as positive controls. In vitro transcribedRNA from four K. brevis genes involved in photosynthesis were added (+) to oyster RNA samples in a 10-fold dilutionseries before labeling and hybridization The strong R2 values are indicative of consistent labeling and hybridization. Incontrast, those oyster RNA samples without the Bspiked^ RNA (–) do not display hybridization intensity values abovenormal background.
Table 3. Technical reproducibility of the Crassostrea cDNA microarray
Spearmancorrelation
Between replicate1 and 2
Between replicate1 and 3
Between replicate2 and 3
Mediancorrelation
Cv Gill 0.90 0.88 0.87 0.88Cv Digestive gland 0.94 0.88 0.88 0.88Cg Gill 0.74 0.69 0.75 0.74Cg Digestive gland 0.83 0.86 0.85 0.85Ca Digestive gland 0.73 0.69 0.61 0.69
M. J. JENNY ET AL.: AN OYSTER CDNA MICROARRAY

cDNA libraries for transcripts putatively induced orsuppressed by a variety of challenges were used tocreate a collective pool of transcripts with which theoyster microarray was constructed (Table 1). A totalof 5586 and 3961 sequences from C. virginica and C.gigas, respectively, were collected from these cDNAlibraries and subjected to Gene Ontology (GO)analysis allowing putative functional annotation(molecular function, biological process, and cellularcomponent) of the sequences (Ashburner et al. 2000)to determine the diversity within the EST collectionsused to construct the microarray. Approximately67% of C. virginica and 60% of C. gigas sequenceshad no significant homology with annotations in theGO database, but of the sequences that could beputatively annotated, 11,211 and 3394 biologicalprocess, 1048 and 322 molecular function, and 2504and 974 cellular component annotations wereobtained for C. virginica and C. gigas, respectively(Figure 1). Each of the three major categories has alsobeen divided into its major hierarchies (Figure 1)representing broadly specialized functions orcomponents. Although C. virginica has a muchgreater number of annotations, the distribution offunctional annotations is diverse and broadlyequivalent for both oyster species. In an effort todetermine the extent of mitochondrial sequences
within the collection of ESTs the 5586 and 3961sequences from C. virginica and C. gigas,respectively, were compared to the completemitochondrial genome sequences for both species(NC_005881, AY905542, NC_001276, AF177226). Ofthe C. virginica ESTs, 8.8% of the sequences were ofmitochondrial origin, and of the C. gigas ESTs 10.4%of the clones were of mitochondrial origin. The ESTcollections from both species of Crassostrea weresubjected to redundancy analysis and subsets ofclones were chosen to be included on the microarray.
Design of the Crassostrea cDNA Microarray. TheCrassostrea cDNA microarray slide consists of twocomplete, side-by-side arrays, with each arraycontaining duplicate spots for 4460 C. virginicaamplicons and 2320 C. gigas amplicons and 96amplicons representing 16 different non-oystercontrols (see later) for a total of 13,752 features perarray (27,504 features per slide). Of the 6780Crassostrea amplicons on the array, only 355represent clones that have not been sequenced, andbased on the redundancy analysis less than 8% of thetotal numbers of clones are estimated to representsequences of mitochondrial origin. Each arraycontains a collection of non-oyster cDNAs to serveas negative controls for nonspecific background
Figure 5. Species-specific hybridization to the oyster microarray. The bar graph highlights the percentage of features,separated by species, displaying significant intensity (at least 2-fold above background) after hybridization with samplesfrom two different tissues collected from three different oyster species.
M. J. JENNY ET AL.: AN OYSTER cDNA MICROARRAY

detection and as positive controls for Bspiked-in^control RNA samples (Table 2). Included among thenon-oyster transcripts spotted onto the array are fourdinoflagellate (Karenia brevis) chloroplast transcriptsinvolved in photosynthesis (Lidie et al. 2005), as wellas copies of the duck (Anas platyrhynchos) IgY heavychain and shrimp (Litopenaeus vannamei) hemocyanintranscripts, that are provided to serve as targets forBspiked-in^ control RNA samples. Eight to twelvecopies of all six of these transcripts were printed perslide. The remaining non-oyster transcripts (Table 2)
were printed at a higher frequency (16 to 88 copies perslide) and are intended to serve as negative controls forthe detection of nonspecific hybridization.
Validation of the Microarray. To normalize thegene expression data sets, a robust generalized logtransformation and variance stabilization andnormalization (VSN) method was applied (Huber et al.2002). The success of the VSN normalization inproducing a smoother and more consistent intensitydistribution among the various arrays compared to a
Figure 6. Homologous and heterologous hybridization with features on the oyster microarray. Pairwise comparisons oftissue-specific gene expression profiles between both C. virginica and C. gigas were performed to determine the specificpercentages of clones displaying homologous and heterologous hybridization (determined as at least 2-fold above back-ground).
M. J. JENNY ET AL.: AN OYSTER CDNA MICROARRAY
standard log2 transformation is illustrated in Figure 2.Moreover, the variance-versus-mean dependence wasminimized after normalization before our analyses(Figure 3). The median Spearman correlation for allthe replicated arrays was 0.85 and the correlation foreach pairwise comparison of the technical replicates isshown in Table 3. Technical reproducibility of theoyster microarrays can also be observed in Figures8 and 9.
The utility of the non-oyster genes added to themicroarray, as both positive controls (with Bspiked-in^ labeled RNA) and as negative controls (to detectboth background and any inappropriate hybridiza-tion of oyster sequences) was addressed. The addi-tion of in vitro transcribed K. brevis RNAs to eitherC. virginica or C. gigas total RNA samples in a 10-fold serial dilution demonstrated that these tran-scripts would serve effectively as a positive control(Figure 4). The Bspiked in^ K. brevis RNA hybrid-ized specifically to the features that contained itscognate sequences, and the K. brevis spots on the
array did not show hybridization with oyster tran-scripts when the Bspiked-in^ RNA was not added tothe labeling reaction. Other non-oyster sequencesprinted on the microarray also serve as negativecontrols for the detection of nonspecific hybridiza-tion. None of the negative controls showed hybrid-ization exceeding background intensity levels withRNA samples from either gill or digestive gland ofthe three oyster species tested (Figure 4).
Cross-Hybridization Detection Across Species. Theutility of the oyster microarray as a multispeciestool can be enhanced by the degree of cross-hybridization it is capable of detecting. Thispotential was investigated by analysis of detectablehybridization when using the microarray tointerrogate the transcriptomes not only of the twospecies represented on the microarray (C. gigas andC. virginica) but also that of a third species (C.ariakensis). For the purposes of classifying a featureon the microarray as positive for hybridization in
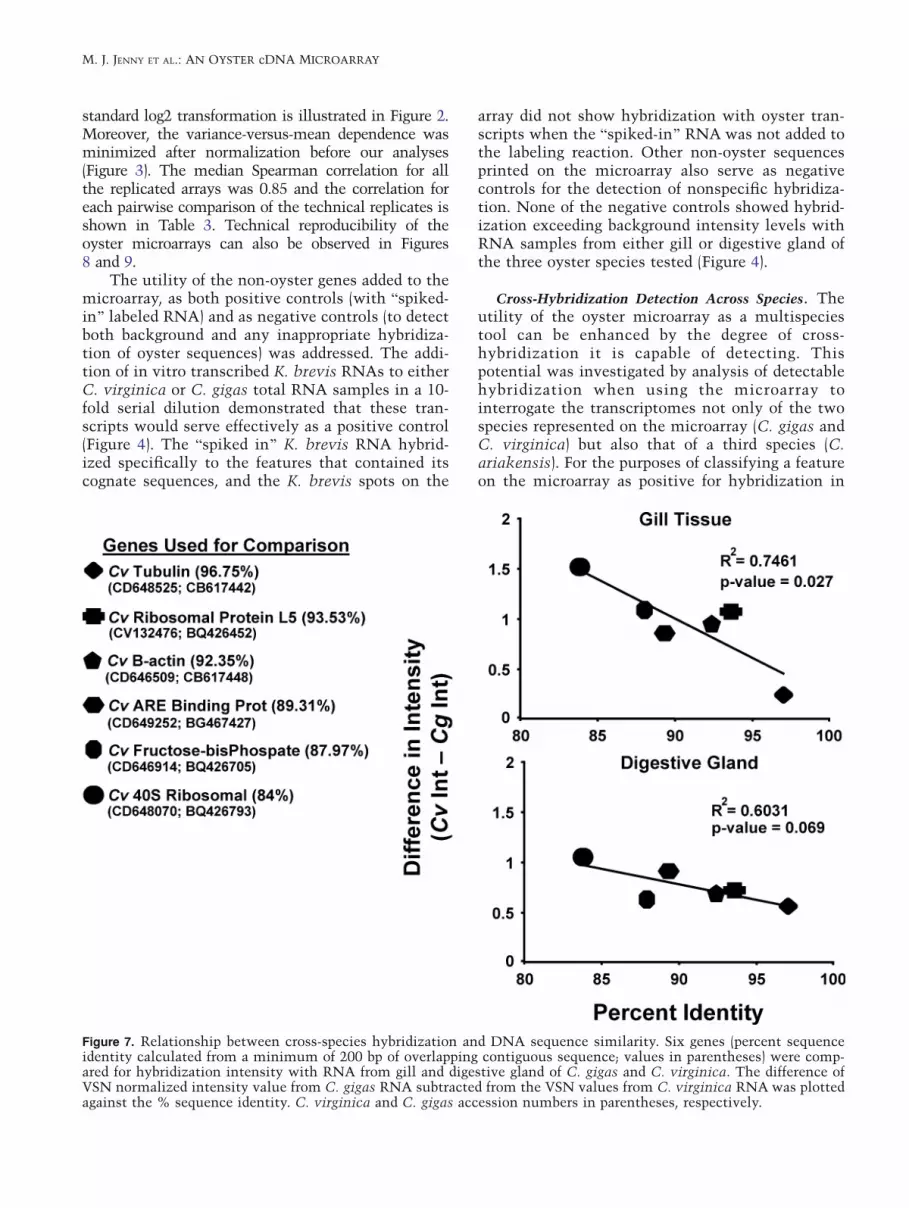
Figure 7. Relationship between cross-species hybridization and DNA sequence similarity. Six genes (percent sequenceidentity calculated from a minimum of 200 bp of overlapping contiguous sequence; values in parentheses) were comp-ared for hybridization intensity with RNA from gill and digestive gland of C. gigas and C. virginica. The difference ofVSN normalized intensity value from C. gigas RNA subtracted from the VSN values from C. virginica RNA was plottedagainst the % sequence identity. C. virginica and C. gigas accession numbers in parentheses, respectively.
M. J. JENNY ET AL.: AN OYSTER cDNA MICROARRAY

this comparison, a conservative threshold of 2-foldabove the average background was used (Gracey et al.2001; de Lorgeril et al. 2005). The percentage ofmicroarray features of C. gigas or C. virginica originthat were positive when hybridized with RNA fromeach of the three different oyster species is shown inFigure 5. As expected, RNA from C. gigas and C.virginica showed the highest levels of hybridization(between 32% and 45% of features) in a species-specific manner (Figure 5). However, significantcross-species hybridization was observed with allsamples, including C. ariakensis digestive glandRNA, which hybridized with greater than 16% ofthe total number of oyster features on themicroarray. Pairwise comparisons of tissue-specificC. virginica and C. gigas gene expression profilesdemonstrate that approximately 30% to 40% of theclones (for both species) displaying significanthybridization were reciprocal for both species and8% to 10% of the features displayed significant
hybridization solely with RNA samples from theopposite species (Figure 6).
To assess the effect of sequence difference onthe observed cross-hybridization, a plot was made ofchanges in hybridization intensity against percentsequence identity for six genes (Figure 7). Despitethe unknown impact upon the results of differenttranscript abundance between the two species ofoyster, the observed strength of cross-hybridizationintensity between the two species is clearly posi-tively correlated with the degree of sequence iden-tity (Figure 7).
Differential Expression of Genes Between Tissues and
Species. In comparing the hybridization to themicroarray observed with gill and digestive glandRNA from two and three species of oyster,respectively, it is reasonable to anticipate thatsignificantly different levels of observed hybridizationto given genes on the microarray will reflect both the
Figure 8. Clustergram of the 2717 genes differentially expressed between species and tissues. Each column represents asingle array and the clustering of the arrays demonstrates the high reproducibility of the technical replicates. Geneexpression intensity is represented by a color- coded scale based on the VSN transformed values. Tree branch length is ameasure of Euclidean distance.
M. J. JENNY ET AL.: AN OYSTER CDNA MICROARRAY

differential abundance of transcripts and thedifferential efficiencies of hybridization, as a result ofnucleotide sequence divergence. In spite of these twopotential effects, a global comparison identified 2541genes with significantly different expressionintensities between species (when controlling theFDR at 0.001) and 438 genes significantly differentbetween tissues (when controlling the FDR at 0.01). Aclustergram (Figure 8) of expression pattern of thesegenes showed a basal distinction at the species level,with a C. virginica branch and one that includes bothC. gigas and C. ariakensis. The microarrayshybridized (in groups of 3) against single tissues fromeach species showed not only the closestrelationships, but also very similar patterns ofexpression, confirming the technical reproducibilityof the microarray (Figure 8). In a cluster analysisfocused on differential expression between gill anddigestive gland tissue of C. virginica, both thetechnical reproducibility and the ability of themicroarray to distinguish tissue-specific geneexpression (in this case of 438 differentiallyexpressed genes between tissues when controllingthe FDR at 0.01) could also be visualized (Figure 9).
Discussion
The oyster microarray described in this report containssequences expressed in C. gigas and C. virginica.These sequences were derived from different tissuesand developmental stages as well as oysters exposedto different physical, chemical, and biological chal-lenges. The data presented document the reproduc-ibility and utility of this microarray in probing geneexpression profiles from different tissues and fromdifferent species of oyster (including C. ariakensis,which was not represented on the array).
The gill and digestive gland were tissues chosenfor the initial characterization of the microarraybecause of their important physiological roles andrelatively large size. While both tissues gave robustexpression profiles, in the case of both C. virginicaand C. gigas, the digestive gland gave the strongestprofile in terms of the number of features displayingsignificant hybridization intensity. This is likely dueto the cellular heterogeneity and functional diversityof this tissue, as well as to the strong representationof clones derived from digestive gland libraries on thearray. However, the diversity of tissues used for ESTcollections, which included hemocytes, mantle, andgonad, suggests that the microarray should be auseful tool for examining gene expression in tissuesother than gill and digestive gland.
During the initial planning for printing theoyster microarray it was decided that includinggenes from both C. virginica and C. gigas couldenhance the effective size and experimental value ofthe array by heterologous hybridizations. Recentpublications have highlighted the utility of thisapproach in other groups of related species (Adjayeet al. 2004; Renn et al. 2004; von Schalburg et al.2005). Predicting the level of sequence identitynecessary to ensure effective and specific cross-hybridization is not straightforward because factorsbeyond percent identity (such as GC content andthe length of contiguous stretches of identity) play arole in the hybridization efficiency (Chen et al.2006). However, in the case of heterologous hybrid-ization an increase in phylogenetic distance corre-lates with a loss of hybridization efficiency (Renn etal. 2004). It is clear that in the present study, asubstantial proportion of features on the oyster micro-array are capable of providing useful gene expressioninformation through cross-species hybridization. Al-though the columns representing C. ariakensis inFigure 8 may suggest that this species provided verylimited hybridization to the array it is important topoint out that greater than 16% of all the oysterfeatures on the array (õ13% of the C. virginica and23% of the C. gigas features) displayed significant
Figure 9. Tissue-specific gene expression profiles from C.virginica. A clustergram of the 438 genes differentiallyexpressed between gill and digestive gland tissue. Eachcolumn represents a single array and gene expression inten-sity is represented by a color-coded scale based on theVSN transformed values.
M. J. JENNY ET AL.: AN OYSTER cDNA MICROARRAY

hybridization with RNA from C. ariakensis (Figure 5).Because the clustergram (Figure 8) represents differ-ences in expression, it is likely that the significanthybridization from C. ariakensis RNA is the result ofgreater shared homology to Bhousekeeping^ genes.The unique observation that 8% to 10% of thefeatures displaying significant hybridization resultedfrom heterologous hybridization (Figure 6) is mosteasily explained by differential gene expressionbetween individual samples. Many of these resultsare similar to observations made with a salmonidgene array that assessed the levels of heterologoushybridization from several fish species against genesselected from the Atlantic salmon and the rainbowtrout (von Schalburg et al. 2005). It seems clear thatthe potential utility of the oyster microarray has beengreatly enhanced by the inclusion of features fromboth C. virginica and C. gigas.
In an effort to determine how much overlap incross-species hybridization can be expected fromthe two oyster species, a comparison of differencesin hybridization intensity of several putativeBhousekeeping^ genes was used to highlight the rela-tionship between sequence similarity and hybridiza-tion efficiency (Figure 7). Although the analysis isbased on the assumption that the homologous geneswere expressed at similar levels in both oyster species,the observed correlations are quite consistent with theexpected relationship.
Even though the oyster microarray describedhere represents only a portion of the oyster tran-scriptome, the results presented, coupled with thedeliberate bias of using genes regulated in responseto stress and environmental challenge on the array,indicate that it should prove a useful tool for studiesof the oyster transcriptional response to a variety ofchallenges, including those relevant to the marineestuarine habitat of the oyster.
Acknowledgments
The authors thank Dr. Fran van Dolah (NOAA) andKristy B. Lidie for donation of the K. brevischloroplast clones, Mara Lennard for the donationof the catfish Bob1 clone, and Dr. Javier Robalino forthe donation of the white spot syndrome virusclones. This paper is Marine Genome ProjectContribution no. 30 and no. 618 of the SouthCarolina Department of Natural Resources. Part ofthe research (graduate research support for M.J.Jenny) was conducted under an award from theEstuarine Reserves Division, Office of Ocean andCoastal Resource Management, National OceanService, National Oceanic and Atmospheric Admin-istration and the Science to Achieve Results Grad-
uate Fellowship, U.S. Environmental ProtectionAgency. Construction and characterization of theCrassostrea cDNA microarray was also supported byNational Oceanic and Atmospheric AdministrationCenter of Excellence for Oceans and Human Health atthe Hollings Marine Laboratory (National OceanService, National Centers for Coastal Ocean Science),as well as the Ernest F. Hollings Visiting ScholarProgram (C. Cunningham). Additional funding camefrom the Oyster Disease Research Program, NOAAagreement no. NA16RG1039 and Sea GrantProject R/SAQ-08-NSI. The authors would also like to thankDrs. A.F. Holland and P.A. Sandifer for their encour-agement and enthusiasm throughout all phases of thework. We thank Drs. Christopher Bayne, PhilippeRoch, and Andrew Mount for careful reading of themanuscript and many helpful suggestions. The oystercDNA microarray is publicly available to the researchcommunity on a cost-recovery basis (contact PaulGross; [email protected]).
References
Adjaye J, Herwig A, Herrmann D, Wruck W, BenKahla A,Brink TC, Nowak M, Carnwath JW, Hultschig C,Niemann H, Lehrach H (2004) Cross-species hybrid-isation of human and bovine orthologous genes on highdensity cDNA microarrays. BMC Genomics 5, 83
Ashburner M, Ball AC, Blake JA, Botstein D, Butler H,Cherry M, Davis AP, Dolinski K, Dwight SS, Eppig JT,Harris MA, Hill DP, Issel-Tarver L, Kasarskis A, Lewis S,Matese JC, Richardson JE, Ringwald M, Rubin GM,Sherlock G (2000) Gene ontology: tool for the unifica-tion of biology. Nat Genet 25, 25–29
Benjamini Y, Holchberg Y (1995) Controlling the falsediscovery rate: a practical and powerful approach tomultiple testing. J R Statist Soc B 57, 289–300
Boutet I, Tanguy A, Moraga D (2004) Response of the Pacificoyster Crassostrea gigas to hydrocarbon contaminationunder experimental conditions. Gene 329, 147–157
Chen YA, McKillen DJ, Wu S, Jenny MJ, Chapman RW,Gross PS, Warr GW, Almeida JS (2004) Optimal cDNAmicroarray design using expressed sequence tags fororganisms with limited genomic information. BMCBioinformatics 5, 191
Chen Y, Chou C-C, Lu X, Slate E, Peck K, Xu W, Voit E,Almeida J (2006) A multivariate prediction model formicroarray cross-hybridization. BMC Bioinformatics 7, 101
Cheney DP, MacDonald BF, Elston RA (2000) Summermortality of Pacific oysters, Crassostrea gigas (Thunberg):initial finding on multiple environmental stressors in PugetSound, Washington, 1998. J Shellfish Res 19, 353–359
Cunningham C, Hikima J, Jenny MJ, Chapman RW, FangG-C, Saski C, Lundqvist M, Wing RA, Cupit PM, GrossPS, Warr RW, Tomkins JP (2006) New resources formarine genomics: bacterial artificial chromosome li-braries for the eastern and Pacific oysters (Crassostreavirginica and C gigas). Mar Biotechnol 8, 521–533
M. J. JENNY ET AL.: AN OYSTER CDNA MICROARRAY

David E, Tanguy A, Pichavant K, Moraga D (2005)Response of the Pacific oyster Crassostrea gigas tohypoxia exposure under experimental conditions. FEBSJ 272, 5635–5652
de Lorgeril J, Saulnier D, Janech MG, Guegen Y, Bachere E(2005) Identification of genes that are differentiallyexpressed in hemocytes of the Pacific blue shrimp(Litopenaeus stylirostris) surviving an infection withVibrio penaeicida. Physiol Genomics 21, 174–183
Goulletquer P, Soletchnik P, Le Moine O, Razet D,Geairon P, Faury N, Taillade S (1998) Summer mortal-ity of the Pacific cupped oysters Crassostrea gigas inthe Bay of Marennes-Oleron (France). Cons Int ExplorMer CIEM 14, 20
Gracey AY, Troll JV, Somero GN (2001) Hypoxia-inducedgene expression profiling in the euryoxic fish Gillich-thys mirabilis. Proc Natl Acad Sci USA 98, 1993–1998
Gueguen Y, Cadoret JP, Flament D, Barreau-Roumiguiere C,Girardot AL, Garnier J, Hoareau A, Bachere E, EscoubasJM (2003) Immune gene discovery by expressed sequencetags generated from hemocytes of the bacteria-challengedoyster, Crassostrea gigas. Gene 303, 139–145
Hedgecock D, Gaffney PM, Goulletquer P, Guo X, Reece K,Warr GW (2005) The case for sequencing the Pacificoyster genome. J Shellfish Res 24, 429–441
Huber W, von Heydebreck A, Sultmann H, Poustka A,Vingron M (2002) Variance stabilization applied tomicroarray data calibration and to the quantificationof differential expression. Bioinformatics 18(Suppl1):S96–S104
Huvet A, Herpin A, Degremont L, Labreuche Y, Samain J-F,Cunningham C (2004) The identification of genes fromthe oyster Crassostrea gigas that are differentiallyexpressed in progeny exhibiting opposed susceptibilityto summer mortality. Gene 343, 211–220
Jenny MJ, Ringwood AH, Lacy ER, Lewitus AJ, Kempton JW,Gross PS, Warr GW, Chapman, RW (2002) Potentialindicators of stress response identified by expressed se-quence tag analysis of hemocytes and embryos from theAmerican oyster, Crassostrea virginica. Mar Biotechnol 4,81–93
Kleinbaum D, Kupper L, Muller K, Nizam A (1998)Applied Regression Analysis and Other MultivariableMethods, 3rd ed (Pacific Grove, CA: Duxbury)
Koganezawa A (1974) Present status of studies on themass mortality of cultured oysters in Japan and itsprevention. USA–Japan Meeting on Aquaculture,Tokyo, Japan, pp 29–34
Lidie KB, Ryan JC, Barbier M, Van Dolah FM (2005) Geneexpression in Florida red tide dinoflagellate Kareniabrevis: analysis of an expressed sequence tag libraryand development of DNA microarray. Mar Biotechnol5, 481–493
Martinez W, Martinez A (2002) Computational StatisticsHandbook with MATLAB. (Boca Raton, FL: Chapman& Hall/CRC)
McKillen DJ, Chen YA, Chen C, Jenny MJ, Trent HF,Robalino J, McLean DC, Gross PS, Chapman RW, WarrGW, Almeida JS (2005) Marine genomics: a clearing-house for genomic and transcriptomic data of marineorganisms. BMC Genomics 6, 34
Newell RIE (1988) Ecological changes in Chesapeake Bay:are they the result of over-harvesting the Eastern oyster(Crassostrea virginica)? In: Understanding the Estuary:Advances in Chesapeake Bay Research, Lynch MP,Krome EC, eds. (Solomons, MD: Chesapeake ResearchConsortium) pp 536–546
Peatman EJ, Wei X, Feng J, Liu L, Kucuktas H, Li P, He C,Rouse D, Wallace R, Dunham R, Liu Z (2004) Devel-opment of expressed sequence tags from Eastern oyster(Crassostrea virginica): lessons learned from previousefforts. Proc Mar Biotechnol 6, S491–S496
Renn SC, Aubin-Horth N, Hofmann HA (2004) Biologi-cally meaningful expression profiling across speciesusing heterologous hybridization to a cDNA micro-array. BMC Genomics 5, 42
Robalino J, Bartlett T, Shepard E, Prior S, Jaramillo G,Scura E, Chapman RW, Gross PS, Browdy CL, Warr GW(2005) Double-stranded RNA induces sequence-specificantiviral silencing in addition to nonspecific immunityin a marine shrimp: convergence of RNA interferenceand innate immunity in the invertebrate antiviralresponse? J Virol 79, 13561–13571
Soletchnik P, Le Moine O, Faury N, Razet D, Geairon P,Goulletquer P (1999) Summer mortality of the oysterin the Bay Marennes-Oleron: spatial variability ofenvironment and biology using a geographical infor-mation system (GIS). Aquat Living Res 12, 131–143
Storey JD (2002) A direct approach to false discovery rate. JR Statist Soc B 64, 479–498
Storey JD, Tibshirani R (2003) Statistical significance forgenomewide studies. Proc Natl Acad Sci USA 100,9440–9445
Tanguy A, Guo X, Ford, S (2004) Discovery of genesexpressed in response to Perkinsus marinus challengein eastern (Crassostrea virginica) and Pacific (C gigas)oysters. Gene 338, 121–131
Tanguy A, Boutet I, Laroche J, Moraga D (2005) Molecularidentification and expression study of differentiallyregulated genes in the Pacific oyster Crassostrea gigasin response to pesticide exposure. FEBS J 272, 390–403
von Schalburg KR, Rise ML, Cooper GA, Brown GD,Gibbs AR, Nelson CC, Davidson WS, Koop BF (2005)Fish and chips: various methodologies demonstrate theutility of a 16,006-gene salmonid microarray. BMCGenomics 6, 126
M. J. JENNY ET AL.: AN OYSTER cDNA MICROARRAY