uptake of cadmium from pacific oysters (crassostrea gigas) in british columbia oyster growers
TRANSCRIPT
ARTICLE IN PRESS
0013-9351/$ - se
doi:10.1016/j.en
Abbreviations
Cr, creatinine; G
MT, metallothi
per billion; SD,�Correspond
12th Avenue, V
E-mail addr
Environmental Research 107 (2008) 160–169
www.elsevier.com/locate/envres
Uptake of cadmium from Pacific oysters (Crassostrea gigas) in BritishColumbia oyster growers
Ray Copesa,b,c,d,�, Nina Annika Clarkb, Karen Rideoute, Jan Palatyf, Kay Teschkeb,c
aBC Centre for Disease Control, 655 West 12th Avenue, Vancouver, BC, Canada V5Z 4R4bDepartment of Health Care and Epidemiology, University of British Columbia, BC, Canada
cSchool of Occupational and Environmental Hygiene, University of British Columbia, BC, CanadadDepartment of Medicine, University of British Columbia, BC, Canada
eFaculty of Land and Food Systems, University of British Columbia, BC, CanadafChildren’s & Women’s Health Centre of B.C, BC, Canada
Received 27 June 2007; received in revised form 9 January 2008; accepted 29 January 2008
Available online 20 March 2008
Abstract
Background: Pacific oysters along the North American coast from Washington to Alaska contain concentrations of cadmium (Cd) that
are high by comparison with Atlantic oysters, frequently exceeding 2 mg/g wet weight, but it is unclear whether this Cd is absorbed by
consumers.
Objectives: To determine the effect of oyster consumption on Cd in blood and urine among a group with high oyster consumption.
Methods: Sixty-one non-smoking oyster growers and family members with a mean age of 47.377.6 years (range 33–64) were interviewed
by telephone to assess their oyster consumption and other sources of Cd exposure at present and 5 years prior to the start of oyster
farming. Their blood and urine Cd concentrations were measured.
Results: The geometric mean Cd concentration in blood was 0.83 mg/L and in urine was 0.76mg/g creatinine. Thirty-six percent of
participants had urinary Cd levels above 1mg/g creatinine and 5% were above 2mg/g creatinine. Recent (last 12 months) and long-term
oyster consumptions were positive predictors of blood Cd but did not directly predict urinary Cd. The optimal model for predicting the
variance in blood Cd included recent intake of oyster-derived Cd, serum iron concentration and recent ketchup consumption (R2¼ 0.34,
p ¼ 0.00004), with the latter two variables showing a protective effect. The factors found to predict urinary Cd were blood Cd
concentration and duration of oyster farming. A rise in blood Cd was observed after 12 years of farming oysters, likely caused by higher
consumption of oysters during this period.
Conclusions: Oyster-derived Cd is bioavailable and affects body stores of the metal.
r 2008 Elsevier Inc. All rights reserved.
Keywords: Cadmium; Biomarkers; Oysters; Diet
1. Introduction
Pacific oysters (Crassostrea gigas) are harvested alongthe northwest coast of North America from Washington toAlaska and accumulate levels of cadmium (Cd) that are
e front matter r 2008 Elsevier Inc. All rights reserved.
vres.2008.01.014
: AM, arithmetic; BC, British Columbia; Cd, cadmium;
M, geometric mean; GSD, geometric standard deviation;
onein; PTWI, proposed tolerable weekly intake; ppb, parts
standard deviation.
ing author at: BC Centre for Disease Control, 655 West
ancouver, BC, Canada V5Z 4R4. Fax: +1601 660 6628.
ess: [email protected] (R. Copes).
high by comparison with Atlantic oysters and may exceedsome international tolerances for cadmium. In the provinceof British Columbia (BC), Canada in 1999, severalshipments of oysters were rejected by the Hong KongFood and Environmental Hygiene Department for exceed-ing the 2 mgCd/g wet weight import limit. Investigation bythe Canadian Food Inspection Agency (CFIA) confirmedthese shipments were not an isolated incident; the mean Cdconcentration of oysters cultured in various areas of theprovince ranged from 0.99 to 2.21 mg/g wet weight.Fisheries and Oceans Canada concluded that the Cd inBC oysters is mainly due to the geology of the area and

ARTICLE IN PRESSR. Copes et al. / Environmental Research 107 (2008) 160–169 161
anthropogenic sources are minor contributors (Kruzynski,2000). Due to natural global circulation, the North Pacifichas a Cd concentration of 100 ng/L, which is three to fivetimes greater than the North Atlantic where Cd concentra-tions in oysters are generally below 1 mg/g wet weight(Kruzynski, 2003).
Cadmium in foods is of concern because diet is the mostsignificant source of exposure to this known nephrotox-icant in the non-smoking, non-occupationally exposedpopulation (ATSDR, 1999). Ingested Cd is not readilyabsorbed but due to the long half-life of the metal in thebody, even moderate exposure may cause detrimentaleffects to health over time (Akesson et al., 2005; Noonanet al., 2002). The Joint Food and Agriculture Organizationand World Health Organization Expert Committee onFood Additives established a proposed tolerable weeklyintake (PTWI) for Cd of 7 mg/kg of body weight (JEFCA,2004). Weekly consumption of 6–8 average sized BCoysters (230 g) containing 2 mgCd/g results in intake of460 mg of Cd, exceeding the PTWI for anyone underthe weight of 65 kg. However, the PTWI is calculatedbased on the assumption that 5% of Cd from all dietarysources is absorbed (ATSDR, 1999; JEFCA, 2004) and isintended to be applied to long-term consumption and noton a single week. Recent studies have shown that Cdabsorption from the intestine may vary anywhere from afraction of a percent to 30% depending on dietary source,iron status, and possibly many other factors (Kikuchi et al.,2003; Vahter et al., 1996; Vanderpool and Reeves, 2001).Oyster-derived Cd in particular is very inefficientlyabsorbed (Vahter et al., 1996; Sharma et al., 1983).Smoking has a far more significant impact on Cd bodyburden (Sharma et al., 1983). Current limits on Cdconcentration in oysters do not consider relative absorp-tion efficiencies.
This study attempts to clarify the potential impacts ofregularly consuming BC oysters by examining oysterconsumption and Cd biomarkers among a sample ofoyster farmers and their families. This population hasconsistent access to oysters and is likely to show an aboveaverage intake of oysters that is continuous over a periodof years. Previous studies may have failed to see significanteffects on Cd biomarkers because of oyster intakes that aretoo low (e.g. Vahter et al., 1996) or too short in duration(e.g. Sharma et al., 1983).
2. Methods
2.1. Sample
British Columbia oyster growers and their family members were
identified through the Ministry of Agriculture, Food, and Fisheries
(MAFF) and the BC Shellfish Growers Association. Eligible subjects were
from 30 to 65 years of age, were not current smokers, and had not smoked
in the past (defined as having smoked no more than 20 packs of cigarettes,
no more than 12 oz of tobacco in a pipe, and no more than one cigar per
week for 1 year). Up to three family members from the same grower’s
residence were allowed to participate.
2.2. Exposure assessment
Eligible subjects who agreed to participate completed a telephone
interview to assess current and retrospective Cd exposure.
The subjects estimated dietary consumption of various foods over the
last 12 months and over a 12-month period 5 years prior to the start of
oyster farming by the family. Subjects reported frequency of intake,
serving size, and for oysters, the BC growing region. Other foods included
in the questionnaire were mussels, scallops, organ meats (beef and pork
liver, chicken liver, beef kidney), leafy green vegetables (spinach, lettuce,
seaweed; cooked and uncooked), potatoes (French fries, chips, boiled,
mashed), carrots, and tomatoes (fresh, processed into sauce, ketchup, or
juice). These foods were chosen because of their potential to contribute to
dietary Cd intake. An information package was mailed to subjects to assist
with estimating portion size. The package included photographs of five
possible serving sizes for all food items. A paper cutout of the size of the
plate used in the photographs allowed a sense of perspective when
estimating portion size. Subjects were also provided with diagrams of
oyster shells of varying lengths beside metric and imperial measurements
so that subjects could estimate the average size of oysters they consumed.
Non-dietary exposure assessment consisted of a brief history of second
hand smoke, occupational, and hobby exposures to Cd. Subjects were also
asked about their medical history, specifically kidney and bone disorders
and diabetes, as these conditions may affect Cd metabolism.
We estimated dietary exposure to Cd for the past year and for the adult
lifetime (since age 18) using the questionnaire data. Recent consumption
was estimated by multiplying the participants’ frequency of intake by
serving size for the past 12 months. Lifetime consumption for foods other
than oysters was estimated by averaging recent and past consumption and
multiplying this by the adult age. For oysters, subjects were free to report
various periods of differing oyster consumption and total adult
consumption was the sum of oysters consumed during each of these
periods. The growing region of the oysters (reported by participants) was
used to further refine the estimate of the total amount of cadmium they
consumed.
2.3. Biological samples
Subjects were asked to visit a local laboratory to provide blood and
urine samples. Blood samples were collected in heparinized trace metal-
grade Vacutainers (Becton-Dickinson) and urine samples in regular
urinalysis containers (Starplex). All samples were shipped for analysis to
the Laboratory at BC Children and Women’s Hospital in Vancouver.
Cadmium concentration in whole blood and urine was determined by
inductively coupled plasma mass spectrometry (ICP/MS) using a Perkin-
Elmer ELAN 6100. Samples were diluted 1:50 (whole blood) or 1:100
(urine) in an alkaline Triton X-100/EDTA/gold/n-butanol/rhodium
(internal standard) solution followed by gentle mixing and centrifugation
prior to analysis by ICP/MS. Quality control samples (Seronorm) were
measured with each batch and the accuracy of this method was verified by
bi-monthly testing of blood and urine samples from the Quebec Centre de
Toxicologie Interlaboratory Comparison Program. Iron and creatinine
measurements were performed with the Vitros 950s (Ortho Clinical
Diagnostics, Rochester, New York). The limits of detection for cadmium
in blood and urine were 0.16 and 0.23mg/L, respectively.
2.4. Statistical analysis
Descriptive data analysis was completed for all questionnaire data and
biomarker data. The distributions of the blood and urine parameters were
examined, and where log-normally distributed they were log-transformed
(base e) for all analyses. Simple linear regression was used to determine the
association between various dietary and personal characteristics vs. blood
and urine Cd levels. The exposure variables that significantly predicted
biomarker concentrations (po0.05) were offered in multiple regression
models. ANOVA was used to further investigate the factors that most
affect long- and short-term Cd biomarkers. All statistical analysis was

ARTICLE IN PRESS
Fig. 1. Distribution of urine cadmium in participants.
R. Copes et al. / Environmental Research 107 (2008) 160–169162
completed using the SPlus statistical program v.6.2 (Insightful Corpora-
tion, Seattle, WA).
3. Results
3.1. Characteristics of sample
The initial list of potential oyster farmers included265 people of whom we were able to contact 224. Onehundred and fifty-four people on this list were current BCoyster farmers and willing to participate. A further 39family members were also willing to participate for a totalof 193. From this group, 117 people were ineligible due tosmoking or age. All the remaining 76 people completed thetelephone questionnaire and of this group 59 provided ablood and urine sample and 2 provided only a bloodsample. The sample of 61 with blood and questionnairedata included 33 men and 28 women with a mean age of47.377.6 years (ranging from 33 to 64). The mean ages ofmen (46.876.7) and women (47.978.8) did not differsignificantly (p ¼ 0.58).
3.2. Biological samples
Blood Cd, urinary Cd and serum iron concentrations aresummarized in Table 1. All were positively skewed andwere log-transformed for subsequent regression analyses.Fig. 1 shows the distribution of urinary cadmium levels.The geometric mean Cd concentrations were 0.83 mg/L inblood and 0.76 mg/g creatinine (cr) in urine. Although forboth blood and urinary Cd, the geometric means forwomen were higher than for men, these differences were
Table 1
Concentrations of cadmium and iron in urine and blood
Element BMIa Blood concentration (mg/L) Urin
AMb GMc GSDd Range AM
Cadmium
All 25.3 73.5 0.88 0.83 1.44 0.34–2.27 0.95
Men 25.9 72.9 0.83 0.78 1.44 0.34–1.74 0.99
Women 24.6 74.1 0.94 0.88 1.42 0.44–2.27 0.91
30–39 years 24.6 71.8 0.78 0.76 1.27 0.58–1.19 0.48
40–49 years 25.7 74.5 0.89 0.82 1.47 0.34–2.27 1.13
50–59 years 24.8 72.6 0.96 0.90 1.44 0.44–1.74 0.99
60–69 years 25.3 72.6 0.93 0.84 1.67 0.42–1.73 1.17
Iron
All 900 849 1.43 326–1883
Men 984 943 1.36 374–1883
Women 802 751 1.46 326–1639
30–39 years 1054 997 1.40 560–1883
40–49 years 804 751 1.47 331–1406
50–59 years 950 911 1.38 326–1497
60–69 years 841 830 1.21 642–1025
aArithmetic mean7standard deviation.bArithmetic mean.cGeometric mean.dGeometric standard deviation.
not statistically significant (p ¼ 0.18 for blood, p ¼ 0.98 forurine). The geometric mean serum iron in the study samplewas 849.2 mg/L, and was lower for women than for men(p ¼ 0.01).Participants’ average yearly consumption of evaluated
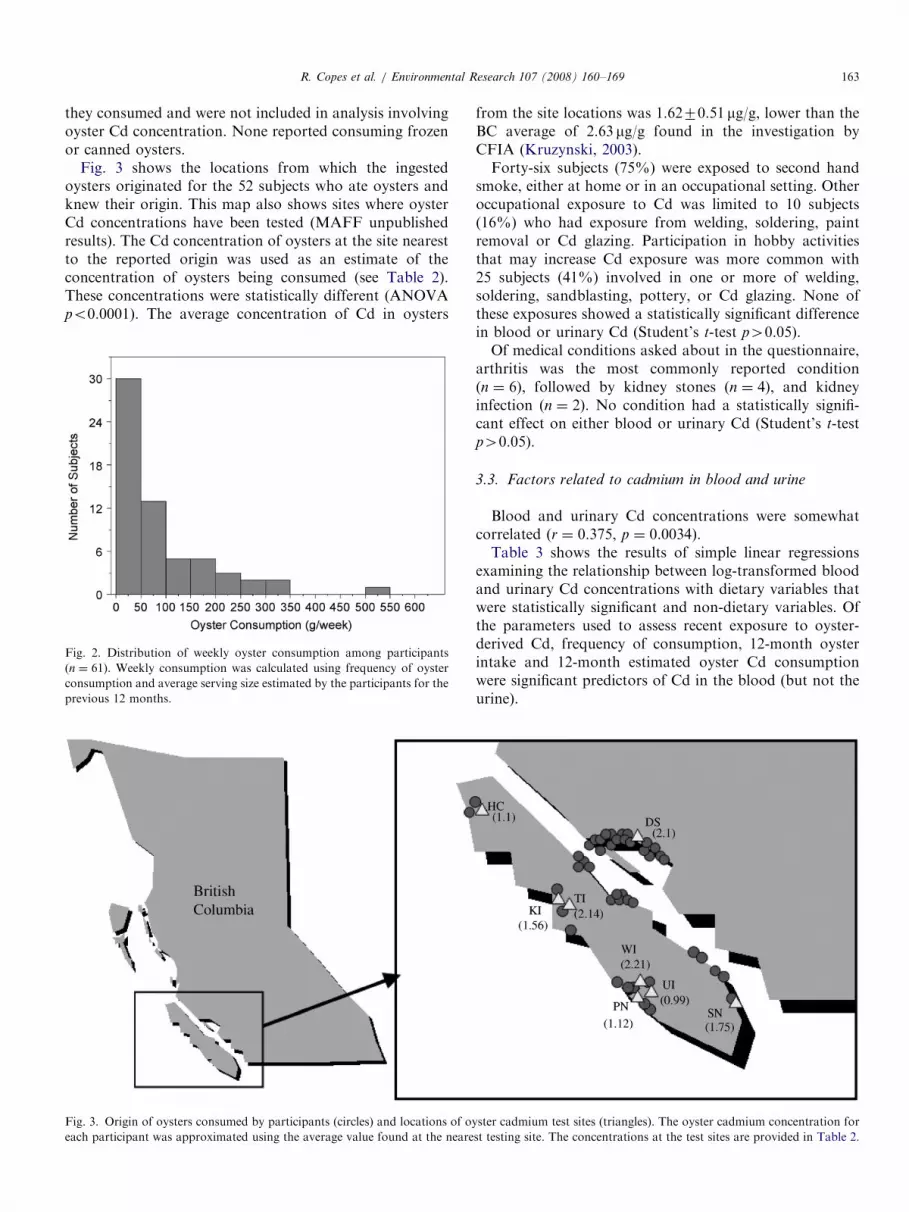
foods varied widely. Fig. 2 shows the distribution of oysterconsumption among the participants. It varied from nevereating oysters (n ¼ 6) to a maximum of 537 g of oyster/week (approximately 18 oysters/week), with an average of86.77105.7 g/week. Of the 55 subjects who consumedsome oysters, 52 (95%) ate fresh BC oysters that originatedeither from their own farm, another farm, or from the wild.Three subjects (5%) did not know the origin of the oysters
e concentration (mg/L) Urine concentration (mg/g cr)
b GMc GSDd Range AMb GMc GSDd Range
0.71 2.38 0.06–3.32 0.91 0.76 1.84 0.16–4.04
0.80 2.09 0.12–2.30 0.86 0.77 1.67 0.24–1.92
0.61 2.72 0.06–3.32 0.97 0.75 2.05 0.16–4.04
0.38 2.27 0.06–0.88 0.56 0.51 1.64 0.16–0.96
0.87 2.17 0.15–3.32 1.12 0.93 1.86 0.24–4.04
0.72 2.63 0.07–2.30 0.92 0.81 1.78 0.20–1.92
1.08 1.60 0.50–1.70 0.78 0.74 1.44 0.48–1.10
ARTICLE IN PRESSR. Copes et al. / Environmental Research 107 (2008) 160–169 163
they consumed and were not included in analysis involvingoyster Cd concentration. None reported consuming frozenor canned oysters.
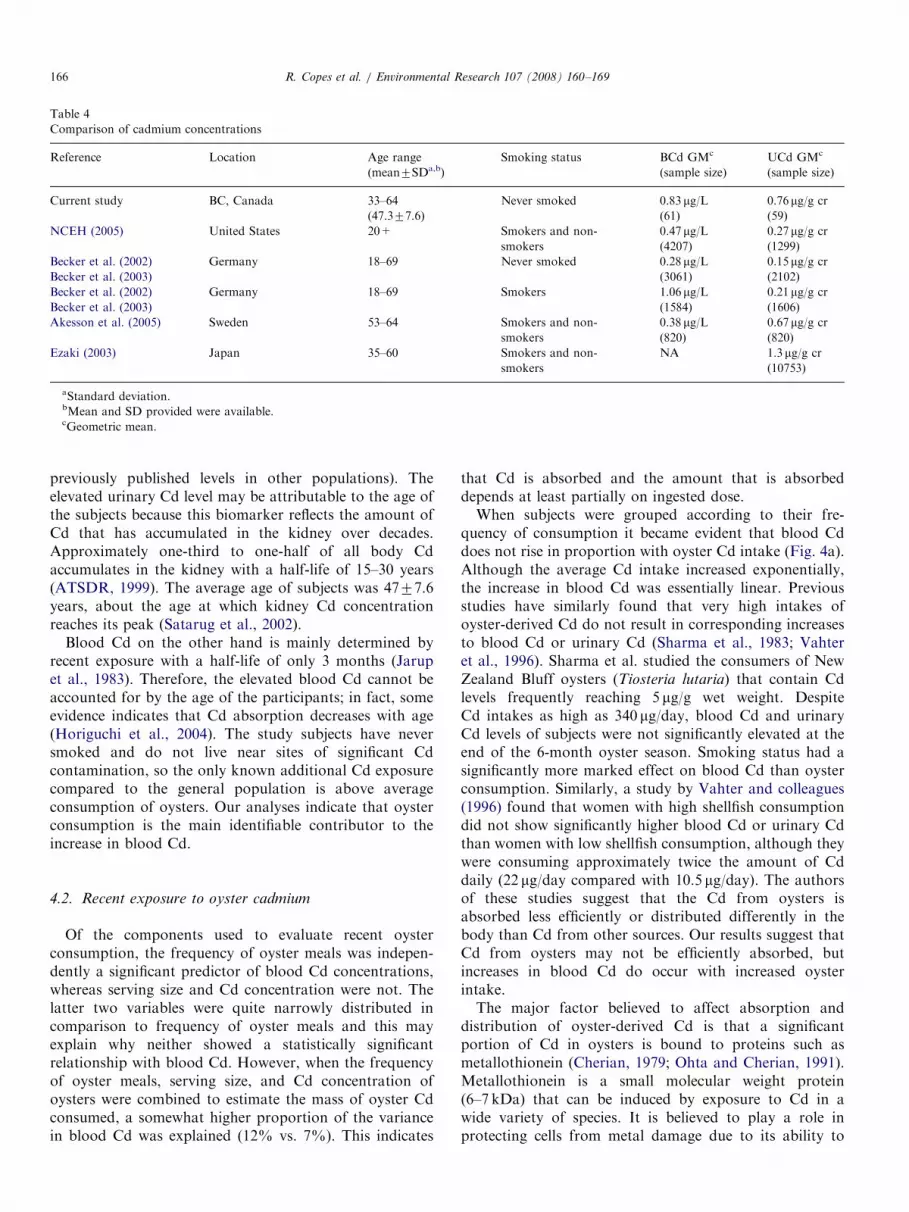
Fig. 3 shows the locations from which the ingestedoysters originated for the 52 subjects who ate oysters andknew their origin. This map also shows sites where oysterCd concentrations have been tested (MAFF unpublishedresults). The Cd concentration of oysters at the site nearestto the reported origin was used as an estimate of theconcentration of oysters being consumed (see Table 2).These concentrations were statistically different (ANOVApo0.0001). The average concentration of Cd in oysters
Fig. 2. Distribution of weekly oyster consumption among participants
(n ¼ 61). Weekly consumption was calculated using frequency of oyster
consumption and average serving size estimated by the participants for the
previous 12 months.
Fig. 3. Origin of oysters consumed by participants (circles) and locations of oy
each participant was approximated using the average value found at the neare
from the site locations was 1.6270.51 mg/g, lower than theBC average of 2.63 mg/g found in the investigation byCFIA (Kruzynski, 2003).Forty-six subjects (75%) were exposed to second hand
smoke, either at home or in an occupational setting. Otheroccupational exposure to Cd was limited to 10 subjects(16%) who had exposure from welding, soldering, paintremoval or Cd glazing. Participation in hobby activitiesthat may increase Cd exposure was more common with25 subjects (41%) involved in one or more of welding,soldering, sandblasting, pottery, or Cd glazing. None ofthese exposures showed a statistically significant differencein blood or urinary Cd (Student’s t-test p40.05).Of medical conditions asked about in the questionnaire,
arthritis was the most commonly reported condition(n ¼ 6), followed by kidney stones (n ¼ 4), and kidneyinfection (n ¼ 2). No condition had a statistically signifi-cant effect on either blood or urinary Cd (Student’s t-testp40.05).
3.3. Factors related to cadmium in blood and urine
Blood and urinary Cd concentrations were somewhatcorrelated (r ¼ 0.375, p ¼ 0.0034).Table 3 shows the results of simple linear regressions
examining the relationship between log-transformed bloodand urinary Cd concentrations with dietary variables thatwere statistically significant and non-dietary variables. Ofthe parameters used to assess recent exposure to oyster-derived Cd, frequency of consumption, 12-month oysterintake and 12-month estimated oyster Cd consumptionwere significant predictors of Cd in the blood (but not theurine).
ster cadmium test sites (triangles). The oyster cadmium concentration for
st testing site. The concentrations at the test sites are provided in Table 2.

ARTICLE IN PRESS
Table 2
Average cadmium concentration of oysters consumed by subjects
Regiona Abbreviation Number of
samples tested
No. of participants
consuming region’s oysters
Oyster cadmium
concentrationb Mean7SDc
Desolation sound DS 617 35 2.170.78
Poett nook PN 90 2 1.1270.60
Useless inlet UI 413 1 0.9970.39
Webster island WI 136 4 2.2170.95
Sansum narrows SN 7 5 1.7570.24
Tlupana inlet TI 61 2 2.1470.93
Kendrick inlet KI 94 1 1.5670.61
Hecate cove HC 98 2 1.170.60
aSee Fig. 3 for map of regions and testing sites.bANOVA indicates that concentrations at the various sites are statistically different (p ¼o0.0001).cStandard deviation.
Table 3
Simple linear regressions with log transformed BCd or UCd as the dependent variables
Independent variable BCd UCd
Coefficient R2 p-Value Coefficient R2 p-Value
Sex (male ¼ 0, female ¼ 1) �0.1250 0.0302 0.1808 0.0083 0.0002 0.9180
Age 0.0101 0.0463 0.0989 0.0133 0.0299 0.1941
Second hand smoke (years) �0.0027 0.0078 0.4974 0.0020 0.0015 0.7683
Occupational exposure (hours) �0.00001 0.0030 0.6794 �0.00002 0.0163 0.3395
Hobby activities (years) 0.0048 0.0337 0.1565 �0.001 0.0278 0.2330
Recent exposure to oyster-derived cadmium
Frequency of oyster intake (meals/year) 0.0025 0.0744 0.0334 0.0027 0.0298 0.1911
Oyster serving size (g/meal) 0.0003 0.0187 0.2928 -0.0006 0.0287 0.1993
Oyster cd concentration (mg/g) 0.2339 0.0422 0.1441 -0.0652 0.0011 0.8213
12-month oyster intake (kg) 0.0201 0.0933 0.0166 0.0115 0.0110 0.4294
12-month oyster Cd intake (mg) o0.0001 0.1247 0.0066 0.00001 0.0110 0.4410
Long-term exposure to oyster-derived cadmium
Duration of oyster farming 0.0139 0.0800 0.0272 0.0336 0.1703 0.0012
Lifetime oyster intake (kg) 0.0008 0.0939 0.0163 0.0002 0.0020 0.7358
Lifetime oyster Cd intake (mg) o0.0001 0.1048 0.0159 o0.0001 0.0017 0.7724
12-month ketchup intake (kg) �0.5984 0.0677 0.0429 �0.4412 0.0133 0.3836
Ln (Serum Iron) �0.3054 0.0902 0.0187 �0.3601 0.0453 0.1056
R. Copes et al. / Environmental Research 107 (2008) 160–169164
Long-term oyster exposure was assessed in terms ofduration of exposure and total oyster consumption. Totalduration of exposure for oyster consumers is approximatedby adult age because they have eaten some oystersthroughout this time. Since most subjects reported asignificant increase in oyster consumption when they beganfarming, the duration of oyster farming is an indicator ofhow long they have been eating a significantly increasedquantity of oysters. Age was not a significant predictor ofeither blood or urinary Cd, but duration of oyster farmingwas significantly related to both blood and urinary Cd.Mass of oysters ingested in adult lifetime and lifetimeestimated oyster Cd consumption were related to blood,but not urinary, Cd.
The only other dietary exposure variable with astatistically significant relationship to body Cd was massof ketchup consumption, which showed a negative
association with blood Cd. Serum concentration of ironalso had a negative association with blood Cd.The optimal multiple regression model for describing
blood Cd was:
�
Blood Cd ¼ 2.1+0.00002(12-month oyster Cd inta-ke)�0.35(Ln FeS)�0.66(12-month ketchup intake). Thismodel explained 34.2% of the variance in blood Cd(p ¼ 0.00004). � When ketchup is excluded, the model was: bloodCd ¼ 2.29+0.00001(12-month oyster Cd intake)�0.39(Ln FeS). It explained 26.4% of the variance in bloodCd (p ¼ 0.0002).
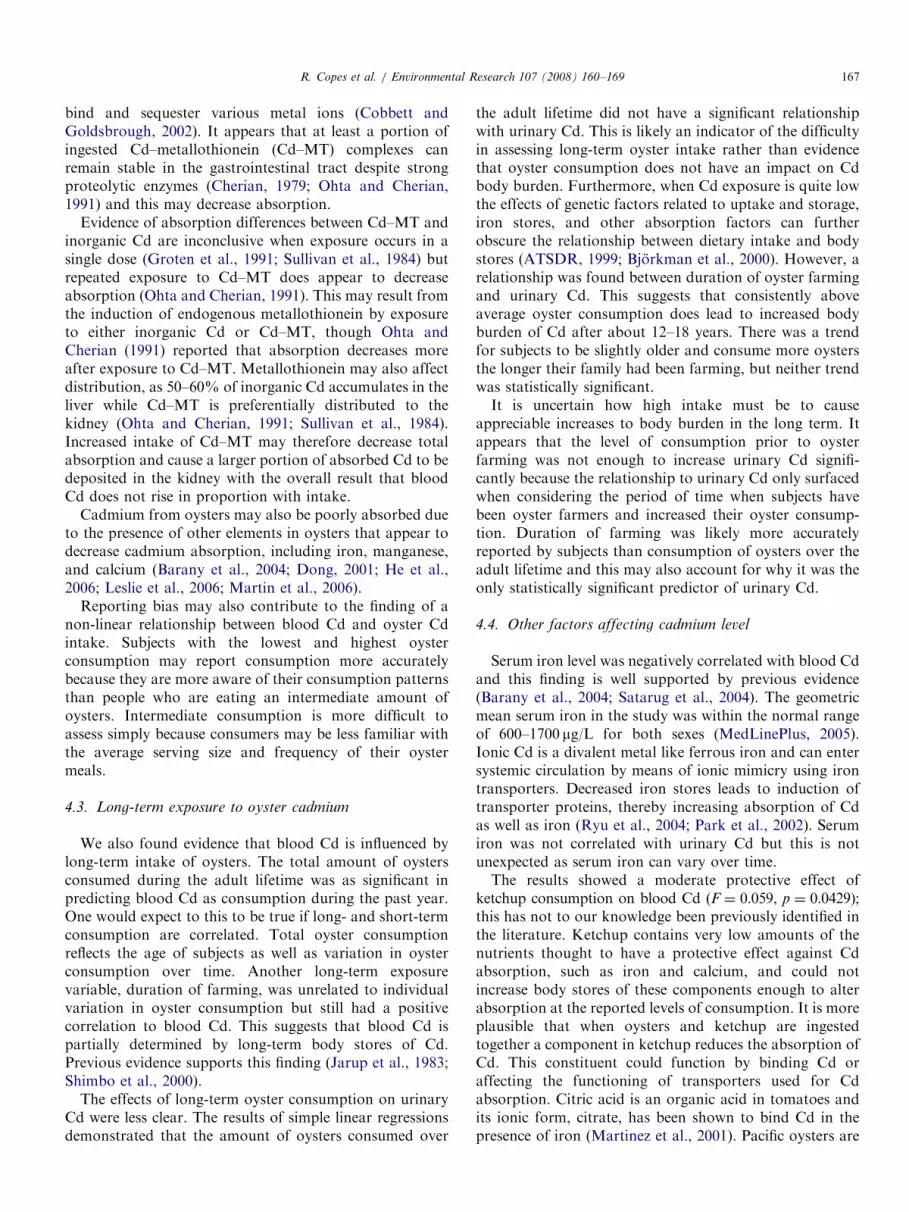
Fig. 4a illustrates the influence of the frequency of oysterconsumption in the last 12 months on oyster Cd ingestionand on blood and urinary Cd concentrations. Blood and

ARTICLE IN PRESS
1
0.9
0.8
0.7
0.6
0.5
0.4
0.3
0.2
0.1
0
Blo
od C
adm
ium
Con
cent
ratio
n (u
g/L)
Urin
e C
adm
ium
Con
cent
ratio
n (u
g/g
cr)
1.2
0.8
0.6
0.4
0.2
0
1
1.2
0.8
0.6
0.4
0.2
0
1
Blo
od C
adm
ium
Con
cent
ratio
n (u
g/L)
Urin
e C
adm
ium
Con
cent
ratio
n (u
g/L)
Duration of Farming (years)
Frequency of Oyster Consumption (servings/yr)
Blood cadmium Urine CadmiumEstimade of oyster cadmium consumption
0 <12 12 to <52 ≥52
≤6 >6 to 12 >12 to 18 >18
Fig. 4. Changes in blood and urine cadmium with the frequency of oyster consumption (a) and duration of farming (b). Frequency of oyster consumption
was estimated by participants for the previous 12 months.
R. Copes et al. / Environmental Research 107 (2008) 160–169 165
urinary Cd rise in a nearly linear pattern although averageCd intake rises exponentially. Fig. 4b illustrates the long-term effects of oyster consumption based on the durationof oyster farming. It shows a stronger rise in urinary thanblood Cd.
4. Discussion
4.1. Cadmium level in biological samples
Cadmium occurs in most foods with concentrationstypically ranging from 2 to 40 ppb (parts per billion)(ATSDR, 1999). Average dietary exposure to Cd in the USis estimated to be 2.8 mg/kg body weight/week (Choudhuryet al., 2001) and in Canada, 2.1–2.5 mg/kg body weight/week (Health Canada, 1999). Moschandreas et al. (2002)
apportioned dietary Cd exposure among a variety of fooditems and estimated that shellfish account for only 11.4%of total dietary exposure in a typical US diet, while plantfoods usually contribute a far greater portion. Our datasuggest that oyster growers and their families have muchhigher than average exposure to dietary Cd. The averageoyster consumption in the current study subjects was877106 g/week. Using the average body weights of oursubjects and the concentrations of Cd in the oysters theyate, this corresponds to approximately 2.272.8 mgCd/kgbody weight/week from oyster-derived Cd alone.The geometric mean blood Cd was 0.83 mg/L and urinary
Cd, 0.76 mg/g creatinine (mg/g cr). These means are higherthan usually seen in non-smoking populations but belowlevels often found for smokers and people who live in areasof higher Cd contamination, such as Japan (see Table 4 for
ARTICLE IN PRESS
Table 4
Comparison of cadmium concentrations
Reference Location Age range
(mean7SDa,b)
Smoking status BCd GMc
(sample size)
UCd GMc
(sample size)
Current study BC, Canada 33–64 Never smoked 0.83mg/L 0.76mg/g cr
(47.377.6) (61) (59)
NCEH (2005) United States 20+ Smokers and non-
smokers
0.47mg/L 0.27mg/g cr
(4207) (1299)
Becker et al. (2002) Germany 18–69 Never smoked 0.28mg/L 0.15mg/g cr
Becker et al. (2003) (3061) (2102)
Becker et al. (2002) Germany 18–69 Smokers 1.06mg/L 0.21mg/g cr
Becker et al. (2003) (1584) (1606)
Akesson et al. (2005) Sweden 53–64 Smokers and non-
smokers
0.38mg/L 0.67mg/g cr
(820) (820)
Ezaki (2003) Japan 35–60 Smokers and non-
smokers
NA 1.3 mg/g cr
(10753)
aStandard deviation.bMean and SD provided were available.cGeometric mean.
R. Copes et al. / Environmental Research 107 (2008) 160–169166
previously published levels in other populations). Theelevated urinary Cd level may be attributable to the age ofthe subjects because this biomarker reflects the amount ofCd that has accumulated in the kidney over decades.Approximately one-third to one-half of all body Cdaccumulates in the kidney with a half-life of 15–30 years(ATSDR, 1999). The average age of subjects was 4777.6years, about the age at which kidney Cd concentrationreaches its peak (Satarug et al., 2002).
Blood Cd on the other hand is mainly determined byrecent exposure with a half-life of only 3 months (Jarupet al., 1983). Therefore, the elevated blood Cd cannot beaccounted for by the age of the participants; in fact, someevidence indicates that Cd absorption decreases with age(Horiguchi et al., 2004). The study subjects have neversmoked and do not live near sites of significant Cdcontamination, so the only known additional Cd exposurecompared to the general population is above averageconsumption of oysters. Our analyses indicate that oysterconsumption is the main identifiable contributor to theincrease in blood Cd.
4.2. Recent exposure to oyster cadmium
Of the components used to evaluate recent oysterconsumption, the frequency of oyster meals was indepen-dently a significant predictor of blood Cd concentrations,whereas serving size and Cd concentration were not. Thelatter two variables were quite narrowly distributed incomparison to frequency of oyster meals and this mayexplain why neither showed a statistically significantrelationship with blood Cd. However, when the frequencyof oyster meals, serving size, and Cd concentration ofoysters were combined to estimate the mass of oyster Cdconsumed, a somewhat higher proportion of the variancein blood Cd was explained (12% vs. 7%). This indicates
that Cd is absorbed and the amount that is absorbeddepends at least partially on ingested dose.When subjects were grouped according to their fre-
quency of consumption it became evident that blood Cddoes not rise in proportion with oyster Cd intake (Fig. 4a).Although the average Cd intake increased exponentially,the increase in blood Cd was essentially linear. Previousstudies have similarly found that very high intakes ofoyster-derived Cd do not result in corresponding increasesto blood Cd or urinary Cd (Sharma et al., 1983; Vahteret al., 1996). Sharma et al. studied the consumers of NewZealand Bluff oysters (Tiosteria lutaria) that contain Cdlevels frequently reaching 5 mg/g wet weight. DespiteCd intakes as high as 340 mg/day, blood Cd and urinaryCd levels of subjects were not significantly elevated at theend of the 6-month oyster season. Smoking status had asignificantly more marked effect on blood Cd than oysterconsumption. Similarly, a study by Vahter and colleagues(1996) found that women with high shellfish consumptiondid not show significantly higher blood Cd or urinary Cdthan women with low shellfish consumption, although theywere consuming approximately twice the amount of Cddaily (22 mg/day compared with 10.5 mg/day). The authorsof these studies suggest that the Cd from oysters isabsorbed less efficiently or distributed differently in thebody than Cd from other sources. Our results suggest thatCd from oysters may not be efficiently absorbed, butincreases in blood Cd do occur with increased oysterintake.The major factor believed to affect absorption and
distribution of oyster-derived Cd is that a significantportion of Cd in oysters is bound to proteins such asmetallothionein (Cherian, 1979; Ohta and Cherian, 1991).Metallothionein is a small molecular weight protein(6–7 kDa) that can be induced by exposure to Cd in awide variety of species. It is believed to play a role inprotecting cells from metal damage due to its ability to
ARTICLE IN PRESSR. Copes et al. / Environmental Research 107 (2008) 160–169 167
bind and sequester various metal ions (Cobbett andGoldsbrough, 2002). It appears that at least a portion ofingested Cd–metallothionein (Cd–MT) complexes canremain stable in the gastrointestinal tract despite strongproteolytic enzymes (Cherian, 1979; Ohta and Cherian,1991) and this may decrease absorption.
Evidence of absorption differences between Cd–MT andinorganic Cd are inconclusive when exposure occurs in asingle dose (Groten et al., 1991; Sullivan et al., 1984) butrepeated exposure to Cd–MT does appear to decreaseabsorption (Ohta and Cherian, 1991). This may result fromthe induction of endogenous metallothionein by exposureto either inorganic Cd or Cd–MT, though Ohta andCherian (1991) reported that absorption decreases moreafter exposure to Cd–MT. Metallothionein may also affectdistribution, as 50–60% of inorganic Cd accumulates in theliver while Cd–MT is preferentially distributed to thekidney (Ohta and Cherian, 1991; Sullivan et al., 1984).Increased intake of Cd–MT may therefore decrease totalabsorption and cause a larger portion of absorbed Cd to bedeposited in the kidney with the overall result that bloodCd does not rise in proportion with intake.
Cadmium from oysters may also be poorly absorbed dueto the presence of other elements in oysters that appear todecrease cadmium absorption, including iron, manganese,and calcium (Barany et al., 2004; Dong, 2001; He et al.,2006; Leslie et al., 2006; Martin et al., 2006).
Reporting bias may also contribute to the finding of anon-linear relationship between blood Cd and oyster Cdintake. Subjects with the lowest and highest oysterconsumption may report consumption more accuratelybecause they are more aware of their consumption patternsthan people who are eating an intermediate amount ofoysters. Intermediate consumption is more difficult toassess simply because consumers may be less familiar withthe average serving size and frequency of their oystermeals.
4.3. Long-term exposure to oyster cadmium
We also found evidence that blood Cd is influenced bylong-term intake of oysters. The total amount of oystersconsumed during the adult lifetime was as significant inpredicting blood Cd as consumption during the past year.One would expect to this to be true if long- and short-termconsumption are correlated. Total oyster consumptionreflects the age of subjects as well as variation in oysterconsumption over time. Another long-term exposurevariable, duration of farming, was unrelated to individualvariation in oyster consumption but still had a positivecorrelation to blood Cd. This suggests that blood Cd ispartially determined by long-term body stores of Cd.Previous evidence supports this finding (Jarup et al., 1983;Shimbo et al., 2000).
The effects of long-term oyster consumption on urinaryCd were less clear. The results of simple linear regressionsdemonstrated that the amount of oysters consumed over
the adult lifetime did not have a significant relationshipwith urinary Cd. This is likely an indicator of the difficultyin assessing long-term oyster intake rather than evidencethat oyster consumption does not have an impact on Cdbody burden. Furthermore, when Cd exposure is quite lowthe effects of genetic factors related to uptake and storage,iron stores, and other absorption factors can furtherobscure the relationship between dietary intake and bodystores (ATSDR, 1999; Bjorkman et al., 2000). However, arelationship was found between duration of oyster farmingand urinary Cd. This suggests that consistently aboveaverage oyster consumption does lead to increased bodyburden of Cd after about 12–18 years. There was a trendfor subjects to be slightly older and consume more oystersthe longer their family had been farming, but neither trendwas statistically significant.It is uncertain how high intake must be to cause
appreciable increases to body burden in the long term. Itappears that the level of consumption prior to oysterfarming was not enough to increase urinary Cd signifi-cantly because the relationship to urinary Cd only surfacedwhen considering the period of time when subjects havebeen oyster farmers and increased their oyster consump-tion. Duration of farming was likely more accuratelyreported by subjects than consumption of oysters over theadult lifetime and this may also account for why it was theonly statistically significant predictor of urinary Cd.
4.4. Other factors affecting cadmium level
Serum iron level was negatively correlated with blood Cdand this finding is well supported by previous evidence(Barany et al., 2004; Satarug et al., 2004). The geometricmean serum iron in the study was within the normal rangeof 600–1700 mg/L for both sexes (MedLinePlus, 2005).Ionic Cd is a divalent metal like ferrous iron and can entersystemic circulation by means of ionic mimicry using irontransporters. Decreased iron stores leads to induction oftransporter proteins, thereby increasing absorption of Cdas well as iron (Ryu et al., 2004; Park et al., 2002). Serumiron was not correlated with urinary Cd but this is notunexpected as serum iron can vary over time.The results showed a moderate protective effect of
ketchup consumption on blood Cd (F ¼ 0.059, p ¼ 0.0429);this has not to our knowledge been previously identified inthe literature. Ketchup contains very low amounts of thenutrients thought to have a protective effect against Cdabsorption, such as iron and calcium, and could notincrease body stores of these components enough to alterabsorption at the reported levels of consumption. It is moreplausible that when oysters and ketchup are ingestedtogether a component in ketchup reduces the absorption ofCd. This constituent could function by binding Cd oraffecting the functioning of transporters used for Cdabsorption. Citric acid is an organic acid in tomatoes andits ionic form, citrate, has been shown to bind Cd in thepresence of iron (Martinez et al., 2001). Pacific oysters are

ARTICLE IN PRESSR. Copes et al. / Environmental Research 107 (2008) 160–169168
quite high in iron with approximately 5.1mg/100 g (Dong,2001). The presence of this iron along with the citrate fromtomatoes may therefore reduce the absorption of Cd(Martinez et al., 2001). Vitamins A and C are also presentin ketchup and both have been associated with evidence ofenhancing iron absorption (Teucher et al., 2004; Garcia-Casal et al., 1998), which may decrease the availability ofiron transporters for Cd transport. These hypotheses relyon consumption of oysters with ketchup, a combinationthat was not queried in our interview. However, they arelikely to be consumed together as oysters are commonlyeaten with a cocktail sauce that is mainly made of ketchupand horseradish. More research is needed to test therobustness of this finding.
5. Conclusions
These results clearly indicate that the Cd in oysters isabsorbed by the body and increases long- and short-termbody stores of the metal when consumed in above averagequantities. Based on a review of the literature, Lauweryset al. (1994) recommended a maximum urine cadmiumlevel of 2 mg/g creatinine for the general public. Ninety-fivepercent of current participants had cadmium levels belowthis guideline and all subjects were below occupationalguidelines, generally set at 5 mg/g creatinine (OSHA).Urinary excretion of low molecular weight proteins hasbeen reported at levels from 0.6 to 2 mg/g cr in urine(Akesson et al., 2005; Noonan et al., 2002), although theclinical significance of this is unclear. Mean levels in oursubjects were at the low end of this range. Since our studyexamined exposures, not health endpoints, our results donot provide evidence about the presence or absence ofhealth effects at the exposure levels in our study.
Acknowledgments
This work was funded by a grant from the BritishColumbia Ministry of Agriculture, Food and Fisheries.The authors wish to thank Terri Skelton, Teresa Switzer,Andre Mattman and staff of the BC Ministry ofAgriculture, Food and Fisheries for their assistance incarrying out this study.
References
Akesson, A., Lundh, T., Vahter, M., Bjellerup, P., Lidfeldt, J., Nerbrand,
C., et al., 2005. Tubular and glomerular kidney effects in Swedish
women with low environmental cadmium exposure. Environ. Health
Perspect. 13 (11), 1627–1631.
ATSDR, 1999. Case Toxicological Profile for Cadmium. Agency for Toxic
Substances and Disease Registry, Atlanta, GA.
Barany, E., Bergdahl, L.A., Bratteby, L.-E., Lundh, T., Samuelson, G.,
Skerfving, S., Oskarsson, A., 2004. Iron status influences trace element
levels in human blood and serum. Environ. Res. 98 (2), 215–223.
Becker, K., Kaus, S., Krause, C., Lepom, P., Schulz, C., Seiwert, M.,
Seifert, B., 2002. German environmental survey 1998 (GerES III):
environmental pollutants in blood of the German population. Int. J.
Hyg. Environ. Health 205, 297–308.
Becker, K., Schulz, C., Kaus, S., Seiwert, M., Seifert, B., 2003. German
environmental survey 1998 (GerES III): environmental pollutants in
the urine of the German population. Int. J. Hyg. Environ. Health 206,
15–24.
Bjorkman, L., Vahter, M., Pedersen, NL., 2000. Both the environment
and genes are important for concentrations of cadmium and lead in
blood. Environ. Health Perspect. 108 (8), 719–722.
Cherian, M.G., 1979. Metabolism of orally administered cadmium–
metallothionein in mice. Environ. Health Perspect. 28, 127–130.
Choudhury, H., Harvey, T., Thayer, W.C., Lockwood, T.F., Stiteler,
W.M., Goodrum, P.E., et al., 2001. Urinary Cd elimination as a
biomarker of exposure for evaluating a Cd dietary exposure-
biokinetics model. J. Toxicol. Environ. Health, Part A 63 (5), 321–350.
Cobbett, C., Goldsbrough, P., 2002. Phytochelatins and metallothioneins:
roles in heavy metal detoxification and homeostasis. Annu. Rev. Plant
Biol. 53, 159–182.
Dong, F.M., 2001. The Nutritional Value of Shellfish. School of Aquatic
and Fishery Sciences, University of Washington. Available: /http://
www.wsg.washington.edu/pubs/nutritional.pdfS [Accessed 8 October
2007].
Ezaki, T., Tsukahara, T., Moriguchi, J., Furuki, K., Fukui, Y., Ukai, H.,
et al., 2003. No clear-cut evidence for cadmium-induced renal tubular
dysfunction among over 10,000 women in the Japanese general
population: a nationwide large-scale survey. Int. Arch. Occup.
Environ. Health 76 (3), 186–196.
Garcia-Casal, M.N., Layrisse, M., Solano, L., Baron, M.A., Arguello, F.,
Llovera, D., et al., 1998. Vitamin A and beta-carotene can improve
nonheme iron absorption from rice, wheat and corn by humans.
J. Nutr. 128 (3), 646–650.
Groten, J.P., Sinkeldam, E.J., Luten, J.B., Van Bladeren, P.J., 1991.
Cadmium accumulation and metallotionein concentrations after
4-week dietary exposure to cadmium chloride or cadmium–metal-
lothionein in rats. Toxicol. Appl. Pharmacol. 111, 504–513.
He, L., Girijashanker, K., Dalton, T.P., Reed, J., Li, H., Soleimani, M.,
et al., 2006. ZIP8, member of the solute-carrier-39 (SLC39) metal-
transporter family: characterization of transporter properties. Mol.
Pharmacol. 70 (1), 171–180.
Health Canada, 1999. Dietary Intakes of Contaminants & Other
Chemicals for Different Age–Sex Groups of Canadians: Trace
Elements (1993–1999). Available: /http://www.hc-sc.gc.ca/fn-an/alt_
formats/hpfb-dgpsa/pdf/surveill/metal_intake-plomb_apport_93-99_
e.pdfS [Accessed 1 December 2005].
Horiguchi, H., Oguma, E., Sasaki, S., Miyamoto, K., Ikeda, Y., Machida,
M., et al., 2004. Comprehensive study of the effects of age, iron
deficiency, diabetes mellitus, and cadmium burden on dietary cadmium
absorption in cadmium-exposed female Japanese farmers. Toxicol.
Appl. Pharmacol. 196 (1), 114–123.
Jarup, L., Rogenfelt, A., Elinder, C.G., Nogawa, K., Kjellstrom, T., 1983.
Biological half-time of Cd in the blood of workers after cessation of
exposure. Scand. J. Work Environ. Health 9 (4), 327–331.
JEFCA, 2004. Safety. Cadmium (addendum). WHO Food Additives
Series: 52. Available: /http://www.inchem.org/documents/jecfa/
jecmono/v52je22.htmS [Accessed 28 January 2006].
Kikuchi, Y., Nomiyama, T., Kumagai, N., Dekio, F., Uemura, T.,
Takebayashi, T., et al., 2003. Uptake of cadmium in meals from the
digestive tract of young non-smoking Japanese female volunteers.
J. Occup. Health 45, 43–52.
Kruzynski, G.M., 2000. Cadmium in BC farmed oysters: a review of
available data, potential sources, research needs and possible mitiga-
tion strategies. Canadian Stock Assessment Secretariat Research
Document 2000/104, Fisheries and Oceans Canada. Available:
/http://www.dfo-mpo.gc.ca/csas/Csas/publications/ResDocs-DocRech/
2000/2000_104_e.htmS [Accessed 30 March 2006].
Kruzynski, G.M., 2003. Cadmium in oysters and scallops: the BC
experience. Toxicol. Lett. 148, 159–169.
Lauwerys, R.R., Bernard, A.M., Roels, H.A., Buchet, J.P., 1994.
Cadmium: exposure markers as predictors of nephrotoxic effects.
Clin. Chem. 40 (7, Part 2), 1391–1394.

ARTICLE IN PRESSR. Copes et al. / Environmental Research 107 (2008) 160–169 169
Leslie, E.M., Liu, J., Klaassen, C.D., Waalkes, M.P., 2006. Acquired
cadmium resistance in metallothionein-I/II (�/�) knockout cells: role
of the T-type calcium channel cacnalpha1g in cadmium uptake. Mol.
Pharmacol. 69 (2), 629–639.
Martin, P., Fareh, M., Poggi, M.C., Boulukos, K.E., Pognonec, P., 2006.
Manganese is highly effective in protecting cells from cadmium
intoxication. Biochem. Biophys. Res. Commun. 351 (1), 294–299.
Martinez, R., Brassard, P., Mwanjewe, J., Grover, A.K., 2001. Iron
promotes Cd binding to citrate. Mol. Cell. Biochem. 225, 93–96.
MedlinePlus. 2005. Serum iron. Available: /http://www.nlm.nih.gov/
medlineplus/ency/article/003488.htmS [Accessed 1 March 2006].
Moschandreas, D.J., Karuchit, S., Berry, M.R., O’Rourke, M.K., Lo, D.,
Lebowitz, M.D., et al., 2002. Exposure apportionment: ranking food
items by their contribution to dietary exposure. J. Expo. Anal.
Environ. Epidemiol. 12 (4), 233–243.
NCEH, 2005. Third national report on human exposure to environmental
chemicals. Publication No. 05-0570. Department of Health and
Human Services, Centers for Disease Control and Prevention.
Available: /http://www.cdc.gov/exposurereport/3rd/pdf/thirdreport.
pdfS [Accessed 30 March 2006].
Noonan, C.W., Sarasua, S.M., Campagna, D., Kathman, S.J., Lybarger,
J.A., Mueller, P.W., 2002. Effects of exposure to low levels of
environmental cadmium on renal biomarkers. Environ. Health
Perspect. 110 (2), 151–155.
Ohta, H., Cherian, M.G., 1991. Gastrointestinal absorption of Cd and
metallothionein. Toxicol. Appl. Pharmacol. 107 (1), 63–72.
OSHA, 2004. Cadmium. US Department of Labor Report 3136-06R.
Available:/http://www.osha.gov/Publications/osha3136.pdfS [Accessed
4 October 2007].
Park, J.D., Cherrington, N.J., Klaassen, C.D., 2002. Intestinal absorption
of cadmium is associated with divalent metal transporter 1 in rats.
Toxicol. Sci. 68, 288–294.
Ryu, D.Y., Lee, S.J., Park, D.W., Choi, B.S., Klaassen, C.D., Park, J.D.,
2004. Dietary iron regulates intestinal Cd absorption through iron
transporters in rats. Toxicol. Lett. 152, 19–25.
Satarug, S., Baker, J.R., Reilly, P.E., Moore, M.R., Williams, D.J., 2002.
Cadmium levels in the lung, liver, kidney cortex, and urine samples
from Australians without occupational exposure to metals. Arch.
Environ. Health 57 (1), 69–77.
Satarug, S., Ujjin, P., Vanavanitkun, Y., Baker, J.R., Moore, M.R., 2004.
Influence of body iron store status and cigarette smoking on Cd body
burden of healthy Thai women and men. Toxicol. Lett. 148 (3),
177–185.
Sharma, R.P., Kjellstrom, T., McKenzie, J.M., 1983. Cadmium in blood
and urine among smokers and non-smokers with high Cd intake via
food. Toxicology 29, 163–171.
Shimbo, S., Zhang, Z.W., Moon, C.S., Watanabe, T., Nakatsuka, H.,
Matsuda-Inoguchi, N., et al., 2000. Correlation between urine and
blood concentrations, and dietary intake of Cd and lead among
women in the general population of Japan. Int. Arch. Occup. Environ.
Health 73, 163–170.
Sullivan, M.F., Hardy, J.T., Miller, B.M., Buschbom, R.L., Siewicki,
T.C., 1984. Absorption and distribution of Cd in mice fed diets
containing either inorganic or oyster-incorporated Cd. Toxicol. Appl.
Pharmacol. 72 (2), 210–217.
Teucher, B., Olivares, M., Cori, H., 2004. Enhancers of iron absorption:
ascorbic acid and other organic acids. Int. J. Vitam. Nutr. Res. 74 (6),
403–419.
Vahter, M., Berglund, M., Nermell, B., Akesson, A., 1996. Bioavailability
of Cd from shellfish and mixed diet in women. Toxicol. Appl.
Pharmacol. 136, 332–341.
Vanderpool, R.A., Reeves, P.G., 2001. Cadmium absorption in women
fed processed edible sunflower kernels labeled with a stable isotope of
Cd, 113Cd. Environ. Res. 87, 69–80.