phylogeography and historical ecology of the north atlantic intertidal
TRANSCRIPT
2455
q 2001 The Society for the Study of Evolution. All rights reserved.
Evolution, 55(12), 2001, pp. 2455–2469
PHYLOGEOGRAPHY AND HISTORICAL ECOLOGY OF THENORTH ATLANTIC INTERTIDAL
JOHN P. WARES1,2 AND CLIFFORD W. CUNNINGHAM1
1Duke University Department of Biology, Box 90325,Durham, North Carolina 27708-0325
Abstract. Recent glaciation covered the full extent of rocky intertidal habitat along the coasts of New England andthe Canadian Maritimes. To test whether this glaciation in fact caused wholesale extinction of obligate rocky intertidalinvertebrates, and thus required a recolonization from Europe, we compared American and European populations usingallelic diversity and techniques adapted from coalescent theory. Mitochondrial DNA sequences were collected fromamphi-Atlantic populations of three cold-temperate obligate rocky intertidal species (a barnacle, Semibalanus bal-anoides, and two gastropods, Nucella lapillus and Littorina obtusata) and three cold-temperate habitat generalist species(a seastar, Asterias rubens; a mussel, Mytilus edulis, and an isopod, Idotea balthica). For many of these species wewere able to estimate the lineage-specific mutation rate based on trans-Arctic divergences between Pacific and Atlantictaxa. These data indicate that some obligate rocky intertidal taxa have colonized New England from European pop-ulations. However, the patterns of persistence in North America indicate that other life-history traits, including mech-anisms of dispersal, may be more important for surviving dramatic environmental and climatic change.
Key words. Coalescent, glaciation, North Atlantic, phylogeography, range expansion.
Received January 17, 2001. Accepted August 29, 2001.
A primary goal of historical ecology is to determine howcommunities and biological interactions develop (Ricklefsand Schluter 1993; Stone et al. 1996). Interactions amongspecies may vary geographically based on the ecological con-text, and such variation may arise in very recent species as-sociations (Vermeij 1992; Travis 1996). For example, theisopod Idotea balthica is a more dominant herbivore and isfound in a broader range of algal and seagrass habitats (J. P.Wares, pers. obs.) in New England populations than in Eu-ropean populations. In European populations, this speciestends to be ecologically marginalized through competitionwith congeneric grazers (Franke and Janke 1998). What eco-logical variables play a determinant role in producing thisvariation in community composition and interactions? Onlyby knowing both the historical and ecological contexts ofthese interactions can we decide (Endler 1982; Brooks andMcLennan 1991; Vermeij 1992), and studies of comparativephylogeography represent a solid approach to this problem.
In North Atlantic intertidal marine communities, the lastglacial maximum (around 20,000 years ago; Barash et al.1992; Holder et al. 1999) is thought to have been especiallydifficult for obligate rocky intertidal species on the NorthAmerican coast. Many such species may have been forcedfrom their typical habitat by Pleistocene glaciation, becausethere is currently little hard substrate beyond the southern-most extent of the glaciers at Long Island Sound (Knott andHoskins 1968; Ingolfsson 1992; Riggs et al. 1996). If gla-ciation caused localized extinction in New England rockyintertidal species, then much of the extant rocky intertidalcommunity may have recently immigrated from Europe,where hard substrata were more available and Pleistoceneclimatic changes were not as severe (Vermeij 1991; van Op-pen et al. 1995). Distributional evidence suggests this is alikely scenario because the list of obligate rocky intertidal
2 Present address: Department of Biology, University of NewMexico, Castetter Hall, Albuquerque, New Mexico 87131-1091;E-mail: [email protected].
species in North America is a subset of the same group ofspecies found in Iceland, which in turn represents a subsetof these species found in northern Europe (Ingolfsson 1992).Although many marine species may have been able to shiftor contract their geographic range into southern refugia alongthe North American coast, species requiring hard substratamay not have been able to find suitable habitat.
Analysis of data from multiple species with varied life-history traits (including larval dispersal, trophic level, andecological traits such as substrate requirements) allows us tofocus on species or groups of species that did not survivethe most recent glacial maximum in North America. Popu-lations of these species in New England should be recogniz-able based on two basic genetic patterns. First, recentlyfounded populations are expected to represent a subset of thegenetic diversity in the source population. This leads to theprediction that recently founded populations should have asignificantly lower genetic diversity and have a high fre-quency of alleles that are identical to or descended fromalleles in the founding population (Hewitt 1996, 2000; Aus-terlitz et al. 1997; Johnson et al. 2000; Zink et al. 2000).Second, recently founded populations should show the ge-netic signature of a rapidly expanding population (e.g., Neeet al. 1995; Kuhner et al. 1998), in part because they areunlikely to have reached an equilibrium between allelic di-versity (mutation) and demographic changes (genetic drift).
In this paper, we use genetic markers to describe the post-glacial reassembly of the intertidal marine community in NewEngland and the Canadian Maritimes. We will focus on thehypothesis that substratum requirements have played a majorrole in North Atlantic historical biogeography. Because thereare recognizable patterns that we expect in recently foundedpopulations, we test these predictions using both standardpopulation genetic measures as well as recently developedcoalescent methods. Coalescent methods (for review, seeHudson 1990) are expected to more accurately estimate thesepatterns than methods using pairwise sequence comparisons
2456 J. P. WARES AND C. W. CUNNINGHAM
TABLE 1. Species collected for this study, with geographic range and collection sites indicated. Dispersal type for each species is summarizedin the first column and described further in the Discussion. Sister groups used to ensure proper identification and for estimate of m are alsolisted. Collection sites include Beaufort, NC (NC); Beavertail State Park, RI (RI); Woods Hole, MA (WH); Darling Marine Center, Damariscotta,ME (M); Antigonish, Nova Scotia (NS); St. John’s, Newfoundland (W); Reykjavik, Iceland (Ic); Trondheim, Norway (No); Galway, Ireland(Ir); and Roscoff, France (Fr). Species considered to be obligate rocky intertidal taxa are marked with an asterisk. Outgroup species used formutation rate calibration are marked with the symbol‡.
Species (n)dispersal type Geographic range Collection sites Congeners identified
Data collected(Genbank accession)
Asterias rubens (48) Echino-dermata: Asteroideabroad planktonic dispersal
N. Europe, Iceland; N. Ameri-ca to Long Island Sound,submerged to mid-Atlantic
M, NS, W, Ic, No,Ir, Fr
‡A. amurensis (Pacific) A. for-besii (Atlantic, N. Americanendemic)
627 bpAF240022–240081
Idotea balthica (34) Arthropo-da: Isopoda
low dispersal, brooder
Mediterranean, W. Europe; N.America from Cape Hatter-as north
NC, IR, M, NS,W, Ic, No, Ir, Fr
I. metallica, I. emarginata, I.granulosa (Atlantic)
516 bpAF241889–241935
Mytilus edulis (91) Mollusca:Bivalviabroad planktonic dispersal
Mediterranean, W. Europe; N.America from Cap Hatterasnorth
NC, RI, M, NS, W,Ic, No, Ir, Fr
M. galloprovincialis (Atlantic,included) ‡M. trossulus (Pa-cific, Atlantic populations)
463 bpAF241936–142035
Littorina obtusata* (44) Mol-lusca: Gastropodalow dispersal, crawl-away
N. Europe, Iceland; N. Ameri-ca to Long Island Sound
RI, M, NS, W, Ic,No, Ir, Fr
L. fabalis (Atlantic) ‡L. saxa-tilis (Atlantic)
537 bpAF242067–242117
Semibalanus balanoides* (69)Arthropoda: Cirripediabroad planktonic dispersal
N. Europe, Iceland; N. Ameri-ca to Long Island Sound;Alaska
RI, M, NS, W, Ic,No, Ir, Fr
S. cariosus (Pacific) ‡S. balan-oides (Alaskan populations)
615 bpAF242660–242728
Nucella lapillus* (61) Mollus-ca: Gastropodalow dispersal, crawl-away
N. Europe, Iceland; N. Ameri-ca to Long Island Sound
RI, M, NS, W, Ic,No, Ir, Fr
‡N. freyceneti (Pacific) 589 bpAF242118–242178
(e.g., Slatkin and Hudson 1991; Rogers and Harpending1992), which do not make full use of the genealogical struc-ture of the data (Felsenstein 1992). Furthermore, because wewere able to estimate lineage-specific mutation rates for thespecies in this study, we use these coalescent methods tocompare the population sizes and ages of North Americanand European populations. Although there are uncertaintiesin using such estimates, they nevertheless allow us to estab-lish a quantitative, as well as qualitative, test of the hypoth-esis that New England rocky intertidal populations werefounded since the most recent glaciation.
Here we apply these methods to a series of empirical da-tasets that allow us to compare the idiosyncratic history ofeach species with expectations based on the coalescent mod-el. We have studied mitochondrial DNA (mtDNA) sequencesfrom amphi-Atlantic populations of three cold-temperate ob-ligate rocky intertidal species (a barnacle, Semibalanus bal-anoides, and two gastropods, Nucella lapillus and Littorinaobtusata) and three cold-temperate habitat generalist species(a seastar, Asterias rubens; an isopod, I. balthica; and theblue mussel, Mytilus edulis). These data indicate that someobligate rocky intertidal taxa have colonized New Englandfrom European populations; however, the patterns of persis-tence in North America indicate that other life-history traits,including mechanisms of dispersal, may be more importantfor surviving dramatic environmental and climatic change.
MATERIALS AND METHODS
Specimen Collection and Preservation
Specimens were collected from intertidal sites listed inTable 1, and tissues were then placed in 95% ethanol or aDMSO-based buffer (Seutin et al. 1991) immediately. Withtwo exceptions, species were identified based on morpho-
logical characters listed in Hayward and Ryland (1995) andGosner (1978).
For M. edulis, the phenomenon of doubly uniparental mi-tochondrial inheritance (reviewed in Quesada et al. 1996)required that female lineages be identified by comparison toidentified male and female lineages in Hoeh et al. (1996);only females were incorporated into our analyses. Mytilusedulis were distinguished from the European endemic speciesM. galloprovincialis using both the nuclear Glu-59 polymer-ase chain reaction (PCR) marker (Rawson et al. 1996) andcomparisons with sequence data from the mitochondrial cy-tochrome oxidase III locus (Quesada et al. 1995). Individualsidentified as M. galloprovincialis were not excluded if theirmitochondrial type was that of M. edulis.
Littorina obtusata is difficult to distinguish morphologi-cally from its congener L. fabalis. We identified a clade ofL. fabalis individuals with our cytochrome oxidase I (COI)data and confirmed their identity by comparing sequence datafrom the cytochrome oxidase b gene to published L. fabalissequences (Reid et al. 1996); these individuals were removedfrom further analysis.
DNA Extraction and Amplification
Tissues were phenol-extracted and amplified with the PCRprotocol listed in Wares (2001a) and the mitochondrial COIgene primers LCO1490/HCO2198 (Folmer et al. 1994). Forsome taxa, species-specific primer pairs were developed frominitial sequence data (available from authors). All individualswere sequenced from both directions using PCR primers.Sequences were obtained in both directions and edited usingSequencher 3.0 (Genecodes Corp., Ann Arbor, MI). No indelswere found, but missing or ambiguous end regions weretrimmed so that all individuals in a species had the samesequence length.
2457PHYLOGEOGRAPHY AND NORTH ATLANTIC GLACIATION
Phylogenetic Analysis
Parsimony networks were developed for each species usingthe methods of Templeton et al. (1992). The network for eachspecies was compared with the topology of the maximum-likelihood (ML) phylogeny to ensure concordance; the best-fit ML model (Goldman 1993; Cunningham et al. 1998) foreach dataset was determined using ModelTest (Posada andCrandall 1998). Searches were performed with stepwise ad-dition (simple addition sequence) and TBR branch swappingwith zero-length branches collapsed.
Isolation by Distance and Haplotype Diversity
Pairwise estimates of Nm (where N is the effective pop-ulation size and m is the rate of migration) between sampledlocations for each species were calculated based on an islandmodel using Slatkin’s linearized FST-values (Slatkin 1991,1995) in the program Arlequin 2.001 (Schneider et al. 1997),along with AMOVA tests (Excoffier et al. 1992) for eachspecies. Geographic distances (km) between locations werecalculated using the great circle distance between each site.A Mantel test (1000 permutations using Mantel 2.0; availablevia www.sci.qut.edu.au/NRS/mantel.htm) compared the cor-relation between log(Nm) and log(km) distance matrices tothe null hypothesis that they are not linearly related (Slatkin1993; Hellberg 1994). Additionally, haplotype diversity (H,Nei 1987, eq. 8.4) and its sampling variance were calculatedfor each species and/or continental population using Arlequinvers. 2.001.
Estimation of Ancestral Population Parameters
The full geographic range of each species was divided intoNorth American and European/Icelandic regions. Estimatesof Q (5 2Nm, where m is the mutation rate for mtDNA) weremade for each region as well as the North Atlantic as a whole.The ML estimate of the parameters Q and g (the exponentialgrowth parameter in units of m21) were made using Fluctuate(Kuhner et al. 1998). Seeds for all analyses were generatedrandomly. The appropriate transition:transversion ratio (es-timated by maximum likelihood in PAUP* 4.0; Swofford1998) was input for each dataset. Analyses were repeated fivetimes per species and/or population to ensure stability ofparameter estimates; the mean values are reported. Final anal-ysis of each dataset employed 10 short Monte Carlo chainsof 4000 steps each and five long chains of length 20,000,with a sampling increment of 20. Fluctuate generated a ran-dom topology for initial searching. These estimates of ex-ponential growth are used to generate the historical size ofeach population:
2(gm)tN 5 Qe ,t (1)
where Nt is the effective population size at any time t in thepast (Kuhner et al. 1998).
RESULTS
Phylogenetic Analysis
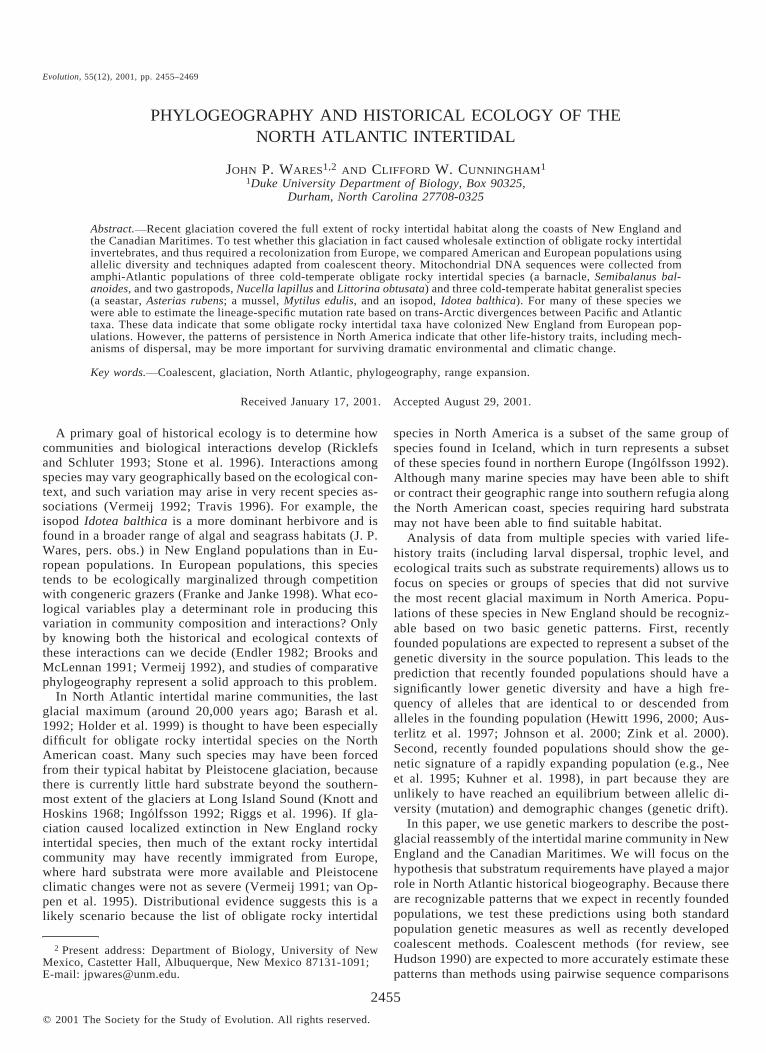
Haplotype networks representing the complete datasets forall six species are shown in Figure 1. Because outgroup root-
ing is not reliable for intraspecific genealogies (Castelloe andTempleton 1994), the most likely root haplotypes are indi-cated on each network. For datasets that are compatible withthe infinite-sites model (Watterson 1975), the likelihood ofthe genealogy given each possible root haplotype was cal-culated using Genetree (Griffiths and Tavare 1994). The datafor M. edulis violate this model, so the heuristic method ofCastelloe and Templeton (1994) was used. This method alsoobtained the same haplotype for each of the other species asthe ML methods described above.
Isolation by Distance and Haplotype Diversity
There were no patterns of isolation by distance in theseNorth Atlantic species that were more than marginally sig-nificant (J. P. Wares, unpubl. data). In each case, the signalof population structure could be traced to the European pop-ulations; trans-Atlantic isolation by distance does not seemto be an important mechanism. Haplotype diversities (H) ofAmerican and European populations are shown in Table 2.In all cases but M. edulis, North American populationsshowed significantly lower haplotype diversity than Europeanpopulations. Complete AMOVA results indicating how ge-netic variation is partitioned in each species are reported inAppendix 2. Only in two species (A. rubens and L. obtusata)was there any indication of subdivision between North Amer-ican and European populations. In Littorina there is a distinctclade in the European population (Fig. 1) that contributes tothis statistical partitioning, whereas in Asterias all Americanhaplotypes are shared with Europe, suggesting that the AMO-VA result is artifactual (see genealogical description below).This result is likely an artifact of pairwise FST analysis gen-erated by the significant difference in genetic diversity be-tween these two populations (see Whitlock and McCauley1999).
Lineage-Specific Estimates of Mutation Rate
Fossil evidence indicates that many of the lineages in thisstudy invaded the North Atlantic from the Pacific during thetrans-Arctic interchange 3.5 million years ago (Worley andFranz 1983; Vermeij 1991; Collins et al. 1996; Reid et al.1996). Although earlier estimates have been made for theopening of the Bering Strait (Marincovich and Gladenkov1999), the first fossil evidence of large-scale invasion fromthe Pacific was at 3.5 million years ago (Vermeij 1991). Be-cause this invasion took place just before the onset of North-ern Hemisphere cooling and glaciation (Berggren and Hol-lister 1974), the cold-temperate species in this study wereable to invade the North Atlantic, but have had little oppor-tunity for recent gene flow across the Arctic. For each species(except I. balthica), we identified the Pacific sister taxon, andused Atlantic/Pacific sequence divergence as the basis for ourlineage-specific mutation rates, with an estimated date of di-vergence of 3.5 million years ago.
To account for polymorphism in ancestral species lineages,the ML estimate of the internal branch length separating thesister taxa/populations from the Pacific and Atlantic was usedto estimate the appropriate amount of divergence per site (seeEdwards and Beerli 2000). This measure represents the netnucleotide divergence, d (Nei and Li 1979), and allows a
2458 J. P. WARES AND C. W. CUNNINGHAM
FIG. 1. Parsimony networks for each species in this study. Dark circles represent alleles found in Europe, and white circles representalleles found in North America. Each branch represents a single nucleotide substitution, with missing intermediates shown as smallempty circles. Bold lines indicate first/second position substitutions. Shared alleles are shown as half-shaded ovals. Sample locationsare designated as in Table 1. The maximum-likelihood root presented (arrows) is always at least an order of magnitude greater likelihoodthan other possible root alleles; in Mytilus the maximum-likelihood root could not be calculated using an infinite-sites model. The Castelloeand Templeton (1994) method indicates that the root probability of the shared allele combined with the alleles marked ‘‘9Fr,’’ ‘‘Eur,’’and ‘‘N.Am.’’ is 0.662. Additional information on allele sampling and composition of shared alleles for each species is available inAppendix 1.
2459PHYLOGEOGRAPHY AND NORTH ATLANTIC GLACIATION
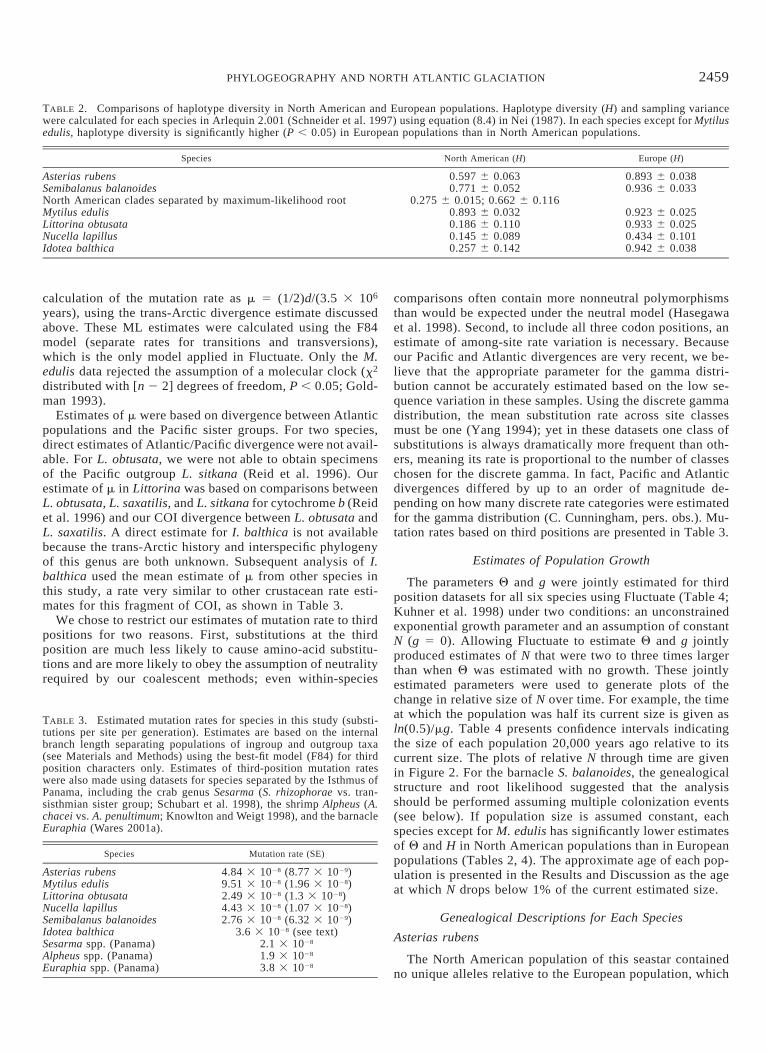
TABLE 2. Comparisons of haplotype diversity in North American and European populations. Haplotype diversity (H) and sampling variancewere calculated for each species in Arlequin 2.001 (Schneider et al. 1997) using equation (8.4) in Nei (1987). In each species except for Mytilusedulis, haplotype diversity is significantly higher (P , 0.05) in European populations than in North American populations.
Species North American (H) Europe (H)
Asterias rubensSemibalanus balanoidesNorth American clades separated by maximum-likelihood rootMytilus edulisLittorina obtusataNucella lapillusIdotea balthica
0.597 6 0.0630.771 6 0.052
0.275 6 0.015; 0.662 6 0.1160.893 6 0.0320.186 6 0.1100.145 6 0.0890.257 6 0.142
0.893 6 0.0380.936 6 0.033
0.923 6 0.0250.933 6 0.0250.434 6 0.1010.942 6 0.038
TABLE 3. Estimated mutation rates for species in this study (substi-tutions per site per generation). Estimates are based on the internalbranch length separating populations of ingroup and outgroup taxa(see Materials and Methods) using the best-fit model (F84) for thirdposition characters only. Estimates of third-position mutation rateswere also made using datasets for species separated by the Isthmus ofPanama, including the crab genus Sesarma (S. rhizophorae vs. tran-sisthmian sister group; Schubart et al. 1998), the shrimp Alpheus (A.chacei vs. A. penultimum; Knowlton and Weigt 1998), and the barnacleEuraphia (Wares 2001a).
Species Mutation rate (SE)
Asterias rubensMytilus edulisLittorina obtusataNucella lapillusSemibalanus balanoides
4.84 3 1028 (8.77 3 1029)9.51 3 1028 (1.96 3 1028)2.49 3 1028 (1.3 3 1028)4.43 3 1028 (1.07 3 1028)2.76 3 1028 (6.32 3 1029)
Idotea balthicaSesarma spp. (Panama)Alpheus spp. (Panama)Euraphia spp. (Panama)
3.6 3 1028 (see text)2.1 3 1028
1.9 3 1028
3.8 3 1028
calculation of the mutation rate as m 5 (1/2)d/(3.5 3 106
years), using the trans-Arctic divergence estimate discussedabove. These ML estimates were calculated using the F84model (separate rates for transitions and transversions),which is the only model applied in Fluctuate. Only the M.edulis data rejected the assumption of a molecular clock (x2
distributed with [n 2 2] degrees of freedom, P , 0.05; Gold-man 1993).
Estimates of m were based on divergence between Atlanticpopulations and the Pacific sister groups. For two species,direct estimates of Atlantic/Pacific divergence were not avail-able. For L. obtusata, we were not able to obtain specimensof the Pacific outgroup L. sitkana (Reid et al. 1996). Ourestimate of m in Littorina was based on comparisons betweenL. obtusata, L. saxatilis, and L. sitkana for cytochrome b (Reidet al. 1996) and our COI divergence between L. obtusata andL. saxatilis. A direct estimate for I. balthica is not availablebecause the trans-Arctic history and interspecific phylogenyof this genus are both unknown. Subsequent analysis of I.balthica used the mean estimate of m from other species inthis study, a rate very similar to other crustacean rate esti-mates for this fragment of COI, as shown in Table 3.
We chose to restrict our estimates of mutation rate to thirdpositions for two reasons. First, substitutions at the thirdposition are much less likely to cause amino-acid substitu-tions and are more likely to obey the assumption of neutralityrequired by our coalescent methods; even within-species
comparisons often contain more nonneutral polymorphismsthan would be expected under the neutral model (Hasegawaet al. 1998). Second, to include all three codon positions, anestimate of among-site rate variation is necessary. Becauseour Pacific and Atlantic divergences are very recent, we be-lieve that the appropriate parameter for the gamma distri-bution cannot be accurately estimated based on the low se-quence variation in these samples. Using the discrete gammadistribution, the mean substitution rate across site classesmust be one (Yang 1994); yet in these datasets one class ofsubstitutions is always dramatically more frequent than oth-ers, meaning its rate is proportional to the number of classeschosen for the discrete gamma. In fact, Pacific and Atlanticdivergences differed by up to an order of magnitude de-pending on how many discrete rate categories were estimatedfor the gamma distribution (C. Cunningham, pers. obs.). Mu-tation rates based on third positions are presented in Table 3.
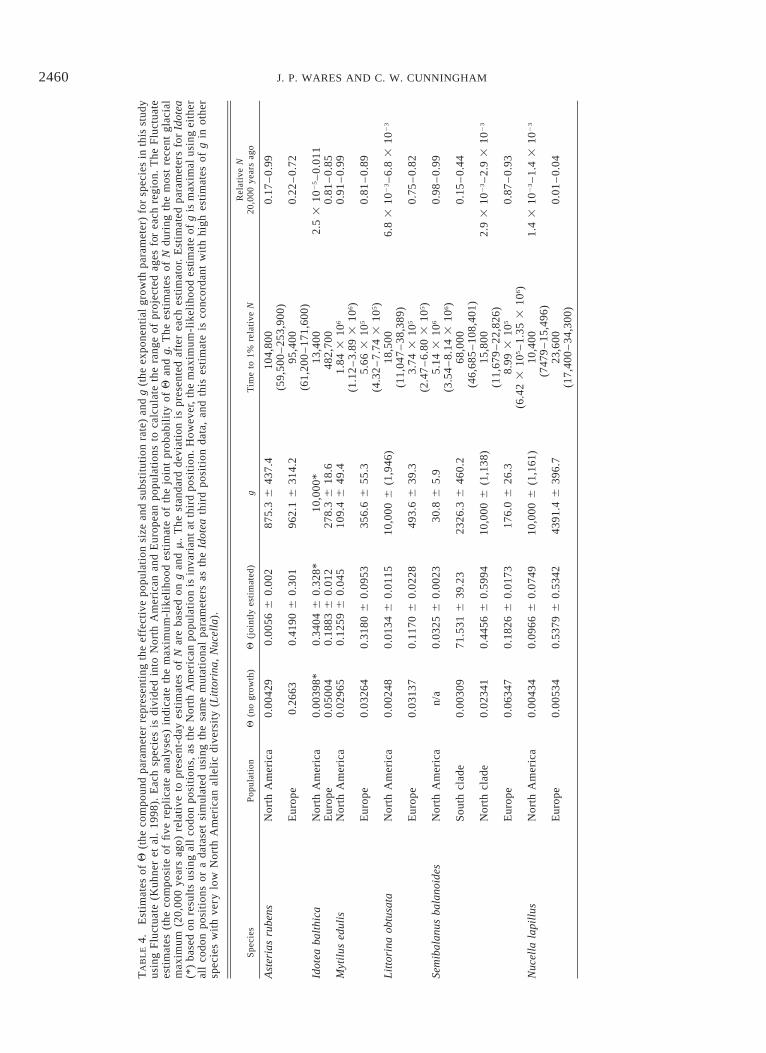
Estimates of Population Growth
The parameters Q and g were jointly estimated for thirdposition datasets for all six species using Fluctuate (Table 4;Kuhner et al. 1998) under two conditions: an unconstrainedexponential growth parameter and an assumption of constantN (g 5 0). Allowing Fluctuate to estimate Q and g jointlyproduced estimates of N that were two to three times largerthan when Q was estimated with no growth. These jointlyestimated parameters were used to generate plots of thechange in relative size of N over time. For example, the timeat which the population was half its current size is given asln(0.5)/mg. Table 4 presents confidence intervals indicatingthe size of each population 20,000 years ago relative to itscurrent size. The plots of relative N through time are givenin Figure 2. For the barnacle S. balanoides, the genealogicalstructure and root likelihood suggested that the analysisshould be performed assuming multiple colonization events(see below). If population size is assumed constant, eachspecies except for M. edulis has significantly lower estimatesof Q and H in North American populations than in Europeanpopulations (Tables 2, 4). The approximate age of each pop-ulation is presented in the Results and Discussion as the ageat which N drops below 1% of the current estimated size.
Genealogical Descriptions for Each Species
Asterias rubens
The North American population of this seastar containedno unique alleles relative to the European population, which
2460 J. P. WARES AND C. W. CUNNINGHAM
TA
BL
E4.
Est
imat
esof
Q(t
heco
mpo
und
para
met
erre
pres
enti
ngth
eef
fect
ive
popu
lati
onsi
zean
dsu
bsti
tuti
onra
te)
and
g(t
heex
pone
ntia
lgr
owth
para
met
er)
for
spec
ies
inth
isst
udy
usin
gF
luct
uate
(Kuh
ner
etal
.19
98).
Eac
hsp
ecie
sis
divi
ded
into
Nor
thA
mer
ican
and
Eur
opea
npo
pula
tion
sto
calc
ulat
eth
era
nge
ofpr
ojec
ted
ages
for
each
regi
on.
The
Flu
ctua
tees
tim
ates
(the
com
posi
teof
five
repl
icat
ean
alys
es)
indi
cate
the
max
imum
-lik
elih
ood
esti
mat
eof
the
join
tpr
obab
ilit
yof
Qan
dg.
The
esti
mat
esof
Ndu
ring
the
mos
tre
cent
glac
ial
max
imum
(20,
000
year
sag
o)re
lati
veto
pres
ent-
day
esti
mat
esof
Nar
eba
sed
ong
and
m.
The
stan
dard
devi
atio
nis
pres
ente
daf
ter
each
esti
mat
or.
Est
imat
edpa
ram
eter
sfo
rId
otea
(*)
base
don
resu
lts
usin
gal
lco
don
posi
tion
s,as
the
Nor
thA
mer
ican
popu
lati
onis
inva
rian
tat
thir
dpo
siti
on.H
owev
er,
the
max
imum
-lik
elih
ood
estim
ate
ofg
ism
axim
alus
ing
eith
eral
lco
don
posi
tion
sor
ada
tase
tsi
mul
ated
usin
gth
esa
me
mut
atio
nal
para
met
ers
asth
eId
otea
thir
dpo
siti
onda
ta,
and
this
esti
mat
eis
conc
orda
ntw
ith
high
esti
mat
esof
gin
othe
rsp
ecie
sw
ith
very
low
Nor
thA
mer
ican
alle
lic
dive
rsit
y(L
itto
rina
,N
ucel
la).
Spe
cies
Pop
ulat
ion
Q(n
ogr
owth
)Q
(joi
ntly
esti
mat
ed)
gT
ime
to1%
rela
tive
NR
elat
ive
N20
,000
year
sag
o
Ast
eria
sru
bens
Idot
eaba
lthi
ca
Nor
thA
mer
ica
Eur
ope
Nor
thA
mer
ica
Eur
ope
0.00
429
0.26
63
0.00
398*
0.05
004
0.00
566
0.00
2
0.41
906
0.30
1
0.34
046
0.32
8*0.
1883
60.
012
875.
36
437.
4
962.
16
314.
2
10,0
00*
278.
36
18.6
104,
800
(59,
500
–25
3,90
0)95
,400
(61,
200
–17
1,60
0)13
,400
482,
700
0.17
–0.
99
0.22
–0.
72
2.5
310
25–
0.01
10.
81–
0.85
Myt
ilus
edul
is
Lit
tori
naob
tusa
ta
Nor
thA
mer
ica
Eur
ope
Nor
thA
mer
ica
Eur
ope
0.02
965
0.03
264
0.00
248
0.03
137
0.12
596
0.04
5
0.31
806
0.09
53
0.01
346
0.01
15
0.11
706
0.02
28
109.
46
49.4
356.
66
55.3
10,0
006
(1,9
46)
493.
66
39.3
1.84
310
6
(1.1
2–
3.89
310
6 )5.
663
105
(4.3
2–
7.74
310
5 )18
,500
(11,
047
–38
,389
)3.
743
105
(2.4
7–
6.80
310
5 )
0.91
–0.
99
0.81
–0.
89
6.8
310
23–
6.8
310
23
0.75
–0.
82
Sem
ibal
anus
bala
noid
esN
orth
Am
eric
a
Sou
thcl
ade
Nor
thcl
ade
n/a
0.00
309
0.02
341
0.03
256
0.00
23
71.5
316
39.2
3
0.44
566
0.59
94
30.8
65.
9
2326
.36
460.
2
10,0
006
(1,1
38)
5.14
310
6
(3.5
4–
8.14
310
6 )68
,000
(46,
685
–10
8,40
1)15
,800
(11,
679
–22
,826
)
0.98
–0.
99
0.15
–0.
44
2.9
310
23–
2.9
310
23
Nuc
ella
lapi
llus
Eur
ope
Nor
thA
mer
ica
Eur
ope
0.06
347
0.00
434
0.00
534
0.18
266
0.01
73
0.09
666
0.07
49
0.53
796
0.53
42
176.
06
26.3
10,0
006
(1,1
61)
4391
.46
396.
7
8.99
310
5
(6.4
23
105–
1.35
310
6 )10
,400
(747
9–
15,4
96)
23,6
00(1
7,40
0–
34,3
00)
0.87
–0.
93
1.4
310
23–
1.4
310
23
0.01
–0.
04
2461PHYLOGEOGRAPHY AND NORTH ATLANTIC GLACIATION
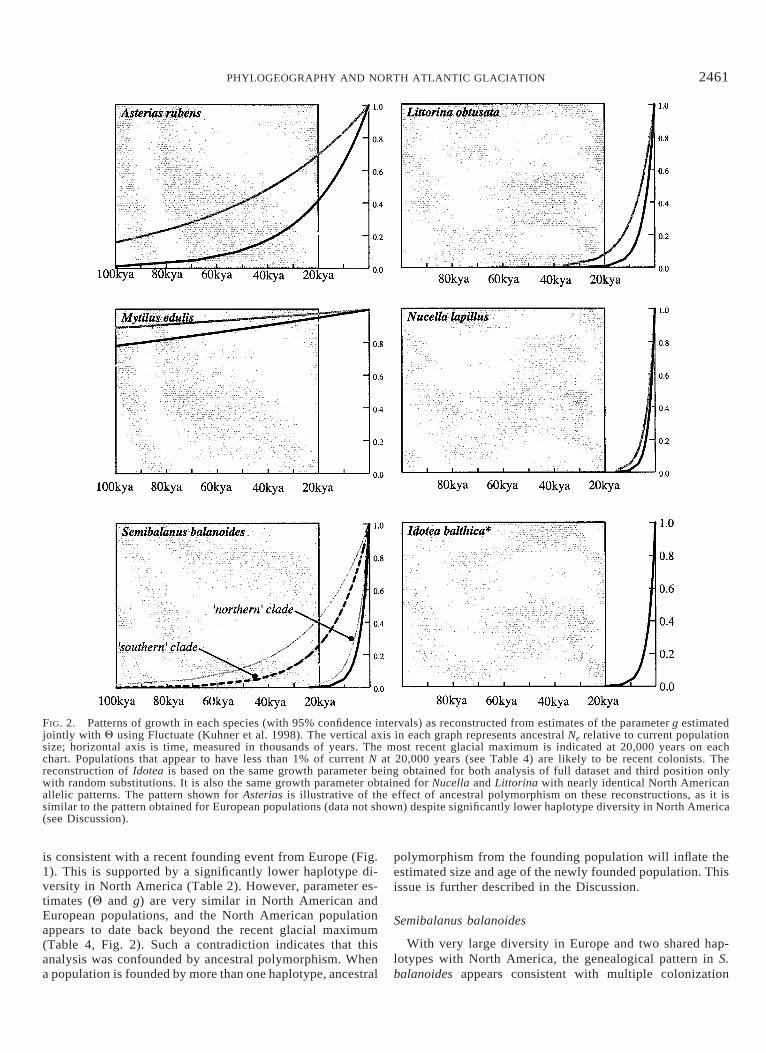
FIG. 2. Patterns of growth in each species (with 95% confidence intervals) as reconstructed from estimates of the parameter g estimatedjointly with Q using Fluctuate (Kuhner et al. 1998). The vertical axis in each graph represents ancestral Ne relative to current populationsize; horizontal axis is time, measured in thousands of years. The most recent glacial maximum is indicated at 20,000 years on eachchart. Populations that appear to have less than 1% of current N at 20,000 years (see Table 4) are likely to be recent colonists. Thereconstruction of Idotea is based on the same growth parameter being obtained for both analysis of full dataset and third position onlywith random substitutions. It is also the same growth parameter obtained for Nucella and Littorina with nearly identical North Americanallelic patterns. The pattern shown for Asterias is illustrative of the effect of ancestral polymorphism on these reconstructions, as it issimilar to the pattern obtained for European populations (data not shown) despite significantly lower haplotype diversity in North America(see Discussion).
is consistent with a recent founding event from Europe (Fig.1). This is supported by a significantly lower haplotype di-versity in North America (Table 2). However, parameter es-timates (Q and g) are very similar in North American andEuropean populations, and the North American populationappears to date back beyond the recent glacial maximum(Table 4, Fig. 2). Such a contradiction indicates that thisanalysis was confounded by ancestral polymorphism. Whena population is founded by more than one haplotype, ancestral
polymorphism from the founding population will inflate theestimated size and age of the newly founded population. Thisissue is further described in the Discussion.
Semibalanus balanoides
With very large diversity in Europe and two shared hap-lotypes with North America, the genealogical pattern in S.balanoides appears consistent with multiple colonization
2462 J. P. WARES AND C. W. CUNNINGHAM
events from Europe to North America (Fig. 1). When allNorth American individuals are included, our Fluctuate anal-ysis suggests an unrealistic time of origin for North Americanpopulations, an age that actually predates the trans-Arcticinterchange (Table 4). As with A. rubens, this result can beeasily explained by ancestral polymorphism, because the twomajor clades in North America (Fig. 1) are distantly relatedto one another. Each clade shares a common haplotype withEuropean populations and taken individually, each clade issignificantly less diverse than the European population (Table2). This hypothesis of multiple colonization events is sup-ported by the separation of the two North American cladesby the ML root in Europe (Fig. 1). Separate analysis of eachNorth American clade indicates that, whereas one of theseevents may be quite recent (time to most recent commonancestor [TMRCA] 5 3.3 3 104 years, population less than1% current size less than 20,000 years ago), the other cladeappears to predate the last glacial maximum (Table 4), ahypothesis also suggested by Brown et al. (2001).
Mytilus edulis
The mussel M. edulis appears to have long histories onboth coasts (Table 4), with a tremendous amount of endemicdiversity present in each region. The only shared allele be-tween North America and Europe was also identified as theroot haplotype; note that the presence of high allelic diversityin North America cannot be easily explained by a very large,recent founding population because there is only a singleshared haplotype. Inspection of the network in Figure 1 showsseveral unique clades to each continent, including two NorthAmerican lineages that are distantly related to an isolatedEuropean clade and the shared North American–Europeanhaplotype. This pattern of missing intermediate haplotypesmay indicate incomplete lineage sorting or gene flow fromNorth America to Europe. When these genetically isolatedlineages are removed, our conclusion of a long history forM. edulis in North America is not affected; similarly, exclu-sion of the haplotypes collected from M. galloprovincialisindividuals (see Materials and Methods) did not affect ourconclusion of a long history in Europe.
Littorina obtusata and Nucella lapillus
Littorina obtusata and N. lapillus share remarkably similarpatterns in the North Atlantic (Fig. 1). Both have a high-frequency haplotype in North America that is shared withEurope, and each species has two unique North Americanhaplotypes. Both have significantly lower haplotype diversityin North America than in Europe and both have populationages that are almost identical; these results are consistentwith postglacial colonization from Europe. For both species,translation of the ML estimates of g indicate that the NorthAmerican populations of these species were less than 1% ofthe current size during the most recent glacial maximum (Ta-ble 4, Fig. 2). The apparent migration event from NorthAmerica to Europe by L. obtusata (Fig. 1) seems to be theresult of a homoplastic amino-acid substitution that unites aNorth American and European haplotype.
Idotea balthica
The isopod I. balthica has significantly lower diversity inNorth America than in Europe (Tables 2, 4). Unlike all otherspecies in this study, there are no shared haplotypes betweenNorth America and Europe. Moreover, Genetree identifiesthe common North American haplotype as the root of thenetwork and, therefore, the oldest allele in the North Atlantic.Because all seven European lineages are descended from theroot haplotype, it is parsimonious to conclude that this hap-lotype was once present in the European population. Ourfailure to find it in our European sample can be explainedby its loss due to lineage sorting or simply by our limitedsampling effort. The very large diversity of the Europeanpopulation confirms a long history in Europe. We concludethat this pattern is consistent with a recent colonization ofNorth America from Europe. The alternative hypothesis—that the root allele originated in North America—would re-quire either seven independent invasions of Europe or sevenunique mutation events following a single invasion, followedby extinction of the invading haplotype(s). These hypotheseshave been statistically rejected (J. P. Wares, unpubl. data).
Although I. balthica has three haplotypes in North Amer-ica, the two singleton haplotypes are characterized by first/second-position substitutions and are therefore not present inour third position datasets. This means that at third positions,the North American population is monotypic, making an es-timate of age from third positions by Fluctuate impossible.Dating the age of the North American population of I. bal-thica is also complicated because it is the only species forwhich we lack lineage-specific estimates of mutation rate.That being said, the allelic diversity of the North Americanpopulation is comparable to other species whose ages appearto date since the last glacial maximum (L. obtusata and N.lapillus; Table 4, Fig. 2), and analysis of either the full datasetor a third position dataset with two randomly introducedsubstitutions generates a maximal estimate of populationgrowth and is reflected in the curve drawn in Figure 2.
DISCUSSION
Glaciation and North Atlantic Populations
Our central focus has been to test the hypothesis that glacialevents had a greater impact on the rocky intertidal of NorthAmerica than in Europe, and species requiring rocky substratawould be more likely to go extinct in North American pop-ulations. This hypothesis makes two specific predictions.First, all species that currently have an amphi-Atlantic dis-tribution will show a genetic signature of a long populationhistory in Europe. Second, some or all amphi-Atlantic specieswill show a genetic signature of postglacial range expansionfrom Europe to North America. By distinguishing betweenspecies with North American populations that did or did notsurvive the last glacial maximum, we can begin to understandthe organismal characteristics necessary to survive this ex-treme climatic event.
Of these two predictions, it is easiest to show that all Eu-ropean populations of amphi-Atlantic species survived thelast glacial maximum. An older population is more likely tobe at an equilibrium level of genetic diversity and is char-

2463PHYLOGEOGRAPHY AND NORTH ATLANTIC GLACIATION
acterized by high allelic diversity with many unique haplo-types. All of our European populations fit this prediction, andin each case except for N. lapillus, the estimated age of theEuropean population appears to be much older than the lastglacial maximum (Table 4). In the case of Nucella, high hap-lotype diversity (Table 2) and the fact that French populationsare distinguished from other European populations by a fixedsubstitution (Fig. 1) substantiate the claim for the old age ofEuropean populations. Additionally, there are high levels ofboth allozyme and karyotypic polymorphism in Europe (Dayet al. 1993; Collins et al. 1996). This evidence of geographicsubdivision in European N. lapillus populations is evidenceof an older population than is estimated using coalescentmethods.
The prediction that some or all amphi-Atlantic species willhave recently colonized North America from Europe is moredifficult to test definitively, but makes the following threepredictions: (1) haplotype diversity will be significantly low-er in North American populations; (2) the estimated age(based on the time to the most recent common ancestor) ofNorth American populations will postdate the last glacialmaximum; and (3) all North American haplotypes will eitherbe shared with Europe or be descended from European hap-lotypes that have participated in range expansion.
Of our six species, five show evidence of colonization fromEurope, including the barnacle S. balanoides, the gastropodsN. lapillus and L. obtusata, the seastar A. rubens, and theisopod I. balthica (see Results). Of these, all but S. balanoidesshow patterns consistent with postglacial colonization fromEurope (Fig. 2, Table 4). One of two American clades of S.balanoides appears to have survived the last glacial maxi-mum, a result supported by an independent study of thisspecies (Brown et al. 2001). Although the actual times sincecolonization of some of these species, such as Asterias, areconfounded by ancestral polymorphism or cannot be explic-itly determined using the coalescent methods we employed(i.e., Idotea), each dataset is consistent with postglacial rangeexpansion from Europe. This conclusion follows the datashowing consistently lower allelic diversity in North Americaand the signal of population growth obtained from coalescentanalysis of each species’ gene tree.
Several methods of inference were used in this study be-cause it is difficult to accurately test hypotheses about theage of recently founded populations due to ancestral poly-morphism. Ancestral polymorphism is known to confoundestimates of population divergence time in many typical phy-logeographic studies (Nielsen et al. 1998; Edwards and Beerli2000; Hewitt 2000). Estimating the time to the most recentcommon ancestor in a population will be biased when thefounding population itself was genetically diverse, as in stud-ies such as this one where populations from North Americaand Europe are not divergent but are largely composed ofthe same common alleles. We have taken ancestral poly-morphism into account by considering how alternative col-onization histories could affect our estimates. In S. balano-ides, it seems apparent that there are two independent col-onization events to be analyzed separately. However, datingthe invasion of species such as A. rubens is still complicatedbecause it is unclear how much diversity in North Americais due to multiple events or to founding population diversity.
We realize that an alternative hypothesis exists that is con-sistent with some, but not all, of our observations. If NorthAmerican populations did not go extinct, but existed in aglacial refugium of restricted size, we could expect signifi-cantly lower North American haplotype diversity. Our esti-mates of recent population age from our Fluctuate analysesdo not rule out this hypothesis, because Fluctuate was onlyused to generate a growth curve that suggests the time to themost recent common ancestor of the alleles in a population(the minimum population age, assuming no effects due toancestral polymorphism).
Our best chance of distinguishing the refugium bottleneckand colonization hypothesis comes from our repeated obser-vation that North American haplotypes are either shared withor descend from European haplotypes (Fig. 1). The repeatedobservation of descent from European haplotypes is unlikelyunder the refugium bottleneck hypothesis, and is specificallypredicted by the colonization hypothesis. Given the lengthof time that hypothetical North American refugia and Eu-ropean refugia would have been separated due to unfavorableclimatic conditions during glacial maxima, simulations in-dicate that the likelihood of observing shared alleles betweenthese populations today is vanishingly small if gene flow wasnot maintained (Johnson et al. 2000; J. P. Wares, unpubl.ms.). Simply put, separate refugia in North America and Eu-rope would tend to generate greater divergence among allelesfrom each population.
Even within our data, there is a good example of the dif-ference expected between the North American refugium andrecolonization hypotheses. All I. balthica individuals col-lected from Iceland form a clade with low haplotype diver-sity, and this population shares no alleles with other Atlanticpopulations. The Icelandic clade has three fixed substitutionsrelative to all other North Atlantic haplotypes. Applying aNei and Li (1979) correction for the polymorphism extant inthe ancestral population, the divergence between Iceland andthe rest of Europe is greater than 200,000 years ago (con-servatively based on the most rapid estimate of m, Table 3).This is consistent with the hypothesis that southwestern Ice-land was unglaciated during the last glacial maximum (seeHolder et al. 1999) and that I. balthica survived in this re-fugium. Other species, including the ocean quahog Arcticaislandica, also show evidence of high endemic diversity inIceland (Dahlgren et al. 2000), supporting a refugium hy-pothesis over predictions of recent gene flow.
Of the species that do not appear to have survived the lastglacial maximum, both N. lapillus and L. obtusata have beenfound as fossil remains on the North American coast priorto Pleistocene glaciation (Vermeij 1991), and archaeologicalevidence places these species again in New England prior tohuman colonization from Europe (Jenkins et al. 1997). Aliteral reading of the fossil record in these cases could bemisleading, because our data strongly suggest that they havenot been continually present in North America and yet theyhave not been introduced by humans either. Although thepossibility of historical introduction by humans should al-ways be considered (Carlton and Geller 1993), the amountof unique genetic diversity in North American populationsof each of these species (see Hewitt 2000; Johnson et al.2000; J. P. Wares, D. Goldwater, and C. W. Cunningham,
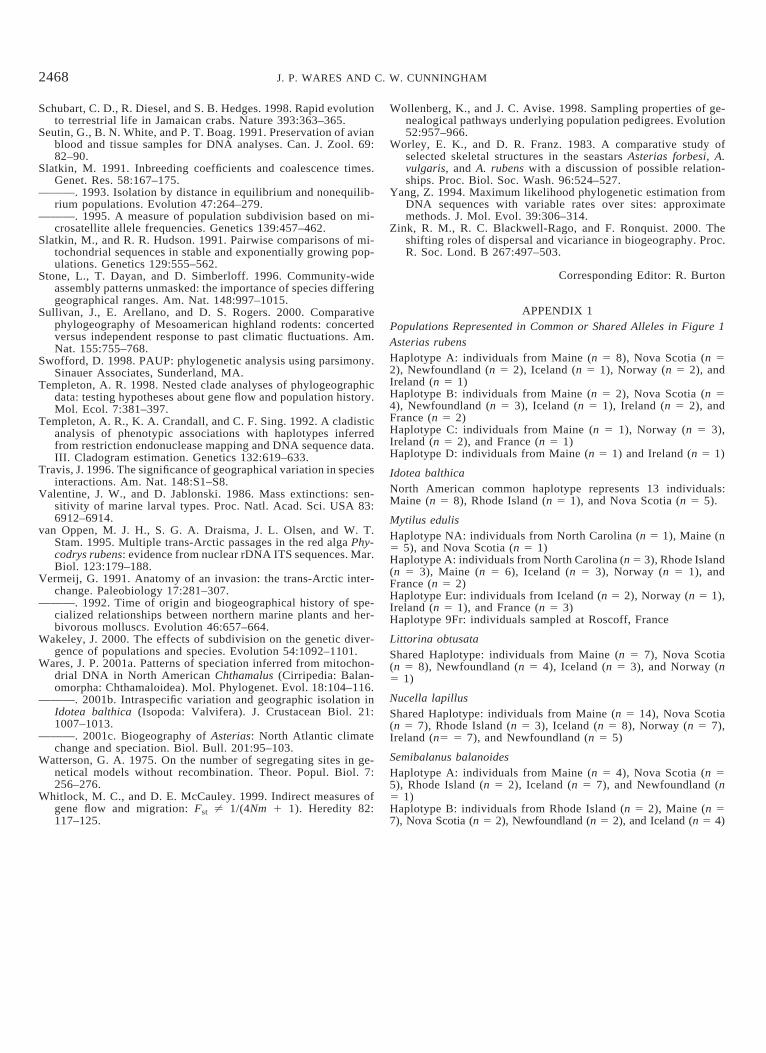
2464 J. P. WARES AND C. W. CUNNINGHAM
unpubl. ms.) and the fact that they are easily recognizedmacroinvertebrates suggests human-mediated introduction isunlikely.
Persistence and Range Expansion: Associations withLife-History Characteristics
What characteristics allowed species to survive the lastglacial maximum in North America? We have presentedstrong evidence that a population of the obligate rocky in-tertidal barnacle S. balanoides survived the most recent gla-cial maximum (see also Brown et al. 2001), and other obligaterocky intertidal species in this study were apparently dis-tributed through New England long before those rocky shoreswere defined by glacial scouring (Pratt and Schlee 1969;Vermeij 1991). It may be more appropriate to assume thatthere has long been suitable substrata for a variety of speciesin this region, and glacial maxima simply increased theamount of rocky shore available north of Cape Cod. Someobligate rocky intertidal species were able to find suitablehabitat during glacial maxima, whereas others were not.Therefore, substrate requirements do not adequately explainthe patterns of persistence and range expansion seen in thesespecies.
Persistence and colonization may require a mechanism ofdispersal that allows species to find suitable habitat quicklyduring environmental change. Modes of dispersal are prob-ably not indicative of colonization ability (Johannesson1988); L. obtusata and N. lapillus, two species that appearto have recently colonized North America, have crawl-awaylarvae or very short planktonic dispersal (Crothers 1985; Reidet al. 1996), suggesting that lack of a pelagic phase does notprevent trans-Atlantic colonization. However, dispersalmodes may explain the persistence of taxa in North Americathrough glacial maxima. The two species with the strongestsignatures of preglacial persistence in North America, M.edulis and S. balanoides, each have long-dispersing plank-totrophic larvae (Gosling 1992; Holm and Bourget 1994).
To the list of glacial survivors in North America we canadd several other temperate species. Although A. rubens hasrecently colonized North America from Europe, its sister spe-cies A. forbesi is endemic to North America, has plankto-trophic larvae (Clark and Downey 1992), and clearly survivedglacial maxima (Worley and Franz 1983; Wares 2001c). Ourdata show that whereas most haplotypes of I. balthica sharea recent ancestor with European colonists, two endemic NorthAmerican cryptic species have also been identified (Wares2001b). Idotea broods its offspring but is frequently foundon algal rafts that play a large role in its dispersal (Lockeand Corey 1989; Ingolfsson 1995), suggesting again that dis-persal may allow persistence through climatic changes. Sev-eral other North American endemic species with broadly dis-persing larvae are reciprocally monophyletic with respect tosister species in Europe (e.g., the hermit crab, Pagurus aca-dianus, Cunningham et al. 1992; C. W. Cunningham, unpubl.data; and the lobster, Homarus americanus, Kit and Kornfield1998), suggesting long-term persistence in North America.
These results suggest that persistence through glacial max-ima in North America may be facilitated by a capability forincreased dispersal, whether by pelagic larvae or by other
mechanisms (i.e., algal rafting in isopods). This might beexplained by opportunistic colonization of ephemeral habitatsduring glaciation. The hypothesis that high dispersal abilitymay help species resist extinction was proposed by Jablonskiand Lutz (1983) and Valentine and Jablonski (1986) basedon paleontological findings. These fossil data illustrate thatplanktonic species tend to survive longer in the fossil recordand survive major extinction events with a higher frequencythan expected. This life-history character may be crucial tounderstanding the patterns of diversity found in regions thatwere previously altered by glaciation or other climatic andenvironmental changes. However, it is also of great interestto community ecologists to recognize the differences amongspecies in terms of community assembly and colonizationdynamics. Although planktonic larval dispersal may play arole in the long-term survival of species populations, it isalso clear that other ecological and physiological dynamicsplay a role in this system.
Methodological Considerations
Inference of population histories has become a popular andcontroversial enterprise. In this paper, we focus on estimatingrates of population growth using coalescent methods (Fluc-tuate, Kuhner et al. 1998). Here we focus on three aspectsof our approach that deserve attention: our reliance onmtDNA, our estimation of taxon-specific substitution rates,and the idiosyncrasies of coalescent methods for estimatingancestral population parameters.
Corroboration from additional loci
It is well known that estimates of population historiesbased on a single locus will have high variances (Kuhner etal. 1998; Wollenberg and Avise 1998; Fu and Li 1999). Al-though mtDNA is especially useful for inferring populationhistory, with its advantages of a high mutation rate, lack ofrecombination, and small effective population size (Avise etal. 1987), we must take care to recognize its shortcomings.In this study, we are mainly concerned with identifying spe-cies that survived the last glacial maximum in North America.How might our mtDNA data be misleading in this regard?If mtDNA shows a signature of long population history onboth coasts, this is unlikely to be contradicted by the additionof more loci. This is confirmed for M. edulis, which has asecond locus available in its paternally inherited mtDNA. Infact, the male mtDNA shows even stronger evidence than thefemale mtDNA for long histories on both coasts. Based onlimited sampling, Quesada et al. (1998) found reciprocalmonophyly between Europe and North America in the malemtDNA, a result that is confirmed by additional sampling inour laboratory (C. Riginos, pers. comm.).
However, our inference of recent immigration from Europefor several species can only be regarded as tentative withoutadditional loci. What we interpret as a recent colonizationfrom Europe might simply reflect a recent introgression ofEuropean haplotypes into a long-standing North Americanpopulation. If this were the case, nuclear loci should showevidence of long divergence between Europe and NorthAmerica. We tested this hypothesis with preliminary studiesusing sequence data from the ribosomal internal transcribed

2465PHYLOGEOGRAPHY AND NORTH ATLANTIC GLACIATION
spacer (ITS) region for the seastar A. rubens (Wares 2001c),the barnacle S. balanoides and the gastropod N. lapillus (J.P. Wares, unpubl. data). For Asterias we sampled the Pacificoutgroup and both Atlantic species (A. amurensis, A. forbesi,and A. rubens). Based on the Pacific and Atlantic divergences,the ITS showed a mutation rate that was comparable to theCOI third position rate (m 5 3.6 3 1028), but found nosubstitutions at all between five North American and fiveEuropean A. rubens individuals. This is entirely consistentwith the recent colonization event from Europe inferred fromthe mtDNA data and inconsistent with a hypothesis of long-term residence on both coasts. Very limited ITS analyses inthe other two species also indicated no divergence betweenEuropean and North American populations.
Estimating mutation rates
As with any estimation of mutation rate, our estimates mustbe considered provisional. A potential source of error is ouruse of a date of 3.5 million years ago for the divergencebetween North Pacific and North Atlantic cold-temperatepopulations (see Materials and Methods). There have beenreports of the Bering Strait opening as early as 5 millionyears ago (Collins et al. 1996; Marincovich and Gladenkov1999), although the major fossil evidence of invasion did notappear until 3.5 million years ago (Vermeij 1991). Using theolder date would increase our population age estimates byabout 40%, which does not dramatically change our inter-pretations of postglacial histories.
It is encouraging that our estimates of mtDNA mutationrate are similar to those in other taxa. Our estimates for COIthird positions range from m 5 2.5–4.8 3 1028 (Table 2),excluding Mytilus, which is known to have an elevated mu-tation rate (Hoeh et al. 1996). These are within the rangenoted for COI third position data in other taxa estimated fromeither side of the Isthmus of Panama using our methodology(Table 3). Finally, our estimate of mutation rate in Littorinausing the date of the Bering Strait opening (3.5 million yearsago; m 5 2.5 3 1028) is close to the estimate obtained if weuse a fossil date (m 5 1.9 3 1028), based on fossil-dataestimates of divergence between L. obtusata and L. saxatilis(2.0 million years ago, Reid et al. 1996).
Coalescent methods and coalescent problems
Our inferences are also clearly affected by methods ofestimating Q and the exponential growth parameter g. Whenan estimate of the growth parameter g is incorporated, esti-mates of Q are much higher than under a model of constantpopulation size. Thus, although the use of an exponentialgrowth model may or may not be biologically accurate (seeKuhner et al. 1998), it is again conservative in that our es-timates of historical population size assuming growth arelarger than when we do not.
However, this highlights potentially serious biases thatarise during joint estimation of parameters from genealogicaldata (Wakeley 2000). There appears to be a strong bias inthe estimation of growth parameters that may cause over-estimation of population size and age; this bias may be aninherent property of estimating growth from genealogicaldata (Kuhner et al. 1998). Thus, strong covariation among
parameters estimated from genealogical data makes definitiveestimates of historical demographics elusive (Markovtsovaet al. 2000).
The strongest confirmation of the methods we advocate istheir success when applied to other empirical systems. Hell-berg et al. (2001) propose that the gastropod Acanthinucellaspirata expanded its range north of Point Conception in Cal-ifornia since the last glacial maximum. As with our two gas-tropods with crawling larvae (N. lapillus and L. obtusata),newly colonized northern populations are predominantlycomposed of a common haplotype shared with the south, withseveral unique haplotypes descended from the putativefounding haplotype. When we applied our approach usingFluctuate to A. spirata third positions using our mutation ratecalculated for N. lapillus, the population growth curve strong-ly suggested that northern populations were founded in thelast 20,000 years (C.W. Cunningham, unpubl. data). In gen-eral, it appears that estimates of population age are affectedmore by the problem of ancestral polymorphism (i.e., ourAsterias data) than the problem of coestimation of parameterssuch as Q and g.
Finally, it should be noted that although nested clade anal-ysis (reviewed in Templeton 1998) is potentially useful insuch studies, it can only infer range expansion when theranges of younger allelic lineages are more broadly distrib-uted than older lineages. In our datasets, in which range ex-pansion is too recent to be associated with much geneticdiversity, there is not enough allelic or geographic resolutionto make a statistical inference using this method. For ourtaxa, the putatively invading haplotypes are the most deeplynested haplotype in the European (putative source) popula-tion (Fig. 1). This is to be expected, because deeply nestedancestral haplotypes are often the most common (Castelloeand Templeton 1994), therefore they have a higher proba-bility of participating in long-distance dispersal events.
Conclusions: Historical Biogeography and its Role inComparative Ecology
Reconstruction of historical change in a complex intertidalcommunity is perhaps inseparable from the idiosyncrasiesintroduced by the population genetics and life-history char-acteristics of the component species (Ricklefs and Schluter1993; Cunningham and Collins 1998). In many ways, it isthis variation among species in their response to climaticchange and community disruption that is most interesting forthe study of historical ecology and community reassembly.Despite some broad similarities among groups of species inthis study, there are also patterns of community history andcomposition that cannot be fully explained in terms of thetraits discussed here.
For example, the two species of Asterias in North Americaare distinguished not only by historical patterns, but also byphysiological and geographic range differences (Worley andFranz 1983), and there are hypotheses remaining to be testedabout the historical associations among endemic North Amer-ican lineages of Idotea and their ecological milieu (Wares2001b). Although there are apparent relationships betweenmodes of larval dispersal and genetic patterns in the NorthAtlantic, comparative work in two polychaete species (Nean-
2466 J. P. WARES AND C. W. CUNNINGHAM
thes virens and Hediste diversicolor) also points to adaptationto estuarine environments as another mechanism that couldisolate populations and prevent trans-Atlantic migrationevents (S. Breton, P. Blier, F. Dufresne, and G. Desrosiers,unpubl. ms.).
Nevertheless all of these species have experienced the samehistory of climatic change and this common cause shouldlead to some common patterns. In the North Atlantic, Pleis-tocene glaciation not only scoured the rocky intertidal of NewEngland, but also caused sea level to drop up to 200 m; thisprobably exposed suitable habitat for organisms displaced byglaciers and accompanying climatic change (Emery and Gar-rison 1967; Cronin 1988; Riggs et al. 1996), although thetrue shoreline and its composition is as yet unknown forglacial periods (Pielou 1991). Here we show, albeit with onlya handful of species, that mechanisms of dispersal in inter-tidal organisms may be an important factor in the survivalof North American populations because these proposed off-shore reefs and mounts may have been widely scattered andonly temporarily available.
Some important patterns are described with these data thatdo not directly test the proposed hypotheses of this study butthat illustrate the utility of comparative phylogeography tostudies of the genetics and ecology of North Atlantic inver-tebrates. The growing body of literature on the populationgenetics of species such as M. edulis and N. lapillus indicatethat there are many elements of mitochondrial heredity andpatterns of gene flow that may only be resolved by a betterunderstanding of the underlying life-history traits, an under-standing gained through comparisons with other species suchas in this study. Additional ecological experimentation, with-in the context of these phylogeographic patterns, may be ableto discern the historical influences on the diversity of thiscommunity. It is likely to be difficult to tease apart all theinfluences, as studies show that predicting even simple com-munity responses to climatic change are quite complex (Bert-ness et al. 1999; Sullivan et al. 2000).
ACKNOWLEDGMENTS
Many thanks go to D. S. Goldwater, C. Torres, D. Garbary,D. M. Rand, A. Ingolfsson, R. Osmundsson, B. O’Connor,S. Zaklan, and G. Manchenko for assistance in the field andin the laboratory. M. J. Hickerson, C. Riginos, S. Palumbi,D. M. Rand, T. F. Turner, M. E. Hellberg, T. H. Oakley, K.Zigler, C. Henzler, and two anonymous reviewers also pro-vided valuable feedback and criticism on the initial appli-cation of these methods and this manuscript. This researchwas funded by the National Science Foundation (DEB-96808267 to CWC) and a National Science Foundation Dis-sertation Improvement Grant (NSF-DEB-99-72707) and Sig-ma Xi Grant-in-Aid of Research to JPW.
LITERATURE CITED
Austerlitz, F., B. Jung-Muller, B. Godelle, and P.-H. Gouyon. 1997.Evolution of coalescence times, genetic diversity and structureduring colonization. Theor. Popul. Biol. 51:148–164.
Avise, J. C., J. Arnold, R. M. Ball Jr., E. Bermingham, T. Lamb,J. E. Neigel, C. A. Reeb, and N. C. Saunders. 1987. Intraspecificphylogeography: the mitochondrial DNA bridge between pop-
ulation genetics and systematics. Annu. Rev. Ecol. Syst. 18:489–522.
Barash, M. S., and 61 additional authors. 1992. Atlas of paleocli-mates and paleoenvironments of the Northern Hemisphere. B.Frenzel, M. Pecsi, and A. A. Velichko, eds. Geographical Re-search Institute, Hungarian Academy of Science, Budapest.
Berggren, W. A., and C. D. Hollister. 1974. Paleogeography, pa-leobiogeography, and the history of circulation in the AtlanticOcean. Society of Economic Paleontologists and Mineralogists,special publication 20:126–186.
Bertness, M. D., G. H. Leonard, J. M. Levine, and J. F. Bruno.1999. Climate-driven interactions among rocky intertidal or-ganisms caught between a rock and a hot place. Oecologia 120:446–450.
Brooks, D. R., and D. A. McLennan. 1991. Phylogeny, ecology,and behavior: a research program in comparative biology. Univ.of Chicago Press, Chicago, IL.
Brown, A. F., L. M. Kann, and D. M. Rand. 2001. Gene flow versuslocal adaptation in the northern acorn barnacle, Semibalanusbalanoides: insights from mtDNA control regions polymor-phisms. Evolution 55:1972–1979.
Carlton, J. T., and J. B. Geller. 1993. Ecological roulette: the globaltransport of nonindigenous marine organisms. Science 261:78–82.
Castelloe, J., and A. R. Templeton. 1994. Root probabilities forintraspecific gene trees under neutral coalescent theory. Mol.Phyl. Evol. 3:102–113.
Clark, A. M., and M. E. Downey. 1992. Seastars of the Atlantic.Natural History Museum Publications. Vol. 3. Chapman andHall, London.
Collins, T. M., K. Frazer, A. R. Palmer, G. J. Vermeij, and W. M.Brown. 1996. Evolutionary history of Northern Hemisphere Nu-cella (Gastropoda, Muricidae): molecular, morphological, eco-logical, and paleontological evidence. Evolution 50:2287–2304.
Cronin, T. M. 1988. Evolution of marine climates of the U.S. At-lantic coast during the past four million years. Proc. R. Soc.Lond. B 318:661–678.
Crothers, J. H. 1985. Dog-whelks: an introduction to the biologyof Nucella lapillus (L.) Field Stud. 6:291–360.
Cunningham, C. W., and T. M. Collins. 1998. Beyond area rela-tionships: extinction and recolonization in molecular marine bio-geography. Pp. 297–321 in B. Schierwater, B. Streit, G. Wagner,and R. DeSalle, eds. Molecular ecology and evolution: ap-proaches and applications. Birkhauser Verlag, Basel, Switzer-land.
Cunningham, C. W., N. W. Blackstone, and L. W. Buss. 1992.Evolution of king crabs from hermit crab ancestors. Nature 355:539–542.
Cunningham, C. W., H. Zhu, and D. M. Hillis. 1998. Best-fit max-imum-likelihood models for phylogenetic inference: empiricaltests with known phylogenies. Evolution 52:978–987.
Dahlgren, T. G., J. R. Weinberg, and K. M. Halanych. 2000. Phy-logeography of the ocean quahog (Arctica islandica): influencesof paleoclimate on genetic diversity and species range. Mar.Biol. 137:487–495.
Day, A. J., H. P. Leinas, and M. Anstersrud. 1993. Allozyme dif-ferentiation of populations of the dogwhelk Nucella lapillus (L.):the relative effects of geographic distance and variation in chro-mosome number. Biol. J. Linn. Soc. 51:257–277.
Edwards, S. V., and P. Beerli. 2000. Perspective: gene divergence,population divergence and the variance in coalescence time inphylogeographic studies. Evolution 54:1839–1854.
Emery, K. O., and L. E. Garrison. 1967. Sea levels 7,000 to 20,000years ago. Science 157:684–687.
Endler, J. A. 1982. Problems in distinguishing historical from eco-logical factors in biogeography. Am. Zool. 22:441–452.
Excoffier, L., P. E. Smouse, and J. Quattro. 1992. Analysis of mo-lecular variance inferred from metric distances among DNA hap-lotypes: application to human mitochondrial DNA restrictiondata. Genetics 131:479–491.
Felsenstein, J. 1992. Estimating effective population size from sam-ples of sequences: inefficiency of pairwise and segregating sitesas compared to phylogenetic estimates. Genet. Res. 59:139–147.
2467PHYLOGEOGRAPHY AND NORTH ATLANTIC GLACIATION
Folmer, O., M. Black, W. Hoeh, R. Lutz, and R. Vrijenhoek. 1994.DNA primers for amplification of mitochondrial cytochrome coxidase subunit I from diverse metazoan invertebrates. Mol.Mar. Biol. Biotech. 3:294–299.
Franke, H.-D., and M. Janke. 1998. Mechanisms and consequencesof intra- and interspecific interference competition in Idotea bal-thica (Pallas) and Idotea emarginata (Fabricius) (Crustacea: Is-opoda): a laboratory study of possible proximate causes of hab-itat segregation. J. Exp. Mar. Biol. Ecol. 227:1–21.
Fu, Y., and W.-H. Li. 1999. Coalescing into the 21st century: anoverview and prospects of coalescent theory. Theor. Popul. Biol.56:1–10.
Goldman, N. 1993. Statistical tests of models of DNA substitution.J. Mol. Evol. 36:182–198.
Gosling, E. M. 1992. Genetics of Mytilus. Pp. 1–20 in E. Gosling,ed. The mussel Mytilus: ecology, physiology, genetics, and cul-ture. Elsevier Press, New York.
Gosner, K. L. 1978. A field guide to the Atlantic seashore from theBay of Fundy to Cape Hatteras. Houghton Mifflin, Boston, MA.
Griffiths, R. C., and S. Tavare. 1994. Sampling theory for neutralalleles in a varying environment. Philos. Trans. R. Soc. Lond.B 344:403–410.
Hasegawa, M., Y. Cao, and Z. Yang. 1998. Preponderance of slight-ly deleterious polymorphism in mitochondrial DNA: nonsynon-ymous/synonymous rate ratio is much higher within species thanbetween species. Mol. Biol. Evol. 15:1499–1505.
Hayward, P. J., and J. S. Ryland. 1995. Handbook of the marinefauna of North-West Europe. Oxford Univ. Press, Oxford, U.K.
Hellberg, M. E. 1994. Relationships between inferred levels of geneflow and geographic distance in a philopatric coral, Balano-phyllia elegans. Evolution 48:1829–1854.
Hellberg, M. E., D. P. Balch, and K. Roy. 2001. Climate drivenrange-expansion and morphological evolution in a marine gas-tropod. Science 292:1707–1710.
Hewitt, G. M. 1996. Some genetic consequences of ice ages, andtheir role in divergence and speciation. Biol. J. Linn. Soc. 58:247–276.
———. 2000. The genetic legacy of the Quaternary ice ages. Nature405:907–913.
Hoeh, W. R., D. T. Stewart, G. W. Sutherland, and E. Zouros. 1996.Multiple origins of gender-associated mitochondrial DNA lin-eages in bivalves (Mollusca: Bivalvia). Evolution 50:2276–2286.
Holder, K., R. Montgomerie, and V. L. Friesen. 1999. A test of theglacial refugium hypothesis using patterns of mitochondrial andnuclear DNA sequence variation in rock ptarmigan (Lagopusmutus). Evolution 53:1936–1950.
Holm, E. R., and E. Bourget. 1994. Settlement behavior and mi-crogeographic population structure in the barnacle Semibalanusbalanoides. Pp. 154–158 in A. R. Beaumont, ed. Genetics andevolution of aquatic organisms. Chapman and Hall, London.
Hudson, R. R. 1990. Gene genealogies and the coalescent process.Pp. 1–44 in D. Futuyma and J. Antonovics, eds. Oxford surveysin evolutionary biology. Vol. 7. Oxford Univ. Press, Oxford,U.K.
Ingolfsson, A. 1992. The origin of the rocky shore fauna of Icelandand the Canadian maritimes. J. Biogeogr. 19:705–712.
———. 1995. Floating clumps of seaweed around Iceland: naturalmicrocosms and a means of dispersal for shore fauna. Mar. Biol.122:13–21.
Jablonski, D., and R. A. Lutz. 1983. Larval ecology of marinebenthic invertebrates: paleobiological implications. Biol. Rev.58:21–89.
Jenkins, J. B., A. Morrison, and C. L. MacKenzie. 1997. The mol-luscan fisheries of the Canadian Maritimes. NOAA Tech. Rep.NMFS 127:15–44.
Johannesson, K. 1988. The paradox of Rockall: Why is a broodinggastropod (Littorina saxatilis) more widespread than one havinga planktonic larval dispersal stage (L. littorea)? Mar. Biol. 99:507–513.
Johnson, K. P., F. R. Adler, and J. L. Cherry. 2000. Genetic andphylogenetic consequences of island biogeography. Evolution54:387–396.
Kit, Y., and I. Kornfield. 1998. Phylogenetic relationships of clawedlobster genera (Decapoda: Nephropidae) based on mitochondrial16S rRNA gene sequences. J. Crustacean Biol. 18:138–146.
Knott, S. T., and H. Hoskins. 1968. Evidence of Pleistocene eventsin the structure of the continental shelf off the northeastern Unit-ed States. Mar. Geol. 6:5–43.
Knowlton, N., and L. A. Weigt. 1998. New dates and new rates fordivergence across the Isthmus of Panama. Proc. R. Soc. Lond.B 265:2257–2263.
Kuhner, M. K., J. Yamato, and J. Felsenstein. 1998. Maximumlikelihood estimation of population growth rates based on thecoalescent. Genetics 149:429–434.
Locke, A., and S. Corey. 1989. Amphipods, isopods and surfacecurrents: a case for passive dispersal in the Bay of Fundy, Can-ada. J. Plankton Res. 11:419–430.
Marincovich, L., and A. Y. Gladenkov. 1999. Evidence for an earlyopening of the Bering Strait. Nature 397:149–151.
Markovtsova, L., P. Marjoram, and S. Tavare. 2000. The effects ofrate variation on ancestral inference in the coalescent. Genetics156:1427–1436.
Nee, S., E. C. Holmes, A. Rambaut, and P. H. Harvey. 1995. In-ferring population history from molecular phylogenies. Philos.Trans. R. Soc. Lond. B 349:25–31.
Nei, M. 1987. Molecular evolutionary genetics. Columbia Univ.Press, New York.
Nei, M., and W.-H. Li. 1979. Mathematical model for studyinggenetic variation in terms of restriction endonucleases. Proc.Natl. Acad. Sci. USA 76:5269–5273.
Nielsen, R., J. L. Mountain, J. P. Huelsenbeck, and M. Slatkin.1998. Maximum-likelihood estimation of population divergencetimes and population phylogeny in models without mutation.Evolution 52:669–677.
Pielou, E. C. 1991. After the Ice Age: the return of life to glaciatedNorth America. Univ. of Chicago Press, Chicago, IL.
Posada, D., and K. A. Crandall. 1998. Modeltest: testing the modelof DNA substitution. Bioinformatics 14:817–818.
Pratt, R. M., and J. Schlee. 1969. Glaciation on the continentalmargin off New England. Bull. Geol. Soc. Am. 80:2335–2342.
Quesada, H., R. Wenne, and D. O. F. Skibinski. 1995. Differentialintrogression of mitochondrial DNA across species boundarieswithin the marine mussel genus Mytilus. Proc. R. Soc. Lond. B262:51–56.
Quesada, H., D. A. G. Skibinski, and D. O. F. Skibinski. 1996. Sex-biased heteroplasmy and mitochondrial DNA inheritance in themussel Mytilus galloprovincialis Lmk. Curr. Genet. 29:423–426.
Quesada, H., M. Warren, and D. O. F. Skibinski. 1998. Nonneutralevolution and differential mutation rate of gender-associated mi-tochondrial DNA lineages in the marine mussel Mytilus. Genetics149:1511–1526.
Rawson, P. D., K. L. Joyner, K. Meetze, and T. J. Hilbish. 1996.Evidence for intragenic recombination within a novel geneticmarker that distinguishes mussels in the Mytilus edulis speciescomplex. Heredity 77:599–607.
Reid, D. G., E. Rumbak, and R. H. Thomas. 1996. DNA, mor-phology and fossils: phylogeny and evolutionary rates of thegastropod genus Littorina. Philos. Trans. R. Soc. Lond. B 351:877–895.
Ricklefs, R. E., and D. Schluter. 1993. Species diversity: regionaland historical influences. Pp. 350–363 in R. E. Ricklefs and D.Schluter, eds. Species diversity in ecological communities. Univ.of Chicago Press, Chicago, IL.
Riggs, S. R., S. W. Snyder, A. C. Hine, and D. L. Mearns. 1996.Hardbottom morphology and relationship to the geologic frame-work: mid-Atlantic continental shelf. J. Sediment. Res. 66:830–846.
Rogers, A. R., and H. Harpending. 1992. Population growth makeswaves in the distribution of pairwise genetic differences. Mol.Biol. Evol. 9:552–569.
Schneider, S., J. Kueffer, D. Roessli, and L. Excoffier. 1997. Ar-lequin ver. 1.1: a software for population genetic data analysis.Genetics and Biometry Laboratory, Univ. of Geneva, Switzer-land.
2468 J. P. WARES AND C. W. CUNNINGHAM
Schubart, C. D., R. Diesel, and S. B. Hedges. 1998. Rapid evolutionto terrestrial life in Jamaican crabs. Nature 393:363–365.
Seutin, G., B. N. White, and P. T. Boag. 1991. Preservation of avianblood and tissue samples for DNA analyses. Can. J. Zool. 69:82–90.
Slatkin, M. 1991. Inbreeding coefficients and coalescence times.Genet. Res. 58:167–175.
———. 1993. Isolation by distance in equilibrium and nonequilib-rium populations. Evolution 47:264–279.
———. 1995. A measure of population subdivision based on mi-crosatellite allele frequencies. Genetics 139:457–462.
Slatkin, M., and R. R. Hudson. 1991. Pairwise comparisons of mi-tochondrial sequences in stable and exponentially growing pop-ulations. Genetics 129:555–562.
Stone, L., T. Dayan, and D. Simberloff. 1996. Community-wideassembly patterns unmasked: the importance of species differinggeographical ranges. Am. Nat. 148:997–1015.
Sullivan, J., E. Arellano, and D. S. Rogers. 2000. Comparativephylogeography of Mesoamerican highland rodents: concertedversus independent response to past climatic fluctuations. Am.Nat. 155:755–768.
Swofford, D. 1998. PAUP: phylogenetic analysis using parsimony.Sinauer Associates, Sunderland, MA.
Templeton, A. R. 1998. Nested clade analyses of phylogeographicdata: testing hypotheses about gene flow and population history.Mol. Ecol. 7:381–397.
Templeton, A. R., K. A. Crandall, and C. F. Sing. 1992. A cladisticanalysis of phenotypic associations with haplotypes inferredfrom restriction endonuclease mapping and DNA sequence data.III. Cladogram estimation. Genetics 132:619–633.
Travis, J. 1996. The significance of geographical variation in speciesinteractions. Am. Nat. 148:S1–S8.
Valentine, J. W., and D. Jablonski. 1986. Mass extinctions: sen-sitivity of marine larval types. Proc. Natl. Acad. Sci. USA 83:6912–6914.
van Oppen, M. J. H., S. G. A. Draisma, J. L. Olsen, and W. T.Stam. 1995. Multiple trans-Arctic passages in the red alga Phy-codrys rubens: evidence from nuclear rDNA ITS sequences. Mar.Biol. 123:179–188.
Vermeij, G. 1991. Anatomy of an invasion: the trans-Arctic inter-change. Paleobiology 17:281–307.
———. 1992. Time of origin and biogeographical history of spe-cialized relationships between northern marine plants and her-bivorous molluscs. Evolution 46:657–664.
Wakeley, J. 2000. The effects of subdivision on the genetic diver-gence of populations and species. Evolution 54:1092–1101.
Wares, J. P. 2001a. Patterns of speciation inferred from mitochon-drial DNA in North American Chthamalus (Cirripedia: Balan-omorpha: Chthamaloidea). Mol. Phylogenet. Evol. 18:104–116.
———. 2001b. Intraspecific variation and geographic isolation inIdotea balthica (Isopoda: Valvifera). J. Crustacean Biol. 21:1007–1013.
———. 2001c. Biogeography of Asterias: North Atlantic climatechange and speciation. Biol. Bull. 201:95–103.
Watterson, G. A. 1975. On the number of segregating sites in ge-netical models without recombination. Theor. Popul. Biol. 7:256–276.
Whitlock, M. C., and D. E. McCauley. 1999. Indirect measures ofgene flow and migration: Fst ± 1/(4Nm 1 1). Heredity 82:117–125.
Wollenberg, K., and J. C. Avise. 1998. Sampling properties of ge-nealogical pathways underlying population pedigrees. Evolution52:957–966.
Worley, E. K., and D. R. Franz. 1983. A comparative study ofselected skeletal structures in the seastars Asterias forbesi, A.vulgaris, and A. rubens with a discussion of possible relation-ships. Proc. Biol. Soc. Wash. 96:524–527.
Yang, Z. 1994. Maximum likelihood phylogenetic estimation fromDNA sequences with variable rates over sites: approximatemethods. J. Mol. Evol. 39:306–314.
Zink, R. M., R. C. Blackwell-Rago, and F. Ronquist. 2000. Theshifting roles of dispersal and vicariance in biogeography. Proc.R. Soc. Lond. B 267:497–503.
Corresponding Editor: R. Burton
APPENDIX 1Populations Represented in Common or Shared Alleles in Figure 1Asterias rubensHaplotype A: individuals from Maine (n 5 8), Nova Scotia (n 52), Newfoundland (n 5 2), Iceland (n 5 1), Norway (n 5 2), andIreland (n 5 1)Haplotype B: individuals from Maine (n 5 2), Nova Scotia (n 54), Newfoundland (n 5 3), Iceland (n 5 1), Ireland (n 5 2), andFrance (n 5 2)Haplotype C: individuals from Maine (n 5 1), Norway (n 5 3),Ireland (n 5 2), and France (n 5 1)Haplotype D: individuals from Maine (n 5 1) and Ireland (n 5 1)
Idotea balthicaNorth American common haplotype represents 13 individuals:Maine (n 5 8), Rhode Island (n 5 1), and Nova Scotia (n 5 5).
Mytilus edulisHaplotype NA: individuals from North Carolina (n 5 1), Maine (n5 5), and Nova Scotia (n 5 1)Haplotype A: individuals from North Carolina (n 5 3), Rhode Island(n 5 3), Maine (n 5 6), Iceland (n 5 3), Norway (n 5 1), andFrance (n 5 2)Haplotype Eur: individuals from Iceland (n 5 2), Norway (n 5 1),Ireland (n 5 1), and France (n 5 3)Haplotype 9Fr: individuals sampled at Roscoff, France
Littorina obtusataShared Haplotype: individuals from Maine (n 5 7), Nova Scotia(n 5 8), Newfoundland (n 5 4), Iceland (n 5 3), and Norway (n5 1)
Nucella lapillusShared Haplotype: individuals from Maine (n 5 14), Nova Scotia(n 5 7), Rhode Island (n 5 3), Iceland (n 5 8), Norway (n 5 7),Ireland (n5 5 7), and Newfoundland (n 5 5)
Semibalanus balanoidesHaplotype A: individuals from Maine (n 5 4), Nova Scotia (n 55), Rhode Island (n 5 2), Iceland (n 5 7), and Newfoundland (n5 1)Haplotype B: individuals from Rhode Island (n 5 2), Maine (n 57), Nova Scotia (n 5 2), Newfoundland (n 5 2), and Iceland (n 5 4)
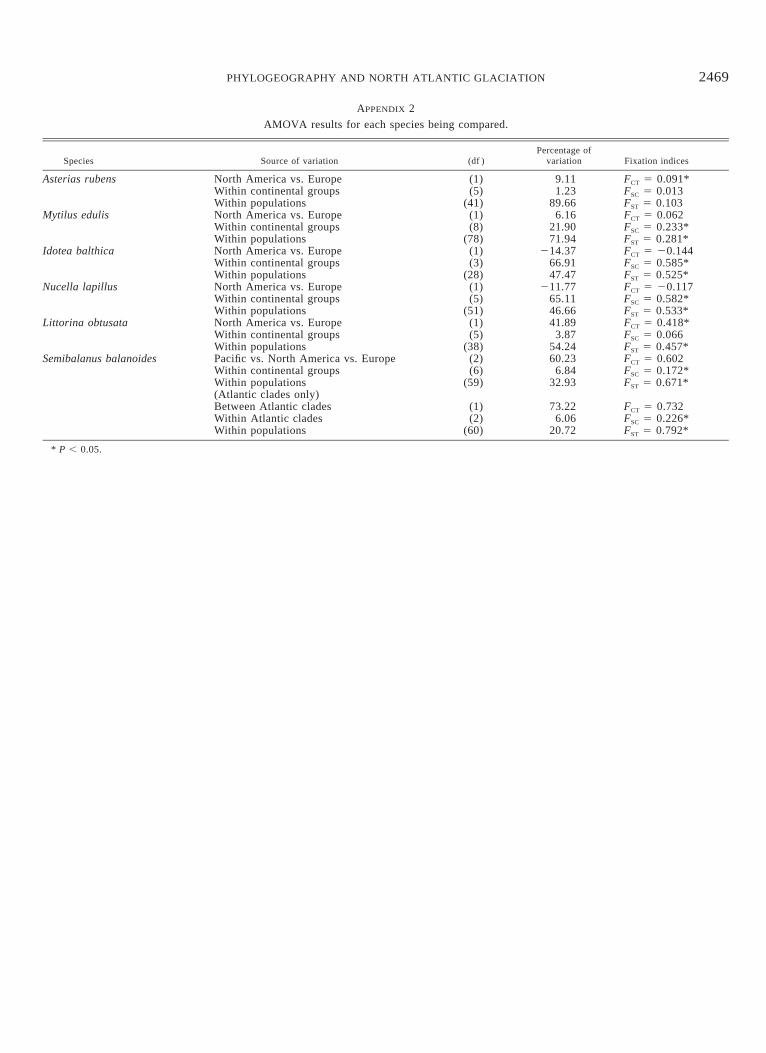
2469PHYLOGEOGRAPHY AND NORTH ATLANTIC GLACIATION
APPENDIX 2
AMOVA results for each species being compared.
Species Source of variation (df )Percentage of
variation Fixation indices
Asterias rubens North America vs. EuropeWithin continental groupsWithin populations
(1)(5)
(41)
9.111.23
89.66
FCT 5 0.091*FSC 5 0.013FST 5 0.103
Mytilus edulis North America vs. EuropeWithin continental groupsWithin populations
(1)(8)
(78)
6.1621.9071.94
FCT 5 0.062FSC 5 0.233*FST 5 0.281*
Idotea balthica North America vs. EuropeWithin continental groupsWithin populations
(1)(3)
(28)
214.3766.9147.47
FCT 5 20.144FSC 5 0.585*FST 5 0.525*
Nucella lapillus North America vs. EuropeWithin continental groupsWithin populations
(1)(5)
(51)
211.7765.1146.66
FCT 5 20.117FSC 5 0.582*FST 5 0.533*
Littorina obtusata North America vs. EuropeWithin continental groupsWithin populations
(1)(5)
(38)
41.893.87
54.24
FCT 5 0.418*FSC 5 0.066FST 5 0.457*
Semibalanus balanoides Pacific vs. North America vs. EuropeWithin continental groupsWithin populations(Atlantic clades only)Between Atlantic cladesWithin Atlantic cladesWithin populations
(2)(6)
(59)
(1)(2)
(60)
60.236.84
32.93
73.226.06
20.72
FCT 5 0.602FSC 5 0.172*FST 5 0.671*
FCT 5 0.732FSC 5 0.226*FST 5 0.792*
* P , 0.05.