ecology 20017
TRANSCRIPT
i
ECOLOGY 2017 11-13 May, Kayseri TURKEY
ORGANIZING COMMITTEE
HONORARY CHAIR
Prof. Dr. MUHAMMET GÜVEN
(Rector of Erciyes University)
SYMPOSIUM CHAIR
Prof. Dr. Fatih DUMAN
SYMPOSIUM COMMITTEES
Prof. Dr. Sedat V. YERLİ, Hacettepe University
Prof. Dr. Süleyman AKBULUT, Düzce University
Prof. Dr. Nazım ŞEKEROĞLU, Kilis 7 Aralık University
Prof. Dr. Ahmet İSTANBULLUOĞLU, Tekirdağ Namık Kemal University
Prof. Dr. İlkay ERDOĞAN ORHAN, Gazi University
Prof. Dr. İsmet BERBER, Sinop University (In our hearts)
Assoc. Prof. Dr. Mehmet Ali KIRPIK, Kafkas University
SECRETARY
Res. Assist. Fatih Doğan KOCA
Res. Assist. Mithat GÜLLÜ Exp. Erkan UREY
ORGANIZING COMMITTEE MEMBERS
Prof. Dr. Nusr AYYILDIZ (Chair)
Prof. Dr. Abdurrahman AYVAZ
Prof. Dr. Aydın Ş. TUNÇBİLEK
Prof.Dr. Cem VURAL
Prof. Dr. Coşkun TEZ
Prof. Dr. Dilek DEMİREZEN YILMAZ
Prof. Dr. Yalçın Şevki YILDIZ
Assoc. Prof. Dr. Ali Cesur ONMAZ
Assoc. Prof. Dr. Ayşe TOLUK
Assoc. Prof. Dr. Fatma ÖZTÜRK KÜP
Assoc. Prof. Filiz Dadaşer ÇELİK
Assoc. Prof. Dr. Nuray ATEŞ
Assoc. Prof. Dr. Sevil ALBAYRAK
Assist. Prof. Dr. Evrim KARAÇETİN
Assist. Prof. Dr. İsmail ÜLGER
Dr. Abdulkadir TAŞDEMİR
Dr. Mehmet TAŞKIRAN
Dr. Rıdvan TEMİZGÜL
Exp. Ali BUDAK
Res. Assist. Dr. Ahmet CEYLAN
Res. Assist. Ali Tuğrul AKIN
Exp. Erkan UREY
Res. Assist. Fatih Doğan KOCA
Res. Assist. Mithat GÜLLÜ
ii
ECOLOGY 2017 11-13 May, Kayseri TURKEY
SCIENTIFIC COMMITTEE
Dr. Abdullah Ulas --- Erciyes University
Dr. Abin Sebastian --- University of Hyderabad/India
Dr. Abuzer Çelekli --- Gaziantep University
Dr. Ahmet Aksoy --- Akdeniz University
Dr. Ahmet Alp --- Kahraman Maraş Sütçü İmam University
Dr. Ahmet Emre Yaprak --- Ankara University
Dr. Ahmet Sahin --- Erciyes University
Dr. Ahmet Mert --- Süleyman Demirel Üniversity
Dr. Akbar Alyhanovich Mamadrizahonov --- Tajikistan / Khorong State University
Dr. Aleksandr Vasilyevich Ilyinyh --- Russia/Systematic and Ecology Animals Instute
Dr. Ali Alaş --- Necmettin Erbakan University
Dr. Ali Aslan Dönmez --- Hacettepe University
Dr. Altaf Ahmad --- India / Hamdard University
Dr. Arif Gönülol --- Ondokuz Mayıs University
Dr. Bülent Deniz --- Adnan Menderes University
Dr. Bülent Cihangir --- Dokuz Eylül University
Dr. Çağatay Güler --- Hacettep University
Dr Daniel Gebler --- Poland/Poznan University
Dr Djillali Tassalit --- UDES/CDER, Algeria
Dr Emine Olcay Obalı --- Ankara University
Dr. Ergin Kariptas --- Ahi Evran University
Dr. Elshad Mecnun Gurbanov --- University of Bakü
Dr. Faiz-ul Hassan Nasim --- Pakistan / Islamia University of Bahawalpur
Dr. Gadir Byramlı --- Azerbaijan State Economics University
Dr. Galiola Tulendinovich Meyrman --- Kazakhistan/Institue Agriculture and Plant
Dr. Ghobad Souri --- Iran/Acarological Society of Iran and Entomological Societ
Dr. Goksal Sezen --- Harran University
Dr. Hafiz Haider Ali --- Australia / The University of Queensland
Dr. Halil Süel --- Süleyman Demirel University
Dr. Haq Nawaz Bhatti --- Pakistan / University of Agriculture
Dr. Hasan Sevgili --- Ordu University
Dr. Hayri Duman --- Gazi University
Dr. Isatay Ahayevich Nurpeyisov --- Kazakhistan / Institute of Agriculture and Plant Cultivation
Dr. Ivan Sergeevich Sazykin --- Russia / Southern Federal University
Dr. Ibrahim Ilker Ozyigit --- Marmara University
Dr. Irfan Albayrak --- Kırıkkale University
Dr. Jonas Schoelynck --- Poland / Poznan University
Dr. Kadirbay Bekbalaebich Chekirov --- Kyrgyzstan / Turkish Manas University
Dr. Kadri Cetin --- Fırat University
Dr. Kemal Büyükgüzel --- Bülent Ecevit University
Dr. Kemal Tuluhan Yılmaz --- Çukurova University
Dr. Krzysztof Szoszkiewicz --- Poland / Poznan University
Dr. Kürşad Özkan --- Süleyman Demirel University
Dr. Latif Kurt --- Ankara University
Dr. Leyla Acık --- Gazi University
Dr Majeti Narasimha Vara Prasad --- India / University of Hyderabad
Dr. Makshoof Ahmad --- Pakistan / The Islamia University of Bahawalpur
Dr. Marina Aleksandrovna Sazykina --- Russia / Southern Federal University
Dr. Matthew O'Hare --- CEH, UK
Dr. Mehmet Cicek --- Pamukkale University
Dr. Mehmet Karakaş --- Ankara University
Dr. Mikkola Heimo --- Finland/University Of Eastern Finland
iii
ECOLOGY 2017 11-13 May, Kayseri TURKEY
Dr. Mohamed Abbas --- UDES/CDER, Algeria
Dr. Mohammad Khanjani --- Iran/Acarological Society of Iran and Entomological Society
Dr. Muhammad Iqbal Hussain --- Pakistan/Agricultural Officer Soil and Water Testing Lab.
Dr. Muhammad Mazhar Iqbal --- Pakistan/University of Sargodha
Dr. Murat Kaya --- Aksaray University
Dr. Musa Cabbarov --- University of Bakü
Dr. Mustafa Sözen --- Bülent Ecevit University
Dr. Mustafa Talas --- Ömer Halisdemir University
Dr. Mustafa Ünal --- Erciyes University
Dr. Nadia Chekir --- USTHB, Algeria
Dr. Nashtay Mukhitdinovich Mukhitdinov --- Kazakhistan/Al-Farabi Kazakh National University
Dr. Nazgül Amanovna Imanberdiyeva --- Kyrgyzstan / КТМУ
Dr. Nazmi Polat --- Ondokuz Mayıs University
Dr. Okan Külköylüoğlu --- Abant İzzet Baysal University
Dr. Osman Samsun --- Sinop University
Dr. Osman Seyyar --- Omer Halis Demir University
Dr. Povilas Mulercikas --- Lithuania/Lithuanian University of Agriculture
Dr. Sabir Hussain --- Ireland / University College Dublin
Dr. Sadek Igoud --- UDES/CDER, Algeria
Dr. Sakysh Tanyrbergenovna Erjanova --- Kazakhistan / Institute of Agriculture and Plant
Dr. Savaş Canbulat --- Kastamonu University
Dr. Sergey Nykolaevich Gashev --- Russia / Tyumen State University
Dr. Serkan Gülsoy --- Süleyman Demirel University
Dr. Sevinç Sener --- Akdeniz University
Dr. Sezgin Celik --- Yıldız Teknik University
Dr. Sher Muhammad Shahzad --- Pakistan / University of Sargodha
Dr. Snezana Stavreva Veselinovska --- Macedonia /University Goce Delcev.
Dr. Svetlana Georgiyevna Nesterova --- Kazakhistan/Al-Farabi Kazakh National University
Dr. Svetlana Valentinovna Gorohova --- Russia/ Russian Academy of Sciences
Dr. Tahir Atıcı --- Gazi University
Dr. Vykintas Baublys --- Lithuania / Vytautas Magnus University
Dr. Yorgos Chatzinikolaou --- Greece/RIBAMAP
Dr. Yusuf Ayvaz --- Suleyman Demirel University

iv
ECOLOGY 2017 11-13 May, Kayseri TURKEY
SPONSORS
v
ECOLOGY 2017 11-13 May, Kayseri TURKEY
CONTENTS
ORGANIZING COMMITTEE .............................................................................................. i
SCIENTIFIC COMMITTEE ................................................................................................. ii
SPONSORS .......................................................................................................................... iv
CONTENTS .......................................................................................................................... v
Linear and Non-linear Regression Equations for Estimating the Crown Diameter and Diameter
at Breast height of Cedrus libani Trees .............................................................................................. 1
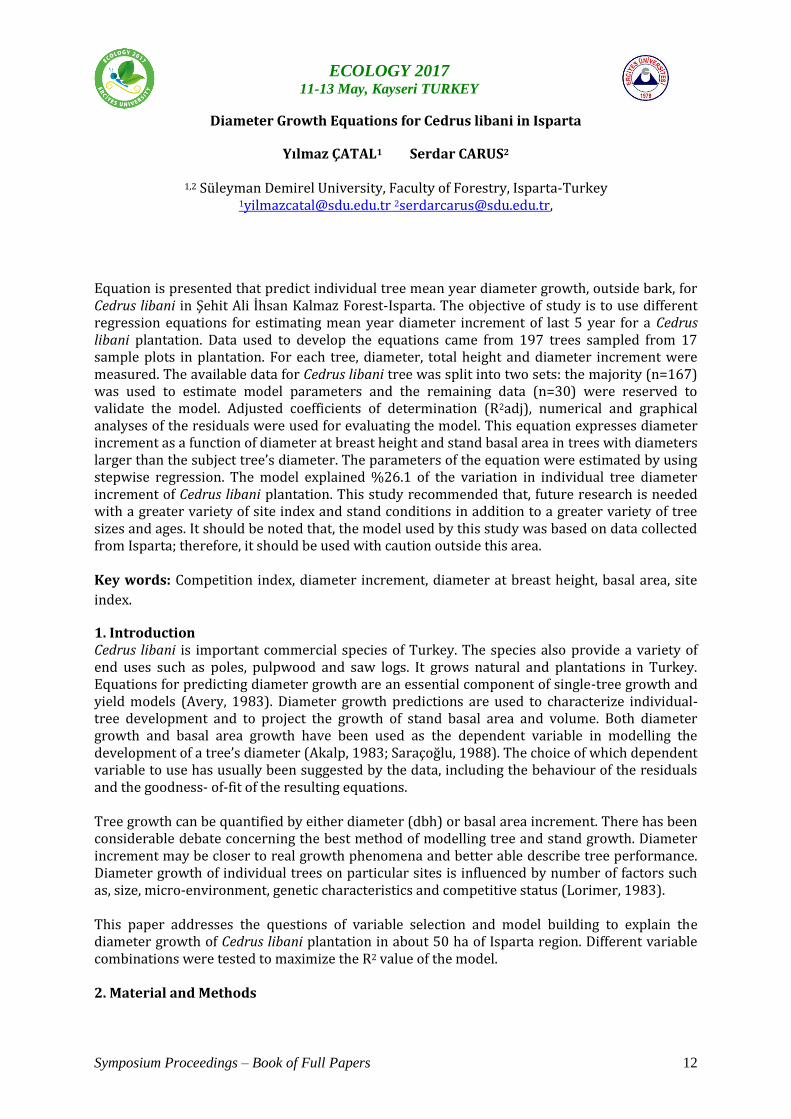
Diameter Growth Equations for Cedrus libani in Isparta ........................................................................... 12
Clean Environmental Management (Kocaeli-Turkey) ..................................................................................... 21
The Algae of the Yazlık Ilıcası Spring (Kocaeli-Türkiye)............................................................................... 34
Decolorization of a Reactive Textile Dye by non-acclimatized Pseudomonas aeruginosa under
various conditions ............................................................................................................................... 44
Use of factor and cluster analysis to evaluate the surface and groundwater quality of Balkan
Arboretum area (Edirne, Turkey) ........................................................................................................ 56
Bioremoval of Phosphate from Aqueous Solution Using Macroalga Chara sp. ............................................. 67
Assessment of Water Quality in Mert Stream (Samsun, Turkey) Base on Some Physicochemical
Parameters ........................................................................................................................................... 77
Przewalski`s wild horses and their 18th years management in the Chornobyl exclusion zone, Ukraine .......... 90
Kinetic Studies of Remazol Brillant Blue R Biosorption Onto Pistachio Hull: Ecological Engineering
Approach............................................................................................................................................. 99
Investigation of the chemical content of some industrial tree barks’ extracts by GC-MS ............................. 107
Variation in Chemical Constituents of Ancient Black Pine Leaves: In relation to tree age ........................... 117
Eastern Black Sea Region in Terms of Urbanization and Environmental Problems: Artvin Example .......... 140
Effect of different substrates on growth performance of Mexican orange dwarf crayfish (Cambarellus
patzcuarensis) ................................................................................................................................... 150
Adsorption of Methylene Blue from Aquatic Solution On Vermicompost: Green Engineering
Approach........................................................................................................................................... 157
Transformation Process of Agricultural Lands with Plans in Expanding Metropolitan Boundaries:
Case of Antalya-Serik ....................................................................................................................... 168
A Nature and Human Sensitive Rural Settlement Suggestion for Pensioners Returning their
Hometowns in Northeast Anatolia (TRA1 NUTS 2) Region ............................................................ 178
Adsorption of a Reactive Textile Dye by a Low-Cost Activated Carbon ...................................................... 189
Iron-dependent modulation of paddy field ecology ....................................................................................... 198
An Experimental Approach to study the Distribution of Endemic Orchids in the Southern Western
Ghats, Kerala, India .......................................................................................................................... 217
Investigation of the chemical content of some industrial tree barks’ extracts by GC-MS ............................. 244
Microbiological analysis of waters of river Rimnik, nearby city Rahovec (Kosovo) during winter
season 2014 ....................................................................................................................................... 255
Municipal Solid Waste Management in Gumushane of Turkey .................................................................... 263
Site Selection Process and Environmental Effects of Stone Quarries, Case of Izmir- Cesme-Germiyan
Neighborhood (Village) .................................................................................................................... 270

vi
ECOLOGY 2017 11-13 May, Kayseri TURKEY
Microbiological estimation of water of river nerodime, during autumn season 2009................................... 285
RE-EVALUATION OF SOME ENDEMIC TAXA DISTRIBUTED IN HİRO PLATEAU (ADAKLI-
BİNGÖL) IN TERMS OF RISK CATEGORIES ............................................................................. 292
ECOLOGICAL STATE OF URBAN ECOSYSTEMS (ON THE EXAMPLE OF LAWNS IN
UZHHOROD) ................................................................................................................................... 301
The Evaluation of Landscape Typology and Richness for Achieving Conservation Priorities of
Habitats ............................................................................................................................................. 309
Preliminary study on rainwater composition of Suşehri in Turkey ............................................................... 319
ECOLOGICAL STATE OF URBAN ECOSYSTEMS (ON THE EXAMPLE OF LAWNS IN
UZHHOROD, UKRAINE) ............................................................................................................... 327
Symposium Proceedings – Book of Full Papers 1
ECOLOGY 2017 11-13 May, Kayseri TURKEY
Linear and Non-linear Regression Equations for Estimating the Crown Diameter and Diameter at Breast height of Cedrus libani Trees
Serdar CARUS1 Yılmaz ÇATAL2
1,2 Süleyman Demirel University, Faculty of Forestry, Isparta-Turkey
[email protected], [email protected] Abstract Relationships between stem diameter, tree height, crown diameter, crown height and crown ratio of Cedrus libani were investigated and regression prediction models were derived in Isparta. The objective of study is to use linear and non-linear equations for estimating crown diameter (CD) and diameter at breast height (dbh) for Cedrus libani. For each tree, diameter, total height and crown width were measured. SPSS statistical package was used to fit the selected equations. Akaike’s information criterion (AIC), correlation coefficient (R), root mean squared error (RMSE), numerical and graphical analyses of the residuals were used for evaluating the models. The results showed that, all fitted equations gave acceptable results with values vary from R 0.2250 to 0.7505, RMSE 0.31301 to 0.4586, AIC -188.42 to -126.159 for crown diameter and from R 0.2243 to 0.7413, RMSE 1.4114 to 2.2273, AIC 63.5477 to 137.7394 for dbh, respectively. The study concluded that, the crown diameter could be estimated by the mean of diameter at breast height as it is easy to measure for ground-based inventory and stand structure determination. The equations examined in this study produced reasonably precise estimates for crown diameter and could be used to predict the crown diameter of Cedrus libani under consideration. This study recommended that, future research is needed with a greater variety of site and stand conditions in addition to a greater variety of tree sizes and ages. It should be noted that, the models used by this study were based on data collected from Isparta; therefore, it should be used with caution outside this area. Key words: Forest canopy, tree crown, crown diameter, diameter at breast height, linear and non-linear equations. 1. Introduction Forestry is rightly termed as an expensive and extensive form of land use in comparison with such other activities as horticulture, but forestry is also called labour intensive and capital intensive. Diameter at breast height (dbh), tree height (h) and crown diameter (CD) are important tree characteristics. It is necessary to measure dbh and height in forest inventory studies and dbh, height and crown diameter in stand structure determination studies (Avsar, 2004). Crown width is used in tree and crown level growth modeling systems, where simple competition indices are not available to adequately predict recovery from competition when a competitor is removed (Vanclay, 1994). Crown width is also used in calculating competition indices based on crown overlap (Biging and Dobbertin, 1992) and predicting aboveground biomass. Estimation of forest canopy cover has recently become an important part of forest inventories. First, canopy cover has been shown to be a multi-purpose ecological indicator, which is useful for distinguishing different plant and animal habitats, assessing forest floor micro-climate and light conditions, and estimating functional variables like the leaf area index (LAI) that quantifies the photosynthesizing leaf area per unit ground area (Kalıpsız, 1982). Secondly, many remote sensing applications involve estimation of either canopy cover or individual tree canopy area as
Symposium Proceedings – Book of Full Papers 2
ECOLOGY 2017 11-13 May, Kayseri TURKEY
an intermediate stage in distinguishing the signals reflected from forest canopy and forest floor, after which, for instance, estimation of timber volume becomes possible (Vanclay, 1994). Professional forest management requires precise, accurate, timely and complete forest information. Forest information can be acquired by forest inventory, which includes collection of individual tree parameters such as location, diameter at breast height (dbh), tree height, tree crown size and tree species within a sampled forest plot, and also includes the derivation of forest stand measurements such as forest density, age, mean height and crown closure, using statistical extrapolation of plot measurements (Kalıpsız, 1984; El-Mugheira and Osman, 2014). Cedrus libani is important commercial species of Turkey. The species also provide a variety of end uses such as poles, pulpwood and saw logs. It grows natural and plantations in Turkey (Evcimen, 1963). The selection of species was principally based on the fact that, Cedrus libani is endangered woody plant in the forest in addition to its economic value and play a vital role in life of local communities around the forest. The wide uses of this in the area in the absence of proper natural regeneration, due to overgrazing, wild fires and drought, has resulted in gradual depletion of these species especially in areas close to villages. Estimation of the present growing stock in such large area using the traditional inventory system is expected to be both uneconomic and time consuming (Sönmez, 2009). Taking all these facts into consideration it become necessary to find out cheapest and less time consuming alternatives like a dbh-CD relationship as a base for using remote sensing and GIS techniques. Therefore, the objective of this study is to use linear and non-linear equations for estimating the crown diameter from diameter at breast height for Cedrus libani. 2. Material and methods Study area This study is located in Isparta region. The forest is located 10 km north of Isparta between longitudes 37°50’13’’N and 37°49’57’’N and 30°30’37’’E and 30°29’59’’E. The trees were planted with a distance of 3x2 m in 1992. Study area is about 50 ha size. The study area is identified as being semi-humid. Sampling Selective sampling was used for data collection where each individual open grown tree was considered as a sample, and dbh, total tree height and crown diameter (CD) were recorded for all sampled trees. During the measurement process dbh (cm) was measured over bark at 1.3 m to the nearest millimeter by using tree caliper and diameter tape for larger trees (Table 1). Total tree height (m) was measured by using Suunto Clinometers’ (Table 1), while crown diameter (m) was measured in eight directions from the main bole (every 45° beginning with magnetic north) to the vertically projected edge of the crown (Table 1). Table 1. Descriptive statistics for crown diameter and diameter at breast height model and test data: means and standard deviations
Variables
Model data (n=167) Model test data (n=30) Mean Min. Max. Sd. Mean Min. Max. Sd.
d (cm) 10.85 4.62 17.83 2.28 10.87 7.54 15.60 2.12 h (m) 5.98 3.50 8.00 0.84 5.86 4.50 8.75 0.90 HCB (m) 4.54 2.25 6.46 0.81 4.35 3.04 7.18 0.90 CD (m) 3.00 1.88 4.43 0.47 2. 85 1.66 4.03 0.54
Statistical analysis
Symposium Proceedings – Book of Full Papers 3
ECOLOGY 2017 11-13 May, Kayseri TURKEY
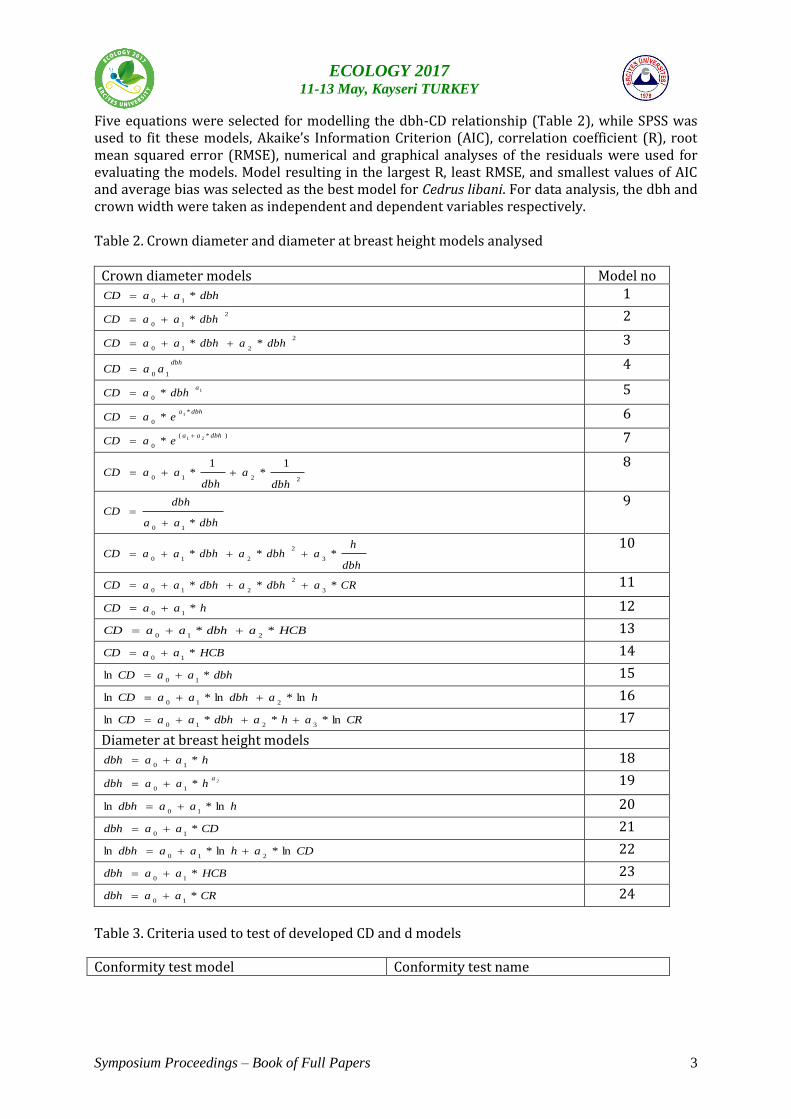
Five equations were selected for modelling the dbh-CD relationship (Table 2), while SPSS was used to fit these models, Akaike’s Information Criterion (AIC), correlation coefficient (R), root mean squared error (RMSE), numerical and graphical analyses of the residuals were used for evaluating the models. Model resulting in the largest R, least RMSE, and smallest values of AIC and average bias was selected as the best model for Cedrus libani. For data analysis, the dbh and crown width were taken as independent and dependent variables respectively. Table 2. Crown diameter and diameter at breast height models analysed
Crown diameter models Model no
dbhaaCD *10
1 2
10* dbhaaCD 2
2
210** dbhadbhaaCD
3
dbh
aaCD10
4
1*0
adbhaCD 5
dbhaeaCD
*
0
1* 6
)*(
0
21*dbhaa
eaCD
7
2210
1*
1*
dbha
dbhaaCD
8
dbhaa
dbhCD
*10
9
dbh
hadbhadbhaaCD ***
3
2
210
10
CRadbhadbhaaCD ***3
2
210 11
haaCD *10
12
HCBadbhaaCD **210
13
HCBaaCD *10
14
dbhaaCD *ln10
15
hadbhaaCD ln*ln*ln210
16
CRahadbhaaCD ln***ln3210
17
Diameter at breast height models
haadbh *10
18
2*10
ahaadbh 19
haadbh ln*ln10
20
CDaadbh *10
21
CDahaadbh ln*ln*ln210
22
HCBaadbh *10
23
CRaadbh *10
24
Table 3. Criteria used to test of developed CD and d models
Conformity test model Conformity test name
Symposium Proceedings – Book of Full Papers 4
ECOLOGY 2017 11-13 May, Kayseri TURKEY
n
yy
MAE
n
i
ii
1
ˆ
Mean absolute error
)ˆ(ii
yyMaxMaxAE Maximum absolute error
pn
yy
RMSE
n
i
ii
1
2)ˆ(
The square root of the average of error squares
n
i
ii
n
i
ii
iii
n
i
i
yyyy
yyyy
R
1
22
1
1
)ˆˆ(*)(
)ˆˆ(*)(
Correlation coefficient
n
yy
ME
n
i
ii
1
)ˆ(
Mean error
pRMSEnAIC *2)ln(* Akaike information criterion
Where, 𝑦𝑖, �̅�𝑖, �̂�𝑖, and �̂��̅� respectively, observation value, mean of observation values, prediction value and mean of prediction values, n= number of observation, p= number of parameter and ln= natural logarithm. The mean absolute error (MAE), the maximum absolute error (MaxAE), the square root of the mean of error squares (RMSE), the correlation coefficient (R), the mean error (ME) and the Akaike information criterion (AIC) were used to evaluate the validity of the developed CD and diameter models (Table 3). Among these criteria, the accuracy of the RMSE estimates, the correlation between the R estimated value and the measured value, the mean error, the coherence in the estimates, and the AIC were used to select the most successful among the different models. In determining the best model, the lowest MAE, MAE, RMSE, ME, and AIC values were used, but the highest R-rated criteria were used. In addition, the performances of the developed models have been evaluated graphically. Two different notations have been used for this purpose. In the first place; the distribution of the mean error values according to the estimated y (CD and d) values and the one-to-one (1:1) distribution of the y values measured with the estimated y values were shown. The non-linear (NLIN) feature of the statistical package program of IBM SPSS Version 22 was used to determine the fitness of the data and the regression coefficients. 3. Results and Discussion 3.1.Crown diameter Modeling biological systems in the sense is an important tool. Modeling is the process of defining a system's change with equations. It is therefore important to accurately determine the components of the system during modeling and to select the correct equation to describe this system. In our study, it was tried to reveal the variability of the variation of tree height and basal area according to the crown diameter regression models in Cedrus libani plantation of Isparta region. The values of the parameters determined for the equations were given in Table 4. The model parameters for all the tested models were found to be significant at the significance level of 0.001.
Table 4. Parameter estimates for developed crown diameter models
Symposium Proceedings – Book of Full Papers 5
ECOLOGY 2017 11-13 May, Kayseri TURKEY
Model no Coefficients a0 a1 a2 a3
1 1.338473 0.152671 - - 2 2.137546 0.006977 - - 3 1.300091 0.160233 -0.000355 - 4 1.720386 1.051801 - - 5 0.839801 0.535727 - - 6 1.720385 0.050504 - - 7 1.218482 0.344943 0.050504 - 8 5.636483 -37.742097 101.420984 - 9 1.881115 0.156846 - - 10 0.174545 0,248431 -0.003064 0.883049 11 1.212271 0.159901 -0.000375 0.124139 12 1.058835 0.323645 - - 13 1.211511 0.149813 0.109498 - 14 2.420981 0.398241 - - 15 0.519842 0.052046 - - 16 -0.256797 0.435274 0.176688 - 17 0.306475 0.023397 0.066672 -0.215771
Criteria values obtained for 17 different crown diameter models using model development data for Isparta region artificial Cedrus libani stand were given in Table 5. When the criterion valuesobtained for the tested models are examined, the correlation coefficients are high (R> 0.75) and therefore there is a high correlation between the crown diameter relations and the stand characteristics of all the models. In order to find out which model is more successful in explaining crown diameter relations, a ranking is made for all the models according to the specified criteria and the results are given below. In this ranking method, numerical values are given starting from the smallest MAE, MaxAE, RMSE, ME, AIC values and for the R value, starting with the largest one. When the ranking values obtained for each model are collected, the model with the smallest value is determined as the best model (Table 5). When the table was examined, it was seen that the most successful model among the 20 crown diameter models is model 10, model 1 and model 3, respectively. Table 5. Criterion values and succession rankings of developed crown diameter models
Model no
Criteria MAE MaxAE RMSE R ME AIC Rank
1 0.242065 (9) 0.820600(4) 0.315921(4) 0.741379(7) 0.000037(7) -188.42(1) 2 2 0.250798(15) 0.825853(10) 0.321402(14) 0.730673(14) 0.000085(9) -185.55(11) 14 3 0.241777 (8) 0.819852(3) 0.316870(6) 0.741404(6) -0.000004(3) -185.92(9) 3 4 0.246372(13) 0.820722 (5) 0.317940(10) 0.737475(10) -0.00034(10) -187.36(3) 8 5 0.241328 (7) 0.851151(13) 0.317563(8) 0.738207(9) -0.00043(13) -187.56(2) 9 6 0.246371(11) 0.820723 (6) 0.317940(11) 0.737475(12) -0.00034 (11) -187.364 (4) 11 7 0.246371(12) 0.820725(7) 0.318908(13) 0.737475(11) -0.00034(12) -184.856(14) 13 8 0.240025(4) 0.862347(14) 0.317459 (7) 0.740274(8) 0.000020(5) -185.617(10) 7 9 0.242752(10) 0.890450(15) 0.321557(15) 0.730364(15) 0.001671(14) -185.475(13) 15 10 0.234680(1) 0.802567(1) 0.313006 (1) 0.750517(1) -0.000009(4) -185.976(8) 1 11 0.241261(6) 0.824358(9) 0.317787 (9) 0.741507(5) 0.000069(8) -183.444(15) 10 12 0.308316(16) 1.008384(16) 0.383644(16) 0.579540(16) -0.0000004(2) -155.993(16) 16 13 0.241150(5) 0.821696(8) 0.315603(5) 0.743824(4) 0.000033(6) -186.596(7) 4 14 0.362816(17) 1.447499(17) 0.458684(17) 0.225056(17) 0.00000002(1) -126.159(17) 17 15 0.246982(14) 0.813697(2) 0.318500(12) 0.736384(13) 0.016291(16) -187.070(6) 12 16 0.235846(2) 0.844039(12) 0.314319(3) 0.746259(3) 0.016667(17) -187.277(5) 5 17 0.236704(3) 0.840643(11) 0.313861(2) 0.748923(2) 0.015858(15) -185.520(12) 6
Symposium Proceedings – Book of Full Papers 6
ECOLOGY 2017 11-13 May, Kayseri TURKEY
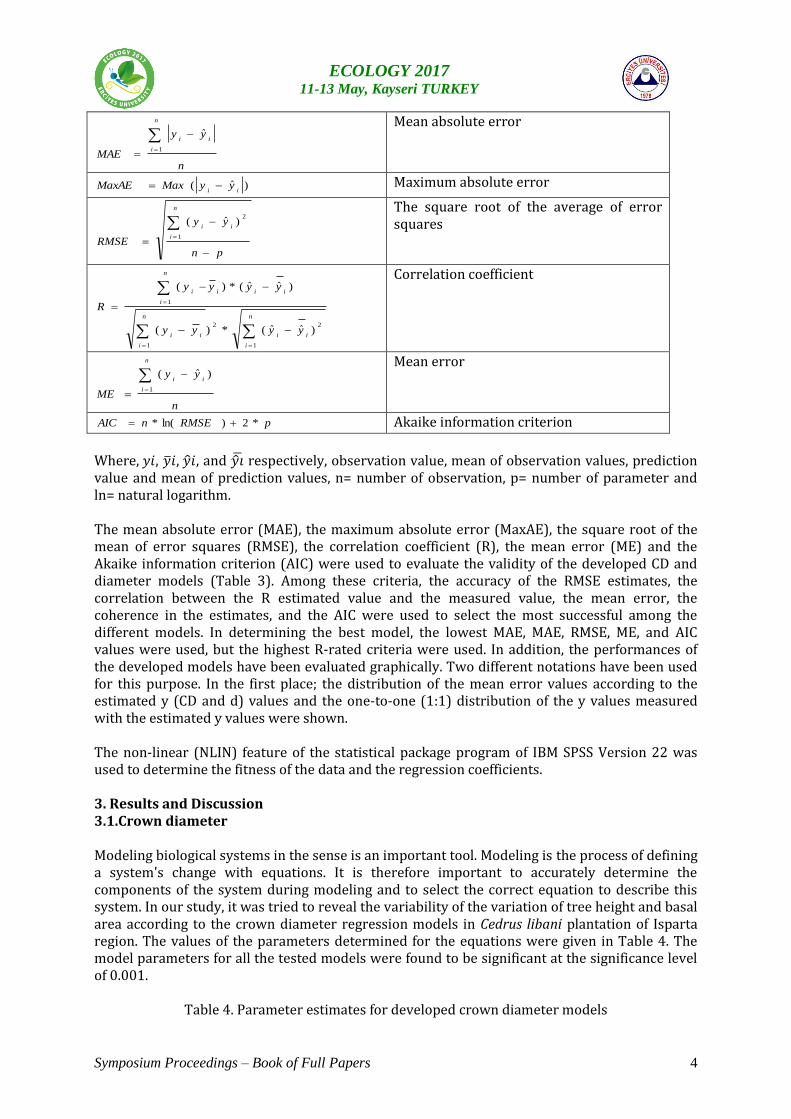
The ME values of the model were found to be very small. The small deviation in ME values indicated that the total average Crown diameter error would be small. The of mean error squares valuesshowing variance also showed that the variance was not much. The statistics and coefficients for the model in the study were found to be similar to the model results previously used for the diameter-length relationship (Colbert et al., 2002). In addition, the differences between the predicted crown diameter values obtained by the regression equation and the actual values obtained by the measurements were given in Figure 3 by marking the binary coordinate system for 5 cm diameter steps. Figure 3. Distribution of mean error values for model 10, 1 and 3 Where, only the best five models are given the distribution of errors according to their estimated crown diameter step value. As can be seen from Figure 3, the error distributions obtained for the most successful models are similar within the groups themselves. In general, although it has been found that error amounts increase in successful models due to crown diameter values increase the amount of error in our study did not increase but decreased. The variation with respect to error distributions obtained with the generalized crown diameter models can be said to be relatively constant. In general, when it is decided whether a model is successful, it is required that the amount of error is small, and that it has a certain and constant variance in the errors obtained. In this respect, Model 15 and Model 14 can be considered successful. Estimates of crown diameter models developed for artificial Cedrus libani stand were also tested using an independent data set and the results obtained are given in Table 6. The crown diameter models tested, as can be seen from Table 6, are not very different from the model development data. Table 6. Criterion values and succession rank of successful crown diameter models with independent data set Model
number Criteria
MAE MaxAE RMSE R ME AIC Rank m10 0.319393(2) 0.833853(2) 0.408932(4) 0.702964(3) -0.13472(3) -18.8262(5) 3 m1 0.321060(3) 0.835215(3) 0.397259(2) 0.697068(4) -0.14817(4) -23.6950(1) 2 m3 0.313290(1) 0.815011(1) 0.393711(1) 0.716295(1) -0.10467(1) -21.9641(2) 1
m13 0.325984(5) 0.840921(4) 0.410612(5) 0.685841(5) -0.15497(5) -20.7032(4) 5 m16 0.322007(4) 0.843698(5) 0.400635(3) 0.704132(2) -0.12234(2) -21.4411(3) 4
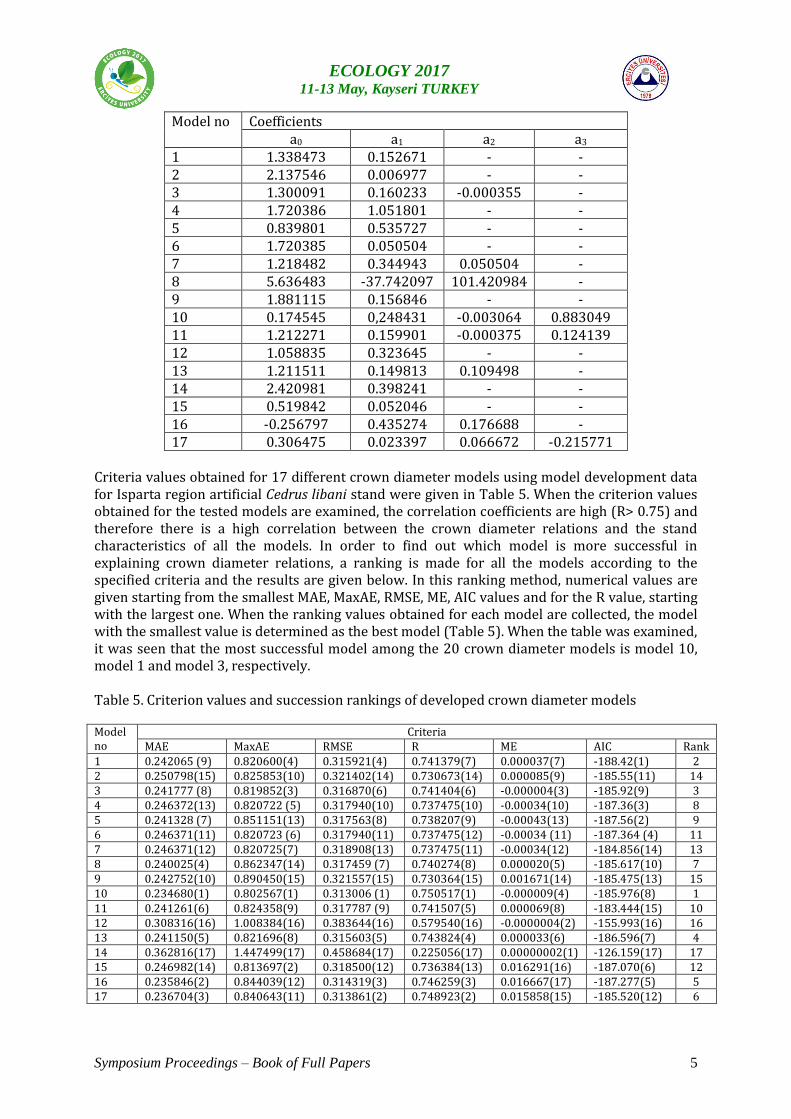
For the tested models, the results obtained using the independent data set was given in Figure 4. In these graphs, the most successful models, model 10, model 1 and model 3, respectively, are given the predicted tree crown diameter overlap cases corresponding to the measured tree
Symposium Proceedings – Book of Full Papers 7
ECOLOGY 2017 11-13 May, Kayseri TURKEY
crown diameter. Relatively similar results were obtained in the three models. Here again, a situation similar to that of figure 3 is mentioned. The overlap ratio of the predicted crown diameter values with the measured crown diameter values increases as the crown diameter value is increases. Figure 4. The relationship between estimated crown diameter models and the estimated crown
diameter values (model 10, model 1 and model 3)
Finally, the most successful and recommended crown diameter models were used together with all sample area data, and their coefficients and statistics are given in Table 7. By using these parameters, reliable crown diameter estimations can be made for artificial Cedrus libani stand of Isparta region. Table 7. The regression coefficients and statistics obtained for crown diameter models using the entire data set
Model number
Parameters a0 a1 a2 a3
10 0.121640 0.253299 -0.003089 0.855295 1 1.254832 0.158463 - - 3 1.228459 0.163614 -0.000240 - 13 1.184809 0.156949 0.059537 - 16 -0.324950 0.469182 0.165591 -
3.2.Diameter at breast height In our study, it was tried to reveal the variability of the variation of tree height and basal area according to the diameter regression models in Cedrus libani plantation of Isparta region. The values of the parameters determined for the equations were given in Table 8. The model parameters for all the tested models were found to be significant at the significance level of 0.001. Table 8. Parameter estimates for developed diameter models
Model number
Coefficients a0 a1 a2
18 0.104632 1.796314 - 19 -81.156452 74.943303 0.115227 20 0.422493 1.089070 - 21 0.069624 3.600114 - 22 0.478036 0.593255 0.761934 23 8.073194 1.927357 - 24 0.960321 13.092470 -
Symposium Proceedings – Book of Full Papers 8
ECOLOGY 2017 11-13 May, Kayseri TURKEY
Criteria values obtained for seven different diameter models using model development data for Isparta region artificial Cedrus libani stand were given in Table 8. When the criterion valuesobtained for the tested models are examined, the correlation coefficients are high (R>0.78) and therefore there is a high correlation between the diameter relations and the stand characteristics of all the models. In order to find out which model is more successful in explaining diameter relations, a ranking is made for all the models according to the specified criteria and the results are given below. In this ranking method, numerical values are given starting from the smallest MAE, MAE, RMSE, ME, AIC values and for the R value, starting with the largest one. When the ranking values obtained for each model are collected, the model with the smallest value is determined as the best model (Table 9). When the table was examined, it was seen that the most successful model among the 7 diameter models is model 22, 21 and 18, respectively. Table 9. Criterion values and succession rankings of developed diameter models Model number
Criteria MAE MaxAE RMSE R ME AIC Rank
18 1.371775 (4) 5.214367(4) 1.712157(4) 0.662477(4) -0.000220(1) 93.80491(4) 3 19 1.361557 (3) 5.285016(5) 1.697729(3) 0.669547(3) 0.004036(5) 92.39168(3) 4 20 1.382802 (5) 5.117591(3) 1.724401(5) 0.656370(5) 0.135843(7) 94.99492(5) 5 21 1.174739 (2) 4.385264(2) 1.533884(2) 0.741379(2) -0.000220(2) 75.44311(2) 2 22 1.121697 (1) 4.124099(1) 1.411421(1) 0.788032(1) 0.085942(6) 63.54770(1) 1 23 1.739940 (7) 6.788676(7) 2.227399(7) 0.224368(7) -0.000221(3) 137.7394(7) 7 24 1.707783 (6) 6.422112(6) 2.194073(6) 0.280260(6) -0.000222(4) 135.2219(6) 6
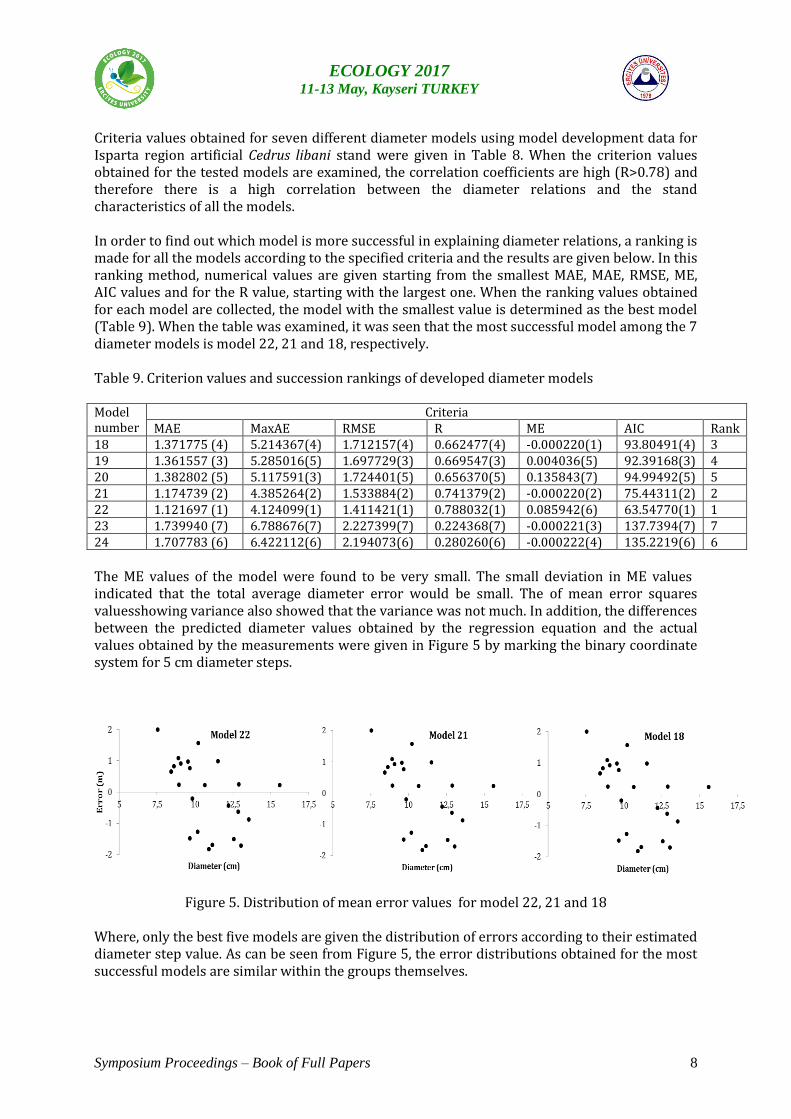
The ME values of the model were found to be very small. The small deviation in ME values indicated that the total average diameter error would be small. The of mean error squares valuesshowing variance also showed that the variance was not much. In addition, the differences between the predicted diameter values obtained by the regression equation and the actual values obtained by the measurements were given in Figure 5 by marking the binary coordinate system for 5 cm diameter steps.
Figure 5. Distribution of mean error values for model 22, 21 and 18 Where, only the best five models are given the distribution of errors according to their estimated diameter step value. As can be seen from Figure 5, the error distributions obtained for the most successful models are similar within the groups themselves.
Symposium Proceedings – Book of Full Papers 9
ECOLOGY 2017 11-13 May, Kayseri TURKEY
In general, although it has been found that error amounts increase in successful models due to diameter values increase the amount of error in our study did not increase but decreased. The variation with respect to error distributions obtained with the generalized diameter models can be said to be relatively constant. In general, when it is decided whether a model is successful, it is required that the amount of error is small, and that it has a certain and constant variance in the errors obtained. In this respect, model 22 and 21 can be considered successful. Estimates of diameter models developed for artificial Cedrus libani stand were also tested using an independent data set and the results obtained are given in Table 9. The diameter models tested, as can be seen from Table 10, are not very different from the model development data. Table 10. Criterion values and succession rank of successful diameter models with independent data set
Model number
Criteria MAE MaxAE RMSE R ME AIC Rank
22 1.079575(1) 4.886550(5) 1.491877(1) 0.734304(1) 0.644593(5) 18.00105(2) 2 21 1.168010(2) 4.289236(1) 1.522496(2) 0.708745(2) 0.541123(4) 16.61053(1) 1 18 1.329103(3) 4.363507(3) 1.691962(3) 0.620775(3) 0.249021(1) 19.77666(3) 3 19 1.348974(5) 4.354004(2) 1.733601(4) 0.614640(4) 0.257581(2) 22.50602(5) 4 20 1.341606(4) 4.626427(4) 1.750762(5) 0.584721(5) 0.403621(3) 20.80153(4) 5
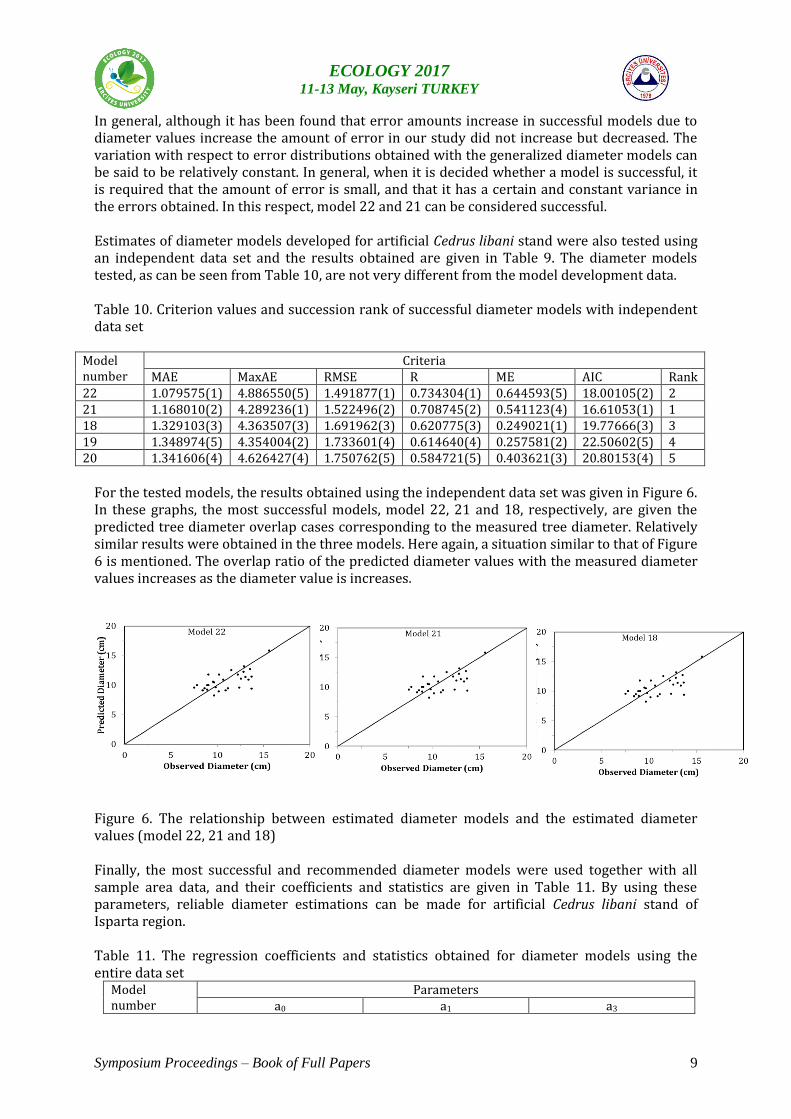
For the tested models, the results obtained using the independent data set was given in Figure 6. In these graphs, the most successful models, model 22, 21 and 18, respectively, are given the predicted tree diameter overlap cases corresponding to the measured tree diameter. Relatively similar results were obtained in the three models. Here again, a situation similar to that of Figure 6 is mentioned. The overlap ratio of the predicted diameter values with the measured diameter values increases as the diameter value is increases. Figure 6. The relationship between estimated diameter models and the estimated diameter values (model 22, 21 and 18) Finally, the most successful and recommended diameter models were used together with all sample area data, and their coefficients and statistics are given in Table 11. By using these parameters, reliable diameter estimations can be made for artificial Cedrus libani stand of Isparta region. Table 11. The regression coefficients and statistics obtained for diameter models using the entire data set
Model number
Parameters a0 a1 a3
Symposium Proceedings – Book of Full Papers 10
ECOLOGY 2017 11-13 May, Kayseri TURKEY
22 0.569744 0.578013 0.710453 21 0.610939 3.443655 - 18 0.460045 1.743052 - 19 -293.304661 286.337575 0.034000 20 0.508323 1.043483 -
4. Conclusions The study reveals that, crown diameter can easily be estimated by using linear and non-linear equations from diameter at breast height with high accuracy and precision. These models could simply be used in forest inventory operations for determining the forest stock and wildlife suitability index with less cost and time consuming. More research is needed with a greater variety of site and stand conditions in addition to a greater variety of tree sizes and ages. It should be noted that, the models developed by this study were based on data collected from Isparta in Turkey; therefore, it should be used width caution outside this area. Alometric equations are used to quantify the growth characteristics of biological events over a specific time period. With these equations, the growth and development characteristics of the trees which are biological entities can be defined at a certain period. Trees are also a difficult process in forestry. Even if the size of all trees is measured, their correctness is causing controversy due to some application errors. In this study, crown diameter and diameter model which is included in 24 literature including crown diameter (17 pieces) and diameter (7 pieces) for Cedrus libani were brought to Isparta region by afforestation was tried. For this purpose, 17 sample plots were taken and diameter, height, crown diameter, crown diameter, crown height measurements were made on 197 trees. The following conclusions were reached in the comparison using six different criteria values. The statistics and coefficients for the model in the study are similar to the model results used for the diameter-length relationship previously. Among the tested crown diameter and diameter models, the most successful are some models. While these results are compatible with the literature information, some of the models that failed in this study were among the successful models in other studies. This is due to the difference in biology and local conditions of the tree species. When the error distribution graphs of the models are examined, it can be said that the error distribution is relatively homogeneous for different diameter values and this distribution has a constant variance. Models tried for Cedrus libani can explain the tree height at the level of accuracy according to the diameter. Thus, in the Isparta region, tree crown diameter and diameter can be estimated with sufficient accuracy by measuring diameter in stands constructed by afforestation. The obtained equation can be used safely in estimating crown diameter and diameter according to the height, crown diameter, crown ratio and crown height in various simulation models to be made with increment and growth models to be formed in the local and artificial stands. As a result, the most suitable crown diameter and diameter models were determined for Isparta region artificial Cedrus libani plantation. These models should be preferred to traditional crown diameter and diameter models because they better reflect the increment and growth characteristics. However, separate crown diameter and diameter models should be developed
Symposium Proceedings – Book of Full Papers 11
ECOLOGY 2017 11-13 May, Kayseri TURKEY
taking into account differences in tree species, breeding patterns and growing environments in determining crown diameter and diameter relationships. References Avsar, M.O (2004). The relationships between diameter at breast height, tree height and crown diameter in Calabrain pines (Pinus brutia Ten.) of Baskonus Mountain, Kahramanmaras, Turkey. Journal of Biological Sciences 4(4): 437-440. Biging G.S, Dobbertin, M (1992). A comparison of distance- dependent competition measures for height and basal area growth of individual conifer trees. For. Sci. 38:695-720. Colbert, K.C., Larsen, D.R, Lootens, J.R (2002). Height-diameter equations for thirteen midwestern bottomland hardwood species. Northern Journal of Applied Forestry, 19(4):171-176. El-Mugheira M.I, Osman E.H (2014). Modelling the Relationship between and Diameter at Breast Height- Crown width Prediction models for Anogeissus leiocarpus (DC.) Guill & Perr and Combretum hartmannianum Schweinf. Journal of Forest Products and Industries, 3(4):191-197. Evcimen, B.S (1963). The Ecological Importance of Turkey Cedar Forests, Principles of Revenue Management. General Directorate of Forestry Publications, 199 p, Istanbul (in Turkish). Kalıpsız, A (1982). Forest Yield Study. İstanbul University Faculty of Forestry Publications, 349 p, Istanbul (in Turkish). Kalıpsız, A (1984). Dendrometry. İstanbul University Faculty of Forestry Publications, 359 p, Istanbul (in Turkish). Sönmez, T (2009). Diameter at breast height-crown diameter prediction models for Picea orientalis. African Journal of Agricultural Research 4(3): 215- 219. Vanclay, J.K (1994). Modeling forest growth and yield. Applications to Mixed Tropical Forests. CAB International, 312p., Wallingford.
Symposium Proceedings – Book of Full Papers 12
ECOLOGY 2017 11-13 May, Kayseri TURKEY
Diameter Growth Equations for Cedrus libani in Isparta
Yılmaz ÇATAL1 Serdar CARUS2
1,2 Süleyman Demirel University, Faculty of Forestry, Isparta-Turkey [email protected] [email protected],
Equation is presented that predict individual tree mean year diameter growth, outside bark, for Cedrus libani in Şehit Ali İhsan Kalmaz Forest-Isparta. The objective of study is to use different regression equations for estimating mean year diameter increment of last 5 year for a Cedrus libani plantation. Data used to develop the equations came from 197 trees sampled from 17 sample plots in plantation. For each tree, diameter, total height and diameter increment were measured. The available data for Cedrus libani tree was split into two sets: the majority (n=167) was used to estimate model parameters and the remaining data (n=30) were reserved to validate the model. Adjusted coefficients of determination (R2adj), numerical and graphical analyses of the residuals were used for evaluating the model. This equation expresses diameter increment as a function of diameter at breast height and stand basal area in trees with diameters larger than the subject tree’s diameter. The parameters of the equation were estimated by using stepwise regression. The model explained %26.1 of the variation in individual tree diameter increment of Cedrus libani plantation. This study recommended that, future research is needed with a greater variety of site index and stand conditions in addition to a greater variety of tree sizes and ages. It should be noted that, the model used by this study was based on data collected from Isparta; therefore, it should be used with caution outside this area. Key words: Competition index, diameter increment, diameter at breast height, basal area, site
index.
1. Introduction Cedrus libani is important commercial species of Turkey. The species also provide a variety of end uses such as poles, pulpwood and saw logs. It grows natural and plantations in Turkey. Equations for predicting diameter growth are an essential component of single-tree growth and yield models (Avery, 1983). Diameter growth predictions are used to characterize individual-tree development and to project the growth of stand basal area and volume. Both diameter growth and basal area growth have been used as the dependent variable in modelling the development of a tree’s diameter (Akalp, 1983; Saraçoğlu, 1988). The choice of which dependent variable to use has usually been suggested by the data, including the behaviour of the residuals and the goodness- of-fit of the resulting equations. Tree growth can be quantified by either diameter (dbh) or basal area increment. There has been considerable debate concerning the best method of modelling tree and stand growth. Diameter increment may be closer to real growth phenomena and better able describe tree performance. Diameter growth of individual trees on particular sites is influenced by number of factors such as, size, micro-environment, genetic characteristics and competitive status (Lorimer, 1983). This paper addresses the questions of variable selection and model building to explain the diameter growth of Cedrus libani plantation in about 50 ha of Isparta region. Different variable combinations were tested to maximize the R2 value of the model. 2. Material and Methods
Symposium Proceedings – Book of Full Papers 13
ECOLOGY 2017 11-13 May, Kayseri TURKEY
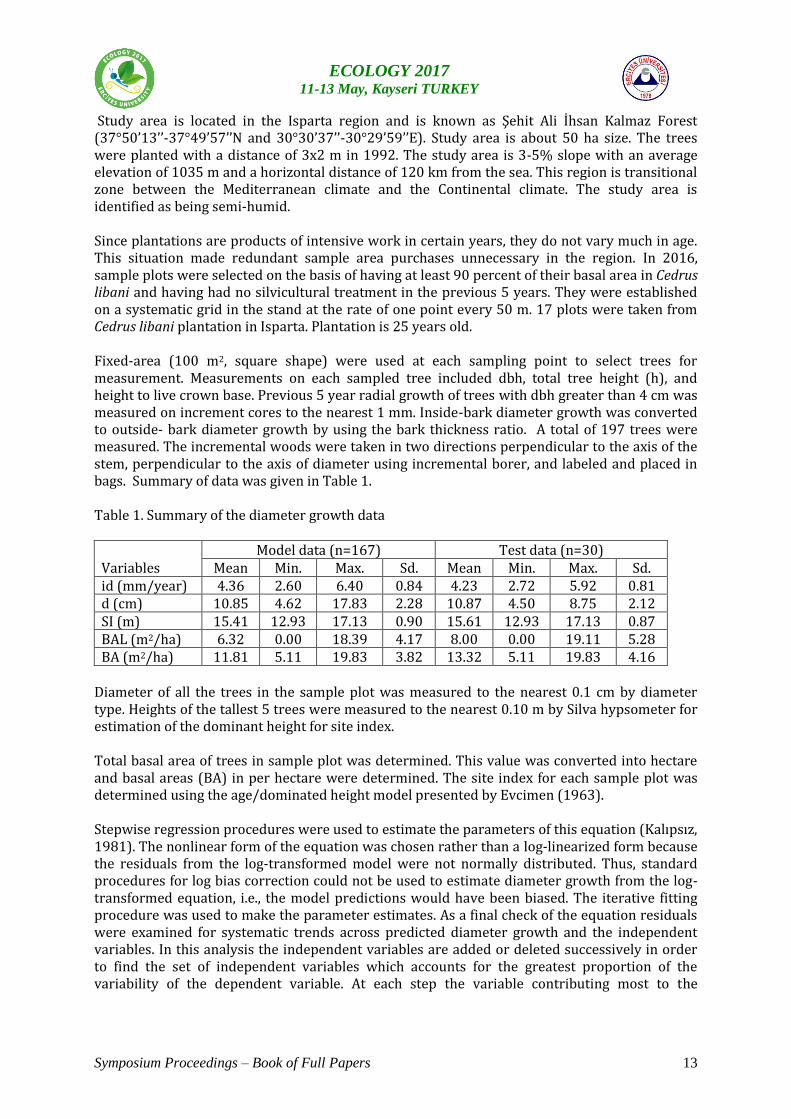
Study area is located in the Isparta region and is known as Şehit Ali İhsan Kalmaz Forest (37°50’13’’-37°49’57’’N and 30°30’37’’-30°29’59’’E). Study area is about 50 ha size. The trees were planted with a distance of 3x2 m in 1992. The study area is 3-5% slope with an average elevation of 1035 m and a horizontal distance of 120 km from the sea. This region is transitional zone between the Mediterranean climate and the Continental climate. The study area is identified as being semi-humid. Since plantations are products of intensive work in certain years, they do not vary much in age. This situation made redundant sample area purchases unnecessary in the region. In 2016, sample plots were selected on the basis of having at least 90 percent of their basal area in Cedrus libani and having had no silvicultural treatment in the previous 5 years. They were established on a systematic grid in the stand at the rate of one point every 50 m. 17 plots were taken from Cedrus libani plantation in Isparta. Plantation is 25 years old. Fixed-area (100 m2, square shape) were used at each sampling point to select trees for measurement. Measurements on each sampled tree included dbh, total tree height (h), and height to live crown base. Previous 5 year radial growth of trees with dbh greater than 4 cm was measured on increment cores to the nearest 1 mm. Inside-bark diameter growth was converted to outside- bark diameter growth by using the bark thickness ratio. A total of 197 trees were measured. The incremental woods were taken in two directions perpendicular to the axis of the stem, perpendicular to the axis of diameter using incremental borer, and labeled and placed in bags. Summary of data was given in Table 1. Table 1. Summary of the diameter growth data
Variables
Model data (n=167) Test data (n=30) Mean Min. Max. Sd. Mean Min. Max. Sd.
id (mm/year) 4.36 2.60 6.40 0.84 4.23 2.72 5.92 0.81 d (cm) 10.85 4.62 17.83 2.28 10.87 4.50 8.75 2.12 SI (m) 15.41 12.93 17.13 0.90 15.61 12.93 17.13 0.87 BAL (m2/ha) 6.32 0.00 18.39 4.17 8.00 0.00 19.11 5.28 BA (m2/ha) 11.81 5.11 19.83 3.82 13.32 5.11 19.83 4.16
Diameter of all the trees in the sample plot was measured to the nearest 0.1 cm by diameter type. Heights of the tallest 5 trees were measured to the nearest 0.10 m by Silva hypsometer for estimation of the dominant height for site index. Total basal area of trees in sample plot was determined. This value was converted into hectare and basal areas (BA) in per hectare were determined. The site index for each sample plot was determined using the age/dominated height model presented by Evcimen (1963). Stepwise regression procedures were used to estimate the parameters of this equation (Kalıpsız, 1981). The nonlinear form of the equation was chosen rather than a log-linearized form because the residuals from the log-transformed model were not normally distributed. Thus, standard procedures for log bias correction could not be used to estimate diameter growth from the log-transformed equation, i.e., the model predictions would have been biased. The iterative fitting procedure was used to make the parameter estimates. As a final check of the equation residuals were examined for systematic trends across predicted diameter growth and the independent variables. In this analysis the independent variables are added or deleted successively in order to find the set of independent variables which accounts for the greatest proportion of the variability of the dependent variable. At each step the variable contributing most to the
Symposium Proceedings – Book of Full Papers 14
ECOLOGY 2017 11-13 May, Kayseri TURKEY
“goodness of fit” is added to the analysis. Furthermore, theoretical growth relationships, graphical analysis of data and fit measures were considered in the model building. 3. Results It was aimed to establish a multiple variable model for estimating the diameter increment. Diameter increment, diameter, site index and competition index were investigated and a diameter increment model was developed. 3.1. Diameter- diameter increment relationship One of the factors that influence diameter increment is diameter. The diameter, which is related to the diameter increment, shows a linear relationship with the even aged stands and is expressed by Equation 1 (Kalıpsız, 1984).
daaid *10
(1)
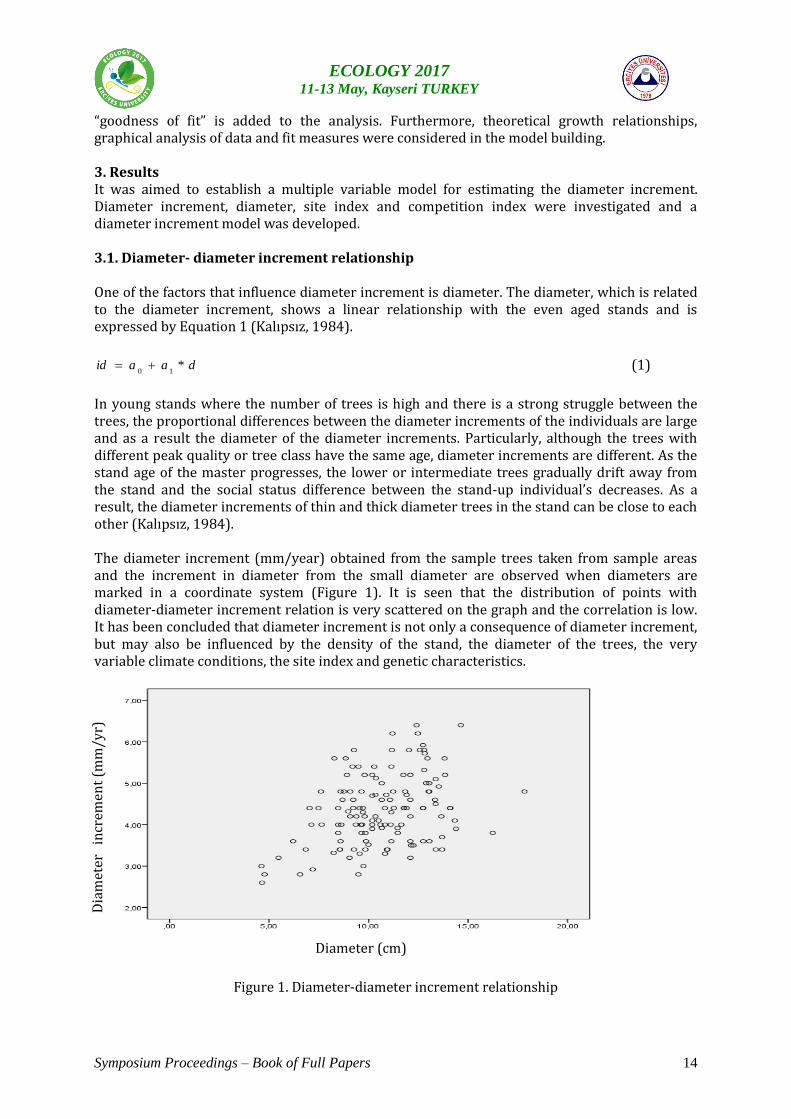
In young stands where the number of trees is high and there is a strong struggle between the trees, the proportional differences between the diameter increments of the individuals are large and as a result the diameter of the diameter increments. Particularly, although the trees with different peak quality or tree class have the same age, diameter increments are different. As the stand age of the master progresses, the lower or intermediate trees gradually drift away from the stand and the social status difference between the stand-up individual’s decreases. As a result, the diameter increments of thin and thick diameter trees in the stand can be close to each other (Kalıpsız, 1984). The diameter increment (mm/year) obtained from the sample trees taken from sample areas and the increment in diameter from the small diameter are observed when diameters are marked in a coordinate system (Figure 1). It is seen that the distribution of points with diameter-diameter increment relation is very scattered on the graph and the correlation is low. It has been concluded that diameter increment is not only a consequence of diameter increment, but may also be influenced by the density of the stand, the diameter of the trees, the very variable climate conditions, the site index and genetic characteristics.
Figure 1. Diameter-diameter increment relationship
Diameter (cm)
Dia
met
er
incr
emen
t (m
m/y
r)
Symposium Proceedings – Book of Full Papers 15
ECOLOGY 2017 11-13 May, Kayseri TURKEY
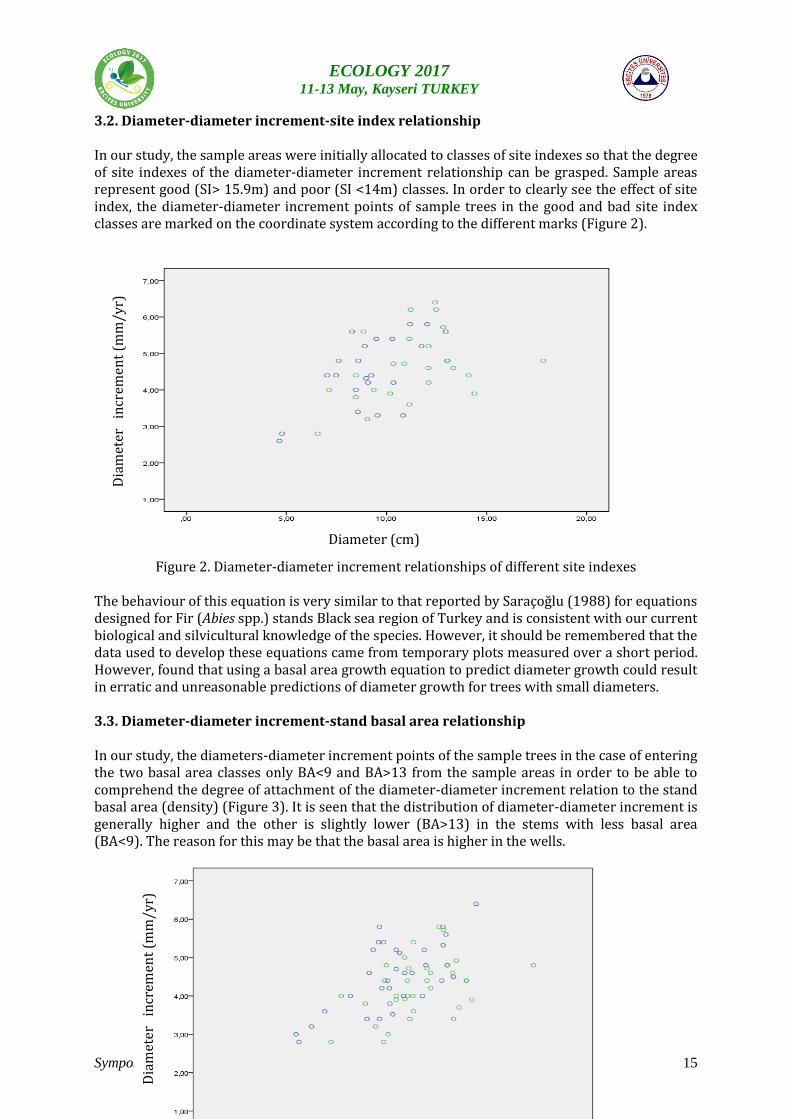
3.2. Diameter-diameter increment-site index relationship In our study, the sample areas were initially allocated to classes of site indexes so that the degree of site indexes of the diameter-diameter increment relationship can be grasped. Sample areas represent good (SI> 15.9m) and poor (SI <14m) classes. In order to clearly see the effect of site index, the diameter-diameter increment points of sample trees in the good and bad site index classes are marked on the coordinate system according to the different marks (Figure 2).
Figure 2. Diameter-diameter increment relationships of different site indexes The behaviour of this equation is very similar to that reported by Saraçoğlu (1988) for equations designed for Fir (Abies spp.) stands Black sea region of Turkey and is consistent with our current biological and silvicultural knowledge of the species. However, it should be remembered that the data used to develop these equations came from temporary plots measured over a short period. However, found that using a basal area growth equation to predict diameter growth could result in erratic and unreasonable predictions of diameter growth for trees with small diameters. 3.3. Diameter-diameter increment-stand basal area relationship In our study, the diameters-diameter increment points of the sample trees in the case of entering the two basal area classes only BA<9 and BA>13 from the sample areas in order to be able to comprehend the degree of attachment of the diameter-diameter increment relation to the stand basal area (density) (Figure 3). It is seen that the distribution of diameter-diameter increment is generally higher and the other is slightly lower (BA>13) in the stems with less basal area (BA<9). The reason for this may be that the basal area is higher in the wells.
Dia
met
er
incr
emen
t (m
m/y
r)
Diameter (cm)
Dia
met
er
incr
emen
t (m
m/y
r)
Symposium Proceedings – Book of Full Papers 16
ECOLOGY 2017 11-13 May, Kayseri TURKEY
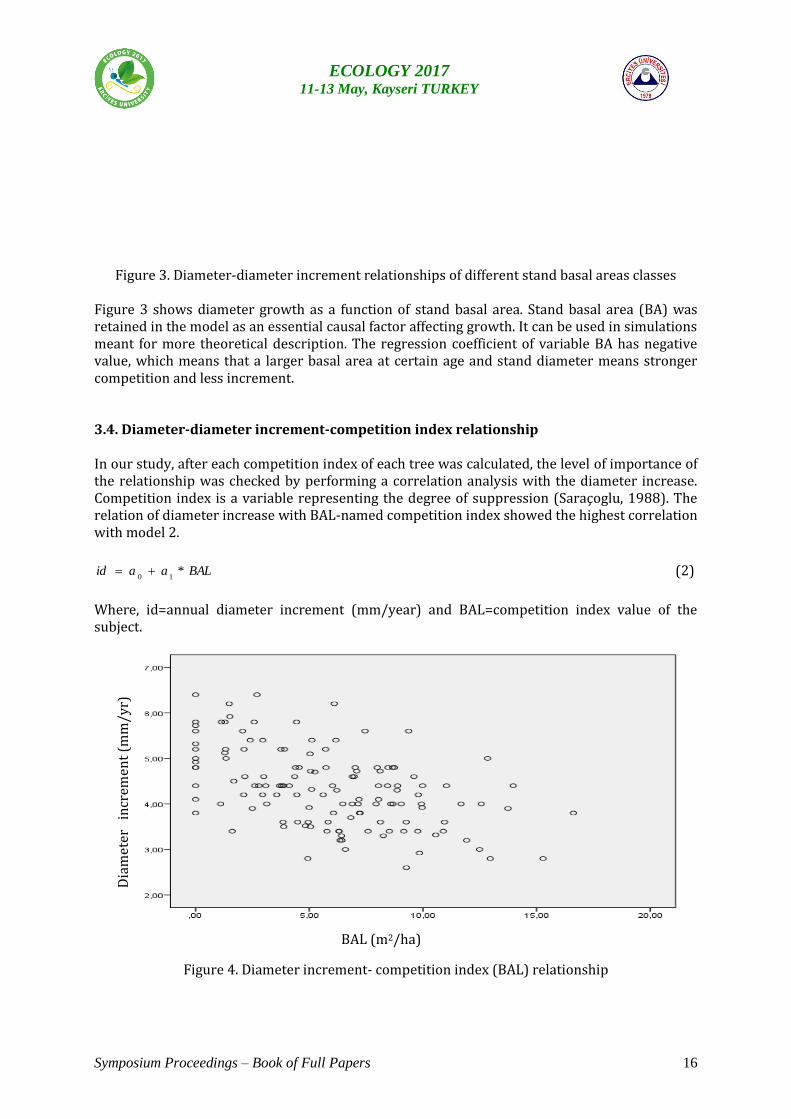
Figure 3. Diameter-diameter increment relationships of different stand basal areas classes Figure 3 shows diameter growth as a function of stand basal area. Stand basal area (BA) was retained in the model as an essential causal factor affecting growth. It can be used in simulations meant for more theoretical description. The regression coefficient of variable BA has negative value, which means that a larger basal area at certain age and stand diameter means stronger competition and less increment. 3.4. Diameter-diameter increment-competition index relationship In our study, after each competition index of each tree was calculated, the level of importance of the relationship was checked by performing a correlation analysis with the diameter increase. Competition index is a variable representing the degree of suppression (Saraçoglu, 1988). The relation of diameter increase with BAL-named competition index showed the highest correlation with model 2.
BALaaid *10
(2)
Where, id=annual diameter increment (mm/year) and BAL=competition index value of the subject.
Figure 4. Diameter increment- competition index (BAL) relationship
Dia
met
er
incr
emen
t (m
m/y
r)
BAL (m2/ha)
Symposium Proceedings – Book of Full Papers 17
ECOLOGY 2017 11-13 May, Kayseri TURKEY
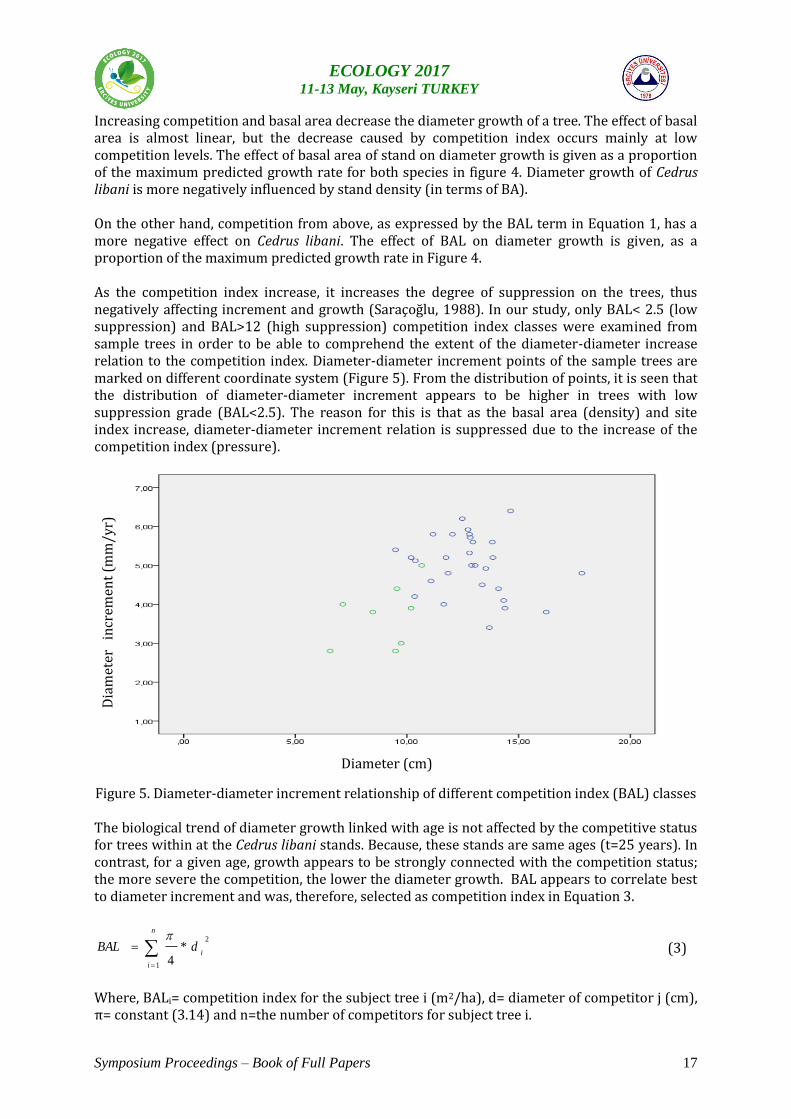
Increasing competition and basal area decrease the diameter growth of a tree. The effect of basal area is almost linear, but the decrease caused by competition index occurs mainly at low competition levels. The effect of basal area of stand on diameter growth is given as a proportion of the maximum predicted growth rate for both species in figure 4. Diameter growth of Cedrus libani is more negatively influenced by stand density (in terms of BA). On the other hand, competition from above, as expressed by the BAL term in Equation 1, has a more negative effect on Cedrus libani. The effect of BAL on diameter growth is given, as a proportion of the maximum predicted growth rate in Figure 4. As the competition index increase, it increases the degree of suppression on the trees, thus negatively affecting increment and growth (Saraçoğlu, 1988). In our study, only BAL< 2.5 (low suppression) and BAL>12 (high suppression) competition index classes were examined from sample trees in order to be able to comprehend the extent of the diameter-diameter increase relation to the competition index. Diameter-diameter increment points of the sample trees are marked on different coordinate system (Figure 5). From the distribution of points, it is seen that the distribution of diameter-diameter increment appears to be higher in trees with low suppression grade (BAL<2.5). The reason for this is that as the basal area (density) and site index increase, diameter-diameter increment relation is suppressed due to the increase of the competition index (pressure).
Figure 5. Diameter-diameter increment relationship of different competition index (BAL) classes
The biological trend of diameter growth linked with age is not affected by the competitive status for trees within at the Cedrus libani stands. Because, these stands are same ages (t=25 years). In contrast, for a given age, growth appears to be strongly connected with the competition status; the more severe the competition, the lower the diameter growth. BAL appears to correlate best to diameter increment and was, therefore, selected as competition index in Equation 3.
2
1
*4
i
n
i
dBAL
(3)
Where, BALi= competition index for the subject tree i (m2/ha), d= diameter of competitor j (cm), π= constant (3.14) and n=the number of competitors for subject tree i.
Dia
met
er
incr
emen
t (m
m/y
r)
Diameter (cm)
Symposium Proceedings – Book of Full Papers 18
ECOLOGY 2017 11-13 May, Kayseri TURKEY
3.5. Diameter increment and diameter, site index, stand basal area and competition index
relationship Estimating the diameter increase only by the diameter is not reliable enough. Because the factors such as the density of stand and site index on the diameter increment are also influential. Akalp (1983) periodic diameter increment, competition index and basal area and Carus and Çiçek (2007) age, diameter and competition index. They tried to explain with the model which includes competition index. In this study, it is considered appropriate to use a regression equation suitable for estimating the diameter increase of single trees by taking the free parameters of the competition index, age and the diameter of the tree, which also include these factors. Dominant individuals with the same diameter and age in the sample areas were observed to have significantly different diameter increment differences compared to the site index or the basal area (due to side and crown pressures). Although good staggered stalks have the same age of the stands, the basal area and the site index class have the same diameter-diameter increment relationship as they will have more basal area (Saraçoğlu, 1988). The use of a large number of variables in the model to be selected will make it difficult to grasp the usability and relationship of the model. In addition, the number of variables should be reduced by introducing the most efficient model from the variables that affect the diameter increment (dependent variable) in the same direction (Saraçoğlu, 1988). In our study, BA, SI and BAL of the independent variables have negative effect on the diameter increment. Other word, if their value increases, the diameter increment will decrease. If these variables were independent of each other, it would be appropriate to insert all of the modeling, since the sum of their effects would have a negative effect on the diameter increase. However, they are variables that represent the same pressure variable, but are not related to each other and are not collectable. For this, it is more appropriate to model those variables that best represent the impression. Because of this same side effect, it has been decided to include only the competition index, which is thought to be a little more effective, in a general statistical model to represent the diameter-diameter increment. In our study the shape of the diameter-diameter increment relation was defined by linear model 4.
BALdaBALadaaid ****3210
(4)
Where, id= diameter growth of tree (mm/yr), dbh= diameter at breast height (cm), BAL= stand basal area in trees with dbh larger than that of the subject tree (m2/ha) and a0,,,,a6= parameters to be estimated. Coefficients of the expression determined by model 4 were processed into a data log on the computer in triplicate data groups, such as annual diameter increment, diameter and competition index measurements from the sample trees in the sample areas. Coefficients and statistics for model 4 are given in Table 2. The curves drawn by using the adjusted regression equation (model 4) according to the competition index of diameter increments (mm/year) in the diameter steps was shown in Figure 6.
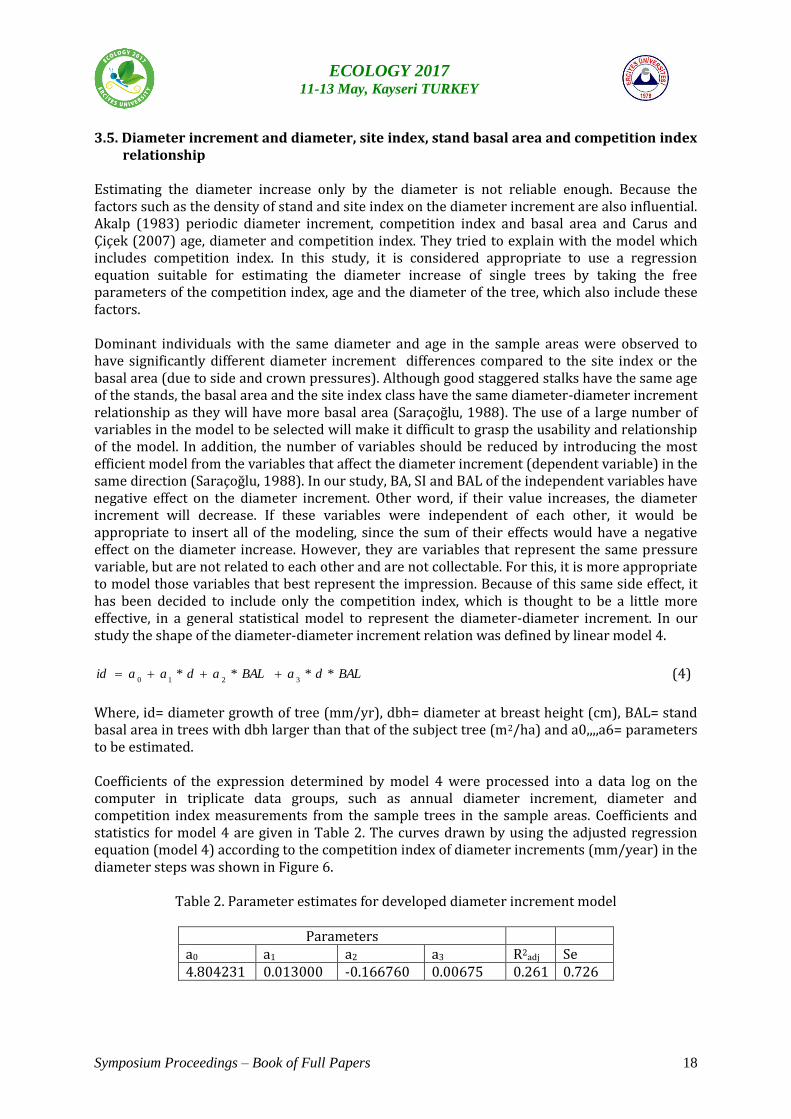
Table 2. Parameter estimates for developed diameter increment model
Parameters a0 a1 a2 a3 R2adj Se 4.804231 0.013000 -0.166760 0.00675 0.261 0.726
Symposium Proceedings – Book of Full Papers 19
ECOLOGY 2017 11-13 May, Kayseri TURKEY
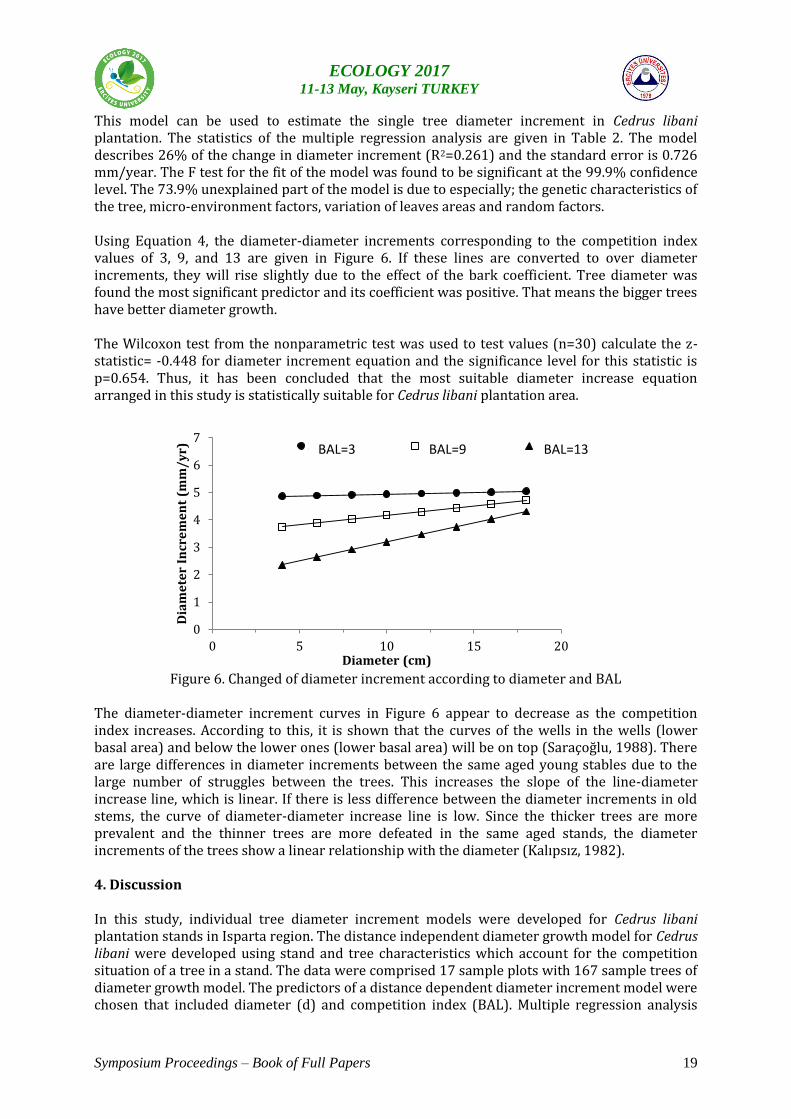
This model can be used to estimate the single tree diameter increment in Cedrus libani plantation. The statistics of the multiple regression analysis are given in Table 2. The model describes 26% of the change in diameter increment (R2=0.261) and the standard error is 0.726 mm/year. The F test for the fit of the model was found to be significant at the 99.9% confidence level. The 73.9% unexplained part of the model is due to especially; the genetic characteristics of the tree, micro-environment factors, variation of leaves areas and random factors. Using Equation 4, the diameter-diameter increments corresponding to the competition index values of 3, 9, and 13 are given in Figure 6. If these lines are converted to over diameter increments, they will rise slightly due to the effect of the bark coefficient. Tree diameter was found the most significant predictor and its coefficient was positive. That means the bigger trees have better diameter growth. The Wilcoxon test from the nonparametric test was used to test values (n=30) calculate the z-statistic= -0.448 for diameter increment equation and the significance level for this statistic is p=0.654. Thus, it has been concluded that the most suitable diameter increase equation arranged in this study is statistically suitable for Cedrus libani plantation area.
Figure 6. Changed of diameter increment according to diameter and BAL
The diameter-diameter increment curves in Figure 6 appear to decrease as the competition index increases. According to this, it is shown that the curves of the wells in the wells (lower basal area) and below the lower ones (lower basal area) will be on top (Saraçoğlu, 1988). There are large differences in diameter increments between the same aged young stables due to the large number of struggles between the trees. This increases the slope of the line-diameter increase line, which is linear. If there is less difference between the diameter increments in old stems, the curve of diameter-diameter increase line is low. Since the thicker trees are more prevalent and the thinner trees are more defeated in the same aged stands, the diameter increments of the trees show a linear relationship with the diameter (Kalıpsız, 1982). 4. Discussion In this study, individual tree diameter increment models were developed for Cedrus libani plantation stands in Isparta region. The distance independent diameter growth model for Cedrus libani were developed using stand and tree characteristics which account for the competition situation of a tree in a stand. The data were comprised 17 sample plots with 167 sample trees of diameter growth model. The predictors of a distance dependent diameter increment model were chosen that included diameter (d) and competition index (BAL). Multiple regression analysis
0
1
2
3
4
5
6
7
0 5 10 15 20
Dia
me
ter
Incr
em
en
t (m
m/
yr)
Diameter (cm)
Seri 1 Seri 2 Seri 3BAL=13 BAL=3 BAL=9
Symposium Proceedings – Book of Full Papers 20
ECOLOGY 2017 11-13 May, Kayseri TURKEY
was used to estimate the effect of these variables on diameter growth (Equation 3). Models explained about 60% of the variation at the average in individual tree diameter increment. These models can be estimated diameter increment of individual trees at highly significant level (p<0.001). Pukkala and Kolstrom (1987) for Pinus sylvestris L. and Tome and Burkhart (1989) for Eucalyptus globus stated that competition index can decrease the residual variation in diameter increment by about 20% and 12%, respectively. In this study, residual variance of competition index (BAL) was the highest (23.9%). Competition index (BAL) was the strongest predictor of the diameter growth models. In the model, increasing competition, decrease diameter increment of a tree (Figures 1 and 2). The high average past growth is also an indication of a high diameter increment in the future. Diameter increment models will provide useful information in order to make projections of future forest dynamics for Cedrus libani stands in Isparta region. References Akalp, T (1983). Simulation of Increment and Growth of Uneven Aged Stands. Istanbul
University Forest Faculty Publications, 169 p., Istanbul (in Turkish). Avery, T E, Burkhart, H E (1983). Forest measurements. Ed.3. McGraw-Hill, 331p., New York. Carus, S, Çiçek, E (2007). A diameter increment model for individual trees of ash (Fraxinus
angustifolia Vahl.) plantations in Adapazarı- Suleymaniye. Süleyman Demirel University Journal of Forestry, 1, 34-48.
Evcimen, B S (1963). The Ecological Importance of Turkey Cedar Forests, Principles of Revenue Management. General Directorate of Forestry Publications, 199 p, Istanbul (in Turkish).
Kalıpsız, A (1981). Statistical Methods. İstanbul University Faculty of Forestry Publications, 359 p, Istanbul (in Turkish).
Kalıpsız, A (1982). Forest Yield Study. İstanbul University Faculty of Forestry Publications, 349 p, Istanbul (in Turkish).
Kalıpsız, A (1984). Dendrometry. İstanbul University Faculty of Forestry Publications, 359 p, Istanbul (in Turkish).
Lorimer, C G (1983). Tests of a age independent competition indices for individual trees in natural hardwood stands. For Ecol Manage 6:343- 360.
Pukkala T, Kolström, T (1987). Competition indices and the prediction of radial growth in Scots pine. Silva Fen. 1: 55–67.
Saraçoğlu, Ö (1988). Increment and Growth in Fir Stands of Black Sea Region. General Directorate of Forestry Publications, 312 p., Istanbul (in Turkish).
Tomé M. Burkhart, H.E (1989). Distance-dependent competition measures for predicting growth of individual trees. For. Sci. 35: 816–831.
Symposium Proceedings – Book of Full Papers 21
ECOLOGY 2017 11-13 May, Kayseri TURKEY
Clean Environmental Management (Kocaeli-Turkey)
Arzu MorkoyunluYüce1, A.Osman Yıldırım
2, Ufuk S.Kaya
2, Şebnem Erkebay
3 ,Gönül
Konakay1
1Kocaeli University, Hereke Ö.İ. Uzunyol Vocational High School, 41800/Kocaeli/Turkey
2Körfez Municipality, Cleaning Services Department, 41800 Kocaeli/Turkey
1Kocaeli University, Gazanfer Bilge Uzunyol Vocational High School, 41800/Kocaeli/Turkey
Corresponding Author: e-mail:[email protected]
Abstract:In this study, the main center of Kocaeli in Turkey industrial / bay located on the main street
of the town was carried out in 2015, 195 in business . As a result, traffic density with 38.5 % and to
park the vehicles of the street , the inadequacy of 25.5 % environmental monitoring , pollution
continuous street of 20.5 % public and trades, problems are identified lack of 15.5 % housekeeping
staff. However, an increase of 29% of the environmental audit , the awareness of 22.7% shopkeepers
and citizens, environmental cleanliness , cleanliness preventing the sidewalk occupations, 19.5 % to be
made small dustbins for waste 14.6 % and 14.2% recycling they suggested that increasing the number
of containers. Local government as the short, medium and long-term sustainable environmental
planning programs have been created.
KeyWords:Environmentalmanagement, waste, business,survey, Kocaeli
1.Introduction
Sustainable environmental management is made possible by raising the environmental awareness of
the individuals who form the societies and by taking environmental measures. National and
international organizations and institutions often emphasize the importance of environmental
education for the development of environmental awareness. Creating and developing environmental
awareness in the society, and encouraging everyboby to protect the environment in which they live is
an important step in the solution of environmental problems (Özbebek Tunç et al., 2012). Studies
related to environmental education carried out in our country have increased substantially especially in
recent years (Oğuz et al,. 2011). While most of the studies are carried out in the field of education, the
number of studies related to environmental awareness is increasing in other areas as well (Uzun and
Sağlam, 2005; Çavuş et al., 2013; Kızılaslan and Kızılaslan, 2005; Yalım and Kurban, 2013;
Mansuroğlu et al., 2008; Artun and Bakırcı, 2012). In a study carried out in Adana urban scale, it was
aimed to determine the level of environmental sensitivity of the people living the city, and as a result
of the study; it was determined that there was difference between environmental consciousness and
attitude values, and that environmental awareness level of the urban people was evaluated as
"moderate" (Oğuz et al., 2011). In a study conducted by Mersin Metropolitan Municipality, citizens'
satisfaction levels with municipal services were measured (Duman and Yüksel 2008). The most
effective and lasting solution to remove environmental problems and combat these problems is
undoubtedly to educate communities with environmental awareness. Effective environmental
education should be given to individuals in order to raise awareness about the environment.
Environmental education is a process that requires continuous learning that enables individuals to
develop awareness of their surroundings, provides the recognition of environmental values, attitudes
and concepts, and provides knowledge, skills, value and experience to solve environmental problems
to leave a healthy and clean environment for the future generations. With environmental awareness
Symposium Proceedings – Book of Full Papers 22
ECOLOGY 2017 11-13 May, Kayseri TURKEY
training, it is aimed to get the individuals to know especially the environment they live in and the
environmental problems, to raise awareness towards them, to acquire positive and realistic attitudes
about the environment and actively participate in solving their problems (Güven and Aydoğdu 2012).
Social activities and their effects are very important in environmental management. The most concrete
way to prevent or minimize environmental problems is to educate people. It is then believed that
environmental problems will be partially reduced (Artun-Bakırcı, 2012). The municipalities play a
major role in the conduct of environmental studies. One of the reasons increasing the importance of
the municipalities in the environmental management is their infrastructure, which is largely based on
public participation. The municipalities need a joint effort by individuals to maintain the
sustainability of environmental resources (Şengül, 1999). In this respect, coordinated work of
municipalities and people is needed. In Kocaeli-Körfez region, it was aimed to raise the awareness of
the environment and to create a projection for sustainable clean environment management by taking
into consideration the existing municipality applications, the problems of the residents in the region
and the solution proposals for these problems.
2.Research Area and Methodology
Kocaeli is at the center of major land, sea and rail transport networks connecting Europe to Anatolia
and the Middle East. Its proximity to major metropoles and its connection to the Black Sea and the
Marmara has been a factor in its development as a center for industry, commerce, transportation and
logistics. Kocaeli makes up a 13% share of the Turkish manufacturing industry. There are
approximately 2,350 important industrial investments in Kocaeli, including 247 foreign capital.
Infrastructure facilities such as dam, natural gas, communication, electricity, waste incineration
facilities have been developed in the region. The sectors in Kocaeli are; vehicle and subsidiary
industries, chemicals and petrochemicals, machinery, plastics and iron and steel. The chemical
industry in Kocaeli Manufacturing industry ranks first with 27% share in the Manufacturing Industry
of Turkey (Anonymous, 2014). The study was carried out in the Körfez district with a population of
146,210 located in the north of the Izmit Gulf. Its geographical coordinates are 40 ° 46 '36 "North and
29 ° 43' 46" East. Industrial establishments in different areas operate in the region. In the study,
Ağadere Caddesi, Mehmet Akif Ersoy Caddesi and Tuğrul Caddesi, which are the most important
streets of the district, were chosen as the survey application area. It is aimed to increase the
environmental awareness and establish sustainable clean environment management by taking into
account the municipality applications in the district, problems of the district residents and solution
proposals to those problems. In this context, a face-to-face survey study was conducted on 390
tradesmen by the Environmental Cleaning and Auditing Department of Kocaeli University
and Cleaning Services Department of Kocaeli Municipality. In addition, proposals of the
tradesmen for the streets were also determined during the survey study.
3.Results
The results of the survey conducted in order to reach a cleaner and more environmentally friendly
understanding in our selected main streets in Kocaeli -Körfez region (Ağadere, Tuğrul and Mehmet
Akif Ersoy) were evaluated. This study has revealed the general view of our tradesmen in the main
arteries. The results of the survey are shown in Table 1-11 and Figure 1-11.
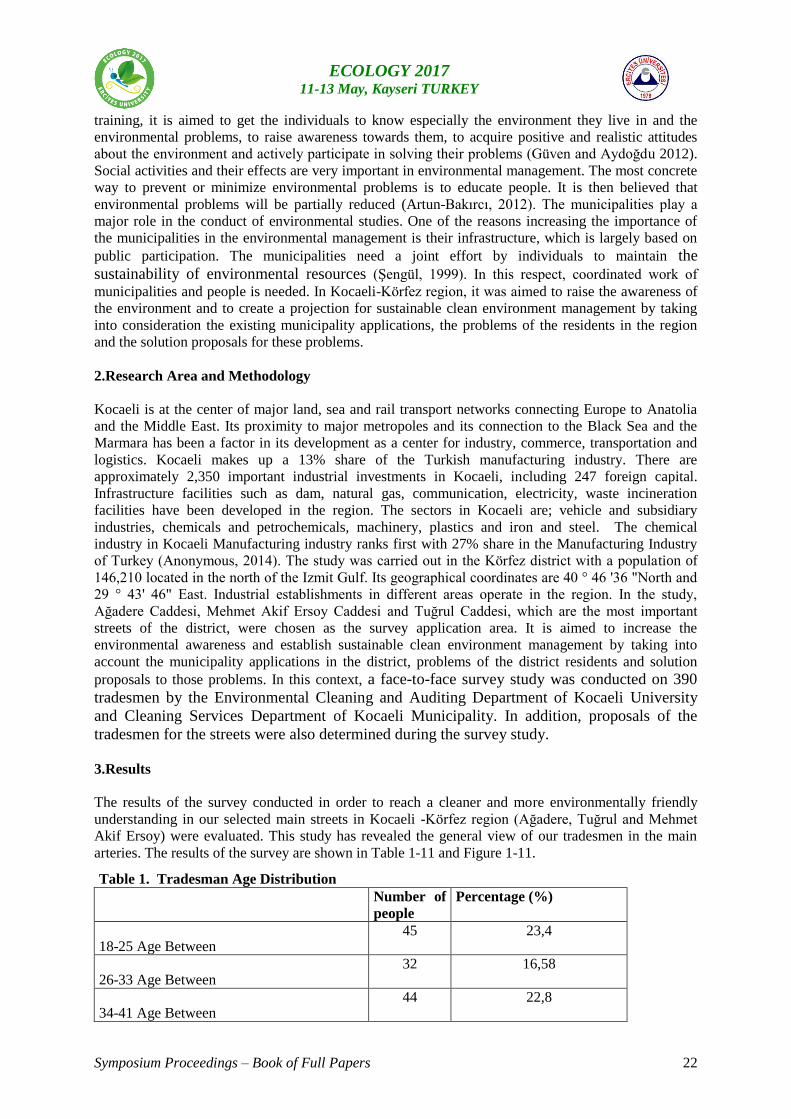
Table 1. Tradesman Age Distribution
Number of
people
Percentage (%)
18-25 Age Between 45 23,4
26-33 Age Between 32 16,58
34-41 Age Between 44 22,8
Symposium Proceedings – Book of Full Papers 23
ECOLOGY 2017 11-13 May, Kayseri TURKEY
39-42 Age Between 32 16,6
50 Age Over 40 20,7
Total 193 100
Figure1. Age values of the tradesmen surveyed
The majority of traders in the streets (with 23.4%) are in the age range of 18-25.
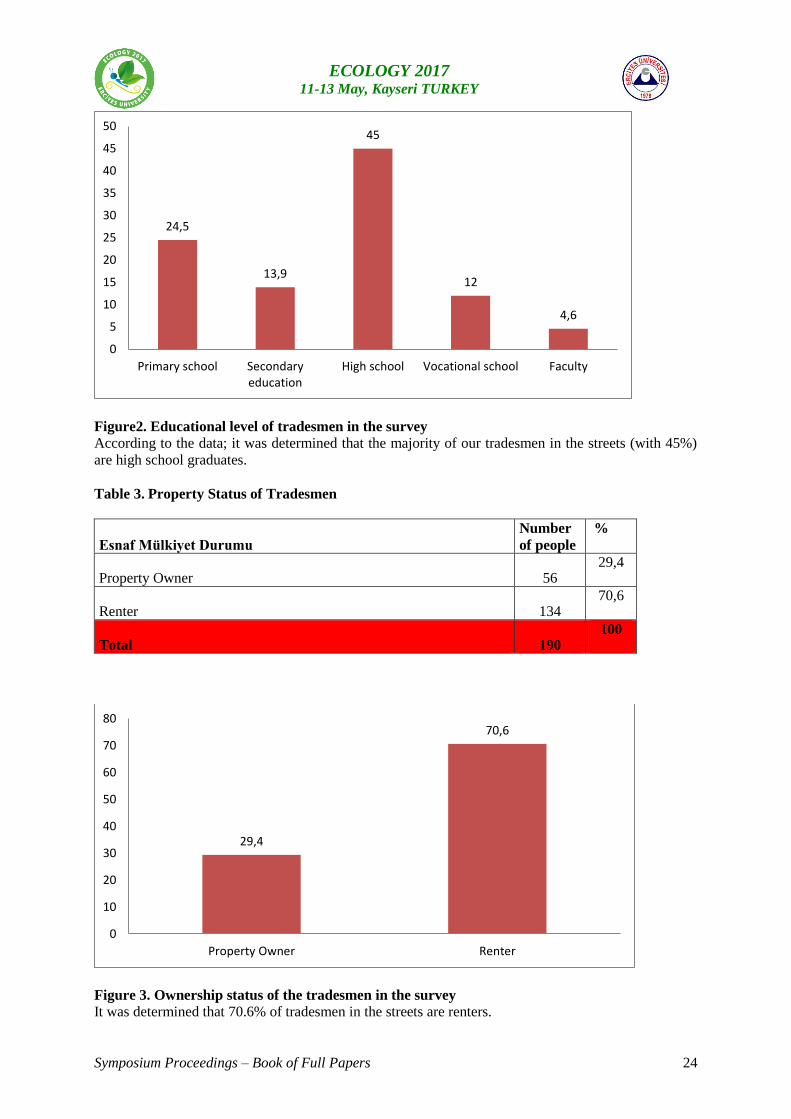
Table 2. Tradesman's Education
Tradesman's Education Number of
people
Percentage (%)
Primary school 47 24,5
Secondary education 27 13,9
High school 87 45
Vocational school 23 12
Faculty 9 4,6
23,5
16,58
22,8
16,6
20,7
0
5
10
15
20
25
18-25 AgeBetween
26-33 AgeBetween
34-41 AgeBetween
39-42 AgeBetween
50 Age Over
Symposium Proceedings – Book of Full Papers 24
ECOLOGY 2017 11-13 May, Kayseri TURKEY
Figure2. Educational level of tradesmen in the survey
According to the data; it was determined that the majority of our tradesmen in the streets (with 45%)
are high school graduates.
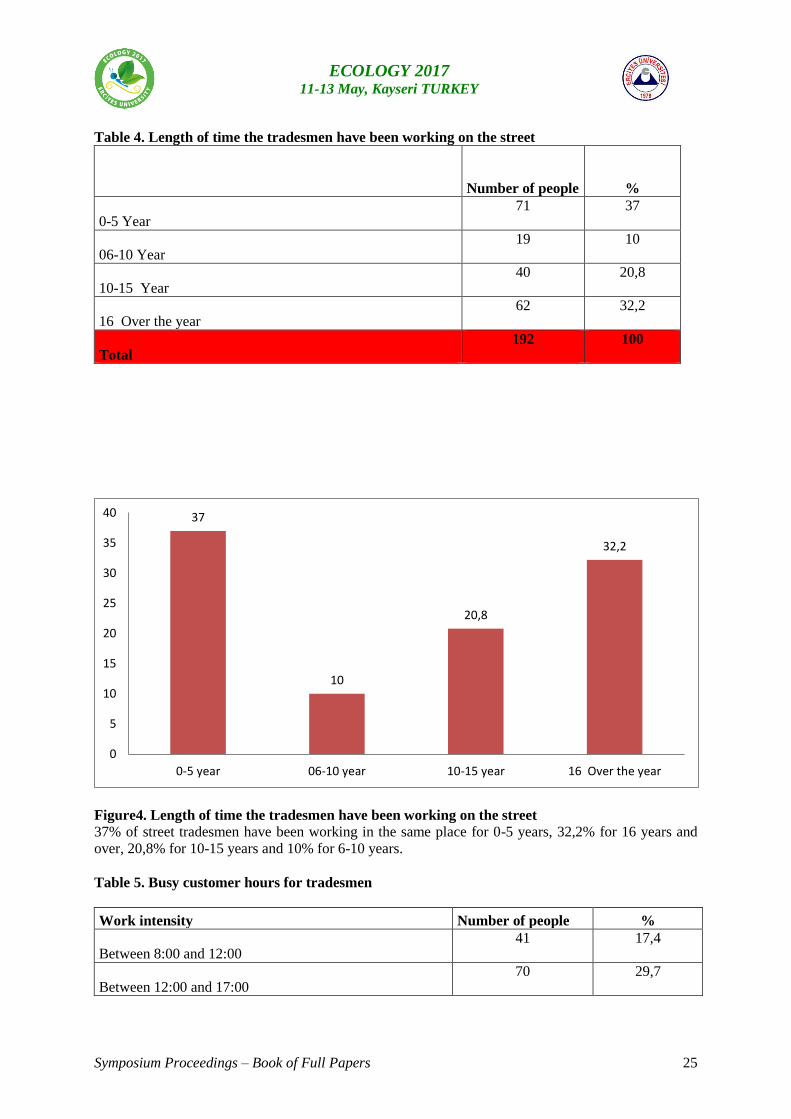
Table 3. Property Status of Tradesmen
Esnaf Mülkiyet Durumu
Number
of people
%
Property Owner 56 29,4
Renter 134 70,6
Total 190 100
Figure 3. Ownership status of the tradesmen in the survey
It was determined that 70.6% of tradesmen in the streets are renters.
24,5
13,9
45
12
4,6
0
5
10
15
20
25
30
35
40
45
50
Primary school Secondaryeducation
High school Vocational school Faculty
29,4
70,6
0
10
20
30
40
50
60
70
80
Property Owner Renter
Symposium Proceedings – Book of Full Papers 25
ECOLOGY 2017 11-13 May, Kayseri TURKEY
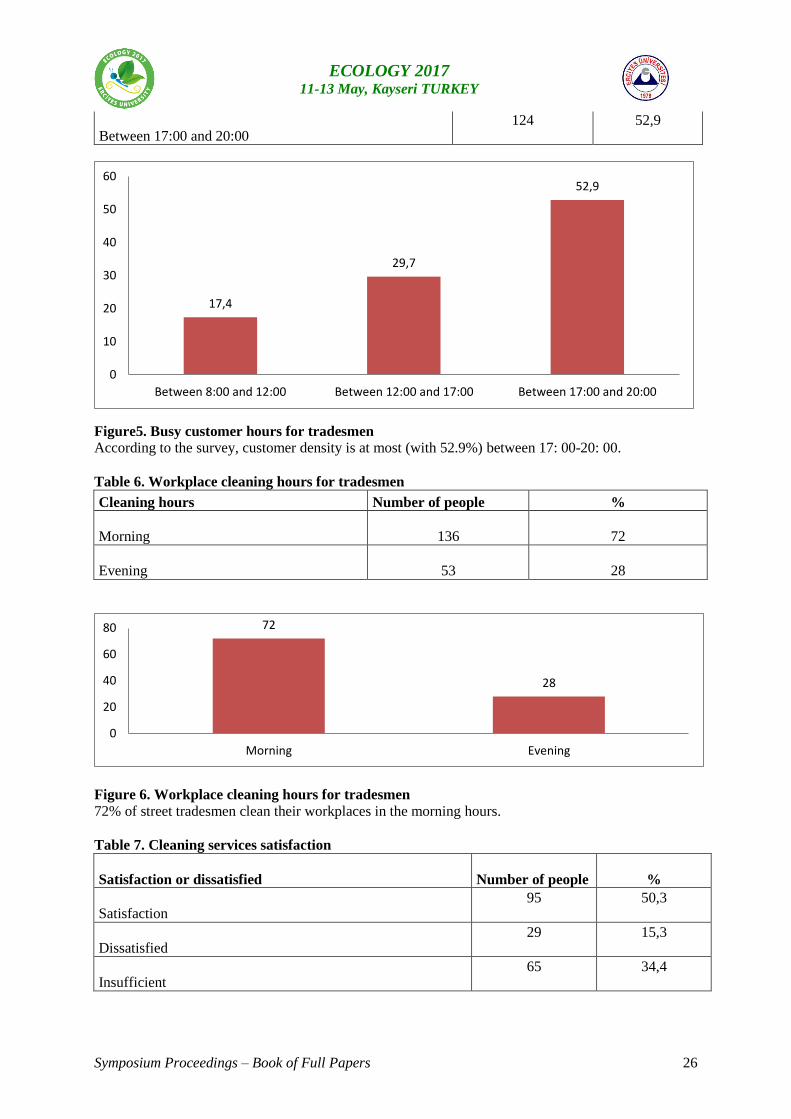
Table 4. Length of time the tradesmen have been working on the street
Number of people
%
0-5 Year 71 37
06-10 Year 19 10
10-15 Year 40 20,8
16 Over the year 62 32,2
Total 192 100
Figure4. Length of time the tradesmen have been working on the street
37% of street tradesmen have been working in the same place for 0-5 years, 32,2% for 16 years and
over, 20,8% for 10-15 years and 10% for 6-10 years.
Table 5. Busy customer hours for tradesmen
Work intensity Number of people %
Between 8:00 and 12:00 41 17,4
Between 12:00 and 17:00 70 29,7
37
10
20,8
32,2
0
5
10
15
20
25
30
35
40
0-5 year 06-10 year 10-15 year 16 Over the year
Symposium Proceedings – Book of Full Papers 26
ECOLOGY 2017 11-13 May, Kayseri TURKEY
Between 17:00 and 20:00 124 52,9
Figure5. Busy customer hours for tradesmen According to the survey, customer density is at most (with 52.9%) between 17: 00-20: 00.
Table 6. Workplace cleaning hours for tradesmen
Cleaning hours Number of people %
Morning 136
72
Evening 53
28
Figure 6. Workplace cleaning hours for tradesmen
72% of street tradesmen clean their workplaces in the morning hours.
Table 7. Cleaning services satisfaction
Satisfaction or dissatisfied Number of people %
Satisfaction 95 50,3
Dissatisfied 29 15,3
Insufficient 65 34,4
17,4
29,7
52,9
0
10
20
30
40
50
60
Between 8:00 and 12:00 Between 12:00 and 17:00 Between 17:00 and 20:00
72
28
0
20
40
60
80
Morning Evening
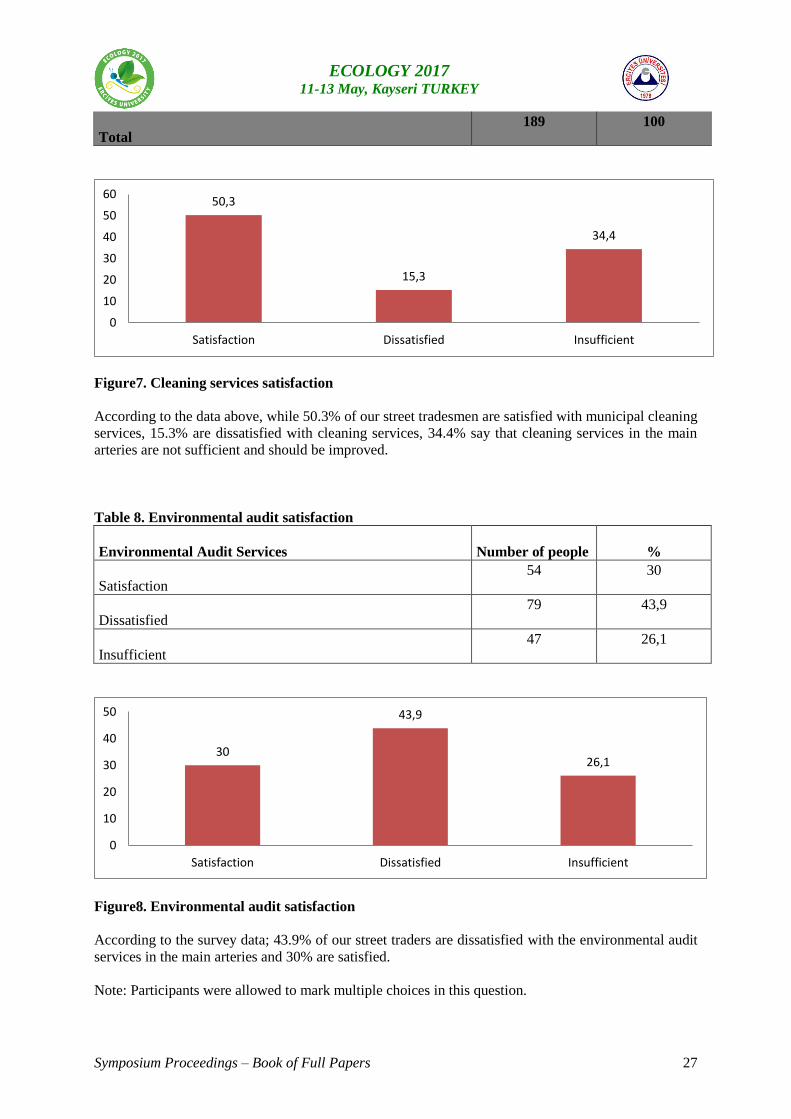
Symposium Proceedings – Book of Full Papers 27
ECOLOGY 2017 11-13 May, Kayseri TURKEY
Total 189 100
Figure7. Cleaning services satisfaction
According to the data above, while 50.3% of our street tradesmen are satisfied with municipal cleaning
services, 15.3% are dissatisfied with cleaning services, 34.4% say that cleaning services in the main
arteries are not sufficient and should be improved.
Table 8. Environmental audit satisfaction
Environmental Audit Services Number of people %
Satisfaction 54 30
Dissatisfied 79 43,9
Insufficient 47 26,1
Figure8. Environmental audit satisfaction
According to the survey data; 43.9% of our street traders are dissatisfied with the environmental audit
services in the main arteries and 30% are satisfied.
Note: Participants were allowed to mark multiple choices in this question.
50,3
15,3
34,4
0
10
20
30
40
50
60
Satisfaction Dissatisfied Insufficient
30
43,9
26,1
0
10
20
30
40
50
Satisfaction Dissatisfied Insufficient
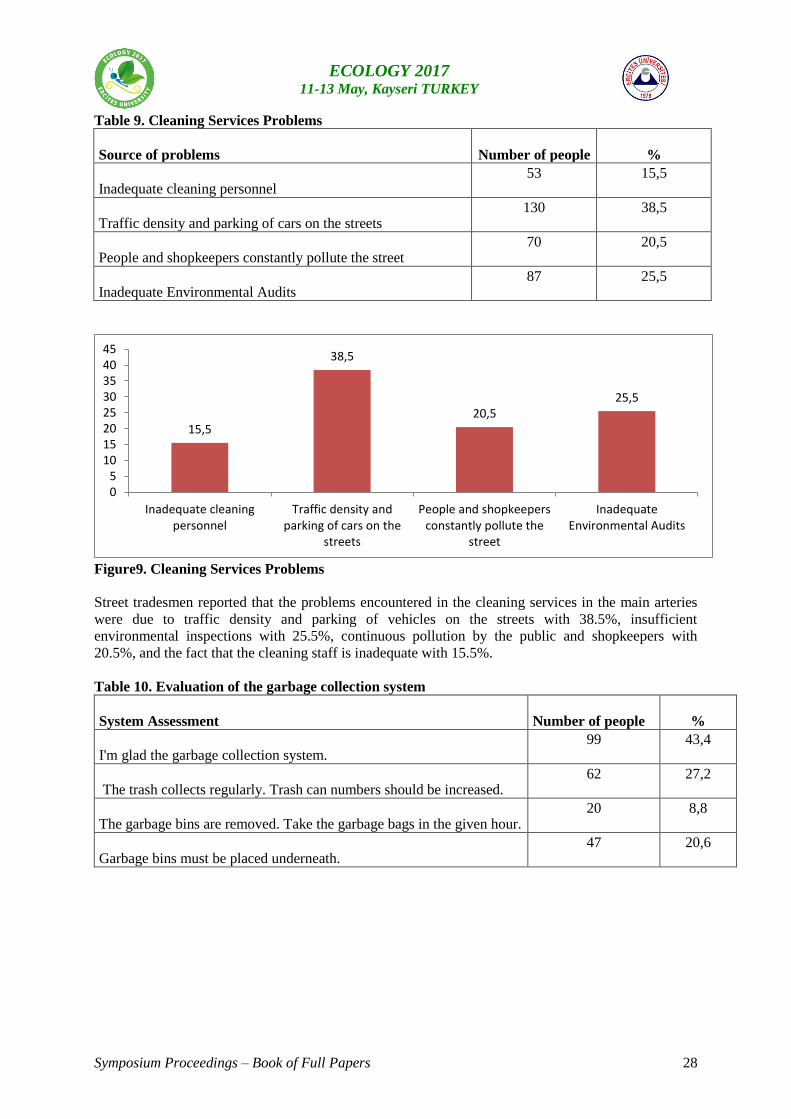
Symposium Proceedings – Book of Full Papers 28
ECOLOGY 2017 11-13 May, Kayseri TURKEY
Table 9. Cleaning Services Problems
Source of problems Number of people %
Inadequate cleaning personnel 53 15,5
Traffic density and parking of cars on the streets 130 38,5
People and shopkeepers constantly pollute the street 70 20,5
Inadequate Environmental Audits 87 25,5
Figure9. Cleaning Services Problems
Street tradesmen reported that the problems encountered in the cleaning services in the main arteries
were due to traffic density and parking of vehicles on the streets with 38.5%, insufficient
environmental inspections with 25.5%, continuous pollution by the public and shopkeepers with
20.5%, and the fact that the cleaning staff is inadequate with 15.5%.
Table 10. Evaluation of the garbage collection system
System Assessment Number of people %
I'm glad the garbage collection system. 99 43,4
The trash collects regularly. Trash can numbers should be increased. 62 27,2
The garbage bins are removed. Take the garbage bags in the given hour. 20 8,8
Garbage bins must be placed underneath. 47 20,6
15,5
38,5
20,5 25,5
05
1015202530354045
Inadequate cleaningpersonnel
Traffic density andparking of cars on the
streets
People and shopkeepersconstantly pollute the
street
InadequateEnvironmental Audits
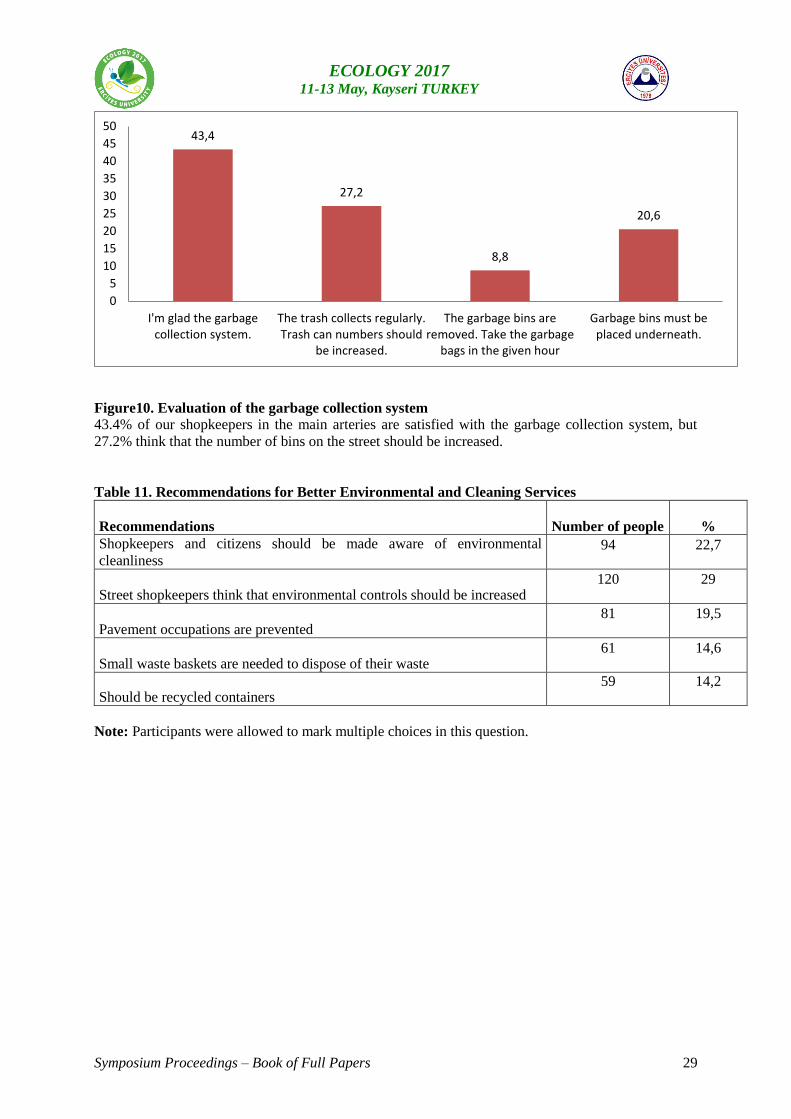
Symposium Proceedings – Book of Full Papers 29
ECOLOGY 2017 11-13 May, Kayseri TURKEY
Figure10. Evaluation of the garbage collection system
43.4% of our shopkeepers in the main arteries are satisfied with the garbage collection system, but
27.2% think that the number of bins on the street should be increased.
Table 11. Recommendations for Better Environmental and Cleaning Services
Recommendations Number of people %
Shopkeepers and citizens should be made aware of environmental
cleanliness 94 22,7
Street shopkeepers think that environmental controls should be increased 120 29
Pavement occupations are prevented 81 19,5
Small waste baskets are needed to dispose of their waste 61 14,6
Should be recycled containers 59 14,2
Note: Participants were allowed to mark multiple choices in this question.
43,4
27,2
8,8
20,6
0
5
10
15
20
25
30
35
40
45
50
I'm glad the garbagecollection system.
The trash collects regularly.Trash can numbers should
be increased.
The garbage bins areremoved. Take the garbage
bags in the given hour
Garbage bins must beplaced underneath.
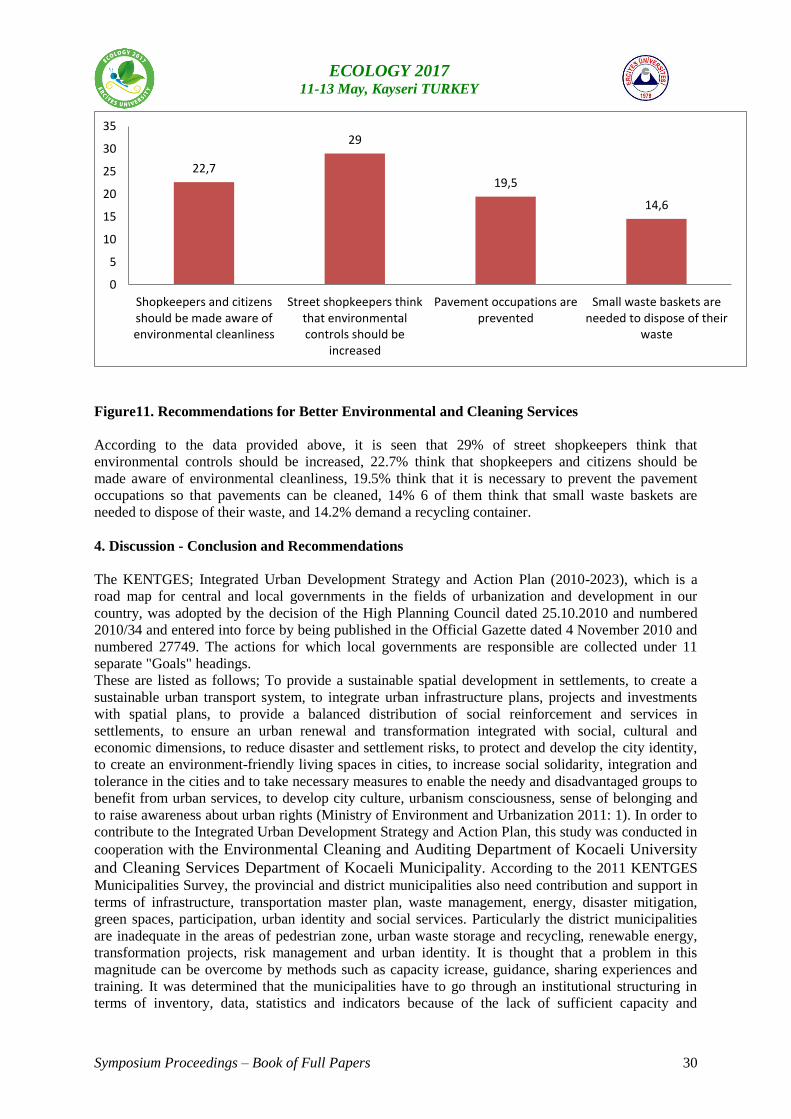
Symposium Proceedings – Book of Full Papers 30
ECOLOGY 2017 11-13 May, Kayseri TURKEY
Figure11. Recommendations for Better Environmental and Cleaning Services
According to the data provided above, it is seen that 29% of street shopkeepers think that
environmental controls should be increased, 22.7% think that shopkeepers and citizens should be
made aware of environmental cleanliness, 19.5% think that it is necessary to prevent the pavement
occupations so that pavements can be cleaned, 14% 6 of them think that small waste baskets are
needed to dispose of their waste, and 14.2% demand a recycling container.
4. Discussion - Conclusion and Recommendations
The KENTGES; Integrated Urban Development Strategy and Action Plan (2010-2023), which is a
road map for central and local governments in the fields of urbanization and development in our
country, was adopted by the decision of the High Planning Council dated 25.10.2010 and numbered
2010/34 and entered into force by being published in the Official Gazette dated 4 November 2010 and
numbered 27749. The actions for which local governments are responsible are collected under 11
separate "Goals" headings.
These are listed as follows; To provide a sustainable spatial development in settlements, to create a
sustainable urban transport system, to integrate urban infrastructure plans, projects and investments
with spatial plans, to provide a balanced distribution of social reinforcement and services in
settlements, to ensure an urban renewal and transformation integrated with social, cultural and
economic dimensions, to reduce disaster and settlement risks, to protect and develop the city identity, to create an environment-friendly living spaces in cities, to increase social solidarity, integration and
tolerance in the cities and to take necessary measures to enable the needy and disadvantaged groups to
benefit from urban services, to develop city culture, urbanism consciousness, sense of belonging and
to raise awareness about urban rights (Ministry of Environment and Urbanization 2011: 1). In order to
contribute to the Integrated Urban Development Strategy and Action Plan, this study was conducted in
cooperation with the Environmental Cleaning and Auditing Department of Kocaeli University
and Cleaning Services Department of Kocaeli Municipality. According to the 2011 KENTGES
Municipalities Survey, the provincial and district municipalities also need contribution and support in
terms of infrastructure, transportation master plan, waste management, energy, disaster mitigation,
green spaces, participation, urban identity and social services. Particularly the district municipalities
are inadequate in the areas of pedestrian zone, urban waste storage and recycling, renewable energy,
transformation projects, risk management and urban identity. It is thought that a problem in this
magnitude can be overcome by methods such as capacity icrease, guidance, sharing experiences and
training. It was determined that the municipalities have to go through an institutional structuring in
terms of inventory, data, statistics and indicators because of the lack of sufficient capacity and
22,7
29
19,5
14,6
0
5
10
15
20
25
30
35
Shopkeepers and citizensshould be made aware ofenvironmental cleanliness
Street shopkeepers thinkthat environmentalcontrols should be
increased
Pavement occupations areprevented
Small waste baskets areneeded to dispose of their
waste

Symposium Proceedings – Book of Full Papers 31
ECOLOGY 2017 11-13 May, Kayseri TURKEY
infrastructure in the inventory and statistics areas (Ministry of Environment and Urbanization 2011:
14). In this study, which is expected to contribute to the KENTGES Integrated Urban Development
Strategy and Action Plan; It has been found that 23.4% of street tradesmen are in the age range of 18-
25, 45% of them are high school graduates, 70.6% are tenants, 37% have been working on that street
for 0-5 years, 32.2% for 16 years and over, 20.8% for 10-15 years, 10% for 6-10 years, 52.9% state
that customer density is between 17: 00-20: 00 hours and 72% clean their workplace in the morning
hours. While 50.3% of the tradesmen stated that they were satisfied with municipal cleaning services,
15.3% were not satisfied with the cleaning services, 34.4% did not find the cleaning services in the
main arteries satisfactory and 43.9% were dissatisfied with the environmental inspection services in
the main arteries, and 30% were satisfied. Street tradesmen reported that the problems encountered in
the cleaning services in the main arteries were due to traffic density and parking of vehicles on the
streets with 38.5%, insufficient environmental inspections with 25.5%, continuous pollution by the
public and shopkeepers with 20.5%, and the fact that the cleaning staff is inadequate with 15.5%. It
has been seen that 43.4% of our shopkeepers in the main arteries are satisfied with the garbage
collection system, but 27.2% stated that the number of garbage bins on the street has to be increased.
Suggestions by the shopkeepers on the street; it has been observed that 29% of street shopkeepers
think that environmental controls should be increased, 22.7% think that shopkeepers and citizens
should be made aware of environmental cleanliness, 14.5% think that it is necessary to prevent the
pavement occupations so that pavements can be cleaned, 14% 6 of them think that small waste baskets
are needed to dispose of their waste, and 14.2% demand a recycling container. In the survey study,
short, medium and long term solutions were produced for the determined situations.
4.1.Short term solutions
Since 72% of street shopkeepers clean their workplaces between 08:00 and 10:00 in the
morning, our environmental workers on the street will continuously check the street after these
hours and clean the dirty areas again.
Especially after sweeping the fronts of shops in Ağadere Street, our shopkeepers are throwing
the garbage out of them into the channels of rainwater and this is a wrong behavior in terms of
environmental sensitivity and our shopkeepers will be especially alerted to this issue in our
environmental informing activities.
15.5% of the sources of cleanliness problems that are experienced in the streets are due to lack
of personnel. For this reason it has been understood that environmental worker reinforcement
has become compulsory in the main streets. One of the most important results of the survey
was that the side streets near these main streets where commercial activities take place and
which are densely populated with people have to be kept clean constantly.
In order to improve our environment and cleanliness services in our main arteries, 29% of our
shopkeepers stated that environmental audits should be increased. In the main streets, it will
be ensured that the number of environmental audits will be increased by contacting the
Municipal Police Directorate.
In the study, it was decided that this system should be continued because 43.4% of our
tradesmen were satisfied with our garbage collection system. However, 27.2% of shopkeepers
think that the garbage cans are inadequate in the streets, indicating that the number of plastic
garbage containers in the main arteries should be increased.
In the survey conducted on the main arteries, 15.3% of our shopkeepers are dissatisfied with
cleaning services, 34.4% do not find cleaning services satisfactory and want them to be
improved. In order to increase the satisfaction rate; one of the recently-bought road sweeping
vehicles will be put into operation between 23:00 and 07:00 hours in order to make the streets
cleaner and ready for our people and shopkeepers in the morning when they wake up.
4.2.Medium-term solutions
Symposium Proceedings – Book of Full Papers 32
ECOLOGY 2017 11-13 May, Kayseri TURKEY
22.7% of our shopkeepers stated that tradesmen and citizens should be made aware of
environmental cleanliness in order to improve our environmental and cleaning services in our
main arteries. Efforts to raise public awareness about environmental cleanliness to avoid the
pollution by the public and shopkeepers will be provided through joint projects with the
Environmental Cleaning and Auditing Department of Kocaeli University.
14,6% of our shopkeepers want the number of small waste baskets to be increased to dump
their waste in order to make our environment and cleaning services in our main arteries better.
The number of small waste baskets in main streets will be increased.
14.2% of our tradesmen recommend separate collection of recyclable wastes so that our
environment and cleaning services in our main arteries will be better. Specific points of
recycling bins will be installed in the main arteries in order to reduce the amount of waste and
to ensure recycling of waste.
4.3.Long term solutions
Our tradesmen have seen the traffic density and parking the cars on the streets with the highest
percentage (38.5%) at the source of the cleaning problems in our main arteries. In order to
resolve this problem, we need to work in coordination with the municipal police directorate
and the Directorate of Transportation of the Metropolitan City Municipality.
With this survey conducted in our province, since the pollution caused by industry and
workplace comes 1st with 68.3%, we will try to establish a public opinion against industrial
and other pollutant corporations in our city and will work with public authorities and
institutions that have auditing authority.
5. References
Anonymous, (2011) KENTGES Municipalities Survey, KENTGES Integrated Urban Development
Strategy and Action Plan, Ministry of Environment and Urbanization, KİB, p. 19
Anonymous, (2014) Kocaeli Environmental Situation Report, Kocaeli Governorship, Provincial
Directorate of Environment and Urbanism 1-154.
Artun H, Bakırcı H (2012), Evaluation of the Factors Affecting the Environmental Education of
Countries, Kastamonu Education Journal, Vol: 20 No: 2 365-384.
Çavuş R., Umdu Topsakal Ü.,Öztuna Kaplan A (2013), Teacher Opinions on the Informal Learning
Environments Related to Gaining Environmental Awareness: Kocaeli Bilgievleri Case, Pegem
Education and Training Journal Vol: 3, No: 1, 15-26.
Duman T., Yüksel F (2008), Measurement of Citizen Satisfaction in Municipalities: Mersin
Metropolitan Case, Contemporary Local Authorities, Volume 17, issue 1, 43-57.
Güven E., Aydogdu M (2012), Development of Awareness Scale for Environmental Problems and
Determination of Awareness Levels of Teacher Candidates, Journal of Teacher Education and
Educators, Volume 1, Issue 2, 185-202
Mansuroğlu S.,Karagüzel O., Atik M (2008), Environmental Awareness Level In Antalya Cıty
(Turkey) And its Relations With Socio-Economic Characteristics, Akdeniz University, Journal of
Agriculture, 21 (2), 167-177.
Kızılaslan H., Kızılaslan N (2005), Awareness Levels and Behaviors of Rural People on
Environmental Issues (The Case of Artova District of Tokat Province, ZKU Journal of Social
Sciences Volume 1, Issue 1,67-89.
Özbebek Tunç, A. , Akdemir Ömür G., Düren Z (2012), Environmental Awareness, I.U. Journal of
Faculty of Political Science No: 47. 227-246.
Oğuz D., Çakcı I., Kavas S (2011), SDU Journal of Faculty of Forestry, 2: 34-39

Symposium Proceedings – Book of Full Papers 33
ECOLOGY 2017 11-13 May, Kayseri TURKEY
Şengül M (1999), Environmental management and municipalities at local level, Contemporary local
governments, vol. 8, issue 3, 91-102.
Uzun N.,Sağlam N (2005), The Influence of Socio-Economic Status on Environmental Awareness and
Environmental Academic Success, Hacettepe University Journal of Education, 29: 194-202
Yalım F.,Kurban S (2013), Using Festivals as a Public Relation Tool in the Process of Establishing
Environmental Consciousness in Urban Areas: A Research on Istanbul Ecofest Participants,
Selçuk İletişim, 7, 4, 81-93.
Symposium Proceedings – Book of Full Papers 34
ECOLOGY 2017 11-13 May, Kayseri TURKEY
The Algae of the Yazlık Ilıcası Spring (Kocaeli-Türkiye)
Arzu Morkoyunlu Yüce1, , Gönül Konakay
1, Şebnem Erkebay
2, Ayfer Özmen
1
1Kocaeli Üniversitesi, Hereke Ö.İ. Uzunyol MYO, 41800/Kocaeli/Türkiye
1Kocaeli Üniversitesi, Gazanfer Bilge MYO, 41800/Kocaeli/Türkiye
Corresponding Author:e-mail:[email protected]
Abstract: Turkey has a 145,000 km-long water network and a large amount of life exist in
inland waters. Among the variety of living things algae are important because they are the
first part of the food chain. They ensure ecological balance and contain the species which are
important indicator taxa in the determination of water pollution. Diatoms are the dominant
group of algae in the wetlands of Turkey in terms of the species diversity. Therefore, findings
obtained from studies on diatoms will reflect the characteristics of the diatom flora of the area
studied and provide information on the characteristics of freshwater environments. In order to
examine the phytoplankton and epipelic and epilithic algal flora of Yazlık Ilıcası Spring three
station was chosen. The number of sampling stations depended on the size of the spring. The
study were investigated seasonally in 2016. In the algological investigations 15 taxa belong to
Bacillariophyta; 2 taxa belong to Chlorophyta; 4 taxa belong to Cyanophyta and totally 21
taxa were identified. According to the results of our study, 71,42 % of the total algal flora of
Yazlık Ilıcası Spring was represented by members of Bacillariophyta . The same result has
been observed in the rivers and streams in Turkey.
Keywords: Epipelic, Epilithic, Phytoplankton,Environment,Spring
1. Introduction
Knowing the hydrobiological characteristics of spring waters is important from an economic
standpoint and in terms of achieving a balanced use of these resources. Cold water sources are
widely used for drinking and irrigation purposes, and hot water sources are also used as
thermal services. Physical and chemical factors are fairly stable at places where waters are
surfacing from underground. However, depending on the amount of water transported, a
balance is quickly established with the environment. It is known that algal floras develop on
living, inanimate materials in the waters, and floral species also exist in other habitats.
Numerous soil species are also seen in the sources and it is stated that this is the result of
contamination. It is aimed to determine algal, benthic organisms, geochemical and
hydrochemical properties with the studies carried out on the thermal waters in the world and
in our country (Yüksel et al.,2009; Jonker et al. 2013; Balaban et al.,2016 ; Barut and
Erdogan,2011). One of the first thermal algal studies is on algae and other living groups of
the Yellowstone national park in America. In the studies carried out by Davis in 1897, colored
species were categorized into the Cyanophyceae class and colorless and primitive algal bands
were categorized into Schizomycetes as bacteria or primitive fungi groups. In this study, it
was noted that there were no life above 85oC and it was stated in what color groups lives in
what temperature range. In 1898, Tilden's work on the thermal algae of Western America
identified 17 blue-green algae of 11 genera. In his study in 1934, Flowers found 19 blue-green
algae in 7 springs around the Great Salt Lake (Büyük Tuz Gölü). In a survey conducted by
Gray in 1941, 36 species of 16 genera were identified in the algae of two hot springs in
Arkansas (Altınöz,2011). In the South African region, the relationship between the
geochemical characteristics of thermal sources and algal diversity has been determined
(Jonker et al. 2013). In 2014, phytoplankton and periphyton composition was studied in lakes
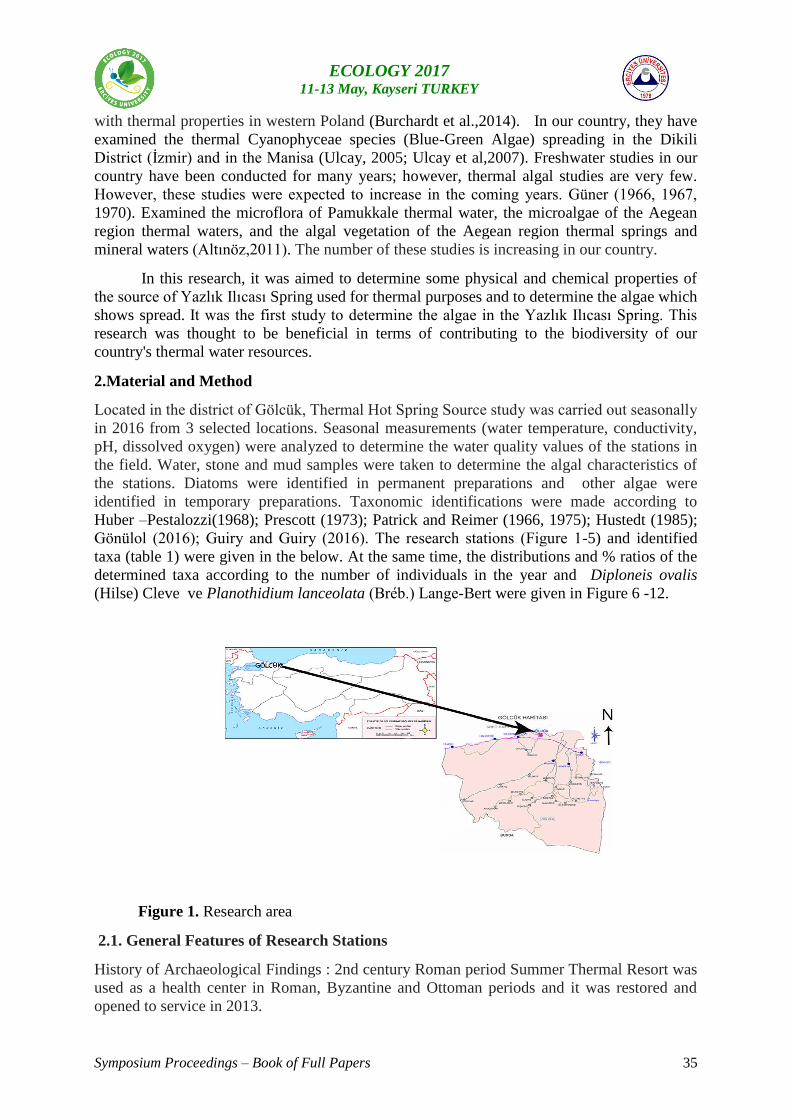
Symposium Proceedings – Book of Full Papers 35
ECOLOGY 2017 11-13 May, Kayseri TURKEY
with thermal properties in western Poland (Burchardt et al.,2014). In our country, they have
examined the thermal Cyanophyceae species (Blue-Green Algae) spreading in the Dikili
District (İzmir) and in the Manisa (Ulcay, 2005; Ulcay et al,2007). Freshwater studies in our
country have been conducted for many years; however, thermal algal studies are very few.
However, these studies were expected to increase in the coming years. Güner (1966, 1967,
1970). Examined the microflora of Pamukkale thermal water, the microalgae of the Aegean
region thermal waters, and the algal vegetation of the Aegean region thermal springs and
mineral waters (Altınöz,2011). The number of these studies is increasing in our country.
In this research, it was aimed to determine some physical and chemical properties of
the source of Yazlık Ilıcası Spring used for thermal purposes and to determine the algae which
shows spread. It was the first study to determine the algae in the Yazlık Ilıcası Spring. This
research was thought to be beneficial in terms of contributing to the biodiversity of our
country's thermal water resources.
2.Material and Method
Located in the district of Gölcük, Thermal Hot Spring Source study was carried out seasonally
in 2016 from 3 selected locations. Seasonal measurements (water temperature, conductivity,
pH, dissolved oxygen) were analyzed to determine the water quality values of the stations in
the field. Water, stone and mud samples were taken to determine the algal characteristics of
the stations. Diatoms were identified in permanent preparations and other algae were
identified in temporary preparations. Taxonomic identifications were made according to
Huber –Pestalozzi(1968); Prescott (1973); Patrick and Reimer (1966, 1975); Hustedt (1985);
Gönülol (2016); Guiry and Guiry (2016). The research stations (Figure 1-5) and identified
taxa (table 1) were given in the below. At the same time, the distributions and % ratios of the
determined taxa according to the number of individuals in the year and Diploneis ovalis
(Hilse) Cleve ve Planothidium lanceolata (Bréb.) Lange-Bert were given in Figure 6 -12.
Figure 1. Research area
2.1. General Features of Research Stations
History of Archaeological Findings : 2nd century Roman period Summer Thermal Resort was
used as a health center in Roman, Byzantine and Ottoman periods and it was restored and
opened to service in 2013.
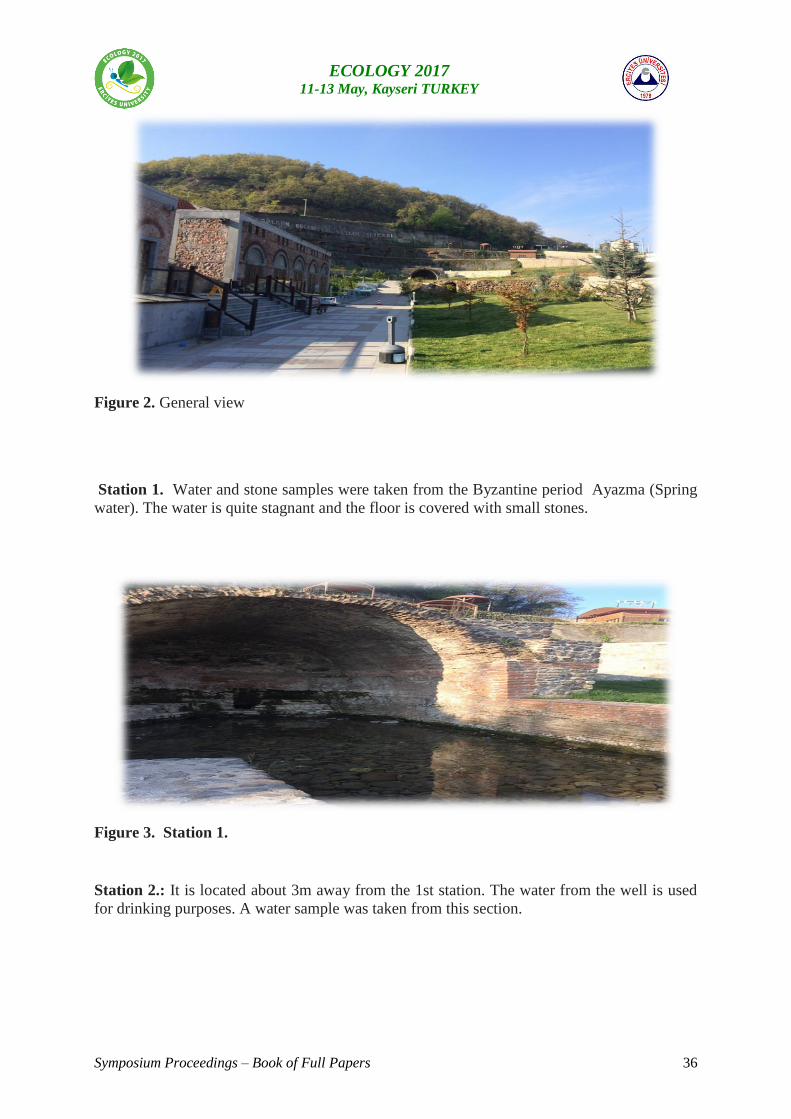
Symposium Proceedings – Book of Full Papers 36
ECOLOGY 2017 11-13 May, Kayseri TURKEY
Figure 2. General view
Station 1. Water and stone samples were taken from the Byzantine period Ayazma (Spring
water). The water is quite stagnant and the floor is covered with small stones.
Figure 3. Station 1.
Station 2.: It is located about 3m away from the 1st station. The water from the well is used
for drinking purposes. A water sample was taken from this section.
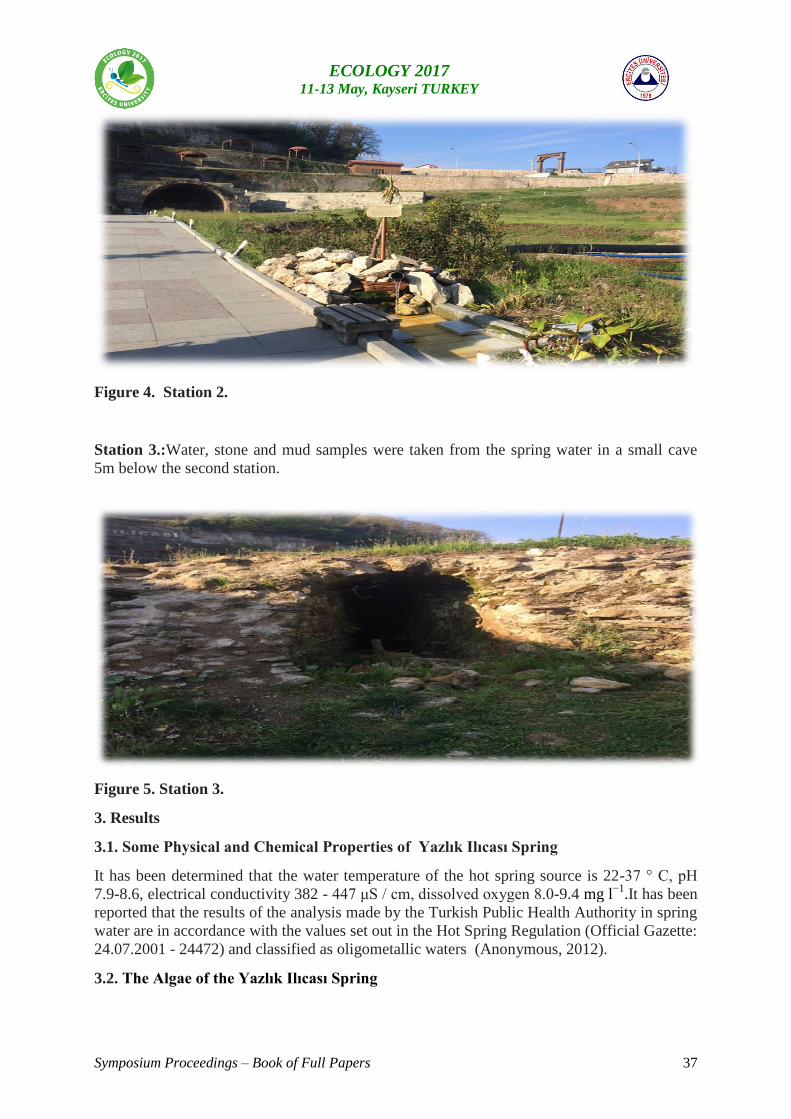
Symposium Proceedings – Book of Full Papers 37
ECOLOGY 2017 11-13 May, Kayseri TURKEY
Figure 4. Station 2.
Station 3.:Water, stone and mud samples were taken from the spring water in a small cave
5m below the second station.
Figure 5. Station 3.
3. Results
3.1. Some Physical and Chemical Properties of Yazlık Ilıcası Spring
It has been determined that the water temperature of the hot spring source is 22-37 ° C, pH
7.9-8.6, electrical conductivity 382 - 447 μS / cm, dissolved oxygen 8.0-9.4 mg l−1
.It has been
reported that the results of the analysis made by the Turkish Public Health Authority in spring
water are in accordance with the values set out in the Hot Spring Regulation (Official Gazette:
24.07.2001 - 24472) and classified as oligometallic waters (Anonymous, 2012).
3.2. The Algae of the Yazlık Ilıcası Spring
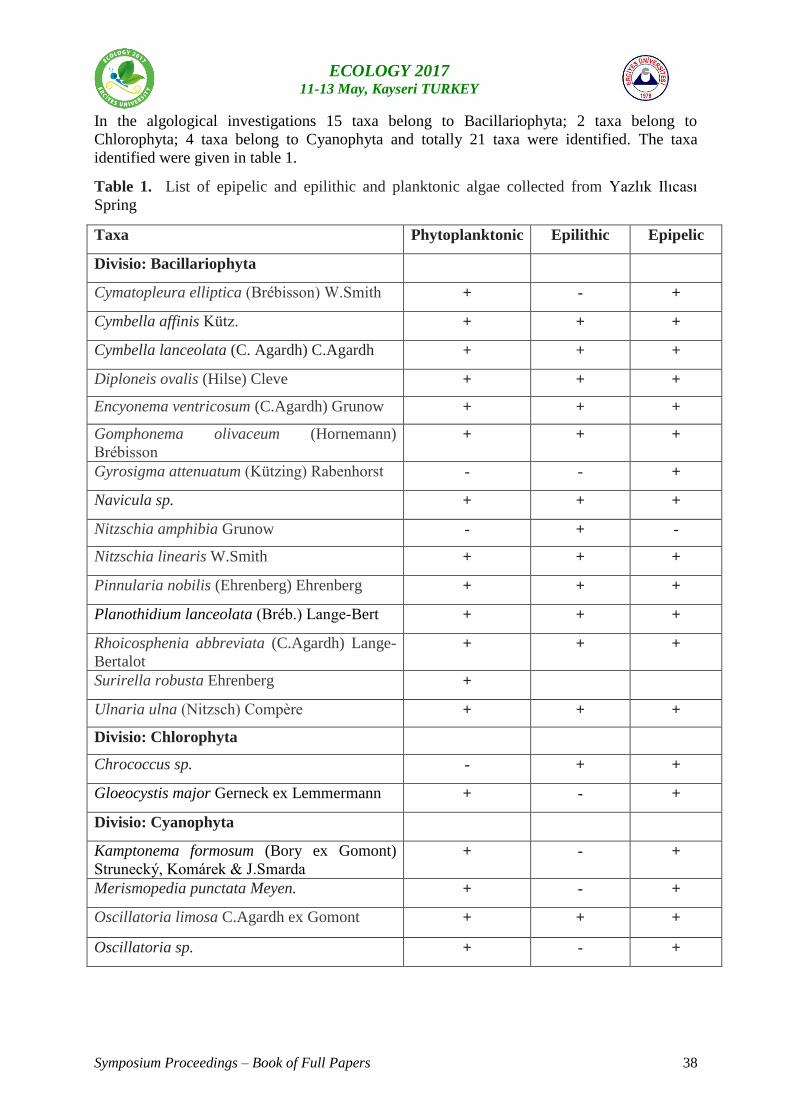
Symposium Proceedings – Book of Full Papers 38
ECOLOGY 2017 11-13 May, Kayseri TURKEY
In the algological investigations 15 taxa belong to Bacillariophyta; 2 taxa belong to
Chlorophyta; 4 taxa belong to Cyanophyta and totally 21 taxa were identified. The taxa
identified were given in table 1.
Table 1. List of epipelic and epilithic and planktonic algae collected from Yazlık Ilıcası
Spring
Taxa Phytoplanktonic Epilithic Epipelic
Divisio: Bacillariophyta
Cymatopleura elliptica (Brébisson) W.Smith + - +
Cymbella affinis Kütz. + + +
Cymbella lanceolata (C. Agardh) C.Agardh + + +
Diploneis ovalis (Hilse) Cleve + + +
Encyonema ventricosum (C.Agardh) Grunow + + +
Gomphonema olivaceum (Hornemann)
Brébisson + + +
Gyrosigma attenuatum (Kützing) Rabenhorst - - +
Navicula sp. + + +
Nitzschia amphibia Grunow - + -
Nitzschia linearis W.Smith + + +
Pinnularia nobilis (Ehrenberg) Ehrenberg + + +
Planothidium lanceolata (Bréb.) Lange-Bert + + +
Rhoicosphenia abbreviata (C.Agardh) Lange-
Bertalot + + +
Surirella robusta Ehrenberg +
Ulnaria ulna (Nitzsch) Compère + + +
Divisio: Chlorophyta
Chrococcus sp. - + +
Gloeocystis major Gerneck ex Lemmermann + - +
Divisio: Cyanophyta
Kamptonema formosum (Bory ex Gomont)
Strunecký, Komárek & J.Smarda + - +
Merismopedia punctata Meyen. + - +
Oscillatoria limosa C.Agardh ex Gomont + + +
Oscillatoria sp. + - +
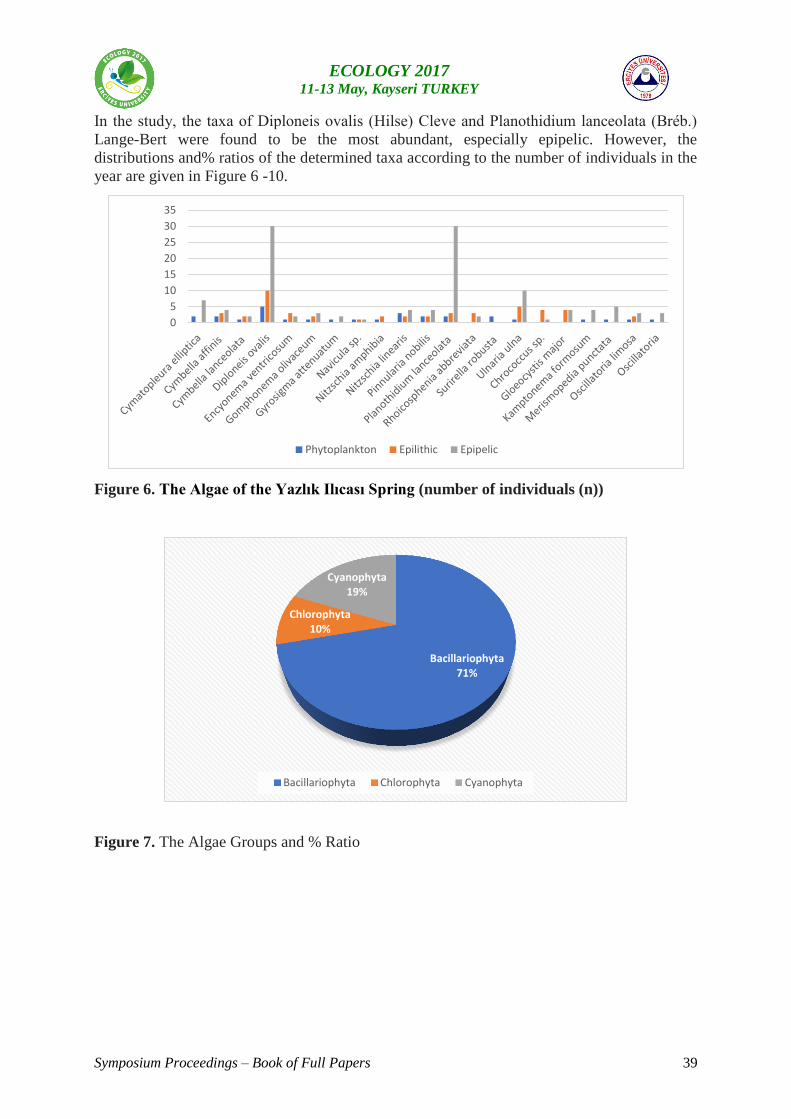
Symposium Proceedings – Book of Full Papers 39
ECOLOGY 2017 11-13 May, Kayseri TURKEY
In the study, the taxa of Diploneis ovalis (Hilse) Cleve and Planothidium lanceolata (Bréb.)
Lange-Bert were found to be the most abundant, especially epipelic. However, the
distributions and% ratios of the determined taxa according to the number of individuals in the
year are given in Figure 6 -10.
Figure 6. The Algae of the Yazlık Ilıcası Spring (number of individuals (n))
Figure 7. The Algae Groups and % Ratio
0
5
10
15
20
25
30
35
Phytoplankton Epilithic Epipelic
Bacillariophyta 71%
Chlorophyta 10%
Cyanophyta 19%
Bacillariophyta Chlorophyta Cyanophyta
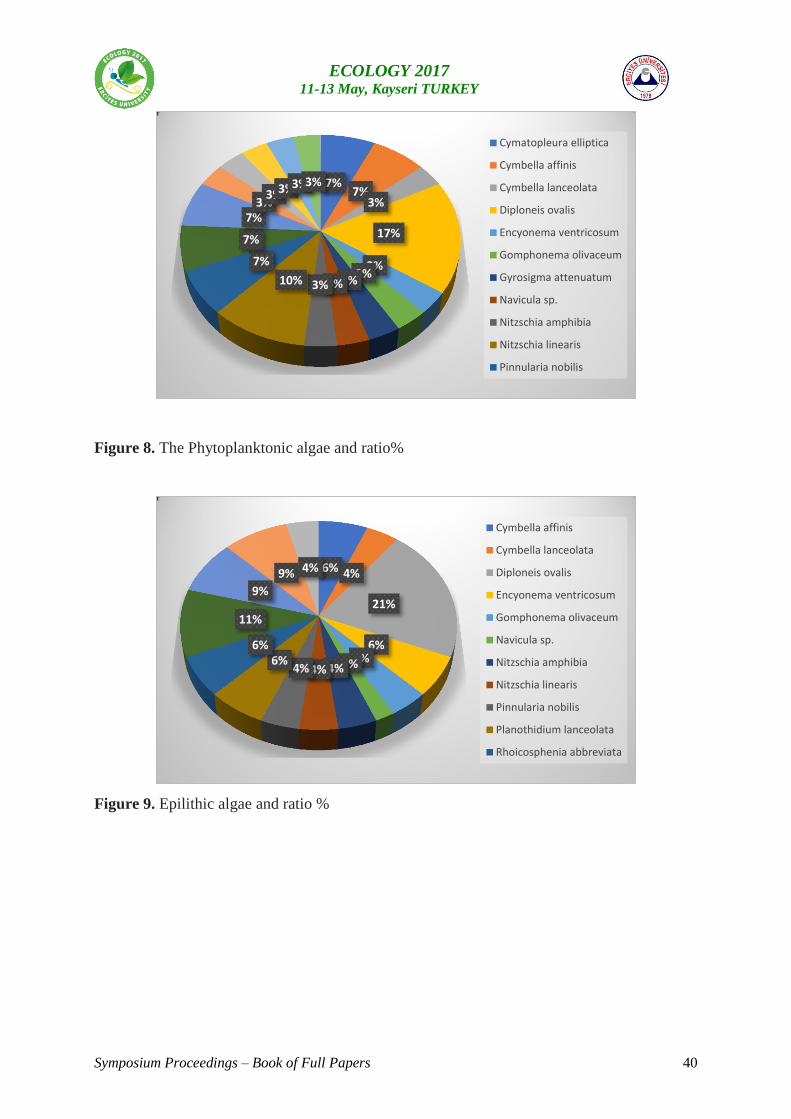
Symposium Proceedings – Book of Full Papers 40
ECOLOGY 2017 11-13 May, Kayseri TURKEY
Figure 8. The Phytoplanktonic algae and ratio%
Figure 9. Epilithic algae and ratio %
7% 7%
3%
17%
3% 3%
3% 3% 3% 10%
7%
7%
7% 3%
3% 3% 3% 3%
Cymatopleura elliptica
Cymbella affinis
Cymbella lanceolata
Diploneis ovalis
Encyonema ventricosum
Gomphonema olivaceum
Gyrosigma attenuatum
Navicula sp.
Nitzschia amphibia
Nitzschia linearis
Pinnularia nobilis
6% 4%
21%
6% 4% 2% 4% 4% 4%
6% 6%
11%
9%
9% 4%
Cymbella affinis
Cymbella lanceolata
Diploneis ovalis
Encyonema ventricosum
Gomphonema olivaceum
Navicula sp.
Nitzschia amphibia
Nitzschia linearis
Pinnularia nobilis
Planothidium lanceolata
Rhoicosphenia abbreviata
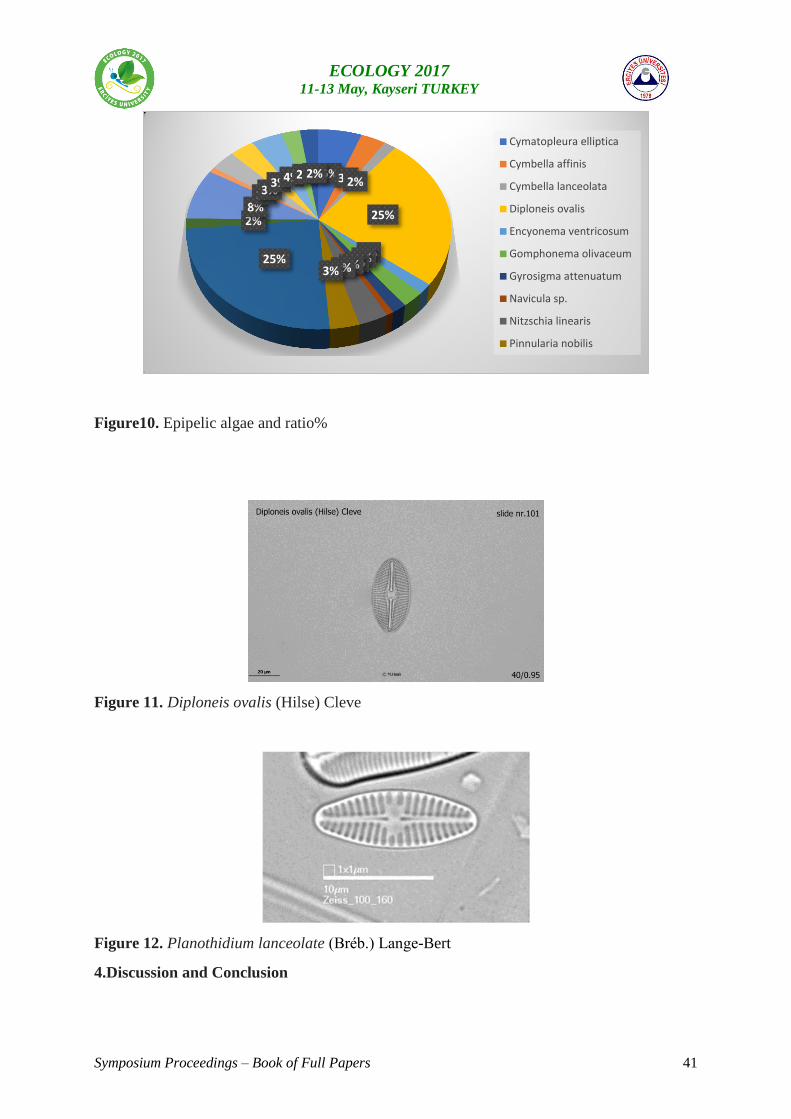
Symposium Proceedings – Book of Full Papers 41
ECOLOGY 2017 11-13 May, Kayseri TURKEY
Figure10. Epipelic algae and ratio%
Figure 11. Diploneis ovalis (Hilse) Cleve
Figure 12. Planothidium lanceolate (Bréb.) Lange-Bert
4.Discussion and Conclusion
6% 3% 2%
25%
2% 2% 2% 1% 3% 3% 25%
2% 8%
1% 3% 3% 4% 2% 2%
Cymatopleura elliptica
Cymbella affinis
Cymbella lanceolata
Diploneis ovalis
Encyonema ventricosum
Gomphonema olivaceum
Gyrosigma attenuatum
Navicula sp.
Nitzschia linearis
Pinnularia nobilis
Symposium Proceedings – Book of Full Papers 42
ECOLOGY 2017 11-13 May, Kayseri TURKEY
This study aimed to assess the algal diversity in thermal springs in Yazlık Ilıcası. In
the survey, algae belonging to 71% Bacillariophyta, 19% Cyanophyta and 10% Chlorophyta
were distributed. When taxa were evaluated as %, 23% Diploneis ovalis (Hilse) Cleve and
18% Planothidium lanceolata (Bréb.) Lange-Bert taxa were the most abundant. These species
are especially distributed in areas where organic matter is abundant. The main source of
nutrients for algal growth in thermal waters would be in the form of dissolved physico-
chemical parameters, which is dependent on the geochemical mineral content of the thermal
water. In the study, Chrococcus sp.and Oscillatoria sp. were found in the group of
thermophilic algae. The other taxa found in the survey are also supported by studies in our
country and in the world where taxa are spread especially in thermal waters, although it was
seen in a small numerical ratio. It was determined that the water temperature 22-37 ° C, pH
7.9-8.3, electrical conductivity 382 - 447 μS / cm, dissolved oxygen 8.0-9.4 mg l−1
. It was
reported that the Turkish Public Health Authority in spring water are in accordance with the
values set out in the Hot Spring Regulation (Official Gazette: 24.07.2001 - 24472) and
classified as oligometallic waters. It was reported in studies that the proportion of sulfur was
generally high in thermal waters in our country and in the world. This ratio was determined as
1.10 mg l−1
in Yazlık Ilıcası Spring. As a result, determining the biodiversity of thermal
sources together with its physico-chemical properties is also very important in terms of
making more use of hot water resources.
Acknowledgements
I would like to thank Gölcük Municipality,.,they provided full support.
5. References
Anonymous (2012). T.C. Ministry of Health, Turkey Public Health Agency report, 9 p.
Altınöz EM (2011). Algae Flora Of Pamukkale Travertınes And Hot Water Sprıngs (Denizli),
Ankara University , Graduate School of Natural and Applied Sciences Department of
Biology, Master thesis ,86p.
Balaban TO, Akın H, Tarcan G, Gemici U, Çolak M, Karamenderes İH (2016),
Hydrogeochemical study of the gümüşköy spa (Aydin) and its vicinity, Pamukkale
University Journal of Engineering Sciences. 2016, Vol. 22 Issue 6, p553-558.
Barut IF, Erdoğan N (2011). Thermal Spring Waters of The Marmara Region:
Hydrochemical Characteristics and Temporal Changes , İstanbul Yerbilimleri
Dergisi, 24(1):19-64.
Burchardt L, Hindák F, Komárek J, Lange-Bertalot H, Messyasz B, Pikosz M, Wejnerowski
Ł, Jakubas E, Rybak A, Gąbka M (2014). Spring phytoplankton and periphyton
composition: case study from a thermally abnormal lakes in Western Poland, Biodiv.
Res. Conserv. 36: 17-24.
GönülolA(2016).Turkish algae electronic publication, Samsun, Turkey.
http://turkiyealgleri.omu.edu.tr. (access date:07.08.2016).
Guiry, MD, Guiry GM (2016). AlgaeBase. World-wide electronic publication, National
University of Ireland, Galway. http://www.algaebase.org (searched on 03 October
2016)
Symposium Proceedings – Book of Full Papers 43
ECOLOGY 2017 11-13 May, Kayseri TURKEY
Huber-Pestalozzi G (1968). Das Phytoplankton des Susswasser Systematik und Biology. Teil:
1 Cyanophycean(Blaualgen),ESchweizebath’scheVerlagsbuchhandlung (Naegele u.
Obermiller), Stuttgart, 342 p.
Husted, F (1985). The Pennat Diatoms, a translation of Husted ‘Die Kieselalgen ,2.Teil’ with
supplement by Norman G. Jensen, Koeltz Scientific Books, Koenigstein, 918pp.
Jonker CZ, Ginkel van C, Olivier J (2013). Association between physical and geochemical
characteristics of thermal springs and algal diversity in Limpopo Province, South
Africa, ISSN 0378-4738 (Print) Water SA Vol. 39 No. 1, 95-104.
Patrick R, Reimer CW (1966).The Diatoms of The United States I, Acad. Sci, Philad. 687 pp.
Patrick R, Reimer CW(1973). The Western Great Lakes Area, M., C., Brown, Comp., Pub.,
Dubugue Iova, 977 pp.
Prescott, GW (1973). Algae of the Western greater lakes area, Department of Biology and
Plant Pathology, Michigan State University, WM. C. Brown Company Publisher,
977pp. Michigan
Ulcay SO (2005). Distribution of Blue-Green algae species in Manisa and around the hot
springs (in Turkish). Master thesis, University of Celal Bayar.
Ulcay SO., Kurt T, Taşkın O, Öztürk M (2007). Distribution of thermal Cyanophyceae (Blue-
Green algae) species in Dikili (İzmir) thermal water, (in Turkish). Türk Sucul Yaşam
Dergisi, 5-8: 371-378.
Yüksel K, Demirel Z, Koçyiğit A, Sukatar A (2009). Some Thermophilic Blue-Green
Emerging in Thermal Waters in İzmir Province Isolation and Molecular Assay of Algae
(Cyanobacteria), E.U. Journal of Fisheries & Aquatic Sciences, Cilt/Volume 26,
Sayı/Issue 4: 267–270.
Symposium Proceedings – Book of Full Papers 44
ECOLOGY 2017 11-13 May, Kayseri TURKEY
Decolorization of a Reactive Textile Dye by non-acclimatized Pseudomonas aeruginosa
under various conditions
Behzat Balci, F. Elcin Erkurt, E. Su Turan
[email protected] [email protected] [email protected]
Cukurova University Department of Environmental Engineering, 01136, Balcali/Saricam,
Adana/Turkey
ABSTRACT
Textile dyes can be toxic and harmful on aquatic organisms in water bodies. The aim of this
work is to evaluate decolorization of a textile dye Reactive Blue 29 ( RB29) by Pseudomonas
aeruginosa, which was isolated from a non-dye contaminated activated sludge biomass. In the
present study, the effect of various physicochemical parameters, initial dye concentration,
temperature, pH and yeast extract concentration as an organic source on decolorization were
investigated. P. aeruginosa was able to decolorize 200 mg/L RB5 with 98% efficiency
within 132 h. Experiences showed that yeast extract, temperature and pH have a significant
effect on decolorization of RB29 by Pseudomonas aeruginosa. Decolorization of RB29
increased with increasing yeast concentration from 0.5 to 1 g/L. Decolorization efficiencies
of 200 mg/L RB29 for 0.5, 0.75 and 1 g/L yeast extract were found to be 32%, 60%, and 80%,
respectively.
Keywords: Decolorization, Reactive Blue 29, Pseudomonas aeruginosa
INTRODUCTION
Recently, large quantities of wastewater produced by human population have become one of
the essential problems of the world. These wastewaters are usually hazardous to human health
and they must be treated prior to receiving bodies. Their carcinogenic and toxic effect to
certain form of aquatic life is well known. Influent wastewaters of treatment plants coming
from industrial plants may contain various chemicals that difficult to remove from
wastewaters. Therefore there may still exist various chemicals in wastewaters such as dyes.
Dye producing capacity of industries is very large. These are about 10000 different dyes and
their weight is approximately 0.7 million tons. During the dyeing processes large amount of
these dyes are discharged by effluents to receiving environment. Colored wastewaters may
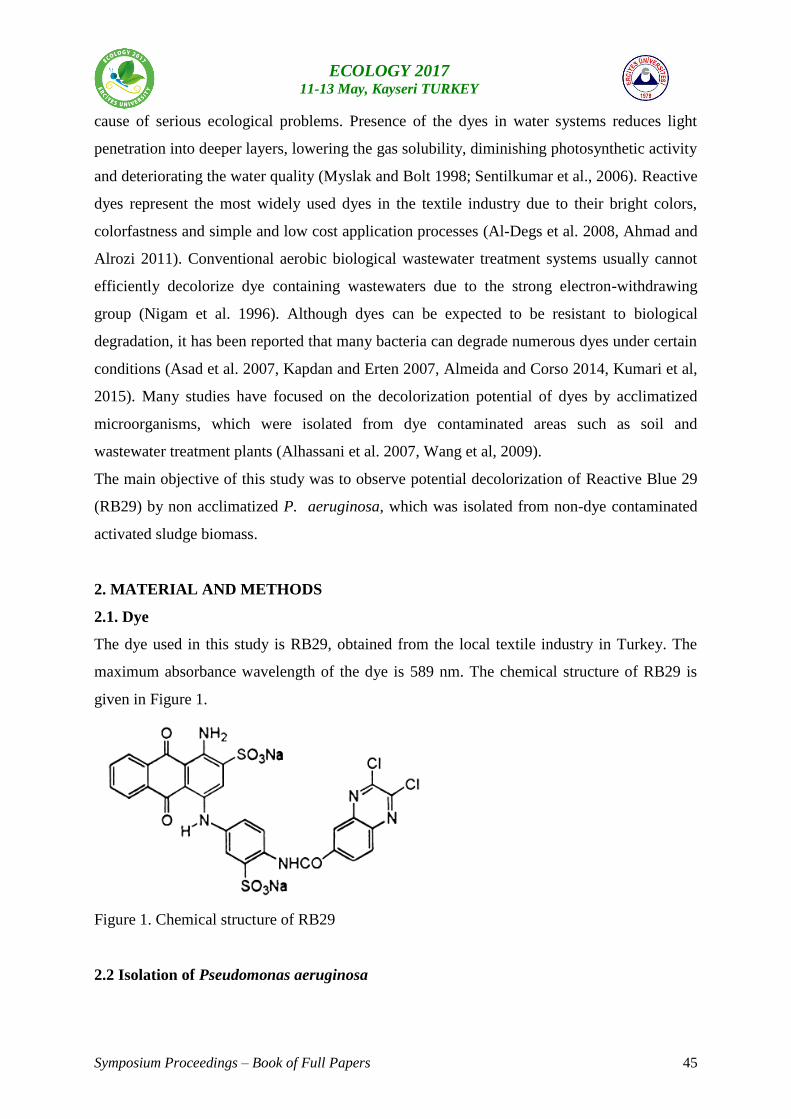
Symposium Proceedings – Book of Full Papers 45
ECOLOGY 2017 11-13 May, Kayseri TURKEY
cause of serious ecological problems. Presence of the dyes in water systems reduces light
penetration into deeper layers, lowering the gas solubility, diminishing photosynthetic activity
and deteriorating the water quality (Myslak and Bolt 1998; Sentilkumar et al., 2006). Reactive
dyes represent the most widely used dyes in the textile industry due to their bright colors,
colorfastness and simple and low cost application processes (Al-Degs et al. 2008, Ahmad and
Alrozi 2011). Conventional aerobic biological wastewater treatment systems usually cannot
efficiently decolorize dye containing wastewaters due to the strong electron-withdrawing
group (Nigam et al. 1996). Although dyes can be expected to be resistant to biological
degradation, it has been reported that many bacteria can degrade numerous dyes under certain
conditions (Asad et al. 2007, Kapdan and Erten 2007, Almeida and Corso 2014, Kumari et al,
2015). Many studies have focused on the decolorization potential of dyes by acclimatized
microorganisms, which were isolated from dye contaminated areas such as soil and
wastewater treatment plants (Alhassani et al. 2007, Wang et al, 2009).
The main objective of this study was to observe potential decolorization of Reactive Blue 29
(RB29) by non acclimatized P. aeruginosa, which was isolated from non-dye contaminated
activated sludge biomass.
2. MATERIAL AND METHODS
2.1. Dye
The dye used in this study is RB29, obtained from the local textile industry in Turkey. The
maximum absorbance wavelength of the dye is 589 nm. The chemical structure of RB29 is
given in Figure 1.
Figure 1. Chemical structure of RB29
2.2 Isolation of Pseudomonas aeruginosa
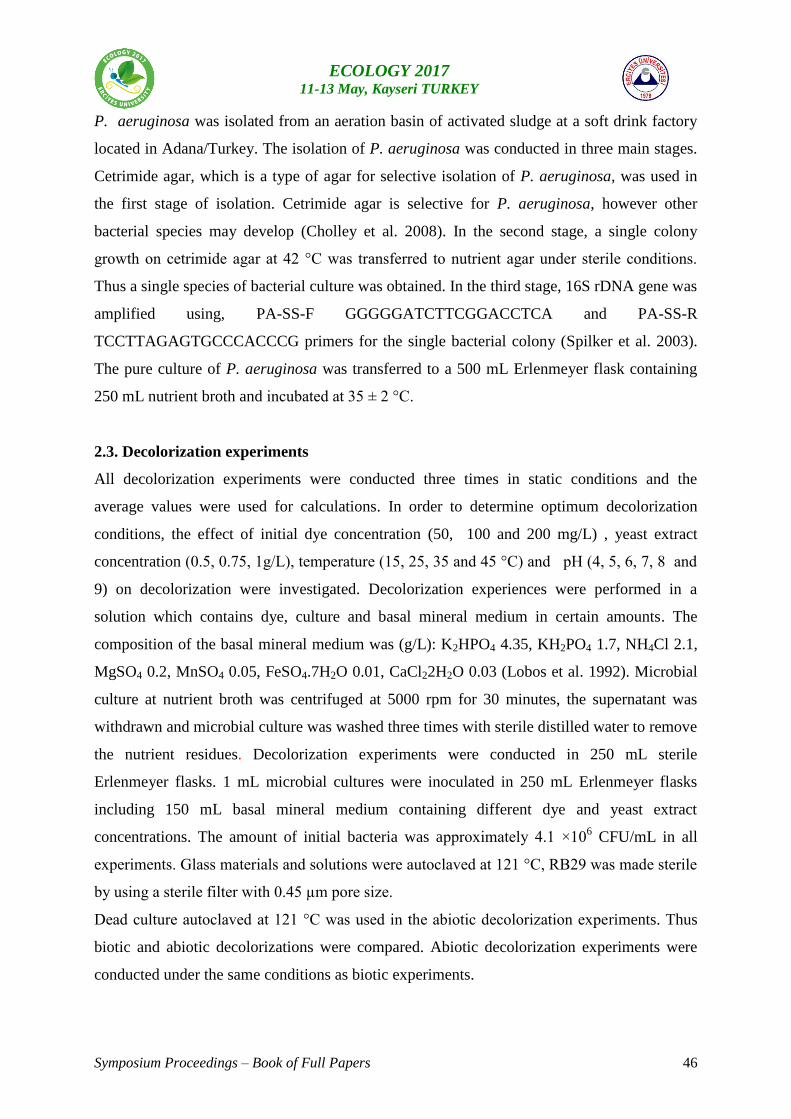
Symposium Proceedings – Book of Full Papers 46
ECOLOGY 2017 11-13 May, Kayseri TURKEY
P. aeruginosa was isolated from an aeration basin of activated sludge at a soft drink factory
located in Adana/Turkey. The isolation of P. aeruginosa was conducted in three main stages.
Cetrimide agar, which is a type of agar for selective isolation of P. aeruginosa, was used in
the first stage of isolation. Cetrimide agar is selective for P. aeruginosa, however other
bacterial species may develop (Cholley et al. 2008). In the second stage, a single colony
growth on cetrimide agar at 42 °C was transferred to nutrient agar under sterile conditions.
Thus a single species of bacterial culture was obtained. In the third stage, 16S rDNA gene was
amplified using, PA-SS-F GGGGGATCTTCGGACCTCA and PA-SS-R
TCCTTAGAGTGCCCACCCG primers for the single bacterial colony (Spilker et al. 2003).
The pure culture of P. aeruginosa was transferred to a 500 mL Erlenmeyer flask containing
250 mL nutrient broth and incubated at 35 ± 2 °C.
2.3. Decolorization experiments
All decolorization experiments were conducted three times in static conditions and the
average values were used for calculations. In order to determine optimum decolorization
conditions, the effect of initial dye concentration (50, 100 and 200 mg/L) , yeast extract
concentration (0.5, 0.75, 1g/L), temperature (15, 25, 35 and 45 °C) and pH (4, 5, 6, 7, 8 and
9) on decolorization were investigated. Decolorization experiences were performed in a
solution which contains dye, culture and basal mineral medium in certain amounts. The
composition of the basal mineral medium was (g/L): K2HPO4 4.35, KH2PO4 1.7, NH4Cl 2.1,
MgSO4 0.2, MnSO4 0.05, FeSO4.7H2O 0.01, CaCl22H2O 0.03 (Lobos et al. 1992). Microbial
culture at nutrient broth was centrifuged at 5000 rpm for 30 minutes, the supernatant was
withdrawn and microbial culture was washed three times with sterile distilled water to remove
the nutrient residues. Decolorization experiments were conducted in 250 mL sterile
Erlenmeyer flasks. 1 mL microbial cultures were inoculated in 250 mL Erlenmeyer flasks
including 150 mL basal mineral medium containing different dye and yeast extract
concentrations. The amount of initial bacteria was approximately 4.1 ×10⁶ CFU/mL in all
experiments. Glass materials and solutions were autoclaved at 121 °C, RB29 was made sterile
by using a sterile filter with 0.45 µm pore size.
Dead culture autoclaved at 121 °C was used in the abiotic decolorization experiments. Thus
biotic and abiotic decolorizations were compared. Abiotic decolorization experiments were
conducted under the same conditions as biotic experiments.
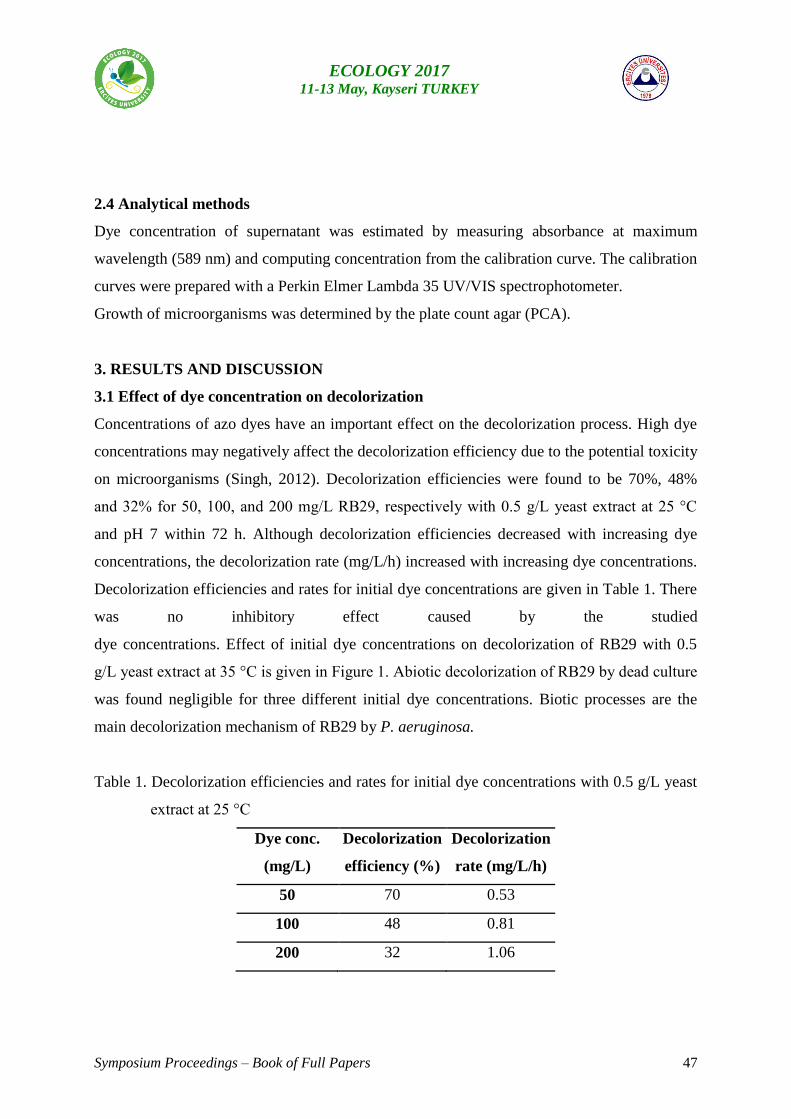
Symposium Proceedings – Book of Full Papers 47
ECOLOGY 2017 11-13 May, Kayseri TURKEY
2.4 Analytical methods
Dye concentration of supernatant was estimated by measuring absorbance at maximum
wavelength (589 nm) and computing concentration from the calibration curve. The calibration
curves were prepared with a Perkin Elmer Lambda 35 UV/VIS spectrophotometer.
Growth of microorganisms was determined by the plate count agar (PCA).
3. RESULTS AND DISCUSSION
3.1 Effect of dye concentration on decolorization
Concentrations of azo dyes have an important effect on the decolorization process. High dye
concentrations may negatively affect the decolorization efficiency due to the potential toxicity
on microorganisms (Singh, 2012). Decolorization efficiencies were found to be 70%, 48%
and 32% for 50, 100, and 200 mg/L RB29, respectively with 0.5 g/L yeast extract at 25 °C
and pH 7 within 72 h. Although decolorization efficiencies decreased with increasing dye
concentrations, the decolorization rate (mg/L/h) increased with increasing dye concentrations.
Decolorization efficiencies and rates for initial dye concentrations are given in Table 1. There
was no inhibitory effect caused by the studied
dye concentrations. Effect of initial dye concentrations on decolorization of RB29 with 0.5
g/L yeast extract at 35 °C is given in Figure 1. Abiotic decolorization of RB29 by dead culture
was found negligible for three different initial dye concentrations. Biotic processes are the
main decolorization mechanism of RB29 by P. aeruginosa.
Table 1. Decolorization efficiencies and rates for initial dye concentrations with 0.5 g/L yeast
extract at 25 °C
Dye conc.
(mg/L)
Decolorization
efficiency (%)
Decolorization
rate (mg/L/h)
50 70 0.53
100 48 0.81
200 32 1.06
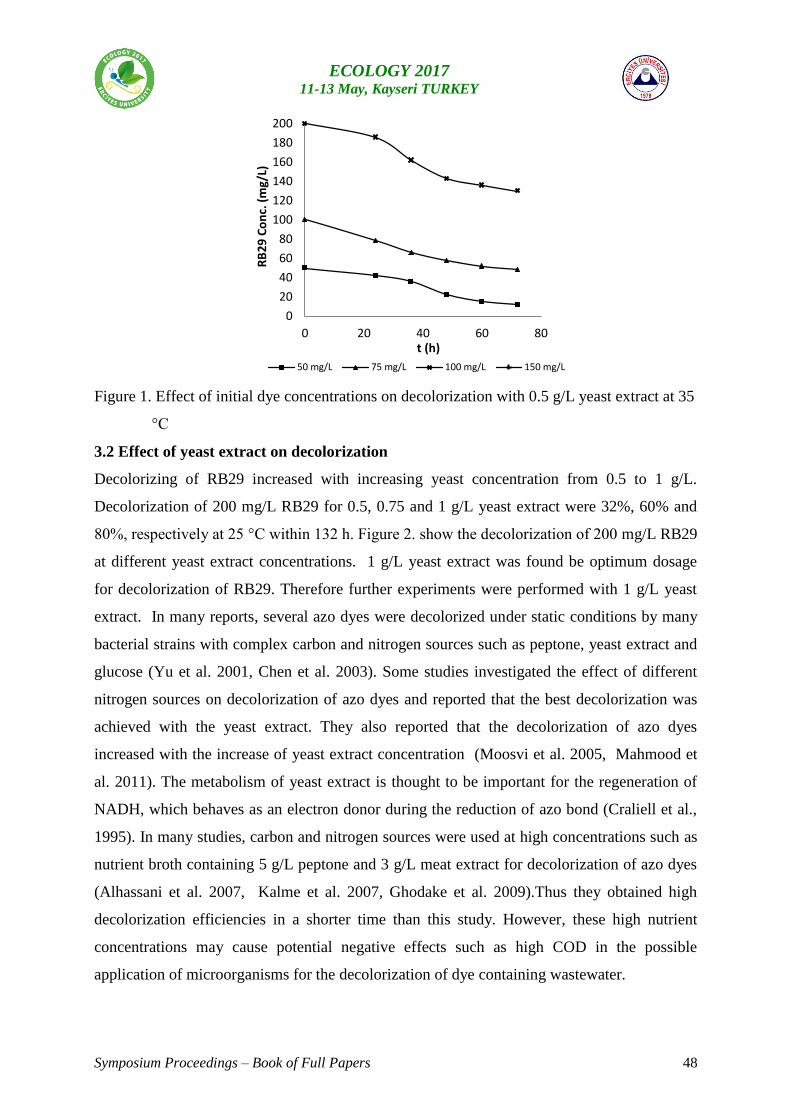
Symposium Proceedings – Book of Full Papers 48
ECOLOGY 2017 11-13 May, Kayseri TURKEY
Figure 1. Effect of initial dye concentrations on decolorization with 0.5 g/L yeast extract at 35
°C
3.2 Effect of yeast extract on decolorization
Decolorizing of RB29 increased with increasing yeast concentration from 0.5 to 1 g/L.
Decolorization of 200 mg/L RB29 for 0.5, 0.75 and 1 g/L yeast extract were 32%, 60% and
80%, respectively at 25 °C within 132 h. Figure 2. show the decolorization of 200 mg/L RB29
at different yeast extract concentrations. 1 g/L yeast extract was found be optimum dosage
for decolorization of RB29. Therefore further experiments were performed with 1 g/L yeast
extract. In many reports, several azo dyes were decolorized under static conditions by many
bacterial strains with complex carbon and nitrogen sources such as peptone, yeast extract and
glucose (Yu et al. 2001, Chen et al. 2003). Some studies investigated the effect of different
nitrogen sources on decolorization of azo dyes and reported that the best decolorization was
achieved with the yeast extract. They also reported that the decolorization of azo dyes
increased with the increase of yeast extract concentration (Moosvi et al. 2005, Mahmood et
al. 2011). The metabolism of yeast extract is thought to be important for the regeneration of
NADH, which behaves as an electron donor during the reduction of azo bond (Craliell et al.,
1995). In many studies, carbon and nitrogen sources were used at high concentrations such as
nutrient broth containing 5 g/L peptone and 3 g/L meat extract for decolorization of azo dyes
(Alhassani et al. 2007, Kalme et al. 2007, Ghodake et al. 2009).Thus they obtained high
decolorization efficiencies in a shorter time than this study. However, these high nutrient
concentrations may cause potential negative effects such as high COD in the possible
application of microorganisms for the decolorization of dye containing wastewater.
0
20
40
60
80
100
120
140
160
180
200
0 20 40 60 80
RB
29
Co
nc.
(m
g/L)
t (h)
50 mg/L 75 mg/L 100 mg/L 150 mg/L
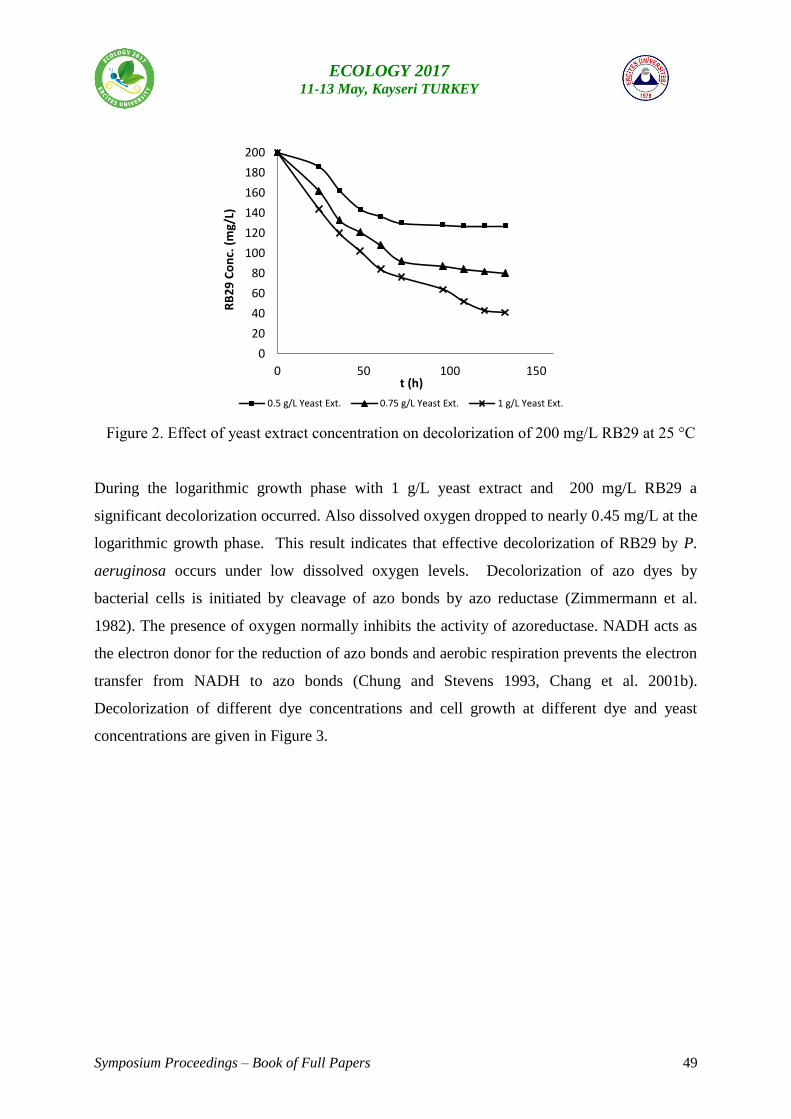
Symposium Proceedings – Book of Full Papers 49
ECOLOGY 2017 11-13 May, Kayseri TURKEY
Figure 2. Effect of yeast extract concentration on decolorization of 200 mg/L RB29 at 25 °C
During the logarithmic growth phase with 1 g/L yeast extract and 200 mg/L RB29 a
significant decolorization occurred. Also dissolved oxygen dropped to nearly 0.45 mg/L at the
logarithmic growth phase. This result indicates that effective decolorization of RB29 by P.
aeruginosa occurs under low dissolved oxygen levels. Decolorization of azo dyes by
bacterial cells is initiated by cleavage of azo bonds by azo reductase (Zimmermann et al.
1982). The presence of oxygen normally inhibits the activity of azoreductase. NADH acts as
the electron donor for the reduction of azo bonds and aerobic respiration prevents the electron
transfer from NADH to azo bonds (Chung and Stevens 1993, Chang et al. 2001b).
Decolorization of different dye concentrations and cell growth at different dye and yeast
concentrations are given in Figure 3.
0
20
40
60
80
100
120
140
160
180
200
0 50 100 150
RB
29
Co
nc.
(m
g/L)
t (h)
0.5 g/L Yeast Ext. 0.75 g/L Yeast Ext. 1 g/L Yeast Ext.
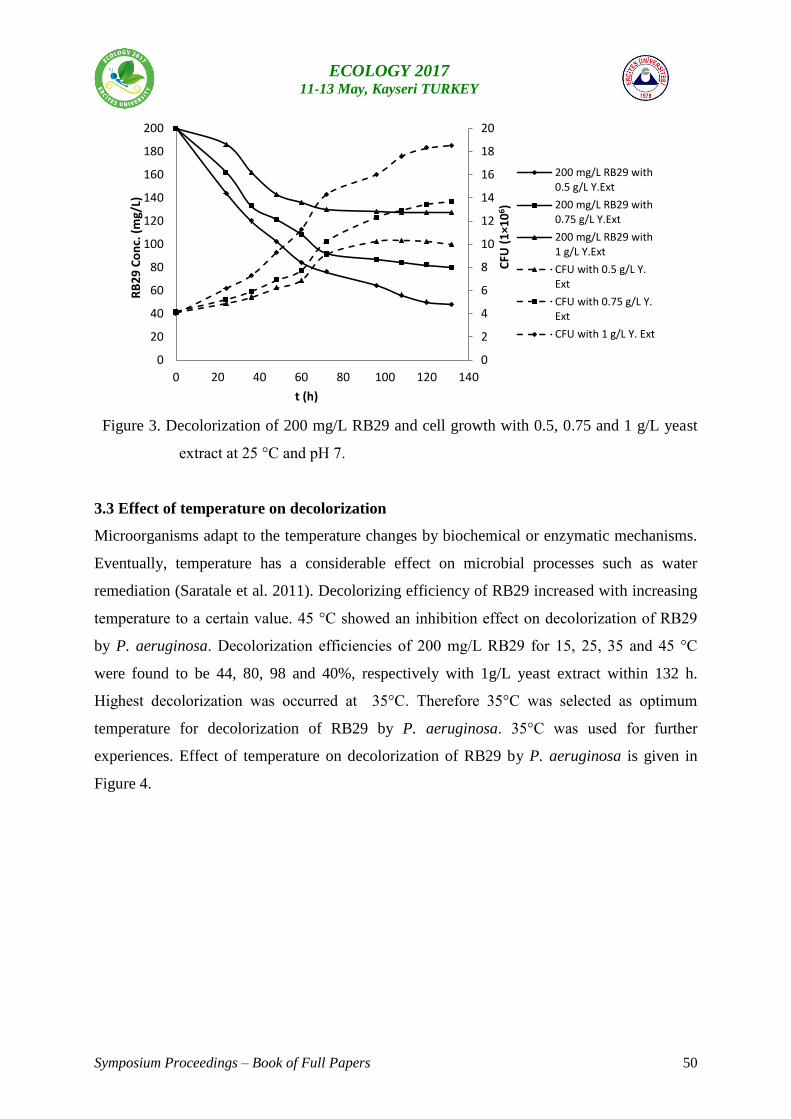
Symposium Proceedings – Book of Full Papers 50
ECOLOGY 2017 11-13 May, Kayseri TURKEY
Figure 3. Decolorization of 200 mg/L RB29 and cell growth with 0.5, 0.75 and 1 g/L yeast
extract at 25 °C and pH 7.
3.3 Effect of temperature on decolorization
Microorganisms adapt to the temperature changes by biochemical or enzymatic mechanisms.
Eventually, temperature has a considerable effect on microbial processes such as water
remediation (Saratale et al. 2011). Decolorizing efficiency of RB29 increased with increasing
temperature to a certain value. 45 °C showed an inhibition effect on decolorization of RB29
by P. aeruginosa. Decolorization efficiencies of 200 mg/L RB29 for 15, 25, 35 and 45 °C
were found to be 44, 80, 98 and 40%, respectively with 1g/L yeast extract within 132 h.
Highest decolorization was occurred at 35°C. Therefore 35°C was selected as optimum
temperature for decolorization of RB29 by P. aeruginosa. 35°C was used for further
experiences. Effect of temperature on decolorization of RB29 by P. aeruginosa is given in
Figure 4.
0
2
4
6
8
10
12
14
16
18
20
0
20
40
60
80
100
120
140
160
180
200
0 20 40 60 80 100 120 140
CFU
(1×1
06 )
RB
29
Co
nc.
(m
g/L)
t (h)
200 mg/L RB29 with0.5 g/L Y.Ext
200 mg/L RB29 with0.75 g/L Y.Ext
200 mg/L RB29 with1 g/L Y.Ext
CFU with 0.5 g/L Y.Ext
CFU with 0.75 g/L Y.Ext
CFU with 1 g/L Y. Ext
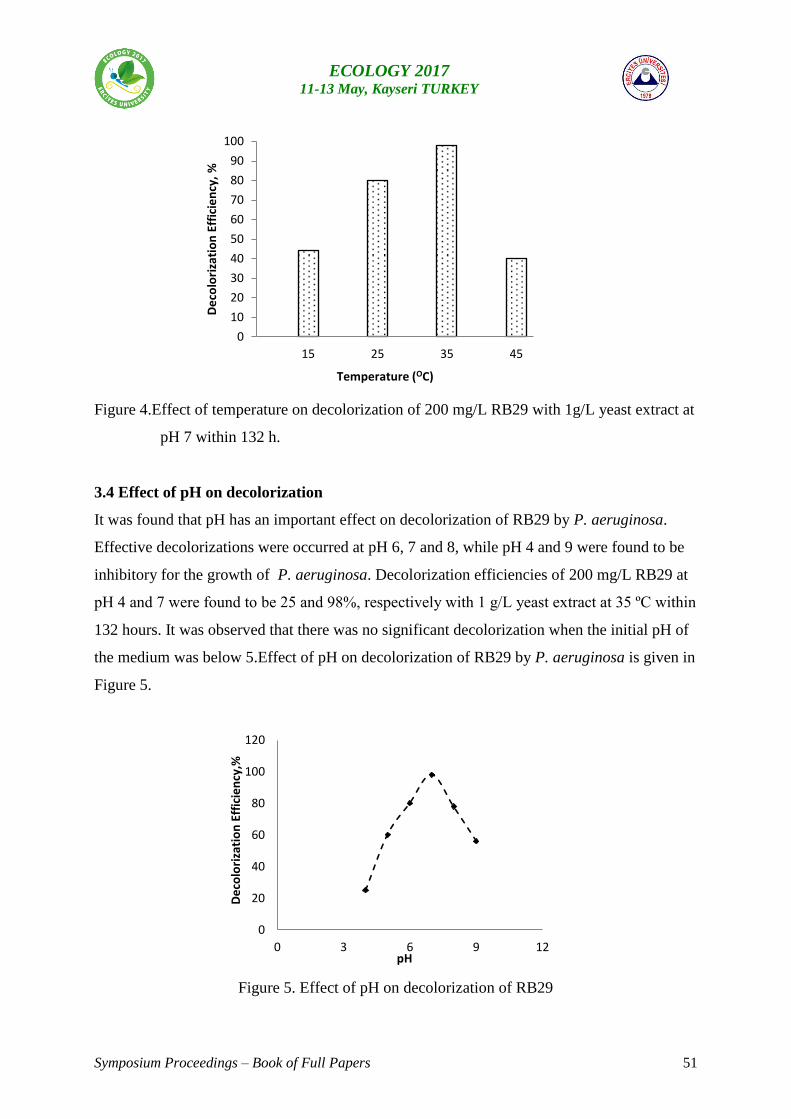
Symposium Proceedings – Book of Full Papers 51
ECOLOGY 2017 11-13 May, Kayseri TURKEY
Figure 4.Effect of temperature on decolorization of 200 mg/L RB29 with 1g/L yeast extract at
pH 7 within 132 h.
3.4 Effect of pH on decolorization
It was found that pH has an important effect on decolorization of RB29 by P. aeruginosa.
Effective decolorizations were occurred at pH 6, 7 and 8, while pH 4 and 9 were found to be
inhibitory for the growth of P. aeruginosa. Decolorization efficiencies of 200 mg/L RB29 at
pH 4 and 7 were found to be 25 and 98%, respectively with 1 g/L yeast extract at 35 ºC within
132 hours. It was observed that there was no significant decolorization when the initial pH of
the medium was below 5.Effect of pH on decolorization of RB29 by P. aeruginosa is given in
Figure 5.
Figure 5. Effect of pH on decolorization of RB29
0
10
20
30
40
50
60
70
80
90
100
15 25 35 45
De
colo
riza
tio
n E
ffic
ien
cy,
%
Temperature (OC)
0
20
40
60
80
100
120
0 3 6 9 12
De
colo
riza
tio
n E
ffic
ien
cy,%
pH
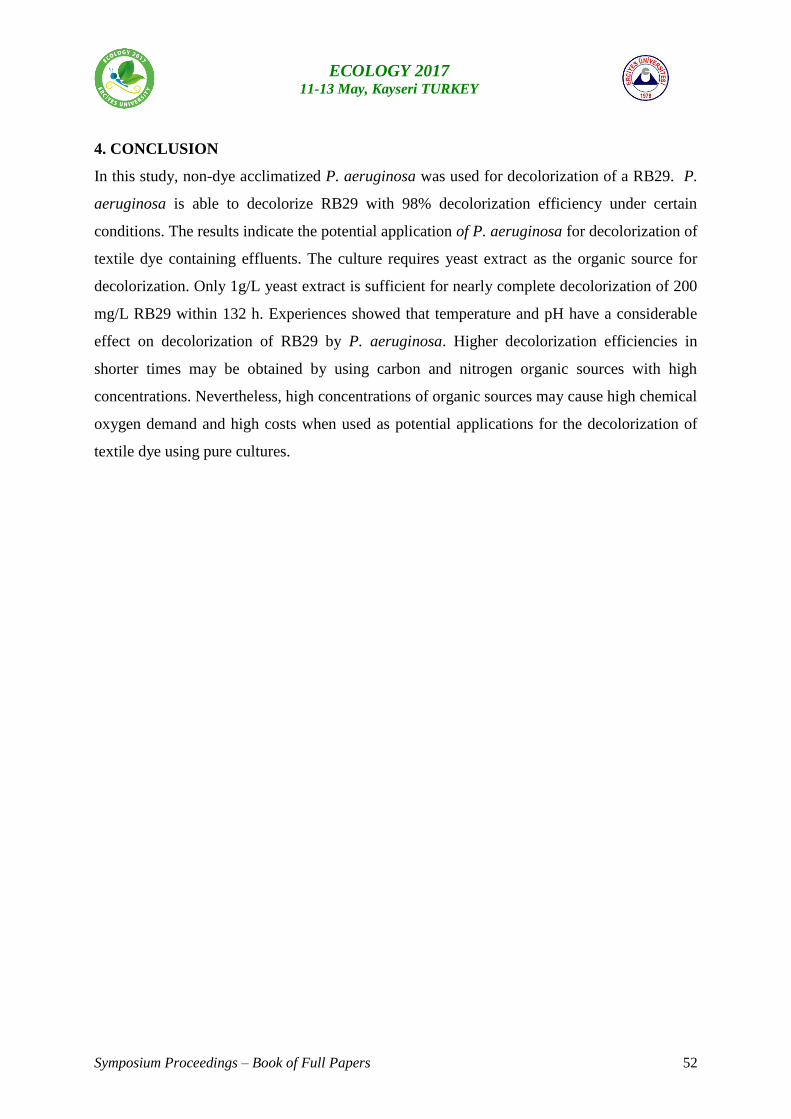
Symposium Proceedings – Book of Full Papers 52
ECOLOGY 2017 11-13 May, Kayseri TURKEY
4. CONCLUSION
In this study, non-dye acclimatized P. aeruginosa was used for decolorization of a RB29. P.
aeruginosa is able to decolorize RB29 with 98% decolorization efficiency under certain
conditions. The results indicate the potential application of P. aeruginosa for decolorization of
textile dye containing effluents. The culture requires yeast extract as the organic source for
decolorization. Only 1g/L yeast extract is sufficient for nearly complete decolorization of 200
mg/L RB29 within 132 h. Experiences showed that temperature and pH have a considerable
effect on decolorization of RB29 by P. aeruginosa. Higher decolorization efficiencies in
shorter times may be obtained by using carbon and nitrogen organic sources with high
concentrations. Nevertheless, high concentrations of organic sources may cause high chemical
oxygen demand and high costs when used as potential applications for the decolorization of
textile dye using pure cultures.
Symposium Proceedings – Book of Full Papers 53
ECOLOGY 2017 11-13 May, Kayseri TURKEY
REFERENCES
Ahmad MA, Alrozi R (2011) Optimization of rambutan peel based activated carbon
preparation conditions for remazol brilliant blue removal. Chem. Eng. Journ,
168(1): 280–85.
Al-Degs YS, El-Barghouthi MI, El-Sheikh AH, Walker GA (2008) Effect of solution
pH, ionic strength, and temperature on adsorption behavior of reactive dyes on
activated carbon. Dyes Pigments 77: 16–23.
Alhassani AH, Rauf M A, Ashraf SS (2007) Efficient microbial degradation of toluidine
blue dye by Brevibacillus sp. Dyes and Pigments 75: 395-400.
Almeida EJR, Corso CR (2014) Comparative study of toxicity of azo dye Procion Red
MX-5B following biosorption and biodegradation treatments with the fungi
Aspergillusniger and Aspergillusterreus. Chemosphere 112: 317–322.
Asad S, Amoozegar MA, Pourbabaee AA, Sarbolouki MN, Dastgheib SMM (2007)
Decolorization of textile azo dyes by newly isolated halophilic and halotolerant
bacteria. Bioresource Technology 98: 2082–2088.
Craliell, C.M., Barclay, S.J., Naidoo, N., Buckley, C.A., Mulholland, D.A., Senior, E.
(1995) Microbial Decolorization of a Reactive Azo Dye Under Anaerobic
Conditions. Water SA., 21, 61–69.
Chang JS, Chou C, Chen SY (2001) Decolorization of azo dyes with immobilized
Pseudomonas luteola. Process Biochem. 36: 757–63.
Chen KC, Wu JY, Liou DJ, Hwang SJ (2003) Decolorization of textile dyes by newly
isolated bacterial strains. Journal of Biotechnol. 101: 57–68.
Cholley P, Thouverez M, Floret N, Bertrand X, Talon D (2008) The role of water
fittings in intensive care rooms as reservoirs for the colonization of patients with
Pseudomonas aeruginosa. Intensive Care Med. 34:1428–1433.
Chung KT, Stevens SE Jr (1993) Degradation of Azo Dyes by environmental
microorganisms and helminths. Environ. Toxicol. Chem. 12: 2121–2132.
Ghodake G, Jadhav S, Dawkar V, Govindwar S (2009) Biodegradation of Diazo Dye
Direct Brown MR by Acinetobactercalcoaceticus NCIM 2890. International
Biodeterioration& Biodegradation 63: 433–439.
Symposium Proceedings – Book of Full Papers 54
ECOLOGY 2017 11-13 May, Kayseri TURKEY
Kalme SD, Parshetti GK, Jadhav SU, Govindwar SP (2007) Biodegradation of
Benzidine Based Dye Direct Blue-6 by Pseudomonas desmolyticum NCIM
2112. Bioresource Technol. 98: 1405–1410.
Kapdan IK, Erten B (2007) Anaerobic treatment of saline wastewater by
Halanaerobiumlacusrosei. Process Biochem. 42: 449–453.
Kumari L, Ajay KV, Dhanesh T, Deen D, Gopal N, Pradeep K M (2015)
Biodegradation of Navy N5RL1 carpet dye by Staphylococcus saprophyticus
strain BHUSSX33. Biotech. 1: 1-8.
Lobos JH, Leib TK, Su TM (1992) Biodegradation of Bisphenol A and other
bisphenols by a gram-negative aerobic bacterium. Appl. Environ. Microbiol.
58(6): 1823-1831.
Mahmood S, Arshad M, Khalid A, Nazli ZH, Mahmood T (2011) Isolation and
screening of azo dye decolorizing bacterial isolates from dye-contaminated
textile wastewater. Soil Environ. 30 (1): 7-12.
Mohan D, Singh KP, Singh G, Kumar K (2002) Removal of dyes from wastewater
using flyash, a low-cost adsorbent. Ind. Eng. Chem. Res. 41: 3688–3695.
Myslak ZW, Bolt HM (1988) Occupational exposure to azo dyes and risk of bladder
cancer. Zbl. Arbeitsmed. 38: 310–321.
Nigam P, Banat IM, Singh D, Marchant R (1996) Microbial process for the
decolorization of textile effluent containing azo, diazo and reactive dyes. Process
Biochem. 31: 435–442.
Senthilkumaar S, Kalaamani P, Porkodi K, Varadarajan PR, Subburaam CV. (2006)
Adsorption of dissolved reactive red dye from aqueous phase onto activated
carbon prepared from agricultural waste. Bioresource Technology; 97/14: 1618–
25.
Saratale RG, Saratale GD, Chang JS, Govindwar SP (2011) Bacterial decolorization and
degradation of azo dyes: A review. Journal of the Taiwan Instit. of Chem. Eng.
42: 138–157.
Singh SN (2012) Microbial degradation of xenobiotics, Springer-Verlag Berlin
Heidelberg.
Spilker T, Coenye T, Vandamme P, Lipuma J (2003) PCR-Based assay for
differentiation of Pseudomonas aeruginosa from other pseudomonas species
Symposium Proceedings – Book of Full Papers 55
ECOLOGY 2017 11-13 May, Kayseri TURKEY
recovered from cystic fibrosis patients. Journal Of Clinical Microbiol. 42 (5):
2074–2079.
Wang H, Su JQ, Zheng XW, Tian Y, Xiong XJ, Zhen TL (2009) Bacterial
decolorization and degradation of the Reactive Dye Reactive Red 180 by
Citrobacter sp. CK3. International Biodeterioration& Biodegradation 63: 395–
399.
Yu J, Wang X, Yue PL (2001) Optimal decolorization and kinetic modeling of synthetic
dyes by Pseudomonas strains. Water Research 35: 3579–3586.
Zimmermann T, Kulla HG, Leisinger T (1982) Properties of purified orange II
Azoreductase, the enzyme initiating Azo Dye degradation by Pseudomonas
KF46. Eur. J. Biochem. 129: 197–203.
Symposium Proceedings – Book of Full Papers 56
ECOLOGY 2017 11-13 May, Kayseri TURKEY
Use of factor and cluster analysis to evaluate the surface and groundwater quality
of Balkan Arboretum area (Edirne, Turkey)
Cem TOKATLI1,*
1 Department of Laboratory Technology, İpsala Vocational School, Trakya University,
İpsala/Edirne, Turkey
*Correspondence: [email protected]
Abstract: Balkan Arboretum Area is located in Balkan Campus of Trakya University
and it has significant surface and groundwater resources including a pond (Artificial
Pond), a creek (Güllapoğlu Stream) and a well (Güllapoğlu Well). In this study, water
qualities of these freshwater resources of Balkan Arboretum Area were evaluated by
some statistical techniques including Pearson Correlation Index (PCI), Factor Analysis
(FA) and Cluster Analysis (CA). For this purpose, total of 9 water quality parameters
including total dissolves solids (TDS), salinity, electrical conductivity (EC), pH,
turbidity, sulphate (SO4), nitrite (NO2), nitrate (NO3) and phosphate (PO4) were
measured in freshwater samples, which were collected monthly from 3 stations between
the dates of January – December in 2016. According to results of PCI, significant
positive and negative relations were recorded among the investigated parameters at the
0.01 and 0.05 significance levels. According to results of FA, 3 factors named as “Ionic
Factor”, “Agricultural Factor” and “Sewage Factor" explained 75.38% of the total
variance. According to CA, 2 statistically significant clusters were formed, which were
corresponded to creek and well stations (Cluster 1) and pond station (Cluster 2).
Key words: Balkan Arboretum Area, Freshwater quality, Statistical evaluation
Introduction
Symposium Proceedings – Book of Full Papers 57
ECOLOGY 2017 11-13 May, Kayseri TURKEY
Statistical techniques are being widely used in many countries for environmental
pollution assessment studies. Multivariate statistical techniques are helping the
interpretation of complex data matrices to better understand. Factor and Cluster
Analysis are two of the most convenient multivariate statistical methods and they are
being used commonly all over the world for especially evaluating water quality
(Shrestha and Kazama, 2007; Tokatlı et al., 2013).
Balkan Arboretum Area is located in the north east part of the Trakya University
(Balkan Campus) and it has significant surface and groundwater resources including a
pond (Artificial Pond), a creek (Güllapoğlu Stream) and a well (Güllapoğlu Well)
(Tokatlı, 2013).
In this study, Pearson Correlation Index (PCI), Factor Analysis (FA) and Cluster
Analysis (CA) were used to evaluate the water quality of freshwater resources in Balkan
Arboretum Area.
Material and Method
Study area and collection of samples
Balkan Campus is the biggest campus of the Trakya University and it has 2.215.744
square meter area (256.835 square meter closed area) (http://www-en.trakya.edu.tr/).
Balkan Arboretum Area is located in the Balkan Campus of Trakya University and
contains an artificial pond, a creek and a well.
Surface water samples were collected monthly from 3 selected stations between the
dates of January 2016 – December 2016 from Güllapoğlu Stream (lotic part), Artificial
Pond (lentic part), and Güllapoğlu Well (groundwater part). The map of Balkan
Campus of Trakya University and the selected stations are given in Figure 1.
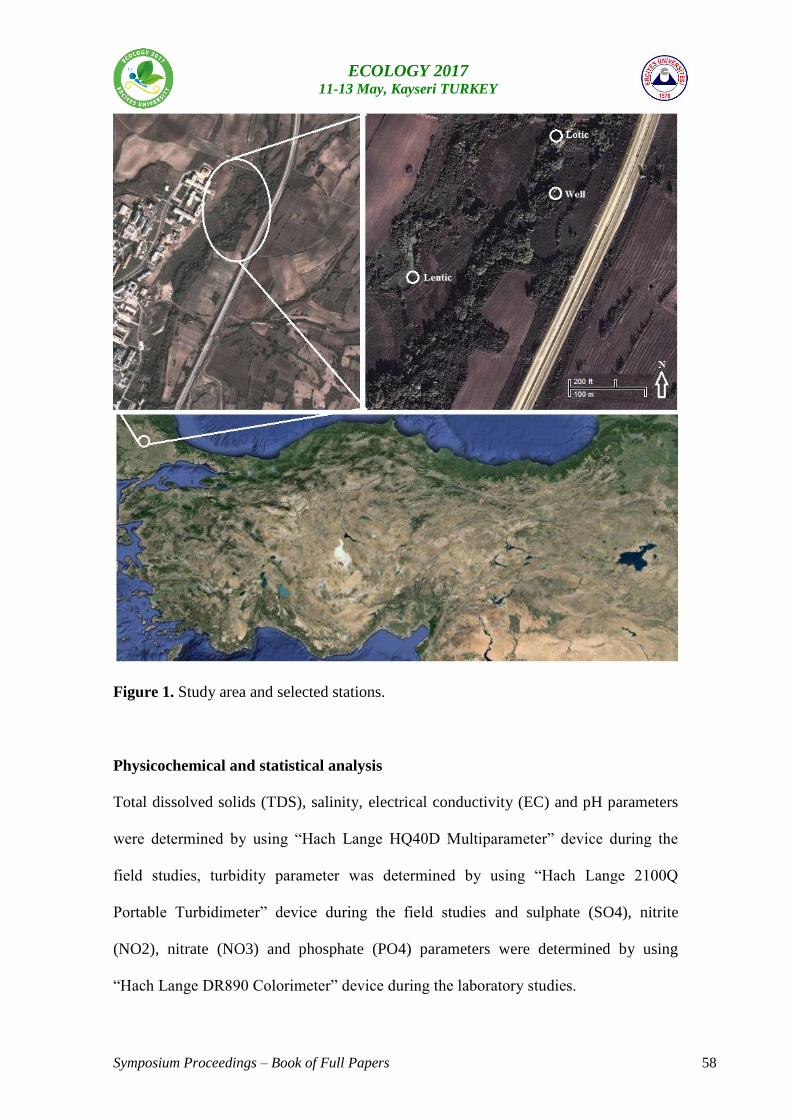
Symposium Proceedings – Book of Full Papers 58
ECOLOGY 2017 11-13 May, Kayseri TURKEY
Figure 1. Study area and selected stations.
Physicochemical and statistical analysis
Total dissolved solids (TDS), salinity, electrical conductivity (EC) and pH parameters
were determined by using “Hach Lange HQ40D Multiparameter” device during the
field studies, turbidity parameter was determined by using “Hach Lange 2100Q
Portable Turbidimeter” device during the field studies and sulphate (SO4), nitrite
(NO2), nitrate (NO3) and phosphate (PO4) parameters were determined by using
“Hach Lange DR890 Colorimeter” device during the laboratory studies.
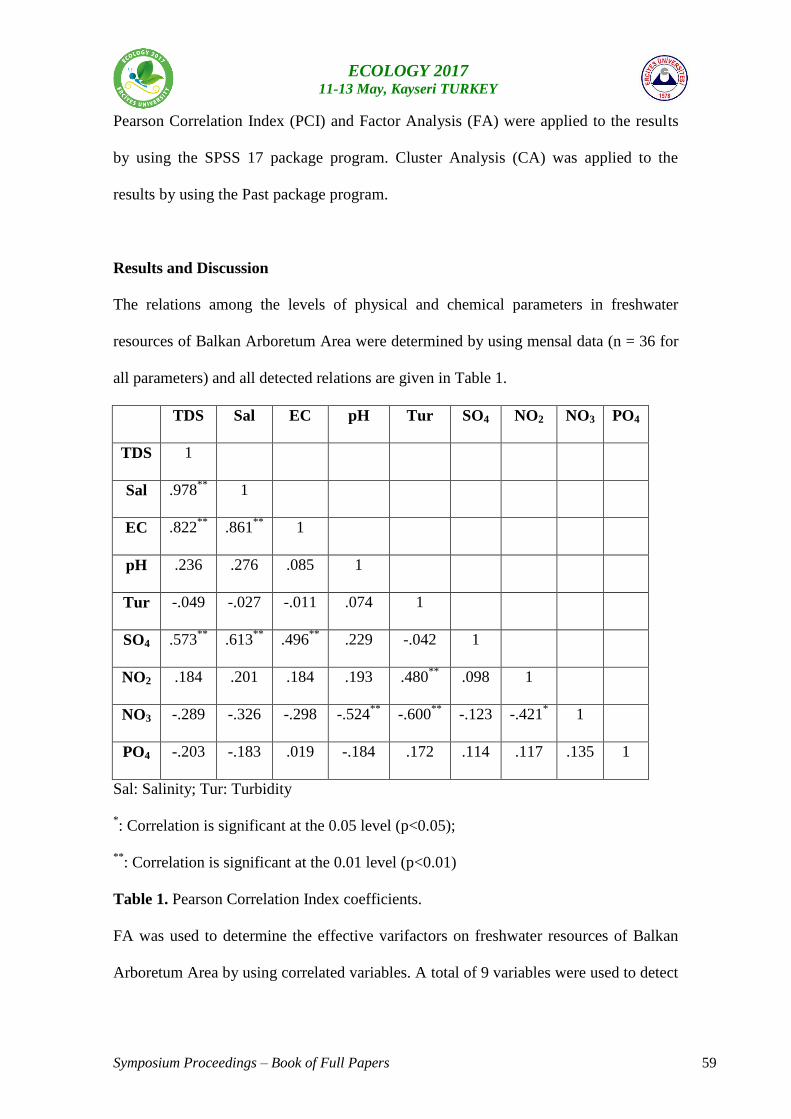
Symposium Proceedings – Book of Full Papers 59
ECOLOGY 2017 11-13 May, Kayseri TURKEY
Pearson Correlation Index (PCI) and Factor Analysis (FA) were applied to the results
by using the SPSS 17 package program. Cluster Analysis (CA) was applied to the
results by using the Past package program.
Results and Discussion
The relations among the levels of physical and chemical parameters in freshwater
resources of Balkan Arboretum Area were determined by using mensal data (n = 36 for
all parameters) and all detected relations are given in Table 1.
TDS Sal EC pH Tur SO4 NO2 NO3 PO4
TDS 1
Sal .978**
1
EC .822**
.861**
1
pH .236 .276 .085 1
Tur -.049 -.027 -.011 .074 1
SO4 .573**
.613**
.496**
.229 -.042 1
NO2 .184 .201 .184 .193 .480**
.098 1
NO3 -.289 -.326 -.298 -.524**
-.600**
-.123 -.421* 1
PO4 -.203 -.183 .019 -.184 .172 .114 .117 .135 1
Sal: Salinity; Tur: Turbidity
*: Correlation is significant at the 0.05 level (p<0.05);
**: Correlation is significant at the 0.01 level (p<0.01)
Table 1. Pearson Correlation Index coefficients.
FA was used to determine the effective varifactors on freshwater resources of Balkan
Arboretum Area by using correlated variables. A total of 9 variables were used to detect
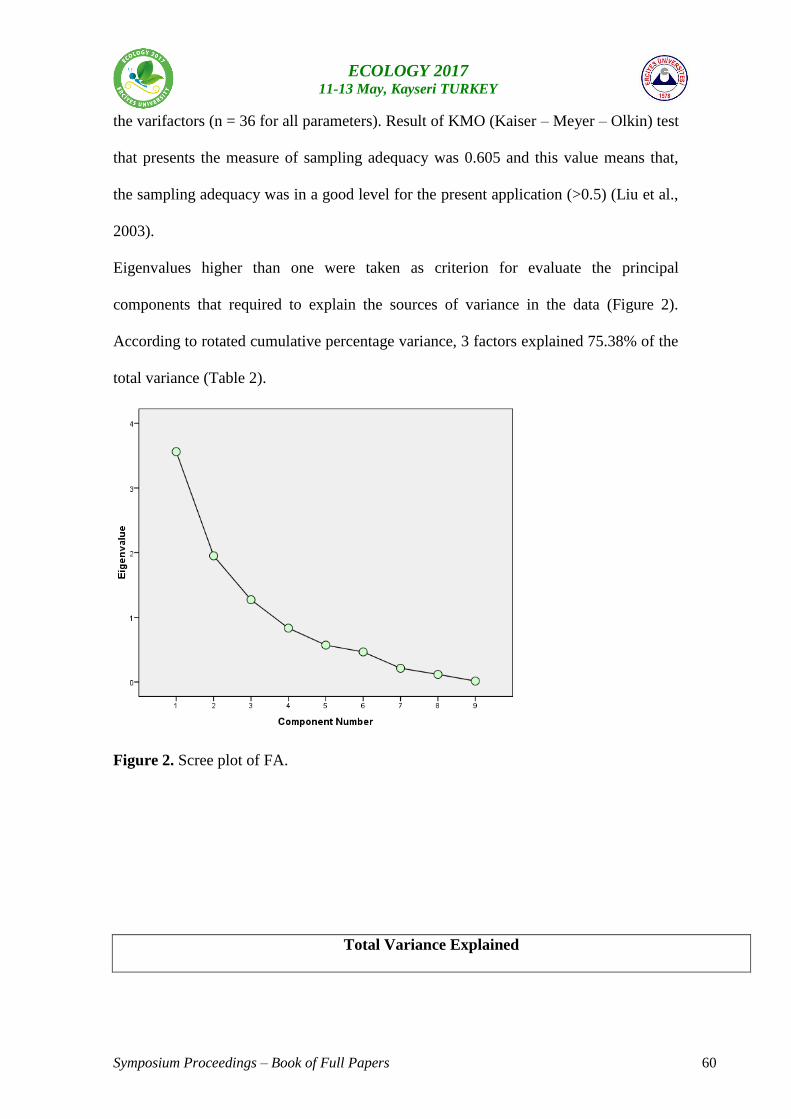
Symposium Proceedings – Book of Full Papers 60
ECOLOGY 2017 11-13 May, Kayseri TURKEY
the varifactors (n = 36 for all parameters). Result of KMO (Kaiser – Meyer – Olkin) test
that presents the measure of sampling adequacy was 0.605 and this value means that,
the sampling adequacy was in a good level for the present application (>0.5) (Liu et al.,
2003).
Eigenvalues higher than one were taken as criterion for evaluate the principal
components that required to explain the sources of variance in the data (Figure 2).
According to rotated cumulative percentage variance, 3 factors explained 75.38% of the
total variance (Table 2).
Figure 2. Scree plot of FA.
Total Variance Explained
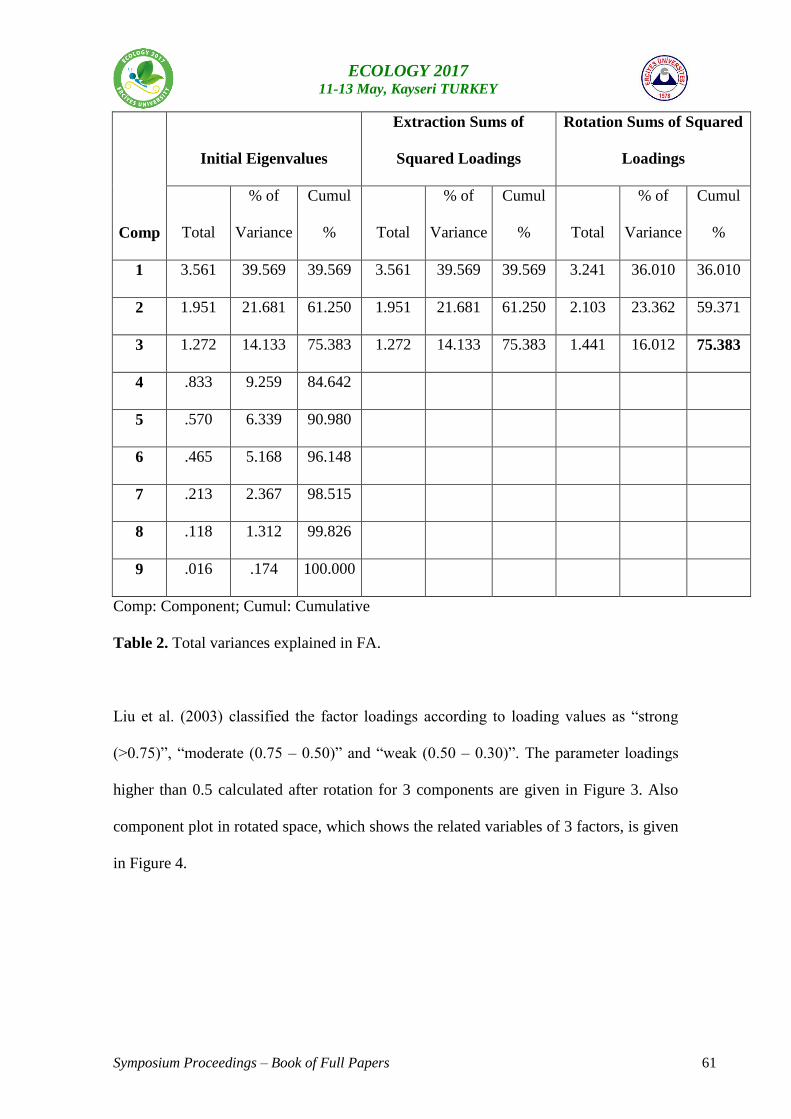
Symposium Proceedings – Book of Full Papers 61
ECOLOGY 2017 11-13 May, Kayseri TURKEY
Comp
Initial Eigenvalues
Extraction Sums of
Squared Loadings
Rotation Sums of Squared
Loadings
Total
% of
Variance
Cumul
% Total
% of
Variance
Cumul
% Total
% of
Variance
Cumul
%
1 3.561 39.569 39.569 3.561 39.569 39.569 3.241 36.010 36.010
2 1.951 21.681 61.250 1.951 21.681 61.250 2.103 23.362 59.371
3 1.272 14.133 75.383 1.272 14.133 75.383 1.441 16.012 75.383
4 .833 9.259 84.642
5 .570 6.339 90.980
6 .465 5.168 96.148
7 .213 2.367 98.515
8 .118 1.312 99.826
9 .016 .174 100.000
Comp: Component; Cumul: Cumulative
Table 2. Total variances explained in FA.
Liu et al. (2003) classified the factor loadings according to loading values as “strong
(>0.75)”, “moderate (0.75 – 0.50)” and “weak (0.50 – 0.30)”. The parameter loadings
higher than 0.5 calculated after rotation for 3 components are given in Figure 3. Also
component plot in rotated space, which shows the related variables of 3 factors, is given
in Figure 4.
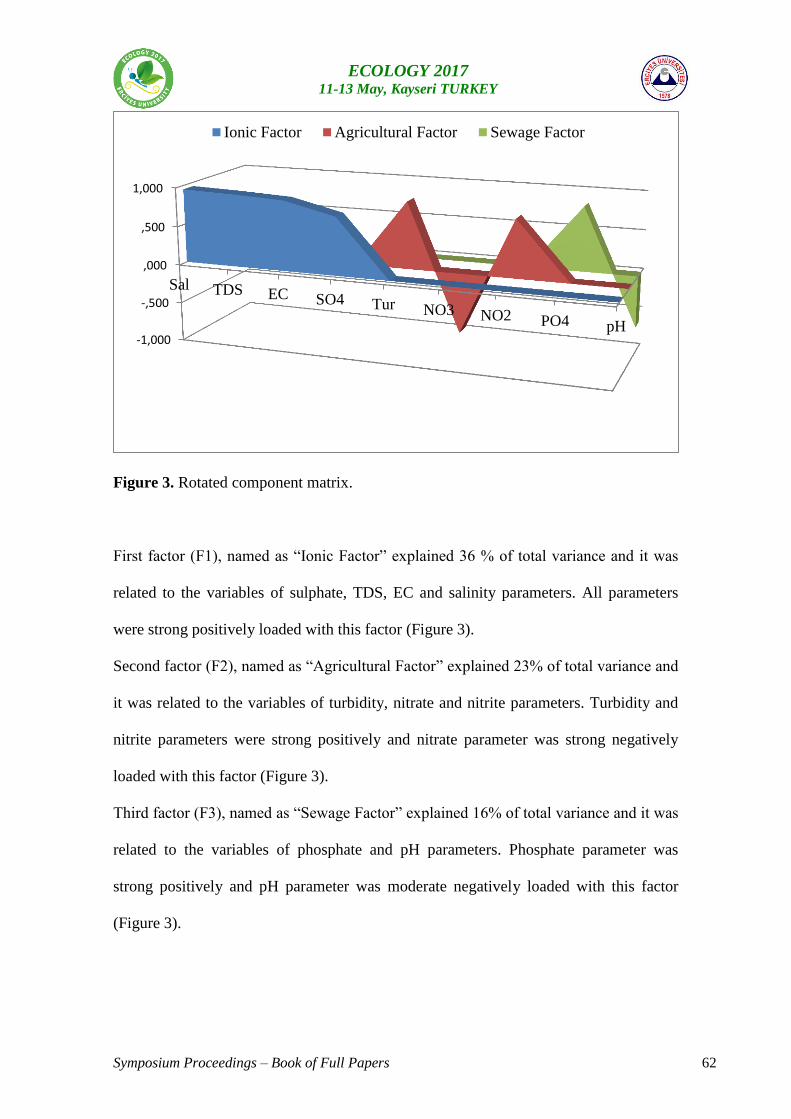
Symposium Proceedings – Book of Full Papers 62
ECOLOGY 2017 11-13 May, Kayseri TURKEY
Figure 3. Rotated component matrix.
First factor (F1), named as “Ionic Factor” explained 36 % of total variance and it was
related to the variables of sulphate, TDS, EC and salinity parameters. All parameters
were strong positively loaded with this factor (Figure 3).
Second factor (F2), named as “Agricultural Factor” explained 23% of total variance and
it was related to the variables of turbidity, nitrate and nitrite parameters. Turbidity and
nitrite parameters were strong positively and nitrate parameter was strong negatively
loaded with this factor (Figure 3).
Third factor (F3), named as “Sewage Factor” explained 16% of total variance and it was
related to the variables of phosphate and pH parameters. Phosphate parameter was
strong positively and pH parameter was moderate negatively loaded with this factor
(Figure 3).
-1,000
-,500
,000
,500
1,000
Sal TDS EC SO4 Tur NO3 NO2 PO4 pH
Ionic Factor Agricultural Factor Sewage Factor
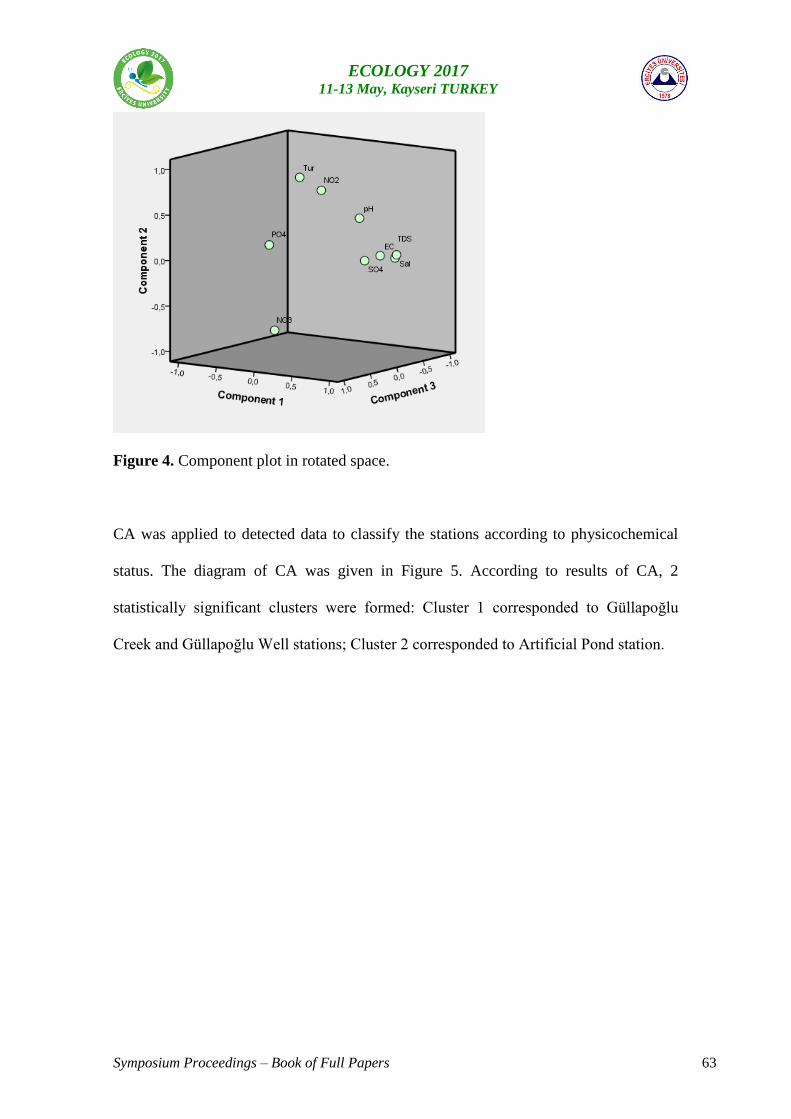
Symposium Proceedings – Book of Full Papers 63
ECOLOGY 2017 11-13 May, Kayseri TURKEY
Figure 4. Component plot in rotated space.
CA was applied to detected data to classify the stations according to physicochemical
status. The diagram of CA was given in Figure 5. According to results of CA, 2
statistically significant clusters were formed: Cluster 1 corresponded to Güllapoğlu
Creek and Güllapoğlu Well stations; Cluster 2 corresponded to Artificial Pond station.
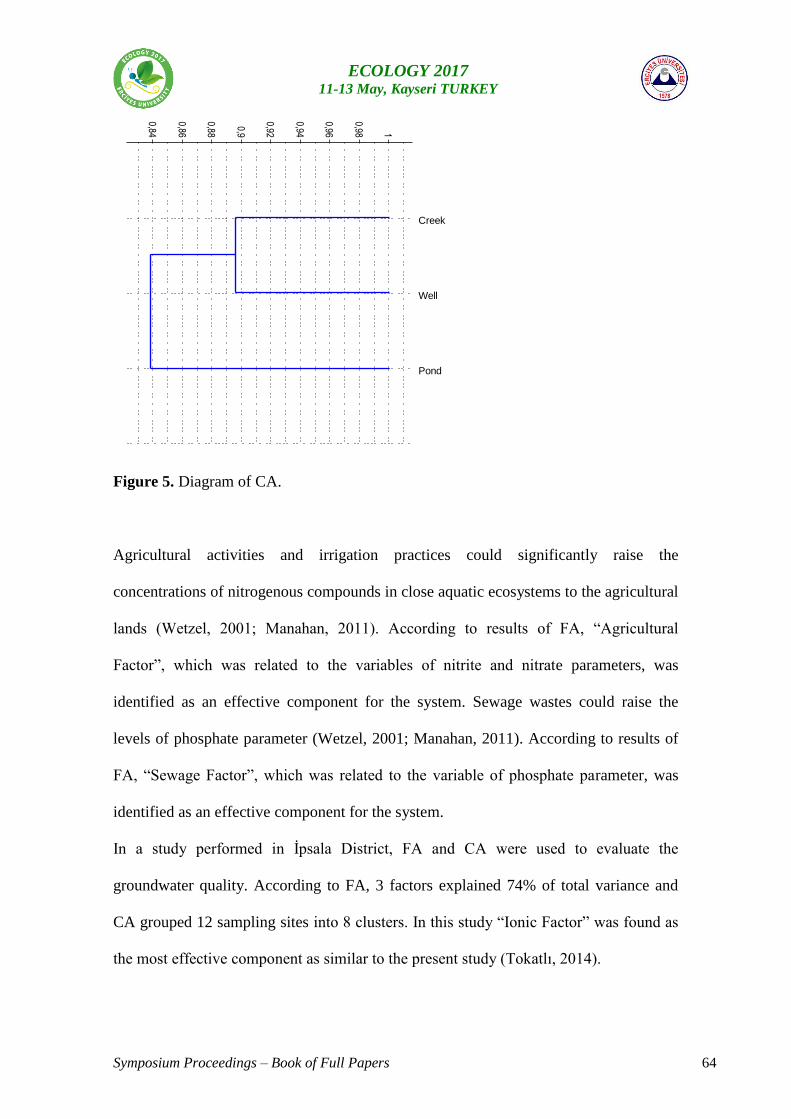
Symposium Proceedings – Book of Full Papers 64
ECOLOGY 2017 11-13 May, Kayseri TURKEY
Figure 5. Diagram of CA.
Agricultural activities and irrigation practices could significantly raise the
concentrations of nitrogenous compounds in close aquatic ecosystems to the agricultural
lands (Wetzel, 2001; Manahan, 2011). According to results of FA, “Agricultural
Factor”, which was related to the variables of nitrite and nitrate parameters, was
identified as an effective component for the system. Sewage wastes could raise the
levels of phosphate parameter (Wetzel, 2001; Manahan, 2011). According to results of
FA, “Sewage Factor”, which was related to the variable of phosphate parameter, was
identified as an effective component for the system.
In a study performed in İpsala District, FA and CA were used to evaluate the
groundwater quality. According to FA, 3 factors explained 74% of total variance and
CA grouped 12 sampling sites into 8 clusters. In this study “Ionic Factor” was found as
the most effective component as similar to the present study (Tokatlı, 2014).
0,40,8
1,21,6
22,4
2,83,2
3,64
0,84
0,86
0,88
0,9
0,92
0,94
0,96
0,98 1
Creek
Well
Pond
Symposium Proceedings – Book of Full Papers 65
ECOLOGY 2017 11-13 May, Kayseri TURKEY
In this study, some statistical techniques were used to evaluate the freshwater resources
quality of the Balkan Arboretum Area by using a large number of physico – chemical
data. Factor Analysis helped to identify the effective factors on the system and 3
effective factors were determined that were explained 75% of the total variance. Cluster
Analysis helped to group the sampling stations into 2 statistically significant clusters of
similar water quality characteristics.
In conclusion, statistical techniques are necessary for a sophisticated environmental
assessment especially in water quality monitoring studies because of difficulty of the
interpretations of the data. Results of this study reveal the benefits of statistical
techniques in water quality assessment studies.
Acknowledgement
The author would like to acknowledge the support provided by Trakya University.
References
http://www-en.trakya.edu.tr/
Liu CW, Lin KH, Kuo YM (2003). Application of factor analysis in the assessment of
groundwater quality in a Blackfoot disease area in Taiwan. Science of the Total
Environment, 313, 77–89.
Manahan SE (2011). Water Chemistry: Green Science and Technology of Nature's Most
Renewable Resource. Taylor & Francis Group, CRC Press, 398 pages.
Symposium Proceedings – Book of Full Papers 66
ECOLOGY 2017 11-13 May, Kayseri TURKEY
Shrestha S, Kazama F (2007). Assessment of surface water quality using multivariate
statistical techniques: A case study of the Fuji river basin; Japan. Environmental
Modelling & Software, 22, 464–475.
Tokatlı C, Çiçek A, Köse E (2013). Groundwater Quality of Türkmen Mountain
(Turkey). Polish Journal of Environmental Studies, 22 (4), 1197-1208.
Tokatlı C (2013). Use of Statistical Methods in Water Quality Assessment: A Case
Study of Balkan Arboretum Area In Trakya University (Edirne, Turkey). Journal of
Applied Biological Sciences, 7 (3): 79-83.
Tokatlı C (2014). Drinking Water Quality of a Rice Land in Turkey by a Statistical and
GIS Perspective: Ipsala District. Polish Journal of Environmental Studies, 23 (6): 2247-
2258.
Wetzel RG (2001). Limnology: Lake and River Ecosystems. Elsevier Academic Press,
1006 pages.
Symposium Proceedings – Book of Full Papers 67
ECOLOGY 2017 11-13 May, Kayseri TURKEY
Bioremoval of Phosphate from Aqueous Solution Using Macroalga
Chara sp.
Fatih Deniz1 and Elif Tezel Ersanlı
2
1Sinop University, Department of Environmental Engineering, Sinop, [email protected]
2Sinop University, Department of Biology, Sinop, [email protected]
Abstract
The cetyltrimethylammonium bromide (CTAB) modified biomass of Chara sp.
macroalga were studied to remove phosphate from aqueous solution. The environmental
parameters including biosorbent quantity, pH, phosphate concentration and contact time
were explored for biosorption performance. The biosorption isotherm data were
analyzed using Freundlich, Langmuir and Dubinin-Radushkevich models while the
kinetic data of biosorption were modelled with the pseudo-first-order, pseudo-second-
order and intra-particle diffusion models. The bioremoval of phosphate increased with
increased ion concentration and contact time, and decreased with increased pH and
biosorbent quantity. The equilibrium state was reached within 60 min. Freundlich and
pseudo-second-order models fitted well to the biosorption experimental data. The
maximum biosorption capacity of biosorbent was estimated to be 38.987 mg g-1
at the
optimized biosorption conditions. Hence, the modified algal biomass can be used as an
economic and effective biosorbent in the bioremoval of phosphate ions from aquatic
environment.
Keywords: Bioremoval; Phosphate; Macroalga; Modified biosorbent
Symposium Proceedings – Book of Full Papers 68
ECOLOGY 2017 11-13 May, Kayseri TURKEY
Makroalg Chara sp. Kullanarak Sulu Solüsyondan Fosfatın Biyolojik
Giderimi
Fatih Deniz1ve Elif Tezel Ersanlı
2
1Sinop Üniversitesi, Çevre Mühendisliği Bölümü, Sinop, [email protected]
2Sinop Üniversitesi, Biyoloji Bölümü, Sinop, [email protected]
Özet
Chara sp. makroalginin cetyltrimethylammonium bromide (CTAB) ile modifiye edilmiş
biyoması sulu solüsyondan fosfat giderimi için araştırılmıştır. Biyosorbent miktarı, pH,
fosfat konsantrasyonu ve temas süresini içeren çevresel parametreler, biyosorpsiyon
performansı için incelenmiştir. Biyosorpsiyon izoterm verileri, Freundlich, Langmuir ve
Dubinin-Radushkevich modellerini kullanarak analiz edilirken, biyosorpsiyon kinetik
verileri, yalancı birinci mertebe, yalancı ikinci mertebe ve partikül içi difüzyon
modelleri ile modellenmiştir. Fosfatın biyolojik giderimi artan iyon konsantrasyonu ve
temas süresi ile artarken, artan pH ve biyosorbent miktarı ile azalmıştır. Denge
durumuna 60 dakika içinde ulaşılmıştır. Freundlich ve yalancı ikinci mertebe modelleri,
biyosorpsiyon deneysel verilerine oldukça iyi bir şekilde uymuştur. Optimize edilmiş
biyosorpsiyon koşullarında biyosorbentin maksimum biyosorpsiyon kapasitesi, 38,987
mg g-1
olarak tahmin edilmiştir. Bu nedenle, modifiye edilmiş algal biyokütle, sucul
ortamdan fosfat iyonlarının biyolojik olarak uzaklaştırılmasında ekonomik ve etkili bir
biyosorbent olarak kullanılabilir.
Anahtar Kelimeler: Biyolojik giderim; Fosfat; Makroalg; Modifiye biyosorbent
Symposium Proceedings – Book of Full Papers 69
ECOLOGY 2017 11-13 May, Kayseri TURKEY
1. Introduction
The human activities including mining, agricultural, industrial and household uses as
well as the natural processes such as weathering of rocks lead to releasing dissolved
nutrients such as phosphorous in aquatic environments [1, 2]. It is often present in
wastewater in low concentrations mostly as phosphates including organic phosphate and
inorganic phosphate. A typical raw domestic wastewater has a total phosphorus
concentration of approximately 10 mg L-1
with orthophosphate as the principal form of
phosphate in addition to small amount of other forms of phosphate [3]. Phosphorous is
an essential, often limiting, nutrient for growth of organisms in most ecosystems. An
excessive concentration of this nutrient in water is often responsible for eutrophication
leading to short term and long term environmental and esthetic problems in lakes and
reservoirs, coastal areas and other confined water bodies, and is a threat to ecological
health [4]. On the other hand, phosphorous resources are limited and high grade
phosphate ores are going to be depleted in the near future due to the agricultural,
industrial and household uses [1]. Therefore, it is very important to remove phosphates
from wastewater and also to recover this nutrient element for use as an alternative
source.
Several phosphate removal technologies have been used in water/wastewater treatment
including biological, chemical and physical process. Of these methods, biosorption is
considered a promising choice because of its relatively low operational costs, simplicity
and minimal production of waste. Numerous biosorbents have been reported for
biosorption of pollutant ions [5]. In recent years, the development of bio-based
biosorbents for phosphate ion removal has gained increasing attention. Thus, the present
study focused on the bioremoval of phosphate from aqueous solution through
biosorption using Chara sp. macroalga biomass. Besides, recent studies have focused
on applying different modification agents to improve biosorption capacities of
biosorbents, and this operation showed a great improvement [4, 6-8]. Thus,
cetyltrimethylammonium bromide (CTAB) was applied to modify the algal biomass,
aiming to acquire an influential biosorbent for phosphate bioremoval from liquid
environment. Biosorption characteristics of phosphate ions onto the CTAB modified
biosorbent were systematically studied under batch conditions. The effects of various
operating conditions, namely, solution pH, ion concentration, quantity of biosorbent and
contact time, were investigated. The biosorption test data were modeled using various
kinetic and equilibrium models.
2. Materials and methods
2.1. Biosorbate and other chemicals
Potassium dihydrogen phosphate (KH2PO4) as an orthophosphate source was purchased
from Carlo Erba. A stock solution of 1 g L-1
was prepared by dissolving required
amount of the chemical in distilled water. The experimental phosphate concentrations in
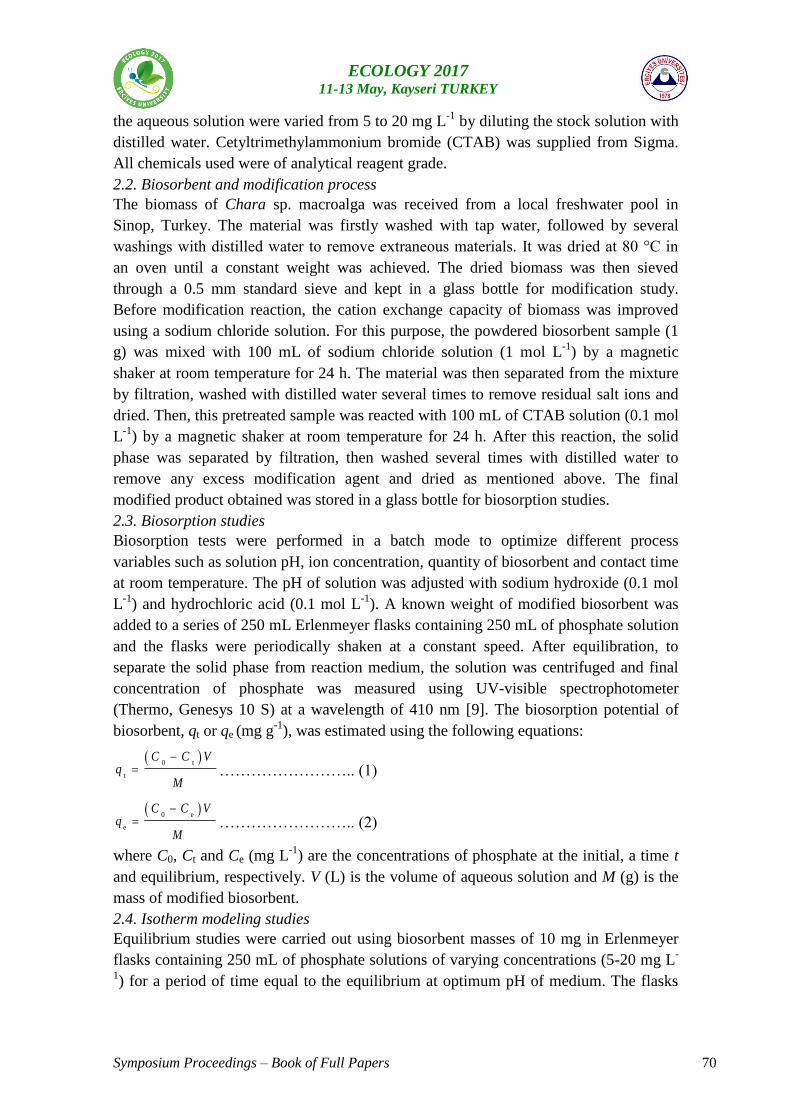
Symposium Proceedings – Book of Full Papers 70
ECOLOGY 2017 11-13 May, Kayseri TURKEY
the aqueous solution were varied from 5 to 20 mg L-1
by diluting the stock solution with
distilled water. Cetyltrimethylammonium bromide (CTAB) was supplied from Sigma.
All chemicals used were of analytical reagent grade.
2.2. Biosorbent and modification process
The biomass of Chara sp. macroalga was received from a local freshwater pool in
Sinop, Turkey. The material was firstly washed with tap water, followed by several
washings with distilled water to remove extraneous materials. It was dried at 80 °C in
an oven until a constant weight was achieved. The dried biomass was then sieved
through a 0.5 mm standard sieve and kept in a glass bottle for modification study.
Before modification reaction, the cation exchange capacity of biomass was improved
using a sodium chloride solution. For this purpose, the powdered biosorbent sample (1
g) was mixed with 100 mL of sodium chloride solution (1 mol L-1
) by a magnetic
shaker at room temperature for 24 h. The material was then separated from the mixture
by filtration, washed with distilled water several times to remove residual salt ions and
dried. Then, this pretreated sample was reacted with 100 mL of CTAB solution (0.1 mol
L-1
) by a magnetic shaker at room temperature for 24 h. After this reaction, the solid
phase was separated by filtration, then washed several times with distilled water to
remove any excess modification agent and dried as mentioned above. The final
modified product obtained was stored in a glass bottle for biosorption studies.
2.3. Biosorption studies
Biosorption tests were performed in a batch mode to optimize different process
variables such as solution pH, ion concentration, quantity of biosorbent and contact time
at room temperature. The pH of solution was adjusted with sodium hydroxide (0.1 mol
L-1
) and hydrochloric acid (0.1 mol L-1
). A known weight of modified biosorbent was
added to a series of 250 mL Erlenmeyer flasks containing 250 mL of phosphate solution
and the flasks were periodically shaken at a constant speed. After equilibration, to
separate the solid phase from reaction medium, the solution was centrifuged and final
concentration of phosphate was measured using UV-visible spectrophotometer
(Thermo, Genesys 10 S) at a wavelength of 410 nm [9]. The biosorption potential of
biosorbent, qt or qe (mg g-1
), was estimated using the following equations:
0 t
t
C C Vq
M
…………………….. (1)
0 e
e
C C Vq
M
…………………….. (2)
where C0, Ct and Ce (mg L-1
) are the concentrations of phosphate at the initial, a time t
and equilibrium, respectively. V (L) is the volume of aqueous solution and M (g) is the
mass of modified biosorbent.
2.4. Isotherm modeling studies
Equilibrium studies were carried out using biosorbent masses of 10 mg in Erlenmeyer
flasks containing 250 mL of phosphate solutions of varying concentrations (5-20 mg L-
1) for a period of time equal to the equilibrium at optimum pH of medium. The flasks
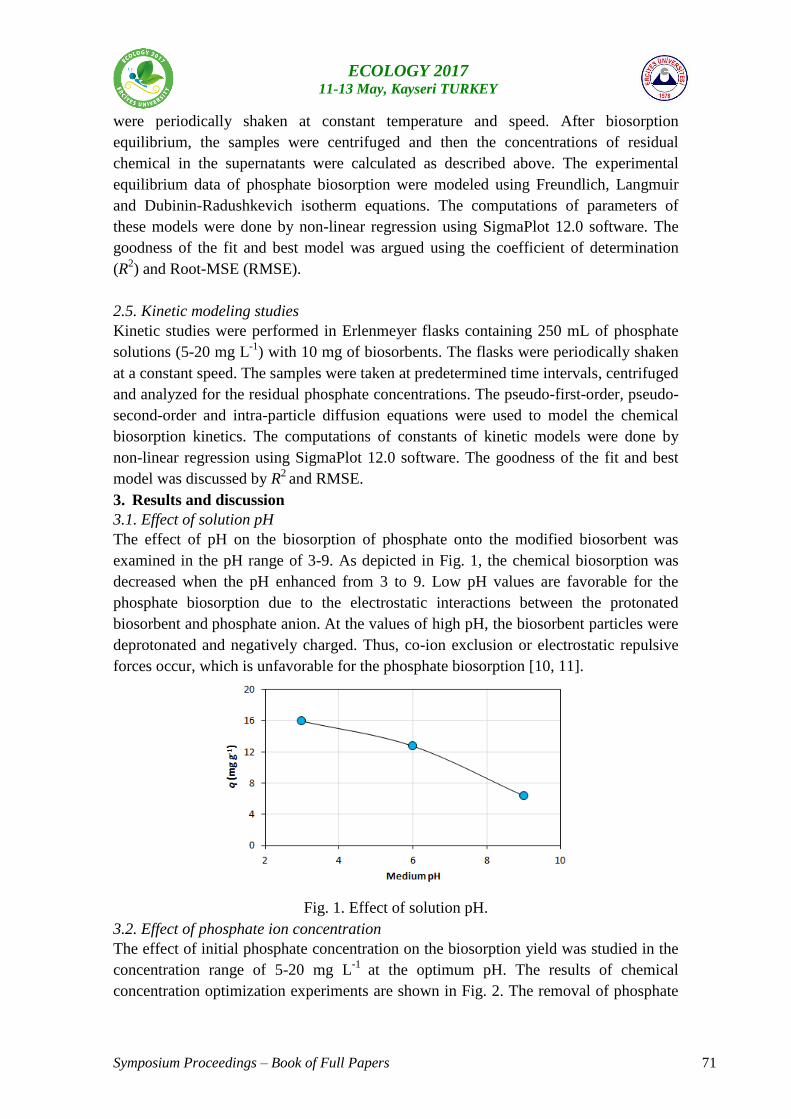
Symposium Proceedings – Book of Full Papers 71
ECOLOGY 2017 11-13 May, Kayseri TURKEY
were periodically shaken at constant temperature and speed. After biosorption
equilibrium, the samples were centrifuged and then the concentrations of residual
chemical in the supernatants were calculated as described above. The experimental
equilibrium data of phosphate biosorption were modeled using Freundlich, Langmuir
and Dubinin-Radushkevich isotherm equations. The computations of parameters of
these models were done by non-linear regression using SigmaPlot 12.0 software. The
goodness of the fit and best model was argued using the coefficient of determination
(R2) and Root-MSE (RMSE).
2.5. Kinetic modeling studies
Kinetic studies were performed in Erlenmeyer flasks containing 250 mL of phosphate
solutions (5-20 mg L-1
) with 10 mg of biosorbents. The flasks were periodically shaken
at a constant speed. The samples were taken at predetermined time intervals, centrifuged
and analyzed for the residual phosphate concentrations. The pseudo-first-order, pseudo-
second-order and intra-particle diffusion equations were used to model the chemical
biosorption kinetics. The computations of constants of kinetic models were done by
non-linear regression using SigmaPlot 12.0 software. The goodness of the fit and best
model was discussed by R2
and RMSE.
3. Results and discussion
3.1. Effect of solution pH
The effect of pH on the biosorption of phosphate onto the modified biosorbent was
examined in the pH range of 3-9. As depicted in Fig. 1, the chemical biosorption was
decreased when the pH enhanced from 3 to 9. Low pH values are favorable for the
phosphate biosorption due to the electrostatic interactions between the protonated
biosorbent and phosphate anion. At the values of high pH, the biosorbent particles were
deprotonated and negatively charged. Thus, co-ion exclusion or electrostatic repulsive
forces occur, which is unfavorable for the phosphate biosorption [10, 11].
Fig. 1. Effect of solution pH.
3.2. Effect of phosphate ion concentration
The effect of initial phosphate concentration on the biosorption yield was studied in the
concentration range of 5-20 mg L-1
at the optimum pH. The results of chemical
concentration optimization experiments are shown in Fig. 2. The removal of phosphate
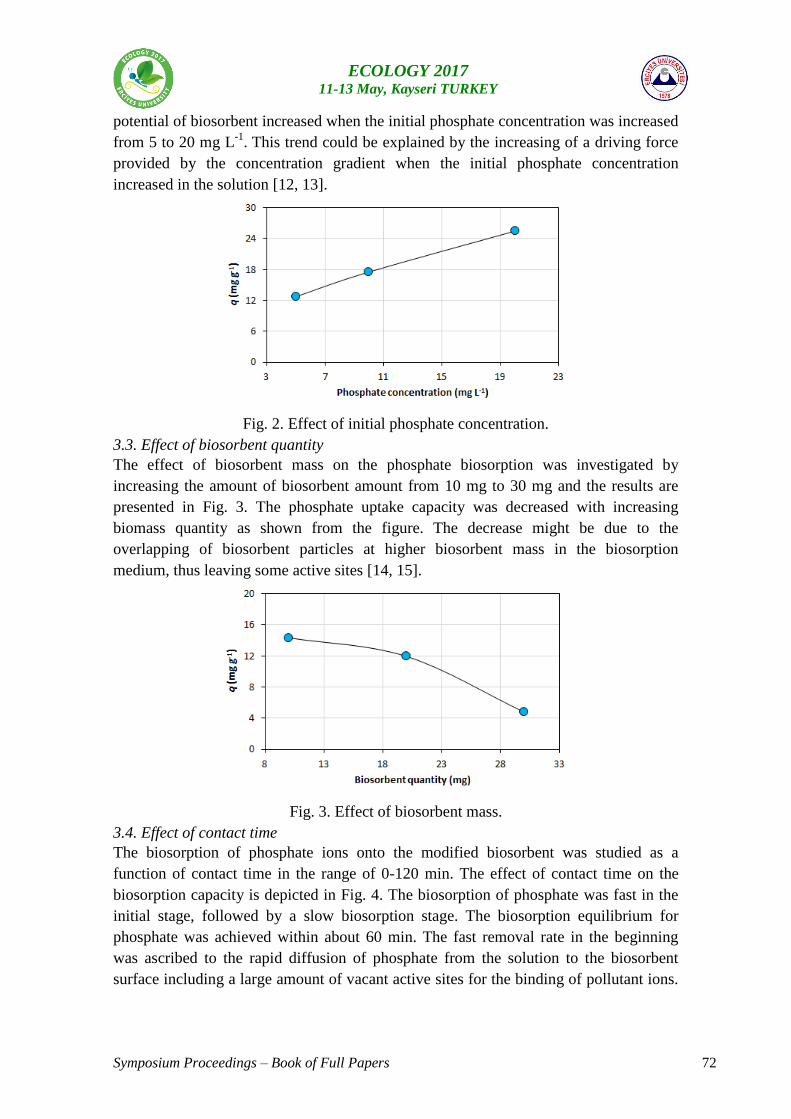
Symposium Proceedings – Book of Full Papers 72
ECOLOGY 2017 11-13 May, Kayseri TURKEY
potential of biosorbent increased when the initial phosphate concentration was increased
from 5 to 20 mg L-1
. This trend could be explained by the increasing of a driving force
provided by the concentration gradient when the initial phosphate concentration
increased in the solution [12, 13].
Fig. 2. Effect of initial phosphate concentration.
3.3. Effect of biosorbent quantity
The effect of biosorbent mass on the phosphate biosorption was investigated by
increasing the amount of biosorbent amount from 10 mg to 30 mg and the results are
presented in Fig. 3. The phosphate uptake capacity was decreased with increasing
biomass quantity as shown from the figure. The decrease might be due to the
overlapping of biosorbent particles at higher biosorbent mass in the biosorption
medium, thus leaving some active sites [14, 15].
Fig. 3. Effect of biosorbent mass.
3.4. Effect of contact time
The biosorption of phosphate ions onto the modified biosorbent was studied as a
function of contact time in the range of 0-120 min. The effect of contact time on the
biosorption capacity is depicted in Fig. 4. The biosorption of phosphate was fast in the
initial stage, followed by a slow biosorption stage. The biosorption equilibrium for
phosphate was achieved within about 60 min. The fast removal rate in the beginning
was ascribed to the rapid diffusion of phosphate from the solution to the biosorbent
surface including a large amount of vacant active sites for the binding of pollutant ions.
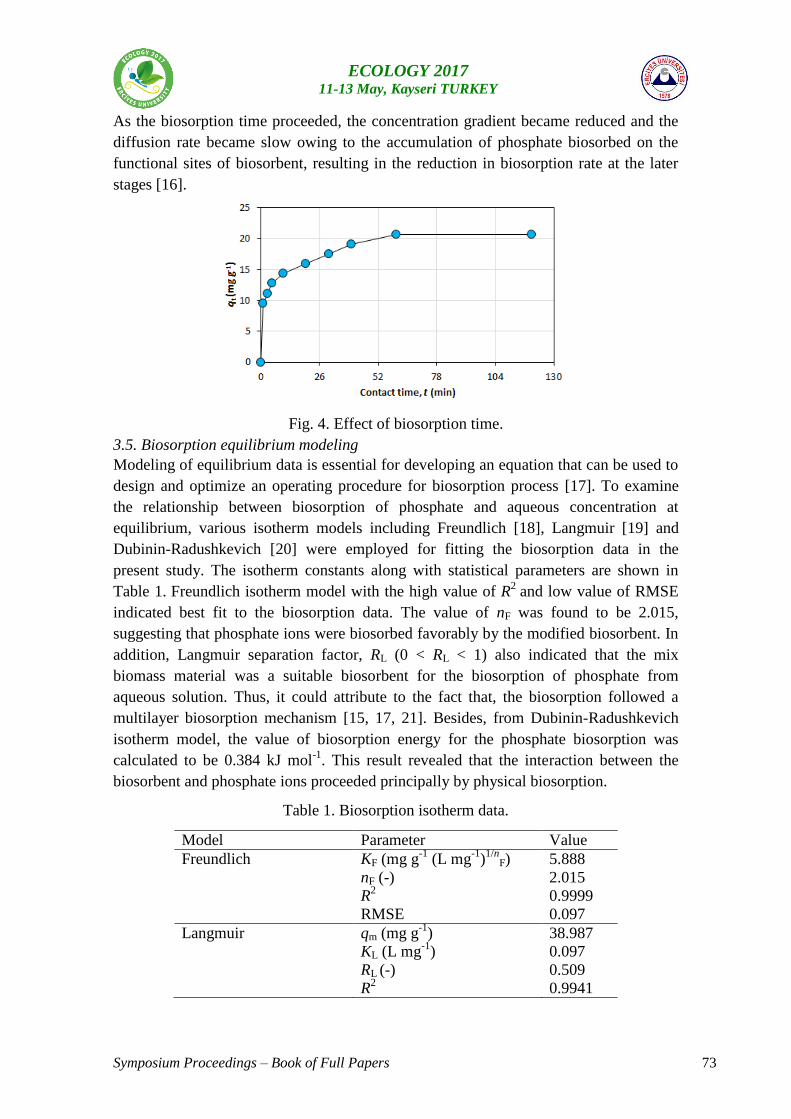
Symposium Proceedings – Book of Full Papers 73
ECOLOGY 2017 11-13 May, Kayseri TURKEY
As the biosorption time proceeded, the concentration gradient became reduced and the
diffusion rate became slow owing to the accumulation of phosphate biosorbed on the
functional sites of biosorbent, resulting in the reduction in biosorption rate at the later
stages [16].
Fig. 4. Effect of biosorption time.
3.5. Biosorption equilibrium modeling
Modeling of equilibrium data is essential for developing an equation that can be used to
design and optimize an operating procedure for biosorption process [17]. To examine
the relationship between biosorption of phosphate and aqueous concentration at
equilibrium, various isotherm models including Freundlich [18], Langmuir [19] and
Dubinin-Radushkevich [20] were employed for fitting the biosorption data in the
present study. The isotherm constants along with statistical parameters are shown in
Table 1. Freundlich isotherm model with the high value of R2
and low value of RMSE
indicated best fit to the biosorption data. The value of nF was found to be 2.015,
suggesting that phosphate ions were biosorbed favorably by the modified biosorbent. In
addition, Langmuir separation factor, RL (0 < RL < 1) also indicated that the mix
biomass material was a suitable biosorbent for the biosorption of phosphate from
aqueous solution. Thus, it could attribute to the fact that, the biosorption followed a
multilayer biosorption mechanism [15, 17, 21]. Besides, from Dubinin-Radushkevich
isotherm model, the value of biosorption energy for the phosphate biosorption was
calculated to be 0.384 kJ mol-1
. This result revealed that the interaction between the
biosorbent and phosphate ions proceeded principally by physical biosorption.
Table 1. Biosorption isotherm data.
Model Parameter Value
Freundlich KF (mg g-1
(L mg-1
)1/n
F)
nF (-)
R2
RMSE
5.888
2.015
0.9999
0.097
Langmuir qm (mg g-1
)
KL (L mg-1
)
RL (-)
R2
38.987
0.097
0.509
0.9941
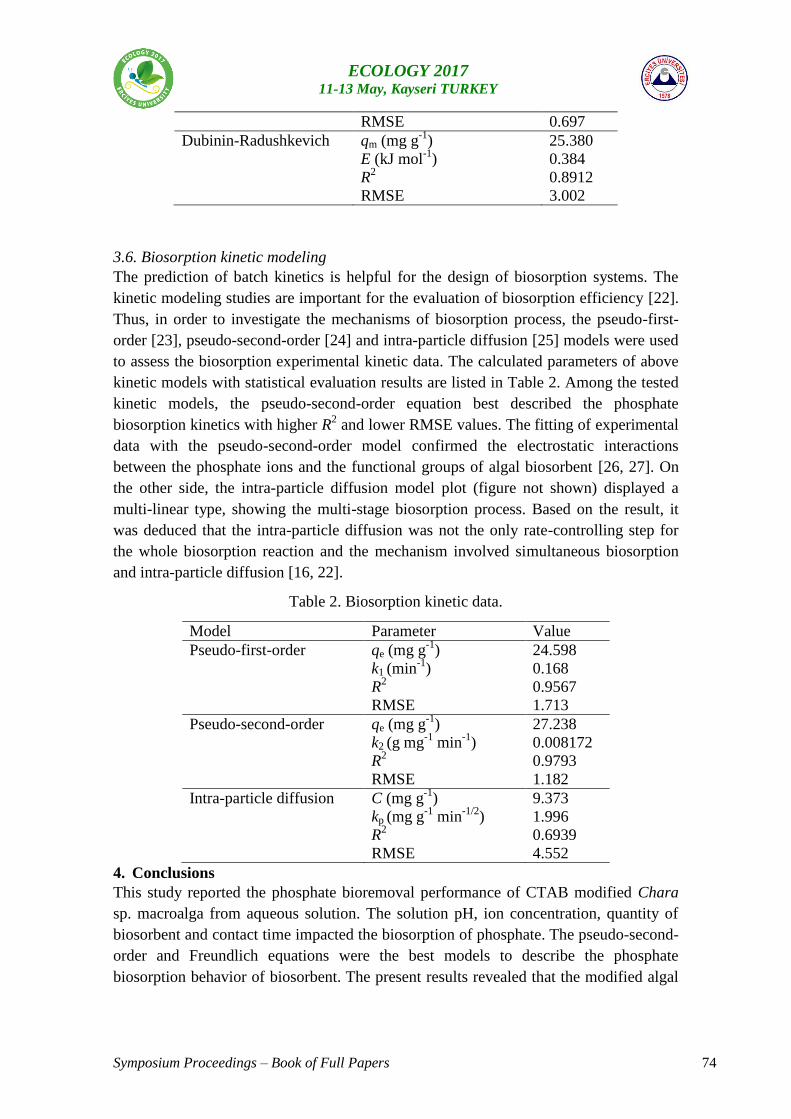
Symposium Proceedings – Book of Full Papers 74
ECOLOGY 2017 11-13 May, Kayseri TURKEY
RMSE 0.697
Dubinin-Radushkevich qm (mg g-1
)
E (kJ mol-1
)
R2
RMSE
25.380
0.384
0.8912
3.002
3.6. Biosorption kinetic modeling
The prediction of batch kinetics is helpful for the design of biosorption systems. The
kinetic modeling studies are important for the evaluation of biosorption efficiency [22].
Thus, in order to investigate the mechanisms of biosorption process, the pseudo-first-
order [23], pseudo-second-order [24] and intra-particle diffusion [25] models were used
to assess the biosorption experimental kinetic data. The calculated parameters of above
kinetic models with statistical evaluation results are listed in Table 2. Among the tested
kinetic models, the pseudo-second-order equation best described the phosphate
biosorption kinetics with higher R2 and lower RMSE values. The fitting of experimental
data with the pseudo-second-order model confirmed the electrostatic interactions
between the phosphate ions and the functional groups of algal biosorbent [26, 27]. On
the other side, the intra-particle diffusion model plot (figure not shown) displayed a
multi-linear type, showing the multi-stage biosorption process. Based on the result, it
was deduced that the intra-particle diffusion was not the only rate-controlling step for
the whole biosorption reaction and the mechanism involved simultaneous biosorption
and intra-particle diffusion [16, 22].
Table 2. Biosorption kinetic data.
Model Parameter Value
Pseudo-first-order qe (mg g-1
)
k1 (min-1
)
R2
RMSE
24.598
0.168
0.9567
1.713
Pseudo-second-order qe (mg g-1
)
k2 (g mg-1
min-1
)
R2
RMSE
27.238
0.008172
0.9793
1.182
Intra-particle diffusion C (mg g-1
)
kp (mg g-1
min-1/2
)
R2
RMSE
9.373
1.996
0.6939
4.552
4. Conclusions
This study reported the phosphate bioremoval performance of CTAB modified Chara
sp. macroalga from aqueous solution. The solution pH, ion concentration, quantity of
biosorbent and contact time impacted the biosorption of phosphate. The pseudo-second-
order and Freundlich equations were the best models to describe the phosphate
biosorption behavior of biosorbent. The present results revealed that the modified algal
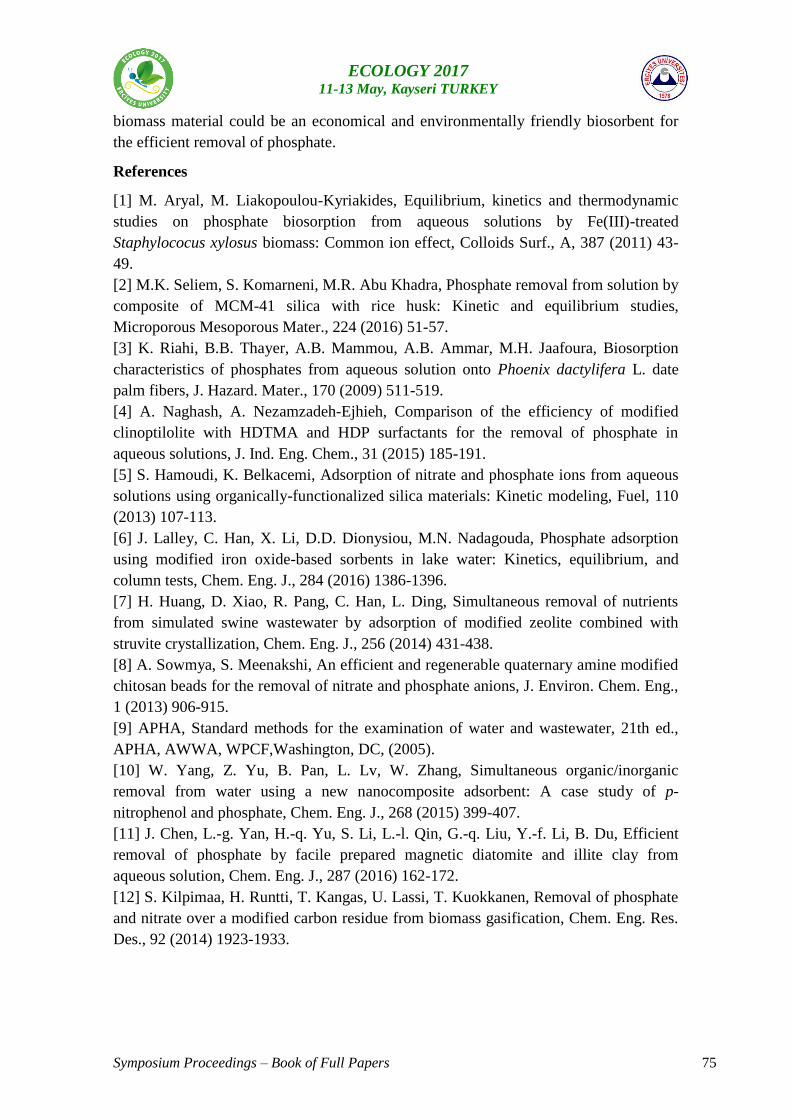
Symposium Proceedings – Book of Full Papers 75
ECOLOGY 2017 11-13 May, Kayseri TURKEY
biomass material could be an economical and environmentally friendly biosorbent for
the efficient removal of phosphate.
References
[1] M. Aryal, M. Liakopoulou-Kyriakides, Equilibrium, kinetics and thermodynamic
studies on phosphate biosorption from aqueous solutions by Fe(III)-treated
Staphylococus xylosus biomass: Common ion effect, Colloids Surf., A, 387 (2011) 43-
49.
[2] M.K. Seliem, S. Komarneni, M.R. Abu Khadra, Phosphate removal from solution by
composite of MCM-41 silica with rice husk: Kinetic and equilibrium studies,
Microporous Mesoporous Mater., 224 (2016) 51-57.
[3] K. Riahi, B.B. Thayer, A.B. Mammou, A.B. Ammar, M.H. Jaafoura, Biosorption
characteristics of phosphates from aqueous solution onto Phoenix dactylifera L. date
palm fibers, J. Hazard. Mater., 170 (2009) 511-519.
[4] A. Naghash, A. Nezamzadeh-Ejhieh, Comparison of the efficiency of modified
clinoptilolite with HDTMA and HDP surfactants for the removal of phosphate in
aqueous solutions, J. Ind. Eng. Chem., 31 (2015) 185-191.
[5] S. Hamoudi, K. Belkacemi, Adsorption of nitrate and phosphate ions from aqueous
solutions using organically-functionalized silica materials: Kinetic modeling, Fuel, 110
(2013) 107-113.
[6] J. Lalley, C. Han, X. Li, D.D. Dionysiou, M.N. Nadagouda, Phosphate adsorption
using modified iron oxide-based sorbents in lake water: Kinetics, equilibrium, and
column tests, Chem. Eng. J., 284 (2016) 1386-1396.
[7] H. Huang, D. Xiao, R. Pang, C. Han, L. Ding, Simultaneous removal of nutrients
from simulated swine wastewater by adsorption of modified zeolite combined with
struvite crystallization, Chem. Eng. J., 256 (2014) 431-438.
[8] A. Sowmya, S. Meenakshi, An efficient and regenerable quaternary amine modified
chitosan beads for the removal of nitrate and phosphate anions, J. Environ. Chem. Eng.,
1 (2013) 906-915.
[9] APHA, Standard methods for the examination of water and wastewater, 21th ed.,
APHA, AWWA, WPCF,Washington, DC, (2005).
[10] W. Yang, Z. Yu, B. Pan, L. Lv, W. Zhang, Simultaneous organic/inorganic
removal from water using a new nanocomposite adsorbent: A case study of p-
nitrophenol and phosphate, Chem. Eng. J., 268 (2015) 399-407.
[11] J. Chen, L.-g. Yan, H.-q. Yu, S. Li, L.-l. Qin, G.-q. Liu, Y.-f. Li, B. Du, Efficient
removal of phosphate by facile prepared magnetic diatomite and illite clay from
aqueous solution, Chem. Eng. J., 287 (2016) 162-172.
[12] S. Kilpimaa, H. Runtti, T. Kangas, U. Lassi, T. Kuokkanen, Removal of phosphate
and nitrate over a modified carbon residue from biomass gasification, Chem. Eng. Res.
Des., 92 (2014) 1923-1933.
Symposium Proceedings – Book of Full Papers 76
ECOLOGY 2017 11-13 May, Kayseri TURKEY
[13] M.A. Wahab, S. Jellali, N. Jedidi, Ammonium biosorption onto sawdust: FTIR
analysis, kinetics and adsorption isotherms modeling, Bioresour. Technol., 101 (2010)
5070-5075.
[14] M. Islam, R. Patel, Physicochemical characterization and adsorption behavior of
Ca/Al chloride hydrotalcite-like compound towards removal of nitrate, J. Hazard.
Mater., 190 (2011) 659-668.
[15] T.S. Anirudhan, T.A. Rauf, S.R. Rejeena, Removal and recovery of phosphate ions
from aqueous solutions by amine functionalized epichlorohydrin-grafted cellulose,
Desalination, 285 (2012) 277-284.
[16] L. Deng, Z. Shi, Synthesis and characterization of a novel Mg–Al hydrotalcite-
loaded kaolin clay and its adsorption properties for phosphate in aqueous solution, J.
Alloys Compd., 637 (2015) 188-196.
[17] M. Rathod, K. Mody, S. Basha, Efficient removal of phosphate from aqueous
solutions by red seaweed, Kappaphycus alverezii, J. Clean. Prod., 84 (2014) 484-493.
[18] H.M.F. Freundlich, Uber die adsorption in lösungen, Z. Phys. Chem., 57 (1906)
385-470.
[19] I. Langmuir, The adsorption of gases on plane surfaces of glass, mica and
platinum, J. Am. Chem. Soc., 40 (1918) 1361-1403.
[20] M.M. Dubinin, L.V. Radushkevich, Equation of the characteristic curve of
activated charcoal, Proc. Acad. Sci. Phys. Chem. Sec. USSR, 55 (1947) 331-333.
[21] P. Ganesan, R. Kamaraj, S. Vasudevan, Application of isotherm, kinetic and
thermodynamic models for the adsorption of nitrate ions on graphene from aqueous
solution, J. Taiwan Inst. Chem. Eng., 44 (2013) 808-814.
[22] H. Jiang, P. Chen, S. Luo, X. Tu, Q. Cao, M. Shu, Synthesis of novel
nanocomposite Fe3O4/ZrO2/chitosan and its application for removal of nitrate and
phosphate, Appl. Surf. Sci., 284 (2013) 942-949.
[23] S. Lagergren, Zur theorie der sogenannten adsorption gelöster stoffe, K. Sven.
Vetenskapsakad. Handl., 24 (1898) 1-39.
[24] Y.-S. Ho, Review of second-order models for adsorption systems, J. Hazard.
Mater., 136 (2006) 681-689.
[25] W.J. Weber, J.C. Morris, Kinetics of adsorption on carbon from solution, J. Sanit.
Eng. Div. Am. Soc. Civ. Eng., 89 (1963) 31-60.
[26] J.-x. Yu, B.-h. Li, X.-m. Sun, Y. Jun, R.-a. Chi, Adsorption of methylene blue and
rhodamine B on baker's yeast and photocatalytic regeneration of the biosorbent,
Biochem. Eng. J., 45 (2009) 145-151.
[27] M. Gholami, M.T. Vardini, G.R. Mahdavinia, Investigation of the effect of
magnetic particles on the Crystal Violet adsorption onto a novel nanocomposite based
on κ-carrageenan-g-poly(methacrylic acid), Carbohydr. Polym., 136 (2016) 772-781.
Symposium Proceedings – Book of Full Papers 77
ECOLOGY 2017 11-13 May, Kayseri TURKEY
Assessment of Water Quality in Mert Stream (Samsun, Turkey) Base on Some
Physicochemical Parameters
Faruk MARAŞLIOĞLU1*
, Arif GÖNÜLOL2 and Serdar BEKTAŞ
2
1Department of Environmental Protection Technologies, Vocational School of
Technical Sciences, Hitit University, Çorum, Turkey 2Department of Biology, Faculty of Arts and Science, Ondokuz Mayıs University,
Samsun, Turkey
* Corresponding Author: e-mail: [email protected]
Abstract
Mert Stream is located on Mert Stream Basin in the Middle Black Sea
(Samsun). The sampling has been started in July 2011 in order to determine the levels
of physical and chemical parameters constituting water quality, and the analyses of
samples have been conducted monthly for one year since June 2012. In addition, the
stream has been evaluated according to water quality criteria.
During the monthly evaluations in the Mert stream, the levels of of nitrate, pH
and dissolved oxygen have been found to be very low, even ammonium couldn’t be
detected in most months. The Mert stream has been found to be 1st class in accordance
with Surface Water Quality Management Regulation (SWQMR) in terms of parameters,
and its nitrogen-based nutrient content was much less than acceptable upper limits.
During the study which has been conducted about the monthly and seasonal
changes of Mert stream’s water quality characteristics in 6 stations, the water samples
obtained from stations were evaluated from the aspect of physical and chemical water
quality, and assessed from the aspect of water quality and aquaculture. When analyses
results compared with according to Surface Water Quality Management Regulation
(SWQMR), the stream water is class I (excellent water) in terms of most measured
parameters (nitrate, ammonium, pH, dissolved oxygen), whereas it is class IV water
quality (poor water) in terms of orthophosphate. Otherwise, eutrophycation limit values
have not been exceeded during the study period in respect to nitrate, ammonium, pH,
dissolved oxygen base on Water Pollution Control Regulation (WPCR). As a result, it
can be mentioned that while there is no serious pollution yet at the first part of the
stream, at the second part of the stream (St 5 and St 6) there is partial pollution danger.
1. Introduction Water is the main source of life and is also a towards protecting the earth, and
tracking the necessity for the organisms' survival. Total water environmental effects and
changes in the entire stock of the world is 1.4 billion km3, and only world. For this
reason, the terms “sustainable 2.5% of this amount is in lakes and fresh water
development” and “environment management”sources. 90% of this scarce water stock
is in poles nowadays became two fundamental concepts that and under the ground
(Anonymous, 2013). There should be considered together. The most is an increasing
inclination and awareness important one of these interactions is the negative effects of
environmental or water pollution on the water quality according to Surficial Water the
aquatic organisms and aquatic life (Mert et al., 2010).
The protection and appropriate usage of water resources vary depending on
sensitiveness of societies about this matter besides their awareness. Nowadays, the
factors such as industrialization, increasing population and urbanization, global climate
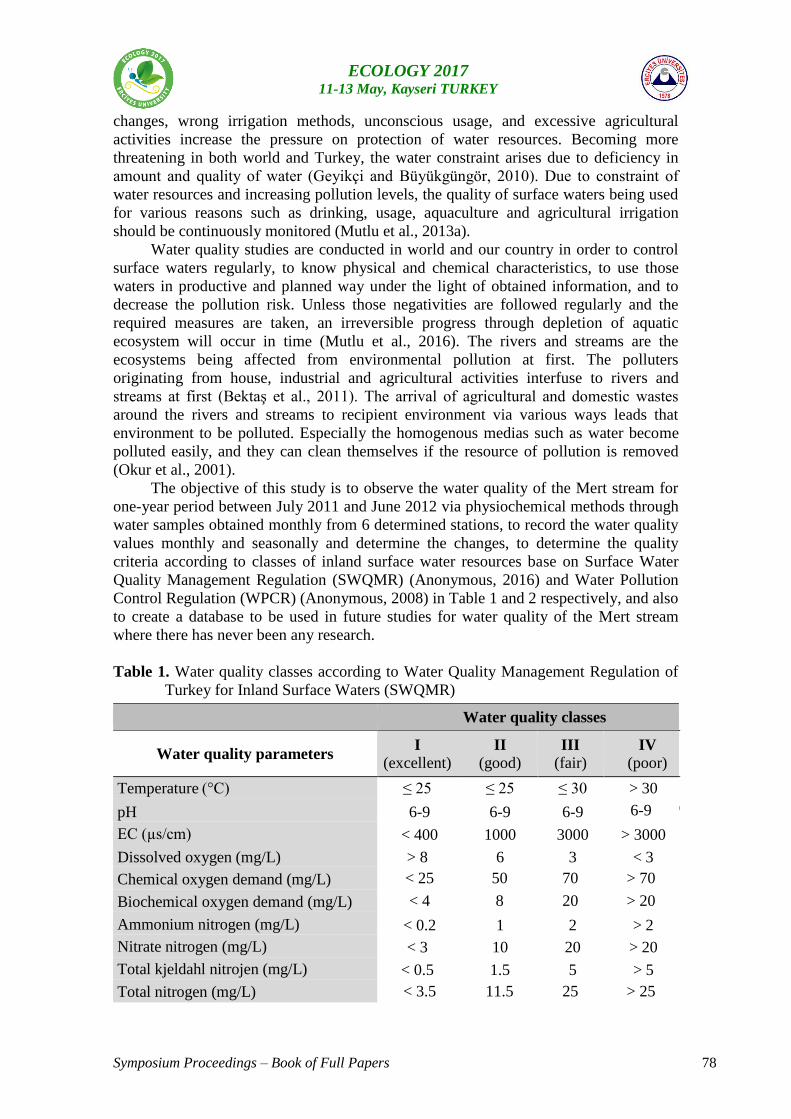
Symposium Proceedings – Book of Full Papers 78
ECOLOGY 2017 11-13 May, Kayseri TURKEY
changes, wrong irrigation methods, unconscious usage, and excessive agricultural
activities increase the pressure on protection of water resources. Becoming more
threatening in both world and Turkey, the water constraint arises due to deficiency in
amount and quality of water (Geyikçi and Büyükgüngör, 2010). Due to constraint of
water resources and increasing pollution levels, the quality of surface waters being used
for various reasons such as drinking, usage, aquaculture and agricultural irrigation
should be continuously monitored (Mutlu et al., 2013a).
Water quality studies are conducted in world and our country in order to control
surface waters regularly, to know physical and chemical characteristics, to use those
waters in productive and planned way under the light of obtained information, and to
decrease the pollution risk. Unless those negativities are followed regularly and the
required measures are taken, an irreversible progress through depletion of aquatic
ecosystem will occur in time (Mutlu et al., 2016). The rivers and streams are the
ecosystems being affected from environmental pollution at first. The polluters
originating from house, industrial and agricultural activities interfuse to rivers and
streams at first (Bektaş et al., 2011). The arrival of agricultural and domestic wastes
around the rivers and streams to recipient environment via various ways leads that
environment to be polluted. Especially the homogenous medias such as water become
polluted easily, and they can clean themselves if the resource of pollution is removed
(Okur et al., 2001).
The objective of this study is to observe the water quality of the Mert stream for
one-year period between July 2011 and June 2012 via physiochemical methods through
water samples obtained monthly from 6 determined stations, to record the water quality
values monthly and seasonally and determine the changes, to determine the quality
criteria according to classes of inland surface water resources base on Surface Water
Quality Management Regulation (SWQMR) (Anonymous, 2016) and Water Pollution
Control Regulation (WPCR) (Anonymous, 2008) in Table 1 and 2 respectively, and also
to create a database to be used in future studies for water quality of the Mert stream
where there has never been any research.
Table 1. Water quality classes according to Water Quality Management Regulation of
Turkey for Inland Surface Waters (SWQMR)
Water quality classes
Water quality parameters I
(excellent) II
(good) III
(fair) IV
(poor)
Temperature (°C) ≤ 25 ≤ 25 ≤ 30 > 30
pH 6-9 6-9 6-9 6-9 6
-
9 EC (µs/cm) < 400 1000 3000 > 3000
Dissolved oxygen (mg/L) > 8 6 3 < 3
Chemical oxygen demand (mg/L) < 25 50 70 > 70
Biochemical oxygen demand (mg/L) < 4 8 20 > 20
Ammonium nitrogen (mg/L) < 0.2 1 2 > 2
Nitrate nitrogen (mg/L) < 3 10 20 > 20
Total kjeldahl nitrojen (mg/L) < 0.5 1.5 5 > 5
Total nitrogen (mg/L) < 3.5 11.5 25 > 25
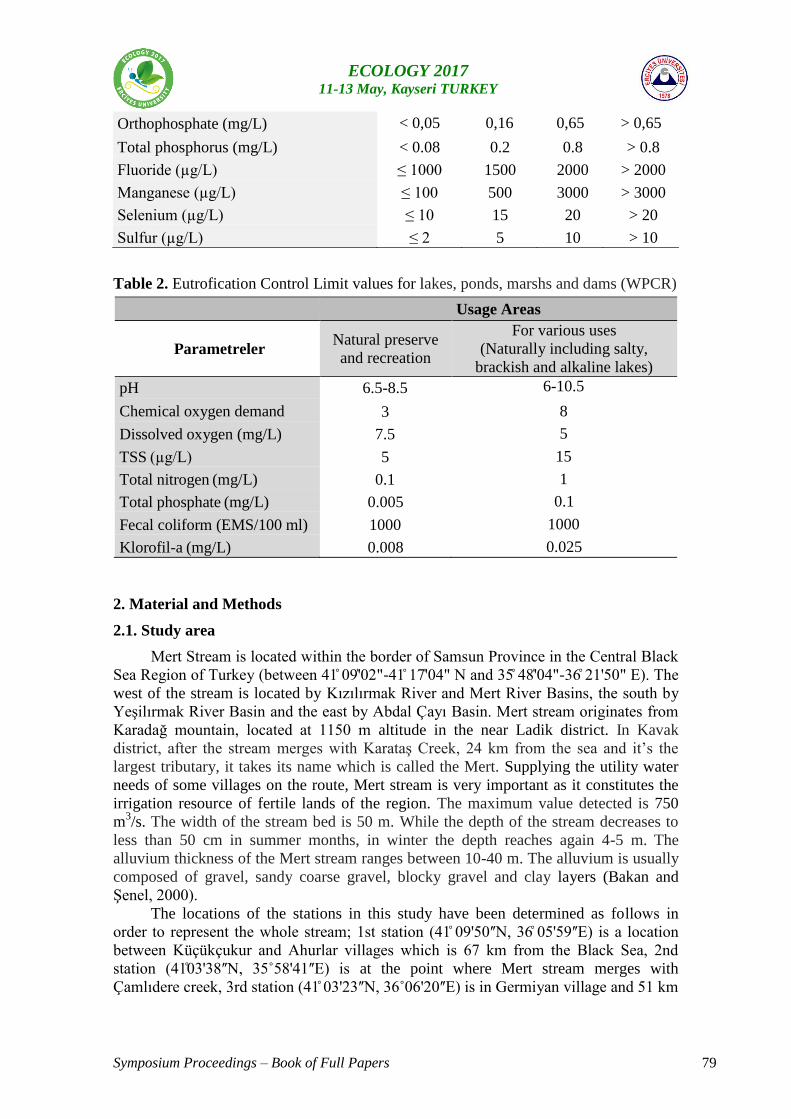
Symposium Proceedings – Book of Full Papers 79
ECOLOGY 2017 11-13 May, Kayseri TURKEY
Orthophosphate (mg/L) < 0,05 0,16 0,65 > 0,65
Total phosphorus (mg/L) < 0.08 0.2 0.8 > 0.8
Fluoride (µg/L) ≤ 1000 1500 2000 > 2000
Manganese (µg/L) ≤ 100 500 3000 > 3000
Selenium (µg/L) ≤ 10 15 20 > 20
Sulfur (µg/L) ≤ 2 5 10 > 10
Table 2. Eutrofication Control Limit values for lakes, ponds, marshs and dams (WPCR)
Usage Areas
Parametreler Natural preserve
and recreation
For various uses
(Naturally including salty,
brackish and alkaline lakes)
pH 6.5-8.5 6-10.5
Chemical oxygen demand
(mg/L) 3 8
Dissolved oxygen (mg/L) 7.5 5
TSS (µg/L) 5 15
Total nitrogen (mg/L) 0.1 1
Total phosphate (mg/L) 0.005 0.1
Fecal coliform (EMS/100 ml) 1000 1000
Klorofil-a (mg/L) 0.008 0.025
2. Material and Methods
2.1. Study area
Mert Stream is located within the border of Samsun Province in the Central Black
Sea Region of Turkey (between 41̊ 09̍'02"-41̊ 17̍'04" N and 35̊ 48̍'04"-36̊ 21'50" E). The
west of the stream is located by Kızılırmak River and Mert River Basins, the south by
Yeşilırmak River Basin and the east by Abdal Çayı Basin. Mert stream originates from
Karadağ mountain, located at 1150 m altitude in the near Ladik district. In Kavak
district, after the stream merges with Karataş Creek, 24 km from the sea and it’s the
largest tributary, it takes its name which is called the Mert. Supplying the utility water
needs of some villages on the route, Mert stream is very important as it constitutes the
irrigation resource of fertile lands of the region. The maximum value detected is 750
m3/s. The width of the stream bed is 50 m. While the depth of the stream decreases to
less than 50 cm in summer months, in winter the depth reaches again 4-5 m. The
alluvium thickness of the Mert stream ranges between 10-40 m. The alluvium is usually
composed of gravel, sandy coarse gravel, blocky gravel and clay layers (Bakan and
Şenel, 2000).
The locations of the stations in this study have been determined as follows in
order to represent the whole stream; 1st station (41̊ 09'50ʺN, 36̊
05'59ʺE) is a location
between Küçükçukur and Ahurlar villages which is 67 km from the Black Sea, 2nd
station (41̊03'38ʺN, 35˚58'41ʺE) is at the point where Mert stream merges with
Çamlıdere creek, 3rd station (41̊ 03'23ʺN, 36˚06'20ʺE) is in Germiyan village and 51 km
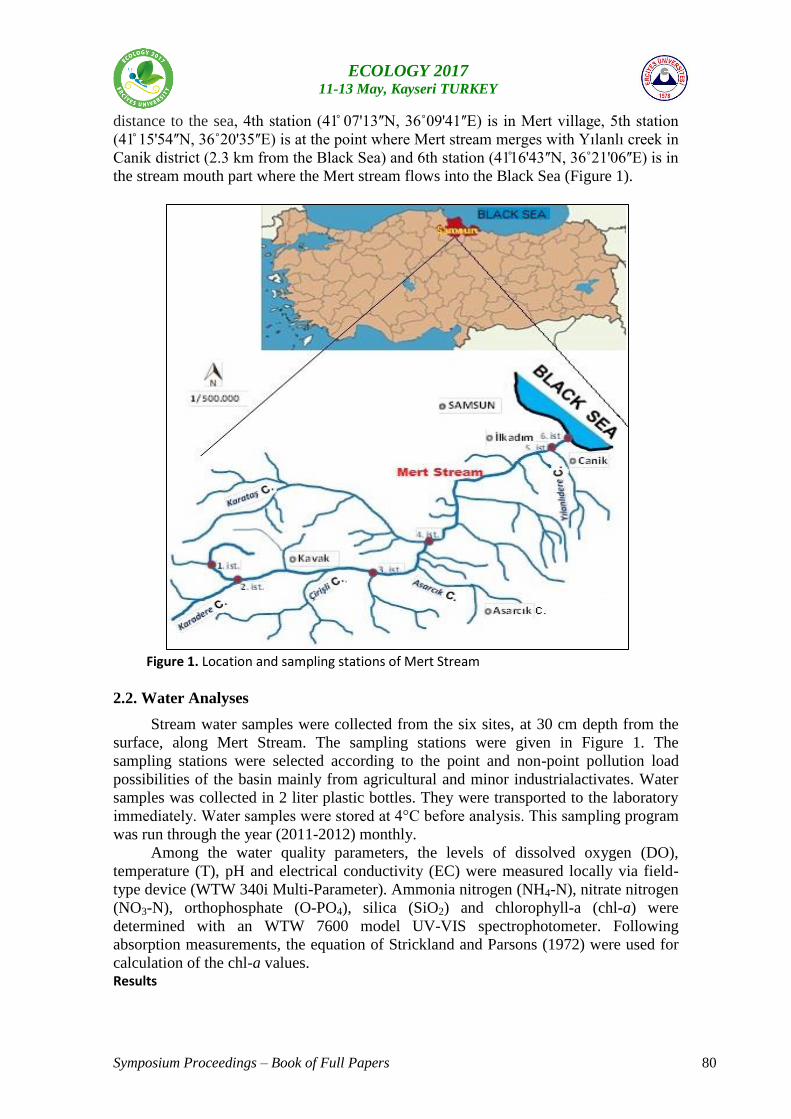
Symposium Proceedings – Book of Full Papers 80
ECOLOGY 2017 11-13 May, Kayseri TURKEY
distance to the sea, 4th station (41̊ 07'13ʺN, 36˚09'41ʺE) is in Mert village, 5th station
(41̊ 15'54ʺN, 36˚20'35ʺE) is at the point where Mert stream merges with Yılanlı creek in
Canik district (2.3 km from the Black Sea) and 6th station (41̊16'43ʺN, 36˚21'06ʺE) is in
the stream mouth part where the Mert stream flows into the Black Sea (Figure 1).
Figure 1. Location and sampling stations of Mert Stream
2.2. Water Analyses
Stream water samples were collected from the six sites, at 30 cm depth from the
surface, along Mert Stream. The sampling stations were given in Figure 1. The
sampling stations were selected according to the point and non-point pollution load
possibilities of the basin mainly from agricultural and minor industrialactivates. Water
samples was collected in 2 liter plastic bottles. They were transported to the laboratory
immediately. Water samples were stored at 4°C before analysis. This sampling program
was run through the year (2011-2012) monthly.
Among the water quality parameters, the levels of dissolved oxygen (DO),
temperature (T), pH and electrical conductivity (EC) were measured locally via field-
type device (WTW 340i Multi-Parameter). Ammonia nitrogen (NH4-N), nitrate nitrogen
(NO3-N), orthophosphate (O-PO4), silica (SiO2) and chlorophyll-a (chl-a) were
determined with an WTW 7600 model UV-VIS spectrophotometer. Following
absorption measurements, the equation of Strickland and Parsons (1972) were used for
calculation of the chl-a values. Results
Symposium Proceedings – Book of Full Papers 81
ECOLOGY 2017 11-13 May, Kayseri TURKEY
The temperature values of Mert stream varied between months, seasons, and
among measurement stations. The mean water temperature value during one year of
monthly measurement is 14.3°C. The lowest value was measured in November 2011 as
1.5°C in 4st station, while the highest value has been observed in 6th station in July
2011 as 27.6°C. Also the seasonal mean temperature values between July 2011 and June
2012 are as follows, respectively; winter 5.1°C, spring 15.5°C, summer 23.3°C, and
autumn 13.3°C (Table 3).
The dissolved oxygen amount in Mert stream has varied monthly and seasonally
during the study period. The mean value observed during one-year period is 9.9 mg/L,
the lowest value is 3.5 mg/L in July 2011 at 6th station, while the highest value has been
observed in November 2011 in 4st station as 14 mg/L. As a result of a study conducted
for one year in 4 seasons, the mean dissolved oxygen values in winter, spring, summer
and autumn seasons have been observed as follows, respectively; 12.2 mg/L, 9.5 mg/L,
7.9 mg/L and 10.1 mg/L (Table 3).
The electrical conductivity (EC) values of Mert stream have varied between
months, seasons and among 6 stations. The mean electrical conductivity value of 6
stations where the study has been conducted was found to be 1087 μs/cm. The electrical
conductivity values, in parallel with saltiness and temperature values, have decreased in
winter months and increased in months where the water temperature has been high. The
value in December 2011 in 2st station was 550 μs/cm while it reached to its highest
point in July 2012 in 6th station as 3420 μs/cm. Also during one year of measurements
between between July 2011 and June 2012, the seasonal mean electrical conductivity
values have been found to be 789 μs/cm for winter, 974 μs/cm for spring, 1480 μs/cm
for summer and 1104 μs/cm for autumn (Table 3).
The monthly mean pH value of six stations one year-round is 7.6. The highest pH
value has been observed in 3th station in December 2011 as 9.2, while the lowest value
has been observed in August 2011 in 6st station as 6.4. The mean values in winter,
spring, summer and autumn of Mert stream following one-year sampling period are 7.9,
7.4, 7.3 and 7.7, respectively (Table 3).
The nitrate (NO3) level of the Mert stream has found to be lower in spring months
than other seasons. On the other hand, while the nitrate levels have been decreases in
autumn months in all stations, in November 2011 when the water temperature was at
low level but the amount of dissolved oxygen was high, it has reached at its highest
level in 1th station as 8.7 mg/L. Even the highest amount of ammonium observed in
stream is less than the half of the acceptable upper limit for human consumption.
Otherwise, september and october were the months on which nitrate (NO3) was found
the least in all stations.
The ammonium nitrogen (NH4+) level of Çınarlı Stream is very low, and no
ammonium has been found in none months except February 2012 and July 2011 in the
stream. Its highest level has been observed in 1th station in July 2011 as 0.5 mg/L. This
value is equal to acceptable limit according to regulation concerning water intended for
human consumption. Following the measurements made monthly during the study, the
mean ammonium nitrogen (NH4+) value of the stream has been found to be 0.01 mg/L.
The amount of o-phosphate (o-PO4), which is an important mineral affecting the
efficiency of aquatic life, in Mert stream has varied between months, seasons and
among stations during study period. The mean o-phosphate value, as a result of regular
monthly measurement during one year, has been found to be 0.9 mg/L. The highest
phosphate (PO4) value has been observed in 2st station in August 2011 as 2.5 mg/L.
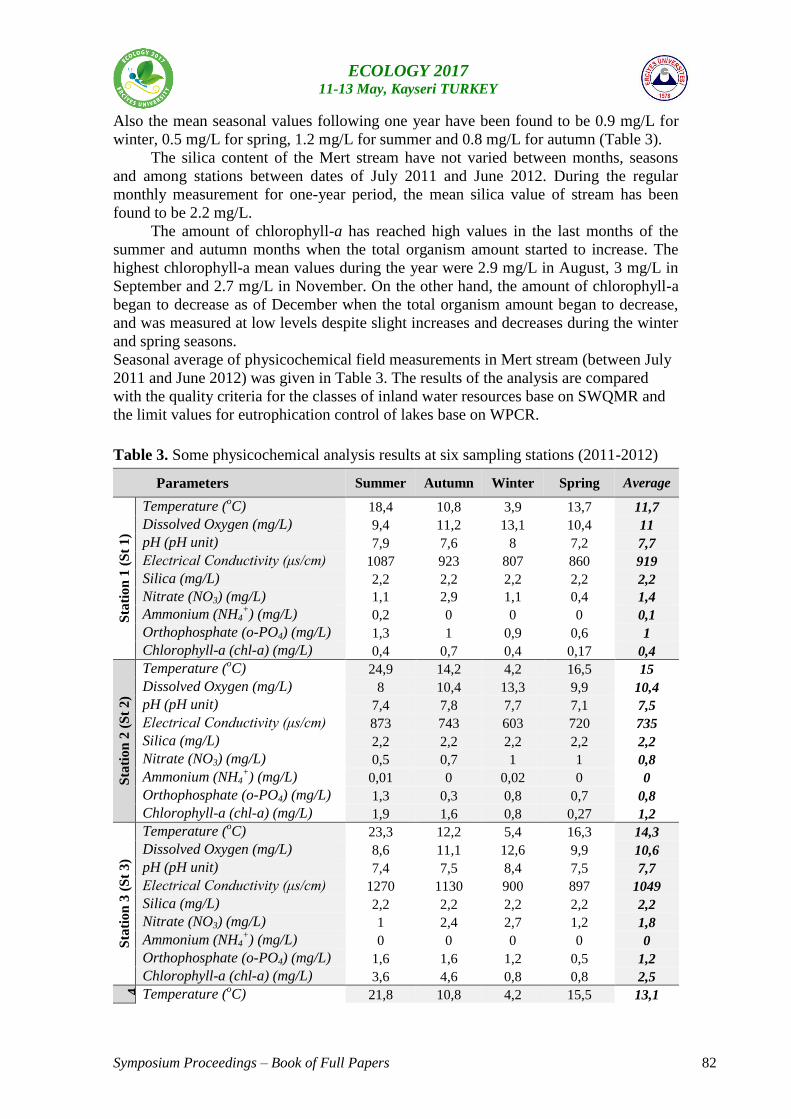
Symposium Proceedings – Book of Full Papers 82
ECOLOGY 2017 11-13 May, Kayseri TURKEY
Also the mean seasonal values following one year have been found to be 0.9 mg/L for
winter, 0.5 mg/L for spring, 1.2 mg/L for summer and 0.8 mg/L for autumn (Table 3).
The silica content of the Mert stream have not varied between months, seasons
and among stations between dates of July 2011 and June 2012. During the regular
monthly measurement for one-year period, the mean silica value of stream has been
found to be 2.2 mg/L.
The amount of chlorophyll-a has reached high values in the last months of the
summer and autumn months when the total organism amount started to increase. The
highest chlorophyll-a mean values during the year were 2.9 mg/L in August, 3 mg/L in
September and 2.7 mg/L in November. On the other hand, the amount of chlorophyll-a
began to decrease as of December when the total organism amount began to decrease,
and was measured at low levels despite slight increases and decreases during the winter
and spring seasons.
Seasonal average of physicochemical field measurements in Mert stream (between July
2011 and June 2012) was given in Table 3. The results of the analysis are compared
with the quality criteria for the classes of inland water resources base on SWQMR and
the limit values for eutrophication control of lakes base on WPCR.
Table 3. Some physicochemical analysis results at six sampling stations (2011-2012)
Parameters Summer Autumn Winter Spring Average
Sta
tion
1 (
St
1)
Temperature (oC) 18,4 10,8 3,9 13,7 11,7
Dissolved Oxygen (mg/L) 9,4 11,2 13,1 10,4 11
pH (pH unit) 7,9 7,6 8 7,2 7,7
Electrical Conductivity (μs/cm) 1087 923 807 860 919
Silica (mg/L) 2,2 2,2 2,2 2,2 2,2
Nitrate (NO3) (mg/L) 1,1 2,9 1,1 0,4 1,4
Ammonium (NH4+) (mg/L) 0,2 0 0 0 0,1
Orthophosphate (o-PO4) (mg/L) 1,3 1 0,9 0,6 1
Chlorophyll-a (chl-a) (mg/L) 0,4 0,7 0,4 0,17 0,4
Sta
tion
2 (
St
2)
Temperature (oC) 24,9 14,2 4,2 16,5 15
Dissolved Oxygen (mg/L) 8 10,4 13,3 9,9 10,4
pH (pH unit) 7,4 7,8 7,7 7,1 7,5
Electrical Conductivity (μs/cm) 873 743 603 720 735
Silica (mg/L) 2,2 2,2 2,2 2,2 2,2
Nitrate (NO3) (mg/L) 0,5 0,7 1 1 0,8
Ammonium (NH4+) (mg/L) 0,01 0 0,02 0 0
Orthophosphate (o-PO4) (mg/L) 1,3 0,3 0,8 0,7 0,8
Chlorophyll-a (chl-a) (mg/L) 1,9 1,6 0,8 0,27 1,2
Sta
tion
3 (
St
3)
Temperature (oC) 23,3 12,2 5,4 16,3 14,3
Dissolved Oxygen (mg/L) 8,6 11,1 12,6 9,9 10,6
pH (pH unit) 7,4 7,5 8,4 7,5 7,7
Electrical Conductivity (μs/cm) 1270 1130 900 897 1049
Silica (mg/L) 2,2 2,2 2,2 2,2 2,2
Nitrate (NO3) (mg/L) 1 2,4 2,7 1,2 1,8
Ammonium (NH4+) (mg/L) 0 0 0 0 0
Orthophosphate (o-PO4) (mg/L) 1,6 1,6 1,2 0,5 1,2
Chlorophyll-a (chl-a) (mg/L) 3,6 4,6 0,8 0,8 2,5
S t a t i o n 4 ( S t 4 ) Temperature (oC) 21,8 10,8 4,2 15,5 13,1
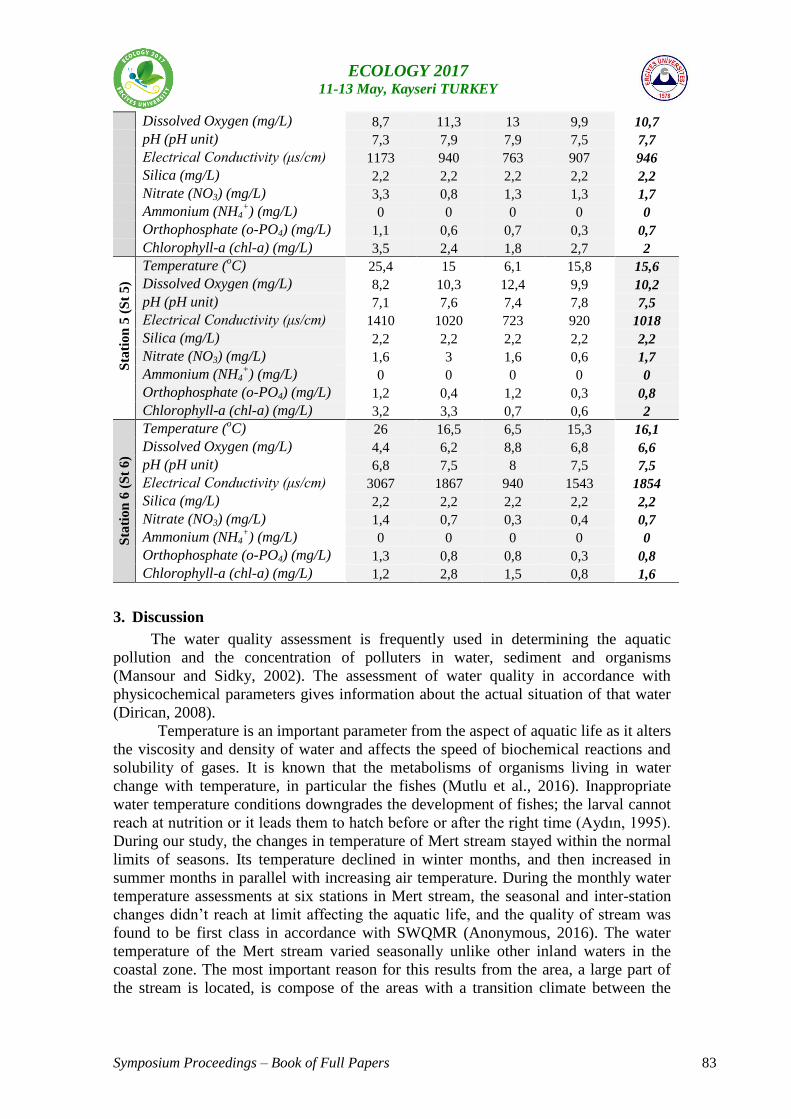
Symposium Proceedings – Book of Full Papers 83
ECOLOGY 2017 11-13 May, Kayseri TURKEY
Dissolved Oxygen (mg/L) 8,7 11,3 13 9,9 10,7
pH (pH unit) 7,3 7,9 7,9 7,5 7,7
Electrical Conductivity (μs/cm) 1173 940 763 907 946
Silica (mg/L) 2,2 2,2 2,2 2,2 2,2
Nitrate (NO3) (mg/L) 3,3 0,8 1,3 1,3 1,7
Ammonium (NH4+) (mg/L) 0 0 0 0 0
Orthophosphate (o-PO4) (mg/L) 1,1 0,6 0,7 0,3 0,7
Chlorophyll-a (chl-a) (mg/L) 3,5 2,4 1,8 2,7 2
Sta
tio
n 5
(S
t 5
)
Temperature (oC) 25,4 15 6,1 15,8 15,6
Dissolved Oxygen (mg/L) 8,2 10,3 12,4 9,9 10,2
pH (pH unit) 7,1 7,6 7,4 7,8 7,5
Electrical Conductivity (μs/cm) 1410 1020 723 920 1018
Silica (mg/L) 2,2 2,2 2,2 2,2 2,2
Nitrate (NO3) (mg/L) 1,6 3 1,6 0,6 1,7
Ammonium (NH4+) (mg/L) 0 0 0 0 0
Orthophosphate (o-PO4) (mg/L) 1,2 0,4 1,2 0,3 0,8
Chlorophyll-a (chl-a) (mg/L) 3,2 3,3 0,7 0,6 2
Sta
tion
6 (
St
6)
Temperature (oC) 26 16,5 6,5 15,3 16,1
Dissolved Oxygen (mg/L) 4,4 6,2 8,8 6,8 6,6
pH (pH unit) 6,8 7,5 8 7,5 7,5
Electrical Conductivity (μs/cm) 3067 1867 940 1543 1854
Silica (mg/L) 2,2 2,2 2,2 2,2 2,2
Nitrate (NO3) (mg/L) 1,4 0,7 0,3 0,4 0,7
Ammonium (NH4+) (mg/L) 0 0 0 0 0
Orthophosphate (o-PO4) (mg/L) 1,3 0,8 0,8 0,3 0,8
Chlorophyll-a (chl-a) (mg/L) 1,2 2,8 1,5 0,8 1,6
3. Discussion
The water quality assessment is frequently used in determining the aquatic
pollution and the concentration of polluters in water, sediment and organisms
(Mansour and Sidky, 2002). The assessment of water quality in accordance with
physicochemical parameters gives information about the actual situation of that water
(Dirican, 2008).
Temperature is an important parameter from the aspect of aquatic life as it alters
the viscosity and density of water and affects the speed of biochemical reactions and
solubility of gases. It is known that the metabolisms of organisms living in water
change with temperature, in particular the fishes (Mutlu et al., 2016). Inappropriate
water temperature conditions downgrades the development of fishes; the larval cannot
reach at nutrition or it leads them to hatch before or after the right time (Aydın, 1995).
During our study, the changes in temperature of Mert stream stayed within the normal
limits of seasons. Its temperature declined in winter months, and then increased in
summer months in parallel with increasing air temperature. During the monthly water
temperature assessments at six stations in Mert stream, the seasonal and inter-station
changes didn’t reach at limit affecting the aquatic life, and the quality of stream was
found to be first class in accordance with SWQMR (Anonymous, 2016). The water
temperature of the Mert stream varied seasonally unlike other inland waters in the
coastal zone. The most important reason for this results from the area, a large part of
the stream is located, is compose of the areas with a transition climate between the
Symposium Proceedings – Book of Full Papers 84
ECOLOGY 2017 11-13 May, Kayseri TURKEY
Black Sea and the Central Anatolia climate. Similar situtations were also recorded in
Tersakan stream (Maraşlıoğlu et al., 2016), Kürtün stream (Bulut, 2012), Batlama
stream (Altürk, 2015) and Yeşilırmak river (Soylu and Gönülol, 2003).
The pH showing the balance between acidity and basicity in water is a basic
parameter which should be assessed in any study about water chemistry and pollution.
As well as it plays role in some chemical reactions in living organisms, it has also a
characteristic that increases the toxic effect of some chemical and metals when acidic
waters merges with that chemicals and metals (Bektaş et al., 2011). In order for an
aquatic media’s pH to not harm the aquatic life, and for that water resource to be able
to be used for aquaculture, that pH level shouldn’t excess the limit values between 6.0
and 9.0. During one-year period in Mert stream, it was determined that the pH changes
of stream weren’t excessive and the mean pH value was 7.6, which indicates that the
water is slightly basic. The pH value of Mert stream indicates an environment being
suitable for aquatic organisms and fishes, and it is first class in terms of water quality
standards (SWQMR). The eutrophication limit values for lakes, ponds, marshes and
dams have not been also exceeded. The studies carried out in the Black Sea Region
have indicated that streams generally have slightly basic characters (Soylu and
Gönülol, 2003; Bulut, 2012; Altürk, 2015; Maraşlıoğlu et al., 2016).
Dissolved Oxygen (DO) concentration is an important factor for improving the
balanced aquatic fauna. As well as it is a very important component for aquatic life,
dissolved oxygen is also important for biochemical oxidations (Atay and Pulatsü,
2000). The dissolved oxygen constitutes the very important part of ecological stability
and activity of water. Decreases are seen in oxygen concentration with rising air
temperature in summers, while increases are seen in winter months when air
temperature decreases (Tanjolaç, 2009). The dissolved oxygen amount in Mert stream
was found to be high in winter months and low in summer months. In fresh waters, the
minimum dissolved oxygen amount required for aquatic life is 5 mg/L (Atay and
Pulatsü, 2000). The lowest dissolved oxygen amount in stream was found to be 3.5
mg/L in 6th station in July 2011 and the DO values of 6th station in summer months
present a danger for aquatic life. Besides, the appearance of mass fish deaths at the 6th
station in some summer seasons confirm it what we have said above. Also, the
eutrophication limit value for lakes, ponds, marshes and dams determined as ≤ 5 mg/L
by the ministry (Anonymous, 2008) have been also exceeded at 6th station in summer
months. In light of this information, all stations except 6th station with second class in
the Mert stream have first class in terms of water quality standards (SWQMR). The
highest oxygen values of the stream were measured in the 1st and 4th stations.
Because, 1st station is close to the birth source of the Mert stream and in 4th station
Mert stream merges with Karataş Stream which has oxygen-rich waters.
Electrical conductivity (EC) is the value of 1 ohm electrical resistance in the
column with 1 cm length and 1 cm cross-sectional area at 25°C temperature. Electrical
conductivity may change depending on water temperature, dissolved matters in water
(such as salt), and solution content (Özpınar, 2007). Electrical conductivity value is
very important in water quality studies; electrical conductivity value excesses (1000
μsx10cm)-1 as pollution increases (Polat, 1997). The electrical conductivity capacity
of water increases as saltiness increases. That’s why; electrical conductivity (EC) is an
indicator in saltiness level (Mutlu et al., 2013b). The electrical conductivity (EC)
showed analogy with temperature and saltiness in Mert stream; it was low in all
stations during winter, while it significantly increased in all stations during winter. The
Symposium Proceedings – Book of Full Papers 85
ECOLOGY 2017 11-13 May, Kayseri TURKEY
mean electrical conductivity in Mert stream was found to be 1087 μs/cm, and it
indicates that it is in good conditions (second class) in accordance with SWQMR. On
the other hand, on the fact that 6th station is close to the sea, the conductivity increases
excessively at the station especially in summer months depending on saltiness.
Therefore, 6th station has fair water quality as mean value, but in summer months it
has poor water quality because of exceeding 3000 μs/cm. The lowest conductivity
value measured in the 2nd station as 550 μS/cm is consistent with the fact that this
station is close to the source of the stream which is remote from salinity.
The most widespread nitrogen compounds in natural waters are nitrite, nitrate
and ammonium nitrogen. The water quality can be determined by measuring those
compounds. The resource of those nitrous matters might be the compounds
transferred by domestic and industrial wastes while cleaning, as well as it can be
atmospheric nitrogen transferred by rain, and nitrate salt in structure of soil (Mutlu et
al., 2016). The high levels of nitrous compounds of nitrite (NO2), nitrate (NO3) and
ammonium nitrogen (NH4) may show toxic effect for aquatic organisms. In such a
case, the toxicity of nitrous compounds increases as pH and water temperature
increase (Mutlu et al., 2013a). Nitrate (NO3) toxicity is less than that of nitrite and
ammonium nitrogen (Tepe et al., 2006). It was determined that the nitrate (NO3) level
of stream is very low. While the amount of nitrate decreased in all stations during
spring, in November when the dissolved oxygen amount is at highest level and the
water temperature is at the lowest level, the highest level in 1th station as 8.7 mg/L is
recorded. According to water quality standards (SWQMR), Mert stream has first
quality water in terms of average nitrate value. Therefore, the amount of nitrate in the
Mert stream was recorded less than Tersakan and Çınarlı streams where partial
pollution is observed (Maraşlıoğlu et al., 2016; Mutlu et al., 2016, respectively). The
ammonium nitrogen (NH4) levels in Mert stream are substandard in all stations during
the study period. The highest value found as 0.5 mg/L at 1th station in July 2011 is
appropriate for aquaculture. According to SWQMR (Anonymous, 2016), the stream is
first quality in terms of ammonium nitrogen (NH4) content. However, the total
amount of nitrogen in all stations of the Mert stream is limited in respect to
eutrophication limit values for lakes, ponds, marshes and dams determined as 1 mg/L
by ministry of forestry and water affairs (Anonymous, 2008).
The phosphor being a key product exists in waters in phosphate form. The
phosphate exists in natural waters in concentration between 0.01 and 0.03 mg/L, and
it affects the productivity of aquatic organisms, such as planktons, and the water
resources (Tepe and Boyd, 2003). The non-existence of enough amount of phosphor
in waters is the most important factor limiting the development of aquatic creatures
(Atay and Pulatsü, 2000). The phosphor reaches at rivers, lakes and seas from various
resources such as commercial fertilizers, other agricultural inputs, sewages,
detergents, and wastes of food industry. Phosphor is also the most basic element of
eutrophication that occurs in the water environment (Harper, 1992).
Phosphor is found in small amounts in uncontaminated natural waters and
determines the productivity of lakes (Tepe and Boyd, 2003). Nisbet and Verneaux
(1970) reported that if phosphate content in the water is 0.15 to 0.30 mg/L, the
productivity becomes high, but if the phosphate content in water exceeds 0.3 mg/L, the
water is considered contaminated. Further to that, if the phosphate content exceeds 0.5
mg/L, excessive contamination and eutrophication are mentioned. In Mert stream, the
highest amount of orthophosphate which is an important nutritive mineral affecting the
Symposium Proceedings – Book of Full Papers 86
ECOLOGY 2017 11-13 May, Kayseri TURKEY
productivity was observed in 3th station in August 2011 as 2.5 mg/L, while the
average of monthly measurements during the study is 0.9 mg/L. Accordingly, the
amount of o-phosphate in Mert stream is not suitable for aquaculture. The reason for
increasing in the amount of o-phosphate in the stream between July and August
months is thought to arise from the fertilization done with fertilizers which have
phosphate content. The phosphate content of fertilizers mixes into stream through rain
and surface waters. Consequently, Mert stream is accepted as fourth quality water
according to water quality standards (SWQMR) and even eutrophication limit value
was exceeded in the stream determined as ≥ 0.1 mg/L by ministry for total phosphate
(Anonymous, 2008).
Silica is not a restrictive nutrient salt as nitrogen and phosphorus, but high
concentrations of silica can promote diatom growth and strong silicification of diatom
frustules (Busse and Snoeijs, 2003). In general, the amount of silica in the water is
reduced during the months when diatoms start increasing and increases again with the
decrease in the number of diatoms. However, it was not possible to determine
whether the silica values measured in the study area were limiting effects since they
were measured as 2.20 mg/L at all sampling days.
The seasonal variations of the chlorophyll-a were generally in accordance with
the seasonal variation of phytoplankton in the stream (Bektaş, 2016). Accordingly, the
eutrophication limiting value for chlorophyll-a determined as ≥ 0,025 mg/L by the
ministry (Anonymous, 2008) have been also exceeded at all stations in the stream.
During the study which has been conducted about the monthly and seasonal
changes of Mert stream’s water quality characteristics between July 2011 and June
2012 in 6 stations, the water samples obtained from stations were evaluated from the
aspect of physical and chemical water quality, and assessed from the aspect of water
quality and aquaculture. As a result of this study carried out in the Mert stream, it was
seen that physical and chemical analysis data did not constitute a pollution pressure
except orthophosphate. But, because the agriculture is widely common in near
agricultural fields, the leakage of nitrogen and phosphate waters from fields through
surface waters to Mert stream, and the interaction with organic-based wastes that are
released to the stream from animal breeding facilities near the 3th station should be
prevented, and the immediate measures must be taken about the domestic and
industrial wastes of the stream basin part within the city where the stream reaches the
black sea after passing through this part of the city. Besides, in a study on
phytoplankton and benthic algae of the Mert stream similar determinations has been
reported by Bektaş (2016) that in the poultry farms located in the Kavak district of the
stream and within 3 km region of the Samsun city near to the sea algal species,
pollution indicators, arising from domestic and industrial wastes increase in the total
number of individuals. In addition, in the part of the stream within the city center in
some summer seasons it was also observed collective fish deaths due to lack of oxygen
in the water.
According to the results of our study; When the water of Mert stream is
compared with the water quality standards of the ministry (Anonymous, 2016) on the
basis of average values, it is apparent that the stream is first class (excellent quality) in
terms of all parameters apart from orthophosphate (nitrate, ammonium, pH, dissolved
oxygen) and is fourth class (poor quality) in terms of orthophosphate. In actual fact,
the accepted situation of the stream is fourth quality as stated in SWQMR that the
lowest parameter value determines the quality of water when compared with table and
Symposium Proceedings – Book of Full Papers 87
ECOLOGY 2017 11-13 May, Kayseri TURKEY
daily usage water standards. Also, eutrophication control limit values for inland waters
have been not exceeded in terms of nitrate, ammonium, pH, dissolved oxygen values.
When we examine the water quality of Mert stream in terms of average values,
the result may be misleading. Because the above results, which are calculated on the
basis of average values, do not reflect the part of the river in the city very well. For this
reason, it would be more appropriate to evaluate the stream in two separate sections in
order to analyze the water quality of Mert stream better. Because inner part remote
from the coast and urban part near the black sea of the stream differ from each other in
terms of pollution threats and potentials. In the first part of the stream that is remote
from the coast, according to the analysis data of the stream water, there is not serious
pollution danger yet. But, in urban part of the stream that is near the sea, the difference
is seen from first part of the stream both in terms of the factors that cause pollution and
in terms of preventive measures. This second part of the stream (St 5 and St 6) is a part
where the city and industrial settlements is intensive. Therefore, the second part of the
stream is under the threat of domestic and various industrial wastes. Besides, Bakan
and Şenel (2000)’s research results confirm organic-based pollution in this second part
of the stream.
Consequently, Mert stream is under the pressure of pollution, the regulations
about the protection of the stream should be carefully implemented, and the ecological
disruption should be prevented. In order to protect Mert stream from pollution, to
improve the water quality, to protect the natural fish stocks, to sustain the natural
ecological balance of other aquatic organisms, and because of its importance from the
aspect of irrigation of near agricultural fields, the stream should be periodically
monitored. Besides, pollution factors especially in the urban part of the stream must be
identified and removed as soon as possible in order to prevent fish deaths arising from
oxygen deficiency and to remove stink arising from fermentation.
References
Altürk S (2015). The Seasonal Variation of Phytoplankton and Epilithic Algae Flora of
Batlama Stream. MSc, Giresun University, Giresun, Turkey.
Anonymous (2008). Water Pollution Control Regulation (WPCR), the Republic of
Turkey Official Gazette No. 26786, Ankara, Turkey.
Anonymous (2013). TR Ministry of Forestry and Water Affairs, Water Quality
Management Workgroup Report. Convention of Forestry and Water, 21st-23rd
Mart 2013.
Anonymous (2016). Surface Water Quality Management Regulation (SWQMR), the
Republic of Turkey Official Gazette No. 29797, Ankara, Turkey.
Atay D, Pulatsü S (2000). Water Pollution and Control. Ankara University Faculty
Publication No: 1513, Ankara.
Aydın F. 1995. Water in Fish Production Criteria Lecture Notes (Unpublished). Ankara
University, Faculty of Agriculture Publications.
Bakan G, Şenel B (2000). Research on Bottom Sediment and Water Quality of Samsun-
Mert Stream at the Discharge into the Black Sea. Turk J Engin Environ Sci 24 (3):
135-142.
Bektaş S (2016). Investigations on The Algal Flora of Samsun Mert Stream. MSc,
Ondokuz Mayıs University, Samsun, Turkey.
Symposium Proceedings – Book of Full Papers 88
ECOLOGY 2017 11-13 May, Kayseri TURKEY
Bektaş S, Yıldırım A, Becer Özvarol ZA (2011). Compression of Some Water Quality
Parameters of the Different Trout Streams in Çoruh Basin. Biological Sciences
Research Journal 4(1): 61-66.
Bektaş S, Yıldırım A, Becer Özvarol ZA (2011). Compression of Some Water Quality
Parameters of the Different Trout Streams in Çoruh Basin. Biological Sciences
Research Journal 4(1): 61-66.
Bulut D (2012). Investigations on The Algal Flora of Samsun Kürtün Stream. MSc,
Ondokuz Mayıs University, Samsun, Turkey.
Busse S, Snoeijs P (2003). Gradient responses of diatom communities in the Botlaian
Sea (northern Baltic Sea), with emphasis on responses to water movement.
Phycoloqia 42: 451-464.
Dirican S (2008). Kılıçkaya Dam Lake (Sivas, Turkey) has established the evaluation of
water quality. Harran University, Faculty of Agriculture Journal 12(4): 25-31.
Geyikçi F, Büyükgüngör H (2010). Surface Water in The Black Sea Region of Physical
Parameters in the Evaluation of Calcein. Turkey's Coastal and Marine Areas
VIII. National Congress. Proceedings, April 27-May 1, Trabzon. 1429-1436.
Harper D (1992). Eutrophication of Freshwaters: Principles, problems and restoration.
London: Chapman and Hall Press.
Mansour SA, Sidky MM (2002). Ecotoxicological Studies. 3. Heavy metals
contaminating water and fish from Fayoum Governorate, Egypt. Food Chem. 78:
15-22.
Maraşlıoğlu F, Gönülol A, Baş-Pelit G (2016). Seasonal Variation of Phytoplankton
and Determination of Pollution Level in the Tersakan Stream (Samsun-Amasya,
Turkey). Sinop Uni J at Sci 1(2): 46-58.
Mert R, Bulut S, Yıldırım G, Yılmaz M, Gül A (2010). Investigation of Damsa Dam
Lake’s Water Physico-Chemical Parameters. Gazi University Journal of Gazi
Educational Faculty (GUJGEF) 30(2): 285-302.
Mutlu E, Demir T, Kutlu B, Yanık T (2013b). Determination of Water Quality
Parameters in Sivas - Kurugöl Lake. Turkish Journal of Agriculture ‒ Food
Science and Technology 1(1): 37-43.
Mutlu E, Demir T, Yanık T (2013a). Cermik Stream (Hafik-Sivas) and Monthly
Changes in Water Quality Characteristics. Central Anatolia Region Proceedings
of the First Congress of Agriculture and Food. Volume III. 57-67.
Mutlu E, Kutlu B, Demir T (2016). Assessment of Çinarli Stream (Hafik -Sivas)'s
Water Quality via Physico-Chemical Methods. Turkish Journal of Agriculture ‒
Food Science and Technology 4(4): 267-278.
Nisbet M, Verneaux J (1970). Composants chimiques des eaux courantes: discussion et
propositions des classes en tant que base d’interprétation des analyses
chimiques. Annales de Limnologie 6(2): 161-190.
Okur B, Yener H, Okur N, İrget E (2001). Monthly And Seasonal Variation Of Some
Pollution Parameters Of Büyük Menderes River. Pamukkale University
Engineering College. Journal of Engineering Sciences 7(2): 243-250.
Özpınar Z (2007). Göksu be Determined by A Photometric Method of Water Quality in
The Delta. MSc, Mersin University, Mersin, Turkey.
Polat M (1997). Streams and Lakes Monitored Physical and Chemical Parameters.

Symposium Proceedings – Book of Full Papers 89
ECOLOGY 2017 11-13 May, Kayseri TURKEY
Water Quality Management Seminar. DSI General Directorate, Ankara, 45-47.
Soylu EN, Gönülol A (2003). Phytoplankton and Seasonal variations of the river
Yeşilırmak, Amasya, Turkey. Turk J Fish Aquat Sci 3: 17-24.
Strickland JD, Parsons TR (1972). A practical handbook of seawater analysis, 2nd edn.
Bulletin 167, Fisheries Research Board of Canada, Ottawa.
Tanyolaç J (2009). Limnology (Freshwater Science). Hatiboğlu Press, Ankara, Turkey,
290 pp.
Tepe Y, Ateş A, Mutlu E, Töre Y ( 2006). Some physico-chemical properties of
lake Karagöl (Erzin-Hatay). EU J Fish Aquat Sci 23 (1/1): 155-161.
Tepe Y, Boyd CE (2003). A reassessment of nitrogen fertilization for sunfish ponds.
Journal of World Aquaculture Society 34 (4): 505-511.
Symposium Proceedings – Book of Full Papers 90
ECOLOGY 2017 11-13 May, Kayseri TURKEY
Przewalski`s wild horses and their 18th
years management in the Chornobyl
exclusion zone, Ukraine
Kateryna SLIVINSKA¹*
, Nataliya YASYNETSKA2 and Daniel KLICH
3
¹ I. I. Schmalhausen Institute of Zoology, Department of Parasitology, National
Academy of Sciences of the Ukraine, Kyiv, Ukraine
2 Askania-Nova Biosphere Reserve, Askania-Nova, Ukraine
3 Warsaw University of Life Sciences, Faculty of Animal Sciences, Department of
Genetics and Animal Breeding, Warszawa, Poland
*Corresponding author: [email protected]
Abstract: The free-living herd of Przewalski`s wild horses has been introduced to the
Chornobyl exclusion zone (CEZ) for acceleration of enrichment of the biodiversity of
the ecosystems damaged after human activities and to maintain the natural balance in
such ecosystems. In July 1998 group of Przewalski`s wild horses were brought to the
CEZ from the Askania-Nova Biosphere Reserve. At present, near 130 Przewalski`s wild
horses roam freely in the grasslands of CEZ. They separated in some groups
reproductive and bachelor stallion group. The number of horses per group is ranging
from 4-20 individuals. The horses living free for more than 18 years in the CEZ are an
unique group for biological investigation. Human interference in their life is reduced to
a minimum. Under natural conditions in CEZ the Przewalski`s horse fill up the empty
ecological niche with emergence of a new grass vegetation green mass consumer,
ensure stability of ecosystem on the whole. The aim of this study was to estimate the
management (ecological and parasitological aspects) of wild horses under natural
conditions in CEZ (Ukraine).
Complex ecological and parasitological investigations of wild horses are held from the
moment of their introduction to the CEZ.
Symposium Proceedings – Book of Full Papers 91
ECOLOGY 2017 11-13 May, Kayseri TURKEY
The horses rapidly adapted to the local environment and to fallow lands forage
resources. 67 species of grassy plants forms the ration of feed of Przewalski`s horse in
the CEZ. In winter they are getting their forage from under the snow. They partly
consume tree and bush leaves and shoots. A total of 30 helminth species and 2 species
larves of botflies were recorded in the free-living Przewalski`s horses. By comparative
investigations a high stability was determined to radiation conditions of a new dwelling
of wild horses, their ecological and physiological plasticity. Horses are healthy and well
nourished, normally reproducing animals. They successfully resist the wolves` attacks.
The herds have their own areas (350 sq. km), keep mostly on fallow pastures of total
surface ca. 100,000 ha.
The horse’s population preserve typical biological features and high stability to
invasions. It is revealed in a good clinical horse state and number growth of herd. It
argues in favour of using of Przewalski`s horses in renaturalization of disturbed
territories.
Key words: Przewalski`s wild horse, management, Chornobyl Exclusion Zone, Ukraine
Introduction
After the Chornobyl nuclear disaster in 1986, an exclusion zone has been established for
the renaturalization of the polluted area around the disused nuclear plant. Since 1986, so
called long-fallow lands has appeared in abandoned farmlands in this zone. Each year
grasses thriving in these long-fallow lands produce enormous biomass which is only
partly consumed by native large herbivores. Exploring the ecological situation in the
Chornobyl exclusion zone (CEZ) and making certain that the ecological resistance and
compensatory phenomena allow animals to adapt to the environment exposed to
moderate radiation doses (Krighanovskiy et al., 1991; Francevich et al., 1991). The
Symposium Proceedings – Book of Full Papers 92
ECOLOGY 2017 11-13 May, Kayseri TURKEY
scientists of the I. I. Schmalhausen Institute of Zoology and Askania-Nova Biosphere
Reserve have initiated an inter-agency programme Fauna (1998) with a purpose to assist
ecological rehabilitation in the CEZ aided by the primary faunistic complexes recovery
as they existed in the areas before its transformation under the human activity pressure
in order to provide the natural ecosystems stability. The Przewalski`s horse (Equus ferus
przewalskii Poljakov, 1881) introduction were proposed to fill up the empty ecological
niche.
Grazing by horses in this area has been proposed as in comparison with other large
herbivore mammals, horses are the most efficient grass consumers (Janis, 1976; Duncan
et al., 1990; Duncan, 1990; Janis et al., 1994). Therefore, in 1998 and 1999, 28
individuals were transported to CEZ from the Askania-Nova Biosphere Reserve, south
Ukraine, where Przewalski`s horses reared under semi-wild conditions and 3 came from
the local zoo of the Lozovski stud-farm, northeastern Ukraine. The Przewalski`s horse
is included in the IUCN Red Data Book as an endangered species (Baillie and
Groombridge, 1996). Therefore, wild population creation of this species in Europe, to
solve a question their surviving and preservation. Parasitic fauna may play an important
role in the survival of this species. It is, therefore, especially important to investigate
parasite diversity, and extension and intensity of parasite infestation in free-living
animals.
The aim of this study was to estimate the management including ecological and
parasitological aspects of wild horses under natural conditions in CEZ (Ukraine).
Materials and methods
Methods
Symposium Proceedings – Book of Full Papers 93
ECOLOGY 2017 11-13 May, Kayseri TURKEY
The decision was complex. We left on expeditions to CEZ at least twice a year during
1999-2016 years. Each expedition lasted 7-9 days but there were some two-three days
expeditions. We used cars, horse carts and helicopter on occasion for the search of
Przewalski`s horses. The day route varied between 20 and 200 km. A 10 x 45
monocular or a 75-magnificant-factor telescope was used.
We came to horses on foot at a distance up to 50 m and closer. Horses were identified
by their individual characteristics: gender, age; body conditions. New-born foals were
registered every year. When remains of dead Przewalski`s horses were found, the cause
of death was stated where possible. Reliable information about Przewalski`s horses
found by other people was also collected and used for this study.
We used complex methods of field investigations of ecology, habits, horses’ feeding. At
the same time, we had gathered feaces, which were investigated by MacMaster method
(Herd,1986) and by diagnostic dehelmintisation method (Kuzmina et al., 2005).
In order to study radionuclide metabolism (Cs-137, Sr-90) in the organism of
Przewalski`s horse, browses samples forage, feaces and innards of the dead horse were
taken.
The comparative determination of the specific structure of the grass and accumulation
of a dry last year’s grass on the territory of different pasture press was done in order to
study the influence of Przewalski`s horse on biome.
1.3. Study Area
The CEZ is located c. 200 km N of Kiev (lat. 51º 16 min. 41 sec.; long. 30º 13 min. 24
sec.), 123 m above sea level. This zone covers an area of 2 070 km2, and falls entirely
within the Polesie Lowland, Russian Plain. Climate of the CEZ is humid, with relatively
mild winter and warm summers. The mean annual temperature is 5-7˚C. The mean
Symposium Proceedings – Book of Full Papers 94
ECOLOGY 2017 11-13 May, Kayseri TURKEY
temperature in July is 18˚C (max. 32˚C), while in January –6.1˚C (min. –25˚C). The
annual precipitation ranges from 550 to 750 mm. The snow cover lasts on average c. 50
days per year. The mean depth of the snow cover is 12-13 cm (Chornobyl disaster,
1996).
The CEZ is fenced with metal nets. Along with c. 100 peasants still living in the CEZ,
only w few other man have constant access to this area. Before the nuclear disaster, the
CEZ consists farmlands with forest fragments. At present, c. 60% pf the area is covered
with forests (50% of which is pine forest) and the remaining consists of abandoned
arable grounds, meadows, pastures and human settlements.
3. Results and Discussion
The 18 year experience of Przewalski`s horse existence in CEZ demonstrated that
horses adapted to the great territory in the zone (according to our counting 350 square
km), pastures, climate of Polesie, particularities of the inner herd relations. Annually the
number of wild horses was growing. The horses had formed the corresponding forms of
behavior, harem groups, the posterity appeared which was capable to survive in the wild
nature. Horses of a free population are included in natural attitudes, comprehend the
forms of behavior generated during natural selection. Independently generated family
groups are most ready to survive in changeable conditions of an environment with
numerous family and other connections.
It is registered that Przewalski`s horses ate 67 species of grassy plants. As for the
number of species of grassy plants cereals (17) are on the first place, then comes
legumes (7) and composites (7), the others 36 species of plants belong to 22 other
families. In winter they are getting their forage under the snow. They partly eat tree and
Symposium Proceedings – Book of Full Papers 95
ECOLOGY 2017 11-13 May, Kayseri TURKEY
bush leaves and shoots especially in winter and early spring when a stock of a grassy
forage is minimum.
The helmith fauna consists of 29 species represented by three nematode (Strongylidae,
Oxyuridae, Ascaridae) and one cestode family (Anoplocephalida). The nematode family
Strongylidae was represented by 26 species belonging to the subfamily Strongylinae
(six species) and Cyathostominae (20 species). In general the intensity of nematode
infestation was low. Two non-helminth gastro-intestinal parasites (Diptera:
Gasterophilidae) were also recorded in single specimens. It is revealed, that in
conditions of free existence in CEZ a significant specific variety of parasites in
Przewalski’і horse correlates with their low intensity of infection. The comparative
analysis of aspectual composition of parasites fauna of this animals showed that the
qualitative composition of species of parasite does not differ from that earlier investigated
Przewalski`s horses (Dvojnos and Kcharchenko, 1994). Clinical symptoms of the
helminthoses of wild horse population are not exposed. Observations show that the horses
population preserve typical biological features and high stability to invasions in all
seasons. It is revealed in a good clinical horse state and a number of herd`s growth.
It is established, that pollution of the basic forages by Cs-137 changes from 160 up to
1300 becquerel/kg. Accordingly, pollution of horse excrements changes - 1300-1800
becquerel/kg. The concentration of Cs-137 in excrements of the wild horses prevails
above its maintenance in forages just like domestic horses. Coefficient of concentration
of radionuclide, calculated from these data, and also on maintenance of radionuclide in
the organism of an animal, makes 2%. It is twice lower than cattle have, and three times
lower - than domestic horses have. It shows a high stability of species to radiation
conditions new to the wild horses.
Symposium Proceedings – Book of Full Papers 96
ECOLOGY 2017 11-13 May, Kayseri TURKEY
We reveal positive influence of grazing of horses for the pasture on a specific variety of
a vegetative cover. Thus, during definition of specific structure of plants on CEZ
territory with miscellaneous pasturable press, there were detected 18 species of plants
on an experimental platform (open-air cage), in a control part – 11 species. It is
necessary to note, that moderate pasture favours qualitative and quantitative growth of
cereals and clover. The condition of a meadow phytocenosis as for the stocks of dead
vegetative weight was analyzed. There appeared, that the presence of horses constrains
accumulation of a grassy laying - a thick stratum of dead vegetative weight. So, the
more horses attended the certain places, the less was layer of a dry grass.
Thus, Przewalski`s horse has shown high adaptation potential in new conditions on CEZ
territory. 18 years existence of Przewalski`s horses in CEZ have revealed that animals
adapted to the big territory of a zone (about 350 square km), to existing pastures,
features of a forage reserve, a climate of Polesie, specificity of the herd’s relations,
which are absent in bondage. The number of wild horses are near 130 individuals.
Animals keep characteristic external attributes and high stability to parasites during all
seasons of the year. The coefficient of a concentration of radionuclide in an organism of
Przewalski`s horse makes 2%, that is three times lower in comparison with a domestic
horse. It is revealed, that regulated pasture on CEZ territories reduces the accumulation
of a grassy laying, stimulates its decomposition and favours the growth of a specific
variety of grassy plants. Such influence of Przewalski`s horses, under condition of
enough of a livestock, will speed up the processes of restoration of a homeostasis in the
damaged ecosystem. We recommend to use horses as the natural mechanism of
restoration of the damaged pasture ecosystems. The Chornobyl` wild horses` population
constitute about 20% of all free living Przewalski`s horses in the World. Our further
Symposium Proceedings – Book of Full Papers 97
ECOLOGY 2017 11-13 May, Kayseri TURKEY
plans include a development strategy for management of this population, which will
base on modern monitoring methods, increase a role of the CEZ as a unique place in the
Europe almost totally without human interference.
Acknowledgements
Authors are very grateful to Prof. L. Balashov from Kholodny Institute of Botany,
Ukraine for his invaluable help in botanical part of this work and Dr. L. Romanov from
Institute of Agricultural Radiobiology, Ukraine for his advice on radiometric data in our
research.
References
Dvojnos GM, Balashov LS, Samzuk NG (1999). Grazing management of pastures in
Chornobyl exclusion zone. In: Problems preservation and Reintroducing in Nature
Area. Proceedings of the VI Intern. Symp. of the Preservation of the Przewalski`s horse
dedication to 100-th Breeding the Species in Askania-Nova Reserve, Vestnik Zoologii,
Supplement 11: pp. 67-71. (In Russ.)
Krighanovskiy VI, Mikituyk AY, Panov GM, Legeida IS, Dvojnos GM (1991). A
proposal to the efficient using of animal resources in the radiationally polluted territory.
In: Radiological, economics and legal aspects of the land tenure after the Chornobyl
disaster. Sbornik nauchnyh trudov, Part II, Kiev: pp. 294-298. (In Russ.)
Francevich LI, Gaichenko VI, Krighanovskiy VI (1991). Animals in the radio-active
zone. Naukova Dumka Press, Кiev: 128 p. (In Russ.)
Fauna: Program. (1998). «Fauna» of the Chornobyl Nuclear Power-Plant Exclusion and
Absolute Resettlement Zones. Ministry of Extraordinary Situations of the Ukraine Pres,
Kiev: 10 p. (In Russ.)
Symposium Proceedings – Book of Full Papers 98
ECOLOGY 2017 11-13 May, Kayseri TURKEY
Janis CM (1976). The evolutionary strategy of the Equidae and the origins of rumen and
cecal digestion. Evolution 30: 757-774.
Duncan P, Foose TJ, Gordon IJ, Gakahu CG, Lloyd M (1990). Comparative nutrient
extraction from forages by grazing bovids and equids: a test of the nutritional model of
equid/bovid competition and coexistence. Oecologia 84: 411-418.
Duncan P (1990). Ecologie et comportement. Actas del seminario MAPIMI, p. 371-387.
Janis CM, Gordon IJ, Illius AW (1994). Modelling equid/ruminant competition in the
fossil record. Histor. Biology 2: 111-125.
Baillie J, Groombridge B (compilers and editors) 1996. 1996 IUCN Red List of
Treatened Animals. IUCN, Glad, Swizerland and Cambridge, UK
Herd R P (1986). Epidemiology and control of parasites in northern temperate regions.
The veterinary clinics of North America: Equine Practice, Parasitology 2(2): 337-355.
Kuzmina TA, Kharchenko VA, Starovir AI, Dvojnos GM (2005). Analysis of the
strongylid nematodes (Nematoda: Strongylidae) community after deworming of brood
horse in Ukraine. Veterinary Parasitology 131: 283-290.
Chornobyl disaster. Barjachtar VG (Eds.) (1996). Naukova Dumka Pres, Kiev. 560 p.
(In Russ.)
Dvojnos GM, Kcharchenko VA (1994). The strongylid of domestic and wild horses.
Naukova Dumka Pres, Kiev. 233 p. (In Russ.)
Symposium Proceedings – Book of Full Papers 99
ECOLOGY 2017 11-13 May, Kayseri TURKEY
Kinetic Studies of Remazol Brillant Blue R Biosorption Onto Pistachio Hull:
Ecological Engineering Approach
Mutlu Yalvaç1, Serpil Savcı
2 and Zeynep Karaman
3
1,3 Mersin University, Engineering Faculty, Environmental Engineering
Department,Mersin 2
Bozok University, Engineering Arthitecture Faculty, Biosystems Engineering
Department,Yozgat
Corresponding Author: [email protected]
Abstract
The kinetic studies of Remazol Brillant Blue R (RBBR) biosorption onto pistachio hulls
were investigated. In order to determine the kinetics of RBBR dye onto pistachio hulls
adsorbent, pseudo first order, pseudo second order and intraparticle diffusion kinetic
models were calculated. Pseudo second order kinetic model is the best fitted to RBBR
biosorption pistachio hull. Thus, pistachio hulls can be an effective and easy availibity
adsorbent for removal of dyestuff.
Keywords: Pistachio hulls, Dye removal, Kinetic, Biosorption, Environment.
1. Introduction:
The pistachio (Pistacia vera), a member of the cashew family is one of crustacean fruit.
The top of the hard shell is covered with a yellow-red, fibrous and soft sheath (Pistacia
hull-PH). PH is tightly attached to the hard shell (Tekin et al. 2001; Grace et al. 2016).
This part constitutes the biggest waste (%35-45) of the pistachio industry (Açıkalın et
al. 2012; Barreca et al. 2016). Barreca et al. (2016) and Grace et al. (2016) found that
pistachio hull (PH) could be used as a food supplement in the pharmaceutical industry
(Grace et al. 2016; Barreca et al. 2016). Also, it has been demonstrated that PH contains
phenolic compounds with antioxidant, antimicrobial and antimutagenic effects (Rafiee
et al. 2017). Nonetheless, there is no study yet to found that PH is turned into a product
that is economic value.
Turkey is third for production of pistachio in the world after Iran and the US (Ahmad et
al. 2003). Turkey is located in one of the two gene centers of pistachio. The 90 percent
of pistachio trees in our country are located Gaziantep, Şanlıurfa, Adıyaman,
Kahramanmaraş and Siirt (Ertürk et al. 2015). In 2015, Turkey produced 144 000 tons
of pistachio (TUİK, 2015). About 48,000 to 50,000 tons of solid waste have been
formed at the pistachio plants between June and September. These wastes are left to
land and disposed of according to dump methods. These wastes are left to land and
disposed of according to dump methods.
Most of the textile products are painted to increase consumer enjoyment. However, the
wastewater generated as a result of the process affects both public and environmental
health (Crini, 2008).
For this reason, the waters need to be treatment and after that, they given to the
receiving environment. There are many physico-chemical methods for removal of dyes
Symposium Proceedings – Book of Full Papers 100
ECOLOGY 2017 11-13 May, Kayseri TURKEY
from aquatic solution (Aksu et al. 2000). But, these methods are too expensive and also
it caused secondary pollution. Hence, it is necessary to investigate alternative methods
which are effective and at the same time low cost and more environmental friendly. Due
to the presence of different chemical substances in the textile wastewater, their
treatment is difficult and expensive. Acidic, basic, disperse, azo, pigment, reactive dyes
have different chemical structure. Structural differences make difficult to remove the
dyes and often require different treatment methods to be applied in the same process
(Ravi Kuman et al. 1998).
Although activated carbons and resins are known as the best adsorbents for removing
chemical wastes from wastewaters, they have many disadvantages. For this reason,
researchers have also studied with more economical adsorbents (Mittal et al. 2005;
Srivastaga et al. 2005; Kumar et al. 2005; Baek et al. 2010; Ho, 2006).
In recent years, treatment of textile wastewater has been given great importance not
only its toxicity but also its properties such as turbidity. According to receiving
environment discharge standard, the color parameter for textile industry wastewater in
Turkey is allow to be in the range 280-260 (Pt-Co) in Water Pollution Control
Regulation (Table 10) (SKKY, 2016).
PH was used as an adsorbent in the removal of Cr (VI) (Moussavi et al. 2010), cyanide
(Moussavi et al. 2010) and methylene blue (Moussavi et al. 2011) from aqueous
solutions by adsorption. These studies have observed that PH is both applicable and
promising adsorbent for treatment of industrial wastewater by adsorption. Bazrafshan et
al. (2014) studied the adsorption kinetics of reactive red 198 (RR 198) dye with active
carbon obtained from PH and they found that Langmuir isotherm model is the best
fitted for the system (Bazrafshan et al. 2014).
Although, in literatures, there are many studies are about use as an adsorbent of
pistachio shell waste, there are limited studies about PH (pistachio hull) as seen above.
2. Material and Methods:
2.1. Material
The PH used as an adsorbent material in the study was obtained at a factory in Nizip on
August 2016 and stored at +4 ° C. Raw pistachio and waste PH are shown in Fig 1.
Remazol Brillant Blue R was used as textile dye in the study. Remazol Brilliant Blue R
(RBBR) is one of the most important dyes used in the textile industry.
RBBR, an anthraquinone derivative, is a dye that is toxic and irreversible class of
organic contaminants (Deveci et al. 2004; Eichlenova et al. 2007). The chemical
structure and properties of Remazol Brillant Blue R are given in Table 1.
This study was carried out in Mersin University Engineering Faculty, Environmental
Engineering Laboratories.
2.2. Preparation of biosorbent
The pistachio hulls were obtained from a factory in Gaziantep-Turkey. In order to
prepare the adsorbent, pistachio hulls were separated from pistachio shell and then
washed with distilled water many times. After, pistachio hulls were dried at 60oC for 24
h, they allowed to cool in a desiccators. It was ground into fine powder to use as an
adsorbent in the following experiments.
Symposium Proceedings – Book of Full Papers 101
ECOLOGY 2017 11-13 May, Kayseri TURKEY
2.3. Adsorption Experiments
After pistachio hulls were washed in tap water and pure water, the material was dried at
80 0C for 2 days and sieved from 20-30-35-50 and 70 mesh screens and used as an
adsorbent. RBBR (C22H16N2Na2O11S3) was purchased from (Carlo Erba Reagent). It is a
reactive dyestuff. This dye was commercial product and used without purification. The
stock solution was prepared by dissolving RBBR of 1000 mg in 1 L distilled water.
Adsorption studies were performed in 750 mL Erlenmeyer Flasks including 5 g of
pistachio hulls with 500 mL of RBBR solution. All the biosorption experiments were
performed at room temperature (25oC) via batch method and four sets (25 mg/L, 50
mg/L, 75 mg/L and 100 mg/L). The solution was shaken by a mechanical shaker
(Edmund Bühler GmbH) at the constant agitation time (100 rpm) during 120 min. Then
the supernatant was centrifuged at 6000 rpm and 5 minutes in a centrifuge (Hettich
Zentrifugen) after the batch tests. The absorbance of RBBR was measured at maximum
wavelength (λmax: 582 nm) by UV–VIS Spectrophotometer (T 90). For the contact time
experiments, the initial dye concentrations were varied from 25 to 100 mg/L. The
incubation time was tested in a time from 5 to 120 min. All experiments were repeated
three times.
3. Results:
The effect of adsorption time on adsorption capacities of RBBR were studied with four
dye concentration of 25 mg/L, 50 mg/L, 75 mg/L and 100 mg/L at 25 °C and 5 g/L
adsorbent dosage. The results are shown in Fig. 1. as shown in Fig 1, while the increase
in concentration, the adsorption capacity of RBBR onto pistachio hulls increases. Fig 2
shows variation of specific adsorption with time for various initial dye concentrations.
Moreover, Fig 3 shows pseudo second-order of RBBR dye on pistachio hulls. The
pseudo second order equation can be written as in Eq. (1)
tqqkq
t
eqeqadt
11
2
,2
(1)
Where k2 (g/mg.min) is the rate constant for the pseudo-second-order kinetics, qeq is the
mass of adsorbed at equilibrium (mg/g), qt is the mass of adsorbed at time t (minute).
Experimental data confirmed that the reaction of the RBBR biosorption onto pistachio
hulls the biosorbent fits the pseudo-second-order kinetic model. Values of qe obtained
from pseudo second order kinetic model listed and compared to related values from
experiments as seen in Table 2.
In order to determine the rate controlling step, the kinetic experimental results were
fitted to the Weber Morris intraparticle diffusion model. Fig 4 shows RBBR plots for
the intraparticle diffusion.
qt=kidt1/2+C (2)
Symposium Proceedings – Book of Full Papers 102
ECOLOGY 2017 11-13 May, Kayseri TURKEY
where kid is the intraparticle diffusion rate constant (mg.g–1
h–1/2
) and C (mg.g–1
) is a
constant that gives idea about the thickness of the boundary layer. If the qt vs. t1/2
plotis
a straight line, then the adsorption process is only controlled by intraparticle diffusion.
Table 3.shows that the intraparticle diffusion for RBBR on pistachio hulls.
3.1. Result and Discussions
In this study, removal of RBBR onto pistachio hulls was investigated by adsorption. In
order to investigate adsorption kinetic, pseudo first order, pseudo second order and
intraparticle diffusion models were calculated from available data from adsorption of
RBBR onto pistachio hulls. The adsorption was the best suited to the pseudo second
order kinetics equation with higher correlation coefficients R.
4. References
Tekin H, Arpacı S, Atlı HS, Açar İ, Karadağ S, Yükçeken Y, Yaman A (2001).
Antepfıstığı Yetiştiriciliği (Kitap). Antepfıstığı Araştırma Enstitüsü Müdürlüğü,
Gaziantep, Yayın No: 13, 132 s.
Antep fıstığı yetiştiriciliği, Milli Eğitim Bakanlığı, Ankara, 2010.
Grace MH, Debora Esposito, Michael A Timmers, Jia Xiong, Gad Yousef, Slavko
Komarnytsky, Mary Ann Lila (2016). Chemical composition, antioxidant and anti-
inflammatory properties of pistachio hull extracts. Food Chemistry 210: 85-95.
Açıkalın K, Karaca F, Bolat E (2012). Pyrolysis of pistachio shell: Effects of pyrolysis
conditions and analysis of products. Fuel 95: 169-177.
Barreca D, Laganà G, Leuzzi U, Smeriglio A, Trombetta D, Bellocco E (2016).
Evaluation of the nutraceutical, antioxidant and cytoprotective properties of ripe
pistachio (Pistacia vera L., variety Bronte) hulls. Food Chemistry 196: 493-502.
Rafiee Z, Barzegar M, Sahari MA, Maherani B (2017). Nanoliposomal carriers for
improvement the bioavailability of high - valued phenolic compounds of pistachio green
hull extract. Food Chemistry 220: 115-122.
Ahmad R, Ferguson L, Southwick SM (2003). Identification of pistachio (Pistacia vera
L.) nuts with microsatellite markers. Journal of the American Society for Horticultural
Science 128: 898-903.
“2011 Yılı Antep fıstığı Raporu”, T.C. Gümrük ve Ticaret Bakanliği, Kooperatifçilik
Genel Müdürlüğü, Ankara, 2012.
Ertürk YE, Geçer MK, Gülsoy E, Yalçın S (2015). Antepfıstığı Üretimi ve Pazarlaması.
Iğdır Üni. Fen Bilimleri Enst. Der. / Iğdır Univ. J. Inst. Sci. & Tech. 5(2): 43-62.
Türkiye İstatistik Kurumu (TÜİK). 2015.
Symposium Proceedings – Book of Full Papers 103
ECOLOGY 2017 11-13 May, Kayseri TURKEY
Crini G (2008). Kinetic and equilibrium studies on the removal of cationic dyes from
aqueous solution by adsorption onto a cyclodextrin polymer. Dyes Pigments 77: 415-
426.
Aksu Z, Tezer S (2000). Equilibrium and kinetic modelling of biosorption of Remazol
Black B by Rhizopus arrhizus in a batch system: effect of temperature. Process
Biochem. 36: 431-439.
Ravi Kumar MNV, Sridhari TR, Bhavani KD, Dutta PK (1998). Trends in color
removal from textile mill effluents. Colorage 40: 25-34.
Mittal A, Kurup (Krishnan) L, Gupta V K (2005). Use of waste materials-Bottom Ash
and De-Oiled Soya, as potential adsorbents for the removal of Amaranth from aqueous
solutions. Journal of Hazardous Materials B117:171-178.
Intra deo mall, Srivastaga VC, Agarwal NK, Mishara IV (2005). Adsorptive Removal
of Malachite Green Dye From Aqueous Solution By Bagasse Fly Ash and Activated
Carbon Kinetic Study And Equilibrium Isotherm Analyses. Colloids and Surfaces A:
Physicochemical and Engineering Aspects.
Kumar KV, Sivanesan S, Ramamurthi V (2005). Adsorption of malachite green onto
Pithophora sp., a fresh water algae: Equilibrium and kinetic modelling. Process
Biochemistry 40: 2865-2872.
Baek MH, Ijagbemi CO, Se-Jin O, Dong-Su Kim (2010). Removal of Malachite Green
from aqueous solution using degreased coffee bean. Journal of Hazardous Materials
176:820-828.
Ho YS (2006). Isotherms for the sorption of lead onto peat: comparison of linear and
non-linear methods. Polish Journal of Environmental Study 15:81-6.
Su Kirliliği Kontrol Yönetmeliği, 25687, 16.10.2016.
Moussavi G, Barikbin B (2010). Biosorption of chromium(VI) from industrial
wastewater onto pistachio hull waste biomass. Chem. Eng. J. 162: 893-900.
Moussavi G, Khosravi R (2010). Removal of cyanide from wastewater by adsorption
onto pistachio hull wastes:Parametric experiments, kinetics and equilibrium analysis. J.
Hazard. Mater 183: 724-730.
Moussavi G, Khosravi R (2011). The removal of cationic dyes from aqueous solutions
by adsorption onto pistachio hull waste. Chem. Eng. Res. Des. 89: 2182-2189.
Bazrafshan E, Mostafapour FK, Mahvi AH (2014). Decolorization of reactive red 198
by adsorption onto ZnCl2 activated pistachio hull wastes. Int J Env Health Eng 37: 38-
45.
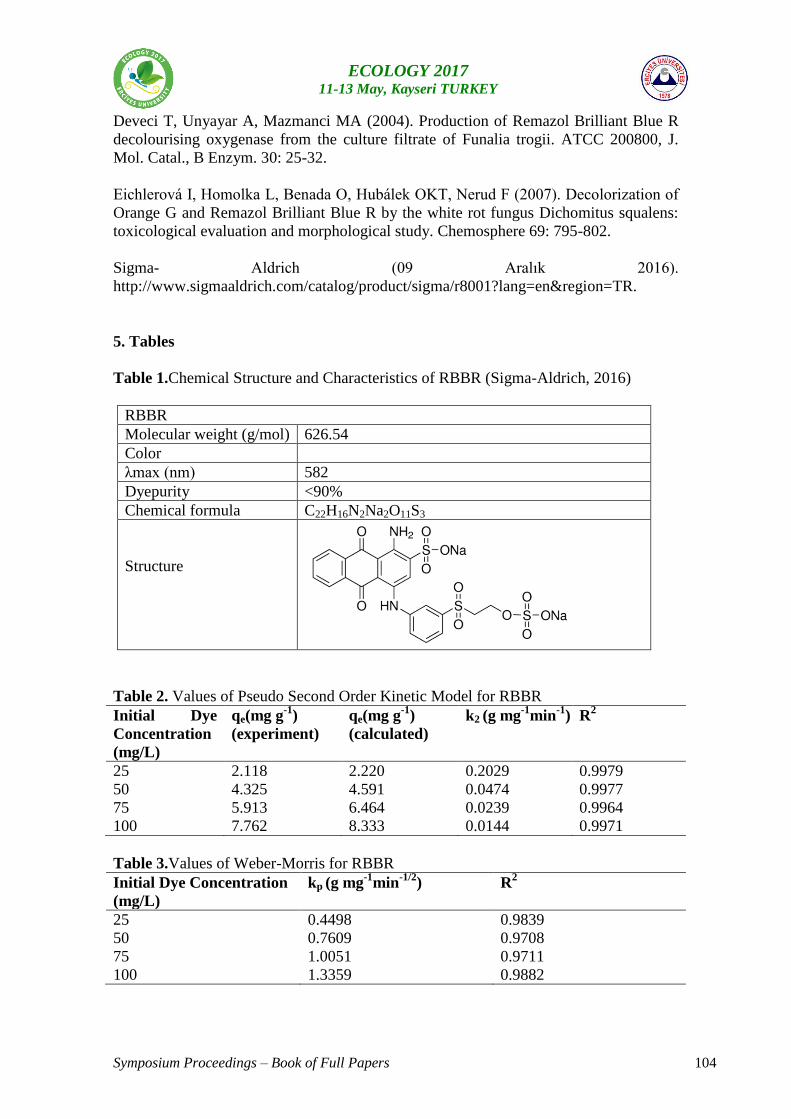
Symposium Proceedings – Book of Full Papers 104
ECOLOGY 2017 11-13 May, Kayseri TURKEY
Deveci T, Unyayar A, Mazmanci MA (2004). Production of Remazol Brilliant Blue R
decolourising oxygenase from the culture filtrate of Funalia trogii. ATCC 200800, J.
Mol. Catal., B Enzym. 30: 25-32.
Eichlerová I, Homolka L, Benada O, Hubálek OKT, Nerud F (2007). Decolorization of
Orange G and Remazol Brilliant Blue R by the white rot fungus Dichomitus squalens:
toxicological evaluation and morphological study. Chemosphere 69: 795-802.
Sigma- Aldrich (09 Aralık 2016).
http://www.sigmaaldrich.com/catalog/product/sigma/r8001?lang=en®ion=TR.
5. Tables
Table 1.Chemical Structure and Characteristics of RBBR (Sigma-Aldrich, 2016)
RBBR
Molecular weight (g/mol) 626.54
Color
λmax (nm) 582
Dyepurity <90%
Chemical formula C22H16N2Na2O11S3
Structure
Table 2. Values of Pseudo Second Order Kinetic Model for RBBR
Initial Dye
Concentration
(mg/L)
qe(mg g-1
)
(experiment)
qe(mg g-1
)
(calculated)
k2 (g mg-1
min-1
) R2
25 2.118 2.220 0.2029 0.9979
50 4.325 4.591 0.0474 0.9977
75 5.913 6.464 0.0239 0.9964
100 7.762 8.333 0.0144 0.9971
Table 3.Values of Weber-Morris for RBBR
Initial Dye Concentration
(mg/L)
kp (g mg-1
min-1/2
) R2
25 0.4498 0.9839
50 0.7609 0.9708
75 1.0051 0.9711
100 1.3359 0.9882
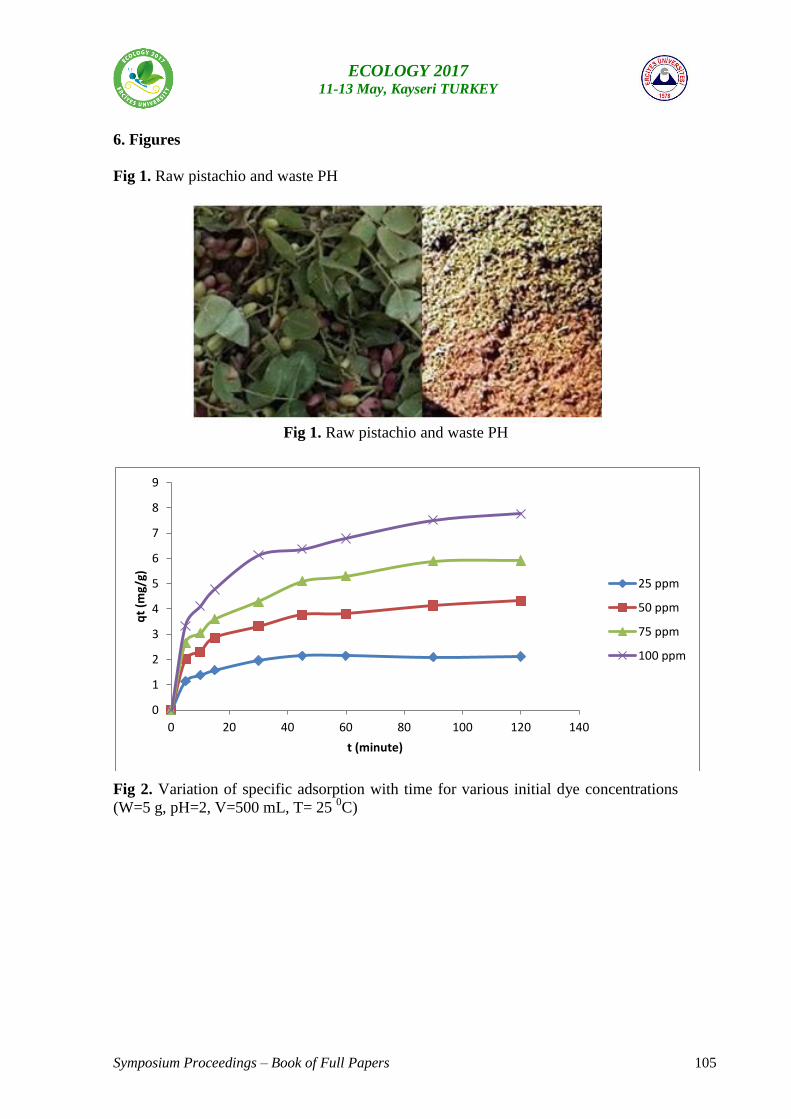
Symposium Proceedings – Book of Full Papers 105
ECOLOGY 2017 11-13 May, Kayseri TURKEY
6. Figures
Fig 1. Raw pistachio and waste PH
Fig 1. Raw pistachio and waste PH
Fig 2. Variation of specific adsorption with time for various initial dye concentrations
(W=5 g, pH=2, V=500 mL, T= 25 0C)
0
1
2
3
4
5
6
7
8
9
0 20 40 60 80 100 120 140
qt
(mg/
g)
t (minute)
25 ppm
50 ppm
75 ppm
100 ppm
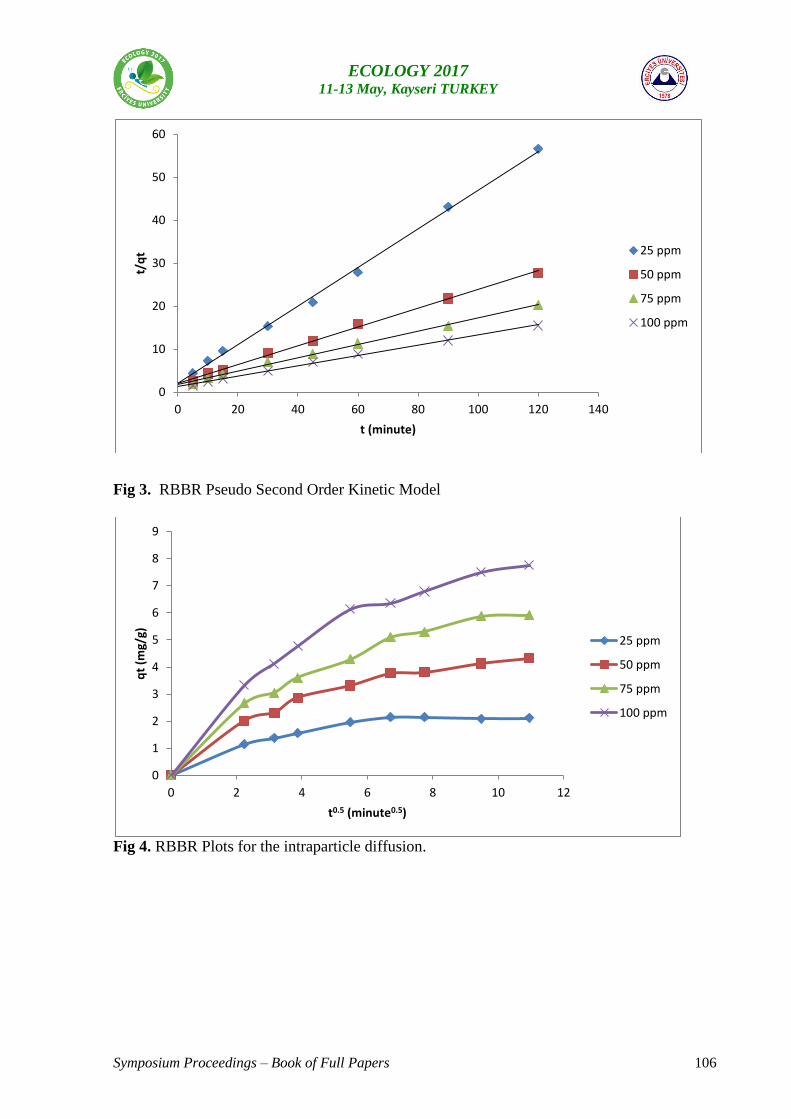
Symposium Proceedings – Book of Full Papers 106
ECOLOGY 2017 11-13 May, Kayseri TURKEY
Fig 3. RBBR Pseudo Second Order Kinetic Model
Fig 4. RBBR Plots for the intraparticle diffusion.
0
10
20
30
40
50
60
0 20 40 60 80 100 120 140
t/q
t
t (minute)
25 ppm
50 ppm
75 ppm
100 ppm
0
1
2
3
4
5
6
7
8
9
0 2 4 6 8 10 12
qt
(mg/
g)
t0.5 (minute0.5)
25 ppm
50 ppm
75 ppm
100 ppm
Symposium Proceedings – Book of Full Papers 107
ECOLOGY 2017 11-13 May, Kayseri TURKEY
Investigation of the chemical content of some industrial tree barks’ extracts by
GC-MS
Mehmet AKÇA1*
, Aytaç GÜDER2, Mahmut GÜR
3
1Department of Forestry and Forest Products, Dursunbey Vocational School, Balıkesir
University, Balıkesir, Turkey
2Department of First and Emergency Assistance, Vocational Health School, Giresun
University, Giresun, Turkey
3Department of Forest Industrial Engineering, Forest Faculty, Kastamonu University,
Kastamonu, Turkey
Abstract
Wood barks, which are very rich in secondary metabolites, are not used effectively
during industrial processes. Determination of the bark content is important in assessing
the potential of this very large amount of underutilized bark material. Coniferous tree
species widely used in the industrial sector in Turkey include Scots pine (SP) (Pinus
sylvestris), Black pine (BP) (Pinus Nigra), Calabrian pine (CP) (Pinus brutia), Ida
Mountain fir (IMF) (Abies subsp nordmannia it. equi-Trojan) and Oriental spruce (OS)
(Picea orientalis). Chloroform and petroleum ether extractions were carried out on
barks of these species and their chemical contents were analyzed using the GC-MS
technique. The highest extraction yields in chloroform and petroleum ether were found
for black pine (1.19%) and Scots pine (1.14%), respectively. In the GC-MS analysis,
the most abundant components in the chloroform’ extract were identified as 2-ethyl-1-
hexanol for Scots pine, Methyl stearate for oriental spruce, 1,2-Benzenedicarboxylic
acid, bis (2-ethylhexyl) ester for black pine, Calabrian pine and Ida Mountain fir. In
addition, the most abundant components in the petroleum ether extracts were
determined as 9-Octadecenoic acid, methyl ester for oriental spruce, Methyl stearate for
Ida Mountain fir, and 2-ethyl-1-Hexanol for Scots pine, black pine and Calabrian pine.
Keywords: Wood bark, extract, chloroform, petroleum ether, GC-MS
Symposium Proceedings – Book of Full Papers 108
ECOLOGY 2017 11-13 May, Kayseri TURKEY
1. Introduction
For many years forests have been thought of as a source of raw wood material for the
forest products industry. However, because of their composition, both wood and non-
wood forest products have a great potential as a chemical resource. These products
found in the structure can be removed by using neutral solvents and water. Very small
and variable quantities of extractable components which are quite valuable in the fields
of pharmacology and chemistry can easily be volatized with water vapor.
During wood processing, the bark is considered as fuel by many factories in the sector,
even though for reasons that are inherent in its very nature it is chemically similar to
wood, and quite rich in terms of its extractive variety and content. Because the
quantities of the potentially rich extractives in the bark do not reach substantial levels, it
is very important to employ chromatographic methods in order to determine the
extractive contents of the bark of tree species in Turkey.
Mankind has been benefiting from tree bark for many years. One of the best examples
of the benefits of bark is cinnamon and its use as a natural sweetener. Bark-derived
quinine was used as an antimalarial drug (Dönmez 2013). Material obtained from
yohimbe bark is now used in the treatment of diabetic patients (Rosengren et al. 2009).
Oleic acid, which can be obtained from wood or bark, is used in the production of
lacquers, and in the leather, textile, ceramic and paper industries (http1).
A number of studies have been conducted in Turkey on the chemical content of bark.
Hafızoğlu and Holmbom (1987) carried out two separate studies on cedar tree bark in
which they examined lipophilic substances and oleoresin materials they had extracted
from the bark. Usta (1993) conducted a comparative chemical analysis of Calabrian
pine bark and wood and attributed the high amount of dilute alkaline-soluble matter in
the bark to the fact that it was rich in polyphenols. Hafizoğlu et al. conducted a study in
1997 to determine the chemical structure of oriental spruce wood and bark. They found
that there were about ten times more lipophilic extractives in the bark than in the wood,
and that the cambium contained a large number of substances, including
Symposium Proceedings – Book of Full Papers 109
ECOLOGY 2017 11-13 May, Kayseri TURKEY
monosaccharides and lignins. Kılıç and Altuntaş in 2006 identified the volatile
components in the wood and bark of the Mediterranean laurel. Dönmez et al.
investigated the effect of increased amounts of suberin monomers in the outer bark of
Scots pine wood (Dönmez et al., 2012). Dichloromethane solvent was used to extract
the following compounds from Quercus cerris bark, which were detected via GC-MS:
azelaic acid, hexadecanoic acid, octadecanoic acid, oleic acid, hexadecanedioic acid,
octadec-9-enedioic acid, 18-hydroxyoctadec-9-enoic acid, 9,10-
dihydroxyoctadecanedioic acid, 9,10,18-trihydroxyoctadecanoic acid, 22-
hydroxydocosanoic acid, eicosanol, docosanol and friedelin (Şen et al. 2010). In a study
to identify the tannins in Calabrian pine bark, chromatographic analysis yielded the
following compounds: taxifolin, catechin, quercetin, ferulic acid, glycerol, p-hydroxy
benzoic acid and 3,4-dihydroxy benzoic acid (Uçar et al. 2013).
In this study, petroleum ether and chloroform yields were extracted from the bark of
tree species widely used in the forest products industry in Turkey. In addition, GC-MS
analyses of the obtained extracts were carried out in order to determine their chemical
content.
2. Materials and methods
2.1. Materials
The sample trees used in the experiments and their source locations are shown in Table
1.
Table 1. Sample trees and their site origins
Coniferous Trees Supply Location
Scots pine (Pinus sylvestris) Kastamonu Regional Directorate of
Forestry
Black pine (Pinus nigra) Kastamonu Regional Directorate of
Forestry
Calabrian pine (Pinus brutia) Muğla Regional Directorate of
Forestry
Ida Mountain fir (Abies nordmanniana subsp. equi-trojani) Kastamonu Regional Directorate of
Forestry
Oriental spruce (Picea orientalis) Trabzon Regional Directorate of
Forestry
Symposium Proceedings – Book of Full Papers 110
ECOLOGY 2017 11-13 May, Kayseri TURKEY
2.1.1. Chemicals
Petroleum ether (petroleum benzine) E.: Merck (Darmstadt, Germany)
Chloroform 99%: Sigma (Sigma-Aldrich GmbH, Sternheim, Germany)
2.2. Methods
2.2.1. Preparation of wood samples
Wood bark samples were obtained from the listed Regional Directorates of Forestry
according to the TAPPI standard T257 cm-85 (1985). Wood bark samples were
prepared from freshly cut wood and left to dry under ambient conditions. The dried
wood bark samples (moisture content: 8%) were chopped into small parts with a special
knife and pulverized with a hammer mill. The wood powder (particle size between 0.05
and 0.4 mm) was stored in closed glass jars at room temperature.
2.2.2. Extraction
The extraction test was carried out using Soxhlet extractors in accordance with TAPPI
standard T204 om-88 (1988). Wood bark samples (10 g) were extracted separately by
using petroleum ether and chloroform (150 mL) for 6 h. Petroleum ether and
chloroform extracts were evaporated and the dried extractive samples were kept in glass
bottles at approximately -18 °C until future experiments.
2.2.3. Gas chromatography mass spectrometry (GC-MS)
GCMS-QP2010 Ultra (Shimadzu,
Kyoto, Japan)
Column: Rtx-5MS, 30 m length, 0.25
mm thickness, 0.25 µm diameter.
Carrier Gas: Helium, 1.26 ml/min
Volume Injected: 1µl
Temperature Program: From 90 ℃ to
250 ℃ at 15 ℃/min
Split Ratio: 5:1
Purge Flow: 3 mL/min
Pressure: 90 kPa
Time of Analysis: 60 min
Ion source temp.: 200 oC
Interface temp.: 250 oC
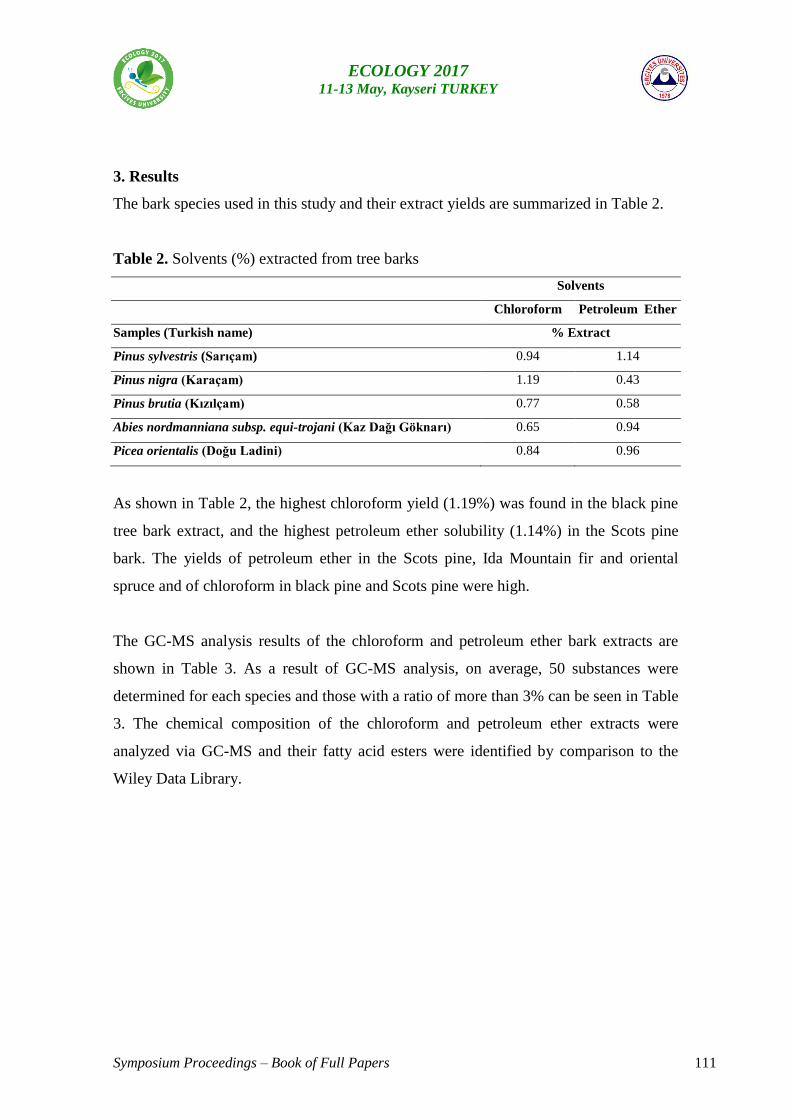
Symposium Proceedings – Book of Full Papers 111
ECOLOGY 2017 11-13 May, Kayseri TURKEY
3. Results
The bark species used in this study and their extract yields are summarized in Table 2.
Table 2. Solvents (%) extracted from tree barks
Solvents
Chloroform Petroleum Ether
Samples (Turkish name) % Extract
Pinus sylvestris (Sarıçam) 0.94 1.14
Pinus nigra (Karaçam) 1.19 0.43
Pinus brutia (Kızılçam) 0.77 0.58
Abies nordmanniana subsp. equi-trojani (Kaz Dağı Göknarı) 0.65 0.94
Picea orientalis (Doğu Ladini) 0.84 0.96
As shown in Table 2, the highest chloroform yield (1.19%) was found in the black pine
tree bark extract, and the highest petroleum ether solubility (1.14%) in the Scots pine
bark. The yields of petroleum ether in the Scots pine, Ida Mountain fir and oriental
spruce and of chloroform in black pine and Scots pine were high.
The GC-MS analysis results of the chloroform and petroleum ether bark extracts are
shown in Table 3. As a result of GC-MS analysis, on average, 50 substances were
determined for each species and those with a ratio of more than 3% can be seen in Table
3. The chemical composition of the chloroform and petroleum ether extracts were
analyzed via GC-MS and their fatty acid esters were identified by comparison to the
Wiley Data Library.
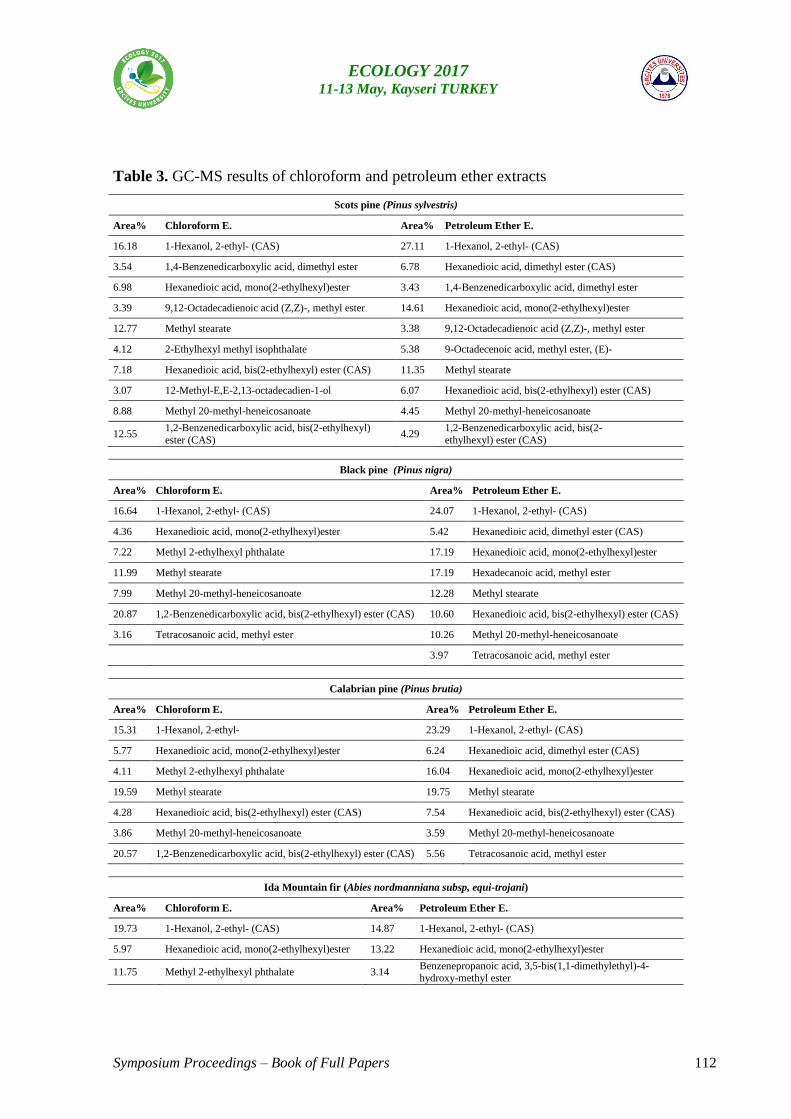
Symposium Proceedings – Book of Full Papers 112
ECOLOGY 2017 11-13 May, Kayseri TURKEY
Table 3. GC-MS results of chloroform and petroleum ether extracts
Scots pine (Pinus sylvestris)
Area% Chloroform E. Area% Petroleum Ether E.
16.18 1-Hexanol, 2-ethyl- (CAS) 27.11 1-Hexanol, 2-ethyl- (CAS)
3.54 1,4-Benzenedicarboxylic acid, dimethyl ester 6.78 Hexanedioic acid, dimethyl ester (CAS)
6.98 Hexanedioic acid, mono(2-ethylhexyl)ester 3.43 1,4-Benzenedicarboxylic acid, dimethyl ester
3.39 9,12-Octadecadienoic acid (Z,Z)-, methyl ester 14.61 Hexanedioic acid, mono(2-ethylhexyl)ester
12.77 Methyl stearate 3.38 9,12-Octadecadienoic acid (Z,Z)-, methyl ester
4.12 2-Ethylhexyl methyl isophthalate 5.38 9-Octadecenoic acid, methyl ester, (E)-
7.18 Hexanedioic acid, bis(2-ethylhexyl) ester (CAS) 11.35 Methyl stearate
3.07 12-Methyl-E,E-2,13-octadecadien-1-ol 6.07 Hexanedioic acid, bis(2-ethylhexyl) ester (CAS)
8.88 Methyl 20-methyl-heneicosanoate 4.45 Methyl 20-methyl-heneicosanoate
12.55 1,2-Benzenedicarboxylic acid, bis(2-ethylhexyl)
ester (CAS) 4.29
1,2-Benzenedicarboxylic acid, bis(2-
ethylhexyl) ester (CAS)
Black pine (Pinus nigra)
Area% Chloroform E. Area% Petroleum Ether E.
16.64 1-Hexanol, 2-ethyl- (CAS) 24.07 1-Hexanol, 2-ethyl- (CAS)
4.36 Hexanedioic acid, mono(2-ethylhexyl)ester 5.42 Hexanedioic acid, dimethyl ester (CAS)
7.22 Methyl 2-ethylhexyl phthalate 17.19 Hexanedioic acid, mono(2-ethylhexyl)ester
11.99 Methyl stearate 17.19 Hexadecanoic acid, methyl ester
7.99 Methyl 20-methyl-heneicosanoate 12.28 Methyl stearate
20.87 1,2-Benzenedicarboxylic acid, bis(2-ethylhexyl) ester (CAS) 10.60 Hexanedioic acid, bis(2-ethylhexyl) ester (CAS)
3.16 Tetracosanoic acid, methyl ester 10.26 Methyl 20-methyl-heneicosanoate
3.97 Tetracosanoic acid, methyl ester
Calabrian pine (Pinus brutia)
Area% Chloroform E. Area% Petroleum Ether E.
15.31 1-Hexanol, 2-ethyl- 23.29 1-Hexanol, 2-ethyl- (CAS)
5.77 Hexanedioic acid, mono(2-ethylhexyl)ester 6.24 Hexanedioic acid, dimethyl ester (CAS)
4.11 Methyl 2-ethylhexyl phthalate 16.04 Hexanedioic acid, mono(2-ethylhexyl)ester
19.59 Methyl stearate 19.75 Methyl stearate
4.28 Hexanedioic acid, bis(2-ethylhexyl) ester (CAS) 7.54 Hexanedioic acid, bis(2-ethylhexyl) ester (CAS)
3.86 Methyl 20-methyl-heneicosanoate 3.59 Methyl 20-methyl-heneicosanoate
20.57 1,2-Benzenedicarboxylic acid, bis(2-ethylhexyl) ester (CAS) 5.56 Tetracosanoic acid, methyl ester
Ida Mountain fir (Abies nordmanniana subsp, equi-trojani)
Area% Chloroform E. Area% Petroleum Ether E.
19.73 1-Hexanol, 2-ethyl- (CAS) 14.87 1-Hexanol, 2-ethyl- (CAS)
5.97 Hexanedioic acid, mono(2-ethylhexyl)ester 13.22 Hexanedioic acid, mono(2-ethylhexyl)ester
11.75 Methyl 2-ethylhexyl phthalate 3.14 Benzenepropanoic acid, 3,5-bis(1,1-dimethylethyl)-4-hydroxy-methyl ester
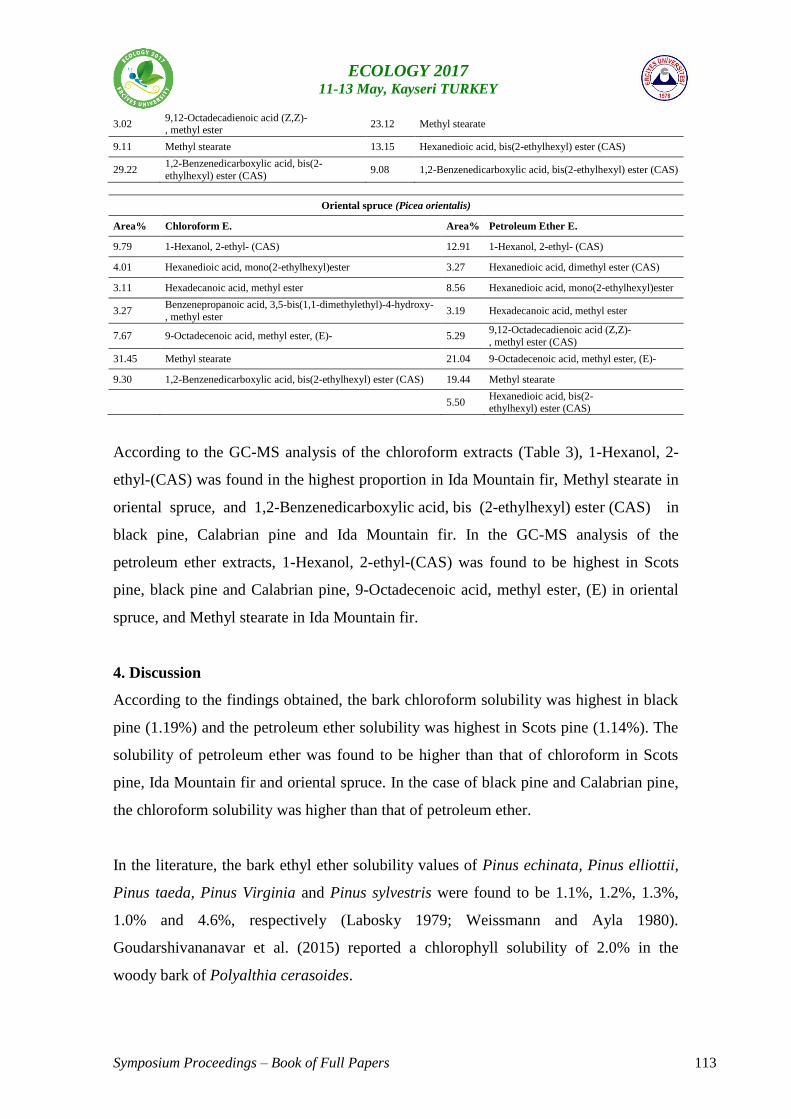
Symposium Proceedings – Book of Full Papers 113
ECOLOGY 2017 11-13 May, Kayseri TURKEY
3.02 9,12-Octadecadienoic acid (Z,Z)-, methyl ester
23.12 Methyl stearate
9.11 Methyl stearate 13.15 Hexanedioic acid, bis(2-ethylhexyl) ester (CAS)
29.22 1,2-Benzenedicarboxylic acid, bis(2-
ethylhexyl) ester (CAS) 9.08 1,2-Benzenedicarboxylic acid, bis(2-ethylhexyl) ester (CAS)
Oriental spruce (Picea orientalis)
Area% Chloroform E. Area% Petroleum Ether E.
9.79 1-Hexanol, 2-ethyl- (CAS) 12.91 1-Hexanol, 2-ethyl- (CAS)
4.01 Hexanedioic acid, mono(2-ethylhexyl)ester 3.27 Hexanedioic acid, dimethyl ester (CAS)
3.11 Hexadecanoic acid, methyl ester 8.56 Hexanedioic acid, mono(2-ethylhexyl)ester
3.27 Benzenepropanoic acid, 3,5-bis(1,1-dimethylethyl)-4-hydroxy-
, methyl ester 3.19 Hexadecanoic acid, methyl ester
7.67 9-Octadecenoic acid, methyl ester, (E)- 5.29 9,12-Octadecadienoic acid (Z,Z)-
, methyl ester (CAS)
31.45 Methyl stearate 21.04 9-Octadecenoic acid, methyl ester, (E)-
9.30 1,2-Benzenedicarboxylic acid, bis(2-ethylhexyl) ester (CAS) 19.44 Methyl stearate
5.50 Hexanedioic acid, bis(2-ethylhexyl) ester (CAS)
According to the GC-MS analysis of the chloroform extracts (Table 3), 1-Hexanol, 2-
ethyl-(CAS) was found in the highest proportion in Ida Mountain fir, Methyl stearate in
oriental spruce, and 1,2-Benzenedicarboxylic acid, bis (2-ethylhexyl) ester (CAS) in
black pine, Calabrian pine and Ida Mountain fir. In the GC-MS analysis of the
petroleum ether extracts, 1-Hexanol, 2-ethyl-(CAS) was found to be highest in Scots
pine, black pine and Calabrian pine, 9-Octadecenoic acid, methyl ester, (E) in oriental
spruce, and Methyl stearate in Ida Mountain fir.
4. Discussion
According to the findings obtained, the bark chloroform solubility was highest in black
pine (1.19%) and the petroleum ether solubility was highest in Scots pine (1.14%). The
solubility of petroleum ether was found to be higher than that of chloroform in Scots
pine, Ida Mountain fir and oriental spruce. In the case of black pine and Calabrian pine,
the chloroform solubility was higher than that of petroleum ether.
In the literature, the bark ethyl ether solubility values of Pinus echinata, Pinus elliottii,
Pinus taeda, Pinus Virginia and Pinus sylvestris were found to be 1.1%, 1.2%, 1.3%,
1.0% and 4.6%, respectively (Labosky 1979; Weissmann and Ayla 1980).
Goudarshivananavar et al. (2015) reported a chlorophyll solubility of 2.0% in the
woody bark of Polyalthia cerasoides.
Symposium Proceedings – Book of Full Papers 114
ECOLOGY 2017 11-13 May, Kayseri TURKEY
In the present study, the petroleum ether solubility of Scots pine was found to be higher
than that of other species, a result supported by the work of Labosky (1979) and
Weissmann and Ayla (1980). In general, the black pine chloroform solubility and Scots
pine ether solubility are close to the values found in the literature, while the solubility
values of the other species used in the study were found to be lower than those in the
literature.
As a result of the GC-MS analysis of the chloroform extracts, the highest levels of 1-
Hexanol, 2-ethyl- (CAS) were seen in Ida Mountain fir, Methyl stearate in oriental
spruce and 1,2-Benzenedicarboxylic acid, bis (2-ethylhexyl) ester (CAS) in black pine,
Calabrian pine and Ida Mountain fir. In the analysis of the petroleum ether extracts, the
highest levels of 1-Hexanol, 2-ethyl- (CAS) were detected in Scots pine, black pine and
Calabrian pine, 9-Octadecenoic acid and methyl ester, (E) in oriental spruce, and
Methyl stearate in Ida Mountain fir.
The 1-Hexanol, 2-ethyl compound is mostly used as a plasticizer. Since it is an oily
alcohol, its esters have softening properties. For example, octocrylene, which contains
2-ethylhexyl, is used in sunscreens for this reason. Moreover, the generics are used as
low volatility solvents. In addition, 2-ethylhexyl can be used as an octane booster when
reacted with nitric acid (http2).
The 1,2-Benzenedicarboxylic acid, bis (2-ethylhexyl) ester is generally called di (2-
ethylhexyl) phthalate or phthalic acid di (2-ethylhexyl) ester. Phthalic acid is a fatty acid
ester which has poor solubility in water and ether, but is soluble in alcohol and
decomposes at 191 °C. It is used as a chemical intermediate in the production of paint,
pharmaceuticals and synthetic perfumes. It is also known as terephthalic acid in its para
form, and is used to make polyester resins and as an additive in poultry feed (http3).
In general, Methyl stearate and 9-Octadecenoic acid, methyl ester are employed in
foodstuffs in which fatty acid esters are used and as emulsifiers or lubricant agents for
textiles. Additionally, they can be used as lubricants for plastics, additives for dyes and
Symposium Proceedings – Book of Full Papers 115
ECOLOGY 2017 11-13 May, Kayseri TURKEY
ink, in the agricultural industry as solvents and as intermediates in the perfume industry
(http4).
5. Conclusion
This study has revealed the value of tree wood bark in terms of its chemical content.
Thus, the determination of these chemical substances proves that bark extracts can be an
indisputable resource for the many sectors which are based on the use of chemical raw
materials. Future studies in which the isolation of these components is carried out will
show the increasingly significant value of these substances.
Acknowledgements
The corresponding author wishes to thank the Scientific and Technological Research
Council of Turkey (TUBITAK 2211-D) and the Kastamonu University Scientific
Projects Research Office (Project Number KU-BAP03/2016-10) for supporting this
research.
References
Dönmez, I. E., Hafızoğlu, H., Kılıç, A., Hemming J., Eckerman C. (2012). Effect of
altitude on the composition of suberin monomers in the outer bark of Scots pine
(Pinus sylvestris L.). Industrial Crops and Products, 37, 441- 444.
Dönmez, İ. E., Dönmez, Ş. (2013). Structure of tree bark and possibility of
utilization. Turkish Journal of Forestry, 14(2), 156-162.
Goudarshivananavar, B. C., Vigneshwaran, V., Somegowda, M., Dharmappa, K. K.,
Pramod, S. N. (2015). Therapeutic potential of Polyalthia cerasoides stem bark
extracts against oxidative stress and nociception. Ancient Science of Life, 35(2), 70.
Hafizoğlu, H., & Holmbom, B. (1987). Studies on the Chemistry of Cedrus libani A.
Rich.-III. Oleoresin Composition of Cones and Bark from Cedrus
libani. Holzforschung-International Journal of the Biology, Chemistry, Physics and
Technology of Wood, 41(3), 141-145.
Symposium Proceedings – Book of Full Papers 116
ECOLOGY 2017 11-13 May, Kayseri TURKEY
Hafizoğlu, H., Usta, M., & Bilgin, Ö. (1997). Wood and bark composition of Picea
orientalis (L.) Link. Holzforschung-International Journal of the Biology, Chemistry,
Physics and Technology of Wood, 51(2), 114-118.
Kılıç, A., Altuntas, E. (2006). Wood and bark volatile compounds of Laurus nobilis L.
Holzs als roh- und werkstoff, 64, 317-320.
Labosky, P. (1979). Wood Science, 12, 80-85.
Rosengren, A.H., Jokubka, R., Tojjar, D., Granhall, C., Hansson, O., Li, D.-Q., Nagaraj,
V., Reinbothe, T.M. (2009). Overexpression of Alpha2A-Adrenergic Receptors
Contributes to Type 2 Diabetes. Science 327 (5962), 217–220.
Şen, A., Miranda, I., Santos, S., Graça, J., Pereira, H. (2010). The chemical composition
of cork and phloem in the rhytidome of Quercus cerris bark. Industrial Crops and
Products, 31(2), 417-422.
TAPPI T204 om-88. (1988). Solvent Extractives of Wood and Pulp, TAPPI Press,
Atlanta, GA, USA.
TAPPI T257 cm-85. (1985). Sampling and Preparing Wood for Analysis, TAPPI Press,
Atlanta, GA, USA.
Ucar, M. B., Ucar, G., Pizzi, A., Gonultas, O. (2013). Characterization of Pinus brutia
bark tannin by MALDI-TOF MS and 13C NMR. Industrial Crops and Products, 49
697–704.
Usta, M. (1993). Comparing wood and bark constituents of endemic
species. ORENKO, 93, 288-292.
Weissmann, G. and Ayla, C. (1980), Holz Roh-Werkst, 38, 307-312.
http1: https://chemicalceo.com/2016/05/28/oleik-asit-oleic-acid-nedir-nerelerde-
kullanilir/
http2: https://en.wikipedia.org/wiki/2-Ethylhexanol
http3: http://encyclopedia2.thefreedictionary.com/1,2-benzenedicarboxylic+acid
http4:
http://www.chemicalland21.com/lifescience/foco/METHYL%20STEARATE.htm
Symposium Proceedings – Book of Full Papers 117
ECOLOGY 2017 11-13 May, Kayseri TURKEY
Variation in Chemical Constituents of Ancient Black Pine Leaves: In relation to
tree age
Nezahat TURFAN1,*
, Mehtap ALAY1
1Biology Department,Science and Art Faculty, Kastamonu University, Kastamonu,
Turkey
*Correspondence: [email protected]
Abstract:Ancient trees reached over upper limits of the natural individual life are both
a function of the gene pool. They provide some ideas for planners about the necessary
physical administration time during the planning of forest resources and natural material
for the dendroclimatological researches in order to provide an insight to the estimation
of the past climate variables. Ancient tree are also important for national culture, local
history and folkloric culture, and so their importance is increasing every day. This
present study is aimed at investigating the development physiology of 500 year-old
ancient Black Pine (Pinus nigra L.) in Kastamonu, Turkey. Leaves of Black Pine
growing in similar environment with the age of over 500, 200, 100, 50 and 25 year olds
were sampled and analyzed for photosynthetic pigment, proline, total soluble protein
total amino acid, glucose, sucrose, total soluble sugar, peroxidation level (MDA-
malondialdehyde), H2O2 and also antioxidants such as APx, GPx, CAT and SOD
activities.The result indicated that, the highest amount of chlorophyll, carotenoid and
MDA was detected in the black pine needles at 50 years of age while proline, protein,
H2O2, sucrose, total soluble carbohydrate amount highest in the 500-year-old black pine
needles. APx, CAT, SOD activity were high in the 500-year-old black pine needles.
Highest glucose levels were determined in the -year-old black pine samples. When all
results are evaluated, it is found that, the amount of chlorophyll, carotenoid and MDA
Symposium Proceedings – Book of Full Papers 118
ECOLOGY 2017 11-13 May, Kayseri TURKEY
are high in leaves the black pine needles at 50 years of age whereas the proline, total
soluble protein, H2O2, sucrose, total soluble carbohydrate amount and APx, CAT, SOD
activity are high in the 500-year-old black pine needles. It is concluded that high total
soluble protein, sucrose, H2O2, APX, CAT, SOD enzymes and low MDA are very
efficient for high longevity of ancient trees. The results showed that physiological
characteristics of Pinus nigra leaves varied depending on age.
Keywords: Ancient trees, Black Pine, chemical constituents, Kastamonu
1.Introduction
Growth in trees denotes the increase in diameter, size and volume of the tree over
time. However, these formations are completed in three separate stages, namely as
formative (productive), maturity and old age phases, and within a very long period of
time. The formation phase is the stage in which the synthesis events occur at a high rate
due to rapid growth by using plenty of energy and when the top of the tree and of the
leaf surface area becomes closed due to density (Wong et al., 1985; Köstner et al.,
2002). In the second phase (maturity) where closure reaches optimum, metabolic
activity continues on the leaves, but wood morphology and chemistry start to
change. Although the cambial activity slowdown the tree looks quite large and has a big
appearance (Kozlowska, 1971; Greenwood, 1995; Koch et al., 2004). The last phase,
called old age although the environmental growth is ongoing, is the stage when the
increase is complete and stability starts. Closure, leaf area and production are reduced,
branch losses are accelerated. The aging of the tree accelerates according to the age
such as having deer heading, top-to-root drying, trunk deformations such as decay of
bark and leaks, stimulation of injuries in tree top wood, and attack of pathogens or
pests (Gower et al., 1996; Köstner et al., 2002). Growth and development in trees occur
Symposium Proceedings – Book of Full Papers 119
ECOLOGY 2017 11-13 May, Kayseri TURKEY
due to the collective influence of environmental conditions such as the speed of
metabolic reactions working in genetic structure, age, growth and development
processes of the tree as well as senescence, climate and others abiotic and biotic
factories (Wilson and White, 1986; Cherubini et al., 1997; Wodzicki, 2001). Both
internal factors originating from the genetics and physiology of the tree and change of
environmental factors affect the amount of primer metabolites such as nitrogen, protein,
proline and other amino acids, as well as glucose, fructose and sucrose, and secondary
metabolites such as lignin, glycosides, total phenolic and flavonoid compounds and
antioxidant activity, photosynthesis and carbohydrate metabolism and amount of macro
and micro elements and affect the morphology, physiology and lifespan of the tree
(Gower et al., 1996; Sarıyıldız and Anderson, 2005/2006). Chemical content of black
pine (Pinus nigra L), over the age of 500 in Kaşçılar village of Kastamonu province’s
central district has been examined in comparison with different black pine trees over the
age of 200, 100, 50 and 25 in the same region in this study.
2. Material and Methods
2.1. Study area
This study has been carried out in Kaşçılar village 18 km away from Kastamonu
province’s central districtat an altitude of 1350 m (41 0 11'38 "N, 33
o53'07" E) (see
Figure 1). Kastamonu province has a climate which is generally damp, cold in winters,
warm in summers which has no water excess and under the effect of sea
climate.According to data of Kastamonu Province Meteorology Station (established at
800 m altitude) for the years between 1950 and 2015, the average temperature of the
study area was 9.8 ºC while the highest temperature was recorded on July 30, 2000 and
the lowest temperature was recorded on January 15, 1950.
Symposium Proceedings – Book of Full Papers 120
ECOLOGY 2017 11-13 May, Kayseri TURKEY
2.2. Sample collection
Annual rings of three dominant trees taken by Pressler increment borer at chest height
(1.30 m) in each trial area were also counted in the study area on the incrementcorein
determination of average age of different black pine trees in each study area. When
determining the age of the tree by virtue of the increment borer attention has been paid
to the fact that the increment cores are in two perpendicular directions to each other to
avoid the error that may occur in the annual ring measurement with eccentric growth
(Carus, 1995).The diameters of the trees were determined by using a tree diameter
caliper on the chest surface with a cross sensitivity of cm, from the upper slope of the
tree. In measurements made in the tree classes it was determined that the circumference
of the tree over the age of 500 at chest height (130 cm) was 320 cm while the
circumference of the tree over the age of 200 at chest height was 234 cm and the
circumference of the tree over the age of 100 at the chest height (130 cm) was 157 cm
and the circumference of the tree over the age of 50 was 78 cm while the circumference
of the tree over the age of 25 was 34 cm. Fresh leaves from the low parts and each side
of 3 trees determined randomly belonging to other age classes except for>500 were
collected and placed in bags in the study area and then these samples were combined to
form a mixed sample for each age class.Photosynthetic pigments amounts (chlorophyll
a, chlorophyll b and carotenoids), proline, protein, lipid peroxidation and hydrogen
peroxide (H2O2), total phenolics, flavonoids, glucose, sucrose, total soluble
carbohydrates and starch contents and ascorbate peroxidase, guaiacolperoxidase,
catalase, and superoxide dismutase enzyme activities of leaf samples of black pine trees
in different age groups were determined.
2.3. Chemical Methods
Symposium Proceedings – Book of Full Papers 121
ECOLOGY 2017 11-13 May, Kayseri TURKEY
Chlorophyll content of the leaves was measured by the method of Arnon (1949).
Carotenoid amount was estimated by Jaspars Formula according to the method Witham
et al (1971). Proline content was determined according to the modified method of Bates
et al (1973). Total soluble protein contents were determined according to the method of
Bradford (1976) using the Bio-Rad assay kit with bovine serum albumin as a calibration
standard. The level of lipid peroxidation products was determined and expressed as
MDA content according to Luts et al (1996). Hydrogen peroxide in the plant samples
was determined by the method of Velikova et al(2000).Soluble sugars were determined
according to Pearson (1976) and the total carbohydrate was determined by anthrone
method following by Hedge and Hofreiter (1962).
2.4. Determination of Antioxidant
The dry leaves (500 mg) were grinded in powder using nitrogen liquid. The powder was
homogenized in 5 mL phosphate potassium (pH 7.6 with 0.1 mM of EDTA). The
homogenate were centrifuged to 15.000 x g for 20 min at 4°C. The supernatant were
kept, and 0.8 ml phosphate potassium 0.2 M was added. The homogenate were
centrifuged again to 15.000 x g during 15 min. The combined supernatants were stored
on ice and used in order to determine the activity of detoxifying enzymes. The activity
of SOD was assayed by measuring its ability to inhibit the photochemical reduction of
NBT, adopting the method of Çakmak (2002). The activity of CAT was determined by
Bergmeyer (1974), APX was assayed following the procedure described by Nakano and
Asada (1981). APX and CAT were expressed per mg protein, and one unit represented
1 μmol of substrate undergoing reaction per mg protein per min.
2.5. Statistical Analysis
Symposium Proceedings – Book of Full Papers 122
ECOLOGY 2017 11-13 May, Kayseri TURKEY
Each result shown in tables was the mean of at least three replicated treatments. The
significance of differences between treatments was statistically evaluated by ANOVA.
3. Results
3.1. Quantity of chemical compound in leaf samples
The amount of photosynthetic pigments (chlorophyll a, b, total, and carotenoids mg/g)
in leaf samples for black pine trees of different age groups are given in Table
1. Statistically, the amount of photosynthetic pigment in leaf samples varied
significantly between age classes (p <0.05).The black pine tree over the age of 50 had
the highest values of chlorophyll a (29.8%), chlorophyll b (47.8%), total chlorophyll
(47.64%) and carotenoid (48.21%) while the black pine tree over the age of 500 had the
lowest values. In addition, pigment amounts were found to be high in the tree over the
age of 25 following the tree over the age of 500. Trees over the age of 200 and 100 had
the lowest values in terms of pigment amount (Table 1).
The amount of proline is highest in the walnut tree over the age of 500 and lowest in the
tree over the age of 200 (p <0.05). The amount of proline did not have a statistically
significant change in the other trees (Table 2). The total amount of soluble protein
tended to increase with increasing age. 28.34 mg/g protein was found in the tree over
the age of 500 while 11.5 mg/g protein was found in the tree over the age of 25 (p
<0.05, Table 2).The level of lipid peroxidation in cells is measured by the amount of
malondialdehyde. The amount of MDA in the trees was found to be high in the trees
over the age of 50 (44 μmol) and 100 (39.95 μmol) while it was found to be low in the
trees over the age of 25 (25.97 μmol) and 200 (29.32 μmol). The amount of Hydrogen
peroxide (H2O2) was found to be high in the trees over the age of 500 (150.2 μmol)
Symposium Proceedings – Book of Full Papers 123
ECOLOGY 2017 11-13 May, Kayseri TURKEY
andlowest in the trees over the age of 200 (100.47 μmol) and 25 (123.4 ol) (P <0.05,
Table 2).
Glucose is the lowest in trees over the age of 500 among black pine trees while sucrose
is lowest in trees over the age of 25 and soluble carbohydrates is lowest in trees over
the age of 200. On the contrary, glucose is highest in trees over the age of 200 while,
sucrose and soluble carbohydrates are highest in trees over the age of 500 (p <0.05,
Table 3).
Enzyme activities showed significant differences among the trees (p <0.05). Ascorbate
peroxidase (APx) activity is highest in trees over the age of 500;Catalase (CAT) activity
is highest in trees over the age of 500 and 200 while superoxide dismutase activity
(SOD) is highest in trees over the age of 500 and 50 (p <0.05, Table 4). APx and SOD
were found to be lowest in trees over the age of 25 and CAT was found to be lowest in
trees over the age of 50 (Table 4).
4. Discussion
Age-related growth and development physiology of black pine which is one of the most
important forest trees were researched in this study on the basis of photosynthetic
pigments, proline, total soluble protein, lipid peroxidation level, hydrogen peroxide
concentration, sugar (glucose, sucrose and total soluble carbohydrate) and antioxidant
enzyme activities.
Chlorophyll a, chlorophyll b and total chlorophyll are the most important compounds
that absorb light at different wavelengths and affect the speed and efficiency of
photosynthetic activity. On the other hand carotenoids play a role in the absorption of
light, as well as the protection of chlorophyll molecules and inactivation of lipid
peroxidation products (Smirnoff, 2005;Keyvan, 2010). Pigment quantities in trees
Symposium Proceedings – Book of Full Papers 124
ECOLOGY 2017 11-13 May, Kayseri TURKEY
exhibit age-dependent differences. Chlorophyll a, b, total chlorophyll and carotenoid
amount were highest in trees over the age of 50 and 25 and lowest in trees over the age
of 500 (Table 1). In general, the amount of pigment decreased as the age increased. The
findings overlap with the results of the works done in this area. Bauer and Bauer (1980),
Bond, (2000), Carbone et al., (2013) found that the amount of photosynthetic pigment
varies depending on the characteristics such as species, plant age/length, leaf age,
position of the leaf on the plant and environmental factors and additionally pigment
content is high in the young trees. The researchers have reported that studies done with
different plant species have verified that increase in tree size and volume affects
photosynthesis and C distribution as well as ecological processes such as mortality and
sexual activity (Hutchinson et al., 1995; Mencuccini et al., 2005). In some trees with a
maximum length of 120-130 m, water transmission can be measured by the application
of physical pressures (Koch et al., 2004). However, some trees reach only 20-50 m. This
leads to the assumption that volume as well as the length has effect on growth (Ryan
and Waring, 1992; Ryan et al., 1997).
Proline,free amino acids and total soluble protein are used as nitrogen, carbon and
energy sources in regulating growth and development in plants as well as playing a role
as precursors of secondary metabolites such as wall proteins, lignin, terpenoids,
pigments, phenols, flavonoids as well as some hormones(Harborne,1980; Battaglia ve
ark., 2007). In addition, they increase the tolerance of plants against changes in
environmental conditions such as drought, light stress; mineral deficiency/excess
(Weibull et al., 1990; Verslues and Sharp, 1999, Millard and Grelet, 2010).The content
of proline and total soluble protein in black pine trees of different age classes is low in
young trees and high in old trees.The amount of proline is lowest in trees over the age
Symposium Proceedings – Book of Full Papers 125
ECOLOGY 2017 11-13 May, Kayseri TURKEY
of 200 while the amount of protein is lowest in trees over the age of 25 and highest in
trees over the age of 500 (Table 2). Proline and protein results are inconsistent with the
literature data. Because,the many researchers have stated that the amount of nitrogenous
compounds in young tissues and organs is high than that of mature and aged ones
(Bond, 2000; Gruis et al., 2004).Gastal and Nelson (1994), Cosgrove (1997) have
reported that proteins and amino acids present in cells and tissues of active growth
constitute 16% of the total amount of N. The low amount of proline and protein in
young trees is attributed to the high metabolic activity in these trees. Because growth
and development in these trees is rapid, nitrogen compounds may also be used in
enzyme synthesis as well as carbon, nitrogen and energy sources, and also as a
precursor to nitrogen compounds incorporated into the wall structure (Bradley et al.,
1992; Cho and Kende, 1997). Sure enough, the amounts of protein, proline and
antioxidant enzymes are high in elderly black pine trees. Furthermore, because of the
high volume, height and diameter ratio in elderly trees, more water consumption and
metabolite transport may also be in question (Donovan and Fhleringer, 1992; Dawson,
1996; Bruhn et al., 2000). Sure enough, researchers have reported that proline and
soluble proteins are functional in maintaining the osmotic potential in plants (Millard
and Grelet, 2010; Zheng et al., 2014).
The level of lipid peroxidation, known as oxidative stress-linked phospholipid
degradation, is determined through the amount of malondialdehyde. High levels of
MDA accumulation in cells indicate excessive lipid peroxidation. MDA suppresses
growth and development in plants with damages such as cellular membrane integrity,
DNA, RNA and protein degradation, as well as increased toxic ROS production (Lutts
et al., 1996; Sofo et al., 2004). Low concentration of H2O2 is aROS derivative signaling
Symposium Proceedings – Book of Full Papers 126
ECOLOGY 2017 11-13 May, Kayseri TURKEY
molecule involved in the regulation of reactions working in growth and development
such as the cells differentiating and turning into new tissues, stem/body coordination
and maintenance of stomata activities and accumulations of lignin and suberin in
walls.However, high concentrations are toxic and suppress growth as well as
development (Zhao et al., 1994; Mulisch and Krupinska, 2013). Lipid peroxidation level
is low in trees over the age of 25 and 200 and high in trees in trees over the age of 500,
100 and 50 (Table 2). H2O2 concentration is highin trees over the age of 500, 50 and
100 and low in trees over the age of 25 and 200(Table 2). A relationship was found
between M and H2O2.in the study. Sure enough MDA and H2O2 amount is low in trees
over the age of 25 and 200 while MDA and H2O2 amount is high in trees over the age of
50, 100 and 500. These results confirm that lipid peroxidation stimulates the
accumulation of toxic radicals in the cells (Demiral and Türkan, 2005; Cruz et al.,
2013). Furthermore,trunk diameter growth and new tissue formation may also have
caused an increase in the amount of H2O2 in trees over the age of 50 and 100(Passardi
et al., 2004; Gechev and Hille, 2005). And it has also been concluded that there may be
the effect of senescence events due to aging the H2O2 amount’s reaching the highest
value in trees over the age of 500 (Leopold, 1975; Buchanan-Wollaston et al.,
2003).Simple sugars like glucose, fructose and sucrose, and total soluble carbohydrates
play a significant role in the growth and development of plants as being included in the
structure, carbon, and energy source(Rolland et al., 2002; Hammond and White,
2008).These compounds are particularly involved in physiological processes such as
transport of sucrose and assimilate maintenance of respiratory and osmotic balance,
preservation of cellular membranes, structure of DNA and proteins, and also the
Symposium Proceedings – Book of Full Papers 127
ECOLOGY 2017 11-13 May, Kayseri TURKEY
enhancement of plant resistance to abiotic stress factors (Huber and Huber,
1996;Karkonen and Koutaniemi, 2010).
Glucose is high in trees over the age of 200 while the amount of sucrose and total
soluble carbohydrates are high in trees over the age of 500. Glucose is lowest in trees
over the age of 500 while the amount of sucrose is lowest in trees over the age of 25
andtotal soluble carbohydrates arelow in trees over the age of 500 (Table 3). Glucose’s
being lowest in trees over the age of 500 are linked to the low level of photosynthetic
activity, while high sucrose is linked to slowing of photoassimilate distribution (Allard
and Nelson, 1991; Carbone et al., 2013). Sure enough, the lowest amount of pigment
and glucose in this tree strengthens this result. Therelationbetween total soluble
carbohydrate amount and tree classes could not be detected.
Aging which accelerates during the growth and development process with maturation in
the entire plant or in different organs causes increase in amount of toxic radicals in
biotic and abiotic stress factors (ROS) and at the cell and tissue level (McKersie and
Leshem, 1994).
Antioxidant enzymes, such as ascorbate peroxidase (APX), glutathione reductase (GR),
peptidase (GuPX, POD), catalase (CAT) and superoxide dismutase (SOD) increase
cellular resistance by stimulating theactive defense of the plant against ROS, lipid
peroxidation and adverse effects of environmental factors (Tarasashvili et al., 1982;
Ostrovskaya et al., 1990; Caverzan et al., 2012).APX, CAT and SOD activities in trees
are high in old trees and low in young trees. Especially in trees over the age of 500, all
three enzyme activities are at the highest value, while in trees over the age of 25 they
are very low. Furthremore CAT activity has decreased in proportion to age (Table
4). There are not many studies on enzyme activity changes depending on tree age in the
Symposium Proceedings – Book of Full Papers 128
ECOLOGY 2017 11-13 May, Kayseri TURKEY
literature. However, many investigators report that APX, CAT, GuPX and SOD
enzymes play a role in required metabolisms in growth and development of plant and
that these enzymes work in increasing tolerance to abiotic and biotic stress conditions
(Reuveni, 1998;Gruis et al., 2004). Sure enough Cevahir et al., (2004) have reported
that peroxidase activity of young seedlings of Gazaniasplendens plant is high compared
to mature and the elderly individuals while Jackson and Ricardo, (1994) have reported
that peroxidases are synthesized more in mature individuals due to their role in lignin
biosynthesis and Huang et al., (2003)have reported that peroxidase activity is used as a
marker in differentiating the juvenile/maturity phase of plants and Fry (1996) has
reported that ascorbate peroxidase plays an important role in the accumulation of wall
polysaccharides.
Acknowledgement
This paper, which was carried out and prepared outside the scope of the project, was
conductedby utilizing the projects of KÜBAP-01/2013-17 and KÜBAP-01/2014-21.
References
Allard G, Nelson C (1991). Photosynthate partitioning in basal zones of tall fescue leaf
blades. Plant Physiol 663-668.
Bates LS, Waldern RP, Teare ID (1973). Rapid determination of free proline for water-
stress studies. Plant and Soil 39: 205-207.
Battaglia M, Olvera-Carrillo Y, Garciarrubio A, Campos F, Covarrubias AA (2008).The
enigmatic LEA proteins and other hydrophilins. Plant Physiology148:6-24. ISSN
00320889.
Bauer H, Bauer U (1980). Photosynthesis in leaves of the juvenile and adult phase of
ivy (Hedera helix). Physiol Plant49: 366-372.
Symposium Proceedings – Book of Full Papers 129
ECOLOGY 2017 11-13 May, Kayseri TURKEY
Bergmeyer HU (1970). Methoden der Enzymatischen Analyse, Akademie Verlag, 1:
636-562.
Bond BJ (2000). Age-related changes in photosynthesis of woody plants. Trends Plant
Sci 5:349-353.
Bradford M (1976). A Rapid and Sensitive Method for the Quantitation of Microgram
Quantities of Protein Utilizing the Principle of Protein-Dye Binding. Anal Biochem
72:248-254.
Bradley D, Kjellbom P, Lamb CJ (1992). Elicitor-induced and wound induced
oxidative cross-linking of a proline rich plant cell wall protein: a novel,rapid defense
response. Cell70:21-30.
Buchanan-Wollaston V, Harrison ES, Mathas E., Navabpour S, Page T, Pink D (2003).
The Molecular Analysis of Leaf Senescence- A Genomics Approach. Plant Biotech J 1:
3-22.
Cakmak I, Horst WJ (1991). Effect of Aluminium on lipid peroxidation, Superoxide
dismutase, Catalase and Peroxidase activities in root tips of Soybean (Glycine max).
Physiol Plant 83: 463-468.
Carbone MS, Czimczik C, Keenan TF, Murakami PF, Pederson N, Schaberg PG, Xu
X, Richardson AD (2013). Age, allocation and availability of nonstructural carbon in
mature red maple trees. New Phytologist 200: 1145-1155.
Carus S (1995). Aynı Yaşlı Doğu Kayını (Fagus orientalis Lispky.) Meşcerelerinde Çap
Artımının Meşcere Yağış ve Göğüs Yüzeyine Göre Değişimi. İ.Ü. Orman Fak. Der.,
Seri B, Cilt 45, Sayı 3-4, 95-109 s.
Symposium Proceedings – Book of Full Papers 130
ECOLOGY 2017 11-13 May, Kayseri TURKEY
Caverzan A, Passaia G, Rosa SB, Ribeiro CW, Lazzarotto F, Margis-Pinheiro M,
(2012). Plant responses to stresses: Role of ascorbate peroxidase in the antioxidant
protection. Genet Mol Biol 35: 1011-1019.
Cevahir G, Yentur S, Yazgan M, Unal M, Yilmazer N (2004). Peroxidase activity in
relation to anthocyanin and chlorophyll content in juvenile and adult leaves of “mini-
stra” Gazania splendens. Pak J Bot. 36(3): 603-609.
Cho HT, Kende H (1997). Expansins and internodal growth of deepwater rice. Plant
Physiol 113: 1145-1151.
Cosgrove DJ (1997). Relaxation in a high-stress environment: the molecular bases of
extensible cell walls and cell enlargement. Plant Cell 9: 1031-1041.
Cruz FJR., Castro GLS, Silva Júnior DD, Festucci-Buselli RA, Pinheiro HA (2013).
Exogenous glycine betaine modulates ascorbate peroxidase and catalase activities and
prevent lipid peroxidation in mild water-stressed Carapa guianensis plants.
Photosynthetica 51:102-108.
Dawson TE (1996). Determining water use by trees and forests from isotopic, energy
balance and transpiration analysis: the roles of tree size and hydraulic lift.Tree
Physiol16: 263-272.
Demiral T, Türkan I (2005). Comparative lipid peroxidation, antioxidant defense
systems and proline content in roots of two rice cultivars differing in salt tolerance.
Environ Exp Bot 53: 247-257.
Donovan LA, Ehleringer, JR (1992).Contrasting water-use patterns among size and life-
history classes of a semi-arid shrub. Funct Eco 6: 482-488.
Fry SC(1986). Cross-linking of matrix polymers in the growing cell walls of
angiosperms. Annu Rev Plant Physiol 37:65-86.
Symposium Proceedings – Book of Full Papers 131
ECOLOGY 2017 11-13 May, Kayseri TURKEY
Gastal F, Nelson CJ (1994). Nitrogen use within the growing leaf blade of tall fescue.
Plant Physiol 105:191-197.
Gechev TS, Hille J (2005). Hydrogen peroxide as a signal controlling plant
programmed cell death. J. Cell Biol 168: 17-20.
Gower ST, McMurtrie RE, Murty D (1996). Abovegound net primary production
decline with stand age: potential causes. Trends Ecol Evol 11:378-382.
Gruis D, Schulze J, Jung R (2004). Storage Protein Accumulation in the Absence of the
Vacuolar Processing Enzyme Family of Cysteine Proteases. Plant Cell 16:270-290.
Hammond JP, White PJ (2008). Sucrose transport in the phloem. Integrating root
responses to phosphorus starvation. Journal Experimintal Botany 59: 109-113.
Harborne JB (1980). Plant Phenolics. Secondary Pl ant Products, Ed. by E. A. Bell and
B. V. Charlwood Springer.Verlag Berlin Heidelberg, New.York, USA.
Harborne JB (1980). Plant Phenolics. Secondary Pl ant Products, Ed. by E. A. Bell and
B. V. Charlwood Springer.Verlag Berlin Heidelberg, New.York, USA.
Hedge JE, Hofreiter BT (1962). Chemistry. 17 (Eds. Whistler, R.L. and Be Miller, J.N.),
Academic Press, NewYork.
Huang, L.C., J.H. Weng, C.H. Wang, C.I. Kuo and Y.J. Shieh. 2003. Photosynthetic
potentials of in vitro grown juvenile, adult, and rejuvenated Sequoia sempervirens (D.
Don) Endl., shoots. Bot Bull Acad Sin 44: 31-35.
Huber SC, Huber JL (1996). Role and regulation of sucrose-phosphate synthase in
higher plants. Annu Rev Plant Physiol Platn Mol Biol 47: 431-444.
Hutchinson KW, Sherman CD, Weber J, Smith SS, Singer PB, Greenwood MS (1995).
Juvenility and maturation in conifers: current concepts. Tree Physioogy 15: 433-
438.Titus Fondo Ambebe and Qing-Lai Dang 10.
Symposium Proceedings – Book of Full Papers 132
ECOLOGY 2017 11-13 May, Kayseri TURKEY
Keyvan S (2010). The effects of drought stress on yield, relative water content, proline,
soluble carbohydrates and chlorophyll of bread wheat cultivars. Journal of Animal and
Plant Sciences 8(3): 1051-1060.
Koch GW, Sillett SC, Jennings GM, Davis SD (2004). The limits of tree height. Nature
428:851-854.
Köstner B, Falge E, Tenhunen JD (2002). Age-related effects on leaf area/sapwood area
relationships, canopy transpiration and carbon gain of Norway spruce stands (Picea
abies) in the Fichtelgebirge, Germany. Tree Physiol 22:567-574.
Leopold AC (1975). Aging, senescence and turnover in plants. BioScience 25: 659-662.
Lutts S, Kınet JM, Bouharmont J (1996). NaCl-Induced Senescence in Leaves of Rice
(Oryza sativa L.) Cultivars Differing in Salinity Res istance. Annals of Botany 78: 389-
398.
McKersie BD, Leshem YY (1994). Stress and stress coping in cultivated plants. Kluwer
Academic Publishers, Nederland. 256 p.
Mencuccini M, Martinez-Vilalta J, Hamid HA, Korakaki E, Vanderklein D, Lee S, and
Michiels B (2005). Size, not cellular senescence, explains reduced vigor in tall trees.
Ecological Letters8: 1183-1190.
Millard P, Grelet GA (2010). Nitrogen storage and remobilization by trees:
ecophysiological relevance in a changing world. Tree Physiology. 30: 1083-1095.
Mulisch M, Krupinska K (2013). Ultrastructural analyses of senescence associated
dismantling of chloroplasts revisited. In Plastid Development In Leaves During Growth
and Senescence(pp. 307-335). Springer Netherlands
Nakano Y, Asada K (1981). Hydrogen Peroxide is Scavenged by Ascorbate-specific
Peroxidase in Spinach Chloroplasts. Plant Cell Physiology 22: 867-880.
Symposium Proceedings – Book of Full Papers 133
ECOLOGY 2017 11-13 May, Kayseri TURKEY
Ostrovskaya LK, Truch VV, Mikhailik OM (1990). Superoxide dismutase activation in
response to lime-induced chlorosis. New Phytologist 114: 39-45.
Passardi F, Penel C, Dunand C (2004). Performing the paradoxical: How plant
peroxidases modify the cell wall. Trends Plant Sci 9: 534-540.
Pearson D, Melon HK, Ronald S (1976). Chemical analysis of Food,8th edition.
Churchill Livingstone. Pp 5-63.
Reuveni M (1998). Relationships between leaf age, peroxidase and /beta/-1,3-glucanase
activity and resistance to downy mildew in grapevine. Journal of Phytopathology 146
(10): 525-530.
Rolland F, Moore B, Sheen J (2002). Sugar Sensing and Signaling in Plants. Plant Cell,
14, S185-S205.
Ryan MG, Binkley D, Fownes JH (1997). Age-related decline in forest productivity:
pattern and process. Advances in Ecological Research27: 213-262.
Ryan MG, Waring RH (1992). Maintenance respiration and stand development in a
subalpine lodgepole pine forest. Ecology73: 2100-2108.
Sariyildiz T, Anderson JM (2005). Variation in the chemical composition of green
leaves and leaf litters from three deciduous tree species growing on different soil types.
Forest Ecology and Managemen 210 (1-3): 303-319.
Sariyildiz T, Anderson JM (2006). Intra-specific variation in cell Wall constituents of
needle age classes of Pinus sylvestris in relation to soil fertility status in Southwest
England. Silva Fennica40(1): 15-26.
Smirnoff N (2005). Ascorbate, Tocopherol and Carotenoids: Metabolism, Pathway
Engineering and Functions. In: Smirnoff N., Ed. AntioXidants and Reactive Oxygen
Species in Plants. Oxford: Blackwell Publishing Ltd., p:53-86.
Symposium Proceedings – Book of Full Papers 134
ECOLOGY 2017 11-13 May, Kayseri TURKEY
Sofo A, Xiloyannis BC, Masia AE (2004). Effects of different irradiance levels on some
antioxidant enzymes and on malondialdehyde content during rewatering in olive tree.
Plant Sci 166: 293-302.
Tarasashvili KM, Gvamichava NE, Kezeli TA, Beridze AG (1982). Significance of the
ascorbic acid glutathione system in the frost resistance of grapevine. Viticulture and
Enology Abstracts 21 (1) C.
Velikova V, Yordanov I, Edreva A (2000). Oxidative stress and some antioxidant
systems in acid rain-treated bean plants: protective roles of exogenous polyamines.
Plant Sci151:59-66.
Verslues PE, Sharp RE (1999). Proline accumulation in maize (Zea mays L.) primary
roots at low water potentials. 11. Metabolic source of increased proline deposition in the
elongation zone. Plant Physiol 119:1349-1360.
Verslues PE, Sharp RE (1999). Proline accumulation in maize (Zea mays L.) primary
roots at low water potentials. II. Metabolic source of increased proline deposition in the
elongation zone. Plant Physiol. 119: 1349-1360. doi: 10.1104/pp.119.4.1349.
Weibull J, Ronquist F, Brishammar S (1990). Free amino acid composition of leaf
exudates and phloem sap: a comparative study in oats and barley. Plant Physiol 92:222-
226.
Witham FH, Blaydes DF, Devli RM (1971). Experiments in plant physiology. pp 55-56.
Van Nostrand Reinhold Company, New York.
Wong SC, Cowan IR, Farquhar GD (1985). Leaf conductance in relation to rate of CO2
assimilation. III. Influences of water stress and photoinhibition. Plant Physiol 78:830-
834.
Symposium Proceedings – Book of Full Papers 135
ECOLOGY 2017 11-13 May, Kayseri TURKEY
Yang KC (1994). Impact of Spacing on Width and Basal Area of Juvenile Mature Wood
in Picea mariana and Picea glauca, Wood Fiber Sci 26(4): 479-488.
Zhao SJ, Xu CC, Zhou Q, Meng QW (1994). Improvementsof method for measurement
of malondialdehyde in plant tissue. Plant Physiol Commun 30: 207–210.
Zheng M, Meng Y, Yang C, Zhou Z, Wang Y, Chen B (2014). Protein expression
changes during cotton fiber elongation in response to drought stress and recovery.
Proteomics 14: 1776-1795.
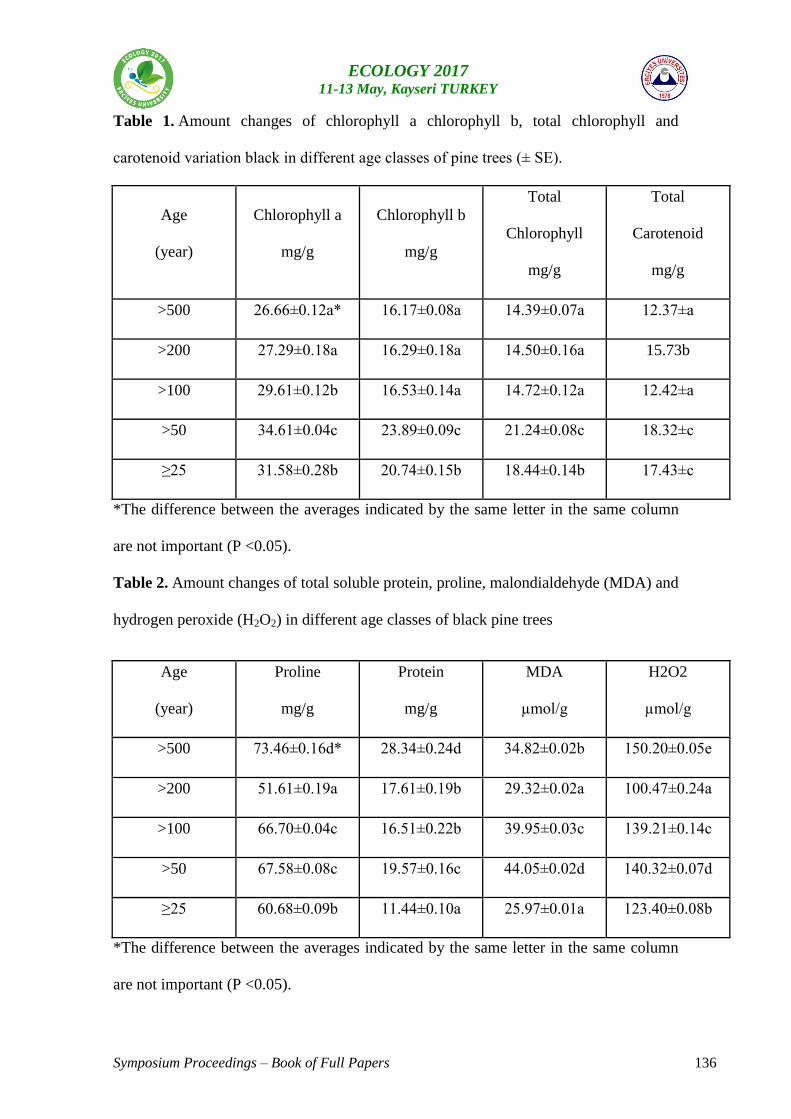
Symposium Proceedings – Book of Full Papers 136
ECOLOGY 2017 11-13 May, Kayseri TURKEY
Table 1. Amount changes of chlorophyll a chlorophyll b, total chlorophyll and
carotenoid variation black in different age classes of pine trees (± SE).
Age
(year)
Chlorophyll a
mg/g
Chlorophyll b
mg/g
Total
Chlorophyll
mg/g
Total
Carotenoid
mg/g
>500 26.66±0.12a* 16.17±0.08a 14.39±0.07a 12.37±a
>200 27.29±0.18a 16.29±0.18a 14.50±0.16a 15.73b
>100 29.61±0.12b 16.53±0.14a 14.72±0.12a 12.42±a
>50 34.61±0.04c 23.89±0.09c 21.24±0.08c 18.32±c
≥25 31.58±0.28b 20.74±0.15b 18.44±0.14b 17.43±c
*The difference between the averages indicated by the same letter in the same column
are not important (P <0.05).
Table 2. Amount changes of total soluble protein, proline, malondialdehyde (MDA) and
hydrogen peroxide (H2O2) in different age classes of black pine trees
Age
(year)
Proline
mg/g
Protein
mg/g
MDA
µmol/g
H2O2
µmol/g
>500 73.46±0.16d* 28.34±0.24d 34.82±0.02b 150.20±0.05e
>200 51.61±0.19a 17.61±0.19b 29.32±0.02a 100.47±0.24a
>100 66.70±0.04c 16.51±0.22b 39.95±0.03c 139.21±0.14c
>50 67.58±0.08c 19.57±0.16c 44.05±0.02d 140.32±0.07d
≥25 60.68±0.09b 11.44±0.10a 25.97±0.01a 123.40±0.08b
*The difference between the averages indicated by the same letter in the same column
are not important (P <0.05).
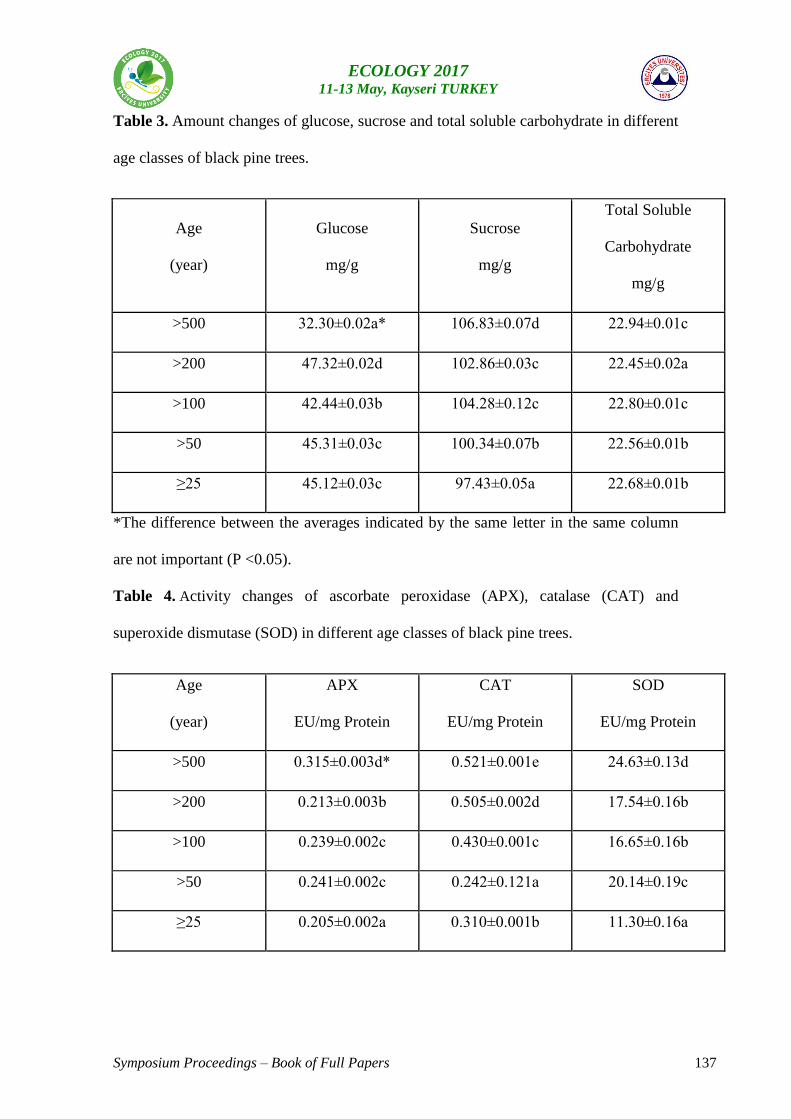
Symposium Proceedings – Book of Full Papers 137
ECOLOGY 2017 11-13 May, Kayseri TURKEY
Table 3. Amount changes of glucose, sucrose and total soluble carbohydrate in different
age classes of black pine trees.
Age
(year)
Glucose
mg/g
Sucrose
mg/g
Total Soluble
Carbohydrate
mg/g
>500 32.30±0.02a* 106.83±0.07d 22.94±0.01c
>200 47.32±0.02d 102.86±0.03c 22.45±0.02a
>100 42.44±0.03b 104.28±0.12c 22.80±0.01c
>50 45.31±0.03c 100.34±0.07b 22.56±0.01b
≥25 45.12±0.03c 97.43±0.05a 22.68±0.01b
*The difference between the averages indicated by the same letter in the same column
are not important (P <0.05).
Table 4. Activity changes of ascorbate peroxidase (APX), catalase (CAT) and
superoxide dismutase (SOD) in different age classes of black pine trees.
Age
(year)
APX
EU/mg Protein
CAT
EU/mg Protein
SOD
EU/mg Protein
>500 0.315±0.003d* 0.521±0.001e 24.63±0.13d
>200 0.213±0.003b 0.505±0.002d 17.54±0.16b
>100 0.239±0.002c 0.430±0.001c 16.65±0.16b
>50 0.241±0.002c 0.242±0.121a 20.14±0.19c
≥25 0.205±0.002a 0.310±0.001b 11.30±0.16a

Symposium Proceedings – Book of Full Papers 138
ECOLOGY 2017 11-13 May, Kayseri TURKEY
*The difference between the averages indicated by the same letter in the same column
are not important (P <0.05).
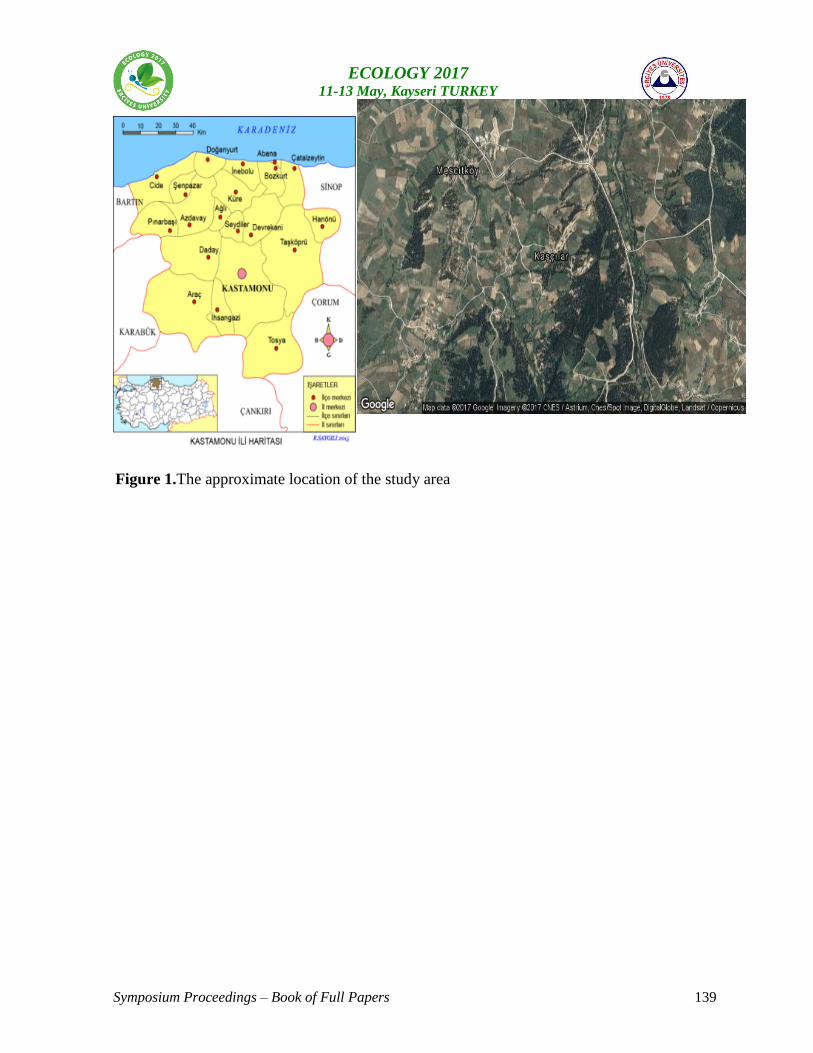
Symposium Proceedings – Book of Full Papers 139
ECOLOGY 2017 11-13 May, Kayseri TURKEY
Figure 1.The approximate location of the study area
Symposium Proceedings – Book of Full Papers 140
ECOLOGY 2017 11-13 May, Kayseri TURKEY
Eastern Black Sea Region in Terms of Urbanization and Environmental Problems:
Artvin Example
Kazım Onur DEMİRARSLAN1,*
, Serden BAŞAK2
1Artvin Çoruh University, Engineering Faculty, Environment Engineering Department, Artvin
2 Artvin Çoruh University, Faculty of Health Sciences, Occupational Health and Safety
Department, Artvin
*Corresponding Author: e-mail: [email protected]
Abstract: Artvin is in the eastern end of the Eastern Black Sea region. It constitutes 18.8% of
the region with a surface area of 7367 km2. In 2016, the population of Artvin Province is
166068, including all the counties. The most crowded settlement is the Central District with a
population of 26329. According to the information received from Artvin Provincial
Directorate of Environment and Urbanism, there are 4847 buildings and 13964 households in
the provincial centre in 2014. Depending on this and geographical conditions, the city has air,
water pollution and solid waste problems. The wastewater from the city centre is discharged to
the Çoruh River without treatment. The amount of wastewater generated in the centre is 0.1
m3/person.day. In total, 2633 m
3/day of wastewater is discharged to Çoruh River. Air pollution
is another important pollutant. In Artvin, where natural gas is not available, fossil fuels used
for warming in winter and traffic, are the main causes of air pollution. When the solid wastes
are examined, it is seen that the amount of waste collected daily in the Provincial Centre is 25-
28 tons. The collected garbage is disposed of as unregulated storage. In this study, increasing
environmental problems with urbanization in Artvin Provincial Centre discusses and proposes
the necessary solution methods.
Keywords: Artvin, urbanization, environmental problems.
1. Introduction
Symposium Proceedings – Book of Full Papers 141
ECOLOGY 2017 11-13 May, Kayseri TURKEY
Artvin is a city located at the eastern end of the Eastern Black Sea region between 40.35 and
41.32 northern latitudes and between 41.07 and 42.00 eastern longitudes with an area of 7367
km2 and it constitutes 18.8% of the region. The neighbours of the city are Ardahan in the east,
Rize in the west, Georgia Republic in the north, and Erzurum in the south. The Black Sea is
located in the north west of the city and the coastline length of the city is approximately 34
km. Although the population increased continuously between 1927 and 1980, it continued to
decrease after that. In 2016, the population of Artvin Province is 166068, including all the
counties. The most crowded settlement is the Central District with a population of 26329. This
figure is 34626 together with 36 villages connected to the centre. The industry sector is quite
low in this city. Enterprises operating in the industrial sector have a structure predominantly of
food, mineral and forest products, which are mainly oriented towards assessing the natural
resource potential of the province. The main feature of enterprises operating in the industry
sector is small and medium-sized enterprises. There is no organized industrial zone in Artvin.
However, small industrial sites (Center, Arhavi, Hopa, Borçka Districts) are available
(Demirarslan, 2016, URL-1).
Artvin province centre, which is a study area, consists of 7 districts. According to the
information obtained from Artvin Provincial Directorate of Environment and Urban Planning,
there are 4847 buildings and 13964 households in the province centre in 2014. Urbanization in
the city is different from other cities due to its topographic structure. The low level of flat land
causes the city centre to develop towards the hill. Artvin province centre is given in Figure 1.
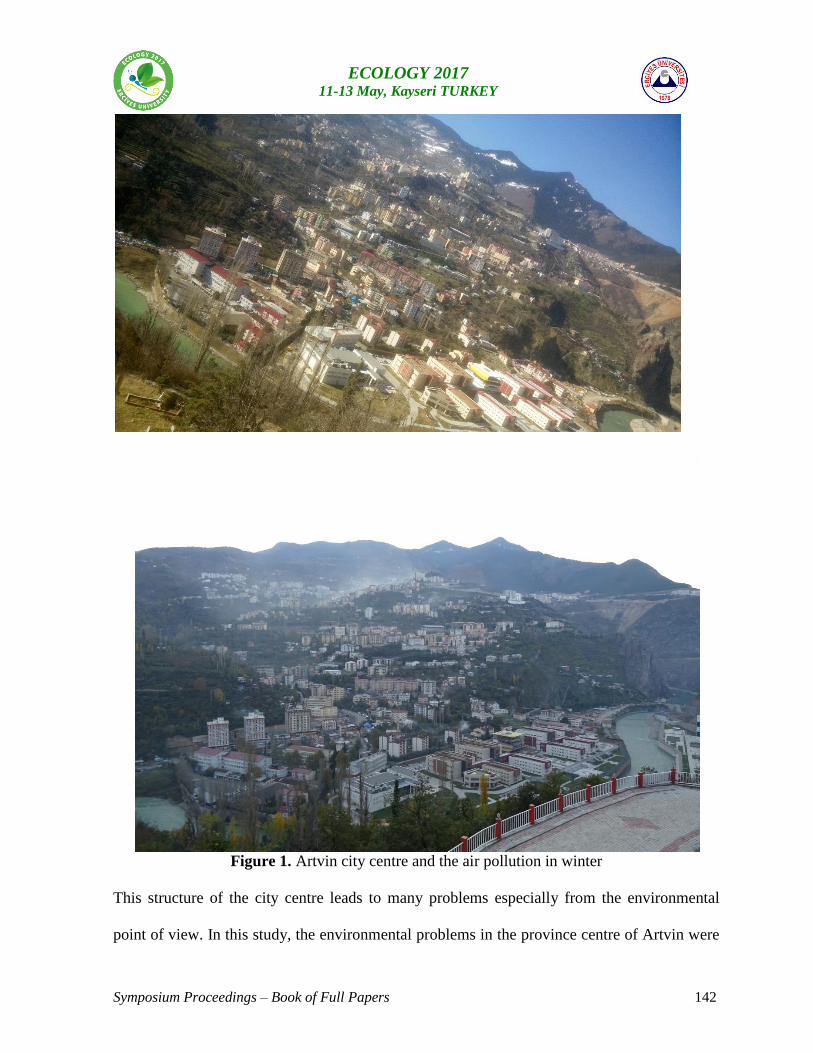
Symposium Proceedings – Book of Full Papers 142
ECOLOGY 2017 11-13 May, Kayseri TURKEY
Figure 1. Artvin city centre and the air pollution in winter
This structure of the city centre leads to many problems especially from the environmental
point of view. In this study, the environmental problems in the province centre of Artvin were
Symposium Proceedings – Book of Full Papers 143
ECOLOGY 2017 11-13 May, Kayseri TURKEY
discussed. Among these problems, water pollution emerges. When it is examined to air
pollution, it is a heavy pollution due to warming especially in winter months. Solid wastes
constitute a major problem, with nearly 25 tonnes of waste coming out daily and being
disposed of in an irregular manner.
Material and Method
In this study for the province of Artvin, the environmental problems in the province centre
were investigated. Data on pollution problems were obtained from the air quality monitoring
stations website of the Ministry of Environment and the institutions and organizations such as
Artvin Central Municipality, Provincial Environment and Urban Planning Directorate, Special
Provincial Administration and General Directorate of State Hydraulic Works (DSI in Turkish
acronym)
2. Results
The Çoruh River flows from Artvin province center with a flow rate of approximately 154 m3
/sec. The total length of the Çoruh River is 376 km and 354 km of the river is within the
borders of Turkey. The average annual flow rate is 5.9 billion m3 (Demirarslan and Yener,
2016). According to the information received from Artvin Municipality, a total of 1576800 m3
/year water was consumed in the province centre in 2015 and 12783 subscribers benefited
from this water. According to information received from the municipality, annual water
consumption is 1255200 m3 /year. Artvin province centre can only refer to domestic
wastewater as a source of wastewater. Moreover, Artvin Çoruh University City Campus and
Provincial Gendarmerie Command located in the Çayağızı neighborhood near the Çoruh River
can be considered as a source of domestic wastewater. There are totally 3430 students in the
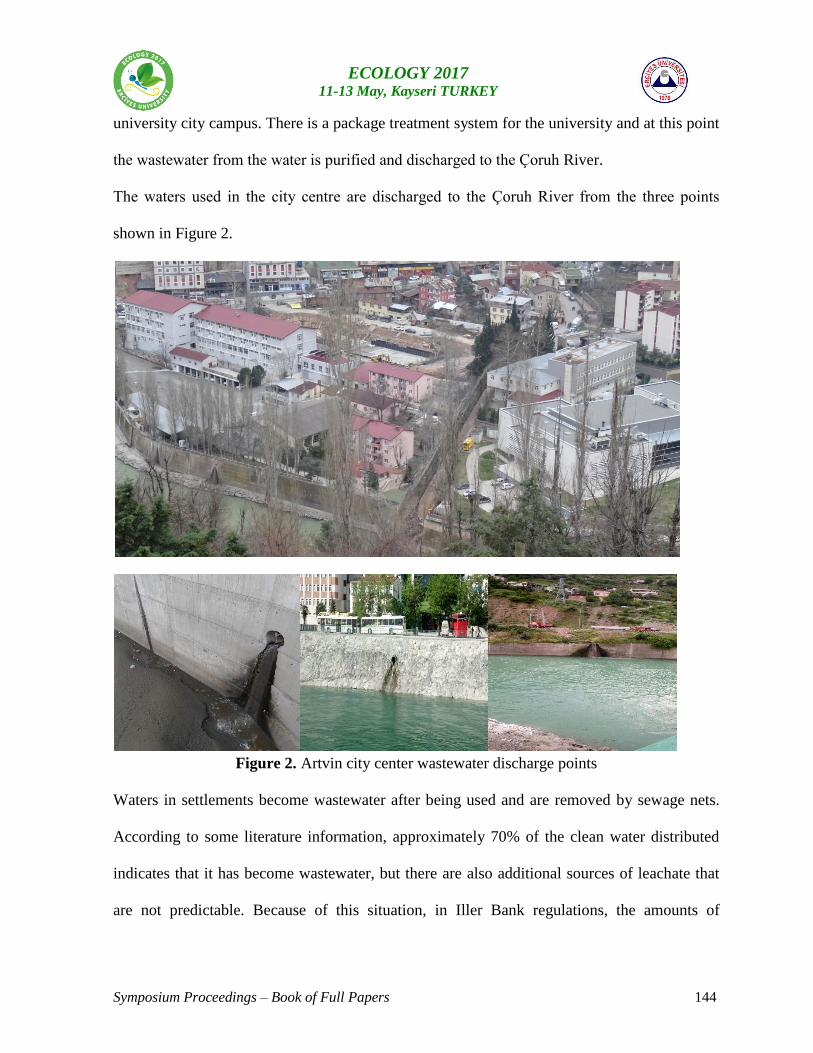
Symposium Proceedings – Book of Full Papers 144
ECOLOGY 2017 11-13 May, Kayseri TURKEY
university city campus. There is a package treatment system for the university and at this point
the wastewater from the water is purified and discharged to the Çoruh River.
The waters used in the city centre are discharged to the Çoruh River from the three points
shown in Figure 2.
Figure 2. Artvin city center wastewater discharge points
Waters in settlements become wastewater after being used and are removed by sewage nets.
According to some literature information, approximately 70% of the clean water distributed
indicates that it has become wastewater, but there are also additional sources of leachate that
are not predictable. Because of this situation, in Iller Bank regulations, the amounts of
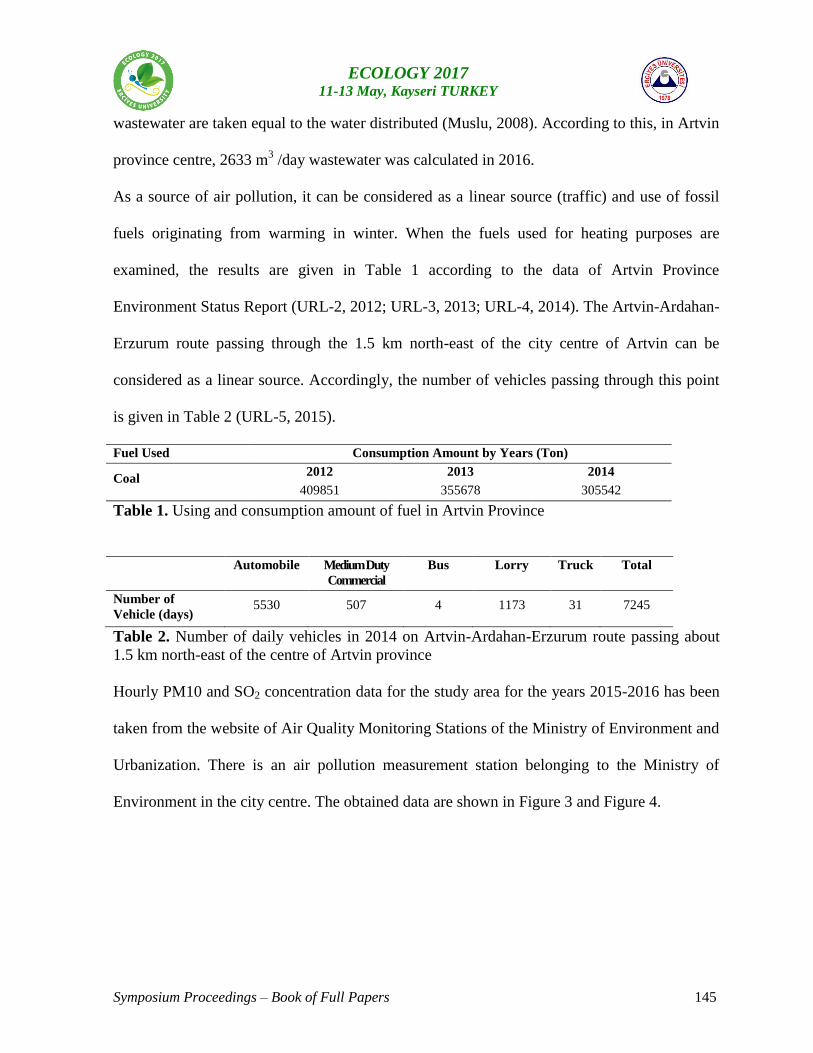
Symposium Proceedings – Book of Full Papers 145
ECOLOGY 2017 11-13 May, Kayseri TURKEY
wastewater are taken equal to the water distributed (Muslu, 2008). According to this, in Artvin
province centre, 2633 m3 /day wastewater was calculated in 2016.
As a source of air pollution, it can be considered as a linear source (traffic) and use of fossil
fuels originating from warming in winter. When the fuels used for heating purposes are
examined, the results are given in Table 1 according to the data of Artvin Province
Environment Status Report (URL-2, 2012; URL-3, 2013; URL-4, 2014). The Artvin-Ardahan-
Erzurum route passing through the 1.5 km north-east of the city centre of Artvin can be
considered as a linear source. Accordingly, the number of vehicles passing through this point
is given in Table 2 (URL-5, 2015).
Fuel Used Consumption Amount by Years (Ton)
Coal 2012 2013 2014
409851 355678 305542
Table 1. Using and consumption amount of fuel in Artvin Province
Automobile Medium Duty
Commercial
Vehicle
Bus Lorry Truck Total
Number of
Vehicle (days) 5530 507 4 1173 31 7245
Table 2. Number of daily vehicles in 2014 on Artvin-Ardahan-Erzurum route passing about
1.5 km north-east of the centre of Artvin province
Hourly PM10 and SO2 concentration data for the study area for the years 2015-2016 has been
taken from the website of Air Quality Monitoring Stations of the Ministry of Environment and
Urbanization. There is an air pollution measurement station belonging to the Ministry of
Environment in the city centre. The obtained data are shown in Figure 3 and Figure 4.
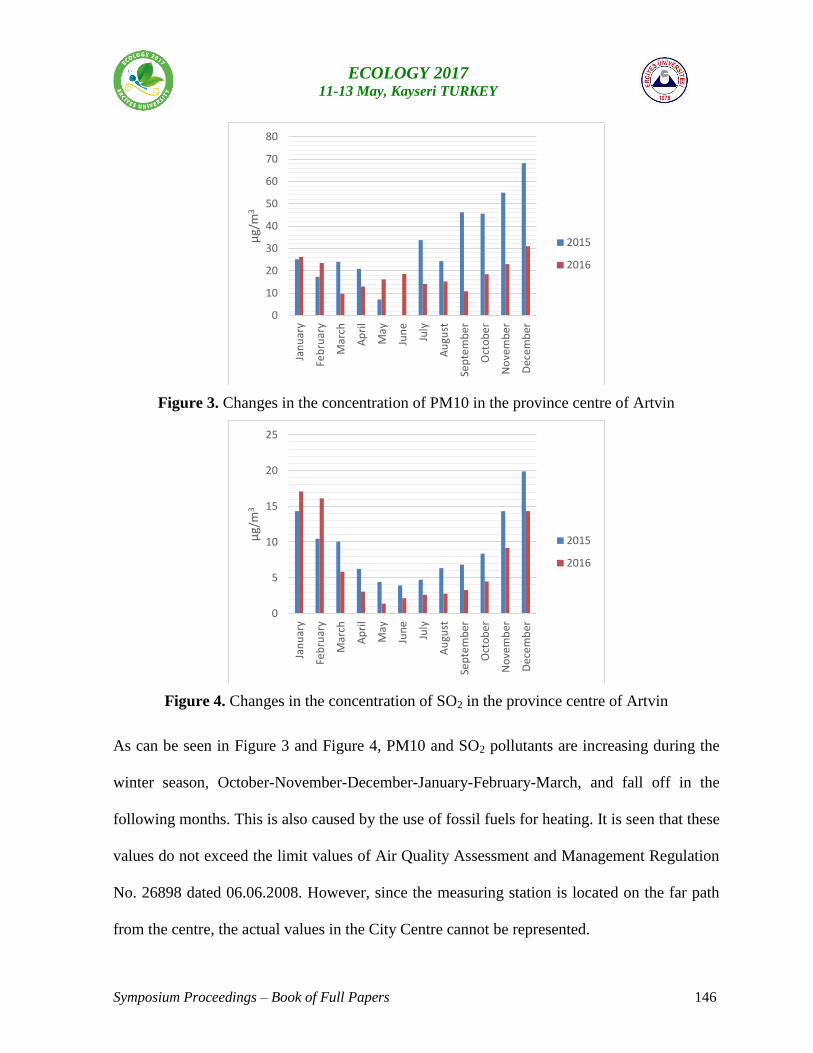
Symposium Proceedings – Book of Full Papers 146
ECOLOGY 2017 11-13 May, Kayseri TURKEY
Figure 3. Changes in the concentration of PM10 in the province centre of Artvin
Figure 4. Changes in the concentration of SO2 in the province centre of Artvin
As can be seen in Figure 3 and Figure 4, PM10 and SO2 pollutants are increasing during the
winter season, October-November-December-January-February-March, and fall off in the
following months. This is also caused by the use of fossil fuels for heating. It is seen that these
values do not exceed the limit values of Air Quality Assessment and Management Regulation
No. 26898 dated 06.06.2008. However, since the measuring station is located on the far path
from the centre, the actual values in the City Centre cannot be represented.
0
10
20
30
40
50
60
70
80
Jan
uar
y
Feb
ruar
y
Mar
ch
Ap
ril
May
Jun
e
July
Au
gust
Sep
tem
ber
Oct
ob
er
No
vem
ber
Dec
em
ber
µg/
m3
2015
2016
0
5
10
15
20
25
Jan
uar
y
Feb
ruar
y
Mar
ch
Ap
ril
May
Jun
e
July
Au
gust
Sep
tem
ber
Oct
ob
er
No
vem
ber
Dec
em
ber
µg/
m3
2015
2016
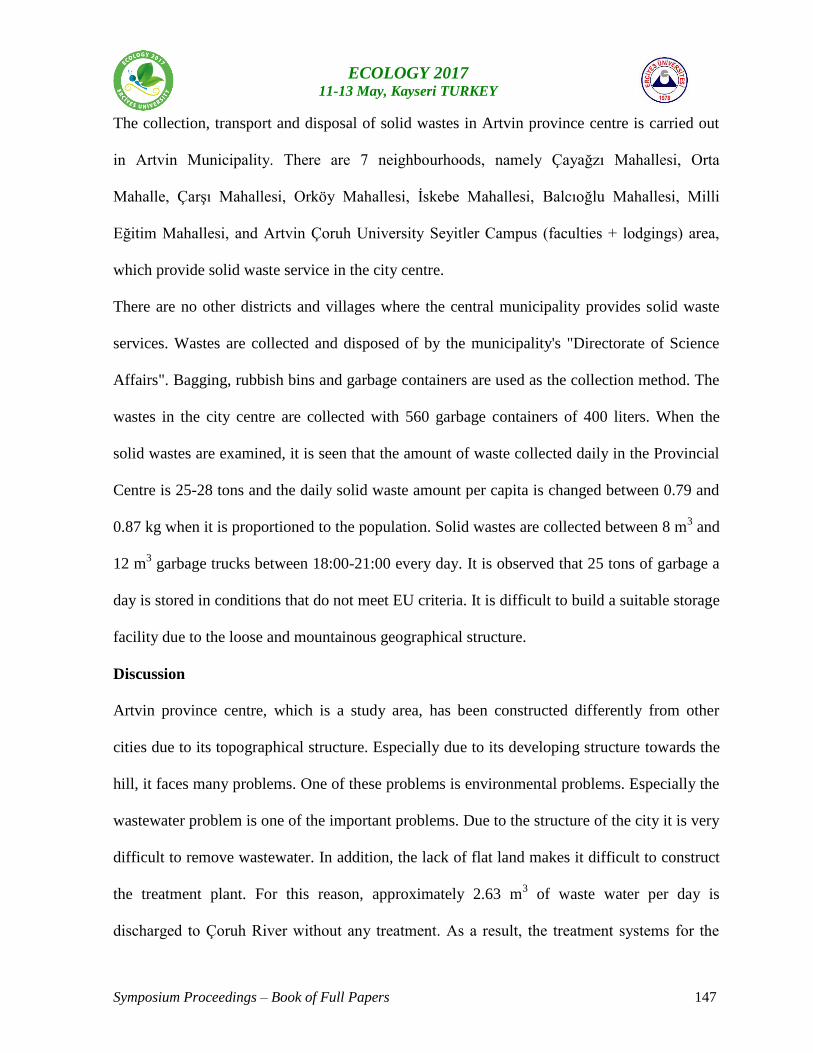
Symposium Proceedings – Book of Full Papers 147
ECOLOGY 2017 11-13 May, Kayseri TURKEY
The collection, transport and disposal of solid wastes in Artvin province centre is carried out
in Artvin Municipality. There are 7 neighbourhoods, namely Çayağzı Mahallesi, Orta
Mahalle, Çarşı Mahallesi, Orköy Mahallesi, İskebe Mahallesi, Balcıoğlu Mahallesi, Milli
Eğitim Mahallesi, and Artvin Çoruh University Seyitler Campus (faculties + lodgings) area,
which provide solid waste service in the city centre.
There are no other districts and villages where the central municipality provides solid waste
services. Wastes are collected and disposed of by the municipality's "Directorate of Science
Affairs". Bagging, rubbish bins and garbage containers are used as the collection method. The
wastes in the city centre are collected with 560 garbage containers of 400 liters. When the
solid wastes are examined, it is seen that the amount of waste collected daily in the Provincial
Centre is 25-28 tons and the daily solid waste amount per capita is changed between 0.79 and
0.87 kg when it is proportioned to the population. Solid wastes are collected between 8 m3 and
12 m3 garbage trucks between 18:00-21:00 every day. It is observed that 25 tons of garbage a
day is stored in conditions that do not meet EU criteria. It is difficult to build a suitable storage
facility due to the loose and mountainous geographical structure.
Discussion
Artvin province centre, which is a study area, has been constructed differently from other
cities due to its topographical structure. Especially due to its developing structure towards the
hill, it faces many problems. One of these problems is environmental problems. Especially the
wastewater problem is one of the important problems. Due to the structure of the city it is very
difficult to remove wastewater. In addition, the lack of flat land makes it difficult to construct
the treatment plant. For this reason, approximately 2.63 m3 of waste water per day is
discharged to Çoruh River without any treatment. As a result, the treatment systems for the
Symposium Proceedings – Book of Full Papers 148
ECOLOGY 2017 11-13 May, Kayseri TURKEY
work area must be passed on urgently. Another environmental problem in the city centre is air
pollution. Increasing fossil fuel consumption, especially for warming in the winter months, is
triggering this problem. Although this problem cannot be recorded due to the location of the
measurement station belonging to the Ministry of Environment, this problem can be noticed in
the Çarşı Mahallesi in winter months. Natural gas is not available and using of coal as fuel is
widespread in this city. The solution of the problem of natural gas is again very difficult for
topographical reasons. For this reason, it is necessary to pay attention to parameters such as
sulphur content, quality and thermal value of the coal coming to province centre. Another
problem in the study area is solid waste. Collection and relocation of wastes is especially
difficult compared to other cities due to the narrow streets of the province. The amount of
waste collected per day is approximately 25 tons and is disposed of as unregulated storage.
Due to the geographical conditions currently available, it is not possible to establish a regular
storage area for the time being. For this reason, waste management systems such as recycling,
composting are required to be passed on as soon as possible.
References
Demirarslan KO (2016). Kentsel gelişmenin hava kalitesi üzerine etkileri ve Doğu Karadeniz
bölgesi kentlerindeki partikül madde kirliliği. Karadeniz Araştırmaları Dergisi, 52, 27-55.
Demirarslan KO, Yener İ (2016). Artvin il merkezine ait kentsel atıksu miktar ve kalitesinin
projeksiyonu. Uluslararası Su ve Atıksu Yönetimi Sempozyumu. Editör: Özdemir Ö, Doç. Dr.
Fırat M. 26-28 Ekim 2016, Malatya, pp. 319 -327.
Muslu, Y. (2008). Çözümlü Problemlerle Su Temini ve Çevre Sağlığı. Su Vakfı Yayınları, 4.b.
İstanbul, s.27.
URL-1, Adrese Dayalı Nüfus Kayıt Sistemi, http://www.tuik.gov.tr.
Symposium Proceedings – Book of Full Papers 149
ECOLOGY 2017 11-13 May, Kayseri TURKEY
URL-2, Artvin İl Çevre Durum Raporu (2012), http://www.csb.gov.tr/gm/ced/.
URL-3, Artvin İl Çevre Durum Raporu (2013). http://www.csb.gov.tr/gm/ced/.
URL-4, Artvin İl Çevre Durum Raporu (2014). http://www.csb.gov.tr/gm/ced/ .
URL-5, Trafik Güvenliği Dairesi Başkanlığı Ulaşım Etütleri Şubesi Müdürlüğü (2015),
Otoyollar ve Devlet Yollarının Trafik Dilimlerine Göre Yıllık Ortalama Günlük Trafik
Değerleri ve Ulaşım Bilgileri, 2014 Trafik ve Ulaşım Bilgileri, http://www.kgm.gov.tr/.
Symposium Proceedings – Book of Full Papers 150
ECOLOGY 2017 11-13 May, Kayseri TURKEY
Effect of different substrates on growth performance of Mexican orange dwarf crayfish
(Cambarellus patzcuarensis)
Onur Karadal1*, Gürel Türkmen
2
1 Department of Aquaculture, Armutlu Vocational School, Yalova University, 77500, Armutlu, Yalova, Turkey
2 Department of Aquaculture, Faculty of Fisheries, Ege University, 35100, Bornova, İzmir, Turkey
*Corresponding author: [email protected]
Abstract
Examining of substrate requirement is one of the important issue for development of crayfish
species. In this study, effects of six different substrates (basalt, bare glass, pebble, calcite,
sand, plastic mesh) on growth performance of Mexican orange dwarf crayfish (Cambarellus
patzcuarensis) were investigated. Ten juvenile crayfish (mean body weight 0.25±0.01 g) were
placed in each of the 18 aquariums with three replicates. Growth performance was monitored
biweekly by individually weighing the crayfish from each aquarium. After 100 days, the best
weight gain, specific growth rate and feed conversion ratio were observed in the group raised
on the basalt substrate (P<0.01) which is close to natural habitat for this crayfish species. The
results of this experiment showed that the natural substrate of crayfish is very important for
their growth performance and other requirements.
Symposium Proceedings – Book of Full Papers 151
ECOLOGY 2017 11-13 May, Kayseri TURKEY
Keywords: Crayfish, Substrate, Growth performance, Survival, Mexican orange dwarf
crayfish, Cambarellus patzcuarensis.
1. Introduction
New species are being introduced to hobbyists at a remarkable pace, especially freshwater
decapod crustaceans such as shrimps, crayfish and crabs (Faulkes, 2015; Patoka et al., 2016).
Among these decapods, crayfish are becoming more commonly seen for sale in aquarium
stores and websites because of their interesting behaviours, individual personalities, attractive
colours and patterns (Karadal and Türkmen, 2014). Species found in the aquarium trade
mainly include crayfish from the Cambaridae family, such as Mexican dwarf orange crayfish,
Cambarellus patzcuarensis (Kwang et al., 2010). This species comes from Lago de Pátzcuaro
which is a volcanic crater lake in Michoacán, Mexico and they are categorized as dwarf
crayfish (Pottern, 2007). Therefore, this crayfish suitable for smaller sized aquarium.
Substrate type is important to stream communities (Francis and Kane, 1995). Crayfish live in
sandy and muddy benthic areas and they are typically considered keystone species to the
biological communities in which they belong because of their feeding and burrowing
behaviours (Wingerter, 2011). In the present study, effects of six different substrates on
growth and survival of juvenile Mexican dwarf orange crayfish were investigated.
2. Materials and Methods
Symposium Proceedings – Book of Full Papers 152
ECOLOGY 2017 11-13 May, Kayseri TURKEY
The study was carried out in Faculty of Fisheries, Ege University, İzmir, Turkey. Mexican
orange dwarf crayfish (Cambarellus patzcuarensis) were provided from a commercial facility
(Antalya, Turkey). All the experiments were carried out in glass aquariums. Each aquarium
with 10 juveniles (average body weight 0.25±0.01 g) contained 2-cm-diameter PVC pipes in
excess as refuge. Six substrates as bare glass (control), plastic mesh, pebble, sand, basalt and
calcite were tested with triplicate for total of 18 aquariums. Every day, all animals were fed ad
libitum with commercial granule feed (44% of protein). Temperature was maintained at
24.5±0.7 ºC, and photoperiod was held at 14:10 (light/dark). Dissolved oxygen, pH, ammonia,
total hardness and alkalinity were determined in each aquarium. The study was maintained for
100 days. Total lengths and body weights were measured for evaluating growth performance,
biweekly.
The data were analysed using a one-way analysis of variance (ANOVA). Statistical
differences were examined by Student-Newman-Keuls (SNK) test. In all tests, a significance
level of P<0.01 was used.
3. Results
The mean body weight, specific growth rate and feed conversion ratio of advanced juveniles
raised on the basalt substrate was significantly greater (P<0.01) than those in the glass
(control) substrate, while the plastic net, calcite and sand caused an intermediate effect. Stones
group was statistically similar to basalt than the others (Figure 1). Differences among mean
weights emerged after 60 days. There were no significant differences in total length of
advanced juveniles (P>0.01). The survival rate 100% in this study because of no animals died
during the study period.
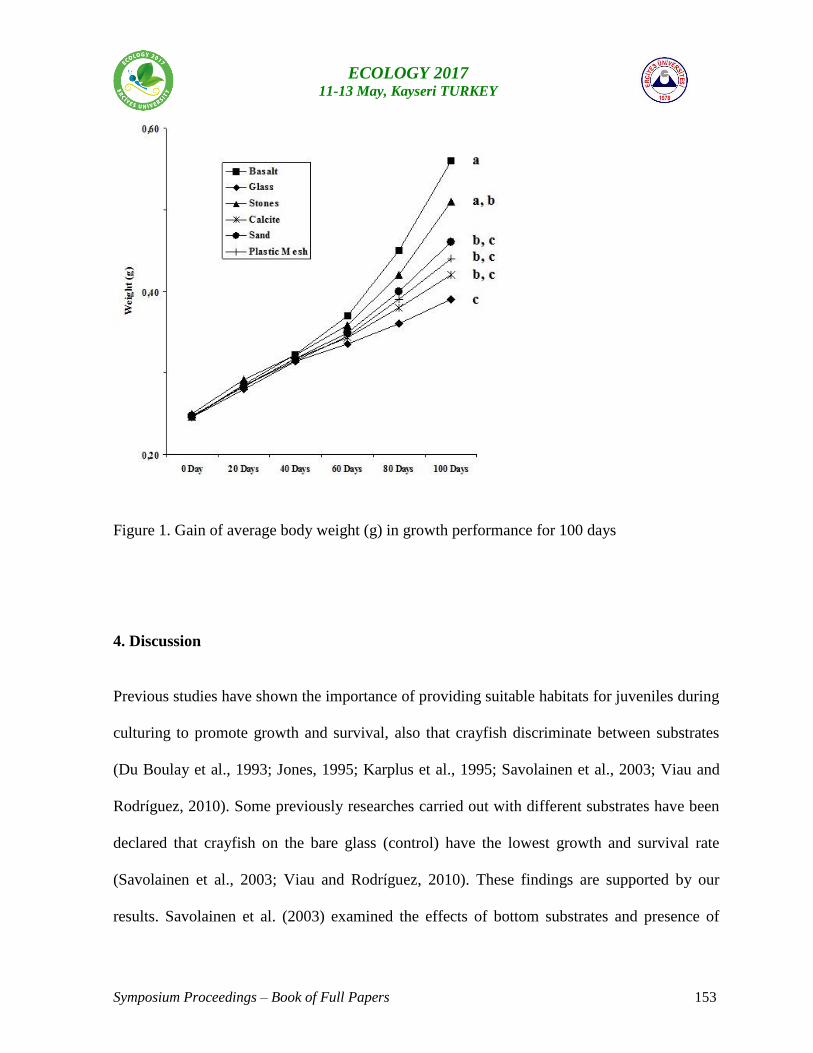
Symposium Proceedings – Book of Full Papers 153
ECOLOGY 2017 11-13 May, Kayseri TURKEY
Figure 1. Gain of average body weight (g) in growth performance for 100 days
4. Discussion
Previous studies have shown the importance of providing suitable habitats for juveniles during
culturing to promote growth and survival, also that crayfish discriminate between substrates
(Du Boulay et al., 1993; Jones, 1995; Karplus et al., 1995; Savolainen et al., 2003; Viau and
Rodríguez, 2010). Some previously researches carried out with different substrates have been
declared that crayfish on the bare glass (control) have the lowest growth and survival rate
(Savolainen et al., 2003; Viau and Rodríguez, 2010). These findings are supported by our
results. Savolainen et al. (2003) examined the effects of bottom substrates and presence of
Symposium Proceedings – Book of Full Papers 154
ECOLOGY 2017 11-13 May, Kayseri TURKEY
shelter in experimental tanks on growth and survival of signal crayfish (Pacifastacus
leniusculus) juveniles. They found that the highest final biomass in various treatments of
experiment at the gravel bottom. Viau and Rodríguez (2010) examined the substrate selection
and effect of different substrates on survival and growth of juveniles of the Australian red
claw crayfish (Cherax quadricarinatus). They observed that the highest final weight at the
stone substrate. Both gravel and stone substrates are natural substrates for these species,
respectively. Herrnkind and Butler (1986) carried out a study with Caribbean spiny lobster
(Panulirus argus) and they reported that natural substrates have important effects.
The results of the present study indicate that Mexican orange dwarf crayfish kept in basalt
were attained higher body weights. Basalt is close to natural substrate of this species with its
small particles and grey-black colour. Viau and Rodríguez (2010) pointed that juveniles
showed marked preference for stones over the other substrates independently of body weight
or acclimation to a particular substrate. They noticed that it was feasible that a nutritional or
behavioural response to a substrate similar to the one found in nature increased the growth of
these juveniles. Our findings are supported with these previously results.
5. Conclusion
In conclusion, on the purpose of growing and keeping of juvenile Mexican orange dwarf
crayfish in aquarium systems, it is recommended the use of basalt which is close to their
natural substrates for this species. However, further studies on the environment requirements
in aquarium systems are needed to decrease aggressive interactions and cannibalism of this
poorly known species.
Symposium Proceedings – Book of Full Papers 155
ECOLOGY 2017 11-13 May, Kayseri TURKEY
Acknowledgements
Some data used in the present study has formerly been the subject of the master thesis of Onur
Karadal prepared in Graduate School of Natural and Applied Sciences, Ege University, İzmir,
Turkey. As the authors, we would like to thank Dr. Hülya Saygı for helping to data analysis.
References
Du Boulay AJH, Sayer MDJ, Holdich DM (1993). Investigations into intensive culture of the
Australian red claw crayfish Cherax quadricarinatus. Freshwater Crayfish 9: 70-78.
Faulkes Z (2015). The global trade in crayfish as pets. Crustacean Research 44: 75-92.
Francis DR, Kane TC (1995). Effect of substrate on colonization of experimental ponds by
Chironomidae (Diptera). Journal of Freshwater Ecology 10(1): 57-63.
Herrnkind WF, Butler MJ (1986). Factors regulating postlarval settlement and juvenile
microhabitat use by spiny lobsters Panulirus argus. Marine Ecology Progress Series
34: 23-30.
Jones CM (1995). Production of juvenile redclaw crayfish Cherax quadricarinatus (von
Martens) (Decapada, Parestacidae) II. Juvenile nutrition and habitat. Aquaculture
138(1-4): 239-245.
Karadal O, Türkmen G (2014). Effects of substrate preference on growth and survival of blue
tiger crayfish (Cherax albertisii). Ege Journal of Fisheries and Aquatic Sciences 31(1):
1-4.
Symposium Proceedings – Book of Full Papers 156
ECOLOGY 2017 11-13 May, Kayseri TURKEY
Karplus I, Barki A, Levi T, Hulata G, Harpaz S (1995). Effects of kinship and shelters on
growth and survival of juvenile Australian redclaw crayfish (Cherax quadricarinatus).
Freshwater Crayfish 10: 494-505.
Kwang PY, Lee L, Wong A, Lin LY (2010). Norway’s WTO notification on draft regulations
relating to the import and release of alien organisms. Ornamental Fish Newsletter 1(2):
2.
Patoka J, Bláha M, Devetter M, Rylková K, Čadková Z, Kalous L (2016). Aquarium
hitchhikers: attached commensals imported with freshwater shrimps via the pet trade.
Biological Invasions 18(2): 457-461.
Pottern G (2007). Mexican dwarf orange crayfish, Cambarellus patzcuarensis. The Raleigh
Aquarium Society Monthly Feature, May 2007, pp. 2-3.
Savolainen R, Ruohonen K, Tulonen J (2003). Effects of bottom substrate and presence of
shelter in experimental tanks on growth and survival of signal crayfish, Pacifastacus
leniusculus (Dana) juveniles. Aquaculture Research 34(4): 289-297.
Viau VE, Rodríguez EM (2010). Substrate selection and effect of different substrates on
survival and growth of juveniles of the freshwater crayfish Cherax quadricarinatus
(von Martens 1868) (Decapoda, Parastacidae). Aquaculture International 18: 717-724.
Wingerter K (2011). Freshwater Crustaceans, Part One: Shrimps. Tropical Fish Hobbyist
Magazine, April 2011, pp. 84-88.
Symposium Proceedings – Book of Full Papers 157
ECOLOGY 2017 11-13 May, Kayseri TURKEY
Adsorption of Methylene Blue from Aquatic Solution On Vermicompost: Green
Engineering Approach
Serpil Savcı1, Halil Kayalp
2 and Mutlu Yalvaç
3
1 Bozok University, Engineering Arthitecture Faculty, Biosystems Engineering Department,
Yozgat 2
Bozok University, Engineering Arthitecture Faculty, Biosystems Engineering Department,
Yozgat 3
Mersin University, Engineering Faculty, Environmental Engineering Department, Yozgat
Corresponding Author: [email protected]
Abstract
In this study, investigation of using vermicompost of methylene blue dye by adsorption was
removed. Langmuir, Freundlich and Dubinin-Radushkevic (D-R) isotherm models were
studied. However, batch adsorption experimental data were the best suitable for the Langmuir
isotherm model. The maximum adsorption capacity was found to be 15.625 mg/g for (pH=4).
Methylene blue adsorbed vermicompost was examined by the use of SEM analysis techniques
after adsorption. It was found that the vermicompost is stable without losing their activity.
Keywords: Adsorption; Kinetic; Methylene blue; Vermicompost; SEM.
1. Introduction:
Most of the textile products are painted to increase consumer enjoyment. However,
wastewater generated at the end of the process is discharged natural water bodies. After that,
they affected both public and environment health negatively. For this reason, waters need to be
treated to various treatment processes. Adsorption is the most common process for treatment
of wastewater (El-Sayed, 2011; Mahmoodi et al., 2011; Fernandez et al., 2012).
Vermicompost is a low-cost biotechnological process that provides the conversion of organic
waste to fertilizer with effect of earth worms and microorganisms (Reinecke et al., 1990;
Fernández-Gómez et al., 2010). Eisenia fetida is the most commonly used an epige worm
species in vermicompost production in temperate climatic conditions. Animal manure is the
best nutrient for earthworms. In addition, fruit, vegetable, greenhouse and garden wastes can
be used as a food source (Fernández-Gómez et al., 2010). The vermicompost formed by the
passage of organic wastes through the worm digestive system is a composition rich in nitrate,
phosphorus, potassium, calcium and magnesium (Fernández-Gómez et al., 2011;
Taeporamaysamai et al., 2016). Nowadays, vermicompost is one of the most important inputs
of organic agriculture. However, its use in other areas is still a research topic.
The treatment of textile wastewater is too difficult and expensive, because of the presence of
different chemical substances in it. The different types of dyestuff are used for textile
Symposium Proceedings – Book of Full Papers 158
ECOLOGY 2017 11-13 May, Kayseri TURKEY
products. Acidic, basic, disperse, azo, pigment, reactive etc. These substances have different
chemical structures. The structures differences in the dyestuff make it difficult to remove these
materials and often require the application of different treatment methods in the same process.
In this study, vermicompost used as an adsorbent and the removal of methylene blue from the
aquatic solution by batch system (Ezechi et al., 2015; Tharaneedhar, 2017; Ngulube, 2017).
2. Material and Methods:
Methylene blue was purchased from (Carlo Erba Reagent). It is a cationic dyestuff (chemical
formula C16H18CIN3S, dye purity >90%). This dye was commercial product and used without
purification. The characteristics of this dye are presented in Table 1. The solution was
prepared by dissolving Methylene blue of 1000 mg in 1 L distilled water.
Adsorption studies were performed in 100 mL Erlenmeyer Flasks including 0.1 g of
vermicompost with 30 mL of Methylene blue solution. Adsorption experiments done at room
temperature (25oC).The solution was shaken by a mechanical shaker (VWR)at the constant
agitation time (150 rpm) during 5 hours. Then the supernatant was centrifuged at 4000 rpm
and 10 minutes in a centrifuge (HettichZentrifugen) after the batch tests. The absorbance of
Methylene blue was measured at maximum wavelength (λmax:665 nm) by UV–VIS
Spectrophotometer (Shimadzu UV 1208).
For the contact time experiments, the initial dye concentrations were varied from 100 to 500
mg/L. The incubation time was tested in a time from 10 to 180 min. All experiments were
repeated twice. The adsorption amount of Methylene blue dye was calculated as follows, Eq.
1:
Amount of adsorption (Q) = (𝐶𝑜 − 𝐶𝑡)𝑉
𝑚 (1)
Co is the initial dye concentration (mg/L) whereas Ct is the dye concentration after adsorption,
V dye volume (mL), m adsorbent mass (g) (Baek et al, 2010).
Vermicompost is a low-cost biotechnological process that provides the conversion of organic
waste to fertilizer with effect of earth worms and microorganisms (Reinecke et al., 1990;
Fernández-Gómez et al., 2010). Eisenia fetida is the most commonly used an epige worm
species in vermicompost production in temperate climatic conditions. Animal manure is the
best nutrient for earthworms. In addition, fruit, vegetable, greenhouse and garden wastes can
be used as a food source (Fernández-Gómez et al., 2010). The vermicompost formed by the
passage of organic wastes through the worm digestive system is a composition rich in nitrate,
phosphorus, potassium, calcium and magnesium (Fernández-Gómez et al., 2011;
Taeporamaysamai et al., 2016). Nowadays, vermicompost is one of the most important inputs
of organic agriculture. However, its use in other areas is still a research topic.
3. Results and Discussion:
3.1. Microscopic observations
Symposium Proceedings – Book of Full Papers 159
ECOLOGY 2017 11-13 May, Kayseri TURKEY
Fig 1.a shown that SEM images before and after adsorption. SEM micrographs of
vermicompost have got some pores and rough structures. In literatures, many adsorbents have
got similar surface characteristics. It means that such properties of adsorbent, increased of dye
uptake capacity (Albadarin et al., 2015). After the adsorption, as seen in Fig 1.b, a large
number of pores are filled with large amount of dyes.
3.2. Effect of time on adsorption
The influence of contact time on the dye adsorption was studied in the range of 0-180 min (Fig
3.). The initial dye concentration effect on the adsorption of dye was examined in the range of
100-500 mg L-1
. As shown in Fig 2., adsorption rate is very fast.
3.3. Adsorption isotherms
Langmuir, Freundlich and Dubinin-Radushkevich isotherm models were used to described the
experimental data of dye adsorption onto vermicompost.
Langmuir model which describes the monolayer adsorption of dye molecules on a
homogenous surface with a limited number of identical sites is given by Eq. 2 (Ho, 2006):
e
L
L
Le
eC
K
a
Kq
C)(
1
(2)
According to equation 2, where; Ce is the equilibrium concentration of adsorbate in solution
after adsorption (mg/L), qe is the equilibrium solid phase concentration (mg/g), as well as KL
(L/g) and aL (L/mg) are the Langmuir constants.
However, the Freundlich isotherm supposes a heterogeneous surface with a no uniform
distribution and can be expressed by Eq. 3:
eFeC
nKq log
1loglog
(3)
where KF (L/g) is the adsorption capacity at unit concentration and 1/n is adsorption intensity.
Dubinin-Radushkevic isotherm is an model initially conceived for the adsorption (Dubinin,
1960; Gupta et al., 2009).
𝐸 = [1
√2𝐵𝐷𝑅] (4)
Where BDR is denoted as the isotherm constant. Meanwhile, the parameter ε can be correlated
as:
𝜀 = 𝑅𝑇𝑙𝑛 [1 +1
𝐶𝑒] (5)
Symposium Proceedings – Book of Full Papers 160
ECOLOGY 2017 11-13 May, Kayseri TURKEY
In equation 5, where R, T and Ce represent the gas constant (8.314 J/mol K), absolute
temperature (K) and adsorbate equilibrium concentration (mg/L) respectively. Adsorption of
Methylene blue on vermicompost were suitable for the Langmuir isotherm (pH=4). The
maximum adsorption capacity was found to be 15.625 mg g-1
. It is described that adsorption
is monolayer. When It is compared with given values in literatures, in this study found
adsorption capacity is higher than the others.
3.4. Kinetic of dye adsorption
The kinetic rate equations can be written as:
303.2
)(log
,1tk
q
qq ad
e
te
(6)
where qe and qt are the amount of adsorbed on the vermicompost (mg/g) at equilibrium and at
time t (min), respectively, and k1 (1/min) is the rate constant of pseudo-first-order kinetics.
The pseudo second order equation is:
tqqkq
t
eqeqadt
11
2
,2
(7)
k2 (g/mg.min) is the rate constant for the pseudo-second-order kinetics (Santoz et al., 2013).
Second order rate equation can be written as:
ktqqq
ete
1
)(
1
(8)
k (g/mg.min) is the rate constant for second order .
In order to determine the rate controlling step, the kinetic experimental results were fitted to
the Weber’s intraparticle diffusion model.
qt=kidt1/2+C (9)
where kid is the intraparticle diffusion rate constant (mg.g–1
h–1/2
) and C (mg.g–1
) is a constant
that gives idea about the thickness of the boundary layer. If the qt vs. t1/2
plot is a straight line,
then the adsorption process is only controlled by intraparticle diffusion (Baclıoglu and Arslan,
Symposium Proceedings – Book of Full Papers 161
ECOLOGY 2017 11-13 May, Kayseri TURKEY
2001). Fig 4. shows that the intraparticle diffusion for methylene blue on vermicompost. The
parameters of these three models are given in Table 2-3. According to the Table 2-3,
adsorption of methylene blue on vermicompost is more fitted pseudo second order kinetic
model than pseudo first order kinetic model and intraparticle diffusion, due to high R2
values.
Also, found experiment of qe values are very near calculated of qe values.
3.5. Studies of reusability
Fig 5. shown that methylene blue adsorption capacity of vermicompost after
adsorption/desorption cycle. The reusability experiments were repeat five times. 5 M NaOH
used for experiments. The adsorption capacity of vermicompost never changed. It means that
vermicompost is easy available and inexpensive material for removal of methylene blue from
aquatic solution. Also, there is no need to activated. The activation process can be done to
increase the adsorption capacity.
4. Acknowledgement: Editors thank to Bozok University Scientific Research and Project
Department (BAP).
5. References:
Baek, M-H., Ijagbemi, C. O., Se-Jin O, Kim, D-S., (2010) Removal of Malachite Green from
aqueous solution using degreased coffee bean. Journal of Hazardous Materials, 176: 820.
Baclioglu, I. A. and Arslan, I. (2001) Partial oxidation of reactive dyestuffs and synthetic
textile dye-bath by the O3 and O3/H2O2 processes. Water Sci. Technol. Vol. 43:221.
El-Sayed GO (2011). Removal of methylene blue and crystal violet from aqueous solutions by
palm kernel fiber. Desalination 272, 225-232.
Mahmoodi NM, Salehi R and Arami M (2011). Binary system dye removal from colored
textile wastewater using activated carbon: Kinetic and isotherm studies. Desalination 272:
187-195.
Fernandez ME, Nunell GV, Bonelli PR, Cukierman AL (2012). Batch and dynamic
biosorption of basic dyes from binary solutions by alkaline-treated cypress cone chips.
Bioresource Technology 106: 55-62.
Ezechi EH, Kutty SRBM, Malakahmad A and Isa MH (2015). Characterization and
optimization of effluent dye removal using a new low cost adsorbent: Equilibrium, kinetics
and thermodynamic study. Process Saf. Environ. Protect 98: 16-32.
Tharaneedhar V, Kumar PS, Saravanan A, Ravikumar C, Jaikumar V (2017). Prediction and
interpretation of adsorption parameters for these questration of methylene blue dye from
aqueous solution using microwave assisted corncobactivated carbon. Sustainable Materials
and Technologies 11: 1-11.
Ngulube T, Jabulani Ray Gumbo , Vhahangwele Masindi , Arjun Maity (2017). An update on
synthetic dyes adsorption on to clay based minerals: A state-of-art review. Journal of
Environmental Management 191: 35-57.
Symposium Proceedings – Book of Full Papers 162
ECOLOGY 2017 11-13 May, Kayseri TURKEY
Reinecke AJ, Viljoen SA (1990). Theinfluence of feeding patterns on growth and reproduction
of the vermicomposting earthworm Eisenia fetida (Oligochaeta). Biol. Fertil. Soils 10: 184-
187.
Fernández-Gómez MJ, Nogales R, Insam H, Romero E, Goberna M (2010). Continuous-
feeding vermicomposting as a recycling management method torevalue tomato-fruit wastes
from green house crops. Waste Manage. 30: 2461-2468.
Fernández-Gómez MJ, Romero E, Nogales R (2010). Feasibility of vermicomposting for
vegetable green house waste recycling. Bioresour. Technol. 101: 9654-9660.
Fernandez-Gomez MJ, Nogales R, Insam H, Romero E, Goberna M (2011). Role of
vermicompost chemical composition, microbial functional diversity and fungal community
structure in their microbial respiratory responseto three pesticides. Bioresour. Technol. 102:
9638-9645.
Santos, M. S. F., Schaule, G., Alves, A., Madeira, L. M. (2013). Adsorption of paraquat
herbicide on deposits from drinking water Networks. Chem. Eng. J., 229: 324.
Taeporamaysamai O, Ratanatamskul C (2016). Co-composting of various organic substrates
from municipal solid waste using an on-site prototype vermicomposting reactor. International
Biodeterioration&Biodegradation 113: 357-366.
Albadarin, AB, Mangwandi C (2015). Mechanisms of Alizarin Red S and Methylene blue
biosorption on too lives tone by-product: Isothermstudy in single and binary systems. J.
Environ. Manag. 164: 86.
Ho YS (2006). Isotherms for the sorption of lead on to peat: Comparison of linear and non-
linear methods Polish. Journal of Environmental Study 15: 81.
Dubinin MM (1960). The potential theory of adsorption of gases and vapors for adsorbents
with energetically non-uniform surface. Chem. Rev. 60: 235.
Gupta VK, Mittal A, Malviya A, Mittal J (2009). Adsorption of carmoisine A from wastewater
using waste materials—Bottom ash and deoiled soya. Journal of Colloid and Interface Science
335: 24.
6. Tables:
Table 1. Isotherm parameters obtained from equilibrium models
Langmuir Parameter (unit) Value
KL (L/g) 14.727
aL (L/mg) 0.942
Qmax (mg/g) 15.625
R2 0.9913
Freundlich Isotherm nF 2.019
KF 18.595
R2 0.8703
Dubinin-Radushkevich qm 32.825
E 7.745 10-7
Symposium Proceedings – Book of Full Papers 163
ECOLOGY 2017 11-13 May, Kayseri TURKEY
R2 0.0848
Table 2. Pseudo Second Order Kinetic Model (k2,ad) (g/mg.dakika) Değerleri (pH=4)
Initial dye
concentration for
vermicompost
(mg/L)
qe k2,ad R2
100 16.313 0.0266 0.999
200 43.478 0.0237 0.999
300 72.992 0.00391 0.999
400 96.153 0.00250 0.999
500 11.494 0.0544 0.991
Table 3. Intraparticle Diffussion (pH=4)
Initial dye concentration for
vermicompost (mg/L)
kid (mg g-1
dk-1/2
)
R2
100 0.9795 0.9496
200 1.7068 0.9102
300 5.8673 0.8784
400 6.4293 0.9058
500 9.3366 0.9689
6. Figures:
Figure 1. SEM Images of Unloaded (a) and Dye Loaded (b) Vermicompost.
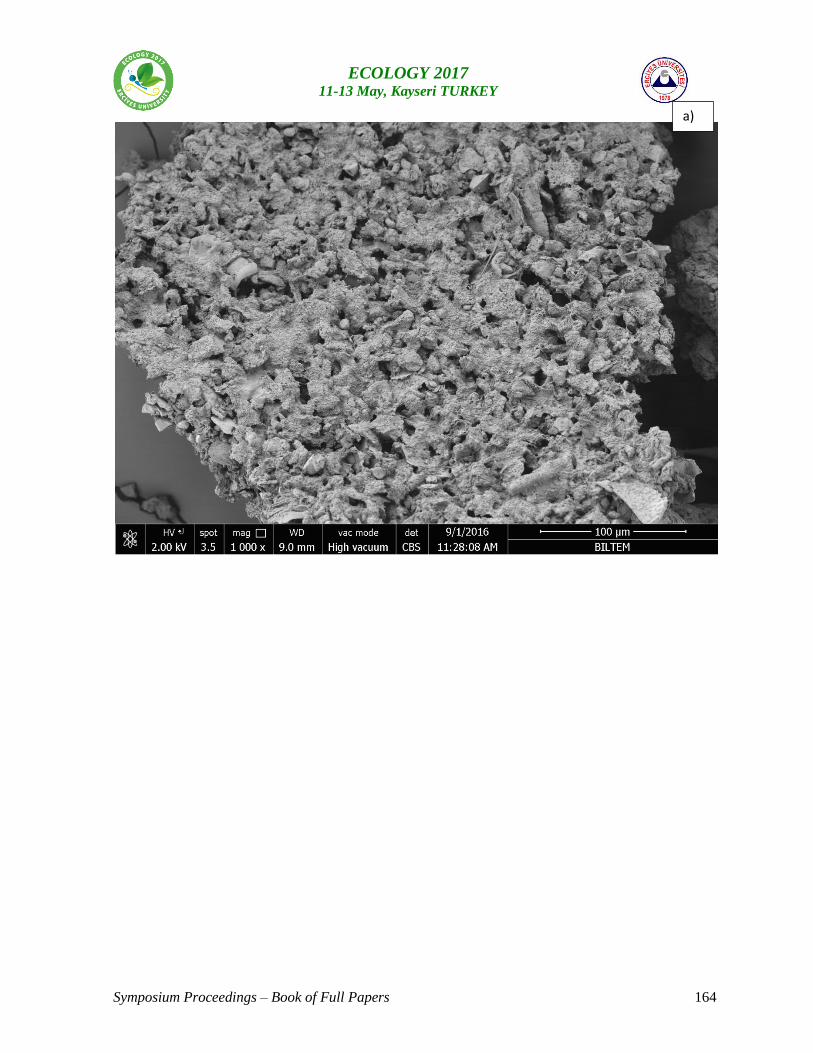
Symposium Proceedings – Book of Full Papers 164
ECOLOGY 2017 11-13 May, Kayseri TURKEY
a)
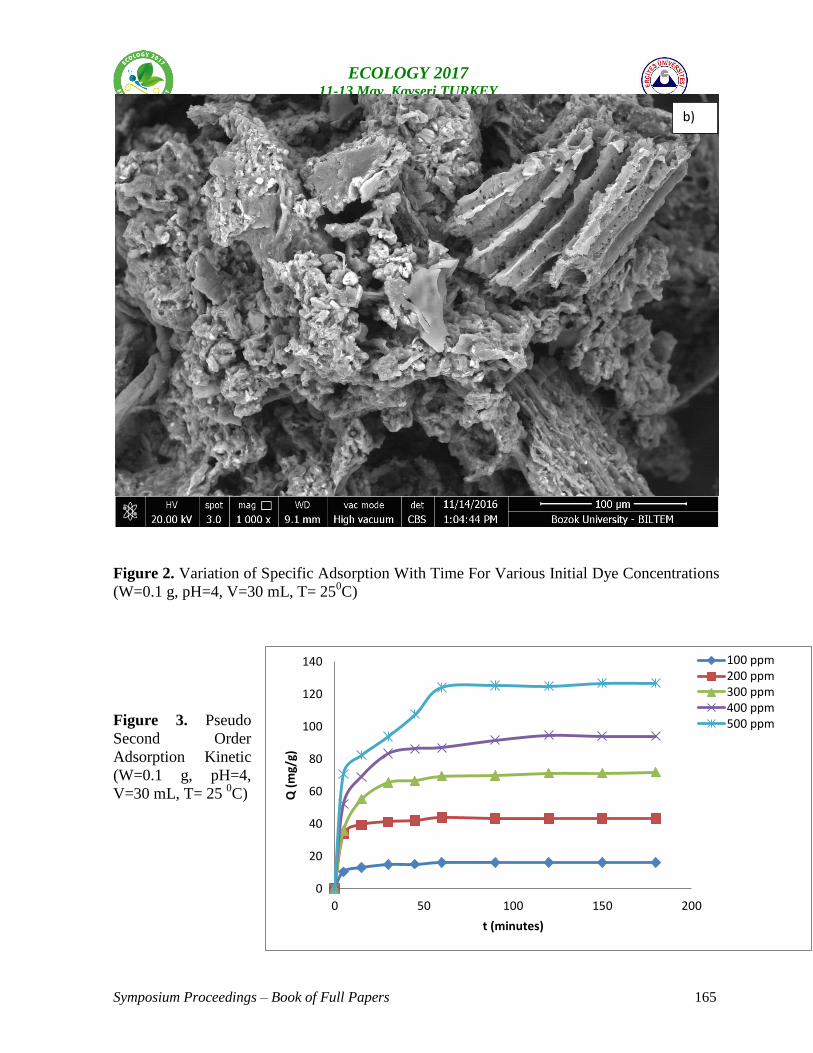
Symposium Proceedings – Book of Full Papers 165
ECOLOGY 2017 11-13 May, Kayseri TURKEY
Figure 2. Variation of Specific Adsorption With Time For Various Initial Dye Concentrations
(W=0.1 g, pH=4, V=30 mL, T= 250C)
Figure 3. Pseudo
Second Order
Adsorption Kinetic
(W=0.1 g, pH=4,
V=30 mL, T= 25 0C)
0
20
40
60
80
100
120
140
0 50 100 150 200
Q (
mg/
g)
t (minutes)
100 ppm200 ppm300 ppm400 ppm500 ppm
b)
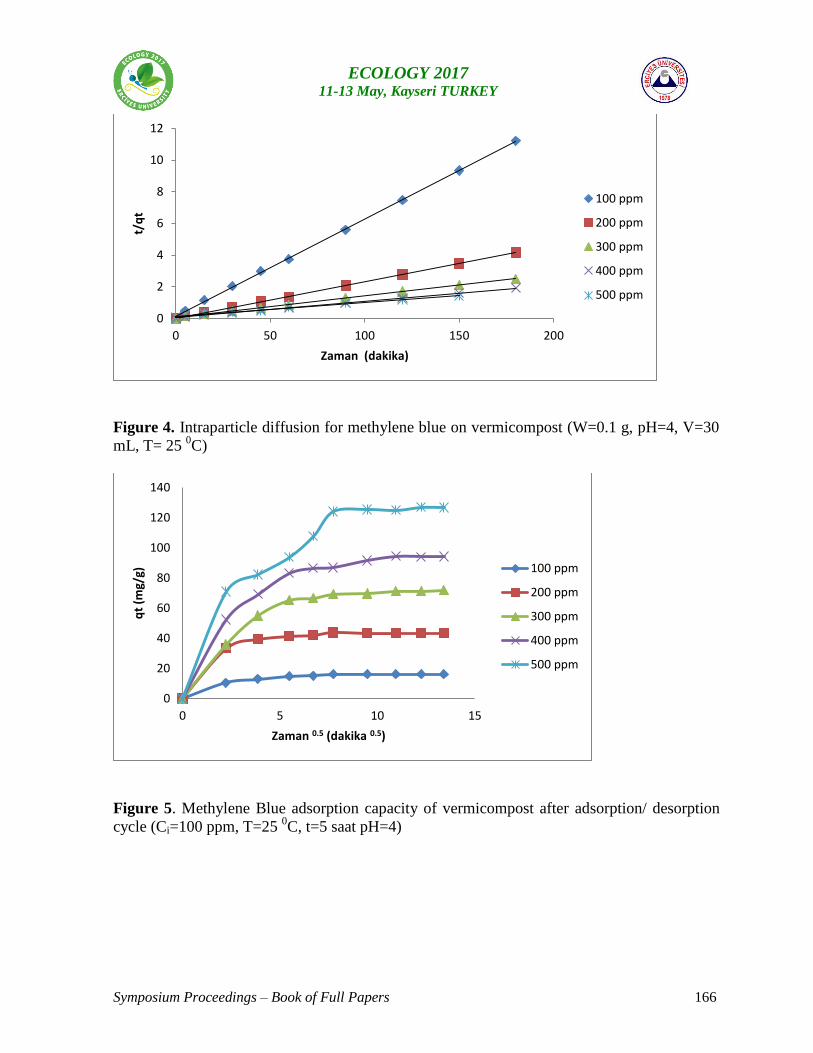
Symposium Proceedings – Book of Full Papers 166
ECOLOGY 2017 11-13 May, Kayseri TURKEY
Figure 4. Intraparticle diffusion for methylene blue on vermicompost (W=0.1 g, pH=4, V=30
mL, T= 25 0C)
Figure 5. Methylene Blue adsorption capacity of vermicompost after adsorption/ desorption
cycle (Ci=100 ppm, T=25 0C, t=5 saat pH=4)
0
2
4
6
8
10
12
0 50 100 150 200
t/q
t
Zaman (dakika)
100 ppm
200 ppm
300 ppm
400 ppm
500 ppm
0
20
40
60
80
100
120
140
0 5 10 15
qt
(mg/
g)
Zaman 0.5 (dakika 0.5)
100 ppm
200 ppm
300 ppm
400 ppm
500 ppm
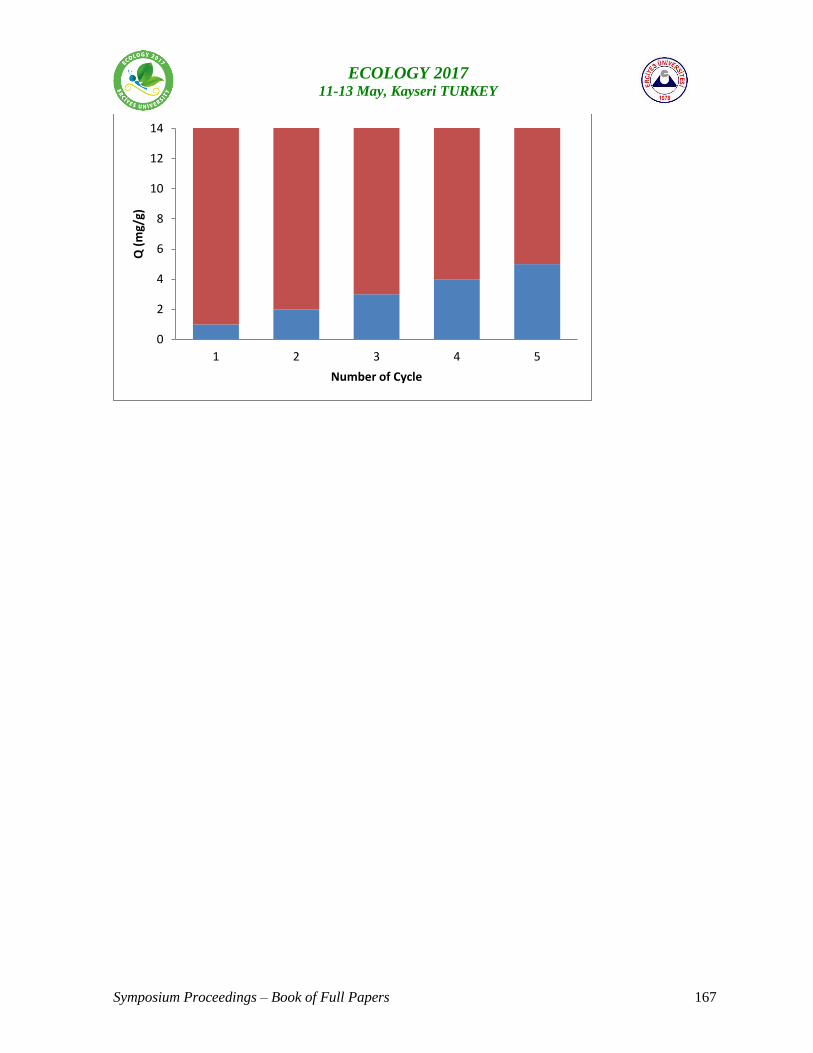
Symposium Proceedings – Book of Full Papers 167
ECOLOGY 2017 11-13 May, Kayseri TURKEY
0
2
4
6
8
10
12
14
1 2 3 4 5
Q (
mg/
g)
Number of Cycle
Symposium Proceedings – Book of Full Papers 168
ECOLOGY 2017 11-13 May, Kayseri TURKEY
Transformation Process of Agricultural Lands with Plans in Expanding Metropolitan
Boundaries: Case of Antalya-Serik
Sibel ECEMİŞ KILIÇ1 and Neriman YÖRÜR
2
1 Dokuz Eylül University, Architectural Faculty, City and Regional Planning Department, İzmir
2 Dokuz Eylül University, Architectural Faculty, City and Regional Planning Department, İzmir
Corresponding Author: e-mail: [email protected]
Abstract:
Antalya is one of Turkey's leading producers of fresh fruits and vegetables and greenhouse
farming. Serik, along with Aksu in the west, has an important share in the agricultural
production of the province of Antalya. The region, which also has significant irrigated
agricultural potential, is also opposed to the pressure of tourism and urban development. Belek
Tourism Center, one of Turkey's leading tourism centers, is located within the borders of the
district. On the other hand, the district located to the east of the central districts of Antalya
remained within the borders of the metropolitan municipality with the law no. 6360 extending
the borders of the municipalities to the provincial borders. With the same arrangement, 47
villages and 9 municipalities within the district have been transformed into neighborhoods.
Antalya, which has high agricultural and tourism potential, is a rapidly changing settlement in
terms of population and urban expansion. The Metropolitan Municipality initiated the
1/25.000 scale master plan works including the Serik region adjacent to central district of
Antalya and intensive interaction with the city center, after the 1/25000 scale zoning plan
works containing the central district of Antalya and approved the plan.
Material and Methods:
With this study, it is aimed to evaluate approaches of 1/100.000 Scale regional Plan and
1/25.000 Scale Development Plan prepared by Metropolitan Municipality to the agricultural
lands under development pressure. Maps showing agricultural potential and irrigated areas
will be obtained. Planned decisions (housing, industry, tourism, etc.) produced on these areas
will be evaluated.
Results:
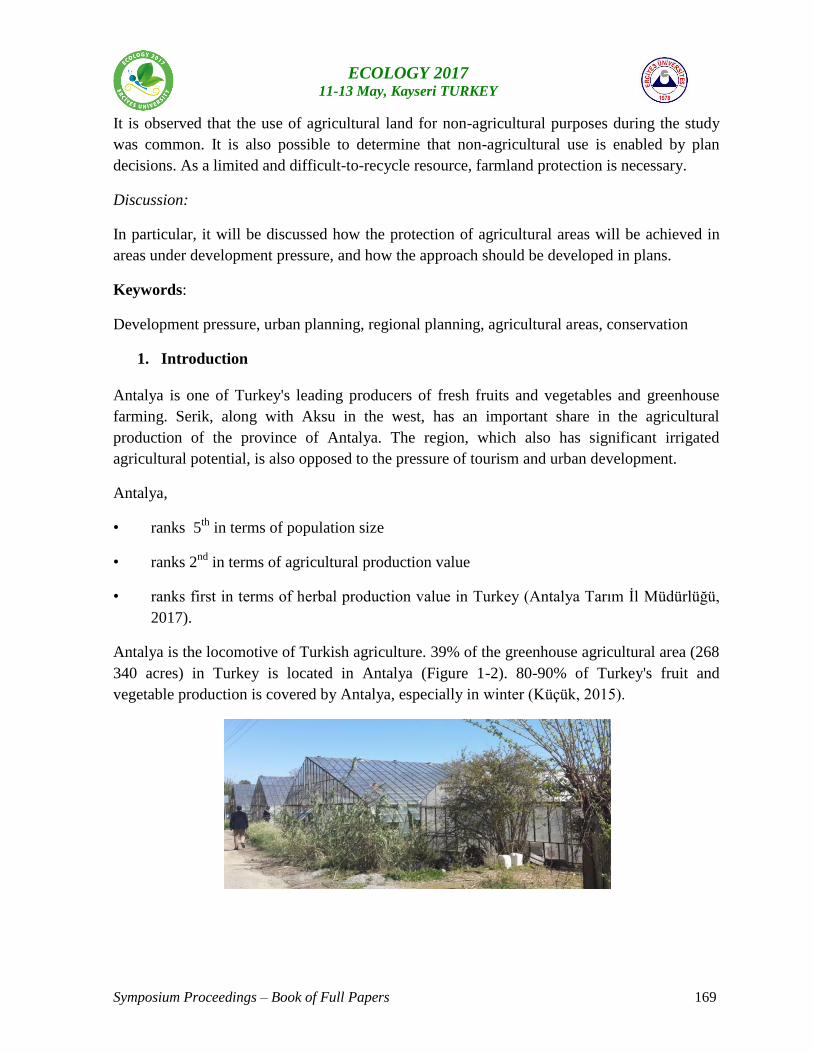
Symposium Proceedings – Book of Full Papers 169
ECOLOGY 2017 11-13 May, Kayseri TURKEY
It is observed that the use of agricultural land for non-agricultural purposes during the study
was common. It is also possible to determine that non-agricultural use is enabled by plan
decisions. As a limited and difficult-to-recycle resource, farmland protection is necessary.
Discussion:
In particular, it will be discussed how the protection of agricultural areas will be achieved in
areas under development pressure, and how the approach should be developed in plans.
Keywords:
Development pressure, urban planning, regional planning, agricultural areas, conservation
1. Introduction
Antalya is one of Turkey's leading producers of fresh fruits and vegetables and greenhouse
farming. Serik, along with Aksu in the west, has an important share in the agricultural
production of the province of Antalya. The region, which also has significant irrigated
agricultural potential, is also opposed to the pressure of tourism and urban development.
Antalya,
• ranks 5th
in terms of population size
• ranks 2nd
in terms of agricultural production value
• ranks first in terms of herbal production value in Turkey (Antalya Tarım İl Müdürlüğü,
2017).
Antalya is the locomotive of Turkish agriculture. 39% of the greenhouse agricultural area (268
340 acres) in Turkey is located in Antalya (Figure 1-2). 80-90% of Turkey's fruit and
vegetable production is covered by Antalya, especially in winter (Küçük, 2015).
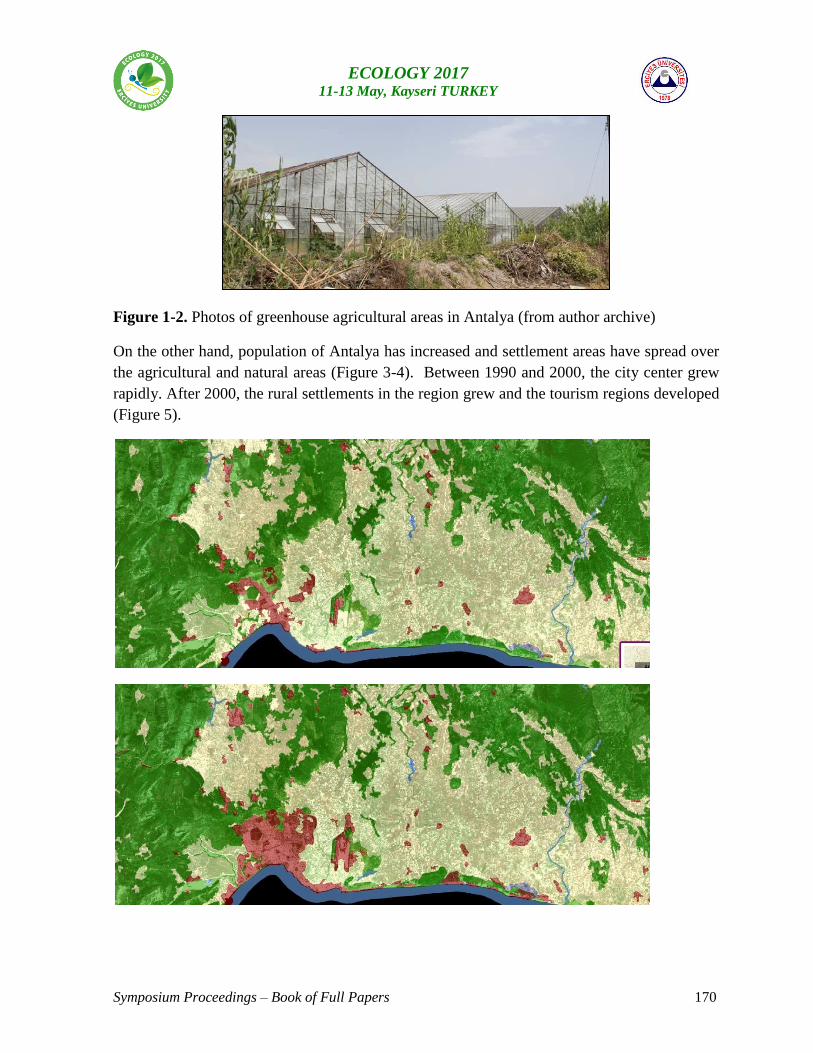
Symposium Proceedings – Book of Full Papers 170
ECOLOGY 2017 11-13 May, Kayseri TURKEY
Figure 1-2. Photos of greenhouse agricultural areas in Antalya (from author archive)
On the other hand, population of Antalya has increased and settlement areas have spread over
the agricultural and natural areas (Figure 3-4). Between 1990 and 2000, the city center grew
rapidly. After 2000, the rural settlements in the region grew and the tourism regions developed
(Figure 5).
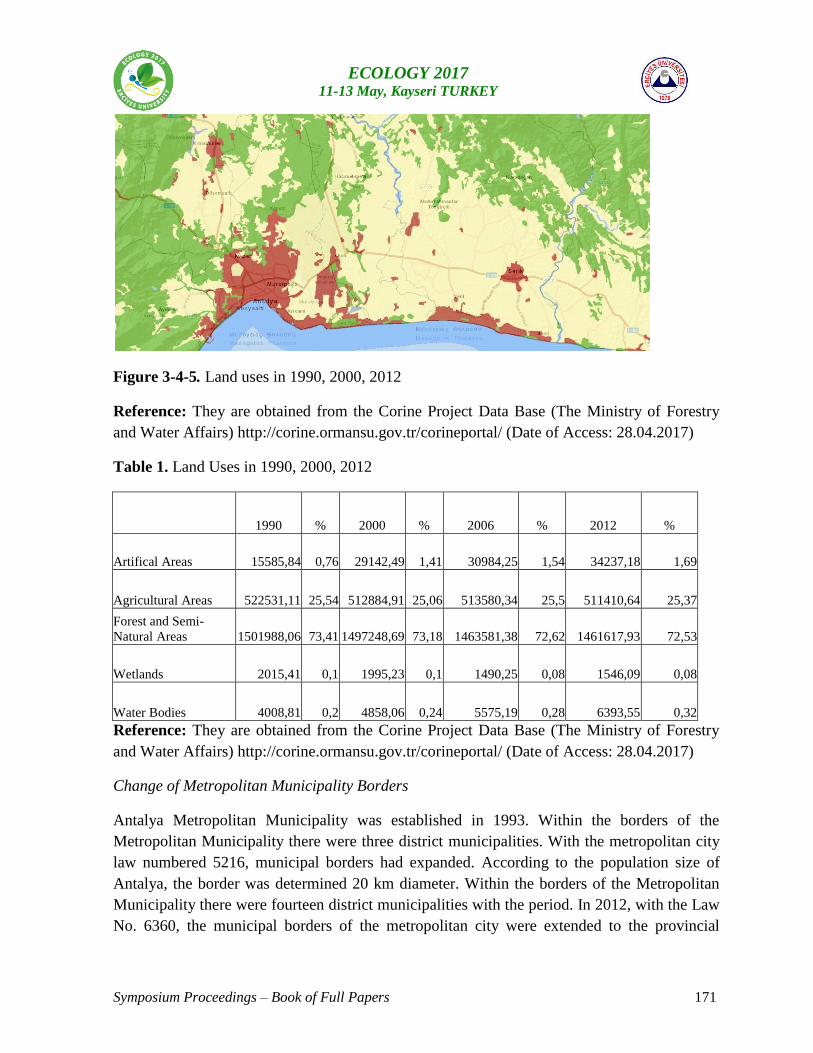
Symposium Proceedings – Book of Full Papers 171
ECOLOGY 2017 11-13 May, Kayseri TURKEY
Figure 3-4-5. Land uses in 1990, 2000, 2012
Reference: They are obtained from the Corine Project Data Base (The Ministry of Forestry
and Water Affairs) http://corine.ormansu.gov.tr/corineportal/ (Date of Access: 28.04.2017)
Table 1. Land Uses in 1990, 2000, 2012
1990 % 2000 % 2006 % 2012 %
Artifical Areas 15585,84 0,76 29142,49 1,41 30984,25 1,54 34237,18 1,69
Agricultural Areas 522531,11 25,54 512884,91 25,06 513580,34 25,5 511410,64 25,37
Forest and Semi-
Natural Areas 1501988,06 73,41 1497248,69 73,18 1463581,38 72,62 1461617,93 72,53
Wetlands 2015,41 0,1 1995,23 0,1 1490,25 0,08 1546,09 0,08
Water Bodies 4008,81 0,2 4858,06 0,24 5575,19 0,28 6393,55 0,32
Reference: They are obtained from the Corine Project Data Base (The Ministry of Forestry
and Water Affairs) http://corine.ormansu.gov.tr/corineportal/ (Date of Access: 28.04.2017)
Change of Metropolitan Municipality Borders
Antalya Metropolitan Municipality was established in 1993. Within the borders of the
Metropolitan Municipality there were three district municipalities. With the metropolitan city
law numbered 5216, municipal borders had expanded. According to the population size of
Antalya, the border was determined 20 km diameter. Within the borders of the Metropolitan
Municipality there were fourteen district municipalities with the period. In 2012, with the Law
No. 6360, the municipal borders of the metropolitan city were extended to the provincial
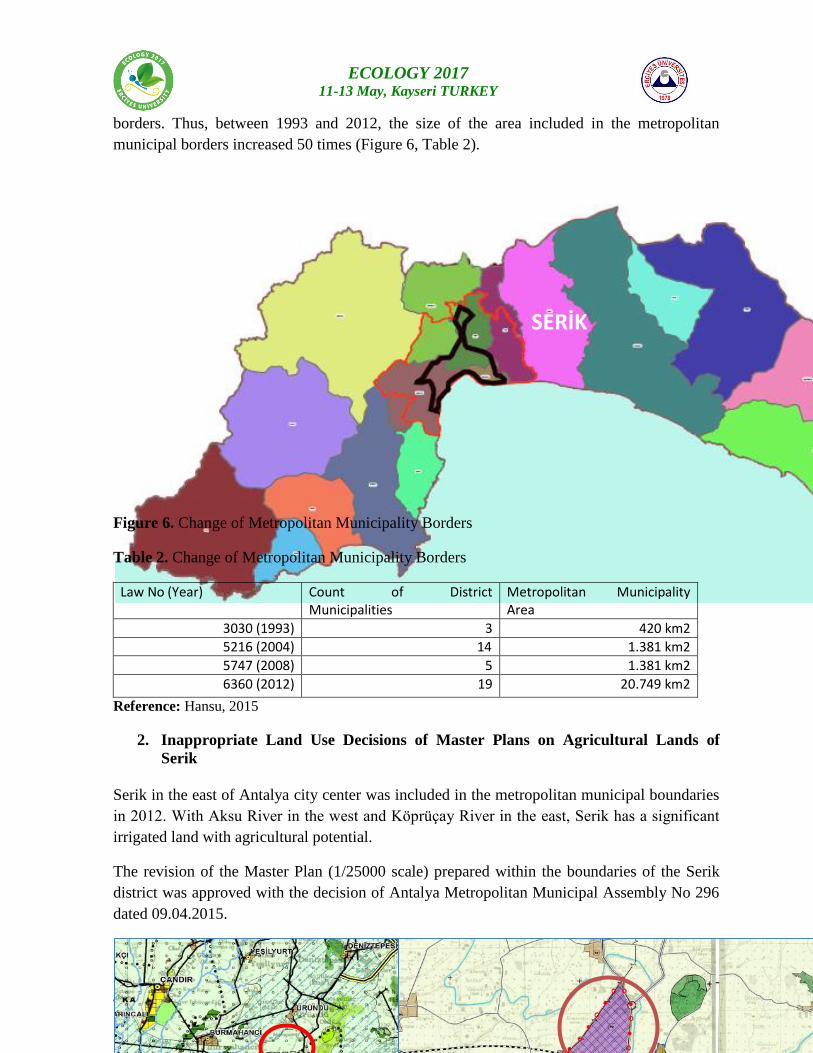
Symposium Proceedings – Book of Full Papers 172
ECOLOGY 2017 11-13 May, Kayseri TURKEY
SERİK
borders. Thus, between 1993 and 2012, the size of the area included in the metropolitan
municipal borders increased 50 times (Figure 6, Table 2).
Figure 6. Change of Metropolitan Municipality Borders
Table 2. Change of Metropolitan Municipality Borders
Law No (Year) Count of District Municipalities
Metropolitan Municipality Area
3030 (1993) 3 420 km2
5216 (2004) 14 1.381 km2
5747 (2008) 5 1.381 km2
6360 (2012) 19 20.749 km2
Reference: Hansu, 2015
2. Inappropriate Land Use Decisions of Master Plans on Agricultural Lands of
Serik
Serik in the east of Antalya city center was included in the metropolitan municipal boundaries
in 2012. With Aksu River in the west and Köprüçay River in the east, Serik has a significant
irrigated land with agricultural potential.
The revision of the Master Plan (1/25000 scale) prepared within the boundaries of the Serik
district was approved with the decision of Antalya Metropolitan Municipal Assembly No 296
dated 09.04.2015.
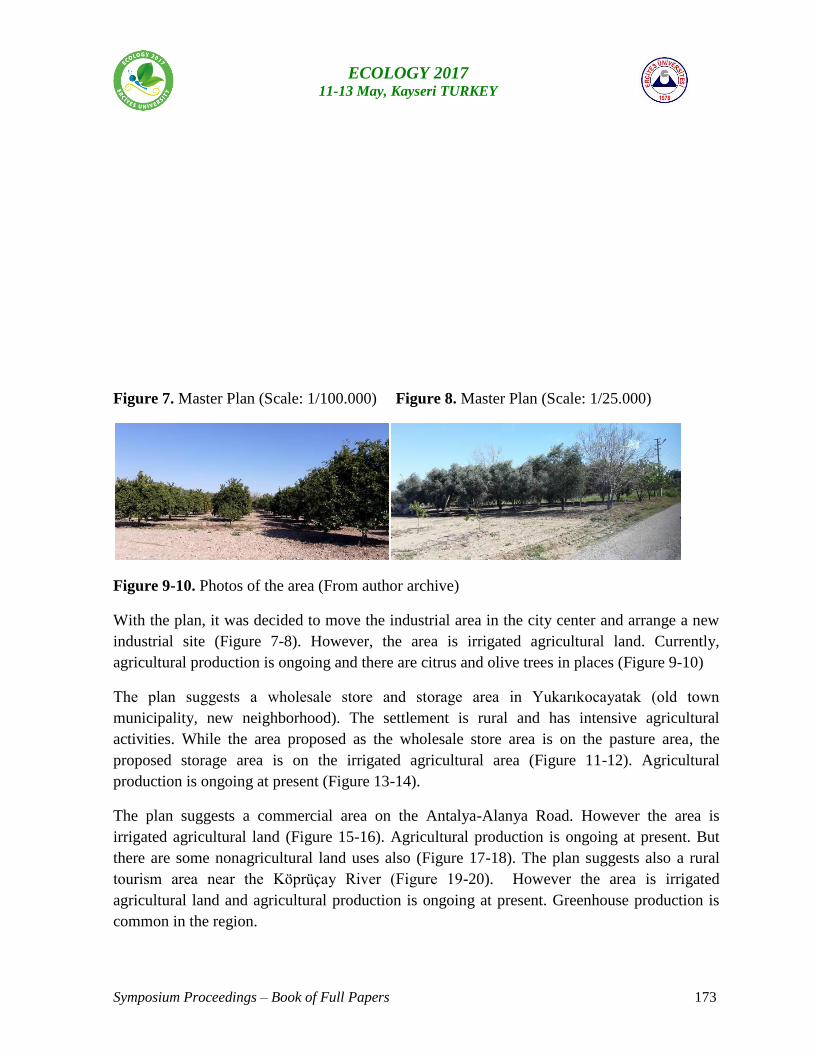
Symposium Proceedings – Book of Full Papers 173
ECOLOGY 2017 11-13 May, Kayseri TURKEY
Figure 7. Master Plan (Scale: 1/100.000) Figure 8. Master Plan (Scale: 1/25.000)
Figure 9-10. Photos of the area (From author archive)
With the plan, it was decided to move the industrial area in the city center and arrange a new
industrial site (Figure 7-8). However, the area is irrigated agricultural land. Currently,
agricultural production is ongoing and there are citrus and olive trees in places (Figure 9-10)
The plan suggests a wholesale store and storage area in Yukarıkocayatak (old town
municipality, new neighborhood). The settlement is rural and has intensive agricultural
activities. While the area proposed as the wholesale store area is on the pasture area, the
proposed storage area is on the irrigated agricultural area (Figure 11-12). Agricultural
production is ongoing at present (Figure 13-14).
The plan suggests a commercial area on the Antalya-Alanya Road. However the area is
irrigated agricultural land (Figure 15-16). Agricultural production is ongoing at present. But
there are some nonagricultural land uses also (Figure 17-18). The plan suggests also a rural
tourism area near the Köprüçay River (Figure 19-20). However the area is irrigated
agricultural land and agricultural production is ongoing at present. Greenhouse production is
common in the region.
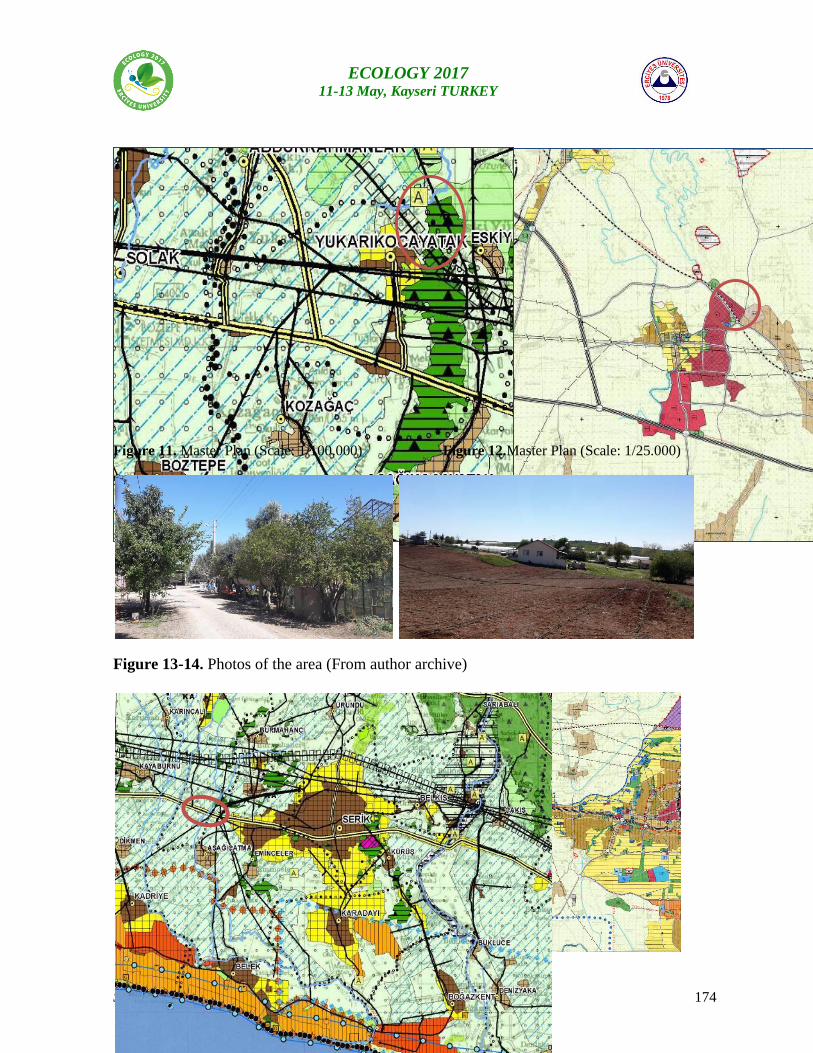
Symposium Proceedings – Book of Full Papers 174
ECOLOGY 2017 11-13 May, Kayseri TURKEY
Figure 11. Master Plan (Scale: 1/100.000) Figure 12.Master Plan (Scale: 1/25.000)
Figure 13-14. Photos of the area (From author archive)
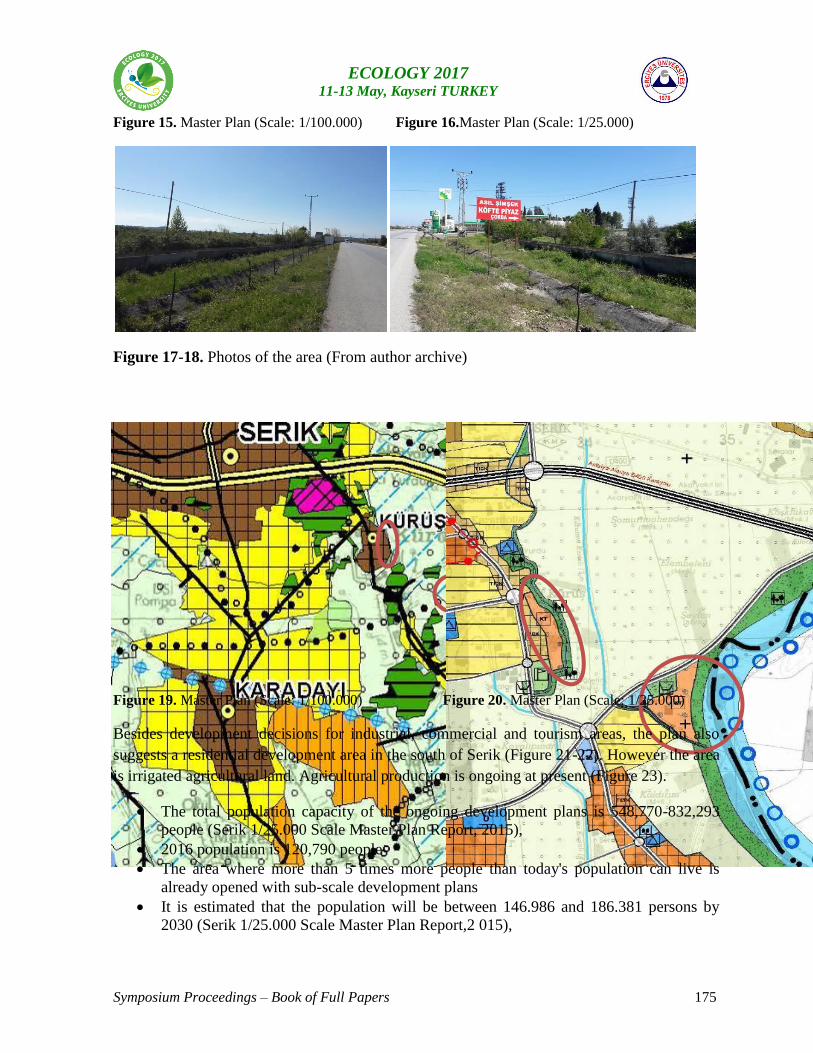
Symposium Proceedings – Book of Full Papers 175
ECOLOGY 2017 11-13 May, Kayseri TURKEY
Figure 15. Master Plan (Scale: 1/100.000) Figure 16.Master Plan (Scale: 1/25.000)
Figure 17-18. Photos of the area (From author archive)
Figure 19. Master Plan (Scale: 1/100.000) Figure 20. Master Plan (Scale: 1/25.000)
Besides development decisions for industrial, commercial and tourism areas, the plan also
suggests a residential development area in the south of Serik (Figure 21-22). However the area
is irrigated agricultural land. Agricultural production is ongoing at present (Figure 23).
The total population capacity of the ongoing development plans is 548,770-832,293
people (Serik 1/25.000 Scale Master Plan Report, 2015),
2016 population is 120,790 people
The area where more than 5 times more people than today's population can live is
already opened with sub-scale development plans
It is estimated that the population will be between 146.986 and 186.381 persons by
2030 (Serik 1/25.000 Scale Master Plan Report,2 015),
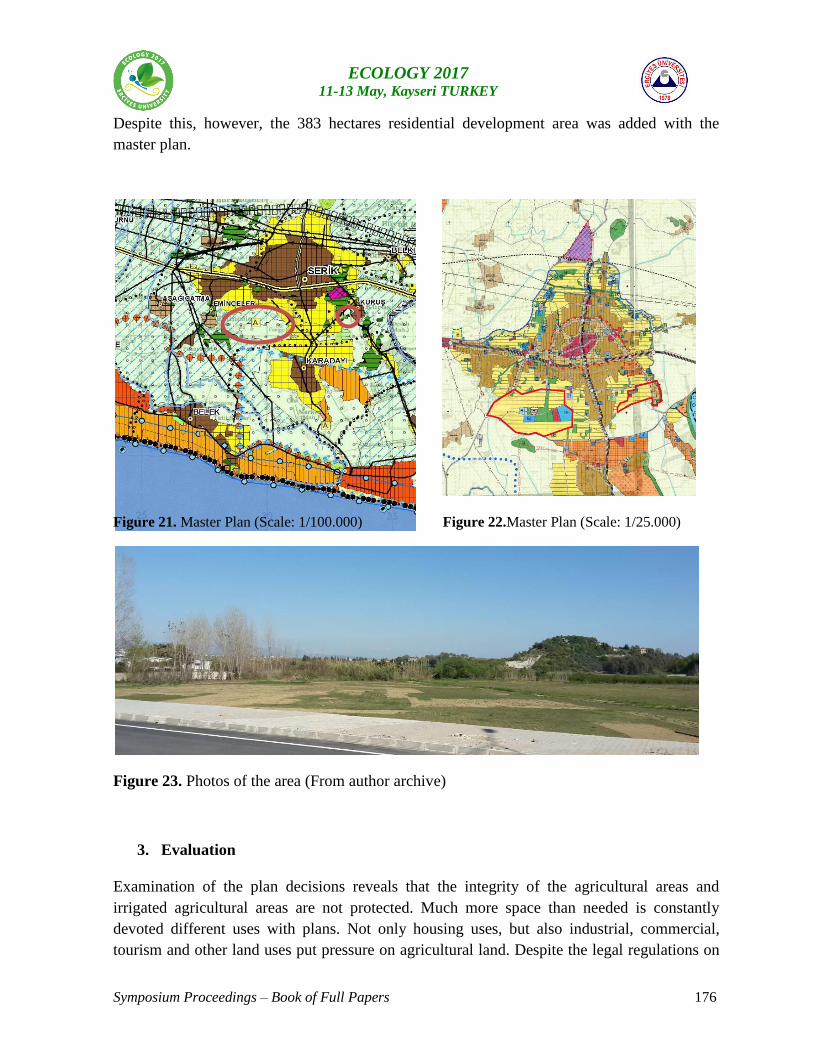
Symposium Proceedings – Book of Full Papers 176
ECOLOGY 2017 11-13 May, Kayseri TURKEY
Despite this, however, the 383 hectares residential development area was added with the
master plan.
Figure 21. Master Plan (Scale: 1/100.000) Figure 22.Master Plan (Scale: 1/25.000)
Figure 23. Photos of the area (From author archive)
3. Evaluation
Examination of the plan decisions reveals that the integrity of the agricultural areas and
irrigated agricultural areas are not protected. Much more space than needed is constantly
devoted different uses with plans. Not only housing uses, but also industrial, commercial,
tourism and other land uses put pressure on agricultural land. Despite the legal regulations on
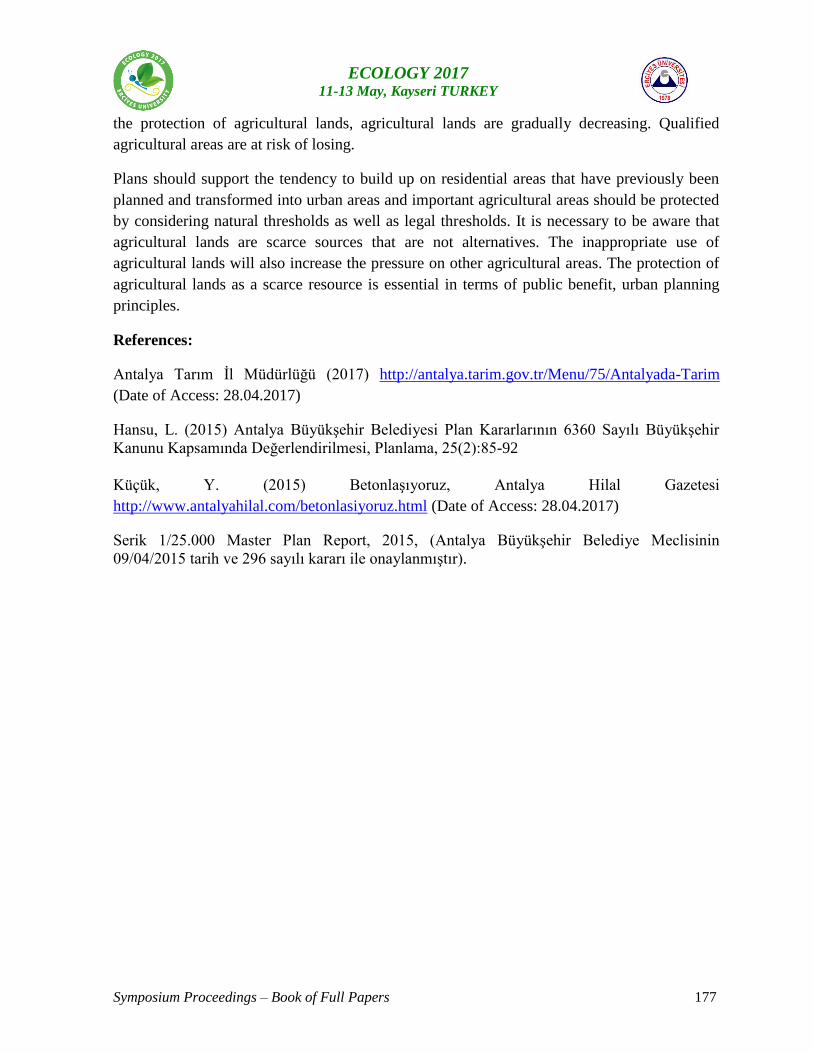
Symposium Proceedings – Book of Full Papers 177
ECOLOGY 2017 11-13 May, Kayseri TURKEY
the protection of agricultural lands, agricultural lands are gradually decreasing. Qualified
agricultural areas are at risk of losing.
Plans should support the tendency to build up on residential areas that have previously been
planned and transformed into urban areas and important agricultural areas should be protected
by considering natural thresholds as well as legal thresholds. It is necessary to be aware that
agricultural lands are scarce sources that are not alternatives. The inappropriate use of
agricultural lands will also increase the pressure on other agricultural areas. The protection of
agricultural lands as a scarce resource is essential in terms of public benefit, urban planning
principles.
References:
Antalya Tarım İl Müdürlüğü (2017) http://antalya.tarim.gov.tr/Menu/75/Antalyada-Tarim
(Date of Access: 28.04.2017)
Hansu, L. (2015) Antalya Büyükşehir Belediyesi Plan Kararlarının 6360 Sayılı Büyükşehir
Kanunu Kapsamında Değerlendirilmesi, Planlama, 25(2):85-92
Küçük, Y. (2015) Betonlaşıyoruz, Antalya Hilal Gazetesi
http://www.antalyahilal.com/betonlasiyoruz.html (Date of Access: 28.04.2017)
Serik 1/25.000 Master Plan Report, 2015, (Antalya Büyükşehir Belediye Meclisinin
09/04/2015 tarih ve 296 sayılı kararı ile onaylanmıştır).
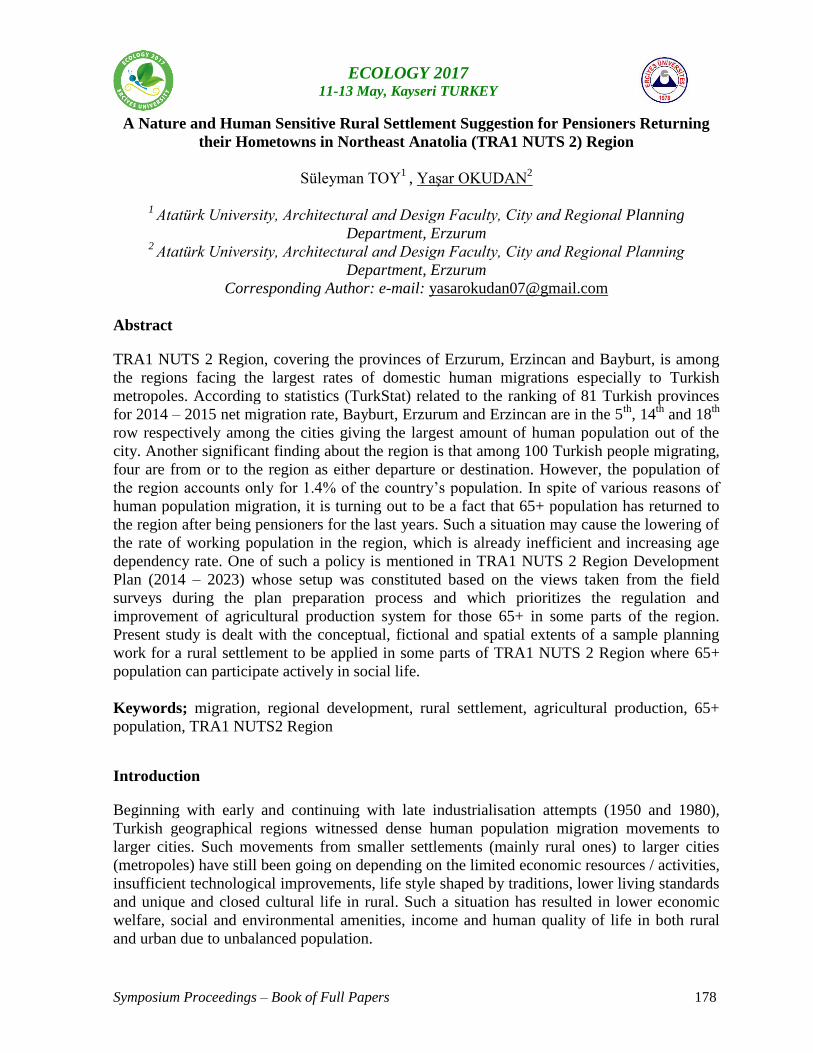
Symposium Proceedings – Book of Full Papers 178
ECOLOGY 2017 11-13 May, Kayseri TURKEY
A Nature and Human Sensitive Rural Settlement Suggestion for Pensioners Returning
their Hometowns in Northeast Anatolia (TRA1 NUTS 2) Region
Süleyman TOY1
, Yaşar OKUDAN2
1 Atatürk University, Architectural and Design Faculty, City and Regional Planning
Department, Erzurum 2
Atatürk University, Architectural and Design Faculty, City and Regional Planning
Department, Erzurum
Corresponding Author: e-mail: [email protected]
Abstract
TRA1 NUTS 2 Region, covering the provinces of Erzurum, Erzincan and Bayburt, is among
the regions facing the largest rates of domestic human migrations especially to Turkish
metropoles. According to statistics (TurkStat) related to the ranking of 81 Turkish provinces
for 2014 – 2015 net migration rate, Bayburt, Erzurum and Erzincan are in the 5th
, 14th
and 18th
row respectively among the cities giving the largest amount of human population out of the
city. Another significant finding about the region is that among 100 Turkish people migrating,
four are from or to the region as either departure or destination. However, the population of
the region accounts only for 1.4% of the country’s population. In spite of various reasons of
human population migration, it is turning out to be a fact that 65+ population has returned to
the region after being pensioners for the last years. Such a situation may cause the lowering of
the rate of working population in the region, which is already inefficient and increasing age
dependency rate. One of such a policy is mentioned in TRA1 NUTS 2 Region Development
Plan (2014 – 2023) whose setup was constituted based on the views taken from the field
surveys during the plan preparation process and which prioritizes the regulation and
improvement of agricultural production system for those 65+ in some parts of the region.
Present study is dealt with the conceptual, fictional and spatial extents of a sample planning
work for a rural settlement to be applied in some parts of TRA1 NUTS 2 Region where 65+
population can participate actively in social life.
Keywords; migration, regional development, rural settlement, agricultural production, 65+
population, TRA1 NUTS2 Region
Introduction
Beginning with early and continuing with late industrialisation attempts (1950 and 1980),
Turkish geographical regions witnessed dense human population migration movements to
larger cities. Such movements from smaller settlements (mainly rural ones) to larger cities
(metropoles) have still been going on depending on the limited economic resources / activities,
insufficient technological improvements, life style shaped by traditions, lower living standards
and unique and closed cultural life in rural. Such a situation has resulted in lower economic
welfare, social and environmental amenities, income and human quality of life in both rural
and urban due to unbalanced population.
Symposium Proceedings – Book of Full Papers 179
ECOLOGY 2017 11-13 May, Kayseri TURKEY
The definition of rural area may vary from country to country, even from institution to
institution. However, within general terms and from geographical and demographical
perspectives, rural area is classified to be an area or a region where human population is
generally low and economic activities and production are mainly based on agriculture and
animal husbandry. Rural people in Turkey remain poor and economic inequality between
urban and rural areas increase. Lower agricultural productivity, poor infrastructure, lack of
access to finance, poor education and the development of skills, and other constraints may
limit economic opportunities for rural poor and make them vulnerable to economic, social, and
personal risks. For these reasons, while young people tend to migrate to cities, retired people
tend to migrate to rural and coastal areas for the slower and more relaxed pace and the natural
beauty. Spencer (2000) stated that the migration of elderly people from cities to the coastal
areas is an increasing trend, which will stretch the resources of small communities to a limit.
This situation is similar to that in China, England, Germany or many other countries as it is in
Turkey. Although 70% of Turkey's population lives in urban areas, a large proportion of the
elderly population live in rural areas. Rate of 65 and above age group is known to be over
10.3% in rural population while the rate of those living in cities is 5.6 percent.
As a demographic measure, why age 65 should be taken as a criterion? Social aging is a
situation in which the power and ability of an individual is lost in her/his works and social life,
and (s)he is no longer able to use her/his talents and skills in the community. Numerous
national and international organizations are concerned about the numerical age even though
the definition of aging may vary depending on the demographic status of scientific
perspectives, locations (country, region or city), and the nature of data obtained / analysed. It
is stated in the World Population Aging Report (UNDESA 2013), which is accepted to be the
most comprehensive and up-to-date source of aging and prepared by Department of Economic
and Social Affairs that for all statistical purposes, the population aged 60 years and over is
considered as the elderly population.
Rural Aging
Elder human population in rural is mainly from two sources as in other age groups; aging local
people and aged foreign people coming or intending to come to rural out of the area, which is
their original hometown. Either local or foreign elder people live together in rural and face the
same (un)favourable conditions.
Even though there is no clear definition for elder people in rural in especially Turkish
literature, the concept of "rural elderly" may be accepted to express their some characteristics
available for the present study (Spencer 2000). The concept of "rural elderly" can be evaluated
by assessing their economic opportunities, physical conditions, nutritional status, health care
conditions, language problems and other psycho-social problems under the (hard) conditions
the rural areas provide. These people are less able to access health care and security services
compared to those living in urban areas.
Deterioration in their natural environment and living areas, and reducing agricultural
production may cause some socio-economic problems for rural elderly people. In addition, a
consistently aging population may cause some problems like the increase in income from state
earnings based on pension scheme, higher healthcare costs and a shrinkage of the rate of
people at working age. Other difficulties in rural for the elderly may be the access to basic
services such as food shops, banks and post offices. In addition, public transport may not be
Symposium Proceedings – Book of Full Papers 180
ECOLOGY 2017 11-13 May, Kayseri TURKEY
efficient since sparsely populated areas cannot receive enough public transport service. Local
labour shortage is another problem to be faced in rural areas with high rate of pensioners
(Spencer, 2000).
From these points of view, content of problems, rural challenges and solutions for problems
will be presented in the ahead of the study.
Problems of Rural Aging People and Suggestions
Two important facts on the rural issue should not be forgotten, first of which is that rural
poverty remains a key social problem, i.e. according to data from the TurkStat (TUIK),
poverty rates in rural areas are higher than that in urban areas. This reality is true if people are
called "aging before wealth". Second fact is that changes in cultural beliefs and family
structures have weakened the traditional family, which is the traditional source of social and
economic support for the elderly in rural areas. Given these two assumptions, it is important to
produce spatial and strategic policies to address the challenges of 65+ people living in rural
areas, which may be given as follows.
Low service provision
Sparse populations and the increasing rationalisation of services can result in a lack of locally
available services. As services tend to follow populations, many depopulated rural areas are
left without important public and social services (O’Shea, 2009). This can be problematic for
elderly people who do not have the capacity to travel longer distances, especially to access the
services needed. The decline in basic services can also negatively influence the capacity to
link rural areas with friends and neighbourhood. Socializing of aging people decrease.
Opportunities to access local shops, cream shops, post offices and other social gatherings is
problematic for older people due to their physical disabilities. Transportation is the main issue
because it relates to the socialization, accessibility, urgency, security, and quality of life. When
the deterioration of health, death or the high cost of driving and car, public transportation is
important thing for older people in rural areas. Ensuring the access to services and facilities
may overstrain to the older people with walking in particularly urgent situations. In addition,
pavements may be difficult for moving and stopping continuously and reduce the mobility.
Lack of transportation has the potential to affect negatively access to services and people,
resulting in unmet needs, reduced quality of life and increased isolation. Older people in rural
areas have highly to use private car because cars have advantages such as timesaving and
freedom on the way. They often stop using private car when they are obliged to use
alternatives because of their mobility problems often worsening or driving licensing loss. In
less populated rural areas, it is extremely difficult to find an efficient and convenient bus route
and timetable needed by the users. Adapting bus fares to the aging population is another
concern since the service suppliers exclude difficult, expensive and less mobile bus routes.
Public transportation may have disadvantages such as infrequent, unreliable and inconvenient
buses, inaccessible bus stops, mismatching timetables and routes which may cause difficulties
in accessing health care – particularly for early morning appointments – and returning home
from health visits (Defra, 2013). Taxis and private rent a car may be needed in the case of
health problems but the elderly cannot afford pay the amount.
For the solution, bookable mini buses can be useful in response to the challenges of bus and
private cars.
Health Services
Symposium Proceedings – Book of Full Papers 181
ECOLOGY 2017 11-13 May, Kayseri TURKEY
It is a fact that aging is one of the inevitable stages of human life. In this phase, the health
status of the people is gaining importance in making their lives resolved. Along with the
growth of the age, some physiological and anatomical changes occur and this causes the
people of certain ages to be more sensitive to some health problems. When we look at the
distribution of general health status of elderly people by settlement area and sex, 43.1% of
men living in Turkey and 17.8% of women declared general health status as good or very
good. While this ratio is 46.7 per cent for men and 18.5 per cent for women in cities, it is 39.0
per cent for men and 16.8 per cent for women in rural areas. 35.1 percent of males and 51.9
percent of females stated that their health status is bad or very bad over the age of 75. (TUIK,
2012).
According to the data from Turkish Ministry of Health (Table 1), bed capacity of Erzurum and
Erzincan is above average of country in terms of universities, private and total health
institutions. We can see this quantitative indicator from schema of number of health
institutions and beds in the region. However, these health services are located in the city and
people who live in rural areas cannot benefit from these amenities easily in Turkey. It is also
emphasized that the elderly have difficulties since health care centres do not work regularly in
their villages.
Table 1. The number of Health Institutions and Beds in the Region (Ministry of Health, 2015)
Location Number of
hospitals
Number of
beds
The number
of beds per
10 thousand
people
The number
of qualified
beds
The number
of intensive
care beds
Erzincan 11 601 27.0 330 52
Erzurum 24 3.611 47.4 2,135 380
Bayburt 1 200 25.5 91 13
Turkey 1,533 209,648 26.6 106,279 31,525
It is emphasized in the "Health Transformation Program" of Turkey that in rural areas the
services of primary health care cannot fully be performed and must be improved. In rural
areas, however, elderly individuals, especially those in disadvantageous position, should be
able to access to their healthcare, preventive and curative services they need more easily.
Social Exclusion
As mentioned above, rural people especially disadvantageous individuals including the elderly
remain isolated depending on the factors caused by the poor transport links and designs. The
settlements with lower population density in rural face irregular transport services and
timetables. Therefore, they face difficulty integrating, cooperating and communicating with
other people out of their towns or villages. Migration of young rural people from their homes
to other larger locations is another reason for social exclusion (isolation) of the rural elderly
since such type of migration can diminish the family pattern links. Family structure has slowly
been changing in Turkey and in its rural part. Since younger members of the families leave
their homes, older ones remain to be alone, unattended and have to face problems of rural
areas such as economic difficulties or health issues.
Staying at Home
The elderly are willing to pertain their autonomy, independence and self-reliance as in their
old days and thus they prefer to stay at home, where they need private care and support. Such
Symposium Proceedings – Book of Full Papers 182
ECOLOGY 2017 11-13 May, Kayseri TURKEY
an activity requires the elderly to lead a life at home and face difficulties providing affordable,
supportive age-appropriate housing services, cost of home service delivery, coordination with
services, decreasing number of volunteers and whether or not there are informal caregivers,
and barriers to service due to low awareness, user misunderstandings and low expectations.
Elderly care is usually left to the responsibility of the woman living in that dwelling, although
it requires special knowledge and approach, or is given by caregivers who do not have enough
information. Especially in the rural areas where the patriarchal family structure is more
intense, the care of the elderly is seen as the duty of the woman in the family. So this cycle
continues depending on the good intentions of the people. On the other hand, care services in
rural Turkey are taken in the name of institutionalization. Care services for elderly individuals
are offered as institutional care and home care services. Institutional care can vary according
to the physical and mental capacity of the elderly in need, the monetary status of the elderly,
and the social security situation (TUIK, 2013). Nowadays there are studies on the way of
supporting and supervising home care (Karahan and Güven, 2002). According to the Turkish
Code 2022 on the connection of the elderly with no income in Turkey, Monthly Fulfilment of
65 years old, needy and orphaned Turkish Citizens, 145.51 TL per month in 2015. Payment
and 300 TL per month for the person looking after the elderly family member at home. In
addition to the financial support provided at home, care services, however, it is also important
to take the support of a specialist to ensure that the elderly can lead a healthy life, and to
protect this expert from potential old problems, to alleviate or solve existing problems.
Aging Population and Labor Force
Demographically, out of 15 – 64 age group is accepted to be unworkable. 65+ age group is
among the unworkable groups out of economic activities or limited to participation in the
workforce (TUIK, 2013). The decline in the rate of elderly population that can work with
advancing ages causes a negative condition for the economic workforce and production.
Even though, elderly population in a country poses a greater danger to its economy, present
study aims to make a good relationship between aging population and labour force in
especially in rural areas, which face land use and physical design challenges that make it
harder for elderly adults to remain independent, limited transit and housing options and
physical disconnects.
New initiatives have been developed to make life easier for the elderly such as mixed-use
zoning, dense urban pattern, complete streets and universal design. In convenience with this
design approach, sites can be selected for production areas by considering the same principles.
Mixed-site production areas can help the elderly move and work handily. Separate and
fragmented soil structure may cause slowdown in production while making it difficult for
them move. It will be necessary to spend extra time for activities such as collecting and
maintaining products in separate places. However, suitable designs and site selections can be
performed for the elderly to produce all types of products and make the required physical
activities for their health and wellbeing.
TRA1 NUTS II Region exhibits favourable soil, water and environmental conditions for
agricultural production. It is possible in the region to produce products such as wheat, alfalfa,
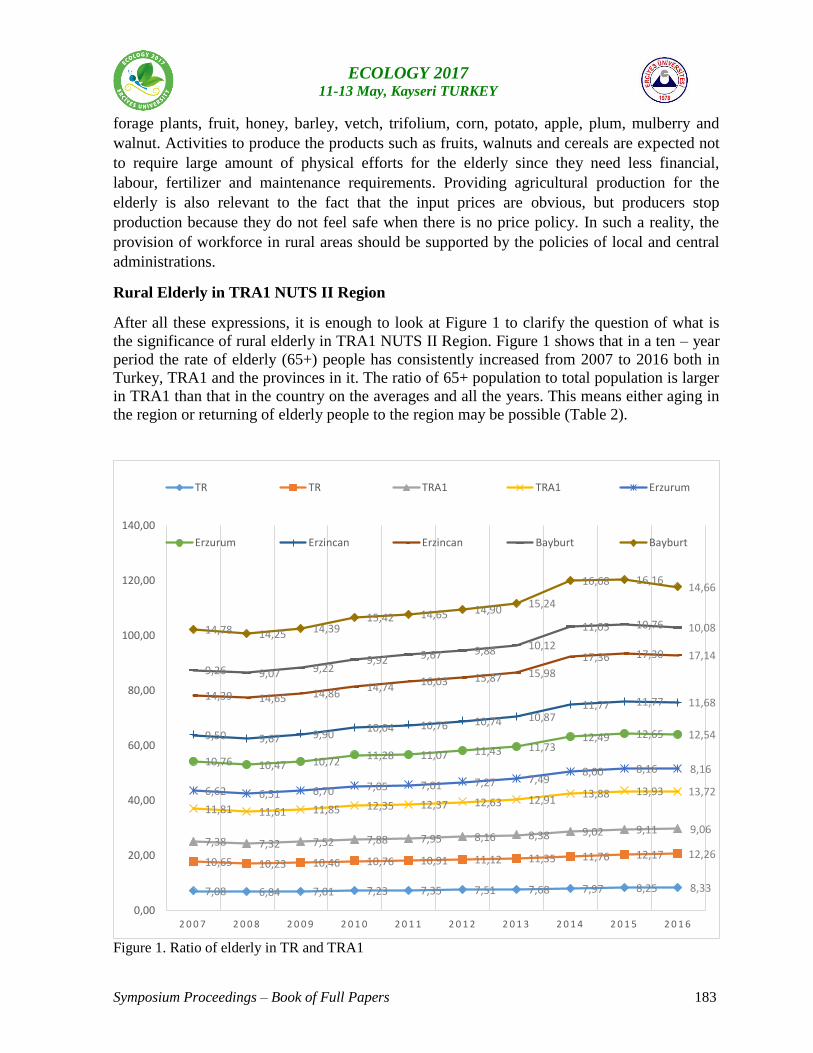
Symposium Proceedings – Book of Full Papers 183
ECOLOGY 2017 11-13 May, Kayseri TURKEY
forage plants, fruit, honey, barley, vetch, trifolium, corn, potato, apple, plum, mulberry and
walnut. Activities to produce the products such as fruits, walnuts and cereals are expected not
to require large amount of physical efforts for the elderly since they need less financial,
labour, fertilizer and maintenance requirements. Providing agricultural production for the
elderly is also relevant to the fact that the input prices are obvious, but producers stop
production because they do not feel safe when there is no price policy. In such a reality, the
provision of workforce in rural areas should be supported by the policies of local and central
administrations.
Rural Elderly in TRA1 NUTS II Region
After all these expressions, it is enough to look at Figure 1 to clarify the question of what is
the significance of rural elderly in TRA1 NUTS II Region. Figure 1 shows that in a ten – year
period the rate of elderly (65+) people has consistently increased from 2007 to 2016 both in
Turkey, TRA1 and the provinces in it. The ratio of 65+ population to total population is larger
in TRA1 than that in the country on the averages and all the years. This means either aging in
the region or returning of elderly people to the region may be possible (Table 2).
Figure 1. Ratio of elderly in TR and TRA1
7,08 6,84 7,01 7,23 7,35 7,51 7,68 7,97 8,25 8,33
10,65 10,23 10,46 10,76 10,91 11,12 11,35 11,76 12,17 12,26 7,38 7,32 7,52 7,88 7,95 8,16 8,38 9,02 9,11 9,06
11,81 11,61 11,85 12,35 12,37 12,63 12,91 13,88 13,93 13,72 6,62 6,51 6,70 7,05 7,01 7,27 7,49 8,00 8,16 8,16
10,76 10,47 10,72 11,28 11,07 11,43 11,73
12,49 12,65 12,54 9,50 9,67 9,90 10,04 10,76 10,74 10,87
11,77 11,77 11,68 14,39 14,65 14,86
14,74 16,03 15,87 15,98
17,36 17,30 17,14 9,26 9,07 9,22
9,92 9,67 9,88 10,12
11,05 10,76 10,08 14,78 14,25 14,39 15,42 14,65 14,90
15,24
16,68 16,16 14,66
0,00
20,00
40,00
60,00
80,00
100,00
120,00
140,00
2 0 0 7 2 0 0 8 2 0 0 9 2 0 1 0 2 0 1 1 2 0 1 2 2 0 1 3 2 0 1 4 2 0 1 5 2 0 1 6
TR TR TRA1 TRA1 Erzurum
Erzurum Erzincan Erzincan Bayburt Bayburt

Symposium Proceedings – Book of Full Papers 184
ECOLOGY 2017 11-13 May, Kayseri TURKEY
These general patterns, along with an aging population means that rural areas will experience
the greatest amount of age-related problems. In this point, this study aims to examine the rural
aging, participation of 65+ population in social and economic development with the low
density agricultural production, tourism or mass production. In addition, for the purpose of
improving people's quality of life, health, participation, transportation, spatial facilities
policies will be produced.
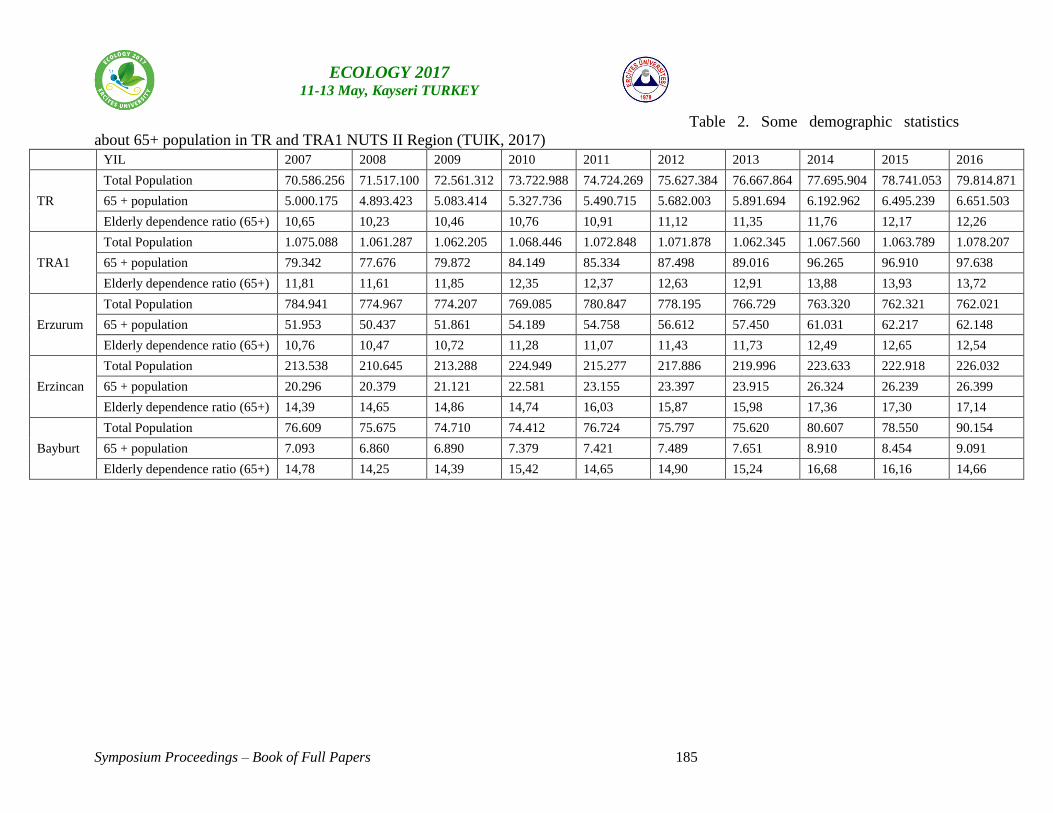
Symposium Proceedings – Book of Full Papers 185
ECOLOGY 2017 11-13 May, Kayseri TURKEY
Table 2. Some demographic statistics
about 65+ population in TR and TRA1 NUTS II Region (TUIK, 2017)
YIL 2007 2008 2009 2010 2011 2012 2013 2014 2015 2016
TR
Total Population 70.586.256 71.517.100 72.561.312 73.722.988 74.724.269 75.627.384 76.667.864 77.695.904 78.741.053 79.814.871
65 + population 5.000.175 4.893.423 5.083.414 5.327.736 5.490.715 5.682.003 5.891.694 6.192.962 6.495.239 6.651.503
Elderly dependence ratio (65+) 10,65 10,23 10,46 10,76 10,91 11,12 11,35 11,76 12,17 12,26
TRA1
Total Population 1.075.088 1.061.287 1.062.205 1.068.446 1.072.848 1.071.878 1.062.345 1.067.560 1.063.789 1.078.207
65 + population 79.342 77.676 79.872 84.149 85.334 87.498 89.016 96.265 96.910 97.638
Elderly dependence ratio (65+) 11,81 11,61 11,85 12,35 12,37 12,63 12,91 13,88 13,93 13,72
Erzurum
Total Population 784.941 774.967 774.207 769.085 780.847 778.195 766.729 763.320 762.321 762.021
65 + population 51.953 50.437 51.861 54.189 54.758 56.612 57.450 61.031 62.217 62.148
Elderly dependence ratio (65+) 10,76 10,47 10,72 11,28 11,07 11,43 11,73 12,49 12,65 12,54
Erzincan
Total Population 213.538 210.645 213.288 224.949 215.277 217.886 219.996 223.633 222.918 226.032
65 + population 20.296 20.379 21.121 22.581 23.155 23.397 23.915 26.324 26.239 26.399
Elderly dependence ratio (65+) 14,39 14,65 14,86 14,74 16,03 15,87 15,98 17,36 17,30 17,14
Bayburt
Total Population 76.609 75.675 74.710 74.412 76.724 75.797 75.620 80.607 78.550 90.154
65 + population 7.093 6.860 6.890 7.379 7.421 7.489 7.651 8.910 8.454 9.091
Elderly dependence ratio (65+) 14,78 14,25 14,39 15,42 14,65 14,90 15,24 16,68 16,16 14,66
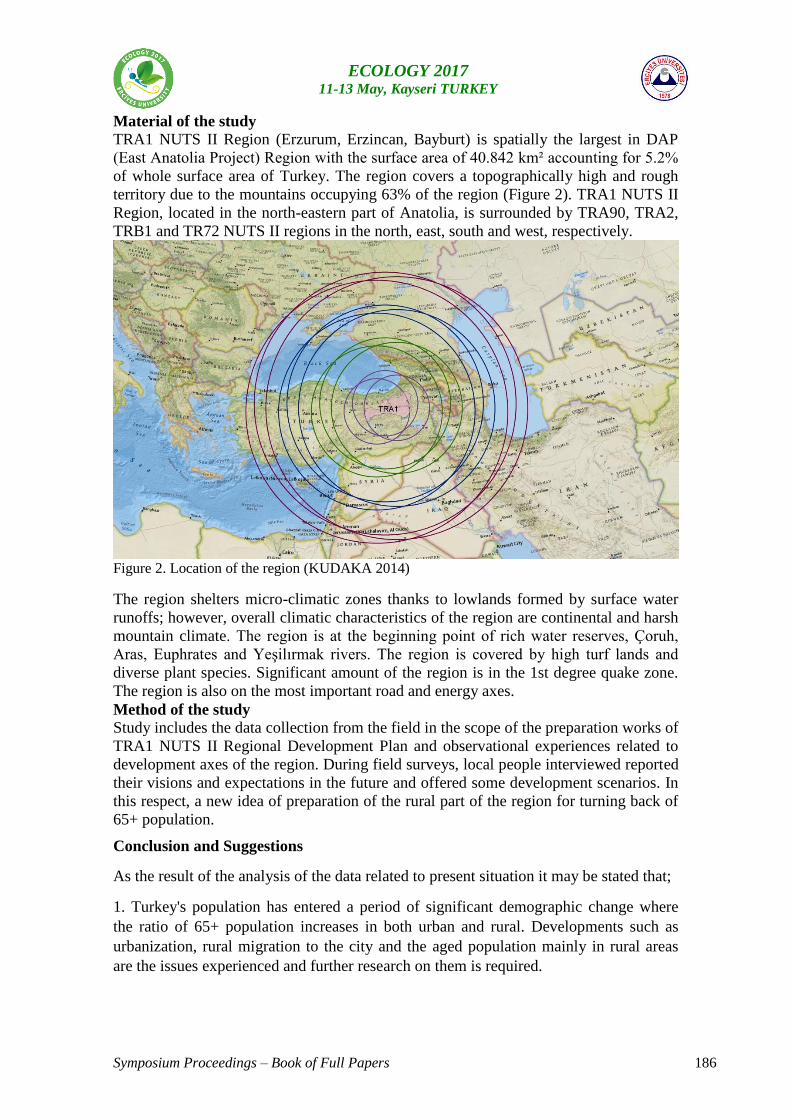
Symposium Proceedings – Book of Full Papers 186
ECOLOGY 2017 11-13 May, Kayseri TURKEY
Material of the study
TRA1 NUTS II Region (Erzurum, Erzincan, Bayburt) is spatially the largest in DAP
(East Anatolia Project) Region with the surface area of 40.842 km² accounting for 5.2%
of whole surface area of Turkey. The region covers a topographically high and rough
territory due to the mountains occupying 63% of the region (Figure 2). TRA1 NUTS II
Region, located in the north-eastern part of Anatolia, is surrounded by TRA90, TRA2,
TRB1 and TR72 NUTS II regions in the north, east, south and west, respectively.
Figure 2. Location of the region (KUDAKA 2014)
The region shelters micro-climatic zones thanks to lowlands formed by surface water
runoffs; however, overall climatic characteristics of the region are continental and harsh
mountain climate. The region is at the beginning point of rich water reserves, Çoruh,
Aras, Euphrates and Yeşilırmak rivers. The region is covered by high turf lands and
diverse plant species. Significant amount of the region is in the 1st degree quake zone.
The region is also on the most important road and energy axes.
Method of the study
Study includes the data collection from the field in the scope of the preparation works of
TRA1 NUTS II Regional Development Plan and observational experiences related to
development axes of the region. During field surveys, local people interviewed reported
their visions and expectations in the future and offered some development scenarios. In
this respect, a new idea of preparation of the rural part of the region for turning back of
65+ population.
Conclusion and Suggestions
As the result of the analysis of the data related to present situation it may be stated that;
1. Turkey's population has entered a period of significant demographic change where
the ratio of 65+ population increases in both urban and rural. Developments such as
urbanization, rural migration to the city and the aged population mainly in rural areas
are the issues experienced and further research on them is required.
Symposium Proceedings – Book of Full Papers 187
ECOLOGY 2017 11-13 May, Kayseri TURKEY
2. In a very near future, a significant proportion of the country’s population will be
above 65 and this rate is larger in the eastern part of the country especially in rural
areas. It is therefore necessary to conduct further research, develop policies, make
spatial planning, and set up new life styles for the rural elderly in order to sustain
socioeconomic development and incrrase prosperity in rural areas.
3. In the policies and planning efforts, great care must be spent to focus on the solutions
of elderly’s present problems such as difficulty accessing to services (health care,
transport, food shopping etc.), by analysing their needs order to determine whether they
can access to services and to what extent these services are provided.
4. In order to show the advantages and benefits of living in a rural area after 65, model
elderly sensitive settlements should be designed paying special attentions to elderly
people’s social, economic, physical and health status.
5. As the result of such policies, not only local elderly but also those out of the region
should be happy to live and come in their hometowns. Only in this way may the
emigrants intend to turn back to their home once upon a time they left and increase their
contributions to local and national economy.
References
UNDESA 2013. United Nations, Department of Economic and Social Affairs,
Population Division. World Population Ageing 2013. ST/ESA/SER.A/348.
ST/SEA/SER.A/348 United Nations publication
http://www.un.org/en/development/desa/population/publications/pdf/ageing/Worl
dPopulationAgeing2013.pdf
O’Shea E. 2009. Rural ageing and public policy in Ireland in McDonagh J, Varley T,
Dhortall S (eds); A Living Countryside: The Politics of Sustainable Development
in Rural Ireland. England: Ashgate
CONNOLLY, S., FINN, C., & O’SHEA, E. 2014. Rural Ageing in Ireland: Key Trends
and Issues.
In http://www.icsg.ie/files/personfiles/m2184_ruralage1_issuesinageing.pdf.
Retrieved March 25, 2017.
Morken, L., & Warner, M. (2012, October). Planning for the Aging Population: Rural
Responses to the Challenge.
In http://s3.amazonaws.com/mildredwarner.org/attachments/000/000/196/origina
l/5a05087ac5578fa1f3cbf7b4fcefb24a. Retrieved March 25, 2017.
Spencer, G. (2000, December 14). We must plan for elderly migration.
In https://www.theguardian.com/society/2000/dec/14/housingpolicy.communities.
Retrieved March 25, 2017
The Maturing of America Communities Moving Forward for an Aging Population.
(2011, June). Retrieved from http://www.aarp.org/content/dam/aarp/livable-
communities/learn/civic/the-maturing-of-america-communities-moving-forward-
for-an-aging-population-2011-aarp.pdf
KUDAKA 2014. TRA1 Düzey 2 2014-2023 BÖLGE PLANI MEVCUT DURUM
ANALİZİ.
In http://kudaka.org.tr/apb/KUDAKA_Mevcut_Durum_Analizi_2014_2023.pdf.
Retrieved March 25, 2017.
Symposium Proceedings – Book of Full Papers 188
ECOLOGY 2017 11-13 May, Kayseri TURKEY
Wang, L., & Béland, D. 2014. Assessing the Financial Sustainability of China’s Rural
Pension System [Electronic
version]. http://www.mdpi.com/journal/sustainability, 6, 3271-3290.
Öztürk, H. 2015. Yaşlanma Ve Kirsal Yaşlilik Mevcut Durum Raporu. Altan Matbaası.
Ankara. 52 sayfa. http://www.kalkinmaatolyesi.org/v2/wp-
content/uploads/2015/03/YASLILIK-VE-KIRSAL-YASLANMA.pdf. Retrieved
March 25, 2017.
Karahan, A. ve Güven, S. (2002). Yaşlılıkta evde bakım, Geriatri, 5(4): 155- 159.
DEFRA 2013. (Department for Environment & Food & Rural Affairs) 2013 Rural
Ageing Research Summary Report of Findings.
In DEFRARuralAgeingReport.pdf. Retrieved March 25, 2017. Retrieved 25
March 2017, from
ADB (Asian Development Bank). ….. Social Protection Project Briefs. Reforming the
Rural Pension System in the People’s Republic of China.
https://www.adb.org/sites/default/files/publication/28595/prc-rural-pension-system.pdf
Symposium Proceedings – Book of Full Papers 189
ECOLOGY 2017 11-13 May, Kayseri TURKEY
Adsorption of a Reactive Textile Dye by a Low-Cost Activated Carbon
Balci Behzat, F. Elcin Erkurt, E. Su
Turan
[email protected] [email protected]
Cukurova University Department of Environmental Engineering, 01136,
Balcali/Saricam, Adana/Turkey
Abstract
Synthetic textile dyes are potential hazard to living organisms in aquatic media. In the
present study, activated carbon produced from Eucalyptus camaldulensis (ECAC) was
used as a low-cost adsorbent for the removal of a textile dye Reactive Blue 29 (RB29)
from aqueous solution. The effects of various independent parameters, contact time, pH,
temperature, and initial RB29 concentration on adsorption were investigated. It was
found that the adsorption capacity of ECAC increases with the increasing of RB29
concentration, temperature and pH. The adsorption capacity for 250 mg/L RB29 was
found to be 314.7 mg/g at pH 9 and 40 °C with 0.1 g ECAC. Freundlich isotherm
successfully described the adsorption process with 0.995 R2 value.
Keywords: Eucalyptus camaldulensis, Reactive Blue 29, Adsorption, Langmuir,
Freundlich
1. Introduction
Dyes usually have a synthetic origin and complex aromatic structures. These synthetic
dyes are widely used in the textile, food, pharmaceutical, tanning, cosmetics and
electroplating industries (Saban 2011). These industrial processes can discharge
wastewaters containing dye into water systems (Mohan et al. 2002). Dyes are potential
hazardous chemicals to living aquatic organisms. Dye containing wastewater could have
carcinogen and toxic effects on aqueous life due to their permanent color. The presence
of dyes in water systems reduces light penetration into deeper layers, lowering the gas
solubility, diminishing photosynthetic activity and deteriorating the water quality
(Myslak and Bolt 1988; Kumar et al. 2012). The methods generally used for treating
dye-containing wastewaters are membrane filtration, coagulation-flocculation
(Crawford and Gretlyn 1990), reverse osmosis (Asano, 1998) and adsorption (Wong et
al. 2004). Adsorption is a widely-used and effective physical method for the treatment
of colored wastewater. Adsorption systems have gained prominence as treatment
processes that ensure good quality effluents that are low in concentrations of dissolved
organic compounds, such as dyes (Walker and Weatherley 1997). Activated carbon is
one of the most popular and widely-used adsorbents. In most industries, activated
carbon is used for the treatment of toxic, non-biodegradable process effluents and as a
tertiary treatment following biological oxidation (Eckenfelder ,1989). On the other
hand, application of commercially activated carbons remains limited due the high cost
resulting from the production of activated carbon from expensive materials, such as coal
(Tamer et al., 2013).
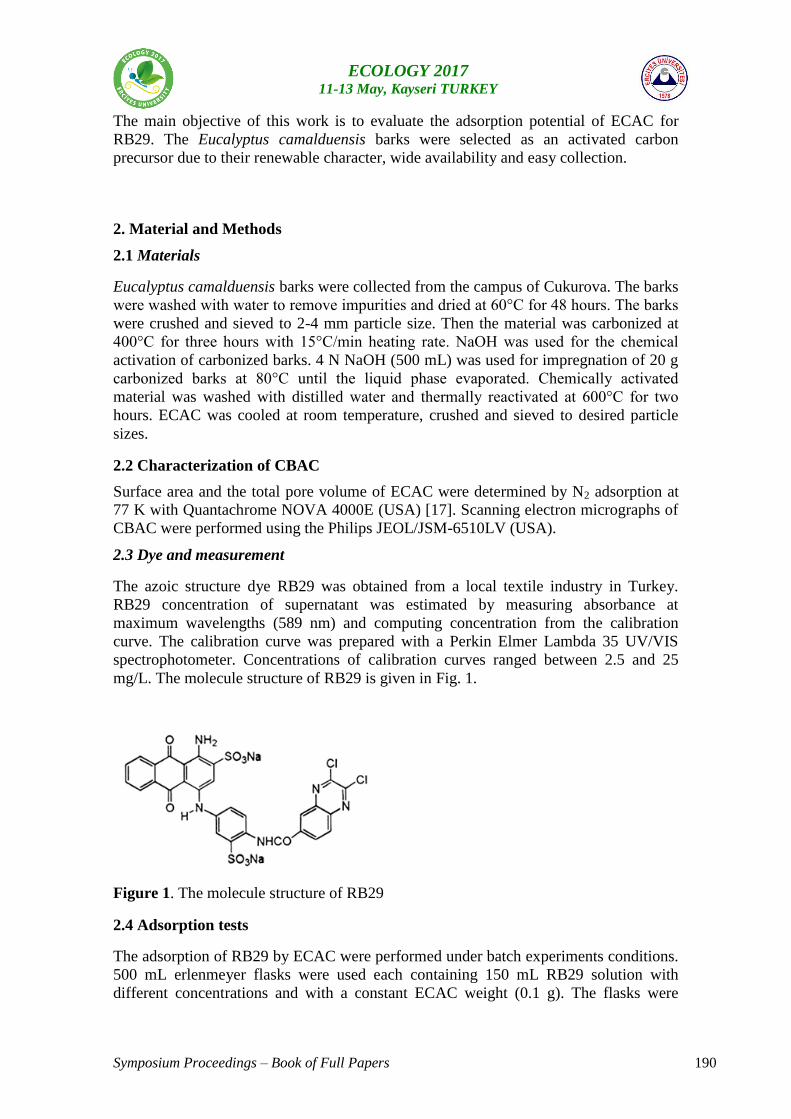
Symposium Proceedings – Book of Full Papers 190
ECOLOGY 2017 11-13 May, Kayseri TURKEY
The main objective of this work is to evaluate the adsorption potential of ECAC for
RB29. The Eucalyptus camalduensis barks were selected as an activated carbon
precursor due to their renewable character, wide availability and easy collection.
2. Material and Methods
2.1 Materials
Eucalyptus camalduensis barks were collected from the campus of Cukurova. The barks
were washed with water to remove impurities and dried at 60°C for 48 hours. The barks
were crushed and sieved to 2-4 mm particle size. Then the material was carbonized at
400°C for three hours with 15°C/min heating rate. NaOH was used for the chemical
activation of carbonized barks. 4 N NaOH (500 mL) was used for impregnation of 20 g
carbonized barks at 80°C until the liquid phase evaporated. Chemically activated
material was washed with distilled water and thermally reactivated at 600°C for two
hours. ECAC was cooled at room temperature, crushed and sieved to desired particle
sizes.
2.2 Characterization of CBAC
Surface area and the total pore volume of ECAC were determined by N2 adsorption at
77 K with Quantachrome NOVA 4000E (USA) [17]. Scanning electron micrographs of
CBAC were performed using the Philips JEOL/JSM-6510LV (USA).
2.3 Dye and measurement
The azoic structure dye RB29 was obtained from a local textile industry in Turkey.
RB29 concentration of supernatant was estimated by measuring absorbance at
maximum wavelengths (589 nm) and computing concentration from the calibration
curve. The calibration curve was prepared with a Perkin Elmer Lambda 35 UV/VIS
spectrophotometer. Concentrations of calibration curves ranged between 2.5 and 25
mg/L. The molecule structure of RB29 is given in Fig. 1.
Figure 1. The molecule structure of RB29
2.4 Adsorption tests
The adsorption of RB29 by ECAC were performed under batch experiments conditions.
500 mL erlenmeyer flasks were used each containing 150 mL RB29 solution with
different concentrations and with a constant ECAC weight (0.1 g). The flasks were
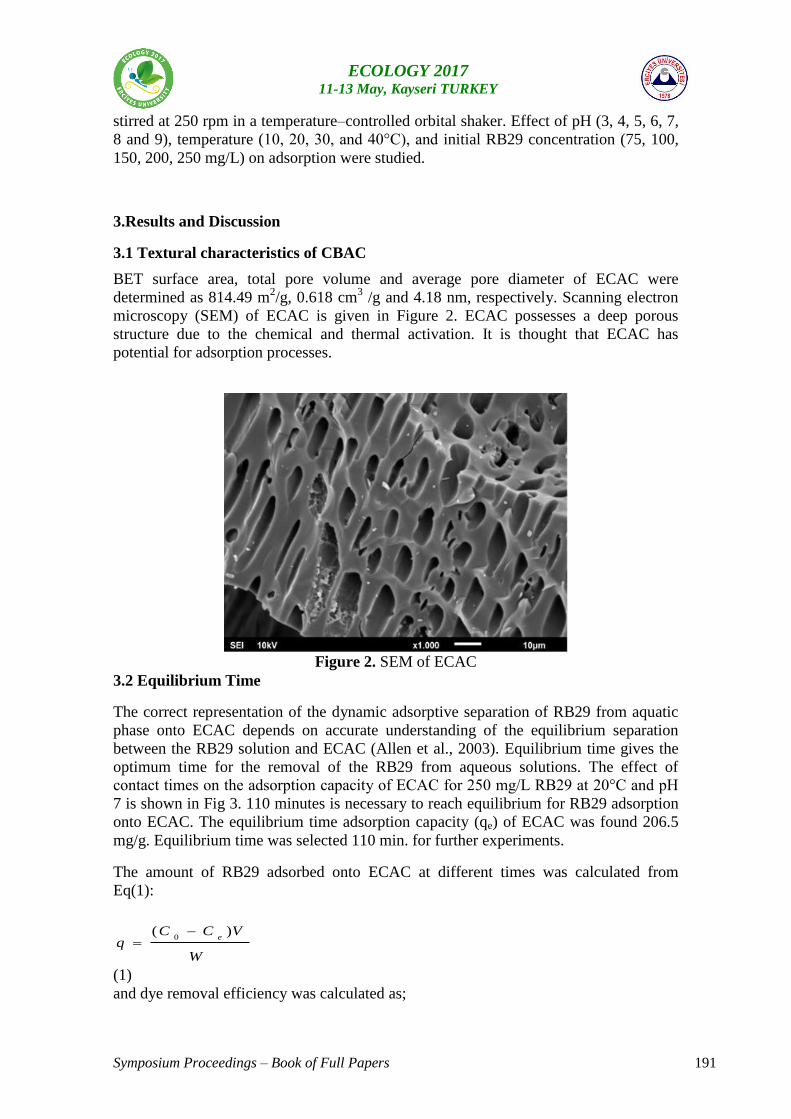
Symposium Proceedings – Book of Full Papers 191
ECOLOGY 2017 11-13 May, Kayseri TURKEY
stirred at 250 rpm in a temperature–controlled orbital shaker. Effect of pH (3, 4, 5, 6, 7,
8 and 9), temperature (10, 20, 30, and 40°C), and initial RB29 concentration (75, 100,
150, 200, 250 mg/L) on adsorption were studied.
3.Results and Discussion
3.1 Textural characteristics of CBAC
BET surface area, total pore volume and average pore diameter of ECAC were
determined as 814.49 m2/g, 0.618 cm
3 /g and 4.18 nm, respectively. Scanning electron
microscopy (SEM) of ECAC is given in Figure 2. ECAC possesses a deep porous
structure due to the chemical and thermal activation. It is thought that ECAC has
potential for adsorption processes.
Figure 2. SEM of ECAC
3.2 Equilibrium Time
The correct representation of the dynamic adsorptive separation of RB29 from aquatic
phase onto ECAC depends on accurate understanding of the equilibrium separation
between the RB29 solution and ECAC (Allen et al., 2003). Equilibrium time gives the
optimum time for the removal of the RB29 from aqueous solutions. The effect of
contact times on the adsorption capacity of ECAC for 250 mg/L RB29 at 20°C and pH
7 is shown in Fig 3. 110 minutes is necessary to reach equilibrium for RB29 adsorption
onto ECAC. The equilibrium time adsorption capacity (qe) of ECAC was found 206.5
mg/g. Equilibrium time was selected 110 min. for further experiments.
The amount of RB29 adsorbed onto ECAC at different times was calculated from
Eq(1):
(1)
and dye removal efficiency was calculated as;
W
VCCq
e)(
0
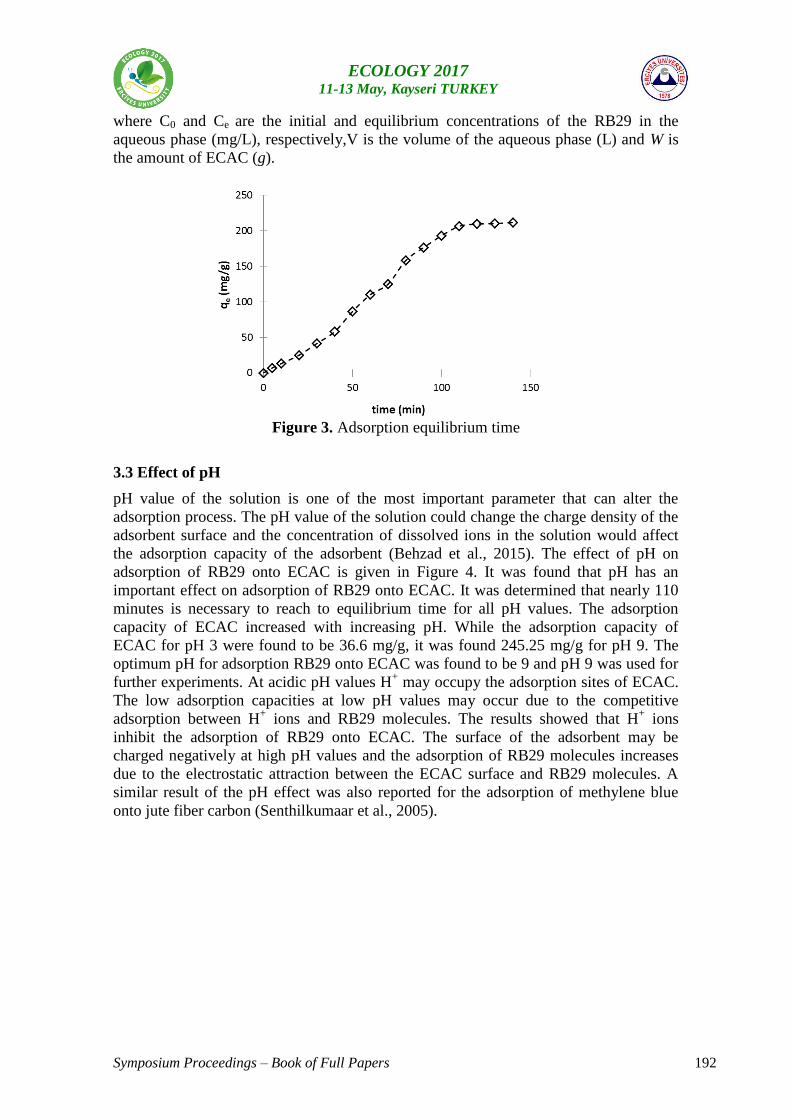
Symposium Proceedings – Book of Full Papers 192
ECOLOGY 2017 11-13 May, Kayseri TURKEY
where C0 and Ce are the initial and equilibrium concentrations of the RB29 in the
aqueous phase (mg/L), respectively,V is the volume of the aqueous phase (L) and W is
the amount of ECAC (g).
Figure 3. Adsorption equilibrium time
3.3 Effect of pH
pH value of the solution is one of the most important parameter that can alter the
adsorption process. The pH value of the solution could change the charge density of the
adsorbent surface and the concentration of dissolved ions in the solution would affect
the adsorption capacity of the adsorbent (Behzad et al., 2015). The effect of pH on
adsorption of RB29 onto ECAC is given in Figure 4. It was found that pH has an
important effect on adsorption of RB29 onto ECAC. It was determined that nearly 110
minutes is necessary to reach to equilibrium time for all pH values. The adsorption
capacity of ECAC increased with increasing pH. While the adsorption capacity of
ECAC for pH 3 were found to be 36.6 mg/g, it was found 245.25 mg/g for pH 9. The
optimum pH for adsorption RB29 onto ECAC was found to be 9 and pH 9 was used for
further experiments. At acidic pH values H+ may occupy the adsorption sites of ECAC.
The low adsorption capacities at low pH values may occur due to the competitive
adsorption between H+ ions and RB29 molecules. The results showed that H
+ ions
inhibit the adsorption of RB29 onto ECAC. The surface of the adsorbent may be
charged negatively at high pH values and the adsorption of RB29 molecules increases
due to the electrostatic attraction between the ECAC surface and RB29 molecules. A
similar result of the pH effect was also reported for the adsorption of methylene blue
onto jute fiber carbon (Senthilkumaar et al., 2005).
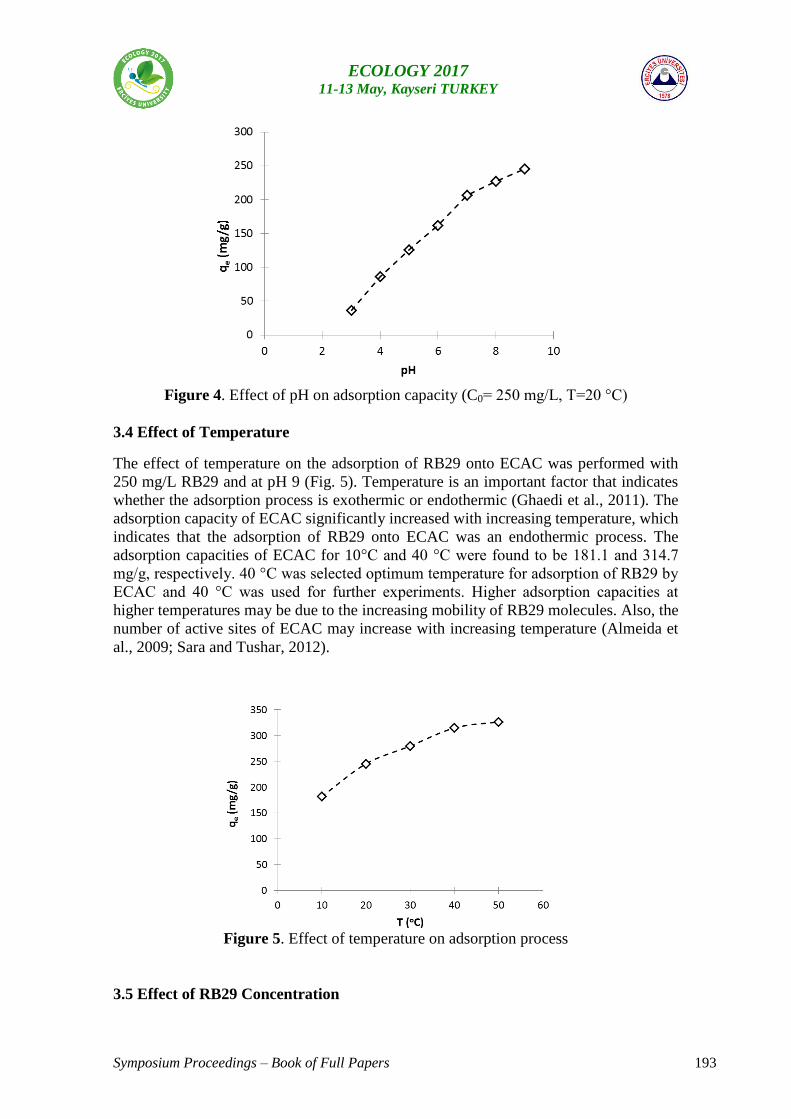
Symposium Proceedings – Book of Full Papers 193
ECOLOGY 2017 11-13 May, Kayseri TURKEY
Figure 4. Effect of pH on adsorption capacity (C0= 250 mg/L, T=20 °C)
3.4 Effect of Temperature
The effect of temperature on the adsorption of RB29 onto ECAC was performed with
250 mg/L RB29 and at pH 9 (Fig. 5). Temperature is an important factor that indicates
whether the adsorption process is exothermic or endothermic (Ghaedi et al., 2011). The
adsorption capacity of ECAC significantly increased with increasing temperature, which
indicates that the adsorption of RB29 onto ECAC was an endothermic process. The
adsorption capacities of ECAC for 10°C and 40 °C were found to be 181.1 and 314.7
mg/g, respectively. 40 °C was selected optimum temperature for adsorption of RB29 by
ECAC and 40 °C was used for further experiments. Higher adsorption capacities at
higher temperatures may be due to the increasing mobility of RB29 molecules. Also, the
number of active sites of ECAC may increase with increasing temperature (Almeida et
al., 2009; Sara and Tushar, 2012).
Figure 5. Effect of temperature on adsorption process
3.5 Effect of RB29 Concentration
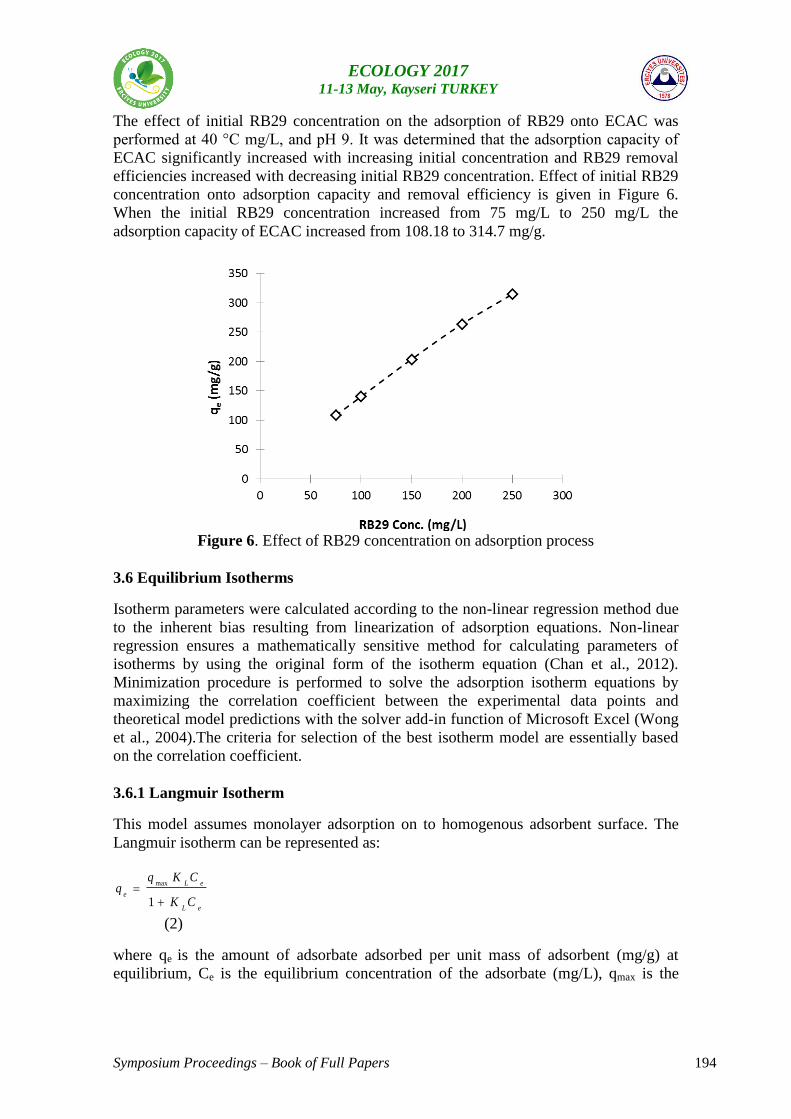
Symposium Proceedings – Book of Full Papers 194
ECOLOGY 2017 11-13 May, Kayseri TURKEY
The effect of initial RB29 concentration on the adsorption of RB29 onto ECAC was
performed at 40 °C mg/L, and pH 9. It was determined that the adsorption capacity of
ECAC significantly increased with increasing initial concentration and RB29 removal
efficiencies increased with decreasing initial RB29 concentration. Effect of initial RB29
concentration onto adsorption capacity and removal efficiency is given in Figure 6.
When the initial RB29 concentration increased from 75 mg/L to 250 mg/L the
adsorption capacity of ECAC increased from 108.18 to 314.7 mg/g.
Figure 6. Effect of RB29 concentration on adsorption process
3.6 Equilibrium Isotherms
Isotherm parameters were calculated according to the non-linear regression method due
to the inherent bias resulting from linearization of adsorption equations. Non-linear
regression ensures a mathematically sensitive method for calculating parameters of
isotherms by using the original form of the isotherm equation (Chan et al., 2012).
Minimization procedure is performed to solve the adsorption isotherm equations by
maximizing the correlation coefficient between the experimental data points and
theoretical model predictions with the solver add-in function of Microsoft Excel (Wong
et al., 2004).The criteria for selection of the best isotherm model are essentially based
on the correlation coefficient.
3.6.1 Langmuir Isotherm
This model assumes monolayer adsorption on to homogenous adsorbent surface. The
Langmuir isotherm can be represented as:
eL
eL
e
CK
CKqq
1
max
(2)
where qe is the amount of adsorbate adsorbed per unit mass of adsorbent (mg/g) at
equilibrium, Ce is the equilibrium concentration of the adsorbate (mg/L), qmax is the
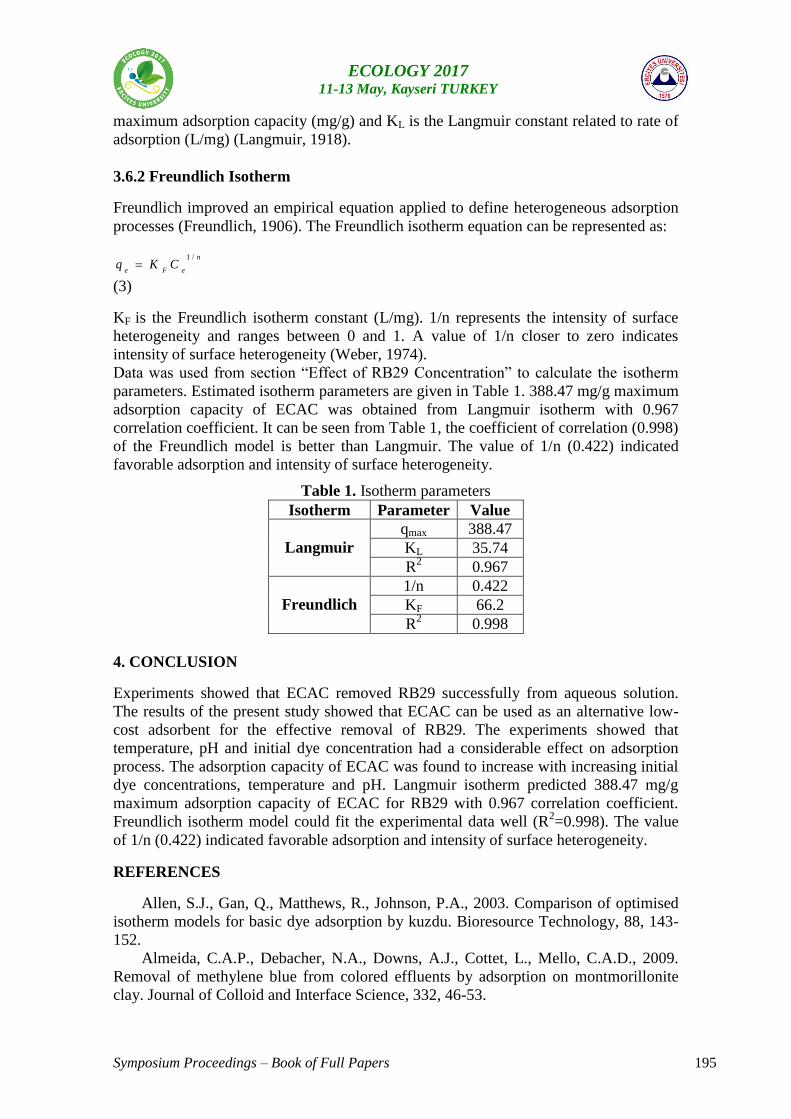
Symposium Proceedings – Book of Full Papers 195
ECOLOGY 2017 11-13 May, Kayseri TURKEY
maximum adsorption capacity (mg/g) and KL is the Langmuir constant related to rate of
adsorption (L/mg) (Langmuir, 1918).
3.6.2 Freundlich Isotherm
Freundlich improved an empirical equation applied to define heterogeneous adsorption
processes (Freundlich, 1906). The Freundlich isotherm equation can be represented as:
n
eFeCKq
/1
(3)
KF is the Freundlich isotherm constant (L/mg). 1/n represents the intensity of surface
heterogeneity and ranges between 0 and 1. A value of 1/n closer to zero indicates
intensity of surface heterogeneity (Weber, 1974).
Data was used from section “Effect of RB29 Concentration” to calculate the isotherm
parameters. Estimated isotherm parameters are given in Table 1. 388.47 mg/g maximum
adsorption capacity of ECAC was obtained from Langmuir isotherm with 0.967
correlation coefficient. It can be seen from Table 1, the coefficient of correlation (0.998)
of the Freundlich model is better than Langmuir. The value of 1/n (0.422) indicated
favorable adsorption and intensity of surface heterogeneity.
Table 1. Isotherm parameters
Isotherm Parameter Value
Langmuir
qmax 388.47
KL 35.74
R2 0.967
Freundlich
1/n 0.422
KF 66.2
R2 0.998
4. CONCLUSION
Experiments showed that ECAC removed RB29 successfully from aqueous solution.
The results of the present study showed that ECAC can be used as an alternative low-
cost adsorbent for the effective removal of RB29. The experiments showed that
temperature, pH and initial dye concentration had a considerable effect on adsorption
process. The adsorption capacity of ECAC was found to increase with increasing initial
dye concentrations, temperature and pH. Langmuir isotherm predicted 388.47 mg/g
maximum adsorption capacity of ECAC for RB29 with 0.967 correlation coefficient.
Freundlich isotherm model could fit the experimental data well (R2=0.998). The value
of 1/n (0.422) indicated favorable adsorption and intensity of surface heterogeneity.
REFERENCES
Allen, S.J., Gan, Q., Matthews, R., Johnson, P.A., 2003. Comparison of optimised
isotherm models for basic dye adsorption by kuzdu. Bioresource Technology, 88, 143-
152.
Almeida, C.A.P., Debacher, N.A., Downs, A.J., Cottet, L., Mello, C.A.D., 2009.
Removal of methylene blue from colored effluents by adsorption on montmorillonite
clay. Journal of Colloid and Interface Science, 332, 46-53.
Symposium Proceedings – Book of Full Papers 196
ECOLOGY 2017 11-13 May, Kayseri TURKEY
Asano, T., 1998. Wastewater reclamation and reuse. Water Quality Management
Library, Vol. 10, Technomic Publishing Company, Lancaster, PA, USA.
Behzad, H., Susana, R., Abdeltif, A., Mohd, R., Alaa, H., Mohammad, A. A., 2014.
Uptake of Reactive Black 5 by pumice and walnut activated carbon: Chemistry and
adsorption mechanisms. Journal of Industrial and Engineering Chemistry, 20, 2939–
2947.
Chan, L.S., Cheung, W.H., Allen, S.J., McKay, G., 2012. Error analysis of
adsorption isotherm models for acid dyes onto bamboo derived activated carbon.
Chinese Journal of Chemical Engineering, 20(3), 535-542.
Crawford, H.B., Gretlyn, C., 1990. Water treatment plant design. American Society
of Civil Engineers/American Water Works Association, 2nd Edition, McGraw-Hill,
New York.
Eckenfelder, W.W., 1989. Industrial water pollution control. NewYork: McGraw-
Hill International Editions.
Freundlich, H.M.F., 1906. Over the adsorption in solution. Journal of Physical
Chemistry, 57, 385-470.
Ghaedi, M., Hassanzadeh, A., NasiriKokhdan, S., 2011. Multiwalled carbon
nanotubes as adsorbents for the kinetic and equilibrium study of the removal of alizarin
red S and morin. J.Chem. Eng. Data, 56, 2511-2520.
Kannan, N., Sundaram, M.M., 2001. Kinetics and mechanism of removal of
methylene blue by adsorption on various carbon-a comparative study. Dyes Pigments,
51, 25-40.
Kumar, P., Agnihotri, R., Wasewar, K.L., Uslu, H., Yoo, C.K., 2012. Status of
adsorptive removal of dye from textile industry effluent. Desalin. Water Treat., 50, 226–
244.
Langmuir, I., 1918. Adsorption of gases on plain surfaces of glass mica platinum. J.
Am. Chem. Soc., 40, 136-403.
Mohan, D., Singh, K.P., Singh, G., Kumar, K., 2002. Removal of dyes from
wastewater using flyash, a low-cost adsorbent. Ind. Eng. Chem. Res., 41, 3688-3695.
Myslak, Z.W., Bolt, H.M., 1988. Occupational Exposure to azo dyes and risk of
bladder cancer. Zbl. Arbeitsmed, 38, 310-321.
Saban, T.M., 2011. Modeling of adsorption isotherms and kinetics of reactive dye
from aqueous solution by peanut hull. Chem. Eng. Journ., 168, 1234-1240.
Sara, D., Tushar, K.S., 2012. Removal of anionic dye Congo red from aqueous
solution by raw pine and acid-treated pine cone powder as adsorbent: Equilibrium,
thermodynamic, kinetics, mechanism and process design. Water Research, 46, 1933-
1946.
Senthilkumaar, S., Varadarajan, P.R., Porkodi, K., Subbhuraam, C.V., 2005.
Adsorption of methylene blue onto jute fiber carbon: kinetics and equilibrium studies. J.
Colloid Interf. Sci., 284, 78-82.
Tamer, M.A., Ismail, A., Mohd, A.A., Ahmad, A.F., 2013. Cadmium removal from
aqueous solution using microwaved olive stone activated carbon. J. Environ. Chem.
Eng.; 1(5): 89-99.
Walker, G.M., Weatherley, L.R., 1997. Adsorption of acid dyes onto granular
activated carbon in fixed beds. Water Research, 31(8), 2093-101.
Weber, T.W., Chakkravorti, R.K., 1974. Pore and solid diffusion models for fixed
bed adsorbers. AIChE Journal, 20(2) 228-38.

Symposium Proceedings – Book of Full Papers 197
ECOLOGY 2017 11-13 May, Kayseri TURKEY
Wong, Y.C., Szeto, Y.S., Cheung, W.H., McKay, G., 2004. Adsorption of acid
dyes on chitosan– equilibrium isotherm analyses. Process Biochemistry, 39(6), 695-704.
Symposium Proceedings – Book of Full Papers 198
ECOLOGY 2017 11-13 May, Kayseri TURKEY
Iron-dependent modulation of paddy field ecology
Abin Sebastian*1
, Ashwini Nangia1 and M.N.V. Prasad
2
1School of Chemistry,
2Dept. Plant Sciences, University of Hyderabad,
Hyderabad, India.
*Corresponding author email: [email protected]
Abstract: Paddy field represents wetland ecosystem. In the present study,
Fe dependency on properties of paddy field soils, and iron-mediated
chemical reactions under oxygenic and anoxygenic conditions were studied
with emphasis on Fe nutrion in rice (Oryza sativa). It is noticed that
coloration of the paddy soil varies with chemical forms of Fe. Iron in rice
paddies gets precipitated in the form of ferric oxide due to presence of
oxygen. Thus, aerobic conditions in the paddy field decrease plant
available Fe. However, anoxygenic condition during flooding leads
existence of Fe in the form of Fe2+ which will be readily uptake by the
plants. Temporary submergence related changes in oxidation state of Fe
also had consequences on the microbial consortium in the field that
influence mobilization of Fe, oxidative stress, and colonization of
anoxygenic bacteria responsible for methane and hydrogen sulphide
emission from paddy fields. Field management with irrigation and reactive
soil amendments are practical solutions to the dynamics of Fe ions and Fe
Symposium Proceedings – Book of Full Papers 199
ECOLOGY 2017 11-13 May, Kayseri TURKEY
nutrition in paddy fields. These approaches help to control the prevalence
of anoxia and existence of free ionic Fe in the field that has a consequence
on the field ecology of rice paddies and crop productivity.
Keywords: iron, rice paddies, Fe mobilization, microbial consortia,
amendments
1. Introduction
Iron is the second most abundant metal in the earth crust. Most of the Fe in
soil found as silicate minerals, Fe oxides, and hydroxides. Iron control
bioproductivity by taking part in the photosynthetic production of organic
compounds. Reduction of CO2, SO42-
, and NO3- require Fe. Atmosphere
CO2 levels also indirectly controlled by Fe because this element assists
conversion of CO2 to organic carbon via photosynthesis. The Fe hypothesis
suggests that large-scale Fe fertilization of ocean regions as a means of
enhancing the ability of the ocean to store anthropogenic CO2 and mitigate
21st-century climate change (Martin, 1990). But Fe concentrations in vast
areas of the ocean are very low (<1 nM) due to the low solubility of Fe in
oxygenic ocean water. Similarly, plant availability of Fe is less in
continents because of precipitation of Fe as Fe oxide. So it is clear that
Symposium Proceedings – Book of Full Papers 200
ECOLOGY 2017 11-13 May, Kayseri TURKEY
even though Fe is abundant in the earth, the availability Fe to a living
organism is limited. Thus changes in solubility of Fe in the earth have a
vast consequence on primary productivity in ecosystems.
Paddy soils are comprised of ferrihydrite, lepidocrocite, goethite, and
hematite (Liesack et al. 2000). It is the content of these minerals which
affects soil physicochemical properties especially the color. The paddy
soils vary in color from Yellow to yellow-brown, reddish, grayish, etc.
because of variation in the mineral form of Fe. Iron rich soil having
distinctive mineralogy is distinguished as ferruginous. This type of soil
contains a lot of Fe oxides. The paddy soils can undergo Fe enrichment as a
result of weathering and leaching of major cations such as Ca, K, and Mg.
This phenomenon is common in the rain fed acidic soils, and these soils
appear in reddish brown color (Buol, 2009). Reduction and partial re-
oxidization of Fe oxides also occur as a result of water logging and result in
mottled grayish subsurface horizons in the paddy soil (Sebastian et al.
2016). If the concentration of humus is relatively low, the paddy soils are
referred as ferric where dark brown or ochreous Fe-enriched subsoil is
present.
Apart from the color, the presence of Fe determines the hardness of the
soil. Acid soils in wet temperate regions are prone to leaching of Fe oxides
Symposium Proceedings – Book of Full Papers 201
ECOLOGY 2017 11-13 May, Kayseri TURKEY
from the upper layer to lower anaerobic layer. The horizon of this type of
soil has Fe pans with a hard cementing layer comprised of Fe, carbonate,
and humus having a thickness less than 1 cm found at a depth of half a
meter (Cunninghama et al. 2001). These types of Fe pans are common in
rice paddies near forestry plantations. The presence of Fe pan restricts the
amount of soil required for exploitation of minerals and water, and hence
rice grows in these soils are highly prone to drought. Laterite soils in
tropics are also characterize by an impermeable layer formed after
deposition of Fe and Al which restrict crop productivity.
Iron control flocculation of paddy soil colloids. Dispersion of soil colloids
affects the transport of colloids with surface runoff or with percolating
water moving through soil macropores. Rainfall and weathering of
minerals in warm humid climate often result in leaching of alumina and
silica. This event leads prevalence of sesquioxides of aluminum hydroxide,
Fe oxide, and Fe hydroxide in the paddy soil which can grade from
amorphous to crystalline (Kögel-Knabner et al. 2010). Gibbsite and
goethite are examples of sesquioxides which make soil impermeable to
water and enhance adsorption of phosphate to a solid phase. Redox nature
of the Fe strongly influences flocculation of organic matter in the soil
irrespective pH. The presence of Fe in the form of Fe3+
had a significant
effect on flocculation of organic matter. Further, a high metal to soil carbon
Symposium Proceedings – Book of Full Papers 202
ECOLOGY 2017 11-13 May, Kayseri TURKEY
ratio is required for flocculation organic matter with Fe in paddy soils
compare to Al. Thus it is clear that Fe plays an important role in the
foundation of soil structure.
Rice paddies agroecosystem where semiaquatic rice cultivates. These fields
are common in East, South and South East Asia. Traditionally these fields
are built as terraces in hills or depressed areas near rivers. Irrigation is
mandatory in rice paddies to ensure plant growth and crop productivity.
But these fields are subjected to intermittent flooding periods which make
the soil of this land to fit the category of temporary water logged soils. Iron
in the temporarily waterlogged soil take part in both reversible and
irreversible reactions which have a consequence on the redox potential and
acidity of the soil (Sebastian and Prasad, 2015). The changes in oxidation
state of Fe create dynamics in soil physicochemical properties as well as
the biological status of the soil. Hence a study of Fe dependent reactions in
rice paddies is critical to ensure maximum crop productivity and convert
rice paddies to an ecosystem having the potential to act as a sink for
atmosphere carbon dioxide.
2. Material and methods
2.1. Iron and coloration of paddy soils
Symposium Proceedings – Book of Full Papers 203
ECOLOGY 2017 11-13 May, Kayseri TURKEY
Iron imparts color to the soil. Hence soils having different colors were
collected from Hyderabad, Telangana State, India. The samples were air
dried and sieved. The photograph of the soils was taken and based on color
soils were classified. The composition and properties of these soils were
described based on Sebastian and Prasad, 2014.
2.2. Chemical reactions of Fe in rice paddies
Rice paddies are temporary waterlogged fields. Hence these soils are
subjected to intermittent aerobic and anaerobic conditions. Therefore
possible chemical reactions of Fe under varying oxygen status were
explained with chemical equations.
2.3. Iron and bacterial consortia
Rice paddies confront a periodic aquatic and terrestrial life. So the bacterial
community of rice paddies changes with the varying presence of water. A
literature survey was conducted to understand the effect of microbial
consortia on the ionic state of Fe in rice paddies, and the result tabulated.
2.4. Iron and soil amendments
Iron nutrition of crops is important to ensure crop productivity. A slow
releasing agent of Fe synthesized from caffeic acid and ferric chloride
(Sebastian et al. 2017) was applied to grow rice in a pot containing vertisol.
Symposium Proceedings – Book of Full Papers 204
ECOLOGY 2017 11-13 May, Kayseri TURKEY
Biomass and Fe content of the plant were measured using a weigh balance
and atomic absorption spectrophotometer respectively (Sebastian et al.
2017). A literature survey was also conducted to suggest ideal soil
amendments for Fe nutrition of rice plants.
3. Results
3.1. Coloration of paddy soils
The color of the soils collected from paddy fields of Telangana were red,
gray and black. These soils identified as Alfisol, Alluvial soil, and Vertisol
(Fig.1). The variations in color of these soils are due to the difference in Fe
content and organic matter. Alfisol had the highest content of Fe. The soils
also differed in alkalinity, cation exchange capacity and percentage of sand,
silt and clay ratio (Fig.1).
3.2. Chemical reactions of Fe in rice paddies
The intermittent oxygenic and anoxygenic conditions create dynamics in Fe
pool in rice paddies. The chemical reactions occur in aerobic conditions
are:
Fe2+
+ O2 Fe3+
………………………………... (1)
FeS2+7O2+2H2O 2Fe2+
+4SO42-
+ 4H+………... (2)
Symposium Proceedings – Book of Full Papers 205
ECOLOGY 2017 11-13 May, Kayseri TURKEY
2Fe2+
+1/2 O2+ 2H2O Fe2O3+4H+……………...(3)
It is noteworthy that aerobic condition exists in rice roots even during
flooding conditions because of radical oxygen release (Fig. 2)and creates
precipitation of Fe as ferric oxides and hydroxides that are known as Fe
plaque. The chemical reaction occurs in flooded conditions are:
Fe (OH)3+CH2O +H+
Fe2+
+ CO2+H2O……….(4)
Fe2+
OH.5H2O+H3O+
Fe3+
.6H2O at pH>3…….(5)
Fe3+
.6H2O Fe(OH)3…………………………..(6)
It is clear that anoxia leads reduction of Fe3+
to Fe2+
. But the accumulation
of Fe2+
at higher concentration retard rice plant growth due to Fe toxicity.
The root aerenchyma mediated oxygen release helps in the conversion of
ferrous ion in the ferrous complex to ferric oxides, and the newly formed
complex deposited on root surface in the form Fe plaque which prevents
entry of Fe2+
ion and thereby prevent Fe toxicity.
3.3. Iron and bacterial consortia
The presence of Fe-oxidizing bacteria in the ferric precipitates on roots of
aquatic plants suggests that microbial Fe oxidation contributes substantially
to Fe precipitation in the rhizosphere. The bacterial consortia in a rice
paddy comprised of oxygen-respiring bacteria, nitrate reducers, Fe
Symposium Proceedings – Book of Full Papers 206
ECOLOGY 2017 11-13 May, Kayseri TURKEY
reducers, sulfate reducers, fermenting bacteria and methane producing
archaea. In general, after flooding oxygen is consumed by aerobic bacteria
and chemical oxidation reactions. So when oxygen depletes, alternative
electron acceptors such as Fe3+
act to drive the chemical reactions based on
thermodynamics. The reactions that are triggered by bacteria at anaerobic
and aerobic environments are:
H2O + Fe2O3 2Fe (OH)2 + O2 (Anaerobic)…...(7)
2Fe (OH)2 + O2 H2O + Fe2O3 (Aerobic)…….(8)
Oxygen releasing reactions during flooding related anoxia favors oxidation
of Fe2+
and thereby favors Fe plaque formation. Iron also plays a critical
role in the decrease of methane and hydrogen sulfide production when
there are low organic content and the low CO2 consumption in the
methanogenic zone of the soil (Fig.2). This scenario also favors
precipitation of Fe as siderite.
3.4. Soil amendments and Fe nutrition
Carbon-bound Fe oxide nanoparticles found to enhance Fe content of rice
plants to grow in vertisol (Fig. 3). It is also noticed that biomass of the
plants increased in response to nanoparticles amendment (Fig. 3).
Literature survey concluded that natural products such as compost are
Symposium Proceedings – Book of Full Papers 207
ECOLOGY 2017 11-13 May, Kayseri TURKEY
efficient for making Fe more available for plant uptake. Lowering of soil
pH by addition of acidifying agents such as sulfur amendments, ammonium
sulfate, ammonium nitrate, and urea are also practical solution to enhance
plant uptake of Fe.
4. Discussion
Iron had an influence on the structure and physic-chemical properties of
soil. The color of the soil in rice paddies of Telangana state differed mainly
because of the difference in abundance of the mineral form of Fe. Alfisol is
red colored due to the abundance of hematite and goethite (Viscarra Rossel
et al. 2010). The dark coloration of vertisol is the result of incorporation of
organic matter to the soil (Virmani et al..1982). Alluvial soil developed in
riverfronts as a result of deposition from streams. This soil appears as
brownish because of the abundance of the humic substances (Gao et al.
2017). But it is noteworthy that alfisol is the least productive among the
soil types studied form Telangana because of the lack of proper aeration
and low moisture holding capacity.
Iron oxide forms in rice paddies during oxygenic and anoxygenic
environments. Oxidations of Fe occur when the soil is dry and exposed to
oxygen. These reactions cause precipitation of Fe as Fe oxides and limit the
availability of Fe to plants. But flooding and drop of pH create the
Symposium Proceedings – Book of Full Papers 208
ECOLOGY 2017 11-13 May, Kayseri TURKEY
existence of Fe in the form of Fe2+
(Sebastian and Prasad, 2015). Rice
plants readily uptake Fe2+
and the excess accumulation of Fe create Fe
toxicity in rice plants because of Fenton reaction-mediated oxidative stress.
But the entry of oxygen to rhizosphere through radical oxygen release
causes conversion of Fe2+
to Fe3+
, and the Fe3+
is deposited as ferric
hydroxide on the rice roots and act as a barrier to uptake of excess Fe2+
(Sebastian and Prasad, 2016). Thus rice plants develop resistance to Fe
toxicity.
Intermittent flooding in the rice field affects bacterial colonization in the
rice paddies (Liesack et al. 2000). Iron-oxidizing bacteria assist oxidation
of Fe2+
under aerobic conditions. This process occurs when a flooded rice
paddy transit to aerobic state as well as when oxygen is released into
rhizosphere via radical oxygen loss. Thus colonization of Fe-oxidizing
bacteria also assists the formation of Fe plaque in the soil as well as root
surface. But under flooded conditions, Fe-reducing bacteria can convert
Fe3+
to Fe2+
. This reaction makes Fe as more soluble ferrous hydroxides in
rice paddies. Acidophilic bacteria also affect solubilization of Fe by
catalyzing the dissimilatory oxidation of Fe2+
or reduction of Fe3+
respectively (Johnson et al. 2017). The hydroxides and oxyhydroxides of
Fe can absorb hydrogen sulfide and this process decreases the release of
hydrogen sulfide from rice paddies. This process also can promote the
Symposium Proceedings – Book of Full Papers 209
ECOLOGY 2017 11-13 May, Kayseri TURKEY
reductive release of Fe2+
from ferric hydroxides. The negative correlation
of Fe and methane release from rice paddies is the result of the activity of
Fe-reducing bacteria which consume hydrogen and CO2 thus resulting in no
hydrogen available for production of methane.
Carbon-bound Fe oxides act as an adsorbent for calcium ions and slow
releasing agent of Fe. Application of these particles helped to tolerate
calcium-induced Fe deficiency in the vertisol and resulted in more
bioproductivity (Sebastian and Prasad, 2017). Organic amendments are rich
in mineral nutrients such as Fe and degradation of these materials act as a
slow releasing agent for Fe (Moreno-Jiménez et al. 2017). On the other
hand, acidifying agents makes more plant available Fe by redox
transformation of Fe (Sebastan and Prasad, 2015). Acidic pH triggers both
oxidative dissolution of Fe minerals such as pyrite and solubilization of
uncomplexed Fe, especially Fe3+
.
In summary, Fe modulates ecology of rice paddies. Soil coloration is
largely devoted to minerals form of Fe. Iron status affects flocculation of
soil colloids and organic matter which have an influence on aeration of the
soil. The redox chemistry of Fe contributes to dynamics of soil pH and
bacterial flora which in turn create a shift in ionic state and complexes of
Fe in rice paddies. Time controlled irrigation help to adjust Fe2+
in the field
Symposium Proceedings – Book of Full Papers 210
ECOLOGY 2017 11-13 May, Kayseri TURKEY
and also help to avoid Fe toxicity. Soil amendments for Fe nutrition can be
a slow releasing agent of Fe or soil acidifying agents.
Acknowledgments
Abin Sebastian gratefully acknowledges Dr. DS Kothari Postdoctoral
fellowship (No. BL/14-15/0162), UGC, India for financial support. Thanks
are due to Crystalin research Pvt. Ltd, Technology business incubator, the
University of Hyderabad for facilities.
References
Buol SW (2009). Soils and agriculture in central-west and north Brazil. Sci.
Agric. 66:697-707.
Cunninghama DA, Collins JF, Cumminsa T (2001). Anthropogenically-
triggered iron pan formation in some Irish soils over various time spans.
CATENA 43: 167–176.
Gao J, Liang C, Shen G, Lv J, Wu H (2017). Spectral characteristics of
dissolved organic matter in various agricultural soils throughout China.
Chemosphere 176: 108–116.
Symposium Proceedings – Book of Full Papers 211
ECOLOGY 2017 11-13 May, Kayseri TURKEY
Johnson DB, Hedrich S, Pakostova E (2017). Indirect Redox
Transformations of Iron, Copper, and Chromium-Catalyzed by Extremely
Acidophilic Bacteria. Front Microbiol 8: 211.
Kögel-Knabner I, Amelung, W, Cao, Z, Fiedler, S, Frenzel, P, Jahn, R,
Kalbitz, K, Kölbl, A, Schloter M (2010). Biogeochemistry of paddy soils.
Geoderma 157: 1–14.
Liesack W, Schnell S, Revsbech NP (2000) Microbiology of flooded rice
paddies. FEMS Microbiol Rev. 24(5):625-45.
Martin JH (1990). Glacial – interglacial CO2 change: the iron hypothesis.
Paleoceanography 5:1-13.
Moreno-Jiménez E, Sepúlveda R, Esteban E (2017). Efficiency of organic
and mineral based amendments to reduce metal[loid]mobility and uptake
(Lolium perenne) from a pyrite-waste contaminated soil. J Geochem
Explor 174:46–52.
Sebastian A, Nangia A, Prasad MNV (2017). Carbon-Bound Iron Oxide
Nanoparticles Prevent Calcium-Induced Iron Deficiency in Oryza sativa L.
J. Agric Food Chem 65 (3): 557–564.
Sebastian A, Prasad MNV (2015). Trace Element Management in Rice.
Agronomy 5(3):374-404.
Symposium Proceedings – Book of Full Papers 212
ECOLOGY 2017 11-13 May, Kayseri TURKEY
Sebastian A, Prasad, MNV (2014). Vertisol prevents cadmium
accumulation in rice: analysis by ecophysiological toxicity markers.
Chemosphere 108:85-92.
Sebastian A, Nakbanpote W, Panitlertumpai N, Prasad MNV (2016). Fate
of trace elements in rice paddies. In: Jörg Rinklebe, Anna S. Knox,
Michael Paller editors. Trace elements in temporary waterlogged soils and
sediments: Bioavailability, geochemical processes, management, and
remediation approaches. Eds. CRC Press Australia, pp. 313-325.
Sebastian A, Prasad MNV (2016). Iron plaque decreases cadmium
accumulation in Oryza sativa L. and serves as a source of iron. Plant Biol
18:1008–1015.
Virmani, SM, Sahrawat KL, Burford JR (1982). Physical and Chemical
Properties of Vertisols and their Management. In: Vertisols and Rice Soils
of the Tropics, Symposia Papers II, 12th Int. Congr. Soil Sci. Indian
Society of Soil Science, New Delhi, India, pp. 80–93.
Viscarra Rossel RA, Bui EN, de Caritat P, McKenzie NJ (2010). Mapping
iron oxides and the color of Australian soil using visible –near ‐infrared
reflectance spectra. J Geophys Res115: 1-13
Symposium Proceedings – Book of Full Papers 213
ECOLOGY 2017 11-13 May, Kayseri TURKEY
Tables
Caption of Table
Table. 1 Bacteria act on mobilization and immobilization of Fe in rice
paddies
Aerobic iron oxidizers
Sideroxydans lithotrophicus
Sideroxydans paludicola
Ferrimicrobium acidiphilum
Ferrithrix thermotolerans
Acidithiobacillus ferrooxidans
Acidithiobacillus ferrivorans
Anaerobic iron reducers
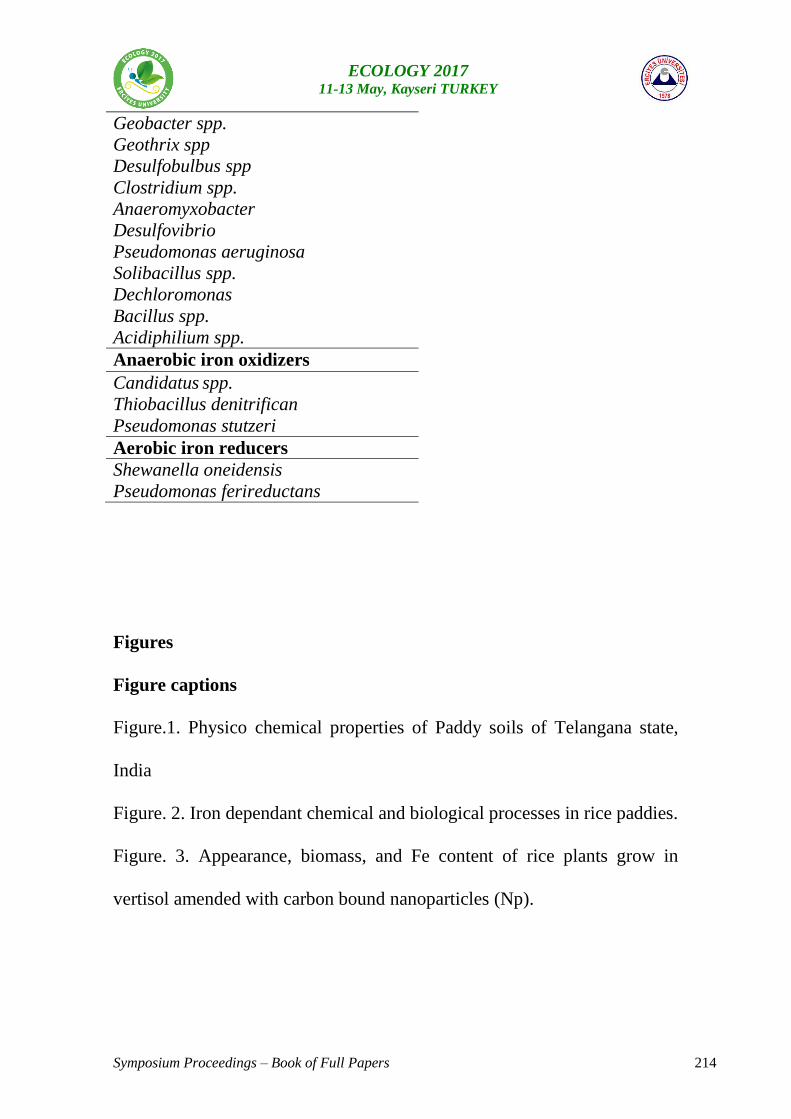
Symposium Proceedings – Book of Full Papers 214
ECOLOGY 2017 11-13 May, Kayseri TURKEY
Geobacter spp.
Geothrix spp
Desulfobulbus spp
Clostridium spp.
Anaeromyxobacter
Desulfovibrio
Pseudomonas aeruginosa
Solibacillus spp.
Dechloromonas
Bacillus spp.
Acidiphilium spp.
Anaerobic iron oxidizers
Candidatus spp.
Thiobacillus denitrifican
Pseudomonas stutzeri
Aerobic iron reducers
Shewanella oneidensis
Pseudomonas ferireductans
Figures
Figure captions
Figure.1. Physico chemical properties of Paddy soils of Telangana state,
India
Figure. 2. Iron dependant chemical and biological processes in rice paddies.
Figure. 3. Appearance, biomass, and Fe content of rice plants grow in
vertisol amended with carbon bound nanoparticles (Np).
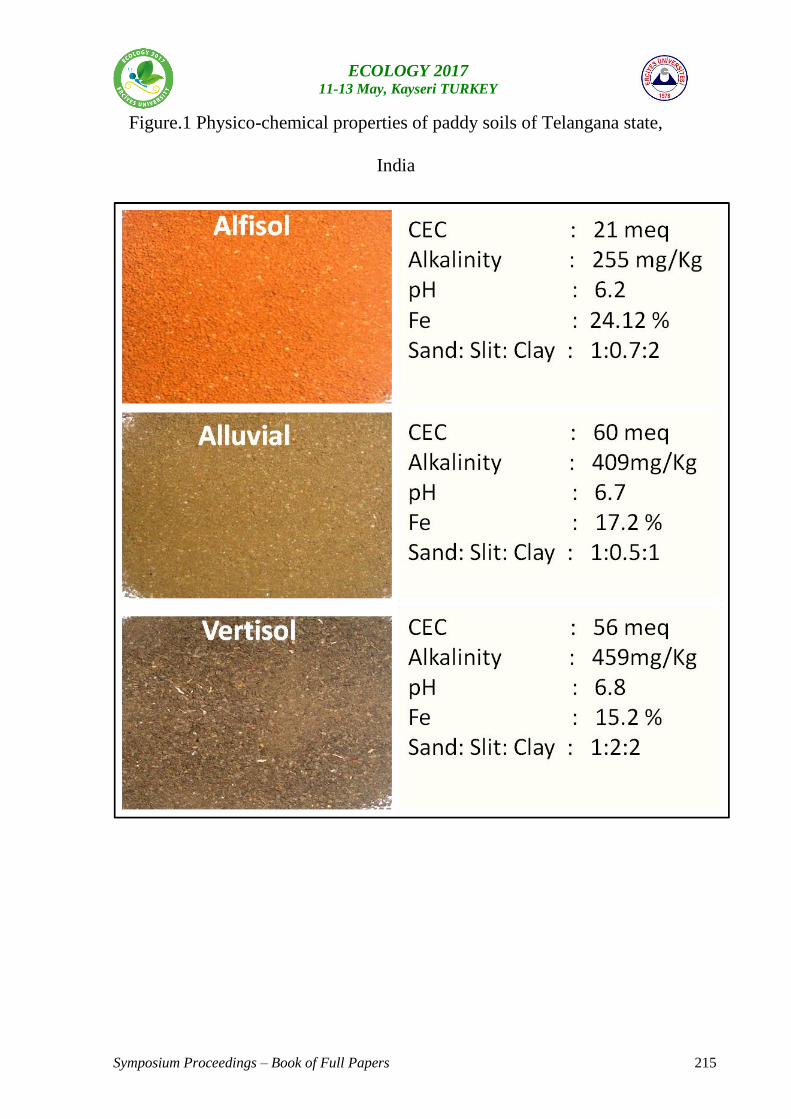
Symposium Proceedings – Book of Full Papers 215
ECOLOGY 2017 11-13 May, Kayseri TURKEY
Figure.1 Physico-chemical properties of paddy soils of Telangana state,
India
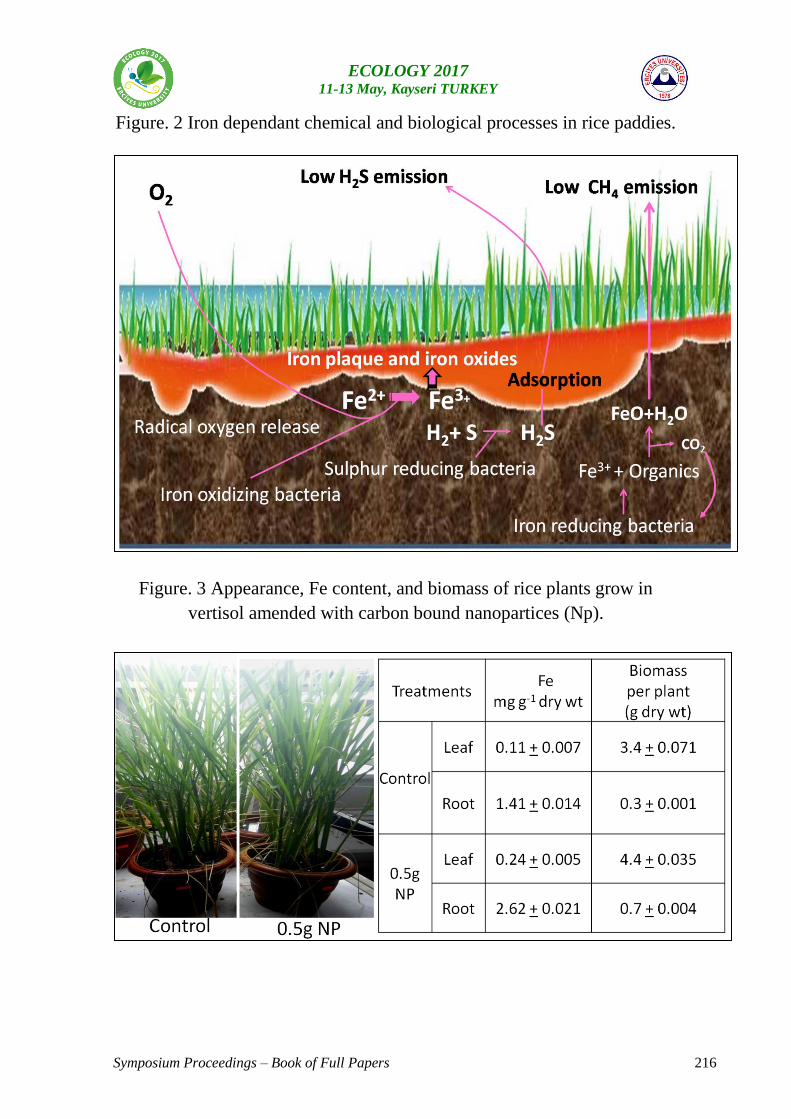
Symposium Proceedings – Book of Full Papers 216
ECOLOGY 2017 11-13 May, Kayseri TURKEY
Figure. 2 Iron dependant chemical and biological processes in rice paddies.
Figure. 3 Appearance, Fe content, and biomass of rice plants grow in
vertisol amended with carbon bound nanopartices (Np).
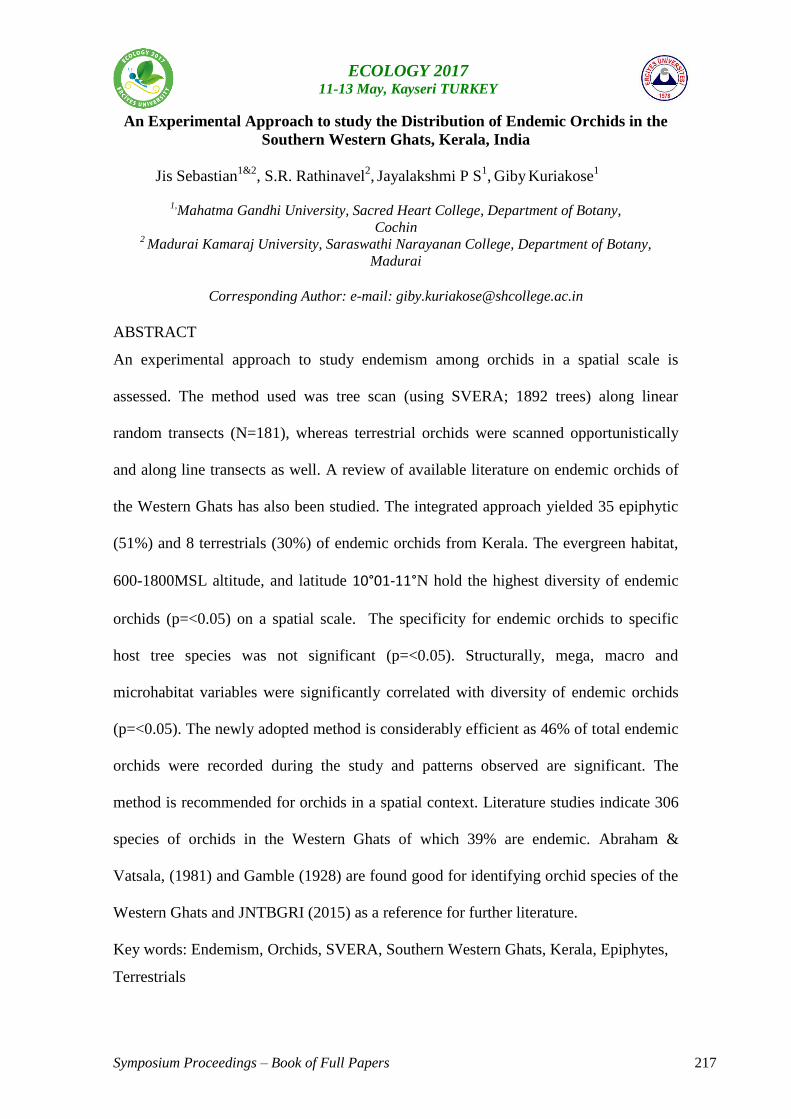
Symposium Proceedings – Book of Full Papers 217
ECOLOGY 2017 11-13 May, Kayseri TURKEY
An Experimental Approach to study the Distribution of Endemic Orchids in the
Southern Western Ghats, Kerala, India
Jis Sebastian1&2
, S.R. Rathinavel2, Jayalakshmi P S
1, Giby
Kuriakose
1
1,Mahatma Gandhi University, Sacred Heart College, Department of Botany,
Cochin 2 Madurai Kamaraj University, Saraswathi Narayanan College, Department of Botany,
Madurai
Corresponding Author: e-mail: [email protected]
ABSTRACT
An experimental approach to study endemism among orchids in a spatial scale is
assessed. The method used was tree scan (using SVERA; 1892 trees) along linear
random transects (N=181), whereas terrestrial orchids were scanned opportunistically
and along line transects as well. A review of available literature on endemic orchids of
the Western Ghats has also been studied. The integrated approach yielded 35 epiphytic
(51%) and 8 terrestrials (30%) of endemic orchids from Kerala. The evergreen habitat,
600-1800MSL altitude, and latitude 10°01-11°N hold the highest diversity of endemic
orchids (p=<0.05) on a spatial scale. The specificity for endemic orchids to specific
host tree species was not significant (p=<0.05). Structurally, mega, macro and
microhabitat variables were significantly correlated with diversity of endemic orchids
(p=<0.05). The newly adopted method is considerably efficient as 46% of total endemic
orchids were recorded during the study and patterns observed are significant. The
method is recommended for orchids in a spatial context. Literature studies indicate 306
species of orchids in the Western Ghats of which 39% are endemic. Abraham &
Vatsala, (1981) and Gamble (1928) are found good for identifying orchid species of the
Western Ghats and JNTBGRI (2015) as a reference for further literature.
Key words: Endemism, Orchids, SVERA, Southern Western Ghats, Kerala, Epiphytes,
Terrestrials
Symposium Proceedings – Book of Full Papers 218
ECOLOGY 2017 11-13 May, Kayseri TURKEY
1. INTRODUCTION Endemism is a phenomenon where a species is restricted in geographical distributions.
The geographical elements that limit such species could be islands, rivers, mountain
ranges or provinces (Peterson, 1988) and sometimes local climatic conditions as well.
Therefore, endemics are localized in distribution and unable to invade new areas. Some
of the notable endemic hotspots are Madagascar, Southeast Asia, the Caribbean and
South Africa (see http://www.cnrs.fr/inee/recherche/fichiers/Biodiversite_hotspots for
more details). The phenomenon of endemism has raised several questions and many
have attempted to unravel its specificities. The continental drift theory suggests Pangea
was divided and 65million years later, brought into present day configuration (see
http://waynesword.palomar.edu for more details). Evolutionarily, this split has led to
speciation, isolation of populations, mixing of populations and adaptation or extinction
of populations. Such endemic populations were sometimes wide or narrow in their
distribution. In order to recognize a species as being endemic, the data on its
distribution patterns across different spatial scale must be scrutinized. Endemic species
are also instrumental in enabling conservationists to demarcate regions with high
concentrations of narrow endemics as priority conservation areas provided that they are
at a greater risk of extinction (Myers et al., 2000) due to multilevel threats. The
functional role of a species or niche is what determines their specific position or
distributions (Putman, 1984). It is often much more complicated than expected and is
addressed differently in different places worldwide focusing various taxa. To
understand patterns of endemics, their niche requirements and coexistence or
competition we need to understand the relation between species and their distribution
Symposium Proceedings – Book of Full Papers 219
ECOLOGY 2017 11-13 May, Kayseri TURKEY
range (Green, 2003). Any plausible threats to their niche might sweep off the endemics
from a region. Hence, a study of the distribution of endemism is highly relevant and
centers of endemism have been recognized across the globe for this purpose.
In India, Peninsular India is the second richest endemic center after the Himalayas (Jalal
and Jayanthi, 2012). Within it, a large attention of endemics is found in the evergreen,
moist deciduous and semi-evergreen patches of the Western Ghats and to a much lesser
degree in the Eastern Ghats (Nayar, 1996). The Western Ghats, recognized as one of the
world biodiversity hotspots (Myers et al., 2000), includes a considerable gradient of
climatic conditions which have resulted in diverse forest types that harbor centers of
endemism. Data pertaining to the endemic flora of the region are scattered in different
floristic documents such as regional and local flora, scientific reports and other
publications. Amongst the flora orchids are poorly studied. As of now, ‘The flowering
plants of the Western Ghats, India’ (Nayar et al., 2014) is the only compiled information
available to understand orchid diversity of the Western Ghats. There is a handful of
preliminary studies done on the ecology of orchids in India. They depend on herbarium
specimens for ecological information (Jalal, 2012) and transect and plots for habitats of
medicinal orchids (Jalal and Rawat, 2009). A more detailed study on the epiphytic
orchid diversity (Sinu et al., 2011) using ecological sampling plots in the Soppinabetta
forests pointed out the rich epiphytic orchid diversity in farmer managed forests and
highlighted their conservation significance in central Karnataka. However, the lack of
an accepted methodology to address orchids in space is a challenge to ecologists and
conservation scientists as well. Hence, this study was carried out with a purpose to
develop an approach to study the distribution and ecology of endemic orchids in a
spatial scale in the Southern Western Ghats.
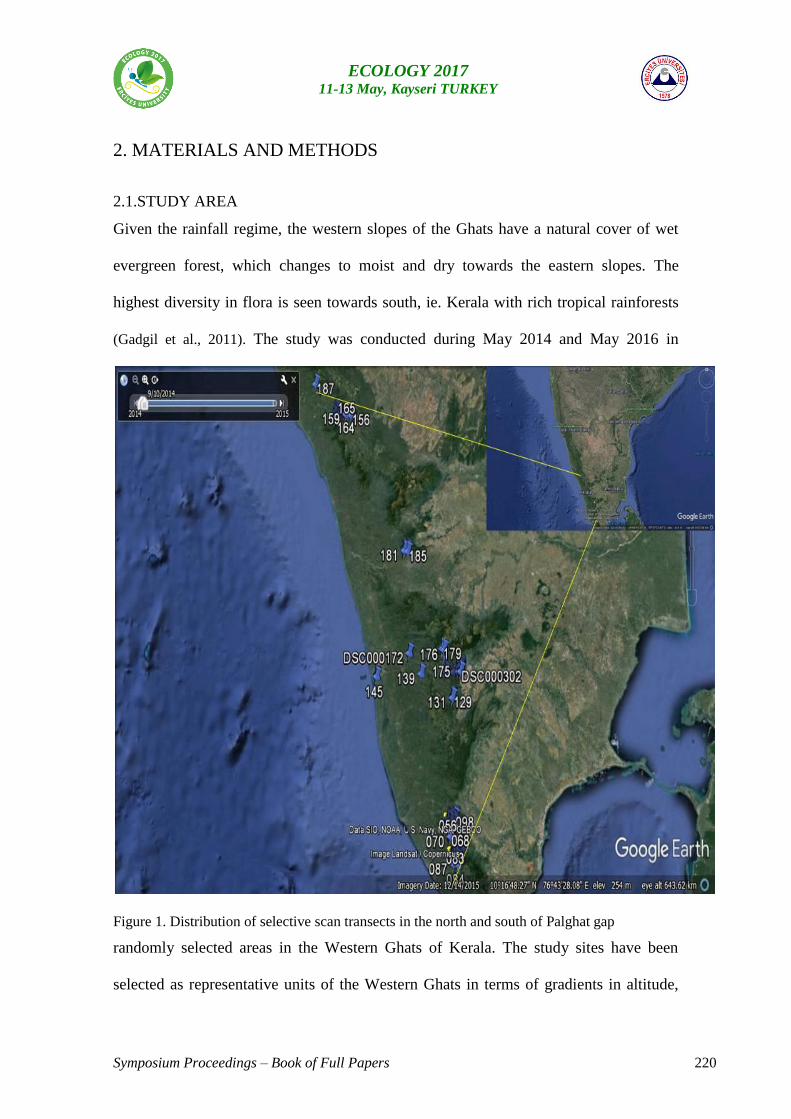
Symposium Proceedings – Book of Full Papers 220
ECOLOGY 2017 11-13 May, Kayseri TURKEY
2. MATERIALS AND METHODS
2.1.STUDY AREA
Given the rainfall regime, the western slopes of the Ghats have a natural cover of wet
evergreen forest, which changes to moist and dry towards the eastern slopes. The
highest diversity in flora is seen towards south, ie. Kerala with rich tropical rainforests
(Gadgil et al., 2011). The study was conducted during May 2014 and May 2016 in
Figure 1. Distribution of selective scan transects in the north and south of Palghat gap
randomly selected areas in the Western Ghats of Kerala. The study sites have been
selected as representative units of the Western Ghats in terms of gradients in altitude,
Symposium Proceedings – Book of Full Papers 221
ECOLOGY 2017 11-13 May, Kayseri TURKEY
vegetation types, continuous stretch of natural forest, less anthropogenic disturbances
and the representation of orchids in North, Central, and Southern Kerala (Figure 1). The
sites display an altitudinal range extending from 31 MSL to 2400 MSL and latitudinal
gradients ranges between 8°01’N and 12°10’ N (henceforth designated as classes of one
degree as Lat 1,2,3,4 and 5) and encompasses evergreen, semi-evergreen, deciduous,
shola forests and savannahs. The altitudinal ranges are categorized as low (30-600 m),
mid (601-1200 m, 1201-1800 m) and high (1801-2400 m) elevation zones.
2.2.DATA COLLECTION
Following many trial and error using conventional quadrat method, clustered quadrats
and random tree scan, epiphyte sampling was done on a plot less basis, i.e. based on the
presence of epiphytes on individual trees grounded on the method of Sampling of
Vascular Epiphytes Richness and Abundance or SVERA (Wolf et al., 2009). Selective
tree scanning method, which is based on line transects in a linear direction, was
developed for the study. Selective tree scanning was carried out in each spatial units by
laying line transects. A line transect was laid after finding a tree with at least three
individuals of orchids on it. Then, the next tree is selected at the 10th
meter from the first
individual and noted down all possible data pertaining to orchids and their phorophytes.
Also, trees in four cardinal directions (5 m away from the central one) of the first and
tenth trees were also recorded. This assured the randomness in sample selection. This
was repeated until data from a total of 10 individual trees from each line transect is
collected. Data on habitat characteristics such as the habitat type based on major
vegetation associations, the degree of slope and its aspect (face), proximity to water
sources were collected. The major vegetation types described by Champion& Seth
(1968) from the region were followed. They were Evergreen (EVEG), Semi-Evergreen
Symposium Proceedings – Book of Full Papers 222
ECOLOGY 2017 11-13 May, Kayseri TURKEY
(SEVG), Moist Deciduous (MDEC), Semi-natural Plantations (SPLNT), Shola (SHLA)
and Savannah (SVNA); the accompanying abbreviations will be used henceforth. Data
on terrestrial orchids and were also opportunistically collected.
2.3. LITERATURE STUDY
The following publications were used for the present study to gather the secondary data
regarding endemic orchids of the Western Ghats in detail. They are, “Flora of the
Presidency of Madras” (Gamble, 1928 Vol. III) 2. “Introduction to Orchids with
illustrations and descriptions of 150 South Indian Orchids” (Abraham and Vatsala,
1981) 3. “Flowering plants of the Western Ghats, India” (Nayar et al., 2014)
Henceforth, these publications would be mentioned as follows, Gamble flora, Abraham
and Vatsala and JNTBGRI respectively.
2.4.DATA ANALYSIS
To estimate the efficiency of the method adopted, patterns of endemism were observed
in the data generated. For calculating species diversity of terrestrial and epiphytic
endemic orchids, Shannon and Simpson indices were calculated (Magurran, 2004). The
diversity, abundance, and pattern of species distribution across altitude and latitude have
been analyzed using EstimateS 9.1.0 (Colwell l.c) and PAST 3.07. EstimateS were
used to create species accumulation curve per transects and Incidence Coverage Based
Estimator (ICE) and Chao -1 was used to calculate expected species richness based on
observed species data. The rarefied and mean species richness and abundance per
transect, latitude, and altitude was done using PAST 3.07.
To visualize endemic epiphyte community composition Non-Metric Multidimensional
Scaling (NMDS) in XLSTAT-2016 was done based on proximity matrix (with
Symposium Proceedings – Book of Full Papers 223
ECOLOGY 2017 11-13 May, Kayseri TURKEY
Euclidian dissimilarity). The significance of the relationship between variables and
orchid species diversity and abundance was tested using Nonparametric Kruskal-Wallis
test using the Steel-Dwass-Critchlow-Fligner procedure/Two-tailed test and
Agglomerative Hierarchical Clustering (AHC) with un-weighted pair-average based on
Bray-Curtis dissimilarity matrix. The distribution of endemics across habitat, altitude,
and latitude was estimated and the significance was tested using non-parametric
Kruskal-Wallis test (XLSTAT-2016). The host-epiphyte associations were analyzed for
specificity by identifying whether a specific species of orchid was linked to a specific
host, a group of species of orchids for a specific host or a group of species of orchids for
a group of a host. Spearman Correlation (XLSTAT-2016) between the abundance of
orchid and host species and abundance were checked. The significance in specificity
was tested using non- parametric Kruskal-Wallis test (XLSTAT-2016).
3.RESULTS
3.1. COMPARISON OF METHODS
Table 1. Comparison of data generated from methods used
COMPARISON BASED ON PRELIMINARY DATA
No. of
Quadrats/Tr.
Sp.
Richness
Sp.
Abd.
Host for
Orchids
Quadrat sampling 10 10 52 14
Clustered quadrat sampling 10 28 109 45
Random walk and tree scan 10 6 140 10
Linear transects with
selective scan 10 38 900 59
The data on orchids from quadrat sampling was very meagre and clustered quadrats
were time consuming. Random walk and scan resulted in repetition of same sampling
Symposium Proceedings – Book of Full Papers 224
ECOLOGY 2017 11-13 May, Kayseri TURKEY
units. Linear line transects with selective tree scan yielded highest abundance and
richness with equal effort (Table 1).
3.2. SPECIES DIVERSITY
3.2.1. EPIPHYTIC ORCHIDS
A total of 1892 individual trees belonging to 321 species of trees from 181 transects
were scanned during the present study. It resulted in recording a total of 5400
individuals of epiphytic orchids belonging to 35 endemic orchid species that accounted
for 53% (66 species total endemic epiphytes) of the total endemic epiphytic orchids of
Kerala (Jayalakshmi et al., 2016).
3.2.2. TERRESTRIAL ORCHIDS
A total of 2078 individuals of endemic terrestrial orchids belonging to 17 species (of
which nine are also adapted to grow as epiphytes while the rest of the species are strictly
terrestrial) were recorded.
The mean species richness of endemic epiphytes per transects recorded during the study
was 0.19 (SE +0.1, N=181) and abundance was 29.8 (SE+ 7.5, N=181).
3.3. SPATIAL PATTERN OF ENDEMIC ORCHID DISTRIBUTION
3.3.1. SPECIES-AREA CURVE ACROSS TRANSECTS FOR ENDEMIC EPIPHYTES
Different species accumulation curves of estimators ICE and Chao-1 (which were the
best satisfied) were plotted against the observed species richness which was also
accumulated across transects (Figure 2). Species accumulation curves, both observed
and estimated, attained asymptote at the last transect. ICE and Chao-1 estimator values
were almost stabilized after 100th
transect whereas the values for observed species got
stabilized only around 155th
transect. The number of singletons (species with only one
Symposium Proceedings – Book of Full Papers 225
ECOLOGY 2017 11-13 May, Kayseri TURKEY
individual in the pooled sample) at 181th
transect becomes zero which is visibly distinct
from the number of unique species (species that occur in only one sample) that is six at
the same scale, and doubletons (species with only two individuals in the pooled sample)
is one which is again distinguishable from the number of duplicates (species that occur
in only two samples) six after 181 transects.
Figure 2. Species accumulation curve of endemic epiphytic orchids in the Southern
Western Ghats of Kerala, showing the observed and the estimated ICE and Chao-1
means
3.3.2. SPECIES DISTRIBUTION OF ENDEMIC EPIPHYTES AND TERRESTRIAL ORCHIDS ACROSS
ALTITUDE
Species richness and abundance of endemic epiphytes across four altitudinal gradients
were significantly (at p = < 0.05, Kruskal-Wallis, Df = 3) different from each other
(Table2). The maximum rarefied mean species richness was recorded from 1201-1800
m altitude range followed by 601-1200 m altitude range. However, maximum mean
abundance was recorded from1801-2400 m altitude class followed by 601-1200 m
altitude class. Mean species richness and mean abundance per altitude class was 0.35
(SE + 0.05, N = 4) and 36.03 (SE + 12.3) respectively. Only two endemic epiphytic
orchid species viz.. Xenikophyton smeeanum and Conchidium exilis were distributed in
all altitudinal classes. However, Bulbophyllum keitens, Dendrobium heyneanum,
0
10
20
30
40
50
1
11
21
31
41
51
61
71
81
91
10
1
11
1
12
1
13
1
14
1
15
1
16
1
17
1
18
1
CU
MU
LATI
VE
NU
MB
ER O
F SP
ECIE
S
TRANSECTS
Sobs Chao 1 Mean ICE Mean
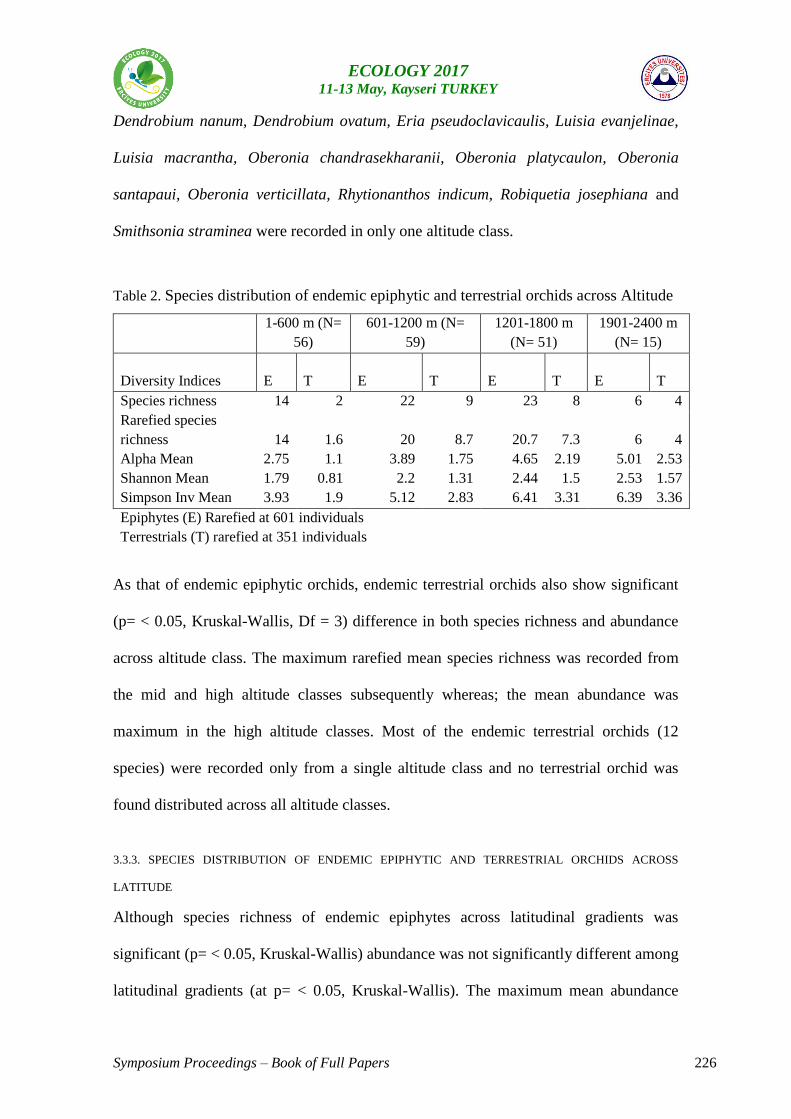
Symposium Proceedings – Book of Full Papers 226
ECOLOGY 2017 11-13 May, Kayseri TURKEY
Dendrobium nanum, Dendrobium ovatum, Eria pseudoclavicaulis, Luisia evanjelinae,
Luisia macrantha, Oberonia chandrasekharanii, Oberonia platycaulon, Oberonia
santapaui, Oberonia verticillata, Rhytionanthos indicum, Robiquetia josephiana and
Smithsonia straminea were recorded in only one altitude class.
Table 2. Species distribution of endemic epiphytic and terrestrial orchids across Altitude
1-600 m (N=
56)
601-1200 m (N=
59)
1201-1800 m
(N= 51)
1901-2400 m
(N= 15)
Diversity Indices E T E T E T E T
Species richness 14 2 22 9 23 8 6 4
Rarefied species
richness 14 1.6 20 8.7 20.7 7.3 6 4
Alpha Mean 2.75 1.1 3.89 1.75 4.65 2.19 5.01 2.53
Shannon Mean 1.79 0.81 2.2 1.31 2.44 1.5 2.53 1.57
Simpson Inv Mean 3.93 1.9 5.12 2.83 6.41 3.31 6.39 3.36
Epiphytes (E) Rarefied at 601 individuals
Terrestrials (T) rarefied at 351 individuals
As that of endemic epiphytic orchids, endemic terrestrial orchids also show significant
(p= < 0.05, Kruskal-Wallis, Df = 3) difference in both species richness and abundance
across altitude class. The maximum rarefied mean species richness was recorded from
the mid and high altitude classes subsequently whereas; the mean abundance was
maximum in the high altitude classes. Most of the endemic terrestrial orchids (12
species) were recorded only from a single altitude class and no terrestrial orchid was
found distributed across all altitude classes.
3.3.3. SPECIES DISTRIBUTION OF ENDEMIC EPIPHYTIC AND TERRESTRIAL ORCHIDS ACROSS
LATITUDE
Although species richness of endemic epiphytes across latitudinal gradients was
significant (p= < 0.05, Kruskal-Wallis) abundance was not significantly different among
latitudinal gradients (at p= < 0.05, Kruskal-Wallis). The maximum mean abundance
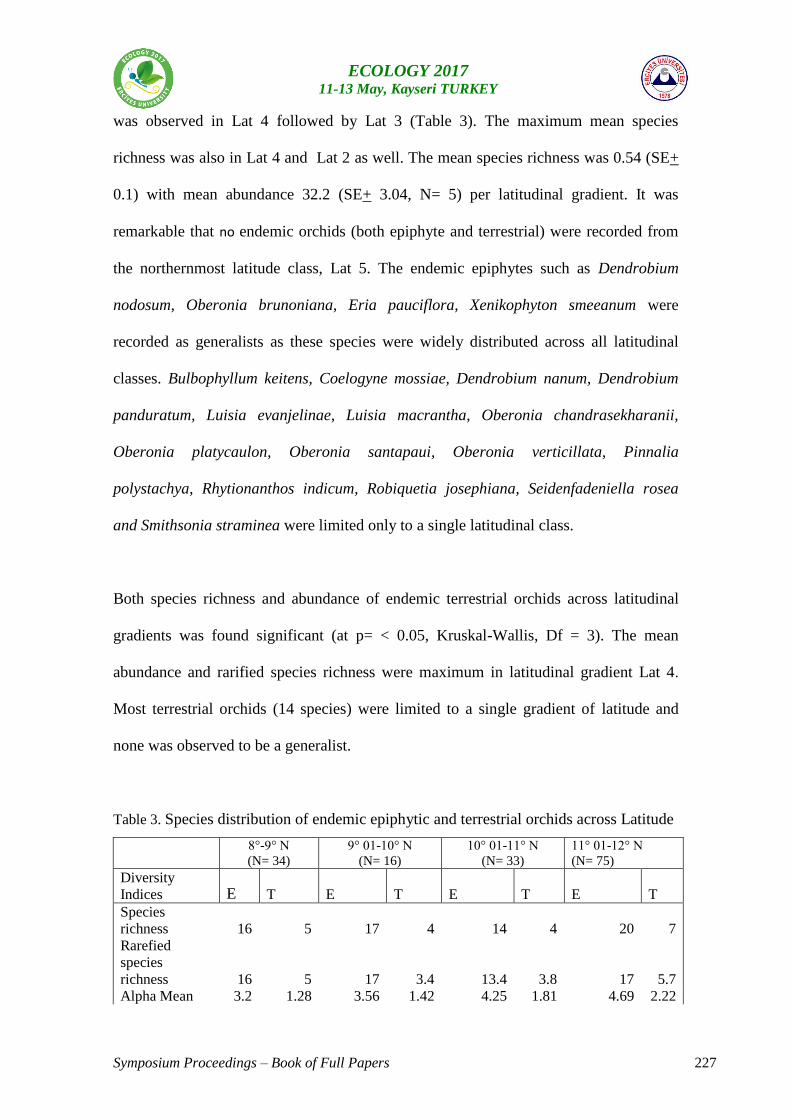
Symposium Proceedings – Book of Full Papers 227
ECOLOGY 2017 11-13 May, Kayseri TURKEY
was observed in Lat 4 followed by Lat 3 (Table 3). The maximum mean species
richness was also in Lat 4 and Lat 2 as well. The mean species richness was 0.54 (SE+
0.1) with mean abundance 32.2 (SE+ 3.04, N= 5) per latitudinal gradient. It was
remarkable that no endemic orchids (both epiphyte and terrestrial) were recorded from
the northernmost latitude class, Lat 5. The endemic epiphytes such as Dendrobium
nodosum, Oberonia brunoniana, Eria pauciflora, Xenikophyton smeeanum were
recorded as generalists as these species were widely distributed across all latitudinal
classes. Bulbophyllum keitens, Coelogyne mossiae, Dendrobium nanum, Dendrobium
panduratum, Luisia evanjelinae, Luisia macrantha, Oberonia chandrasekharanii,
Oberonia platycaulon, Oberonia santapaui, Oberonia verticillata, Pinnalia
polystachya, Rhytionanthos indicum, Robiquetia josephiana, Seidenfadeniella rosea
and Smithsonia straminea were limited only to a single latitudinal class.
Both species richness and abundance of endemic terrestrial orchids across latitudinal
gradients was found significant (at p= < 0.05, Kruskal-Wallis, Df = 3). The mean
abundance and rarified species richness were maximum in latitudinal gradient Lat 4.
Most terrestrial orchids (14 species) were limited to a single gradient of latitude and
none was observed to be a generalist.
Table 3. Species distribution of endemic epiphytic and terrestrial orchids across Latitude
8°-9° N
(N= 34)
9° 01-10° N
(N= 16)
10° 01-11° N
(N= 33)
11° 01-12° N
(N= 75)
Diversity
Indices E T E T E T E T Species
richness 16 5 17 4 14 4 20 7 Rarefied
species
richness 16 5 17 3.4 13.4 3.8 17 5.7 Alpha Mean 3.2 1.28 3.56 1.42 4.25 1.81 4.69 2.22
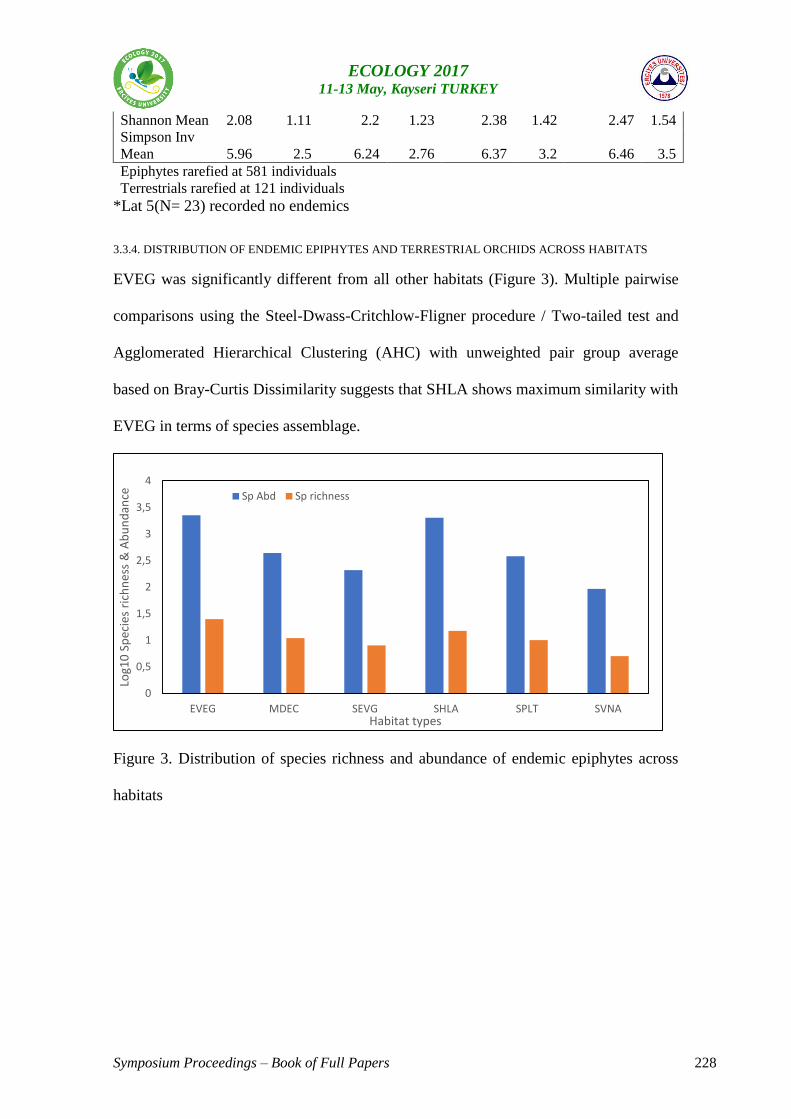
Symposium Proceedings – Book of Full Papers 228
ECOLOGY 2017 11-13 May, Kayseri TURKEY
Shannon Mean 2.08 1.11 2.2 1.23 2.38 1.42 2.47 1.54 Simpson Inv
Mean 5.96 2.5 6.24 2.76 6.37 3.2 6.46 3.5 Epiphytes rarefied at 581 individuals Terrestrials rarefied at 121 individuals
*Lat 5(N= 23) recorded no endemics
3.3.4. DISTRIBUTION OF ENDEMIC EPIPHYTES AND TERRESTRIAL ORCHIDS ACROSS HABITATS
EVEG was significantly different from all other habitats (Figure 3). Multiple pairwise
comparisons using the Steel-Dwass-Critchlow-Fligner procedure / Two-tailed test and
Agglomerated Hierarchical Clustering (AHC) with unweighted pair group average
based on Bray-Curtis Dissimilarity suggests that SHLA shows maximum similarity with
EVEG in terms of species assemblage.
Figure 3. Distribution of species richness and abundance of endemic epiphytes across
habitats
0
0,5
1
1,5
2
2,5
3
3,5
4
EVEG MDEC SEVG SHLA SPLT SVNA
Log1
0 S
pec
ies
rich
nes
s &
Ab
un
dan
ce
Habitat types
Sp Abd Sp richness
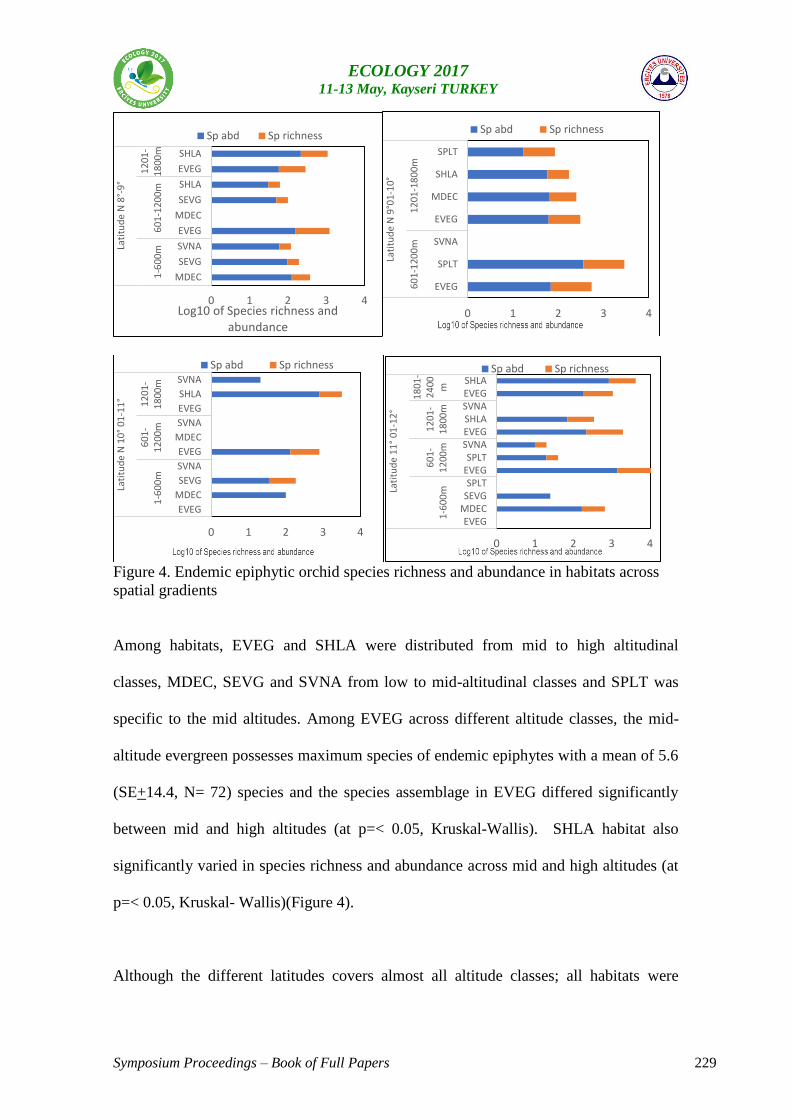
Symposium Proceedings – Book of Full Papers 229
ECOLOGY 2017 11-13 May, Kayseri TURKEY
Figure 4. Endemic epiphytic orchid species richness and abundance in habitats across
spatial gradients
Among habitats, EVEG and SHLA were distributed from mid to high altitudinal
classes, MDEC, SEVG and SVNA from low to mid-altitudinal classes and SPLT was
specific to the mid altitudes. Among EVEG across different altitude classes, the mid-
altitude evergreen possesses maximum species of endemic epiphytes with a mean of 5.6
(SE+14.4, N= 72) species and the species assemblage in EVEG differed significantly
between mid and high altitudes (at p=< 0.05, Kruskal-Wallis). SHLA habitat also
significantly varied in species richness and abundance across mid and high altitudes (at
p=< 0.05, Kruskal- Wallis)(Figure 4).
Although the different latitudes covers almost all altitude classes; all habitats were
0 1 2 3 4
MDEC
SEVG
SVNA
EVEG
MDEC
SEVG
SHLA
EVEG
SHLA1
-60
0m
60
1-1
200
m1
201
-1
800
m
Lati
tud
e N
8°-
9°
Log10 of Species richness and abundance
Sp abd Sp richness
0 1 2 3 4
EVEG
SPLT
SVNA
EVEG
MDEC
SHLA
SPLT
60
1-1
200
m1
201
-18
00
m
Lati
tud
e N
9°0
1-1
0°
Sp abd Sp richness
0 1 2 3 4
EVEG
MDEC
SEVG
SVNA
EVEG
MDEC
SVNA
EVEG
SHLA
SVNA
1-6
00
m6
01-
12
00m
12
01-
18
00m
Lati
tud
e N
10
° 01
-11
°
Sp abd Sp richness
0 1 2 3 4
EVEGMDECSEVGSPLT
EVEGSPLT
SVNAEVEGSHLASVNAEVEGSHLA
1-6
00
m6
01-
12
00m
12
01-
18
00m
18
01-
24
00 m
Lati
tud
e 1
1°
01-1
2°
Sp abd Sp richness
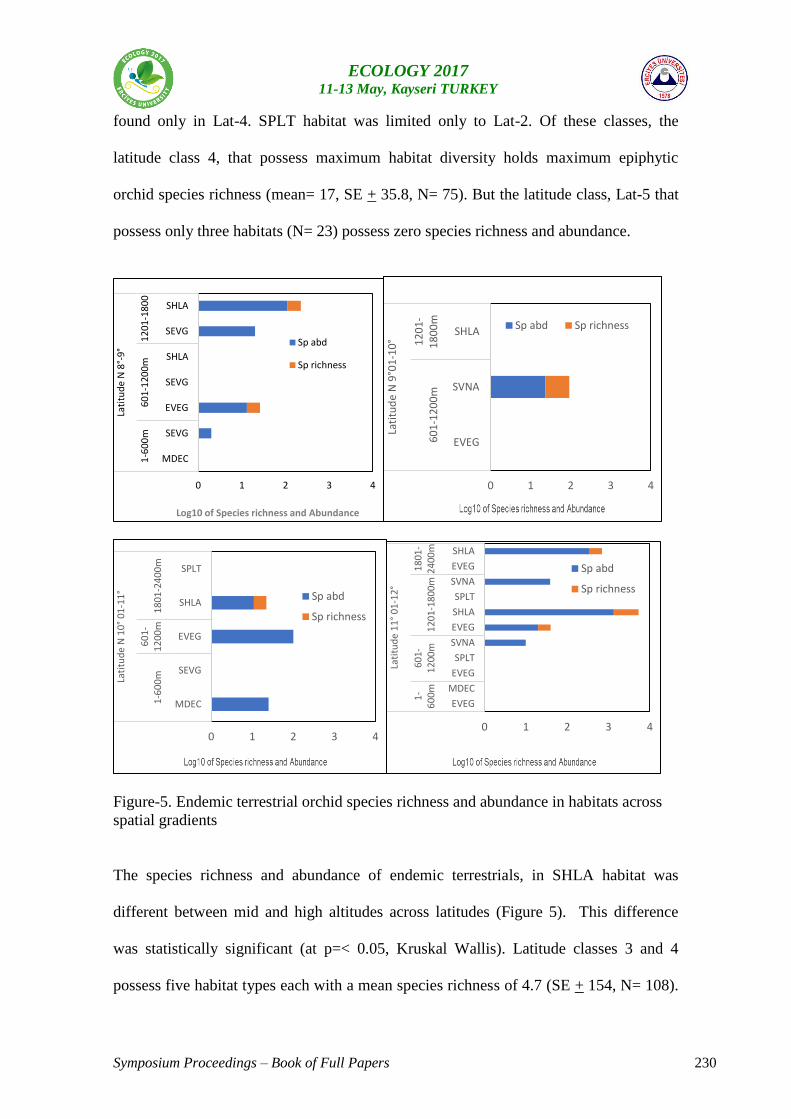
Symposium Proceedings – Book of Full Papers 230
ECOLOGY 2017 11-13 May, Kayseri TURKEY
found only in Lat-4. SPLT habitat was limited only to Lat-2. Of these classes, the
latitude class 4, that possess maximum habitat diversity holds maximum epiphytic
orchid species richness (mean= 17, SE + 35.8, N= 75). But the latitude class, Lat-5 that
possess only three habitats (N= 23) possess zero species richness and abundance.
Figure-5. Endemic terrestrial orchid species richness and abundance in habitats across
spatial gradients
The species richness and abundance of endemic terrestrials, in SHLA habitat was
different between mid and high altitudes across latitudes (Figure 5). This difference
was statistically significant (at p=< 0.05, Kruskal Wallis). Latitude classes 3 and 4
possess five habitat types each with a mean species richness of 4.7 (SE + 154, N= 108).
0 1 2 3 4
MDEC
SEVG
EVEG
SEVG
SHLA
SEVG
SHLA
1-6
00
m6
01-
120
0m
12
01-1
80
0
Lati
tud
e N
8°-
9°
Log10 of Species richness and Abundance
Sp abd
Sp richness
0 1 2 3 4
EVEG
SVNA
SHLA
60
1-1
20
0m
12
01
-1
80
0m
Lati
tud
e N
9°0
1-1
0°
Sp abd Sp richness
0 1 2 3 4
MDEC
SEVG
EVEG
SHLA
SPLT
1-6
00
m6
01-
12
00m
18
01-2
40
0m
Lati
tud
e N
10
° 01
-11
° Sp abd
Sp richness
0 1 2 3 4
EVEG
MDEC
EVEG
SPLT
SVNA
EVEG
SHLA
SPLT
SVNA
EVEG
SHLA
1-
60
0m6
01-
12
00m
12
01-1
80
0m
18
01-
24
00m
Lati
tud
e 1
1°
01-1
2°
Sp abd
Sp richness
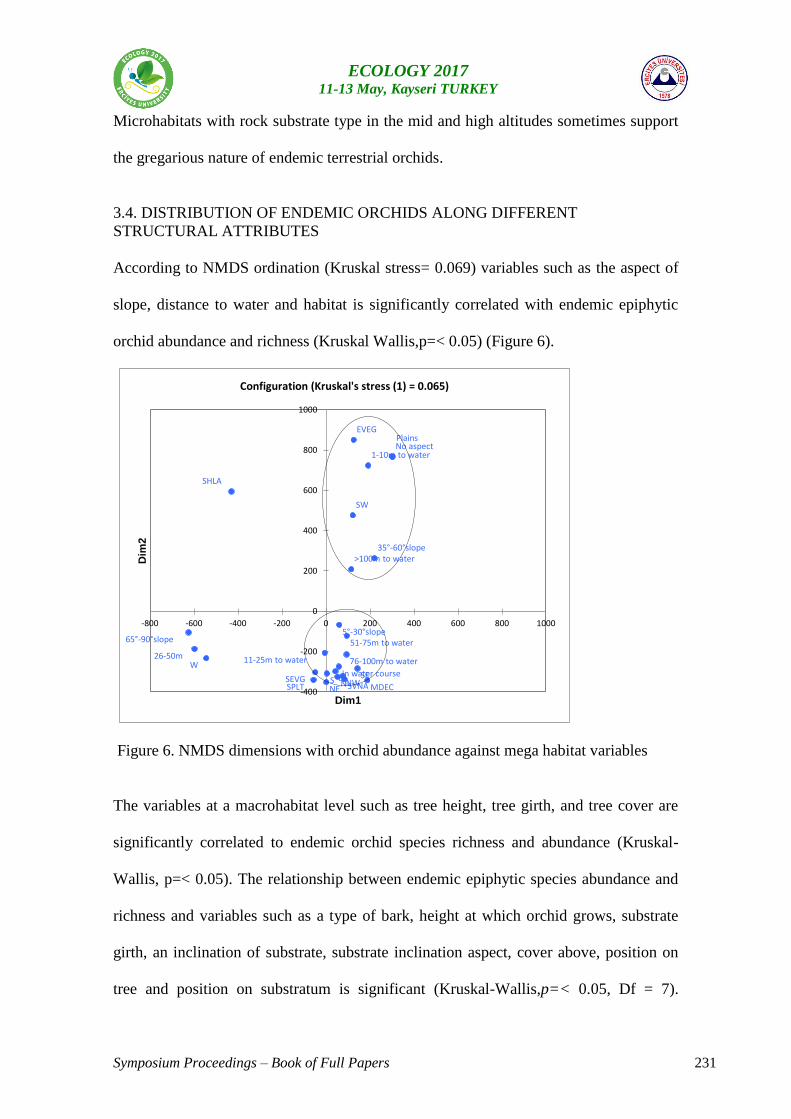
Symposium Proceedings – Book of Full Papers 231
ECOLOGY 2017 11-13 May, Kayseri TURKEY
Microhabitats with rock substrate type in the mid and high altitudes sometimes support
the gregarious nature of endemic terrestrial orchids.
3.4. DISTRIBUTION OF ENDEMIC ORCHIDS ALONG DIFFERENT
STRUCTURAL ATTRIBUTES
According to NMDS ordination (Kruskal stress= 0.069) variables such as the aspect of
slope, distance to water and habitat is significantly correlated with endemic epiphytic
orchid abundance and richness (Kruskal Wallis,p=< 0.05) (Figure 6).
Figure 6. NMDS dimensions with orchid abundance against mega habitat variables
The variables at a macrohabitat level such as tree height, tree girth, and tree cover are
significantly correlated to endemic orchid species richness and abundance (Kruskal-
Wallis, p=< 0.05). The relationship between endemic epiphytic species abundance and
richness and variables such as a type of bark, height at which orchid grows, substrate
girth, an inclination of substrate, substrate inclination aspect, cover above, position on
tree and position on substratum is significant (Kruskal-Wallis,p=< 0.05, Df = 7).
EVEG
MDEC SEVG
SHLA
SPLT SVNA
Plains
5°-30°slope
35°-60°slope
65°-90°slope
No aspect
N E S
W
NE
SE
SW
NW In water course
1-10m to water
11-25m to water 26-50m
51-75m to water
76-100m to water
>100m to water
-400
-200
0
200
400
600
800
1000
-800 -600 -400 -200 0 200 400 600 800 1000
Dim
2
Dim1
Configuration (Kruskal's stress (1) = 0.065)
Symposium Proceedings – Book of Full Papers 232
ECOLOGY 2017 11-13 May, Kayseri TURKEY
Among endemic terrestrials, vegetation type (habitat), type of substrate, the degree of
slope, slope aspect, distance to water and vegetation cover were found significant
(Kruskal-wallis, P> 0.05, Df = 5) in determining habitat.
3.5. ENDEMIC ORCHIDS AND SPECIFICITY FOR SPECIES OF PHOROPHYTE
Among 1130 orchid supporting trees (59.73% of total trees scanned during the study),
only 319 trees (28.24%) belonging to 144 species were found as host for 35 species of
endemic epiphytic orchids with an abundance of 5400 orchid individuals. Among
phorophytes, the maximum endemic epiphytic species richness (16 species) was
recorded from Syzygium cumini (along with 26 non-endemic epiphytic orchids).
Schefflera sp, another species of a host has the highest abundance of endemic orchids
1030 on a single individual tree. Oberonia chandrasekharanii, Oberonia santapaui,
Oberonia verticillata were recorded only from a single host of single species and
Coelogyne nervosa was recorded from 50 host trees belonging to 27 species and shall
be considered as a generalist in terms of host specificity. The specificity of an endemic
orchid to host tree was not significant (Kruskal-Wallis, P=< 0.05).
Spearman correlation of abundance suggests that the abundance of an endemic orchid
increases with increase in the number of host species and the individuals available for it
(Kruskal-Wallis, at p=< 0.05, Df = 2) (Table 4). However, certain endemic orchids
(such as Conchidium microchilos (previously known as Eria microchilos), Conchidium
filiforme (syn.Eria dalzelli), Conchidium nanum (syn.Eria nana) and Eria albiflora)
were observed to have established on very few numbers of host species and host
individuals but possess high abundance.
Symposium Proceedings – Book of Full Papers 233
ECOLOGY 2017 11-13 May, Kayseri TURKEY
Table 4. Spearman Correlation between Endemic orchid abundance and host
Variables No of host
no of sp of host Sp abd
No of host 1 0.984 *0.747
no of sp of host 0.984 1 *0.751
Sp abd 0.747 0.751 1
*Significant at p=< 0.05, Spearman Correlation matrix
3.6. REVIEW OF LITERATURE – ENDEMIC ORCHIDS OF THE WESTERN
GHATS
The number of orchid species enumerated in Gamble flora, Abraham& Vatsala, and
JNTBGRI book is 189, 150 and 306 respectively. Gamble enlisted 94 (ie.50%) species
of terrestrials and 95 (50%) epiphytic species, whereas Abraham and Vatsala accounted
about 90 (60%) terrestrial species and 60 (40%) species of epiphytes from the Western
Ghats. JNTBGRI enumerated about 176 (57%) terrestrials and 132 (43%) epiphytic
species of orchids, recording the highest number of species when compared to other two
publications (Figure 7). The present study could not consider Gamble flora to study
endemism of orchids of the Western Ghats because it has not specifically mentioned
about the endemic species. Therefore, Abraham and Vatsala and JNTBGRI were
considered to generate the secondary data regarding endemic orchids of the Western
Ghats in detail. Abraham and Vatsala (1981) enlisted 74 (49%) species whereas
JNTBGRI book included 120 (ie.39%) species of endemic orchids in the Western
Ghats. Of the 250 orchids recorded from Kerala (Jayalakshmi et al., 2016) 66 are
endemic epiphytes (with 86 nonendemic epiphytes) and 26 are endemic terrestrials
(with 74 nonendemic terrestrials) (Figure 8).
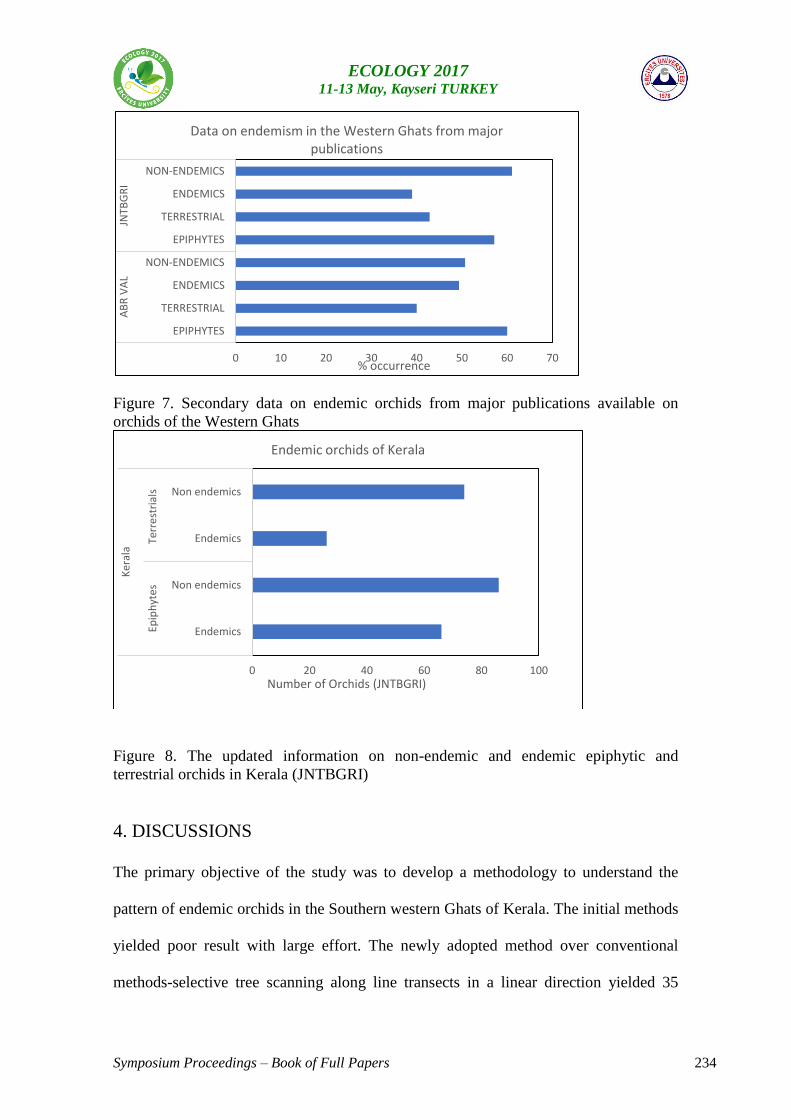
Symposium Proceedings – Book of Full Papers 234
ECOLOGY 2017 11-13 May, Kayseri TURKEY
Figure 7. Secondary data on endemic orchids from major publications available on
orchids of the Western Ghats
Figure 8. The updated information on non-endemic and endemic epiphytic and
terrestrial orchids in Kerala (JNTBGRI)
4. DISCUSSIONS
The primary objective of the study was to develop a methodology to understand the
pattern of endemic orchids in the Southern western Ghats of Kerala. The initial methods
yielded poor result with large effort. The newly adopted method over conventional
methods-selective tree scanning along line transects in a linear direction yielded 35
0 10 20 30 40 50 60 70
EPIPHYTES
TERRESTRIAL
ENDEMICS
NON-ENDEMICS
EPIPHYTES
TERRESTRIAL
ENDEMICS
NON-ENDEMICS
AB
R V
AL
JNTB
GR
I
% occurrence
Data on endemism in the Western Ghats from major publications
0 20 40 60 80 100
Endemics
Non endemics
Endemics
Non endemics
Epip
hyt
es
Terr
est
rial
s
Ker
ala
Number of Orchids (JNTBGRI)
Endemic orchids of Kerala
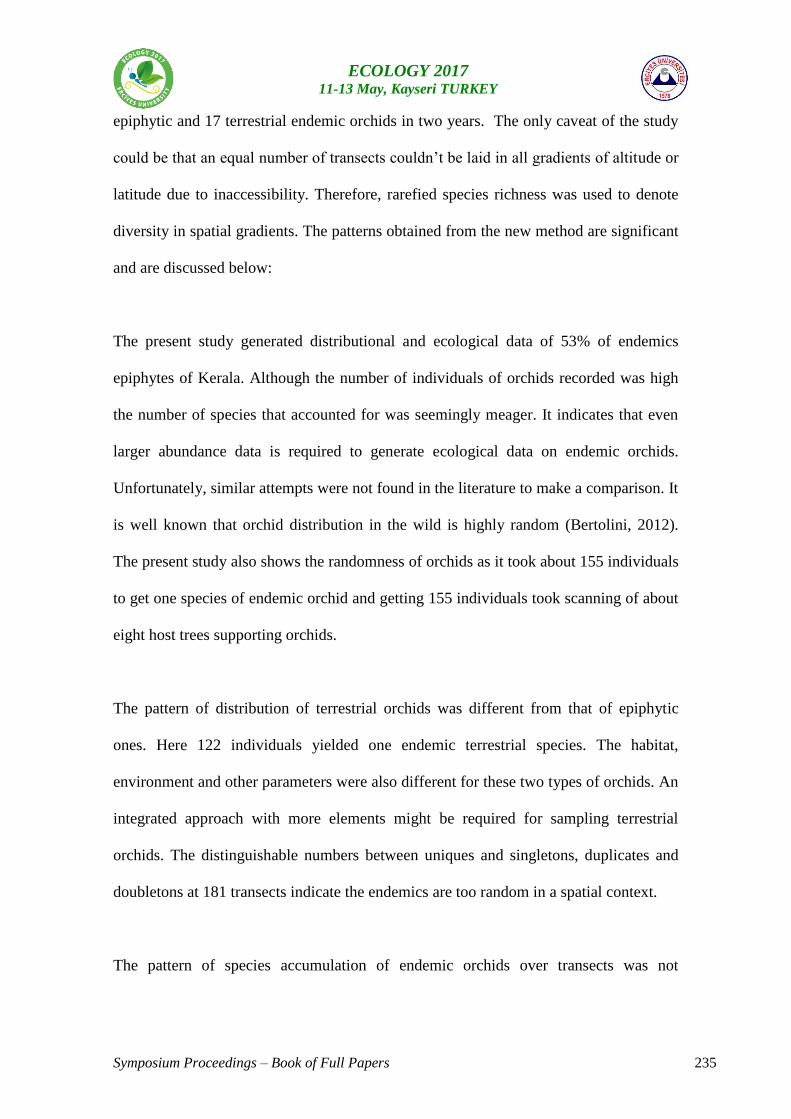
Symposium Proceedings – Book of Full Papers 235
ECOLOGY 2017 11-13 May, Kayseri TURKEY
epiphytic and 17 terrestrial endemic orchids in two years. The only caveat of the study
could be that an equal number of transects couldn’t be laid in all gradients of altitude or
latitude due to inaccessibility. Therefore, rarefied species richness was used to denote
diversity in spatial gradients. The patterns obtained from the new method are significant
and are discussed below:
The present study generated distributional and ecological data of 53% of endemics
epiphytes of Kerala. Although the number of individuals of orchids recorded was high
the number of species that accounted for was seemingly meager. It indicates that even
larger abundance data is required to generate ecological data on endemic orchids.
Unfortunately, similar attempts were not found in the literature to make a comparison. It
is well known that orchid distribution in the wild is highly random (Bertolini, 2012).
The present study also shows the randomness of orchids as it took about 155 individuals
to get one species of endemic orchid and getting 155 individuals took scanning of about
eight host trees supporting orchids.
The pattern of distribution of terrestrial orchids was different from that of epiphytic
ones. Here 122 individuals yielded one endemic terrestrial species. The habitat,
environment and other parameters were also different for these two types of orchids. An
integrated approach with more elements might be required for sampling terrestrial
orchids. The distinguishable numbers between uniques and singletons, duplicates and
doubletons at 181 transects indicate the endemics are too random in a spatial context.
The pattern of species accumulation of endemic orchids over transects was not
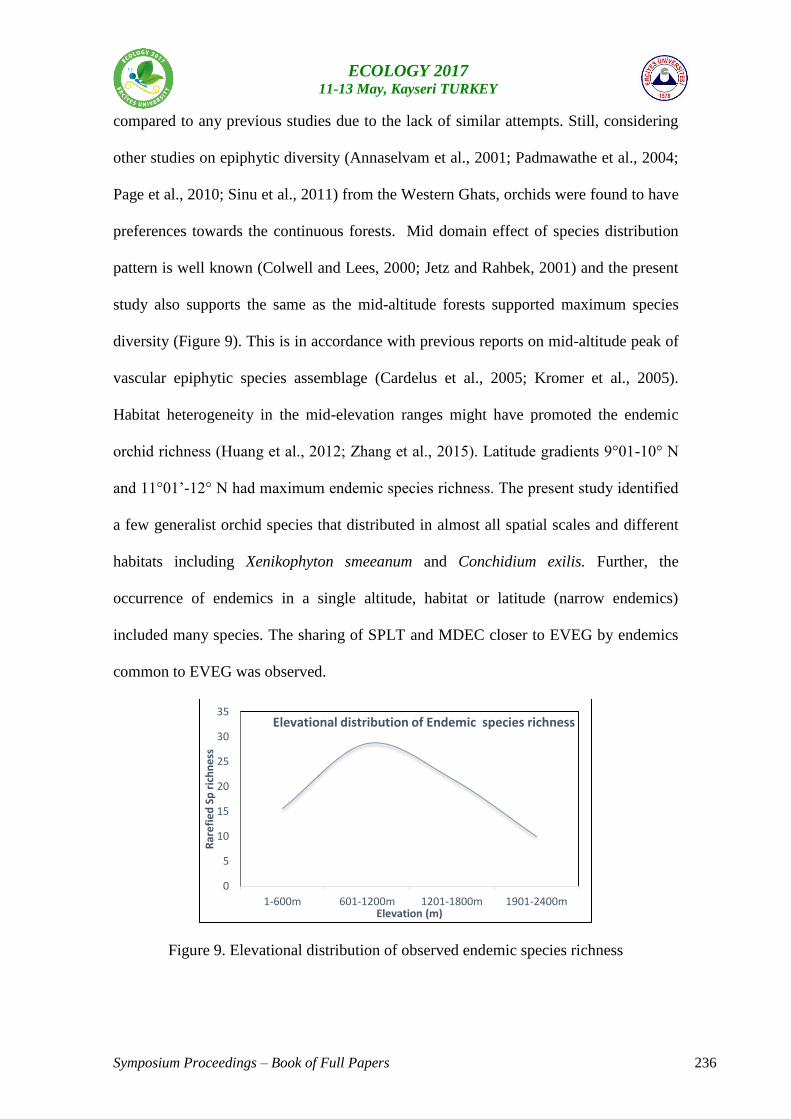
Symposium Proceedings – Book of Full Papers 236
ECOLOGY 2017 11-13 May, Kayseri TURKEY
compared to any previous studies due to the lack of similar attempts. Still, considering
other studies on epiphytic diversity (Annaselvam et al., 2001; Padmawathe et al., 2004;
Page et al., 2010; Sinu et al., 2011) from the Western Ghats, orchids were found to have
preferences towards the continuous forests. Mid domain effect of species distribution
pattern is well known (Colwell and Lees, 2000; Jetz and Rahbek, 2001) and the present
study also supports the same as the mid-altitude forests supported maximum species
diversity (Figure 9). This is in accordance with previous reports on mid-altitude peak of
vascular epiphytic species assemblage (Cardelus et al., 2005; Kromer et al., 2005).
Habitat heterogeneity in the mid-elevation ranges might have promoted the endemic
orchid richness (Huang et al., 2012; Zhang et al., 2015). Latitude gradients 9°01-10° N
and 11°01’-12° N had maximum endemic species richness. The present study identified
a few generalist orchid species that distributed in almost all spatial scales and different
habitats including Xenikophyton smeeanum and Conchidium exilis. Further, the
occurrence of endemics in a single altitude, habitat or latitude (narrow endemics)
included many species. The sharing of SPLT and MDEC closer to EVEG by endemics
common to EVEG was observed.
Figure 9. Elevational distribution of observed endemic species richness
0
5
10
15
20
25
30
35
1-600m 601-1200m 1201-1800m 1901-2400m
Rar
efi
ed
Sp
ric
hn
ess
Elevation (m)
Elevational distribution of Endemic species richness
Symposium Proceedings – Book of Full Papers 237
ECOLOGY 2017 11-13 May, Kayseri TURKEY
Paphiopedilum druryi (Critically Endangered; IUCN 2016-3) was one among the red-
listed terrestrial orchid species recorded during the present study.
However, most of the other endangered or highly threatened red listed species were not
recorded during the present study. This indicates that we may need to increase the size
of the transect and increase the number of trees to be scanned. Further, in light of the
present study, we suggest that data shall be generated after finding them in their natural
habitat and transects (or any other relevant and apt sampling strategies) shall be
deployed in an eccentric radiating manner to different directions to gather data
pertaining to their distribution. This shall be worked out after another field study. All of
the endemic (true) terrestrial species were observed only from the mid-altitude (601-
1800 m) open grassland patches or area that are ecotones with EVEG and SHLA
habitats. Thus, we find that mid-elevation range, its associated habitats (Huang et al.,
2012 and Zhang et al., 2015) and openness (Johnson, 2012) may probably provide a
more specific niche for endemic terrestrial orchids. This suggests that terrestrials are
more randomly distributed than when compared to their epiphytic counter parts. The
randomness may be due to the distribution pattern of their specific habitat. Grasslands,
open areas, rocky area, perennial and seasonal stream or river beds, etc. are patchy in
distribution and not all patches supports orchids. There were no terrestrial orchid
species recorded as generalists in their spatial distribution pattern. This might be due to
the fact that the patchiness of habitat might prevent low-lying terrestrial orchids to get
dispersed from their point of origin. Although the distribution is limited, in places where
terrestrial orchids are seen growing shows gregarious growth. Some of the terrestrial
orchids recorded were also adapted to grow as epiphytes (or the other way around)
especially in the evergreen forests. In such a suitable habitat, openness, distance to
Symposium Proceedings – Book of Full Papers 238
ECOLOGY 2017 11-13 May, Kayseri TURKEY
water and aspect of the slope and availability of type substratum further enhances the
species richness of terrestrial orchids. The habitat, SPLT does not support endemic
terrestrial orchids as anthropogenic disturbance might trample them (Beltran-Nambo,
2012). SPLT (where cardamom or coffee is cultivating) is a habitat where only wild
trees are conserved and agricultural practices are being carried out on the ground. The
natural trees are protected as means of shade to the cultivated cash crops. Therefore, the
ground is always under manipulation and cannot provide conditions for terrestrial
orchids to establish. Only a single species of terrestrial orchid, Tropidia angulosa have
seen growing in an SPLT during a random visit other than field sampling.
Macro and microhabitats such as tree size, tree height, cover, bark type (Idris et al.,
2009) branch strata (Zhao et al., 2015) and substrate girth (D’Cunha, 2013) are proven
to support the distribution of epiphytes (Jalal and Rawat, 2009). The present study
elaborates the types of these microhabitats and brought out different types of
microhabitat attributes that support orchid survival.
The present study also suggests that none of the endemic epiphytic orchids were
phorophyte specific. But there is not much information available to establish whether
orchids, especially endemic orchids, are host specific. However, certain orchid
(Eria/Conchidium sp.) genera establish successfully and maintain high abundance in
less number of host tree individuals or species. This indicates that rather than host
species, endemic epiphytic orchids prefer other parameters such as habitat type, altitude
and latitude and are mechanically determined by bark structure, architecture (Laube and
Zotz, 2006), stratification within a tree (Kromer et al., 2007) for their establishment and
Symposium Proceedings – Book of Full Papers 239
ECOLOGY 2017 11-13 May, Kayseri TURKEY
survival.
Gamble and Abraham and Vatsala, could be used as first-hand reference for species
identification. However, the recently updated publication (Nayar et al., 2014) has
incorporated the most current information available. However, this publication does not
provide descriptions of species. Therefore, it may be used as the most authentic and a
reliable baseline data source for orchids. This does not mean that the other two floras
(Abraham and Vatsala 1981, Gamble 1928) are not reliable sources for orchid data and
they can be used as firsthand information for field identification and characterization.
This suggests the need for a new publication incorporating plant description, ecology,
distribution data etc. for authentic reference.
5.CONCLUSION
The present study is the first of its kind on endemic orchids of the Western Ghats.
Further, it is an innovative investigation on a group of plants and their endemic patterns
in the Western Ghats. The linear line transect method is considerably more efficient,
having yielded 35 epiphytic, 17 terrestrial endemic orchids and their spatial distribution
from Kerala. It is an effective approach while addressing the pattern of endemism
amongst orchids in the Southern Western Ghats. The Evergreen habitats and mid (600-
1800 m) altitudes are observed to be major centers of endemic orchids. The structural
assemblage of endemic orchids is influenced by habitat variables, tree, and micro
habitat characteristics thus forming clustered occurrences of orchids. Endemic terrestrial
orchids are specific to habitats with favorable elements which makes them more
vulnerable to multiple threats. These significant patterns observed affirms earlier or
Symposium Proceedings – Book of Full Papers 240
ECOLOGY 2017 11-13 May, Kayseri TURKEY
similar findings. Therefore, linear line transects with tree scan is suggested to study
orchids in a spatial scale. A comprehensive integrated approach (with equal focus on
endemic terrestrials) would help in conservation planning for endemic orchids.
ACKNOWLEDGEMENTS
The authors would like to thank Department of Science and Technology, Government
of India; San Diego County Orchid Society, California, the United States of America for
financial support. Also, we thank the department of Forests and Wildlife, Government
of Kerala; Sacred Heart College, Cochin, Kerala and Saraswathi Narayanan College,
Perungudi, Tamil Nadu for facilitating the research. Thanks are also due to Mr. Aravind
R Nair of SH college Thevara, Cochin for his ample effort in correcting the language of
the manuscript.
REFERENCES
Abraham A, Vatsala P (1981). Introduction to Orchids with Illustrations and
Descriptions Of 150 South Indian Orchids. The Tropical Botanic Garden and Research
Institute, India: St.Josephs’s Press.
Annaselavam J, Parthasarathy N (2001). Diversity and Distribution of Herbaceous
Vascular Epiphytes in A Tropical Evergreen Forest at Varagaalaiar, Western Ghats,
India. Biodiversity and conservation 10: 317-329.
Beltran -Nambo MA, Larrocea PO, Garciglia RS, Ospina JTO, Trujillo MM, Carreon-
Abud Y (2012). Distribution and Abundance of Terrestrial Orchids of The Genus Bletia
In Sites with Different Degrees of Disturbance, In the Cupatitzio Natural Reserve,
Mexico. International journal of Biodiversity and Conservation 4(8):316-325.
Bertolini V, Damon A, Mora JV, Velazquez ANR (2012). Distribution and Ecological
Patterns of Orchids in Monte Pelegrino Reserve, Palermo, Sicily, Italy. Biodiversity
Journal 3(4): 375-384.
Symposium Proceedings – Book of Full Papers 241
ECOLOGY 2017 11-13 May, Kayseri TURKEY
Cardelus CL, Colwell CK, Watkins Jr JE (2005). Vascular Epiphyte Distribution
Patterns Explaining Mid-Elevation Richness Peak. Journal of Ecology 94: 144–156.
Champion HG, Seth SK (1968). A Revised Survey of Forest Types of India, Govt. of
India Press, New Delhi, p. 404.
Colwell RK, Lees DC (2000). The Mid-Domain Effect: Geometric Constraints on The
Geography of Species Richness. Trends in Ecology & Evolution 15:70–76.
D’Cunha, Jyothi P, Gowda PV (2013). Epiphyte Diversity on Avenue Trees of National
and State Highways of Udupi District, Karnataka, India. International Research Journal
of Biological Sciences 2(5):30-39.
Gadgil M, Krishnan BJ, Ganeshaiah KN, Vijayan VS, Borges R, Sukumar R, Noronha
L, Nayak VS, Subramaniam DK, Varma RV et al. (2011). Report of The Western Ghats
Ecology Expert Panel Part I. The Ministry of Environment and Forests, Government of
India.
Gamble JS (1928). Flora of the Presidency of Madras. Vol III. London: Published under
the authority of the Secretary of state for India in Council.
Green JL, Ostling A (2003). Endemics-Area Relationships: The Influence of Species
Dominance and Spatial Aggregation. Ecology 84(11):3090-3097
Huang J, Chen B, Liu C, Lai J, Zhang J, Ma K (2012). Identifying Hotspots of Endemic
Woody Seed Plant Diversity in China. Diverse.Distrib. 18:673-688.
Idris MI, Parker GA, Ruman AM (2009). The Effect of Bark Type, Canopy
Architecture, And Leaf Characteristics on Epiphyte Abundance and Diversity In Maliau
Basin Conservation Area, Sabah, Malaysia. Phylodiversity.net
Jalal JS (2012). Status, Threats and Conservation Strategies for Orchids of Western
Himalaya, India. Journal of Threatened Taxa 4(15): 3401-3409.
Jalal JS, Rawat GS (2009). Habitat Studies for Conservation of Medicinal Orchids of
Uttarakhand, Western Himalaya. African Journal of Plant Science 3(9): 200-204.
Jalal JS, Jayanthi J (2012). Endemic Orchids of Peninsular India: A Review. Journal of
Threatened Taxa 4(15): 3415–3425.
Jayalkshmi PS (2016). Are the Existing Publications Enough To Study The Endemic
Orchids Of The Western Ghats? MSc, Mahatma Gandhi University, Kottayam, Kerala.
Jetz W, Rahbek C (2001). Geometric Constraints Explain Much of The Species
Richness Pattern in African Birds. Proceedings of the National Academy of Sciences of
the USA. 98:5661–5666.
Symposium Proceedings – Book of Full Papers 242
ECOLOGY 2017 11-13 May, Kayseri TURKEY
Johnsosn AK (2012). A Survey of The Orchid Diversity (Orchidaceae) In Saint Luce,
Petriky And Mandena (Southeast Madagascar). Independent Study Project (ISP)
Collection. Paper 1264.
Kromer T, Kessler M, Gradstein SR (2007). Vertical Stratification of Vascular
Epiphytes in Sub-Montane and Montane Forest of The Bolivian Andes: The Importance
of The Understory. Plant Ecology 189:261-278.
Krömer T, Kessler M, Gradstein SR, Acebey A (2005). Diversity Patterns of Vascular
Epiphytes Along an Elevational Gradient in The Andes. J Biogeogr. 2005; 32: 1799–
1809.
Laube S, Zotz G (2006). Neither Host-Specific Nor Random: Vascular Epiphytes On
Three Tree Species In A Panamanian Lowland Forest. Annals of Botany 97:1103-1114.
Magurran AE (2004). Measuring Biological Diversity. 1st ed. Wiley-Blackwell.
Myers N, Mittermeier RA, Mittermeier CG, da Fonseca GAB, Kent J (2000).
Biodiversity Hotspots for Conservation Priorities. Nature 403: 853–858.
Nayar TS, RasiyaBeegum A, Sibi M (2014). Flowering Plants of The Western Ghats,
India. Trivandrum: Jawahar Lal Nehru tropical Botanical Garden and Research Institute.
Nayar MP (1996). Hot Spots of Endemic Plants of India, Nepal, and Bhutan. Tropical
Botanic Garden and Research Institute, Thiruvananthapuram, 252pp.
Padmawathe R, Qureshi Q, Rawat GS (2004). Effects of Selective Logging on Vascular
Epiphyte Diversity in A Moist Lowland Forest of Eastern Himalaya, India. Biol.
Conserv. 119, 81–92.
Page NV, Qureshi Q, Rawat GS, Kushalappa CG (2010). Plant Diversity in Sacred
Forest Fragments of Western Ghats: A Comparative Study of Four Life Forms. Plant
Ecol. 206: 237–250.
Peterson AT, Watson DM (1988). Problems with Aerial Definitions of Endemism: The
Effects Of Spatial Scaling. Diversity and Distributions 4:189-194.
Putman RJ, Wratten SD (1984). Principles of Ecology. Springer Netherlands.
Sinu P, Kuriakose G, Chandrashekara K (2011). Epiphytic Orchid Diversity in Farmer
Managed Soppinabetta Forests of The Western Ghats: Implications For Conservations.
Current Science 101 (10):1337-1346.
Wolf JHD, Gradstein SR, NM Nadkarni (2009). A Protocol for Sampling Vascular
Epiphyte Richness and Abundance. Journal of Tropical Ecology 25: 107-121.
Zhang Z, Yan Y, Tian Y, Li J, He J, Tang Z (2015). Distribution and Conservation of
Orchid Species Richness in China. Biological conservation 181:64-72.

Symposium Proceedings – Book of Full Papers 243
ECOLOGY 2017 11-13 May, Kayseri TURKEY
Zhao M, Geekiyanage N, Xu J, Khin MM, Nurdiana DR, Paudel E (2015). Structure of
the Epiphyte Community in a Tropical Montane Forest in SW China. PLoS ONE
10(4):1-19.
Symposium Proceedings – Book of Full Papers 244
ECOLOGY 2017 11-13 May, Kayseri TURKEY
Investigation of the chemical content of some industrial tree barks’ extracts by
GC-MS
Mehmet AKÇA1*
, Aytaç GÜDER2, Mahmut GÜR
3
1Department of Forestry and Forest Products, Dursunbey Vocational School, Balıkesir
University, Balıkesir, Turkey
2Department of First and Emergency Assistance, Vocational Health School, Giresun
University, Giresun, Turkey
3Department of Forest Industrial Engineering, Forest Faculty, Kastamonu University,
Kastamonu, Turkey
Abstract
Wood barks, which are very rich in secondary metabolites, are not used effectively
during industrial processes. Determination of the bark content is important in assessing
the potential of this very large amount of underutilized bark material. Coniferous tree
species widely used in the industrial sector in Turkey include Scots pine (SP) (Pinus
sylvestris), Black pine (BP) (Pinus Nigra), Calabrian pine (CP) (Pinus brutia), Ida
Mountain fir (IMF) (Abies subsp nordmannia it. equi-Trojan) and Oriental spruce (OS)
(Picea orientalis). Chloroform and petroleum ether extractions were carried out on
barks of these species and their chemical contents were analyzed using the GC-MS
technique. The highest extraction yields in chloroform and petroleum ether were found
for black pine (1.19%) and Scots pine (1.14%), respectively. In the GC-MS analysis,
the most abundant components in the chloroform’ extract were identified as 2-ethyl-1-
hexanol for Scots pine, Methyl stearate for oriental spruce, 1,2-Benzenedicarboxylic
acid, bis (2-ethylhexyl) ester for black pine, Calabrian pine and Ida Mountain fir. In
addition, the most abundant components in the petroleum ether extracts were
determined as 9-Octadecenoic acid, methyl ester for oriental spruce, Methyl stearate for
Ida Mountain fir, and 2-ethyl-1-Hexanol for Scots pine, black pine and Calabrian pine.
Keywords: Wood bark, extract, chloroform, petroleum ether, GC-MS
Symposium Proceedings – Book of Full Papers 245
ECOLOGY 2017 11-13 May, Kayseri TURKEY
1. Introduction
For many years forests have been thought of as a source of raw wood material for the
forest products industry. However, because of their composition, both wood and non-
wood forest products have a great potential as a chemical resource. These products
found in the structure can be removed by using neutral solvents and water. Very small
and variable quantities of extractable components which are quite valuable in the fields
of pharmacology and chemistry can easily be volatized with water vapor.
During wood processing, the bark is considered as fuel by many factories in the sector,
even though for reasons that are inherent in its very nature it is chemically similar to
wood, and quite rich in terms of its extractive variety and content. Because the
quantities of the potentially rich extractives in the bark do not reach substantial levels, it
is very important to employ chromatographic methods in order to determine the
extractive contents of the bark of tree species in Turkey.
Mankind has been benefiting from tree bark for many years. One of the best examples
of the benefits of bark is cinnamon and its use as a natural sweetener. Bark-derived
quinine was used as an antimalarial drug (Dönmez 2013). Material obtained from
yohimbe bark is now used in the treatment of diabetic patients (Rosengren et al. 2009).
Oleic acid, which can be obtained from wood or bark, is used in the production of
lacquers, and in the leather, textile, ceramic and paper industries (http1).
A number of studies have been conducted in Turkey on the chemical content of bark.
Hafızoğlu and Holmbom (1987) carried out two separate studies on cedar tree bark in
which they examined lipophilic substances and oleoresin materials they had extracted
from the bark. Usta (1993) conducted a comparative chemical analysis of Calabrian
pine bark and wood and attributed the high amount of dilute alkaline-soluble matter in
the bark to the fact that it was rich in polyphenols. Hafizoğlu et al. conducted a study in
1997 to determine the chemical structure of oriental spruce wood and bark. They found
that there were about ten times more lipophilic extractives in the bark than in the wood,
and that the cambium contained a large number of substances, including
monosaccharides and lignins. Kılıç and Altuntaş in 2006 identified the volatile
Symposium Proceedings – Book of Full Papers 246
ECOLOGY 2017 11-13 May, Kayseri TURKEY
components in the wood and bark of the Mediterranean laurel. Dönmez et al.
investigated the effect of increased amounts of suberin monomers in the outer bark of
Scots pine wood (Dönmez et al., 2012). Dichloromethane solvent was used to extract
the following compounds from Quercus cerris bark, which were detected via GC-MS:
azelaic acid, hexadecanoic acid, octadecanoic acid, oleic acid, hexadecanedioic acid,
octadec-9-enedioic acid, 18-hydroxyoctadec-9-enoic acid, 9,10-
dihydroxyoctadecanedioic acid, 9,10,18-trihydroxyoctadecanoic acid, 22-
hydroxydocosanoic acid, eicosanol, docosanol and friedelin (Şen et al. 2010). In a study
to identify the tannins in Calabrian pine bark, chromatographic analysis yielded the
following compounds: taxifolin, catechin, quercetin, ferulic acid, glycerol, p-hydroxy
benzoic acid and 3,4-dihydroxy benzoic acid (Uçar et al. 2013).
In this study, petroleum ether and chloroform yields were extracted from the bark of
tree species widely used in the forest products industry in Turkey. In addition, GC-MS
analyses of the obtained extracts were carried out in order to determine their chemical
content.
2. Materials and methods
2.1. Materials
The sample trees used in the experiments and their source locations are shown in Table
1.
Table 1. Sample trees and their site origins
Coniferous Trees Supply Location
Scots pine (Pinus sylvestris) Kastamonu Regional Directorate of
Forestry
Black pine (Pinus nigra) Kastamonu Regional Directorate of
Forestry
Calabrian pine (Pinus brutia) Muğla Regional Directorate of
Forestry
Ida Mountain fir (Abies nordmanniana subsp. equi-trojani) Kastamonu Regional Directorate of
Forestry
Oriental spruce (Picea orientalis) Trabzon Regional Directorate of
Forestry
Symposium Proceedings – Book of Full Papers 247
ECOLOGY 2017 11-13 May, Kayseri TURKEY
2.1.1. Chemicals
Petroleum ether (petroleum benzine) E.: Merck (Darmstadt, Germany)
Chloroform 99%: Sigma (Sigma-Aldrich GmbH, Sternheim, Germany)
2.2. Methods
2.2.1. Preparation of wood samples
Wood bark samples were obtained from the listed Regional Directorates of Forestry
according to the TAPPI standard T257 cm-85 (1985). Wood bark samples were
prepared from freshly cut wood and left to dry under ambient conditions. The dried
wood bark samples (moisture content: 8%) were chopped into small parts with a special
knife and pulverized with a hammer mill. The wood powder (particle size between 0.05
and 0.4 mm) was stored in closed glass jars at room temperature.
2.2.2. Extraction
The extraction test was carried out using Soxhlet extractors in accordance with TAPPI
standard T204 om-88 (1988). Wood bark samples (10 g) were extracted separately by
using petroleum ether and chloroform (150 mL) for 6 h. Petroleum ether and
chloroform extracts were evaporated and the dried extractive samples were kept in glass
bottles at approximately -18 °C until future experiments.
2.2.3. Gas chromatography mass spectrometry (GC-MS)
GCMS-QP2010 Ultra (Shimadzu,
Kyoto, Japan)
Column: Rtx-5MS, 30 m length, 0.25
mm thickness, 0.25 µm diameter.
Carrier Gas: Helium, 1.26 ml/min
Volume Injected: 1µl
Temperature Program: From 90 ℃ to
250 ℃ at 15 ℃/min
Split Ratio: 5:1
Purge Flow: 3 mL/min
Pressure: 90 kPa
Time of Analysis: 60 min
Ion source temp.: 200 oC
Interface temp.: 250 oC
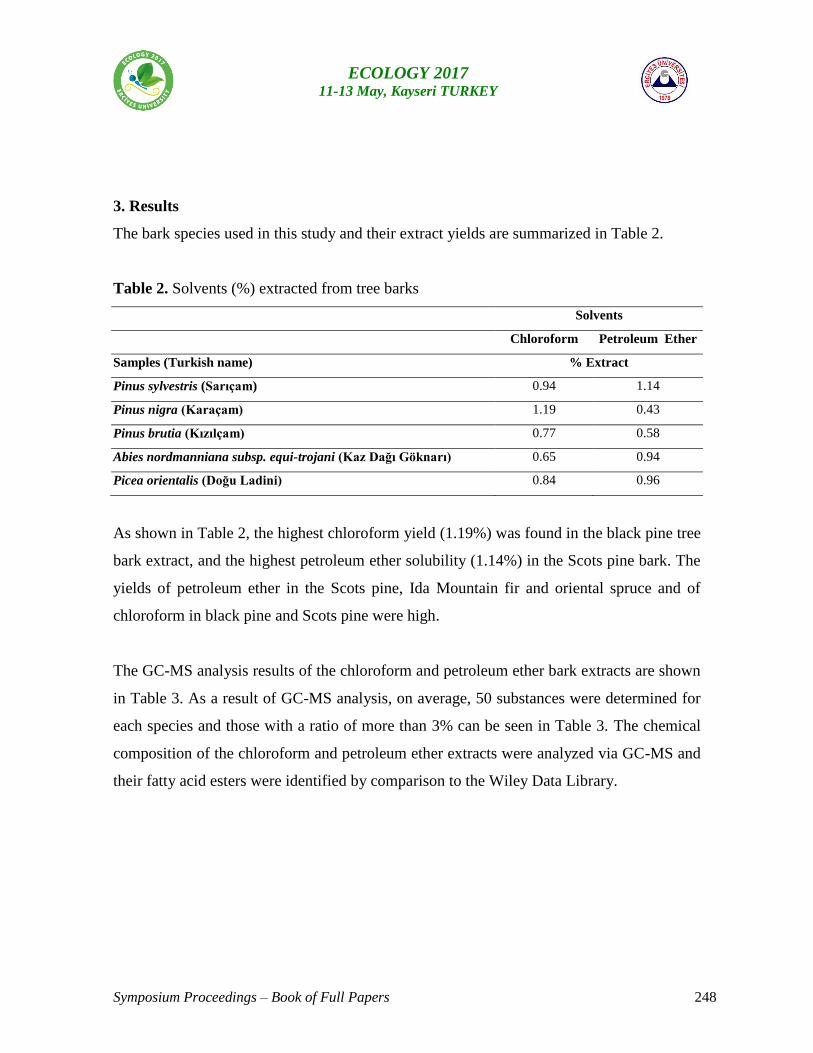
Symposium Proceedings – Book of Full Papers 248
ECOLOGY 2017 11-13 May, Kayseri TURKEY
3. Results
The bark species used in this study and their extract yields are summarized in Table 2.
Table 2. Solvents (%) extracted from tree barks
Solvents
Chloroform Petroleum Ether
Samples (Turkish name) % Extract
Pinus sylvestris (Sarıçam) 0.94 1.14
Pinus nigra (Karaçam) 1.19 0.43
Pinus brutia (Kızılçam) 0.77 0.58
Abies nordmanniana subsp. equi-trojani (Kaz Dağı Göknarı) 0.65 0.94
Picea orientalis (Doğu Ladini) 0.84 0.96
As shown in Table 2, the highest chloroform yield (1.19%) was found in the black pine tree
bark extract, and the highest petroleum ether solubility (1.14%) in the Scots pine bark. The
yields of petroleum ether in the Scots pine, Ida Mountain fir and oriental spruce and of
chloroform in black pine and Scots pine were high.
The GC-MS analysis results of the chloroform and petroleum ether bark extracts are shown
in Table 3. As a result of GC-MS analysis, on average, 50 substances were determined for
each species and those with a ratio of more than 3% can be seen in Table 3. The chemical
composition of the chloroform and petroleum ether extracts were analyzed via GC-MS and
their fatty acid esters were identified by comparison to the Wiley Data Library.
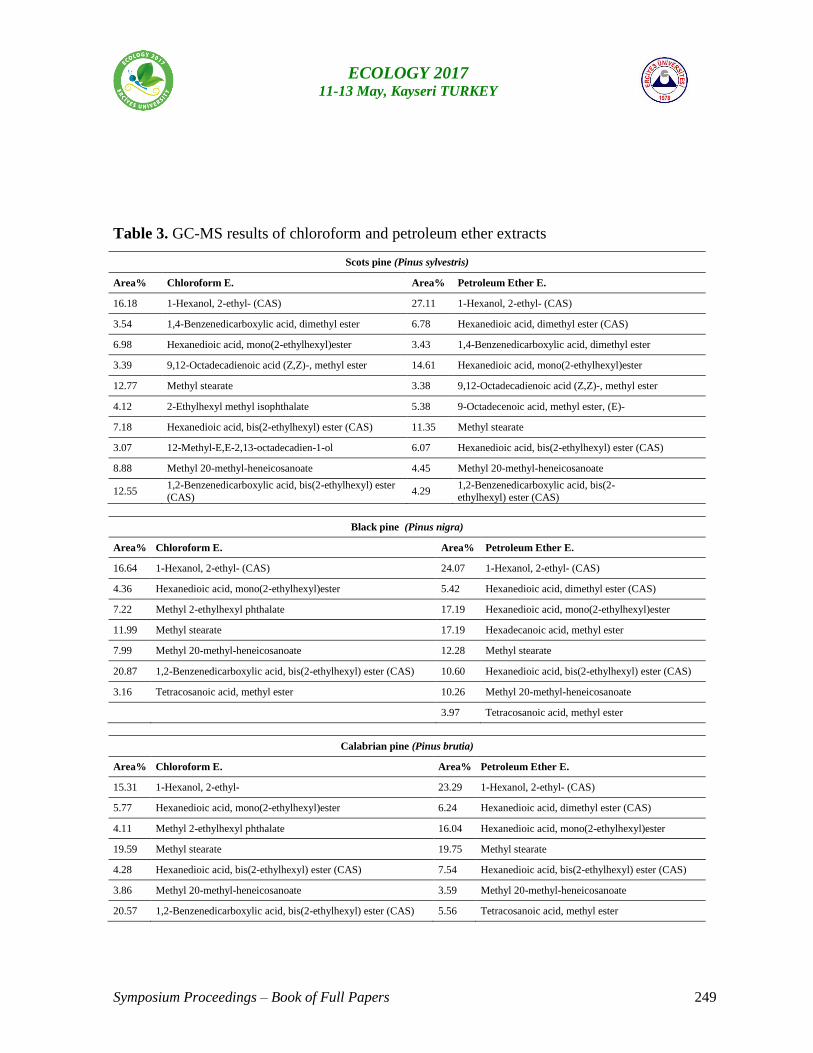
Symposium Proceedings – Book of Full Papers 249
ECOLOGY 2017 11-13 May, Kayseri TURKEY
Table 3. GC-MS results of chloroform and petroleum ether extracts
Scots pine (Pinus sylvestris)
Area% Chloroform E. Area% Petroleum Ether E.
16.18 1-Hexanol, 2-ethyl- (CAS) 27.11 1-Hexanol, 2-ethyl- (CAS)
3.54 1,4-Benzenedicarboxylic acid, dimethyl ester 6.78 Hexanedioic acid, dimethyl ester (CAS)
6.98 Hexanedioic acid, mono(2-ethylhexyl)ester 3.43 1,4-Benzenedicarboxylic acid, dimethyl ester
3.39 9,12-Octadecadienoic acid (Z,Z)-, methyl ester 14.61 Hexanedioic acid, mono(2-ethylhexyl)ester
12.77 Methyl stearate 3.38 9,12-Octadecadienoic acid (Z,Z)-, methyl ester
4.12 2-Ethylhexyl methyl isophthalate 5.38 9-Octadecenoic acid, methyl ester, (E)-
7.18 Hexanedioic acid, bis(2-ethylhexyl) ester (CAS) 11.35 Methyl stearate
3.07 12-Methyl-E,E-2,13-octadecadien-1-ol 6.07 Hexanedioic acid, bis(2-ethylhexyl) ester (CAS)
8.88 Methyl 20-methyl-heneicosanoate 4.45 Methyl 20-methyl-heneicosanoate
12.55 1,2-Benzenedicarboxylic acid, bis(2-ethylhexyl) ester
(CAS) 4.29
1,2-Benzenedicarboxylic acid, bis(2-
ethylhexyl) ester (CAS)
Black pine (Pinus nigra)
Area% Chloroform E. Area% Petroleum Ether E.
16.64 1-Hexanol, 2-ethyl- (CAS) 24.07 1-Hexanol, 2-ethyl- (CAS)
4.36 Hexanedioic acid, mono(2-ethylhexyl)ester 5.42 Hexanedioic acid, dimethyl ester (CAS)
7.22 Methyl 2-ethylhexyl phthalate 17.19 Hexanedioic acid, mono(2-ethylhexyl)ester
11.99 Methyl stearate 17.19 Hexadecanoic acid, methyl ester
7.99 Methyl 20-methyl-heneicosanoate 12.28 Methyl stearate
20.87 1,2-Benzenedicarboxylic acid, bis(2-ethylhexyl) ester (CAS) 10.60 Hexanedioic acid, bis(2-ethylhexyl) ester (CAS)
3.16 Tetracosanoic acid, methyl ester 10.26 Methyl 20-methyl-heneicosanoate
3.97 Tetracosanoic acid, methyl ester
Calabrian pine (Pinus brutia)
Area% Chloroform E. Area% Petroleum Ether E.
15.31 1-Hexanol, 2-ethyl- 23.29 1-Hexanol, 2-ethyl- (CAS)
5.77 Hexanedioic acid, mono(2-ethylhexyl)ester 6.24 Hexanedioic acid, dimethyl ester (CAS)
4.11 Methyl 2-ethylhexyl phthalate 16.04 Hexanedioic acid, mono(2-ethylhexyl)ester
19.59 Methyl stearate 19.75 Methyl stearate
4.28 Hexanedioic acid, bis(2-ethylhexyl) ester (CAS) 7.54 Hexanedioic acid, bis(2-ethylhexyl) ester (CAS)
3.86 Methyl 20-methyl-heneicosanoate 3.59 Methyl 20-methyl-heneicosanoate
20.57 1,2-Benzenedicarboxylic acid, bis(2-ethylhexyl) ester (CAS) 5.56 Tetracosanoic acid, methyl ester
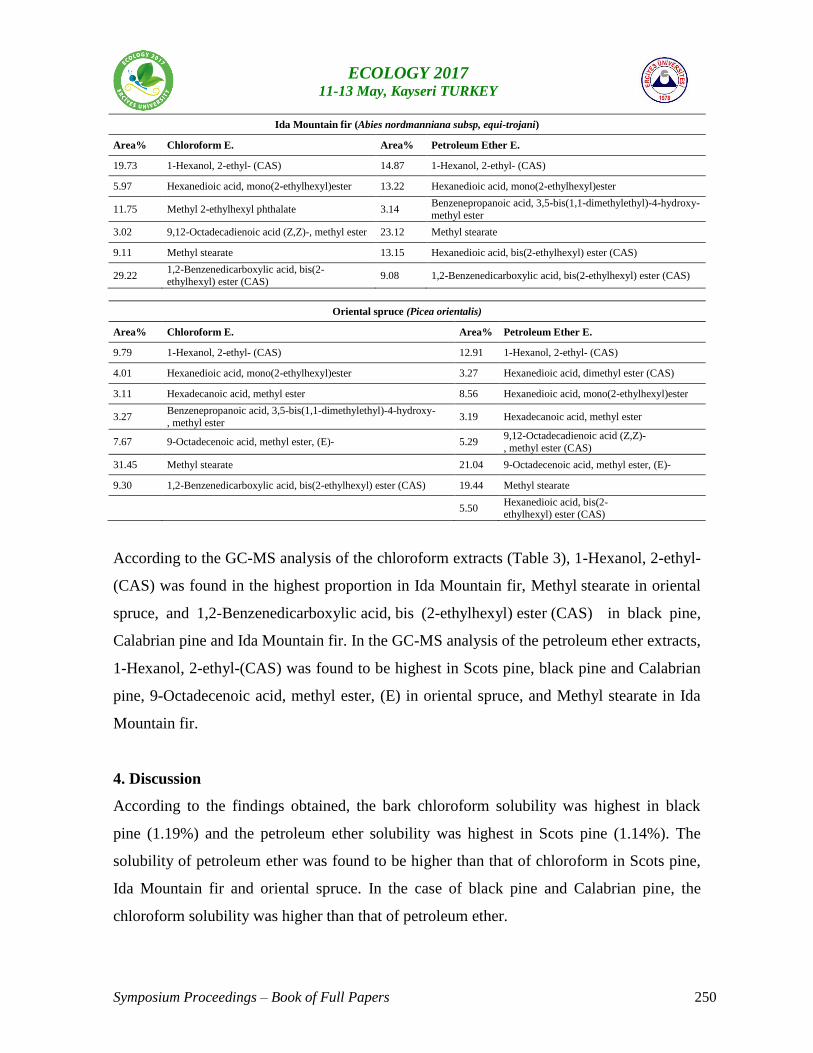
Symposium Proceedings – Book of Full Papers 250
ECOLOGY 2017 11-13 May, Kayseri TURKEY
Ida Mountain fir (Abies nordmanniana subsp, equi-trojani)
Area% Chloroform E. Area% Petroleum Ether E.
19.73 1-Hexanol, 2-ethyl- (CAS) 14.87 1-Hexanol, 2-ethyl- (CAS)
5.97 Hexanedioic acid, mono(2-ethylhexyl)ester 13.22 Hexanedioic acid, mono(2-ethylhexyl)ester
11.75 Methyl 2-ethylhexyl phthalate 3.14 Benzenepropanoic acid, 3,5-bis(1,1-dimethylethyl)-4-hydroxy-
methyl ester
3.02 9,12-Octadecadienoic acid (Z,Z)-, methyl ester 23.12 Methyl stearate
9.11 Methyl stearate 13.15 Hexanedioic acid, bis(2-ethylhexyl) ester (CAS)
29.22 1,2-Benzenedicarboxylic acid, bis(2-
ethylhexyl) ester (CAS) 9.08 1,2-Benzenedicarboxylic acid, bis(2-ethylhexyl) ester (CAS)
Oriental spruce (Picea orientalis)
Area% Chloroform E. Area% Petroleum Ether E.
9.79 1-Hexanol, 2-ethyl- (CAS) 12.91 1-Hexanol, 2-ethyl- (CAS)
4.01 Hexanedioic acid, mono(2-ethylhexyl)ester 3.27 Hexanedioic acid, dimethyl ester (CAS)
3.11 Hexadecanoic acid, methyl ester 8.56 Hexanedioic acid, mono(2-ethylhexyl)ester
3.27 Benzenepropanoic acid, 3,5-bis(1,1-dimethylethyl)-4-hydroxy-
, methyl ester 3.19 Hexadecanoic acid, methyl ester
7.67 9-Octadecenoic acid, methyl ester, (E)- 5.29 9,12-Octadecadienoic acid (Z,Z)-
, methyl ester (CAS)
31.45 Methyl stearate 21.04 9-Octadecenoic acid, methyl ester, (E)-
9.30 1,2-Benzenedicarboxylic acid, bis(2-ethylhexyl) ester (CAS) 19.44 Methyl stearate
5.50 Hexanedioic acid, bis(2-ethylhexyl) ester (CAS)
According to the GC-MS analysis of the chloroform extracts (Table 3), 1-Hexanol, 2-ethyl-
(CAS) was found in the highest proportion in Ida Mountain fir, Methyl stearate in oriental
spruce, and 1,2-Benzenedicarboxylic acid, bis (2-ethylhexyl) ester (CAS) in black pine,
Calabrian pine and Ida Mountain fir. In the GC-MS analysis of the petroleum ether extracts,
1-Hexanol, 2-ethyl-(CAS) was found to be highest in Scots pine, black pine and Calabrian
pine, 9-Octadecenoic acid, methyl ester, (E) in oriental spruce, and Methyl stearate in Ida
Mountain fir.
4. Discussion
According to the findings obtained, the bark chloroform solubility was highest in black
pine (1.19%) and the petroleum ether solubility was highest in Scots pine (1.14%). The
solubility of petroleum ether was found to be higher than that of chloroform in Scots pine,
Ida Mountain fir and oriental spruce. In the case of black pine and Calabrian pine, the
chloroform solubility was higher than that of petroleum ether.
Symposium Proceedings – Book of Full Papers 251
ECOLOGY 2017 11-13 May, Kayseri TURKEY
In the literature, the bark ethyl ether solubility values of Pinus echinata, Pinus elliottii,
Pinus taeda, Pinus Virginia and Pinus sylvestris were found to be 1.1%, 1.2%, 1.3%, 1.0%
and 4.6%, respectively (Labosky 1979; Weissmann and Ayla 1980). Goudarshivananavar et
al. (2015) reported a chlorophyll solubility of 2.0% in the woody bark of Polyalthia
cerasoides.
In the present study, the petroleum ether solubility of Scots pine was found to be higher
than that of other species, a result supported by the work of Labosky (1979) and
Weissmann and Ayla (1980). In general, the black pine chloroform solubility and Scots
pine ether solubility are close to the values found in the literature, while the solubility
values of the other species used in the study were found to be lower than those in the
literature.
As a result of the GC-MS analysis of the chloroform extracts, the highest levels of 1-
Hexanol, 2-ethyl- (CAS) were seen in Ida Mountain fir, Methyl stearate in oriental spruce
and 1,2-Benzenedicarboxylic acid, bis (2-ethylhexyl) ester (CAS) in black pine, Calabrian
pine and Ida Mountain fir. In the analysis of the petroleum ether extracts, the highest levels
of 1-Hexanol, 2-ethyl- (CAS) were detected in Scots pine, black pine and Calabrian pine, 9-
Octadecenoic acid and methyl ester, (E) in oriental spruce, and Methyl stearate in Ida
Mountain fir.
The 1-Hexanol, 2-ethyl compound is mostly used as a plasticizer. Since it is an oily
alcohol, its esters have softening properties. For example, octocrylene, which contains 2-
ethylhexyl, is used in sunscreens for this reason. Moreover, the generics are used as low
volatility solvents. In addition, 2-ethylhexyl can be used as an octane booster when reacted
with nitric acid (http2).
The 1,2-Benzenedicarboxylic acid, bis (2-ethylhexyl) ester is generally called di (2-
ethylhexyl) phthalate or phthalic acid di (2-ethylhexyl) ester. Phthalic acid is a fatty acid
Symposium Proceedings – Book of Full Papers 252
ECOLOGY 2017 11-13 May, Kayseri TURKEY
ester which has poor solubility in water and ether, but is soluble in alcohol and decomposes
at 191 °C. It is used as a chemical intermediate in the production of paint, pharmaceuticals
and synthetic perfumes. It is also known as terephthalic acid in its para form, and is used to
make polyester resins and as an additive in poultry feed (http3).
In general, Methyl stearate and 9-Octadecenoic acid, methyl ester are employed in
foodstuffs in which fatty acid esters are used and as emulsifiers or lubricant agents for
textiles. Additionally, they can be used as lubricants for plastics, additives for dyes and ink,
in the agricultural industry as solvents and as intermediates in the perfume industry (http4).
5. Conclusion
This study has revealed the value of tree wood bark in terms of its chemical content. Thus,
the determination of these chemical substances proves that bark extracts can be an
indisputable resource for the many sectors which are based on the use of chemical raw
materials. Future studies in which the isolation of these components is carried out will show
the increasingly significant value of these substances.
Acknowledgements
The corresponding author wishes to thank the Scientific and Technological Research
Council of Turkey (TUBITAK 2211-D) and the Kastamonu University Scientific Projects
Research Office (Project Number KU-BAP03/2016-10) for supporting this research.
References
Dönmez, I. E., Hafızoğlu, H., Kılıç, A., Hemming J., Eckerman C. (2012). Effect of altitude
on the composition of suberin monomers in the outer bark of Scots pine (Pinus sylvestris
L.). Industrial Crops and Products, 37, 441- 444.
Dönmez, İ. E., Dönmez, Ş. (2013). Structure of tree bark and possibility of
utilization. Turkish Journal of Forestry, 14(2), 156-162.
Symposium Proceedings – Book of Full Papers 253
ECOLOGY 2017 11-13 May, Kayseri TURKEY
Goudarshivananavar, B. C., Vigneshwaran, V., Somegowda, M., Dharmappa, K. K.,
Pramod, S. N. (2015). Therapeutic potential of Polyalthia cerasoides stem bark extracts
against oxidative stress and nociception. Ancient Science of Life, 35(2), 70.
Hafizoğlu, H., & Holmbom, B. (1987). Studies on the Chemistry of Cedrus libani A. Rich.-
III. Oleoresin Composition of Cones and Bark from Cedrus libani. Holzforschung-
International Journal of the Biology, Chemistry, Physics and Technology of
Wood, 41(3), 141-145.
Hafizoğlu, H., Usta, M., & Bilgin, Ö. (1997). Wood and bark composition of Picea
orientalis (L.) Link. Holzforschung-International Journal of the Biology, Chemistry,
Physics and Technology of Wood, 51(2), 114-118.
Kılıç, A., Altuntas, E. (2006). Wood and bark volatile compounds of Laurus nobilis L.
Holzs als roh- und werkstoff, 64, 317-320.
Labosky, P. (1979). Wood Science, 12, 80-85.
Rosengren, A.H., Jokubka, R., Tojjar, D., Granhall, C., Hansson, O., Li, D.-Q., Nagaraj, V.,
Reinbothe, T.M. (2009). Overexpression of Alpha2A-Adrenergic Receptors Contributes
to Type 2 Diabetes. Science 327 (5962), 217–220.
Şen, A., Miranda, I., Santos, S., Graça, J., Pereira, H. (2010). The chemical composition of
cork and phloem in the rhytidome of Quercus cerris bark. Industrial Crops and
Products, 31(2), 417-422.
TAPPI T204 om-88. (1988). Solvent Extractives of Wood and Pulp, TAPPI Press, Atlanta,
GA, USA.
TAPPI T257 cm-85. (1985). Sampling and Preparing Wood for Analysis, TAPPI Press,
Atlanta, GA, USA.
Ucar, M. B., Ucar, G., Pizzi, A., Gonultas, O. (2013). Characterization of Pinus brutia bark
tannin by MALDI-TOF MS and 13C NMR. Industrial Crops and Products, 49 697–704.
Usta, M. (1993). Comparing wood and bark constituents of endemic species. ORENKO, 93,
288-292.

Symposium Proceedings – Book of Full Papers 254
ECOLOGY 2017 11-13 May, Kayseri TURKEY
Weissmann, G. and Ayla, C. (1980), Holz Roh-Werkst, 38, 307-312.
http1: https://chemicalceo.com/2016/05/28/oleik-asit-oleic-acid-nedir-nerelerde-kullanilir/
http2: https://en.wikipedia.org/wiki/2-Ethylhexanol
http3: http://encyclopedia2.thefreedictionary.com/1,2-benzenedicarboxylic+acid
http4: http://www.chemicalland21.com/lifescience/foco/METHYL%20STEARATE.htm
Symposium Proceedings – Book of Full Papers 255
ECOLOGY 2017 11-13 May, Kayseri TURKEY
Microbiological analysis of waters of river Rimnik, nearby city Rahovec (Kosovo)
during winter season 2014
Jeton ORLLATI1, Idriz VEHAPI
2, Kemajl KURTESHI
2, Fisnik SPAHIU
1, Hakan
DEMIR4
1,3Master study, Department of Bilogy, Faculty of Natural Science, University of Prishtina ,
Kosovo
2Department of Biology, Faculty of Natural Science, University of Prishtina, Prishtina,
Kosovo
4Department of Biology, Faculty of Science and Arts, Ömer Halisdemir Üniversites, Niğde,
Turkey
Abstract:The relationships between indicator bacteria of pollution and the organic load
were conducted through winter season 2014. Discharge of wastewater in rivers, makes it
necessary their bacteriological research. Investigation is done during winter season, 2014.
Samples for microbiological analyses are collected in four localities along the river. Based
on obtained results led us to conclude: The waters of river “Rimnik ” it is polluted by
bacteria at all localities. Registered relatively higher number of all microorganism, at all
locality. On base of coliform bacteria according to Tumpling system the waters of
“Rimnik” river belongs at third class of pollution.
Key words: microbiological, river, winter, Rimnik, Kosovo.
1.Introduction
Surface waters may have a
microbial � ora of great diversity,
including bacteria and fungi. Depending
on the physical and chemical conditions,
a variety of bacterial communities may
occur.
Analysis of bacterial population in
an aquatic system is of primary
importance for evaluating its trophic
Symposium Proceedings – Book of Full Papers 256
ECOLOGY 2017 11-13 May, Kayseri TURKEY
conditions (1 Bezirtzoglou, 1995,
Panagiou 1995).
The bacteriological quality of
water has traditionally been assessed by
monitoring the levels of total coliforms
(TC) and fecal coliforns (FC). C.
perfringens has been suggested as an
alternative bacterial indicator of fecal
pollution because it is consistently
associated with human wastes . C.
perfringens, and especially its spores,
which are more tolerant to various
physicochemical parameters than other
fecal indicator bacteria, could serve as a
useful indicator in ecosystems suffering
from stress factors ( Bezirtzoglou , 1994;
Bezirtzoglou 1996 ).
On the other hand, it has been
suggested that the number of
heterotrophic aerobic bacteria in
freshwater ecosystems is directly
proportional to the degree of organic
pollution (EPA, 2003).
Natural water bodies have been
polluted as a result of receiving domestic
sewage and effl uents.
2.Materials And Methods
The samples for this analysis were
collected with two-litre sterile polyvinyl
chloride (PVC) plastic water bottles from
three (3) designated sampling point in
river Rimnik during winter season,
2014.
The water samples were collected
for both physiochemical and
microbiological analysis. The objective of
the sampling was to collect a portion of
material small enough in volume to be
conveniently transported to lab, while still
accurately representing the material being
sampled. The preservation method for
storage was refrigeration.
Water samples were analysed for
physiochemical and microbiological
quality and chemical characteristic (TDS,
conductivity, pH, salinity) were
determined by digital aparature HACH.
2.1.Bacteriological Analysis In the bacteria isolation, nutrient
agar for heterotrophic bacteria, bile
Symposium Proceedings – Book of Full Papers 257
ECOLOGY 2017 11-13 May, Kayseri TURKEY
aesculin agar for Streptococcus faecalis,
Violet red agar for total coliform bacteria,
SS agar for salmonela and shigella,
saborud agar for fungi, were used. All
media were prepared and sterilized as
instructed by manufacturer.
3.Results
Microbiological results obtained
from investigation realized during
winter season of the water of river
Rimnik shown in Table 1. As it show at
table the higher number of heterotrophic
bacteria is registred at second locality by
528.000 cfu /100 ml water. While at third
locality registered 400.000 cfu / 100 ml
water. At fourth locality determined
312.000 cfu / 100 ml water. The lower
number is registered at first locality with
120.000.
As regards to the total coliform
bacteria the higher number is registered at
second locality, 448.000 cfu/100 ml
water. The low number, of total coliform
bacteria, is registered at first locality
96.000 cfu /100 ml water. While at third
locality registered 280.000 cfu / 100 ml
water. At fourth locality is registered
134.000 cfu/100 ml water.The higher
number of SS bacteria is registered at
second locality, 230.000 cfu /100 ml
water. The low number of SS bacteria is
registered in first locality (20.000 cfu
/100 ml water). While at third locality
registered 70.000 cfu / 100 ml water. At
fourth locality is registered 34.000
cfu/100 ml water.
The higher number of
Streptococcus faecalis bacteria is
registered also at second locality,
248.000 cfu /100 ml/water . The low
number of Streptococcus faecalis bacteria
is registered in first locality (58.000 cfu
/10 ml /water). While at third locality
registered 224.000 cfu / 100 ml water. At
fourth locality is registered 120.000
cfu/100 ml water.
The higher number of fungi is
registered at fourth locality, 164.000 cfu
/100 ml water. The low number of fungi
is registered in first locality (26.000 cfu
/100 ml/water). While at second locality
registered 94.000 cfu / 100 ml water. At
Symposium Proceedings – Book of Full Papers 258
ECOLOGY 2017 11-13 May, Kayseri TURKEY
third locality is registered 124.000
cfu/100 ml water.
The high total heterotrophic count
is indicative of the presence of high
organic and dissolved salts in the water.
The primary sources of these bacteria in
water are animal and human wastes.
These sources of bacterial contamination
include surface runoff, pasture, and other
land areas where animal wastes are
deposited. Additional sources include
seepage or discharge from septic tanks,
sewage treatment facilities and natural
soil /plant bacteria (EPA, 2002).
Table 1. Microbiological results of waters of river “Rimnik” during winter season 2014
Group of
microorganism
Locations and colony of bacteria in 100 ml of water
Locality 1 Locality 2 Locality 3 Locality 4
Heterotrophic bacteria 120.000 528.000 400.000 312.000
Total coliform bacteria 96.000 448.000 280.000 134.000
Salmonela Shigella- SS 20.000 230.000 70.000 34.000
Streptococcus 58.000 284.000 224.000 120.000
Fungi (moulds and
yeast)
26.000 94.000 124.000 164.000
Symposium Proceedings – Book of Full Papers 259
ECOLOGY 2017 11-13 May, Kayseri TURKEY
4.Discussion
The water quality showed high
concentration of bacteria upstream to
downstream of Rimnik river.
According to the microbiological
data investigated in this research, it was
possible to analyze the efficiency of the 4
stations according to the average total
number of viable microbial agents in
water.
Accordingly, the total coliform
count for all samples were exceedingly
high the EPA maximum contamination
level (MCL) for coliform bacteria in
drinking water of zero total coliform per
100ml of water (EPA, 2003). The high
coliform count obtained in the samples
may be an indication that the water
sources are faecally contaminated (EPA,
2003; Osuinde and Enuezie, 1999). None
of the water samples complies with EPA
standard for coliform in water. According
to EPA standard, every water sample that
has coliform must be analyzed for either
fecal coliforms or E. coli (EPA, 2003)
with a view to ascertaining contamination
with human or animal waste and possibly
pathogenic bacteria or organism, such as
Gardia and Cryptosporidium may be
present (EPA, 2003).
From these results show that the
waters of the river Rimnik is higher
polluted , than standards according to
FAO(1997a) allows. These higher
number of bacteria is found in very low
amount of water (100 ml water).
Recommended standard for water is less
than 2 most probable number
(MPN/100ml (FAO, 1997a). Water
ecosystems are nowadays under
increased threat from rising
human populations accompanied by
increased agricultural and
industrial growth. These results
were in accordance with the results
obtained by Alobaidy et al.(2010). WHO
drinking water quality guidelines
recommend that fecal coliform must not
exist in 100 mL of water sample (WHO,
2004, WHO 2004).

Symposium Proceedings – Book of Full Papers 260
ECOLOGY 2017 11-13 May, Kayseri TURKEY
5.Conclusions
According to the results obtained,
we conclude with the following: -Total
coliform counts and other
bacteria counts at the four stations in
winter seasons were more than the
international permissible levels
recommended by WHO.
Symposium Proceedings – Book of Full Papers 261
ECOLOGY 2017 11-13 May, Kayseri TURKEY
Ref
erences
Alobaidy AM J, Moulood BK, Kadhem AJ (2010). “Evaluating raw and treated water quality
of Tigris river within Baghdad by index analysis,” Journal of Water Resource and
Protection, vol. 2, pp. 629–635,.
Bezirtzoglou E, Panagiou A, Savvaidis I, Maipa V.( 1997). Distribution of C. perfringens in
polluted lake environments. Anaer- obe; 3: 172–96.
Bezirtzoglou E, Dimitriou D, Panagiou A, Kagalou I, Demoliates Y( 1994). Distribution of C.
perfringens in different aquatic environments in Greece. Microbial Res; 149: 129 –34.
Bezirtzoglou E, Dimitriou D, Panagiou A. (1996). Occurrence of C. perfringens in river water
by using a new procedure. Anaerobe; 2: 169–73.
EPA, (2002). US Environment Protection Agency, Safe Drinking Water Act Ammendment.
EPA (2003). US Environmental Protection Agency Safe Drinking Water Act. EPA, 816 – F – 03
–016,
Food and Agriculture Organization (FAO) (1997a). Chemical analysis manual for food and
water, 5th Ed, FAO ROME 1: 20-26.
Fobes BA, DF Sahm, Weisfeld A. (2002). Baily and Scott's Diagnostic Microbiology, Mosby,St.
Louis, Mo, USA, 11th edition.
Hiraishi A, Saheki K, Horie S (1984). Relationships of total coliforms, fecal coliform and
organic pollution levels in the Tamagawa River. Bull J Soc Sci Fisheries; 50 (6): 991–7.
Symposium Proceedings – Book of Full Papers 262
ECOLOGY 2017 11-13 May, Kayseri TURKEY
Hrudey SE, Hrudey EJ.( 2007).“Published case studies of waterborne disease outbreaks—
evidence of a recurrent threat,” Water Environment Research, vol. 79, no. 3, pp. 233–
256,
Kondakal-Olukemi YI, Mawak JD, Onjo M M. (2009). “Isolation of
enteropathogenic Escherichia colifrom children with diarrhea attending the national
hospital in Abuja, Nigeria shiraz,” E- Medical Journal, vol. 10, no. 3, pp. 99–106.
Osuinde MI, Eneuzie, N R. (1999). “Bacteriological analysis of ground water.” Nigeria Journal
of Microbiology vol. 13:47-54.
Panagiou A, Savaidis I, Theodoroy D, Bezirtzoglou E. (1995). Influuence of light on the
presence of C. perfringens in caves. Clin Infect Dis; 20 (2): 380–1.
Reynolds KA, Mena K D, Gerba CP.(2008). “Risk of waterborne illness via drinking water in the
United States,” Reviews of Environmental Contamination and Toxicology, vol. 192, pp.
117–158,
World Health Organization (2004), Guidelines For Drinking—Water Quality, World Health
Organization, Geneva, Switzerland, 3rd edition,.
World Health Organization, (2004). Introducing Parameters for the Assessment of Drinking
Water Quality, World Health Organization, Geneva, Switzerland,.
Symposium Proceedings – Book of Full Papers 263
ECOLOGY 2017 11-13 May, Kayseri TURKEY
Mu
nicipal Solid Waste Management in Gumushane of Turkey
Günay ÇAKIR1,*
, Murat AYDIN
2
1 Gumushane University Gumushane Vocational School Forestry Department, Gumushane,
Turkey 2 Gümüşhane Municipalities, Environmental Department, Gumushane, Turkey
*Correspondence: [email protected]
Abstract: Municipal solid waste is one of the problem caused by environmental pollution
in the world. Solid waste management has been no progress in developing countries. The
inadequacy of the resources transferred to the local governments for the regulation of
environmental areas also affects the environmental investments. This study was conducted to
management of municipal solid waste in Gumushane district. The amount of municipal solid
waste is being formed in the central district that known to be approximately 40 tons on a daily
basis. This amount can be increased or decreased depending on seasonal conditions and
population variability. The resulting organic household waste began to be referred to municipal
waste landfill. Presently wild waste storage areas in the districts could not be full with the
environmental conditions.
Key words: Municipal Solid Waste, Irregular Landfill, Waste Management, Wild Storage,
Gumushane.
Introduction
In developing countries; rising population, developments in the field of industry, and
urbanization are the problems of solid waste management. Local authorities in these countries;
the high cost of collection, transport, treatment and disposal of domestic solid wastes and the
new generation of applications are a very economical burden. Local governments trying to
Symposium Proceedings – Book of Full Papers 264
ECOLOGY 2017 11-13 May, Kayseri TURKEY
man
age solid waste tend to cooperate with the private sector to solve implementation problems or
reduce costs. Since private sector representatives evaluate these activities with the logic of
generating earnings, it is seen that they manage system efficiency more than public institutions in
Turkey (Shekdar, 2009; Varır, 2015). Turkish population is about 80 million and 76% of this
population has been living in cities (TUIK 2016). People have been living in 81 cities of Turkey,
but all cites have been no municipal solid waste management applications.
This study is aimed that domestic waste management studies and waste management
problems in Gümüşhane province. Administrators have prepared proposals for solution of waste
problems.
Materials and methods
The daily waste is an amount of 40 tons collected household waste at the municipal
boundaries in Gümüşhane. This amount is collected with about 800 galvanized containers, 100
barrels, 4 compaction trucks, 1 closed truck for about 40 people in an operation in the morning
and evening for about 12 hours (Anonym 2015). This garbage collected is transferred to Bayburt
Domestic Solid Waste Regular Storage Facility via Gümüşhane Local Administrations Union,
solid waste transfer station. The wilderness area on the Kurudere valley on the southwest slopes
of the Parmak Hill in Gümüşhane Center has not been rehabilitated yet. (Figure 1 A). For the
management of domestic wastes in Gumushane province, 2 municipal solid waste transfer
stations with the support of the The Ministry of Environment and Urbanization were completed
in December 2015. The distance to the sanitary landfill site in Bayburt, where these stations are
members of Gümüşhane, is about 85 km (figure 1 B).
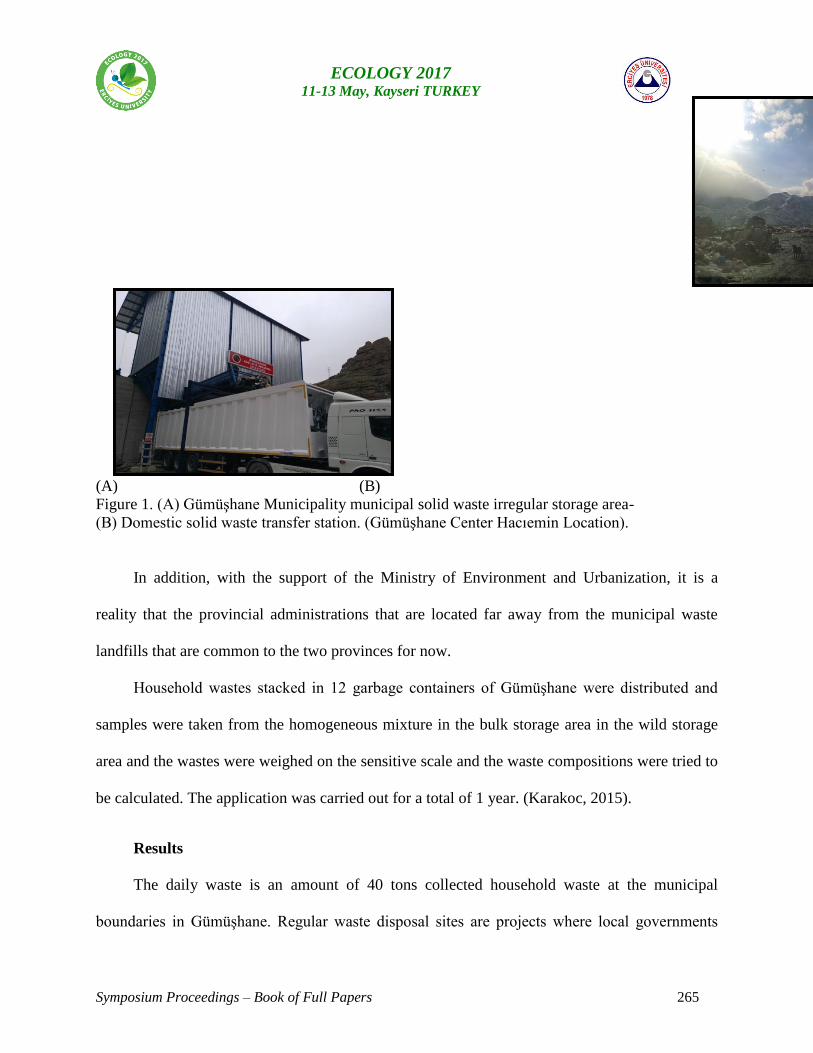
Symposium Proceedings – Book of Full Papers 265
ECOLOGY 2017 11-13 May, Kayseri TURKEY
(A) (B)
Figure 1. (A) Gümüşhane Municipality municipal solid waste irregular storage area-
(B) Domestic solid waste transfer station. (Gümüşhane Center Hacıemin Location).
In addition, with the support of the Ministry of Environment and Urbanization, it is a
reality that the provincial administrations that are located far away from the municipal waste
landfills that are common to the two provinces for now.
Household wastes stacked in 12 garbage containers of Gümüşhane were distributed and
samples were taken from the homogeneous mixture in the bulk storage area in the wild storage
area and the wastes were weighed on the sensitive scale and the waste compositions were tried to
be calculated. The application was carried out for a total of 1 year. (Karakoc, 2015).
Results
The daily waste is an amount of 40 tons collected household waste at the municipal
boundaries in Gümüşhane. Regular waste disposal sites are projects where local governments
Symposium Proceedings – Book of Full Papers 266
ECOLOGY 2017 11-13 May, Kayseri TURKEY
hav
e contributed positively to the protection of the environment. The general problem must be
remote from the settlements in terms of logistical support of these areas. This increases the cost
of transportation. On the other hand, Gümüşhane province is sufficient in terms of urbanization
and waste management. More work is being done on the protection of the environment and
pollution control. In 2014, the wastewater treatment is one of them. Multi-directional waste
management studies have been projected in provincial and district centers.
It was aimed to save more economically by transporting more waste to the Bayburt
household waste landfill facility at one time by loading the domestic wastes that they brought
with small capacity refuse trucks by the municipal and provincial special administrations such as
municipalities and special provincial administrations. However, for municipalities in the Kürtün
region that is 45 km away from these two stations, waste management is costly and economically
compulsory for municipal resources. In order to avoid such problems, it would be useful to make
additional transfer stations to the Kürtün region.
The municipal waste composition of Gumushane Municipality and Gumushane University
was used for compaction garbage trucks belonging to Gumushane Municipality and garbage
containers at waste collection points.
Although the direct proportion of regular storage waste is 66% in the construction work. It
is estimated that 40% of the domestic waste is included in the park garden and agricultural waste,
market waste, road waste, ash waste and organic waste. The total population of Gümüşhane
province has a potential of 172034 in 2015.
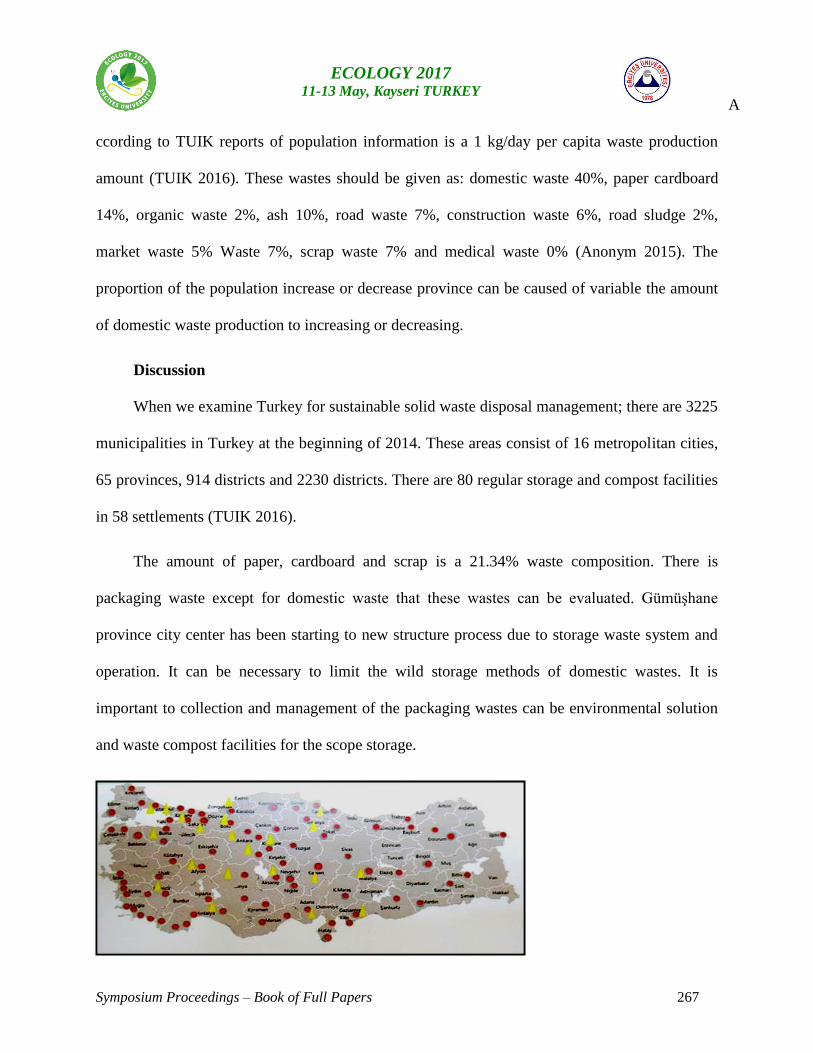
Symposium Proceedings – Book of Full Papers 267
ECOLOGY 2017 11-13 May, Kayseri TURKEY
A
ccording to TUIK reports of population information is a 1 kg/day per capita waste production
amount (TUIK 2016). These wastes should be given as: domestic waste 40%, paper cardboard
14%, organic waste 2%, ash 10%, road waste 7%, construction waste 6%, road sludge 2%,
market waste 5% Waste 7%, scrap waste 7% and medical waste 0% (Anonym 2015). The
proportion of the population increase or decrease province can be caused of variable the amount
of domestic waste production to increasing or decreasing.
Discussion
When we examine Turkey for sustainable solid waste disposal management; there are 3225
municipalities in Turkey at the beginning of 2014. These areas consist of 16 metropolitan cities,
65 provinces, 914 districts and 2230 districts. There are 80 regular storage and compost facilities
in 58 settlements (TUIK 2016).
The amount of paper, cardboard and scrap is a 21.34% waste composition. There is
packaging waste except for domestic waste that these wastes can be evaluated. Gümüşhane
province city center has been starting to new structure process due to storage waste system and
operation. It can be necessary to limit the wild storage methods of domestic wastes. It is
important to collection and management of the packaging wastes can be environmental solution
and waste compost facilities for the scope storage.
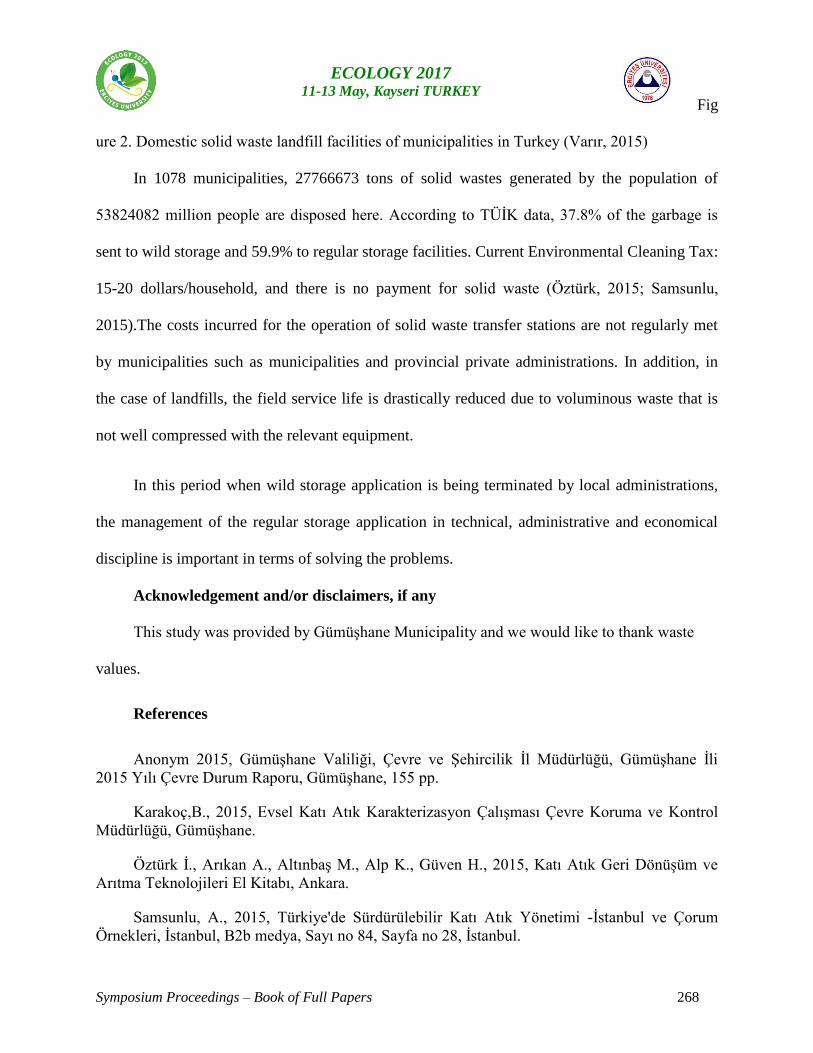
Symposium Proceedings – Book of Full Papers 268
ECOLOGY 2017 11-13 May, Kayseri TURKEY
Fig
ure 2. Domestic solid waste landfill facilities of municipalities in Turkey (Varır, 2015)
In 1078 municipalities, 27766673 tons of solid wastes generated by the population of
53824082 million people are disposed here. According to TÜİK data, 37.8% of the garbage is
sent to wild storage and 59.9% to regular storage facilities. Current Environmental Cleaning Tax:
15-20 dollars/household, and there is no payment for solid waste (Öztürk, 2015; Samsunlu,
2015).The costs incurred for the operation of solid waste transfer stations are not regularly met
by municipalities such as municipalities and provincial private administrations. In addition, in
the case of landfills, the field service life is drastically reduced due to voluminous waste that is
not well compressed with the relevant equipment.
In this period when wild storage application is being terminated by local administrations,
the management of the regular storage application in technical, administrative and economical
discipline is important in terms of solving the problems.
Acknowledgement and/or disclaimers, if any
This study was provided by Gümüşhane Municipality and we would like to thank waste
values.
References
Anonym 2015, Gümüşhane Valiliği, Çevre ve Şehircilik İl Müdürlüğü, Gümüşhane İli
2015 Yılı Çevre Durum Raporu, Gümüşhane, 155 pp.
Karakoç,B., 2015, Evsel Katı Atık Karakterizasyon Çalışması Çevre Koruma ve Kontrol
Müdürlüğü, Gümüşhane.
Öztürk İ., Arıkan A., Altınbaş M., Alp K., Güven H., 2015, Katı Atık Geri Dönüşüm ve
Arıtma Teknolojileri El Kitabı, Ankara.
Samsunlu, A., 2015, Türkiye'de Sürdürülebilir Katı Atık Yönetimi -İstanbul ve Çorum
Örnekleri, İstanbul, B2b medya, Sayı no 84, Sayfa no 28, İstanbul.

Symposium Proceedings – Book of Full Papers 269
ECOLOGY 2017 11-13 May, Kayseri TURKEY
S
hekdar AV., Sustainable solid waste management: an integrated approach for Asian countries.
Waste Management 2009; 29:1438–48.
TUIK, 2016, Turkish Statistics Institute, Repoublic of Turkey.
Varır A., 2015, Türkiye’de Sürdürülebilir Atık Yönetimi, T.C. Çevre ve Şehircilik
Bakanlığı, Ankara.
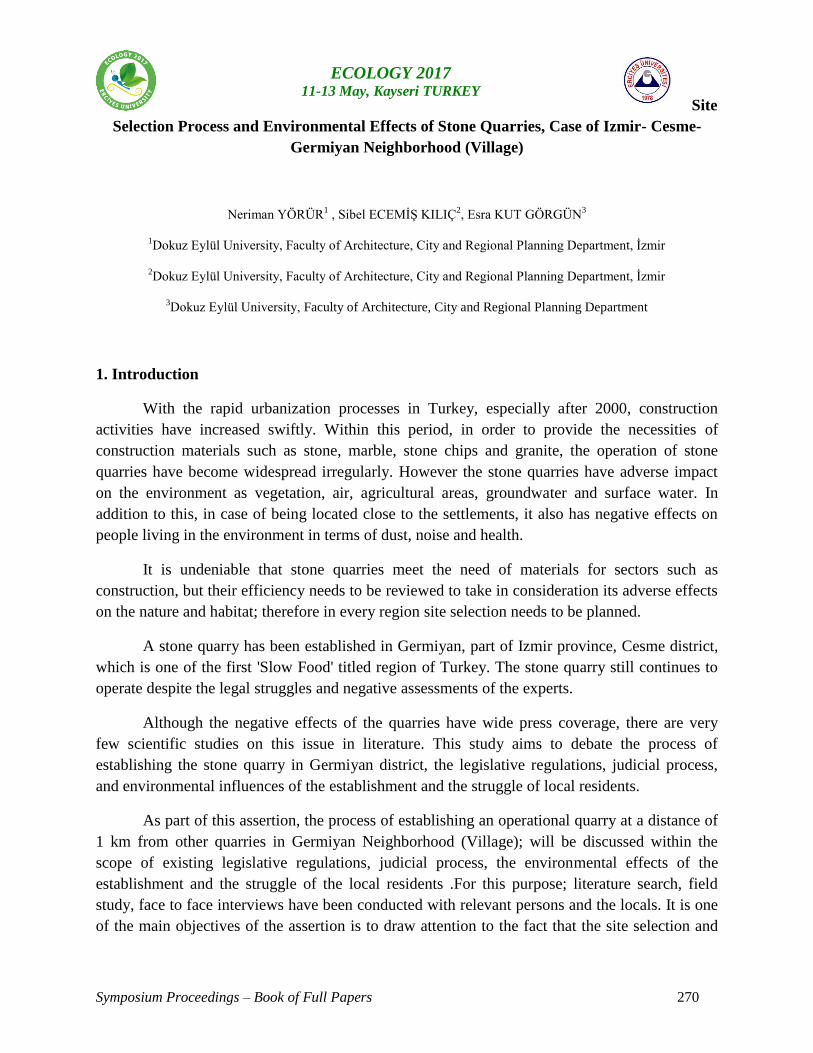
Symposium Proceedings – Book of Full Papers 270
ECOLOGY 2017 11-13 May, Kayseri TURKEY
Site
Selection Process and Environmental Effects of Stone Quarries, Case of Izmir- Cesme-
Germiyan Neighborhood (Village)
Neriman YÖRÜR1 , Sibel ECEMİŞ KILIÇ
2, Esra KUT GÖRGÜN
3
1Dokuz Eylül University, Faculty of Architecture, City and Regional Planning Department, İzmir
2Dokuz Eylül University, Faculty of Architecture, City and Regional Planning Department, İzmir
3Dokuz Eylül University, Faculty of Architecture, City and Regional Planning Department
1. Introduction
With the rapid urbanization processes in Turkey, especially after 2000, construction
activities have increased swiftly. Within this period, in order to provide the necessities of
construction materials such as stone, marble, stone chips and granite, the operation of stone
quarries have become widespread irregularly. However the stone quarries have adverse impact
on the environment as vegetation, air, agricultural areas, groundwater and surface water. In
addition to this, in case of being located close to the settlements, it also has negative effects on
people living in the environment in terms of dust, noise and health.
It is undeniable that stone quarries meet the need of materials for sectors such as
construction, but their efficiency needs to be reviewed to take in consideration its adverse effects
on the nature and habitat; therefore in every region site selection needs to be planned.
A stone quarry has been established in Germiyan, part of Izmir province, Cesme district,
which is one of the first 'Slow Food' titled region of Turkey. The stone quarry still continues to
operate despite the legal struggles and negative assessments of the experts.
Although the negative effects of the quarries have wide press coverage, there are very
few scientific studies on this issue in literature. This study aims to debate the process of
establishing the stone quarry in Germiyan district, the legislative regulations, judicial process,
and environmental influences of the establishment and the struggle of local residents.
As part of this assertion, the process of establishing an operational quarry at a distance of
1 km from other quarries in Germiyan Neighborhood (Village); will be discussed within the
scope of existing legislative regulations, judicial process, the environmental effects of the
establishment and the struggle of the local residents .For this purpose; literature search, field
study, face to face interviews have been conducted with relevant persons and the locals. It is one
of the main objectives of the assertion is to draw attention to the fact that the site selection and

Symposium Proceedings – Book of Full Papers 271
ECOLOGY 2017 11-13 May, Kayseri TURKEY
mo
nitoring the following effects ecologically are very important issues and the studies on this field
should become more widespread.
2. The Legal Arrangement for Stone Quarries in Turkey
''Quarry'' refers to small surface mining which is subject to mining law dated 4.6.1985 and
No. 3213, from which materials used for buildings, roads and other construction works industrial
raw materials are provided'' (Karadağ et al., 2001). This law aims to regulate the principles
and the procedures for the searching, operating, right of possession and the abandonment of the
mines (Url 1).
Mining activities in Turkey are carried out according to the provisions of the Mining Law
No. 3213 issued in 1985.In this law, regulations were made with Law No.5117 issued in 2004
and Law No.5995 issued in 2010.With these alterations; the stone, sand-gravel quarries which
previously were not in the scope of mining law is now included in the mining law and
concerning the permissions for the mining activities have put in order.
There are more than 85.000 quarries in Turkey. The legal framework that takes measures
to reduce the adverse effects of the necessary materials in the natural areas after the supply; is the
Environmental Impact Assessment (EIA) regulation published in 7 February 1993 in accordance
with the Environmental Law No. 2872. Moreover, the EIA regulation has been revised 7 times
(have changed 17 times) from 1993 till today (Bilgin, 2015, p.1004).Ministry of Environment
and Urban Planning defines EIA as follows; ‘Studies to be carried out in the determination of
positive or adverse effects on the environment, of the Project planned to be developed, in
determination and assessment of the measures to be taken for preventing the adverse effects or
minimizing these effect in a way that will not harm the environment and of the chosen place and
technological alternatives and in monitoring and controlling of the implementation of the
projects’ (Url 2).
3. Izmir-Cesme Germiyan Neighborhood (Village) Quarry Establishment Process
3.1. Izmir-Cesme Germiyan Neighborhood (Village)
Germiyan Neighborhood (Village) is a part of Izmir Province Cesme District and it
is situated 70 km to the center of Izmir Province and about 12 km to Cesme (Figure1).
Surrounded with Ildır Neighborhood (Village) on the North Kadıovacık Neighborhood (Village)
on the northeast Nohutalan and Barbaros Neighborhoods (Villages)
on the east and Reisdere Neighborhood(Village) on the west. Germiyan is a village
that compared to the other surrounding neighborhoods (villages) owns the biggest land and the
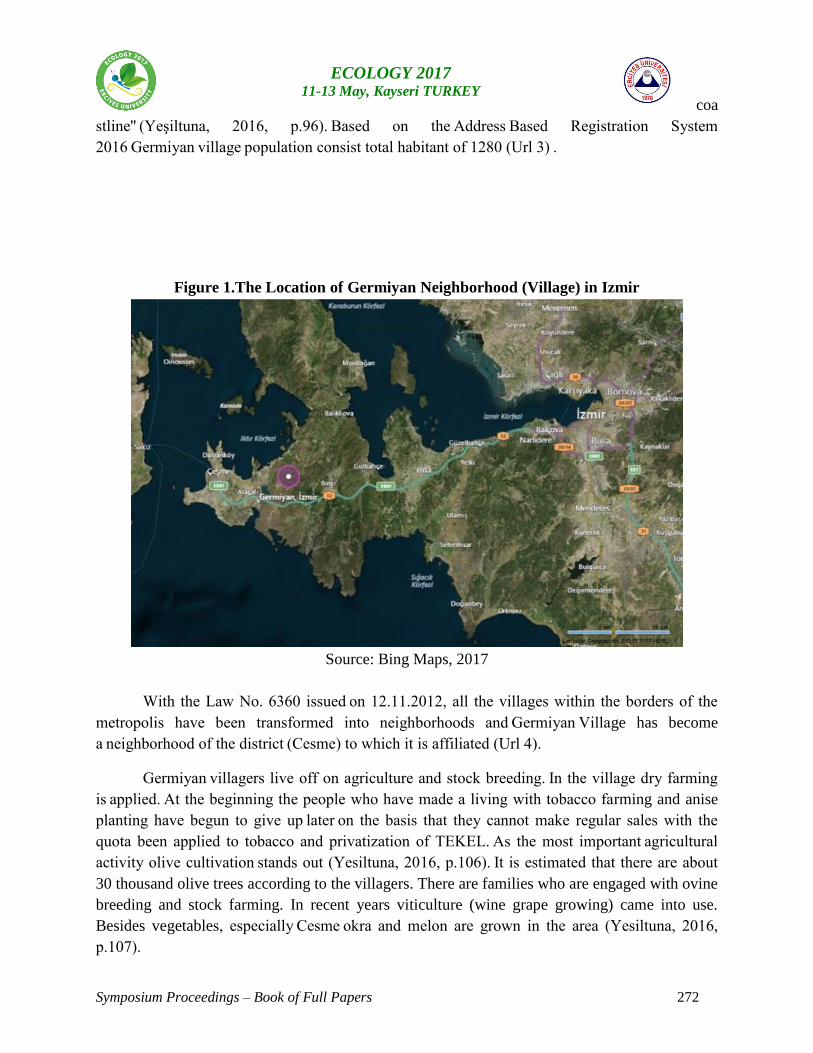
Symposium Proceedings – Book of Full Papers 272
ECOLOGY 2017 11-13 May, Kayseri TURKEY
coa
stline'' (Yeşiltuna, 2016, p.96). Based on the Address Based Registration System
2016 Germiyan village population consist total habitant of 1280 (Url 3) .
Figure 1.The Location of Germiyan Neighborhood (Village) in Izmir
Source: Bing Maps, 2017
With the Law No. 6360 issued on 12.11.2012, all the villages within the borders of the
metropolis have been transformed into neighborhoods and Germiyan Village has become
a neighborhood of the district (Cesme) to which it is affiliated (Url 4).
Germiyan villagers live off on agriculture and stock breeding. In the village dry farming
is applied. At the beginning the people who have made a living with tobacco farming and anise
planting have begun to give up later on the basis that they cannot make regular sales with the
quota been applied to tobacco and privatization of TEKEL. As the most important agricultural
activity olive cultivation stands out (Yesiltuna, 2016, p.106). It is estimated that there are about
30 thousand olive trees according to the villagers. There are families who are engaged with ovine
breeding and stock farming. In recent years viticulture (wine grape growing) came into use.
Besides vegetables, especially Cesme okra and melon are grown in the area (Yesiltuna, 2016,
p.107).
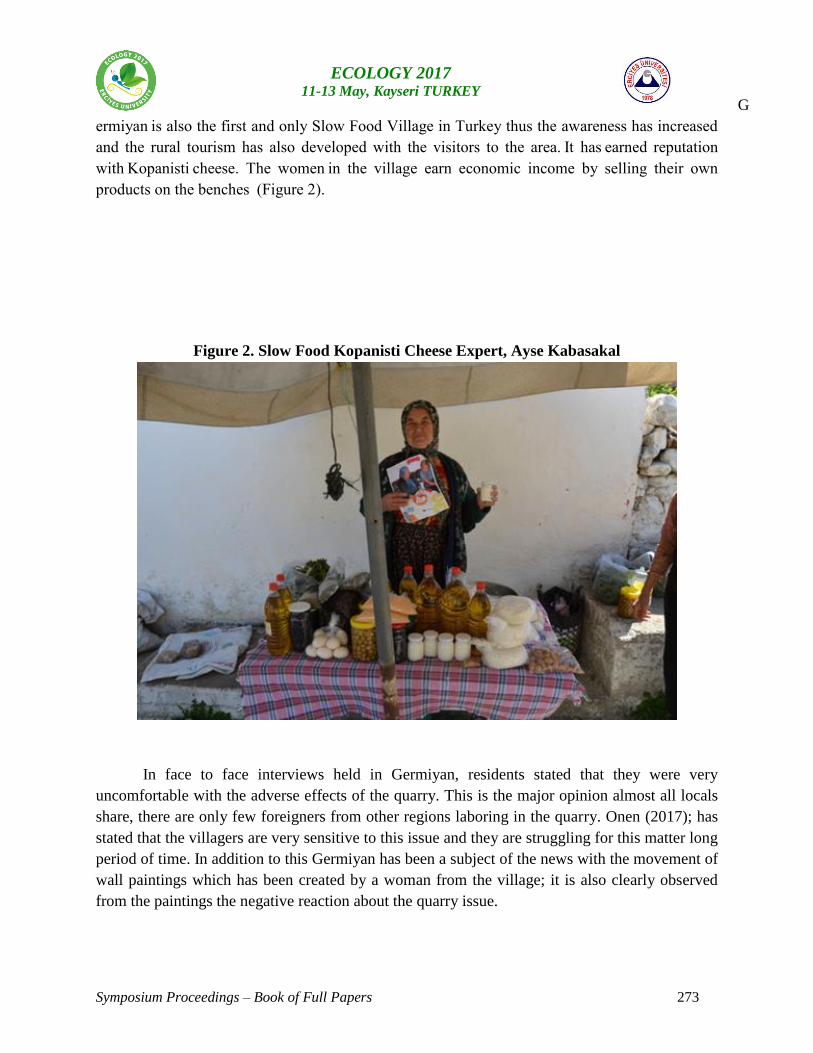
Symposium Proceedings – Book of Full Papers 273
ECOLOGY 2017 11-13 May, Kayseri TURKEY
G
ermiyan is also the first and only Slow Food Village in Turkey thus the awareness has increased
and the rural tourism has also developed with the visitors to the area. It has earned reputation
with Kopanisti cheese. The women in the village earn economic income by selling their own
products on the benches (Figure 2).
Figure 2. Slow Food Kopanisti Cheese Expert, Ayse Kabasakal
In face to face interviews held in Germiyan, residents stated that they were very
uncomfortable with the adverse effects of the quarry. This is the major opinion almost all locals
share, there are only few foreigners from other regions laboring in the quarry. Onen (2017); has
stated that the villagers are very sensitive to this issue and they are struggling for this matter long
period of time. In addition to this Germiyan has been a subject of the news with the movement of
wall paintings which has been created by a woman from the village; it is also clearly observed
from the paintings the negative reaction about the quarry issue.
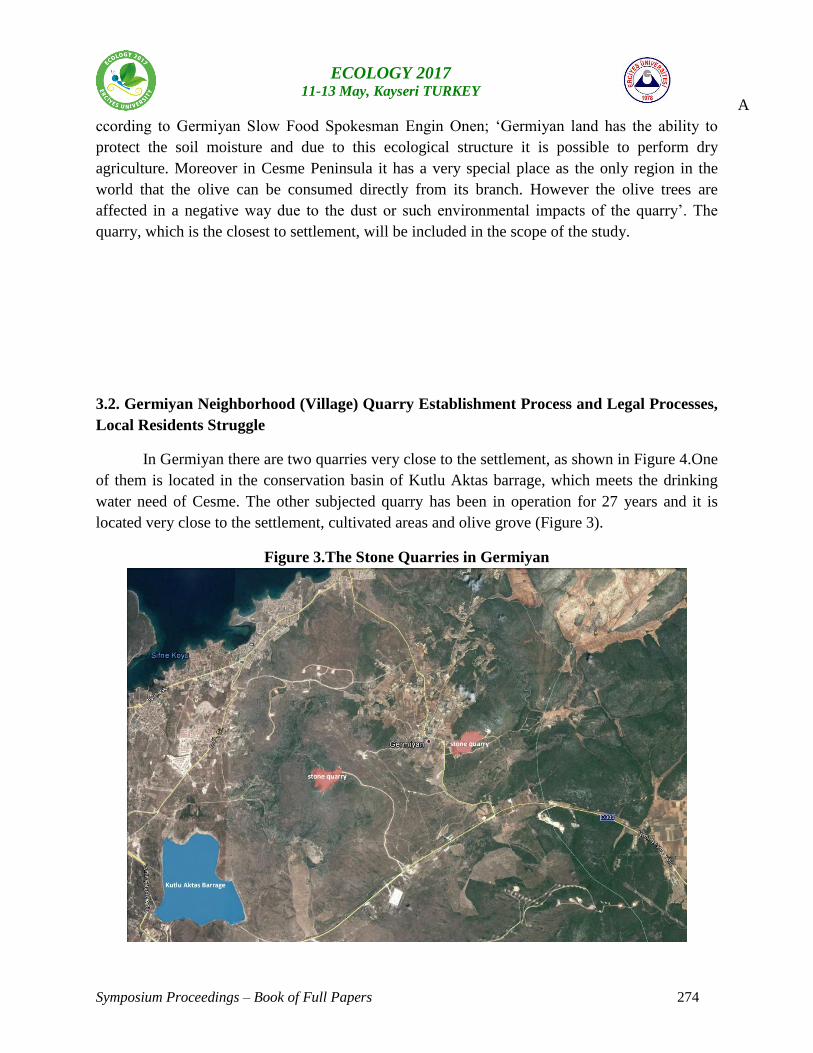
Symposium Proceedings – Book of Full Papers 274
ECOLOGY 2017 11-13 May, Kayseri TURKEY
A
ccording to Germiyan Slow Food Spokesman Engin Onen; ‘Germiyan land has the ability to
protect the soil moisture and due to this ecological structure it is possible to perform dry
agriculture. Moreover in Cesme Peninsula it has a very special place as the only region in the
world that the olive can be consumed directly from its branch. However the olive trees are
affected in a negative way due to the dust or such environmental impacts of the quarry’. The
quarry, which is the closest to settlement, will be included in the scope of the study.
3.2. Germiyan Neighborhood (Village) Quarry Establishment Process and Legal Processes,
Local Residents Struggle
In Germiyan there are two quarries very close to the settlement, as shown in Figure 4.One
of them is located in the conservation basin of Kutlu Aktas barrage, which meets the drinking
water need of Cesme. The other subjected quarry has been in operation for 27 years and it is
located very close to the settlement, cultivated areas and olive grove (Figure 3).
Figure 3.The Stone Quarries in Germiyan
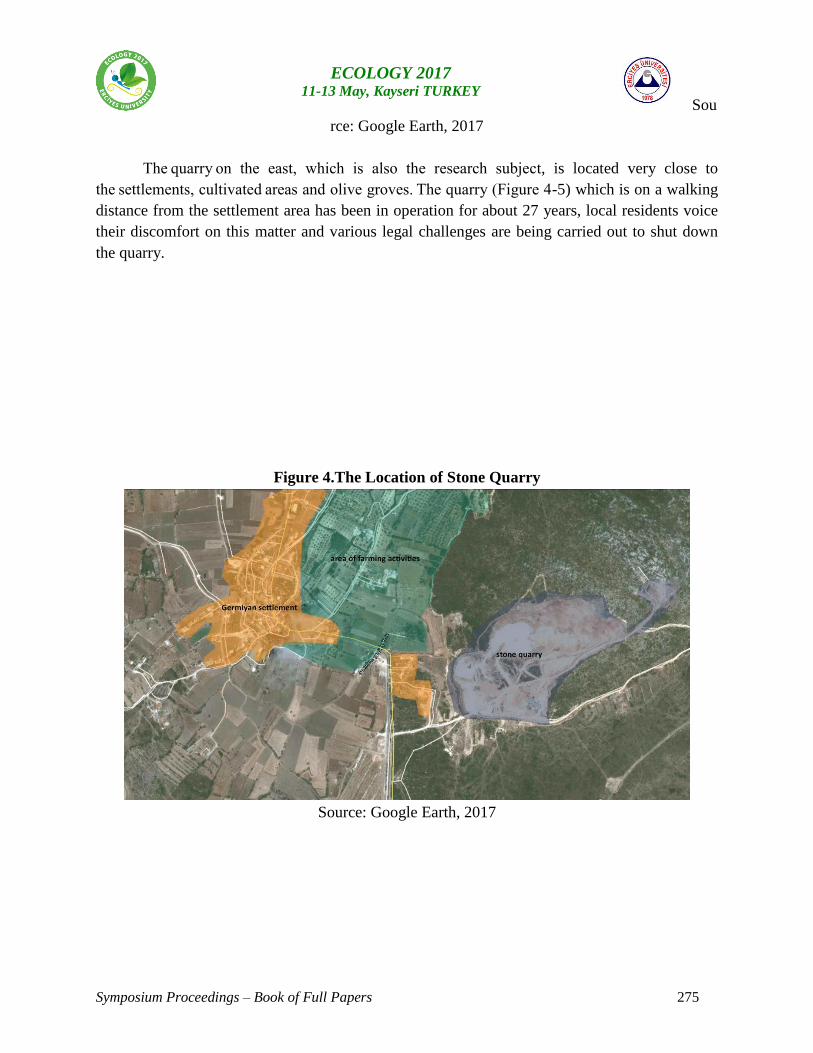
Symposium Proceedings – Book of Full Papers 275
ECOLOGY 2017 11-13 May, Kayseri TURKEY
Sou
rce: Google Earth, 2017
The quarry on the east, which is also the research subject, is located very close to
the settlements, cultivated areas and olive groves. The quarry (Figure 4-5) which is on a walking
distance from the settlement area has been in operation for about 27 years, local residents voice
their discomfort on this matter and various legal challenges are being carried out to shut down
the quarry.
Figure 4.The Location of Stone Quarry
Source: Google Earth, 2017
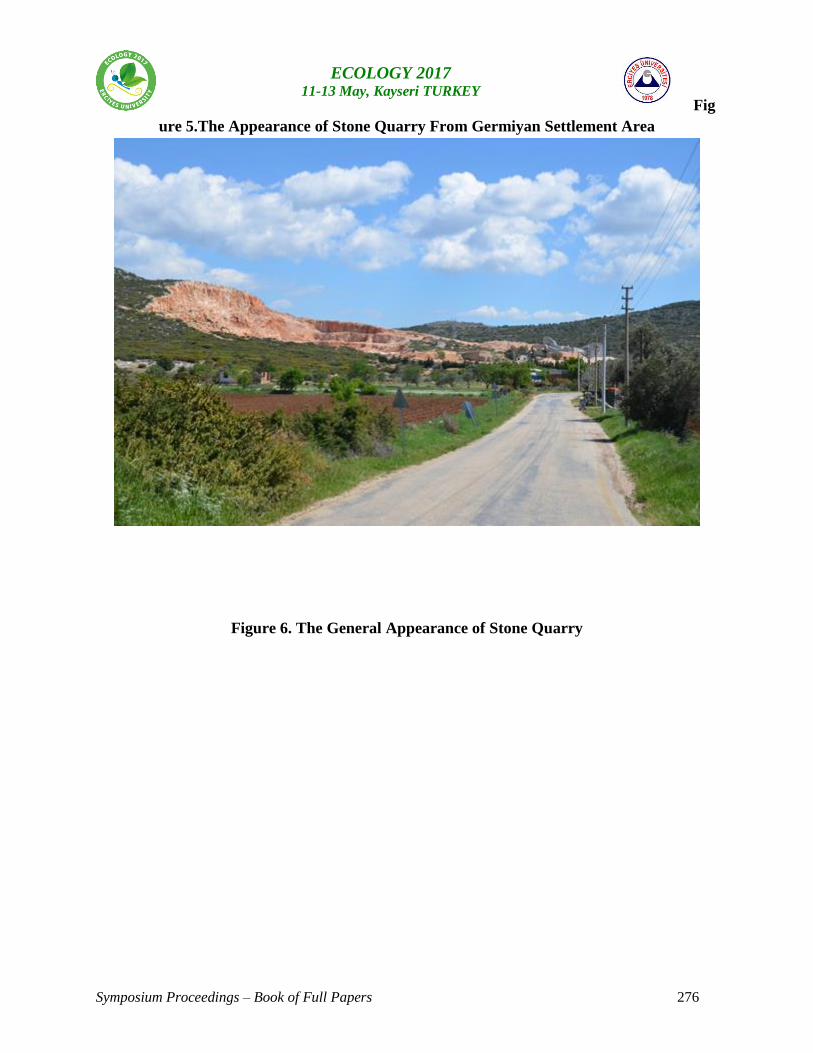
Symposium Proceedings – Book of Full Papers 276
ECOLOGY 2017 11-13 May, Kayseri TURKEY
Fig
ure 5.The Appearance of Stone Quarry From Germiyan Settlement Area
Figure 6. The General Appearance of Stone Quarry
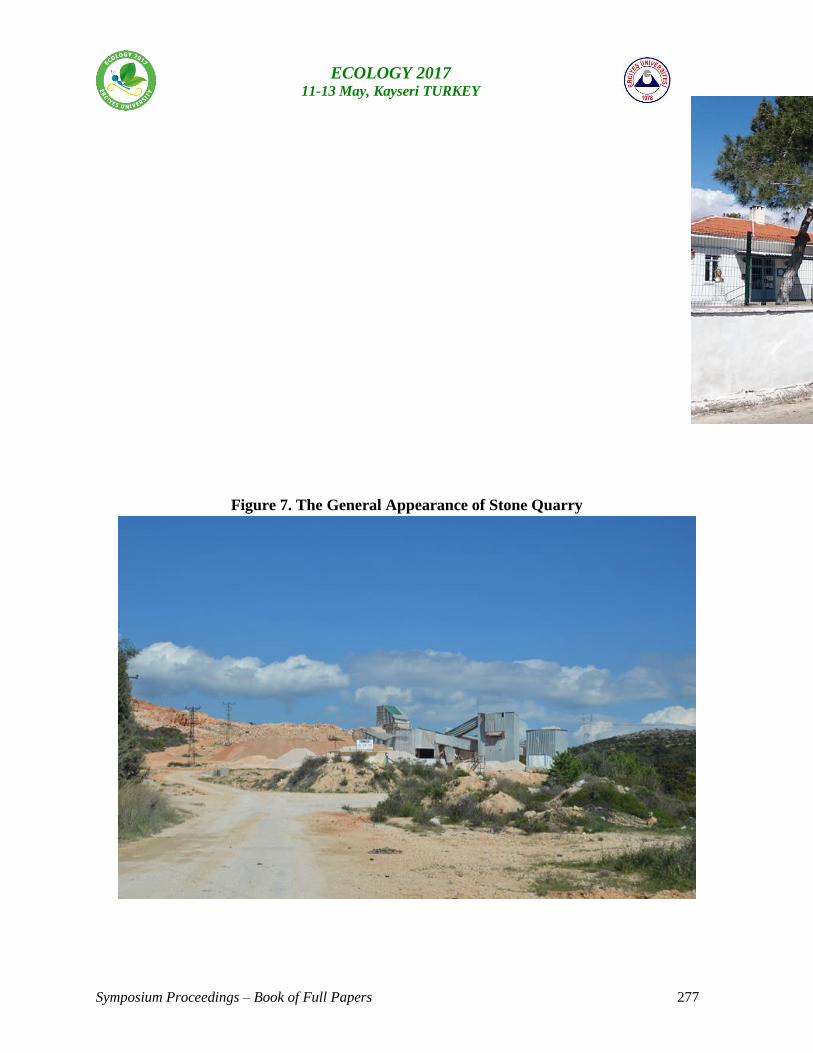
Symposium Proceedings – Book of Full Papers 277
ECOLOGY 2017 11-13 May, Kayseri TURKEY
Figure 7. The General Appearance of Stone Quarry
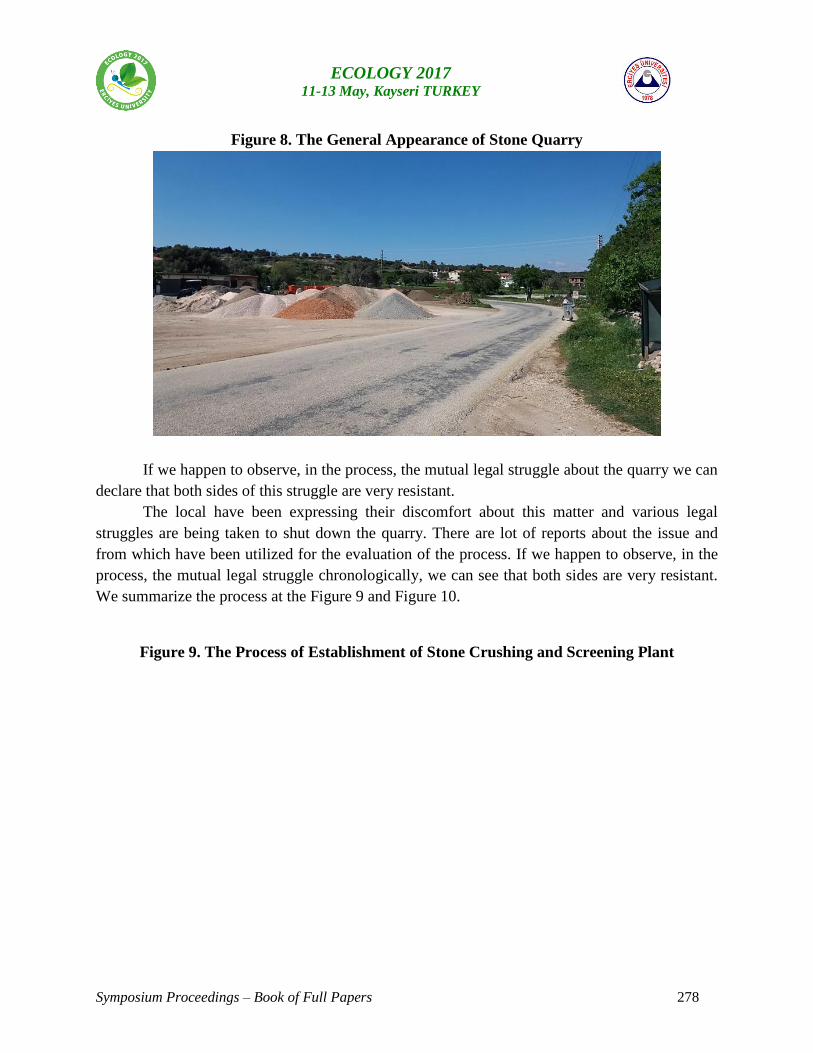
Symposium Proceedings – Book of Full Papers 278
ECOLOGY 2017 11-13 May, Kayseri TURKEY
Figure 8. The General Appearance of Stone Quarry
If we happen to observe, in the process, the mutual legal struggle about the quarry we can
declare that both sides of this struggle are very resistant.
The local have been expressing their discomfort about this matter and various legal
struggles are being taken to shut down the quarry. There are lot of reports about the issue and
from which have been utilized for the evaluation of the process. If we happen to observe, in the
process, the mutual legal struggle chronologically, we can see that both sides are very resistant.
We summarize the process at the Figure 9 and Figure 10.
Figure 9. The Process of Establishment of Stone Crushing and Screening Plant
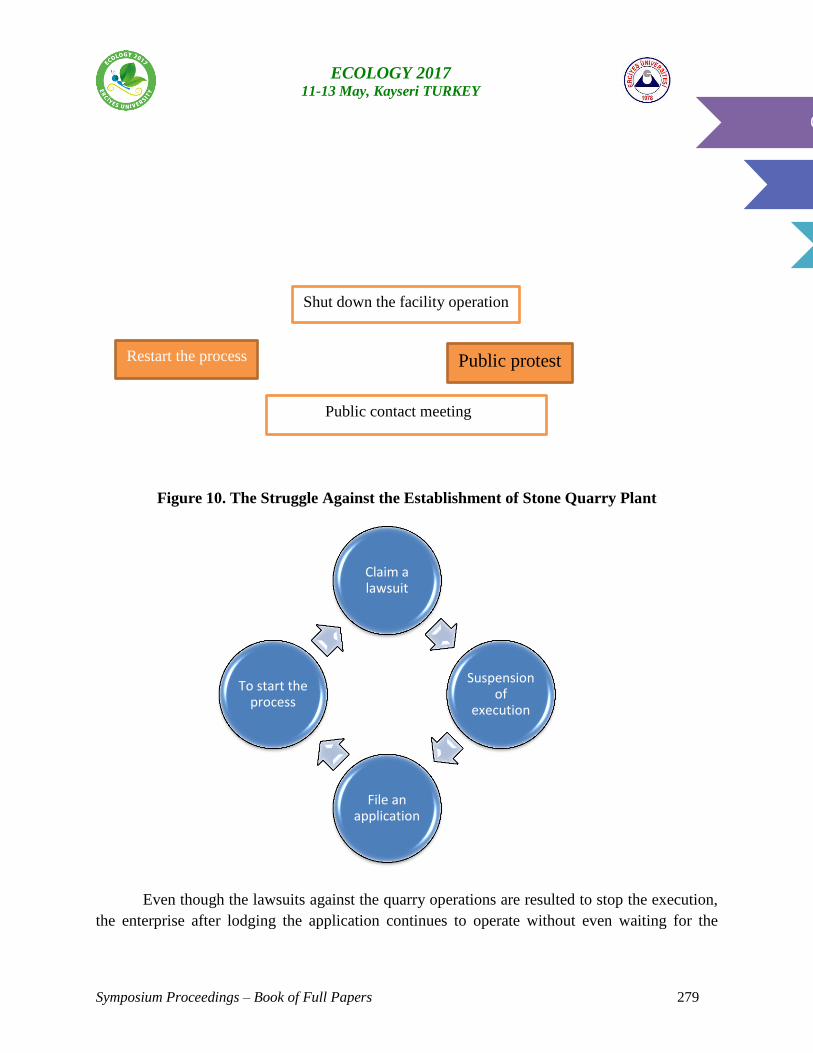
Symposium Proceedings – Book of Full Papers 279
ECOLOGY 2017 11-13 May, Kayseri TURKEY
Figure 10. The Struggle Against the Establishment of Stone Quarry Plant
Even though the lawsuits against the quarry operations are resulted to stop the execution,
the enterprise after lodging the application continues to operate without even waiting for the
Quarry crushing screening plant construction
EIA document issuance
EIA cancellation application
Claim a lawsuit
Suspension of
execution
File an application
To start the process
Shut down the facility operation
Restart the process Public protest Public contact meeting
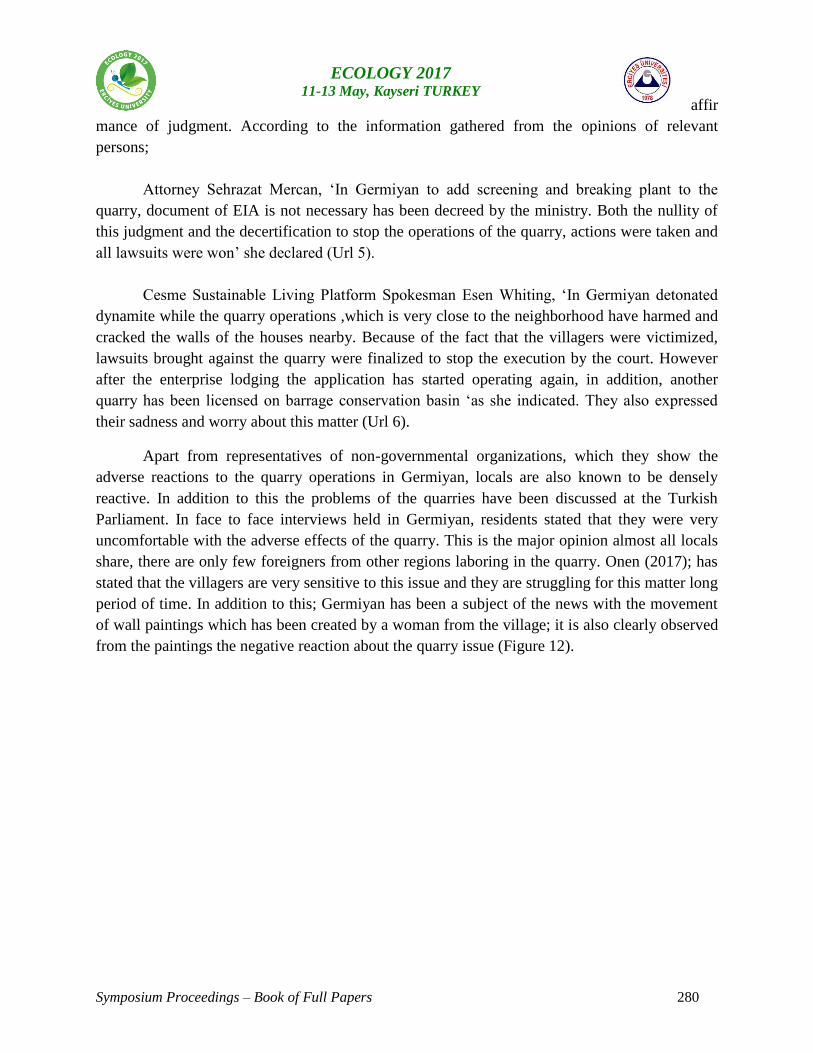
Symposium Proceedings – Book of Full Papers 280
ECOLOGY 2017 11-13 May, Kayseri TURKEY
affir
mance of judgment. According to the information gathered from the opinions of relevant
persons;
Attorney Sehrazat Mercan, ‘In Germiyan to add screening and breaking plant to the
quarry, document of EIA is not necessary has been decreed by the ministry. Both the nullity of
this judgment and the decertification to stop the operations of the quarry, actions were taken and
all lawsuits were won’ she declared (Url 5).
Cesme Sustainable Living Platform Spokesman Esen Whiting, ‘In Germiyan detonated
dynamite while the quarry operations ,which is very close to the neighborhood have harmed and
cracked the walls of the houses nearby. Because of the fact that the villagers were victimized,
lawsuits brought against the quarry were finalized to stop the execution by the court. However
after the enterprise lodging the application has started operating again, in addition, another
quarry has been licensed on barrage conservation basin ‘as she indicated. They also expressed
their sadness and worry about this matter (Url 6).
Apart from representatives of non-governmental organizations, which they show the
adverse reactions to the quarry operations in Germiyan, locals are also known to be densely
reactive. In addition to this the problems of the quarries have been discussed at the Turkish
Parliament. In face to face interviews held in Germiyan, residents stated that they were very
uncomfortable with the adverse effects of the quarry. This is the major opinion almost all locals
share, there are only few foreigners from other regions laboring in the quarry. Onen (2017); has
stated that the villagers are very sensitive to this issue and they are struggling for this matter long
period of time. In addition to this; Germiyan has been a subject of the news with the movement
of wall paintings which has been created by a woman from the village; it is also clearly observed
from the paintings the negative reaction about the quarry issue (Figure 12).
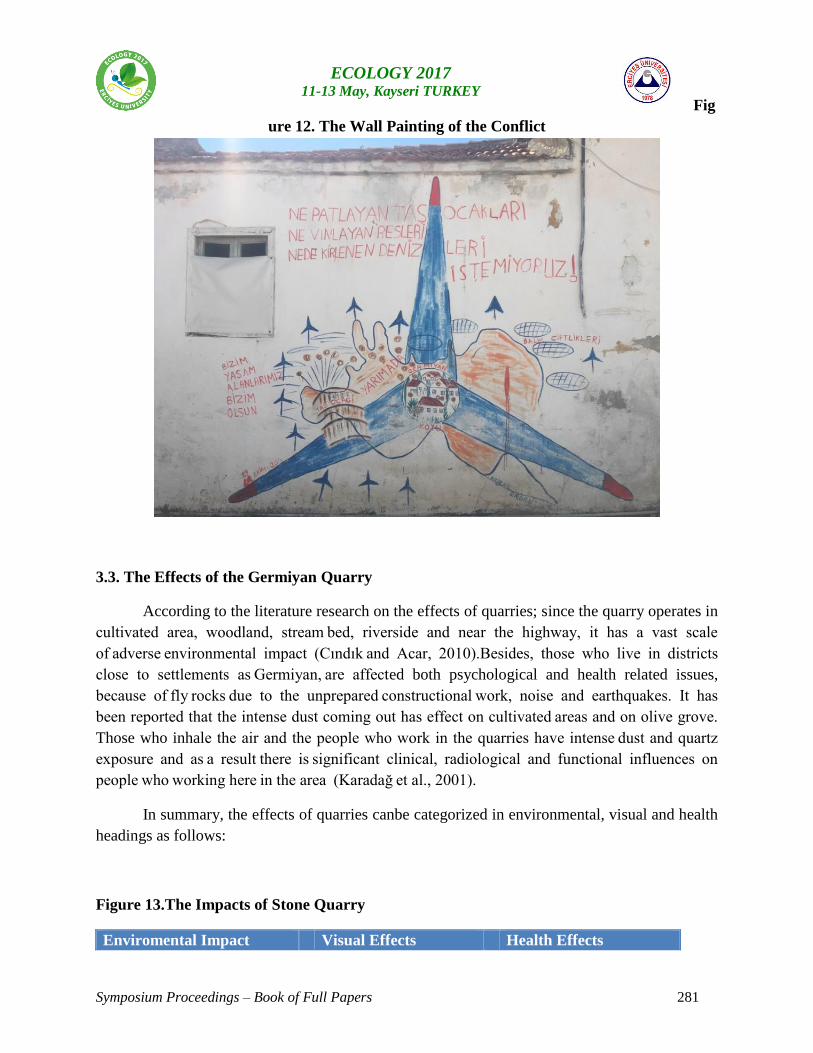
Symposium Proceedings – Book of Full Papers 281
ECOLOGY 2017 11-13 May, Kayseri TURKEY
Fig
ure 12. The Wall Painting of the Conflict
3.3. The Effects of the Germiyan Quarry
According to the literature research on the effects of quarries; since the quarry operates in
cultivated area, woodland, stream bed, riverside and near the highway, it has a vast scale
of adverse environmental impact (Cındık and Acar, 2010).Besides, those who live in districts
close to settlements as Germiyan, are affected both psychological and health related issues,
because of fly rocks due to the unprepared constructional work, noise and earthquakes. It has
been reported that the intense dust coming out has effect on cultivated areas and on olive grove.
Those who inhale the air and the people who work in the quarries have intense dust and quartz
exposure and as a result there is significant clinical, radiological and functional influences on
people who working here in the area (Karadağ et al., 2001).
In summary, the effects of quarries canbe categorized in environmental, visual and health
headings as follows:
Figure 13.The Impacts of Stone Quarry
Enviromental Impact Visual Effects Health Effects
Symposium Proceedings – Book of Full Papers 282
ECOLOGY 2017 11-13 May, Kayseri TURKEY
Extinction of the living
creatures on land (herb
and animal)
Destruction of natural
landscape
Adverse effects of the
explosion sounds on local
residents psychology
Change in flora Destruction of trees Clinical, radiological and
functional effects on quarry
workers
Change in land profile Damaged land views Effects on nutrition as a
result of the damaged
products
Harm the agricultural
product
Damage to nearby
buildings
Changes in physical,
chemical structure or
temperature in
underground and surface
waters
Noise and dust formation
Source: Created by utilized Isık and Demir, 2015; Karadağ et al., 2001.
A part from these as mentioned effects; the negative influence on the cultivated products
have adverse impact on economic income. All of these affects each other, therefore creates
ecological problems which are difficult to recover.
4. Discussion and Conclusion
Mining and quarry operations are necessary with regards to purchase of goods and
services. Measures need to be taken in order to prevent the adverse effects of these actions and
some criterion should be determined as the quarry being located at a certain distance from the
settlement. Today far from taking required precautions, the number of uncontrolled and
unplanned quarries has increased. The quarries being operated to provide the necessary materials
for the construction activities in Turkey have exceeded up to 85.000.In particular, surface mining
activities have a feature to disturb the natural balance and land structure, change the environment
and have adverse effect on creatures (Isık ve Demir, 2015, p.1).
In Germiyan there are two quarries one is located very close to the settlement while the
other is located in the barrage conservation basin. In the scope of this study the quarry which has
been focused on its effects is close to the settlement area and it is not being wanted by the local.
he reasons for opposition of villagers are as following:
Symposium Proceedings – Book of Full Papers 283
ECOLOGY 2017 11-13 May, Kayseri TURKEY
1. T
rigger health problems in region
2. Property damage to land and houses
3. Negative impact of olive land
Legal struggle of the locals has not succeeded completely. The quarry has been operating
for many years have adverse effects on local residents, natural habitat such as olive grove and
living creatures on the area.
It is thought that the construction activities will continue in the process of rapid
urbanization and the quarries will increase accordingly. Castilla-Gómez and Herrera-Herbert,
(2014) said that the development of modern society depends on the supply of goods and services
according to needs. The mining sector that occupying a vital position in the raw material supply
chain is one of the most important forces for global economy. However, the mining activities
have to be operated without harming the environment (Castilla-Gómez and Herrera-Herbert,(
2014) as cited in Bilgin, 2015, s.1005).While site selection decisions are made it should be
considered along with its effects on near and remote distance surroundings, also freedom of life
of the locals need to be taken into consideration. As a result, the site selection of the quarries
should be located at a determined minimum distance value to cultivated areas such olive groves
and the settlement. Attention should be paid to the rehabilitation decisions after the operation and
also the reactions of the local residents should be taken into consideration.
Kaynakça
1) Bilgin, A. (2015). “Madencilik Faaliyetleri ve Çevresel Etki Değerlendirme Kararlarının
Değerlendirilmesi”. Türkiye 24. Uluslararası Madencilik Kongresi ve Sergisi, 14-17 Nisan 2015,
(1004-1010), Antalya, Türkiye 24. Uluslararası Madencilik Kongresi Bildiriler Kitabı, TMMOB
Maden Mühendisleri, Odası, Ankara.
2) Castilla-Gómez, J.,Herrera-Herbert, J., (2014). Environmental analysis of mining operations:
Dynamic tools for impact assessment Minerals Engineering.
3) Cındık, Y.,Acar, C. (2010). “Faaliyeti Bitmiş Taş Ocaklarının Yeniden Rehabilite Edilmesi ve
Doğaya Kazandırılması”. Artvin Çoruh Üniversitesi Orman Fakültesi Dergisi, 11 (1) (11-18)
4) Işık, B., Ö. ve Demir, S. (2015). “Açık İşletme Maden Ocaklarındaki Bitkisel İyileştirme
Çalışmalarının Peyzaj Mimarlığı Öğrencilerine Göre Değerlendirilmesi”. İnönü Üniversitesi
Sanat ve Tasarım Dergisi, Cilt:5, Sayı:12 (1-12).
5)Karadağ, Ö. K.., Akkurt, İ.., Önal, B., Altınörs, M.., Bilir, N., Ersoy, N., Özuludağ, A., Sabır,
H.., Ardıç, S. (2001). “Taş Ocakları İşçilerinde Silikozis ve Solunumsal Bulgular”. Tüberküloz
ve Toraks Dergisi 49(1) (73-80).
Symposium Proceedings – Book of Full Papers 284
ECOLOGY 2017 11-13 May, Kayseri TURKEY
6)
Onen, Engin (2017). Sözlü Görüşme. Mayıs, İzmir.
7) Yesiltuna, D. Ç. (2016). Küreselleşme ve Kırsal Dönüşüm, Komşu Mahalleden
“ButikSite”yeS andalye Marketten “SlowFood”a. Nobel Yayınları, Ankara.
8) Url 1 :http://www.mevzuat.gov.tr/MevzuatMetin/1.5.3213.pdf, Date of access: 13 Nisan 2017
9) Url 2: https://csb.gov.tr/db/izmir/webmenu/webmenu3941.pdf, Date of access: 13 Nisan 2017
10) Url 3: https://biruni.tuik.gov.tr/medas/?kn=95&locale=tr, Date of access: 17 Nisan 2017
11) Url 4: http://www.mevzuat.gov.tr/MevzuatMetin/1.5.6360.pdf, Date of access: 17 Nisan
2017
12) Url 5: www.manisadenge.comhttp://www.manisadenge.com/ulusal-haberler/germiyan-koyu-
tas-ocagi-na-direniyor-h22110.html, Date of access: 18 Nisan 2017
13) Url 6: http://www.cesmeplatformu.org/kampanya/tasocaklari, Date of access: 15 Nisan 2017
Note: The photographs taken by authors in paper.
Symposium Proceedings – Book of Full Papers 285
ECOLOGY 2017 11-13 May, Kayseri TURKEY
Mic
robiological estimation of water of river nerodime, during autumn season 2009
Idriz VEHAPI1
, Kemajl KURTESHI1, Kasum LETAJ
1, Jeton ORLLATI
2,
1Department of Biology, Faculty of Natural Science, University of Prishtina, Prishtina, Kosovo
2 Master study, Department of Bilogy, Faculty of Natural Science, University of Prishtina ,
Kosovo
Corresponding Author: [email protected]
Abstract : Bacteriological analyses were carried out on river water used for drinking and
swimming purposes in river Nerodime, nearby Ferizaj city. The results obtained were compared
with WHO and EPA standards for drinking and recreational water.
Physicochemical parameters analysed are: Turbidity, pH, Color, Total solids, Total dissolved
solids (TDS),conductivity, temperature.
The obtained results(Bacteriological and Physicochemical) did not comply with standards(for
drinking and recreational water) of WHO and EPA.
The presence of pathogens in water for drinking and swimming purposes is of public health
significance considering the possibility of the presence of other bacteria, protozoa and enteric
viruses that are implicated in gastro-intestinal water borne diseases and the low infectious dose
for these water borne pathogens.
Key words: microbiology, analysis, river, water, Nerodime
1.INTRODUCTION
No single day passes without water being
put to use by a community or group of
individuals. Water remains about the most
significant and mandatory commodity that
supports the existence of life on earth, yet
disproportionately distributed throughout the
Symposium Proceedings – Book of Full Papers 286
ECOLOGY 2017 11-13 May, Kayseri TURKEY
world. Hence, all efforts must be put in
place to ensure its safety (Olayemi, 2007).
Pollution is the introduction into the
environment substances or energy liable to
cause hazards to human health ( Alloway,
1991). Water pollution is recognized
globally as a potential threat to both human
and animals which interact with the aquatic
environments. Pollution may result from
point sources or non-point sources.
Wat
er quality monitoring is the actual collection
of information at set locations and
at regular intervals in order to provide the
data which may be used to define current
conditions and establish trends ( Chapman,
1996 ). Monitoring is usually done indirectly
by identifying and quantifying indicators of
faecal pollution such as the coliform group.
Water temperatures fluctuate naturally both
daily and seasonally ( UNEP 2006).
2.MATERIALS AND METHODS
The samples for this analysis were collected
with two-litre sterile polyvinyl chloride
(PVC) plastic water bottles from three (4)
designated sampling point in river Nerodime
during autumn season, 2009.
The water samples were collected for both
physiochemical and microbiological
analysis. The objective of the sampling was
to collect a portion of material small enough
in volume to be conveniently transported to
lab, while still accurately representing the
material being sampled. The preservation
method for storage was refrigeration.
Water samples were analysed for
physiochemical and microbiological quality
and chemical characteristic (TDS,
conductivity, pH, salinity) were determined
by digital aparature HACH.
2.1.Bacteriological Analysis
In the bacteria isolation, nutrient agar for
heterotrophic bacteria, bile aesculin agar for
Streptococcus faecalis, Violet red agar for
total coliform bacteria, SS agar for
salmonela and shigella, saborud agar for
fungi, were used. All media were prepared
and sterilized as instructed by manufacturer.
Symposium Proceedings – Book of Full Papers 287
ECOLOGY 2017 11-13 May, Kayseri TURKEY
3.RESULTS
Microbiological results obtained from
investigation realized during autumn
season 2009 ,of the water of river Nerodime
shown in Table 1. As it show at table the
higher number of heterotrophic bacteria is
registred at fourth locality by 296.000 cfu
/100 ml water. While at third locality
registered 235.000 cfu / 100 ml water. At
second locality determined 138.000 cfu /
100 ml water. The lower number is
registered at first locality with 80.000.
As regards to the total coliform bacteria the
higher number is registered at fourth
locality, 58.000 cfu/100 ml water. The low
number, of total coliform bacteria, is
registered at first locality 16.000 cfu /100
ml water. From the results seen in that at the
fourth locality the number of bacteria is
about fivefold compared with first locality.
While at third locality registered 46.000
cfu / 100 ml water. At second locality is
registered 32.000 cfu/100 ml water.
The higher number of SS bacteria is
registered at fourth locality, 19.000 cfu /100
ml water. The low number of SS bacteria is
registered in first locality (9.000 cfu /100
ml water). While at third locality registered
15.000 cfu / 100 ml water. At second
locality is registered 11.000 cfu/100 ml
water.
The higher number of Streptococcus faecalis
bacteria is registered also at second locality,
47.000 cfu /100 ml/water . The low number
of Streptococcus bacteria is registered in
first locality (12.000 cfu /10 ml /water).
While at third locality registered 34.000 cfu
/ 100 ml water. At second locality is
registered 25.000 cfu/100 ml water.
The higher number of fungi is registered at
fourth locality, 21.000 cfu /100 ml water.
The low number of fungi is registered in
first locality (5.000 cfu /100 ml/water).
While at second locality registered 7.000 cfu
/ 100 ml water. At third locality is
registered 16.000 cfu/100 ml water.
The high total heterotrophic count is
indicative of the presence of high organic
and dissolved salts in the water. The primary
sources of these bacteria in water are animal
and human wastes. These sources of
bacterial contamination include surface
runoff, pasture, and other land areas where
animal wastes are deposited. Additional
sources include seepage or discharge from
Symposium Proceedings – Book of Full Papers 288
ECOLOGY 2017 11-13 May, Kayseri TURKEY
septic tanks, sewage treatment facilities and
natu
ral soil /plant bacteria (EPA, 2002).
Table 1. Microbiological results of waters of river “Nerodime” during autumn season 2009
Group of
microorganism
Locations and colony of bacteria in 100 ml of water
Locality 1 Locality 2 Locality 3 Locality 4
Heterotrophic bacteria 80.000 138.000 235.000 296.000
Total coliform bacteria 16.000 32.000 46.000 58.000
Salmonela Shigella- SS 9.000 11.000 15.000 19.000
Streptococcus 12.000 25.000 34.000 47.000
Fungi (moulds and
yeast)
5.000 7.000 16.000 21.000
4.DISCUSSION
The water samples investigated in this study
were mainly analysed for the bacteriological
contamination.
The water quality showed high
concentration of bacteria in downstream
part of river Nerodime
For the presumptive coliforms test, the
WHO(1984) guideline for both treated and
untreated water samples is 0/ 100 ml (WHO,
1984), but in an occasional untreated water
sample 3(Witt, 1982) coliform/100 ml are
allowed on the condition that these would
not be found in consecutive water samples
Symposium Proceedings – Book of Full Papers 289
ECOLOGY 2017 11-13 May, Kayseri TURKEY
The high coliform count obtained in the
samples may be an indication that the water
sources are faecally contaminated (EPA,
2003; Osuinde and Enuezie, 1999).
These results were in accordance with the
results obtained by Zumra(1988) Alobaidy
et
al.(2010). WHO drinking water quality
guidelines recommend that fecal coliform
must not exist in 100 mL of water sample
(WHO, 2004, WHO 2004).
Presence of such high bacterial counts and
presence of faecal coliforms and other
indicator organisms as Streptococcus
faecaiis, indicate inadequate treatment, post
treatment contamination and contaminated
water sources. Therefore, everything
possible should be done to prevent pollution
of the drinking water, special attention being
given to the safe disposal of excrement. But
the significance of routes of transmission
other than drinking water should not be
underestimated as the provision of a safe
potable water supply by itself will not
necessarily prevent infection without
accompanying improvement in sanitation
and personal habits. Education in simple
hygiene is also essential.
5.Conclusions
According to the results obtained, we
conclude with the following: -
The fourth locality it was more polluted
bacteriologicaly compared with other
locality
Total coliform counts and other
bacteria counts at the four stations in
autumn seasons 2009 were more than the
international permissible levels
recommended by WHO.
REFERENCES
Symposium Proceedings – Book of Full Papers 290
ECOLOGY 2017 11-13 May, Kayseri TURKEY
Alloway B.J. and Ayres C.D.. British
Medical Association 1991.
Hazardous wastes and human health.
In: Chemical Principles
Environmental Pollution by, 2nd
edition. 10-24.
APHA. 1981. Standard Methods for the
Examination of Water and
Wastewater. 15th Ed. American
Public Health Association,
Washington, DC. 85-99,773-
779,786-828.
Chapman D. [Ed.] 1996. Water Quality
Assessments: A Guide to the Use of
Biota, Sediments and Water in
Environmental Monitoring. 2nd
edition. Chapman & Hall (for
UNESCO/WHO/UNEP), London. 2:
43- 76.
EPA (2003). US Environmental Protection
Agency Safe Drinking Water Act.
EPA .816 – F – 03 –016,
Fea
cham, R.G. Bacterial standards for
drinking water quality in developing
countries. Lancet, l980;2: 255
Olayemi A B. 2007. Crisis of the
Commons: Global Water Challenge.
University of Ilorin, 81st Inaugural
Lecture, Printed at Unilorin press. 8-
12.
Osuinde MI, Eneuzie, N R. (1999).
“Bacteriological analysis of ground
water.” Nigeria Journal of
Microbiology vol. 13:47-54.
UNEP 2006. Water Quality for Ecosystem
and Human Health. United Nations
Environment Programme Global
Environment Monitoring
System/Water Programme. National
Water Research Institute, Ontario
Canada.
(http://www.gemswater.org). 32- 54.
Witt, V.M. Developing and applying
international water quality guideline.
I. Am. Water Work’s Assoc.,
1982;74:178.
Symposium Proceedings – Book of Full Papers 291
ECOLOGY 2017 11-13 May, Kayseri TURKEY
WHO 1997. Guidelines for drinking water
quality 2nd Ed. – Surveillance and
control of communities
supplies, Geneva. 3.51 – 68.
WHO 2006. Water Safety Plan: Guidelines
for drinking water quality 3rd Ed.
Volume 1 Recommendations 3rd
edition, WHO, Geneva (2nd edition)
Switzerland. 3-10, 51-72, 75- 120.
WHO 1993.Revision of WHO guidelines.
www.who.int/water-sanitation-
health/GDWQ
draftchemicals/list.htm for drinking
water quality, Bilthova, Netherlands.
43- 71.
World Health Organization Guidelines for
drinking-water quality. vol. 1.
Recommendations. Geneva, WHO.,
1984, p. 17,83.
WHO 2002. Drinking water guidelines;
Bacteriological parameters. WHO
Geneva. 5:2. Research Journal of
Science, 13: 1- 2.
WH
O 1997. Guidelines for drinking
water quality 2nd Ed. – Surveillance
and control of communities supplies,
Geneva. 3.51 – 68.
Zumra S , Mubashir A. Khan, Abdul
Ghafoor , 1988. Bacteriological
analysis of drinking water. Journal of
Pakistan Medical association, 92-96
Symposium Proceedings – Book of Full Papers 292
ECOLOGY 2017 11-13 May, Kayseri TURKEY
RE-EVALUATION OF SOME ENDEMIC TAXA DISTRIBUTED IN HİRO
PLATEAU (ADAKLI-BİNGÖL) IN TERMS OF RISK CATEGORIES
Yakup YAPAR, Lütfi BEHÇET
1 Bingol University, Faculty of Science and Art, Department of Biology, Bingöl
Corresponding Author: e-mail: [email protected]
Absract: In this study, risk categories were reassessed by taking into account the populations
of five endemic taxa and their spreading areas. As a result, new risk catagories of these taxa
have been proposed as follows; Anacyclus anatolicus Behçet & Almanar (EN), Ranunculus
bingoeldaghensis Engin (LC), Centaurea bingoelensis Behçet & İlçim (EN), Cephalaria
anatolica Shkhiyan (EN), Ptilotrichum angustifolium Hausskn. ex Bornm. (syn:
Physocardamum davisii Hedge, Physocardamum angustifolium (Hausskn. ex Bornm.)
Kandemir, Bornmuellera angustifolia (Hausskn.& Bornm.) Cullen & T.R.Dudley,
Bornmuellera davisii (Hedge) Rešetnik (LC).
Key words: Flora, Hiro Plateau, Adaklı, Bingöl, IUCN
Introduction: It has been comprehensively studied recent times to protect endemic plants
that especially spread in a restricted area and a particular region and it has also been tried to
stated that restricted they take part in wich categories according to IUCN criteria.
During the study of Hiro plateau and flora of its surrounding (Yapar 2017) important data
was obtained concerning new extent of areas and population situations for some endemic
taxa (Anacyclus anatolicus Behçet & Almanar (Figure 2), Centaurea bingoelensis Behçet &
İlçim, (Figure 4 ), Ranunculus bingoeldaghensis Engin (Figure 5), Cephalaria anatolica
Shkhiyan (Figure 8), Ptilotrichum angustifolium Hausskn. ex Bornm. (Figure 10) that we
have detected in our area. In this study, risk categories were reassessed,
Material and Methods: The material of the study consists of 5 endemic taxa that their extent
was determined to be in our area during the study about Hiro plateau and its surrounding
flora between 2013 and 2016. Flora of Turkey and the East Aegean Islands and species
related articles were used to identify these plants (Davis, 1965-1985; Davis et al., 1988;
Behçet and Almanar, 2004, Kandemir et al., 2014, Behçet et al., 2017; Yıldırımlı 2014a). The
IUCN version 12 (2016) was used to interpret the risk classes and Google Earth (2016) is
used to count the extant area of taxa.
Results: A. anatolicus which is known to spread from a single locality of Malazgirt (Muş)
was also determined in our area. This species which had previously assessed in the category
of Critical Risk (CR) (Behçet and Almanar 2004) was assessed in the category of
Symposium Proceedings – Book of Full Papers 293
ECOLOGY 2017 11-13 May, Kayseri TURKEY
Endangered (EN) by taking into account its spreading area and number of localities. The
intensive populations of R. bingoeldaghensis which is known to spread from Mount Bingöl
was encountered in our area and various parts of Bingöl. When considering the number of
individuals and localities of this taxon which had previously been assessed in the EN (Ekim
at al 2000) risk class, it was included in the LC risk class. Spreading of C. bingoelensis
which is known to spread from a single locality of Bingöl was also determined in our area
and Beyhan (Palu-Elazığ). This species which had previously assessed in the Critical Risk
(CR) (Behçet et al., 2017) category was included in EN risk class by taking into
consideration the its spreading area and number of localities. C. anatolica taxon which is
known to spread from a single locality was also collected from our area. This taxon, which
had been assessed in the CR (Ekim at al., 2000) risk category, was included in the EN risk
class. P. angustifolium is a species which spreads to a large number of localities in different
provinces (Ağrı, Erzincan, Erzurum, Van, Bingöl) in Eastern Anatolia. This taxon, which
previously had been assessed in the VU(Ekim at al., 2000) risk category, was assessed in the
LC risk class by taking into account its new spreading areas and population densities
identified.
Discussion: According to IUCN, it would be appropriate that A.anatolicus to be included in
EN(B1)abiii category since taxa's extent of area (Figure 1),is more than 100 km2
and the
number of localities are 3 (B9 Muş: Malazgirt, E. Slopes, Aktuzla village, steppe, 1550 m,
12.06.2001, L. Behçet & S. Almanar 1437, B8 Bingöl, Adaklı center S., Steppe, 25.05.2014,
1400 m, YY 187; Adaklı center S.E., Steppe, 19.06.2014, 1376 m, YY364); C. bingoelensis
taxa to be included in EN(B1)abiii category since, its extent of area (Figure 3) is more than
100 km2 and the number of localities are 3 (B8 Bingöl: Adaklı, Hiro Plateau S, Sevkar
village, southern rocky slopes, 04.08.2014, 1911 m, YY748, 25 km west of city of Bingöl,
north of Yelesen village, southern rocky slopes, 1900–2050 m, 26.06.2014, L. Behçet 9648,
B8 Elazığ; from Palu to Beyhan 10.km, rocky slopes, 1200-1250 m, 20.08.2016, L. Behçet
11929.); R.bingoeldaghensis to be included in the LC risk class, since the number of locality
in taxa are more than 10 (B8 Bingöl, Adaklı, Kozlu village, steppe, 26.04.2015, 1790 m,
YY921; Karacubuk plateau, steppe, 01.05.2015, 1860 m, YY945; Hiro plateau S., steppe,
16.05.2015, 1860 m, YY963; Hiro plateau, steppe, 16.05.2015, 2030 m,YY993, YY994;
Karaçubuk village, steppe, 09.04.2016, 1607 m, YY1603; Karababa hill, steppe, 21.04.2016,
2085 m, YY1671 (Yapar 2017), Bingöl center, Topalan village, moist area, 1400-1500 m,
08.05.2012, L. Behçet 7622, Karlıova, Halifan village N.W, steppe, 28.04.2014, 1569 m,
HC1017 (Cengiz 2016), B8 Bingol: Hinis to Ortakoy plateau, moist and wet pastures, 2600
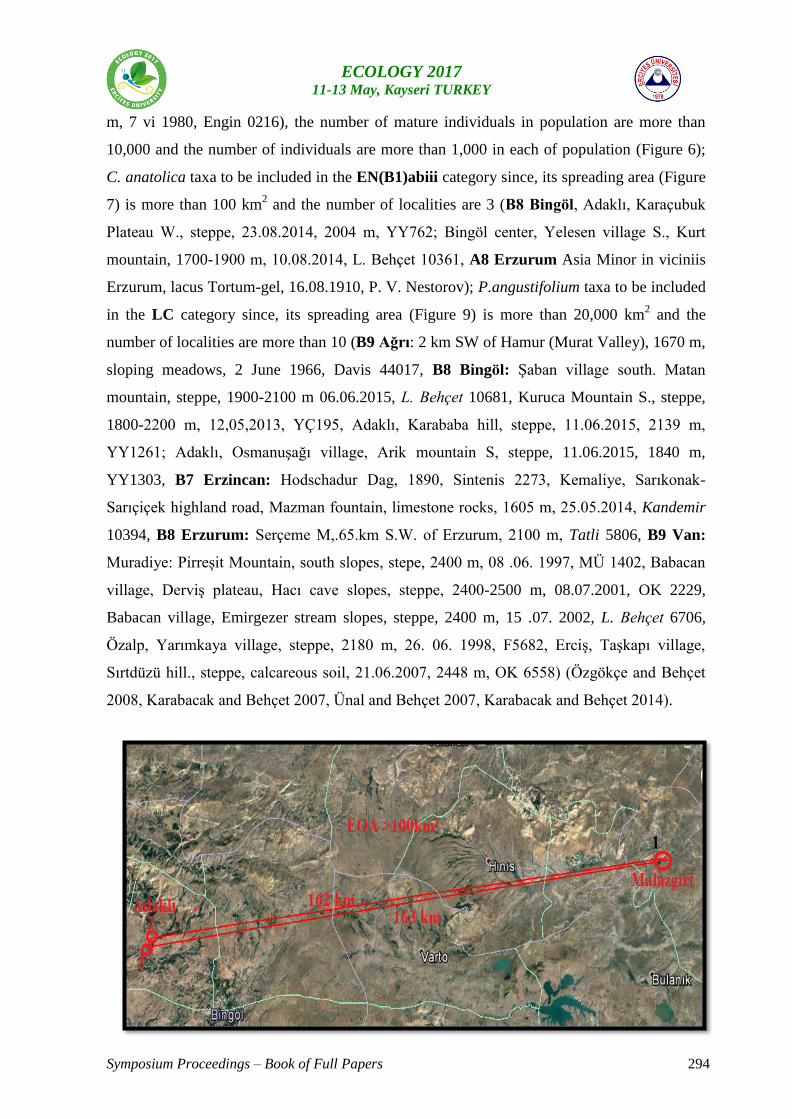
Symposium Proceedings – Book of Full Papers 294
ECOLOGY 2017 11-13 May, Kayseri TURKEY
m, 7 vi 1980, Engin 0216), the number of mature individuals in population are more than
10,000 and the number of individuals are more than 1,000 in each of population (Figure 6);
C. anatolica taxa to be included in the EN(B1)abiii category since, its spreading area (Figure
7) is more than 100 km2 and the number of localities are 3 (B8 Bingöl, Adaklı, Karaçubuk
Plateau W., steppe, 23.08.2014, 2004 m, YY762; Bingöl center, Yelesen village S., Kurt
mountain, 1700-1900 m, 10.08.2014, L. Behçet 10361, A8 Erzurum Asia Minor in viciniis
Erzurum, lacus Tortum-gel, 16.08.1910, P. V. Nestorov); P.angustifolium taxa to be included
in the LC category since, its spreading area (Figure 9) is more than 20,000 km2 and the
number of localities are more than 10 (B9 Ağrı: 2 km SW of Hamur (Murat Valley), 1670 m,
sloping meadows, 2 June 1966, Davis 44017, B8 Bingöl: Şaban village south. Matan
mountain, steppe, 1900-2100 m 06.06.2015, L. Behçet 10681, Kuruca Mountain S., steppe,
1800-2200 m, 12,05,2013, YÇ195, Adaklı, Karababa hill, steppe, 11.06.2015, 2139 m,
YY1261; Adaklı, Osmanuşağı village, Arik mountain S, steppe, 11.06.2015, 1840 m,
YY1303, B7 Erzincan: Hodschadur Dag, 1890, Sintenis 2273, Kemaliye, Sarıkonak-
Sarıçiçek highland road, Mazman fountain, limestone rocks, 1605 m, 25.05.2014, Kandemir
10394, B8 Erzurum: Serçeme M,.65.km S.W. of Erzurum, 2100 m, Tatli 5806, B9 Van:
Muradiye: Pirreşit Mountain, south slopes, stepe, 2400 m, 08 .06. 1997, MÜ 1402, Babacan
village, Derviş plateau, Hacı cave slopes, steppe, 2400-2500 m, 08.07.2001, OK 2229,
Babacan village, Emirgezer stream slopes, steppe, 2400 m, 15 .07. 2002, L. Behçet 6706,
Özalp, Yarımkaya village, steppe, 2180 m, 26. 06. 1998, F5682, Erciş, Taşkapı village,
Sırtdüzü hill., steppe, calcareous soil, 21.06.2007, 2448 m, OK 6558) (Özgökçe and Behçet
2008, Karabacak and Behçet 2007, Ünal and Behçet 2007, Karabacak and Behçet 2014).
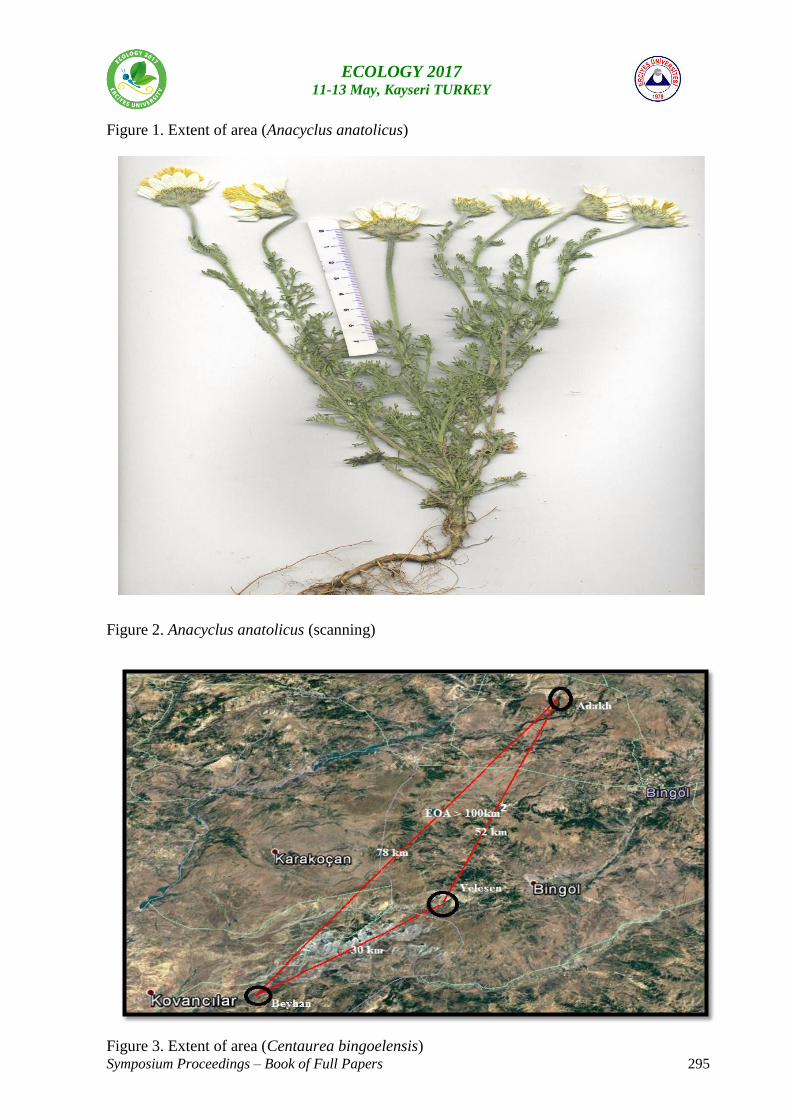
Symposium Proceedings – Book of Full Papers 295
ECOLOGY 2017 11-13 May, Kayseri TURKEY
Figure 1. Extent of area (Anacyclus anatolicus)
Figure 2. Anacyclus anatolicus (scanning)
Figure 3. Extent of area (Centaurea bingoelensis)
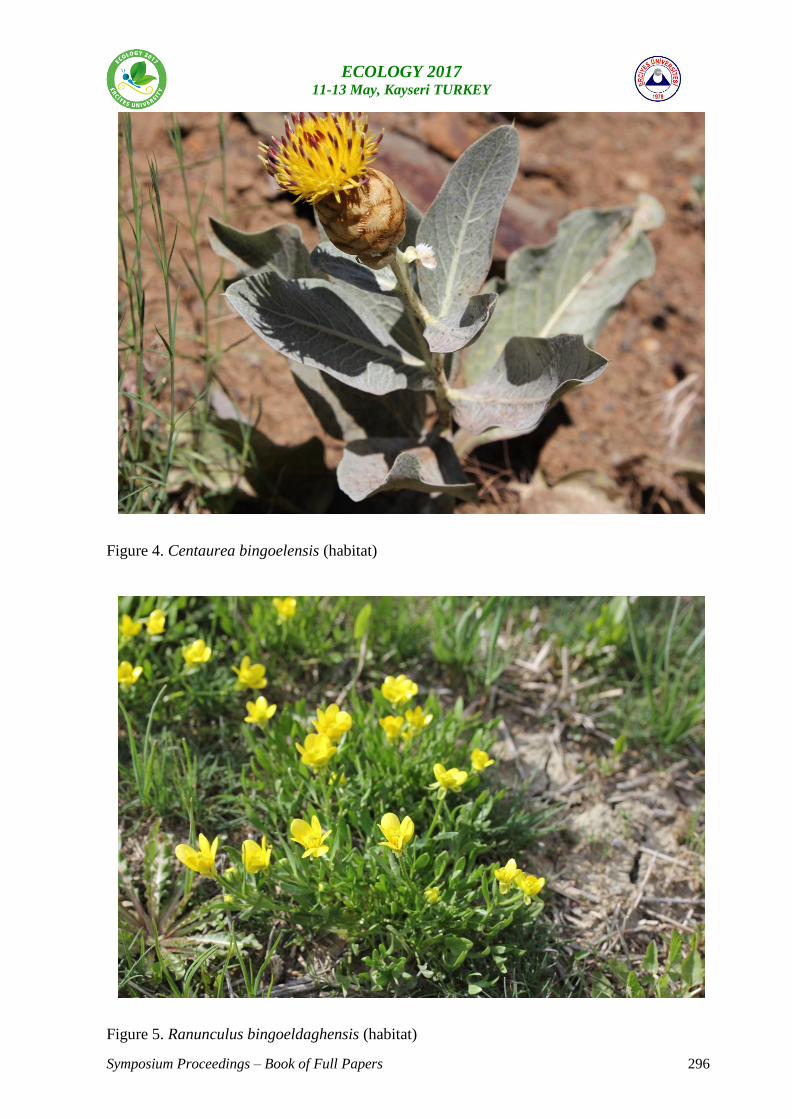
Symposium Proceedings – Book of Full Papers 296
ECOLOGY 2017 11-13 May, Kayseri TURKEY
Figure 4. Centaurea bingoelensis (habitat)
Figure 5. Ranunculus bingoeldaghensis (habitat)
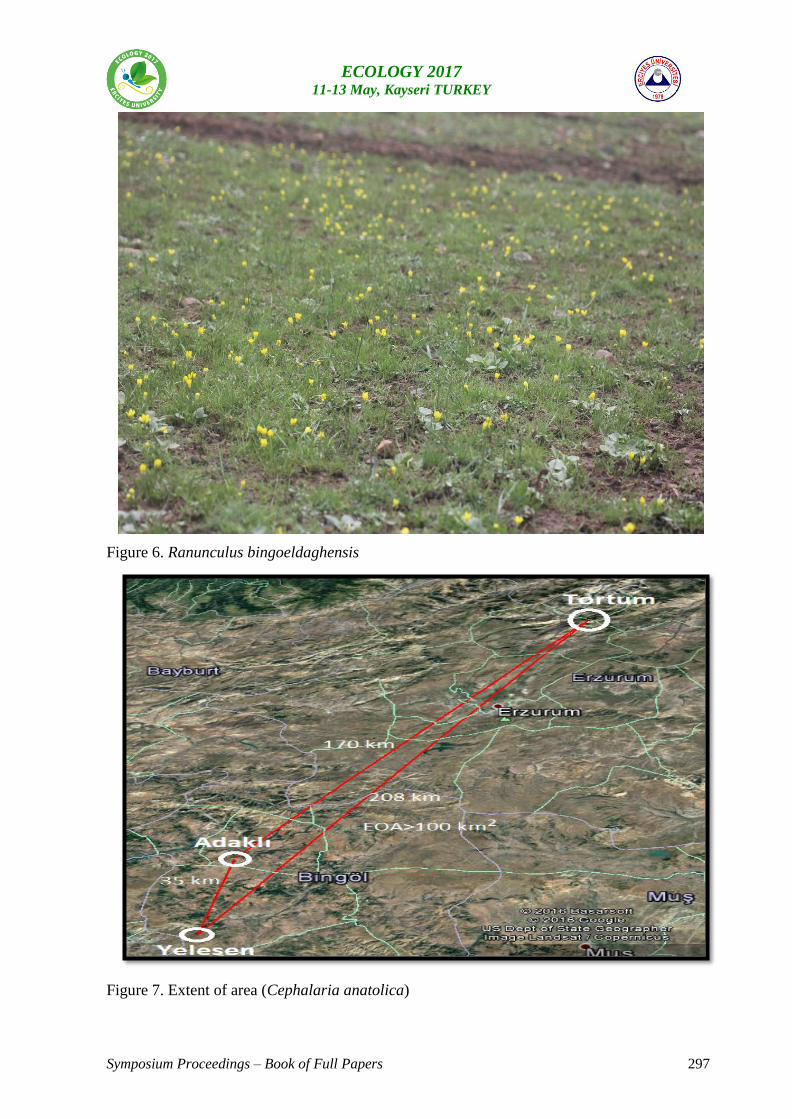
Symposium Proceedings – Book of Full Papers 297
ECOLOGY 2017 11-13 May, Kayseri TURKEY
Figure 6. Ranunculus bingoeldaghensis
Figure 7. Extent of area (Cephalaria anatolica)
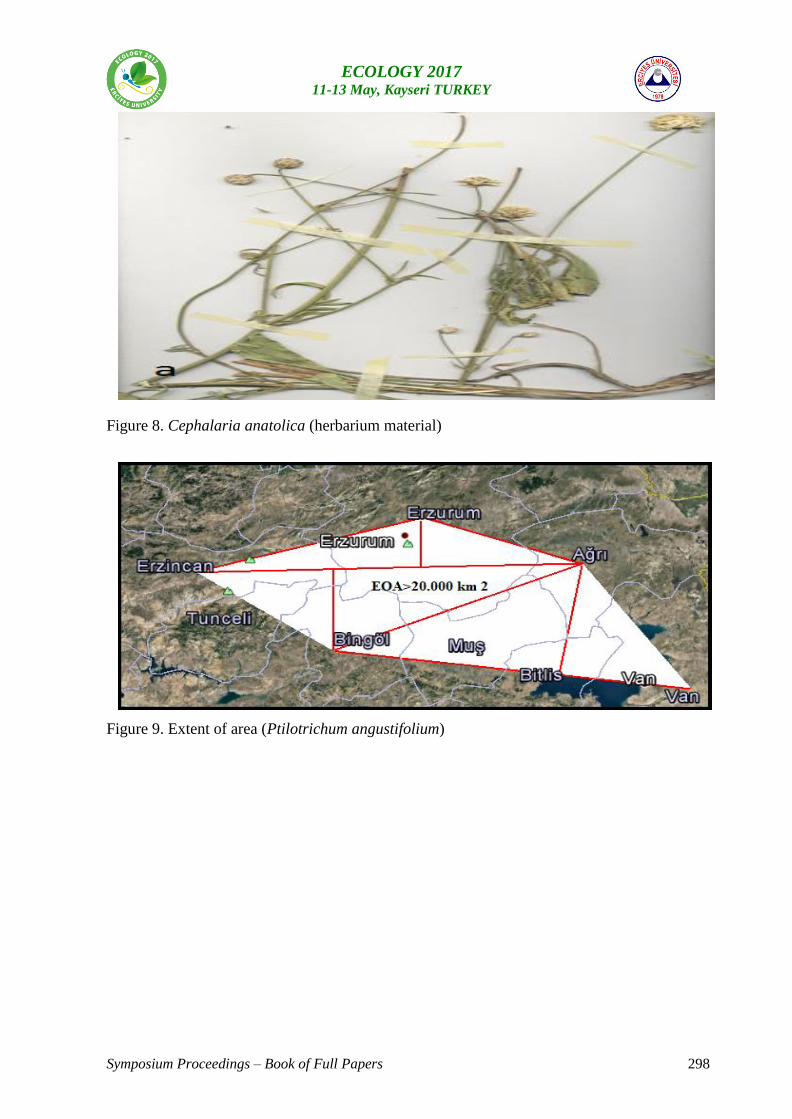
Symposium Proceedings – Book of Full Papers 298
ECOLOGY 2017 11-13 May, Kayseri TURKEY
Figure 8. Cephalaria anatolica (herbarium material)
Figure 9. Extent of area (Ptilotrichum angustifolium)
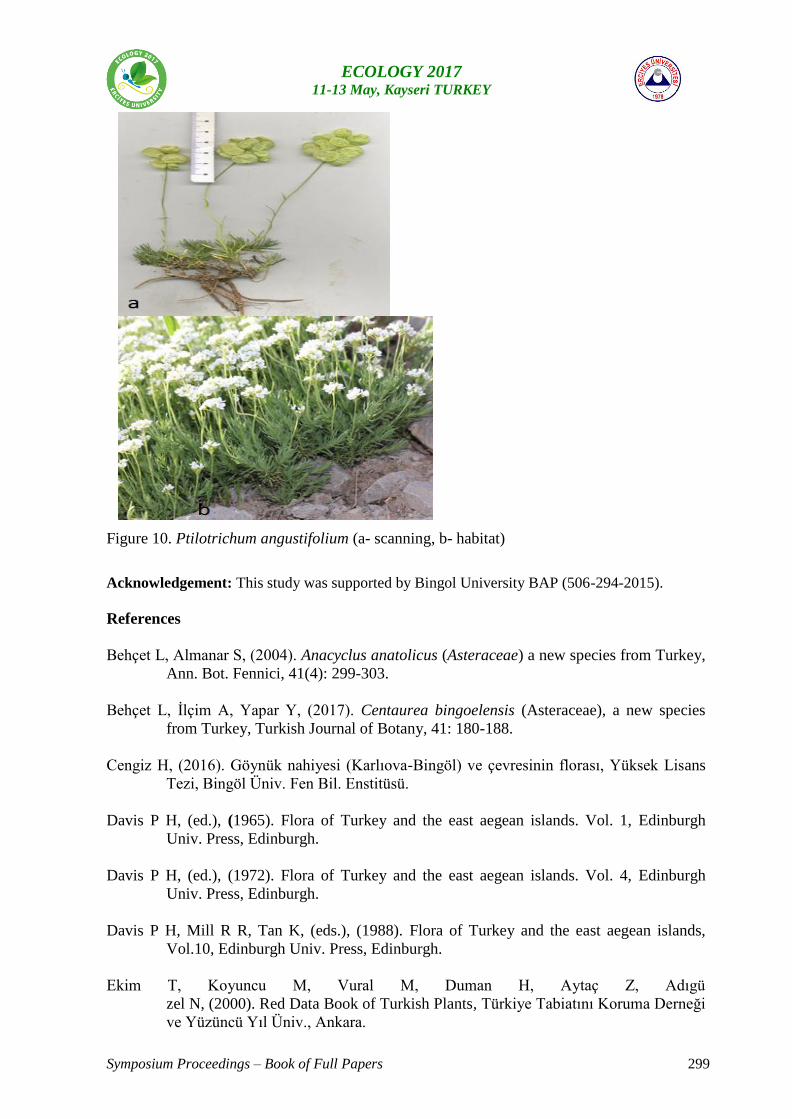
Symposium Proceedings – Book of Full Papers 299
ECOLOGY 2017 11-13 May, Kayseri TURKEY
Figure 10. Ptilotrichum angustifolium (a- scanning, b- habitat)
Acknowledgement: This study was supported by Bingol University BAP (506-294-2015).
References
Behçet L, Almanar S, (2004). Anacyclus anatolicus (Asteraceae) a new species from Turkey,
Ann. Bot. Fennici, 41(4): 299-303.
Behçet L, İlçim A, Yapar Y, (2017). Centaurea bingoelensis (Asteraceae), a new species
from Turkey, Turkish Journal of Botany, 41: 180-188.
Cengiz H, (2016). Göynük nahiyesi (Karlıova-Bingöl) ve çevresinin florası, Yüksek Lisans
Tezi, Bingöl Üniv. Fen Bil. Enstitüsü.
Davis P H, (ed.), (1965). Flora of Turkey and the east aegean islands. Vol. 1, Edinburgh
Univ. Press, Edinburgh.
Davis P H, (ed.), (1972). Flora of Turkey and the east aegean islands. Vol. 4, Edinburgh
Univ. Press, Edinburgh.
Davis P H, Mill R R, Tan K, (eds.), (1988). Flora of Turkey and the east aegean islands,
Vol.10, Edinburgh Univ. Press, Edinburgh.
Ekim T, Koyuncu M, Vural M, Duman H, Aytaç Z, Adıgü
zel N, (2000). Red Data Book of Turkish Plants, Türkiye Tabiatını Koruma Derneği
ve Yüzüncü Yıl Üniv., Ankara.
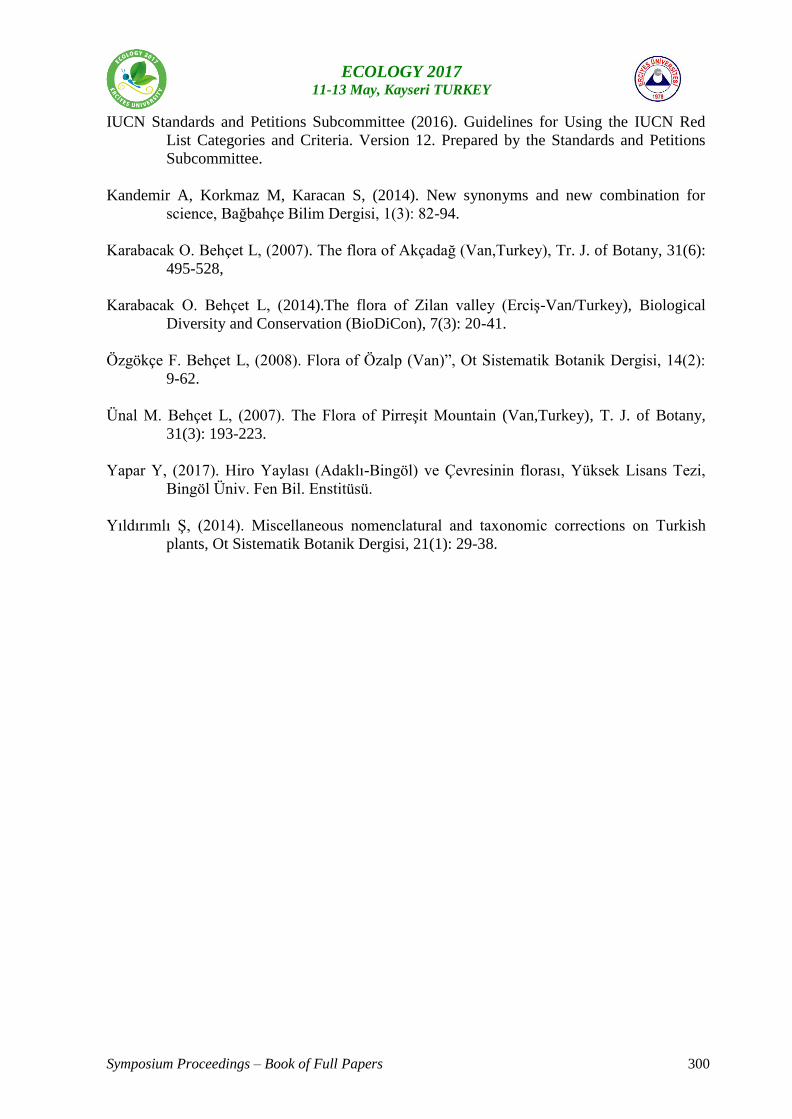
Symposium Proceedings – Book of Full Papers 300
ECOLOGY 2017 11-13 May, Kayseri TURKEY
IUCN Standards and Petitions Subcommittee (2016). Guidelines for Using the IUCN Red
List Categories and Criteria. Version 12. Prepared by the Standards and Petitions
Subcommittee.
Kandemir A, Korkmaz M, Karacan S, (2014). New synonyms and new combination for
science, Bağbahçe Bilim Dergisi, 1(3): 82-94.
Karabacak O. Behçet L, (2007). The flora of Akçadağ (Van,Turkey), Tr. J. of Botany, 31(6):
495-528,
Karabacak O. Behçet L, (2014).The flora of Zilan valley (Erciş-Van/Turkey), Biological
Diversity and Conservation (BioDiCon), 7(3): 20-41.
Özgökçe F. Behçet L, (2008). Flora of Özalp (Van)”, Ot Sistematik Botanik Dergisi, 14(2):
9-62.
Ünal M. Behçet L, (2007). The Flora of Pirreşit Mountain (Van,Turkey), T. J. of Botany,
31(3): 193-223.
Yapar Y, (2017). Hiro Yaylası (Adaklı-Bingöl) ve Çevresinin florası, Yüksek Lisans Tezi,
Bingöl Üniv. Fen Bil. Enstitüsü.
Yıldırımlı Ş, (2014). Miscellaneous nomenclatural and taxonomic corrections on Turkish
plants, Ot Sistematik Botanik Dergisi, 21(1): 29-38.
Symposium Proceedings – Book of Full Papers 301
ECOLOGY 2017 11-13 May, Kayseri TURKEY
ECOLOGICAL STATE OF URBAN ECOSYSTEMS (ON THE EXAMPLE OF
LAWNS IN UZHHOROD)
Kryvtsova M., Kolesnyk A., Ignatko T., Bobrik N., Koguch T.
Uzhhorod National University, Faculty of Biology,
Department of Genetics, Plant Physiology and Microbiology,
32, Voloshyn str.
E-mail: [email protected]
Summary
The article deals with issues of vehicular pollution, and substantiates the topicality of the
problem. A complex study of the state of the microbiota and contents of heavy metals in the
soils of urbanized ecosystems is conducted, and the air pollution is analyzed by chemical and
microbiological indicators. The soils of the lawns (grass-plots) located in the proximity of
heavy traffic are shown to be characterized by a heightened content of Pb and Cu as
compared with the maximum permissible concentrations (MPC) for these metals, and
increased concentrations of all heavy metals reviewed as compared with their background
figures. The soil microbiocoenosis is established to have undergone a reconstruction
characterized by an increased number of oligonitrophils and ammonifiers, and a decreased
content of Azotobacter and actinomycetes (ray fungi).
Introduction
The urbanization level that is growing constantly calls forth the topicality of scientific
papers aimed at complex studying of all aspects of the functioning of urbanized ecosystems
as a life environment for many micro- and macroorganisms. It is formations of stable urban
phytocoenoses able to successfully withstand the growing levels of anthropogenic
environmental pollution or even probably to help at least partially clean the urbo-systems off
most widely spread pollutants that constitute an applied aspect for such studies. Lawns
(grass-plots) are an indispensable part of a contemporary city. They are widely used for
landscaping and decorative purposes in public gardens and parks, and serve as the basis for
the planting of wood and scrub species and decorative herbaceous plants, and as independent
elements of urban landscaping and gardening. However, to choose correctly the plants that
may and must be grown on lawns, it is necessary to know the main principles of their
adaptation mechanisms providing for the accomplishment of the ontogenetic program in
conditions of continuous technogeneous pollution. Despite availability of a series works
dedicated to the study of urboflorae, only few of them dealt with the peculiarities of
adaptation of plants at different stages of their life cycle to a whole number of urban
Symposium Proceedings – Book of Full Papers 302
ECOLOGY 2017 11-13 May, Kayseri TURKEY
anthropogenic factors. Besides, there has been no clear idea of the participation of lawn
herbage in the biogeochemical turnover of heavy metals in urbanized phytocoenoses.
To gain an insight into it, it is important to consider the reaction and role of soil microbial
associations that on the one hand sensitively react to a technogeneous impact and on the other
hand take part in soil formation processes and determine to a considerable extent the plants’
soil growth conditions. All these will help successfully beautify our cities and provide us
with new data on the peculiarities of main mechanisms of ecological adaptation of plants and
microorganisms in urban conditions, on correction of their state, and on the peculiarities of
the biogeochemical turnover of substances in the biosphere.
The purpose of the paper is to study the vehicular impact upon the soil microbiota, to
identify the level of heavy metals and nitrates in the soil covered with lawn herbage, and to
evaluate the air pollution by microbiological indicators.
Material and methods
To determine the ecological state of the areas exposed to vehicular pollution, we studied
the contents of heavy metals and nitrates in the soil, quantitative and qualitative indicators of
soil microbiota.
Soil samples were taken from the following 4 spots in Uzhhorod:
№ 1 - as a control sample was taken Bozdosh Park − the city’s recreation zone located in a
relatively environmentally unpolluted area;
№ 2 - B. Khmelnytsky Street and № 3 - Koriatovych Square- the centre of the city;
№ 4 - Gagarin Street − characterized by heavy and at the same time low speed vehicular
traffic;
The soil microbial coenosis analysis was conducted with the use of differentially
diagnostic nutrient media by the method of serial dilutions of soil suspension.
Soil sampling was performed from 4 – 5 spots of the plots chosen at the depth of 10 – 15
cm. The ammonifying bacteria were calculated on meat-peptone agar (MPA); the
actinomycetes and mycobacteria – on starch-ammonium agar (SAA); the oligotrophs – on
Ashby medium; the myxobacteria – on potato agar; the micromycetes – on Czapek Dox
medium;the oligotrophs – on starvation agar; the Azotobacter – on Ashby medium using the
method of soil lumps fouling; the enteric bacteria – on Ploskirev medium (Zviagintsev,
1991). The results were evaluated by the number of colony-forming units per 1 g of
absolutely dry soil (CFU/g).
The microbiological air analysis was conducted by ‘Koch-type’ microbial sedimentation
method, with the use of elective media.
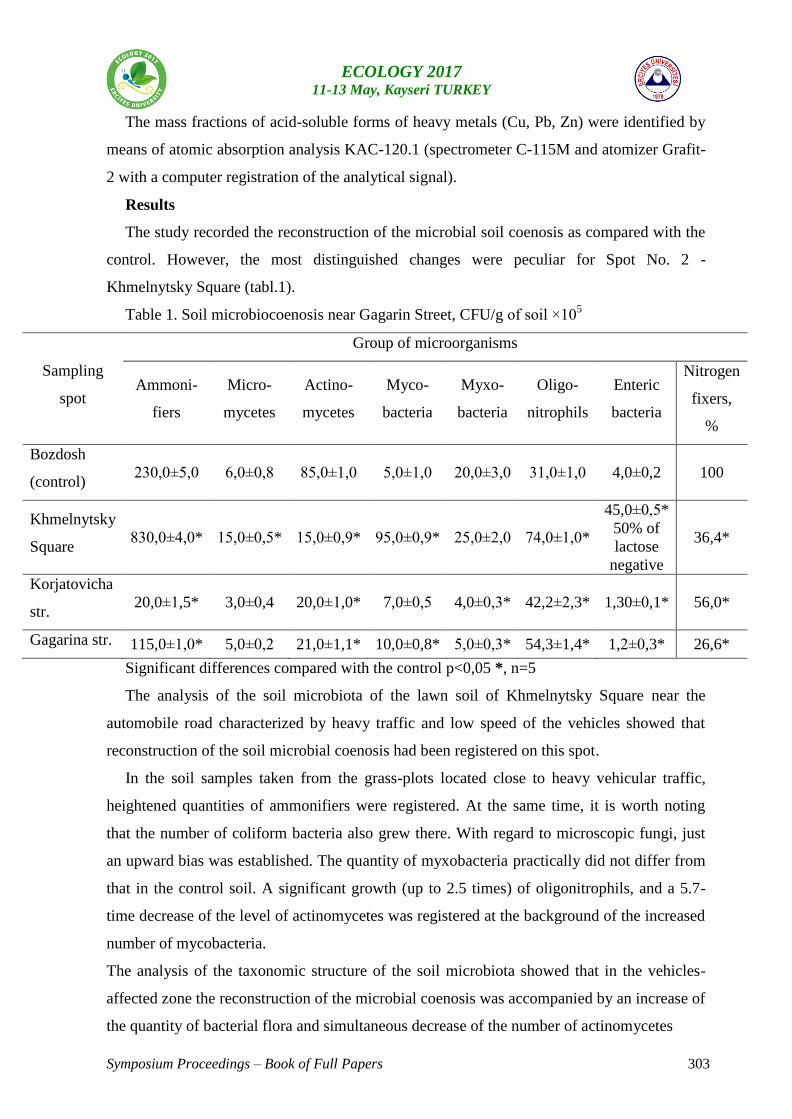
Symposium Proceedings – Book of Full Papers 303
ECOLOGY 2017 11-13 May, Kayseri TURKEY
The mass fractions of acid-soluble forms of heavy metals (Cu, Pb, Zn) were identified by
means of atomic absorption analysis KAC-120.1 (spectrometer C-115M and atomizer Grafit-
2 with a computer registration of the analytical signal).
Results
The study recorded the reconstruction of the microbial soil coenosis as compared with the
control. However, the most distinguished changes were peculiar for Spot No. 2 -
Khmelnytsky Square (tabl.1).
Table 1. Soil microbiocoenosis near Gagarin Street, CFU/g of soil ×105
Sampling
spot
Group of microorganisms
Ammoni-
fiers
Micro-
mycetes
Actino-
mycetes
Myco-
bacteria
Myxo-
bacteria
Oligo-
nitrophils
Enteric
bacteria
Nitrogen
fixers,
%
Bozdosh
(control) 230,0±5,0 6,0±0,8 85,0±1,0 5,0±1,0 20,0±3,0 31,0±1,0 4,0±0,2 100
Khmelnytsky
Square 830,0±4,0* 15,0±0,5* 15,0±0,9* 95,0±0,9* 25,0±2,0 74,0±1,0*
45,0±0,5*
50% of
lactose
negative
36,4*
Korjatovicha
str. 20,0±1,5* 3,0±0,4 20,0±1,0* 7,0±0,5 4,0±0,3* 42,2±2,3* 1,30±0,1* 56,0*
Gagarina str. 115,0±1,0* 5,0±0,2 21,0±1,1* 10,0±0,8* 5,0±0,3* 54,3±1,4* 1,2±0,3* 26,6*
Significant differences compared with the control p<0,05 *, n=5
The analysis of the soil microbiota of the lawn soil of Khmelnytsky Square near the
automobile road characterized by heavy traffic and low speed of the vehicles showed that
reconstruction of the soil microbial coenosis had been registered on this spot.
In the soil samples taken from the grass-plots located close to heavy vehicular traffic,
heightened quantities of ammonifiers were registered. At the same time, it is worth noting
that the number of coliform bacteria also grew there. With regard to microscopic fungi, just
an upward bias was established. The quantity of myxobacteria practically did not differ from
that in the control soil. A significant growth (up to 2.5 times) of oligonitrophils, and a 5.7-
time decrease of the level of actinomycetes was registered at the background of the increased
number of mycobacteria.
The analysis of the taxonomic structure of the soil microbiota showed that in the vehicles-
affected zone the reconstruction of the microbial coenosis was accompanied by an increase of
the quantity of bacterial flora and simultaneous decrease of the number of actinomycetes
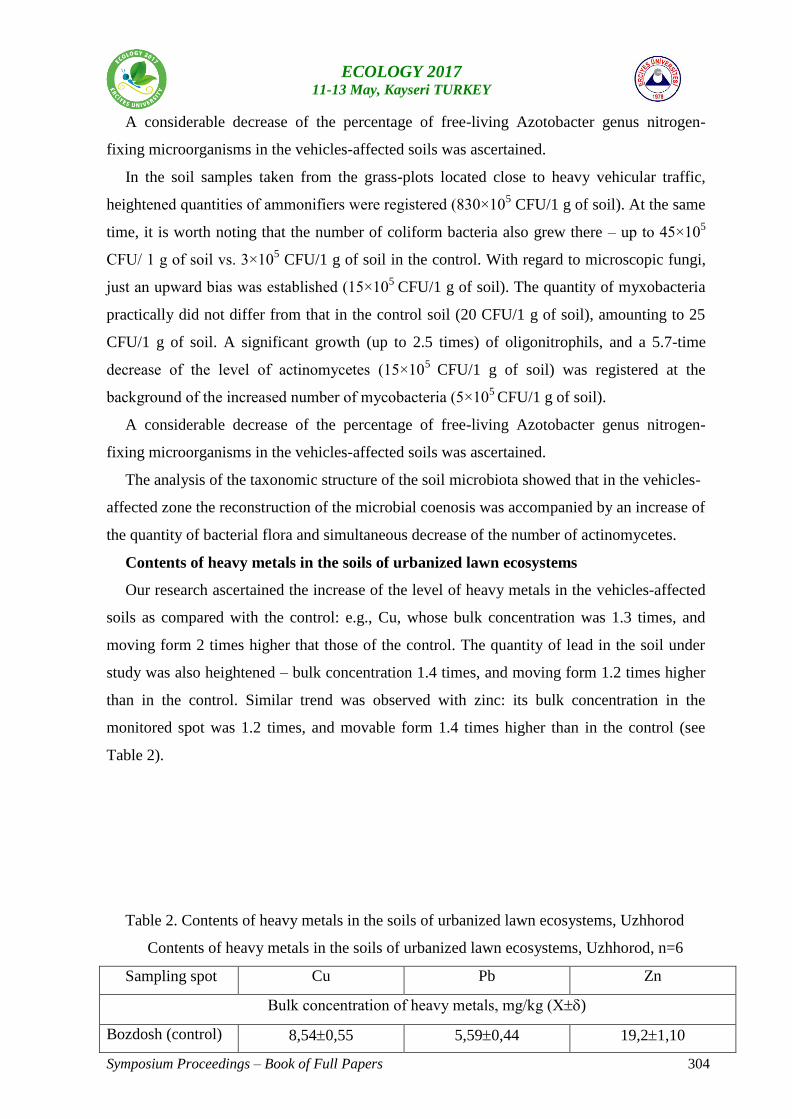
Symposium Proceedings – Book of Full Papers 304
ECOLOGY 2017 11-13 May, Kayseri TURKEY
A considerable decrease of the percentage of free-living Azotobacter genus nitrogen-
fixing microorganisms in the vehicles-affected soils was ascertained.
In the soil samples taken from the grass-plots located close to heavy vehicular traffic,
heightened quantities of ammonifiers were registered (830×105 CFU/1 g of soil). At the same
time, it is worth noting that the number of coliform bacteria also grew there – up to 45×105
CFU/ 1 g of soil vs. 3×10⁵ CFU/1 g of soil in the control. With regard to microscopic fungi,
just an upward bias was established (15×105
CFU/1 g of soil). The quantity of myxobacteria
practically did not differ from that in the control soil (20 CFU/1 g of soil), amounting to 25
CFU/1 g of soil. A significant growth (up to 2.5 times) of oligonitrophils, and a 5.7-time
decrease of the level of actinomycetes (15×105
CFU/1 g of soil) was registered at the
background of the increased number of mycobacteria (5×10⁵
CFU/1 g of soil).
A considerable decrease of the percentage of free-living Azotobacter genus nitrogen-
fixing microorganisms in the vehicles-affected soils was ascertained.
The analysis of the taxonomic structure of the soil microbiota showed that in the vehicles-
affected zone the reconstruction of the microbial coenosis was accompanied by an increase of
the quantity of bacterial flora and simultaneous decrease of the number of actinomycetes.
Contents of heavy metals in the soils of urbanized lawn ecosystems
Our research ascertained the increase of the level of heavy metals in the vehicles-affected
soils as compared with the control: e.g., Cu, whose bulk concentration was 1.3 times, and
moving form 2 times higher that those of the control. The quantity of lead in the soil under
study was also heightened – bulk concentration 1.4 times, and moving form 1.2 times higher
than in the control. Similar trend was observed with zinc: its bulk concentration in the
monitored spot was 1.2 times, and movable form 1.4 times higher than in the control (see
Table 2).
Table 2. Contents of heavy metals in the soils of urbanized lawn ecosystems, Uzhhorod
Contents of heavy metals in the soils of urbanized lawn ecosystems, Uzhhorod, n=6
Sampling spot Cu Pb Zn
Bulk concentration of heavy metals, mg/kg (Х)
Bozdosh (control) 8,540,55 5,590,44 19,21,10
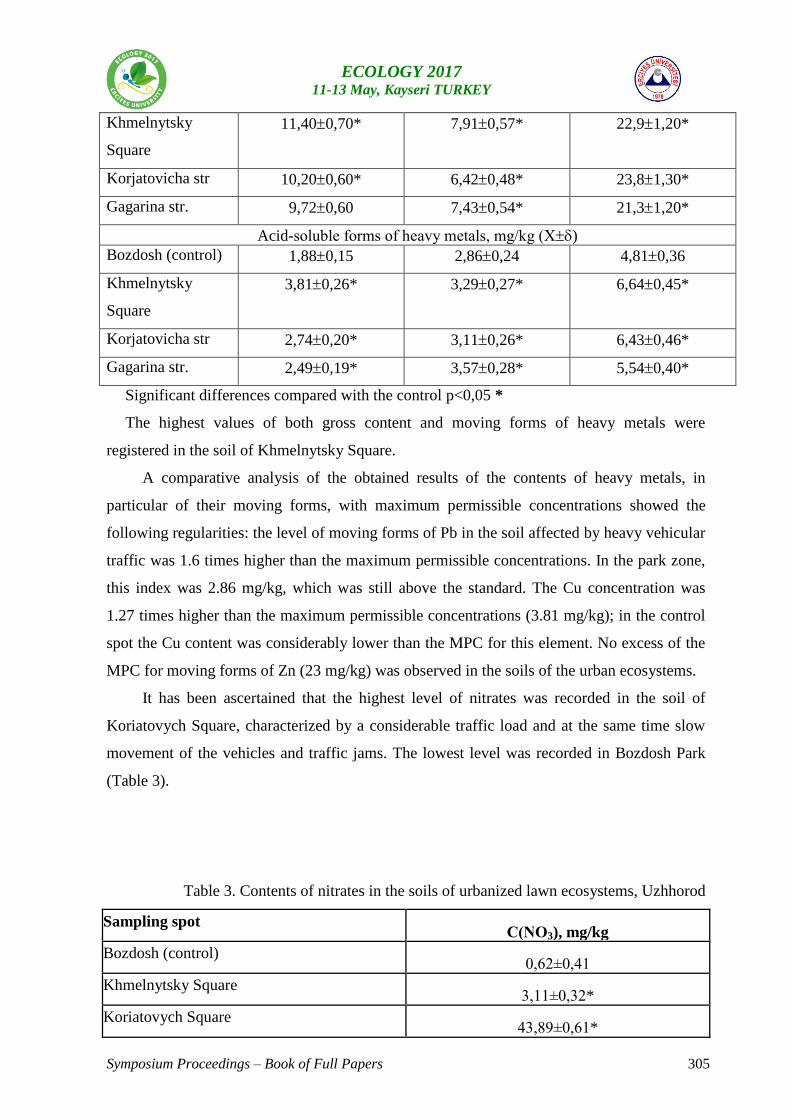
Symposium Proceedings – Book of Full Papers 305
ECOLOGY 2017 11-13 May, Kayseri TURKEY
Khmelnytsky
Square
11,400,70* 7,910,57* 22,91,20*
Korjatovicha str 10,200,60* 6,420,48* 23,81,30*
Gagarina str. 9,720,60 7,430,54* 21,31,20*
Acid-soluble forms of heavy metals, mg/kg (Х)
Bozdosh (control) 1,880,15 2,860,24 4,810,36
Khmelnytsky
Square
3,810,26* 3,290,27* 6,640,45*
Korjatovicha str 2,740,20* 3,110,26* 6,430,46*
Gagarina str. 2,490,19* 3,570,28* 5,540,40*
Significant differences compared with the control p<0,05 *
The highest values of both gross content and moving forms of heavy metals were
registered in the soil of Khmelnytsky Square.
A comparative analysis of the obtained results of the contents of heavy metals, in
particular of their moving forms, with maximum permissible concentrations showed the
following regularities: the level of moving forms of Pb in the soil affected by heavy vehicular
traffic was 1.6 times higher than the maximum permissible concentrations. In the park zone,
this index was 2.86 mg/kg, which was still above the standard. The Cu concentration was
1.27 times higher than the maximum permissible concentrations (3.81 mg/kg); in the control
spot the Cu content was considerably lower than the MPC for this element. No excess of the
MPC for moving forms of Zn (23 mg/kg) was observed in the soils of the urban ecosystems.
It has been ascertained that the highest level of nitrates was recorded in the soil of
Koriatovych Square, characterized by a considerable traffic load and at the same time slow
movement of the vehicles and traffic jams. The lowest level was recorded in Bozdosh Park
(Table 3).
Table 3. Contents of nitrates in the soils of urbanized lawn ecosystems, Uzhhorod
Sampling spot С(NO3), mg/kg
Bozdosh (control) 0,62±0,41
Khmelnytsky Square 3,11±0,32*
Koriatovych Square 43,89±0,61*
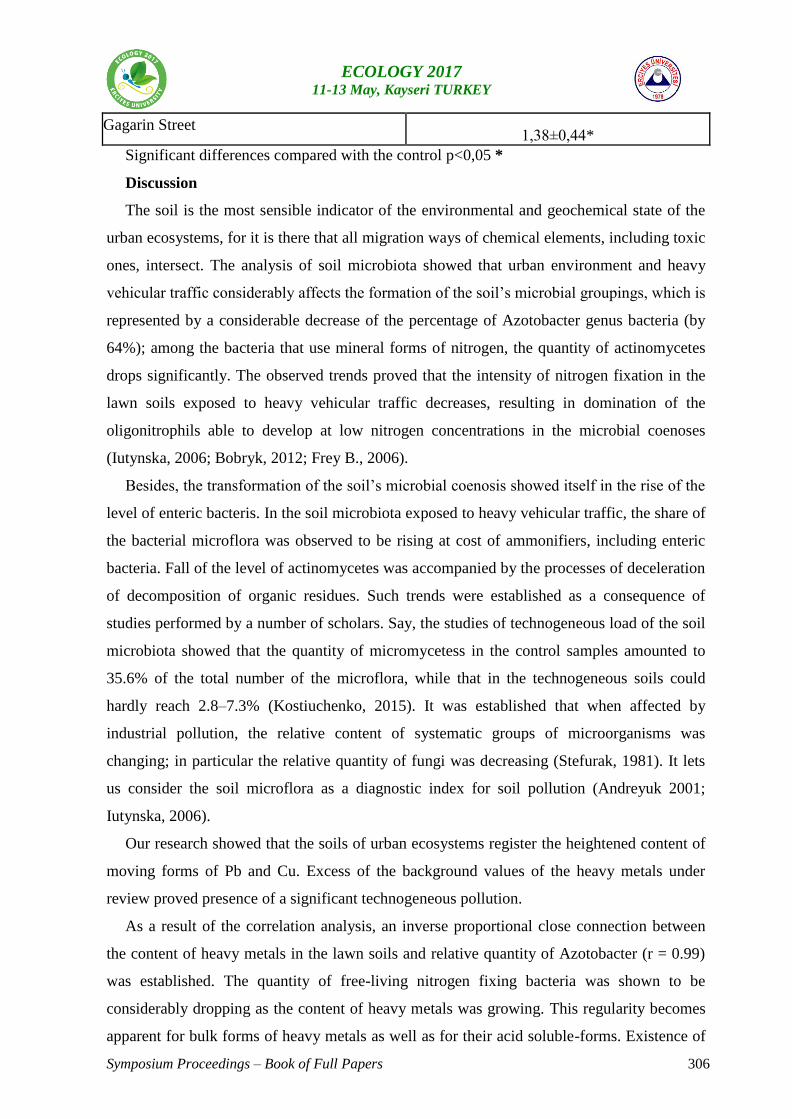
Symposium Proceedings – Book of Full Papers 306
ECOLOGY 2017 11-13 May, Kayseri TURKEY
Gagarin Street 1,38±0,44*
Significant differences compared with the control p<0,05 *
Discussion
The soil is the most sensible indicator of the environmental and geochemical state of the
urban ecosystems, for it is there that all migration ways of chemical elements, including toxic
ones, intersect. The analysis of soil microbiota showed that urban environment and heavy
vehicular traffic considerably affects the formation of the soil’s microbial groupings, which is
represented by a considerable decrease of the percentage of Azotobacter genus bacteria (by
64%); among the bacteria that use mineral forms of nitrogen, the quantity of actinomycetes
drops significantly. The observed trends proved that the intensity of nitrogen fixation in the
lawn soils exposed to heavy vehicular traffic decreases, resulting in domination of the
oligonitrophils able to develop at low nitrogen concentrations in the microbial coenoses
(Iutynska, 2006; Bobryk, 2012; Frey B., 2006).
Besides, the transformation of the soil’s microbial coenosis showed itself in the rise of the
level of enteric bacteris. In the soil microbiota exposed to heavy vehicular traffic, the share of
the bacterial microflora was observed to be rising at cost of ammonifiers, including enteric
bacteria. Fall of the level of actinomycetes was accompanied by the processes of deceleration
of decomposition of organic residues. Such trends were established as a consequence of
studies performed by a number of scholars. Say, the studies of technogeneous load of the soil
microbiota showed that the quantity of micromycetess in the control samples amounted to
35.6% of the total number of the microflora, while that in the technogeneous soils could
hardly reach 2.8–7.3% (Kostiuchenko, 2015). It was established that when affected by
industrial pollution, the relative content of systematic groups of microorganisms was
changing; in particular the relative quantity of fungi was decreasing (Stefurak, 1981). It lets
us consider the soil microflora as a diagnostic index for soil pollution (Andreyuk 2001;
Iutynska, 2006).
Our research showed that the soils of urban ecosystems register the heightened content of
moving forms of Pb and Cu. Excess of the background values of the heavy metals under
review proved presence of a significant technogeneous pollution.
As a result of the correlation analysis, an inverse proportional close connection between
the content of heavy metals in the lawn soils and relative quantity of Azotobacter (r = 0.99)
was established. The quantity of free-living nitrogen fixing bacteria was shown to be
considerably dropping as the content of heavy metals was growing. This regularity becomes
apparent for bulk forms of heavy metals as well as for their acid soluble-forms. Existence of
Symposium Proceedings – Book of Full Papers 307
ECOLOGY 2017 11-13 May, Kayseri TURKEY
a close inverse correlation was revealed between the level of heavy metals and quantitative
indices of actinomycetes (r = 0.99), whereas a close direct correlation dependence was
revealed between the level of heavy metals and the quantity of mycobacteria.
Key words: heavy metals, microbial coenosis, urbanized ecosystems.
Acknowledgements
Excesses of Cu and Pb MPCs in the soils of lawn phytocoenoses exposed to heavy
vehicular traffic were established. The concentration of all reviewed elements was higher in
the soil of the monitored spot as compared with that of the park zone. Reconstruction of the
microbial coenosis in the soils of the lawn ecosystems was shown to take place towards
significant decrease of the quantity of free-living nitrogen fixing bacteria, increase of
oligonitrophils, considerable growth of ammonifiers at cost of enteric bacteria, and decrease
of actinomycetes.
Reference
Andreyuk K., 2001. Funktsionuvannia mikrobnykh tsenoziv gruntu v umovakh
antropohennoho navantazhennia (Functioning of microbial soil coenoses in conditions of
anthropogeneous load). In: K. Andreyuk, H. Iutynska, A. Antypchuk. Kyiv: Oberehy, 2001. –
240 p. (in Ukrainian)
Bobryk N., Kryvtsova M., Nikolaichuk V. Mikrobiotsenoz gruntu v umovakh vplyvu
zaliznychnoho transportu (Soil microbiocoenosis as affected by railway transport). In: Visnyk
Dnipropetrovskoho universytetu. Biolohiya. Ekolohiya (Bulletin of the Dnipropetrovsk
University. Biology. Environmental Studies). No. 20, 2012. Vol. 2. – P. 3–9. (in Ukrainian)
Zviagintsev D. Metody pochvennoi mikrobiologii i biokhimii (Methods of soil biology and
biochemistry). Ed. by D. Zviagintsev. Moscow: Moscow State University Publishers, 1991. –
330 p. (in Russian)
Iutynska H. Gruntova mikrobiolohiya (Soil microbiology). Kyiv: Aristei, 2006. – 284 p. (in
Ukrainian)
Kostiuchenko N. Vplyv tekhnohennoho navantazhennia na ekolohichnyi stan gruntiv baseinu
richky Mokra Moskovka (Zaporizka oblast) (Impact of technogeneous load upon the
environmental state of the soils of the Mokra Moskovka River, Zaporizhia oblast). In:
Zbirnyk naukovykh prats V Vseukrainskoho zyizdu ekolohiv z mizhnarodnoyu uchastiu
(Collected papers of the 5th All-Ukraine Congress of Environmentalists with international
participation) (Ekolohiya / Ecology – 2015). – P. 201. (in Ukrainian)
Pinigin M. Teoriya i praktika otsenki kombinirovannogo deistviya khimicheskogo
zagriazneniya atmosfernogo vozdukha (Atmospheric air chemical pollution combined effect.
Symposium Proceedings – Book of Full Papers 308
ECOLOGY 2017 11-13 May, Kayseri TURKEY
Evaluation theory and practice). In: Gigiena i sanitariya (Hygiene and Sanitary), No. 1,
2001. – P. 9–13. (in Russian)
Stefurak V. Vliyanie promyshlennogo zagriazneniya na pochvennuyu mikrofloru (Impact of
industrial pollution upon soil microflora). In: Mikrobnye soobshchestva i ikh
funktsionirovanie v pochve (Microbial communities and their functioning in soils). Scientific
papers. Kiev: Naukova Dumka, 1981. – 280 p. (in Russian)
Kharytonov M. Ekolohichna otsinka aerotekhnohennoho zaprudnennia dovkillia u
Dnipropetrovskomu industrialnomu regioni (Ecological evaluation of aero-technogeneous
environmental pollution in the Dnipropetrovsk industrial region). In: M. Kharytonov, A.
Benselhub, L. Shupranova, V. Khlopova. Naukovy visnyk universytetu bioresursiv i
pryrodokorystuvannia Ukrainy (Scientific bulletin of the University of Bioresources and
Nature Management). Series: Biology, Biotechnology, Environmental Studies. Issue No. 204,
2014. – P. 65–73. (in Ukrainian)
Frey B., Stemmer M., Widmer F., Luster J. and Sperisen C., 2006. Microbial Activity and
Community Structure of a Soil after Heavy Metal Contamination in a Model Forest
Ecosystem. Soil Biology & Biochemistry. Vol. 38, No. 7. – P. 1745–1756.
Symposium Proceedings – Book of Full Papers 309
ECOLOGY 2017 11-13 May, Kayseri TURKEY
The Evaluation of Landscape Typology and Richness for Achieving Conservation
Priorities of Habitats
Derya Yazgi1 and K. Tulühan Yilmaz2
1Adnan Menderes University, Faculty of Agriculture, Dept. of Landscape Architecture, Aydın 2Cukurova University, Faculty of Agriculture, Department of Landscape Architecture, Adana
Corresponding Author: e-mail: [email protected]
ABSTRACT
Landscape planning activities aim to provide conservation priorities and reclamation of
landscapes, and recreational services through green infrastructure, meanwhile to meet the
sectorial needs and optimal land use organization for landscape units. In this context, nature
conservation planning is based on decision making for conservation of landscapes, habitats
and biodiversity. Landscapes contain ecological units that interact each other and these units
vary in ecological functions as well as physiognomy. Therefore, assessing landscape
character is an important tool for conserving bio-diversity as well as spatial planning and
management of habitats and landscapes. Recently, landscape character assessment (LCA)
studies mostly lead to land use decisions by describing character and ecological value of
landscapes. This paper presents and tests LCA methodology at the local scale of Aydin
province and the north site of lower catchment of Meander River where significant potential
of waders and waterfowl species are represented. Datasets obtained from ASTER Global
Digital Elevation Model (ASTER GDEM), forest map showing spatial distribution of stands,
and existing topographical map were used to complete analysis. Three thematic maps (bio-
climatic belts, vegetation cover and land use) were produced for the analysis of landscape
character and after overlaying of these maps, landscape types were mapped according to
their spatial distribution. Following landscape analysis, relation between landscape typology
and habitat function of landscape types were evaluated in the case of coastal wetland
habitats.
Key words: Landscape character assessment, Landscape richness, waders and waterfowl
habitats
INTRODUCTION
Landscape ecology which is the core of nature conservation offers theory-based approaches,
methods and applications revealing the importance of spatial patterning on the dynamics of
interacting ecosystems (Turner, 2001). According to Forman and Godron (1986), landscape
is defined as a mosaic of these interacting ecosystems. Due to the rapid changes of the 20th
century, pollution, climate change, and other environmental stresses have an adverse impact
on ecosystems and landscape quality resulting in landscape fragmentation and degradation.
To respond the critical need to assess the impact of rapid, broad-scale changes in our
environment, the last decade has seen a dramatic growth in the number of landscape analysis
studies (Riiters and Wickham, 1995; Antrop, 2000). For this aim, classification of landscape
and its character is fundamental for providing practical solutions for the management of
landscape change, and should be seen as one of many different information sets for assessing
landscape (Brabyn, 2009).
Symposium Proceedings – Book of Full Papers 310
ECOLOGY 2017 11-13 May, Kayseri TURKEY
Landscape character is defined as a distinct pattern of elements, recognizable and consistent
pattern that occur consistently in a particular type of landscape. Particular combinations of
objective indicators as geology, landform, soil conditions, and the associated vegetation,
land use, and human settlement create the character, which makes different landscapes
distinct from each other (Swanwick, 2002; Swanwick, 2004; Van Eetvelde et al., 2005;
Yilmaz, 2011).
Assessing landscape character is an important tool for conserving bio-diversity as well as
spatial planning and management of landscapes. The procedure of indicating landscapes
starts with landscape atlases which are the instruments used for environmental assessment
that described distinct landscape types and their dynamic structures to protect biodiversity
and develop the related policies (Wascher, 2005; Council of Europe, 2009; Uzun et al.,
2011). In this context, Riiters and Wickham (1995) applied a regional-scale ecological
assessment and produced a landscape atlas of the Chesapeake Bay Watershed. Additionally,
“the Atlas of the Irish Rural Landscape” was published as a book by Aalen et al. (1997) in
order to retain landscape quality of Ireland and provide a much needed basis for an
understanding of landscape conservation and planning. Hofkens and Roossens (2001)
presented “the Flemish Landscape Atlas” which was widely used in landscape conservation,
spatial planning, and environmental impact assessment indicating zones with well-conserved
relics of the traditional landscapes (Eetvelde and Antrop, 2012). Miklós (2002) introduced
“Landscape Atlas of the Slovak Republic” which was another outstanding work presenting
the hierarchy of landscape classification. One of the recent representation of landscape
atlases made by Hrnčiarová et al. (2009) in Czech Republic which won the first jury’s prize
in the category Atlases at the 25th International Cartography Conference in Paris, France.
There were also another methods and applications that based on the intuitive interpretation
of observed patterns according to environmental differences. Some of these qualitative
approaches including maps of European landscapes (Meeus, 1995), the Potential Natural
Vegetation Map (Bohn et al., 2000), and Biogeographic Regions Map of Europe (Roekaerts,
2002) are representative samples in the European context (Hazeu et al., 2011).
Developed under the auspices of the Council of Europe, European Landscape Convention
(ELC) is the first international agreement specifically addressing landscape issues which has
come to be seen as a legitimate topic for international action (Bishop and Philips, 2012).
Since the significance of landscape character was underlined in terms of landscape
protection in ELC, Landscape Character Assessment (LCA) has become an important tool
for identifying and assessing landscapes. In this context, a number of policy initiatives have
been launched in many countries. Among them, European Landscape Character Assessment
Initiative (ELCAI) was evaluated as the most comprehensive one that aimed to respond the
need for new conceptual and procedural approaches with clear implications for the
management, planning and assessment of landscapes at European level (Van Eetvelde and
Antrop, 2009; Wascher, 2005).
It is stated that each country ratifying ELC is responsible for identifying their landscapes
(Şahin, 2003; Uzun et al., 2011). Turkey signed the convention in 2000 which put into force
on October 20th. As a result of this, there has been a rapidly growing demand for assessing
landscapes by using LCA in Turkey as well. Although, there are some researches for testing
LCA with different approaches, we are still in need of preparing a legal instrument which
could be an opportunity for the management and conservation of Turkey’s habitats and
biodiversity (Atik et al., 2015). To meet this need, we focus on LCA methodology at the
local scale in Aegean region of Turkey considering nature conservation with an ecological
approach which would contribute for the implementation of ELC and provide a reference
guideline for spatial planning and land use decisions.
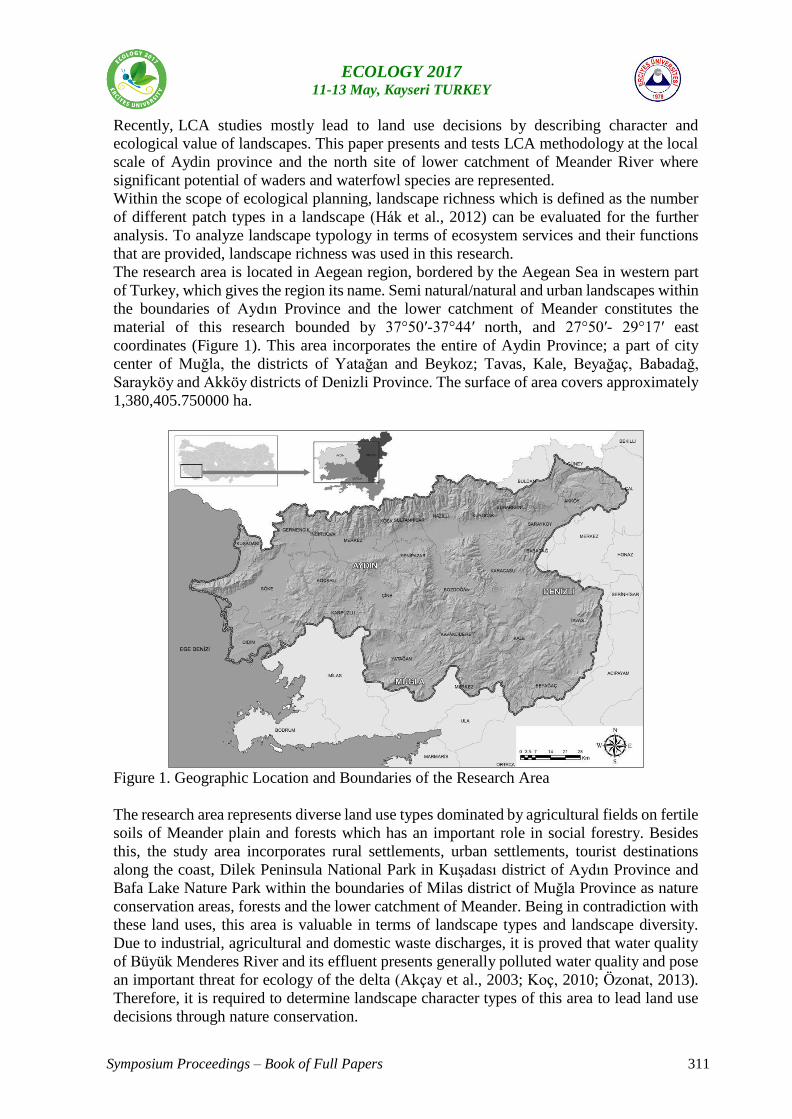
Symposium Proceedings – Book of Full Papers 311
ECOLOGY 2017 11-13 May, Kayseri TURKEY
Recently, LCA studies mostly lead to land use decisions by describing character and
ecological value of landscapes. This paper presents and tests LCA methodology at the local
scale of Aydin province and the north site of lower catchment of Meander River where
significant potential of waders and waterfowl species are represented.
Within the scope of ecological planning, landscape richness which is defined as the number
of different patch types in a landscape (Hák et al., 2012) can be evaluated for the further
analysis. To analyze landscape typology in terms of ecosystem services and their functions
that are provided, landscape richness was used in this research.
The research area is located in Aegean region, bordered by the Aegean Sea in western part
of Turkey, which gives the region its name. Semi natural/natural and urban landscapes within
the boundaries of Aydın Province and the lower catchment of Meander constitutes the
material of this research bounded by 37°50′-37°44′ north, and 27°50′- 29°17′ east
coordinates (Figure 1). This area incorporates the entire of Aydin Province; a part of city
center of Muğla, the districts of Yatağan and Beykoz; Tavas, Kale, Beyağaç, Babadağ,
Sarayköy and Akköy districts of Denizli Province. The surface of area covers approximately
1,380,405.750000 ha.
Figure 1. Geographic Location and Boundaries of the Research Area
The research area represents diverse land use types dominated by agricultural fields on fertile
soils of Meander plain and forests which has an important role in social forestry. Besides
this, the study area incorporates rural settlements, urban settlements, tourist destinations
along the coast, Dilek Peninsula National Park in Kuşadası district of Aydın Province and
Bafa Lake Nature Park within the boundaries of Milas district of Muğla Province as nature
conservation areas, forests and the lower catchment of Meander. Being in contradiction with
these land uses, this area is valuable in terms of landscape types and landscape diversity.
Due to industrial, agricultural and domestic waste discharges, it is proved that water quality
of Büyük Menderes River and its effluent presents generally polluted water quality and pose
an important threat for ecology of the delta (Akçay et al., 2003; Koç, 2010; Özonat, 2013).
Therefore, it is required to determine landscape character types of this area to lead land use
decisions through nature conservation.
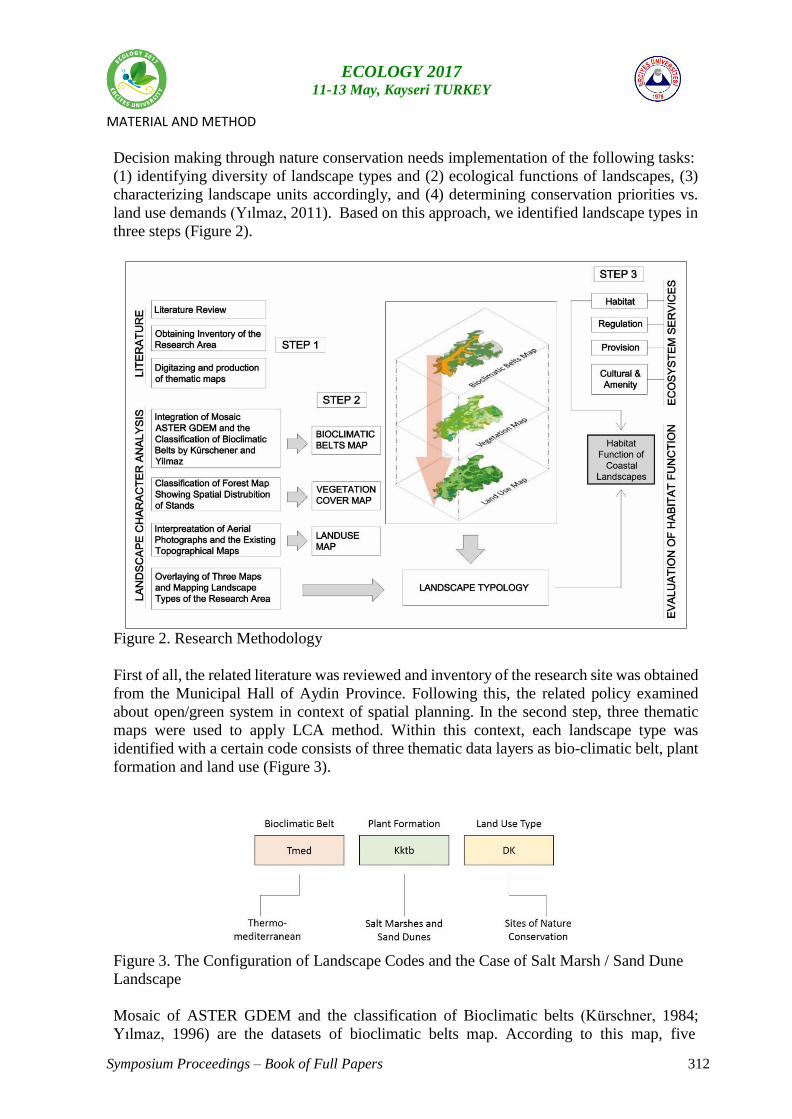
Symposium Proceedings – Book of Full Papers 312
ECOLOGY 2017 11-13 May, Kayseri TURKEY
MATERIAL AND METHOD
Decision making through nature conservation needs implementation of the following tasks:
(1) identifying diversity of landscape types and (2) ecological functions of landscapes, (3)
characterizing landscape units accordingly, and (4) determining conservation priorities vs.
land use demands (Yılmaz, 2011). Based on this approach, we identified landscape types in
three steps (Figure 2).
Figure 2. Research Methodology
First of all, the related literature was reviewed and inventory of the research site was obtained
from the Municipal Hall of Aydin Province. Following this, the related policy examined
about open/green system in context of spatial planning. In the second step, three thematic
maps were used to apply LCA method. Within this context, each landscape type was
identified with a certain code consists of three thematic data layers as bio-climatic belt, plant
formation and land use (Figure 3).
Figure 3. The Configuration of Landscape Codes and the Case of Salt Marsh / Sand Dune
Landscape
Mosaic of ASTER GDEM and the classification of Bioclimatic belts (Kürschner, 1984;
Yılmaz, 1996) are the datasets of bioclimatic belts map. According to this map, five
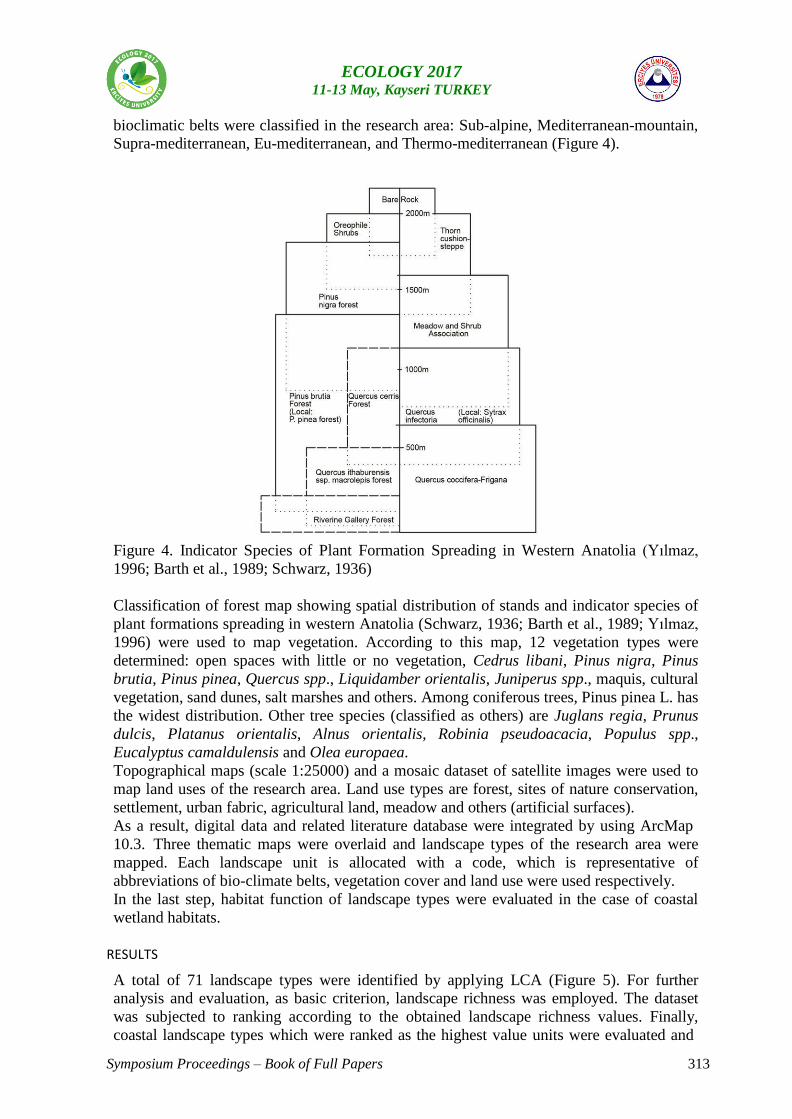
Symposium Proceedings – Book of Full Papers 313
ECOLOGY 2017 11-13 May, Kayseri TURKEY
bioclimatic belts were classified in the research area: Sub-alpine, Mediterranean-mountain,
Supra-mediterranean, Eu-mediterranean, and Thermo-mediterranean (Figure 4).
Figure 4. Indicator Species of Plant Formation Spreading in Western Anatolia (Yılmaz,
1996; Barth et al., 1989; Schwarz, 1936)
Classification of forest map showing spatial distribution of stands and indicator species of
plant formations spreading in western Anatolia (Schwarz, 1936; Barth et al., 1989; Yılmaz,
1996) were used to map vegetation. According to this map, 12 vegetation types were
determined: open spaces with little or no vegetation, Cedrus libani, Pinus nigra, Pinus
brutia, Pinus pinea, Quercus spp., Liquidamber orientalis, Juniperus spp., maquis, cultural
vegetation, sand dunes, salt marshes and others. Among coniferous trees, Pinus pinea L. has
the widest distribution. Other tree species (classified as others) are Juglans regia, Prunus
dulcis, Platanus orientalis, Alnus orientalis, Robinia pseudoacacia, Populus spp.,
Eucalyptus camaldulensis and Olea europaea.
Topographical maps (scale 1:25000) and a mosaic dataset of satellite images were used to
map land uses of the research area. Land use types are forest, sites of nature conservation,
settlement, urban fabric, agricultural land, meadow and others (artificial surfaces).
As a result, digital data and related literature database were integrated by using ArcMap
10.3. Three thematic maps were overlaid and landscape types of the research area were
mapped. Each landscape unit is allocated with a code, which is representative of
abbreviations of bio-climate belts, vegetation cover and land use were used respectively.
In the last step, habitat function of landscape types were evaluated in the case of coastal
wetland habitats.
RESULTS
A total of 71 landscape types were identified by applying LCA (Figure 5). For further
analysis and evaluation, as basic criterion, landscape richness was employed. The dataset
was subjected to ranking according to the obtained landscape richness values. Finally,
coastal landscape types which were ranked as the highest value units were evaluated and
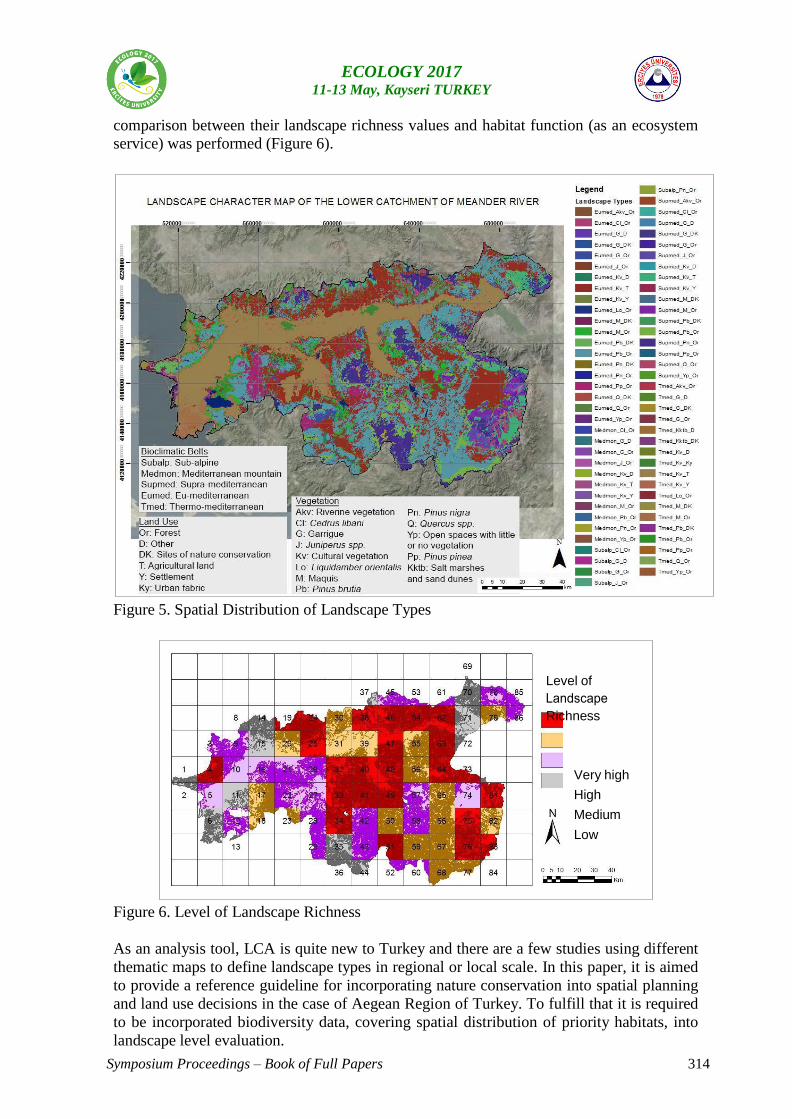
Symposium Proceedings – Book of Full Papers 314
ECOLOGY 2017 11-13 May, Kayseri TURKEY
comparison between their landscape richness values and habitat function (as an ecosystem
service) was performed (Figure 6).
Figure 5. Spatial Distribution of Landscape Types
Figure 6. Level of Landscape Richness
As an analysis tool, LCA is quite new to Turkey and there are a few studies using different
thematic maps to define landscape types in regional or local scale. In this paper, it is aimed
to provide a reference guideline for incorporating nature conservation into spatial planning
and land use decisions in the case of Aegean Region of Turkey. To fulfill that it is required
to be incorporated biodiversity data, covering spatial distribution of priority habitats, into
landscape level evaluation.
Level of
Richness
Very high
High
Medium
Low
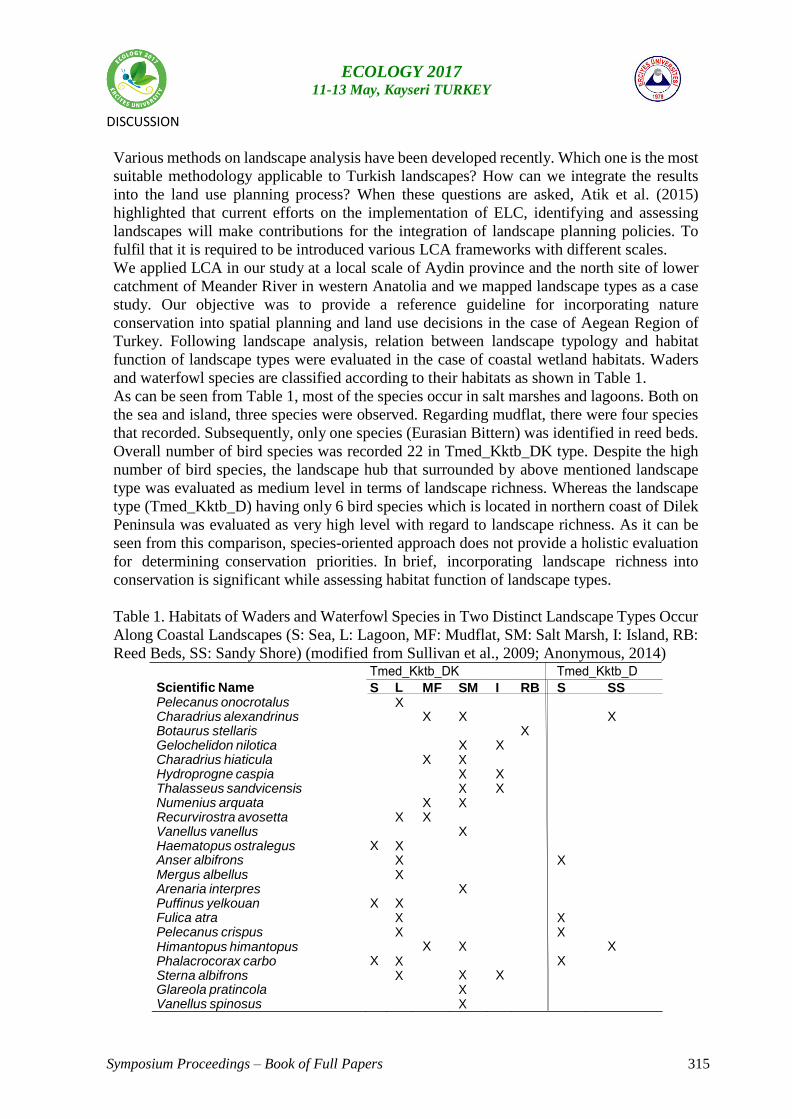
Symposium Proceedings – Book of Full Papers 315
ECOLOGY 2017 11-13 May, Kayseri TURKEY
DISCUSSION
Various methods on landscape analysis have been developed recently. Which one is the most
suitable methodology applicable to Turkish landscapes? How can we integrate the results
into the land use planning process? When these questions are asked, Atik et al. (2015)
highlighted that current efforts on the implementation of ELC, identifying and assessing
landscapes will make contributions for the integration of landscape planning policies. To
fulfil that it is required to be introduced various LCA frameworks with different scales.
We applied LCA in our study at a local scale of Aydin province and the north site of lower
catchment of Meander River in western Anatolia and we mapped landscape types as a case
study. Our objective was to provide a reference guideline for incorporating nature
conservation into spatial planning and land use decisions in the case of Aegean Region of
Turkey. Following landscape analysis, relation between landscape typology and habitat
function of landscape types were evaluated in the case of coastal wetland habitats. Waders
and waterfowl species are classified according to their habitats as shown in Table 1.
As can be seen from Table 1, most of the species occur in salt marshes and lagoons. Both on
the sea and island, three species were observed. Regarding mudflat, there were four species
that recorded. Subsequently, only one species (Eurasian Bittern) was identified in reed beds.
Overall number of bird species was recorded 22 in Tmed_Kktb_DK type. Despite the high
number of bird species, the landscape hub that surrounded by above mentioned landscape
type was evaluated as medium level in terms of landscape richness. Whereas the landscape
type (Tmed_Kktb_D) having only 6 bird species which is located in northern coast of Dilek
Peninsula was evaluated as very high level with regard to landscape richness. As it can be
seen from this comparison, species-oriented approach does not provide a holistic evaluation
for determining conservation priorities. In brief, incorporating landscape richness into
conservation is significant while assessing habitat function of landscape types.
Table 1. Habitats of Waders and Waterfowl Species in Two Distinct Landscape Types Occur
Along Coastal Landscapes (S: Sea, L: Lagoon, MF: Mudflat, SM: Salt Marsh, I: Island, RB:
Reed Beds, SS: Sandy Shore) (modified from Sullivan et al., 2009; Anonymous, 2014)
Scientific Name Pelecanus onocrotalus
S L X
MF SM I RB S SS
Charadrius alexandrinus Botaurus stellaris Gelochelidon nilotica
X X
X
X
X X
Charadrius hiaticula Hydroprogne caspia
X X X
X
Thalasseus sandvicensis Numenius arquata
X X X
X
Recurvirostra avosetta Vanellus vanellus Haematopus ostralegus
X
X
X
X
X
Anser albifrons X X Mergus albellus Arenaria interpres Puffinus yelkouan
X
X
X
X
Fulica atra Pelecanus crispus Himantopus himantopus Phalacrocorax carbo Sterna albifrons
X
X X
X X
X
X
X
X
X X
X
X
Glareola pratincola Vanellus spinosus
X X
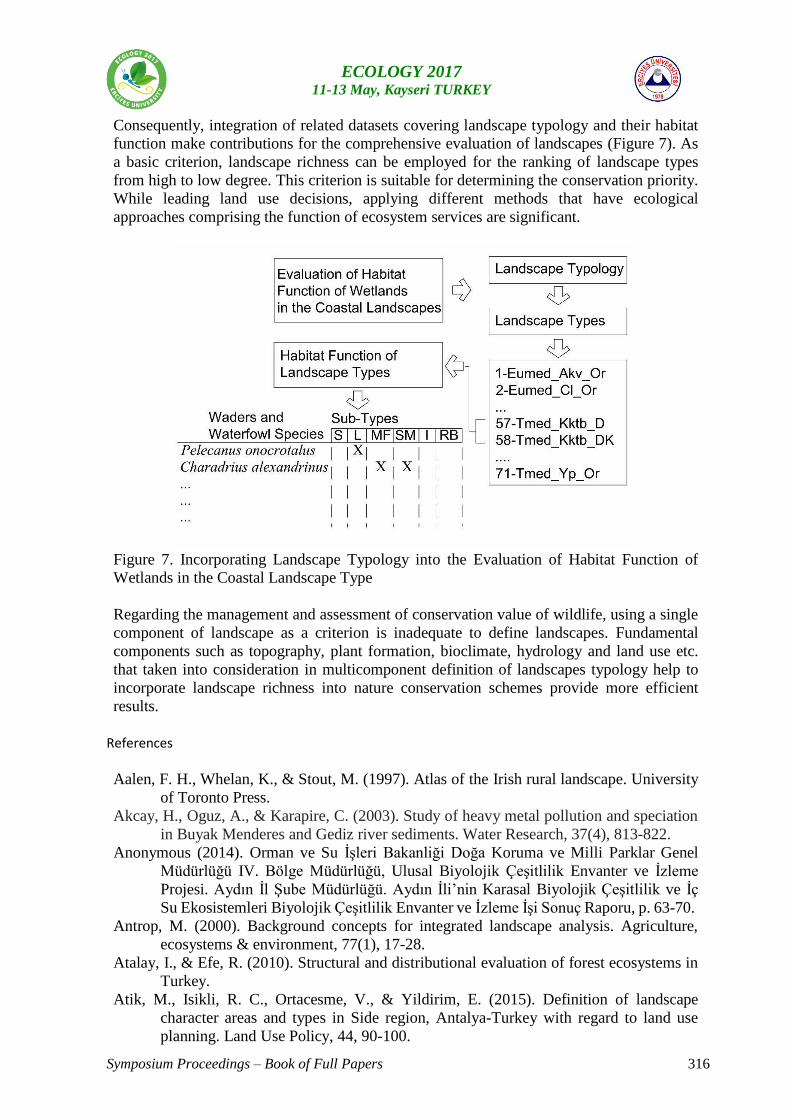
Symposium Proceedings – Book of Full Papers 316
ECOLOGY 2017 11-13 May, Kayseri TURKEY
Consequently, integration of related datasets covering landscape typology and their habitat
function make contributions for the comprehensive evaluation of landscapes (Figure 7). As
a basic criterion, landscape richness can be employed for the ranking of landscape types
from high to low degree. This criterion is suitable for determining the conservation priority.
While leading land use decisions, applying different methods that have ecological
approaches comprising the function of ecosystem services are significant.
Figure 7. Incorporating Landscape Typology into the Evaluation of Habitat Function of
Wetlands in the Coastal Landscape Type
Regarding the management and assessment of conservation value of wildlife, using a single
component of landscape as a criterion is inadequate to define landscapes. Fundamental
components such as topography, plant formation, bioclimate, hydrology and land use etc.
that taken into consideration in multicomponent definition of landscapes typology help to
incorporate landscape richness into nature conservation schemes provide more efficient
results.
References
Aalen, F. H., Whelan, K., & Stout, M. (1997). Atlas of the Irish rural landscape. University
of Toronto Press.
Akcay, H., Oguz, A., & Karapire, C. (2003). Study of heavy metal pollution and speciation
in Buyak Menderes and Gediz river sediments. Water Research, 37(4), 813-822.
Anonymous (2014). Orman ve Su İşleri Bakanliği Doğa Koruma ve Milli Parklar Genel
Müdürlüğü IV. Bölge Müdürlüğü, Ulusal Biyolojik Çeşitlilik Envanter ve İzleme
Projesi. Aydın İl Şube Müdürlüğü. Aydın İli’nin Karasal Biyolojik Çeşitlilik ve İç
Su Ekosistemleri Biyolojik Çeşitlilik Envanter ve İzleme İşi Sonuç Raporu, p. 63-70.
Antrop, M. (2000). Background concepts for integrated landscape analysis. Agriculture,
ecosystems & environment, 77(1), 17-28.
Atalay, I., & Efe, R. (2010). Structural and distributional evaluation of forest ecosystems in
Turkey.
Atik, M., Isikli, R. C., Ortacesme, V., & Yildirim, E. (2015). Definition of landscape
character areas and types in Side region, Antalya-Turkey with regard to land use
planning. Land Use Policy, 44, 90-100.
Symposium Proceedings – Book of Full Papers 317
ECOLOGY 2017 11-13 May, Kayseri TURKEY
Barth, H. G., & Duthweiler, H. (Eds.). (1988). Umweltqualität und Naturraumpotentiale im
Ballungsraum Izmir: Luftimmissionen, Veränderung und Beeinträchtigung von
Landschaft und Vegetation, Siedlungsstruktur und Siedlungsentwicklung.
Bishop, K., & Phillips, A. (2012). Countryside planning: new approaches to management
and conservation. Routledge.
Bohn, U., Gollub, G. & Hettwer, C. (2000) Karte der natürlichen vegetation Europas:
Maßstab 1 : 2.500.000. Bundesamt für Naturschutz, Bon-Bad Godesberg.
Brabyn, L. (2009). Classifying landscape character. Landscape research, 34(3), 299-321.
Council of Europe, (2009). Landscape included in the Flemish regional planning process.
Seventh meeting of the Workshops of the Council of Europe for the implementation
of the European Landscape Convention proceedings. Workshop 3: Council of
Europe Publishing, Piestany, Slovak Republic, 24-25 April 2008.
Forman, R. T. T., & Gordron, M. (1986). Landscape ecology. John Wiley. New York 67-
104). University of Toronto Press.
Hák, T., Moldan, B., & Dahl, A. L. (Eds.). (2012). Sustainability indicators: a scientific
assessment (Vol. 67). Island Press.
Hazeu, G. W., Metzger, M. J., Mücher, C. A., Perez-Soba, M., Renetzeder, C. H., &
Andersen, E. (2011). European environmental stratifications and typologies: an
overview. Agriculture, ecosystems & environment, 142(1), 29-39.
Hazeu, G. W., Metzger, M. J., Mücher, C. A., Perez-Soba, M., Renetzeder, C. H., &
Andersen, E. (2011). European environmental stratifications and typologies: an
overview. Agriculture, ecosystems & environment, 142(1), 29-39.
Hofkens E, Roossens I (eds), 2001. Nieuwe impulsen voor de landschapszorg. De
landschapsatlas, baken voor een verruimd beleid. Ministerie van de Vlaamse
Gemeenschap, Afdeling Monumenten en Landschappen, Brussel.
Hrnčiarová, T., Mackovčin, p., Zvara, I. et al. (2009): Atlas krajiny České republiky.
Ministerstvo životního prostředí ČR a Výzkumný ústav Silva Taroucy, Praha-
Průhonice
Koc, C. (2010). A study on the pollution and water quality modeling of the River Buyuk
Menderes, Turkey. CLEAN–Soil, Air, Water, 38(12), 1169-1176.
Meeus, J. H. A. (1995). Pan-European landscapes. Landscape and Urban planning, 31(1-3),
57-79.
Miklós, L. (2002). Landscape atlas of the Slovak Republic. Ministry of Environment of the
Slovak Republic, Slovak Environmental Agency Banska Bystrica; Bratislava,
Banska Bystrica (Slovakia); ISBN 80-88833-27-2.
Ozonat, Ç. (2013). İntegrated River Basin Management: A Case of Büyük Menderes River
Basin (Doctoral dissertation, Middle East Technical University).
Riiters, K. H., & Wickham, J. D. (1995). A landscape atlas of the Chesapeake Bay
Watershed. Environmental Research center, Tennessee Valley Authority, Norris,
Tennessee, USA.
Roekaerts, M. (2002). The biogeographical regions map of Europe. Basic principles of its
creation and overview of its development. European Environment Agency,
Copenhagen, 17.
Sahin, S. (2003). European Landscape Convention. TMMOB Landscape Architecture
Champer publication. Landsc. Archit. J. Ankara-Turkey
Schwarz, O. (1936). Die Vegetationsverhältnisse Westanatoliens. Bot Jahrb Syst 67: 297-
436
Sullivan, B.L., C.L. Wood, M.J. Iliff, R.E. Bonney, D. Fink, & S. Kelling. (2009). eBird: a
citizen-based bird observation network in the biological sciences. Biological
Conservation 142: 2282-2292.
Symposium Proceedings – Book of Full Papers 318
ECOLOGY 2017 11-13 May, Kayseri TURKEY
Swanwick, C. (2002). Landscape Character Assessment. Guidance for England andScotland.
Countryside Agency, Cheltenham/Scottish National Heritage, Edinburgh.
Swanwick, C. (2004). The assessment of countryside and landscape character in England:
an overview. In: Bishop, K., Phillips, A. (Eds.), Countryside Planning: New
Approaches to Management and Conservation. Earthscan, London, pp.109–124.
Turner, M. G. (2001). Landscape ecology in theory and practice: pattern and process.
Springer Science & Business Media.
Uzun, O., Dilek, F., Erduran, F., & Accedil, S. (2011). National and regional landscape
classification and mapping of Turkey: Konya closed basin, Suğla Lake and its
surrounding area. International Journal of Physical Sciences, 6(3), 550-565.
Van Eetvelde, V., & Antrop, M. (2009). A stepwise multi-scaled landscape typology and
characterisation for trans-regional integration, applied on the federal state of
Belgium. Landscape and urban planning, 91(3), 160-170.
Van Eetvelde, V., & Antrop, M. (2012). Landscape policy and participative processes:
examples at the Flemish level. In 1st Careggi seminar: Participation in landscape
planning: the cases of the Tuscany Region and the Flemish region: theory and
governance aspects compared (No. 1, pp. 14-21). European Network for the
Implementation of the European Landscape Convention (UNISCAPE).
Van Eetvelde, V., Sevenant M., & Antrop M. (2005). Trans-regional Landscape
Characterization: the example of Belgium. Proceeding IALE Europe Faro 2005.
Wascher, D. (Ed.), (2005). European Landscape Character Areas. Typologies, Cartography
and Indicators for the Assessment of Sustainable Landscapes. Final Report as
Deliverable form the EU’s Accompanying Measure Project European Landscape
Character Assessment Initiative (ELCAI), Funded under the 5th Framework Program
on Energy, Environment and Sustainable Development
Yilmaz, K.T. (1996). Akdeniz Doğal Bitki Örtüsü. Ç.Ü. Ziraat Fakültesi Yayınları Ders
Kitabı, Adana, Yayın No:141, 179s.
Yilmaz, K.T. (2011). Incorporating vegetation analysis into ecological characterization of
landscapes: the Turkish case. Fitosociologia 48 (2), 83–92.
Symposium Proceedings – Book of Full Papers 319
ECOLOGY 2017 11-13 May, Kayseri TURKEY
Preliminary study on rainwater composition of Suşehri in Turkey
Seher Dirican1,*
1 Department of Fisheries, Suşehri Timur Karabal Vocational Training School, Cumhuriyet
University, Sivas, Turkey
*Correspondence: [email protected]
Abstract: This preliminary study of the rainwater composition of Suşehri in Turkey was
carried out from June 2013 to June 2014. The rainwater samples were collected from three
different stations in Suşehri, a rural area situated in Central Anatolian region of Turkey. The
ranges of values of the investigated parameters were; pH (6.50-7.50), ammonium (0.16-2.30
mg/L), nitrite (0.00-0.15 mg/L), nitrate (0.00-2.00 mg/L), chloride (3.00-10.00 mg/L),
carbonate hardness (0.40-1.80 0dH), total hardness (0.60-7.20
0dH), acid binding capability
(0.20-0.60 mmol/L), calcium (4.28-51.41 mg/L) and magnesium (2.57-30.82 mg/L) for the
first time in rainwater samples in Suşehri. A perfect correlation between calcium and
magnesium, indicates that wind carried dust and soil play a significant role. Mean of pH
measurement is 7.06 during the study period. The pH value measured is higher than
unpolluted rainwater pH, 5.6. The results had shown that the rainwaters were not acidic in
Suşehri. To protect rainwater quality in Suşehri, it is important that rainwater monitoring
studies are continued.
Key words: Rainwater, composition, quality, Suşehri, Turkey
1. Introduction
Water is a renewable natural resource, fundamental for the survival of living beings. On the water
cycle, rain is the most effective scavenging factor for cleaning the atmosphere. During the
condensation and precipitation or washout, the gases and particulate materials present in the
atmosphere are dissolved in raindrops and deposited. Thus, many substances from air pollution are
present in rainwater, changing its chemical composition and the pH value. Rainwater chemical
constituents come from marine and biogenic aerosols, soil particles and volcanic emissions.
Anthropogenic activities, like the use of fossil fuel, industrial emissions, waste incineration,
agriculture and mining also contributes to the rainwater composition. The rainwater composition can
reflect the atmospheric quality of a specific region and depends on the emission site, on the sea level
elevation and on the meteorological conditions (Mimura et al., 2016). Rainwater composition is
important in evaluating the role of transport of soluble material and the contribution of different
Symposium Proceedings – Book of Full Papers 320
ECOLOGY 2017 11-13 May, Kayseri TURKEY
sources of atmospheric pollutants. Composition of rainwater varies from site to site and it is difficult
to control as it is influenced by both natural and anthropogenic sources (Chughtai et al., 2014). The
goal of the study was to characterize the general composition of rainwater in Suşehri.
2. Materials and methods
2.1. Study area
Suşehri with a population of about 15 thousand, is located at 40º10' N–38º06' E in Central
Anatolian region of Turkey. Its average altitude is 1163 m above sea level. Suşehri is
classified as a rural area and its has especially contributions to the Turkey's economics in the
production of wheat and sugar beet. The area of Suşehri, which is a district of Sivas in terms
of administration and is about 985 square kilometers. In the district which has been named as
Suşehri because of the bounty of water in the region. Suşehri reflects the continental climate
features. The climate of Suşehri is a typical continental climate with relatively wet and cold
winters, and dry and warm summers. The annual average temperature is 10.2 0C with a
minimum average temperature in January as -1.4 0C and with a maximum average
temperature in August as 21.0 0C. The annual average rainfall is 417.4 mm with a minimum
average rainfall in August as 7.5 mm and with a maximum average rainfall in May as 60.1
mm. Suşehri's annual average humidity is 57.8% (Yücetepe, 2010). Natural gas in Suşehri is
main energy source for heating in buildings. The second energy source for heating is coal
burning in Suşehri.
2.2. Experimental practices
The rainwater samples were collected monthly from different 3 stations in Suşehri namely;
Öksülü (Station-I), Köroğlu (Station-II) and Yalnızbağlar (Station-III) between June 2013 and
June 2014. After a rain event, the sample bottle is removed from the polyethylene container
and brought to the laboratory. All rainwater samples were analyzed within 24 h after
sampling. The pH, ammonium, nitrite and nitrate were measured during sampling in situ by
colorimetric method using Aquamerck test kits 1.08027.0001, 1.08024.0001, 1.08025.0001
and 1.11170.0001 respectively. The chloride, carbonate hardness-acid binding capability and
total hardness were measured by titrimetric method using Aquamerck test kits 1.11106.0001,
1.08048.0001 and 1.08039.0001 respectively. Calcium and magnesium values were calculated
according to the formula of total hardness change (Höll, 1979; Dirican and Barlas, 2005).
Symposium Proceedings – Book of Full Papers 321
ECOLOGY 2017 11-13 May, Kayseri TURKEY
2.3. Data comparisons and statistical analyses
The data were analyzed to find out the variations in the rainwater composition of the samples
collected from 3 station, which reflects the background concentrations of various parameters
present in Suşehri. The minimum, maximum, range, skewness, kurtosis, mean, standard deviation
and correlation were calculated using SPSS for windows version 17.5 statistical software was used for
all data analysis.
3. Results
A total of 33 rainwater samples were collected and analyzed from June 2013 and June 2014.
No rain events were observed on July 2013 and August 2013. The minimum, maximum,
range, skewness, kurtosis, mean and standard deviation values generated from the analysis of
the rainwater samples are presented in Table 1.
Table 1. Descriptive statistics for rainwater composition of Suşehri
Parameters Units N Min. Max. Range Skewness Kurtosis Mean SD
pH - 33 6.50 7.50 1.00 -0.29 -0.31 7.06 0.31
Ammonium mg/L 33 0.16 2.30 2.14 1.18 1.58 0.74 0.51
Nitrite mg/L 33 0.00 0.15 0.15 0.83 -0.45 0.06 0.05
Nitrate mg/L 33 0.00 2.00 2.00 -0.45 -1.83 1.39 1.10
Chloride mg/L 33 3.00 10.00 7.00 0.05 -0.40 7.03 1.83
Carbonate Hardness 0dH 33 0.40 1.80 1.40 0.53 -0.73 0.99 0.39
Acid Binding Capability mmol/L 33 0.20 0.60 0.40 0.38 -1.23 0.38 0.15
Total Hardness 0dH 33 0.60 7.20 6.60 1.20 0.69 2.60 1.83
Calcium mg/L 33 4.28 51.41 47.13 1.20 0.69 18.56 13.09
Magnesium mg/L 33 2.57 30.82 28.25 1.20 0.69 11.13 7.85
N: number of observations, Min: minimum, Max: maximum, SD: standard deviation in the table.
In the study, Pearson correlation analysis was used to determine the relationship
between the variables. The numerical values of correlation coefficient, r for the ten rain water
Symposium Proceedings – Book of Full Papers 322
ECOLOGY 2017 11-13 May, Kayseri TURKEY
parameters are presented in Table 2. A perfect positive correlations coefficient is appeared
between magnesium and calcium (r = 1.000**
), magnesium and total hardness (r = 1.000**
),
calcium and total hardness (r = 1.000**
) in Suşehri. A strong positive correlation coefficient is
observed between magnesium and nitrite (r = 0.736**
), calcium and nitrite (r = 0.736**
), total
hardness and nitrite (r = 0.736**
), acid binding capability and carbonate hardness (r =
0.725**
).
Table 2. Pearson correlation coefficients among the rainwater parameters in Suşehri
Parameters
pH
Am
mo
niu
m
Nit
rite
Nit
rate
Ch
lori
de
Car
bo
nat
e H
ard
nes
s
Aci
d B
ind
ing
Cap
abili
ty
Tota
l Har
dn
ess
Cal
ciu
m
Mag
nes
ium
pH 1
Ammonium -0.272 1
Nitrite -0.204 0.606**
1
Nitrate -0.096 0.578**
0.632**
1
Chloride -0.140 0.510**
0.451**
0.103 1
Carbonate Hardness 0.042 0.288 0.395* 0.405
* -0.026 1
Acid Binding Capability 0.100 0.045 0.104 0.323 -0.159 0.725**
1
Total Hardness -0.251 0.497**
0.736**
0.618**
0.559**
0.146 -0.074 1
Calcium -0.251 0.497**
0.736**
0.617**
0.559**
0.146 -0.074 1.000**
1
Magnesium -0.251 0.497**
0.736**
0.617**
0.559**
0.145 -0.074 1.000**
1.000**
1
N= 33, *, Significant at the 0.05 level (P < 0.05); **, Significant at the 0.01 level (P < 0.01).
A moderate positive correlation coefficient is observed between magnesium and
nitrate (r = 0.617**
), calcium and nitrate (r = 0.617**
), total hardness and nitrate (r = 0.618**
),
nitrate and nitrite (r = 0.632**
), nitrite and ammonium (r = 0.606**
), nitrate and ammonium (r
= 0.578**
), magnesium and chloride (r = 0.559**
), calcium and chloride (r = 0.559**
), total
Symposium Proceedings – Book of Full Papers 323
ECOLOGY 2017 11-13 May, Kayseri TURKEY
hardness and chloride (r = 0.559**
), chloride and ammonium (r = 0.510**
). A weak positive
correlation is found between magnesium and ammonium (r = 0.497**
), calcium and
ammonium (r = 0.497**
), total hardness and ammonium (r = 0.497**
), chloride and nitrite (r =
0.451**
), carbonate hardness and nitrate (r = 0.405*), carbonate hardness and nitrite (r =
0.395*). The correlation study showed significant linear relationship among different pairs of
rainwater parameters in Suşehri.
4. Discussion
The pH of rainwater in Suşehri varies between 6.50 and 7.50 with a mean 7.06, indicating alkaline
nature as compared to the Charlson and Rodhe (1982) referred level of 5.60. The pH values indicated
that in all station the rainfall is alkaline or neutral in Suşehri. In 33 rainwater samples 100% of the
rain event in the alkaline range, as compare to 5.60 which point to the neutral pH value of unpolluted
rain water at equilibrium atmospheric carbondioxide in Suşehri. The pH of rainwater at all the study
stations showed a narrow range of variation (6.50-7.50) in this study period. The results had shown
that the rainwaters were not acidic during the study period in Suşehri. The mean pH for rainwater
from different localities in Turkey was reported as 6.1 in Ankara (Tuncel and Üngör, 1996); 6.78 in
Sivas (Beyazıt and Peker, 2000); 6.9 in Rize (Balcı et al., 2001); 7.1 in İskenderun (Örnektekin and
Çakmaklı, 2003); 6.79 in Mersin (Türker, 2005); 6.90 in Muğla (Demirak et al., 2006) and 6.81 in
Trabzon (Dalman and Arslan, 2012). The mean pH for rainwater obtained in this study were generally
in agreement with obtained by Tuncel and Üngör (1996), Beyazıt and Peker (2000), Balcı et al. (2001),
Örnektekin and Çakmaklı (2003), Türker (2005), Demirak et al. (2006), Dalman and Arslan (2012).
Ammonium was found in all samples. Ammonium in rainwater samples has a mean of 0.74
mg/L and shows ranges between 0.16 and 2.30 mg/L. The maximum ammonium concentration was
2.30 mg/L from Station-I. Nitrite was found in 32 of the 33 samples. Nitrite has a mean of 0.06 mg/L
and shows ranges from 0.00 to 0.15 mg/L (Table 1). The mean nitrite for rainwater from different
localities in Turkey was reported as 0.047 mg/L in Rize (Balcı et al., 2001) and 0.05 mg/L in Trabzon
(Dalman and Arslan, 2012). The mean nitrite for rainwater obtained in this study were generally in
agreement with obtained by Dalman and Arslan (2012) in Trabzon and Balcı et al., (2001) in Rize.
Nitrate was found in 21 of the 33 samples. Nitrate has a mean of 1.39 mg/L and shows ranges
from 0.00 to 2.00 mg/L (Table 1). The mean nitrate for rainwater from different localities in Turkey
was reported as 0.334 mg/L in Rize (Balcı et al., 2001) and 0.30 mg/L in Trabzon (Dalman and Arslan,
2012). The mean nitrate for rainwater obtained in this study were higher than those obtained by
Dalman and Arslan (2012) in Trabzon and Balcı et al., (2001) in Rize.
Symposium Proceedings – Book of Full Papers 324
ECOLOGY 2017 11-13 May, Kayseri TURKEY
Chloride in rainwater samples has a mean of 7.03 mg/L and shows ranges between 3.00 and
10.00 mg/L. Carbonate hardness has a mean of 0.99 0dH and its values range between 0.40 and 1.80
0dH, while the total hardness has a mean of 2.60 0dH and range between 0.60 and 7.20 0dH. Acid
binding capability has a mean of 0.38 mmol/L and shows ranges from 0.20 to 0.60 mmol/L. Calcium
has a mean of 18.56 mg/l and its values range between 4.28 and 51.41 mg/L, while the magnesium
has a mean of 11.13 mg/L and range between 2.57 and 30.82 mg/L (Table 1). The mean calcium for
rainwater from different localities in Turkey was reported as 1.32 mg/L in Rize (Balcı et al., 2001) and
0.61 mg/L in Trabzon (Dalman and Arslan, 2012). Similarly, the mean magnesium was reported as
0.58 mg/L in Rize (Balcı et al., 2001) and 0.60 mg/L in Trabzon (Dalman and Arslan, 2012). The mean
calcium and magnesium for rainwater obtained in this study were higher than those obtained by
Dalman and Arslan (2012) in Trabzon and Balcı et al., (2001) in Rize.
The highest concentrations of nitrite, nitrate, chloride, total hardness, calcium and
magnesium in rainwater were observed in December, Jaunuary, February and March corresponding
with the winter season of Suşehri in Turkey. The effect of the heating demand on the composition of
the rainwater was observed clearly in Suşehri. During the heating season (December to March),
nitrite, nitrate, chloride, total hardness, calcium and magnesium concentrations in the rainwater
were high; ammonium fluctuating between 0.8 and 2.3 mg/L. On the other hand, they dropped to
low levels during the April to November period when the heating demand decreases or ceases in
Suşehri. The rainwater parameters are largely contributed by the anthropogenic sources in Suşehri.
Calcium and magnesium may have been correlated because they occur in similar salts in soil,
water, etc. (Polkowska et al., 2005). Occurrence of perfect correlation between calcium and
magnesium indicates about the total hardness of the Suşehri rainwater. In the study, it is evident that
distribution of calcium, magnesium and total hardness were significantly correlated (r > 0.9). Calcium
and magnesium, which are essential components of soil, have good correlation with each other
implying a common origin in Suşehri rainwater.
Significant positive correlation coefficient is observed between nitrate and ammonium (r =
0.578**) indicating that a correlation between nitrate and ammonium is attributed mainly to livestock
and fertilizer use in the study.
Chloride also shows moderate correlation with calcium (r = 0.559**) and magnesium (r =
0.559**), which suggests that some portion of chloride maybe due to wind blown soil dust and
unpaved roads. Calcium, magnesium and total hardness have good correlation coefficient among
them implying that they might have originated from the same source, viz. the soil. On the other hand
Symposium Proceedings – Book of Full Papers 325
ECOLOGY 2017 11-13 May, Kayseri TURKEY
nitrate was significantly correlated with calcium (r = 0.617**), magnesium (r = 0.617**) and total
hardness (r = 0.618**) indicating that some nitrate is also in non-acidic salt form. Soil is also the
source of nitrate to rainwater, which is present in the atmosphere in coarse mode during the study
period in the form of their corresponding salts, viz. Ca(NO3)2, Mg(NO3)2. This was corroborated by
significant correlation between calcium and nitrate (r = 0.617**), magnesium and nitrate (r = 0.617**)
in Suşehri. Calcium and magnesium which are essential components of soil, have very good
correlation with each other (r = 1.000**) implying a common origin. All these features indicated that
wind carried dust and soil play a significant role in rainwater composition in Suşehri.
This preliminary study is an initial analysis, based on a limited data set in Suşehri. The study
provides new information on the rainwater composition of Suşehri in Turkey. These initial data
provide an ideal baseline against which changes in rainwater quality as a result of local land use
changes, may be monitored. Also, the statistical assessment is carried out for the rainwater
parameters. The study showed significant linear relationship among different pairs of rainwater
parameters in Suşehri. Based on the data recorded, the measurements showed there is no serious
sign of acid rain in Suşehri. These results can serve as baseline data for Suşehri rainwater parameters
and for comparisons with future studies. The study will help rainwater quality conservation in
Suşehri. To protect rainwater quality in Suşehri, it is important that rainwater monitoring studies are
continued.
References
Balcı A, Demirak A (2001). Investigation of the some chemical properties of the rains in Rize. Ekoloji
10(40): 18-20.
Beyazıt N, Peker İ (2000). Chemical analysis of rain waters in the city center of Sivas. Ekoloji 10(37):
20-22.
Charlson RJ, Rodhe H (1982). Factors controlling the acidity of natural rainwater. Nature 295: 683-
685.
Chughtai M, Mustafa S, Mumtaz M (2014). Study of physicochemical parameters of rainwater: A case
study of Karachi, Pakistan. American Journal of Analytical Chemistry 5: 235-242.
Dalman Ö, Arslan AE (2012). Analysis of rain water in Trabzon. Ekoloji 21(85): 107-113.
Symposium Proceedings – Book of Full Papers 326
ECOLOGY 2017 11-13 May, Kayseri TURKEY
Demirak A, Balcı A, Karaoğlu H, Tosmur B (2006). Chemical characteristics of rain water at an urban
site of south western Turkey. Environmental Monitoring and Assessment 123: 271-283.
Dirican S, Barlas M (2005). Physico-chemical characteristics and fish of Dipsiz and Çine (Muğla-Aydın)
Stream. Ekoloji 14(54): 25-30.
Höll K (1979). Wasser (untersuchung, beurteilung, aufbereitung, chemie, bakteriologie, virologie,
biologie). 6. Auflage de Gruyter, Berlin, pp. 1-586.
Mimura AMS, Almeida JM, Vaz FAS, Oliveira MAL, Ferreira CCM, Silva JCJ (2016). Chemical
composition monitoring of tropical rainwater during an atypical dry year. Atmospheric
Research 169: 391-399.
Örnektekin S, Çakmaklı S (2003). Chemical composition and acidity of rain at the gulf of İskenderun
(North-East Mediterranean). Water, Air and Soil Pollution 3: 151-166.
Polkowska Z, Astel A, Walna B, Malek S, Medrzycka K, Gorecki T, Siepak J, Namiesnik J (2005).
Chemometric analysis of rainwater and throughfall at several sites in Poland. Atmospheric
Environment 39: 837-855.
Tuncel GS, Üngör S (1996). Rainwater chemistry in Ankara, Turkey, Atmospheric Environment 30:
2721-2727.
Türker P (2005). Basic ionic composition of rainwater-acid rains in Mersin. Master Thesis, Mersin
University, Institute of Science and Technology, pp. 1-74.
Yücetepe SI (2010). The agricultural life in Suşehri Plain. Master Thesis, İstanbul University, Institute
of Social Sciences, Geography Department, pp. 1-294.
Symposium Proceedings – Book of Full Papers 327
ECOLOGY 2017 11-13 May, Kayseri TURKEY
ECOLOGICAL STATE OF URBAN ECOSYSTEMS (ON THE EXAMPLE OF LAWNS IN
UZHHOROD, UKRAINE)
Kryvtsova M., Kolesnyk A., Bobrik N., Ignatko T., Nikolaychuk V., Koguch T.
Uzhhorod National University, Faculty of Biology,
Department of Genetics, Plant Physiology and Microbiology, 32, Voloshyn str.
E-mail: [email protected]
Summary
The article deals with issues of vehicular pollution, and substantiates the topicality of the
problem. A complex study of the state of the microbiota and contents of heavy metals in the
soils of urbanized ecosystems is conducted, and the air pollution is analyzed by chemical and
microbiological indicators. The soils of the lawns (grass-plots) located in the proximity of
heavy traffic are shown to be characterized by a heightened content of Pb and Cu as
compared with the maximum permissible concentrations (MPC) for these metals, and
increased concentrations of all heavy metals reviewed as compared with their background
figures. The soil microbiocoenosis is established to have undergone a reconstruction
characterized by an increased number of oligonitrophils and ammonifiers, and a decreased
content of Azotobacter and actinomycetes (ray fungi).
Introduction
The urbanization level that is growing constantly calls forth the topicality of scientific
papers aimed at complex studying of all aspects of the functioning of urbanized ecosystems as
a life environment for many micro- and macroorganisms. It is formations of stable urban
phytocoenoses able to successfully withstand the growing levels of anthropogenic
environmental pollution or even probably to help at least partially clean the urbo-systems off
most widely spread pollutants that constitute an applied aspect for such studies. Lawns (grass-
plots) are an indispensable part of a contemporary city. They are widely used for landscaping
and decorative purposes in public gardens and parks, and serve as the basis for the planting of
wood and scrub species and decorative herbaceous plants, and as independent elements of
urban landscaping and gardening. However, to choose correctly the plants that may and must
be grown on lawns, it is necessary to know the main principles of their adaptation
mechanisms providing for the accomplishment of the ontogenetic program in conditions of
continuous technogeneous pollution (Rees, 2003). Despite availability of a series works
Symposium Proceedings – Book of Full Papers 328
ECOLOGY 2017 11-13 May, Kayseri TURKEY
dedicated to the study of urboflorae, only few of them dealt with the peculiarities of
adaptation of plants at different stages of their life cycle to a whole number of urban
anthropogenic factors. Besides, there has been no clear idea of the participation of lawn
herbage in the biogeochemical turnover of heavy metals in urbanized phytocoenoses.
To gain an insight into it, it is important to consider the reaction and role of soil microbial
associations that on the one hand sensitively react to a technogeneous impact and on the other
hand take part in soil formation processes and determine to a considerable extent the plants’
soil growth conditions. All these will help successfully beautify our cities and provide us with
new data on the peculiarities of main mechanisms of ecological adaptation of plants and
microorganisms in urban conditions, on correction of their state, and on the peculiarities of
the biogeochemical turnover of substances in the biosphere.
The purpose of the paper is to study the vehicular impact upon the soil microbiota, to
identify the level of heavy metals and nitrates in the soil covered with lawn herbage, and to
evaluate the air pollution by microbiological indicators.
Material and methods
To determine the ecological state of the areas exposed to vehicular pollution, we studied the
contents of heavy metals and nitrates in the soil, quantitative and qualitative indicators of soil
microbiota.
Soil samples were taken from the following 4 spots in Uzhhorod:
№ 1 - as a control sample was taken Bozdosh Park − the city’s recreation zone located in a
relatively environmentally unpolluted area;
№ 2 - B. Khmelnytsky Street and № 3 - Koriatovych Square- the centre of the city;
№ 4 - Gagarin Street − characterized by heavy and at the same time low speed vehicular traffic;
The soil microbial coenosis analysis was conducted with the use of differentially diagnostic
nutrient media by the method of serial dilutions of soil suspension.
Soil sampling was performed from 4 – 5 spots of the plots chosen at the depth of 10 – 15 cm. The
ammonifying bacteria were calculated on meat-peptone agar (MPA); the actinomycetes and
mycobacteria – on starch-ammonium agar (SAA); the oligotrophs – on Ashby medium; the
myxobacteria – on potato agar; the micromycetes – on Czapek Dox medium;the oligotrophs – on
starvation agar; the Azotobacter – on Ashby medium using the method of soil lumps fouling; the
enteric bacteria – on Ploskirev medium (Zviagintsev, 1991). The results were evaluated by the
number of colony-forming units per 1 g of absolutely dry soil (CFU/g).
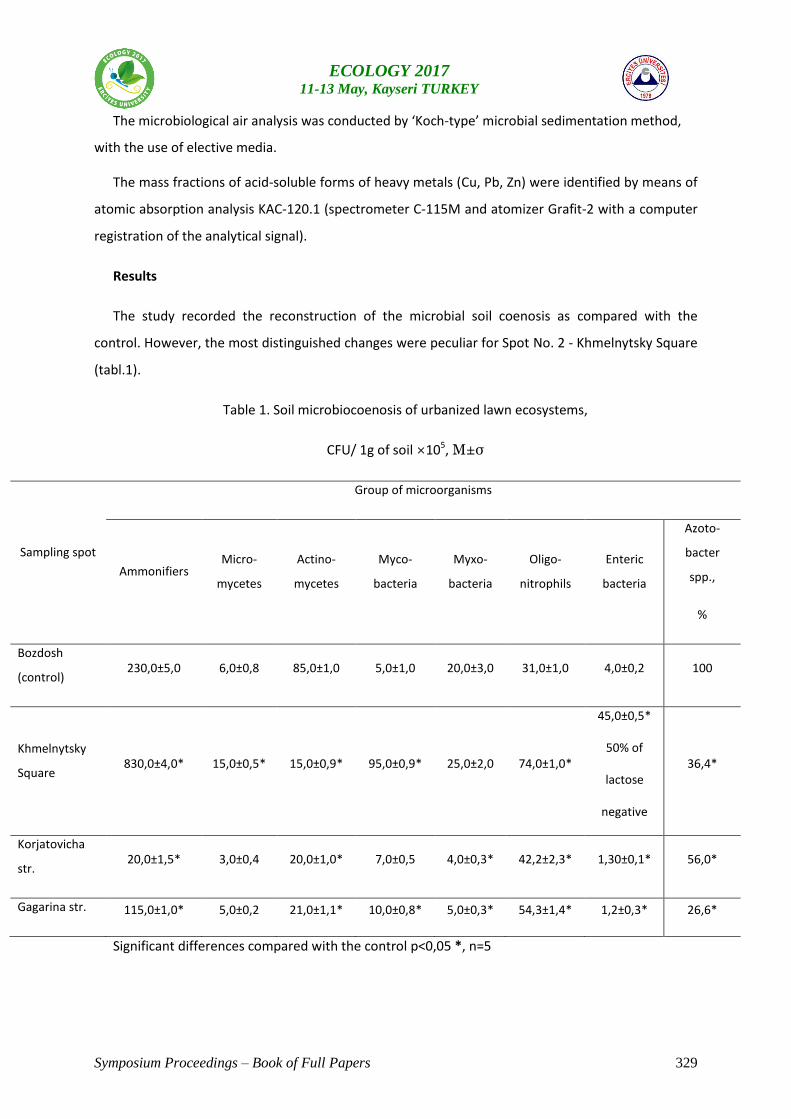
Symposium Proceedings – Book of Full Papers 329
ECOLOGY 2017 11-13 May, Kayseri TURKEY
The microbiological air analysis was conducted by ‘Koch-type’ microbial sedimentation method,
with the use of elective media.
The mass fractions of acid-soluble forms of heavy metals (Cu, Pb, Zn) were identified by means of
atomic absorption analysis KAC-120.1 (spectrometer C-115M and atomizer Grafit-2 with a computer
registration of the analytical signal).
Results
The study recorded the reconstruction of the microbial soil coenosis as compared with the
control. However, the most distinguished changes were peculiar for Spot No. 2 - Khmelnytsky Square
(tabl.1).
Table 1. Soil microbiocoenosis of urbanized lawn ecosystems,
CFU/ 1g of soil ×105, М±σ
Sampling spot
Group of microorganisms
Ammonifiers Micro-
mycetes
Actino-
mycetes
Myco-
bacteria
Myxo-
bacteria
Oligo-
nitrophils
Enteric
bacteria
Azoto-
bacter
spp.,
%
Bozdosh
(control) 230,0±5,0 6,0±0,8 85,0±1,0 5,0±1,0 20,0±3,0 31,0±1,0 4,0±0,2 100
Khmelnytsky
Square 830,0±4,0* 15,0±0,5* 15,0±0,9* 95,0±0,9* 25,0±2,0 74,0±1,0*
45,0±0,5*
50% of
lactose
negative
36,4*
Korjatovicha
str. 20,0±1,5* 3,0±0,4 20,0±1,0* 7,0±0,5 4,0±0,3* 42,2±2,3* 1,30±0,1* 56,0*
Gagarina str. 115,0±1,0* 5,0±0,2 21,0±1,1* 10,0±0,8* 5,0±0,3* 54,3±1,4* 1,2±0,3* 26,6*
Significant differences compared with the control p<0,05 *, n=5
Symposium Proceedings – Book of Full Papers 330
ECOLOGY 2017 11-13 May, Kayseri TURKEY
The analysis of the soil microbiota of the lawn soil of Khmelnytsky Square near the automobile
road characterized by heavy traffic and low speed of the vehicles showed that reconstruction of the
soil microbial coenosis had been registered on this spot.
In the soil samples taken from the grass-plots located close to heavy vehicular traffic, heightened
quantities of ammonifiers were registered. At the same time, it is worth noting that the number of
coliform bacteria also grew there. With regard to microscopic fungi, just an upward bias was
established. The quantity of myxobacteria practically did not differ from that in the control soil. A
significant growth (up to 2.5 times) of oligonitrophils, and a 5.7-time decrease of the level of
actinomycetes was registered at the background of the increased number of mycobacteria.
The analysis of the taxonomic structure of the soil microbiota showed that in the vehicles-
affected zone the reconstruction of the microbial coenosis was accompanied by an increase of
the quantity of bacterial flora and simultaneous decrease of the number of actinomycetes.
A considerable decrease of the percentage of free-living Azotobacter genus nitrogen-fixing
microorganisms in the vehicles-affected soils was ascertained.
In the soil samples taken from the grass-plots located close to heavy vehicular traffic, heightened
quantities of ammonifiers were registered (830×105 CFU/1 g of soil). At the same time, it is worth
noting that the number of coliform bacteria also grew there – up to 45×105 CFU/ 1 g of soil vs. 3×10⁵
CFU/1 g of soil in the control. With regard to microscopic fungi, just an upward bias was established
(15×105 CFU/1 g of soil). The quantity of myxobacteria practically did not differ from that in the
control soil (20 CFU/1 g of soil), amounting to 25 CFU/1 g of soil. A significant growth (up to 2.5
times) of oligonitrophils, and a 5.7-time decrease of the level of actinomycetes (15×105 CFU/1 g of
soil) was registered at the background of the increased number of mycobacteria (5×10⁵ CFU/1 g of
soil).
A considerable decrease of the percentage of free-living Azotobacter genus nitrogen-fixing
microorganisms in the vehicles-affected soils was ascertained.
The analysis of the taxonomic structure of the soil microbiota showed that in the vehicles-affected
zone the reconstruction of the microbial coenosis was accompanied by an increase of the quantity of
bacterial flora and simultaneous decrease of the number of actinomycetes.
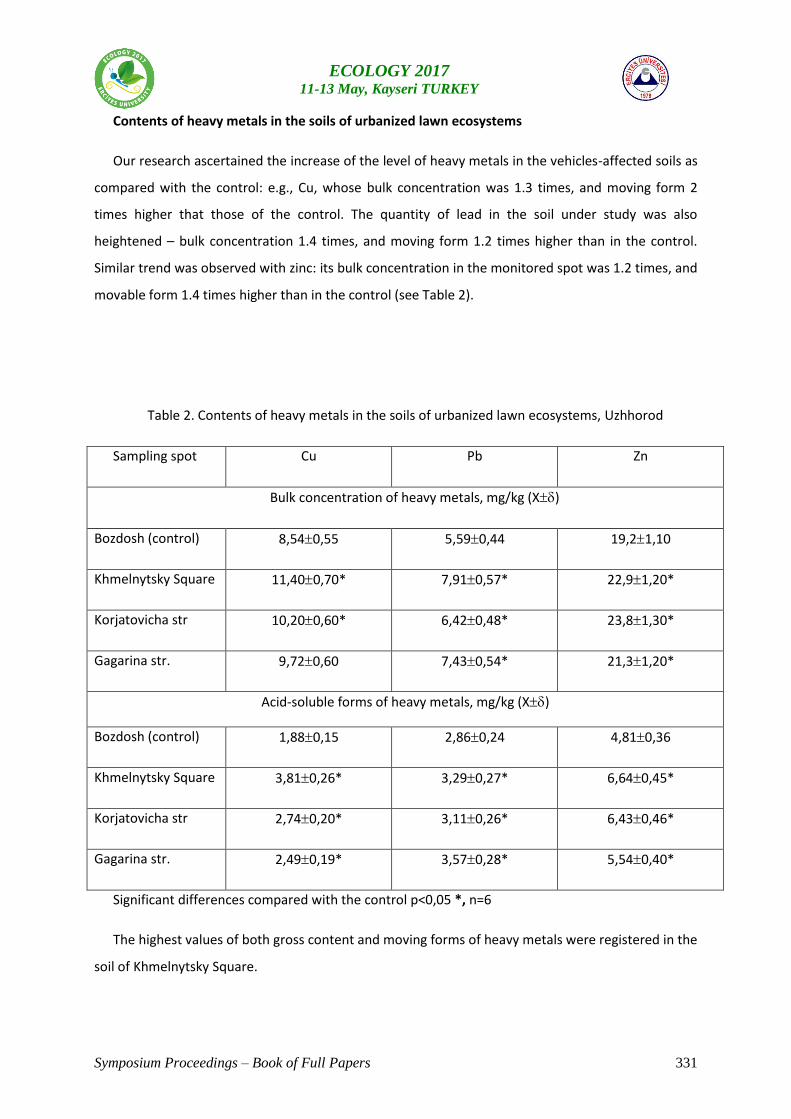
Symposium Proceedings – Book of Full Papers 331
ECOLOGY 2017 11-13 May, Kayseri TURKEY
Contents of heavy metals in the soils of urbanized lawn ecosystems
Our research ascertained the increase of the level of heavy metals in the vehicles-affected soils as
compared with the control: e.g., Cu, whose bulk concentration was 1.3 times, and moving form 2
times higher that those of the control. The quantity of lead in the soil under study was also
heightened – bulk concentration 1.4 times, and moving form 1.2 times higher than in the control.
Similar trend was observed with zinc: its bulk concentration in the monitored spot was 1.2 times, and
movable form 1.4 times higher than in the control (see Table 2).
Table 2. Contents of heavy metals in the soils of urbanized lawn ecosystems, Uzhhorod
Sampling spot Cu Pb Zn
Bulk concentration of heavy metals, mg/kg (Х)
Bozdosh (control) 8,540,55 5,590,44 19,21,10
Khmelnytsky Square 11,400,70* 7,910,57* 22,91,20*
Korjatovicha str 10,200,60* 6,420,48* 23,81,30*
Gagarina str. 9,720,60 7,430,54* 21,31,20*
Acid-soluble forms of heavy metals, mg/kg (Х)
Bozdosh (control) 1,880,15 2,860,24 4,810,36
Khmelnytsky Square 3,810,26* 3,290,27* 6,640,45*
Korjatovicha str 2,740,20* 3,110,26* 6,430,46*
Gagarina str. 2,490,19* 3,570,28* 5,540,40*
Significant differences compared with the control p<0,05 *, n=6
The highest values of both gross content and moving forms of heavy metals were registered in the
soil of Khmelnytsky Square.
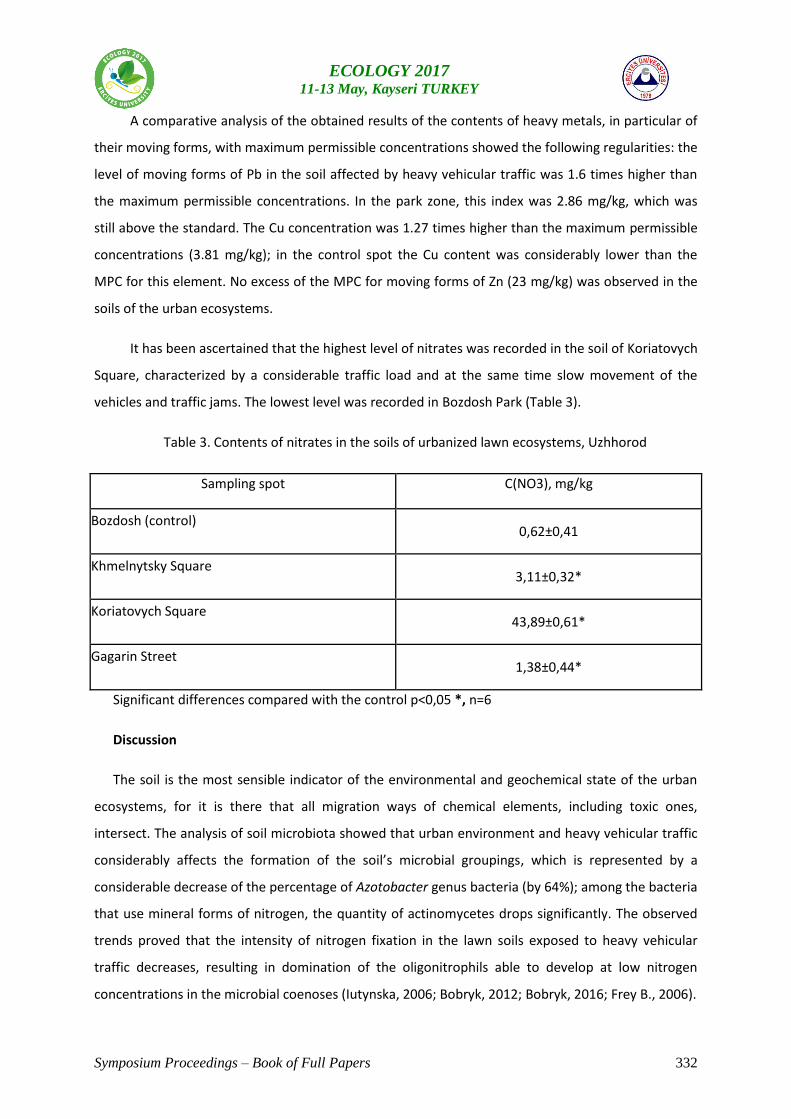
Symposium Proceedings – Book of Full Papers 332
ECOLOGY 2017 11-13 May, Kayseri TURKEY
A comparative analysis of the obtained results of the contents of heavy metals, in particular of
their moving forms, with maximum permissible concentrations showed the following regularities: the
level of moving forms of Pb in the soil affected by heavy vehicular traffic was 1.6 times higher than
the maximum permissible concentrations. In the park zone, this index was 2.86 mg/kg, which was
still above the standard. The Cu concentration was 1.27 times higher than the maximum permissible
concentrations (3.81 mg/kg); in the control spot the Cu content was considerably lower than the
MPC for this element. No excess of the MPC for moving forms of Zn (23 mg/kg) was observed in the
soils of the urban ecosystems.
It has been ascertained that the highest level of nitrates was recorded in the soil of Koriatovych
Square, characterized by a considerable traffic load and at the same time slow movement of the
vehicles and traffic jams. The lowest level was recorded in Bozdosh Park (Table 3).
Table 3. Contents of nitrates in the soils of urbanized lawn ecosystems, Uzhhorod
Sampling spot С(NO3), mg/kg
Bozdosh (control) 0,62±0,41
Khmelnytsky Square 3,11±0,32*
Koriatovych Square 43,89±0,61*
Gagarin Street 1,38±0,44*
Significant differences compared with the control p<0,05 *, n=6
Discussion
The soil is the most sensible indicator of the environmental and geochemical state of the urban
ecosystems, for it is there that all migration ways of chemical elements, including toxic ones,
intersect. The analysis of soil microbiota showed that urban environment and heavy vehicular traffic
considerably affects the formation of the soil’s microbial groupings, which is represented by a
considerable decrease of the percentage of Azotobacter genus bacteria (by 64%); among the bacteria
that use mineral forms of nitrogen, the quantity of actinomycetes drops significantly. The observed
trends proved that the intensity of nitrogen fixation in the lawn soils exposed to heavy vehicular
traffic decreases, resulting in domination of the oligonitrophils able to develop at low nitrogen
concentrations in the microbial coenoses (Iutynska, 2006; Bobryk, 2012; Bobryk, 2016; Frey B., 2006).
Symposium Proceedings – Book of Full Papers 333
ECOLOGY 2017 11-13 May, Kayseri TURKEY
Besides, the transformation of the soil’s microbial coenosis showed itself in the rise of the level of
enteric bacteris. In the soil microbiota exposed to heavy vehicular traffic, the share of the bacterial
microflora was observed to be rising at cost of ammonifiers, including enteric bacteria. Fall of the
level of actinomycetes was accompanied by the processes of deceleration of decomposition of
organic residues. Such trends were established as a consequence of studies performed by a number
of scholars. Say, the studies of technogeneous load of the soil microbiota showed that the quantity of
micromycetess in the control samples amounted to 35.6% of the total number of the microflora,
while that in the technogeneous soils could hardly reach 2.8–7.3% (Kostiuchenko, 2015). It was
established that when affected by industrial pollution, the relative content of systematic groups of
microorganisms was changing; in particular the relative quantity of fungi was decreasing (Stefurak,
1981). It lets us consider the soil microflora as a diagnostic index for soil pollution (Andreyuk 2001;
Rajapaksha R., 2004; Iutynska, 2006; Nwuche, 2008; Aoyama, 2013).
Our research showed that the soils of urban ecosystems register the heightened content of
moving forms of Pb and Cu. Excess of the background values of the heavy metals under review
proved presence of a significant technogeneous pollution.
As a result of the correlation analysis, an inverse proportional close connection between the
content of heavy metals in the lawn soils and relative quantity of Azotobacter (r = 0.99) was
established. The quantity of free-living nitrogen fixing bacteria was shown to be considerably
dropping as the content of heavy metals was growing. This regularity becomes apparent for bulk
forms of heavy metals as well as for their acid soluble-forms. Existence of a close inverse correlation
was revealed between the level of heavy metals and quantitative indices of actinomycetes (r = 0.99),
whereas a close direct correlation dependence was revealed between the level of heavy metals and
the quantity of mycobacteria.
Acknowledgements
Excesses of Cu and Pb MPCs in the soils of lawn phytocoenoses exposed to heavy
vehicular traffic were established. The concentration of all reviewed elements was higher in
the soil of the monitored spot as compared with that of the park zone. Reconstruction of the
microbial coenosis in the soils of the lawn ecosystems was shown to take place towards
significant decrease of the quantity of free-living nitrogen fixing bacteria, increase of
oligonitrophils, considerable growth of ammonifiers at cost of enteric bacteria, and decrease
of actinomycetes.
Key words: heavy metals, microbial coenosis, urbanized ecosystems.
Symposium Proceedings – Book of Full Papers 334
ECOLOGY 2017 11-13 May, Kayseri TURKEY
Reference
Andreyuk K., 2001. Funktsionuvannia mikrobnykh tsenoziv gruntu v umovakh antropohennoho
navantazhennia (Functioning of microbial soil coenoses in conditions of anthropogeneous load). In:
K. Andreyuk, H. Iutynska, A. Antypchuk. Kyiv: Oberehy, 2001. – 240 p. (in Ukrainian)
Aoyama M., Tanaka R., 2013. Effects of Heavy Metal Pollution of Apple Orchard Surface Soils
Associated with Past Use of Metal-Based Pesticides on Soil Microbial Biomass and Microbial
Communities Journal of Environmental Protection. Vol. 4. − Р. 27–36. doi:10.4236/jep.2013.44a005
Bobryk N., Kryvtsova M., Nikolaichuk V. Mikrobiotsenoz gruntu v umovakh vplyvu
zaliznychnoho transportu (Soil microbiocoenosis as affected by railway transport). In: Visnyk
Dnipropetrovskoho universytetu. Biolohiya. Ekolohiya (Bulletin of the Dnipropetrovsk
University. Biology. Environmental Studies). No. 20, 2012. Vol. 2. – P. 3–9. (in Ukrainian)
Bobryk N., Kryvtsova M., Nikolaychuk V., Voloshchuk I. Reaktsiya mikrobioty gruntu na diyu vazhkykh
metaliv u zoni vplyvu zaliznychnoho transportu (Response of soil microflora to impact of heavy
metals in zones of influence of railway transport). In: Visnyk Dnipropetrovskoho universytetu.
Biolohiya. Ekolohiya (Bulletin of the Dnipropetrovsk University. Biology. Environmental Studies). –
No. 24 (1). – 2016. – P. 151–156. doi:10.15421/011618.
Frey B., Stemmer M., Widmer F., Luster J. and Sperisen C., 2006 Microbial Activity and Community
Structure of a Soil after Heavy Metal Contamination in a Model Forest Ecosystem. Soil Biology &
Biochemistry. Vol. 38, No. 7. – P. 1745–1756. doi:10.1016/j.soilbio.2005.11.032
Iutynska H. Gruntova mikrobiolohiya (Soil microbiology). Kyiv: Aristei, 2006. – 284 p. (in Ukrainian)
Kharytonov M. Ekolohichna otsinka aerotekhnohennoho zaprudnennia dovkillia u
Dnipropetrovskomu industrialnomu regioni (Ecological evaluation of aero-technogeneous
environmental pollution in the Dnipropetrovsk industrial region). In: M. Kharytonov, A.
Benselhub, L. Shupranova, V. Khlopova. Naukovy visnyk universytetu bioresursiv i
Symposium Proceedings – Book of Full Papers 335
ECOLOGY 2017 11-13 May, Kayseri TURKEY
pryrodokorystuvannia Ukrainy (Scientific bulletin of the University of Bioresources and
Nature Management). Series: Biology, Biotechnology, Environmental Studies. Issue No. 204,
2014. – P. 65–73. (in Ukrainian)
Kostiuchenko N. Vplyv tekhnohennoho navantazhennia na ekolohichnyi stan gruntiv baseinu
richky Mokra Moskovka (Zaporizka oblast) (Impact of technogeneous load upon the
environmental state of the soils of the Mokra Moskovka River, Zaporizhia oblast). In: Zbirnyk
naukovykh prats V Vseukrainskoho zyizdu ekolohiv z mizhnarodnoyu uchastiu (Collected
papers of the 5th All-Ukraine Congress of Environmentalists with international participation)
(Ekolohiya / Ecology – 2015). – P. 201. (in Ukrainian)
Nwuche C., Ugoji E., 2008. Effects of heavy metal pollution on the soil microbial activity International
Journal of Environmental Science & Technology. Vol. 5. – Р. 409–414. doi:10.1007/bf03326036
Pinigin M. Teoriya i praktika otsenki kombinirovannogo deistviya khimicheskogo
zagriazneniya atmosfernogo vozdukha (Atmospheric air chemical pollution combined effect.
Evaluation theory and practice). In: Gigiena i sanitariya (Hygiene and Sanitary), No. 1, 2001.
– P. 9–13. (in Russian)
Rajapaksha R., Tobor-Kapіon M., Bееth E., 2004. Metal Toxicity Affects Fungal and
Bacterial Activities in Soil Differently Applied and Environmental Microbiology. Vol. 70, No.
5. – P. 2966–2973. doi:10.1128/aem.70.5.2966-2973.2004
Rees, W. E. (n.d.)., 2003. Understanding Urban Ecosystems: An Ecological Economics
Perspective. Understanding Urban Ecosystems, 115–136. doi:10.1007/0-387-22615-x_8
Stefurak V. Vliyanie promyshlennogo zagriazneniya na pochvennuyu mikrofloru (Impact of
industrial pollution upon soil microflora). In: Mikrobnye soobshchestva i ikh
funktsionirovanie v pochve (Microbial communities and their functioning in soils). Scientific
papers. Kiev: Naukova Dumka, 1981. – 280 p. (in Russian)
Zviagintsev D. Metody pochvennoi mikrobiologii i biokhimii (Methods of soil biology and
biochemistry). Ed. by D. Zviagintsev. Moscow: Moscow State University Publishers, 1991. – 330 p. (in
Russian)